WASTEWATER SYSTEM CAPITAL FACILITIES PLAN UPDATE
198
WASTEWATER SYSTEM CAPITAL FACILITIES PLAN UPDATE CITY OF SISTERS DESCHUTES COUNTY OREGON FEBRUARY 2016
-
Upload
khangminh22 -
Category
Documents
-
view
2 -
download
0
Transcript of WASTEWATER SYSTEM CAPITAL FACILITIES PLAN UPDATE
WASTEWATER SYSTEM
CAPITAL FACILITIES
PLAN UPDATE
CITY OF SISTERS
DESCHUTES COUNTY
OREGON
FEBRUARY 2016
Water System Capital Facilities Plan Update
February 2016
Acknowledgements
Sisters City Council Chris Frye, Mayor
Nancy Connolly
David A. Asson
Amy Burghstahler
Andrea Blum
Sisters City Staff Andrew Gorayeb
Paul Bertagna
Kathy Nelson
Joseph O'Neill
Nicole Abbenhuis
Kim Keeton
Dustin Walsh
Sisters Engineer of Record Erik Huffman
-1-
T A B L E O F C O N T E N T S
EXECUTIVE SUMMARY
S.1 Purpose . . . . . . . . . . . . . . . . . . . . . . . . . . . . . . . . . . . . . . . . . . . . . . . Summary - 1
S.2 Population and Growth .......................................................................................... 1
S.3 Existing Wastewater System .................................................................................. 1
S.4 Wastewater Flows .................................................................................................. 1
Actual and Projected Wastewater Flows .................................................. 2
S.5 Collection System Improvements .......................................................................... 2
S.6 Wastewater Treatment Facility Recommendations ............................................... 3
S.7 Wastewater Reuse System Improvements ............................................................. 3
SECTION 1: INTRODUCTION 1.1 General ................................................................................................................ 1-1
1.2 Background ......................................................................................................... 1-1
Figure 1.1 - Vicinity Plan ...................................................................... 1-2
1.3 Previous Planning Documents ............................................................................ 1-3
1.4 Current Situation ................................................................................................. 1-3
1.5 Authorization ...................................................................................................... 1-3
1.6 Organization ........................................................................................................ 1-4
1.7 Planning Area ...................................................................................................... 1-4
1.8 Planning Scope .................................................................................................... 1-4
Figure 1.2 - Zoning Map ........................................................................ 1-6
SECTION 2: METHODOLOGY FOR WASTEWATER SYSTEM EVALUATION 2.1 General ................................................................................................................ 2-1
2.2 Design Period ...................................................................................................... 2-1
2.3 System Capacity and Layout ............................................................................... 2-1
2.4 Regulatory Requirements .................................................................................... 2-1
2.5 Priorities .............................................................................................................. 2-1
2.6 Basis for Opinions of Probable Cost ................................................................... 2-2
2.6.1 General ................................................................................................... 2-2
2.6.2 Construction Cost................................................................................... 2-2
Table 2.1 Engineering News Record Construction Cost Index
with Calculated Annual Percent Increases ............................... 2-3
2.6.3 Contingencies ......................................................................................... 2-3
2.6.4 Engineering, Legal and Administrative ................................................. 2-4
2.6.5 Opinion of Probable Cost Summary ...................................................... 2-4
2.7 Recommended Improvements ............................................................................. 2-4
SECTION 3: EXISTING WASTEWATER SYSTEM 3.1 General ................................................................................................................ 3-1
3.2 Wastewater Collection System ........................................................................... 3-1
3.2.1 Gravity Mains and Manholes . ............................................................... 3-1
Figure 3.1 - Existing Wastewater System .............................................. 3-2
3.2.2 Collection System Quality ..................................................................... 3-3
3.2.3 Pressure Mains ....................................................................................... 3-3
3.3 Wastewater Pump Stations ................................................................................. 3-4
3.4 Wastewater Treatment Facility ........................................................................... 3-6
Figure 3.2 - T.P. Schematic ................................................................... 3-7
-2-
Table 3.1 - Sisters Wastewater Treatment Facility Design Data........... 3-8
3.4.1 Theory of Treatment Process ................................................................. 3-9
3.4.2 Influent Flow Measurement and Sampling .......................................... 3-10
3.4.3 Headworks ........................................................................................... 3-10
3.4.4 Aerated Lagoons .................................................................................. 3-11
3.4.4.1 Aerators ................................................................................... 3-11
3.4.4.2 Transfer Structures .................................................................. 3-12
3.4.4.3 Disinfection Facilities ............................................................. 3-12
3.4.4.4 Effluent Flow Measurement and Sampling ............................ 3-13
3.4.4.5 Treatment and Pumping Facility Control Building ................. 3-13
3.4.4.6 General Plant Conditions ........................................................ 3-13
3.5 Wastewater Effluent Reuse ............................................................................... 3-14
3.5.1 General ................................................................................................. 3-14
3.5.2 Effluent Reuse System ......................................................................... 3-14
SECTION 4: POPULATION AND LAND USE 4.1 Historical Population .......................................................................................... 4-1
4.2 Current Population .............................................................................................. 4-1
4.3 Projected Future Population in Year 2025 .......................................................... 4-1
4.4 Comparison with Previous Growth Projections .................................................. 4-1
4.5 Capital Facilities Plan Population Forecasts ....................................................... 4-1
4.6 Buildout Of Current UGB ................................................................................... 4-1
4.7 Land Use ............................................................................................................. 4-2
4.7.1 Current Land Use ................................................................................... 4-2
4.7.2 Comprehensive Plans and Zoning Ordinance Revisions (2014) ............ 4-2
4.7.3 General Comments................................................................................. 4-2
SECTION 5: WASTEWATER CHARACTERISTICS
5.1 Introduction ......................................................................................................... 5-1
5.1.1 Definitions ............................................................................................. 5-1
5.1.2 Parameters of Interest ............................................................................ 5-3
5.1.3 Methodology for Computing Flows ...................................................... 5-3
5.2 Accuracy of Data .............................................................................................. 5-4
5.2.1 Influent Flowmeter and Sampler .......................................................... 5-4
5.2.2 Bypass and Overflows ......................................................................... 5-4
5.2.3 Inflow and Infiltration (I/I) .................................................................. 5-4
5.2.4 Effects of Population Growth............................................................... 5-4
5.3 Flow Analysis ................................................................................................... 5-5
5.3.1 Observed Data ...................................................................................... 5-5
Table 5.1 – Wastewater Influent Flow Data ........................................ 5.5
Table 5.2 – Daily Wastewater Data Summary ..................................... 5-6
Table 5.3 – Summary of wastewater Flow Characteristics ................. 5-6
5.3.2 Design Flows........................................................................................ 5-7
Table 5.4 – Design Flow Summary ...................................................... 5-7
5.4 Wastewater Quality ............................................................................................ 5-8
5.4.1 Current Influent Loadings ................................................................... 5-8
Table 5.5 – Influent BOD’s Data ........................................................ 5-8
Table 5.6 – Influent TSS Data ............................................................. 5-9
Table 5.7 – Influent TSS Data ........................................................... 5-10
Table 5.8 – Influent TSS Data ........................................................... 5-10
-3-
SECTION 6: COLLECTION SYSTEM IMPROVEMENTS 6.1 General ................................................................................................................ 6-1
6.2 Design Parameters .............................................................................................. 6-1
Table 6.1 - EDU Designation ................................................................ 6-1
6.3 System Assessment ............................................................................................. 6-2
Table 6.2 - System Flow Capacities ....................................................... 6-2
SECTION 7: WASTEWATER TREATMENT ANALYSIS
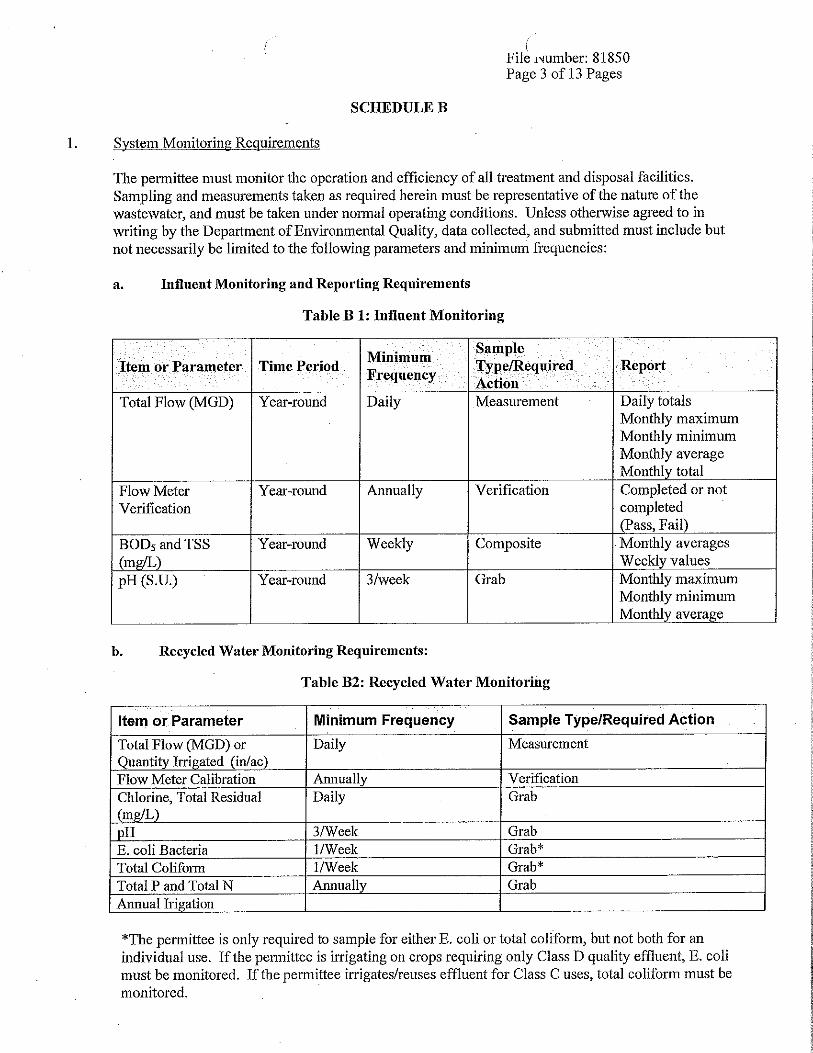
7.1 WPCF Permit ....................................................................................................... 7-1
Table 7.1 – WPCF (Permit 101779) Minimum Monitoring
Requirements ....................................................................... 7-1
7.2 Effluent Quality ................................................................................................... 7-2
Table 7.2 – Effluent TSS Data ................................................................ 7-2
Table 7.3 – Effluent E. Coli and Chlorine Data .................................... 7-3
7.3 Treatment Capacity .............................................................................................. 7-4
7.3.1 Hydraulic Capacity ................................................................................ 7-4
Table 7.4 – Holding Pond Surface Areas and Volume .......................... 7-4
Table 7.5 – Water Balance (October 2014-September 2015) ................ 7-5
Table 7.6 – Synthetic Water Balance and Estimate of Holding Pond
Hydraulic Capacity .............................................................. 7-6
Table 7.7 – Holding Pond Hydraulic Capabilities ................................ 7-6
7.3.2 BODs Capacity Evaluation ................................................................... 7-6
Table 7.8 – BODs Loadings and Capacity Utilization ......................... 7-7
7.4 Recommendations ............................................................................................... 7-7
SECTION 8: WASTEWATER DISPOSAL 8.1 Introduction ......................................................................................................... 8-1
8.1.1 Current Status......................................................................................... 8-1
8.1.2 Disposal Alternatives - Preliminary Considerations .............................. 8-1
8.2 Regulatory Requirements .................................................................................... 8-2
8.2.1 General Regulatory Requirements ......................................................... 8-2
8.2.2 WPCF Permit Requirements .................................................................. 8-2
8.3 Current Disposal Practices .................................................................................. 8-4
8.3.1 Effluent Water Quantity and Quality ..................................................... 8-4
8.3.2 Irrigation Site ......................................................................................... 8-4
8.3.3 Irrigation System .................................................................................... 8-5
8.3.4 Crops ...................................................................................................... 8-5
8.3.5 Effluent Application............................................................................... 8-5
Table 8.1 - Effluent Irrigation Application Totals (2005) ..................... 8-5
8.3.6 Access, Setbacks, and Aerosol Drift ...................................................... 8-5
Table 8.2 - Irrigation Season Wind Data - Summary
(Redmond Airport) .................................................................... 8-6
8.4 Compliance Evaluation ....................................................................................... 8-7
8.5 Future Irrigation Needs ....................................................................................... 8-7
8.5.1 Water Quantity and Quality ................................................................... 8-7
8.5.2 Irrigation Acreage Needed ..................................................................... 8-7
8.5.3 Expansion Sites ...................................................................................... 8-7
8.5.4 Disinfection System ............................................................................... 8-8
8.5.5 Irrigation System .................................................................................... 8-8
Figure 8.1 - Effluent Reuse Areas ........................................................... 8-9
8.6 Recommendations .............................................................................................. 8-10
-4-
8.6.1 Crops ...................................................................................................... 8-5
8.6.2 Effluent Application............................................................................... 8-5
Table 8.1 - Effluent Irrigation Application Totals (2005) ..................... 8-5
8.6.3 Access, Setbacks, and Aerosol Drift ...................................................... 8-5
Table 8.2 - Irrigation Season Wind Data - Summary
(Redmond Airport) .................................................................... 8-6
8.7 Compliance Evaluation ....................................................................................... 8-7
8.8 Future Irrigation Needs ....................................................................................... 8-7
8.8.1 Water Quantity and Quality ................................................................... 8-7
8.8.2 Irrigation Acreage Needed ..................................................................... 8-7
8.8.3 Expansion Sites ...................................................................................... 8-7
8.8.4 Disinfection System ............................................................................... 8-8
8.8.5 Irrigation System .................................................................................... 8-8
Figure 8.1 - Effluent Reuse Areas ......................................................... 8-9
8.9 Recommendations .............................................................................................. 8-10
SECTION 9: BIOSOLIDS MANAGEMENT
9.1 Introduction .......................................................................................................... 9-1
9.2 General Regulatory Requirements ....................................................................... 9-1
9.3 WPCF Permit Requirements ................................................................................ 9-2
9.4 Current Biolsolids Treatment and Disposal ......................................................... 9-3
9.5 Accumulated Biosolids ........................................................................................ 9-3
9.5.1 Quantity ................................................................................................ 9-3
9.5.2 Quality .................................................................................................. 9-4
9.6 Compliance Evaluation ........................................................................................ 9-4
9.7 Recommendations ................................................................................................ 9-4
SECTION 10: IMPROVEMENT RECOMMENDATIONS
10.1 Effluent Reuse Disposal Improvements ............................................................. 10-1 10.2 Treatment Plant Improvements .......................................................................... 10-2
10.3 Collection System Improvements ...................................................................... 10-3
10.4 Proposed Sewer System Infrastructure Improvements Timing and Cost
Summary ............................................................................................................ 10-4
SECTION 11: FINANCE OPTIONS
11.1 Introduction ........................................................................................................ 11-1
11.2 Public Works Financing Programs ..................................................................... 11-1
11.2.1 US Department of Agriculture (USDA) Rural Development .......... 11-2
11.2.2 Department of Environmental Quality ............................................. 11-2
11.2.3 Infrastructure Finance Authority (IFA) ............................................ 11-3
11.2.4 League of Oregon Cities (LOC) ....................................................... 11-3
11.2.5 Municipal Bond Financing ............................................................... 11-3
11.3 Local Funding Sources ....................................................................................... 11-3
11.3.1 General Obligation Bonds ................................................................ 11-4
11.3.2 Revenue Bonds ................................................................................. 11-5
11.3.3 Improvement Bonds (Local Improvement District) ......................... 11-6
11.3.4 Serial Levies .................................................................................... 11-7
11.3.5 Sinking Funds.................................................................................. 11-7
11.3.6 Ad Valorem Tax .............................................................................. 11-7
-5-
11.3.7 System User Fees ............................................................................ 11-8
11.3.8 Assessments .................................................................................... 11-8
11.3.9 System Development Charges ........................................................ 11-8
11.4 Proposed Financial Program .............................................................................. 11-8
SECTION 12: WASTEWATER RATES AND FINANCING
12.1 Wastewater Fund Budget ................................................................................... 12-1
Table 12.1 ........................................................................................ 12-1
12.2 Wastewater System Revenue ............................................................................ 12-1
12.2.1 Current Wastewater Rates ............................................................... 12-1
12.2.2 Current Rate Revenue ..................................................................... 12-2
12.2.3 Property Tax .................................................................................... 12-2
12.2.4 Other Revenue ................................................................................. 12-2
12.3 Wastewater System Expenses ........................................................................... 12-2
12.3.1 Debt Service .................................................................................... 12-2
12.3.2 Operations and Maintenance (O &M) ............................................. 12-2
12.4 Current Rates – Analysis and Recommendations ............................................. 12-2
12.5 Future Rates....................................................................................................... 12-3
12.6 Capital Improvements Plan ............................................................................... 12-3
12.6.1 Capital Improvements .................................................................... 12-3
12.6.2 Financing ........................................................................................ 12-4
12.7 System Development Charges (SDC’s) ............................................................ 12-4
A. City of Sisters Wastewater Reuse and Conservation Plan
B. Discharge Monitoring Reports
C. Water Pollution Control Facility (WPCF) Permit
February 2016 City of Sisters
Summary - 1
EXECUTIVE SUMMARY
S.1 PURPOSE
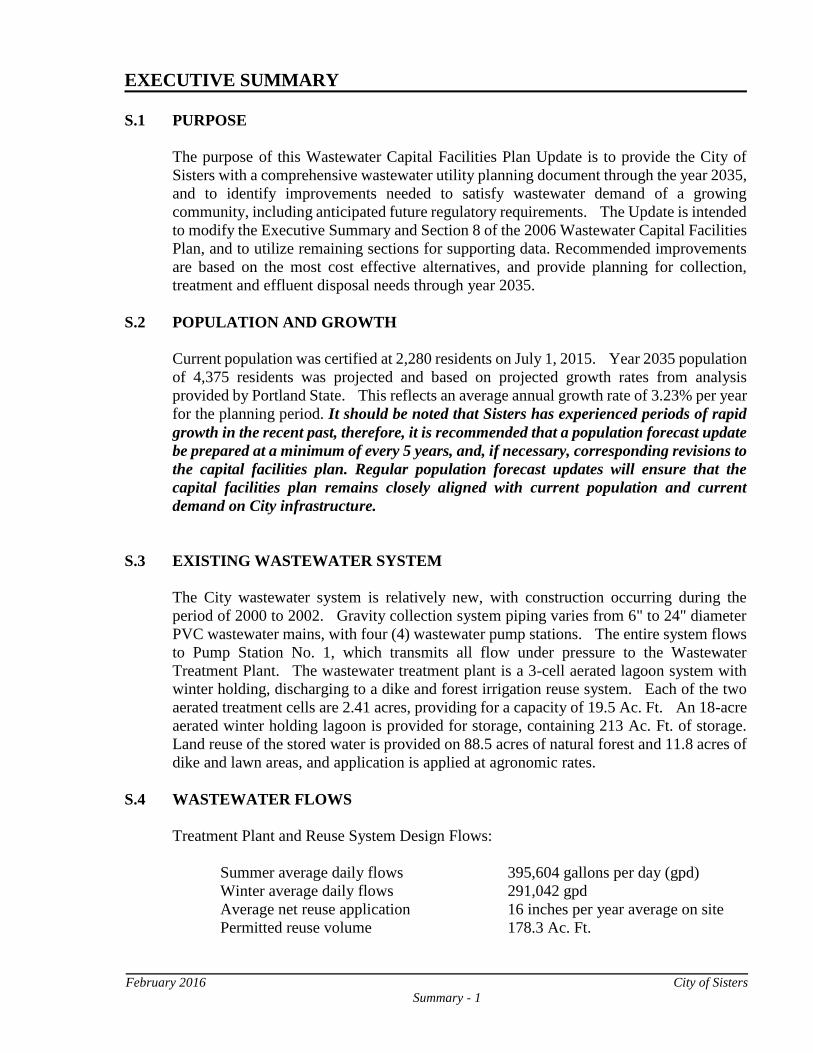
The purpose of this Wastewater Capital Facilities Plan Update is to provide the City of
Sisters with a comprehensive wastewater utility planning document through the year 2035,
and to identify improvements needed to satisfy wastewater demand of a growing
community, including anticipated future regulatory requirements. The Update is intended
to modify the Executive Summary and Section 8 of the 2006 Wastewater Capital Facilities
Plan, and to utilize remaining sections for supporting data. Recommended improvements
are based on the most cost effective alternatives, and provide planning for collection,
treatment and effluent disposal needs through year 2035.
S.2 POPULATION AND GROWTH
Current population was certified at 2,280 residents on July 1, 2015. Year 2035 population
of 4,375 residents was projected and based on projected growth rates from analysis
provided by Portland State. This reflects an average annual growth rate of 3.23% per year
for the planning period. It should be noted that Sisters has experienced periods of rapid
growth in the recent past, therefore, it is recommended that a population forecast update
be prepared at a minimum of every 5 years, and, if necessary, corresponding revisions to
the capital facilities plan. Regular population forecast updates will ensure that the
capital facilities plan remains closely aligned with current population and current
demand on City infrastructure.
S.3 EXISTING WASTEWATER SYSTEM
The City wastewater system is relatively new, with construction occurring during the
period of 2000 to 2002. Gravity collection system piping varies from 6" to 24" diameter
PVC wastewater mains, with four (4) wastewater pump stations. The entire system flows
to Pump Station No. 1, which transmits all flow under pressure to the Wastewater
Treatment Plant. The wastewater treatment plant is a 3-cell aerated lagoon system with
winter holding, discharging to a dike and forest irrigation reuse system. Each of the two
aerated treatment cells are 2.41 acres, providing for a capacity of 19.5 Ac. Ft. An 18-acre
aerated winter holding lagoon is provided for storage, containing 213 Ac. Ft. of storage.
Land reuse of the stored water is provided on 88.5 acres of natural forest and 11.8 acres of
dike and lawn areas, and application is applied at agronomic rates.
S.4 WASTEWATER FLOWS
Treatment Plant and Reuse System Design Flows:
Summer average daily flows 395,604 gallons per day (gpd)
Winter average daily flows 291,042 gpd
Average net reuse application 16 inches per year average on site
Permitted reuse volume 178.3 Ac. Ft.
City of Sisters Wastewater System Capital Facilities Plan Update
Executive Summary
February 2016 City of Sisters
Summary - 2
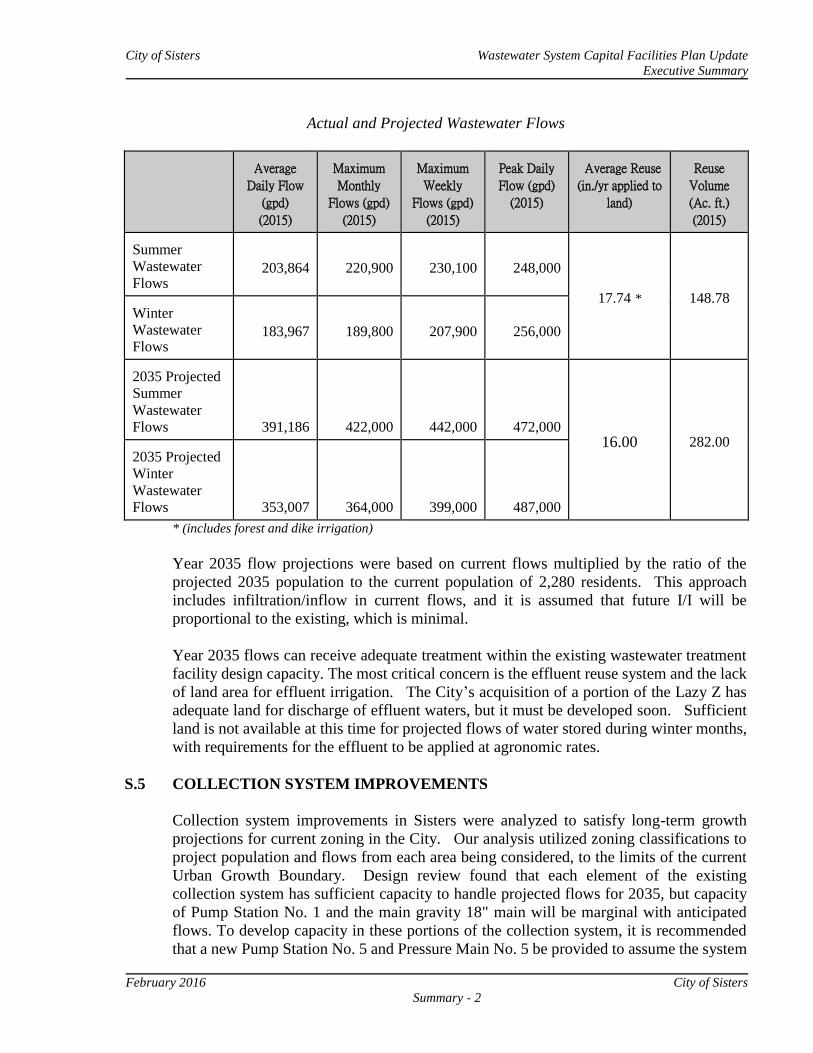
Actual and Projected Wastewater Flows
Average
Daily Flow
(gpd)
(2015)
Maximum
Monthly
Flows (gpd)
(2015)
Maximum
Weekly
Flows (gpd)
(2015)
Peak Daily
Flow (gpd)
(2015)
Average Reuse
(in./yr applied to
land)
Reuse
Volume
(Ac. ft.)
(2015) Summer
Wastewater
Flows
203,864
220,900
230,100
248,000
17.74 *
148.78 Winter
Wastewater
Flows
183,967
189,800
207,900
256,000
2035 Projected
Summer
Wastewater
Flows
391,186
422,000
442,000
472,000 16.00
282.00
2035 Projected
Winter
Wastewater
Flows
353,007
364,000
399,000
487,000
* (includes forest and dike irrigation)
Year 2035 flow projections were based on current flows multiplied by the ratio of the
projected 2035 population to the current population of 2,280 residents. This approach
includes infiltration/inflow in current flows, and it is assumed that future I/I will be
proportional to the existing, which is minimal.
Year 2035 flows can receive adequate treatment within the existing wastewater treatment
facility design capacity. The most critical concern is the effluent reuse system and the lack
of land area for effluent irrigation. The City’s acquisition of a portion of the Lazy Z has
adequate land for discharge of effluent waters, but it must be developed soon. Sufficient
land is not available at this time for projected flows of water stored during winter months,
with requirements for the effluent to be applied at agronomic rates.
S.5 COLLECTION SYSTEM IMPROVEMENTS
Collection system improvements in Sisters were analyzed to satisfy long-term growth
projections for current zoning in the City. Our analysis utilized zoning classifications to
project population and flows from each area being considered, to the limits of the current
Urban Growth Boundary. Design review found that each element of the existing
collection system has sufficient capacity to handle projected flows for 2035, but capacity
of Pump Station No. 1 and the main gravity 18" main will be marginal with anticipated
flows. To develop capacity in these portions of the collection system, it is recommended
that a new Pump Station No. 5 and Pressure Main No. 5 be provided to assume the system
City of Sisters Wastewater System Capital Facilities Plan Update
Executive Summary
February 2016 City of Sisters
Summary - 3
capacity needs West of Highway 20 in this rapidly expanding portion of the City. This
work will need to be developed prior to 2035, and sooner if the USFS land is developed
into residential, commercial, or industrial usages. The pumps in Pump Station No. 1 are
used extensively, and the effective lifetime of these units will be reached in the planning
period. We also recommend that provisions be made to replace these pumps prior to
2035.
S.6 WASTEWATER TREATMENT FACILITY RECOMMENDATIONS
Wastewater treatment facility improvements will be required to satisfy increasing
population demand. Based on population projections, expansion of wastewater treatment
capabilities and effluent reuse facilities will be required. Treatment facility needs are
limited to software and security upgrades, and the irrigation reuse system needs to be
expanded into the 49 acre forested parcel of the City’s portion of the Lazy Z Ranch.
Existing and recommended land area to provide reuse capacity for wastewater disposal in
Sisters is adequate to allow for reuse of effluent waters through the Year 2035.
SCADA (Supervisory Control And Data Acquisition) and security upgrades for the
existing treatment facility are recommended when each of the Lazy Z irrigation
improvements occur.
Wastewater treatment facility improvements will involve biosolids removal and disposal,
and removal and replacement of the existing lagoon aerators with larger, new energy
efficient units.
S.7 WASTEWATER REUSE SYSTEM IMPROVEMENTS
Wastewater reuse system improvements will be required in the near future to satisfy
increasing resident demand. Population growth will require additional reuse capabilities,
which will involve expansion into the 49-acre forested parcel of the City’s ownership on
the Lazy Z Ranch.
Additional reuse improvements should include developing additional agricultural portions
of the City’s Lazy Z property for reuse purposes when necessary.
February 2016 City of Sisters
1 - 1
SECTION 1
INTRODUCTION 1.1 GENERAL
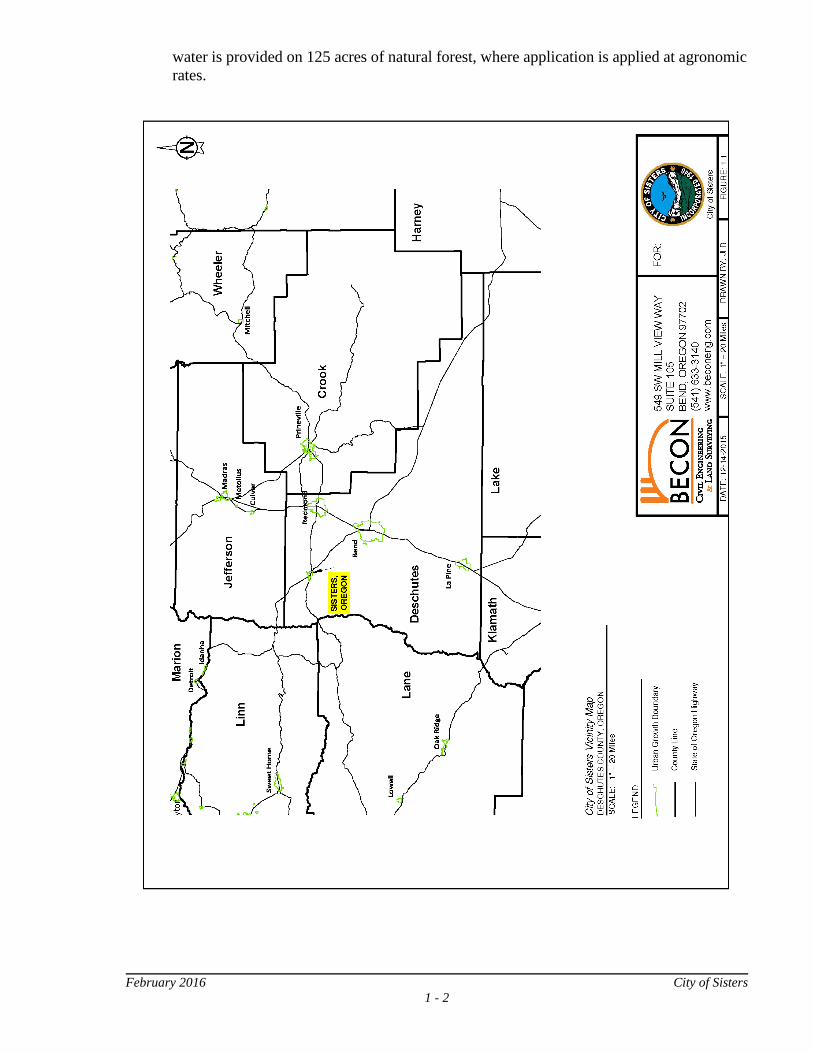
Sisters is located in Deschutes County, 21 miles northwest of Bend and 20 miles west of
Redmond (Figure 1.1). The major transportation routes between the mid-Willamette
Valley and central and eastern Oregon pass through Sisters. The City is a focal point for
travelers, tourists, and part-time residents. Sisters was established along the Santiam and
McKenzie Highways around 1880, and became an incorporated City in 1946.
Resident population was estimated on July 1, 2015 as approximately 2,280 people, with a
significant influx of retirees, tourists, travelers, part time residents and associated
commercial development. Sisters has been rapidly growing since completion of a new
wastewater system in 2002, which allowed for a number of residential developments to
occur.
1.2 BACKGROUND
The City of Sisters owns and operates a municipal wastewater collection and treatment
system. The system is relatively new, with construction extending from 2000-2002.
Sisters had contemplated construction of a municipal sewer system since 1972, and
residents approved bonds for $7,000,000 in construction funds on May 19, 1998.
Construction grants and loans for construction were received from Rural Development,
OECDD, EDA, Oregon Community Development Block Grants, the Rural Investment
Fund, and from the Oregon Department of Environmental Quality to allow the project to
proceed. Planning projections from the City of Sisters and from Deschutes County
projected a resident population of 1,575 people by the year 2020, and this projection was
exceeded in 2004. Oregon State funding sources were not willing to assist with major
financial contributions for construction of the wastewater system, because they believed
that planning projections were overly optimistic, and would not occur.
The entire City wastewater collection system was constructed of quality ASTM 3034 PVC
pipe materials, with rubber ring joint connections. Construction included new service
lines to connect every residence and business to the sewer system, and all lines were
pressure tested. In addition, all manholes were vacuum tested, and all main lines were
televised to make certain that a quality installation was achieved. Since the initial
construction, similar materials have been utilized for all extensions, and all main and
service line connections have been installed to City of Sisters and Oregon Plumbing
Specialty Code Standards. Emphasis has been placed on maintaining a quality wastewater
system. Continued community growth will demand substantial improvements in sizing,
with construction of a new major pump station no. 5 and force main no. 5 to contain
expansion.
An aerated lagoon wastewater treatment plant was constructed with two 2.41 acre cells,
each holding 19.5 Ac. Ft. The treatment facility was followed with an 18-acre winter
holding lagoon containing 213 Ac. Ft. of storage for wastewater. Land reuse of the stored
February 2016 City of Sisters
1 - 2
water is provided on 125 acres of natural forest, where application is applied at agronomic
rates.
City of Sisters Wastewater System Capital Facilities Plan Update
Section 1 - Introduction
February 2016 City of Sisters
1 - 3
The City of Sisters purchased a 230 acre parcel of the Lazy Z Ranch following development
of the November 2006 Wastewater Capital Facilities Plan, and this can readily be utilized
for effluent reuse. Initial plans are to utilize a 49 acre forested section of the parcel for
continuance of irrigation on natural forest, again at agronomic rates. As the community
grows, adequate land is available on the Lazy Z parcel to provide reuse for the long term
future needs of the City. Reuse on the remaining portions of the parcel will concentrate
on agricultural production, with crops that are self-sustaining and consume reuse waters at
agronomic rates.
1.3 PREVIOUS PLANNING DOCUMENTS
Master Planning for public wastewater improvements in Sisters has occurred on a regular
basis in Sisters since 1972, including the following:
1. Comprehensive Development Plan for Sewerage Improvements,@ May 1972, HGE
Inc., Engineers & Planners
2. Comprehensive Wastewater Facilities Plan, 1977, HGE Inc., Engineers & Planners
3. Sewer System Local Improvement District, 1979, HGE Inc., Engineers & Planners
4. Phase 1 Engineering and Sewer Technical Assistance Study, 1987-1990, Century
West Engineers.
5. Wastewater System Engineering Study, 1994, HGE Inc., Architects, Engineers,
Surveyors & Planners.
6. Wastewater System Facilities Plan, 1997, HGE Inc., Architects, Engineers,
Surveyors & Planners
7. Wastewater System Capital Facilities Plan, 2006, HGE Inc., Architects, Engineers,
Surveyors & Planners.
8. Wastewater Reuse and Conservation Project Planning Study, 2013, Newton
Consultants, Inc.
1.4 CURRENT SITUATION
The City of Sisters has and continues to experience rapid growth and an update to the 2006
Wastewater Capital Facilities Plan is needed to evaluate and provide capacity for
anticipated growth to year 2035. Land for treatment and disposal needs is owned at this
time by the City of Sisters, and expansion plans will be addressed in this Capital Facilities
Plan Update.
1.5 AUTHORIZATION
The City of Sisters has prepared this Wastewater System Capital Facilities Plan Update for
current zoning of property within the Sisters Urban Growth Boundary (UGB).
City of Sisters Wastewater System Capital Facilities Plan Update
Section 1 - Introduction
February 2016 City of Sisters
1 - 4
1.6 ORGANIZATION
The overall structure of this Wastewater System Capital Facilities Plan Update follows the
flow of wastewater from consumers to treatment and ultimate disposal of the effluent.
Much of the 2006 Plan remains valid, and needed modifications to consider changed
conditions are addressed in this Update. Separate chapters have been written to evaluate
each of the following system components: wastewater collection and pumping
improvements, wastewater treatment and winter holding facilities, and effluent land reuse
meeting WPCF and Oregon Department of Environmental Quality Standards. Tables and
figures in this update are numbered consecutively within each chapter, and they generally
appear in the text of the report on the page or pages following the first reference.
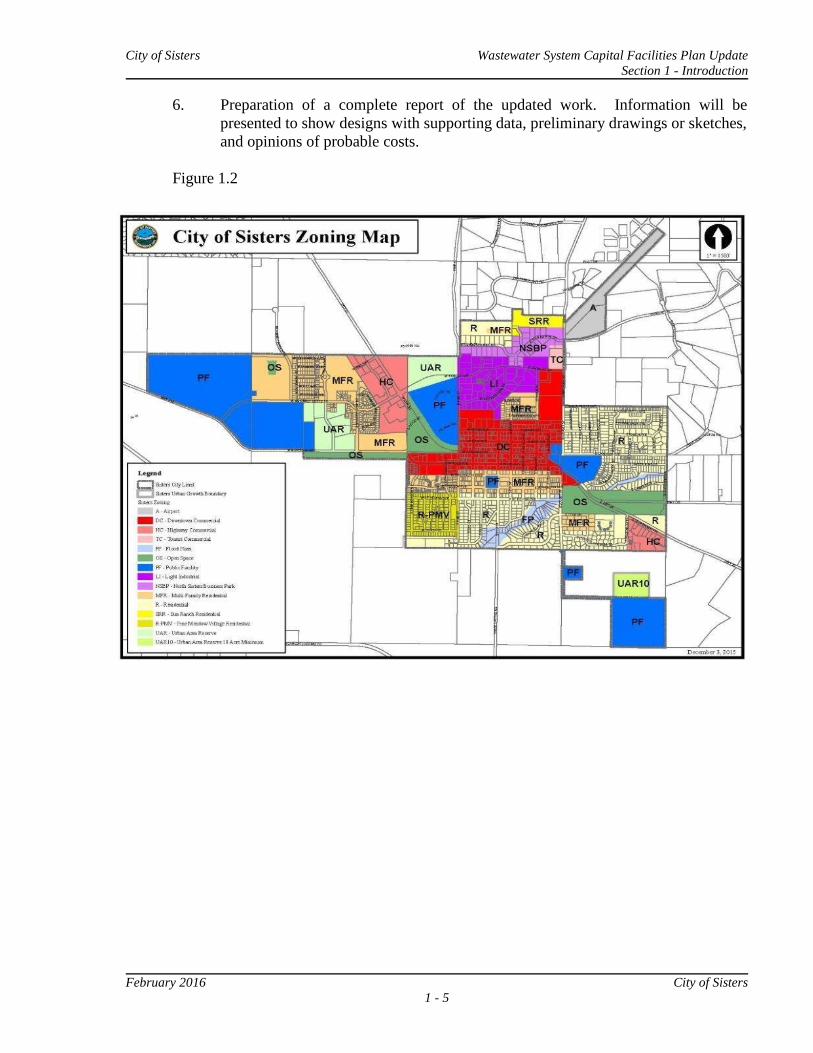
1.7 PLANNING AREA
The planning area used in this Wastewater System Capital Facilities Plan Update is the
area encompassed by the current Sisters UGB. See Figure 1.2
1.8 PLANNING SCOPE
The objective of this updated plan is to establish a short-term and long-term wastewater
system capital facilities plan for the present and future needs of the City of Sisters.
Overall, the scope of work is meant to enumerate an exacting plan for growth and satisfy
requirements for potential funding sources. Needs will be addressed relative to
wastewater collection, pumping, treatment and land reuse. An outline of basic
considerations of the facilities plan update is as follows:
1. Describe the existing wastewater facilities and the area to be served. Include land
use, current and estimated future population, and environmental concerns.
2. Utilize existing wastewater system requirements from the 2006 plan, based on
estimated water consumption, and land use plans. Develop projected wastewater
capacity needs to the year 2035.
3. Description of the existing collection, pumping, treatment, and land reuse systems,
and their ability to meet existing and future wastewater system demand.
Long-range system needs will also be developed by the application of growth
projections into the collection system model, and with a detailed layout of future
system needs within the UGB.
4. Provide a base map showing the wastewater collection system, with pumping
stations. Separate mapping shall be provided showing the wastewater treatment
and land reuse systems.
5. Opinions of probable costs for various alternatives will be prepared and
recommendations will be separated into priorities for development.
City of Sisters Wastewater System Capital Facilities Plan Update
Section 1 - Introduction
February 2016 City of Sisters
1 - 5
6. Preparation of a complete report of the updated work. Information will be
presented to show designs with supporting data, preliminary drawings or sketches,
and opinions of probable costs.
Figure 1.2
February 2016 City of Sisters
2 - 1
SECTION 2
METHODOLOGY USED FOR WASTEWATER SYSTEM EVALUATION 2.1 GENERAL
This section of the study covers the procedure used to establish the design parameters for
the upgraded wastewater system, priorities for implementation, and the method used to
develop opinions of probable cost.
2.2 DESIGN PERIOD
This update is based on a 20-year planning period with future projections to the year 2035.
It is felt that this time frame is adequate to allow for adaptation to future needs, while being
short enough to ensure that the facilities will be effectively utilized within their economic
life. System recommendations are developed for construction in phases (priorities) and
all components are designed to allow future expansion. Alternate recommendations are
made to future improvements which are dependent on growth patterns and other variables
which cannot be accurately predicted at this time.
2.3 SYSTEM CAPACITY AND LAYOUT
Capacity requirements and consequent system sizing are based on evaluations of
population, and land use. Potential wastewater system volume is estimated based on
actual flows received at the wastewater treatment facility, and on experience with facilities
in other communities. System collection system layout includes an allowance for future
growth to the limits of the established UGB.
2.4 REGULATORY REQUIREMENTS
Wastewater treatment in the state of Oregon must meet the requirements of the Oregon
Department of Environmental Quality (DEQ) and the United States Environmental
Protection Agency (EPA).
2.5 PRIORITIES
Major wastewater system construction requires considerable financial resources. In
developing a wastewater system capital facilities plan, it is necessary to consider the
relative importance of the proposed improvements and to assign priorities to the
development program accordingly. An advantage of the phased approach, especially in
regard to collection, treatment and land reuse system expansion, is the allowance of time in
which actual system usage and growth can be evaluated in order to refine the sizing of
subsequent improvements.
By prioritizing the proposed improvements, construction costs can be extended over a
longer period of time in an effort to remain within the financial capabilities of the
community. This will allow the City to take maximum advantage of potential Federal and
State grants and loans that are available to assist small communities with major wastewater
City of Sisters Wastewater System Capital Facilities Plan Update
Section 2 - Methodology Used for Wastewater System Evaluation
February 2016 City of Sisters
2 - 2
system improvements. Initial improvements should be based on the most immediate
critical needs and should provide the greatest benefit at the lowest cost. Later
improvements should follow the short and long-range guidelines and meet future demands
as the community develops and can finance the improvements.
2.6 BASIS FOR OPINIONS OF PROBABLE COST
2.6.1 General
Opinions of probable cost presented in this study include three components, each of
which is discussed separately in this section. It must be recognized that opinions
of probable cost are preliminary and are based on the level and detail of planning
presented in this study. As any project element proceeds forward, it may be
necessary to update the costs from time to time, as more information becomes
available.
2.6.2 Construction Cost
Opinions of probable construction costs in this capital facilities plan are based on
actual construction bidding results for similar work, published cost guides, and
other construction cost experience of the authors within the state of Oregon.
Opinions of probable cost are based on preliminary layouts of the proposed
improvements.
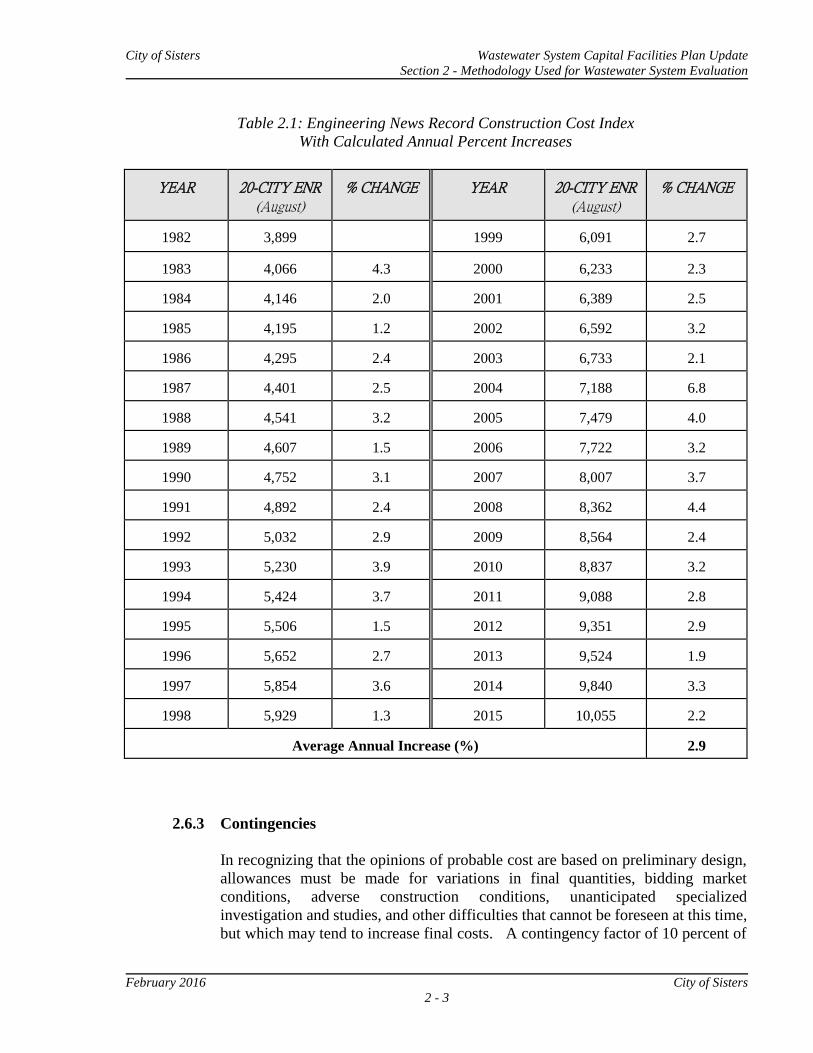
Future changes in the cost of labor, equipment, and materials, may justify
comparable changes in the opinions of probable cost presented herein. For this
reason, it is common engineering practice to relate the costs to a particular index
that varies in proportion to long-term changes in the national economy. The
Engineering News Record (ENR) Construction Cost Index is most commonly used.
It is based on a value of 100 for the year 1913, and the values since 1982 are shown
in Table 2.1 along with calculated annual percent increases.
All costs in this study are based on the August 2015 ENR Construction Cost Index
value of 10,055. Opinions of probable costs should be updated at the actual time
of funding applications and a decision made as to whether loan funds will be
required. Note that when the community secures financing, a reserve factor should
be added at that time for estimated increases in cost due to inflation. Estimates can
be prepared at any future date by comparing the future ENR Construction Cost
Index with the index value of 10,055; however, this approach is generally only
considered valid for a 2 or 3 year period since construction techniques and
materials change with time. If more time than this has elapsed, opinions of
probable cost should be updated by an Engineer.
City of Sisters Wastewater System Capital Facilities Plan Update
Section 2 - Methodology Used for Wastewater System Evaluation
February 2016 City of Sisters
2 - 3
Table 2.1: Engineering News Record Construction Cost Index
With Calculated Annual Percent Increases
YEAR 20-CITY ENR
(August)
% CHANGE
YEAR
20-CITY ENR
(August)
% CHANGE
1982
3,899
1999
6,091
2.7
1983
4,066
4.3
2000
6,233
2.3
1984
4,146
2.0
2001
6,389
2.5
1985
4,195
1.2
2002
6,592
3.2
1986
4,295
2.4
2003
6,733
2.1
1987
4,401
2.5
2004
7,188
6.8
1988
4,541
3.2
2005
7,479
4.0
1989
4,607
1.5
2006
7,722
3.2
1990
4,752
3.1
2007
8,007
3.7
1991
4,892
2.4
2008
8,362
4.4
1992
5,032
2.9
2009
8,564
2.4
1993
5,230
3.9
2010
8,837
3.2
1994
5,424
3.7
2011
9,088
2.8
1995
5,506
1.5
2012
9,351
2.9
1996
5,652
2.7
2013
9,524
1.9
1997
5,854
3.6
2014
9,840
3.3
1998
5,929
1.3
2015
10,055
2.2
Average Annual Increase (%)
2.9
2.6.3 Contingencies
In recognizing that the opinions of probable cost are based on preliminary design,
allowances must be made for variations in final quantities, bidding market
conditions, adverse construction conditions, unanticipated specialized
investigation and studies, and other difficulties that cannot be foreseen at this time,
but which may tend to increase final costs. A contingency factor of 10 percent of
City of Sisters Wastewater System Capital Facilities Plan Update
Section 2 - Methodology Used for Wastewater System Evaluation
February 2016 City of Sisters
2 - 4
the construction cost has therefore been added.
2.6.4 Engineering, Legal and Administrative
An allowance of 10 percent of the projected construction cost has been added for
engineering, legal and administration. This allowance is intended to include
internal project planning and budgeting, grant administration, liaison, interest on
interim financing, legal services, review fees, legal advertising, and other related
expenses associated with the project.
2.6.5 Opinion of Probable Cost Summary
Opinions of probable costs presented in this study include a combined allowance of
20 percent for contingencies, engineering, legal, and administrative costs.
2.7 RECOMMENDED IMPROVEMENTS
The assessment of the proposed wastewater system will be summarized and a
recommended plan for construction will be developed in Section 10.
February 2016 City of Sisters
3 -1
SECTION 3:
EXISTING WASTEWATER SYSTEM
3.1 GENERAL
This section includes a brief description of existing wastewater facilities in Sisters. The City
wastewater system is relatively new, with construction occurring during the period of 2000
through 2002. Following sections discuss components of the system in greater detail, and
present recommended improvements. The current wastewater system consists of a gravity
sewer system with over 122,000 lineal feet of wastewater mains, four wastewater pump
stations and force mains, a three-cell aerated lagoon treatment system with winter holding,
and a 100.3 acre automated land reuse system. Land reuse is provided on 11.8 acres of dike
and pasture grass, and on 88.5 acres of natural forest land.
System locations and sizing were developed from available as-built records in the City, and
in extensive records available in t he C i t y Engineer ’ s files. Construction plans were
provided for all developments since the original wastewater system was completed, and
City staff provided their knowledge of existing facilities.
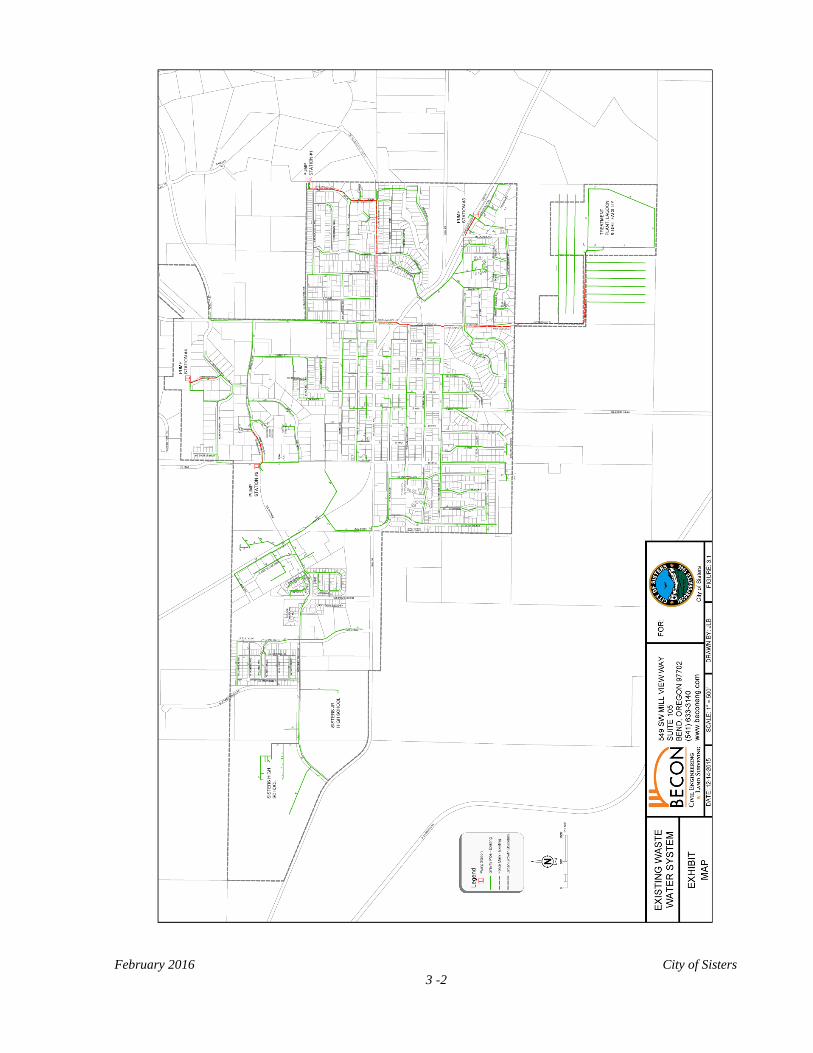
3.2 WASTEWATER COLLECTION SYSTEM
The existing wastewater collection system is shown in Figure 3.1. Collection facilities
include 6" to 24" diameter ASTM 3034 PVC wastewater mains with 4" and 6" PVC service
lines, all laid at varying grades. There are a limited number of individual semi-positive
displacement grinder wastewater pump stations that provide wastewater service to residences
that could not be served through the gravity collection system (Creekside and Timber Creek
Phase VI subdivisions). Gravity conveyance facilities convey wastewater by gravity from
individual users to the four wastewater pump stations. Individual developments have
completed major expansions to the wastewater collection system since the original
construction was completed in 2002. Two of the existing wastewater pumping facilities
were completed by new private development, and numerous main extensions have been
completed. All of the wastewater pump stations transmit flows through AWWA C-900
force mains of varying sizing.
In general, wastewater is conveyed to the primary wastewater pumping facilities via gravity
lines. Wastewater from three of the pumping facilities is transmitted through force mains
and additional gravity mains to the location of Wastewater Pump Station No. 1. All
wastewater in the system is currently processed through Pump Station No. 1 and transmitted
through a 12" diameter force main to the wastewater treatment facility, for ultimate land
application to the forested reuse site.
3.2.1 Gravity Mains and Manholes
Mains. The collection system has 916 lineal feet of 6" gravity main, 95,050 lineal feet of 8" gravity
main, 11,992 lineal feet of 10" gravity main, 5,909 lineal feet of 12" gravity main, 859 lineal feet of
15" gravity main, 8,204 lineal feet of 18" gravity main, 104 lineal feet of 21" gravity main, and 106
lineal feet of 24" gravity main. All mains are constructed of ASTM 3034 PVC pipe. Burial depths
February 2016 City of Sisters
3 -2
City of Sisters Wastewater System Capital Facilities Plan Update
Section 3 - Existing Wastewater System
February 2016 City of Sisters
3 -3
are typically 5' - 10' deep, with 16' feet being the deepest. Layout of the collection system is shown in Figure 3.1.
Manholes. There are 488 precast manholes in the collection system.
Overflows/Bypasses. There are no constructed overflows or bypasses in the system
Hydrogen Sulfide. City staff regularly maintains the collection system, and they
have little evidence of hydrogen sulfide damage in the system.
3.2.2. Collection System Quality
Mains. The City of Sisters has worked diligently to develop a wastewater collection
system that minimizes infiltration/inflow into the system. All construction has been
air-tested in compliance with adopted Public Works Construction Standards for the
City of Sisters, and with Oregon DEQ regulations. All gravity mains have been air-
tested, and had a 95% mandrel pulled to verify that excessive deflection was not
present. When all testing was completed, a television inspection was performed on
the interior of all pipelines, and any deficiencies were corrected.
Manholes. All manholes have also been constructed in compliance with adopted
Public Works Construction Standards for the City of Sisters, which are in excess of
adopted DEQ regulations. All manholes have been vacuum tested, applying 10
inHG of vacuum and limiting allowable air loss to 1 psi for a fixed period of time.
This test is the best means of testing to prevent infiltration available today, and the
success of the program is evident in the infiltration/inflow discussion below.
Infiltration/Inflow. Infiltration/Inflow in the Sisters wastewater system is virtually
non-existent. Influent flows to the wastewater treatment facility are substantially less
than water consumption within the community, which indicates that infiltration and
inflow to the system are very minimal.
3.2.3. Pressure Mains
Pressure mains are shown in Figure 3.1. Four pressure mains exist to transmit flows
from each of the existing wastewater pump stations. All of the force mains are
constructed of AWWA C-900 piping, of the following lengths and sizing.
Force main for Pump Station No. 1. 9,290 lineal feet -12" inch force main.
Force main for Pump Station No. 2. 710 lineal feet - 4" inch force main.
Force main for Pump Station No. 3. 1,152 lineal feet - 6" inch force main.
Force main for Pump Station No. 4. 687 lineal feet - 6" inch force main.
City of Sisters Wastewater System Capital Facilities Plan Update
Section 3 - Existing Wastewater System
February 2016 City of Sisters
3 -4
3.2.4 Wastewater Pump Stations Four wastewater pump stations currently exist in the collection system. The stations
are described as follows:
Wastewater Pump Station No. 1. This station was constructed in place, and is a
triplex submersible facility with a trench style wetwell. Pumping is provided with
three KSB pumps initially designed with two pumps capable of providing 850 gpm
@ 95' feet TDH when pumping together. The third pump is provided for
redundancy. The pump manufacturer made an error in trimming the impellers for all
of the pumps, and the pumps were actually installed with the capability for two
pumps to provide approximately 525 gpm @ 95' feet TDH. It was determined to be
in the best interests of the City to have the correct impellers provided, but that the
original impellers be utilized until demand necessitated the additional pumping
capacity. City staff replaced the original impellers with the new impellers from
storage in 2009 to increase the capacity of the pumps to the original design. Normal
wear from the 14 years of system operation has incurred to the original pumps and
staff will need to monitor the pumps through motor oil and amperage testing to
determine when these pumps need to be re-built or if capacity issues arise be
replaced.
100% of wastewater flow in the City of Sisters collection system is tributary to Pump
Station No. 1. The station (constructed in 2001), is located at the north end of Rope
Place, in the far northeast corner of the UGB. Flows from this station are
conveyed via 9,290 lineal feet of 12" class 150 AWWA C-900 force main to the
headworks of the WWTP. This station was constructed as a portion of the original
Sisters wastewater system, and was completed in 2001.
Triplex submersible pumps located in a self-cleaning trench style wetwell are KSB,
Model KRTK 100-316/294 XG, with 37 Hp motors. The station is a site-constructed
submersible pump station with a block building constructed over the top. The
building is insulated and has a concrete floor with drains. Pump controls are located
in the building. The overall condition of the pump station is very good, and all
equipment functions properly as originally constructed.
A 135 KW diesel generator manufactured by Kohler, Model 135ROZJ is provided
for standby power purposes, complete with a 400 Amp Kohler automatic transfer
switch. This unit is set on a 125 gallon double wall fuel tank that provides protection
against contamination.
A sluice gate is provided on the influent to the station to stop the influent flows, and
to allow buildup of flows for wetwell cleansing purposes. A Chatterbox dialer is
utilized to call operators in the event that problems develop with station operation.
New telemetry equipment will be needed to communicate with the treatment plant
SCADA system during the planning period when increased flows result in
capacity related concerns with the station (i.e. 2 pumps need to run to keep up with
influent flows).
City of Sisters Wastewater System Capital Facilities Plan Update
Section 3 - Existing Wastewater System
February 2016 City of Sisters
3 -5
Wastewater Pump Station No. 2. This station is a package wetwell mounted
vacuum lift duplex pump station by Smith & Loveless, mounted on a 5' diameter
precast concrete manhole. All pumping and electrical equipment is mounted under
a fiberglass structure, and is above the wetwell. The station provides service to a
small portion of the industrial park, and is located on the Northwest corner of Barclay
Drive and North Pine Street. Pumping is provided with two Smith & Loveless
Model 4B2B pumps, each capable of pumping 150 gpm at 43' feet TDH. Motors are
5 Hp, located under the fiberglass shell, and the station includes two small
compressors for creating vacuum for operation. All electrical controls are also
located inside the station cover. All pump station equipment functions properly as
originally constructed with the Sisters wastewater system in 2002. A Chatterbox
dialer is utilized to notify operators in the event that problems develop with system
operation.
Wastewater Pump Station No. 3. This station is a package wet well mounted
vacuum lift duplex pump station by Smith & Loveless, mounted on an 8' diameter
precast concrete manhole. All pumping and electrical equipment is mounted under
a fiberglass structure, and is above the wetwell. The station is located in the Five
Pine Development, and provides service to the most easterly portion of the City,
both North and South of Highway 20. Pumping is provided with two Smith &
Loveless Model 4B2B pumps, each capable of pumping 260 gpm at 20' feet TDH.
Motors are 3 Hp, located under the fiberglass shell, and the station includes two small
compressors for creating vacuum for operation. All electrical controls are also
located inside the station cover. The pump station equipment functions properly as
originally constructed in 2004. This station was provided by developers in
expansion of the Sisters wastewater system. A Chatterbox dialer is utilized to notify
operators in the event that problems develop with system operation.
Wastewater Pump Station No. 4. This station is a package wet well mounted
vacuum lift duplex pump station by Smith & Loveless, mounted on an 8' diameter
precast concrete manhole. All pumping and electrical equipment is mounted under
a fiberglass structure, and is above the wetwell. The station is located in the Sun
Ranch Business Park, and provides service to the Sun Ranch and Three Sisters
Business Parks North of Barclay Drive. Pumping is provided with two Smith &
Loveless Model 4B2D pumps, each capable of pumping 270 gpm at 45' feet TDH.
Motors are 7.5 Hp, located under the fiberglass shell, and the station includes two
small compressors for creating vacuum for operation. All electrical controls are also
located inside the station cover. The pump station equipment functions properly as
originally constructed in 2006. This station was provided by developers in
expansion of the Sisters wastewater system. A Chatterbox dialer is utilized to notify
operators in the event that problems develop with system operation.
City of Sisters Wastewater System Capital Facilities Plan Update
Section 3 - Existing Wastewater System
February 2016 City of Sisters
3 -6
3.3 WASTEWATER TREATMENT FACILITY
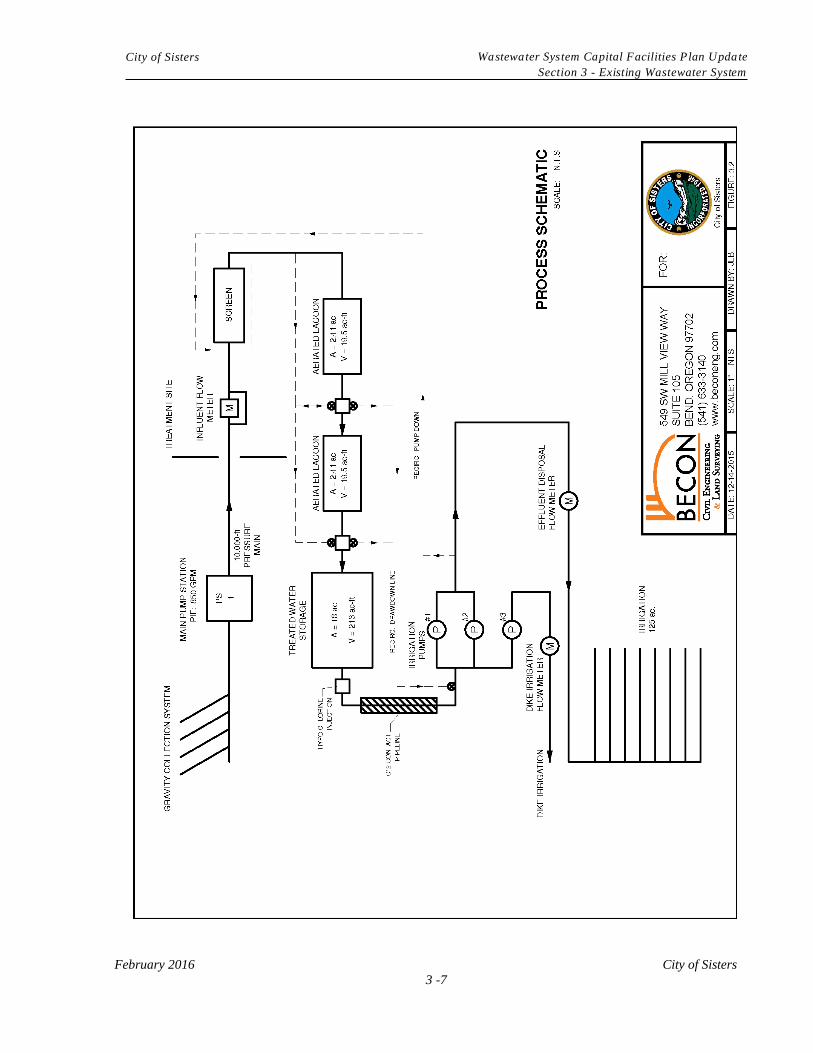
The existing Sisters wastewater treatment plant (WWTP) is shown schematically in Figure
3.2. The wastewater treatment plant and effluent reuse site are located immediately south
of the Sisters City limits on the south ½ of Section 9, T15S, 10E, W.M. Treatment is
provided with two 2.41 acre aerated lagoons, followed by an 18 acre storage lagoon and
100.3 acres of land utilized for automated land reuse purposes. Design data for the existing
wastewater treatment facility is provided in Table 3.1.
City of Sisters Wastewater System Capital Facilities Plan Update
Section 3 - Existing Wastewater System
February 2016 City of Sisters
3 -7
City of Sisters Wastewater System Capital Facilities Plan Update
Section 3 - Existing Wastewater System
February 2016 City of Sisters
3 -8
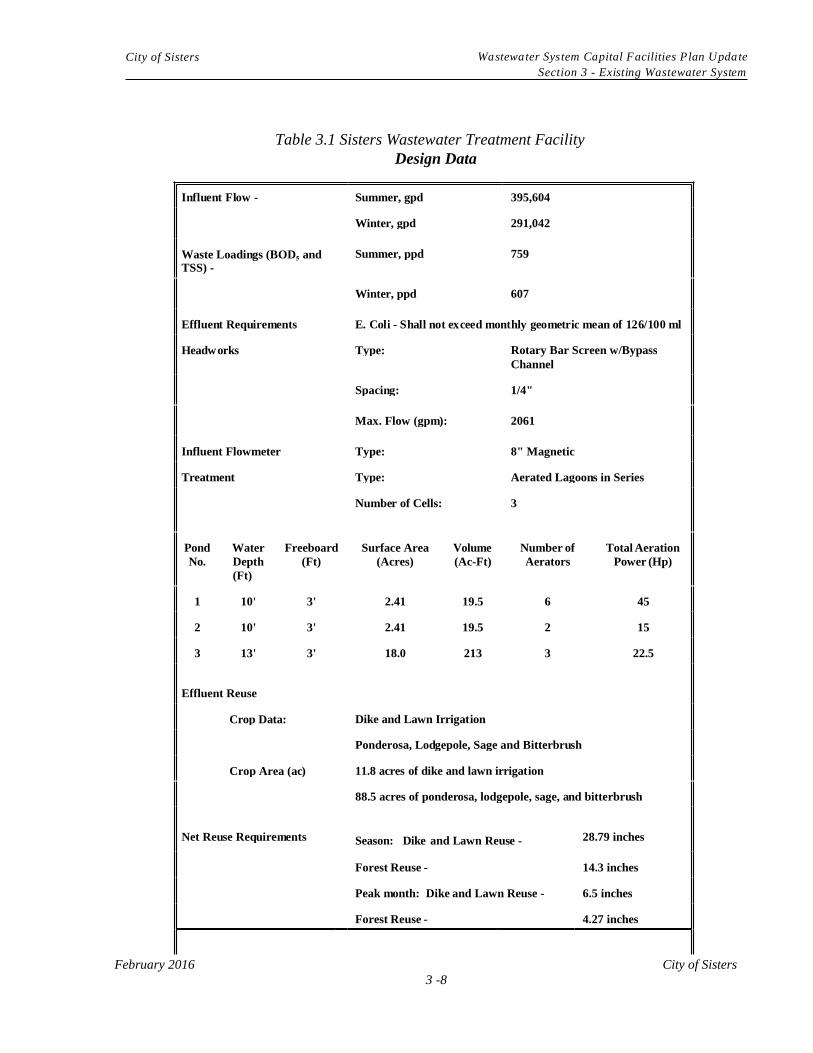
Influent Flow - Summer, gpd 395,604
Winter, gpd 291,042
Waste Loadings (BOD and TSS) -
Summer, ppd 759
Winter, ppd 607
Effluent Requirements E. Coli - Shall not exceed monthly geometric mean of 126/100 ml
Headworks Type: Rotary Bar Screen w/Bypass
Channel
Spacing: 1/4"
Max. Flow (gpm): 2061
Influent Flowmeter Type: 8" Magnetic
Treatment Type: Aerated Lagoons in Series
Number of Cells: 3
Effluent Reuse
Crop Data: Dike and Lawn Irrigation
Ponderosa, Lodgepole, Sage and Bitterbrush
Crop Area (ac) 11.8 acres of dike and lawn irrigation
88.5 acres of ponderosa, lodgepole, sage, and bitterbrush
Net Reuse Requirements Season: Dike and Lawn Reuse - 28.79 inches
Forest Reuse - 14.3 inches
Peak month: Dike and Lawn Reuse - 6.5 inches
Forest Reuse - 4.27 inches
Table 3.1 Sisters Wastewater Treatment Facility
Design Data
Pond
No.
Water
Depth
(Ft)
Freeboard
(Ft)
Surface Area
(Acres)
Volume
(Ac-Ft)
Number of
Aerators
Total Aeration
Power (Hp)
1 10' 3' 2.41 19.5 6 45
2 10' 3' 2.41 19.5 2 15
3 13' 3' 18.0 213 3 22.5
City of Sisters Wastewater System Capital Facilities Plan Update
Section 3 - Existing Wastewater System
February 2016 City of Sisters
3 -9
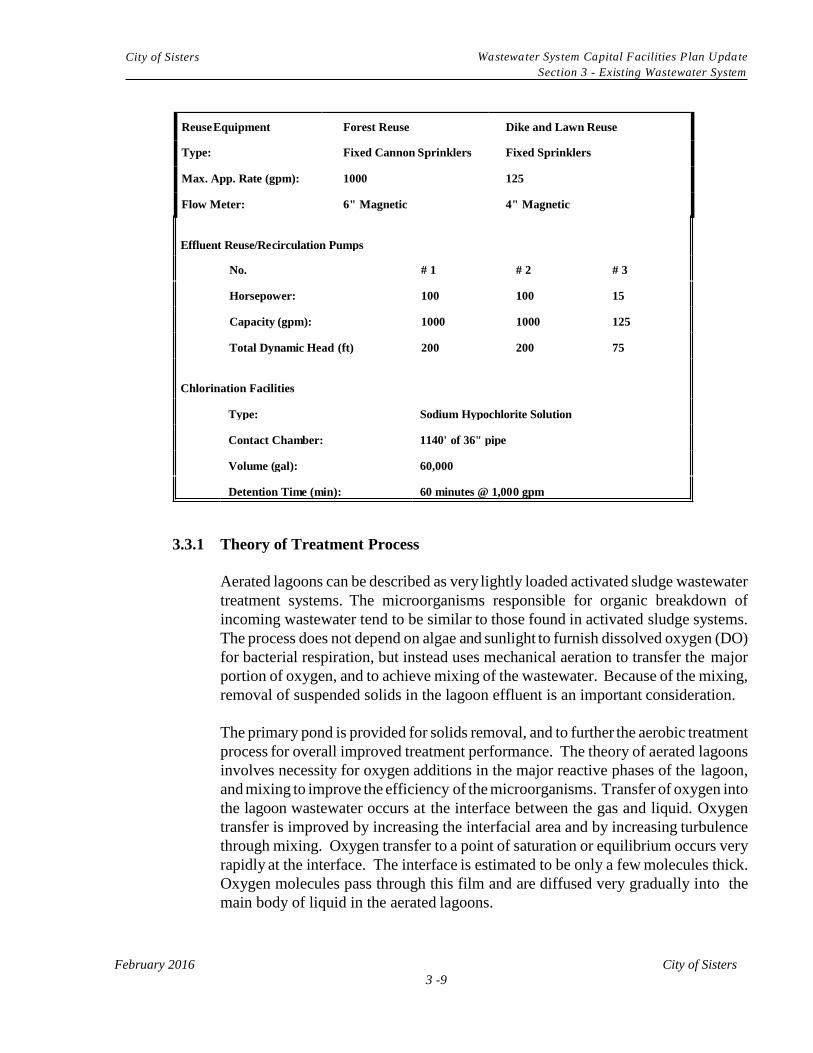
Effluent Reuse/Recirculation Pumps
Chlorination Facilities
Type: Sodium Hypochlorite Solution
Contact Chamber: 1140' of 36" pipe
Volume (gal): 60,000
Detention Time (min): 60 minutes @ 1,000 gpm
Reuse Equipment Forest Reuse Dike and Lawn Reuse
Type: Fixed Cannon Sprinklers Fixed Sprinklers
Max. App. Rate (gpm): 1000 125
Flow Meter: 6" Magnetic 4" Magnetic
No. # 1 # 2 # 3
Horsepower: 100 100 15
Capacity (gpm): 1000 1000 125
Total Dynamic Head (ft) 200 200 75
3.3.1 Theory of Treatment Process
Aerated lagoons can be described as very lightly loaded activated sludge wastewater
treatment systems. The microorganisms responsible for organic breakdown of
incoming wastewater tend to be similar to those found in activated sludge systems.
The process does not depend on algae and sunlight to furnish dissolved oxygen (DO)
for bacterial respiration, but instead uses mechanical aeration to transfer the major
portion of oxygen, and to achieve mixing of the wastewater. Because of the mixing,
removal of suspended solids in the lagoon effluent is an important consideration.
The primary pond is provided for solids removal, and to further the aerobic treatment
process for overall improved treatment performance. The theory of aerated lagoons
involves necessity for oxygen additions in the major reactive phases of the lagoon,
and mixing to improve the efficiency of the microorganisms. Transfer of oxygen into
the lagoon wastewater occurs at the interface between the gas and liquid. Oxygen
transfer is improved by increasing the interfacial area and by increasing turbulence
through mixing. Oxygen transfer to a point of saturation or equilibrium occurs very
rapidly at the interface. The interface is estimated to be only a few molecules thick.
Oxygen molecules pass through this film and are diffused very gradually into the
main body of liquid in the aerated lagoons.
City of Sisters Wastewater System Capital Facilities Plan Update
Section 3 - Existing Wastewater System
February 2016 City of Sisters
3 -10
Oxygen will transfer more readily into a liquid with low residual dissolved oxygen
than when the dissolved oxygen level is at or near saturation. Therefore, mixing is
required to create turbulence, so that liquid saturated with dissolved oxygen can be
replaced with liquid that has an oxygen content less than saturation.
3.3.2 Influent Flow Measurement and Sampling
Influent flow measurement is provided in the pump room of the control building for
the wastewater treatment plant. The meter is an 8" ASA electromagnetic flow meter
which has been calibrated annually since installation.
Influent sampling is provided by an ISCO 3710FR refrigerated sampler located in the
pump room of the control building at the treatment plant. This is a 24-hour
composite sampler which provides composite data for influent BODs and TSS.
3.3.3 Headworks
The headworks contains a mechanical fine screen with a coarse bar screen in the
bypass channel and a fine screen in the normal channel for treatment operations.
Only one screen is used at a time, and normal flows are directed through the fine
screen mechanism unless problems prevent its operation. The screen is a Lakeside
Equipment Corporation Rotamat, with weather protection. Operation of the fine
screen allows for more efficient biological treatment within subsequent treatment
units. Improved treatment is accomplished by removing all solids of a size 1/4" or
larger from the raw influent. An aluminum gate is provided in front of each channel
to manually direct flow in the desired location. During extreme flow periods, or
during emergency conditions, the gate maybe overtopped with flow. This allows the
bypass channel to automatically function for containment of excess flows. A spray
wash system is provided on the fine screens to clean the removed screening prior to
disposal. The main channel has been corroded by hydrogen sulfide action, and needs
repair to function as it was originally intended.
A discharge chute, bagger and screenings collector are provided to dispose of
screenings. Screenings are washed and dewatered upon deposit in the feed trough.
The chute directs screenings to the bagger. Collected screenings are sent to the
Deschutes County landfill for disposal.
All equipment in the Sisters Wastewater Treatment Plant is provided with control
through the SCADA system provided for system operation. This unit is no longer
supported by the manufacturer and will need to be replaced either with the
expansion of the effluent disposal system or if there is a significant failure due to
its importance of running the entire treatment plant.
City of Sisters Wastewater System Capital Facilities Plan Update
Section 3 - Existing Wastewater System
February 2016 City of Sisters
3 -11
3.3.4 Aerated Lagoons
The Sisters wastewater treatment plant has three aerated lagoons which are piped to
flow in series. Total acreage provided at the top of the banks is approximately 22.82
acres of lagoon surface. Pond depths are capable of running at 10 feet in Lagoons
No. 1 and No. 2, but are running at 9 feet due to inlet pipe placement, and 13 feet in
Lagoon No. 3. (Holding Pond), when the units are filled to capacity. Total pond
volume, with 3 feet of freeboard provided, is approximately 82 million gallons.
Lagoon levels in Lagoons No. 1 and No. 2 can be independently controlled with stop
logs in their effluent transfer structures. An effluent structure with sluice gates
controls the flow of effluent from the holding pond to the transfer structure, and an
effluent decanter is provided to draw water from below the lagoon surface. 60 mil
HDPE liners are provided to prevent leakage from all of the lagoons.
All the lagoons are provided with mechanical aeration. The holding pond operates
as both a holding and polishing pond, and is also provided with mechanical aeration.
Chlorine is introduced for disinfection purposes into a 1,140 feet long 36" contact
pipeline installed in the diking West of Lagoons No. 1 and No. 3. Disinfection
occurs prior to effluent reuse.
Varying flow regimes are possible in the lagoons, utilizing transfer structures
provided. The lagoons can be operated on a flow through basis, which should be the
normal process, batch basis, or a combination of the treatment methods. In addition,
any lagoon can be bypassed for operational or cleaning purposes.
3.3.4.1 Aerators
Lagoons No. 1 and No. 2 are equipped with eight (8) Aire-02 aerators; six (6)
in the first lagoon and two (2) in the second. Aerators are provided for
reduction of much of the settable solids (TSS) and associated BOD5 loading
from the liquid stream before it reaches the subsequent lagoons. The holding
pond has three (3) identical aerators, which operate when the depth of liquid
reaches a minimum of 5 feet underneath the aerators. Aerators are of the
submerged aspirator type, meaning that they pull air from above the water
surface and inject and disperse it below the water surface with a propeller
aspirator pump. They are arranged to cause the contents of the lagoons to
flow in a circular pattern, with the pattern created being away from the motor
end of the aerator. This mixing action reduces short circuiting in the lagoons,
thus effectively using the entire capacity for lagoon No. 1, and the area being
aerated in the remaining lagoons.
Aerators are controlled through the SCADA system with the PLC provided,
and timers are available to control the length of the operating cycle and the
percentage of running time in that cycle for operation of all units. The
City of Sisters Wastewater System Capital Facilities Plan Update
Section 3 - Existing Wastewater System
February 2016 City of Sisters
3 -12
percentage of time on can be changed with the time of year to reflect changes
in BOD5 loading to the lagoons, water temperature, amount of solar energy
and related algae growth, degree of ice cover, etc. In the summer, BOD5
loading is the highest, but natural treatment activity is also the highest
because of peak sunlight and water temperature. In the winter, BOD5 loading
is the lowest, but natural activity is also lowest because of low water
temperature and ice cover. Aerators should be operated enough to maintain
dissolved oxygen in the water, to prevent from freezing in winter ice and to
produce an effluent which meets permit conditions.
Lagoon depths and surface areas are provided in Table 3.1. Lagoon levels are
adjustable with stop logs provided in transfer structures, but generally
lagoons No. 1 and No. 2 remain full depth, allowing variation in lagoon No.
3 with the season and the extent of land reuse. Control of lagoon depths can
be utilized for operational flexibility, and to control the holding and
biological capacity for the lagoons.
Holding capacity in lagoon No. 3 is provided to contain all flows from
November 1 to March 31 when no effluent reuse is permitted. Containment
is also provided when weather conditions, such as high humidity, high
winds, and low ambient temperatures do not permit land reuse.
The aerators have been in nearly continuous operation since the plant
became operational in 2001 with a maximum 20 year life expectancy, and
will need continued maintenance and eventually replacement during the
planning period for this study. Larger aerators and more efficient models
will need to be installed as BOD levels rise to the point of needing additional
aeration for adequate treatment. In addition, there are now more energy
efficient models, including solar options that could be installed to reduce
operational costs.
3.3.4.2 Transfer Structures
Transfer structures for the lagoons are equipped with wooden stop logs or
slide gates to control the level in the ponds, and to provide for draining of
each lagoon. An effluent decanter is attached to the effluent transfer structure
to provide a means of securing quality water for land reuse purposes. A drain
is also provided from lagoon No. 3 to the effluent transfer structure for
draining of the final lagoon.
3.3.4.3 Disinfection Facilities
Disinfection of effluent at the Sisters plant is provided by chlorination,
specifically through sodium hypo-chlorite. Equipment includes a Lightnin
chemical mixer, a 500-gallon polyethylene sodium hypo-chlorite tank, a
Wallace & Tiernan chemical feed pump, a Grundgs Fost back-up chemical
City of Sisters Wastewater System Capital Facilities Plan Update
Section 3 - Existing Wastewater System
February 2016 City of Sisters
3 -13
feed pump, a Gas Mastrrr 3-hp flash mixer, a vacuum regulator, rate
controller, ejector water supply system, and a chlorine contact pipeline. The
chlorine contact pipeline is 1,140 feet of 36" PVC piping buried in the dike
along the west side of lagoon # 1 and the holding pond. A Gas Mastrrr
Series 32 chlorine induction feeder-flash mixer is provided in the transfer
structure from the holding pond to the chlorine contact pipeline. This unit
provides a positive flash mix of sodium hypo- chlorite solution which flows
through the chlorine contact pipeline toward the land reuse system. A
sampling tap is provided on the effluent (reuse) piping to allow for sampling
of effluent pumped from the reuse pumps to either of the two reuse systems
provided. Disinfection facilities are controlled through the SCADA system
with the PLC provided.
The disinfection system is in good condition and working effectively.
However, the chlorine pump and the flash mixer will need to be replaced as
a portion of normal plant maintenance procedures, and budget should be
provided for replacement of the aged equipment.
3.3.4.4 Effluent Flow Measurement and Sampling
Effluent flow measurements are provided in the pump room of the control
building for the WWTP. Two meters are provided, with one on the dike and
lawn reuse system, and one on the forest reuse system. Each meter is an
ASA model IF6 electromagnetic flow meter, which have been calibrated
annually since installation. Grab samples are taken out of the transfer
structure before the effluent enters the chlorine contact line. These samples
are then tested for concentration of e.coli. Flow measurements are recorded
in the SCADA system provided.
Flowmeter performance has been excellent, all the units were rebuilt in 2007
due to the pump building inadvertently flooding. All flow meters are flow
tested and calibrated annually to ensure accuracy within specifications.
Operations have experienced no problems in meeting permit conditions for
e-coli.
3.3.4.5 Treatment and Pumping Facility Control Building
The treatment and pumping facility control structure has functioned well.
Existing pumps were flooded in 2007, and are being monitored and tested
annually to help prevent pump and motor failures.
3.3.4.6 General Plant Conditions
Overall conditions at this treatment facility are adequate, other than for the
age of installed equipment. Equipment has functioned well, however, all
operating equipment has a lifetime, and proper maintenance would suggest
City of Sisters Wastewater System Capital Facilities Plan Update
Section 3 - Existing Wastewater System
February 2016 City of Sisters
3 -14
replacement of all pumping and aeration equipment on a 15-20 year basis.
3.4 WASTEWATER EFFLUENT REUSE
3.4.1 General
The effluent reuse facilities are intended to discharge treated and disinfected effluent
for land reuse through irrigation of both forest land and lagoon dikes and lawns on
the treatment plant site. The effluent reuse system that is in place includes a holding
pond for storage, a chlorine contact line for effluent disinfection, three irrigation
pumps, a re-circulation system, and a sprinkler system to provide reuse on treatment
plant lagoon dikes and lawn areas, and on 88.5 acres of forest land. Additional area
for reuse is set aside for buffer to adjacent properties on the North, East and South
boundaries of the treatment plant site, in compliance with Oregon DEQ regulations.
In addition, a separate buffer area was set aside initially between the forest reuse site
and the Buck Run Subdivision, and this area is potentially available for future
expansion of the reuse site, utilizing Class A effluent (current treatment plant
processes result in a Class D effluent), although not recommended due to proximity
to development.
Prior to land reuse, the effluent is disinfected in 1,140 feet of 36" chlorine contact
line, which provides for a minimum detention time of 60 minutes at peak discharge
flows of 1,000 gpm. Sodium hypochlorite from the 500 gallon HDPE storage tank
is mixed with effluent from Lagoon No. 3, in the chlorine contact facility. Effluent
is discharged to forest land and pond dikes and lawn areas from April 1 to October
31 and stored in the holding pond during the remaining months.
3.4.2 Effluent Reuse System
The land reuse system diverts the majority of the effluent to 88.5 acres of forest land,
and the remaining to the treatment plant lagoon dikes and lawn areas (11.8 acres).
The effluent is pumped to these locations using three pumps. Two 100 HP, 1000
gpm capacity pumps transport effluent to the forest land, while one 15 HP, 125 gpm
capacity pushes the water to the dike. The effluent is carried to the forest land in a
10" main line which branches out into 8" lines across the irrigation area. There are
flow meters stationed after the pumping facility that are measuring the quantity of
effluent traveling to both the forest land and dike.
Both effluent reuse systems provided for discharge from the Sisters WWTP are
controlled through the SCADA system, with the Programmable Logic Controller
provided.
Both the SCADA system and the PLC have been in use since the plant became
operational, and equipment of this type and age becomes outdated, is not supported
and difficult to repair due to availability of parts. Both the SCADA system and the
PLC will need to be replaced in the near future.
February 2016 City of Sisters
4 - 1
SECTION 4:
POPULATION AND LAND USE
4.1 HISTORICAL POPULATION
Sisters maintained a historical population from 600 residents to 690 residents for more than
30 years through the year 1990. Population growth was relatively stagnant between 1980
and 1990, but averaged approximately 2 percent a year from 1990 to 1996. The
population reached 775 residents in 1996. Beginning in 1997, when the citizens approved
construction funding for the community sewer system, growth has escalated rapidly, in
similar fashion to the growth throughout all of Deschutes County. By the year 2003,
population in Sisters had reached 1,430 residents, and despite the slowing of growth
during the recession of 2008-2013, Sisters population now stands at around 2,315.
4.2 CURRENT POPULATION
The certified population in 2015 for the City of Sisters was 2,280 residents on July 1,
2015, by the Population Research Center at Portland State University.
4.3 PROJECTED FUTURE POPULATION IN YEAR 2035
The City of Sisters Comprehensive Plan projects that population in the City will be moderate
within the planning period. From 2015 to 2035 population is expected to grow at 3.23% per
year. Assuming that the projections are realistic, and that the growth has slowed to the
projected 3.23% growth rate, the City should anticipate a 89% population growth by the year
2035. It should be noted that Sisters has experienced periods of rapid growth in the
recent past, therefore, it is recommended that a population forecast update be prepared
at a minimum of every 5 years, and, if necessary, corresponding revisions to the capital
facilities plan. Regular population forecast updates will ensure that the capital facilities
plan remains closely aligned with current population and current demand on City
infrastructure.
4.4 COMPARISON WITH PREVIOUS GROWTH PROJECTIONS
Previous population projections by the City of Sisters and Deschutes County, and
projections in the 1988 Water Facilities Study (Westech Engineering), and 1997
Wastewater System Facilities Plan (HGE Inc., Architects, Engineers, Surveyors &
Planners) substantially underestimated the growth that has occurred in the City. The 1988
projection estimated that approximately 1,100 people would reside in Sisters by the year
2005, while the remaining projections all anticipated a population in the range of 1,000
people by the year 2005. Growth has been much more rapid than anticipated in
projections during the 1980's and 1990's.
4.5 CAPITAL FACILITIES PLAN POPULATION FORECASTS
Development is occurring in Sisters and is anticipated to result in population growth of
3.23% per year between 2015 and 2035. (Source: Portland State University). A
City of Sisters Wastewater System Capital Facilities Plan Section 4: Population and Land Use
February 2016 City of Sisters
4 - 2
population of 4,375 residents is forecast for year 2035.
4.6 BUILDOUT OF CURRENT UGB
The aforementioned population estimates assume year 2035 growth will occur as a result of
the buildout of infill land within the existing UGB. Ultimate population in the Sisters UGB is
difficult to estimate with continuing infill and partitioning of lots in older sections of the
City. It is anticipated that future years will see a tendency toward partitioning of lots for
coming generations, taking into account increasing land values. Growth projections should
occur within the existing UGB, with the potential for continuing population expansion as
existing land area continues to be redeveloped into smaller partitions. The Sisters Planning
Department anticipates stable occupancy rates to occur within the 20-year planning period
with an average of 2.08 people per dwelling unit by 2035 and approximately 2,140
dwelling units.
4.7 LAND USE
4.7.1 Current Land Use
Current land use is shown on Figure 1.2 based on Sisters’ Comprehensive Plan and
zoning ordinances, effective in 2015. The Urban Growth Boundary (UGB) may be
adequate for anticipated growth in the planning period.
4.7.2 Comprehensive Plans and Zoning Ordinance Revisions (Amended 2014)
The current Comprehensive Plan was adopted by the City of Sisters in 2005, and
amended in 2014. Revisions since the 2005 plan include adoption of mixed use
developments incorporating residential and light industrial development. The
revisions also allow and encourage smaller minimum lot sizes, a density bonus and
a height bonus when residential is incorporated with commercial development. Both
have an impact on increasing needs for public infrastructure.
4.7.3 General Comments
Sisters is primarily a residential community, with a significant tourist-based
economy. The City has a vibrant commercial district located on either side of U.S.
Highway 20, and room for considerable expansion within the industrial district.
Historically, there has not been a clear division between residential and industrial
areas. As a result, the City has developed a zoning system that restricts industrial
development to designated areas, while permitting mixed-use residential
development in areas zoned for industrial purposes. Future industry, according to
the City’s Comprehensive Plan, will be encouraged to locate in areas with
readily available utilities and minimal conflicts with existing development.
February 2016 City of Sisters
5 - 1
SECTION 5:
WASTEWATER CHARACTERISTICS 5.1 INTRODUCTION
5.1.1 Definitions
The following terms are used to define seasonal differences in wastewater flow
characteristics:
Dry-Weather (or Summer) Period: Generally defined as the period when
precipitation is limited and stream flows are low. This period is commonly
defined in the Oregon Administrative Rules (OARs) for specific basins as
May 1 through October 31. Sisters WPCF Permit does not include any
specific reference to, or definition of, this parameter. It roughly
corresponds, in Sisters, to the period during which irrigation takes place.
Summer is a shorthand reference.
Wet-Weather (or Winter) Period: Generally defined as the period when
precipitation is greatest and stream flow is highest. This period is
commonly defined in the OARs for specific basins as November 1 through
April 30. It roughly corresponds, in Sisters, to the period when no irrigation
takes place and all effluent is held in the wastewater lagoon. Winter is a
shorthand reference.
The following terms are used to characterize wastewater flows:
Average Daily Flow (ADF): Total wastewater flow for a defined period
divided by the number of days in the period or season.
Maximum Monthly Flow (MMF): Total wastewater flow in the month of
the highest flow, within a defined period or season, divided by the number
of days in that month.
Peak Daily Flow (PDF): Total flow for the day with the highest flow,
within a defined period or season.
Peak Instantaneous Flow (PIF) or Peak Hourly Flow (PHF): Highest
sustained one hour flow during the year. For purposes of this facilities plan,
the terms are treated as synonymous.
The following subscripts are utilized to further define the flow parameters according
to the period or season of interest:
A: Annual. Defines a full year period.
WW: Wet-Weather. As defined above.
DW: Dry-Weather. As defined above.
City of Sisters Wastewater System Capital Facilities Plan
Section 5 - Wastewater Characteristics
February 2016 City of Sisters
5 - 2
Flow parameters in this facilities plan are typically abbreviated and combined with
subscripts as follows1:
ADFA: Annual Average Daily Flow
ADFWW Average Daily Wet-Weather Flow
ADFDW: Average Daily Dry-Weather Flow
MMFWW: Maximum Monthly Wet-Weather Flow
MMFDW: Maximum Monthly Dry-Weather Flow
PDFWW: Peak Daily Wet-Weather Flow
PHFWW: Peak Hourly Wet-Weather Flow
If a flow parameter is referenced without a subscript then it should be interpreted as
applying equally to any season.
Flow parameters are typically abbreviated and expressed as:
mgd: millions of gallons per day
gpd: gallons per day
gpcd: gallons per capita per day
Other flow rates commonly used include:
gpm: gallons per minute
cfs: cubic feet per second
Totalized flows are commonly referred to as:
gal: gallons
MG: million gallons
cf: cubic feet
Ac-ft.: acre feet
Water quality parameters discussed in this section include:
BOD5: Biochemical Oxygen Demand
TSS: Total Suspended Solids
Water quality loadings are typically expressed as:
mg/l: milligrams per liter
ppd: pounds per day
ppcd: pounds per capita per day
1 Other combinations are easily formed and may be utilized for reference.
City of Sisters Wastewater System Capital Facilities Plan
Section 5 - Wastewater Characteristics
February 2016 City of Sisters
5 - 3
The following terms are included for clarification:
Current: Generally refers to recent condition valid for year 2015.
Design: With regard to flows, design refers to anticipated flows that
would occur under conditions corresponding to the flow
characteristics defined above. Design takes into account a
full analysis of the flows and generally ignores current system
limitation such as inadequate plant, pump station, and
collection system capacities. As a result, current design
flows may vary considerably from the record of flow
currently or recently observed at the wastewater facility.
Future design flows include allowances for community
growth and, possibly, other changes in system characteristics.
Unless qualified otherwise, future design parameters refer to
projected parameters at the end of the design period. In this
case, year 2035.
5.1.2 Parameters of Interest
The City’s main pump station (Pump Station No. 1) transfers all of the City
wastewater to the treatment facility. The primary parameter of interest is the
extrapolated peak hourly flow. Headworks are also evaluated and sized according
to peak hourly flow requirements.
Lagoon treatment/holding includes considerable equalization capabilities.
Parameters of primary interest are averages of defined periods (winter or summer).
For mechanical treatment facilities, parameters of interest vary according to the
nature of the processes involved. In general, hourly, daily, weekly, and monthly
parameters may all be needed.
5.1.3 Methodology for Computing Flows
DEQ has developed guidelines for projecting wastewater flows, using relationships
between wastewater flow and rainfall. These guidelines work well for estimating
wastewater flows in Western Oregon, where winter rainfall often is a major
contributor to the total and peak flows reaching the plant (through infiltration and
inflow into the collection system). However, in Sisters these guidelines are not
appropriate since rainfall does not directly have a significant impact on the amount
or peaking of flow reaching the treatment facility. Sisters’ design flows will be based
on flows measured at the wastewater treatment facility. Peak hourly flow for
Sisters will be extrapolated using general design guidelines.
5.2 ACCURACY OF DATA
City of Sisters Wastewater System Capital Facilities Plan
Section 5 - Wastewater Characteristics
February 2016 City of Sisters
5 - 4
5.2.1 Influent Flowmeter and Sampler
The influent flowmeter is located in the pump room of the control building at the
Wastewater Treatment Plant. The meter is an 8" ASA electromagnetic flow meter,
which records all flows received from Wastewater Pump Station No. 1. And was
installed in 2001 as part of the City’s wastewater treatment facility. Flowmeter
calibration has been verified by a factory representative on an annual basis.
Flowmeter performance has not been problematic.
The influent sampler is also located in the WWTP Control Building to record
composite samples of influent flows. The sampler is an ISCO 3710 FR refrigerated
sampler which provides for a 24 hour composite sample. Samples are taken weekly
by the Lead Operator and all testing is provided by City staff. Sampler operation
and sample handling/testing has not been problematic.
5.2.2 Bypass and Overflows
There are no constructed bypasses or overflows in the wastewater system.
5.2.3 Inflow and Infiltration (I/I)
There is little evidence of I/I in the Sisters collection system. The system itself was
substantially constructed in 2002. Sewer lines are generally above the groundwater
table. Annual precipitation is 13.62 inches; annual evaporation is approximately 46
inches (see Section 7.4.1). It is unlikely that I/I will pose a concern during the
planning period.
5.2.4 Effects of Population Growth
Population growth has been very high in recent years. Growth from the 2000
Census figure of 959 persons to the Portland State Population Research Center
(PSU) figure of 1,490 for July 1, 2004 averaged 11.65 percent per year. The largest
growth occurred between 2002 and 2003 with an increase of 32.4 percent based on
PSU figures of 1,080 and 1,430 persons respectively. Growth from 2003 to 2004
was more moderate at 4.2 percent (based on PSU figures on 1,430 and 1,490
respectively) and growth in population has reached 2,315 at 2015 end. The effect of
such high growth rates on wastewater flows is marked; therefore, only the most
recent flow data will be evaluated for the purposes of estimating current and future
flow parameters.
The PSU figure of 2,280 persons will be used to estimate current per capita flows
from the recent data. This will ensure a conservative design basis for recommended
improvements and counter deficiencies associated with an abbreviated data set.
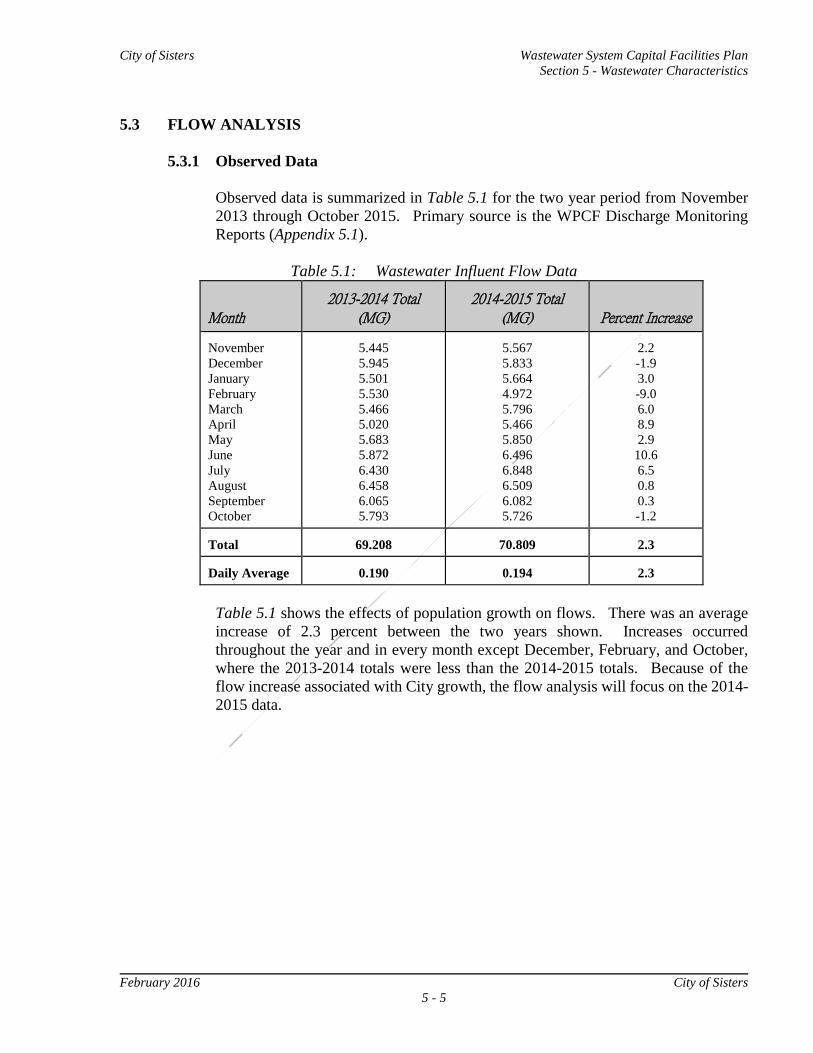
City of Sisters Wastewater System Capital Facilities Plan
Section 5 - Wastewater Characteristics
February 2016 City of Sisters
5 - 5
5.3 FLOW ANALYSIS
5.3.1 Observed Data
Observed data is summarized in Table 5.1 for the two year period from November
2013 through October 2015. Primary source is the WPCF Discharge Monitoring
Reports (Appendix 5.1).
Table 5.1: Wastewater Influent Flow Data
Month
2013-2014 Total
(MG)
2014-2015 Total
(MG) Percent Increase
November
December
January
February
March
April
May
June
July
August
September
October
5.445
5.945
5.501
5.530
5.466
5.020
5.683
5.872
6.430
6.458
6.065
5.793
5.567
5.833
5.664
4.972
5.796
5.466
5.850
6.496
6.848
6.509
6.082
5.726
2.2
-1.9
3.0
-9.0
6.0
8.9
2.9
10.6
6.5
0.8
0.3
-1.2 Total
69.208
70.809
2.3
Daily Average
0.190
0.194
2.3
Table 5.1 shows the effects of population growth on flows. There was an average
increase of 2.3 percent between the two years shown. Increases occurred
throughout the year and in every month except December, February, and October,
where the 2013-2014 totals were less than the 2014-2015 totals. Because of the
flow increase associated with City growth, the flow analysis will focus on the 2014-
2015 data.
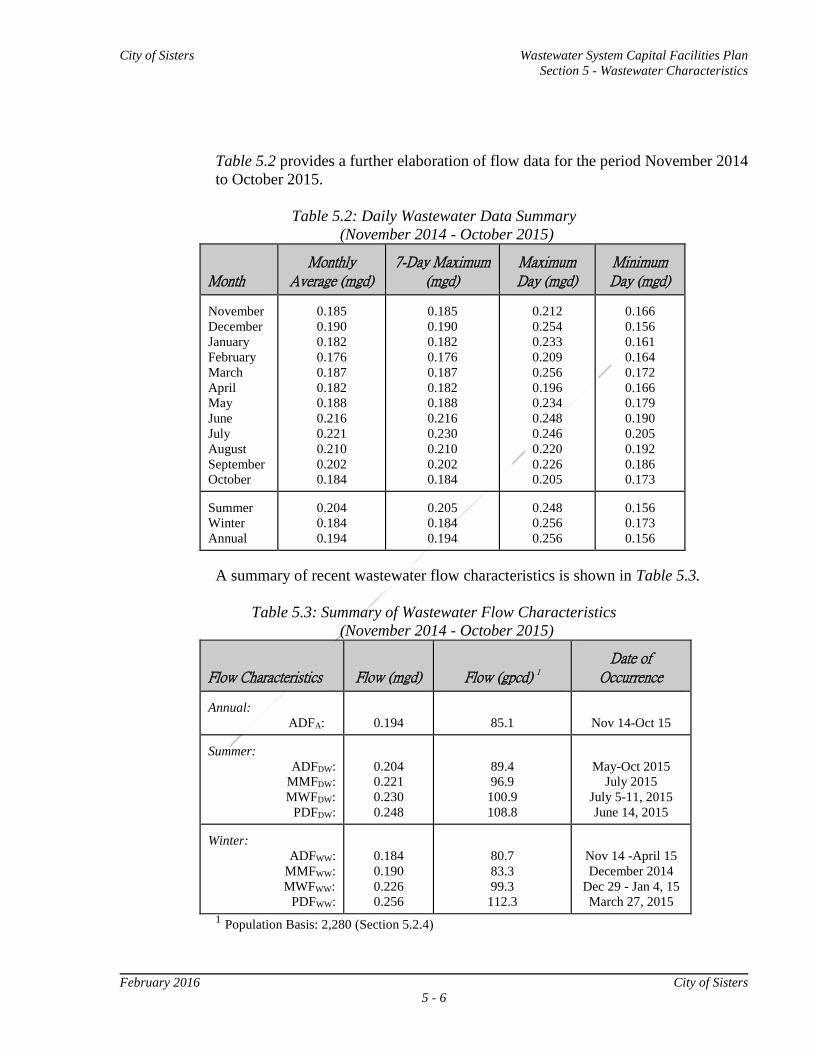
City of Sisters Wastewater System Capital Facilities Plan
Section 5 - Wastewater Characteristics
February 2016 City of Sisters
5 - 6
Table 5.2 provides a further elaboration of flow data for the period November 2014
to October 2015.
Table 5.2: Daily Wastewater Data Summary
(November 2014 - October 2015)
Month
Monthly
Average (mgd)
7-Day Maximum
(mgd)
Maximum Day (mgd)
Minimum Day (mgd)
November
December
January
February
March
April
May
June
July
August
September
October
0.185
0.190
0.182
0.176
0.187
0.182
0.188
0.216
0.221
0.210
0.202
0.184
0.185
0.190
0.182
0.176
0.187
0.182
0.188
0.216
0.230
0.210
0.202
0.184
0.212
0.254
0.233
0.209
0.256
0.196
0.234
0.248
0.246
0.220
0.226
0.205
0.166
0.156
0.161
0.164
0.172
0.166
0.179
0.190
0.205
0.192
0.186
0.173 Summer
Winter
Annual
0.204
0.184
0.194
0.205
0.184
0.194
0.248
0.256
0.256
0.156
0.173
0.156
A summary of recent wastewater flow characteristics is shown in Table 5.3.
Table 5.3: Summary of Wastewater Flow Characteristics
(November 2014 - October 2015)
Flow Characteristics Flow (mgd)
Flow (gpcd) 1
Date of
Occurrence Annual:
ADFA:
0.194
85.1
Nov 14-Oct 15 Summer:
ADFDW:
MMFDW:
MWFDW:
PDFDW:
0.204
0.221
0.230
0.248
89.4
96.9
100.9
108.8
May-Oct 2015
July 2015
July 5-11, 2015
June 14, 2015 Winter:
ADFWW:
MMFWW:
MWFWW:
PDFWW:
0.184
0.190
0.226
0.256
80.7
83.3
99.3
112.3
Nov 14 -April 15
December 2014
Dec 29 - Jan 4, 15
March 27, 2015
1 Population Basis: 2,280 (Section 5.2.4)
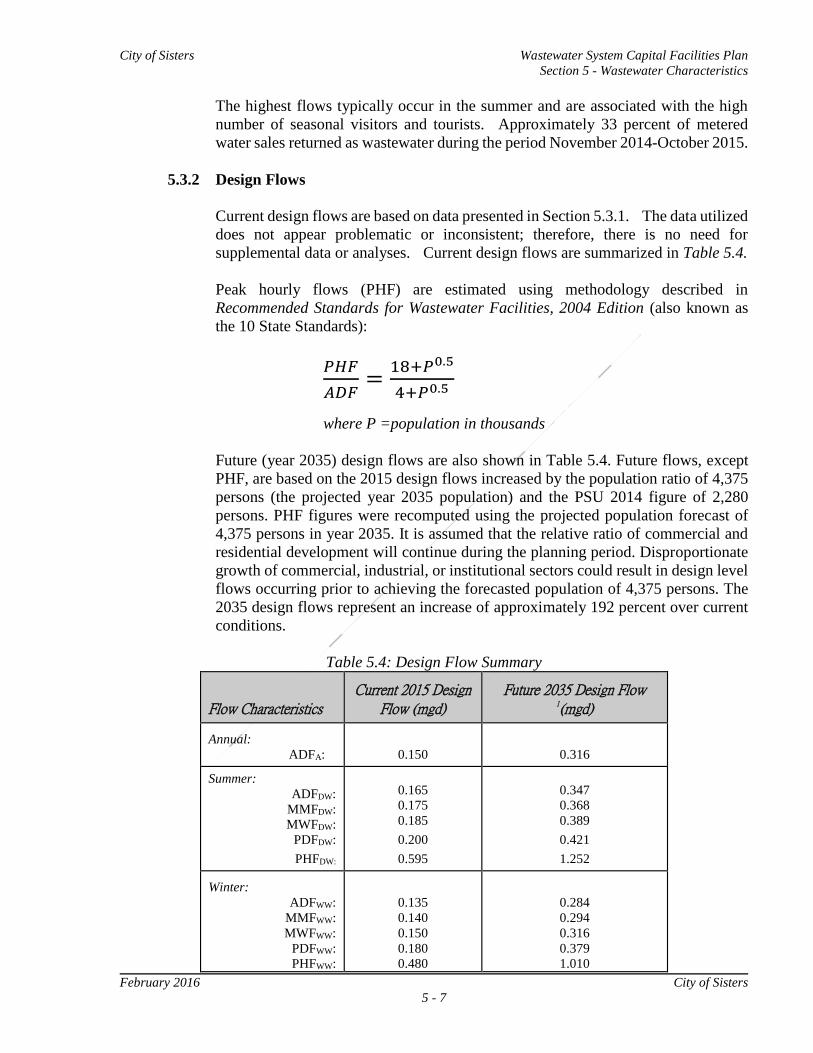
City of Sisters Wastewater System Capital Facilities Plan
Section 5 - Wastewater Characteristics
February 2016 City of Sisters
5 - 7
The highest flows typically occur in the summer and are associated with the high
number of seasonal visitors and tourists. Approximately 33 percent of metered
water sales returned as wastewater during the period November 2014-October 2015.
5.3.2 Design Flows
Current design flows are based on data presented in Section 5.3.1. The data utilized
does not appear problematic or inconsistent; therefore, there is no need for
supplemental data or analyses. Current design flows are summarized in Table 5.4.
Peak hourly flows (PHF) are estimated using methodology described in
Recommended Standards for Wastewater Facilities, 2004 Edition (also known as
the 10 State Standards):
𝑃𝐻𝐹
𝐴𝐷𝐹=
18+𝑃0.5
4+𝑃0.5
where P =population in thousands
Future (year 2035) design flows are also shown in Table 5.4. Future flows, except
PHF, are based on the 2015 design flows increased by the population ratio of 4,375
persons (the projected year 2035 population) and the PSU 2014 figure of 2,280
persons. PHF figures were recomputed using the projected population forecast of
4,375 persons in year 2035. It is assumed that the relative ratio of commercial and
residential development will continue during the planning period. Disproportionate
growth of commercial, industrial, or institutional sectors could result in design level
flows occurring prior to achieving the forecasted population of 4,375 persons. The
2035 design flows represent an increase of approximately 192 percent over current
conditions.
Table 5.4: Design Flow Summary
Flow Characteristics
Current 2015 Design
Flow (mgd)
Future 2035 Design Flow
1(mgd) Annual:
ADFA:
0.150
0.316
Summer:
ADFDW:
MMFDW:
MWFDW:
PDFDW:
PHFDW:
0.165
0.175
0.185
0.200
0.595
0.347
0.368
0.389
0.421
1.252
Winter:
ADFWW:
MMFWW:
MWFWW:
PDFWW:
PHFWW:
0.135
0.140
0.150
0.180
0.480
0.284
0.294
0.316
0.379
1.010
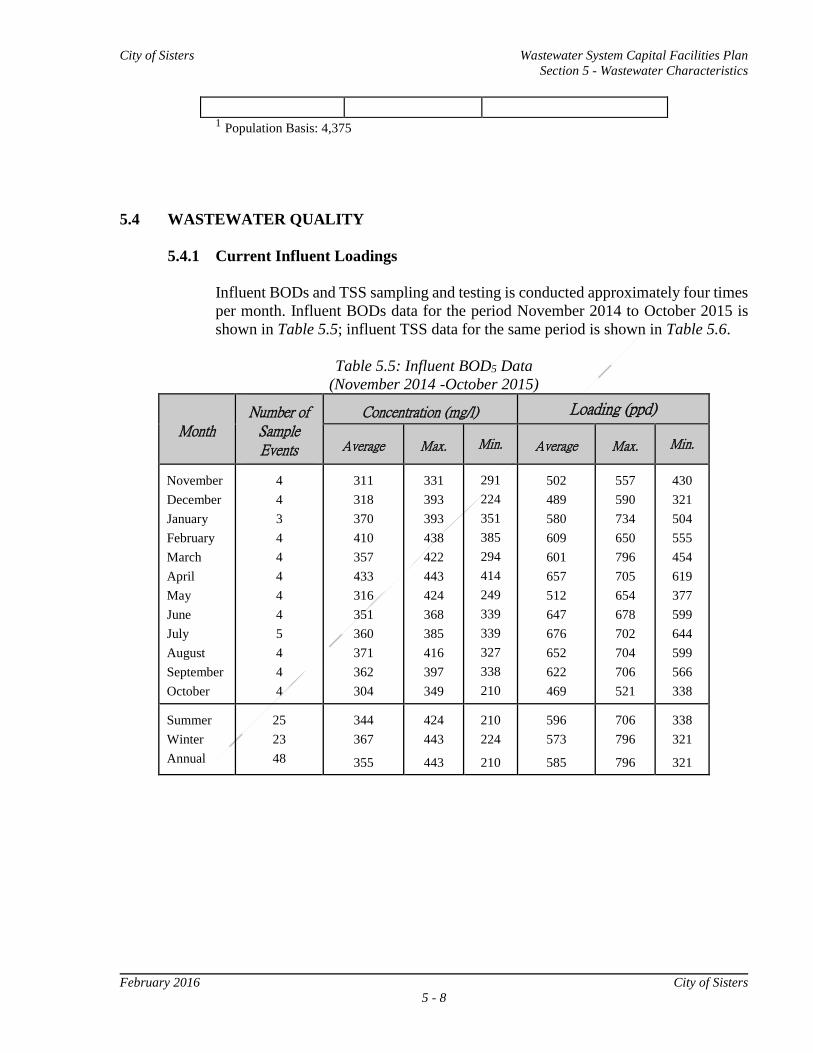
City of Sisters Wastewater System Capital Facilities Plan
Section 5 - Wastewater Characteristics
February 2016 City of Sisters
5 - 8
1 Population Basis: 4,375
5.4 WASTEWATER QUALITY
5.4.1 Current Influent Loadings
Influent BODs and TSS sampling and testing is conducted approximately four times
per month. Influent BODs data for the period November 2014 to October 2015 is
shown in Table 5.5; influent TSS data for the same period is shown in Table 5.6.
Table 5.5: Influent BOD5 Data
(November 2014 -October 2015)
Month
Number of
Sample Events
Concentration (mg/l) Loading (ppd)
Average
Max. Min.
Average
Max. Min.
November
December
January
February
March
April
May
June
July
August
September
October
4
4
3
4
4
4
4
4
5
4
4
4
311
318
370
410
357
433
316
351
360
371
362
304
331
393
393
438
422
443
424
368
385
416
397
349
291
224
351
385
294
414
249
339
339
327
338
210
502
489
580
609
601
657
512
647
676
652
622
469
557
590
734
650
796
705
654
678
702
704
706
521
430
321
504
555
454
619
377
599
644
599
566
338
Summer
Winter
Annual
25
23
48
344
367
355
424
443
443
210
224
210
596
573
585
706
796
796
338
321
321
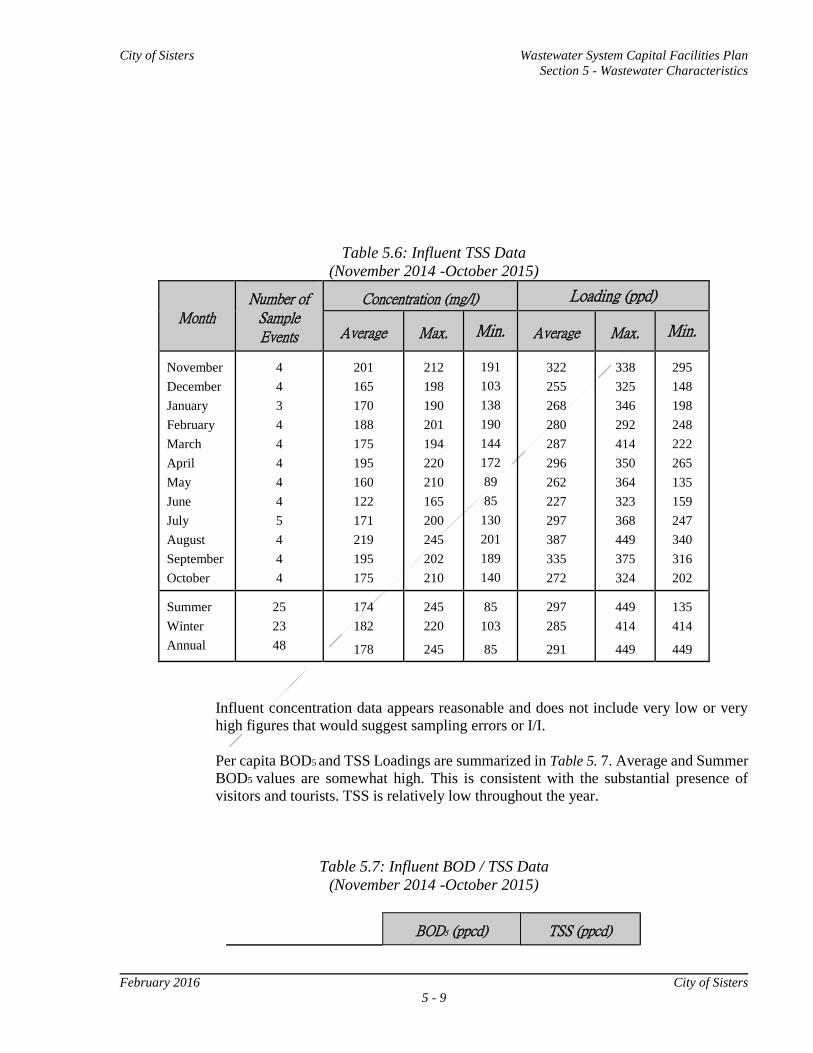
City of Sisters Wastewater System Capital Facilities Plan
Section 5 - Wastewater Characteristics
February 2016 City of Sisters
5 - 9
Table 5.6: Influent TSS Data
(November 2014 -October 2015)
Month
Number of
Sample Events
Concentration (mg/l) Loading (ppd)
Average
Max. Min.
Average
Max. Min.
November
December
January
February
March
April
May
June
July
August
September
October
4
4
3
4
4
4
4
4
5
4
4
4
201
165
170
188
175
195
160
122
171
219
195
175
212
198
190
201
194
220
210
165
200
245
202
210
191
103
138
190
144
172
89
85
130
201
189
140
322
255
268
280
287
296
262
227
297
387
335
272
338
325
346
292
414
350
364
323
368
449
375
324
295
148
198
248
222
265
135
159
247
340
316
202
Summer
Winter
Annual
25
23
48
174
182
178
245
220
245
85
103
85
297
285
291
449
414
449
135
414
449
Influent concentration data appears reasonable and does not include very low or very
high figures that would suggest sampling errors or I/I.
Per capita BOD5 and TSS Loadings are summarized in Table 5. 7. Average and Summer
BOD5 values are somewhat high. This is consistent with the substantial presence of
visitors and tourists. TSS is relatively low throughout the year.
Table 5.7: Influent BOD / TSS Data
(November 2014 -October 2015)
BOD5 (ppcd)
TSS (ppcd)
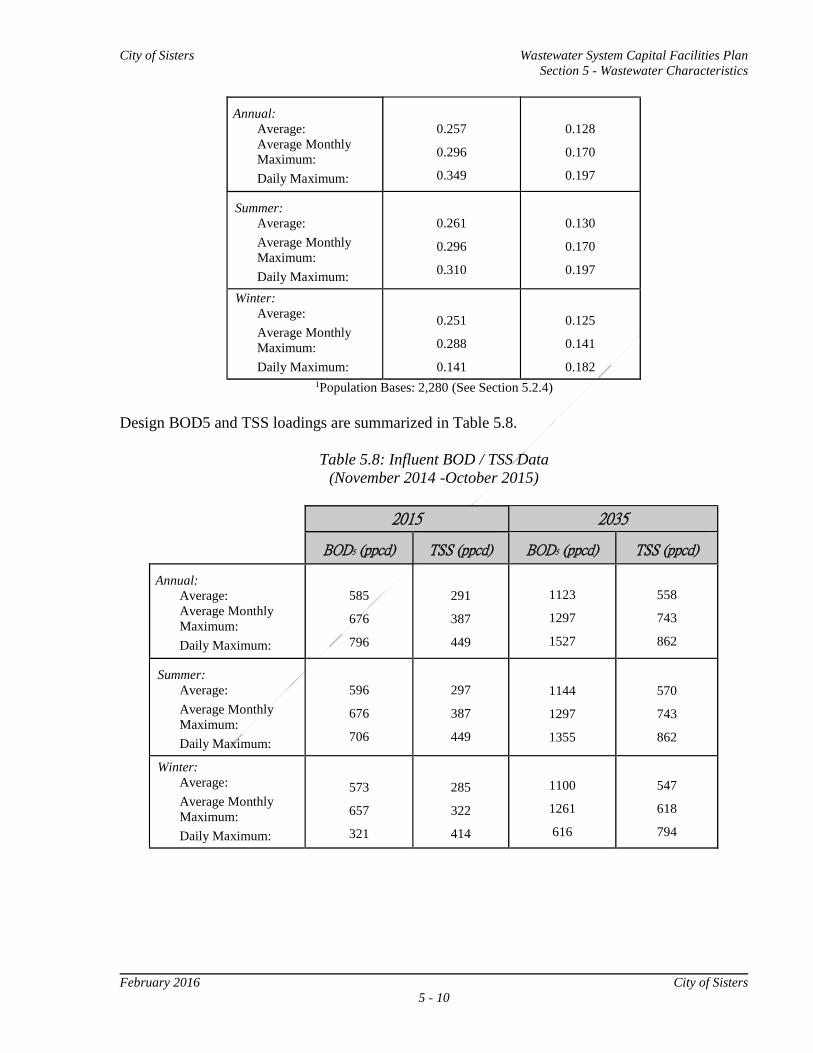
City of Sisters Wastewater System Capital Facilities Plan
Section 5 - Wastewater Characteristics
February 2016 City of Sisters
5 - 10
Annual:
Average:
Average Monthly
Maximum:
Daily Maximum:
0.257
0.296
0.349
0.128
0.170
0.197
Summer:
Average:
Average Monthly
Maximum:
Daily Maximum:
0.261
0.296
0.310
0.130
0.170
0.197
Winter:
Average:
Average Monthly
Maximum:
Daily Maximum:
0.251
0.288
0.141
0.125
0.141
0.182
1Population Bases: 2,280 (See Section 5.2.4)
Design BOD5 and TSS loadings are summarized in Table 5.8.
Table 5.8: Influent BOD / TSS Data
(November 2014 -October 2015)
2015 2035
BOD5 (ppcd)
TSS (ppcd)
BOD5 (ppcd)
TSS (ppcd)
Annual:
Average:
Average Monthly
Maximum:
Daily Maximum:
585
676
796
291
387
449
1123
1297
1527
558
743
862
Summer:
Average:
Average Monthly
Maximum:
Daily Maximum:
596
676
706
297
387
449
1144
1297
1355
570
743
862
Winter:
Average:
Average Monthly
Maximum:
Daily Maximum:
573
657
321
285
322
414
1100
1261
616
547
618
794
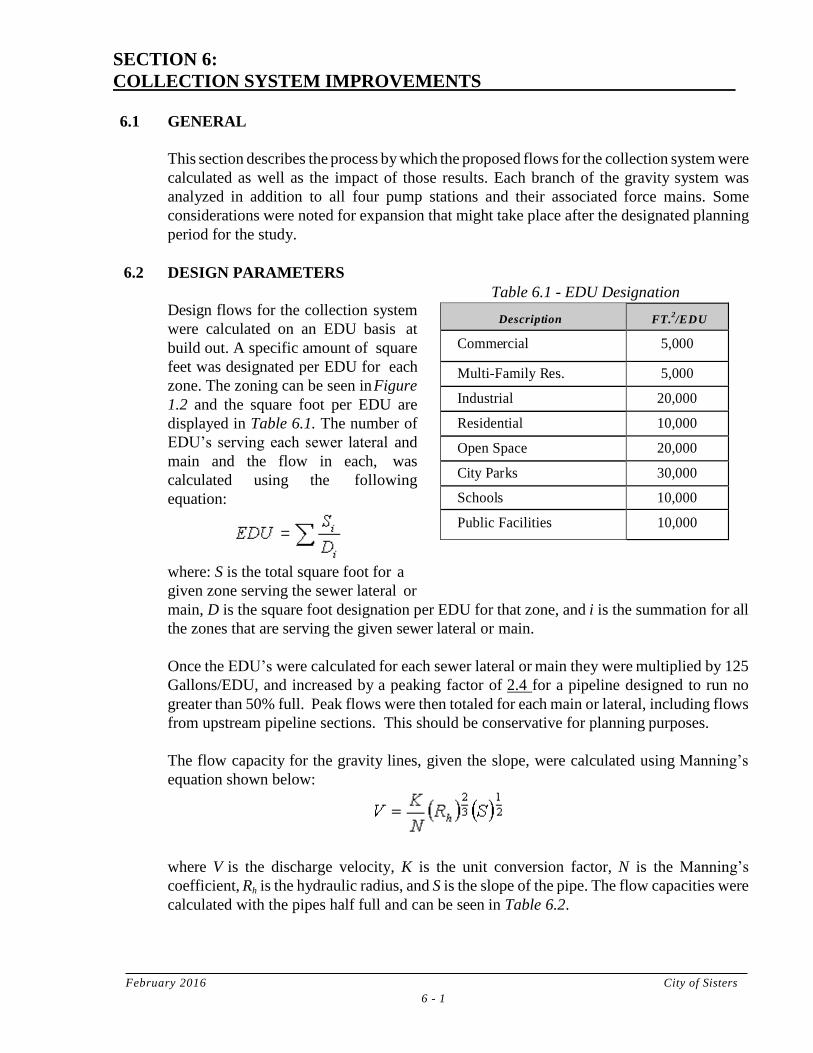
February 2016 City of Sisters
6 - 1
SECTION 6:
COLLECTION SYSTEM IMPROVEMENTS 6.1 GENERAL
This section describes the process by which the proposed flows for the collection system were
calculated as well as the impact of those results. Each branch of the gravity system was
analyzed in addition to all four pump stations and their associated force mains. Some
considerations were noted for expansion that might take place after the designated planning
period for the study.
6.2 DESIGN PARAMETERS
Design flows for the collection system
were calculated on an EDU basis at
build out. A specific amount of square
feet was designated per EDU for each
zone. The zoning can be seen in Figure
1.2 and the square foot per EDU are
displayed in Table 6.1. The number of
EDU’s serving each sewer lateral and
main and the flow in each, was
calculated using the following
equation:
Table 6.1 - EDU Designation
where: S is the total square foot for a
given zone serving the sewer lateral or
main, D is the square foot designation per EDU for that zone, and i is the summation for all
the zones that are serving the given sewer lateral or main.
Once the EDU’s were calculated for each sewer lateral or main they were multiplied by 125
Gallons/EDU, and increased by a peaking factor of 2.4 for a pipeline designed to run no
greater than 50% full. Peak flows were then totaled for each main or lateral, including flows
from upstream pipeline sections. This should be conservative for planning purposes.
The flow capacity for the gravity lines, given the slope, were calculated using Manning’s
equation shown below:
where V is the discharge velocity, K is the unit conversion factor, N is the Manning’s
coefficient, Rh is the hydraulic radius, and S is the slope of the pipe. The flow capacities were
calculated with the pipes half full and can be seen in Table 6.2.
Description FT.2/EDU
Commercial 5,000
Multi-Family Res. 5,000
Industrial 20,000
Residential 10,000
Open Space 20,000
City Parks 30,000
Schools 10,000
Public Facilities 10,000
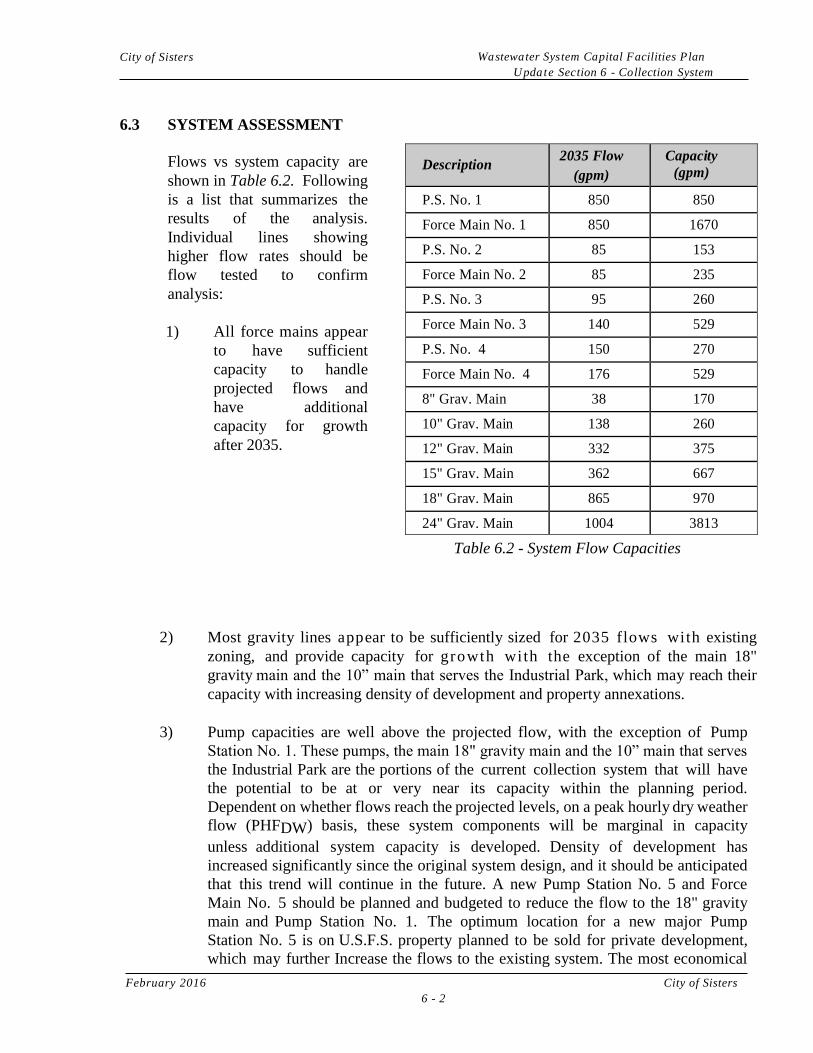
February 2016 City of Sisters
6 - 2
City of Sisters Wastewater System Capital Facilities Plan
Update Section 6 - Collection System
Improvements
6.3 SYSTEM ASSESSMENT
Flows vs system capacity are
shown in Table 6.2. Following
is a list that summarizes the
results of the analysis.
Individual lines showing
higher flow rates should be
flow tested to confirm
analysis:
1) All force mains appear
to have sufficient
capacity to handle
projected flows and
have additional
capacity for growth
after 2035.
Table 6.2 - System Flow Capacities
2) Most gravity lines appear to be sufficiently sized for 2035 flows with existing
zoning, and provide capacity for growth with the exception of the main 18"
gravity main and the 10” main that serves the Industrial Park, which may reach their
capacity with increasing density of development and property annexations.
3) Pump capacities are well above the projected flow, with the exception of Pump
Station No. 1. These pumps, the main 18" gravity main and the 10” main that serves
the Industrial Park are the portions of the current collection system that will have
the potential to be at or very near its capacity within the planning period.
Dependent on whether flows reach the projected levels, on a peak hourly dry weather
flow (PHFDW) basis, these system components will be marginal in capacity
unless additional system capacity is developed. Density of development has
increased significantly since the original system design, and it should be anticipated
that this trend will continue in the future. A new Pump Station No. 5 and Force
Main No. 5 should be planned and budgeted to reduce the flow to the 18" gravity
main and Pump Station No. 1. The optimum location for a new major Pump
Station No. 5 is on U.S.F.S. property planned to be sold for private development,
which may further Increase the flows to the existing system. The most economical
Description 2035 Flow
(gpm)
Capacity
(gpm)
P.S. No. 1 850 850
Force Main No. 1 850 1670
P.S. No. 2 85 153
Force Main No. 2 85 235
P.S. No. 3 95 260
Force Main No. 3 140 529
P.S. No. 4 150 270
Force Main No. 4 176 529
8" Grav. Main 38 170
10" Grav. Main 138 260
12" Grav. Main 332 375
15" Grav. Main 362 667
18" Grav. Main 865 970
24" Grav. Main 1004 3813
City of Sisters Wastewater System Capital Facilities Plan Update
Section 6 - Collection System Improvements
location for a new pumping facility would be where the existing 18" line
approaches North Pine Street on the westerly side, although the pump station
could be located at alternative locations along the 18" line. Alternate locations that
appear feasible at additional cost are at the beginning of the 18" line just East of
Highway 20, in the East Portal property.
The 10” mainline that serves the Industrial Park and then flows east to Pump
station #1 also collects flow from the Edge of the Pines and Saddlestone
subdivisions. This line will need to be intercepted after it leaves the Industrial Park
and collects the northern downtown commercial areas in the general area of N.
Larch St. and N. Locust St. A new mainline will need to be installed from that
point to Pump station #1 to create new capacity in the existing 10” Industrial Park
line. West of Highway 20, installation of the new Pump Station No. 5 will be
required. Future development of all types in the City should provide SDC fees for the
City’s portion of the construction of this pump station, and developer contributions
should be imposed for future development planned for the U.S.F.S. property. In
addition, the needed force main will likely extend along Pine Street to potentially
Jefferson Avenue or St. Helens Avenue to minimize construction costs. As parking,
street, and sidewalk improvements continue, costs for construction of the needed
force main will increase substantially. Force Main No. 5 should be extended to
interconnect with the existing Force Main No. 1 at Jefferson Avenue or St. Helens
Avenue, and a common force main from that point to the Wastewater Treatment
Plant will suffice beyond 2035.
In addition to a need for additional pumping and main line capacity, the main pumps
in Pump Station No. 1 will have been in operation for 20 years by 2021. These
pumps currently pump all of the sewage transmitted to the wastewater treatment
plant, and should be replaced within the planning period.
February 2016 City of Sisters
6 - 3
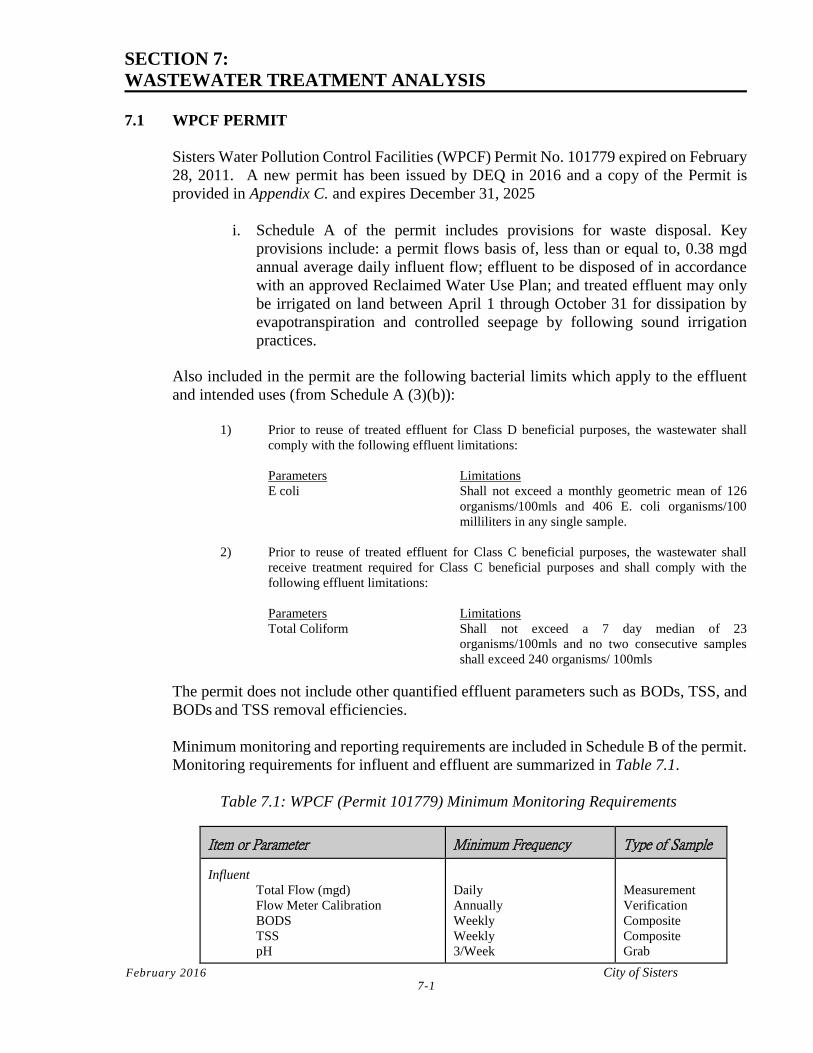
February 2016 City of Sisters 7-1
SECTION 7:
WASTEWATER TREATMENT ANALYSIS
7.1 WPCF PERMIT
Sisters Water Pollution Control Facilities (WPCF) Permit No. 101779 expired on February
28, 2011. A new permit has been issued by DEQ in 2016 and a copy of the Permit is
provided in Appendix C. and expires December 31, 2025
i. Schedule A of the permit includes provisions for waste disposal. Key
provisions include: a permit flows basis of, less than or equal to, 0.38 mgd
annual average daily influent flow; effluent to be disposed of in accordance
with an approved Reclaimed Water Use Plan; and treated effluent may only
be irrigated on land between April 1 through October 31 for dissipation by
evapotranspiration and controlled seepage by following sound irrigation
practices.
Also included in the permit are the following bacterial limits which apply to the effluent
and intended uses (from Schedule A (3)(b)):
1) Prior to reuse of treated effluent for Class D beneficial purposes, the wastewater shall
comply with the following effluent limitations:
Parameters Limitations
E coli Shall not exceed a monthly geometric mean of 126
organisms/100mls and 406 E. coli organisms/100
milliliters in any single sample.
2) Prior to reuse of treated effluent for Class C beneficial purposes, the wastewater shall
receive treatment required for Class C beneficial purposes and shall comply with the
following effluent limitations:
Parameters Limitations
Total Coliform Shall not exceed a 7 day median of 23
organisms/100mls and no two consecutive samples
shall exceed 240 organisms/ 100mls
The permit does not include other quantified effluent parameters such as BODs, TSS, and
BODs and TSS removal efficiencies.
Minimum monitoring and reporting requirements are included in Schedule B of the permit.
Monitoring requirements for influent and effluent are summarized in Table 7.1.
Table 7.1: WPCF (Permit 101779) Minimum Monitoring Requirements
Item or Parameter Minimum Frequency
Type of Sample
Influent
Total Flow (mgd)
Flow Meter Calibration
BODS
TSS
pH
Daily
Annually
Weekly
Weekly
3/Week
Measurement
Verification
Composite
Composite
Grab
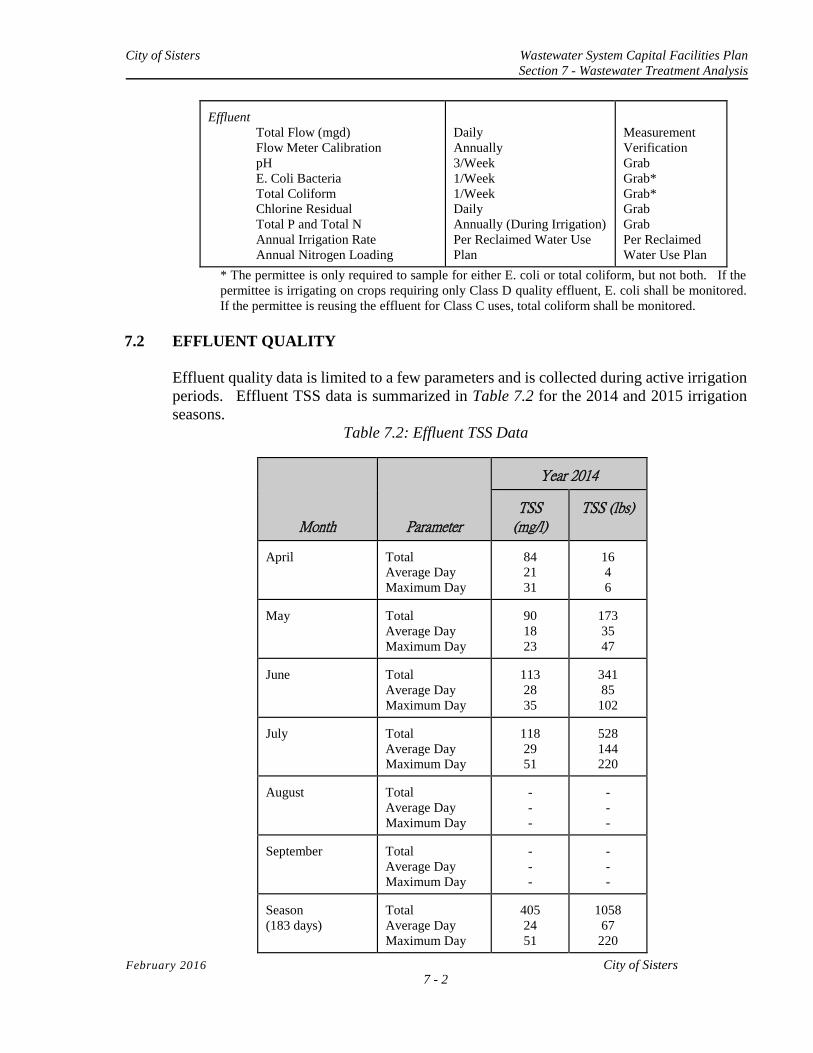
City of Sisters Wastewater System Capital Facilities Plan
Section 7 - Wastewater Treatment Analysis
February 2016 City of Sisters 7 - 2
Effluent
Total Flow (mgd)
Flow Meter Calibration
pH
E. Coli Bacteria
Total Coliform
Chlorine Residual
Total P and Total N
Annual Irrigation Rate
Annual Nitrogen Loading
Daily
Annually
3/Week
1/Week
1/Week
Daily
Annually (During Irrigation)
Per Reclaimed Water Use
Plan
Measurement
Verification
Grab
Grab*
Grab*
Grab
Grab
Per Reclaimed
Water Use Plan
* The permittee is only required to sample for either E. coli or total coliform, but not both. If the
permittee is irrigating on crops requiring only Class D quality effluent, E. coli shall be monitored.
If the permittee is reusing the effluent for Class C uses, total coliform shall be monitored.
7.2 EFFLUENT QUALITY
Effluent quality data is limited to a few parameters and is collected during active irrigation
periods. Effluent TSS data is summarized in Table 7.2 for the 2014 and 2015 irrigation
seasons.
Table 7.2: Effluent TSS Data
Month
Parameter
Year 2014
TSS
(mg/l)
TSS (lbs)
April
Total
Average Day
Maximum Day
84
21
31
16
4
6 May
Total
Average Day
Maximum Day
90
18
23
173
35
47 June
Total
Average Day
Maximum Day
113
28
35
341
85
102 July
Total
Average Day
Maximum Day
118
29
51
528
144
220 August
Total
Average Day
Maximum Day
-
-
-
-
-
- September
Total
Average Day
Maximum Day
-
-
-
-
-
- Season
(183 days)
Total
Average Day
Maximum Day
405
24
51
1058
67
220
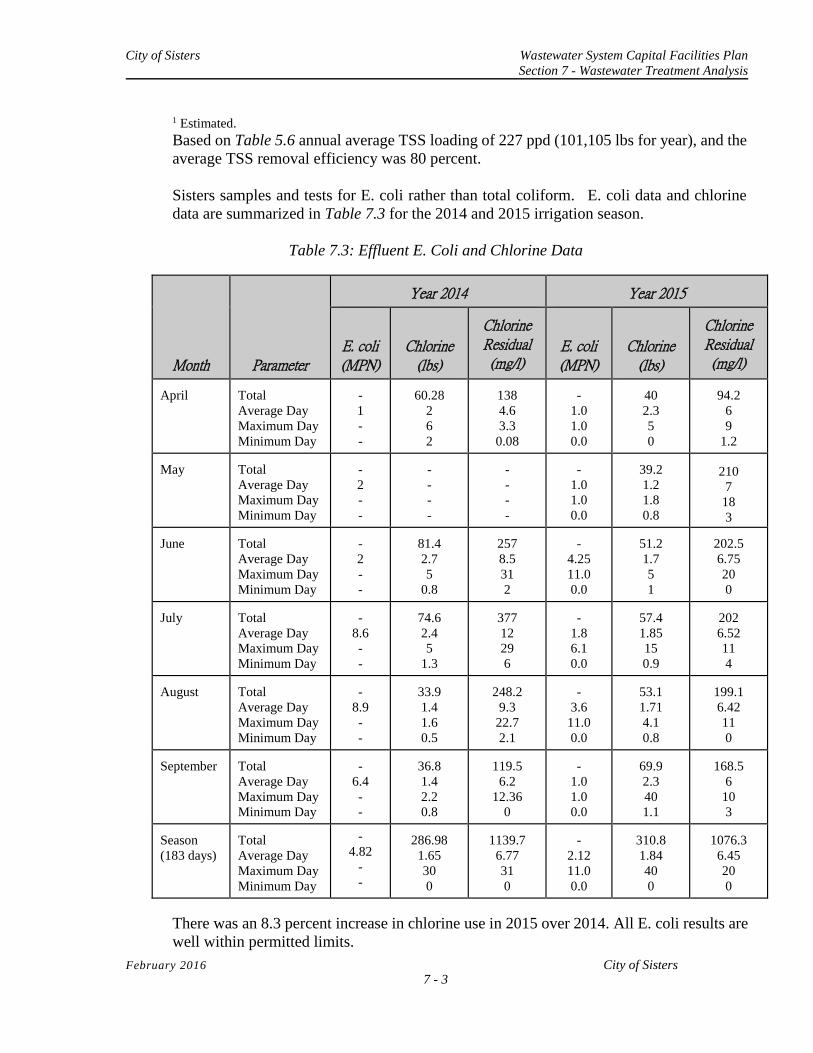
City of Sisters Wastewater System Capital Facilities Plan
Section 7 - Wastewater Treatment Analysis
February 2016 City of Sisters 7 - 3
1 Estimated.
Based on Table 5.6 annual average TSS loading of 227 ppd (101,105 lbs for year), and the
average TSS removal efficiency was 80 percent.
Sisters samples and tests for E. coli rather than total coliform. E. coli data and chlorine
data are summarized in Table 7.3 for the 2014 and 2015 irrigation season.
Table 7.3: Effluent E. Coli and Chlorine Data
Month
Parameter
Year 2014
Year 2015
E. coli (MPN)
Chlorine (lbs)
Chlorine Residual (mg/l)
E. coli (MPN)
Chlorine (lbs)
Chlorine Residual (mg/l)
April
Total
Average Day
Maximum Day
Minimum Day
-
1
-
-
60.28
2
6
2
138
4.6
3.3
0.08
-
1.0
1.0
0.0
40
2.3
5
0
94.2
6
9
1.2 May
Total
Average Day
Maximum Day
Minimum Day
-
2
-
-
-
-
-
-
-
-
-
-
-
1.0
1.0
0.0
39.2
1.2
1.8
0.8
210
7
18
3 June
Total
Average Day
Maximum Day
Minimum Day
-
2
-
-
81.4
2.7
5
0.8
257
8.5
31
2
-
4.25
11.0
0.0
51.2
1.7
5
1
202.5
6.75
20
0 July
Total
Average Day
Maximum Day
Minimum Day
-
8.6
-
-
74.6
2.4
5
1.3
377
12
29
6
-
1.8
6.1
0.0
57.4
1.85
15
0.9
202
6.52
11
4 August
Total
Average Day
Maximum Day
Minimum Day
-
8.9
-
-
33.9
1.4
1.6
0.5
248.2
9.3
22.7
2.1
-
3.6
11.0
0.0
53.1
1.71
4.1
0.8
199.1
6.42
11
0 September
Total
Average Day
Maximum Day
Minimum Day
-
6.4
-
-
36.8
1.4
2.2
0.8
119.5
6.2
12.36
0
-
1.0
1.0
0.0
69.9
2.3
40
1.1
168.5
6
10
3 Season
(183 days)
Total
Average Day
Maximum Day
Minimum Day
-
4.82
-
-
286.98
1.65
30
0
1139.7
6.77
31
0
-
2.12
11.0
0.0
310.8
1.84
40
0
1076.3
6.45
20
0
There was an 8.3 percent increase in chlorine use in 2015 over 2014. All E. coli results are
well within permitted limits.
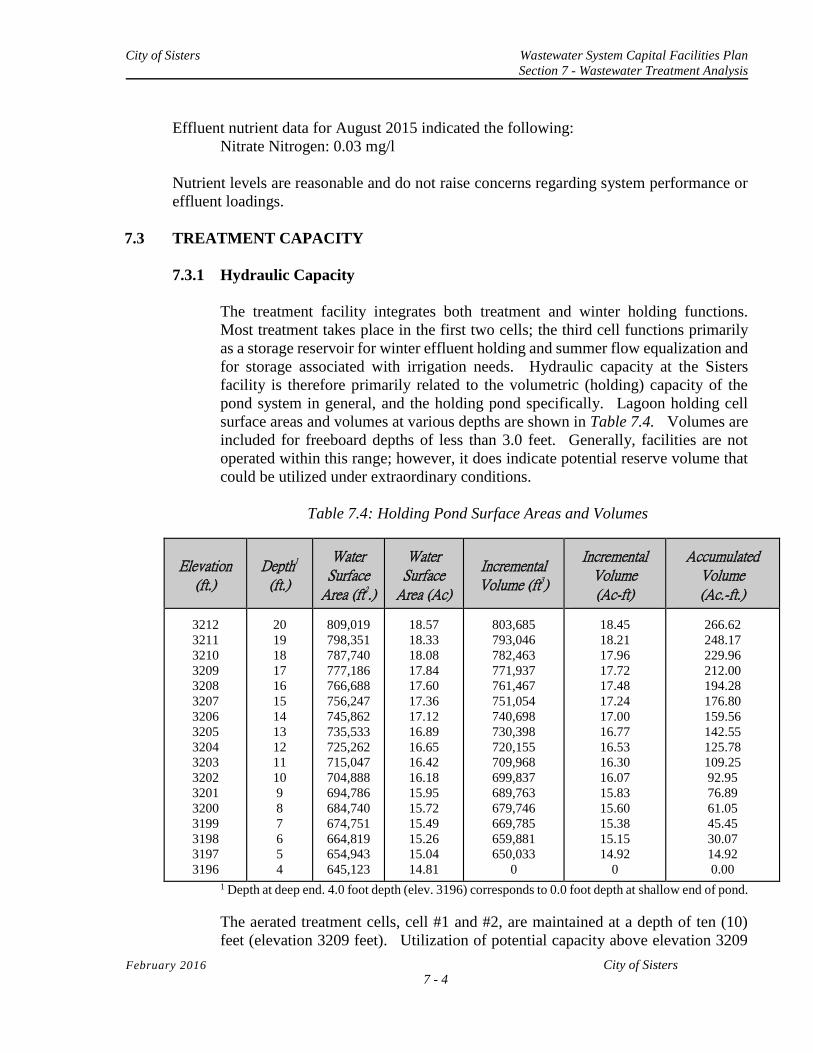
City of Sisters Wastewater System Capital Facilities Plan
Section 7 - Wastewater Treatment Analysis
February 2016 City of Sisters 7 - 4
Effluent nutrient data for August 2015 indicated the following:
Nitrate Nitrogen: 0.03 mg/l
Nutrient levels are reasonable and do not raise concerns regarding system performance or
effluent loadings.
7.3 TREATMENT CAPACITY
7.3.1 Hydraulic Capacity
The treatment facility integrates both treatment and winter holding functions.
Most treatment takes place in the first two cells; the third cell functions primarily
as a storage reservoir for winter effluent holding and summer flow equalization and
for storage associated with irrigation needs. Hydraulic capacity at the Sisters
facility is therefore primarily related to the volumetric (holding) capacity of the
pond system in general, and the holding pond specifically. Lagoon holding cell
surface areas and volumes at various depths are shown in Table 7.4. Volumes are
included for freeboard depths of less than 3.0 feet. Generally, facilities are not
operated within this range; however, it does indicate potential reserve volume that
could be utilized under extraordinary conditions.
Table 7.4: Holding Pond Surface Areas and Volumes
Elevation (ft.)
Depth1
(ft.)
Water
Surface Area (ft2.)
Water
Surface Area (Ac)
Incremental Volume (ft3)
Incremental
Volume (Ac-ft)
Accumulated
Volume (Ac.-ft.)
3212
3211
3210
3209
3208
3207
3206
3205
3204
3203
3202
3201
3200
3199
3198
3197
3196
20
19
18
17
16
15
14
13
12
11
10
9
8
7
6
5
4
809,019
798,351
787,740
777,186
766,688
756,247
745,862
735,533
725,262
715,047
704,888
694,786
684,740
674,751
664,819
654,943
645,123
18.57
18.33
18.08
17.84
17.60
17.36
17.12
16.89
16.65
16.42
16.18
15.95
15.72
15.49
15.26
15.04
14.81
803,685
793,046
782,463
771,937
761,467
751,054
740,698
730,398
720,155
709,968
699,837
689,763
679,746
669,785
659,881
650,033
0
18.45
18.21
17.96
17.72
17.48
17.24
17.00
16.77
16.53
16.30
16.07
15.83
15.60
15.38
15.15
14.92
0
266.62
248.17
229.96
212.00
194.28
176.80
159.56
142.55
125.78
109.25
92.95
76.89
61.05
45.45
30.07
14.92
0.00
1 Depth at deep end. 4.0 foot depth (elev. 3196) corresponds to 0.0 foot depth at shallow end of pond.
The aerated treatment cells, cell #1 and #2, are maintained at a depth of ten (10)
feet (elevation 3209 feet). Utilization of potential capacity above elevation 3209
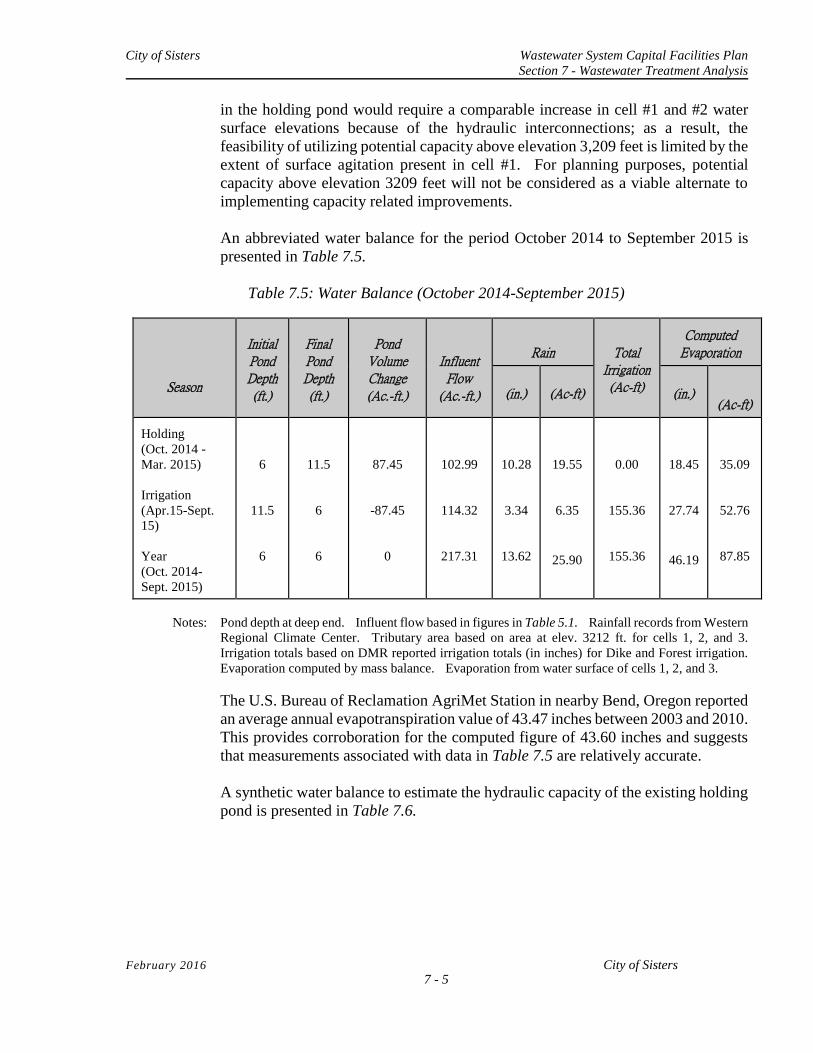
City of Sisters Wastewater System Capital Facilities Plan
Section 7 - Wastewater Treatment Analysis
February 2016 City of Sisters 7 - 5
in the holding pond would require a comparable increase in cell #1 and #2 water
surface elevations because of the hydraulic interconnections; as a result, the
feasibility of utilizing potential capacity above elevation 3,209 feet is limited by the
extent of surface agitation present in cell #1. For planning purposes, potential
capacity above elevation 3209 feet will not be considered as a viable alternate to
implementing capacity related improvements.
An abbreviated water balance for the period October 2014 to September 2015 is
presented in Table 7.5.
Table 7.5: Water Balance (October 2014-September 2015)
Season
Initial Pond Depth (ft.)
Final Pond Depth (ft.)
Pond
Volume Change (Ac.-ft.)
Influent Flow
(Ac.-ft.)
Rain
Total Irrigation (Ac-ft)
Computed
Evaporation
(in.)
(Ac-ft)
(in.)
(Ac-ft) Holding
(Oct. 2014 -
Mar. 2015)
Irrigation
(Apr.15-Sept.
15)
Year
(Oct. 2014-
Sept. 2015)
6
11.5
6
11.5
6
6
87.45
-87.45
0
102.99
114.32
217.31
10.28
3.34
13.62
19.55
6.35
25.90
0.00
155.36
155.36
18.45
27.74
46.19
35.09
52.76
87.85
Notes: Pond depth at deep end. Influent flow based in figures in Table 5.1. Rainfall records from Western
Regional Climate Center. Tributary area based on area at elev. 3212 ft. for cells 1, 2, and 3.
Irrigation totals based on DMR reported irrigation totals (in inches) for Dike and Forest irrigation.
Evaporation computed by mass balance. Evaporation from water surface of cells 1, 2, and 3.
The U.S. Bureau of Reclamation AgriMet Station in nearby Bend, Oregon reported
an average annual evapotranspiration value of 43.47 inches between 2003 and 2010.
This provides corroboration for the computed figure of 43.60 inches and suggests
that measurements associated with data in Table 7.5 are relatively accurate.
A synthetic water balance to estimate the hydraulic capacity of the existing holding
pond is presented in Table 7.6.
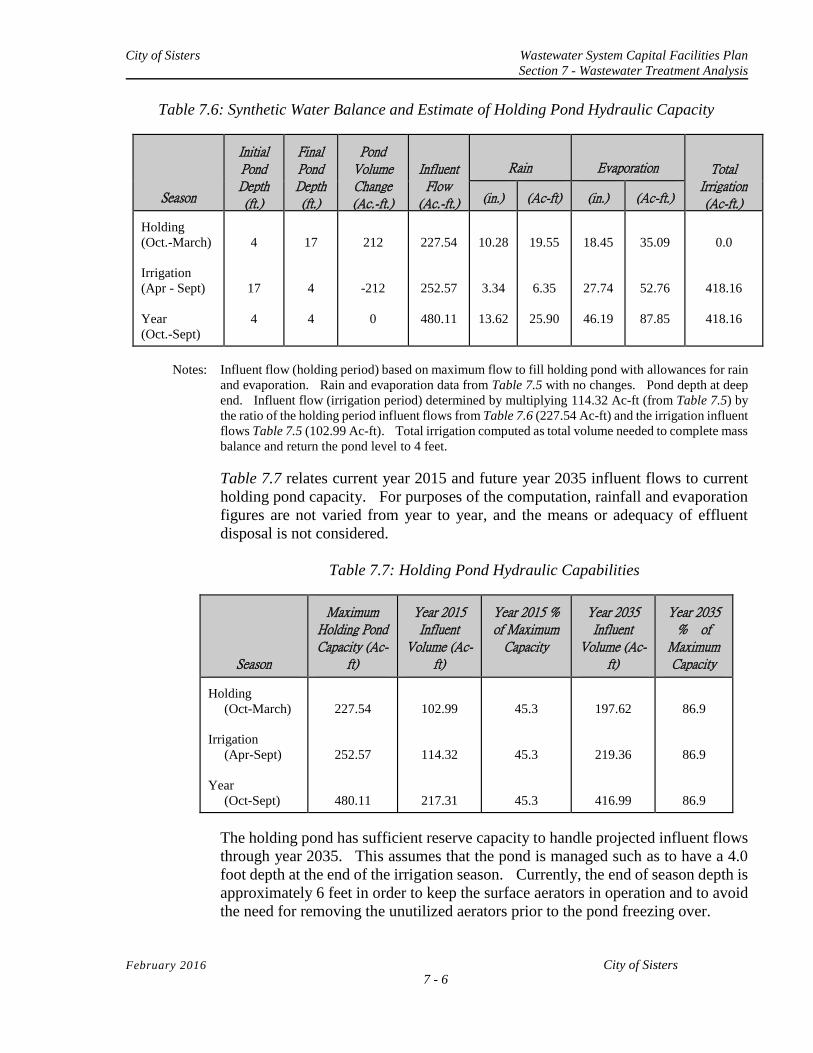
City of Sisters Wastewater System Capital Facilities Plan
Section 7 - Wastewater Treatment Analysis
February 2016 City of Sisters 7 - 6
Table 7.6: Synthetic Water Balance and Estimate of Holding Pond Hydraulic Capacity
Season
Initial Pond Depth (ft.)
Final Pond Depth (ft.)
Pond
Volume Change (Ac.-ft.)
Influent Flow
(Ac.-ft.)
Rain
Evaporation
Total Irrigation (Ac-ft.)
(in.)
(Ac-ft)
(in.)
(Ac-ft.)
Holding
(Oct.-March)
Irrigation
(Apr - Sept)
Year
(Oct.-Sept)
4
17
4
17
4
4
212
-212
0
227.54
252.57
480.11
10.28
3.34
13.62
19.55
6.35
25.90
18.45
27.74
46.19
35.09
52.76
87.85
0.0
418.16
418.16
Notes: Influent flow (holding period) based on maximum flow to fill holding pond with allowances for rain
and evaporation. Rain and evaporation data from Table 7.5 with no changes. Pond depth at deep
end. Influent flow (irrigation period) determined by multiplying 114.32 Ac-ft (from Table 7.5) by
the ratio of the holding period influent flows from Table 7.6 (227.54 Ac-ft) and the irrigation influent
flows Table 7.5 (102.99 Ac-ft). Total irrigation computed as total volume needed to complete mass
balance and return the pond level to 4 feet.
Table 7.7 relates current year 2015 and future year 2035 influent flows to current
holding pond capacity. For purposes of the computation, rainfall and evaporation
figures are not varied from year to year, and the means or adequacy of effluent
disposal is not considered.
Table 7.7: Holding Pond Hydraulic Capabilities
Season
Maximum
Holding Pond Capacity (Ac-
ft)
Year 2015 Influent
Volume (Ac-ft)
Year 2015 % of Maximum
Capacity
Year 2035 Influent
Volume (Ac-ft)
Year 2035
% of Maximum Capacity
Holding
(Oct-March)
Irrigation
(Apr-Sept)
Year
(Oct-Sept)
227.54
252.57
480.11
102.99
114.32
217.31
45.3
45.3
45.3
197.62
219.36
416.99
86.9
86.9
86.9
The holding pond has sufficient reserve capacity to handle projected influent flows
through year 2035. This assumes that the pond is managed such as to have a 4.0
foot depth at the end of the irrigation season. Currently, the end of season depth is
approximately 6 feet in order to keep the surface aerators in operation and to avoid
the need for removing the unutilized aerators prior to the pond freezing over.
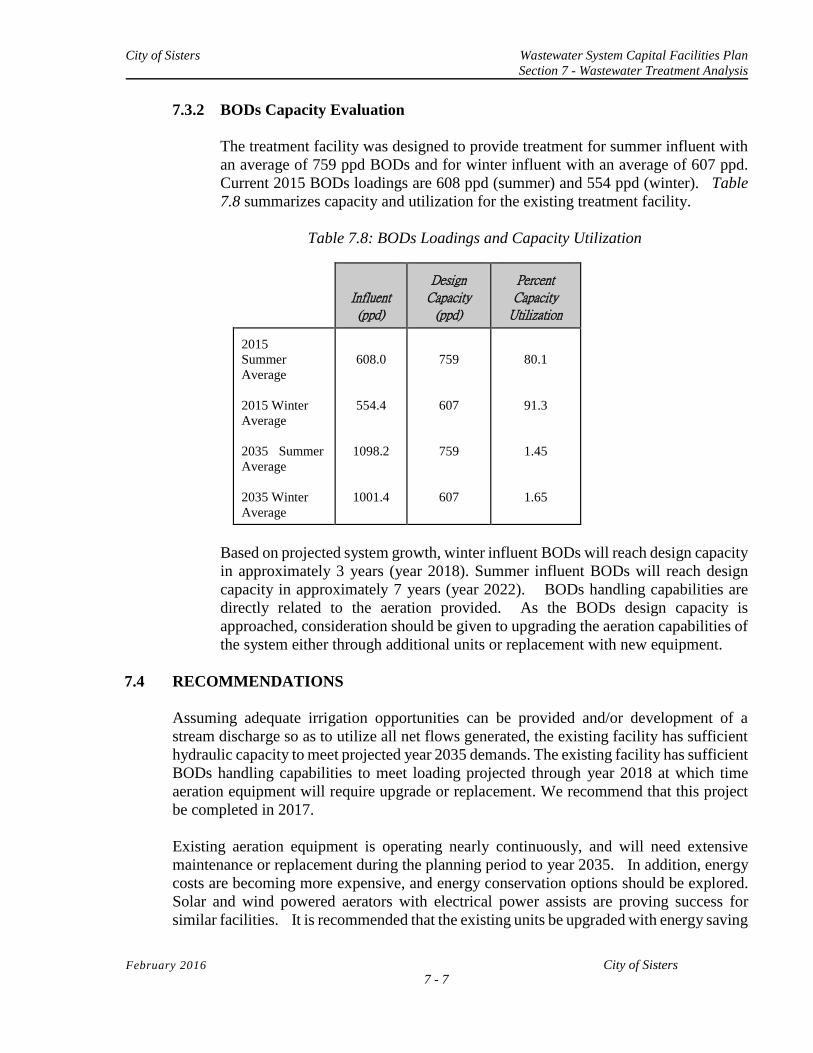
City of Sisters Wastewater System Capital Facilities Plan
Section 7 - Wastewater Treatment Analysis
February 2016 City of Sisters 7 - 7
7.3.2 BODs Capacity Evaluation
The treatment facility was designed to provide treatment for summer influent with
an average of 759 ppd BODs and for winter influent with an average of 607 ppd.
Current 2015 BODs loadings are 608 ppd (summer) and 554 ppd (winter). Table
7.8 summarizes capacity and utilization for the existing treatment facility.
Table 7.8: BODs Loadings and Capacity Utilization
Influent (ppd)
Design
Capacity (ppd)
Percent Capacity
Utilization 2015
Summer
Average
2015 Winter
Average
2035 Summer
Average
2035 Winter
Average
608.0
554.4
1098.2
1001.4
759
607
759
607
80.1
91.3
1.45
1.65
Based on projected system growth, winter influent BODs will reach design capacity
in approximately 3 years (year 2018). Summer influent BODs will reach design
capacity in approximately 7 years (year 2022). BODs handling capabilities are
directly related to the aeration provided. As the BODs design capacity is
approached, consideration should be given to upgrading the aeration capabilities of
the system either through additional units or replacement with new equipment.
7.4 RECOMMENDATIONS
Assuming adequate irrigation opportunities can be provided and/or development of a
stream discharge so as to utilize all net flows generated, the existing facility has sufficient
hydraulic capacity to meet projected year 2035 demands. The existing facility has sufficient
BODs handling capabilities to meet loading projected through year 2018 at which time
aeration equipment will require upgrade or replacement. We recommend that this project
be completed in 2017.
Existing aeration equipment is operating nearly continuously, and will need extensive
maintenance or replacement during the planning period to year 2035. In addition, energy
costs are becoming more expensive, and energy conservation options should be explored.
Solar and wind powered aerators with electrical power assists are proving success for
similar facilities. It is recommended that the existing units be upgraded with energy saving

City of Sisters Wastewater System Capital Facilities Plan
Section 7 - Wastewater Treatment Analysis
February 2016 City of Sisters 7 - 8
aeration devices as the units require replacement. Aeration equipment recommendations
are described further in Section 10.
If water quality improvements are needed to allow other effluent disposal opportunities,
such as stream discharge or less restrictive irrigation, then treatment improvements or
alternate facilities will be needed. These should be developed consistent with the needs
of the disposal scenarios considered. Other disposal opportunities are discussed in Section
8.
February 2016 City of Sisters
8 - 1
SECTION 8:
WASTEWATER DISPOSAL
8.1 INTRODUCTION
8.1.1 Current Status
Sisters currently holds all effluent over winter and irrigates all effluent on sites
adjacent to the treatment facility. The 100.3 acre irrigation site currently includes:
88.5 acres of forest with an annual application limit of 14.3 inches, and 11.8 acres of
grass-covered dikes with an annual application limit of 28.79 inches (the overall
average application rate is 16.00 inches 1). Current (2015) application (reported)
totals are: forest – 17.04 inches, and dikes - 30.20 inches. These totals did not include a
correction for irrigation evaporation. The overhead sprinklers have an approximate
75% efficiency; therefore, actual 2015 application totals were: forest -12.78 inches
and dikes - 22.65 inches. Although these totals are within imposed limits, it is
evident that additional acreage for effluent irrigation must be provided in the near
future on the Lazy Z Ranch.
With current City growth, the City must pursue expansion of irrigation opportunities
on their portion of the Lazy Z Ranch in the near future. At the projected growth rate,
Sisters must have new disposal options completed by 2018 to remain within permit
conditions. Growth in the past five (5) years has averaged 1.91% per year, and
projections anticipate that continued population growth will increase to a 3.23%
rate through the year 2035.
8.1.2 Disposal Alternatives - Preliminary Considerations
The 1994 Wastewater System Engineering Study (WSES) included consideration of
numerous effluent disposal alternatives including: year-round discharge to Whychus
(formerly Squaw) Creek, wetlands polishing, winter holding and summer land
irrigation, summer land irrigation and winter discharge to Whychus Creek, effluent
filtration, and a subsurface drainfield. Treatment options were considered for Level
1 to Level 3 discharges. Subsequent discussions with DEQ indicated that Whychus
Creek was considered to be a high quality water as (then) defined in OAR 340-41-
026 and that stream discharge at any location would not be a viable option for Sisters.
Moderate rate infiltration, which allows a controlled rate of subsurface percolation,
was also considered to be a viable option. The City of Redmond was also pursuing
a similar option at the time. Due to regulatory reservations and the great expense of
demonstrating no adverse impact to groundwater, the subsurface disposal option was
not deemed to be a viable option for Sisters. During preparation of the 1997
Wastewater System Facilities Plan (WSFP) it became apparent that winter holding
1 [(88.5 acres)(14.3 inches) + (11.8 acres)(28.79 inches)]/100.3 acres = 16 inches
February 2016 City of Sisters
8 - 2
City of Sisters Wastewater System Capital Facilities Plan Update
Section 8: Wastewater Disposal
and summer irrigation was the only option practicable. The City’s present system
was developed against this background and history.
8.2 REGULATORY REQUIREMENTS
8.2.1 General Regulatory Requirements
General regulatory requirements related to wastewater disposal are described in:
• OAR Chapter 340, Division 40 (Groundwater Quality Protection)
• OAR Chapter 340, Division 41 (Water Quality Standards: Beneficial
Uses, Policies, and Criteria for Oregon)
• OAR Chapter 340, Division 55 (Regulations Pertaining to the Use of
Reclaimed Water (Treated Effluent) from Sewage Treatment Plants).
The rules include numerous provisions and exceptions, but in general reflect a
concern with preservation or enhancement of receiving surface waters or
groundwater. This is expressed in the OAR’s as an anti-degradation policy.
8.2.2 WPCF Permit Requirements
Sisters' WPCF permit expired in 2011. DEQ has issued a draft WPCF permit which
is anticipated to be issued in 2016. Schedule A of the draft Sisters’ WPCF Permit
includes the following provisions:
1. The permittee is authorized to construct, operate, and maintain
wastewater collection, treatment and disposal systems to serve
the City of Sisters in accordance with the conditions set forth in
the permit.
2. The wastewater collections, treatment and land application
system must not be hydraulically or organically loaded in excess
of their respective, DEQ approved design capacities. At full
build-out, however, the annual average daily infulent flow must
not exceed 0.38 MGD.
3. All wastewater treatment and disposal systems must be operated
in compliance with the following conditions:
a. No discharge to state waters is permitted. All wastewater
must be stored and treated for disposal by land
application following sound irrigation practices.
February 2016 City of Sisters
8 - 3
City of Sisters Wastewater System Capital Facilities Plan Update
Section 8: Wastewater Disposal
b. Recycled Wastewater
i. Prior to land application of the recycled water, it must
receive at least Class D treatment as defined in OAR
340-055. Class D recycled water must not exceed a
30-day log mean day log mean of 126 E. coli organisms
per 100 milliliters and 406 E. coli organisms per 100
milliliters in any single sample. Class C recycled water
must not exceed a 7 day median of 23 organisms/100
milliliters and no two consecutive samples must exceed
240 organisms/100 milliliters.
ii. Irrigation must conform to a Recycled Water Use Plan
approved by DEQ and meet the required setbacks as
defined in OAR 340-055.
iii. The City of Sisters must restrict public access to the reuse
site(s) for the protection of public health.
iv. Treated effluent may only be irrigated on land between
April 1 through October 31 for dissipation by
evapotranspiration and controlled seepage by following
sound irrigation practices unless otherwise approved in
writing by DEQ.
v. Recycled water equipment must be operated so as to
prevent:
(A) Prolonged ponding of treated recycled water on the
ground surface;
(B) Surface runoff or subsurface drainage through
drainage tile;
(C) The creation of odors, fly and mosquito breeding or
other nuisance conditions;
(D) The overloading of land with nutrients, organics, or
other pollutant parameters; and
(E) Impairment of existing or potential beneficial uses of
groundwater.
February 2016 City of Sisters
8 - 4
City of Sisters Wastewater System Capital Facilities Plan Update
Section 8: Wastewater Disposal
(F) Until otherwise approved in writing by the Department
via a revised reclaimed water use plan, treated effluent
must only be reused on Class D beneficial uses.
4. The storage lagoon must be lowered sufficiently by the end of the irrigation
season to ensure maximum practicable storage capacity during the non-
irrigation months.
5. The permittee must, during all times of treatment and disposal, provide
personnel whose primary responsibilities are to assure the continuous
performance of the disposal system in accordance with the conditions of
this permit.
6. No activities must be conducted that could cause an adverse impact on
existing or potential beneficial uses of groundwater. All wastewater and
process related residuals must be managed and disposed in a manner that
will prevent a violation of the Groundwater Quality Protection Rules (OAR
340-040).
8.3 CURRENT DISPOSAL PRACTICES
8.3.1 Effluent Water Quantity and Quality
Quantity. Based on computations in Table 7.5 (Water Balance Table), a total of
155.36 Ac-ft of effluent was produced in 2015.
Water Quality. Effluent quality is discussed in Section 7.3. There are no
parameters of concern. Effluent is classed as Class D. Class D is the most restrictive
in terms of application and use.
8.3.2 Irrigation Site
Irrigation Site. The existing wastewater treatment facility and reclaimed water use
irrigation site is on a 160 acre site immediately south of the Sisters City Limits on
the South ½ of Section 9, T 15S, 10 E, W.M. Irrigation of the lagoon dikes provide
for approximately 11.8 acres of grass irrigation, and irrigation of a natural forest
provides for another 88.5 acres of irrigation area. Site elevation is approximately
3,200 feet above mean sea level.
Soils. Soils in the existing wastewater treatment and irrigation site were sampled (84
drilled holes and 16 test pits) and evaluated in 1997 by Wert & Associates,
Inc. Soils are generally well drained and consist of a fine sand or loamy fine sand
top layer (4" to 20" deep) followed by brown sand to a depth of 35"-60". Gravels
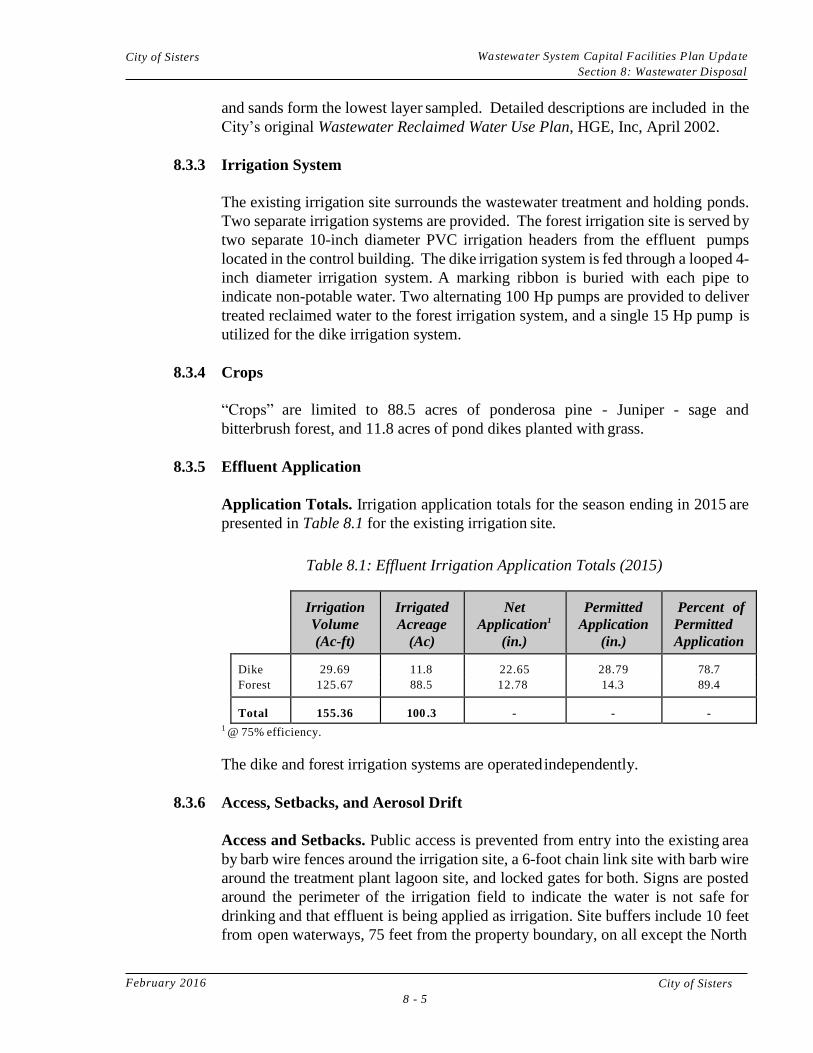
February 2016 City of Sisters
8 - 5
City of Sisters Wastewater System Capital Facilities Plan Update
Section 8: Wastewater Disposal
and sands form the lowest layer sampled. Detailed descriptions are included in the
City’s original Wastewater Reclaimed Water Use Plan, HGE, Inc, April 2002.
8.3.3 Irrigation System
The existing irrigation site surrounds the wastewater treatment and holding ponds.
Two separate irrigation systems are provided. The forest irrigation site is served by
two separate 10-inch diameter PVC irrigation headers from the effluent pumps
located in the control building. The dike irrigation system is fed through a looped 4-
inch diameter irrigation system. A marking ribbon is buried with each pipe to
indicate non-potable water. Two alternating 100 Hp pumps are provided to deliver
treated reclaimed water to the forest irrigation system, and a single 15 Hp pump is
utilized for the dike irrigation system.
8.3.4 Crops
“Crops” are limited to 88.5 acres of ponderosa pine - Juniper - sage and
bitterbrush forest, and 11.8 acres of pond dikes planted with grass.
8.3.5 Effluent Application
Application Totals. Irrigation application totals for the season ending in 2015 are
presented in Table 8.1 for the existing irrigation site.
Table 8.1: Effluent Irrigation Application Totals (2015)
Irrigation
Volume
(Ac-ft)
Irrigated
Acreage
(Ac)
Net
Application1
(in.)
Permitted
Application
(in.)
Percent of
Permitted
Application
Dike 29.69 11.8 22.65 28.79 78.7
Forest 125.67 88.5 12.78 14.3 89.4
Total 155.36 100 .3 - - - 1 @ 75% efficiency.
The dike and forest irrigation systems are operated independently.
8.3.6 Access, Setbacks, and Aerosol Drift
Access and Setbacks. Public access is prevented from entry into the existing area
by barb wire fences around the irrigation site, a 6-foot chain link site with barb wire
around the treatment plant lagoon site, and locked gates for both. Signs are posted
around the perimeter of the irrigation field to indicate the water is not safe for
drinking and that effluent is being applied as irrigation. Site buffers include 10 feet
from open waterways, 75 feet from the property boundary, on all except the North
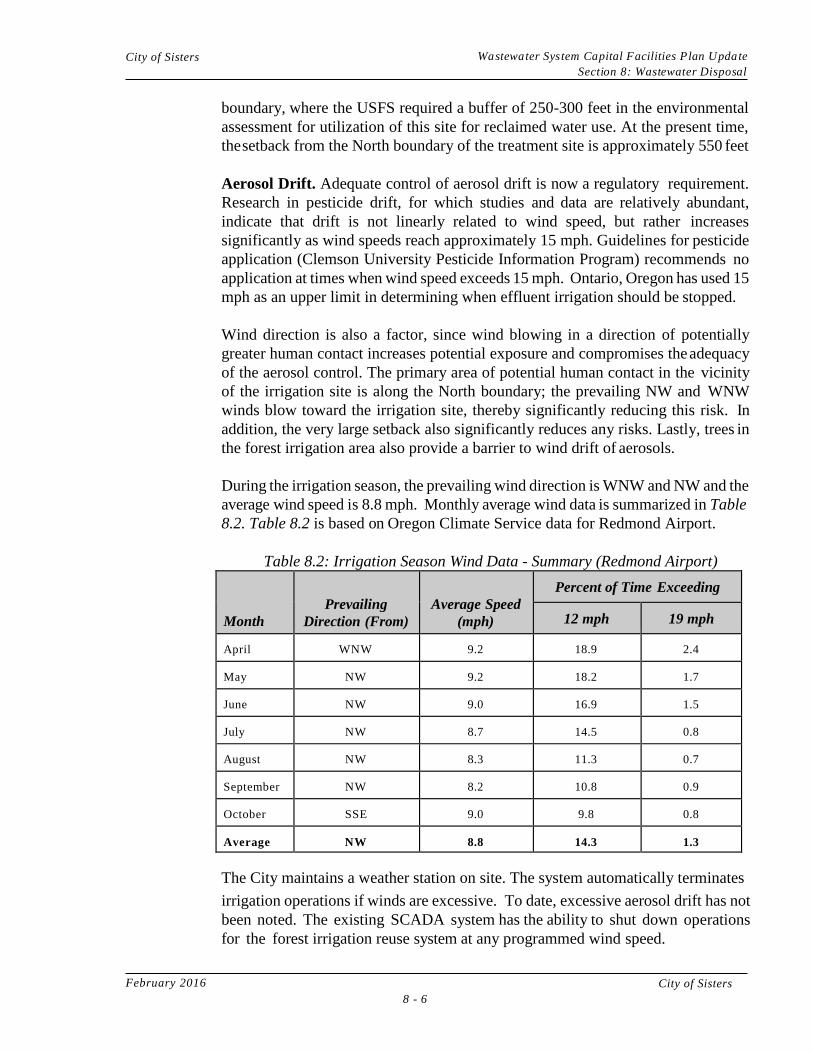
February 2016 City of Sisters
8 - 6
City of Sisters Wastewater System Capital Facilities Plan Update
Section 8: Wastewater Disposal
boundary, where the USFS required a buffer of 250-300 feet in the environmental
assessment for utilization of this site for reclaimed water use. At the present time,
the setback from the North boundary of the treatment site is approximately 550 feet
Aerosol Drift. Adequate control of aerosol drift is now a regulatory requirement.
Research in pesticide drift, for which studies and data are relatively abundant,
indicate that drift is not linearly related to wind speed, but rather increases
significantly as wind speeds reach approximately 15 mph. Guidelines for pesticide
application (Clemson University Pesticide Information Program) recommends no
application at times when wind speed exceeds 15 mph. Ontario, Oregon has used 15
mph as an upper limit in determining when effluent irrigation should be stopped.
Wind direction is also a factor, since wind blowing in a direction of potentially
greater human contact increases potential exposure and compromises the adequacy
of the aerosol control. The primary area of potential human contact in the vicinity
of the irrigation site is along the North boundary; the prevailing NW and WNW
winds blow toward the irrigation site, thereby significantly reducing this risk. In
addition, the very large setback also significantly reduces any risks. Lastly, trees in
the forest irrigation area also provide a barrier to wind drift of aerosols.
During the irrigation season, the prevailing wind direction is WNW and NW and the
average wind speed is 8.8 mph. Monthly average wind data is summarized in Table
8.2. Table 8.2 is based on Oregon Climate Service data for Redmond Airport.
Table 8.2: Irrigation Season Wind Data - Summary (Redmond Airport)
Month
Prevailing
Direction (From)
Average Speed
(mph)
Percent of Time Exceeding
12 mph 19 mph
April WNW 9.2 18.9 2.4
May NW 9.2 18.2 1.7
June NW 9.0 16.9 1.5
July NW 8.7 14.5 0.8
August NW 8.3 11.3 0.7
September NW 8.2 10.8 0.9
October SSE 9.0 9.8 0.8
Average NW 8.8 14.3 1.3
The City maintains a weather station on site. The system automatically terminates
irrigation operations if winds are excessive. To date, excessive aerosol drift has not
been noted. The existing SCADA system has the ability to shut down operations
for the forest irrigation reuse system at any programmed wind speed.
February 2016 City of Sisters
8 - 7
City of Sisters Wastewater System Capital Facilities Plan Update
Section 8: Wastewater Disposal
8.4 COMPLIANCE EVALUATION
In general, the City is in compliance with its WPCF Permit and Reclaimed Water Reuse
Plan. It should be noted, however, that to-date, City reported irrigation totals have not
included a reduction for irrigation efficiency.
8.5 FUTURE IRRIGATION REQUIREMENTS
8.5.1 Water Quantity and Quality
Water Quantity. Projected year 2035 irrigation water disposal needs will be 282.5
Ac.ft., representing a 127.1 Ac.ft. increase over the current total of 155.36 Ac.ft. This
estimate includes the assumption that precipitation and evaporation totals will be
comparable and proportional to those indicated in Table 7.62 of the original plan.
Water Quality. No significant change in water quality is anticipated over the design
period. However, new business proposals with high strength wastewater discharges,
including water from commercial or industrial processes, should be evaluated by an
engineer to determine the potential impact on treatment and disposal. It may be
necessary to require pretreatment of some business wastewater prior to discharge to
the public sewer.
8.5.2 Irrigation Acreage Needed
The current irrigation systems, when utilized to the DEQ permitted applications,
taking evaporation into account, will allow for irrigation of 178.32 Ac-ft of reuse
water. If land irrigation is to remain as the primary means of effluent reuse,
approximately 95.33 net acres of new irrigation site3 with similar capabilities will
need to receive reuse water to accommodate year 2035 projected growth (In addition
to full usage of the existing site). This land area assumes continued application of
Class D effluent. Any parcels considered will need to be sufficiently larger to
accommodate set-backs, unsuitable areas, and areas that cannot be irrigated with the
type of irrigation system selected.
8.5.3 Expansion Sites
During the design of the original City of Sisters wastewater system, reuse on adjacent
farm lands, such as portions of the Lazy Z Ranch, was considered. However,
ownership of the land at that time was opposed to effluent reuse, and none of the
Lazy Z was made available for reuse purposes. Several alternative reuse sites were
considered, but owners were hesitant to commit lands for use over an extended
period of time, or required other considerations such as future development
guarantees.
February 2016 City of Sisters
8 - 8
City of Sisters Wastewater System Capital Facilities Plan Update
Section 8: Wastewater Disposal
Near the completion of the November 2006 Wastewater System Capital Facilities
Plan, the opportunity arose for the City of Sisters to purchase 230.98 acres of the
Lazy Z Ranch, in close proximity to the wastewater treatment facility. This site
should have adequate area for effluent reuse, without modifications to the existing
reuse site, for the design period of 2035 and beyond. Soils on the site were extensively
sampled by Wert & Associates, Inc. prior to the purchase, and the majority of the
purchased site appears to meets Oregon statutes for effluent reuse with Class D
effluent. This site is immediately accessible from the existing wastewater treatment
plant and effluent reuse site, contains adequate land area for required buffers to
meet Oregon DEQ regulations, and topography is conducive to installation of
automated type reuse systems. Portions of the purchased land has been farmed for
many years, and effluent reuse can provide benefit to crop production on this portion
of the site. A 62-acre portion of the Lazy Z site remains forested, and it is anticipated
that this area will be the first to receive reuse waters, since it is remote from
residential homes and is bounded on two sides by other forested properties. 3200’
of mainline was installed to this area as part of the Uncle John Ditch piping project.
This site is planned to receive reuse waters in a manner very similar to the existing
reuse site, with the existing effluent pumps, a similar forest irrigation system for
disposal, identical irrigation rates of application, use of the existing weather control
system to control aerosol drift, and the existing SCADA system for reuse operation
on both the existing and Lazy Z sites. Effluent reuse on remaining portions of the
Lazy Z can utilize higher application rates, dependent on the crop utilized for
harvesting. Crop choices for farmed sections of the site were analyzed in the
2013 Reuse Study and options are provided for future decision making.
Figure 8.1 shows the proximity of potential reuse and disposal sites described in this
plan.
8.5.4 Disinfection System
The existing hypochlorite system is designed to provide 60 minutes of contact
time at the capacity of the irrigation pumps (1,000 gpm each). Allowing for
higher mid-summer application rates, and potential downtime for wind, the
system should be adequate for projected year 2035 needs.
8.5.5 Irrigation System
Any new irrigation areas developed will need an irrigation system constructed
and connected to the existing system. The two existing irrigation pumps (1,000
gpm each) should be adequate to transfer effluent to the irrigation site for the
planning period to year 2035.
.
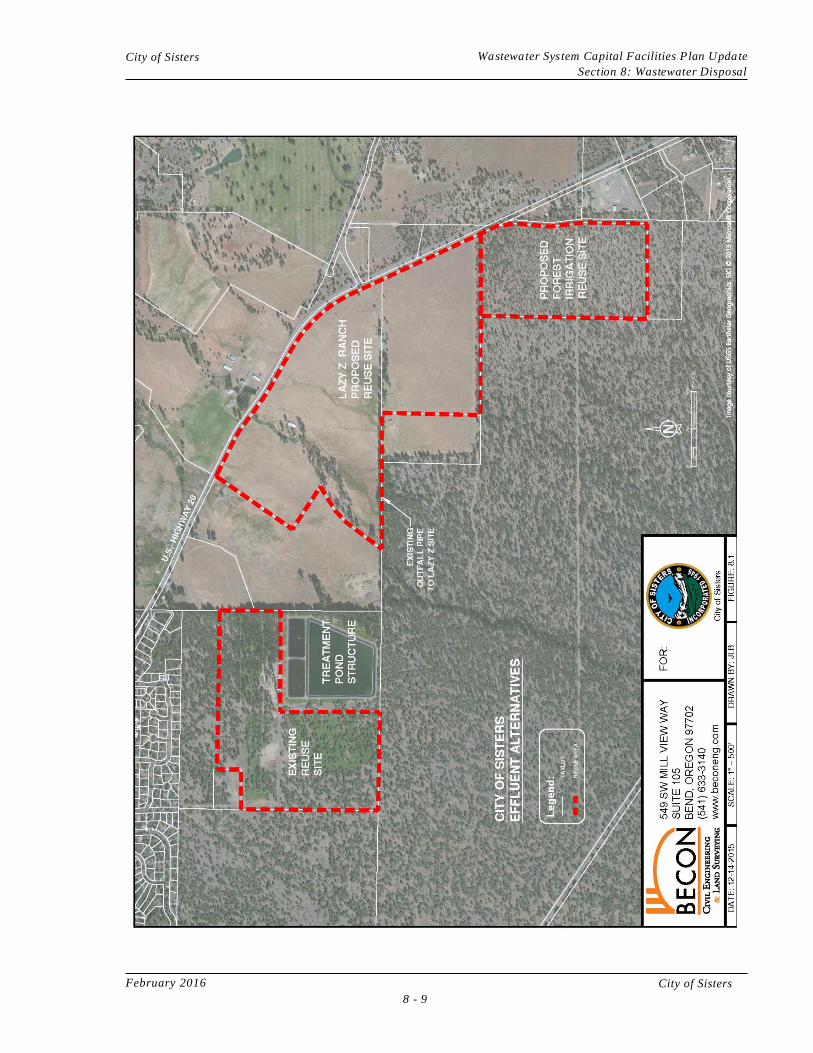
February 2016 City of Sisters
8 - 9
City of Sisters Wastewater System Capital Facilities Plan Update
Section 8: Wastewater Disposal
February 2016 City of Sisters
8 - 10
City of Sisters Wastewater System Capital Facilities Plan Update
Section 8: Wastewater Disposal
8.6 RECOMMENDATIONS
Effluent disposal recommendations are summarized below:
• Continue with forest and dike irrigation up to the maximum allowed.
• Develop the forested 62-acre (net 49 acres) portion of the Lazy Z site as
described previously, in a very similar manner to the existing City reuse site
as part of the Phase I Lazy Z Re-use improvements.
• Expand effluent disposal onto the remaining portions of the Lazy Z property
as outlined in the 2013 Wastewater Re-Use study (Appendix A)
• The City of Sisters purchase of the 230.98 acre portion of the Lazy Z
assures the City of a long term reuse site, with immediate accessibility
to the existing wastewater treatment plant. The site appears to meet all
of the Oregon Department of Environmental Quality effluent
requirements for Class D reuse application, and a water reuse plan needs
to be updated and approved by DEQ prior to disposing of effluent.
• The City of Sisters must continue to plan for long term disposal of
wastewater effluent from the expanding community.
February 2016 City of Sisters
9 - 1
SECTION 9:
BIOSOLIDS MANAGEMENT 9.1 INTRODUCTION
Biosolids contain beneficial nutrients and soil conditioning properties for vegetation;
however, they also contain viruses, parasites, and other disease-causing organisms
(pathogens) considered potentially dangerous to human health and the environment.
Biosolids are not stabilized when removed from the waste stream and must be handled and
disposed of properly. Biosolids management practices are therefore needed to reduce the
biological activity of the sludge and make it a relatively benign material for final disposal.
9.2 GENERAL REGULATORY REQUIREMENTS
Regulations for biosolids use and disposal were promulgated on February 19, 1993, as 40
CFR Part 503 (Subpart D). The regulation protects public health and the environment
through requirements designed to reduce the potential for contact with disease-bearing
microorganisms (pathogens) in wastewater biosolids applied to the land or placed on a
surface disposal site. Wastewater biosolids cannot be applied to land or placed on a
surface disposal site unless it has met the following two requirements:
Requirements for pathogen reduction.
Requirements to reduce the potential of the sewage to attract vectors (rodents,
birds, insects, and other organisms that can transport pathogens).
Compliance with these two requirements must be demonstrated separately, which allows
for some flexibility in biosolids management practice. The basic concepts for
implementation of these rules are to understand potential routes of exposure to biosolids,
both direct and indirect contacts. Direct and indirect contacts are defined as:
Direct Contact:
Inadvertent contact with wastewater biosolids.
Walking through an area (i.e. field, forest, or reclamation area) shortly after
wastewater biosolids application.
Handling soil and raw produce from fields or home gardens where wastewater
biosolids has been applied.
Inhaling microbes that become airborne (via aerosols, dust, etc.) during
wastewater biosolids spreading or by strong winds, plowing, or cultivating the
soil after application.
City of Sisters Wastewater System Capital Facilities Plan
Section 9: Biosolids Management
February 2016 City of Sisters
9 - 2
Indirect Contact:
Consumption of pathogen-contaminated crops grown on wastewater biosolids
amended soil or of other food products that have been contaminated by contact
with these crops.
Consumption of pathogen-contaminated milk or other food products from
animals grazing in pastures or feed crops grown on wastewater biosolids
amended fields.
Ingestion of drinking water or recreational waters contaminated by runoff from
nearby land application sites or by organisms from wastewater biosolids
migrating into groundwater aquifers.
Consumption of inadequately cooked or uncooked pathogen-contaminated fish
from water contaminated by runoff from a nearby land application site.
Contact with wastewater biosolids or pathogens transported away from the land
application or surface disposal site by rodents, insects, or other vectors,
including grazing animals.
Understanding routes of potential exposure allows for development of an overall strategy
to protect public health and the environment. The biosolids rules were developed to
implement this strategy. The overall strategy is described as follows:
Reduce the number of pathogens in wastewater biosolids through treatment
and/or environmental attenuation.
Reduce transport of pathogens by reducing the attractiveness of the sewage
wastewater biosolids to disease vectors (insects, rodents, birds, and other living
organisms that can transport pathogens).
Limit human and animal contact with the wastewater biosolids through site
restrictions to allow natural die-off to reduce pathogen levels to low levels.
A detailed discussion of pathogen reduction requirements, vector attraction reduction
requirements, and land application for biosolids disposal, is included as Appendix 9.1.
9.3 WPCF PERMIT REQUIREMENTS
Schedule D of Sisters draft WPCF Permit (No. 101779) includes the following special
conditions:
City of Sisters Wastewater System Capital Facilities Plan
Section 9: Biosolids Management
February 2016 City of Sisters
9 - 3
Within 6 months of such time as the sewage lagoons require removal of accumulated
biosolids, the permittee shall submit a biosolids management plan that complies with the
Department's biosolids management regulations as established in OAR 340-50
This permit may be modified to incorporate any applicable standard for sewage sludge use
or disposal promulgated under section 405(d) of the Clean Water Act, if the standard for
sewage sludge use or disposal is more stringent than any requirements for sludge use or
disposal in the permit, or controls a pollutant or practice not limited in this permit.
9.4 CURRENT BIOSOLIDS TREATMENT AND DISPOSAL
Sisters retains all biosolids in its aerated lagoon treatment and holding facilities. The City
has not yet needed to dredge and dispose of accumulated solids, nor has it been required to
do so by any regulatory authority. The City should plan for removal in Lagoon 1 in 2021,
the 20th year of operation.
Untreated solids, separated from the raw wastewater by means of the fine screen at the
headworks, are collected, bagged, and sent to the Deschutes County Landfill.
9.5 ACCUMULATED BIOSOLIDS
9.5.1 Quantity
Solids accumulations in pond systems can vary considerably based on overall
facility sizing and relative BOD5 loading rates. As long as a facility is not
overloaded (with BOD5), solids tend to be digested over an extremely long
retention time. It is quite common for such facilities to go well beyond their initial
design life prior to needing solids removal. The original design provided additional
depth in the lagoon system to provide an allowance for solids accumulation,
without impacting the effective hydraulic capacity of the facility under normal
hydraulic regimes, and this will allow for accumulation over time.
Because of the potential variability in real-world solids accumulations, the most
reliable means of determining accumulations and, potentially, accumulation rates,
is by physically sampling with a device called a "sludge-judge". As average
BOD5 influent loadings approach that of the facilities design, sampling should be
undertaken to determine the amount of accumulated solids. Recommendations for
handling the accumulated solids, or recommendations for future sampling, can be
made at that time. The City of Sisters has acquired a sludge-judge and should
periodically taken measurements of sludge depths, in order to calculate cumulative
sludge volume.
Increased loading to this facility will ultimately create a need for some level of
solids removal, and planning to the year 2035 should make provisions for removal
and disposal of biosolids in compliance with an approved biosolids management
plan. Cost projections for biosolids removal are provided in Section 10.
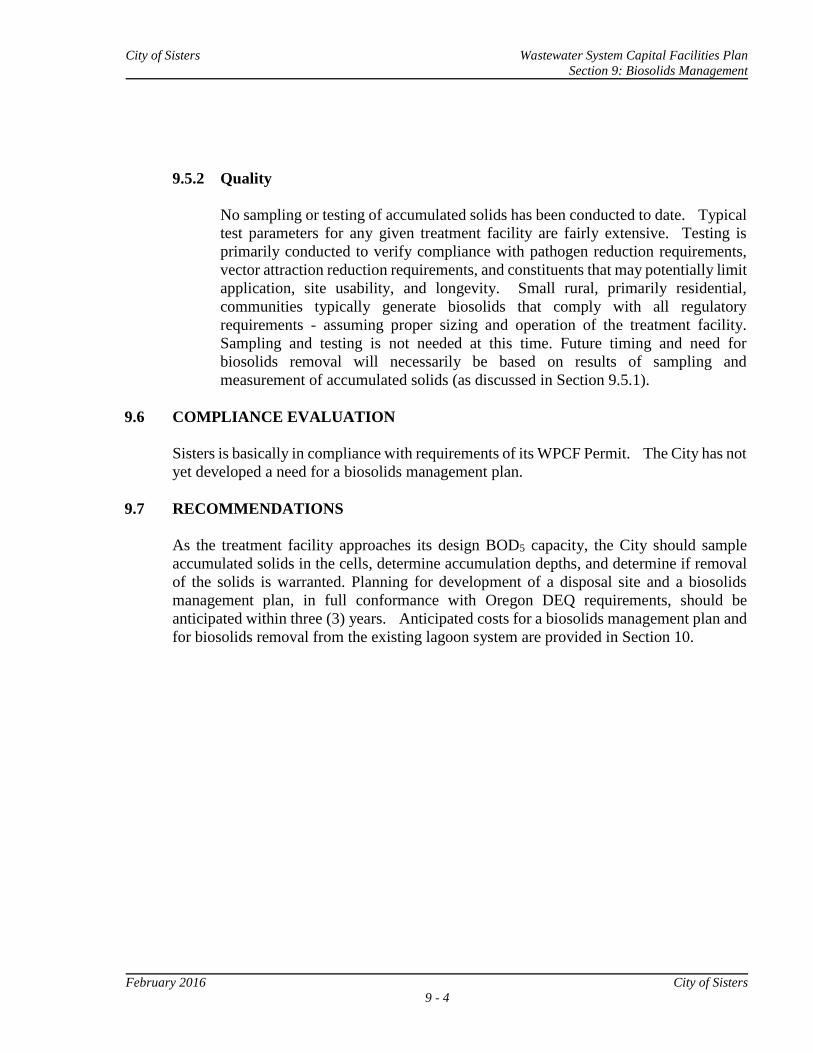
City of Sisters Wastewater System Capital Facilities Plan
Section 9: Biosolids Management
February 2016 City of Sisters
9 - 4
9.5.2 Quality
No sampling or testing of accumulated solids has been conducted to date. Typical
test parameters for any given treatment facility are fairly extensive. Testing is
primarily conducted to verify compliance with pathogen reduction requirements,
vector attraction reduction requirements, and constituents that may potentially limit
application, site usability, and longevity. Small rural, primarily residential,
communities typically generate biosolids that comply with all regulatory
requirements - assuming proper sizing and operation of the treatment facility.
Sampling and testing is not needed at this time. Future timing and need for
biosolids removal will necessarily be based on results of sampling and
measurement of accumulated solids (as discussed in Section 9.5.1).
9.6 COMPLIANCE EVALUATION
Sisters is basically in compliance with requirements of its WPCF Permit. The City has not
yet developed a need for a biosolids management plan.
9.7 RECOMMENDATIONS
As the treatment facility approaches its design BOD5 capacity, the City should sample
accumulated solids in the cells, determine accumulation depths, and determine if removal
of the solids is warranted. Planning for development of a disposal site and a biosolids
management plan, in full conformance with Oregon DEQ requirements, should be
anticipated within three (3) years. Anticipated costs for a biosolids management plan and
for biosolids removal from the existing lagoon system are provided in Section 10.
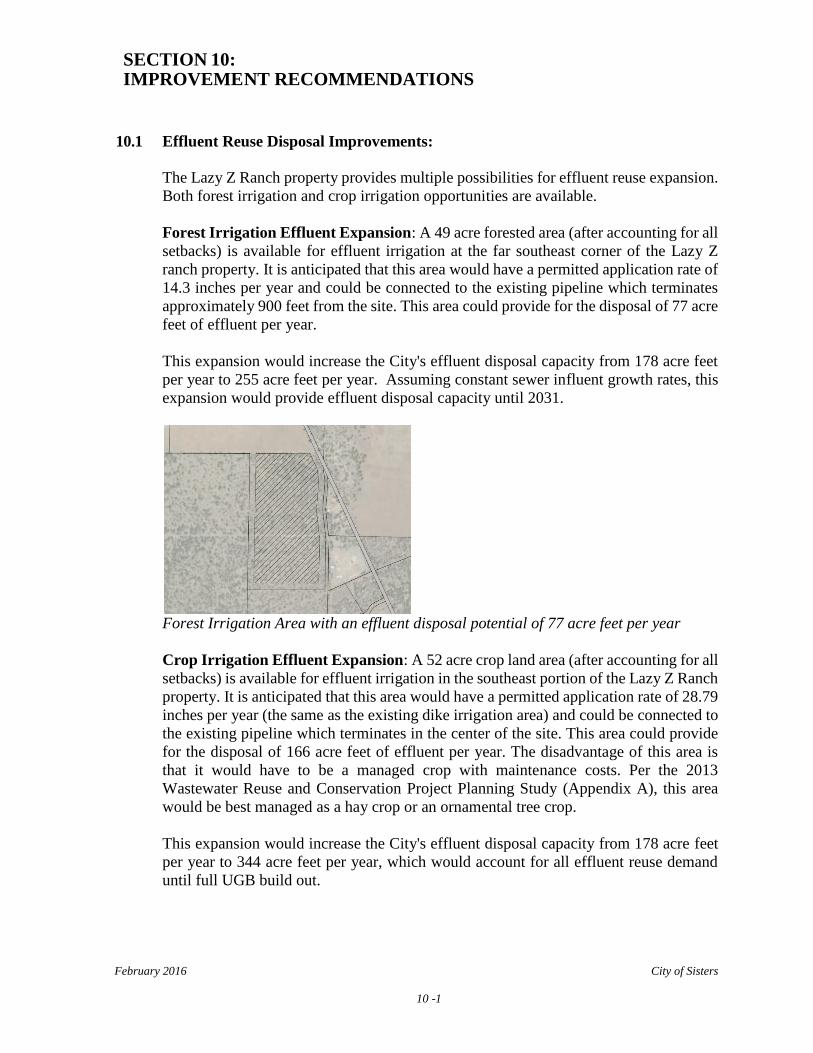
February 2016 City of Sisters
10 -1
SECTION 10: IMPROVEMENT RECOMMENDATIONS
RECOMMENDATIONS
10.1 Effluent Reuse Disposal Improvements:
The Lazy Z Ranch property provides multiple possibilities for effluent reuse expansion.
Both forest irrigation and crop irrigation opportunities are available.
Forest Irrigation Effluent Expansion: A 49 acre forested area (after accounting for all
setbacks) is available for effluent irrigation at the far southeast corner of the Lazy Z
ranch property. It is anticipated that this area would have a permitted application rate of
14.3 inches per year and could be connected to the existing pipeline which terminates
approximately 900 feet from the site. This area could provide for the disposal of 77 acre
feet of effluent per year.
This expansion would increase the City's effluent disposal capacity from 178 acre feet
per year to 255 acre feet per year. Assuming constant sewer influent growth rates, this
expansion would provide effluent disposal capacity until 2031.
Forest Irrigation Area with an effluent disposal potential of 77 acre feet per year
Crop Irrigation Effluent Expansion: A 52 acre crop land area (after accounting for all
setbacks) is available for effluent irrigation in the southeast portion of the Lazy Z Ranch
property. It is anticipated that this area would have a permitted application rate of 28.79
inches per year (the same as the existing dike irrigation area) and could be connected to
the existing pipeline which terminates in the center of the site. This area could provide
for the disposal of 166 acre feet of effluent per year. The disadvantage of this area is
that it would have to be a managed crop with maintenance costs. Per the 2013
Wastewater Reuse and Conservation Project Planning Study (Appendix A), this area
would be best managed as a hay crop or an ornamental tree crop.
This expansion would increase the City's effluent disposal capacity from 178 acre feet
per year to 344 acre feet per year, which would account for all effluent reuse demand
until full UGB build out.
City of Sisters Wastewater system Capital Improvement Facilities Plan
Section 10: Improvement Recommendations
February 2016 City of Sisters
10 -2
Crop irrigation with an effluent disposal potential of approximately 166acre feet per
year
It is recommended that Forest irrigation improvements are constructed prior to 2018 to
maintain compliance with DEQ effluent permit limits. It is recommended that Crop
Irrigation improvements are implemented prior to 2031 to again maintain compliance
with DEQ effluent permit limits.
Costs for Effluent Reuse Expansion Improvements:
Conceptual plans have not yet been prepared, but for budgetary purposes, the
approximate costs for effluent expansion improvements are as follows:
Forest Irrigation Effluent Expansion
Construction Cost $485,000
Engineering and Administration (10%) $ 48,500
Contingency Factor (10%) $ 56,100
Estimated Total Cost $579,600
Crop Irrigation Effluent Expansion
Cost (provided by Water Reuse Study) $786,857
Estimated Total Cost $786,857
10.2 Treatment Plant Improvements:
Treatment Facility Software and Security System Upgrades
This infrastructure is shown in the capital facilities plan as a short term priority. The
proposed software improvements will improve monitoring of activities at the treatment
plant. Security system upgrades include additional software and on-site cameras to
provide additional monitoring of the treatment plant and disposal sites. It is
recommended that these improvements be implemented by 2018.
Treatment Facility Software and Security Upgrades
Software and Security Upgrades $72,000
Contingency Factor (10%) $ 7,200
City of Sisters Wastewater system Capital Improvement Facilities Plan
Section 10: Improvement Recommendations
February 2016 City of Sisters
10 -3
Estimated Total Cost $79,200
Aeration Improvements
The Capital Facilities Plan recommends replacement of the existing aerators at the
treatment plant to provide more aeration which will improve the capacity and efficiency
of the treatment process in the lagoons. The aeration improvements are recommended
to be implemented by 2018 which is when the treatment plant will have been in
operation for 17 years. If BOD design loading limits are exceeded then aeration
improvements will be necessary to provide adequate treatment.
Replacement of Aeration Equipment in Effluent Ponds
Replacement of Existing Aerators $185,000
Engineering and Administration (10%) $ 18,500
Contingency Factor (10%) $ 20,350
Estimated Total Cost $223,850
Biosolids Removal
Biosolids Removal includes the removal of "sludge" or the remaining material in the
treatment ponds after treatment. These biosolids accumulate in the ponds and reduce the
capacity of the treatment ponds over time. The removal of biosolids requires the
creation of a biosolids management plan to determine the disposal methods and
locations of the material. It is recommended that the biosolids management plan be
prepared in 2017 and that preparations for the biosolids removal could begin as early
2018, which is 17 years from the construction of the treatment facility.
Biosolids Removal and Disposal
Biosolids Management Plan $ 24,000
Biosolids Removal $240,000
Contingency Factor (10%) $ 26,400
Estimated Total Cost $290,400
10.3 Collection System Improvements
Pump Station #1 New Pumps
The existing pumps at Pump Station #1 are anticipated to reach capacity between 2022
and 2025. It is recommended that the existing pumps be replaced by larger pumps when
the pumps are at a maximum of 75% of their operating capacity.
Pump Station #1 New Pumps
Pump Replacement $106,000
Contingency Factor (10%) $ 10,600
Estimated Total Cost $116,600
Locust Street Interceptor
The Locust Street Interceptor is a proposed new sewer main which will divert sewer
flows from the area of town north of Adams Avenue and east of Pine Street. Sewer
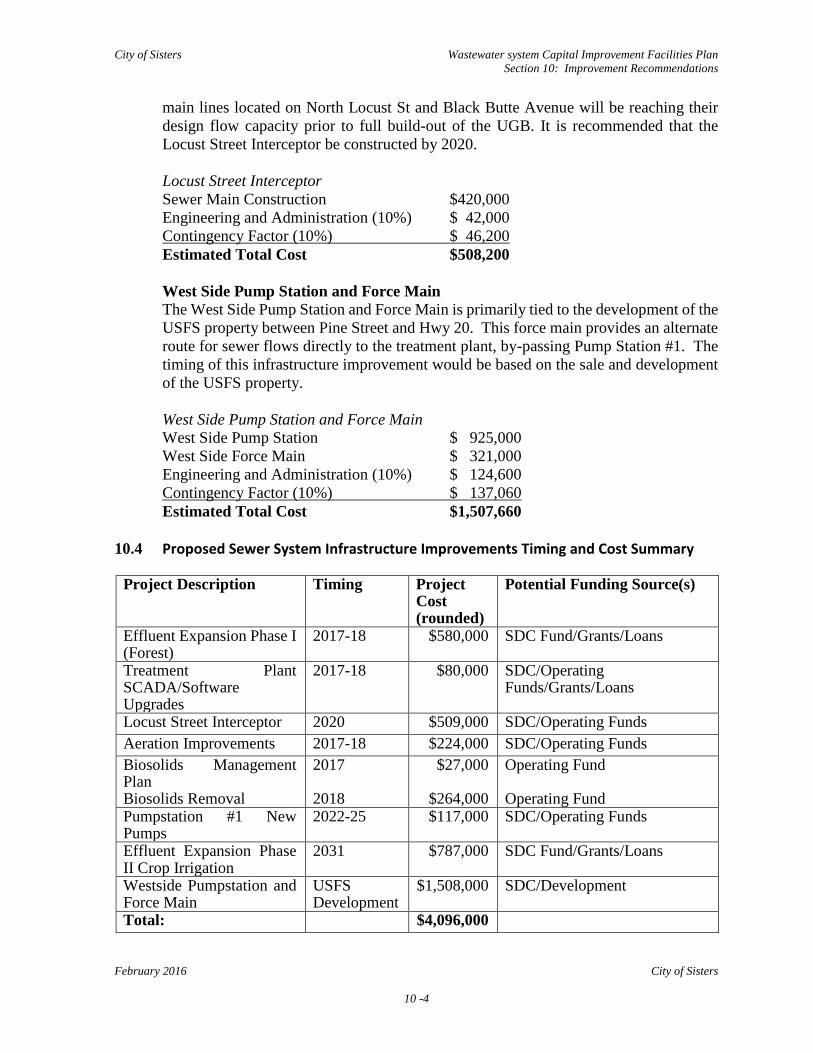
City of Sisters Wastewater system Capital Improvement Facilities Plan
Section 10: Improvement Recommendations
February 2016 City of Sisters
10 -4
main lines located on North Locust St and Black Butte Avenue will be reaching their
design flow capacity prior to full build-out of the UGB. It is recommended that the
Locust Street Interceptor be constructed by 2020.
Locust Street Interceptor
Sewer Main Construction $420,000
Engineering and Administration (10%) $ 42,000
Contingency Factor (10%) $ 46,200
Estimated Total Cost $508,200
West Side Pump Station and Force Main
The West Side Pump Station and Force Main is primarily tied to the development of the
USFS property between Pine Street and Hwy 20. This force main provides an alternate
route for sewer flows directly to the treatment plant, by-passing Pump Station #1. The
timing of this infrastructure improvement would be based on the sale and development
of the USFS property.
West Side Pump Station and Force Main
West Side Pump Station $ 925,000
West Side Force Main $ 321,000
Engineering and Administration (10%) $ 124,600
Contingency Factor (10%) $ 137,060
Estimated Total Cost $1,507,660
10.4 Proposed Sewer System Infrastructure Improvements Timing and Cost Summary
Project Description
Timing Project Cost (rounded)
Potential Funding Source(s)
Effluent Expansion Phase I (Forest)
2017-18 $580,000 SDC Fund/Grants/Loans
Treatment Plant SCADA/Software Upgrades
2017-18 $80,000 SDC/Operating Funds/Grants/Loans
Locust Street Interceptor 2020 $509,000 SDC/Operating Funds
Aeration Improvements 2017-18 $224,000 SDC/Operating Funds
Biosolids Management Plan Biosolids Removal
2017 2018
$27,000
$264,000
Operating Fund Operating Fund
Pumpstation #1 New Pumps
2022-25 $117,000 SDC/Operating Funds
Effluent Expansion Phase II Crop Irrigation
2031 $787,000 SDC Fund/Grants/Loans
Westside Pumpstation and Force Main
USFS Development
$1,508,000 SDC/Development
Total: $4,096,000

City of Sisters Wastewater system Capital Improvement Facilities Plan
Section 10: Improvement Recommendations
February 2016 City of Sisters
10 -5
City of Sisters Wastewater System Capital Facilities Plan
Section 11 - Finance Options
February 2016 City of Sisters
11 - 1
SECTION 11
FINANCE OPTIONS
11.1 INTRODUCTION
The funding of needed wastewater improvements for the City of Sisters may utilize one or
more of the following funding sources:
o Sale of Bonds by Acquiring Federal or State Grants and/or Loans
o Special Assessments
o Local Improvement Districts
o Serial Levies
o Capital Improvements (Sinking) Funds
o Systems Development Charges
The most successful financing plans utilize state or federal grants and/or loans that best
address the characteristics of needed improvements. It is difficult to finance
improvements with grant funding alone, and grant funding in general is limited. Some
level of local funding or borrowing from available loan programs is usually necessary,
although some cities accumulate sufficient reserves for construction. Funding programs
vary in terms of their economic impact on the community, and often are created with
specific program focuses. Some programs are available to create and retain jobs or benefit
areas of low to moderate income families. Other programs provide for specific types of
infrastructure improvements, such as improvements to address wastewater related
compliance issues.
A thorough consideration of applicable state and federal funding programs, in addition to
a potential means of securing local funding, is needed to minimize the long-term cost of
wastewater system improvements, while providing quality construction.
If the City decides to pursue agency funding for recommended projects, it should contact
Oregon DEQ, Oregon Business Development (Infrastructure Finance Authority), USDA
and Rural Community Assistance for information and scheduling of a one-stop meeting.
One-stop meetings are held in Salem or in Sisters. These meetings bring together staff
from the various agencies that could potentially contribute funds, and representatives of
the community, to discuss the project and funding needs. Staff has already begun this
process and preliminary meetings have occurred in anticipation of adoption of this Master
Plan.
This section is intended to provide a general overview of recently available programs.
Agency and program policies are continually evolving and specifics may vary if
funding of improvements is delayed to any major extent.
City of Sisters Wastewater System Capital Facilities Plan
Section 11 - Finance Options
February 2016 City of Sisters
11 - 2
11.2 PUBLIC WORKS FINANCING PROGRAMS
Four grant programs and five loan/bond sale programs, which have the potential to provide
funding for the City, are listed below:
Grants
Federal
$ USDA / Rural Development
State
$ DEQ – Clean Water Revolving
Fund (principle forgiveness)
$ IFA - Special Public Works Fund Loans/Bond Sales
Federal
$ USDA / Rural Development
State
$ DEQ – Clean Water Revolving
Fund
$ IFA – Safe Drinking Water /
Special Public Works Fund
$ League of Oregon Cities – LOC
Capital Asset Program
Each of the available grant and loan programs varies in terms of the extent and complexity
of the application process. In all cases, it is extremely important to communicate the
program needs to the funding agency at the earliest possible date. A close working
relationship with the potential grantor or lending agency can optimize the timing and
amount of the grant and/or loan assistance. A brief overview of potential public works
financing programs and an assessment of their availability follows.
11.2.1 US Department of Agriculture (USDA) Rural Development
Water Environmental Programs – Offer funds for construction, repair or
improvement of Water, Wastewater, Solid Waste or Storm Water projects. Loans
can be amortized for up to 40 years at current Municipal Bond market rates. Rate
subsidies are available for distressed communities.
11.2.2 Department of Environmental Quality (DEQ)
Clean Water State Revolving Fund (CWSRF) – This program offers funding for
planning, design and construction of Wastewater projects. Loans can be amortized
for up to 30 years, current rates can go as low as 1.47% (depending on
City of Sisters Wastewater System Capital Facilities Plan
Section 11 - Finance Options
February 2016 City of Sisters
11 - 3
demographics / economic distress). Up to $500,000 in principle forgiveness is
available for distressed communities. Between $500,000 and $1,000,000 can be
available for Green Infrastructure / Storm Water restoration projects
11.2.3 Infrastructure Finance Authority (IFA)
Oregon Health Authority / Safe Drinking Water Revolving Loan Fund (SDWRLF)
– This program offers funding for resolving potential or existing compliance issues.
Loans can be amortized for up to 20 years at 80% of the current Municipal Bond
market rate. For distressed communities loans are available for up to 30 years at
1% interest.
11.2.4 League of Oregon Cities (LOC)
Capital Asset Program – This loan program is available through LOC for cities that
lack the expertise to avail themselves of public market financing. It offers
Municipal Bond funds at market rates.
11.2.5 Municipal Bond Financing
The city of Sisters can use the Municipal Bond markets, through an underwriter, to
obtain financing at then current market rates.
11.3 LOCAL FUNDING SOURCES
A significant portion of a project may need to be financed with local funding sources.
Local funding sources are listed below:
General Obligation Bonds
Revenue Bonds
Improvement Bonds (Local Improvement District)
Serial Levies
Sinking Funds
Ad Valorem Tax
System User Fees
Assessments
System Development Charges (SDC's)
The 1991 legislature clarified and defined the impact of Ballot Measure 5 on municipal
finance in several special ways. Cities, counties, and special districts need to clearly
City of Sisters Wastewater System Capital Facilities Plan
Section 11 - Finance Options
February 2016 City of Sisters
11 - 4
understand, and follow these rules, when they consider bonding for the financing of needed
improvements.
The following information was provided in part by Howard A. Rankin, retired Bond
Counsel:
1. Chapters 287 and 288 of the Oregon Revised Statutes describe the borrowing and
bonding of counties, cities, and special districts, generally.
2. The advance sheets of the Laws of 1991 indicate that the general bond limitations
of ORS 287.004 are still in force. Except with regard to the old 3% limitation on
all issued and outstanding bonds, on true-cash value of all taxable property within
the city's boundaries, has been changed to a 3% limitation on "real market value"
as determined by the County Assessor.
3. The above limitation still does not apply to bonds issued for water, sanitary or storm
sewers, sewage disposal plants; nor to bonds issued to pay assessments for
improvements in installments under statutory or charter authority (i.e., revenue
bonds).
A description of each of the preceding listed funding sources follows.
11.3.1 General Obligation Bonds
Financing of wastewater improvements by General Obligation (G.O.) Bonds is
accomplished by the following procedures:
1. The City Engineer prepares a detailed cost estimate to determine the total
monies required for construction.
2. An election is held.
3. When voter approval is granted (by a simple majority or a majority of the
registered voters, depending on when the vote occurs), bonds are offered
for sale. The money for detailed planning and construction is obtained
prior to preparation of final engineering plans and the start of project
construction unless interim financing has been developed.
G.O. bonds are backed by the full credit of the issuer and authorize the issuer to
levy ad valorem taxes. The issuer can make the required payments on the bonds
solely from the new tax levy or may instead use revenue from assessment, user
charges, or some other source.
City of Sisters Wastewater System Capital Facilities Plan
Section 11 - Finance Options
February 2016 City of Sisters
11 - 5
Oregon Revised Statutes limit the maximum term of G.O. bonds to 40 years for
cities and 25 years for sanitary districts. Except in the event that RD purchases the
bonds, the realistic term for which general obligation bonds would be issued is 15
to 20 years.
Ballot Measure 5 has limited the ability of communities to levy property taxes.
Capital improvement projects, such as the proposed wastewater system
improvements, are exempt from property tax limitations if an election is held and
new public hearing requirements are met.
Cities, counties and special districts (all non-school taxing entities) must be very
careful when seeking approval from the voters for a general obligation bond, new
tax base, annual budget levy, or special levy. The current law now requires that
all non-school taxing entities, including cities, counties, and special districts, hold
a special public hearing more than 30 days before filing the election statement with
the County Clerk. Notice of this special public hearing must be sent to all other
non-school taxing entities with overlapping taxing jurisdictions no later than 10
days before the special public hearing. This special public hearing offers the
opportunity for all overlapping taxing entities to determine the compaction impact
of the proposed election on their respective assessment capability. Effectively, the
municipality proposing the election measure must be thoroughly prepared with
notice of special public hearing published no later than 41 days before a final public
hearing and filing of the election statement.
If the special public hearing procedures are not followed, and no certificate is
included in the filing that attests that the special public hearing was conducted
pursuant to law, the County Clerk is required to reject the filing for an election.
This results in additional unnecessary delays. Consideration should be given to
hiring a competent Bond Counsel before proceeding with a General Bond Election.
This action will insure that all requirements of current law are met.
Since bonding requirements are very stringent, most recent municipal
improvements have been financed with either revenue bonds or one of the state
financing programs which can be accomplished outside of bonding requirements.
11.3.2 Revenue Bonds
A revenue bond is one that is payable solely from charges made for the services
provided or from collection of Systems Development Charges, although the City
would need to be very careful that SDCs would be collectible. Such bonds cannot
be paid from tax levies or special assessments, and their only security is the
borrower's promise to operate the wastewater system in a way that will provide
sufficient net revenue to meet the obligations of the bond issue. Revenue bonds
are most commonly retired with revenue from user fees.
City of Sisters Wastewater System Capital Facilities Plan
Section 11 - Finance Options
February 2016 City of Sisters
11 - 6
Successful issuance of revenue bonds depends on bond market evaluation of the
dependability of the revenue pledged. Normally there are no legal limitations on
the amount of revenue bonds to be issued, but excessive bond issue amounts are
generally unattractive to bond buyers because they represent high investment risk.
In rating revenue bonds, buyers consider the economic justification for the project,
reputation of the borrower, methods for billing and collection, rate structures, and
the degree to which forecasts of net revenues are realistic. RD will fund revenue
bonds in which user rates are committed for the repayment of the bonds.
Under the provisions of the Oregon Uniform Revenue Bond Act (ORS 288.805-
288.945), municipalities may elect to issue Revenue Bonds for revenue producing
facilities without a vote of the electorate. In this case, certain notice and posting
requirements must be met including a mandatory 60-day waiting period. A
petition signed by 5% of the municipalities' registered voters may cause the issue
to be referred to an election.
Laws enacted by the 1991 legislature have eliminated the limitation on revenue
bonds. The law formally required that the revenues pledged for payment of the
bonds have a direct relationship to the services financed by the bonds. Current law
now allows revenue bonds to be paid with any revenue pledged for "any public
purpose," without the relationship restriction.
11.3.3 Improvement Bonds (Local Improvement District)
Improvement bonds may be issued to assess certain portions of wastewater
improvements directly against the parties being benefitted. An equitable means of
distributing the assessed cost must be utilized so that all property, whether
developed or undeveloped, receives the assessment on an equal basis. Cities are
limited to improvement bonds not exceeding 3% of true cash value. For a
particular improvement, all property within the assessment area is assessed on an
equal basis, regardless of whether it is developed or undeveloped.
Improvement bond financing requires that an improvement district be formed, the
boundaries established, and that benefitted properties and property owners be
determined. The engineer usually determines an approximate assessment based
on a square-foot, a front-foot basis, or a combined basis. Property owners are then
given an opportunity to remonstrate against the project. The assessment against
the properties is usually not levied until the actual total cost of the project is
determined. Since this determination is normally not possible until the project is
completed, funds are not available from assessments for the purpose of making
monthly payments to the contractor. Therefore, some method of interim financing
must be arranged, or a pre-assessment program, based on the estimated total costs,
City of Sisters Wastewater System Capital Facilities Plan
Section 11 - Finance Options
February 2016 City of Sisters
11 - 7
must be adopted. It is common practice to issue warrants, which are paid when
the project is completed, to cover debts.
The primary disadvantages to this source of revenue (improvement bonds) are
described below:
1. The property to be assessed must have a true cash valuation at least equal
to 50% of the total assessments to be levied. This may require a substantial
cash payment by owners of undeveloped property.
2. An assessment district is very cumbersome and expensive when facilities
for an entire community are contemplated.
3. The project is impacted by Measure 5 tax limitations because the
improvement bonds are backed or guaranteed by the city's authority to raise
revenue via taxation. If the city is in compaction, then a general election
(same procedures as for a general obligation bond) is required. If the city's
property taxes are not under compaction, then the city can proceed with a
L.I.D. as in the past; however, the project cost will count against the $10.00
limitation for non-school taxes.
This program should not be considered for improvements to satisfy the City’s needs
in general, but could be a definite consideration for specific projects benefitting an
area of the community.
11.3.4 Serial Levies
Under Oregon Revised Statutes, if approved by the voters, the City can levy taxes
for a fixed period of time to construct new facilities and maintain existing facilities.
Generally, when a serial levy is presented to the voters, it is based upon a specific
program and listing of planned improvements.
Since the time frame required for construction of the needed wastewater
improvements is quite limited, it is doubtful that residents could afford a serial levy
of sufficient size to provide for needed construction revenues.
11.3.5 Sinking Funds
Sinking funds can be established by budget for a particular capital improvement
need. Budgeted amounts, from each annual budget, are carried in a sinking fund
until sufficient revenue is available for the needed project. Funds can also be
developed with revenue derived from system development charges or serial levies.
The City’s wastewater system financial needs can be met with a sinking fund,
City of Sisters Wastewater System Capital Facilities Plan
Section 11 - Finance Options
February 2016 City of Sisters
11 - 8
although the cost of needed facilities will be higher after funds are collected than if
revenues are utilized to repay a loan for construction in the near term.
11.3.6 Ad Valorem Tax
Many communities utilize an ad valorem tax as the basis for repaying general
obligation bonds for system expansions, and provide partial or full repayment
through means of additional wastewater use charges. This means of financing
reach all properties to be ultimately benefitted by the wastewater system, whether
the property is presently developed or not. Construction costs are more equally
distributed among all property owners and the program does not impose a penalty
on existing residential or business development. However, with Oregon tax
limitations and the public’s perception of taxes, this means of securing funds would
not be popular.
11.3.7 System User Fees
Monthly charges are made to all residences, businesses, etc., that are connected to
the wastewater system. Wastewater use charges are established by resolution, and
can be modified as needed to serve increased or decreased operating costs. Rates
are established depending on the various classes of users and the metered demand
through their connection. By establishment of proper use charges, the City could
repay the local share of bond amortization without imposition of property taxes.
An increase in user fees could finance portions of the wastewater system that are
maintenance related, particularly if done in conjunction with a revenue bond.
11.3.8 Assessments
In some cases the beneficiary of a public works improvement can simply be
assessed for the cost of the project. It is not uncommon for an industrial or
commercial developer to provide up-front capital to pay for a community
administered improvement which serves the development.
11.3.9 System Development Charges
System Development Charges (SDC's) are charges assessed against new
development to recover the costs incurred by local government who provide the
capital facilities required to serve the new development. SDC's apply to new
developments that generate revenue for the expansion or construction of facilities
located outside the boundaries of new development. When capital improvements
increase usage, SDC's can be billed for water, wastewater, drainage and flood
control, transportation, and parks or recreational facilities.
City of Sisters Wastewater System Capital Facilities Plan
Section 11 - Finance Options
February 2016 City of Sisters
11 - 9
11.4 PROPOSED FINANCIAL PROGRAM
Initially it appears that either the DEQ or IFA programs may be the most attractive since
they offer lower rates and the potential for grants / principle forgiveness as well as loans at
below market rates. Funding is likely to be predominantly loan, under any of the available
funding programs.
A combination of loan, grant and systems development charges are recommended for
funding of needed system improvements. Systems Development Charges should fund
system improvements either through repayment of loans, or potentially by utilizing sinking
funds to pay for improvements as monies become available. After selection of the initial
project scope, the City will contact the IFA, DEQ and Regional Solutions Team to schedule
a one-stop meeting with available state and federal funding agencies, to discuss project
needs. When the project is presented to all funding agencies, each agency will evaluate
their program’s potential to assist with financing the needed wastewater system
improvements, and the City can determine how construction can best be implemented.
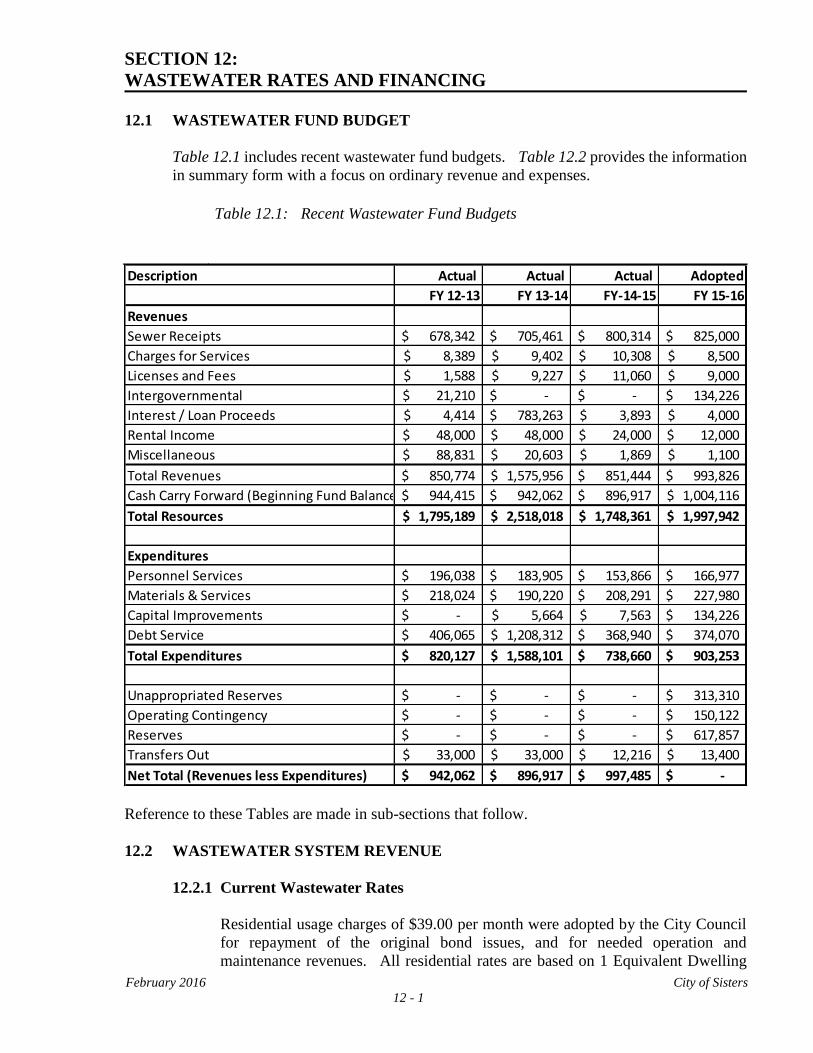
February 2016 City of Sisters
12 - 1
SECTION 12:
WASTEWATER RATES AND FINANCING
12.1 WASTEWATER FUND BUDGET
Table 12.1 includes recent wastewater fund budgets. Table 12.2 provides the information
in summary form with a focus on ordinary revenue and expenses.
Table 12.1: Recent Wastewater Fund Budgets
Reference to these Tables are made in sub-sections that follow.
12.2 WASTEWATER SYSTEM REVENUE
12.2.1 Current Wastewater Rates
Residential usage charges of $39.00 per month were adopted by the City Council
for repayment of the original bond issues, and for needed operation and
maintenance revenues. All residential rates are based on 1 Equivalent Dwelling
Description Actual Actual Actual Adopted
FY 12-13 FY 13-14 FY-14-15 FY 15-16
Revenues
Sewer Receipts 678,342$ 705,461$ 800,314$ 825,000$
Charges for Services 8,389$ 9,402$ 10,308$ 8,500$
Licenses and Fees 1,588$ 9,227$ 11,060$ 9,000$
Intergovernmental 21,210$ -$ -$ 134,226$
Interest / Loan Proceeds 4,414$ 783,263$ 3,893$ 4,000$
Rental Income 48,000$ 48,000$ 24,000$ 12,000$
Miscellaneous 88,831$ 20,603$ 1,869$ 1,100$
Total Revenues 850,774$ 1,575,956$ 851,444$ 993,826$
Cash Carry Forward (Beginning Fund Balance) 944,415$ 942,062$ 896,917$ 1,004,116$
Total Resources 1,795,189$ 2,518,018$ 1,748,361$ 1,997,942$
Expenditures
Personnel Services 196,038$ 183,905$ 153,866$ 166,977$
Materials & Services 218,024$ 190,220$ 208,291$ 227,980$
Capital Improvements -$ 5,664$ 7,563$ 134,226$
Debt Service 406,065$ 1,208,312$ 368,940$ 374,070$
Total Expenditures 820,127$ 1,588,101$ 738,660$ 903,253$
Unappropriated Reserves -$ -$ -$ 313,310$
Operating Contingency -$ -$ -$ 150,122$
Reserves -$ -$ -$ 617,857$
Transfers Out 33,000$ 33,000$ 12,216$ 13,400$
Net Total (Revenues less Expenditures) 942,062$ 896,917$ 997,485$ -$
City of Sisters Wastewater System Capital Facilities Plan
Section 12 - Wastewater Rates and Financing
February 2016 City of Sisters
12 - 2
Unit (EDU) per residence or equivalent dwelling unit. All other system users are
charged on an equivalent residential or dwelling unit basis, at the identical cost per
EDU.
12.2.2 Current Rate Revenue
Potential rate revenue, based on projected service connections, is anticipated to
equal $825,000 in the adopted 15/16 fiscal budget.
12.2.3 Property Taxes
Currently wastewater system revenue includes no property tax component.
12.2.4 Other Revenue
Other revenue may include such revenue as wastewater connections, lateral
connection fees, interest, carryover funds, grants, etc. These sources, typically,
contribute a relatively small portion of overall revenue and may vary considerably
from year to year. Grant funding revenue may be significant; however, it is
typically obtained and obligated for specific projects or purposes. Lateral
connection fees are generally developed to cover the actual cost of making a new
connection. System development charges (SDCs) can only be used for adding
system capacity and cannot be used for general operating and maintenance
expenses.
12.3 WASTEWATER SYSTEM EXPENSES
12.3.1 Debt Service
The wastewater system had outstanding bonds of $5,207,541 on September 2015.
12.3.2 Operations and Maintenance (O&M)
Operations, maintenance, and administrative costs are summarized in Table 12.1.
Current expenditures appear to approximate revenues in both actual and adopted
budgets. There are cash carry forward funds to cover the costs of major equipment
or facility replacements, capital outlay reserves, and a contingency. Good fiscal
planning would maintain the contingency fund for emergency purposes. Sisters
has a relatively simple wastewater system, but replacements and maintenance are
necessary. Mechanical equipment should be repaired or replaced as needed.
12.4 CURRENT RATES - ANALYSIS AND RECOMMENDATIONS
A simple formula for budget viability is: Revenue - Expenses = 0. At the present time,
with a minimum level of reserves for emergencies, and contingencies, the budget is in
balance, with the exception of the cash carried forward and the capital outlay reserves.
City of Sisters Wastewater System Capital Facilities Plan
Section 12 - Wastewater Rates and Financing
February 2016 City of Sisters
12 - 3
These funds include monies obtained from grant reimbursements from the original
wastewater construction project, and are available for facility expansion. Available
budget revenues for future construction total approximately $463,000.
The current rate structure is very simple and easy to apply. A specific reserve fund is
probably not required, since unplanned expenses should not exceed the budgeted reserve
and contingency amounts. However, rates may need to be adjusted for equipment
replacement and increased operation and maintenance expenses addressed in the Capital
Improvement Plan provided in Section 10.
12.5 FUTURE RATES
Usage fees are currently based on EDUs derived from winter water consumption for all
users. This approach was originally adopted such that summer irrigation was not a factor
in establishing usage fees for non-residential users. However, with a substantial tourist
based economy, many commercial users are not paying fairly for sewer service, and water
meter records are available to indicate overall summer peak usage. It is recommended
that the rate structure be modified for non-residential users to charge equitably for flows
contributed to the sewer system, on the basis of metered flows to the user. A primary
factor in wastewater treatment plant design is peak flow volumes and capacity as described
thoroughly in this Capital Facilities Plan.
For consideration of commercial flow contributions to the wastewater system, calculation
of EDUs must take into account flows on a monthly basis throughout the year, rather than
for 3 winter months as originally provided for residential evaluation purposes. Many
commercial establishments do not provide landscape irrigation during summer periods,
and the majority of their water usage generally enters the wastewater system throughout
the year. Commercial usage should be considered separately on a monthly basis, based on
total metered water usage averaged per day and equated to average residential usage. An
equivalent number of EDUs should be calculated monthly for each non-residential user,
and monthly service fees based on the current adopted monthly service fee per EDU. It is
recommended that a minimum of 1 EDU per commercial user be maintained in
establishment of monthly service fees.
12.6 CAPITAL IMPROVEMENTS PLAN
12.6.1 Capital Improvements
Recommended Capital improvements are addressed in detail in the Wastewater Capital
Improvement Recommendations provided as Section 10. Costs are itemized in both
priorities and by funding sources. It is recommended that available revenues from capital
outlay funds be combined with available SDC funds to finance needed wastewater system
improvements. It is recommended that bonds be issued for all improvements other than
the West Side Pump Station, in order to minimize capital costs and to maintain rates at the
lowest possible level. Capital costs which are eligible for Systems Development Charges
total $ 3,823,000.
City of Sisters Wastewater System Capital Facilities Plan
Section 12 - Wastewater Rates and Financing
February 2016 City of Sisters
12 - 4
12.6.2 Financing
A general discussion of financing options is presented in Section 11. Probable financing
is limited to loans (based on project scope, cost, impact on rates, and City eligibility).
Loans can be obtained from either DEQ or IFA.
12.7 SYSTEMS DEVELOPMENT CHARGES (SDCs)
System Development Charges (SDCs) can be charged to all users of transportation, water,
sewer, storm drainage, and parks and recreation facilities. The fee is usually charged as
each piece of property is developed in the future and goes into a capital construction fund
to pay for improvements required by growth in the community. The Oregon System
Development Charges Act, House Bill 3224, became effective in 1991. Legislation
requires that capital improvement plans be developed, and that methodology used to
compute SDCs be documented and reviewed by the community before SDCs can be
charged.
The Oregon System Development Charges Act permits two types of charges: 1) a
reimbursement fee, and 2) an improvement charge. A reimbursement fee is a charge for
unused capacity in existing capital improvements. An improvement charge is associated
with capital improvements to be constructed, which creates new capacity. Improvement
fees will likely need to be utilized for needed improvements to the Sisters Wastewater
System. In addition, a reimbursement fee should be considered for eligible portions of the
existing wastewater system that will benefit new development.
Inflation does continue at a steady pace, and all construction projections are based on an
Engineering News Record Index (ENR) of 10,055. This index of construction costs is
updated monthly, and it is recommended that the ENR be utilized to provide for inflation
on an annual basis. Beginning in July 2016, we recommend that the City update SDC
values based on this updated plan and construction estimates.
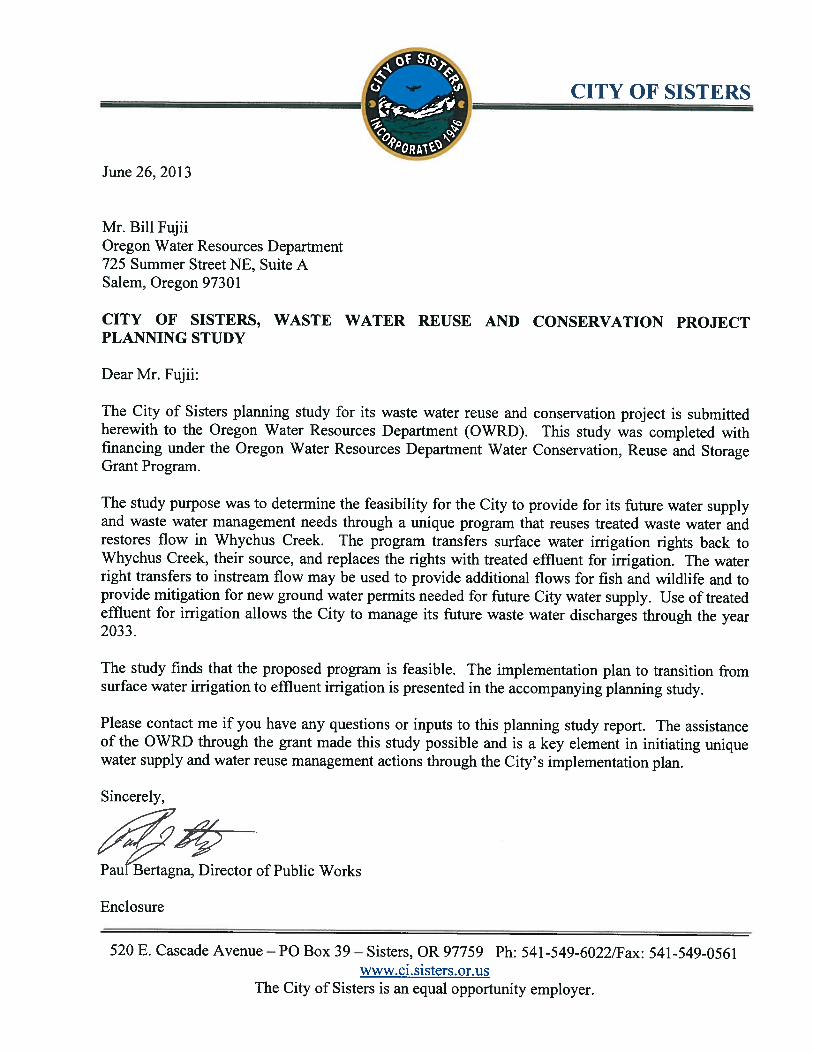
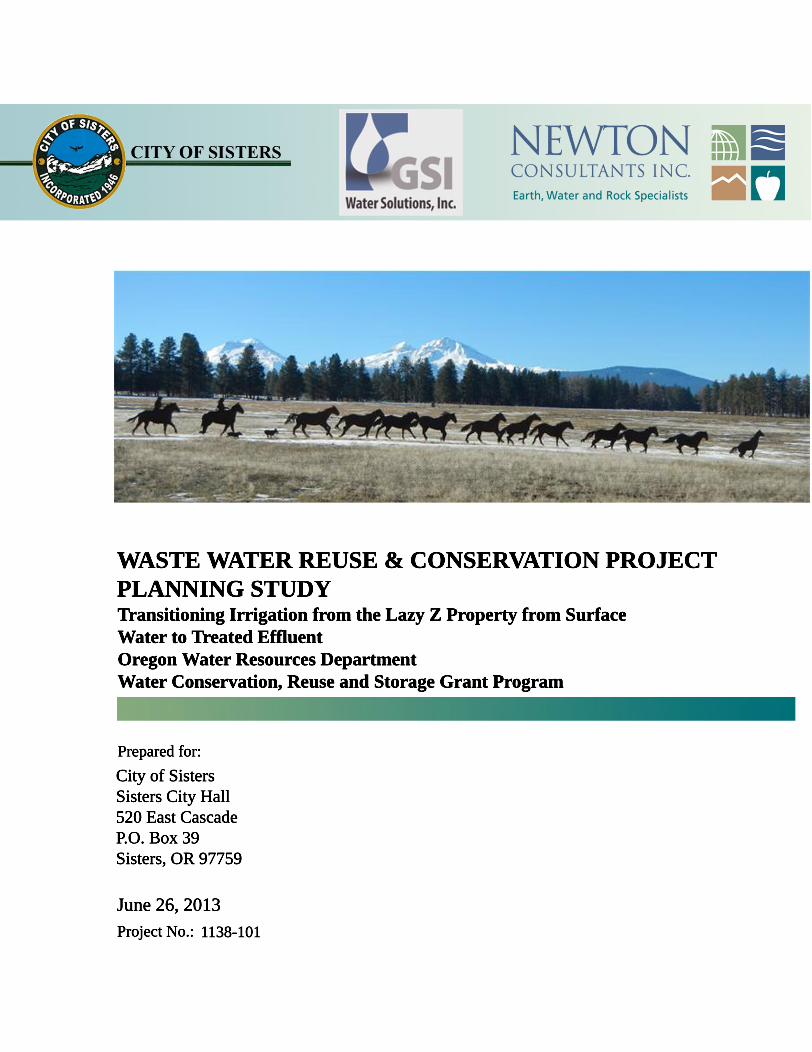
1138-101Project No.:
June 26, 2013
City of SistersSisters City Hall520 East CascadeP.O. Box 39Sisters, OR 97759
Prepared for:
Transitioning Irrigation from the Lazy Z Property from SurfaceWater to Treated EffluentOregon Water Resources DepartmentWater Conservation, Reuse and Storage Grant Program
WASTE WATER REUSE & CONSERVATION PROJECTPLANNING STUDY
WASTE WATER REUSE AND CONSERVATION PROJECT
PLANNING STUDY
TRANSITIONING IRRIGATION FROM THE LAZY Z PROPERTY FROM SURFACE
WATER TO TREATED EFFLUENT
OREGON WATER RESOURCES DEPARTMENT
WATER CONSERVATION, REUSE AND STORAGE GRANT PROGRAM
June 26, 2013
City of Sisters
Sisters City Hall
520 East Cascade
P.O. Box 39
Sisters, Oregon 97759
i
TABLE OF CONTENTS
EXECUTIVE SUMMARY ............................................................................................................ 1
INTRODUCTION .......................................................................................................................... 3
EXISTING FACILITIES ................................................................................................................ 3
General ........................................................................................................................................ 3
Waste water Facilities ................................................................................................................. 6
Waste water Treatment Facility .................................................................................................. 6
SUMMARY OF REGULATORY REQUIREMENTS .................................................................. 8
Site Specific ODEQ Regulations (Administrative Rules) for Recycled Water .......................... 8
Land Use Requirements for Recycled Water............................................................................ 10
Other General Requirements for Recycled Water .................................................................... 13
Ground Water Protection Requirements ................................................................................... 14
Other Considerations ................................................................................................................ 14
EFFLUENT AVAILABLE FOR IRRIGATION.......................................................................... 14
Background ............................................................................................................................... 14
Analysis..................................................................................................................................... 15
WATER RIGHT ANALYSIS ...................................................................................................... 17
Lazy Z Property Water Rights Summary.................................................................................. 17
Surface Water Rights ................................................................................................................ 17
Transfer Application T-11318 and Conserved Water Application CW-71 .......................... 17
Certificate 83355 (Squaw Creek Decree) ............................................................................. 20
Certificate 86824 (Squaw Creek Decree) ............................................................................. 20
Certificate 85389 (Squaw Creek Decree) ............................................................................. 20
Certificate 86828 (Squaw Creek Decree) ............................................................................. 20
Certificate 85391 (Squaw Creek Decree) ............................................................................. 21
Certificate 86826 (Squaw Creek Decree) ............................................................................. 21
Certificate 85392 (Squaw Creek Decree) ............................................................................. 21
Ground water Rights ................................................................................................................. 22
Certificate 85254 (Permit G-3095, Application G-3489) ..................................................... 22
Certificate 82875 (Permit G-8148, Application G-8548) ..................................................... 22
Certificate 87345 (Permit G-4841, Application G-5295) ..................................................... 22
Certificate 87347 (Permit G-3095, Application G-3489) ..................................................... 22
Conclusion ................................................................................................................................ 23
POTENTIAL CROPS AND IRRIGATION DEMAND .............................................................. 23
Purpose and Data Sources ......................................................................................................... 23
Regulatory Limitations Relative to Potential Crops ................................................................. 24
Constraints & Opportunities for Crop Types ............................................................................ 24
Locality ................................................................................................................................. 24
Localized Climate Zones and Frost Free Days ..................................................................... 24
ii
Crop Types ............................................................................................................................ 25
Water Demand .......................................................................................................................... 27
Irrigation Constraints ................................................................................................................ 28
Economic Considerations ......................................................................................................... 31
Production Costs ................................................................................................................... 31
Market Value ........................................................................................................................ 31
Deschutes County Soil and Water Conservation District Input................................................ 33
International Agri-Business Consultant Input .......................................................................... 33
Constructed Wetlands ............................................................................................................... 34
Conclusions ............................................................................................................................... 34
OPPORTUNITIES AND TIMING – CONVERTING SURFACE WATER RIGHTS TO
INSTREAM RIGHTS ................................................................................................................... 36
Opportunities to Convert Surface Water Right to Instream Rights .......................................... 36
Transactions and Market Characterization ............................................................................... 37
Types of Transactions Available .............................................................................................. 38
Permanent Transactions ........................................................................................................ 38
Temporary Transactions ....................................................................................................... 38
Timing of Opportunities ........................................................................................................... 39
EFFLUENT IRRIGATION MECHANISMS............................................................................... 43
Purpose and Data Sources ......................................................................................................... 43
Regulatory Limitations Relative to Irrigation Mechanisms ...................................................... 44
Evaluation Criteria - Irrigation Mechanisms ............................................................................ 44
Effluent Irrigation Mechanisms ................................................................................................ 45
Conclusions ............................................................................................................................... 48
COST ANALYSIS – IRRIGATION MECHANISMS................................................................. 49
Identified Irrigation Mechanisms .............................................................................................. 49
Preferred Irrigation Mechanisms .............................................................................................. 50
Irrigation of Poplar Trees ...................................................................................................... 53
FINANCING OPPORTUNITIES – CONVERSION OF SURFACE WATER RIGHTS TO
INSTREAM RIGHTS ................................................................................................................... 56
Valuation & Feasibility of Transactional Opportunities ........................................................... 56
Permanent Transactions ........................................................................................................ 56
Temporary Transactions ....................................................................................................... 58
Conclusion ................................................................................................................................ 61
iii
LIST OF TABLES
Table 1. Effluent Irrigation Water Usage for 2010 and 2011 ....................................................... 15
Table 2. Treated Effluent Available for Irrigation ........................................................................ 16
Table 3. Treated Effluent Available for Irrigation, 5 Year Increments ........................................ 17
Table 4. Frost Free Days in Central Oregon ................................................................................. 25
Table 5. Net Irrigation Water Demand ......................................................................................... 28
Table 6. Estimated Acreage and Cost for Wetlands ..................................................................... 34
Table 7. Whychus Creek Instream Water Rights.......................................................................... 36
Table 8. Water Rights and Available Acreage by Phase .............................................................. 42
Table 9. Basic Design Considerations for Irrigation System ........................................................ 45
Table 10. Reuse Improvements *.................................................................................................. 50
Table 11. Cost Summary for Irrigation of Hay/Alfalfa/Grass ...................................................... 52
Table 12. Estimated Annual Power Cost for Irrigation (Hay/Alfalfa/Grass) ............................... 53
Table 13. Cost Summary for Irrigation of Poplar Tree Crop ........................................................ 54
Table 14. Estimated Annual Power Cost for Irrigation (Poplar Trees) ........................................ 54
Table 15. Water Rights and Available Acreage by Phase ............................................................ 55
Table 16. Summary of Capital Costs and Potential Benefits ....................................................... 61
LIST OF FIGURES
Figure 1. Vicinity Map .................................................................................................................... 4
Figure 2. Site Area - Proposed Conversion of Surface Water ....................................................... 5
Figure 3. Waste Water Facilities Plan............................................................................................. 7
Figure 4. Lazy Z Water Rights ..................................................................................................... 19
Figure 5. Wert Identified Soil Areas ............................................................................................. 29
Figure 6. Wert Identified Sprayfield Locations ............................................................................ 30
Figure 7. Lazy Z Proposed Phasing .............................................................................................. 40
Figure 8. Lazy Z Existing Infrastructure and Proposed Phasing .................................................. 41
Figure 9. Irrigation Mechanisms Scenarios – Phases 1-3 ............................................................. 51
Figure 10. Potential Transaction Pathways for Phases I and II .................................................... 60
WASTEWATER REUSE AND CONSERVATION PROJECT PLANNING STUDY
Transitioning Irrigation From The Lazy Z Property From Surface Water To Treated Effluent
June 26, 2013 Page 1
EXECUTIVE SUMMARY
The City of Sisters, Oregon (the City) presently recycles its waste water for irrigation uses. The
City collects waste water from within its service area, treats the effluent in aeration lagoons,
stores it in a large holding pond over the winter and irrigates pine forest and grass areas with the
treated effluent in the summer. The effluent collection, treatment and irrigation process is
conducted under a Water Pollution Control Facilities permit (WCPF) issued to the City by the
Oregon Department of Environmental Quality (ODEQ). This process is also conducted
according to the City’s updated Recycled Water Use Plan approved by the ODEQ in 2007.
The City is growing. Demand for water supply is increasing and provisions are required for
managing increasing waste water discharges in the future. The increasing water demand and
waste water discharge brings unique opportunities to the City and to Whychus Creek. The
source of supply for increasing water demand is ground water. Hydraulic connectivity between
the aquifer system and Whychus Creek requires mitigation of ground water pumping effects on
creek flows. Water supply is needed by the City to accomplish the required mitigation, which is
done conventionally in the upper Deschutes Basin by vacating irrigated land of water rights and
transferring the rights back to their source stream to restore flows as an offset to pumping effects.
Provisions for future water supply and waste water management contemplated by the City can
also benefit Whychus Creek through flow restoration with surface water rights held by the City.
The present City process of recycling its waste water for irrigation use is successful.
Accordingly, the City purchased 240 acres of Lazy Z Ranch property as a component of its plan
for additional water supply and for managing additional waste water flows into the future. Under
this plan, the City can transfer irrigation water rights on the Lazy Z property back to Whychus
Creek, responding to its mitigation obligations and restoring flows in the creek. In exchange for
the water right transfers, the City will irrigate the effected lands with treated effluent, expanding
its capacity to manage increasing waste water discharges into the future.
The planning study presented in this report was intended to evaluate the feasibility of this plan to
transition from surface water irrigation to effluent irrigation on the Lazy Z property. Feasibility
depends on several factors including: 1) regulatory requirements; 2) amount of effluent available
for future irrigation; 3) existing water rights on the Lazy Z property; 4) crops best-suited for
effluent irrigation at the site and their irrigation water demand; 5) timing for conversion of
surface water rights to instream rights; 6) suitable effluent irrigation mechanisms and their costs;
and 7) financing opportunities for converting surface water rights to instream rights.
Evaluation of the feasibility factors finds that implementation of this plan or phases of the plan is
feasible. The Lazy Z property provides more than enough capacity to irrigate 294 acre-feet of
effluent under the Case I option in the year 2033 (and enough capacity to irrigate the total
estimate effluent volume of 361 acre-feet in 2033). Hay (alfalfa, grass and timothy), poplar trees
for wood fiber and ornamental trees can be grown by irrigation with treated effluent and are best
suited for the site.
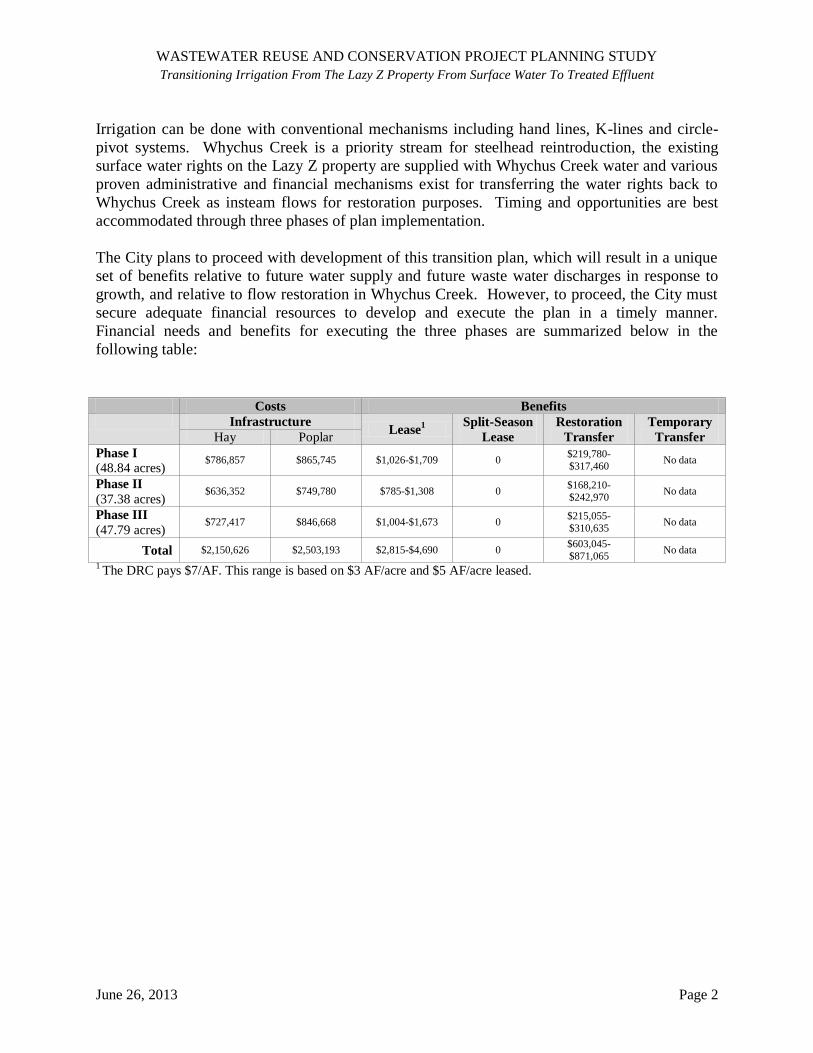
WASTEWATER REUSE AND CONSERVATION PROJECT PLANNING STUDY
Transitioning Irrigation From The Lazy Z Property From Surface Water To Treated Effluent
June 26, 2013 Page 2
Irrigation can be done with conventional mechanisms including hand lines, K-lines and circle-
pivot systems. Whychus Creek is a priority stream for steelhead reintroduction, the existing
surface water rights on the Lazy Z property are supplied with Whychus Creek water and various
proven administrative and financial mechanisms exist for transferring the water rights back to
Whychus Creek as insteam flows for restoration purposes. Timing and opportunities are best
accommodated through three phases of plan implementation.
The City plans to proceed with development of this transition plan, which will result in a unique
set of benefits relative to future water supply and future waste water discharges in response to
growth, and relative to flow restoration in Whychus Creek. However, to proceed, the City must
secure adequate financial resources to develop and execute the plan in a timely manner.
Financial needs and benefits for executing the three phases are summarized below in the
following table:
Costs Benefits
Infrastructure Lease
1
Split-Season
Lease
Restoration
Transfer
Temporary
Transfer Hay Poplar
Phase I (48.84 acres)
$786,857 $865,745 $1,026-$1,709 0 $219,780-
$317,460 No data
Phase II
(37.38 acres) $636,352 $749,780 $785-$1,308 0
$168,210-
$242,970 No data
Phase III
(47.79 acres) $727,417 $846,668 $1,004-$1,673 0
$215,055-
$310,635 No data
Total $2,150,626 $2,503,193 $2,815-$4,690 0 $603,045-
$871,065 No data
1 The DRC pays $7/AF. This range is based on $3 AF/acre and $5 AF/acre leased.
WASTEWATER REUSE AND CONSERVATION PROJECT PLANNING STUDY
Transitioning Irrigation From The Lazy Z Property From Surface Water To Treated Effluent
June 26, 2013 Page 3
INTRODUCTION
Over time the City of Sisters (the City) must expand its waste water disposal capacity. To this
end, the City is developing this planning study to transition from surface water irrigation to
effluent irrigation on the City’s Lazy Z Ranch property (Lazy Z property). This will fulfill the
City’s original intent in acquiring the property, expand waste water disposal capacity, and
provide instream benefits to Whychus Creek.
The City has a Recycled Water Use Plan (RWUP) that was updated for the Lazy Z property and
approved by the Oregon Department of Environmental Quality (ODEQ) in 2007. The City
submitted for renewal of its Water Pollution Control Facilities (WPCF) permit in 2011.
This planning study evaluated considerations associated with (a) disposal of treated effluent by
irrigation, including regulatory requirements, (b) the amount of treated effluent available over
time, (c) surface water rights and phasing of the transition from surface water irrigation to
effluent irrigation, and (d) irrigation mechanisms and costs, and financing. The study also
assessed whether modifications to the RWUP or the WPCF permit are required.
The results of the study are described below and include conceptual design framework, timeline
for implementation and opportunities to use the City’s Lazy Z property water rights to meet
instream water demands and help finance the infrastructure necessary to irrigate with effluent.
The location of the site is shown on Figure 1 (Vicinity Map). The site area, existing waste water
treatment facilities and Lazy Z property are shown on Figure 2.
EXISTING FACILITIES
General
The description of existing waste water facilities in this report section is focused on the waste
water treatment facility. A brief summary of the City’s waste water system is below. A detailed
description of the waste water facilities is presented in the document “Wastewater System
Capital Facilities Plan – Final; City of Sisters, Deschutes County, Oregon,” November 2006
(Facilities Plan).
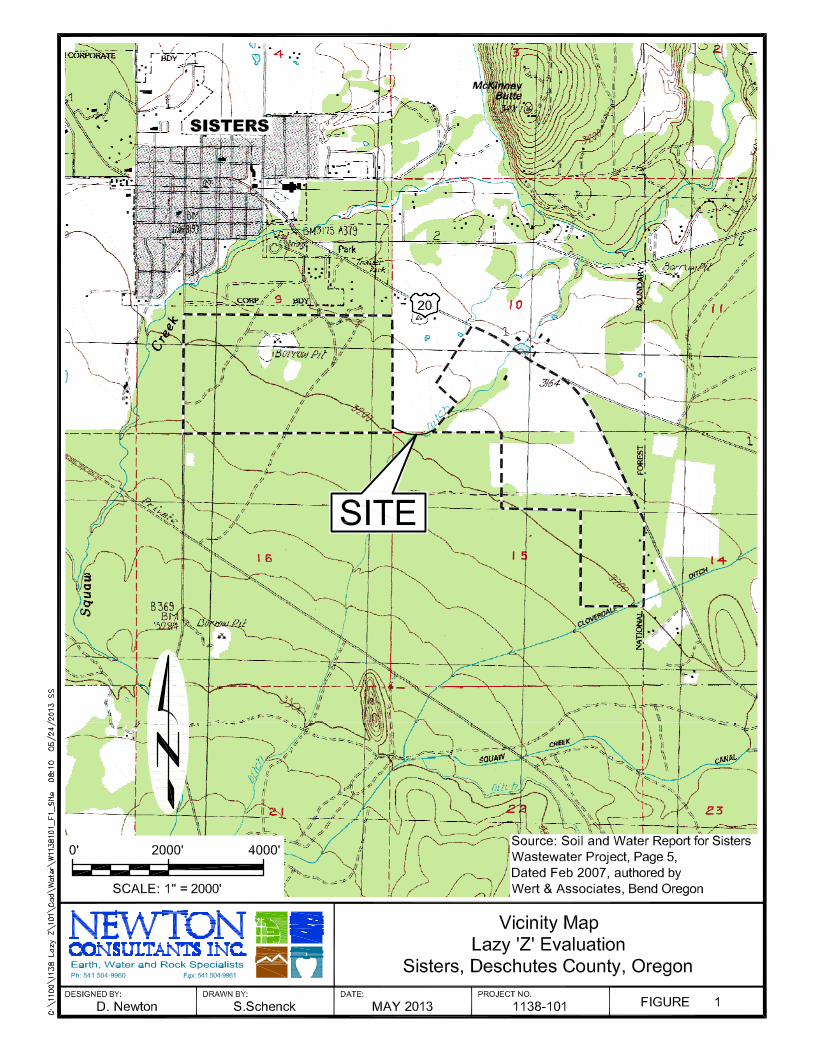
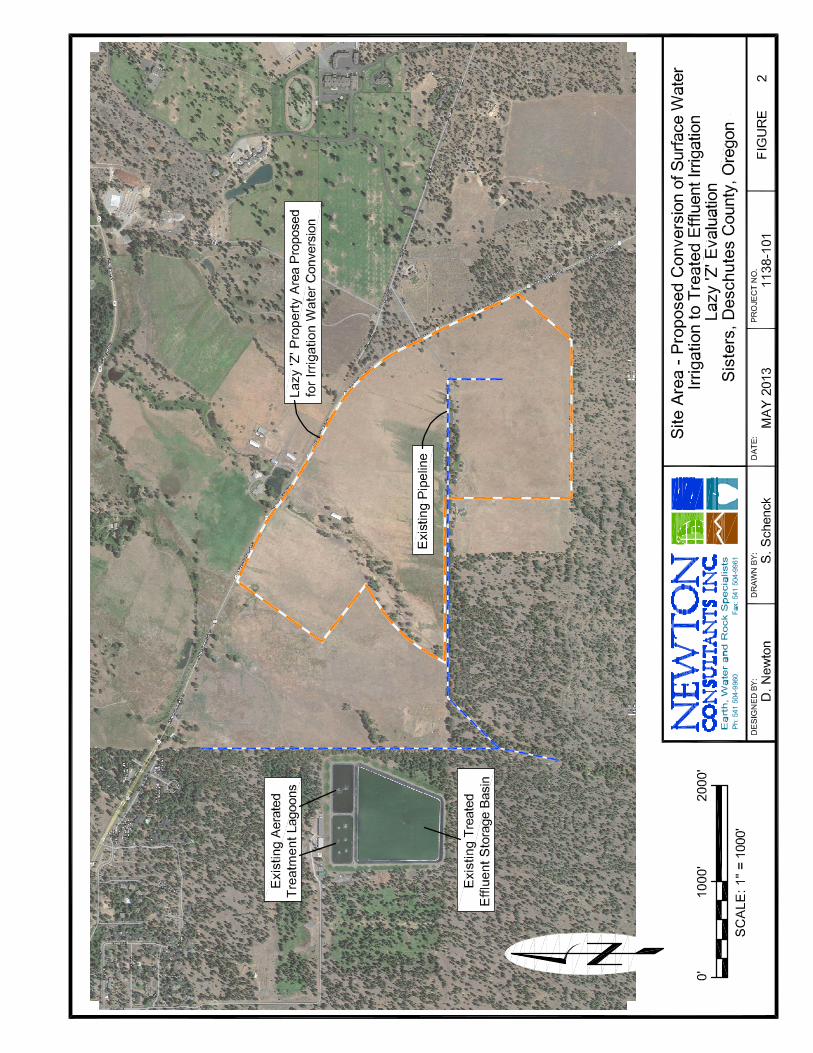
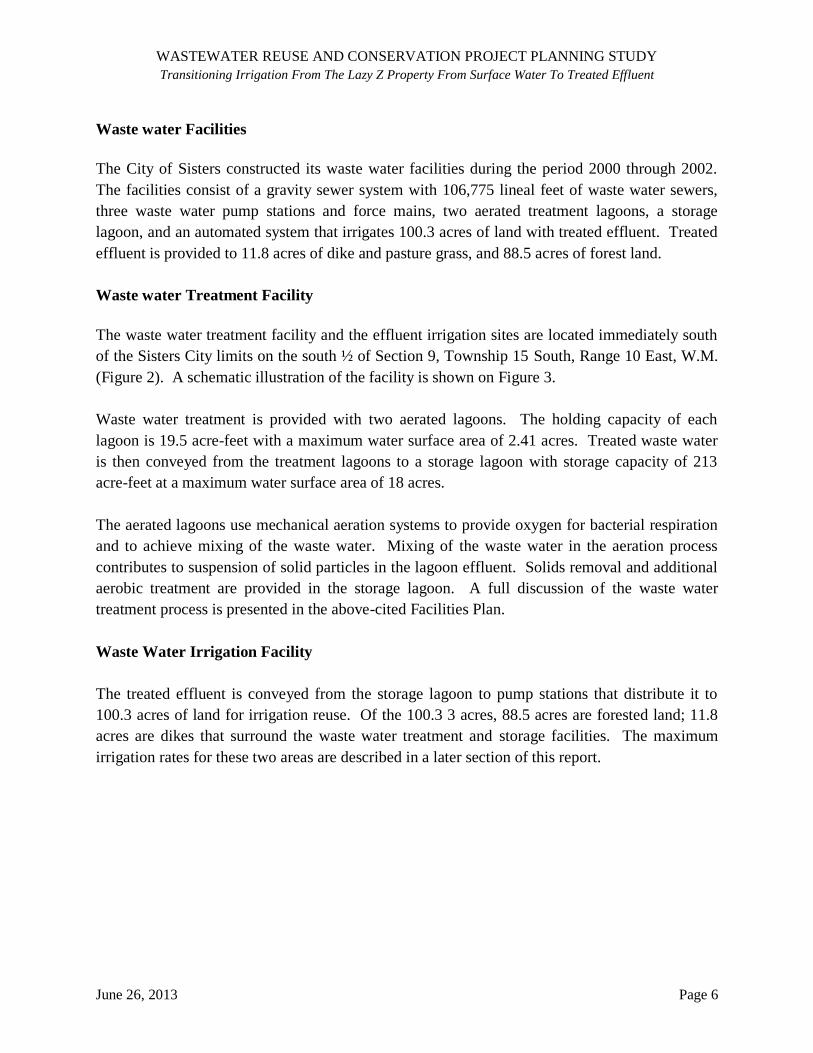
WASTEWATER REUSE AND CONSERVATION PROJECT PLANNING STUDY
Transitioning Irrigation From The Lazy Z Property From Surface Water To Treated Effluent
June 26, 2013 Page 6
Waste water Facilities
The City of Sisters constructed its waste water facilities during the period 2000 through 2002.
The facilities consist of a gravity sewer system with 106,775 lineal feet of waste water sewers,
three waste water pump stations and force mains, two aerated treatment lagoons, a storage
lagoon, and an automated system that irrigates 100.3 acres of land with treated effluent. Treated
effluent is provided to 11.8 acres of dike and pasture grass, and 88.5 acres of forest land.
Waste water Treatment Facility
The waste water treatment facility and the effluent irrigation sites are located immediately south
of the Sisters City limits on the south ½ of Section 9, Township 15 South, Range 10 East, W.M.
(Figure 2). A schematic illustration of the facility is shown on Figure 3.
Waste water treatment is provided with two aerated lagoons. The holding capacity of each
lagoon is 19.5 acre-feet with a maximum water surface area of 2.41 acres. Treated waste water
is then conveyed from the treatment lagoons to a storage lagoon with storage capacity of 213
acre-feet at a maximum water surface area of 18 acres.
The aerated lagoons use mechanical aeration systems to provide oxygen for bacterial respiration
and to achieve mixing of the waste water. Mixing of the waste water in the aeration process
contributes to suspension of solid particles in the lagoon effluent. Solids removal and additional
aerobic treatment are provided in the storage lagoon. A full discussion of the waste water
treatment process is presented in the above-cited Facilities Plan.
Waste Water Irrigation Facility
The treated effluent is conveyed from the storage lagoon to pump stations that distribute it to
100.3 acres of land for irrigation reuse. Of the 100.3 3 acres, 88.5 acres are forested land; 11.8
acres are dikes that surround the waste water treatment and storage facilities. The maximum
irrigation rates for these two areas are described in a later section of this report.
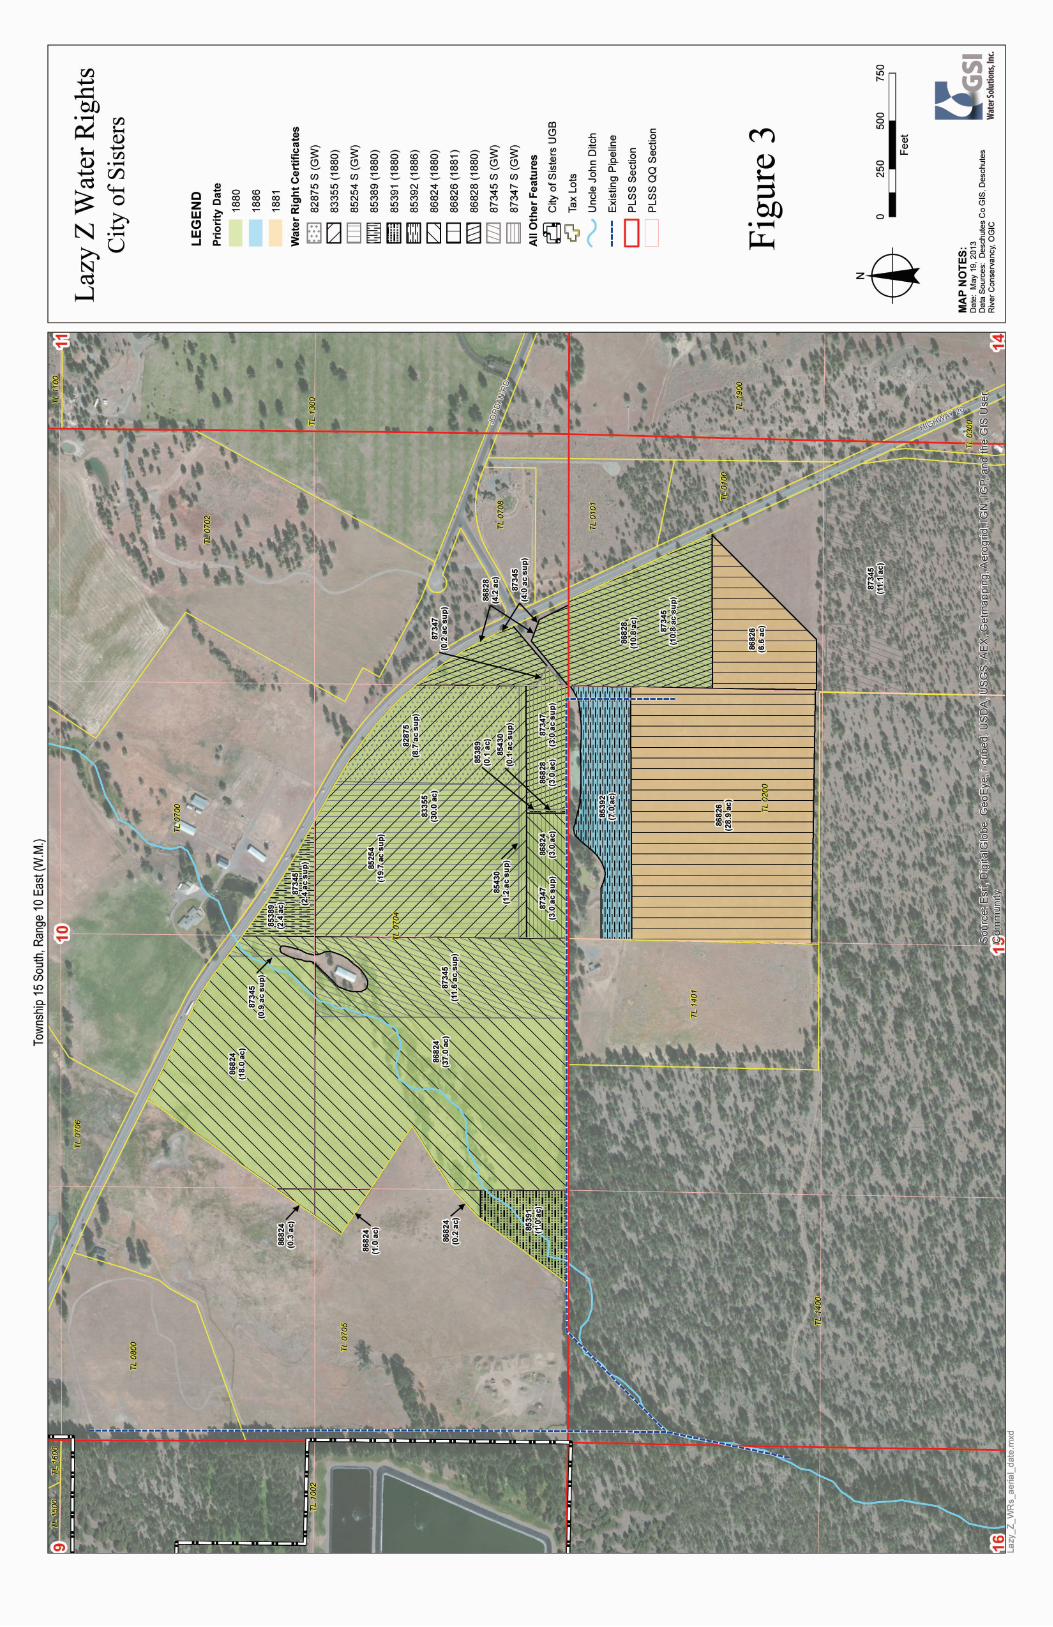
WASTEWATER REUSE AND CONSERVATION PROJECT PLANNING STUDY
Transitioning Irrigation From The Lazy Z Property From Surface Water To Treated Effluent
June 26, 2013 Page 8
SUMMARY OF REGULATORY REQUIREMENTS
The City of Sisters waste water facility operates under the authority of a Water Pollution Control
Facilities (WPCF) permit issued by the Oregon Department of Environmental Quality (ODEQ).
The permit allows the current waste water facility to produce and irrigate with an “enhanced”
Level I effluent. The only effluent quality limitation in the permit for this level of treatment is
that the E. coli in the effluent “shall not exceed a monthly geometric mean of 126 organisms per
100 milliliters. According to the City, it has no plans to upgrade its waste water facility to
produce a higher class of effluent.
Site Specific ODEQ Regulations (Administrative Rules) for Recycled Water
The use of recycled water (treated effluent) is governed by Oregon Administrative Rules (OAR)
Chapter 340, Division 55. Since the City’s current permit was issued in May of 2008, ODEQ
updated its administrative rules that restrict the use of recycled water. An “enhanced” Level I
effluent is now called Class D effluent.
The effluent quality requirements for Class D effluent state that the recycled water shall “not
exceed a 30-day log mean of 126 E. coli organisms per 100 milliliters and 406 E. coli organisms
per 100 milliliters in any single sample. A log mean as required by the new rules and a
geometric mean, as required by the current permit, produce the same result.
OAR 340-041-0009(5) allows an exceedance of effluent limits for bacteria provided immediate
and subsequent monitoring after an exceedance event shows no exceedances. The exception,
however, is written to only apply to NPDES permits or storage and irrigation facilities with total
coliform limits. The exception does not appear to apply to the type of facility and limitations
required in the City’s WPCF permit. While not certain, ODEQ may interpret the exception rule
to apply to the City’s facility. If it does, no violation would be found, for an exceedance of a
single sample test if the permittee takes at least five consecutive re-samples at four-hour intervals
beginning as soon as practicable (preferably within 28 hours) after the original sample was taken
and the log mean of the five re-samples is less than or equal to 126 E. coli.
The original administrative rules, under which the current permit was issued, allowed effluent
limits to be met anywhere in the treatment process. This meant that if the limits were met after
treatment but prior to storage and irrigation, the requirements were met. The updated rules do
not have this same allowance. When the permit is renewed, ODEQ may require that the effluent
limits be met just prior to irrigation.
WASTEWATER REUSE AND CONSERVATION PROJECT PLANNING STUDY
Transitioning Irrigation From The Lazy Z Property From Surface Water To Treated Effluent
June 26, 2013 Page 9
According to the current ODEQ rules, irrigation of Class D effluent is restricted to growing
fodder, fiber, seed crops not intended for human ingestion, commercial timber, firewood,
ornamental nursery stock, Christmas trees, sod, or pasture for animals.
In addition to the restrictions on the irrigation of Class D effluent, the following requirements
also apply:
1. Monitoring for E. coli organisms must occur once per week at a minimum.
2. The following setback distances apply.
a. Where an irrigation method is used to apply recycled water directly to the soil,
there must be a minimum of 10 feet from the edge of the site used for irrigation
and the site property line.
b. Where sprinkler irrigation is used, there must be a minimum of 100 feet from the
edge of the site used for irrigation and the site property line.
c. There must be a minimum of 100 feet from the edge of an irrigation site to a
water supply source used for human consumption.
d. Where sprinkler irrigation is used, recycled water must not be sprayed within 70
feet of an area where food is prepared or served, or where a drinking fountain is
located.
3. Access and Exposure.
a. Animals used for production of milk must be restricted from direct contact with
the recycled water.
b. When using recycled water for irrigation of sod, ornamental nursery stock, or
Christmas trees, the personnel at the use area must be notified that the water used
is recycled water and is not safe for drinking. The recycled water use plan must
specify how notification will be provided.
4. Site Management.
a. When irrigating, signs must be posted around the perimeter of the irrigation site
stating recycled water is used and is not safe for drinking.
b. Irrigation of fodder, fiber, seed crops not intended for human ingestion, sod,
commercial timber, firewood, ornamental nursery stock, or Christmas trees is
prohibited for three days before harvesting.
The City could propose to blend its recycled water with other irrigation water in order to irrigate
more land. Before blending recycled water, however, the owner must obtain written
authorization from the ODEQ. In obtaining authorization, the waste water treatment system
owner must submit to the ODEQ, at a minimum the following:
1. An operations plan,
2. A description of any additional treatment process,
3. A description of blending volumes, and
4. A range of final recycled water quality at the compliance point identified in the
NPDES or WPCF permit.
WASTEWATER REUSE AND CONSERVATION PROJECT PLANNING STUDY
Transitioning Irrigation From The Lazy Z Property From Surface Water To Treated Effluent
June 26, 2013 Page 10
Land Use Requirements for Recycled Water
The regulations requiring a recycled water use plan are ambiguous as it applies to the City. The
City has a WPCF permit that authorizes reuse and it has an approved recycle water use plan for
its current operation. OAR 3400-055-0016(2)(a) states that, except for use of recycled water
authorized by a NPDES or WPCF permit, a waste water treatment system owner may not
provide any recycled water for distribution or use or both until a recycled water use plan meeting
the requirements of OAR 340-055-0025 has been approved in writing by the ODEQ. Upon
approval of the plan, the permittee must comply with the conditions of the plan. OAR 3400-055-
0016(2)(c) states that for use of recycled water previously authorized under a NPDES or WPCF
permit but without a department approved recycled water use plan, the waste water treatment
system owner must submit a recycled water use plan to the ODEQ within one year of the
effective date of these rules. It would appear that the City would not have to submit a recycled
water use plan because it has a WPCF permit authorizing use and it has an approved plan. It is
highly unlikely, however, that ODEQ will allow use of recycled water on the Lazy Z Ranch
property without an updated recycled water use plan. Most likely, the City will need to update
the recycled water use plan to identify the location of treated effluent use.
Assuming that a new recycled water use plan will be required, the following requirements
relative to land use will apply:
OAR 340-055-0016(3) states that: A recycled water use plan will not be approved for the
land application of recycled water on land zoned exclusive farm use until the
requirements of ORS 215.213(1)(bb) and 215.283(1)(y) for recycled water are met.
Since the ODEQ rules were adopted in 2008, the specific citations in ORS 215 have been
re-codified. ORS 215.213(1)(bb) is now ORS 215.213(1)(y); ORS 215.283(1)(y) is now
ORS 215.283(1)(v). The two statutes have to do with whether or not the county has or
has not adopted marginal lands provisions. In any case, however, both statutes require
compliance with in ORS 215.246 to 215.251. A summary of these requirement are
provided in a ODEQ fact sheet and are repeated as follows:
a. Subject to issuance of a permit or approval by ODEQ, land application of
industrial process water, recycled water and biosolids is an allowed use on EFU
zoned land. Because land application is listed as an allowed use in ORS
215.213(1), counties may not impose additional land use restrictions or conditions
on land application practices, beyond those specified in the statute.
b. Other facilities or uses on the same EFU tract are included in the allowed use if
they are accessory to and reasonably needed for land application to occur on the
WASTEWATER REUSE AND CONSERVATION PROJECT PLANNING STUDY
Transitioning Irrigation From The Lazy Z Property From Surface Water To Treated Effluent
June 26, 2013 Page 11
proposed site. The statutes also disallow certain uses, e.g. utility facility service
lines.
c. Before a county land use decision is made on a land application proposal, the
applicant responds in writing to public comments received by the county that
identify alternative sites or methods for managing the industrial process water,
recycled water or biosolids. The applicant’s response describes how the
alternative sites or methods were considered and why they were not selected. The
land use decision cannot be remanded or reversed, unless the applicant fails to
provide a written response when required.
d. ODEQ is required to determine, through its review and approval process, that the
practice of land application will not reduce the productivity of the subject land.
e. Land application of biosolids is exempt under the Act when transported by
vehicle to EFU land. A ODEQ Land Use Compatibility Statement (LUCS) is not
required.
f. Land application of materials that are not described in the Act are not subject to
the Act’s provisions, e.g. confined animal feeding operation wastes.
g. Land division, for purposes of land application, is not allowed in EFU zones.
h. Restrictions apply in changing the use of land where land application practices
has occurred.
ODEQ has adopted a process for assuring that the requirements of these land use statutes are
met. Also from the ODEQ fact sheet, the process is as follows:
a. The applicant obtains the required ODEQ application and LUCS forms, and
submits the LUCS to the county planning office for its review and approval.
b. The county conducts its land use review process in accordance with the
requirements under the Act.
c. The county completes the LUCS form and returns it to the applicant with the
attached findings:
o The proposed activity constitutes land application for purposes of agricultural,
horticultural, silviculture production, or for irrigation in connection with a use
allowable in EFU zoned land under ORS 215.
o Any proposed facilities necessary for the land application practice to occur on
the subject site are accessory to and reasonably necessary as allowed by the
Act.
WASTEWATER REUSE AND CONSERVATION PROJECT PLANNING STUDY
Transitioning Irrigation From The Lazy Z Property From Surface Water To Treated Effluent
June 26, 2013 Page 12
o Approval of the LUCS is subject to ODEQ’s issuance of the necessary
environmental approvals or permits.
d. The applicant submits the ODEQ application and approved LUCS to ODEQ for
processing. ODEQ processes the application and conducts a technical review in
accordance with its rules. The review, depending on what material is applied to
the land, may include the following:
o Pollutant and nutrient testing
o Determination of agronomic rate
o Determination of agronomic or pollutant loading
o Determination of water assimilation capacity
o Site assessment and evaluation
o Crop type and cropping system
o Application methods and equipment requirements
o Site access and harvest restrictions
o Monitoring requirements
o A written determination that the land application activity will not reduce the
productivity of the land in question.
e. ODEQ submits all Recycled Water Reuse Plans to the DHS for comment (OAR
340-055-0015(2)), and consults with DHS on any effluent quality limitations
(OAR 340-055-0015(4)).
f. Applicants intending to land apply recycled water are required to submit a
“Registration of Recycled Water Use” form
(http://www1.wrd.state.or.us/pdfs/reclaimform96.pdf) to the Oregon Water
Resources Department (ORS 537.131, 537.132 and 537.610(h)). Either agency
can supply applicants with this form, however it requires a ODEQ signature.
g. DEQ issues an approval or denial to the applicant, and provides a copy to the
county planning office.
In situations where a LUCS is denied or appealed:
a. When ODEQ receives a county-denied LUCS, the applicant is informed that
ODEQ cannot process the application until county approval is provided.
b. If a county land use decision is appealed after ODEQ receives an approved
LUCS, ODEQ’s policy is to process the application unless ordered otherwise by a
court stay or invalidation of the county decision.
c. A county may withdraw or modify its LUCS decision before the permit is issued.
WASTEWATER REUSE AND CONSERVATION PROJECT PLANNING STUDY
Transitioning Irrigation From The Lazy Z Property From Surface Water To Treated Effluent
June 26, 2013 Page 13
d. If a county-approved LUCS is successfully appealed after ODEQ issues a permit,
ODEQ may revoke or suspend the permit, or delay its decision until the appeals
process is exhausted. In making its decision, ODEQ consults closely with the
applicant and county government.
Other General Requirements for Recycled Water
The following requirements must also be met when reusing recycled water. Most of these are
likely already met by the City under its current, approved recycled water use plan.
1. Bypassing. The intentional diversion of waste water from any unit process in the waste
water treatment system for a beneficial purpose is not allowed, unless with the unit
process out of service the recycled water meets the criteria of this division for a specific
class and beneficial purpose described in the recycled water use plan.
2. Alarm devices. Alarm devices are required to provide warning of power loss and failure
of process equipment essential to the proper operation of the waste water treatment
system and compliance with this division.
3. Standby power. Unless otherwise approved in writing by the ODEQ, a waste water
treatment system providing recycled water for use must have sufficient standby power to
fully operate all essential treatment processes. The ODEQ may grant an exception to this
section only if the waste water treatment system owner demonstrates that power failure
will not result in inadequately treated water being provided for use and will not result in
any violation of an NPDES or WPCF permit limit or condition or Oregon Administrative
Rule.
4. Redundancy. A waste water treatment system that provides recycled water for use must
have a sufficient level of redundant treatment facilities and monitoring equipment to
prevent inadequately treated recycled water from being used or discharged to public
waters.
5. Distribution system requirements. Unless otherwise approved in writing by the
department, all piping, valves, and other portions of the recycled water use system that is
outside a building must be constructed and marked in a manner to prevent cross-
connection with a potable water system. Unless otherwise approved in writing by the
department or as required by the rules of this division, construction and marking must be
consistent with sections (2), (3), (4), and (5) of the 1992 “Guidelines for the Distribution
of Nonpotable Water” of the California-Nevada Section of the American Water Works
Association.
6. Cross-connection control. Connection between a potable water supply system and a
recycled water distribution system is not authorized unless the connection is through an
air gap separation approved by the ODEQ. A reduced pressure principle backflow
WASTEWATER REUSE AND CONSERVATION PROJECT PLANNING STUDY
Transitioning Irrigation From The Lazy Z Property From Surface Water To Treated Effluent
June 26, 2013 Page 14
prevention device may be used only when approved in writing by the ODEQ and the
potable water system owner.
7. Annual report. The City must submit an annual report to the ODEQ describing the
effectiveness of the system to comply with the approved recycled water use plan, the
rules of this division, and the permit limits and conditions for recycled water.
Ground Water Protection Requirements
Recycled water will not be authorized for use unless all ground water quality protection
requirements in OAR chapter 340, division 40 are met. The requirements in OAR chapter 340,
division 40 are considered to be met if the waste water treatment system owner demonstrates
recycled water will be used or land applied in a manner and at a rate that minimizes the
movement of contaminants to ground water and does not adversely impact ground water quality.
Generally, if the recycled water is irrigated at rates consistent with the needs to the crop being
irrigated, compliance with the ground water quality requirements are deemed to be met.
Other Considerations
The current ODEQ rules do not require the City to have a contract if it decides to provide its
recycled water to another party for use. Regardless of this omission, if the City does decide to
provide its recycled water, it is highly recommended that a well-conceived contract be
established between the City and the other party to ensure the City’s interests are protected.
EFFLUENT AVAILABLE FOR IRRIGATION
The opportunity for the City to transition from irrigation with surface water to treated effluent
over time depends on the projected volume of treated effluent. The section below estimates the
total volume of treated effluent that would be available for irrigation on the Lazy Z lands from
the present time to the year 2033.
Background
The City currently uses treated effluent to irrigate lands near its waste water treatment facilities.
These lands include grasses on the lagoon system dikes and forest lands (Ponderosa pine trees).
The analysis for estimating the total volume of available treated effluent water in 2033 for
irrigation at the Lazy Z lands was completed with the following assumptions:
1. The dikes are irrigated at 14.375 inches per season; the forest is irrigated at 7.15 inches
per season; and the remainder is irrigated at the Lazy Z lands.
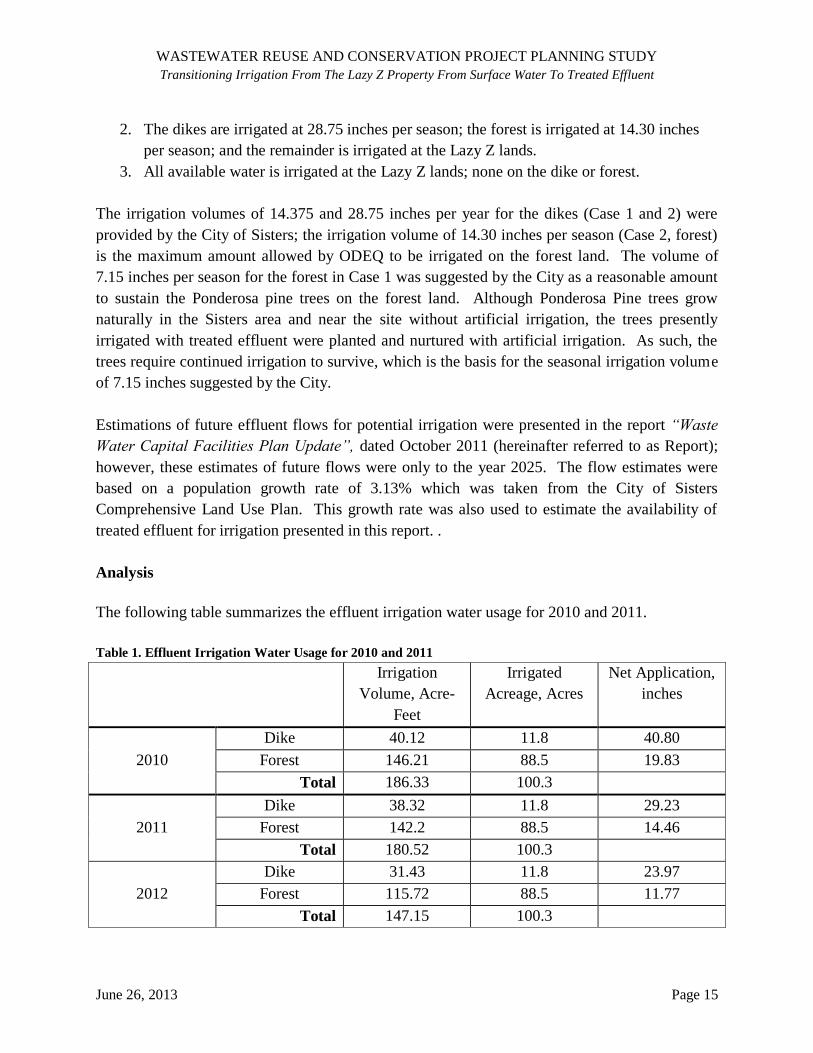
WASTEWATER REUSE AND CONSERVATION PROJECT PLANNING STUDY
Transitioning Irrigation From The Lazy Z Property From Surface Water To Treated Effluent
June 26, 2013 Page 15
2. The dikes are irrigated at 28.75 inches per season; the forest is irrigated at 14.30 inches
per season; and the remainder is irrigated at the Lazy Z lands.
3. All available water is irrigated at the Lazy Z lands; none on the dike or forest.
The irrigation volumes of 14.375 and 28.75 inches per year for the dikes (Case 1 and 2) were
provided by the City of Sisters; the irrigation volume of 14.30 inches per season (Case 2, forest)
is the maximum amount allowed by ODEQ to be irrigated on the forest land. The volume of
7.15 inches per season for the forest in Case 1 was suggested by the City as a reasonable amount
to sustain the Ponderosa pine trees on the forest land. Although Ponderosa Pine trees grow
naturally in the Sisters area and near the site without artificial irrigation, the trees presently
irrigated with treated effluent were planted and nurtured with artificial irrigation. As such, the
trees require continued irrigation to survive, which is the basis for the seasonal irrigation volume
of 7.15 inches suggested by the City.
Estimations of future effluent flows for potential irrigation were presented in the report “Waste
Water Capital Facilities Plan Update”, dated October 2011 (hereinafter referred to as Report);
however, these estimates of future flows were only to the year 2025. The flow estimates were
based on a population growth rate of 3.13% which was taken from the City of Sisters
Comprehensive Land Use Plan. This growth rate was also used to estimate the availability of
treated effluent for irrigation presented in this report. .
Analysis
The following table summarizes the effluent irrigation water usage for 2010 and 2011.
Table 1. Effluent Irrigation Water Usage for 2010 and 2011
Irrigation
Volume, Acre-
Feet
Irrigated
Acreage, Acres
Net Application,
inches
2010
Dike 40.12 11.8 40.80
Forest 146.21 88.5 19.83
Total 186.33 100.3
2011
Dike 38.32 11.8 29.23
Forest 142.2 88.5 14.46
Total 180.52 100.3
2012
Dike 31.43 11.8 23.97
Forest 115.72 88.5 11.77
Total 147.15 100.3
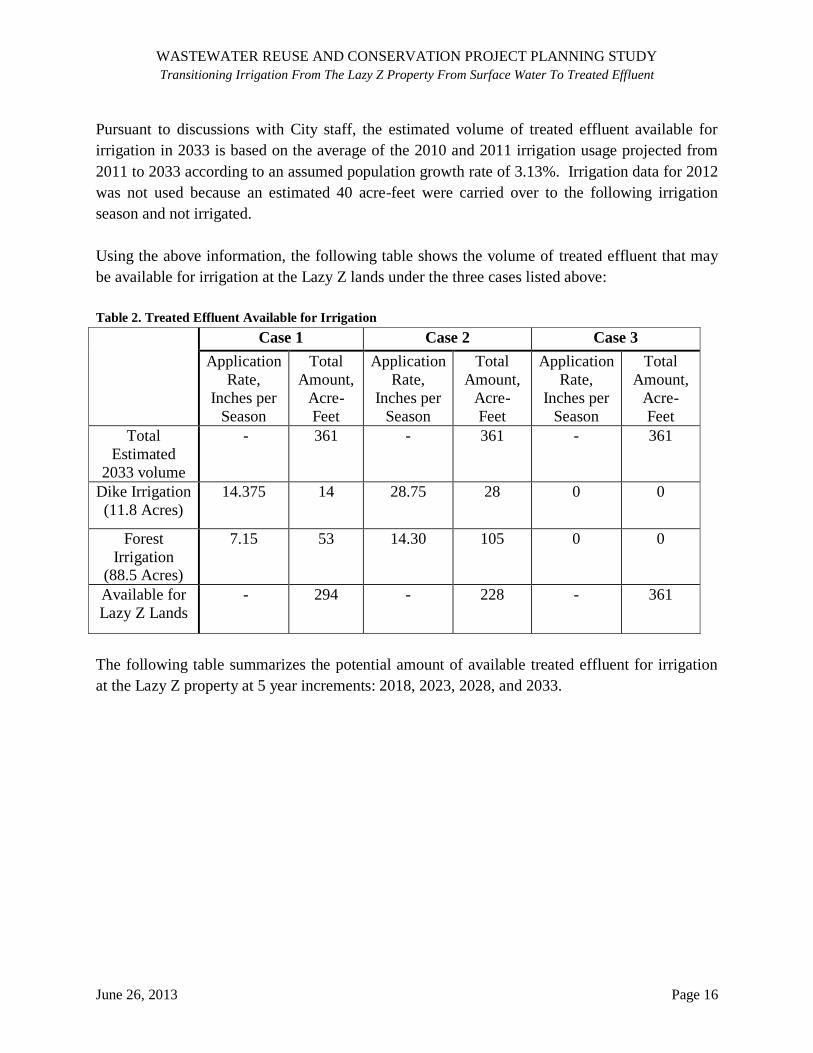
WASTEWATER REUSE AND CONSERVATION PROJECT PLANNING STUDY
Transitioning Irrigation From The Lazy Z Property From Surface Water To Treated Effluent
June 26, 2013 Page 16
Pursuant to discussions with City staff, the estimated volume of treated effluent available for
irrigation in 2033 is based on the average of the 2010 and 2011 irrigation usage projected from
2011 to 2033 according to an assumed population growth rate of 3.13%. Irrigation data for 2012
was not used because an estimated 40 acre-feet were carried over to the following irrigation
season and not irrigated.
Using the above information, the following table shows the volume of treated effluent that may
be available for irrigation at the Lazy Z lands under the three cases listed above:
Table 2. Treated Effluent Available for Irrigation
Case 1 Case 2 Case 3
Application
Rate,
Inches per
Season
Total
Amount,
Acre-
Feet
Application
Rate,
Inches per
Season
Total
Amount,
Acre-
Feet
Application
Rate,
Inches per
Season
Total
Amount,
Acre-
Feet
Total
Estimated
2033 volume
- 361 - 361 - 361
Dike Irrigation
(11.8 Acres)
14.375 14 28.75 28 0 0
Forest
Irrigation (88.5 Acres)
7.15 53 14.30 105 0 0
Available for
Lazy Z Lands
- 294 - 228 - 361
The following table summarizes the potential amount of available treated effluent for irrigation
at the Lazy Z property at 5 year increments: 2018, 2023, 2028, and 2033.
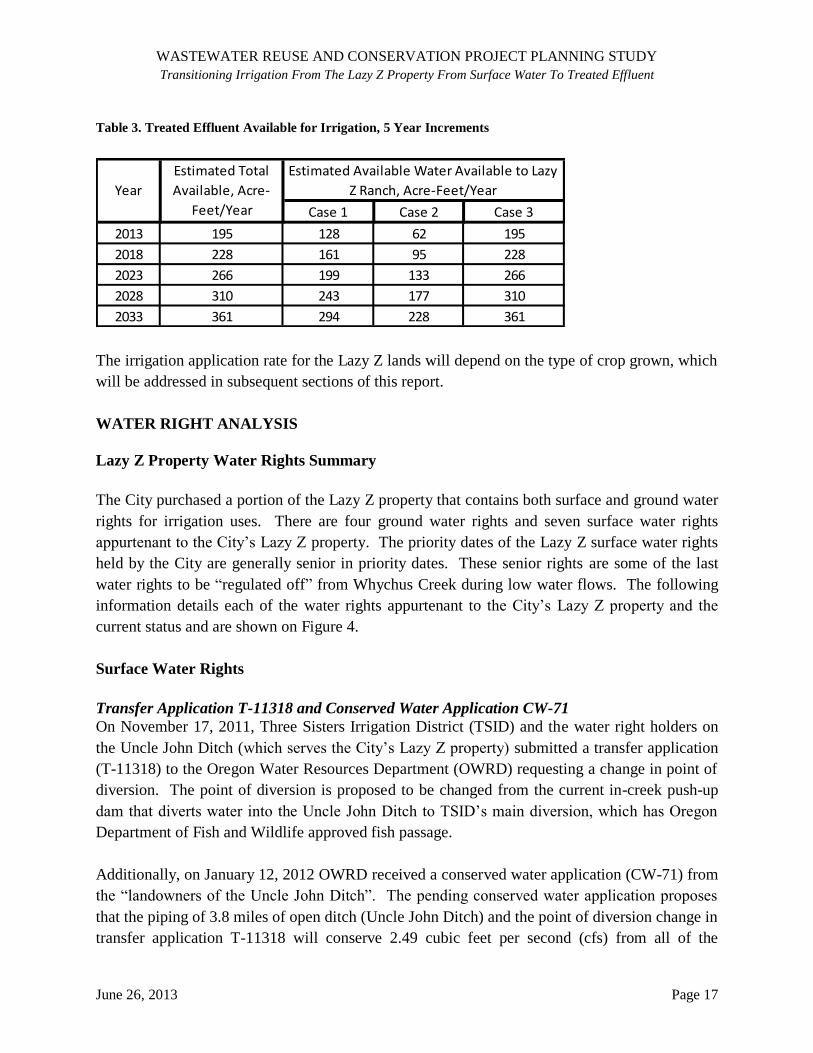
WASTEWATER REUSE AND CONSERVATION PROJECT PLANNING STUDY
Transitioning Irrigation From The Lazy Z Property From Surface Water To Treated Effluent
June 26, 2013 Page 17
Table 3. Treated Effluent Available for Irrigation, 5 Year Increments
Case 1 Case 2 Case 3
2013 195 128 62 195
2018 228 161 95 228
2023 266 199 133 266
2028 310 243 177 310
2033 361 294 228 361
Estimated Available Water Available to Lazy
Z Ranch, Acre-Feet/Year
Estimated Total
Available, Acre-
Feet/Year
Year
The irrigation application rate for the Lazy Z lands will depend on the type of crop grown, which
will be addressed in subsequent sections of this report.
WATER RIGHT ANALYSIS
Lazy Z Property Water Rights Summary
The City purchased a portion of the Lazy Z property that contains both surface and ground water
rights for irrigation uses. There are four ground water rights and seven surface water rights
appurtenant to the City’s Lazy Z property. The priority dates of the Lazy Z surface water rights
held by the City are generally senior in priority dates. These senior rights are some of the last
water rights to be “regulated off” from Whychus Creek during low water flows. The following
information details each of the water rights appurtenant to the City’s Lazy Z property and the
current status and are shown on Figure 4.
Surface Water Rights
Transfer Application T-11318 and Conserved Water Application CW-71
On November 17, 2011, Three Sisters Irrigation District (TSID) and the water right holders on
the Uncle John Ditch (which serves the City’s Lazy Z property) submitted a transfer application
(T-11318) to the Oregon Water Resources Department (OWRD) requesting a change in point of
diversion. The point of diversion is proposed to be changed from the current in-creek push-up
dam that diverts water into the Uncle John Ditch to TSID’s main diversion, which has Oregon
Department of Fish and Wildlife approved fish passage.
Additionally, on January 12, 2012 OWRD received a conserved water application (CW-71) from
the “landowners of the Uncle John Ditch”. The pending conserved water application proposes
that the piping of 3.8 miles of open ditch (Uncle John Ditch) and the point of diversion change in
transfer application T-11318 will conserve 2.49 cubic feet per second (cfs) from all of the
WASTEWATER REUSE AND CONSERVATION PROJECT PLANNING STUDY
Transitioning Irrigation From The Lazy Z Property From Surface Water To Treated Effluent
June 26, 2013 Page 18
included Lazy Z water rights. The City’s portion of conserved water is proposed to be a total of
0.76 cfs.
The transfer and conserved water project affect all of the City’s surface water rights appurtenant
to the Lazy Z property. On November 27, 2012, OWRD issued a draft Preliminary
Determination proposing to approve the transfer request. To date, no orders have been issued
regarding the conserved water application. The following water rights are appurtenant to the
City’s Lazy Z property.
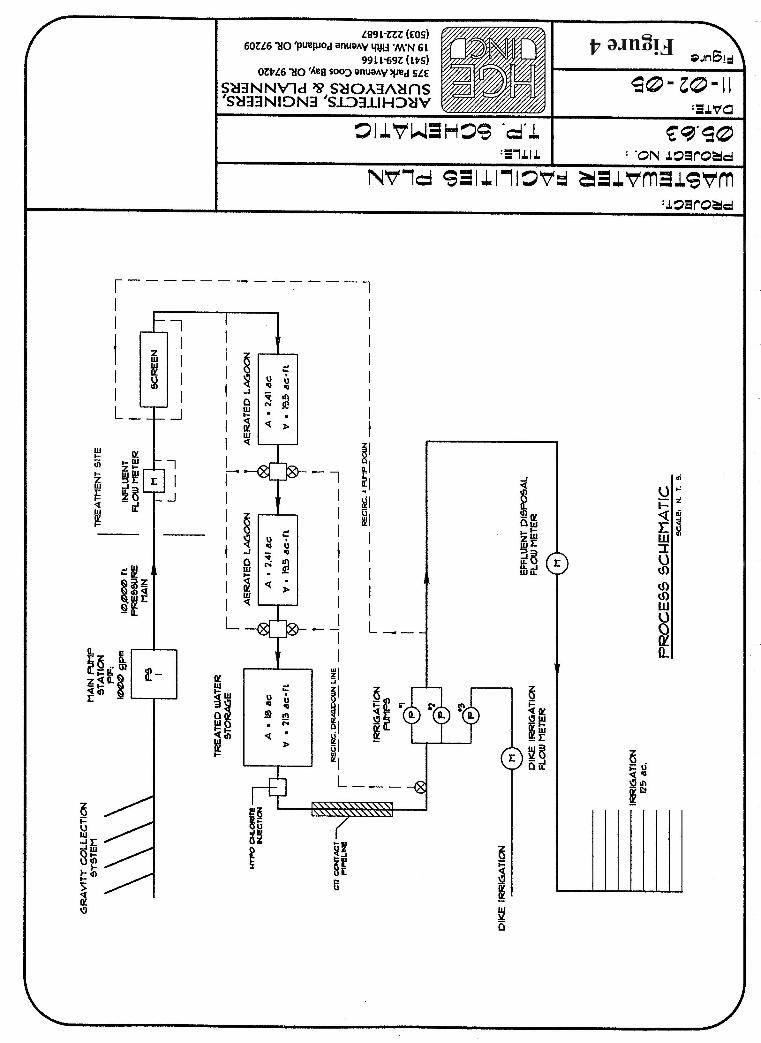
WASTEWATER REUSE AND CONSERVATION PROJECT PLANNING STUDY
Transitioning Irrigation From The Lazy Z Property From Surface Water To Treated Effluent
June 26, 2013 Page 20
Certificate 83355 (Squaw Creek Decree)
The water right allows the use of up to 0.62 cfs, from Whychus Creek (formerly Squaw Creek),
for primary irrigation of 30.0 acres with a priority of 1880. The water rights approved through
the Squaw Creek Decree do not have an assigned volume per acre (duty).
Current Status:
Upon OWRD’s issuance of the final order approving transfer T-11318, water right Certificate
83355 will be cancelled. A new confirming certificate will be issued once beneficial use is
demonstrated from the new point of diversion, consistent with the order approving the transfer.
The rate the water right is projected to be reduced by upon approval of CW-71 is 0.136 cfs,
leaving a remaining rate of 0.48 cfs.
Certificate 86824 (Squaw Creek Decree)
The water right allows the use of up to 1.23 cfs, from Whychus Creek for primary irrigation of
59.5 acres with a priority of 1880. The water right does not have an assigned duty.
Current Status:
Upon OWRD’s issuance of the final order approving transfer T-11318, water right Certificate
86824 will be cancelled. A new confirming certificate will be issued once beneficial use is
demonstrated from the new point of diversion, consistent with the order approving the transfer.
The rate the water right is projected to be reduced by upon approval of CW-71 is 0.271 cfs,
leaving a remaining rate of 0.96 cfs.
Certificate 85389 (Squaw Creek Decree)
The water right allows the use of up to 0.08 cfs, from Whychus Creek for primary irrigation of
2.5 acres with a priority of 1880. The water right does not have an assigned duty.
Current Status:
Upon OWRD’s issuance of the final order approving transfer T-11318, water right Certificate
85389 will be cancelled. A new confirming certificate will be issued once beneficial use is
demonstrated at the new point of diversion, consistent with the order approving the transfer. The
rate the water right is projected to be reduced by upon approval of CW-71 is 0.018 cfs, leaving a
remaining rate of 0.06 cfs.
Certificate 86828 (Squaw Creek Decree)
The water right allows the use of up to 0.57 cfs, from Whychus Creek, for primary irrigation of
18.0 acres with a priority of 1880. The water right does not have an assigned duty.
WASTEWATER REUSE AND CONSERVATION PROJECT PLANNING STUDY
Transitioning Irrigation From The Lazy Z Property From Surface Water To Treated Effluent
June 26, 2013 Page 21
Current Status:
Upon OWRD’s issuance of the final order approving transfer T-11318, water right Certificate
86828 will be cancelled. A new confirming certificate will be issued once beneficial use is
demonstrated at the new point of diversion, consistent with the order approving the transfer. The
rate the water right is projected to be reduced by upon approval of CW-71 is 0.126 cfs, leaving a
remaining rate of 0.44 cfs.
Certificate 85391 (Squaw Creek Decree)
The water right allows the use of up to 0.10 cfs, from Whychus Creek for primary irrigation of
3.0 acres with a priority of 1880. The water right does not have an assigned duty.
Current Status:
Upon OWRD’s issuance of the final order approving transfer T-11318, water right Certificate
85391 will be cancelled. A new confirming certificate will be issued once beneficial use is
demonstrated at the new point of diversion, consistent with the order approving the transfer. The
rate the water right is projected to be reduced by upon approval of CW-71 is 0.022 cfs, leaving a
remaining rate of 0.08 cfs.
Certificate 86826 (Squaw Creek Decree)
The water right allows the use of up to 0.71 cfs, from Whychus Creek, for primary irrigation of
35.5 acres with a priority of 1881. The water right does not have an assigned duty.
Current Status:
Upon OWRD’s issuance of the final order approving transfer T-11318, water right Certificate
86826 will be cancelled. A new confirming certificate will be issued once beneficial use is
demonstrated at the new point of diversion, consistent with the order approving the transfer. The
rate the water right is projected to be reduced by upon approval of CW-71 is 0.156 cfs, leaving a
remaining rate of 0.55 cfs.
Certificate 85392 (Squaw Creek Decree)
The water right allows the use of up to 0.14 cfs, from Whychus Creek, for primary irrigation of
7.0 acres with a priority of 1886. The water right does not have an assigned duty.
Current Status:
Upon OWRD’s issuance of the final order approving transfer T-11318, water right Certificate
85392 will be cancelled. A new confirming certificate will be issued once beneficial use is
demonstrated at the new point of diversion, consistent with the order approving the transfer. The
rate the water right is projected to be reduced by upon approval of CW-71 is 0.031 cfs, leaving a
remaining rate of 0.11 cfs.
WASTEWATER REUSE AND CONSERVATION PROJECT PLANNING STUDY
Transitioning Irrigation From The Lazy Z Property From Surface Water To Treated Effluent
June 26, 2013 Page 22
Ground water Rights
There are 4 ground water rights appurtenant to the City’s Lazy Z property. Three rights are for
supplemental irrigation only and the fourth is for both primary and supplemental irrigation.
Certificate 85254 (Permit G-3095, Application G-3489)
The water right allows the use of up to 0.246 cfs from a well in Whychus Creek basin, with a
priority date of May 13, 1966. The use is for supplemental irrigation of 19.7 acres. The
diversion is limited to 1/80th
of a cfs per acre and is further limited to a diversion not to exceed 3
acre-feet (AF) per acre.
Current Status:
This certificate is in the name of Lloyd Brogan and was issued on December 26, 2008. There are
no transactions currently pending on this water right.
Certificate 82875 (Permit G-8148, Application G-8548)
The water right allows for the use of up to 0.11 cfs from a well in Whychus Creek basin and has
a priority date of November 25, 1977. The use is for supplemental irrigation of 8.7 acres. The
diversion is limited to 1/80th
of a cfs per acre and is further limited to a diversion not to exceed 3
AF per acre.
Current Status:
This certificate is in the name of Lloyd Brogan and was issued on November 17, 2006.
Currently there are no transactions pending on this water right.
Certificate 87345 (Permit G-4841, Application G-5295)
This water right allows for the use of the up to 0.039 cfs for primary irrigation of 3.1 acres and
0.108 cfs for supplemental irrigation of 29.7 acres. The source is a well in Whychus Creek basin
and has a priority date of August 25, 1970.
Current Status:
The City still holds the rights to 3.1 acres of primary irrigation under Certificate 87345 but the
purchase agreement for the Lazy Z stated that 3.1 acres of this right would be transferred to the
seller (David Herman) in the future. To date no transfer application requesting a change in place
of use (off City property) has been submitted to OWRD.
Certificate 87347 (Permit G-3095, Application G-3489)
This water right allows for the use of up to 0.094 cfs from a well in Whychus Creek basin and
has a priority date of May 13, 1966. The use is for supplemental irrigation of 7.5 acres. The
WASTEWATER REUSE AND CONSERVATION PROJECT PLANNING STUDY
Transitioning Irrigation From The Lazy Z Property From Surface Water To Treated Effluent
June 26, 2013 Page 23
diversion is limited to 1/80th
of a cfs per acre and is further limited to a diversion not to exceed 3
AF per acre.
Current Status:
This water right was issued on December 9, 2011. There does not appear to be any transactions
occurring currently related to this water right.
Conclusion
The City holds 155.5 acres of senior surface water rights for primary irrigation on the Lazy Z
property; in addition they hold a few ground water rights which are mostly supplemental to the
surface water. Currently all the surface water rights are involved in a point of diversion transfer
and an allocation of conserved water project. Currently the City is irrigating two sections of the
property and the remaining section is included in a one-year instream lease.
POTENTIAL CROPS AND IRRIGATION DEMAND
Purpose and Data Sources
Key considerations in evaluating the feasibility of irrigation with treated effluent include types of
crops and their water demand, regulatory limits and opportunities, and economic factors
important to the City. This section describes an evaluation of potential crops based on these
considerations. Several information sources were used for evaluating allowable and likely crop
choices for the Lazy Z property, including:
ODEQ Oregon Administrative Rules (OAR)340-055-0012;
Oregon State University Extension Service (OSU) personnel and Extension Miscellaneous 8530 Report, “Oregon Crop Water Use and Irrigation Requirements”
1999;
Wert & Associates, Inc. Report “Soil and Water Reuse Report for Sisters Wastewater
Project” Sisters, Oregon, February 2007 (Wert);
Deschutes County Soil and Water Conservation District;
Richard Zimmerlee, International Agri-Business Consultant; and
Available online sources for climate and agricultural crops and potential seasonal growing conditions related to the Site.
The above sources provided useful, detailed information regarding potential crop types for the
Lazy Z property and potential for crop value upon harvest.
WASTEWATER REUSE AND CONSERVATION PROJECT PLANNING STUDY
Transitioning Irrigation From The Lazy Z Property From Surface Water To Treated Effluent
June 26, 2013 Page 24
Regulatory Limitations Relative to Potential Crops
An initial review of OAR 340-055-012(4)(a) identifies allowable crops for a class D effluent;
stating “Any beneficial purpose defined in subsection (3)(a) of this rule; [((3)(a) allows fodder,
fiber, seed crops not intended for human ingestion, or commercial timber]; (B) Irrigation of
firewood, ornamental nursery stock, Christmas trees, sod, or pasture for animals”. These
allowable crops may not be produced for human consumption; although, as discussed below,
additional restrictions may be applied as well.
Constraints & Opportunities for Crop Types
Locality
The OSU extension service (OSU) was contacted to determine a list of crops that are compatible
with the Lazy Z property, considering location, elevation and soil type. Based on the location,
OSU narrowed the crops more suited for cultivation on the Lazy Z property to two basic groups:
1) hay, including grass hay and alfalfa hay, orchard grass and timothy hay; and 2) cereal grains.
Cereal grains include oats, barley, wheat and triticale. Both general categories of grasses and
cereal grains would be a marketable crop for animal feel, specifically cows, cattle and possibly
horses.
OSU also provided insight as to the likely period of irrigation for the two crop categories. The
grass hay, alfalfa hay and timothy hay will take water from essentially the beginning of the
irrigation season, weather dependent, to November 1 of each year. The nutrient uptake and need
for irrigation could be variable in April and October of each year depending on temperature,
precipitation and overall climate conditions; however, a relatively full irrigation season for
application of water is likely.
Localized Climate Zones and Frost Free Days
A summary table of frost free days throughout the major areas of Central Oregon is presented
below:
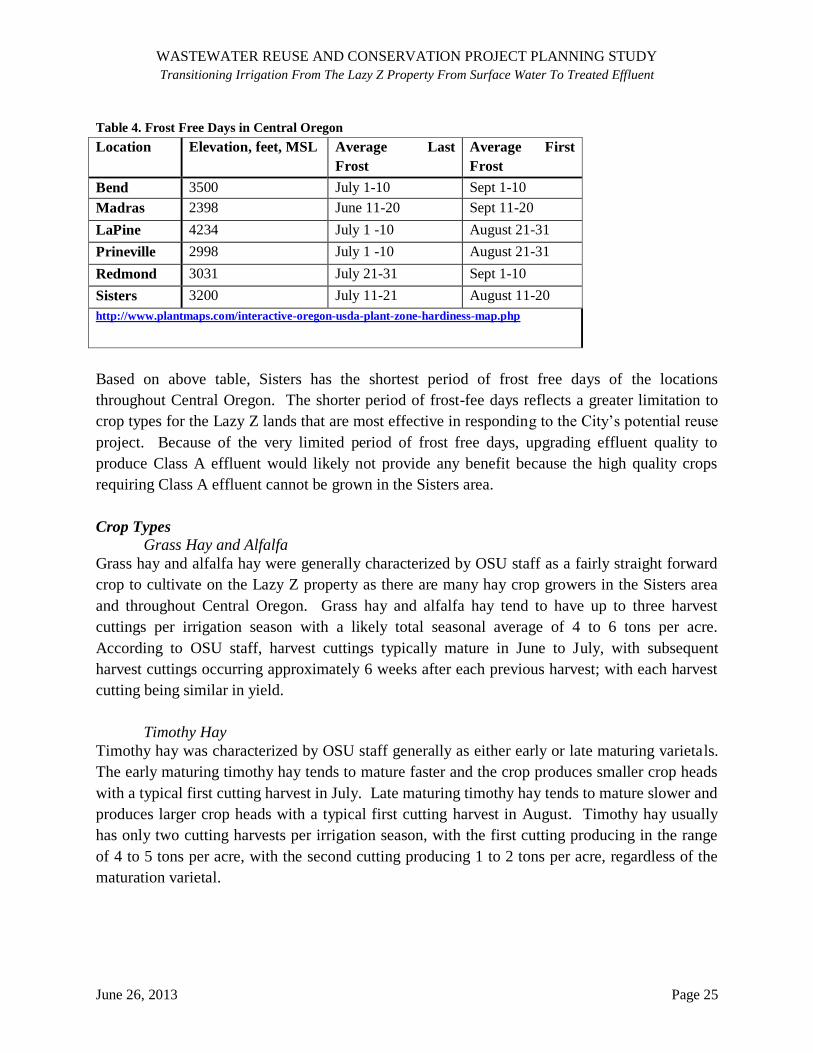
WASTEWATER REUSE AND CONSERVATION PROJECT PLANNING STUDY
Transitioning Irrigation From The Lazy Z Property From Surface Water To Treated Effluent
June 26, 2013 Page 25
Table 4. Frost Free Days in Central Oregon
Location Elevation, feet, MSL Average Last
Frost
Average First
Frost
Bend 3500 July 1-10 Sept 1-10
Madras 2398 June 11-20 Sept 11-20
LaPine 4234 July 1 -10 August 21-31
Prineville 2998 July 1 -10 August 21-31
Redmond 3031 July 21-31 Sept 1-10
Sisters 3200 July 11-21 August 11-20
http://www.plantmaps.com/interactive-oregon-usda-plant-zone-hardiness-map.php
Based on above table, Sisters has the shortest period of frost free days of the locations
throughout Central Oregon. The shorter period of frost-fee days reflects a greater limitation to
crop types for the Lazy Z lands that are most effective in responding to the City’s potential reuse
project. Because of the very limited period of frost free days, upgrading effluent quality to
produce Class A effluent would likely not provide any benefit because the high quality crops
requiring Class A effluent cannot be grown in the Sisters area.
Crop Types
Grass Hay and Alfalfa
Grass hay and alfalfa hay were generally characterized by OSU staff as a fairly straight forward
crop to cultivate on the Lazy Z property as there are many hay crop growers in the Sisters area
and throughout Central Oregon. Grass hay and alfalfa hay tend to have up to three harvest
cuttings per irrigation season with a likely total seasonal average of 4 to 6 tons per acre.
According to OSU staff, harvest cuttings typically mature in June to July, with subsequent
harvest cuttings occurring approximately 6 weeks after each previous harvest; with each harvest
cutting being similar in yield.
Timothy Hay
Timothy hay was characterized by OSU staff generally as either early or late maturing varietals.
The early maturing timothy hay tends to mature faster and the crop produces smaller crop heads
with a typical first cutting harvest in July. Late maturing timothy hay tends to mature slower and
produces larger crop heads with a typical first cutting harvest in August. Timothy hay usually
has only two cutting harvests per irrigation season, with the first cutting producing in the range
of 4 to 5 tons per acre, with the second cutting producing 1 to 2 tons per acre, regardless of the
maturation varietal.
WASTEWATER REUSE AND CONSERVATION PROJECT PLANNING STUDY
Transitioning Irrigation From The Lazy Z Property From Surface Water To Treated Effluent
June 26, 2013 Page 26
Cereal Grain
Cereal grains, on the other hand, are limited in the need for irrigation, as the crops tend to mature
faster and are harvested usually beginning in August. Because of this, the cereal crop would
likely not need irrigation after the first part of August, allowing time for the crop to cure prior to
harvest. There would be no growing crop after harvest to assimilate the recycled water. Because
of this, cereal crops are not a likely suitable crop for irrigation of the City’s effluent.
Additional Crop Constraints
Crop types were narrowed by OSU based on the likely growing conditions of the site,
specifically the likely temperature and average frost free days that significantly reduce the crops
that are capable of being grown on the site. Discussions with OSU led to the understanding that
Central Oregon is highly variable with localized climate zones, with the area of Sisters being the
more restrictive areas for viable crop types.
These limitations as described by OSU staff negates crops that qualify under DEQ regulations,
such as seed crops (carrot seed, grass seed, etc.) that are grown in other areas of Central Oregon
with longer frost free days to allow for crop maturation for harvest. Grass hay, alfalfa hay and
timothy hay were identified as being hardy crops that can withstand ice encasement and have
growing seasons that generally can accept irrigation water throughout the available irrigation
season. Cereal grain crops are tend to be hardy crops that can likely withstand the growing
conditions in the Sisters area, however, cereal grains have a limited duration growing season.
Poplar
The City of Woodburn developed a small poplar plantation around 1999 to dispose of their
treated effluent. According to the City of Woodburn, its poplar irrigation program indicates it
has very stringent effluent limits relative to discharge to the Pudding River and irrigation of
treated effluent in the summer is essential. The plantation has 80 acres of poplars. About 26
acres were harvested 3 to 4 years ago, for which the City obtained about $15 per wet ton of
chipped material after harvesting, chipping and shipping of the material to the pulp mill in
Toledo, Oregon. Curtis Stultz, Woodburn waste water superintendent, did not readily have cost
figures for growing the poplar trees, but stated that the operation is not a money maker for the
City1
In 2007, the cost of producing poplar for pulp ranged between $24 and $30 per dry metric ton
($21.34 and $26.67 per American ton).2 Poplar wood moisture content is about 50% to 58% so
1 Personal conversation with Curtis Stultz on February 8, 2013 and subsequent e-mail of the same date.
2 Brian J. Stanton, Hybrid Poplar Feedstock Production: Economic Opportunity for Renewable Energy in North
America, Power Point Presentation, Atlanta, Georgia, May 2007. Website:
http://www.tappi.org/content/Events/07renew/07ren05.pdf.
WASTEWATER REUSE AND CONSERVATION PROJECT PLANNING STUDY
Transitioning Irrigation From The Lazy Z Property From Surface Water To Treated Effluent
June 26, 2013 Page 27
the price received by the City of Woodburn, in dry tons, is about half of that derived from wet
tons, or about $7.50 per dry ton. It is highly unlikely that The City of Sisters would receive the
same price for its poplar production because the transportation costs would be higher due to the
longer distance to the pulping plant. Poplar chips harvested by the City of Woodburn were
transported to the pulp mill in Toledo, Oregon which was about 100 miles away. The City of
Sisters is between 150 and 180 miles from Toledo, depending on which route is taken. If the
pulp mill in Springfield would buy the City’s poplar chips, the travel distance would be about
100 miles, the same as it was for Woodburn to Toledo. In another case, poplar chips harvested
near Boardman are transported about 50 miles to Wallula, Washington. In any case, it is
reasonable to expect that using treated effluent to grow poplars in Sisters could cost substantially
more money than could be derived from the sale of the product.
Ornamental Nursery Stock
This could be a viable crop for the City of Sisters. The amount of water required for nursery
stock will depend on the type of stock and its size (large plants would use more water than
smaller, younger plants). The City would likely need to utilize soil moisture probes to determine
crop water requirements over a given growing season. Managing nursery stock would also likely
require more oversight by City employees to ensure proper irrigation, recognize and control pests
and to plant and transplant stock. Irrigation methods would likely be similar to that used for
poplar.
Hops
Hops require at least 120 frost free days so it is not a viable crop for the Sisters area.
Water Demand
A review of the OSU Extension Miscellaneous 8530 Report, 1999 (EM8530) separates the state
into 27 distinct regions and provides tables for likely crop water need and the generalized
growing season for up to 17 generalized crops for each of the 27 regions. The Sisters area resides
in the western-most portion of region 17, which includes Bend in the northwest portion of the
region, Brothers in the eastern portion and Christmas Valley in the far south-central portion of
the region. Of the crops identified and recommended by OSU personnel, the general irrigation
seasons and net irrigation water demand are shown below in Table 5.
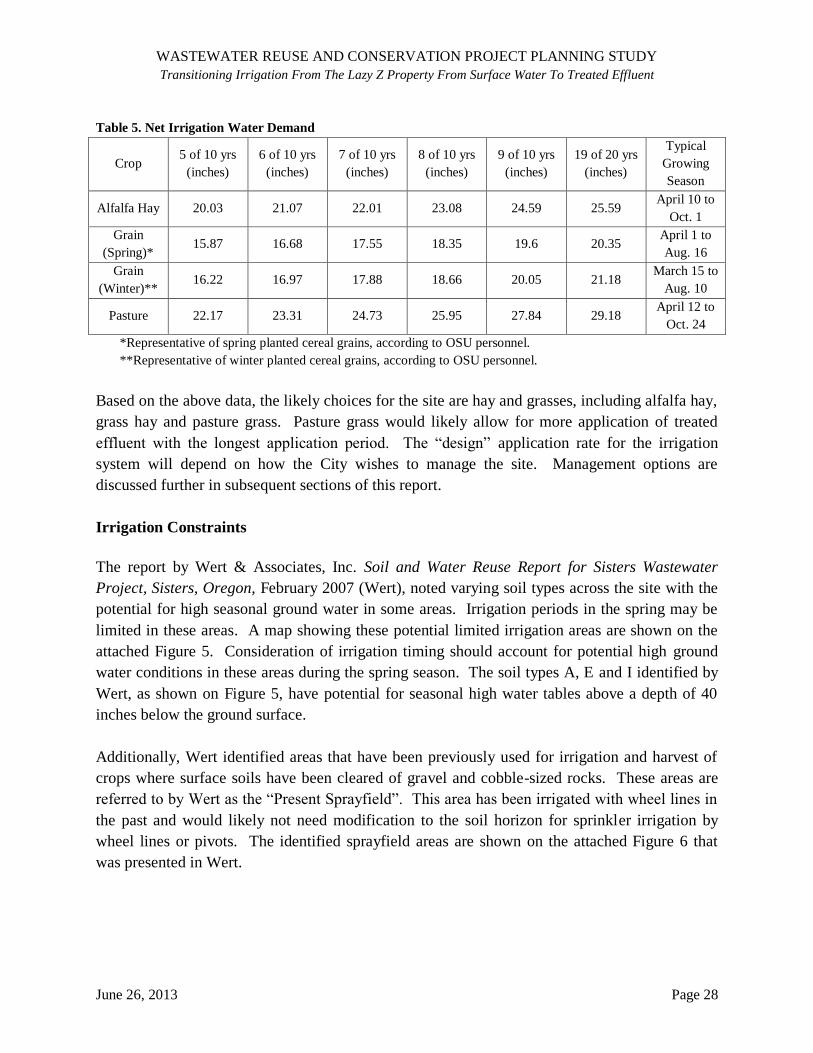
WASTEWATER REUSE AND CONSERVATION PROJECT PLANNING STUDY
Transitioning Irrigation From The Lazy Z Property From Surface Water To Treated Effluent
June 26, 2013 Page 28
Table 5. Net Irrigation Water Demand
Crop 5 of 10 yrs
(inches)
6 of 10 yrs
(inches)
7 of 10 yrs
(inches)
8 of 10 yrs
(inches)
9 of 10 yrs
(inches)
19 of 20 yrs
(inches)
Typical
Growing
Season
Alfalfa Hay 20.03 21.07 22.01 23.08 24.59 25.59 April 10 to
Oct. 1
Grain
(Spring)* 15.87 16.68 17.55 18.35 19.6 20.35
April 1 to
Aug. 16
Grain
(Winter)** 16.22 16.97 17.88 18.66 20.05 21.18
March 15 to
Aug. 10
Pasture 22.17 23.31 24.73 25.95 27.84 29.18 April 12 to
Oct. 24
*Representative of spring planted cereal grains, according to OSU personnel.
**Representative of winter planted cereal grains, according to OSU personnel.
Based on the above data, the likely choices for the site are hay and grasses, including alfalfa hay,
grass hay and pasture grass. Pasture grass would likely allow for more application of treated
effluent with the longest application period. The “design” application rate for the irrigation
system will depend on how the City wishes to manage the site. Management options are
discussed further in subsequent sections of this report.
Irrigation Constraints
The report by Wert & Associates, Inc. Soil and Water Reuse Report for Sisters Wastewater
Project, Sisters, Oregon, February 2007 (Wert), noted varying soil types across the site with the
potential for high seasonal ground water in some areas. Irrigation periods in the spring may be
limited in these areas. A map showing these potential limited irrigation areas are shown on the
attached Figure 5. Consideration of irrigation timing should account for potential high ground
water conditions in these areas during the spring season. The soil types A, E and I identified by
Wert, as shown on Figure 5, have potential for seasonal high water tables above a depth of 40
inches below the ground surface.
Additionally, Wert identified areas that have been previously used for irrigation and harvest of
crops where surface soils have been cleared of gravel and cobble-sized rocks. These areas are
referred to by Wert as the “Present Sprayfield”. This area has been irrigated with wheel lines in
the past and would likely not need modification to the soil horizon for sprinkler irrigation by
wheel lines or pivots. The identified sprayfield areas are shown on the attached Figure 6 that
was presented in Wert.
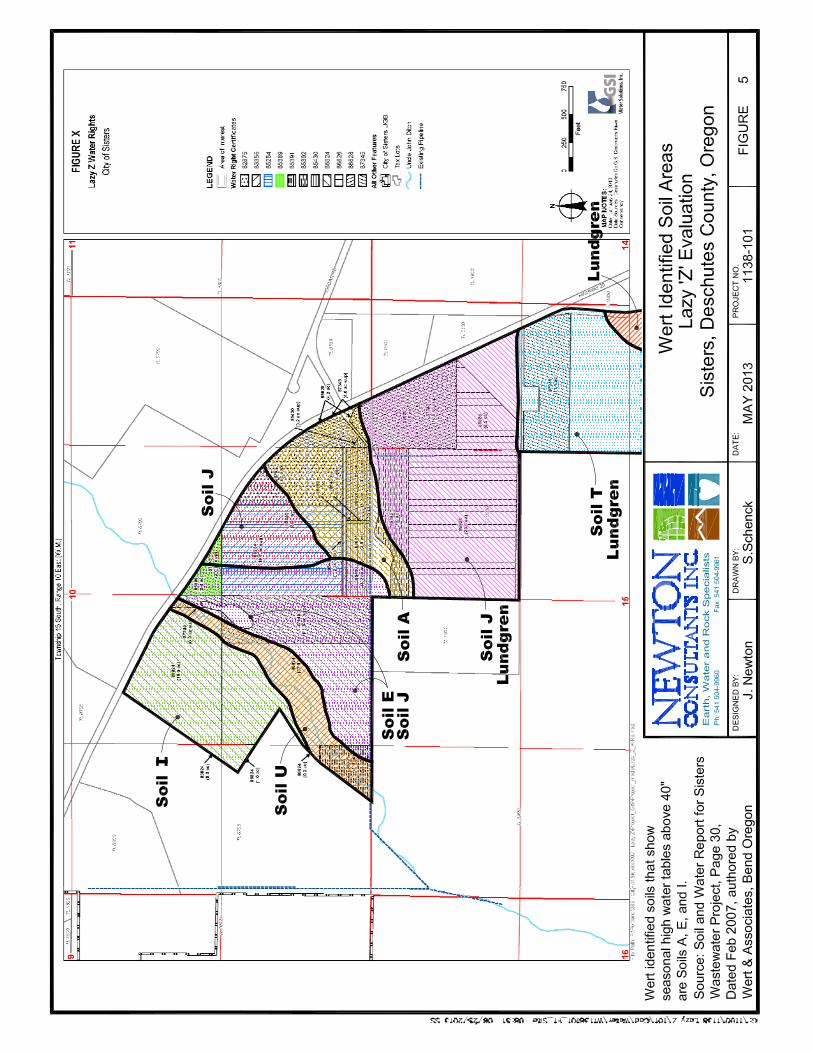
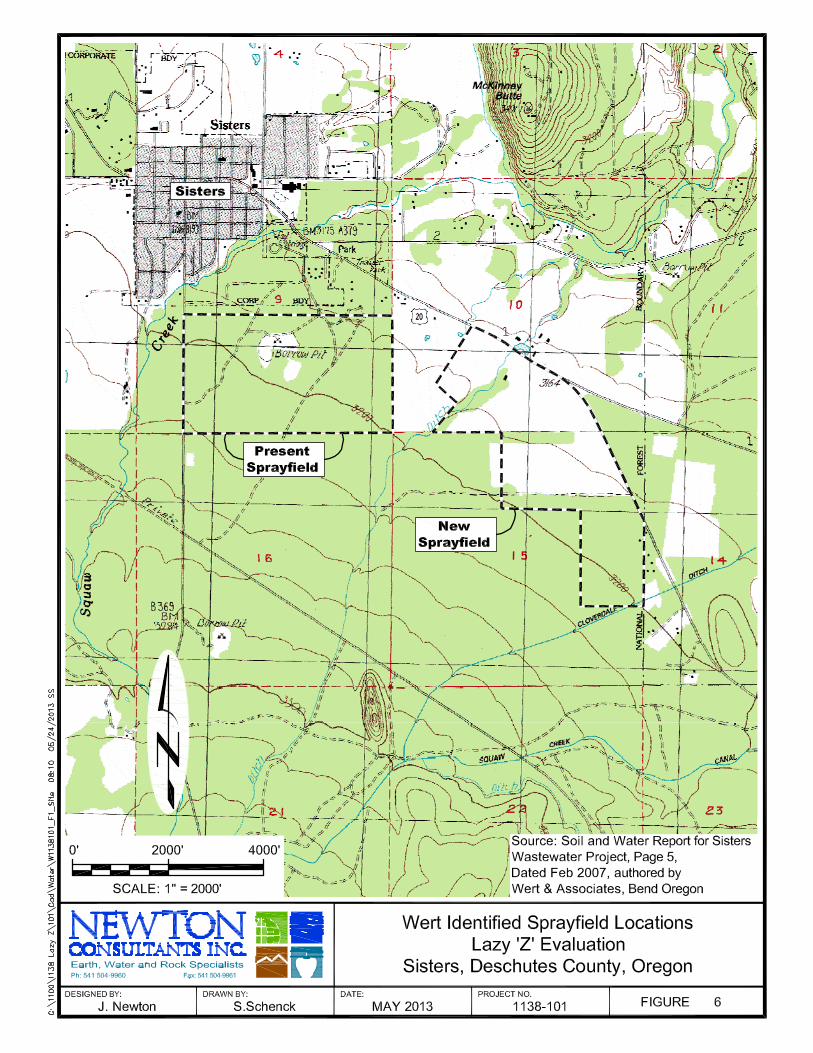
WASTEWATER REUSE AND CONSERVATION PROJECT PLANNING STUDY
Transitioning Irrigation From The Lazy Z Property From Surface Water To Treated Effluent
June 26, 2013 Page 31
Areas identified by Wert and referred to as “New Sprayfield” have been flood irrigated in the
past for pasture. Apparently, gravel and cobble-sized rocks have not been removed from this
area. Irrigation in this area could likely be done for pasture with hand lines or pivots (minimal
rock removal may be required to allow for efficient travel of the pivot wheel tracks). Cultivation
of a harvested crop could be impeded by gravel and cobble-sized rocks.
Economic Considerations
Production Costs
OSU personnel provided estimated costs to produce alfalfa hay and grass hay on a per acre basis
annually. The estimated cost3 to produce alfalfa hay is $135 per ton of alfalfa harvested; the
estimated cost to produce grass hay is $155 per ton of grass hay harvested (OSU stated that
although timothy hay was not specifically estimated for the cost to produce, that its cost to
produce would likely be similar to grass hay). These estimated costs are based on an OSU-
calculated value in 2008 dollars. Based on an average rate of inflation between 2008 and 2012 of
approximately 6.6%4; the enterprise cost may have risen from $135 per ton harvested for alfalfa
to $144; and from $155 per ton harvested for grass hay to $165.
OSU is currently conducting a study on the nitrogen uptake requirements for grass crops. This
study is currently underway and nearing completion by OSU and may be useful to allow for a
beneficial balance of nitrogen in effluent water and fertilizer introduced nitrogen. The results of
this OSU study could allow for a reduction in the required fertilizer applied to the Site and
subsequently reduce fertilizer costs.
Market Value
OSU provided current and expected market value ranges for alfalfa hay and grass hay based on
winter 2012-2013 pricing. Currently alfalfa hay pricing for beef cattle is typically $180 to $200
per ton; grass hay pricing is typically $230 to $250 per ton. Current pricing of timothy hay was
estimated by OSU to typically range $250 to $300 per ton.
The Central Oregon Hay Report (COHR) is available online and updated and released weekly on
Thursday and reports the price range for alfalfa and orchard grass (includes grass hay and pasture
grasses), the website is:
http://www.ams.usda.gov/mnreports/ml_gr313.txt.
3 OSU referred this as the “enterprise cost”, which includes all input costs to grow and harvest a grass crop;
including, but not limited to, soil preparation, seed, fertilizer, maintenance, irrigation and harvest. 4 Data Source: Organization for Economic Cooperation and Development,
http://stats.oecd.org/Index.aspx?DatasetCode=MEI_PRICES.
WASTEWATER REUSE AND CONSERVATION PROJECT PLANNING STUDY
Transitioning Irrigation From The Lazy Z Property From Surface Water To Treated Effluent
June 26, 2013 Page 32
The current reported range for alfalfa as of the February 14, 2013 COHR is $220 to $250 per ton
(good to premium grade); orchard grass is listed as $245 to $250 per ton (premium grade only
shown); oat (cereal grain) is $145 per ton (fair grade only shown); timothy hay is not reported on
the COHR.
Condition & Yield of Harvested Crops
Regarding the condition of possible harvested crops from the Lazy Z lands and the potential for
marketability, OSU and an agri-business consultant (Richard Zimmerlee) were contacted to
further investigate the potential value of harvested crops. Harvested feed crops, as discussed
above, can vary depending on the nutrient capacity of the crop and also the general nature of the
crop. Based on the above stated average sale price of harvested crops, cereal grains tend to bring
the lowest value on a per ton basis; whereas, grass hay, alfalfa hay and timothy hay tend to bring
greater value on a per ton basis.
Variability in the condition of the harvested crop will have an effect related to the market value
as well (this was stated by both OSU staff and Mr. Zimmerlee); which includes weed potential,
nutrients contained within the crop, size and condition of crop heads, etc. The general condition
of the crop will likely dictate the potential sale, with domestic markets being more tolerant of
moderate to lower quality feed crops, and international markets requiring premium quality feed
crops. Generally, international feed crop markets maintain higher crop values.
Crop Nutrient Uptake
Discussions were conducted with OSU staff to ascertain further limitations that could affect
marketability arising from the use of effluent water for irrigation, considering that the City of
Redmond in the past has had some difficulty with cultivation and sale of crops grown from
irrigated effluent. OSU worked with Redmond to conduct chemical analysis of alfalfa hay
cultivated from effluent irrigated crop. This work found the crops to have elevated levels of
nitrate. OSU stated that the nature of effluent irrigation containing nitrogen can concentrate
nitrate in the feed crop, adversely affecting its marketability.
Limits on the marketability of feed crop with elevated nitrate, according to OSU staff, can limit
the sale of the feed material and exclude cows and cattle that have a low tolerance for nitrate.
OSU stated that horses have a higher tolerance for elevated nitrate in feed and, if feed crops
display elevated nitrate at levels that could preclude cattle or cows, it could limit the
marketability of feed crops for horses, or other similar nitrate tolerant livestock-or, if possible
attempt to control nitrate build-up in harvested crops to allow for more wide acceptance of
livestock that could accept the harvested crop.
WASTEWATER REUSE AND CONSERVATION PROJECT PLANNING STUDY
Transitioning Irrigation From The Lazy Z Property From Surface Water To Treated Effluent
June 26, 2013 Page 33
Available Feed Crop Markets
Discussion was held with OSU regarding timothy hay based on its potential for high value crop
production. OSU stated that timothy hay has a limited market based on its tendency for high
calorie and carbohydrate content. Based on the high calories and carbohydrates the best markets
for timothy hay, generally, are feed stores and horse race tracks-establishments that catering to
working animals or livestock that may benefit from higher caloric and carbohydrate rich feed.
Deschutes County Soil and Water Conservation District Input
Deschutes County Soil and Water Conservation District (DCSWCD) was contacted to obtain
information relative to crop selection and agricultural budget information. Discussion with Rex
Barber of the DCSWCD indicated that the DCSWCD could not provide any specific information
relative to the Lazy Z lands. However, Mr. Barber owns and operates a large agricultural farm
near Lower Bridge on the Deschutes River approximately 5 miles west of Terrebonne, Oregon.
His experience and knowledge in this regard brought hands-on information relative to cultivation
of crops at the Lazy Z lands and the potential to market crops grown with treated effluent. Mr.
Barber indicated, in his opinion, that the likely market for crops grown from treated effluent
would be narrow, consisting mainly of hay or alfalfa hay crops. Regulatory limitations on crops
only for non-human consumption would limit the ability to grow a larger variety of crops at the
Lazy Z lands.
International Agri-Business Consultant Input
Discussion was held with Richard Zimmerlee, an international agri-business consultant, to
investigate the potential for marketing crops grown from treated effluent. Mr. Zimmerlee has
over 40 years of experience in managing and marketing agricultural crops, including
international contracting and sales of specialized animal feed crops. Also discussed with Mr.
Zimmerlee were additional potential business opportunities that could be authorized under
ODEQ OARs for effluent reuse water.
The discussions indicate several limitations apply to crops grown from effluent reuse water
versus fresh water. Although animal feed crops are authorized under ODEQ OARs, Mr.
Zimmerlee stated that dairy cow farmers would resist the use of effluent-irrigated livestock feed,
and that feed grown from such water would likely incur a 25% to 50% reduction in sale prices
from the going rate of comparable crops grown from fresh water. These restrictions and
limitations may further reduce the potential sale of feed crops grown on the Lazy Z lands.
Additional agricultural opportunities beyond grown-for-sale crops were discussed with Mr.
Zimmerlee, including potential for a transitional nursery. A transitional nursery is typically an
intermittent nursery used to acclimate nursery stock (ornamental trees, flowering plants, etc.) to
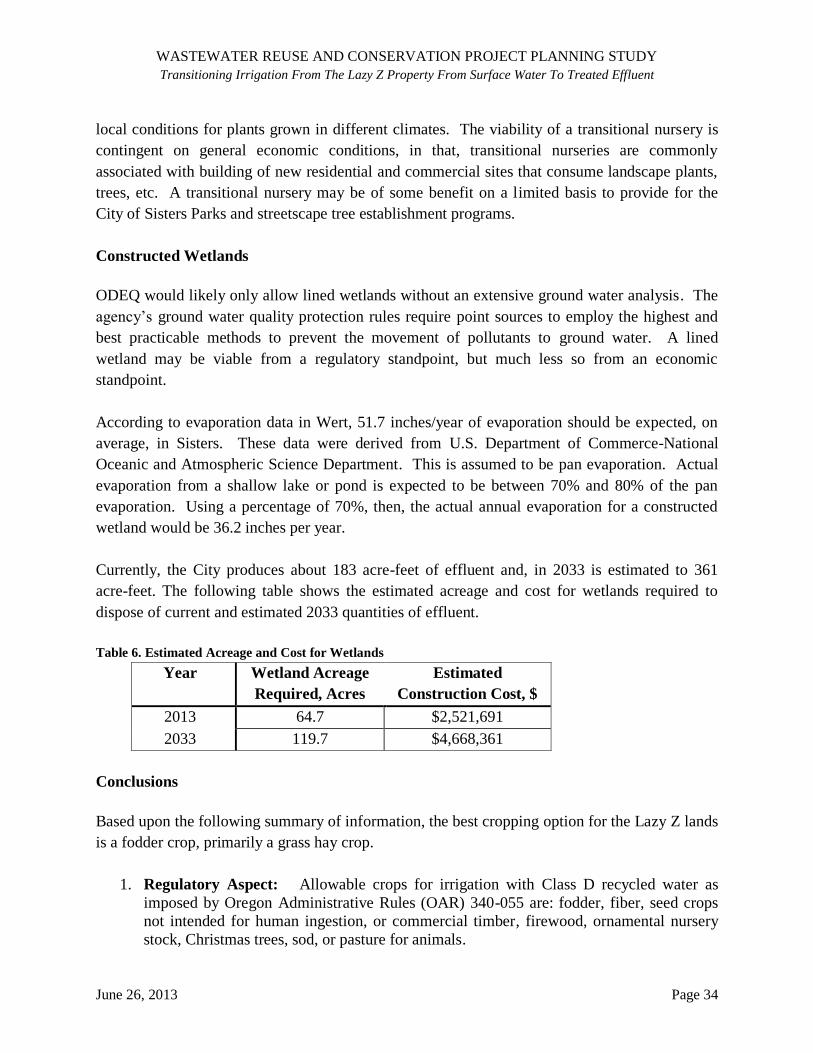
WASTEWATER REUSE AND CONSERVATION PROJECT PLANNING STUDY
Transitioning Irrigation From The Lazy Z Property From Surface Water To Treated Effluent
June 26, 2013 Page 34
local conditions for plants grown in different climates. The viability of a transitional nursery is
contingent on general economic conditions, in that, transitional nurseries are commonly
associated with building of new residential and commercial sites that consume landscape plants,
trees, etc. A transitional nursery may be of some benefit on a limited basis to provide for the
City of Sisters Parks and streetscape tree establishment programs.
Constructed Wetlands
ODEQ would likely only allow lined wetlands without an extensive ground water analysis. The
agency’s ground water quality protection rules require point sources to employ the highest and
best practicable methods to prevent the movement of pollutants to ground water. A lined
wetland may be viable from a regulatory standpoint, but much less so from an economic
standpoint.
According to evaporation data in Wert, 51.7 inches/year of evaporation should be expected, on
average, in Sisters. These data were derived from U.S. Department of Commerce-National
Oceanic and Atmospheric Science Department. This is assumed to be pan evaporation. Actual
evaporation from a shallow lake or pond is expected to be between 70% and 80% of the pan
evaporation. Using a percentage of 70%, then, the actual annual evaporation for a constructed
wetland would be 36.2 inches per year.
Currently, the City produces about 183 acre-feet of effluent and, in 2033 is estimated to 361
acre-feet. The following table shows the estimated acreage and cost for wetlands required to
dispose of current and estimated 2033 quantities of effluent.
Table 6. Estimated Acreage and Cost for Wetlands
Year Wetland Acreage
Required, Acres
Estimated
Construction Cost, $
2013 64.7 $2,521,691
2033 119.7 $4,668,361
Conclusions
Based upon the following summary of information, the best cropping option for the Lazy Z lands
is a fodder crop, primarily a grass hay crop.
1. Regulatory Aspect: Allowable crops for irrigation with Class D recycled water as
imposed by Oregon Administrative Rules (OAR) 340-055 are: fodder, fiber, seed crops
not intended for human ingestion, or commercial timber, firewood, ornamental nursery
stock, Christmas trees, sod, or pasture for animals.
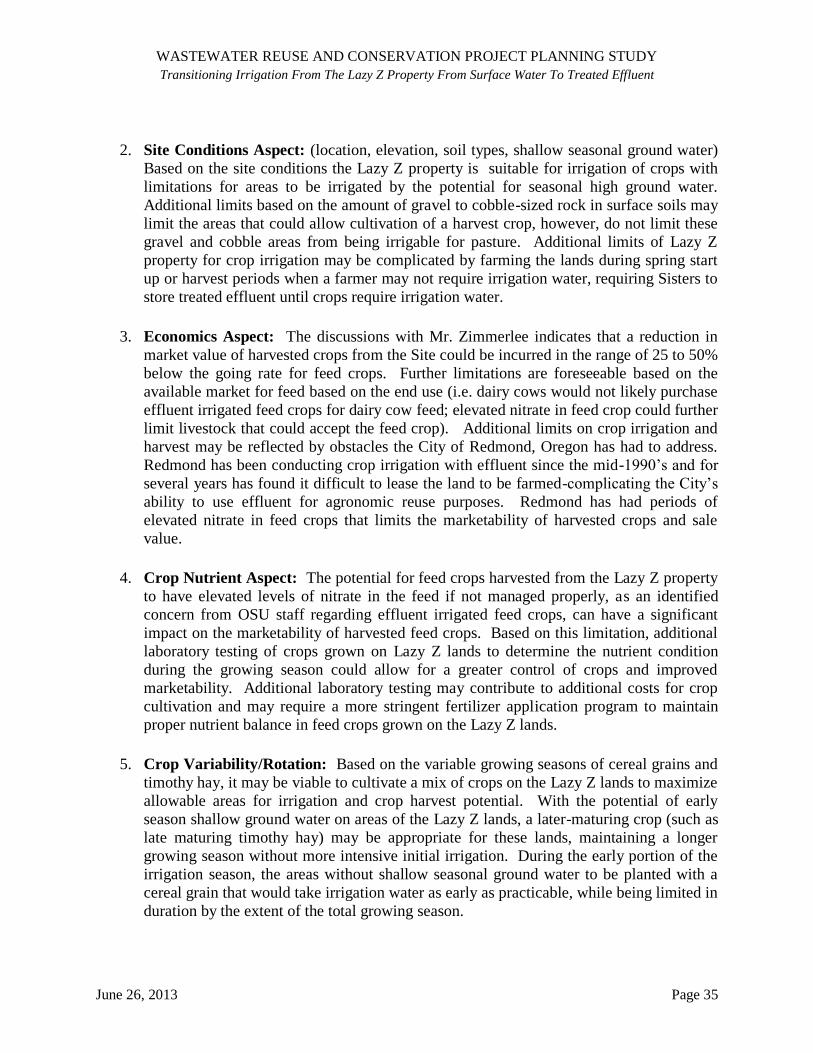
WASTEWATER REUSE AND CONSERVATION PROJECT PLANNING STUDY
Transitioning Irrigation From The Lazy Z Property From Surface Water To Treated Effluent
June 26, 2013 Page 35
2. Site Conditions Aspect: (location, elevation, soil types, shallow seasonal ground water)
Based on the site conditions the Lazy Z property is suitable for irrigation of crops with
limitations for areas to be irrigated by the potential for seasonal high ground water.
Additional limits based on the amount of gravel to cobble-sized rock in surface soils may
limit the areas that could allow cultivation of a harvest crop, however, do not limit these
gravel and cobble areas from being irrigable for pasture. Additional limits of Lazy Z
property for crop irrigation may be complicated by farming the lands during spring start
up or harvest periods when a farmer may not require irrigation water, requiring Sisters to
store treated effluent until crops require irrigation water.
3. Economics Aspect: The discussions with Mr. Zimmerlee indicates that a reduction in
market value of harvested crops from the Site could be incurred in the range of 25 to 50%
below the going rate for feed crops. Further limitations are foreseeable based on the
available market for feed based on the end use (i.e. dairy cows would not likely purchase
effluent irrigated feed crops for dairy cow feed; elevated nitrate in feed crop could further
limit livestock that could accept the feed crop). Additional limits on crop irrigation and
harvest may be reflected by obstacles the City of Redmond, Oregon has had to address.
Redmond has been conducting crop irrigation with effluent since the mid-1990’s and for
several years has found it difficult to lease the land to be farmed-complicating the City’s
ability to use effluent for agronomic reuse purposes. Redmond has had periods of
elevated nitrate in feed crops that limits the marketability of harvested crops and sale
value.
4. Crop Nutrient Aspect: The potential for feed crops harvested from the Lazy Z property
to have elevated levels of nitrate in the feed if not managed properly, as an identified
concern from OSU staff regarding effluent irrigated feed crops, can have a significant
impact on the marketability of harvested feed crops. Based on this limitation, additional
laboratory testing of crops grown on Lazy Z lands to determine the nutrient condition
during the growing season could allow for a greater control of crops and improved
marketability. Additional laboratory testing may contribute to additional costs for crop
cultivation and may require a more stringent fertilizer application program to maintain
proper nutrient balance in feed crops grown on the Lazy Z lands.
5. Crop Variability/Rotation: Based on the variable growing seasons of cereal grains and
timothy hay, it may be viable to cultivate a mix of crops on the Lazy Z lands to maximize
allowable areas for irrigation and crop harvest potential. With the potential of early
season shallow ground water on areas of the Lazy Z lands, a later-maturing crop (such as
late maturing timothy hay) may be appropriate for these lands, maintaining a longer
growing season without more intensive initial irrigation. During the early portion of the
irrigation season, the areas without shallow seasonal ground water to be planted with a
cereal grain that would take irrigation water as early as practicable, while being limited in
duration by the extent of the total growing season.
WASTEWATER REUSE AND CONSERVATION PROJECT PLANNING STUDY
Transitioning Irrigation From The Lazy Z Property From Surface Water To Treated Effluent
June 26, 2013 Page 36
OPPORTUNITIES AND TIMING – CONVERTING SURFACE WATER RIGHTS TO
INSTREAM RIGHTS
Opportunities to Convert Surface Water Right to Instream Rights
For the last ten to fifteen years, there has been significant interest in restoring instream flows to
Whychus Creek. Like many streams in the Deschutes Basin, Whychus Creek is over-
appropriated, meaning during certain times of the year the amount of water in the stream is less
than the sum of water use authorizations. Generally, during dry summer months, only water
rights issued before 1895 are fully met in Whychus Creek.
Historically, Oregon Department of Fish and Wildlife’s instream water right (ISWR) has served
as an informal goal for both stream flow and water quality purposes. The ODFW ISWR is based
on temperature criteria for redband trout (18 degrees) and current data show that it closely
correlates with the minimum flow necessary to achieve these temperature criteria in Sisters. Due
to a very junior priority date, the ODFW ISWR’s are not met. To realize meaningful flow
restoration in Whychus Creek, senior water rights must be transferred instream temporarily or
permanently either through lease, purchase, or through an allocation of conserved water through
the State’s Conserved Water Program.
Table 7. Whychus Creek Instream Water Rights
Whychus Creek Instream Water Rights
Jan Feb Mar Apr May Jun Jul Aug Sep Oct Nov Dec
Whychus Cr Indian Ford Creek Mouth 10/11/1990 33 33 50 50 50 33 33 33 33 33 33 33
Whychus Cr S. Fk Whychus Indian Ford Creek 10/11/1990 30 20 20 20 20 20 20 20 30 50 30 30
Instream Rates (cfs)Source From To Priority Date
Fisheries provide the primary driver for flow restoration in Whychus Creek. Low stream flows
limit habitat availability and fish movement. Water quality provides the second driver for flow
restoration in Whychus Creek. Whychus Creek upstream of river mile 21 is listed as water
quality limited for temperature. Low stream flow is a major factor contributing to temperature
impairments in this reach. Public interest in restoring flows increased with the recent
reintroduction of summer steelhead and spring Chinook above the Pelton Round Butte Dam
Complex on the mainstem Deschutes River and into Whychus Creek. As part of their new
Federal Energy Regulatory Commission license to operate the dam complex, Portland General
Electric and the Confederated Tribes of the Warm Springs Reservation are facilitating fish
passage and are investing in upstream restoration to increase the likelihood of success. Multiple
partners in the basin are heavily invested in ensuring the success of the reintroduction. In
addition, summer steelhead is listed as a threatened species under the Endangered Species Act.
Historically, Whychus was an important tributary for steelhead in the Deschutes Basin.
WASTEWATER REUSE AND CONSERVATION PROJECT PLANNING STUDY
Transitioning Irrigation From The Lazy Z Property From Surface Water To Treated Effluent
June 26, 2013 Page 37
Another driver for instream flow transactions in the Deschutes Basin is the State’s Ground water
Mitigation Program, established in 2002. In 1998, a United States Geological Services Ground
water Study confirmed that ground water and surface water in the study area within the
Deschutes Basin are directly linked, and that the removal of ground water will ultimately
diminish stream flow. In response, OWRD established the Deschutes Basin Ground water
Mitigation Program, which requires “mitigation” for all new ground water permits in the study
area. Mitigation is typically generated by transferring existing surface water rights instream.
This has created a new demand, varying throughout the basin, for instream flow transactions that
can generate temporary and permanent ground water mitigation credits.
Transactions and Market Characterization
Over the last twelve years, there have been approximately 445 acres of Whychus and tributary
irrigation water rights transferred permanently instream. About half of these water rights were
transferred purely for restoration purposes, and half generated permanent mitigation credits. The
mitigation transfers were generally to provide landowners the opportunity to pump ground water
under a new permit. To our knowledge, permanent mitigation credits were not sold to other
buyers.
On a temporary basis, the DRC annually leases instream 1,150-1,400 acres of Whychus and
tributary water rights. A large percentage of this is leased from Three Sisters Irrigation Districts
from farmers who choose not to use water in a certain year. Approximately 250 of these leased
acres produce temporary mitigation credits. In addition, the Three Sisters Irrigation District has
implemented an aggressive program of water conservation, transferring 8,500 acre-feet of water
from 15 conserved water projects.
There are several funders actively financing instream restoration in Whychus Creek, including
the Pelton Fund, the Oregon Watershed Enhancement Board, and the BPA/National Fish and
Wildlife Foundation’s Columbia Water Transactions Program. The Pelton Fund was set up
specifically to provide habitat restoration funds to support the Confederated Tribes of the Warm
Springs Reservation and Portland General Electric’s reintroduction of anadromous fish. This
Fund has a limited duration, and will likely be spent out in the next five to ten years. The DRC
aims to meet its initial streamflow restoration goal of 33 cfs in Whychus Creek below the
confluence of Indian Fork Creek in the next five or so years. While it is likely that there will still
be public investment in instream restoration in Whychus Creek, it may become a less robust
market in five to ten years. The market for mitigation credits will continue to be tied to
development and growth demands.
WASTEWATER REUSE AND CONSERVATION PROJECT PLANNING STUDY
Transitioning Irrigation From The Lazy Z Property From Surface Water To Treated Effluent
June 26, 2013 Page 38
Types of Transactions Available
There are several “instream transactions” that can be utilized to add value to the City’s Lazy Z
water rights while irrigating the Lazy Z property with effluent. There are both permanent and
temporary transactions that are available.
Permanent Transactions
Permanent instream transfers allow for water rights, subject to transfer, to be placed instream.
This mechanism allows the “new” instream water right to retain the priority of the originating
water right. As the City’s Lazy Z water rights are senior in priority, the ensuing instream rights
would also be senior and therefore of high value. Water right transfers, including instream, are a
relatively lengthy process as the water rights are thoroughly examined to verify use, ownership,
enlargement and potential injury to holders of existing water rights on the system. The process
can take anywhere from nine months to several years.
Water conserved from an efficiency project, known as an Allocation of Conserved Water,
generates a new water right that can be transferred instream or on-farm like any water right
subject to transfer, or some of the water can be used to firm-up a deficient water right.
Allocations of Conserved Water automatically protect a portion of the subject water right,
minimum 25 % instream, but an applicant can choose to transfer up to 100 % of the conserved
water instream.
Temporary Transactions
Instream leasing is a mechanism to place water instream temporarily (1 to 5 years) as a beneficial
use. Instream leases can be renewed an indefinite number of times. Under a lease, the water
right is never severed from the land so the right automatically reverts to the authorized place of
use when the lease is expired or cancelled by the applicant. Leasing instream is a relatively quick
process with applications generally being approved within a couple of months.
Split-season leasing is another temporary transaction that can be used to place water instream.
This transaction allows the water right holder to protect the right instream for a portion of the
season of use and apply water on-farm for a portion of the season of use. This is a useful
mechanism but requires the applicant to measure and report the water use regularly throughout
the season; this condition often creates a barrier to water right holders choosing this path.
Time-limited instream transfers allow the water right holder to place the water right instream for
any period of time, generally for periods greater than a lease would be established for, i.e. 10 to
50+ years. A benefit of a time-limited transfer is that the water right holder can protect the water
WASTEWATER REUSE AND CONSERVATION PROJECT PLANNING STUDY
Transitioning Irrigation From The Lazy Z Property From Surface Water To Treated Effluent
June 26, 2013 Page 39
instream for a significant amount of time yet still remain the water right holder when the transfer
expires. Unlike a lease, a time-limited instream transfer cannot be terminated unless conditions
are written into the transfer ahead of time.
Since the City holds a ground water permit that requires mitigation under the Deschutes Basin
Ground water Mitigation Program it may choose to use some portion of the Lazy Z water rights
for mitigation. Currently, permanent mitigation credits can be generated from permanent
instream transfers and temporary mitigation can be generated through instream leasing, time-
limited transfers and potentially through split-season leasing. Any temporary credits generated
must be through the DRC mitigation bank and currently those temporary credits have an annual
fee of $105 per credit.
Timing of Opportunities
According to the analysis of effluent available for irrigation detailed earlier in this report, it is
anticipated that there will be 128 acre-feet (AF) of effluent available in 2013. This volume, 128
AF, is the volume available under Case 1 (See Table 3), where the City continues to irrigate the
forest and dikes at half the rate of current irrigation and moves the other half of the water to the
Lazy Z. If applied on the City’s Lazy Z property, this volume could irrigate approximately 51.2
acres applied at a rate of 2.5 AF per acre. This could allow the City to remove the equivalent
number of acres of surface water irrigation from the land and protect the water instream either
permanently or temporarily.
Through this feasibility study, 3 phases have been identified as likely group targets for effluent
application and water right removal (see Figure 7). In each phase the mandatory set-back for
irrigating with effluent was mapped and the new acreage footprint calculated. Figure 7 shows
this phasing without the water rights overlay. When calculating the number of acres the City
will have available for irrigating with effluent, the acreage totals accounted for the set-backs
required for effluent irrigation. For example, Phase I has a total surface water right footprint of
53.3 acres, once the set-backs are accounted for there are 48.84 acres available for the City to
apply effluent. Table 8 summarizes water rights and available acreage by phase.
Phase I is an area that the City identified as the most readily available for application of effluent
due to existing infrastructure; this area has approximately 53.3 acres of senior Whychus Creek
water rights appurtenant to it. Accounting for the mandatory set-backs, there are approximately
48.84 acres available to irrigate with effluent. Applying irrigation at a volume of 2.5 AF/acre
allows for 122.1 AF of effluent irrigation on the 48.84 acres. The projected available effluent for
2013, 128 AF, is more than sufficient for irrigating Phase I.
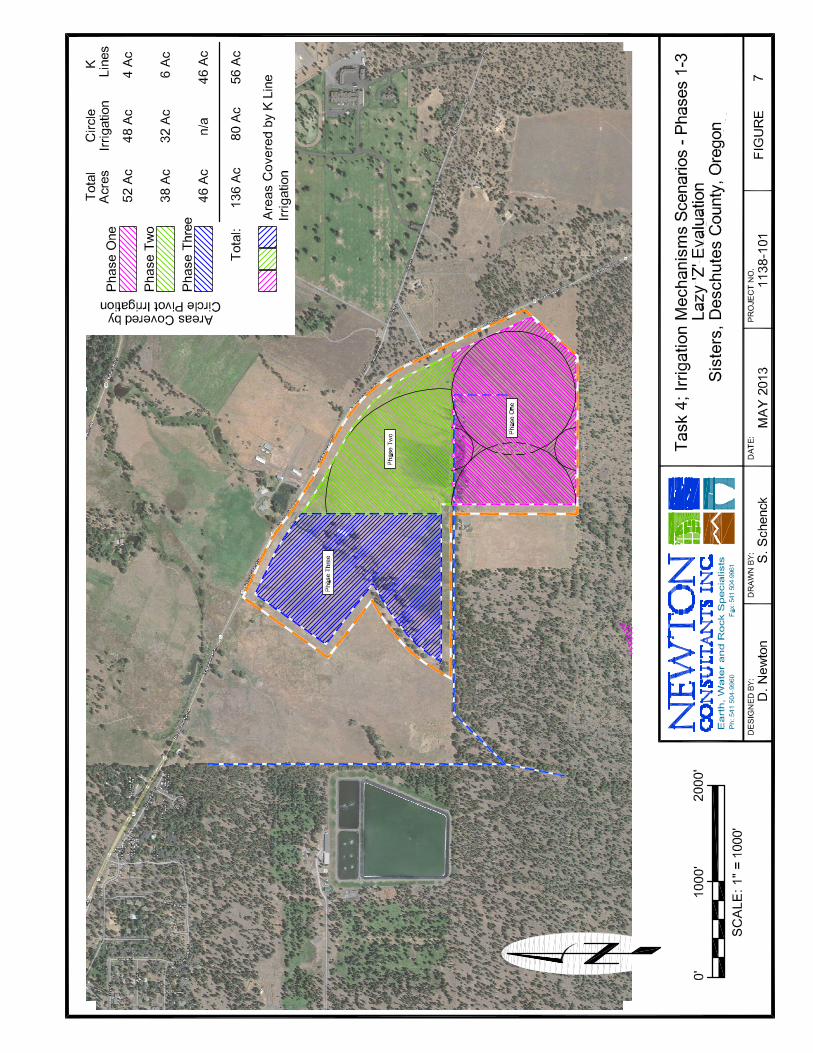
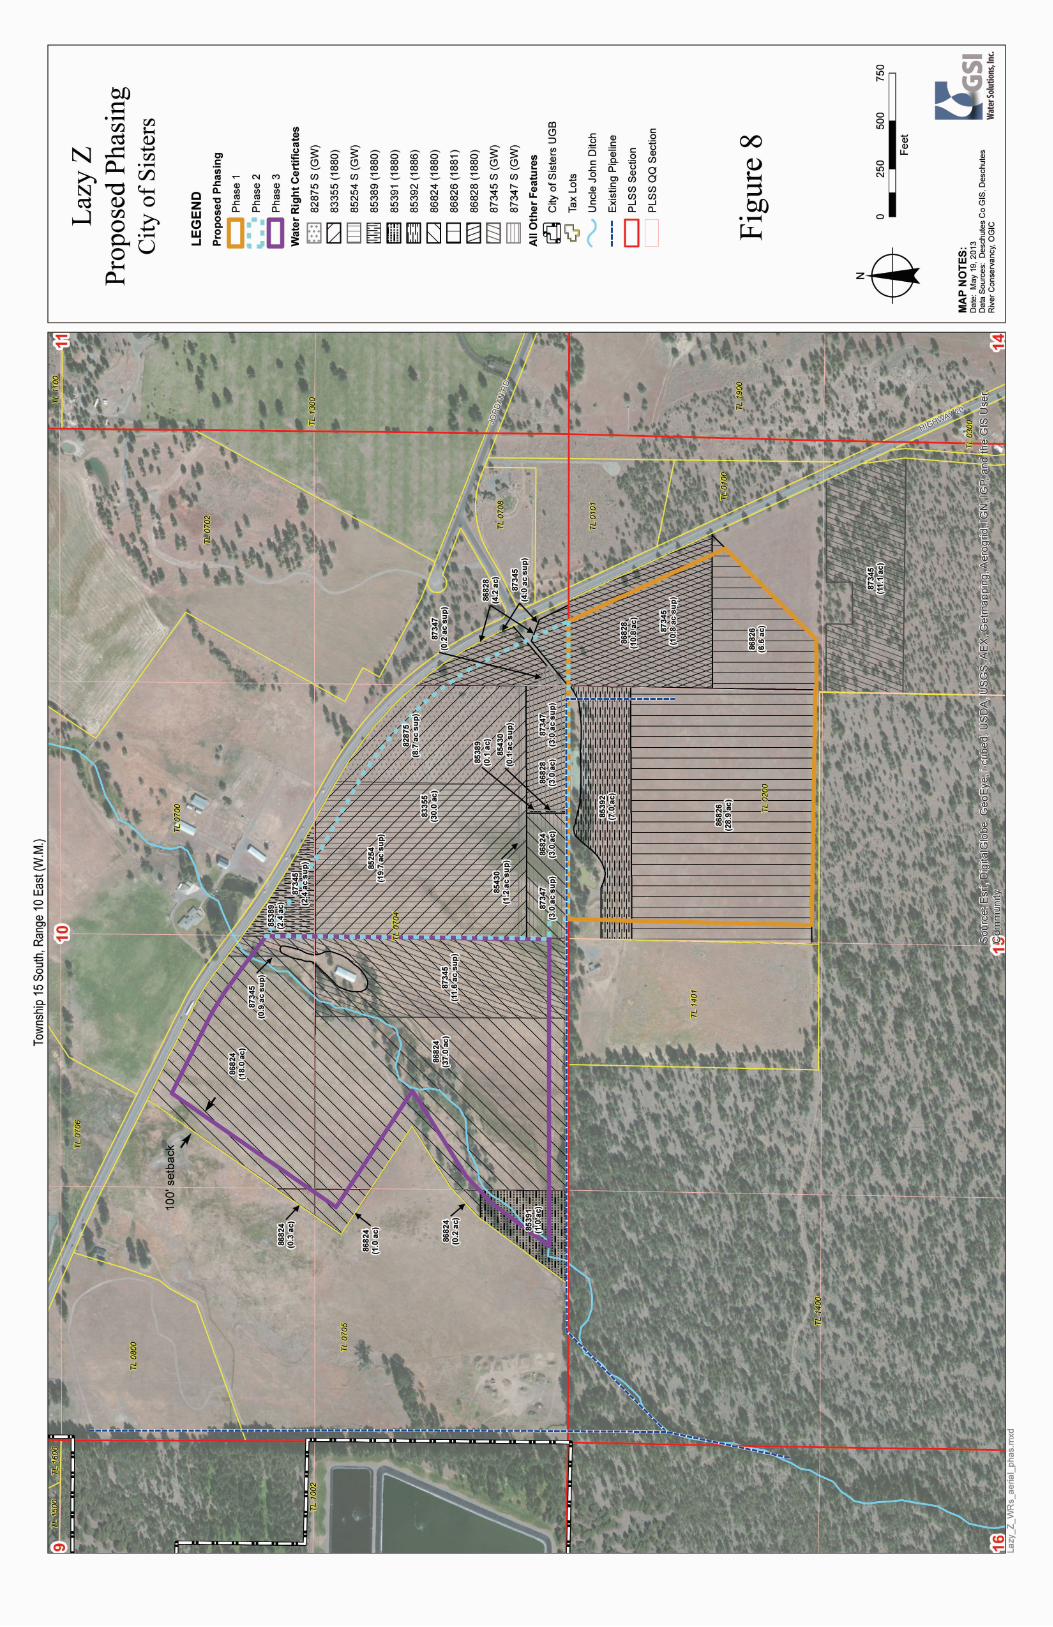
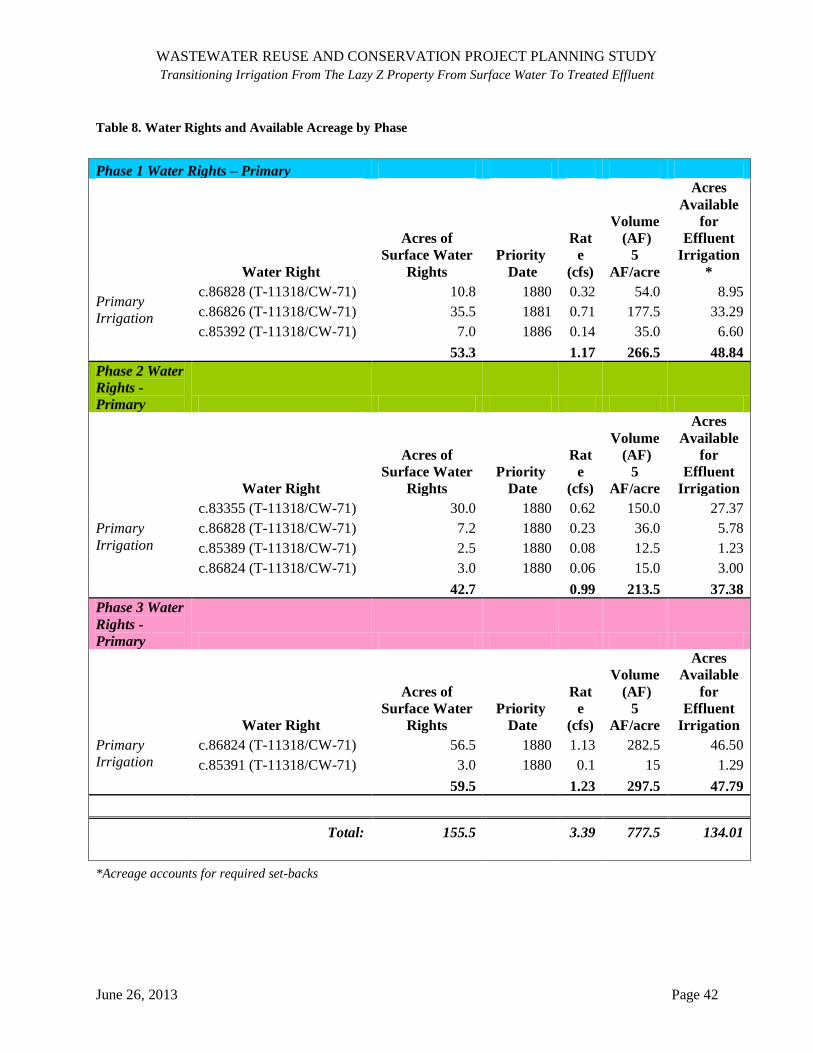
WASTEWATER REUSE AND CONSERVATION PROJECT PLANNING STUDY
Transitioning Irrigation From The Lazy Z Property From Surface Water To Treated Effluent
June 26, 2013 Page 42
Table 8. Water Rights and Available Acreage by Phase
Phase 1 Water Rights – Primary
Water Right
Acres of
Surface Water
Rights Priority
Date
Rat
e
(cfs)
Volume
(AF)
5
AF/acre
Acres
Available
for
Effluent
Irrigation
*
Primary
Irrigation
c.86828 (T-11318/CW-71) 10.8 1880 0.32 54.0 8.95
c.86826 (T-11318/CW-71) 35.5 1881 0.71 177.5 33.29
c.85392 (T-11318/CW-71) 7.0 1886 0.14 35.0 6.60
53.3 1.17 266.5 48.84
Phase 2 Water
Rights -
Primary
Water Right
Acres of
Surface Water
Rights Priority
Date
Rat
e
(cfs)
Volume
(AF)
5
AF/acre
Acres
Available
for
Effluent
Irrigation
Primary
Irrigation
c.83355 (T-11318/CW-71) 30.0 1880 0.62 150.0 27.37
c.86828 (T-11318/CW-71) 7.2 1880 0.23 36.0 5.78
c.85389 (T-11318/CW-71) 2.5 1880 0.08 12.5 1.23
c.86824 (T-11318/CW-71) 3.0 1880 0.06 15.0 3.00
42.7 0.99 213.5 37.38
Phase 3 Water
Rights -
Primary
Water Right
Acres of
Surface Water
Rights Priority
Date
Rat
e
(cfs)
Volume
(AF)
5
AF/acre
Acres
Available
for
Effluent
Irrigation
Primary
Irrigation c.86824 (T-11318/CW-71) 56.5 1880 1.13 282.5 46.50
c.85391 (T-11318/CW-71) 3.0 1880 0.1 15 1.29
59.5 1.23 297.5 47.79
Total: 155.5 3.39 777.5 134.01
*Acreage accounts for required set-backs
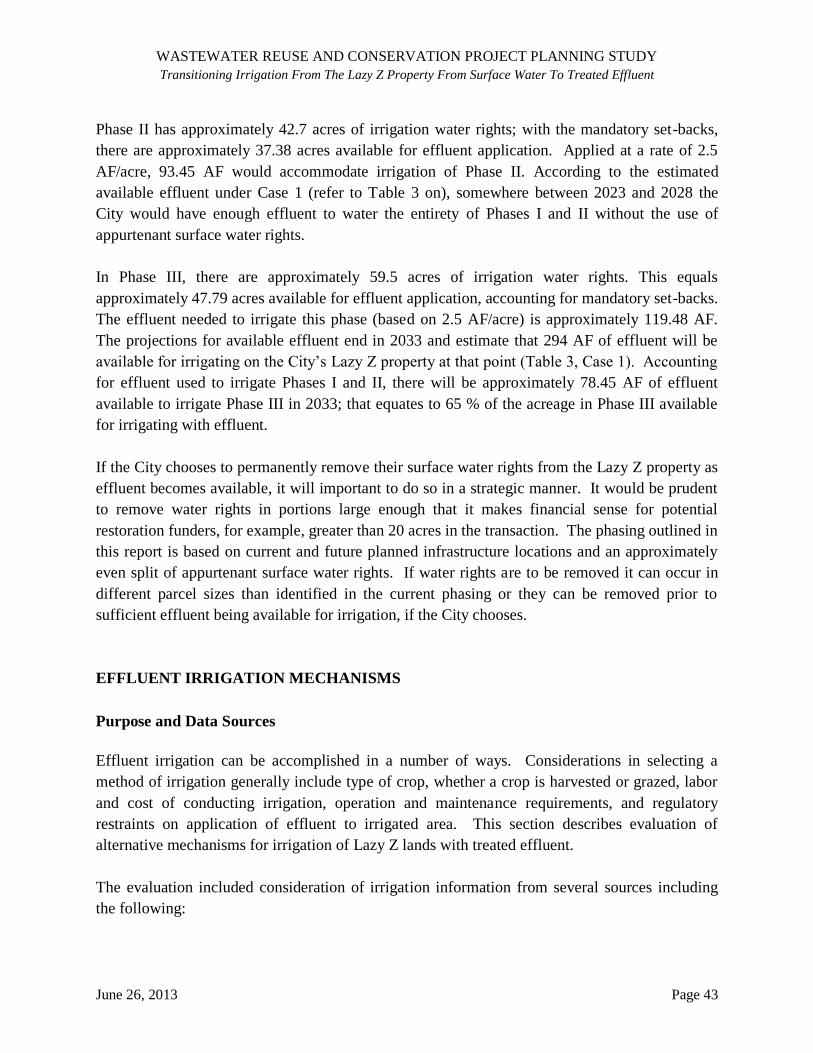
WASTEWATER REUSE AND CONSERVATION PROJECT PLANNING STUDY
Transitioning Irrigation From The Lazy Z Property From Surface Water To Treated Effluent
June 26, 2013 Page 43
Phase II has approximately 42.7 acres of irrigation water rights; with the mandatory set-backs,
there are approximately 37.38 acres available for effluent application. Applied at a rate of 2.5
AF/acre, 93.45 AF would accommodate irrigation of Phase II. According to the estimated
available effluent under Case 1 (refer to Table 3 on), somewhere between 2023 and 2028 the
City would have enough effluent to water the entirety of Phases I and II without the use of
appurtenant surface water rights.
In Phase III, there are approximately 59.5 acres of irrigation water rights. This equals
approximately 47.79 acres available for effluent application, accounting for mandatory set-backs.
The effluent needed to irrigate this phase (based on 2.5 AF/acre) is approximately 119.48 AF.
The projections for available effluent end in 2033 and estimate that 294 AF of effluent will be
available for irrigating on the City’s Lazy Z property at that point (Table 3, Case 1). Accounting
for effluent used to irrigate Phases I and II, there will be approximately 78.45 AF of effluent
available to irrigate Phase III in 2033; that equates to 65 % of the acreage in Phase III available
for irrigating with effluent.
If the City chooses to permanently remove their surface water rights from the Lazy Z property as
effluent becomes available, it will important to do so in a strategic manner. It would be prudent
to remove water rights in portions large enough that it makes financial sense for potential
restoration funders, for example, greater than 20 acres in the transaction. The phasing outlined in
this report is based on current and future planned infrastructure locations and an approximately
even split of appurtenant surface water rights. If water rights are to be removed it can occur in
different parcel sizes than identified in the current phasing or they can be removed prior to
sufficient effluent being available for irrigation, if the City chooses.
EFFLUENT IRRIGATION MECHANISMS
Purpose and Data Sources
Effluent irrigation can be accomplished in a number of ways. Considerations in selecting a
method of irrigation generally include type of crop, whether a crop is harvested or grazed, labor
and cost of conducting irrigation, operation and maintenance requirements, and regulatory
restraints on application of effluent to irrigated area. This section describes evaluation of
alternative mechanisms for irrigation of Lazy Z lands with treated effluent.
The evaluation included consideration of irrigation information from several sources including
the following:
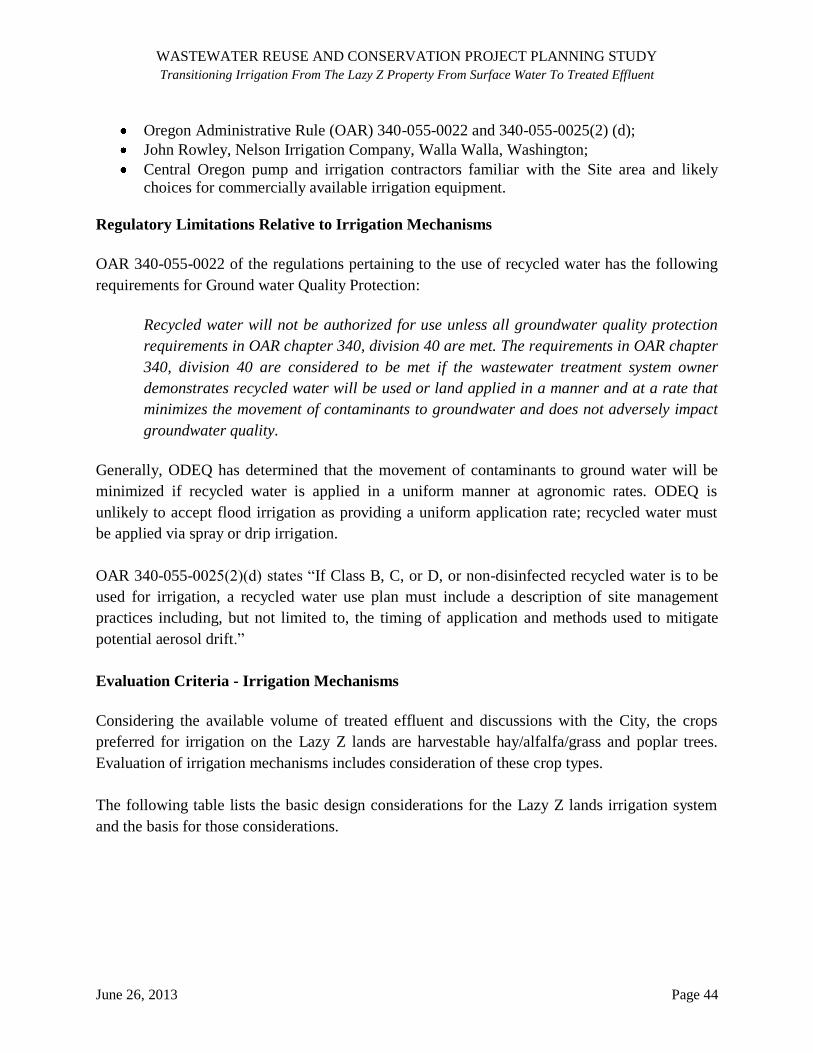
WASTEWATER REUSE AND CONSERVATION PROJECT PLANNING STUDY
Transitioning Irrigation From The Lazy Z Property From Surface Water To Treated Effluent
June 26, 2013 Page 44
Oregon Administrative Rule (OAR) 340-055-0022 and 340-055-0025(2) (d);
John Rowley, Nelson Irrigation Company, Walla Walla, Washington;
Central Oregon pump and irrigation contractors familiar with the Site area and likely choices for commercially available irrigation equipment.
Regulatory Limitations Relative to Irrigation Mechanisms
OAR 340-055-0022 of the regulations pertaining to the use of recycled water has the following
requirements for Ground water Quality Protection:
Recycled water will not be authorized for use unless all groundwater quality protection
requirements in OAR chapter 340, division 40 are met. The requirements in OAR chapter
340, division 40 are considered to be met if the wastewater treatment system owner
demonstrates recycled water will be used or land applied in a manner and at a rate that
minimizes the movement of contaminants to groundwater and does not adversely impact
groundwater quality.
Generally, ODEQ has determined that the movement of contaminants to ground water will be
minimized if recycled water is applied in a uniform manner at agronomic rates. ODEQ is
unlikely to accept flood irrigation as providing a uniform application rate; recycled water must
be applied via spray or drip irrigation.
OAR 340-055-0025(2)(d) states “If Class B, C, or D, or non-disinfected recycled water is to be
used for irrigation, a recycled water use plan must include a description of site management
practices including, but not limited to, the timing of application and methods used to mitigate
potential aerosol drift.”
Evaluation Criteria - Irrigation Mechanisms
Considering the available volume of treated effluent and discussions with the City, the crops
preferred for irrigation on the Lazy Z lands are harvestable hay/alfalfa/grass and poplar trees.
Evaluation of irrigation mechanisms includes consideration of these crop types.
The following table lists the basic design considerations for the Lazy Z lands irrigation system
and the basis for those considerations.
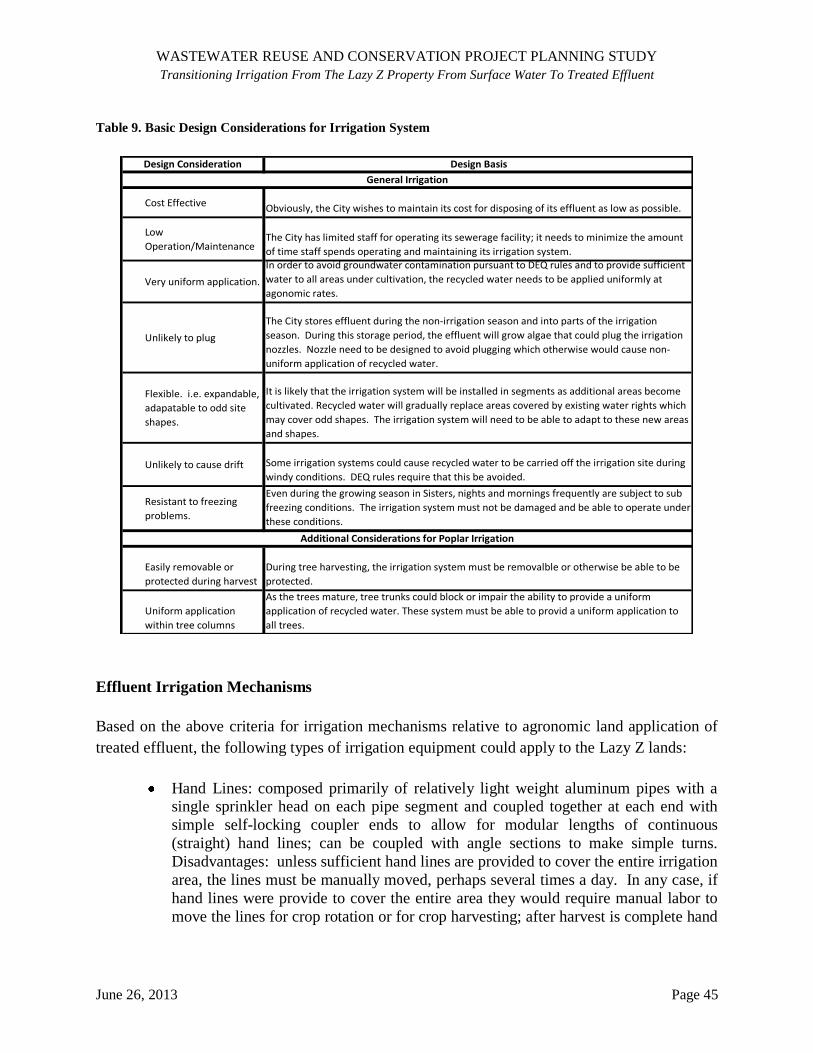
WASTEWATER REUSE AND CONSERVATION PROJECT PLANNING STUDY
Transitioning Irrigation From The Lazy Z Property From Surface Water To Treated Effluent
June 26, 2013 Page 45
Table 9. Basic Design Considerations for Irrigation System
Design Consideration Design Basis
Cost Effective Obviously, the City wishes to maintain its cost for disposing of its effluent as low as possible.
Low
Operation/MaintenanceThe City has limited staff for operating its sewerage facility; it needs to minimize the amount
of time staff spends operating and maintaining its irrigation system.
Very uniform application.
In order to avoid groundwater contamination pursuant to DEQ rules and to provide sufficient
water to all areas under cultivation, the recycled water needs to be applied uniformly at
agonomic rates.
Unlikely to plug
The City stores effluent during the non-irrigation season and into parts of the irrigation
season. During this storage period, the effluent will grow algae that could plug the irrigation
nozzles. Nozzle need to be designed to avoid plugging which otherwise would cause non-
uniform application of recycled water.
Flexible. i.e. expandable,
adapatable to odd site
shapes.
It is likely that the irrigation system will be installed in segments as additional areas become
cultivated. Recycled water will gradually replace areas covered by existing water rights which
may cover odd shapes. The irrigation system will need to be able to adapt to these new areas
and shapes.
Unlikely to cause drift Some irrigation systems could cause recycled water to be carried off the irrigation site during
windy conditions. DEQ rules require that this be avoided.
Resistant to freezing
problems.
Even during the growing season in Sisters, nights and mornings frequently are subject to sub
freezing conditions. The irrigation system must not be damaged and be able to operate under
these conditions.
Easily removable or
protected during harvest
During tree harvesting, the irrigation system must be removalble or otherwise be able to be
protected.
Uniform application
within tree columns
As the trees mature, tree trunks could block or impair the ability to provide a uniform
application of recycled water. These system must be able to provid a uniform application to
all trees.
General Irrigation
Additional Considerations for Poplar Irrigation
Effluent Irrigation Mechanisms
Based on the above criteria for irrigation mechanisms relative to agronomic land application of
treated effluent, the following types of irrigation equipment could apply to the Lazy Z lands:
Hand Lines: composed primarily of relatively light weight aluminum pipes with a single sprinkler head on each pipe segment and coupled together at each end with
simple self-locking coupler ends to allow for modular lengths of continuous
(straight) hand lines; can be coupled with angle sections to make simple turns.
Disadvantages: unless sufficient hand lines are provided to cover the entire irrigation
area, the lines must be manually moved, perhaps several times a day. In any case, if
hand lines were provide to cover the entire area they would require manual labor to
move the lines for crop rotation or for crop harvesting; after harvest is complete hand
WASTEWATER REUSE AND CONSERVATION PROJECT PLANNING STUDY
Transitioning Irrigation From The Lazy Z Property From Surface Water To Treated Effluent
June 26, 2013 Page 46
lines must be replaced for continued crop irrigation; and susceptibility of livestock or
wildlife knocking over the sprinkler risers.
Large Gun Sprinklers on hose reels: large gun sprinklers distribute water over relatively long distances with high trajectories. The high trajectories have a high
potential to cause air borne water droplets that would likely drift on to adjacent
properties. It is likely that ODEQ would require an increased buffer distance if it
allowed large gun sprinklers. For this reason, this irrigation mechanism is not
recommended.
Wheel Lines: composed primarily of lightweight aluminum pipes with a single sprinkler head on each pipe segment mounted on an aluminum spoke wheel to allow
for easy traverse of series of wheel lines across a relatively level field. Each end is
coupled together with simple self-locking coupler ends to allow for modular lengths
of continuous (straight) wheel lines. Disadvantages: wheel lines require an irrigable
field to be relatively flat and square or rectangular in shape and have minimal rocks;
wheel lines tend to be very susceptible to wind movement and disruption of irrigation
application.
Circle Pivot: composed of large rubber wheel sections of overhead pipe with drop
sprinklers that rotate about a center point (or pivot). A circle pivot can be operated to
move across fields with moderate slope with clear wheel tracks. The one advantage
to a circle pivot is that it requires minimal manual labor to operate. The
disadvantages to circle pivots include high cost of installation, and, to irrigate field
configuration other than a circle, it must be combined with other methods (hand
lines, K Lines, etc.) to irrigate corners or areas not traversable by the circle pivot.
Permanent Set Lines: may be composed of underground pipe installation with surface exposure of permanent riser sprinklers, or automated pop-up sprinklers, or
individually installed ‘plug-in’ sprinklers. Disadvantages to permanent set lines are
that, during plowing/disking of fields or during harvest, permanent set lines would
likely be damaged and could lead to significant maintenance on an annual basis.
Removable Set Lines: these are composed primarily a hand lines or K Lines (see below). Disadvantages to removable set lines are they need to be moved out of the
way of equipment during harvest, field plowing/disking and reset prior to continued
irrigation. K Lines can be moved with a vehicle and do not have the significant labor
required to move and set hand lines.
K Lines: composed of a non-rigid hose that connects a string of sprinklers mounted in self-contained polymer pods that can be moved with a vehicle (i.e. ATV, tractor,
pickup truck). Standard length includes 5 sprinkler pods and can be coupled to make
a continuous string of up to 10 sprinkler pods in a single K Line string. K Lines,
WASTEWATER REUSE AND CONSERVATION PROJECT PLANNING STUDY
Transitioning Irrigation From The Lazy Z Property From Surface Water To Treated Effluent
June 26, 2013 Page 47
having sprinkler pods, provide protection from livestock or wildlife rubbing or
knocking the pods out of position for irrigation.
Sprinkler heads for each of the above mechanisms are anticipated to be impact or rotary type
sprinklers. These types of sprinklers are typical for these types of mechanisms.
Sprinklers
Impact Sprinklers
The basic operation of an impact sprinkler is relatively simple. As water leaves the sprinkler
nozzle it comes in contact with a spring-loaded drive arm. This arm is shoved aside by the force
of the water. The spring then returns the arm to its original position and it again comes into
contact with the water and also a stop or shoulder on the sprinkler body. The impact against the
shoulder causes the entire head assembly (and sprinkler stream) to rotate slightly. This constant
impact and movement will cause the head to rotate a complete circle and slowly water the entire
area within that circle. In addition, each time the water makes contact with the sprinkler arm, a
small amount of “splash” is created that falls near the sprinkler head.
Advantages to impact sprinklers are uniform coverage of the area to be irrigated and with most
impact sprinklers made of brass or stainless steel bodies, the sprinklers tend to have a long
service life. Interchangeable nozzles within the sprinkler head allows for variability in the
irrigation water volume and adjustability for varied input water pressure.
Disadvantages of impact sprinklers are the potential for high maintenance cost related to the
exposed nature of the rotation mechanism with possible operation impedance by debris or
contact with vegetation, and corrosion or deterioration of the rotation mechanism causing failure
of the sprinkler head. Additionally, if an impact sprinkler becomes entangled with debris or
becomes clogged, disabling rotation, an impact sprinkler will tend to spray in a single direction.
If left unrepaired, this can cause oversaturation or erosion of soil in area of water impact.
Rotary Sprinklers
Rotary sprinklers (or more specifically, gear-driven rotary sprinklers), operate by water turning a
small turbine (water wheel or fan) in the base of the unit which drives a series of gears that cause
the head to rotate. The gear drive mechanism is protected from soil and debris by a screen.
The advantage of the Nelson rotary sprinkler is that the sprinkler heads can be fed by
polyethylene pipe laterals or portable pipes including aluminum, polyethylene or PVC which
would allow the sprinkler system to be removed during harvesting of poplar trees, if they are the
chosen crop. Additionally, rotary sprinklers have the gear-driven portion (the unit within the
WASTEWATER REUSE AND CONSERVATION PROJECT PLANNING STUDY
Transitioning Irrigation From The Lazy Z Property From Surface Water To Treated Effluent
June 26, 2013 Page 48
sprinkler that allows for sprinkler rotation) enclosed within the sprinkler providing protection
from clogging or impacted by external debris.
Some potential drawbacks may come with these sprinklers. Nelson Irrigation Company (Nelson)
of Walla Walla, Washington manufactures and sells rotary sprinkler heads of various types.
Discussion with Nelson indicates they do not have experience with use of the rotary sprinklers to
irrigate recycled water with high concentrations of algae. In addition, there could be problems
during freezing conditions. According to John Rowley, “if the irrigation water temperature in
use is greater the 55 degrees F, the R2000 will resist Rotator failure in most conditions. If the
water temperature is below 40 degrees F, in some of the conditions, there will be freezing up of
the sprinkler and rotation failure. Overall the R2000 will resist rotation failure in freezing
temperatures if water is above 55 degrees and there are low winds. Wind speed is also an
important factor, High winds (greater than 7 MPH) will cause rotation failure in freezing
temps.”
Sprinkler Options Summary
Before considering a sprinkler system, it is recommended that a small set be purchased and
installed on an existing irrigation site for a season. This would allow the City to determine if
nozzle plugging and sprinkler freezing would be a problem, as sprinklers of all types may be
subject to potential freezing conditions.
The poplar plantation at Woodburn, Oregon uses the R-10 sprinkler heads. John Rowley of
Nelson, recommends the R-2000 sprinkler head, which is also rotary, because it can be fitted
with a one-eighth inch nozzle which may be less prone to plugging due to algal concentrations in
the recycled water. This head would apply recycled water at 0.4 inches/hour.
Based on discussions with other municipalities that conduct effluent irrigation, rotary sprinklers
were identified as a likely best choice for sprinkler irrigation of effluent.
Conclusions
Based upon the following summary of information, and discussions with City of Sisters
personnel, irrigation mechanisms with minimal labor to operate are preferred. With that in mind,
limitations on irrigation mechanisms for either hay/alfalfa/grass or poplar trees, distinct irrigation
mechanisms are described below:
WASTEWATER REUSE AND CONSERVATION PROJECT PLANNING STUDY
Transitioning Irrigation From The Lazy Z Property From Surface Water To Treated Effluent
June 26, 2013 Page 49
Hay/Alfalfa/Grass
Irrigation mechanisms that are best applied to a hay/alfalfa/grass crop would be circle pivots, K
Lines, and permanent set lines (permanent set lines will only work on a harvested crop if in-
ground sprinklers are mounted outside of the harvest area, as harvest equipment or plow/disking
of the field would likely damage the equipment). The K Lines would likely be a best choice for
ease of movement to irrigate the corner areas not irrigable by circle pivots.
Poplar Trees
Irrigation Mechanisms that are best applied to a poplar tree crop would be had lines or K Lines.
With the harvest duration of poplar trees being on the order of 9 to 12 years, K Lines could be
pulled into and out of position with an ATV, tractor, etc. and set for the crop duration. Hand
lines could be laid in rows and removed prior to tree harvest; however, wildlife may knock the
sprinkler risers requiring periodic attention to reset the sprinkler risers.
COST ANALYSIS – IRRIGATION MECHANISMS
Identified Irrigation Mechanisms
A generalized cost estimate has been prepared based on the irrigation mechanisms identified
under the section Cost Analysis – Irrigation Mechanisms. Newton conduct research for
installation costs of irrigation mechanisms from Cascade Pump and Irrigation of Bend, Oregon.
The estimated costs for irrigation mechanisms included the following key items below:
Discussions with City of Sisters personnel on irrigation equipment that requires minimal supervision and maintenance cost;
Capital costs to for initial purchase and installation of irrigation equipment based on the phase scenario included on the attached Table 10 7;
Estimates of annualized power demands to operate the system;
Potential annual operation and maintenance cost;
Cost improvements provided by HGE, Inc. to allow for delivery of effluent irrigation water to each project phase (see table below):

WASTEWATER REUSE AND CONSERVATION PROJECT PLANNING STUDY
Transitioning Irrigation From The Lazy Z Property From Surface Water To Treated Effluent
June 26, 2013 Page 50
Table 10. Reuse Improvements *
Phase I
Mobilization $32,600
Clearing and Grubbing $3,500
Gravel Roadway Construction 3,250 ft. $65,000
Excavation and Class 3 BF, 3,250 ft. $81,250
Rock Excavation $5,000
Foundation Stabilization, 120 CY $3,600
18” HDPE Force Main, 3,250 ft. $121,875
18” Culvert Installation $2,500
Forcemain Appurtenances $42,700
Aggregate Base and Surfacing, 20 CY $600
Total Phase I $358,625
Phase II**
Irrigation Line Controllers $13,333
Conduit $13,333
SCADA Modifications $13,333
Total Phase II $400,000
Engineering Contingencies $150,000
PROJECT TOTAL $908,625 *Values for the reuse improvements were provided by HGE, Inc. in a letter to Paul Bertagna, Sisters Public Works Director, dated
May 6, 2013.
**Phase II cost was provided as a lump sum value and was divided equally among each component. The cost will likely change
extensively depending on equipment desired, conduit lengths, and the extent of SCADA modifications.
Preferred Irrigation Mechanisms
The rate of recycled water application is limited to the agronomic requirement of the crop.
Exceeding the agronomic rate creates the potential for waste water to migrate into the ground
water and cause contamination. The agronomic rate varies based upon the type of crop, the time
of year, and actual weather conditions which are impossible to predict from year to year. The
irrigation system on the Lazy Z Ranch should include a system to measure soil moisture content
so that application rates can be adjusted as needed based upon actual conditions. Irrigation of
Hay/Alfalfa/Grass
Irrigation of hay/alfalfa/grass crops has been estimated in each phase of the project, with a
specific layout of likely irrigation methods presented on the attached Figure 9. In this scenario
the primary areas for irrigation of phase 1 and phase 2 have been provided, with the potential
cost for irrigation of phase 3 being based on the average per acre cost of phases 1 and 2.
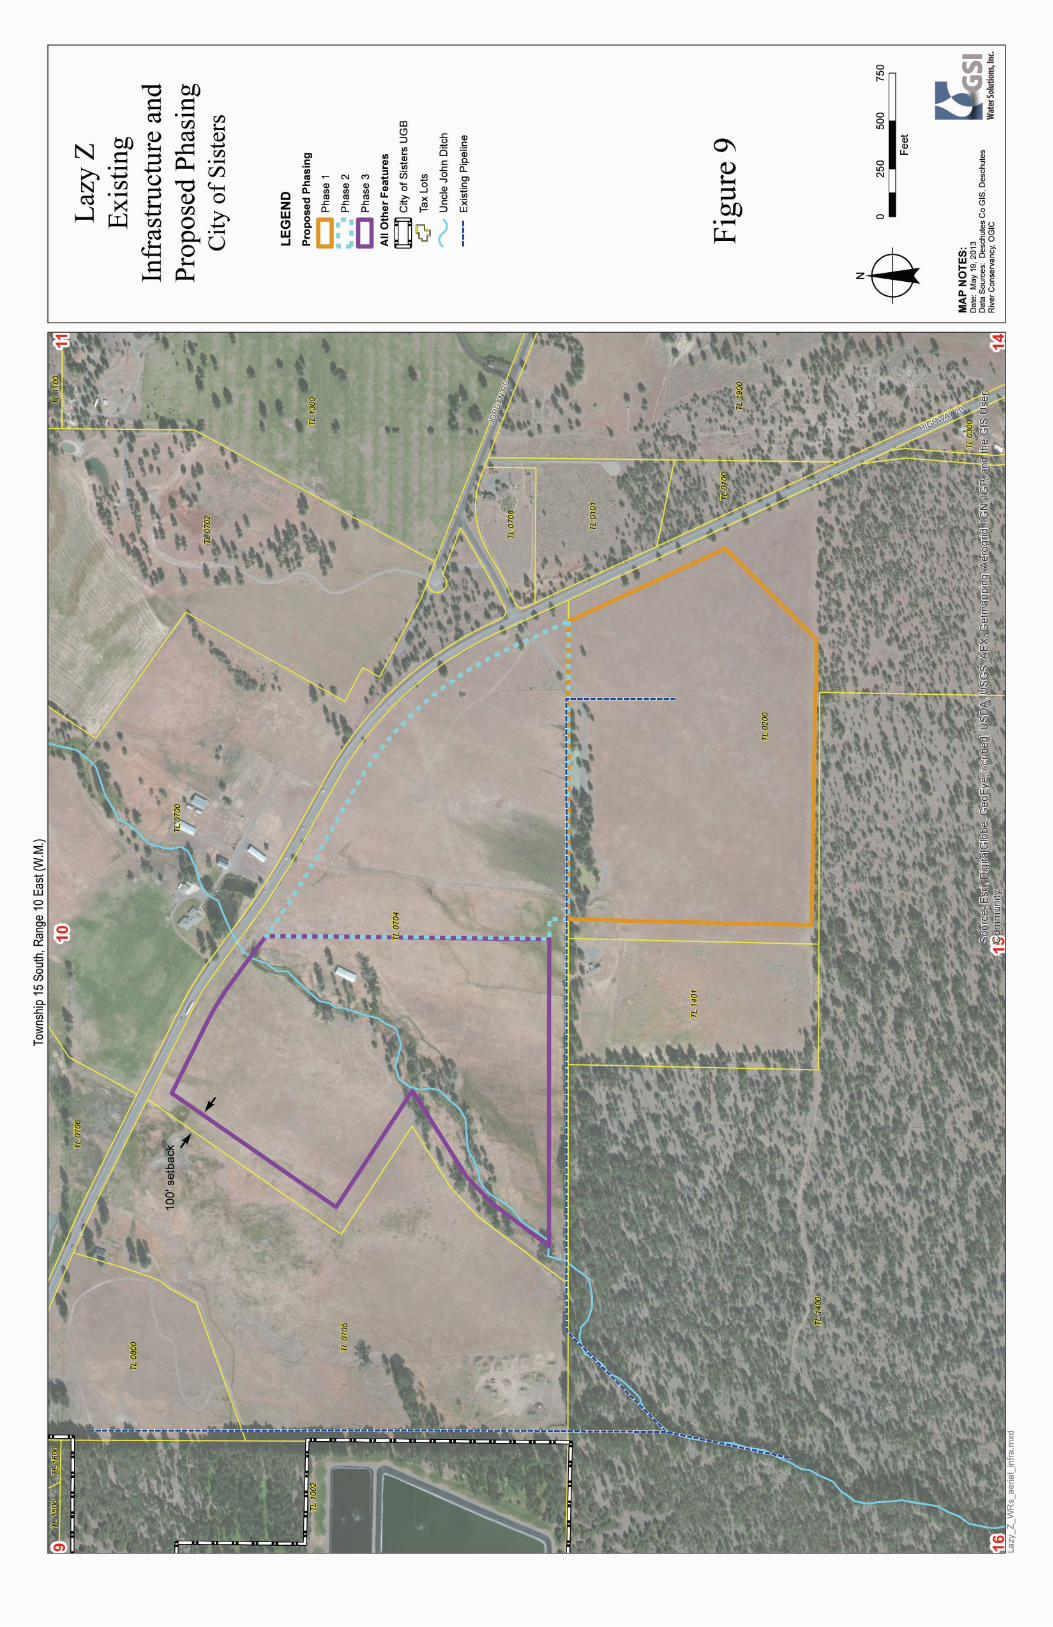
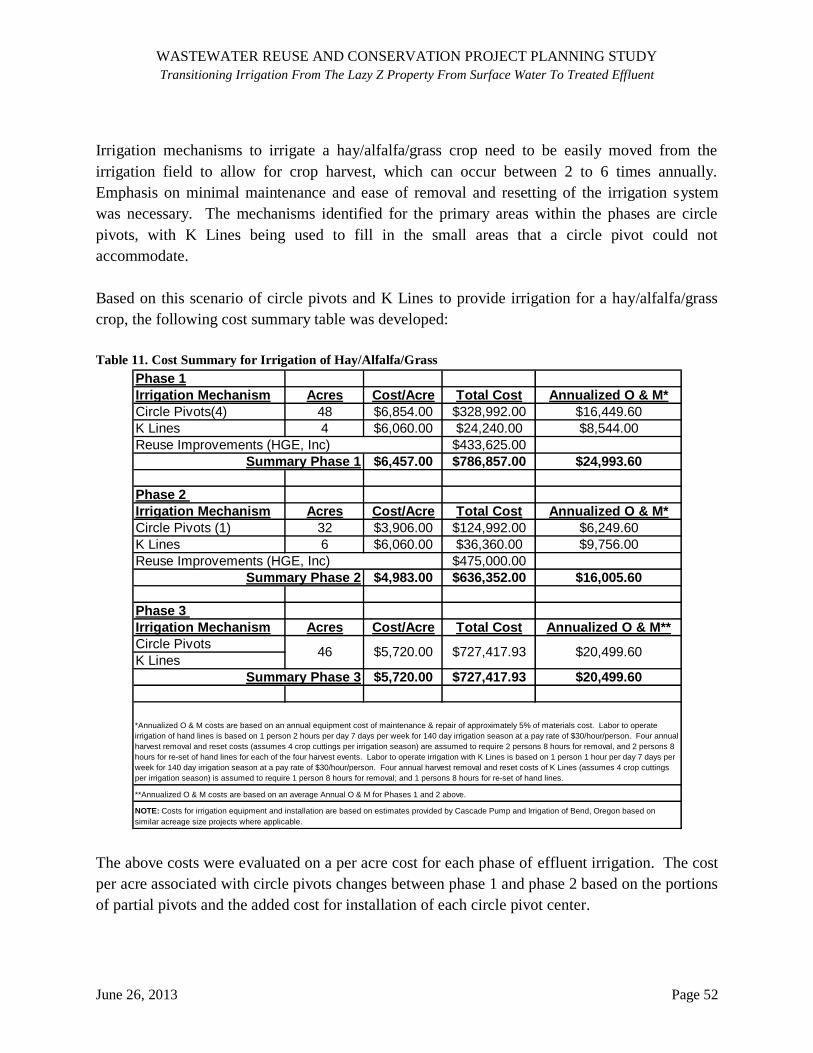
WASTEWATER REUSE AND CONSERVATION PROJECT PLANNING STUDY
Transitioning Irrigation From The Lazy Z Property From Surface Water To Treated Effluent
June 26, 2013 Page 52
Irrigation mechanisms to irrigate a hay/alfalfa/grass crop need to be easily moved from the
irrigation field to allow for crop harvest, which can occur between 2 to 6 times annually.
Emphasis on minimal maintenance and ease of removal and resetting of the irrigation system
was necessary. The mechanisms identified for the primary areas within the phases are circle
pivots, with K Lines being used to fill in the small areas that a circle pivot could not
accommodate.
Based on this scenario of circle pivots and K Lines to provide irrigation for a hay/alfalfa/grass
crop, the following cost summary table was developed:
Table 11. Cost Summary for Irrigation of Hay/Alfalfa/Grass
Phase 1
Irrigation Mechanism Acres Cost/Acre Total Cost Annualized O & M*
Circle Pivots(4) 48 $6,854.00 $328,992.00 $16,449.60
K Lines 4 $6,060.00 $24,240.00 $8,544.00
Reuse Improvements (HGE, Inc) $433,625.00
$6,457.00 $786,857.00 $24,993.60
Phase 2
Irrigation Mechanism Acres Cost/Acre Total Cost Annualized O & M*
Circle Pivots (1) 32 $3,906.00 $124,992.00 $6,249.60
K Lines 6 $6,060.00 $36,360.00 $9,756.00
$475,000.00
$4,983.00 $636,352.00 $16,005.60
Phase 3
Irrigation Mechanism Acres Cost/Acre Total Cost Annualized O & M**
Circle Pivots
K Lines
$5,720.00 $727,417.93 $20,499.60
NOTE: Costs for irrigation equipment and installation are based on estimates provided by Cascade Pump and Irrigation of Bend, Oregon based on
similar acreage size projects where applicable.
Reuse Improvements (HGE, Inc)
Summary Phase 1
Summary Phase 2
*Annualized O & M costs are based on an annual equipment cost of maintenance & repair of approximately 5% of materials cost. Labor to operate
irrigation of hand lines is based on 1 person 2 hours per day 7 days per week for 140 day irrigation season at a pay rate of $30/hour/person. Four annual
harvest removal and reset costs (assumes 4 crop cuttings per irrigation season) are assumed to require 2 persons 8 hours for removal, and 2 persons 8
hours for re-set of hand lines for each of the four harvest events. Labor to operate irrigation with K Lines is based on 1 person 1 hour per day 7 days per
week for 140 day irrigation season at a pay rate of $30/hour/person. Four annual harvest removal and reset costs of K Lines (assumes 4 crop cuttings
per irrigation season) is assumed to require 1 person 8 hours for removal; and 1 persons 8 hours for re-set of hand lines.
**Annualized O & M costs are based on an average Annual O & M for Phases 1 and 2 above.
Summary Phase 3
$20,499.6046 $5,720.00 $727,417.93
The above costs were evaluated on a per acre cost for each phase of effluent irrigation. The cost
per acre associated with circle pivots changes between phase 1 and phase 2 based on the portions
of partial pivots and the added cost for installation of each circle pivot center.
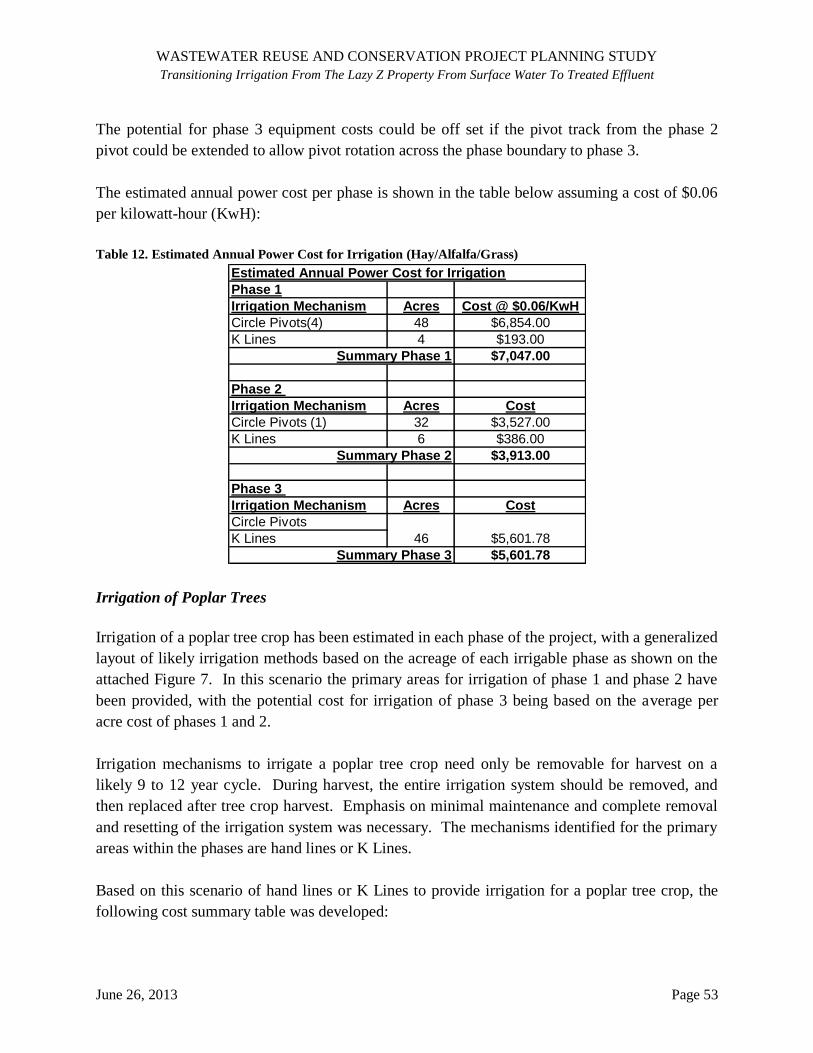
WASTEWATER REUSE AND CONSERVATION PROJECT PLANNING STUDY
Transitioning Irrigation From The Lazy Z Property From Surface Water To Treated Effluent
June 26, 2013 Page 53
The potential for phase 3 equipment costs could be off set if the pivot track from the phase 2
pivot could be extended to allow pivot rotation across the phase boundary to phase 3.
The estimated annual power cost per phase is shown in the table below assuming a cost of $0.06
per kilowatt-hour (KwH):
Table 12. Estimated Annual Power Cost for Irrigation (Hay/Alfalfa/Grass)
Phase 1
Irrigation Mechanism Acres Cost @ $0.06/KwH
Circle Pivots(4) 48 $6,854.00
K Lines 4 $193.00
$7,047.00
Phase 2
Irrigation Mechanism Acres Cost
Circle Pivots (1) 32 $3,527.00
K Lines 6 $386.00
$3,913.00
Phase 3
Irrigation Mechanism Acres Cost
Circle Pivots
K Lines
$5,601.78Summary Phase 3
Estimated Annual Power Cost for Irrigation
Summary Phase 1
Summary Phase 2
46 $5,601.78
Irrigation of Poplar Trees
Irrigation of a poplar tree crop has been estimated in each phase of the project, with a generalized
layout of likely irrigation methods based on the acreage of each irrigable phase as shown on the
attached Figure 7. In this scenario the primary areas for irrigation of phase 1 and phase 2 have
been provided, with the potential cost for irrigation of phase 3 being based on the average per
acre cost of phases 1 and 2.
Irrigation mechanisms to irrigate a poplar tree crop need only be removable for harvest on a
likely 9 to 12 year cycle. During harvest, the entire irrigation system should be removed, and
then replaced after tree crop harvest. Emphasis on minimal maintenance and complete removal
and resetting of the irrigation system was necessary. The mechanisms identified for the primary
areas within the phases are hand lines or K Lines.
Based on this scenario of hand lines or K Lines to provide irrigation for a poplar tree crop, the
following cost summary table was developed:
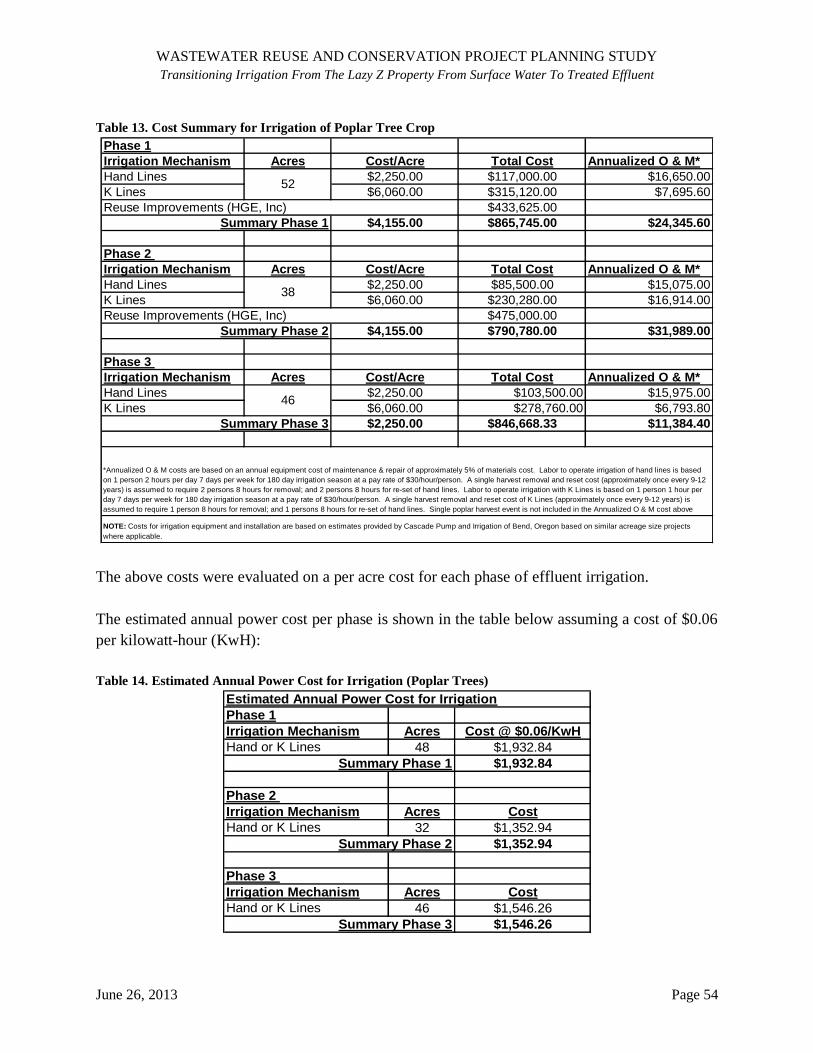
WASTEWATER REUSE AND CONSERVATION PROJECT PLANNING STUDY
Transitioning Irrigation From The Lazy Z Property From Surface Water To Treated Effluent
June 26, 2013 Page 54
Table 13. Cost Summary for Irrigation of Poplar Tree Crop
Phase 1
Irrigation Mechanism Acres Cost/Acre Total Cost Annualized O & M*
Hand Lines $2,250.00 $117,000.00 $16,650.00
K Lines $6,060.00 $315,120.00 $7,695.60
Reuse Improvements (HGE, Inc) $433,625.00
$4,155.00 $865,745.00 $24,345.60
Phase 2
Irrigation Mechanism Acres Cost/Acre Total Cost Annualized O & M*
Hand Lines $2,250.00 $85,500.00 $15,075.00
K Lines $6,060.00 $230,280.00 $16,914.00
$475,000.00
$4,155.00 $790,780.00 $31,989.00
Phase 3
Irrigation Mechanism Acres Cost/Acre Total Cost Annualized O & M*
Hand Lines $2,250.00 $103,500.00 $15,975.00
K Lines $6,060.00 $278,760.00 $6,793.80
$2,250.00 $846,668.33 $11,384.40
*Annualized O & M costs are based on an annual equipment cost of maintenance & repair of approximately 5% of materials cost. Labor to operate irrigation of hand lines is based
on 1 person 2 hours per day 7 days per week for 180 day irrigation season at a pay rate of $30/hour/person. A single harvest removal and reset cost (approximately once every 9-12
years) is assumed to require 2 persons 8 hours for removal; and 2 persons 8 hours for re-set of hand lines. Labor to operate irrigation with K Lines is based on 1 person 1 hour per
day 7 days per week for 180 day irrigation season at a pay rate of $30/hour/person. A single harvest removal and reset cost of K Lines (approximately once every 9-12 years) is
assumed to require 1 person 8 hours for removal; and 1 persons 8 hours for re-set of hand lines. Single poplar harvest event is not included in the Annualized O & M cost above
NOTE: Costs for irrigation equipment and installation are based on estimates provided by Cascade Pump and Irrigation of Bend, Oregon based on similar acreage size projects
where applicable.
Summary Phase 3
52
38
Summary Phase 1
Summary Phase 2
46
Reuse Improvements (HGE, Inc)
The above costs were evaluated on a per acre cost for each phase of effluent irrigation.
The estimated annual power cost per phase is shown in the table below assuming a cost of $0.06
per kilowatt-hour (KwH):
Table 14. Estimated Annual Power Cost for Irrigation (Poplar Trees)
Phase 1
Irrigation Mechanism Acres Cost @ $0.06/KwH
Hand or K Lines 48 $1,932.84
$1,932.84
Phase 2
Irrigation Mechanism Acres Cost
Hand or K Lines 32 $1,352.94
$1,352.94
Phase 3
Irrigation Mechanism Acres Cost
Hand or K Lines 46 $1,546.26
$1,546.26Summary Phase 3
Estimated Annual Power Cost for Irrigation
Summary Phase 1
Summary Phase 2
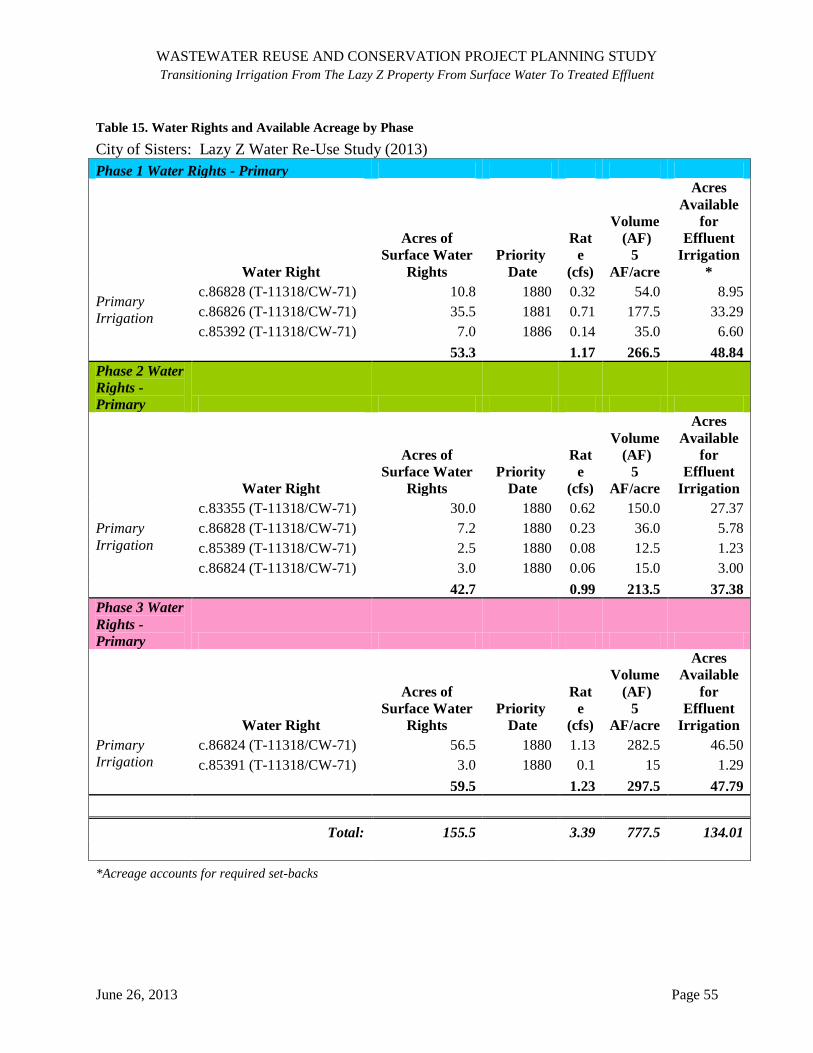
WASTEWATER REUSE AND CONSERVATION PROJECT PLANNING STUDY
Transitioning Irrigation From The Lazy Z Property From Surface Water To Treated Effluent
June 26, 2013 Page 55
Table 15. Water Rights and Available Acreage by Phase
City of Sisters: Lazy Z Water Re-Use Study (2013)
Phase 1 Water Rights - Primary
Water Right
Acres of
Surface Water
Rights Priority
Date
Rat
e
(cfs)
Volume
(AF)
5
AF/acre
Acres
Available
for
Effluent
Irrigation
*
Primary
Irrigation
c.86828 (T-11318/CW-71) 10.8 1880 0.32 54.0 8.95
c.86826 (T-11318/CW-71) 35.5 1881 0.71 177.5 33.29
c.85392 (T-11318/CW-71) 7.0 1886 0.14 35.0 6.60
53.3 1.17 266.5 48.84
Phase 2 Water
Rights -
Primary
Water Right
Acres of
Surface Water
Rights Priority
Date
Rat
e
(cfs)
Volume
(AF)
5
AF/acre
Acres
Available
for
Effluent
Irrigation
Primary
Irrigation
c.83355 (T-11318/CW-71) 30.0 1880 0.62 150.0 27.37
c.86828 (T-11318/CW-71) 7.2 1880 0.23 36.0 5.78
c.85389 (T-11318/CW-71) 2.5 1880 0.08 12.5 1.23
c.86824 (T-11318/CW-71) 3.0 1880 0.06 15.0 3.00
42.7 0.99 213.5 37.38
Phase 3 Water
Rights -
Primary
Water Right
Acres of
Surface Water
Rights Priority
Date
Rat
e
(cfs)
Volume
(AF)
5
AF/acre
Acres
Available
for
Effluent
Irrigation
Primary
Irrigation c.86824 (T-11318/CW-71) 56.5 1880 1.13 282.5 46.50
c.85391 (T-11318/CW-71) 3.0 1880 0.1 15 1.29
59.5 1.23 297.5 47.79
Total: 155.5 3.39 777.5 134.01
*Acreage accounts for required set-backs
WASTEWATER REUSE AND CONSERVATION PROJECT PLANNING STUDY
Transitioning Irrigation From The Lazy Z Property From Surface Water To Treated Effluent
June 26, 2013 Page 56
FINANCING OPPORTUNITIES – CONVERSION OF SURFACE WATER RIGHTS TO
INSTREAM RIGHTS
Valuation & Feasibility of Transactional Opportunities
This section provides some historical information on water transactions and a range of estimates
for potential transactions the City may consider. The valuation of water contains many variables
and needs to be looked at on a case-by-case basis. Important variables include specifics of the
water rights in question, including location, priority date, rate and duty (allowable application
volume per-acre over an irrigation season), as well as current market demand for the water. In
some cases, third-party appraisals are required. Thus, this discussion should be viewed as a tool
for the City to consider their options, not as a firm valuation of water rights. Extensive due
diligence is required as part of individual water transactions. This section also briefly discusses
the current feasibility and utility of each opportunity.
Permanent Transactions
Permanent Restoration Transfer
Several Whychus Creek surface water rights have been acquired over the last several years
within the range of $4,500-$6,500/acre. The value of surface water rights for restoration are
heavily-dependent on the specifics of the water right, including point of diversion and return
flow from source stream, priority date, rate and duty. It is also contingent on what a restoration
funder is willing to pay to purchase the water rights, based on variables like how important the
outcome is to the funder and the price of other options available to generate the water instream.
Any permanent purchase of water rights requires extensive due diligence on the transferability of
the right and its value. While permanent transfers can take several years to get finalized through
the State, it is possible to get paid up-front upon execution of a purchase agreement with a
funder.
There is a well-defined and active market for permanent restoration transfers in Whychus Creek.
It is anticipated that funders exist in the near term to invest in this activity. In the next decade, as
restoration interests get closer to reaching the current instream water right target in Whychus
Creek, and as the Pelton Fund gets spent out, this market may decline. Permanent restoration
transfers represent the highest value opportunity for the City.
As a policy, Three Sisters Irrigation District does not allow district water rights to exit the
district, including permanent instream transfers. In 2001, the owners of the Lazy Z Ranch (Lazy
Z Partners, LLC) entered into an agreement with the Three Sisters Irrigation District to include
442 irrigated acres within the property into the irrigation district’s service area. This “Inclusion
WASTEWATER REUSE AND CONSERVATION PROJECT PLANNING STUDY
Transitioning Irrigation From The Lazy Z Property From Surface Water To Treated Effluent
June 26, 2013 Page 57
Agreement” also allowed for 201.2 acres of water rights, within the 442 acre area, to be excluded
from the irrigation district. To date, 63 acres have been “excluded” from the irrigation district
which leaves 138.2 acres remaining that are available to be removed from the irrigation district.
Thus, the City presently has the ability to exclude 138.2 of its 155.5 acres from the irrigation
district, opening up the potential to permanently transfer those water rights instream. Further
conversation with the district would be required to assess the feasibility of excluding the
remaining 17.3 acres of water rights on the City’s Lazy Z property.
Permanent Mitigation Transfer
No data on the acquisition of permanent mitigation exists to our knowledge. Several landowners
have transferred surface water rights instream to generate permanent mitigation credits, but to
our knowledge those mitigation credits have not been sold to mitigation buyers.
While there is not currently an active market for permanent instream transactions that result in
mitigation credits in Whychus Creek, transferring Lazy Z water rights instream for its own
mitigation needs may be a cost-effective way for the City to fulfill its own mitigation obligations.
The City would need to consider its projected mitigation obligation, assess the costs of
alternative ways to meet these needs, and consider the opportunity cost of holding onto the water
rights.
Allocation of Conserved Water
Restoration funders have invested in Allocation of Conserved Water projects within Three
Sisters Irrigation District. OWRD requires that 25% of the savings are protected as an instream
water right. Restoration funders can invest in efficiency projects to protect a higher percentage of
the conserved water instream.
Attracting conservation investment by restoration funders as part of a long-term effluent
irrigation plan, however, is uncertain. Potential restoration buyers will likely question the value
of investing up-front in infrastructure to irrigate more efficiently with surface water when that
water may ultimately be transferred instream. The cost of setting up a surface water sprinkler
irrigation system in advance of an effluent system would also need to be considered.
The USDA Farm Bill has an EQIP Program that is designed to cost-share with landowners on
on-farm efficiency projects. While that program has been successfully used in Three Sisters
Irrigation District, municipalities are not eligible to apply to the EQIP program.
WASTEWATER REUSE AND CONSERVATION PROJECT PLANNING STUDY
Transitioning Irrigation From The Lazy Z Property From Surface Water To Treated Effluent
June 26, 2013 Page 58
Temporary Transactions
Temporary Instream Transfer (10-50+ years)
To date, there has been no investment by restoration funders in temporary instream transfers in
Whychus Creek. The level of interest from restoration funders in this type of transaction is
uncertain. A temporary transfer would likely attract greater investment than an annual lease
because it ensures water is instream for a longer period of time. Because it provides no
assurances, however, that the water will be permanently protected instream, it would likely not
approach the value of a permanent instream transfer. Funders would most likely value this
approach more highly if it played a functional role within a longer-term restoration strategy in
Whychus Creek.
This approach would build in long-term flexibility for the City to make future decisions about its
surface water rights, but the interest in and value of the water would be markedly less than a
permanent instream transfer due to the future uncertainty of the water.
Instream Leasing
The Deschutes River Conservancy actively funds leasing in Whychus Creek, and pays $7/acre-
foot for water that is protected instream. Because Whychus Creek is over-appropriated, the
actual volume of water protected instream per acre of irrigation varies widely by priority date.
Depending on the priority dates of the water rights the DRC has leased historically, the payment
has ranged from $21-$38/acre. For the purposes of this report, based on the priority dates of the
City’s Lazy Z water rights, we estimate that the City would receive at least 5 acre-feet per acre,
or $35/acre. The DRC is unable to pay public entities for leased water. If, however, the City
submitted a lease as a temporary mitigation project, the DRC could compensate for the lease.
District patrons who lease instream are still obligated to pay annual assessments to the Three
Sisters Irrigation District. These assessments are based on the acre-feet per acre delivered on-
farm, or protected instream in the case of instream leases. Thus, the City may choose to lease less
than 5 AF/acre instream, which would reduce the City’s assessment, but would also reduce the
potential lease payment.
The DRC has done split-season leases with Three Sisters Irrigation District, and pays the same
$7/acre foot for water protected instream. Because the water is leased for only part of the season,
the compensation is lower than a full-season lease. However, since the DRC is unable to
generate temporary mitigation credits from split-season leases, it would be unable to compensate
the City for a split-season lease. The City would also incur additional costs with a split-season
lease because the OWRD requires weekly monitoring and measurement of water use.
WASTEWATER REUSE AND CONSERVATION PROJECT PLANNING STUDY
Transitioning Irrigation From The Lazy Z Property From Surface Water To Treated Effluent
June 26, 2013 Page 59
Instream leasing maximizes the City’s flexibility with its surface water rights, and protects the
beneficial use of the water rights, however does not provide significant offset to operating costs.
Summary
A permanent restoration transfer of Lazy Z water rights is the highest-value opportunity for the
City with a high certainty of funding, particularly in the next five years. A permanent mitigation
transfer could satisfy potential mitigation obligations, but would not generate revenue to offset
infrastructure and operating costs associated with the effluent irrigation system. A time-limited
transfer may generate some revenue, but the level is uncertain and, from the perspective of
restoration funders, would likely depend on the utility of the transfer within a long-term
restoration strategy. Instream leasing and split-season leasing offers flexibility with water rights
on an annual basis, and protects the beneficial use of the water rights. It does not, however,
generate significant financial value to offset operating costs, and may not have utility as a long-
term solution once effluent irrigation is in place.
Figure 10 diagrams potential water transaction pathways for Phases I and II.
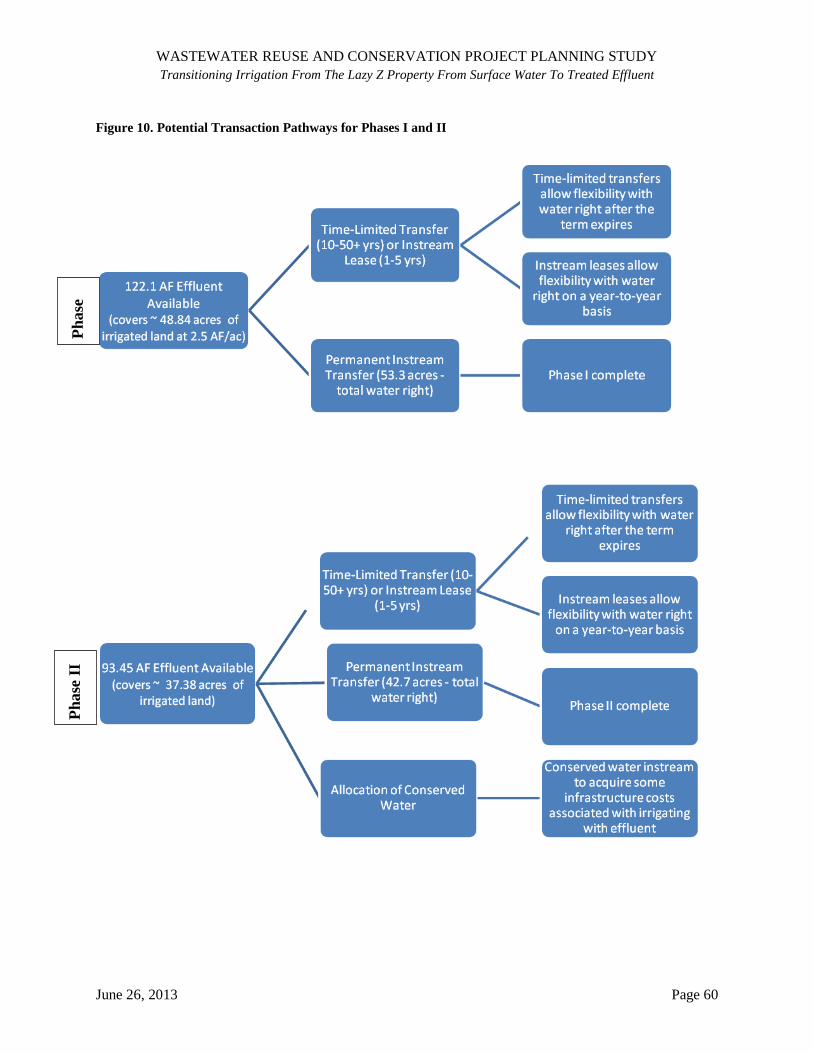
WASTEWATER REUSE AND CONSERVATION PROJECT PLANNING STUDY
Transitioning Irrigation From The Lazy Z Property From Surface Water To Treated Effluent
June 26, 2013 Page 60
Figure 10. Potential Transaction Pathways for Phases I and II
Ph
ase
I e I
Ph
ase
II
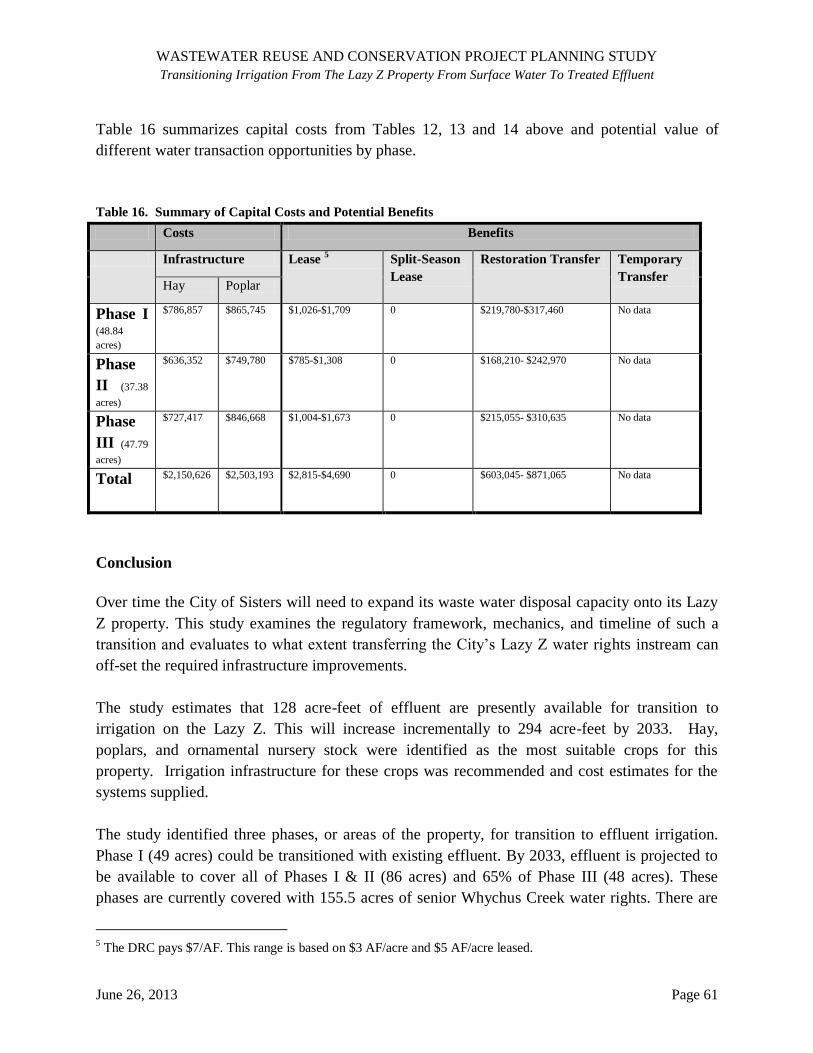
WASTEWATER REUSE AND CONSERVATION PROJECT PLANNING STUDY
Transitioning Irrigation From The Lazy Z Property From Surface Water To Treated Effluent
June 26, 2013 Page 61
Table 16 summarizes capital costs from Tables 12, 13 and 14 above and potential value of
different water transaction opportunities by phase.
Table 16. Summary of Capital Costs and Potential Benefits
Costs Benefits
Infrastructure Lease 5 Split-Season
Lease
Restoration Transfer Temporary
Transfer Hay Poplar
Phase I (48.84
acres)
$786,857 $865,745 $1,026-$1,709 0 $219,780-$317,460 No data
Phase
II (37.38
acres)
$636,352 $749,780 $785-$1,308 0 $168,210- $242,970 No data
Phase
III (47.79
acres)
$727,417 $846,668 $1,004-$1,673 0 $215,055- $310,635 No data
Total
$2,150,626 $2,503,193 $2,815-$4,690 0 $603,045- $871,065 No data
Conclusion
Over time the City of Sisters will need to expand its waste water disposal capacity onto its Lazy
Z property. This study examines the regulatory framework, mechanics, and timeline of such a
transition and evaluates to what extent transferring the City’s Lazy Z water rights instream can
off-set the required infrastructure improvements.
The study estimates that 128 acre-feet of effluent are presently available for transition to
irrigation on the Lazy Z. This will increase incrementally to 294 acre-feet by 2033. Hay,
poplars, and ornamental nursery stock were identified as the most suitable crops for this
property. Irrigation infrastructure for these crops was recommended and cost estimates for the
systems supplied.
The study identified three phases, or areas of the property, for transition to effluent irrigation.
Phase I (49 acres) could be transitioned with existing effluent. By 2033, effluent is projected to
be available to cover all of Phases I & II (86 acres) and 65% of Phase III (48 acres). These
phases are currently covered with 155.5 acres of senior Whychus Creek water rights. There are
5 The DRC pays $7/AF. This range is based on $3 AF/acre and $5 AF/acre leased.

WASTEWATER REUSE AND CONSERVATION PROJECT PLANNING STUDY
Transitioning Irrigation From The Lazy Z Property From Surface Water To Treated Effluent
June 26, 2013 Page 62
several permanent and temporary water transactions the City could pursue with these surface
water rights. Permanent instream transfers for restoration are the highest value opportunity for
the City that could help offset costs of effluent irrigation. Permanent instream transfers for
mitigation could be used to meet mitigation obligations associated with one of the City’s ground
water permits. Instream leases or temporary transfers retain flexibility with the water rights and
could provide temporary mitigation credits but do not generate significant revenue to offset
operating costs.
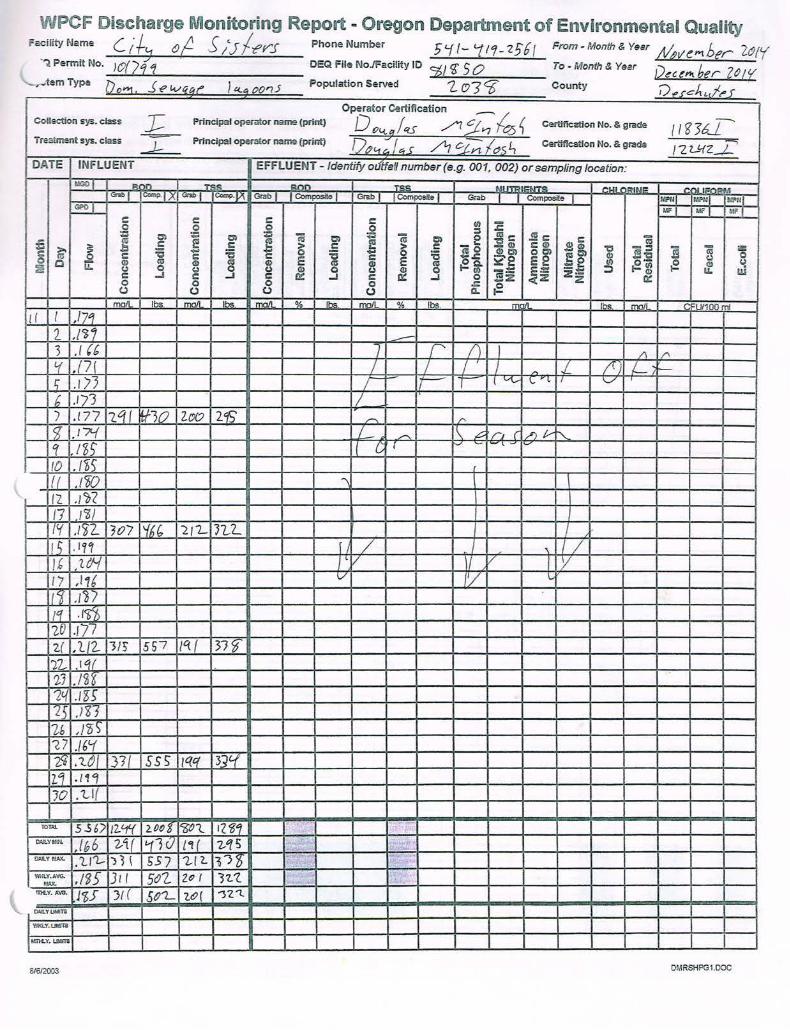
WPCF Discharge Monitoring Report - Oregon Department of Environmental Quality FacilltyName Ci-/- ()~ S;:J/ ev-S PhoneNumber 5'{1 - '-fl"t-'Z!ib( From-Monfh&Year t0vem.ber 2&(<(
·~Permit No. J0(//1 DEQ File No./FacHity 10 ~/ 'l 50 To - Month & Year D~ctrtt ber z~ IV '-...,.-1em Type ~. J e 1.v fi. en"' } &<.q ()()'? 5 Population Served 1.. o5CZ" County /)a_cJ...,J~ .[.
Operator Certification ..-.. k Collection sys. class T- Principal operator name (print) D ()v._q!q_} ./'1 ~J;] 0 ~ Certification No. & grade 1 1~36..1-.. Treatment sys. class -==-- Principal operator narre (print) 1)17<-r: f .. s A t::t:-;;; I~~ Certification No. & grade --,
-1:::_ I '2 7.J-fZ_J_
DATE INFLUENt EFFLUENT - Identify otltfeU number (e.g. 001, 002) or sampling location:
UGO I _a,O_ ~;s_ ...BOll.. TSS ~loll I~INI= C~UI"(')RM Gtlbl CcmpJ~ GtabJ Coo1!>:..1"1 Grab _1 _1 Composl!& I Gra.b 1 1 eompostte J. Grab I I Composit& I J(.Pfll r.!Ptll fr.:.='~l G9D I 1/.FI Mf I I r.lr_l
c c c c 1/) :c 0 0 0 0 :s ; CD ~ = = ;; CD = '; Cl _e ra e Sc _e; ii5 .c g e c Ia
~ c e ~ c :9G> C G> , -:s 3! "; ..,.. :::.. $ ;:; .... :s J:; :s ... :s ~ao G>&:n OCSI rai:S> Q) .!-c 0 c -.c u CIS 0 c c c E c E ~~ ~e se .:::e ~ ~11 ~ Cll ~ 0 0 u: Q) (\7 <D (\7 ~ Ia Cll ~ ~ u 0 u 0 ~ 0 u CJ) cu~ e= z= 1&. 1.!.1 c -1 c ...J c _, c a:: _, 0 -2 <~:Z 2 a:: 0 0 0 0 .c
~ 0 0 0 (J a. ___rm[), ibs moll lbs _lllOll % lbs moll •• lbs. m lbs. mall U/100ml
I( I ,!B_ 2._ .nl_ ---3 ,( (b 7 [ ' f I Ll_ /1
Lf .17{ j_ 1 1 I j_ f l k -c; .I/) r-:- i/ r ( '-"\.- L c I ' \./
w .171 / f--) .177 ?..q{ lff30 zoo 2f{; ,., /'
<l .17<-f j_ "'""' ~ ,c; ·rJ r />vi'\..
'f .IZ5 C I r- r~
Ito . l'b5 f_L f60 '"\ I 1 /2 .J"D( 11 J'i>/ I l'i .I <fl. JOI 'if(, 2!'L J?._l_ j_
115 .11't r / _i lL
'" .ttH JV J/ v I X:: I I ,11t v /'/ L
111 ./~)
l'f .1<:(/) ~0 .177 2.( ,lJ2 .. 1/'5 557 JC{ { 37<j ?.2. .1<1( ZJ .nz ?'{ .1'6.5" '25 yn ~b ,/'bl 7-7 .IN 756 .1.&J )?( SS) jC('{ 'S]l.{
Z.1 . / 'f <)
JO :U(
rom 5.56/ /2.lf{ 2.bOS 'i)O(_ IZ ~i ,
OU.YMI:-! .fb6 2-1{ 1-(h/ l<t ( ~qs "
DAlLY !!AX. .1.1'1- ) ~ \ 557 '2-f L. ~)~ ~
WAY.AVG. , /CJS ]1/ 50?. 2" l 1'l.'l. -"' -.
mt..Y. AVS. J~S ) (( SQ"L 'Z.c9{ "J"Z'l CoM.YIJMilS
YOOY.UI6TS
t.mt.Y. UtfTS
DMRSHPG1.00C

I CERT!i'Y THAT lAM
FAilolllARWITH THE
Notes:
X 22':71 ~5 ~If-Authorized Signature Date
INFORM.4.TION CONTAINED
1H lh1S REPORT N«J
THAT TO THE BEST Of M'f
KNOWlEDGE SUCH
INFORA'.ATION IS TRUE,
COMPlETE IIIlO ACCURATE.
LAGOON AND POLISHING POND
i. I ,,
I/ l 'j \
X
X X X v
IX
v
1....-1
v
{2-/- ty Mall Original To: Oregon DEQ, Bend Office
Name (print)
475 NE Bellevue Drive, Suite 110
Bend, OR 97701 Do~ J q_; /1 ':f~ los~ -----------------------------------
RECLAIMED SEWER SYS. WATER BYPASS
OU!tal __
c 8 e :I 0
ln./Acr Gat H""
1\
\I I \ \ [\
1\ \ \ \ I I
I
tf'\ \
I I I ( \ ,\1 I \ ,, \1 .\"1 \ \ \ \
v '\ )
MAINTENANCE ACTMTIES (CHECK OFF ACTIVITY UPON COMPLETION)
X
X (\
I
.\ X (.<f) \ )(
X
\ ¥ ~7.76
<
y
t--k: \ X
II /.07
J--t \\ '7.1(
IX \ I ...X 71)
LOG Regarding bRakdowns, t>ypuelng.
cdora, compl:lnls, etc.
DAILYUMIT$
WEEK1. v urms MONTH1. Y UMii'S
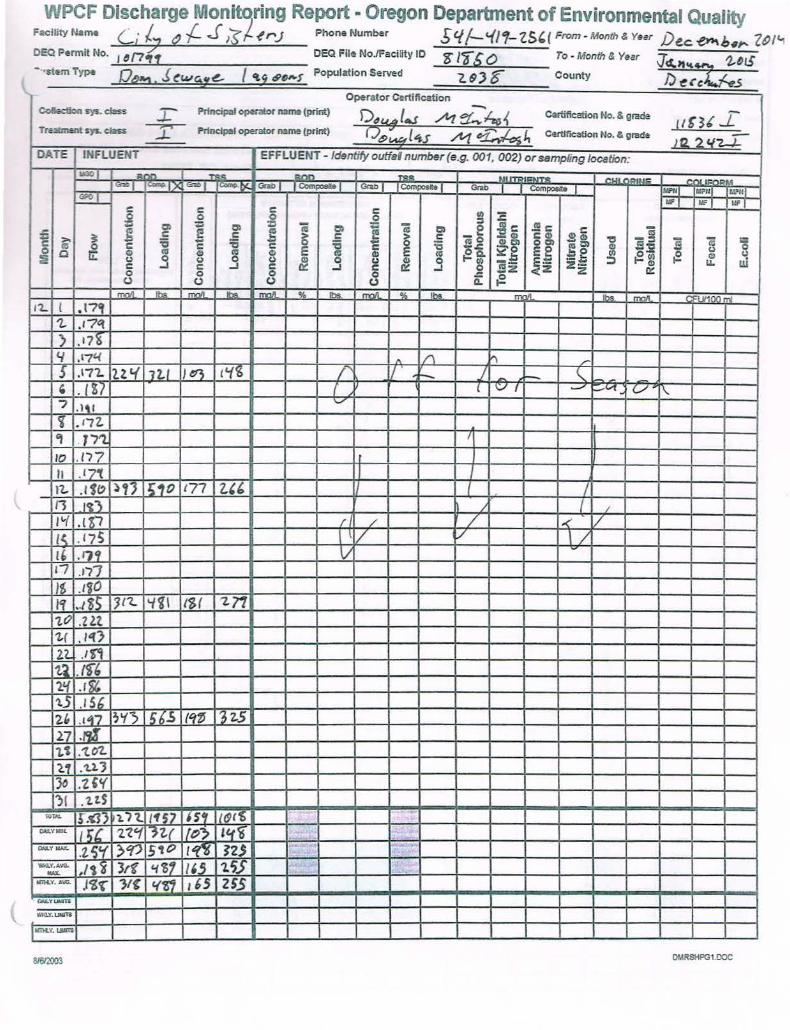
WPCF Discharge Monit9ring Report - Oregon Department of Environmental Quality Facility Name Ci ~ ? {- ..f ;Sf- -tr-J Phone Number ~'{ /-'111- ZS'( From - Month & Year Dec ~b.,... 21)/'-, OEQ Permit No. 1 6177, CEQ File No./Facility 10 Z'/i" S 0 To · Month & Year Jc~.Jt'4 '2-DIS - si T 0. J f Population Served J t" County /) :lJ: ., em ype
~~ (W~ft~ 't~ c9DA-$ ?..9 -e6e :.5 Operator Certification
-... tiC3t .I
Coll;;dloa sys. dass :r: Principal opcrat.or na~ (print) D,~l..s /f-1 ~~< Certiflcafion No. & grade
Tr.:3tment sys. dass ~ Prlndpal operator JWne (print) ot>~L4s /1-1 ~-ks~ Certlflcation No. a. grade ...J_ Hl. 2. ~"2..J-
DATE INFLUENT EFFLUENT - Identify outfal number (e.g. 001, 002) or sampling location:
IQ)I 1'1"\n Tll_C: llnn ~- ... CI-IL IQttJS:: CNI ..... D IG>IbJ !~IX G>D J ~ Gnb I J o:>mposaeJ GtaD I I o:>mposi!e I atab J 1 eompos~~e 1 -I M?IIJ IDIII
~ IAFI LIF I I.!FI c c c c til :c 0 0 s 0 :::s ;:; = = = .. a; Cll = a; Cll _e ~ c ~= <De a; = ~ c e c _g ~ c 2! ~ c -<D C <D ...,Q) ~ -:::s ! '; ~ >- ~ :g .... :s :s - :s 111 0 Q)Q:I o= Ecn S-c c c -.c S2'E ~ (.,) Ill 0 c c E ; E ~~ se _o
~~ ~ ~ 0 Q u: G> Cll G> ~ ~ Cll Cll z:t:
Q) 5 (.,) .s (.,) Cl) 0 (.,) Gl 0 ca~ e~ u. w c c _J c a:: ..J c a:: ..J 0 -z .:t:Z z Q: 0 0 0 0 .c: {:. (J (J (J (J a.. rr.all lbs moll. lbs mall '*' lbs __m::il. % lbs. m lbs mnll UI1D( T1l
11... ( . l7, 'l. ,17~
) .r?_! 4 ,17'{ 1\ 11"'1 h /" s .r11. Ut.f 172.1 }el) I 'if> I !/ ' t- j
I' ,___ , __
' . lS] r { VI - ;;_vt (./ 1\ ., .l\1
'-'
'l J7~
" 77'1 I
10 .117 L II .1 7"( I lt. .If~ )'J l;,o t77 ?.,,, j . I t1 Ltl .L. { /
1'1 .(X/ / L L -< v ~~ .t7S J lL_ v 1/ -,, .rn v It .1'77 It; .tiO
!" •. t~5_ ') {7... ~i\ IZf '2.n tP .U.t 't( .14f}
22. .I~ t1 .If' 1'1 .r~ 1.5 .1 56 2h . t__fl ;v; ~65 ('f~ '_lZ.S 27 .fll_ 1.1 :t0'2.. ,, .'l~J Jo ,t,C( '}{ . '2,t$
lOW. r.<JJ ~·n. 1157 H_t lL6'C$ ,..
QU.YIIifC. I I ~( 'l~tt ,~( lfD} l_l.f_i"
., .... """- .ZJ)'( }e(J 510 l'r'4 1'ZJ WA.Y.kYG. .1~_! 3rt '11>'1 I'S '2.75 ...X.
MlM..Y.A~ .l~'f .,,, '(1Jj ,,5 2S.S
oo.&.YIJOI!n
V.1CLY.LMTS
lllllKY. 1:11<1'3
OMRSHPG1.DOC
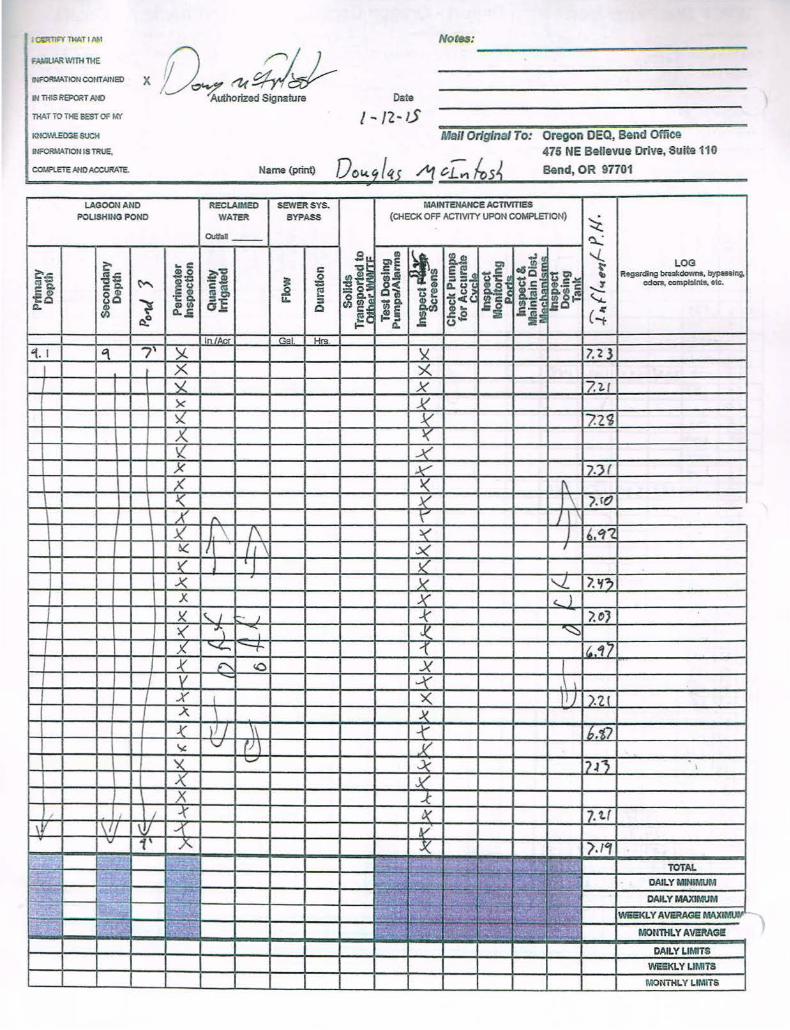
l cvmn''llii'T I /IItll Nots:s:
IN THIS REPORT /ll«J
x{l ~;;!J-~uthorized Signature
----------~--~~~-------
IHFOR!MTIONCONTAINED
Date
lW<T TO THE 5EST OF II« , ... ,2-15 1<1.10\\\.EIY"..eSUCH Mail Original To: Oregon OEQ, Bend Office INFORA'AnoNisTRue, 475 NE Bellevue Drive, Suite 110
l!:ccx~Mi'LETE~-AHD-ACCURA'TE..----------N-ame_(p_n_·nt)_...;.;;D;...;;.o""'!Lc.~/..:.~"--~- ~~ /o51 Bend, OR 97701
LAGOON AND RECLAIMED SEWERSYS. MAINTENANCE ACTMTIES
POLISHING POND WATER BYPASS (CHECK OFF ACTIVITY UPON COMPLETION)
~ outfall --- ~
1! Ill
~~ ~ ~~ ""-.. ~ ... c c '0 g'E
e !i -lj t LOG
~= ~= G>O ~-a 0 ~~ ~s u~.ll! Regarding breakdownS, bypassing.
~0. "'00. ~ l¥ c:.$ s ; 8~
:s:s ~'I: -c: ~
cdonl. ccmpl>li~ etc.
.et! c: Cil ~~ .2 e =g !~
- G) Q.U
~ l:B CD ·- C:
8o :SCI u ... .¥ 't c: i~ t!! ~ ~
·co. u.. :::1 -a. &<X u< Q. ~
G>!/1 ali 0 Cll! fl) s .!,e -~ .ij: _o (~ o?
o...s e t!:s j 1- a. (.)
, In /Ar:r Gal Hrc:. '(. I q 7 ' X 'X 7.2 3
X ><. "- X 7.~ (
>< X ')( ~ 7.2~ X ~ \( X )< y [ 7.'3 ( J( ~ r\ ~ X' \ /. (()
\ X " \""' 1 \ ' X 1\ 1\ :!(' T b.-i"Z t.( I It \ .>(
-, }( I I K" J( X .....;_ i'. lf~
I X X (. ) X:: \. I - ) k ~~J
'<' "'I .... , .( ~ J( '-'-- -r { fZ<tl K f"", <0 .X
I v .._ ~ I
I X ( )( I) ).21 ~ X K )J I \\ --r {,~1.7
"" v (J \ J(
'>( ......,
~ f1i1 ' X X X ...{
I I I
""' ()( ]. t (
\ !\ 11 w ..{ v· v 1' )'. J( )". ,,
l' 'r ' .;, :~ .::" -c.··
I.:·T TOTAL , .... "1': .~ - ;,_ 1?:.:- ' It
. " .,,r li~~.::; ~ DAILY MINIMUM
I" 1--- ~ "~ ..... ..,
·,, ~ ' '"!>'·~ •. • '.;:_ r!;': DAILY MAXIMUM
~ --~· '1l:; · ~ I ·"" >·u-.!i- \.<~.) 1a:~';'· ~t:;!~ I:-. .-.,: I\ ~\:;-~.:1 WEEKLY AVERAGS MAXIMIN'-r~ .!'f.""". j., '{ip·:· 1Vii~.1: . .::[8 k" ~~~:fj MONTHLY AVERAGE
DAILY LIMITS
WEEKI. Y LIMITS
l'f.ONiHL Y LIMITS

WPCF Discharge Monitoring Report .. Oregon Department of Environmental Quality Facility Name L ,· f;;; 0 f 5 ; s It: rs Phone Number s '11- 'i rll[ -1. 5 b ( From - Month & Year J <>..>1 "'Y) 2. "rs OEQ Pennlt No. 10 ( 7 'I''{ CEQ File No./Facility 10 ~/<J 50 To · Month & Year f: ehw<t ?.0/5
Svstem Type i)"M s ~wQ~e_ ~ ~~ ()O "' S PopulatlonServed 1.!93"&" County D~~~?c..f~ f "-,... - Operator Certification
t><H~4 1 cts A ~ .... }o$.4 ---Cclection sys. class -L- Principal operntor name {print) Cettific2tion No. & grade I !8 '3b ./... Tre:lbmnt sys. cbss .L Principal operator nane (prfnt) f5Zfl Ted A~;~s~ CerUflcation tJo. & glade rnqz_£
DATE INFLUENT EFFLUENT- Identify outtal number (e.g. 001, 002) or sampling location: IIGO f)'. R)[) -r.;..ct """"' Tctct Lit I"'UI •DO~te '"'"' "'""' ,..,... ,._. :x !..,.. I 1~1 ): Grot> I I C~:>mp:~ste I Grab l r~r Grab I I eomposu T _, _, lllrliJ ~ - IFf YFI IFf c c
~ 1: 1/1 :c 0 0 0 ;:, ;:s CD = CD i; = = "; CD _e :2 ; J!! c
<li e ii = ~ c !! c ~ > c ~ ~ c C <ll - & , -= ! (ij ~ :>. ~ ;:; ... :s 0 :s :s s~ ~I
O CD 0 .! 'CI c ., £ c c c E c E ~~ ee ~2 Cl) .E i {:
Q u 0 Q <II tiJ 0 tiJ <II (II CD tiJ ::l CD
u.i :! u 0 u 0 (,) Cl) 0 u CD 0 l!z ~i :z~ IL. c ...I c ...J c ~ ...J c 0:: ..I 0 z ~ 0 0 0 0 .:: {:. (.) (.) (.) 0 a. mnll '""' ..nn/i 1~">«. mnll_ % '""'· mall % lbs. m lbs. moll FtJ/100 nl
I I .ZH l ,1.3] 376 7 3l-{ 17'5 3'f G
1 , 2./b L( ,uq {\ /' /) fh.,.,.. I/' s ,/ 'bO lA I L f.- )/<:. P r. " {, .171> /j I I (./
7 , /77 v
~ .171. 3~'{ 5~ I~ lq'f>
'! , 177 10 ./'i! (( .I $J
11. .1'!0 I 7 11 J/6 I I /
l'f fl~ I / 1.5 ,17~ t I / l7 \ / I (p ,t Z7. >'fJ 5'11 t ~O 2.3$ \ / I/ \ I \ I
17 . t~S lj I I I
~~ ,12 7 !/ v v
(~ . I ~I l() .17/ ll /t5
<-L , It I
'2-1 .1/ "l.. JSJ S ~l{ ~~~ (60 ~'-( .ns Z5 ./~ 5 ~ ./72.. ?.7 lbf 7$ .16'1 ?.<t .)6'6
30 ,c'bO )71.. 55~ 16'1 (}( b
31 ,IW lOll<L 5.6,"1 11>~ 2,<(~ ( 1~5( rn~ -
DiU.YMift ./{i JSI 50"( n(J It(~ o:AY"""- .1.3} J 1) /)~ I C(tJ )'{6 'WXl.Y.A.YG. . /~Z. no S <tO J?(} '267> -MAX. IOH.V.A.v:J. ./$'!.. )70 s~o 170 H~ -<I.YL81ts
l'.UWilS
IMTM.Y. L:loiiiS
8/612003 OMRSHPG1.00C

I CliiiTh-"Y ~TINA
FAMILIAR WITH THE
INFORMAOO.'II CONTAINED
IN iMIS REPORT AAD
THAT TO THE EEST OF 1.«
I<NOWl£001: SUCH
INFORMAOONISTRUE,
COMPlET'E AND ACCIJAATE.
Authorized Signature
Mall Original To: Oregon DEQ, Bond Office
Name (print) J)~ 475 NE Bellevue Drive, Suite 110
/ '0 /1 c _1---:,_ ko ~ Bend, OR 97701
~----------------------------------~--------
~. I
LAGOOlll AND POLISHING POND
\
(
X X X
v X )( X X X X
X X X
X
)(
)C
X
RECLAIMED SEWER SYS. WATER BYPASS
outtal --
r (\
v I \
1'-...J I
\II \ v \
c 0 = e :I Q
MAINTEHAHCE ACTlVJT1ES (CHECK OFF ACT1VITY UPON COMPLETION}
X {, .1;7
X
lio9
(\ ?.n J\ \ lt,.'b3 T
.J( I )./0
{.cJ5
)( \ 6. 7! \ \ \ 7.10
IX 7-17
y (.Ill
)(
LOG Reglrdlng breatdowna, boypanlng.
odors, complaltft. elc.
TOTAL
DAILY MINIMUM
DAILY MAXIMUM
WEEl(LY AVERAGE MAXIMIRI'I
MOtnMLY AVI&RAG&
DAILYLIMTS
WEEKI. Y LIMITS
MONTHLY LIMITS
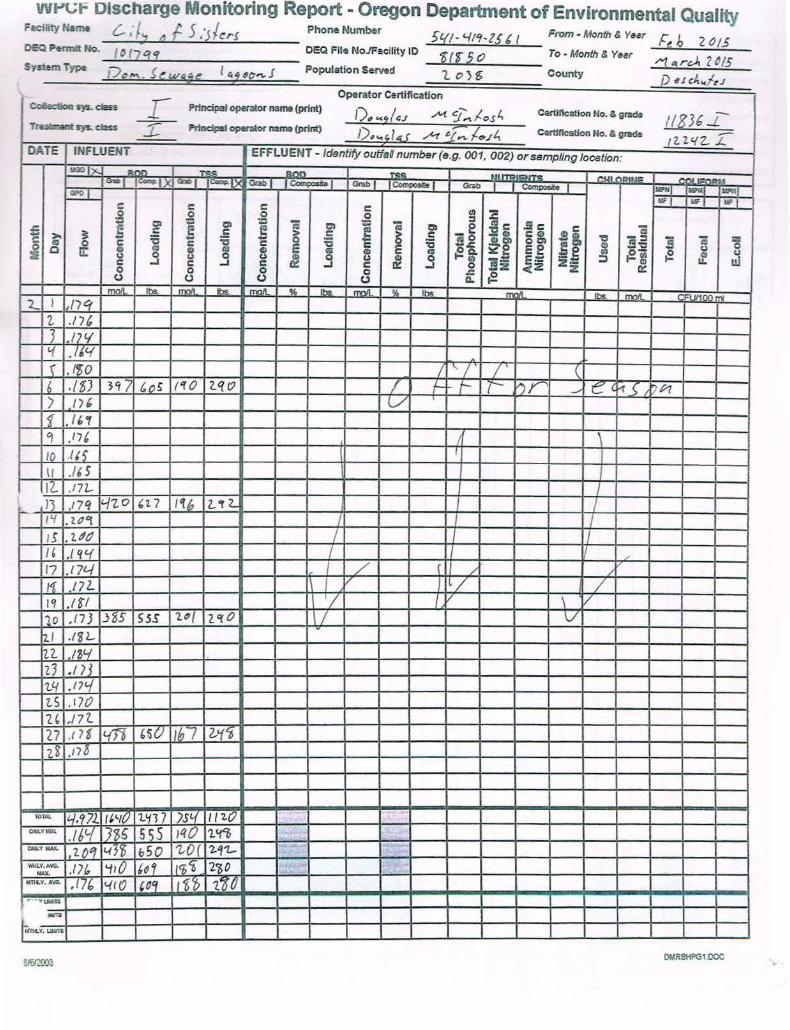
WtJ(.;f" Discharge Monitoring Report • Oregon Department of Environmental Quality FccilityNarm C- ."/, a f 5,)/crs PhoneNumber Sl.(!-41'1-ZSb( From- Monfh&Yeer f:eh 2~1.5 DEQ Penn.lt No. / D ( ) q <f DEQ File No./Facility ID $($"5O To· Month & Year /'j '~ rcJt l b IS
Symm Type ;-:; S ~ w ,. e 1 4 ~ ~""" J Population Served ?_ t:? ) f; County J) ~ 1
cJ.. l o """" . !i ... 2
' Operator Certification Cola:tico sys. dass r Pr1ncipa1 operator name (print)
1),«2/t.;J ~ c.~-:..Jo.s4 Certification No. & grade 118)~....L-Tre:Gnant sys. d3:s:s .r Pr1ndpal operotor name (print} /),...,r.l.: ( ~ et;;_Jeo/4 Certification No. & gn~de lZ. 7.'{2.. £
DATE INFLUENT EFFLUENT- Identify outfsU number (e.g. 001, 002) or sampling location: M130 f)<. RIY'l -;;.., Rl'\f\ ~Q ... I"UI •&:ttole f' r\1-_ll'lli:PH _,
C:O.I)( f<n>l C....... I)< Grab I I ComposD I Gtab I I Compose I Gtab r eompos~e T -I - _, ~ I.IFJ tsl wT c c c c Ill ~ 0 0 ~ 0 ::s = t» = t» i; t» = i; Cl _e -! c ~c CD C «; = ~ c e c e > c ~ ~ c -CII C CII -CD 'g -::s 3 «; ~
>- ~ :s .... :s - 0 :s :s (11 0 GICS) Ot»
~e ..!!!-a c c c --'= ~,g se (,) til 0 c c: e e ~a. Ill
~~ ~ ~ 0 0 !r CD Ill Cll ! CD Ill Cl) (IS
Cll 5 (,) 0 (,) (,) Cl) 0 (,) CD .3 ~ Ez e:~:: z:t:= ::;, &L w c: -1 c -1 c ~ ...1 c IX: c:t2 z IX: 0 0 0 0 .s:: {:. (,) 0 (.) (.) a. mnll lbs. mn/1 liN mall % lbs. mnll -_y; IllS: mill lbs ~ c U/100
1._ I [,t7q 1. .nb 3 .17Cf '1 .li<.f
A
\ . (~0 ' 7 7 ( 6 ./f>J H 7 tos f 'f 0 'l.qo I f- F F br _... e' f-f i P7
17 \ ) 1) 6 11 ,lb"t 9 .17h \
10 .I I) I I
l l ·" s 12.. .172- I n nq t..{~O &n l'tt; l.. 'Y 2.. 7 1-l "f . Zd"t I I IS • 1..dt:J I 16 .( q <.( /
17 .liZ! / /
11 .IlL v / / l<t .ttl r; ,v \ v 10 .173 J55 5SS ?..~{ 7. q O I l7
t?. l .t'gL
u. .1?/-1 7.) . I H 'L4 .171.{ tS ,170
'' ,/77.. 1.7 .tlt l.{f6 ,so Jht b('i
7J .17~
TOTAS.. 14/!71.. I t~ttJ 1..'(1 7 /St-1 1(1-0 OOl.YIIiU .16Cf ]'$S 555 J({0 'L't~ C<a.YIIt.ll.. 7..0'1 Ll}Y) &50 '1,0( '2.1f'Z- "' Wt«..Y.li.VG • '-t10 Co1 It~~ 2"60
,, !lAX. . llh
llnt..Y.AW. .rn 1.{((2 ' d'f I ~<f:> 17/0 , •• V t.MlS
t-~Y.= DMRSHPG1.DOC ..
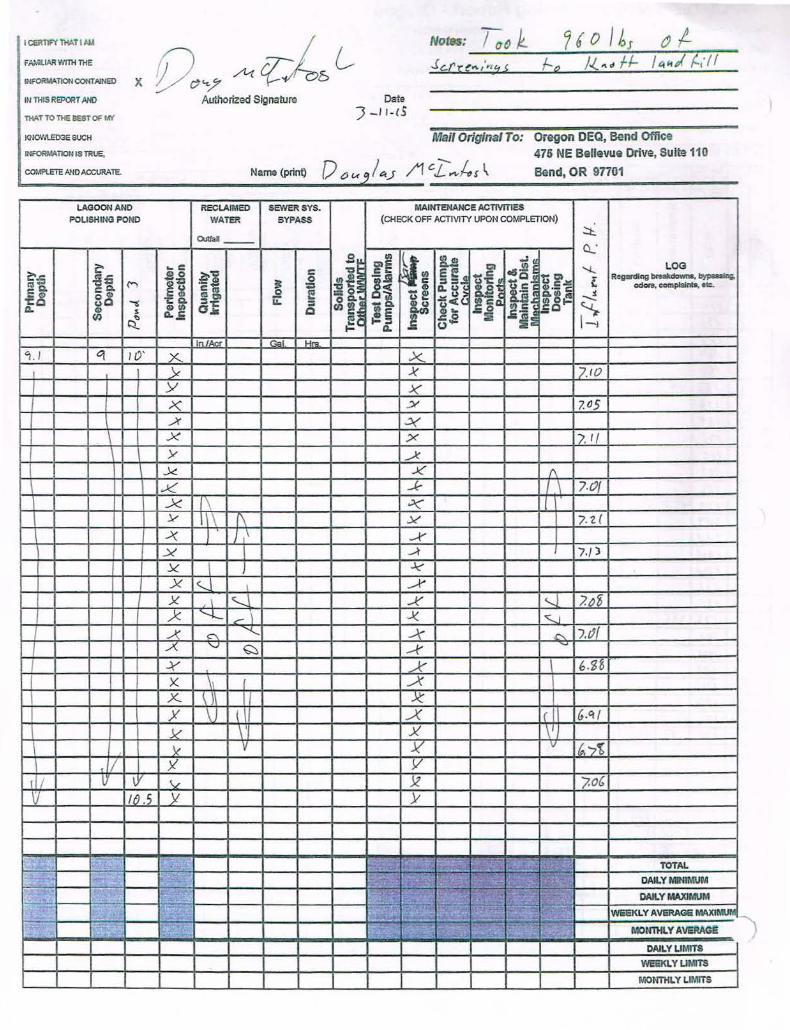
FAMILIAR WllH THE
QIFORIAATIOII COHTAINED
ltJ THIS REPORT AND
THAT TO TliE BEST OF Lf'f
KNOWlEDGE SUCH
INFOIUAATlOII IS TRUE,
COMPLETE AND ACCURATE.
Date J _ ,l - iS
7 6 o I h1 rJ 1-J.!... ,.d fl- /4kp(f..,·f{
Mail Original To: Oregon OEQ, Bend Office 475 NE Bellevue Drive, Suite 110
Name (print) D c; u /c._; /1 c f',,j.~ s ~ Bend, OR 97701
6-------------------------------------~~----LAGOON AND RECLAIMED SEWERSYS. MAINTENANCE ACTMTIES
POLISHING POND WATER BYPASS (CHECK OFF ACTIVITY UPON COMPLETION)
Outta! ~
-- a..:
~il II)
~~ CJlep ~! >. ... c 01E ~- -il ~ LOG
~;i ..
s~ ,&:'= c c .. E,~ .s-! CIJij
("') - ,$ s 0 'i).!li ::s::s u -~ ..; t;~~ f Reg8rdlng-, ~ 1\tQ. 1:JQ. C!)u ;:
8~ -(I) a.u !j1 cdono, complalrD, etc.
.f~ C Q) E <!l ~& £ e ep ,_ c
~ 8o 'CQ. 01~ u ~ ~:ic ~~~ ~ ::S-z: = C/) 2 - ~ r Ja ~ J~ ~ G. CP s Q)CI) 0.:: Q ~ne le .sc
C/) ~
0. ,5 e t!= :; ~~ .... G. (.)
ln./Acr Gal Hrs
~-' q 10' )<.. )<__
I x X 7.10 y X X: :X 7.tJ5 ..X ,:)(
I \ X X 17. 1/ y .....X .k .X (\
,...\:( ..k I ).f)[
X I ~ I I .Y II \ (\ X 7. z (
.)( J \ ......... .X .A 7./) J( k .X ,<..__ I ......-+" X I !"--..\ ...k' <...... ?.~~ )c '-..t_ __. \ ...1( <::....J
A' C'\ ~ .....t .r.... ).tJ{ ./( "' ~ .....r
I .y _X 6.Z8 I I X \, ~
)(_ \} Jt y I I ...X lc (,.q I X' \ X \ X' \ X' v ~ ~-/~
I X y I I u \ 'v )( ?,o& I I{) .5 y y
!;v .. ~~ 1':'.-i-,j l~·rlc.Jo .':,· :~:C'.;~5.1 r~o.TI ri ~ TOTAl J :··~. 1: ='i:} ·i}:~ .... i <>.·~ •• t .. \: II='~"'~~ r.v··~~ ~·~·:::·, DAILY MINIMUM 1;.. li ;~ ~~--:- ·-"!~ f~ 2':: . .:: r:. 't~. r,:·:-'-: DAILY MAXIMUM - 1-~-
' ,!( 1 1.8.-:i~ i i·~f}J 1-~~ I'~ 7 WEEKLY AveRAGE MAXIMUM ·~
r....-,, ;:, . ~ ·- ;'. J. -~····
-~, It 1 MOrmtLY AVERAGI:!
DAILY LIMITS
WE&KLY UMITS
JlftOrmtLY LIMITS
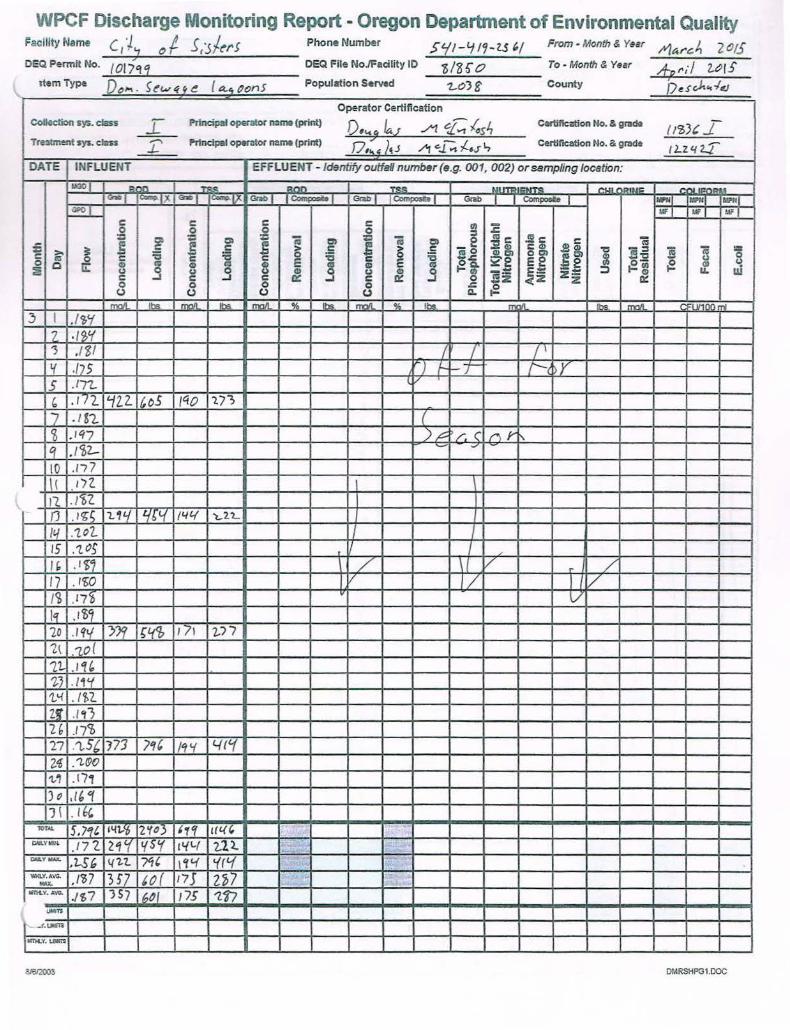
WPCF Discharge Monitoring Report - Oregon Department of Environmental Quality FacllltyName c,·J:; ()t S,"J/~rS PhoneNumber S'fl -"' l? ~tS'I From-Month&Yesr 1'1141"~~ 2()/J OEQ Permit No. (OI/'11 OEQ File No./Facility 10 f>/3 ~ 0 To- Month & Year kt";/ ~~IS
rtem Type D ~ s Population Served '2...0) 8 County D sch .f#) "'"" · ~"" t( ~ ~ a.~ tJon e ..
Operator Certification Collection sy.;. class I Principal operator nama {print) D.I4Q L..l. /1 ~fos4 Certification No. & grade ( I?>)( .J.-Trutnwrt sys. class ......... Principal operator name (print) o/:" ~..s .;<t "-..1.~ /...yl., Certification No. & grade
{1...24 2..T ..1-DATE INFLUENT EFFLUENT- Identify outfeU number (e.g. 001, 002) or sampling location:
1.100 I l:l"\1'\ T~ _BOO ft..<t lUI ~'-II IDtll~ ,. .... ,.,,.. .. f?h" J 1~1~ <hOI 1"-'~ Gnll> I I Composia I Grab I JComplslel Gra.b I 1 eompoe~a 1 _, _,
WHI
~ ""'' wr WI
c c c c (/) :c 0 .2 :8 0 :I = ~ - CD "; en = "; CD _ e !c .!!!c .ei "; = ;= ~ f c ~ > c: 1l ~ c -CD CCD
i -:s i! i! ~ ::0.. :a :a 0 :s :s s ,g CD D) ODI ,g., S -o c IIJ 0 c c: c ~e ee ... <.) <.) E U)
t2~ ~ 0 Q ~ CD IIJ CD :g CD 8 CD ~ t20.. _e :;)
CD u.i 5 <.) .s <.) <.) CD <.) CD 0 ~ i~ e~ z~ u..
c c ..J c a:: _, c 0: _, ct:Z z 0: 0 0 0 0 .c ~ (.,) (.,) (.,) (J a..
mnll
'""' mnll IM. moll " ~ rmii: ~ .JES m:lll lbs. mnll - c~oomr
3 I ./?;'! 7 .f9H '3 ,/ gt I I I' '{ ./75 ') 1->-t- ('--( y 5 .1/L l.
" . 172 Lfl2. lto5 /'iO 1/"';
7 .IS?_ (
~ Yf7 ),c. /:( ('"\ Y' ~ I 'I .11>2-
'- ~
10 .1"77 '\( I)Z ll .t'b'l n .I~< l.'L/ 1.{61.{ (4'{ ~2.'L
ft./ .'1.02. 15 .'?.OS 1/ I I ~ .I $' / \ I v r / 17 .1~0 v 1/ I I v j<f, .17~ _y lq .1~1 '20 .IN YY( {'{b 171 ?.:'>7 ~( .'10(
if .IH ~J ./1"( 1_<{ ./1>2 it .1 '11 lb .17<7> '27 :1St 17'3 ?'f' 1'1 '( t..{[f-{
2'0 .'1..!90 1,..1 .17'1 Jq ,/& ~ ') \ . 16(.
lOTAL 5,/'ff. 1'-lt-<6 2'f03 'T'f 1(1.(' IWI.V- .t7Z Z4C( '{S'f [ 1{'-{ 1..1. 2.. -.v....,. .z..s, l('2.t. ~' I <f'{ 'fr'f WKl.Y.AVG. fl>7 3S7 tO( t7J 2'b7 -.,- :::
MAX. lf11ool.Y. A~ ./$7 )5) IM/ !IS 1.17 ~
\ - ...f.UIIIlS
IITH..Y.~
OMRSHPG1.DOC
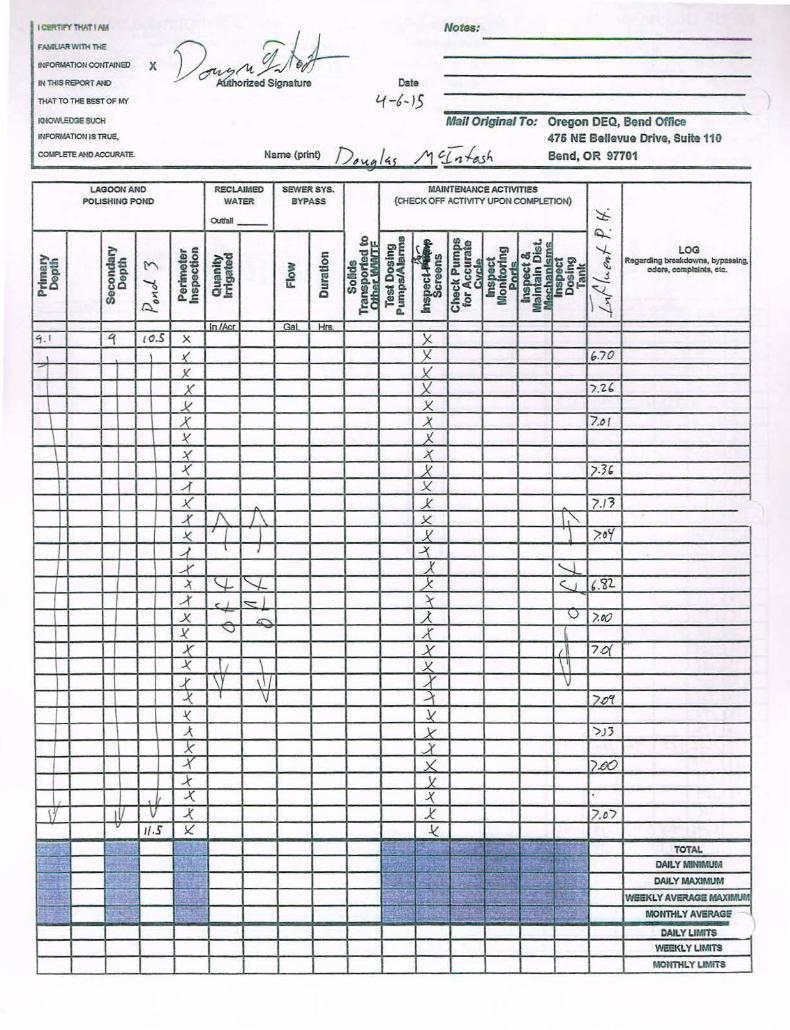
I O:ltTf'Y Ttio'IT I Nd
D~J.~!-Notsll:
FA~o~W-'IWITM THE
INFORI.!ATIOil CONTAINED X IN THlS~T N¥J Date
THAT TO THE BSST OF Pl:f '1-6~J5 ICNOWLEIY'..e SUCti Mail Original To: Oregon DEQ, Bend Office INFORMATION IS TRUE, 475 NE Bellawe Drive, Suite 110 CXlMFlETE NfDACCURAlE.. Name (print) D~ /'1 ~~d..S" Bend, OR 97701
LAGOON AND RECLAIA1ED SEWERSYS. MAINTENANCE ACTMTlES POLISHING POND WATER BYPASS (CHECK OFF ACTIVITY UPON COMPlETION)
Qrttaft -- "::i-
!i Cll
~~ !s
14-.: g'~
..: '..J.. i:!' ~=
~J c 1:1
E~~ -ij e!S.!!l LOG ~ii .a= CDO 0 ~~ ";;.I ... o t;~~ ~ Regard!~ breakdowns, b)IIIUSing. £"'"\ -~ 3: :s:s ~"C ~a. ca. ~(,) :& ; 81 A.CJ u '!~ oclcn, complalniS, etc.
-c! gCD ~ -c:& s e ~,~ C,)e ~(,) ~ -....:!
CJO &:s LL. :s -a. u ucr: !!= ~c.-
\~ A. CD ,. Cl)f/1 Q en~ ~§ .!~ -~ IIIC
A..S .s;-en ~ ~ J ~ A. u--In IAcr Ga Hrs.
'j. I &( I O.S X X K X 6.70 - X X X X ),2,
.J( X \ X .X 7.b(
\ ~ )I_ )( X_ .( )( /-1' ..1 X J( j( ?.(~ ..{ 1\ J\ X
'"" ..\( ( I X "/.O'f _,{ I J :..l( ...-( ..X '-l. )i '4- "-J__ _,X '-..1 , .~l
..-{ -:_ _1_ s:::_ ! ~ )( ,c-o.._ .A v "?.«J X '-'
"" -K .X { 7.o( J( I \ X i .-r \Y '\I .X ~ v ~- /tff .l( )( ); x '>JJ .k .X -K )( /..{)() .-\' k'
I
""' )(
v .X X /.D 1/.S >( ~
'"-"" ~ ,;-J,..._,., ,.;r&:
~ ~:;.6 L:i.~ ~--~ TOTAL
'-"'"· '~,:~ ,,;~~ .::::2 . .:.:: ~~ li~ SV.:if:-]l DAILY MINN.IfA ;_ ~::.:?,! l",;.:tJ.·.:": . lc•
.~ ••· .. c ~·r5,'o DAILY MAXIMUM
;::,_ -• _::,~~~ I~ ·::'t T':.. ;:~-':: ;~·:·~~ weEKLY AVERAGS MAXIMUM ~ ;. ::, ~ _'i: .~ 2 -~ '~!': 1 :'.:72!~: ~J-. MONTHLY AVERAGJ:
DAILYUrMTS
~YLIMITS
MONTHI. Y LIMITS
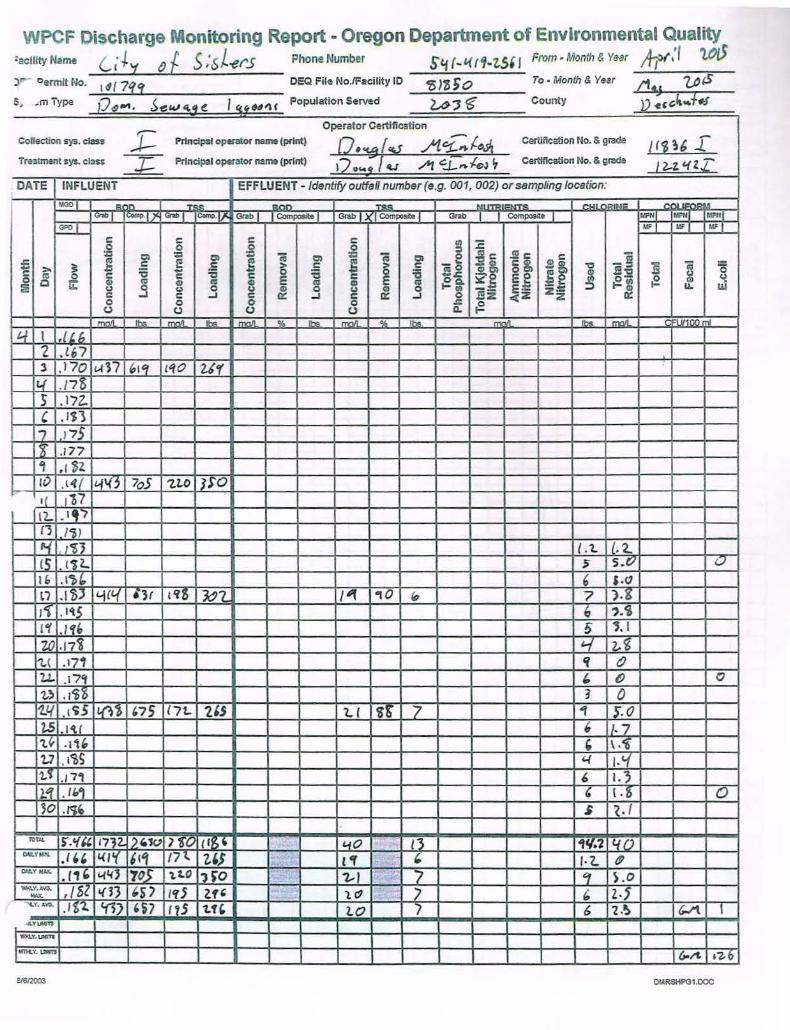
WPCF Discharge Monitoring Report - Oregon Department of Environmental Quality :acfllty Name (,j J't () { 5 :sJ-er..S Phone Number S't f~l{riJ-tS' ! From · Month & Year Aft.'l 'U?tJ y - · oermit No. 1 d ( 7<?<t' DEQ File No./Facility 10 "5 )3, O To · Month & Year /1":J ~iS
S m Type Q .} Population Served 2,.6 "J tg County l) ~ f.; ' ~
1 ~""'· 1!:kl~4~ q'"H~f .,& ..
J: Operator Certification
Collection sys. class Principal ope;"ator nama (print) Q,~ f~ /lci:f.~tJ Certification No. & grade -Ui ~6 -L ireatrnent sys. c lass _::1:::_ Prtnapal operator name (print) 1/ o ... t_ 74..1 _..,.., GJ.-~ lcJ ~ Cert111catlon No. & grada [2.:z. "{ 2.£ DATE INFLUENT EFFLUENT- Identify outfaO number (e.g. 001, 002) or sampling location:
0001 ~:~ nn .,. ,., <>nn '"'"" --ru. ...... u: rNu:nA Grao I Camp. ,)' [Gnl>l ICOir4>·1J" Grab 1 I Composite I GrabT.) :'! COmposite f Gr.tb -r l COmposite l MPNJ MPNJ - I
~ I.IF I I.V' J I.IF J c c c c ! :c 0 0 0 0 :c
~ ;::: = ;::: ii = = ii = e .ac .!!! c _e; '; -= ~ G ~ g C CI> .... :it: .. c ~ c
~ c -o -«~» ~ -~ !§ iV :g
c :>. :e .... :s :s :s s -'= ~e OC»
g~ 3l s~ G 0 c c c c ee (.1 0 0 Ii: «<t ~ «<t G «<t E CIS «<t G ~ ~ ~= {2 Ql "'! 5 u u 0 u «<t 0 (.1 «<t 0 ca~ e.: z.: :::;) 1&. w
c c ...J c ~ ...J c ~ ..I 0 -z <Z z ~ 0 0 0 0 -'= ~ (J (J (,) (,) Q.
moll lbs. mo/l lbs. mall ~ lh<; nnll ""' lb!<. m ltK mall CFLV100
4 t .li.& "2 . lh7 l ,) 70 ~n ~l 'f I 'tO ur
f.{ .178 ) .172.
' .1$1
17 175
iZ' .177 'l · ' $~ 10 .l'l( £1'{5 7oS "'Z.LO JS'O I{ ,o7 IL .I , '"? n / "6) Pi I ~J {. t. I. '2.. cs I"JL. 5 5.C7 (.}
lb .I$" ' '·" n .t$J £1('{ i}r t 4l3 ~1 /"f .,0 (g 7 ),g
11" .1'\5 6 ?.1 ,, .l'lb 5 '·' 20 .J?i 1.-{ z."I 't.( .171 tt & u.. .17<t ' (f) 0 'l,.} .J$8 3 0
'l_l{ . 1 ~.5 l~l ,75 l7t.. 'l.U t.( sr 7 1 s.o 1.5 .I 't ( (, 11. 7
't" ·11~ ' \.i" t.7 .• ~s 4 J.'-1 u .171 ' 1.3 li .Ill'! ' l . g- 0 30 -l'ib s ?,. (
101>1. ).'{" 17?2. [24W ')fO t iK~ '"tO l3 1t(.l 1475 W.YI£!< .I" ~I'( t l'f /7l... 2,) l ~ ' I·"Z.. " -YIWC.
. l1' '14} '105 l.Z.O ., ro I t~ "'1--1 7 Cf ~.0 'Ma..Y,Avt;. ,/ Sl l£33 'S' t f( 5 Zf' I""" 1. «=' / ' 2·1 OW<. , Y.AW. .1$'1. '11) '57 ft5 u' to ) 6 '2·~ W\ I
1 4YUiolltl
11nQ.Y. UIG1'a
Mllt.Y. U!lilm {,.A •OZ. 6
DMRSHPGI.COC
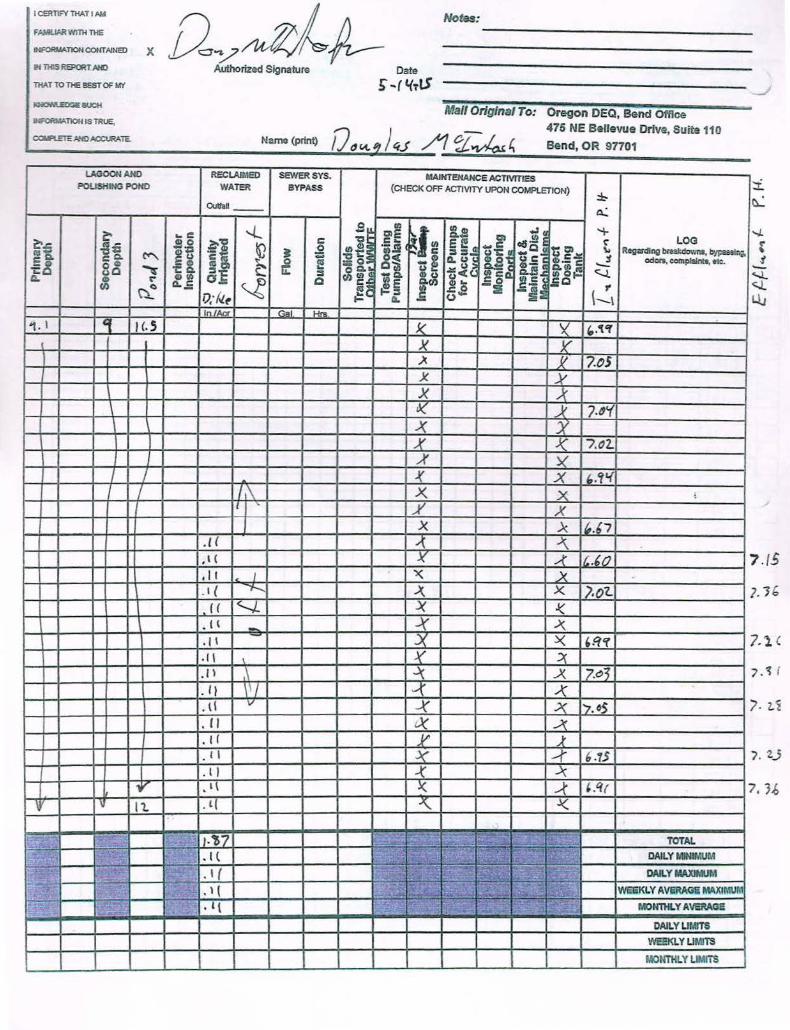
I CERnFY THAT 1 NA
THAT 10 THE BEST Of Mf
LAGOOHAHO POUSHING POND
q I C. S
\ 1
I
I
Not$$:
---------------------------------~ Mall Original To: Oregon DEQ, Bend Office
Name (prtnt) 475 NE Bellevue Drive, Suite 110
f./d~ J~J ~--~~~~~~----B-en_d_,o_R--97_7_01-----------RECLAIMED SEWER SYS.
WATER BYPASS
ClultaU __
g = e = Q
In /Acr Gal !-mo.
/I\ I' ,
. ll
,,; . : . . \ ( ·;I ,q
MAINTEHANCE ACTMTIES (CHECK OFF ACTIVITY UPON COMPLETION)
X y )t v 7.05 X /
X X % )(
TOTAL
DAILY MINIMUM
DAILY MAXIMUM
MOtm4LY AVEAACU:
DAILYUMITS
WEEKLY UPIJTS
MONTHLY LIMITS
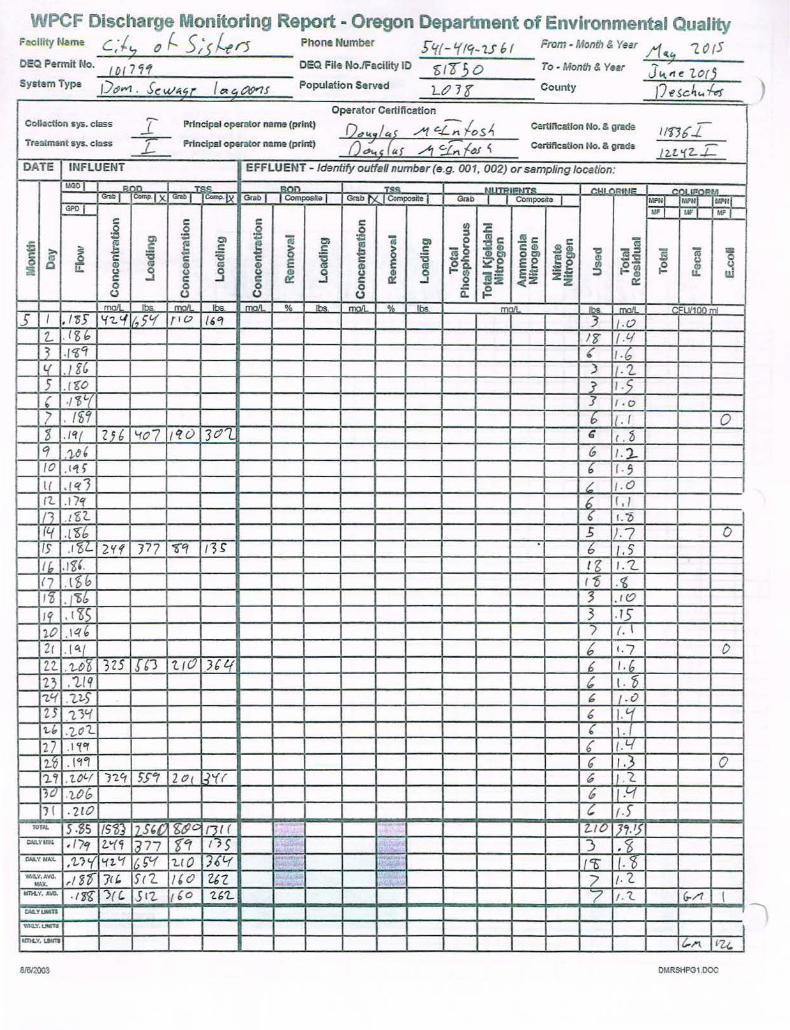
WPCF Discharge Monitoring Report - Oregon Deparbnent of Environmental Quality F~ility Name C: /. J ~ (-. 5; f le r5 Phone Number J"l(( _ '( fct- 7..J 6 ( From- Month & Year /'( l{.ft 7.. 0 ( 5
OEQ Permit No. I{) 1 7 'i 1 DEQ File No./Facility 10 f) 1 '[" 5 0 To- Month & Year J 1'1.~ e tor J System Type /) S, aYl Population Served Lt? ] ( County J) ~ -f.es ) &.,., . <:WA'ir et4 s e.sc. ...
Operator Certification CoiiGction sys. class I Principal operator name (print} of!. ... ,./ c.~ ~ c..L--;: los~ Certification No. & grade lt'f'Jb"I Treatment sys. class
--,.-----Prlnclpal operator name (print) ()~t;7uf ~ c.:Lnl~ ~ Certification No. & grad& -J_ / 2.t '(Z. ..L
DATE INFLUENT EFFLUENT - ldentffy outfall number (e.g. 001, 002) or sampling location:
LIGI) I BOD T~c; Rnn T~.!'l "'' t'LLORIN~ ....... ~..;;;; 1"""'1 (CC>tnp.( )C. 1.....,1 1""""'·1>1 cnb I I Compos~ta I G<ab r> . 1 Composite I Grab I I Composite I MPill MrN) f.~rtll
~ MF( ....... MFI c c c c Ill :c 0 .2 0 .2 :::J :o:s g) - a! !z:s '; g) - '; = 0 -8c ~c G>c -m £ s ~ c:: I! c:: ~ > c l!
~ c: ti~ -CII CCII 'lG& -g -:::J 3 "(5 ~ c:: >- :s - :s 0 :s - :s Qltn o m S-a Ill .2 c c c E c -.c ~g EE .. o (/)
~Si ~ (,)
~ 0 Q CD (Q 0 ca Q) :J CD ~ ~Q. -.. CD :iii u. (,) 0 (,) 0 (,) 01 (,) & ~ 1§2 e= z: ::;) u. w c _. c _. c 0:: _. c 0:: _. <z z 0:: 0 0 0 0 .: {2 (J 0 (.) 0 a.. mall lbs moll lbs man: % bs malt % lbs. m.il lbs malt C:lll1nr n1
s I .t~S '-(7......, lr.5'f (10 {6"1 J / .0 2.. . ( g f, 1'6 f_l{ 3 ./'b'f ~ l·b '{ .I gr, ) .'2. 5 .(8'0 J 1-5
' ·! ~(.,.( ] (, 0
7 . [f/1 6 { . ( 0 z .I 'I ( - Zjb '107 I q () ]c?1 b ( . l> q 'l-"' G /. J_ {0 .l"t ~ b r. 5 I ( ,( q) ~ f.O rz. .17'!' b I .I Ff . l ?;Z.. ~ r.£5 I fl.( .t f>"b .5 J-7 0 IS .i'6l... 2'{11 177 ~'1 " ~ b /. 5 li: .JZ'- I tg 1.'2.. l7 .l~b t'5 .<g T~ .(bb 3 ,(V
Jq • t 'b5 3 .15 ').() _l(( h I / . I
21 .1 4 ( b 1.7 ()
22. . t-19~ 325 ISO t (0 )CL( b /. {, 1.} ."2-19 c ( . ~ 7H . 1.1,) 6 ,.o Z5 .11'1 & 1. Lf 'l-~ .1,.c?'t ( 1- f 2/ .I <(Cf ( (. '-{
2.~ .(<j") ~ 1.3 0 1.'f . Ufl.! ncr ~ser 2 C?( L-? 'f r G I .'-. 3tJ .tOG 6 U1 J I -2l0 c r.J
li>TAI. 5$5 /51>1 17 s'c: lg'&C irJ {( ~· l./0 }1.'5 0
11.\a.YU:n ·ll&f l."('i 1377 '{'1 os ) . <i$ ' twi.YW.tJt. ,t-J'( '-( 2. '1 &N 7...10 ')ll.f (<f) /. ~ Wn'l.Y.AVO. ,/80 ]({,. Sr?... ,,o U?. ? t-'2. ...... IIM.Y. AVO. .fztl ) ({.. JI'Z. r &o 7.6'2.. 7 /. 1. (r/1 l GOI.YIMtl
,.lQ.Y.uwn I KnoL y. LAIInW t..l"\ vu. I
OMRSHPG1.DOC
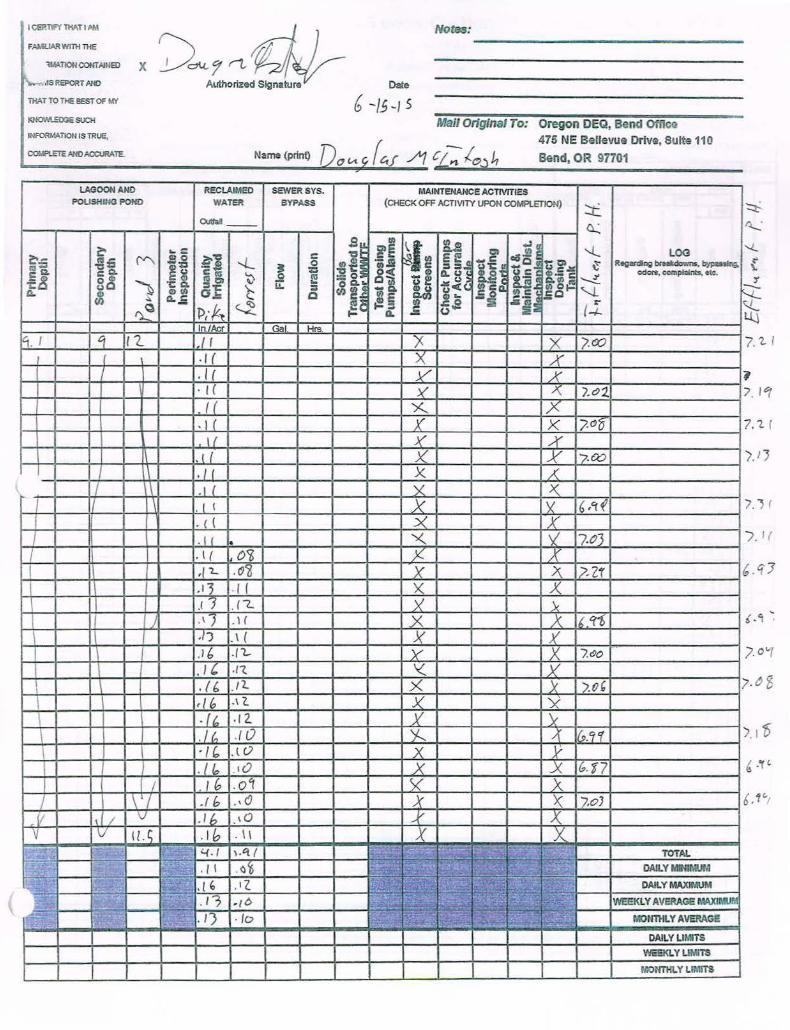
I CERTIFY TIY.Tl AM
FAA'IUAR WITH THE
-TlON CONTAINS>
• dS REPORT AI«J
THAT TO TIE SEST OF MY
Notes:
Mail Original To: Oregon DEQ, Bend ~e tNFORJMTIONtsTRue. 475 NE Bellevue Drive, Suite 110
LCOK'tETE ___ NI_D_I'COJAA __ :n:. _________ N_ame_(p_n_·n_t)...:..:;~;.,;.i:..:...(4;.;;f~~__;. c.t_: /C)..)£, Bend, OR 97701
LAGOON AND
POUSHINO POl«> RECLAIMED SEWER SYS.
WATER BYPASS
outtaft __
MAINTENANCE ACTMTIES
(CHECK OFF ACTIVITY UPON COMPLETION)
LOG ~ Repcing brukdowns, ~ {
odors, ccmplal."lts, etc. .,. --
~~--~~~--~./~(4--4--4--+--+--+~y~--+--+--~A~~~--------~1 -1c x x: /.CJ1. 7. 'cr . If ~ X
i\ .I ( X >(
v v (/.~ .ih .11 X X
DAILY LIMITS
WEEXL Y UMITS
MONTML Y LIMITS
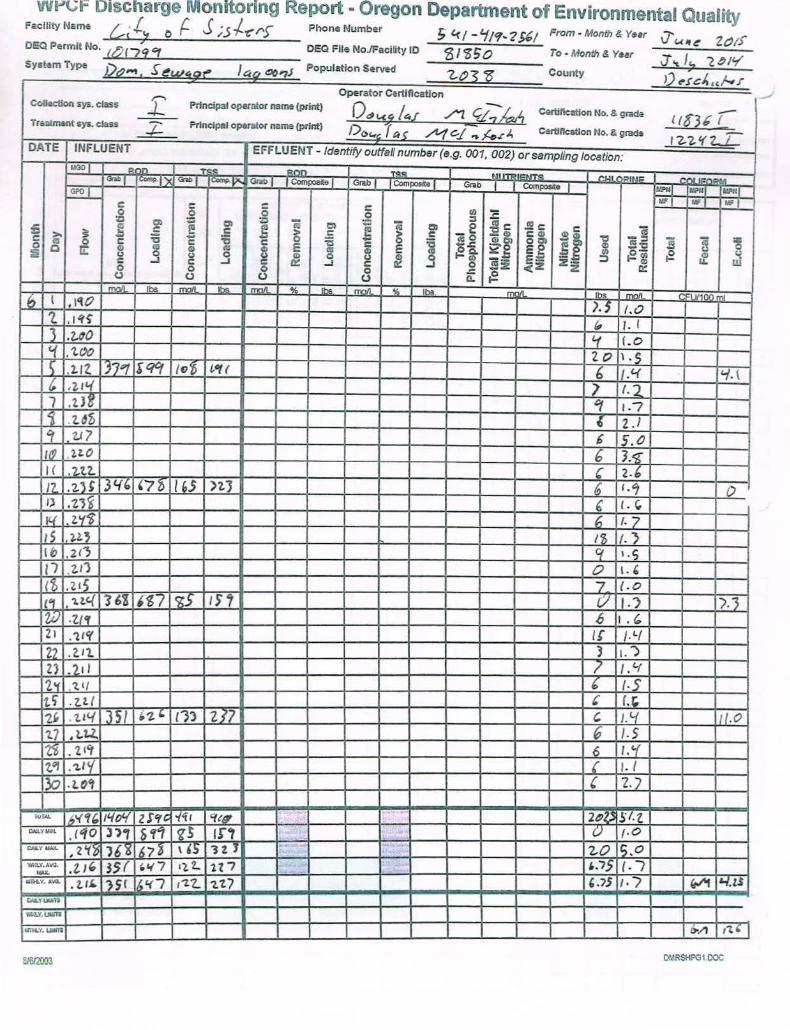
Wt'GF Discharge Monitoring Report • Oregon Department of Environmental Quality FacllityName Lei·(, 0 {. J;5 .j...~1"f PhoneNumber 5"c l - lf!<f~?S6! From - Monih&Year V{..(lf ~ tot> OEQ Permit No. { t!) ( ...,~ cr DEQ File No./Faclllty 10 z I z 50 To • Month & Yellr J' I~ 'Z ~ !'i" Sy$1em Type Dt?,.., s ~_Wti_O_~ I~:< o eJD "'J Population Served
'-t>3 "5 County Q ~.rc~"f.,r
Operator Certification ,...... PrfncfP31 operator nama (print) o ... l.<~ ;4[. - Certlncetion No. & grada -Collection sys. class ..)_
./'1 Y£2/oA l{$'3~ ( Tr.utmentsys. class z Prfnclpal operator name {print) Dow~; f~u_ w:::
Certification No. & grade ./1-1 c. .1 .. ~.r J, I '2-7, l( z..L DATE INFLUENT EFFlUENT - Identify outfs/1 number (e.g. 001, 002) or sampling location:
MGDI 800 _"[SS BOll TS~ Nl ~1.11 II:HNI= J COUJ:o~ Gnoi>J Ccmp.l)( Grilli Grab i j _ Composite I Giab 1 1 Composite 1 Grab _l J Composlle 1 ION_l l911l M?HJ ~ MFI UFJ "'' c c = c r/l :c 0 0 0 0 ~ = D) ;::: D) ~ Ci C!l ;:: 75 1:1) _e «~c .!!Zc <D C iii .: ~ c e c ~ > c l! > c ~<D C <D -CI) i -~ ~ (i
~ - >. s =s ... =s 0 =s - 0 :s «s O C!IC!l oa ~1:1) S -a c c c: - -= S2'e e e <l
«< 0 c c E E .22- ~ .2i {2 0 Q I! <D Ia <II «< 8 as <D ~ - E (!) :;: u 0 u 0 Cl) Q u <D c;~ E~ 2·- LL I.!! c ..! c ..! c: 0:: ..! c ~ ..! 0 -z <(2 z Q! 0 0 0 0 .: t2 (,) 0 0 0 a..
mall fbs mall IDS. mall _% l!ls, mall % lhA. mlll lbs moll .Llf100..ml_ A I , l't0 ). 5 1.0 I 1 'l<i$ /, /.I J .uo _'-( f. D f.{ .too 20 LS s .liZ. J7P/ ~qa, to,l fjlf( 6 !H '1. ( (, ,~ II.{ ') (. 2 7 .t}g '1 1-7
l'l . t~S ' 2 .J er 1..17 & s.o I& ,ttO 6 J.<g I ( .2.t~ ' 2-' IZ. .2.'H J'f' '7~ 165 )2.J G I ·<7 0 I) :Z1~ ' l. " ~ • 7. 'f't _6_ '·2 IS • 2.l.' l'b (.} lb .2(~ q 1. ~
n 2.11 0 '-' <1> .215 7 ( .o l'1 • 1.Z.c.( 161 •z7 l<bS l f1 (/ '· '} ).]_ IU' .'l.{lf 6 I·' 21 .'2l't' If 1.'-1 22 .Vt ) I . ")
ZJ .1tl 1 /. "f 2_'1' . "1..1 / ' (.5_ tS' .v.t ' (, ,
' /. '1 w_.o .tl'{ JS/ ' '2. ~ l1l Zll 'Z,(,
6 1. S "1..] . t-tl. II! . 'l •'1 6 t.Y t"f .?.I<{ ( 1- I 3o .to' ' 7..)
lOT~ ,,'(ot{ lh'<f ZilfC -/'it "f(" :"' 2t?l) J l. t. O.U.Vu.t-1. ,(41(0 ) ') ' sn ~-s If' () ,.o
O>ILY """'- • z I(~ J6'8 167~ \~ ltJ l c· 'Z-0 IS.O •. 15 f. I w.Q.Y,AVG.. .t.l' 35 ( (,'(7 ·~ t.. H 7 ~
IWC.
tirri.Y. A'tO.
. 2. '"' IJ5f {,'<7 t"t '- <t't7 ,_,J I·/ (t.l'f '-I.U CM.YUMtlJ
uu. Ull"ll
lli'H.Y. L.JIMl1, 6-/1 t't' J DMRSHPG1.00C
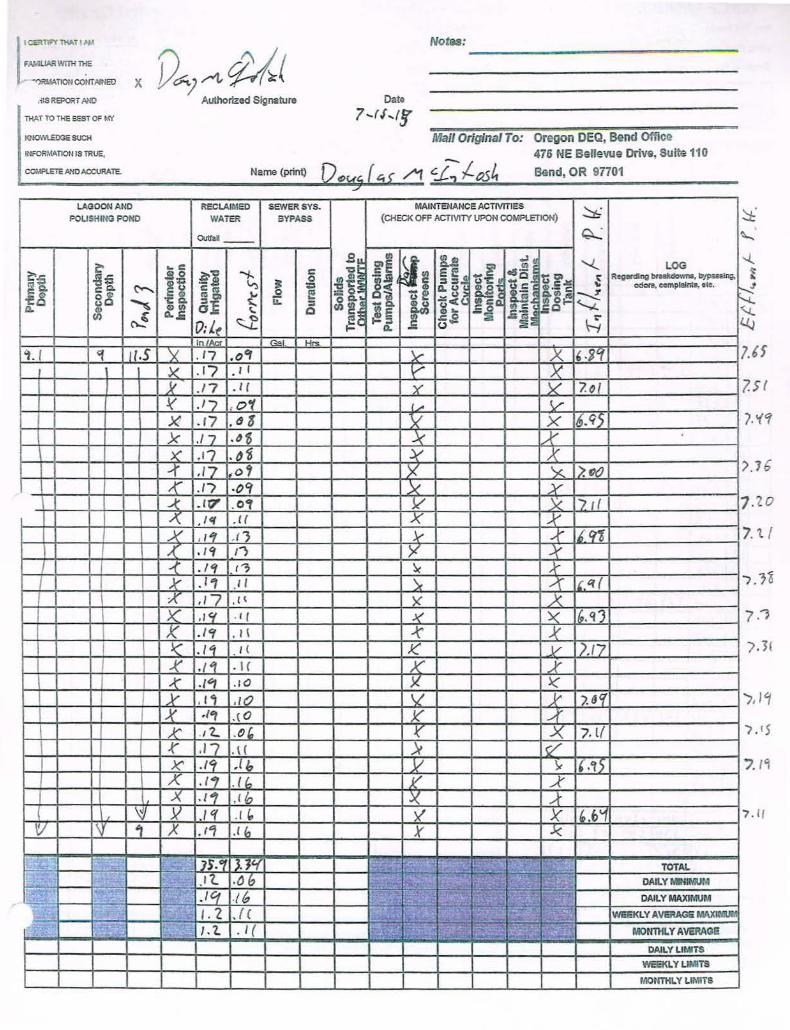
t 1 ce;!TIFY THAT 1 HA
I FAIIILIAR WITH nil:
- -0RMATIOfl CO~ IT AI NED
.11SREPORT IWO
iHAT TO THE bEST OF Wif
Notes:
X D~;A#( Authorized Signature Date
7 .... rl ... tf 1G.'O'NLEoos SUCH 1'.'1ail Original To: Oregon DEQ, Bend Office
1NFORMAnoN ts TRuE, 475 NE Bellevue Drive, Suite 110
._COIAPL ....... ' _ETE_~>~_"!o-AOOVRA--TE.------------~.::..::::~o:~-~.-:."'-/"1~ c. ... Z; .j_ osh Bend, OR 97701
LAGOON AND RECLAIMED SEWERSYS. MAINTENANCE ACTIVITIES ::::t; POLISHING POND WATER BYPASS (CHECK OFF ACTIVITY UPON COMPLETION)
CMtall -- ~
!i If) :t.s ..: '-./..... i::' ... c ~e -!j o5 .!l LOG
i::'= .s~ ~) 'I-. c "' ~0 E 1~ ~t 0 0Cil -s _c t; g',ao: ~
Reganllng brtal«So\vns, bypass~.....,
'-':> s ~,~ §~
c == u~ "'a. <:--. ~ ~~~ CCIJ
;:: -~~~ Q,U u ¥.E !U>.i
odc<s. complaint., etc.
-€a C CI liSe~~ ,. e. e ue _u -.! 8c ~ -ca. =t: ~ ::; -a. u -u<e CIJC c..s !OF <......i. t!. Ill 1110 a_ ~ Q (I)! 0E Ill ... co !4~ _c
(I) *" a...s -~ ~ ~ ~ t!:s ~ .cJa -~ N 0:1.(! Q, (,)
In/Act Gal Hrs.
't. I ~ ll.S 'X ./7 • ()'J x- X ,.~Cf ~ .17 ·'' v X )( ./7 • I ( y y 7. O/ ~ .I/ ,o-t {""" v >< .17 . ~ 6 )( X 6.<t5 x ./7 .4S · ~· r:::F >( .17 .b~ ~ x -1 • 17 ,o, X '><. >.tJO ,.( .I/ -o<t )( v ~ . IQ" .01 y I( '}· , ( ~ • I <t .If X y y ,, .n x- .-t 1£ 9'6 A • I <t n y ..Y / . I <t 1"3 ~ .A
I v .11 I I )r ~ l!.'f ( "/ ,/7 , I \ >( )( y . I<( . I( X S( lk. q')
l ): .IC'f . I \ .{' X .v .It; I( K v ).17 -K .{~ . I ( X -y .{' ./"1 .10 >< )(:"
I X ' I 'i .tO \t y '). tfif iX .,, .{0 K ·:;,r
I .k' ./ '2.. .tJ' k' X 7.l( .r .17 . \ ( )( I? X' . IC, .(l, 11 ~ '.Cf5 ,x ·'' . { b K' __,( X .14f ,t h )( A-
\'!} y l'f .I " ><' X 1,_6'1 \!1 1\ 1 ,X • 1'7 .(" X' -J(
II:~. .::.! - Jr.t:t J."J'f 1 :..~-- .. r;.· ., ~ li:. i' 1~: ~~:: ,.,¥
I;.~.~ TOTAL - ·' z. .ob ._~ : ~.'J~ ~~-· 1::..·~.:· .. It~~:.: [~;"'~ ~~ DAILY MINIMJM
l~t . ·;; .1'1 ./6 -' -~;: ~..~. i. !£'~·~ l ':'t:~ ....... ~ ~¥. ~~;J;,i' DAllY MAXIMUM
\:,~··: I . '2 , {( .~X :·~· ~ ,<!..(~ !§:.:..;. tf..Z • 4-~•" WEEKLY AVERAGe MAX~
·~' ~ /. t . I ( 1 1~::.: .. ~ i;L. ~ ,;; ' '·~·.;~~ ~-;;;:=-· G~""' ~2:· MOtmtLYAVERAGiii
DAILY LIMITS
WEEKI. Y LIMITS
f(.ONTHI. Y LIMITS
::::t: 'll.....
'-l ~ ~ ~ ~
7.
?.
] .
/ . 16
1 . 'l O
7. 1. {
I .
7
)
"),
I
7.
?.
:1
.3(
I~
If
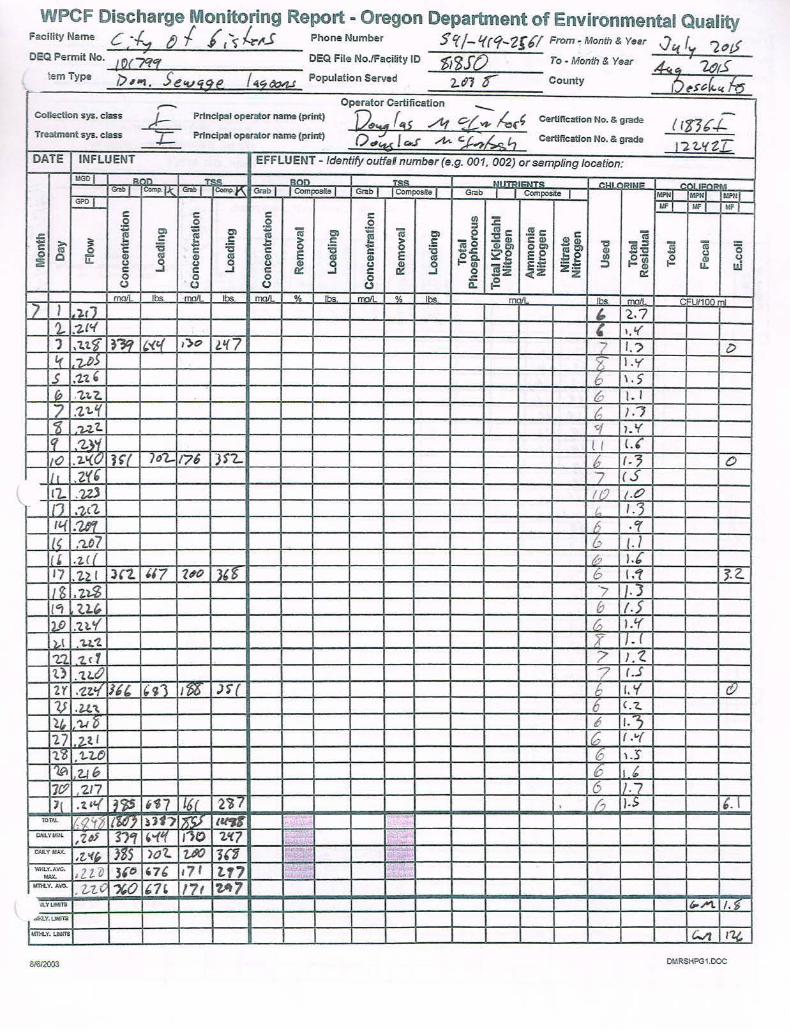
WPCF Discharge Monitoring Report - Oregon Department of Environmental Quality FacilityName C ·.f.. tJ { j "<;41'.S PhoneNumber S'(j- lfrtf- Zf b"/ From~Monfh&Year .Juf. ~~~l'
, ~ r --~~~Y~~,v~ DEQ Permit No. / Q(7tl<f DEQ File No.lfacility ID ~ZJQ To . Month & Year 4-sc 7..tJtS
lem Type 1) I "1 s e t:j ~ p I <c~ ~ Population Served 2. n 0 County ,5 $ ~'- h5 'V ~ "
r- Operator Certification -. -Collection sys. class
~ Principal operator name (print) ~'!! r~s /11 o{_.., "''"~ Certification No. & grade { lb"!t".f-Principal operator name (print) .....-.. Treatment sys. class
o~~ ~~ h. ~k.0_ Certification No. & grade I"2'U{Z.L
DATE INFLUENT EFFLUENT - Identify outfaH number (e.g. 001, 002) or sampling location:
t.IGD_I_ _s,:;,n_ T:~ ROD TSS PJI. t'!l-ll ~~·"'= _COUFOR Glabj_ Conop.l~ Gnob I Comp.t\ Grab j_ 1. Composite J Grab 1 1 Composite _1 Grab I I Composite j _ MPNj_ MPNJ l'.tr"N(
~ MFJ Mf l t.'.F( c c c c Ill :c ~ 0 0 0 ::J
= ;
= ; c; Cl
; c; = 0 "'c .l!c <lie c; .c e e cu !!! (i~ :g(l) C<ll s c c b > c > c -(I) '0 - ::J s (i ~ .... >- .... :s - :s 0 :c - 0 :c (I)= OCI> e&" Ql f!'tl c cu 0 c c c c -.c 52'2 ee (,) 0 Q u: (I) I'll (I) cu Q) E cu Q) E cu ~~ -... Ill o ·- ~ Ql ~ :e (,) .s (,) 0 (,) ti 0 (,) Q) 0 -~ E:t: z=: :::l .-:g u. 1&1 c c ..J c ...J c £t: ...J 0 f!Z <(Z z a:: 0 0 0 0 .c {:. (.) (.) () 0 Q.
mall lbs. mall lbs mall % bs. mall % lbs. _ mllt lbs. mall CFU/100 ml ] I .l.rJ ' ~.? I
2. "],{<.(
' 1,'{
J ;u.~ l1'i_ '-<t( , ')e> l'l7 2 I.") t> l( t,./)5 z I .Y s ,'2.'t ' 6 \ . S' .h. .'Z.l.?.. 0 \. I 7 :2t.lf _{;,_ /./
L[ 'U.'- "1 }. v It? 1,._)'j_ ll {.(
lie? .2.'(0 l~l_ 7o?- 17 6 )S''Z.. _6. (.' 0 li t Z'f' 2 (~
\ 1'2- .w 1& ( .t? t')_ {M'Z. {, /.) IL{ .']gJ__ _6_ ·'r {{ .'2.0 7 12_ ( .l I { .zel b I.C 17 .2~1 )('2. ~17 'ltl() J'g G 1.1 ~. 2.
lL! .2l-Z / j.) 1'1 (.2,, b / .5 12P .~tcf _0_ IH l._kl .'l..z..'Z X l· ( "l.'l 1.C f ? J. 'Z. t~ .1.Lt' 2 ( . .S
2Y .'l.z.'f_ Jb' '~1 JZIO )$"( h I.Y (!)
1) .U.'\. 6 c.z l~_ 'l.IZ) 6 ,. -~
17 ..z_t r L0_ f.''(
1.'6 ,'LW 6 LS 1..01 ub b ll" 1lP :z.n 6 ll-7 1( . t lt{ ll~ t~7 16( •21/ . £2 ).S '·' lOlAL II; 'l_ <t~ 11!!.1_ ))f") IW ~~
I>U.YIGN. , 'Z65 l}'f ,...,1( t"lO 1.l(7 _y....._
,'{, 'tf, }!5 >o'l.. t,iK) 16"1 WI'J..Y.AVG. d. t 'b 3tD ,7& 171 l..f7 . ....... -"" lltH.Y. A.VG. . z:z.c -xo {.1' 171 "t47
\LYUWTI 6--A l ,__'i_ I cOO.Y. Uio!FTS
M'nt..Y. UliiiTS M ~~
DMRSHPG\.OOC
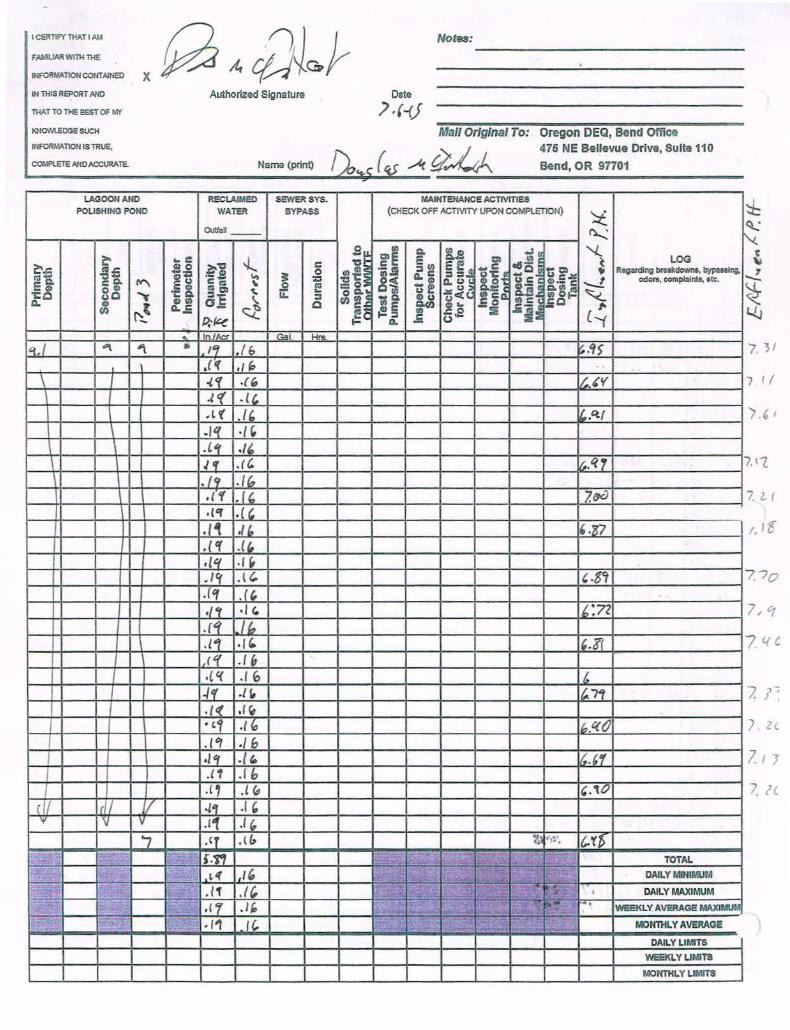
I CERTIFY THAT I PNo GJ Ai)l~~ FAMUAR WITH ir1E
INFORMATION CONTAINED X IN tHIS REPORT AN0 Authorized Signature
THAT TO THE BEST Of Ml'
KNOWI..EOOE SUCH
INFORMAnON IS TRUE,
COMF'I.ETE AND ACCURATE Name (print)
LAGOON AND RECLAIMED SEWERSYS.
POLISHING POND WATER BYPASS
OuttaU --
~~ ~ ... c -l 'C ~= G>O ,a.-c c
IU= 0
~,~ IU Q. 't:SQ. 1~ ·-S ~ ~ ;: IV', C(U " ~a cG> CII Q .2 f! 8c "'\' ~Q. :II- ~ ~ :II Q. Cl) G) II) at: \. 0 0!
(/) ~~ a..s ~ ~ - f);~ .. In Ac;r Gal Hrs
ct. "'\ ~ • I~ .f& , ( f( .I~ ~<( .(" .l<( . ( (,
• L r( ·'' .ll( '" \ .lf( .u.
"' .(' . / 'f .[" , { f . r' ,(lf .('
.1 1 ,['
.( '( .{"
.t({ . I r, , I~ . (" .( 'f . (" ·IT. ·I G.
.(~ .lb
.l1 ·'' (f .[ b .( C( .I & ./f ./ {, . [( .r" .,,
.( " • I '1 ./ b
I ·l<f ./' .Cf . I h .(' .l ~
cl ell I( ·llf .I ' "' v .l'f ,,
'7 .<f • ( l> ~ u~ s:n
):- ~ ~ '( ,,
.• ·• .I 'f . ( (,
.• .cr . I f, l~ ,::-."''";7. -11 I C.
Notes:
Date
) .(if
Mail Original To: Oregon DEQ, Bend Office
Aq~ 475 NE Bellevue Drive, Suite 110
Bend, OR 97701
MAINTENANCE ACTIVITIES
(CHECK OFF ACTIVITY UPON COMPlETION) '::i. ~
Ill Q. !s 11 './....
~e E lll
~j .a .!fl ~
LOG
§~~ ~s ::sc t;~ t; =.:.: Regarding bleakdowm, 17/puslng,
81 Q.(l) G> c -1. od0111, complalnta, etc. a.u 'Z I! .;;,:U u ~Ui.i
-Q !~ u< !C Ill OF "<.. II) E .!,S -:S fiC .50 l~ t!::s " .5j:
a. ..5 (,)
~ .if~
:t..6Y
"'.C't(
&.fi1
7.{Ji)
'·~7
' .$'t
lt :n
I,.Si
/, 1~7,
I~ .C(()
~.~r
,,,0 1 ~.~· . t.Y~
I•· ... ;~·-~ "''" [.,;··:.~. _<,., I:.J. TOTAL
I ~ /; I"'·~~ ·•·
~~.~ :·:.o;0,~ lEi~: DAILY MINIMUM . .-.-; ·L.~ J.·:~ }:.;~ .~! ~?·:: . DAILY MAXIMUM ,,, . ..,., .,.
~..·.~ ::.._,_-c.; J .. ¥ ~:_,'~ r-• WEEKLY AVERAGE MAXIMUM . .: ,~·---·~ .~ . :: --~~~ ~~;J. -·--'··· ;;: MOtm4LY AVERAGE
DAILYUMITS
WEEKLY UMITS
MONTHLY LIMITS
~ 'X
I
I 3 /
') I (
{ ·' ' 7.1 1..
7.
/,
7.
7
7
'?.
)
7
7
l. (
1(
,q
.,, } . l(
I }
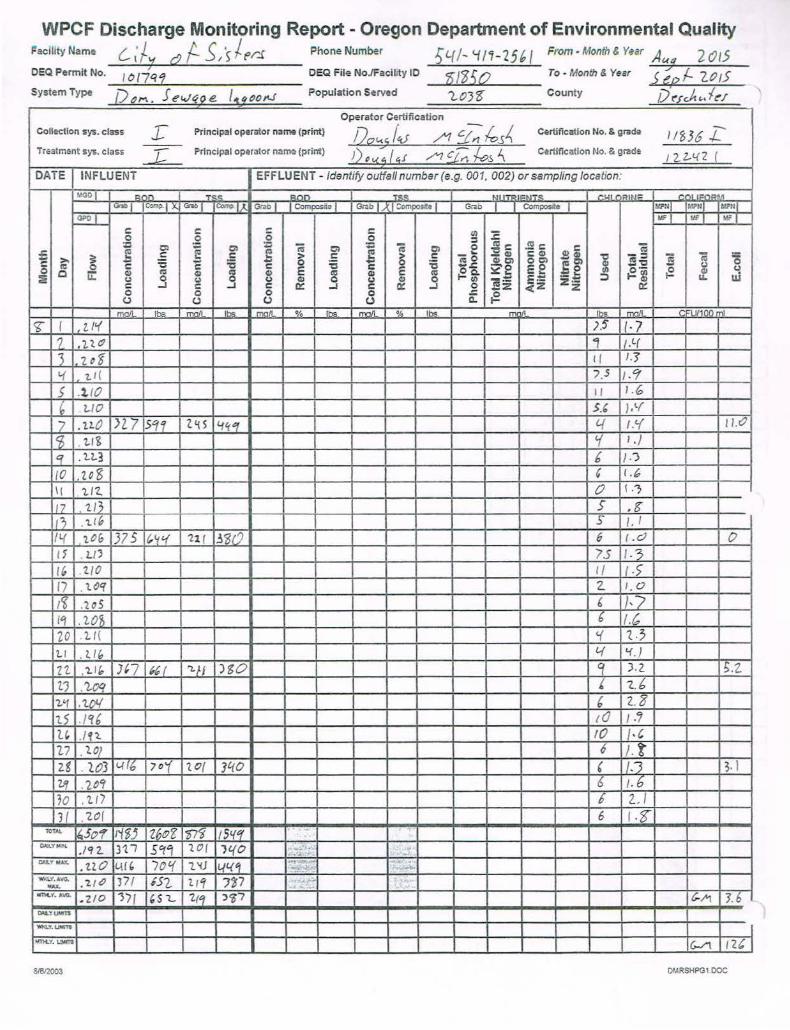
WPCF Discharge Monitoring Report - Oregon Department of Environmental Quality l'!acllltyName c;/-"1 C?f- 5/·r;lpr.! PhoneNumber f)c..rf-tt/1-1.561 F=rom - Monfh&Year Auq 2015 OEQ Permit No. I 0 tiq't OEQ File No./Facility 10 ~/'$50 To· Month & Year J ep f-. {.() !5 System Type i) J Population Served £.. J g- County D cit {. (. ()M. e&.Jt;r; e r't 9()01"-f () /. t'f ... !!'/
Operator Certification
Collection sys. class r Principal operator name (print) l)o ... "fv /'1 :t-:; f.os4 Certification No. & grade -11836 .f_ --Treatment sys. class ___k_ Principal operator name (print) i)_#t.l:t~.I /"1 ~,.. /..c;,s "
Certification No. & grade J2.Z.t<2 (
DATE INFLUENT EFFLUENT - Identify outfall number (e.g. 001, 002) or sampling location:
MGDI B)O T~;s BOD TSS NlJ 1"1..11 IC:.I~JJ: l"!"'lll"nc:>
Go!> I COtop.l )(. G-ab I I"-" I~ atab 1 1 Composite 1 Grab 1 U Composite 1 G:ab I I Composite I lf.?llj Mi'tlj Mi'tll
~ ""I II.Fj ll.r I c: c: c: c: (/1 :E .2 .2 0 0 ~ - en e en ~ -; en ; i6 en 0 111c: .l!c Q) c: iS .c ~
Q f -~ :Ee~~ CCII ~
c: c .. > c > c: .... , -g -;::, i6 iS 0 .. » :s - :a - 0 :s - 0 :0 ~J: ellen oen ~'a c: Ill 0 c: c c c ~~ ee fo - u u 0 0 i! Q) 111 Q) Q Q) E 111 Cll E 111 ~~ ....... (/1
~~ ~ Cll u.i := u 0 u 0 u Q) Q u (!) 0 e~ :z ~ :::1 u..
c -1 c: -1 c c:r:: -1 c 0:: -1 0 ,!!:z ctZ z 0:: 0 0 0 0 .c
~ u (J (J (.,) CL.
moll lbs moll lbs moll % lbs mall •A lbs. mnll lbs. moll Uf100 nl
'1: I z.f<{ ).5 1·7 I 7_ .l l c7 4 ll.tr 3 -u<t tl 1.1 '-( <.I( 7,.S /.'1 s .1 10 I I l. b
' t./0 .S,, )H
7 .12.0 >7..7 Y/1 Z'iS l.f~ter 4 IH 11.11
l<i> . 1..1~ '{ I . )
1'1 .U.3 b I·') {0 . zo8 c 1.6
\ ( '1.1'2.. CJ 1.7
17 . 1 /3 s -~ t? , 1. 1~ s /. I IL( tOG )7 5 (,~'{ '21 ( 3"6/J 6 ( .cJ 0 I~ . 2.0 7S / . ., I' .1/0 I 1/ { .)
17 . t~ 2. 1.0
t<6 .HS 6 /-7 ~~ . 20~ b !.&, 20 11( <.( '{ .,; t l ,2.1{, 1.{ '1.)
1'l. ,1.1 {, N7 ~" "'..fJ )gO 'f ).2. 5.2 1:) ,?,oq {. 7...b '2-'1 . t()l{ ' Z.8 '1..5 .l'lb tO I ."1 H .In tO I· c l7 . lOJ 6 /. t z.g . 103 <..f (6 'Jc'f 1..0{ JC(O ' f.J 3·1 1Jf .20'r 6 I.~ }O .111 ' 2.. I J ( .~or 6 I .g-
toTAl. ~Jo1' rt~5 Z6e?g 17~ IS'(Cf C.U.YKtt .l t:t 2. 31 '1 SCti 1..C1 { Jl{O .. -· CA.I.Y IWt. .uo !..\(' )()'( 1. '{j l../'<1
., - ... ~ ..
'MQ.Y.AVO. ,'l.tt? J7/ i.S?, t t'f 7~7 , : ...,., -
Wl'M..Y. A\G. . Z/0 1/f 's 'L ?.ttt ')~7 &:.~ 1.6 MLYUMn
'Ma..Y.UMT'a I MTH..Y. utM1'I G-/l 12.'
DMRSHPG1 DOC
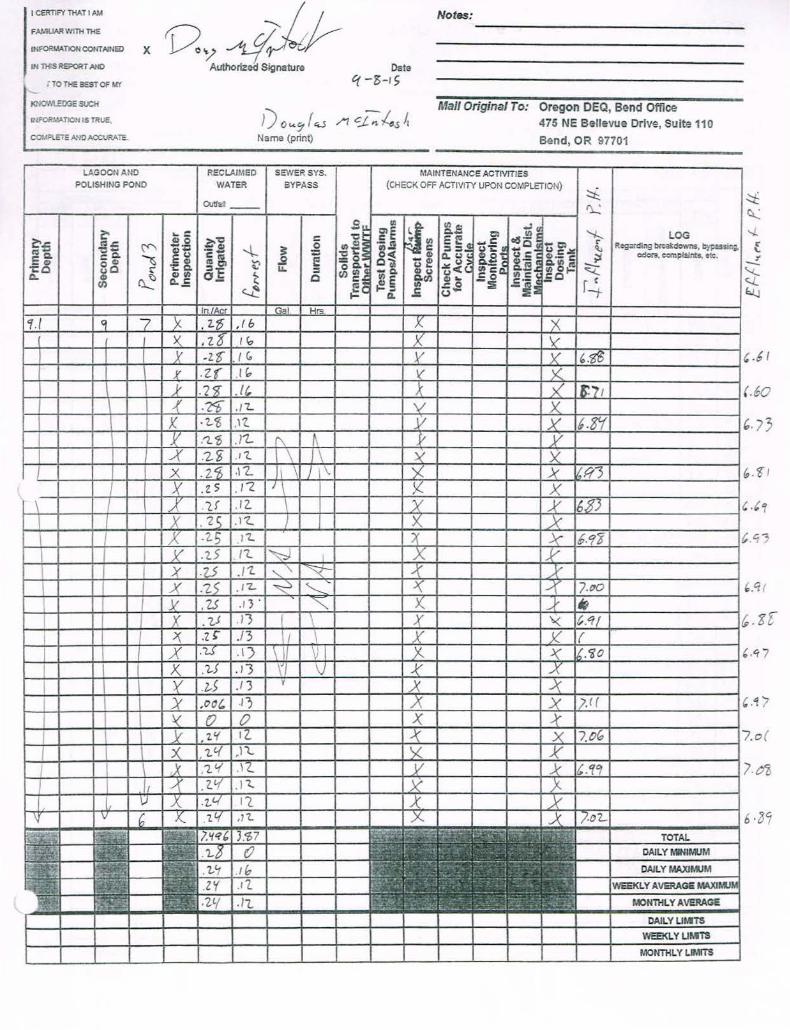
xD.y4-;LY Authorize<! Signature Date
Notes: I CERTIFY THAT lAM
FANliJARWITH THE
INfORIAA.TlON CONTAINED
; TO THE BSST OF MY
INFORJI'.ATION IS TRUE,
COM"lETE ANDACC\JAA'l'E-
LAGOON AND
POLISHING PONO
i::' ~-'= ~.c
~ ~ .. "C-eg. ca.
~ o~~> '1:0 uO (" 0.. Q)
~ (/)
1 9 7
\
II )
'-i \i b ~-~~ f;~~ .~ ~- I~ I :-li ~'J l1
t.e tJ; ~ J:i ~ ~
q -3-IS
) ) 0 "''1 r 4.S /1 <:1.-: l.e.s 4 Mail Original To: Oregon DEQ, Bend Office
475 NE Bellevue Drive, Suite 110
Bend, OR 97701 Name (print)
RECLAIMED SEWERSYS. MAINTENANCE ACTIVITIES WATER BYPASS (CHECK OFF ACTIVITY UPON COMPLETION)
~ OUtfaU -- 1\...:
llj! Cl)
~i 11)4)
I~ I ~ ... c alE a. ....
ii~ '?- LOG 4>0 ~"C c c ..
E 11 ~ r~ R~dlng breatdowns, .__ -- -c.! -4- ~ .S! 'i.!! :s:s
l: i] ~ e-
E~ ~~ 0 e ~~ Q.Y ~ ~ od<lrs. eomp131nts, ate.
:SCl ~ iL: ~y
~. 'i:C. :s -c. Q)(,l u< usc 4){1) o:S t 0 (I) E Q.C/) CliO. co
I·~;~~ r ' 11.£ ~ ~= .6 (3$ -:i
a. -t • lnfAcr Gal 1-1""
X . Z.'6 , { b X X )( zo I~ X \(
X -Z.t" {~ y X _,.zs X .2( .l_i \( X. ~ . ? <,6 [_£,_ x x ~7_1_ .{ :(.1; .13-_ v X
.K ·2.~ YZ. y X 'U'f_ y ."2.. ~ .rz.. r\ / y ~ :z_g ·' 3- \ \ )( x .) 2.'b •. \"l.. ,, \ J \ X: .X ~q) y .z s 1?. I \ X: X
.) .1f .'1-_ X X 163/ X '25 .l'Z... J X )( }( -25 J'-. X x ~ X' .tS /7.. I~ X y X -25 .11.. ' " ~ .{' y
X •. '25 ,1'2... ~ <....... X' . ../ 17.tXJ y :z..s .I'}
""" X ../ I~
X .V .11_ X \( lt.-1[ X .z f J l_ I X )( lL
_X .1.S .I) \ I )( ~ lb'."80 )( .?..5 J} \ \) .K X ¥ .z.-> .1 ) .X .){ X ,ooc. ,,., .X X ;.c ( ~ (2_ 0 X ..f y . 2 '( I Z. ~ X l7.oG X . (..'{ l ,n .. )( X
,L. '( YZ .. y .X I~. er" ./ . 2. '{ .11. x X ) .7._ c..( n .. .X X X.. :z.C{ ,) "1.. X )( IJ.O'L
r~ [l.lf<?& J.'~7 TOTAL
~ .t.Z J2 DAILY MINIWM
.1.'1 lh DAILY ..... ..,, .. ,._.
.Z '( .tl I WEEKLY •-•-- .. avo••••· "¥"""'"'""
.'l,Lf I .ll. MONTHLY ·-·-"'
DAILY Ur.on'S
~YUMTS
rviOtf'"HL" UMITS
' .6 1
( .GO
.?3 ' ~ .$1
c
I?
' I~ ,g[
' .<, 7
' 7 .o (
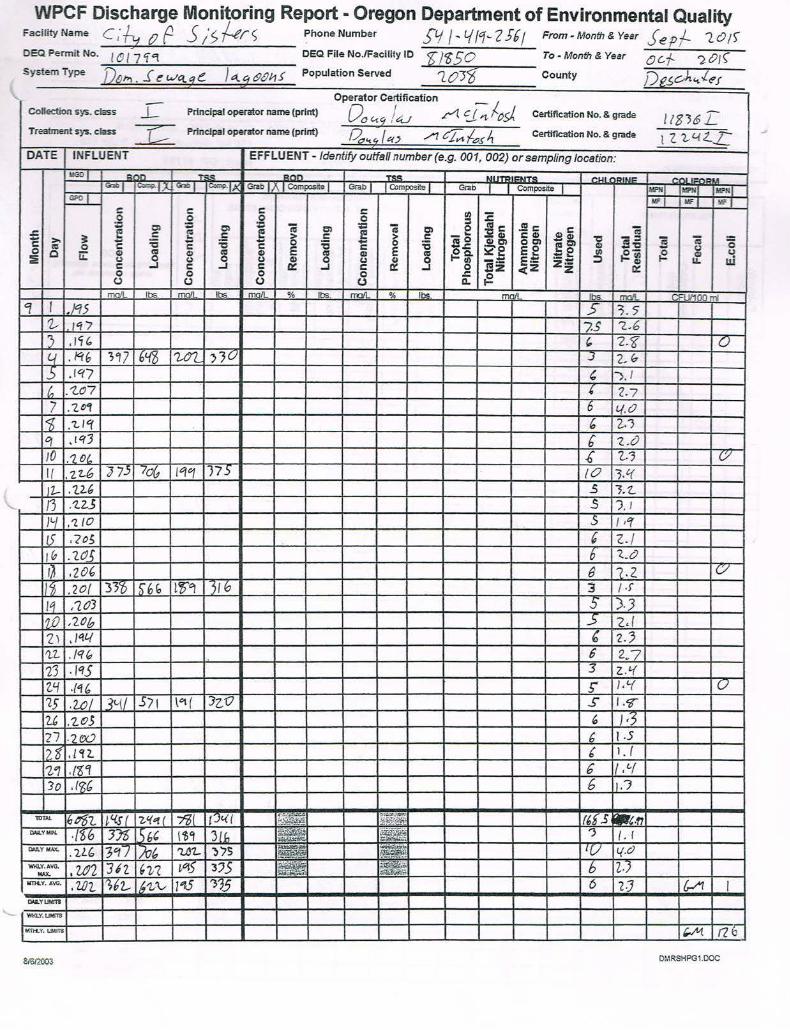
WPCF Discharge Monitoring Report - Oregon Department of Environmental Quality FacilityName C,"bt. oP 5;>-!ers PhoneNumber SLf/~Lff<1-- ZS6f From- Month & Year Sep/- l.CJf) OEQ Permit No. ll9/ 7'i<'t OEQ File No.!Facility 10 r; J$50 To - Month & Year c;c..f ').0/~ system Type )1),.,., _f ~ W '{q e_ I et C1 &tJt-t s Population Served 7.03<6 County j)p.5vh .... .f.ef
Operator Certification
.r1 ':..1 ~ lod CoDection sys. class I Principal operator name (print) Do<-<9 /0 Certification No. & grade l1$ 36L
Treatment sys. class C: Prfnclpal operator name (print) ~ .. <, lq) /? c]~f.~ Certfflcation No. & grade 1 Z. '2..42...£ DATE INFLUENT EFFLUENT - Identify outfall number (e.g. 001, 002) or sampling location:
[lol601 !;t'lO TSS Rnn ~ct ~II ...... . ...... c ,..,..,,.,..., fGXII ICI>Qp.l): ~Gra!>l fCoQp· l .~< I G!ab IJ , I Composite I ! Grab 1 t Composite 1 Grab I I Composite 1 IMI'Iif (MPNI IK?NI
IG?O' I~~~' I IUF I l~~r I c c c c Ill :E 0 .2 0 0 ::s ; 0 e ell
; ;; ell ;I 'i ell 0 "' c ~c ..s c iii .::: ~ c c I!! > c f > e (i ~ ~& C4l , -::s s iii - >. ~ :a - :s .... 0 :a - 0 :s O Cl f& 4l s, 0 c CIS 0 c c c s:: -.::: i2'E E E (,1 E E ~~ ~,g (II
~Si ~ (,1 0 Q u:: (I) CIS (I) ~ 4l I'll 4l CIS
:I Cll ui :E (,1 0 (,1 (,1 4l 0 (,1 Gl 0 -~ e~ Z ·- u. c ..J c ..J c ~ ..J s:: a:: ..J 0 J3Z < Z z 0:: 0 0 0 0 .c
~ 0 0 0 0 a. molt lbs. mall 11>< ...,..;n o;., 11>< mall % lbs. m lbs. mall c FtJI1()( nl
Cf I _Jq) 5 ~~ ) 7[; . l'i '7 17-S '2..6 3 '1'7' ' '2. '6 0 l.l /Ct6 Vl7 6'(g IU72. )JO J 2..f-5 .1'0 ' I"') I
7. .1..CJ7 4 7.. 7 7 • "2. D'f 6 ltf.c?
I<Jt .1 . ./C( ' 2..) q ,tqJ b "2. .0 !0 .1.lJt. .{ 7..7 C/ It ' 2Z.6 (} 75 7o& ICf~ T75 {0 ) .t(
ll..- .U:6 _5 11- 't. if3 :z.z.J s I?. I IR ,'7. /0 s ,cr ItS ,? 05 ~ I?... / I r" . ?.0~ 6 ?.. .o ~~ '2 {)(, 6 11.2 :o
fi1" .20( 337> :S"bb I L~C) jJ_b 3 I .f
l it; ,£ 03 s I). J 1?.0 ,,?..Oh 5 I '2, I 1'2 ) .l'tL{ ' 1'2. } r~tz. ./<?(, 6 2.7 1'23 I'1S J : Z .'{
IZ'1 .(i (, 5' 1.'-( 0 rzs .2./)/ 3~/ ;Sit \&1 ( Jz_O s 1 .~
u .2. 05 ' _}t)_
:?7 .? (20 b II .5 !?:8" , l n. t 1 (
r~., .{'l)'i 6 I I 8 l3o ,/<gb 6 IJ.7
I ttnu. 16 t'i$7. lt«f f ['2-'t''f ( l ~l [Qi(
I lr&f.S•c.n
tii.LYMIN. .f'f> G TY6 1.5 6' \$j )lb '} {. I OiiY.wc:- . ll.b l3&f7 IA?b I 1..0"2..._ _l/5 I[) 14'·0 ··~ .UJ2 '3 , 2 ,'2/Z z,qS 3?.) b ll-J IITM.Y. AVO • . W'L ~62... l kz~'l-- I 'IS '3'35 6 ?..] ~ i OAI.YU!IJ"B -I ... >eLY:-UNITS
lo<o>t:v:- uwrs . ~ rz6
81"612003 DMRSHPG1.00C
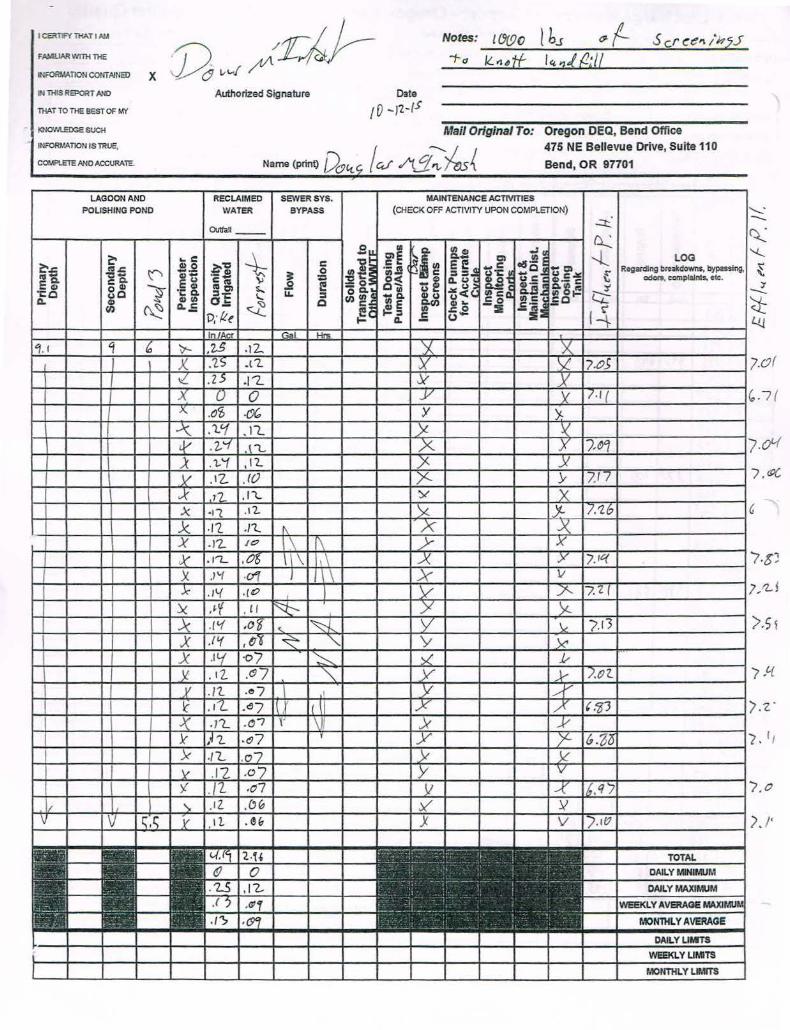
I cemFY lMAT I I'M
F~Wl1HTHE
INFORMATION CONTAINED
IH THIS REPORT N«J
THATTOIHE BEST OF r.tf
KNOWI.EOOE SUCH
lNFOR'-'ATlON IS TRUE,
COMPLETE ANOACCIJRATE.
X
LAGOON AND POUSHING POND
>. ~.J:
... ~.c: \'"'\ ~- ~-E% ca. oGl
~ 'i:O uO a. Q) (/)
.. c GlO G);: E~
'1: Q. Q)t/) a...s
Authorized SignabJre
Name (print) DC}((.
RECLAIMED SEWER SYS. WATER BYPASS
c .2 t! = 0
Notes: t {J(f)o l b..s <11- f- S cr ce" ihJ.5 "1-o kA8tf !41£/2://
Date
tO -rz-tS Mail Original To: Oregon DEQ, Bend Office
/4/~~~ 475 NE Bellevue Drive, Suite 110
Bend, OR 97701
----------------------------------MAINTENANCE ACTMTIES
(a-lECK OFF ACTIVITY UPON COMPLETION)
LOG
....._. -Regarding b<eal<downs, b'JpaSslng. ~
oc1or1. complaints, etc.
-!.. ~ ~
~--r---+---+---4---~~~--~~-+~-+---4---4--~~--~--r---+---+-~4-------------~ ~
~r-+---~r--+-+--r-~+-~~~~----r---+---~---+~--r---+---~---+-T~r-~+----------------1 ).011
~~~-44--4~-+~-+~~~~--~--4---~--~--+---r---r--4~~~~------------~/ .~
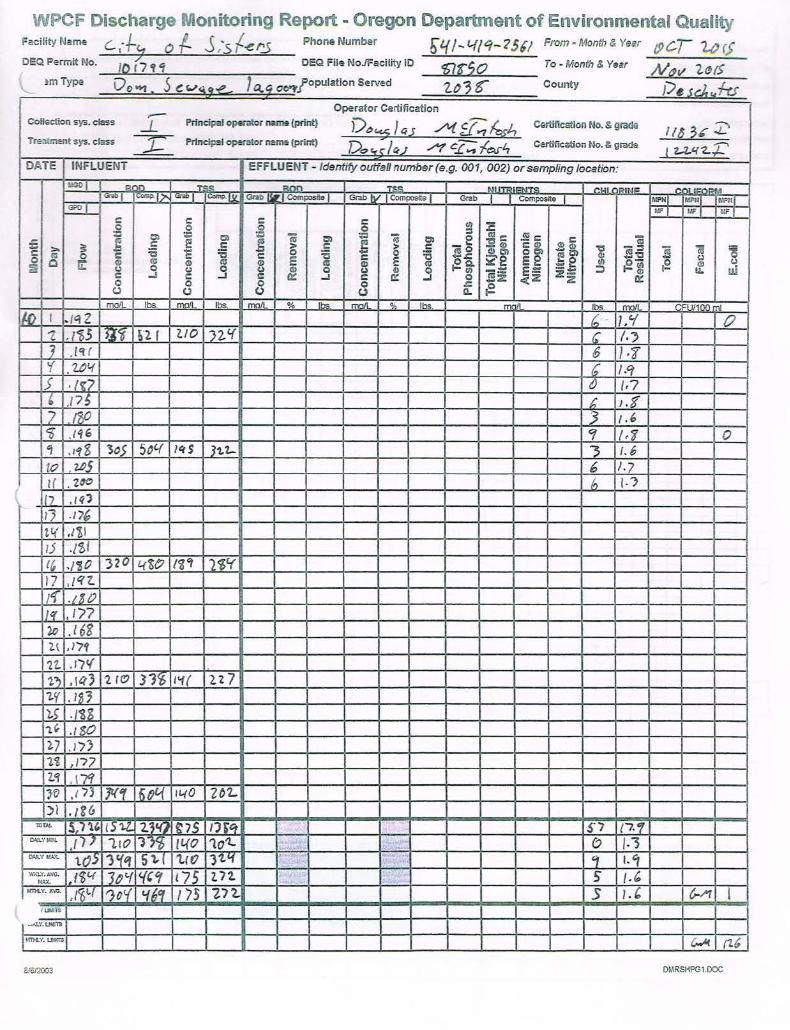
WPCF Discharge Monitoring Report - Oregon Department of Environmental Quality FacHityName C..,·J-.)1 0 /- J ,5 /~~ PhoneNumber F;L(/-t1/'1-25fl From•Month & Year tPCT 1../)(f
OEQ Permit No. 10 r 7 ~ <; OEQ File No./Facility 10 $7($0 To - Month & Year N "" ~«' r> '-- : m Type Do-.,. 5 ~t.."<'.i.jL 1ct~OC"\'/opulationServed 'Z.03tf" County J/e.u),,.J"'6
Collection sys. class
Tre~-ntsys.c~
DATE INFLUENT
.--_1_ Principal operator nall'l9 (print)
r Principal operator nams (print)
Operator Certification
D "'5' ~; /11 ££---:, ~4 Dc~c:I~J .-A7 cz:; fc>.r4
Certification No. & grade
Celiffication No. & grade
EFFLUENT - lclantify outfall number (e.g. 001, 002) or sampling location:
UG!) I Rnn T s cnn TSS Ml "UI ...... u:: ~rw u::ni:!M
c 0
i c Q) u c 0 (.)
c 0 :.;: e c Q) u c 0 (.)
I mall lbs. moll lbs.
-z .1'$5 131~ n r ?..to )'i..Cf 1 .ltt f
'f .wl.f I s . {f.7
' .t75 17 ./80
to . w5
15 . /~ 1
iJ<l • 1/7 lo .168
1t .1(!(
l.S . 1~& I
27 . 1/} 1.'Z ,177 l'f .1 7'1
=.vw• .f) J 110 1")Cb 11.{0 1o't.
, •• <l.Y.UMITS
Jt.mt.Y. U.uTS
8f61'2003
mall bs. lbs lbs. mall CFU/100 ml
1,'( 0 /.;
/.'f
J.~
'·' 0 /. 6
6 (. '}
0 /. "3
5 ' · '
OMRSHPGl.DOC
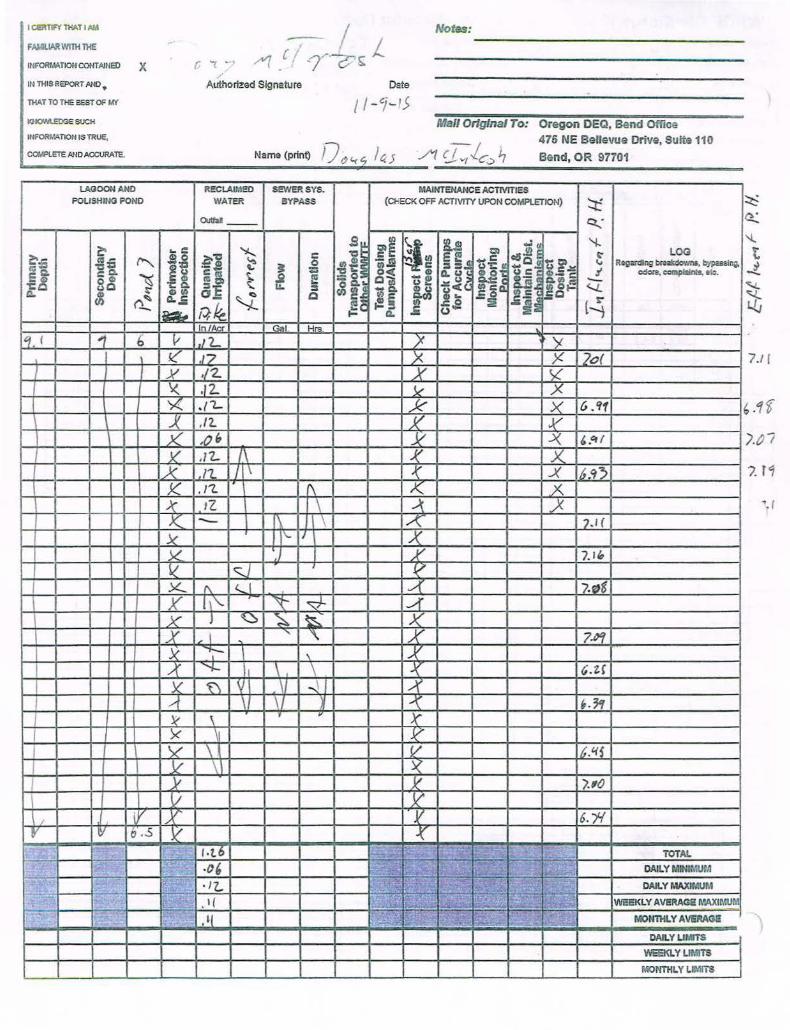
I CERl1I'Y lliAT I N.l
FAA41.1ARWITH 1llE
INFORINI.TIOU CONTAINED X
IN THIS REPORT ANO •
lliAT TO THE BEST Of MY
KtlOWl.EOOE SUCH
INFORMATION IS TRUE,
COMPLETE AND ACCURATE.
/
-I L /""{ -( ~--c; ~
Authorized Signature
Notes:
Mall Original To: Oregon DEQ, Bend OffiCe 475 NE Bellevue Drive, Sulta 110
Name (print) J) ~4 h.J ./'1 c~}-;ic.:> ~ Bend, OR 97701
~----~----------------------------~--~----LAGOON AND RECLAIMED SEWERSY$. I\1AINTENANCE ACTIVITIES
POLISHING POND WATER BYPASS (O.ECI< OFF ACTIVITY UPON COMPLETION) ::t: QrtfaJI -- Q_,'
!I IIJ
~~ ~! ...: 'I-
2:' ... c ~ c "CC ~E -iJ o!S.i!l c- LOG
~= cafi ~ (1)0 a-"CC ~ 0 .:~ -;;s .. c tjell "' Regsrdlng matdo\•ms, byp£SSIQ;!. -;-.:s _ c» J :s 11 Q ... IIJ Q. "CCa. e¥ eli
~ = 81 c» Q.U c»O QC
c»!! ::1 o:1cra, compldntt, etl:.
~8 C CII ~ caca s l! =o.~ ~e .:.:: ~~ a..t: !.j ~8 -8c 'r;Q. :s"E &I- 01~ IIJC <.....!.. ~ :s Cl)~ -Q. u u< ~.s· Q,. c» (1)1/) a_ ~ Q .!§ .!,2 co .sc
(/) (")_~ Q.,S
~~~ l! IIJ -~ i: (~ - •aa- ... a. .s (.)
ln. Aa Gal Hrs. -" lq I ; 6 v I,J'2_ ;x ~
!( .17 _X )( ?of I X ./2 X ..2(
\( .12. x X ~ .(1- x X 6.91 .X , /2.. )( .{"' K ,o(, y X 6.Ct (
J( .rL I.\ ~ X )( n I \ .X lb_.tt_2_ J( . rz. (\ X: ~ ~ IZ \ _-1_ )< )( - I \ lA: ].1 (
x I 1'- I J .X K X 7.1h
~ I'- ~ x_ (\ <... ~ ).~s y _Ll"- ~ ~ 1----1 X J ~ ~ ~ y X I ' ' y ?§I
x i- \ y
I A" "1- \ \ v 6.ZC )( ~ 'Y II ~ I .-1
.--1 I y -"( ~.;, )( \ " _K_ x \I ~ y \\ v k-'15 / \ \ )( v v ').,()
I v V'
L v v v 6.1{ v I b.S k'. ~
1-t6 !-.,.'.,::_ ~~~-~
TOTAL .~
:~ .o, .,._, .- <, . .J'=- ~ l.E ~~ DAII. Y MINIMUM ~ . IZ.. ~ ~ "· f•. -~ "-2 :;_ -~~ I· ~ DAILY MAXIfr.UM I'...; 1--- .
.II ":,_ 1 ~\.: l"b_ ~~ ~ WEEKLY AVERAGE MAXIMUt, -
__ , . ~I - _·"': I .~~ """'-'- I' ' ·" [ MOtffiii.Y AVil'tAGii
DAILY UPMTS
Wi:EKL Y LIMITS
MONTHLY LIMITS
7.1 I
/.()7
?. f<7
~. (