PhD Thesis: CFD Simulation of Silica Gel and Water Adsorbent Beds Used in Adsorption Cooling System
lable at ScienceDirect
International Biodeterioration & Biodegradation 65 (2011) 513e521
Contents lists avai
International Biodeterioration & Biodegradation
journal homepage: www.elsevier .com/locate/ ibiod
Waste biomass of Nostoc linckia as adsorbent of crystal violet dye:Optimization based on statistical model
Sharma Mona, Anubha Kaushik*, C.P. KaushikDepartment of Environmental Science and Engineering, Guru Jambheshwar University of Science & Technology, Hisar-125001, India
a r t i c l e i n f o
Article history:Received 6 January 2011Received in revised form28 January 2011Accepted 1 February 2011Available online 26 February 2011
Keywords:NostocTri-phenylmethane dyeCrystal violetCCDSpent biomassImmobilization
* Corresponding author. Tel.: þ91 1662 263164; faxE-mail address: [email protected] (A. K
0964-8305/$ e see front matter � 2011 Elsevier Ltd.doi:10.1016/j.ibiod.2011.02.002
a b s t r a c t
The potential of spent biomass of a hydrogen producing cyanobacterial strain Nostoc linckia froma hydrogen fermentor was studied for decolorization of a tri-phenylmethane dye, crystal violet. Thewaste cyanobacterial biomass immobilized in calcium alginate was used as a biosorbent and the processvariables were optimized for maximum dye removal using the statistical response surface methodology(RSM). Batch mode experiments were performed to determine the kinetic behavior of the dye in aqueoussolution allowing the computation of kinetic parameters. Influence of interacting parameters liketemperature (25e35 �C), pH (4e8), initial dye concentration (100e200 mg/L) and cyanobacterial dose(0.2e0.4 g) on dye removal were examined using central composite design (CCD) which included twoadditional levels for each parameter. Second-order polynomial regression model, was applied which wasstatistically validated using analysis of variance. Ability of the immobilized biomass to decolorize the dyewas maximum (72%) at pH 8.0, temperature 35 �C, 200 mg/L initial dye concentration and 0.2 g cya-nobacterial dose. Adsorption of the dye on cell surface was further confirmed by scanning electronmicrographs of the biomass before and after dye loading. FT-IR studies revealed that decolorization wasdue to biosorption mediated mainly by functional groups like hydroxyl, amide, carboxylate, methyl andmethylene groups present on the cell surface.
� 2011 Elsevier Ltd. All rights reserved.
1. Introduction
Dyes are among the most notorious organic contaminants thatare discharged into the environment from textile, tanning, leather,paints, paper, food processing and pharmaceutical industries(Khattri and Singh, 2000; Monash and Pugazhenthi, 2009). About15% of the dyes are reported to get lost in the effluent and are highlyresistant (Zollinger, 1987; Robinson et al., 2001; Sivalingam et al.,2003) due to their complex aromatic molecular structure that isdifficult to biodegrade (Fu and Viraraghavan, 2002; Atmani et al.,2009). About 90% of these dyes often remain unaffected evenafter activated sludge treatment (Pierce, 1994). Removal ofsynthetic dyes from industrial waste-wash is of serious concern,keeping in view the toxic and carcinogenic nature of some dyes andtheir degradation products (Grabowska and Gryglewicz, 2007;Ramakrishnan and Nagarajan, 2009). Dyes may also adverselyaffect flora and fauna in the aquatic food-web by reducing lightpenetration through water surface (Ali and Muhammad, 2008).Increasing public awareness about toxic nature of these dyes and
: þ91 1662 277942.aushik).
All rights reserved.
stringent environmental standards has prompted development ofnovel treatment methods for removing or converting these organicdyes to harmless compounds (Stylidi et al., 2003).
Crystal violet is a tri-phenylmethane dye used extensively asa biological stain, as a dermatological agent and in variouscommercial textile operations (Senthilkumaar et al., 2006). It is alsoknown as hexamethyl pararosaniline chloride, a basic dye withmolecular formula C25H30N3Cl, has the chemical structure asshown in Fig. 1. The dye has been found to be a mitotic poisoningagent, which is recalcitrant and carcinogenic, and thus regarded asa biohazard (Au et al., 1978). Its removal from wastewaters beforetheir discharge is, therefore, essential for environmental safety.However, conventional wastewater treatment facilities haveproved to be markedly ineffective to remove commercial dyestuffsincluding crystal violet dye from wastewaters (Shaul et al., 1991).Amongst various methods biosorption is considered to be moreefficient and economical for the treatment of wastewaters con-taining dyes, pigments and other colorants (Akbal, 2005). Granularactivated carbon is used widely as a commercial adsorbent, but isvery costly and suffers from regeneration problems (Meshko et al.,2001). This has led to search for cheaper adsorbent substitutes fromagricultural and wood wastes (Ramakrishnan and Nagarajan, 2009)or biomass of microorganisms (Forgacs et al., 2004). There are
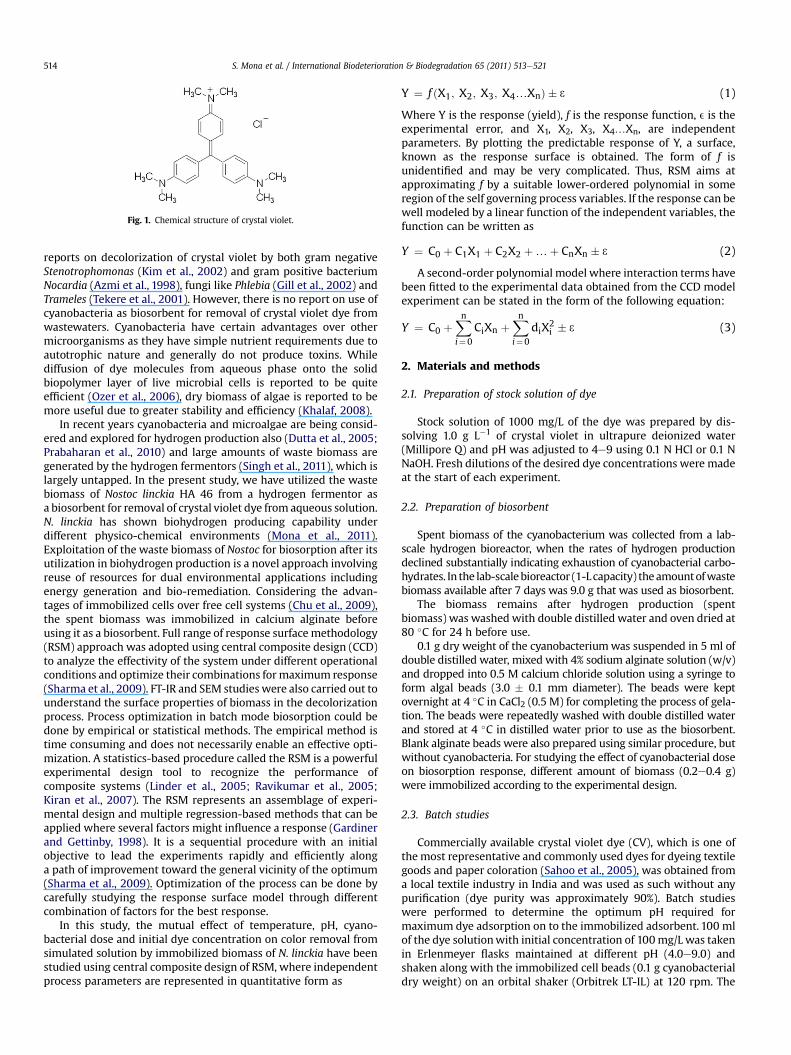
Fig. 1. Chemical structure of crystal violet.
S. Mona et al. / International Biodeterioration & Biodegradation 65 (2011) 513e521514
reports on decolorization of crystal violet by both gram negativeStenotrophomonas (Kim et al., 2002) and gram positive bacteriumNocardia (Azmi et al., 1998), fungi like Phlebia (Gill et al., 2002) andTrameles (Tekere et al., 2001). However, there is no report on use ofcyanobacteria as biosorbent for removal of crystal violet dye fromwastewaters. Cyanobacteria have certain advantages over othermicroorganisms as they have simple nutrient requirements due toautotrophic nature and generally do not produce toxins. Whilediffusion of dye molecules from aqueous phase onto the solidbiopolymer layer of live microbial cells is reported to be quiteefficient (Ozer et al., 2006), dry biomass of algae is reported to bemore useful due to greater stability and efficiency (Khalaf, 2008).
In recent years cyanobacteria and microalgae are being consid-ered and explored for hydrogen production also (Dutta et al., 2005;Prabaharan et al., 2010) and large amounts of waste biomass aregenerated by the hydrogen fermentors (Singh et al., 2011), which islargely untapped. In the present study, we have utilized the wastebiomass of Nostoc linckia HA 46 from a hydrogen fermentor asa biosorbent for removal of crystal violet dye from aqueous solution.N. linckia has shown biohydrogen producing capability underdifferent physico-chemical environments (Mona et al., 2011).Exploitation of the waste biomass of Nostoc for biosorption after itsutilization in biohydrogen production is a novel approach involvingreuse of resources for dual environmental applications includingenergy generation and bio-remediation. Considering the advan-tages of immobilized cells over free cell systems (Chu et al., 2009),the spent biomass was immobilized in calcium alginate beforeusing it as a biosorbent. Full range of response surface methodology(RSM) approach was adopted using central composite design (CCD)to analyze the effectivity of the system under different operationalconditions and optimize their combinations formaximum response(Sharma et al., 2009). FT-IR and SEM studies were also carried out tounderstand the surface properties of biomass in the decolorizationprocess. Process optimization in batch mode biosorption could bedone by empirical or statistical methods. The empirical method istime consuming and does not necessarily enable an effective opti-mization. A statistics-based procedure called the RSM is a powerfulexperimental design tool to recognize the performance ofcomposite systems (Linder et al., 2005; Ravikumar et al., 2005;Kiran et al., 2007). The RSM represents an assemblage of experi-mental design and multiple regression-based methods that can beapplied where several factors might influence a response (Gardinerand Gettinby, 1998). It is a sequential procedure with an initialobjective to lead the experiments rapidly and efficiently alonga path of improvement toward the general vicinity of the optimum(Sharma et al., 2009). Optimization of the process can be done bycarefully studying the response surface model through differentcombination of factors for the best response.
In this study, the mutual effect of temperature, pH, cyano-bacterial dose and initial dye concentration on color removal fromsimulated solution by immobilized biomass of N. linckia have beenstudied using central composite design of RSM, where independentprocess parameters are represented in quantitative form as
Y ¼ f ðX1; X2; X3; X4.XnÞ � 3 (1)
Where Y is the response (yield), f is the response function, e is theexperimental error, and X1, X2, X3, X4.Xn, are independentparameters. By plotting the predictable response of Y, a surface,known as the response surface is obtained. The form of f isunidentified and may be very complicated. Thus, RSM aims atapproximating f by a suitable lower-ordered polynomial in someregion of the self governing process variables. If the response can bewell modeled by a linear function of the independent variables, thefunction can be written as
Y ¼ C0 þ C1X1 þ C2X2 þ.þ CnXn � 3 (2)
A second-order polynomial model where interaction terms havebeen fitted to the experimental data obtained from the CCD modelexperiment can be stated in the form of the following equation:
Y ¼ C0 þXn
i¼0
CiXn þXn
i¼0
diX2i � 3 (3)
2. Materials and methods
2.1. Preparation of stock solution of dye
Stock solution of 1000 mg/L of the dye was prepared by dis-solving 1.0 g L�1 of crystal violet in ultrapure deionized water(Millipore Q) and pH was adjusted to 4e9 using 0.1 N HCl or 0.1 NNaOH. Fresh dilutions of the desired dye concentrations were madeat the start of each experiment.
2.2. Preparation of biosorbent
Spent biomass of the cyanobacterium was collected from a lab-scale hydrogen bioreactor, when the rates of hydrogen productiondeclined substantially indicating exhaustion of cyanobacterial carbo-hydrates. In the lab-scalebioreactor (1-Lcapacity) theamountofwastebiomass available after 7 days was 9.0 g that was used as biosorbent.
The biomass remains after hydrogen production (spentbiomass) was washed with double distilled water and oven dried at80 �C for 24 h before use.
0.1 g dry weight of the cyanobacteriumwas suspended in 5 ml ofdouble distilled water, mixed with 4% sodium alginate solution (w/v)and dropped into 0.5 M calcium chloride solution using a syringe toform algal beads (3.0 � 0.1 mm diameter). The beads were keptovernight at 4 �C in CaCl2 (0.5 M) for completing the process of gela-tion. The beads were repeatedly washed with double distilled waterand stored at 4 �C in distilled water prior to use as the biosorbent.Blank alginate beads were also prepared using similar procedure, butwithout cyanobacteria. For studying the effect of cyanobacterial doseon biosorption response, different amount of biomass (0.2e0.4 g)were immobilized according to the experimental design.
2.3. Batch studies
Commercially available crystal violet dye (CV), which is one ofthe most representative and commonly used dyes for dyeing textilegoods and paper coloration (Sahoo et al., 2005), was obtained froma local textile industry in India and was used as such without anypurification (dye purity was approximately 90%). Batch studieswere performed to determine the optimum pH required formaximum dye adsorption on to the immobilized adsorbent. 100 mlof the dye solutionwith initial concentration of 100mg/L was takenin Erlenmeyer flasks maintained at different pH (4.0e9.0) andshaken along with the immobilized cell beads (0.1 g cyanobacterialdry weight) on an orbital shaker (Orbitrek LT-IL) at 120 rpm. The
S. Mona et al. / International Biodeterioration & Biodegradation 65 (2011) 513e521 515
required pH was adjusted with 0.1 N HCl or 0.1 N NaOH. Afteroptimizing the pH for maximum dye removal, which was found tobe 8.0, batch studies were conducted for determining the optimumcontact time required for maximum dye removal at different initialdye concentrations (100 and 200 mg/L). Samples were withdrawnat fixed time intervals from the flasks in triplicates and analyzedspectro-photometrically at 590 nm (lmax for CV) for residual dyeconcentration in the aqueous solution. Adsorption of the dye byblank alginate beads was also examined.
2.3.1. Kinetics studiesKinetics of biosorption of CV dye by immobilized cyanobacterial
beads (0.1 g biomass)was studied byvarying the contact time from5to 180 min for 100 and 200 mg/L initial dye concentration at120 rpm, keeping other conditions constant (pH 8.0, temperature25 �C). Removal of the dye by blank alginate beads was also exam-ined by using alginate beads without cyanobacterium. Concentra-tion of the dye was calculated by applying the following equation:
Decolorization of dye ð%Þ ¼ ðC0 � CeÞ=C0 � 100 (4)
Where C0 is the initial dye concentration (mg/L) and Ce is theresidual concentration of the dye (mg/L) at different time intervals.
2.4. Scanning electron microscopy (SEM)
Dry samples of immobilized N. linckia before and after CV bio-sorptionwere mounted on stubs and coated with gold palladium of100e150 Å thickness and transferred to the sample chamber of SEM(Model JSM-6100) operated at 10 kV to confirm surface adsorptionof the dye on the biomass (Neerven et al., 1990).
2.5. Optimization of decolorization process using RSM approach
In the present study, CCD model for four variables, temperature(25e35 �C), pH (4e8), initial dye concentration (100e200 mg/L)and cyanobacterial dose (0.2e0.4 g) were used in the experimentaldesign model. The CCD model includes one additional value onboth lower and higher side of all the variables (Table 1). The amountof dye removed (Y) was taken as the response of the designexperiments. Thirty experiments were conducted in triplicatesbased on the model design. Design Expert software was used forregression and graphical analysis of the data obtained. The objec-tive of the RSM is to study interactions and quadratic effects ofvarious parameters, which is indicated in the shape of the responsesurface. The CCDmodel had the advantage that it permitted the useof relatively few combinations of variables for determining thecomplex response function. The optimal values of the chosenvariables were obtained by solving the regression equation and byanalyzing the response surface 3D plots (Montgomery, 2001). Theinconsistency in dependent variables was explained by themultiple coefficient of determination, R2 and the model equationwas used to forecast the optimum value and afterward to elucidatethe interaction involving the variables within the particular range(Elibol, 2002). All the experiments were performed in triplicate andtheir mean values are reported here.
Table 1Experimental range and levels of independent variables.
Factors Range and levels (coded)
�1.682 �1 0 þ1 þ1.682
Temperature (�C) 20 25 30 35 40pH 2 4 6 8 10Initial dye concentration (mg/L) 50 100 150 200 250Cyanobacterial dose (g) 0.1 0.2 0.3 0.4 0.5
2.6. FT-IR study
The FT-IR spectra of the cyanobacterium before and afteradsorption of CV were obtained using the KBr disk technique. Thecyanobacterial biomass was ground in a mortar for 5e10 min afterdrying it for a period of 2 h at 80 �C. Dilution and homogenization to0.01% (w/w) with KBr (spectroscopic grade) were carried out withadditional grinding. The disks were pressed in a hydraulic KBr press(Aravindhan et al., 2007). The transmission FT-IR spectra were thenrecorded between 400 and 4000 cm�1 using PerkineElmer, ModelSpectrum BX Series FT-IR system.
3. Results and discussions
3.1. Biosorption kinetics
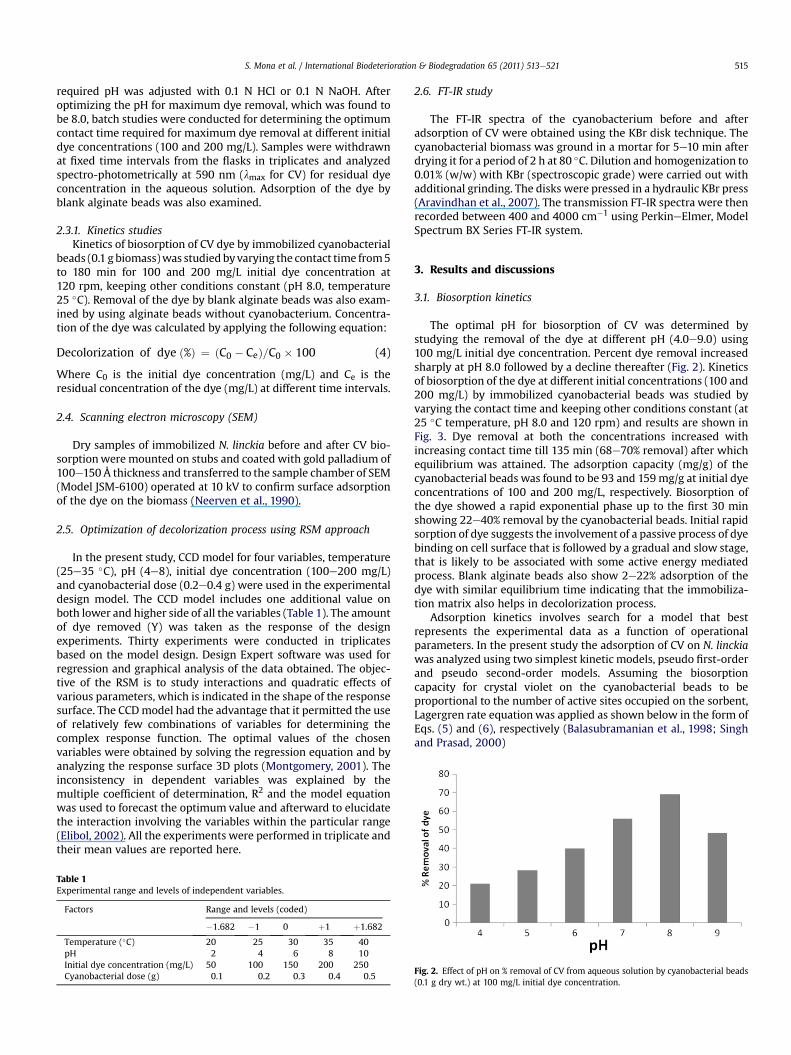
The optimal pH for biosorption of CV was determined bystudying the removal of the dye at different pH (4.0e9.0) using100 mg/L initial dye concentration. Percent dye removal increasedsharply at pH 8.0 followed by a decline thereafter (Fig. 2). Kineticsof biosorption of the dye at different initial concentrations (100 and200 mg/L) by immobilized cyanobacterial beads was studied byvarying the contact time and keeping other conditions constant (at25 �C temperature, pH 8.0 and 120 rpm) and results are shown inFig. 3. Dye removal at both the concentrations increased withincreasing contact time till 135 min (68e70% removal) after whichequilibrium was attained. The adsorption capacity (mg/g) of thecyanobacterial beads was found to be 93 and 159mg/g at initial dyeconcentrations of 100 and 200 mg/L, respectively. Biosorption ofthe dye showed a rapid exponential phase up to the first 30 minshowing 22e40% removal by the cyanobacterial beads. Initial rapidsorption of dye suggests the involvement of a passive process of dyebinding on cell surface that is followed by a gradual and slow stage,that is likely to be associated with some active energy mediatedprocess. Blank alginate beads also show 2e22% adsorption of thedye with similar equilibrium time indicating that the immobiliza-tion matrix also helps in decolorization process.
Adsorption kinetics involves search for a model that bestrepresents the experimental data as a function of operationalparameters. In the present study the adsorption of CV on N. linckiawas analyzed using two simplest kinetic models, pseudo first-orderand pseudo second-order models. Assuming the biosorptioncapacity for crystal violet on the cyanobacterial beads to beproportional to the number of active sites occupied on the sorbent,Lagergren rate equationwas applied as shown below in the form ofEqs. (5) and (6), respectively (Balasubramanian et al., 1998; Singhand Prasad, 2000)
Fig. 2. Effect of pH on % removal of CV from aqueous solution by cyanobacterial beads(0.1 g dry wt.) at 100 mg/L initial dye concentration.

Fig. 3. Biosorption kinetics of CV dye on immobilized cyanobacterial beads (pH 8.0,temperature 25 �C, cyanobacterial dose 0.1 g, initial dye concentration 100 mg/L).
S. Mona et al. / International Biodeterioration & Biodegradation 65 (2011) 513e521516
dq=dt ¼ k1ðqe � qtÞ2 (5)
Where qe and qt (mg g�1) are the amounts of adsorbed dye on theadsorbent at equilibrium and at time t. k1 is the Lagergren rateconstant (min�1) of pseudo first-order kinetic model. For applyingboundary conditions t¼ 0 to t and q¼ 0 to qt the integrated form ofEq. (5) leads to:
logðqe � qtÞ ¼ log qe � k1t=2:303 (6)
The parameters and correlation coefficients of pseudo first-order kinetic model for the adsorption of CV were determined fromthe plot of log(qe � qt) versus t.
The pseudo second-order model is represented as:
dqt=dt ¼ k2ðqe � qtÞ2 (7)
Where k2 is the pseudo second-order rate constant (g mg�1 min�1).For boundary conditions t ¼ 0 to t and q ¼ 0 to qe, the integratedform of Eq. (7) leads to:
t=qt ¼ 1=k2q2e þ 1=qe (8)
Adsorption capacityðmg=gÞ ¼ ðC0 � CeÞ V=M (9)
Where C0 is the initial dye concentration (mg/L) and Ce is theresidual concentration of the dye (mg/L) at different time intervals,V is the volume (mL) and M is the mass of the biomass (g).
The straight line obtained for the log(qe � qt) versus t plotsuggests the applicability of this model. The first-order equation ofLagergren is generally not found to fit well for the whole range ofcontact time and is generally applicable during the initial rapidphase of adsorption (Aravindhan et al., 2007). The linear plot of t/qversus t shows better fitness of data at different initial dyeconcentrations as compared to the plot log(qe � qt) versus t indi-cating that the pseudo second-order model better describes thekinetics of CV adsorption on N. linckia. The values of k1, k2 and qecalculated from the slope and intercept of the plots are given inTable 2. The theoretical values of qe obtained from the graph werecompared with experimental values of qe. Values of qe calculated
Table 2Kinetic model parameters for dye adsorption on cyanobacterial beads at 100 and 200 m
Initial dye concentration (mg/l) Experimetal qe (mg/g) First-order model
Theoretical qe (mg/g)
100 93.6 68.3200 159 108.7
from the first-order kinetic model by plotting log(qe � qt) versus twere, quite different from the experimental value of qe, at initial dyeconcentrations of 100 and 200 mg/L showing little applicability ofthis model for the present system. However, good agreementbetween experimental and calculated values of qe obtained fromsecond-order kinetic model was observed with high values of R2
(Table 2), showing that the biosorption kinetics followed thismodel.
3.2. Scanning electron microscopy (SEM)
Scanning electron micrographs of N. linckia obtained before andafter crystal violet dye loading indicated surface alterations in thebiosorbent after biosorption (Fig. 4). Porous nature of the cyano-bacterial biomass with a grooved structure was clearly visible in thescanning electron micrograph. The large surface area of the bio-sorbent was thus ideal for binding the solute. Binding of the dyewas found to be more or less homogenous onto the surface of thebiosorbent filling the pores (Fig. 4B).
3.3. Optimization of process variables using RSM approach
In the present work, statistically designed experiments wereused to obtain a quadraticmodel consisting of 24 trials plus 6-centerpoints involving four important parameters affecting the efficiencyof dye biosorption. Batch runs conducted in the CCDmodel designedexperiments to visualize the effects of independent factors on theresponse. The range and levels of the four independent variables,viz, temperature, pH, initial dye concentration and cyanobacterialdose used in the study are presented in Table 3 along with observedresponses. Each runwas performed in triplicate andmean values for% decolorization of CV are presented in Table 3. Actual values werethe measured response data for a particular run, and the predictedvalues were evaluated from the model. The fair correlation coeffi-cients might have resulted by the insignificant terms in Table 3, andmost likely due to four different variables selected in wide rangeswith a limited number of experiments as well as the nonlinearinfluence of the investigated parameters on process response. It isobserved that there are tendencies in the linear regression fit, andthe model explains the experimental range studied adequately. Thefitted regression equation showed a good fit of the model.
The experimental results were evaluated and approximatingfunction of dye decolorization percent was obtained in the form ofthe following equation:
% Decolorization ðYÞ ¼ þ47:07� 2:71� Aþ 8:28� B� 0:20
� C � 2:32� Dþ 1:81� A2 þ 3:08
� B2 þ 1:83� C2 þ 1:44� D2 þ 0:73
� A� Bþ 1:74� A� C � 2:75� A� D
þ 0:091� B� C � 1:85� B� D
� 0:89�C� D
(10)
Where Y is the predicted dye decolorization (%) response and A, B, Cand D are the coded values of the test variables, temperature (�C),
g/L initial CV dye concentration (at temperature 25 �C, pH 8.0).
Second-order model
k1 (min�1) R2 Theoretical qe (mg/g) k2 (g mg�1 min�1) R2
0.0054 0.712 96.8 0.0134 0.9960.047 0.887 164 0.0143 0.997
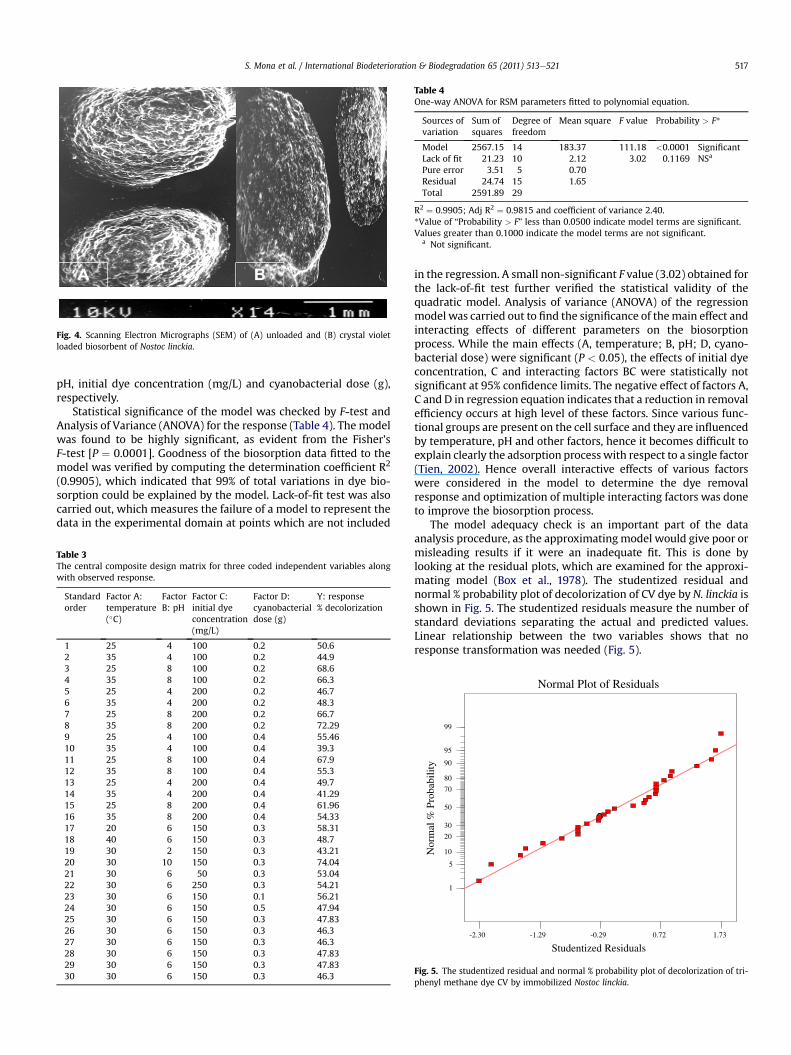
Fig. 4. Scanning Electron Micrographs (SEM) of (A) unloaded and (B) crystal violetloaded biosorbent of Nostoc linckia.
Table 4One-way ANOVA for RSM parameters fitted to polynomial equation.
Sources ofvariation
Sum ofsquares
Degree offreedom
Mean square F value Probability > F*
Model 2567.15 14 183.37 111.18 <0.0001 SignificantLack of fit 21.23 10 2.12 3.02 0.1169 NSa
Pure error 3.51 5 0.70Residual 24.74 15 1.65Total 2591.89 29
R2 ¼ 0.9905; Adj R2 ¼ 0.9815 and coefficient of variance 2.40.*Value of “Probability > F” less than 0.0500 indicate model terms are significant.Values greater than 0.1000 indicate the model terms are not significant.
a Not significant.
S. Mona et al. / International Biodeterioration & Biodegradation 65 (2011) 513e521 517
pH, initial dye concentration (mg/L) and cyanobacterial dose (g),respectively.
Statistical significance of the model was checked by F-test andAnalysis of Variance (ANOVA) for the response (Table 4). The modelwas found to be highly significant, as evident from the Fisher’sF-test [P ¼ 0.0001]. Goodness of the biosorption data fitted to themodel was verified by computing the determination coefficient R2
(0.9905), which indicated that 99% of total variations in dye bio-sorption could be explained by the model. Lack-of-fit test was alsocarried out, which measures the failure of a model to represent thedata in the experimental domain at points which are not included
Table 3The central composite design matrix for three coded independent variables alongwith observed response.
Standardorder
Factor A:temperature(�C)
FactorB: pH
Factor C:initial dyeconcentration(mg/L)
Factor D:cyanobacterialdose (g)
Y: response% decolorization
1 25 4 100 0.2 50.62 35 4 100 0.2 44.93 25 8 100 0.2 68.64 35 8 100 0.2 66.35 25 4 200 0.2 46.76 35 4 200 0.2 48.37 25 8 200 0.2 66.78 35 8 200 0.2 72.299 25 4 100 0.4 55.4610 35 4 100 0.4 39.311 25 8 100 0.4 67.912 35 8 100 0.4 55.313 25 4 200 0.4 49.714 35 4 200 0.4 41.2915 25 8 200 0.4 61.9616 35 8 200 0.4 54.3317 20 6 150 0.3 58.3118 40 6 150 0.3 48.719 30 2 150 0.3 43.2120 30 10 150 0.3 74.0421 30 6 50 0.3 53.0422 30 6 250 0.3 54.2123 30 6 150 0.1 56.2124 30 6 150 0.5 47.9425 30 6 150 0.3 47.8326 30 6 150 0.3 46.327 30 6 150 0.3 46.328 30 6 150 0.3 47.8329 30 6 150 0.3 47.8330 30 6 150 0.3 46.3
in the regression. A small non-significant F value (3.02) obtained forthe lack-of-fit test further verified the statistical validity of thequadratic model. Analysis of variance (ANOVA) of the regressionmodel was carried out to find the significance of themain effect andinteracting effects of different parameters on the biosorptionprocess. While the main effects (A, temperature; B, pH; D, cyano-bacterial dose) were significant (P < 0.05), the effects of initial dyeconcentration, C and interacting factors BC were statistically notsignificant at 95% confidence limits. The negative effect of factors A,C and D in regression equation indicates that a reduction in removalefficiency occurs at high level of these factors. Since various func-tional groups are present on the cell surface and they are influencedby temperature, pH and other factors, hence it becomes difficult toexplain clearly the adsorption process with respect to a single factor(Tien, 2002). Hence overall interactive effects of various factorswere considered in the model to determine the dye removalresponse and optimization of multiple interacting factors was doneto improve the biosorption process.
The model adequacy check is an important part of the dataanalysis procedure, as the approximatingmodel would give poor ormisleading results if it were an inadequate fit. This is done bylooking at the residual plots, which are examined for the approxi-mating model (Box et al., 1978). The studentized residual andnormal % probability plot of decolorization of CV dye by N. linckia isshown in Fig. 5. The studentized residuals measure the number ofstandard deviations separating the actual and predicted values.Linear relationship between the two variables shows that noresponse transformation was needed (Fig. 5).
Studentized Residuals
Nor
mal
% P
roba
bilit
y
Normal Plot of Residuals
-2.30 -1.29 -0.29 0.72 1.73
1
5
10
20
30
50
70
80
90
95
99
Fig. 5. The studentized residual and normal % probability plot of decolorization of tri-phenyl methane dye CV by immobilized Nostoc linckia.

S. Mona et al. / International Biodeterioration & Biodegradation 65 (2011) 513e521518
3.3.1. Effect of process variablesThe regression equations are graphically represented as three-
dimensional response surface plots presented (Fig. 6aed). Themaingoal of response surface is to track efficiently for the optimumvalues of the variables such that the response is maximized.Keeping in view variation in pH of textile wastewaters the effect ofpH varying from 4.0 to 8.0 was studied. There was a sharp increasein decolorization rate as pH increased from 4.0 to 8.0 (Fig. 6a),showing that removal of the dye is favored in alkaline environment.Biosorption increased with increase in pH from 4 to 8, showing thebest removal at pH 8.0 (Fig. 6a). This can be explained on the basisof zero point charge of the biomass. As isoelectric point of variousalgal species has been found to be around pH 3e4, the cell surface ispresumably positively charged in acidic solution and negativelycharged in alkaline solution (Khataee et al., 2011). Since CV isa cationic dye, its adsorption on to the negatively charged surface ofNostoc in an alkaline pH 8.0 favored, thus increasing the decolor-ization efficiency. A similar behavior was also reported for Pith-ophora sp. for removal of malachite green, a tri-phenylmethane dye(Kumar et al., 2006).
A decrease in decolorization rate was observed as the temper-ature increased from 25 �C to 35 �C temperature (Fig. 6a). Thisindicates that with rise in temperature, affinity of the binding siteson the biomass for the dye decrease and the process seems to beexothermic in nature. The mechanism of adsorption at relatively
40.23
45.72
51.22
56.71
62.21
% D
eclo
rizat
ion
of d
ye
25.00
27.50
30.00
32.50
35.00
4.00
5.00
6.00
7.00
8.00
Temperature pH
41.85
46.48
51.11
55.74
60.36
% D
eclo
rizat
ion
of d
ye
4.00
5.00
6.00
7.00
8.00
100.00
125.00
150.00
175.00
200.00
pH Initial dye conc.
a
c
Fig. 6. Three-dimensional response surface plot for the effect of a) temperature and pH, b)cyanobacterial dose and initial metal concentration on biosorption of CV by N. linckia.
lower temperature also suggests the process of biosorption to bemainly a physical process though chemical adsorption is alsoinvolved (Aksu and Tezer, 2005). Interactive effects of pH andtemperature (Fig. 6a) were positive and statistically significant, asrevealed by the contour lines.
Initial dye concentrations provide an important driving force toovercome all mass transfer resistance of the dye between theaqueous and solid phases (Marungrueng and Pavasant, 2006;Aravindhan et al., 2007). The adsorption of CV at different initialdye concentrations with respect to varying temperature is shown inFig. 6b. It was observed that increasing initial dye concentrationsignificantly increaseddye removal. The reasonof this observation isthought to be the fact that increasing the initial concentration of thedye increases the probability of contact between dyemolecules andalgae species (Khataee et al., 2011). The finding was in agreementwith literature reports where higher concentration of pollutantswould result in higher initial concentration efficiency (Daneshvaret al., 2007; Khataee et al., 2011). The interactive effects of temper-ature and initial dye concentration are shown in Fig. 6b.
Interactive effects of initial dye concentration and temperature(Fig. 6b) were positive and statistically significant, as revealed bythe contour lines and multiple regression equation.
Effect of initial dye concentrations and varying pH on bio-sorption of the dye is shown in Fig. 6c. Removal of CV increasedwith increase in dye concentration and pH. Statistically the
45.84
48.22
50.59
52.97
55.35
% D
eclo
rizat
ion
of d
ye
25.00
27.50
30.00
32.50
35.00
100.00
125.00
150.00
175.00
200.00
Temperature Initial dye conc.
46.01
47.84
49.68
51.52
53.35
% D
eclo
rizat
ion
of d
ye
100.00
125.00
150.00
175.00
200.00
0.20
0.25
0.30
0.35
0.40
Initial dye conc. Cyanobacterial dose
b
d
Initial dye concentration and temperature, c) Initial dye concentration and pH and d)

S. Mona et al. / International Biodeterioration & Biodegradation 65 (2011) 513e521 519
interactive effect of the BC (pH and initial dye concentration) ispositive and significant.
Removal of dye against as interactive function of cyanobacterialdose and initial dye concentration is shown in Fig. 6d. It wasobserved that percent dye removal decreased with increasing dyeand biomass concentration. Interactive effect of initial dye concen-tration and cyanobacterial dose was found to be negative andstatistically significantwhichwas also revealed by the contour lines.Dye removal decreased with increase in biomass dose and the twoshowed statistically significant inverse relationship (Eq. (10)). It hasbeen postulated that greater biomass dose could create a screeningeffect hindering the attachmentof ions onbinding sites on thedenselayer of cells (Zulkali et al., 2006). The interactive effects of cyano-bacterial dose with every other parameter like pH, initial dyeconcentration and temperature were negative and statisticallysignificant indicating that the dye removal response would changedue to their multiple interacting factors. Hence overall interactiveeffects of the four factorswere considered in themodel to determinethe dye removal response. Maximum removal of the dye (74.04%)was observed at 150 mg/L initial dye concentration; pH 10,temperature 30 �C and cyanobacterial dose 0.3 g. The next bestresponseswere temperature of 35 �C, pH 8, initial dye concentration200 mg/L and cyanobacterial dose (0.2 g), when 72% color removalwas achieved (Table 3). Since the dye concentration reported in thewastewaters of textile mills in sub-tropical is also in the range of200mg/L, pH 8.0 and temperature 35 �C, these conditions would bemore suitable for removal of the dye using N. linckiawaste biomass.
3.4. Characterization of surface by FT-IR
To understand the involvement of the functional groups on thecell surface in biosorption of CV, biomass of N. linckia before andafter dye biosorption was examined using FT-IR spectroscopy,
Fig. 7. FT-IR spectra of a) unloaded and
vibrational spectra of which are shown in Fig. 7. The biomass ofN. linckia before and after biosorption shows shifting and intensi-fication of some peaks after dye loading, indicating their involve-ment in dye biosorption, which were interpreted based on thestandard wave number (Skoog and Leary, 1992). The broad peak at3318.19 shifted to a more prominent peak at 3394.43 cm�1, whichseems likely due to the overlap of OeH and NeH stretchingvibrations, indicating the presence of both surface free hydroxylgroups and chemisorbed water on the biosorbent (Sari and Tuzen,2008). The shifting and intensification of peaks from 2925.49 to2926.81 cm�1 indicates CeH symmetric stretch of the methylenegroups (eCH2) and deformation vibration of methyl groups (eCH3)that are involved in the biosorption process. The distinct peak at1655.30 cm�1 observed in the dye loaded samples may be attrib-uted to C]O stretching vibration of carboxylate (eCOOe). Thepeaks at 1244.75 and 1152.44 cm�1, visible mainly on dye loadedbiomass are due to the C]O stretching vibration of ketones, alde-hydes and lactones or carboxyl groups (Chandrasekhar andPramada, 2006). Thus, amide, hydroxy, carboxylate, CeO, methyland methylene groups seem to participate in CV biosorption on thesurface of Nostoc causing shifts in wave numbers, due to change inbonding energy in the corresponding functional groups (Balariaand Schiewer, 2008). Though a few new peaks at 827.9, 772.02,609.8 and 579.07 were seen in dye loaded biomass indicatinginvolvement of SeO group (Marungrueng and Pavasant, 2006) andno distinct new peaks were observed in the vibrational spectrumand shifting of peaks were usually marginal in the dye loadedbiomass as compared to the unloaded biomass. Thus, decoloriza-tion of the CV dye was predominantly due to biosorption onto thebiomass with little likelihood of any biodegradation of the dyeduring the process (Daneshvar et al., 2007). Degradation metabo-lites of tri-phenylmethane dyes have usually been found to be toxic.Since in the present system no such degradation is observed, use of
b) dye loaded biomass of N. linckia.

S. Mona et al. / International Biodeterioration & Biodegradation 65 (2011) 513e521520
N. linckiawaste biomass as a biosorbent for removal of the dye fromaqueous system would be safe without releasing any toxic prod-ucts, besides being cheap environment friendly and efficient.
Waste biomass of N. linckia from hydrogen fermentors may beutilized for removal of the toxic crystal violet dye fromwastewater.Productivity of Nostoc is 20e22 g/m2/day during the optimalsummermonths and the overall favorable period for growth in sub-tropical regions is about 250 days in a year. The biomass is in theform of a mat, which makes it easy to harvest and use in thebioreactor. The pH, temperature and concentration of the dyesolution found optimum for maximum decolorization also showthat the waste biomass of the cyanobacterium is practically appli-cable for removing the CV dye from the alkaline wastewater oftextile mills in the sub-tropical regions at ambient temperature.Optimization of multiple interacting parameters influencing thebiosorption process in batch mode is important for the continuousmode biosorption studies to follow. The preset study suggests thatfuture investigation on integration of wastewater treatmentprocess with microbial biohydrogen production should be exploredfor dual environmental benefits.
Acknowledgments
Financial support from University Grant Commission, N. Delhi asSAP-DRS-II for lab facilities and Council of Scientific and IndustrialResearch (CSIR), New Delhi in the form of senior research fellow-ship (SRF) to one of the authors (SM) is gratefully acknowledged.
References
Akbal, F., 2005. Adsorption of basic dyes from aqueous solution onto pumicepowder. Journal of Colloidal and Interface Science 286, 455e458.
Aksu, Z., Tezer, S., 2005. Biosorption of reactive dyes on the green alga Chlorellavulgaris. Process Biochemistry 40, 1347e1361.
Ali, H., Muhammad, S.K., 2008. Biosorption of crystal violet from water on leafbiomass of Calotropis procera. Journal of Environmental Science and Technology1, 143e150.
Aravindhan, R., Rao, J.R., Nair, B.U., 2007. Removal of basic yellow dye from aqueoussolution by sorption on green alga Caulerpa scalpelliformis. Journal of HazardousMaterials 142, 68e76.
Atmani, F., Bensmaili, A., Mezenner, N.Y., 2009. Synthetic textile effluent removal byskin almonds waste. Journal of Environmental Science and Technology 2,53e169.
Au, W., Pathak, S., Collie, C.I., Hsu, T.S., 1978. Cytogenic toxicity of gentian violet(crystal violet) on mammalian cells in vitro. Mutation Resources 58, 269e276.
Azmi, W., Sani, R.K., Banerjee, U.C., 1998. Biodegradation of triphenylmethane dyes.Enzyme and Microbial Technology 22, 185e191.
Balaria, A., Schiewer, S., 2008. Assessment of biosorption mechanism for Pb bindingby citrus pectin. Separation and Purification Technology 63, 577e581.
Balasubramanian, N., Raja, R.E., Lalitha, K., Uma, R., 1998. Adsorption dynamics:study of applicability of the Lagergren plot. Journal of Environmental Studiesand Policy 1, 21e24.
Box, G.E.P., Hunter, W.G., Hunter, J.S., 1978. Statistics for Experiments: an Intro-duction to Design, Data Analysis and Model Building. Wiley Interscience, pp.653.
Chandrasekhar, S., Pramada, P.N., 2006. Rice husk ash as an adsorbent for methy-lene blue-effect of ashing temperature. Adsorption 12, 27e43.
Chu, W.-L., See, Y.-C., Phang, S.-M., 2009. Use of immobilized Chlorella vulgaris forthe removal of colour from textile dyes. Journal of Applied Phycology 21,641e648.
Daneshvar, N., Ayazloo, M., Khataee, A.R., Pourhassan, M., 2007. Biological decol-orization of dye solution containing malachite green by microalgae Cosmariumsp. Bioresource Technology 98, 1176e1182.
Dutta, D., De, D., Chaudhuri, S., Bhattacharya, S.K., 2005. Hydrogen production bycyanobacteria. Microbial Cell Factories 4, 1e14.
Elibol, M., 2002. Response surface methodological approach for inclusion of per-fluorocarbon in actinorhodin fermentation medium. Process Biochemistry 38,667e673.
Forgacs, E., Cserhati, T., Oros, G., 2004. Removal of synthetic dyes fromwastewaters:a review. Environmental International 30, 953e971.
Fu, Y., Viraraghavan, T., 2002. Removal of congo red from aqueous solution byfungus Aspergillus niger. Advances in Environmental Research 7, 239e247.
Gardiner, W.P., Gettinby, G., 1998. Experimental Design Techniques in StatisticalPractice: a Practical Software-based Approach. Horwood, England, pp. 416.
Gill, P.K., Arora, D.S., Chander, M., 2002. Biodecolourization of azo and triphenyl-methane dyes by Dichomitus squalens and Phlebia spp. Journal of IndustrialMicrobiology and Biotechnology 28, 201e203.
Grabowska, E.L., Gryglewicz, E., 2007. Adsorption characteristics of congo red oncoal based mesoporous activated carbon. Dyes and Pigments 74, 34e40.
Khalaf, M.A., 2008. Biosorption of reactive dye from textile wastewater by non-viable biomass of Aspergillus niger and Spirogyra sp. Bioresource Technology 99,6631e6634.
Khataee, A.R., Dehghan, G., Zarei, M., Ebadi, E., Pourhassan, M., 2011. Neural networkmodeling of biotreatment of tri-phenylmethane dye solution by a greenmicroalga. Chemical Engineering Research and Design 89, 172e178.
Khattri, S.D., Singh, M.K., 2000. Colour removal from synthetic dye wastewaterusing a biosorbent. Water, Air, & Soil Pollution 120, 283e294.
Kim, J.D., Yoon, J.H., Park, Y.H., Kawai, F., Kim, H.T., Lee, D.W., 2002. Identification ofStenotrophomonas maltophilia LK-24 and its degradability of crystal violet.Journal of Microbiology and Biotechnology 12, 437e443.
Kiran, B., Kaushik, A., Kaushik, C.P., 2007. Response surface methodologicalapproach for optimizing removal of Cr(VI) from aqueous solution usingimmobilized cyanobacterium. Chemical Engineering Journal 126, 147e153.
Kumar, K.V., Ramamurthi, V., Sivanesan, S., 2006. Biosorption of malachite green,a cationic dye onto Pithophora sp., a fresh waster algae. Dyes and Pigments 69,102e107.
Linder, M., Kochanowski, N., Fanni, J., Parmentier, M., 2005. Response surfaceoptimization of lipase-catalysed esterification of glycerol and n-3 poly-unsaturated fatty acids from salmon oil. Process Biochemistry 40,273e279.
Marungrueng, K., Pavasant, P., 2006. Removal of basic dye (Astrazon Blue FGRL)using macroalga Caulerpa lentillifera. Journal of Environmental Management 78,268e274.
Meshko, V., Markovska, L., Mincheva, M., Rodrigues, A.E., 2001. Adsorption of basicdyes on granular activated carbon and natural zeolite. Water Research 33,3357e3366.
Mona, S., Kaushik, A., Kaushik, C.P., 2011. Hydrogen production and metal-dyebioremoval by a Nostoc linckia strain isolated from textile mill oxidation pond.Bioresource Technology 102, 3200e3205.
Monash, P., Pugazhenthi, G., 2009. Adsorption of crystal violet dye from aqueoussolution using mesoporous materials synthesized at room temperature.Adsorption 15, 390e405.
Montgomery, D.C., 2001. Design and Analysis of Experiments, fifth ed. John Wiley &Sons, Inc., New York, pp. 451e454.
Neerven, AR.W.V., Wijffels, R.H., Zehnder, A.J.B., 1990. Scanning electron microscopyof immobilized bacteria in gel beads: a comparative study of fixation methods.Journal of Microbiological Methods 11, 157e168.
Ozer, A., Akkaya, G., Turabik, M., 2006. The removal of acid red 274 from waste-water: combined biosorption and biocoagulation with Spirogyra rhizopus. Dyesand Pigments 71, 83e89.
Pierce, J., 1994. Colour in textile effluents-the origins of the problem. Journal of theSociety of Dyers and Colourists 110, 131e134.
Prabaharan, D., Kumar, D.A., Uma, L., Subramanian, G., 2010. Dark hydrogenproduction in nitrogen atmosphere e an approach for sustainability by marinecyanobacterium Leptolyngbya valderiana BDU 20041. International Journal ofHydrogen Energy 35, 10725e10730.
Ramakrishnan, M., Nagarajan, S., 2009. Utilization of waste biomass for the removalof basic dye from water. World Applied Sciences Journal 5, 114e121.
Ravikumar, K., Pakshirajan, K., Swaminathan, T., Balu, K., 2005. Optimization ofbatch process parameters using response surface methodology for dye removalby a novel adsorbent. Chemical Engineering Journal 105, 131e138.
Robinson, T., Mcmullan, G., Marchant, R., Nigam, P., 2001. Remediation of dyes intextile effluent: a critical review on current treatment technologies witha proposed alternative. Bioresource Technology 77, 247e255.
Sahoo, C., Gupta, A.K., Pal, A., 2005. Photocatalytic degradation of crystalviolet (C.I. basic violet 3) on silver ion doped TiO2. Dyes and Pigments 66,189e196.
Sari, A., Tuzen, M., 2008. Biosorption of cadmium(II) from aqueous solution by redalgae (Ceramium virgatum): equilibrium, kinetic and thermodynamic studies.Journal of Hazardous Materials 157, 448e454.
Senthilkumaar, S., Kalaamani, P., Subburaam, C.V., 2006. Liquid phase adsorption ofcrystal violet onto activated carbons derived from male flowers of coconut tree.Journal of Hazardous Materials 136, 800e808.
Sharma, P., Singh, L., Dilbaghi, N., 2009. Response surface methodological approachfor the decolorization of simulated dye effluent using Aspergillus fumigatusfresenius. Journal of Hazardous Materials 161, 1081e1086.
Shaul, G.M., Holdsworth, T.J., Dempsey, C.R., Dostal, K.A., 1991. Fate of water solubleazo dyes in the activated sludge process. Chemosphere 22, 107e119.
Singh, A., Nigam, P.S., Murphy, J.D., 2011. Renewable fuels from algae: an answer todebatable land based fuels. Bioresource Technology 102, 10e16.
Singh, R., Prasad, B.B., 2000. Trace metal analysis: selective sample (copper II)enrichment on an AlgaSORB column. Process Biochemistry 35, 897e905.
Sivalingam, G., Nagaveni, K., Hegde, M.S., Madras, G., 2003. Photocatalytic degra-dation of various dyes by combustion synthesized nano anatase TiO2. AppliedCatalysis B: Environmental 41, 23e38.
Skoog, D.A., Leary, J.J., 1992. Principles of Instrumental Analysis, fourth ed. SaundersCollege Publishing, pp. 224.
Stylidi, M., Kondarides, D.I., Verykios, X.E., 2003. Applied Catalysis B: Environmental40, 271e286.

S. Mona et al. / International Biodeterioration & Biodegradation 65 (2011) 513e521 521
Tekere, M., Mswaka, A.Y., Zvauya, R., Read, J.S., 2001. Growth, dye degradation andligninolytic activity studies on Zimbabwean white rot fungi. Enzyme andMicrobial Technology 28, 420e426.
Tien, C.-J., 2002. Biosorption of metal ions by freshwater algae with different surfacecharacteristics. Process Biochemistry 38, 605e613.
Zollinger, H., 1987. Color Chemistry e Synthesis, Projects and Applications ofOrganic Dyes and Pigments. VCH Publisher, New York, pp. 92e102.
Zulkali, M.M.D., Ahmad, A.L., Norulakmal, N.H., 2006. Oryza sativa L. husk as heavymetal adsorbent: optimization with lead as model solution. Bioresource Tech-nology 97, 21e25.
Copyright © 2022 FDOKUMEN