Determination of Voriconazole and its Degradation products in Pharmaceutical formulations using High...
11
Eurasian J Anal Chem 5(3): 254-264, 2010 Determination of Voriconazole and its Degradation products in Pharmaceutical formulations using High Performance Liquid Chromatography with Ultra-Violet Detection Ahmed Ibrahim Badr Eldin a , Abdalla Shalaby b* a SIGMA Pharmaceuticals Corporation, Zagazig, Egypt b Zagazig University, Analytical Chemistry Department, Faculty of Pharmacy, Zagazig, Egypt. Received: 20/11/2009; Accepted: 23/01/2010 Abstract Simple, sensitive and accurate stability indicating analytical method has been developed and validated for determination of voriconazole and its degradation products using RP-HPLC method with ultra- violet detection. The resulting method was applied for determination of voriconazole tablets (Vfend®). The procedure was developed and validated under acidic, basic, oxidative and photo- irradiated conditions. The compounds were separated on C 18 column using 0.05 mol L -1 disodium hydrogen phosphate buffer (pH 5.5) : acetonitrile (1:1, v/v) as a mobile phase. at a flow rate of 1.0 mL per min and UV detection at 255 nm, the run time was less than 15 minutes The calibration curves were linear between 6.0 and 60 µg mL -1 . The proposed method was simple, highly sensitive, precise, accurate and, is useful for routine quality control analysis and stability testing. It was found that voriconazole was more sensitive to the basic conditions, photodegradation was observed only under severe conditions of light exposure and oxidation may also appear, however, it was stable in acidic medium. Keywords: Assay, Stability indicating method, Voriconazole, HPLC 1. Introduction Voriconazole, ((2R, 3S) -2- (2,4-difluorophenyl) -3- (5-fluoro -4- pyrimidinyl) -1- (1H-1,2,4-triazol-1-yl)-2-butan-2-ol) (Fig. 1). Is the newest agent in the armamentarium antifungal. It is a triazole antifungal; structurally related to fluconazole, with a comparable spectrum of activity to itraconazole. Voriconazole inhibits the fungal ergosterol biosynthesis [1] This inhibition is more selective for fungal enzyme system than mammalian enzyme system[2]. The accumulation of 14-alphamethyl sterols results in a decrease in ergosterol, which is an essential component of fungal cell wall formation. The resulting cell wall abnormalities are thought to be responsible for voriconazole's antifungal activity. Voriconazole was approved by the Food and Drug Administration in May 2002 for the treatment of invasive aspergillosis and refractory infections of Scedosporium apiospermum and Fusarium spp. * Corresponding Author E-mail: [email protected] ISSN: 1306-3057, Moment Publication ©2010
Transcript of Determination of Voriconazole and its Degradation products in Pharmaceutical formulations using High...
Eurasian J Anal Chem 5(3): 254-264, 2010
Determination of Voriconazole and its Degradation products in Pharmaceutical formulations using High Performance Liquid Chromatography with Ultra-Violet Detection
Ahmed Ibrahim Badr Eldina, Abdalla Shalabyb* a SIGMA Pharmaceuticals Corporation, Zagazig, Egypt b Zagazig University, Analytical Chemistry Department, Faculty of Pharmacy, Zagazig, Egypt.
Received: 20/11/2009; Accepted: 23/01/2010
Abstract
Simple, sensitive and accurate stability indicating analytical method has been developed and validated for determination of voriconazole and its degradation products using RP-HPLC method with ultra-violet detection. The resulting method was applied for determination of voriconazole tablets (Vfend®). The procedure was developed and validated under acidic, basic, oxidative and photo-irradiated conditions. The compounds were separated on C18 column using 0.05 mol L-1 disodium hydrogen phosphate buffer (pH 5.5) : acetonitrile (1:1, v/v) as a mobile phase. at a flow rate of 1.0 mL per min and UV detection at 255 nm, the run time was less than 15 minutes The calibration curves were linear between 6.0 and 60 µg mL-1. The proposed method was simple, highly sensitive, precise, accurate and, is useful for routine quality control analysis and stability testing. It was found that voriconazole was more sensitive to the basic conditions, photodegradation was observed only under severe conditions of light exposure and oxidation may also appear, however, it was stable in acidic medium.
Keywords:
Assay, Stability indicating method, Voriconazole, HPLC
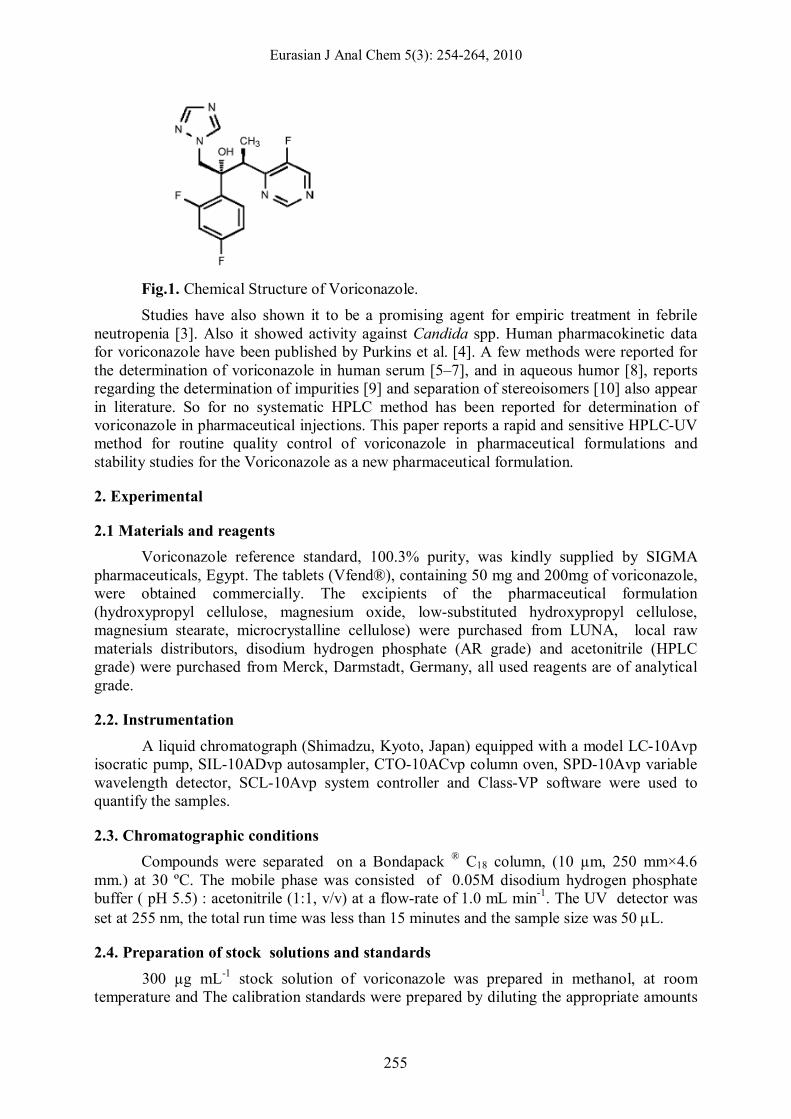
1. Introduction Voriconazole, ((2R, 3S) -2- (2,4-difluorophenyl) -3- (5-fluoro -4- pyrimidinyl) -1-
(1H-1,2,4-triazol-1-yl)-2-butan-2-ol) (Fig. 1). Is the newest agent in the armamentarium antifungal. It is a triazole antifungal; structurally related to fluconazole, with a comparable spectrum of activity to itraconazole. Voriconazole inhibits the fungal ergosterol biosynthesis [1] This inhibition is more selective for fungal enzyme system than mammalian enzyme system[2]. The accumulation of 14-alphamethyl sterols results in a decrease in ergosterol, which is an essential component of fungal cell wall formation. The resulting cell wall abnormalities are thought to be responsible for voriconazole's antifungal activity. Voriconazole was approved by the Food and Drug Administration in May 2002 for the treatment of invasive aspergillosis and refractory infections of Scedosporium apiospermum and Fusarium spp.
* Corresponding Author E-mail: [email protected] ISSN: 1306-3057, Moment Publication ©2010
Eurasian J Anal Chem 5(3): 254-264, 2010
255
Fig.1. Chemical Structure of Voriconazole. Studies have also shown it to be a promising agent for empiric treatment in febrile
neutropenia [3]. Also it showed activity against Candida spp. Human pharmacokinetic data for voriconazole have been published by Purkins et al. [4]. A few methods were reported for the determination of voriconazole in human serum [5–7], and in aqueous humor [8], reports regarding the determination of impurities [9] and separation of stereoisomers [10] also appear in literature. So for no systematic HPLC method has been reported for determination of voriconazole in pharmaceutical injections. This paper reports a rapid and sensitive HPLC-UV method for routine quality control of voriconazole in pharmaceutical formulations and stability studies for the Voriconazole as a new pharmaceutical formulation.
2. Experimental
2.1 Materials and reagents Voriconazole reference standard, 100.3% purity, was kindly supplied by SIGMA
pharmaceuticals, Egypt. The tablets (Vfend®), containing 50 mg and 200mg of voriconazole, were obtained commercially. The excipients of the pharmaceutical formulation (hydroxypropyl cellulose, magnesium oxide, low-substituted hydroxypropyl cellulose, magnesium stearate, microcrystalline cellulose) were purchased from LUNA, local raw materials distributors, disodium hydrogen phosphate (AR grade) and acetonitrile (HPLC grade) were purchased from Merck, Darmstadt, Germany, all used reagents are of analytical grade.
2.2. Instrumentation A liquid chromatograph (Shimadzu, Kyoto, Japan) equipped with a model LC-10Avp
isocratic pump, SIL-10ADvp autosampler, CTO-10ACvp column oven, SPD-10Avp variable wavelength detector, SCL-10Avp system controller and Class-VP software were used to quantify the samples.
2.3. Chromatographic conditions Compounds were separated on a Bondapack ® C18 column, (10 µm, 250 mm×4.6
mm.) at 30 ºC. The mobile phase was consisted of 0.05M disodium hydrogen phosphate buffer ( pH 5.5) : acetonitrile (1:1, v/v) at a flow-rate of 1.0 mL min-1. The UV detector was set at 255 nm, the total run time was less than 15 minutes and the sample size was 50 L.
2.4. Preparation of stock solutions and standards 300 µg mL-1 stock solution of voriconazole was prepared in methanol, at room
temperature and The calibration standards were prepared by diluting the appropriate amounts
Eldin and Shalaby
256
of the stock solution with mobile phase.. Nominal concentrations were 6, 12, 18, 24, 30, 36 and 60 µg mL-1 of voriconazole,
2.5. Sample preparation Randomly selected voriconazole tablets were powdered and diluted with the
appropriate volumes of mobile phase for the assay test or used as it is for the content uniformity test. The samples were filtered using 0.45µ nylon sample filter (Whatman).
2.6. Stress treatment of voriconazole in acidic, basic, oxidative and photo-irradiation conditions
8 mL of the above stock solution (300 µg mL-1) was diluted to 100 mL using 1N hydrochloric acid, 1N sodium hydroxide, 1.5% hydrogen peroxide solution or methanol. The acidic, basic and oxidative solutions were incubated at 50ºC for 2 hours; however, the neutral solution was irradiated under a CAMAG 200-W high-pressure mercury lamp for 40hrs. The distance between the light source and the sample was maintained at 25 cm. Samples in triplicates were analyzed using HPLC-UV analysis.
2.7. Quantification 20 µL of the standard solutions, voriconazole tablets solutions and forced degradation
solutions were injected into the HPLC-UV system. The responses (peak area) for the major peaks were measured and the quantity of voriconazole was calculated from the equation Cs(Au/As) where Au is the area under the peak of the test solution and As the area under the peak of the standard solution and Cs is the concentration of voriconazole in the standard solution.
2.8. Linearity, lower limit of detection and lower limit of quantitation Calibration curves were constructed form the working standard solutions of
voriconazole at the concentrations range of 6.0 - 60 µg mL-1. A linear regression was obtained by plotting the peak areas against concentrations. The correlation coefficient, intercept, slope and the confidence intervals for the slope and the intercept of the regression line were calculated the lower limit of detection (LLOD) and the lower limit of quantitation (LLOQ) were calculated as 3 S.D. and 10 S.D. of the blank, respectively, according to the treatment by Miller and Miller [11]. Before injecting solutions, the column was equilibrated for at least 20 minutes with the mobile phase.
3. Result and discussion
3.1. Method development HPLC-UV method was developed to resolve voriconazole from its degradation
products and to comply with the general requirements of system suitability. Effect of various variables as detection wavelength, types and quantites of the organic modifiers, column, column temperature, buffer concentration, and the pH of the mobile phase were studied.
Voriconazole and its degradation products showed maximum absorption at a wavelength of 255 nm. A reversed phase C18 column (Hypersil ODS, 5 µm, 250×4.6 mm) with a mixture of acetonitrile and 0.01 mol L-1 disodium hydrogen phosphate (6:4, v/v), pH 5.5 was initially used, the retention times were short and unresolved peaks were obtained. Decreasing the percentage of acetonitrile from 60 to 50% resulted in longer retention time but the tailing factor was so high for the voriconazole peak, however, increasing of the

Eurasian J Anal Chem 5(3): 254-264, 2010
257
modifier ratio was associated with a shorter retention times for all compounds. Using of methanol as an organic modifier showed a high tailing factor and longer retention times. Hypersil C18 column of 5 µm was then replaced by Bondapack C18 column of 10 µm, the tailing factor was reduced and good peak shape was obtained. Maintaining column temperature at 30ºC showed good peak symmetry. Changing the concentration of disodium hydrogen phosphate from 0.01 to 0.05 M increased the peak symmetry reduced the tailing factor. pH 5.5 of the mobile phase was found to be optimum, decreasing the pH from 5.5 to 4 resulted in shorter retention times and unresolved peaks. The optimized chromatographic conditions as described above were applied for all measurements.
3.2. Specificity Selectivity was demonstrated for voriconazole in a mixture of the drug excipients. No
interferences were found at the retention time of voriconazole. The specificity was also demonstrated by induced degradation of voriconazole samples.
Stress treatment of voriconazole in acidic, basic, oxidative and photo-irradiation conditions). Under the studied conditions, It was found that voriconazole was degradated in aqueous solutions, especially under basic conditions. Photodegradation is observed only under severe conditions of light exposure. Oxidation may also appear.
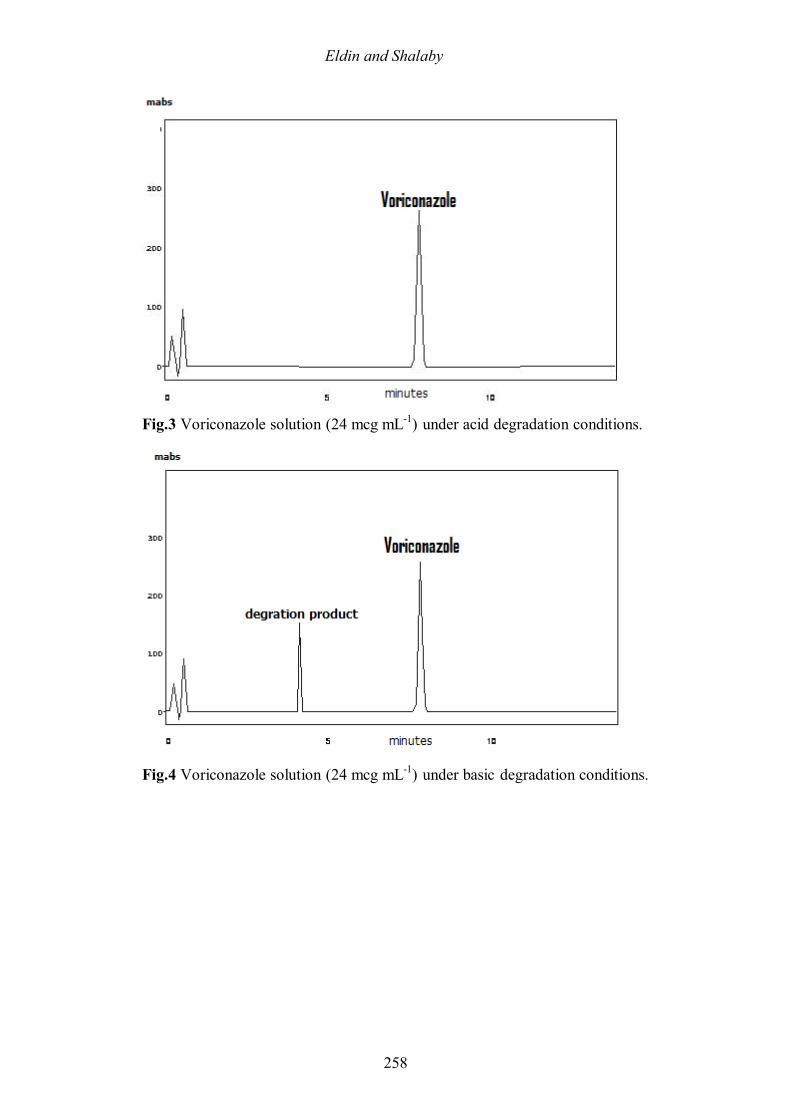
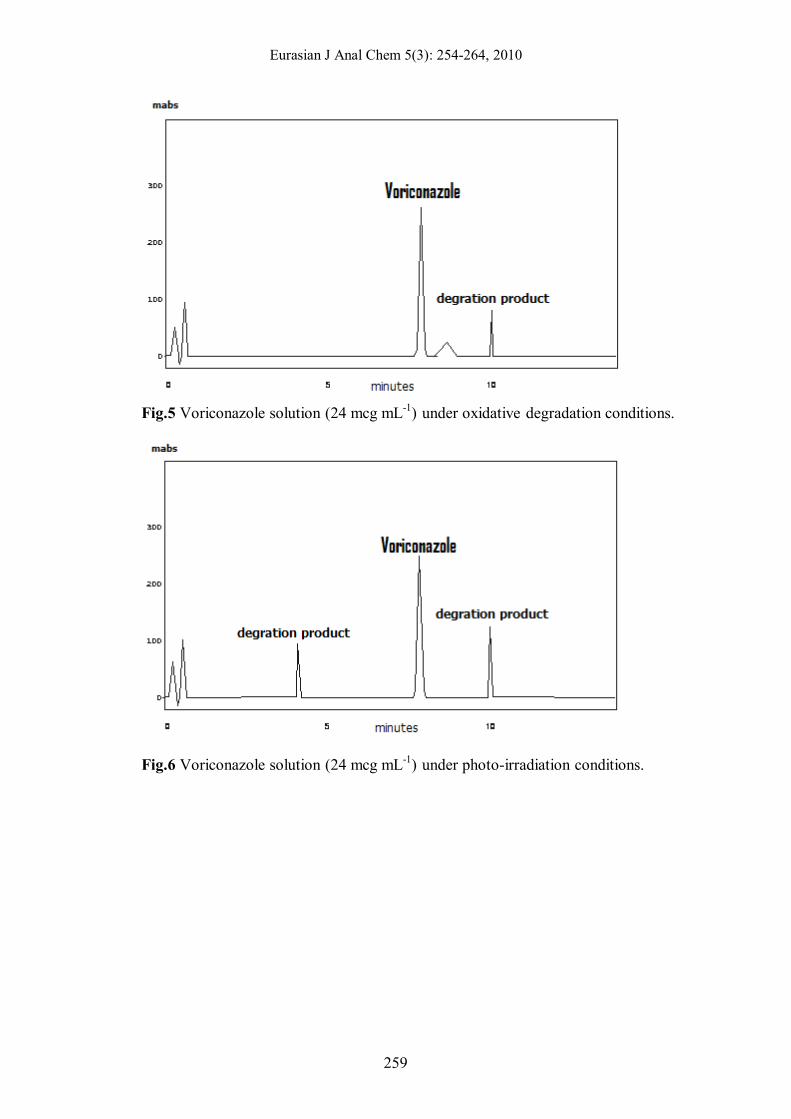
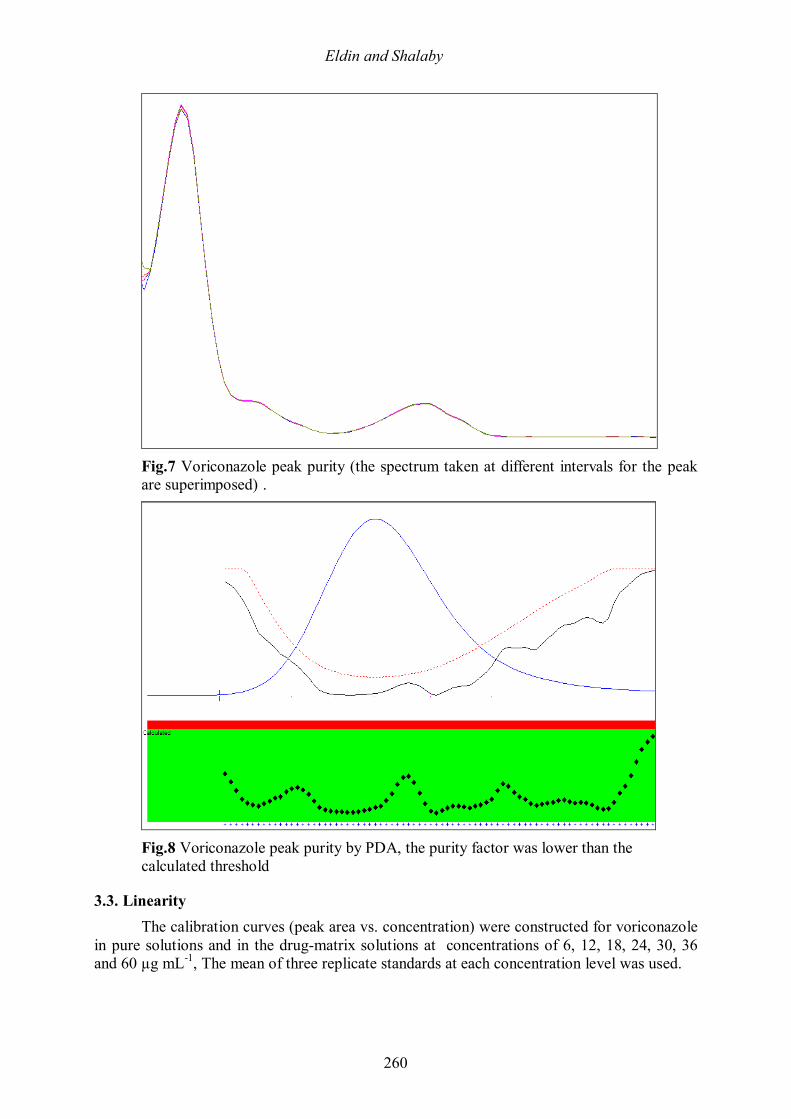
The recovery of voriconazole was 99.3% with a total degradation of 0.7% in the case of 1 M HCl, however, the decomposition was significant when voriconazole was treated with 1N sodium hydroxide or 1.5% H2O2 where the voriconazole recovery was 63.0 and 87.0% and the total degradation was 37.0 and 13.0%, respectively. Voriconazole sample solutions showed a photodegradation of about 40 % (two photodegradation products appears) . Thus, the degradation products peaks were chromatographically resolved from voriconazole peak as shown in figures 2, 3, 4, 5, and 6 for voriconazole under neutral, acidic, basic, oxidative and photo-irradiation conditions, respectively. Also the peak purity check through the photodiode array detector was considered as a proof for the specificity of the proposed method as the spectrum taken for the peak of the voriconazole at different intervals were super imposed (figures 7) also the determined purity factor was lower than the calculated threshold (Fig.8).
Fig.2 Voriconazole solution (24 mcg mL-1) under neutral conditions.
Eldin and Shalaby
258
Fig.3 Voriconazole solution (24 mcg mL-1) under acid degradation conditions.
Fig.4 Voriconazole solution (24 mcg mL-1) under basic degradation conditions.
Eurasian J Anal Chem 5(3): 254-264, 2010
259
Fig.5 Voriconazole solution (24 mcg mL-1) under oxidative degradation conditions.
Fig.6 Voriconazole solution (24 mcg mL-1) under photo-irradiation conditions.
Eldin and Shalaby
260
Fig.7 Voriconazole peak purity (the spectrum taken at different intervals for the peak are superimposed) .
Fig.8 Voriconazole peak purity by PDA, the purity factor was lower than the calculated threshold
3.3. Linearity The calibration curves (peak area vs. concentration) were constructed for voriconazole
in pure solutions and in the drug-matrix solutions at concentrations of 6, 12, 18, 24, 30, 36 and 60 µg mL-1, The mean of three replicate standards at each concentration level was used.
Eurasian J Anal Chem 5(3): 254-264, 2010
261
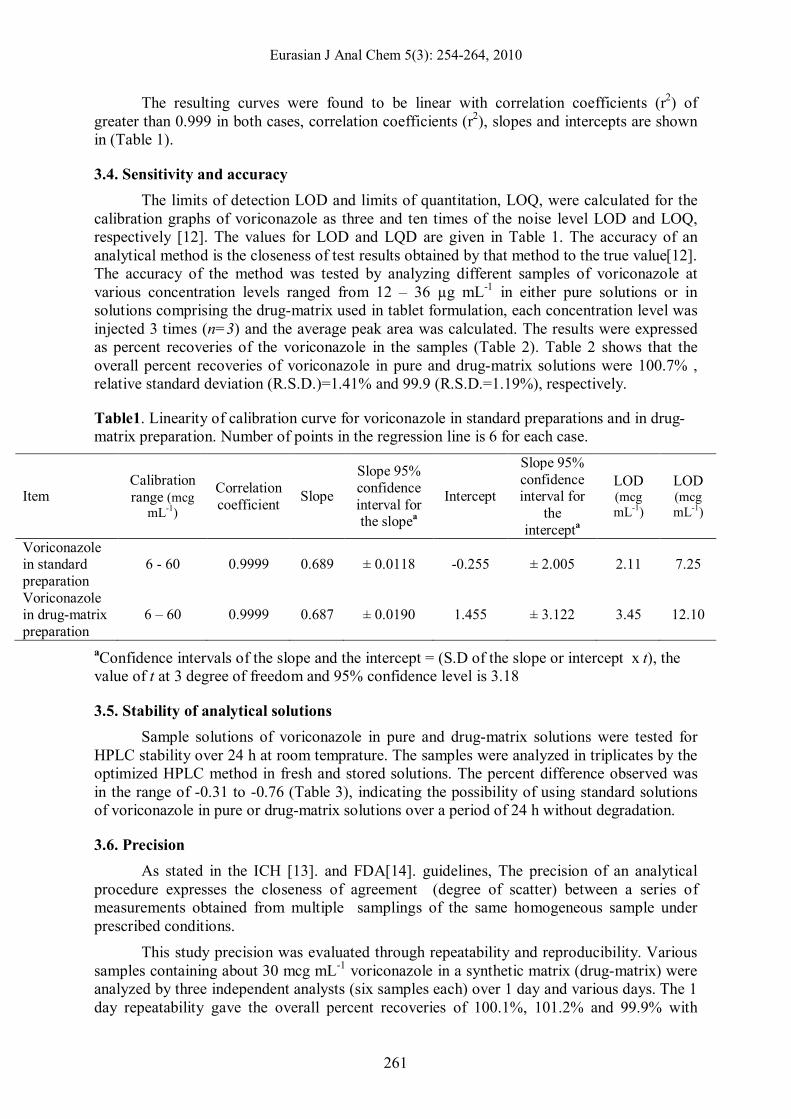
The resulting curves were found to be linear with correlation coefficients (r2) of greater than 0.999 in both cases, correlation coefficients (r2), slopes and intercepts are shown in (Table 1).
3.4. Sensitivity and accuracy The limits of detection LOD and limits of quantitation, LOQ, were calculated for the
calibration graphs of voriconazole as three and ten times of the noise level LOD and LOQ, respectively [12]. The values for LOD and LQD are given in Table 1. The accuracy of an analytical method is the closeness of test results obtained by that method to the true value[12]. The accuracy of the method was tested by analyzing different samples of voriconazole at various concentration levels ranged from 12 – 36 µg mL-1 in either pure solutions or in solutions comprising the drug-matrix used in tablet formulation, each concentration level was injected 3 times (n=3) and the average peak area was calculated. The results were expressed as percent recoveries of the voriconazole in the samples (Table 2). Table 2 shows that the overall percent recoveries of voriconazole in pure and drug-matrix solutions were 100.7% , relative standard deviation (R.S.D.)=1.41% and 99.9 (R.S.D.=1.19%), respectively.
Table1. Linearity of calibration curve for voriconazole in standard preparations and in drug-matrix preparation. Number of points in the regression line is 6 for each case.
Item Calibration range (mcg
mL-1)
Correlation coefficient Slope
Slope 95% confidence interval for the slopea
Intercept
Slope 95% confidence interval for
the intercepta
LOD (mcg mL-1)
LOD (mcg mL-1)
Voriconazole in standard preparation
6 - 60 0.9999 0.689 ± 0.0118 -0.255 ± 2.005 2.11 7.25
Voriconazole in drug-matrix preparation
6 – 60 0.9999 0.687 ± 0.0190 1.455 ± 3.122 3.45 12.10
aConfidence intervals of the slope and the intercept = (S.D of the slope or intercept x t), the value of t at 3 degree of freedom and 95% confidence level is 3.18
3.5. Stability of analytical solutions Sample solutions of voriconazole in pure and drug-matrix solutions were tested for
HPLC stability over 24 h at room temprature. The samples were analyzed in triplicates by the optimized HPLC method in fresh and stored solutions. The percent difference observed was in the range of -0.31 to -0.76 (Table 3), indicating the possibility of using standard solutions of voriconazole in pure or drug-matrix solutions over a period of 24 h without degradation.
3.6. Precision As stated in the ICH [13]. and FDA[14]. guidelines, The precision of an analytical
procedure expresses the closeness of agreement (degree of scatter) between a series of measurements obtained from multiple samplings of the same homogeneous sample under prescribed conditions.
This study precision was evaluated through repeatability and reproducibility. Various samples containing about 30 mcg mL-1 voriconazole in a synthetic matrix (drug-matrix) were analyzed by three independent analysts (six samples each) over 1 day and various days. The 1 day repeatability gave the overall percent recoveries of 100.1%, 101.2% and 99.9% with
Eldin and Shalaby
262
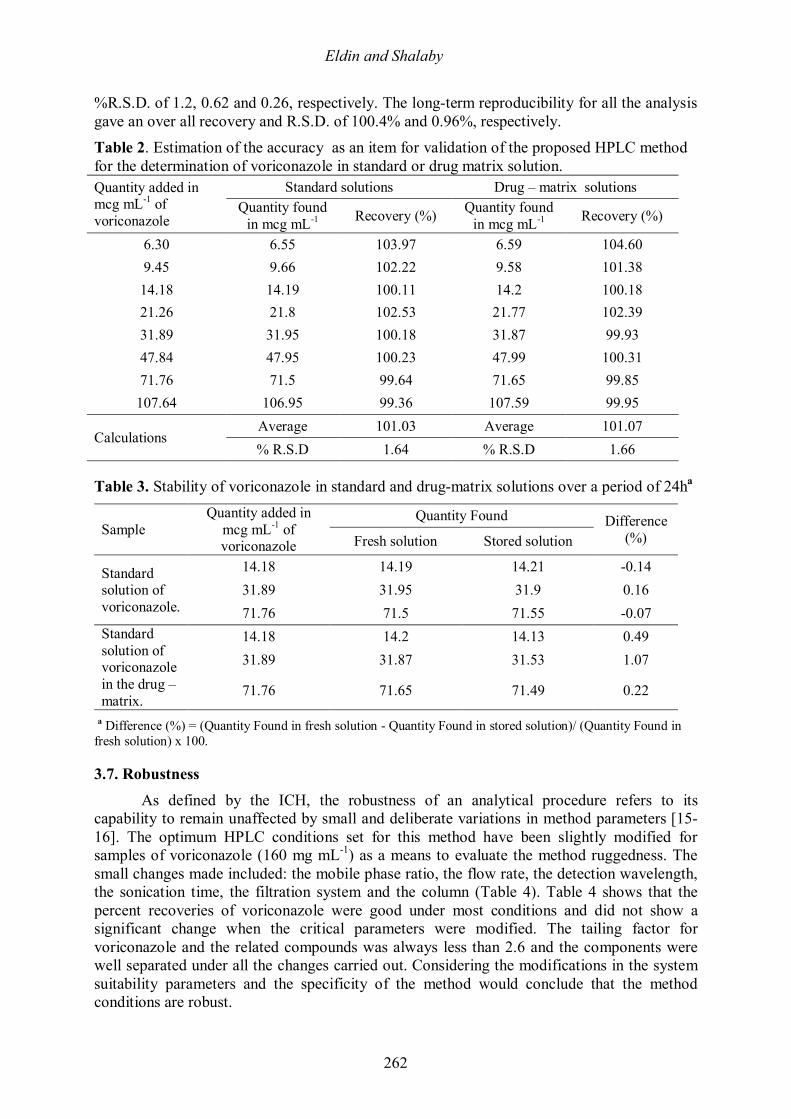
%R.S.D. of 1.2, 0.62 and 0.26, respectively. The long-term reproducibility for all the analysis gave an over all recovery and R.S.D. of 100.4% and 0.96%, respectively. Table 2. Estimation of the accuracy as an item for validation of the proposed HPLC method for the determination of voriconazole in standard or drug matrix solution. Quantity added in mcg mL-1 of voriconazole
Standard solutions Drug – matrix solutions Quantity found
in mcg mL-1 Recovery (%) Quantity found in mcg mL-1 Recovery (%)
6.30 6.55 103.97 6.59 104.60 9.45 9.66 102.22 9.58 101.38 14.18 14.19 100.11 14.2 100.18 21.26 21.8 102.53 21.77 102.39 31.89 31.95 100.18 31.87 99.93 47.84 47.95 100.23 47.99 100.31 71.76 71.5 99.64 71.65 99.85
107.64 106.95 99.36 107.59 99.95
Calculations Average 101.03 Average 101.07 % R.S.D 1.64 % R.S.D 1.66
Table 3. Stability of voriconazole in standard and drug-matrix solutions over a period of 24ha
Sample Quantity added in
mcg mL-1 of voriconazole
Quantity Found Difference (%) Fresh solution Stored solution
Standard solution of voriconazole.
14.18 14.19 14.21 -0.14 31.89 31.95 31.9 0.16 71.76 71.5 71.55 -0.07
Standard solution of voriconazole in the drug – matrix.
14.18 14.2 14.13 0.49 31.89 31.87 31.53 1.07
71.76 71.65 71.49 0.22
a Difference (%) = (Quantity Found in fresh solution - Quantity Found in stored solution)/ (Quantity Found in fresh solution) x 100.
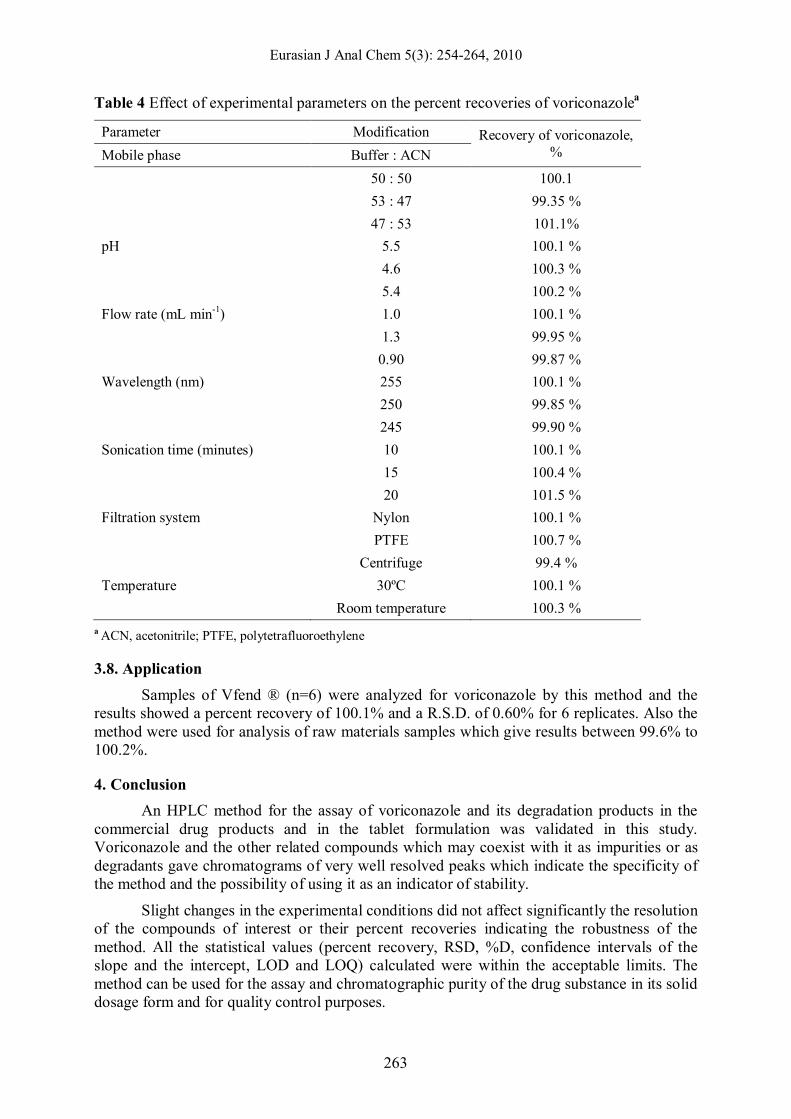
3.7. Robustness As defined by the ICH, the robustness of an analytical procedure refers to its
capability to remain unaffected by small and deliberate variations in method parameters [15-16]. The optimum HPLC conditions set for this method have been slightly modified for samples of voriconazole (160 mg mL-1) as a means to evaluate the method ruggedness. The small changes made included: the mobile phase ratio, the flow rate, the detection wavelength, the sonication time, the filtration system and the column (Table 4). Table 4 shows that the percent recoveries of voriconazole were good under most conditions and did not show a significant change when the critical parameters were modified. The tailing factor for voriconazole and the related compounds was always less than 2.6 and the components were well separated under all the changes carried out. Considering the modifications in the system suitability parameters and the specificity of the method would conclude that the method conditions are robust.
Eurasian J Anal Chem 5(3): 254-264, 2010
263
Table 4 Effect of experimental parameters on the percent recoveries of voriconazolea
Parameter Modification Recovery of voriconazole, % Mobile phase Buffer : ACN
50 : 50 100.1 53 : 47 99.35 % 47 : 53 101.1% pH 5.5 100.1 % 4.6 100.3 % 5.4 100.2 % Flow rate (mL min-1) 1.0 100.1 % 1.3 99.95 % 0.90 99.87 % Wavelength (nm) 255 100.1 % 250 99.85 % 245 99.90 % Sonication time (minutes) 10 100.1 % 15 100.4 % 20 101.5 % Filtration system Nylon 100.1 % PTFE 100.7 % Centrifuge 99.4 % Temperature 30ºC 100.1 % Room temperature 100.3 %
a ACN, acetonitrile; PTFE, polytetrafluoroethylene
3.8. Application Samples of Vfend ® (n=6) were analyzed for voriconazole by this method and the
results showed a percent recovery of 100.1% and a R.S.D. of 0.60% for 6 replicates. Also the method were used for analysis of raw materials samples which give results between 99.6% to 100.2%.
4. Conclusion An HPLC method for the assay of voriconazole and its degradation products in the
commercial drug products and in the tablet formulation was validated in this study. Voriconazole and the other related compounds which may coexist with it as impurities or as degradants gave chromatograms of very well resolved peaks which indicate the specificity of the method and the possibility of using it as an indicator of stability.
Slight changes in the experimental conditions did not affect significantly the resolution of the compounds of interest or their percent recoveries indicating the robustness of the method. All the statistical values (percent recovery, RSD, %D, confidence intervals of the slope and the intercept, LOD and LOQ) calculated were within the acceptable limits. The method can be used for the assay and chromatographic purity of the drug substance in its solid dosage form and for quality control purposes.
Eldin and Shalaby
264
The proposed method was developed for estimation of voriconazole in its tablets dosage form. The method was successfully validated according to current ICH and FDA guidelines. This method could be used to optimize the formulation and in process control during manufacturing process and to assess the quality and performance of each tablet lot through the regular quality control testing of the pharmaceutical product.
References 1. VFEND (voriconazole) (2002) Tablets and injection [package insert]. New York:
Pfizer, Inc;. 2. Hoffman H L, Rathbun R C (2002) Review of the safety and efficacy of
voriconazole. Expert Opin Investig Drugs 11:409–429. 3. Pfaller M A, Messer S A, Hollis R J, Jones R N, Diekema D J (2002) In vitro
activities of ravuconazole and voriconazole compared with those of four approved systemic antifungal agents against 6, 970 clinical isolates of Candida.
4. Purkins L, Wood N, Gharamani P, Greenhalgh K, Allen M J, Kleinermans D (2002) Antimicrob Agents Chemother 46: 2546.
5. Egle H, Trittler R, Koenig A, Kuemmerer K (2005) J Chromatogr B: Anal Technol Biomed Life Sci 814(2): 361.
6. Keevil B G, Newman S, Lockhart S, Howard S J, Moore C B, Denning D W (2004) Ther Drug Monit 26(6): 650.
7. Pehourcq F, Jarry C, Bannwarth B (2004) Biomed Chromatogr 18 (9) 719. 8. Zhou L, Glickman R D, Chen N, Sponsel W E, Graybill J R, Lam K W (2002) J
Chromatogr B: Anal Technol Biomed Life Sci 776(2): 213. 9. Ferretti R, Gallinella B, La Torre F, Zanitti L (1998) Chromatographia 47 (11–12)
649. 10. Owens P K, Fell A F, Coleman M W, Berridge J C (1999) Enantiomer 4 (2) 79.
11. FDA Guidance for Industry (1997) Dissolution Testing of Immediate Releas Solid Oral Dosage Forms, Food and Drug Administration, Rockville.
12. International Conference on Harmonisation Topic Q2B, Validation of Analytical Methods: Methodology. The Third International Conference on Harmonization of Technical Requirements for Registration of Pharmaceuticals for Human Use (ICH) Yokohama-Japan.
13. Vander H, Nijhuis A, Smeyers V J, Vandeginste D L (2001) J Pharm Biomed Anal 24: 723.