Flow-injection spectrophotometric determination of phosphate using Crystal Violet

Journal of Chromatography A, 1078 (2005) 113–119
High-performance anion-exchange chromatography combined withintrinsic fluorescence detection to determine erythropoietin in
pharmaceutical products
Dion M.A.M. Luykx, Pieter J. Dingemanse, Soenita S. Goerdayal, Peter M.J.M. Jongen∗
Centre for Biological Medicines and Medical Technology, National Institute for Public Health and the Environment (RIVM),P.O. Box 1, 3720 BA Bilthoven, The Netherlands
Received 11 November 2004; received in revised form 28 April 2005; accepted 3 May 2005
Abstract
A high-performance anion-exchange chromatography (HPAEC) method was developed for determination of recombinant human ery-thropoietin (EPO) in pharmaceutical products. A fluorescence detector was added to the HPLC system as intrinsic fluorescence detectionc nalyse ery-t aled variousp r the range1 ble methodf nce elutionp fication ofr©
K
1
ibocatcheap
. They-temtionatedtivity
allysureeantions
genof
nts ofapid
may
0d
ompared favourably to UV detection regarding sensitivity and selectivity. The HPLC method has been successfully applied to ahropoietin products even in the presence of albumin as excipient. The intrinsic fluorescence chromatograms of both proteins reveeaks attributed to either micro-heterogeneous erythropoietin or albumin variants. The intrinsic fluorescence signal was linear ove0–200�g/ml erythropoietin corresponding to pharmaceutically relevant concentrations. The HPLC method appeared to be a suita
or differentation between recombinant human erythropoietin epoetin-alpha and -beta as they revealed different intrinsic fluorescerofiles. In conclusion, this study contributes to the development of a straightforward physicochemical method for specific quantiecombinant human erythropoietin in pharmaceutical preparations.
2005 Elsevier B.V. All rights reserved.
eywords:HPLC; HPAEC; Intrinsic fluorescence; Erythropoietin; Epoetin-alpha; Epoetin-beta; Albumin
. Introduction
Erythropoietin (EPO) is a glycoprotein produced primar-ly by the kidney and it is the main factor regulating redlood cell production[1]. The protein has a molecular massf 30–34 kDa and 40% of the molecular weight representsarbohydrates of which 17% are sialic acids[1–3]. The sug-rs are attached to the protein via one O-linked (serine) and
hree N-linked (asparagine) glycosylation sites[4]. Since thearbohydrates vary in amount, size and structure, EPO has aeterogeneous structure. Since the mid 1980s EPO has beenxpressed applying recombinant DNA technology (rhEPO)nd is now one of the most successful biopharmaceuticalroducts. Besides, rhEPO is known for the extensive misuse
∗ Corresponding author. Tel.: +31 30 2743701; fax: +31 30 2744421.E-mail address:[email protected] (P.M.J.M. Jongen).
as performance-enhancing agent in endurance sportsbiological activity of EPO in vivo is affected by the glycoslation pattern (sialic acid content). Since production sysand process conditions for rhEPO affect the glycosylapattern the production process should be carefully validand monitored to assure consistency of the biological acthroughout different production batches[5].
At present the content of rhEPO preparations is typictested by complex in vivo potency assays which meathe relevant biological activity. For instance, the EuropPharmacopoeia describes an assay for rhEPO bulk soluin which the effect of rhEPO on mice kept under low oxyconditions is monitored by measuring incorporationradio-labelled ferric chloride[6]. For assaying the conteof rhEPO preparations in a routine setting these typebioassays require a significant number of animals. A rand less resource demanding physico-chemical assay
021-9673/$ – see front matter © 2005 Elsevier B.V. All rights reserved.oi:10.1016/j.chroma.2005.05.017

114 D.M.A.M. Luykx et al. / J. Chromatogr. A 1078 (2005) 113–119
not specifically mimic bioactivity but it would provide awider forum for controlling the quality of these commonpharmaceutical products. Moreover, from an analytical pointof view content assays based on physicochemical technologywill be more precise than bioassays. Developing a suitablephysicochemical assay for rhEPO preparations is hamperedby the low dose of the micro-heterogeneous glycoprotein inpresence of relatively large amounts of excipients. Particulardifficulties are encountered when human serum albumin(HSA) is present. The protein HSA is obtained from largepools of human plasma and cannot be considered chemicallyhomogeneous. Although HSA is not present in currentlylicensed rhEPO preparations in the European Union, HSAcontaining preparations are still widely available on themarket such as in the USA. Candidate physicochemicalassays should have a high degree of selectivity for rhEPO andassay reproducibility. So far capillary electrophoresis (CE)methods have been developed to characterize the rhEPO gly-coform pattern and a capillary zone electrophoresis methodhas now been prescribed by the European Pharmacopoeiaas an identification test for rhEPO in concentrated bulksolutions[6]. In addition to this method, another CE methodhas been developed that is capable of analysing rhEPOpharmaceutical preparations containing salts and HSA, andin the concentration range of 0.03–1.92 mg rhEPO/ml[7].
HPLC in combination with UV-detection is a separationm g theh mat-r tion,r n oft is ofc (e.g.,o u-s n buti pro-t gates[ therp ciesi angec g tot lseda pliedtM aren rgeso ps,p rmsb
s ofH allyr hro-m ertiesf d thep tivec hasec O
preparations containing epoetin-alpha and/or epoetin-beta inabsence or presence of HSA were analysed. Previously, wereported about the enhanced sensitivity and selectivity prop-erties of intrinsic fluorescence detection compared to UVdetection in the analysis of biopharmaceuticals[16]. There-fore, in this study a fluorescence detector was introduced tothe HPAEC system and its performances were compared toa UV detector. Next to monitoring the amount of protein, in-trinsic fluorescence spectroscopy also provides informationon changes in the local environment of the aromatic sidechains (tertiary protein structure). Eventually, this investiga-tion contributes to the development of a straightforward andfast physicochemical method for determining the amount aswell as the type of EPO in pharmaceutical products.
2. Materials and methods
2.1. Reagents
‘EPO BRP’ (batch 2) was purchased from the EuropeanDirectorate for the Quality of Medicines (EDQM, Stras-bourg, France). The vials contained 250�g of rhEPO beinga mixture of equal amounts of epoetin-alpha and epoetin-beta. ‘Eprex 10000 IE/ml’ (Janssen-Cilag, charge number02BS09T) was a licensed solution for injection providedi /mlc l).‘ 7610 a0 ml( a( tainH uin,T ntly( asedf S),ca ereH .
2
-q BStt nep d3
er a0
2
2100
s 12A
ethod that provides a powerful means for characterisinomogeneity of common biopharmaceuticals such as soopin, insulin and interferons. Because of its high resolueversed-phase HPLC is often applied for quantificatiohe active pharmaceutical ingredient and for the analyslosely related protein variants or degradation productsxidised, deamidated)[8–10]. High performance size exclion chromatography may also be used for quantificatiot is normally applied to determine the native size of theein and to reveal possible dimers, oligomers and aggre11–13]. Ion exchange chromatography provides anorinciple for separating closely related monomeric spe
n a protein preparation. High-performance anion-exchhromatography (HPAEC) separates proteins accordinheir negative electric charge. In combination with pumperometric detection HPAEC has often been ap
o analyse carbohydrates cleaved from glycoproteins[14].ethods to analyse an intact glycoprotein by HPAECot common although the various negative electric chaf the glycoforms, contributed by the sialic acid grourovide conditions for separation of the EPO glycofoy HPAEC.
In the present study we investigate the possibilitiePAEC for determination of rhEPO at pharmaceutic
elevant concentrations. Our preference for HPAEC catography was based on its expected selective prop
or charged compounds such as rhEPO isoforms anossibility HPAEC offers to analyse the protein under naonditions which would not be the case in reversed-phromatography[15,16]. For this purpose several rhEP
n a 1.0 ml syringe having a label claim of 10,000 IUorresponding to 84.0�g/ml epoetin-alpha (10,000 IU/mNeoRecormon 10000 IE’ (Roche, charge number MH645) was a licensed solution for injection provided in.6 ml syringe having a label claim of 10,000 IU/0.616,667 IU/ml) corresponding to 83�g/0.6 ml epoetin-bet138�g/ml). Both Eprex and NeoRecormon did not conSA as excipient. The HSA preparation ‘Cealb’ (Sanqhe Netherlands) contained 20% protein predomina>95%) albumin. Tween-80 (polysorbate-80) was purchrom Merck. Phosphate buffered saline, pH 7.2 (PBonsisted of 8 mM Na2HPO4·2H2O, 2 mM NaH2PO4·H2Ond 154 mM NaCl. Solvents for chromatography wPLC grade and salts were analytical grade chemicals
.2. Sample preparation
EPO BRP (250�g) was dissolved in 250�l water. Subseuently, this 1 mg/ml protein solution was diluted with P
o obtain 10, 30, 60, 100, 150, 200, 300 and 400�g/ml solu-ions before 100�l was applied to the HPAEC column. Orepared protein solution contained 100�g/ml EPO BRP anmg/ml HSA.All samples and solutions were filtered before use ov
.45�m filter.
.3. HPLC
.3.1. InstrumentationHPLC experiments were performed on an Agilent 1
ystem including a G1379A micro vacuum degasser, G13

D.M.A.M. Luykx et al. / J. Chromatogr. A 1078 (2005) 113–119 115
binary pump, G1329A auto-sampler, G1330B auto-samplerthermostat, G1316A thermostatted column compartment,G1315B diode array detector and G1321A fluorescence scan-ning detector. This Agilent HPLC system was operated byChemStation software. UV detection was performed at 214and 280 nm, intrinsic fluorescence emission detection at343 nm with an excitation wavelength of 295 nm (excitationof tryptophan). The fluorescence spectra were measured at1 nm intervals over the range 320–380 nm with a scanningspeed of 80 nm/s (PMT-gain 12).
2.3.2. High-performance anion-exchangechromatography
EPO BRP dilutions (10, 30, 60, 100, 150, 200, 300and 400�g/ml), 100�g/ml EPO BRP in presence of3 mg/ml HSA and Eprex were applied in injectionsof 100�l to a DNAPac PA-100 analytical column(4 mm× 250 mm) (Dionex), equilibrated with 20 mMN-2-hydroxyethylpiperazine-N′-2-ethanesulfonic acid (HEPES)buffer containing 25 mM NaCl, pH 7.0. The DNAPac PA-100anion exchange column is specifically designed to providehigh-resolution separations and is composed of 100 nmquaternary amine functionalised MicroBeadsTM bound to a13�m solvent-compatible, non porous substrate. NeoRecor-mon was applied to the column in a volume correspondingto a protein loading of 84�g. The elution was performed at2 ingN eo o as
3
3
cP UVa t thes asp nceefl een 5a highs sa ed attp andaa ealeda alsos Withr tp ed forE ought ntly
Table 1Gradient programs applied to the HPAEC analysis
Time (min) A (%) B (%)
Program 10 97.5 2.53.0 97.5 2.53.1 88.0 12.0
21.0 88.0 12.027.0 82.5 17.533.0 82.5 17.539.0 50.0 50.045.0 50.0 50.045.5 0 10051.5 0 10052.0 97.5 2.555.0 97.5 2.5
Program 20 97.5 2.53.0 97.5 2.53.1 89.5 10.55.1 89.5 10.55.2 89.0 11.07.2 89.0 11.07.3 88.5 11.59.3 88.5 11.59.4 88.0 12.0
15.0 88.0 12.016.0 0 10022.0 0 10023.0 97.5 2.527.0 97.5 2.5
Buffer A: 20 mM HEPES, pH 7.0. Buffer B: 20 mM HEPES containing 1 MNaCl, pH 7.0.
Fig. 1. EPO BRP, 100�g/ml (black line) and PBS (grey line) applied toHPAEC and monitored by intrinsic fluorescence (A), EPO BRP, 100�g/mlapplied to HPAEC and monitored by UV absorbance at 214 nm (grey line)and 280 nm (black line) (B).
5◦C and at a flow rate of 1 ml/min, and with an increasaCl gradient as described inTable 1(program 1). In casf EPO BRP (100�g/ml), Eprex and NeoRecormon alsecond gradient program was applied (Table 1, program 2).
. Results
.1. Performances of detection systems
EPO BRP (100�g/ml) was applied to a DNAPaA-100 column and the eluate was monitored with annd intrinsic fluorescence scanning detector to tesuitability of both detection systems. UV detection werformed at 214 and 280 nm and intrinsic fluorescemission detection at 343 nm (Fig. 1). The HPAEC intrinsicuorescence chromatogram showed a main peak betwnd 10 min and minor peaks at the void volume and atalt concentrations (Fig. 1A, Table 1). The main peak wattributed to EPO as the minor peaks were also observ
he same intensity in a blank (PBS) run. The HPAEC UV214rofile of EPO BRP showed a signal at the void volumesmall peak around 6 min (Fig. 1B). These UV214 signals
ppeared to be artefacts since a blank (PBS) run revn identical chromatogram (data not shown). It washown that the signal to noise ratio was not satisfactory.espect to the HPAEC UV280 profile (Fig. 1B), a significaneak appeared at the same retention as was observPO in the fluorescence emission chromatogram. Alth
his peak showed a low absorbance, it was significa
116 D.M.A.M. Luykx et al. / J. Chromatogr. A 1078 (2005) 113–119
present compared to the corresponding blank elutionprofile.
3.2. Separation of erythropoietin-albumin
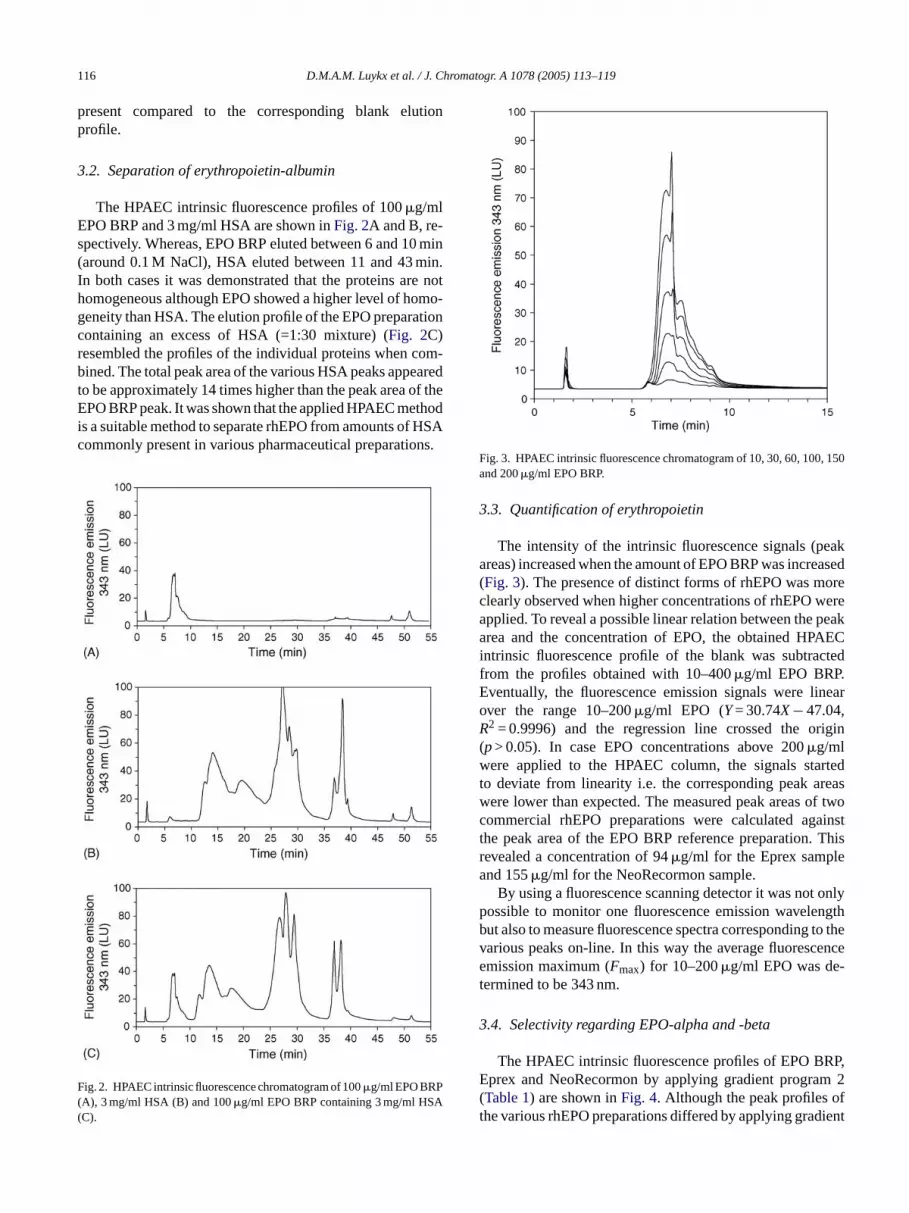
The HPAEC intrinsic fluorescence profiles of 100�g/mlEPO BRP and 3 mg/ml HSA are shown inFig. 2A and B, re-spectively. Whereas, EPO BRP eluted between 6 and 10 min(around 0.1 M NaCl), HSA eluted between 11 and 43 min.In both cases it was demonstrated that the proteins are nothomogeneous although EPO showed a higher level of homo-geneity than HSA. The elution profile of the EPO preparationcontaining an excess of HSA (=1:30 mixture) (Fig. 2C)resembled the profiles of the individual proteins when com-bined. The total peak area of the various HSA peaks appearedto be approximately 14 times higher than the peak area of theEPO BRP peak. It was shown that the applied HPAEC methodis a suitable method to separate rhEPO from amounts of HSAcommonly present in various pharmaceutical preparations.
F((
Fig. 3. HPAEC intrinsic fluorescence chromatogram of 10, 30, 60, 100, 150and 200�g/ml EPO BRP.
3.3. Quantification of erythropoietin
The intensity of the intrinsic fluorescence signals (peakareas) increased when the amount of EPO BRP was increased(Fig. 3). The presence of distinct forms of rhEPO was moreclearly observed when higher concentrations of rhEPO wereapplied. To reveal a possible linear relation between the peakarea and the concentration of EPO, the obtained HPAECintrinsic fluorescence profile of the blank was subtractedfrom the profiles obtained with 10–400�g/ml EPO BRP.Eventually, the fluorescence emission signals were linearover the range 10–200�g/ml EPO (Y= 30.74X− 47.04,R2 = 0.9996) and the regression line crossed the origin(p> 0.05). In case EPO concentrations above 200�g/mlwere applied to the HPAEC column, the signals startedto deviate from linearity i.e. the corresponding peak areaswere lower than expected. The measured peak areas of twocommercial rhEPO preparations were calculated againstthe peak area of the EPO BRP reference preparation. Thisrevealed a concentration of 94�g/ml for the Eprex sampleand 155�g/ml for the NeoRecormon sample.
By using a fluorescence scanning detector it was not onlypossible to monitor one fluorescence emission wavelength
ig. 2. HPAEC intrinsic fluorescence chromatogram of 100�g/ml EPO BRPA), 3 mg/ml HSA (B) and 100�g/ml EPO BRP containing 3 mg/ml HSAC).
but also to measure fluorescence spectra corresponding to thevarious peaks on-line. In this way the average fluorescenceemission maximum (F ) for 10–200�g/ml EPO was de-t
3
RP,E m 2( oft ient
maxermined to be 343 nm.
.4. Selectivity regarding EPO-alpha and -beta
The HPAEC intrinsic fluorescence profiles of EPO Bprex and NeoRecormon by applying gradient progra
Table 1) are shown inFig. 4. Although the peak profileshe various rhEPO preparations differed by applying grad

D.M.A.M. Luykx et al. / J. Chromatogr. A 1078 (2005) 113–119 117
Fig. 4. HPAEC intrinsic fluorescence chromatogram of EPO BRP (A), Eprex(B) and NeoRecormon (C) by applying gradient program 2 (Table 1).
program 1 (data not shown), the differences in peak profileswere more pronounced when gradient program 2 was ap-plied. In the latter case Eprex showed a clear peak at 7.5 minand NeoRecormon at 10.0 and 12.5 min. Next to this, thepeak pattern of NeoRecormon revealed more minor peaks incomparison to that of Eprex. The intrinsic fluorescence pro-file of EPO BRP resembled the combined profiles of Eprexand NeoRecormon. When the various elution profiles werecompared it was also noticed that in case of Eprex the voidvolume peak around 2 min was significantly higher. The cor-responding intrinsic fluorescence spectrum revealed aFmaxof 349 nm. The latter peak was also observed when 100�l ofa blank solution containing 0.03% Tween-80 was applied tothe column. The correspondingFmax was 347 nm.
4. Discussion
Physicochemical methods have been successfully appliedto determine the amount, structural identity, purity, integrityand stability of various biopharmaceuticals[7,10,17–21].However, for rhEPO an in vivo bioassay is the golden standardfor measuring the potency. On the other hand, CE methodscan be applied for specific identification of rhEPO. CE isknown as a highly selective technique that is applicable for theidentification, purity and structural evaluation (microhetero-g thec andr pro-d ativei ce ofH QCs thodf od-u mplec EPOu t anH ouldp RP-H esa wass uent.I d inc n.
forme ncee ores tion( na ins.H andab thati asn
eneity) of rhEPO. In general, limitations of CE concernoncentration sensitivity, interference of the excipientseproducibility. In contrast, HPLC is a more robust and reucible technique and therefore more suitable for quantit
nter-run comparisons. This explains a general preferenPLC rather than CE for assaying biopharmaceuticals inettings. Therefore, our aim was to develop an HPLC meor specific quantification of rhEPO in pharmaceutical prcts i.e. at low concentrations without a separate salean-up. We expected HPAEC to be able to separate rhnder native conditions. Moreover, we considered thaPAEC method, displaying subtle charge properties, wrovide a higher level of specificity to an assay thanPLC or SE-HPLC. After trying several column matricnd buffer systems a DNA-Pac anion exchange columnelected together with HEPES buffer at neutral pH as eln the present study we investigated this HPAEC methoombination with UV and intrinsic fluorescence detectio
To test the suitability of the detection systemsonitoring EPO applied to HPAEC, the UV214 and UV280lution profiles were compared to the intrinsic fluorescelution profile. Intrinsic fluorescence detection was mensitive and showed a higher selectivity than UV detecFig. 1). Normally, HPLC in combination with UV-detectiot 214 nm is a powerful method for detecting proteowever, in our study EPO was not detected this waylow signal to noise ratio was observed (Fig. 1B). This cane explained by the presence of HEPES in the eluents
nterferes with the UV214 signal. This inconvenience wot observed with intrinsic fluorescence detection (Fig. 1A).

118 D.M.A.M. Luykx et al. / J. Chromatogr. A 1078 (2005) 113–119
In general, matrix compounds such as pharmaceuticalexcipients and buffer components do not interfere in theintrinsic fluorescence chromatogram which specificallydisplays the fluorescence emitted by the trytophan residuesin the protein. Therefore, less complex chromatogramswill be obtained and peaks can be readily attributed to beproteinaceous compounds or not. The fact that the sensitivityof intrinsic fluorescence detection of proteins comparedfavourably to UV detection was demonstrated before[16].
The HPAEC method combined with intrinsic fluorescencedetection appeared to be a suitable method to analyse rhEPOin presence of HSA. HSA is added to some biopharmaceu-ticals as stabiliser during the manufacturing process and/orstorage[22,23]. From an analytical perspective particulardifficulties are encountered with this excipient since it isanother protein, present in large amounts and not homoge-neous. Therefore, in size exclusion chromatography rhEPOas well as HSA would elute as single peaks that overlapconsidering the content ratio and molecular masses of theproteins. The HPAEC method developed by us is capable ofanalysing rhEPO/HSA mixtures. HSA preparations containseveral variants such as mercapto, non-mercapto and gly-cated forms as well as oxidised, deamidated and polymerisedvariants of these latter forms[24]. These variants can beseparated by charge based techniques such as isoelectricfocusing[25] and CE[26]. Since HPAEC separates proteinsa uteda eaksi la nsicfl encei f theT tainst avea d toH vedia etherw ablem .
rela-t anst nt ofl angeb rs EPOc PBSfi ainstt EPOc thec ightb atchv duc-t es ofn duall hEur
reference preparation has not been established for the purposeof physicochemical content assays. The declared content of250�g rhEPO used in our calculations is based on the amountfilled during its manufacturing process and has not beenverified after lyophilisation by independent physicochemicalassays (A. Bristow, personal communication). The contentsof the pharmaceutical preparations obtained by our methodare compared to concentrations (�g/ml) deduced from bioac-tivity figures (IU/ml) and the specific activity figures (IU/�g)as labelled by the manufacturers. Both preparations havea very similar ‘specific bioactivity’ i.e. 10.000 IU = 84�gfor epoetin-alpha and 10.000 IU = 83�g for epoetin-beta.Although both manufacturers apply different types of in-vivobioassays these assays appear to give equivalent results as wasrecently shown in a collaborative study[27]. This similarityin specific activity of epoetin-alpha and epoetin-beta pro-vides a basis for corresponding results of physico-chemicaland biological activity assays for both compounds. The factthat the results of our physico-chemical method resemblethe labelled contents of both EPO preparations supports this.
The HPAEC method also provides selectivity for rhEPO.Two main rhEPO products on the European market are Eprexand NeoRecormon containing epoetin-alpha and -beta, re-spectively. By adjusting the gradient program in the HPAECmethod (Table 1) it was possible to obtain clear differences inthe elution profiles for epoetin-alpha and -beta (Fig. 4B andC riousE heseg d byt s re-t and- ed byC tionp ingt rencep lphaa ofE
leso wasn wass icfl ed g-g roteinuT olare -b inedb ics thatw tionp nks thec st-i ests
ccording to their negative electric charges, HSA elt various salt concentrations resulting in various p
n the HPAEC chromatogram (Fig. 2B). An additionadvantage of the HPAEC method is the use of intriuorescence as detection system. The intrinsic fluorescntensity is dependent on the amount and location orp residues in the protein molecule. Since rhEPO con
hree tryptophan residues and HSA one, rhEPO will hrelatively more intense fluorescence signal compareSA. Therefore, less interference of HSA will be obser
n the fluorescence chromatrogram (Fig. 2C). Eventually, thedvantages of the HPAEC method described above togith an appropriate gradient program provide a suitethod to analyse rhEPO even in the presence of HSAThe HPAEC method showed a linear dose/response
ionship in the range of 0.01–0.20 mg/ml rhEPO. This mehat the method is sensitive enough to assay the conteicensed pharmaceutical preparations of rhEPO which retween 2000 and 40,000 IU/ml (∼ 0.015–0.4 mg/ml). Prioample concentration or clean-up is not needed but rhoncentrations above 0.20 mg/ml should be diluted withrst. When assaying two commercial preparations aghe PhEur reference preparation, the measured rhontents only slightly deviated (i.e. 12% higher) fromoncentrations declared by their manufacturers. This me explained by several factors. First, significant interbariation exists. Our measurements relate to single proion batches while the labelled concentrations are averagumerous production lots, the actual content of an indivi
ot may indeed deviate from this average. Secondly, the P
). These profiles are most probably explained by the vaPO glycoforms present in epoetin-alpha and -beta. Tlycoforms contain negative electric charges contribute
he sialic acid groups and therefore they elute at variouention times. Although the glycoforms of epoetin-alphabeta were not separated as well as was demonstratE [6,7], the obtained HPAEC intrinsic fluorescence elurofiles of the epoetins provide fingerprints for determin
he type of rhEPO. The European Pharmacopoeia refereparation ‘EPO BRP’ consists of a mixture of epoetin-and -beta. This was clearly visible in the elution profilePO BRP (Fig. 4).When the HPAEC intrinsic fluorescence elution profi
f the various rhEPO preparations were compared itoticed that in case of Eprex the peak at the void volumeignificantly higher (Fig. 4). The corresponding intrinsuorescence spectrum revealed aFmax of 349 nm. This valuiffers from theFmax of the main peak (343 nm) and suests the presence of denatured EPO in the samples. Pnfolding induces an increase of theFmax as the emittingrp residues will be more exposed to the solvent (more pnvironment)[17,19]. Moreover, the measuredFmax resemles theFmax, 351 nm, of denatured EPO species determy Toyoda et al.[28]. Eprex contains 0.03% of the non-ionurfactant Tween-80 (polysorbate 80). The higher peakas observed in the HPAEC intrinsic fluorescence elurofile of Eprex (Fig. 4B) was also observed when a blaolution containing 0.03% Tween-80 was applied toolumn. The correspondingFmax was 347 nm also suggeng a protein with conformational alterations. This sugg
D.M.A.M. Luykx et al. / J. Chromatogr. A 1078 (2005) 113–119 119
that the void volume peak in the Eprex elution profile is ananalytical artefact due to the presence of 0.03% Tween-80.
In conclusion, we developed an HPAEC method for thedetermination of EPO in common pharmaceutical prepara-tions. In particular the use of intrinsic fluorescence detectioncontributes to the selectivity and sensitivity of the method.In addition, it provides conformational information of thestudied biopharmaceutical. In its present status the HPAECmethod provides a rapid and accurate assay for in-processmaterial and finished products to target and precisely con-trol the amount of EPO-protein. In particular the method issuggested for official medicines control laboratories involvedin testing suspect preparations declared to contain EPO. Themethod is a promising candidate for further establishment andcross-validation against current reference methods which arelaborious bioassays involving the use of stressful animal ex-periments. Moreover, the concept of HPAEC separation com-bined with intrinsic fluorescence detection may be suitablefor analysing other glycoproteins as well.
References
[1] S.B. Krantz, Blood 77 (1991) 419.[2] J.C. Cheetman, D.M. Smith, K.H. Aoki, J.L. Stevenson, T.J. Hoeffel,
R.S. Syed, J. Egrie, T.S. Harvey, Nat. Struct. Biol. 5 (1998) 861.m-
d so-
bilityress,
[9] K.H. Buchheit, A. Daas, K.H. Jonsson, Pharmeuropa BIO 1 (2002)7.
[10] R. Pearlman, T.A. Bewley, in: Y.J. Wang, R. Pearlman (Eds.), Sta-bility and Characterization of Protein and Peptide Drugs, PlenumPress, New York, 1993, 1–58.
[11] B.M. Eckhardt, J.Q. Oeswein, T.A. Bewley, Pharm. Res. 8 (1991)1360.
[12] J.F. Hansen, M. Ezban, Dev. Biol. Stand. 48 (1980) 105.[13] A. Litzen, J.K. Walter, H. Krischollek, K.G. Wahlund, Anal.
Biochem. 212 (1993) 469.[14] P. Hermentin, R. Witzel, J.F.G. Vliegenthart, J.P. Kamerling, M.
Nimtz, H.S. Conradt, Anal. Biochem. 203 (1992) 281.[15] J. Holthuis, R. Driebergen, in: J.N. Herron, W. Jiskoot, D.J.A. Crom-
melin (Eds.), Physical Methods to Characterize Pharmaceutical Pro-teins, Plenum Press, New York and London, 1995, pp. 243–299.
[16] D.M.A.M. Luykx, S.S. Goerdayal, P.J. Dingemanse, W. Jiskoot,P.M.J.M. Jongen, J. Chromatogr. B, in press.
[17] P. Johansen, H.P. Merkle, B. Gander, Biochim. Biophys. Acta 1425(1998) 425.
[18] C. Jones, D.T. Crane, X. Lemercinier, B. Bolgiano, S.E. Yost, Dev.Biol. Stand. 87 (1996) 143.
[19] D.M.A.M. Luykx, M.G. Casteleijn, W. Jiskoot, J. Westdijk, P.M.J.M.Jongen, Eur. J. Pharm. Sci. 23 (2004) 65.
[20] J.M. Matthews, A. Hammacher, G.J. Howlett, R.J. Simpson, Bio-chemistry 37 (1998) 10671.
[21] P.L. Storring, R.E. Gaines Das, J.W.M. Mulders, M. Halder, Biolog-icals 30 (2002) 217.
[22] G.H. Krystal, R.C. Pankratz, N.M. Farber, J.E. Smart, Blood 67(1986) 71.
[23] T. Moreira, L. Cabrera, A. Gutierrez, A. Cadiz, M.E. Castellano,Acta Pharm. Nord. 4 (1992) 59.
[ pl. I
[ De
[ 35.[ 004)
[ J.
[3] J.M. Davis, T. Arakawa, T.W. Strickland, D.A. Yphantis, Biocheistry 26 (1987) 2633.
[4] W. Jelkmann, Physiol. Rev. 72 (1992) 449.[5] P.L. Storring, R.E. Gaines Das, J. Endocrinol. 134 (1992) 459.[6] European Pharmacopoeia, fifth ed., Erythropoietin concentrate
lution, Council of Europe, Strasbourg, 2005, pp. 1528–1532.[7] H.P. Bietlot, M. Girard, J. Chromatogr. A 759 (1997) 177.[8] J. Brange, L. Langkjaer, in: Y.J. Wang, R. Pearlman (Eds.), Sta
and Characterization of Protein and Peptide Drugs, Plenum PNew York, 1993, p. 315.
24] M. Girard, T. Cyr, N. Mousseau, J.-C. Ethier, Chromatogr. Sup49 (1999) S-21.
25] B.M. Van Liedekerke, H.J. Nelis, J.A. Kint, F.W. Vanneste, A.P.Leenheer, J. Pharm. Sci. 80 (1991) 11.
26] M. Girard, H.P. Bietlot, T.D. Cyr, J. Chromatogr. A 772 (1997) 227] M.-E. Behr-Gross, A. Daas, A.F. Bristow, Pharmeuropa BIO 1 (2
23.28] T. Toyoda, T. Itai, T. Arakawa, K.H. Aoki, H. Yamaguchi,
Biochem. 128 (2000) 731.
Copyright © 2022 FDOKUMEN