Washington State Strategic Highway Safety Plan 2016
262
Washington State Strategic Highway Safety Plan 2016 Zero Deaths & Zero Serious Injuries by 2030
-
Upload
khangminh22 -
Category
Documents
-
view
0 -
download
0
Transcript of Washington State Strategic Highway Safety Plan 2016

Washington State Strategic Highway
Safety Plan2016
Zero Deaths & Zero Serious Injuries by 2030

Target Zero® and the Target Zero logo are registered marks of the Washington State’s Washington Traffic Safety Commission effective 2013 and 2015 respectively.
August 18, 2016 To the People of Washington: In 2000, Washington was the first state in the nation to set a uniquely ambitious goal: to reduce traffic fatalities and serious injuries to zero by the year 2030. This vision is called “Target Zero®.” Many people thought it could not be done, but as we inch closer and closer to 2030, the trend lines tell us it can be achieved. In setting this goal and establishing a viable plan to get there, Washington has become a national leader in traffic safety, implementing innovative new strategies such as anti-texting laws and new partnerships like the locally-based Target Zero Teams. Our progress has been impressive, as we’ve watched traffic fatalities fall each year since 2005. While I am proud of that achievement, in 2014 we saw an increase of 34 fatalities. That is too many people dying on our roads – and is a concerning increase. To continue the reduction in traffic fatalities, we are enlisting your help in implementing more groundbreaking programs in the next few years. This Target Zero plan includes many of these programs and strategies. Target Zero is a highly collaborative plan created through the work of a number of talented people representing state agencies, city and county law enforcement, tribal transportation planners and law enforcement, and private organizations. Over 180 traffic safety experts from all over Washington actively participated in the development of the plan during the Target Zero revision project. The updated Target Zero plan is a detailed roadmap that coordinates the efforts and investments of traffic safety organizations across Washington, ensuring the use of the most effective strategies to improve traffic safety, and tracking progress toward the ultimate goal: Target Zero. Target Zero is Washington State’s call to action for all citizens. I encourage you to read this Plan and become a traffic safety advocate to help implement these strategies in your communities. Together we can meet our Target Zero goal. Very truly yours, Jay Inslee Governor

Governor Jay InsleeCommission Chair
Roger MillarDepartment of Transportation
Chief John BatisteWashington State Patrol
Pat KohlerDepartment of Licensing
John WiesmanDepartment of Health
Judge James P. SwangerClark County District Court
Randy DornSuperintendent of Public Instruction
Patricia LashwayDepartment of Social and Health Services
Rosemary Brinson SiipolaAssociation of Washington Cities
Carolann SwartzWashington State Association of Counties
Darrin GrondelWashington State Transportation Commission
Washington Traffic Safety Commission

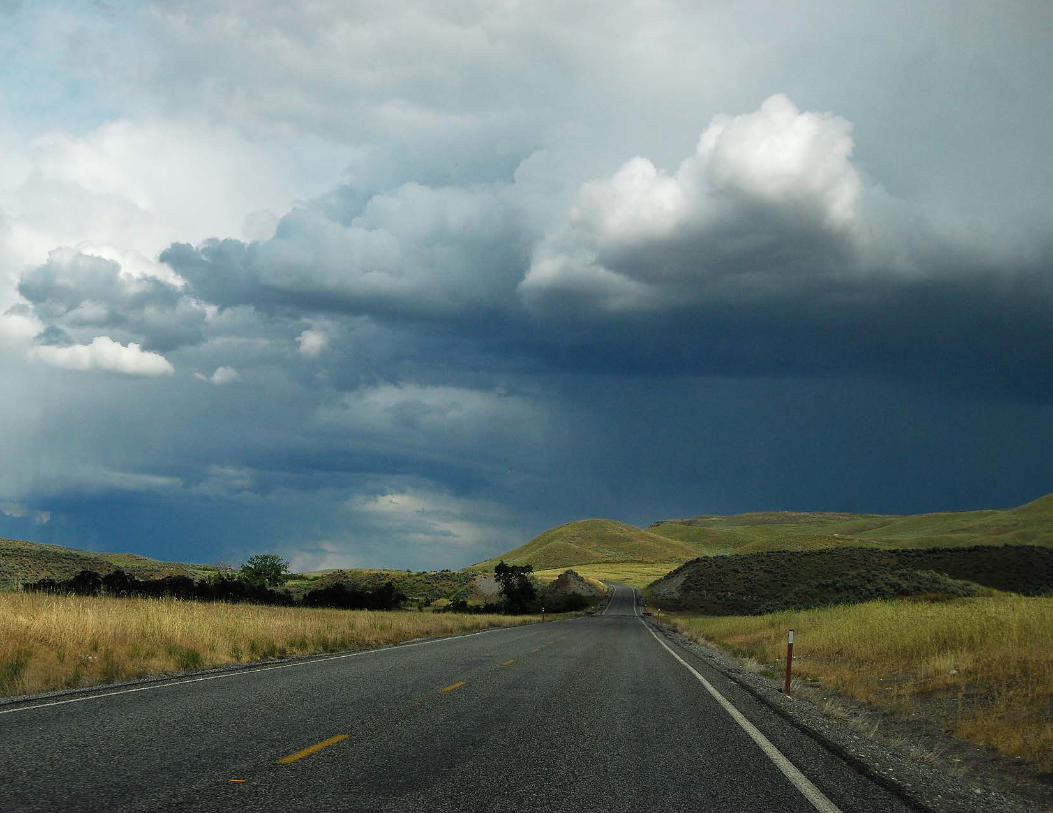
1 Overview2 About Target Zero6 Executive Summary10 Target Zero Priorities14 Legislation and Policy32 Improving our Traffic Safety Culture34 New Technology and Traffic Safety36 High Risk Rural Roads in Washington State
37 High Risk Behavior38 Impairment Involved50 Speeding Involved60 Distraction Involved70 Unrestrained Vehicle Occupants80 Unlicensed Driver Involved86 Drowsy Driver Involved
91 Crash Type92 Lane Departure98 Intersection Related106 Work Zone, Wildlife, School Bus, and Vehicle-Train
109 Road Users110 Young Drivers 16–25 Involved124 Motorcyclists134 Pedestrians152 Older Drivers 70+ Involved162 Heavy Trucks168 Bicyclists178 Tribes and Target Zero
189 Decision-Making and Performance Improvement190 Traffic Data Systems194 Emergency medical services (EMS) and trauma care system200 Evaluation, analysis, and diagnosis206 Local Agencies and Target Zero
Appendix A: AcronymsAppendix B: GlossaryAppendix C: MethodologiesAppendix D: Target Zero Data SourcesAppendix E: Data Definitions
Appendix F: Strategy Definitions and CriteriaAppendix G: Federal Requirements and Target ZeroAppendix H: Target Zero Plan DevelopmentAppendix I: Additional ResourcesAppendix J: Special Thanks
Appendices


Ove
rvie
w

2 Overview: About Target Zero
From 2012 through 2014, the time period analyzed in this plan, 1,336 people lost their lives in motor vehicle crashes in Washington State. We have to ask ourselves: How many deaths and serious injuries are “acceptable” on Washington’s roadways? How many of your family members would it be “acceptable” to lose to traffic crashes each year? Ten? Five?
Of course, the answer is none. Zero. The goal of every Washington State citizen should be zero deaths and serious injuries on our roads and highways. The personal, financial, and societal loss for every person killed or injured in traffic crashes is enormous. The loss of even one family member, co-worker, or friend is unacceptable.
That’s why Washington State has adopted Target Zero — a goal to reduce traffic fatalities and serious injuries on Washington's roadways to zero by the year 2030. Our goal is zero deaths and serious injuries, because every life counts.
What is the Strategic Highway Safety Plan?Each state must have a Strategic Highway Safety Plan (SHSP); Washington’s is called Target Zero. This plan is developed through a collaboration of traffic safety professionals and stakeholders from many different organizations and disciplines:
| Engineers from the Washington Department of Transportation (WSDOT) and local public works agencies.
| Training and licensing experts from the Department of Licensing (DOL). | Tribal and city police, county sheriffs’ deputies, and troopers from the Washington
State Patrol (WSP). | Medical professionals and emergency medical services (EMS) personnel, working
with hospitals and public health agencies. | Educational and subject-matter experts from the Washington Traffic Safety
Commission (WTSC). | Data specialists from state agencies and the Governor’s Office. | And many other traffic safety specialists and interested parties from every corner of
the state, all dedicated to making our roads safer.
About Target Zero
The Strategic Highway Safety Plan is our guideTarget Zero is a data-driven
strategic plan used to identify priorities and solutions, help create
common goals, and develop a language so we can work together across disciplines. Specifically, our
partners use it to:
| Set statewide priorities for all traffic safety partners over the next three to four years.
| Provide a resource of various strategies to address each emphasis area and factor.
| Help guide federal and state project funding toward the highest priorities and most effective strategies.
| Monitor outcomes at a statewide level for each priority area.
3Washington State Strategic Highway Safety Plan 2016: Target Zero
Target Zero is a practitioner’s plan, uniting the contributing organizations toward a common goal. It is intended to complement and be incorporated into the plans and programs of key state traffic safety agencies, as well as Tribes, cities, counties, and private organizations. The plan helps partners coordinate traffic safety programs, better align priorities and strategies, and build a common language and approach to traffic safety efforts across Washington State.
A fundamental element of the plan is that it is data driven, identifying the critical factors that contribute to fatal and serious injury crashes on Washington's roads. The plan then uses those factors to identify proven, recommended strategies along with new ones for reducing traffic deaths and serious injuries in a number of common areas.
The Target Zero plan identifies highway safety strategies for the next three to four years. Target Zero partners develop and implement specific projects that use Target Zero strategies, and also create applicable success measures. The actions, strategies, and measures are documented in partners’ plans throughout the state, wherever the strategies are being implemented.
Target Zero complies with federal requirements
Federal law requires that our Strategic Highway Safety Plan
be coordinated with the state’s Highway Safety Plan, Commercial
Vehicle Safety Plan, and the Highway Safety Improvement
Program. This coordination includes harmonizing certain performance measures and targets. The role of our SHSP is to support the state’s efforts to achieve these targets
by establishing appropriate goals and objectives, outlining emphasis
areas, and presenting effective strategies. To learn more about
federal requirements, please see Appendix G.
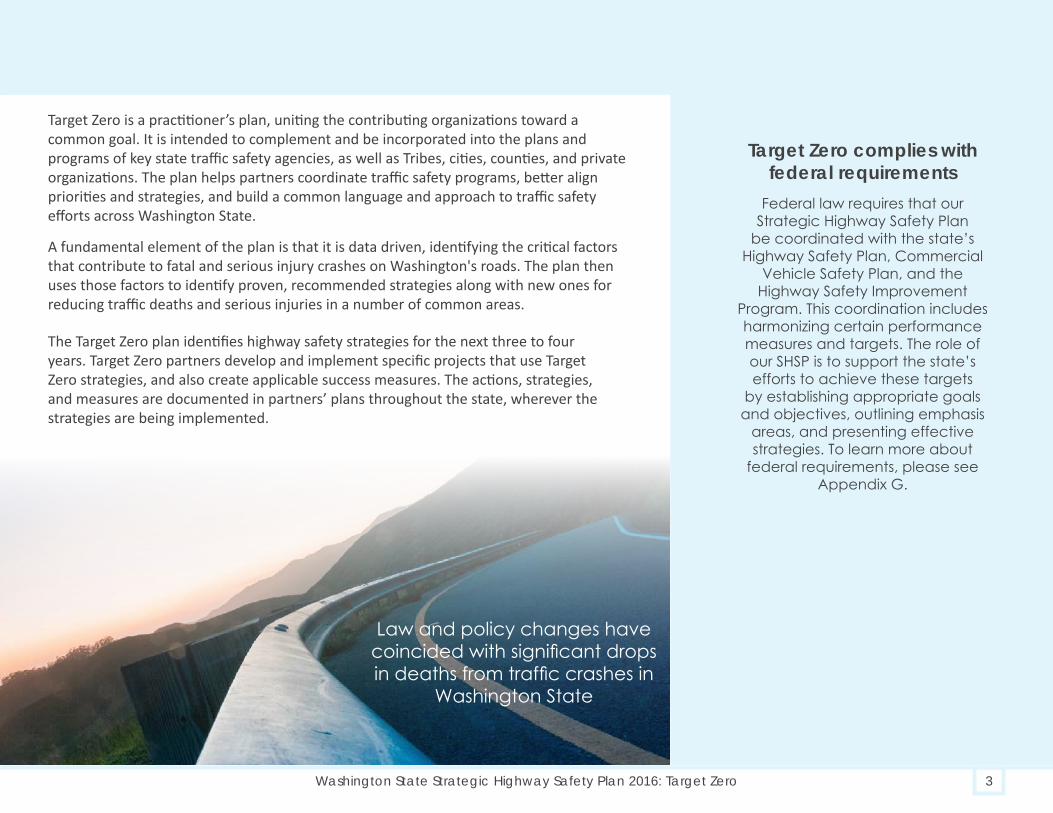
Law and policy changes have coincided with significant drops in deaths from traffic crashes in
Washington State

Overview
4 Overview: About Target Zero

Ove
rvie
w
5Washington State Strategic Highway Safety Plan 2016: Target Zero
Achieving zero deaths and serious injuries will not be easyWashington State created the first Target Zero plan in 2000. The plan established an ambitious goal of zero traffic fatalities by the year 2030, and the state has made significant progress since then. Over the years, we have seen positive trends in almost every traffic area — improvements in Impaired Driving stemming from the strengthening of DUI laws and increased enforcement, significant roadway engineering improvements, and implementation of stronger anti-texting and phone use laws.
Additionally, in the last several decades the auto industry has given us life-saving air bags, more crash-resistant vehicles, and better roll-over protection technology. Meanwhile, organizations such as the National Comprehensive Highway Research Program (NCHRP), Mothers Against Drunk Driving (MADD), the United States Department of Transportation (USDOT), the Governor’s Highway Safety Association (GHSA), the American Automobile Association (AAA), and the Insurance Institute for Highway Safety (IIHS) have provided many tools and programs that have made our roads safer.
However, if Washington is to actually reach Target Zero by the year 2030, it will take a continued concerted effort on many fronts. Reaching our Target Zero goal will only be accomplished through federal, state, and local partnerships leveraging innovation, research, and changes in the traffic safety culture of our state. Together we can realize zero traffic deaths and serious injuries by 2030.
We’ve made great strides towards zero deaths and injuries – but haven’t made it far enough yetEach year from 2012 to 2014, more than 400 people died and another 2,000 were seriously injured on Washington’s roadways. Looking further back, we find that from 2002 through 2011, Washington averaged 22 fewer traffic fatalities and 80 fewer serious injuries each year. While this is a great achievement, it is not enough to reach the goal of zero fatalities and serious injuries by 2030. Even one traffic fatality or serious injury is one too many. We must continue to do more.
Zero traffic deaths in your family, zero traffic deaths in our stateTo achieve Target Zero by 2030, Washington must average 28 fewer fatalities and 134 fewer serious injuries each year, starting right now. As time passes, it becomes harder to achieve our goal because partners have already accomplished the simpler efforts. The improvements we have to make now are harder and more transformative than the ones that have come before. Complicating this issue, we have seen an upswing in fatalities and serious injuries, and a slowdown in our continuing trend toward zero in recent years. With limited resources and personnel, every strategy — every effort — must count toward achieving our goal. This requires deliberate thought, meaningful analysis, careful planning, and strong commitment to a variety of effective traffic safety strategies. Let’s reach our Target Zero goal together — zero traffic deaths in your family, zero traffic deaths in our state.

6 Overview: Executive Summary
In the years 2012 through 2014, 1,336 people died on Washington State public roadways and 6,123 people were seriously injured. Each of these deaths and injuries is not just a number, but an actual person — one who lost his or her life, or suffered a severe trauma. And each of those deaths or injuries ripples out to dozens of family members, friends, and co-workers who suffer grief at a sudden death, or a loved one’s injuries.
To combat these tragedies, Washington leaders continue to build partnerships among state agencies, all levels of Washington State governments, private citizens, safety advocates, and many other traffic safety partners.
The Washington Department of Transportation (WSDOT) and Washington Traffic Safety Commission (WTSC), along with dozens of partners, have joined together to create the Target Zero Strategic Highway Safety Plan (SHSP). Target Zero is a statewide, data-driven effort to reduce fatalities and serious injuries to zero by the year 2030. We will do this by developing strong leadership in organizations that directly impact highway safety, and using partnerships to develop and implement innovative, data-based solutions.
Our goal is zero deaths and serious injuries, because every life counts.
We have made significant progress – but are not on track to achieve Target ZeroSince Washington State adopted the first Target Zero plan in 2000, the results have been impressive. The number of annual traffic fatalities in Washington has decreased by 27% from 2000–2014, even while the state’s population has grown by 18%.
Executive Summary

7Washington State Strategic Highway Safety Plan 2016: Target Zero
Over the years, we have experienced positive trends in almost every emphasis area. Through the power of our partnerships, we have strengthened our Driving Under the Influence (DUI) laws, increased enforcement of impaired driving, improved automotive safety equipment, evolved our roadway engineering standards, and passed anti-texting and phone use laws.
Despite these great achievements, however, we are not on track to reach zero fatalities and serious injuries by 2030.
What’s new in the 2016 planThe 2016 plan includes new chapters: Improving our Traffic Safety Culture; New Technology and Traffic Safety;
Evaluation, Analysis, and Diagnosis; and Legislation and Policy.
This version also features more graphics to better show traffic safety trends. This
includes infographics, graphs, and tables, all downloadable at targetzero.com.
The Priority Table groups the priorities into emphasis areas based on similar factors and characteristics. Its organization is reflected in
the order of the chapters in this version.
Run-off-the-road crash data has been combined with opposite direction crash data to create a
new lane departure priority area.
Both the impairment and distraction involved priority areas now include pedestrians and
bicyclists, in addition to the original drivers and motorcyclists.
The older driver age threshold has been lowered from 75 to 70 years old, because data shows that risk factors for older drivers have a statistically significant break point at age 70.

Overview
8 Overview: Executive Summary
About the Target Zero Plan Each state is required to have a Strategic Highway Safety Plan. Washington’s plan — called Target Zero — is developed through a collaboration of traffic safety professionals and stakeholders from many different organizations and disciplines, including the WTSC, WSDOT, local public works agencies, the Department of Licensing, Tribal and city police, county sheriffs’ deputies, the Washington State Patrol, public health agencies, medical professionals, Emergency Medical Services personnel, and many other traffic safety specialists.
The 2016 Target Zero SHSP is a data-driven strategic plan used to identify traffic safety solutions, help create common goals, and develop a shared language so these many agencies and organizations can work together across disciplines. The plan focuses on specific emphasis areas and priorities to lay out systemic safety strategies. To develop the plan, traffic safety leaders convened a wide range of stakeholder groups who participated in a series of meetings to develop the final list of emphasis areas and priorities, review traffic safety strategies, and write the plan.
Coordination, collaboration, and communication among traffic safety partners are key to the implementation of the strategies. The efforts of traffic safety partners across the state are focused on implementing strategies that will help achieve the Target Zero goal.
How to use Target ZeroTarget Zero is a practitioner’s plan, uniting its contributing organizations toward a common goal. It is intended to complement and be incorporated into the plans and programs of key state traffic safety agencies, as well as Tribes, cities, counties, and private organizations.
At the end of most chapters, you will find a list of strategies for achieving zero fatalities and serious injuries. Target Zero partners design and implement projects and programs based on those strategies. They document the recommended actions, strategies, and measures that can be used in local plans throughout the state, wherever traffic safety strategies are being implemented.
To be most effective, Target Zero puts emphasis on the largest contributing
factorsTarget Zero sets statewide traffic safety priorities based upon the most frequently cited contributing factors. During the 2012 to 2014 period, the top three factors were:
| Impairment — contributed to 57% of all traffic fatalities.
| Lane Departure — contributed to 56% of all traffic fatalities.
| Speeding — contributed to 38% of all traffic fatalities.
Overall, 81% of traffic fatalities involved at least one of these top three traffic safety priorities, and 20% involved all three.

Ove
rvie
w
9Washington State Strategic Highway Safety Plan 2016: Target Zero
Recent Target Zero AchievementsOur state is proud of the safety improvements made in areas where we have focused a great deal of time, attention, and funding:
Young drivers aged 16–25. Fatalities involving younger drivers aged 16-25 have seen significant reductions since 2007. Current projections based on the 10-year trend show zero fatalities being achieved in 2024 and zero serious injuries in 2026. This success reflects effectiveness of the implementation of intermediate driver licenses, high visibility enforcement campaigns, and programs such as the Party Intervention Patrols.
Unrestrained vehicle occupants. Fatalities among vehicle passengers not wearing appropriate safety restraints have dropped more quickly than in other areas. Currently, projections based on the 10-year trend show zero fatalities in 2021 and zero serious injuries in 2026. This success reflects the effectiveness of the Click It or Ticket campaign’s combination of education and enforcement, as well as several other innovative efforts to encourage greater and appropriate use of restraints for adults and children.
Lane departure crashes. Lane departure crashes resulting in fatalities and serious injuries have also seen dramatic reductions. Current ten-year trends project zero lane departure fatalities by 2027, and zero head-on serious injuries by 2028. This success is a reflection of various safety efforts on behalf of many Target Zero partners in reducing head-on and run-off-the-road events.
Current Target Zero Areas for ImprovementThere are other areas where we are unfortunately not seeing such improved trends. In some areas, we need much higher declines in order to achieve Target Zero.
Pedestrians. Current trends for pedestrian fatalities and serious injuries are flat and may be on the rise. It may also be that more people are walking and increasing exposure, but state specific walking rates are not available. WSDOT, the state lead on pedestrian safety, has recently revised the WSDOT Design Manual as part of a formal design change intended to improve roadway safety for all users by considering modal needs and roadway context.
Motorcyclists. The ten-year trend in motorcyclist fatalities is flat, not increasing, but not decreasing. Looking at these fatalities in a rate per 100,000 motorcycle registrations, the outcome shows a slight decline in fatalities relative to number of registered riders, which is a promising sign. Declines among seriously injured motorcyclists are also promising; however, they are not quite on track to reach zero in 2030. Training and education for motorcycle riders and other drivers is crucial. Consistent helmet use is also critical to progress. Despite Washington’s primary law requiring all motorcyclists to wear helmets, nearly 8% of fatally injured motorcycle riders were not wearing helmets.
Next Steps for the 2016 Target Zero PlanTarget Zero lays the foundation for achieving the vision of zero fatalities and serious injuries in the future. However, this vision will only become a reality if intentional steps are taken to implement and evaluate the plan on an ongoing basis. Partners at the federal, state, local, and Tribal levels must be able to implement the strategies listed in this plan in order to actually achieve zero deaths and injuries on Washington State’s roads.

10 Overview: Priorities
We base traffic safety priorities on the latest dataTo focus efforts on eliminating deaths and serious injuries on our state’s roadways, partners analyzed the data from 2012–2014 to determine the highest priorities for immediate efforts. The team grouped the primary factors found in fatal and serious traffic crashes into priority levels one, two, and three. The levels are based on the percentage of traffic fatalities and serious injuries associated with each factor.
Priority level one includes the factors associated with the largest number of fatalities and serious injuries in the state. Each of these factors was involved in at least 30% of the traffic fatalities or serious injuries between 2012 and 2014.
Priority level two factors, while frequent, are not as common as priority level one factors. Level two factors were seen in at least 10% of traffic fatalities or serious injuries, but fewer than 30%.
Priority level three factors are associated with less than 10% of fatalities and serious injuries.
In this edition of Target Zero, we have changed several priority areas to reflect the more sophisticated data and better understanding that we now have regarding these factors. For example, run-off-the-road crash data have been combined with opposite direction crash data to create a new lane departure priority area. Also, both the impairment and distraction involved priority areas now include impaired non-drivers (pedestrians and cyclists), as well as the traditional impaired drivers and motorcyclists. In addition, the older driver age threshold has been lowered from 75+ to 70+, because analysis shows that risk factors for older drivers have a statistically significant break point at age 70.
Additionally, Traffic Data Systems, Emergency Medical Services (EMS) and Trauma Response, and Evaluation and Diagnostics are included as priority level one factors because of their significance in reducing death and serious injuries. Better data systems significantly improve our analysis of traffic fatalities and serious injuries, and effective EMS response has a significant effect on preserving life and minimizing injury. Meanwhile, a focus on improving how we analyze and evaluate our strategic plans has the potential to reduce traffic deaths and injuries alongside strategies designed to impact the other priority level one factors.
Fatality and Serious Injury Data Drive the Target Zero PrioritiesThe strategies laid out in this plan were identified through data evaluation and analysis and are targeted to address the top safety priorities in Washington. They include both broad-ranging as well as specific strategies for reducing traffic fatalities and serious injuries. These strategies were developed using national-level research, existing pilot programs, and input from many statewide stakeholders.
Target Zero Priorities

11Washington State Strategic Highway Safety Plan 2016: Target Zero
Priority level oneEmphasis areas include:
• Factors occurring in at least 30% of total fatalities or serious injuries.
• Decision and Performance Improvement.
Priority level twoEmphasis areas are factors occurring in at least 10% of total fatalities or serious injuries.
Priority level threeEmphasis areas are factors occurring in less than 10% of total fatalities or serious injuries.
**Serious injury data for unlicensed drivers are
unavailable
Decision and Performance Improvement1 Traffic Data Systems Decision Improvement1 EMS and Trauma Response Performance Improvement1 Evaluation, Analysis, and Diagnosis Decision and Performance Improvement
Washington State2012-2014
Fatalities Serious InjuriesNumber % Total Number % Total1,336 100% 6,123 100%
High Risk Behavior1 Impairment Involved 756 56.6% 1,366 22.3%1 Speeding Involved 508 38.0% 1,622 26.5%2 Distraction Involved 395 29.6% 1,403 22.9%2 Unrestrained Occupants 296 22.2% 627 10.2%2 Unlicensed Driver Involved 248 18.6% ** **3 Drowsy Driver Involved 39 2.9% 194 3.2%
Crash Type1 Lane Departure 750 56.1% 2,357 38.5%1 Intersection Related 276 20.7% 2,129 34.8%
Road Users1 Young Drivers 16–25 Involved 423 31.7% 2,057 33.6%2 Motorcyclists 224 16.8% 1,110 18.1%2 Pedestrians 204 15.3% 906 14.8%2 Older Drivers 70+ Involved 162 12.1% 524 8.6%3 Heavy Truck Involved 122 9.1% 318 5.2%3 Bicyclists 29 2.2% 294 4.8%
Other Monitored Emphasis AreasWildlife 7 0.5% 49 0.8%
Work Zone 3 0.2% 96 1.6%Vehicle-Train 2 0.2% 5 0.1%
School Bus-Involved 0 0.0% 15 0.2%

Overview
12 Overview: Priorities
Each of the strategies in Target Zero has been given one of the following effectiveness ratings, indicated by the initial P, R, or U at the end of each strategy:
| (P) Proven effective through professional evaluation in Washington or in other states or countries.
| (R) Recommended based on documented best practices or federal recommendations.
| (U) Unknown strategies that are new or with limited evaluations.The most established strategies are proven or recommended. However, Target Zero partners believe it is also important to include unknown strategies in the overall plan to promote innovative approaches. For the projects using unknown strategies, it will be critical to have a properly designed evaluation component included as part of the project.
When determining effectiveness of the strategies in this document, we used three main sources:
| Countermeasures That Work: A Highway Safety Countermeasure Guide for State Highway Safety Offices (8th Edition, 2016), which focuses on behavior.
| Crash Modification Factors Clearinghouse, which focuses on engineering.
| The National Cooperative Highway Research Program Report 500 Series, which focuses on both engineering and behavior.
More information on determining the effectiveness of strategies is available in Appendix F.
In addition, we are continuously evaluating our programs and strategies to ensure that we are being effective. See the Evaluation, Analysis, and Diagnostics chapter for more information.
The strategies call for five types of approaches
The strategies presented in this plan vary in their timeframe for implementation, their long-term effectiveness, and their responsible parties. The Target Zero strategies focus on the Five Es, with the addition of Leadership and Policy strategies. To make it easy for readers to find the kind of strategies they are looking for, we have indicated which area the strategies fall into:
| Education. Give road-users the information to make good choices, such as driving unimpaired, wearing a seatbelt, and avoiding distractions.
| Enforcement. Use data-driven analysis to help law enforcement officers pinpoint and address locations with a high number of behavior-driven fatal and serious-injury crashes, such as speeding and impairment.
| Engineering. Design roads and roadsides using practical solutions to reduce crashes, or to reduce the severity of crashes if they do occur.
| Emergency Medical Services (EMS). Provide high-quality and rapid medical response to injury crashes.
| Leadership/Policy. Change laws, agency rules, or policies to support safer roads and driving. In this version of the Target Zero plan, we have included these strategies in a separate chapter for easy reference by policy-makers, legislators, and legislative staff.
Evaluation, Analysis, and Diagnosis helps us to determine how we are doing in meeting our goals, to understand what is contributing to crash occurrences, and to select appropriate countermeasures to reduce those crashes using the approaches listed above.

Ove
rvie
w
13Washington State Strategic Highway Safety Plan 2016: Target Zero
Where does our crash data come from? Throughout the Target Zero plan, traffic fatality and serious injury data (if available) are presented for each priority emphasis area. Fatality data is from the Fatality Analysis Reporting System (FARS), and serious injury data is from WSDOT’s Crash Location and Analysis System (CLAS). Fatalities are represented with the color red, and serious injuries with orange.
The fatality and serious injury graphs throughout Target Zero display a performance trend line based on six five-year rolling averages derived from the most recent ten years of data, along with the Target Zero line.
The Target Zero line is where we need to be to achieve our vision of zero deaths by 2030. Many of the trends show an impressive decline for 2012–2014. However, most trends also show that we must continue to push harder in order to reach zero fatalities and serious injuries by 2030. The area between the five-year rolling average performance trend and the Target Zero line is our performance gap (shaded in light blue) and shows the improvement needed to achieve Target Zero.
For more information on the methodologies and data sources used to calculate these numbers, please see Appendix C and Appendix D.

14 Overview: Legislation and Policy
Washington has been a legislative leader in highway safety. We have an intermediate license law for young drivers, and a nationally recognized DUI offender ignition interlock program. However, our state has yet to adopt a few critical evidence-based interventions that are proven to reduce deaths and injuries. In addition, some of our current laws could be updated to be more effective, based on recent data. This section outlines the additional remaining legislative strategies that will help us achieve Target Zero: no more traffic deaths or serious injuries on Washington State’s roads.
OverviewWashington’s Legislature has already adopted most of the top-identified life-saving traffic safety laws. In some cases, however, our laws could be updated to include new, researched-based best practices. There are also some remaining legislative strategies that have been proven effective at saving lives, but that Washington has yet to adopt, such as sobriety checkpoints. In addition, the Legislature has passed laws to allow proven traffic safety programs, but many local governments have not yet prioritized and funded them.
This chapter provides an overview of some of Washington’s important traffic safety laws; it also suggests both new laws, as well as improvements to existing laws. Additionally, it outlines how local governments could implement existing laws to reduce fatalities and serious injuries.
Key FactsAccording to the Center for Disease Control
(CDC), allowing sobriety checkpoints in Washington would save about 15 lives,
prevent about 1,350 injuries, and save $52 million in avoided crashes each year.
Similarly, allowing wider use of speed cameras in Washington would save about 21 lives, prevent about 1,700 injuries, and save nearly $68 million in avoided crashes
each year.
See the CDC Crash Calculator for more information.
Legislation and Policy
15Washington State Strategic Highway Safety Plan 2016: Target Zero
What’s NewNew Legislation with Traffic Safety Implications, 2012 to 2014
12-Hour impound hold. Mandates a 12-hour impound hold on motor vehicles used by persons arrested for DUI.
24/7 sobriety programs. Establishes a statewide 24/7 Sobriety Program Pilot Program, an alternative to incarceration for repeat impaired driving offenders. This program ensures that participants are monitored and tested for drug and alcohol use so that they remain sober and are following court-directed activity.
Conditions of pre-trial release. Repeat DUI arrestees in Washington are now required to be held until they see a judge. As a condition of pre-trial release, the judge must require the repeat DUI arrestees to only drive a vehicle with ignition interlock device installed, attend a 24/7 sobriety program, or both.
Marijuana. Washington voters legalized recreational marijuana through a 2012 initiative process. The initiative set a 5 ng of THC per se limit. The first recreational marijuana stores in the state opened in the summer of 2014. While it is too soon to tell if this new legislation will affect traffic deaths and serious injuries, a preliminary report by the Washington Traffic Safety Commission showed an initial increase in the number of drivers involved in deadly traffic crashes with THC in their blood.1
Open Container Marijuana Law. It is illegal for drivers or passengers to keep or consume marijuana in a motor vehicle when the vehicle is upon a highway, unless the marijuana is in an unopened, sealed container, or in a spot not immediately accessible by passengers or drivers.
Automated school bus safety cameras. Authorizes school districts to install automated safety cameras on school buses to detect vehicles that fail to stop for a bus. All revenue collected is used for school zone safety projects.

Overview
16 Overview: Legislation and Policy
Legislation and policy for impaired driving Washington has enacted laws designed to deter driving while impaired by alcohol or positive for marijuana or any other drug. The foundational law defines driving while under the influence (DUI) four ways:
1. Driving with a blood alcohol concentration (BAC) of .08 or higher.2. Driving with a THC (delta-9 tetrahydrocannabinol, the psychoactive component of marijuana), concentration of 5.0 nanograms or higher.3. Driving while under the influence of, or affected by: intoxicating liquor, marijuana, or any drug.4. Driving while under the combined influence of, or affected by: alcohol, marijuana, or any drug.
DUI CourtsGeneral deterrence methods and traditional sanctions often do not impact DUI offenders with an alcohol or drug dependence or abuse diagnosis.
DUI courts are criminal justice programs that combine drug and alcohol treatment with intensive court supervision to reduce DUI recidivism. DUI courts follow ten guiding principles as established by the National Center for DWI Courts.2 Judges, case managers, substance abuse treatment providers, prosecutors, defense attorneys, law enforcement officers, and parole officers work together to oversee and manage participants’ progress. These programs emphasize accountability and long-term treatment.
DUI courts are the most effective way to reduce recidivism in hard-core DUI offenders.3 Studies show DUI courts to be effective at reducing recidivism of both DUIs and other crimes. The studies also show the model is effective at reducing taxpayer costs due to positive outcomes for DUI offenders including fewer rearrests, less time in jail, and less time in prison.4
Discussion
Recommendation for Local JurisdictionsDevelop a DUI court program. Give judges the ability to order offenders to attend DUI court.
Washington allows DUI courts, but their use is limited to a few counties. While many DUI courts are optional for a DUI offender, the Spokane District DUI Court is mandatory. In partnership with
Washington State University (WSU), the WTSC is conducting an outcomes evaluation of the mandatory DUI court model to determine its effectiveness at reducing DUI recidivism.
Ove
rvie
w
17Washington State Strategic Highway Safety Plan 2016: Target Zero
Sobriety CheckpointsSobriety checkpoints are traffic stops, or checkpoints, where officers are set up on a roadway to stop vehicles to check for impaired drivers. Law enforcement officers operate sobriety checkpoints at times and places where data show impaired driving is common, such as cities and towns after bars and restaurants close, or heavily traveled holiday weekend routes. These checkpoints are publicized in advance to give drivers who might be at risk of driving impaired a chance to plan ahead to find safe ways to travel. Target Zero considers sobriety checkpoints a proven strategy, based on Countermeasures That Work.
DiscussionSobriety checkpoints are one of the most effective countermeasures to combat impaired driving, and the sole remaining proven impaired driving measure not currently deployed in Washington.5 Allowing sobriety checkpoints in Washington would save about 15 lives, prevent 1,350 injuries, and reduce taxpayer crash costs by about $47 million each year.6
In 1988, the Washington State Supreme Court heard the case of the City of Seattle v. Mesiani.7 The Court held that the checkpoints conducted without authority of law were unconstitutional. However, some opinions suggested that sobriety checkpoints could be executed constitutionally in Washington when conducted under “authority of law” and appropriately structured conditions.
In Michigan Department of State Police v. Sitz in 1990, the US Supreme Court found sobriety checkpoints to be constitutionally permissible under the “special needs” exception, in which law enforcement officers may directly conduct searches and seizures without individualized suspicion for the purpose of minimizing risk of harm to the public. The Court held that the removal of impaired drivers pursuant to a sobriety checkpoint program did not violate the Fourth Amendment.
In 2008 and 2011, Washington legislators introduced bills that would provide necessary “authority of law” to conduct sobriety checkpoints.
No committee action was taken on either bill.
Washington’s constitutional privacy protections may call for additional sobriety checkpoint protocols in order to operate within Washington State’s legal framework. In addition to the NHTSA recommendations, strict protocol for Washington could consist of checkpoints complying with the following:
| Conduct checkpoints only in areas where data show high incidence of impaired-driving-related crashes, DUI arrests, or citizen complaints.
| Obtain a warrant that clearly describes the how, what, where, and why of the checkpoint activity.
| Only ask drivers for identification, insurance, and vehicle registration when an officer has reasonable suspicion that a crime has occurred.
A well-crafted statute authorizing sobriety checkpoints using the above procedures may provide the “authority of law” required to meet the Washington State Constitutional standard set forth in Article 1, Section 7. Once the authority has been established, it will be the work of the Washington Supreme Court to determine the constitutionality of sobriety checkpoints conducted in accordance with the provisions outlined here.
RecommendationPass legislation allowing sobriety checkpoints in Washington State.

Overview
18 Overview: Legislation and Policy
Ignition Interlock DevicesAll DUI offenders are subject to a driver’s license restriction to use ignition interlock devices on all vehicles that they drive for a set period of time. The restricted period is one year for a first restriction, two years for a second restriction, and ten years for third and subsequent restrictions. Offenders also must have no interlock violations — such as blowing into the device with a BAC level above .02 — for the last four months of their restriction in order for the restriction to be removed. The Legislature has enacted many improvements to Washington’s interlock laws, including requirements that interlocks have cameras and GPS functions.
Washington allows a person who has been arrested for DUI to install the ignition interlock device any time after arrest. During their license suspension, DUI offenders can get an ignition interlock driver’s license which allows them to keep driving as long as they only drive vehicles with ignition interlock devices. All of the time spent between arrest and relicensing with an ignition interlock device installed counts toward DUI offenders’ time fulfilling the interlock restriction to be eligible for a restricted license. Washington has also established an ignition interlock indigent account, which helps to support the cost of interlocks for very low income offenders.
Ignition interlocks are a proven effective strategy for reducing impaired driving (NCHRP). They are most effective at decreasing DUI recidivism when their use is broadly implemented and closely monitored. Washington’s Ignition Interlock Driver’s License provides an incentive for offenders to install the interlock, maintaining their
legal driving privileges and by extension ability to keep their jobs. Washington’s interlock use is increasing, to over 18,000 in 2014, and our state ranks third among US states for the number of interlocks, based on a 2014 study. (rothinterlock.org)
Recommendation for Local JurisdictionsWhile existing policy is strong, implementation at the local level is the key to success. Strong local probation departments that can
monitor DUI offender ignition interlock reports will increase the effectiveness of ignition interlock’s impaired driving reductions.
Discussion

Ove
rvie
w
19Washington State Strategic Highway Safety Plan 2016: Target Zero
24/7 Sobriety ProgramsLocal jurisdictions are authorized to establish 24/7 sobriety programs for DUI offenders. This program requires DUI offenders to submit to testing, often twice a day, for alcohol or any drug. A study found a 12% reduction in DUI recidivism in counties that adopted the program in South Dakota. Additionally, a RAND Corporation study suggests that providing a 24/7 sobriety monitoring option for DUI offenders and offenders of other substance abuse related crimes has a positive public health effect on traffic fatality rates.
Recommendation for Local JurisdictionsEstablish 24/7 sobriety programs for DUI offenders
Other possible impaired driving lawsMany other potential laws could change the landscape of traffic safety in Washington State. Although Target Zero partners are not currently proposing the legal interventions listed below, we are tracking these programs in other states and countries to see if they eventually might be transferable to our state.
Sanctions. The first four times within 10 years that a person is convicted of a DUI in Washington, it is a gross misdemeanor punishable by up to a year in jail and up to a $5,000 fine. On fifth and subsequent convictions within ten years, a DUI is a class C felony. For the past few years, Washington’s Legislature has considered bills that would make a person’s fourth and subsequent DUI convictions felonies. At the time of this writing, these bills have not progressed through the process to be enacted. The expense of adding people to the state’s prison system is often cited as one of the reasons this bill has not passed.
Deferred prosecution for DUI. Washington offers a formal deferred prosecution in statute, but limits it to once per lifetime. Requirements for this formal deferred prosecution include treatment, ignition interlock provisions, and other conditions as ordered by the court.8 Washington’s formal deferred prosecution has been proven effective at reducing DUI recidivism.9 A study showed that deferred prosecution participants had an overall recidivism rate of 35.5%, compared to a comparison group’s recidivism rate of 52%. However, a formal deferred prosecution is tracked as a prior offense if the offender commits a later offense.
It is a common practice for prosecutors in Washington to negotiate a plea agreement resulting in reduced penalties. If an original DUI is plead to a lesser offense, such as reckless or negligent driving, that lesser-offense conviction would end up being counted as a prior DUI if the person were to incur a subsequent DUI. Since Washington limited deferred prosecutions to one per lifetime, many DUI defense attorneys now advise their clients against taking a deferred prosecution on their first DUI. Allowing more than one deferred prosecution may encourage treatment for first-time offenders earlier, when it is more likely to be effective.
Per se levels. All 50 states have set an illegal per se limit of .08 BAC for drivers over 21, and a .02 or less for drivers under 21. No states, but many countries, have stricter BAC per se limits, from .02 to .05.
Overview
20 Overview: Legislation and Policy
Legislation and policy for speeding Washington’s laws prohibit drivers from exceeding maximum speed limits, as well as exceeding a safe and prudent speed given road hazards and conditions. The fine for speeding increases as the driver’s speed over the limit increases. Increasing speed limits over the past two decades have caused additional deaths, estimated at 33,000 nationwide, according to an Insurance Institute for Highway Safety (IIHS) report.10 In fact, the study found that every 5 mph increase in maximum speed limit is associated with an 8% increase in fatality rates on interstates and freeways.
Automated speed enforcementLaw enforcement officers are not able to enforce speed limits on all roads and all times. At times, road conditions, such as no shoulder, can make officer speed enforcement dangerous or difficult. Speed cameras can provide speeding enforcement in these difficult-to-patrol locations, and also increase the public perception that drivers will receive a ticket if they speed. Speed cameras also send a strong traffic safety culture message to counter the perception that speeding is an acceptable or even admirable behavior.
Automated speed enforcement devices use a speed measuring tool and a camera to identify drivers who are exceeding the speed limit. The devices could potentially be used in areas where speeding-related crashes occur frequently, in areas that are difficult or dangerous to enforce, work zones, and in areas with a high volume of pedestrians.
However, in Washington the law only allows for automated enforcement in work zones, school zones, and at signalized intersections. There is one exception: the City of Tacoma is authorized by statute to use a single automated speed camera.
Discussion
Recommendation
Expand the use of automated speed enforcement to difficult-to-enforce locations, areas where speeding-related crashes occur frequently, work zones, and areas with a high volume of pedestrians.
The use of automated speed cameras has been shown to reduce crashes 20–25% if placed at conspicuous, fixed locations.11 Legislation in Washington could expand the use of automated speed cameras. However, public acceptance is key to successful implementation. State legislation could ensure these devices were used on roadways with speeding problems, or areas where traditional law enforcement is difficult or dangerous. Legislation could build public support by
requiring that funds generated by fines are put into projects to improve traffic safety, in order to avoid the perception that the automated speed device is used solely to generate revenue.
Allowing wider use of speed cameras in Washington would save about 21 lives, prevent 1,700 injuries, and reduce taxpayer crash costs by almost $50 million each year.

Ove
rvie
w
21Washington State Strategic Highway Safety Plan 2016: Target Zero
Legislation and policy for young driversIn Washington, teens 16–17 years old move through two restricted phases of licensing before being granted an unrestricted driver’s license: first the instruction permit, then intermediate driver’s license. The Legislature established the intermediate driver’s license a decade ago. It has been credited with reducing the number of fatality crashes involving 16 and 17 year olds. Many other states also established intermediate driver’s licensing at that time. As researchers have studied the effects of these laws, traffic safety experts have developed a model graduated licensing system.
Requirements to receive an instruction permit
Component Current Washington State law Recommendation
Minimum age for instruction permit • If enrolled in a driver training course, age 15• If not enrolled in a driver training course, age
15 ½ if you pass a knowledge test
Age 16FAST Act: requires vision and knowledge assessment prior to receiving learner’s permit
Minimum months in instruction permit phase 6 months 12 months
Requirements to receive an Intermediate Driver’s License
Component Current Washington State law Recommendation
Minimum age for intermediate license Age 16 Age 17Minimum months in intermediate license phase No minimum requirement. Restrictions apply until
driver is 1812 months
Supervised hours of driving experience 50 hours 80–120 hoursNighttime restriction 1 am to 5 am 9 pm to 5 am. Restriction should last one yearTeenage passengers No passengers under 20 for the first six months
(except for immediate family members)No more than 3 passengers under 20 (except for immediate family members) for the next six months
The “no teen passenger limit” should last one year
New driver decal requirement No requirement Help law enforcement identify Intermediate drivers license holders through a license plate tag
Overview
22 Overview: Legislation and Policy
Legislation and policy for distracted driversCell phone law
Washington led the nation in recognizing the distinct distraction posed by phones and other handheld personal wireless electronic devices. In 2007, the Legislature passed a law that bans texting while driving, as well as a law that bans holding a phone to your ear while driving. The law was updated in 2010 to make a violation a primary offense. It currently prevents tickets from being reported to insurance agencies, or to employers who check employees’ driving records.
Discussion
Recommendations for state legislation
Prohibit drivers from using handheld personal electronic devices at all times while the car is on the road. Apply the prohibition even while a driver is temporarily stopped because of traffic or at a stoplight. Ensure violations are reportable to insurance and employers.
Recommendations for local jurisdictionsEnact ordinances that allow officers to cite drivers for distracted driving for using handheld personal electronic devices. Apply the
prohibition even while a driver is temporarily stopped because of traffic or at a stoplight.
Washington’s phone law has failed to bring about the desired behavior change. Observational surveys estimate one in ten Washington drivers are holding and interacting with their phone at any given time.12 The model that is most effective at driver behavior change uses good policy, backed up by education and enforcement.
It is difficult for law enforcement officers to enforce Washington’s law. It’s hard to tell if drivers are holding the phone to their ear or a few inches away from their ear. Further, many courts have determined that the law only covers texting, and does not cover other forms
of entering or reading data, making it difficult for law enforcement officers to know if a driver is texting or posting to social media.
Additionally, new research from the Automobile Association of America (AAA) shows that it takes nearly 30 seconds after ending a call or text for the driver’s mind to return to the task of driving.13 Given that one in five of all traffic fatalities happen at intersections, this research points to the danger of allowing phone use at stop lights.

Ove
rvie
w
23Washington State Strategic Highway Safety Plan 2016: Target Zero
Notes:
1. “Driver Toxicology Testing and the Involvement of Marijuana in Fatal Traffic Crashes, 2010–2014,” Washington Traffic Safety Commission Traffic Safety Studies, Revised February 2016, http://wtsc.wa.gov/wp-content/uploads/dlm_uploads/2015/10/Driver-Toxicology-Testing-and-the-Involvement-of-Marijuana-in-Fatal-Crashes_REVFeb2016.pdf
2. National Center for DWI Courts, National Association of Drug Court Professionals, http://www.dwicourts.org
3. Countermeasures That Work: A Highway Safety Countermeasure Guide for State Highway Safety Offices, 8th Edition, DOT HS 812 202, November 2015, “Chapter 1, Alcohol- and Drug-Impaired Driving,” (National Highway Traffic Safety Administration, NHTSA, Washington, DC), http://www.ghsa.org/html/publications/countermeasures.html
4. Michigan DUI Courts Outcome Evaluation, Final Report to the Michigan Supreme Court State Court, Administrative Office, March 2008, (Carey, Fuller, Kissick, Taylor, & Zold-Kilbourn), http://www.dwicourts.org/sites/default/files/nadcp/MI%20DUI%20Outcome%20Evaluation%20FINAL%20REPORT%20Re-Release%20March%202008_0.pdf
5. Countermeasures That Work: A Highway Safety Countermeasure Guide for State Highway Safety Offices, 8th Edition, DOT HS 812 202, November 2015, “Chapter 3, Speeding and Speed Management,” (National Highway Traffic Safety Administration, NHTSA, Washington, DC), http://www.ghsa.org/html/publications/countermeasures.html
6. Prioritizing Interventions and Cost Calculator for States, Centers for Disease Control and Prevention (CDC). https://wwwn.cdc.gov/mvip/
7. “City of Seattle v. Mesian.” 755 P.2d 775 (Wa. 1988) required legislative authority for checkpoints, http://law.justia.com/cases/washington/supreme-court/1988/53825-5-1.html
8. Revised Code of Washington (RCW). RCW 10.05.150:Alcoholism program requirements, http://app.leg.wa.gov/RCW/default.aspx?cite=10.05.150
9. Washington State Institute for Public Policy, “Deferred Prosecution of DUI Cases in Washington State: Evaluating the Impact on Recidivism,” August 2007, Document No. 07-08-1901, http://www.wsipp.wa.gov/ReportFile/992/Wsipp_Deferred-Prosecution-of-DUI-Cases-in-Washington-State-Evaluating-the-Impact-on-Recidivism_Full-Report.pdf
10. Insurance Institute for Highway Safety, Relationship of Traffic Fatality Rates to Maximum State Speed Limits, April 2016, Charles M. Farmer, http://www.iihs.org/frontend/iihs/documents/masterfiledocs.ashx?id=2117
11. Countermeasures That Work, p 3-2112. Washington Distracted Driving Report Cards, 2014.
Statewide Collaboration: Harborview Injury Prevention and Research Center, UW Medicine, Public Health-Seattle & King County, King County Prosecuting Attorney’s Office. http://depts.washington.edu/hiprc/collaborate/%20outreach/distracted-driving/
13. Measuring Cognitive Distraction in the Automobile III: A Comparison of Ten 2015 In-Vehicle Information Systems, October 2015. AAA Foundation for Traffic Safety (David L. Strayer, Joel M. Cooper, Jonna Turrill, James R. Coleman, and Rachel J. Hopman). https://www.aaafoundation.org/sites/default/files/strayerIII_FINALREPORT.pdf
Please see Appendix I: Additional Resources for a complete list of references.

Overview
24 Overview: Legislation and Policy
Legislative and policy strategies for reducing fatalities and serious injuriesOBJECTIVE STRATEGIES IMPLEMENTATION AREAS
IMP.1. Prevent excessive drinking, underage drinking, and impaired driving
IMP.1.1 Increase the state excise tax on beer. (R, NCHRP) Leadership/PolicyIMP.1.2 Continue mandatory alcohol server training and explore expanding
responsible beverage service policies for alcohol retailers. (U)Education, Leadership/Policy
IMP.1.6 Support alternative transportation services such as transit (especially at night), designated driver programs, and other alternative ride programs to help eliminate need for impaired individuals to drive. (U)
Leadership/Policy
IMP.2. Enforce and publicize DUI laws
IMP.2.9 Discourage expansion of access to alcohol, marijuana, and other drugs. (U) Leadership/Policy
IMP.3. Prosecute, sanction, and treat DUI offenders
IMP.3.1 Expand use of ignition interlocks. (P, CTW) Leadership/Policy
IMP.3.2 Suspend driver license administratively upon arrest. (P, CTW) Leadership/PolicyIMP.3.4 Conduct alcohol/drug assessments on all DUI offenders and enhance
treatment and probation when warranted. (P, CTW)Leadership/Policy
IMP.3.5 Match treatment and rehabilitation to the diagnosis. (P, NIH) Leadership/PolicyIMP.3.6 Require stronger penalties for BAC test refusal than test failure. (R, CTW) Leadership/PolicyIMP.3.7 Encourage attendance at DUI Victim's Panels. (U) Leadership/PolicyIMP.3.8 Place limits on plea agreements. (R, CTW) Leadership/PolicyIMP.3.9 Establish 24/7 sobriety program. (R, CTW) Leadership/Policy
IMP.4. Control high-BAC and repeat DUI offenders
IMP.4.1 Monitor DUI offenders closely. (P, CTW) Leadership/PolicyIMP.4.2 Require ignition interlock as a condition for license reinstatement. (P, NCHRP) Leadership/PolicyIMP.4.3 Incarcerate offenders who fail to comply with court-ordered alternative
sanctions (P, NCHRP)Leadership/Policy
IMP.4.4 Support and establish DUI Courts. (P, CTW) Leadership/PolicyP: Proven R: Recommended U: Unknown

Ove
rvie
w
25Washington State Strategic Highway Safety Plan 2016: Target Zero
Legislative and policy strategies for reducing fatalities and serious injuriesOBJECTIVE STRATEGIES IMPLEMENTATION AREAS
IMP.5. Foster leadership to facilitate impaired driving system improvements
IMP.5.1 Continue to build partnerships designed to reduce impaired driving. (P, NCHRP)
Leadership/Policy
IMP.5.2 Encourage laws that will allow the state to utilize sobriety checkpoints. (P, CTW)
Leadership/Policy
IMP.5.3 Implement the corridor safety model in high-crash locations where data suggest a high rate of impaired driving. (P, NCHRP)
Leadership/Policy
IMP.5.4 Encourage laws that use any money collected from DUI fines in excess of $101 to support impaired driving reduction efforts. (R, GHSA)
Leadership/Policy
IMP.5.5 Lower the per se BAC limit from .08 to .05 (P, META) Leadership/PolicyIMP.5.6 Establish and support the Judicial Outreach Liaison program. (R, NHTSA) Leadership/PolicyIMP.5.7 Monitor ignition interlock manufacturers and installers to ensure a continued
viability and validity of program. (P, CTW)Leadership/Policy
IMP.5.8 Monitor reports from ignition interlock manufacturers on alcohol failures on ignition interlocks and conduct compliance checks. (P, CTW)
Leadership/Policy
IMP.5.9 Investigate ignition interlock circumvention attempts. (P, CTW) Leadership/PolicySPE.1. Reduce speeding through
enforcement activitiesSPE.1.3 Increase penalties for repeat and excessive speeding offenders. (R, CTW) Leadership/PolicySPE.1.4 Equip law enforcement officers with appropriate equipment for speeding
enforcement. (R, WSP )Enforcement, Leadership/Policy
SPE.3. Build partnerships to increase support for speed reducing measures
SPE.3.1 Use the corridor safety model in high-crash locations where data suggests a high rate of speeding-related fatal or serious injury crashes. (P, CTW)
Leadership/Policy, Education, Engineering, Enforcement
SPE.3.3 Increase data sharing between local officers, Tribal police, and engineering agencies to identify and develop solutions for areas where speeding is a problem. (R, DDACTS)
Leadership/Policy
SPE.3.5 Work with Washington Trucking Association and WSP’s Commercial Vehicle Enforcement Division to encourage company policies which, when backed with speed monitors or speed regulators, can reduce speeding in commercial vehicles. (R, WSP)
Leadership/Policy
SPE.3.9 Collaborate with BIA, Indian Health Services, and NATEO to support Tribal Nations who seek to reduce speeding-related crashes on Tribal lands. (U)
Leadership/Policy
DIS.2. Increase/strengthen fines and assist in improved adjudication of distracted driving citations
DIS.2.1 Visibly enforce existing statutes to deter distracted driving. (U) Enforcement, Leadership/Policy
P: Proven R: Recommended U: Unknown
Overview
26 Overview: Legislation and Policy
Legislative and policy strategies for reducing fatalities and serious injuriesOBJECTIVE STRATEGIES IMPLEMENTATION AREAS
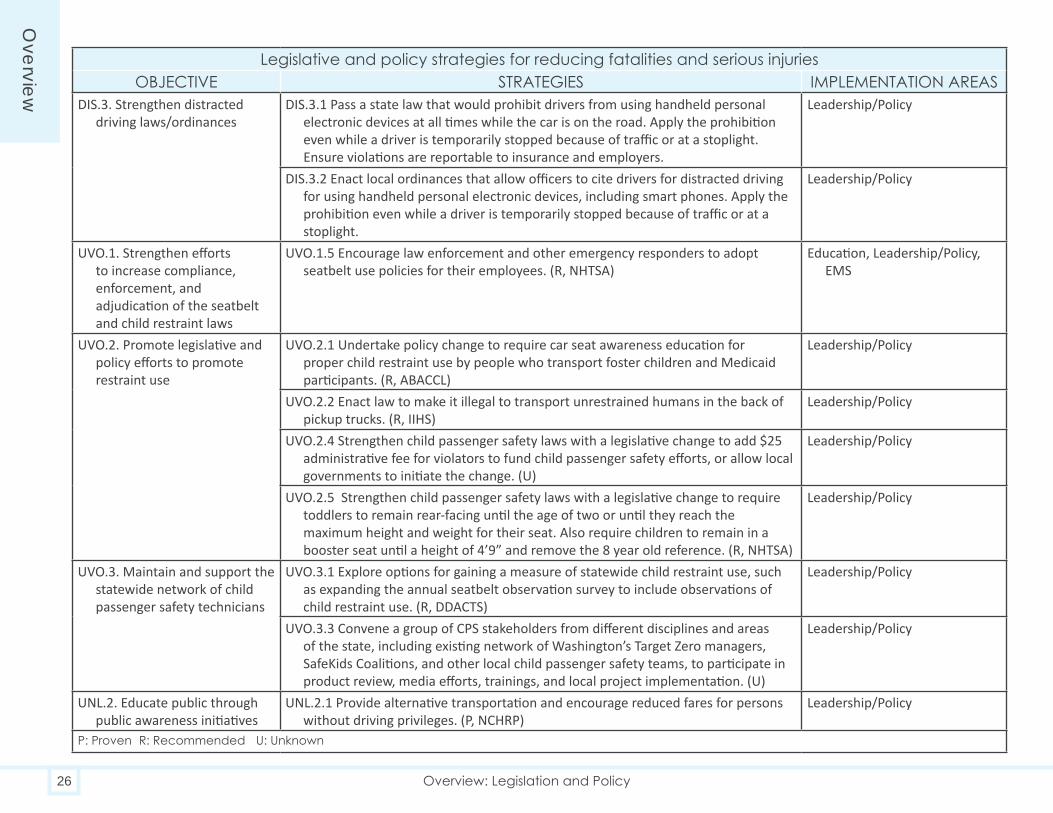
DIS.3. Strengthen distracted driving laws/ordinances
DIS.3.1 Pass a state law that would prohibit drivers from using handheld personal electronic devices at all times while the car is on the road. Apply the prohibition even while a driver is temporarily stopped because of traffic or at a stoplight. Ensure violations are reportable to insurance and employers.
Leadership/Policy
DIS.3.2 Enact local ordinances that allow officers to cite drivers for distracted driving for using handheld personal electronic devices, including smart phones. Apply the prohibition even while a driver is temporarily stopped because of traffic or at a stoplight.
Leadership/Policy
UVO.1. Strengthen efforts to increase compliance, enforcement, and adjudication of the seatbelt and child restraint laws
UVO.1.5 Encourage law enforcement and other emergency responders to adopt seatbelt use policies for their employees. (R, NHTSA)
Education, Leadership/Policy, EMS
UVO.2. Promote legislative and policy efforts to promote restraint use
UVO.2.1 Undertake policy change to require car seat awareness education for proper child restraint use by people who transport foster children and Medicaid participants. (R, ABACCL)
Leadership/Policy
UVO.2.2 Enact law to make it illegal to transport unrestrained humans in the back of pickup trucks. (R, IIHS)
Leadership/Policy
UVO.2.4 Strengthen child passenger safety laws with a legislative change to add $25 administrative fee for violators to fund child passenger safety efforts, or allow local governments to initiate the change. (U)
Leadership/Policy
UVO.2.5 Strengthen child passenger safety laws with a legislative change to require toddlers to remain rear-facing until the age of two or until they reach the maximum height and weight for their seat. Also require children to remain in a booster seat until a height of 4’9” and remove the 8 year old reference. (R, NHTSA)
Leadership/Policy
UVO.3. Maintain and support the statewide network of child passenger safety technicians
UVO.3.1 Explore options for gaining a measure of statewide child restraint use, such as expanding the annual seatbelt observation survey to include observations of child restraint use. (R, DDACTS)
Leadership/Policy
UVO.3.3 Convene a group of CPS stakeholders from different disciplines and areas of the state, including existing network of Washington’s Target Zero managers, SafeKids Coalitions, and other local child passenger safety teams, to participate in product review, media efforts, trainings, and local project implementation. (U)
Leadership/Policy
UNL.2. Educate public through public awareness initiatives
UNL.2.1 Provide alternative transportation and encourage reduced fares for persons without driving privileges. (P, NCHRP)
Leadership/Policy
P: Proven R: Recommended U: Unknown

Ove
rvie
w
27Washington State Strategic Highway Safety Plan 2016: Target Zero
Legislative and policy strategies for reducing fatalities and serious injuriesOBJECTIVE STRATEGIES IMPLEMENTATION AREAS
UNL.3. Enhance enforcement UNL.3.4 Evaluate the impact of the removal of suspension for failure to appear on non-moving citations. (U)
Leadership/Policy
UNL.4. Enhancement of data gathering and reporting ability
UNL.4.1 Make system changes necessary at WSDOT and DOL to enable analysts to identify unlicensed drivers involved in serious injury crashes. (R, DDACTS)
Leadership/Policy
UNL.4.2 Ensure routine linkage of citations to driver records so appropriate citations may be added to the crash being investigated. (R, NCHRP)
Leadership/Policy
LDX.3. Minimize the consequences of leaving the roadway
LDX.3.7 Locate and inventory fixed objects inside the clear zone to support development of programs and projects to reduce the severity of run-off-the-road crashes. (R, WSDOT)
Leadership/Policy
INT.1. Reduce motor vehicle crashes at intersections
INT.1.10 Restrict or eliminate turning maneuvers at intersections. (R, NCHRP) Engineering, Leadership/Policy
INT.2. Improve driver compliance at intersections
INT.2.1 Implement automated enforcement (photo red-light cameras) of red-light running at locations with angle crashes. (P, NCHRP)
Enforcement, Engineering, Leadership/Policy
INT.2.4 Implement automated enforcement (cameras) of approach speeds. (R, NCHRP) Enforcement, Engineering, Leadership/Policy
YDI.1. Foster compliance with the State’s IDL laws
YDI.1.1 Encourage Tribes to pass IDL laws. (P, CTW) Leadership/PolicyYDI.1.2 Provide resources to Young Driver Action Council to improve awareness —
especially for parents and teens — and compliance with the IDL law. Highlight high-risk situations where clear parental limit-setting will be most effective. (R, CTW)
Leadership/Policy
YDI.1.3 Promote increased enforcement of IDL by passing legislation requiring a sticker program to identify vehicles used by IDL license holders. (R, LIT)
Leadership/Policy
YDI.1.4 Provide local Target Zero Task Forces with information and materials about IDL for teens, parents, law enforcement, and driver education programs. (R, WTSC)
Education Leadership/Policy
YDI.2. Strengthen Intermediate Driver License restrictions
YDI.2.1 Adjust curfew to include 9 p.m. – 5 a.m., the hours when young driver serious injury and fatality crashes are highest. (P, CTW)
Leadership/Policy
YDI.2.2 Lengthen permit holding period beyond six months. (R, CTW) Leadership/PolicyYDI.2.3 Extend passenger restriction to one full year after licensed. (R, NCHRP) Leadership/PolicyYDI.2.4 Strengthen requirements for parents around the documentation and
certification of the 50-hour behind-the-wheel time young drivers are to complete before licensure. (U)
Leadership/Policy
YDI.2.5 Strengthen restrictions so penalties kick in with the first ticket IDL driver gets. (U)
Leadership/Policy
P: Proven R: Recommended U: Unknown

Overview
28 Overview: Legislation and Policy
Legislative and policy strategies for reducing fatalities and serious injuriesOBJECTIVE STRATEGIES IMPLEMENTATION AREAS
YDI.3. Improve young driver education and intervention
YDI.3.1 Review and revise the Driver Guide, testing process, curriculum guidelines, and training standards to construct an overall driver training package focused more on hazard identification and less on skill training. (R, CTW)
Leadership/Policy
YDI.3.2 Conduct a recidivism study to assess the impact of the DOL early warning letter program for 18- to 21-year-olds. (U)
Leadership/Policy
YDI.3.3 Consider expanding driver restrictions and driver education requirements to new drivers of all ages. (U)
Leadership/Policy
YDI.3.4 Update model traffic safety education curriculum to match NHTSA standards. (U)
Leadership/Policy
YDI.3.5 Consider implementation of licensing standards used in countries with superior driving statistics such as the United Kingdom. (U)
Leadership/Policy
MCX.1. Reduce numbers of unendorsed and untrained riders
MCX.1.6 Place emphasis on impoundment policy and education; change RCW 46.55.113 (2) from “officer may” to “officer will” impound. (U)
Education, Leadership/Policy
MCX.2. Reduce numbers of impaired, unskilled, and unsafe riders
MCX.2.1 Lower the per se BAC limit for motorcycle riders from .08 to .05. (P, META) Leadership/PolicyMCX.2.2 Increase motorcyclist awareness of the risks of impaired motorcycle
operation. Promote self-policing within the motorcycle community by expanding existing prevention programs, including at specific motorcycle events. (R, NCHRP)
Education, Leadership/Policy
MCX.2.3 Re-establish a tiered endorsement program with specific endorsements based on motorcycle engine size. (U)
Leadership/Policy
MCX.2.4 Implement re-testing for endorsement every five years. (U) Enforcement, Leadership/PolicyMCX.2.5 Require novice rider training (including knowledge and skills testing) to
obtain permit. (U)Leadership/Policy
MCX.2.6 Implement mandatory on-street training and testing. (U) Leadership/PolicyMCX.5. Engage stakeholders in
improving motorcycle safetyMCX.5.1 Promote public forums to share/receive feedback concerning safety
strategies and/or needs. (U)Education, Leadership/Policy
MCX.5.2 Form a new working group similar to the Washington Impaired Driving Advisory Council (WIDAC) to include members from DOL, DOT, WTSC, WSP, Motorcycle Dealers association, motorcycle safety school contractors, members of the riding community. (U)
Education, Leadership/Policy
P: Proven R: Recommended U: Unknown

Ove
rvie
w
29Washington State Strategic Highway Safety Plan 2016: Target Zero
Legislative and policy strategies for reducing fatalities and serious injuriesOBJECTIVE STRATEGIES IMPLEMENTATION AREAS
MCX.6. Strengthen and improve motorcycle laws to increase motorcycle safety
MCX.6.1 Promote the option for motorcyclists to take a safety class in lieu of a traffic ticket being added to his/her driving record. Currently some county courts offer drivers of other vehicles the option of traffic school to dismiss certain driving violations from their record and insurance. (U)
Education, Leadership/Policy
MCX.6.2 Require mandatory motorcycle insurance coverage—minimum of liability just as automobiles require. (U)
Leadership/Policy
PED.1. Reduce vehicle operating speeds where the land use context indicates that pedestrians will/may be present.
PED.1.1 Revise design practices to emphasize context and target speed to reflect the needs of all road users. (R) (P, AASHTO)
Engineering/Policy
PED.4. Expand and improve pedestrian facilities
PED.4.5 Implement Complete Streets policies to provide for all modes of transportation. (R, NCSC)
Leadership/Policy, Engineering
PED.6. Improve data and performance measures
PED.6.1 Collect miles walked data (similar to collecting VMT); continue to track pedestrian counts through Washington’s Pedestrian and Bicycle Documentation Project. (R, DDACTS)
Leadership/Policy
ODI.1. Identify old drivers at an elevated crash risk
ODI.1.1 Implement Model Driver Screening and Evaluation Program Guidelines for Motor Vehicle Administrators for screening and evaluating older drivers’ physical and cognitive abilities and skills. (P, CTW)
Leadership/Policy, Education
ODI.1.2 Provide training to law enforcement, medical professionals, licensing representatives, and community members for recognizing physical and cognitive deficiencies affecting safe driving in older drivers, including submitting reevaluation referrals to DOL. (P, CTW)
Enforcement, Leadership/Policy, Education
ODI.1.3 Continue to restrict driver license online eligibility and renewals for drivers age 70+. (U)
Leadership/Policy
ODI.3. Reduce risk of serious injury and fatalities
ODI.3.1 Provide incentives for older drivers who use alternative modes of transportation. (R, FTA)
Education, Leadership/Policy
BIC.1. Improve bicyclist and driver safety awareness and behavior
BIC.1.2 Increase the number of people bicycling to achieve safety in numbers. (R, LIT) Leadership/Policy, Education
BIC.2. Enact policies/laws to improve bicycle safety
BIC.2.1 Encourage bicycle helmet use for children and adults. (U) Leadership/Policy, Education
BIC.3. Improve bicyclist facilities BIC.3.6 Implement Complete Streets policies to provide for all modes of transportation. (R, NCSC)
Leadership/Policy, Engineering
P: Proven R: Recommended U: Unknown

Overview
30 Overview: Legislation and Policy
Legislative and policy strategies for reducing fatalities and serious injuriesOBJECTIVE STRATEGIES IMPLEMENTATION AREAS
BIC.5. Improve data and performance measures
BIC.5.1 Collect Bicycle Miles Traveled (similar to collecting Vehicle Miles Traveled); continue to track bicycle counts through Washington’s Pedestrian and Bicycle Documentation Project. (R, DDACTS)
Leadership/Policy
TDS.1. Provide quality data, analysis, and tools to customers
TDS.1.1 Develop new features in SECTOR to address user needs, including additional ticketing options and report types. Expand SECTOR software edit checks to enhance reporting accuracy and consistency. (R, eTRIP GT)
Leadership/Policy, Enforcement
TDS.1.2 Expand prosecutors’ use of SECTOR statewide to create, review, amend, and electronically file criminal cases with the courts. (R, TRC)
Leadership/Policy, Enforcement
TDS.1.3 Increase the number of electronic tickets and collision reports through expanded adoption and agency-wide implementation of SECTOR. (R, TRC)
Leadership/Policy, Enforcement
TDS.1.4 Incorporate a GPS-type location component into SECTOR to enhance accurate reporting and integration of location data. (R, TRC)
Leadership/Policy, Enforcement, Engineering
TDS.1.5 Provide officers with roadside access to driver and vehicle history information through SECTOR. (R, TRC)
Leadership/Policy, Enforcement
TDS.1.6 Enhance SECTOR functionality to allow violations bureaus (not part of the state JIS system) to electronically process tickets from SECTOR to DOL. (R, TRC)
Leadership/Policy
TDS.1.7 Make system changes necessary at WSDOT and DOL to enable analysts to identify unlicensed drivers involved in serious injury crashes. (R, DDACTS)
Leadership/Policy
TDS.1.8 Develop a linear referencing system (LRS) for all public roadways without a LRS to enhance safety analysis. (P, 23 U.S.C. Section 148)
Leadership/Policy
TDS.1.9 Revise the Police Traffic Collision Report, including both SECTOR and paper reports, to improve nomenclature and ensure business needs are met with stakeholder involvement. (R, TRC)
Leadership/Policy, Enforcement
TDS.2. Remove barriers to data sharing and integration
TDS.2.1 Derive a more accurate classification of injury severity based on clinical assessments from medical records to augment the investigating officer’s assessment of traffic crash injury severity. (P, CODES)
Leadership/Policy, EMS
TDS.2.2 Enhance the use of the ESSENCE system for using Emergency Department Data to enhance Injury Surveillance capabilities. Increase provider reporting to ESSENCE. (P, CODES)
Leadership/Policy, EMS
TDS.2.3 Create a central repository for integrated, linked data records including crash records, health (EMS, Trauma, CHARS) records, court records, licensing records, and state toxicology records. (P, CODES)
Leadership/Policy, EMS
P: Proven R: Recommended U: Unknown

Ove
rvie
w
31Washington State Strategic Highway Safety Plan 2016: Target Zero
Legislative and policy strategies for reducing fatalities and serious injuriesOBJECTIVE STRATEGIES IMPLEMENTATION AREAS
TDS.2. Remove barriers to data sharing and integration (continued)
TDS.2.4 Increase EMS reporting by first responders throughout the state to the Washington Emergency Medical Services Information System (WEMSIS). (R, DOH)
Leadership/Policy, EMS Leadership/Policy,
TDS.2.6 Educate data reporting agencies about state/federal fatal crash timeliness reporting statutes and increase enforcement of these statutes. (P, WTSC)
Leadership/Policy, Education
TDS.2.7 Create connections for systems with similar or duplicate data to eliminate duplicate entry. (R, TRC)
Leadership/Policy
TDS.3. Sustain high levels of collaboration and acquired knowledge within the TRC
TDS.3.1 Provide more frequent and enhanced traffic safety trend reporting. Present data/trends in a manner that is easy to understand and is actionable. (R, DDACTS)
Leadership/Policy, Education
TDS.3.2 Maintain a meaningful and valid set of traffic records performance measures to gauge the quality of traffic safety data. Ensure measures are accessible and periodically reviewed. (R, DDACTS)
Leadership/Policy
TDS.3.3 Support training opportunities to enhance traffic safety data analysis and research skills. (U)
Leadership/Policy
TDS.4. Identify and secure targeted investments to sustain TRC initiatives
TDS.4.1 Create a maintenance and support model for SECTOR that further that improves operations, speeds change request implementation, and enhances user support. (R, eTRIP GT)
Leadership/Policy
EMS.1. Reduce injury deaths and hospitalizations through EMS response and access to trauma care
EMS.1.3 Identify funding strategies that assist air medical services in filling gaps in coverage for emergency air medical response as identified in the state EMS and Trauma System Plan. (R, DOH)
Leadership/Policy, EMS
EMS.1.6 Ensure adequate and efficient distribution of pre-hospital EMS resources at all levels (aid and ambulance) according to the EMS and Trauma State and Regional Plans. (R, DOH)
Leadership/Policy, EMS
EMS.2. Increase communication and data capacity
EMS.2.1 Enable seamless communications capabilities among EMS, law enforcement, and fire services agencies through interoperability. (R, NCHRP)
EMS, Enforcement, Leadership/Policy
EMS.2.2 Ensure that the Washington State EMS and Trauma Care System (WEMSIS) has a statewide comprehensive, robust pre-hospital data system utilizing a data set with standard definitions. (R, NCHRP)
Leadership/Policy, EMS
EMS.2.3 Increase the number of EMS agencies reporting to WEMSIS. (R, NCHRP) Leadership/Policy, EMSEMS.2.4 Provide WEMSIS data for linking to collision records. (R, DOH) Leadership/Policy, EMS
P: Proven R: Recommended U: Unknown

32 Overview: Improving our Traffic Safety Culture
Improving our Traffic Safety CultureIn the late 1950s, at the height of America’s cigarette culture, the prevalence of smoking among US adults was estimated at nearly 45%. But now, after several decades of coordinated effort, America has experienced a dramatic shift in culture, with recent estimates from the Centers for Disease Control placing the adult smoking rate at 17% nationwide.
So what happened that transformed the US from a culture that unapologetically endorsed cigarette smoking to a culture of intolerance for it? What lessons from this experience can be applied to the world of traffic safety?
In 1964, US Surgeon General Luther Terry stirred America by proclaiming in a special report that cigarette smoking unequivocally causes cancer. The report built on similar publications released earlier in Europe and leveraged emerging research to help make the case. The Surgeon General’s announcement came amid cigarettes’ pinnacle of popularity. Fueled by decades of appealing advertising and clever placement in entertainment and pop culture, the cigarette had taken its seat alongside the automobile and the television as a staple of American society.
The Surgeon General’s proclamation ignited a firestorm of concern around tobacco among policymakers and the public at large. Following the announcement, the prevalence of smoking began a precipitous decline. Anti-smoking forces gained initial traction and built momentum over time. This work involved establishing scientifically sound public policy and a variety of environmental and social interventions. For instance, the disappearance of ashtrays from public and private spaces strengthened the message new laws and policies sent on smoking restrictions. Likewise, mass educational campaigns consisting of creative counter-advertising repeatedly reinforced a new paradigm, transforming our society’s view of tobacco use in America.
The monumental shift in the collective mindset around smoking among Americans is nothing short of a cultural revolution. It is also a cultural revolution that can be replicated. The striking reduction in tobacco use over the last 40 years stands as a great beacon of hope to the millions of Americans deeply affected each year by traffic crashes, including serious injuries or loss of life for themselves or a loved one.
Consider this: Over half of traffic deaths involved an impaired driver; two in five involved a speeding driver; one in three involved a distracted driver or pedestrian. In fact, in nine out of ten traffic fatalities, human behavior contributes to the crash. Often we term these events “accidents,” when, in fact, they result from our behavior, including negligence, willful recklessness, and blatant disregard for our laws.
Why then do some of us drive like this? Presumably, it’s not because our intent is to cause harm to others or ourselves. Yet when we don’t buckle up, or we deliberately speed, or we pay closer attention to our phone than to the road — we are behaving in ways that reveal our indifference, whether we like what that says about us or not.
While a variety of individual factors contribute to our driving behaviors, we are often unaware of the profound impact our perceptions of what is considered normal has on our behaviors. As social beings, we behave in ways we think are normal so we feel accepted by people and groups that matter to us. For example, if we think everyone else speeds, we are more likely to speed ourselves because we think speeding is normal — even expected — in our community culture. In this way, those who choose unsafe driving behaviors today are no different from those in the 1950s who saw the prevailing culture around smoking and then lit up their first cigarette.

33Washington State Strategic Highway Safety Plan 2016: Target Zero
So what do we think is normal for Washington drivers? Do we all see traffic safety as an important issue to most people in our communities? Do we all believe it is possible to prevent fatal and serious injury crashes? Do we all believe seatbelts are effective in saving lives? Do we all think most people obey the speed limit? Do we all have the attitude that police enforcement of traffic laws is beneficial? And finally, do we admire those people we know who are safe drivers?
We need to collectively make safe driving not just normal, but admirable. Our culture should motivate us to aspire to become safe road users, in the same way that we now value smoke-free environments. We need our culture to embrace, celebrate, and promote the responsibility each of us has to be a safe road user. When we reach this place, being a safe driver will not only be important for our own self-esteem and sense of belonging, but it will also be the foundation to ensure the safety of our family, friends, neighbors, and colleagues.
Target Zero is a call to action. It shakes the roots of our belief that “accidents happen” and that the loss of life and health are acceptable outcomes of driving. As partners in the pursuit of Target Zero, we strive for a culture of safe driving in Washington. We reject prevailing cultural norms around driving behaviors such as speeding, distraction, and impaired driving in favor of absolute intolerance for these behaviors. Such sweeping changes in normative driving behavior are critical to reaching the vision of zero traffic deaths and serious injuries by 2030.
We invite Washingtonians to challenge the prevailing belief that fatality and serious injury crashes are inevitable prices to pay for mobility. Together we can improve safe driving beliefs and behaviors until we reduce the risk of death and serious injury to zero — because every life counts.
Taking action to change traffic safety cultureStarting in 2016, WTSC will fund a project to establish a better understanding of our current traffic safety culture. Partners will analyze this data to determine which values and beliefs are the most influential on Washington drivers’ behavior. The data will provide direction in the development of a systematic and coordinated approach to traffic safety marketing across sub-cultures within our state. The study will also give partners a baseline to test against, to see if newly developed messages and their delivery are improving our state’s traffic safety culture as intended. The next version of Target Zero will include updates on this work.

At one time, the primary safety features of the roadway consisted of guardrails, rumble strips, and lane striping. Today, technological advancements are providing new roadway vehicle safety mechanisms once thought impossible.
Many vehicle crash avoidance systems are already in newer carsTechnology already exists in newer vehicles that will alert drivers, or actually perform automatically to ensure safe operations. Examples include:
| Frontal crash avoidance systems (FCAS) that warn drivers when they are too close to an object in front of the car. The system will even automatically apply the brakes to avoid a crash, if the driver does not do so first.
| Adaptive headlights that shift the headlights in the direction the driver steers.
| Lane departure alert systems that sound an alarm or flash to alert the driver that he is leaving the lane of travel without a signal.
| Lane change/merge warning systems that warn the driver if there is car in her blind spot when attempting to change lanes or merge. In some systems, the car will resist the driver’s attempt to change lanes in the presence of a conflict.
| Backup camera and conflict warning systems provide the driver with a wide angle camera view looking behind the vehicle when backing. They also warn of any obstructions or conflicts they can identify.
Connected vehicles will use communications to prevent crashesConnected vehicles are those with the ability to communicate wirelessly with other connected vehicles and roadway equipment in order to reduce crashes or other dangers. These Intelligent Transportation Systems (ITS), commonly known as vehicle-to-vehicle (V2V) and vehicle-to-infrastructure (V2I) communications, are based on mobile data technologies. This technology is just beginning to make its way into the marketplace, including in light, heavy, and transit vehicles.
Connected vehicle technology is designed to alert drivers — based on signals received from other vehicles and roadside infrastructure — when there is a risk of crashing. Warnings could be for potential danger, such as:
| Changing lanes. | Approaching an intersection. | Approaching a stationary or parked vehicle. | Another driver loses control. | Traffic patterns are changing.
There are other uses as well. Devices may send warning messages to a driver and other nearby vehicles when detecting pedestrians or bicyclists. Drivers might even be able to avoid head-on crashes if vehicles approaching from opposite directions were communicating with each other, and their drivers warned.
Newer-model cars are not the only place that these technologies may be found. The concept may also be applied to aftermarket devices for older vehicles. Drivers might bring mobile devices with these capabilities into their vehicles.
34 Overview: The Future of Vehicle Technology
New Technology and Traffic Safety

These mobile devices may also be carried by vulnerable users like pedestrians, motorcyclists, bicyclists, and transit users, making them more visible to surrounding traffic.
Autonomous vehicles will likely be on our roads soonAutonomous connected vehicles — also known as automated or self-driving vehicles — use advanced control systems to sense and react to their environment through various technology systems. The vehicles can operate with little or no driver input. The anticipated benefits of these vehicles include decreased crashes, increased mobility, and an increase in fuel efficiency.
Car manufacturers currently envision that autonomous connected vehicles will be equipped with an override switch, which would allow a human driver, sitting in the driver’s seat, to take control when needed. Vehicles with significant autonomous operations capability will likely be available for use by the general public by 2020 with significant new capabilities being added each model year between now and then.
Cars will soon be able to prevent alcohol-impaired people from driving The Driver Alcohol Detection System for Safety (DADSS) program was launched to research, develop, and demonstrate non-invasive in-vehicle alcohol detection technologies. These technologies can quickly and accurately measure a driver’s blood alcohol concentration (BAC), by testing for alcohol in a potential driver’s breath or touch. These advanced technologies offer the potential for a system that will prevent a vehicle from being driven when the driver’s BAC exceeds the US legal limit of 0.08.
Road-side drug testing is also on the horizonIn the not-too-distant future, law enforcement could have handheld devices to check for drug use in drivers. Currently, in Washington, this work must be done by a certified Drug-Recognition Expert (DRE). These devices would allow officers to test for drug positivity on the side of the road, much in the same manner that an officer can currently use a portable breath-testing device to detect alcohol and get a preliminary BAC reading. The handheld devices may use saliva, breath, or perspiration to test for the presence of cocaine, heroin, cannabis, amphetamines, methamphetamine, and possibly other impairing drugs.
Over the horizon… What these advancements may mean related to new safety strategies and approaches will take shape nationally over the next several years. The enduring question for the traffic safety community, regardless of the innovation, will be how or if it should be applied to enhance the safety of the traveling public. Washington State agencies are tracking progress in this area, engaging in national dialogue, and considering opportunities to demonstrate and apply new safety solutions as they develop.
35Washington State Strategic Highway Safety Plan 2016: Target Zero

36 Overview: High Risk Rural Roads
The Fixing America’s Surface Transportation Act (FAST Act), signed into federal law in 2015, requires each state to include its definition for High Risk Rural Roads (HRRR) in the Strategic Highway Safety Plan. This continues a Special Rule from MAP-21, per the US Congress, for improvements in safety for HRRR.
Eligible roadways for the HRRR Special Rule include smaller rural roads, which consist of the following functional classifications:
| Rural Major Collector | Rural Minor Collector | Rural Local Access
The Washington State Strategic Highway Safety Plan defines High Risk Rural Roads at the county level. Counties are defined as HRRR counties if their smaller rural roads (listed above) rank in the top 10 counties statewide, based on either of the following:
| Fatal and serious injury crash rate per mile of road | Fatal and serious injury crash rate per million vehicle miles
traveled (VMT) Based on federal criteria, the HRRR Special Rule applies to a state if “the fatality rate on [all] rural roads in a state increases over the most recent two-year period for which data are available." FHWA calculates this rate using fatalities and VMT for all eligible roadways in the state.
Each year, this rate is calculated by dividing the number of fatalities by the number of million vehicle miles traveled. Analysts compare five-year averages, separated by a two-year period, in order to determine if a state qualifies for the HRRR Special Rule. If this number increases by at least one-tenth in that comparison, the state is required to implement the special rule in order to increase resources for rural roads.
For any years that Washington State is obligated to implement the HRRR Special Rule, the state is required to put up funding to match 200% of the federal monies that our state received (based on the amount received in 2009). For Washington State, that funding level would be $3,144,572. Washington did not have to implement the HRRR Special Rule during 2012–2014, but it will for 2016. In that year, the HRRR funds will be spent on projects affecting eligible roadways within our state’s HRRR counties.
High Risk Rural Roads in Washington State

High
Risk
Beh
avio
r
Driver behavior is a factor in a majority of fatal and serious injury collisions. It is clear that affecting driver decisions is a key part of improving traffic safety, whether it is by changing behaviors through education and enforcement, or minimizing their effects through engineering.
Some behaviors have been known for decades as being dangerous, such as speeding or driving under the influence of alcohol or while positive for drugs. Others are relatively newly recognized, such as distracted driving and drowsy driving. This chapter will evaluate which behaviors are likely to result in serious and fatal collisions, and how to address those behaviors and their effects to get to Target Zero.
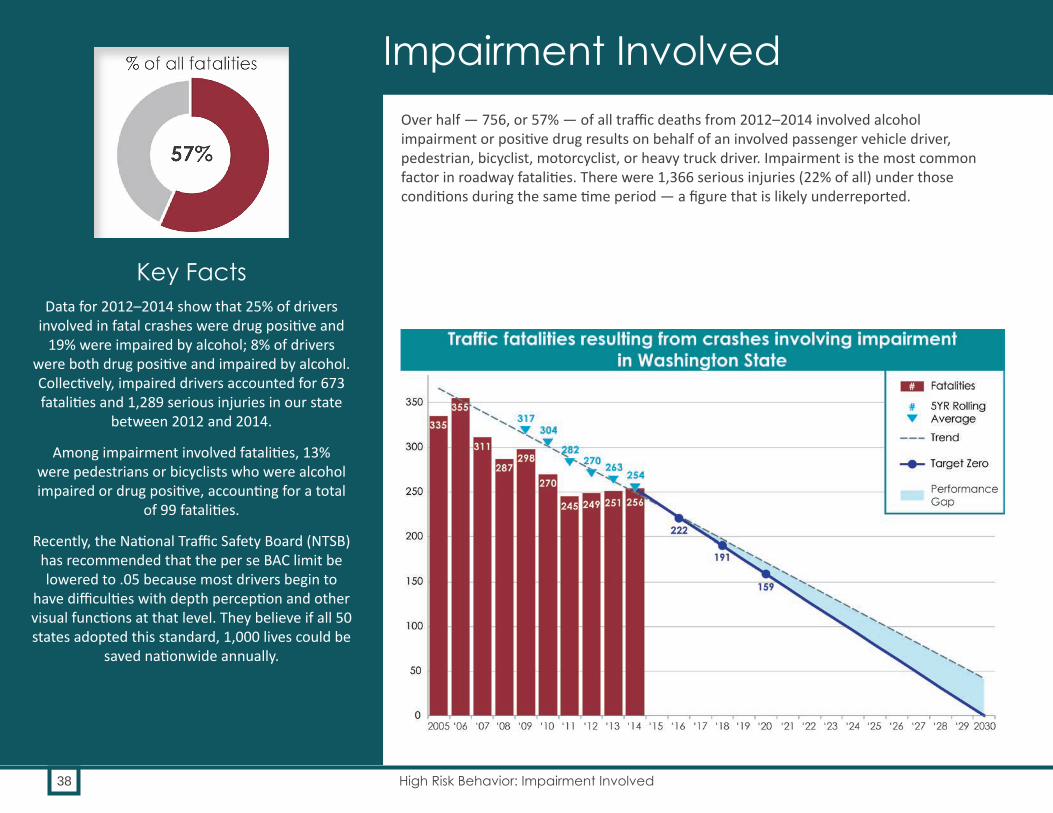
38 High Risk Behavior: Impairment Involved
Over half — 756, or 57% — of all traffic deaths from 2012–2014 involved alcohol impairment or positive drug results on behalf of an involved passenger vehicle driver, pedestrian, bicyclist, motorcyclist, or heavy truck driver. Impairment is the most common factor in roadway fatalities. There were 1,366 serious injuries (22% of all) under those conditions during the same time period — a figure that is likely underreported.
Key FactsData for 2012–2014 show that 25% of drivers
involved in fatal crashes were drug positive and 19% were impaired by alcohol; 8% of drivers
were both drug positive and impaired by alcohol. Collectively, impaired drivers accounted for 673 fatalities and 1,289 serious injuries in our state
between 2012 and 2014.
Among impairment involved fatalities, 13% were pedestrians or bicyclists who were alcohol impaired or drug positive, accounting for a total
of 99 fatalities.
Recently, the National Traffic Safety Board (NTSB)has recommended that the per se BAC limit be lowered to .05 because most drivers begin to
have difficulties with depth perception and other visual functions at that level. They believe if all 50 states adopted this standard, 1,000 lives could be
saved nationwide annually.
Impairment Involved

39Washington State Strategic Highway Safety Plan 2016: Target Zero
OverviewWashington has been combating impairment in motor vehicles crashes for decades and has made significant progress. Despite this, impairment continues to be the main factor in fatal crashes in Washington. From 2012–2014, there were 756 fatalities involving impairment (57%), and 1,366 serious injuries involving impairment (22%). Fatalities involving impairment decreased seven percent, compared with 2009–2011. During this same time period, serious injuries involving impairment decreased by 15%. What’s New
Target Zero has expanded the definition of impairment from just impaired drivers: it now contains
impairment on behalf of all people involved in a crash, including pedestrians and bicyclists. Partners widened this definition to draw attention to impairment among non-drivers, and to help create policies and strategies
to help prevent those crashes.
Washington State voters approved Initiative 502, which legalized the growing, sale, and use of recreational
marijuana. There are currently over 200 retail stores for recreational marijuana in the state.
Partners created The Impaired Driving Work Group to consider recommendations for smarter and tougher
impaired driving laws for the Washington State Legislature. The Work Group was convened to discuss technical corrections to the DUI statute, in preparation
for the 2016 and 2017 legislative sessions.
The state created a 24/7 sobriety monitoring program to provide an alternative to incarceration for impaired
drivers. The program ensures that participants are monitored and tested for drug and alcohol use so they remain sober and are following court-directed activity.
continued on next page
Priority 1
Priority 2
Priority 3
Note: Alcohol impairment and drug-positivity is significantly underreport-ed as a factor in serious injury crashes in Washington State.

Target Zero impairment data now includes pedestrians and bicyclists
In this edition of Target Zero, we have expanded the definition of impairment to include impaired bicyclists and pedestrians. Among impairment-involved fatalities from 2012–2014, 13% (99) were impaired pedestrian or bicyclist fatalities.
Impairment among pedestrians and bicyclists is not a criminal offense. Further, the consequences of walking or bicycling while impaired should not be death or serious injury. The pedestrian and bicyclist chapters explore ways to address safety concerns for all pedestrians and bicyclists, including those who are impaired.
High Risk Behavior
40 High Risk Behavior: Impairment Involved
Data for 2012–2014 show that:
| 25% of drivers in fatal crashes were drug positive. | 19% were impaired by alcohol. | 8% of drivers were both impaired by alcohol and positive for drugs.
Drug positive driver-involved fatalities first became more frequent than alcohol impaired driver-involved fatalities in 2010. Among the impairment-involved fatalities in 2012–2014, 657 deaths were due to an impaired driver, while the remaining 99 deaths involved impaired pedestrians or bicyclists.
System-wide approach leads to decline in impaired drivingWashington’s system-wide approach to addressing impaired driving has led to:
| Comprehensive ignition interlock laws. | Better law enforcement and prosecutor training. | More DUI courts. | Innovative, targeted, full-time DUI enforcement.
Much of the decline over the past decades can be attributed to aggressive campaigns to change the public perception of the acceptability and consequences of drinking and driving. These have been coupled with tougher laws, from the 1968 voter-passed implied consent law to the 1999 law lowering the blood alcohol concentration (BAC) per se limit to .08. The state has imposed ignition interlock requirements on all DUI offenders, and applied tougher sanctions for repeat and high BAC offenders. This includes the 2007 felony DUI law that applies to those offenders with four prior DUI convictions within ten years. Strict penalties are also imposed for drivers under age 21 who drink and drive as part of the Zero Tolerance statute.
Despite these intensive efforts, impaired driving remains a challenging issue for both Washington State and for the nation.
Washington law has a .08 BAC level. This is the level at which drivers in Washington are guilty per se (no further proof needed) of the crime of DUI. However, this threshold might not be low enough.
What’s New, continuedLaw enforcement officers are now required
to arrest any person who is driving under the influence and has at least one prior impaired
driving offense in the previous ten years. Judges are then required to establish pre-trial release conditions that include one of the following:
• The installation of an ignition interlock device.
• Participation in the 24/7 sobriety monitoring program.
• The filing of a sworn statement with the court that they will not operate a motor vehicle without an ignition interlock device.

WTSC marijuana study shows the number of THC-positive drivers involved in fatal crashes increasedIn response to legalized marijuana in Washington State, the WTSC partnered with the WSP Toxicology Lab to review detailed toxicology results on drivers involved in fatal crashes. Although the FARS database collects information on drug results from toxicology testing, the existing code set does not distinguish between delta-9 THC (the psychoactive substance shown to cause driver impairment) and the inactive metabolite of marijuana that may be detected in the body for up to 30 days.
This detailed marijuana information was combined with the existing detailed FARS information to create a one-of-a-kind data set that is currently being used to analyze and monitor the impact of legalized marijuana in Washington State. Among the findings:
| The number of THC-positive drivers involved in fatal crashes increased. The frequency of drivers in fatal crashes that tested positive for THC, alone or in combination with alcohol or other drugs, was highest in 2014 (75 drivers) compared to the previous four-year average (36 drivers annually).
| The number of drivers in fatal crashes who were impaired by alcohol only (not drug-positive as well) decreased. The frequency of drivers with alcohol ≥ BAC .08 and no other drugs was lowest in 2014 (51 drivers) compared to the previous four-year average (98 drivers).
| The largest proportion of THC- or carboxy-THC-positive drivers in fatal crashes were young drivers. Among drivers in fatal crashes who tested positive for only THC or only carboxy-THC, the largest proportion are ages 16–25. This age group also had the highest proportion of drivers with alcohol ≥ BAC .08. Of drivers that tested positive for the combination of THC and alcohol ≥ BAC .08, 39.8% were ages 16–25.
| The most frequently reported driver error among drivers in fatal crashes with only THC was lane deviation (13%), followed by overcorrecting (8.9% ).
More than half of drivers with only alcohol ≥ BAC .08 involved in fatal crashes were speeding. Over 60% of drivers with alcohol ≥ BAC .08 as well as THC impairment were speeding.
High
Risk
Be
havi
or
41Washington State Strategic Highway Safety Plan 2016: Target Zero
A rigorous analysis by Peck et al (2009) found that drivers ages 21 and above with a BAC of .07 are 39% more likely to be involved in a traffic crash than drivers with a BAC of 0. Furthermore, drivers under the age of 21 (who are not legally allowed to drink at all) with a BAC of .07 are 400% more likely to crash than young drivers with a BAC of 0.
Recently, NTSB recommended the per se BAC limit be lowered to .05 because most drivers begin to have difficulties with depth perception and other visual functions at that level. All 50 states currently have a .08 per se limit; NTSB believes if all states adopted the .05 standard, it would save 1,000 lives nationwide annually.
The impacts of Initiative 1183 (privatized sales of hard liquor in Washington as of June, 2012) and Initiative 502 (legalized the sale and distribution of marijuana in Washington as of 2013) continue to bring new challenges. The number of stores with hard liquor licenses increased from 328 in 2010 to more than 1,400 in 2015. Marijuana is easily accessible with over 200 retail stores statewide and more licenses are being sold monthly. The state established a per se limit of 5 nanograms of active THC per milliliter of blood as the standard for impairment by marijuana. Currently, a blood draw is required to prove impairment by marijuana. Researchers are working on a breath or saliva test. Partners need to formulate new strategies and policies to address these changes.
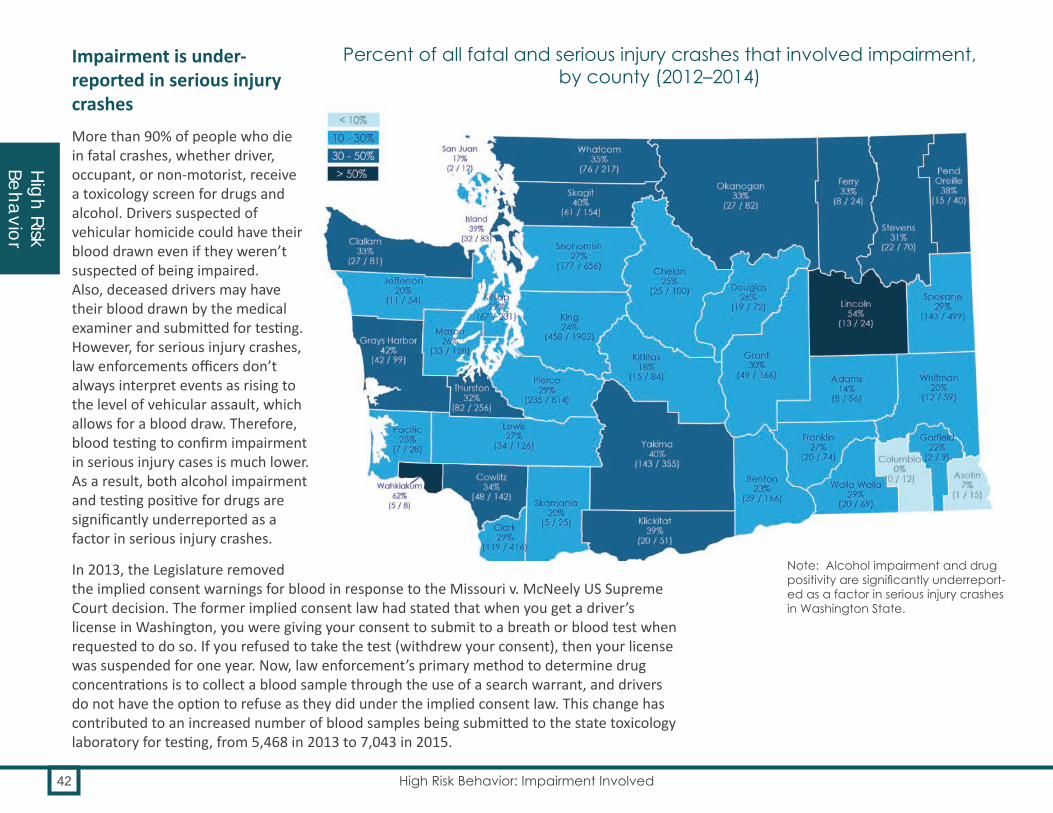
High Risk Behavior
42 High Risk Behavior: Impairment Involved
Impairment is under-reported in serious injury crashesMore than 90% of people who die in fatal crashes, whether driver, occupant, or non-motorist, receive a toxicology screen for drugs and alcohol. Drivers suspected of vehicular homicide could have their blood drawn even if they weren’t suspected of being impaired. Also, deceased drivers may have their blood drawn by the medical examiner and submitted for testing. However, for serious injury crashes, law enforcements officers don’t always interpret events as rising to the level of vehicular assault, which allows for a blood draw. Therefore, blood testing to confirm impairment in serious injury cases is much lower. As a result, both alcohol impairment and testing positive for drugs are significantly underreported as a factor in serious injury crashes.
In 2013, the Legislature removed the implied consent warnings for blood in response to the Missouri v. McNeely US Supreme Court decision. The former implied consent law had stated that when you get a driver’s license in Washington, you were giving your consent to submit to a breath or blood test when requested to do so. If you refused to take the test (withdrew your consent), then your license was suspended for one year. Now, law enforcement’s primary method to determine drug concentrations is to collect a blood sample through the use of a search warrant, and drivers do not have the option to refuse as they did under the implied consent law. This change has contributed to an increased number of blood samples being submitted to the state toxicology laboratory for testing, from 5,468 in 2013 to 7,043 in 2015.
Percent of all fatal and serious injury crashes that involved impairment, by county (2012–2014)
Note: Alcohol impairment and drug positivity are significantly underreport-ed as a factor in serious injury crashes in Washington State.

High
Risk
Be
havi
or
43Washington State Strategic Highway Safety Plan 2016: Target Zero
Impaired drivingWashington State has focused on impaired driving for many years, and as a result there is a great deal of data on impairment. Target Zero partners have explored the data through many different lenses in order to better analyze the impairment problem. Here is a short list of impairment terms and their definitions as used in Target Zero:
Impaired driver involved (drugs, alcohol, or both)Fatalities: Any driver with a Blood Alcohol Concentration (BAC) of .08 or higher and/or a positive drug result, as confirmed by the state Toxicology Laboratory.
Serious injuries: Any driver or non-motorist in which the investigating officer or drug recognition expert (DRE) indicated that the person was impaired by drugs or alcohol and reported in contributing circumstances as “Under the Influence of Alcohol,” “Under the Influence of Drugs,” or “Had Taken Medication” or sobriety reported as “HBD – Ability Impaired” or “HBD – Ability Impaired (tox test).”
Impaired pedestrian/bicyclist involved (drugs, alcohol, or both)Fatalities: Any pedestrian or bicyclist with a BAC of .08 or higher and/or a positive drug result, as confirmed by the state Toxicology Laboratory.
Serious injuries: No data.
Drug impaired driver involved Fatalities: Any driver with a positive drug result, as confirmed by the state Toxicology Laboratory.
Serious injuries: NOT APPLICABLE. Due to no confirmation by toxicology, drug impairment involved serious injuries are not reported.
Alcohol impaired driver involvedFatalities: Any driver with a BAC of .08 or higher, as confirmed by the state Toxicology Laboratory.
Serious injuries: Any driver or non-motorist in which the investigating officer or DRE indicated that the person was impaired by alcohol and reported in contributing circumstances.
Drinking driver involvedFatalities: Any driver with a BAC of any value except 0, as confirmed by the state Toxicology Laboratory. This also includes alcohol impaired drivers (those with BAC at or above .08).
Serious injuries: Any driver who the investigating officer or DRE indicated had been drinking any alcohol, or with a BAC of any value except 0, as confirmed by the state Toxicology Laboratory. These are not mutually exclusive, and also include alcohol impaired drivers those with BAC at or above .08).
Driving under the influence (DUI) (legal definition) In Washington State, a person is guilty of driving while under the influence of intoxicating liquor, marijuana, or any drug if the person drives a vehicle within this state and:
| Has, within two hours after driving, an alcohol concentration of .08 or higher as shown by analysis of the person’s breath or blood made under RCW 46.61.506; or
| Has, within two hours after driving, a THC concentration of 5.00 or higher as shown by analysis of the person’s blood made under RCW 46.61.506; or
| Is under the influence of or affected by intoxicating liquor, marijuana, or any drug; or
| Is under the combined influence of or affected by intoxicating liquor, marijuana, and any drug.
Per se alcohol limitNo further proof is needed. When a person is found to have, within two hours after driving, an alcohol concentration of .08 or higher or a THC concentration of 5.00 nanograms per milliliter of blood or higher, that person is guilty “per se” of driving under the influence.
Impairment definitions

High Risk Behavior
44 High Risk Behavior: Impairment Involved
Related fatalities & serious injuries: overlap with other Target Zero factorsIMPAIRMENT INVOLVED
What percentage of IMPAIRMENT INVOLVED
crashes involved another factor?
FATALITIES SERIOUS INJURIES
Note: Alcohol impairment and drug positivity are significantly underreported as a factor in serious injury crashes in Washington State.
For example, 32% of IMPAIRMENT INVOLVED
fatal crashes also involved a young
driver.

Washington State laws relating to impaired driving
RCW 46.61.502 Driving under the influence
RCW 46.61.503 Driver under 21 years of age consuming alcohol or marijuana
RCW 46.61.504 Physical control of vehicle under the influence
RCW 46.25.110 Operating a commercial motor vehicle while having alcohol or THC in system
RCW 46.61.5055 Alcohol violators — Additional fee — Distribution
High
Risk
Be
havi
or
45Washington State Strategic Highway Safety Plan 2016: Target Zero
Contributing circumstances and factors
2012–2014: Impaired drivers | More than half (60%) of alcohol-impaired and/or drug-
positive drivers in fatal crashes, and 64% of those in serious injury crashes, were ages 16–39.
| Eighty-two percent of alcohol-impaired and/or drug-positive drivers in fatal crashes, and 78% in serious crashes, were male.
| More than half (52%) of impairment-involved fatalities occurred in rural areas. The other 48% occurred in urban areas.
| Six counties in Washington accounted for over 60% of impairment involved fatalities: King (20%), Pierce (11%), Snohomish (10%), Yakima (seven percent), Spokane (seven percent), and Clark (seven percent).
| Nearly half (52%) of fatalities occurred at nighttime (7 p.m. – 4:59 a.m.)
| Nearly half (48%) of fatalities occurred on Friday–Sunday. | The most impairment-involved fatalities occurred in May
(13%) and the fewest in January (7%). | Sixty-three percent (63%) of those killed died in single-
vehicle crashes. | Half of pedestrians and bicyclists impaired by alcohol or
positive for drugs were between the ages of 21 and 49. | Nearly three out of four impaired pedestrians and bicyclists
involved in a fatal crash were male.
Programs and successes
Integrated systems approach brings in many partners to address impaired driving Impaired driving is a societal issue that pushes us beyond traditional traffic safety partnerships. Washington Traffic Safety Commission (WTSC) chairs the Washington Impaired Driving Advisory Council (WIDAC). WIDAC consists of representatives from highway safety office, law enforcement, health, injury prevention, treatment/rehabilitation, ignition interlock programs, prosecution, judiciary, toxicology, data and traffic records, training, private business, advocacy, community task forces, probation, corrections, Tribal Nations, and the Washington State Liquor and Cannabis Board (LCB). WIDAC seeks to reduce impaired driving statewide through coordinated planning, training, programs, and evaluation.

High Risk Behavior
46 High Risk Behavior: Impairment Involved
These subject matter experts provide input about:
| Adjudication | Administrative sanctions | Driver licensing programs | Alcohol and other drug misuse | The criminal justice system (law and policies, DUI
enforcement, DUI training, and prosecutor training) | Impaired driving program management | Prevention | Program evaluation and data | Other topics as they emerge
With the passage of Initiative 1183, which privatized sales of hard liquor in Washington, and Initiative 502, which legalized the growing, distribution, and sale of marijuana in Washington, WIDAC has expanded its work to include studies of the impacts of these law changes, and to ensure that there are minimal effects on public safety.
The Target Zero Team (TZT) expandedBeginning in late 2009, the Target Zero Teams placed full-time Washington State Patrol (WSP) DUI squads in King, Pierce, and Snohomish Counties. Based on the success in these counties, the project expanded to Yakima and Spokane Counties in 2013. Local law enforcement officers joined the WSP teams on weekends and other common DUI times. These multi-jurisdictional squads focused their efforts on locations with the highest concentrations of DUI crashes. During the first 24 months of this project (July 1, 2010 – June 30, 2012) in King, Pierce, and Snohomish Counties:
| TZT members contacted more than 34,000 motorists and arrested 6,693 DUI offenders.
| TZT arrests for DUI and tickets for speeding and seatbelt violations have resulted in over $14 million in fines and fees.
Based on the Federal Highway Administration’s fatality cost estimate, which includes societal costs, this project showed a 115:1 return on investment for the project funds.
High visibility enforcement (HVE) programs for DUIWTSC funds quarterly statewide DUI patrols called “Drive Sober or Get Pulled Over.” Over 150 law enforcement state, local, and Tribal agencies participate in these campaigns. Partners fund media campaigns to inform the public of the increased enforcement. Information campaigns in advance, paired with high visibility enforcement (HVE) patrols, and follow-up reporting of the results, have proven an effective combination, as documented in Countermeasures that Work.
Impairment involved crash, fatality, and serious injury data for 2012–2014
From 2012–2014 in Washington State, there were:
| 756 people killed in impairment-related crashes | 1,366 people seriously injured in impairment-
related crashes | 1,045 impairment involved crashes with
ONLY serious injuries* | 562 impairment involved crashes with
ONLY fatalities* | 132 impairment involved crashes with
BOTH fatalities and serious injuries*
* These crashes may or may not also include minor injuries

High
Risk
Be
havi
or
47Washington State Strategic Highway Safety Plan 2016: Target Zero
Law Enforcement training in alcohol and drug detectionThe Drug Evaluation and Classification Program (DEC), established in February 1996, trains law enforcement officers to become Drug Recognition Experts (DREs). Officers complete a rigorous training course and certification process. This enables them to recognize the signs and symptoms of impairment related to seven different categories of drugs, using a 12-step standardized and systematic process. The WSP provides DRE training to both WSP troopers and local law enforcement officers. Since the program’s inception, the number of trained DREs in Washington has risen from 16 to over 196 in 2015, representing 66 law enforcement agencies.
Reducing excessive drinking About 50% of people arrested for DUI were drinking at a licensed establishment; further, data show that 70–89% of bars will serve alcohol to intoxicated persons, in violation of the law. The Liquor and Cannabis Board’s Enforcement and Education Division identifies establishments with the greatest number of reported DUIs and focuses resources on these establishments through a program called Locations of Strategic Interest.
Reducing underage drinkingParental influence is an important factor in helping keep children from drinking and drug use. WTSC partners with the Liquor and Cannabis Board and MADD to educate parents with the “Power of Parents” curriculum. This curriculum, developed by MADD and Pennsylvania State University, provides parents with guidance for talking with teens about the dangers of drinking before age 21, and is based on research proven to reduce underage drinking by up to 30%.

High Risk Behavior
48 High Risk Behavior: Impairment Involved
Strategies for reducing impaired driving (IMP) fatalities and serious injuriesObjective Strategies Implementation areas
IMP.1. Prevent excessive drinking, underage drinking, and impaired driving
IMP.1.1 Increase the state excise tax on beer. (R, NCHRP) Leadership/PolicyIMP.1.2 Continue mandatory alcohol server training and explore expanding responsible beverage
service policies for alcohol retailers. (U)Education, Leadership/Policy
IMP.1.3 Continue and expand use of brief intervention and screening. (P, CTW) Education, EMSIMP.1.4 Conduct well-publicized compliance checks of alcohol retailers to reduce sales to
underage persons. (R, CTW)Enforcement
IMP.1.5 Conduct well-publicized enforcement aimed at underage drinking parties. (R, CTW) Enforcement, EducationIMP.1.6 Support alternative transportation services such as transit (especially at night), designated
driver programs, and other alternative ride programs to help eliminate need for impaired individuals to drive. (U)
Leadership/Policy
IMP.2. Enforce and publicize DUI laws
IMP.2.1 Continue statewide high visibility enforcement (HVE) and media campaigns to reduce impaired driving. (P, CTW)
Enforcement, Education
IMP.2.2 Enforce and publicize zero tolerance laws for drivers under age 21. (R, CTW) Education, EnforcementIMP.2.3 Enhance law enforcement DUI training with Standard Field Sobriety Test (SFST) training
and refresher training. (P, NHTSA)Education
IMP.2.4 Enhance law enforcement DUI training with Advance Roadside Impaired Driving Enforcement (ARIDE) training. (P, NHTSA)
Education
IMP.2.5 Expand the Drug Recognition and Classification Program. (R, CTW) EducationIMP.2.6 Support efforts to simplify and streamline the DUI arrest process including developing
an electronic DUI arrest package, utilizing the mobile impaired driving unit for high visibility campaigns. (R, NHTSA)
Enforcement, Traffic Records
IMP.2.7 Expand full-time DUI squads that target areas with high numbers of DUI-related crashes. (R, DDACTS)
Enforcement
IMP.2.8 Encourage parents to talk with their children about the risks of alcohol and other drugs. (R, DBHR)
Education
IMP.2.9 Discourage expansion of access to alcohol, marijuana, and other drugs. (U) Leadership/PolicyP: Proven R: Recommended U: Unknown

High
Risk
Be
havi
or
49Washington State Strategic Highway Safety Plan 2016: Target Zero
Strategies for reducing impaired driving (IMP) fatalities and serious injuriesObjective Strategies Implementation areas
IMP.3. Prosecute, sanction, and treat DUI offenders
IMP.3.1 Expand use of ignition interlocks. (P, CTW) Leadership/PolicyIMP.3.2 Suspend driver license administratively upon arrest. (P, CTW) Leadership/PolicyIMP.3.3 Support the Traffic Safety Resource Prosecutor Program. (R, NHTSA) EducationIMP.3.4 Conduct alcohol/drug assessments on all DUI offenders and enhance treatment and
probation when warranted. (P, CTW)Leadership/Policy
IMP.3.5 Match treatment and rehabilitation to the diagnosis. (P, NIH) Leadership/PolicyIMP.3.6 Require stronger penalties for BAC test refusal than test failure. (R, CTW) Leadership/PolicyIMP.3.7 Encourage attendance at DUI Victim's Panels. (U) Leadership/PolicyIMP.3.8 Place limits on plea agreements. (R, CTW) Leadership/PolicyIMP.3.9 Establish 24/7 sobriety program. (R, CTW) Leadership/PolicyIMP.3.10 Provide prosecution of DUIs as part of the Target Zero Teams. (U) Education
IMP.4. Control high-BAC and repeat DUI offenders
IMP.4.1 Monitor DUI offenders closely. (P, CTW) Leadership/PolicyIMP.4.2 Require ignition interlock as a condition for license reinstatement. (P, NCHRP) Leadership/PolicyIMP.4.3 Incarcerate offenders who fail to comply with court-ordered alternative sanctions (P,
NCHRP)Leadership/Policy
IMP.4.4 Support and establish DUI Courts. (P, CTW) Leadership/PolicyIMP.5. Foster
leadership to facilitate impaired driving system improvements
IMP.5.1 Continue to build partnerships designed to reduce impaired driving. (P, NCHRP) Leadership/PolicyIMP.5.2 Encourage laws that will allow the state to utilize sobriety checkpoints. (P, CTW) Leadership/PolicyIMP.5.3 Implement the corridor safety model in high-crash locations where data suggests a high
rate of impaired driving. (P, NCHRP)Leadership/Policy
IMP.5.4 Encourage laws that use any money collected from DUI fines in excess of $101 to support impaired driving reduction efforts. (R, GHSA)
Leadership/Policy
IMP.5.5 Lower the per se BAC limit from .08 to .05 (P, META) Leadership/PolicyIMP.5.6 Establish and support the Judicial Outreach Liaison program. (R, NHTSA) Leadership/PolicyIMP.5.7 Monitor ignition interlock manufacturers and installers to ensure a continued viability and
validity of program. (P, CTW)Leadership/Policy
IMP.5.8 Monitor reports from ignition interlock manufacturers on alcohol failures on ignition interlocks and conduct compliance checks. (P, CTW)
Leadership/Policy
IMP.5.9 Investigate ignition interlock circumvention attempts. (P, CTW) Leadership/PolicyP: Proven R: Recommended U: Unknown

50 High Risk Behavior: Speeding Involved
From the tires and the steering wheel to the seatbelt and the airbag, cars are designed to move quickly while keeping occupants safe. However, drivers often travel above safe speeds, whether that is the posted speed limit, or the speed that is safe for current conditions. From 2012–2014, 508 people died and 1,622 people were seriously injured in speeding crashes in Washington State.
Ongoing education of the public about the dangers of speeding, high visibility patrols to enforce speed limits, and enhanced road and vehicle engineering have proven to be effective countermeasures.Key Facts
Since most traffic crash data is recorded by law enforcement officers, Target Zero partners
emphasize the importance of accurate and consistent crash investigations as well as active
and impactful enforcement.
High visibility enforcement (HVE) campaigns have been effective in changing driver
behavior. Patrols are most effective when conducted in areas identified as having a high number of speed-related crashes while being
supported with relevant, impactful media. WTSC, along with state and local agencies,
participates in collaborative HVEs throughout the year.
Speeding Involved

51Washington State Strategic Highway Safety Plan 2016: Target Zero
Overview Speeding involves drivers traveling either above the posted speed limit or too fast for conditions. Both types of speeding are represented in this data. In Washington, speeding is the third-most common factor contributing to fatal and serious injury crashes, after impairment and lane departure. Our laws require drivers to comply with a posted speed limit and to adjust their rate of speed based on the conditions.
Compared with 2009–2011, speeding-involved fatalities have declined 5% and serious injuries have decreased 24% in 2012–2014. Between 2012 and 2014, 508 (38%) fatal crashes involved excessive speed; for serious injury crashes, 1,622 (27%) involved speeding.
What’s NewCompared with 2009–2011, speeding-involved fatalities have declined 5% and serious injuries
have decreased 24%.
The WTSC has recently funded four community-level pilot projects aimed at
identifying high risk areas and implementing interventions that hold promise for reducing
speed-involved fatal and serious injury crashes. The selected sites for these projects include
Thurston County, Kitsap County, Auburn, and Wenatchee.
Priority 1
Priority 2
Priority 3

52 High Risk Behavior: Speeding Involved
The decline in fatal and serious injury crashes may be attributed to several factors including:
| Improved roadway design | Vehicle technology | Driver education | Targeted enforcement | High fuel prices
However, these factors can and do change, creating an environment requiring constant observation, analysis, and adaptation if we are to continue this downward trend.
Probably the most recognized strategy when it comes to speed reduction is enforcement. After that, roadway engineering, licensing, driver training, vehicle technology, culture, and many other factors play a role in reducing our speed-related crashes. In addition, it is important to gather the right type of data and interpret that data carefully. Since most crash data starts with officers, we must emphasize the importance of accurate and consistent crash investigation as well as active and impactful enforcement. Lastly, we must engage our communities in the problem-solving processes.
An IIHS study found that every five mph increase in the maximum posted speed limit resulted in a 4% increase in fatalities.
High Risk Behavior
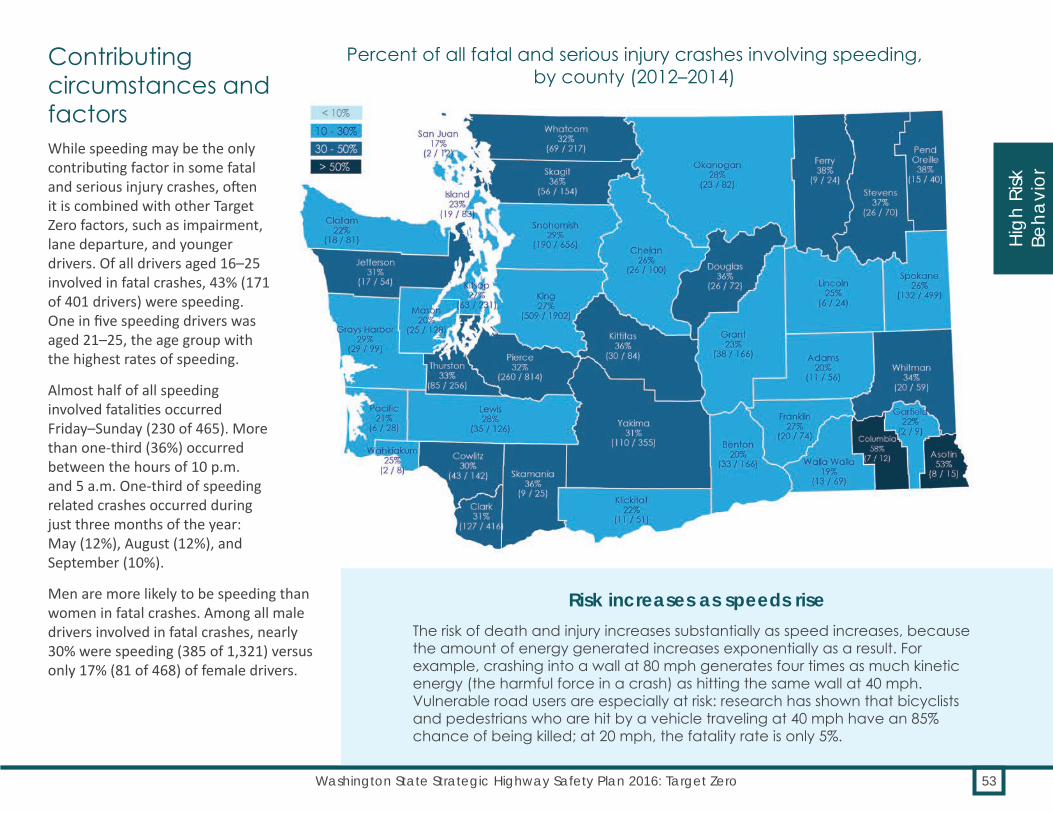
53Washington State Strategic Highway Safety Plan 2016: Target Zero
Percent of all fatal and serious injury crashes involving speeding, by county (2012–2014)
Contributing circumstances and factorsWhile speeding may be the only contributing factor in some fatal and serious injury crashes, often it is combined with other Target Zero factors, such as impairment, lane departure, and younger drivers. Of all drivers aged 16–25 involved in fatal crashes, 43% (171 of 401 drivers) were speeding. One in five speeding drivers was aged 21–25, the age group with the highest rates of speeding.
Almost half of all speeding involved fatalities occurred Friday–Sunday (230 of 465). More than one-third (36%) occurred between the hours of 10 p.m. and 5 a.m. One-third of speeding related crashes occurred during just three months of the year: May (12%), August (12%), and September (10%).
Men are more likely to be speeding than women in fatal crashes. Among all male drivers involved in fatal crashes, nearly 30% were speeding (385 of 1,321) versus only 17% (81 of 468) of female drivers.
Risk increases as speeds riseThe risk of death and injury increases substantially as speed increases, because the amount of energy generated increases exponentially as a result. For example, crashing into a wall at 80 mph generates four times as much kinetic energy (the harmful force in a crash) as hitting the same wall at 40 mph. Vulnerable road users are especially at risk: research has shown that bicyclists and pedestrians who are hit by a vehicle traveling at 40 mph have an 85% chance of being killed; at 20 mph, the fatality rate is only 5%.
High
Risk
Be
havi
or

54 High Risk Behavior: Speeding Involved
High Risk Behavior
Related fatalities & serious injuries: overlap with other Target Zero factorsSPEEDING
What percentage of crashes involving SPEEDING involved
another factor?
FATALITIES SERIOUS INJURIES
For example, 42% of fatal crashes
involving SPEEDING also involved a young driver.
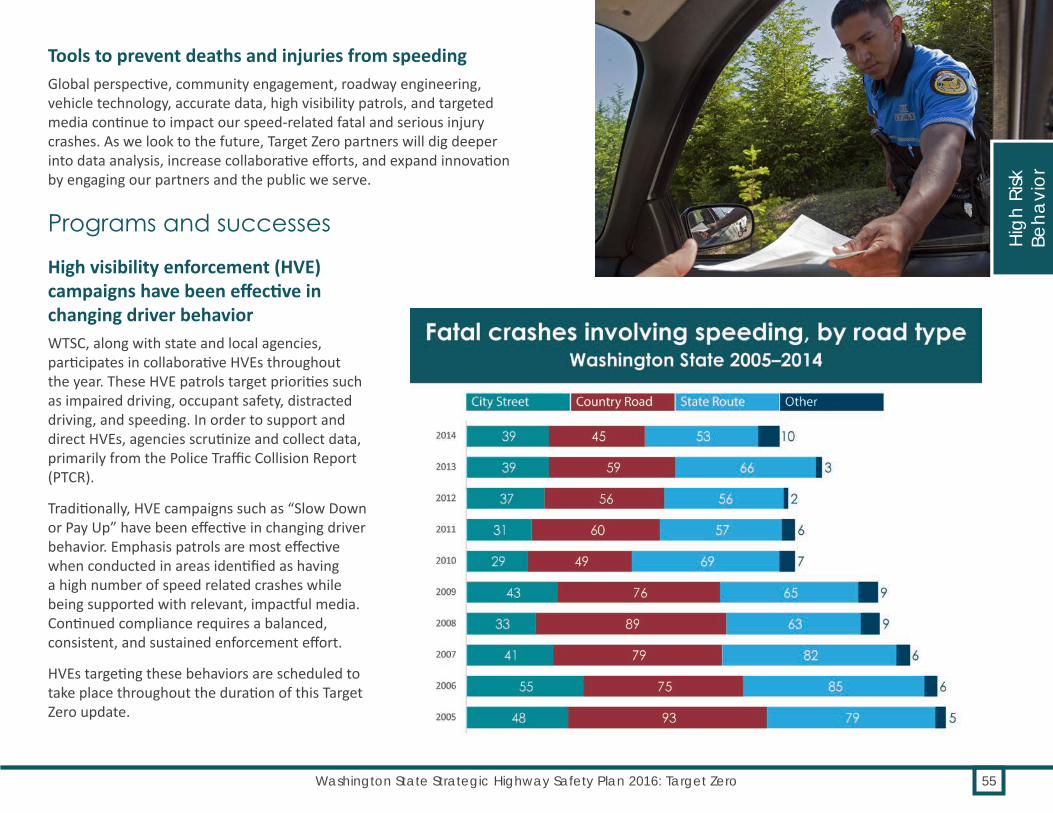
55Washington State Strategic Highway Safety Plan 2016: Target Zero
Tools to prevent deaths and injuries from speedingGlobal perspective, community engagement, roadway engineering, vehicle technology, accurate data, high visibility patrols, and targeted media continue to impact our speed-related fatal and serious injury crashes. As we look to the future, Target Zero partners will dig deeper into data analysis, increase collaborative efforts, and expand innovation by engaging our partners and the public we serve.
Programs and successes
High visibility enforcement (HVE) campaigns have been effective in changing driver behaviorWTSC, along with state and local agencies, participates in collaborative HVEs throughout the year. These HVE patrols target priorities such as impaired driving, occupant safety, distracted driving, and speeding. In order to support and direct HVEs, agencies scrutinize and collect data, primarily from the Police Traffic Collision Report (PTCR).
Traditionally, HVE campaigns such as “Slow Down or Pay Up” have been effective in changing driver behavior. Emphasis patrols are most effective when conducted in areas identified as having a high number of speed related crashes while being supported with relevant, impactful media. Continued compliance requires a balanced, consistent, and sustained enforcement effort.
HVEs targeting these behaviors are scheduled to take place throughout the duration of this Target Zero update.
High
Risk
Be
havi
or

56 High Risk Behavior: Speeding Involved
Speed feedback signs track driver behavior WTSC has recently funded four community-level pilot projects aimed at identifying high risk areas and implementing interventions that hold promise for reducing speed-related fatal and serious injury crashes. The selected sites for these projects are: Thurston County, Kitsap County, Auburn, and Wenatchee. All projects include local steering committees that oversee the main components of these speed intervention projects. Each project has the following components:
| Public outreach in the form of both paid and earned media.
| Enforcement of speeding limits in high risk areas. | Use of technology to identify high risk areas and to
reduce vehicle speeds when enforcement is not present.The technology used for these projects includes mobile speed feedback signs and variable message signs. When active, these signs have been shown to reduce speeds as drivers approach the signs. In addition to displaying the speeds of oncoming vehicles, these signs capture vehicle speed data and generate summary reports for users. This allows local agencies to easily measure the need for speed intervention on a particular roadway and implement a very targeted intervention if needed.
These projects show a promising strategy for targeting speeding, but are unlikely to be expanded statewide due to the high cost of the signs and paid media outreach. Despite the cost, however, this approach is a possible intervention in targeted areas throughout the state that experience high levels of speeding-related crashes.
Washington State laws relating to speedingRCW 46.61.400 Basic rule and maximum limits.
RCW 46.61.410 Increases by Secretary of Transportation. Maximum speed limit for trucks.
RCW 46.61.440 Maximum speed limit when passing school or playground crosswalks.
RCW 46.61.465 Exceeding speed limit — reckless driving.
RCW 46.61.470 Speed traps defined, certain types permitted. Measured courses, speed measuring devices, timing from aircraft.
RCW 46.61.275 Reporting of certain speed zone violations — Subsequent law enforcement investigation.
Clear data collection from law enforcement officers is criticalLaw enforcement officers are not only enforcers of the traffic laws, they are also the originators of most of the Target Zero data on fatality and serious injury crashes. Officers at the state, local, and Tribal levels collect, interpret, and document reportable crash data on Police Traffic Collision Reports (PTCRs). Target Zero partners use this data to focus efforts on speeding hot spots, intended to reduce speeding, save lives, and prevent injuries.
Due to the critical nature of this data, Target Zero partners must emphasize the importance of accurate and consistent crash investigations. Investigating agencies have a responsibility to ensure officers are accurately and definitively determining and documenting the cause of each crash. Causes such as “wheels off roadway,” “speed too fast for conditions,” and “following too closely” must be carefully investigated and accurately assigned. Inaccuracy in assigning the cause of a crash reduces the effectiveness of our response — and could keep us from preventing more deaths and serious injuries.
High Risk Behavior
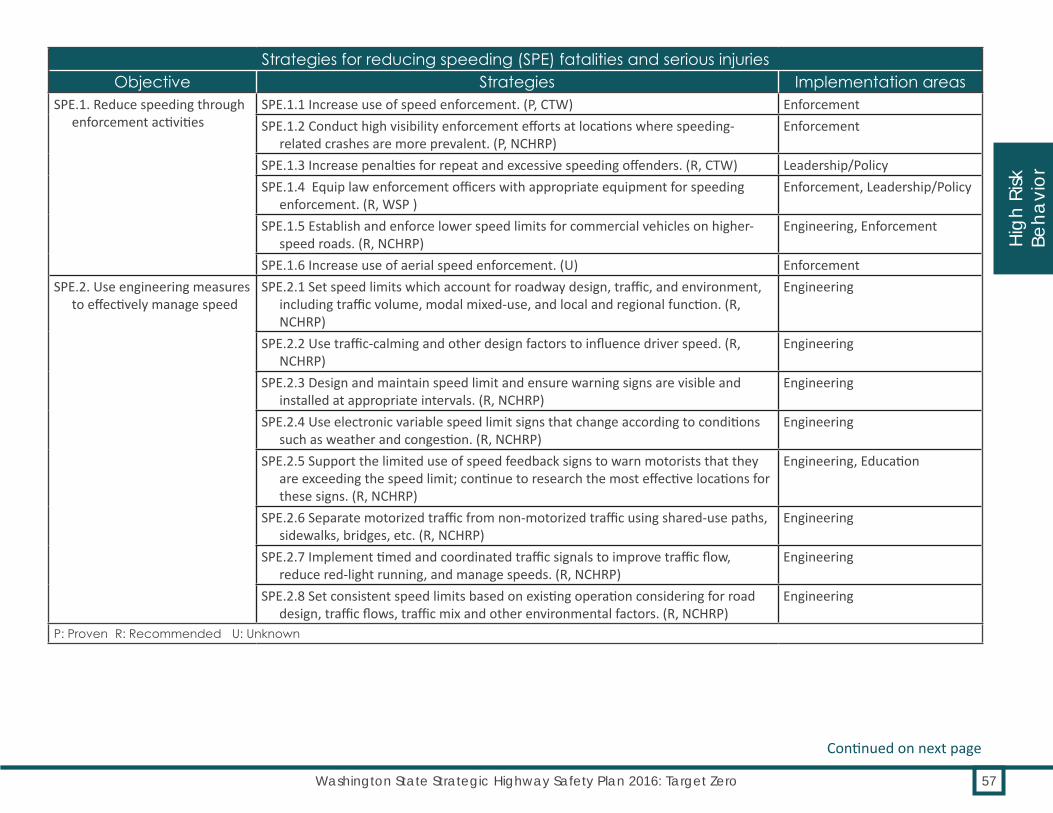
57Washington State Strategic Highway Safety Plan 2016: Target Zero
Strategies for reducing speeding (SPE) fatalities and serious injuriesObjective Strategies Implementation areas
SPE.1. Reduce speeding through enforcement activities
SPE.1.1 Increase use of speed enforcement. (P, CTW) EnforcementSPE.1.2 Conduct high visibility enforcement efforts at locations where speeding-
related crashes are more prevalent. (P, NCHRP)Enforcement
SPE.1.3 Increase penalties for repeat and excessive speeding offenders. (R, CTW) Leadership/PolicySPE.1.4 Equip law enforcement officers with appropriate equipment for speeding
enforcement. (R, WSP )Enforcement, Leadership/Policy
SPE.1.5 Establish and enforce lower speed limits for commercial vehicles on higher-speed roads. (R, NCHRP)
Engineering, Enforcement
SPE.1.6 Increase use of aerial speed enforcement. (U) EnforcementSPE.2. Use engineering measures
to effectively manage speedSPE.2.1 Set speed limits which account for roadway design, traffic, and environment,
including traffic volume, modal mixed-use, and local and regional function. (R, NCHRP)
Engineering
SPE.2.2 Use traffic-calming and other design factors to influence driver speed. (R, NCHRP)
Engineering
SPE.2.3 Design and maintain speed limit and ensure warning signs are visible and installed at appropriate intervals. (R, NCHRP)
Engineering
SPE.2.4 Use electronic variable speed limit signs that change according to conditions such as weather and congestion. (R, NCHRP)
Engineering
SPE.2.5 Support the limited use of speed feedback signs to warn motorists that they are exceeding the speed limit; continue to research the most effective locations for these signs. (R, NCHRP)
Engineering, Education
SPE.2.6 Separate motorized traffic from non-motorized traffic using shared-use paths, sidewalks, bridges, etc. (R, NCHRP)
Engineering
SPE.2.7 Implement timed and coordinated traffic signals to improve traffic flow, reduce red-light running, and manage speeds. (R, NCHRP)
Engineering
SPE.2.8 Set consistent speed limits based on existing operation considering for road design, traffic flows, traffic mix and other environmental factors. (R, NCHRP)
Engineering
P: Proven R: Recommended U: Unknown
Continued on next page
High
Risk
Be
havi
or

58 High Risk Behavior: Speeding Involved
Strategies for reducing speeding (SPE) fatalities and serious injuriesObjective Strategies Implementation areas
SPE.3. Build partnerships to increase support for speed- reducing measures
SPE.3.1 Use the corridor safety model in high-crash locations where data suggests a high rate of speeding-related fatal or serious injury crashes. (P, CTW)
Leadership/Policy, Education, Engineering, Enforcement
SPE.3.2 Educate the public about the dangers of excessive speed and speed too fast for conditions, and its role in traffic fatalities. (R, CTW)
Education
SPE.3.3 Increase data sharing between local officers, Tribal police, and engineering agencies to identify and develop solutions for areas where speeding is a problem. (R, DDACTS)
Leadership/Policy
SPE.3.4 Educate prosecutors and judges to ensure speeding violations are treated seriously and fairly. (R, NCHRP)
Education, Enforcement
SPE.3.5 Work with Washington Trucking Association and WSP’s Commercial Vehicle Enforcement Division to encourage company policies which, when backed with speed monitors or speed regulators, can reduce speeding in commercial vehicles. (R, WSP)
Leadership/Policy
SPE.3.6 Develop appropriate messages and methods to reach segments of the population inclined to speeding or driving too fast for conditions. (U)
Education
SPE.3.7 Develop education messages in multiple languages. (U) EducationSPE.3.8 Educate about the effects of weather on appropriate speed. (U) EducationSPE.3.9 Collaborate with BIA, Indian Health Services, and NATEO to support Tribal
Nations who seek to reduce speeding-related crashes on Tribal lands. (U)Leadership/Policy
SPE.3.10 Implement neighborhood speed watch/traffic management programs. (U) Education, EnforcementP: Proven R: Recommended U: Unknown
High Risk Behavior


60 High Risk Behavior: Distraction Involved
Crashes that involve distraction include drivers of all types of vehicles, as well as bicyclists and pedestrians. Distracted driving includes any non-driving activity that diverts a driver’s attention from the task of driving itself. This includes general inattentiveness/carelessness, phone use, eating, drinking, smoking, passengers, and attending to objects inside and outside of the vehicle. The same can be said for distracted pedestrians, motorcyclists, and bicyclists. Anything that takes the eyes and mind away from the roadway can be defined as distraction.
There has been a decrease of 13% in distraction involved fatalities and since 2009–2011. Even with this decrease, distraction is a factor in at least 30% of fatal crashes in Washington. We are not on target to reach zero deaths and serious injuries by 2030.
Key FactsDistracted driving data as a contributing factor in crashes is underreported because many drivers
do not self-report that they were distracted. This makes data analysis for distracted driving
less meaningful when compared to other, more reliably measurable behaviors, such as speeding
and impaired driving.
Because of this lack of robust data from the field, academic studies of distracted driving are being conducted at an impressive pace. Many recent
studies are helping us understand the real risk in relation to distracted driving, walking, and riding.
Phone use is a different kind of distraction than eating a hamburger or putting on make-up.
Using a phone, especially a smart phone, while driving is not only a visual and manual distraction,
but also a cognitive one as well. Many drivers mistakenly believe hands-free phones are safer
than handheld. However, hands-free phones and dashboard features do not eliminate mental
distraction from the task of driving.
Distraction Involved

61Washington State Strategic Highway Safety Plan 2016: Target Zero
OverviewFrom 2012–2014, 395 people died in crashes involving distraction on the part of the driver, non-motorist or both. Target Zero partners believe that these numbers are underreported, especially for smart phone use. While phone-involved distraction currently gets a lot of attention, it is rarely reported as a contributing factor in crashes when distractions are noted. For instance, in the 2012–2014 period, driver phone use was noted as a contributing factor in only 3% of all fatality and serious injury crashes.
What’s NewThe WTSC is working with a stakeholder group to strengthen the Washington State laws that
address phone and smart phone use while driving.
Washington now has a distracted driving video for law enforcement. It is hosted on WTSC’s
YouTube channel.
In 2014, Washington launched an annual high visibility enforcement campaign to reduce phone distraction. Over 100 law enforcement agencies participate every year in an effort to crack down
on drivers who use their phone on the road. Despite this effort, laws for distracted driving
remain difficult to enforce.
In 2013, researchers at Harborview Injury Prevention and Research Center observed that nearly one in 10 drivers was using a phone or
texting behind the wheel. Among those driving distracted, nearly half (47%) were texting. The WTSC will conduct a statewide survey of driver
phone use in summer 2016.
Priority 1
Priority 2
Priority 3
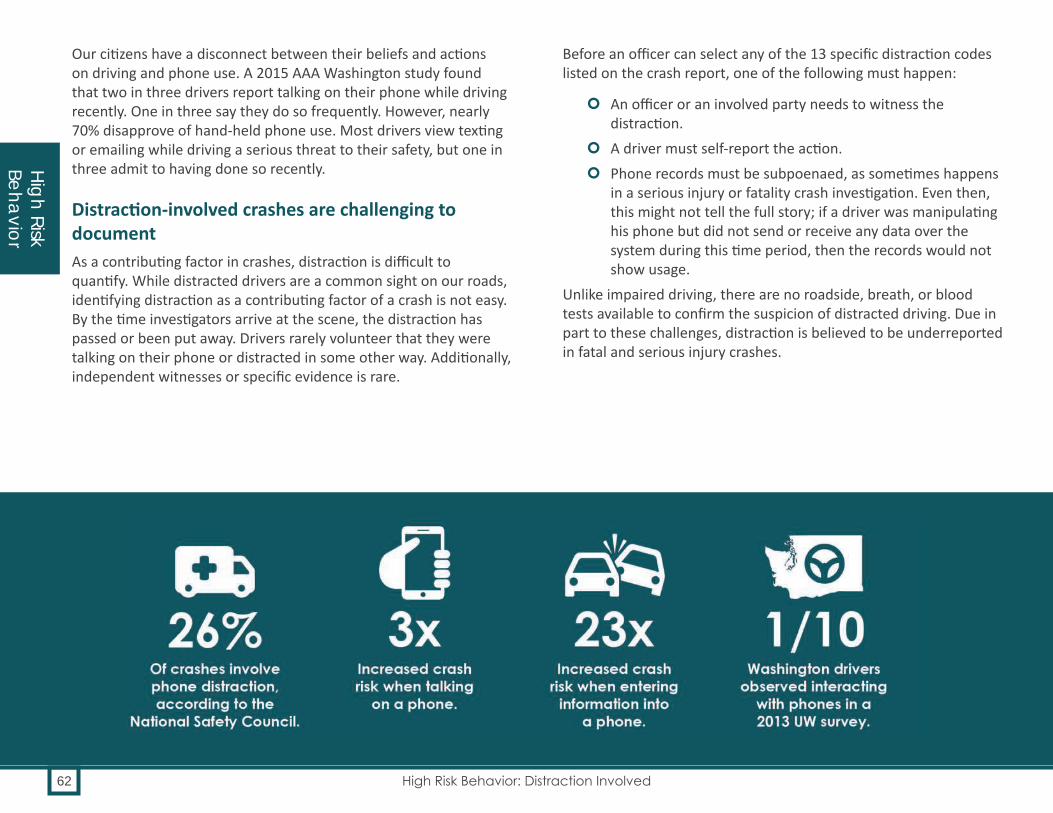
High Risk Behavior
62 High Risk Behavior: Distraction Involved
Our citizens have a disconnect between their beliefs and actions on driving and phone use. A 2015 AAA Washington study found that two in three drivers report talking on their phone while driving recently. One in three say they do so frequently. However, nearly 70% disapprove of hand-held phone use. Most drivers view texting or emailing while driving a serious threat to their safety, but one in three admit to having done so recently.
Distraction-involved crashes are challenging to documentAs a contributing factor in crashes, distraction is difficult to quantify. While distracted drivers are a common sight on our roads, identifying distraction as a contributing factor of a crash is not easy. By the time investigators arrive at the scene, the distraction has passed or been put away. Drivers rarely volunteer that they were talking on their phone or distracted in some other way. Additionally, independent witnesses or specific evidence is rare.
Before an officer can select any of the 13 specific distraction codes listed on the crash report, one of the following must happen:
| An officer or an involved party needs to witness the distraction.
| A driver must self-report the action. | Phone records must be subpoenaed, as sometimes happens
in a serious injury or fatality crash investigation. Even then, this might not tell the full story; if a driver was manipulating his phone but did not send or receive any data over the system during this time period, then the records would not show usage.
Unlike impaired driving, there are no roadside, breath, or blood tests available to confirm the suspicion of distracted driving. Due in part to these challenges, distraction is believed to be underreported in fatal and serious injury crashes.

High
Risk
Be
havi
or
63Washington State Strategic Highway Safety Plan 2016: Target Zero
Research on phone use makes clear links to dangerously distracted driving Because the distracted driving data for serious injury and fatal crashes is unreliable, much of what we can infer about distracted driving comes from observational studies, as well as studies of human distraction. These studies make a clear link between phone use and dangerous driving.
The first thing that we can tell from the studies is that distraction is in fact a common factor in crashes. The NHTSA National Motor Vehicle Crash Causation Survey collects on-scene information about the events leading up to crashes. In their most recent survey, the critical reason for the crash – the last event in the crash causal chain – was assigned to the driver in 94% of the crashes. Analysis of crashes investigated by these on-scene researchers concluded that recognition errors, which include driver inattention, internal and external distraction, and inadequate surveillance, accounted for 41% of crashes (Singh, 2015.)
The next thing the studies tell us is phones are nearly universal, and frequently used by drivers. The Pew Research Center reports that 61% of Americans own a smart phone, and 91% of the adult population total owns some sort of mobile phone.
Meanwhile, in 2013, researchers at Harborview Injury Prevention and Research Center (University of Washington Medicine) performed an observational study that found that nearly one in ten Washington State drivers is using a phone or texting behind the wheel. Among those driving while distracted by a phone, nearly half (47%) were texting. Another recent national study by the AAA Foundation for Traffic Safety analyzed video recordings of 1,691 crashes involving young drivers (aged 16–19). These recordings revealed that, in 58% of those crashes, the drivers were engaging in some type of potentially distracting behavior.
Although drivers have faced distractions since cars became a common form of transportation in the 1920s, the phone has been shown to be a distraction that significantly increases crash risk.
In their analysis of 206 empirical studies on distracted driving, Ferdinand and Menachemi (2014) found that phone use, which in this study collapsed all phone interactions into a single variable, was more highly predictive of poor driving performance than any other potential distraction. Similarly, a 2011 meta-analysis of phone use and crashes showed that dialing, talking, and listening on a phone increased a driver’s risk of crash by almost three times (Elvik, 2011).
The reason that phones, including smart phones, create a higher crash risk for drivers than other distractions is because of the ways in which they distract. Phones are not just a physical or visual distraction, like eating food or changing a radio station; they take our minds away from the task of driving by connecting us to complex social and informational interchanges.

High Risk Behavior
64 High Risk Behavior: Distraction Involved
Additionally, researchers are now pointing to the addictive nature of smart phones, and note that the urge to attend to every notification, call, and text is driven by a strong desire to stay socially connected. This finding exposes the complexity of attempts to curb drivers use of smart phones.
Recent AAA research has shown test subjects needed up to 27 seconds to fully restore their mental focus on driving after ending a call or texting from voice controlled systems in their cars. At 25 mph, a vehicle could travel up to 988 feet — the approximate length of three football fields — before the residual cognitive costs completely dissipated. These finding have implications for people who think it’s safe to dial or send a text message while stopped at a traffic signal: the mental distractions from these interactions are likely to persist after the light turns green.
Another AAA research study confirms that the distraction of phones goes beyond the physical: in-vehicle information systems (IVIS) use — none of which require drivers to take their hands off the wheel or eyes off the road — was associated with moderate to high levels of cognitive distraction.
The last series of studies links the use of phones, and their distracting consequences, to real-world outcomes on Washington State roads. In 2014, University of Washington researchers conducted a case-control study of licensed Washington drivers. They linked distracted driving citations to statewide police crash records to examine the association between distraction-related citations and crash risk. The study concluded drivers who were cited for texting, talking on a phone, or inattentive driving were much more likely to be involved in a police-reported crash than drivers who did not receive citations.
Percent of all fatal and serious injury crashes involving distraction, by county (2012–2014)
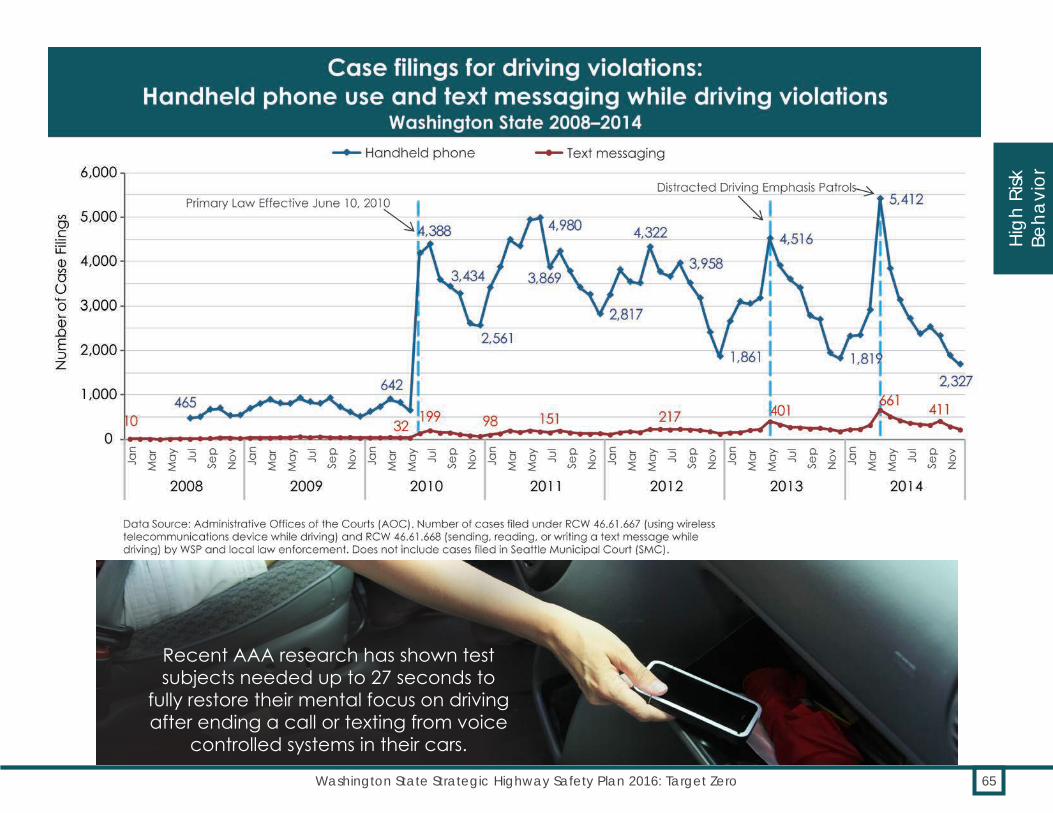
High
Risk
Be
havi
or
65Washington State Strategic Highway Safety Plan 2016: Target Zero
Recent AAA research has shown test subjects needed up to 27 seconds to
fully restore their mental focus on driving after ending a call or texting from voice
controlled systems in their cars.

High Risk Behavior
66 High Risk Behavior: Distraction Involved
Related fatalities & serious injuries: overlap with other Target Zero factorsDISTRACTION INVOLVED
What percentage of DISTRACTION INVOLVED
crashes involved another factor?
FATALITIES SERIOUS INJURIES
For example, 33% of DISTRACTION INVOLVED fatal
crashes also involved a young driver.

Distraction increases pedestrian vulnerability It is not just drivers who suffer the cognitive effects of cell phone distraction. A Harborview study from 2012 evaluated the impact of technological and social distraction on cautionary behaviors and crossing times in pedestrians. Nearly one third of all pedestrians performed a distracting activity while crossing. Distractions included listening to music (11%), text messaging (7.3%), and using a handheld phone (6.2%). The study concluded that distracting activity is common among pedestrians, even when crossing intersections. Technological and social distractions increase pedestrian crossing times. Pedestrians who were text messaging displayed the highest risk of all distracted walkers, with slower crossing times and failure to display cautionary crossing behaviors.
High
Risk
Be
havi
or
67Washington State Strategic Highway Safety Plan 2016: Target Zero
Additionally, the study showed that:
| One out of every three teens cited for distraction was later involved in a police-reported crash.
| The earliest driving period for young drivers is the most dangerous, distraction-wise. Drivers ages 16–17, for whom even hands-free phone use is banned, had the strongest link between distraction citations and crash risk.
| The association between texting citation and crash rate is higher for women.
Picking up where the 2013 UW study left off, in Summer 2016 the WTSC will conduct its first biannual statewide survey of driver phone use. This will establish a baseline number for the percentage of drivers using devices while driving.
With this research showing that phones create a major, dangerous distraction for drivers, Target Zero partners will continue to focus efforts to prevent phone use during driving, and will also encourage bicyclists and pedestrians to put down their phones.
Contributing circumstances and factorsOther high-risk behaviors are also often coupled with distraction involved crashes, as seen in the infographic. In addition, age and gender are also factors in distracted driving.
Younger and older driversDistraction also shows up notably for younger and older drivers. Sixteen to 17 year old, 18–20, and 70+ drivers are involved in the highest number of distraction-related fatal and serious injury crashes, as seen in the bar graph on the following page. Inexperience and immaturity combine to make young drivers especially at-risk in relation to distraction. Their risk is especially heightened under specific conditions, such as at night, after consuming alcohol or drugs, and with passengers in the car.
In general, male drivers across all age groups engage in high risk behaviors such as impairment and speeding more often than female drivers of comparable ages. However, female drivers in fatal crashes are slightly more likely to be distracted than their male counterparts.
From 2012–2014, male drivers outnumbered female drivers by roughly 3-to-1 in all fatal crashes statewide. However, a greater proportion of female drivers (21%) were identified by investigators as distracted than their male counterparts (19%).
Programs and successes
High visibility enforcement campaigns enforce Washington’s law prohibiting phone use while drivingIn 2014, Washington launched an annual high visibility enforcement (HVE) campaign to reduce phone distraction. Over 100 law enforcement agencies participate in this national effort to crack down on drivers who use their smart phones on the road.
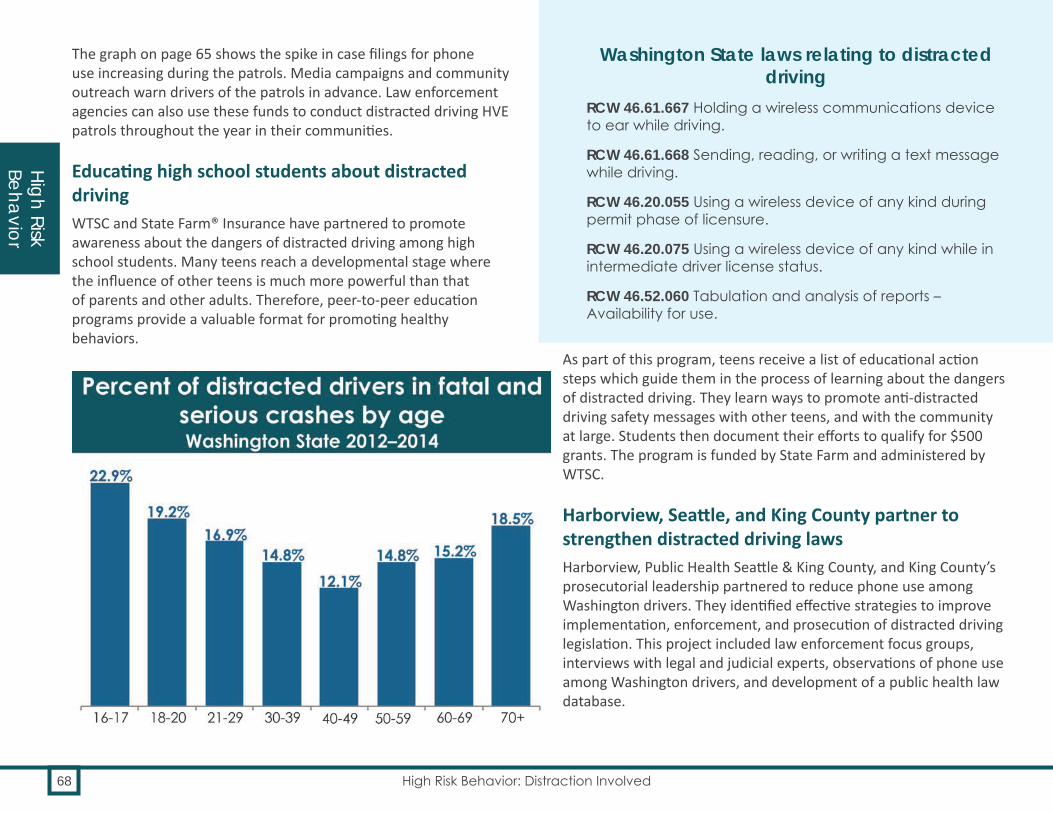
High Risk Behavior
68 High Risk Behavior: Distraction Involved
The graph on page 65 shows the spike in case filings for phone use increasing during the patrols. Media campaigns and community outreach warn drivers of the patrols in advance. Law enforcement agencies can also use these funds to conduct distracted driving HVE patrols throughout the year in their communities.
Educating high school students about distracted drivingWTSC and State Farm® Insurance have partnered to promote awareness about the dangers of distracted driving among high school students. Many teens reach a developmental stage where the influence of other teens is much more powerful than that of parents and other adults. Therefore, peer-to-peer education programs provide a valuable format for promoting healthy behaviors.
As part of this program, teens receive a list of educational action steps which guide them in the process of learning about the dangers of distracted driving. They learn ways to promote anti-distracted driving safety messages with other teens, and with the community at large. Students then document their efforts to qualify for $500 grants. The program is funded by State Farm and administered by WTSC.
Harborview, Seattle, and King County partner to strengthen distracted driving laws Harborview, Public Health Seattle & King County, and King County’s prosecutorial leadership partnered to reduce phone use among Washington drivers. They identified effective strategies to improve implementation, enforcement, and prosecution of distracted driving legislation. This project included law enforcement focus groups, interviews with legal and judicial experts, observations of phone use among Washington drivers, and development of a public health law database.
Washington State laws relating to distracted driving
RCW 46.61.667 Holding a wireless communications device to ear while driving.
RCW 46.61.668 Sending, reading, or writing a text message while driving.
RCW 46.20.055 Using a wireless device of any kind during permit phase of licensure.
RCW 46.20.075 Using a wireless device of any kind while in intermediate driver license status.
RCW 46.52.060 Tabulation and analysis of reports – Availability for use.
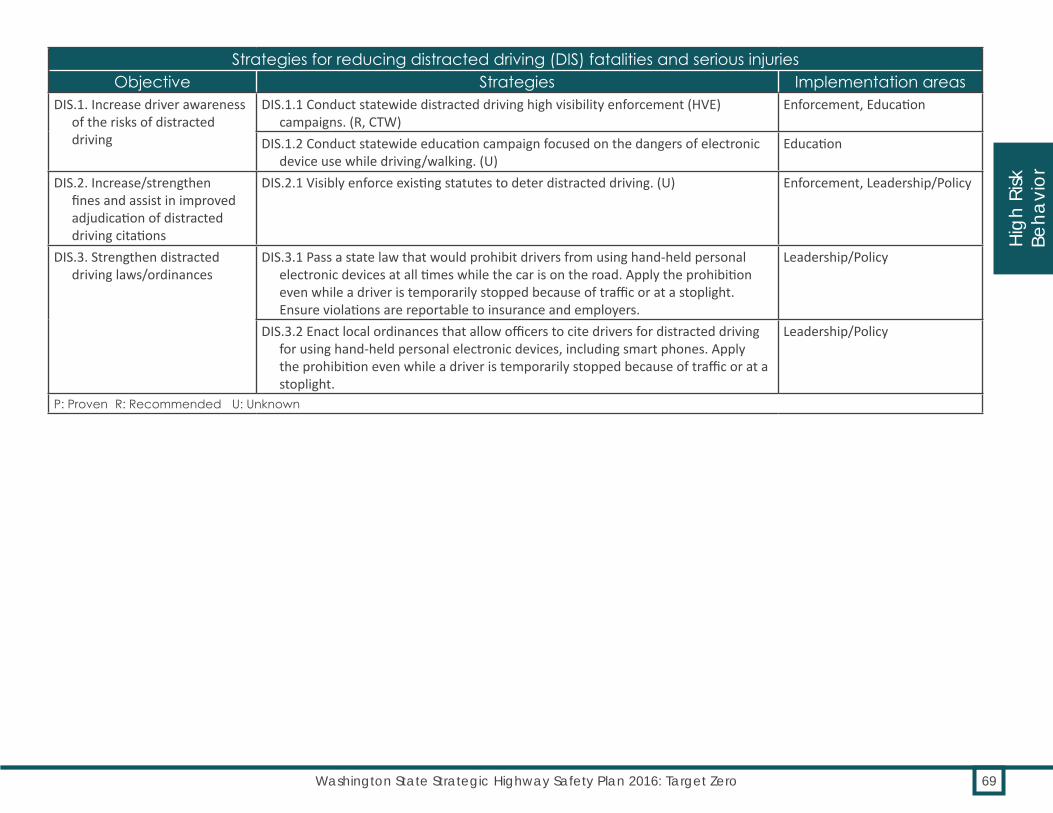
High
Risk
Be
havi
or
69Washington State Strategic Highway Safety Plan 2016: Target Zero
Strategies for reducing distracted driving (DIS) fatalities and serious injuriesObjective Strategies Implementation areas
DIS.1. Increase driver awareness of the risks of distracted driving
DIS.1.1 Conduct statewide distracted driving high visibility enforcement (HVE) campaigns. (R, CTW)
Enforcement, Education
DIS.1.2 Conduct statewide education campaign focused on the dangers of electronic device use while driving/walking. (U)
Education
DIS.2. Increase/strengthen fines and assist in improved adjudication of distracted driving citations
DIS.2.1 Visibly enforce existing statutes to deter distracted driving. (U) Enforcement, Leadership/Policy
DIS.3. Strengthen distracted driving laws/ordinances
DIS.3.1 Pass a state law that would prohibit drivers from using hand-held personal electronic devices at all times while the car is on the road. Apply the prohibition even while a driver is temporarily stopped because of traffic or at a stoplight. Ensure violations are reportable to insurance and employers.
Leadership/Policy
DIS.3.2 Enact local ordinances that allow officers to cite drivers for distracted driving for using hand-held personal electronic devices, including smart phones. Apply the prohibition even while a driver is temporarily stopped because of traffic or at a stoplight.
Leadership/Policy
P: Proven R: Recommended U: Unknown

70 High Risk Behavior: Unrestrained Vehicle Occupants
Seatbelts, car seats, and booster seats protect vehicle occupants. Since the 2013 version of Target Zero, unrestrained motor vehicle occupant fatalities decreased 15%. Although the downward trend of serious injuries has leveled out, Washington is still on track to reach zero deaths and zero serious injuries for unrestrained vehicle occupants, according to 2012–2014 data.
Key FactsFor the past 10 years, Washington consistently has had one of the highest seatbelt use rates in the country. In 2015, 94.6% of Washingtonians
buckled up.
In order to gauge statewide child restraint use, in 2014 WTSC conducted observational surveys
at elementary schools across the state. The surveys found:
• An estimated one in five children are illegally riding in the front seat
• Overall, the majority of children are restrained with a seatbelt (approximately 80%)
• Less than 1/3 are actually properly restrained — with a car or booster seat — in the back seat
For American Indians and Alaskan Natives (AIANs) in Washington State, the lack of
seatbelt use results in a fatality rate that is 7.3 times higher than for everyone else. Of the
AIANs who died in 2012–2014 traffic crashes, 43% were not buckled at the time of the crash.
Unrestrained Vehicle Occupants

71Washington State Strategic Highway Safety Plan 2016: Target Zero
OverviewWashington has consistently been a national leader on seatbelt use. Since the adoption of the Click It or Ticket program and the primary enforcement seatbelt law in 2002, Washington has had one of the highest rates of seatbelt use in the country. Strong support from the law enforcement community, aggressive efforts to publicize seatbelt patrols, and assistance from Target Zero managers (TZMs) in 17 regions provide the backbone of this success. The use of child restraint systems such as car seats and booster seats is supported by a statewide network of car seat technicians. Nevertheless, as the infographic shows, unrestrained occupants are very likely to engage in other high risk behaviors.
What’s NewWTSC published their Online Car Seat
Awareness Training for Law Enforcement. This one-hour curriculum is intended to improve
enforcement of the laws around seatbelts, car seats, and booster seats.
Washington State changed the methodology for its annual seatbelt use survey in 2013 due to new federal rules. This change prevents us from comparing the seatbelt use rate to other
states from 2012–2014, as methodologies were changing in every state.
Priority 1
Priority 2
Priority 3

72 High Risk Behavior: Unrestrained Vehicle Occupants
Washington adopted its first seatbelt law in 1986. At that time, the first survey in the state showed a 36% seatbelt use rate. Since the passage of the primary seatbelt enforcement law, Washington consistently has had one of the highest seatbelt use rates in the country. In 2015, 94.6 % of Washingtonians buckled up.
Those not using their seatbelts are disproportionately more likely to be driving while impaired, speeding, unlicensed, or distracted. Unrestrained occupants are also more likely to die in rural road crashes.
High Risk Behavior

73Washington State Strategic Highway Safety Plan 2016: Target Zero
43% of American Indians and Alaskan Natives who died in crashes were not buckled upTraffic fatality rates of American Indians and Alaskan Natives (AIANs) are higher than for the AIAN population in several counties, and the most disproportionate rate is for seatbelt use. The fatality rate for unrestrained vehicle occupants is 7.3 times higher for AIAN than for non-AIAN populations. Of the AIAN people who died in 2012–2014 traffic crashes, 43% were not buckled at the time they crashed.
Child safety seats reduce the risk of death Correctly used child safety seats reduce the risk of death in passenger vehicles by 71% for infants and by 54% for toddlers (Safe Kids WorldWide). Washington State crash data show that children who incur either minor injuries or none at all in crashes were appropriately restrained at least 86% of the time. Despite the effectiveness of properly used child restraints, and widespread adherence to Washington’s strong child restraint law, many children are still either not restrained or are incorrectly restrained. These children are at higher risk for injury or death.
Changes to the observational seatbelt surveyWashington’s observational seatbelt survey, which determines what our state’s seatbelt use rate is, has been repeated every year since 1986. All states were required to change to a more precise methodology, and Washington switched to the new methodology in 2013. The new methodology uses continually updated information on population, Vehicles Miles Traveled (VMT), and roadway function class.
With this change, seatbelt use rates that were determined under the new methodology cannot be compared to use rates determined under the old methodology. In Washington State, traffic safety data experts are confident the new methodology is solid because of the consistency in seatbelt use rates for the three years:
• 2013: 94.5%• 2014: 94.5%• 2015: 94.6%
High
Risk
Be
havi
or

74 High Risk Behavior: Unrestrained Vehicle Occupants
High Risk Behavior
Related fatalities & serious injuries: overlap with other Target Zero factorsUNRESTRAINED OCCUPANTS
What percentage of UNRESTRAINED crashes
involved another factor?
FATALITIES SERIOUS INJURIES
For example, 35% of fatal crashes
with UNRESTRAINED OCCUPANTS also involved a young
driver.

75Washington State Strategic Highway Safety Plan 2016: Target Zero
In Washington, between 2012 and 2014, 21 children age 12 and under died in traffic crashes while inside cars. Two of these children were not sitting in the back seat, the safest place for a child under age 12. Only nine of these 21 children were confirmed to have been seated in a child restraint, and seven were not restrained at all — not even a seatbelt. Over 80% (17 out of 21) of the fatalities were children two years and older.
From 2012–2014, an additional 116 children age 12 and under suffered serious injuries inside passenger vehicles. Nineteen of these children were illegally riding in the front seat. Only 34 of these children were seated in a child car seat or booster, and 19 were not restrained at all.
Washington conducted a observational survey at elementary schools across the state. This study found:
| An estimated one in five children were illegally riding in the front seat.
| 80% were restrained by seatbelt; however, less than one-third of those children were properly restrained.
| Continued educational outreach and enforcement is needed.
Percent of all fatal and serious injury crashes involving unrestrained occupants, by county (2012–2014)
Occupant protection definitionOccupant protection refers to safety features designed to protect occupants of motor vehicles in the event of a crash. While the manufactured component parts of motor vehicles are the responsibility of the federal government, states are tasked with encouraging the use of seatbelts by adults and the use of child restraint systems such as car seats and booster seats.
High
Risk
Be
havi
or

76 High Risk Behavior: Unrestrained Vehicle Occupants
Contributing circumstances and factorsThe correlation between being impaired by alcohol or positive for drugs and lack of seatbelt use is extremely high. Almost three-fourths of unrestrained deaths involved impairment, and over half of unrestrained serious injuries involved impairment. Impaired driving often leads to lane departure, and 79% of unrestrained deaths and 81% of unrestrained serious injuries involved lane departure.
In addition, younger drivers are particularly likely to be involved. Among all drivers who were unrestrained at the time of a fatality crash, more than one-third were ages 16–29. As with crashes involving other risky behaviors, the highest percent of unrestrained occupant crashes occur on weekends and on rural roads.
Programs and successes
Click It or Ticket program enforces seatbelt useThe Click it or Ticket (CIOT) program is a high visibility enforcement model. The effort begins with intensive publicity to inform people that law enforcement will be ticketing seatbelt law violators. Publicity includes both a media buy, as well as a push to get information about the patrols into the news. WSDOT also places messages about the patrols on their Variable Message Sign system across the state.
After this wave of publicity, statewide enforcement patrols will begin. These patrols are held at locations where the data indicate that the most people are riding without proper restraints. Time of day is also a factor: in Washington, about the same number of traffic deaths occur during the daytime hours as at night, even though traffic volumes at night are only 12–15% of what they are during the day. Because of this, the CIOT program encourages patrols to start after 4 pm.
When this program started in 2002, only 82% of Washingtonians buckled up. After the first round of CIOT patrols the rate jumped to 92%. In the years following, it rose to 95%, one of the highest in the nation, where it has remained. Consistent CIOT patrols through the years have been the cornerstone of Washington’s occupant protection program.
Safest Ride Campaign encourages parents to have their children ride in the back seat of the carThe 2014 statewide child restraint observational survey results showed approximately one in five child passengers under age 13 were illegally riding in the front seat. This places those children at greater risk of injury.
Washington’s Child Passenger Safety program (CPS) partnered with Safe Kids Washington to develop a media campaign about the importance of children riding buckled up in the back seat. The Safest Ride was developed during CPS week in September. Several SafeKids Coalitions and Target Zero Task Forces participated. The group designed three community awareness activities in addition to conducting pre- and post- observational surveys at targeted elementary schools. Safe Kids Washington provided mini-grants,
Keep Kids Under age 13:
• In the back seat
• Properly restrained
• Every time
IT’S THE LAW!
The Safest Ride
High Risk Behavior
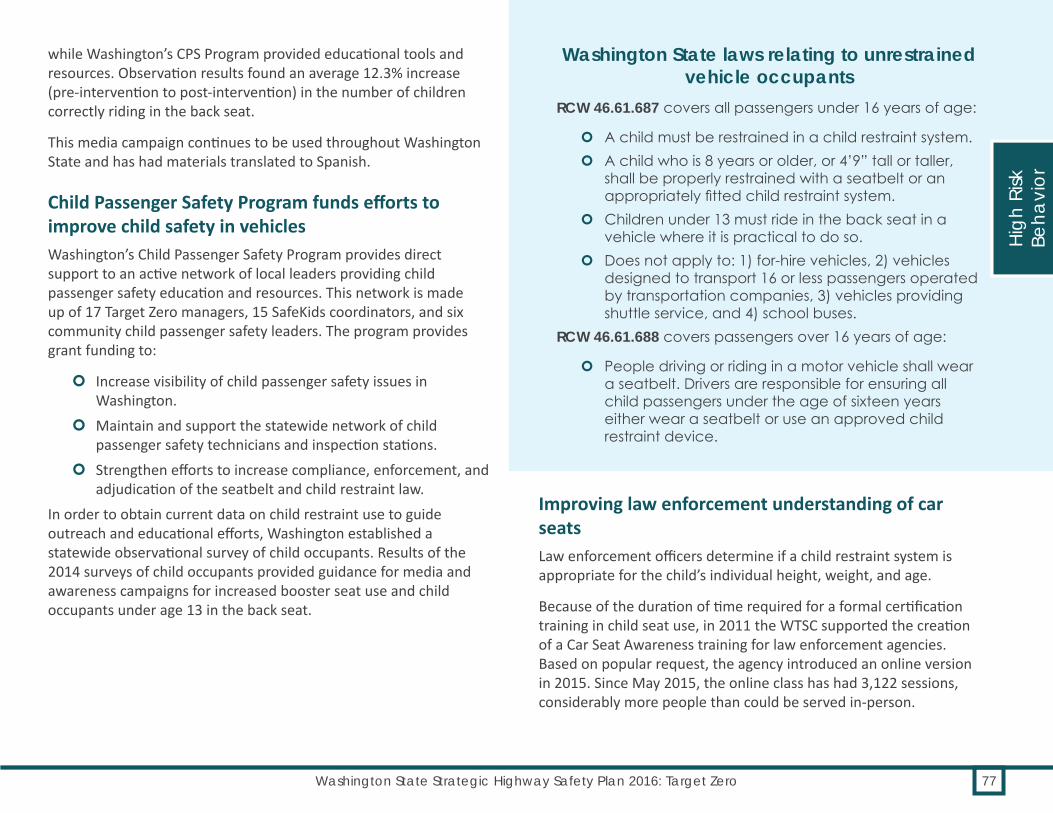
77Washington State Strategic Highway Safety Plan 2016: Target Zero
while Washington’s CPS Program provided educational tools and resources. Observation results found an average 12.3% increase (pre-intervention to post-intervention) in the number of children correctly riding in the back seat.
This media campaign continues to be used throughout Washington State and has had materials translated to Spanish.
Child Passenger Safety Program funds efforts to improve child safety in vehiclesWashington’s Child Passenger Safety Program provides direct support to an active network of local leaders providing child passenger safety education and resources. This network is made up of 17 Target Zero managers, 15 SafeKids coordinators, and six community child passenger safety leaders. The program provides grant funding to:
| Increase visibility of child passenger safety issues in Washington.
| Maintain and support the statewide network of child passenger safety technicians and inspection stations.
| Strengthen efforts to increase compliance, enforcement, and adjudication of the seatbelt and child restraint law.
In order to obtain current data on child restraint use to guide outreach and educational efforts, Washington established a statewide observational survey of child occupants. Results of the 2014 surveys of child occupants provided guidance for media and awareness campaigns for increased booster seat use and child occupants under age 13 in the back seat.
Improving law enforcement understanding of car seatsLaw enforcement officers determine if a child restraint system is appropriate for the child’s individual height, weight, and age.
Because of the duration of time required for a formal certification training in child seat use, in 2011 the WTSC supported the creation of a Car Seat Awareness training for law enforcement agencies. Based on popular request, the agency introduced an online version in 2015. Since May 2015, the online class has had 3,122 sessions, considerably more people than could be served in-person.
Washington State laws relating to unrestrained vehicle occupants
RCW 46.61.687 covers all passengers under 16 years of age:
| A child must be restrained in a child restraint system. | A child who is 8 years or older, or 4’9” tall or taller,
shall be properly restrained with a seatbelt or an appropriately fitted child restraint system.
| Children under 13 must ride in the back seat in a vehicle where it is practical to do so.
| Does not apply to: 1) for-hire vehicles, 2) vehicles designed to transport 16 or less passengers operated by transportation companies, 3) vehicles providing shuttle service, and 4) school buses.
RCW 46.61.688 covers passengers over 16 years of age:
| People driving or riding in a motor vehicle shall wear a seatbelt. Drivers are responsible for ensuring all child passengers under the age of sixteen years either wear a seatbelt or use an approved child restraint device.
High
Risk
Be
havi
or

78 High Risk Behavior: Unrestrained Vehicle Occupants
Strategies for reducing unrestrained vehicle occupant (UVO) fatalities and serious injuriesObjective Strategies Implementation areas
UVO.1. Strengthen efforts to increase compliance, enforcement, and adjudication of the seatbelt and child restraint laws
UVO.1.1 Identify population groups with lower than average restraint use rates and implement communications, outreach, and enforcement campaigns directed at groups/areas where restraint use is lowest, particularly rural areas. (P, CTW and P, NCHRP)
Education, Enforcement
UVO.1.2 Engage and collaborate with all levels of law enforcement to effectively carry out high-visibility communications, outreach, and enforcement of seatbelt use, such as the Click It or Ticket campaign. (P, CTW)
Education, Enforcement
UVO.1.3 Conduct nighttime patrols during the May Click it or Ticket statewide seatbelt mobilization. Combine short-term, high-visibility seatbelt use enforcement with nighttime enforcement programs. (R, CTW)
Enforcement
UVO.1.4 Implement Click It or Ticket-style child car seat short-term, high-visibility education and enforcement campaigns.(P, CTW)
Education, Enforcement
UVO.1.5 Encourage law enforcement and other emergency responders to adopt seatbelt use policies for their employees. (R, NHTSA)
Education, Leadership/Policy, EMS
UVO.1.6 Host car seat awareness and instruction classes, especially in diverse community locations with populations that have lower than average proper car seat use. Target child transport agencies, hospitals, child care centers, schools, etc. Partner with Target Zero Manager, SafeKids Coalition, or local Child Passenger Safety Team. (R, NCHRP)
Education
UVO.1.7 Engage in discussions with and educate prosecutors and judges about the importance of restraint programs, enforcement, and adjudication of these violations. (R, NHTSA)
Education, Enforcement
UVO.1.8 Collaborate with WA’s Criminal Justice Training Commission and the WA State Patrol Academy to conduct trainings for new law enforcement officers and seasoned officers on Washington’s child restraint law, increasing comfort level for spotting and citing violations. (R, NCHRP)
Education, Enforcement
UVO.1.9 Promote child car seat distribution programs. (U) EducationUVO.2. Promote legislative and
policy efforts to promote restraint use
UVO.2.1 Undertake policy change to require car seat awareness education for proper child restraint use by people who transport foster children and Medicaid participants. (R, ABACCL)
Leadership/Policy
UVO.2.2 Enact law to make it illegal to transport unrestrained humans in the back of pickup trucks. (R, IIHS)
Leadership/Policy
UVO.2.3 Encourage policy change to allow using photo enforcement to increase seatbelt compliance. (U)
Enforcement
P: Proven R: Recommended U: Unknown
High Risk Behavior

79Washington State Strategic Highway Safety Plan 2016: Target Zero
Strategies for reducing unrestrained vehicle occupant (UVO) fatalities and serious injuriesObjective Strategies Implementation areas
(continued from previous page)
UVO.2. Promote legislative and policy efforts to promote restraint use
UVO.2.4 Strengthen child passenger safety laws with a legislative change to add $25 administrative fee for violators to fund child passenger safety efforts, or allow local governments to initiate the change. (U)
Leadership/Policy
UVO.2.5 Strengthen child passenger safety laws with a legislative change to require toddlers to remain rear-facing until the age of two or until they reach the maximum height and weight for their seat. Also require children to remain in a booster seat until a height of 4’9” and remove the 8 year old reference. (R, NHTSA)
Leadership/Policy
UVO.3. Maintain and support the statewide network of child passenger safety technicians
UVO.3.1 Explore options for gaining a measure of statewide child restraint use, such as expanding the annual seatbelt observation survey to include observations of child restraint use. (R, DDACTS)
Leadership/Policy
UVO.3.2 Continuously monitor fatality and serious injury crash data involving unrestrained or improperly restrained child passengers to help direct geographic/demographic areas of focus. (R, DDACTS)
Education
UVO.3.3 Convene a group of CPS stakeholders from different disciplines and areas of the state, including existing network of Washington’s Target Zero managers, SafeKids Coalitions, and other local child passenger safety teams, to participate in product review, media efforts, trainings, and local project implementation. (U)
Leadership/Policy
UVO.3.4 Support opportunities for child car seat inspection events, CPS Technician certification courses, and recertification of technicians. Work collectively with Washington’s Target Zero managers, SafeKids Coalitions, and local child passenger safety teams. (R, NHTSA)
Education
UVO.3.5 Establish a database to collect all of Washington’s car seat inspection data. Analyze information received to determine major misuse issues; share with statewide CPS network; incorporate findings into media campaigns. (U)
Education
UVO.4. Increase visibility of child passenger safety issues in Washington
UVO.4.1 Provide access to appropriate information, materials, and guidelines for implementing media and programs to increase proper child restraint use. (U)
Education
UVO.4.2 Develop and implement media campaigns targeting major misuse issues in Washington State, which are currently booster age children and riding in the front seat. (U)
Education
UVO.4.3 Look for ways to offer positive reinforcement to parents correctly transporting children. (U)
Education
P: Proven R: Recommended U: Unknown
High
Risk
Be
havi
or

80 High Risk Behavior: Unlicensed Driver Involved
Drivers involved in fatalities who do not have a valid license at the time of the crash are called unlicensed drivers. Generally, this means they either drive before passing a test to earn their driving privilege, or they continue to drive after committing traffic crimes and losing that privilege. More significantly, however, it’s their risky driving behavior that causes crashes, not their license status.
Unlicensed drivers were involved in 248 (19%) of Washington’s traffic fatalities from 2012 through 2014. Almost every one of the fatalities that involved unlicensed drivers also involved one or more high risk driving behaviors, usually at a higher rate than all fatalities:
| Impairment: 79%, compared with 57% of all fatalities | Speeding: 48%, compared with 38% of all fatalities | Unrestrained vehicle occupants: 38%, compared with 22% of all fatalities | Distraction: 28%, compared with 30% of all fatalities
With such high rates of involvement, it is reasonable to conclude that high risk behaviors were the root cause of those unlicensed driver fatalities. Therefore, reducing risky driving behavior — rather than catching unlicensed drivers — will reduce unlicensed driver involved fatalities.
Overview In 2014 alone, 95 fatalities involved unlicensed drivers. This makes 2014 the worst year since 2008, with 108 deaths, higher than the five year rolling average of 82. The fatality trend line from 2010–2014 suggests unlicensed-driver-involved fatalities could still reach zero before 2030. That possibility fades, however, when we look at preliminary data for 2015, which looks similar to 2014.
Key FactsUnlicensed driving is difficult to prevent. Three
out of four unlicensed drivers involved in fatalities had a suspended license at the time of their crash (as opposed to the driver never
getting licensed in the first place). A suspended license cannot deter every suspended driver
from driving.
Unlicensed drivers are difficult to detect. They are typically not found until an unsafe driving
behavior causes law enforcement to pull them over, or until a crash has already occurred.
Most fatalities (79%) involving an unlicensed driver also involved alcohol impairment or testing positive for drugs. Pursuing proven
strategies to detect and reduce impairment will reduce unlicensed driver involved
fatalities.
Nearly half of the fatalities involving an unlicensed driver also involved speeding. Reducing speeding will reduce unlicensed
driver fatalities.
Unlicensed Driver Involved

81Washington State Strategic Highway Safety Plan 2016: Target Zero
Almost all unlicensed driver fatalities involve another risk factorFrom 2012–2014, the 248 unlicensed driver fatalities were found to involve 485 instances of high risk behaviors, including impairment, speeding, unrestrained vehicle occupants, distraction, or drowsiness. Unlicensed drivers involved in fatalities clearly take many more risks beyond just driving without a valid license.
All these risk behaviors are avoidable, and all fatalities involving these behaviors are potentially avoidable. Therefore, proven strategies that reduce impairment, speeding, and other behaviors can be expected to reduce unlicensed driver involved fatalities as well.
What’s NewStarting in June 2013, legislation removed
certain non-moving violations (such as failure to pay a ticket or appear in court) from causes
for suspension. License suspensions quickly dropped by over 12,000 per month. This
significant decrease in suspensions frees up law enforcement time for moving violations
that pose risks to road safety.
This law change is considered a best practice by the American Association of Motor
Vehicle Administrators. Target Zero partners agreed, finding that non-moving violators in Washington do not typically cause danger on the roads. Moving violators are nearly three
times more likely to have a crash.
Although this change will not directly impact unlicensed driver fatalities, it could allow law enforcement to redeploy an estimated 71,000
hours of state trooper time each year. This means that officers can increasingly focus on high-risk behavior such as impairment and distracted driving, rather than on relatively
low-risk behavior like driving with a suspended license for a non-moving violation.
Priority 1
Priority 2
Priority 3

High Risk Behavior
82 High Risk Behavior: Unlicensed Driver Involved
Related fatalities & serious injuries: overlap with other Target Zero factorsUNLICENSED DRIVER INVOLVED
What percentage of UNLICENSED
DRIVER INVOLVED crashes involved another factor?
FATALITIES SERIOUS INJURIES**Serious Injury data are unavailable for Unlicensed Drivers
For example, 36% of fatal crashes involving
an UNLICENSED DRIVER also involved
a young driver.

High
Risk
Be
havi
or
83Washington State Strategic Highway Safety Plan 2016: Target Zero
Other features of unlicensed driversNearly one third of unlicensed driving fatalities occurred between 11 p.m. and 3 a.m., double what would be expected if all hours were equal. Also, more than three times as many males as females were unlicensed drivers involved in fatalities. However, these are merely correlating factors. The high risk behaviors noted previously caused the crashes.
Most unlicensed drivers at the time of their fatal crash had a suspended license. From 2012–2014:
| 75% (170) had a suspended license (Since 2006, this number has hovered between 62% and 78% of unlicensed drivers).
| 19% (43) had no license or license status history | 6% (the remaining 13) included four revoked, eight expired,
and one denied license
National research and strategies show around 19% of fatalities involve unlicensed driversUnlicensed drivers have been studied around the nation. The AAA Foundation for Traffic Safety found 19% of US traffic fatalities involved unlicensed drivers from 2007–2009. This is consistent with Washington’s percentage, which has varied from 18% to 20% since 2006.
The California Department of Motor Vehicles studied 23 years of data (1987–2009), and found that unlicensed drivers were nearly three times more likely to cause a fatal accident than licensed drivers.
There are some strategies to prevent unlicensed driving, such as impounding an unlicensed driver’s vehicle license plates, or providing access to alternative forms of transportation. But no strategies have been proven to be truly effective in reducing unlicensed driving. If proven strategies were found, even then they might not be as effective as the proven strategies to reduce the root causes of unlicensed driver involved fatalities — namely impairment, speeding, and unrestrained occupants, among others.
Unlicensed driver definitionAn unlicensed driver is a person who does not have driving privileges in Washington State. These include drivers who:
| Never obtained a license. | Had their license suspended or revoked by
DOL. | Have an expired license. | Voluntarily surrendered their license. | Had their license invalidated by a court of
law or another state’s licensing agency. | Have a valid out-of-state license but had a
driving incident in Washington, resulting in Washington-based restrictions.
Focus on enforcement against risky behaviorsUnlicensed driving is hard to see. An officer has no idea if a person driving by has a valid license or not. By comparison, speeding, signs of impairment, and not wearing a seatbelt are relatively easy to see. Therefore, by focusing on enforcing against dangerous behaviors — the true cause of crashes — Target Zero partners will get the biggest return on investment for traffic safety.

Washington State laws relating to unlicensed drivers
RCW 46.20.001 License Required
RCW 46.20.207 License Cancellation
RCW 46.20.285 License Revocation
RCW 46.20.291 License Suspension
RCW 46.20.342 License Invalidated
High Risk Behavior
84 High Risk Behavior: Unlicensed Driver Involved
Getting a drivers license saves lives and moneyOne in five unlicensed drivers involved in fatalities had no license history, therefore it’s likely they had no driver training. They might have taken fewer risks if they had received training on the likelihood of costly accidents and tragic outcomes associated with risky driving behaviors.
Unlicensed driving can also impact future social and economic security. Unpaid tickets can damage credit history, which can make it harder to secure housing or jobs.

High
Risk
Be
havi
or
85Washington State Strategic Highway Safety Plan 2016: Target Zero
Strategies for reducing unlicensed driver (UNL) fatalities and serious injuriesObjective Strategies Implementation areas
UNL.1. Restrict mobility of unlicensed drivers through administrative actions and vehicle modifications
UNL.1.1 Mandatory incarceration period for repeat unlicensed driving offenders. (P, NCHRP)
Enforcement
UNL.1.2 Impose electronic monitoring of repeat unlicensed driving offenders. (P, NCHRP)
Enforcement
UNL.1.3 Expand the use of ignition interlock for drivers suspended due to a DUI. (P, CTW)
Enforcement
UNL.1.4 Impound or destroy license plates of vehicles registered to repeat unlicensed driving offenders. (P, NCHRP)
Enforcement
UNL.1.5 Immobilize or impound vehicles registered to repeat unlicensed driving offenders. (P, NCHRP)
Enforcement
UNL.1.6 Allow registrations of vehicles operated by unlicensed drivers to be canceled and license plates denoted with stickers. (P, NCHRP)
Enforcement
UNL.2. Educate public through public awareness initiatives
UNL.2.1 Provide alternative transportation and encourage reduced fares for persons without driving privileges. (P, NCHRP)
Leadership/Policy
UNL.2.2 Emphasize administrative and criminal sanctions for unlicensed driving offenders and re-offenders. (R, NCHRP)
Education
UNL.2.3 Increase public awareness of public transportation options. (U) EducationUNL.3. Enhance enforcement UNL.3.1 Standardize vehicle actions against unlicensed drivers with mandatory
immobilization/impound. (P, NCHRP)Enforcement
UNL.3.2 Create and distribute hot sheets, frequently updated lists of current unlicensed drivers who live in the vicinity and distribute to area enforcement agencies. (R, NCHRP)
Enforcement, Education
UNL.3.3 Enact laws to allow for stopping a vehicle registered to an unlicensed driver (without other cause for stop) to ensure unlicensed driver is not at the wheel. (U)
Enforcement
UNL.3.4 Evaluate the impact of the removal of suspension for failure to appear on non-moving citations. (U)
Leadership/Policy
UNL.4. Enhancement of data gathering and reporting ability
UNL.4.1 Make system changes necessary at WSDOT and DOL to enable analysts to identify unlicensed drivers involved in serious injury crashes. (R, DDACTS)
Leadership/Policy
UNL.4.2 Ensure routine linkage of citations to driver records so appropriate citations may be added to the crash being investigated. (R, NCHRP)
Leadership/Policy
P: Proven R: Recommended U: Unknown
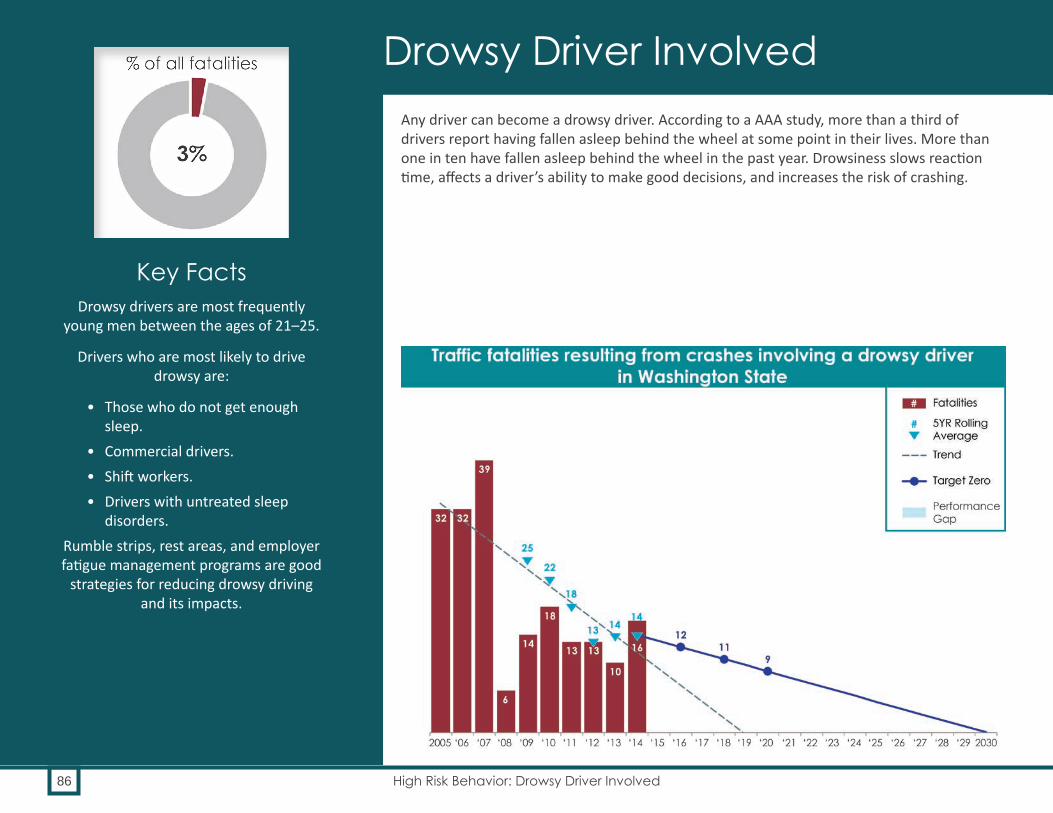
86 High Risk Behavior: Drowsy Driver Involved
Any driver can become a drowsy driver. According to a AAA study, more than a third of drivers report having fallen asleep behind the wheel at some point in their lives. More than one in ten have fallen asleep behind the wheel in the past year. Drowsiness slows reaction time, affects a driver’s ability to make good decisions, and increases the risk of crashing.
Key FactsDrowsy drivers are most frequently
young men between the ages of 21–25.
Drivers who are most likely to drive drowsy are:
• Those who do not get enough sleep.
• Commercial drivers.• Shift workers.• Drivers with untreated sleep
disorders.Rumble strips, rest areas, and employer fatigue management programs are good
strategies for reducing drowsy driving and its impacts.
Drowsy Driver Involved

87Washington State Strategic Highway Safety Plan 2016: Target Zero
OverviewDrowsy driving was a factor in 39 traffic deaths and 194 serious injuries from 2012 to 2014. During that same time, drowsy driving accounted for roughly 3% of the state’s total traffic deaths, and 3% of serious injuries. Data on drowsy driving are most likely underreported since drivers may be reluctant to admit they dozed off prior to a crash. A 2014 AAA study estimates that drowsiness was involved in one in five fatal crashes nationwide.
A driver who has been awake for 18 hours experiences cognitive impairment similar to that of a driver with a blood alcohol content (BAC) of .05. After 24 hours of being awake, a driver’s impairment is similar to a BAC of .10 or higher.
What’s NewData on drowsy driving is most likely under-
reported since drivers may be reluctant to admit they dozed off prior to a crash. A 2014 AAA study estimates that drowsiness
was involved in one in five fatal crashes nationwide.
Priority 1
Priority 2
Priority 3
88 High Risk Behavior: Drowsy Driver Involved
Alcohol, drugs, and over-the-counter and prescription medications can contribute to drowsiness. In Washington, if a driver’s ability to drive has been affected by alcohol or drugs, including inducing drowsiness, then the driver could be charged with driving under the influence.
Drowsy driving fatalities are likely underreported, since confirmation relies on self-reporting by the involved drivers. When drivers perish in the crashes, it is usually not possible to confirm that they were drowsy. Similarly, drivers involved in serious injury crash might be hesitant to self-report that they fell asleep at the wheel. AAA estimates that drowsy driving is a factor in one of five fatal crashes nationally. Washington State data shows less than 3% of fatal crashes, and slightly more than 3% of serious injury crashes, are drowsy driving related. Because of the small number of events in the fatality data set (only 39), partners use serious injury data (194 events) to better understand the circumstances surrounding these types of crashes.
Between 2012–2014, 70% of drowsy driver involved serious injury crashes involved a single vehicle. Sixty-two percent occur during standard daytime working hours (5 a.m–6 p.m.), contrary to the popular belief that most drowsy driving happens at night. Four out of five of these serious injury crashes occurred on weekends (Friday 6 p.m. to Monday 5 a.m.).
Meanwhile, between 2012–2014, 60% of drowsy driver involved fatal crashes involved a single vehicle. Fifty-seven percent occurred during standard daytime working hours (5 a.m.–6 p.m.). Sunday crashes were slightly more frequent at 20%, but crashes occurred on every day of the week, with each day experiencing between 11–14% of the crashes.
Contributing circumstances and factorsMany circumstances can contribute to drowsy driving, including lack of sleep, too much time on the road without stopping, shift work, and untreated sleep disorders such as sleep apnea. It’s difficult to prove a crash-causing driver was drowsy, so the numbers are likely underreported. The majority of drowsy-driver-involved fatalities and serious injuries occur on highways or interstates, where people often travel long, monotonous distances.
According to the Center for Sleep Disorders, up to 20% of crashes that occur on monotonous roads can be attributed to sleepiness. Two sleep disorders in particular can cause drivers to fall asleep at the wheel:
| Insomnia is a sleep disorder characterized by difficulty falling asleep or staying asleep. It affects an estimated 11% of the US population. People who experience insomnia are two to three times more likely to be involved in a motor vehicle crash than people without insomnia.
| Sleep apnea is a breathing disorder causing brief interruptions of breathing during sleep. The National Sleep Foundation estimates that about 4% of men and 2% of women have sleep apnea. Drivers who have untreated sleep apnea are six times more likely to be involved in a crash.
New guidelines have been drafted to provide health care practitioners with a framework for the evaluation and management of sleepy driving. Center for Disease Control (CDC) representatives report that addressing the issue of drowsy driving requires the combined effort of physicians, patients, and policy makers.
High Risk Behavior

89Washington State Strategic Highway Safety Plan 2016: Target Zero
Washington State laws relating to drowsy driving
Washington has no laws specific to drowsy driving, but depending on the circumstances a drowsy driver may be charged with:
| RCW 46.61.5249 Negligent driving | RCW 46.61.500 Reckless driving
Programs and successes
Engineering can prevent drowsy driving, or mitigate its effectsWSDOT is addressing drowsy driving crashes through several engineering interventions, including shoulder and centerline rumble strips, cable guard rails, and cable median barriers. In addition, WSDOT owns and operates 48 rest areas within the state to encourage drivers to stop and rest along their journeys. Most facilities are open 24 hours a day, seven days a week, and offer a free coffee program.
Drowsy Driving Prevention Week promotes educationThe National Sleep Foundation’s Drowsy Driving Prevention Week® is observed in November each year, just prior to annual heavy Thanksgiving travel. This campaign provides public education about the underreported risks of driving while drowsy, and advocates for countermeasures to improve safety on the road.
High
Risk
Be
havi
or
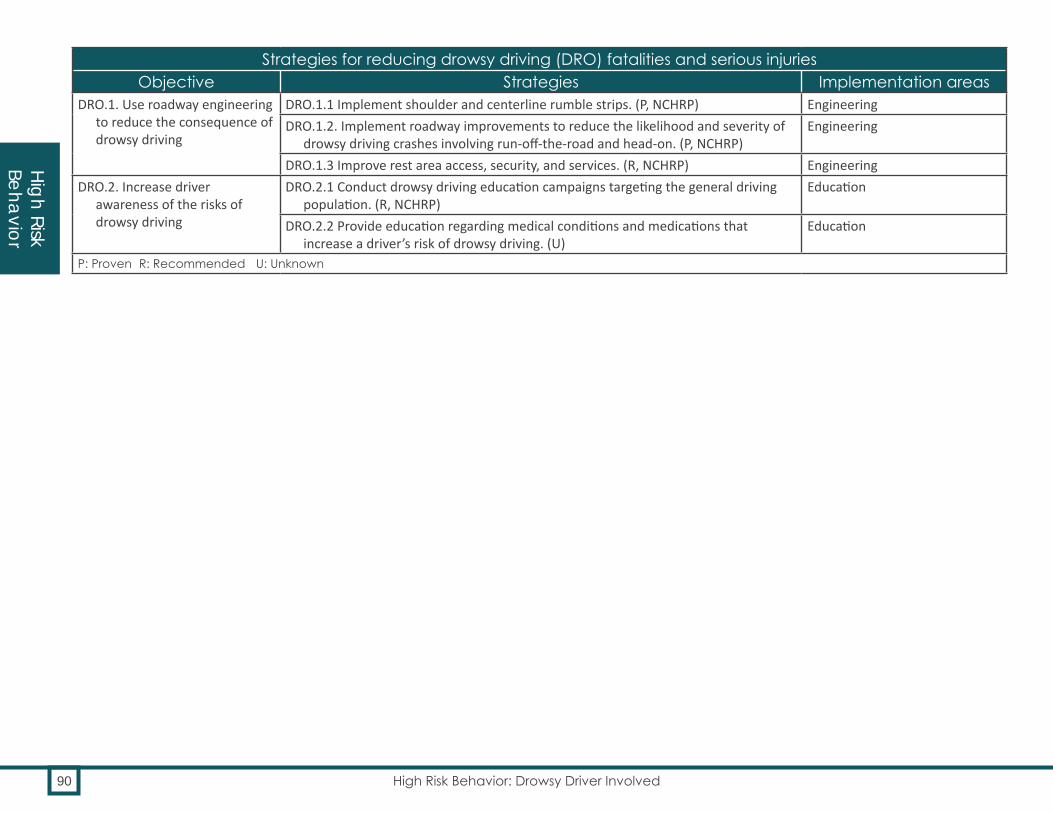
90 High Risk Behavior: Drowsy Driver Involved
Strategies for reducing drowsy driving (DRO) fatalities and serious injuriesObjective Strategies Implementation areas
DRO.1. Use roadway engineering to reduce the consequence of drowsy driving
DRO.1.1 Implement shoulder and centerline rumble strips. (P, NCHRP) EngineeringDRO.1.2. Implement roadway improvements to reduce the likelihood and severity of
drowsy driving crashes involving run-off-the-road and head-on. (P, NCHRP)Engineering
DRO.1.3 Improve rest area access, security, and services. (R, NCHRP) EngineeringDRO.2. Increase driver
awareness of the risks of drowsy driving
DRO.2.1 Conduct drowsy driving education campaigns targeting the general driving population. (R, NCHRP)
Education
DRO.2.2 Provide education regarding medical conditions and medications that increase a driver’s risk of drowsy driving. (U)
Education
P: Proven R: Recommended U: Unknown
High Risk Behavior

Cra
sh T
ype
Certain types of vehicle crashes are more dangerous to drivers and other road users. The data show that crashes that involve lane departure and intersections are particularly perilous.
Meanwhile, Target Zero also focuses on work zones, wildlife, school buses, and vehicle-train collisions. While small, they also need to be reduced to meet the Target Zero goal.

92 Crash Type: Lane Departure
Lane departure crashes involve a vehicle unintentionally leaving its lane of travel. This includes both vehicles leaving a lane to the right (run-off-the-road crashes) as well as vehicles leaving a lane to the left (either opposite direction crashes or run-off-the-road crashes). This is the first edition of Target Zero to combine run-off-the-road crashes with opposite direction crashes.
Key FactsLane departure crashes have the second most fatalities and the highest number of
serious injuries of any emphasis area in the 2016 Target Zero plan.
There are two main objectives for addressing serious injury and fatal crashes involving lane departure: to reduce the number of vehicles
leaving the lane of travel, and to minimize the consequences of leaving the lane when it
does occur.
Lane Departure

93Washington State Strategic Highway Safety Plan 2016: Target Zero
What’s New Thirty-one of Washington’s 39 counties have
developed local road safety plans.
Engineers are implementing High Friction Surface Treatment (HFST) projects on state and county
roads after a 2014 demonstration project.
OverviewLane departure crashes have the second most number of fatalities and the highest number of serious injuries of any emphasis area in the 2016 Target Zero plan. There were 750 lane departure fatalities (56%) and 2,357 serious injuries (39%) from 2012–2014. Fatalities are currently on a long-term trend to achieve Target Zero by 2030. However, the number of fatalities has remained relatively constant since 2010.
Serious injuries are not on a trend to achieve Target Zero by 2030, but the performance gap is small (one to two years).
Priority 1
Priority 2
Priority 3

Crash
Type
94 Crash Type: Lane Departure
Related fatalities & serious injuries: overlap with other Target Zero factorsLANE DEPARTURE
What percentage of LANE DEPARTURE
crashes involved another factor?
FATALITIES SERIOUS INJURIES
For example, 35% of LANE DEPARTURE
fatal crashes involved a young driver.

Cra
sh
Type
95Washington State Strategic Highway Safety Plan 2016: Target Zero
Since the 2013 Target Zero plan, there has been a 10% drop in lane departure fatalities and an 18% drop in lane departure serious injuries. This is twice the decrease in statewide fatalities (5%) and slightly better than the decrease in statewide serious injuries (15%). It is not certain at this time why these types of crashes have seen a more substantial decrease than the overall rate. Target Zero partners will be watching these numbers closely to see if the decrease continues, and hope to have analysis in the future if the trend continues.
Contributing circumstances and factorsLane departure crashes have a substantial overlap (over 30%) with impairment involved crashes, speeding involved crashes, and young driver involved crashes. Lane departure crashes are over-represented in each of these crash types, as well as in unrestrained vehicle occupant crashes and drowsy driver involved crashes.
These crashes are also spread across all types of jurisdictions, but are over-represented on county roads (33% of lane departure fatalities, 29% of lane departure serious injuries) compared to all fatalities and serious injuries (29% and 24%, respectively).
Percent of all fatal and serious injury crashes that were lane departure related, by county (2012–2014)

Crash
Type
96 Crash Type: Lane Departure
Local agencies face challenges in addressing county road crashes. For example, state highways include more than 7,000 centerline miles of roads and carry higher traffic volumes. By contrast, county roads include nearly 40,000 centerline miles of roads but carry smaller daily traffic volumes. The sporadic nature of crashes on county roads makes it difficult to use past data to show trends, and therefore to identify good locations for intervention.
Thus the Washington State Department of Transportation (WSDOT) might be able to target roadways with higher concentrations of lane departure crashes, while counties must take a very systemic, widespread approach to determine good project locations across a vast network, rather than just focusing on past crash locations.
Over half (54%) of fatal and serious injury lane departure crashes occur in right- or left-turning curves. Addressing driver behavior and the roadway environment in curves, which are a small part of the roadway system, could be one of the best ways to reduce lane departure crashes.
Some of the most common and effective strategies to keep vehicles in the lane of travel include:
| Add roadway signing and pavement markings, especially near curves.
| Increase pavement friction in curves. | Install rumble strips on the center line and edge lines or
both.Some of the most common and effective strategies to minimize the consequences of leaving the lane include:
| Remove or relocate fixed objects. | Reduce the grade on roadside slopes. | Add safety hardware such as guardrail to minimize crash
severity.
Current programs underway to address lane departure safety include:
| Developing local road safety plans to prioritize systemic improvements to county roads.
| Upgrading signing in curves to meet current Manual on Uniform Traffic Control Devices (MUTCD) guidance.
| Adding high friction surface treatment (HFST) to existing pavement.
Emerging vehicle technologies are also likely to have an impact on lane departure safety. First and foremost, this includes lane-keeping technologies, which identify lane lines and curbs to keep vehicles from leaving their lane. This technology, as it is deployed in newer vehicles, should reduce lane departure crashes in locations where pavement markings exist, including most urban roads and many major rural roads.
Programs and successes
High Friction Surface TreatmentIn 2014, the Washington State Local Technical Assistance Program (LTAP) Center, a part of WSDOT, partnered with the Washington State Association of County Engineers and the Federal Highway Administration to conduct a High Friction Surface Treatment Demonstration Project.
High Friction Surface Treatment (HFST) is a polymer resin binder that is applied to the roadway surface, dramatically increasing the surface friction of pavement for enhanced braking and steering control within curves. This event demonstrated the installation process of this new countermeasure for many state and local agency engineers. LTAP held a question-and-answer session regarding the technology after the installation. As a result of this demonstration project, engineers have initiated several state and county HFST projects, including over $2 million of HFST installations in King County alone.
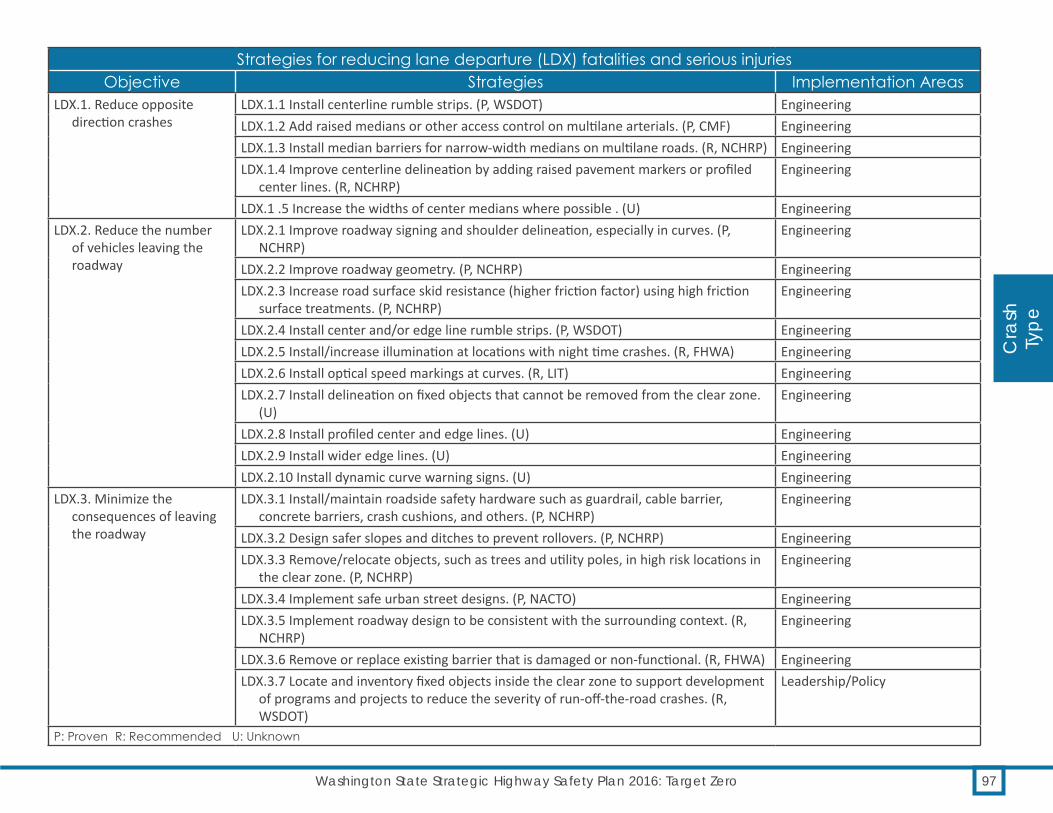
Cra
sh
Type
Strategies for reducing lane departure (LDX) fatalities and serious injuriesObjective Strategies Implementation Areas
LDX.1. Reduce opposite direction crashes
LDX.1.1 Install centerline rumble strips. (P, WSDOT) EngineeringLDX.1.2 Add raised medians or other access control on multilane arterials. (P, CMF) EngineeringLDX.1.3 Install median barriers for narrow-width medians on multilane roads. (R, NCHRP) EngineeringLDX.1.4 Improve centerline delineation by adding raised pavement markers or profiled
center lines. (R, NCHRP)Engineering
LDX.1 .5 Increase the widths of center medians where possible . (U) EngineeringLDX.2. Reduce the number
of vehicles leaving the roadway
LDX.2.1 Improve roadway signing and shoulder delineation, especially in curves. (P, NCHRP)
Engineering
LDX.2.2 Improve roadway geometry. (P, NCHRP) EngineeringLDX.2.3 Increase road surface skid resistance (higher friction factor) using high friction
surface treatments. (P, NCHRP)Engineering
LDX.2.4 Install center and/or edge line rumble strips. (P, WSDOT) EngineeringLDX.2.5 Install/increase illumination at locations with night time crashes. (R, FHWA) EngineeringLDX.2.6 Install optical speed markings at curves. (R, LIT) EngineeringLDX.2.7 Install delineation on fixed objects that cannot be removed from the clear zone.
(U)Engineering
LDX.2.8 Install profiled center and edge lines. (U) EngineeringLDX.2.9 Install wider edge lines. (U) EngineeringLDX.2.10 Install dynamic curve warning signs. (U) Engineering
LDX.3. Minimize the consequences of leaving the roadway
LDX.3.1 Install/maintain roadside safety hardware such as guardrail, cable barrier, concrete barriers, crash cushions, and others. (P, NCHRP)
Engineering
LDX.3.2 Design safer slopes and ditches to prevent rollovers. (P, NCHRP) EngineeringLDX.3.3 Remove/relocate objects, such as trees and utility poles, in high risk locations in
the clear zone. (P, NCHRP)Engineering
LDX.3.4 Implement safe urban street designs. (P, NACTO) EngineeringLDX.3.5 Implement roadway design to be consistent with the surrounding context. (R,
NCHRP)Engineering
LDX.3.6 Remove or replace existing barrier that is damaged or non-functional. (R, FHWA) EngineeringLDX.3.7 Locate and inventory fixed objects inside the clear zone to support development
of programs and projects to reduce the severity of run-off-the-road crashes. (R, WSDOT)
Leadership/Policy
P: Proven R: Recommended U: Unknown
97Washington State Strategic Highway Safety Plan 2016: Target Zero

98 Crash Type: Intersection Related
Intersections are a conflict point for traffic. Because of this, when people make mistakes at these locations, it often results in a crash. One of the major objectives of addressing intersection related crashes is to reduce the severity of those crashes when they occur.
Key FactsIntersection related crashes do not have a high overlap with other high priority emphasis areas in the 2016 Target Zero
plan. This lack of overlap makes this emphasis area more independent to
address and improve than most other emphasis areas in this plan.
Intersection related crashes are mostly found within cities, which from 2012–2014
had 64% of all fatal and serious injury crashes within their jurisdictions. State routes (outside cities) had 21% of these crashes, while county roads had 15%.
Intersection Related

99Washington State Strategic Highway Safety Plan 2016: Target Zero
OverviewIntersection related crashes are involved in 21% of statewide fatalities (276) and 35% of statewide serious injuries (2,129) from 2012–2014. Both fatalities and serious injuries have a performance gap, meaning they are not on pace to achieve Target Zero by 2030. The number of intersection related fatalities has remained relatively constant for most of the past decade. Serious injuries are on a steadier decline, but are not at a pace to achieve Target Zero on schedule.
Since the 2013 Target Zero plan, intersection related crashes have seen a 5% drop in fatalities and a 14% drop in serious injuries. This nearly mirrors the overall statewide numbers, which experienced a 5% drop in fatalities and a 15% drop in serious injuries.
What’s NewState, local, and Tribal governments are using retroreflective borders on traffic signals. This results in greater visibility
for signals, especially in busy urban environments.
State, local, and Tribal governments all continue to install roundabouts, including
the first few urban compact roundabouts in the state.
WSDOT has installed the first dynamic intersection warning systems in the state, providing real-time warnings to drivers at
intersections with stop signs.
Priority 1
Priority 2
Priority 3

Crash
Type
100 Crash Type: Intersection Related
Related fatalities & serious injuries: overlap with other Target Zero factorsINTERSECTIONS
What percentage of INTERSECTION RELATED
crashes involved another factor?
FATALITIES SERIOUS INJURIES
For example, 26% of INTERSECTION RELATED fatal crashes involved a
young driver.

Cra
sh
Type
101Washington State Strategic Highway Safety Plan 2016: Target Zero
Contributing circumstances and factorsIntersection related crashes do not have a high overlap with other high priority emphasis areas in the 2016 Target Zero plan. The only emphasis areas that represent more than 1/4 of intersection related crashes are impairment, distraction, and young drivers, as seen in the infographic. When looking at the overlap of other factors with crashes, impairment is below the statewide proportion of fatalities (which is at 57%), distraction is slightly above at the statewide average of 29%, and young drivers are slightly below statewide averages of 32% of fatalities and 34% of serious injuries. This lack of overlap makes this emphasis area more independent to address and improve than most other emphasis areas in this plan.
Intersection related crashes are mostly found within cities, which from 2012–2014 had 64% of all fatal and serious injury crashes within their jurisdictions. State routes (outside cities) had 21% of these crashes, while county roads had 15%.
It is also worth noting that pedestrians, bicyclists, and older drivers are all overrepresented in their overlap with intersection related crashes. Intersections are one of the most likely places for pedestrian and bicyclist fatal or serious injury crashes. For both pedestrians and bicyclists, more than 1/3 of fatalities and more than 1/2 of serious injuries occur at intersections.
Percent of all fatal and serious injury crashes that were intersection related, by county (2012–2014)

Crash
Type
102 Crash Type: Intersection Related
Statewide, partners are implementing changes that can help the growing older driver population, among others:
| With the installation of roundabouts, safety practitioners are working to remove the need to make left turns, a common source of fatal or serious injury crashes.
| Converting permitted left turns from green circles to flashing yellow arrows helps avoid driver confusion that might lead some to assume they can go on the green without yielding.
| Engineers are increasing sign sizes to make their messages clearer for drivers, especially those with diminishing vision such as older drivers.
Some of the most effective strategies to reduce the likelihood or severity of crashes at intersections for all users include:
| Convert intersections to roundabouts. | Improve traffic signal timing, including the use of traffic signals
that use arrows to provide protected turns. | Improve intersection visibility using signs, markings, improved
sight distance, and illumination. | Add real-time warning information at rural, two-way, stop-
signed intersections. The real-time warnings can either be for drivers on the mainline (telling them stopped cars are waiting at the intersection ahead) or for drivers on the side street (telling them that mainline traffic is approaching).
| Improve pedestrian crossings through shorter distances, illumination, and leading pedestrian intervals.
An example of a current program underway to address intersection-related safety is:
| Deploying the Intersection Safety Improvement Program to make low-cost, systemic improvements to intersections.
The types of fatal and serious injury crashes that most commonly occur at intersections are shown in the chart above. This is valuable information for determining what types of interventions are needed at intersections from an engineering perspective.
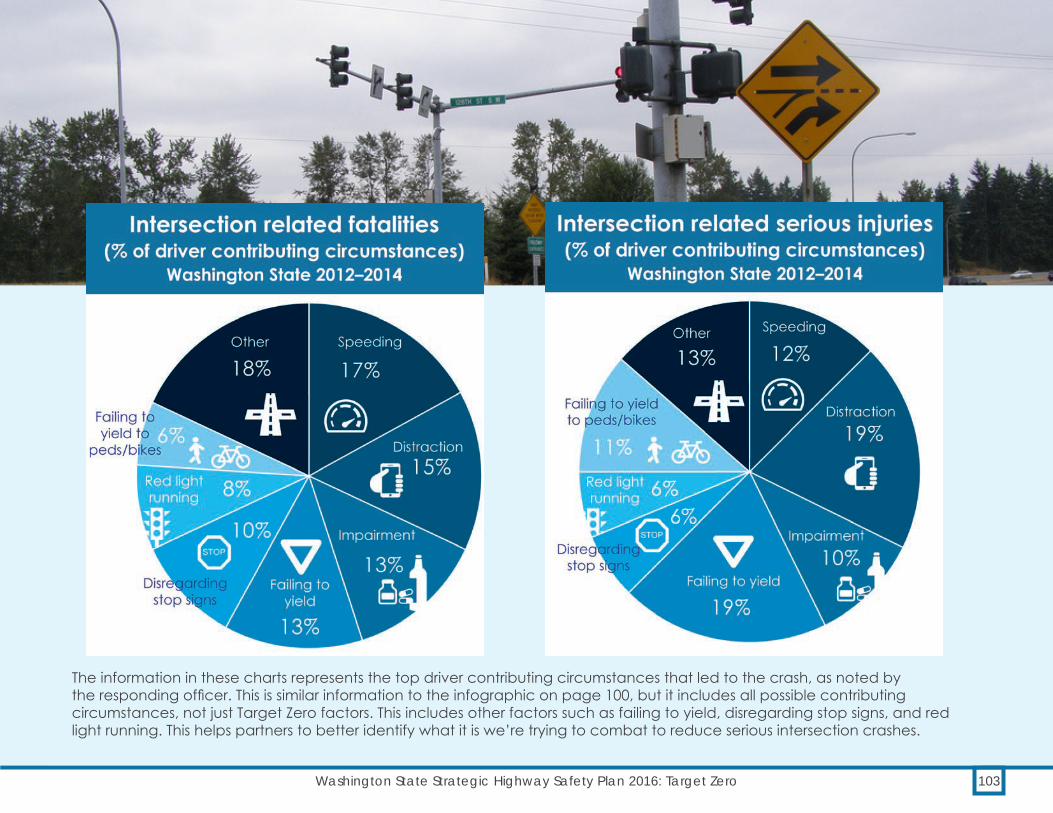
Cra
sh
Type
103Washington State Strategic Highway Safety Plan 2016: Target Zero
The information in these charts represents the top driver contributing circumstances that led to the crash, as noted by the responding officer. This is similar information to the infographic on page 100, but it includes all possible contributing circumstances, not just Target Zero factors. This includes other factors such as failing to yield, disregarding stop signs, and red light running. This helps partners to better identify what it is we’re trying to combat to reduce serious intersection crashes.

Crash
Type
104 Crash Type: Intersection Related
Strategies for reducing Intersection (INT) related fatalities and serious injuriesObjective Strategies Implementation Areas
INT.1. Reduce motor vehicle crashes at intersections
INT.1.1 Install or convert intersections to roundabouts. (P, NCHRP) EngineeringINT.1.2 Optimize traffic signal clearance intervals. (P, NCHRP) EngineeringINT.1.3 Provide/improve left- and right-turn channelization. (P, NCHRP) EngineeringINT.1.4 Install illumination at locations with nighttime crashes. (P, NCHRP) EngineeringINT.1.5 Convert permitted left turns to protected left turns at signals. (P, HSM) EngineeringINT.1.6 Remove unwarranted signals. (P, NCHRP) EngineeringINT.1.7 Employ signal coordination. (P, NCHRP) EngineeringINT.1.8 Employ flashing yellow arrows at signals. (P, CMF) EngineeringINT.1.9 Provide dynamic intersection warning (real-time) to drivers on mainline or side
streets of conflicting vehicle traffic at rural intersections. (R, NCHRP)Engineering
INT.1.10 Restrict or eliminate turning maneuvers at intersections. (R, NCHRP) Engineering, Leadership/PolicyINT.1.11 Implement restricted access to properties/driveways adjacent to
intersections using closures or turn restrictions. (R, NCHRP)Engineering
INT.1.12 Provide skid resistance in intersections and on approaches. (R, NCHRP) EngineeringINT.1.13 Improve visibility of intersections by providing enhanced signing and
delineation. (R, NCHRP)Engineering
INT.2. Improve driver compliance at intersections
INT.2.1 Implement automated enforcement (photo red-light cameras) of red-light running at locations with angle crashes. (P, NCHRP)
Enforcement, Engineering, Leadership/Policy
INT.2.2 Provide targeted speed enforcement. (P, NCHRP) EnforcementINT.2.3 Provide targeted stop sign/signal enforcement at intersections and
intersection approaches. (R, NCHRP)Enforcement
INT.2.4 Implement automated enforcement (cameras) of approach speeds. (R, NCHRP) Enforcement, Engineering, Leadership/Policy
P: Proven R: Recommended U: Unknown

Cra
sh
Type
105Washington State Strategic Highway Safety Plan 2016: Target Zero
Strategies for reducing Intersection (INT) related fatalities and serious injuriesObjective Strategies Implementation Areas
INT.3. Improve driver awareness of intersections
INT.3.1 Redesign intersection approaches to improve sight distances. (P, NCHRP) EngineeringINT.3.2 Add back plates with retro-reflective borders to signals. (P, CMF) EngineeringINT.3.3 Provide advance warning of intersections using dynamic signal warning
flashers or actuated advance warning dilemma zone protection systems at high-speed signalized intersections. (P, CMF)
Engineering
INT.3.4 Improve visibility of intersections on approaches. (R, NCHRP) EngineeringINT.3.5 Improve visibility of signals and signs at intersections. (R, NCHRP) EngineeringINT.3.6 Install transverse rumble strips on intersection approaches. (R, NCHRP) EngineeringINT.3.7 Provide targeted public information and education about safety problems
found at specific intersections. (R, NCHRP)Education
INT.4. Reduce vehicle crashes involving pedestrians and bicyclists at intersections
INT.4.1 Improve safety at pedestrian crossings by installing refuge islands, scale lighting, and shortening crossing distances. (R, CMF)
Engineering
INT.4.2 Expand targeted crosswalk enforcement and education for both vehicles and pedestrians. (R, CTW)
Enforcement, Education
INT.4.3 Improve sight distances and/or visibility between motor vehicles and pedestrians at high risk and high volume pedestrian crossings. Move the stop bar farther back from the intersection, clear vegetation, extend crossing times, and implement pedestrian lead intervals. (U)
Engineering
INT.4.4 Upgrade pavement markings using high visibility crosswalks and bicycle lanes. (U)
Engineering
INT.4.5 Install bicycle lanes and bicycle boxes. (U) EngineeringINT.4.6 Implement Complete Streets to provide for all modes of transportation. (R,
NCSC)Leadership/Policy, Engineering
P: Proven R: Recommended U: Unknown

106 Crash Type: Work Zone, Wildlife, School Bus Involved, Vehicle-Train
Work Zone, Wildlife, School Bus, and Vehicle-TrainWork ZoneBetween 2012–2014, three fatalities (0.2%) and 96 serious injuries (1.6%) resulted from crashes occurring in, or related to, Washington work zones. Approximately half of these crashes occurred on state highways and the remainder occurred on city and county roads.
The safety of workers and the traveling public is the highest priority during roadway design, construction, maintenance, and related activities. WSDOT sponsors both ongoing work zone traffic control design best practices and traffic control supervisor certification training for its own employees as well as for local agencies. Other emphasis areas include:
| Ensuring personnel and vehicles in work zones are visible. Personnel in work zones are required to meet clothing visibility standards for both daylight and dark conditions.
| Ensuring all workers within a worksite are familiar with site-specific hazards. Contractors and agency employees at work sites hold site specific safety meetings and document issues in safety plan.
| Providing safe and accessible conditions for emergency responders within and through work zones. When appropriate, work zone planning efforts include coordination with emergency responders.
| Using state-of-the-art work zone design policies. WSDOT supports the evaluation and implementation of new work zone safety related products, devices, and technology, such as automated flagger assistance and temporary signals. WSDOT also promotes the use of positive protection methods such a temporary concrete barrier, truck mounted attenuators, and detours for separating workers from traffic.
| Providing timely work zone information to the traveling public to assist in trip planning, and to allow motorists to take alternate routes when possible.
Wildlife Wildlife crashes accounted for seven fatalities (0.5%) and 49 serious injuries (0.8%) between 2012–2014 in Washington State. Approximately half these crashes occurred on state highways with the remaining crashes occurring on county or city roads.
The State is committed to environmental stewardship, as evidenced by Results WSDOT priority outcome 3.1: Improve environmental conditions; leave better than before. To accomplish this, WSDOT has adopted a habitat connectivity policy mandating consideration of habitat and wildlife in all state transportation actions. The recent need to remove fish barriers has also allowed for installation of wildlife crossing structures and fencing in some instances. In others, the fish passage structures themselves provide attractive, safe wildlife passage opportunities.
Better information regarding locations with wildlife crash issues is now available through the state’s highway asset tracking system. This system is used by WSDOT to collect actual location information on large animal carcass removal sites. The system was implemented in July 2015, and staff gathered over 4,700 locations between July and November 2015. WSDOT also completed a GIS analysis of the state highway system, ranking sites for ecological stewardship and wildlife-related safety. These rankings will help prioritize funds to the most critical locations, and allow for better site treatments and warning sign installations.
Additional approaches to reducing wildlife crashes:
| Provide grade separated wildlife crossings when possible. WSDOT will incorporate wildlife crossing opportunities as part of fish barrier removal projects when possible.
| Promote clear sight lines in areas with abundant wildlife. | Use traveler information devices to provide public service
announcements in areas with high wildlife crashes.

107Washington State Strategic Highway Safety Plan 2016: Target Zero
School Bus InvolvedIn Washington State 2012–2014, there were zero fatalities that involved a school bus. During this same time frame, school bus crashes accounted for 15 serious injuries, three of which were school-aged children: one school bus occupant, one automobile occupant, and one pedestrian. Although serious crash events involving school buses are rare, the state continuously monitors school bus involved crashes.
The Office of Superintendent of Public Instruction (OSPI) has overall responsibility for school bus safety. Statewide, five regional transportation coordinators liaison between OSPI and local school districts. The transportation coordinators assist with school bus driver certification, initial and continuing driver training, and development of guidance documents for school districts. The OSPI and regional liaisons also collaborate with the WSP’s Commercial Vehicle Division (CVD) for executing annual, high-quality, and thorough school bus safety inspections.
In considering students’ traffic safety, Target Zero partners are not just concerned with school bus riders. In February 2015, WSDOT, in collaboration with the WTSC, OSPI, and Department of Health (DOH), updated the state’s School Walk and Bike Routes guide. This guide is used by school districts to develop, modify, and maintain safe school walk and bike routes.
Vehicle-TrainFrom 2012–2014, trains were involved in two traffic fatalities and five serious injuries. Highway-rail grade crossings are intersections involving two very different modes of transportation, with different sizes and speeds. In addition, these intersections are multi-jurisdictional, involving both highway and railroad authorities responsible for different aspects of design and maintenance. The Washington Utilities and Transportation Commission (UTC) has regulatory authority over public safety at these intersections.
The train involvement data in Target Zero is limited to fatal and serious crash events involving trains that also involved a motor vehicle and occurred at crossings accessible to the public. The UTC monitors all fatalities and injuries involving trains, including those occurring at private crossings, such as crossings at residential driveways or service roads, or on industrial properties.
The UTC’s Rail Safety Program implements engineering, education, and compliance programs that reduce deaths, injuries, and property damage on or around railroads. The program oversees rail operations, protects railroad crossings, resolves complaints, ensures railroad employee safety, and funds rail safety projects. It also promotes public awareness in partnership with the national Operation Lifesaver Program.
WSDOT is also involved in vehicle-train safety. In March 2014, WSDOT published the Washington State Rail Plan 2013–2035 to serve as a strategic blueprint for future public investment in the state’s rail transportation system, including safety at crossings. The integrated plan provides short- and long-term funding strategies and meets federal and state requirements.


Road
Use
rs
Certain road users are more susceptible to vehicle collisions. Some are types of drivers, such as younger and older drivers. Others are non-drivers who are inherently vulnerable in vehicle collisions, such as pedestrians and bicyclists. In this section of the Target Zero Plan, we analyze who these users of our roadways are, why they are more likely to be involved in fatalities and serious injuries, and how to safeguard them.

110 Road Users: Young Drivers 16-25 Involved
The leading cause of unintentional death for young people aged 16–25 in Washington is motor vehicle crashes. From 2012–2014, 32% of all traffic fatalities involved a young driver. The good news is there has been a 13% decrease in young driver involved fatalities and 24% decrease in young driver involved serious injuries since 2009–2011. Washington State is making good progress among young drivers, and we are on track to meet our goal of zero deaths and serious injuries by 2030.
Key FactsImpairment was involved in nearly 57% of all young driver involved fatality crashes in 2012–2014. Male drivers 16–25 years of age in particular are more than twice
as likely to be impaired in fatal crashes as compared to men aged 36–45.
Distracted driving continues to be a problem among young drivers. A Washington Healthy Youth survey
conducted in 2014 found that 59% of high school seniors reported riding in the car
with a driver who was texting or emailing.
Despite tremendous attention to new drivers under 18 years of age, the data continue to show that newly licensed
drivers ages 18–20 are some of the riskiest drivers on the road, as demonstrated by
high traffic citation issuance rates.
Young Drivers 16–25 Involved

111Washington State Strategic Highway Safety Plan 2016: Target Zero
OverviewYoung drivers fall into three distinct groups:
1. Newly licensed teen drivers under age 18. This group represents the largest number of newly licensed drivers annually in Washington.
2. Newly licensed drivers aged 18–20. These drivers often have not taken a traffic safety education course, which is not required for new drivers over 18.
3. Drivers aged 21–25, who often have driving experience but require special attention because they are of legal drinking age and are more likely to drive impaired.
What’s NewDOL and WTSC created a new Action Council on Young Drivers to build on the successes of
the Young Driver Task Force, develop legislative proposals, and increase public outreach.
DOL, in partnership with WTSC, driver training schools, and other traffic safety partners, is
working to improve driver training and testing — an effort that will better prepare young drivers to handle hazards on the road and
make safe driving decisions.
Priority 1
Priority 2
Priority 3

Road
Use
rs
Road Users
112 Road Users: Young Drivers 16-25 Involved
Drivers in these three groups behave differently on the road, and have unique characteristics. Reducing young driver involved fatalities and serious injuries requires different strategies based on these differences.
Inexperience and developmental changesYoung drivers face an increased crash risk due to both their inexperience and immaturity. Nearly all newly licensed drivers in Washington States fit into the aged 16–25 young driver age bracket, making young drivers and new drivers nearly synonymous. Studies show that young drivers, who are just learning to drive, lack the skills and experience necessary to recognize and respond to risk appropriately. Additionally, studies also recognize age-related immaturity, which is associated with adolescent brain development, as a key factor in dangerous decision-making on the road. Further research on adolescent development suggests key areas of the brain — especially in the prefrontal cortex, the brain center for judgment, decision-making, and deferring immediate reward — are not fully developed until about age 25.
It’s for these reasons that the strategies to reduce young driver involved fatality and serious injury crashes must take a two-pronged approach: helping these drivers gain valuable experience, while mitigating their risk by keeping them out of dangerous situations.
Washington’s Intermediate Driver License (IDL) law helps young drivers gain valuable experience safelyIn Washington, drivers aged 16–17 receive an intermediate driver license that carries certain restrictions around nighttime driving, passengers, and phone use, among other things. As these newly licensed drivers mature and gain experience driving, they’re no longer subject to these restrictions. These young drivers can lose their driving privilege for certain violations, however. After a third violation, the young driver’s license is suspended until age 18.
Intermediate Driver License (IDL) requirements for drivers ages 16–17
| Get the consent of a parent or guardian. | Hold an instruction permit for at least six months. | Complete a Driver Training School course. | Complete 50 hours of supervised driving, 10 of which
are at night. | Commit no violations within six months of
application. | Pass a knowledge test and driving test. | During the first six months of licensure, carry no
passengers under 20 years old except members of the driver’s immediate family.
| During the second six months of licensure, carry no more than three passengers under 20 years old except members of the driver’s immediate family.
| Refrain from driving between 1–5 a.m., unless with a parent, a guardian, or a licensed driver who is at least 25 years old.
| Refrain from using phones while driving, even hands-free. This includes talking on phones and sending or receiving text messages. Wireless devices may be used to report an emergency.

Road
Use
rsRo
ad U
sers
113Washington State Strategic Highway Safety Plan 2016: Target Zero
Drivers are waiting until age 18 to get their licenseContinuing a trend noted in the 2013 Target Zero, a significant number of newly licensed drivers are waiting until age 18 to get their license. In Washington, intermediate driving restrictions and driver training requirements do not apply to drivers once they turn 18. Approximately 41,000 16-year-olds, 11,000 17-year-olds, and 16,000 18-year-olds obtain a first time license annually. About 9,000 19-year-olds obtain first time licenses each year.
A 2012 AAA Foundation study found that less than half of all teens were licensed within 12 months of the minimum age in their state, while 54% were licensed before their 18th birthday. Survey respondents gave several reasons for why they delayed getting their license.
Washington citation data shows that newly licensed drivers ages 18–20, who are not required to undergo the same training as 16–17 year olds, are some of the riskiest on the road. They are far more likely to receive traffic infractions within six months of driving, often the predictor of a future crash.
There are similar differences for those young drivers that die in a fatal crash within their first year of licensure.

Road
Use
rs
Road Users
114 Road Users: Young Drivers 16-25 Involved
This graph makes apparent the role of impairment and the legal drinking age (21) in young driver crashes.
A young driver in Washington who got her license at age 16 and died in a crash, on average, died around age 21.
A young driver in Washington who got her license at age 19 and died in a crash, on average, also died around 21.

Road
Use
rsRo
ad U
sers
115Washington State Strategic Highway Safety Plan 2016: Target Zero
Contributing circumstances and factorsImpairment is the greatest contributing factor in young driver fatalities.
Impairment was a factor in nearly 57% of all young driver involved fatality crashes in 2012–2014. Male drivers 16- to 25-years old in particular are more than twice as likely to be impaired in fatal crashes as compared to 36- to 45-year-old men.
A closer examination of 2014 young driver fatalities reinforces the role impairment plays. As shown on the graph in the graph on the facing page, of those young drivers who died, the average age at death was 21, the legal drinking age, regardless of age at licensing.
Distracted driving also plays a significant role in young driver crashesDistraction is another factor present in a significant number of young driver involved crashes. Just under a third of all their fatality crashes involved distraction, and just over 20% of all young driver involved serious injury crashes involved distraction. Even though the rates of distraction aren’t as high as impairment or speeding, studies suggest that it’s prevalent, as discussed in the distracted driving chapter. In a recent Washington Healthy Youth survey conducted in 2014, 59% of high school seniors reported riding in the car with a driver who was texting or emailing.
Percent of fatal and serious injury crashes involving young drivers, by county (2012–2014)

Road
Use
rs
Road Users
116 Road Users: Young Drivers 16-25 Involved
Related fatalities & serious injuries: overlap with other Target Zero factorsYOUNG DRIVERS
What percentage of YOUNG DRIVER crashes involved another factor?
FATALITIES SERIOUS INJURIES
For example, 63% of fatal crashes involving
a YOUNG DRIVER also involved a lane
departure.

Road
Use
rsRo
ad U
sers
117Washington State Strategic Highway Safety Plan 2016: Target Zero
Young men are more likely to be impaired, and young women are more likely to be distracted, in fatal crashesGender differences are stark in young driver involved fatalities. Even though licensed drivers are about 50/50 male/female, just over 75% of all young drivers who died in 2012–2014 were male.
Gender differences are particularly prevalent when it comes to impairment. Both 16- and 17-year-old males and 18- to 20-year-old males were over three times more likely to be impaired in fatal crashes than their female counterparts. An even greater disparity exists with 21- to 25-year-old males, who are over five times more likely to be impaired than their female counterparts.
Female young drivers, on the other hand, drive distracted at a greater rate than their male counterparts. Sixteen- to 17-year-old female drivers involved in fatal crashes were more than twice as likely to have been driving distracted as their male counterparts.
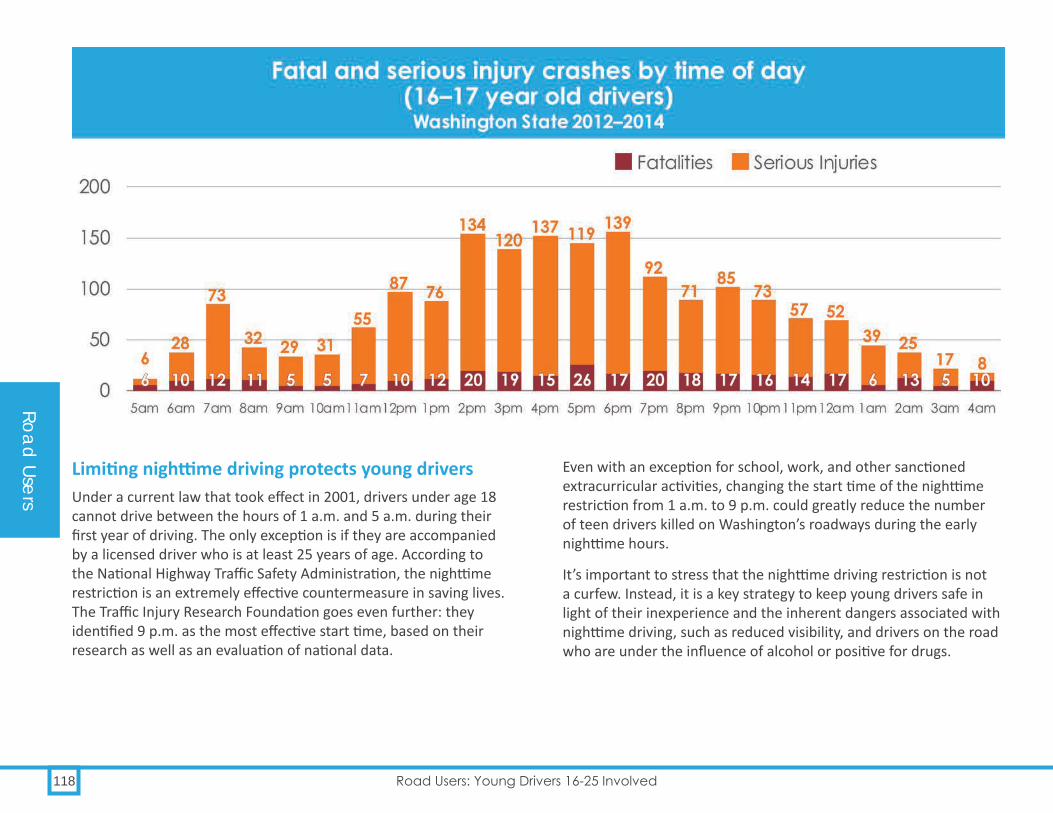
Road
Use
rs
Road Users
118 Road Users: Young Drivers 16-25 Involved
Limiting nighttime driving protects young driversUnder a current law that took effect in 2001, drivers under age 18 cannot drive between the hours of 1 a.m. and 5 a.m. during their first year of driving. The only exception is if they are accompanied by a licensed driver who is at least 25 years of age. According to the National Highway Traffic Safety Administration, the nighttime restriction is an extremely effective countermeasure in saving lives. The Traffic Injury Research Foundation goes even further: they identified 9 p.m. as the most effective start time, based on their research as well as an evaluation of national data.
Even with an exception for school, work, and other sanctioned extracurricular activities, changing the start time of the nighttime restriction from 1 a.m. to 9 p.m. could greatly reduce the number of teen drivers killed on Washington’s roadways during the early nighttime hours.
It’s important to stress that the nighttime driving restriction is not a curfew. Instead, it is a key strategy to keep young drivers safe in light of their inexperience and the inherent dangers associated with nighttime driving, such as reduced visibility, and drivers on the road who are under the influence of alcohol or positive for drugs.

Road
Use
rsRo
ad U
sers
119Washington State Strategic Highway Safety Plan 2016: Target Zero
Young passengers in the car pose a risk for young driversThere is a direct correlation between the number of young passengers in a vehicle and crash risk. A 2012 study by the AAA Foundation found that having young passengers in the car with a young driver is a significant risk factor in crashes. That study found that just one passenger under age 21 increases a 16- or 17-year-old driver’s risk per mile driven of being killed by 44%. Under current law, a driver under age 18 cannot drive with passengers who are under 20 years old during their first six months of driving, and they cannot drive with more than three passengers who are under 20 years old during the next six months of driving.
Programs and successes
Improving driver training and testingDriver training sets the stage for a lifetime of safe driving. Nearly 60,000 people take driver training each year in Washington State. Since traffic safety education funding was decreased dramatically in 2001, a large majority of driver training in Washington has been conducted by private driver training schools. DOL regulates private driving schools, and the Office of Superintendent of Public Instruction (OSPI) regulates public school programs.
In 2013, DOL evaluated its curriculum, driver education, and testing standards relative to the Target Zero plan. Through this work as well as grant funding from WTSC, DOL has increased coverage of key subjects in its model driver training curriculum, expanded content in the Washington Driver Guide, and added new questions to the written knowledge test to ensure drivers have the knowledge they need to make safe driving decisions.
Early warning letters are reducing subsequent infractions and crashesIn March of 2011, DOL began sending letters to all drivers aged 18–21 receiving their first moving violation. DOL implemented this program because data show a driver’s chances of crashing doubles after receiving their first violation. Intermediate driver license holders already receive similar letters after violations or crashes.
The early warning letter is sent on the first day of the month the violation shows on the driver’s record. The letter is intended only to provide advice and is not punitive. The goal of the letter is to make young drivers realize the risks associated with continued violations and reduce repeat offenses.
The data show the letter is making a difference. After a 22-month review involving more than 100,000 drivers, DOL found that the Early Warning Letter Program reduced secondary violations by 13%, which translates to 15,126 fewer infractions. DOL is continuing to evaluate the effectiveness of the program and is working to identify additional opportunities to reach high risk drivers.
Washington State laws relating to young drivers
RCW 46.20.055 Instruction permit
RCW 46.20.075 Intermediate license
RCW 46.20.267 Intermediate licensees

Road
Use
rs
Road Users
120 Road Users: Young Drivers 16-25 Involved
Young Driver Task Force and Action Council on Young DriversFor nearly a decade, the Young Driver Task Force, made up of representatives from both public and private organizations, has been working to improve young driver safety. In order to build on this effort, WTSC and DOL, along with the other member organizations have transitioned the Task Force into a new Action Council on Young Drivers. The Action Council meets at least quarterly to support statewide efforts to reduce fatalities and serious injuries among young drivers in Washington. The Action Council is also focused on developing and recommending legislative changes that will increase compliance with the IDL and expand driver training to newly licensed young adult drivers.
Parent involvement keeps kids safeParents play an integral role in keeping their kids safe on the road, as seen in GHSA’s Promoting Parent Involvement in Teen Driving report. This is why WTSC, DOL, WSP and other traffic safety partners are supporting programs and efforts that help parents educate their teen drivers. In 2015, DOL began providing a parent’s guide to new teen drivers at its licensing offices throughout the state. DOL has also worked closely with driver training schools to add a Parent Night at the beginning of each traffic safety education course. The goal is to help parents understand the requirements teen drivers face in getting their licenses.
Washington State Coalition to Reduce Underage Drinking (RUaD)The RUaD Coalition provides state-level leadership to reduce underage drinking by leveraging resources and strengthening communities in Washington State. Reducing underage access to alcohol is one way to curb young driver crashes involving impairment. The coalition goals are to:
| Analyze and disseminate information and, as appropriate, promote public or corporate policy changes (includes information on laws, ordinances, advertising, packaging, energy drink mixing, emerging issues, and others).
| Monitor pertinent legislation and rule-making. | Support youth influencers such as parents, caregivers,
educators, coaches, religious leaders, and other youth.RUaD’s StartTalkingNow.org program is based on research showing parents are a significant influence in a young person’s life. The program supports parents and other youth influencers such as coaches, religious leaders, and educators by providing information and resources that help youth make healthy choices and lead substance-free lives. Its “Let’s Draw the Line between Youth and Alcohol” (LDTL) program helps support groups across the state, mostly comprised of youth, carry out a variety of underage drinking prevention activities in their communities. The range of LDTL activities has included partnering with law enforcement, assessing local alcohol advertising, and promoting the positive, healthy norms most teens have.

Road
Use
rsRo
ad U
sers
121Washington State Strategic Highway Safety Plan 2016: Target Zero
Party Intervention Patrol addresses impairment and young driversPierce and Thurston Counties have implemented Party Intervention Patrol (PIP) projects that use multi-jurisdictional law enforcement teams to locate underage drinking parties. This project uses the core components of successful intervention programs: alcohol screening and motivational interviewing.
Immediate volunteer and professional support is provided to youths and their parents through an alcohol screening process known as brief intervention. Alcohol screenings and brief interventions, at a location other than the party, have been shown to successfully reduce future underage drinking (D’Onofrio and Degutis, 2004). Youth have the opportunity to meet one-on-one with chemical dependency professionals and receive referrals to relevant resources.
In advance of the PIP patrols, projects use media campaigns and news media outreach to publicize the patrols to both teens and their parents, in an effort to deter the behavior before it happens. Mass media campaigns are a proven countermeasure when combined with program activities. Alcohol compliance checks using underage decoys, citations, and rechecks of offending stores are also a part of the PIP program.

Road
Use
rs
Road Users
122 Road Users: Young Drivers 16-25 Involved
Strategies for reducing young driver involved (YDI) fatalities and serious injuriesObjective Strategies Implementation
areasYDI.1. Foster compliance
with Washington State’s IDL laws
YDI.1.1 Encourage Tribes to pass IDL laws. (P, CTW) Leadership/PolicyYDI.1.2 Provide resources to Young Driver Action Council to improve awareness — especially for
parents and teens — and compliance with the IDL law. Highlight high-risk situations where clear parental limit-setting will be most effective. (R, CTW)
Leadership/Policy
YDI.1.3 Promote increased enforcement of IDL by passing legislation requiring a sticker program to identify vehicles used by IDL license holders. (R, LIT)
Leadership/Policy
YDI.1.4 Provide local Target Zero Task Forces with information and materials about IDL for teens, parents, law enforcement, and driver education programs. (R, WTSC)
Education Leadership/Policy
YDI.2. Strengthen Intermediate Driver License restrictions
YDI.2.1 Adjust curfew to include 9 p.m. – 5 a.m., the hours when young driver serious injury and fatality crashes are highest. (P, CTW)
Leadership/Policy
YDI.2.2 Lengthen permit holding period beyond six months. (R, CTW) Leadership/PolicyYDI.2.3 Extend passenger restriction to one full year after licensed. (R, NCHRP) Leadership/PolicyYDI.2.4 Strengthen requirements for parents around the documentation and certification of the
50-hour behind-the-wheel time young drivers are to complete before licensure. (U)Leadership/Policy
YDI.2.5 Strengthen restrictions so penalties kick in with the first ticket IDL driver gets. (U) Leadership/PolicyYDI.3. Improve young
driver education and intervention
YDI.3.1 Review and revise the Driver Guide, testing process, curriculum guidelines, and training standards to construct an overall driver training package focused more on hazard identification and less on skill training. (R, CTW)
Leadership/Policy
YDI.3.2 Conduct a recidivism study to assess the impact of the DOL early warning letter program for 18- to 21-year-olds. (U)
Leadership/Policy
YDI.3.3 Consider expanding driver restrictions and driver education requirements to new drivers of all ages. (U)
Leadership/Policy
YDI.3.4 Update model traffic safety education curriculum to match NHTSA standards. (U) Leadership/PolicyYDI.3.5 Consider implementation of licensing standards used in countries with superior driving
statistics such as the United Kingdom. (U)Leadership/Policy
YDI.3.6 Promote teen/parent safe driving contract. (U) EducationP: Proven R: Recommended U: Unknown

Road
Use
rsRo
ad U
sers
123Washington State Strategic Highway Safety Plan 2016: Target Zero
Strategies for reducing young driver involved (YDI) fatalities and serious injuriesObjective Strategies Implementation
areasYDI.4. Improve
enforcement of high risk behaviors among young drivers
YDI.4.1 Conduct statewide high visibility enforcement and media campaigns focused on young drivers. (U)
Enforcement, Education
YDI.5. Enforce compliance with the state’s underage drinking law
YDI.5.1 Conduct well-publicized enforcement aimed at underage drinking parties. (R, CTW) Education, EnforcementYDI.5.2 Publicize and enforce underage drinking and driving laws. (R, CTW) Education
P: Proven R: Recommended U: Unknown

124 Road Users: Motorcyclists
Motorcycles represent just 4% of the registered passenger vehicles in Washington, but accounted for 17% of fatalities and 18% of serious injuries between 2012 and 2014. The federal government estimates that, per vehicle mile traveled in 2013, the number of deaths on motorcycles was over 26 times the number in cars. Washington’s rate of motorcycle fatalities is consistent with other states in the nation, so this problem is not unique to our state—but it is a troubling trend that deserves our attention. Washington is using education for both motorcycle operators and other drivers, as well as a focus on training and endorsement (licensing for motorcyclists), to address motorcycle fatalities and serious injuries.
Key FactsWashington has not seen any notable
reduction in motorcycle fatalities over the last decade. Neither measure is on track to
meet Target Zero goals by 2030.
Serious injuries, while showing a slight decline using five year rolling averages, have been essentially unchanged for the last five
years.
Training saves lives: about 60% of endorsed riders take a training course prior to riding
on their own; these trained riders are far less likely to be involved in fatalities, representing only 25% of those killed in
motorcycle crashes.
Motorcyclists
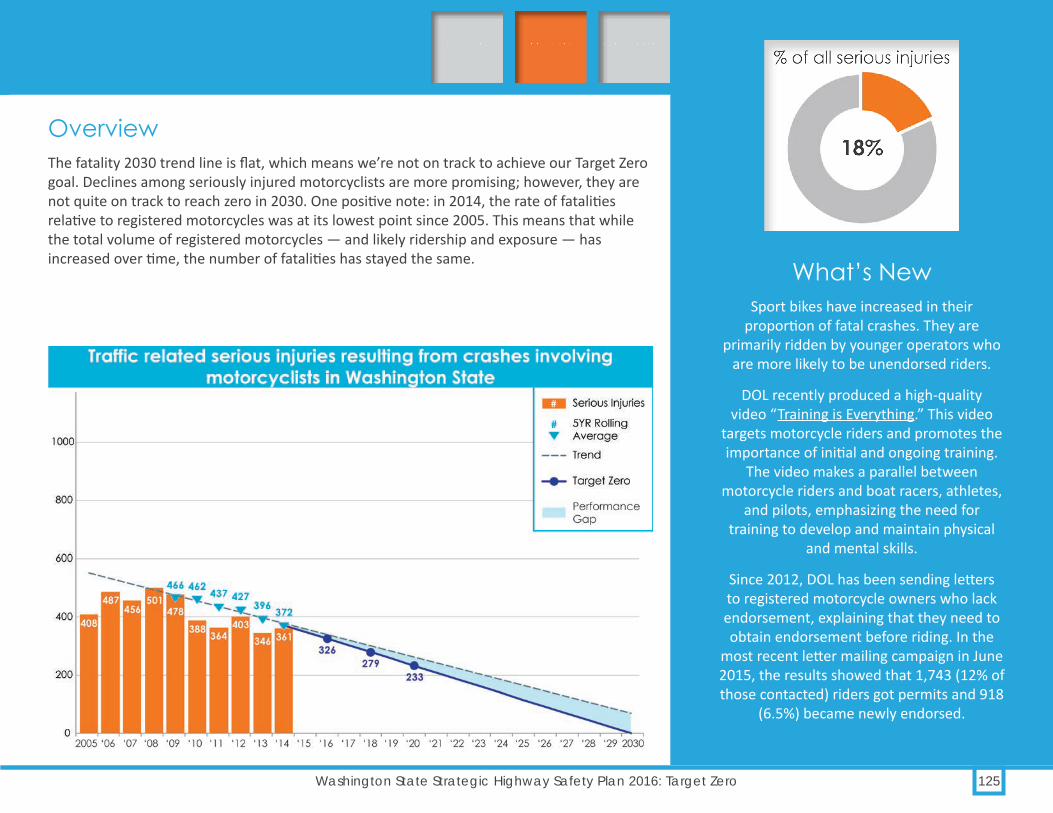
125Washington State Strategic Highway Safety Plan 2016: Target Zero
OverviewThe fatality 2030 trend line is flat, which means we’re not on track to achieve our Target Zero goal. Declines among seriously injured motorcyclists are more promising; however, they are not quite on track to reach zero in 2030. One positive note: in 2014, the rate of fatalities relative to registered motorcycles was at its lowest point since 2005. This means that while the total volume of registered motorcycles — and likely ridership and exposure — has increased over time, the number of fatalities has stayed the same.
What’s NewSport bikes have increased in their
proportion of fatal crashes. They are primarily ridden by younger operators who
are more likely to be unendorsed riders.
DOL recently produced a high-quality video “Training is Everything.” This video
targets motorcycle riders and promotes the importance of initial and ongoing training.
The video makes a parallel between motorcycle riders and boat racers, athletes,
and pilots, emphasizing the need for training to develop and maintain physical
and mental skills.
Since 2012, DOL has been sending letters to registered motorcycle owners who lack endorsement, explaining that they need to obtain endorsement before riding. In the
most recent letter mailing campaign in June 2015, the results showed that 1,743 (12% of those contacted) riders got permits and 918
(6.5%) became newly endorsed.
Priority 1
Priority 2
Priority 3

Motorcycle Types | Sport bikes: a general term describing high-
performance motorcycles designed to be ridden faster and more aggressively.
| Cruisers: a term for motorcycles that are bigger, heavier, and generally designed for long ride comfort. They are generally more expensive than sport bikes.
| Others: Similar vehicles that don’t fit in the two main categories, such as dual-sport, adventure, trikes, off-road, classics, and some others. It does not include mopeds or scooters.
Road
Use
rs
Road Users
126 Road Users: Motorcyclists
Motorcycles are riskier than automobilesRiding a motorcycle has inherent risks. Save for protective riding gear and helmets, a rider who crashes is completely exposed to the crash elements, unlike the car driver who has multiple safety mechanisms. It’s not a surprise that NHTSA calculates the risk of death on a motorcycle at 26 times that of automobiles.
Who’s involved in fatal motorcycle crashes? Motorcycle riders involved in fatal and serious injury crashes are primarily male, comprising 91% of the fatalities during 2012–2014.
At first glance, it appears that the distribution of fatalities by age is fairly evenly spread between age 21 and about 60. However, when we look at the type of motorcycle ridden by age, we see a distinct pattern emerge: younger operator deaths are far more likely to be associated with sport bikes, versus older riders and cruisers. Fatalities in the other category, meanwhile, are lesser in number and fairly evenly distributed across age groups. This discovery opens the door for targeted training and outreach programs to these specific demographics.
Challenges to motorcycle safety – and opportunities to influence those factorsThe common belief that most motorcycle crashes are caused by other motorists is inaccurate. In actuality, 75% of all 2012–2014 fatalities can be traced to causal factors committed by the motorcyclist. When we break this down by type of motorcycle, the risky nature of sport bikes again shows up — 86% of their fatalities were rider-caused. Looking at the 25% of the overall fatalities where the rider is not at fault, the data indicates that older riders are more likely to be the victim of others drivers’ errors.
Endorsement and training of operators is another factor. Currently, motorcycles may be purchased and registered in Washington without a valid motorcycle endorsement. This contributed to the fact that from 2012–2014, 36% of riders involved in fatal crashes were not endorsed to be riding a motorcycle.
The recreational nature of riding can help us target educational efforts. In general, motorcycle riders make the most of Washington’s good weather while putting their bikes away in wet, cold, and snowy weather, and fatality trends track that behavior.
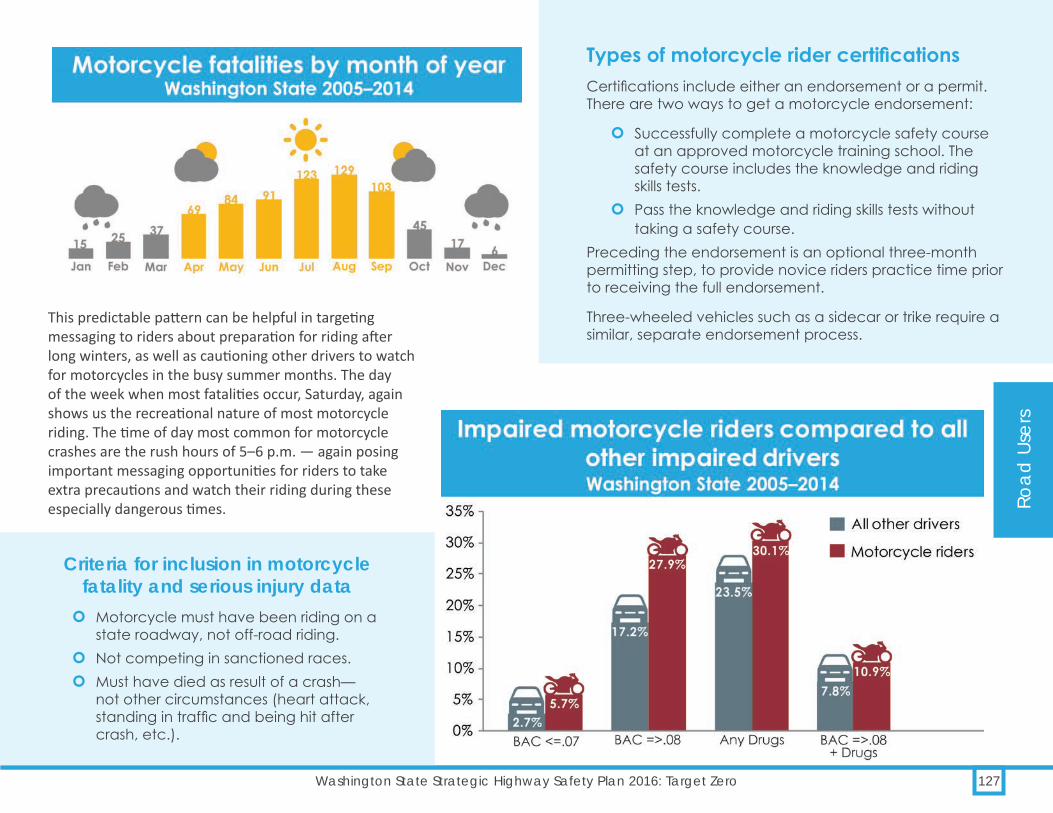
Types of motorcycle rider certificationsCertifications include either an endorsement or a permit. There are two ways to get a motorcycle endorsement:
| Successfully complete a motorcycle safety course at an approved motorcycle training school. The safety course includes the knowledge and riding skills tests.
| Pass the knowledge and riding skills tests without taking a safety course.
Preceding the endorsement is an optional three-month permitting step, to provide novice riders practice time prior to receiving the full endorsement.
Three-wheeled vehicles such as a sidecar or trike require a similar, separate endorsement process.
Road
Use
rsRo
ad U
sers
127Washington State Strategic Highway Safety Plan 2016: Target Zero
This predictable pattern can be helpful in targeting messaging to riders about preparation for riding after long winters, as well as cautioning other drivers to watch for motorcycles in the busy summer months. The day of the week when most fatalities occur, Saturday, again shows us the recreational nature of most motorcycle riding. The time of day most common for motorcycle crashes are the rush hours of 5–6 p.m. — again posing important messaging opportunities for riders to take extra precautions and watch their riding during these especially dangerous times.
Criteria for inclusion in motorcycle fatality and serious injury data | Motorcycle must have been riding on a
state roadway, not off-road riding. | Not competing in sanctioned races. | Must have died as result of a crash—
not other circumstances (heart attack, standing in traffic and being hit after crash, etc.).
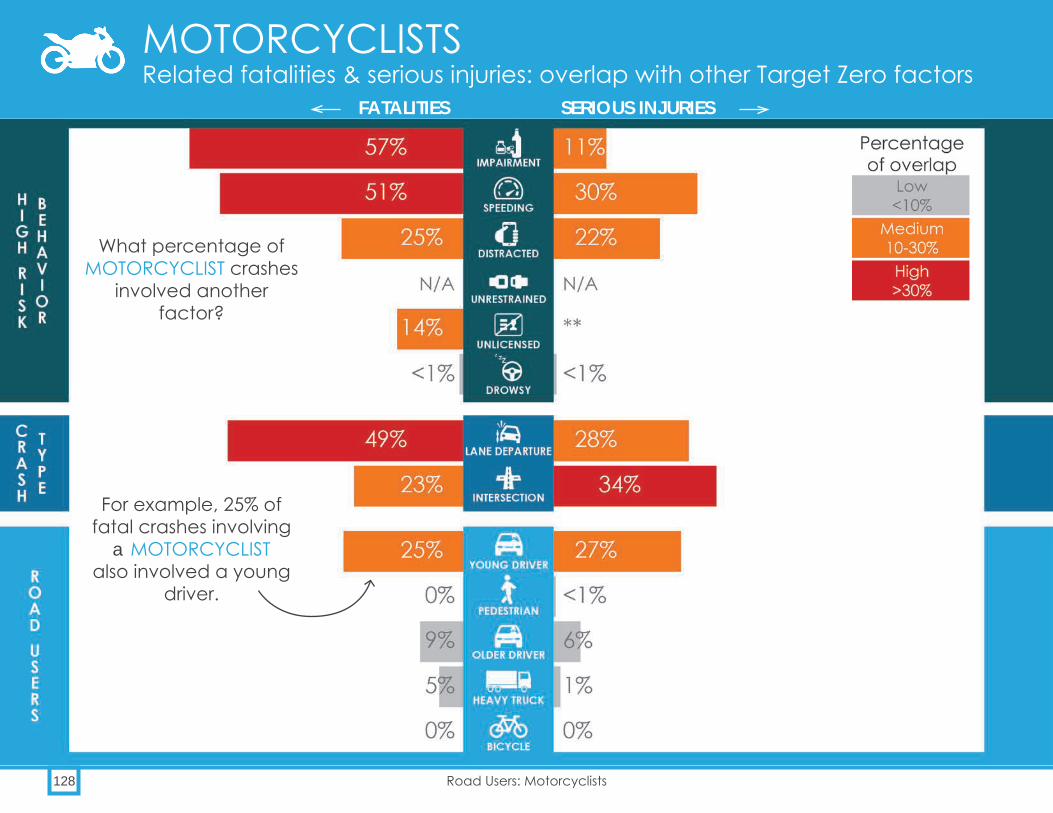
Road
Use
rs
Road Users
128 Road Users: Motorcyclists
Related fatalities & serious injuries: overlap with other Target Zero factorsMOTORCYCLISTS
What percentage of MOTORCYCLIST crashes
involved another factor?
FATALITIES SERIOUS INJURIES
For example, 25% of fatal crashes involving
a MOTORCYCLIST also involved a young
driver.

Road
Use
rsRo
ad U
sers
129Washington State Strategic Highway Safety Plan 2016: Target Zero
Contributing circumstances and factorsIn this 2012–2014 review, motorcycle riders were more prone to both alcohol impairment and drug positivity than all other drivers. Clearly substance abuse is a larger problem for the motorcycle community and efforts to address that should be a priority.
Endorsement is legally required in Washington. Despite this, 36% of the fatal crashes involved unendorsed motorcyclists who chose to ride without the proper credential and without any formal training.
To gain the motorcycle operator endorsement on one’s Washington State driver license, a rider can either pass a test by a licensed tester, or take a training course and receive a certificate of completion. Training is universally recognized as producing safer motorcycle operators, and the Motorcycle Safety Program at DOL strives to promote the training avenue for endorsement applicants. About 75% of fatal motorcycle crash victims have no record of a training program completion.
Washington has a strict law that requires all riders, regardless of age or motorcycle type, to wear a DOT compliant helmet. Only 8% of the riders involved in fatalities were not wearing helmets. Helmets are about 37% effective in preventing motorcycle deaths and about 67% effective in preventing brain injuries. This is important because there are annual challenges to Washington’s helmet laws by advocates wishing the law repealed. To reach zero fatalities and serious injuries, it is important that this law stay in place.
Percent of all fatal and serious injury crashes involving motorcyclists, by county (2012–2014)

Washington State laws relating to motorcyclists
RCW 46.37.530 Motorcycles — Helmets, other equipment.
RCW 46.81A Motorcycle skills education program.
RCW 46.61.608 Operating motorcycles on roadways laned for traffic.
RCW 46.61.610 Riding on motorcycles.
RCW 46.61.611 Motorcycles — Maximum height for handlebars.
RCW 46.61.612 Riding on motorcycles — Position of feet.
RCW 46.61.613 Motorcycle temporary suspension of restrictions for parades/public demonstrations.
RCW 46.61.614 Riding on motorcycles — Clinging.
Road
Use
rs
Road Users
130 Road Users: Motorcyclists
Programs and successes
Letters to unendorsed ownersEndorsement improves motorcycle safety by ensuring that riders have the minimum skills needed to ride. Since 2012, DOL has been sending letters to registered motorcycle owners who lack endorsement, explaining that they need to obtain endorsement before riding. In the most recent letter mailing campaign in June 2015, the results showed that 1,743 (12% of those contacted) riders got permits and 918 (6.5%) became newly endorsed. This reminder inspired many to become legally endorsed, and therefore a safer rider.
Raising driver awareness of motorcyclesIn 25% of fatal motorcycle crashes, an automobile driver is at fault. To raise driver awareness of motorcycles, DOL and WTSC collaborated to place “Look Twice — Save a Life” signs in rest stops around the state. They’ve been installed now for about three years and have been seen by countless motorists.
DOL also produced a high-quality video that has received critical acclaim worldwide and is being used with DOL’s approval in many state and national safety programs. The response to the driver awareness of motorcycles, A Second Look, has been astounding, with over 370,000 views on social media from the DOL website, as well as thousands of hits on numerous other websites. This video, along with supplemental training materials, is provided to all driver training schools in Washington, ensuring all new drivers received this critical information.
Encouraging training and impounding unendorsed riders’ motorcycles In 2012, DOL moved the motorcycle endorsement testing location for all applicant riders exclusively into DOL-approved training facilities. A benefit of this move was that it affords an opportunity to encourage applicants to take a training course, which is a known way to improve operator safety.
In 2007, Washington passed a law allowing law enforcement to impound a motorcycle being ridden by an unendorsed operator. In the following years, the data have shown a shift in the percent of riders opting to take training courses in order to become endorsed. Where the split was traditionally about 50/50, getting a training certificate versus testing only, the split is now about 60% trained and 40% testing only. Further, impounding the bikes of non-endorsed riders has been shown to increase the rate of motorcycle endorsement through training, mostly due to the motorcyclist’s desire to avoid having their motorcycle impounded — another benefit of the 2007 impound law.

Road
Use
rsRo
ad U
sers
131Washington State Strategic Highway Safety Plan 2016: Target Zero
Strategies for reducing motorcyclist (MCX) fatalities and serious injuriesObjective Strategies Implementation areas
MCX.1. Reduce numbers of unendorsed and untrained riders
MCX.1.1 Collaborate with dealers and manufacturers to promote motorcycle training and endorsement. (R, NCHRP)
Education
MCX.1.2 Increase number of riders participating in safety training. (U) EducationMCX.1.3 Provide training tuition incentives for riders’ completion of training. (U) EducationMCX.1.4 Conduct targeted safety/endorsement media outreach and education. (U) EducationMCX.1.5 Conduct outreach to motorcycle registration owners who are not endorsed.
(U)Education
MCX.1.6 Place emphasis on impoundment policy and education; change RCW 46.55.113 (2) from “officer may” to “officer will” impound. (U)
Education, Leadership/Policy
MCX.1.7 Increase opportunities for motorcyclist field training. (U ) EducationMCX.2. Reduce numbers of
impaired, unskilled, and unsafe riders
MCX.2.1 Lower the per se BAC limit for motorcycle riders from .08 to .05. (P, META) Leadership/PolicyMCX.2.2 Increase motorcyclist awareness of the risks of impaired motorcycle
operation. Promote self-policing within the motorcycle community by expanding existing prevention programs, including at specific motorcycle events. (R, NCHRP)
Education, Leadership/Policy
MCX.2.3 Re-establish a tiered endorsement program with specific endorsements based on motorcycle engine size. (U)
Leadership/Policy
MCX.2.4 Implement re-testing for endorsement every five years. (U) Enforcement, Leadership/PolicyMCX.2.5 Require novice rider training (including knowledge and skills testing) to
obtain permit. (U)Leadership/Policy
MCX.2.6 Implement mandatory on-street training and testing. (U) Leadership/PolicyMCX.3. Increase rider safety
awarenessMCX.3.1 Educate motorcyclists to increase their visibility to drivers by wearing bright
reflective clothing. (P, CTW)Education
MCX.4. Increase rider safety awareness
MCX.4.1 Support specialized law enforcement training in motorcycle DUI detection and motorcycle crash investigation. (R, CTW)
Education, Enforcement
MCX.4.2 Increase use of WSP aviation for enforcement of high risk behaviors. (U) EnforcementMCX.4.3 Mandatory motorcycle impound if riding without an endorsement. (U) EnforcementMCX.4.4 Maintain resistance to proposals to law changes that work to repeal MC
helmet safety standards. (U)Education, Enforcement
P: Proven R: Recommended U: Unknown
Continued on next page

Road
Use
rs
Road Users
132 Road Users: Motorcyclists
Strategies for reducing motorcyclist (MCX) fatalities and serious injuriesObjective Strategies Implementation areas
MCX.5. Engage stakeholders in improving motorcycle safety
MCX.5.1 Promote public forums to share/receive feedback concerning safety strategies and/or needs. (U)
Education, Leadership/Policy
MCX.5.2 Form a new working group similar to the Washington Impaired Driving Advisory Council (WIDAC) to include members from DOL, DOT, WTSC, WSP, Motorcycle Dealers association, motorcycle safety school contractors, members of the riding community. (U)
Education, Leadership/Policy
MCX.6. Strengthen and improve motorcycle laws to increase motorcycle safety
MCX.6.1 Promote the option for motorcyclists to take a safety class in lieu of a traffic ticket being added to his/her driving record. Currently some county courts offer drivers of other vehicles the option of traffic school to dismiss certain driving violations from their record and insurance. (U)
Education, Leadership/Policy
MCX.6.2 Require mandatory motorcycle insurance coverage—minimum of liability just as automobiles require. (U)
Leadership/Policy
P: Proven R: Recommended U: Unknown

Training saves lives: about 60% of endorsed riders take a training course prior to riding on their own; these trained riders are far less likely to be involved in fatalities, representing only 25% of those killed in motorcycle crashes.

134 Road Users: Pedestrians
In 2012–2014, pedestrian fatalities accounted for 15% of total traffic deaths, an increase from 14% in 2009–2011. The number of pedestrian fatalities increased by 5.2% and serious injuries increased by 3.5% compared to 2009–2011. The flat trend line in the graph below indicates that we are not on target to reach zero pedestrian fatalities by 2030.
There are a multitude of variables involved in pedestrian fatal and serious injury crashes. Getting to zero will take a variety of approaches. For example, strategies for roads with higher posted speeds will be different and require more of an iterative approach than those at lower speeds. Focusing on vehicle speed, pedestrian crossings, and visibility are key first steps to addressing deaths and serious injuries among pedestrians. Also important is enforcement to reduce driver distraction, education related to pedestrian impairment, and a greater awareness about pedestrian visibility and what we can do to avoid crashes.
Key FactsThe data show that 14% of fatalities occurred
on roads with a posted speed of 25 mph or less, 42% occurred on 30-35 mph roads, 17% on 40-45 mph roads, and 23% on roads with a posted
speed of 50 mph and above.
Most pedestrian fatalities (69%) and serious injuries (67%) happen within cities.
More than half (60%) of pedestrian fatalities and 62% of serious injuries occurred while the
pedestrian was crossing the road.
These percentages reflect a mix of how vehicle impact speed affects injury severity and how
crashes are more common where there are more conflicts. It points to the need to prioritize efforts
where the expected prevalence of pedestrians is highest. While less prominent, the two
behavioral factors most often sited when there were pedestrian fatalities are driver distraction
(32%) and pedestrian impairment (43%).
Pedestrians

135Washington State Strategic Highway Safety Plan 2016: Target Zero
Overview Almost all Washingtonians walk on a daily basis, even if it’s just between a parked car and a door. For the estimated 25% to 30% of Washington’s population who do not drive, however, walking is a necessary means of transportation. This includes children, people with disabilities, the elderly, and those who either cannot afford a vehicle, or choose not to own one. What’s New
In 2015, the legislature passed a law to create a pedestrian fatality and serious injury review panel charged with using data to find pedestrian crash patterns that Target Zero partners can address.
WSDOT awarded $30.2 million to 73 Pedestrian and Bicycle and Safe Routes to School projects for the 2015–2017 biennium, part of an all-time high for
walking and biking safety investments in Washington. WSDOT plans to contribute another $37.5 million in
the 2017–2019 biennium for these programs.
WSDOT has endorsed the Urban Streets and Bikeway Design Guides developed by the National Association
of City Transportation Officials (NACTO). Work continues to expand multi-modal networks and
reduce the design speed of roads, consistent with WSDOT’s Strategic Plan.
WSDOT revised its design manual in November 2015, part of a formal policy change which embraces the NACTO guides. This included updates allowing for changes to our roads based more on the context
and modal needs of the locations they pass through, rather than on a strict application of pre-determined
design criteria. This makes it easier to take speeds into account for all road users.
Priority 1
Priority 2
Priority 3

Getting to the target zero goal for pedestrians means focusing on three
aspects of exposureVolume exposure. Where there are higher numbers of pedestrians and vehicle traffic, there is a higher likelihood of conflicts between the two, and a higher potential for crashes. Most pedestrian fatalities (69%) and serious injuries (67%) happen within cities where the prevalence of pedestrians tends to be higher. The data also show the following pedestrian fatality percentage splits by posted speed: 14% at 25 mph or less, 42% at 30–35 mph, 17% at 40 –45 mph, and 23% at 50 mph and above. These percentages reflect a mix of the volume exposure and the severity exposure as defined below.
Severity exposure. The potential for fatal or serious injury increases as speed increases because the forces imparted on the pedestrian are much greater at higher speeds.
Exposure to event. Numerous factors may increase the exposure to events. Examples include:
| Drivers not being able to see a pedestrian. | The time that a pedestrian may be exposed to a
conflict, such as time to cross a street. | A pedestrian’s time to react to a vehicle: higher
speeds are more difficult for the pedestrian to judge the speed of the vehicle.
| Pedestrians crossing at unexpected locations; this makes it more difficult for the driver to perceive, react, and determine what action to take.
| Driver and pedestrian behaviors that reduce judgment capabilities, such as drugs and alcohol.
Many factors go into a safe environment for all pedestrians. The first major step toward pedestrian safety involves understanding that pedestrians’ characteristics are different from those of most other road users:
| People who walk are more vulnerable in motor vehicle crashes than motorists, who are protected by their vehicles.
| Pedestrians may include those who do not know or cannot follow the same rules of the road.
| Pedestrians are physically free to change direction quickly, and to go where vehicles cannot.
In addition to these unique characteristics, pedestrians are not physically constrained in their crossing locations. Many pedestrians are not willing to go out of their direct line of travel to cross at an intersection. State law allows pedestrians to cross outside of a crosswalk upon yielding the right of way to the other road users.
Finally, vehicle speed at impact is the leading factor in determining the extent of injury to a pedestrian in a crash.
Pedestrian injury and fatality rates in Washington need more studyBetween 2012 and 2014, there were 204 pedestrian fatalities and 906 serious injuries in Washington. Pedestrian fatalities represent 15% of total traffic deaths in the state. This percentage remains disproportionately high, given that national level data from 2009 show that pedestrians accounted for only 10.4% of all trips. The number of pedestrian crashes are not decreasing, and we are not on target to reach zero by 2030.
Unfortunately, we do not have more recent national data, nor Washington State-specific data, on the number of pedestrian trips. Currently, Target Zero partners are working to collect this data and to sponsor related research in order to gain a better understanding of how best to reduce pedestrian crashes. For example, WSDOT is funding the installation of permanent bicycle and pedestrian counters, and continuing support for the Pedestrian and Bicycle Documentation Project.
Road
Use
rs
Road Users
136 Road Users: Pedestrians

Road
Use
rsRo
ad U
sers
137Washington State Strategic Highway Safety Plan 2016: Target Zero
Driver actions and contributing factors (2012–2014)
Pedestrian contributing circumstances, action or factors (2012–2014)
Washington State laws relating to pedestrians
RCW 46.61.245 Driver responsibility to avoid colliding with any pedestrian.
RCW 46.61.235 Marked and unmarked crosswalks.
RCW 46.61.240 Pedestrian yield the right of way to vehicles at non-crosswalk locations.
RCW 46.61.050 Pedestrian responsibilities.
RCW 46.61.261 Drivers and bicyclists must yield to pedestrians on sidewalks and in crosswalks.
RCW 46.61.250 Pedestrians must use sidewalks, or walk on the side of the roadway or shoulder facing traffic.
RCW 46.61.235 No pedestrian or bicycle shall suddenly leave a curb and move into traffic so that the driver cannot stop.
RCW 46.61.526 Negligent driving and pedestrians and bicyclists.
RCW 46.61.415 (3)(a) Cities and towns may establish a maximum speed limit of 20 mph on certain roads.
Road
Use
rs
Road Users
138 Road Users: Pedestrians
Beyond this, the analysis for vehicle-pedestrian crashes brings to light the need for more data, better quality data, and a deeper understanding of the details involved in each crash. For example, it indicates a need to take a closer look at how traffic control at the crash location is recorded, the role of traffic control at pedestrian crashes, and how best to use that information to determine the types of places where more traffic control is needed. The currently available data show the following patterns.
Pedestrian fatalities occur most commonly to males and middle-aged peopleMore than two-thirds (69%) of pedestrians killed were male. The highest percent of pedestrian fatalities occurred among people between the ages of 46–55 (21%), followed by those aged 56–65 (17%).
Most pedestrian fatalities occur in the winter and fall, and in dark or duskMost pedestrian fatalities happen during the fall and winter, with 18% happening during the month of December. They are more prevalent during the early evening between 6 and 9 p.m. More than two-thirds (69%) occurred when it was dark or dusk.
Where do pedestrian fatalities and serious injuries occur? More than half (58%) of pedestrian fatalities and 50% of serious injuries occurred when the pedestrian was using the roadway as opposed to the shoulder, crosswalk, or sidewalk. Only three percent of pedestrian fatalities and serious injuries occurred when the pedestrian was using a sidewalk or walkway.
In terms of jurisdiction, most pedestrian fatalities (69%) and serious injuries (67%) happen within cities. Fatalities occurred 47% of the time on city streets, versus 35% of the time on state routes (some of which are inside cities) and 16% of the time on county roads. Serious injuries occurred 64% of the time on city streets, 25% of the time on state routes, and 10% of the time on county roads. Given the prevalence of pedestrians in urban areas, the overrepresentation of cities in pedestrian fatality and serious injury data is not surprising.

Road
Use
rsRo
ad U
sers
139Washington State Strategic Highway Safety Plan 2016: Target Zero
Roadway characteristic (2012–2014)
More investigation is needed to better understand how traffic control at the crash location is recorded, the role of traffic control at pedestrian crashes and how best to use the information to determine the types of places where more traffic control is needed.

Road
Use
rs
Road Users
140 Road Users: Pedestrians
Related fatalities & serious injuries: overlap with other Target Zero factorsPEDESTRIANS
What percentage of crashes involving PEDESTRIANS also involved another
factor?
FATALITIES SERIOUS INJURIES
For example, 33% of fatal crashes
involving PEDESTRIANS also involved an
intersection.

Road
Use
rsRo
ad U
sers
141Washington State Strategic Highway Safety Plan 2016: Target Zero
Percent of fatal and serious injury crashes involving pedestrians, by county (2012–2014)
Contributing circumstances and factorsThere are many variables involved in pedestrian fatal and serious injury crashes. The most common road characteristics of these crashes are a posted speed above 25 mph, and a lack of traffic control (no signals, stop signs, yield signs, or flashing beacons) at the location. The most common road type is a two-way undivided road with two or more lanes. The most common driver action is traveling straight ahead, and the most common pedestrian action is crossing the street. Other important contributing behavioral factors most often sited when there were pedestrian fatalities are driver distraction and pedestrian impairment.
Getting to zero pedestrian fatalities and serious injuries requires engineering that emphasizes how speeds, visibility, and roadway/roadside traffic features affect pedestrians. The challenge is in providing engineering improvements for pedestrian safety while meeting the needs of other road users and transportation priorities. A zero-based strategy will also:
| Use enforcement and education. | Focus on those locations based on land use context where people are most likely to walk. | Include consideration for an emphasis on countermeasures that reduce the likelihood of a pedestrian’s death in the
event of a vehicle/pedestrian crash. Ideally if a pedestrian makes a mistake, the consequences would not result in death or serious injury. A safe system approach does not place blame on the individual making the mistake; rather the system should attempt to address the potential consequence should error occur.
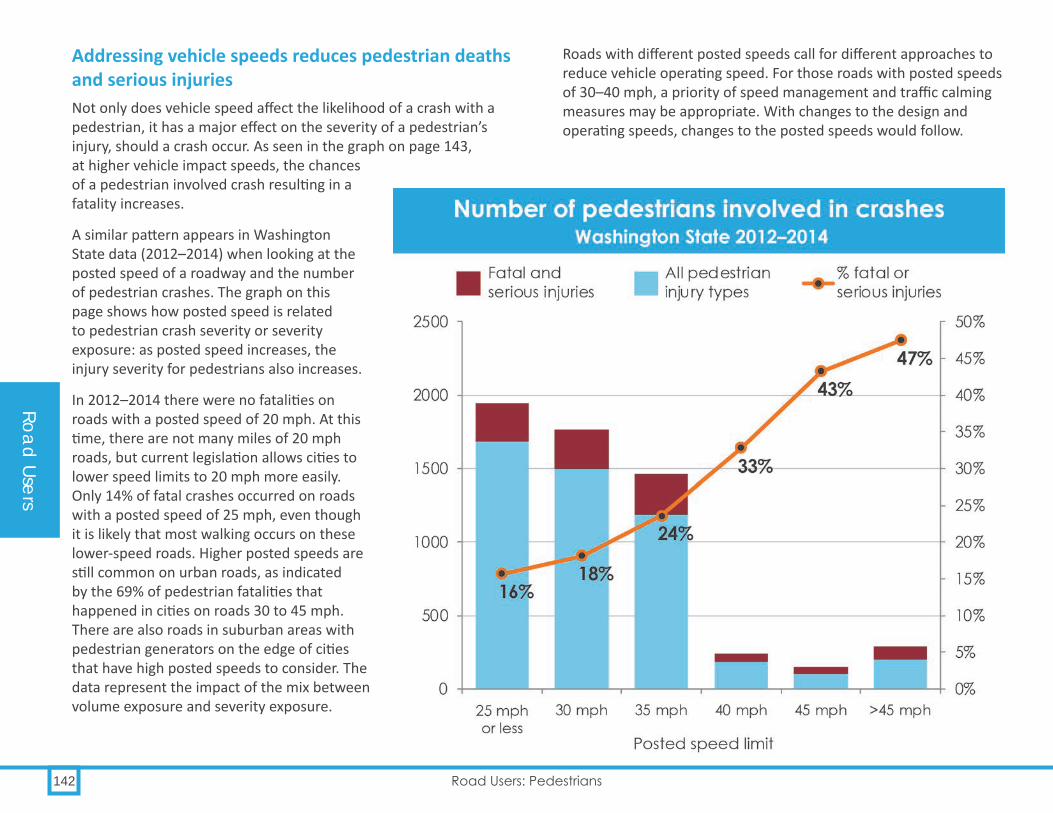
Road
Use
rs
Road Users
142 Road Users: Pedestrians
Addressing vehicle speeds reduces pedestrian deaths and serious injuriesNot only does vehicle speed affect the likelihood of a crash with a pedestrian, it has a major effect on the severity of a pedestrian’s injury, should a crash occur. As seen in the graph on page 143, at higher vehicle impact speeds, the chances of a pedestrian involved crash resulting in a fatality increases.
A similar pattern appears in Washington State data (2012–2014) when looking at the posted speed of a roadway and the number of pedestrian crashes. The graph on this page shows how posted speed is related to pedestrian crash severity or severity exposure: as posted speed increases, the injury severity for pedestrians also increases.
In 2012–2014 there were no fatalities on roads with a posted speed of 20 mph. At this time, there are not many miles of 20 mph roads, but current legislation allows cities to lower speed limits to 20 mph more easily. Only 14% of fatal crashes occurred on roads with a posted speed of 25 mph, even though it is likely that most walking occurs on these lower-speed roads. Higher posted speeds are still common on urban roads, as indicated by the 69% of pedestrian fatalities that happened in cities on roads 30 to 45 mph. There are also roads in suburban areas with pedestrian generators on the edge of cities that have high posted speeds to consider. The data represent the impact of the mix between volume exposure and severity exposure.
Roads with different posted speeds call for different approaches to reduce vehicle operating speed. For those roads with posted speeds of 30–40 mph, a priority of speed management and traffic calming measures may be appropriate. With changes to the design and operating speeds, changes to the posted speeds would follow.
Number of pedestrians involved in crashes

Road
Use
rsRo
ad U
sers
143Washington State Strategic Highway Safety Plan 2016: Target Zero
For roads with speed limits above 40 mph, the most critical first steps are addressing the issues of separation, exposure, and reduction in conflicts. Addressing pedestrian crash and injury reduction on roads with posted speeds between 45–50 mph would include a more iterative approach, beginning with an emphasis on pedestrian/vehicle separation. For roads with posted speeds higher than 50 mph, other techniques to reduce the possibility of conflicts may be needed. Separate countermeasures will need to be developed for limited access roads. This is an area for further investigation to help pinpoint solutions. All of these efforts will be most successful if done in combination with education and enforcement to highlight the importance of lower speeds and to achieve compliance with the target speed limit.
Addressing road crossings for pedestrians More than half of fatal and serious injury pedestrian crashes occurred while the pedestrian was crossing the street. Many of these were not at marked crossings. An increase in the frequency of crosswalks and increasing the frequency of use of these crossings by pedestrians will help to address these crashes.
Enhanced crosswalk treatments include:
| Median islands. | Rectangular rapid flashing beacons. | Roundabouts are highly effective as they are designed
to lower entering and exiting speeds, reduce pedestrian exposure with crossing islands, and provide clear views of pedestrians entering the roundabout. There were no pedestrian fatalities or serious injuries at roundabouts from 2012-2014.
| A traffic signal pedestrian phase leading interval, which allows for the pedestrian to get a head start into the intersection before the light turns green for the motor vehicles.
| A pedestrian “scramble” phase, which allows for the pedestrian to cross the street while all other traffic is stopped.
| Curb extensions.Road re-configurations (also known as road diets, which reduce the number and/or width of travel lanes), reductions to turning radii, and right-turn-on-red restrictions are other measures that have been shown to reduce vehicle speeds and improve pedestrian crossing safety.
Ped Injury
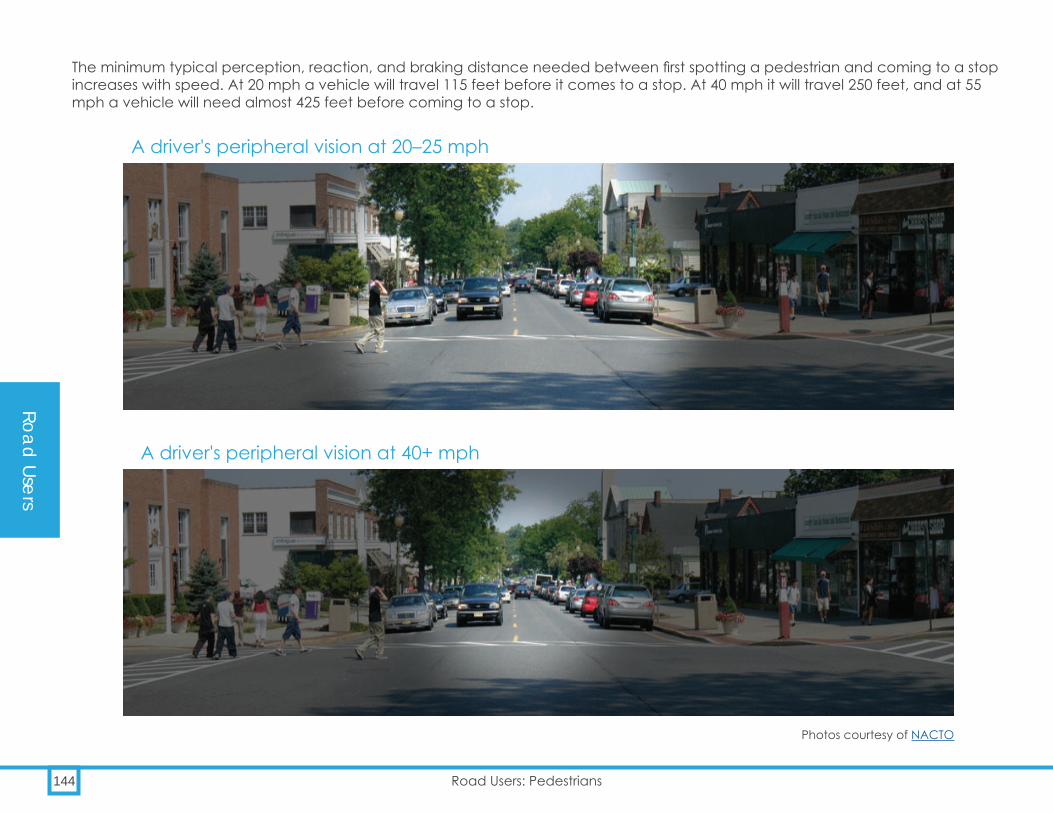
Road
Use
rs
Road Users
144 Road Users: Pedestrians
The minimum typical perception, reaction, and braking distance needed between first spotting a pedestrian and coming to a stop increases with speed. At 20 mph a vehicle will travel 115 feet before it comes to a stop. At 40 mph it will travel 250 feet, and at 55 mph a vehicle will need almost 425 feet before coming to a stop.
Photos courtesy of NACTO
A driver's peripheral vision at 20–25 mph
A driver's peripheral vision at 40+ mph
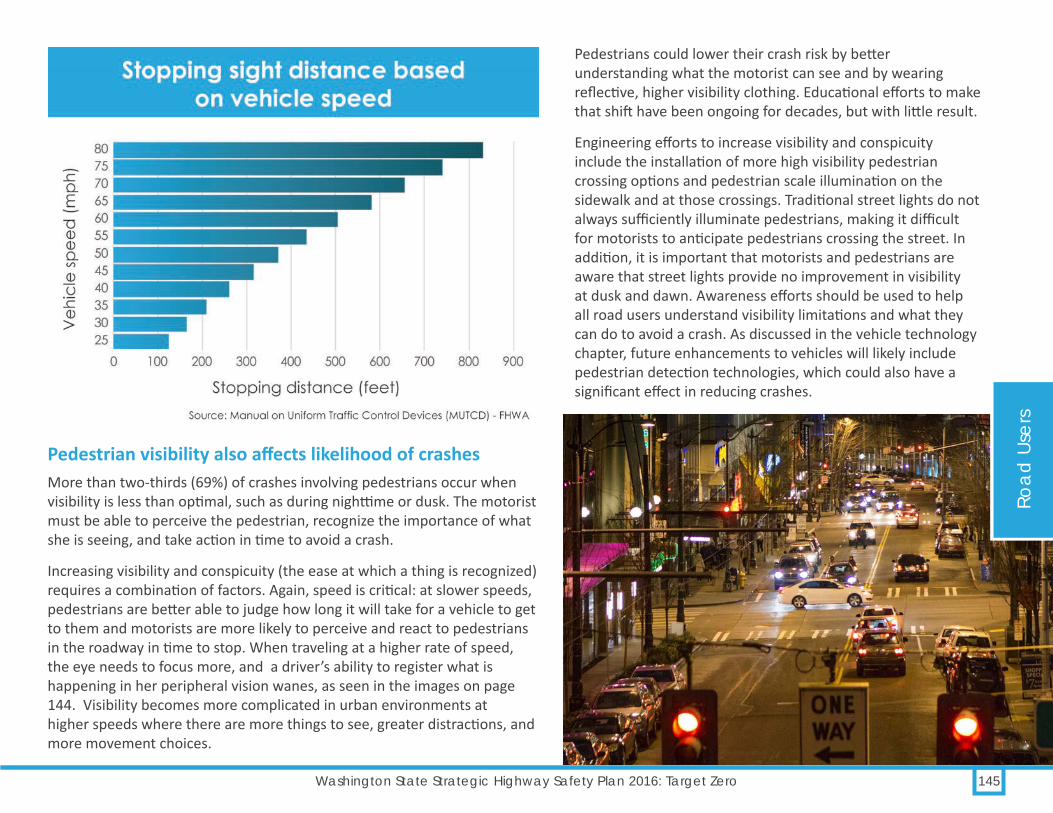
Road
Use
rsRo
ad U
sers
145Washington State Strategic Highway Safety Plan 2016: Target Zero
Pedestrian visibility also affects likelihood of crashes More than two-thirds (69%) of crashes involving pedestrians occur when visibility is less than optimal, such as during nighttime or dusk. The motorist must be able to perceive the pedestrian, recognize the importance of what she is seeing, and take action in time to avoid a crash.
Increasing visibility and conspicuity (the ease at which a thing is recognized) requires a combination of factors. Again, speed is critical: at slower speeds, pedestrians are better able to judge how long it will take for a vehicle to get to them and motorists are more likely to perceive and react to pedestrians in the roadway in time to stop. When traveling at a higher rate of speed, the eye needs to focus more, and a driver’s ability to register what is happening in her peripheral vision wanes, as seen in the images on page 144. Visibility becomes more complicated in urban environments at higher speeds where there are more things to see, greater distractions, and more movement choices.
Pedestrians could lower their crash risk by better understanding what the motorist can see and by wearing reflective, higher visibility clothing. Educational efforts to make that shift have been ongoing for decades, but with little result.
Engineering efforts to increase visibility and conspicuity include the installation of more high visibility pedestrian crossing options and pedestrian scale illumination on the sidewalk and at those crossings. Traditional street lights do not always sufficiently illuminate pedestrians, making it difficult for motorists to anticipate pedestrians crossing the street. In addition, it is important that motorists and pedestrians are aware that street lights provide no improvement in visibility at dusk and dawn. Awareness efforts should be used to help all road users understand visibility limitations and what they can do to avoid a crash. As discussed in the vehicle technology chapter, future enhancements to vehicles will likely include pedestrian detection technologies, which could also have a significant effect in reducing crashes.

Road
Use
rs
Road Users
146 Road Users: Pedestrians
Pedestrian impairment calls for a focus on the motorist’s ability to see and react in time to prevent a fatalityPedestrian impairment is an important factor contributing to the high number of pedestrian traffic deaths in Washington State. In addition to educational efforts to prevent risk among impaired pedestrians, roadway modifications can help motorists see and react in time to prevent a fatal crash. These roadway modifications can include countermeasures such as providing enhanced pedestrian scale illumination and visibility features, coupled with traffic calming and reductions in road design speeds as discussed previously. Some pedestrian design options also exist, such as using decorative railing as means of guiding pedestrians to a more appropriate crossing location. Other interventions that might be helpful include:
| Education to increase awareness of the risks of impaired walking.
| Providing transit or taxi subsidies. | Enforcement efforts to reduce speeding, distracted driving,
and motorist impairment.
Equity: pedestrian facilities in lower-income neighborhoods often require improvementNational pedestrian fatality rates (deaths per 100,000 people) in lower-income neighborhoods are twice as high as in other neighborhoods. For this research, lower-income neighborhoods are those in the bottom third of census tracts, in terms of per capita income. Pedestrian safety issues tend to affect a higher percent of people living in poverty, which includes an overrepresentation of people who are minorities, the elderly, and people with disabilities. Pedestrian facilities are not always available in lower income neighborhoods where pedestrian activity is likely higher due to fewer transportation choices. This results in higher volumes of pedestrians with fewer opportunities to safely and securely walk as part of daily routines.
Identifying and addressing these challenges will lower pedestrian crash risk in lower-income neighborhoods, increasing opportunities for these underserved populations to safely access their jobs, community resources, and healthy food.
Next steps for improving pedestrian safety in Washington StateReducing pedestrian fatal and serious injury crashes requires collaboration by engineering, education, enforcement, and evaluation experts. This includes:
| Better designs for safer speeds for all road users. | Enforcement to reduce speed. | Improved design to protect pedestrians. | Education of drivers and pedestrians. | Improved data collection on pedestrian numbers and
locations.

Road
Use
rsRo
ad U
sers
147Washington State Strategic Highway Safety Plan 2016: Target Zero
Programs and successes
Seattle school zone photo enforcement is convincing drivers to ease off on the pedalThe City of Seattle has invested in the installation of 14 school zone speed enforcement cameras. They selected sites based on speed and volume of traffic. Average violations cited per camera per day have steadily declined between December 2012 and December 2014.
Plus, 90% of people who were ticketed by these cameras never got another ticket, which means that the cameras are working to change behavior and make school zones safer. Revenue from violations was reinvested in additional school zone safety improvements.
“Stickman Knows” campaign improve traffic safety in SpokaneSpokane Regional Health District implemented the “Stickman Knows” safety education campaign, targeted to pedestrians, bicyclists, and motorists. The campaign emphasized traffic safety rules and tips for all users of the road to increase personal safety behaviors and reduce crashes. The media component included:
| TV commercials. | Billboard and bus advertising. | Print ads. | Promotional items. | Earned media. | The presence of Stickman Knows at community events, in
neighborhoods, and in school.Overall, the campaign was successful, with evaluations showing that residents who were exposed to the campaign know more about pedestrian, bicyclist, and motorist traffic safety. http://www.stickmanknows.org/
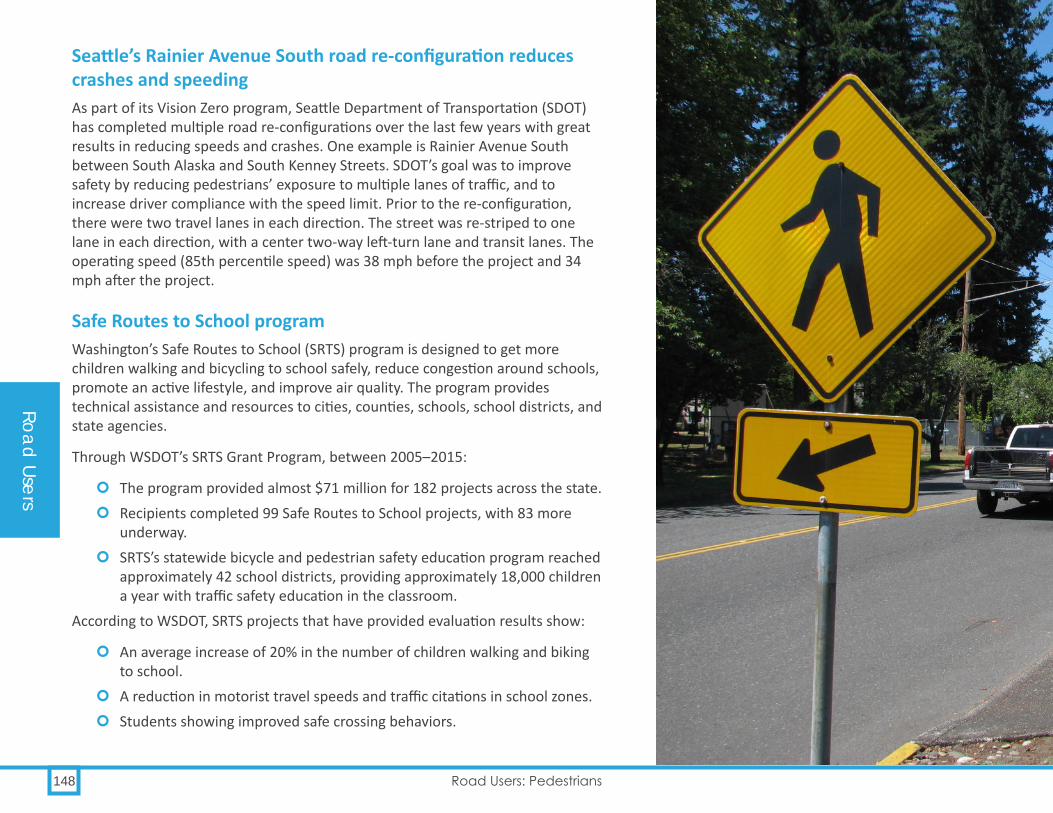
Road
Use
rs
Road Users
148 Road Users: Pedestrians
Seattle’s Rainier Avenue South road re-configuration reduces crashes and speeding As part of its Vision Zero program, Seattle Department of Transportation (SDOT) has completed multiple road re-configurations over the last few years with great results in reducing speeds and crashes. One example is Rainier Avenue South between South Alaska and South Kenney Streets. SDOT’s goal was to improve safety by reducing pedestrians’ exposure to multiple lanes of traffic, and to increase driver compliance with the speed limit. Prior to the re-configuration, there were two travel lanes in each direction. The street was re-striped to one lane in each direction, with a center two-way left-turn lane and transit lanes. The operating speed (85th percentile speed) was 38 mph before the project and 34 mph after the project.
Safe Routes to School programWashington’s Safe Routes to School (SRTS) program is designed to get more children walking and bicycling to school safely, reduce congestion around schools, promote an active lifestyle, and improve air quality. The program provides technical assistance and resources to cities, counties, schools, school districts, and state agencies.
Through WSDOT’s SRTS Grant Program, between 2005–2015:
| The program provided almost $71 million for 182 projects across the state. | Recipients completed 99 Safe Routes to School projects, with 83 more
underway. | SRTS’s statewide bicycle and pedestrian safety education program reached
approximately 42 school districts, providing approximately 18,000 children a year with traffic safety education in the classroom.
According to WSDOT, SRTS projects that have provided evaluation results show:
| An average increase of 20% in the number of children walking and biking to school.
| A reduction in motorist travel speeds and traffic citations in school zones. | Students showing improved safe crossing behaviors.

Road
Use
rsRo
ad U
sers
149Washington State Strategic Highway Safety Plan 2016: Target Zero
Strategies for reducing pedestrian (PED) fatalities and serious injuriesObjective Strategies Implementation areas
PED.1. Align vehicle speeds with the adjacent land use and context to reflect the needs of all users.
PED.1.1 Revise design practices to emphasize context and target speed to reflect the needs of all road users. (R) (P, AASHTO)
Engineering/Policy
PED.1.2 Use roadway design features to change operating speeds to support reduction in posted speeds. (P, NCHRP)
Engineering
PED.1.3 Use enforcement and speed feedback signs to help motorists change speeding behavior. (R, NCHRP)
Enforcement
PED.2. Improve pedestrian safety awareness and behaviors
PED.2.1 Promote the use of reflective apparel among pedestrians. (R, CTW) EducationPED.2.2 Educate pedestrians about the risks of distracted walking. (U) EducationPED.2.3 Conduct communication and outreach efforts, including using the proven Brief
Intervention and Screening approach to contact crash-involved impaired pedestrians, as well as with law enforcement agencies, alcohol servers, social and health service providers to reduce impairment as a factor in pedestrian-involved crashes. (U)
Education
PED.1.4 Increase public awareness of the significance of speed on pedestrian injury severity. (R, CTW)
Education
PED.3. Increase enforcement of laws pertaining to pedestrians
PED.3.1 Implement pedestrian safety zones, targeting geographic locations and audiences with pedestrian crash concerns. (P, CTW)
Education, Enforcement, Engineering
PED.3.2 Expand targeted crosswalk enforcement and education for both motorists and pedestrians. (R, CTW)
Education, Enforcement
PED.3.3 Improve training on pedestrian laws for law enforcement officers at state, Tribal, and local levels. (R)
Education
P: Proven R: Recommended U: Unknown

Road
Use
rs
Road Users
150 Road Users: Pedestrians
Strategies for reducing pedestrian (PED) fatalities and serious injuriesObjective Strategies Implementation areas
PED.4. Expand and improve pedestrian facilities
PED.4.1 Improve safety at pedestrian crossings by investing in and installing refuge islands, and shortening crossing distances with curb extensions where these crosswalk enhancements are needed. (P, NCHRP)
Engineering
PED.4.2 Invest in and increase the use of rectangular rapid flashing beacons and pedestrian hybrid beacons where these crosswalk enhancements are needed. (R, CMF)
Engineering
PED.4.3 Implement programs that improve the built environment. Solutions should focus on appropriate zoning, and pedestrian connections to public transit. (R, LIT)
Engineering and land use planning
PED.4.4 Improve sight distance and visibility at pedestrian crossings by clearing vegetation, extending crossing times, adding pedestrian leading intervals or adding pedestrian scale illumination. At midblock location provide adequate distance between stop bars and the crossing. (R, CMF, NCHRP).
Engineering
PED.4.5 Implement Complete Streets policies to provide for all modes of transportation. (R, NCSC) Leadership/Policy, EngineeringPED.4.6 Invest in and construct roadway reconfigurations, round-abouts and other FHWA proven
safety countermeasures specific to pedestrian safety. (P, FHWA)Engineering
PED.4.7 Provide for more frequent pedestrian crossing opportunities. (U) EngineeringPED.4.8 Invest in and construct separated pedestrian facilities (sidewalks and multi-use paths). (P,
NCHRP)Engineering
PED.5. Improve safety for children walking to school
PED.5.1 Expand high visibility speed enforcement in school zones, including automated speed photo enforcement. (R, P, CTW)
Education, Enforcement
PED.5.2 Implement middle school pedestrian and bicycle safety training curricula in schools. (U) EducationPED.5.3 Apply consistent signing and other pedestrian crossing features in school zones as
appropriate (based on the number of lanes, speeds, age of pedestrians, etc.). (R, FHWA)Engineering
PED.5.4 Distribute and encourage the use of School Walk and Bike Routes: A Guide for Planning and Improving Walk and Bike to School Options for Students to assist schools in creating school walk route maps. (R, WSDOT)
Education, Engineering
PED.5.5 Encourage school districts to implement appropriate elements of the Safe Routes to School program, including walking campaigns such as Walking School Buses. (U)
Education, Engineering
PED.5.6 Invest in and implement the Safe Routes to School Program to construct pedestrian and bicycle facilities near schools. (U)
Engineering
PED.6. Improve data and performance measures
PED.6.1 Collect miles walked data (similar to collecting VMT); continue to track pedestrian counts through Washington’s Pedestrian and Bicycle Documentation Project. (R, DDACTS)
Leadership/Policy
P: Proven R: Recommended U: Unknown

More than half (57%) of pedestrian fatalities and 67%
serious injuries occurred while the
pedestrian was crossing the road.
In 2012–2014 there were no pedestrian fatalities on roads
with a posted speed of 20 mph.

152 Road Users: Older Drivers 70+ Involved
Between 2012–2014, drivers aged 70 and older were involved in 12% of all traffic fatalities and 8.6% of all serious injuries, while they represented 10% of the state licensed drivers. The elderly driving population in Washington State is projected to expand greatly in the coming years. By 2030, citizens over 70 will reach 1.3 million — nearly double the size of today’s over-70 population. This demographic change presents public safety challenges that will require new approaches for an aging population.
Key FactsWashington’s elderly driving population is
growing dramatically. The population of those aged 70 and over is expected to grow 94%, from
661,000 today to almost 1.3 million by 2030. By contrast, our young adult population aged 17–22 is expected to grow by only 8% during
this same time period.
Even though older drivers are involved in fewer crashes than young drivers, they are more likely
to be at fault than middle-aged drivers, and the crashes they are involved in are far more
likely to result in serious injury or death — most commonly, their own.
Older drivers routinely give up their driver licenses voluntarily. Only 56% of those aged 85+ have a driver license, compared to nearly 100%
for those age 25–54.
Older Drivers 70+ Involved
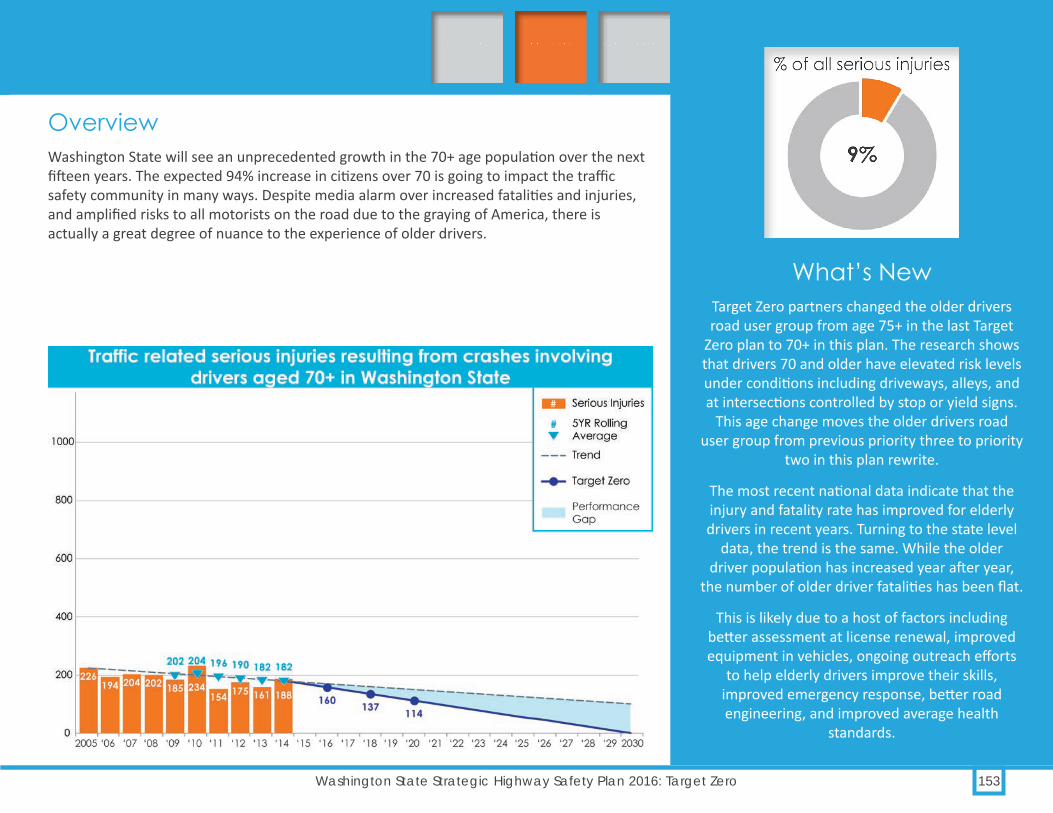
153Washington State Strategic Highway Safety Plan 2016: Target Zero
OverviewWashington State will see an unprecedented growth in the 70+ age population over the next fifteen years. The expected 94% increase in citizens over 70 is going to impact the traffic safety community in many ways. Despite media alarm over increased fatalities and injuries, and amplified risks to all motorists on the road due to the graying of America, there is actually a great degree of nuance to the experience of older drivers.
What’s NewTarget Zero partners changed the older drivers road user group from age 75+ in the last Target
Zero plan to 70+ in this plan. The research shows that drivers 70 and older have elevated risk levels under conditions including driveways, alleys, and at intersections controlled by stop or yield signs.
This age change moves the older drivers road user group from previous priority three to priority
two in this plan rewrite.
The most recent national data indicate that the injury and fatality rate has improved for elderly drivers in recent years. Turning to the state level
data, the trend is the same. While the older driver population has increased year after year,
the number of older driver fatalities has been flat.
This is likely due to a host of factors including better assessment at license renewal, improved equipment in vehicles, ongoing outreach efforts
to help elderly drivers improve their skills, improved emergency response, better road engineering, and improved average health
standards.
Priority 1
Priority 2
Priority 3

Road
Use
rs
Road Users
154 Road Users: Older Drivers 70+ Involved
Older drivers are involved in fewer crashes, but are more likely to be in fatal or serious crashes Despite significant media attention to elderly drivers, younger drivers are responsible for far more crashes on Washington’s roadways. In fact, drivers aged 70+ make up 10% of the driving population and account for 6% of all crashes. Younger drivers aged 16–34, on the other hand, make up 31% of the driving population and account for 45% of crashes.
Even though elderly drivers are involved in fewer crashes, drivers aged 70–79 are two times more likely to be at fault when they are in a crash compared to drivers aged 30–69. It’s even higher for drivers over 80 years of age, who are four times more likely to be at fault. And due to their frailty from aging, the crashes are far more likely to result in their own serious injury or death.
Crash Involvement Ratio (CIR)The method used to determine risk level is a ratio of at-fault to not-at-fault drivers for various crash types for each age group. This is called the Crash Involvement Ratio or CIR. Values lower than 1.0 indicate lower than average rates of at-fault crashes, and higher than 1.0 represent higher at-fault rates.
Older drivers are prone to make driving errors which become more pronounced as they age. Overall, FARS data indicate that drivers 60 to 69 had a CIR of 0.75, indicating a below-average risk of being found at fault in a crash. This risk increased to 1.75 for drivers 70 to79, and to 4.0 for those 80 and older, indicating a growing problem of risk as drivers age.
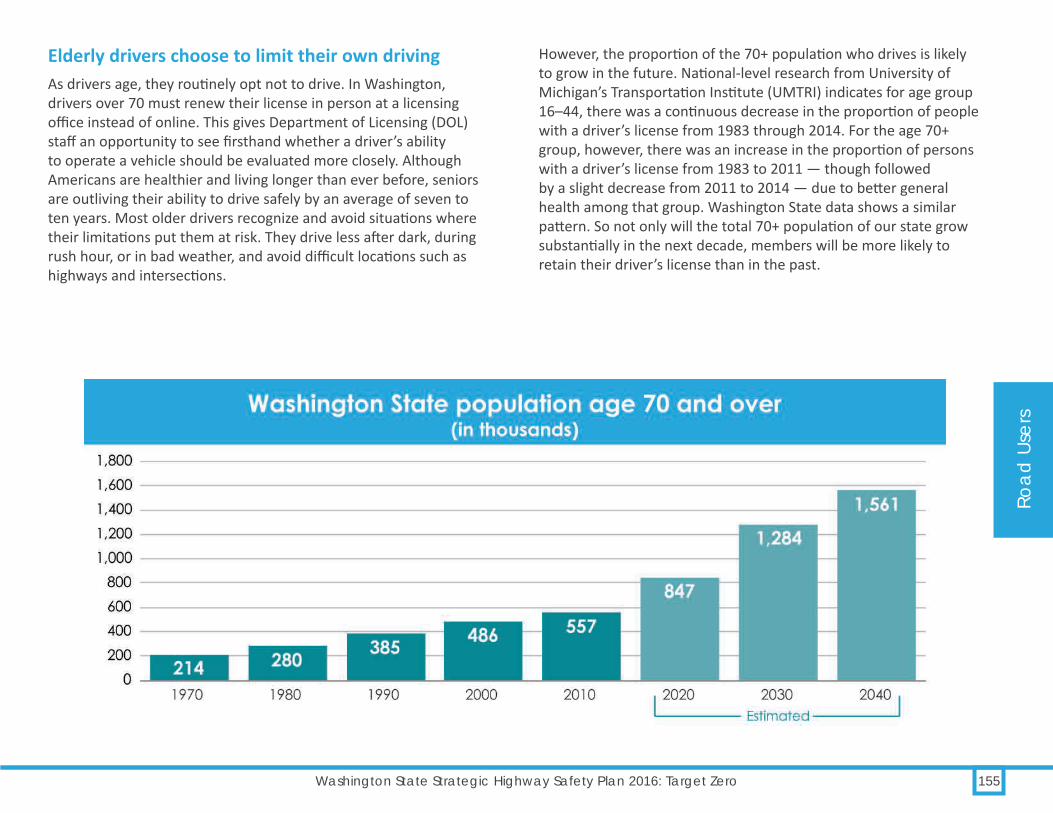
Road
Use
rsRo
ad U
sers
155Washington State Strategic Highway Safety Plan 2016: Target Zero
Elderly drivers choose to limit their own drivingAs drivers age, they routinely opt not to drive. In Washington, drivers over 70 must renew their license in person at a licensing office instead of online. This gives Department of Licensing (DOL) staff an opportunity to see firsthand whether a driver’s ability to operate a vehicle should be evaluated more closely. Although Americans are healthier and living longer than ever before, seniors are outliving their ability to drive safely by an average of seven to ten years. Most older drivers recognize and avoid situations where their limitations put them at risk. They drive less after dark, during rush hour, or in bad weather, and avoid difficult locations such as highways and intersections.
However, the proportion of the 70+ population who drives is likely to grow in the future. National-level research from University of Michigan’s Transportation Institute (UMTRI) indicates for age group 16–44, there was a continuous decrease in the proportion of people with a driver’s license from 1983 through 2014. For the age 70+ group, however, there was an increase in the proportion of persons with a driver’s license from 1983 to 2011 — though followed by a slight decrease from 2011 to 2014 — due to better general health among that group. Washington State data shows a similar pattern. So not only will the total 70+ population of our state grow substantially in the next decade, members will be more likely to retain their driver’s license than in the past.

Road
Use
rs
Road Users
156 Road Users: Older Drivers 70+ Involved
Related fatalities & serious injuries: overlap with other Target Zero factorsOLDER DRIVERS (70+)
What percentage of OLDER DRIVER crashes involved another factor?
FATALITIES SERIOUS INJURIES
For example, 49% of fatal crashes involving
an OLDER DRIVER also involved a lane
departure.

Road
Use
rsRo
ad U
sers
157Washington State Strategic Highway Safety Plan 2016: Target Zero
Rates of older driver involved crashes have droppedAlong with voluntary surrender of their licenses, elderly drivers have reduced their number of fatal crashes in recent years, by both number of licensed drivers and by miles driven. A recent report from the Insurance Institute for Highway Safety (IIHS) compared trends for drivers ages 70+ with those for drivers aged 35–54 for national fatal passenger vehicle crash involvement. No matter how they looked at the fatal crash data for this age group — by licensed drivers or miles driven — the fatal crash involvement rates for drivers 70+ declined, and did so at a faster pace than the rates for drivers ages 35–54.
Contributing circumstances and factorsYielding maneuvers, intersections in general, and left turns are especially problematic for the elderly. Distraction is also a big issue among older drivers: 24% were distracted in fatality crashes, and 17% were distracted in serious injury crashes. Further, the physical condition of elderly drivers makes them as much as five times as likely to die in a crash than younger drivers.
In the end, what we have is a population that is more often at fault in a crash, gets in relatively fewer of them than younger counterparts, has difficulty with recognition of danger due to diminished cognitive skills, and who is far more prone to be injured or killed compared to others.
Percent of all fatal and serious injury crashes involving older drivers, by county (2012–2014)

Road
Use
rs
Road Users
158 Road Users: Older Drivers 70+ Involved
Intersection situations pose an elevated risk for older drivers Left turns can have a Crash Involvement Ratio (CIR) of 4 to 8 for older drivers, while flashing signals also pose a problem for older drivers, with a CIR of 2 to 4. Yield signs, however, are by far the greatest obstacle for them, with a CIR of 26 for those over 80 years of age; this means that for every 27 fatal crashes involving an 80+ year-old at a yield sign intersection, 26 of them would be the fault of the elderly driver. Clearly there is a limitation in older drivers’ ability to navigate yielding to traffic. Road designers are working to make intersections more accessible for older drivers; see Programs and Successes for more information.
Formal guidelines for older drivers Older drivers who can no longer drive safely in some situations may need to have their driver license restricted or revoked. It may be helpful to establish a State Medical Advisory Board to develop guidelines to determine medical conditions, regardless of age, when driver license restrictions or revocation might be needed.
Washington State laws relating to older drivers
RCW 46.20.031 DOL is prohibited from issuing a license to a person who has a physical or mental condition that could impact driving.
RCW 46.20.041 Permits DOL to require a medical evaluation if it has reason to believe that a person may have a physical or mental condition that could impact driving.
RCW 46.20.305 Permits DOL to require a driver’s license examination if it has reason to believe that a person is incompetent or otherwise not qualified to be licensed.
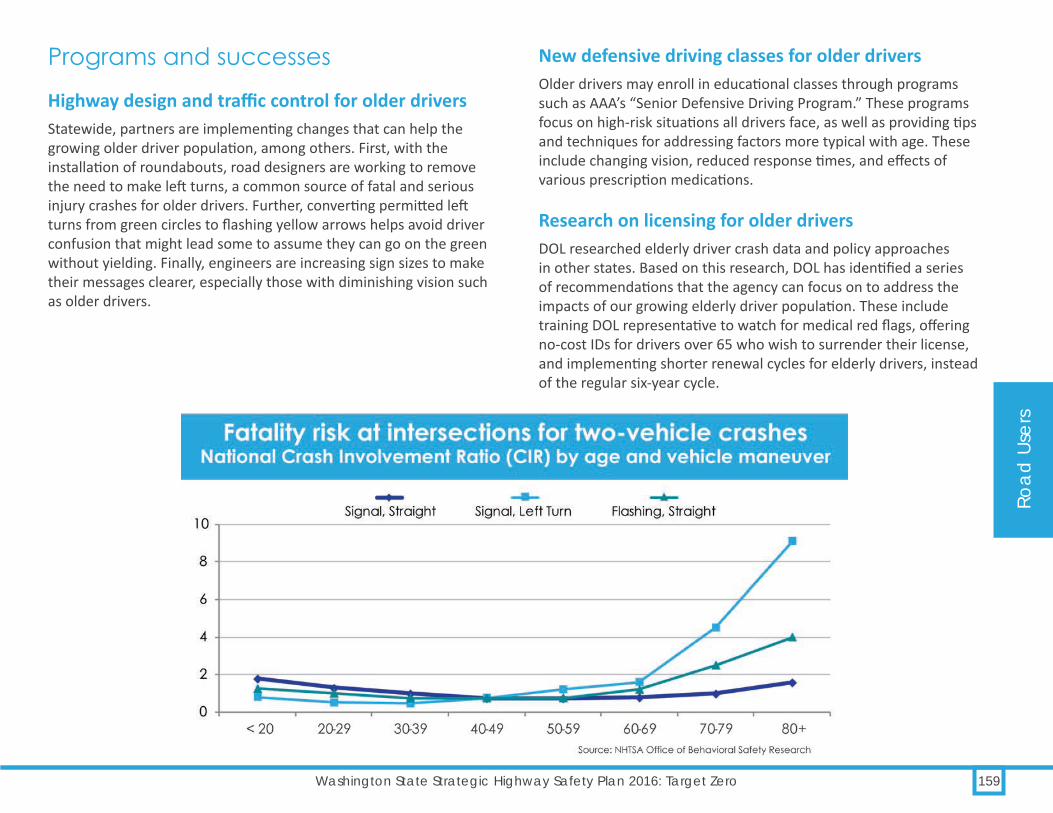
Road
Use
rsRo
ad U
sers
159Washington State Strategic Highway Safety Plan 2016: Target Zero
Programs and successes
Highway design and traffic control for older driversStatewide, partners are implementing changes that can help the growing older driver population, among others. First, with the installation of roundabouts, road designers are working to remove the need to make left turns, a common source of fatal and serious injury crashes for older drivers. Further, converting permitted left turns from green circles to flashing yellow arrows helps avoid driver confusion that might lead some to assume they can go on the green without yielding. Finally, engineers are increasing sign sizes to make their messages clearer, especially those with diminishing vision such as older drivers.
New defensive driving classes for older driversOlder drivers may enroll in educational classes through programs such as AAA’s “Senior Defensive Driving Program.” These programs focus on high-risk situations all drivers face, as well as providing tips and techniques for addressing factors more typical with age. These include changing vision, reduced response times, and effects of various prescription medications.
Research on licensing for older driversDOL researched elderly driver crash data and policy approaches in other states. Based on this research, DOL has identified a series of recommendations that the agency can focus on to address the impacts of our growing elderly driver population. These include training DOL representative to watch for medical red flags, offering no-cost IDs for drivers over 65 who wish to surrender their license, and implementing shorter renewal cycles for elderly drivers, instead of the regular six-year cycle.

Road
Use
rs
Road Users
160 Road Users: Older Drivers 70+ Involved
Strategies for reducing older driver involved (ODI) fatalities and serious injuriesObjective Strategies Implementation areas
ODI.1. Identify older drivers who are at an elevated crash risk
ODI.1.1 Implement Model Driver Screening and Evaluation Program Guidelines for Motor Vehicle Administrators for screening and evaluating older drivers’ physical and cognitive abilities and skills. (P, CTW)
Leadership/Policy, Education
ODI.1.2 Provide training to law enforcement, medical professionals, licensing representatives, and community members for recognizing physical and cognitive deficiencies affecting safe driving in older drivers, including submitting reevaluation referrals to DOL. (P, CTW)
Enforcement, Leadership/Policy, Education
ODI.1.3 Continue to restrict driver license online eligibility and renewals for drivers age 70+. (U)
Leadership/Policy
ODI.1.4 Develop and provide educational materials at DOL offices that encourage family discussions about driving and medical and optical reviews by doctors. (U)
Education
ODI.2. Improve older driver competency
ODI.2.1 Increase driver education opportunities for older drivers. (U) Education
ODI.3. Reduce risk of serious injury and fatalities
ODI.3.1 Provide incentives for older drivers who use alternative modes of transportation. (R, FTA)
Education, Leadership/Policy
ODI.3.2 Involve caregivers and family members of older drivers in discussions and education about aging and driving and provide techniques they can use to help the older driver assess safe driving, and, when necessary, transition from driving. (R, NHTSA)
Education
ODI.3.3 Follow current guidelines/standards to improve readability of road signs for older drivers. (U)
Engineering
P: Proven R: Recommended U: Unknown

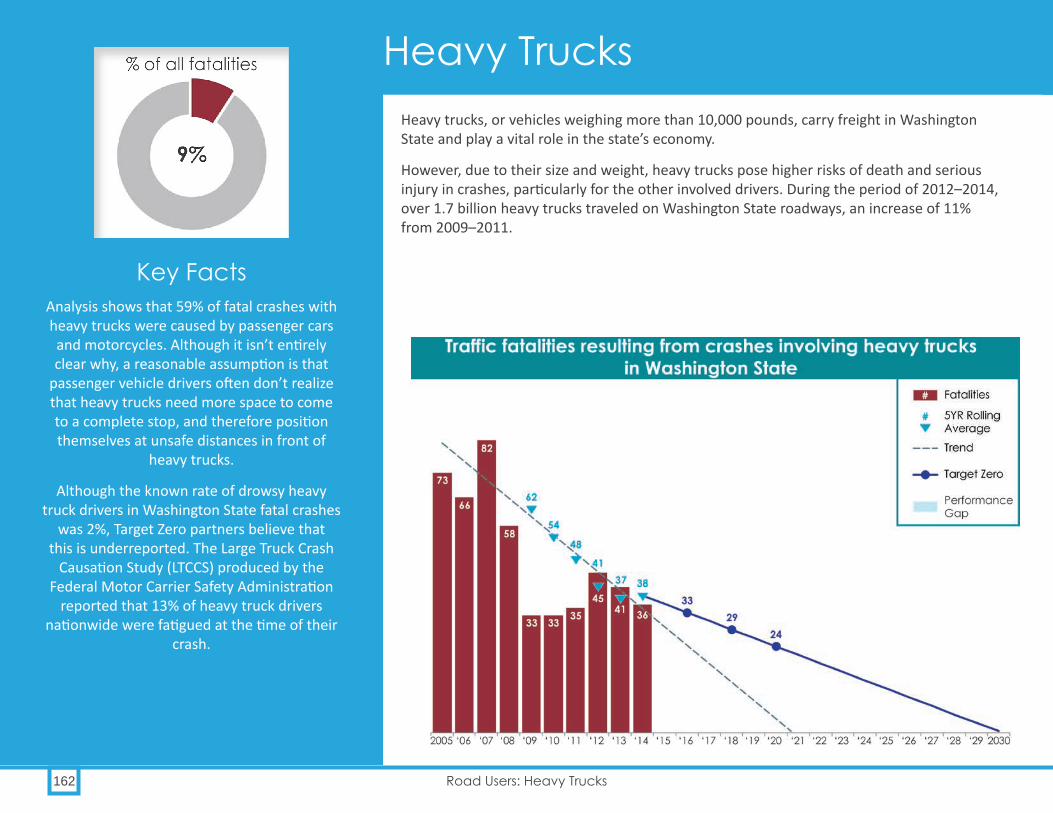
162 Road Users: Heavy Trucks
Heavy trucks, or vehicles weighing more than 10,000 pounds, carry freight in Washington State and play a vital role in the state’s economy.
However, due to their size and weight, heavy trucks pose higher risks of death and serious injury in crashes, particularly for the other involved drivers. During the period of 2012–2014, over 1.7 billion heavy trucks traveled on Washington State roadways, an increase of 11% from 2009–2011.
Key FactsAnalysis shows that 59% of fatal crashes with heavy trucks were caused by passenger cars and motorcycles. Although it isn’t entirely clear why, a reasonable assumption is that
passenger vehicle drivers often don’t realize that heavy trucks need more space to come to a complete stop, and therefore position themselves at unsafe distances in front of
heavy trucks.
Although the known rate of drowsy heavy truck drivers in Washington State fatal crashes
was 2%, Target Zero partners believe that this is underreported. The Large Truck Crash
Causation Study (LTCCS) produced by the Federal Motor Carrier Safety Administration
reported that 13% of heavy truck drivers nationwide were fatigued at the time of their
crash.
Heavy Trucks

163Washington State Strategic Highway Safety Plan 2016: Target Zero
OverviewIn 2012–2014, heavy trucks were involved in 122 (9.1%) of Washington’s traffic fatalities and 318 (5.2%) of the serious injuries. Analysis of fatal crashes involving heavy trucks during this time period showed that 59% of the crashes were caused by passenger cars and motorcycles. Heavy trucks accounted for 30%, and the remaining 11% were due to other causes. Fatalities increased by 21% during 2012–2014 when compared to 2009–2011, likely due to an increase in heavy trucks on the road.
What’s NewWSP has taken steps to reduce the number of heavy truck crashes in the state through the
use of a data-driven deployment model.
The model analyzes crash data and uses this information to identify high crash areas, which allows for the deployment of law
enforcement resources to focus efforts on crash-causing violations, such as aggressively
driven passenger cars and heavy trucks, in order to reduce the number of fatalities.
For this edition of Target Zero, the data definition of heavy trucks was revised to be
more inclusive of all types of commercial motor vehicles. The heavy truck numbers now also include any commercial vehicle
classification for vehicles reported through a commercial vehicle supplement to the Police
Traffic Collision Report (PTCR).
Priority 1
Priority 2
Priority 3

Road
Use
rs
Road Users
164 Road Users: Heavy Trucks
While Washington State’s heavy truck fatality numbers have increased, they are still below the national trend. Nationally, in 2012, heavy trucks were involved in 3,484 (11.2%) fatal crashes and in 2013, heavy trucks were involved in 3,541 (11.8%) fatal crashes. Numbers for 2014 are not yet available.
Contributing circumstances and factorsCompared to 2009–2011 figures, the number of heavy trucks traveling on Washington’s highways increased by approximately 11%. In 2012–2014, over 71% of heavy truck involved fatal crashes occurred where posted speeds are 50 mph or greater, with 86% of these crashes occurring on state routes.
Heavy truck drivers are underrepresented for impairment and speeding in fatal crashes, compared to passenger vehicle drivers. In fatal crashes from 2012–2014, 7.1% of heavy truck operators were found to be impaired and a similar number, approximately 7.1%, were speeding. During the same time period, 33% of passenger vehicle drivers involved in fatal crashes were impaired, and 22% were speeding.
Other factors contributing to the fatal crashes involving heavy truck drivers were:
| Less than 2% of heavy truck drivers were found to be drowsy. However, based on research from the NHTSA and the Federal Motor Carrier Safety Administration, Target Zero partners believe that this is underreported.
| 9.7% were distracted. | 15 drivers were improperly endorsed or unlicensed.
Analysis shows that 59% of heavy truck involved fatal crashes were caused by passenger cars and motorcycles. Although it isn’t entirely clear why, a reasonable assumption is that passenger vehicle drivers often don’t realize that heavy trucks need more space to come to a complete stop, and position themselves at unsafe distances in front of heavy trucks.
Programs and successes
Commercial Vehicle Enforcement Bureau (CVEB) inspectionsWSP is recognized as a national leader in implementing technology to reduce heavy truck crashes, as well as support freight mobility. With the increased focus on crash-causing violations, in 2014 Washington enforcement officers inspected 89,204 heavy trucks, a decrease of 10,885 inspections compared to 2013. The reduction in total inspections was caused by a 6% decrease of WSP personnel over the past three years. However, even with a shortage of personnel, Washington State still continues to work hard and conducted more inspections per year than the national average. In 2014, Washington State performed 41% more inspections than the national average, and 54% above the national average in 2013. WSP uses this data to identify high-risk carriers at roadside and weigh station inspection facilities, and to prioritize compliance reviews.
Heavy Truck Definitions1. Any vehicle with a trailer classified at gross vehicle
weight rating (GVWR) of 10,001 lbs. or more, a single vehicle with GVWR of 26,001 lbs. or more, or a single vehicle of 26,000 lbs. or less that is commercial driver license (CDL)-required, or a commercial vehicle supplement to the crash report.
2. A vehicle type of truck and trailer, truck tractor, truck tractor and semi-trailer, or truck-double trailer combinations.
3. A vehicle usage classification of concrete mixer, dump truck, logging truck, refuse/recycle truck, van over 10,001 lbs, tanker truck, or auto carrier.

Road
Use
rsRo
ad U
sers
165Washington State Strategic Highway Safety Plan 2016: Target Zero
Fatigued driving emphasis on heavy truck drivers Drowsiness makes drivers less attentive, slows reaction time, and affects a driver’s ability to make decisions.
Although the known rate of drowsy heavy truck drivers in Washington State fatal crashes was 2%, we believe that this is underreported. The Large Truck Crash Causation Study (LTCCS) produced by the Federal Motor Carrier Safety Administration reported that 13% of heavy truck drivers nationwide were fatigued at the time of their crash. NHTSA has found a similar underreporting in their research. WSP focuses enforcement on fatigued heavy truck drivers by participating in four statewide fatigue driving campaigns each year. In addition, at the local level, officers use heavy truck crash data to develop location-specific efforts that focus on heavy truck drivers exhibiting driving behaviors such as inattention and fatigue.
Ticket Aggressive Cars and Trucks (TACT) ProgramIn 2005, the WTSC, in cooperation with WSP, the Washington Trucking Association (WTA), the Washington Association of Sheriffs and Police Chiefs (WASPC), and many other stakeholders, implemented a pilot project called Ticket Aggressive Cars and Trucks (TACT) in Washington. The TACT program uses education and enforcement to help car and heavy truck drivers share the road safely and reduce heavy truck related crashes. This successful program has now been implemented nationwide. In 2014, the nine WSP TACT officers assigned to the statewide TACT program contacted 12,176 drivers of all vehicle types, who committed the following moving violations:
| 2,614 driving aggressively | 6,899 speeding | 278 not wearing seatbelts | 26 driving negligently | 14 arrested for DUI | Eight arrested for drug violations | Five driving recklessly
In addition, TACT officers completed 872 roadside heavy truck inspections.

Road
Use
rs
Road Users
166 Road Users: Heavy Trucks
Strategies for reducing heavy truck (HTX) fatalities and serious injuriesObjective Strategies Implementation areas
HTX.1. Increase safety and reduce crashes through quality driver and vehicle inspections and enforcement
HTX.1.1 Increase and strengthen commercial vehicle safety and performance inspections, including focus on heavy truck and commercial vehicle drivers. (P, NCHRP)
Enforcement
HTX.1.2 Promote industry safety initiatives by performing safety consultations with carrier safety management. (P, NCHRP)
Education
HTX.1.3 Provide ongoing education and outreach utilizing ‘“Share the Road” information. (R, NCHRP)
Education
HTX.1.4 Establish commercial vehicle compliance checkpoints in areas identified as high risk for crashes involving heavy trucks and commercial vehicles. (R, DDACTS)
Enforcement
HTX.1.5 Increase commercial vehicle enforcement contacts targeting the top five crash-causing moving violations. (R, DDACTS)
Enforcement
HTX.1.6 Increase enforcement personnel use of FMCSA’s PORTAL for identifying high-risk carriers. (U)
Enforcement
HTX.1.7 Provide CMV training to enforcement officers at the state, county, and local levels. (U)
Enforcement, Education
HTX.2. Improve roadway infrastructure to reduce heavy truck/commercial vehicle crashes
HTX.2.1 Install interactive truck rollover and curve warning signage. (P, NCHRP) EngineeringHTX.2.2 Incorporate rumble strips into new and existing roadways to reduce fatigue-
related crashes. (R, CMF)Engineering
P: Proven R: Recommended U: Unknown

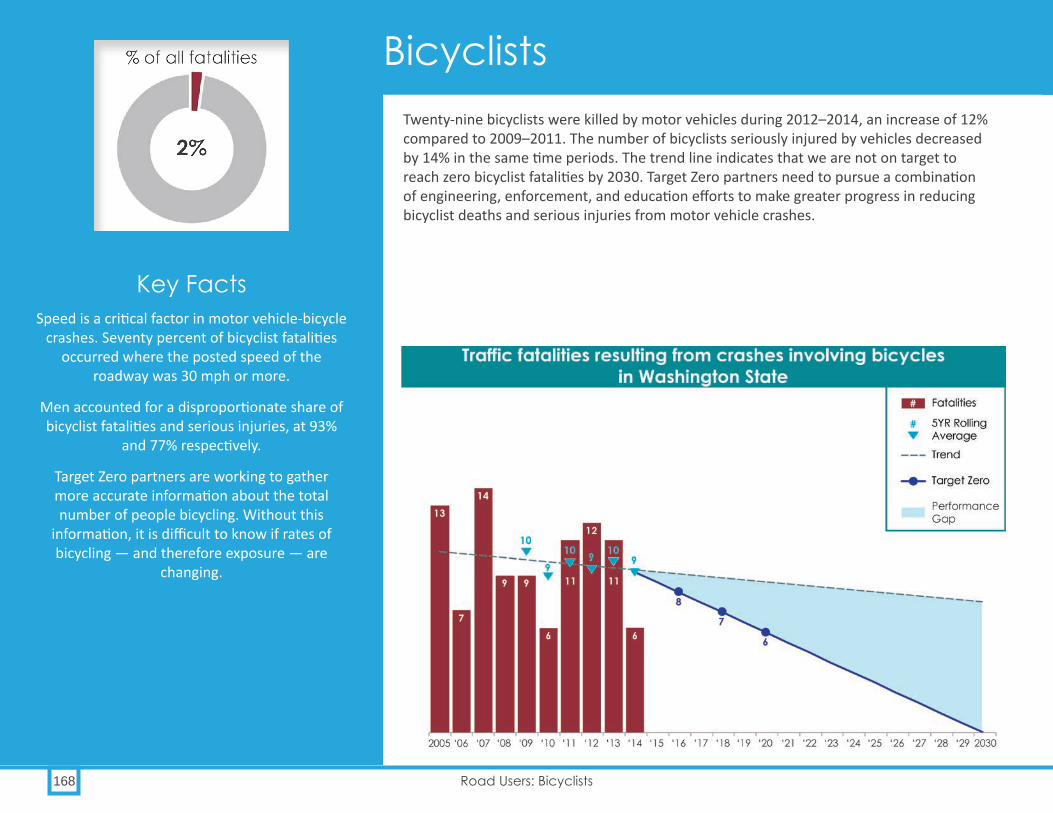
168 Road Users: Bicyclists
Twenty-nine bicyclists were killed by motor vehicles during 2012–2014, an increase of 12% compared to 2009–2011. The number of bicyclists seriously injured by vehicles decreased by 14% in the same time periods. The trend line indicates that we are not on target to reach zero bicyclist fatalities by 2030. Target Zero partners need to pursue a combination of engineering, enforcement, and education efforts to make greater progress in reducing bicyclist deaths and serious injuries from motor vehicle crashes.
Key FactsSpeed is a critical factor in motor vehicle-bicycle
crashes. Seventy percent of bicyclist fatalities occurred where the posted speed of the
roadway was 30 mph or more.
Men accounted for a disproportionate share of bicyclist fatalities and serious injuries, at 93%
and 77% respectively.
Target Zero partners are working to gather more accurate information about the total number of people bicycling. Without this
information, it is difficult to know if rates of bicycling — and therefore exposure — are
changing.
Bicyclists

169Washington State Strategic Highway Safety Plan 2016: Target Zero
OverviewLike pedestrians, people who bicycle are more vulnerable than motorists. Due to the mass and speed differentials between bicycles and motor vehicles, bicyclists are much more likely to suffer severe injuries as motor vehicle speeds increase, regardless of the contributing circumstances.
Between 2012–2014 in Washington, there were 29 bicyclist fatalities and 294 bicyclist serious injuries in crashes with motor vehicles. Bicyclist fatalities represent 2.2% of total traffic deaths for this time period, an increase from 1.8% in 2009–2011. The number of bicyclists seriously injured decreased by 14%, from 339 in 2009–2011 to 294 in 2012–2014.
What’s NewAs part of Connecting Washington, the legislature
has committed $220 million over the next 16 years to improve conditions for bicyclists and pedestrians.
In implementing Practical Solutions, WSDOT became the first state DOT to endorse the Urban Streets and
Urban Bikeway Design Guides from the National Association of City Transportation Official (NACTO). Consistent with this, WSDOT updated the WSDOT
Design Manual to allow for greater flexibility in designing facilities for bicyclists and their safety
needs.
Through the Safer People – Safer Streets initiative, WSDOT, in collaboration with Target Zero partners and USDOT, is using a comprehensive approach to reduce bicycle fatal and serious injury crashes. This
approach addresses infrastructure safety, education, vehicle safety, and data collection.
Priority 1
Priority 2
Priority 3

Road
Use
rs
Road Users
170 Road Users: Bicyclists
Target Zero partners do not have accurate information about the total number of people bicycling. Without this information, it is difficult to know if rates of bicycling — and therefore exposure — are changing. There is some indication that the number of people bicycling has been increasing. According to sample bicycle volume data collected through the Washington State Pedestrian and Bicycle Documentation Project, there has been a 2% increase in the number of people bicycling in Washington State from 2010–2012 to 2013–2015. Target Zero partners are currently expanding the bicycle and pedestrian count program to more accurately capture changes in the number of people walking and bicycling.
Men and middle-aged bicyclists are most likely to be killed or seriously injured Nationally, men make up about 75% of all trips made by bicycle. However, they accounted for a disproportionate share of Washington’s bicyclist fatalities at 93%. They accounted for 77% of serious injuries.
Looking at age, the highest percent of bicyclist fatalities occurred among those aged 40–49 (24%), followed by those aged 60–69 and 50–59 (both 17%). Twenty percent of bicyclist fatalities involved bicyclists under the age of 18.
WSDOT uses target speeds for roadway designWSDOT has always approached setting speeds with the safety of all roadway users in mind, based on the best available information. WSDOT now uses a “target speed” approach for determining design speed. The objective of the target speed approach is to design the roadway to encourage drivers to drive at the desired speed. For instance, adding trees on a street constrains drivers concept of driving space, which encourages slower speeds. The target speed selection takes into account transportation and land use characteristics to better meet the safety and mobility needs of all roadway users.

Driver actions and contributing factors
Roadway characteristicBicyclist contributing circumstances,
action or factors
Road
Use
rsRo
ad U
sers
171Washington State Strategic Highway Safety Plan 2016: Target Zero

Washington State laws relating to bicyclistsRCW 47.04.330 Street projects, consultation with local jurisdictions, and context-sensitive design solutions.
RCW 47.36.025 Traffic control signals are required to detect bicycles.
RCW 46.61.755 Traffic laws apply to bicyclists. When riding on a roadway, a cyclist has all the rights and responsibilities of a vehicle driver.
RCW 46.61.750 Bicyclists who violate traffic laws may be ticketed.
RCW 46.61.700 Parents or guardians may not knowingly permit bicycle traffic violations by children.
RCW 46.61.770 On roadways and bicycle paths, bicyclists may ride side by side, but not more than two abreast. Bicyclists may choose to ride on the path, bike lane, shoulder, or travel lane as suits their safety needs.
RCW 46.61.780 Night bicycle riding requires a white front light visible for 500 feet, plus a red rear reflector.
Road
Use
rs
Road Users
172 Road Users: Bicyclists
Bicyclist fatal and serious injury crashes predominantly occur on urban and suburban roadwaysMost bicycle fatal (69%) and serious injury (80%) crashes happen in cities. Between 2012–2014, 62% of bicyclist fatal crashes occurred on city streets; 21% on state routes (some of which can be inside cities), and 17% on county roads. Bicyclist serious injury crashes occurred 69% of the time on city streets, 19% of the time on state routes, and 12% of the time on county roads.
Contributing circumstances and factors
Speed is a major factor in the outcome of bicycle crashesLooking at posted speeds in the locations where bicycle crashes occurred in our state, 70% of bicyclist fatalities and 65% of bicyclist serious injuries occurred where the posted speed of the roadway was 30 mph or more. This data supports the findings of current research, which shows that crash severity and risk for bicyclists and other non-motorized roadway users increase as motor vehicle speeds increase. For instance, research has shown that bicyclists and pedestrians who are hit by a vehicle traveling at 40 mph have an 85% chance of being killed; at 30 mph the fatality rate is 50%; while at 20 mph, the fatality rate is only 5%. Target Zero advocates roadway designs that use target speeds to better meet the safety needs of all roadway users.
Intersections and crossings are a common vehicle/bicycle crash locationThe majority of crashes between bicyclists and motor vehicles occur at intersections, crossings, and other roadway access points. More than 68% of bicyclist fatalities and 72% of bicyclist serious injuries occurred at intersections, or at locations where the bicyclist was crossing or turning. Strategies should focus on creating slower speed and higher visibility conditions for bicyclists at these locations by creating bicycle lanes, adding lane markings that indicate bicyclists, reducing curb radius for turning vehicles, and increasing the visibility, conspicuity, and predictability of actions for all road users.
One known crossing intervention is roundabouts. Roundabouts are highly effective for all modes of traffic as they are designed to lower entering and exiting speeds, and to provide clear views of bicycles entering the roundabout.
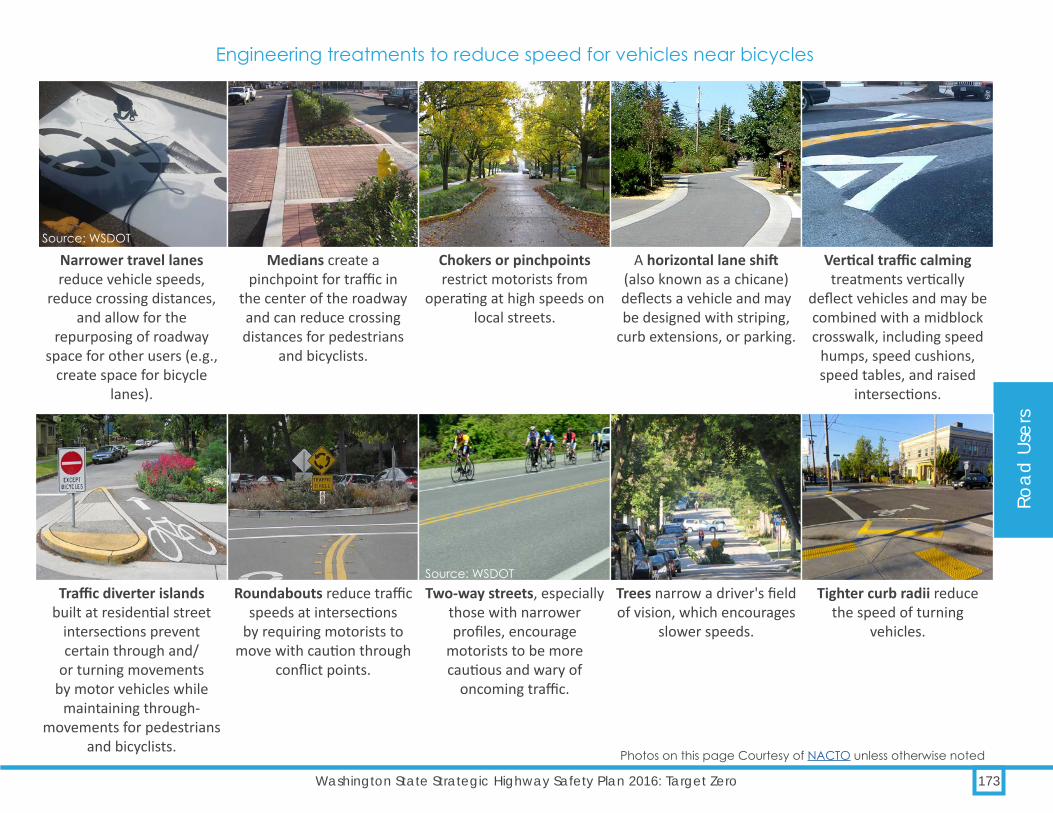
Road
Use
rsRo
ad U
sers
173Washington State Strategic Highway Safety Plan 2016: Target Zero
Engineering treatments to reduce speed for vehicles near bicycles
Narrower travel lanes reduce vehicle speeds,
reduce crossing distances, and allow for the
repurposing of roadway space for other users (e.g.,
create space for bicycle lanes).
Medians create a pinchpoint for traffic in
the center of the roadway and can reduce crossing distances for pedestrians
and bicyclists.
Chokers or pinchpoints restrict motorists from
operating at high speeds on local streets.
A horizontal lane shift (also known as a chicane) deflects a vehicle and may be designed with striping,
curb extensions, or parking.
Vertical traffic calming treatments vertically
deflect vehicles and may be combined with a midblock crosswalk, including speed
humps, speed cushions, speed tables, and raised
intersections.
Traffic diverter islands built at residential street
intersections prevent certain through and/
or turning movements by motor vehicles while
maintaining through- movements for pedestrians
and bicyclists.
Roundabouts reduce traffic speeds at intersections
by requiring motorists to move with caution through
conflict points.
Two-way streets, especially those with narrower profiles, encourage
motorists to be more cautious and wary of
oncoming traffic.
Trees narrow a driver's field of vision, which encourages
slower speeds.
Tighter curb radii reduce the speed of turning
vehicles.
Source: WSDOT
Source: WSDOT
Photos on this page Courtesy of NACTO unless otherwise noted

Road
Use
rs
Road Users
174 Road Users: Bicyclists
Creating dedicated spaces for bicycles reduces roadway conflictsMore than 20% of bicyclist fatalities occurred when both the bicyclist and the motor vehicle driver were moving straight ahead and in the same direction. Building dedicated facilities for bicycles can help mitigate such conflicts. An exclusive space for bicyclists creates separation, while facilitating predictable behavior and movements between bicyclists and motorists.
Education and enforcement are also key to reducing bicycle fatalities and serious injuriesAlthough speed is a major determinant of outcomes in crashes involving bicyclists and motor vehicles, high risk behaviors of drivers and bicyclists also contribute to crashes. Distracted driving contributed to 26% of fatal bicyclist crashes, driver impairment was involved in 16%, driver speeding was involved in 10%, and driver failing to yield the right of way was involved in 10% of these crashes. The most frequent bicyclist contributing action for fatal crashes was failing to yield the right of way (34%), followed by bicyclist impairment (21%), then distraction (16%). In addition to the engineering and speed management strategies mentioned above, education can be a major contributor to encourage safe driving and bicycling behavior on shared roadways, and at intersections and crossings. Finally, increased enforcement should be used to discourage high-risk behaviors by both drivers and bicyclists.
Helmets do not prevent crashes, and bicyclists can be badly hurt or killed in a crash with a moving vehicle whether or not they are wearing a helmet. However, helmets may help reduce traumatic head injuries in certain situations. From 2012–2014, 57% of Washington bicyclists killed in vehicle crashes were not wearing a bike helmet.
Programs and successes
Updated WSDOT Design Manual adds new tools to address bicyclistsWith the 2015 update to the WSDOT Design Manual, design policies at WSDOT have seen significant changes in many areas. These changes provide for a collaborative approach to establishing project boundaries, criteria, and design controls such as modal priority and target speed.
For example, the Design Manual now includes guidance on the application and use of speed management treatments to achieve a targeted speed. These changes allow for greater consideration of the trade-offs between road improvements that lower motor vehicle speed, versus those that may only promote motor vehicle mobility or congestion benefits. The new policy supports greater flexibility in the application of design treatments and standard dimensions in order to better serve all road users. This approach uses information about land use context, the presence of intermodal connections, businesses, schools, medical facilities, and destinations where pedestrians and bicyclists will likely be present.
Several other chapters of the manual have been revised to incorporate emerging guidance on multimodal design from AASHTO, NACTO, and others. This work includes a comprehensive update to design policy on roadway bicycle facility selection and design. The manual also features low-cost options for reconfiguring roadways to address multimodal needs, providing for various retrofit possibilities, including road diets.
The updated Design Manual also provides for a performance-based approach to design rather than one focused only on achieving design standards. By going beyond a simple standards-based approach, projects can be expected to result in roadway and intersection facilities that specifically address the identified performance outcomes for pedestrians, bicyclists, and other users.

Road
Use
rsRo
ad U
sers
175Washington State Strategic Highway Safety Plan 2016: Target Zero
Engineering treatments tor bicyclists at intersections and crossings
Intersection crossing markings indicate the intended path of
bicyclists. They guide bicyclists on a safe and direct path
through intersections, including driveways, and ramps.
Green-colored pavement within a bicycle lane increases
the visibility of the facility, identifies potential areas of
conflict, and reinforces priority to bicyclists in conflict areas.
Bike boxes are designated areas at the head of
traffic lanes at signalized intersections. They provide
bicyclists with a visible way to get ahead of queuing traffic during the red signal phase.
Two-stage turn boxes offer bicyclists a protected way
to make left turns at multi-lane signalized intersections
from a right side separated or standard bicycle lane.
Bicycle signals are traffic signals used specifically for bicycle
movements at intersections. They are used in combination
with existing conventional traffic signals or hybrid
beacons, and can operate with a leading bicycle interval.
Median refuge islands are protected spaces placed in the center of the street to
facilitate bicycle and pedestrian crossings.
Active warning beacons are user-actuated amber flashing
lights that supplement warning signs at unsignalized
intersections or mid-block crossings. Rectangular Rapid
Flashing Beacons are examples of such traffic control devises.
Hybrid beacons are special types of beacons used to
warn and control traffic at unsignalized locations. They
assist pedestrians and bicyclists in crossing roadways at marked
crossing locations.
Source: WSDOT
Photos on this page courtesy of NACTO unless otherwise noted

Road
Use
rs
Road Users
176 Road Users: Bicyclists
Washington State invests in bicyclist and pedestrian improvements Washington supports bicycling and walking as part of an integrated, multimodal transportation system. Investments in bicyclist and pedestrian facilities, along with Americans with Disabilities Act (ADA) improvements, provide for a Washington State transportation system that allows for travel options for everyone. As part of Connecting Washington, the Legislature has committed $220 million over the next 16 years to improve conditions for bicycling and walking. In addition, the federal transportation act includes several programs that fund pedestrian and bicycle improvements. These resources, in combination with recent policy changes that increase the consideration of pedestrian and bicycle improvements in all projects, have and will continue to be used to address pedestrian and bicycle fatalities and serious injury crashes in Washington.
Meanwhile, WSDOT’s Pedestrian and Bicycle Safety Program has administered $54 million for 132 projects improving known pedestrian and bicyclist safety risk locations. Through Washington’s Safe Routes to Schools Program, WSDOT has administered an additional $71 million for 182 projects that reduce risks for children walking and biking to school, and provided safety education for schools across Washington.
WSDOT expands statewide bicycle and pedestrian count program to better account for exposure ratesWSDOT’s Bicycle and Pedestrian Count Program is part of the National Documentation Project, an annual bicycle and pedestrian count and survey effort sponsored by the Pedestrian and Bicycle Council of the Institute of Transportation Engineers. Over the past eight years, WSDOT, the Cascade Bicycle Club, and Feet First have organized volunteers to count bicyclists and pedestrians at 282 locations in 50 cities across the state.
To more accurately estimate bicyclist and pedestrian safety and mobility needs, WSDOT has begun to install a network of permanent bicycle counters to supplement the manual count sample data. WSDOT has invested in 16 electronic counters to automatically count bicyclists and pedestrians in locations across the state. The agency will install an additional 50 permanent counters throughout 2016. WSDOT hosts an open data website that will provide both the manual and electronic count information publicly in order to share data used in the decision-making process.

Road
Use
rsRo
ad U
sers
177Washington State Strategic Highway Safety Plan 2016: Target Zero
Strategies for reducing bicyclist (BIC) fatalities and serious injuriesObjective Strategies Implementation areas
BIC.1. Improve bicyclist and driver safety awareness and behavior
BIC.1.1 Promote the use of reflective apparel and bicycle lights among bicyclists. (R, CTW)
Education
BIC.1.2 Increase the number of people bicycling to achieve safety in numbers. (R, LIT) Leadership/Policy, EducationBIC.1.3 Increase use of Safe Routes to School Pedestrian and Bicycle Safety Education
curriculum in schools. (U)Education
BIC.1.4 Provide bicycle safety awareness as part of driver education programs. (U) EducationBIC.2. Enact policies/laws to
improve bicycle safetyBIC.2.1 Encourage bicycle helmet use for children and adults. (U) Leadership/Policy, EducationBIC.2.2 Improve training on bicycle laws for law enforcement officers at state, Tribal,
and local levels. (R, WSDOT)Education
BIC.3. Improve bicyclist facilities BIC.3.1 Implement traffic calming techniques. (P, NCHRP) EngineeringBIC.3.2 Implement speed management using target speeds and context sensitive
solutions. (P, AASHTO)Engineering
BIC.3.3 Utilize road reconfigurations/diets to improve safety for all roadway users. (R, CMF)
Engineering
BIC.3.4 Follow national guidelines on the use of reflective markings and sign materials. (R, FHWA)
Engineering
BIC.3.5 Construct more bike lanes, separated bicycle lanes, and separated bicycle facilities, especially in urban areas. (R, CMF)
Engineering
BIC.3.6 Create bicycle boulevards on low volume, low speed streets. (R, CMF) EngineeringBIC.3.7 Implement Complete Streets policies to provide for all modes of
transportation. (R, NCSC)Leadership/Policy, Engineering
BIC.3.8 Install colored bicycle boxes at intersections. (U) EngineeringBIC.4. Improve safety for children
bicycling to schoolBIC.4.1 Expand high visibility speed enforcement in school zones, including automated
speed photo enforcement. (R, CTW)Education, Enforcement
BIC.4.2 Distribute and encourage the use of “School Walk and Bike Routes: A Guide for Planning and Improving Walk and Bike to School Options for Students” to assist schools in creating school biking route maps. (R, WSDOT)
Education, Engineering
BIC.4.3 Encourage school districts to implement the Safe Routes to School program. (U)
Education, Engineering
BIC.5. Improve data and performance measures
BIC.5.1 Collect Bicycle Miles Traveled (similar to collecting Vehicle Miles Traveled); continue to track bicycle counts through Washington’s Pedestrian and Bicycle Documentation Project (R, DDACTS)
Leadership/Policy
P: Proven R: Recommended U: Unknown

178 Road Users: Tribes and Target Zero
From 2012–2014, 63 American Indians and Alaskan Natives (AIANs) died in traffic crashes according to the national Fatality Analysis Reporting System (FARS) database. FARS records race and ethnicity from Washington Death Certificates; this information is used to calculate race-specific death rates. Using data from 2005–2014, which represents 267 AIAN traffic deaths, to produce a reliable population rate estimate, the AIAN traffic fatality rate is 27.6 deaths per 100,000 people in the population. This rate is more than three times higher than the next highest death rate.
In addition to calculating death rates based on race/ethnicity, the Tribal traffic safety community and partners also analyzed fatal and serious crash events occurring on reservations. From 2012–2014, there were 66 fatalities occurring on reservations, of which 21 (32%) were AIAN deaths. There were also 187 serious injuries on reservation roads. Since race/ethnicity is gathered from death certificates, it is unknown how many of the 187 serious injuries were AIANs.
OverviewThere are twenty-nine federally-recognized Tribes in Washington State. Through the Centennial Accord, the State of Washington and Tribes have formally committed to working together on a government-to-government basis to address a number of common problems, including traffic safety issues.
Today, Tribes play a vital role and are active partners with other agencies in addressing the goals identified in Target Zero. Transportation planning and engineering, as well as the human
factors of traffic safety on Tribal lands, are important areas of focus in our state. Reservations in Washington often include a mix of Tribal, state, county, city, and Bureau of Indian Affairs (BIA) roads, which creates jurisdictional complexities with law enforcement, EMS, crash reporting, road maintenance, and capital safety projects. Additionally, many tribes in the state hold properties that are non-contiguous to their reservations and provide vital services to their communities.
Tribes and Target Zero

179Washington State Strategic Highway Safety Plan 2016: Target Zero
To address this complex mix of jurisdictions and experts, Tribes have multiple forums that meet regularly for transportation and traffic safety issues. The Tribal Traffic Safety Advisory Board is dedicated to Tribal traffic safety issues. The Board meets monthly to discuss Tribal traffic safety concerns and partnership opportunities, and to implement projects identified through its strategic planning. Its members include Tribal leaders, planners, law enforcement, and representatives from WTSC and WSDOT. Other, more general forums that occasionally address Tribal traffic safety issues include:
| The Washington Indian Transportation Policy Advisory Committee (WITPAC)
| Tribal Transportation Planning Organization (TTPO) | The Northwest Association of Tribal Law Enforcement
Officers (NATEO) | Northwest Tribal Technical Assistance Program (NWTTAP)
Fatalities and serious injuries on reservationsThrough a partnership with the BIA and using US Census data, WSDOT was able to include reservation boundaries in its data collection and reporting program. Of the 63 AIAN crash deaths from 2012–2014, 21 (32%) occurred on reservations. Target Zero partners suspect that this number is underreported due to gaps in data sharing between the State and Tribes. Additionally, several Tribal representatives have shared that the number of fatalities and serious injuries occurring on their reservations in the recent past exceeded what has been reported to the state.
The table below shows the over-representation of American Indians and Alaskan Native fatalities by county. These counties reflect higher AIAN proportion of traffic fatalities compared to the proportion of AIAN population.
County PercentAmerican Indian and
Alaskan Native Population
Percent American Indian and
Alaskan Native Traffic Fatalities
Clallam 5.3% 13.7%Ferry 17.6% 25.0%
Grays Harbor 4.9% 9.2%Jefferson 2.4% 5.1%
Kitsap 1.7% 4.0%Lincoln 1.7% 7.1%
Okanogan 12.0% 26.4%Pierce 1.6% 3.7%
Spokane 1.5% 4.1%Stevens 5.7% 8.0%
Walla Walla 1.1% 8.2%Whatcom 3.0% 5.7%Whitman 0.8% 3.6%
Yakima 5.3% 24.1%

Road
Use
rs
Road Users
180 Road Users: Tribes and Target Zero
The map below illustrates where AIAN fatalities are over-represented based on the AIAN population for the county where the fatality occurred (based on 2010 Census data and FARS fatalities for Native Americans 2005–2014). This map blends both data sources available to Washington state: race/ethnicity from death certificates, and the locations where fatal AIAN crashes occur.
Overrepresentation of American Indian and Alaskan Native Traffic Fatalities in Washington State Counties

Road
Use
rsRo
ad U
sers
181Washington State Strategic Highway Safety Plan 2016: Target Zero
Data challenges: how different data sources tell different stories Target Zero partners used three data sets in order to tell the most complete story possible about American Indian and Alaskan Native (AIAN) traffic fatalities and serious injuries in Washington:
| Statewide fatality rates for AIANs. This data is based on ethnicity derived from state death certificates and provides traffic fatality data for the entire State of Washington, regardless of jurisdiction. This data is captured using the Fatality Analysis Reporting System (FARS).
| On-reservation fatalities. This data is captured by focusing on crashes occurring on roadways located within reservation boundaries. This data set includes all recorded fatalities and serious injuries occurring on these lands, regardless of the race/ethnicity of the people involved.
| Fatality proportion compared to population proportion. The population data estimates of race/ethnicity are produced by the US Census Bureau.
Data gaps continue to exist, and in some cases the data sources tell a conflicting story. Pedestrian fatalities are a prime example. Fatality information that considers ethnicity based on death certificates from crashes occurring both on and off reservations is in alignment with national data and anecdotal information from Tribal representatives: pedestrian safety is a significant issue among American Indian and Alaskan Native people. That data source shows that the pedestrian fatality rates are five times higher for AIANs than non-AIANs.
However, crash information that considers the location of crashes on reservations, regardless of ethnicity, indicates that pedestrian safety is a lower priority. Pedestrian fatalities occurring on reservation lands comprised just 7.6% of the fatalities and serious injuries. Target Zero partners believe that this demonstrates significant under-reporting of fatalities and serious injuries occurring on non-state roadways within reservations. This interpretation (under-reporting) is in alignment with information from WSDOT on the identity of reporting law enforcement agencies.

Differences in Tribal Target Zero prioritiesMany of the Tribal categories end up in the same Priority Level as the overall population. However, major differences between Tribal Target Zero priorities and overall Target Zero priorities include:
| Unrestrained occupants are a priority 1 instead of priority 2.
| Unlicensed drivers are a priority 1 instead of a priority 2.
| Heavy trucks are a priority 2 instead of priority 3. | Older drivers are a priority 3 instead of a priority 2.
How Target Zero determined Tribal prioritiesTo focus efforts on eliminating deaths and serious injuries on our state’s roadways, Target Zero partners grouped the primary factors found in statewide fatal and serious traffic crashes into priority levels one, two, and three. The levels are based on the percentage of traffic fatalities and serious injuries associated with each factor in 2012–2014. This chapter looks at just the subset of data that includes reservation roads in order to set Tribal Target Zero priorities. It uses the same cut-off points for priority levels as the statewide figures do.
Priority level one includes the factors associated with the largest number of fatalities or serious injuries occurring on reservations. Each of these factors was involved in at least 30% of traffic fatalities or serious injuries occurring on reservations.
Priority level two factors, while frequent, are not as common as priority level one factors. Level two factors were seen in at least 10% of traffic fatalities or serious injuries, but fewer than 30%.
Priority level three factors are associated with less than 10% of fatalities and serious injuries occurring on reservations.
Road
Use
rs
Road Users
182 Road Users: Tribes and Target Zero
Based on this analysis and diagnosis, Target Zero partners believe that pedestrian safety is a significant issue for American Indians and Alaskan Natives in Washington, both on- and off-reservation. Despite the rural character of many reservations, a high percentage of the residents walk, bicycle, and use other non-motorized transportation. Unfortunately, several factors on reservation roads can create unsafe conditions and contribute to the disproportionate fatality rates:
| Minimal availability of transit services | Lack of sidewalks, crosswalks, and street lights | High speeds | Lack of enforcement due to staffing and geography

Road
Use
rsRo
ad U
sers
183Washington State Strategic Highway Safety Plan 2016: Target Zero
Tribal Target Zero Priorities Given the disproportionately high rate of American Indian and Alaskan Native fatalities in Washington, it’s important that the priorities in Target Zero are tailored to meet Tribal needs. Recently, several Tribes throughout Washington State received funding under the federal Tribal Transportation Program in MAP-21 and the FAST Act to develop their own Traffic Safety Plans for their reservations. The unique priorities of individual tribes are reflected in those plans. Based on fatalities and serious injuries that have occurred on reservation roads statewide, the overall Tribal Priorities are as follows:
Fatalities and serious injuries occurring on reservation roads in Washington State
2012–2014
Fatalities Serious Injuries# of People % of total for
all fatalities on reservations
% of this emphasis area for fatalities on all Washington
State roads
# of People % of total for all serious injuries on reservations
% of this emphasis area
for serious injuries on all Washington State roads
Priority Level OneImpairment Involved 42 63.6% 56.6% 46 24.6% 22.3%Lane Departure 39 59.1% 56.1% 85 45.5% 38.5%Unrestrained Vehicle Occupants 28 42.4% 22.2% 81 43.3% 10.2%Intersection Related 14 21.2% 20.7% 59 31.6% 34.8%Young Driver Aged 16–25 Involved 21 31.8% 31.7% 54 28.9% 33.6%Speeding Involved 21 31.8% 38.0% 45 24.1% 26.5%Unlicensed Driver Involved 20 30.3% 18.6% - - -
Priority Level Two Distraction Involved 19 28.8% 29.5% 43 23.0% 22.9%Motorcyclists 8 12.1% 16.8% 19 10.2% 18.1%Heavy Truck Involved 6 9.1% 9.1% 25 13.4% 5.2%Pedestrians* 5 7.6% 15.3% 14 7.5% 14.8%
Priority Level Three Older Drivers 70+ Involved 3 4.5% 12.1% 15 8.0% 8.6%Drowsy Driver Involved 3 4.5% 2.9% 10 5.4% 3.2%Bicyclists 0 0.0% 2.2% 5 2.7% 4.8%* Data based on the ethnicity of the fatal person show that 21% of American Indian and Alaskan Native fatalities (occurring anywhere in the state) are pedestrians.

Road
Use
rs
Road Users
184 Road Users: Tribes and Target Zero
Programs and successes
Suquamish Tribal Police’s Drug Recognition Experts (DREs)Data from 2012–2014 show that impairment is the most common contributing factor (64%) in fatalities and serious injuries on reservation roads statewide. Of those impaired, 26% were impaired by alcohol, while 44% were both impaired by alcohol and positive for drugs. Another 31% were positive for one or more drugs. Among traffic fatalities occurring on Tribal reservations in Washington State, not counting alcohol, cannabis was the most frequently occurring drug, followed by central nervous system stimulants (methamphetamine, cocaine) and narcotic analgesics (pain killers, heroin).
Ten years ago, a Suquamish Tribe police officer (now a Deputy Chief) received training and became certified as a Drug Recognition Expert (DRE). A DRE is a law enforcement officer trained to recognize impairment in drivers who are positive for drugs other than, or in addition to, alcohol. DREs have specialized training to identify the symptoms of intoxication for seven different categories of drugs. They conduct a 12-step standardized and systematic examination of persons arrested or suspected of drug-positive driving or similar offenses. A DRE’s expert opinion on a case improves the entire process to identify, arrest, and prosecute impaired drivers for their crimes. Currently there are more than 230 DREs in Washington who perform more than 1,600 evaluations annually.
The rigorous training and certification maintenance requirements call for a significant commitment on the part of the individual and the law enforcement agency. The Suquamish Police Department has a DRE instructor and a DRE in training to become an instructor. They are often called on by neighboring jurisdictions to conduct evaluations.
One year later the Suquamish Tribe police officer became a DRE, and the Suquamish Tribe used a grant from their drug court to host a DRE class at the Clearwater Casino, which is now an annual location for the Spring DRE class for all law officers, including non-Tribal. Since then, a second Suquamish Tribe police officer has received this certification, making them the only two DRE’s operating on Tribal reservations in Washington State.
Representatives of the Northwest Association of Tribal Enforcement Officers (NATEO)

Road
Use
rsRo
ad U
sers
185Washington State Strategic Highway Safety Plan 2016: Target Zero
Data challenges and improvements for American Indians and Alaskan Natives and
traffic dataHaving accurate data is key to identifying safety problems, selecting appropriate countermeasures, and evaluating performance. Without data, the evaluation, analysis, and diagnosis of traffic safety becomes more difficult. It’s also more difficult for Tribes to compete for safety funding and justify their needs if they lack supporting data.
Given the disproportionate impact of traffic crashes on Tribal communities, it is critical that we close these gaps and use data to help identify and address problems. Some of these challenges are described below.
Reporting
It’s important for Tribes and the state to share data on traffic crashes, fatalities, and serious injuries. It will allow both Tribes and state agencies to have a comprehensive picture of traffic safety issues. Tribal attorneys, law enforcement, WSP, and WTSC are working together to resolve concerns with data sharing across jurisdictions. Notably, eTRIP managers and Tribal representatives with expertise in jurisdictional and contractual law, policing procedures, and information technologies are working to remove obstacles to data sharing through contractual and computer programming remedies.
Roadway Jurisdiction
Through a partnership with the BIA, WSDOT was able to include reservation boundaries in its data collection and reporting program, and can now identify whether a crash occurred within a specific reservation. Additional information is still needed regarding roadway ownership. Target Zero partners want to work with Tribes to identify tribally owned road networks.
Nooksack Mobility and Safety Education ProgramThirty percent of fatalities or serious injuries occurring on reservation roads in 2012–2014 involved an unlicensed driver. Tribal representatives report limited access to driver education programs on or near their reservations. To help address several traffic safety needs, the Nooksack Tribe is developing a Safety Mobility Education Program. The goal of this project is to establish a holistic approach to educating communities about all modes of transportation. The program includes instruction in operating a vehicle, walking, biking, and busing. A component part of the Mobility Safety Education Program will be a public awareness program that will address:
| Impaired driving | Unlicensed driving | Occupant protection | Distracted driving | Sharing the road and with motorcyclists, pedestrians, and
bicyclists | Bicycle Safety | Water/land foot traffic safety
It will also cover alternative transportation services, designated driving programs, and alternative ride programs. The Nooksack Tribe plans to begin offering classes in Spring and Fall 2016.

Road
Use
rs
Road Users
186 Road Users: Tribes and Target Zero
Culturally appropriate traffic safety materialsThe WTSC’s Tribal Traffic Safety Advisory Board developed and distributed culturally relevant traffic safety educational materials. They sent these materials to volunteer contacts from each of the 29 federally recognized tribes in October 2015. The materials included posters, rackcards, vinyl banners, and brief videos covering the five top factors contributing to AIANs dying in traffic crashes. On behalf of the BIA, NHTSA requested and received electronic files of the print materials to allow any Tribe in the US to customize these educational materials for their communities. The project was highlighted during the 2015 National Tribal Transportation Conference. Print materials will be available during Washington’s 2016 Canoe Journey, hosted by the Nisqually Tribe.
Videos and materials are available on WTSC’s Programs and Priorities page for Tribes.
NATEO grants help Washington’s Tribal Police get funding and equipment for traffic safetyTribal police in Washington are an important partner in reducing the disproportionate traffic fatality rate of AIAN people. For several years NATEO, through the Chehalis Tribal Police Department, has been administering $40,000 worth of grants to Tribal police departments each year. These grants have funded important traffic safety equipment purchases and enabled officers to receive traffic safety training.

Road
Use
rsRo
ad U
sers
187Washington State Strategic Highway Safety Plan 2016: Target Zero
Eastern Washington University (EWU) study leads to sharing best practices across tribesIn 2014–2015, the Northwest Tribal Technical Assistance Program (NWTTAP) and participating tribes, funded by WTSC, conducted traffic safety assessments on six reservations:
| Confederated Tribes of the Colville Reservation | Kalispel Tribe of Indians | Lummi Nation | Spokane Tribe | Swinomish Indian Tribal Community | Confederated Tribes and Bands of the Yakama Nation
For the assessments, NWTTAP used Eastern Washington University (EWU) faculty and graduate students who were working on Executive Tribal Planning Graduate Certificates. The assessments collected data from several sources including WSDOT, WTSC, Tribal police departments, and EMS organizations. The assessments found significant variation in data collection and ease of accessing data. Each Tribe, however, was using a best practice in at least one area of traffic safety. The study found that Tribes could benefit from sharing information on successful programs.
Based on the assessment, EWU developed a concept of an inter-disciplinary Tribal traffic safety committee that could be adapted to meet the needs of any Tribe — large or small, rural or urban. EWU staff and students have made several national and regional presentations on the highly regarded project. WTSC Commissioners have approved funding a second phase of implementing the assessments on a portion of the participating reservations.


Dec
ision
-Mak
ing
and
Per
form
ance
Im
prov
emen
t
The experience of traffic safety specialists has shown that it takes a wide variety of efforts to reduce fatalities and serious injuries on roadways; enforcement, engineering, and education are only part of the effort.
To really achieve Target Zero, it will require a concerted effort on many fronts. This includes a robust evaluation of the Target Zero Plan implementation, along with a meaningful analysis of the diagnostics of our traffic safety systems. Improved EMS and trauma systems are another element of the plan.
In addition, local agencies and Tribal governments play a key role in establishing a network of projects, systems, and strategies that will take the Target Zero philosophy and efforts to areas that will have significant impact across our state.
The chapters in this section describe how the state’s data, EMS, and locally based implementers improve the entire decision-making process, and bring us closer to Target Zero.

190 Decision and Performance Improvement: Traffic Data Systems
Washington State’s traffic data systems serve as the primary source of knowledge about Washington’s transportation environment. The system is a collection of information about crashes, vehicles, drivers, citations, legal outcomes, and injuries. Together, this information helps partners determine how to reduce injuries and fatalities on Washington’s roadways.
This information supports Target Zero, a data-driven highway safety plan. Its purpose is to highlight optimum locations to use limited resources of time, talent, and funding to have the most impact.
Traffic data systems support Target Zero by providing quality data needed to:
| Diagnose the contributing factors to crashes. | Assess the effectiveness of implemented countermeasures. | Identify innovative and targeted strategies that will have the
greatest impact on achieving the goal of zero deaths and zero serious injuries.
In order to help us save lives and prevent injuries, Washington’s traffic data systems must be able to provide timely, accurate, integrated, and accessible data. This data is foundational to focusing resources and monitoring progress toward the Target Zero goal.
OverviewThe Washington Traffic Records Committee (TRC) is a partnership of federal, state, local, and Tribal stakeholders from the fields of transportation, law enforcement, criminal justice, and health. The statewide TRC was created to foster collaboration and develop projects to improve the state’s traffic records system. One example of this is a recent collaboration between the County Road Administration Board (CRAB) and WSDOT to study how their two
unique roadway data systems could share data and create a more seamless experience for their users, who are primarily engineers.
The TRC’s mission is to support the state’s goal of Target Zero by providing timely, accurate, integrated, and accessible traffic records data. They work to achieve this through four goals:
1. Remove barriers to data sharing and integration.2. Provide quality data, analysis, and tools to customers.3. Sustain high levels of collaboration and acquired knowledge
within the TRC.4. Identify and secure targeted investments to sustain TRC
initiatives.
Programs and successes
Electronic Ticketing and Collision Reporting Program (eTRIP) integrates ticketing and crash dataeTRIP — a collaboration between WSP, WSDOT, DOL, Washington Administrative Office of the Courts (AOC), the Washington State Association of Sheriffs & Police Chiefs (WASPC) and Washington Technology Solutions (WaTech) — created a seamless and integrated system for electronically gathering and distributing crash reports and traffic tickets, then tracking subsequent activity on those events. This system has been in use since 2007 and currently captures 90% of crashes, and 84% of issued tickets, in Washington State. The system continues to evolve and has recently added tow impound forms. Meanwhile, SECTOR, an electronic ticket and crash reporting application that is part of eTRIP, has added enhanced search features, self-service user registration, and password resets. Eventually, it will include user dashboards with statistical information.
Traffic Data Systems

191Washington State Strategic Highway Safety Plan 2016: Target Zero
Linking crash and health records to better understand injury severityState agencies and other traffic safety partners continue to improve data linking and sharing. A dedicated data integration specialist at the WTSC is making significant progress in linking crash records from Washington State law enforcement agencies with hospital records DOH. Ultimately, the goal is to improve the understanding of injury severity for crashes.
Linking local and state roads for better engineering data analysisWSDOT and CRAB are working to improve the quality, efficiency, and accessibility of systems that support safety engineering improvement decision making:
| WSDOT launched the Crash Data Portal to provide easily accessible crash data reports and maps for state and local engineers, as well static maps for the public.
| CRAB implemented an application, Systemic Safety Project Selection Tool, to help county engineers improve their selection of safety improvement projects based on roadway and crash characteristics.
| WSDOT and CRAB worked together to improve the tracking of changes in intersections, bridges, functional classification, lane width, traffic, and other aspects of the roadway.
Many systems hold traffic safety data
Washington’s traffic information and support data systems are comprised of hardware, software, and accompanying processes that capture, store, transmit, and analyze a variety of data. The following systems makes up Washington’s traffic data system:
• Driver (DOL)• Vehicle (DOL) • eCitation and eCrash (WSP) • Crash
• WSDOT
• WSP
• Roadway • WSDOT
• CRAB
• Adjudication (AOC)• Injury surveillance
• EMS (DOH)
• Emergency Department (DOH)
• Hospital data (DOH)
• Trauma Registry (DOH)
Priority 1
Priority 2
Priority 3

Decision and
Perform
ance Im
provement
192 Decision and Performance Improvement: Traffic Data Systems
Strategies for traffic data systems (TDS)Objective Strategies Implementation areas
TDS.1. Provide quality data, analysis, and tools to customers
TDS.1.1 Develop new features in SECTOR to address user needs, including additional ticketing options and report types. Expand SECTOR software edit checks to enhance reporting accuracy and consistency. (R, eTRIP GT)
Leadership/Policy, Enforcement
TDS.1.2 Expand prosecutors’ use of SECTOR statewide to create, review, amend, and electronically file criminal cases with the courts. (R, TRC)
Leadership/Policy, Enforcement
TDS.1.3 Increase the number of electronic tickets and collision reports through expanded adoption and agency-wide implementation of SECTOR. (R, TRC)
Leadership/Policy, Enforcement
TDS.1.4 Incorporate a GPS-type location component into SECTOR to enhance accurate reporting and integration of location data. (R, TRC)
Leadership/Policy, Enforcement, Engineering
TDS.1.5 Provide officers with roadside access to driver and vehicle history information through SECTOR. (R, TRC)
Leadership/Policy, Enforcement
TDS.1.6 Enhance SECTOR functionality to allow violations bureaus (not part of the state JIS system) to electronically process tickets from SECTOR to DOL. (R, TRC)
Leadership/Policy
TDS.1.7 Make system changes necessary at WSDOT and DOL to enable analysts to identify unlicensed drivers involved in serious injury crashes. (R, DDACTS)
Leadership/Policy
TDS.1.8 Develop a linear referencing system (LRS) for all public roadways without a LRS to enhance safety analysis. (P, 23 U.S.C. Section 148)
Leadership/Policy
TDS.1.9 Revise the Police Traffic Collision Report, including both SECTOR and paper reports, to improve nomenclature and ensure business needs are met with stakeholder involvement. (R, TRC)
Leadership/Policy, Enforcement

Dec
ision
and
Pe
rform
ance
Im
prov
emen
t
193Washington State Strategic Highway Safety Plan 2016: Target Zero
Strategies for traffic data systems (TDS)Objective Strategies Implementation areas
TDS.2. Remove barriers to data sharing and integration
TDS.2.1 Derive a more accurate classification of injury severity based on clinical assessments from medical records to augment the investigating officer’s assessment of traffic crash injury severity. (P, CODES)
Leadership/Policy, EMS
TDS.2.2 Enhance the use of the ESSENCE system for using Emergency Department Data to enhance Injury Surveillance capabilities. Increase provider reporting to ESSENCE. (P, CODES)
Leadership/Policy, EMS
TDS.2.3 Create a central repository for integrated, linked data records including crash records, health (EMS, Trauma, CHARS) records, court records, licensing records, and state toxicology records. (P, CODES)
Leadership/Policy, EMS
TDS.2.4 Increase EMS reporting by first responders throughout the state to the Washington Emergency Medical Services Information System (WEMSIS). (R, DOH)
Leadership/Policy, EMS
TDS.2.5 Implement Data-Driven Approaches to Crime and Traffic Safety (DDACTS) model in local law enforcements agencies statewide. (R, DDACTS)
Enforcement
TDS.2.6 Educate data reporting agencies about state/federal fatal crash timeliness reporting statutes and increase enforcement of these statutes. (P, WTSC)
Leadership/Policy, Education
TDS.2.7 Create connections for systems with similar or duplicate data to eliminate duplicate entry. (R, TRC)
Leadership/Policy
TDS.3. Sustain high levels of collaboration and acquired knowledge within the TRC
TDS.3.1 Provide more frequent and enhanced traffic safety trend reporting. Present data/trends in a manner that is easy to understand and is actionable. (R, DDACTS)
Leadership/Policy, Education
TDS.3.2 Maintain a meaningful and valid set of traffic records performance measures to gauge the quality of traffic safety data. Ensure measures are accessible and periodically reviewed. (R, DDACTS)
Leadership/Policy
TDS.3.3 Support training opportunities to enhance traffic safety data analysis and research skills. (U)
Leadership/Policy
TDS.4. Identify and secure targeted investments to sustain TRC initiatives
TDS.4.1 Create a maintenance and support model for SECTOR and JINDEX that further that improves operations, speeds change request implementation, and enhances user support. (R, eTRIP GT)
Leadership/Policy
P: Proven R: Recommended U: Unknown

194 Decision and Performance Improvement: EMS and Trauma Care System
Washington’s emergency medical services (EMS) and trauma care are part of a coordinated system of ambulance services, hospital-based trauma centers, and other emergency organizations. Together, these responders ensure appropriate care for injured people, with the goal of keeping them alive and able to achieve full recovery. By providing emergency care as quickly as possible, EMS helps reduce deaths and serious injuries in our state, including those from traffic crashes.
Overview Nearly 40% of all trauma deaths occur within hours of injury. In a national evaluation of the effect of trauma center care on mortality, MacKenzie et al. discussed the importance of triaging severely injured patients to the highest-level trauma center. Their results underscored the fact that overall risk of death is “significantly lower when care is provided in a trauma center than when it is provided in a non-trauma center.” This highlights the importance of a well-coordinated system that ensures severely traumatized patients arrive at the most appropriate level trauma center in the optimum amount of time.
Key FactsNearly 40% of all deaths from trauma — defined as a major injury requiring
medical or surgical care to prevent death or permanent disability — occur within hours of injury. The minutes directly following a traumatic injury are often critical to saving lives or minimizing the long-term effects of
serious injury.
The death rate for trauma patients involved in traffic crashes decreased from 9.0% in 1995 to 5.2% in 2014. The Washington
State Department of Health translates this downward trend into about 1,600 additional
lives saved by Washington’s EMS and trauma care system over those 20 years.
Unintentional injury is the leading cause of death for young people aged 15–24. In
Washington in 2014, about 20% of the 569 deaths in this age group were from motor
vehicle crashes.
Emergency medical services (EMS) and trauma care system
Traffic-related trauma is defined as a major injury requiring medical or surgical care to prevent death or permanent disability. During 1995–2006, as the EMS and trauma care system matured, inpatient deaths caused by traffic-related trauma went down significantly. Since 2007, the rate has stabilized around 5%. Similar trends
were evident in most age groups. Since the initiation of the EMS and trauma care system, younger (aged 15–24) and older (aged 65+) groups have had the most significant decreases in hospital deaths.

195Washington State Strategic Highway Safety Plan 2016: Target Zero
Priority 1
Priority 2
Priority 3
What’s New Advances in medical equipment have improved
patient care. Equipment such as video laryngoscopy, alternative airway devices such
as multi-lumen airways, and capnography are all used to assist and monitor patient
breathing. Additionally, the use of hydraulic gurneys has improved patient movement. Smart phone applications and electronic
patient care reporting systems have improved the documentation of patient care and data
collection.
Innovative programs known as Community Paramedic (or Mobile Integrated Health) are
improving how EMS is deployed, ensuring efficient and available EMS resources when traumatic injuries require rapid response,
treatment, and ambulance transport.
The recent collection and analysis of rehabilitation data demonstrates that trauma patients who receive inpatient rehabilitation care are more likely to survive and go home
with increased functional ability.
In addition to the speed of the response immediately following an injury, a patient’s outcome also depends on other important facets of trauma care. These include prevention activities, hospital care, and rehabilitation resources. These components work together to reduce the death and disability of injured people throughout Washington.
EMS responders have been able to save more trauma patients involved in vehicle crashes by getting them to the right trauma center faster, where they receive trauma care appropriate for their level of injury. The death rate for trauma patients involved in traffic crashes decreased from 9.0% in 1995 to 5.2% in 2014. The Washington State Department of Health estimates this downward trend represents about 1,600 additional lives saved by Washington’s EMS and trauma care system over those 20 years.
Washington’s state trauma system saves the life of a car crash victim
Jerry was in a car crash in rural Chelan County, sustaining bone fractures and a traumatic brain injury. Witnesses called the 911 emergency response system. Emergency responders arrived and treated Jerry at the scene, then immediately took him to the closest designated trauma hospital. Doctors there took critical lifesaving steps to treat Jerry, who was bleeding internally and received a massive transfusion.
Jerry was then transferred to the state’s highest designated Level I trauma hospital in Seattle, where specialists successfully cared for his additional injuries from the crash. The integrated trauma system that our state has created saved Jerry’s life, as well as the lives of many others injured in car crashes.

Washington State laws relating to the EMS and trauma care system
RCW 18.71 Physicians.
RCW 18.73 Emergency medical care and transportation services.
RCW 70.168 Statewide trauma care system.
Decision and
Perform
ance Im
provement
196 Decision and Performance Improvement: EMS and Trauma Care System
Partnerships are a key component of EMS’s success Washington’s EMS and trauma care system have been built upon broad cooperation among a diverse group of health care professionals and industry experts. These groups have continuously worked to address the complex political, economic, logistical, legal, and clinical issues associated with trauma care in the state. Addressing challenges in a collaborative approach allows us to continue reducing the number of crash related fatalities and serious injuries.
Components of Washington State’s EMS and trauma care system
| 459 trauma verified pre-hospital (EMS) agencies.
| Eight EMS and trauma regions. | 82 designated acute care trauma centers.
| 14 trauma rehabilitation centers.
Programs and successes
Data on EMS’s response to crashes drive the evolution of the program Using data to develop forward-thinking strategies and make decisions is critical to the continued success of Washington’s EMS and trauma care system. When it is fully implemented, the Washington EMS Information System (WEMSIS) will serve as a statewide EMS patient care database to promote evidence-based decision-making, and help evaluate EMS system response and performance.
Currently most of the EMS and trauma care system evaluation relies heavily on patient outcome in the Washington Trauma Registry (WTR). The WTR collects demographic and clinical data on trauma patients from pre-hospital agencies and trauma-designated acute care services.
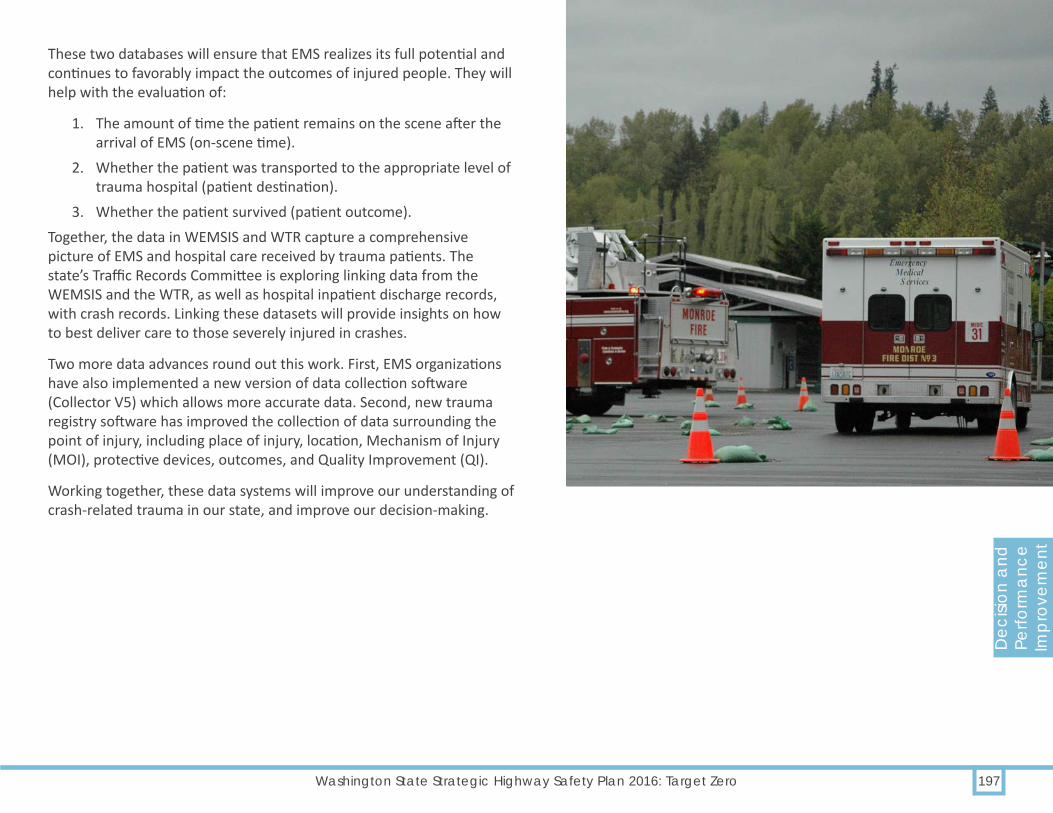
Dec
ision
and
Pe
rform
ance
Im
prov
emen
t
197Washington State Strategic Highway Safety Plan 2016: Target Zero
These two databases will ensure that EMS realizes its full potential and continues to favorably impact the outcomes of injured people. They will help with the evaluation of:
1. The amount of time the patient remains on the scene after the arrival of EMS (on-scene time).
2. Whether the patient was transported to the appropriate level of trauma hospital (patient destination).
3. Whether the patient survived (patient outcome).Together, the data in WEMSIS and WTR capture a comprehensive picture of EMS and hospital care received by trauma patients. The state’s Traffic Records Committee is exploring linking data from the WEMSIS and the WTR, as well as hospital inpatient discharge records, with crash records. Linking these datasets will provide insights on how to best deliver care to those severely injured in crashes.
Two more data advances round out this work. First, EMS organizations have also implemented a new version of data collection software (Collector V5) which allows more accurate data. Second, new trauma registry software has improved the collection of data surrounding the point of injury, including place of injury, location, Mechanism of Injury (MOI), protective devices, outcomes, and Quality Improvement (QI).
Working together, these data systems will improve our understanding of crash-related trauma in our state, and improve our decision-making.

Decision and
Perform
ance Im
provement
Strategies for EMS and trauma services (EMS)Objective Strategies Implementation areas
EMS.1. Reduce injury deaths and hospitalizations through EMS response and access to trauma care
EMS.1.1 Ensure efficient and adequate distribution of Level 1 and Level 2 Designated Trauma Centers. Increase the number of Level 2 Trauma Centers in the state. (P, META).
EMS
EMS.1.2 Ensure that all major trauma patients are transported to the highest appropriate level of designated trauma center within a 30-minute transport. (R, DOH)
EMS
EMS.1.3 Identify funding strategies that assist air medical services in filling gaps in coverage for emergency air medical response as identified in the state EMS and Trauma System Plan. (R, DOH)
Leadership/Policy, EMS
EMS.1.4 Increase injury prevention programs that reduce traffic related injuries and death. (R, LIT)
Education
EMS.1.5 Increase the percentage of EMS on-scene arrival responses that are within state requirements. (R, DOH)
EMS
EMS.1.6 Ensure adequate and efficient distribution of pre-hospital EMS resources at all levels (aid and ambulance) according to the EMS and Trauma State and Regional Plans. (R, DOH)
Leadership/Policy, EMS
EMS.1.7 Improve enforcement and public understanding of "move-over" law. (U) Education, EnforcementEMS.1.8 Consider EMS access in engineering development plans. (U) EMS, Engineering
EMS.2. Increase communication and data capacity
EMS.2.1 Enable seamless communications capabilities among EMS, law enforcement, and fire services agencies through interoperability. (R, NCHRP)
EMS, Enforcement, Leadership/Policy
EMS.2.2 Ensure that the Washington State EMS and Trauma Care System (WEMSIS) has a statewide comprehensive, robust pre-hospital data system utilizing a data set with standard definitions. (R, NCHRP)
Leadership/Policy, EMS
EMS.2.3 Increase the number of EMS agencies reporting to WEMSIS. (R, NCHRP) Leadership/Policy, EMSEMS.2.4 Provide WEMSIS data for linking to collision records. (R, DOH) Leadership/Policy, EMSEMS.2.5 Ensure that the Washington State EMS and Trauma Care System collects,
integrates, links, and analyzes data from all system components. (R, DOH)EMS
P: Proven R: Recommended U: Unknown
198 Decision and Performance Improvement: EMS and Trauma Care System


200 Decision and Performance Improvement: Evaluation, Analysis, and Diagnosis
In Target Zero, evaluation, analysis, and diagnosis is a critical component of success in reducing traffic deaths and injuries, helping us to make decisions that affect engineering, enforcement, education, and EMS. This work is the "fifth E" of highway safety.
Rather than relying on perceptions or anecdotal evidence to make these decisions, Target Zero requires a data-driven and targeted approach. This approach allows us to identify measures, target investments, track performance, and determine the impacts of our efforts. Target Zero’s partners use this information to increase the return on our investments, improving the likelihood of achieving our goal of zero fatalities and serious injuries.
Target Zero is the state’s strategic highway safety plan. It focuses attention on reducing fatalities and serious injuries. Target Zero serves as the basis for building both Washington State’s Highway Safety Plan and the Highways Safety Improvement Program (HSIP). Fatality and serious injury targets in Washington State are being handled by the WTSC via the Highway Safety Plan and by WSDOT through the HSIP. Target-setting work is also underway with the state’s metropolitan planning organizations (MPOs).
Local agency and WSDOT projects to address Target Zero priorities are selected and ranked for HSIP funding. HSIP projects addressing Target Zero priorities are then included in the Statewide Transportation Improvement Program.
Target Zero uses data to measure performanceTarget Zero measures what we want to change: the number of traffic fatalities and serious injuries. Measuring helps us understand how well programs or projects are doing in achieving the intended results. In this case, we ultimately want to reduce fatal and serious injuries to zero by 2030. When all our partners use the same measures, we are able to set priorities and identify strategies that are targeted toward this common goal. We use these same measures to track performance over time, and to provide accountability to the public we serve. We also set targets so we can determine what constitutes progress.
Evaluation, analysis, and diagnosis

201Washington State Strategic Highway Safety Plan 2016: Target Zero
Priority 1
Priority 2
Priority 3
Evaluation: looking at the big pictureWe start with a system-level evaluation of Washington's roads, looking at large amounts of traffic safety data. We begin by evaluating our performance at the system level — all fatalities and serious injuries, across all roads in the state — to get a big picture look at how we are doing.
Safety practice often focuses in three areas:
| The vehicle, such as operation and restraint systems. | The driver, such as user capability and user behavior. | The environment, such as the road system roadway
conditions and weather.
These three areas allow for the development of high-level categories. In Washington, we have chosen to focus on how aspects of the vehicle, driver, and environment contribute to the serious and fatal injury crash and severity outcomes. We call these the contributing factors to crashes, and we look for the ones that are higher than we would expect.
Factors include behavior such as such as impairment and distraction, or crash types such as intersection or lane departure crashes, or road system issues such as congestion or speed differential between road users.
These factors help us to develop meaningful categories of data, evaluate them to determine the magnitude and nature of these outcomes, and ultimately to set priority areas (see table on page
Definitions for evaluation, analysis, and diagnosis of traffic safetyDefinition Example
Evaluation Assess the big picture or categories of data to evaluate performance against a pre-determined set of criteria. For Target Zero, this means looking at whether or not we met targets for traffic-related fatalities and serious injuries within our priority areas. Each agency may set individual targets or criteria that would indicate a need to take some action. If a location or factor is not meeting expectations, it is identified for analysis.
We find that a specific roadway has more crashes at intersections than we would expect for similar roads.
Analysis Study the location of factor in depth, using different means or methods in order to interpret the data and understand why a factor or location is particularly high. For instance, using crash statistics to help us understand why crashes are reducing, staying the same, or increasing.
We analyze the data to determine that the majority of those crashes are related to impaired driving.
Diagnosis Identify contributing factors or root cause leading to an increase or decrease in crashes, similar to the way that a doctor diagnoses a patient for the root cause of her symptoms. Done well, diagnostics help us understand the factors leading to a crash or series of crashes.
We diagnose that the problem is coming from numerous drinking establishments in a very localized area, with two locations in particular that are known to overserve.

Decision and
Perform
ance Im
provement
202 Decision and Performance Improvement: Evaluation, Analysis, and Diagnosis
11). This information is used to identify statewide, region-specific, or even corridor- or location-specific priorities for interventions to improve traffic safety performance.
For instance, we have high-visibility enforcement (HVE) programs that focus on corridors with many distracted driving and impaired driving crashes. We have engineering programs to place curve warning signs at sharp curve locations to reduce run off road crashes. Finally, we use education programs to teach safe crossing skills to young pedestrians, as well as driver safety education courses for new drivers and chronically high-risk drivers.
Having concentrated our data to these priority areas, we can then evaluate trends in the data. Trends help us to understand whether types of crashes are reducing, staying the same, or increasing. This matters because, as described above, we develop projects and programs to address priorities, and as stewards of the system we want to understand whether our interventions are effective.
Analysis: understanding why a factor or location has a high number of serious and fatal crashesAnalysis involves understanding why a factor or location has a higher-than-expected rate of serious and fatal crashes. The network screening process can identify regions, corridors, or locations that would benefit from a specific countermeasure. Network screening generally establishes a specific level that would constitute a need. For example, WSDOT might look for locations where head-on injury crashes are greater than the injury average of other, similar highways, to identify locations for cable barrier. The Washington State Patrol might identify locations based on the percentage of speed in excess of ten miles per hour to perform an emphasis patrol. The Department of Licensing might identify total DUI arrests that are related to a particular location over-serving alcohol.
One of the key tools for analysis is the Highway Safety Manual (HSM), a national document from the American Association of State Highway Transportation Officials. The HSM provides tools and knowledge for quantifying safety in decision-making. With this tool, transportation professionals can consider the impacts on safety across the full range of highway activities: planning, programming, project development, construction, operations and maintenance. It is updated periodically to incorporate new developments in safety.
One example of analysis in action is the recent Marijuana Study by the WTSC. In response to the legalization of marijuana in Washington State, the WTSC partnered with the WSP Toxicology Lab to examine detailed toxicology results on drivers involved in fatal crashes. Although the FARS database collects information on drug results from toxicology testing, the existing data does not distinguish between delta-9 THC (the psychoactive substance shown to cause driver impairment) and the inactive metabolite of marijuana, which may be detected in the body for up to 30 days. This detailed marijuana information was combined with the existing detailed FARS information to create a one-of-a-kind data set that is currently being used to analyze and monitor the impact of legalized marijuana in Washington State.
Our countermeasures come from national sources
We have several tools for evaluating countermeasures and their potential to reduce crashes. These are referred to as crash modification factors (CMFs) and are used to project the potential outcomes and to compare countermeasure effectiveness for engineering in the Crash Modification Clearinghouse, or behavioral issues in Countermeasures that Work.

Diagnostics involve a high level of detail to find crash patterns
This crash diagram and data table are examples of the level of detail involved in diagnosis.
Five years of crash data
Dec
ision
and
Pe
rform
ance
Im
prov
emen
t
203Washington State Strategic Highway Safety Plan 2016: Target Zero
Diagnosis: digging deeper into the dataDiagnosis focuses on the contributing factors or root causes of a crash, types of crashes, or the factors that are common in a series of crashes. This requires a more thorough and detailed review than the analysis, so that partners can make good decisions about how to address traffic safety concerns.
Good decision-making begins with an understanding of:
| What constitutes a safety concern? | What we can do to address those concerns? | What is causing or contributing to the
concern in the first place? This is the most important aspect of good decision-making.
Why is diagnosis important? As an example, a doctor does not give a prescription without first understanding the symptoms and conditions that the patient is experiencing, and how these are different from normal expectations for health. Similarly, when we analyze the roadway, we first need to understand what is contributing to the crash risk, and whether or not the level of risk is in excess of what would be expected for that type of roadway. For instance, we will expect different crash numbers and types for a busy interstate highway with high speed and no pedestrians, compared to those of a quiet residential street with low speeds and many pedestrians.
First crash typeEntering at angle 14Left turn opposite direction 5Run off the road 3Rear end 1
Crash injury severity Fatal injury crash 1Serious injury crash 2Evident injury crash 4Possible injury crash 5Property damage only crash 11
Contributing circumstancesDid not grant right of way to
vehicle12
Disregarded STOP sign 5Exceeded reasonable safe speed 2Improper turn 1Inattention 2Impaired by alcohol 1

Diagnostics show us the best interventions The diagnostics guide us in our interventions. For example, if the primary contributing factor to a crash is speeding, and through our analysis we have found that a high frequency of speeding is occurring during late Friday and Saturday nights, then an enforcement campaign that targets excessive speed at those times would be more effective than an engineering solution that modifies the highway for all drivers at all times. On the other hand, if we were to see excessive speed in a residential area, and we also knew that the road was designed for higher speeds and mid-20th-century land use, then permanent traffic calming devices like a traffic circle might be appropriate.
We can also select multiple countermeasures when primary and secondary contributing factors indicate that collectively they will benefit a particular location or factor. Washington is a pioneer and national leader in a partnership style that promotes collaboration among experts from many fields and levels of government in order to achieve the optimal solutions to highway safety issues. Our state’s highway safety programs often include the coordinated use of enforcement, education, engineering, and EMS.
Decision and
Perform
ance Im
provement
204 Decision and Performance Improvement: Evaluation, Analysis, and Diagnosis
Having diagnosed the primary contributing factors across each of the areas (human, vehicle, and environment) for a given area, corridor, or spot location, we are then able to identify countermeasures or interventions that will be most effective in addressing these crash contributing factors.
Using our data to improve highway safetyHaving diagnosed the contributing factors and crash types involved in fatality and serious injury crashes, our next step is to develop approaches to address the crash outcomes. Whether referred to as alternatives, countermeasures, or interventions, the intent is to reduce fatal and serious injury crashes. We do this by cost-effectively selecting a series of actions to address the contributing factors that lead to crashes.
Our approach to evaluation will evolve as our technical abilities and our challenges change What we know about the science of highway safety continues to evolve, as does our knowledge of projects and programs to address safety. It is important that we evaluate and then adjust for both the positive and negative results we see. We will not improve, and we will not achieve our Target Zero goal, if we don’t address the interventions that have resulted in less-than-successful outcomes.
In the past, we evaluated highway safety performance in terms of lagging data: data that represents the past experience. For example, the safety performance of an intersection used to be based solely on reported crashes over a very short time frame. A location that experienced multiple crashes over this short time would be given priority over one that might be experiencing a more consistent and higher longer term trend, but had fewer crashes during the peak couple of years when we made project or program selections. This type of approach results in locations receiving funding and interventions that aren’t going to have a major effect: if nothing had been done at that location, the crashes would have reduced anyway because they were random events. Statistically, this is called regression to the mean, but from a practitioner’s perspective, this means that the crash reduction benefits of an intervention based on past approaches may not be the best use of our limited resources.

Dec
ision
and
Pe
rform
ance
Im
prov
emen
t
205Washington State Strategic Highway Safety Plan 2016: Target Zero
Choosing cost-effective safety investments that benefit the whole system
The value of safety investments must be considered at both the local and system levels. This is important because high costs on one project or program may prevent us from doing other projects and programs. For example, spending $40 million to build an interchange at a single location, when a $3 million roundabout would reduce the same amount of crashes, would not provide greater benefit for that location, and would in fact detract from improvements on the entire system. If we build the $40 million interchange, then we forgo $37 million in safety investments that we could have used to target other parts of the system.
Target Zero partners are working to analyze potential projects to increase the certainty of project selection by using more comprehensive analysis techniques and by using rigorous analysis methods in research and detailed analysis. For example, WSDOT is using The Highway Safety Manual and its associated tools to predict crashes given the characteristics of a highway. These tools use safety performance function and crash modification factors to determine the potential change in crash frequency or severity for the implementation of a given road change. They are very helpful in making decisions related to different alternatives. (AASHTO, 2010).
In addition, Washington’s success in reducing fatalities has also brought a new challenge. As fatal and serious injury crashes occur further apart in time and less densely at particular locations or corridors, it becomes increasingly more difficult to identify patterns and specific locations with some level of certainty. Systemic, risk-based approaches such as predictive models, which focus on expected trends based on similar roadways, are necessary to overcome this challenge. WTSC and WSDOT have used these approaches successfully since the mid-1990s, and will continue to build on them for future analysis.
Making the data meaningful and useable for partners as our approaches evolveWith a more proactive, predictive, risk-based approach comes the need for data to be more integrated and accessible to users. Many Target Zero partners use information to identify and address their current safety business needs. In the past, organizations were able to develop effective programs and projects using their own data. Now, the need to develop collaborative approaches provides the opportunity for us to bring many different data sets, layers of GIS information, and multidisciplinary approaches to a single location.
In 2012, the federal MAP-21 legislation directed FHWA and NHTSA to require state and local safety partners to work collaboratively in the development and implementation of the Strategic Highway Safety Plans, such as Washington's Target Zero. MAP-21 requires federally funded state programs to develop a more integrated, multidisciplinary, and multiagency safety program, across different modes of transportation.
Expanding the evaluation, analysis, and diagnostic skills of Target Zero staff
To be most effective in the evaluation, analysis, and diagnosis of crash reduction opportunities, Target Zero partners must provide training and specialized staff members. We need this skilled workforce to provide services in the overlapping and increasingly complex field of highway safety education, enforcement, engineering, and EMS. Staff such as statisticians, epidemiologists, human factors experts, and roadway safety engineers are required to keep up with increasingly analytical and technical needs.

206 Decision and Performance Improvement: Local Agencies and Target Zero
Washington’s continued progress toward our goal of zero traffic deaths and serious injuries is due in large part to the critical work being done by local agencies and organizations who help both write and implement the state’s Target Zero plan.
Local data drives local investmentsThe Target Zero work accomplished by local partners is most effective when it is guided by robust data sources. The data presented in Target Zero is aggregated at the statewide level, but can also be broken down by county — as seen in several maps throughout the plan — or even at the city or smaller level. This data can be very useful for prioritizing resources and programs at the county level, using the same data-driven approach as with state-wide programs.
An important component of the Target Zero plan is that the information highlights which factors are contributing locally to the most fatalities and serious injuries. The most common factors in one county or city might be very different from another, requiring different intervention strategies.
Target Zero analysts update this information regularly on the Research and Data page of the Washington Traffic Safety Commission website. It can be found at the WSDOT Crash Portal.
This community-specific data helps local and regional agencies prioritize their traffic safety projects and programs, and also assists in developing localized Target Zero plans. A data-driven approach to problem identification and prioritization can provide local-level justification for allocating funds and resources.
Further, local priorities can vary significantly from statewide priorities, based on the data.
Target Zero managers guide local effortsWashington State is known for strong state and local partnerships in traffic safety efforts. For over 30 years, our state has invested in a coordinated network of local traffic safety professionals. This network has evolved over time as the traffic safety picture has changed at the local, state, and national levels.
Today, we have Target Zero managers (TZMs) to guide local task forces around many counties and Tribal reservations in the state. These task forces are ideally composed of engineering, enforcement, education, and emergency medical services (EMS) experts, as well as other community agencies and organizations with an interest in traffic safety. The TZMs and task forces coordinate local traffic safety efforts and resources by tracking data, trends, and issues in their area. They develop and provide a variety of traffic safety programs, services, and public outreach throughout their communities by working with local partners.
Local Agencies and Target Zero

207Washington State Strategic Highway Safety Plan 2016: Target Zero
Counties and regions with an assigned Target Zero manager (TZM)
WTSC and WSDOT have highway safety funds for local organizationsFunding is available for local governments and organizations through four statewide grant programs, one from WTSC and three from WSDOT. The WTSC Federal Grant process funds behavioral change projects, and local data helps determine priority areas for funding grant requests each year. Meanwhile, WSDOT's federal Highway Safety Improvement Program (HSIP) program awards funding for local traffic safety engineering improvements and the Bicycle, Pedestrian, and Safe Routes to School programs.
Local representation on the WTSC
City and county government representatives are an important part of our state’s traffic safety effort. The Governor appoints a member of the Washington State Association of Counties (WSAC), the Association of Washington Cities (AWC), and a local judge to the Washington Traffic Safety Commission so they can work with state agency directors involved in traffic safety. The WTSC commissioners oversee and approve the grant funding recommendations of WTSC staff.
Priority 1
Priority 2
Priority 3

Decision and
Perform
ance Im
provement
208 Decision and Performance Improvement: Local Agencies and Target Zero
Local program examples
King County distracted driving campaignsKing County Task Force addresses distracted driving throughout the county
The King County Target Zero Task Force received federal grant funding from the WTSC to conduct public outreach and high visibility enforcement (HVE) campaigns to reduce and prevent distracted driving. The Task Force represents multiple King County agencies. Starting in 2012, the task force implemented the project with early- and late-summer campaigns across the county in order to reach motorists during peak driving periods, specifically the end and start of the school year and summer holidays. During the campaigns, task force members patrolled hundreds of extra hours and contacted thousands of violators. In 2014, the Task Force’s work accounted for:
| 1,281 contacts | 1,086 citations | 390 citations for phone usage | 152 citations for texting or other electronic device usage
In 2015, the task force continued the project with two emphasis patrols.
Washington State Patrol (WSP)’s county-wide and city distracted driving initiatives
To help reduce crashes in King County, WSP has developed a comprehensive plan that captures five years of fatalities and serious injury data on state highways and freeways in the county. In 2013 alone, WSP investigated 18 fatal crashes and 2,149 injury crashes in King County; distracted driving was cited as a key factor in many of these cases.
From this analysis came the King County Target Enforcement Area (TEA) Deployment, a comprehensive plan that addresses serious injury and fatality crashes on all of the King County interstate and state routes for which the WSP has responsibility. The data in the plan shows locations that have had a high incident of fatality and serious injury crashes.
Additionally, with funding from King County EMS, WSP conducted city-specific patrol projects to address areas of high need. Local partners and crash data identified a cluster of fatal and serious injury crashes in Kirkland on I-405 between mile post 20 and 22. In October 2014, troopers targeted the area for a five-day period with teams of five to seven troopers per shift. Troopers made contact with 259 drivers during this time, resulting in:
| 102 arrests (including outstanding warrants, etc.) | 61 phone violations | 53 warnings | 43 moving violations
Those projects were planned in cooperation with the Task Force. The teams partnered on media, outreach, and officer recruitment, among other elements. In previous years, WSP has also conducted city-specific patrols in SeaTac, Kirkland, and Redmond.
Full-time DUI patrols in Spokane and Yakima reduce impaired drivingThe Washington State Patrol operates Target Zero Team programs in King, Pierce, Snohomish, Yakima, and Spokane counties. This program supports impaired driving patrols by teams of dedicated, full-time DUI troopers.

Dec
ision
and
Pe
rform
ance
Im
prov
emen
t
209Washington State Strategic Highway Safety Plan 2016: Target Zero
In Yakima and Spokane counties, regional TZMs coordinate with local and county law enforcement agencies, and the Washington Liquor and Cannabis Board (WLCB), to supplement these efforts to reduce impaired driving. These efforts include:
| Conducting impaired driving high visibility enforcement campaigns.
| Alcohol retailer compliance checks | Increased public outreach regarding impaired driving.
In coming years, Pierce, King, and Snohomish will pursue this work as well.
Coordinated high visibility enforcement (HVE) campaigns target dangerous behaviorsAn important focus of the Target Zero manager (TZM) network is coordination of a number of statewide high visibility DUI, distracted driving, and seatbelt traffic safety campaigns. Deterrence is the main goal of the HVE campaigns, but enforcement of the laws also plays an important role. These campaigns are unique as multiple agencies often cross jurisdictional lines to collaborate for the enforcement patrols.
First, TZMs educate the public about the traffic safety issue and upcoming emphasis patrols through media campaigns. They then coordinate multiple agencies to create a broadened enforcement presence on the roads during the campaign. TZMs work with city and Tribal police departments, county sheriffs’ offices, and WSP to plan and schedule patrols in high-risk areas and times identified by local crash data.
Local EMS and trauma services support enforcement and prevention efforts
Local EMS and trauma services programs play a significant role in enforcement and prevention efforts around the state, guided by the eight EMS and Trauma Regional Councils statewide. EMS participates in programs such as the Safe Kids project, recommending and funding injury prevention efforts. EMS also provides an important liaison between law enforcement agencies and Regional EMS and Trauma Care Councils, local hospitals, and fire departments, working to bridge the gap on issues that affect these professions. In King County, EMS has provided funding to local agencies and WSP for distracted driving prevention projects since 2012.
Decision and
Perform
ance Im
provement
210 Decision and Performance Improvement: Local Agencies and Target Zero
Several Washington State cities are adopting Vision Zero Vision Zero began in Sweden in the late 1990s, and helped inspire Washington State’s Target Zero plan. This zero traffic fatality initiative has led to Sweden having one of the lowest highway fatality rates in the world.
The core values of Vision Zero are:
| All traffic deaths and severe injuries are preventable. | No loss of life is acceptable. | We are human and make mistakes. | The road system must be designed to protect us at every
turn. | Safe mobility is a basic right for all people.
In the past five years, advocates around the United States have promoted Vision Zero at the local level. Washington State has an active Vision Zero movement in several cities:
| Seattle has adopted a Vision Zero plan. | Bellevue has adopted a Vision Zero resolution by City
Council. | Kirkland and Tacoma have Vision Zero policies in their
Transportation Master Plans. | Kirkland also has Vision Zero policy language in its
Comprehensive Plan. | Seattle and Kenmore both have developed Vision Zero
programming.
Seattle’s Vision Zero program had a recent success with their NE 75th Street Road Safety Corridor Project. This rapidly implemented project — which was designed and put into place in six months — achieved notable results for traffic safety:
| Crashes reduced by 45%. | Speeds reduced 9% eastbound and 11% westbound. | Top-end speeders (10+ mph over the posted speed limit)
reduced 75% eastbound and 79% westbound. | Travel times unchanged.
In addition, as with Washington State’s Target Zero plan, Vision Zero has a core value to promote partnerships. The Vision Zero movement is a complementary effort to the state and local outreach of Target Zero, which has been mainly focused at the state, county, and Tribal levels in Washington. These two movements will be coordinating in coming years, united by a goal of reducing traffic fatalities and serious injuries to zero in Washington State.
Target Zero and Vision Zero Plans in Washington State
Developing local Target Zero or Vision Zero plans can be an effective way to expand partnerships with area agencies and develop a common vision. These local plans create priorities and strategies based on community-specific fatality and serious injury data.
Many cities and counties around Washington have adopted “zero fatality” and “zero fatality and serious injury” plans, including Bellevue, Kenmore, Kirkland, Seattle, and Tacoma. Target Zero managers are available to help with work on the local level.

App
end
ices

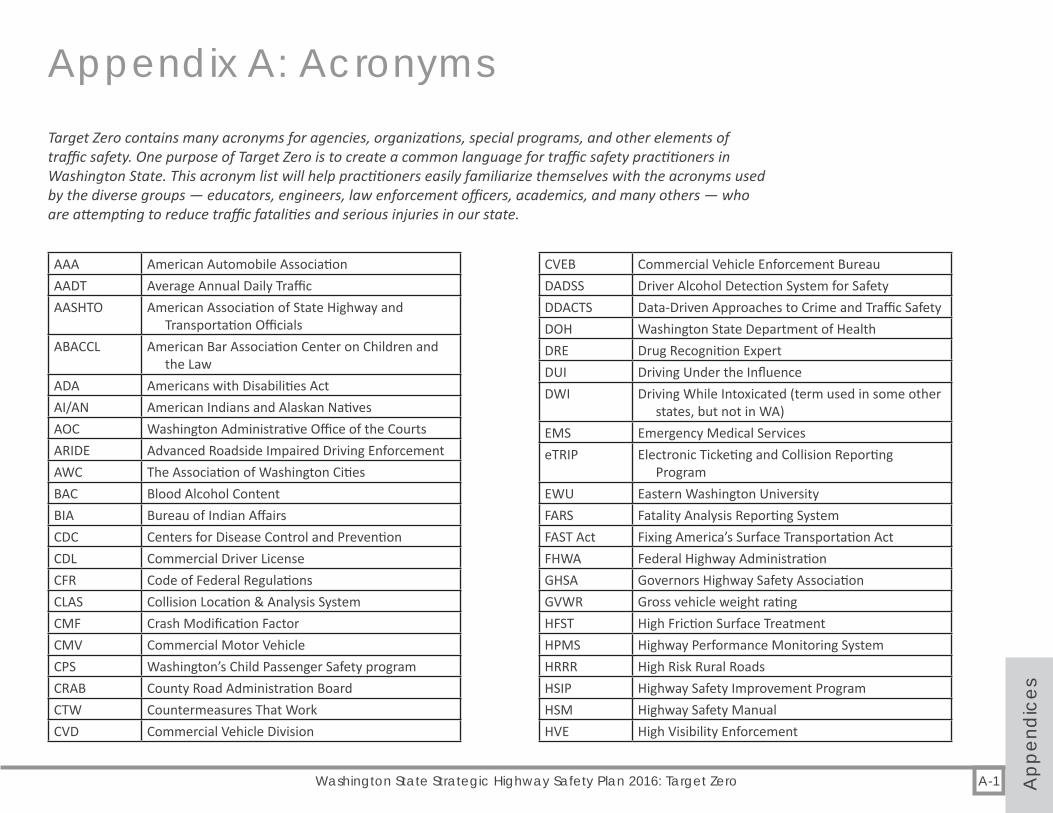
A-1Washington State Strategic Highway Safety Plan 2016: Target Zero App
end
ices
AAA American Automobile AssociationAADT Average Annual Daily Traffic AASHTO American Association of State Highway and
Transportation OfficialsABACCL American Bar Association Center on Children and
the LawADA Americans with Disabilities ActAI/AN American Indians and Alaskan NativesAOC Washington Administrative Office of the Courts ARIDE Advanced Roadside Impaired Driving EnforcementAWC The Association of Washington CitiesBAC Blood Alcohol ContentBIA Bureau of Indian Affairs CDC Centers for Disease Control and Prevention CDL Commercial Driver LicenseCFR Code of Federal RegulationsCLAS Collision Location & Analysis SystemCMF Crash Modification FactorCMV Commercial Motor VehicleCPS Washington’s Child Passenger Safety programCRAB County Road Administration BoardCTW Countermeasures That WorkCVD Commercial Vehicle Division
CVEB Commercial Vehicle Enforcement BureauDADSS Driver Alcohol Detection System for Safety DDACTS Data-Driven Approaches to Crime and Traffic SafetyDOH Washington State Department of HealthDRE Drug Recognition ExpertDUI Driving Under the InfluenceDWI Driving While Intoxicated (term used in some other
states, but not in WA)EMS Emergency Medical ServiceseTRIP Electronic Ticketing and Collision Reporting
Program EWU Eastern Washington UniversityFARS Fatality Analysis Reporting SystemFAST Act Fixing America’s Surface Transportation ActFHWA Federal Highway AdministrationGHSA Governors Highway Safety AssociationGVWR Gross vehicle weight rating HFST High Friction Surface TreatmentHPMS Highway Performance Monitoring SystemHRRR High Risk Rural RoadsHSIP Highway Safety Improvement ProgramHSM Highway Safety ManualHVE High Visibility Enforcement
Appendix A: AcronymsTarget Zero contains many acronyms for agencies, organizations, special programs, and other elements of traffic safety. One purpose of Target Zero is to create a common language for traffic safety practitioners in Washington State. This acronym list will help practitioners easily familiarize themselves with the acronyms used by the diverse groups — educators, engineers, law enforcement officers, academics, and many others — who are attempting to reduce traffic fatalities and serious injuries in our state.

A-2 Appendix A: Acronyms
Append
ices
IIHS Insurance Institute for Highway Safety ITS Intelligent Transportation SystemsIVIS In-Vehicle Information SystemsLDTL Let’s Draw the Line between Youth and AlcoholLIT A strategy supported by extensive literature but
lacks a metastudyLTAP Local Technical Assistance ProgramLTCCS Large Truck Crash Causation StudyMADD Mothers Against Drunk DrivingMAP-21 Moving Ahead for Progress in the 21st Century ActMETA A strategy supported with published, favorable
outcomes in the form of a metastudy (a review of several related studies for methodological strength and consistent outcomes
MPH Miles per HourMUTCD Manual on Uniform Traffic Control DevicesNACTO National Association of City Transportation OfficialsNATEO The Northwest Association of Tribal Law
Enforcement Officers NCHRP National Cooperative Highway Research ProgramNCSC National Center for State CourtsNHTSA National Highway Traffic Safety AdministrationNTSB National Transportation Safety BoardNW TTAP Northwest Tribal Transportation Assistance ProgramOSPI Office of Superintendent of Public InstructionPIP Party Intervention Patrol PTCR Police Traffic Collision ReportRAND Research and DevelopmentRCW Revised Code of WashingtonRUaD Washington State Coalition to Reduce Underage
Drinking SECTOR Statewide Electronic Collision and Ticket Online
Records systemSDOT Seattle Department of Transportation
SFST Standardized Field Sobriety TestsSHSP Strategic Highway Safety PlanSMC Seattle Municipal CourtSRTS Safe Routes to SchoolsTACT Ticket Aggressive Cars and TrucksTEA Target Enforcement AreaTHC Tetrahydrocannabinol TRC Traffic Records Committee TTPO Tribal Transportation Planning OrganizationTZM Target Zero ManagerTZT Target Zero TeamsUSC Code of Laws of the United States of America USDOT United States Department of TransportationUTC Utilities and Transportation Commission UW University of WashingtonV2I Vehicle-to-Infrastructure communicationsV2V Vehicle-to-Vehicle communicationsVMT Vehicle Miles TraveledWASPC Washington State Association of Sheriffs & Police
ChiefsWEMSIS Washington EMS Information SystemWIDAC Washington's Impaired Driving Advisory Council WITPAC The Washington Indian Transportation Policy
Advisory CommitteeWLCB Washington Liquor and Cannabis BoardWSAC Washington State Association of CountiesWSDOT Washington State Department of TransportationWSP Washington State PatrolWTA Washington Trucking AssociationWTR Washington Trauma RegistryWTSC Washington Traffic Safety Commission
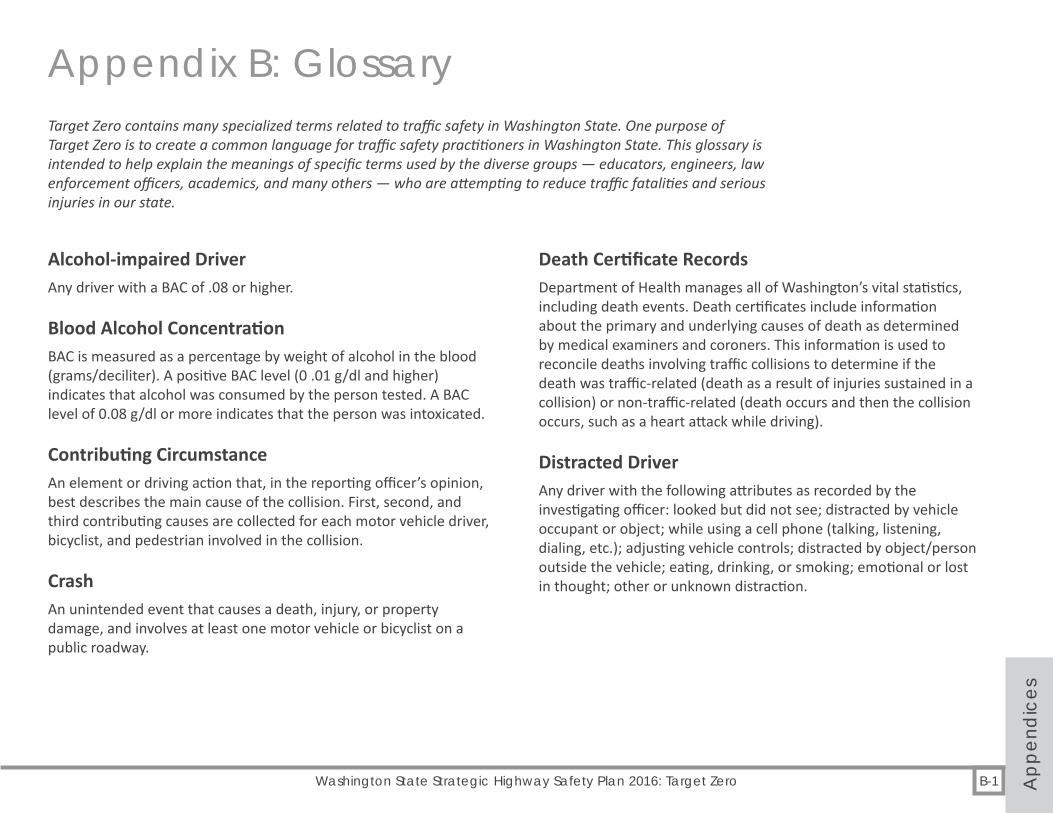
B-1Washington State Strategic Highway Safety Plan 2016: Target Zero App
end
ices
Alcohol-impaired DriverAny driver with a BAC of .08 or higher.
Blood Alcohol ConcentrationBAC is measured as a percentage by weight of alcohol in the blood (grams/deciliter). A positive BAC level (0 .01 g/dl and higher) indicates that alcohol was consumed by the person tested. A BAC level of 0.08 g/dl or more indicates that the person was intoxicated.
Contributing CircumstanceAn element or driving action that, in the reporting officer’s opinion, best describes the main cause of the collision. First, second, and third contributing causes are collected for each motor vehicle driver, bicyclist, and pedestrian involved in the collision.
CrashAn unintended event that causes a death, injury, or property damage, and involves at least one motor vehicle or bicyclist on a public roadway.
Death Certificate RecordsDepartment of Health manages all of Washington’s vital statistics, including death events. Death certificates include information about the primary and underlying causes of death as determined by medical examiners and coroners. This information is used to reconcile deaths involving traffic collisions to determine if the death was traffic-related (death as a result of injuries sustained in a collision) or non-traffic-related (death occurs and then the collision occurs, such as a heart attack while driving).
Distracted DriverAny driver with the following attributes as recorded by the investigating officer: looked but did not see; distracted by vehicle occupant or object; while using a cell phone (talking, listening, dialing, etc.); adjusting vehicle controls; distracted by object/person outside the vehicle; eating, drinking, or smoking; emotional or lost in thought; other or unknown distraction.
Appendix B: GlossaryTarget Zero contains many specialized terms related to traffic safety in Washington State. One purpose of Target Zero is to create a common language for traffic safety practitioners in Washington State. This glossary is intended to help explain the meanings of specific terms used by the diverse groups — educators, engineers, law enforcement officers, academics, and many others — who are attempting to reduce traffic fatalities and serious injuries in our state.

B-2 Appendix B: Glossary
Append
ices
Driving under the influence (DUI) (legal definition)In Washington State, a person is guilty of driving while under the influence of intoxicating liquor, marijuana, or any drug if the person drives a vehicle within this state and:
| Has, within two hours after driving, an alcohol concentration of .08 or higher as shown by analysis of the person’s breath or blood made under RCW 46.61.506; or
| Has, within two hours after driving, a THC concentration of 5.00 or higher as shown by analysis of the person’s blood made under RCW 46.61.506; or
| Is under the influence of or affected by intoxicating liquor, marijuana, or any drug; or
| Is under the combined influence of or affected by intoxicating liquor, marijuana, and any drug.
Electronic Traffic Information Processing (eTRIP) InitiativeA collaborative effort among state and local agencies to create a seamless and integrated system through which traffic-related information can travel from its point of origin to its end use and analysis. The intent of this undertaking is to move from the current paper-based process to an automated system that will enable law enforcement agencies to electronically create tickets and crash reports in the field and transmit this data to state repositories and authorized users.
FatalityA person who died within 30 days of a crash as a result of injuries sustained in the collision.
Fatality Analysis Reporting System (FARS)A database system containing data on a census of fatal traffic crashes within the 50 states, the District of Columbia, and Puerto Rico. To be included in FARS, a crash must involve a motor vehicle traveling on a trafficway customarily open to the public and result in the death of a person (occupant of a vehicle or a non-occupant) within 30 days of the crash. FARS collects information on over 100 different coded data elements that characterize the crash, the vehicle, and the people involved.
Fatality RateNumber of deaths resulting from reportable crash for a specified segment of public roadway per 100 million vehicle miles of travel or per 100,000 people.
Heavy Truck1. Any vehicle with a trailer classified at gross vehicle weight
rating (GVWR) of 10,001 lbs. or more, a single vehicle with GVWR of 26,001 lbs. or more, or a single vehicle of 26,000 lbs. or less that is commercial driver license (CDL)-required, or a commercial vehicle supplement to the collision report.
2. A vehicle type of truck and trailer, truck tractor, truck tractor and semi-trailer, or truck-double trailer combinations.
3. A vehicle usage classification of concrete mixer, dump truck, logging truck, refuse/recycle truck, van over 10,001 lbs., tanker truck, or auto carrier.
Impaired DriverAny driver with a BAC of .08 or greater and/or any driver with a positive result on a drug test or through an investigating officer or drug recognition expert (DRE) assessment of impairment.

B-3Washington State Strategic Highway Safety Plan 2016: Target Zero App
end
ices
Impairment Related CollisionAny driver, pedestrian, bicyclist, etc., with a BAC of .08 or greater and/or a positive result on a drug test.
Licensed DriverA person who is licensed by any state, province, or other governmental entity to operate a motor vehicle on public roadways.
Motor VehicleAny motorized device in, upon, or by which any person or property is or may be transported or drawn upon a public roadway, excepting devices used exclusively upon stationary rails or tracks. This includes every motorized vehicle that is self-propelled or propelled by electric power (excluding motorized wheelchairs), including that obtained from overhead trolley wires but not operated on rails.
Non-motoristAny person who is not an occupant of a motor vehicle in transport and includes the following:
4. Pedestrians5. Bicyclists, tricyclists, and unicyclists6. Occupants of parked motor vehicles7. Others such as people riding on animals and persons riding
in animal-drawn conveyances
PassengerAny occupant of a motor vehicle who is not a driver.
PedestrianAny person not in or upon a motor vehicle or other vehicle but includes persons on personal conveyance devices, such as skateboards or wheelchairs.
Per se Alcohol LimitNo further proof is needed. When a person is found to have, within two hours after driving, an alcohol concentration of .08 or higher or a THC concentration of 5.00 nanograms per milliliter of blood or higher, that person is guilty “per se” of driving under the influence.
RestraintA device such as a seatbelt, shoulder belt, booster seat, or child seat used to hold the occupant of a motor vehicle in the seat at all times while the vehicle is in motion.
RuralAll areas, incorporated and unincorporated, with a population of less than 5,000.
Serious InjuryAny injury other than a fatal injury that prevents the injured person from walking, driving, or normally continuing the activities the person was capable of performing before the injury occurred. This definition applies to traffic crash data only. This is not the legal definition or medical definition of serious injury.

B-4 Appendix B: Glossary
Append
ices
SpeedingSpeeding occurs when drivers travel above the posted speed limit or too fast for conditions. Drivers may be traveling well under the posted speed limit, but may be considered speeding when weather conditions such as icy roads or poor visibility such as fog may cause drivers to lose control of their vehicles or increase normal stopping distance.
TraumaA major single or major multiple injury requiring immediate medical or surgical intervention or treatment to prevent death or permanent disability.
UrbanAny incorporated area with a population of over 5,000.
Vehicle Miles Traveled (VMT)The number of miles traveled annually by motor vehicles.
Work ZoneAny activity involving construction, maintenance, or utility work on or in the immediate vicinity of a public roadway. A work zone may be active (workers present) or inactive.
Young Driver InvolvedA driver age 16–25 involved in a fatal or serious injury collision. Involvement does not indicate fault.

C-1Washington State Strategic Highway Safety Plan 2016: Target Zero App
end
ices
Five-year rolling averages and the performance trend lineWashington State formed its Target Zero vision in 2000: zero deaths and serious injuries by 2030. This edition of Target Zero provides the most recent ten years of traffic fatality and serious injury data for our state.
The vision of zero by 2030 itself is a linear concept: a direct relationship between the two variables of fatalities and time (or of serious injuries and time) converging at zero in 2030. Therefore, it makes sense to use a linear measure of progress to compare with a linear goal. The trend line may indicate a declining, flat, or increasing trend, depending on the average change among the series of five-year rolling averages.
Each average contributes equally to the average change driving the direction of the trend. The five-year rolling averages smooth the effect a single year fluctuation would have on a linear trend. The most recent ten years of data presented in this edition result in six five-year rolling averages on which the performance trend is based. Data years 2005–2014, represented by the blue triangles on the graph, result in rolling averages of 2005–2009, 2006–2010, 2007–2011, 2008–2012, 2009–2013, and 2010–2014.
Trend lines represent a future projection assuming all variation, fluctuation, and preventive measures stay at historic and current levels. In practice, by continuously implementing new strategies and enhancing and maintaining existing strategies, we can drive the trend downward, closer to the overall goal of zero by 2030.
Appendix C: MethodologiesThis appendix explains the methodology we used in developing the Target Zero serious injury and fatality data. For information on the sources of data, please see Appendix D: Target Zero Data Sources.

C-2 Appendix C: Methodologies
Append
ices
The Target Zero goal lineFor this edition of Target Zero, we projected fatality and serious injury trend charts out to the year 2030. This approach allows us to measure incremental progress within the entire 2030 timeframe and see what’s required to reach zero by 2030. The Target Zero goal line is simply a straight line to zero in 2030, starting from the most recent five-year average (2010–2014). Using the five-year average helps mitigate the skewing effect any single year might have on our progress toward zero.
While the exact values of the Target Zero goal line may serve as annual targets for reaching zero, we can make more accurate assessments of progress when we group and compare several years of data.
The performance gapThe solid line on the graph represents the Target Zero line — the downward trend needed to reach zero by 2030. The performance gap is the space between the Target Zero goal line and the trend line projected from the five-year rolling averages. The trend charts show this performance gap in a light blue color.
Some Target Zero graphs do not show a gap, because the trend actually goes to zero before 2030.
The performance gap may also be used as a monitoring tool. For example, if the performance gap is smaller in 2015 and grows on its way to 2030, it indicates we not only need a greater decrease in overall counts, but also a greater average annual decline than we have had. This type of gap represents areas in need of new and expanded strategies. However, if the gap is of similar width in 2015 as it is in 2030, then we have achieved the necessary average annual decline, but need an immediate downward drive in annual counts to close the gap.
Fatality and serious injury ratesWe reference rates in some chapters of this Target Zero edition. There are three types of rates in our analysis:
1. Rates based on vehicle miles traveled (VMT)
2. Rates based on population
3. Rates based on registered or endorsed drivers
The most common rates used in traffic safety statistics are the number of fatalities or serious injuries per 100 million VMT. These rates represent the measure of risk for traffic deaths or serious injuries based on estimated annual traffic volume. VMT is available for state, county, rural, and urban classifications (see Appendix D for more information on VMT).
Rates of fatalities and serious injuries specific to population subgroups, such as racial/ethnic and age-specific groups, are calculated per 100,000 people. Comparisons of these population rates enable identification of high risk groups. Such groups may be at higher risk for traffic death or serious injury than other population subgroups, as is the case with older drivers, younger drivers, and American Indians and Alaskan Natives.
Some rates are presented based on the number of licensed or endorsed drivers. These rates are similar to VMT rates, but represent a measure of risk of traffic death or serious injury based on the estimated number of drivers. The rates are useful when comparing different categories of drivers, such as motorcyclists.

C-3Washington State Strategic Highway Safety Plan 2016: Target Zero App
end
ices
As we get closer to zero fatalities and serious injuries, it gets harder to affect the trendsThe traffic safety community recognizes there are factors related to traffic deaths and serious injuries outside the reach of listed strategies. Additionally, we recognize most strategies have immediate benefits that level off. As we look to the future, we also realize that as overall fatal and serious injury counts are driven downward, it will be harder to meet average annual reduction goals.These recognitions are particularly true related to affecting fatality and serious injury trends among the more isolated, higher risk, and/or less receptive members of Washington’s population.
As linear trends flatten and we get closer to 2030, we will need more sophisticated statistical methods to monitor and predict outcomes. Our challenge is to continue to accurately identify and monitor these changing trends, and keep ahead of them with new and expanded strategies.
The factors contributing to traffic fatalities and serious injuries are an intimate web of environmental, behavioral, and vehicular factors. Some factors are related to the triggering of the event, while others are related to the severity of the event. Using various facets of enforcement, education, engineering, emergency medical services, and evaluation, we will continue to prevent these crashes from happening in the first place, and to mitigate the harm incurred when they do happen.
While we may not be able to prevent all crashes, we can eliminate those that result in deaths and serious injuries, our vision for Washington State.


D-1Washington State Strategic Highway Safety Plan 2016: Target Zero App
end
ices
The Fatality Analysis Reporting SystemThe Fatality Analysis Reporting System (FARS) is the source of Target Zero’s fatality data. The Washington Traffic Safety Commission (WTSC) contracts with the National Highway Traffic Safety Administration (NHTSA) to provide FARS data for Washington State. FARS is a nationwide census of traffic fatalities that characterizes the crash, the vehicles, and the people involved in each reported fatal crash. FARS contains more than 100 coded data elements that are collected from official documents, including Police Traffic Crash Reports (PTCR), state driver licensing and vehicle registration files, death certificates, toxicology reports, and emergency medical services (EMS) reports.
To be included in FARS, a crash must involve a motor vehicle traveling on a trafficway that is customarily open to the public, and result in the death of a person (either an occupant of a vehicle or a non-motorist) within 30 days of the crash. For more information about the parameters in FARS traffic fatality counts, visit WTSC’s Research and Data Division page.
The collision locator analysis systemThe collision location & analysis system (CLAS), a crash data repository, is the source of Target Zero’s serious injury data. CLAS is housed at WSDOT. Most of the data in CLAS comes from law enforcement officers via the PTCR. Citizens may also submit non-police assisted reports of crash events via the Vehicle Collision Report.
CLAS stores all reportable traffic crash data for Washington State public roadways. A crash needs to meet at least one of the two following criteria to be considered “reportable”: 1) a minimum property
damage threshold of $1,000, and/or 2) bodily injury occurred as a result of the crash.
Target Zero uses CLAS crash data for counts of seriously injured people. However, there are sections within Target Zero that also use CLAS crash information for deriving counts of fatally injured people through record merging with FARS. Those sections are Lane Departure and Intersection. CLAS crash data were also used to reconcile jurisdictional assignment in FARS for road type/jurisdiction analysis.
It is widely acknowledged that serious injury classifications assigned by investigating officers are not as accurate as injury severity derived from health records. The serious injury data presented in this edition of Target Zero is classified by the investigating officer at the scene. However, Washington’s Traffic Records Committee is making progress on a collaborative, multiagency effort to get more accurate injury severity data, particularly for serious injury crashes. For more information about the efforts of the Traffic Records Committee (TRC), see the Traffic Data Systems chapter.
Vehicle Miles Traveled estimatesVehicle Miles Traveled (VMT) is a measure of the total number of miles traveled by all vehicles over a segment of road over a specific period of time, usually either a day or a year. WSDOT collects and reports several different types of road and street data to the Federal Highway Performance Monitoring System (HPMS) each year. WSDOT collects traffic data for state highways and relies on local jurisdictions to provide traffic data for their roads and streets.
Appendix D: Target Zero data sourcesTo develop the data that drives Target Zero, practitioners draw data from multiple sources in Washington State. This appendix describes those sources.

D-2 Appendix D: Data Sources
Append
ices
VMT is calculated as follows:
VMT = (length of road segment) x (the Average Annual Daily Traffic [AADT] traveling on that road segment)
The total VMT for a highway network or region is a summation of VMT for all segments of roads that make up the network or region. Statewide VMT is a summation of all segments of road statewide.
Department of Licensing driver record data The Washington State Department of Licensing (DOL) provides the driver record data used in Target Zero from their Drivers Data Mart database. This data is updated daily from several sources, and contains the complete driver records for all Washington drivers.
Administrative Office of the Courts citation dataWashington Administrative Office of the Courts (AOC) provides court and citation data, which includes enforcement and court processing. For example, AOC collects the number of texting while driving citations when they are filed with the court.
Data gaps exist, which Target Zero partners address, such as tracking a single DUI case through the myriad of internal and external data systems that the information passes through. The AOC actively participates in the Traffic Records Committee and is working to identify and find solutions for these data gaps, and to develop methods for linking AOC data with WTSC and WSDOT crash data.
Office of Financial Management population estimatesWashington’s Office of Financial Management (OFM) has been providing annual population estimates for revenue allocation purposes since the 1940s. OFM provides population estimates, including breakouts by county, age, gender, and race/ethnicity, on their population page.

E-1Washington State Strategic Highway Safety Plan 2016: Target Zero App
end
ices
MEASURES FATALITY DEFINITION From FARS database
SERIOUS INJURY DEFINITIONFrom CLAS database
PRIORITY LEVEL ONE: Fatality resulting from a crash that involved: Serious injury resulting from a crash that involved:Impairment Involved Any driver or non-motorist with a Blood Alcohol
Concentration (BAC) of 0.08 or higher or a positive drug result as confirmed by the state Toxicology Laboratory.
Any driver or non-motorist in which the investigating officer or drug recognition expert (DRE) indicated that the person was impaired by drugs or alcohol and reported in contributing circumstances as “Under the Influence of Alcohol,” “Under the Influence of Drugs,” or “Had Taken Medication” or sobriety reported as “HBD – Ability Impaired” or “HBD – Ability Impaired (tox test).”
Drug Impairment Involved Any driver or non-motorist with a positive drug result as confirmed by the state Toxicology Laboratory.
NOT APPLICABLE. Due to no confirmation by toxicology, drug impairment involved serious injuries are not reported.
Alcohol Impairment Involved Any driver or non-motorist with a BAC of 0.08 or higher as confirmed by the state Toxicology Laboratory.
Any driver or non-motorist in which the investigating officer or DRE indicated that the person was impaired by alcohol and reported in contributing circumstances.
Drinking Involved Any driver or non-motorist with a BAC of any value except zero, as confirmed by the state Toxicology Laboratory (also includes alcohol impaired persons).
Any driver or non-motorist for whom the investigating officer or DRE reported sobriety as “Had Been Drinking” or contributing circumstance of “Under the Influence of Alcohol.”
Appendix E: Data DefinitionsTarget Zero draws its fatality data from the national Fatality Analysis Reporting System (FARS), housed at WTSC for Washington State’s data. Its serious injury data comes from the state-level Collision Location & Analysis System (CLAS), housed at WSDOT. This appendix describes the specific definitions and codes used to determine which crashes are included in emphasis area data, and which are not.

E-2 Appendix E: Data Definitions
Append
ices
MEASURES FATALITY DEFINITION From FARS database
SERIOUS INJURY DEFINITIONFrom CLAS database
PRIORITY LEVEL ONE: Fatality resulting from a crash that involved: Serious injury resulting from a crash that involved:Lane Departure Derived from CLAS and flagged in FARS. WSDOT
provides reports to WTSC for flagging run-off-the-road and head-on crashes. If either the run-off-the-road or head-on condition is true, then that case is counted for lane departure. Uses the same criteria described in the “Serious Injury” column.
A run-off-the-road event defined as the primary crash type is reported as “one parked-one moving,” “struck fixed object,” “struck other object,” or “vehicle overturned” AND object struck is NOT “Animal-Drawn Vehicle,” “Closed Toll Gate,” “Domestic Animal (ridden),” “Drawbridge Crossing Gate Arm,” “Fallen rock hit by vehicle (on the road),” “Fallen Rock or Tree Hit by Vehicle,” “Fallen tree hit by vehicle (on the road),” “Falling rock on vehicle (on the road),” “Falling Rock or Tree Fell on Vehicle,” “Falling tree on vehicle (on the road),” “Manhole Cover,” “Miscellaneous Object or Debris on Road,” “Mud or Landslide,” “Not Stated,” “Railway Crossing Gate,” “Reversible Lane Control Gate,” “Snowslide,” “Toll Booth,” “Toll Booth Island,” “Underside of Bridge,” or miscellaneous object or debris on road AND junction relationship is “At Driveway but Not Related,” “At Intersection and Not Related,” “At Roundabout but not Related,” “Not at Intersection and Not Related” AND the first impact location code is not “A1,” “A2,” “A3,” “A4,” “A5,” “A6,” “AA,” “AB,” “AC,” “C1,” “D1,” “D2,” “D3,” “D4,” “D5,” “D6,” “DA,” “DB,” “DC,” “H1,” “H2,” “H3,” “H4,” “H5,” “H6,” “L1,” “L2,” “L3,” “L4,” “L5,” “L6,” “M1,” “M2,” “M3,” “M4,” “M5,” “M6,” “N1,” “N2,” “N3,” “N4,” “N5,” “N6,” “P1,” “P2,” “P3,” “P4,” “P5,” “P6,” “Q1,” “Q2,” “Q3,” “Q4,” “Q5,” “Q6,” “R1,” “R2,” “R3,” “R4,” “R5,” “R6,” “S1,” “S2,” “S3,” “S4,” “S5,” “S6,” “V1,” “V2,” “V3,” “V4,” “V5,” “V6,” “X1,” “X2,” “X3,” “X4,” “X5,” “X6.” Exclude cases if the vehicle action is “Going Wrong Way on Divided Highway,” “Going Wrong Way on Ramp,” “Going Wrong Way on One-Way Street or Road” and cases with corresponding junction relationships described in the intersection definition.Lane Departure also includes crashes resulting from opposite direction travel (head-on) defined as the primary crash type reported as “From opposite direction – both moving – head-on,” “From opposite direction – one stopped – head-on,” “From opposite direction – both going straight – sideswipe,” “From opposite direction – both going straight – one stopped – sideswipe,” “From opposite direction – all others” OR junction relationship is “At Driveway but Not Related,” “At Intersection and Not Related,” “At Roundabout but not Related,” “Not at Intersection and Not Related” AND the first recorded vehicle action is “Going wrong way on divided highway,” “Going wrong way on ramp,” or “Going wrong way on one-way street or road.”

E-3Washington State Strategic Highway Safety Plan 2016: Target Zero App
end
ices
MEASURES FATALITY DEFINITION From FARS database
SERIOUS INJURY DEFINITIONFrom CLAS database
PRIORITY LEVEL ONE: Fatality resulting from a crash that involved: Serious injury resulting from a crash that involved:Speeding Any driver exceeding the posted speed limit or
driving too fast for conditions at the time of the crash as indicated by the investigating officer.
Any driver exceeding the posted speed limit or driving too fast for conditions at the time of the crash as reported by the investigating officer in contributing circumstances.
Young Driver Age 16-25 Involved
Any driver between the ages of 16 and 25 years. Any driver between the ages of 16 and 25 years.
Intersection Related Derived from CLAS and flagged in FARS. Uses the same criteria described in the “Serious Injury” column.
A junction relationship reported as at intersection and related; intersection related but not at intersection; at driveway within major intersection; entering roundabout; circulating roundabout; exiting roundabout; roundabout related but not at roundabout; or traffic calming circle.
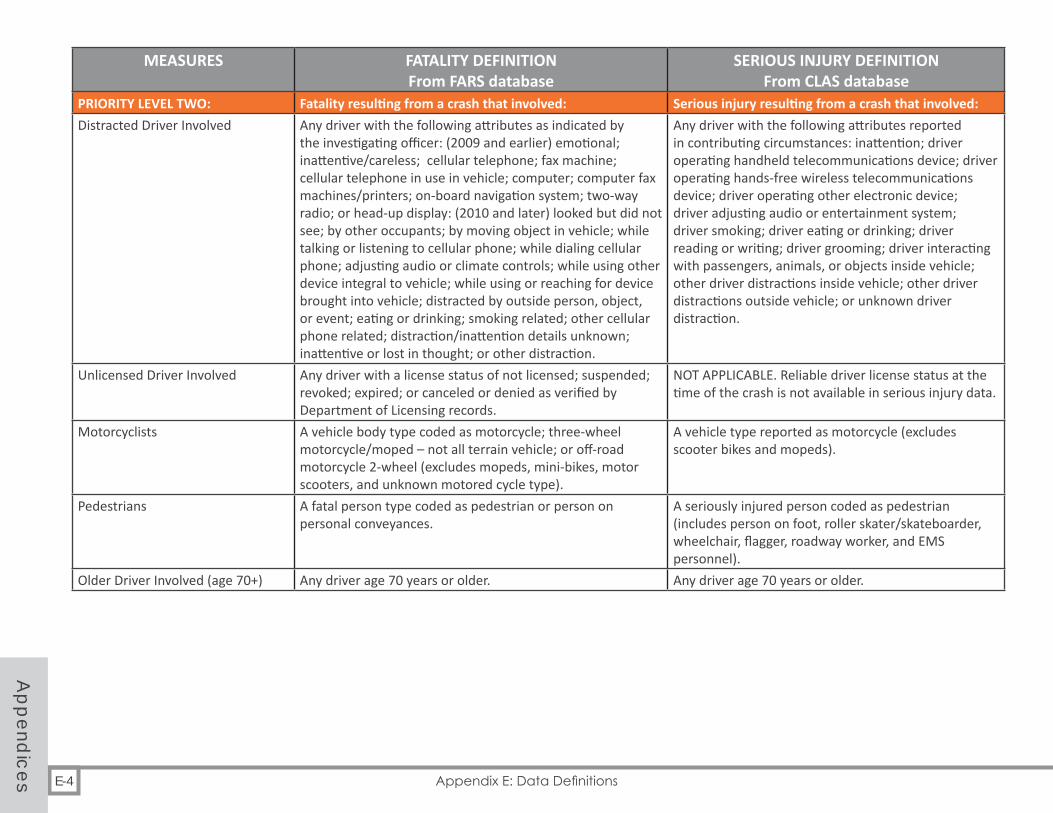
E-4 Appendix E: Data Definitions
Append
ices
MEASURES FATALITY DEFINITION From FARS database
SERIOUS INJURY DEFINITIONFrom CLAS database
PRIORITY LEVEL TWO: Fatality resulting from a crash that involved: Serious injury resulting from a crash that involved:Distracted Driver Involved Any driver with the following attributes as indicated by
the investigating officer: (2009 and earlier) emotional; inattentive/careless; cellular telephone; fax machine; cellular telephone in use in vehicle; computer; computer fax machines/printers; on-board navigation system; two-way radio; or head-up display: (2010 and later) looked but did not see; by other occupants; by moving object in vehicle; while talking or listening to cellular phone; while dialing cellular phone; adjusting audio or climate controls; while using other device integral to vehicle; while using or reaching for device brought into vehicle; distracted by outside person, object, or event; eating or drinking; smoking related; other cellular phone related; distraction/inattention details unknown; inattentive or lost in thought; or other distraction.
Any driver with the following attributes reported in contributing circumstances: inattention; driver operating handheld telecommunications device; driver operating hands-free wireless telecommunications device; driver operating other electronic device; driver adjusting audio or entertainment system; driver smoking; driver eating or drinking; driver reading or writing; driver grooming; driver interacting with passengers, animals, or objects inside vehicle; other driver distractions inside vehicle; other driver distractions outside vehicle; or unknown driver distraction.
Unlicensed Driver Involved Any driver with a license status of not licensed; suspended; revoked; expired; or canceled or denied as verified by Department of Licensing records.
NOT APPLICABLE. Reliable driver license status at the time of the crash is not available in serious injury data.
Motorcyclists A vehicle body type coded as motorcycle; three-wheel motorcycle/moped – not all terrain vehicle; or off-road motorcycle 2-wheel (excludes mopeds, mini-bikes, motor scooters, and unknown motored cycle type).
A vehicle type reported as motorcycle (excludes scooter bikes and mopeds).
Pedestrians A fatal person type coded as pedestrian or person on personal conveyances.
A seriously injured person coded as pedestrian (includes person on foot, roller skater/skateboarder, wheelchair, flagger, roadway worker, and EMS personnel).
Older Driver Involved (age 70+) Any driver age 70 years or older. Any driver age 70 years or older.

E-5Washington State Strategic Highway Safety Plan 2016: Target Zero App
end
ices
MEASURES FATALITY DEFINITION From FARS database
SERIOUS INJURY DEFINITIONFrom CLAS database
PRIORITY LEVEL THREE: Fatality resulting from a crash that involved: Serious injury resulting from a crash that involved:
Heavy Truck Involved Any vehicle coded as “step van >10,000lbs,” “single-unit straight/cab chassis, GVWR >10,000lbs or unknown,” “ Truck-tractor,” “Medium/Heavy P/U >10,000lbs,” “Unk unit or combination >10,000lbs,” “Unk medium/heavy truck type,” OR “Unk truck (light, medium, heavy) with one or more trailers.”
Any vehicle that also has a vehicle classification of “trailer with GVWR of 10,001 lbs. or more, if GVWR of combined vehicle(s) is 26,001 lbs or more – CDL required,” “single vehicle with GVWR of 26,001 lbs. or more; or any school bus regardless of size – CDL required,” “single vehicle of 26,000 lbs. or less, designed to carry 16 passengers or more; or any vehicle regardless of size which requires HAZ MAT Placard -CDL required” or a commercial vehicle supplement to the collision report; OR a vehicle type reported as “truck (flatbed, van, etc.),” “truck and trailer,” “truck tractor,” “truck tractor and semi-trailer,” or “truck-double trailer combinations”; OR a vehicle usage classification reported as concrete mixer, dump truck, logging truck, refuse/recycle truck, vannette over 10,001 lbs., tanker truck, tow truck, or auto carrier.
Drowsy Driver Involved Any driver with a driver related factor coded as “drowsy, sleepy, asleep, fatigued” (2009 and prior) or a driver condition coded as asleep or fatigued (2010 and later).
any driver apparently asleep or apparently fatigued as reported by the investigating officer in the contributing circumstances.
Bicyclists A fatal person type coded as bicyclist or other cyclist.
A seriously injured person coded as pedcyc driver or pedcyc passenger (includes bicycles and tricycles).

E-6 Appendix E: Data Definitions
Append
ices
MEASURES FATALITY DEFINITION From FARS database
SERIOUS INJURY DEFINITIONFrom CLAS database
OTHER MONITORED AREAS: Fatality resulting from a crash that involved: Serious injury resulting from a crash that involved:Work Zone Involved A work zone status coded as construction;
maintenance; utility; or work zone, type unknown.A work zone status reported as within work zone or in external traffic backup caused from work zone.
Wildlife Involved Sequence of events coded as animal. A crash type reported as non-domestic animal (2008 and prior) or a crash type reported as vehicle strikes deer; vehicle strikes elk; or vehicle strikes all other non-domestic animal (2009 and later).
School Bus Involved A vehicle coded as school bus. A vehicle type reported as school bus.Vehicle Train Sequence of events coded as railway train. A crash type reported as train struck moving vehicle; train
struck stopped or stalled vehicle; vehicle struck moving train; or vehicle struck stopped train.

E-7Washington State Strategic Highway Safety Plan 2016: Target Zero App
end
ices
MEASURES FATALITY DEFINITION From FARS database
SERIOUS INJURY DEFINITIONFrom CLAS database
OTHER MEASURES: Fatality resulting from a crash that involved: Serious injury resulting from a crash that involved:Rural Roads A federal functional roadway classification of rural principal
arterial-interstate; rural principal arterial-other; rural minor arterial; rural major collector; rural minor collector; rural local road or street; or rural unknown.
NOT APPLICABLE. Federal functional class missing for crashes occurring within city limits.
Urban Roads A federal functional roadway classification of urban principal arterial-interstate; urban principal arterial-other freeways or expressways; urban other principal arterial; urban minor arterial; urban collector; urban local road or street; or urban unknown.
NOT APPLICABLE. Federal functional class missing for crashes occurring within city limits.
State Routes/Jurisdiction Derived from CLAS and flagged in FARS. Uses the same criteria described in the Serious Injury column.
A report classification of state route.
City Routes/Jurisdiction Derived from CLAS and flagged in FARS. Uses the same criteria described in the Serious Injury column.
A report classification of city street, or a crash classified as state route with access control of limited access occurring within the city limits of a city having a population over 25,000.
County Roads/Jurisdiction Derived from CLAS and flagged in FARS. Uses the same criteria described in the Serious Injury column.
A report classification of county road.
Miscellaneous Trafficways Derived from CLAS and flagged in FARS. Uses the same criteria described in the Serious Injury column.
A report classification of miscellaneous trafficway.


F-1Washington State Strategic Highway Safety Plan 2016: Target Zero App
end
ices
Strategies listed in Target Zero are given a designation of proven, recommended, or unknown as described in the table below. For this review process, Target Zero evaluators chose three main resources to serve as the foundation for the designations:
| Countermeasures That Work: A Highway Safety Countermeasure Guide for State Highway Safety Offices (8th Edition 2016), which focuses on behavior.
| The National Cooperative Highway Research Program Report 500 Series, which focuses on both engineering and behavior. | Crash Modification Factors Clearinghouse, which focuses on engineering.
Disagreement among these sources is rare, but when it happens, evaluators defer to the source that is most aligned with the type of strategy. Therefore, in general, Countermeasures That Work usually takes precedence for behavior/program strategies, Crash Modification Factors takes precedence for engineering strategies, and the NCHRP report prevails when a strategy is not present in either of the first two sources.
Strategy Effectiveness in
Target Zero
Target Zero Definition Countermeasures That Work NCHRP 500 Report
Crash Modification Factors (CMF) Clearinghouse
Proven Demonstrated to be effective by several evaluations with consistent results.
Demonstrated to be effective by several high-quality evaluations with consistent results.
Proven (P). Those strategies that have been used in one or more locations and for which properly designed evaluations have been conducted which show them to be effective.
= 14 quality points
Recommended Generally accepted to be effective based on evaluations or other sources.
Demonstrated to be effective in certain situations, or Likely to be effective based on balance of evidence from high-quality evaluations or other sources
Tried (T). Those strategies that have been implemented in a number of locations, and may even be accepted as standards or standard approaches, but for which there have not been found valid evaluations.
= 7–10 quality points
Unknown Limited evaluation evidence, or experimental.
Effectiveness still undetermined; different methods of implementing this countermeasure produce different results.Limited or no high-quality evaluation evidence.
Experimental (E). Those strategies representing ideas that have been suggested, with at least one agency considering them sufficiently promising to try them as an experimentin at least one location.
= 3–6 quality points
Appendix F: Strategy Definitions and CriteriaEach emphasis area of Target Zero contains a list of strategies that practitioners can use to reduce traffic fatalities. This appendix describes how Target Zero analysts evaluate these strategies for inclusion in the plan.

F-2 Appendix F: Strategy Definitions & Criteria
Append
ices
Evaluators reviewed each of these publications for the Target Zero plan. They looked for the strategies that Target Zero’s statewide partners identified to reduce fatalities and serious injuries, and compared them with the designations adopted according to the table. In some instances, partners slightly modified strategies to be more specific to Washington State, but their strategies were still aligned with the strategies in these publications, and therefore designated the same.
If evaluators could not find a strategy in the three resources described in the table, then they conducted further review, in the following order:
| Was the strategy supported with published, favorable outcomes in the form of a meta study (a review of several related studies for methodological strength and consistent outcomes)? If yes, these strategies were designated proven with META as the source.
| Was the strategy supported by extensive literature but lacks a metastudy? If yes, these strategies were designated proven or recommended with LIT as the source, dependent on evaluation of the quality and outcomes of the available literature.
| Was the strategy a recommendation supported by a state or federal agency, backed by cited evaluation/data? If yes, these strategies were designated recommended with the supporting agency as the source.
| If a strategy did not meet the proven or recommended criteria, or did not meet one of the criteria listed above, then the strategy was designated unknown. The unknown designation was assigned to strategies when:• The strategy was listed in one of the three main
resources with lower quality ratings.• The literature was insufficient to designate it as
recommended.• There was sufficient literature, but outcomes were
inconsistent and inconclusive between studies.While the proven, recommended, and unknown designations provide some indication of relative effectiveness, any system for weighting traffic safety strategies is imperfect. The particular context in which a strategy is employed is immensely important and difficult to capture in prioritization systems. Nevertheless, as a general rule, organizations should give priority to strategies listed as proven, followed by those designated as recommended. Strategies listed as unknown should only be utilized when proven and recommended strategies are not viable. In cases where an unknown strategy is selected for implementation, organizations should develop a straightforward plan for evaluation to add to the body of knowledge and enhance future decision-making.

G-1Washington State Strategic Highway Safety Plan 2016: Target Zero App
end
ices
Two major federal laws influence the content and implementation of Target Zero: Moving Ahead for Progress in the 21st Century (MAP-21) Act and the Fixing America’s Surface Transportation (FAST) Act. Under these laws, the Federal Highway Administration (FHWA) sets policy that guides the implementation and evaluation of the SHSP.
FHWA published their Highway Safety Improvement Program (HSIP) Final Rules with an effective date of April 14, 2016. These Final Rules implement the HSIP requirements established in MAP-21 and the FAST Act, and establish clear requirements for updating the state’s SHSP.
The HSIP is a core federal-aid program with the purpose of achieving a significant reduction in fatalities and serious injuries on all public roads. The HSIP requires a data-driven, strategic approach to improving highway safety on all public roads that focuses on performance. The HSIP regulation under 23 CFR 924 establishes the FHWA’s HSIP policy, as well as program structure, planning, implementation, evaluation, and reporting requirements which state must follow to successfully administer the HSIP. The HSIP Final Rule updates HSIP requirements under 23 CFR 924 to be consistent with MAP-21 and the FAST Act, and clarifies program requirements. In addition to clarifying other programs, the HSIP Final Rule contains performance management requirements for SHSP updates.
FHWA has been working in partnership with key stakeholders for many years to prepare for these new rules. They will reinforce a data-driven approach to making safety decisions, improve collaboration across a wide range of safety partners, and provide transparency for the American public as states set goals, report on safety targets and, most importantly, save lives.
Meeting Federal Requirements for Target Zero23 USC 148 requires all states to have an updated, approved SHSP which is consistent with specific requirements under section 148. The updated SHSP must be submitted to the FHWA Division Administrator, who will ensure that the state has followed a process that meets these requirements.
The FHWA provides an SHSP Process Approval Checklist, which is a tool to help Division Offices assess the process and completeness of the SHSP update. The requirements outlined in the Process Approval Checklist include detailed specific Indicators and Considerations which must be met by the state. Washington’s plan has met all requirements in the past, and believes that it has met them with the 2016 update as well.
Appendix G: Federal Requirements and Target ZeroThis appendix explains the federal requirements regarding establishing and updating the Strategic Highway Safety Plan (SHSP) for all 50 states. Target Zero is Washington’s SHSP.

G-2 Appendix G: Federal Requirements & Target Zero
Append
ices
| Consultation with appropriate stakeholders and traffic safety partners during the update process.
| Comprehensive use of data to develop plan emphasis areas and safety improvement strategies, including safety data from non-state-owned public roads and Tribal land.
| Performance management and adoption of performance-based goals which are consistent with established safety performance measures.
| Employing a multi-disciplinary approach which addresses engineering, management, operations, education, enforcement, and emergency services elements of highway safety as key features when determining SHSP strategies.
| Coordination with other state, regional, local, and Tribal transportation and highway safety planning processes; a demonstration of consultation among partners in the development of transportation safety plans; and an SHSP which provides strategic direction for other transportation plans.
| An implementation focus which describes process, actions, and potential resources for implementing the strategies in the emphasis areas.
| Requirements to evaluate the SHSP as part of the HSIP update process, including confirming the validity of the emphasis areas and strategies based on analysis of safety data, and identifying issues related to the SHSP’s process, implementation, and progress.
| Special rules which require including the state’s definition of High Risk Rural Road and strategies to address the increases in older driver and pedestrian traffic fatalities and serious injuries, if applicable.
| A detailed description of the SHSP update process, included as a section, chapter, or appendix in the SHSP.
| A requirement to complete the SHSP update no later than five years from the date of the previous approved version.
| A requirement that the SHSP be approved and signed by the Governor of the state or a state official that is delegated by the Governor.
| Approval by the FHWA Division Administrator.
SHSP Approval Checklist

H-1Washington State Strategic Highway Safety Plan 2016: Target Zero App
end
ices
Developing and writing Target Zero is a multi-year process, and a collaboration across many groups. This appendix describes the process of developing the plan.
In 2015, the Washington Traffic Safety Commission (WTSC) and the Washington Department of Transportation (WSDOT) partnered together to develop the 2016 version of Washington State’s Target Zero Strategic Highway Safety Plan (SHSP). Over 60 organizations directly contributed to the development of this new SHSP, and dozens of others advised the project along the way. These traffic safety partners intend for the plan to coordinate traffic safety programs across the state, align priorities and strategies among the various partners, and provide a common language and approach for traffic safety efforts.
The Target Zero plan has been revised and updated several times since the first edition in 2000. In the 2016 plan, we took a new look at the data, priorities, strategies, and format. We believe this has resulted in a plan that will be useful for a wide range of Washington’s citizens, policy makers, and traffic safety professionals.
We began the project by establishing the Data Analyst Group, a partnership of data experts from the state agencies that manage Washington’s critical traffic safety data systems. The Data Analyst Group coordinated the update of the fatality and serious injury data, made data-based recommendations on which factors were the biggest contributors to deaths and serious injuries on our roadways, and developed the new Priority Table (on page page 11).
Along with the Data Analyst Group, a number of key partners came together in a formal, multi-disciplinary
Appendix H: Target Zero Plan Development

H-2 Appendix H: Plan Development
Append
ices
project structure to create the Target Zero Project Team and the Steering Committee. The Project Team consisted of manager-level representatives who developed the project plan and timeline, coordinated a vast amount of work, made decisions regarding plan structure and content, wrote the plan sections and chapters, and evaluated strategies for inclusion in the plan. The Steering Committee consisted of senior-level management representatives who provided the project with strategic direction and executive guidance, and helped ensure the project had appropriate resources for success.
In addition, the Target Zero Project Team received advice from leaders at the state and federal levels, including representatives from the Governor’s Office, WSDOT, the Administrative Office of the Courts, the US Department of Transportation, the Federal Highway Administration (FHWA), and the National Highway Traffic Safety Administration (NHTSA).
To round out the project and gather input from a broader stakeholder group, the Project Team held a Target Zero Partners Meeting in December 2015. More than 170 additional people involved in traffic safety from across the state attended. Together they reviewed the preliminary data and new priorities, provided feedback and input on strategies for addressing some of the plan’s priority areas, and gave insight into what specific traffic safety messages will best impact our target audiences.
In May 2016, the Project Team and Steering Committee sent out a draft of the new Target Zero plan for external review by Tribes, partners, and many other stakeholders. The input they received helped finalize the 2016 plan and established a baseline for future revisions.
At the concluding stages of the Target Zero plan development, the Project Team provided final recommendations to the Steering Committee, who then sent the newly-revised Plan to the WTSC Commissioners and FHWA for their approval. In July 2016, the Commissioners delivered the final Strategic Highway Safety Plan to Governor Jay Inslee for his approval and signature.

I-1Washington State Strategic Highway Safety Plan 2016: Target Zero App
end
ices
Impairment InvolvedCountermeasures That Work: A Highway Safety Countermeasure Guide for State Highway Safety Offices, 8th Edition, DOT HS 812 202, November 2015, “Chapter 1, Alcohol- and Drug-Impaired Driving”, (National Highway Traffic Safety Administration, NHTSA, Washington, DC), http://www.ghsa.org/html/publications/countermeasures.html
Drug-Impaired Driving: A Guide for What States Can Do, September, 2015, (Governor’s Highway Safety Association), http://www.ghsa.org/html/publications/2015drugged.html
NCHRP Report 500, “Volume 16: A Guide for Reducing Alcohol-Related Collisions”, (National Cooperative Highway Research Program, Transportation Research Board), http://www.trb.org/Publications/Public/Blurbs/A_Guide_for_Reducing_AlcoholRelated_Collisions_156343.aspx
NHTSA Traffic Safety Facts: Research Note, DOT HS 811 687, November 2012, “Washington’s Target Zero Teams Project: Reduction in Fatalities During Year One”, (National Highway Traffic Safety Administration, NHTSA, Washington, DC), www.nhtsa.gov/staticfiles/nti/pdf/811687.pdf
“The Guiding Principles of DWI Courts”, (National Center for DWI Courts), http://www.dwicourts.org/learn/about-dwi-court/-guiding-principles
“Washington’s Impaired Driving Advisory Council (WIDAC) Strategic Plan”, (Washington Traffic Safety Commission), http://wtsc.wa.gov/programs-priorities/impaired-driving/
Speeding Involved“Speeding and Aggressive Driving”, Accessed January 26, 2015, (Governor’s Highway Safety Association), http://www.ghsa.org/html/issues/speeding.html
Toward Zero Deaths (TZD) Steering Committee, “Towards Zero Deaths: Strategy”, Accessed January 26, 2015, (TZD, National Strategy on Highway Safety), http://www.towardzerodeaths.org/strategy/
D. C. Richards, Transport Research Laboratory, September 2010, Road Safety Web Publication No. 16: “Relationship between Speed and Risk of Fatal Injury: Pedestrians and Car Occupants”, (Department for Transport, London), http://nacto.org/docs/usdg/relationship_between_speed_risk_fatal_injury_pedestrians_and_car_occupants_richards.pdf
Relationship of Traffic Fatality Rates to Maximum State Speed Limits, April 2016, Charles M. Farmer, Insurance Institute for Highway Safety
| Relationship of Traffic Fatality Rates to Maximum State Speed Limits, April 2016, (Insurance Institute for Highway Safety, Charles M. Farmer), http://www.iihs.org/frontend/iihs/documents/masterfiledocs.ashx?id=2117
| “Speed limit increases cause 33,000 deaths in 20 years”, Status Report, Vol. 51, No. 4, April 12, 2016, (Insurance Institute for Highway Safety, Highway Loss Data Institute), http://www.iihs.org/iihs/news/desktopnews/speed-limit-increases-cause-
33000-deaths-in-20-years
Appendix I: Additional Resources

I-2 Appendix I: Additional Resources
Append
ices
Distraction InvolvedCountermeasures That Work: A Highway Safety Countermeasure Guide for State Highway Safety Offices, 8th Edition, DOT HS 812 202, November 2015, “Chapter 4, Distracted and Drowsy Driving“, (National Highway Traffic Safety Administration, NHTSA, Washington, DC), http://www.nhtsa.gov/staticfiles/nti/pdf/811727.pdf
NCHRP Report 500, “Volume 14: A Guide for Reducing Crashes Involving Drowsy and Distracted Drivers”, (National Cooperative Highway Research Program, Transportation Research Board), http://onlinepubs.trb.org/onlinepubs/nchrp/nchrp_rpt_500v14.pdf
Unrestrained Vehicle OccupantsCountermeasures That Work: A Highway Safety Countermeasure Guide for State Highway Safety Offices, 8th Edition, DOT HS 812 202, November 2015, “Chapter 2, Seat Belts and Child Restraints“, (National Highway Traffic Safety Administration, NHTSA, Washington, DC), http://www.nhtsa.gov/staticfiles/nti/pdf/811727.pdf
NCHRP Report 500, “Volume 11: A Guide for Increasing Seat Belt Use”, (National Cooperative Highway Research Program, Transportation Research Board), http://www.trb.org/Publications/Public/Blurbs/A_Guide_for_Increasing_Seatbelt_Use_154846.aspxhttp://onlinepubs.trb.org/onlinepubs/nchrp/nchrp_rpt_500v14.pdf
National Child Passenger Safety Certification, http://cert.safekids.org/
Safe Kids Worldwide, http://www.safekids.org/child-passenger-safety
“2014 Statewide Estimates of Child Restraint Use Among Elementary Students”, (Washington Traffic Safety Commission), http://wtsc.wa.gov/wp-content/uploads/dlm_uploads/2014/12/Statewide-Estimates-of-Child-Restraint-Use-Among-Elementary-Students_FINAL.pdf
“Safe Kids Worldwide - Motor Vehicle Fact Sheet”, January 2015, (Safe Kids Worldwide), http://www.safekids.org/sites/default/files/documents/skw_motor_vehicle_fact_sheet_january_2015.pdf
Unlicensed Driver InvolvedNHTSA Traffic Safety Facts: Research Note, DOT HS 811 392, November 2009, “Washington’s Target Zero Teams Project: Reduction in Fatalities During Year One”, (National Highway Traffic Safety Administration, NHTSA, Washington, DC), http://www-nrd.nhtsa.dot.gov/Pubs/811392.pdf
Sukhvir Brar, California DMV Research and Development Branch, September 2012, RSS-12-238, “Estimation of Fatal Crash Rates for Suspended/Revoked and Unlicensed Drivers in California”, (State of California, Department of Motor Vehicles, DMV), www.dol.wa.gov/about/docs/UnlicensedDriverStudy.pdf
AAA Foundation for Traffic Safety, November 2011, “Unlicensed to Kill”, https://www.aaafoundation.org/sites/default/files/2011Unlicensed2Kill.pdf
California DMV, 2012 RSS-12-238, Sukhvir Brar
| USDOT NHTSA, 2009 reported for 1998 through 2007:• number of drivers without valid license at time of fatal crash
increased 17% nationally
• percent of drivers without valid license at time of fatal crash increased 27% (from 11% in 1998 to 14% in 2007).
| Using 23 years of data (1987-2009), CA DMV found that unlicensed drivers were nearly three times more likely to cause a fatal crash than licensed drivers.
| AAA Foundation for Traffic Safety, 2011 “Unlicensed to Kill” | AAA Foundation for Traffic Safety studies found approximately
one in five fatal crashes involved an unlicensed or invalidly licensed driver (1993-97).
| Analysis of the trends over the past 20 years shows an

I-3Washington State Strategic Highway Safety Plan 2016: Target Zero App
end
ices
increasing proportion of fatal-crash involved drivers who were unlicensed.
| Using 2007-09 national FARS data, 18.2% of the fatal crashes involved a driver who was unlicensed or invalidly licensed, resulting in the deaths of 21, 049 people.
Drivers involved in fatal crashes who had no valid license at time of crash (nationally)
| 13.8% in 1993-1997 (AAA) | 11% of in 1998 (USDOT) | 14% in 2007 (USDOT) | 14.2% in 2007-2009 (AAA)
Drowsy Driver InvolvedAAA Foundation for Traffic Safety, “Drowsy Driving”, https://www.aaafoundation.org/drowsy-driving
NCHRP Report 500, “Volume 14: A Guide for Reducing Crashes Involving Drowsy and Distracted Drivers”, (National Cooperative Highway Research Program, Transportation Research Board), page III-1, http://onlinepubs.trb.org/onlinepubs/nchrp/nchrp_rpt_500v14.pdf
Centers for Disease Control and Prevention, “Drowsy Driving: Asleep at the Wheel”, http://www.cdc.gov/features/dsdrowsydriving/
School BusSchool, Walk and Bike Route Guide, Feb. 2015, “School Walk and Bike Routes: A Guide for Planning and Improving Walk and Bike to School Options for Students”, (WA State Department of Transportation, WSDOT), http://www.wsdot.wa.gov/LocalPrograms/SafeRoutes/GuideProject.htm
Educational Service District 112, “Regional Student Transportation”, http://web3.esd112.org/regionaltrans
Washington Office of Superintendent of Public Instruction (OSPI), “Student Transportation”, http://www.k12.wa.us/transportation/
Vehicle-TrainWashington Utilities and Transportation Commission (UTC), “Rail Safety”, http://www.utc.wa.gov/publicSafety/railSafety/Pages/default.aspx
Operation Lifesaver, Inc., “Rail Safety Education”, http://oli.org/
“WSDOT State Rail Plan”, (Washington State Department of
Transportation), http://www.wsdot.wa.gov/Rail/staterailplan.htm
Young Drivers 16–25 InvolvedCountermeasures That Work: A Highway Safety Countermeasure Guide for State Highway Safety Offices, 7th Edition, DOT HS 811 727, April 2013, “Chapter 6, Young Drivers“, (National Highway Traffic Safety Administration, NHTSA, Washington, DC), http://www.nhtsa.gov/staticfiles/nti/pdf/811727.pdf
OECD Transport Research Centre, 2006, “Young Drivers: The Road to Safety”, (Organization for Economic Cooperation and Development, OECD, European Conference of Ministers of Transport), http://www.itf-oecd.org/sites/default/files/docs/06youngdrivers.pdf
“Promoting Parent Involvement in Teen Driving: An In-Depth Look at the Importance and the Initiatives”, 2013, (Governor’s Highway Safety Association), http://www.ghsa.org/html/files/pubs/sfteens13.pdf
“RUaD Coalition Strategic Plan 2011-2013”, (Washington State Coalition to Reduce Underage Drinking), http://docs.theathenaforum.org/sites/default/files/2011%20RUaD%20Annual%20Report%20_0.pdf
Gail D’Onofrio, M.D., M.S. and Linda Degutis, Dr.P.H., 2004, Alcohol Research & Health, “Screening and Brief Intervention in the
I-4 Appendix I: Additional Resources
Append
ices
Emergency Department”, http://pubs.niaaa.nih.gov/publications/arh28-2/63-72.pdf
AAA Foundation for Traffic Safety, “Teen Driver Safety”, https://www.aaafoundation.org/teen-drivers
Washington State Department of Licensing, http://www.dol.wa.gov/
AAA Foundation for Traffic Safety, May 2012, “Teen Driver Risk in Relation to Age and Number of Passengers”, https://www.aaafoundation.org/sites/default/files/research_reports/2012TeenDriverRiskAgePassengers.pdf.
MotorcyclistsNational Highway Traffic Safety Administration, DOT HS-812-148, 2015, “Traffic Safety Facts, 2013: Motorcycles”, (National Highway Traffic Safety Administration, NHTSA, US Department of Transportation, Washington, DC), http://www-nrd.nhtsa.dot.gov/Pubs/812148.pdf
National Motorcycle Institute, “Washington State Total Motorcycle Driver Fatalities: 1991-2014”, http://www.motorcycleinstitute.org/docs/data/tdf/wa-total-driver-fatalities.pdf
Dr. James Hedlund, Highway Safety North, 2011 Preliminary Data: Spotlight on Highway Safety, “Motorcyclists Traffic Fatalities By State”, (Governors Highway Safety Association), http://www.ghsa.org/html/files/pubs/spotlights/spotlight_motorcycles12.5.pdf
Deutermann, W., National Highway Traffic Safety Administration, DOT HS-809-715, March 2004, “Motorcycle Helmet Effectiveness Revisited”, (National Highway Traffic Safety Administration, NHTSA, Washington, DC), http://www-nrd.nhtsa.dot.gov/Pubs/809715.PDF
National Highway Traffic Safety Administration, DOT HS-810-887W, January 2008, “Traffic Safety Facts, Laws: Motorcycle Helmet Use Laws”, (National Highway Traffic Safety Administration, NHTSA, US Department of Transportation, Washington, DC), http://www.nhtsa.
gov/Laws+&+Regulations/Traffic+Safety+Legislative+Fact+Sheets
PedestriansCountermeasures That Work: A Highway Safety Countermeasure Guide for State Highway Safety Offices, 7th Edition, DOT HS 811 727, April 2013, “Chapter 8, Pedestrians“, (National Highway Traffic Safety Administration, NHTSA, Washington, DC), www.nhtsa.gov/staticfiles/nti/pdf/811727.pdf
Crown, B. “An Introduction to Some Basic Principles of U.K. Roundabouts Design.” Presented at the ITE District 6 Conference on Roundabouts, Loveland, Colorado, October 1998.
Charles DiMaggio, PhD, M.P.H. and Guohua Li, M.D., Dr.P.H., January 2013, Pediatrics Journal, “Effectiveness of a Safe Routes to School Program in Preventing School Aged Pedestrian Injury”, http://pediatrics.aappublications.org/content/early/2013/01/08/peds.2012-2182
Maycock, G. and Hall R. D. Crashes at Four-Arm Roundabouts. TRRL Laboratory Report LR 1120. Transport and Road Research Laboratory, Crowthorne, England, 1984.
NCHRP Report 500, “Volume 10: A Guide for Reducing Collisions Involving Pedestrians”, (National Cooperative Highway Research Program, Transportation Research Board), http://safety.transportation.org/guides.aspx?cid=29
D, Richards, Road Safety Observatory, Department of Transportation, 2010, Road Safety Web Publication No. 16: “Relationship between Speed and Risk of Fatal Injury: Pedestrians and Car Occupants”, (UK Department for Transport), http://www.roadsafetyobservatory.com/Evidence/Details/10649
Jim Nicholls, William Payne, Claire Gear, and Jessica Miller, WSDOT Research Report, WA-RD 733.1, October 2009, “State Highways as Main Streets: A Study of Community Design and Visioning”,

I-5Washington State Strategic Highway Safety Plan 2016: Target Zero App
end
ices
(Washington State Department of Transportation and University of Washington), http://www.wsdot.gov/research/reports/fullreports/733.1.pdf
Washington Department of Transportation, WSDOT, Published February 25, 2013, The Gray Notebook, Edition 48: “People Powered: Planning Ahead to Ensure the State’s Pedestrian and Bicycle Programs Succeed”, (Washington State Department of Transportation), http://wsdot.wa.gov/publications/fulltext/graynotebook/Dec12.pdf
Older Drivers 70+ InvolvedIIHS HLDI, February 2014, Status Report, Vol. 49, No. 1: “Fit For the Road: Older Drivers’ Crash Rates Continue to Drop”, (Insurance Institute for Highway Safety, IIHS, Highway Loss Data Institute, HLDI), http://www.iihs.org/iihs/sr/statusreport/article/49/1/1
Stutts, J., Martell, C., Staplin, L., DOT HS 811 093, June 2009, “Identifying Behaviors and Situations Associated With Increased Crash Risk for Older Drivers”, (NHTSA Office of Behavioral Safety Research), http://www.nhtsa.gov/NCSA
Fabian Cevallos, Jon Skinner, Ann Joslin, and Tekisha Ivy, January 2010, “Attracting Senior Drivers to Public Transportation: Issues and Concerns”, (Federal Transit Administration), http://www.aarp.org/content/dam/aarp/livable-communities/learn/transportation/Attracting-Senior-Drivers-to-Public-Transportation-Issues-and-Concerns-AARP.pdf
NHTSA Technical Report, DOT HS 810 857, November 2007, “Characteristics of Crash Injuries Among Young, Middle-aged, and Older Drivers”, (National Highway Traffic Safety Administration, 2007), http://www-nrd.nhtsa.dot.gov/Pubs/810857.pdf
Countermeasures That Work: A Highway Safety Countermeasure Guide for State Highway Safety Offices, 7th Edition, DOT HS 811 727, April 2013, “Chapter 7, Older Drivers“, (National Highway Traffic Safety Administration, NHTSA, Washington, DC), http://www.nhtsa.gov/staticfiles/nti/pdf/811727.pdf
NHTSA Technical Report, DOT HS 811 152, June 2009, “Driving Transitions Education: Tools, Scripts, and Practice Exercises”, (National Highway Traffic Safety Administration), www.nhtsa.gov/DOT/NHTSA/Traffic%20Injury%20Control/Articles/Associated%20Files/811152.pdf
Washington State Office of Financial Management, Forecast of the State Population: “November 2012 Forecast”, (Washington Office of Financial Management), http://www.ofm.wa.gov/pop/stfc/stfc2012/stfc_2012.pdf
NCHRP Report 500, “Volume 9: A Guide for Reducing Collisions Involving Older Drivers”, (National Cooperative Highway Research Program, Transportation Research Board), http://onlinepubs.trb.org/onlinepubs/nchrp/nchrp_rpt_500v9.pdf
American Association of Motor Vehicle Administrators, “Grand Driver - Older Driver Safety and Mobility”, http://www.aamva.org/GrandDriver/
National Highway Traffic Safety Administration (NHTSA), “Older Drivers: Resources for People Around Older Drivers“, http://www.nhtsa.gov/Senior-Drivers
National Highway Traffic Safety Administration (NHTSA), “Drive Well Toolkit: Promoting Older Driver Safety and Mobility in Your Community ”, http://www.nhtsa.gov/Driving+Safety/Older+Drivers /Drive+Well+Toolkit:+Promoting+Older+Driver+Safety+and+Mobility +in+Your+Community
Heavy TrucksCountermeasures That Work: A Highway Safety Countermeasure Guide for State Highway Safety Offices, 7th Edition, (National Highway Traffic Safety Administration), http://www.nhtsa.gov/staticfiles/nti/pdf/811727.pdf
NCHRP Report 500, “Volume 13: A Guide for Reducing Collisions Involving Heavy Trucks”, (National Cooperative Highway Research Program, Transportation Research Board), http://onlinepubs.trb.org/
http://www.nhtsa.gov/Driving+Safety/Older+Drivers /Drive+Well+Toolkit:+Promoting+Older+Driver+Safety
http://www.nhtsa.gov/Driving+Safety/Older+Drivers /Drive+Well+Toolkit:+Promoting+Older+Driver+Safety

I-6 Appendix I: Additional Resources
Append
ices
onlinepubs/nchrp/nchrp_rpt_500v13.pdf
BicyclistsCountermeasures That Work: A Highway Safety Countermeasure Guide for State Highway Safety Offices, 7th Edition, DOT HS 811 727, April 2013, “Chapter 8, Pedestrians“, (National Highway Traffic Safety Administration, NHTSA, Washington, DC), http://www.nhtsa.gov/staticfiles/nti/pdf/811727.pdf
Countermeasures That Work: A Highway Safety Countermeasure Guide for State Highway Safety Offices, 7th Edition, DOT HS 811 727, April 2013, “Chapter 9, Bicycles“, (National Highway Traffic Safety Administration, NHTSA, Washington, DC), http://www.nhtsa.gov/staticfiles/nti/pdf/811727.pdf
NCHRP Report 500, “Volume 18: A Guide for Reducing Collisions Involving Bicycles”, (National Cooperative Highway Research Program, Transportation Research Board), http://onlinepubs.trb.org/onlinepubs/nchrp/nchrp_rpt_500v18.pdf
Washington Department of Transportation, WSDOT, Published February 25, 2013, The Gray Notebook, Edition 48: “People Powered: Planning Ahead to Ensure the State’s Pedestrian and Bicycle Programs Succeed”, (Washington State Department of Transportation), The Gray Notebook, Edition 48, pages 5-8 (Washington State Department of Transportation), http://wsdot.wa.gov/publications/fulltext/graynotebook/Dec14.pdf
Washington Department of Transportation, WSDOT, Published February 25, 2013, The Gray Notebook, Edition 48: “People Powered: Planning Ahead to Ensure the State’s Pedestrian and Bicycle Programs Succeed”, (Washington State Department of Transportation), http://wsdot.wa.gov/publications/fulltext/graynotebook/Dec12.pdf
“Washington’s Complete Streets and Main Street Highways: Case Study Resource”, (Washington State Department of Transportation), http://www.wsdot.wa.gov/NR/rdonlyres/961C732E-72DA-4D01-BE97-636D69F7EB5D/0/Mainstreet_Highways.pdf
“Washington State Bicycle and Pedestrian Documentation Project”, (Washington State Department of Transportation), http://www.wsdot.wa.gov/bike/Count.htm
“Washington State Bicycle Facilities and Pedestrian Walkways Plan”, (Washington State Department of Transportation), http://www.wsdot.wa.gov/bike/bike_plan.htm
“Urban Bikeway Design Guide”, (National Association of City Transportation Officials), http://nacto.org/publication/urban-bikeway-design-guide/
“Urban Street Design Guide”, (National Association of City Transportation Officials), http://nacto.org/publication/urban-street-design-guide/
“Road Diet Informational Guide”, (Federal Highway Administration), http://safety.fhwa.dot.gov/road_diets/info_guide/
“Separated Bike Lane Planning and Design Guide”, (Federal Highway Administration), http://www.fhwa.dot.gov/environment/bicycle_pedestrian/publications/separated_bikelane_pdg/separatedbikelane_pdg_appendix.pdf
WSDOT Design Manual, Division 11 Practical Design, “Chapter 1103, Design Controls”, (Washington State Department of Transportation), http://www.wsdot.wa.gov/publications/manuals/fulltext/M22-01/1103.pdf
WSDOT Design Manual, “Chapter 1520, Roadway Bicycle Facilities”, (Washington State Department of Transportation), http://www.wsdot.wa.gov/publications/manuals/fulltext/M22-01/1520.pdf
“Bicycle Helmet Requirements in Washington”, (Washington State Department of Transportation), http://www.wsdot.wa.gov/bike/helmets.htm
“Washington State Highways Closed to Bicycles“, (Washington State Department of Transportation), http://www.wsdot.wa.gov/bike/closed.htm

I-7Washington State Strategic Highway Safety Plan 2016: Target Zero App
end
ices
Municipal Rules relating to bicyclists: | Bicycle Helmets – Currently, there is no state law requiring
helmet use. However, some cities and counties do require helmets. See bicycle helmet requirements in Washington by municipality (http://www.wsdot.wa.gov/bike/helmets.htm).
| Roads Closed to Bicycles – Some designated sections of the state’s limited access highway system may be closed to bicycles for safety reasons. See state highway sections closed to bicycles (http://www.wsdot.wa.gov/bike/closed.htm) for more information. In addition, local governments may adopt ordinances banning cycling on specific roads or on sidewalks within business districts.
Tribes and Target ZeroCentennial Accord between the Federally Recognized Indian Tribes in Washington State and the State of Washington, August 4, 1989, (Governor’s Office of Indian Affairs), http://goia.wa.gov/Government-to-Government/Data/CentennialAccord.htm
Revised Code of Washington (RCW), RCW 43.376, Government-To-Government Relationship With Indian Tribes, http://app.leg.wa.gov/RCW/default.aspx?cite=43.376&full=true
Traffic Data Systems“Washington Traffic Records Strategic Plan”, Updated June 2014, (Washington State Department of Licensing, Washington State Traffic Records Committee), http://trafficrecords.wa.gov/wp-content/uploads/2014/09//2014-Traffic-Records-Strategic-Plan.docx
Washington Traffic Records Committee Strategic Plan, 2016 Update, (Washington Traffic Records Committee), http://trafficrecords.wa.gov/about-trc/trc-strategic-plan/
EMS and Trauma Care SystemChiara, O. and S. Cimbanassi, Current Opinion in Critical Care, December 2003, 9(6), pp. 510-514, “Organized Trauma Care: Does Volume Matter and Do Trauma Centers Save Lives?” http://journals.lww.com/co-criticalcare/Abstract/2003/12000/Organized_trauma_care__does_volume_matter_and_do.8.aspx
Miller T.R. and D.T. Levy, Archives of Surgery, February 1995, 130(2), pp. 188-193, “The Effect of Regional Trauma Care Systems on Costs ”, http://archsurg.jamanetwork.com/article.aspx?articleid=596134
Celso, B., J. Tepas, B. Langland-Orban, Journal of Trauma, February 2006, 60(2), pp. 371-378, “A Systematic Review and Meta-Analysis Comparing Outcomes of Severely Injured Patients Treated in Trauma Centers Following the Establishment of Trauma Systems ”, http://personal.health.usf.edu/epracht/publications/celso_etal_2006.pdf
Mann, N. C., R. J. Mullins, et al., Journal of Trauma, September 1999, 47 (suppl. 3), S25-S33, “Systematic Review of Published Evidence Regarding Trauma System Effectiveness”, http://www.ncbi.nlm.nih.gov/pubmed/10496607
Mullins, R. J. and N. C. Mann, Journal of Trauma, September 1999, 47 (suppl. 3), S59-S66, “Population-Based Research Assessing the Effectiveness of Trauma Systems”, http://www.ncbi.nlm.nih.gov/pubmed/10496613
Mackenzie, E. J., Journal of Trauma, September 1999, 47 (suppl. 3), S34-S41, “Review of Evidence Regarding Trauma System Effectiveness Resulting From Panel Studies”, http://www.ncbi.nlm.nih.gov/pubmed/10496608
MacKenzie, E. J., F. P. Rivara, et al., New England Journal of Medicine, January 2006, 354(4), pp. 366-378, “A National Evaluation of the Effect of Trauma-Center Care on Mortality ”, http://www.nejm.org/doi/full/10.1056/NEJMsa052049
Countermeasures That Work: A Highway Safety Countermeasure Guide for State Highway Safety Offices, 7th Edition, DOT HS 811 727,

I-8 Appendix I: Additional Resources
Append
ices
April 2013, (National Highway Traffic Safety Administration, NHTSA, Washington, DC), http://www.nhtsa.gov/staticfiles/nti/pdf/811727.pdf
“Death Data”, (Washington State Department of Health, Center for Health Statistics, 2012), http://www.doh.wa.gov/DataandStatisticalReports/VitalStatisticsData/Death
“EMS and Trauma”, (Washington State Department of Health), http://www.doh.wa.gov/ForPublicHealthandHealthcareProviders/EmergencyMedicalServicesEMSSystems/EMSandTrauma
NCHRP Report 500, “Volume 16: A Guide for Reducing Alcohol-Related Collisions”, (National Cooperative Highway Research Program, Transportation Research Board), http://www.trb.org/Publications/Public/Blurbs/A_Guide_for_Reducing_AlcoholRelated_Collisions_156343.aspx
“Proposed National Unified Goal on Traffic Incident Management”, (National Traffic Incident Management Coalition), http://ntimc.transportation.org/Documents/NUGUnifiedGoal-Nov07.pdf
Evaluation, Analysis, and Diagnosis“American Association of State Highway and Transportation Officials – Highway Safety Manual”, First Edition, 2010, (American Association of State Highway and Transportation Officials), http://safety.fhwa.dot.gov/rsdp/hsm.aspx

J-1Washington State Strategic Highway Safety Plan 2016: Target Zero App
end
ices
Washington State Government:Governor Jay InsleeGovernor’s OfficeAdministrative Office of the CourtsCounty Road Administration BoardCriminal Justice Training CommissionDepartment of HealthDepartment of LicensingDepartment of Social and Health ServicesDepartment of TransportationLiquor Control BoardOffice of Financial ManagementOffice of Indian AffairsOffice of Public DefenseOffice of Superintendent of Public InstructionResults WashingtonState House of Representatives Members and StaffWashington State PatrolState Senate Members and StaffTransportation Policy Office
Washington State UniversityWashington Traffic Safety CommissionTransportation CommissionTransportation Improvement BoardUtilities and Transportation CommissionUW Harborview Injury Prevention and Research Center
Federal Government:National Highway Traffic Safety Administration, Region 10Federal Highway Administration, Washington DivisionFederal Highway Administration, Federal LandsFederal Motor Carrier Safety AdministrationFederal Railroad Administration, Region 8
Tribal Nations and Organizations:Confederated Tribe of the Chehalis ReservationConfederated Tribes of the Colville Reservation
Cowlitz Indian TribeHoh TribeJamestown S’Klallam TribeKalispel TribeLower Elwha Klallam TribeLummi NationMakah TribeMuckleshoot Indian TribeNisqually TribeNooksack TribePort Gamble S’Klallam TribePuyallup TribeQuileute NationQuinault NationSamish NationSauk-Suiattle TribeShoalwater Bay TribeSkokomish TribeSnoqualmie TribeSpokane Tribe of IndiansSquaxin Island TribeStillaguamish TribeSuquamish Tribe
Appendix J: Traffic Safety Partnership ListThe following organizations were consulted in the development of Washington State’s Target Zero Strategic Highway Safety Plan and are critical to achieving SHSP goals.

J-2 Appendix J: Traffic Safety Partnership List
Append
ices
Swinomish Indian Tribal CommunityTulalip TribesUpper Skagit TribeYakama NationBureau of Indian AffairsNorthwest Association of Tribal Enforcement OfficersTribal Transportation Planning OrganizationWashington Indian Transportation Policy Advisory Committee
Local Law Enforcement:Bellingham Police DepartmentBonney Lake Police DepartmentCentralia Police DepartmentClark County Sheriff’s OfficeCowlitz County Sheriff’s OfficeFederal Way Police DepartmentFerndale Police DepartmentFife Police DepartmentGrant County Sheriff’s OfficeGrays Harbor County Sheriff’s OfficeIsland County Sheriff’s OfficeKent Police DepartmentKing County Sheriff’s OfficeKirkland Police DepartmentKitsap County Sheriff’s OfficeLacey Police DepartmentLewis County Sheriff’s Office
Lynnwood Police DepartmentMason County Sheriff’s OfficePuyallup Police DepartmentRenton Police DepartmentSeattle Police DepartmentShelton Police DepartmentSkagit County Sheriff’s OfficeThurston County Sheriff’s OfficeWenatchee Police DepartmentYakima Police Department
Community, Local, and Regional Agencies and Organizations:Target Zero ManagersTarget Zero Community Traffic Safety Task ForcesAssociation of Washington CitiesBicycle Alliance of WashingtonCity of BellevueCity of EverettCity of Gig HarborCity of KirklandCity of Mountlake TerraceCity of PascoCity of SpokaneCity of TacomaCowlitz-Wahkiakum Council of Governments
Cooper Jones Bicycle and Pedestrian CommitteeEducational Service District #113Institute of Transportation Engineers - Washington State SectionKing County Metro TransitKing County Public HealthKitsap County Public WorksLeague of American BicyclistsLewis County Public WorksLewis County Public Health & Social ServicesMossyrock School DistrictOperation LifesaversPacific Northwest Transportation ConsortiumPuget Sound Regional CouncilSafe Kids WorldwideSafe Routes to Schools WASeattle Department of TransportationSpokane City CouncilSpokane County Prosecutor’s OfficeThurston County Prosecuting Attorney’s OfficeThurston County Public WorksThurston Regional Planning CouncilTraffic Records CommitteeUniversity of Washington Transportation ServicesWashington Association of Counties

J-3Washington State Strategic Highway Safety Plan 2016: Target Zero App
end
ices
Washington Association of County EngineersWashington Association of Prosecuting AttorneysWashington Association of Sheriffs and Police ChiefsWashington Impaired Driving Advisory CommitteeWashington Traffic Incident Management CoalitionWashington Traffic Safety Education AssociationWashington Trucking Association
Private and Non-Profit Organizations:3M CorporationAAA WashingtonAltus Traffic ManagementAmerican Traffic Safety Services AssociationCascade Bicycle ClubCenter for Defensive DrivingCSL ConsultingDKS AssociatesDN Traffic ConsultantsDriver Training GroupDriving 101Eco Resource Management SystemsEvergreen Safety Council
Feet FirstFreedom Driving SchoolGovernor’s Highway Safety AssociationHDJ Design GroupIvS AnalyticsKittitas County Community NetworkLifeSafer, Inc.Mothers Against Drunk DrivingMunicipal Research and Services CenterProject ImprintRolland AssociatesTacoma Pierce County Community ConnectionsWashington Road Riders AssociationWashington Trucking Association


K-1Washington State Strategic Highway Safety Plan 2016: Target Zero App
end
ices
Project Co-Sponsors:Chris Madill, Washington Traffic Safety Commission (WTSC) Deputy DirectorJohn Nisbet, Washington Department of Transportation (WSDOT) Director of Traffic Operations
Data Analyst Group:Matthew Enders (Co-Lead), WSDOTStaci Hoff (Co-Lead), WTSCMike Bernard, WSDOTJoe Campo, Office of Financial Management (OFM)Bruce Chunn, WA Department of Licensing (DOL)Dick Doane, WTSCGary Montgomery, WTSCZeyno Nixon, WA Department of Health (DOH)Mamadou Ndiaye, DOHIda van Schalkwyk, WSDOTJoanna Trebaczewski, Washington State Patrol (WSP)
Project Team Members:Shelly Baldwin, WTSCMike Dornfeld, WSDOTDolly Fernandes, DOHDezerae Hayes, Muckleshoot Indian TribeBrady Horenstein, DOLLt. John Matagi, WSPGreg Mukai, DOLJohn Pagel, WTSC Target Zero ManagerLt. Dan Sharp, WSPLt. Rob Sharpe, WSPKeri Shepherd, Nooksack TribeAngie Ward, WTSCHaiping Zhang, DOL
Appendix K: Special ThanksHundreds of traffic safety partners across the state were involved in creating the final Target Zero plan. Their participation included everything from providing suggestions and recommendations on strategies, to contributing data analysis and document reviews. Dozens of dedicated experts rolled up their sleeves and got to work to bring the SHSP update project in on time. For over a year, these folks gathered data, created charts and graphs, met to discuss findings, wrote and edited text, and collaborated with partners both inside and outside their organizations to complete the plan. Their commitment to creating a clear, data-driven, and inspiring document was fueled by their desire to realize the goal of zero traffic deaths and serious injuries by 2030.
We deeply thank them all for their extra efforts and hard work!Sincerely,Myke Gable, Project ManagerWTSC

K-2 Appendix K: Special Thanks
Append
ices
Steering Committee Members:Teresa Berntsen, DOLDr. Fiona Couper, WSPKathleen Davis, WSDOTJeff Devere, DOLBill Drake, Washington Association of Sheriffs and Police ChiefsDr. Beth Ebel, Harborview Injury Prevention & Research CenterGlenn Gorton, Office of the Superintendent of Public InstructionAlison Hellberg, Association of Washington Cities (AWC)Charlie Howard, Puget Sound Regional CouncilKathy Cody, OFMCapt. Tim Coley, WSPGary Rowe, Washington Association of County EngineersSteven Saxe, DOHScott Waller, DSHSDave Williams, AWCChief Ralph Wyman, Chehalis Tribal Police Department
Advisors:John Milton, WSDOTXandre Chateaubriand, Governor’s OfficeDirk Marler, Administrative Office of the CourtsJeff James, US Department of TransportationDon Petersen, Federal Highway AdministrationMax Sevareid, National Highway Traffic Safety Administration
Additional Key Contributors:All Program Managers and Staff, WTSCDebbie Carter, WSPCharlotte Claybrooke, WSDOTAndrea Clinkscales, Cascade Bicycle ClubLt. Jeff Closner, WSPMegan Cotton, WSDOTDaniel Hall, WSPBill Legg, WSDOTEd Spilker, WSDOTCesi Velez, Bonney Lake Police DepartmentJanet Zars, DOLKevin Zeller, WSP

Target Zero® and the Target Zero logo are registered marks of the Washington State’s Washington Traffic Safety Commission effective 2013 and 2015 respectively.