Was there a 1930's Meltdown of Greenland Glaciers
15
Was there a 1930’s Meltdown of Greenland Glaciers? Adam Herrington Prof. J. Box GEOG 693 04/02/2007
-
Upload
independent -
Category
Documents
-
view
2 -
download
0
Transcript of Was there a 1930's Meltdown of Greenland Glaciers

Was there a 1930’s Meltdown of Greenland Glaciers?
Adam Herrington
Prof. J. Box
GEOG 693
04/02/2007
Was there a 1930’s Meltdown of Greenland Glaciers?
Adam Herrington
Abstract
While recent climate warming is hypothesized to have caused acceleration of
Greenland ice sheet outlet glaciers, 1920s through 1940s temperature anomalies were at
least as equal in magnitude yet observations have not been compiled to confirm a 1930s
meltdown. Mining The Ohio State University Libraries, this work compiles historical
observations of glacier front positions and surface velocities from maps, photographs and
other documentary evidence from mid 19th century Arctic expeditions. Of the glaciers
reviewed, an acceleration and retreat indeed occurred during the 1920s warm period. The
research put forth is thus consistent with a dynamical response in Greenland’s outlet
glaciers to the “roaring twenties” warming.
Introduction and Problem Statement
Five years ago, if you were to ask a glaciologist how long it takes an ice sheet
three times the size of Texas to respond to climate warming, he/she would probably tell
you: ‘at least tens of thousands of years’. However, in the last five years, the major outlet
glaciers of Greenland have seized international headlines having substantially increased
in velocity, many glaciers doubling their speeds [Rignot and Kanagaratnam, 2006] via an
apparent mechanism of hydraulic lubrication [Zwally et al. 2002]. This discovery brings
observed sea level rise into a policy spotlight because ~150 million people live within
one meter vertically of mean sea level. The cause of glacier acceleration is most likely
due to the increase in surface temperatures (and melting) in Greenland during the 1990s
(Figure 1) and is perhaps also influenced by the observed increase in ocean temperatures
[Thomas et al. 2003; Levitus, 2005].
Examination of the temperature records of Greenland shows a warming trend,
similar to the recent decade, during the 1920s and lasting until the 1940s, hereafter
referred to as the ‘twenties warming’. In fact, warmer temperatures were observed in the
twenties warming than in the recent “global warming” decade [Chylek et al. 2006].

However, no study has documented if there was a glacier response in the twenties
warming as in the most recent warming decade. This work thus aims to test the
hypothesis that: there is a correlation between glacier flow and temperature during the
1920s warming. The 1920s warm period is before the age of advanced observation
systems such as from satellites and thus necessitates a relatively low-tech approach.
However, by yesterday’s standards, information is high-tech and perhaps remains useful
today. The key to testing this hypothesis may be found through reviewing historical
observations of Greenland outlet glaciers over the first half of the twentieth century using
documentary data from 75+ year old books, maps, photographs, and verbal accounts.
Figure 1. Greenland coastal station temperature records (1880-2006).

Data
Velocity data of Greenland glaciers are very sparse in number for the 1920s, but
some do exist! Data on the position of the ice margin before mid last century exist and
are more abundant than velocity data. Both sources of data are useful, ice front position
changes are linked with glacier dynamical change.
With the help of Ohio State University Librarians Lynn Lay (Goldthwait Polar
Library) and Stephen Rogers (OSU Map Library), data such as photographs (Figure 2)
and maps (Figure 3) from early expeditions were uncovered to investigate changes at
important (large iceberg factory) Greenland glaciers.
Figure 2. Aerial photograph of the Kangerdlugssuaq glacier front in 1933 [Gabrel-
Jørgensen, 1933].

Figure 3. August 1930 map of the Kangerdlugssuaq glacier (see also Figure 2) available
from The British Arctic Air Route Expedition publications [Watkins et al, 1932] .
With the help of OSU librarians, historical evidence was found to reconstruct the
changes in the calving front of Greenland’s glaciers during the early twentieth century.
We uncovered the life’s work of one Anker Weidick of Denmark, with relevant
publications spanning more than 40 years. Weidick [1959; 1994] painstakingly
reconstructed historical changes of nearly 50 Greenland glaciers. It can be concluded
from Weidick’s work that almost all of Southwest Greenland’s glaciers had retreated
between 1900 and 1955. Weidick [1995] also noticed this trend in glacial retreat and
stated that a major recession of Greenland’s glaciers occurred between 1920 and 1950.
Relatively detailed data on the retreat of Arsuk glacier, is particularly illuminating, for it
is synchronous with the warmer than normal temperatures recorded [Cappelen et al.
2007] at the closest meteorological station in Greenland’s capital of Nuuk (Figure 4).
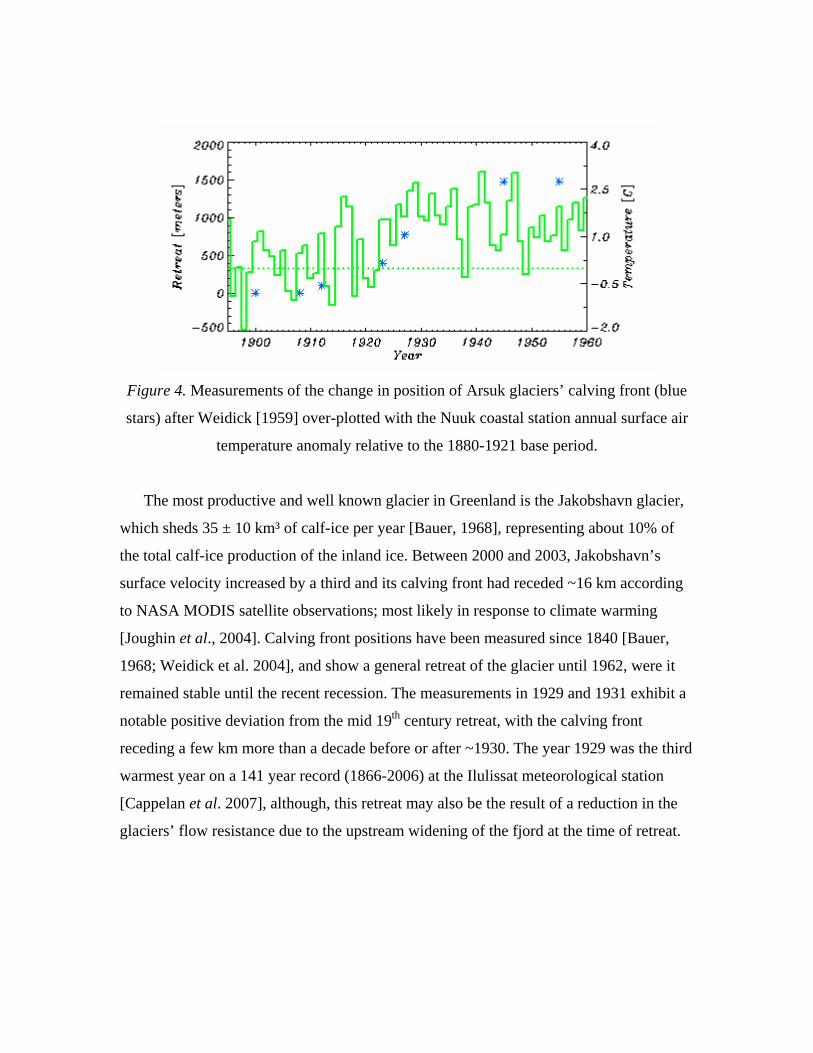
Figure 4. Measurements of the change in position of Arsuk glaciers’ calving front (blue
stars) after Weidick [1959] over-plotted with the Nuuk coastal station annual surface air
temperature anomaly relative to the 1880-1921 base period.
The most productive and well known glacier in Greenland is the Jakobshavn glacier,
which sheds 35 ± 10 km³ of calf-ice per year [Bauer, 1968], representing about 10% of
the total calf-ice production of the inland ice. Between 2000 and 2003, Jakobshavn’s
surface velocity increased by a third and its calving front had receded ~16 km according
to NASA MODIS satellite observations; most likely in response to climate warming
[Joughin et al., 2004]. Calving front positions have been measured since 1840 [Bauer,
1968; Weidick et al. 2004], and show a general retreat of the glacier until 1962, were it
remained stable until the recent recession. The measurements in 1929 and 1931 exhibit a
notable positive deviation from the mid 19th century retreat, with the calving front
receding a few km more than a decade before or after ~1930. The year 1929 was the third
warmest year on a 141 year record (1866-2006) at the Ilulissat meteorological station
[Cappelan et al. 2007], although, this retreat may also be the result of a reduction in the
glaciers’ flow resistance due to the upstream widening of the fjord at the time of retreat.

Figure 6. Greenland location map illustrating sites referred to in this study.
Figure 5 shows the 1886-2006 changes in Upernavik glacier’s ice margin . The
earlier data were collected from the Ryder [1889] and Carlson [1939] maps. 1962, 1973,
and 2006 data are derived from satellite images. The largest retreat occurred between
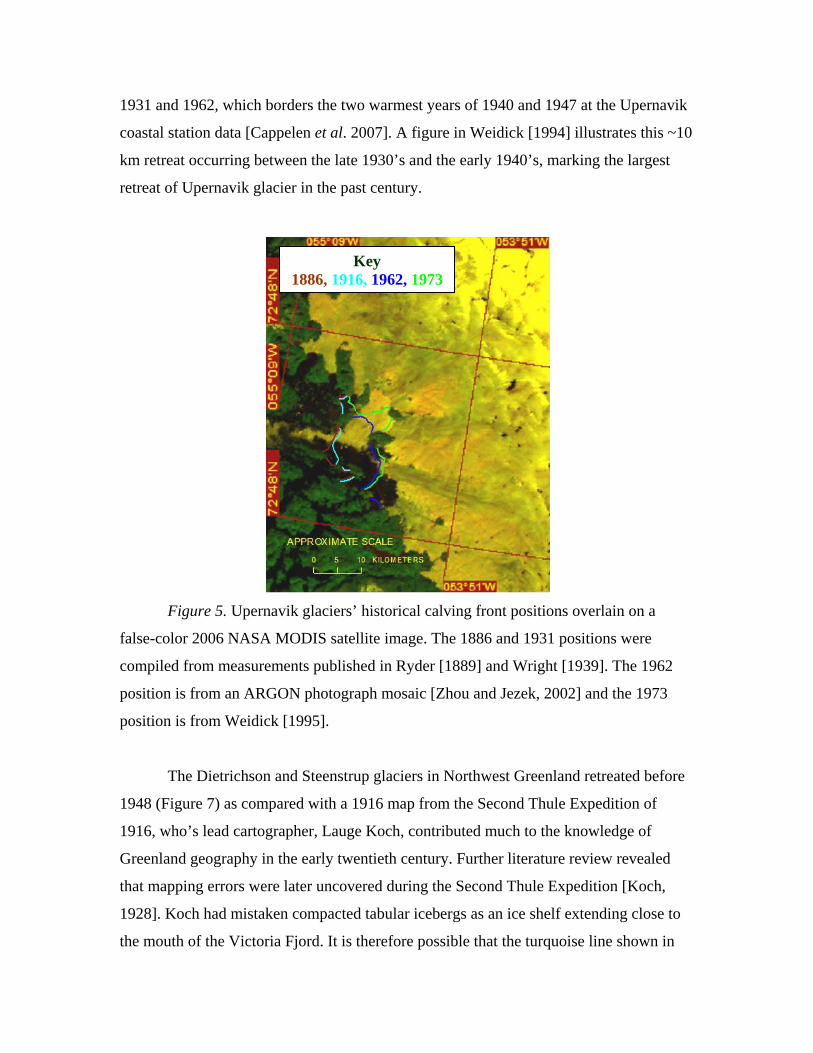
1931 and 1962, which borders the two warmest years of 1940 and 1947 at the Upernavik
coastal station data [Cappelen et al. 2007]. A figure in Weidick [1994] illustrates this ~10
km retreat occurring between the late 1930’s and the early 1940’s, marking the largest
retreat of Upernavik glacier in the past century.
Key 1886, 1916, 1962, 1973
Figure 5. Upernavik glaciers’ historical calving front positions overlain on a
false-color 2006 NASA MODIS satellite image. The 1886 and 1931 positions were
compiled from measurements published in Ryder [1889] and Wright [1939]. The 1962
position is from an ARGON photograph mosaic [Zhou and Jezek, 2002] and the 1973
position is from Weidick [1995].
The Dietrichson and Steenstrup glaciers in Northwest Greenland retreated before
1948 (Figure 7) as compared with a 1916 map from the Second Thule Expedition of
1916, who’s lead cartographer, Lauge Koch, contributed much to the knowledge of
Greenland geography in the early twentieth century. Further literature review revealed
that mapping errors were later uncovered during the Second Thule Expedition [Koch,
1928]. Koch had mistaken compacted tabular icebergs as an ice shelf extending close to
the mouth of the Victoria Fjord. It is therefore possible that the turquoise line shown in
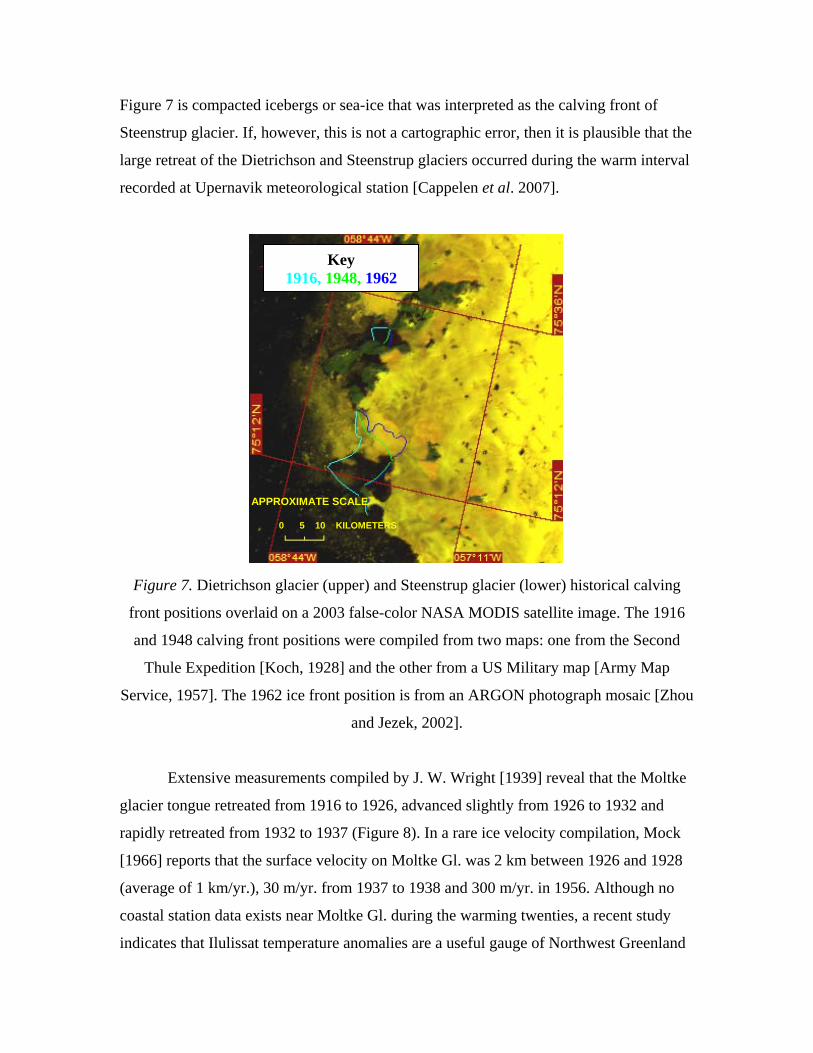
Figure 7 is compacted icebergs or sea-ice that was interpreted as the calving front of
Steenstrup glacier. If, however, this is not a cartographic error, then it is plausible that the
large retreat of the Dietrichson and Steenstrup glaciers occurred during the warm interval
recorded at Upernavik meteorological station [Cappelen et al. 2007].
Key 1916, 1948, 1962
APPROXIMATE SCALE
0 5 10 KILOMETERS
Figure 7. Dietrichson glacier (upper) and Steenstrup glacier (lower) historical calving
front positions overlaid on a 2003 false-color NASA MODIS satellite image. The 1916
and 1948 calving front positions were compiled from two maps: one from the Second
Thule Expedition [Koch, 1928] and the other from a US Military map [Army Map
Service, 1957]. The 1962 ice front position is from an ARGON photograph mosaic [Zhou
and Jezek, 2002].
Extensive measurements compiled by J. W. Wright [1939] reveal that the Moltke
glacier tongue retreated from 1916 to 1926, advanced slightly from 1926 to 1932 and
rapidly retreated from 1932 to 1937 (Figure 8). In a rare ice velocity compilation, Mock
[1966] reports that the surface velocity on Moltke Gl. was 2 km between 1926 and 1928
(average of 1 km/yr.), 30 m/yr. from 1937 to 1938 and 300 m/yr. in 1956. Although no
coastal station data exists near Moltke Gl. during the warming twenties, a recent study
indicates that Ilulissat temperature anomalies are a useful gauge of Northwest Greenland
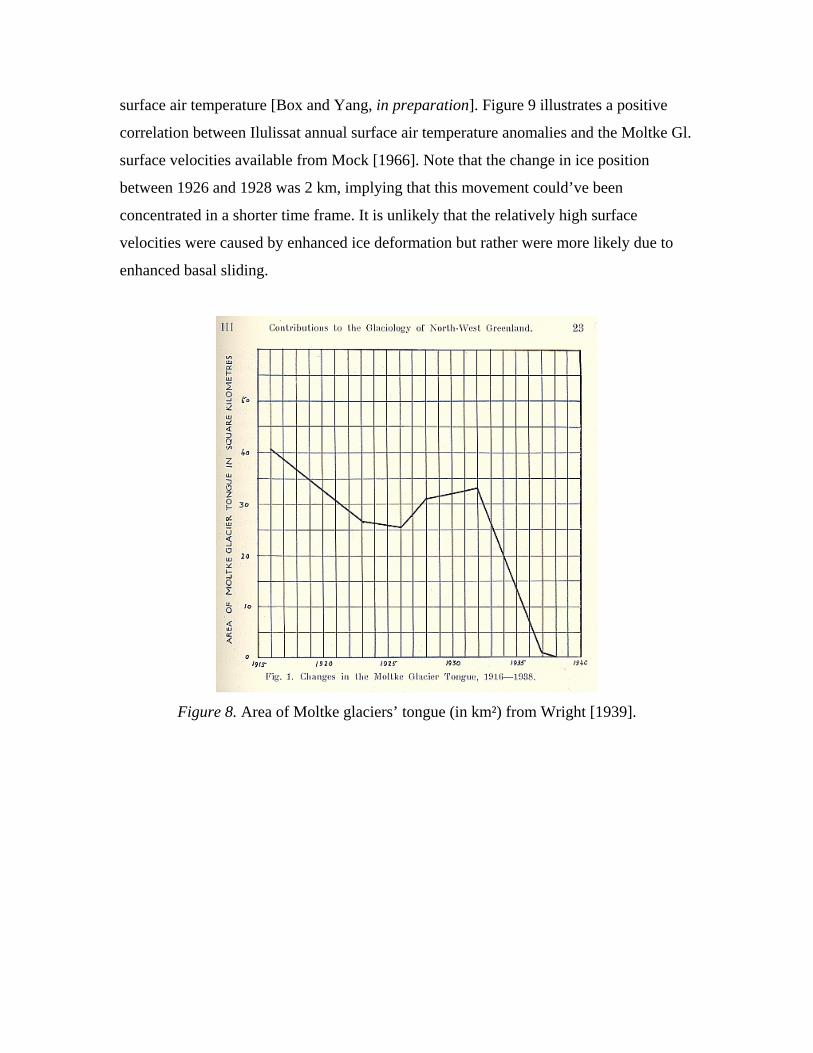
surface air temperature [Box and Yang, in preparation]. Figure 9 illustrates a positive
correlation between Ilulissat annual surface air temperature anomalies and the Moltke Gl.
surface velocities available from Mock [1966]. Note that the change in ice position
between 1926 and 1928 was 2 km, implying that this movement could’ve been
concentrated in a shorter time frame. It is unlikely that the relatively high surface
velocities were caused by enhanced ice deformation but rather were more likely due to
enhanced basal sliding.
Figure 8. Area of Moltke glaciers’ tongue (in km²) from Wright [1939].

Figure 9. Moltke Gl. Mean surface velocity measurements plotted against Ilulissat annual
surface air temperature anomalies with base period 1880-1921 [Cappelen et al., 2007].
Surface velocity data adapted from Mock [1966].
Kangerdlugssuaq glacier is the largest East Greenland glacier; and at times is the
top ranking glacier in Greenland in terms of ice discharge [Rignot and Kanagaratnam,
2006]. Kangerdlugssuaq glacier recently tripled its speed while retreating several km
[Stearns and Hamilton, 2007] during a warm interval between 2000 and 2005. The 2005
surge may be related to climate warming, since the Tasiilaq meteorological station
recorded 2003 as the warmest year on a 112 year record (1895-2006) [Cappelen et al.,
2007]. Using a map from the Danish Scoresby Sund Expedition (Figure 3) and an oblique
aerial photo (Figure 2) from the Seventh Thule Expedition, it was found that a 9 km long
ice tongue broke away sometime between the summers of 1932 and 1933 (Figure 10).
The Tasiilaq coastal station [Cappelen et al., 2007] records the second, forth and sixth
warmest years on record to be 1929, 1928 and 1932, respectively.
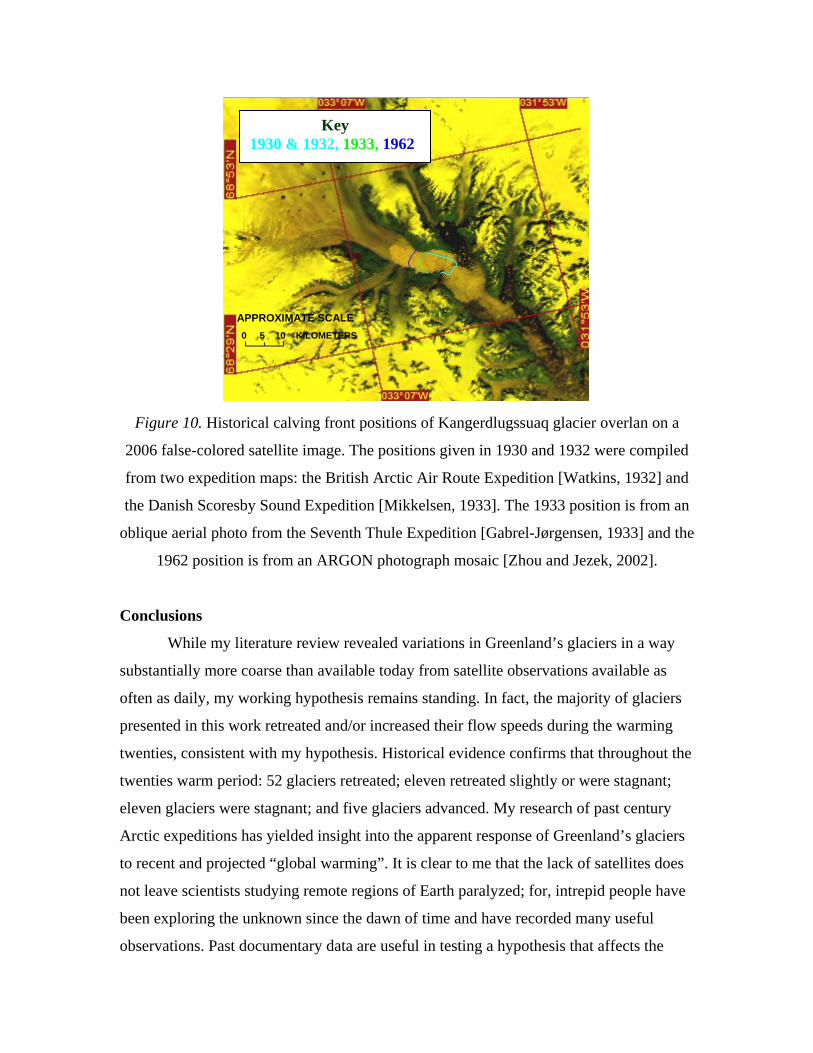
Key 1930 & 1932, 1933, 1962
APPROXIMATE SCALE
0 5 10 KILOMETERS
Figure 10. Historical calving front positions of Kangerdlugssuaq glacier overlan on a
2006 false-colored satellite image. The positions given in 1930 and 1932 were compiled
from two expedition maps: the British Arctic Air Route Expedition [Watkins, 1932] and
the Danish Scoresby Sound Expedition [Mikkelsen, 1933]. The 1933 position is from an
oblique aerial photo from the Seventh Thule Expedition [Gabrel-Jørgensen, 1933] and the
1962 position is from an ARGON photograph mosaic [Zhou and Jezek, 2002].
Conclusions
While my literature review revealed variations in Greenland’s glaciers in a way
substantially more coarse than available today from satellite observations available as
often as daily, my working hypothesis remains standing. In fact, the majority of glaciers
presented in this work retreated and/or increased their flow speeds during the warming
twenties, consistent with my hypothesis. Historical evidence confirms that throughout the
twenties warm period: 52 glaciers retreated; eleven retreated slightly or were stagnant;
eleven glaciers were stagnant; and five glaciers advanced. My research of past century
Arctic expeditions has yielded insight into the apparent response of Greenland’s glaciers
to recent and projected “global warming”. It is clear to me that the lack of satellites does
not leave scientists studying remote regions of Earth paralyzed; for, intrepid people have
been exploring the unknown since the dawn of time and have recorded many useful
observations. Past documentary data are useful in testing a hypothesis that affects the
livelihoods of hundreds of millions of people, a hypothesis that affects economies at local
to global scales, thanks to voluminous libraries such as the many of The Ohio State
University. I remember once feeling confused when I opened my first glaciology
textbook [Patterson, 1994], that it led with the quote “There is nothing new except what
is forgotten” – anonymous. I now know what was meant by this quote.
Acknowledgements
Map Librarian Stephen W. Rogers from the department of Geography assisted in
obtaining historical maps and literature. Goldthwait Polar Librarian Lynn Lay of the Byrd
Polar Research Center provided many rare documents for this paper. Prof. Jason E. Box,
Department of Geography and Byrd Polar Research Center assisted in research design
and provided many useful comments on this manuscript.
References
Army Map Service, United States (1957), Steenstrup glacier, Greenland 1:250,000,
Washington: The Service, sheet no. NS-21-22-11-8.
Box, J.E., L. Yang, Greenland ice sheet surface air temperature reconstruction: 1784-
2006, Journal of Climate, in preparation.
Cappelen J., E.V. Laursen, P.V. Jørgensen and C. Kern-Hansen, DMI monthly Climate
Data Collection 1768-2006, (2007), Denmark, The Faroe Islands and Greenland, DMI
Technical Report No. 07-06.
Bauer, A. (1968), Missions aériennes de reconnaissance au Groenland 1957–1958.
Observations aériennes et terrestres, exploitation des photographies aériennes,
détermination des vitesses des glaciers vêlants dans Disko Bugt et Umanak Fjord. By
A. Bauer, in collaboration with M. Baussart, M. Carbonnell, P. Kasser, P. Perroud
and A. Renaud, Meddelelser om Grønland, v. 173, nr. 3
Carlson, W. S. (1939), Movement of some Greenland Glaciers, Bull. Geol. Soc. Amer., v.
50, nr. 2, 239-255.
Chylek, P., M.K. Dubey, and G. Lesins (2006) Greenland warming of 1920-1930 and
1995-2005, Geophys. Res. Lett., 33, L11707, doi:10.1029/2006GL026510.

Gabrel-Jørgensen, C. C. A. (1933), 6. og 7. Thule-Expedition til Sydostgronland 1931-
33, Report on the Expedition: Meddelelser om Grønland, v. 106.
Joughin, I., W. Abdalati, and M. Fahnestock (2004), Large fluctuations in speed on
Greenland’s Jakobshavn Isbræ glacier, Nature, 432, 608-610.
Koch, L. (1928), Contributions to the glaciology of North Greenland: Meddelelser om
Grønland, v. 65, pt. 2, 181-464.
Levitus, S. (2005), Warming of the World Ocean, 1955-2003. Geophysical Research
Letters, 31, L02604.
Mikkelsen, E. (1933),The Scoresby Sound Committee’s 2nd East Greenland Expedition in
1932 to King Christian IX’s Land, Report on the Expedition: Meddelelser om
Grønland, v. 104, nr. 1.
Mock, S.J. (1966), Fluctuations of the terminus of the Harald Moltke Bræ Greenland:
Journal of Glaciology, v. 6, no. 45, 369-373.
Patterson, W.S.B. 1994. The Physics of Glaciers, 3rd edition. Pergamon, 480 pp.
Pfeffer, W.T., A Simple Mechanism for Irreversible Tidewater Glacier Retreat, Journal
of Geophysical Research, accepted 1/22/2007.
Rignot, E., and P. Kanagaratnam (2006), Changes in the velocity structure of the
Greenland ice sheet, Science, 311, 986-990.
Ryder, C.H. (1889), Undersøgelse af Grønlands Vestkyst fra 72° til 74°35’N. Br., 1886
og 1887 [Investigations of the west coast of Greenland from 72° to 74°35’N. latitude,
1886 and 1887]: Meddelelser om Grønland, v. 8, no. 7, 203-270.
Scambos, T. A.; Bohlander, J. A.; Shuman, C. A.; Skvarca, P., Glacier acceleration and
thinning after ice shelf collapse in the Larsen B embayment, Antarctica, Geophysical
Research Letters, 31 (18)
Stearns, L.A. & G.S. Hamilton. (2007) Rapid volume loss from two East Greenland
outlet glaciers quantified using repeat stereo satellite imagery. Geophysical Research
Letters, 34, in press.
Thomas, R., W. Abdalati, E. Frederick, W. B. Krabill, S. Manizade, and K. Steffen
(2003) Investigation of surface melting and dynamic thinning on Jakobshavn Isbræ,
Greenland, J. Glaciol, 49, 231-239.

Watkins, H. G., D’Aeth, N. H., Quintin Riley, Q., Wager, L. R., Stephenson, A., Spencer
Chapman, F. (1932), The British Arctic Air Route Expedition, The Geographical
Journal, Vol. 79, No. 6., 466-496.
Weidick, A. (1959), Glacial Variations in West Greenland in Historical Time:
Meddelelser om Grønland, v. 158, nr. 4.
Weidick, A. (1994), Historical Fluctuations of Calving Glaciers in South and West
Greenland, Rapp. Grønland Geol. Unders., 161, 73-79.
Weidick, A. (1995), Satellite Image Atlas of Glaciers of the World, U.S. Geol. Surv.
Prof. Pap. 1386C, C1.
Weidick, A., Mikkelsen, N., Mayer, C. & Podlech, S. (2004) Jakobshavn Isbræ, West
Greenland: the 2002-2003 collapse and nomination for the UNESCO World Heritage
List. In: Sønderholm, M. & Higgins, A.K.(eds): Review of Survey activities 2003.
Geological Survey of Denmark and Greenland Bulletin 4 , 85-88.
Wright, J. W. (1939), Contributions to the Glaciology of North-West Greenland:
Meddelelser om Grønland, v. 125, nr. 3, pt. 1.
Zhou, G., Jezek, K. C. (2002), Satellite Photograph Mosaics of Greenland from the 1960s
Era, Int. J. Remote Sensing, v. 23, no. 6, 1143-1159.
Zwally, H. J., W. Abdalati, T. Herring, K. Larson, J. Saba, and K. Steffen (2002), Surface
melt-induced acceleration of Greenland ice sheet flow, Science, 297, 218-222.