Warming induces shifts in microzooplankton phenology and reduces time-lags between phytoplankton and...
13
ORIGINAL PAPER Warming induces shifts in microzooplankton phenology and reduces time-lags between phytoplankton and protozoan production N. Aberle • B. Bauer • A. Lewandowska • U. Gaedke • U. Sommer Received: 27 January 2012 / Accepted: 20 April 2012 Ó Springer-Verlag 2012 Abstract Indoor mesocosm experiments were conducted to test for potential climate change effects on the spring succession of Baltic Sea plankton. Two different temper- ature (D0 °C and D6 °C) and three light scenarios (62, 57 and 49 % of the natural surface light intensity on sunny days), mimicking increasing cloudiness as predicted for warmer winters in the Baltic Sea region, were simulated. By combining experimental and modeling approaches, we were able to test for a potential dietary mismatch between phytoplankton and zooplankton. Two general predator– prey models, one representing the community as a tri-tro- phic food chain and one as a 5-guild food web were applied to test for the consequences of different temperature sen- sitivities of heterotrophic components of the plankton. During the experiments, we observed reduced time-lags between the peaks of phytoplankton and protozoan biomass in response to warming. Microzooplankton peak biomass was reached by 2.5 day °C -1 earlier and occurred almost synchronously with biomass peaks of phytoplankton in the warm mesocosms (D6 °C). The peak magnitudes of microzooplankton biomass remained unaffected by tem- perature, and growth rates of microzooplankton were higher at D6 °C(l D0 °C = 0.12 day -1 and l D6 °C = 0.25 day -1 ). Furthermore, warming induced a shift in micro- zooplankton phenology leading to a faster species turnover and a shorter window of microzooplankton occurrence. Moderate differences in the light levels had no significant effect on the time-lags between autotrophic and hetero- trophic biomass and on the timing, biomass maxima and growth rate of microzooplankton biomass. Both models predicted reduced time-lags between the biomass peaks of phytoplankton and its predators (both microzooplankton and copepods) with warming. The reduction of time-lags increased with increasing Q 10 values of copepods and protozoans in the tritrophic food chain. Indirect trophic effects modified this pattern in the 5-guild food web. Our study shows that instead of a mismatch, warming might lead to a stronger match between protist grazers and their prey altering in turn the transfer of matter and energy toward higher trophic levels. Introduction The potential restructuring of communities in response to climate warming is one of the current topics in ecology (McGowan et al. 2003; Smol et al. 2005; Walther 2010). It is predicted that warming will affect the different trophic levels unequally, which results in a temporal mismatch between predators and their prey (Durant et al. 2007; Thackeray et al. 2010). However, temporal match of zoo- plankton peaks with the spring phytoplankton bloom is required to provide an efficient energy transfer up the food web at the start of the growing season. Thus, the mismatch of phytoplankton with its zooplankton grazers under Communicated by U. Sommer. N. Aberle (&) Biologische Anstalt Helgoland, Alfred-Wegener Institute for Polar and Marine Research, Kurpromenade, 27498 Helgoland, Germany e-mail: [email protected] B. Bauer U. Gaedke Institute for Biochemistry and Biology, University Potsdam, Am Neuen Palais 10, 14469 Potsdam, Germany B. Bauer A. Lewandowska U. Sommer GEOMAR Helmholtz Centre for Ocean Research, Du ¨sternbrooker Weg 20, 24105 Kiel, Germany 123 Mar Biol DOI 10.1007/s00227-012-1947-0
Transcript of Warming induces shifts in microzooplankton phenology and reduces time-lags between phytoplankton and...
ORIGINAL PAPER
Warming induces shifts in microzooplankton phenologyand reduces time-lags between phytoplanktonand protozoan production
N. Aberle • B. Bauer • A. Lewandowska •
U. Gaedke • U. Sommer
Received: 27 January 2012 / Accepted: 20 April 2012
� Springer-Verlag 2012
Abstract Indoor mesocosm experiments were conducted
to test for potential climate change effects on the spring
succession of Baltic Sea plankton. Two different temper-
ature (D0 �C and D6 �C) and three light scenarios (62, 57
and 49 % of the natural surface light intensity on sunny
days), mimicking increasing cloudiness as predicted for
warmer winters in the Baltic Sea region, were simulated.
By combining experimental and modeling approaches, we
were able to test for a potential dietary mismatch between
phytoplankton and zooplankton. Two general predator–
prey models, one representing the community as a tri-tro-
phic food chain and one as a 5-guild food web were applied
to test for the consequences of different temperature sen-
sitivities of heterotrophic components of the plankton.
During the experiments, we observed reduced time-lags
between the peaks of phytoplankton and protozoan biomass
in response to warming. Microzooplankton peak biomass
was reached by 2.5 day �C-1 earlier and occurred almost
synchronously with biomass peaks of phytoplankton in the
warm mesocosms (D6 �C). The peak magnitudes of
microzooplankton biomass remained unaffected by tem-
perature, and growth rates of microzooplankton were
higher at D6 �C (lD0 �C = 0.12 day-1 and lD6 �C = 0.25
day-1). Furthermore, warming induced a shift in micro-
zooplankton phenology leading to a faster species turnover
and a shorter window of microzooplankton occurrence.
Moderate differences in the light levels had no significant
effect on the time-lags between autotrophic and hetero-
trophic biomass and on the timing, biomass maxima and
growth rate of microzooplankton biomass. Both models
predicted reduced time-lags between the biomass peaks of
phytoplankton and its predators (both microzooplankton
and copepods) with warming. The reduction of time-lags
increased with increasing Q10 values of copepods and
protozoans in the tritrophic food chain. Indirect trophic
effects modified this pattern in the 5-guild food web. Our
study shows that instead of a mismatch, warming might
lead to a stronger match between protist grazers and their
prey altering in turn the transfer of matter and energy
toward higher trophic levels.
Introduction
The potential restructuring of communities in response to
climate warming is one of the current topics in ecology
(McGowan et al. 2003; Smol et al. 2005; Walther 2010). It
is predicted that warming will affect the different trophic
levels unequally, which results in a temporal mismatch
between predators and their prey (Durant et al. 2007;
Thackeray et al. 2010). However, temporal match of zoo-
plankton peaks with the spring phytoplankton bloom is
required to provide an efficient energy transfer up the food
web at the start of the growing season. Thus, the mismatch
of phytoplankton with its zooplankton grazers under
Communicated by U. Sommer.
N. Aberle (&)
Biologische Anstalt Helgoland, Alfred-Wegener
Institute for Polar and Marine Research,
Kurpromenade, 27498 Helgoland, Germany
e-mail: [email protected]
B. Bauer � U. Gaedke
Institute for Biochemistry and Biology, University Potsdam,
Am Neuen Palais 10, 14469 Potsdam, Germany
B. Bauer � A. Lewandowska � U. Sommer
GEOMAR Helmholtz Centre for Ocean Research,
Dusternbrooker Weg 20, 24105 Kiel, Germany
123
Mar Biol
DOI 10.1007/s00227-012-1947-0

warming, that has been found in the freshwater as well as in
the marine pelagic realm (Edwards and Richardson 2004;
Winder and Schindler 2004), is a reason for concern. Pre-
vious studies were largely restricted to mesozooplankton as
consumers of phytoplankton. However, microzooplankton
has an important role as trophic intermediary between pri-
mary producers and mesozooplankton (Johansson et al.
2004; Sommer et al. 2005) and as major primary consumer
of autotrophic production in the plankton (Landry and
Calbet 2004; Calbet 2008). It is assumed that warming will
strengthen top-down control of phytoplankton by micro-
zooplankton communities (Rose and Caron 2007) as the
growth of heterotrophic protists is much more temperature
dependent than that of autotrophs. This assumption directly
links to the ‘metabolic theory of ecology’ (MTE; Brown
et al. 2004) as described by Lopez-Urrutia (2008). The
present study focuses on the effects of temperature on the
phenology of microzooplankton communities (ciliates and
heterotrophic dinoflagellates \200 lm).
Besides temperature directly affecting microzooplank-
ton, altered light levels (due to, e.g., increased cloudiness
and atmospheric water vapor content) also influence
microzooplankton growth indirectly by altering the avail-
ability of phytoplankton prey. Therefore, we hypothesized
that the time-lag between autotrophic and heterotrophic
processes in the plankton will be altered by light avail-
ability as well.
We used a cardinal point approach to analyse time-lags
between phytoplankton and microzooplankton during the
spring succession of Baltic Sea plankton in relation to
changing temperature and light conditions. Cardinal points
are considered as sensitive indicators of climate change-
induced shifts in phenology such as shifts in the timing of
phytoplankton spring blooms (Straile and Adrian 2000;
Wiltshire and Manly 2004; Thackeray et al. 2008). How-
ever, as stated by Gaedke et al. (2010), the analysis of
cardinal points does not provide a mechanistic under-
standing of climate change-related impacts on plankton
succession. Thus, in addition to the analysis of time series
of the community structure during the experiments, we
conducted model simulations using a modified Rosenzweig
and MacArthur (1963) predator–prey model incorporating
temperature-dependent growth, grazing and mortality rates
of autotrophic and heterotrophic components. We com-
pared the phenology of two different simulated food webs
under warming to gain insight into the role of trophic
interactions and food web structure influencing the effects
of temperature. Additionally, we tested how different
temperature sensitivities of predators affect the simulated
phenology by varying Q10 values of copepods and proto-
zoans independently.
Based on the observations of Rose and Caron (2007), we
hypothesized that warming will lead to:
1. Acceleration of microzooplankton growth and species
turnover.
2. Reduced time-lags between autotrophs and hetero-
trophs in plankton communities (taking additionally
into account potential effects from changing light
availability).
3. Stronger top-down bloom control by microzoo-
plankton and enhanced dietary competition with
mesozooplankton.
Methods
Experimental set-up
The experimental set-up consisted of twelve mesocosms
made of food safe polyethylene in four temperature-con-
trolled culture rooms. Each mesocosm had a volume of
1,400 L (1 m depth) and was filled with water from the
Kiel Bight: sea water was pumped from the institute’s pier
(from 6 m depth) into an intercepting tank and was dis-
tributed further to the mesocosms by hosepipes. Hence, we
were able to fill all mesocosms simultaneously and guar-
antee almost identical starting conditions. Damage by the
pumping procedure was tolerable for phytoplankton and
microzooplankton, but mesozooplankton organisms did not
survive this transfer. Thus, we added mesozooplankton
from net catches at natural densities (ca. 10–20 ind l-1,
dominated by the copepod Oithona sp. at the beginning),
gathering the organisms by vertical hauls with a 200 lm
WP2 net (Hydrobios, Kiel, Germany) at several stations in
Kiel Bight. After filling, water columns were stirred
moderately with agitators. Stirring speed was slow enough
to ensure that mesozooplankton was not harmed.
The temperature programme was based on the decadal
mean (1993–2002) of water temperatures in Kiel Bight,
Baltic Sea. Two temperature treatments, called D0 �C and
D6 �C for brevity (0 and 6 �C elevation above the decadal
mean, respectively), were established. D6 �C mimicked the
most drastic temperature scenario predicted by the IPCC
(2007) for the end of the century. The natural seasonal
temperature increase during spring was simulated starting
with mean temperatures of 2.4 (D0 �C) and 7.8 �C
(D6 �C). The light set-up simulating daily triangular light
curves and seasonal changes in light climate was calculated
using the astronomic model published by Brock (1981).
Natural surface irradiance was reduced to 49, 57 and 62 %
of sea surface irradiance on sunny days (I0) to simulate
three different light scenarios. The highest I0 (62 %) was
based on a mixed water column mean light intensity during
cloudless days at 10 m mixing depth (depth of the halo-
cline in situ) and a vertical attenuation coefficient (k) of
0.18 m-1. 49 and 57 % simulated light reduction by cloud
Mar Biol
123

cover or any combination of less clouds and higher
attenuation coefficient. Light was supplied by computer-
controlled light units (Profilux II, GHL Groß Hard- and
Software Logistics, Kaiserslautern, Germany) above each
mesocosm, which contained fluorescent tubes with dif-
ferent light spectra (T5 ‘Solar Tropic’ and T5 ‘Solar
Nature’, JBL, Neuhofen, Germany) in order to mimic
solar irradiance. The starting date for the light and tem-
perature programs was set to 15th February (Day of the
year 46; referred to as DOY thereafter) and each temper-
ature and light level was replicated twice. The actual
experimental period lasted from February 6 until March
26, 2008.
Microzooplankton sampling and identification
Microzooplankton samples were taken once a week by
sampling seawater from the mixed water column (30 cm
water depth) with a silicone tube. 250 ml of the sampled
seawater was transferred to brown glass bottles and fixed
with acidic Lugol’s iodine (2 % final concentration).
100 ml of each sample was transferred to sedimentation
chambers and microzooplankton was counted by the
inverted microscope method (Utermohl 1958) at a 2009
magnification with a Zeiss Axiovert 135. The whole area of
the bottom plate was counted for each sample in order to
guarantee comparability of the counting method both at
periods of high and low microzooplankton abundance.
Microzooplankton was identified to the lowest possible
taxonomic level (species or genus level) according to Kahl
(1932), Foissner et al. (1991, 1992, 1994, 1995), Struder-
Kypke et al. (2002), Tomas (1996), and Scott (2005). For
biovolume calculations, geometric proxies were used
according to Hillebrand et al. (1999) and carbon biomass
was calculated using the conversion factors given in Putt
and Stoecker (1989).
Microzooplankton growth rates
The growth rate l (day-1) of microzooplankton was cal-
culated as the slope of a regression of ln biomass on time.
DOY 46 was set as start of the growth rate calculation and
DOY 60 as end for the linear portions in the warm meso-
cosms, while DOY 67, 74 or 81 were the end points in the
cold mesocosms.
Phytoplankton and copepod sampling and classification
Samples for phytoplankton counts were taken three times
per week, fixed with Lugol’s iodine and counted using
the inverted microscope method (Utermohl 1958). To
account for phytoplankton cells \5 lm, samples for flow
cytometry were taken at the same intervals and analyzed
on a Becton Dickson, FACScalibur system. For analysis,
mesocosm water was pre-filtered by a 64-lm net in order
to exclude big particles that might clog the cytometer.
Phytoplankton was measured live from the unfixed water
samples.
Biovolume calculations were conducted using approxi-
mations according to Hillebrand et al. (1999) and converted
into carbon content as described by Menden-Deuer and
Lessard (2000). Phytoplankton was subdivided into small-
sized (particle size \ 1,500 lm3) and medium-sized algae
(1,500–45,000 lm3). The small-sized algae comprised
autotrophic pico- and single-celled nanophytoplankton,
that is, diatoms, autotroph athecate and thecate dinoflag-
ellates, Haptophyceae, Chrysophyceae and Cryptophyceae.
The medium-sized algae were dominated by diatoms con-
tained micro- and chain-forming nanophytoplankton, but
also silicoflagellates, Chryptophyceae, Chlorophyceae and
autotrophic athecate and thecate dinoflagellates. Large-
sized algae ([45,000 lm3) were not included as these
species, for example, Coscinodiscus sp., Ceratium spp. are
not preferred prey items of the dominant microzooplankton
species present in our mesocosms.
Copepod samples were taken once a week by vertical
net tows with a plankton net (Apstei-type, Ø12 cm, 35 cm
length, 64 lm mesh size, Hydro-Bios, Kiel, Germany).
Copepod samples were counted under a dissecting micro-
scope and converted into biomass using conversion factors
by Paffenhofer and Harris (1976), Landry (1983) and
Castellani et al. (2005). Naupliar carbon content was cal-
culated with a mean conversion factor from literature
values (Davis 1984; Castellani et al. 2005), assuming an
equal mixture of the dominating genera. For the total
copepod carbon biomass, values of nauplii and copepodites
were pooled.
Cardinal point definitions
In order to characterize the timing of the microzooplankton
bloom cardinal points, a sigmoidal fit with the equation
f tð Þ ¼ a=ð1þ exp � t � t0ð Þ=bð Þ
where t = time was used (Fig. 1). The sum of microzoo-
plankton biomass during the experimental period was set as
100 % and the dates (or days) when 25, 50 and 75 % of the
total cumulative biomass were reached were defined as: (1)
D25: time when the cumulative biomass surpassed the 25 %
threshold, (2) D50: time when the cumulative biomass
surpassed the 50 % threshold and (3) D75: time when the
cumulative biomass surpassed the 75 % threshold. The
timing of the microzooplankton biomass maximum (Dmax)
was defined as the day when microzooplankton biomass
reached its peak.
Mar Biol
123

Statistical analysis
In order to test for significant effects of the factors light and
temperature on the timing of microzooplankton bloom
maxima, a two-way ANOVA using ‘Timing of microzoo-
plankton maximum (Dmax)’ as dependent variable and
‘Temperature’ and ‘Light’ as independent variables was
performed. To test for significant effects of the different
temperatures (mean actual temperatures in the D0 �C and
D6 �C treatments over the whole duration of the experi-
ment) on the response variables (1) timing of microzoo-
plankton maximum (Dmax) and (2) timing of cumulative
biomass (D25, D50 and D75), statistical tests using regres-
sion analysis were conducted. ‘DT �C’ was used as inde-
pendent factor and ‘Day’ as dependent factor. We used
STATISTICA 6.0 for analyses.
Predator–prey model
We constructed two modified Rosenzweig and MacArthur
(1963) predator–prey models with 3 and 5 species, incor-
porating temperature-dependent growth, grazing and
mortality rates. In the tritrophic model, the biomass of phy-
toplankton (A), protozoans (P), and copepods (C) were
simulated, where copepods grazed both protozoans and
phytoplankton, while the protozoans consumed phyto-
plankton. In the model with 5 species, we distinguished
between small- (A1) and medium-sized (A2) algae, between
ciliates (P1) and heterotrophic dinoflagellates (P2) and
copepods (C). Here, only ciliates grazed small-sized algae,
while dinoflagellates and copepods consumed medium-sized
algae. Copepods grazed both protozoan groups in this model.
The biomass dynamics of the phytoplankton (Ai), protozoans
(Pj), and copepods (C) is described by the following
equations:
dAi
dt¼ prod � Ai �
X
j
gij � Pj � giC � C;
dPj
dt¼ e �
X
i
gij � d � eTHP
!� Pj � gjC � C;
dC
dt¼ e �
X
i
giC þX
j
gjC
!� d � eTHC
!� C:
where the parameter e is the growth efficiency and
d is the mortality rate of the predators at the reference
temperature (2 �C) (for parameter values used see
Table 1).
We assumed temperature-sensitive logistic growth for
phytoplankton. Thus, the production rate (day-1) of phy-
toplankton was calculated as:
prod ¼ r0 � eTA � 1�P
i Ai
K
� �;
where r’ is the potential growth rate of phytoplankton at
2 �C (reference temperature). Temperature regulation fac-
tors for autotrophic (eTA) and heterotrophic (eTHP, eTHC)
processes were calculated as eT ¼ QTðtÞ�2
10
10 . For calculating
eTA, we used Q10 = 1.5. To test the effect of different
temperature dependencies of grazers, we conducted simu-
lations with Q10 = 2, 4, and 6 for copepods and protozoans
(eTHC, eTHP, resp.). The Q10 chosen were in the range of
those found in studies on copepods (Leandro et al. 2006;
Isla et al. 2008) and protozoans (Nielsen and Kiorboe 1994;
Rose and Caron 2007), although it is controversially dis-
cussed in the literature whether protozoan growth increases
rather linearily than exponentially with increasing tem-
perature (Montagnes et al. 2003). We assumed the same
Q10 values for dinoflagellates and ciliates in the 5-guild
model.
Day of the year40 50 60 70 80 90 100
Cu
mu
lati
ve b
iom
ass
(%)
0
20
40
60
80
100
120
D75= 75% threshold
D25= 25% threshold
D50= 50% threshold
Δ 6°C: 62%Δ 6°C: 57%Δ 6°C: 49%Δ 0°C: 62%Δ 0°C: 57%Δ 0°C: 49%
Fig. 1 Sigmoidal fit showing the cumulative microzooplankton
biomass (%) over the whole duration of the experiment. Solid linesindicate the thresholds of cumulative biomass defined as D25, D50,
and D75
Table 1 Abbreviations, values, and description of parameters used in
the simulation models
Parameter Value (unit) Description
r’ 1.6 (day-1) Maximum growth rate of
phytoplankton at T = 2 �C
e 0.35 (day-1) Growth efficiency of predators
d 0.02 (day-1) Mortality rate of predators at
T = 2 �C
K 1,000 (lgC/l) Carrying capacity
g’C 0.15 (day-1) Potential grazing rate of copepods
g’P 0.3 (day-1) Potential grazing rate of protozoans
M 50 (lgC/l) Half-saturation constant of grazers
Mar Biol
123

T(t) indicates temperature values taken from the time
series of the experiment. Grazing exponentially
increased with temperature according to the classical Q10
relationship.
Grazing rates of protozoa on phytoplankton (gij) were
given by:
gij ¼ eTHP � g0PAiP
i Ai þM:
g0P was the potential maximum grazing rate at 2 �C, esti-
mated from measurements at 6 �C (Loeder et al. 2011),
using a Q10 = 4.
Grazing of copepods on phytoplankton (giC) and pro-
tozoans (gjC) was given by:
giC ¼ eTHC � g0C �AiP
i Ai þP
j Pj þM;
gjC ¼ eTHC � g0C �PjP
i Ai þP
j Pj þM:
g0C is the potential maximum grazing rate of copepods at
the reference temperature (2 �C). We studied the simulated
time series of the groups during the first 50 time steps
(days) of model simulations. This is a transient period,
where the biomass maxima were relatively sensitive to
the initial biomasses. Thus, to focus on the effects of
temperature and food web structure on the phenology of
the simulated communities, we set the initial values for
the biomasses 20 lgC/l for all groups instead of using the
initial values from the experiments.
Results
Microzooplankton biomass, cardinal points,
and growth rates
At the beginning of the experiment, microzooplankton
biomass increased in all mesocosms until it reached the
biomass maximum (Dmax) and declined to initial biomass
levels thereafter (Table 2; Fig. 2a–f). Dmax was reached
more rapidly in the warm mesocosms compared with the
cold ones (Table 2) showing a strong acceleration of 2.5
day �C-1 by temperature (y = -2.5x ? 80, r2 = 0.66,
p \ 0.05). At D6 �C, the timing of the phytoplankton and
the microzooplankton biomass maximum (Dmax) occurred
almost simultaneously (Fig. 2a–c), while Dmax was sig-
nificantly delayed at lower temperatures (D0 �C; Fig. 2d–f;
p = 0.027, F = 24.0, Table 3). The factor light did not
significantly affect Dmax and did not enter the model
(p = 0.6297, F = 0.50; Table 3). The timing of cumula-
tive biomass (D25, D50 and D75) showed a significant
temperature dependency (Table 2). D25 was significantly
correlated with temperature showing an acceleration of 1.8
day �C-1 (y = -1.8x ? 70, r2 = 0.82, p \ 0.05). Even
stronger accelerations were observed for D50 (2.7 day
�C-1; y = -2.7x ? 80, r2 = 0.92, p \ 0.05) and D75 (3.3
day �C-1; y = -3.3x ? 87, r2 = 0.89, p \ 0.05).
Peak magnitudes of Dmax did not significantly differ
between the two different temperatures and reached values
between 7.3 (D0 �C, 62 % I0) and 42.9 lg C l-1 (D6 �C;
49 % I0; Fig. 2a–f).
The growth rates of microzooplankton l (day-1) were
significantly higher in the warm mesocosms (mean 0.25
day-1 ± 0.03) than in the cold ones (0.12 day-1 ± 0.03;
Fig. 3).
Phytoplankton and copepod biomass
Small phytoplankton had a higher initial biomass (*55 lg
C l-1) than medium-sized phytoplankton (*1 lg C l-1),
and a rapid increase in phytoplankton biomass was
observed in all treatments (Fig. 4). Small phytoplankton
reached their biomass peaks earlier in the warm meso-
cosms (Fig. 4a–c). Biomass maxima of small algae were
similar at both temperatures but increased with increasing
light intensities. In contrast, the mean biomass maxima of
medium-sized phytoplankton was two times lower in warm
(maxima of *500 lg C l-1, Fig. 4a–c) than in cold
(maxima of *1,100 lg C l-1) mesocosms (Fig. 4d–f) and
increased with increasing light intensities.
Copepod biomass in all twelve mesocosms started at
5 lg C l-1 ‘(SD; Fig. 4). At the beginning of the experi-
ment, an increase in copepod biomass was observed in all
treatments except for the treatment D0 �C, 62 % I0 (Fig. 4d)
where biomass remained almost constant throughout the
Table 2 Cardinal points of microzooplankton growth (in days of the
year = DOY) where DT gives the temperature elevation and I0 the
percentage of sea surface irradiance
DT I0 (%) D25 D50 D75 Dmax
0 �C 49 65 72 79 67
69 74 79 81
57 69 74 80 81
64 71 78 74
62 62 70 77 67
64 70 74 74
6 �C 49 56 59 62 60
56 60 64 60
57 54 56 59 60
54 56 58 60
62 55 57 59 60
55 57 59 60
The timing of cumulative biomass D25, D50, and D75 as well as the
timing of the microzooplankton biomass maximum (Dmax) is given
Mar Biol
123

experiment. The biomass increase was most pronounced in
the warm mesocosms (Fig. 4a–c) where peak values of 29.1
(SD; D6 �C, 57 % I0) and 112.8 lg C l-1 (D6 �C, 49 % I0)
were reached. In contrast, peaks of copepod biomass
remained lower in the cold mesocosms showing values of
18.1 (SD; D0 �C, 49 % I0) and 20.2 lg C l-1 (D0 �C,
57 % I0).
Microzooplankton community structure
Taxonomic composition
While the initial microzooplankton community was
dominated by dinoflagellates, ciliates increased during the
phytoplankton spring bloom at high temperatures (D6 �C)
followed by a rapid decline instantaneously after the
bloom (Fig. 4a–c). The dominance of ciliates in the
microzooplankton community lasted for approximately
1 week while dinoflagellates dominated during the post-
bloom period. In the lower temperature treatments (D0 �C),
similar succession patterns were observed as at elevated
temperatures. However, succession happened much slower
and ciliates dominated the community for almost 3 weeks
and microzooplankton biomass declined only toward the
end of the experiment (Fig. 4d–f). After the bloom, the
microzooplankton community was dominated by dinoflag-
ellates. The factor light played only a minor role in affecting
microzooplankton succession patterns at both temperatures.
The initial taxonomic composition was similar in all
twelve mesocosms (Table 4). At both temperatures, the pre-
spring bloom period was dominated by the dinoflagellates
Protoperidinium sp. (large; mean Ø 40 lm; 50–67 % of the
total biomass) and Gyrodinium spirale (19–29 % of the
total community) while Gymnodinium spp. occurred only at
low biomass. In addition, the ciliates Myrionecta rubra,
Rimostrombidium sp., Euplotes sp. and tintinnids contrib-
uted only low biomass to the overall community. Right after
the beginning of the experiment, the relative proportion of
the small choreotrichid ciliate Lohmaniella oviformis star-
ted to increase reaching its maximum already after 3 weeks
in all mesocosms (73–88 % of the total community;
Fig. 5a). At D6 �C, the relative shares of L. oviformis
declined rapidly and right after the ciliate peak the com-
munity became dominated by Protoperidinium bipes
(small; mean Ø 25 lm; 80–97 % of the total community,
Δ 6°C: 49%
PP
bio
mas
s (
µg C
l-1)
0,1
1
10
100
1000CΔ 6°C: 57%
B
Δ 0°C: 49%
Day of the year40 50 60 70 80 90 100
PP
bio
mas
s (
µg C
l-1)
0,1
1
10
100
1000FΔ 0°C: 57%
Day of the year
E
Δ 6°C: 62%M
ZP
bio
mas
s (µ
g C
l-1)
0,1
1
10
100A
Δ 0°C: 62%
Day of the year
MZ
P b
iom
ass
(µg
C l-1
)
0,1
1
10
100D
40 50 60 70 80 90 10040 50 60 70 80 90 100
Fig. 2 Microzooplankton (MZP) biomass (lg C l-1) (orange lines;
duplicate 1: solid line, duplicate 2: dotted line) and phytoplankton
(PP) biomass (lg C l-1) (green lines; duplicate 1: solid line, duplicate
2: dotted line) for each treatment. Factors temperature (�C) and light
(%) of the different treatments: a D6 �C 62 %, b D6 �C 57 %,
c D6 �C 49 %, d D0 �C 62 %, e D0 �C 57 %, f D0 �C 49 %. Verticallines illustrate the reduced time-lags between phytoplankton biomass
maxima (green) and microzooplankton biomass maxima (orange)
Table 3 Impact of the factors light and temperature on the timing of
microzooplankton biomass maxima (Dmax)
df MS F ratio P level
Temperature 1 588.00 24.00 0.0027
Light 2 12.25 0.500 0.6297
Temperature 9 light 2 12.25 0.500 0.6297
Error 6 24.50
Results of a two-factorial ANOVA with ‘temperature’ (D0, D6 �C)
and ‘light’ (49, 57, 62) as independent factors and ‘timing of
microzooplankton biomass maxima’ (Dmax) as dependent variable
Mar Biol
123

Fig. 5b). In contrast, L. oviformis remained the dominant
species over a period of 3 weeks in the cold mesocosms
(D0 �C; Fig. 5a) and its relative biomass declined only
during the last 2 weeks of the experiment when P. bipes
dominated the community also at colder conditions
(84–99 % of the total community; Fig. 5b).
Predator–prey models with increasing temperature
In both, the tritrophic chain and 5-guild model, increasing
Q10 values in the cold treatments (D0 �C) did not result in
substantially reduced time-lags between phytoplankton and
grazers (copepods and protozoa). In the cold treatments,
the temperature was *2 �C which was close to our chosen
reference temperature (2 �C). Thus, the time-regulation
factor, eT (which represents the increase of grazing rates
with temperature, see Methods: Predator–prey model), was
1 for all Q10 values, resulting in the same grazing rates of
predator and growth rate of algae regardless of Q10 values.
In contrast, time-lags in the warm treatments were strongly
affected by the Q10 values of the grazers and the food web
structure (Figs. 6, 7). In the tritrophic food chain, warming
led to a reduced time-lag between phytoplankton and
copepods (Fig. 6a) as well as protozoa (Fig. 6b). With
increasing Q10 values of copepods and protozoa, this effect
was enhanced (Fig. 6a ? b).
In the 5-guild model, where specific predator and prey
components were considered separately (Fig. 7), the effects
of increasing Q10 values of grazers on the phenology
depended on their trophic position. Increasing Q10 values
of copepods decreased the time-lag between them and
Actual temperature (°C)2 3 4 5 6 7 8 9
Gro
wth
rat
e µ
(d-1
)
0.00
0.05
0.10
0.15
0.20
0.25
0.30
0.35
Fig. 3 Relationship between the actual temperatures (�C) in the
mesocosms and the growth rates l (day-1) of microzooplankton
during the build-up of the phytoplankton bloom
Δ 6°C: 62%
MZ
P b
iom
ass
(µg
C l-1
)
0
10
20
30
40
Δ 0°C: 62%
Day of the year40 50 60 70 80 90 100
MZ
P b
iom
ass
(µg
C l-1
)
0
10
20
30
40
AΔ 6°C: 57%
CB
DΔ 0°C: 57%
Day of the year40 50 60 70 80 90 100
EΔ 0°C: 49%
Day of the year40 50 60 70 80 90 100
Phy
top
lan
kto
n b
iom
ass
(µg
C l-1
)
1
10
100
1000
Co
pep
od
bio
mas
s (
µg C
l-1)
0
20
40
60
80
100F
Δ 6°C: 49%
Co
pep
od
bio
mas
s (
µg C
l-1)
0
20
40
60
80
100
Phy
top
lan
kto
n b
iom
ass
(µg
C l-1
1
10
100
1000
CopepodsCiliatesDinoflagellatessmall phytoplanktonmedium phytoplankton
)
Fig. 4 Microzooplankton (MZP) biomass (lg C l-1) of ciliates and
dinoflagellates (blue) as the mean of duplicate mesocosms, mean
phytoplankton biomass (lg C l-1) (dashed line small-sized phyto-
plankton; solid line medium-sized phytoplankton), and mean copepod
biomass (lg C l-1) (gray areas) for each treatment. Factors
temperature (�C) and light (%) of the different treatments: a D6 �C
62 %, b D6 �C 57 %, c D6 �C 49 %, d D0 �C 62 %, e D0 �C 57 %,
f D0 �C 49 %
Mar Biol
123

Table 4 Taxonomic composition of microzooplankton and biomass (lg C l-1) of different species/genera during the course of the mesocosms
experiment in the six different treatments (D6 �C: 64 %, D6 �C: 48 %, D6 �C: 32 %, D0 �C: 64 %, D0 �C: 48 %, and D0 �C: 32 %)
Day of the year (DOY)
46 53 60 67 74 81 88 95
D6 �C: 62 %
Myrionecta rubra 0.06 0.04 0.00 0.00 0.00 0.00 0.00 0.00
Lohmaniella oviformis 0.01 1.99 25.13 0.26 0.02 0.00 0.00 0.00
Protoperidinium bipes 0.00 0.00 5.00 3.07 2.02 0.08 0.00 0.00
Protoperidinium sp. 0.50 0.34 0.00 0.00 0.00 0.00 0.00 0.00
Rimostrombidium sp. 0.01 0.00 0.00 0.04 0.00 0.10 0.00 0.00
Gyrodinium cf. spirale 0.21 0.17 0.05 0.00 0.00 0.00 0.00 0.00
Gymnodinium spp. 0.11 0.60 0.17 0.00 0.00 0.00 0.00 0.00
Tintinnids 0.08 0.04 0.00 0.00 0.00 0.00 0.00 0.00
Euplotes sp. 0.00 0.00 0.00 0.00 0.00 0.74 0.90 0.00
D6 �C: 57 %
Myrionecta rubra 0.02 0.02 0.00 0.00 0.00 0.00 0.00 0.00
Lohmaniella oviformis 0.01 0.92 17.77 0.17 0.09 0.00 0.00 0.00
Protoperidinium bipes 0.00 0.00 2.33 1.25 0.90 0.01 0.00 0.00
Protoperidinium sp. 0.53 0.67 0.00 0.00 0.00 0.00 0.00 0.00
Rimostrombidium sp. 0.00 0.00 0.00 0.14 0.00 0.05 0.00 0.00
Gyrodinium cf. spirale 0.16 0.07 0.00 0.00 0.00 0.00 0.00 0.00
Gymnodinium spp. 0.08 0.85 0.06 0.00 0.00 0.00 0.00 0.00
Tintinnids 0.00 0.16 0.00 0.00 0.00 0.00 0.00 0.00
Euplotes sp. 0.00 0.00 0.00 0.00 0.00 0.21 0.49 0.00
D6 �C: 49 %
Myrionecta rubra 0.08 0.00 0.00 0.00 0.00 0.00 0.00 0.00
Lohmaniella oviformis 0.00 1.30 33.88 0.32 0.07 0.03 0.01 0.00
Protoperidinium bipes 0.00 0.00 7.34 10.48 8.36 6.13 0.00 0.00
Protoperidinium sp. 0.39 0.39 0.00 0.00 0.00 0.00 0.00 0.00
Rimostrombidium sp. 0.00 0.00 0.10 0.02 0.00 0.72 0.00 0.00
Gyrodinium cf. spirale 0.21 0.21 0.07 0.00 0.00 0.00 0.00 0.00
Gymnodinium spp. 0.08 0.45 0.06 0.00 0.00 0.00 0.00 0.00
Tintinnids 0.00 0.16 0.00 0.00 0.00 0.00 0.00 0.00
Euplotes sp. 0.00 0.00 0.00 0.00 0.00 0.86 0.76 0.00
D0 �C: 62 %
Myrionecta rubra 0.02 0.00 0.00 0.00 0.00 0.00 0.00 0.00
Lohmaniella oviformis 0.00 0.20 1.94 6.41 8.84 3.49 0.27 0.01
Protoperidinium bipes 0.00 0.00 0.07 0.43 1.35 2.11 1.83 1.01
Protoperidinium sp. 0.53 0.28 0.06 0.22 0.00 0.00 0.00 0.00
Rimostrombidium sp. 0.00 0.00 0.00 0.00 0.05 0.10 0.06 0.02
Gyrodinium cf. spirale 0.28 0.27 0.12 0.02 0.00 0.00 0.00 0.00
Gymnodinium spp. 0.12 0.24 0.27 0.10 0.00 0.00 0.00 0.00
Tintinnids 0.00 0.04 0.00 0.00 0.00 0.00 0.00 0.00
Euplotes sp. 0.00 0.00 0.00 0.00 0.00 0.00 0.01 0.00
D0 �C: 57 %
Myrionecta rubra 0.00 0.00 0.00 0.00 0.00 0.00 0.00 0.00
Lohmaniella oviformis 0.00 0.32 2.99 11.78 20.07 11.85 0.02 0.01
Protoperidinium bipes 0.00 0.00 0.12 1.04 4.05 13.42 10.60 5.73
Protoperidinium sp. 0.59 0.64 0.39 0.34 0.00 0.00 0.00 0.00
Rimostrombidium sp. 0.00 0.00 0.00 0.00 0.30 0.85 0.02 0.05
Mar Biol
123
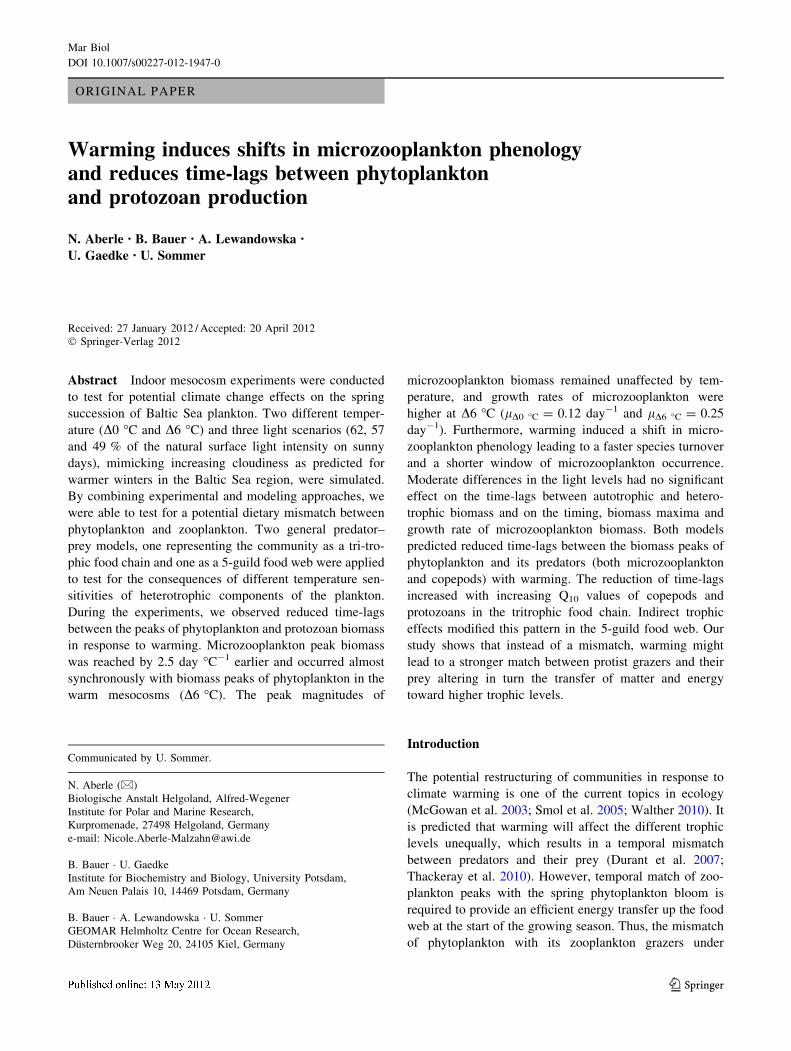
medium-sized algae (Fig. 7a). The time-lag between
copepods and medium-sized algae was slightly affected by
the Q10 values of protozoans. If the latter was 2, copepods
suppressed both protozoans and medium-sized algae early,
resulting in a relatively short time-lag between copepods
and medium-sized algae. If the Q10 of protozoans was 4,
dinoflagellates terminated the bloom of medium-sized algae
and the peak of copepods followed the peak of dinoflagel-
lates; thus, the time-lag between copepods and medium-
sized algae was longer. The bloom phenology was similar
with a Q10 value of 6 for the protozoans, but the dynamics
was faster; thus, the time-lag between copepods and med-
ium-sized algae reduced again. Increasing Q10 values of
Lohmaniella oviformis
Bio
mas
s (µ
g C
l-1)
0
10
20
30
40
D 6°C: 62%D 6°C: 57%D 6°C: 47%D 0°C: 62%D 0°C: 57%D 0°C: 47%
Protoperidinium bipes
Day of the year40 50 60 70 80 90 100
Bio
mas
s (µ
g C
l-1)
0
10
20
30
40
D 6°C: 62%D 6°C: 57%D 6°C: 47%D 0°C: 62%D 0°C: 57% D 0°C: 57%
A
B
Fig. 5 Temporal succession of the dominant ciliate Lohmaniellaoviformis (a) and the dominant heterotrophic dinoflagellate Protope-ridinium bipes (b) (both in the size range 20–30 lm) as the mean of
duplicate mesocosms. Factors temperature (�C) and light (%) of the
different treatments are given in the figure legend
2 4 60
5
10
15
20
25
30
35
40
45
Q10 PROT
Del
ay C
OP
ALG
A
2 4 60
5
10
15
20
25
30
35
40
45
Q10 PROT
Del
ay P
RO
T A
LG
B
Fig. 6 Difference between the day of the biomass peak of copepods,
COP (a) or protozoans, PROT (b) and phytoplankton, ALG, in
relation to the Q10 value of protozoans assuming a Q10 of 2 (solid),
4 (dashed) or 6 (dotted line) for copepods at D6 �C
Table 4 continued
Day of the year (DOY)
46 53 60 67 74 81 88 95
Gyrodinium cf. spirale 0.28 0.33 0.02 0.05 0.00 0.00 0.00 0.00
Gymnodinium spp. 0.09 0.25 0.59 0.19 0.01 0.00 0.00 0.00
Tintinnids 0.12 0.12 0.00 0.00 0.00 0.00 0.00 0.00
Euplotes sp. 0.00 0.00 0.00 0.00 0.00 0.00 0.00 0.00
D0 �C: 49 %
Myrionecta rubra 0.00 0.02 0.00 0.00 0.00 0.00 0.00 0.00
Lohmaniella oviformis 0.00 0.24 3.83 18.78 21.39 14.10 1.21 0.01
Protoperidinium bipes 0.00 0.00 0.12 0.83 2.43 9.49 9.50 6.64
Protoperidinium sp. 0.45 0.48 0.20 0.22 0.11 0.00 0.00 0.00
Rimostrombidium sp. 0.00 0.00 0.00 0.00 0.50 0.55 0.05 0.02
Gyrodinium cf. spirale 0.23 0.21 0.10 0.12 0.00 0.00 0.00 0.00
Gymnodinium spp. 0.10 0.06 0.10 0.22 0.03 0.00 0.00 0.00
Tintinnids 0.00 0.08 0.00 0.00 0.00 0.00 0.00 0.00
Euplotes sp. 0.00 0.00 0.00 0.00 0.00 0.00 0.00 0.00
Mar Biol
123
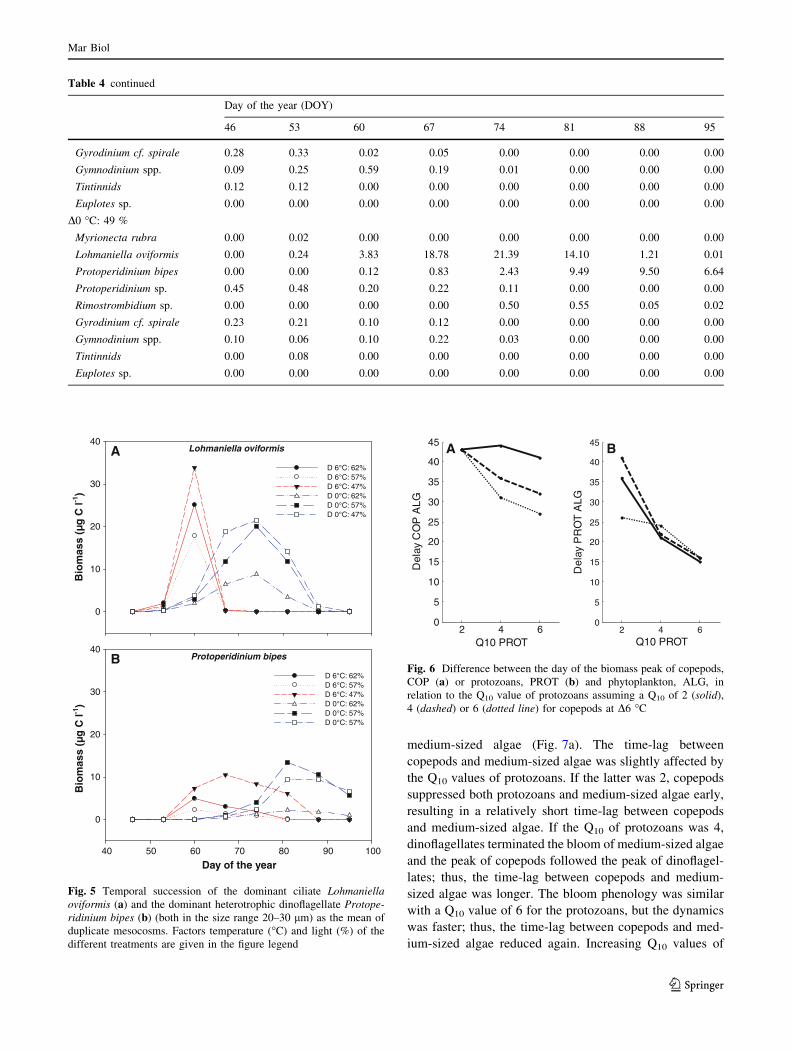
protozoans decreased the time-lag between dinoflagellates
and medium-sized algae, irrespective of the Q10 values of
copepods (Fig. 7b). Increasing Q10 values of protozoans
decreased the time-lag between ciliates and small phyto-
plankton only if we assumed a lower or equal Q10 value for
copepods than for protozoans (Fig. 7c). If the Q10 value of
copepods was higher, they suppressed protozoans early,
thus releasing small phytoplankton from ciliate grazing.
Thus, small phytoplankton developed a bloom after the
peaks of the grazers and of medium-sized algae, result-
ing in a ‘negative’ time-lag between them and ciliates
(Fig. 7c).
Discussion
Acceleration of microzooplankton growth and species
turnover with warming
Microzooplankton communities usually show a rapid
numerical response to increasing food supply. Next to food
availability, temperature is considered as a major control-
ling factor of microzooplankton (Weisse and Montagnes
1998; Rose and Caron 2007), especially during the spring
succession of plankton (Johansson et al. 2004; Rose et al.
2009). In our mesocosm study, warming resulted in an
earlier timing (Dmax, D25, D50 and D75) and higher growth
rates of microzooplankton. Observations of an earlier
timing of microzooplankton are similar to a previous
mesocosm study on the effects of warming on spring
microzooplankton communities (Aberle et al. 2007). Both
an earlier timing and higher growth rates of microzoo-
plankton are an expected phenomenon since the metabo-
lism and production of microzooplankton is known to
increase with increasing temperature (Montagnes et al.
2003; Rose and Caron 2007). In contrast to an earlier
timing, peak magnitudes of Dmax were not significantly
affected by warming. While this is supported by findings of
Berger et al. (2010), it contrasts other experimental studies
where peak magnitudes of spring microzooplankton were
found to increase with warming (Aberle et al. 2007; Rose
et al. 2009). While warming accelerated growth rates, this
does not necessarily translate into a higher carrying
capacity of microzooplankton which depends on resource
availability. Only if a more efficient conversion of food
into microzooplankton production had happened, higher
peak magnitudes could be expected. As stated by Rose
et al. (2009), the combination of both direct temperature
effects and indirect bottom-up (due to changes in phyto-
plankton abundance and community composition) and
top-down effects (due to grazer-induced phytoplankton
community changes) affects microzooplankton dynamics
thus pointing at the counteracting factors, food availability,
grazing, and temperature in affecting microzooplankton in
our mesocosms.
Furthermore, warming induced shifts in microzoo-
plankton phenology resulting from a more rapid turnover
of microzooplankton species. Such reduced time frames of
microzooplankton were, for example, observed for ciliates
where the dominance of L. oviformis lasted for only 1 week
in the warm mesocosms while it dominated the cold mes-
ocosms for 3 weeks. Shifts in the temporal occurrence of
microzooplankton with warming have been scarcely
investigated so far (Aberle et al. 2007; Rose et al. 2009).
However, a faster species turnover at higher temperatures
was shown for one-trophic level microalgal communities
where its implications on community stability depended on
the functional composition of the community (Hillebrand
et al. 2011). In a multitrophic community, as the one
studied here, it is even more complex to evaluate the
consequences of faster species turnover. But it seems likely
that a reduced temporal occurrence of microzooplankton
might affect consumers’ condition and reproductive suc-
cess by increasing the probability of a temporal mismatch
between microzooplankton, copepods, meroplanktonic
larvae and fish larvae (Lasker 1981; Stoecker and Capuzzo
1990; Turner and Graneli 1992; Malzahn and Boersma
2009; Loeder et al. 2011).
Overall, our findings that warming accelerates micro-
zooplankton growth and species turnover confirm hypoth-
esis 1 of the present study and support predictions that
microzooplankton might become a beneficiary of global
warming.
2 4 60
5
10
15
20
25
30
35
40
45
Q10
PROT
Del
ay C
OP
MA
A
2 4 60
5
10
15
20
25
30
35
40
45
Q10
PROT
Del
ay D
IN M
A
B
2 4 6-30
-25
-20
-15
-10
-5
0
5
10
15
20
Q10
PROT
Del
ay C
IL S
A
C
Fig. 7 Difference between the day of the biomass peak of copepods,
COP (a) or dinoflagellates, DIN (b) and medium-sized algae, MA,
and between ciliates, CIL and small-sized algae, SA (c) in relation to
the Q10 value of protozoans, PROT, assuming a Q10 of 2 (solid), 4
(dashed) or 6 (dotted line) for copepods at D6 �C. Please note the
different scale of the y axis used in c
Mar Biol
123

Reduced time-lags between autotrophs
and heterotrophs in plankton communities:
effects of warming and light availability
While warming accelerated Dmax of microzooplankton by
2.5 days per �C, phytoplankton peaks showed only an
acceleration of 1 day �C-1 (Lewandowska and Sommer
2010). This resulted in almost synchronous biomass peaks
of phytoplankton and microzooplankton in the warm
mesocosms while the time-lag in the colder mesocosms
was on average 10 days. The observed patterns of a
stronger thermal response of heterotrophic protists over
autotrophic ones confirm our hypothesis 2. As stated by the
MTE (Brown et al. 2004), the different temperature
dependencies of autotrophic and heterotrophic processes
result from different metabolic activation energies. Con-
trary to previous studies where a mismatch between pre-
dators and their prey was observed under warming
conditions (Durant et al. 2007; Thackeray et al. 2010), the
reduced time-lags between microzooplankton and auto-
trophic prey items resulted in an enhanced match situation
for microzooplankton in our mesocosms.
One fundamental prerequisite for the development of
phytoplankton spring blooms in temperate waters is,
however, a delayed response of microzooplankton during
winter–spring transition when growth of heterotrophs is
restricted by low temperatures and phytoplankton growth
exceeds grazing losses (Rose and Caron 2007). Then, a
‘loophole’ sensu Irigoien et al. (2005) opens thus enabling
phytoplankton to form blooms. In light of a winter warm-
ing scenario for Northern-Central Europe (IPCC 2007), the
combined effects of such an earlier timing of microzoo-
plankton and reduced time-lags between autotrophs and
heterotrophs might cause fundamental imbalances between
growth and removal of phytoplankton thus affecting phy-
toplankton bloom dynamics (Wiltshire et al. 2008) and
composition (Keller et al. 1999; Sommer and Lengfellner
2008).
Hypothesis 2 was also supported by our model results,
which consistently predicted reduced time-lags between
phytoplankton and its grazers with warming, especially
when assuming high temperature sensitivity for the latter.
A mismatch between primary producers and grazers
depended on the dietary overlap between the two grazer
groups and on their relative temperature sensitivities. It
only occurred when temperature sensitivity of secondary
consumers was higher than that of primary consumers. This
assumption seems unrealistic for plankton.
Next to temperature, the factor light might alter the
timing and biomass of phytoplankton and microzooplank-
ton, since, for example, higher light intensities were shown
to increase peak biomass of primary producers thus
enhancing consumers’ production due to enhanced food
availability (Diehl et al. 2002; Tirok and Gaedke 2007). In
our study, neither the timing nor the peak magnitudes of
microzooplankton were affected by light, a pattern which
was most likely related to the rather narrow range of light
intensities applied. Due to the fact that all three treatments
must be categorized as rather ‘high light’, our conclusions
might have to be modified for strongly light limiting
conditions.
Top-down bloom control by microzooplankton
and trophic interactions with mesozooplankton
The breakdown of a phytoplankton bloom can be attributed
to an enhanced sedimentation as a result of nutrient
depletion or grazing. Most likely the combination of both
factors controlled the bloom in our mesocosms. The lower
peak biomass of medium-sized phytoplankton at D6 �C
might result from enhanced aggregation and thus sedi-
mentation of diatom cells (Piontek et al. 2009) as well as
from higher copepod densities and thus enhanced grazing
at elevated temperatures. In the case of small algae, grazing
was more likely to cause the breakdown of the bloom in the
warm mesocosms. Here, we observed almost synchronous
peaks of ciliates (dominated by L. oviformis) and small-
sized phytoplankton, the preferred food items of L. ovi-
formis (Jonsson 1986; Christaki et al. 1998). The reduced
time-lag between autotrophs and heterotrophs resulted in a
rapid depletion of small-sized phytoplankton followed by
an instantaneous microzooplankton decline thereafter. The
rapid overexploitation of food sources with warming points
at an enhanced top-down control of small-sized phyto-
plankton by microzooplankton thus confirming the first part
of hypothesis 3. In the second part, it was assumed that a
stronger depletion of phytoplankton by microzooplankton
with warming might enhance dietary competition with
mesozooplankton due to an increased depletion of their
common resource, that is, phytoplankton. Contrary to our
expectations, we observed constantly high copepod densi-
ties in the warm mesocosms throughout the experiment
while phytoplankton declined significantly. Thus, no direct
negative effect of decreasing phytoplankton biomass on
copepod densities was observed. Therefore, there was no
indication for an enhanced dietary competition for the same
resource between microzooplankton and copepods. This
might be attributable to the predominance of small ciliates
in the present study which prefer nano- and picophyto-
plankton (Jonsson 1986; Christaki et al. 1998). In contrast
to large ciliates, which consume medium-sized phyto-
plankton (Aberle et al. 2007), small ciliates do not compete
with copepods. The dominant copepods Temora sp.,
Acartia sp., and Centropages sp. in our mesocosms
(Lewandowska and Sommer 2010) are categorized as
omnivorous with the ability to catch motile heterotrophic
Mar Biol
123

prey efficiently (Turner and Graneli 1992; Vincent and
Hartmann 2001; Loeder et al. 2011). At times when
microzooplankton occurred at high densities, the strategy
of copepods to switch from suspension feeding to capturing
motile prey might result in a twofold benefit for the con-
sumers. First, it enables the exploitation of an additional,
high quality food source which compensates stoichiometric
imbalances at the primary producer level thus functioning
as a trophic upgrader (Malzahn et al. 2010). Second, pre-
dation on microzooplankton by copepods suppresses a
dietary competitor. Additional support for this assumption
was generated by our models. These showed that small
phytoplankton was only released from grazing by ciliates
when an enhanced top-down control of microzooplankton
by copepods occurred and that the suppression of ciliates
was intensified with increasing Q10 of the copepods. Thus,
warming enhanced the top-down control of microzoo-
plankton by copepods rather than enhancing dietary com-
petition between micro- and mesozooplankton as initially
hypothesized.
So far, most studies investigating the impact of climate
warming on pelagic food webs focused on mesozoo-
plankton (Edwards and Richardson 2004; Winder and
Schindler 2004). The present study points at the necessity
to consider both micro- and mesozooplankton grazers when
addressing match–mismatch situations in the pelagic realm.
Future implications
Our findings stress the relevance of the factors temperature
combined with food supply and predation in altering phy-
toplankton–microzooplankton–mesoplankton interactions
in the plankton (e.g., shifts in timing, species turnover, and
time-lags). The present study adds to the current knowl-
edge on warming-induced changes in the plankton by
stressing the relevance of microzooplankton as a trophic
intermediary and as key players regarding temperature
sensitivity. Phenological changes and potential asynchro-
nies between consumers and their prey in plankton com-
munities were addressed in light of future climate change
scenarios. Our findings suggest that indirect warming
effects via enhanced microzooplankton grazing will not
only alter phytoplankton bloom dynamics but might have
major implications for the cycling of matter and energy
through the microbial and traditional food webs with far
reaching consequences for higher trophic levels, for
example, fish stocks.
Acknowledgments This project was funded by the priority pro-
gramme 1162 ‘AQUASHIFT’ of the German Research Foundation
(DFG). The authors thank T. Hansen, C. Meyer, and H. Tomanetz for
technical support. Colleagues from the AWI Food Web Project are
thanked for fruitful discussions and A.M. Malzahn for comments on
earlier versions of the manuscript.
References
Aberle N, Lengfellner K, Sommer U (2007) Spring bloom succession,
grazing impact and herbivore selectivity of ciliate communities
in response to winter warming. Oecologia 150:668–681
Berger SA, Diehl S, Stibor H, Trommer G, Ruhenstroth M (2010)
Water temperature and stratification depth independently shift
cardinal events during plankton spring succession. Global
Change Biol 16:1954–1965
Brock TD (1981) Calculating solar radiation for ecological studies.
Ecol Modell 14:1–19
Brown JH, Gillooly JF, Allen AP, Savage VM, West GB (2004)
Toward a metabolic theory of ecology. Ecology 85:1771–1789
Calbet A (2008) The trophic roles of microzooplankton in marine
systems. ICES J Mar Sci 65:325–331
Castellani C, Irigoien X, Harris RP, Lampitt RS (2005) Feeding and
egg production of Oithona similis in the North Atlantic. Mar
Ecol Prog Ser 288:173–182
Christaki U, Dolan JR, Pelegri S, Rassoulzadegan F (1998)
Consumption of picoplankton-size particles by marine ciliates:
effects of physiological state of the ciliate and particle quality.
Limnol Oceanogr 43:458–464
Davis CS (1984) Predatory control of copepod seasonal cycles on
Georges Bank. Mar Biol 82:31–40
Diehl S, Berger S, Ptacnik R, Wild A (2002) Phytoplankton, light, and
nutrients in a gradient of mixing depths: field experiments.
Ecology 83:399–411
Durant JM, Hjermann DO, Ottersen G, Stenseth NC (2007) Climate
and the match or mismatch between predator requirements and
resource availability. Clim Res 33:271–283
Edwards M, Richardson AJ (2004) Impact of climate change on marine
pelagic phenology and trophic mismatch. Nature 430:881–884
Foissner W, Berger H, Kohmann F (1991, 1992, 1994, 1995)
Taxonomische und okologische revision der Ciliaten des Sap-
robiensystems Band I–IV, vol, Informationsberichte Bayerisches
Landesamt fur Wasserwirtschaft, Munchen
Gaedke U, Rubenstroth-Bauer M, Wiegand I, Tirok K, Aberle N,
Breithaupt P, Lengfellner K, Wohlers J, Sommer U (2010) Biotic
interactions may overrule direct climate effects on spring
phytoplankton dynamics. Global Change Biology 16:1122–1136
Hillebrand H, Duerselen C-D, Kirschtel D, Pollingher U, Zohary T
(1999) Biovolume calculation for pelagic and benthic microal-
gae. J Phycol 35:403–424
Hillebrand H, Burgmer T, Biermann E (2011) Running to stand still:
temperature effects on species richness, species turnover, and
functional community dynamics. Mar Biol. doi:10.1007/s00227-
011-1827-z
IPCC (2007) Climate change 2007: the physical science basis.
Contribution of working group I to the fourth assessment report
of the intergovernmental panel on climate change. Cambridge
Irigoien X, Flynn KJ, Harris RP (2005) Phytoplankton blooms: a
‘loophole’ in microzooplankton grazing impact? J Plankton Res
27:313–321
Isla JA, Lengfellner K, Sommer U (2008) Physiological response of
the copepod Pseudocalanus sp in the Baltic Sea at different
thermal scenarios. Global Change Biol 14:895–906
Johansson M, Gorokhova E, Larsson U (2004) Annual variability in
ciliate community structure, potential prey and predators in the
open northern Baltic Sea proper. J Plankton Res 26:67–80
Jonsson PR (1986) Particle size selection, feeding rates and growth
dynamics of marine planktonic oligotrichous ciliates (Cilioph-
ora: Oligotrichina). Mar Ecol Prog Ser 33:265–277
Kahl A (1932) Urtiere oder Protozoa I. Wimpertiere oder Ciliata
(Infusoria). In: Dahl F (ed) Tierwelt Deutschlands und der
angrenzenden Meeresteile, vol 18, pp 1–886
Mar Biol
123
Keller AA, Oviatt CA, Walker HA, Hawk JD (1999) Predicted
impacts of elevated temperature on the magnitude of the winter-
spring phytoplankton bloom in temperate coastal waters: a
mesocosm study. Limnol Oceanogr 44:344–356
Landry MR (1983) The development of marine calanoid copepods
with comment on the isochronal rule. Limnol Oceanogr 28:614–
624
Landry MR, Calbet A (2004) Microzooplankton production in the
oceans. ICES J Mar Sci 61:501–507
Lasker R (1981) The role of a stable ocean in larval fish survival and
subsequent recruitment. In: Lasker R (ed) Marine fish larvae.
University of Washington press, Seattle, pp 80–88
Leandro SM, Tiselius P, Queiroga H (2006) Growth and development
of nauplii and copepodites of the estuarine copepod Acartiatonsa from southern Europe (Ria de Aveiro, Portugal) under
saturating food conditions. Mar Biol 150:121–129
Lewandowska A, Sommer U (2010) Climate change and the spring
bloom: a mesocosm study on the influence of light and
temperature on phytoplankton and mesozooplankton. Mar Ecol
Prog Ser 405:101–111
Loeder M, Meunier C, Wiltshire KH, Boersma M, Aberle N (2011)
The role of ciliates, heterotrophic dinoflagellates and copepods
in structuring spring phytoplankton communities at Helgoland
Roads, North Sea. Mar Biol 158(7):1551–1580
Lopez-Urrutia A (2008) The metabolic theory of ecology and algal
bloom formation. Limnol Oceanogr 53:2046–2047
Malzahn AM, Boersma M (2009) Trophic flexibility in larvae of two
fish species (lesser sandeel, Ammodytes marinus and dab,
Limanda limanda). Sci Mar 73:131–139
Malzahn AM, Hantzsche F, Schoo KL, Boersma M, Aberle N (2010)
Differential effects of nutrient-limited primary production on
primary, secondary or tertiary consumers. Oecologia 162:35–48
McGowan JA, Bograd SJ, Lynn RJ, Miller AJ (2003) The biological
response to the 1977 regime shift in the California Current. Deep
Sea Res II 50:2567–2582
Menden-Deuer S, Lessard EJ (2000) Carbon to volume relationships
for dinoflagellates, diatoms, and other protist plankton. Limnol
Oceanogr 45:569–579
Montagnes DJS, Kimmance SA, Atkinson D (2003) Using Q10: can
growth rates increase linearly with temperature? Aquat Microb
Ecol 32:307–313
Nielsen TG, Kiorboe T (1994) Regulation of zooplankton biomass
and production in a temperate, coastal ecosystem.2. Ciliates.
Limnol Oceanogr 39:508–519
Paffenhofer GA, Harris RP (1976) Feeding, growth and reproduction
of marine planktonic copepod Pseudocalanus elongatus (Boeck).
J Mar Biol Ass UK 56:327–344
Piontek J, Handel N, Langer G, Wohlers J, Riebesell U, Engel A
(2009) Effects of rising temperature on the formation and
microbial degradation of marine diatom aggregates. Aquat
Microb Ecol 54:305–318
Putt M, Stoecker DK (1989) An experimentally determined car-
bon:volume ratio for marine ‘‘oligotrichous’’ ciliates from
estuarine and coastal waters. Limnol Oceanogr 34:1097–1103
Rose JM, Caron DA (2007) Does low temperature constrain the
growth rates of heterotrophic protists? Evidence and implications
for algal blooms in cold waters. Limnol Oceanogr 52:886–895
Rose JM, Feng YY, Gobler CJ, Gutierrez R, Hare CE, Leblanc K,
Hutchins DA (2009) Effects of increased pCO(2) and temper-
ature on the North Atlantic spring bloom. II. Microzooplankton
abundance and grazing. Mar Ecol Prog Ser 388:27–40
Rosenzweig ML, MacArthur RH (1963) Graphical representation and
stability conditions of predator-prey ineractions. Am Nat 97:209–
223
Scott FJE (2005) Antarctic marine protists, vol ABRS. Canberra,
Australia, p 563
Smol JP, Wolfe AP, Birks HJB, Douglas MSV, Jones VJ, Korhola A,
Pienitz R, Ruhland K, Sorvari S, Antoniades D, Brooks SJ, Fallu
MA, Hughes M, Keatley BE, Laing TE, Michelutti N, Nazarova
L, Nyman M, Paterson AM, Perren B, Quinlan R, Rautio M,
Saulnier-Talbot E, Siitoneni S, Solovieva N, Weckstrom J
(2005) Climate-driven regime shifts in the biological commu-
nities of arctic lakes. Proc Nat Acad Sci 102:4397–4402
Sommer U, Lengfellner K (2008) Climate change and the timing,
magnitude, and composition of the phytoplankton spring bloom.
Global Change Biol 14:1199–1208
Sommer U, Hansen T, Blum O, Holzner N, Vadstein O, Stibor H
(2005) Copepod and microzooplankton grazing in mesocosms
fertilised with different Si:N ratios: no overlap between food
spectra and Si:N influence on zooplankton trophic level.
Oecologia 142:274–283
Stoecker DK, Capuzzo JM (1990) Predation on protozoa: its
importance to zooplankton. J Plankton Res 12:891–908
Straile D, Adrian R (2000) The North Atlantic oscillation and
plankton dynamics in two European lakes—two variations on a
general theme. Global Change Biol 6:663–670
Struder-Kypke MC, Kypke ER, Agatha S, Warwick J, Montagnes
DJS (2002) Guide to UK coastal planktonic ciliates. http://
www.liv.ac.uk/ciliate/site/index.htm
Thackeray SJ, Jones ID, Maberly SC (2008) Long-term change in the
phenology of spring phytoplankton: species-specific responses to
nutrient enrichment and climatic change. J Ecol 96:523–535
Thackeray SJ, Sparks TH, Frederiksen M, Burthe S, Bacon PJ, Bell
JR, Botham MS, Brereton TM, Bright PW, Carvalho L, Clutton-
Brock T, Dawson A, Edwards M, Elliott JM, Harrington R,
Johns D, Jones ID, Jones JT, Leech DI, Roy DB, Scott WA,
Smith M, Smithers RJ, Winfield IJ, Wanless S (2010) Trophic
level asynchrony in rates of phenological change for marine,
freshwater and terrestrial environments. Global Change Biol
16:3304–3313
Tirok K, Gaedke U (2007) Regulation of planktonic ciliate dynamics
and functional composition during spring in Lake Constance.
Aquat Microb Ecol 49:87–100
Tomas CRE (1996) Identifying marine diatoms and dinoflagellates.
Academic Press, Inc., San Diego, p 598
Turner JT, Graneli E (1992) Zooplankton feeding ecology—grazing
during enclosure studies of phytoplankton blooms from the
West-Coast of Sweden. J Exp Mar Biol Ecol 157:19–31
Utermohl H (1958) Zur Vervollkommnung der quantitativen Phyto-
plankton-Methodik. Mitt Int Ver Limnol 9:1–38
Vincent D, Hartmann HJ (2001) Contribution of ciliated micropro-
tozoans and dinoflagellates to the diet of three copepod species
in the Bay of Biscay. Hydrobiologia 443:193–204
Walther G-R (2010) Community and ecosystem responses to recent
climate change. Philos Trans R Soc B 365:2019–2024
Weisse T, Montagnes DJS (1998) Effect of temperature on inter- and
intraspecific isolates of Urotricha (Prostomatida, Ciliophora).
Aquat Microb Ecol 15:285–291
Wiltshire KH, Manly BFJ (2004) The warming trend at Helgoland
Roads, North Sea: phytoplankton response. Helgol Mar Res
58:269–273
Wiltshire KH, Malzahn AM, Wirtz K, Greve W, Janisch S,
Mangelsdorf P, Manly BFJ, Boersma M (2008) Resilience of
North Sea phytoplankton spring bloom dynamics: an analysis of
long-term data at Helgoland Roads. Limnol Oceanogr 53:1294–
1302
Winder M, Schindler DE (2004) Climatic effects on the phenology of
lake processes. Global Change Biol 10:1844–1856
Mar Biol
123