Warm mixture trial experience after 5 years - C. Plug
14
Research & Development – Conference Papers C.P. Plug and A.H. de Bondt WARM ASPHALT MIXTURE TRIAL EXPERIENCE AFTER 5 YEARS prepared for 8 th International conference on: sustainable aggregates, asphalt technology and pavement engineering Liverpool, United Kingdom February 2009 P.O. Box 1 Phone +31 229 547700 1633 ZG Avenhorn Fax +31 229 547701 The Netherlands www.ooms.nl/research
-
Upload
independent -
Category
Documents
-
view
0 -
download
0
Transcript of Warm mixture trial experience after 5 years - C. Plug

Research & Development – Conference Papers
C.P. Plug and A.H. de Bondt
WARM ASPHALT MIXTURE TRIAL EXPERIENCE AFTER 5 YEARS
prepared for
8th International conference on: sustainable aggregates, asphalt technology and pavement engineering
Liverpool, United Kingdom
February 2009
P.O. Box 1 Phone +31 229 547700 1633 ZG Avenhorn Fax +31 229 547701 The Netherlands www.ooms.nl/research

Warm asphalt mixture trial experience after 5 years
C.P. Plug, Ooms Nederland Holding bv, P.O. box 1, 1633 ZG Avenhorn, The Netherlands, tel: +31229547700, fax: +31229547701, email: [email protected]
A.H. de Bondt, Ooms Nederland Holding bv, P.O. box 1, 1633 ZG Avenhorn, The Netherlands, tel: +31229547700, fax: +31229547701, email: [email protected]
Abstract
In order to get insight into foamed asphalt mixtures in the Netherlands, different trials have been performed according to the WAM-Foam® process. This process consist of two stages. First, the aggregate is mixed with a soft bitumen and after this with a hard bitumen in the form of a foam. The combination of these two steps have to result in a warm asphalt mixture with the same mechanical qualities as a traditional hot mix asphalt mixture. Trial sections were constructed consisting of a wearing course as well as a base course asphalt mixture. Different combinations of bitumen were used in the trial sections, including a polymer modified binder. Furthermore, the foamed bitumen process was used in combination with recycled asphalt. During the construction of the sections the degree of compaction after lay down and rolling was monitored extensively.
Mechanical properties of the trials were compared with reference standard hot mix asphalt. Therefore cores were drilled from the different sections and tested on durability and resistance against rutting and cracking. Furthermore, layer interface shear testing as well as potential curing have been examined.
The tests indicate that there was no significant difference between the foamed mixtures and the conventional standard hot mix asphalt mixtures. Also, the properties found after 5 years in use suggest no significant difference between the mixtures.
Keywords: foamed asphalt mixture, recycled asphalt mixture, polymer modified binder, mechanical properties

1. Introduction WAM-Foam stands for Warm Asphalt Mix made with foamed bitumen1 (Larsen et al, 2004). By using this process, the mixing temperatures in the asphalt mixing plant can be lower than with the usage of a traditional hot mix asphalt plant. The advantage of this process is, that asphalt can be produced with a lower energy consumption than hot mix asphalt. Also the laying process can be performed at reduced temperatures, which reduces traffic disruptions (time needed for road closure). Furthermore, plant related ageing will be reduced, which implies an increased lifetime of the pavement (Prowell and Hurley, 2004). The WAM-Foam process consist of two stages. First, the aggregate is mixed with a soft bitumen and after this with a hard bitumen in the form of a foam. The combination of these two steps have to result in a warm asphalt mixture with the same qualities as a traditional hot mix asphalt mixture. In this paper different WAM-Foam production and lay down trials are described with different types of bitumen and asphalt mixtures, including a 3% SBS polymer modified binder. Furthermore, a production and lay down trial is presented of a warm asphalt mixture using foamed bitumen in combination with recycled asphalt. The mechanical properties of the different trial sections are compared with reference standard hot mix asphalt. Therefore cores were drilled from the different trial sections and tested on durability and resistance against rutting and cracking. Also shear testing of interfaces between layers as well as potential curing have been examined. At last, the trial sections are discussed after 5 years in usage. 2. Trial sections
For the trial sections, standard Dutch asphalt mixtures were used. Only the bitumen has been (partially) replaced by foamed bitumen. Details of the constructed pavements are described in the next sections. 2.1 WAM-Foam trial In October 2003, at two different locations trial sections were constructed of respectively 3500 m2 and 1000 m2, with compositions for so-called traffic class 3 (intensive traffic; according to the Dutch standard) on top of a hot mix asphalt foundation. The quantities of asphalt used for each base course mixture (STAB 0/16) was approximately 130 tons (layer thickness 50 mm) and for each wearing course mixture (dense AC 0/11) 120 tons (layer thickness 35 mm). The different layers were constructed on two consecutive days and between each layer a tack coat (0.3 kg/m2 emulsion with 55% bitumen) was applied. As noted before, the WAM-Foam mixture consist of two types of bitumen. The ratio between these soft and hard bitumen was calculated with the ‘penetration rule’ (A*log Pena + B*log Penb = (A+B)*log Penab), to get approximately the same penetration as a
1 This product is manufactured in accordance with Kolo Veidekke and Shell WAM bitumen technology
licensed from Shell Research Limited.

bitumen for standard hot mix asphalt. In case of the polymer modified bitumen (SFB 3-100) the same bitumen was used for both steps. Details of bitumen used for each section can be found in tables 1 and 2.
Table 1: Constructed base course mixtures.
Asphalt section Bitumen HMA Fina B40/60
V6000 + B35/50 Shell V6000 + Fina B35/50 foam B200 + B35/50 Veba B200 + Fina B35/50 foam
SFB 3-100 Sealoflex SFB 3-100 bitumen and foam
Recycled + HMA Fina B70/100
Recycled + foam Fina B70/100 foam
Table 2: Constructed dense wearing course mixtures. Asphalt section Bitumen
HMA Fina B70/100 V6000 + B35/50 Shell V6000 + Fina B35/50 foam B200 + B40/60 Veba B200 + Fina B40/60 foam
SFB 3-100 Sealoflex SFB 3-100 bitumen and foam Recycled + HMA Fina B70/100 Recycled + foam Fina B70/100 foam
2.2 Foamed asphalt with recycling trial These trials were no part of the Shell WAM-Foam licence and therefore mentioned separately. These sections of in total 850 m2 consist of a recycled asphalt pavement structure for traffic class 3 on top of a hot asphalt base layer with also the usage of recycled asphalt. They were constructed in April 2004. The quantities of asphalt used for each base course mixture (STAB 0/16 with 50% recycled asphalt) was approximately 54 tons (layer thickness 50 mm) and for each wearing course mixture (dense AC 0/16 with 30% recycled asphalt) 45 tons (layer thickness 40 mm). For the recycled warm asphalt mixtures, the new bitumen was replaced by a foamed version of the bitumen used in the standard process (Fina B70/100). Furthermore, the different layers were constructed on two consecutive days and between each layer a tack coat was applied.

100
120
140
160
180
HM
A
V60
00+
foam
B20
0 + fo
am
SFB 3
-100
Recy
cled
+ H
MA
Recy
cled
+ fo
am
Pro
du
cti
on
tem
pera
ture
[ºC
]
0
10
20
30
40
50
60
70
Mix
ing
tim
e [
s]
Base course Wearing course Mixing time
3. Production and lay down
The asphalt was mixed at the asphalt plant in Schagen (situated in the north-west of the Netherlands). The trial sections were located in the near distance of this plant (respectively 8 km and 16 km for the recycled warm asphalt mixtures and the polymer modified warm asphalt mixture). 3.1 Production
The asphalt was mixed in batches of approximately 3.5 tons. For the V6000 and B200 WAM-Foam mixtures the recommended mixing temperature (Moen, Ø; 2003) was used (120ºC). For the SFB 3-100 foamed mixture a higher mixing temperature (140ºC) was used, in order to compensate for the higher viscosity of the used bitumen. The mixing temperature of the recycled foam asphalt mixture was set at 130ºC.
Figure 1: Production temperature and mixing time of asphalt mixtures.
Due to technical reasons (constraints), the mixing time of the WAM-Foam mixtures was longer than the mixing time of the standard hot mix asphalt (depending on the used amount of foamed bitumen). In order to get an economic advantage of the WAM-Foam asphalt, the mixing times of these mixtures have to be similar to the ones for the standard hot mix asphalt mixtures.

86
88
90
92
94
96
98
100
Behind
paving
machine
1st
rolling
2nd
rolling
3rd
rolling
4th
rolling
5th
rolling
end
deg
ree o
f co
mp
acti
on
[%
]
HMA
V6000 + B35/50
B200 + B40/60
SFB 3-100
Recycled + HMA
Recycled + foam
86
88
90
92
94
96
98
100
Behind
paving
machine
1st
rolling
2nd
rolling
3rd
rolling
4th
rolling
5th
rolling
end
deg
ree o
f co
mp
acti
on
[%
]
HMA
V6000 + B35/50
B200 + B35/50
SFB 3-100
Recycled + HMA
Recycled + foam
3.2 Quality control during lay down of trial sections
The degree of compaction after lay down and rolling was determined for each layer and section. The results can be found in figure 2 (base course) and 3 (wearing course).
Figure 2: Degree of compaction after rolling for the base course.
Figure 3: Degree of compaction after rolling for the wearing course. The compaction of foamed mixtures behind the paving machine (screed) is in most cases lower than the hot mix asphalt reference. However, especially the foamed base course mixtures could be compacted more easily by the rollers themselves. Due to irregularities in the volumetric composition, there are differences in the end compaction of the dense course mixtures. Especially, the B200 + B 40/60 mixture showed to be overfilled by bitumen at the pavement surface. Overall, it can be stated that the end compaction of the WAM-Foam asphalt mixtures and the recycled foamed mixtures were comparable with the reference mixtures.

4. Mechanical properties
The mechanical properties of the (WAM)-Foam asphalt mixtures were compared with the reference (recycled) asphalt mixture. To enable this, cores were drilled from the different trial sections and tested just after lay down and after a longer period (more than 2 weeks). 4.1 Short term behaviour
One day after construction of the test sections, static compression tests were performed on the base course cores (Ø100 mm) with the use of a servo-hydraulic actuator at room temperature (20ºC) with a displacement rate of 0.085 mm/s. The results can be found in table 2. Due to practical reasons the SFB 3-100 sections were not tested.
Table 2: Compression test on Ø 100 mm drilled cores (base course).
Asphalt Strength [MPa] Strain at failure [%] Air voids [%] HMA 10.7 2.6 4.2
V6000 + B35/50 10.2 2.7 4.7 B200 + B35/50 7.6 4.0 5.3 HMA + recycled 5.8 3.2 7.4 Recycled + foam 6.3 2.4 7.0
The compressive strength of the tested base course foamed mixtures is comparable with the hot asphalt (recycled) mixtures. Only the strength of B200 + B35/50 WAM-Foam mixture is lower than expected. Probably, this was caused by some differences in the volumetric compositions of this mixture. The indirect tensile strength test has been carried out on the dense graded wearing course cores (Ø100 mm) according to EN 12697-23 at a temperature of 0ºC. The results can be found in table 3.
Table 3: Indirect tensile test results on Ø 100 mm drilled cores (wearing course).
Asphalt Indirect tensile strength [MPa]
Toughness [N.mm/mm2]
Air voids [%]
HMA 3.4 7.1 5.2
V6000 + B35/50 3.3 8.1 5.6
B200 + B40/60 3.7 7.4 3.5 The indirect tensile results of the tested WAM-Foam mixtures, one day after construction, show no significant difference with the reference hot mix asphalt. From the results presented above, it can be concluded that curing is no issue for the studied foamed asphalt mixtures.
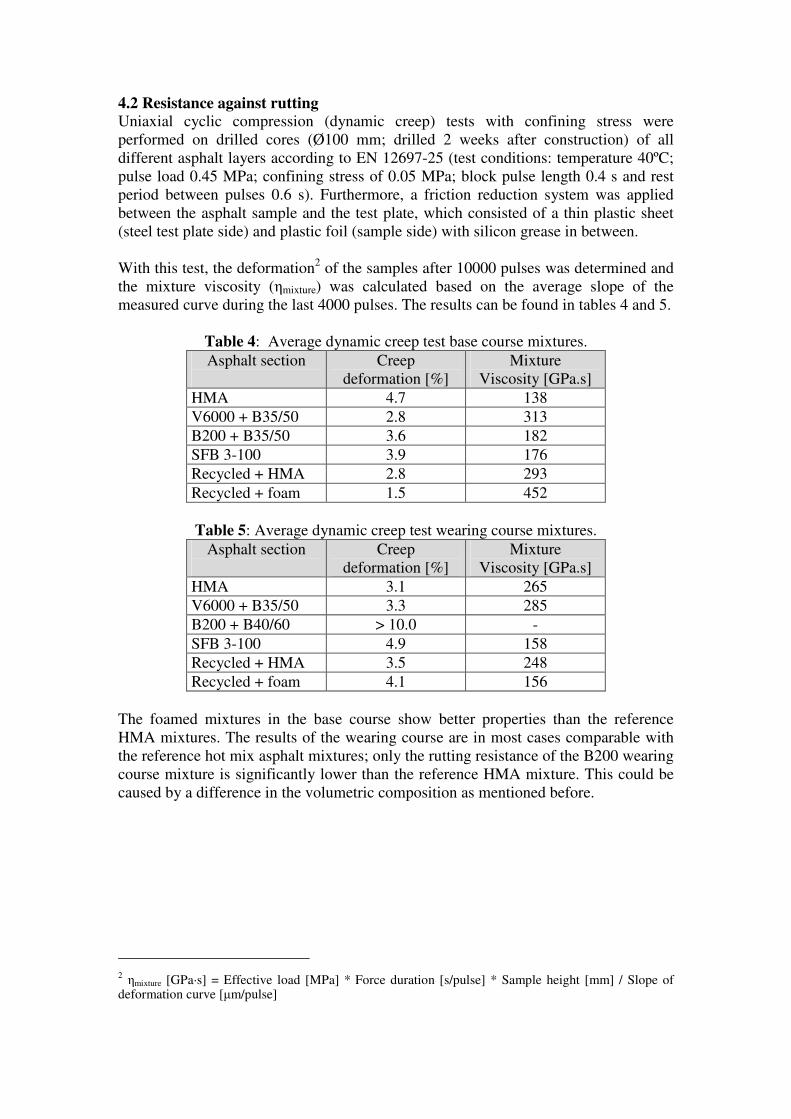
4.2 Resistance against rutting
Uniaxial cyclic compression (dynamic creep) tests with confining stress were performed on drilled cores (Ø100 mm; drilled 2 weeks after construction) of all different asphalt layers according to EN 12697-25 (test conditions: temperature 40ºC; pulse load 0.45 MPa; confining stress of 0.05 MPa; block pulse length 0.4 s and rest period between pulses 0.6 s). Furthermore, a friction reduction system was applied between the asphalt sample and the test plate, which consisted of a thin plastic sheet (steel test plate side) and plastic foil (sample side) with silicon grease in between. With this test, the deformation2 of the samples after 10000 pulses was determined and the mixture viscosity (�mixture) was calculated based on the average slope of the measured curve during the last 4000 pulses. The results can be found in tables 4 and 5.
Table 4: Average dynamic creep test base course mixtures.
Asphalt section
Creep deformation [%]
Mixture Viscosity [GPa.s]
HMA 4.7 138
V6000 + B35/50 2.8 313 B200 + B35/50 3.6 182 SFB 3-100 3.9 176 Recycled + HMA 2.8 293
Recycled + foam 1.5 452
Table 5: Average dynamic creep test wearing course mixtures. Asphalt section
Creep
deformation [%] Mixture
Viscosity [GPa.s] HMA 3.1 265 V6000 + B35/50 3.3 285 B200 + B40/60 > 10.0 -
SFB 3-100 4.9 158 Recycled + HMA 3.5 248 Recycled + foam 4.1 156
The foamed mixtures in the base course show better properties than the reference HMA mixtures. The results of the wearing course are in most cases comparable with the reference hot mix asphalt mixtures; only the rutting resistance of the B200 wearing course mixture is significantly lower than the reference HMA mixture. This could be caused by a difference in the volumetric composition as mentioned before.
2 �mixture [GPa·s] = Effective load [MPa] * Force duration [s/pulse] * Sample height [mm] / Slope of deformation curve [�m/pulse]
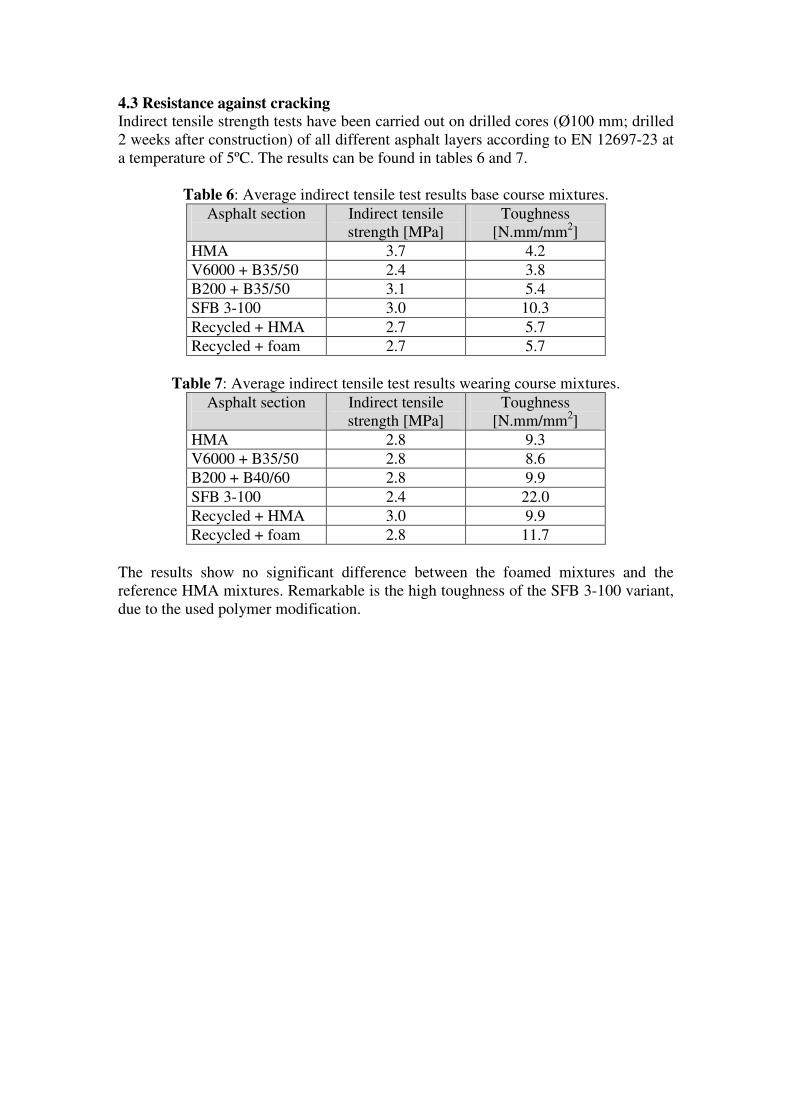
4.3 Resistance against cracking
Indirect tensile strength tests have been carried out on drilled cores (Ø100 mm; drilled 2 weeks after construction) of all different asphalt layers according to EN 12697-23 at a temperature of 5ºC. The results can be found in tables 6 and 7.
Table 6: Average indirect tensile test results base course mixtures.
Asphalt section
Indirect tensile strength [MPa]
Toughness [N.mm/mm2]
HMA 3.7 4.2 V6000 + B35/50 2.4 3.8
B200 + B35/50 3.1 5.4 SFB 3-100 3.0 10.3
Recycled + HMA 2.7 5.7 Recycled + foam 2.7 5.7
Table 7: Average indirect tensile test results wearing course mixtures.
Asphalt section
Indirect tensile strength [MPa]
Toughness [N.mm/mm2]
HMA 2.8 9.3 V6000 + B35/50 2.8 8.6 B200 + B40/60 2.8 9.9
SFB 3-100 2.4 22.0 Recycled + HMA 3.0 9.9 Recycled + foam 2.8 11.7
The results show no significant difference between the foamed mixtures and the reference HMA mixtures. Remarkable is the high toughness of the SFB 3-100 variant, due to the used polymer modification.

0
1
2
3
4
HM
A
V60
00+
B35
/50
B20
0+ B
40/60
SFB 3
-100
Recy
cled
+ H
MA
Recy
cled
+ fo
am
Str
en
gth
[M
Pa]
80
85
90
95
100
105
110T
SR
[%
]
Dry strength [MPa] Wet strength [MPa] TSR [%]
0
1
2
3
4
HM
A
V60
00+
B35
/50
B20
0+ B
35/50
SFB 3
-100
Recy
cled
+ H
MA
Recy
cled
+ fo
am
Str
en
gth
[M
Pa]
70
75
80
85
90
95
100
TS
R [
%]
Dry strength [MPa] Wet strength [MPa] TSR [%]
4.4 Durability
The drilled cores used for these tests were conditioned in a water bath at 40ºC during 72 hours according to EN 12697-12 (without vacuum). After this the indirect tensile strength tests have been carried out according to EN 12697-23 at a temperature of 5ºC. Due to the water immersion, the indirect tensile properties are expected to be lower than before conditioning. The ratio between ‘fresh’ and ‘retained’ is denoted as ITSR (indirect tensile strength ratio). The results can be found in figures 4 and 5.
Figure 4: Indirect tensile strength and ITSR for the base course.
Figure 5: Indirect tensile strength and ITSR for the wearing course. The results show no significant difference between the foamed mixtures and the reference hot mix asphalt mixtures. The ITSR is in most foamed cases even better.

4.5 Adhesion (bond) strength between asphalt layers
Interface shear tests were performed on drilled cores (Ø 150 mm) of the recycled asphalt section with the use of a servo-hydraulic actuator and the ‘Leutner’ device (photo 1). This at room temperature (20ºC) with a displacement rate of 0.85 mm/s. Table 8 shows the results.
Photo 1: Example of shear test with Leutner device.
Table 8: Interface bond strength between layers.
Layer interface Shear strength
[MPa]
Slip @ max. shear strength
[mm]
Shear energy @ 2 mm
[Nmm/mm2]
Shear stiffness @ 1 mm
[Nmm/mm2] HMA base - top 1.3 2.4 2.9 0.7 Foamed base - top 1.1 2.3 2.2 0.5
Support - HMA base 2.0 2.2 3.1 0.8 Sup. - foamed base 1.9 2.5 3.8 0.7 The bond strength between the recycled foamed asphalt layers is slightly lower than for the hot mix asphalt mixtures. This could be caused by the lower temperature of the foamed asphalt.

5. Evaluation
In October 2008, all the trial sections paved according to the WAM-Foam bitumen technology and the trial section with recycling asphalt using foamed bitumen were inspected. Furthermore, from the HMA, V6000 and B200 sections cores (Ø100 mm) were taken and tested on durability as described in section 4.4. 5.1 Visual inspection
The WAM-Foam locations are in use as storage areas for all kind of civil work construction materials. The different sections could still be recognized by some difference in color and a variation in gradation. There was some mechanical damage due to the heavy machines in all the sections (which could be expected given the usage). Furthermore, the conditions of all the sections looked similar. Photo 2: Overview trial section in October 2008 (V6000 + B35/50 foamed asphalt). The sections with recycling asphalt were also evaluated. These sections are also in use as storage area. Due to the heavy machines there is also mechanical damage. The recycling asphalt produced with the foam process looked similar as the part with conventional recycling asphalt. On both locations the construction joints of the foamed variants looked similar as with conventional hot mix asphalt. Photo 3: Section with recycling asphalt foam (left) and conventional (right).

0
1
2
3
4
HM
A
V60
00+
B35
/50
B20
0+ B
35/50
Str
en
gth
[M
Pa]
80
85
90
95
100
105
110
TS
R [
%]
Initial dry strength [MPa] Dry strength 5 years[MPa]
Wet strength 5 years [MPa] TSR 5 years [%]
0
1
2
3
4
HM
A
V60
00+
B35
/50
B20
0+ B
35/50
Str
en
gth
[M
Pa]
80
85
90
95
100
105
110
TS
R [
%]
Initial dry strength [MPa] Dry strength 5 years[MPa]
Wet strength 5 years [MPa] TSR 5 years [%]
5.2 Durability after 5 years
The drilled cores for these tests were treated and tested the same way as described in section 4.4. The ITSR values were calculated and compared with the initial ITSR just after construction. The results can be found in figures 6 and 7.
Figure 6: ITSR for the base course after 0 and 5 years.
Figure 7: ITSR for the wearing course after 0 and 5 years.
The results show no significant difference between the foamed mixtures and the reference hot mix asphalt mixtures. There is not much difference between the cores drilled after lay down and the cores drilled after 5 years.

6. Concluding remarks
With the WAM-Foam process, asphalt can be produced which is comparable in quality to a conventional hot mix asphalt. The achieved temperature reduction with the WAM-Foam process is also very promising in combination with the usage of a polymer modified binder. Normally, such binders require a much higher mixing temperature than conventional hot mix asphalt. Recycling asphalt using the foamed bitumen process can also be carried out without problems. After (almost) 5 years the trial sections perform without problems and no damage was visible. 7. Acknowledgement
The support of Carl Robertus from Shell Research Limited (at that time), Øyvind Moen from Kolo Veidekke and especially Burgard Koenders from Shell Global Solutions during these trials is highly acknowledged. 8. References
1. Larsen, O.R.; Moen, Ø.; Robertus C. and Koenders B.G.; ”WAM Foam asphalt production at lower operating temperatures as an environmental friendly alternative to HMA”; Eurasphalt & Eurobitume 2004, Vienna.
2. Prowell, B.D.; Hurley G.C.; “Evaluation of Warm Asphalt Technologies”; SEAUPG 2004 Conference; Baton Rouge.
3. Moen, Ø.; “WAM Foam technical information”; e-mail communication 2003.