The Tropical Warm Pool International Cloud Experiment
17
A comprehensive observing campaign in Darwin, including a ship, five aircraft, and frequent soundings, is furthering weather and climate change studies through improved understanding and modeling of cloud and aerosol processes in tropical cloud systems. A crucial factor in our ability to forecast future climate change is a better representation of tropical cloud systems, and their heating and radiative impacts in climate models (Stephens 2005; Del Genio and Kovari 2002; Neale and Slingo 2003; Spencer and Slingo 2003). This requires a better understanding of the factors that control tropical convection as well as an improved understanding of how the characteristics of the convection affect the nature of the cloud particles that are found in deep convective anvils and tropical cirrus. Deep convec- tion also lifts boundary layer air into the tropical tropopause layer (TTL), affecting the composition of this region and through it the global stratosphere (e.g., Russell et al. 1993; Folkins 2002). Understanding the transport of gases and particles in deep convec- tion is also therefore of global importance. As a response to this challenge, a major field experiment named the Tropical Warm Pool Interna- tional Cloud Experiment (TWP-ICE), including the U.K. Aerosol and Chemical Transport in Tropical Convection (ACTIVE) consortium, was undertaken in the Darwin, Northern Australia, area in January and February 2006. The experiment was designed to provide a comprehensive dataset for the develop- ment of cloud remote-sensing retrievals and initial- THE TROPICAL WARM POOL INTERNATIONAL CLOUD EXPERIMENT BY PETER T. MAY, JAMES H. MATHER, GERAINT V AUGHAN, CHRISTIAN JAKOB, GREG M. MCFARQUHAR, KEITH N. BOWER, AND GERALD G. MACE AFFILIATIONS: MAY—Centre for Australian Weather and Climate Research, Australian Bureau of Meteorology and CSIRO, Melbourne, Australia; JAKOB—School of Mathematical Sciences, Monash University, Clayton, Australia; MATHER—Pacific North- west National Laboratory, Richland, Washington; VAUGHAN AND BOWER—School of Earth, Atmospheric and Environmental Sciences, University of Manchester, Manchester, United Kingdom; MCFARQUHAR—Department of Atmospheric Sciences, University of Illinois at Urbana–Champaign Urbana, Illinois; MACE—Meteorology Department, University of Utah, Salt Lake City, Utah A supplement to this article is available online (DOI :10.1175/BAMS- 89-5-May) CORRESPONDING AUTHOR: Peter T. May, Centre for Australian Weather and Climate Research, Australian Bureau of Meteorology and CSIRO, GPO Box 1289, Melbourne 3001, Australia E-mail: [email protected] The abstract for this article can be found in this issue, following the table of contents. DOI:10.1175/BAMS-89-5-629 In final form 31 October 2007 ©2008 American Meteorology Society 629 MAY 2008 AMERICAN METEOROLOGICAL SOCIETY |
Transcript of The Tropical Warm Pool International Cloud Experiment

A comprehensive observing campaign in Darwin, including a ship, five aircraft, and frequent soundings, is furthering weather and climate change studies through improved understanding
and modeling of cloud and aerosol processes in tropical cloud systems.
A crucial factor in our ability to forecast future
climate change is a better representation
of tropical cloud systems, and their heating and
radiative impacts in climate models (Stephens 2005;
Del Genio and Kovari 2002; Neale and Slingo 2003;
Spencer and Slingo 2003). This requires a better
understanding of the factors that control tropical
convection as well as an improved understanding of
how the characteristics of the convection affect the
nature of the cloud particles that are found in deep
convective anvils and tropical cirrus. Deep convec-
tion also lifts boundary layer air into the tropical
tropopause layer (TTL), affecting the composition
of this region and through it the global stratosphere
(e.g., Russell et al. 1993; Folkins 2002). Understanding
the transport of gases and particles in deep convec-
tion is also therefore of global importance.
As a response to this challenge, a major field
experiment named the Tropical Warm Pool Interna-
tional Cloud Experiment (TWP-ICE), including the
U.K. Aerosol and Chemical Transport in Tropical
Convection (ACTIVE) consortium, was undertaken
in the Darwin, Northern Australia, area in January
and February 2006. The experiment was designed
to provide a comprehensive dataset for the develop-
ment of cloud remote-sensing retrievals and initial-
THE TROPICAL WARM POOL INTERNATIONAL CLOUD
EXPERIMENTBY PETER T. MAY, JAMES H. MATHER, GERAINT VAUGHAN, CHRISTIAN JAKOB,
GREG M. MCFARQUHAR, KEITH N. BOWER, AND GERALD G. MACE
AFFILIATIONS: MAY—Centre for Australian Weather and Climate Research, Australian Bureau of Meteorology and CSIRO, Melbourne, Australia; JAKOB—School of Mathematical Sciences, Monash University, Clayton, Australia; MATHER—Pacific North-west National Laboratory, Richland, Washington; VAUGHAN AND BOWER—School of Earth, Atmospheric and Environmental Sciences, University of Manchester, Manchester, United Kingdom; MCFARQUHAR—Department of Atmospheric Sciences, University of Illinois at Urbana–Champaign Urbana, Illinois; MACE—Meteorology Department, University of Utah, Salt Lake City, UtahA supplement to this article is available online (DOI:10.1175/BAMS-89-5-May)
CORRESPONDING AUTHOR: Peter T. May, Centre for Australian Weather and Climate Research, Australian Bureau of Meteorology and CSIRO, GPO Box 1289, Melbourne 3001, AustraliaE-mail: [email protected]
The abstract for this article can be found in this issue, following the table of contents.DOI:10.1175/BAMS-89-5-629
In final form 31 October 2007©2008 American Meteorology Society
629MAY 2008AMERICAN METEOROLOGICAL SOCIETY |

izing and verifying a range of process-scale models
(e.g., Blossey et al. 2007), with a view to improve
the parameterization of tropical convection and
clouds in numerical weather prediction and climate
models. Accordingly, a surface measurement net-
work (including a research ship) was combined with
a fleet of five research aircraft to enable in situ and
remote-sensing measurements of clouds, meteoro-
logical variables, and composition from the ground
into the lower stratosphere. A key feature was the
dense sounding array on the scale of a GCM grid
box with 3-hourly balloon launches throughout the
campaign.
A key goal of the research being conducted with
TWP-ICE data is to understand and model the link
between the properties of the atmosphere on the
scale of a typical GCM grid box and the strength and
organization of convection as well as the resulting
characteristics of the accompanying cloud field, in
particular cirrus. Aerosol measurements followed on
from those made by ACTIVE in the pre-Christmas
campaign (Vaughan et al. 2008) to document the evo-
lution of the atmosphere from that with substantial
impact from biomass burning at the end of the dry
season to pristine conditions in late January.
The TWP-ICE design built on such experiments as
the Global Atmospheric Research Program (GARP)
Atlantic Tropical Experiment (GATE); (Houze
and Betts 1981), Winter Monsoon Experiment
(W-MONEX; Greenfield and Krishnamurti 1979),
Australian Monsoon Experiment (AMEX)/Equatorial
Mesoscale Experiment (EMEX; Holland et al. 1986;
Webster and Houze 1991), Tropical Ocean and Global
Atmosphere Coupled Ocean–Atmosphere Response
Experiment (TOGA COARE; Webster and Lukas
1992), Central Equatorial Pacific Ocean Experiment
(CEPEX; Heymsfield and McFarquhar 1996), and
Tropical Rainfall Measuring Mission (TRMM)
Kwajalein Experiment (KWAJEX; Yuter et al. 2005).
These experiments described various elements of
convective cloud systems and their interaction with
the large-scale circulation. Many aspects of their
approaches have been combined, particularly the
combination of a dense sounding network com-
bined with high-altitude aircraft as well as airborne
and ground-based radar and lidar. Cloud-sampling
strategies employed during TWP-ICE built on previ-
ous experiments such as the Cirrus Regional Study
of Tropical Anvils and Cirrus Layers–Florida-Area
Cirrus Experiment (CRYSTAL-FACE; Garrett et al.
2005; Heymsfield et al. 2005), which emphasized the
physical and chemical properties of cirrus and the
upper-troposphere region.
Darwin experiences a wide variety of convective
systems, including those typical of a monsoon coastal
environment, similar to those experienced by large
populations under the influence of the Asian and
Indian monsoons (e.g., Keenan and Carbone 1992;
Cecil et al. 2005; Nesbitt et al. 2006). Monsoon cloud
systems are typically oceanic in character, and some
of the lessons of TWP-ICE can be applied across
tropical oceanic areas, including the intertropical
convergence zone (ITCZ). The monsoon exhibits very
high intraseasonal variability (e.g., Drosdowsky 1996)
and experiences both active periods with storms
typical of a maritime environment and “breaks”
when the storm systems are characteristic of coastal
and continental areas. These break storms have high
lightning activity and are often isolated, forming on
sea breezes and other local circulations, although
some of these ultimately develop into squall lines.
This is in contrast to the widespread, but generally
weaker convective activity sampled during the active
phase of the monsoon (e.g., Mapes and Houze 1992;
Keenan and Carbone 1992; May and Ballinger 2007).
The TWP-ICE period sampled both of these regimes
as well as a relatively suppressed period with storms of
only moderate vertical extent. Furthermore, similar
cloud regimes, as objectively identified from an
analysis of International Satellite Cloud Climatology
Project (ISCCP) data across the western Pacific by
Jakob and Tselioudis (2003), are seen in Darwin
across the tropics (Höglund 2005).
Darwin hosts what is probably the most com-
prehensive long-term meteorological observational
network anywhere in the tropics. This network is
described in the “Ground network observations”
section and provides long-term datasets so that the
TWP-ICE data can be put into a climatological context.
This is particularly important given the limited dura-
tion of the TWP-ICE intensive observing period.
The combination of excellent facilities and the
range of tropical weather experienced have made for
a long history of field programs in the Darwin area.
Important examples of these were the combined
AMEX/EMEX/Stratosphere–Troposphere Exchange
Program (STEP) in the late 1980s, focusing on the
structure of the Australian monsoon and the poten-
tial impact on troposphere–stratosphere transport
(e.g., Keenan et al. 1989; Mapes and Houze 1992;
Russell et al. 1993); the Maritime Continent Thunder-
storm Experiment (MCTEX), focusing on the evolu-
tion of intense island-based thunderstorms (Keenan
et al. 2000); the Darwin Waves Experiment, focusing
on convectively generated gravity waves (Hamilton
et al. 2004); and the Emerald experiment, focusing
630 MAY 2008|

on cirrus measurements around
deep, intense storms (Whiteway
et al. 2004).
The objectives of the experiment
are listed in Table 1. A general theme
was to document in as much detail
as possible the evolution of the cloud
systems in the experiment domain,
the environmental controls on this
evolution, and, in turn, the impact
of the cloud systems on the environ-
ment. Another important component
was to provide data for the validation
of ground- and spaceborne remotely
sensed cloud properties because
these tie the experiment into long-
term observational datasets in the
tropics (e.g., Ackerman and Stokes
2003). The main focus of activities
was within a ring of radiosonde sta-
tions established around Darwin
for the experiment, although survey
aircraft missions were conducted to
measure the large-scale aerosol and
chemical composition of the region
and to sample highly aged cirrus
clouds (clouds separated from their
parent convection for more than 24 h) when the most
active region of deep convection was located well to
the south.
GROUND NETWORK OBSERVATIONS. One of the cornerstones of TWP-ICE was an ex-
tensive ground-based observational network that
included long-term components
as well as instruments deployed
specifically for the campaign. The
network spanned a region with a
radius of approximately 150 km,
centered on Darwin. The long-term
component included the Bureau of Meteorology
(BoM) instrumentation associated with meteorologi-
cal research and operational forecasting applications
(Keenan and Manton 1996), as well as a Department of
Energy (DOE) Atmospheric Radiation Measurement
(ARM) Program Atmospheric Cloud and Radiation
Facility (ACRF) site (Ackerman and Stokes 2003).
TABLE 1. Science objectives for TWP-ICE and ACTIVE.
1) Collect detailed measurements of the cirrus microphysics and relate them to storm intensity and proximity (spatial and temporal) to the parent convection.
2) Relate measurements of aerosol and chemical species in the outflow of deep convection, and in the surrounding TTL, to low-level sources, and identify how the deep convection has modified the aerosol population in the anvils.
3) Compare the concentration of aerosol and chemical tracers (with a range of lifetimes and origins) in the outflow with that in the back-ground TTL, and therefore determine the contribution of convection to the composition of the TTL including NOX and O3 over Darwin.
4) Improve and evaluate cloud property retrievals from satellite- and ground-based remote-sensing measurements.
5) Provide datasets for forcing and evaluating cloud-resolving and single-column models that will attempt to simulate the observed cloud system characteristics.
6) Document the evolution of oceanic convective clouds from the early convection phase through to the remnant cirrus, with particular emphasis on their microphysics.
7) Measure the dynamical and radiative impacts of the cloud systems.
8) Characterize the environment in which the cloud systems occur.
9) Document the evolution of the convective boundary layer throughout the diurnal cycle and through the life cycle of convective systems.
10) Observe the characteristics of convectively generated gravity waves.
F I G . 1. Th e T W P- I C E / AC TI V E experiment domain. The large blue circle indicates a 150-km radius cen-tered on the C-Pol radar. The small circle near 130°E indicates the oper-ating region of the Southern Surveyor. The two interlocking circles near the center of the domain indicate the dual-Doppler lobes associated with the C-Pol and Berrima radars. Height contours are drawn every 100 m. Additional ground-based instruments are listed in Tables 2 and 3.
631MAY 2008AMERICAN METEOROLOGICAL SOCIETY |
Additional instrumentation deployed for the campaign
included a network of radiosonde sites, surface energy
flux systems, radar wind and cloud profilers, multi-
channel microwave instruments, two Atmospheric
Emitted Radiance Interferometers (AERIs), ocean ob-
servations, and a lightning detection network. Figure 1
illustrates the TWP-ICE/ACTIVE campaign region,
including the location of some of these observation
elements. This instrument network served multiple
purposes. It provided detailed information about the
meteorological environment, which was critical for
mission f light planning and will be important for
measurement interpretation as well as information
about the vertical distribution of cloud properties, and
boundary conditions for the experiment domain to aid
in postexperiment model simulations.
BoM observation assets are listed in Table 2. Key
instruments include a Doppler weather radar and a
research polarimetric radar (Keenan et al. 1998) with
a separation of approximately 25 km. This combi-
nation includes a dual-Doppler lobe over the open
ocean, which allows the three-dimensional wind field
to be measured within the precipitation and thicker
cloud regions of the convective systems. Both radars
complete a volume scan every 10 min, allowing the
evolution of the anvils within complex convective
systems to be followed. Thus, they provide key obser-
vations for the interpretation of other measurements.
The polarimetric radar also provides a classification
of the microphysical habit of hydrometeors detected
by the radar (Keenan 2003; May and Keenan 2005).
A Deutsche Zentrum für Luft- und Raumfahrt (DLR)
TABLE 2. Permanent instruments in the Darwin area associated with the Australia Bureau of Meteorology and the Department of Energy (DOE) Atmospheric Radiation Measurement (ARM) Climate Research Facility.
Instrument/system Description
Bureau of Meteorology
5.6-GHz scanning polarimetric radarProvides three-dimensional hydrometeor distributions with a range of approximately 150 km, located 20 km northeast of Darwin
Operational scanning Doppler weather radarProvides spatial distribution of convection/precipitation, located approximately 10 km southeast of Darwin
50-MHz wind profiler Vertical profiles of wind, located 10 km southeast of Darwin
920-MHz wind profilerVertical profiles of wind and precipitation, located 10 km southeast of Darwin
Automated Weather StationsPressure, temperature, humidity, and wind speed and direction at 10 sites around the Northern Territory
Rain gauge network
DOE ARM Climate Research Facility
Millimeter cloud radar35-GHz Doppler radar, provides cloud boundaries and is used to derive microphysical properties
Micropulse lidar532-nm lidar, provides cloud boundaries and is used to derive cloud optical properties
Vaisala ceilometerProvides cloud base to a maximum altitude of 7 km and profiles of backscatter
Total sky imagerHemispheric digital camera provides digital snapshots of the sky and pixel-by-pixel cloud cover determination
Atmospheric Emitted Radiance InterferometerMeasures infrared emission from atmosphere in range 520–3300 cm–1, with 1 cm–1 resolution
Microwave radiometer 23.8/31.4 GHz, provides total column water vapor and liquid water
Multifilter rotating shadow-band radiometerSix narrowband channels between 0.4 and 1 mm provide column aerosol information
Disdrometer Raindrop size distribution
Broadband radiometers Up- and down-looking Eppley solar and terrestrial infrared radiometers
Surface meteorology Pressure, temperature, humidity, rain rate, wind speed, and direction
632 MAY 2008|

lightning network (Betz et al. 2004) was deployed for
the experiment. Lightning activity provides addi-
tional information about convective intensity and the
microphysical processes occurring in the convective
cores (e.g., Carey and Rutledge 2000).
Since 2002, ARM has operated an atmospheric
radiation and cloud observing site in Darwin (Mather
et al. 1998). The site includes measurements of the
surface radiation budget, surface meteorology, and
vertical distribution of clouds (Table 2). Cloud pro-
files are derived primarily from a pair of vertically
pointing active remote sensors: a 35-GHz cloud radar
[Millimeter Wavelength Cloud Radar (MMCR)] and
a cloud lidar (Clothiaux et al. 2000). In addition to
cloud occurrence, these instruments provide profiles
of cloud microphysical properties through various
retrieval algorithms (e.g., Hogan et al. 2000; Mather
et al. 2007). A goal of TWP-ICE is to use in situ
observations of microphysical properties to improve
the retrieval of cloud properties from the long-term
ground-based remote sensors at Darwin and the
other tropical ARM sites. Several other profiling
instruments were located at the ARM site, including
a 50-MHz radar (Vincent et al. 1998), a passive
microwave radiometer [Humidity and Temperature
Profiling Radiometer (HATPRO); Westwater et al.
2005], as well as a 2.8-GHz profiling radar (Ecklund
et al. 1999) at the nearby BoM wind profiler site
(Table 3).
As mentioned above, another goal of TWP-ICE
was to provide the necessary boundary conditions
for model simulations. Of particular interest are
high-resolution models that capture the details of
convection and cirrus production, as well as single-
column models that are key tools for climate model
parameterization development. The observations
from the BoM and ARM radars then provide the
means of evaluating the modeled cloud fields. The lat-
eral boundary conditions are derived using a network
of five radiosonde sites (Fig. 1) from which balloons
TABLE 3. Instruments deployed in the Darwin area for TWP-ICE.
Instrument/system Location Description PI/affiliation
Radiosonde array Perimeter of TWP-ICE domain
Profiles of temperature, humidity, and wind
ACRF/Bureau/Vaisala
Flux network Four sites over water, marsh and savannah (2)
Eddy correlation latent and sensible heat fluxes and surface radiation
Tapper (Monash University)
50-MHz profiler Darwin ACRF site Vertical profiles of wind Vincent (University of Adelaide)
3-GHz profiler Bureau profiler site Vertical profiles of precipitation Williams (NOAA)
Radiometer network Garden Point and Cape Don
Downwelling broadband solar and terrestrial infrared fluxes
Long [Pacific Northwest National Laboratory (PNNL)]
LINET lightning network
Perimeter of TWP-ICE domain
Multiantenna lightning detection operating in the VLF/LF range
Hoeller (DLR)
Lightning sensor Darwin ACRF site VHF broadband digital interferometer for high temporal resolution lightning monitoring
Kawasaki (Osaka University)
HATPRO Darwin ACRF site 14-channel microwave radiometer: profiles of temperature and water
Crewell (University of Munich)
Radiative fluxes Southern Surveyor Broadband solar and terrestrial infrared fluxes and SST
Reynolds [Brookhaven National Laboratory (BNL)]
Bulk fluxes Southern Surveyor Sensible and latent heat fluxes Bradley (CSIRO)
PARSL Southern Surveyor Ceilometer, microwave radiometer, temperature, humidity, and precipitation
Mather (PNNL)
M-AERI Southern Surveyor Marine Atmospheric Emitted Radiance Interferometer
Minnett (University of Miami)
Oceanographic observations
Southern Surveyor Salinity, temperature, and current profiles
Tomczak (Flinders) University)
633MAY 2008AMERICAN METEOROLOGICAL SOCIETY |

carrying Vaisala RS-92 radiosondes were launched at
3-hourly intervals for the experiment period as well
as at 6-hourly intervals at the Darwin facility. The
data from these individual profiles have been inte-
grated into an analysis of the large-scale dynamical
forcing (Zhang et al. 2001). This forcing dataset also
makes use of measurements of the upper and lower
boundary conditions in the experiment domain, such
as the experiment domain averaged precipitation
derived from the BoM polarimetric radar, surface
energy fluxes, and top-of-the-atmosphere and surface
radiative fluxes. In support of this activity, stations
measuring sensible and latent heat fluxes as well as
radiative f luxes were deployed at several locations
throughout the experiment domain chosen to rep-
resent a range of representative surface types from
open water to savannah (e.g., Beringer and Tapper
2002). Top-of-the-atmosphere boundary conditions
are provided by satellites, including the new Japanese
geostationary satellite MTSAT-1R, and various polar-
orbiting platforms. Cloud products associated with
multiple satellites have been derived by the National
Aeronautics and Space Administration (NASA) cloud
and radiation support group (information online at
www-pm.larc.nasa.gov).
To complement aircraft measurements of TTL
composition, a program of ozonesonde launches
was conducted from Darwin during the ACTIVE
campaign. Most of these were launched in November
and December, because of the greater focus on TTL
composition compared to cloud measurements in
that period (Vaughan et al. 2008), but nine were
also launched during TWP-ICE. They showed a
progression from a uniformly low ozone concen-
tration (20 ppbv) during the active monsoon in
mid-January to profiles in mid-February similar to
those measured in the premonsoon period, with a
maximum ozone mixing ratio up to 60 ppbv in the
midtroposphere and a minimum <20 ppbv in the
TTL. This implies a widespread vertical mixing of
chemical constituents during monsoon conditions,
extending from the surface to the TTL, but that at
other times vertical mixing is suppressed, despite
the very deep storms that deposit boundary layer
material in the TTL.
Darwin is a coastal site, which means that a sig-
nificant part of the experiment domain was over
water. To characterize the oceanic region off the
Australian coast, the Australian National Research
Facility Research Vessel Southern Surveyor, operated
by Commonwealth Scientific and Industrial Research
Organisation (CSIRO), was stationed in the Timor Sea
west of Darwin where it served as the base for multiple
observations. Radiosondes were launched from it to
complete the network of sites around the domain
perimeter. The ship also carried instruments for
measuring turbulent and radiative fluxes (e.g., Fairall
et al. 2003), a second set of cloud remote-sensing
instruments, and several instruments to measure
ocean conductivity–temperature–depth (CTD) and
current profiles (Godfrey et al. 1999). These measure-
ments provide an important link between surface
fluxes and the ocean mixed layer structure. Miniature
CTD probes were mounted on a SeaSoar profiling
platform and on three shallow moorings. In addition
periodic CTD casts were made during the voyage to
compare with the continuous profiles. Further aims
of the ocean observations were to provide measure-
ments of the ocean state to support both ocean and
coupled modeling as well as document the impact of
the convection on the structure of the upper ocean.
The ocean dynamics of the ship operations area can
be categorized as being somewhere between a coastal
sea and the open ocean, where the combination of
shallow water (50 m) and strong tides will have some
influence on the mixed layer dynamics. The duration
of the experiment was also long enough that tidal
mixing varied significantly during the observation
period. This should allow the model to isolate tidal
mixing from other mixing processes, such as night-
time convection.
There are a few known data problems. There is a
daytime dry bias in the soundings (Vomel et al. 2007),
and a correction for this through the diurnal cycle
has been developed and implemented on the datasets
available through the ARM server (Hume 2007). The
ARM site at Darwin suffered a lightning strike prior
to the experiment and this led to a loss of sensitivity
in the MMCR so that the minimum detectable signal
was degraded by approximately 18 dBZ. At a range
of 10 km, the minimum detectable signal with the
reduced sensitivity was approximately –28 dBZ.
Vibrations on the ship and high seas severely limited
the shipborne radar and lidar operation, and there is
little usable data from those instruments.
AIRCRAFT OBSERVATIONS AND OPERA-TIONS. Five research aircraft were deployed for
TWP-ICE (Table 4). Flights were coordinated by a
dedicated flight management team using real time
four-dimensional radar visualization and satellite
imagery. Two of the aircraft—the Scaled Composite’s
Proteus, carrying the ARM Unmanned Aerial Vehicle
(UAV) suite of instruments and the Airborne Research
Australia’ (ARA’s) Egrett—were high-altitude aircraft
capable of in situ measurements in the anvil outflow.
634 MAY 2008|

They carried instruments
for detailed microphysi-
ca l and meteorologica l
measurements, and in the
case of the Egrett a suite
of chemical and aerosol
instrumentation. Details
are given in Table 4 and
the supplement (online at
http://dx.doi.org/10.1175/BAMS-89-5-May) but the
payloads included state
measurements, aerosol and
cloud particle counting and
size distributions for both
aircraft, and CCN, H2O,
CO, O3, and black carbon
on the Egrett as well as
total water content, CO,
CO2, and radiation obser-
vations on the Proteus. The
Cloud, Aerosol, Precipita-
tion Spectrometer (CAPS)
instrument on the last two
flights of the Proteus were
limited to sampling small crystals (D < 50 μm) for
much of the flights and the aircraft was thereby op-
erated near cloud top on 8 and 10 February. A third
aircraft, a Twin Otter, carried an airborne vertically
pointing 95-GHz cloud radar and lidar to support
the high-altitude measurements and was flown at an
altitude of about 3300 m. The remaining two aircraft
were dedicated to boundary layer measurements. The
Dimona measured turbulent fluxes and was primar-
ily deployed at very low altitudes, except for some
missions exploring the effect of convection on bound-
ary layer structure and the recovery of the boundary
layer after convection. The U.K. Natural Environment
Research Council (NERC) Dornier aircraft carried a
meteorological probe, particle size spectrometers, an
aerosol mass spectrometer, and fast-response CO, O3,
and condensation nuclei, as well as a gas chromato-
graph and automatic tube sampler for volatile organic
compound (VOC) measurements. Full details of the
Dornier payload may be found in Table 2 of Vaughan
et al. (2008) and a summary of the measurements are
in Allen et al. (2008). This aircraft was deployed for
taking areal surveys as well as partnering the Egrett
in measurements of the low-level inflow and anvil
outflow of convective storms.
There were several classes of mission as outlined
in Table 5. The main effort was directed toward mul-
tiaircraft missions to understand the cirrus structure
and evolution. Remote-sensing observations concur-
rent with the in situ cloud observations were obtained
from the Twin Otter flying beneath the high-altitude
aircraft. There were two classes of cirrus-sampling
missions. In one class, the Egrett and Proteus were
directed as close as possible in space and time to fresh
anvil clouds to study the microphysics, aerosol, and
chemistry of the cloud being ejected from the convec-
tion and its evolution. The Dornier and Dimona were
utilized in these missions to sample the boundary
layer structure both ahead of the storms and in the
lee. The second class of multiaircraft missions were
aimed at sampling aged cirrus where the internal
circulations of the cirrus and new crystal growth
was dominant.
Where possible, the Proteus also performed spiral
ascents and descents through the clouds over the
ground- and ship-based remote-sensing sites. This
has a strong link to algorithm development and
validation of retrievals from the Cloudsat/Calipso
satellites and long-term records at the ARM sites.
A variety of survey-type flights were undertaken
in order to examine the properties of the air masses
around Darwin and the spatial structure, both of
the boundary layer and upper troposphere. These
missions were of three basic types—low-level f lux
flights, flights in clear air at a number of altitudes in
the Darwin area (to obtain profile information), and
TABLE 4. Aircraft Instruments and observational capabilities. Detailed tables including the aircraft instruments are available online.
Aircraft Altitude range Observation type
ARA Dimona 10 m–2 km State parameters, turbulence, SW and LW radiation
NERC Dornier 100 m–4 km State parameters, aerosol size distribu-tion, aerosol composition, ozone, CO, hydrocarbons, and halocarbons
Twin Otter 1–3 km NASA 96-GHz cloud radar,York University 530-nm polarization lidar
ARA Egrett 8–15 km State parameters, upper-tropospheric humidity, cloud particle size distribu-tions of 10 μm to ~ 1.5 mm, ice cloud particle habit, aerosol size distribution, black carbon aerosol, ozone, CO, NOx, hydrocarbons, and halocarbons
ARM-UAV Proteus 8–16 km State parameters, cloud particle size dis-tributions of 10 μm to ~ 1.5 mm, cloud particle habit of 10 μm to ~ 1 mm, total water content and extinction, cloud aerosol of 0.35 to 50 μm, SW and LW radiation, 1.053-μm lidar, CO and CO2 sensors
635MAY 2008AMERICAN METEOROLOGICAL SOCIETY |

long-range missions at a constant altitude. Between
30 January and 3 February the Dornier flew north
toward Indonesia and south to Alice Springs in cen-
tral Australia. At the northern limit of these flights
air with much more pollution than in Darwin was
encountered, consistent with a Northern Hemisphere
origin (Hamilton et al. 2007, manuscript submitted
to J. Geophys. Res.). Far less variation was seen on the
way to Alice Springs.
METEOROLOGICAL CONDITIONS. Four
distinct convective regimes were sampled during
the intense observing period (IOP) of TWP-ICE as
a large amplitude Madden–Julian oscillation (MJO)
event moved through the region. The IOP began with
convectively active monsoon conditions, followed
by a suppressed monsoon, 3 days of clear skies, and
then a break period.1 A series of figures will be used
to illustrate the evolution of the meteorological
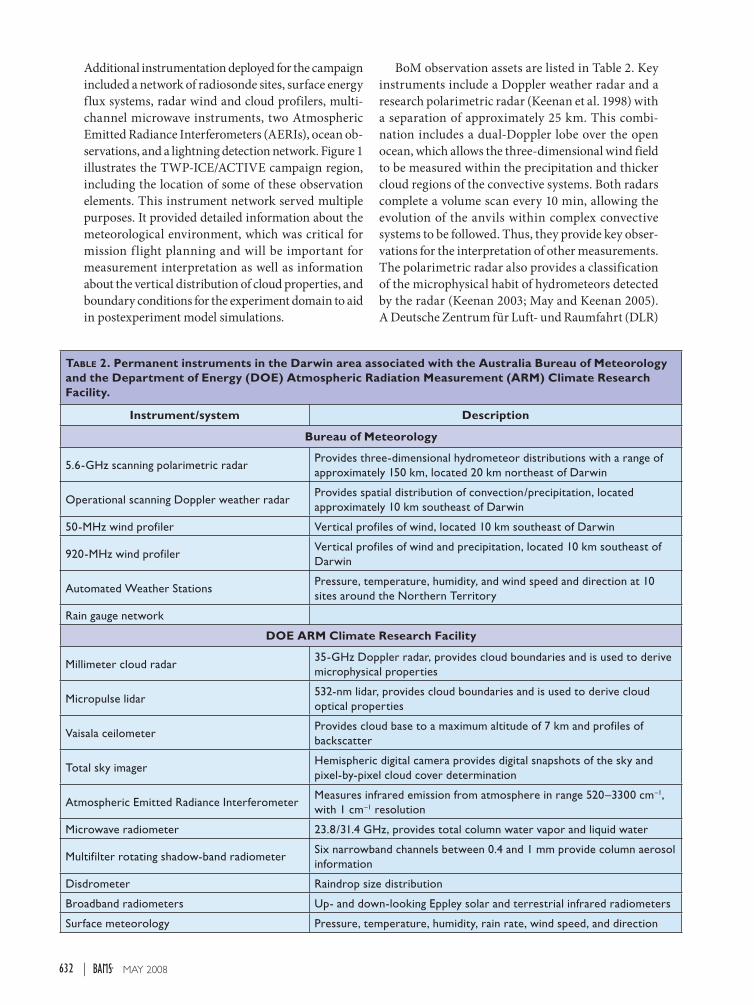
conditions. Figure 2 shows the time accumulation of
polarimetric radar estimates of the rainfall averaged
over the 300-km-diameter domain that was sampled.
Figure 3 shows a time–height cross section of relative
humidity measured by radiosondes at Point Stuart
(Fig. 1). Figure 4 shows the median convective avail-
able potential energy (CAPE) from all sounding sites
(see Fig. 1 for their location), together with the area-
averaged hourly rainfall throughout the TWP-ICE
TABLE 5. TWP-ICE Aircraft Missions. Aircraft: D = Dimona, E = Egrett, N = Dornier, P = Proteus, T = Twin Otter; cloud missions: MA = monsoon anvil, AC = aged cirrus, BA = break anvil; survey missions: L = land survey, M = maritime survey; and other missions: TO = Terra overpass, CO = clear-sky CO profile, I = intercomparison, Li = lidar.
DateCloud missions Survey missions Other missions
Aircraft Mission Aircraft Mission Aircraft Mission
20 Jan E N MA
21 Jan D L
22 Jan E N T MA
23 Jan E T MA
25 Jan E P T AC D N L M
26 Jan N L
27 Jan E P T AC N L
29 Jan P T AC D L
30 Jan N M
31 Jan D L E Li
1 Feb D N L L E Li
2 Feb D P T MA N L
3 Feb E N M M T TO
4 Feb D M P CO
5 Feb D M
6 Feb E P T BA D M
8 Feb D E N T BA
9 Feb E BA
10 Feb D E N P T BA D M
12 Feb D E N P T BA
13 Feb E BA D L
14 Feb E N I I
1 There are various definitions of monsoon conditions (e.g., Drosdowsky 1996), but the principal feature of the monsoon in
Darwin is the presence of westerly winds between 850 and 700 hPa. The use of more complex definitions usually only change
the “monsoon periods” by a few days. We will largely use a simple definition here of westerlies at 700 hPa in a 4-day smoothed
wind time series, except where explicitly discussed.
636 MAY 2008|
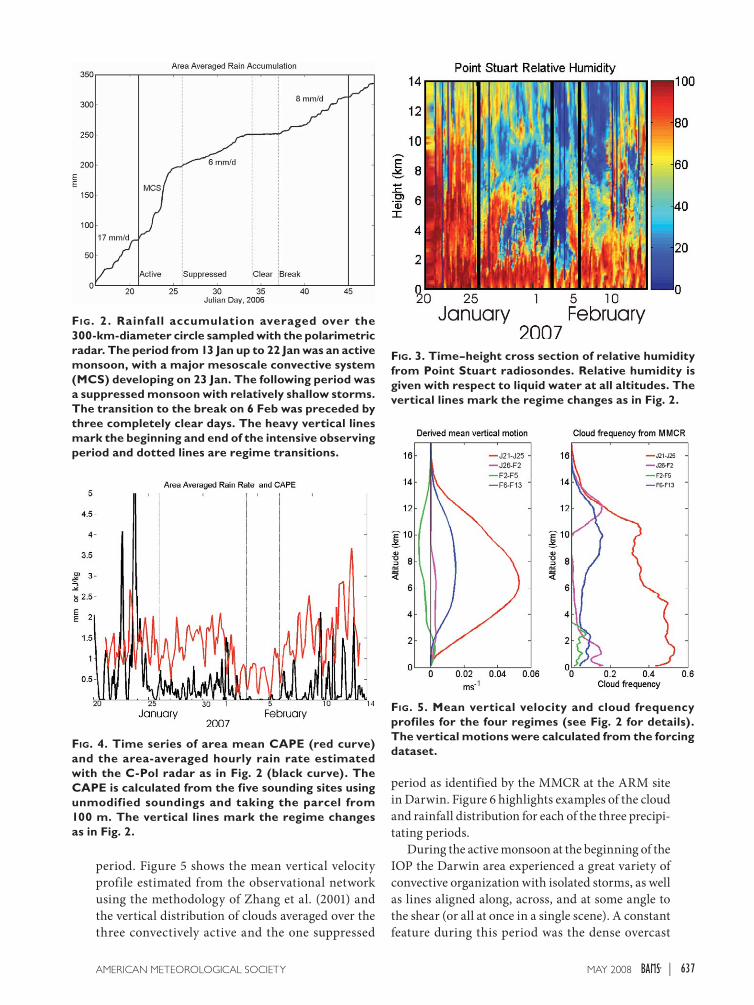
period. Figure 5 shows the mean vertical velocity
profile estimated from the observational network
using the methodology of Zhang et al. (2001) and
the vertical distribution of clouds averaged over the
three convectively active and the one suppressed
period as identified by the MMCR at the ARM site
in Darwin. Figure 6 highlights examples of the cloud
and rainfall distribution for each of the three precipi-
tating periods.
During the active monsoon at the beginning of the
IOP the Darwin area experienced a great variety of
convective organization with isolated storms, as well
as lines aligned along, across, and at some angle to
the shear (or all at once in a single scene). A constant
feature during this period was the dense overcast
FIG. 4. Time series of area mean CAPE (red curve) and the area-averaged hourly rain rate estimated with the C-Pol radar as in Fig. 2 (black curve). The CAPE is calculated from the five sounding sites using unmodified soundings and taking the parcel from 100 m. The vertical lines mark the regime changes as in Fig. 2.
FIG. 3. Time–height cross section of relative humidity from Point Stuart radiosondes. Relative humidity is given with respect to liquid water at all altitudes. The vertical lines mark the regime changes as in Fig. 2.
FIG. 2. Rainfall accumulation averaged over the 300-km-diameter circle sampled with the polarimetric radar. The period from 13 Jan up to 22 Jan was an active monsoon, with a major mesoscale convective system (MCS) developing on 23 Jan. The following period was a suppressed monsoon with relatively shallow storms. The transition to the break on 6 Feb was preceded by three completely clear days. The heavy vertical lines mark the beginning and end of the intensive observing period and dotted lines are regime transitions.
FIG. 5. Mean vertical velocity and cloud frequency profiles for the four regimes (see Fig. 2 for details). The vertical motions were calculated from the forcing dataset.
637MAY 2008AMERICAN METEOROLOGICAL SOCIETY |

cirrus across the domain. Outflows from the deep
convective storms were mixing with existing aged
cirrus, so that cirrus sampled during this period
was unlikely to be representative of either pristine
new or aged anvil cirrus, except close to the convec-
tive towers. As is evident from Fig. 2, the area mean
rainfall rates for this period were remarkably steady
at around 17 mm day–1 despite widely differing levels
of organization and areas covered by stratiform rain.
This period was marked by high values of relative
humidity throughout the troposphere (Fig. 3) and rel-
atively high values of CAPE (Fig. 4). Consistent with
the high humidity values and relatively large mean
upward motion, a high frequency of cloud occurrence
was detected by the MMCR throughout the column,
which is by far the highest values of the TWP-ICE
period. As the example in Fig. 6 (left column) shows,
convection in this period was very widespread, but
most individual cells were not of great intensity, with
high reflectivities rarely extending much above the
freezing level. However, radar echo tops still extended
to about 17 km for the most intense cells (see middle
row of panels of Fig. 6).
By late 23 January the monsoon trough was
receding to the north of Darwin and easterly winds
were being experienced at 700 hPa, although the
cloud conditions and storm character were still
monsoonal. A large MCS developed in the experi-
ment region, which produced a distinct rotation as
it moved across the measurement array toward the
sea west of Darwin. The area-averaged rainfall rate
during the passage of the MCS was about 55 mm day–1
(Fig. 2), with half the rain being convective in origin.
The soundings immediately before the passage of
the system through the experiment area showed
the highest CAPE of the monsoon periods covered
by TWP-ICE. This cloud system developed into a
tropical low and would almost certainly have become
a tropical cyclone had it not made landfall to the
southwest of Darwin at a central pressure of 999 hPa.
FIG. 6. Sample IR satellite images from MTSAT1-R of northern Australia, radar reflectivity maps of the experi-ment area and typical radar cross sections for the three rain regimes. These were (left) active monsoon, (middle) suppressed monsoons, and (right) break period. The red circles show the main experiment domain. Note that these panels are not necessarily at the same dates and times, but were rather chosen as representative of typical structure and organization observed in these periods. The IR enhancement T > 250 K is grayscale, 250–230 K are blue shades, 230–210 K are green shades, 210–190 K are yellow shades, and T < 190 are red shades. Radar contours are drawn every 10 dBZ from 10 dBZ. Dates and times are in UTC.
638 MAY 2008|

The low continued to intensify, eventually deepening
to 988 hPa over the land on 31 January. It established
itself as an almost stationary feature over the central
part of the Northern Territory until 2 February. Its
intensity and spiral cloud structure led to it being
informally dubbed “Landphoon John.” Widespread
deep convection and torrential rain associated with
this low brought extensive flooding to the semiarid
lands south of Darwin.
The presence of this cyclonic center to the south
had several impacts on the cloud systems around
Darwin. Its circulation sustained surface westerly
winds of more than 20 m s–1 across the Darwin area
and adjacent waters, but also advected very dry con-
tinental air over the experimental area at midlevels
(Fig. 3). This had the effect of limiting storm heights
during this period to below 10 km so it was atypical
of “normal” monsoon conditions. The organization
of convection ranged from isolated cells to short lines,
but with no significant stratiform cloud. The upward
vertical velocity was confined to the lower levels with
descending motion aloft. While CAPE remained
high (Fig. 4), observed rain rates were much lower
(5–7 mm day–1), which is likely attributable to the
drier and subsiding middle and upper troposphere.
The vertical cloud distribution during this period
shows two distinct peaks in the lower and upper
troposphere (purple line, Fig. 5). The maximum at
the upper levels was due to advection of cirrus north-
ward from the cyclone center to the south. Most of
the experiment area was covered by relatively low
clouds. The radar images indicate mostly shallow
rain features, although individual small cells reaching
the 10-km level were observed. This period expe-
rienced the cleanest low-level air measured during
the campaign with less than 50 ppbv of CO and one
aerosol particle per cubic centimeter in the size range
> 300-nm diameter.
The low pressure system to the south dissipated
rapidly on 3 February, and 3 days of clear skies and no
precipitation were experienced at Darwin. These days
were associated with the lowest CAPE throughout the
experiment (Fig. 4) and showed the driest conditions
above the boundary layer measured in TWP-ICE
(Fig. 3) associated with the mean descending motion
(Fig. 5). Consistent with these conditions the cloud
radar observed hardly any cloud (green line, Fig. 5).
With the dissipation of the intense low to the south,
conditions in the experiment area changed to those
typical of a break period with easterly flow through-
out the column. As is typical in such cases, convec-
tion during this period exhibited intense afternoon
thunderstorms, and some squall lines passing Darwin
at night. These lines had their genesis in the previ-
ous afternoon’s convection to the east. Despite the
great intensity of the individual thunderstorms, area
mean rainfall during this period was only around
8 mm day–1 due to their relatively small coverage (in
space and time) compared to the active monsoon
conditions (Fig. 2). The period was accompanied by
a gradual moistening of the middle and upper tropo-
sphere (Fig. 3) and a gradual increase of CAPE (Fig. 4),
culminating in the largest values of CAPE observed
toward the very end of the experiment. The lower
mean vertical motion compared to the active monsoon
(Fig. 5) is consistent with the lower mean rain rates,
but the upward motion does extend slightly higher in
the break. Significant amounts of upper-level cloud
associated with the convection were observed by the
MMCR in this period (blue line, Fig. 5), but much less
than during the active monsoon (red curve).
It is interesting to contrast the distribution of
upper-level clouds during the suppressed monsoon
period (26 January–2 February) and the break period
(6 February through the end of the experiment). The
depth of the cirrus layer was limited to altitudes above
10 km during the earlier period when the middle
troposphere was very dry (Fig. 3), but the cirrus layer
was much deeper during the break period consistent
with the moister conditions. It is evident from the
examples shown in Fig. 6 that convection during this
period was of a strongly continental character and was
often related to mesoscale circulation features, such
as the sea breeze. The radar images (third column,
Fig. 6) exemplify the high intensity of the convection,
with ref lectivities above 35 dBZ extending above
15 km on a regular basis. This was accompanied by
strong electrical activity, which was virtually absent
in the earlier monsoon convection.
The convective regimes observed during TWP-ICE
and described above constitute typical examples
of continental and maritime convection observed
elsewhere in the tropics (e.g., Keenan and Carbone
1992), while the relatively shallow but intense convec-
tion in the suppressed regime is somewhat unusual,
and will be a strong test for models. While a longer
sample of active monsoon convection would have
been desirable, the TWP-ICE dataset is a significant
resource for the study of these convective regimes.
Opportunities for such studies will be highlighted
in the next sections.
A SAMPLE OF THE OBSERVATIONS AND RELATED SCIENCE QUESTIONS. The sci-
ence objectives listed in Table 1 include relating cirrus
properties to the convective intensity and to aerosol
639MAY 2008AMERICAN METEOROLOGICAL SOCIETY |

properties, providing validation for remote-sensing
retrievals, and collecting a dynamical forcing dataset
for cloud modeling. Applications of the data to some
of these goals is described in this section.
The experiment array was designed to support
modeling activities and provide boundary conditions
for a range of model activities with a focus on single-
column and cloud-resolving models. Model forcing
datasets calculated using the methodology of Zhang
et al. (2001) are available based on the analysis of
radiosonde, radar, and flux data (online at http://iop.archive.arm.gov/arm-iop/2006/twp/twp-ice/xie-klein-forcing/). These also provide a detailed view of
the diurnal cycle and evolution of the atmosphere at
high temporal resolution, while turbulent and radia-
tive fluxes over a variety of surface types provide a
detailed description of the surface energy balance.
The evolution of boundary layer aerosol during the
course of this experiment and its premonsoon partner
described in the companion paper (Vaughan et al.
2008) provides an opportunity to study the effects of
aerosol on deep convection. Similar meteorological
conditions prevailed at the beginning of November
2005 prior to the monsoon onset and in mid-February
at the end of TWP-ICE—land-based afternoon con-
vection triggered by sea breezes, exemplified by the
afternoon storms on the Tiwi Islands. However, the
boundary layer aerosol character-
istics were markedly different. The
Dornier measurements showed a
transition from copious biomass-
burning products (including black
carbon) in mid-November, to clean-
er conditions in December (Vaughan
et al. 2008), and extremely clean
conditions in the suppressed mon-
soon period when maritime air of
Southern Hemisphere midlatitude
origin reached Darwin. Although
accumulation mode aerosol amounts
were higher in the subsequent break
period, they were still a factor of
2 less than in the premonsoon
period. Their composition was
dominated by the organic fraction
in the monsoon break (as in the
premonsoon period), but during the
active monsoon these aerosols were
predominantly sulfate. Larger aero-
sols (diameter > 1 μm) were around
5–10 times more prevalent in the
monsoon periods than during the
premonsoon and break, consistent
with production of sea salt by the strong monsoonal
westerlies. Such aerosols form very effective cloud
condensation nuclei and modeling studies are cur-
rently under way to examine the impact of the dif-
ferent aerosol regimes on deep convection.
The comprehensive dataset provides opportunities
and challenges for the modeling community. Just as im-
portant as the high-time-resolution forcing data are the
measurements from the aircraft and remote-sensing
instruments [e.g., C-band dual-polarization Doppler
radar (CPOL) profilers, ARM suite], which constrain
factors ranging from broad-scale characteristics of
the convective systems to the details of microphysical
parameterizations. The various meteorological and
aerosol regimes that were sampled will provide an
additional challenge: Can the models represent these
differences, and how do they compare with observa-
tions? For example, it has been shown that models have
particular difficulties representing convection reach-
ing to the midtroposphere only, as observed during the
suppressed monsoon (Inness et al. 2001).
The variations in weather regime during the
experiment sets the scene for studying cirrus proper-
ties in relation to convective intensity and variations
in boundary layer characteristics. The cirrus proper-
ties of several anvils within the sounding array were
sampled in both the monsoonal and break periods
FIG. 7. Rain map from the polarimetric radar at 0710 UTC 6 Feb 2006. Contours are drawn every 20 mm h–1 from 0 mm h–1. Aircraft tracks from the Twin Otter (green), Egrett (red), and Proteus (blue) are overlaid. The circles mark the aircraft position and tracks are drawn for +/– 1 h around the radar scan time (0710 UTC) for the Twin Otter and Egrett and +/– 10 min for the Proteus.
640 MAY 2008|

(Table 5), allowing the cirrus microphysics to be
related to parent storm intensity. Preliminary indica-
tions are that the monsoon cirrus was characterized
by both larger mean sizes and higher ice water con-
tents than break period storms (A. Heymsfield 2007,
personal communication).
An illustration of the approach and data for
studying anvils is shown in Figs. 7–9. Break condi-
tions were established by 6 February, with easterly
flow at 700 hPa overlying westerlies
at the surface. An isolated single-cell
storm broke out over the northeast of
the Tiwi Islands around 0450 UTC,
with radar echoes reaching 17 km.
It produced a detached anvil, which
was advected northwestward over
the next 2 h. The flight strategy and
accompanying rain field is shown
in Fig. 7. The Proteus was first on
station performing two spirals
through the anvil between 11- and
15-km altitude and then lining up
for straight transects stacked with
the Egrett and Twin Otter with the
high-altitude aircraft legs between
11.2 and 14.1 km. At the lower level
the Dornier flew around the storm
at 300 and 800 m after first making a
detailed survey of its inflow (western)
side. This day provides an excellent
example of a single-cell island thun-
derstorm developing in low-aerosol
conditions, in contrast with the
more polluted higher aerosol ex-
ample of 16 November (Vaughan
et al. 2008). Figure 8 shows a rep-
resentative sample of cloud particle
imager (CPI) images as a function of
altitude for the descending spiral at
0700 UTC showing the presence of
plate-like, irregular, and aggregates
of plate-like crystals. An automated
shape analysis using various mea-
sures of crystal morphology showed
that irregular particles dominated
the population of particles with
D > 100 μm, irrespective of altitude.
Particles with D < 100 μm were dom-
inantly quasi spherical and made
significant contributions to the total
mass and optical extinction.
The observations in the fresh
anvil microphysics can be contrasted
with observations in aged cirrus obtained during the
project. For example, on 29 January 2006 the Proteus
flew constant-altitude legs to measure the latitudi-
nal dependence of the microphysical properties of
cirrus bands with minimum ages of approximately
4 h generated by a low pressure system south of the
TWP-ICE domain. As with the case of aged cirrus,
crystals with D < 100 μm were predominantly quasi
spherical in shape and typically contributed more
FIG. 9. CPI images of ice crystals with D > 100 μm in an aged anvil at an altitude of 12 km on 29 Jan sorted by time showing large numbers of bullet rosettes.
FIG. 8. SPEC CPI images of ice crystals with D > 100 μm from a spiral descent through a fresh break period thunderstorm anvil from 6 Feb 2006 showing a mixture of quasi spherical and chain crystal habits sorted by altitude (Courtesy of J. Um, University of Illinois).
641MAY 2008AMERICAN METEOROLOGICAL SOCIETY |

than half to the total mass and extinction. On the
other hand, there were differences in the shapes of
large crystals compared to the aged cirrus. Figure 9
shows ice crystals imaged by the CPI with D > 100 μm.
Pristine shapes, such as bullet rosettes or aggregates
of bullet rosettes, appeared regardless of altitude for
these cirrus bands, which represents a strong con-
trast to the plates and aggregates seen in Fig. 8. The
automated habit classification scheme showed that
bullet rosettes dominated the population of crystals
with D > 100 μm. The difference in crystal habits
between fresh anvils and aged anvils gives informa-
tion about formation mechanisms/growth histories
of crystals in different cloud genre. For example, the
bullet rosettes in the aged anvils indicate that new
particle formation is occurring in regenerating cells.
Knowledge of the variation of crystal habits with
cloud age gives data needed to develop, improve, and
evaluate algorithms to retrieve cloud microphysical
properties from ground-based remote sensors that
will ultimately be used to obtain larger datasets of
cloud properties.
The data from all the microphysical probes
are now being used to estimate the size and shape
distributions of ice crystals and to estimate their
bulk mass and single-scattering properties of the
cirrus following McFarquhar and Heymsfield (1996)
and McFarquhar et al. (2002). The microphysical
data are being placed in meteorological context to
better understand how the characteristics of the
convection affect the sizes, shapes, and number
densities of the cloud particles. This will be used
to improve the assumptions used in satellite- and
ground-based remote-sensing algorithms. Spiral
ascents and descents performed over the ACRF site
at Darwin and the Twin Otter are providing the
needed verification data for the remotely sensed
microphysical retrievals of both ground- and space-
based observations such as Cloudsat and Calipso.
Importantly, a comparison of data from probes on
the Proteus suggest that shattering large ice crystals
on the protruding components of one of the probes
may have artificially amplified small crystal con-
centrations (McFarquhar et al. 2007). This direct
evidence for amplified concentrations due to crystal
shattering is a significant finding, because quanti-
fying the contribution of such small crystals to the
mass and radiative properties of cirrus represents
a controversial and unsolved problem in cloud
physics, yet has a critical impact on determining
how cirrus affects radiative heating.
As well as the planned components, the weather
that was sampled also provides a number of unan-
ticipated research opportunities. These include the
sampling of surface fluxes over warm tropical oceans
at high wind speeds over several days. This dataset
has clear applications in the study of the formation
of intense tropical weather systems forced by surface
fluxes, such as tropical cyclones. Other systems that
were sampled include a large MCS that developed
distinct rotation within the experiment domain.
There is little doubt that this system would have
spawned a tropical cyclone if it had remained over
warm water instead of making landfall, so again there
are opportunities to look at the early stages of tropical
cyclogenesis. The mature cyclone brought Southern
Ocean midlatitude air to Darwin, and survey flights
of the Dornier and Egrett northeastward during this
period measured the transition between this very
clean air and air of Indonesian, and even Northern
Hemispheric origin with much higher concentra-
tions of CO and particulates (Hamilton et al. 2007,
manuscript submitted to J. Geophys. Res.). Even data
from the suppressed period near the middle of the
campaign will be useful. During this period, clear-
sky radiative fluxes were obtained along with vertical
profiles of temperature and humidity undisturbed
by convection. These observations provide a very
useful baseline for measurements obtained under
other conditions.
CONCLUDING COMMENTS. TWP-ICE has
succeeded in collecting an outstanding dataset
describing tropical cloud systems, their evolution,
and their interaction with the larger environment.
The observations taken during TWP-ICE should
be viewed in the context of long-term observations
of clouds using remote-sensing techniques that are
also available via the ARM Web site (online at www.arm.gov). Data taken during the experiment include
several tens of spiral ascents over the ground and air-
borne cloud radar–lidar combinations. These obser-
vations will serve as a valuable resource for both the
development and validation of retrieval techniques, as
well as place the TWP-ICE observations in long-term
statistical contexts. The experiment documented the
cloud systems in a range of convective regimes and
the experiment design assures a quality dataset for
providing boundary conditions for simulations as
well as detailed validation. These provide the core
datasets for budget studies and parameterization
development using a range of modeling and data
analysis approaches.
The TWP-ICE datasets is a resource for the entire
meteorological community. It is significant in terms
of the range and completeness of the observations
642 MAY 2008|

of tropical cloud processes. Much of the data are
already available to the community through the
ARM Web site (online at www.archive.arm.gov/)
as an IOP dataset while U.K.-supported aircraft
data (Egrett and Dornier) will be made public in
early 2008.
ACKNOWLEDGMENTS. TWP-ICE and ACTIVE
were supported under the auspices of the U.S. Depart-
ment of Energy ARM Program, the ARM Unmanned
Aerial Vehicle Program, NASA Cloudsat, the U.K. Natural
Environment Research Council Grant NE/C512688/1, the
NERC Airborne Remote Sensing Facility, the Australian
National Marine Research Facility, the Australian Bureau
of Meteorology, and the Kyoto University Active Geosphere
Investigation (KAGI) for the twenty-first-century COE
program. Vaisala generously donated the radiosonde base
stations. The Charles Darwin University, Darwin RAAF
Base, and Tiwi Island Land Council all made extensive
facilities available to the experiment. More than 100 scien-
tists were in the field. Particular thanks are due to retired
Bureau of Meteorology observers, who led the operations
of the remote-sounding sites. Without the cooperation of
a large team of specialists this experiment would not have
been possible. We thank, in particular, the pilots, aircraft
scientists, and ground crew of the five aircraft for ensuring
that the missions were so successful, and the staff of the
Bureau of Meteorology Regional Centre in Darwin for
their invaluable support both for forecasting and logistics.
The whole experiment team is indebted to Brad Atkinson,
Anthony Noonan, Tim Hume, Andrew Hollis, and Lori
Chappel whose untiring efforts made the experiment
possible. Data were obtained from the ARM program
archive, sponsored by DOE, Office of Science, Office of
Biological and Environmental Research, Environmental
Science Division. The forcing dataset was derived by a col-
laboration between M.-H. Zhang and S. Xie of Los Alamos
National Laboratory and Tim Hume of BMRC.
REFERENCESAckerman, T. P., and G. Stokes, 2003: The Atmospheric
Radiation Measurement Program. Phys. Today, 56,
38–45.
Allen, G., and Coauthors, 2008: Aerosol and trace-gas
measurements in the Darwin area during the wet
season, J. Geophys. Res., 113, D06306, doi:10.1029/
2007JD008706
Beringer, J., and N. Tapper, 2002: Surface energy
exchanges and interactions with thunderstorms
during the Maritime Continent Thunderstorm
Experiment (MCTEX). J. Geophys. Res., 107, 4552,
doi:10.1029/2001JD001431.
Betz, H.-D., K. Schmidt, P. Oettinger, and M. Wirz,
2004: Lightning detection with 3-D discrimination of
intracloud and cloud-to-ground discharges. Geophys.
Res. Lett., 31, L11108, doi:10.1029/2004GL019821.
Blossey, P. N., C. S. Bretherton, J. Cetrone, and M.
Kharoutdinov, 2007: Cloud resolving model simula-
tions of KWAJEX: Model sensitivities and compari-
sons with satellite and radar observations. J. Atmos.
Sci., 64, 1488–1508.
Carey, L. D., and S. A. Rutledge, 2000: The relationship
between precipitation and lightning in tropical island
convection: A C-band polarimetric radar study. Mon.
Wea. Rev., 128, 2687–2710.
Cecil, D. J., S. J. Goodman, D. J. Boccippio, E. J. Zipser,
and S. W. Nesbit, 2005: Three years of TRMM
precipitation features. Part I: Radar, radiometric,
and lightning characteristics. Mon. Wea. Rev., 133,
543–566.
Clothiaux, E. E., T. P. Ackerman, G. G. Mace, K. P.
Moran, R. T. Marchand, M. A. Miller, and B. E.
Martner, 2000: Objective determination of cloud
heights and radar reflectivities using a combination
of active remote sensors at the ARM CART sites. J.
Appl. Meteor., 39, 645–665.
DelGenio, A. D., and W. Kovari, 2002: Climatic prop-
erties of tropical precipitating convection under
varying environmental conditions. J. Climate, 15,
2597–2615.
Drosdowsky, W., 1996: Variability of the Australian
summer monsoon at Darwin: 1957–1992. J. Climate,
9, 85–96.
Ecklund, W. L., C. R. Williams, P. E. Johnston, and K. S.
Gage, 1999: A 3-GHz profiler for precipitating cloud
studies. J. Atmos. Oceanic Technol., 16, 309–322.
Fairall, C. W., E. F. Bradley, J. E. Hare, A. A. Grachev,
and J. B. Edson, 2003: Bulk parameterization of
air–sea f luxes: Updates and verification for the
COARE algorithm. J. Climate, 16, 571–591.
Folkins, I., 2002: Origin of lapse rate changes in the
upper tropical troposphere. J. Atmos. Sci., 59,
992–1005.
Garrett, T. J., and Coauthors, 2005: Evolution of a
Florida cirrus anvil. J. Atmos. Sci., 62, 2352–2372.
Godfrey, J. S., E. F. Bradley, P. A. Coppin, L. F. Pender,
T. J. McDougall, E. W. Schulz, and I. Helmond,
1999: Measurements of upper ocean heat and
freshwater budgets near a drifting buoy in the
equatorial Indian Ocean. J. Geophys. Res., 104 (C6),
13 269–13 302.
Greenfield, R. S., and T. N. Krishnamurti, 1979: The
Winter Monsoon Experiment—Report of December
1978 field phase. Bull. Amer. Meteor. Soc., 60,
439–444.
643MAY 2008AMERICAN METEOROLOGICAL SOCIETY |

Hamilton, K., R. A. Vincent, and P. T. May, 2004:
Darwin Area Wave Experiment (DAWEX) field
campaign to study gravity wave generation and prop-
agation. J. Geophys. Res., 109, D20S01, doi:10.1029/
2003JD004393.
Heymsfield, A. J., and G. M. McFarquhar, 1996: High
albedos of cirrus in the tropical Pacific Warm pool:
Microphysical interpretations from CEPEX and
from Kwajalein, Marshall Islands. J. Atmos. Sci., 53,
2424–2451.
—, Z. Wang, and S. Matrosov, 2005: Improved radar
ice water content retrieval algorithms using coinci-
dent microphysical and radar measurements. J. Appl.
Meteor., 44, 1391–1412.
Hogan, R. J., A. J. Illingworth, and H. Sauvageot, 2000:
Measuring crystal size in cirrus using 35- and 94-GHz
radars. J. Atmos. Oceanic Technol., 17, 27–37.
Höglund, S., 2005: Clouds in Darwin and their rela-
tion to large-scale conditions. M.S. thesis, Dept. of
Applied Physics and Mechanical Engineering, Lulea
University of Technology, 52 pp. [Available online
at http://epubl.ltu.se/1402-1617/2005/169/index-
en.html.]
Holland, G. J., J. L. McBride, R. K. Smith, D. Jasper, and
T. D. Keenan, 1986: The BMRC Australian Monsoon
Experiment: AMEX. Bull. Amer. Meteor. Soc., 67,
1466–1472.
Houze, R. A., Jr., and A. K. Betts, 1981: Convection in
GATE. Rev. Geophys. Space Phys., 19, 541–576.
Hume, T., 2007: Radiation dry bias in the TWP-ICE
radiosonde soundings. Proc. 17th ARM Science Team
Meeting, Monterey, CA, ARM. [Available online at
www.arm.gov/publications/proceedings/conf17/
poster/P00011.pdf.]
Inness, P. M., J. M. Slingo, S. J. Woolnough, R. B. Neale,
and V. D. Pope, 2001: Organization of tropical con-
vection in a GCM with varying vertical resolution:
Implications for the simulation of the Madden–Julian
Oscillation. Climate Dyn., 17, 777–793.
Jakob, C., and G. Tselioudis, 2003: Objective identi-
fication of cloud regimes in the Tropical Western
Pacific. Geophys. Res. Lett., 30, 2082, doi:10.1029/
2003GL018367.
Keenan, T. D., 2003: Hydrometeor classification with
a C-band polarimetric radar. Aust. Meteor. Mag.,
52, 23–31.
—, and R. E. Carbone, 1992: A preliminary morphol-
ogy of precipitation systems in tropical northern
Australia. Quart. J. Roy. Meteor. Soc., 118, 283–326.
—, and M. J. Manton, 1996: Darwin climate monitor-
ing and research station: Observing precipitating
systems in a monsoon environment. BMRC Research
Rep. 53, 31 pp.
—, J. McBride, G. Holland, N. Davidson, and B. Gunn,
1989: Diurnal variations during the Australian Mon-
soon Experiment (AMEX) Phase II. Mon. Wea. Rev.,
117, 2535–2553.
—, K. Glasson, F. Cummings, T. S. Bird, J. Keeler,
and J. Lutz, 1998: The BMRC/NCAR C-band
polarimetric (C-Pol) radar system. J. Atmos. Oceanic
Technol., 15, 871–886.
—, and Coauthors, 2000: The Maritime Continent
Thunderstorm Experiment (MCTEX): Overview
and some results. Bull. Amer. Meteor. Soc., 81,
2433–2455.
Mapes, B., and R. A. Houze Jr., 1992: An integrated view
of the 1987 Australian monsoon and its mesoscale
convective systems. Part 1: Horizontal structure.
Quart. J. Roy. Meteor. Soc., 118, 927–963.
Mather, J. H., Tp. P. Ackerman, W. E. Clements,
F. J. Barnes, M. D. Ivey, L. D. Hatfield, and R. M.
Reynolds, 1998: An Atmospheric Radiation and
Cloud Station in the tropical western Pacific. Bull.
Amer. Meteor. Soc., 79, 627–642.
—, S. A. McFarlane, M. A. Miller, and K. L. Johnson,
2007: Cloud properties and associated heating rates
in the tropical western Pacific. J. Geophys. Res., 112,
D05201, doi:10.1029/2006JD007555.
May, P. T., and T. D. Keenan, 2005: Evaluation of
microphysical retrievals from polarimetric radar with
wind profiler data. J. Appl. Meteor., 44, 827–838.
—, and A. Ballinger, 2007: The statistical characteris-
tics of convective cells in a monsoon regime (Darwin,
Northern Australia). Mon. Wea. Rev., 135, 82–92.
McFarquhar, G. M., and A. J. Heymsfield, 1996:
Microphysical characteristics of three anvils sampled
during the Central Equatorial Pacific Experiment. J.
Atmos. Sci., 53, 2401–2423.
—, P. Yang, A. Macke, and A. J. Baran, 2002: A new
parameterization of single-scattering solar radiative
properties for tropical ice clouds using observed ice
crystal size and shape distributions. J. Atmos. Sci.,
59, 2458–2478.
—, J. Um, M. Freer, D. Baumgardner, G. L. Kok,
and G. Mace, 2007: Importance of small ice crys-
tals to cirrus properties: Observations from the
Tropical Warm Pool International Cloud Experi-
ment (TWP-ICE). Geophys. Res. Lett., 34, L13803,
doi:10.1029/2007GL029865.
Neale, R., and J. Slingo, 2003: The maritime continent
and its role in the global climate: A GCM study. J.
Climate, 16, 834–848.
Nesbitt, S. W., R. Cifelli, and S. A. Rutledge, 2006:
Storm morphology and rainfall characteristics of
TRMM precipitation features. Mon. Wea. Rev., 134,
2702–2721.
644 MAY 2008|

Russell, P. B., L. Phister, and H. B. Selkirk, 1993:
The Tropical Experiment of the Stratosphere–
Troposphere Exchange Project (STEP): Science
objectives, operations, and summary findings. J.
Geophys. Res., 98, 8563–8589.
Spencer, H., and J. M. Slingo, 2003: The simulation of
peak and delayed ENSP teleconnections. J. Climate,
16, 1757–1774.
Stephens, G. L., 2005: Cloud feedbacks in the climate
system: A critical review. J. Climate, 18, 237–273.
Vaughan, G., and Coauthors, 2008: SCOUT-03/
ACTIVE: High-altitude aircraft measurements
around deep tropical convection. Bull. Amer. Meteor.
Soc., 89, 647–662.
Vincent, R. A., S. Dullaway, A. MacKinnon, I. M. Reid,
F. Zinc, P. T. May, and B. Johnson, 1998: A VHF
boundary layer radar: First results. Radio Sci., 33,
845–860.
Vomel, H., and Coauthors, 2007: Radiation dry bias of
the Vaisala RS92 humidity sensor. J. Atmos. Oceanic
Technol., 24, 953–963.
Webster, P. J., and R. A. Houze Jr., 1991: The Equatorial
Mesoscale Experiment (EMEX): An overview. Bull.
Amer. Meteor. Soc., 72, 1481–1505.
—, and R. Lukas, 1992: TOGA COARE: The Coupled
Ocean–Atmosphere Response Experiment. Bull.
Amer. Meteor. Soc., 73, 1377–1416.
Westwater, E. R., S. Crewell, and C. Mätzler, 2005: Surface-
based microwave and millimeter wave radiometric
remote sensing of the troposphere: A tutorial. IEEE
Geoscience and Remote Sensing Newsletter, March,
16–33. [Available online at www.grss-ieee.org.]
Whiteway, J., and Coauthors, 2004: Anatomy of cirrus
clouds: Results from the Emerald airborne cam-
paigns. Geophys. Res. Lett., 31, L24102, doi:10.1029/
2004GL021201.
Yuter, S., R. A. Houze, E. A. Smith, T. T. Wilheit, and
E. Zipser, 2005: Physical characterization of tropical
oceanic convection observed in KWAJEX. J. Appl.
Meteor., 44, 385–415.
Zhang, M. H., J. L. Lin, R. T. Cederwall, J. J. Yio, and
S. C. Xie, 2001: Objective analysis of ARM IOP
data: Method and sensitivity. Mon. Wea. Rev., 129,
295–311.
645MAY 2008AMERICAN METEOROLOGICAL SOCIETY |