
w0336.pdf - National Bureau of Economic Research
41
NBER WORKING PAPER SERIES ANALYZING THE ACCURACY OF FOREIGN EXCHANGE ADVISORY SERVICES: THEORY AND EVIDENCE Richard M. Levich Working Paper No. 336 NATIONAL BUREAU OF ECONOMIC RESEARCH 1050 Massachusetts Avenue Cambridge MA 02138 April 1979 I wish to thank the many kind people who supplied, or are still planning to supply, their forecast data. Helpful discussions with A. Brillembourg, C. Ramond, and B. Smith are gratefully acknowledged. Any remaining errors are my own. The research reported here is part of the NBER's research program in International Studies. Any opinions expressed are those of the author and not those of the National Bureau of Economic Research.
-
Upload
khangminh22 -
Category
Documents
-
view
2 -
download
0
Transcript of w0336.pdf - National Bureau of Economic Research

NBER WORKING PAPER SERIES
ANALYZING THE ACCURACY OF FOREIGN EXCHANGEADVISORY SERVICES: THEORY AND EVIDENCE
Richard M. Levich
Working Paper No. 336
NATIONAL BUREAU OF ECONOMIC RESEARCH1050 Massachusetts Avenue
Cambridge MA 02138
April 1979
I wish to thank the many kind people who supplied, or arestill planning to supply, their forecast data. Helpfuldiscussions with A. Brillembourg, C. Ramond, and B. Smithare gratefully acknowledged. Any remaining errors are myown.
The research reported here is part of the NBER's researchprogram in International Studies. Any opinions expressedare those of the author and not those of the NationalBureau of Economic Research.
NBER Working Paper 336April 1979
Analyzing the Accuracy of Foreign Exchange
Advisory Services: Theory and Evidence
SUMMARY
With the introduction of floating exchange rates, the vari:biiity of
unanticipated exchange rate changes has increased dramatically. A small
forecasting industry has developed to provide information about future exchange
rates. From an academic viewpoint, it is of interest to examine some of the
statistical properties of these forecasts and to relate the forecast errors to
other fundamental economic variables in a model with rational behavior.
Second, from a more practical viewpoint, we woulu like to know if foreign
exchange forecasts are useful to decision makers.
The purpose of this paper is to provide an objective analysis which
addresses some of the above questions for a large sample of forecasts. On the
basis of the current research, we can draw several conclusions. First, most
advisory service forecasts are not as accurate as the forward rate in terms of
mean squared error. Second, judgmental forecasters are superior to econometric
forecasters for short—term forecasts; the relationship is reversed for longer—
term forecasts (one year). Third, two statistical tests indicate that the
fraction of "correct" forecasts is significantly larger than what would be
expected if the advisory services were only guessing at the direction of the
future spot rate. In this sense, the forecast services appear to demonstrate
expertise and usefulness. However, a full analysis of the risk—return oppor-
tunities available to advisory service users is still incomplete.
It should be cautioned that if the forward rate contains a risk premium,
then we expect advisory service models to beat the forward rate according to
the tests we have outlined. In this case we must measure speculative returns
relative to a risk measure. While advisory service forecasts may lead to
profits, they may not be unusual after adjusting for risk.
Richard M. LevichNew York UniversityGraduate School of Business100 Trinity PlaceNew York, N.Y. 10006
(212) 285—6176
1.
I. Int.o4nction
With the introduction of floating exchange rates in the
early 1970's, the statistical variability of exchange rates
increased dramatically. These exchange rate cL13 were not
perfectly anticipated. Hence, the variability of unanticipated
exchange rate changes also increased. The more than five year
history of floating exchange rates has setn periods of both
relative calm and turbulence. In particular, during the last
year unanticipated exchange rate changes increased to unpreci-
dented high levels for many currencies (Levich 1978). In this
setting it is obvious that firms and investors could have
enjoyed higher earnings if they had more timely and accurate
information about future exchange rates. 1
In the present floating rate period, accurate information
about future exchange rates appears to be a scarce resource and,
correspondingly, it has a high value. A small exchange rate
forecasting industry has developed.2 In general, these firms
sell information about future exchange rates. Their specific
methodology and products cover a wide range of possibilities.
Some firms rely on a strictly qualitative approach; others are
highly technical, utilizing simultaneous equation models, spectral
analysis, or catastrophe theory. The output from these models
may be a point estimate of the future spot rate, the quarterly
average for some future period, or possibly just the future
trend movement.
Forecasts play two important roles in economic analysis.
First, the ability to predict the consequences of changes in
underlying circumstances is an important part of economics as

2.
a positive science. Analysis of economic forecasts is an
essential diagnostic check of the adequacy of a theory or
model. Second, economic decisions on consumption and
investment depend on information, which includes predic
tions of future events. Since the future value of economic
variables may be (currently) unobservable, economic agents
must rely on forecasts.
The motivation for this paper is o examine hypotheses
based on these two roles. First, from an academic view-
point, it is of interest to examine the adequacy of foreign
exchange forecasting models. Specifically,we would like to
determine (1) How accurate are professional forecasters, (2)
Do forecasters produce rational, unbiased forecasts, (3) Do
forecasters revise their predictions so that their forecast
errors are serially uncorrelated, (4) What fundamental factors
are associated with forecast errors, and CS) What determines the
heterogeneity of forecasts across advisory services. Second,
from a more practical viewpoint, we would like to know if foreign
exchange forecasts are useful to decision makers. Specifically,
we would like to examine (1) If the predictions of advisory
services are more accurate than the forward rate, (2) How the
accuracy of prediction varies across cinrency, forecasting hori-
zon, and time period as well as forecasting service and (3)
Whether the predictions of any forecasting service would have
resulted in unusual speculative profits. These two motivations
are, of course, highly complementary.

2a.
The purpose of this paper is to provide an objective
analysis which addresses some of the above questions for a
large sample of forecasts. On the basis of the current re-
search, we can draw several conclusions. First, most advisory
service forecasts are not as accurate as the forward rate in
terms of mean squared error. Second, judgmental forecasters
are superior to econometric forecasters for short-term fore-
casts; the relationship is reversed for longer-term forecasts
(one year). Third, two statistical tests indicate that the
fraction of "correct" forecasts is significantly larger than
what would be expected if the advisory services were only
guessing at the direction of the future spot rate. In this
sense, the forecast services appear to demonstrate expertise
and usefulness. However, a full analysis of the risk-return
opportunities available to advisory service users is still
incomplete.
The paper continues in section II, where we present a
theoretical discussion of the conditions under which foreign
exchange forecasts are likely to convey valuable information.
In section III we discuss alternative techniques for evalua-
ting forecasts. The empirical analysis of recent exchange
rate forecasts is presented in section IV.

3.
II. The Value of Information--rnr houldYuEver Pay fora Forecast?
A. Efficient Market Theory and Expertise
A critical building block in microeconomic theory is the
role of prices in aggregating information. A substantial
literature in economics and finance deals with the process by
which information is reflected in prices and its consequences
for investors. In the most simple, frictionless, textbook
economy where information is freely available to all, it is
clear that no one will pay for information. Furthermore, there
will be no optimal strategy for firms or investors to follow;
each investment is fairly priced relative to its risk and the
available information.
In the real world, information is costly to collect. This
fact implies that production of information will be limited to
the point where the marginal cost and marginal benefit from an
additional unit of information are equalized. While information
may be costly to generate, there are enormous economies of scale
in the distribution of existing information (e.g., via news-
papers, television, or news wires). An implication of the
above is that investors may earn the competitive rate of re-
turn on their investment in information only if they have mono-
polis±ic access to th'e iiformation. Once the information

is publicly available (i.e., a public good), it is reflected
in prices and of no further value.6
The conventional wisdom..on the value of information and
the existence of (forecasting) expertise seems to have com-
pleted a cycle. At the risk of generalization, prior to the
1960's the predominant image of the financial community was
one of professionalism and expertise in picking winxiers. The
mid-1960's through the 1970's witnessed an explosion of aca-
demic and professional research testing the efficient market
hypothesis. The general impression left by this literature
was that the performance record of many professional strategies
and many "insiders" did not surpass the performance of naive
and low-cost alternative strategies for investment. As the
evidence favoring market efficiency accumulated, the value of
professional expertise seemed to decline. Passive strategies
which emphasized low management fees and large diversification
gains seemed to dominate more active strategies which emphasized
forecasting individual stock returns.
However the extreme efficient markets view- -that prices
continuously reflect all available information and so superior
performance is not possible- -depends on a very strict set of
assumptions.8 In the past few years, academic research has
attempted to explore models which relax some of these assump-
tions. The results are shifting the academic view back toward

5.
a view more palatable to the financial community-i.e. there
do exist rational models of behavior in which investors will
seek out and pay for professional advice.
The early literature on market efficiency explicitly
recognized this point by grouping empirical research into weak,
semi-strong, and strong form tests to describe tests based on
various information sets--historical prices, public information,
and all available information. Several studies (Lone and
Niederhoffer 1968, Scholes 1972, McDonald 1973, and Jaffe 1974)
report evidence which suggests that insiders can and do earn
unusual returns relative to the market.
More recent research by Grossman and Stiglit: (1976)
has introduced an explicit cost for information. Costly
information implies that investors will not collect all infor-
mation, so markets will never be fully efficient (i.e. strong-
form). In the Grossinan/Stiglitz model, those who chose to be
informed earn higher profits than those who chose to remain
uninformed. But the greater profit is only to compensate for
the cost of information. As long as the information collection
industry is competitive with free entry and exit, there will be
no excess returns earned by collecting information. However, if
the information industry is not fully competitive, then informa-
tion takes on an "inside" character and excess returns are
possible.

7.
While this is one explanation for investor purchases
of information, there are at least two unanswered questions.
First, to the extent that the WSJ tends to survey specific
analysts, these analysts should be able to charge a higher
price since their recommendations (potentially and
initially) will receive a wider distribution. A second problem
is "selection bias!.' There is evidence that those recommendations
which reach the WSJ have value, but how many others were not
selected? And how does the WSJ make its selections? We may
be back in the )eynesian beauty contest.
Another recent approach to market efficiency whjch allows
for some individuals to outperform the market is developed in
Figlewski (1978a, 1978b). Traders in Figlewski's model have
heterogeneous information, but they also are allowed diverse
price expectations, risk aversion, predictive ability and
wealth. Based on these factors, traders make their investments
in perio4 1. Traders with superior (inferior) ability generally
incur an increase (decrease) in wealth in period 2. The
transfer of wealth ("dollar votes") toward traders with superior
track records gives the market a dynamic property and long-run
tendency to full efficiency.
An implication of this analysis is that traders with
superior ability earn unusual returns relative tO the mar-
ket. Once again, if there is a market for trading skills--
e.g. expertise can be increased through schooling or on—the
job training--then the trader may earn only the fair rate
of return based on his investment.

6.
A recent study on the value of information is reported
by Lloyd-Davies and Canes (1978). The authors select the
Wall Street Journal and its "Heard on the Street" column for
their data base. This column summarizes information (e.g.,
earnings estimates, stock price projections) about specific
firms recently prepared by leading financial analysts. Lloyd-
Davies and Canes find that in the twenty days prior to the
Wall Street Journal publication, there is some small (but sig-
nificant) price movement in the direction projected by the
analyst, but the major (and significant) move comes on the
publication date.
Lloyd-Davies and Canes rationalize these results with
the following scenario. In the initial round, the financial
analysts' information and recommendations reach only a small
group of investors with limited capital. Because of portfolio
considerations, they will not commit a large fraction of their
capital to any single asset. In some sense, then, these insiders
stop short in placing a fair value on the asset because this
would add excessive diversifiable risk to their portfolios.
When the information is published in the Wall Street Journal,
more capital is attracted to the asset and the portfolio con-
straint is no longer binding. The asset price now"fully reflects"
the now public information. Those who paid for early access to
the information earn a return.

8.
But if there is no market for expertise--e.g. traders are
endowed with non-transferable skills"then the trader may
capture economic rents based on his special endowment.10
B. Information in the Foreign Exchange Market
It is important to consider what types of information
might be worth collecting in order to forecast exchange rates.
In this regard, it is interesting to contrast how the produc-
tioit and distribution of information differs in the foreign
exchange market and the U.S. securities market. Since the
great majority of stock price variation is explained by firm
specific and industry specific factors, information on these
variables is extremely important to investors. The Securities
Exchange Commission requires firms to report extensive data
on their operations. Accounting procedures are largely
standardized. Brokers cannot act on inside information; they
must make it public. If information appears contradictory
or if rumors appear to be the cause of speculative price
movements, the SEC can suspend trading and require the firm
to make a clarifying statement.
In contrast, foreign exchange market behavior depends
mainly on country specific or world specific factors. These
factors may be determined by political forces rather than
market forces. There is no international watchdog agency to
promote the distribution of information. Institutions,
accounting standards, and accuracy of data vary greatly.
Traders rely on inside information and are not required to
publicize this information.

9
Given the contrasting character of these market
institutions, it could be argued that a larger fraction
of information is publicly available in the stock market
than in the foreign exchange market. As a result, the
diversity of beliefs about individual currencies is likely
to be greater than the diversity of beliefs about individual
stocks.
Another important factor which pertains to currency
forecasting i5 the link between basic information and the
forecast. It is very often assumed that if all information
is efficiently reflected in today's forward rate then
the forward rate is the optimal, publicly available forecast
of the future spot rate (St+). This argument ignores the
possibility that a risk premium or transaction costs may
exist, so that the true forward-spot relationship is
(1) St+ t,n + + T +
where PCX) is a risk premium which depends on other variables,
X. T. js a transaction costs measure. is a random error
term.
If (1) is the correct relationship, then advisory services
should be expected to produce foiecasts which are more accurate
than the forward rate. As a result, users of these forecasts
will earn speculative returns, but it remains to be shown that
these returns are large relative to the risk incurred. This
is an important issue which will be brought up again in the
next section.

10.
We conclude that credible models of market behavior
exist which allow for investments in information and yet
remain consistent with market efficiency. Theory alsopermits investors to be endowed with a range of analytical
skills or to occupy preferred locations in the market, both
of which characteristics may. not be tradeable. There are
clearly numerous examples of inside information leading to
unusual profits. However, it is by no means clear that the foreigflmarket
exchange / produces the optimal amount of information- -or
equivalently, whether additional investments in information
will lead to a profit.
III. Analyzing Foreign Exchange Forecasts
The analysis of foreign exchange forecasts is a tricky
procedure. Without direct information on the costs of
forecasting errors or on the investor's utility of wealth,
there is not a uniform procedure for analyzing different
forecasting methods. There is agreement that, in some sense,
the forecast should "beat the market." There are two general
approaches to determine if an advisory service possesses
"expertise? First, we can examine various statistical pro-
perties of the forecast errors. Second, we can calculatethe speculative returns earned by using the forecast.

11.
Statistical Analysis of Forecast Errors
Under a broad range of conditions, a ccarison of simple stry
statistics can be used to distinguish forecasts. For example, to maximize
utility, investors with a syimnetric linear loss ftuction should se-
lect the forecast with the mininu. mean absolute error while investors
with a symeetric quadratic loss fmction should select the forecast with
the mininn mean squared forecast error. However, the investor' $ loss
ftction may be asymetric or discontinuous at a point in time (e.g. the
investor welcomes profits but camot lose more than some amo*mt with-
out losing his job or declaring ban1tcy) or it can be variable over
tine (e.g. small losses over nine consecutive periods are acceptable
as long as the investor is positioned to catch the big exchange rate
move in period ten). In these latter cases, other criteria aply for
selecting a forecasting model.
Figire 1 illustrates a potential pitfall if forecasts are judged
on the basis of mean or mean squared errors. Assi.mte today's forward
rate is $2.00 and t alternative forecasts of the future spot rate are
and S2—$2.08. If the actual spot rate turns out to be $2.02,
the secoth forecast (S2) is superior even though it resulted in a larger
forecast error because it advised investors to take long and profitable
forward sterling positions.
Consequently, when investors are interested only in
the sign of their profits the fraction of periods where the
forecast correctly predicts only the direction of movement
in the exchange rate, becomes a valid criterion for judging
forecasts. Direction can be defined relative to the current
spot rate (Sr), the current forward rate or some other

.,''/.fl '?.°°
*S.'
Figure 1: Illustrating a Pitfall in Forecast Error Analysis
Figure 2: Illustrating a Test for Advisory Service Expertise
1/
I'
50 /40

12.
decision variable. (e.g. the forward rate plus a risk premium
as in (1) ). An analysis of direction relative to the current
forward rate would be a conservative test if the market price
includes a risk premium.
We can construct the following test. We wish to estimate
the probability (p) of correct advice in any period and then to
infer whether this probability is greater than one-half. More
formally, we are testing12
H0: p0.5 (advisory service has no expertise)
H1: pO.5 (there is forecasting expertise)
For example, in a sample of n—100 observations, assume that
the advisory service produces r60 correct forecasts. The pro-
bability (p1) that this 60% track record could have occurred
under the null hypothesis is 2.3w. Therefore pA_r/n is one measure
of forecasting expertise and p1 is a measure of our confidence
that p is greater than 0.5. (the type I error probability).
In addition, we can calculate the probability (p2) that we
judge a service to have no expertise (p<O.S) given that the
true probability is p0.6. The probability (p2) therefore is
the chance of incorrectly failing to reject the null hypothesis
(the Type II error probability)

13.
Speculative Return arid Risk
Although the previous techniques may offer conservative tests
for forecasting expertise, it is not realistic to asstuce that investors
are interested only in the expected si of their profits. The expected
value of profits and higher ents of the distribution may also play a
role. A stronger test of forecasting expertise is to cupare the perfor-
nce we would have obtained using the forecast relative to the perfor-
mance of an al rnative approach. The forecast is useful if it improves
the investor' s return/risk ratio.The terms "return" and "risk" require special attention as they
apply to the forei exchange market. If the investor uses the fore-
cast for forward speculation, his an%nit of profit will be
(2) X W -
where X - ntmiber of forward contracts
W • weight (+1 • forward purchases; -l • forward sales).
The rate of return - where M is the fracticn required
for margin. Withat loss of generality we can assme that M • 1 so that
the rate of return is
(3) ii -
If the investor choses to speculate in the spot market by taking a
lg position in 04, for example, he ist first borrow U.S. dollars, paying
the cost • 14 The investor now purchases 24 in the spot market (at the
rate 1/Se), Invests the 24 to return 1.24 and sells the entire proceeds in
the future at rate S,1. The investor's rate of return in excess of costs is

14.
- .a
(4) S1 (] + i) / S. (j. + i)
When the interest rate parity theory holds so that PJS — +
and in the case where W1, expressions (3) and (4) are equal. The
equality between spot and forward speculation is well latown (Tsiang, 1959),
but this exposition highlights that any positive return in (3) or (4) is
w2usual, since the cost of the invesent has already been netted out.
In the case where the cost i reflects the risk of the proposed foreii
exchange speculation, the profit is wuisual in a risk adjusted sense also. 15
Ideally, we would lilce to loiow the risk adjusted cost of capital
for speculation (i.e. open positions) in the foreii exchange market.In this case we could make a direct test for niusual returns based on ad-
visory service forecasts. However, general equilibrii. nde1s for pricing
forei exchange risk are still open to considerable dispute, so we
mi3t consider more heuristic alternative approaches. 16
One approach is to calculate a series of speculative returns
and to measure the covariability of these returns with some market port-
folio. Roll and Solnik use this approach and adopt a basket of currencies
as the market portfolio. The covariance statistic provides a measure of
the systatic risk of a currency position. In this framework, speculative
returns are nmsual if they are (1) large relative to transaction costs,
(2) large relative to a risk measure, and (3) consistent over tne.
A second tecimique proposed by Levich (1977) is to calculate the
tmt of profit
(5) _1 -
that an investor could earn over N periods if he had perfect information
in every period. Levich shows that the ratio

15.
N N(6) H — £ W4(S1 4-F. )/ lFt ti—i .,' b,.'
has expected value (2p-1) and variance 4p(1-p)/n where p is the probability
of choosg W correctly in any period and n is the ntmber of independent
sasle observations. For exan1e, a forecast which leads to the correct
position in half of the periods has p-0.5 and E (H) -0.0. ?IUnusualt*prof its
correspond to the case where H is greater than zero or p is greater than
one-half. 17
Discussion of these Procedures
Statistical analysis of foreign exchange forecasts very often will
compare their results with the fotward rate. This assi.nes that the for-
ward rate has sante desirable property- -that it is imbiased or the minmmLmt
?'EE forecast which is publicly available. Research reported by Bilson
and Levich (1977) and Cornell (1977) caimot reject this assumption. How-
ever, an alternative hypothesis--that the foard rate reflects a risk
preaiue which is highly volatile and changes sign--is also consistent with
the data. In this second case, the forward rate is not a ni MSE
forecast and we uld not expect it to have a smaller MSE than forecasts
published by professional analysts.
A second issue relates the investor use of forecasts to their analysis.
Very often, cretcy analysts generate forecasts on a currency-by-ctnrency
basis. Furthermore, the analysis of these forecasts and advice on how to
utilize then are often also organized by individual currencies. Md
typie2lly, exchange rate cthmiges are not perfectly correlated. It seens
therefore, that arency forecasts and their analysis often encourage
currency-by-currency thinking. In developing this argimnt, Maktn (1978)

16,
suggests that firms which concentrate on individual currencies
may be sacrificing important diversification gains. Granting
that in theory shareholders can diversify exchange risk by themselves,
Makin argues that the revealed preference of financial managers is
adainently in favor of risk reduction. This. suggests that currency
forecasts be anayized as a group and not individually.
IV. Empirical Methodology and Results
A. Data Description
In this section we will analyze currency forecasts provided by
nine leading foreign exchange advisory services. While several of
these services have given permission to have their names attached to
their empirical results, the identity of the advisory service is not
important for, the purpose of testing our null hypotheses on forecast
accuracy and the availability of unusual speculative returns.
Therefore, I have elected to refer to the advisory services only by
number.
The forecasts and the services display a wide range of
characteristics which will make data computations and statistical
comparisons somewhat difficult. For example, some services produce
a quarterly average forecast for one to six or eight quarters ahead;
other seririces report an end-of-month forecast for the next four
quarters. Some services adhere to a strict production schedule and
publish forecasts at regular one-month intervals; other services
follow a less strict time schedule and publish forecasts at
irregular intervals ranging from three weeks to, say, eight or nine
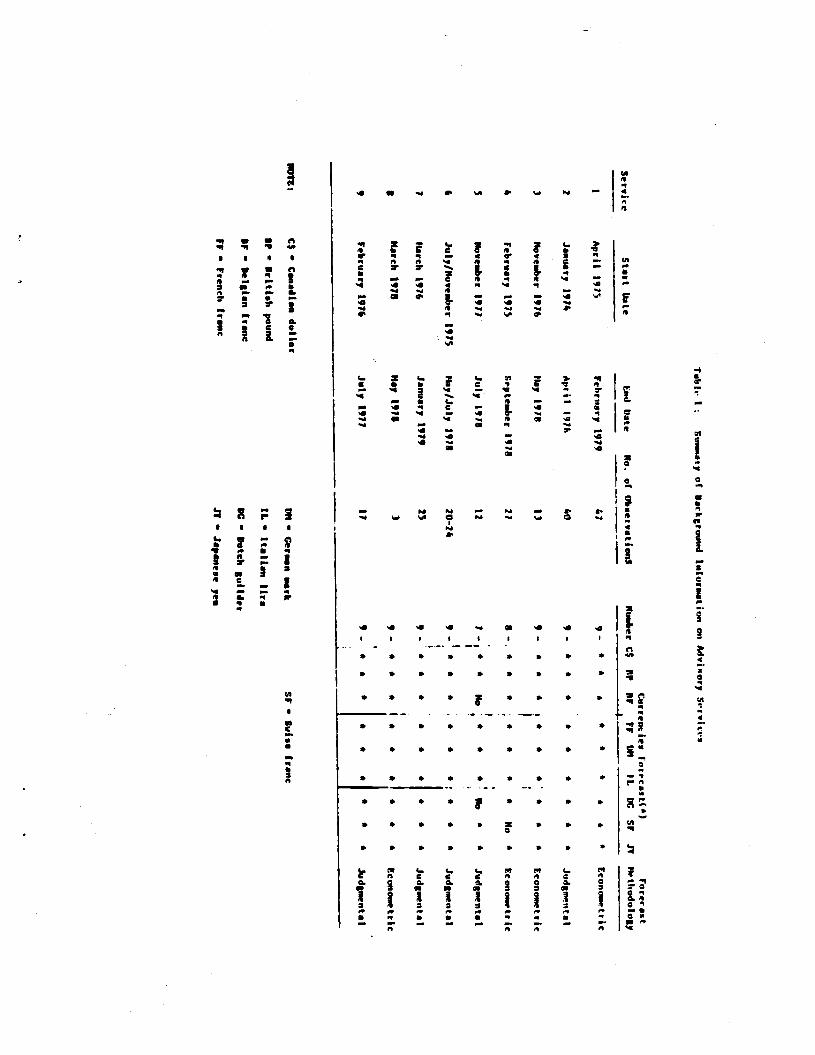
weeks. So*. of the characteristics of the advisory services in our

17.
sample are summarized in Table 1.
A second important set of data for this study is the time
series of spot and forward exchange rates which we use for the
standard of prediction performance. For this purpose we use the
Harris Bank Weekly Review which reports the closing bid prices for..
spot exchange, and one-, three-, six-, and twelve-month forward18
contracts for nine major currencies. This data set begins in
January 1967 and contains 626 weekly observations through
February 2, 1979.
B. Research Methodology
There are several important methodological issues which must
be discussed before we proceed to discuss the results. The first
issue involves the time or date of the forecast. For example, a
service may run their computer model on January 12 Ct ). The1
forecasts are combined with other data for a published report
dated January 19 Ct ). Finally, the report is mailed to sub-2
scribers who receive it on January 26 Ct ). To analyze a forecast3
we need to know the horizon (i.e. how many weeks ahead we are
forecasting) which implies that we must know the forecast date. Is
it t , , or t ? For academic purposes, we should chose t , because1 2 3 1
the service used only information available at t to make its1
forecast. However, for practical investment purposes, we cannot use
the forecast until t , and so we should calculate speculative returns3
based on the transactions we can make at t , but still recognize that3
the forecast date is t1
In this paper, our calculations assume that the forecasts are
effective on t and that subscribers can then transact at prices1
prevailing on the fo.lowing Friday. We require this assumption

18.
because our spot and forward exchange rate data are end-of-week
prices.
A second methodological problem arises from the fact that many
services generate a quarterly average forecast. While we can calculate
the average spot exchange rate in a quarter to suggest a measure of
forecasting accuracy, we cannot easily use this statistic to
measure the accuracy of the service relative to some other predictor
(e.g., the forward rate) or to measure the speculative profits
available by using the forecasts. We therefore elect to convert
the quarterly average forecasts into a set of point estimates of the
future spot rate at various horizons.
Our procudure is to assume that the quarterly average forecast
corresponds to the point forecast for the midpoint of the quarter.
For example, let quarters I, II, III, and IV for a given year
correspond to weeks 1-13, 14-26, 27-39, and 40-52, respectively.
Quarterly average forecasts for these quarters are assumed to cor-
respond to point forecasts for weeks 7, 20, 33, and 46, respectively.
Given the current spot rate, we use linear interpolation to calculate
the implied 4, 13, 26, and 52 week ahead forecasts. We chose these
dates to be consistent with the term structure of forward rates
provided by the Harris Bank Weekly Review.
An example of this procedure is illustrated in Figures .
When point estimate forecasts -- say, one month ahead or end of
quarter -- are provided directly by the service, we can use linear
interpolation directly to calculate the implied term structure of
forecasts.
Consistent with our remarks in section III, the analysis
considers both the distribution of forecast rors and the

/80.
A5 —
A
A I,
I
-
P4.v. g
A
Tturs 3 : CotatructLo of Point Toecssti (S) from QuarterLy Averale Torecuts.

19.
speculative returns available by using the forecast. Forecast
errors are calculated as
E — (S - S )/St,n t+n t,n t+n
Awhere S is the future spot rate, S is the n-period ahead
t+n t,nforecase made at time t, and E is the resulting error. Note
t,nthat the errors are indexed by the point in time when the forecast
is made (t) rather than the time when the result is realized (tn).
To calculate speculative returns, we select the weights
according to a simple criterion:
1i if S
) t,n t,nAt (-1 ifS <Ft,n t,n
The decision to invest a lump sum amount suggests that our investors
are risk neutral and consider each currency individually or form
equally weighted currency portfolios. If investors take into account
other factors (e.g., the magnitude S -F , the standard error of
A t,fl t,fl
the forecast S or the correlation of forecast errors acrosst ,n
currencies), a different set of weights would result.
C. Empirical Results
In the current version of this paper, our analysis is
restricted to the entire sample period for each advisory service.
Since the time period and sample size are not comparable for all
advisory services (see Table 1), it is not valid to make direct
comparisons of the results across currencies.
The empirical results of this study are summarized in Tables
2-6. Table 2 reports the ratio
Ratio MSE (advisory servic forecast)M a'

20.
where the mean squared errors (MSE) are calculated over the same
sample period. Values of "Ratio" less (greater) than 1.0
suggest that the advisory service forecast was more (less)
accurate than the forward rate prediction. The results
indicate that most values of "Ratio" are greater than 1.0,
ranging from 53% of the entries in the three-month panel to 71% of
the entries in the six-month panel.
However, several services indicate a pattern across horizons.
At the one-month horizon, services 5 and 9 generally have
smaller MSE than the forward rate, while service 1 has a greater
MSE for all currencies. At the twelve-month horizon, however,
this pattern is reversed, so that service 1 appears generally more
accurate than the forward rate while services 2, 5, and 9
generally have MSE greater than the forward rate. These results
suggest that judgmental forecasts may be more accurate in the
short-run and econometric forecasts may be more accurate in the
long-run.
Table 3 reports the mean speculative return earned by an
investor who followed a naive trading strategy using the fore-
casts. In the one-month panel, 72% of the entries are positive.
This percentage declines steadily to 46% positive entries in the
twelve-month panel. Seven of the nine services are profitable at
the one-month horizon. At the twelve-month horizon, only two
services are profitable across all currencies; both of these
services use econometric forecasting methods.
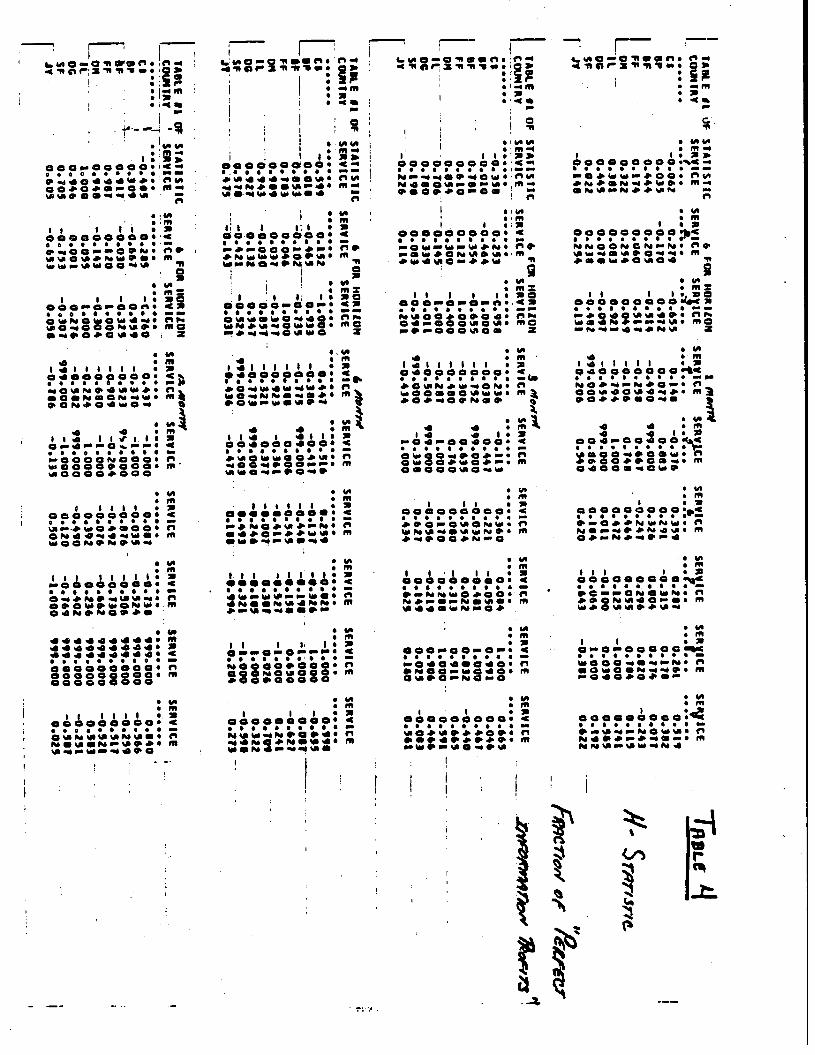
The ratio of speculative profits to perfect information
profits (the H-statistic from equation 6) is reported in Table 4.
Note that as expected, the sign of the entries agree in Table 3 and

21.
4. Only 14 of the entries (or 18%) in the one-month panel
report H greater than 0.6. These large H-statistics are
concentrated in services 3, 5, 8, and 9. In the twelve-month
panel, 12 of the entries (or 17%) are greater than 0.6. One-
half of these values are concentrated in service 1.
As we explained in section III, the H-statistic depends on
both correct prediction aid the distribution of speculative
returns. In order to concentrate on the prediction issue, we
calculate the fraction of forecasts which are correct relative to
the forward rate.Aper/nwhere r — number of correct forecasts
n — sample size
Sample estimates of are reported in Table 5. The calculations
are based on all sample observations (i.e. a dependent sample) in
order to get a more accurate estimate of the true . For each
service, the results are aggregated across currencies.
Table S suggests one result we have mentioned before; namely,
the equation based forecasts (services 1 and 3) appear to be more
accurate in the long-run while the judgmental forecasts (services
2,6,7,9) appear to lose accuracy with longer horizons. The Swiss
franc appears to be the most difficult currency to forecast as
most of the estimates of are less than 50%. Using the same
criterion, the Italian lira appears to be the easiest currency
to predict. Service 9 appears to have the best overall record
at the one-month horizon, while service 1 appears to have the
best overall record at the longer horizons.
Our interest, however, is to determine if the values of
in Table 4 are unusual and indicate expertise. Our approach,
22.
.-—. -
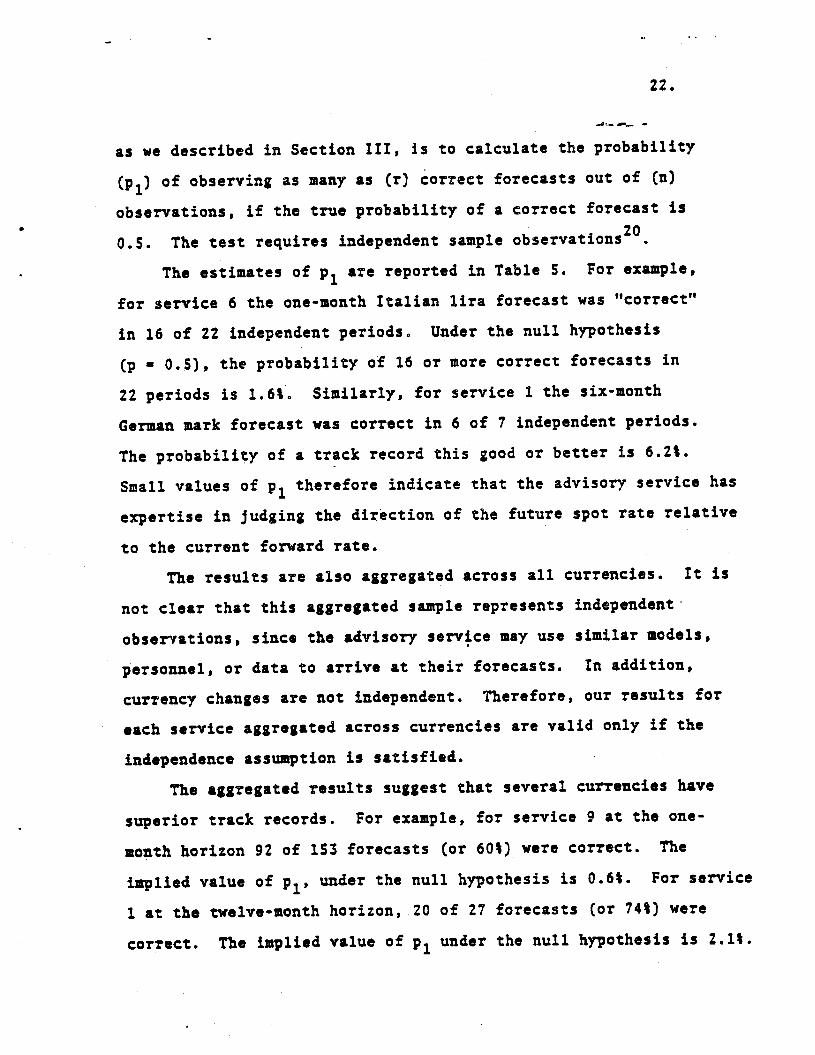
as we described in Section ui, is to calculate the probability
(p1) of observing as many as Cr) correct forecasts out of (n)
observations, if the true probability of a correct forecast is
0.5. The test requires independent sample observations20.
The estimates of p1 are reported in Table 5. For example,
for service 6 the one-month Italian lira forecast was "correct"
in 16 of 22 independent periods. Under the null hypothesis
(p 0.5), the probability of 16 or more correct forecasts in
22 periods is 1.6%. Similarly, for service 1 the six-month
German mark forecast was correct in 6 of 7 independent periods.
The probability of a track record this good or better is 6.2%.
Small values of p1 therefore indicate that the advisory service has
expertise in judging the direction of the future spot rate relative
to the current forward rate.
The results are also aggregated across all currencies. It is
not clear that this aggregated sample represents independent•
observations, since the advisory service may use similar models,
personnel, or data to arrive at their forecasts. In addition,
currency changes are not independent. Therefore, our results for
each service aggregated across currencies are valid only if the
independence assumption is satisfied.
The aggregated results suggest that several currencies have
superior track records. For example, for service 9 at the one-
month horizon 92 of 153 forecasts (or 60%) were correct. The
implied value of p1, under the null hypothesis is 0.6%. For service
1 at the twelve-month horizon, 20 of 27 forecasts (or 74%) were
correct. The implied value of p1 under the null hypothesis is 2.1%.

23.
V. Summary and Conclusions
Financial theory allows for the possibility that investors
may earn unusual returns relative to those generally available in
the market. In order to earn unusual returns, investors must
have access to information or analytical skills that are not
generally available and reflected in market prices. While this
is a theoretical possibility, it is not likely in a highly
competitive market.
The empirical section of this paper analyzed the accuracy
of a wide range of foreign exchange forecasts prepared by
advisory rvices. Our purpose was both to examine the accuracy
of these forecasts and to measure the speculative profits based
on these forecasts. Based on analysis of mean squared errors,
our resulü suggest that most forecasts are not as accurate as
the forward rate.
Our analysis of the speculative returns and the fraction of
"correct" forecasts, however, does suggest that advisory services
have beaten the forward rate in the past. The record of correct
forecasts and percent of perfect information profits are too
good for some services to be explained by chance. These unusual
results aremore convincing for services with a long track record.
It should be cautioned that if the forward rate contains
a risk premium, then we expect advisory service models to beat the
forward rate according to the tests we have outlined. In this
case we must measure speculative returns relative to a risk
measure. While advisory service forecasts may lead to profits,
they may not be unusual after adjusting for risk.
Tebit I :
Suamsaty
of It.ckrouisd Inlurmatsun m
l Mem
ory %rrvlti
Non:
CS — Canadian dollar
IF
Iriti.b pound
IF — B
elgIan franc
iF — Irend.
franc
NI — G
erman
mark
IL — Italian
hr.
IC — B
utch guilder
JT — J.pane.e
yen
Service
I
Statt Ibte
April
l975
Ind Pat.
No.
——
Fcbrtiary
1919
of Obuerv.tIesiS
——
41
Nindsar CS
PP
— 9 —
a
Ni
F!
(IN
I
IL
(IC
a
SF 19
a
Netliodotogy
Econometric
•
2 January
1974 A
pril 191k
40
a a
a *
Judgmental
3
4
Novem
ber l1 February 1975
Hay
1978
Septem
ber 1918
(3
27
a
•
a
a a p
a E
conometric
Econom
etric
5
Novem
ber 1911
July 1918
12
S
* p
* a
Judgmental
B
Julyllluvember I15
HayFJuIy 1918
20—24
a
a
a
a
Judgmental
7 N
arch 19T
h January
1979 25
a
a
a
a
Judgmental
• March I78
Na,
1975 a
a a
a tem
etric
February 197B
July 1911
11 *
* a
Judgmental
9—
a
5—, a
..
,
a a
9-..
9-
*
a
a
a
a
a
a
a
a
a a
a a
a a
a a a a * * a a
* a a
No,
a a al a
SF • S
vi.a friar

IAULI wI t* S
IAIIS
IIC
.1 ICR HORIZON
I mw
r4 }'"
S1R
JCE
IC
E
sLR
yLE
S*R
VU
E
_______________ C
I 1.230
1.063
1.340
U.03
1.120
1.060
1.692
0.951
0.669
OP
1.202
1.260
6.636
1.268
0.910
0.71,1
1.497
0.064
0.819
61
1.220
0.995
1.106
1.045
999.000
1.108
1.345 51.948
1.306
IF
1.262
1.334
0.196
1.029
0.92
1.651
1.260
0.813
1.592
UN
1.131
0.944
1.241
1.515
1.634
1.095
1.011
0.697
0.918
IL
1.447 1.106
0.260
0.99?
0.901
0.650
45.026
1.244
0.844
Ad
06
1.124
1.001
1.188
1.460
999.000
1.152
1.505
50.915
0.611
SF
1.151
1.024
1.630
999.000
0.806
0.956
1.131
0.aOO
1.269
JY
1.292
1.124
1.143
1.043
0.990
0.683
qqq.ooo 1.231
0.105
IROLE 81 IN SIAIISSIL
3 FOR HORIZON
COUNTRY
SE
RV
ICE
SERVICE
SERVICE
SERVICE
SERVICE
SERVICE
SERVICE
SERVICE
SERVICE
.......
S......
••••••• ••.....
....... .......
....... .......
....... C
S
1.021 1.193
1.110
0.613
0.953
1.233
1.519
14.521
0.456
OP
1.150
1.603
0.513
1.091
0.055
0.962
1.336
0.080
1.132
IF
0.164
0.942
1.381
1.359
999.000
1.363
1.131
0.610
1.053
11
1.129
1.363
0.211
1.039
0.951
2.231
1.948
0.085
3.216
CM
0.042
0.193
1.466
1.151
0.066
1.275
1.495
0.130
0.937
IL
0.810
1.194
0.109
0.649
0.199
0.993
0.921
0.912
0.182
DC
).159
0.0.0
1.261
1.666
999.000
1.295
1.991
0.221
0.612
SF
0.93? 1.231
1.558
999.000
1.010
0.961
1.120
1.622
1.393
JY
1.293
1.090
1.022
1.406
0.923
0.794 q1q.o
0.915 0.626
hOLE
II UI STATISIIC
3 FUR HIJRIION
COUNtRY
SERVICE
SERVICE
SERVICE
SERVICE
SERVICE
SERVICE
5IRVICE
SERVICE
SERVICE
....... •5••S
C
s 1.899
1.029
2.691
0.806
1.261
1.214
1.614
6.305
0.39?
OP
1.274
2.216
0.612
1.422
1.351
1.050
1.464
0.456
1.434
01
0.329
0.914
1.591
C.910
999.000
2.035
1.129
3.013
1.120
11
0.945
1.590
0.201
0.616
1.296
1.661
1.769
1.032
3.606
08
0.302
0.052
1.605
1.806
1.193
1.142
1.192
1.654
1.40,
IL
1.421
1.435
0.166
0.649
1.143
1.013
0.091
1.106
0.620
06
0.319
0.939
1.351
1.352
999.000
1.856
2.093
1.111
0.065
SF
0.616
1.665
1.919
999.000
1.622
1.013
1.241
3.060
1.301
JY
1.296
1.161
1.10$
1.311
1.213
0.921
999.O
1.011
0.903
TAOLE II III StAtIStIC
3 ICR HORIZON
/t MO4TW
COUNtRY
SERVICE
SERVICE
SLRVICE
SERVICE
SERVICE
SERVICE
SERVICE
SERVICE
SERVICE
Cs
2.041
1.211
2.911
1.109
1.522
1.198
1.924
999.000
0.536
OP
1.040
2.166
0.432
I.4t1
2.051
1.002
1.643
999.000
1.410
OF
0.115
I.u19
1.511
0.112
999.000
1.697
1.665
999.J00
1.211
Fl
0.002
1.610
0.311
0.002
1.134
I.)uZ
2.391
999.000
1.411
08
0.235
1.102
1.101
1.293
1.611
2.004
2.182
999.000
1.660 IL
0.318
1.341 0.143
1.421
0.995
0.751
0.80
999.000 0.460
06 0.181
1.119
1.163
1.096
Vi.000
1.991
2.2,?
999.000
1.414
SF
3.641
2.113
1.559
999.UUU
I.92 1.217
999.000 1.365
JY
1.413
1.302
0.911
1.201
1.062
0.850
fl9.''r.
999.000
0.960

IABLt II
Lii SIAlIIlL
4 F(jII
HU
NIZ
UII
I fl,fTV
S(R
VIC
E
SE
RV
ICE
$IR
ICE
SERVICE
SERVICE
SERVICE
SERICE
SIR1ICE
SERICE
.......
...t... ..j...
...i...
•..f...
•..f...
...f...
...z...
•...... •..I...
(0
-0.00*
0.002 —0.006
0.001
—0.004
0.003
0.003
0.003
0.005 O
P
0.001
—0.002
0.014
0.000
0.015
0.006
—0.006
0.U0
0.001
1FfiLE
SF
0.000
0.003
—0.007
-0.002
999.000
0.005
—0.000
0.010
0.001
—
Fl
0.003
0.001
0.000
0.005
0.016
-0.004
0.004
0.011
—0.003
ON
0.005
0.004
0.001
—0.005
0.013
0.001
0.001
0.020
0.001
IL
0.001
0.002
0.011
0.003
0.013
0.009
0.004
—0.006
0.010
00
0.000
0.001
—0.001
—0.003
999.000
0.000
-0.002
0.001
0.001
SF
—0.000
0.004
—0.010
9'19.000
0.030
0.003
-0.003
0.032
0.002
E'lY
rrn'e IV
—0.002
0.004
0.003
—0.003
0.011
0.011
—0.011
—0.011
0.000
Fl
AV
ER
AG
E
0.003
0.002
0.001
—0.000
0.0*4
0.00,
—0.001
0.009
0.005
?e7oWi1 7 &
loD
TASLE 01 OF SIAJISIIC
4 FOR HORIZON
COIT*Y
SERVICE
SERVICE
SERVICE
SERVICE
SERVICE
SERVICE
SERVICE
SERVICE
SERVICE
•eee
....... .......
....... •......
....... .......
....... .......
....... C
l —0.001
0.004
—0.019
0.005
—0.003
0.006
0.001
0.004
0.012
OP
0.000
—0.020
0.045
—0.003
0.020
0.012
—0.002
0.043
SF
0.029
0.012
—0.025
—0.000
999.000
—0.003
—0.011
0.029
0.015
Fl
0.011
0.003
0.029
0.003
0.039
-0.015
-0.000
0.035
-0.009
I
0$ 0.025
0.010
—0.014
—0.000
0.040
0.002
—0.009
0.020
0.014
IL
0.031
0.000
0.035
0.035 0.04$
0.012
0.013
0.020
0.026
00
0.021
0.011
0.000
—0.004
999.000
—0.002
—0.001
0.025
0.015
SF
-
U.C
09 0.001
-0.043
999.000
—0.033
0.03*
0.002
—0.000
—0.002
JY
—0.009
0.002
0.012
—0.010
0.012
0.011
—0.030
0.013
0.011
AVERAGE
0.014
0.004
0.002
0.000
0.020
0.001
—0.006
0.022
0.010
7ASU110FITATISTIC —
4 FOR HORIZON
COUIIRV
SERVICE
SERVICE
SERVICE
SERVICE
SERVICE
SERVICE
SERVICE
SERVICE
SERVICE
.......
....... .......
....... •......
....... .......
....... .......
I CS
-0.020
0.009
—0.020
0.015
—0.111
0.000
—0.002
—0.032
0.033
OP
0.001
—0.030
0.059
—0.031
—0.022
-0.006
—0.021
0.011
—0.043
[SF_
0.054
—0.006
—0.041
—0.006
999.000
-0.030
—0.011
—0.061
0.009
FF
0.043
'O.OOI
0.066
0.014
0.002
—0.030—0.009
0.074
-0.024
ON
0.046
0.003
—0.019
-0.019
-0.021
-0.016
-0.024
-0.0,2
0.011
IL
-
0.017 0.001
0.043
0.055
0.020
0.001
0.031
0.00)
0.092
00
0.050
0.000
0.01 —0.001
99•$ØØ
-0.014
-0.000
0.046
0.010
SF
0.045
—0.030
—0.061
999.000
—0.044
0.040
—0.020
—0.152
—0.039
IV
0.032
—0.013
0.00$
—0.055
—0.050
0.012
—0.005
—0.043
0.019
AVERAGE
0.036
—0.001
0.007
—0.004
—0.020
-0.0
—0.010
-0.016
0.004
IAOLE 01 01 STAIISSIC
4 FUR HORIZON
,2,V.S'f7*'
COINIIRY
SERVICE
SERVICE
SERVICE
SERVICE
SERVICE
SERVICE
SERVICE
SERVICE
SERVICE
S......
•S•S
e O
••e •se•eS
••S
Se
•t•eI S
S••e
•••SS
S
••e C
S
—0.026
0.016
—0.044
0.021
—0.051
0.003 —0.042
999.000
0.045
OP
0.039
—0.002
0.113
—0.041
—0.063
—0.000
—0.051
999.000
—0.060
SF
0.110
—0.002
—0.046
0.030
999.000
-0.119
—0.015
999.000 —0.0)1
FF
0.091
0.010
0.130
0.030
—0.045
—0.053
—0.0.0
999.000 —
0.041 U
N
0.004 —
0.011 —
0.033 0.002
—0.121
-0.011
—0.041
999.000
—0.044
IL
0.161
0.017
0.154
0.002
0.111
0.060
0.041
999.000
0.090
00
0.090
0.001
0.036
0.011
999.000
-0.052
—0.044
999.000
—0.021
SF
0.0,1
-0.091
-0.011
999.000
—0.211
0.011
—0.135
999.000
—0.000
JY
0.004
—0.092
0.014
—0.059
—0.025
0.000
-0.20,
999.000
0.000
AVERAGE
0.001 -0.021
0.030
-0.000
-0.050
-0.000
-0.014
0.0
-0.014
4 0 • 0• .ee2r.•.40
•VIVI• -4I.00 0 00000• 4o . 0 0 0 • S • S S ——• 4 0 4 0 4 'a • r* VI0040#aVIOes I-4• —
•*mI, I II •00000000054• 0 S • S S • S • I.—000VIVIO0NS c•'a'aOia4NWO0' m•11
• VI•I I I s.a0GGGG0• 4• . 0 S S S S S S 0 ——G'a0VI0VI41 fP.sma2S
'a S141 I II I I0400000005• ••..o... S0 'a P4 0 4 'a VI 4.• 0 P0 0 0 P0 VI S•0 P44 0 0 0
S
4 4 5114 I II IS0 4VIO .VI VIS• 0S •155S550000P40005'a00000000•'aGO 00 4 00 0• VS• mI I I I I .000000000' 4• . . ••.•SSS —a..#'aCe000S f.P4'a4-44-4VIas 11
• VI• rhII $ JIll.000000005 4SI •5S 55550 0 0 VI0 '00 N VI .
• VI444444444' M44944444454444444445 4•5S551.5•• —000000000'0OO00000' m000 00 0 000• VI• mII 1111 •2000000000' 4• . 0•SIISI —G'aP4'a'a%0P4'aS' fIPde'aOP.I'a0#' ni
'a VIVI 0400
40 0 — a .. ei . ri —0S
• S•m• I
• VIVII. 44.. S S S • S S S S ——4'a44400'a' flVI
I SSIii I ;l Io co 000000'• I S S S S ••S S
— 4 — C C C — 4 — S• Pa 40 40 VI 4 0 0 VI S40 VINO -40 Pa 'a P4
SS
.1 .1 I I,00000VIOG VIS•S....SS''OVI'a.40040'VI N .0 'a 40 40 VI C SVI040WI'a0
'a am*4111*11 •.40000000' 4• 5 5 S S 5 5 5 S S 5.004104W404 f4aSC4P.lPda4O4' h•0 40 'ao 'a -4
'0 .. :119 $ 'al IS004000 40Cm 45S5Ss 5555S004000VI5 Sh
'a *0 0 .4 VI0 0 0 S
• VIS m• 11.111 S
-4SS• •5555SVI4N0#'a4VIN' (I.440VI4#VIVI5 rh*• VI 0 4 VI 'a 044
S,• I I I I l I I S••••••S •SS'a 40 40 VIVI 'a OS4 NO • N 'a 'a N N S• VI VI 44000
S
II I I l0 — — 0 VI 0 — — VI S• S S S S S •S S SP000000000'000N0'a000.000000000
S VSa rnI I I •00000S0' 4.i55SSI•N'aw—.P000 09' ri4N04N0VI4' rn*00 N 4 4 'aS
'a 0 0 0 0 rs , —.2$.'.4.
• VI0
SIVIVI•mI $000 00 000 0. <VI• ' • S S S S 5 SN VI 4 40 040 *9 S 45 VIN 'a a a 'a — a VI 'a' m —•.OO4CVIOO
e40smI0000000005 4•55I5s CSS SVIVIe VIVIVIVI#N' 0VIS VI .0 0 N '40
• 'a• 4,52II I I lse
0 0 0 VI 0 N 0 VI 4 S 4• S • S 0 5 S I S S ——P4'a0040004' 4IP.s04VI000'aQMIS mc..0VI000U505 2
II Ills i04000000055505555505• C 'a Pd .0 '040 PS SVI 0 0 •0 0 VI 'a 'a S404400 NO 0
S'0 '0 514 '0 ISVI04 VICO 400'• 55I50555 S0 *00004000#VI0#s0000
• VIo IVI $4 S000000000' 4—
•OGVIG'aONVIS *1WN'a0'aWP.J0S m.0 -e 0 0 0 .0 P4 VI
• VI• mI I000000000' 4.S•SS••S. S —
000404040' IIIVI '00 VI 90-40 'a
'a C 0 0 0 fI S (4 400ISS 4,5.•
VI
• VIVI• _I IS 0000000000 •4 4• S • S S S S S S S ——VI0440'0VI# 005 (*VI4N40Pd44005 1144•Pd'aVIN4#'aN —
S VI• ni$ ,O0 0 0 0 0 0 0 0 •4555555555IMNCOPJCNPS' rIo'a'a40'a0 0-44• rn.00S4#0*004 44
O VIS 5442II I I•000000000GPC• S S S S S S S • S ——VI40'0e'aVI'aO' r$'0O9N#VI4'a5 mcVIN4VI444Pd*Ø 2• VI
'a .nn141 tIll .O 40000000 4S S S S S S S S 5 0 VIVIN0#4VIP040' fI0a'a4C04-e4' m004400040S VI
.0 sm4 '0004VI 00900 <.55.5.555 •'a000000'a' rI4000400045 in0400040*00• VI• in
4MSVI404PS4'a' MIPa #00VI 4
SW'• inIII I oXCO000OC00S5 •SSSSSSIOCVIVICNOVINS rI•OCN'a4GVISS MI*94 09 0%
• VI• inI I 5*000000C5555555555'0000 .S$SVIPOS rI•0'a0•N-4-40S MIrn a a 04 a
S 4$S MI
000000CC 0'S••SS....I —•'a4VIN0'aVII rIMI
VIMI
-4VI110in
.14
VS
*04*mc2
VIin-4VI
VIin
• 40 5 VIin . in* I II 1* IX4 0000000COS 4— .5.55.... C-r1 OVIP4N'a04005r1in N4VISVINS'aS5 in'a44SVINVIO4VI S 40ne • se* .X4 000VIOOVI0VIS 4— ..••.S..•. —VIO3O4004OS rIml, •NOO'a0'aO. in0'aOG#00
IF
1

TA
PLE
5: P
ER
CS
NT
AG
S O
F
CO
RR
EC
T F
OR
EC
AS
TS
(p • r/n) IN
A
LL
.
SA
)IPIE
OS
SE
RV
AT
ION
S (D
SP
SP
IDB
NT
SAJIPL
ES)
I _pZ
IjjJ1DN
TH
-
.!!!_1Z
NU
NT
IW
_________ __________ C
UR
RE
NC
Y
SERVICE >
CURRENCY
SERVICE >
1
2
3.
4
5
6
-
1 2
3
4
5
6
7
0
V
60
50
65 C
AN
AD
A
;_: ::;-;::- U
.K.
49 30
—-
_64_3_.. 41
U.K
. ____
45 25
85
——
41 30
r
10 P
ELG
IUM
6?
55 31
-- -—
54
Eiriiiiüii
l
--
-- 21
29
-- F
RA
NC
E
56 53
6? --
-- 42
54 --
41 R
AN
tE
no 50
100 -—
--
25 40
-- 29
GE
RM
AN
Y
62 43
46
--
68 4
-- gE
RM
AN
Y
93 48
31
--
-- 14
14 —
- 71
1TALY°""64
5? 9-- .
73 46
-- 71
-
ITA
LY
93
55 ---- -59
57 —
g2 N
ET
HE
RLA
ND
S
69 48
54 --
—-
55 46
--
76 N
ET
HE
RLA
ND
S
90 53
62
—-
—-
32 2?
—-
47 SWITZERLAND
44
53
30
-—
-- 40
38 --
53 S
WIT
ZE
RLA
ND
70
48 23
—-
-- ê
40 —
- 53
JAFAH
- 9046 -5--- 76 jñf4
-- 55_
-- --
82
SA
NF
1tSIZ
E45 40i3---22*
24 --
Il O
AM
SIZ
40
40
Ii - --
?*2-.17 —
• .--- A
LICU
RR
EN
CY
X
00 47
52 --
-- 40
39
—
50 ALL
CU
RR
EN
CY
Z 55
50
55
--
-—
50 40
-—
60 SAMPLE SIZE
360
360
117
197
160
———
153 •
I92 -1S3 - -
IWR
IZO
NII2N
UN
TH
9 -
.-- --
Ii IIO
RIZ
ON
I 3 MONTHS
- —
-
tUR
RtH
tY
RV
ICE
—
- ___________________________________
CU
RR
EN
CY
S
ER
VIC
E •>
1
2
3
4
5
6
7
0
9
/
1
2 3
4 5
6 7
0 9
• -
------ -
- C
AP
4AS
A
62
--
47
11
-1
R2
CA
NA
DA
35
50
15
—-
-—
50 40
-- 71
U.K.
62
24
92
—-
——
00
21 4
II U
.K.
-
51 20
100
——
—-
64 30
--
35 B
ELD
IUM
94
5? 33
—
—'
5 tt t - 41
79 53
23 —
—
——
42 2
6-5Y
TRANCE
— U
41oo --
—-
40 32
—-
2? F
RA
NC
E
70
53
100
——
——
17
40 --
41
UERMANY
94 54
33 --
——
30
Ii
——
35 OERI$ANY __45.
!i.....-
——
45_3V
. -
71 ITALY
100
54
100
—-
-—
60 50
--
76_ ITM.Y
74
50
IOO
—-
——
7f
52 -—
1
I1tTIIhtA
FII19
-—
——
21
26 —?
41 N
ET
HE
RLA
ND
S
74 45
54
-—
——
45
39
-—
53 SWITZERLAND
71
35
42
--
——
44
15 . —
35
63
60
31
--
——
JAPAN
56
30
50
--
—
65. •L'
ê JA
PA
N
47 53
62 -—
—
- 60
-- --
--:: =
SIZ
E
34 37
12 -—
—
—
20* 1?
-—
17 S
AM
PLE
SIZ
E
43 40
13 --
——
22*
23 -
17 _______
_____________
41 80
——
—
—
40 26
47
t_LçU5pICY Z
64
43
60
--
—-
0 40
—-_
sAMV't.E S
IZE
306 333 100
—
197 15* —
153.. —
SA
MP
LE SIZE
307
360
117
-- -
--—
1?? 104
—--
153 -
______ ——

TAILS 6:
PR
OS
AR
ILITY
(p1) OF
OSSSRYINO AS GOOD O
R
SU
PE
RIO
R TRACE
P.EC
OR
D
:
_j U
ND
BR
11111 N
ULL
HY
PO
TH
ES
IS
(IND
EP
EN
DE
NT
S
AJIP
LES
)
-. H
OR
IZO
N 1110P4T11
- —
- —
IIO
RIZ
OH
I 6 M
O_
_____________________________ C
UR
RE
NC
Y
SERVICE =>
1
2
3
4
5
6
7
U
9
1
2
3
4
5
6
7
8
V
___
CA
NA
DA
9?
17 9?
——
—
- 19
21 -—
17
CA
NA
DA
100
50 100
——
——
6?
6?
——
12 U.k.
56
94
1
——
——
10
57 —
—
83 U
.K.
23 94
12 —
—
—
6? JI'ç 07
ItEO
Hn
I 26
V5- --T$4
3 --
-- 94
100 --
SO
-
—
FR
AN
CE
23
35 13
——
-—
79
34
-—
03 F
RA
NC
E
6
77
12
——
——
94
69
——
87 DERNANY _________ 5
83
72
—-
—-
4 34
--
17
tWRIIANY
8
77 50
--
-- 100
100
-—
$2
•
11ALY
—
— -266
-—
- 1
o
5o ---
-Y4
• NETHERLANDS
1
62 50
—-
—-
33 66
-- 3
NE
TH
ER
LAN
DS
6
50
07
--
——
94
94
——
97 SWITZERLAND
77
35
97
——
——
59
89
-—
50 ____S
WIT
ZE
RLA
ND
1
23
100
-—
-—
94 69
——
50 —
.MIA
N
56 5*1
-—
-- -3------:-:.
94
50 87
--
-- 69
-- --12
SANFIt S
IZE
45
14
13
—-
-- 22*
24
——
17
DA
NItE
S
IZE
7
7
3
—
—
4 4
—
3 -
——
-•-- —
—-—
——
—
——
—--—
- —.
-—-
—
---.—-
- —
-.—
.-—
.--—--—
-—
- -—
-—
.—.______ -—
——
—-
-——
---—
_____________ ________ _________
ALL C
UR
RE
NC
Y Z
2
45
58
—-
——
V
S
?6 . -—L
2 i%RFiST7
63 --
—-
36 32
-- 27
• ---
——
—
- •—
-- —
—
-
I -
HU
RIZ
ON
I 3
PIU
NT
HO
IIO
RIZ
ON
I 12
IION
TH
8 -.
iLii .1
CU
RR
EN
CY
SE
RV
ICE
>
__
_____ 2
3 4
5 6
7 0
9 1
2 3
4
5
6
7
0
9
— ___
—
-- - —
---- __=
- ___
- C
AN
AD
A
94 79
97 —
—
——
73
06 -—
34
CA
NA
DA
50
6
,
:,;——
. ——
U.K
. 30
99
3
——
——
6
64 —
—
11 U
.K.
07 69
——
4 P
ELU
JUPI
15 79 VI
--
—-
93 96 -
DrtflT
Un
so 9
FRANCE
15
21
3
——
—
—
93 86
--
89 FRANCE
50
69
DERHANY
5
60
50
——
——
50
96
—-
34 D
ER
MA
NY
12
91
L 11A
L'f 3i03
--
11
ltM.Y
129 N
ET
HE
RLA
ND
S
1
91
50 ——
——
73
06 —
—
34 N
ET
HE
RLA
ND
S
12 94
SW
ITZ
ER
LAN
D
77 60
91
——
—
—
50 36
——
11
_____ SWITZERLAND
50
69
• - —
—
—
MF
R
56 21
91
-- --
23 —
- -1V
T
hFA
N
50 94
SAP$LE S
IZE
15
14 5
-- —
- 0*
8
--
6 -. A
tWLE
_SIZ
E
3 4
1 -
- 2
2
—
- 2
______
ALL
CU
RR
EN
CY
Z
2
76 5
——
-—
45
84 —
—
I _____
____ N
P1U
9U
135 T
26 45 -
-- -
1 •••
• ,• II; C
CURRENCY
SERVICE =>
ALL
CU
RR
EN
CY
X
2
50 15
—-
-- 1
72 -—
I
1W1E
SIZ
E
405 126
1IT
- - 11P
7 f92-I!c3
CURRENCY
SE
RV
ICE
>
1
::: :-::-T::-
SA
MP
LE S
IZE
27
36

F-].
FOOTNOTES
11n the case where risk neutral firms can trade forward
exchange contracts at a price equal to the expected future spot
rate, Baron (1976) demonstrateS that there is no welfare loss from
exchange rate uncertainty. Consequently, in our example, the
owners of information will receive an income transfer from the rest
of the world. (The forward market is a zero sum game). However,
if investors are risk averse, the production of accurate informa-
tion should reduce uncertainty about future relative prices. In-
creased trade in goods and capital results in an increase in world
income.
2A highly informative and readable survey of foreign exchange
advisory services is in Euromoney, August 1978.
3The importance of prediction is stressed by Friedman (1953)
who states "the only relevant test of the validity of a hypothesis
is comparison of its predictions with experience." With respect
to econometric prediction, christ (1951) makes the stronger state-
ment that "The ultimate test of an econometric model.., comes
with checking its predictions."
4Two earlier papers have reported on the accuracy of advisory
service forecasts. ling (1978) aggregated forecasts across advisory
services to form a simple average "professional" forecast. During
the seven quarter period 1976-I to 1977-Ill, the professional fore-
cast was superior to the forward rate forecast only for the 1DM.
Xing suggested that this is a surprising result since the 1DM market
is very active and speculators should act so that the information
in the forecast is quickly reflected in the forward rate. An
alternative explanation, which we consi4er further in section II,
is that speculators are risk averse and as a result the forward rate
is not necessarily the best publicly available forecast.

Goodman (1979) analyzed both medium-term, economic oriented
advisory services and short-term technical advisory services. While
the former group appeared no more accurate than the forward rate, Good-
man concluded that the technical services could lead to large profits
following a daily trading strategy. "(The technically-oriented
services') consistently very strong predictive performance supports
the view that speculative runs do occur in the exchange market and
that the foreign exchange market is not efficient."
5See, for example, Fama (1970) and Black (1971).
6This is essentially a restatement of the semistrong form
tests of asset market efficiency which posits that prices reflect
publicly available information. One straightforward test of this
hypothesis is reported in Scholes (1972).
70n. important study in this regard was by Jensen (1968)
who concluded that professionall)' managed mutual funds did not
in general achieve unusual returns relative to the risk and
management costs incurred. The general decline in stock market
prices (in real terms) over this period also helped to tarnish
the image of professionalism and expertise.
8These assumptions include continuous trading, no transaction
costs and no information costs. The efficient market hypothesis
4oes allow for heterogeneous expectations, but the algebraic foi-
mulation and empirical testing of a model with heterogeneous ex-
pectations is considerably more complex.

p-3
9We should note that we are considering information purchases
only for the purpose of "picking winners or beating the market."
Investors who do not wish to do this will still require some infor-
mation to match a portfolio to their risk preferences.
10As a theoretical matter, even this latter case requires fur-
ther qualification. Other investors may imitate the trader with
expertise and in doing so lower his profits. Alternatively, traders
without expertise may lose over time and leave the market so that
the trader with expertise comes to dominate and become the market.
For a detailed discussion of these issues, see aaiffa and
Schaifer (1968), especially Chapter 6.
l2 p(O.5, the advisory service has no expertise. But in
this case, investors can simply reverse the advisory service
recommendations.
23At the Chicago Mercantile Exchange, interest earning U.S.
Treasury bills are acceptable to meet margin requirements.
141f the investor owns a U.S. dollar asset, he must sell it
and give up return i.
15Dooley and Shafer (1976) recognize this point in their analysis.
6The "Modern Theory" approach popularized by Grubel (1966)
presents a partial equilibrium model. Speculators are assumed to be
risk averse although there is no operational model for estimating
the foreign exchange risk premium.
More recent papers by Roll and Solnik (1977) and Grauer,

F- 4
Litzenberger, and Stehie (1976) present a general equilibrium
framework, but there is disagreement about how, or if, these
models can be made operational. See the discussion in the
Journal of Finance, May 1977.
17As in our earlier test for forecasting expertise, we must a
assume the probability of correct prediction is constant over time.
In addition, however, we must assume that the distribution of
speculative returns is constant over time. When this assumption
is not met, the H-statistic can give misleading results. For
example, suppose a forecasting service provides incorrect forecasts
in nine consecutive preiods, however in each period the loss is
sma-1 ($.01 per contract)0 Assume further that in period ten the
service correctly predicts a large exchange rate change ($.41).
Judging by the H-statistic (H $.32 actual profit / $.S0 potential
profit - 64%), the advisory service is doing an admirable job.
However the probability of correct advise in any single period is
low (p • r/n — 0,10) and significantly worse than guessing.
18The problem of selecting an historical set of spot rates
to represent the market price brings into focus the issue of
selecting a róasonable standard for assessing forecasting accuracy.
We have observed that exchange rates sometimes trade within. a 1% or
2% daily range; recently for the Swiss franc and the Japanese yen,
the range has a-preached 4%-5%. For example, on January 1 at 9:00
a.m., the three-month forward rate may be $2.00. On April 1 at 9:00
a.m. the spot rate may by $2.00 and then proceed to close at $2.06.
Is this a 3% forecast error even if the trader could have sold his

F-S
position during the day at a favorable rate? For this observation,
the selection of an opening rate, anoon rate or a closing rate
has a great impact on the forecast error. We can add that at any
moment of time, foreign exchange rates also may vary somewhat across
the world's many trading rooms.
9Since the forecast frequency is generally one observation per
month, the one-month panel also represents an independent sample.
20We use the exact binomial calculation for samples smaller
than 18, and the normal approximation otherwise.

REFERENCES
Baron, D.P. "Flexible Exchange Rates, Forward Markets and theLevel of Trade." American Economic Review 66, No. 3(June 1976): 253-66.
Bilson, Joh.n F.Ov and Levich, Richard N. "A Test of the Pore-casting Efficiency of the Forward Exchange Rate." NewYork University No. 776l, June 1977.
Black, Fischer. "Implications of the Random Walk Hypothesis forPortfolio Management." Financial Analysts Journal (March!April 1971): 16-22.
Christ, Carl F. "A Test of an Econometric Model for the UnitedStates, 1921-47." In Conference on Business Cycles. New York:National Bureau of Economic Research, I9SI.
Cornell, Bradford. "Spot Rates, Forward Rates and ExchangeMarket Efficiency." Journal_of Financial Economics S(Augi.ist 1977): 55-65.
Dooley, Michael P. and Shafer, Jeffrey R. "Analysis of Short-Run Exchange Rate Behavior: March, 1973 to September, 1975."International Finance Discussion Papers, No. 76. Washington,D.C.: Federal Reserve System, February 1976.
Fama, Eugene F. "Efficient Capital Markets: A Review of Theoryand Empirical Work." Journal of Finance 25, No. 2 (May 1970):383-417.
Figlewski, Stephen. "Market 'Efficiency' in a Market withHeterogeneous Information." Journal of Political Economy86, No. 4 (August 1978): 581-97.
Figlewaki, Stephen. "Investor Diversity and Market Behavior."New York University, Salomon Brothers Center Working PaperNo. 141, April 1978.
Friedman, Milton. Essays in Positive Economics. Chicago:University of Chicago Press, 1953.
Goodman, Stephen H. "Foreign Exchange Rate ForecastingTechniques: Implications for Business and Policy.Journal of Finance 34, No. 2 (May 1979): forthcoming.
Grossman, Sanford J. and Joseph E. Stiglitz. "Informationand Competitive Price Systems." American Economic Review66, No. 2 (May 1976): 246-53.
Jaffe, Jeffrey F. "Special Information and Insider Trading."Journal of Business 47, No. 3 (July 1974): 410-28.
Jensen, Michael. "The Performance of Mutual Funds in thePeriod 1945-64." Journal of Finance 23 No. 2 (May 1968):389-416.

King, David T., "Exchange Market Efficiency and ;1e.. Risk Takerof Last Resort." Mimeographed, OECD and Federil ReserveBank of New York, July 1978.
Levich, Richard M. "The International Money Market: Tests ofForecasting Models and Market Efficiency." Unpublished Ph.DDissertation, University of Chicago, 1977.
Levich, Richard M. "Further Results on the Efficiency ofMarkets for Foreign Exchange." Federal Reserve Bank ofBoston, Conference Series No. 20, 1978.
Lloyd-Davies, Peter, and Canes, Michael. "Stock Pricesand the Publication of Second-Hand Information." Journalof Business 51, No. 1 (January 1978): 43-56.
Lone, James H. and Niederhoffer, Victor. "Predictive andStatistical Properties of Insider Trading." Journal ofLaw and Economics 11, No. 2 (April 1968): 35-51.
Makin, John H. "Portfolio Theory and the Problen. of ForeignExchange Risk." Journal of Finance 33, No. 2(May 1978):517-34.
McDonald, John. "French Mutual Fund Performance: Evaluationof Internationally Diversified Portfolios." Journalof Finance 28, No. 5 (December 1973): 1161-80.
Raiffa, Howard and Schlaifer, Robert. Applied StatisticalDecision Theory. Cambridge: M.I.T. Press, 198.
Roll, Richard and Solnik, Bruno. "A Pure Foreign ExchangeAsset Pricing Model." Journal of International Economics 7,No. 2 (May 1977): 161-179.
Scholes,Myron S. "The Market for Securities: Substitutionversus Price Pressure and the Effects of Information onShare Prices." Journal of Business 45, No. 2 (April 1972):179-211.
Tsiang, S.C. "The Theory of Forward Exchange and the Effects ofGovernment Intervention on the Forward Market." Staff Papers7, No. 1 (April 1959): 75-106.