economic feasibility study for north zone - National ...
552
i I >- It - FINAL REPORT (Volume 1) NATIONAL LEVEL TECHNO- ECONOMIC FEASIBILITY STUDY FOR NORTH ZONE Submitted to: National Horticulture Board 85, Institutional Area Sector 18, Gurgaon -122015 Haryana AUGUST, 2003 ! JPS ASSOCIATES CONSULTANTS NEWDELID
-
Upload
khangminh22 -
Category
Documents
-
view
1 -
download
0
Transcript of economic feasibility study for north zone - National ...
i
I >-
It
-FINAL REPORT (Volume 1)
NATIONAL LEVEL TECHNO-ECONOMIC FEASIBILITY STUDY
FOR NORTH ZONE
Submitted to:National Horticulture Board
85, Institutional AreaSector 18, Gurgaon -122015
Haryana
AUGUST, 2003
!JPS ASSOCIATES
CONSULTANTSNEWDELID

•
t,
1
,
",
TABLE OF CONTENTS
Sections Contents Page Nos.
-~CJR~~:I~;'K~::{if;~fE~~~.:~'. '''''.UTTAR PRADESH . - '.~";'~~'--I-'~~t':~Y~:F;tt:"'.7:;',;'~~:;::-:'-.~.1. Introduction 1-2
1.1 Objectives , I1.2 Scope of work I1.3 Methodology 2
1.4 Organisation of report 2
2 Current Status of Horticulture in Uttar Pradesh 3-14
2.1.1 Introduction 3
2.1.2 Agro-ecological conditions of the state 4
2.1.3 Land holding pattern and land tenure System 7
2.1.4 Irrigation and water management 7
2.1.5 Major Cropping pattern 9
2.1.6 Distribution pattern of different horticulture crops in the State 12
2.1.7 Major horticultural crops ofthe State 14
2.1.7.1.1 Apple 15
2.1.7.1.2 Banana 'growth pattern the decade,.,Crop calendar, 15-17over
'Production technology 'Pest and disease management ,,
Harvest method and yield, 6 Crop economics, 'price trend'problems and constraints, 9Conclusion
2.1.7.1.3 Citrus 18-20
2.1.7.1.4 Grapes 21
2.1.7.1.5 Guava 21-24
2.1.7.1.6 Litchi 25
2.1. 7.1.7 Mango 25-29
2.1.7.1.8 Papaya 30
2.1.7.1.9 Aonla 30-33
2.1.7.1.9 Jackfruit 34-36
2.1.7.1.9 Ber 37-39
2.1.7.2 Vegetables, Roots and Tubers 40-73
2.1.7.2.1 Brinjal 40-42
2.1.7.2.2 Cabbage 43-45
2.1.7.2.3 Cauliflower 46-49
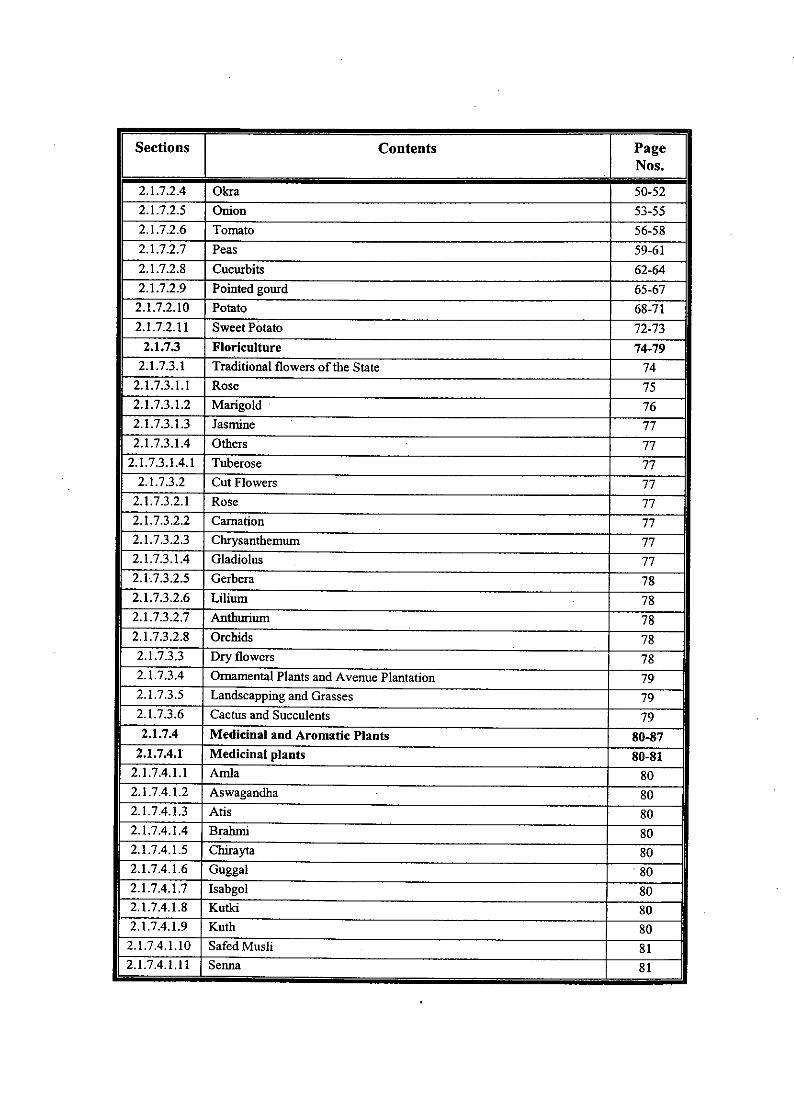
2.1.7.2.4 Okra 50-52
2.1.7.2.5 Onion 53-55
Sections Contents Page Nos.
2.1.7.2.6 Tomato 56-582.1.7.2.7 Peas 59-612.1.7.2.8 Cucurbits 62-642.1.7.2.9 Pointed gourd 65-672.1.7.2.10 Potato 68-712.1.7.2.11 Sweet Potato 72-732.1.7.3 Floriculture 74-792.1.7.3.1 Traditional flowers of the State 742.1.7.3.1.1 Rose 752.1.7.3.1.2 Marigold 762.1.7.3.1.3 Jasmine 772.1. 7.3.1.4 Others 772.1.7.3.1.4.1 Tuberose. . 772.1.7.3.2 Cut Flowers 772.1.7.3.2.1 Rose 772.1.7.3.2.2 Carnation 772.1.7.3.2.3 Chrysanthemum 772.1.7.3.1.4 Gladiolus 772.1. 7.3.2.5 Gerbera 782.1.7.3.2.6 Lilium 782.1.7.3.2.7 Anthurium 782.1.7.3.2.8 Orchids 782.1.7.3.3 Dry flowers 782.1.7.3.4 Ornamental Plants and Avenue Plantation 792.1.7.3.5 Landscapping and Grasses 792.1.7.3.6 Cactus and Succulents 792.1.7.4 Medicinal and Aromatic Plants 80-872.1.7.4.1 Medicinal plants 80-812.1.7.4.1.1 Amla 802.1.7.4.1.2 Aswagandha 802.1.7.4.1.3 Atis 802.1. 7.4.1.4 Brahmi 802.1.7.4.1.5 Chirayta 802.1.7.4.1.6 Guggal 802.1.7.4.1.7 Isabgol 802.1.7.4.1.8 Kudo 80
Sections Contents Page Nos.
2.1.7.4.1.9 Kuth 80
2.1.7.4.1.10 Safed Musli 81
2.1.7.4.1.11 Senna 81
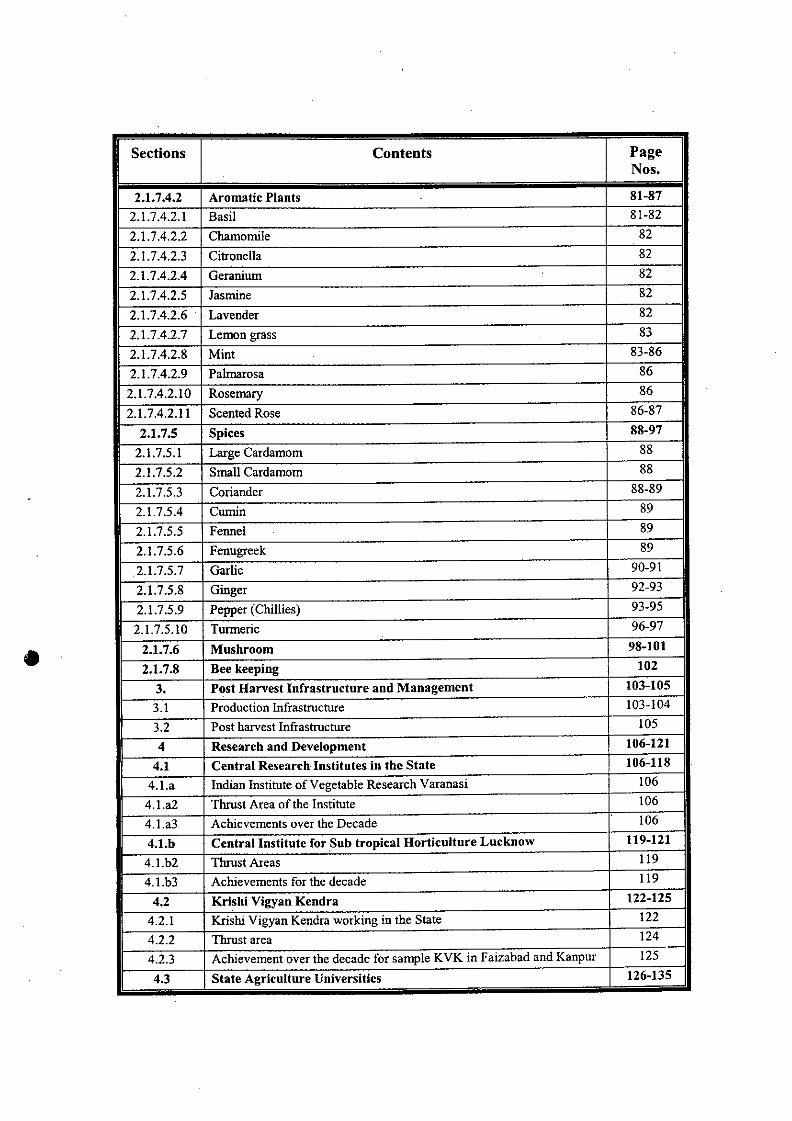
2.1.7.4.2 Aromatic Plants .81-87
2.1.7.4.2.1 Basil 81-82
2.1.7.4.2.2 Chamomile 82
2.1.7.4.2.3 Citronella 82
2.1.7 .4.2.4 Geranium 82
2.1.7.4.2.5 Jasmine 82
.2.1.7.4.2.6 Lavender 82
2.1.7 .4.2.7 Lemon grass 83
2.1.7.4.2.8 Mint 83-86
2.1.7.4.2.9 Palmarosa 86
2.1.7.4.2.10 Rosemary 86
2.1.7 .4.2.11 Scented Rose 86-87
2.1.7.5 Spices 88-97
2.1.7.5.1 Large Cardamom 88,2.1.7.5.2 Small Cardamom 88
,2.1.7.5.3 Coriander 88-89
I, 2.1.7.5.4 Cumin 89II 2.1.7.5.5 Fennel 89
, 2.1. 7.5.6 Fenugreek 89
2.1. 7.5.7 Garlic 90-91
2.1.7.5.8 Ginger 92-93
2.1.7.5.9 Pepper (Chillies) 93-95
2.1.7.5.10 Turmeric 96-97
2.1.7.6 Musbroom 98-101
2.1.7.8 Bee keeping 102
3. Post Harvest Infrastructure and Management 103-105
3.1 Production Infrastructure 103-104
3.2 Post harvest Infrastructure 105
4 Researcb and Development 106-121
4.1 Central Researcb Institutes in tbe State 106-118
4.1.a Indian Institute of Vegetable Research Varanasi 106
4.l.a2 Thrust Area of the Institute 106
4.l.a3 Achievements over the Decade 106
Sections Contents page~1
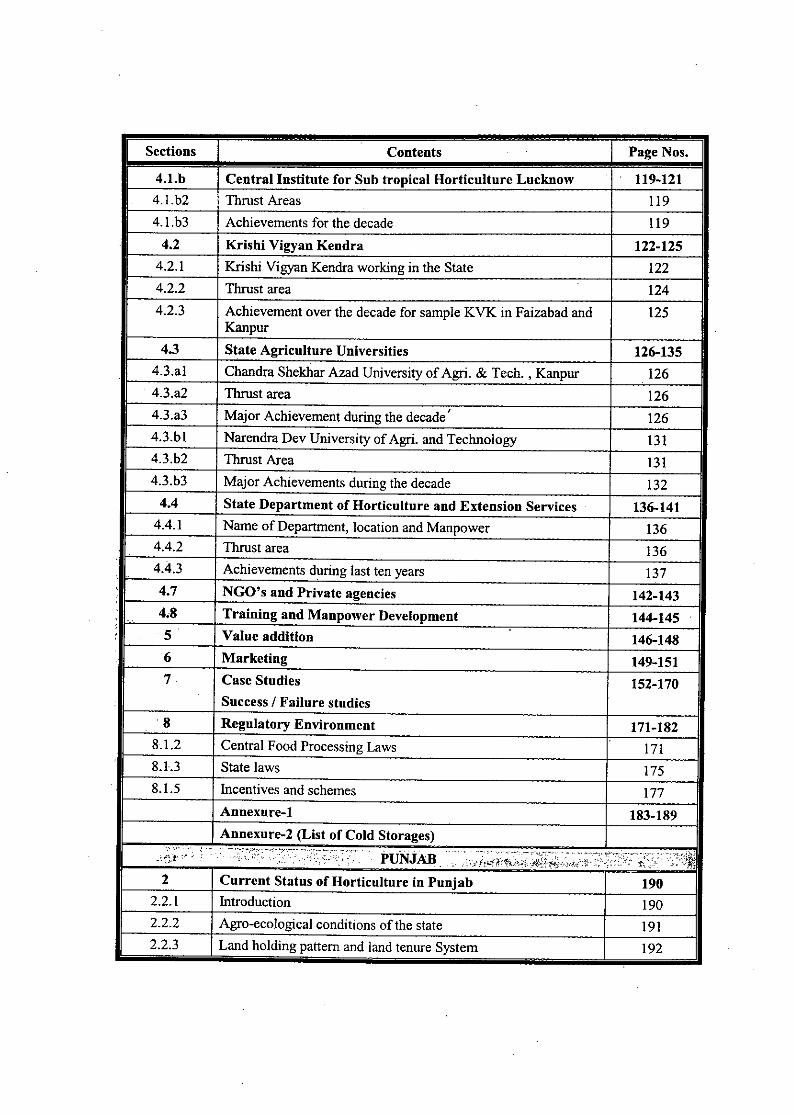
4.l.b Central Institute for Sub tropical Horticulture Lucknow 119-1214.l.b2 Thrust Areas 1194.l.b3 Achievements for the decade 1194.2 Krishi Vigyan Kendra 122-1254.2.1 Krishi Vigyan Kendra working in the State 1224.2.2 Thrust area 1244.2.3 Achievement over the decade for sample KVK in Faizabad and 125
Kanpur
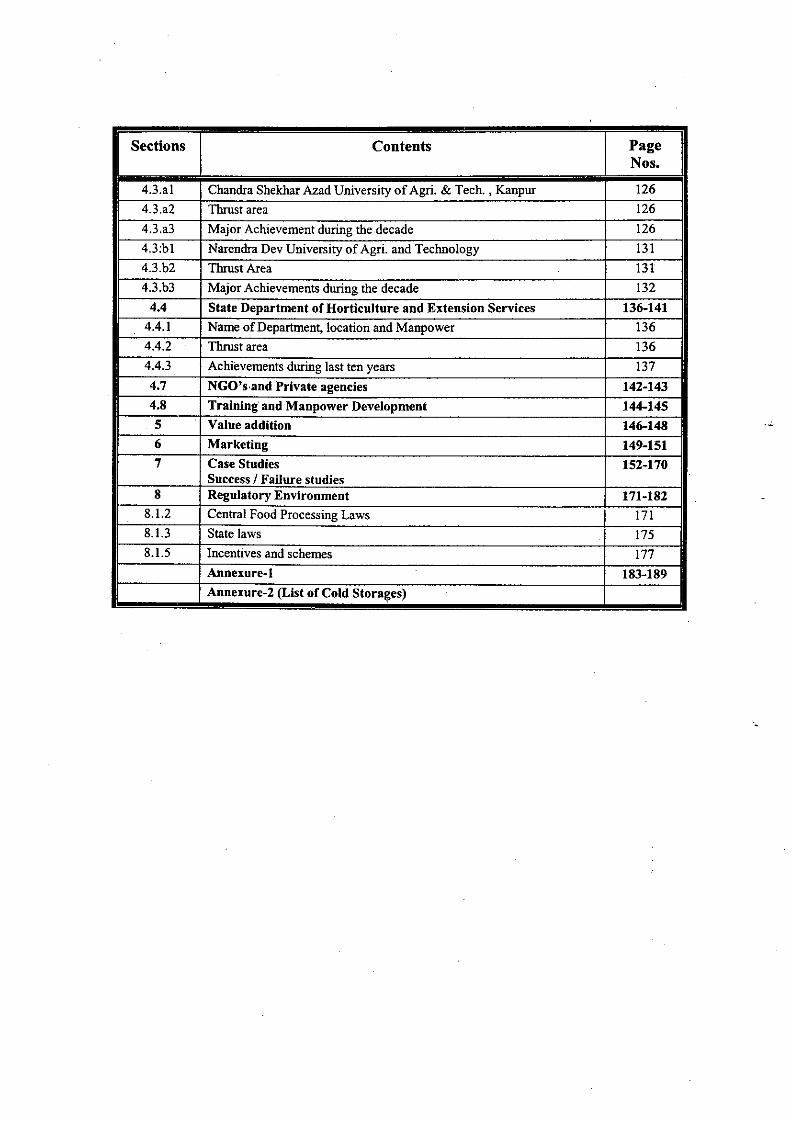
4.3 State Agriculture Universities 126-1354.3.a1 Chandra Shekhar Azad University of Agri. & Tech. , Kanpur 1264.3.a2 Thrust area 1264.3.a3 Major Achievement during the decade' 1264.3.b1 Narendra Dev University of Agri. and Technology 1314.3.b2 Thrust Area 1314.3.b3 Major Achievements during the decade 1324.4 State Department of Horticulture and Extension Services 136-1414.4.1 Name of Department, location and Manpower 1364.4.2 Thrust area 1364.4.3 Achievements during last ten years 1374.7 NCO's and Private agencies 142-1434,8 Training and Manpower Development 144-145
':, 5 Value addition 146-148
6 Marketing 149-1517 Case Studies 152-170
Success / Failure studies8 Regulatory Environment 171-182
8.1.2 Central Food Processing Laws 1718.1.3 State laws 1758.1.5 Incentives and schemes 177
Annexure-1 183-189, Annexure-2 (List of Cold Storages)
"'\";:':,'-,",-", ...
PUNJAB, :' ,. ,":;;:;;',::'":"":',.'s:{=~1,.'''-f'' 0." ", ,"V.
2 Current Status of Horticulture in Punjab 1902.2.1 Introduction 1902.2.2 Agro-ecological conditions of the state 1912.2.3 Land holding pattern and land tenure System 192
Sections Contents Page Nos.
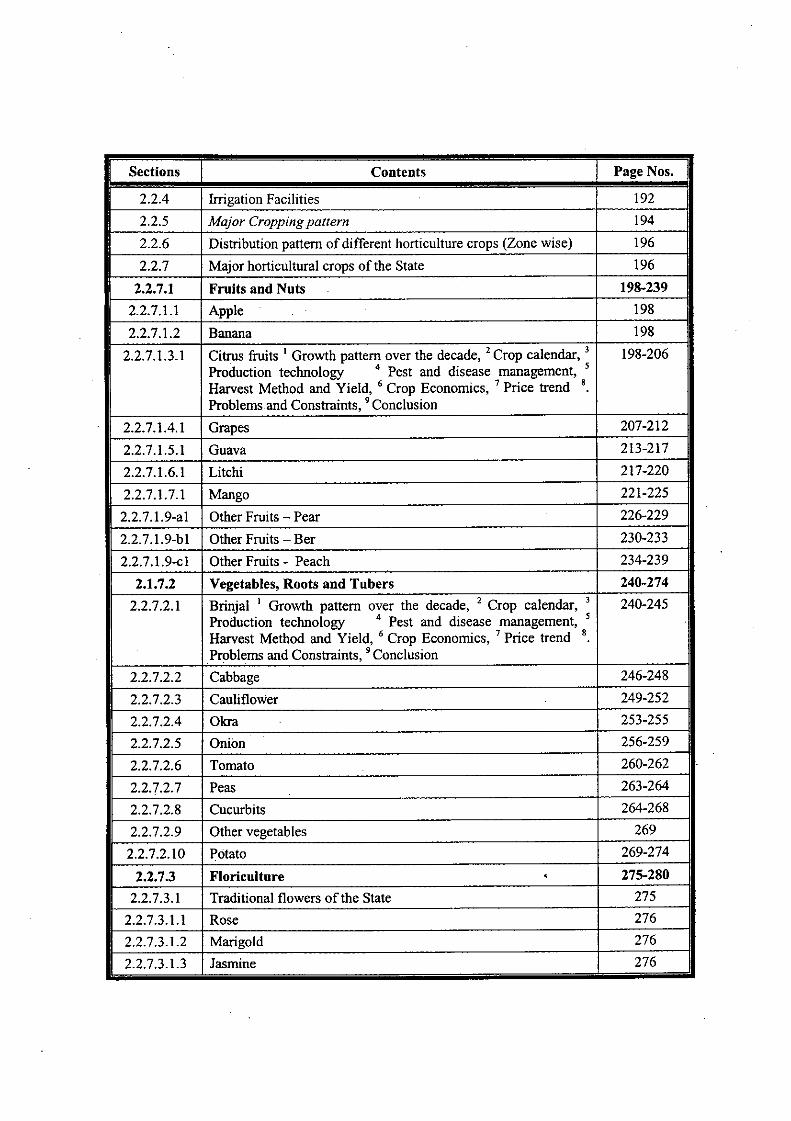
2.2.4 Irrigation Facilities 192
2.2.5 Major Cropping pattern 194
2.2.6 Distribution pattern of different horticulture crops (Zone wise) 196
2.2.7 Major horticultural crops of the State 196
2.2.7.1 Fruits and Nuts 198-239
2.2.7.1.1 Apple .. 198
2.2.7.1.2 Banana 198
2.2.7.1.3.1 Citrus fruits I Growth pattern over the decade, 2 Crop calendar, 3 198-206Production technology 4 Pest and disease management, 'Harvest Method and Yield, 6 Crop Economics, 7 Price trend 8
Problems and Constraints, 9 Conclusion
2.2.7.1.4.1 Grapes 207-212
2.2.7.1.5.1 Guava 213-217
2.2.7.1.6.1 Litchi 217-220
2.2.7.1.7.1 Mango 221-225
2.2.7.1.9-a1 Other Fruits - Pear 226-229
2.2.7.1.9-b1 Other Fruits - Ber 230-233
2.2.7.1.9-c1 Other Fruits - Peach 234-239
2.1.7.2 Vegetables, Roots and Tubers 240-274
2.2.7.2.1 Brinjal I Growth pattern over the decade, 2 Crop calendar, 3 240-245Production technology 4 Pest and disease management, ,Harvest Method and Yield, 6 Crop Economics, 7 Price trend 8
Problems and Constraints, 9 Conclusion
2.2.7.2.2 Cabbage 246-248
2.2.7.2.3 Cauliflower 249-252
2.2.7.2.4 Okra 253-255
2.2.7.2.5 Onion 256-259
2.2.7.2.6 Tomato 260-262
2.2.7.2.7 Peas 263-264
2.2.7.2.8 Cucurbits 264-268
2.2.7.2.9 Other vegetables 269
2.2.7.2.10 Potato 269-274
2.2.7.3 Floriculture • 275-280
2.2.7.3.1 Traditional flowers ofthe State 275
2.2.7.3.1.1 Rose 276
2.2.7.3.1.2 Marigold 276
2.2.7.3.1.3 Jasmine 276
Sections Contents Page Nos.
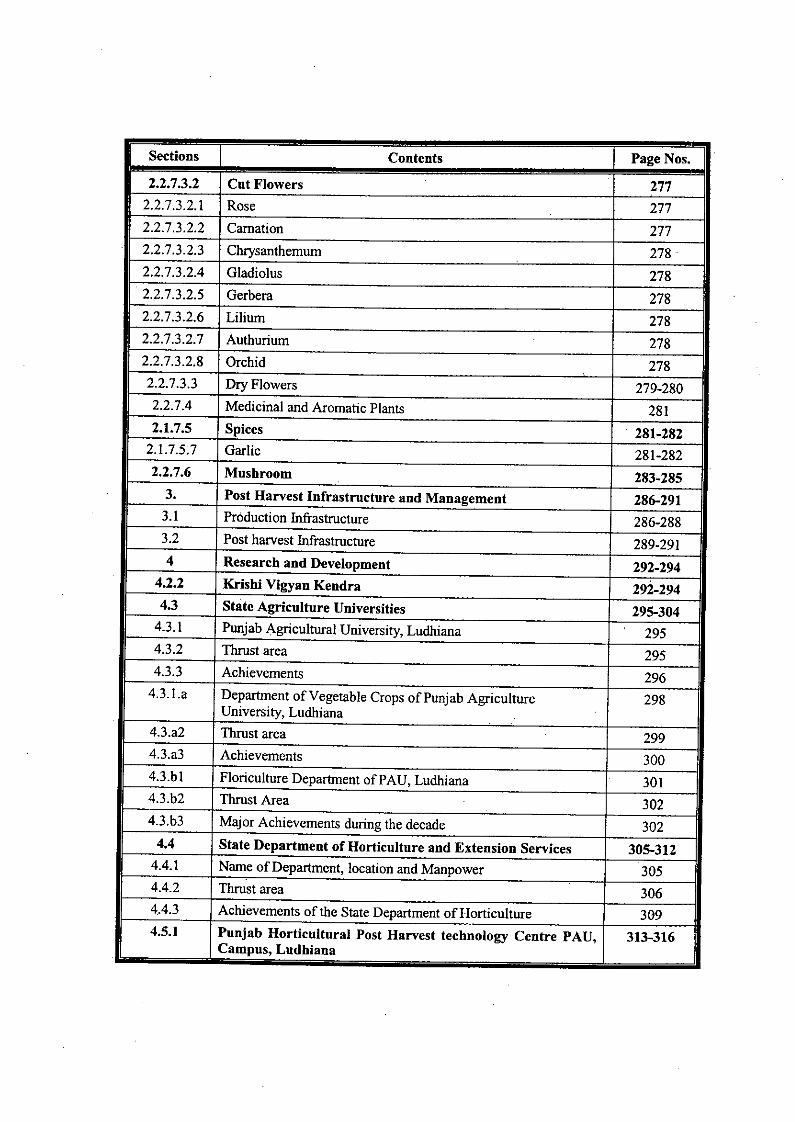
2.2.7.3.2 Cut Flowers .
2772.2.7.3.2.1 Rose 2772.2.7.3.2.2 Carnation 2772.2.7.3.2.3 Chrysanthemum 2782.2.7.3.2.4 Gladiolus 2782.2.7.3.2.5 Gerbera 2782.2.7.3.2.6 Lilium 2782.2.7.3.2;7 Authurium 2782.2.7.3.2.8 Orchid 2782.2.7.3.3 Dry Flowers 279.2802.2.7.4 Medicinal and Aromatic Plants 2812.1.7.5 Spices . 281-2822.1.7.5:7 Garlic 281-2822.2.7.6 Mushroom 283.2853. Post Harvest Infrastructure and Management 286-2913.1 Production Infrastructure 286-2883.2 Post harvest Infrastructure 289-2914 Research and Development 292-294
4.2.2 Krishi Vigyan Kendra 292-2944.3 State Agriculture Universities 295-3044.3.1 Punjab Agricultural University, Ludhiana 2954.3.2 Thrust area 2954.3.3 Achievements 2964.3.l.a Department of Vegetable Crops of Punjab Agriculture 298
University, Ludhiana4.3.31 Thrust area 2994.3.a3 Achievements 3004.3.bl Floriculture Department ofPAU, Ludhiana 3014.3.b2 Thrust Area 3024.3.b3 Major Achievements during the decade 3024.4 State Department of Horticultnre and Extension Services 305-3124.4.1 Name of Department, location and Manpower 3054.4.2 Thrust area 3064..4.3 Achievements of the State Department of Horticulture 3094.5.1 Punjab Horticultural Post Harvest technology Centre PAU, 313.316
Campus, Ludhiana
Sections Contents Page Nos.
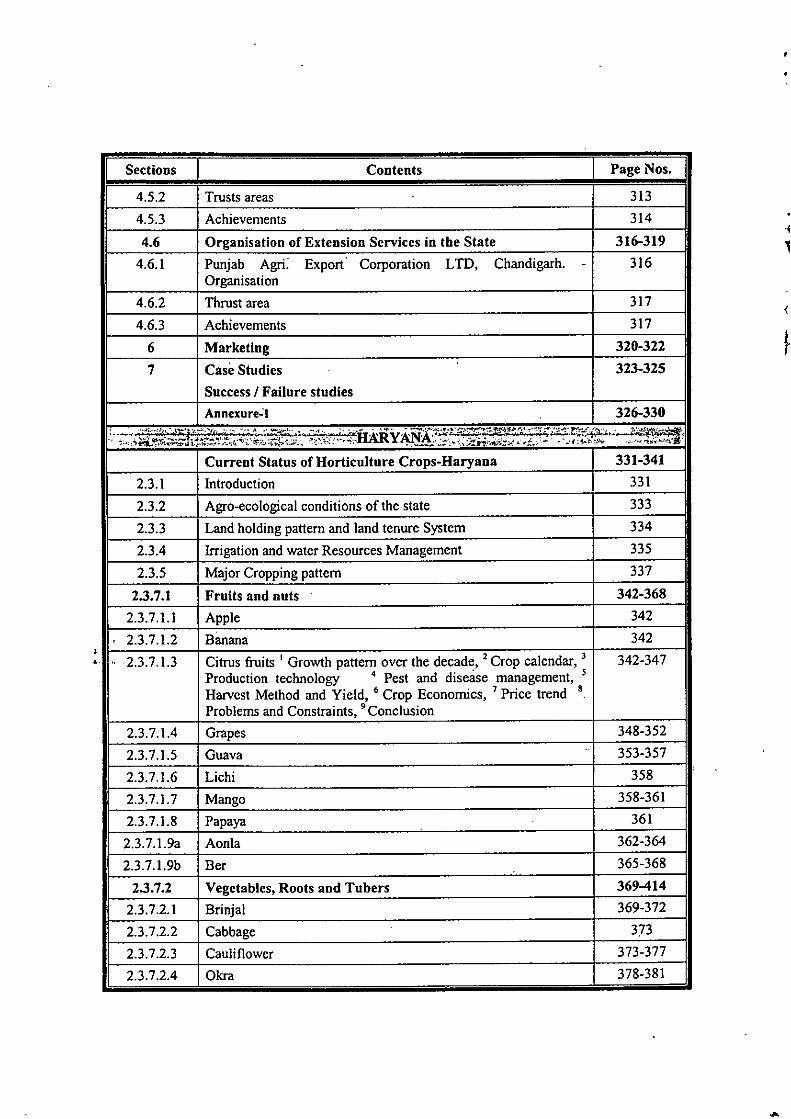
4.5.2 Trusts areas 313
4.5.3 Achievements 314
4.6 Organisation of Extension Services in tbe State 316-319
4.6.1 Punjab Agri: Export Corporation LTD, Chandigarh. - 316Organisation
4.6.2 Thrust area 317
4.6.3 Achievements 317
6 Marketing 326-322
7 Case Studies 323-325
Success I Failure studiesAnnexur •...! 326-330
.;/.;:t~~;:~~1j~~~g.~,;S~.;.~..;;~'~~?~:;\:::~i:-~~IDrliy~*::;~'~~1Z~~.~.:i~:7f;f~~~.--:f:~~~1f;Current Status of Horticulture Crops-Haryana 331-341
2.3.1 Introduction 331
2.3.2 Agro-ecological conditions of the state 333
2.3.3 Land holding pattern and land tenure System 334
2.3.4 Irrigation and water Resources Management 335
2.3.5 Major Cropping pattern 337
2.3.7.1 Fruits and nuts 342-368
2.3.7.1.1 Apple 342
2.3.7.1.2 Banana 342.. 2.3.7.1.3 Citrus fruits I Growth pattern over the decade, 2 Crop calendar, 3 342-347
Production technology 4 Pest and disease management, ,Harvest Method and Yield, 6 Crop Economics, 7 Price trend 8
Problems and Constraints, • Conclusion2.3.7.1.4 Grapes 348-352
2.3.7.1.5 Guava.. 353-357
2.3.7.1.6 Lichi 358
2.3.7.1.7 Mango 358-361
2.3.7.1.8 Papaya 361
2.3.7.1.9a Aonla 362-364
2.3.7.1.9b Ber 365-368
2.3.7.2 Vegetables, Roots and Tubers 369-414
2.3.7.2.1 Brinjal 369-372
2.3.7.2.2 Cabbage 373
2.3.7.2.3 Cauliflower 373-377
2.3.7.2.4 Okra 378-381
{
Sections Contents Page Nos.
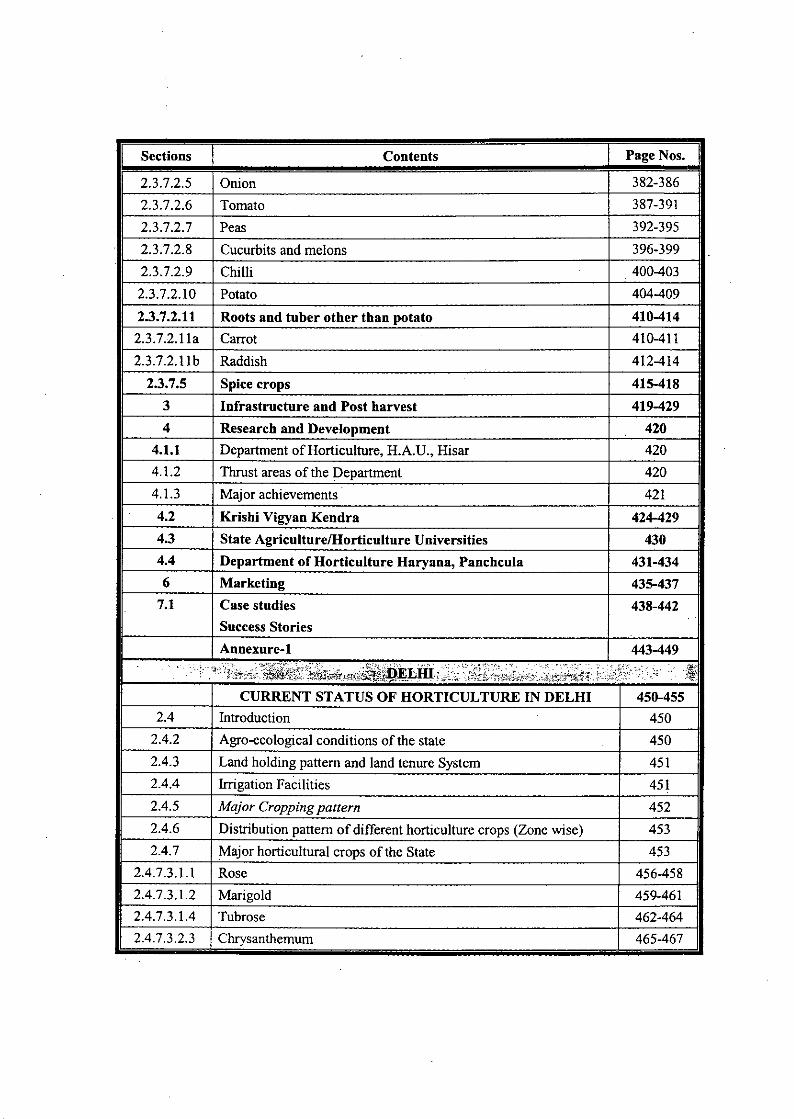
2.3.7.2.5 Onion 382-386
2.3.7.2.6 Tomato 387-391
2.3.7.2.7 Peas 392-395
2.3.7.2.8 Cucurbits and melons 396-399
2.3.7.2.9 Chilli 400-403
2.3.7.2.10 Potato 404-409
2.3.7.2.11 Roots and tuber other than potato 410-414
2.3.7.2.11a Carrot 410-411
2.3.7.2.11 b Raddish 412-414
2.3.7.5 Spice crops,
415-418
3 Infrastructure and Post harvest 419-429
4 Research and Development 4204.1.1 Department of Horticulture, H.A.D., Hisar 4204. \.2 Thrust areas ofthe Department 4204.1.3 Major achievements 4214.2 Krishi Vigyan Kendra 424-4294.3 State AgriculturelHorticulture Universities 4304.4 Department of Horticulture Haryana, Panchcula 431-4346 Marketing 435-4377.1 Case studies 438-442
Success Stories
Annexure-l 443-449-:-, "' ..'. ")';;;;;i;c{;::';$;i;~'-5';i:;c:" f., ",:~~iELmi~: "~'" , ',' :P,,,',; ., ;','
, --~.~,'~,~-,,,.'-~ ..t~_~.. ""-"'J .••$A,1:f:h:;:,'} ..•.~,.'-C,,_,,~i,_•.. " _~cof'-'-~, '.5 ,,'~
CURRENT STATUS OF HORTICULTURE IN DELHI 450-4552.4 Introduction 4502.4.2 Agro-eco1ogical conditions of the state 4502.4.3 Land holding pattern and land tenure System 4512.4.4 Irrigation Facilities 4512.4.5 Major Cropping pattern 4522.4.6 Distribution pattern of different horticulture crops (Zone wise) 4532.4.7 Major horticultural crops ofthe State 453
2.4.7.3.Ll Rose 456-4582.4.7.3. \.2 Marigold 459-4612.4.7.3.\.4 Tubrose 462-4642.4.7.3.2.3 Chrysanthemum 465-467
Sections Contents I Page Nos.
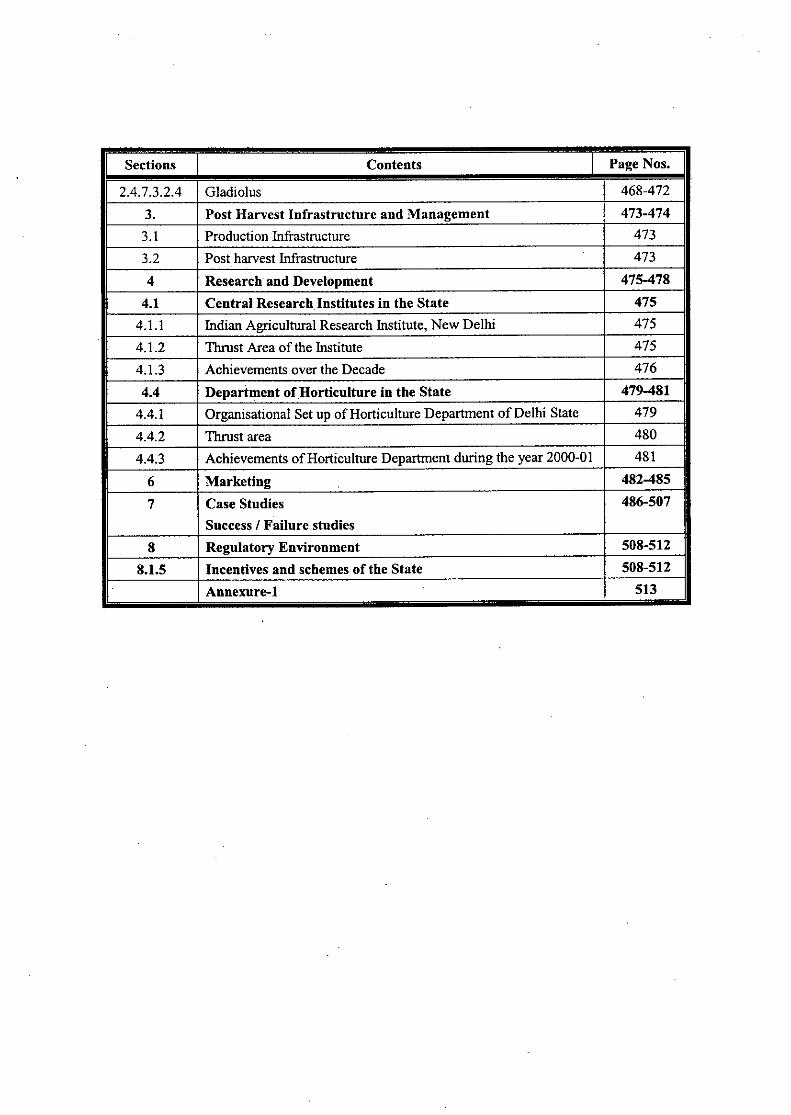
2.4.7.3.2.4 Gladiolus 468-472
3. Post Harvest Infrastructure and Management 473-474
3.1 Production Infrastructure 473
3.2 Post hmvest Infrastructure 473
4 Research and Development 475-478
4.1 Central Research.Institutes in the State 475
4.1.1 Indian Agricultural Research Institute, New Delhi 475
4.1.2 1brust Area of the Institute 475
4.1.3 Achievements over the Decade 476
4.4 Department of.Horticulture in the State 479-481
4.4.1 Organisational Set up of Horticulture Department of Delhi State 479
4.4.2 1brust area 480
4.4.3 Achievements of Horticulture Department during the year 2000-01 481
6 Marketing 482-485
7 Case Studies 486-507
Success I Failure stndies
8 Regulatory Environment 508-512
8.1.5 Incentives and schemes of the State 508-512
Annexure-I 513

UTTAR PRADESH

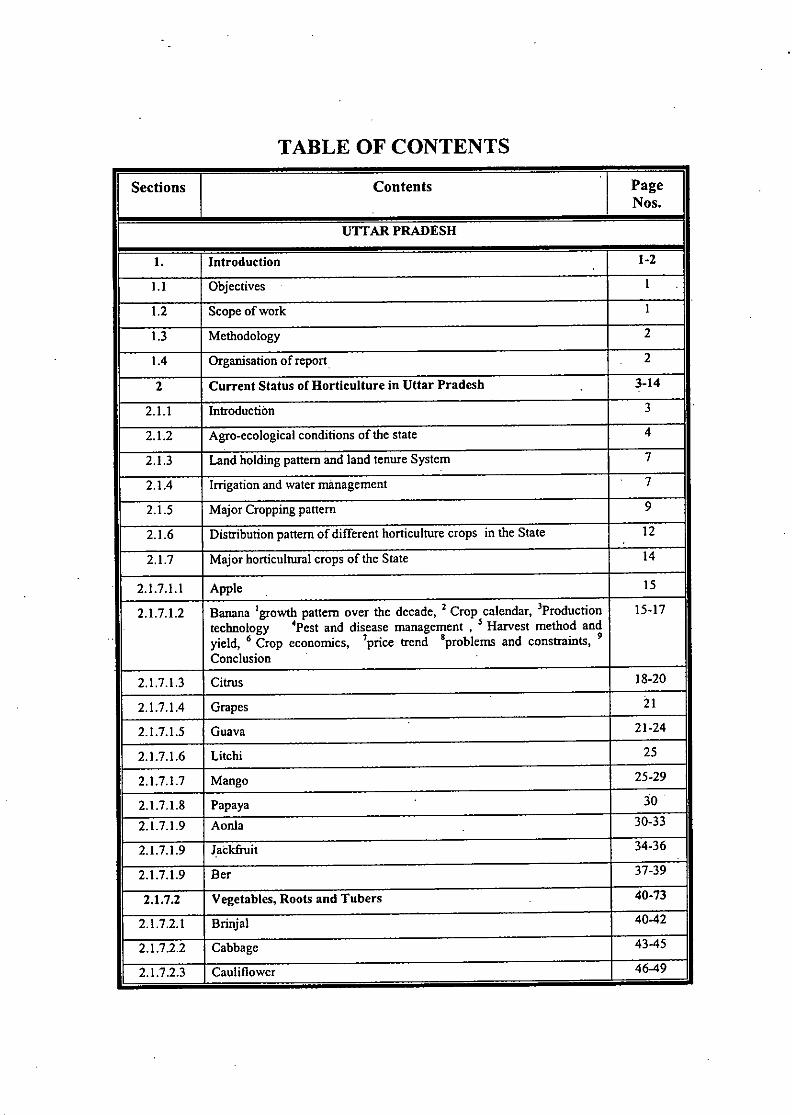
TABLE OF CONTENTS
Sections Contents PageNos.
UTI AR PRADESH
1. Introduction 1-2
1.1 Objectives I
1.2 Scope of work I
1.3 Methodology 2
1.4 Organisation of report. 2
2 Current Status of Horticulture in Uttar Pradesh 3.14
2.1.1 Introduction 3
2.1.2 Agro-ecological conditions of the state 4
2.1.3 Land holding pattern and land tenure System 7
2.1.4 Irrigation and water management 7
2.1.5 Major Cropping pattern 9
2.1.6 Distribution pattern of different horticulture crops in the State 12
2.1.7 Major horticultural crops of the State 14
2.1.7.1.1 Apple 15
2.1.7.1.2 Banana Igrowth pattern over the decade, 2 Crop calendar, 'Production 15-17technology 'Pest and disease management , ' Harvest method andyield, 6 Crop economics, 7price trend 'problems and constraints, 9
Conclusion
2.1.7.1.3 Citrus 18-20
2.1.7.1.4 Grapes 21
2.1.7.1.5 Guava 21-24
2.1.7.1.6 Litchi 25
2.1.7.1.7 Mango 25-29
2.1.7.1.8 Papaya 30
2.1.7.1.9 Aonla 30-33
2.1.7.1.9 Jackfruit 34-36
2.1.7.1.9 Ber 37-39
2.1.7.2 Vegetables, Roots and Tubers 40-73
2.1.7.2.1 Brinjal 40-42
2.1.7.2.2 Cabbage 43-45
2.1.7.2.3 Cauliflower 46-49
ISections
IContents
IPage
INos.
2.1.7.2.4 Okra 50-522.1.7.2.5 Onion 53-552.1.7.2.6 Tomato 56-582.1.7.2.7 Peas 59-612.1.7.2.8 Cucurbits 62-642.1.7.2.9 Pointed gourd 65-672.1.7.2.10 Potato 68-712.1.7.2.11 Sweet Potato 72-732.1.7.3 Floricnlture 74-792.1.7.3.1 Traditional flowers of the State 742.1.7.3.1.1 Rose 752.1.7.3.1.2 Marigold. 762.1.7.3.1.3 Jasmine 772.1.7.3.1.4 Others 772.1.7.3.1.4.1 Tuberose 772.1.7.3.2 Cut Flowers 772.1.7.3.2.1 Rose 772.1.7.3.2.2 Carnation 772.1.7.3.2.3 Chrysanthemum 772.1.7.3.1.4 Gladiolus . 772.1.7.3.2.5 Gerbera 782.1.7.3.2.6 Lilium 782.1.7.3.2.7 Anthurium 782.1.7.3.2.8 Orchids 782.1.7.3.3 Dry flowers 782.1.7.3.4 Ornamental Plants and Avenue Plantation 792.1.7.3.5 Landscapping and Grasses 792.1.7.3.6 Cactus and Succulents 792.1.7.4 Medicinal and Aromatic Plants 80-872.1.7.4.1 Medicinal plants 80-812.1.7.4.1.1 Amla 802.1.7.4.1.2 Aswagandha 802.1.7.4.1.3 Atis 802.1.7.4.1.4 Braluni 802.1.7.4.1.5 Chirayta 802.1.7.4.1.6 Guggal 802.1.7.4.1.7 Isabgol 802.1.7.4.1.8 Kutki 802.1.7.4.1.9 Kuth 802.1.7 .4.1.1 0 SafedMusli 812.1.7.4.1.11 Senna 81
•
ISections
[Contents
[Page
INos.
2.1.7.4.2 Aromatic Plants 81-87
2.1.7 .4.2.1 Basil 81-82
2.1.7.4.2.2 Chamomile 82
2.1.7.4.2.3 Citronella 82
2.1.7 .4.2.4 Geranium 82
2.1.7.4.2.5 Jasmine 82
2.1.7 .4.2.6 Lavender 82
2.1.7.4.2.7 Lemon grass 83
2.1.7.4.2.8 Mint 83-86
2.1.7.4.2.9 Palmarosa 86
2.1. 7.4.2.10 Rosemary 86
2.1.7 .4.2.11 Scented Rose 86-87
2.1.7.5 Spices 88-97
2.1.7.5.1 Large Cardamom 88
2.1.7.5.2 Small Cardamom 88
2.1.7.5.3 Coriander 88-89
2.1.7.5.4 Cumin 89
2.1.7.5.5 Fennel 89
2.1.7.5.6 Fenugreek 89
.2.1.7.5.7 Garlic 90.91
2.1.7.5.8 Ginger 92-93
2.1.7.5.9 Pepper (Chillies) 93-95
2.1.7.5.10 Turmeric 96-97
2.1.7.6 Mushroom 98-101
2.1.7.8 Bee keeping 102
3. Post Harvest Infrastructure and Management 103-105
3.1 Production Infrastructure 103-104
3.2 Post harvest Infrastructure 105
4 Research and Development 106-121
4.1 Central Research Institutes in the State 106-118
4.1.a Indian Institute of Vegetable Research Varanasi 106
4.1.a2 Thrust Area of the Institute 106
4.1.a3 Achievements over the Decade 106
4.1.b Central Institute for Sub tropical Horticulture Lucknow 119-121
4.1.b2 Thrust Areas 119
4.1.b3 Achievements for the decade 119
4.2 Krishi Vigyan Kendra 122-125
4.2.1 Krishi Vigyan Kendra working in the State 122
4.2.2 Thrust area 124
4.2.3 Achievement over the decade for sample KVK in Faizabad and Kanpur 125
4.3 State Agriculture Universities 126-135
ISections
IContents
IPage
INos.
4.3.al Chandra Shekhar Azad University of Agri. & Tech. , Kanpur 1264.3.a2 TInust area 1264.3.a3 Major Achievement during the decade 1264.3:bl Narendra Dev University of Agri. and Technology 1314.3.b2 'Thrust Area 1314.3.b3 Major Achievements during the decade 1324.4 State Department of Horticulture and Extension Services 136-1414.4.1 Name of Department, location and Manpower 1364.4.2 'Thrust area 1364.4.3 Achievements during last ten years 1374.7 NGO's.and Private agencies 142-1434.8 Training and Manpower Development 144-145. 5 Value addition 146-1486 Marketing 149-1517 Case Studies 152-170
Success I Failure studies .
8 Regulatory Environment 171-1828.1.2 Central Food Processing Laws 1718.1.3 State laws . 1758.1.5 Incentives and schemes 177
Annexure-l 183-189Annexure-2 (List of Cold Storages)
"
•
•
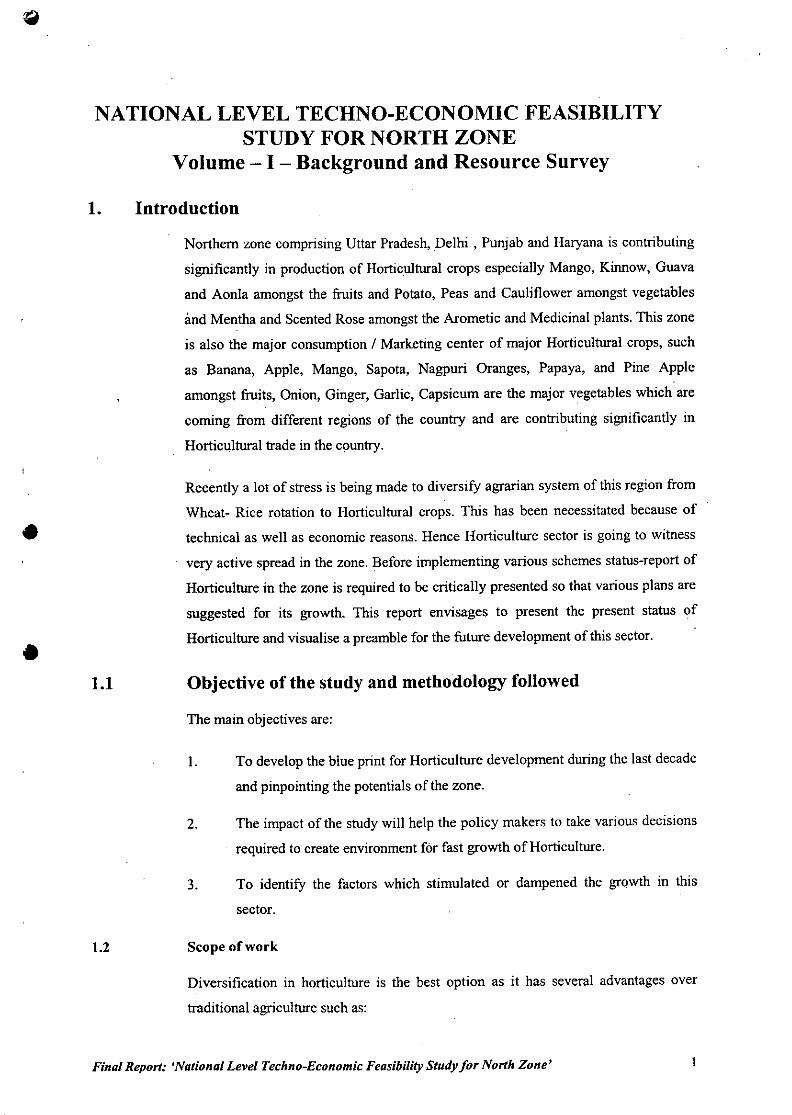
NATIONAL LEVEL TECHNO-ECONOMIC FEASIBILITYSTUDY FOR NORTH ZONE
Volume - I-Background and Resource Survey
1. Introduction
Northern zone comprising Uttar Pradesh, Delhi, Punjab and Haryana is contributing
significantly in production of Horticultural crops especially Mango, Kinnow, Guava
and Aonla amongst the fruits and Potato, Peas and Cauliflower amongst vegetables
imd Mentha and Scented Rose amongst the Arometic and Medicinal plants. This zone
is also the major consumption / Marketing center of major Horticultural crops, such
as Banana, Apple, Mango, Sapota, Nagpuri Oranges, Papaya, and Pine Apple
amongst fruits, Onion, Ginger, Garlic, Capsicum are the major vegetables which are
coming from different regions of the country and are contributing significantly in
Horticultural trade in the cpuntry.
Recently a lot of stress is being made to diversifY agrarian system of this region from
Wheat- Rice rotation to Horticultural crops. This has been necessitated because of
technical as well as economic reasons. Hence Horticulture sector is going to witness
very active spread in the zone. Before implementing various schemes status-report of
Horticulture in the zone is required to be critically presented so that various plans are
suggested for its growth. This report envisages to present the present status of
Horticulture and visualise a preamble for the future development of this sector .
1.1
1.2
Objective of the study and methodology followed
The main objectives are:
I. To develop the blue print for Horticulture development during the last decade
and pinpointing the potentials of the zone.
2. The impact of the study wil1 help the policy makers to take various decisions
required to create environment for fast growth of Horticulture.
3. To identifY the factors which stimulated or dampened the gr(}wth in this
sector.
Scope of work
Diversification in horticulture is the best option as it has several advantages over
traditional agriculture such as:
Final Report: 'National Level Techno-Economic Feasibility Study for North Zone'
1.3
1.4
I. It produces higher biomass than field crops per unit area, resulting in efficient
utilization of natural resources
2. They are highly remunerative for replacing subsistence farming and thus
alleviates poverty level,3. They have potential for development of waste and marginal lands through
planned strategies.4. These crops need comparatively less water than food crops, provides higher
employment, have high potential for earning foreign exchange and provides
nutritional security of the people.
Keeping above facts in view there is tremendous scope of horticulture
development in the state because of its good agro climatic conditions. Inspite
of all the positive factors, progress in horticulture in certain sectors is not as
good as it should be. In depth analysis and suitable remedeal measures have
to be identified and implemented boldly to enhance productivity in
horticulture sector.
Methodology
The methodology for conduct of this study has been through discussions and with
reports and data from various stake holders like Department of Horticulture, Central
Institutes, Agriculture Universities, Krishi Vigyan Kendras (KVKs), Farmers,
Marketers, Processors and Exporters along with the few cases of success and failure
in the field. The data collected will be analysed and inferences drawn to identifYthe
gaps and to suggest suitable remedies.
Organization of the report
The report is in tWoparts i.e. Vol.ume I covers the present status and development of
horticulture that have taken place in the last decade through the data from various
agencies like National Horticulture Board, Deptt. of Horticulture and fruit utilization
State Agriculture Universities, ICAR, National Institutes for horticulture, Ministry of
Food processing and other functionaries, on farm studies of success and failure cases
and Vol. II of the report studies in depth a few of the horticulture crops with high
potential and identified the gaps and suggests suitable measures to increase
production, quality & value addition etc. to enhance the farmers' income or
profitability per unit area.
Detailed Reports: The detailed reports for each of the States follows:
Final Report: 'National Level Techno-Economic Feasibility Study for North Zone' 2
2.2.1.1
Current Status of Horticultural Crops - Uttar Pradesh
Introduction
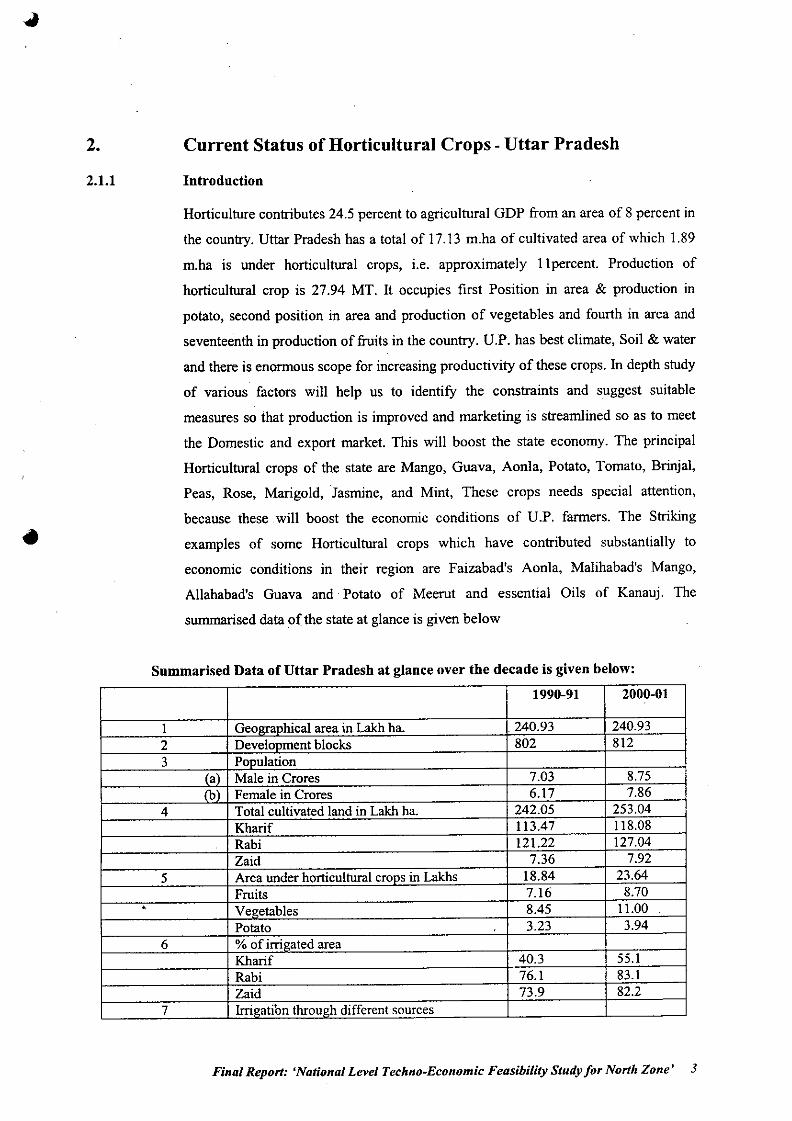
Horticulture contributes 24.5 percent to agricultural GDP from an area of 8 percent in
the country. Uttar Pradesh has a total of 17.13 m.ha of cultivated area of which 1.89
m.ha is under horticultural crops, i.e. approximately II percent. Production of
horticultural crop is 27.94 MT. It occupies fIrst Position in area & production in
potato, second position in area and production of vegetables and fourth in area and
seventeenth in production of fruits in the country. U.P. has best climate, Soil & water
and there is enormous scope for increasing productivity of these crops. In depth study
of various factors will help us to identify the constraints and suggest suitable
measures so that production is improved and marketing is streamlined so as to meet
the Domestic and export market. This will boost the state economy. The principal
Horticultural crops of the state are Mango, Guava, Aonla, Potato, Tomato, Brinjal,
Peas, Rose, Marigold, Jasmine, and Mint, These crops needs special attention,
because these will boost the economic conditions of U.P. farmers. The Striking
examples of some Horticultural crops which have contributed substantially to
economIc conditions in their region are Faizabad's Aonla, Malihabad's Mango,
Allahabad's Guava and Potato of Meerut and essential Oils of Kanauj. The
summarised data of'the state at glance is given below
Summarised Data of Uttar Pradesh at glance over the decade is given below:
1990-91 2000-01
I GeOlrraohicalarea in Lakhha. .240.93 240.932 Develoomentblocks 802 8123 Ponulation
(a) Male in Crores 7.03 8.75(b) Female in Crores 6.17 7.86
4 Total cultivated land in Lakhha. 242.05 253.04Kharif 113.47 118.08Rabi 121.22 127.04
. Zaid 7.36 7.925 Area under horticulturalcrops in Lakhs 18.84 23.64
Fruits 7.16 8.70• Ve<>etables 8.45 11.00
Potato 3.23 3.946 % of irrirmtedarea
Kharif 40.3 55.1Rabi 76.1 83.1Zaid 73.9 82.2
7 lrri"atibn throu"h differentsources
Final Report: 'National Level Techno-Economic Feasibility Study for North Zone' 3
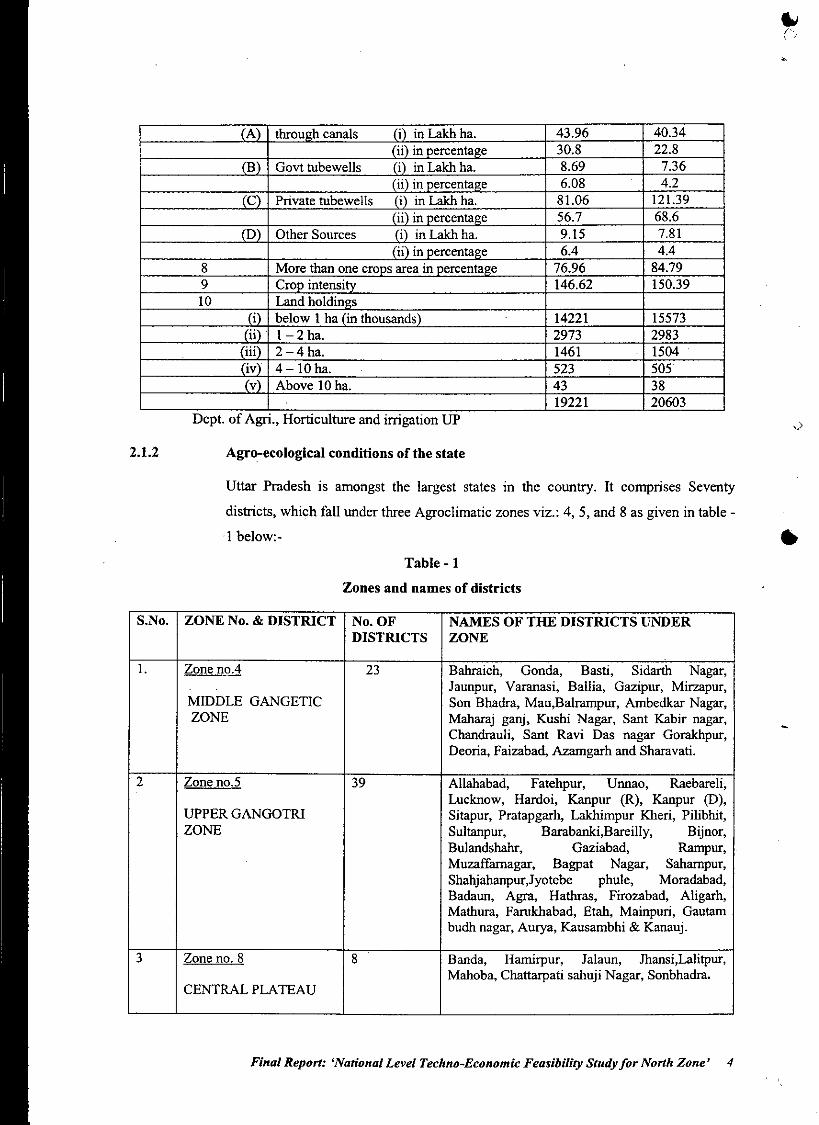
fA) throW!hcanals ffi in Lakh ha. 43.96 40.34(iD in nercenta"e 30.8 22.8
(B) Govt tubewells (i) in Lakh ha. 8.69 7.36(ii) in oercentage 6.08 4.27d Private tubewells min Lakh ha. 81.06 121.39(ii) in percenta"e 56.7 . 68.6
(0) Other Sources (i) in Lakh ha. 9.15 7.81(ii) in oercentage 6.4 4.4
8 More than one croos area in oercentage 76.96 84.799 Crop intensliV 146.62 150.3910 Land holdin"s
(j) below I ha (in thousands) 14221 15573([i) 1-2ha . 2973 2983
.1jji) 2-4ha. 1461 1504(iv) 4-IOha. . 523 505
v) Above 10 ha. 43 3819221 20603
S.No. ZONE No. & DISTRICT No. OF NAMES OF THE DISTRICTS UNDERDISTRICTS ZONE
1. Zone no.4 23 Bahraich, Gonda, Basli, Sidarth Nagar,Jaunpur, Varanasi, Ballia, Gazipur, Mirzapur,
MIDDLE GANGETIC Son Bhadra, Mau,Balrampur, Ambedkar Nagar,ZONE Maharaj ganj, Kushi Nagar, Sant Kabir nagar,
Chandrauli, Sanl Ravi Das nagar Gorakhpur,Deoria, Faizabad, Azamgarh and Sharavati.
2 Zone no.5 39 Allahabad, Fatehpur, Unnao, Raebareli,Lucknow, Hardoi, Kanpur (R), Kanpur (D),
UPPER GANGOTRl Sitapur, Pratapgarh, Lakhimpur Kheri, Pilibhit,ZONE Sultanpur, Barabanki,Bareilly, Bijnor,
Bulandshahr, Gaziabad, Rarnpur,Muzaffamagar, Bagpat Nagar, Sahampur,Shahjahanpur,Jyotebe phule, Moradabad,Badauu, Agra, Hathras, Firozabad, Aligarh,Mathura, Farukhabad, Etah, Mainpuri, Gautambudh nagar, Aurya, Kausambhi & Kanauj.
3 Zone no. 8 8 Banda, Hamirpur, Jalaun, Jhansi,Lalitpur,Mahoba, Chattarpati sahuji Nagar, Sonbhadra.
CENTRAL PLATEAU
2.1.2
Dept. of Agri., Horticulture and irrigation UP
Agro-ecological conditions of the state
Uttar Pradesh is amongst the largest states in the country. It compnses Seventy
districts, which fall under three Agroclimatic zones viz.: 4, 5, and 8 as given in table -
l~~- •
Table -1
Zones and names of districts
Final Report: 'National Level Techno-EconomicFeasibility Study for North Zone' 4
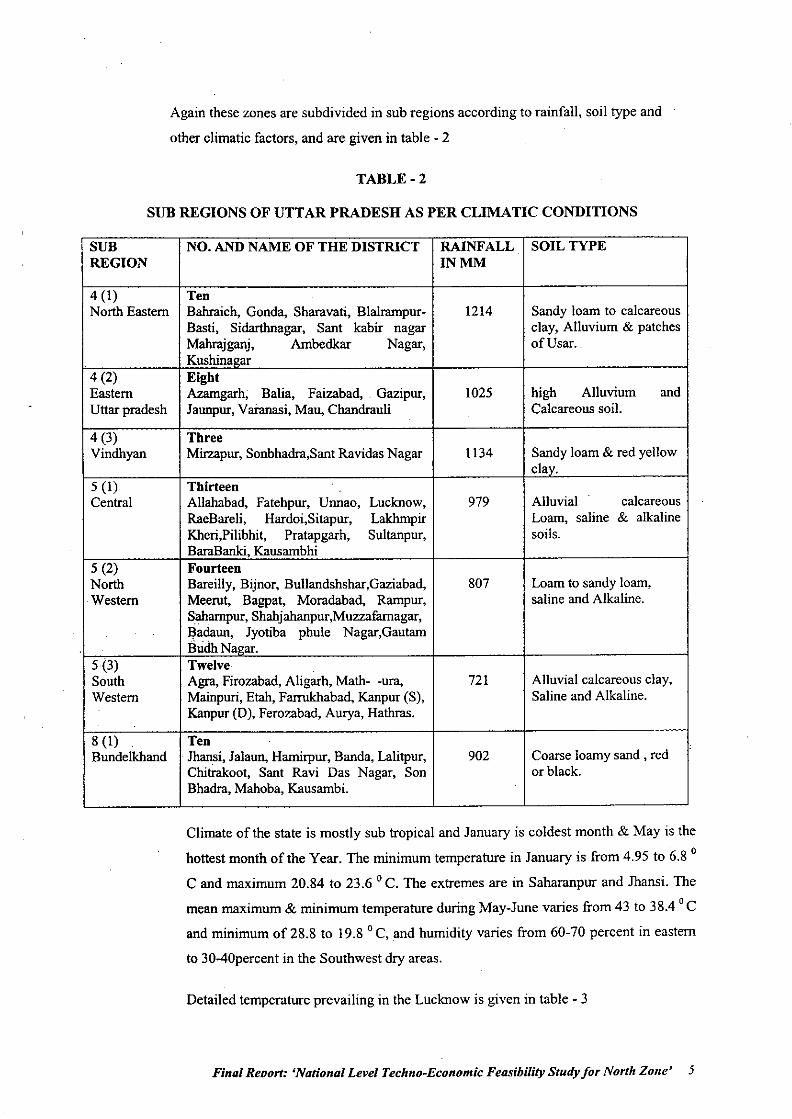
Again these zones are subdivided in sub regions according to rainfall, soil type and
other climatic factors, and are given in table - 2
TABLE-2
SUB REGIONS OF UTTAR PRADESH AS PER CLIMATIC CONDITIONS
SUB NO. AND NAME OF THE DISTRICT RAINFALL SOIL TYPEREGION INMM
4 (I) TenNorth Eastern Bahraich, Gonda, Sharavati, Blalrampur- 1214 Sandy loam to calcareous
Basti, Sidarthnagar, Sant kabir nagar clay, Alluvium & patchesMahrajganj, Ambedkar Nagar, ofUsar ..Kushinagar
4 (2) EigbtEastern Azamgarh, Balia, Faizabad, . Gazipur, 1025 high Alluvium andUttar pradesh Jaunpur, Varanasi, Mau, Cbandrauli Calcareous soil.
4 (3) TbreeVindhyan Mirzapur, Sonbhadra,Sant Ravidas Nagar 1134 Sandy loam & red yellow
clay.5 (I) TbirteenCentral Allahabad, Fatehpur, Unnao, Lucknow, 979 Alluvial calcareous
RaeBareli, Hardoi,Sitapur, Lakhmpir Loam, saline & alkalineKheri,Pilibhit, Pratapgarh, Sultanpur, soils.BaraBanki, Kausambhi
5 (2) FourteenNorth Bareilly, Bijnor, Bullandshshar,Gaziabad, 807 Loam to sandy loam,Western Meerut, Bagpat, Moradabad, Rarnpur, saline and Alkaline.
Saharnpur, Shahjahanpur,Muzzafarnagar,Badaun, Jyotiba phule Nagar,GautamBudhNagar.
5(3) TwelveSouth Agra, Firozabad, Aligarh, Math- -ura, 721 Alluvial calcareous clay,Western Mainpuri, Etah, Farrukhabad, Kanpur (S), Saline and Alkaline.
Kanpur (D), Ferozabad, Aurya, Hathras.
8 (I) TenBundelkhand Jhansi, Jalaun, Hamirpur, Banda, Lalitpur, 902 Coarse loamy sand, red
Chitrakoot, Sant Ravi Das Nagar, Son or black.Bhadra, Mahoba, Kausambi.
Climate of the state is mostly sub tropical and January is coldest month & May is the
hottest month of the Year. The minimum temperature in January is from 4.95 to 6.8 °C and maximum 20.84 to 23.6 °C. The extremes are in Saharanpur and Jhansi. The
mean maximum & minimum temperature during May-June varies from 43 to 38.4 0 C
and minimum of28.8 to 19.8 °c, and humidity varies from 60-70 percent in eastern
to 30-40percent in the Southwest dry areas.
Detailed temperature prevailing in the Lucknow is given in table - 3
Final Renort: 'National Level Techno-Economic Feasibility Study for North Zone' 5
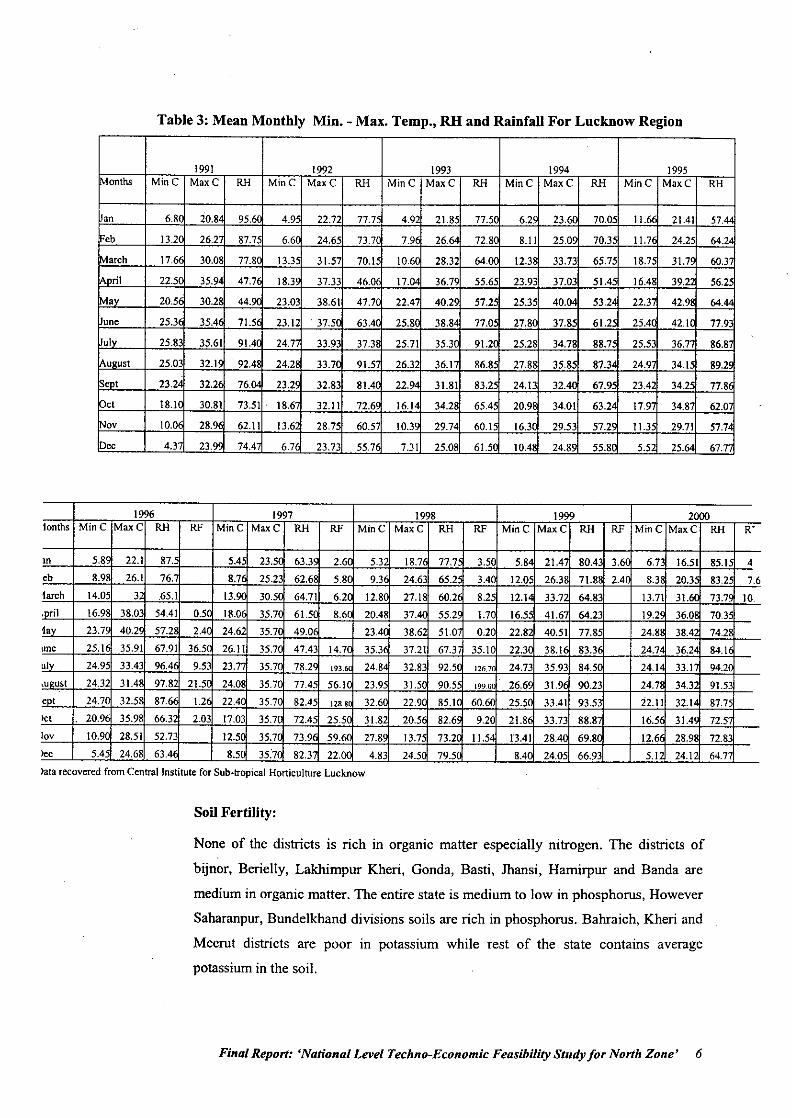
Table 3: Mean Monthly Min. - Max. Temp., RH and Rainfall For Lucknow Region
1991 1992 1993 1994 1995~onlhs Mine MaxC RH Mine MaxC RH Mine MaxC RH Mine MaxC RH Mine MaxC RH
an 6.8" 20.84 95.6 4.9 22.72 77.75 4.92 21.85 77.5 6.29 23.1if 70.0 11.60 21.41 57."
f"eb 13.2" 26.2 87.7 6.60 24.65 73.70 7.9 26.64 72.8( 8.11 25.0 70.3 11.70 24.25 64.2
lMarch 17.'" 30.08 77.8 13.3' 31.5 70.15 1O.6( 28.32 64.0( 12.3 33.73 65.75 18.7 31.7S 60.3'
IAnnI 22.5' 35.9 47.7 18.3' 37.33 46.0' 17.0 36.79 55.6 23.93 37.03 51.4 1604' 39.2 56.2
iMa" 20.5' 30.2 44.9< 2l.O3 38.61 47.7' 2204 40.29 57.2 25.35 40.0 53.2 22.3' 42.9' 64."
une 25.3 35.4 71.5 23.12 . 37.5' 6304' 25.8' 38.8 77.0 27.8 37.85 61.2 25.4 42.1' 77.93
ulv 25.83 35.61 91.4 24.7 33.93 37.3' 25.71 35.3 91.2( 25.28 34.78 88.75 25.53 36.7' 86.8'
[Aupust 25.03 32.1 9204 24.2 33.7( 91.5 26.3 36.1 86.85 27.8 35.8 87.3 24.9 34.1 89.2\
k~1 23.2 32.2 76.'" 23.2 32.83 81.4 22.9 31.81 83.2 24.13 32.4< 67.95 23.4 34.2' 77.8f
hCI 18.1 30.81 73.51 18.6 32.11 72.6 16.1 34.28 65.45 20.9 34.01 63.2 17.9 34.8 62.0
iToov 10.'" 28.9 62.11 13.62 28.7 60.57 10.3< 29.7 60.1 16.3 29.53 57.2' 11.3 29.71 57.7
Inec 4.3 23.9 7404 6.7 23.73 55.7 7.31 25.08 61.5( 10.4 24.8< 55.8' 5.5 25."' 67.7'
1996 1997 1998 1999 200010nths Mine MaxC RH RF Mine MaxC RH RF Mine MaxC RH RF Mine MaxC RH RF Mine MaxC RH R-
IO 5.8< 22.1 87. 5.4 23.5' 63.3' 2.6( 5.3 18.7 77.7 3.50 5.8 2104' 80043 3.6( 6.7 16.51 85.1 4eb 8.98 26.1 76. 8.7 25.23 62.6 5.8' 9.31 24.63 65.2 3.4( 12.05 26.3' 71.8' 204' 8.3 20.3 83.25 7.6
larch 14.05 3 .65.1 13.9< 30.5' 64.71 6.2' 12.8' 27.18 60.2 8.25 12.1 33.7 64.83 13.71 31.1< 73.7< 10,nrii 16.98 38.03 54.41 0.5 18.0 35.7' 61.5' 8.6' 2004' 37.41 55.2 1.7' 16.5 41.6 64.23 19.2' 36.0' 70.35
la" 23.7' 40.2' 57.2 2.4 24.6 35.7 49.0 23.4 38.6 51.0 0.20 22.82 40.51 77.8 24.8 3804 74.2'!Joe 25.1 35.91 I. 67.91 36.5 26.11 35.7 47.43 14.7( 35.3 37.21 67.3 35.1( 22.31 38.11 83.3 24.7 36.2 84.11
"Iv 24.95 33.43 96.4 9.53 23.7 35.7 78.2S 193.M 24.8 32.83 92.5' 126.7 24.73 35.93 84.5 24.1 33.1 ' 94.2',UC:nIst 24.32 31.4 97.8 21.5 24.0 35.7 77.4 56.1' 23.9 31.5' 90.5 199.11> 26.6' 31.9 90.23 24.7 34.3' 91.53enl 24.7 32.5' 87.6 1.2 22.41 35.7 82045 128.8 32.0 22.9' 85.1' 60.6 25.5' 33.41 93.53 22.11 32.1 87.75
let 20.9 35.98 66.3 2.03 17.03 35.7 7204' 25.5 31.8 20.5 82.6' 9.20 21.8 33.73 88.8 16.5 31.4< 72.5
lov 10.9' 28.51 52.73 12.5' 35.7 73.9' 59." 27.8 13.7 73.21 11.5 13.41 28.4 69.81 12.61 28.91 72.83lec 5045 24.68 63.4' 8.5' 35) 82.3 22Jl< 4.83 24.5 79.5' 8041 24.05 66.93 5.1' 24.1' 64.77
)a13 recovered from Central Institute for Sub.tropical Horticulture Lucknow
Soil Fertility:
None of the districts is rich in organic matter especially nitrogen. The districts of
bijnor, Berielly, Lakhimpur Kheri, Gonda, Basti, Jhansi, Hamirpur and Banda are
medium in organic matter. The entire state is medium to low in phosphorus, However
Saharanpur, Bundelkhand divisions soils are rich in phosphorus. Bahraich, Kheri and
Meerut districts are poor in potassium while rest of the state contains averagepotassium in the soil.
Final Report: 'National Level Techno-Economic FeasibilityStudy for North Zone' 6
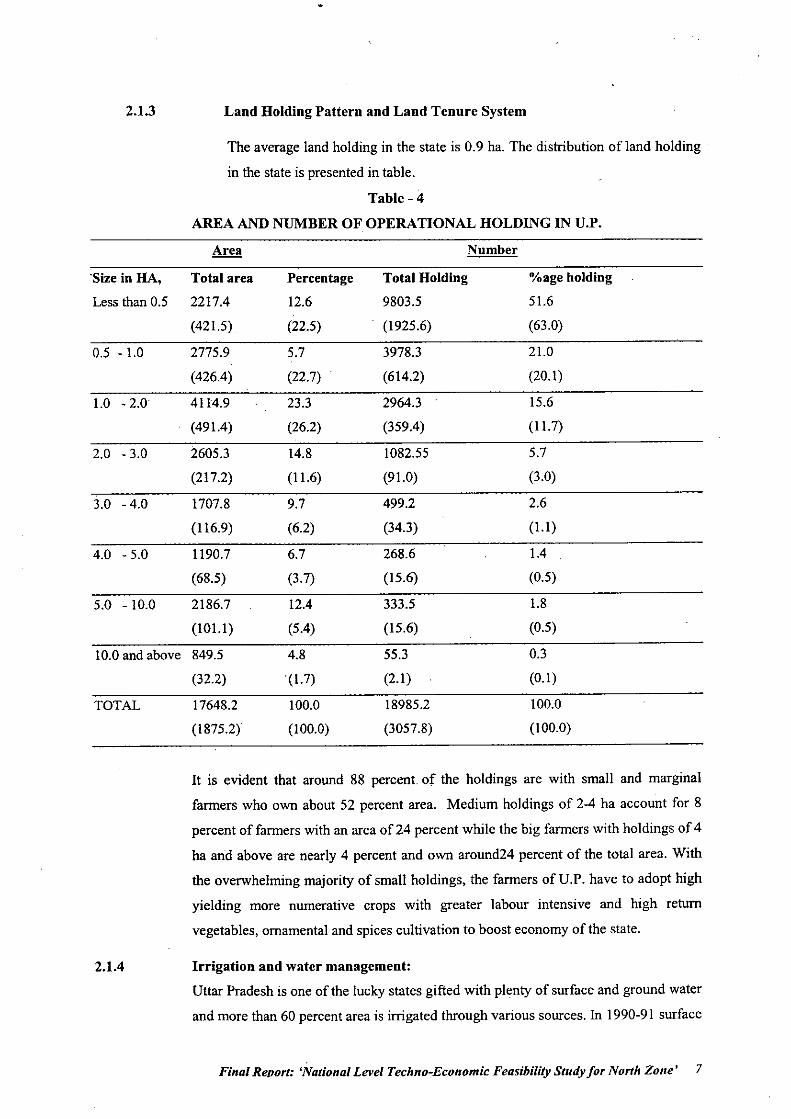
2.1.3 Land Holding Pattern and Land Tenure System
The average land holding in the state is 0.9 ha. The distribution ofland holding
in the state is presented in table.
Table - 4
AREA AND NUMBER OF OPERATIONAL HOLDING IN V.P.
Area Number
'Size in HA, Total area Percentage Total Holding %age holding
Less than 0.5 2217.4 12.6 9803.5 51.6
(421.5) (22.5) (1925.6) (63.0)
0.5 - 1.0 2775.9 5.7 3978.3 21.0
(426.4) (22.7) (614.2) (20.1)
1.0 - 2.0 4114.9 23.3 2964.3 15.6
(491.4) (26.2) (359.4) (11.7)
2.0 - 3.0 2605.3 14.8 1082.55 5.7
(217.2) (11.6) (91.0) (3.0)
3.0 -4.0 1707.8 9.7 499.2 2.6
(116.9) (6.2) (34.3) (1.1)
4.0 - 5.0 1190.7 6.7 268.6 1.4
(68.5) (3.7) (15.6) (0.5)
5.0 - 10.0 2186.7 12.4 333.5 1.8
(101.1) (5.4) (15.6) (0.5)
10.0 and above 849.5 4.8 55.3 0.3
(32.2) (1.7) (2.1) (0.1)
TOTAL 17648.2 100.0 18985.2 100.0
(1875.2) (100.0) (3057.8) (100.0)
It is evident that around 88 percent. of the holdings are with small and marginal
farmers who own about 52 percent area. Medium holdings of 2-4 ha account for 8
percent of farmers with an area of 24 percent while the big farmers with holdings of 4
ha and above are nearly 4 percent and own around24 percent of the total area. With
the overwhelming majority of small holdings, the farmers of V.P. have to adopt high
yielding more numerative crops with greater labour intensive and high return
vegetables, ornamental and spices cultivation to boost economy of the state.
2.1.4 Irrigation and water management:
Vttar Pradesh is one of the lucky states gifted with plenty of surface and ground water
and more than 60 percent area is irrigated through various sources. In 1990-91 surface
Final ReDort: 'National Level Techno-Economic Feasibility Study for North Zone' 7
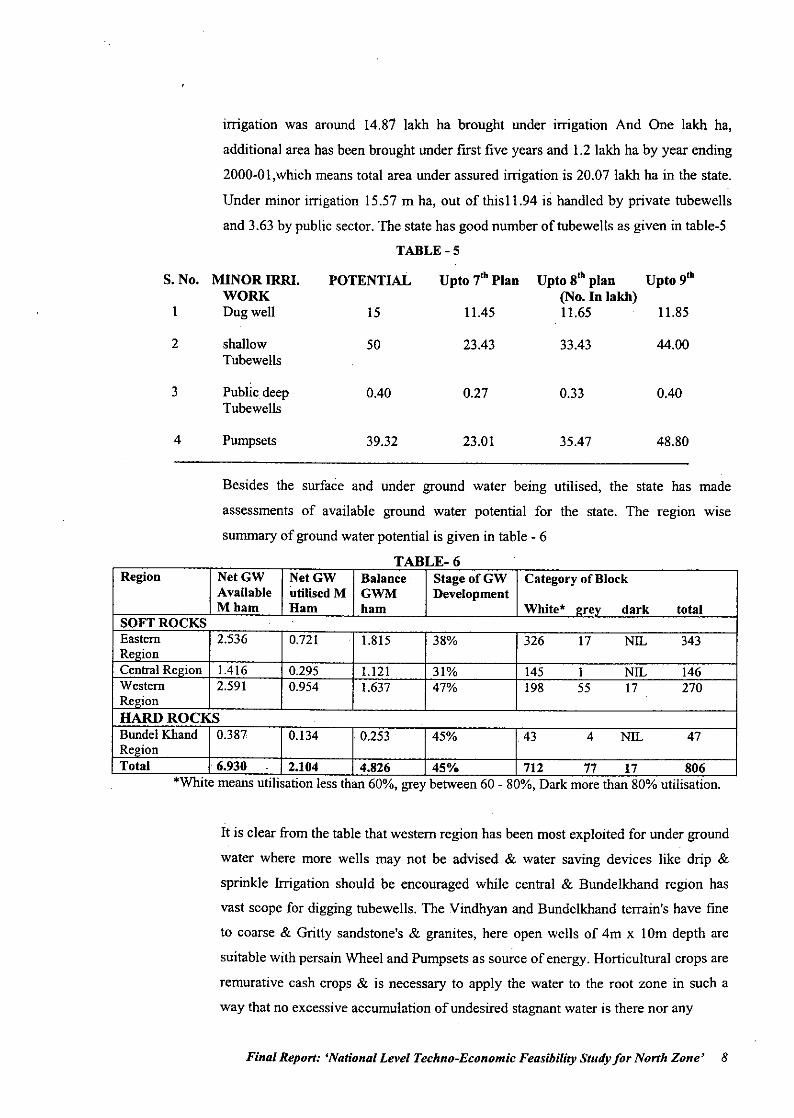
irrigation was around 14.81 lakh ha brought under irrigation And One lakh ha,
additional area has been brought under fIrst fIve years and 1.2 lakh ha by year ending
2000-0 1,which means total area under assured irrigation is 20.07 lakh ha in the state.
Under minor irrigation 15.57 m ha, out ofthisl1.94 is handled by private tubewells
and 3.63 by public sector. The state has good number of tube wells as given in table-5
TABLE-5
S. No. MINORIRRI. POTENTIAL Upto 7th Plan Upto 8th plan Upto 9th
WORK (No. In lakh)1 Dug well 15 11.45 11.65 11.85
2 shallow 50 23.43 33.43 44.00Tubewells
3 Public deep 0.40 0.27 0.33 0.40Tubewells
4 Pumpsets 39.32 23.01 35.47 48.80
Besides the surface and under ground water being utilised, the state has made
assessments of available ground water potential for the state. The region wise
summary of ground water potential is given in table - 6
TABLE-6Region NetGW NetGW Balance StageofGW Category of Block
Available utilised M GWM DevelopmentMham Ham ham White' ~rev dark total
SOFT ROCKS .
Eastern 2.536 0.721 1.815 38% 326 17 NIL 343Re~ionCentral Re~ion 1.416 0.295 1.121 31% 145 1 NIL 146Western 2.591 0.954 1.637 47% 198 55 17 270RelrionHARD ROCKS .
Bundel Khand 0.387 0.134 .0.253 45% 43 4 NIL 47Re~ionTotal 6.930 2.104 4.826 45% 712 77 17 806
'White means utilisation less than 60%, grey between 60 - 80%, Dark more than 80% utilisation.
It is clear from the table that western region has been most exploited for under ground
water where more wells may not be advised & water saving devices like drip &
sprinkle Irrigation should be encouraged while central & Bundelkhand region has
vast scope for digging tubewells. The Vindhyan and Bundelkhand terrain's have fIne
to coarse & Gritiy sandstone's & granites, here open wells of 4m x 10m depth are
suitable with persain Wheel and Pumpsets as source of energy. Horticultural crops are
remurative cash crops & is necessary to apply the water to the root zone in such a
way that no excessive accumulation of undesired stagnant water is there nor any
Final Report: 'National Level Techno-Economic Feasibility Study for North Zone' 8
2.1.5
moisture stress occurs which may hamper the yield and quality of fruits and
vegetables. The modem methods of irrigation i.e. sprinkler & drip system needs
special attention, because water is going to be a scarce input in the coming years.
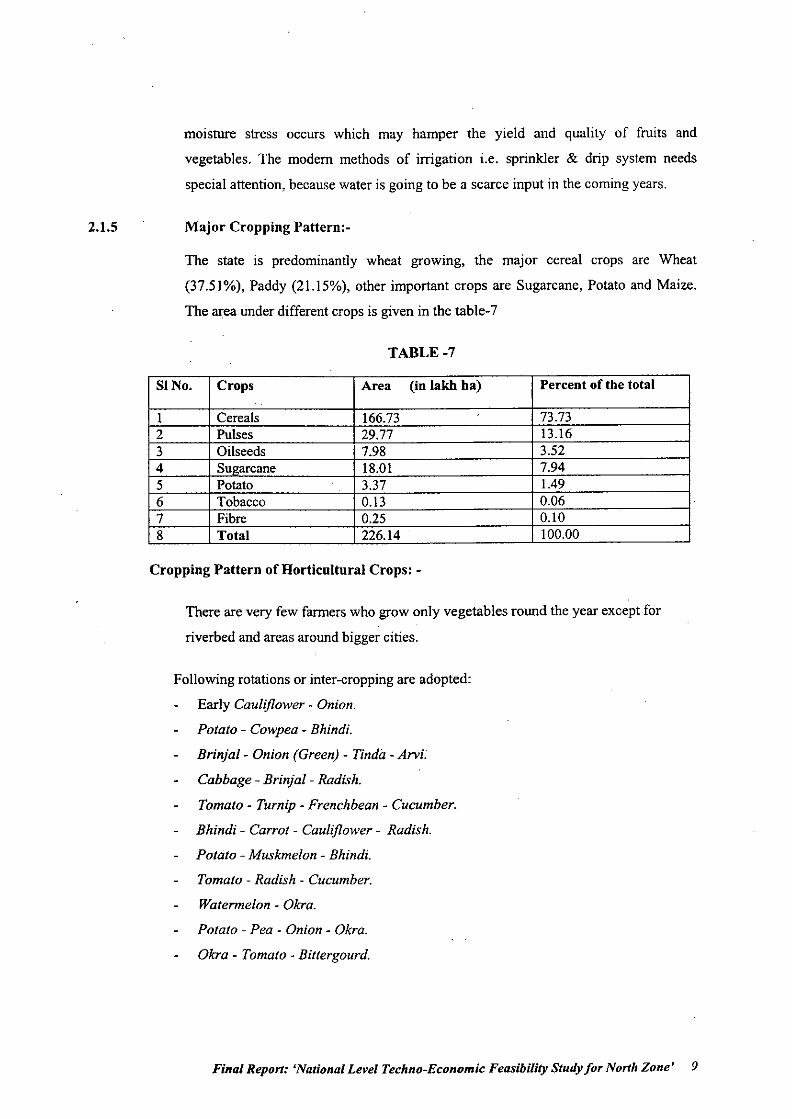
Major Cropping Pattern:-
The state is predominantly wheat growmg, the major cereal crops are Wheat
(37.51%), Paddy (21.15%), other important crops are Sugarcane, Potato and Maize.
The area under different crops is given in the table-7
TABLE-7
81No. Crops Area (in lakh hal Percent of the total
I Cereals 166.73 73.732 Pulses 29.77 13.163 Oilseeds 7.98 3.524 SUl!arcane 18.01 7.945 Potato 3.37 1.496 Tobacco 0.13 0.067 Fibre 0.25 0.108 Total 226.14 100.00
Cropping Pattern of Horticultural Crops: -
There are very few farmers who grow only vegetables round the year except for
riverbed and areas around bigger cities.
Following rotations or inter-cropping are adopted:
Early Cauliflower - Onion.
Potato - Cowpea - Bhindi.
Brinjal - Onion (Green) - Tindil - Arvi.
Cabbage - Brinjal - Radish.
Tomato - Turnip - Frenchbean - Cucumber.
Bhindi - Carrot - Cauliflower - Radish.
Potato - Muskmelon - Bhindi.
Tomato - Radish - Cucumber.
Watermelon - Okra.
Potato - Pea - Onion - Okra.
Okra - Tomato - Bittergourd.
Final Report: 'National Level Techno-Economic Feasibility Study for North Zone' 9
Inter-cropping of young orchards can be done with Pea, Beans, Tomato etc for first
few years. Sugarcane is inter-cropped with Bittergourd, Cowpea, during Spring-
Summer. The main cropping pattern with Cereals is --
Potato - Wheat - Paddy and Paddy - Cauliflower - Okra.
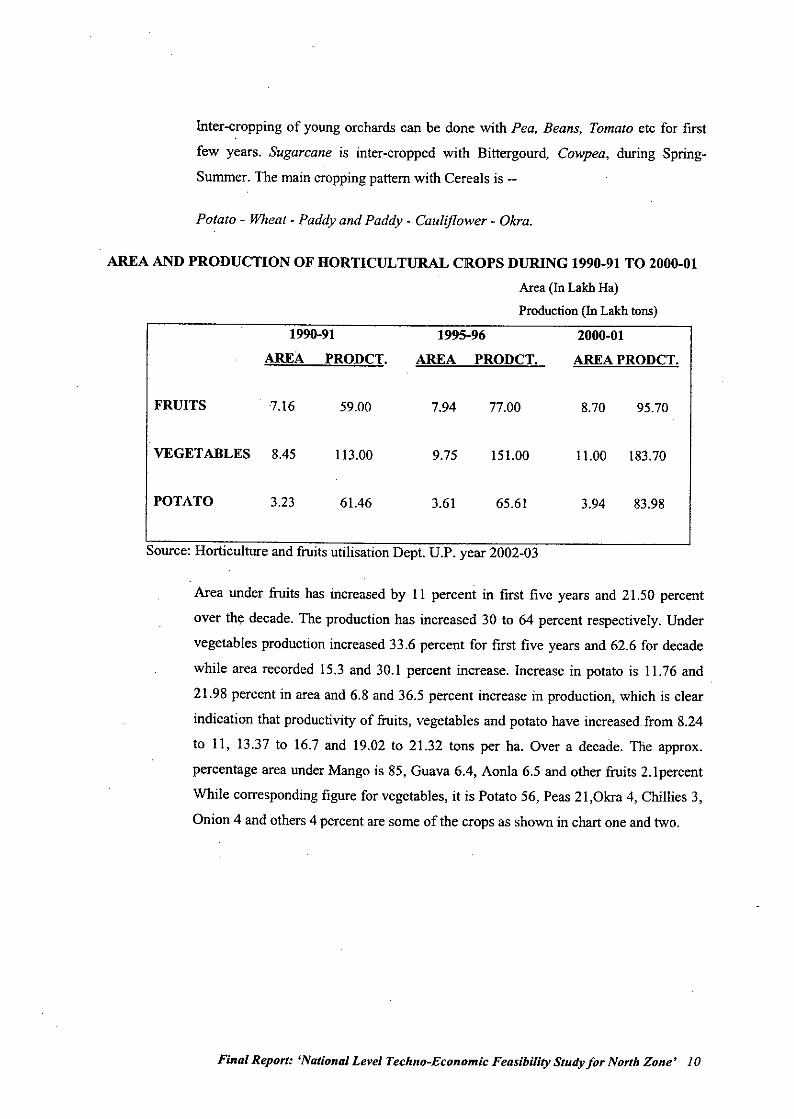
AREA AND PRODUCTION OF HORTICULTURAL CROPS DURING 1990-91 TO 2000-01
Area(InLakhHa)Production(InLakhtons)
1990-91 1995-96 2000-01AREA PRODCT, AREA PRODCT, AREA PRODCT.
FRUITS 7.16 59.00 7.94 77.00 8.70 95.70
VEGETABLES 8.45 113.00 9.75 151.00 11.00 183.70
POTATO 3.23 61.46 3.61 65.61 3.94 83.98
Source: Horticulture and fiuits utilisation Dept. U.P. year 2002-03
Area under fiuits has increased by 11 percent in first five years and 21.50 percent
over the decade. The production has increased 30 to 64 percent respectively. Under
vegetables production increased 33.6 percent for first five years and 62.6 for decade
while area recorded 15.3 and 30.1 percent increase. Increase in potato is 11.76 and
21.98 percent in area and 6.8 and 36.5 percent increase in production, which is clear
indication that productivity of fiuits, vegetables and potato have increased.from 8.24
to 11, 13.37 to 16.7 and 19.02 to 21.32 tons per ha. Over a decade. The approx.
percentage area under Mango is 85, Guava 6.4, Aonla 6.5 and other fiuits 2.1percent
While corresponding figure for vegetables, it is Potato 56, Peas 21,Okra 4, Chillies 3,
Onion 4 and others 4 percent are some of the crops as shown in chart one and two.
Final Report: 'National Level Techno-Economic Feasibility Study for North Zone' 10
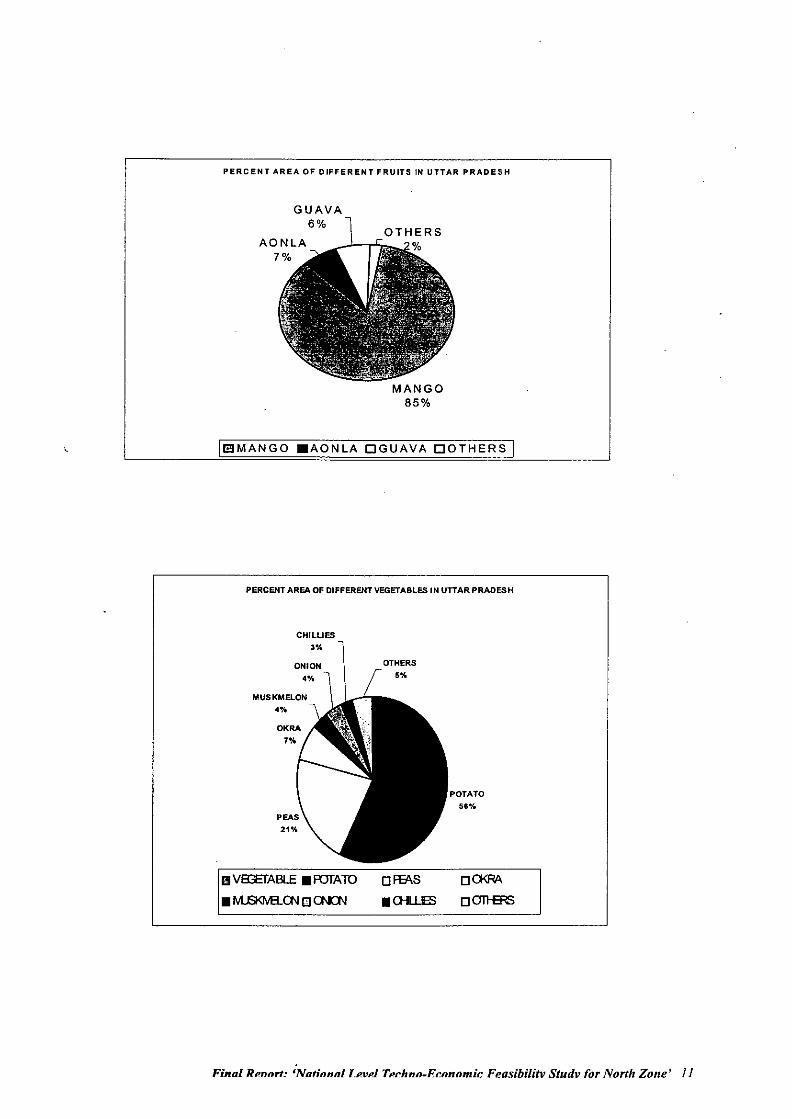
PERCENT AREA OF DIFFERENT FRUITS IN UTTAR PRADESH
GUAVA6%
MANGO85%
II!!JMANGO .AONLA ClGUAVA ClOTHERS I
PERCENT AREA OF DIFFERENT VEGETABLES IN UTTAR PRADESH
CHILUES,%
OTHERS5%
[I!IVB:E"ABLE .RJTAlO• M..S<M3..(l\J l]ctIICN
of6ll.S
.Q-ILLIES
POTATO5So",
oO<RA
OOTl-ERS
Final Rpnnrl! 'Nnf;nnni T,pvpl Tprhnn_Hr.nnomic Feasibilitv Studv for North Zone' I J
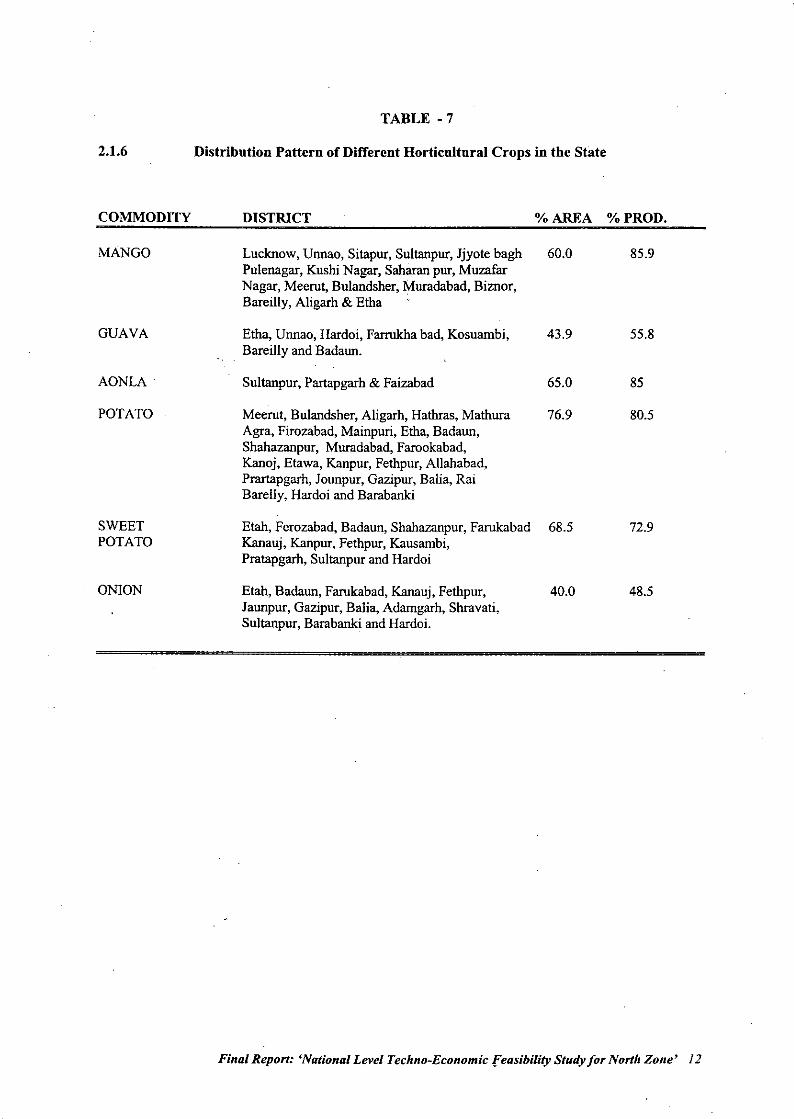
2.1.6
TABLE -7
Distribution Pattern of Different Horticultural Crops in tbe State
COMMODITY DISTRICT % AREA % PROD.
MANGO Lucknow, Unnao, Sitapur, Sultanpur, Jjyote bagh 60.0 85.9Pulenagar, Kushi Nagar, Saharan pur, MuzafarNagar, Meerut, Bulandsher, Muradabad, Biznor,Bareilly, Aligarh & Elba
GUAVA Etha, Unnao, Hardoi, Farrukha bad, Kosuambi, 43.9 55.8Bareill y and Badaun.
AONLA Sultanpur, Partapgarh & Faizabad 65.0 85
POTATO Meerut, Bulandsher, Aligarh, Hathras, Malbura 76.9 80.5Agra, Firozabad, Mainpuri, Elba, Badaun,Shahazanpur, Muradabad,Farookabad,Kanoj, Etawa, Kanpur, Felbpur, Allahabad,Prartapgarh, Jounpur, Gazipur, Balia, RaiBarelly, Hardoi and Barabanki
SWEET Etah,Ferozabad,Badaun,Shahazanpur, Farukabad 68.5 72.9POTATO Kanauj, Kanpur, Fethpur, Kausambi,
Pratapgarh, Sultanpur and Hardoi
ONION Etah, Badaun, Farukabad, Kanauj, Felbpur, 40.0 48.5Jaunpur, Gazipur, Balia, Adamgarh, Shravati,Sultanpur, Barabanki and Hardoi.
Final Report: 'National Level Techno-Economic Feasibility Study for North Zone' 12
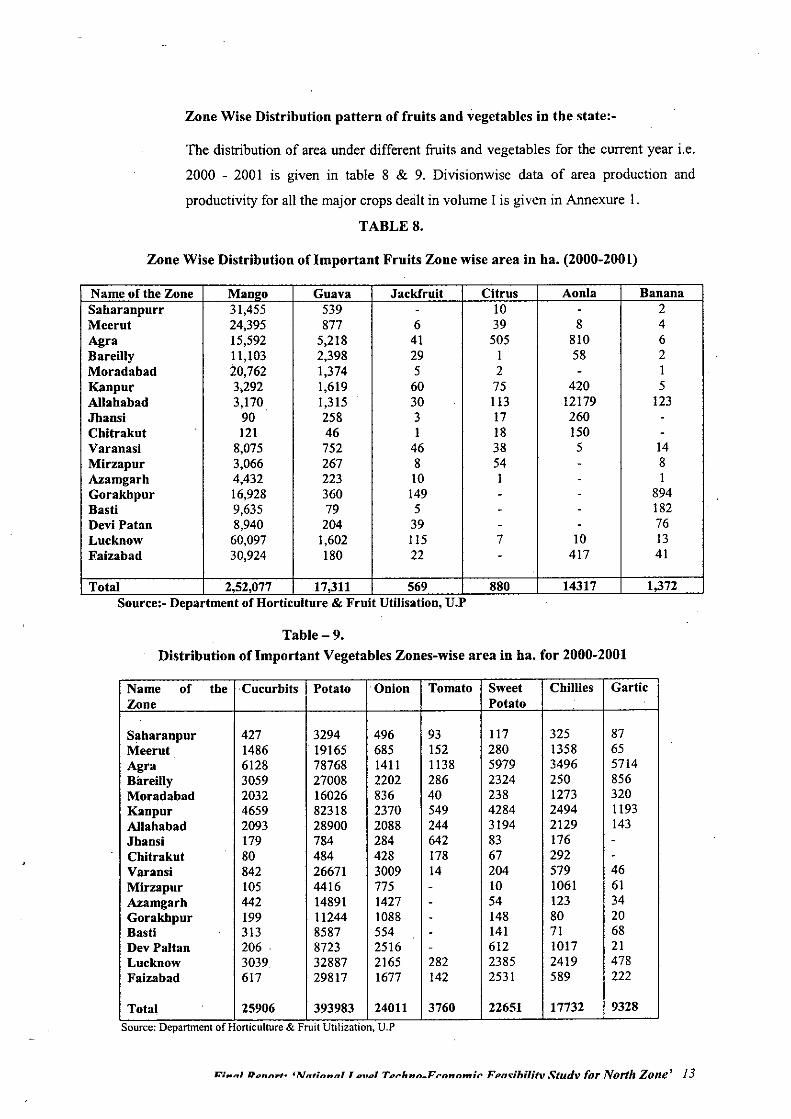
Zone Wise Distribution pattern of fruits and vegetables in the state:-
The distribution of area under different fruits and vegetables for the current year i.e.
2000 - 2001 is given in table 8 & 9. Divisionwise data of area production and
productivity for all the major crops dealt in volume I is given in Annexure 1.
TABLES.
Zone Wise Distribution oflmportant Fruits Zone wise area in ha. (2000-2001)
Name of the Zone MaUl!O Gnava Jackfruit Citrus Aonla BananaSaharanpurr 31,455 539 - 10 - 2Meerut 24,395 877 6 39 8 4Agra 15,592 5,218 41 505 810 6Bareilly 11,103 2,398 29 1 58 2Moradabad 20,762 1,374 5 2 - 1Kanpur 3,292 1,619 60 75 420 5Allahabad 3,170 1,315 30 113 12179 123Jhansi 90 258 3 I 17 260 -Chitraknt 121 46 1 18 150 -Varanasi 8,075 752 46 38 5 14Mirzapur 3,066 267 8 54 - 8Azamgarh 4,432 223 10 1 - 1Gorakhpur 16,928 360 149 - - 894Basti 9,635 79 5 - - 182Devi Patan 8,940 204 39 - - 76Lucknow 60,097 1,602 115 7 10 13Faizabad 30,924 180 22 - 417 41
Total 2,52,077 17,311 569 880 14317 1,372Source:- Department of Horticulture & Fruit Utilisation, U.P
Table- 9.Distribution oflmportant Vegetables Zones-wise area in ha. for 2000-2001
Name of the -Cucurbits Potato -Onion Tomato Sweet Chillies GarticZone Potato
Saharanpur 427 3294 496 93 117 325 87Meerut 1486 19165 685 152 280 1358 65Agra 6128 78768 1411 1138 5979 3496 5714Bareilly 3059 27008 2202 286 2324 250 856Moradabad 2032 16026 836 40 238 1273 320Kanpur 4659 82318 2370 549 4284 2494 1193Allahabad 2093 28900 2088 244 3194 2129 143Jhansi 179 784 284 642 83 176 -Chitrakut 80 484 428 178 67 292 -Varansi 842 26671 3009 14 204 579 46Mirzapur 105 4416 775 - 10 1061 61Azamgarh 442 14891 1427 - 54 123 34Gorakhpur 199 11244 1088 - 148 80 20Bastl 313 8587 554 - 141 71 68Dev Paltan 206 8723 2516 - 612 1017 21Lucknow 3039 32887 2165 282 2385 2419 478Falzabad 617 29817 1677 142 2531 589 222
Total 25906 393983 24011 3760 22651 17732 9328Source: Department of Horticulture & Fruit Utilization, U.P
"':••,.1 Donn"'" 'NntinHnl TDt!DI Tot"hnn_Prnnnntir Fpfl'/dhilitv .f\tudv for North Zone' 13
2.1.7
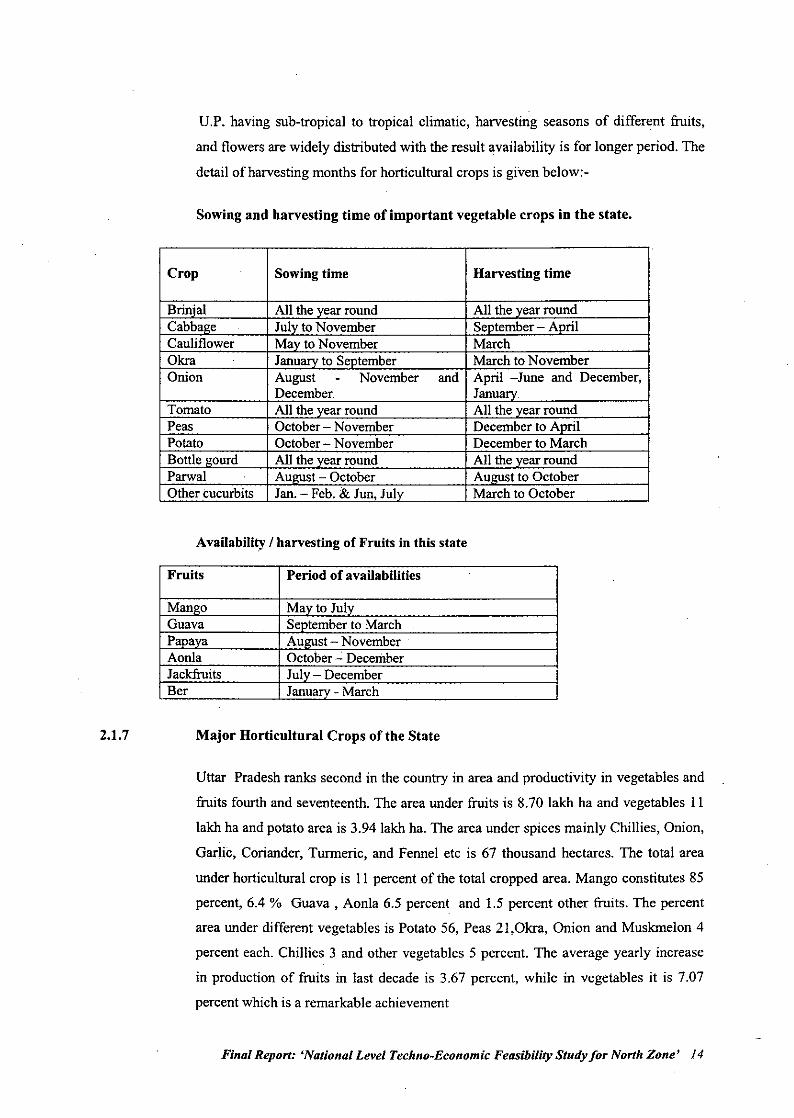
U.P. having sub-tropical to tropical climatic, harvesting seasons of different fruits,
and flowers are widely distributed with the result availability is for longer period. The
detail of harvesting months for horticultural crops is given below:-
Sowing and harvesting time of important vegetable crops in the state.
Crop Sowing time Harvesting time
Brinial All the vear round All the vear roundCabbage . July to November September - AprilCauliflower May to November MarchOkra January to September March to NovemberOnion August - November and April -June and December,
December . JanuaryTomato All the vear round All the vear roundPeas October - November December to AprilPotato October - November December to MarchBottle gourd All the vear round All the vear roundParwal August - October August to OctoberOther cucurbits Jan. - Feb. & Jun, Julv March to October
Availability I harvesting of Fruits in this state
Fruits Period of availabilities
Mango May to JulyGuava September to MarchPapaya August - NovemberAonla October"': DecemberJackfiuits Julv - DecemberBer Januarv - March
Major Horticultural Crops of the State
Uttar Pradesh ranks second in the country in area and productivity in vegetables and
fruits fourth and seventeenth. The area under fruits is 8.70 lakh ha and vegetables II
lakh ha and potato area is 3.94 lakh ha. The area under spices mainly Chillies, Onion,
Garlic, Coriander, Turmeric, and Fennel etc is 67 thousand hectares. The total 'area
under horticultural crop is II percent of the total cropped area. Mango constitutes 85
percent, 6.4 % Guava, Aonla 6.5 percent and 1.5 percent other fruits. The percent
area under different vegetables is Potato 56, Peas 21,Okra, Onion and Muskmelon 4
percent each. Chillies 3 and other vegetables 5 percent. The average yearly increase
in production of fruits in last decade is 3.67 percent, while in vegetables it is 7.07
percent which is a remarkable achievement
Final Report: 'National Level Techno-Economic Feasibility Study for North Zone' J 4
2.1.7.1
2.1.7.1.1
2.1.7.1.2
2.1.7.1.2.1
Fruits and nuts
Apple
There is no substantial area under Apples within the State as the entire Apple growing
area has been transferred to Uttaranchal. Hence the area under the- crop is insignificant
and no data is available for this crop in the State.
Banana
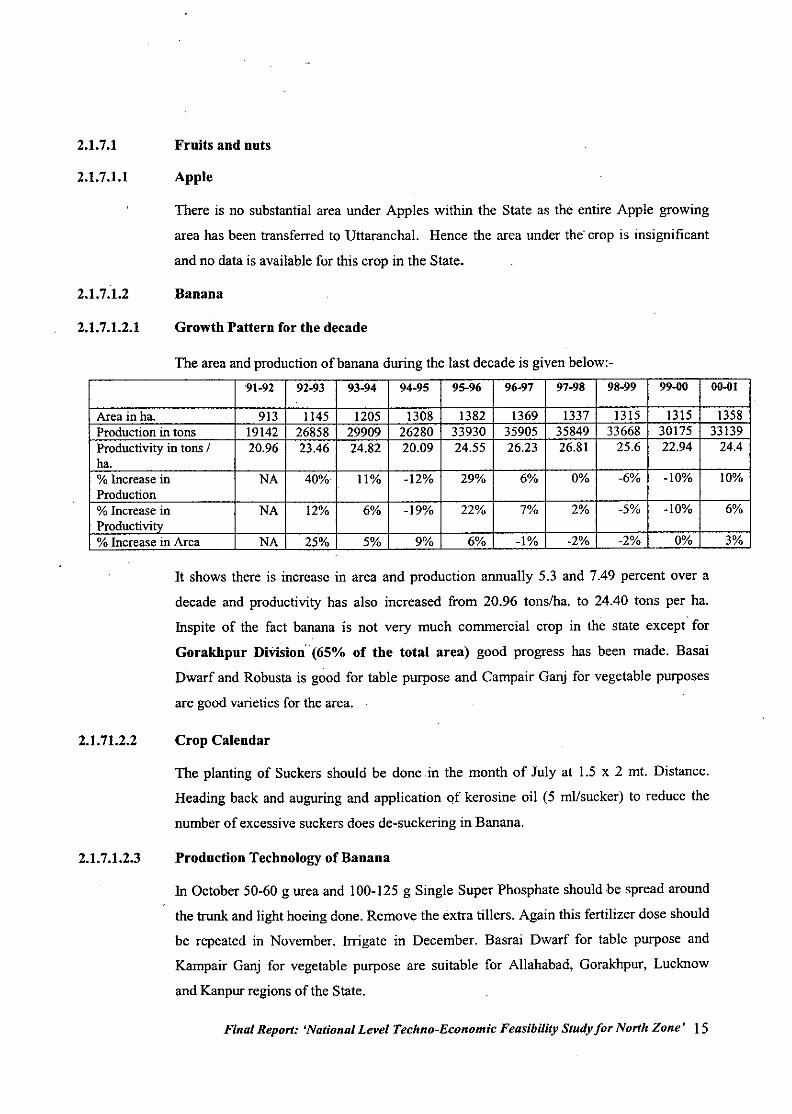
Growth Pattern for the decade
The area and production of banana during the last decade is given below:-
'9t-92 92.93 93-94 94-95 95-96 96-97 97-98 98-99 99-00 OO-ot
Area in ha. 913 1145 1205 1308 1382 1369 1337 1315 1315 1358Production in tons 19142 26858 29909 26280 33930 35905 35849 33668 30175 33139Productivity in tons / 20.96 23-46 24.82 20.09 24.55 26.23 26.81 25.6 22.94 24.4ha.% Increase in NA 40% 11% -12% 29% 6% 0% -6% -10% 10%Production% Increase in NA 12% 6% -19% 22% 7% 2% -5% -10% 6%Productivity% Increase in Area NA 25% 5% 9% 60/0 -1% -2% -2% 0% 3%
It shows there is increase in area and production annually 5.3 and 7.49 percent over a
decade and productivity has also increased from 20.96 tons/ha. to 24.40 tons per ha.
illspite of the fact banana is not very much commercial crop in the state except for
Gorakhpur DiVision' (65% of the total area) good progress has been made. Basai
Dwarf and Robusta is good for table purpose and Campair Ganj for vegetable purposes
are good varieties for the area.
2.1.71.2.2
2.1.7.1.2.3
Crop Calendar
The planting of Suckers should be done in the month of July at 1.5 x 2 mt. Distance.
Heading back and auguring and application of kerosine oil (5 ml/sucker) to reduce the
number of excessive suckers does de-suckering in Banana.
Production Technology of Banana
ill October 50-60 g urea and 100-125 g Single Super Phosphate should be spread around
the trunk and light hoeing done. Remove the extra tillers. Again this fertilizer dose should
be repeated in November. Irrigate in December. Basrai Dwarf for table purpose and
Kampair Ganj for vegetable purpose are suitable for Allahabad, Gorakhpur, Lucknow
and Kanpur regions of the State.
Final Report: 'National Level Techno-Economic Feasibility Study for North Zone' 15
2.1.7.1.2.4
2.1.7.1.2.5
2.1.7.1.2.6
2.1.7.1.2.7
2.1.7.1.2.8
Pest and disease management
For the management of storage rots in banana carbendazim 0.1% and methyl theophanate
0.1% common salt provide maximum control of storage rot. The other major disease
being Bunchy Top which can be controlled by using a good fungicide.
Harvest Method and Yield:
The harvesting of the bunches of Banana is made when they attain the proper size and are
still to ripen, this is to keep them suitable for transportation. The productivity in Banana
within the state presently stands at 24.40 MT per Hectare the quantity which has been
factually ascertained during the interaction with main farmers of the banana growing
regions of the State.
Crop economics
The crop economics for banana has been calculated on the 2nd year of production
considering that total number of plants being 3333 plants per hectare, giving an average
yield of 30 Kgs. per plant i.e. about 133 tons (This information has been taken from the
data made available by DOH, UP). Tbr average sale rate of banana for estimation has
been taken as Rs.2/- per kg generating a total income of Rs.2.66 lacs per hectare. The
expenditure incurred as cost of production being taken as Rs.53835/- per hectare. Thus
giving a net income ofRs.2.12Iacs per hectare.
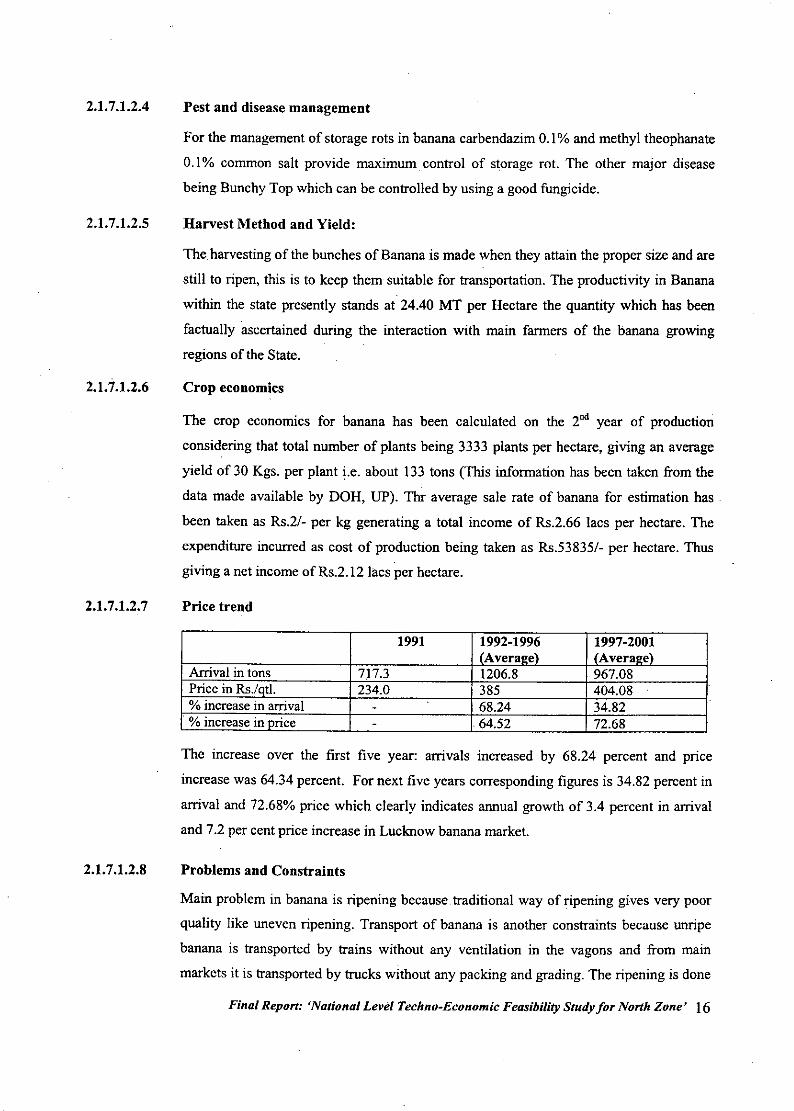
Price trend
1991 1992-1996 1997-2001(Averal!e) (Averal!e)
Arrival in tons 7l7.3 1206.8 967.08Price in Rs.latl. 234.0 385 404.08 .
0/0 increase in arrival - 68.24 34.82. % increase in mice - .64.52 72.68
The increase over the first five year: arrivals increased by 68.24 percent and price
increase was 64.34 percent. For next five years corresponding figures is 34.82 percent in
arrival and 72.68% price which clearly indicates annual growth of 3.4 percent in arrival
and 7.2 per cent price increase in Luckoow banana market.
Problems and Constraints
Main problem in banana is ripening because .traditional way of ripening gives very poor
quality like uneven ripening. Transport of banana is another constraints because unripe
banana is transported by trains without any ventilation in the vagons and from main
markets it is transported by trucks without any packing and grading. The ripening is done
Final Report: 'National Level Techno-Economic Feasibility Study for North Zone' 16
2.1.7.1.2.9
at the district mandi' s or regional mandies. This process takes minimum 5 to 7 days from
harvesting to actually reaching the district mandies where ripening is done and marketed
to retailers. In whole process no proper packing and ripening is done.
Conclusion
Since Banana is commercially not grown on large scale in Uttar Pradesh and quality is
also not comparable with Maharashtra banana we should not encourage banana area in
Uttar Pradesh while concerted efforts should be made to develop infrastructure for
handling of banana at rail heads and scientific ripening sheds using ethelene as ripening
chemical should be used.
Final Report: 'National Level Techno-Economic Feasibility Study for North Zone' 17
2.1.7.1.3
2.1.7.1.3.1
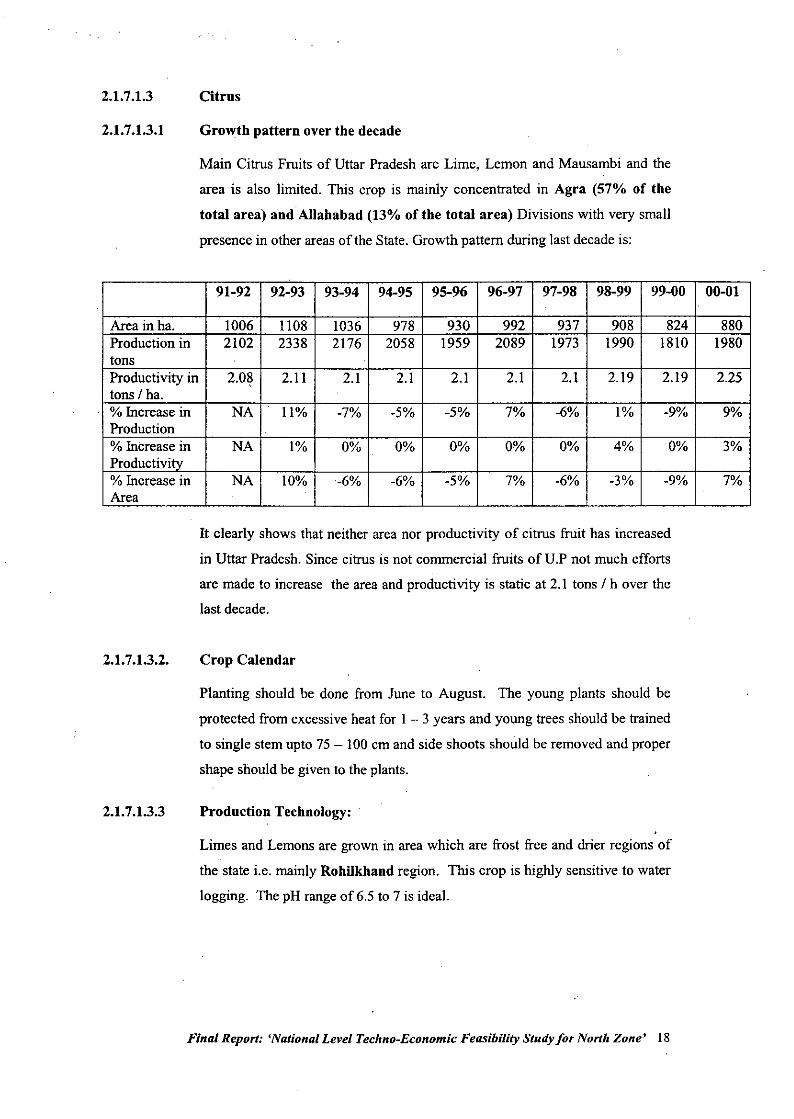
Citrus
Growth pattern over the decade
Main Citrus Fruits of Uttar Pradesh are Lime, Lemon and Mausambi and the
area is also limited. This crop is mainly concentrated in Agra (57% of the
total area) and Allahabad (13% of the total area) Divisions with very small
presence in other areas of the State. Growth pattern during last decade is:
91-92 92-93 93-94 94-95 95-96 96-97 97-98 98-99 99-00 00-01
Area in ha. 1006 1108 1036 978 930 992 937 908 824 880Production in 2102 2338 2176 2058 1959 2089 1973 1990 1810 1980tons .
Productivity in 2.0~ 2.ll 2.1 2.1 2.1 2.1 2.1 2.19 2.19 2.25tons / ha.% Increase in NA 11% -7% -5% -5% 7% -6% 1% -9% 9%Production% Increase in NA 1% 0% 0% 0% 0% 0% 4% 0% 3%Productivity% Increase in NA 10% -6% -6% -5% 7% -6% -3% -9% 7%Area
It clearly shows that neither area nor productivity of citrus fruit has increased
in Uttar Pradesh. Since citrus is not commercial fruits of U.P not much efforts
are made to increase the area and productivity is static at 2.1 tons / h over the
last decade.
2.1.7.1.3.2.
2.1.7.1.3.3
Crop Calendar
Planting should be done from June to August. The young plants should be
protected from excessive heat for 1 - 3 years and young trees should be trained
to single stem upto 75 - 100 cm and side shoots should be removed and proper
shape should be given to the plants.
Production Technology:
Limes and Lemons are grown in area which are frost free and drier regions of
the state i.e. mainly Rohilkhand region. This crop is highly sensitive to water
logging. The pH range of 6.5 to 7 is ideal.
Final Report: 'National Level Techno-Economic Feasibility Study for North Zone' 18
2.1.7.1.3.4
Cultivars
For Kagzi lime - Vikram, Pramalini and Lucknow Seedless are suitable, for
Mausambi or sweat lime Pant Lemon - I, Kagzi Kalan are better. Grapefruit
and chakotra are also suitable for region.
Sowing / Planting Techniqnes
Lime is generally propagated by seed because it is polyembryonic (90 -
100%) and has least chance of viral contamination. Seed propagation is
cheapest and plants are more hardy. But sweet lime should be propagated
through layering and hard wood cuttings while grape fruit and lemons should
be propagated by budding.
Planting'
Distance of 4 - 6 m is sufficient for limes and lemons and grape fruit 6 - 8 m
depending on the variety and soil conditions.
Nutrient Management
A fully grown lime and lemon plants should be given 50 Kg FYM, 750 g N,
400 g P and 750 ofK / year. Total quality ofFYM and P and half ofN and K
should be applied after rains whereas the remaining half of Nand K after
flowering i.e. March - April. In first year 75 : 40.75 gm NPK and quantity .
should be increased to same ratio upto 10th year.
Water Management
Limes and Lemons require 875 inm water / yr. Adequate moisture should be
maintained at critical stages of growth. The first irrigation at vegetative growth
stage and second at fruit growth stage are critical and water must be supplied at
these stages with light and repeated irrigation but water should not touch the
main trunk of the tree.
Pests and Disease Management
Lemon butterfly is serious pest and caterpillars eat the entire leaf except
midrib; citrus cylla is another insect which eat the young growth, citrus leaf
minor in which leaves have irregular white lines. To check these alternate
spray of monocrotophos 1.25 m / I and Dirnetheoate 3 ml / 10 litre water
should be done at 15 days interval. Citrus dieback is serious disease, the twigs
Final Report: 'National Level Techno-Economic Feasibility Study for North Zone' 19
2.1.7.1.3.5
2.1.7.1.3.6
2.1.7.1.3.7
2.1.7.1.3.8
2.1.7.1.3.9
affected should be cut atleast 2 inches below the affected portion and pasted
with B1itox I gm / 5 m1 water and spray the plant with B1itox or Blue copper-
50 or phytolon 0.3%. Citrus canker is another disease and can be controlled by
the above chemicals
Harvesting and Post Harvest
The peak time of harvest in U.P is June - July and September - October. A
good crop of lime gives 2000 to 4000 fruits / year and Lemon 600 - 800 fruits.
Crop economic
The productivity for Citrus fruits peaks off after the lOthyear and in general the
incomes comes to around Rs. 82,500 per hectare which is based on the
calculation that the number of plants per hectare being 275 with an average
yield of 60 Kg per plant and the sale price of Rs. 5 per Kg.
Price trend
There is no regulated market for this fruit in U.P and price trend are just
speculation. The average price during July - September when local product is
available varies between RS.6000 - 8000 / ton. but afterward it increases. The
average price varies between 8000 - 10000 / ton. in the state.
Problems and Constraints
The citrus die back and micro nutrients deficiency are main problems of its
cultivation. The suitable areas of Rohelkhand division there is good scope of
increasing the area.
Conclusion
There is limited scope of expansion of area in the state and we should
concentrate more on high productivity crops than citrus except for limes in
Rohelkhand division.
Final Report: 'National Level Techno-Economic Feasibility Study for North Zone' 20
2.1.7.1.4
2.1.7.1.5
2.1.7.1.5.1
Grapes
This crop has not been considered for study as the area under this crop is quite
insignificant within the state and no data is available regarding its production.
Guava
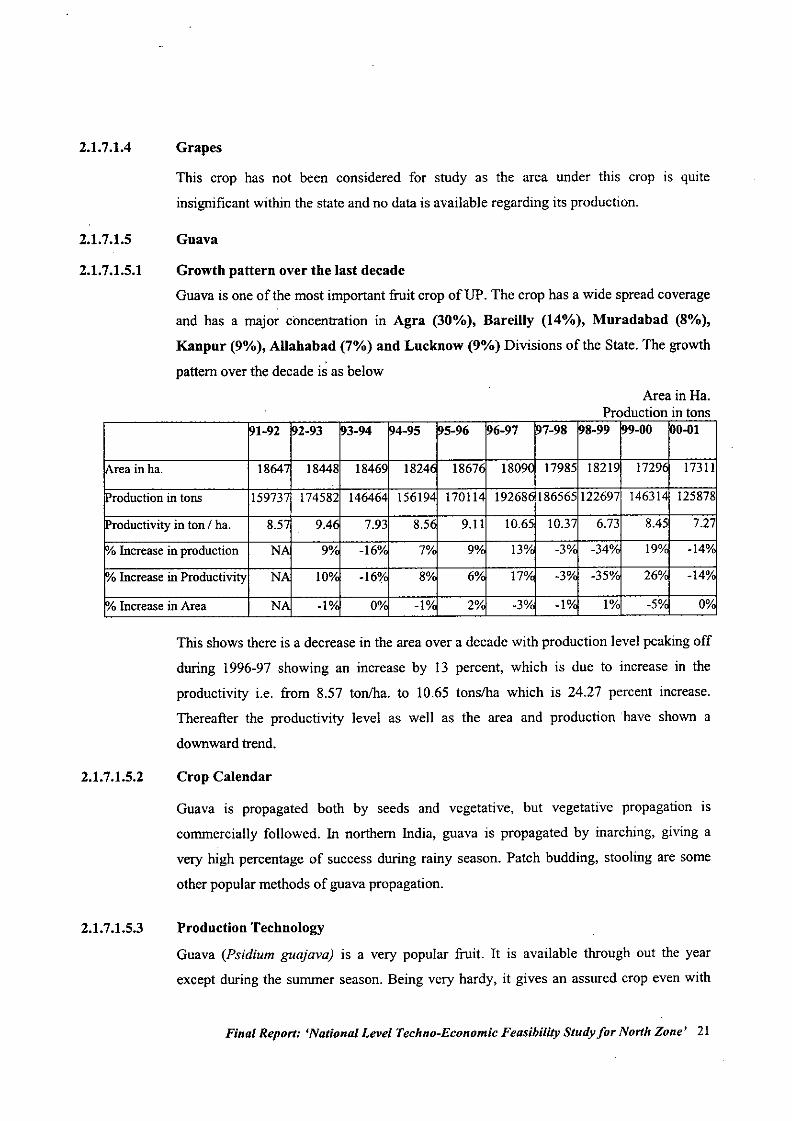
Growth pattern over the last decade
Guava is one of the most important fruit crop of UP. The crop has a wide spread coverage
and has a major concentration in Agra (30%), Bareilly (14%), Muradabad (8%),
Kanpur (9%), Allahabad (7%) and Luclrnow (9%) Divisions of the State. The growth
pattern over the decade is as belowArea in Ha.
Production in tons~1-92 2-93 93-94 Q4-95 5-96 ~6-97 97-98 ~8-99 9-00 00-01
•••.ea inha. 18647 18448 1846q 1824( 18676 18090 17985 18219 17296 17311
roduction in tons 159737 174582 14646' 156194 17011' 19268( 186565 122697 14631~ 125878
Productivityin ton/ ha. 8.57 9.4( 7.93 8.5( 9.11 10.65 10.37 6.73 8.45 7.2
Yo Increaseinproduction N) 9% -16% 7"1. 9% 13% -3% -34% 19"1. -14"1.
Yo IncreaseinProductivity N) 10"1. -16% 8"1. 6% 17% -3"1. -35% 26"1. -14"1.
Yo IncreaseinArea N) -1% 0% -1% 2% -3% -1% 1% -5"1. 0"1.
This shows there is a decrease in the area over a decade with production level peaking off
during 1996-97 showing an increase by 13 percent, which is due to increase in the
productivity i.e. from 8.57 ton/ha. to 10.65 tons/ha which is 24.27 percent increase.
Thereafter the productivity level as well as the area and production have shown a
downward trend.
2.1.7.1.5.2
2.1.7.1.5.3
Crop Calendar
Guava is propagated both by seeds and vegetative, but vegetative propagation IS
commercially followed. In northern India, guava is propagated by inarching, giving a
very high percentage of success during rainy season. Patch budding, stooling are some
other popular methods of guava propagation.
Production Technology
Guava (Psidiurn guajava) is a very popular fruit. It is available through out the year
except during the summer season. Being very hardy, it gives an assured crop even with
Final Report: 'National Level Techno-Economic Feasibility Study for North Zone' 21
very little care. Best quality guavas are produced in Uttar Pradesh, particularly in
Allahabad region.
Climate and Soil - Owing to its hardy nature guava is grown successfully in tropical and
sub-tropical regions. Best quality guavas are obtained where low night temperatures (l0
c) prevail during winter season. It tolerates high temperature and drought conditions in
north India in summers but it is susceptible to severe frost as it can kill the young plant. .
Very good quality guavas are produced in river basins. It tolerates a soil pH 4.5-8.2.
Cultivars - Important guava varieties are - Lucknow-49, Allahabad Safeda, Chittidar,
Harijha,Hafshi, Apple Colour, Saharanpur seedless, Arka Mridula, Allahabadd Surkha.
Propagation -Guava is propagated both by seeds and vegetatively, but vegetative
propagation is commercially followed. In northern India, guava is propagated by
inarching, giving a very high percentage of success during rainy season. Patch budding,
stooling are some other popular methods of guava propagation.
Sowiug and Planting Techniques - Planting: The pits of 1mx 1mx 1m size are dug and
filled with a mixture of FYM and soil. The planting is done during the rainy season by
adopting the rectangular planting system width of Spacing: 5m X 8 m. Training! pruning,
the plants should be trained as low headed trees to facilitate multiple hand pickings. The
open center or delayed open center system may be adopted. The scaffold branches in
young plants are to be tipped back to encourage secondary branching.
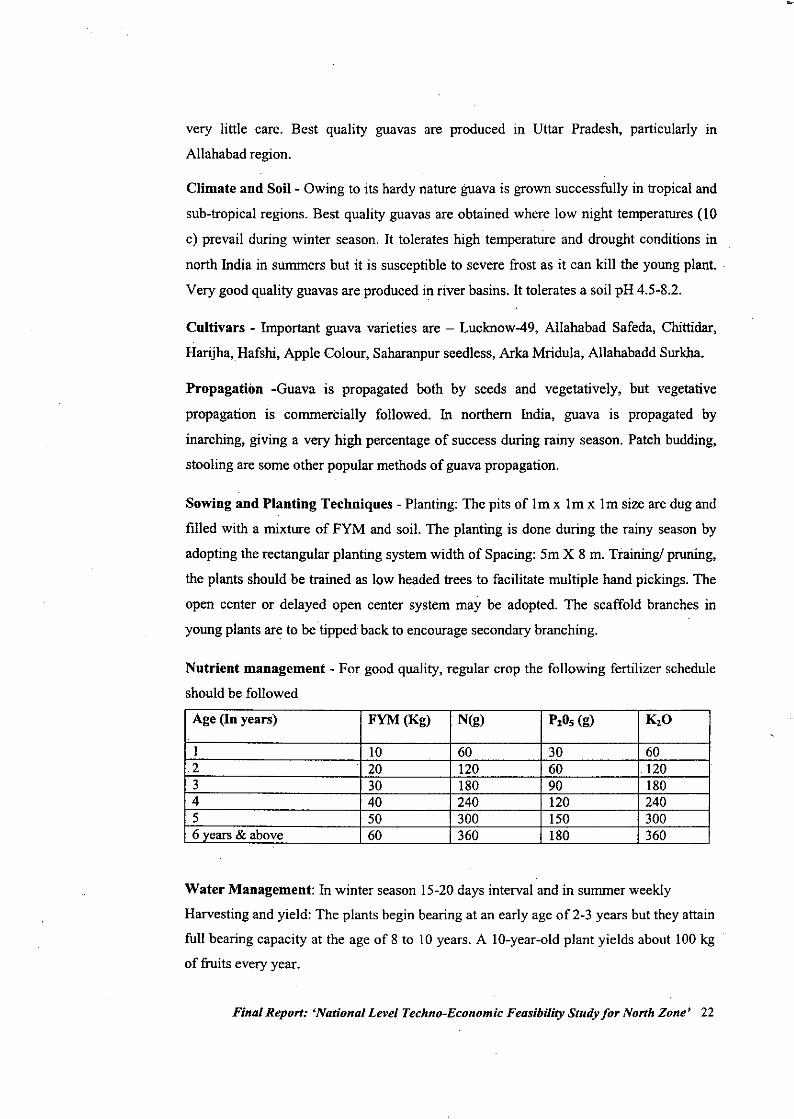
Nutrient management - For good quality, regular crop the following fertilizer schedule
should be followed
Age (In years) FYM (Kg) N(g) P,Os (g) K,O
I 10 60 30 602 20 120 60 1203 30 180 90 1804 40 240 120 2405 50 300 150 3006 vears& above 60 360 180 360
Water Management: In winter season 15-20days interval and in summer weekly
Harvesting and yield: The plants begin bearing at an early age of 2-3 years but they attain
full bearing capacity at the age of 8 to 10 years. A 10-year-old plant yields about 100kg
of fruits every year.
Final Report: 'National Level Techno-Economic Feasibility Study for North Zone' 22
2.1.7.1.5.4
2.1.7.1.5.5
2.1.7.1.5.6
Pest and Disease Management
In April after hoeing, spray 16 percent Urea or prune the young branches to :y., th to
control flowering during rainy season. Dried twigs should be removed. In November a
solution of 1m!. Chlorophos per liter of water should be filled in the holes made by
caterpil1ars in the bark. Thereafter the holes should be plugged with fresh mud.
Neem cake @ 6 kg/plant and gypsum @ 2 kg/plant are effective against guava wilt.
Withholding irrigation from February to June by creating moisture stress also controls
flowering in rainy season crop. Two to Three Spray of 0.1% Malathion at 10-15 days
interval checks fruit fly. Against scales 1.5 ml Rogorllit. water after pruning the infected
twigs. Die back is a serious problem and occurs more when soil pH is above 7.5. Remove
the affected plants and bum them and spray 3 gm thiram 1 liter water in the uprooted tree.
Anthracnose control is possible by removing the affected fruits and spray of Fytolon 2-3
gm Iliter water at least 4-5 sprays at 10 days interval. The incidence of wilt is more in
Kanpur and Allahabad division.
Harvest Method and Yield
The rainy season crop should be avoided by de-blossoming but the practice is not
followed. The present status in majority of Guava orchards is the farmers are not
adopting the manurial schedule and in 70% of the cases even one-third fertilizers are not
applied which result in very poor yields. If the above practices are adopted the yield of
more than 10 tons per hectare can be achieved which would be much more than the
present status of 4 to 6 tons per hectare only.
Crop economics
Currently the average yield of Guava in the State are pegged at 8-9 tons per hectare but
the data given for calculation of the economics for the CH?P by the DOH as shown an
average yield at 22 tons per hectare. The calculations have been made on the basis of this
figure and therefore the income thus generated from the crop comes to Rs.66,000 per
hectare from tenth year onwards with the cost of cultivation benched at Rs.3,1251- per
hectare.
Final Report: 'National Level Techno-Economic Feasibility Study for North Zone' 23
2.1.7.1.5.7
2.1.7.1.5.8
2.1.7.1.5.9
Price trend
There is no regulated market price data available however the price trend over the decade
has just doubled i.e. Rs. 2400 to 4600 per ton in the whole sale market of U.P over a
decade.
Problems and Constraints
Because fruits are perishable in nature and low price fruit no attention is paid to proper
harvesting storage/packing and marketing. Immature fruits are harvested and they do not
ripe because of non-climatic nature value of the fruits. Two major constraints are Guava
wilt and. fruit fly and unfortunately there is no suitable control for wilt the planting
material should not be obtained from a wilt infected region or nursery.
Conclusion
Because of wilt problem the plantation of 25-30 years old trees should be replaced and it
is advisable that ifplants were affected by wilt area should be shifted and proper schedule
of plant protection should be adopted. Being a low input fruit crop little care and attention
is given the profitability of farmers can be increased.
Final Report: 'National Level Techno-Economic Feasibility Study for North Zone' 24
2.1.7.1.6
2.1.7.1.7
2.1.7.1.7.1
Litchi
This crop has not been considered for study as the area under this crop IS quite
insignificant within the state and no data is available regarding its production.
Mango
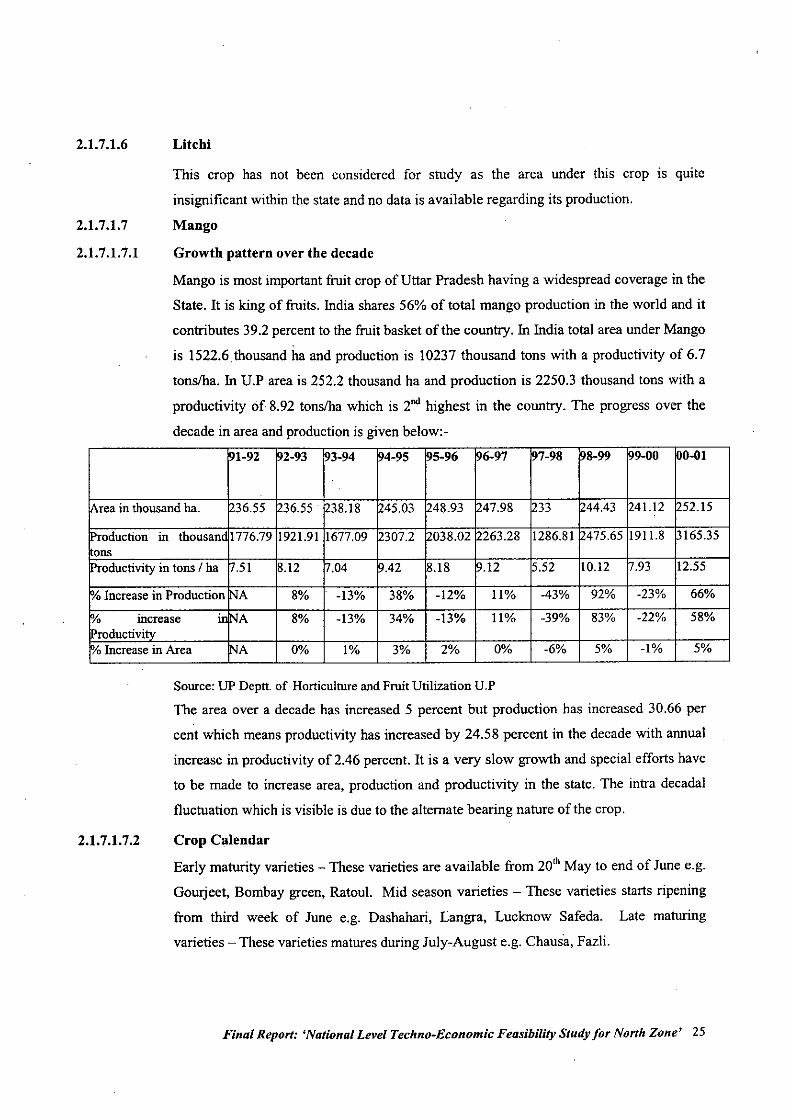
Growth pattern over the decade
Mango is most important fruit crop of Uttar Pradesh having a widespread coverage in the
State. It is king of fruits. India shares 56% of total mango production in the world and it
contributes 39.2 percent to the fruit basket of the country. In India total area under Mango
is 1522.6thousand ha and production is 10237 thousand tons with a productivity of 6.7
tonslha. In U.P area is 252.2 thousand ha and production is 2250.3 thousand tons with a
productivity of 8.92 tonslha which is 2nd highest in the country. The progress over the
decade in area and production is given below:-
91-92 2-93 93-94 94-95 5-96 6-97 97-98 8-99 99-00 0-01
Area in thousand ha. ~36.55 36.55. ~38.18 ~45.03 48.93 47.98 ~33 44.43 ~41.12 52.15
Production in thousand 1776.79 1921.91 1677.09 ~307.2 038.02 263.28 1286.81 475.65 1911.8 165.35onsProductivity in tons / ha n.51 8.12 ~.04 9.42 8.18 .12 [5.52 10.12 n.93 12.55
Yo Increase in Production INA 8% -13% 38% -12% 11% -43% 92% -23% 66%
Yo increase illINA 8% -13% 34% -13% 11% -39% 83% -22% 58%Productivity}bIncrease in Area INA 0% 1% 3% 20/0 0% -6% 5% -1% 5%
Source: UP Deptl. of Horticulture and Fruit Utilization U.P
The area over a decade has increased 5 percent but production has increased 30.66 per
cent which means productivity has increased by 24.58 percent in the decade with annual
increase in productivity of 2.46 percent. It is a very slow growth and special efforts have
to be made to increase area. production and productivity in the state. The intra decadal
fluctuation which is visible is due to the alternate bearing nature of the crop.
2.1.7.1.7.2 Crop Calendar
Early maturity varieties - These varieties are available from 20th May to end of June e.g.
GoUIjeet, Bombay green, Ratoul. Mid season varieties - These varieties starts ripening
from third week of June e.g. Dashahari, Langra, Lucknow Safeda. Late maturing
varieties - These varieties matures during July-August e.g. Chausa, Fazli.
Final Report: 'National Level Techno-Economic Feasibility Study for North Zone' 25
2.1.7.1.7.3 Production TechnologyCultivars
India is the home of about thousand'varieties. However, only about 20 varieties arecommercially cultivated in the state-
(i) Early maturity varieties - These varieties are available from 20'h May to end of
June e.g. Gourjeet, Bombay green, Ratou!.
(ii) . Mid season varieties - These varieties starts ripening from third week of June
e.g, Dashahari, Langra, Lucknow Safeda.
(iii) Late maturing varieties - These varieties matures during July-August e.g.
Chausa, Fazli.
(iv) Varieties for pickle making purpose-e.g. Rarnkela, Shukul, Ketki bihar.
(v) Hybrids developed from IARI, New Delhi.
Amrapali-dwarf variety developed from the cross of Dashahri X Neelum,
suitable for high density planting.
Mallika-Developed from the cross of Neelum X Dashahri, good carrymg
capacity.
Seed / Planting Material -Mango should be commercially propagated by veneer grafting
but at present age old method of in arching is followed in north India and stone
grafting/epicotyl grafting should be followed in humid region of eastern in Uttar Pradesh.
Sowing / Planting Techniques
Pits of IfiX IfiX Im size are dug, exposed to sun about 30 days and filled with FYM. The
grafts should be planted in rainy season.
Inter Culture Operations -It is essential to space the branches properly and to help inintercultural Operations.
Nutrient Management -The nutritional requirement of mango varies with the region,
soil type and age. A dose of 73g N, 18g P, and 68g Klyear of age from first to tenth year
and there after a dose of730g N, l80g P and 680g K should be applied in two split doses
during June-July and October.
Water Management -The water requirement mainly depend on age, soil type climate.
However, the young plants up to 2-years old watered regularly.
Final Report: 'National Level Techno-Economic Feasibility Study for North Zone' 26
Management of Disease and pests• 2.1.7.1.7.4
(i) Alternate bearing -Most of the north Indian varieties are alternate bearing. Soil
drenching with 5 to 10 gm pactobutrazol in October-November gIves more
flowering without affecting fruit size and quality.
,.
(ii) Mango Malformation- Both at Juvenile stage and flowering stage malformaton
occurs. Compact leaves are formed at the opex of shoot or in leaf axil while floral
malformation directly effects the yield. Deblossming alone or coupled with 200
ppm NAA spray malformation is partically checked.
(iii) Black tip - This disorder is caused by smoke of brick-kilns located within 600 m
distance. The chimney of brick kins should be raised to. avoid the affect on
orchards. Spraying borax 0.6% at 10-14 days interval starting from the fruit set
controls the disorder.
(iv) Die back - Prune the disease twigs in such a way that twigs are removed 2-3inches below the affected portion. and spray copper oxychloride 0.3% and alsopaste the twig ends with copper oxychloride.
(v) Mango milly bug- In December 200 gm per adult tree of Methyl Parathion
(Folidol Dust) should be dusted and mud plastering upto I m trunk and 400
gauga polythene strip of 25 em width 30 em above ground level on the main
trunk and fresh mud plastering on both ends of polythene band ends prevents the
milly bugs to climb on the tree.
(vi) Mango hopper- This is most serious pest which causes heavy losses. The heavy
population of insect is in February to April and June to August and it is more
serious in old orchards where shade and humidity is move. Three sprays of
carbaryl 0.15% or 0.04% monocrotophos or 0.05% Phosphomidon or Methyl
Parathion helps in controlling hoppers. First spray at early age of panicle
formation second at full length of panicle but before full bloom and third spray
after fruit set at pea size stage are recommended.
(vii) Fruit fly- This is one of the serious pest and adversely affecting the export market
also. To control this insect bait sprays of Carbaryl 0.2% + molesses in I" week of
April and repeated spray after 21 days.
Final Report: 'National Level Techno-Economic Feasibility Study for North Zone' 27
2.1.7.1.7.5
2.1.7.1.7.6
2.1.7.1.7.7
2.1.7.1.7.8
There are other minor insects pests like scale insect, shoot borer, bark eating
Caterpillars, stem bores. Remove the webs from tree trunks and put emulsion of
Moncrotophos 0.05% or DDVP in each hole and plug with mud.
Harvest Method and Yield
Mango should be harvested with pedicle. Yield of mango varies with the variety and
region. However, on an average mango yields 9 tons/hectare.
Crop Economics
It has been observed that after the 10th Year Mango plantation gives a steady income of
approximately Rs. 45,000 per hectare. The economics has been worked out on the basis
of about 100 plants in a hectare of land averaging a yield of 90 Kgs. keeping in mind the
estimated selling rate of Rs. 5 per Kg. and the expenditure incurred by the farmer of
about Rs. 4,425 per hectare. Thus the net cash flow per hectare to the farmer comes to
around Rs. 40,575 per hectare.
Price trends
1991 1992-1996 1997-2001Yearly average Yearly average
.
Arrival.in tons 5096 2408.8 7078.0Price in Rs. loti 594.5 965.1 939.65Percentage increasedin arrival (-) 52.7 38.9Percentage increasein orice 62.3 58.1
From the base year 1991 the arrival in first four year i.e. 1992-1996 there was decrease in
arrival of mango by 52.7percentage while price rise was 62.3 percent but in the next five
years 1997 to 2001 there was increase of arrival by 38.9% while price rise was 58.1%.
Which indicates the price fluctuation is linked with supply of commodity. The average
annual arrival increased by 3.89 percent and price rise was 5.81 percent over the decade.
Problems and Constraints
Main problem with Mango is alternate bearing nature of fruit coupled with serious
problems of diseases and pest like Milly bug, hoppers, Malformation, black tip of Mango,
Final Report: 'National Level Techno-Economic Feasibility Study for North Zone' 28
•
2.1.7.1.7.9
clustering or Jhamka and fruit fly. There is no ripening standard practices and at farmers
field no proper package of practices are being adopted.
Conclusion
The Mango orchards are very old with very low productivity. The trees between 40-50
years old should be top worked and grafted and still older trees must be replaced with
new plantation. Plant protection measures and proper fertilizer schedule should be
adopted. Preference should be given to newer hybrids and close planting i.e. high density
orchards techniques should be adopted to increase productivity .
Final Report: 'National Level Techno-Economic Feasibility Study for North Zone' 29
2.1.7.1.8
2.1.7.1.9
2.1.7.1.9a
2.1.7~1.9a.l
Papaya
This crop has not been considered for study as the area under this crop is quite
insignificant within the state and no data is available regarding its production.
Other Fruits -
Aonla (Emblica officinalis)
Growth pattern over the decade.
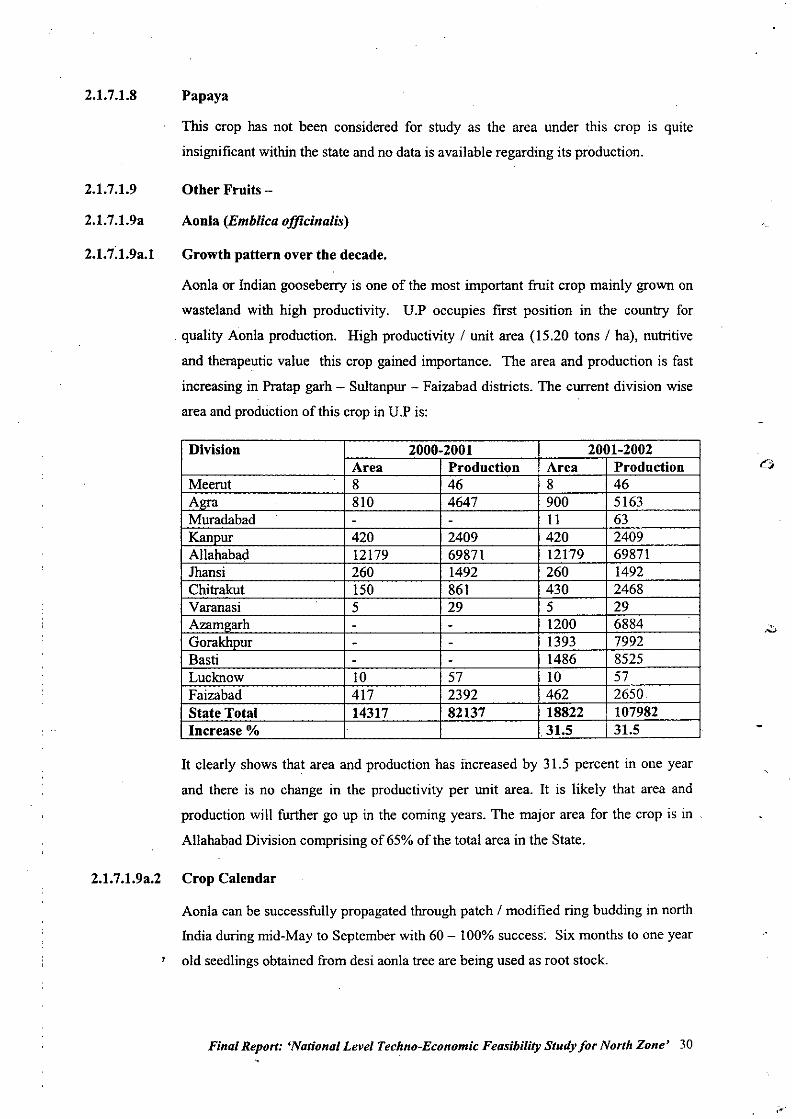
Aonla or Indian gooseberry is one of the most important fruit crop mainly grown on
wasteland with high productivity. U.P occupies first position in the country for
. quality Aonla production. High productivity I unit area (15.20 tons I hal, nutritive
and therapeutic value this crop gained importance. The area and production is fast
increasing in Pratap garh - Sultanpur - Faizabad districts. The current division wise
area and production of this crop in U.P is:
Division 2000-2001 2001-2002Area Production Area Production
Meerut 8 46 8 46Agra 810 4647 900 5163Muradabad - - II 63Kanpur 420 2409 420 2409Allahabad 12179 69871 12179 69871Jhansi 260 1492 260 1492Chitrakut 150 861 430 2468Varanasi 5 29 5 29Azamgarh - - 1200 6884GorakhDur - - 1393 7992Basti - - 1486 8525Lucknow 10 57 10 57Faizabad 417 2392 462 2650State Total 14317 82137 18822 107982Increase % 31.5 131.5
It clearly shows that area and production has increased by 31.5 percent in one year
and there is no change in the productivity per unit area. It is likely that area and
production will further go up in the coming years. The major area for the crop is in
Allahabad Division comprising of 65% of the total area in the State.
2.1.7.1.9a.2 Crop Calendar
Aonla can be successfully propagated through patch I modified ring budding in north
India during mid-May to September with 60 - 100% success. Six months to one year
old seedlings obtained from desi aonla tree are being used as root stock.
Final Report: 'National Level Techno-Economic Feasibility Study for North Zone' 30
,-
2.1.7.1.9a.3 Production Technology
Climate and soil - Aonla is a subtropical plant and prefers dry subtropical climate.
Since aonla is a hardy plant, it can be successfully grown in variable soil condition
and marginal soil-slightly acidic to saline / sodic (pH 6.5-9.5) conditions. Heavy soils
or high water table area are not suited for its cultivation.
Cultivars - There are three main varieties of aonla - Banarasi, Francis and chakaiya,
Other varieties identified and released for commercial cultivation and latest vars are:
Krishna - A selection from Banarasi, medium sized fruits with good yield.
Kanchan(NA-4)-Seedling selection from Chakaiya, it is a heavy and regular bearer.
NA-6 - seedling selection from chakaiya, prolific and heavy bearer, ideal for
preserve.
NA-7 - seedling selection from francis, precocious profile and regular bearer.
Seed / Planting Material - Aonla can be successfully propagated through patch /
modified ring budding in north India during mid-May to September with 60 - 100%
success. Six months to one year old seedlings obtained from desi aonla tree are being
used as root stock.
Sowing / Planting Techniques - Planting: 7-10 m apart during July - August or
February. Pits of I - 1.25m size are dug 2 months prior to planting.
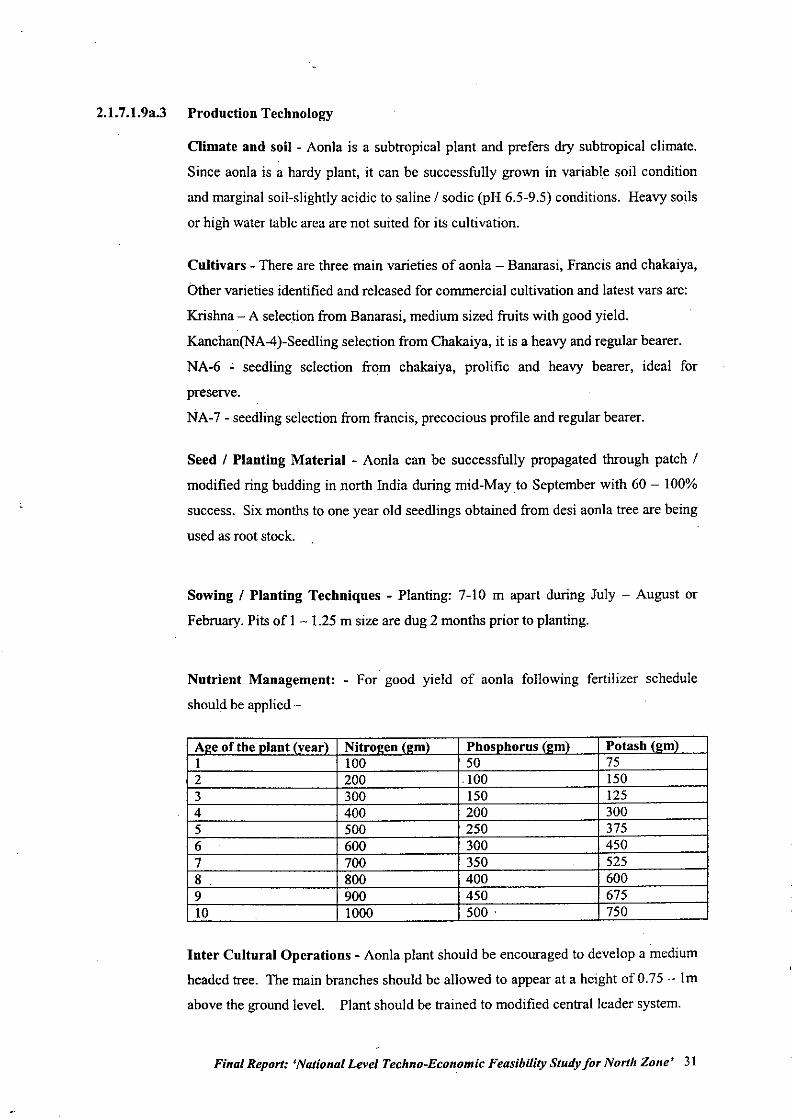
Nutrient Management: - For good yield of aonla following fertilizer schedule
should be applied -
Al!eof the nlant (vear) Nitrol!en (l!m) Phosnhorus (l!m) Potash (l!m)I 100 50 752 200 .100 1503 300 150 1254 400 200 3005 500 250 3756 600 300 4507 700 350 5258 800 400 6009 900 450 67510 1000 500. 750
Inter Cultural Operations - Aonla plant should be encouraged to develop a medium
headed tree. The main branches should be allowed to appear at a height of 0.75 - 1m
above the ground level. Plant should be trained to modified central leader system.
Final Report: 'National Level Techno-Economic Feasibility Study for North Zone' 31
2.1.7.1.9a.4
2.1.7.1.9a.5
2.1.7.1.9a.6
2.1.7.1.9a.7
Water Management:- No irrigation is required during rainy and winter seasons.
However, irrigation at 15-20 days interval is desirable in dry summer particularly
during early years of orchard establishment under waste land conditions.
Pests and disease Management
Bark eating caterpillar is most serious. One part Metasystex or Rogar in 10 parts
Kerosene Oil should be filled in the holes and plugged with fresh mud. Leaf eating
caterpillars and gal making insects can be controlled with 0.03% Dimecron spray.
Before spray in the month of October the affected twigs should be cut and burnt and
then spray of Dimecron is more effective. Termite are big enemy so in November
Forrate lOG@ 25-30 gm should be mixed in soil under the canopy of tree. Spray of
Dimethoate and Mancozab checks plant and fruit diseases.
Harvest & Method of Yield
Change in seed colour from creamy white to brown is an indication of fruit maturity.
An aonla tree may bear 2-3 q / tree, giving 15-20 tormes / ha.
Crop economics
The economics of the crop have been calculated on the basis of the production levels,
which peak off after the II th year. The total income thus generated from the crop
comes to Rs.62,500/- per hectare,.with a maintenance cost pegged at RS.4275/- perhectare.
Price trend.
The whole sale price in Lucknow market remained between Rs.400 - 500 per qtl. in2001.
2.1.7.1.9a.8 Problems and constraints
Necrosis a physiological disorder is major constraints in Aonla cultivation. Some
varieties are more susceptible like Francis. Comparatively tolerant var like Krishna,
Kanchan, NA-6 and NA-7 should be planted. This is .very susceptible to water
logging and pH of soil should not be less than 6.5
Final Report: 'National Level Techno-Economic Feasibility Study for North Zone' 32
2.1.7.1.9a.9 Conclusion
There is vast area under Usar in Uttar Pradesh where no other crop can be taken
successfully and this is gift of nature that our waste lands should be utilized for this
crop. It is worked out that even with low inputs and comparatively bad land gives net
return of Rs. 70 to 80 thousand per ha. in Aonla production.
Final Report: 'National Level Techno-Economic Feasibility Study for North Zone' 33
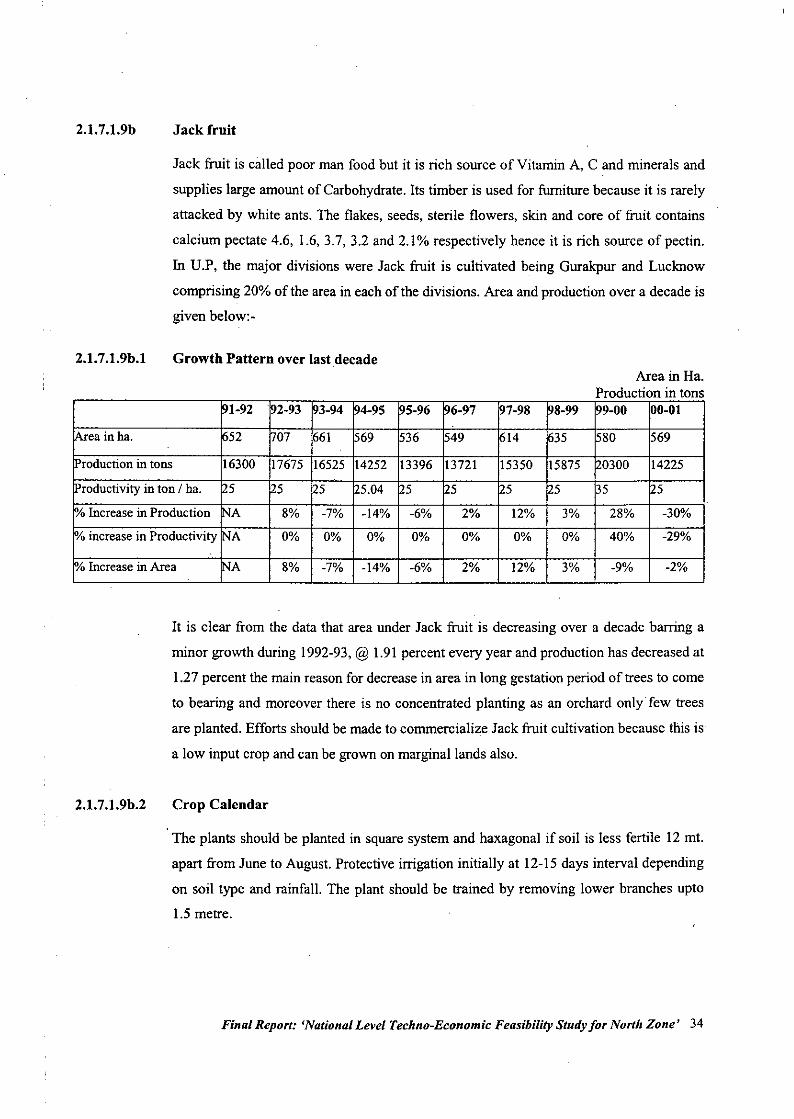
2.1.7.1.9b
2.1.7.1.9b.l
Jack fruit
Jack fruit is called poor man food but it is rich source of Vitamin A, C and minerals and
supplies large amount of Carbohydrate. Its timber is used for furniture because it is rarely
attacked by white ants. The flakes, seeds, sterile flowers, skin and core of fruit contains
calcium pectate 4.6,1.6,3.7,3.2 and 2.1% respectively hence it is rich source of pectin.
In V.P, the major divisions were Jack fruit is cultivated being Gurakpur and Lucknow
comprising 20% of the area in each of the divisions. Area and production over a decade is
given below:-
Growth Pattern over last decadeArea in Ha.
Production in tons~1-92 92-93 93-94 4-95 5-96 ~6-97 7-98 ~8-99 99-00 00-01
Area inha. ~52 07 661 69 536 ~49 614 635 80 569.
Production in tons 16300 17675 16525 14252 13396 13721 15350 15875 0300 14225Productivity in ton / ha. ~5 <5 5 5.04 5 ~5 5 ~5 5 25Yo Increase in Production l'IA 8% -7% -14% -6% 2% 12% 3% 28% -30%Yo increase in Productivity ~A 0% 0% 0% 0% 0% 0% 0% 40% -29%
~ Increase in Area ~A 8% -7% -14% -6% 2% 12% 3% -9% -2%
It is clear from the data that area under Jack fruit is decreasing over a decade barring a
minor growth during 1992-93, @ 1.91 percent every year and production has decreased at
1.27 percent the main reason for decrease in area in long gestation period of trees to come
to bearing and moreover there is no concentrated planting as an orchard only few trees
are planted. Efforts should be made to commercialize Jack fruit cultivation because this is
a low input crop and can be grown on marginal lands also.
2.1.7.1.9b.2 Crop Calendar
The plants should be planted in square system and haxagonal if soil is less fertile 12 mt.
apart from June to August. Protective irrigation initially at 12-15 days interval depending
on soil type and rainfall. The plant should be trained by removing lower branches upto
1.5 metre.
Final Report: 'National Level Techno-Economic Feasibility Study for North Zone' 34
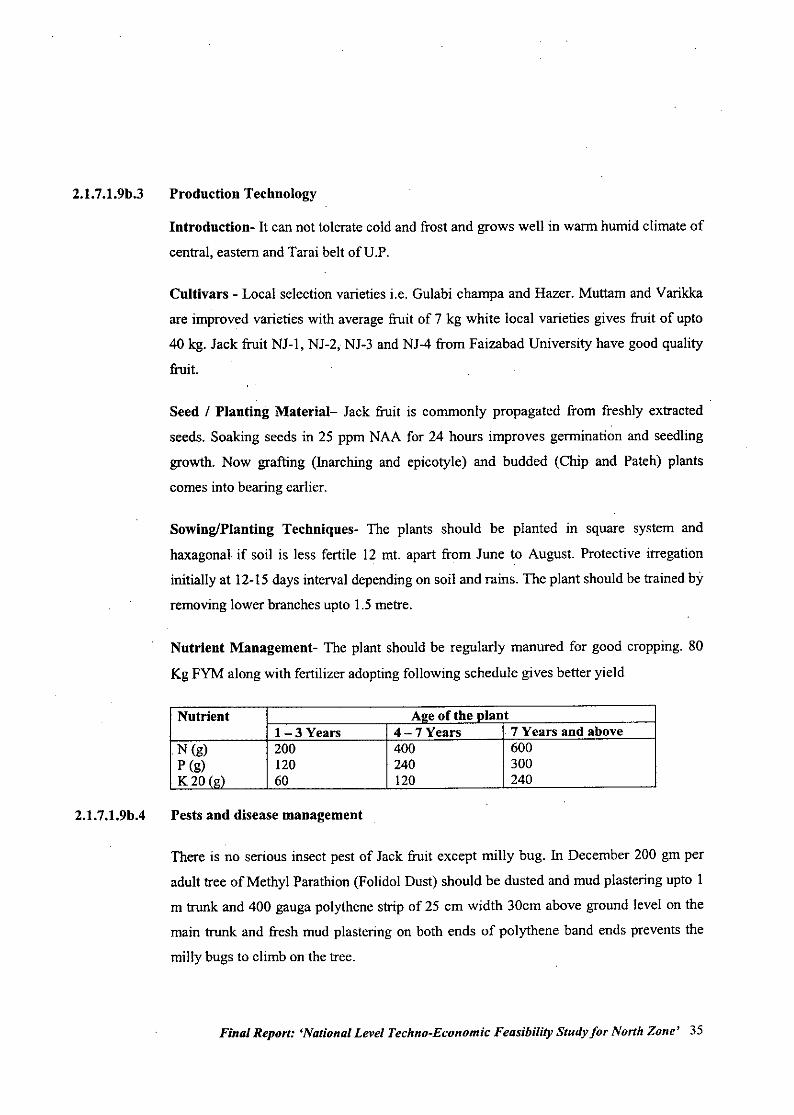
2.1.7.1.9b.3
2.1.7.1.9b.4
Production Technology
Introduction- It can not tolerate cold and frost and grows well in warm humid climate of
central, eastern and Tarai belt ofU.P.
Cultivars - Local selection varieties i.e. Gulabi champa and Hazer. Muttam and Varikka
are improved varieties with average fruit of 7 kg white local varieties gives fruit of upto
40 kg. Jack fruit NJ-l, NJ-2, NJ-3 and NJ-4 from Faizabad University have good quality
fruit.
Seed I Planting Material- Jack fruit is commonly propagated from freshly extracted
seeds. Soaking seeds in 25 ppm NAA for 24 hours improves germination and seedling
growth. Now grafting (Inarching and epicotyle) and budded (Chip and Pateh) plants
comes into bearing earlier.
Sowing/Planting Techniques- The plants should be planted in square system and
haxagonal if soil is less fertile 12 mt. apart from June to August. Protective irregation
initially at 12-15 days interval depending on soil and rains. The plant should be trained by
removing lower branches upto 1.5 metre.
Nutrient Management- The plant should be regularly manured for good cropping. 80
Kg FYM along with fertilizer adopting following schedule gives better yield
Nutrient Al!e ofthe olant1-3 Years 4-7Years 7 Years and above
N (g) 200 400 600P (g) 120 240 300K 20 (g) 60 120 240
Pests and disease management
There is no serious insect pest of Jack fruit except milly bug. In December 200 gm per
adult tree of Methyl Parathion (Folidol Dust) should be dusted and mud plastering upto 1
m trunk and 400 gauga polythene strip of 25 cm width 30cm above ground level on the
main trunk and fresh mud plastering on both ends of polythene band ends prevents the
milly bugs to climb on the tree.
Final Report: 'National Level Techno-Economic Feasibility Study for North Zone' 35
2.1.7.1.9b.5
2.1.7.1.9b.6
2.1.7.1.9b.7
2.1.7.1.9b.8
2.1.7.1.9b.9
Harvesting and Post Harvest Management
Seedling trees start bearing from 7'h to 8th year while grafted plants comes into bearing in
3"' - 4th year. The tree attains its peak bearing in 15-16 years.
Crop Economics
Tree bears upto 250 fruits annua11y. The average yield is 40-50 ton/ha. can be obtained.
Price Trends
There is no reliable data available on the price trend of this fruit in UP. However, as per
estimate whole sale price varies between Rs. 2000 to' 2500 per ton in Lucknow wholesale
market.
Problems and Constraints
Seedling plants comes to bearing late. The newer varieties from Sri lanka and Singapore
should be introduced and grafted on local seedlings which comes to fruiting in 3"' year.
Closer planting to 10m. Should be adopted for higher yield.
Conclusion
Beaing highly productive fruit plant regular orchards should be planted with grafted
plants instead of scattered and few plants to grow commercia11y because per unit
productivity and profitability wi11be much higher than what it is now.
Final Report: 'National Level Techno-Economic Feasibility Study for North Zone" 36
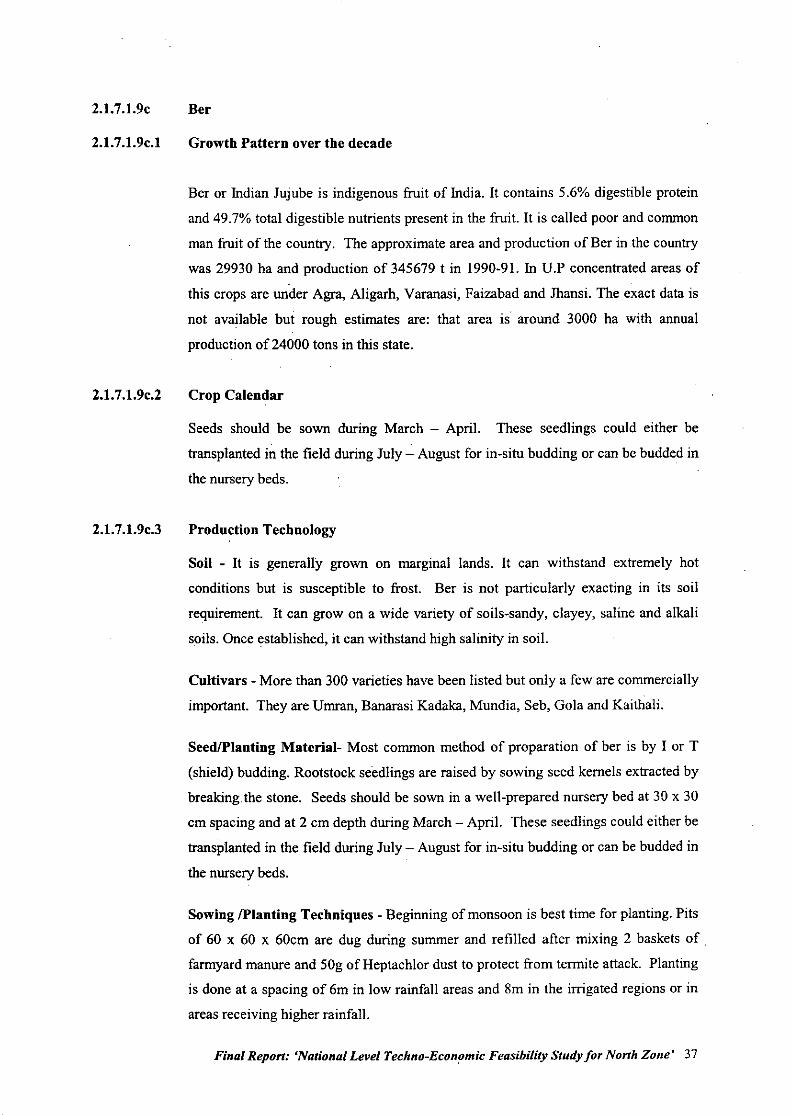
2.1.7.1.9c
2.1.7.1.9c.l
2.1.7.1.9c.2
2.1.7.1.9c3
Ber
Growth Pattern over the decade
Ber or Iodian Jujube is indigenous fruit of Iodia. It contains 5.6% digestible protein
and 49.7% total digestible nutrients present in the fruit. It is called poor and common
man fruit of the country. The approximate area and production ofBer in the country
was 29930 ha and production of 345679 t in 1990-91. 10 U.P concentrated areas of
this crops are under Agra, Aligarh, Varanasi, Faizabad and Jhansi. The exact data is
not available but rough estimates are: that area is around 3000 ha with annual
production of 24000 tons in this state.
Crop Calendar
Seeds should be sown during March - April. These seedlings could either be
transplanted in the field during July - August for in-situ budding or can be budded in
the nursery beds.
Production Technology
Soil - It is generally grown on marginal lands. It can withstand extremely hot
conditions but is susceptible to frost. Ber is not particularly exacting in its soil
requirement. It can grow on a wide variety of soils-sandy, clayey, saline and alkali
soils. Once established, it can withstand high salinity in soil.
Cultivars - More than 300 varieties have been listed but only a few are commercially
important. They are Umran, Banarasi Kadaka, Mundia, Seb, Gola and Kaithali.
Seed/Planting Material- Most common method of proparation of ber is by 1 or T
(shield) budding. Rootstock seedlings are raised by sowing seed kernels extracted by
breaking the stone. Seeds should be sown in a well-prepared nursery bed at 30 x 30
cm spacing and at 2 cm depth during March - April. These seedlings could either be
transplanted in the field during July - August for in-situ budding or can be budded in
the nursery beds.
Sowing /Planting Techniques - Beginning of monsoon is best time for planting. Pits
of 60 x 60 x 60cm are dug during summer and refilled after mixing 2 baskets of ,
farmyard manure and 50g of Heptachlor dust to protect from termite attack. Planting
is done at a spacing of 6m in low rainfall areas and 8m in the irrigated regions or in
areas receiving higher rainfall.
Final Report: 'National Level Techno-Econ,omic Feasibility Study [or North Zone' 37
2.1.7.1.9c.4
2.1.7.1.9c.5
2.1.7.1.9c.6
2.1.7 .1.9c. 7
Nutrient Management- Ber orchards are seldom manured. How~ver, productivity of
trees can be improved if manuring is done every year. A dose of 250g Nand 250g P
increase fruit yield. Application ofK does not give any response.
Inter Cultural Operation- During the first 2-3 years after planting, ber trees should
be trained to develop a strong frame work. After that old growth is beheaded during
March keeping 1-2 nodes above the graft union to induce vigorous new growth.
Water Management - In rainfed areas, arrangement for in-situ water harvesting should be
done by giving 5% slope to the inter-row spaces towards the trees. Black polythene mulch
help conserves soil moisture and improves growth of the trees.
Pest and Disease Management
Bark eating caterpillar is major pest and can be controlled by applying chlorophos
0.1% in kerosin oil filled in the holes and holes should be plugged with fresh mud.
The fruit fly is serious pest and majority of fruits become unfit for consumption.
Spray of 3 ml Endosulphon, 2 mI Malathion / I litre water at 10 days interval from
January to March but fruits should not be harvested upto one week of spray. Major
disease of ber is powdery mildew and it can be controlled by spraying Karathane 5
gm / 10 litre water sprayed from July to December at monthly interval.
Harvest Method and Yield
Ber matures 150.175 days after flowering. Spray of 750 ppm 2-chloroethyl
phosphoric acid (Ehtephone) at colour turning stage induced early maturity. Fully
mature fruits are harvested. Picking should be done in the forenoon. The average
yield during the prime bearing period (10-20 years) ranges 80-200kg / tree.
Crop economics
No authentic data is available for computation of the economics fr this crop' However
it has been observed that the farmers plant about 160 plants per hectare and thus with
an average yield of 100 kgs per plant the total expected yield is about 16 tons which
is being sold at RS.5000/. per ton giving a return ofRs.80,000/- per hectare.
Price trend
Since this fruit comes in January - February in U.P when no other fruit is available .
. Ber gets good price. The authentic figure of price is not available. However, as per
Final Report: 'National Level Techno-Economic Feasibility Study for North Zone' 38
2.1.7.1.9c.8
2.1.7.1.9c.9
estimate and personal discussion in Lucknow whole sale market the average price
varies from Rs.5000 to RS.5500 per ton.
Problem and Constraints
Seedling plants comes to bearing late and hence the farmers has to wait for 2 to 3
years to get ideal yield levels
Conclnsion
Since this is a fruit which grows on marginal lands and scanty rainfall areas.
Concerted efforts should be made to increase the area in central plateau of the state
particularly. Banda, HllII1irpur Jalaun, Jhansi, Lalitpur, Mohaba, Sonbhadra and
adjoining areas and Mathura, Agra areas of State.
Final Report: 'National Level Techno-Economic Feasibility Study for North Zone' 39
2.1.7.2 Vegetables, Roots and Tubers
2.1.7.2.1 Brinjal
2.1.7.2.1.1 Growtb pattern over tbe decade
Brinjal is one of the most common vegetables and cultivated throughout the state and
almost throughout the year. In India brinjal occupies 8 percent of the area amongst the
vegetables with 432202 ha. area and production of 6443062 tons. It is a rich source of Vi!.
A, B, Calcium, Phosphorus and iron. Growth pattern in Uttar Pradesh over the two years
for which data is available is given below:
Contents 1999-2000 2000-2001Area in ha. 1900 1950Production in M.T. 67300 68500Productivitv tJha. . 35.42 35.13Area expansion in % ---- 2.63Production increases % ---- 1.78
There is confusion over the data because as per estimates of 1993-94 the area was 29659
ha. with production of 414397 metric tons and area dropped to 7829 ha. in 1995-96 and
again in year 2000-2001 it is only 1950 ha. only which seems to be totally wrong. The data
collection system seems to be off the actual position. This matter was discussed at the
department level but they seems to be helpless as they have to depend upon the revenue
records. Suitable measures will be suggested in the second volume of this report.
2.1.7.2.1.2 Crop Calendar
Different varieties have different sowing timings and are generally sown between January -
February, Jime-July and September-October. Harvesting is done on maturity offiuits which
is generally 60-80 days from the.date oftransplanting.
2.1.7.2.1.3 Production Technology
Introduction -Below 10°C the growth ofbrinjal is hampered, average temperature of21 to
30° C is optimum which means extreme winters and summers should be avoided for good
crop.
Soils - Since it is heavy feeder rich soil are preferred.
Final Report: 'National Level Techno-Economic Feasibility Study for North Zone' 40
Cultivars -The important varieties are Azad brinjal 2,3 and Azad Hybrid-I, Narendra
Hybrid-I, Narendra Hybrid-2 and Narendra Hybrid-3, ND brinjal-4, Pusa pumple cluster,
8-16, Pant Kranti, PBR-I29-5 Pant samrat, Azad Kranti, ARU-2C, H-8, Punjab Barsati and
FI hybrids are Pusa Hybrid 5,6 and 9, Mahyco hybrid 10 and 39, BH-I, NDBH-6, NDBH-
1 and ARBH-201.
Seed /Planting Material-400 gm seed is required for an ha.
Sowing I Planting Techniques -planting should be at 75x60 cm or 60x45 depending upon
variety.
Nutrient Management -25 tons FYM, 200 kg urea, 375 kg single super phosphate and 100
kg Potassium sulphate per ha. Nitrogen is to applied in three split doses 50%. before
planting 25% each after 3 weeks intervals.
2.1.7.2.1.4 Pest and Disease Management
Fruit and shoot borer is main insect. All effected twigs and fruits should be plucked and
burnt or burried in deep soil. After planting Furradon 10 Kg I ha should be mixed around
root zone and spray endosulphan 2ml/lit after picking of fruits. Mites is another insect
which can be controlled with 0.02% Thiodon spray again after picking of fruits. Mites is
another insects which can be controlled with 0.02% Thiodon spray.
In summer season seedlings are more effective by damping of hence treatment"of nursery with captaf
is essential.
2.1.7.2.1.5 Harvest Method and Yield
The yields vary between 20-40 tons per ha. depending upon the season and variety. Picking
is generally done between 60-80 days from the date of transplanting depending upon the
variety
2.1.7.2.1.6 Crop Economics
It is suggested that farmers should be inculcated. The use ofFI hybrid seeds whose
gennination is more than 90% and the yield gains are much more as compared to the
conventional varieties.
As per the figures given by the DOH the economics for brinjal works out to be as under:
Final Report: 'National Level Techno-Economic Feasibility Study for North Zone' 41
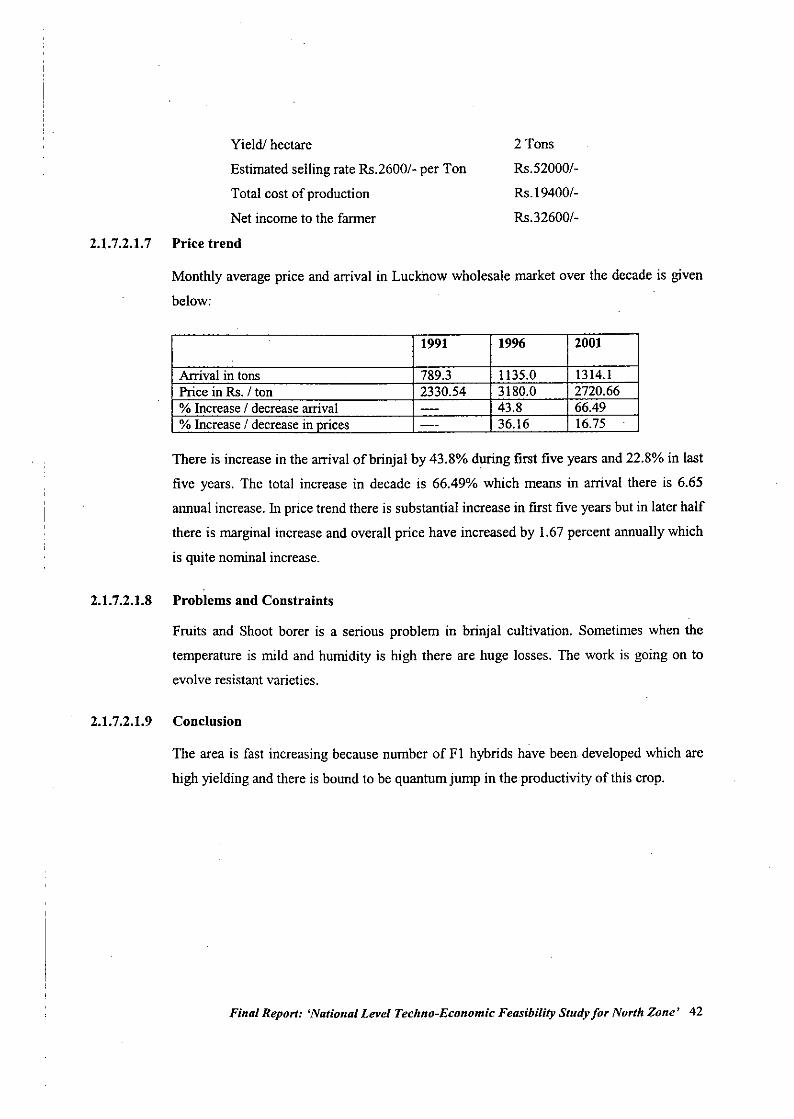
Yield! hectare
Estimated selling rate RS.2600/- per Ton
Total cost of production
Net income to the farmer
2.1.7.2.1.7 Price trend
2 Tons
RS.52000/-
Rs. 19400/-
RS.32600/-
Monthly average price and arrival in Luckhow wholesale market over the decade is given
below:
1991 1996 2001
Arrival in tons 789.3 1135.0 1314.1Price in Rs. / ton 2330.54 3180.0 2720.66% Increase / decrease arrival -- 43.8 66.49% Increase / decrease in nrices --- 36.16 16.75
There is increase in the arrival ofbrinjal by 43.8% during first five years and 22.8% in last
five years. The total increase in decade is 66.49% which means in arrival there is 6.65
annual increase. In price trend there is substantial increase in first five years but in later half
there is marginal increase and overall price have increased by 1.67 percent annually which
is quite nominal increase.
2.1.7.2.1.8 Problems and Constraints
Fruits and Shoot borer is a serious problem in brinjal cultivation. Sometimes when the
temperature is mild and humidity is high there are huge losses. The work is going on to
evolve resistant varieties.
2.1.7.2.1.9 Conclusion
The area is fast increasing because number of Fl hybrids have been developed which are
high yielding and there is bound to be quantum jump in the productivity of this crop.
Final Report: 'National Level Techno-Economic Feasibility Study for North Zone' 42
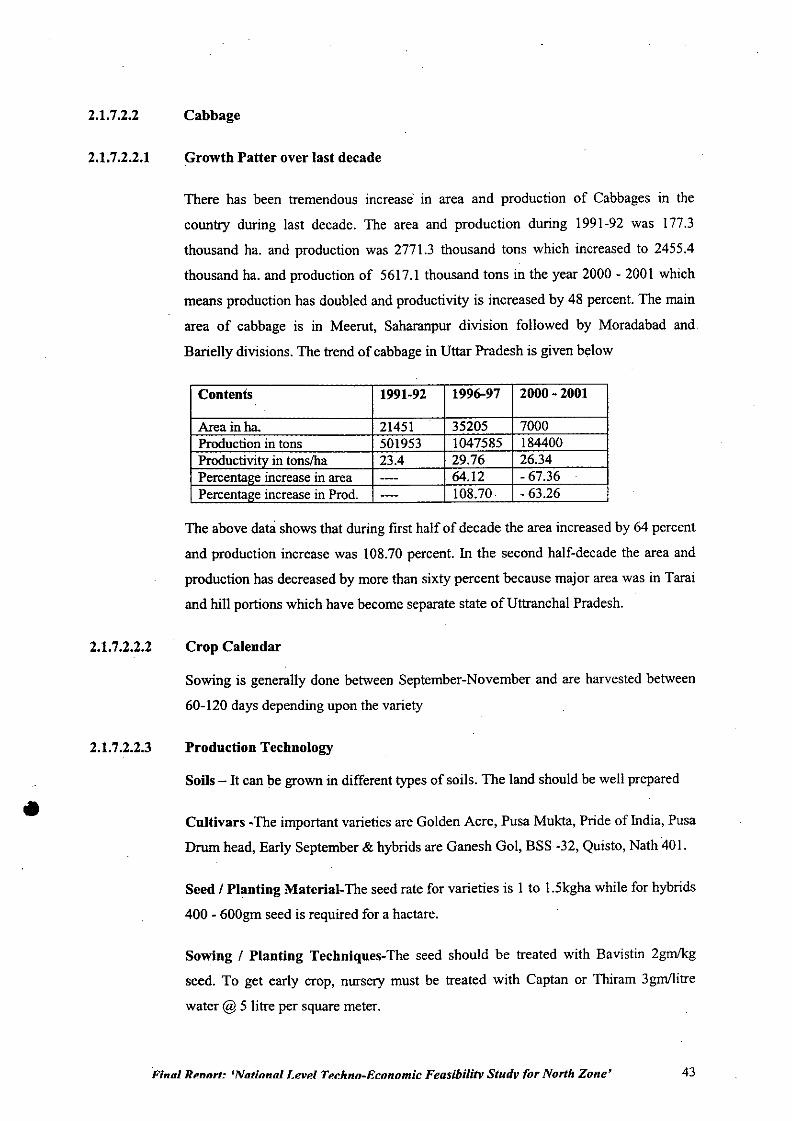
•
2.1.7.2.2
2.1.7.2.2.1
2.1.7.2.2.2
2.1.7.2.2.3
Cabbage
Growth Patter over last decade
There has been tremendous increase' In area and production of Cabbages in the
country during last decade. The area and production during 1991-92 was 177.3
thousand ha. and production was 2771.3 thousand tons which increased to 2455.4
thousand ha. and production of 5617.1 thousand tons in the year 2000 - 2001 which
means production bas doubled and productivity is increased by 48 percent. The main
area of cabbage is in Meerut, Saharanpur division followed by Moradabad and
Barielly divisions. The trend of cabbage in Uttar Pradesh is given below
Contents 1991-92 1996-97 2000 - 2001
Area inba. 21451 35205 7000Production in tons 501953 1047585 184400Productivitv in tonslha 23.4 29.76 26.34Percenlal!eincrease in area ---- 64.12 - 67.36Percenla"e increase in Prod. ---- 108.70 - 63.26
The above data shows that during first half of decade the area increased by 64 percent
and production increase was 108.70 percent. In the second half-decade the area and
production has decreased by more than sixty percent because major area was in Tarai
and hill portions which have become separate slate ofUttranchal Pradesh.
Crop Calendar
Sowing is generally done between September-November and are harvested between
60-120 days depending upon the variety
Production Technology
Soils - It can be grown in different types of soils. The land should be well prepared
Cultivars -The important varieties are Golden Acre, Pusa Mukta, Pride of India, Pusa
Drum head, Early September & hybrids are Ganesh Gol, BSS -32, Quisto, Nath 401.
Seed I Planting Material-The seed rate for varieties is I to 1.5kghawhile for hybrids
400 - 600gm seed is required for a haclare.
Sowing I Planting Techniques-The seed should be treated with Bavistin 2gmlkg
seed. To get early crop, nursery must be treated with Caplan or Thiram 3gmllitre
water @ 5 litre per square meter.
Pinal R,marl: 'National Level Techno-Economic Feasibilitv Studv for North Zone' 43
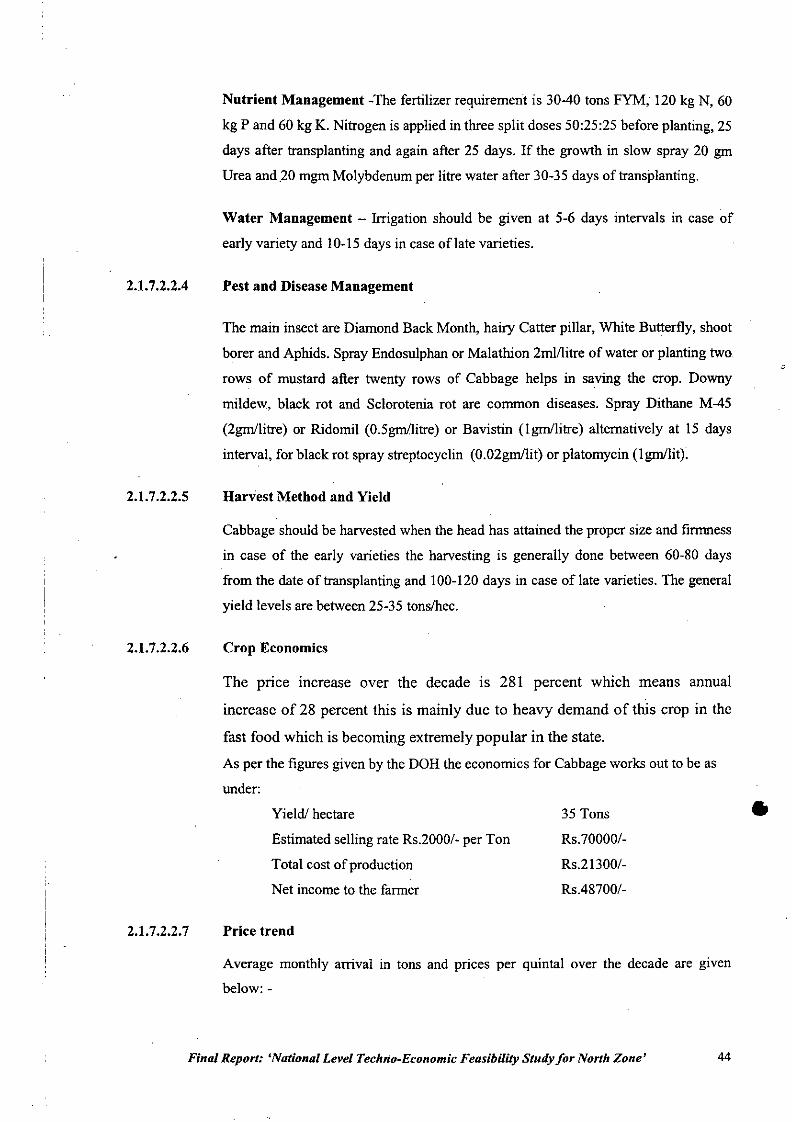
2.1.7.2.2.4
2.1.7.2.2.5
2.1. 7.2.2.6
Nutrient Management .The fertilizer requirement is 30-40 tons FYM, 120 kg N, 60
kg P and 60 kg K. Nitrogen is applied in three split doses 50:25:25 before planting, 25
days after transplanting and again after 25 days. If the growth in slow spray 20 gm
Urea and .20mgm Molybdenum per litre water after 30.35 days of transplanting.
Water Management - Irrigation should be given at 5.6 days intervals in case of
early variety and 10.15 days in case of late varieties.
Pest and Disease Management
The main insect are Diamond Back Month, hairy Catter pillar, White Butterfly, shoot
borer and Aphids. Spray Endosulphan or Malathion 2m111itreof water or planting two
rows of mustard after twenty rows of Cabbage helps in saving the crop. Downy
mildew, black rot and Sc1orotenia rot are common diseases. Spray Dithane M-45
(2gm/litre) or Ridomil (O.5gm/litre) or Bavistin (lgm/litre) alternatively at 15 days
interval, for black rot spray streptocyc1in (0.02gm/lit) or platomycin (lgm/lit).
Harvest Method and Yield
Cabbage should be harvested when the head has attained the proper size and firmness
in case of the early varieties the harvesting is generally done between 60.80 days
from the date of transplanting and 100.120 days in case oflate varieties. The general
yield levels are between 25.35 tons/hec.
Crop Economics
The price increase over the decade is 281 percent which means annual
increase of 28 percent this is mainly due to heavy demand of this crop in the
fast food which is becoming extremely popular in the state.
As per the figures given by the DOH the economics for Cabbage works out to be as
under:
2.1.7.2.2.7
Yield! hectare
Estimated selling rate Rs.2000/. per Ton
Total cost of production
Net income to the farmer
Price trend
35 Tons
RS.70000/.
Rs.21300/.
Rs.48700/.
•
Average monthly arrival in tons and prices per quintal over the decade are given
below: .
Final Report: 'National Level Techno.Economic Feasibility Study for North Zone' 44
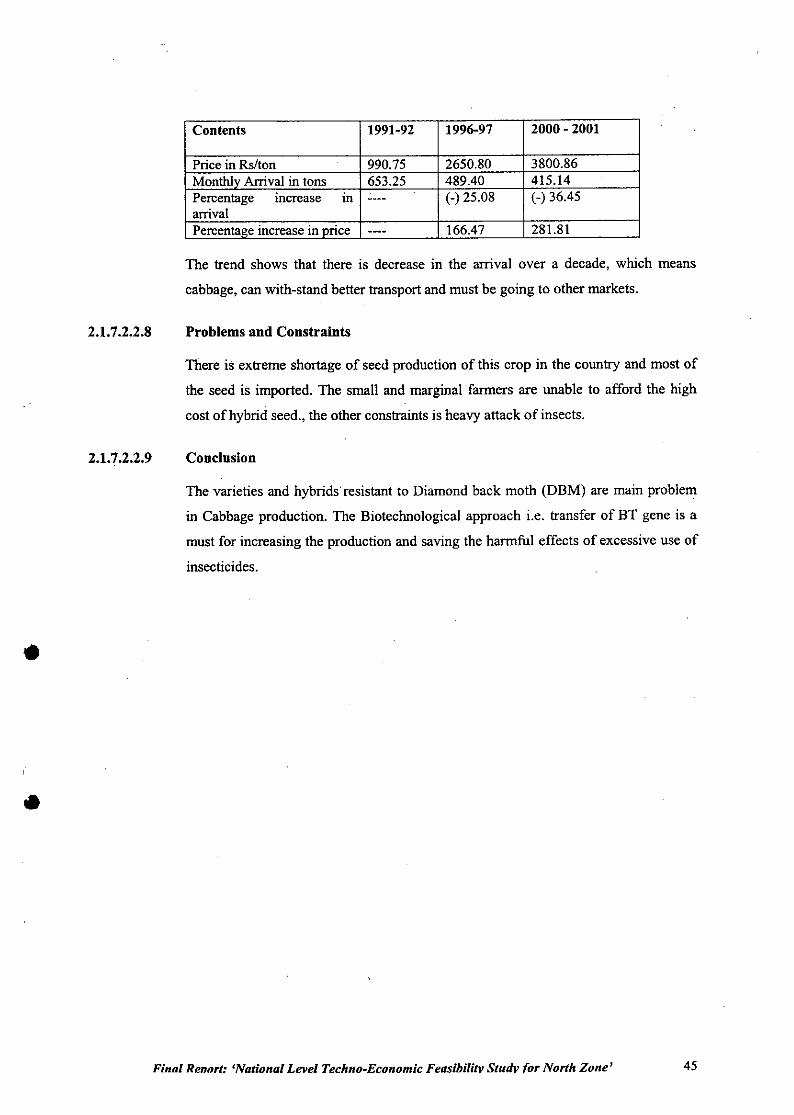
•
•
2.1.7.2.2.8
2.1.7.2.2.9
Contents 1991-92 1996-97 2000 - 2001
Price in Rs/ton . 990.75 2650.80 3800.86Monthly Anival in tons 653.25 489.40 415.14Percentage mcrease 10 ~~~- (-) 25.08 (-)36.45arrivalPercentaQe increase in nrice .... 166.47 281.81
The trend shows that there is decrease in the arrival over a decade, which means
cabbage, can with-stand better transport and must be going to other markets.
Problems and Constraints
There is extreme shortage of seed production of this crop in the country and most of
the seed is imported. The small and marginal farmers are unable to afford the high
cost of hybrid seed., the other constraints is heavy attack of insects.
Conclusion
The varieties and hybrids'resistant to Diamond back moth (DBM) are main problem
in Cabbage production. The Biotechnological approach i.e. transfer of BT gene is a
must for increasing the production and saving the harmful effects of excessive use of
insecticides .
Final Rennrt: 'National Level Techno-Economic Feasibility Studv for North Zone' 45
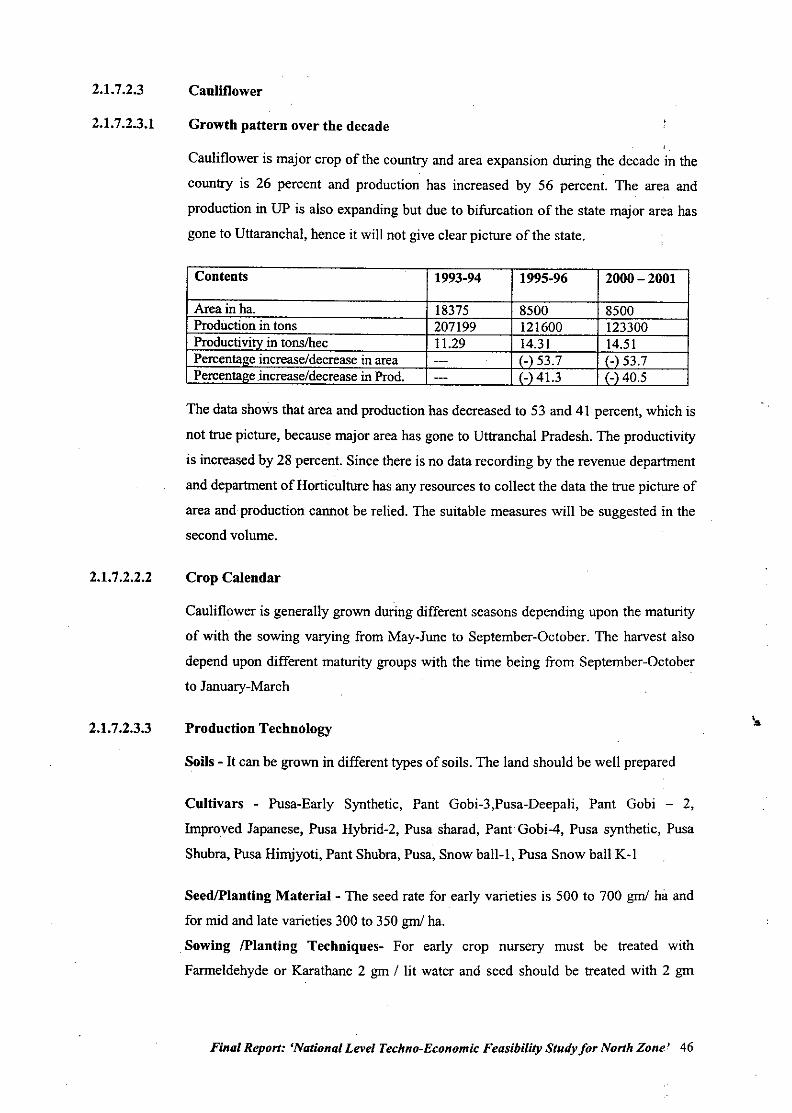
2.1.7.2.3
2.1.7.2.3.1
2.1.7.2.2.2
2.1.7.2.3.3
Cauliflower
Growth pattern over the decade
Cauliflower is major crop of the country and area expansion during the decade in the
country is 26 percent and production has increased by 56 percent. The area and
production in UP is also expanding but due to bifurcation of the state major area has
gone to Uttaranchal, hence it will not give clear picture of the state.
Contents 1993-94 1995-96 2000-2001.
Area in ha. 18375 8500 8500Productionin tons 207199 121600 123300Productivitvin tonslhec 11.29 14.31 14.51Percenta"e increase/decreasein area --- . (-)53.7 (-)53.7Percental!e.increase/decreasein Prod. --- (-) 41.3 (-) 40.5
The data shows that area and production has decreased to 53 and 41 percent, which is
not true picture, because major area has gone to Uttranchal Pradesh. The productivity
is increased by 28 percent. Since there is no data recording by the revenue department
and department of Horticulture has any resources to collect the data the true picture of
area and production cannot be relied. The suitable measures will be suggested in the
second volume.
Crop Calendar
Cauliflower is generally grown during different seasons depending upon the maturity
of with the sowing varying from May-June to September-October. The harvest also
depend upon different maturity groups with the time being from September-October
to January-March
Production Technology
Soils - It can be grown in different types of soils. The land should be well prepared
Cultivars - Pusa-Early Synthetic, Pant Gobi-3,Pusa-Deepali, Pant Gobi - 2,
hnproved Japanese, Pusa Hybrid-2, Pusa sharad, Pant Gobi-4, Pusa synthetic, Pusa
Shubra, Pusa Himjyoti, Pant Shubra, Pusa, Snow ball-I, Pusa Snow ball K-I
Seed/Planting Material - The seed rate for early varieties is 500 to 700 grn/ hil and
for mid and late varieties 300 to 350 grn/ ha.
Sowing /Planting Techniques- For early crop nursery must be treated with
Farmeldehyde or Karathane 2 gm / lit water and seed should be treated with 2 gm
Final Report: 'National Level Techno-Economic Feasibility Study for North Zone' 46
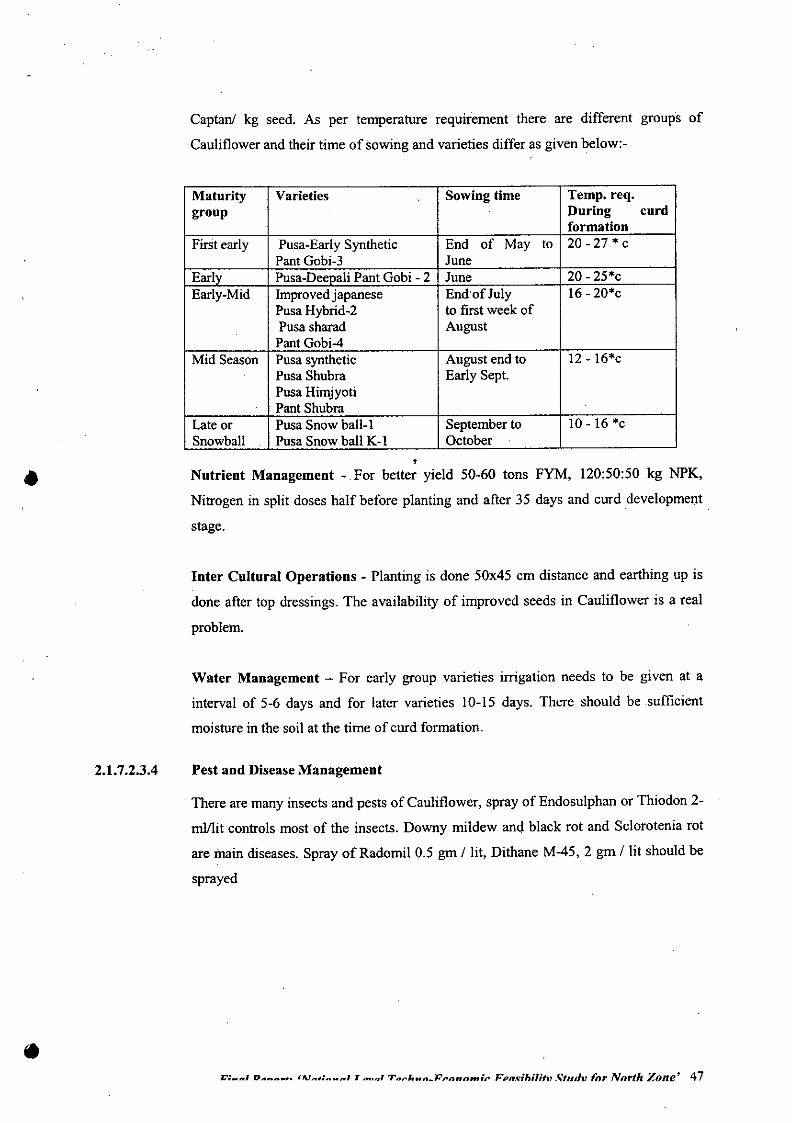
•
•
2.1.7.2.3.4
Captan! kg seed. As per temperature requirement there are different groups of
Cauliflower and their time of sowing and varieties differ as given below:-
Maturity Varieties Sowing time Temp. req.group During curd
formationFirst early Pusa-EarlySynthetic End of May to 20-27*c
PantGobi-3 JuneEarlv Pusa-DeenaliPant Gobi - 2 June 20 - 25*cEarly-Mid Improvedjapanese End'ofJuly 16 - 20*c
PusaHybrid-2 to first week ofPusa sharad AugustPantGobi-4
Mid Season Pusa synthetic August end to 12 - 16*cPusa Shubra Early Sept.PosaHimjyotiPant Shubra
Late or Posa SnowbaIl-I September to 10 - 16 *cSnowbaIl Pusa Snowball K-I October ,
,Nutrient Management - For better yield 50-60 tons FYM, 120:50:50 kg NPK,
Nitrogen in split doses half before planting and after 35 days and curd development
stage.
Inter Cultural Operations - Planting is done 50x45 em distance and earthing up is
done after top dressings. The availability of improved seeds in Cauliflower is a real
problem.
Water Management - For early group varieties irrigation needs to be given at a
interval of 5-6 days and for later varieties 10-15 days. There should be sufficient
moisture in the soil at the time of curd formation.
Pest and Disease Management
There are many insects and pests of Cauliflower, spray of Endosulphan or Thiodon 2-
mlllit controls most of the insects. Downy mildew and black rot and Sclorotenia rot
are main diseases. Spray of Radomil 0.5 gm / lit, Dithane M-45, 2 gm / lit should be
sprayed
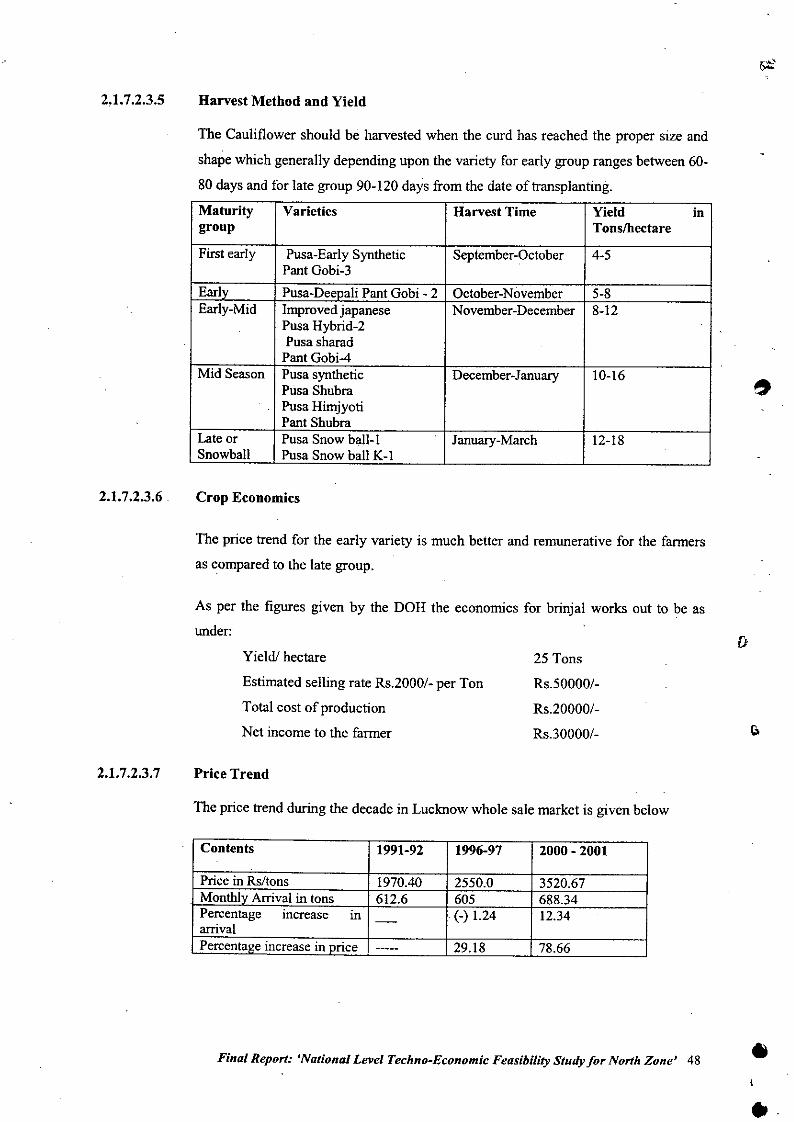
2.1.7.2.3.5
2.1.7.2.3.6.
Harvest Method and Yield
The Cauliflower should be harvested when the curd has reached the proper size and
shape which generally depending upon the variety for early group ranges between 60-
80 days and for late group 90-120 days from the date of transplanting.
Maturity Varieties Harvest Time Yield ingroup Tons/hectare
First early Pusa-Early Synthetic September-October 4-5Pant Gobi-3
Earlv Pusa-Deeoali Pant Gobi - 2 October -November 5-8Early-Mid Improved japanese November-December 8-12
Pusa Hybrid-2Pusa sharadPant Gobi-4 .
Mid Season Pusa synthetic December-January 10-16Pusa ShubraPusa HimjyotiPant Shubra
Late or Pusa Snow ball-I January-March 12-18Snowball Pusa Snow ball K-1
Crop Economics
The price trend for the early variety is much better and remunerative for the farmers
as compared to the late group.
As per the figures given by the DOH the economics for brinjal works out to be as
under:
2.1.7.2.3.7
Yield! hectare
Estimated selling rate RS.2000/- per Ton
Total cost of production
Net income to the farmer
Price Trend
25 Tons
RS.50000/-
Rs.20000/-
Rs.300001-
()
The price trend during the decade in Lucknow whole sale market is given below
Contents 1991-92 1996-97 2000 - 2001
Price in Rsltons 1970.40 2550.0 3520.67Monthlv Arrival in tons 612.6 605 688.34Percentage Increase ill - . (-) 1.24 12.34arrivalPercentage increase in price ----- 29.18 78.66
Final Report: 'National Level Techno-Economic Feasibility Study for North Zone' 48 ••
2.1.7.2.3.8
2.1.7.2.3.9
There is marginal increase in monthly arrival of 12.36 percent over the decade but
prices of Cauliflower increased by 78 percent which is 7.8 percent annually but
arrival is marginally increased.
Problems and constraints
Since this is highly cross pollinated crop and variability is more in selfed seed.
Farmers have to replace the seed every year in early and mid varieties. The late
Cauliflower, they are replacing because seed can not be produced in UP. This is
temperature sensitive crop right variety at right time must be sown otherwise total
failure occurs. Farmers must be educated to produce right variety. The availability of
improved seeds in Cauliflower is a real problem.
Conclusion .
Resistant variety for pests and with wider adaptability should be developed. FI
hybrids and synthetics are becoming popular and yield will go up in coming years.
Finnl Rpnnrt: 'Nntinnall.p.vel Technn.Economic Feasibilitv Study for North Zone' 49
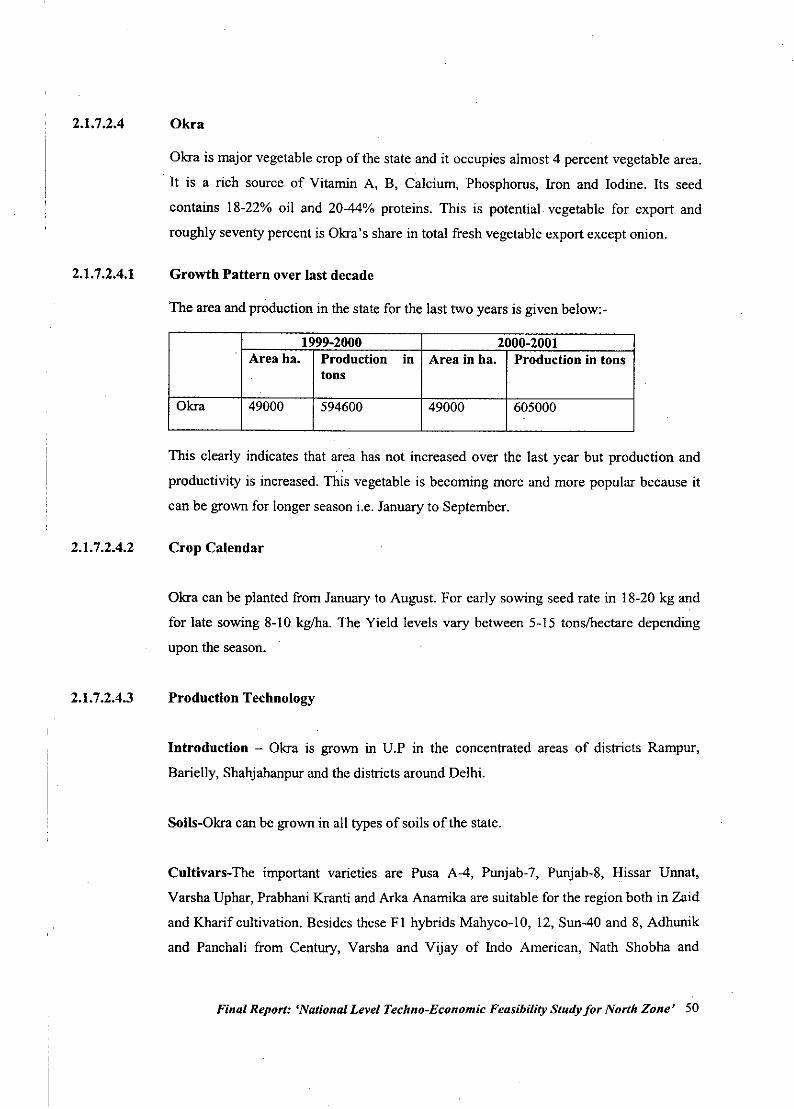
2.1.7.2.4
2.1.7.2.4.1
2.1.7.2.4.2
2.1.7.2.4.3
Okra
Okra is major vegetable crop of the state and it occupies almost 4 percent vegetable area .
. It is a rich source of Vitamin A, B, Calcium, Phosphorus, Iron and Iodine. Its seed
contains 18-22% oil and 20-44% proteins. This is potential vegetable for export and
roughly seventy percent is Okra's share in total fresh vegetable export except onion.
Growth Pattern over last decade
The area and production in the state for the last two years is given below:-
1999-2000 2000-2001Area ha. Production in Area in ha. Production in tons
tons.
Okra 49000 594600 49000 605000
This clearly indicates that area has not increased over the last year but production and
productivity is increased. This vegetable is becoming more and more popular because it
can be grown for longer season i.e. January to September.
Crop Calendar
Okra can be planted from January to August. For early sowing seed rate in 18-20 kg and
for late sowing 8-10 kg/ha. The Yield levels vary between 5-15 tonslhectare depending
upon the season.
Production Technology
Introduction - Okra is grown in U.P in the concentrated areas of districts Rampur,
Barielly, Shahjahanpur and the districts around Delhi.
Soils-Okra can be grown in all types of soils of the state.
Cultivars-The important varieties are Pusa A-4, Punjab-?, Punjab-8, Hissar Unnat,
Varsha Uphar, Prabhani Kranti and Arka Anamika are suitable for the region both in Zaid
and Kharif cultivation. Besides these Fl hybrids Mahyco-l0, 12, Sun-40 and 8, Adhunik
and Panchali from Century, Varsha and Vijay of Indo American, Nath Shobha and
Final Report: 'National Level Techno-Economic Feasibility Study for North Zone' 50
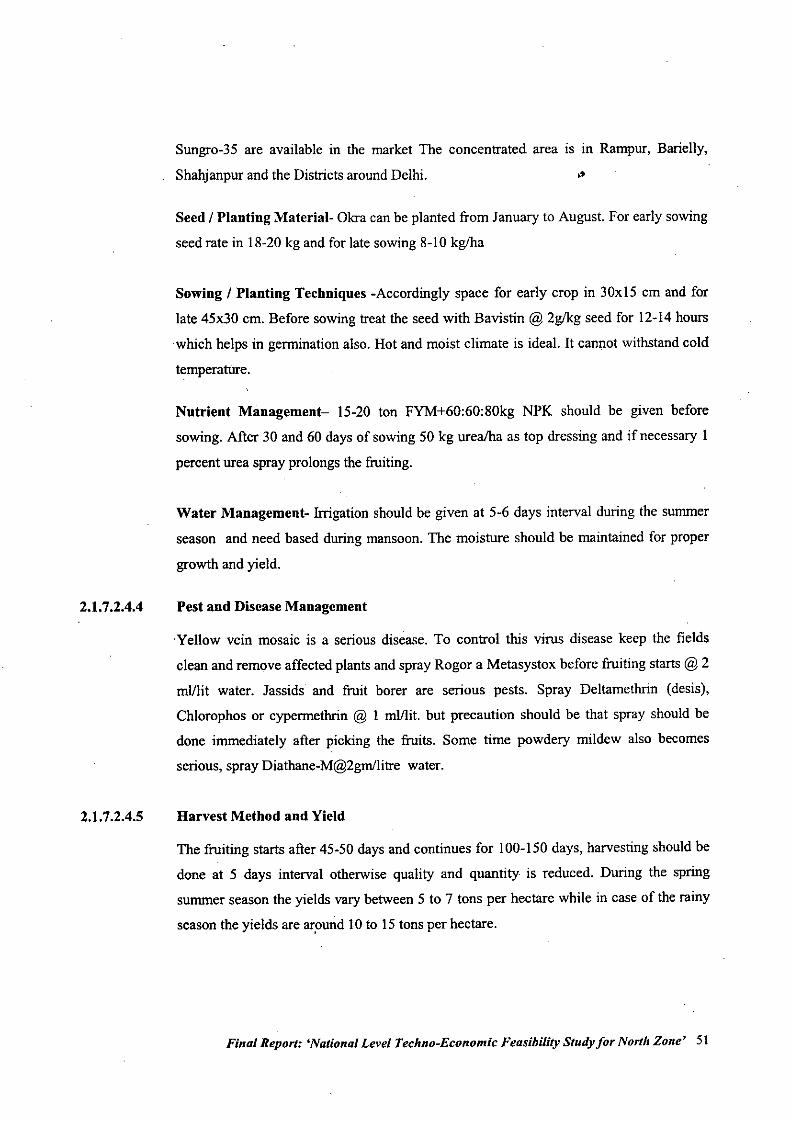
2.1.7.2.4.4
2.1.7.2.4.5
Sungro-35 are available in the market The concentrated area is in Rampur, Barielly,
Shahjanpur and the Districts around Delhi. ••
Seed / Planting Material- Okra can be planted from January to August. For early sowing
seed rate in 18-20 kg and for late sowing 8-10 kg/ha
Sowing / Planting Techniques -Accordingly space for early crop in 30x15 cm and for
late 45x30 cm. Before sowing treat the seed with Bavistin @ 2g/kg seed for 12-14 hours
which helps in germination also. Hot and moist climate is ideal. It cannot withstand cold
temperature.
Nntrient Management- 15-20 ton FYM+60:60:80kg NPK should be given before
sowing. After 30 and 60 days of sowing 50 kg urea/ha as top dressing and if necessary 1
percent urea spray prolongs the fruiting.
Water Management- Irrigation should be given at 5-6 days interval during the summer
season and need based during mansoon. The moisture should be maintained for proper
growth and yield.
Pest and Disease Management
Yellow vein mosaic is a serious disease. To control this virus disease keep the fields
clean and remove affected plants and spray Rogor a Metasystox before fruiting starts @ 2
m1I1itwater. Jassids and fruit borer are serious pests. Spray Deltamethrin (desis),
Ch10rophos or cypermethrin @ I m1/lit. but precaution should be that spray should be
done immediately after picking the fruits. Some time powdery mildew also becomes
serious, spray Diathane-M@2gm/litre water.
Harvest Method and Yield
The fruiting starts after 45-50 days and continues for 100-150 days, harvesting should be
done at 5 days interval otherwise quality and quantity is reduced. During the spring
summer season the yields vary between 5 to 7 tons per hectare while in case of the rainy
season the yields are ar~und 10 to 15 tons per hectare.
Final Report: 'National Level Techno-Economic Feasibility Study for North Zone' 51
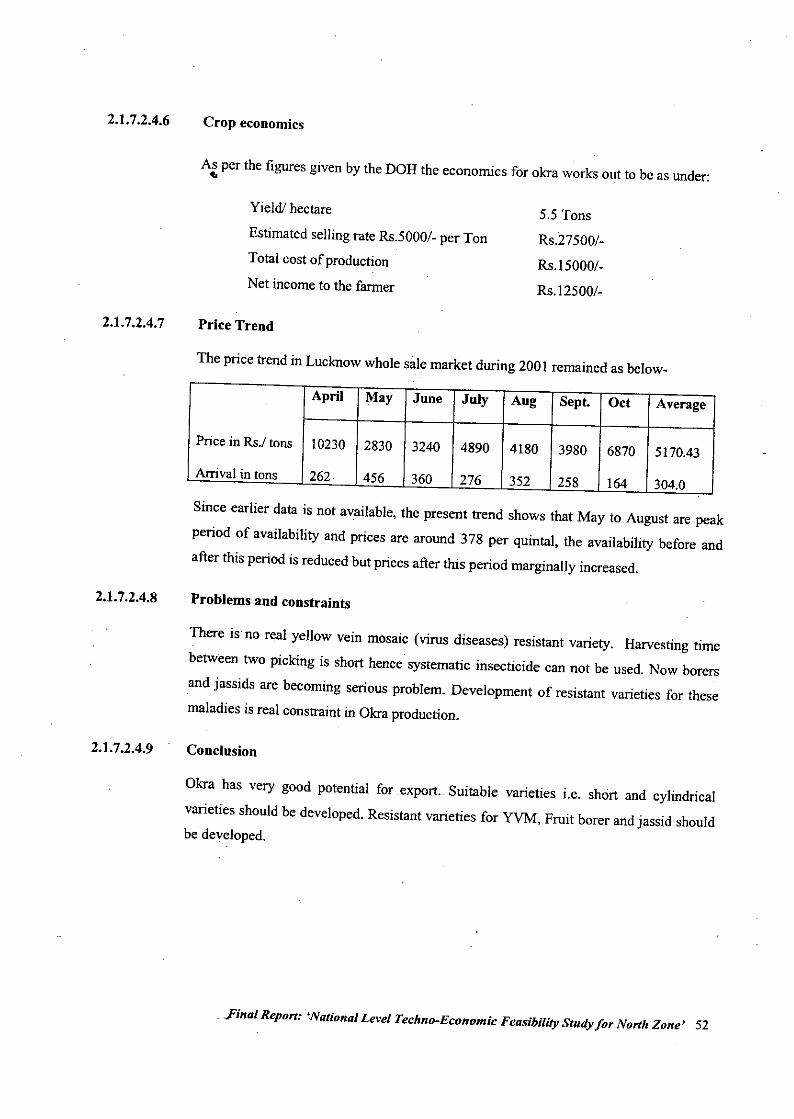
2.1. 7.2.4.6 Crop economics
As per the figures given by the DOH the economics for okra works out to be as under:~ .
2.1.7.2.4.7
Yield! hectare
Estimated selling rate Rs.5000/- per Ton
Total cost of production
Net income to the fanner
Price Trend
5.5 Tons
RS.27500/-
Rs.I5000/-
Rs.12500/-
2.1.7.2.4.8
2.1.7.2.4.9
The price trend in Lucknow whole sale market during 200 I remained as below-
April May June July Ang Sept. Oct Average
Price in Rs./ tons 10230 2830 3240 4890 4180 3980 6870 5170.43Arrival in tons 262 456 360 276 352 258 164 304.0
Since earlier data is not available, the present trend shows that May to August are peak
period of availability and prices are around 378 per quintal, the availability before and
after this period is reduced but prices after this period marginally increased.
Problems and constraints
There is no real yellow vein mosaic (virus diseases) resistant variety. Harvesting time
between two picking is short hence systematic insecticide can not be used. Now borers
and jassids are becoming serious problem. Development of resistant varieties for thesemaladies is real constraint in Okra production.
Conclnsion
Okra has very good potential for export .. Suitable varieties i.e. short and cylindrical
varieties should be developed. Resistant varieties for YVM, Fruit borer and jassid shouldbe developed .
. ..Final Report: 'National Level Techno-Economic Feasibility Study for North Zone' 52
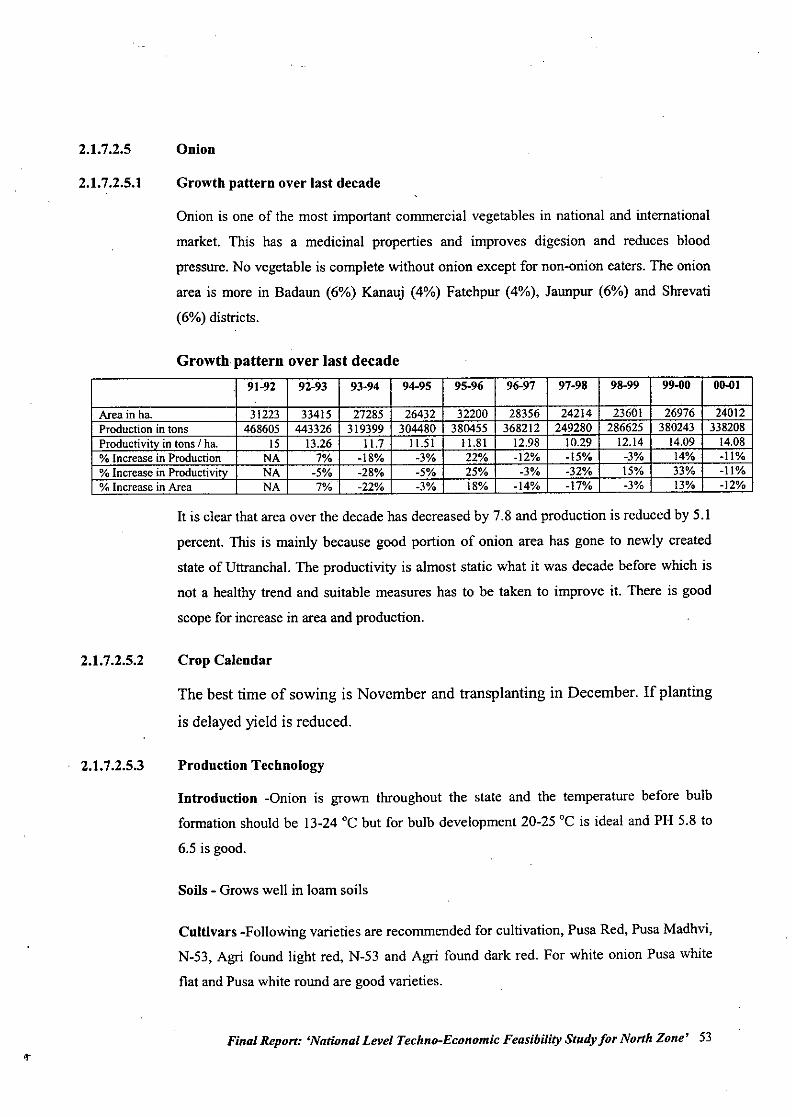
2.1.7.2.5
2.1.7.2.5.1
Onion
Growth pattern over last decade
Onion is one of the most important commercial vegetables in national and international
market. This has a medicinal properties and improves digesion and reduces blood
pressure. No vegetable is complete without onion except for non-onion eaters. The onion
area is more in Badaun (6%) Kanauj (4%) Fatehpur (4%), Jaunpur (6%) and Shrevati
(6%) districts.
Growth pattern over last decade
91-92 92-93 93-94 94-95 95-96 96-97 97-98 98-99 99-00 06-01
Area in ha. 31223 33415 27285 26432 32200 28356 24214 23601 26976 24012Production in tons 468605 443326 319399 304480 380455 368212 249280 286625 380243 338208Productivity in tons I ha. 15 13.26 11.7 11.51 11.81 12.98 10.29 12.14 14.09 14.08% Increase in Production NA 7% -18% -3% 22% -12% -15% -3% 14% -11%% Increase in Productivity NA -5% -28% -5% 25% -3% -32% 15% 33% -11%% Increase in Area NA 7% -22% -3% 18% -14% -17% -3% 13% -12%
It is clear that area over the decade has decreased by 7.8 and production is reduced by 5.1
percent. This is mainly because good portion of onion area has gone to newly created
state of Vtlranchal. The productivity is almost static what it was decade before which is
not a healthy trend and suitable measures has to be taken to improve it. There is good
scope for increase in area and production.
2.1.7.2.5.2
2.1.7.2.5.3
Crop Calendar
The best time of sowing is November and transplanting in December. If planting
is delayed yield is reduced.
Production Technology
Introduction -Onion is grown throughout the state and the temperature before bulb
formation should be 13-24 °C but for bulb development 20-25 °C is ideal and PH 5.8 to
6.5 is good.
Soils - Grows well in loam soils
Cultivars -Following varieties are recommended for cultivation, Pusa Red, Pusa Madhvi,
N-53, Agri found light red, N-53 and Agri found dark red. For white onion Pusa white
flat and Pusa white round are good varieties.
Final Report: 'National Level Techno-Economic Feasibility Study for North Zone' 53
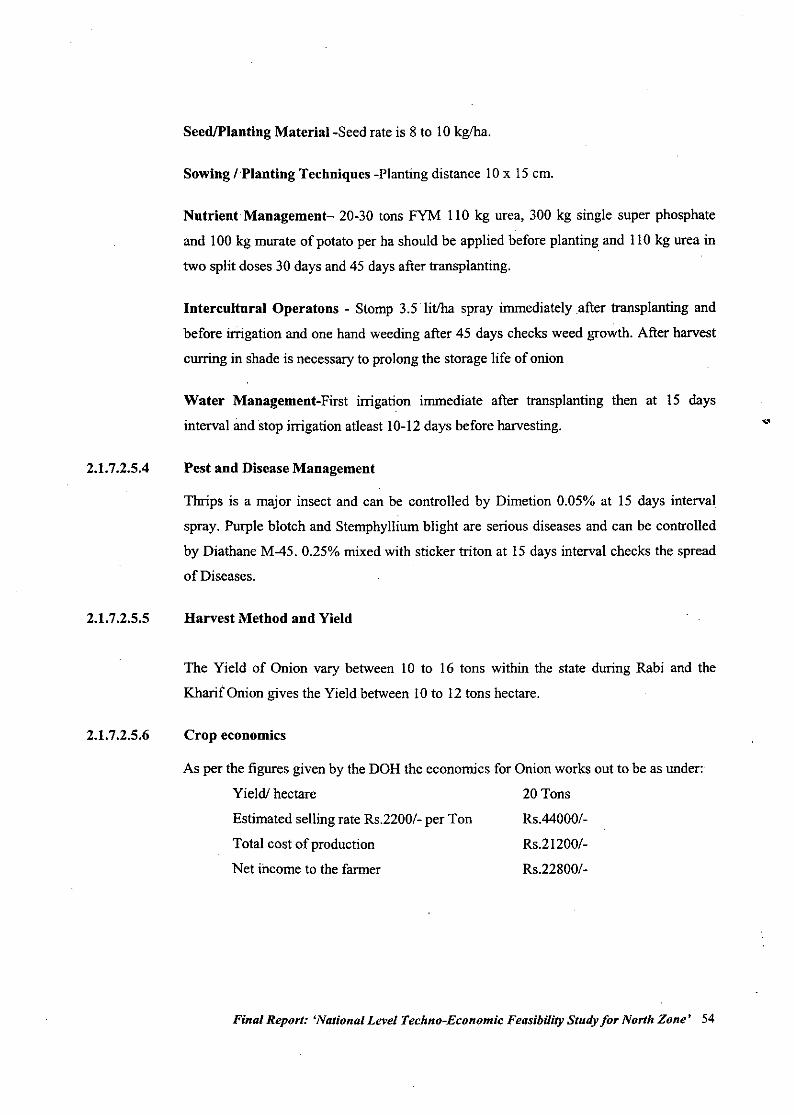
2.1.7.2.5.4
2.1.7.2.5.5
2.1.7.2.5.6
SeedIPlanting Material -Seed rate is 8 to 10kglha.
Sowing I'Planting Techniques -Planting distance lOx 15 cm.
Nutrient Management- 20-30 tons FYM 110 kg urea, 300 kg single super phosphate
and 100 kg murate of potato per ha should be applied before planting and 110 kg urea in
two split doses 30 days and 45 days after transplanting.
Intercultural Operatons - Stomp 3.5 lit/ha spray immediately.after transplanting and
before irrigation and one hand weeding after 45 days checks weed growth. After harvest
curring in shade is necessary to prolong the storage life of onion
Water Management-First irrigation immediate after transplanting then at 15 days
interval and stop irrigation atleast 10-12 days before harvesting.
Pest and Disease Management
Thrips is a major insect and can be controlled by Dimetion 0.05% at 15 days interval
spray. Purple blotch and Stemphyllium blight are serious diseases and can be controlled
by Diathane M-45. 0.25% mixed with sticker triton at 15 days interval checks the spread
of Diseases.
Harvest Method and Yield
The Yield of Onion vary between 10 to 16 tons within the state during Rabi and the
KharifOnion gives the Yield between 10 to 12 tons hectare.
Crop economics
As per the figures given by the DOH the economics for Onion works outto be as under:
Yield! hectare 20 Tons
Estimated selling rate Rs.2200/- per Ton Rs.44000/-
Total cost of production RS.2I200/-
Net income to the farmer RS.22800/-
Final Report: 'National Level Techno-Economic Feasibility Study for North Zone' 54
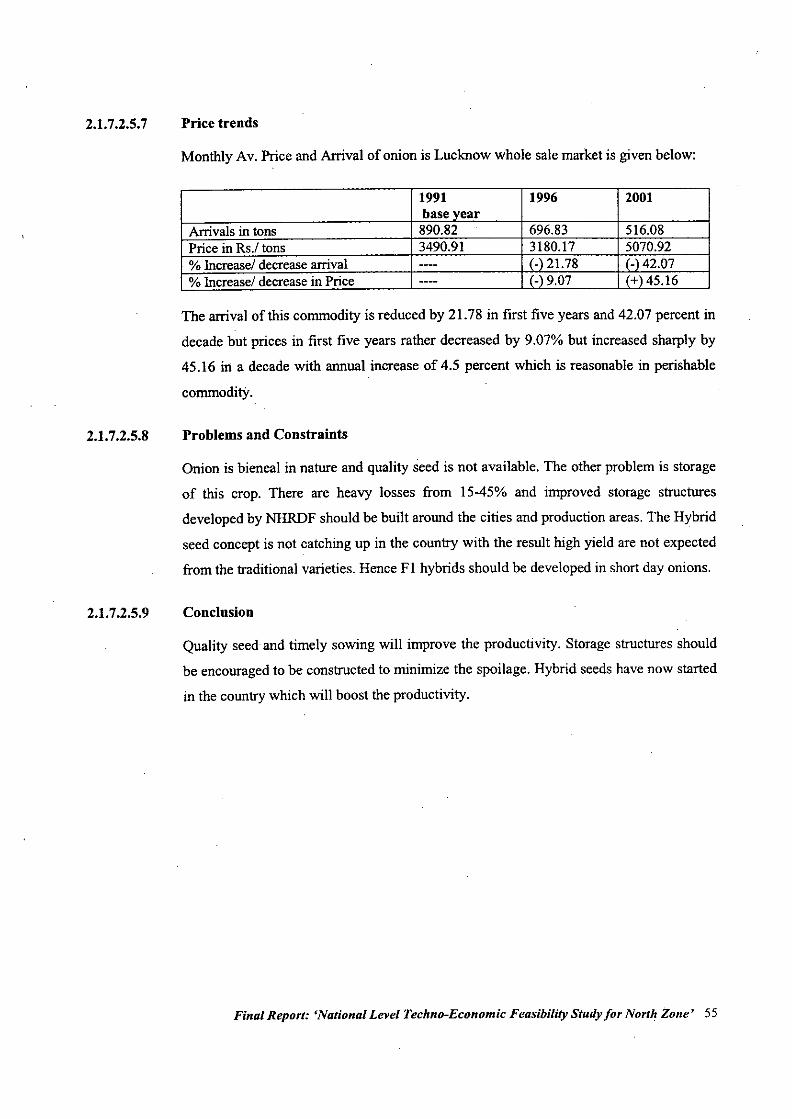
2.1.7.2.5.7
2.1.7.2.5.8
2.1.7.2.5.9
Price trends
Monthly Av. Price and Arrival of onion is Lucknow whole sale market is given below:
1991 1996 2001base year
Arrivals in tons 890.82 . 696.83 516.08Price in Rs.l tons 3490.91 3180.17 5070.92% Increase/decreasearrival ---- (-) 21.78 (-) 42.07% Increase/decrease in Price ---- (-) 9.07 (+)45.16
The arrival of this commodity is reduced by 21.78 in first five years and 42.07 percent in
decade but prices in first five years rather decreased by 9.07% but increased sharply by
45.16 in a decade with annual increase of 4.5 percent which is reasonable in perishable
commodity.
Problems and Constraints
Onion is bieneal in nature and quality seed is not available. The other problem is storage
of this crop. There are heavy losses from 15-45% and improved storage structures
developed by NHRDF should be built around the cities and production areas. The Hybrid
seed concept is not catching up in the country with the result high yield are not expected
from the traditional varieties. Hence F1 hybrids should be developed in short day onions.
Conclusion
Quality seed and timely sowing will improve the productivity. Storage structures should
be encouraged to be constructed to minimize the spoilage. Hybrid seeds have now started
in the country which will boost the productivity.
Final Report: 'National Level Techno-Economic Feasibility Study for North Zone' 55
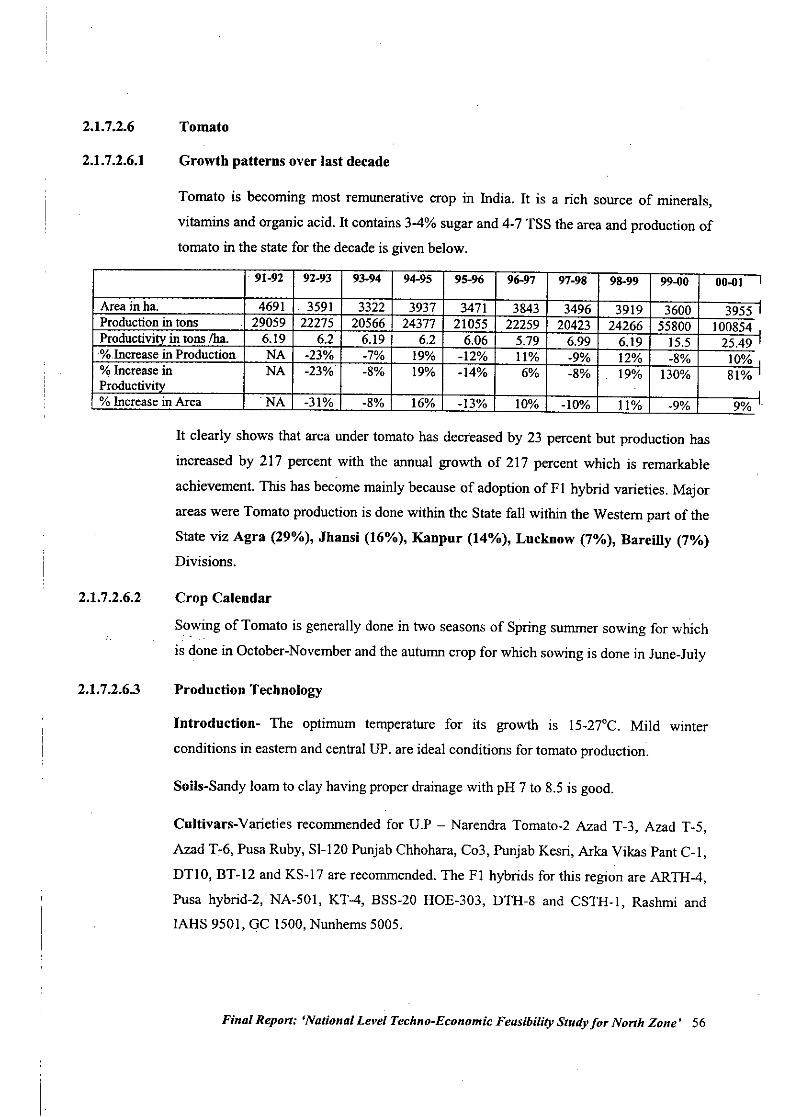
2.1.7.2.6
2.1.7.2.6.1
Tomato
Growth patterns over last decade
Tomato is becoming most remunerative crop in India. It is a rich source of minerals,
vitamins and organic acid. It contains 3-4% sugar and 4-7 TSS the area and production of
tomato in the state for the decade is given below.
91-92 92-93 93-94 94-95 95-96 96-97 97-98 98-99 99-00 OO-ot I
Area inba. 4691 3591 3322 3937 3471 3843 3496 3919 3600 3955 IProduction in tons 29059 22275 20566 24377 21055 22259 20423 24266 55800 100854 ,Productivity in tons fha. 6.19 6.2 6.19 6.2 6.06 5.79 6.99 6.19 15.5 25.491%.lncrease in Production NA -23% -7% 19% -12% 11% -9% 12% -8% 10%,% Increase in NA -23% -8% 19% -14% 6% -8% 19% 130% 81% IProductivity
I% Increase in Area NA -31% -8% 16% -13% 10% -10% 11% -9% 9% L
It clearly shows that area under tomato has decreased by 23 percent but production has
increased by 217 percent with the annual growth of 217 percent which is remarkable
achievement. This has become mainly because of adoption of FI hybrid varieties. Major
areas were Tomato production is done within the State fall within the Western part of the
State viz Agra (29%), Jhansi (16%), Kanpur (14%), Lncknow (7%), Bareilly (7%)
Divisions.
I
2.1.7.2.6.2
2.1.7.2.6.3
Crop Calendar
Sowing of Tomato is generally done in two seasons of Spring summer sowing for which
is done in October-November and the autumn crop for which sowing is done in June-July
Production Technology
Introduction- The optimum temperature for its growth is 15-27°C. Mild winter
conditions in eastern and central UP. are ideal conditions for tomato production.
Soils-Sandy loam to clay having proper drainage with pH 7 to 8.5 is good.
Cultivars-Varieties recommended for D.P - Narendra Tomato-2 Azad T-3, Azad T-5,
Azad T-6, Pusa Ruby, SI-120 Punjab Chhohara, C03, Punjab Kesri, Arka Vikas Pant C-I,
DTlO, BT.12 and KS-17 are recommended. The FI hybrids for this region are ARTH-4,
Pusa hybrid-2, NA-501, KT-4, BSS-20 HOE-303, DTH-8 and CSTH-I, Rashmi and
lARS 9501, GC 1500, Nunhems 5005.
Final Report: 'National Level Techno-Economic Feasibility Study for North Zone' 56
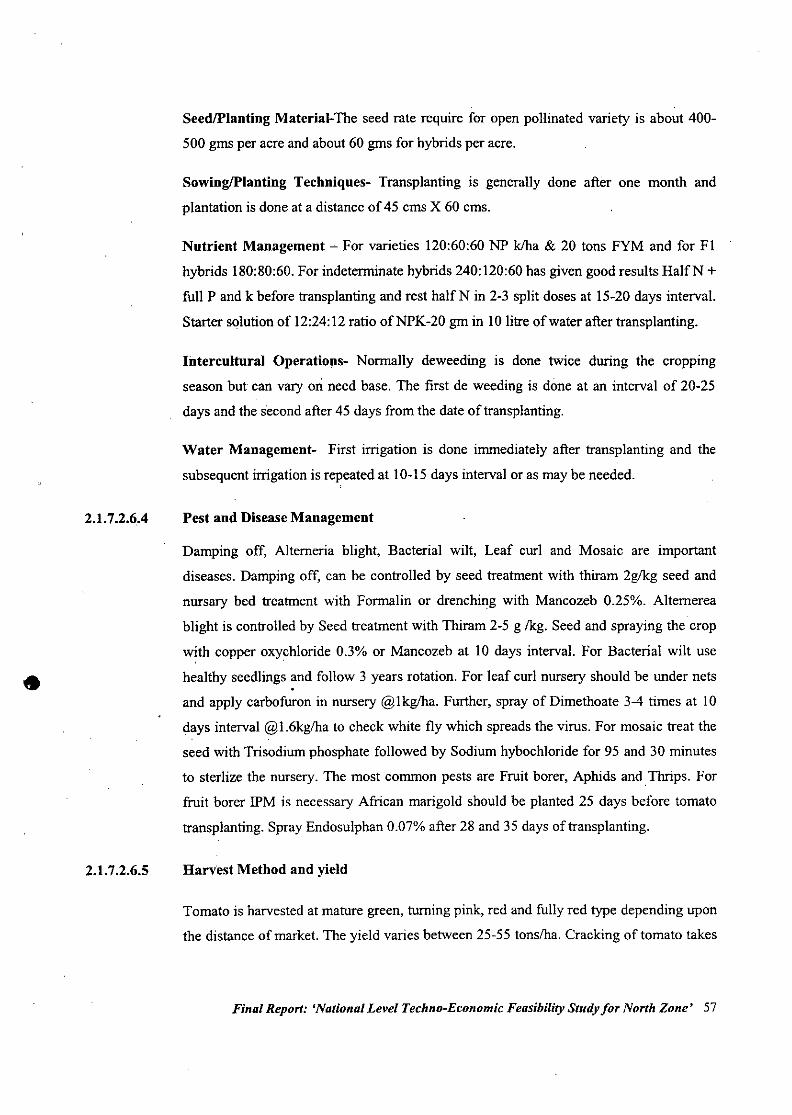
•
2.1.7.2.6.4
2.1.7.2.6.5
SeedIPlanting Material-The seed rate require for open pollinated variety is about 400-
500 gms per acre and about 60 gms for hybrids per acre.
SowingIPlanting Techniques- Transplanting is generally done after one month and
plantation is done at a distance of 45 cms X 60 cms.
Nutrient Management ~ For varieties 120:60:60 NP k/ha & 20 tons FYM and for FI
hybrids 180:80:60. For indeterminate hybrids 240:120:60 has given good results HalfN +full P and k before transplanting and rest halfN in 2.3 split doses at 15.20 days interval.
Starter solution of 12:24:12 ratio ofNPK.20 gm in 10 litre of water after transplanting.
Intercultural Operations- Normally deweeding is done twice during the cropping
season but can vary on need base. The first de weeding is done at an interval of 20.25
days and the second after 45 days from the date of transplanting.
Water Management- First irrigation is done immediately after transplanting and the
subsequent irrigation is repeated at 10.15 days interval or as may be needed.
Pest and Disease Management
Damping off, Altemeria blight, Bacterial wilt, Leaf curl and Mosaic are important
diseases. Damping off, can be controlled by seed treatment with thiram 2g!kg seed and
nursary bed treatment with Formalin or drenching with Mancozeb 0.25%. Altemerea
blight is controlled by Seed treatment with Thiram 2-5 g /kg. Seed and spraying the crop
with copper oxychloride 0.3% or Mancozeb at 10 days interval. For Bacterial wilt use
healthy seedlings and follow 3 years rotation. For leaf curl nursery should be under nets
and apply carbofuron in nursery @lkglha. Further, spray of Dimethoate 3-4 times at 10
days interval @1.6kglha to check white fly which spreads the virus. For mosaic treat the
seed with Trisodium phosphate followed by Sodium hybochloride for 95 and 30 minutes
to sterlize the nursery. The most common pests are Fruit borer, Aphids andThrips. For
fruit borer lPM is necessary African marigold should be planted 25 days before tomato
transplanting. Spray Endosulphan 0.07% after 28 and 35 days of transplanting.
Harvest Method and yield
Tomato is harvested at mature green, turning pink, red and fully red type depending upon
the distance of market. The yield varies between 25-55 tonslha. Cracking of tomato takes
Final Report: 'National Level Techno.Economic Feasibility Study for North Zone' 57
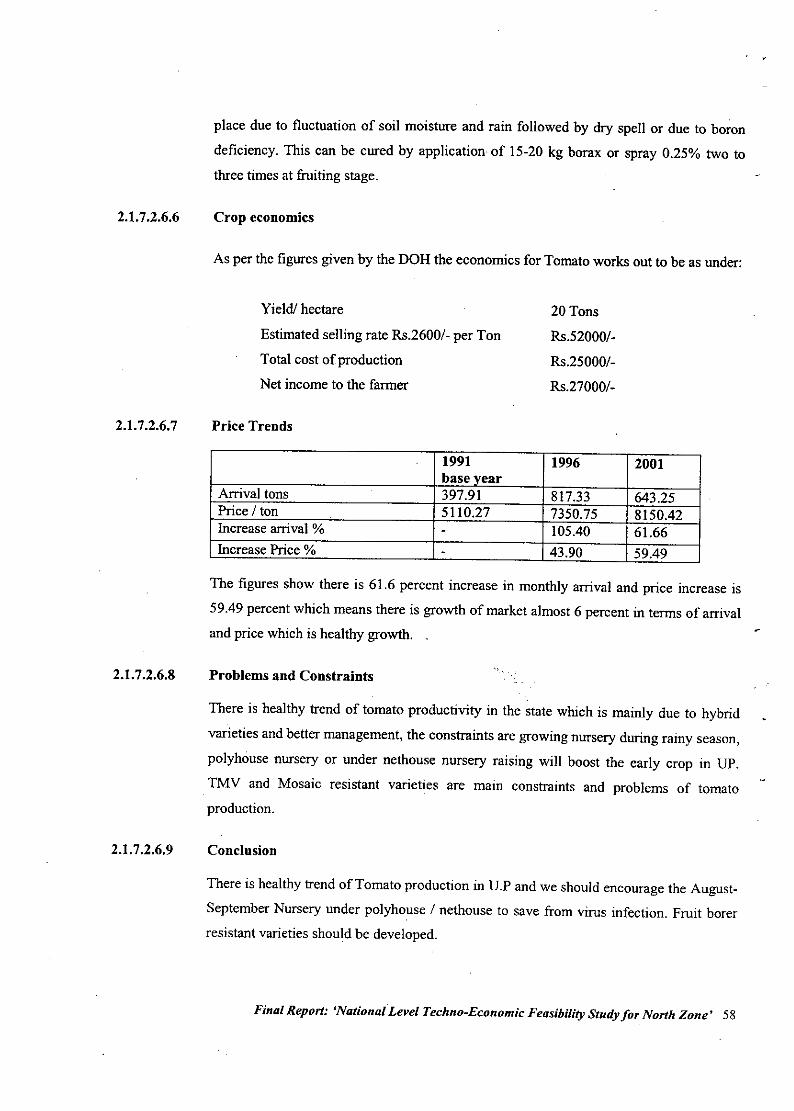
2.1.7.2.6.6
place due to fluctuation of soil moisture and rain followed by dry spell or due to boron
deficiency. This can be cured by application of 15-20 kg borax or spray 0.25% two totluee times at fruiting stage.
Crop economics
As per the figures given by the DOH the economics for Tomato works out to be as under:
2.1.7.2.6.7
Yield! hectare
Estimated selling rate Rs.2600/- per Ton
Total cost of production
Net income to the farmer
Price Trends
20 Tons
Rs.52000/-
Rs.25000/-
Rs.27000/.
2.1.7.2.6.8
2.1.7.2.6.9
1991 1996 2001base year
Arrival tons 397.91 817.33 643.25Price / ton 5110.27 7350.75 8150.42Increase arrival % - 105.40 61.66Increase Price % - 43.90 59.49
The figures show there is 61.6 percent increase in monthly arrival and price increase is
59.49 percent which means there is growth of market almost 6 percent in terms of arrivaland price which is healthy growth.
Problems and Constraints
There is healthy trend of tomato productivity in the state which is mainly due to hybrid
varieties and better management, the constraints are growing nursery during rainy season,
polyhouse nursery or under nethouse nursery raising will boost the early crop in UP.
TMV and Mosaic resistant varieties are main constraints and problems of tomatoproduction.
Conclusion
There is healthy trend of Tomato production in U.P and we should encourage the August-
September Nursery under polyhouse / nethouse to save from virus infection. Fruit borerresistant varieties should be developed.
Final Report: 'National Level Techno-Economic Feasibility Study for North Zone' 58
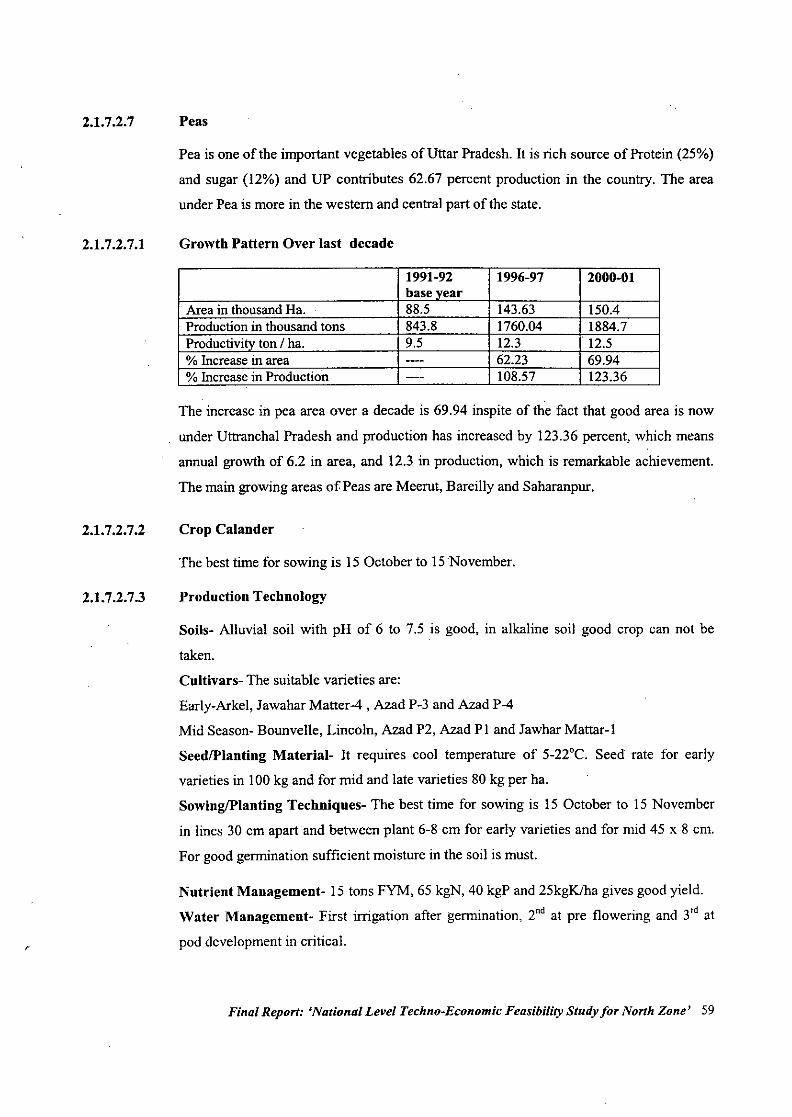
2.1.7.2.7 Peas
Pea is one of the important vegetables of Uttar Pradesh. It is rich source of Protein (25%)
and sugar (12%) and UP contributes 62.67 percent production in the country. The area
under Pea is more in the western and central part of the state.
r
2.1.7.2.7.1
2.1.7.2.7.2
2.1.7.2.7.3
Growth Pattern Over last decade
1991-92 1996-97 2000-01base year
Area in thousandHa. . 88.5 143.63 150.4Productionin thousand tons 843.8 1760.04 1884.7Productivityton / ha. 9.5 12.3 12.5% Increase in area ._-- 62.23 69.94% Increasein Production --- 108.57 123.36
The increase in pea area over a decade is 69.94 inspite of the fact that good area is now
under Uttranchal Pradesh and production has increased by 123.36 percent, which means
annual growth of 6.2 in area, and 12.3 in production, which is remarkable achievement.
The main growing areas of Peas are Meerut, Bareilly and Saharanpur.
Crop Calander
The best time for sowing is 15 October to 15November.
Production Technology
Soils- Alluvial soil with pH of 6 to 7.5 is good, in alkaline soil good crop can not be
taken.
Cultivars- The suitable varieties are:
Early-Arkel, Jawahar Matter-4 , Azad P.3 and Azad P-4
Mid Season- Bounvelle, Lincoln, Azad P2, Azad PI and Jawhar Mattar-I
SeedIPlanting Material- It requires cool temperature of 5-22°C. Seed rate for early
varieties in 100 kg and for mid and late varieties 80 kg per ha.
SowinglPlanting Techniques- The best time for sowing is Is October to 15 November
in lines 30 cm apart and between plant 6-8 cm for early varieties and for mid 45 x 8 cm.
For good germination sufficient moisture in the soil is must.
Nutrient Management- 15 tons FYM, 65 kgN, 40 kgP and 25kgKlba gives good yield.
Water Management- First irrigation after germination, 2ndat pre flowering and 3'd at
pod development in critical.
Final Report: 'National Level Techno-Economic Feasibility Study for North Zone' 59
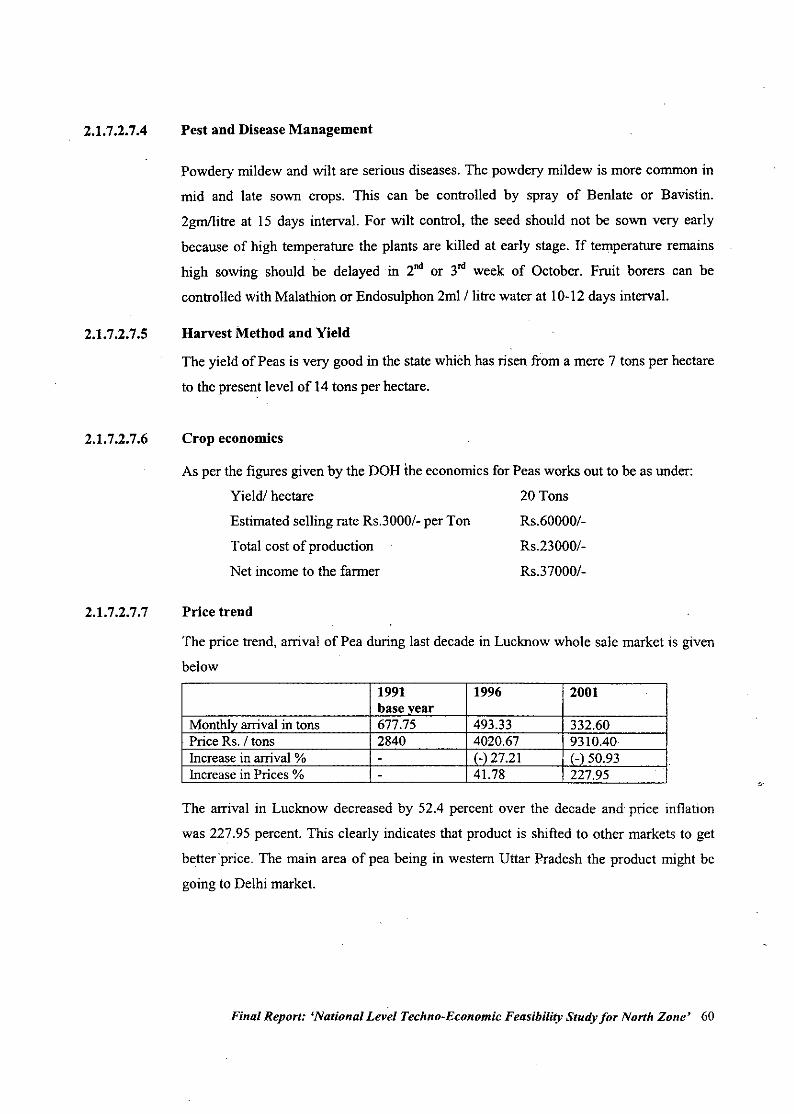
2.1.7.2.7.4
2.1.7.2.7.5
2.1.7.2.7.6
Pest and Disease Management
Powdery mildew and wilt are serious diseases. The powdery mildew is more common in
mid and late sown crops. This can be controlled by spray of Benlate or Bavistin.
2gm/1itre at 15 days interval. For wilt control, the seed should not be sown very early
because of high temperature the plants are killed at early stage. If temperature remains
high sowing should be delayed in 2nd or 3n1 week of October. Fruit borers can be
controlled with Malathion or Endosulphon 2ml / litre water at 10-12 days interval.
Harvest Method and Yield
The yield of Peas is very good in the state which has risen from a mere 7 tons per hectare
to the present level of 14 tons per hectare.
Crop economics
As per the figures given by the DOH the economics for Peas works out to be as under:
Yield! hectare 20 Tons
2.1.7.2.7.7
Estimated selling rate RS.3000/-per Ton
Total cost of production
Net income to the farmer
Price trend
Rs.60000/-
RS.23000/-
Rs.37000/-
The price trend, arrival of Pea during last decade in Lucknow whole sale market is given
below
1991 1996 2001base year
Monthlyarrival in tons 677.75 493.33 332.60Price Rs. / tons 2840 4020.67 9310.40Increase in arrival % - (-)27.21 (-) 50.93Increase in Prices % - 41.78 227.95
The arrival in Lucknow decreased by 52.4 percent over the decade and price inflation
was 227.95 percent. This clearly indicates that product is shifted to other markets to get
betterprice. The main area of pea being in western Uttar Pradesh the product might be
going to Delhi market.
Final Report: 'National Level Techno-Economic Feasibility Study for North Zone' 60
,-~
"
2.1.7.2.7.8
2.1.7.2.7.9
Problems and constraints
The pea production has very good scope in UP and with the release of better varieties
area and production is increasing. The major constraints is wilt that is why early crop
becomes risky. Varieties with wilt resistance should be developed.
Conclusion
Pea has very good scope of area and production increase in the state, if wilt resistant lines
are developed.
Final Report: 'National Level Techno-Economic Feasibility Study for North Zone' 61
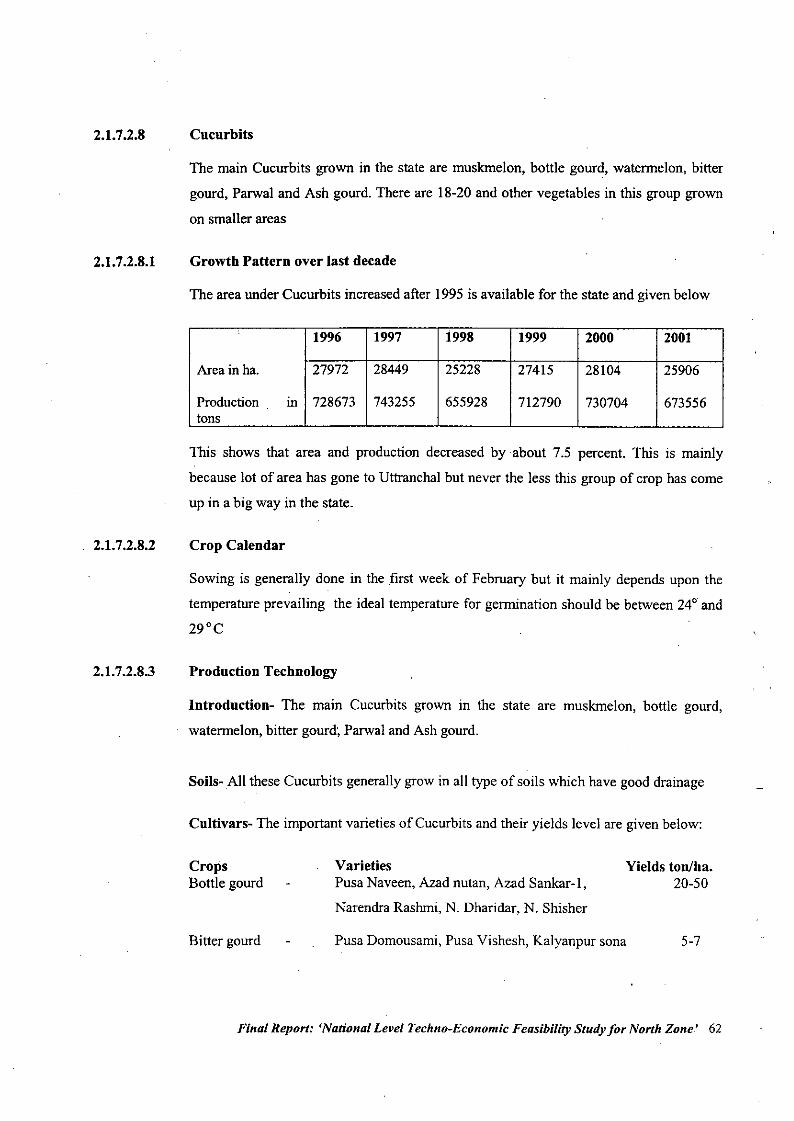
2.1.7.2.8
2.1.7.2.8.1
2.1.7.2.8.2
2.1.7.2.8.3
Cucurbits
The main Cucurbits grown in the state are muskmelon, bottle gourd, watermelon, bitter
gourd, Parwal and Ash gourd. There are 18-20 and other vegetables in this group grown
on smaller areas
Growth Pattern over last decade
The area under Cucurbits increased after 1995 is available for the state and given below
~1996 1997 1998 1999 2000 2001
Area in 00. 27972 28449 25228 27415 28104 25906
Production ill 728673 743255 655928 712790 730704 673556tons
This shows that area and production decreased by about 7.5 percent. This is mainly
because lot of area has gone to UttrancOOI but never the less this group of crop has come
up in a big way in the state.
Crop Calendar
Sowing is generally done in the fIrst week of February but it mainly depends upon the
temperature prevailing the ideal temperature for germination should be between 24° and
29°C
Production Technology
Introduction- The main Cucurbits grown in the state are muskmelon, bottle gourd,
watermelon, bitter gourd; Parwal and Ash gourd.
Soils- All these Cucurbits generally grow in all type of soils which have good drainage
Cultivars- The important varieties of Cucurbits and their yields level are given below:
CropsBottle gourd
VarietiesPusa Naveen, Azad nutan, Azad Sankar-I,
Narendra Rashmi, N. Dharidar, N. Shisher
Yields ton/ha.20-50
Bitter gourd Pusa Domousami, Pusa Vishesh, Kalyanpur sona 5-7
Final Report: 'National Level Techno-Economic Feasibility Study for North Zone' 62
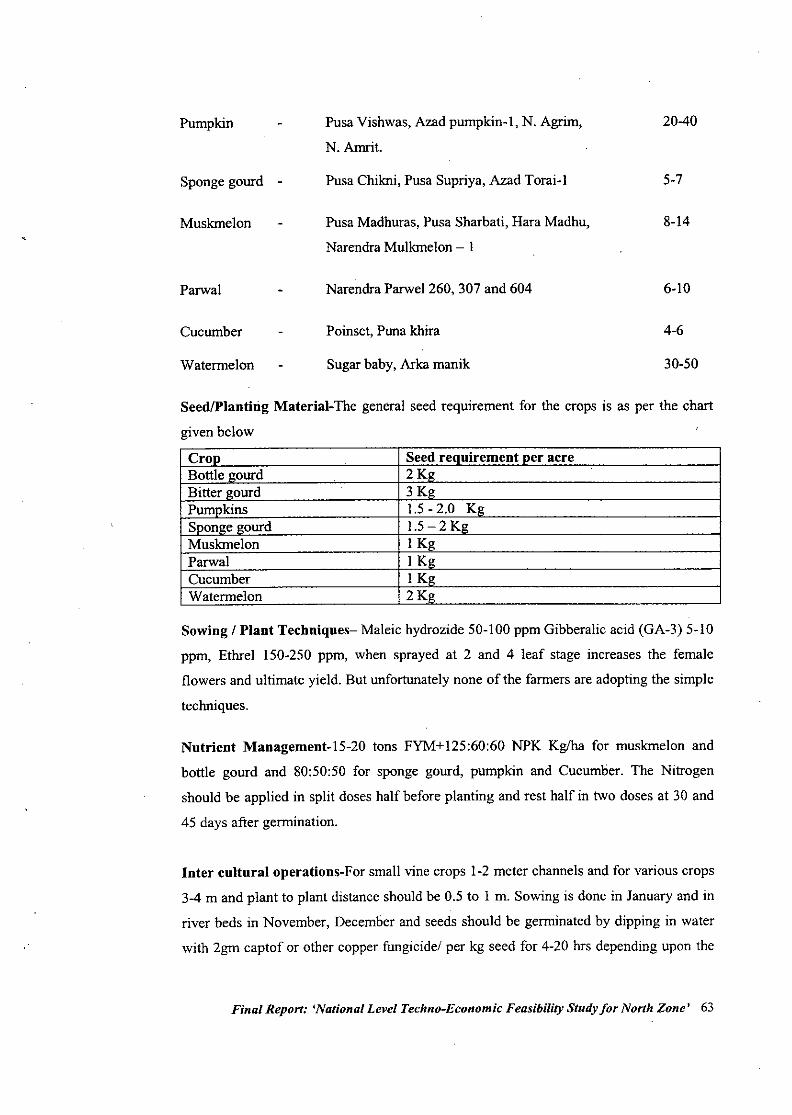
Pumpkin
Sponge gourd
Muskmelon
Parwal
Cucumber
Watermelon
Pusa Vishwas, Azad pumpkin-I, N. Agrim,
N.Amrit.
Pusa Chilmi, Pusa Supriya, Azad Torai-I
Pusa Madhuras, Pusa Sharbati, Hara Madhu,
Narendra Mulkmelon - I
Narendra Parwel 260, 307 and 604
Poinset, Puna khira
Sugar baby, Arka manik
20-40
5-7
8-14
6-10
4-6
30-50
SeedlPlantirig Material-The general seed requirement for the crops is as per the chart
given below
Cron Seed reauirement per acreBottle gourd 2 KgBitter gourd . 3 KgPumokins 1.5 - 2.0 KgSoonge gourd 1.5 - 2 KgMuskmelon I KgParwal I KgCucumber I K"Watermelon 2K"
Sowing / Plant Techniques- Maleic hydrozide 50-100 ppm Gibberalic acid (GA-3) 5-10
ppm, Ethrel 150-250 ppm, when sprayed at 2 and 4 leaf stage increases the female
flowers and ultimate yield. But unfortunately none of the farmers are adopting the simple
techniques.
Nutrient Management-15-20 tons FYM+125:60:60 NPK Kglha for muskmelon and
bottle gourd and 80:50:50 for sponge gourd, pumpkin and Cucumber. The Nitrogen
should be applied in split doses half before planting and rest half in two doses at 30 and
45 days after germination.
Inter cultural operations-For small vine crops 1-2 meter channels and for various crops
3-4 m and plant to plant distance should be 0.5 to I m. Sowing is done in January and in
river beds in November, December and seeds should be germinated by dipping in water
with 2gm captof or other copper fungicide! per kg seed for 4-20 hrs depending upon the
Final Report: 'National Level Techno-Economic Feasibility Study for North Zone' 63
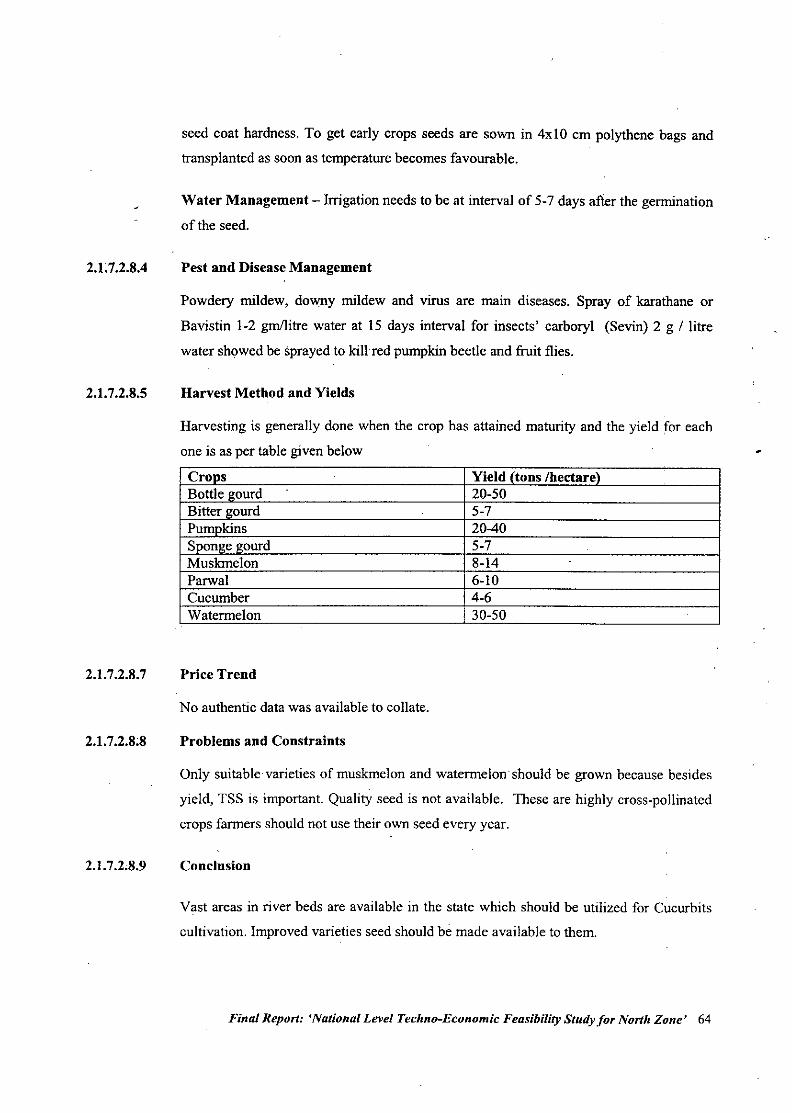
2.1.7.2.8.4
2.1.7.2.8.5
2.1.7.2.8.7
2.1.7.2.8;8
2.1.7.2.8.9
seed coat hardness. To get early crops seeds are sown in 4xlO cm polythene bags and
transplanted as soon as temperature becomes favourable.
Water Management - Irrigation needs to be at interval of 5-7 days after the germination
of the seed.
Pest and Disease Management
Powdery mildew, downy mildew and virus are main diseases. Spray of karathane or
Bavistin 1-2 gm/litre water at 15 days interval for insects' carboryl (Sevin) 2 g I litre
water showed be sprayed to kill red pumpkin beetle and fruit flies.
Harvest Method and Yields
Harvesting is generally done when the crop has attained maturity and the yield for each
one is as per table given below
CroDs Yield (toDS!hectare)Bottle l!ourd 20-50Bitter l!ourd . 5-7Pumnkins 20-40SDOnl!el!ourd 5.7Muskmelon 8.14Parwal 6.10Cucumber 4.6Watermelon 30-50 .
Price Trend
No authentic data was available to collate.
Problems and Constraints
Only suitable varieties of muskmelon and watermelon. should be grown because besides
yield, TSS is important. Quality seed is not available. These are highly cross-pollinated
crops farmers should not use their own seed every year.
Conclusion
Vast areas in river beds are available in the state which should be utilized for Cucurbits
cultivation. Improved varieties seed should be made available to them.
Final Report: 'National Level Techno-Economic Feasibility Study for North Zone' 64
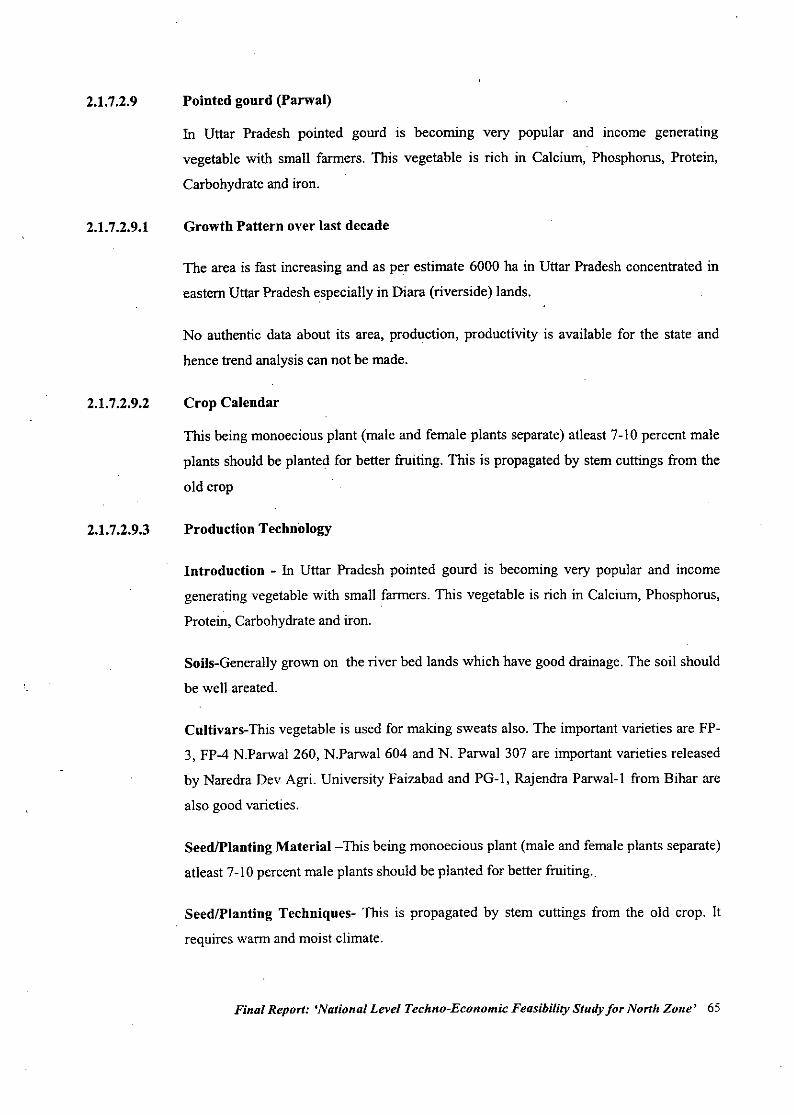
2.1.7.2.9
2.1.7.2.9.1
2.1.7.2.9.2
2.1.7.2.9.3
Pointed gourd (parwal)
In Uttar Pradesh pointed gourd is becoming very popular and income generating
vegetable with small farmers. This vegetable is rich in Calcium, Phosphorus, Protein,
Carbohydrate and iron.
Growth Pattern over last decade
The area is fast increasing and as per estimate 6000 ha in Uttar Pradesh concentrated in
eastern Uttar Pradesh especially in Diara (riverside) lands.
No authentic data about its area, production, productivity is available for the state and
hence trend analysis can not be made.
Crop Calendar
This being monoecious plant (male and female plants separate) atleast 7-10 percent male
plants should be planted for better fruiting. This is propagated by stem cuttings from the
old crop
Production Technology
Introduction - In Uttar Pradesh pointed gourd is becoming very popular and income
generating vegetable with small farmers. This vegetable is rich in Calcium, Phosphorus,
Protein, Carbohydrate and iron.
Soils-Generally grown on the river bed lands which have good drainage. The soil should
be well areated.
Cultivars-This vegetable is used for making sweats also. The important varieties are FP-
3, FP-4 N.Parwal 260, N.Parwal 604 and N. Parwal 307 are important varieties released
by Naredra Dev Agri. University Faizabad and PG-I, Rajendra Parwal-I from Bihar are
also good varieties.
SeedlPlanting Material-This being monoecious plant (male and female plants separate)
atleast 7-10 percent male plants should be planted for better fruiting..
SeedlPlanting Techniques- This is propagated by stem cuttings from the old crop. It
requires warm and moist climate.
Final Report: 'National Level Techno-Economic Feasibility Study for North Zone' 65
2.1.7.2.9.4
2.1.7.2.9.5
2.1.7.2.9.6
2.1.7.2.9.7
Nutrient Management -30 x 30 x 30 em pits filled with soil, FYM and Sand in equal
parts with 50 gm neem cake 150 gm Super Phosphate, 50 gm M.O.P, 50 gm Urea, 100
gm lime and previously sprouted seedlings are planted at 2 mt distance.20-25 gm urea
should be given as top dressing twice.
Intercultural Operatious- This crop continues for 2 to 3 years but top dressing should be
done twice every year. Removal of dried stems should be done regularly.
Pest and Disease Management
Downing mildew, Powdery mildews, Anthracnose and fiuit and stem ot are important
diseases. Spray of Radomil 2.5 gm/lit and sulfax - 80 WP 3 gm lIit controls the lnildews.
Anthracnose Trichodermi hazgianum 100 gm per plant around the base of plants checks
the disease.
Red pumpkin beetle, Mite, fiuit and shoot borer and Fruit fly are important pests. Sevin
50 wp 2gm for red pumpkin beetle Dycofol I mlllit for mite control and Malathion 2
mlllit for borers are effective. Fruit fly and Aphids can be controlled by methyl uginol
(sex faromon) 1.5 ml + 2 m!. In maetathion should be kept in wide mouth bottles to
attract them and kill them and spray Dimetheoate 1.5 m1I1it
Harvest Method and Yield
The harvesting generally begins in March as it is harvested green. In the first year of
cropping the average yield ranges between 12.5-15 tons!hectare while as in the second
and third year the yield varies between 15-20 tons / hectare.
Crop Economics
The net return worked out for this vegetable in eastern Uttar Pradesh comes to around Rs.
One Lakh / ha.
Price "Trends
There is no authentic data available for the crop to make any analysis.
Final Report: 'National Level Techno-Economic Feasibility Study for North Zone' 66
2.1.7.2.9.8
2.1.7.2.9.9
Problems and Constraints
This crop is highly susceptible to pest and disease problems and not much has been done
to impart training to the farmers in this regard.
Conclusion
This is the most economical crop for the farmers as the net returns are quite high with
least investment.
Final Report: 'National Level Techno.Economic Feasibility Study for North Zone' 67
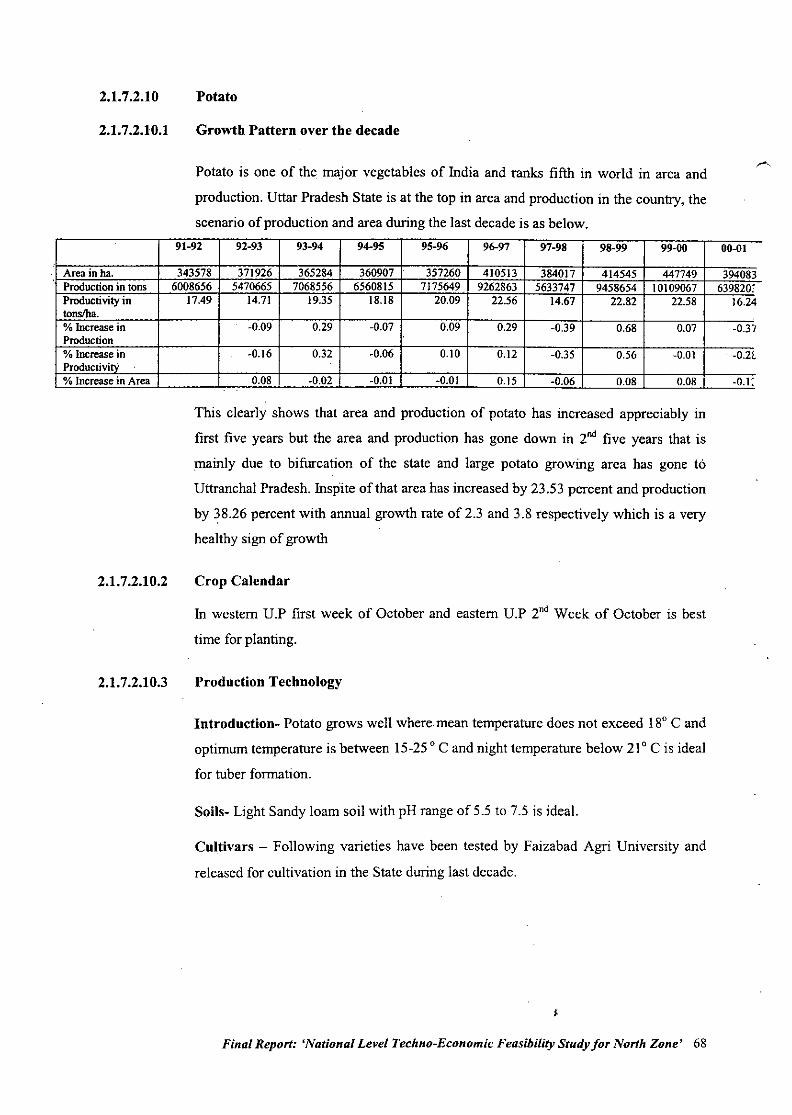
2.1.7.2.10
2.1.7.2.10.1
Potato
Growth Pattern over the decade
Potato is one of the major vegetables of India and ranks fifth in world in area and
production. Uttar Pradesh State is at the top in area and production in the country, the
scenario of production and area during the last decade is as below.
91-92 92-93 93-94 94-95 95-96 96-97 97-98 98-99 99-00 00-01
Area in ha. 343578 371926 365284 360907 357260 410513 384017 414545 447749 394083Production in tons 6008656 5470665 7068556 6560815 7175649 9262863 5633747 9458654 10109067 639820:Productivity in 17.49 14.71 19.35 18.18 20.09 22.56 14.67 22.82 22.58 16.24tonslha.% Increase in -0.09 0.29 -0.07 0.09 0.29 -0.39 0.68 0.07 -0.37Production%Incrc~~n -0.16 0.32 -0.06 0.10 0.12 -0.35 0.56 -0.01 -0.2tProductivi% Increase in Area 0.08 -0.02 -0.01 -0.01 0.15 -0.06 0.08 0.08 -0.1:
This clearly shows that area and production of potato has increased appreciably in
first five years but the area and production has gone down in 2nd five years that is
mainly due to bifurcation of the state and large potato growing area has gone to
Uttranchal Pradesh. Inspite of that area has increased by 23.53 percent and production
by 38.26 percent with annual growth rate of 2.3 and 3.8 respectively which is a very
healthy sign of growth
2.1.7.2.10.2
2.1.7.2.10.3
Crop Calendar
In western U.P first week of October and eastern U.P 2nd Week of October is best
time for planting.
Production Technology
Introduction- Potato grows well where mean temperature does not exceed 180 C and
optimum temperature is between 15_250 C and night temperature below 210 Cis ideal
for tuber formation.
Soils- Light Sandy loam soil with pH range of 5.5 to 7.5 is ideal.
Cultivars - Following varieties have been tested by Faizabad Agri University and
released for cultivation in the State during last decade.
Final Report: 'National Level Techno-Economic Feasibility Study for North Zone' 68
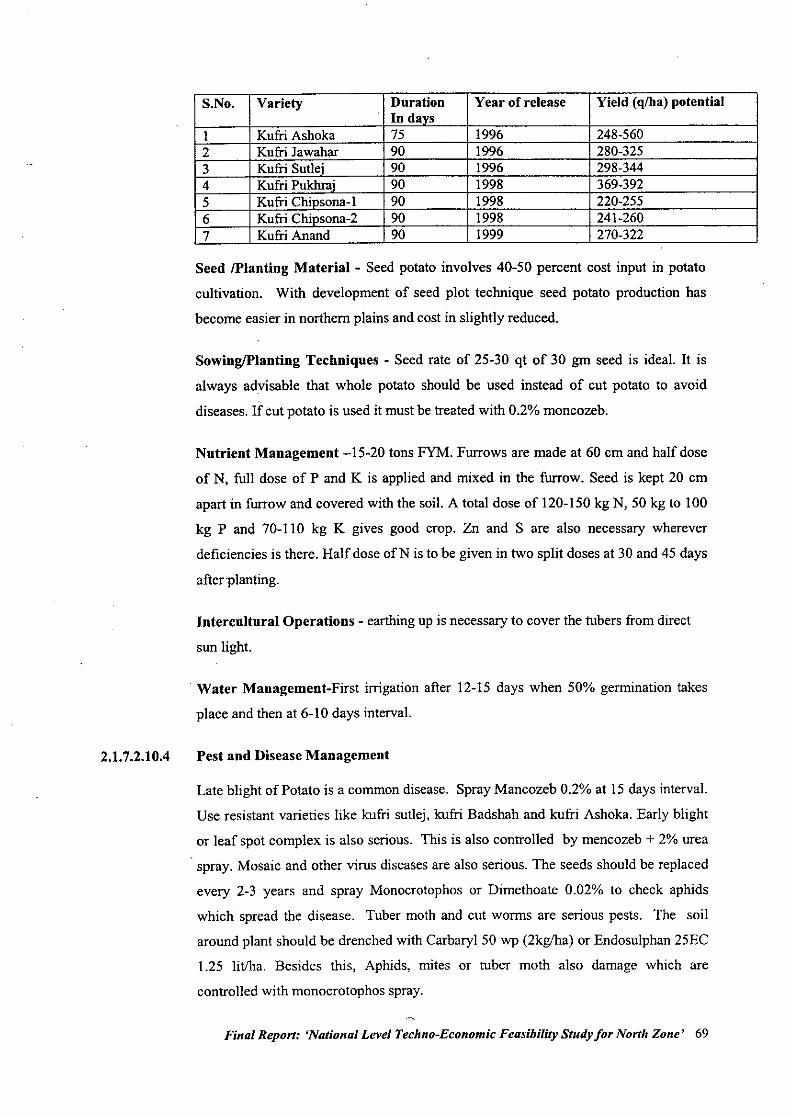
2.1.7.2.10.4
S.No. Variety Duration Year of release Yield (q/ha) potentialIn days
1 Kufri Ashoka 75 1996 248-5602 Kufri Jawahar 90 1996 280-3253 Kufri Sutlei 90 1996 298.3444 Kufri Pukhrai 90 1998 369-3925 Kufri ChiDsona-l 90 1998 220.2556 Kufri ChiDsona-2 90 1998 241.2607 KufriAnand 90 1999 270-322
Seed /Planting Material - Seed potato involves 40-50 percent cost input in potato
cultivation. With development of seed plot technique seed potato production has
become easier in northern plains and cost in slightly reduced.
SowingIPlanting Techniques - Seed rate of 25-30 qt of 30 gm seed is ideal. It is
always advisable that whole potato should be used instead of cut potato to avoid
diseases. If cut potato is used it must be treated with 0.2% moncozeb.
Nntrient Management -15-20 tons FYM. Furrows are made at 60 cm and half dose
of N, full dose of P and K is applied and mixed in the furrow. Seed is kept 20 cm
apart in furrow and covered with the soil. A total dose of 120-150 kg N, 50 kg to 100
kg P and 70-110 kg K gives good crop. Zn and S are also necessary wherever
deficiencies is there. Half dose ofN is to be given in two split doses at 30 and 45 days
after planting.
Intercultural Operations - earthing up is necessary to cover the tubers from direct
sun light.
. Water Management-First irrigation after 12-15 days when 50% germination takes
place and then at 6-10 days interval.
Pest and Disease Management
Late blight of Potato is a common disease. Spray Mancozeb 0.2% at 15 days interval.
Use resistant varieties like kufri sutlej, kufri Badshah and kufri Ashoka. Early blight
or leaf spot complex is also serious. This is also controlled by mencozeb + 2% urea
spray. Mosaic and other virus diseases are also serious. The seeds should be replaced
every 2-3 years and spray Monocrotophos or Dimethoate 0.02% to check aphids
which spread the disease. Tuber moth and cut worms are serious pests. The soil
around plant should be drenched with Carbaryl 50 wp (2kg/ha) or Endosulphan 25EC
1.25 litlha. Besides this, Aphids, mites or tuber moth also damage which are
controlled with monocrotophos spray.
Final Report: 'National Level Techno-Economic Feasibility Study for North Zone' 69
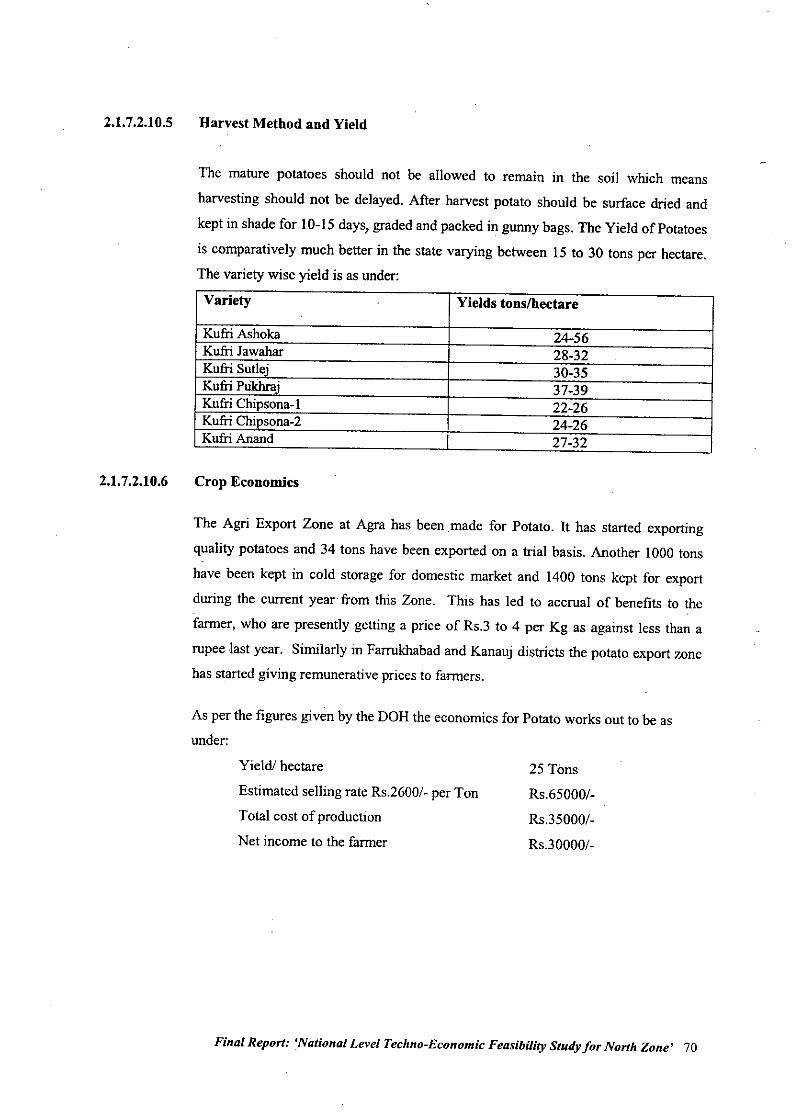
2.1.7.2.10.5
2.1. 7.2.10.6
Harvest Method and Yield
The mature potatoes should not be allowed to remain m the soil which means
harvesting should not be delayed. After harvest potato should be surface dried and
kept in shade for 10-15 days, graded and packed in gunny bags. The Yield of Potatoes
is comparatively much better in the state varying between 15 to 30 tons per hectare.The variety wise yield is as under:
Variety Yields tons/hectare
KufriAshoka 24-56Kufri Jawahar 28-32Kufri Sullej 30-35Kufri Ptikhraj 37-39Kufri Chipsona-I 22-26Kufri Chipsona-2 24-26KufriAnand 27-32
Crop Economics
The Agri Export Zone at Agra has been made for Potato. It has started exporting
quality potatoes and 34 tons have been exported on a trial basis. Another 1000 tons
have been kept in cold storage for domestic market and 1400 tons kept for export
during the current year' from this Zone. This has led to accrual of benefits to the
farmer, who are presently getting a price of Rs.3 to 4 per Kg as against less than a
rupee ,lastyear. Similarly in Farrukhabad and Kanauj districts the potato export zonehas started giving remunerative prices to farmers.
As per the figures given by the DOH the economics for Potato works out to be asunder:
Yield! hectare
Estimated selling rate Rs.2600/- per Ton
Total cost of production
Net income to the farmer
25 Tons
RS.65000/-
Rs.35000/-
RS.30000/-
Final Report: 'National Level Techno-Economic Feasibility Study for North Zone' 70
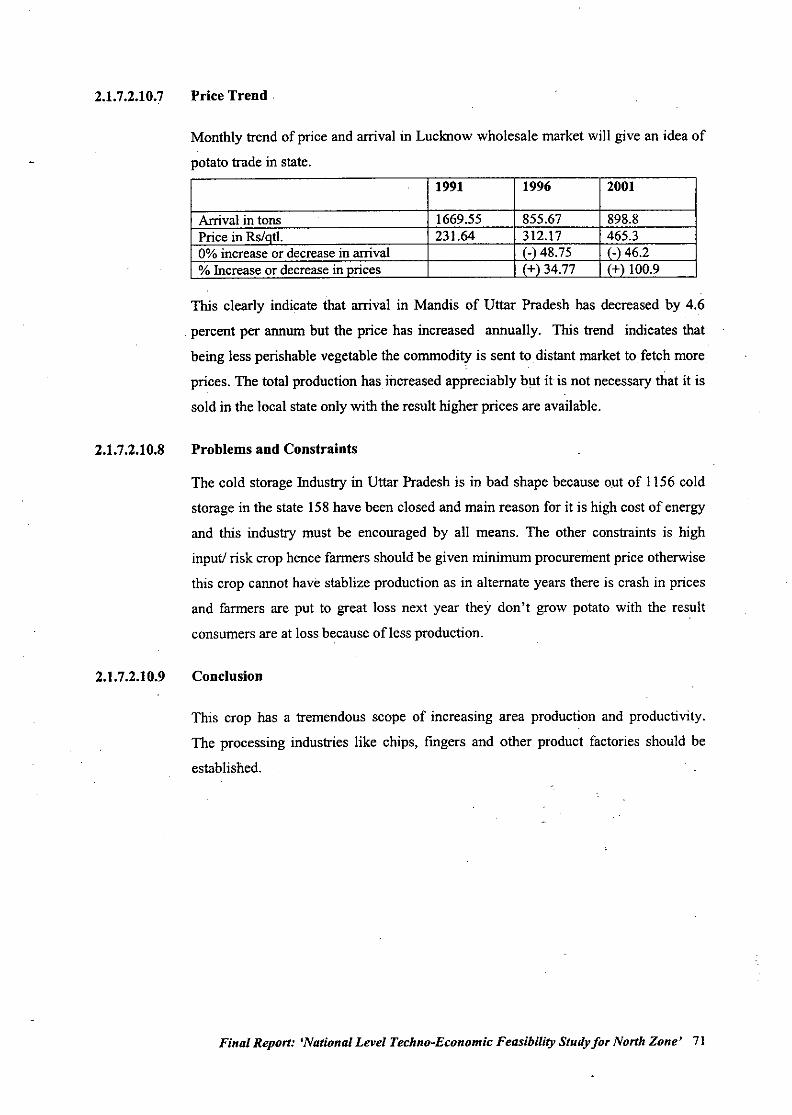
2.1.7.2.10.7
2.1.7.2.10.8
2.1.7.2.10.9
Price Trend.
Monthly trend of price and arrival in Lucknow wholesale market will give an idea of
potato trade in state.
1991 1996 2001
Arrival in tons . 1669.55 855.67 898.8Price in Rs/atl. 23 \.64 312.17 465.30% increase or decrease in arrival 1.)48.75 1.)46.2% Increase or decrease in orices 1+) 34.77 1+) 100.9
This clearly indicate that arrival in Mandis of Uttar Pradesh has decreased by 4.6
percent per annum but the price has increased annually. This trend indicates that
being less perishable vegetable the commodity is sent to distant market to fetch more
prices. The total production has mcreased appreciably but it is not necessary that it is
sold in the local state only with the result higher prices are available.
Problems and Constraints
The cold storage Industry in Uttar Pradesh is in bad shape because out of 1156 cold
storage in the state 158 have bcen closed and main reason for it is high cost of energy
and this industry must be encouraged by all means. The other constraints is high
input! risk crop hence farmers should be given minimum procurement price otherwise
this crop cannot have stablize production as in alternate years there is crash in prices
and farmers are put to great loss next year they don't grow potato with the result
consumers are at loss because ofless production.
Conclusion
This crop has a tremendous scope of increasing area production and productivity.
The processing industries like chips, fingers and other product factories should be
established.
Final Report: 'National Level Techno-Economic Feasibility Study for North Zone' 71
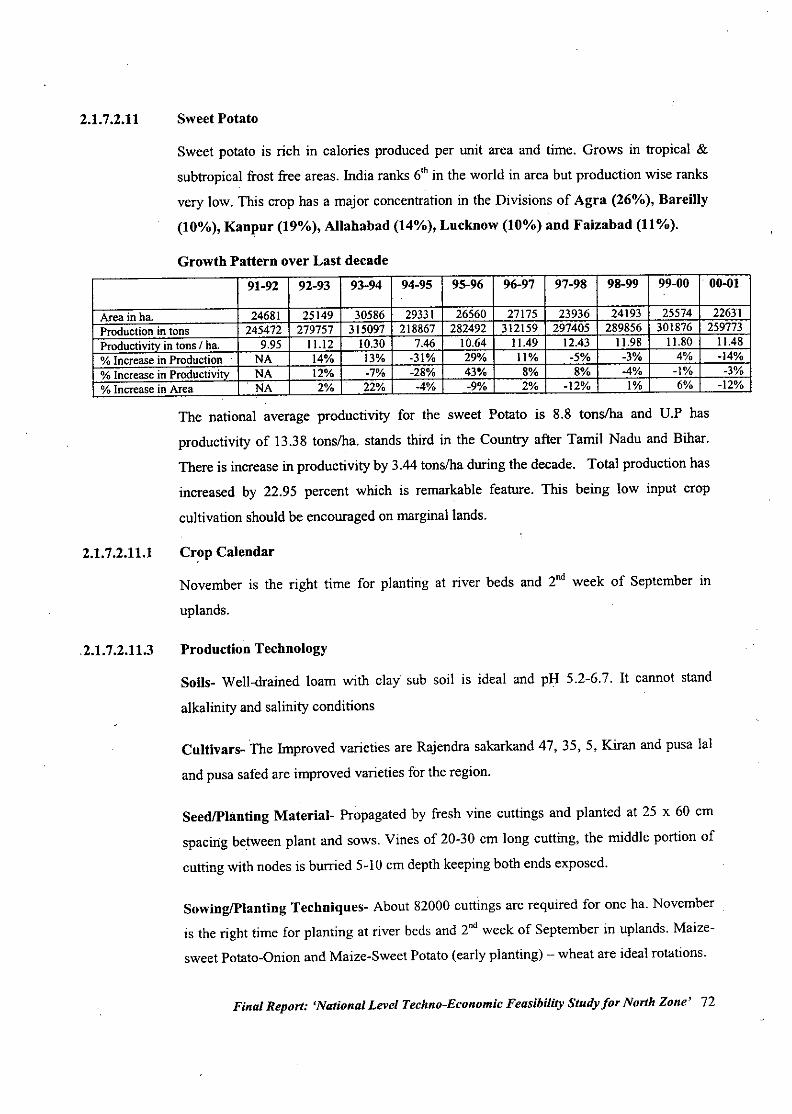
2.1.7.2.11 Sweet Potato
Sweet potato is rich in calories produced per unit area and time. Grows in tropical &
subtropical frost free areas. India ranks 6th in the world in area but production wise ranks
very low. This crop has a major concentration in the Divisions of Agra (26%), Bareilly
(10%), Kanpur (19%), Allahabad (14%), Lucknow (10%) and Faizabad (11%).
Growth Pattern over Last decade
91-92 92-93 93-94 94-95 95-96 96-97 97-98 98-99 99-00 . 00-01
Area in ha. 24681 25149 30586 29331 26560 27175 23936 24193 25574 22631Production in tons 245472 279757 315097 218867 282492 312159 297405 289856 301876 259773ProductiviNintons/ha 9.95 11.12 10.30 7.46 10.64 11.49 12.43 11.98 11.80 11.48% Increase in Production NA 14% 13% -31% 29% 11% -5% -3% 4% .)4%
% Increase in Productivity NA 12% -7% -28% 43% 8% 8% 4% -1% -3%
% Increase in Area .NA 2% 22% -4% -9% 2% -12% 1% 6% -12%
The national average productivity for the sweet Potato is 8.8 tonslha and U.P has
productivity of 13.38 tonslha. stands third in the Country after Tamil Nadu and Bihar.
There is increase in productivity by 3.44 tons/ha during the decade. Total production has
increased by 22.95 percent which is remarkable feature. This being low input crop
cultivation should be encouraged on marginal lands.
2.1.7.2.11.1
2.1.7.2.11.3
Crop Calendar
November is the right time for planting at river beds and 2nd week of September in
uplands.
Production Technology
Soils- Well-drained loam with clay sub soil is ideal and pH 5.2-6.7. It cannot stand
alkalinity and salinity conditions
Cultivars- The Improved varieties are Rajendra sakarkand 47, 35, 5, Kiran and pusa lal
and pusa safed are improved varieties for the region.
SeedIPlanting Material- Propagated by fresh vine cuttings and planted at 25 x 60 cm
spacing between plant and sows. Vines of 20-30 cm long cutting, the middle portion of
cutting with nodes is burried 5-10 cm depth keeping both ends exposed.
SowingIPlanting Techniques- About 82000 cuttings are required for one ha. November
is the right time for planting at river beds and 2nd week of September in uplands. Maize-
sweet Potato-Onion and Maize-Sweet Potato (early planting) - wheat are ideal rotations.
Final Report: 'National Level Techno-Economic Feasibility Study for North Zone' 72
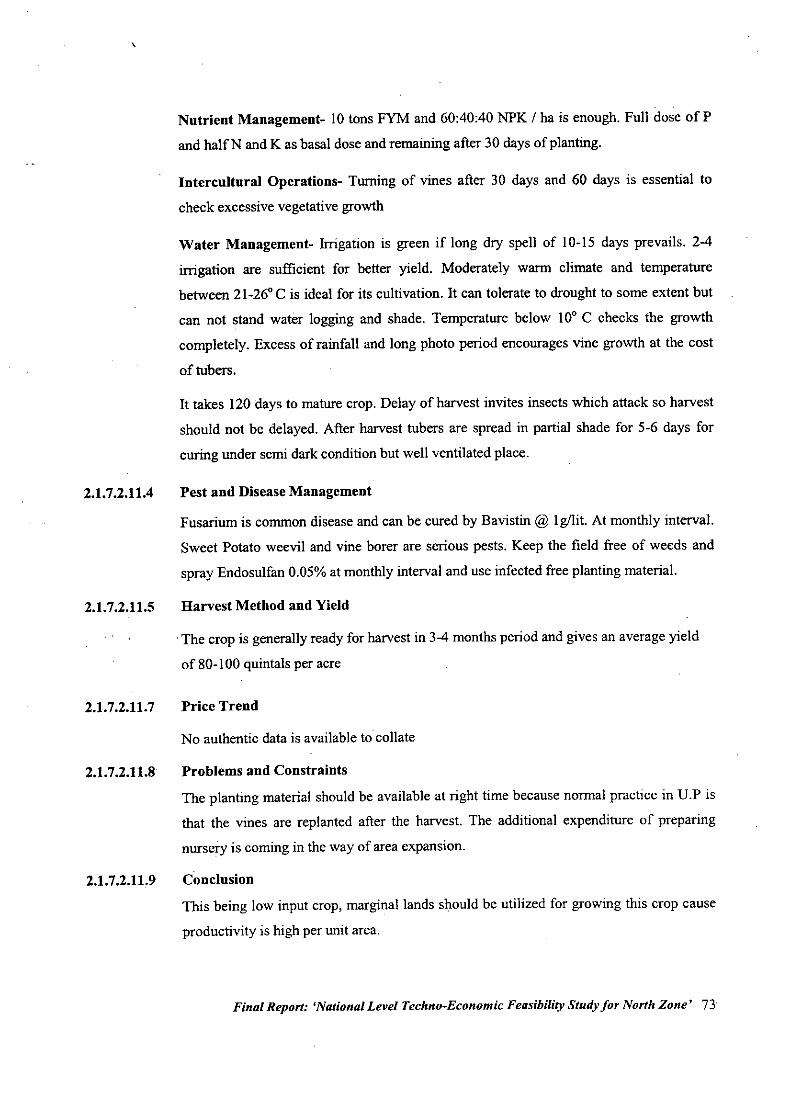
,
2.1.7.2.11.4
2.1.7.2.11.5
2.1.7.2.11.7
2.1.7.2.11.8
2.1.7.2.11.9
Nutrient Management- 10 tons FYM and 60:40:40 NPK / ha is enough. Full dose of P
and halfN and K as basal dose and remaining after 30 days of planting.
Intercultural Operations- Turning of vines after 30 days and 60 days is essential to
check excessive vegetative growth
Water Management- Irrigation is green if long dry spell of 10.15 days prevails. 2-4
irrigation are sufficient for better yield. Moderately warm climate and temperature
between 21_26. C is ideal for its cultivation. It can tolerate to drought to some extent but
can not stand water logging and shade. Temperature below 10. C checks the growth
completely. Excess of rainfall and long photo period encourages vine growth at the cost
of tubers.
It takes 120 days to mature crop. Delay of harvest invites insects which attack so harvest
should not be delayed. After harvest tubers are spread in partial shade for 5.6 days for
curing under semi dark condition but well ventilated place.
Pest and Disease Management
Fusarium is common disease and can be cured by Bavistin @ Ig/lit. At monthly interval.
Sweet Potato weevil and vine borer are serious pests. Keep the field free of weeds and
spray Endosulfan 0.05% at monthly interval and use infected free planting material.
Harvest Method and Yield
,The crop is generally ready for harvest in 3-4 months period and gives an average yield
of 80.100 quintals per acre
Price Trend
No authentic data is available to collate
Problems and Constraints
The planting material should be available at right time because normal practice in U.P is
that the vines are replanted after the harvest. The additional expenditure of preparing
nursery is coming in the way of area expansion.
Conclusion
This being low input crop, marginal lands should be utilized for growing this crop cause
productivity is high per unit area.
Final Report: 'National Level Techno-Economic Feasibility Study for North Zone' 73
2.1.7.3
2.1.7.3.1
Floriculture
Floriculture in India had faced several constraints before attaining the present status. A
decade ago floriculture trade was limited to Mumbai, Pune and Bangalore only and total
area was very little. The export of floriculture products in 1991-92 was Rs. 144.54
million, which rose to 1320 millions in 2000-200 I, and there is significant increase in
area and production of flowers. This fact is visible that now with every street end of big
cities there is florist shop. The area under floriculture in 1993-94 was 53297 ha which
rose to 556424 ha and production of loose flowers 232536.3 tons and cut flowers 5552
lakh numbers rose to 556424 tons loose flowers and 8034.7 lakh cut flowers which
means in last 8 years production has increased almost ten times. Inspite of good progress
India's share in export market is less than 0.4 percent. There is tremendous scope of
expansion in this field.
In Uttar Pradesh area under Floriculture in 1995-96 was 160 ha. with production of 160
lakh flowers which rose to 5790 ha and produced 8280 tons of flowers which shows area
expansion of 36 times and production by fifty times. This shows that Floriculture is doing
very good progress in area and production. High tech projects in approximately 10
hectare were started in Saharanpur, Muzzafarnagar and Ghaziabad. But unfortunately,
none of them could come upto the mark.
NOTE:
The.consultants have not followed the prescribed sequence but have presented the status
of flowers comprehensively for the State. This has been necessitated as floriculture is still
in its infancy in the State and not much of data is available to be collated and presented.
Besides the important individual flower crops have been dealt more exhaustively in
Volume II of the report
Traditional Flowers of the State
Marigold, Jasmine and Rose are traditional flowers of the state and more recently
introduced are gladiolus, chrysanthemun and tubrose are gaining popularity. Besides
these number of annual flowers are grown in the state.
The area and production of flowers in the state during last five years in given in thetable:-
Final Report: 'National Level Techno-Economic Feasibility Study for North Zone' 74
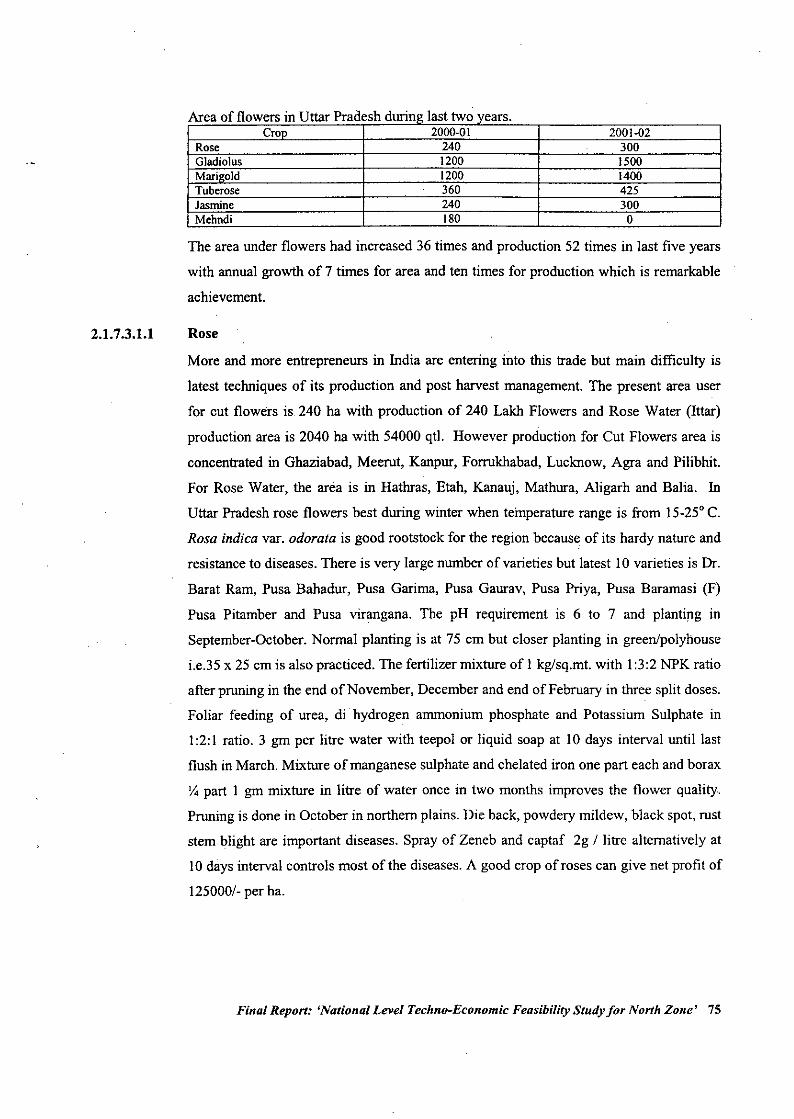
Prd hd . It'Ufflea 0 owersm ttar a es unng as two vears.CroD 2000-01 2001-02
Rose 240 . 300Gladiolus 1200 1500Mari~old 1200 1400Tuberose 360 425Jasmine 240 300Mehndi 180 0
Ar
The area under flowers had increased 36 times and production 52 times in last five years
with annual growth of 7 times for area and ten times for production which is remarkable
achievement.
2.1.7.3.1.1 Rose
More and more entrepreneurs in India are entering into this trade but main difficulty is
latest techniques of its production and post harvest management. The present area user
for cut flowers is. 240 ha with production of 240 Lakh Flowers and Rose Water (Ittar)
production area is 2040 ha with 54000 qtL However production for Cut Flowers area is
concentrated in Ghaziabad, Meerut, Kanpur, Forrukhabad, Lucknow, Agra and Pilibhit.
For Rose Water, the area is in Hathras, Etah, Kanauj, Mathura, Aligarh and Balia. In
Uttar Pradesh rose flowers best during winter when temperature range is from 15-25°C.
Rosa indica var. odorala is good rootstock for the region because of its hardy nature and
resistance to diseases. There is very large number of varieties but latest 10 varieties is Dr.
Barat Ram, Pusa Bahadur, Pusa Garima, Pusa Gaurav, Pusa Priya, Pusa Baramasi (F)
Pusa Pitamber and Pusa virangana. The pH requirement is 6 to 7 and planting in
September-October. Normal planting is at 75 cm but closer planting in green/polyhouse
i.e.35 x 25 cm is also practiced. The fertilizer mixture of 1 kg/sq.mt. with 1:3:2 NPK ratio
after pruning in the end of November, December and end of February in three split doses.
Foliar feeding of urea, di hydrogen ammonium phosphate and Potassium Sulphate in
1:2:I ratio. 3 gm per litre water with teepol or liquid soap at 10 days interval until last
flush in March. Mixture of manganese sulphate and chelated iron one part each and borax
1. part I gm mixture in litre of water once in two months improves the flower quality.
Pruning is done in October in northern plains. Die back, powdery mildew, black spot, rust
stem.blight are important diseases. Spray of Zeneb and captaf 2g / litre alternatively at
10 days interval controls most of the diseases. A good crop of roses can give net profit of
125000/-per ha.
Final Report: 'National Level Techno-Economic Feasibility Sludy for North Zone' 75
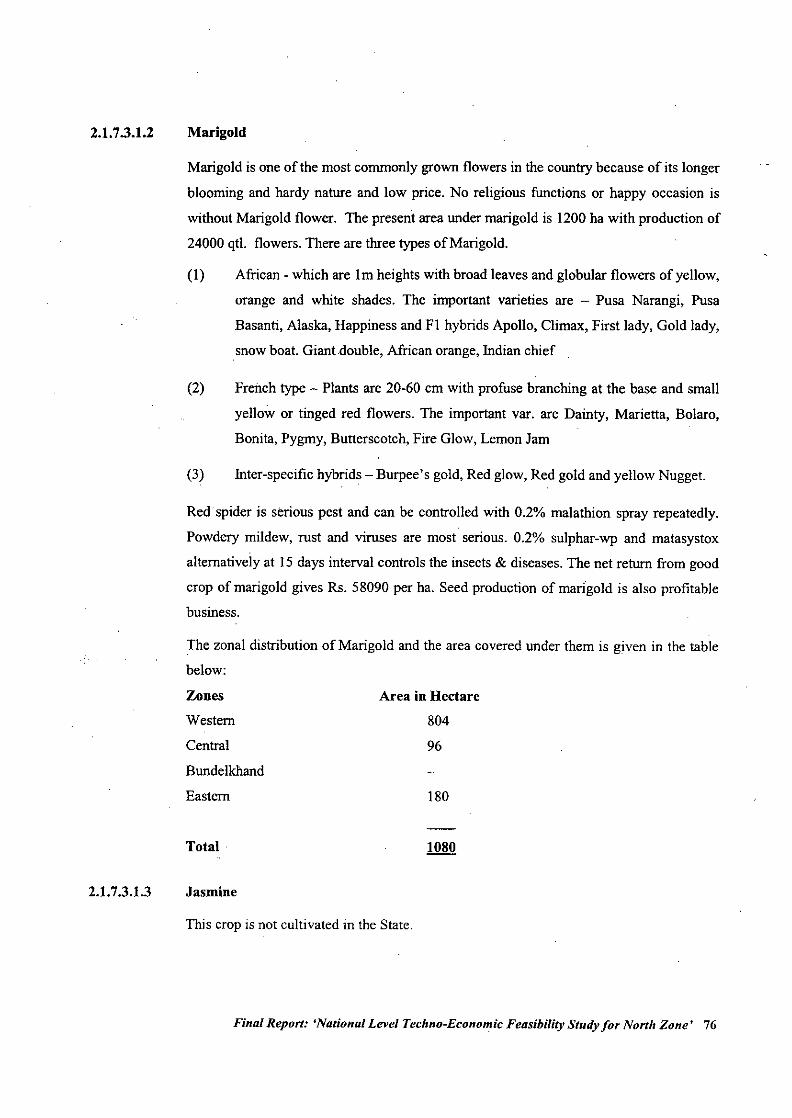
2.1.7.3.1.2 Marigold
Marigold is one of the most commonly grown flowers in the country because of its longer
blooming and hardy nature and low price. No religious functions or happy occasion is
without Marigold flower. The present area under marigold is 1200 ha with production of
24000 qtl. flowers. There are three types of Marigold.
(I) African - which are 1m heights with broad leaves and globular flowers of yellow,
orange and white shades. The important varieties are - Pusa Narangi, Pusa
Basanti, Alaska, Happiness and FI hybrids Apollo, Climax, First lady, Gold lady,
snow boat. Giant double, African orange, Indian chief
(2) French type - Plants are 20-60 cm with profuse branching at the base and small
yellow or tinged red flowers. The important var. are Dainty, Marietta, Bolaro,
Bonita, Pygmy, Butterscotch, Fire Glow, Lemon Jam
(3) Inter-specific hybrids - Burpee's gold, Red glow, Red gold and yellow Nugget.
Redspider is serious pest and can be controlled with 0.2% malathion spray repeatedly.
Powdery mildew, rust and viruses are most serious. 0.2% sulphar-wp and matasystox
alternatively at 15 days interval controls the insects & diseases. The net return from good
crop of marigold gives Rs. 58090 per ha. Seed production of marigold is also profitable
business.
The zonal distribution of Marigold and the area covered under them is given in the table
below:
2.1.7.3.1.3
Zones
Western
Central
Bundelkhand
Eastern
Total
Jasmine
Area in Hectare
804
96
180
This crop is not cultivated in the State.
Final Report: 'National Level Techno-Economic Feasibility Study for North Zone' 76
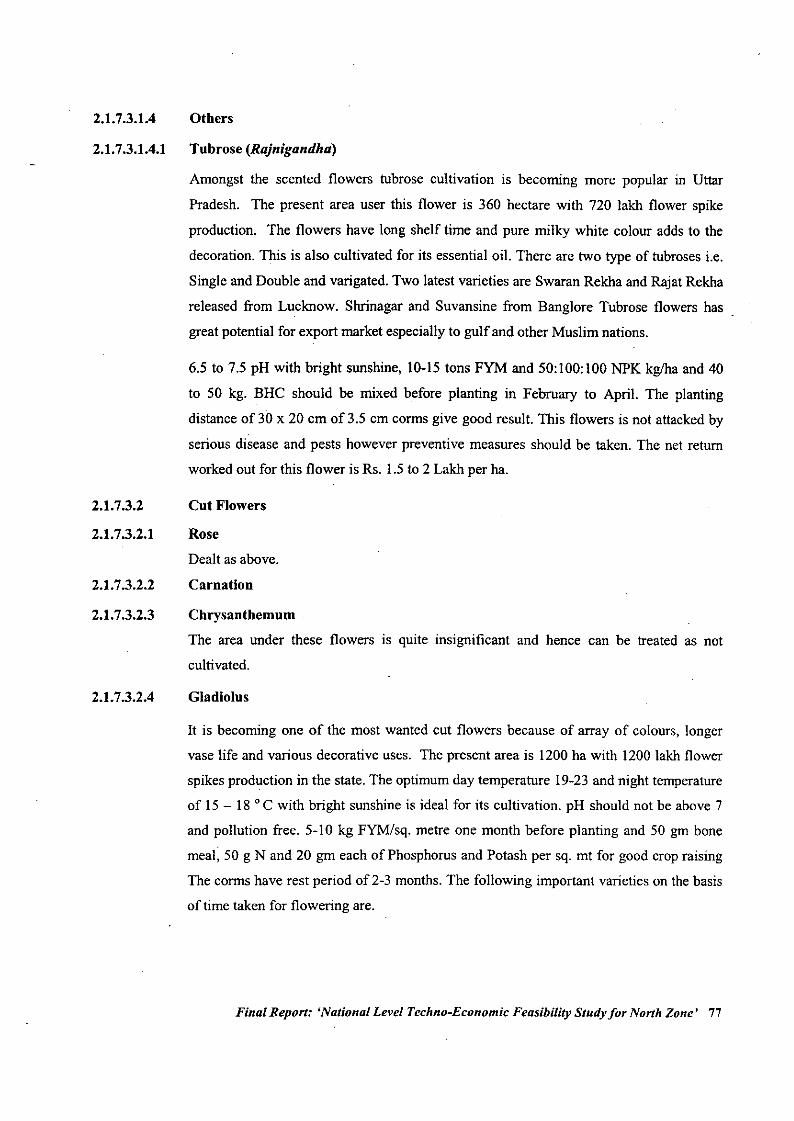
2.1.7.3.1.4
2.1.7.3.1.4.1
2.1.7.3.2
2.1.7.3.2.1
2.1.7.3.2.2
2.1.7.3.2.3
2.1.7.3.2.4
Others
Tubrose (Rajnigandha)
Amongst the scented flowers tubrose cultivation is becoming more popular in Uttar
Pradesh. The present area user this flower is 360 hectare with 720 lakh flower spike
production. The flowers have long shelf time and pure milky white colour adds to the
decoration. This is also cultivated for its essential oil. There are two type of tubroses i.e.
Single and Double and varigated. Two latest varieties are Swaran Rekha and Rajat Rekha
released from Lucknow. Shrinagar and Suvansine from Banglore Tubrose flowers has
great potential for export market especially to gulf and other Muslim nations.
6.5 to 7.5 pH with bright sunshine, 10-15 tons FYM and 50:100:100 NPK kg/ha and 40
to 50 kg. BHC should be mixed before planting in February to April. The planting
distance of 30 x 20 cm of 3.5 cm corms give good result. This flowers is not attacked by
serious disease and pests however preventive measures should be taken. The net return
worked out for this flower is Rs. 1.5 to 2 Lakh per ha.
Cut Flowers
Rose
Dealt as above.
Carnation
Chrysanthemum
The area under these flowers is quite insignificant and hence can be treated as not
cultivated.
Gladiolus
It is becoming one of the most wanted cut flowers because of array of colours, longer
vase life and various decorative uses. The present area is 1200 ha with 1200 lakh flower
spikes production in the state. The optimum day temperature 19-23 and night temperature
of 15 - 18 0 C with bright sunshine is ideal for its cultivation. pH should not be above 7
and pollution free. 5-10 kg FYM/sq. metre one month before planting and 50 gm bone
meal, 50 g Nand 20 gm each of Phosphorus and Potash per sq. mt for good crop raising
The corms have rest period of 2-3 months. The following important varieties on the basis
of time taken for flowering are.
Final Report: 'National Level Techno-Economic Feasibility Study for North Zone' 77
2.1.7.3.2.5
2.1.7.3.2.6
2.1.7.3.2.7
2.1.7.3.2.8
2.1.7.3.3
Early Melody, Friendship, Happy End, Morning-kiss
Rose Supreme, Snow princess and Surya Kiran
Mid Bis-Bis, Patricia, Ratna butterfly, Rose spire,
Suchitra, Vikas glory, yellow stone and Neelum.
Late Hunting song, Mayur, Pusa Suhagin, Sylvia and .
white friendship
The best time for planting in U.P is September to November at 30x15 cm distance.
Major Diseases and Pests are Fussasium wilt, botrytis blight and curvularia blight. The
corms should be treated with Bavistin / Benlate 2gm/lit for 30 minutes and field spray at
15 days interval. Aphids / Thrips and cut warms are common insects. Rogor /
Metasystox-spray at regular intervals. A net profit of Rs. 155600 is expected from good
crop of one hactare.
Gerhera
The area under these flowers is quite insignificant and hence can be treated as not
cultivated.
Lilium
The area under these flowers is quite insignificant and hence can be treated as not
cultivated
Anthurium
The area under these flowers is quite insignificant and hence can be treated as not
cultivated
Orchids
The area under these flowers is quite insignificant and hence can be treated as not
cultivated
Dry Flowers
There is no authentic data available on this category of flowers.
Final Report: 'National Level Techno-Economic Feasibility Study for North Zone' 78
2.1.7.3.4
2.1.7.3.5
2.1.7.3.6
Ornamental Plants and Avenue Plantation
There is no authentic data available on this category of flowers.
Landscaping and Grasses
There is no authentic data available on this category of flowers
Cactus and Succulents
There is no authentic data available on this category of flowers
Final Report: 'National Level Techno-Economic Feasibility Study for North Zone' 79
2.1.7.4
2.1.7.4.1
2.1.7.4.1.1
2.1.7.4.1.2
Medicinal and Aromatic Plants
NOTE:
The consultants have presented the status of Medicinal and aromatic plants
comprehensively for the State. This has been necessitated as the area under these crop is
marginal in the State and not much of data is available to be collated and presented.
Whatever information could be gathered regarding these crops has been presented
below.
Medicinal Plants
Amla
Insignificant area under this crop. Hence treated as not cultivated.
Aswagandha
Insignificant area under this crop. Hence treated as not cultivated
2.1.7.4.1.3 Atis
Insignificant area under this crop. Hence treated as not cultivated
2.1.7.4.1.4
2.1.7.4.1.5
2.1.7.4.1.6
2.1.7.4.1.7
2.1.7.4.1.8
2.1.7 .4.1.9
Brahmi
Insignificant area under this crop. Hence treated as not cultivated
Chirayta
Insignificant area under this crop. Hence treated as not cultivated
Guggal
Insignificant area under this crop. Hence treated as not cultivated
Isabgol
Insignificant area under this crop. Hence treated as not cultivated
Kutki
Insignificant area under this crop. Hence treated as not cultivated
Kuth
Insignificant area under this crop. Hence treated as not cultivated
Final Report: 'National Level Techno-Economic Feasibility Study for North Zone' 80
2.1.7.4.1.10
2.1.7.4.1.11
2.1.7.4.2
2.1.7.4.2.1
2.1.7.4.2.1.1
SafedMusli
Insignificant area under this crop. Hence treated as not cultivated
Senna
Insignificant area under this crop. Hence treated as not cultivated
Aromatic Plants
Basil
Basil or Indain basil (Ocimum basilieum)
Growth pattern over the last decade
The cultivation of basil has picked up in last ten years. The approximate area is 425 ha in
districts of Badaun, and Mathura with a major area of 340 ha in Badaun district itself.
There is another spp. of basil which is grown in tarai districts which contains mainly
eugenol (35-40%) and linalool (35-40%) but Indian basil contains methyl chavicol (70-
80%). These oils are used'in flavouring of food, bakery products and beverages and have
very good demand in USA and Europe.
2.1.7.4.2.1.2 Crop Calander
The best time for sowing of the crop is between Dec and March as this is along day plant.
2.1.7.4.2.1.3 Production Technology
Soils
Basil grows in a wide range of soils, but thrives best in deep well drained soils rich in
organic matter.
CultivarsThe most commonly grown variety in the area is Clo-ocimum variety remains productive
for 240 days.
SeedlPlanting MaterialPropagated through seed. 250 glha seed is enough and direct as well as transplanting is
done.
Final Report: 'National Level Techno-Economic Feasibility Study for North Zone' 81
SowingIPlanting techniqueAdd 20 kg BHC or Aldrin (10%) to protect from soil insects. The seeds are very small
hence should be mixed in sand I: 10 ratio for uniform sowing and thinning is done to
maintain distance between plants at 40 cm. 60x40 cm distance is enough.
Nutrient Management
Usually 40 kg Nand P is applied before sowing and 25-40 N as top dressing. Three times
at 40, 60 and 30 days interval after harvesting.
2.1.7.4.2.1.4 Pest and Disease Management
Add 20 kg BHC or Aldrin (10%) to protect from soil insects.
2.1.7.4.2.1.5 Harvest Method and YieldThe crop is ready in 120-130 days and at peak flowering plants are cut 20 cm above the
ground and thicker stems are discarded and balance chopped and distilled. The fresh
herbage has 0.4-0.5% oil and gives yield of 15-20 tons of herbage which gives 66-70 kg
oillha. The ratoon crop is also taken in variety clo-ocimum and gives total yield of 40
tons with 150-160 kg oil/ha. Methyl chavicol is then chemically converted to anethole
and exported. Besides these Java citronella is cultivated in 60-80 ha. Palmarosa oil grass
is about 100haand rose gerenium in very small area.
2.1.7.4.2.2 Chamomile
Insignificant area under this crop. Hence treated as not cultivated
2.1.7.4.2.3
2.1.7.4.2.4
2.1.7.4.2.5
2.1.7.4.2.6
Citronella
Insignificant area under this crop. Hence treated as not cultivated
Geranium)
Insignificant area under this crop. Hence treated as not cultivated
Jasmine
Insignificant area under this crop. Hence treated as not cultivated
Lavender
Insignificant area under this crop. Hence treated as not cultivated .
Final Report: 'National Level Techno-Economic Feasibility Study for North Zone' 82
2.1.7.4.2.7
2.1.7.4.2.8
2.1.7.4.2.8.1
Lemon Grass(Cymbopogon flexuosus)
It is a stem less, perennial edge, which grows wild in tropical southern state of India. It is
now cultivated commercially in about 30,000 ha in Kerala and Assam are main produces.
Orrisa, Andhra, Karnatka and U.P is coming up in cultivation of this crop. In U.P area is
around 400-450 hactare. The leaves contain aromatic oil called citrol with lemon like
odour. The plant continues growing for four years with 3-4 cuttings of leaves in each
year. Sugandhi is old variety, pragati variety is recommended for U.P RRL-16 and
Tetroploid mutant Praman gives much more herbage and oil yield.
Lemon grass is very hardy, drought tolerant crop and adopted to varied soil and climatic
conditions. It ceases growth where winter are sever. The crop is generally propagated
through seeds sown in nursery in April-May. 4-6 kg fresh seed is sufficient for ha. Two
. months seedlings are planted 40x 15 em during rainy season. 40 kg NPK as basal dose
and 20-25 kg N as top dressing after every cutting gives better returns. Earthing up
encourage more tillering. First cutting starts at 90 days after planting and subsequent 60-
65 days. The leaves contain 0.5 to 0.8% oil. It yields 18-20 ton/ha herbage from rainfed
crop and 25-30 tons from irrigated which produces 80-100 kg and 150-180 kg oil / ha.
The citrol content is 80-86% in oil.
Mint (Mentha)
Mint or Mentha or Japanese mint (Mentha arvensisis variety piperscens) an aromatic herb
of temperate region. The oil and its primary aroma compound menthol have cooling and
gastro-stimulant properties and its oil contains 75 to 80 percent menthol. Its cultivation is
in more than 50,000 ha in the country and main state producing this herbs are Uttar
Pradesh, Punjab and Haryana. India has emerged large exporter of mentha oil and
Menthol to world market especially to USA. There are different species of Mentha as
below:
Growth Pattern over the decade
The data for Mentha production for the decade is not available and the area under the
crop in the last two years are given as under:
1999-2000
54014
2000-2001
54440
Final Report: 'National Level Techno-Economic Feasibility Study for North Zone' 83
2.1.7.4.2.8.2
The main producing areas in U.P are Moradabad (30%), Bijnour (30%), and
Sultanpur (33%). The approximate production is around 75,000 tons as per Dept. of
Horticulture & Fruit Utilization.
Crop Calendar
Since mainly Japanese mint is grown in U.P it requires deep fertile, loose, moist soil with
pH of 6 to 7 it grows on a wild range of soil, but thrives best in deep well drained soils
rich in organic matter.
2.1.7.4.2.8.3 Production Technology
Soils
Peppermint grows in a wide range of soils, but thrives best in deep well drained soils rich
in organic matter. Spear mint prefers loamy sandy soils or peaty soils rich in organic
matter. Drainage is very important and hence clayey soils should be avoided. Japanese
mint requires deep, fertile, loose, moist soil.
Cultivars
Japanese Mint Mentha arvensisis var piperscens
Paper Mint Mentha peperita
Spear Mint Mentha spicata
Btirgamot Mint Mentha citrata
However in U.P generally Japanese will is cultivated
There are other mints like Peppermint, Spearmint and Bergamot mint. The Peppermint
and Spearmint is mostly cultivated in Himachal and Punjab foothills and Japanese mint
(Mentha) and Bergamot mint is most popular in Uttar Pradesh.
Mentha is commercially raised through underground stems called stolons. The improved
varieties are Shivalik, MAS-I, Hybrid 77, EC 41911, Kalka, Gomti, Himalya and Kosi
are popular. The Shivalik variety is most popular and almost 80% in covered under this
variety. Variety kosi contains more oil content.
Final Report: 'National Level Techno-Economic Feasibility Study for North Zone' 84
•
Seed! Planting Material
It is propagated by suckers, runners or stolons. About 500 to 600kg of suckers are
required per hectare. Though planting can be done form the end of December to March,
second week of February is considered best for higher herbage yield. Delay in planting in
reduction of herbage and oil yield.
SowingIPlanting Techniques
Stolons should be of 8-10 cm long with 2-4 growing points should be planted 1-2 cm
deep in furrows at 40xlO cm spacing. The stolons should be dipped in 0.1% agallol or
captaffor two minutes.
Nutrient Management
25-30 tons FYM with 25 kg BHC (10%) at field preparation and 40:60:60 NPK kg/ha
during planting in February another dose of 40 kg N is two split doses after 40 days and
2nd dose after cutting first flush.
Water Management
6-9 irrigation are required before rains and 2-3 after rains i.e. end of September to
November.
2.1.7.4.2.8.4 Pest & Disease Management
Root knot nematodes and lesion nematode is real problem. Apply Neem cake @ I tons I
ha or carbofuran 2 kg Iha or combination' of half dose each. Wilt, Stolon rot, sclorotium
rot, powdry mildew, leaf spot, leaf blight and rusts are common diseases. Always use
disease free planting material and treat with cgallol or captaf and spray wettable sulphar
0.3% or Karhane 0.05% for mildew, Mancozeb 0.2% for leaf spot and blights and rusts.
Water stagnation aggravates the diseases. -
2.1.7.4.2.8.5 Harvest Method and Yield
The harvesting age reaches after 105-110 days after sprouting and subsequent cutting
after 80-90 days. The crop is cut 10 cm above ground and left in the field for 4-6 hours
for wilting and reducing the moisture content by 50 percent. An average yield is 30
tonslha in two cuttings which produces ISOkg oil. The oil recovery ranges from 0.02 to
0.06%
Final Report: 'National Level Techno-Economic Feasibility Study for North Zone' 85
2.1.7.4.2.8.6 Crop Economics
The basic cost of production of Mentha in the state comes to around Rs. 12,152/- which'
includes the cost of planting material manure, fertilizers, irrigation, interculture,
harvesting and distillation with net oiled yield of 100 liters per hectare at an estimated
selling rate ofRs. 250/- per liter generates an income ofRs. 25,000 per hectare realizing a
net profit ofRs. 12,488/- per hectare
2.1.7.4.2.8.7 Price trend
Mentha oil is a major export earner for the country and has been generally procured at
Rs. 250/- per liter over the last 2 years.
2.1.7.4.2.8.8 Problems and Constraints
A major constraints in the area expansion is that this crop requires sub tropical cool and
moist climate besides this is propagated through underground stems called stolons, the
planting material of which is not available in sufficient quantities.
2.1.7.4.2.8.9 Conclusion
This crop has a very good scope in the Tarai belt, Bareilly and Muradabad Division of
UP, The disease free planting material should be made available. The contract farming
and establishment of bigger .extraction plant for mentha oil will boost the production in
the state which will be big foreign exchange earner crop.
2.1.7.4.2.9
2.1.7.4.2.10
2.1.7.4.2.11
Palmarosa
Insignificant area under this crop. Hence treated as not cultivated
Rosemary
Insignificant area under this crop. Hence treated as not cultivated
Sceuted Rose
Scented rose or damask rose is grown in India for its pleasant, sweet smelling, large pink
to red flowers used for making rose water and attar. It is grown in 3000 to 4000 ha. in
Aligarh, Gazipur, Kanauj and Balia Districts of Uttar Pradesh. It is a perennial hardy
Final Report: 'National Level Techno-Economic Feasibility Study for North Zone' 86
shrub growing about 2 m long, flowers are in groups of 5-7 and flowering is restricted to
spring season for 3-4 weeks. Half open flowers have more fragrance and should be
plucked at that stage. The other species called cheti gulab (Rosa centifolia) and Edward
rose (Rosa barbonia) are also grown for rose water and gulkand making are grown on
smaller areas.
The variety NOOljehanand jawala are recommended varieties. Well drained alluvial soil
with pH 8 - 8.5 and plants are raised from semi hard wood cuttings of 20-25 cm long. Use
rnA (Indole butyric acid) 200 ppm over cut ends induces early rooting. About 10,000
rooted cuttings are required for an ha planting at Ixlm spacing. During October to
December 1m deep and 0.5mwide furrows are made and soil is mixed with 2.5 to 3 tons
FYM and 20 Kg each P and K is applied 3 to 5 cm deep and rooted cuttings are planted.
It needs 200 kg N is split dose in October and January every year. Pruning of two year
old plant in 2nd half of December at height of 50cm above the ground level. Bushes
flower after 70-90 days of pruning. The first commercial crops is taken from third year
and continues for 12-15 years. The flowers half opened are pluck in the morning and
immediately distilled in hydro distillation or steam distillation units. The fresh rose oil
has delicate sweet scent containing 34% l-Citronellol, 35% geraniol and 12-13% nerol
and other minor aroma compounds.
Management of Disease and Pests
Powdery mildew, rust and Die back are common diseases. Spray of sulphur compounds
checks powdery mildew, Bordeaux mixture or carbendazim is effective. Red scale, bud
borer and chafer beetle and termites are important pests. Apply Carbofuran I Kg ai/ha
after pruning and spraying with Neem Kernel extract 4% checks insects.
Final Report: 'National Level Techno-Economic Feasibility Study for North Zone' 87
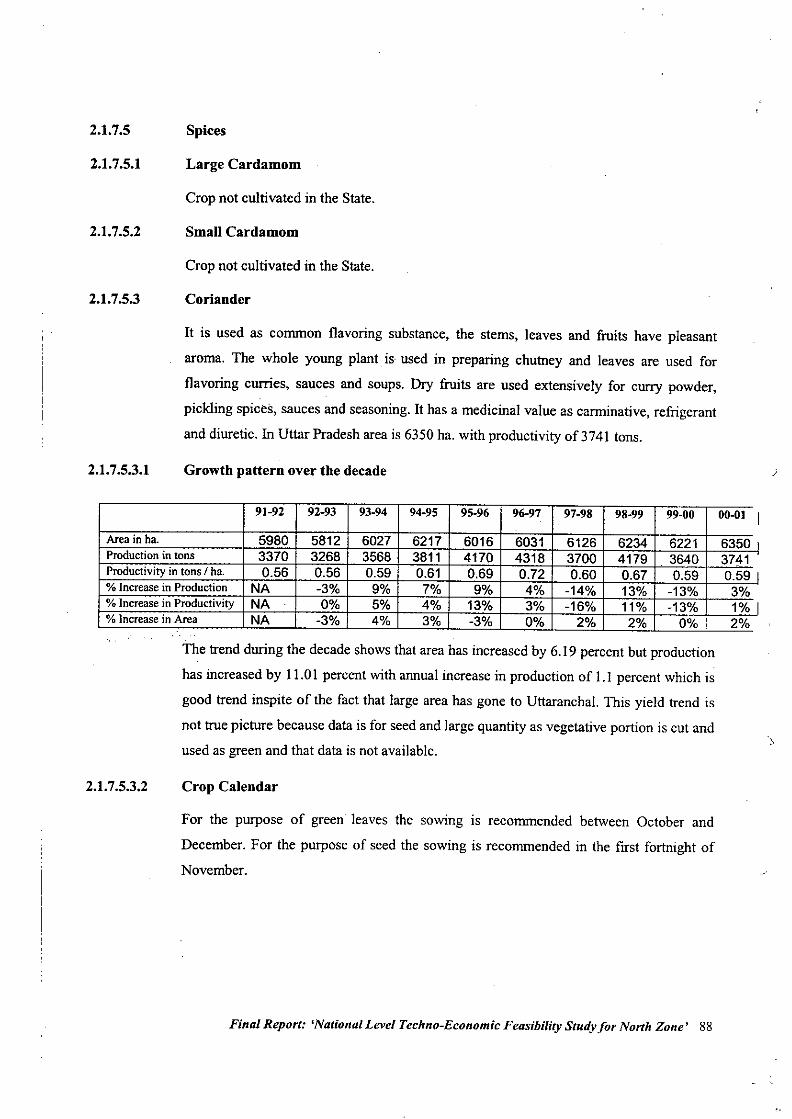
2.1.7.5
2.1.7.5.1
2.1.7.5.2
2.1.7.5.3
2.1.7.5.3.1
Spices
Large Cardamom
Crop not cultivated in the State.
Small Cardamom
Crop not cultivated in the State.
Coriander
It is used as common flavoring substance, the stems, leaves and fruits have pleasant
aroma. The whole young plant is. used in preparing chutney and leaves are used for
flavoring curries, sauces and soups. Dry fruits are used extensively for curry powder,
pickling spices, sauces and seasoning. It has a medicinal value as carminative, refrigerant
and diuretic. In Uttar Pradesh area is 6350 ha. with productivity of3741 tons.
Growth pattern over the decade
91-92 92-93 93-94 94-95 95-96 96-97 97-98 98-99 99-00 00-01 IArea in ha. 5980 5812 6027 6217 6016 6031 6126 6234 6221 6350 IProduction in tons 3370 3268 3568 3811 4170 4318 3700 4179 3640 3741Productivity in tons / ha. 0.56 0.56 0.59 0.61 0.69 0.72 0.60 0.67 0.59 0.59 I% Increase in Production NA -3% 9% 7% 9% 4% -14% 13% -13% 3%% Increase in Productivity NA 0% 5% 4% 13% 3% -16% 11% -13% lOki% Increase in Area NA -3% 4% 3% -3% 0% 2% 2% 0% 2%
The trend during the decade shows that area has increased by 6.19 percent but production
has increased by 11.0I percent with annual increase in production of 1.1percent which is
good trend inspite of the fact that large area has gone to UttaranchaI. This yield trend is
not true picture because data is for seed and large quantity as vegetative portion is cut and
used as green and that data is not available.
2.1.7.5.3.2 Crop Calendar
For the purpose of green leaves the sowing is recommended between October and
December. For the purpose of seed the sowing is recommended in the first fortnight of
November.
Final Report: 'National Level Techno-Economic Feasibility Study for North Zone' 88
2.1.7.5.3.3
2.1.7.5.3.4
2.1.7.5.3.5
2.1.7.5.3.6
2.1.7.5.3.7
2.1.7.5.4
2.1.7.5.5
2.1.7.5.6
Production Technology
Introduction - It is a tropical spice and requires frost free climate particularly at
flowering and seeding stage but moderately dry and cool weather increases flowering and
seed formation which ultimately increases yield and quality.
Soils - This crop can grow in all types of soils of the State.
Cultivars - The improved varieties are Azad Dhania - I, Rajendra swathi, Sindhu,
Sadhna and Dhania hybrid - 5.
Seed/Planting Material - seed rate of 12-15 kg/ha.
SowinglPlanting Techniques - Sowing in 30 cm rows and within plants 10 cm.
Nutrient Management - NPK@20:30:20 and 10-20 tons FYM at the sowing and
another 40 kg N in 3 doses at 30,40 and 70 days after sowing.
Pest and Disease Management
The major pest in coriander is the thrips, which suck the sap from the flowers and the
leaves. This can be controlled by spraying 120 ml cypermethin 10 EC in 200 htres of
water
Harvest Method and Yield
A good crop gives seed yield of 10-14 qtl / ha.
Crop Economics
There is no authentic data on the crop economics.
Price Trend
There is no authentic data on the exact arrival and price trend in different markets of the
state.
Cumin
Crop not cultivated in the State.
Fennel
Crop not cultivated in the State.
Fenugreek
Area under the crop is insignificant and hence treated as not cultivated.
Final Report: 'National Level Techno-Economic Feasibility Study for North Zone' 89
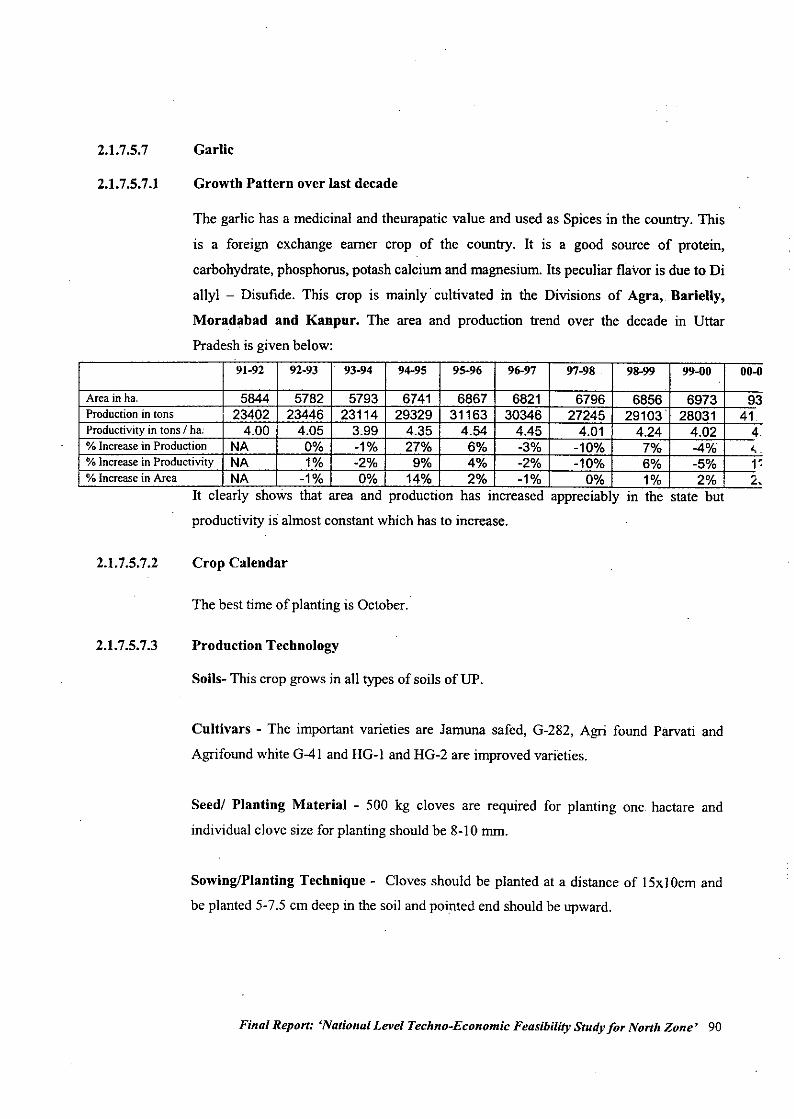
2.1.7.5.7
2.1.7.5.7.1
Garlic
Growth Pattern over last decade
The garlic has a medicinal and theurapatic value and used as Spices in the country. This
is a foreign exchange earner crop of the country. It is a good source of protein,
carbohydrate, phosphorus, potash calcium and magnesium. Its peculiar flavor is due to Di
allyl - Disufide. This crop is mainly. cultivated in the Divisions of Agra, Barieliy,
Moradabad and Kanpur. The area and production trend over the decade in Uttar
Pradesh is given below:91-92 92.93 93-94 94-95 95-96 96-97 97-98 98-99 99-00 00-0
Area in ha. 5844 5782 5793 6741 6867 6821 6796 6856 6973 93Production in tons 23402 23446 23114 29329 31163 30346 27245 29103 28031 41Productivity in tons I ha: 4.00 4.05 3.99 4.35 4.54 4.45 4.01 4.24 4.02 4% lncrease in Production NA 0% -1% 27% 6% -3% -10% 7% -4% ~% Increase in Productivity NA 1% -2% 9% 4% -2% -10% 6% -5% 1<% Increase in Area NA -1% 0% 14% 2% -1% 0% 1% 2% 2.
It clearly shows that area and production has increased appreciably in the state but
productivity is almost constant which has to increase.
2.1.7.5.7.2
2.1.7.5.7.3
Crop Calendar
The best time of planting is October.
Production Tecbnology
Soils- This crop grows in all types of soils of UP.
Cultivars • The important varieties are Jamuna safed, G-282, Agri found Parvati and
Agrifound white G-41 and HG-I and HG-2 are improved varieties.
Seedl Planting Material - 500 kg cloves are required for planting one hactare and
individual clove size for planting should be 8-10 mm.
SowinglPlanting Technique - Cloves should be planted at a distance of 15xlOcm and
be planted 5-7.5 em deep in the soil and pointed end should be upward.
Final Report: 'National Level Techno-Economic Feasibility Study for North Zone' 90
2.1.7.5.7.4
2.1.7.5.7.5
2.1.7.5.7.6
2.1.7.5.7.7
2.1.7.5.7.8
2.1.7.5.7.9
Nutrient Management - 25-30 tons FYM, 150 kg Urea, 325 Kg. single super phosphate
and 100kg Murate of Potash. Half nitrogen at planting and rest in two top dressings at 30
days interval.
Pest and Disease management.
Purple blotch and stemphyllium blight are diseases and spray of sandovit or Tritone I
mllIit. and thrips is serious pest. Spray of Metasystox I ml/lit alongwith sticker in both
fungicide and insecticide spray should be used.
Harvest Method and Yield
The good crop gives 10-I5 tons/ha. yield.
Crop Economics
The yield level of Garlic stand at 10 tons per hectare which is estimated to be selling at
Rs. 5/- per kg, thus the income to the farmers is around Rs. 50,000/- per hectare with the
expenditure on production' being Rs. 9,000/- per hectare. The net realization to the
farmers is about Rs. 41,000/- per hectare.
Price Trend
There is no authentic data on the exact arrival and price trend in different markets of the
state.
Problems and constraints
The seed which is garlic cloves of proper variety are not available in sufficient quantity is
main constraint in garlic production.
Conclusion
With the development of high yielding variety Agrifond Parvati with a greater size cloves
will change the onion production in the country.
Final Report: 'National Level Techno-Economic Feasibility Study for North Zone' 91
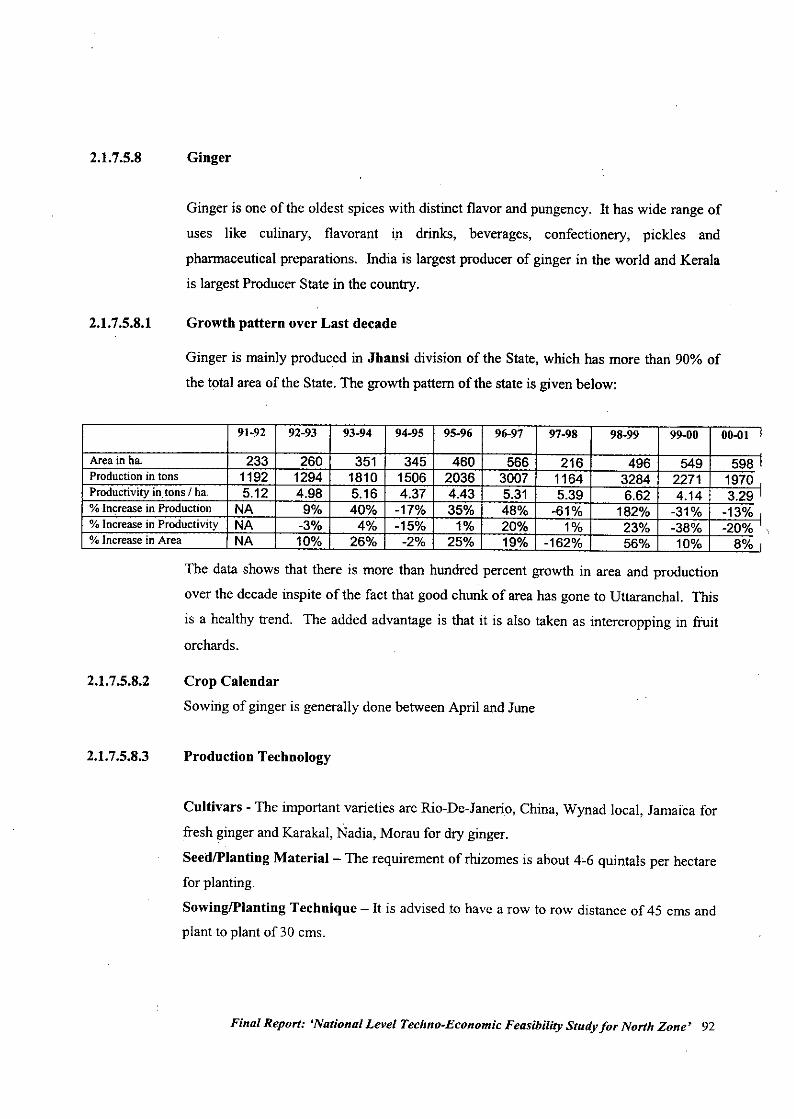
2.1.7.5.8
2.1.7.5.8.1
Ginger
Ginger is one of the oldest spices with distinct flavor and pungency. It has wide range of
uses like culinary, flavorant in drinks, beverages, confectionery, pickles and
pharmaceutical preparations. India is largest producer of ginger in the world and Kerala
is largest Producer State in the country.
Growth pattern over Last decade
Ginger is mainly produced in Jhansi division of the State, which has more than 90% of
the total area of the State. The growth pattern of the state is given below:
91-92 92-93 93-94 94-95 95-96 96-97 97-98 98-99 99-00 00-01 I
Area in ha. 233 260 351 345 460 566 216 496 549 598 IProduction in tons 1192 1294 1810 1506 2036 3007 1164 3284 2271 1970Productivity in. tons I ha. 5.12 4.98 5.16 4.37 4.43 5.31 5.39 6.62 4.14 3.29 I% Increase in Production NA 9% 40% -17% 35% 48% -61% 182% -31% -13% ,% Increase in Productivity NA -3% 4% -15% 1% 20% 1% 23% -38% -20%% Increase in Area NA 10% 26% -2% 25% 19% -162% 56% 10% 8% I
The data shows that there is more than hundred percent growth in area and production
over the decade inspite of the fact that good chunk of area has gone to Uttaranchal. This
is a healthy trend. The added advantage is that it is also taken as intercropping in fruit
orchards.
2.1.7.5.8.2
2.1.7.5.8.3
Crop Calendar
Sowing of ginger is generally done between April and June
Production Technology
Cultivars - The important varieties are Rio-De-Janerio, China, Wynad local, Jamaica for
fresh ginger and Karakal, Nadia, Morau for dry ginger.
SeedlPlanting Material - The requirement of rhizomes is about 4'6 quintals per hectarefor planting.
SowinglPlanting Technique - It is advised to have a row to row distance of 45 ems andplant to plant of 30 ems.
Final Report: 'National Level Techno-Economic Feasibility Study for North Zone' 92
2.1.7.5.8.4
2.1.7.5.8.5
2.1.7.5.8.8
2.1.7.5.9
2.1.7.5.9.1
Nutrient management - GInger is exhaustive crop and requires heavy manuring. 25-30
tons FYM and 50:50:100 NPKlha gives good results.
Intercultural Operations - Ginger is taken as mono crop or intercrop in the young
orchards because this crop can stand partial shade.
Pest and Disease management
Soft rot or Rhizome rot, leaf spots' and thread blight are common diseases. Seed
rhizomes should be treated with Agallol 0.5% for three minutes or cerason 0.1% for 30
minutes.
Harvest Method and Yield
Crop takes about 8 months. If the Crop is for green ginger it takes 5- 6 months to
maturity and the indications are that leaves start turning yellow and start drying. The
average yield is 15 - 30 tons / ha. Rhizomes should be washed twice or thrice and then
dried for a day. For drying ginger only light outer skin is peeled and sundried for a week.
The dried product is 75%. of fresh wt. For storing Rhizomes are dipped in solution of
malathion 0.05 % + 0.3% Diathene M-45 for 30 minutes.
Problems and Constraints
Soft rot or Rhizome rot is real constraint in ginger cultivation. Unfortunately one of the
variety is resistant hence preventive measures are necessary.
Pepper (ChiUies)
Chilly is one of the important vegetable and spice crop of the state. Its uses are salad,
vegetable stuffed preparations, pickles and spices etc. There is no household were chillies
are not eaten in one form or other. It is rich source of protein, carbohydrate and Vit A and
C. This is also one of our export earner crops.
Growth pattern over last decade
The area under chillies in Uttar Pradesh is 17732 ha. with production of 14203 dry
chillies. The area under chillies is concentrated in Moradabad Bahraich, Mirzapur,
Fatahpur, Kanpur, Firozabad and Bulandshahr District.
Final Report: 'National Level Techno-Economic Feasibility Study for North Zone' 93
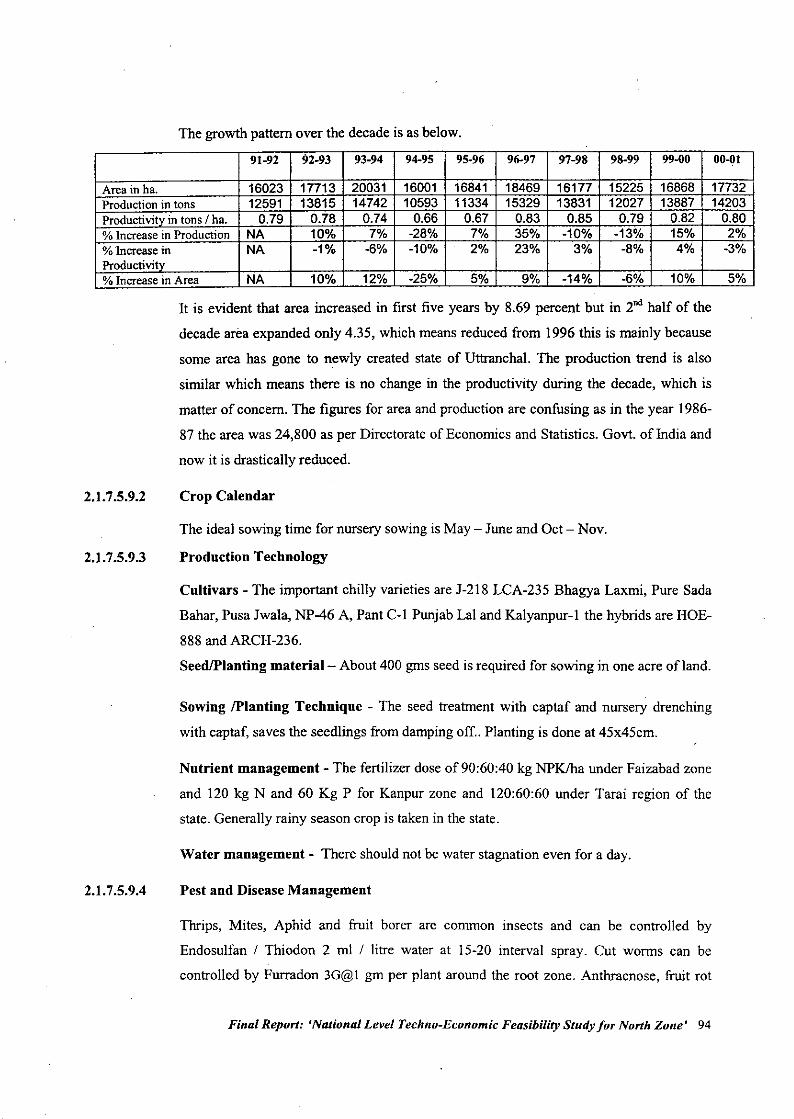
The growth pattern over the decade is as below.
91-92 92-93 93-94 94-95 95-96 96-97 97-98 98-99 99-00 00-01
Area in ha. 16023 17713 20031 16001 16841 18469 16177 15225 16868 17732 'Production in tons 12591 13815 14742 10593 11334 15329 13831 12027 13887 14203Productivity in tons I ha. 0.79 0.78 0.74 0.66 0.67 0.83 0.85 0.79 0.82 0.80% Increase in Production NA 10% 7% -28% 7% 35% -10% -13% 15% 2%% Increase in NA -1% -6% -10% 2% 23% 3% -8% 4% -3%Productivitv .
% Increase in Area NA 10% 12% -25% 5% 9% -14% -6% 10% 5%
It is evident that area increased in frrst five years by 8.69 percent but in 2nd half of the
decade area expanded only 4.35, which means reduced from 1996 this is mainly because
some area has gone to newly created state of Uttranchal. The production trend is also
similar which means there is no change in the productivity during the decade, which is
matter of concern. The figures for area and production are confusing as in the year 1986-
87 the area was 24,800 as per Directorate of Economics and Statistics. Gov!. of India and
now it is drastically reduced.
2.1.7.5.9.2
2.1.7.5.9.3
2.1. 7.5.9.4
Crop Calendar
The ideal sowing time for nursery sowing is May - June and Oct - Nov.
Production Technology
Cultivars - The important chilly varieties are J-218 LCA-235 Bhagya Laxmi, Pure Sada
Bahar, Pusa Jwala, NP-46 A, Pant C-I Punjab Lal and Kalyanpur-I the hybrids are HOE-
888 and ARCH-236.
Seed/Planting material- About 400 gms seed is required for sowing in one acre of land.
Sowing /Planting Technique - The seed treatment with captaf and nursery drenching
with captaf, saves the seedlings from damping off.. Planting is done at 45x45cm.
Nutrient management - The fertilizer dose of 90:60:40 kg NPKJha under Faizabad zone
and 120 kg Nand 60 Kg P for Kanpur zone and 120:60:60 under Tarai region of the
state. Generally rainy season crop is taken in the state.
Water management - There should not be water stagnation even for a day.
Pest and Disease Management
Thrips, Mites, Aphid and fruit borer are cornmon insects and can be controlled by
Endosulfan / Thiodon 2 ml / litre water at 15-20 interval spray. Cut worms can be
controlled by Furradon 3G@! gm per plant around the root zone. Anthracnose, fruit rot
Final Report: 'Nanonal Level Techno-Economic Feasibility Study for North Zone' 94
2.1.7.5.9.5
2.1.7.5.9.6
2.1.7.5.9.7
2.1.7.5.9.8
2.1.7.5.9.9
and Powdry mildew are important disease and can be controlled by sulfax, Dithane M
and Copper Oxychloride alternatively @ 2-3 gmIlit. Wilting is another serious problem.
The Bavistin spray I gm 1 lit. water or Topsin should be drenched around the root zone.
Fussaruim is another serious problem which can be controlled by seed treatment and
again spray of Captof. Bacterial wilt is serious problem. The seed should be treated with
Mercuric compound or use resistant varieties and spray 0.01% plantomycin or
streptocycline.The virus diseases like leaf curl, mosaic are serious and affected plants
should be removed early.
Harvest Method and Yield
The green chilli yield is 9-11 tons./ha and dry chilly 0.5-1 ton. 1ha.
Crop Economics
Chilli yield is around 9 tons per hectare which is estimated to be sold at Rs. 8/- per kg.
Thus the income to the farmers comes to around Rs. 72,000/- per hectare with the cost of
production being around Rs. 8,000 per hectare. The net income to the farmer is Rs.
64,000/- per hectare.
Price Trend
There is no authentic data on the exact arrival and price trend in different markets of the
state. The Dry Chilli markets are in Kanpur, Kairana and Bareilly
Problems and Constraints
This crop is affected by various diseases and insects pests, hence resistance varieties are
required. This is a very sensitive crop to abiotic stress also like excess of water and .
temperature the suitable varieties should be developed with wider adaptability.
Conclusion
With the development of superior varieties and hybrids which are comparatively resistant
1 tolerant to biotic and abiotic stress the area and production will increase substantially in
the near future.
Final Report: 'National Level Techno-Economic Feasibility Study for North Zone' 95
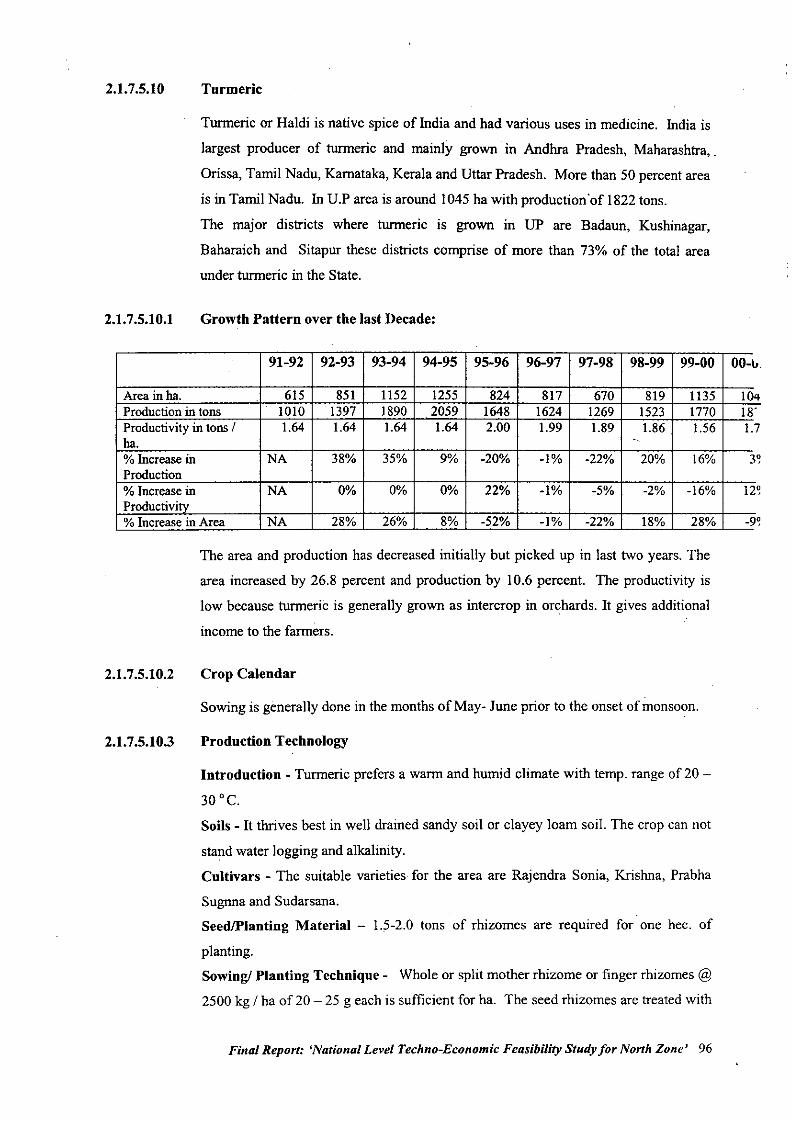
2.1.7.5.10
2.1.7.5.10.1
Turmeric
Turmeric or Haldi is native spice of India and had various uses in medicine. India is
largest producer of turmeric and mainly grown in Andhra Pradesh, Maharashtra,.
Orissa, Tamil Nadu, Karnataka, Kerala and Uttar Pradesh. More than 50 percent area
is in Tamil Nadu. In U.P area is around 1045 ha with production'of 1822 tons.
The major districts where turmeric is grown in UP are Badaun, Kushinagar,
Baharaich and Sitapur these districts comprise of more than 73% of the total area
under turmeric in the State.
Growth Pattern over the last Decade:
91-92 92-93 93-94 94-95 95-96 96-97 97-98 98-99 99-00 00-1..
Areainha. 615 851 1152 1255 824 817 670 819 1135 104Productionin tons 1010 1397 1890 2059 1648 1624 1269 1523 1770 18'Productivityin tonsI 1.64 1.64 1.64 1.64 2.00 1.99 1.89 1.86 1.56 1.7ha. ~% Increase in NA 38% 35% 9% -20% -1% -22% 20% 16% 3~Production% Increase in NA 0% 0% 0% 22% -1% -5% -2% -16% 12~Productivity% Increase in Area NA 28% 26% 8% -52% -1% -22% 18% 28% -9~
The area and production has decreased initially but picked up in last two years. The
area increased by 26.8 percent and production by 10.6 percent. The productivity is
low because turmeric is generally grown as intercrop in orchards. It gives additional
income to the farmers.
2.1.7.5.10.2
2.1.7.5.10.3
Crop Calendar
Sowing is generally done in the months of May- June prior to the onset of monsoon.
Production Technology
Introduction - Turmeric prefers a warm and humid climate with temp. range of 20 -
30°C.
Soils - It thrives best in well drained sandy soil or clayey loam soil. The crop can not
stand water logging and alkalinity.
Cultivars - The suitable varieties for the area are Rajendra Sonia, Krishna, Prabha
Sugnna and Sudarsana.SeedIPlanting Material - 1.5-2.0 tons of rhizomes are required for one hec. of
planting.Sowing! Planting Technique - Whole or split mother rhizome or finger rhizomes @
2500 kg / ha of 20 - 25 g each is sufficient for ha. The seed rhizomes are treated with
Final Report: 'National Level Techno-Economic Feasibility Study for North Zone' 96
','
2.1.7.5.10.4
2.1.7.5.10.5
2.1.7.5.10.7
2.1.7.5.10.8
2.1.7.5.10.9
Diathane M-45 (0.3%) and Ekalux (0.2%) for 30 minutes before planting at distance
of 40 x 25 em on ridges or 30 x 20 in beds.
Nutrient Management - 60: 50 : 120 kg NPK / ha is recommended. The entire dose
of K and half P is applied before planting. Half N after 45 days of planting and
remaining half P and N after 3 months of planting gives better results,
Intercultural Operations - Mulching is required immediately after planting with
green leaves. First earthing up 50 - 60 days and 2nd after another 40 days.
Water management - The water is supplied at 7 - 10 days interval if no rain occurs.
Pest and Disease Management
Rhizome rot is serious disease of rhizomes. Treat seed with 0.25% Ridomil MZ - 72
WP for 40 minutes or 0.3% Mancozeb for 30 minutes before planting. Drench the
mancoze~ 0.2% around plant. Leaf bloteh and leaf spot are other diseases.
MancozebO.25% spray controls these also. Shoot barer is serious pests. Spray
monocrotophos 0.05% from July to October at 21 days interval.
Harvest Method and yield
Turmeric takes 7 - 9 months for harvesting. Average yield is 20 tons / ha of fresh
rhizomes. The harvested rhizomes are washed well and fingers are separated and
cooked in boiling water for I hour with 100 gm sodium bicarbonate or sodium
carbonate in 100 lit water and sun dried for 10 - 15 days. For boiling turmeric
generally copper galvanized / iron or earthen vessels are used. The dried turmeric is
generally 15 - 30 percent and rhizomes are polished with turmeric powder to give
bright colour.
Price TrendNo authentic data was available to collate.
Problems and ConstraintsThe seed rate being very high and shoot barer and rhizome rot are serious problems.
ConclusionThis crop should be taken as intercrop in orchards because it prefers partial shade and
farmers can get additional income.
Final Report: 'National Level Techno-Economic Feasibility Study for North Zone' 97
2.1.7.6
2.1.7.6.1
2.1.7.6.2
2.1.7.6.2.1
2.1.7.6.2.2
Mushroom
Wild
No authentic data is available on this crop in the State for wild grown mushrooms.
Cultivated
Introduction
Amongst the microbes used as human food mushroom is the most common source of
nutrition. Generally three types i.e. white button mushroom (Agaricus bisparus), Oyster
mushroom (Pleura/us spp.) and Paddy straw mushroom (valvariella spp) are
commercially cultivated. Amongst these three, button mushroom share is more than 90
percent. About 40000 tons of mushrooms are produced in the country and Uttar Pradesh
produces 4000 tons annually. The major share is button mushroom and small quantity of
Oyster mushrooms are produced. The production is almost constant for the last three
years.
The production of mushroom have attained the high tech. farming status and requires
constant regulated climatic conditions, and ordinary conditions with essential hygienic
conditions are adopted and this 2nd category is most suited to our conditions.
Production Technology
Mushroom spawn which is technically equivalent to seed of a plant is' produced on
sterilized grain medium which is highly technical work and normal grower may not be
able to produce the spawn. Compost is prepared by mixing in following proportions and
takes about 28 days.
Wheat Straw 300 Kg
Calcium Amm. Nitrate 9Kg
Urea 3Kg
Potassium Sulphate or 3Kg
Murate of Potash
Wheat bran 30Kg
Gypsum 30 Kg
Nemagon 40 ml.
Furudan 3G 15 gm
Lindance or BHC5% 250 gm
Final Report: 'National Level Techno-Economic Feasibility Study for North Zone' 98
2.1.7.6.2.3
The straw after thorough wetting for 24 hrs. is mixed with the bran fertilizer mixture
prepared with 2/3'" quantities of ammonium sulphate and urea and the entire quantity of
Super phosphate and Potash added to 15 Kg of moistened wheat bran and left over night
covered with wet gunny bags. The mixture is put as heap to encourage intense microbial
activity and causing the generation of heat upto 70 - 800 C. The heap is broken and
remade on 6th day after adding the remaining bran fertilizer mixture made on previous
night with remaining ingredients like insecticide etc in 10 litre water. Every 3-4 days the
heap is broken and remade after adding water to maintain 75% moisture. Normally 7-8
turning are necessary with addition of gypsum at third and BHC at the 7th turning. The
compost is ready if no ammonia small comes from the compost.
The short method of compost making is also possible but it requires more investment for
pasturisation. Which may not be economical for common farmers.
Compost is then filled in.trays, shelves or more commonly in polybags after mixing the
spawn @ 0.5% of compost and covered with formalin soaked sheets or mouth of the bag
is closed. If the temperature is 24 0 C and relative humidity is 80-85% gets impregnated
fully with the mushoom mycelluim and the the colour of compost turns light brown from
dark brown and then casing of 1-2 inch layer with well rotten cow dung mixed with clay
loam soil in equal parts. The casing material should be sterilized with 3% formalin atleast
15 days before use then temperature is maintained around 240 C for 7 to 10 days and then
temperature should be brought down to 14 _180 C and ample ventilation is provided to
reduce CO2 level preferably below 1000 ppm and relative humidity is maintained at 85 to
90%. Light spray of water is given to avoid drying of casing material
Harvesting and Post harvest Management
About 2/3'" of the crop comes after 3 weeks of pin head formation and continues upto 6
weeks. The mushrooms should be harvested at button stage and if delayed quality is
deteriorated. They have very short shelf life and should be sold immediately after
harvesting. They can be stored in refrigerator for less than week.
For proper cultivation of mushroom following precautions should be taken
• Maintain cleanliness in and around the farm. Any left over or refuse must be burried
in soil.
Final Report: 'National Level TeclrnocEconomic Feasibility Study for North Zone' 99
2.1.7.6.2.4
o Prepare substrate only on a cemented platform cleaned with 2% formalin solution.
o Use of pasteurized compost and casing should be preferred.
o Use healthy spawn free from contaminants. Reject spawn showing even a little
infection.
o Clean area, trays, old bags before spawning.
o Growing rooms must be cooked-out with live-steam for 12 hr at temperature above
700 C, before / after a crop. Alternatively, spray thoroughly 2% formalin solution on
floor, walls, racks etc. and keep the room closed for 24hr before use.
o Use a foot-dip (with germicidal solution) before entering the growing area / rooms.
• Personal hygiene of workers and use of clean and disinfected tools/implements
during spawning/casing and harvesting
• Rejects any infected bags/mushroom and treat them with formalin before they are
buried in the soil.
• Growing rooms should be provided with insect-proof nets in doors and windows or
any other inlets.
• Use safe and recommended doses of pesticides only when absolutely necessary and
between the flushes.
Management of Diseases and pests
Cobweb disease
Dry and Wet bubble
disease
Yellow mould, green
mould
Mushroom flies, Dung
flies, Mites and
Nematodes
Maintain humidity and temperature below 90% and 18
o C as preventive measure and spray Bavistin orDiathen M-45
Proper pasteurization of casing soil and control of
vector and spray Diathene-Z -78 or Topsin-M
Proper pasturisation of casing and cleanliness and
spray of Diathene - M
are important insects. Old compost or casing material
should not be used again. Putting 14-16 mesh / cm is
preventive. Spray Malathion 0.25% and close the room
for 2 hours between flushes.
Final Report: 'National Level Techno-Economic Feasibility Study for North Zone' 100
2.1.7.7
The main problem faced by the growers is in marketing their produce because of it being
highly perishable commodity with a short shelf life.
Plantation Crops
None of the crops i.e. Cashew, Arecnut, Oil Palm an Coconut are grown in the State and
have not been dealt.
Final Report: 'National Level Techno-Economic Feasibility Study for North Zone' 101
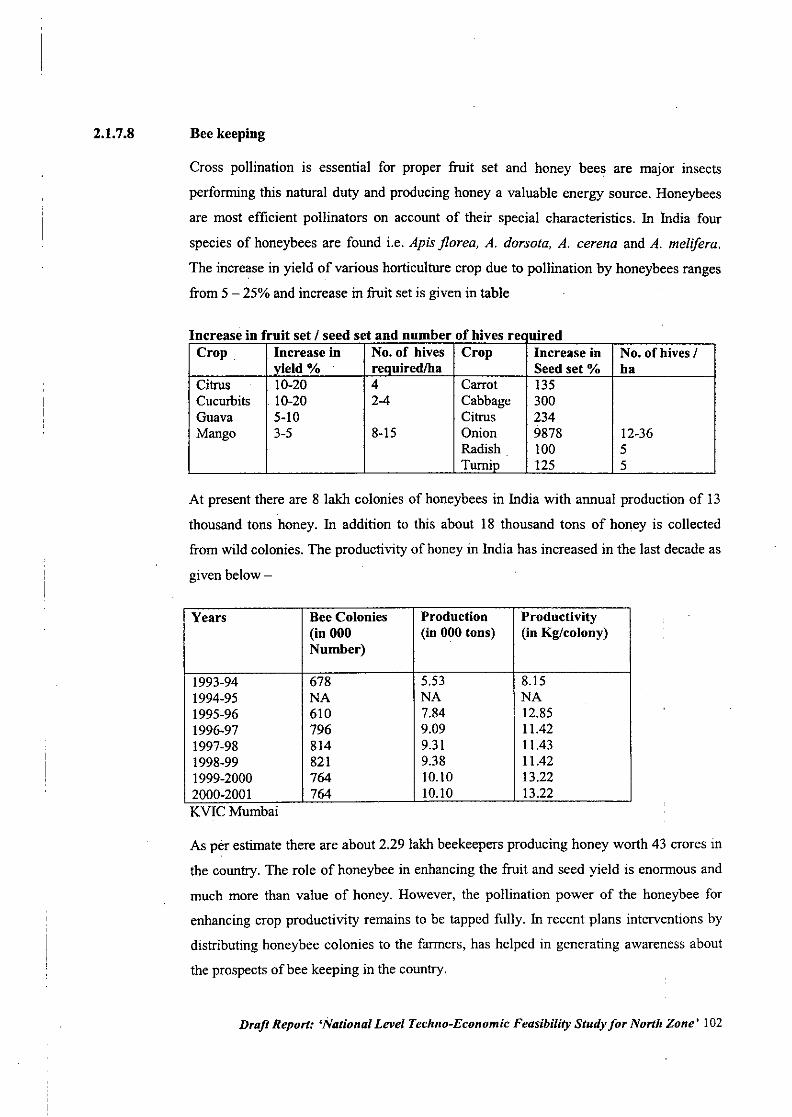
2.1.7.8 Bee keeping
Cross pollination is essential for proper fruit set and honey bees are major insects
performing this natural duty and producing honey a valuable energy source. Honeybees
are most efficient pollinators on account of their special characteristics. In lndia four
species of honeybees are found i.e. Apis florea, A. dorsota, A. cerena and A. melifera.
The increase in yield of various horticulture crop due to pollination by honeybees ranges
from 5 - 25% and increase in fruit set is given in table
. dfh'bd/ d. f .ncrease 10 rUlt set see set an Dum ero Ives re U1reCrop. Increase in No. of hives Crop Increase in No. of hives /
vield % reQuiredlba Seed set % haCitrus 10-20 4 Carrot 135Cucurbits . 10-20 2-4 Cabbage 300Guava 5-10 Citrus 234Mango 3-5 8-15 Onion 9878 12-36
Radish 100 5Turnip 125 5
1
At present there are 8 lakh colonies of honeybees in India with annual production of 13
thousand tons honey. In addition to this about 18 thousand tons of honey is collected
from wild colonies. The productivity of honey in India has increased in the last decade as
given below -
Years Bee Colouies Production Productivity(in 000 (in 000 tons) (in Kg/colony)Number)
1993-94 678 5.53 8.151994-95 NA NA NA1995-96 610 7.84 12.851996-97 796 9.09 11.421997-98 814 9.31 11.431998-99 821 9.38 11.421999-2000 764 10.10 13.222000-2001 764 10.10 13.22KVICMumbai
As per estimate there are about 2.29 lakh beekeepers producing honey worth 43 crores in
the country. The role of honeybee in enhancing the fruit and seed yield is enormous and
much more than value of honey. However, the pollination power of the honeybee for
enhancing crop productivity remains to be tapped fully. In recent plans interventions by
distributing honeybee colonies to the farmers, has helped in generating awareness about
the prospects of bee keeping in the country.
Draft Report: 'National Level Techno-Economic Feasibility Study for North Zone' 102
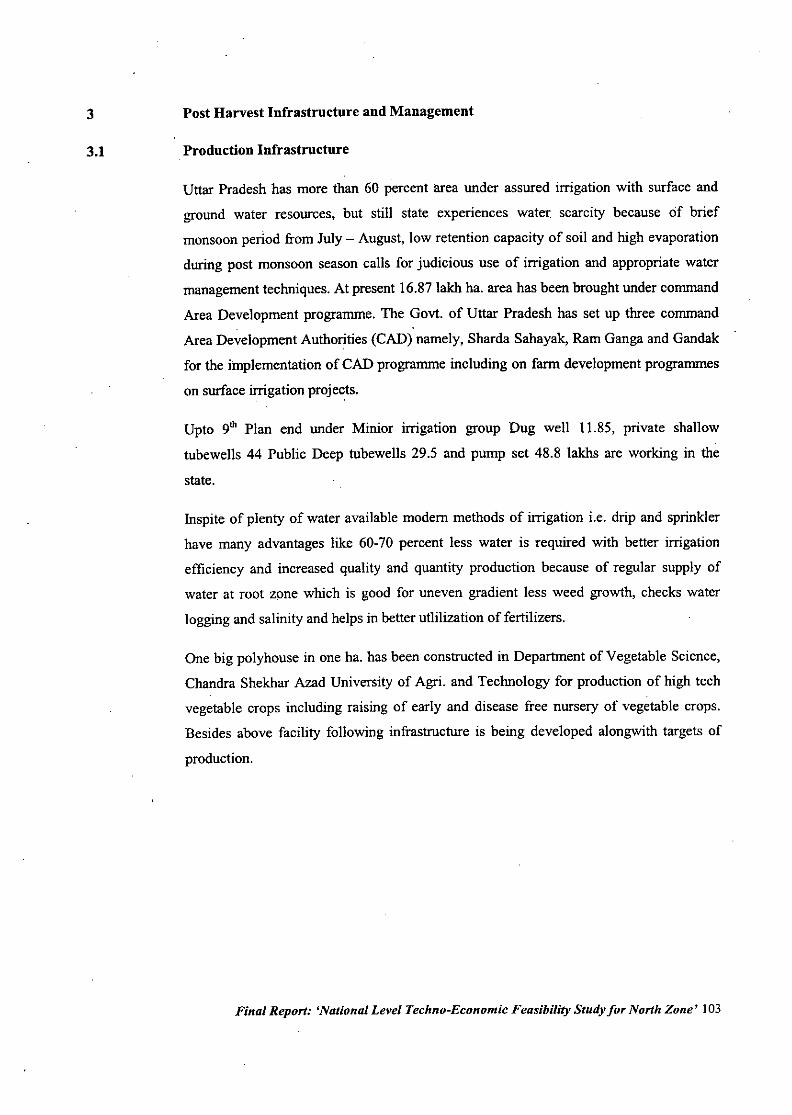
3
3.1
Post Harvest Infrastructure and Management
Production Infrastructure
Uttar Pradesh has more than 60 percent area under assured irrigation with surface and
ground water resources, but still state experiences water scarcity because lif brief
monsoon period from July - August, low retention capacity of soil and high evaporation
during post monsoon season calls for judicious use of irrigation and appropriate water
management techniques. At present 16.87 lakh ha. area has been brought under command
Area Development programme. The Govt. of Uttar Pradesh has set up three command
Area Development Authorities (CAD) namely, Sharda Sahayak, Ram Ganga and Gandak
for the implementation of CAD programme including on farm development programmes
on surface irrigation projects.
Upto 9th Plan end under Minior irrigation group Dug well 11.85, private shallow
tubewells 44 Public Deep tubewells 29.5 and pump set 48.8 lakhs are working in the
state.
Inspite of plenty of water available modem methods of irrigation i.e. drip and sprinkler
have many advantages like 60-70 percent less water is required with better irrigation
efficiency and increased quality and quantity production because of regular supply of
water at root zone which is good for uneven gradient less weed growth, checks water
logging and salinity and helps in better utlilization of fertilizers.
One big polyhouse in one ha. has been constructed in Department of Vegetable Science,
Chandra Shekhar Azad University of Agri. and Technology for production of high tech
vegetable crops including raising of early and disease free nursery of vegetable crops.
Besides above facility following infrastructure is being developed alongwith targets of
production.
Final Report: 'National Level Techno-Economic Feasibility Study for North Zone' 103
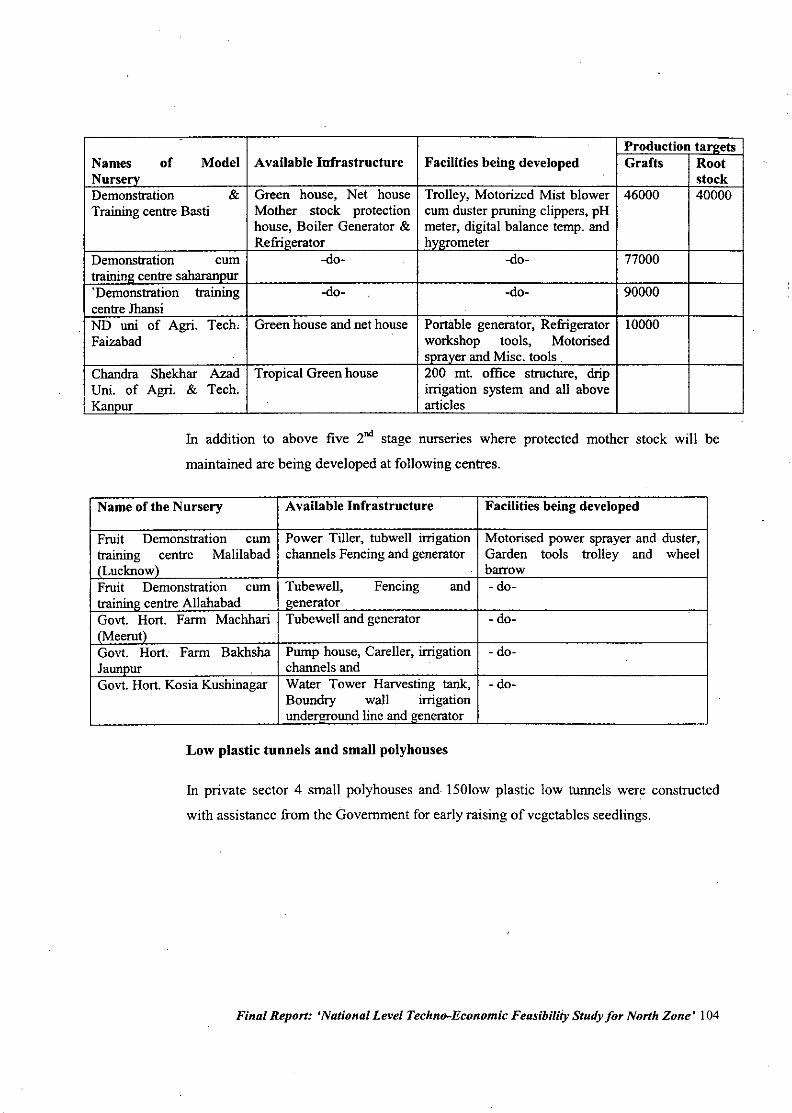
~Production taJ1!ets
Names of Model Available Infrastructure Facilities being developed Grafts RootNurserv stockDemonstration & Green house, Net house Trolley, Motorized Mist blower 46000 40000Training centre Basti Mother stock protection cum duster pruning clippers, pH
house, Boiler Generator & meter, digital balance temp. andRefrigerator hvgrometer
Demonstration cum -do- -do- 77000trairtirtg centre saharanour'Demonstration training -do- -do- 90000centre ThansiNO uni of Agri. Tech, Green house and net house Portable generator, Refrigerator 10000Faizabad workshop tools, Motorised
sprayer and Misc. tools.Chandra Shekbar Azad Tropical Green house 200 mt. office structure, dripUni. of Agri. & Tech. irrigation system and all aboveKanpur articles
In addition to above five 2nd stage nurseries where protected mother stock will be
maintained are being developed at following centres.
Name oftbe Nursery Available Infrastructure Facilities being developed
Fruit Demonstration cum Power Tiller, tubwell irrigation Motorised power sprayer and duster,trairtirtg centre Malilabad channels Fencing and generator Garden tools trolley and wheel(Lucknow) barrowFruit Demonstration cum Tubewell, Fencing and - do-training centre Allahabad generatorGovt. Hort. Farm Machhari Tubewell and generator - do-(Meerut)Govt.Hort. Farm Bakhsha Pump house, Careller, irrigation - do-Jaunpur channels andGovt. Hort. Kosia Kushinagar Water Tower Harvesting tank, - do-
Boundry wall irrigationunderground line and generator
Low plastic tunnels and small polybouses
In private sector 4 small polyhouses and. 15010w plastic low tunnels were constructed
with assistance from the Government for early raising of vegetables seedlings.
Final Report: 'National Level Techno-Economic Feasibiliiy Study for North Zone' 104
3.2 Post Harvest Infrastructure
Post harvest losses in fruits and vegetables are very high (20-40%). About 10-15 percent
fresh fruits and vegetables shrivel and stale, lowering their market value and consumer
acceptability. Minimizing these losses can increase their availability without additional
area expansion. Improper handling and storage causes damage due to mechanical injury,,microbial spoilage and physiological losses. About 36 percent of vegetables decay is due
to soft rot bacteria, whereas 30% fruits decays due to penicillium (fungus) and these
losses can be minimized by proper pre harvest treatments like selection of varieties,
cultural operations, preharvest treatments defming maturity standards, harvesting and
post harvest factors like curing, degreening, precooling, washing and drying, sorting and
grading, disinfaction and treatments like waxing, controlling of ripening processes, pre
packaging in plastic films and proper packaging, pelletization transportation and proper
storage including zero energy cool chambers and irradiation to check sprouting are some
of the important factors for prolonging the life of fruits and vegetables.
To minimize the losses Uttar Pradesh has started Agri. Export zones for mango at
Lucknow and Saharanpur and for potato at Agra where facilities from production to
harvesting and marketing are being developed like sorting and grading sheds, packaging
and storage facilities. At present there are 1156 cold storage's with storage capacity of
6595050 tons of horticultural produce in the state (Annexure-2). Two grading and sorting
sheds at Rehman Khara and Agra are built by D.P. Government for Mango and Potato
sorting and packing. One food park in Rae Barielly is being built where all facilities for
post harvest of horticultural commodities will be provided. There are 188 private
entrepreneurs for preparing fruit and vegetable products in the,state.
Final Report: 'National Level Techno-Economic Feasibility Study for North Zone' 105
4
4.1.a
4.1.a2
4.1.a3
Research and Development
Indian Institute of Vegetable R.esearch, Varanasi, V.P.
Under the umbrella oflCAR, Founded in 1990
The main institute is approximately 20 KM away from City in Adalpura - Mohan
Sarai Road with the following manpower Director - 1, Principal Scientist - 4, Senior
Scientist - 10, Scientists - 10, Technical- 26, Ministrial- 14 and supporting staff-
16 with total strength of 81 personnel.
Thrust Area of the Institute
• To undertake innovative basic, strategic and applied research and developing
technology to enhance productivity of vegetable crops.
• To provide scientific leadership in coordinated netweork research for solving
location specific problems of production and to monitor breeder seed production
of released / notified varieties.
• To act as a national repository of scientific information relevant to vegetable
crops and as a centre for training for upgradation of scientific manpower in
vegetable crops.
•. To disseminate the vegetable production technology to the farmers and to provide
consultancy in vegetable research and development.
• To collaborate with relevant National and International Agencies for achieving
the above mandate.
Achievements overthe Decade
Significant achievements during the decade (1999 - 2000) are:
1.. (a) Vegetable Improvement
• Protocol has been developed for mass multiplication of elite clones of
pointed gourd.
• TLCV resistant lines viz. H24, H36, H86 and H88 have been bred in tomato.
These pre-breeding lines are being utilized worldwide for various purposes
including molecular tagging to TLCV gene.
Final Report: 'National Level Techno-Economic Feasibility Study for North Zone' 106
• In tomato, eggplant, Chille and muskmelon male sterile lines have been
introduced and evaluated in order to examine their utilization in hybrid
breeding programme.
• In tomato, several parental lines have been identified, which possess
resistants to biotic. Such lines have been utilized to develop multiple disease
resistant hybrids, which are under experimental trials.
• In okra, DVR-I and DVR-2 hybrids resistant to YVMV developed at this
Institutes have been recommended for release and cultivation. These two
hybrids are first public sector bred okra hybrids, which have been identified
through AICVIP (All India Coordinated Vegetable Improvement Programe)
• Gynoecious plant in bitter gourd population has been identified and
gynoecism in this plant is being genetically characterized.
(b) Vegetable Production
• Inter culture practices including nutrients, spacing, training & pruning and
planting techniques have been standardized for hybrid tomatoes, cabbage and
capsicum.
• Aztobactor @ IS Kg ha alongwith recommended dose ofNPK (150: 80 :
100kg ha) improves the yield and shelflife in tomato.
• Application of press mud @ 5 t/ha alongwith 50% dose of NPK has been
found beneficial in increasing the yield of solanaceous vegetables, like
tomato and chilli, cabbage, chinense cabbage, cauliflower etc.
• Application of sulphur through press mud improves the yield of capsicum.
• Suitable herbicides have been identified for chemical weed control in okra,
pea, tomato and egg plant.
• For fruit set in autumn crop of tomato, recommendation of PGR (Plant
Growth Regulator) has been made.
(c) Vegetable Protection
• Rational control of okra pests has been. established. through chemical seed
treatment, foliar spray of insecticides and botanicals.
• Management practice for control of yellow mite of chilli is standardized.
• Biocontrol of tomato fruit borer, okra shoot and fruit borer, Spodoptera of
cauliflower has been achieved.
• Cloning of full length genome (2.7 kb) CpGMV and bean dwarf mosaic
gemini virus have been achieved.
Final Repon: 'National Level Techno-Economic Feasibility Study for Nonh Zone' 107
• Inoculum techniques for artificial screening of early blight of tomato has
been standardized with pure mycelial culture.
2 All India Vegetable Improvement Project (AIVIP) is also working at the
Institute. The recommendations for the 4th National Agroclimatic zone
which includes U.P. are summarised below.
Zone N: Sub-Humid Sutlej Ganga Alluvial Plains - This includes Punjab, Delhi and
UP. The following recommendations have emerged from All India trials.
Tomato
• Following open pollinated varieties developed at various centres have performed
well imd have been identified and recommended for cultivation:
Variety
PusaRubySL-I20T-lPusa Early DwarfPunjab ChhuharaKS-2CO-3Pb. KeshariLa BonitaPant T-3Arka VikasArka SaurabhSel-7DT-IOBT-12KS-17
Remark
Small fruitedLarge fruitedLarge fruitedSmall fruitedSmall fruitedDeterminateDeterminateDeterminateDeterminateIndeterminateIndetenninateIndeterminateDeterminateIndeterminateIndeterminateIndeterminate
DevelopingcentreJAR!JAR!CSAUA&TJAR!PAUCSAUA&TTNAUPAUNBPGRGBPUA&TIIHRIIHRHAUJAR!OUATCSAUA&T
• Following tomato hybrids have been identified and recommended for cultivation:
VarietyARTH-4Pusa Hybrid-2NA-50lKT-4FMH-2BSS-20HOE-303DTH-8CSTH-l
Growth habitIndeterminateDeterminateDeterminateIndeterminateIndeterminateIndeterminateDeterminateDeterminateDeterminate
Developing centreAnkur SeedsJARINath SeedIAR! (Katrain)IIHRBeejo SheetalNovartisJAR!Ranchi
• Under resistance varietal trial, nematode resistant variety FMH-2 developed at
IIHR has been recommended for cultivation.
Final Report: 'National Level Techno-Economic Feasibility Study for North Zone' 108
• For Pusa Ruby, HS-IOI and Sioux varieties, 75 x 45 cm spacing and for KS-2
and HS-l 0 1 varieties 50 x 45 cm spacing has been recommended for agro-
climatic conditions ofFaizabad and Kanpur.
• Application of NPK @ 150:60:60 kglha has been recommended for the variety
Pusa Ruby, Sioux and KS-2, to get maximum return and highest costlbenefit ratio
under Kanpur conditions.
• In summer crop, mulching with sugarcane truss has been recommended to
economize the irrigation and maximize the yield and profit under agro-climatic
conditions of Northern Indian plains. The mulching should be done after one
manual weeding at about 35 DAT.
• Application of N as 40 kg/ha as basal dressing + 40 kg/ha as top dressing for
tomato has been recommended for Kanpur conditions.
• Application of N @ 40 kg/ha as basal dressing + 20 kg/ha through top dressing
and 20 kg/ha as foliar spray has been recommended for Varanasi conditions of
eastern U.P.
• Sprays of 4 ppm mixtalol, four weeks after planting, resulted in additional yields
of4.86%.
• Application of difolaton (0.1%) and blitox (0.3%) has been recommended to
control blight disease. These fungicides should be given at the interval of 15
days, starting from first appearance of the disease.
• Three sprays of 2,4-D ( 5 ppm) three times (first spray in nursery one day before
transplanting, second spray at first flower cluster appearance and third spray at
forth flower cluster appearance) has been recommended.
• Three sprays of fenvelerate @ 50 g a.i./ha and endosulfan @ 700 g a.i./ha
alternately at first sight of eggs or larvael5 plants, has been recommended.
• Marigold as a trap crop with only two sprays of endosulfan was found most
effective against fruit borer (H. armigera). However, caution should be taken to
. complete picking and destruction of attacked fruits to prevent emergence of
second generation of fruit borer.
• Against leafrniner, spray of cypermaizin (250 g/ha) at 15 days interval and
Sukrina (a neem formulation) @ 15 mIll has been recommended against
leafrniner.
FinalReport: 'National Level Techno-Economic Feasibility Study for North Zone' 109
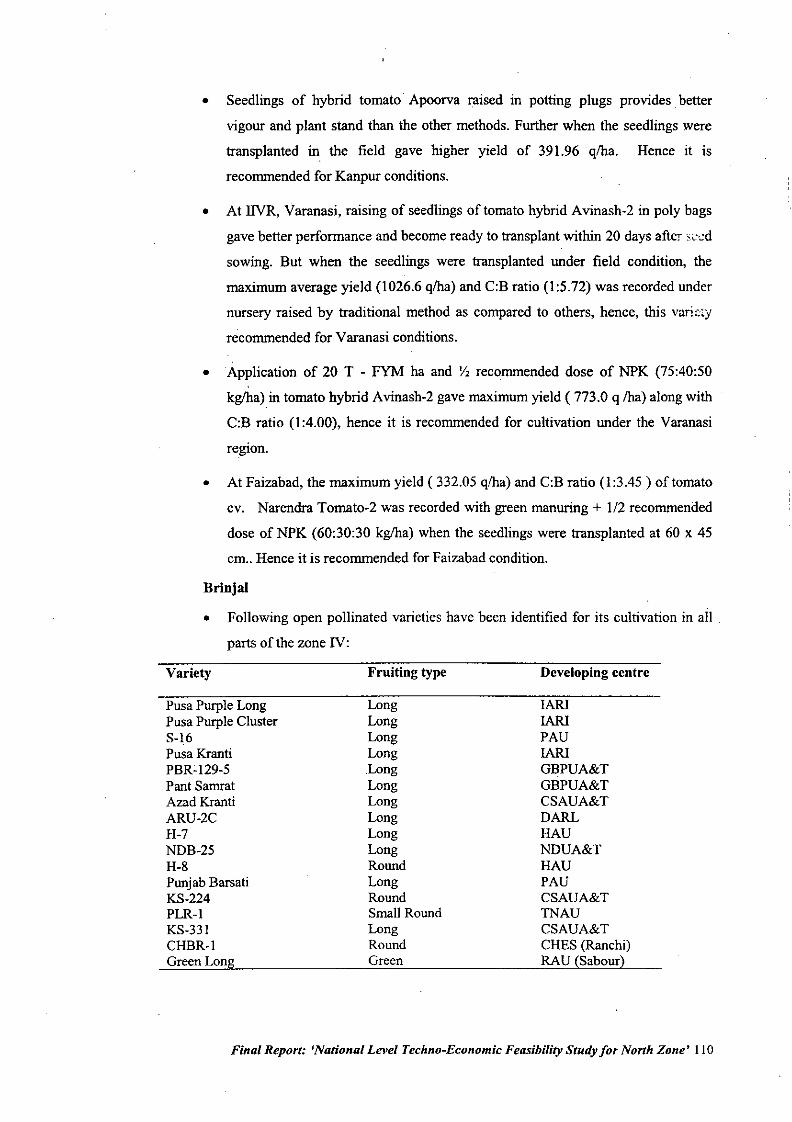
• Seedlings of hybrid tomato Apoorva raised in potting plugs provides better
vigour and plant stand than the other methods. Further when the seedlings were
transplanted in the field gave higher yield of 391.96 q/ha. Hence it is
recommended for Kanpur conditions.
• At INR, Varanasi, raising of seedlings of tomato hybrid Avinash-2 in poly bags
gave better performance and become ready to transplant within 20 days after s,,~d
sowing. But when the seedlings were transplanted under field condition, the
maximum average yield (1026.6 q/ha) and C:B ratio (1:5.72) was recorded under
nursery raised by traditional method as compared to others, hence, this vari~:y
recommended for Varanasi conditions.
• Application of 20 T - FYM ha and Y, recommended dose of NPK (75:40:50
kg/ha) in tomato hybrid Avinash-2 gave maximum yield ( 773.0 q /ha) along with
C:B ratio (I :4.00), hence it is recommended for cultivation under the Varanasi
region.
• At Faizabad, the maximum yield ( 332.05 q/ha) and C:B ratio (I :3.45 ) of tomato
cv. Narendra Tomato-2 was recorded with green manuring + 1/2 recommended
dose of NPK (60:30:30 kg/ha) when the seedlings were transplanted at 60 x 45
em .. Hence it is recommended for Faizabad condition.
Brinjal
• Following open pollinated varieties have been identified for its cultivation in all
parts of the zone IV:
Variety
Pusa Purple LongPusa Purple ClusterS-16PusaKrantiPBR~129-5Pant SamratAzad KrantiARU-2CH-7NDB-25H-8Punjab BarsatiKS-224PLR-lKS-331CHBR-lGreen Long
Fruiting type
LongLongLongLongLongLongLongLongLongLongRoundLongRoundSmall RoundLongRoundGreen
Developing centre
IARIIARIPAUIARIGBPUA&TGBPUA&TCSAUA&TDARLHAUNDUA&THAUPAUCSAUA&TTNAUCSAUA&TCHES (Ranchi)RAU (Sabour)
Final Report: 'National Level Techno-Economic Feasibility Study for North Zone' 110
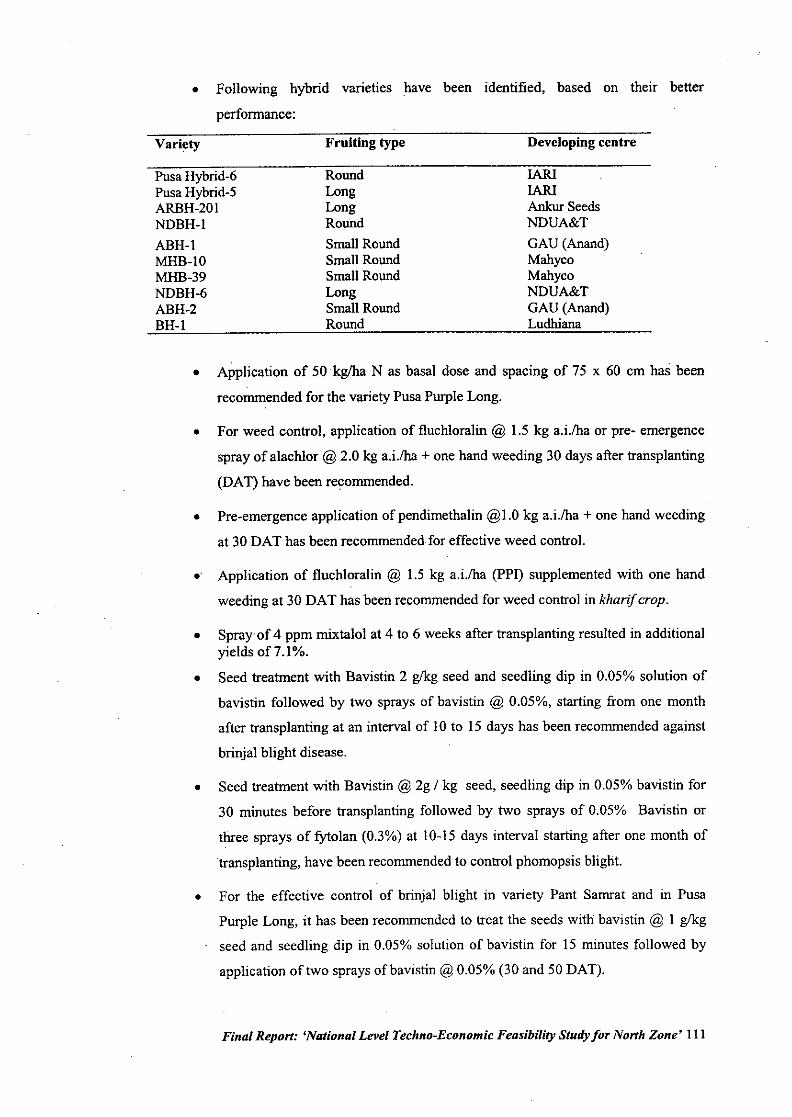
• Following hybrid varieties have been identified, based on their better
performance:
Variety Fruiting type Developing centre
PusaHybrid-6 Round IARIPusaHybrid-5 Long IARIARBH-201 Long Ankur SeedsNDBH-I Round NDUA&TABH-I Small Round GAU (Anand)MHB-IO Small Round MahycoMHB-39 SmallRound MahycoNDBH-6 Long NDUA&TABH-2 Small Round GAU(Anand)BH-I Round Ludhiana
• Application of 50kglha N as basal dose and spacing of 75 x 60 cm has been
recommended for the variety Pusa Purple Long.
• For weed control, application of fluchloralirt @ 1.5 kg a.i./ha or pre- emergence
spray of alachlor @ 2.0 kg a.i./ha + one hand weeding 30 days after transplanting
(DAT) have been recommended.
• Pre-emergence application of pendimethalin @1.0 kg a.i./ha + one hand weeding
at 30 DAT has been recommended for effective weed control.
.' Application of fluchloralin @ 1.5 kg a.i./ha (pPI) supplemented with one hand
weeding at 30 DAT has been recommended for weed control in kharif crop.
• Spray of 4 ppm mixtalol at 4 to 6 weeks after transplanting resulted in additionalyields of7.1 %.
• Seed treatment with Bavistin 2 glkg seed and seedling dip in 0.05% solution of
bavistin followed by two sprays of bavistin @ 0.05%, starting from one month
after transplanting at an interval of 10 to 15 days has been recommended against
brinjal blight disease.
• Seed treatment with Bavistin @ 2g / kg seed, seedling dip in 0.05% bavistin for
30 minutes before transplanting followed by two sprays of 0.05% Bavistin or
three sprays of fYtolan (0.3%) at 10-15 days interval starting after one month of
'transplanting, have been recommended to control phomopsis blight.
• For the effective control of brinjal blight in variety Pant Samrat and in Pusa
Purple Long, it has been recommended to treat the seeds with bavistin @ I glkg
seed and seedling dip in 0.05% solution of bavistin for 15 minutes followed by
application of two sprays ofbavistin @ 0.05% (30 and 50 DAT).
Final Report: 'National Level Techno-Economic Feasibility Study for North Zone' III
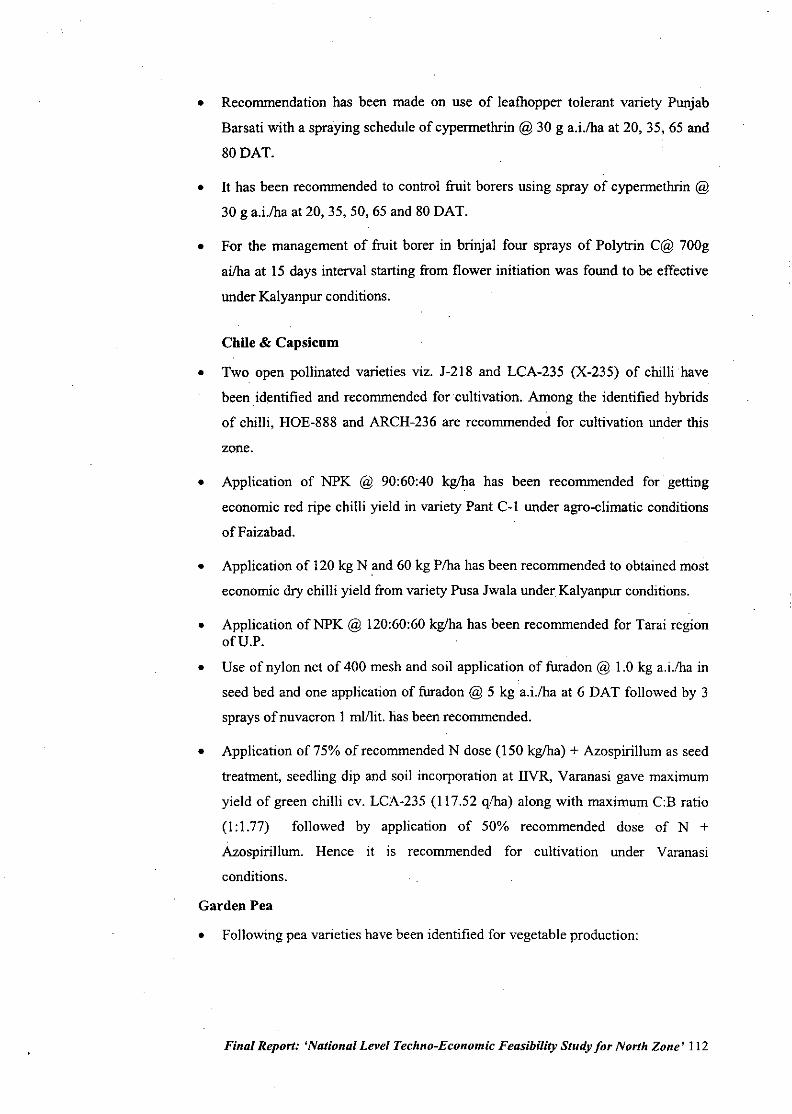
• Recommendation has been made on use of leafhopper tolerant variety Punjab
Barsati with a spraying schedule of cypermethrin @ 30 g a.i.lha at 20, 35, 65 and
80 OAT.
• It has been recommended to control fruit borers using spray of cypermethrin @
30 g a.i.lha at 20,35,50,65 and 80 OAT.
• For the management of fruit borer in brinjal four sprays of Polytrin C@ 700g
ailha at 15 days interval starting from flower initiation was found to be effective
under Kalyanpur conditions.
Chile & Capsicum
• Two open pollinated varieties viz. J-218 and LCA-235 (X-235) of chilli have
been identified and recommended for cultivation ..Among the identified hybrids
of chilli, HOE-888 and ARCH-236 are recommended for cultivation under this
zone.
• Application of NPK @ 90:60:40 kg/ha has been recommended for getting
economic red ripe chilli yield in variety Pant C-l under agro-climatic conditions
of Faizabad.
• Application of 120 kg Nand 60 kg Plha has been recommended to obtained most
economic dry chilli yield from variety Pusa Jwala under Kalyanpur conditions.
• Application of NPK @ 120:60:60 kg/ha has been recommended for Tarai regionofU.P.
• Use of nylon net of 400 mesh and soil application of furadon @ 1.0 kg a.i.lha in
seed bed and one application of furadon @ 5 kg a.i.lha at 6 OAT followed by 3
sprays of nuvacron I ml/li!. has been recommended.
• Application of75% of recommended N dose (150 kg/ha) + Azospirillum as seed
treatment, seedling dip and soil incorporation at lIVR, Varanasi gave maximum
yield of green chilli cv. LCA-235 (117.52 qlha) along with maximum CB ratio
(1:1.77) followed by application of 50% recommended dose of N +Azospirillum. Hence it is recommended for cultivation under Varanasi
conditions.
Garden Pea
• Following pea varieties have been identified for vegetable production:
Final Report: 'National Level Techno-Economic Feasibility Study for North Zone' 112
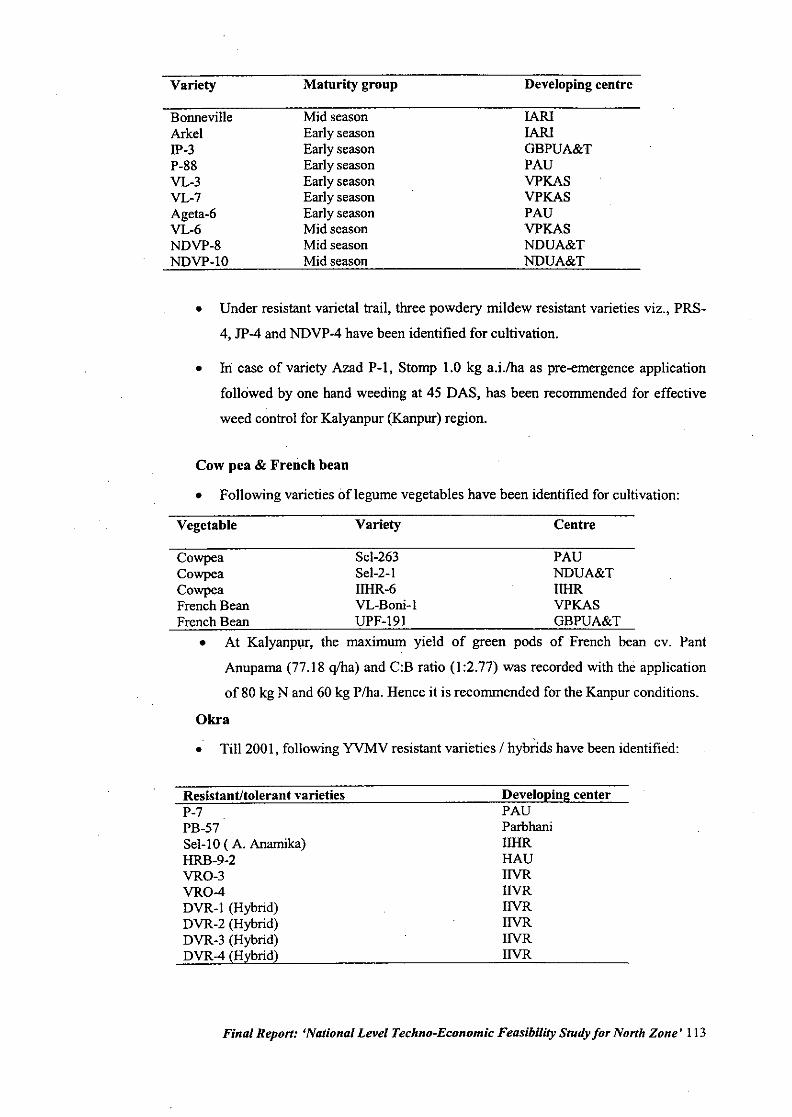
Variety Maturity group Developing centre
Bonneville Mid season IARIArkel Early season IARI1P-3 Early season GBPUA&TP-88 Early season PAUVL-3 Early season VPKASVL-7 Early season VPKASAgeta-6 Early season PAUVL-6 Mid season VPKASNDVP-8 Mid season NDUA&TNDVP-IO Mid season NDUA&T
• Under resistant varietal trail, three powdery mildew resistant varieties viz., PRS-
4, JP-4 and NDVP-4 have been identified for cultivation.
• hi case of variety Azad P-I, Stomp 1.0 kg a.i./ha as pre-emergence application
followed by one hand weeding at 45 DAS, has been recommended for effective
weed control for Kalyanpur (Kanpur) region.
Cow pea & French bean
• Following varieties oflegume vegetables have been identified for cultivation:
Vegetable Variety Centre
Cowpea Sel-263 PAUCowpea Sel-2-1 NDUA&TCowpea IIHR-6 IIHRFrench Bean VL-Boni-I VPKASFrench Bean UPF-!9! GBPUA&T
• At Kalyanpur, the maximum yield of green pods of French bean cv. Pant
Anuparna (77.18 q/ha) and C:B ratio (1:2.77) was recorded with the application
of 80 kg Nand 60 kg Pfha. Hence it is recommended for the Kanpur conditions.
Okra
• Till 200 I, following YVMV resistant varieties I hybrids have been identified:
Resistant/tolerant varietiesP-7PB-57Sel-IO (A. Anamika)HRB-9-2VRO-3VRO-4DVR-! (Hybrid)DVR-2 (Hybrid)DVR-3 (Hybrid)DVR-4 (Hybrid)
Developing centerPAUParbhaniIIHRHAUINRINRIIVRINRINRINR
Final Report: 'National Level Techno-Economic Feasibility Study for North Zone' 113
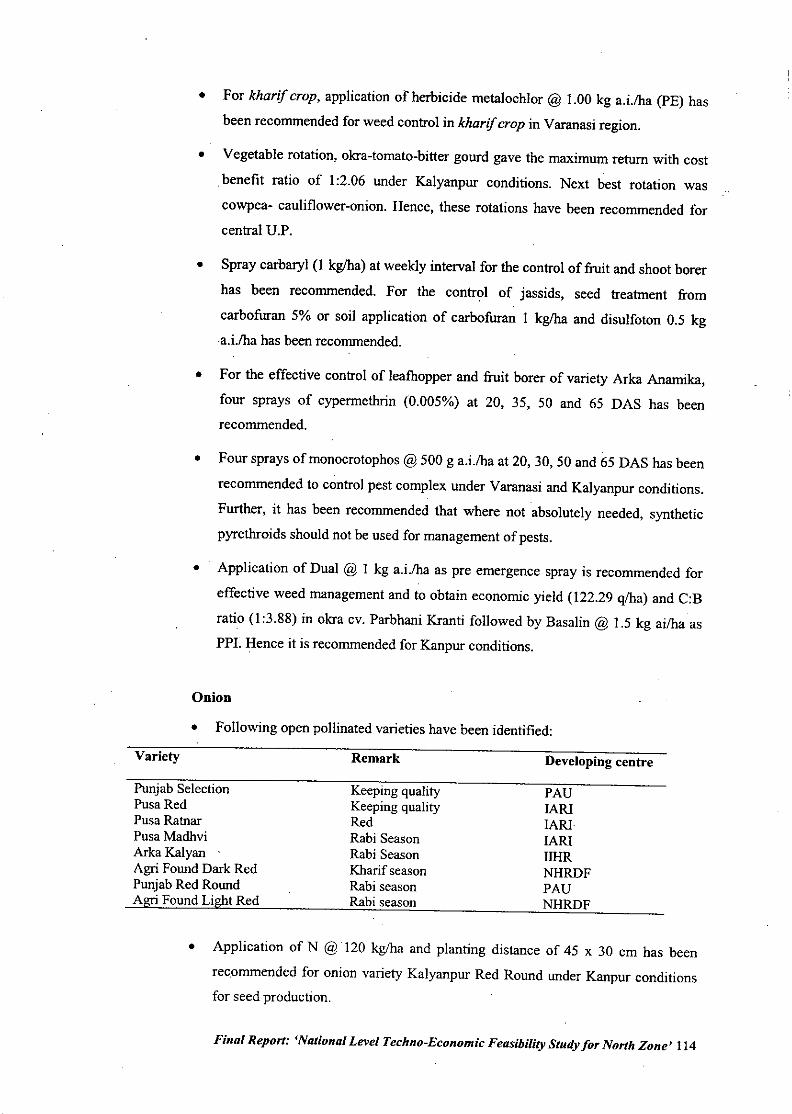
• For kharif crop, application of herbicide metalochlor @ 1.00 kg a.i./ha (PE) has
been recommended for weed control in kharif crop in Varanasi region.
• Vegetable rotation, okra-tomato-bitter gourd gave the maximum return with cost
benefit ratio of I :2.06 under Kalyanpur conditions. Next best rotation was
cowpea- cauliflower-onion. Hence, these rotations have been recommended for
central V.P.
• Spray carbaryl (I kg/ha) at weekly interval for the control of fruit and shoot borer
has been recommended. For the contr?1 of jassids, seed treatment from
carbofuran 5% or soil application of carbofuran I kg/ha and disulfoton 0.5 kg
.a.i./ha has been recommended.
• For the effective control of leafhopper and fruit borer of variety Arka Anamika,
four sprays of cypermethrin (0.005%) at 20, 35, 50 and 65 DAS has been
recommended.
• Four sprays of monocrotophos @ 500 g a.i./ha at 20, 30,50 and 65 DAS has been
recommended to control pest complex under Varanasi and Kalyanpur conditions.
Further, it has been recommended that where not absolutely needed, synthetic
pyrethroids should not be used for management of pests.
• Application of Dual @ I kg a.i./ha as pre emergence spray is recommended for
effective weed management and to obtain economic yield (122.29 q/ha) and C:B
ratio (I :3.88) in okra cv. Parbhani Kranti followed by Basalin @ 1.5 kg ai/ha as
PPJ. Hence it is recommended for Kanpur conditions.
Onion
• Following open pollinated varieties have been identified:
Variety
Punjab SelectionPusa RedPusa RatnarPusa MadhviArka KalyanAgri Found Dark RedPunjab Red RoundAgri Found Light Red
Remark
Keeping qualityKeeping qualityRedRabi SeasonRabi SeasonKbarif seasonRabi seasonRabi season
Developing centre
PAUJARIJARIJARIIIHRNHRDFPAUNHRDF
• Application of N @ 120 kg/ha and planting distance of 45 x 30 cm has been
rec.ommended for onion variety Kalyanpur Red Round under Kanpur conditions
for seed production.
Final Report: 'National Level Techno-Economic Feasibility Study for North Zone' 114
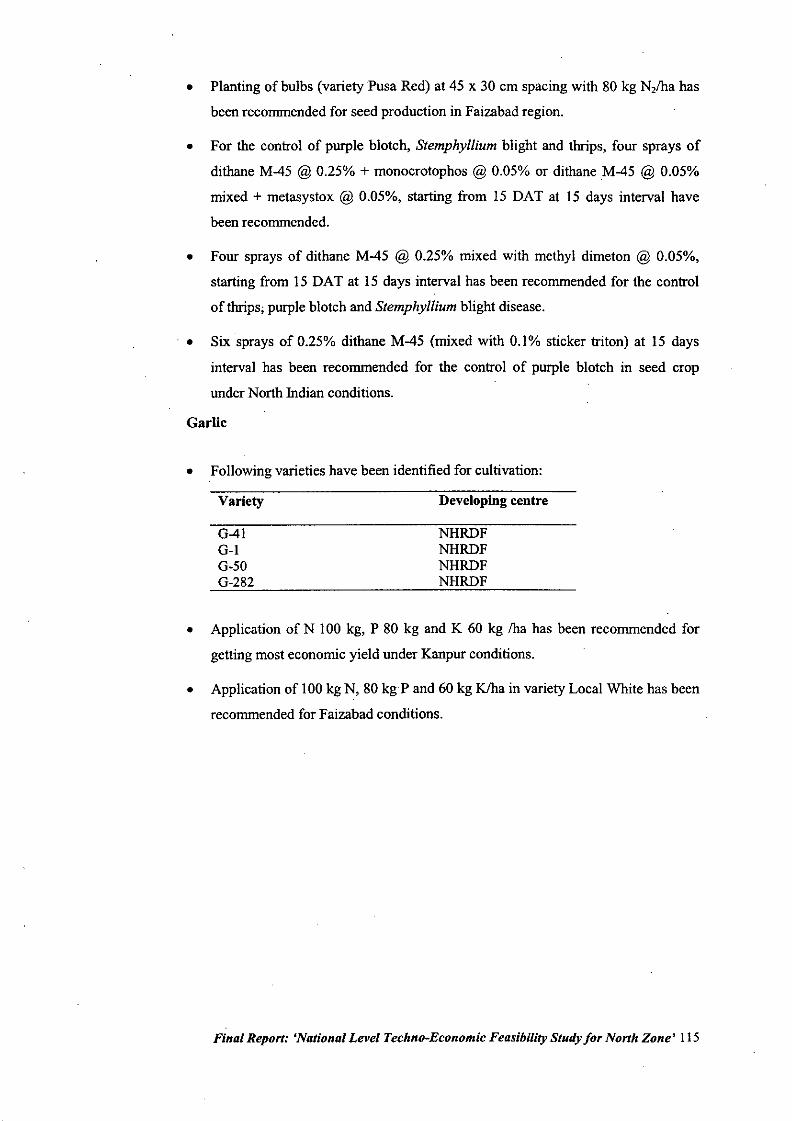
• Planting of bulbs (varietyPusa Red) at 45 x 30 cm spacing with 80 kg N,lha has
been recommended for seed production in Faizabad region.
• For the control of purple blotch, Stemphyllium blight and thrips, four sprays of
dithane M-45 @ 0.25% + monocrotophos @ 0.05% or dithane M-45 @ 0.05%
mixed + metasystox @ 0.05%, starting from 15 DAT at 15 days interval have
been recommended.
• Four sprays of dithane M-45 @ 0.25% mixed with methyl dimeton @ 0.05%,
starting from 15 DAT at 15 days interval has been recommended for the control
of thrips; purple blotch and Stemphyllium blight disease.
• Six sprays of 0.25% dithane M-45 (mixed with 0.1% sticker triton) at 15 days
interval has been recommended for the control of purple blotch in seed crop
under North Indian conditions.
Garlic
• Following varieties have been identified for cultivation:
Variety
G-41G-lG-50G-282
Developing centre
NHRDFNHRDFNHRDFNHRDF
• Application of N 100 kg, P 80 kg and K 60 kg Iha has been recommended for
getting most economic yield under Kanpur conditions.
• Application of 100 kg N, 80 kgP and 60 kg Klha in variety Local White has been
recommended for Faizabad conditions.
Final Report: 'National Level Techno-Economic Feasibility Study for North Zone' 115
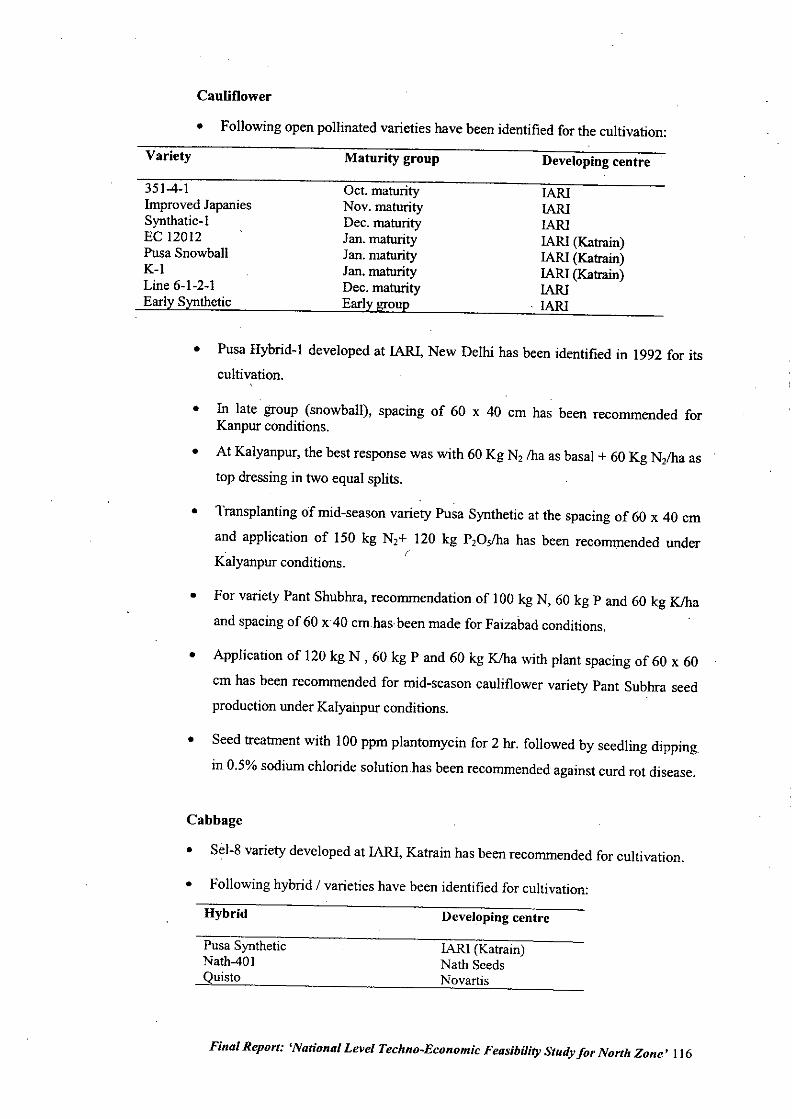
Cauliflower
• Following open pollinated varieties have been identified for the cultivation:
Variety
351-4-1Improved JapaniesSynthatic-IEC 12012Pusa SnowballK-ILine 6-1-2-1Early Synthetic
Maturity group
Oct. maturityNov. maturityDec. maturityJan. maturityJan. maturityJan. maturityDec. maturityEarly grOUp
Developing centre
JAR!JAR!JAR!JAR! (Katrain)JAR! (Katrain)JAR! (Katrain)lARIJAR!
Kalyanpur conditions.
• Pusa Hybrid-I developed at IARI, New Delhi has been identified in 1992 for its
cultivation.
• In late group (snowball), spacing of 60 x 40 cm has been recommended forKanpur conditions.
• At Kalyanpur, the best response was with 60 Kg N, Iha as basal + 60 Kg N,lha as
top dressing in two equal splits.
• Transplanting of mid-season variety Pusa Synthetic at the spacing of 60 x 40 cm
and application of 150 kg N,+ 120 kg P,O,lha has been recommended under(
• For variety Pant Shubhra, recommendation of 100 kg N, 60 kg P and 60 kg Klha
and spacing of60 x40 cmhas.been made for Faizabad conditions.
• Application of 120 kg N , 60 kg P and 60 kg Klha with plant spacing of 60 x 60
cm has been recommended for mid-season cauliflower variety Pant Subhra seed
production under Kalyanpur conditions.
• Seed treatment with 100 ppm plantomycin for 2 hr. followed by seedling dipping
in 0.5% sodium chloride solution has been recommended against curd rot disease.
Cabbage
• Sel-8 variety developed at lARI, Katrain has been recommended for cultivation.
• Following hybrid / varieties have been identified for cultivation:
Hybrid
Pusa SyntheticNath-401Quisto
Developiug ceutre
lARI (Katrain)Nath SeedsNovartis
Final Report: 'National Level Techno-Economic Feasibility Study for North Zone' 116
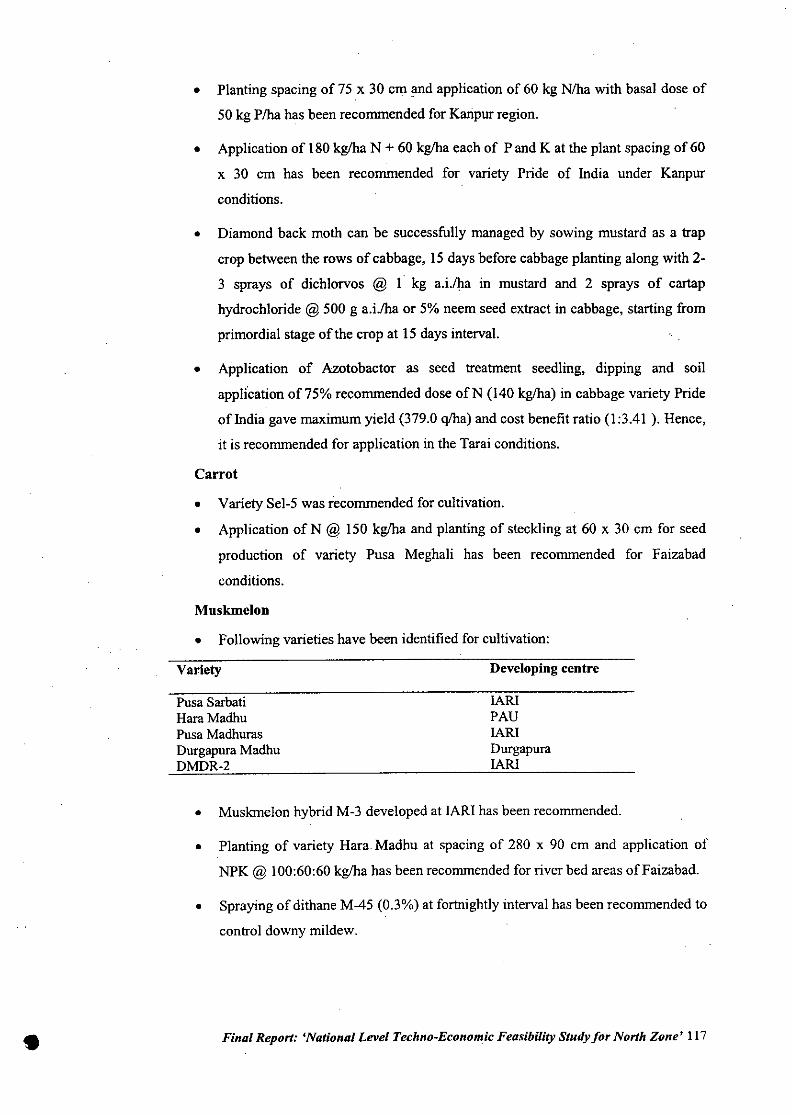
• Planting spacing of 75 x 30 cm and application of 60 kg Nlba with basal dose of
50 kg PIha has been recommended for Kanpur region.
• Application of 180 kg/ha N + 60 kg/ha each of P and K at the plant spacing of 60
x 30 cm has been recommended for variety Pride of India under Kanpur
conditions.
• Diamond back moth can be successfully managed by sowing mustard as a trap
crop between the rows of cabbage, 15 days before cabbage planting along with 2-
3 sprays of dichlorvos @ I. kg a.i.lba in mustard and 2 sprays of cartap
hydrochloride @ 500 g a.i.lba or 5% neem seed extract in cabbage, starting from
primordial stage of the crop at 15 days interval.
• Application of Azotobactor as seed treatment seedling, dipping and soil
appli'cation of75% recommended dose ofN (140 kg/ha) in cabbage variety Pride
of India gave maximum yield (379.0 qlba) and cost benefit ratio (1:3.41 ). Hence,
it is recommended for application in the Tarai conditions.
Carrot
• Variety Sel-5 was recommended for cultivation.
• Application of N @ 150 kg/ha and planting of steck1ing at 60 x 30 cm for seed
production of variety Pusa Meghali has been recommended for Faizabad
conditions.
Muskmelon
• Following varieties have been identified for cultivation:
Variety
Pusa SarbatiHaraMadhuPusa MadhurasDurgapura MadhuDMDR-2
Developing centre
IARIPAUIAR!DurgapuraIARt
• Muskmelon hybrid M-3 developed at IARI has been recommended.
• Planting of variety Hara. Madhu at spacing of 280 x 90 cm and application of
NPK @ 100:60:60 kg/ha has been recommended for river bed areas ofFaizabad.
• Spraying of dithane M-45 (0.3%) at fortnightly interval has been recommended to
control downy mildew.
• Final Report: 'National Level Techno-Economic Feasibility Study for North Zone' 117
Watermelon
• Sugar baby, Durgapura Meetha and Arka Manik varieties have been identified forits cultivation.
• The fertilizer dose of 100 kg N + 60 kg P + 60 KJha at the plant distance of 320 x
120 em has been recommended for getting maximum net return from variety
Sugar Baby under river bed conditions of Faizabad.
Other Cucnrbits
• Following open pollinatep varieties have been identified in different.Cilcurbitaceous vegetables: h,
Vegetable Variety Developing centre
Bittergourd RHRBG-4-1 MPKVBittergourd KBG-16 CSAUA&TPumpkin CM-14 KAUPumpkin PusaVishwas JAR!Spongegourd Sel-99 lARIBottlegourd NDBG-4 NDAUCucumber CH-20 HARRPRanchi
• Recommendation has been made to control powdery mildew of bottle gourd
through spray of BenomyI and Bavistin (0.1%) at 10 days interval.
• In bitter gourd, application of N:P:K @ 90:60:60 kg/ha has recommended under
Faizabad conditions for local variety Jaunpuri Karela.
• The maximum yield (513.3 q/ha) and C:B ratio (1:2.68 ) was recorded when the
plants were trained on arbour system without pinching of shoots in the bottle
gourd hybrid Pant Sankar Lauki-l. Hence it is recommended for the Tarai
conditions.
Final Report: 'National Level Techno-Economic Feasibility Study for North Zone' 118
•
4.1.b
4.l.b2
4.l.b3
Central Institute for sub tropical Horticulture, Lucknow, U.P.
Institute is located at Rehman Khera PO Kakori District, Lucknow which is 20 km away
from Lucknow with following manpower. Scientific 44, TechnicaL56, Administrative 25
and supporting staff 44 and total strength is 169.
Thrust Areas
Varietal improvement of tropical fruits through conventional and modem methods with
special reference to mango, guava, aonla, bael and papaya. Suitable varieties of mango
for export and multiplication of genuine planting material on large scale. Survey of
Disease and pests and work out suitable remedy measures. IPM, INM and IDM.
Development of maturity standards, harvesting methods, Harvesters and graders, suitable
packaging methods for domestic and export and development of processing technologies
for newer products and improvements of technologies for squash, juice, nector, jam and
jelly etc using aseptic packaging technique and analysis and monitoring of pesticides
residues in mango and guava. Utilization of fruit processing waste for value added
products. Marketing, reducing post harvest losses and working on other constraints of
production. Study the economic feasibility of techniques developed by the Institute at
farmers fields and entrepreneurial development amongst the growers.
Achievements for the decade
(I) A superior clone of Dashehari named Dashehari-51 with regular bearing and high
yield has been released for commercial cultivation.
(2) A promising Mango hybrid CISH-M-I (Amrapali X Janardhan Pasand), for export
and domestic is at advanced stage of release,
(3) Mango cr. Elaichi identified to be free from Mango malformation is being used for
breeding resistance varieties.
(4) Guava var Lalit with attractive saffron yellow colour with occasional red blush is
released which gives 25% more yield than Allahabad safeda. Two selections CISH-
G-I and CISH-G-4, are promising CISH-B-I and CISH-B-2 in Bel are identified as
promising clones.
Final Report: 'National Level Techno-Economic Feasibility Study for North Zone' 119
(5) Protocol for Micro propagation of Guava var Allahabad Safeda and Sardar is at
advance stage of release.
(6) The Rejuvenation technology for mango old orchard of 40-50 years and above and
unproductive mango tree pruning beyond 4-5 meters during December is
Standardized.
(7) The one time application of I kg each N, P and K in the month of July gave
maximum yield (99.66 kg I tree) in mango
(8) Application of 300 g Azospirillum culture plus 20 Kg FYM per tree in both on and
off years gives higher yield of 134.37kg/tree in mango.
(9) Soil application of Pactobutrazol @ 3.2 mllper meter tree canopy area in Mango
cv. Dashahri and 4.8 ml in cv . Langra and chousa induced regular bearing and
gave better yield by 20 and 30 percent in on year and 45 and 60 percent in off year.
(10) High density planting (1600 plant/ha) in Amarpali produced fruit yield of 172
qtllha during 4'" Year of fruiting.
(II) Glycophosate @ 10 mIll applied to young orchards in the month of June in young
orchards and May in older orchards controls weeds without any adverse effect.
(12) . Technique for eliminating rainy season crop of Guava with 10 percent Urea
spraying twice in cv. Allahabad safeda and 25% single spray in cv. Sardar.
(13) Highest yield in Guava var. Sardar was with 800g neem coated urea, 600g
superphosphate and 600g Murate of Potosh.
(14) Alcoholic extract of neem Kernel (2%), Alpinia galanga (2%) and Buprofezin
(0.0625%) are effective against mango hoppers and mealy bug insects. Chlorphos
and monocrotophos (0.04%) are effective against bark eating caterpillars in Guava
while Monocrotophos (0.04%) and dimethoate (0.045%) against Guava scale
(Chloropulvinaria sp.)
(15) three pre harvest spray of Bavistin and Topsin-M (0.1% each) at 15 days internal
starting from I" week of May and dipping of fruits after harvest in 0.05%
Final Report: 'National Level Techno-Economic Feasibility Study for North Zone' 120
•
fungicidal suspension completely controls the pre and post harvest losses from
diseases in mango.
(16) Harvester for Mango and guava developed and Mango grader designed and
fabricated for testing.
(17) Simple Technique for uniform ripening of mango, early harvested fruits (2 week
before maturity) can be ripened with 750 ppm Ethrel in hot water at 52 :t 2° C,
while mature fruits can be ripened with 100-500 ppm ethrel according to maturity
stage
(18) Training on production, protection and post-harvest management of Mango, guava,
papaya and aonla is organised for the master trainers i.e Deputy Directors, District
Horticulture officers and Senior Horticulture Inspectors. 20 different trainings
were conducted over a decade.
Final Report: 'National Level Techno-Economic Feasibility Study for North Zone' 121
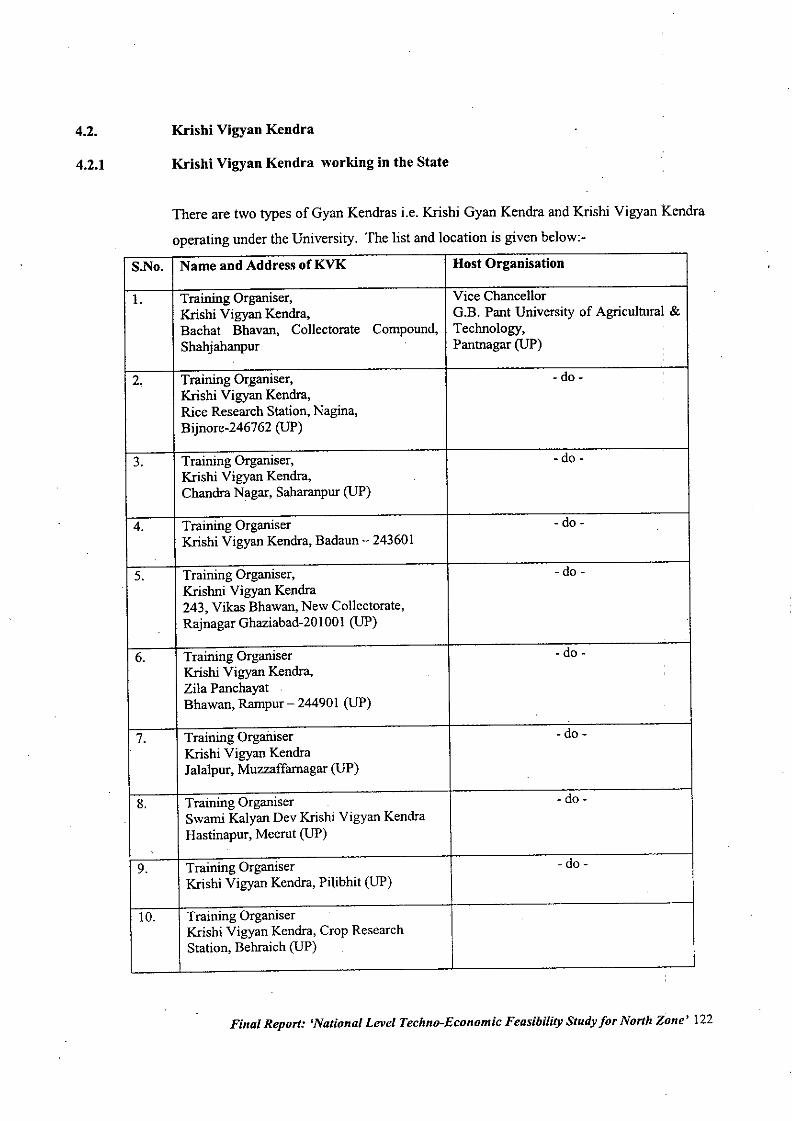
4.2.
4.2.1
Krishi Vigyan Kendra
Krishi Vigyan Kendra working in the State
There are two types of Gyan Kendras i.e. Krishi Gyan Kendra and Krishi Vigyan Kendra
operating under the University. The list and location is given below:-
S.No. Name and Address of KVK Host Organisation
1. Training Organiser, Vice ChancellorKrishi Vigyan Kendra, G.B. Pant University of Agricultural &Bachat Bhavan, Collectorate Compound, Technology,Shahjahanpur Pantnagar (UP)
2, Training O~ganiser, - do-Krishi Vigyan Kendra,Rice Research Station, Nagina,Bijnore-246762 (UP)
3. Training Organiser, - do-Krishi Vigyan Kendra,Chandra Nagar, Saharanpur (UP)
4. Training Organiser - do-Krishi Vigyan Kendra, Badaun - 243601
5. Training Organiser, - do-Krishni Vigyan Kendra243, Vikas Bhawan, New Collectorate,Rajnagar Ghaziabad-20 100I (UP)
6. Training Organiser - do -Krishi Vigyan Kendra,Zila PanchayatBhawan, Rarnpur - 244901 (UP)
7. Training Organiser - do-Krishi Vigyan KendraJalalpur, Muzzaffarnagar (UP)
8. Training Organiser - do-Swami Kalyan Dev Krishi Vigyan KendraHastinapur, Meerut (UP)
.
9. Training Organiser - do-Krishi Vigyan Kendra, Pilibhit (UP)
10. Training Organiser .
Krishi Vigyan Kendra, Crop ResearchStation, Behraich (UP)
Final Report: 'National Level Techno-Economic Feasibility Study for North Zone' 122
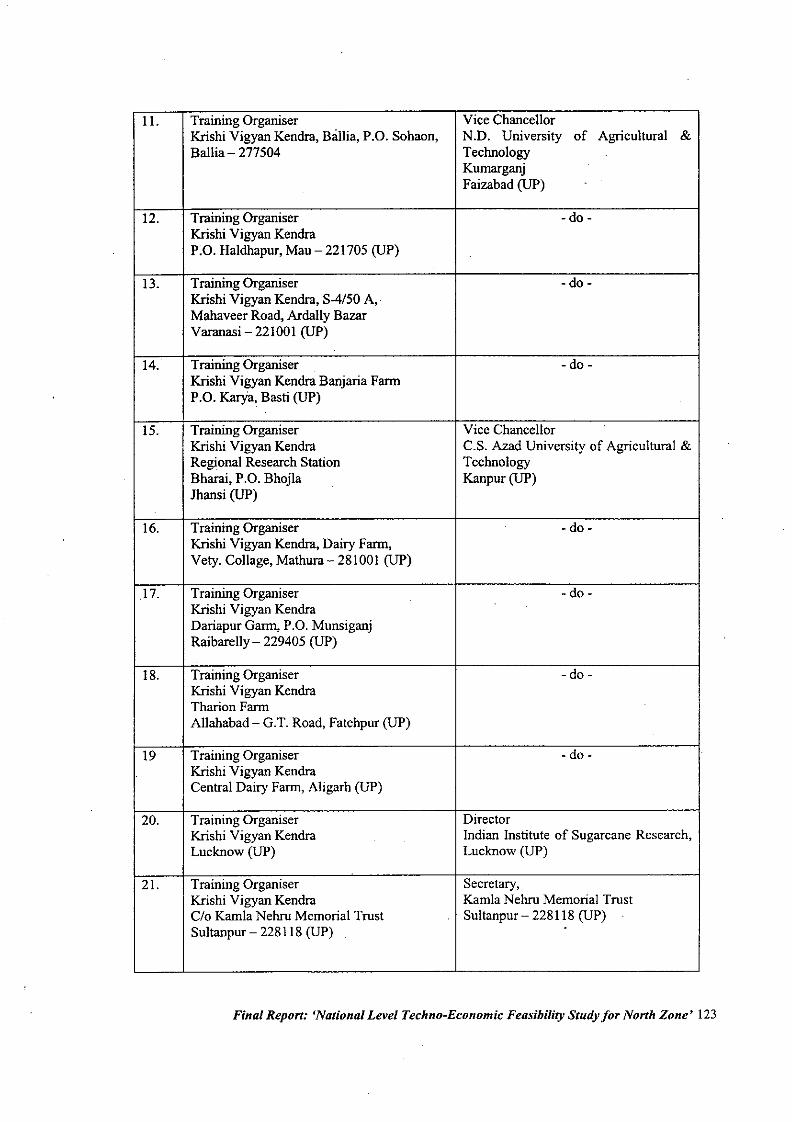
II. Training Organiser Vice ChancellorKrishi Vigyan Kendra, Ballia, P.O. Sohaon, N.D. University of Agricultural &Ballia - 277504 Technology
KumarganjFaizabad (UP)
12. Training Organiser - do-Krishi Vigyan KendraP:O. Haldhapur, Mau - 221705 (Up)
13. Training Organiser - do-Krishi Vigyan Kendra, S-4/50 A,'Mahaveer Road, Ardally BazarVaranasi - 221001 (UP)
.
14. Training Organiser - do-Krishi Vigyan Kendra Banjaria FarmP.O. KarYa, Basti (UP)
15. Training Organiser Vice ChancellorKrishi Vigyan Kendra C.S. Azad University of Agricultural &Regional Research Station TechnologyBharai, P.O. Bhojla Kanpur(Up)Jhansi (Up)
.
16. Training Organiser - do-Krishi Vigyan Kendra, Dairy Farm,Vety. Collage, Mathura - 281001 (Up)
17. Training Organiser - do-Krishi Vigyan KendraDariapur Garm, P.O. MunsiganjRaibarelly - 229405 (Up)
18. Training Organiser - do-Krishi Vigyan KendraTharion FarmAllahabad - G.T. Road, Fatehpur (UP)
19 Training Organiser - do-Krishi Vigyan KendraCentral Dairy Farm, Aligarh (UP)
20. Training Organiser DirectorKrishi Vigyan Kendra Indian Institute of Sugarcane Research,Lucknow (UP) Lucknow (UP)
21. Training Organiser Secretary,Krishi Vigyan Kendra Kamla Nehru Memorial TrustC/o Kamla Nehru Memorial Trust Sultanpur - 228118 (UP)Sultanpur - 228118 (UP)
Final Report: 'National Level Techno-Economic Feasibility Study for North Zone' 123
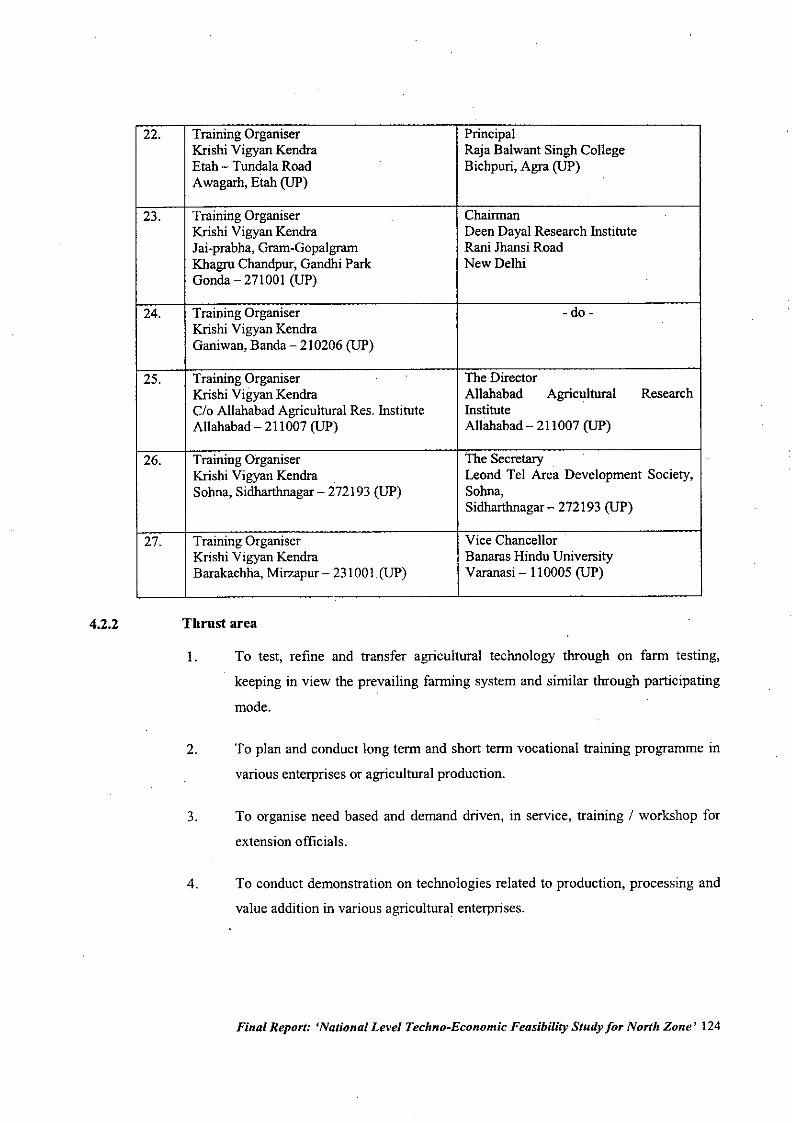
22. Training Organiser PrincipalKrishi Vigyan Kendra Raja Balwant Singh CollegeEtah - Tundala Road Bichpuri, Agra (UP)Awagarh, Etah (UP)
23. Training Organiser ChairmanKrishi Vigyan Kendra Deen Dayal Research InstituteJai-prabha, Gram-Gopalgram Rani Jhansi RoadKhagru Chandpur, Gandhi Park New DelhiGonda - 271001 (UP)
24. Training Organiser - do-Krishi Vigyan KendraGaniwan, Banda - 210206 (UP)
25. Training Organiser The DirectorKrishi Vigyan Kendra Allahabad Agricultural ResearchC/o Allahabad Agricultural Res. Institute InstituteAllahabad - 211007 (UP) Allahabad - 211007 (UP)
26. Training Organiser The Secretary. Krishi Vigyan Kendra Leond Tel Area Development Society,
Sohna, Sidharthnagar - 272193 (UP) Sohna,Sidharthnagar - 272193 (UP)
27. Training Organiser Vice ChancellorKrishi Vigyan Kendra Banaras Hindu UniversityBarakachha, Mirzapur- 231001(UP) Varanasi - 110005 (UP)
4.2.2 Thrust area
1. To test, refine and transfer agricultural technology through on farm testing,
keeping in view the prevailing farming system and similar through participating
mode.
2. To plan and conduct long term and short term vocational training programme in
various enterprises or agricultural production.
3. To organise need based and demand driven, in service, training / workshop for
extension officials.
4. To conduct demonstration on technologies related to production, processing and
value addition in various agricultural enterprises.
Final Report: 'National Level Techno-Economic Feasibility Study for North Zone' 124
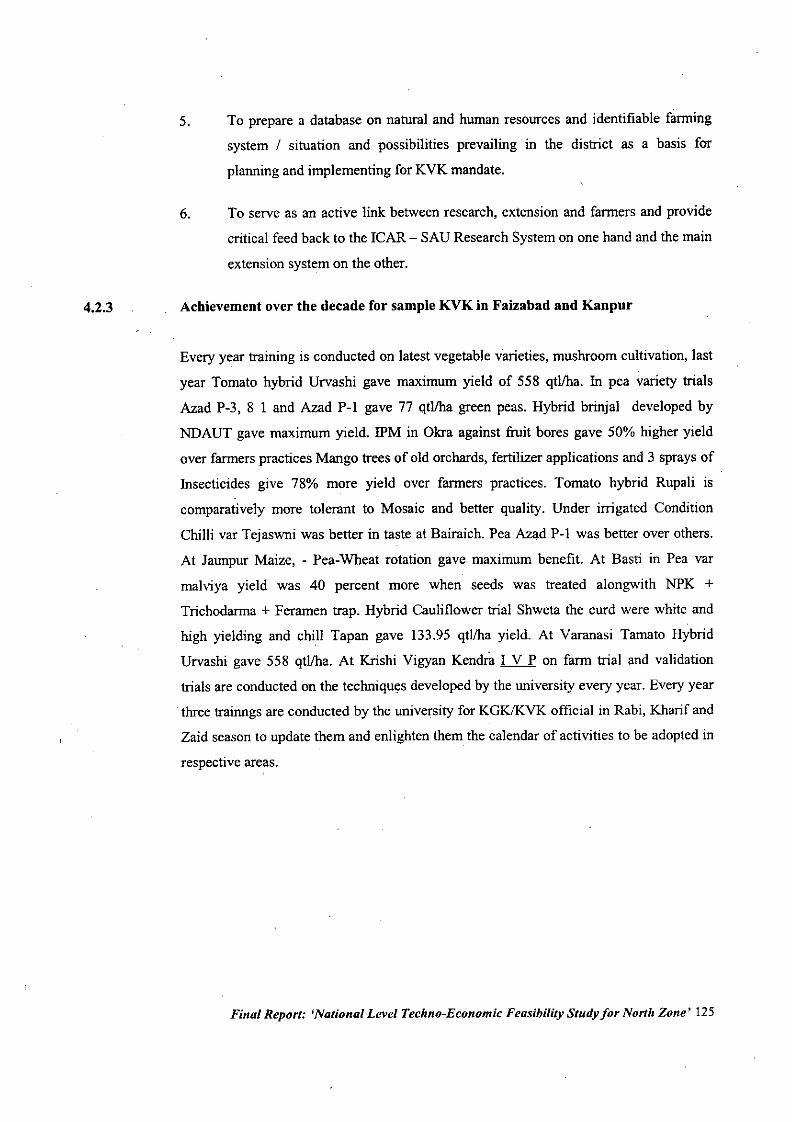
4.2.3
5. To prepare a database on natural and human resources and identifiable farming
system / situation and possibilities prevailing in the district as a basis for
planning and implementing for KVK mandate.
6. To serve as an active link between research, extension and farmers and provide
critical feed back to the ICAR - SAU Research System on one hand and the main
extension system on the other.
Achievement over the decade for sample KVK in Faizabad and Kanpur
Every year training is conducted on latest vegetable varieties, mushroom cultivation, last
year Tomato hybrid Urvashi gave maximum yield of 558 qtl/ha. In pea variety trials
Azad P-3, 8 1 and Azad P-l gave 77 qtl/ha green peas. Hybrid brinjal developed by
NDAUT gave maximum yield. IPM in Okra against fruit bores gave 50% higher yield
over farmers practices Mango trees of old orchards, fertilizer applications and 3 sprays of
Insecticides give 78% more yield over farmers practices. Tomato hybrid Rupali is
comparatively more tolerant to Mosaic and better quality. Under irrigated Condition
Chilli var Tejaswni was better in taste at Bairaich. Pea Az:!d P-l was better over others.
At Jaunpur Maize, - Pea-Wheat rotation gave maximum benefit. At Basti in Pea var
malviya yield was 40 percent more when seeds was treated alongwith NPK +Trichodarma + Feramen trap. Hybrid Cauliflower trial Shweta the curd were white and
high yielding and chill Tapan gave 133.95 qtl/ha yield. At Varanasi Tamato Hybrid
Urvashi gave 558 qtl/ha. At Krishi Vigyan Kenma I V P on farm trial and validation
trials are conducted on the techniqw;:sdeveloped by the university every year. Every year
three trainngs are conducted by the university for KGK!KVK official in Rabi, Kharif and
Zaid season to update them and enlighten them the calendar of activities to be adopted in
respective areas.
Final Report: 'National LltVel Techno-Economic Feasibility Study for North Zone' 125
4.3
4.3.al
4.3.a2
4.3.a3
4.3.3 a.
State Agriculture Universities
Chandra Shekhar Azad University ofAgriculture Technology Kanpur
Department OfHorticulture and Department of Vegetable Crops are main component
of Horticulture work, the manpower of both the Divisions is Professors-6, Associate
Professors/Horticulturists-12, Assistant Professor-12, the total scientific staff is 37.
Thrust area
To develop suitable vegetable, spices and fruit varieties for the region. To develop
Agro techoiques for fruits, vegetables and spices. Standardize the seed production and
plant propagation techoique and work out the economics of production.
Major Achievements during the decade
Fruits
The department conducted pioneering work on bearing habits and floral biology in a
number of fruit crops. viz. Aonla, lackfruit, Litchi, Kamarakh, Khimi, lamun,
Annona, Breadfruit, wood apple, and Loquat etc. These are valuable to breeders and
researchers in planning their schedules and strategies.
Salt tolerance studies have been conducted on Mango, Guava, Ber, Grape, Aonla,
lamun, Bael, Pomegranate etc., which help in selecting salt tolerant strains I varieties.
Propagation studies have been conducted in a number of fruit crops viz. Mango,
Guava, Papaya, Litchi, Lime, Lemon, lackfruit, Ber, Aonla, etc. The stone grafting in
mango has been standardized. Healthy guava plants could be successfully
regenerated through stooling using IDA at 7500 ppm.
Application of 200 ppm NAA in mid October followed by deblossoming or
application of 200 ppm NAA alone is very effective In reducing mango
malformation. In aonla cultivars Banarsi provided good polliniser for cv. Francis
and vice versa. Therefore, both these vars. need be planted together in an orchard.
Studies on regulatin of cropping in guava revealed that use of urea (16%) or shoot
pruning (30 cm) proved useful to .avoid rainy season crop and getting a heaVyand
quality winter crop.
Agretechoiques with regard to pruning, nutritional requirements, screening of suitable
strains I varieties, use of growth regulators including other chemicals, have been
standardized in certain fruits viz. grapes, Phalsa, grape fruit, lime, lemon, mosambi,
ber, litchi, papaya and banana. The pre and post harvest physiological studies have
Final Report: 'National Level Techno-Economic Feasibility Study lor North Zone' 126
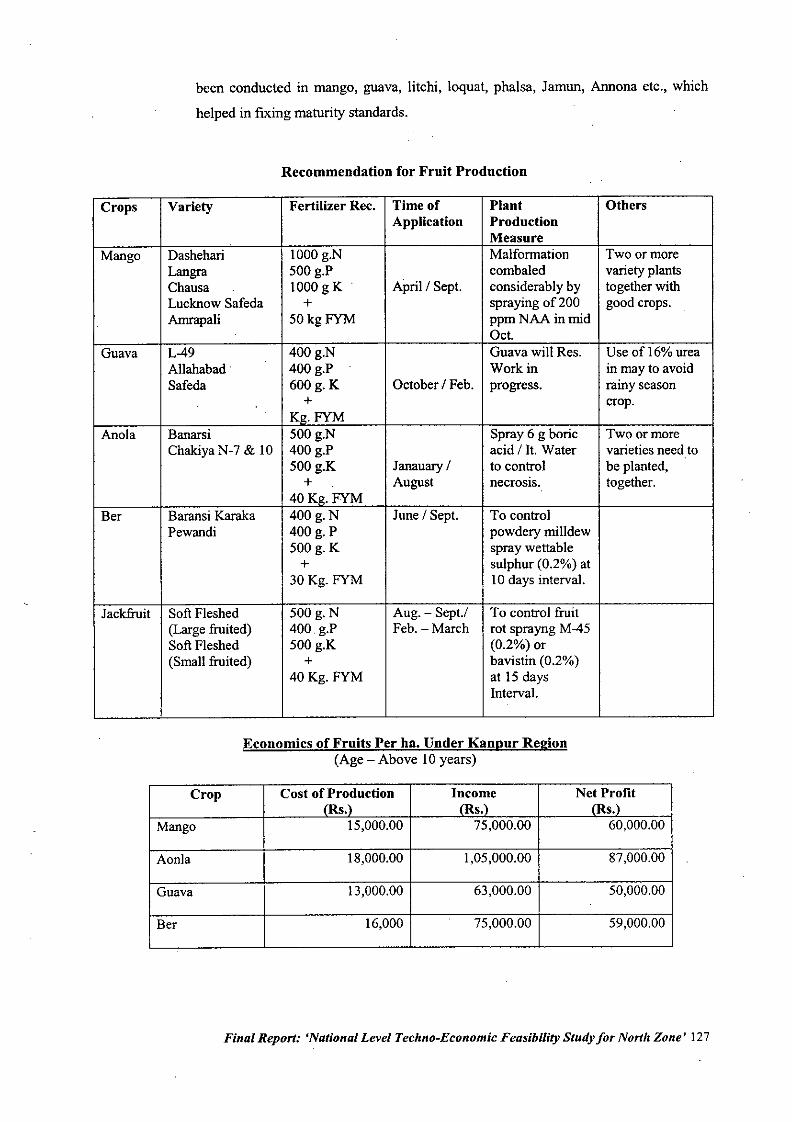
been conducted in mango, guava, litchi, loquat, phalsa, Jamun, Annona etc., which
helped in fixing maturity standards.
Recommendation for Fruit Production
Crops Variety Fertilizer Rec. Time of Plaut OthersApplication Production
MeasureMango Dashehari 1000 g.N Malformation Two or more
Langra 500 g.P combaled variety plantsChausa 1000gK April/Sept. considerably by together withLucknow Safeda + spraying of 200 good crops.Amrapali 50 kg FYM ppm NAA in mid
. Oct.Guava L-49 400g.N Guava will Res. Use of 16% urea
Allahabad. 400 g.P Work in in may to avoidSafeda 600g.K October / Feb. progress. rainy season
+ crop.Kg.FYM
Anoia Banarsi 500g.N Spray 6 g boric Two or moreChakiya N-7 & 10 400 g.P acid / It. Water varieties need to
500 g.K Janauary / to control be planted,+ August necrOSIS. together.
40Ke:. FYMBer Baransi Karaka 400 g.N June / Sept. To control
Pewandi 400 g. P powdery milldew500g.K spray wettable+ sulphur (0.2%) at
30Kg.FYM 10 days interval.
Jackfruit Soft Fleshed 500g.N Aug. - Sept.! To control fruit(Large fruited) 400 g.P Feb.-March rot sprayng M-45Soft Fleshed 500 g.K (0.2%) or(Small fruited) + bavistin (0.2%)
40Kg.FYM at 15 daysInterval.
Economics of Fruits Per ha. Under Kanpur Region(Age - Above 10 years)
Crop Cost of Production Income Net Profitms.) ms.) ms.)
Mango 15,000.00 75,000.00 60,000.00
Aonla 18,000.00 1,05,000.00 87,000.00
Guava 13,000.00 63,000.00 50,000.00
Ber 16,000 75,000.00 59,000.00
Final Report: 'National Level Techno-Economic Feasibility Study for North Zone' 127
4.3.3 b. Vegetable
(I) The irrigation requirement of mid season pea var Azad P-I is two irrigations,
one at pre bloom stage and one after first tricking. The yield was 116qlhawith
net profit ofRs. 87461ha.Applications of stomp CO.5kg. ailha followed by one
hand weeding after 45 days after planting.
(2) Application of 150+60+60kg NPK per hectare gives maximum return in garlic
bulb yield. Net Profit ofRs. 29374lha with cost benefited ratio of I:257. For
cabbage var. Pride of India 160kg N with 60 x 60 cm spacing givesmaximum
return ofRs. 48337 / h with cost benefit ratio of I :3.85. For French beau 80 N +
60 P gives maximum yield.
(3) For'mid season Cauliflower var. pant shubra seed production planting to 60 x
60 cm with 120 kg Nih gave maximum return of Rs. 15995 with cost benefit
ratio of 1:2.95. For Radish seed production 80 Kg N with 60 x 45 cm spacing
gives maximum net return. For onion seed production 120 kg Nlha with 45 x 30
cm spacing gives maximum seed yield.
(4) Vegetable crop rotation of Okra-Tomato- bitter gourd gives maximum returns
ofRs. 287071hwith cost benefit ratio of 1:2.06.
(5) Application of 15 kg ai / ha of Fluchlorelin supplemented with one hand
weeding after 30 days of brinjal transplanting gives maximum control against
weeds. For Okra Dual @ 1 kg / ha and Basalin @ 1.5 kg / ha gives better check
against weeds.
(6) For indeterminate tomato hybrids 240 kg N, 120 kg P and with spacing 80 x 30
cmwith staking gives maximum return
(7) Stone grafting in mango has been standardized.
(8) Healthy quava plants can be successfully regenerated through stooling using
lBA at 7500 ppm.
(9) Application of 200 PPM NAA in Mid October followed by deblossoming is
very effective in reducing mango malformation.
(10) Banarasi Aonla is good pollinator for cv. Francis and vice verse which resulted
in mixed planting of these varieties for higher production.
Final Report: 'National Level Techno-Economic Feasibility Study for North Zone' 128
(II) Urea 16% or shool pruning (upto 30 em) to reduce rainy season crop so that
quality produce of winter crop is more.
(12)
(13)
Agro Technique with regard to pruning nutritional requirement, screening of
suitable varieties / strains, use of growth regulators including chemicals have
been standarized in grapes, Phalsa, grape fruit, lime, lemon, mosambi and ber.
Agro Technique of rose, amaryllis, tuberose, gladiolus and marigold have been•standardized.
(14) Economics of different fruit crops production have been worked out for kanpur
region gives below
Varieties developed: During past decade a total of 27 varieties were developed in
different vegetable/spice crops. The cropwise varieties are:
Brinjal
Tomato
Chilli
Spongegourd
Bottlegourd
Azadhybrid
AzadB-2
Azad B-3
Azad T-3
Azad T-5
Azad T-6
Azad Mirch-l
Azad Mirch-2
Azad Torai-l
Azad Nutan
Azad Sankar-l
Round purple fruited with green calyxVery high yielding 65-70 tonlha shelf lifemore.
Round purple; calyx green high fruitnumber/plant
Long, glossy purple cylendrical withrounded stigmatic end
Determinate bold fruited, smooth Red,compact
Indeterminate, red, round, better shelflife.
Determinate, round, smooth, high fruitnumber per plant.
Fruit erect, borne in cluster plant dwarf
Stuffing purpose, medium long red,smooth, blunt stigmatic end.
Early, smooth, green fruited
Medium long, green, light weight
Fruit medium long, cylindrical attracture,smooth, sweet amenable to packaging
Final Report: 'National Level Techno-Economic FeasibilityStudy for North Zone' 129
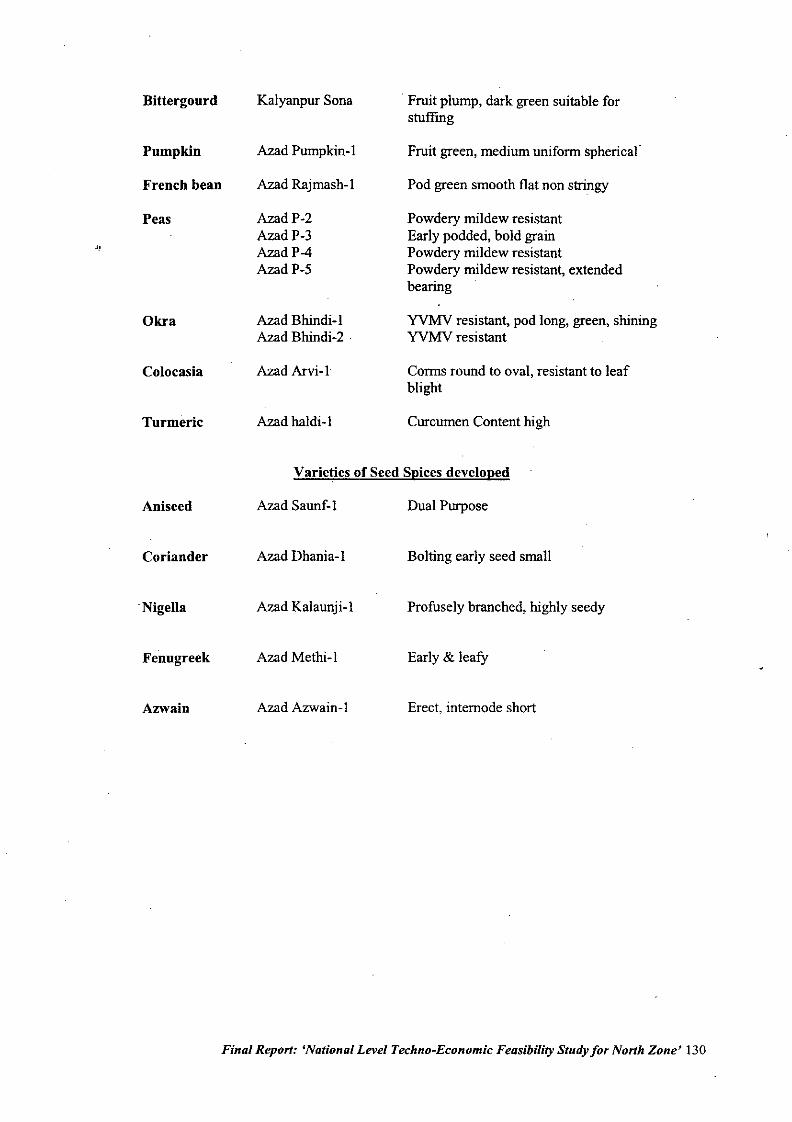
Bittergourd Kalyanpur Sona Fruit plump, dark green suitable forstuffmg
Pumpkin Azad Pumpkin-! Fruit green, medium uniform spherical"
French bean Azad Rajmash-l Pod green smooth flat non stringy
Peas AzadP-2 Powdery mildew resistantAzadP-3 Early podded, bold grain., AzadP-4 Powdery mildew resistantAzadP-5 Powdery mildew resistant, extended
bearing
Okra Azad Bhindi-! YVMV resistant, pod long, green, shiningAzad Bhindi-2 . YVMV resistant
Co!ocasia Azad Arvi-! Corms round to oval, resistant to leafblight
Turmeric Azad haldi-! Curcumen Content high
Varieties of Seed Spices developed
Aniseed Azad Saunf-! Dual Purpose
Coriander Azad Dhania-! Bolting early seed small
"Nigella Azad Kalaunji-! Profusely branched, highly seedy
Fenugreek Azad Methi-! Early & leafY
Azwain Azad Azwain-! Erect, internode short
Final Report: 'National Level Techno-Economic Feasibility Study for North Zone' 130
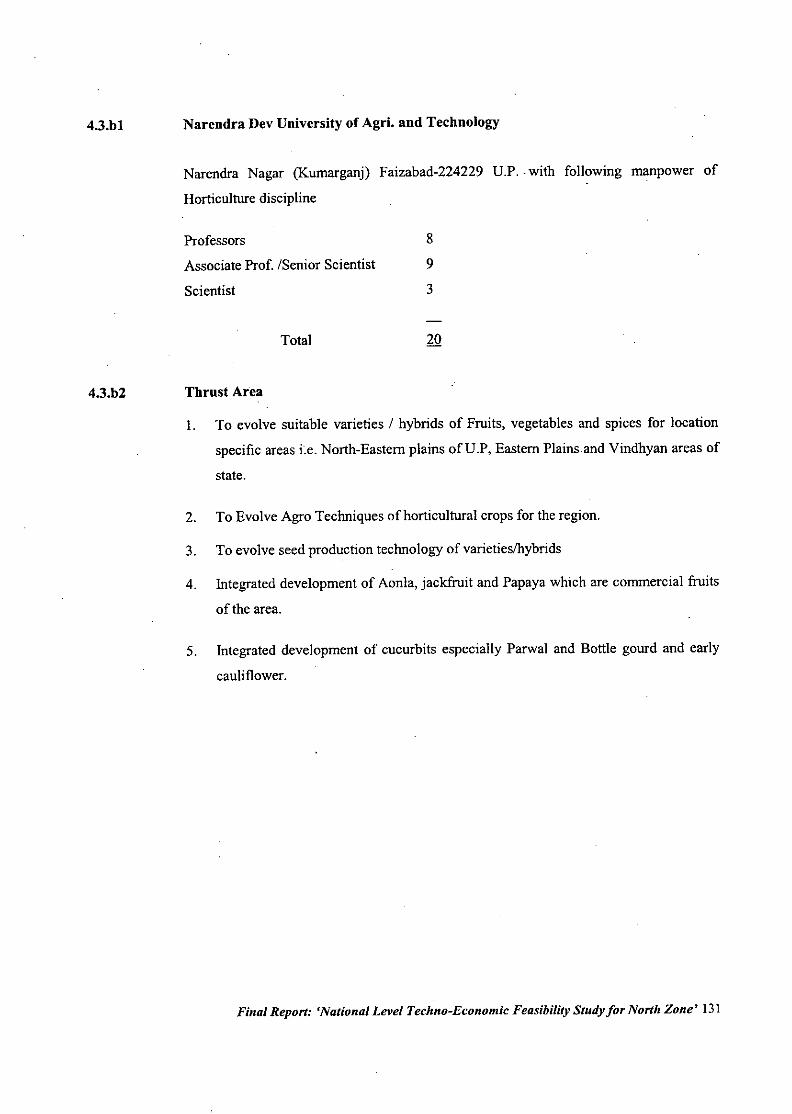
4.3.bl
4.3.b2
Narendra Dev University of Agri. and Technology
Narendra Nagar (Kumarganj) Faizabad-224229 D.P .. with following manpower of
Horticulture discipline
Professors 8
Associate Prof. ISenior Scientist 9
Scientist 3
Total 20
Thrust Area
1. To evolve suitable varieties I hybrids of Fruits, vegetables and spices for location
specific areas i~e.North-Eastern plains ofD.P, Eastern Plains and Vindhyan areas of
state.
2. To Evolve Agro Techniques of horticultural crops for the region.
3. To evolve seed production technology of varieties/hybrids
4. Integrated development of Aonla, jackfruit and Papaya which are commercial fiuits
of the area.
5. Integrated development of cucurbits especially Parwal and Bottle gourd and early
cauliflower.
Final Report: 'National Level Techno-Economic Feasibility Study for North Zone' 131
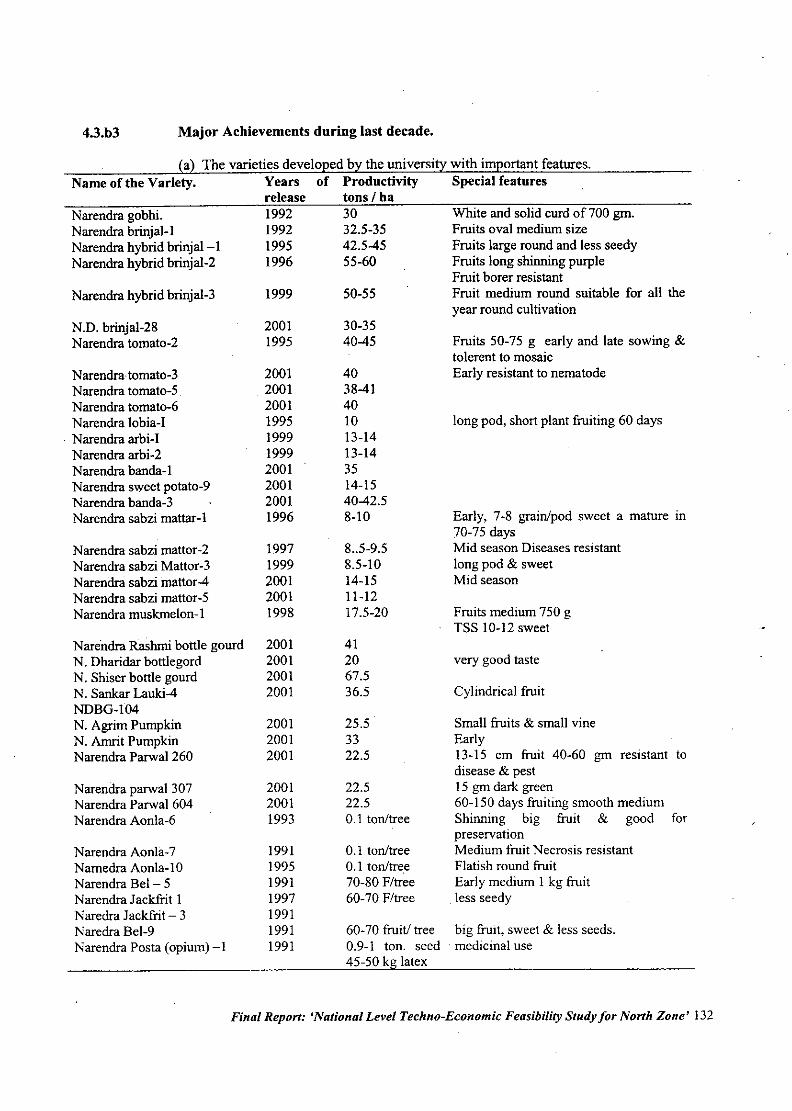
4.3.b3 Major Achievements during last decade.
Cylindrical fiuit
big fruit, sweet & less seeds.medicinal use
very good taste
Small fiuits & small vineEarly13-15 cm fiuit 40-60 gm resistant todisease & pest15 gm dark green60-150 days fiuiting smooth mediumShinning big fiuit & good forpreservationMedium fruit Necrosis resistantFlatish round fruitEarly medium 1 kg fiuitless seedy
Fruits medium 750 gTSS 10-12 sweet
Early, 7-8 grain/pod sweet a mature in70-75 daysMid season Diseases resistantlong pod & sweetMid season
long pod, short plant fiuiting 60 days
Fruits 50-75 g early and late sowing &tolerent to mosaicEarly resistant to nematode
White and solid curd of 700 gm.Fruits oval medium sizeFruits large round and less seedyFruits long shinning purpleFruit borer resistantFruit medium round suitable for all theyear round cultivation
25.53322.5
22.522.5O.I ton/tree
0.1 ton/tree0.1 ton/tree70-80 Fltree60-70 Fltree
60-70 fruit! tree0.9-1 ton. seed45-50 kg latex
412067.536.5
8..5-9.58.5-1014-1511-1217.5-20
50-55
30-3540-45
4038-41401013-1413-143514-1540-42.58-10
<a) The varieties developed by the university with important features.Name oUhe Variety. Years of Productivity Special features
release tons I ha1992 301992 32.5-351995 42.5-451996 55-60
Narendra gobhi.Narendra brinjal-INarendra hybrid brinjal-INarendra hybrid brinjal-2
Narendra hybrid brinjal-3 1999
N.D. brinjal-28 2001Narendra tomato-2 1995
Narendra.tomato-3 2001Narendra tomato-5. 2001Narendra tomato-6 2001Narendra lobia-! 1995
. Narendra arbi-I 1999Narendra arbi-2 1999Narendra banda-I 2001Narendra sweet potato-9 2001Narendra banda-3 2001Narendra sabzi mattar-I 1996
Narendra sabzi mattor-2 1997Narendra sabzi Mattor-3 1999Narendra sabzi mattor-4 2001Narendra sabzi mattor-5 2001Narendra muskmelon-I 1998
Narendra Rashmi bottle gourd 2001N. Dharidar bottlegord 2001N. Shiser bottle gourd 2001N. Sankar Lauki-4 2001NDBG-I04N. Agrim Pumpkin 2001N. Amrit Pumpkin 2001Narendra Parwal260 2001
Narendra parwal 307 2001Narendra Parwal 604 2001Narendra Aonla-6 1993
Narendra Aonla-7 1991Namedra Aonla-IO 1995Narendra Bel- 5 1991Narendra Jackfrit I 1997Naredra Jackfrit - 3 1991Naredra Bel-9 1991Narendra Posta (opium)-I 1991
Final Report: 'National Level Techno-Economic Feasibility Study for North Zone' 132
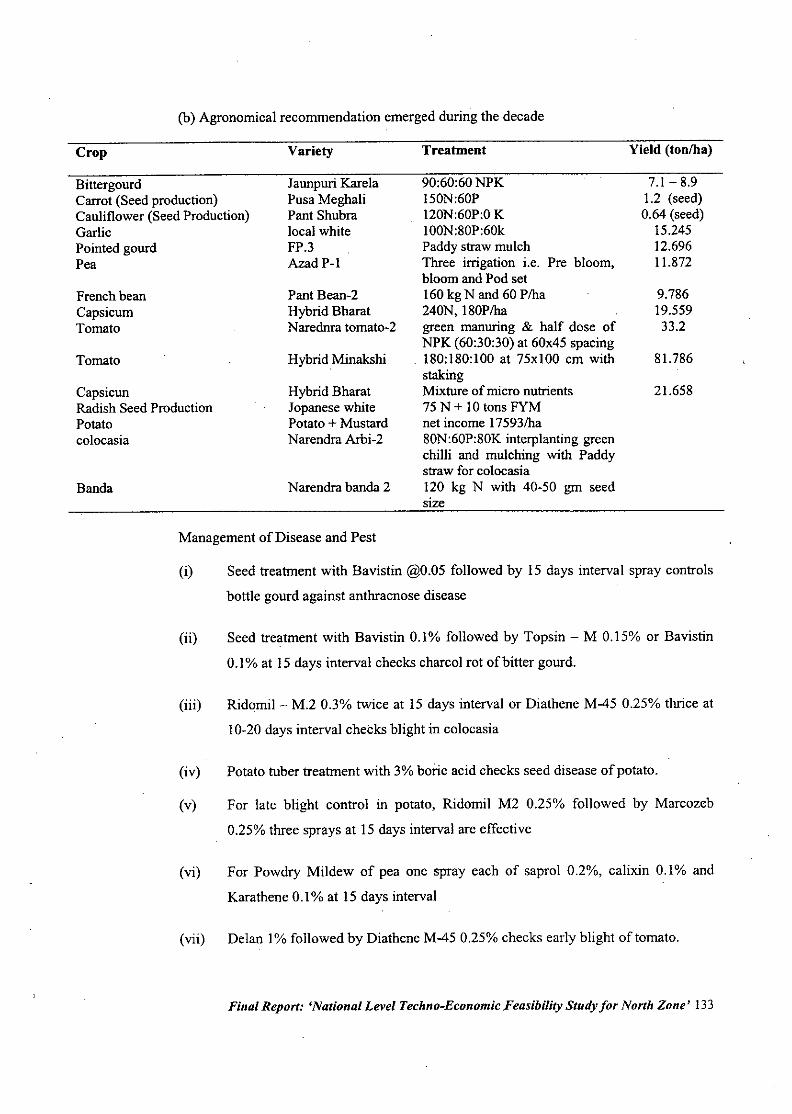
(b) Agronomical recommendation emerged during the decade
Crop
BittergourdCarrot (Seed production)Cauliflower (Seed Production)GarlicPointed gourdPea
French beanCapsicumTomato
Tomato
CapsicunRadish Seed ProductionPotatocolocasia
Banda
Variety
Jaunpuri KarelaPusa MeghaliPant Shubralocal whiteFP.3Azad P-l
Pant Bean-2Hybrid BharatNarednra tomato-2
HybridMinakshi
Hybrid BharatJopanese whitePotato + MustardNarendra Arbi-2
Narendra banda 2
Treatment
90:60:60 NPK150N:60P120N:60P:0 K100N:80P:60kPaddy straw mulchThree irrigation i.e. Pre bloom,bloom and Pod set160 kg Nand 60 Plha240N, 180Plhagreen manuring & half dose ofNPK (60:30:30) at 60x45 spacing180:180:100 at 75xlO0 em withstakingMixture of micro nutrients75 N + 10 tons FYMnet income 17593lha80N :60P:80K interplanting greenchilli and mulching with Paddystraw for colocasia120 kg N with 40-50 gm seedsize
Yield (tonlha)
7.1-8.91.2 (seed)0.64 (seed)
15.24512.69611.872
9.78619.55933.2
81.786
21.658
Management of Disease and Pest
(i) Seed treatment with Bavistin @0.05 followed by 15 days interval spray controls
bottle gourd against anthracnose disease
(ii) Seed treatment with Bavistin 0.1% followed by Topsin - M 0.15% or Bavistin
0.1% at 15 days interval checks charcol rot of bitter gourd.
(iii) Ridomil - M.2 0.3% twice at 15 days interval or Diathene M-45 0.25% thrice at
10-20 days interval checks blight in colocasia
(iv) Potato tuber treatment with 3% boric acid checks seed disease of potato.
(v) For late blight control in potato, Ridomil M2 0.25% followed by Marcozeb
0.25% three sprays at 15 days interval are effective
(vi) For Powdry Mildew of pea one spray each of saprol 0.2%, calixin 0.1% and
Karathene 0.1% at 15 days interval
(vii) Delan I% followed by Diathene M-45 0.25% checks early blight of tomato.
Final Report: 'National Level Techno-Economic .Feasibility Study for North Zone' 133
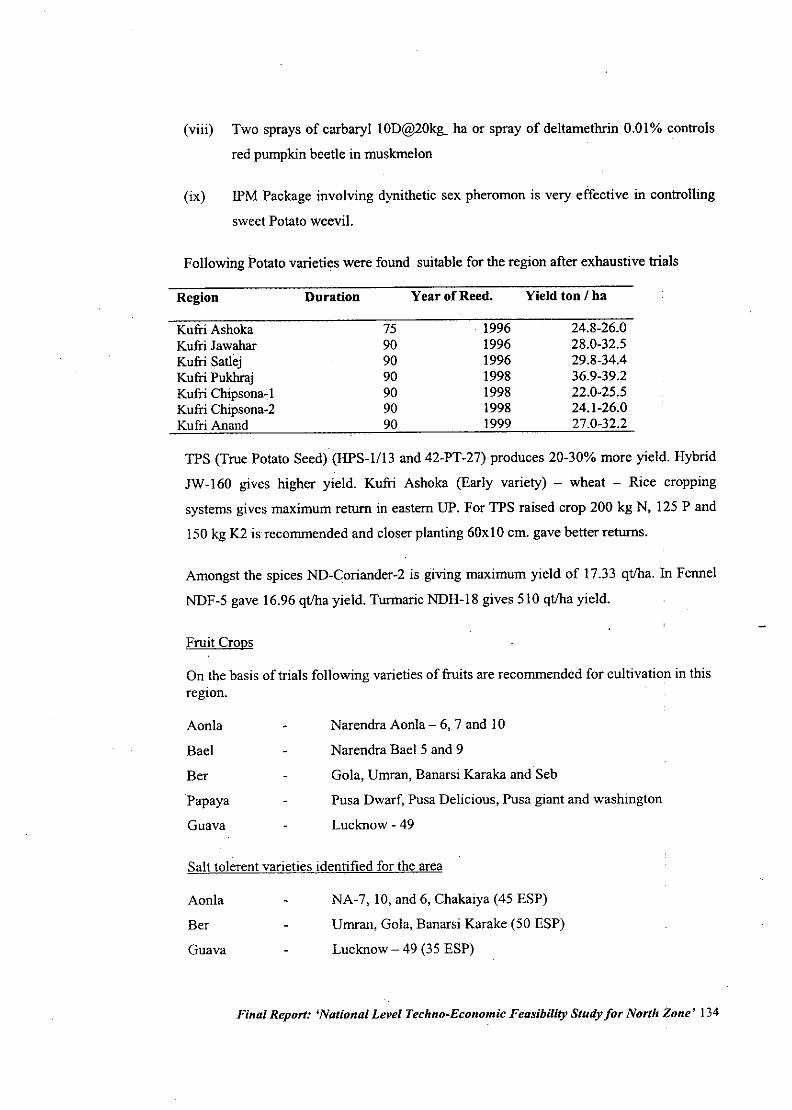
(viii) Two sprays of carbaryl IOD@20k!L ha or spray of deltamethrin 0.01 % controls
red pumpkin beetle in muskmelon
(ix) IPM Package involving dynithetic sex pheromon is very effective in controlling
sweet Potato weevil.
Following Potato varieties were found suitable for the region after exhaustive trials
Region Duration Year of Reed. Yield ton I ba
Kufri Asboka 75 1996 24.8-26.0Kufri Jawahar 90 1996 28.0-32.5Kufri Satlej 90 1996 29.8-34.4Kufri Pukhraj 90 1998 36.9-39.2Kufri Chipsona-I 90 1998 22.0-25.5Kufri Chipsona-2 90 1998 24.1-26.0Kufri Anand 90 1999 27.0-32.2
TPS (True Potato Seed) (HPS-1/13 and 42-PT-27) produces 20-30% more yield. Hybrid
JW-160 gives higher yield. Kufri Ashoka (Early variety) - wheat - Rice cropping
systems gives maximum return in eastern UP. For TPS raised crop 200 kg N, 125 P and
ISO kg K2 is recommended and closer planting 60x I0 em. gave better returns.
Amongst the spices ND-Coriander-2 is giving maximum yield of 17.33 qtlha. In Fennel
NDF-5 gave 16.96 qtlha yield. Turmaric NDH-18 gives 510 qtlha yield.
Fruit Crops
On the basis of trials following varieties of fruits are recommended for cultivation in thisregIon.
Aonla
Bael
Ber
'Papaya
Guava
Narendra Aonla - 6, 7 and 10
Narendra Bael 5 and 9
Gola, Umran, Banarsi Karaka and Seb
Pusa Dwarf, Pusa Delicious, Pusa giant and washington
Lucknow -49
Salt tolerent varieties identified for the area
Aonla
Ber
Guava
NA-7, 10, and 6, Chakaiya (45 ESP)
Umran, Gola, Banarsi Karake (50 ESP)
Lucknow - 49 (35 ESP)
Final Report: 'National Level Techno-Economic Feasibility Study for North Zone' 134
Temrind (50 ESP) and Karonda (50 ESP)
Propagation Techniques Standardized
Jack Fruit
Aonla
Ber
Guava
Bael
Patch budding in May- June
Patch budding in June-July
Patch budding of defoliated seedlings in July under Poly
bag of25 x 15 cm.
Stoollayring - Heading back in February layring and earthing
in June
Patch budding in June-July
Inter-cropping in Papaya plantation with following vegetables gives better returns
Papaya
Papaya
Papaya
Potato -..
Potato -..
Rajma -..
Onion
Suran
Suran
Final Report: 'National Level Techno-Economic Feasibility Study for North Zone' 135
4.44.4.1
4.4.2
State Horticulture Department Uttar Pradesh
Name of Department, location and Manpower: Department of Horticulture and Food
Processing UP Govt., Udyan Bhawan, 2 Sapru Marg Lucknow UP.
(a) Manpower
Senior level officers namely, I Director, I Additional Director, 6 Joint Directors and 3
chief Horticultwists / specialists, 37 Senior class I officers i.e., I Deputy Director
Planning, II Regional Deputy directors, I Senior Accounts Officers and 21 other Senior
Officers, ISS Class II officers, like district Horticulture officers, Potato Development
officers, Subject matter specialists, Accounts officer, Garden Superintendents etc., 4261
Non Gazetted Group ill and IV class Officials with, 4463 total Manpower of the state.
Thrust Area
I. Improve the productivity of fruit, vegetables and potato in the state.
2. More emphasis and time bound improvement in important crops of the state like
mango, guava,aonla, citrus spp., tomato, peas, parwal, okra, brinjal, and cole crops.
3. Export potential crops like mango, potato and flower specific Agri export zones with
single point information for integrated development of these crops will be
established. It will cover 32 districts.
4. Production of improved and pure seeds and planting material on large scale
5. To provide technical information on farmers field so that production and productivity
. is increased
6. To give training of fruit preservation, mushroom cultivation, bee keeping, cookery
and bakery to start small scale production to generate their income and rural
employment.
7. Rejuvenate the old and uneconomic gardens of the state
8. To reduce the post harvest losses, the marketing on cooperative basis will be
encouraged and storage facilities including cold storage capacity will be enhanced.
9. To get implemented the Modem Production Technology developed by different Agri
Universities of the state to farmers and train the horticulture' staff to update the
knowledge
10. More emphasis on organic farming INM, IPM to protect environment
II. Unproductive land like Us~r, Alkaline, Saline and Marshy lands will be put to better
use with hort. plants.
Final Report: 'National Level Techno-Economic Feasibility Study for North Zone' 136
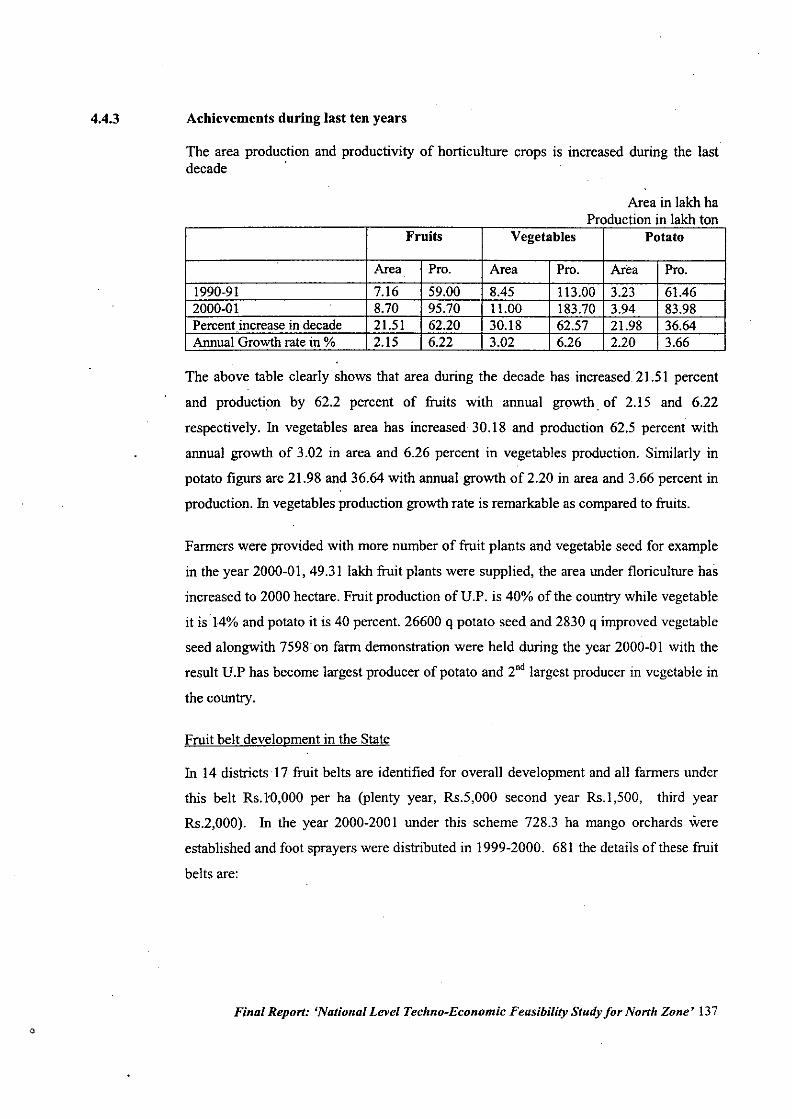
4.4.3 Achievements during last ten years
The area production and productivity of horticulture crops is increased during the lastdecade '
Area in lakh haProduction in lakh ton
Fruits Vegetables Potato
Area Pro. Area Pro. Area Pro.1990.91 7.16 59.00 8.45 113.00 3.23 61.462000-01 8.70 95.70 11.00 183.70 3.94 83.98Percent increase in decade 21.51 62.20 30.18 62.57 21.98 36.64AnnualGrowth rate in % 2.15 6.22 3.02 6.26 2.20 3.66
The above table clearly shows that area during the decade has increased. 21.51 percent
and production by 62.2 percent of fruits witb annual growth of 2.15 and 6.22
respectively. In vegetables area has increased 30.18 and production 62.5 percent witb
annual growtb of 3.02 in area and 6.26 percent in vegetables production. Similarly in
potato figurs are 21.98 and 36.64 with annual growtb of 2.20 in area and 3.66 percent in
production. In vegetables production growtb rate is remarkable as compared to fruits.
Farmers were provided with more number of fruit plants and vegetable seed for example
in the year 2000-0I, 49.31 lakh fruit plants were supplied, the area under floriculture has
increased to 2000 hectare. Fruit production ofU.P. is 40% of the country while vegetable
it is 14% and potato it is 40 percent. 26600 q potato seed and 2830 q improved vegetable
seed alongwitb 7598 on farm demonstration were held during the year 2000-01 with the
result U.P has become largest producer of potato and 2nd largest producer in vegetable in
the country.
Fruit belt development in the State
In 14 districts 17 fruit belts are identified for overall development and all farmers under
this belt Rs.I'O,OOOper ha (plenty year, RS.5,000 second year Rs.I,500, third year
Rs.2,OOO). In the year 2000-2001 under this scheme 728.3 ha mango orchards were
established and foot sprayers were distributed in 1999-2000. 681 the details of these fruit
belts are:
Final Report: 'National Level Techno-Economic Feasibility Study for North Zone' 137
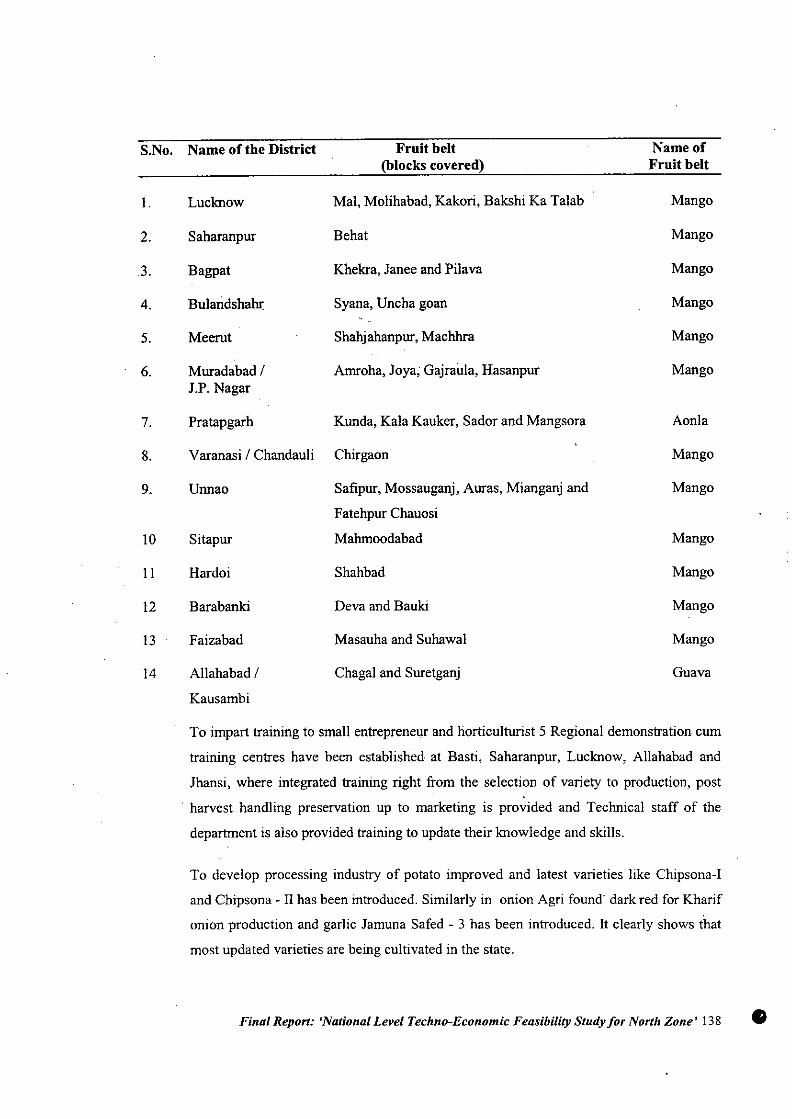
S.No. Name of the District Fruit belt Name of(blocks covered) Fruit belt
I. Luclmow Mal, Molihabad, Kakori, Bakshi Ka Talab Mango
2. Saharanpur Behat Mango
3. Bagpat Khekra, Janee and Pilava Mango
4. BularidshaJu: Syana, Uncha goan Mango
5. Meerut Shahj ahanpur, Machhra Mango
6. Muradabadl Amroha, Joya, Gajraula, Hasanpur MangoJ.P. Nagar
7. Pratapgarh Kunda, Kala Kauker, Sador and Mangsora Aonla
8. Varanasi I Chandauli Chirgaon Mango
9. Unnao Safipur, Mossauganj, Auras, Mianganj and Mango
Fatehpur Chauosi
10 Sitapur Mahmoodabad Mango
II Hardoi Shahbad Mango
12 Barabanki Deva and Bauki Mango
13 Faizabad Masauha and Suhawal Mango
14 Allahabad I Chagal and Suretganj Guava
Kausambi
To impart training to small entrepreneur and horticulturist 5 Regional demonstration cum
training centres have been established. at Basli, Saharanpur, Luclmow, Allahabad and
Jhansi, where integrated training right from the selection of variety to production, post
. harvest handling preservation up to marketing is provided and Technical staff of the
department is also provided training to update their Imowledge and skills.
To develop processing industry of potato improved and latest varieties like Chipsona-I
and Chipsona - II has been introduced. Similarly in onion Agri found' dark red for Kharif
onion production and garlic Jamuna Safed - 3 has been introduced. It clearly shows that
most updated varieties are being cultivated in the state.
Final Report: 'National Level Techno-Economic Feasibility Study for North Zone' 138 •
Establishment of Agri-Export Zones - Potato export zone at Agra and Meerut and
Lucknow and Saharanpur for mango have been established. In these zones high quality
potato seed and mango plants along with package and practices to harvesting and
marketing facilities are provided.
Under UP diversified Agriculture Support Project (UPDAS) 157blocks of 37 districts are
selected for integrated development programme which includes establishment of modem
nursaries at Basti, Saharanpur and Faizabad, Demonstration on farmers fields, use of
corrugated boxes for mango packing, rejuvenation of old orchards and supply of low
tunnel plastic structures for nursery raising and IPM technology. In addition to this 10
nursaries for mango plants and 180 nursaries for vegetable seedlings production were
promoted financed and technical help provided in private sector. 821 departmental
officials and 27945 farmers were trained at state department I universities and Central
Institute. 3662 demonstration were held. Following centres have been identified for
integrated development of different commodities like for vegetables- Varanasi for
Mentha. Rampur and Barabanki for flowers - Ghaziabad and for Aonla - Pratapgarh and
Allahabad. Similarly food park in Barabanki near Lucknow is being developed to provide
all inputs for grading, packing, marketing, storage etc. for horticultural produce.
Fruit Preservation and Canning Institute, Lucknow imparts training of 2 year duration
where 25 students are trained every year and Associate-ship is awarded, at 10 regional
research and demonstration centres provide training to 660 students every year in food
processing, bakery, confectionery and cookery, one year diploma is awarded at 10 Food
Science training centres of Meerut, Moradabad, Barielly, Agra, Jhansi, Kanpur,
Allahabad, Faizabad, Gorakhpur and Varanasi. There are 101 food processing centres in
the state where 15 days training in fruit and vegetable preservation and 100 days training
is provided to small scale commercial entrepreneurs so that they can start home scale
industries.
Final Report: 'National Level Techno-Economic Feasibility Study for North Zone' 139
Achievement under UP Diversified Agriculture Support Project
The remarkable achievements can be narrated as under because close linkages were
between State Department, farmers and NGO's under UPDASP (U.P Diversified
Agricultural Support Project working in the region has resulted fol1owingachievements.
1. Eighteen rehabilitation of old orchards of 0.5 ha. each with Amarpali hybrid
mango in 1999-2000 and 2000-200 I with high density planting of 1600 plants
per ha. in seven districts will set momentum for uprooting old and uneconomical
orchards and replanted with latest hybrid variety Amarpali of Mango in
Lucknow, Saharanpur and Meerut districts.
2. 4 demonstration of rejuvenation of old orchards by Technique developed by
Central Institute of Sub-tropical Horticulture Lucknow is Lucknow, Saharanpur
and Meerut districts in 1999-2000 and 5 demonstrations in 2000-200 I will set an
example for rejuvenation of old orchards between the age group of 40-50 years
will boost the Mango productivity in the state.
3. Replacement of wooden boxes with corrugated boxes for mango packing.
4. Varietal replacement
Garlie variety Yamuna safed with bigger cloves
5. Potato cultivation through True Potato seed. Varietal replacement in Onion and
Kharif onion cultivation in the state.
Kharif onion production of variety Agri. Found Dark Red through sets have
opened new crop of Kharif onion cultivation in the state. Agri. found dark red
for main rabi season have shown encouraging results and through this
intervention area under onion will increase and production wil1be more.
6. Induction of new technology and introduction of vegetable hybrid varieties -
hybrid in tomato, brinjal, cauliflower and chilli were far superior than varieties
on the farmers field trial and ultimately net profits was also much more. This will
encourage other farmers to grown hybrids.
Final Report: 'National Level Techno-Economic Feasibility Study for North Zone' 140
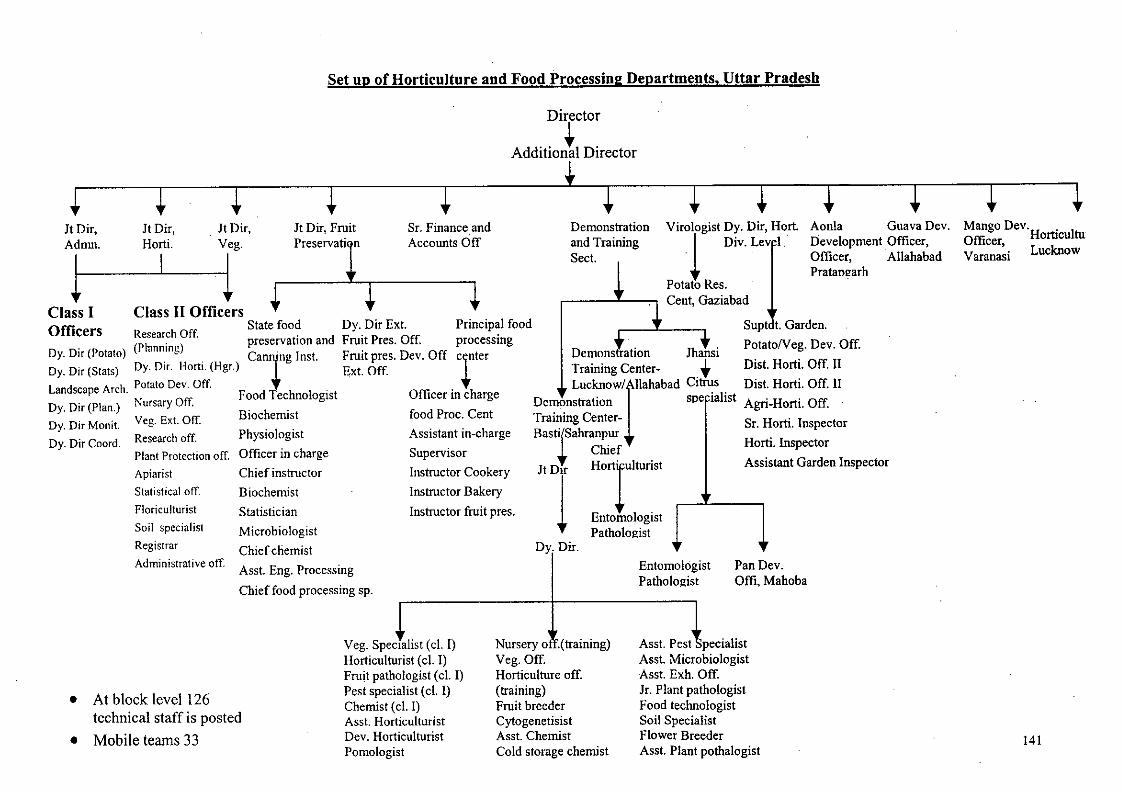
Set up of Horticulture and Food Processing Departments, Uttar Pradesh
Mango Dev.Officer HomcultuVarana~i Lucknow
Aonla Guava Dev.Development Officer,Officer, AllahabadPratanl:!'arh
Pan Dev.Offi, Mahoba
Virologist Dy. Dir, Hort..l Div. Lev I.
Potato Res.Cent, Gaziabad
Supt !. Garden.PotatoNeg. Dev. Off.Dis!. Horti. Off. 1IDist. Horti. Off. 1IAgri-Horti. Off.Sr. Hom. InspectorHom. InspectorAssistant Garden Inspector
EntomologistPatholo~ist
Demonstrationand TrainingSec!.
Dy. Dir.
Demonstration JhansiTraining Center- .••LUCknOW/Illahabad Citrus
Demonstration spe ialistTraining Center-Bast~Sahranpur
.•• ChiefJt Dlf HortrUlturist
1 EntomologistPatholo~ist
Ass!. Eng. Processing
Chief food processing sp.
~ ~Jt Dir, Jt Dir,Horti. Veg.
I 1Jt Dir, Fruit Sr. Finance andpreservatir Acconnts Off
Class II Officers ~ ~ ~State food Dy. Dir Ext. Principal foodpreservation and Fruit Pres. Off. processingCanrlfng Ins!. Fruit pres. Dev. Off c1nter
•• Ex!. Off ••Food Technologist Officer in chargeBiochemist food Proc. CentPhysiologist Assistant in-chargeOfficer in charge SupervisorChief instructor Instructor CookeryBiochemist Instructor BakeryStatistician Instructor fruit pres.MicrobiologistChief chemist
Jt Dir,Adnm.
1
Director
Additiont Director
~-~
Class IOfficers ResearchOff.Dy. Dir (Potato) (Phlllning)Dy. Dir (Stats) Dy. Dir. Horti. (Hgr.)Landscape Arch. Potato Dev.Off.Dy. Dir (Plan.) Nursary Off.Dy. Dir Monit. Veg. Ext. Off.Dy. Dir Coord. Research off.
Plant Protection off.ApiaristStatistical off.FloriculturistSoil specialistRegistrarAdministrative off.
• At block level 126technical staff is posted
• Mobile teams 33
Veg. SpecIalist (d. I)Horticulturist (cl. I)Fruit pathologist (cl. I)Pest specialist (d. I)Chemist (cl. I)Ass!. HorticulturistDev. HorticulturistPomologist
Nursery 0 .(training)Veg. Off.Horticulture off.(training)Fruit breederCylogenetisistAss!. ChemistCold storage chemist
Ass!. Pest pecialistAss!. MicrobiologistAss!. Exh. Off.Jr. Plant pathologistFood technologistSoil SpecialistFlower BreederAsst. Plant pothalogist
141
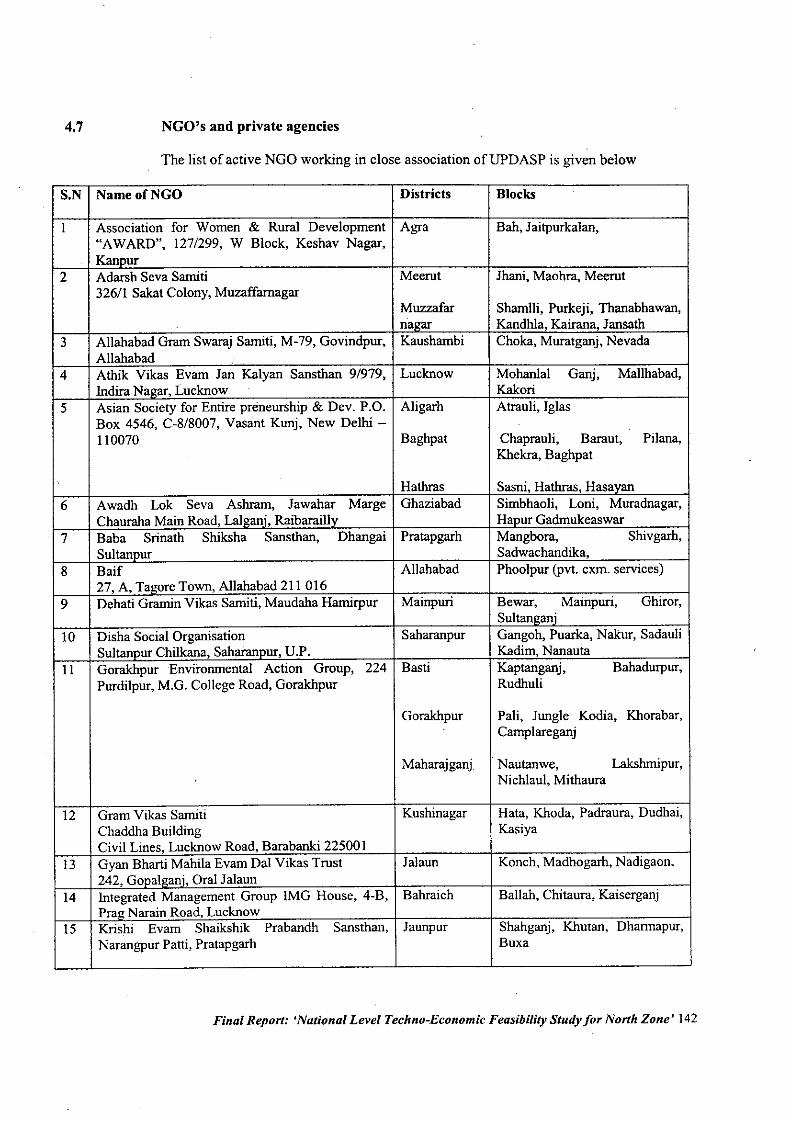
4.7 NGO's and private agencies
The list of active NGO working in close association ofUPDASP is given below
S.N NameofNGO Districts Blocks
I Association for Women & Rural Development Agra Bah, Jaitpurkalan,"AWARD", 127/299, W Block, Keshav Nagar,
. Kanpur2 Adarsh Seva Sarniti Meerut Jhani, Maohra, Meerut
326/1 Sakat Colony, MuzaffarnagarMuzzafar Shamlli, Purkeji, Thanabhawan,
. nalZar Kandhla, Kairana, Jansath3 Allahabad Gram Swaraj Sarniti, M-79, Govindpur, Kaushambi Choka, Muratganj, Nevada
Allahabad ..
4 Athik Vikas Evam Jan Kalyan Sansthan 9/979, Lucknow Mohanlal Ganj, Mallhabad,Indira NalZar,Lucknow Kakori
5 Asian Society for Entire preneurship & Dev. P.O. Aligarh Atrauli, IglasBox 4546, C-8/8007, Vasant Kunj, New Delhi -110070 Baghpat Chaprauli, Baraut, Pilana,
Khekra, Baghpat
Hathras Sasni, Hathras, Hasavan6 Awadh Lok Seva Ashram, Jawahar Marge Ghaziabad Simbhaoli, Loni, Muradnagar,
Chauraha Main Road, Lalgani, Raibaraillv Haour Gadmukeaswar7 Baba Srinath Shiksha Sansthan, Dhangai Pratapgarh Mangbora, Shivgarh,
Sultanour Sadwachandika,8 Baif Allahabad Phoolpur (pvt. cxm. services)
27, A, Tagore Town, Allahabad 2110169 Dehati Gramin Vikas Samiti, Maudaha Harnirpur Mainpuri Bewar, Mainpuri, Ghiror,
Sultanganj10 Disha Social Organisation Saharanpur Gangoh, Puarka, Nakur, Sadauli
Sultanpur Chilkana, Saharanour, U.P. Kadim, Nanauta11 GorakhpurEnvironmental Action Group, 224 Basti Kaptanganj, Bahadurpur,
Purdilpur, M.G. College Road, Gorakhpur Rudhuli
Gorakhpur Pali, Jungle Kodia, Khorabar,Camplareganj
Maharajganj Nautanwe, Lakshmipur,Nichlaul, Mithaura
12 Gram Vikas Sarniti Kushinagar Hata, Khoda, Padraura, Dudhai,Chaddha Building KasiyaCivil Lines, Lucknow Road, Barabanki 22500 I
13 Gyan Bharti Mahila Evam Dal Vikas Trust Jalaun Konch, Madhogarh, Nadigaon,242, GopallZani,Oral Jalaun
14 Integrated Management Group IMG House, 4-B, Bahraich Ballah, Chitaura, KaiserganjPralZNarain Road, Lucknow
15 Krishi Evam Shaikshik Prabandh Sansthan, Jaunpur Shahganj, Khutan, Dharmapur,Narangpur Patti, Pratapgarh Buxa
Final Report: 'National Level Techno-Economic Feasibility Study for North Zone' 142
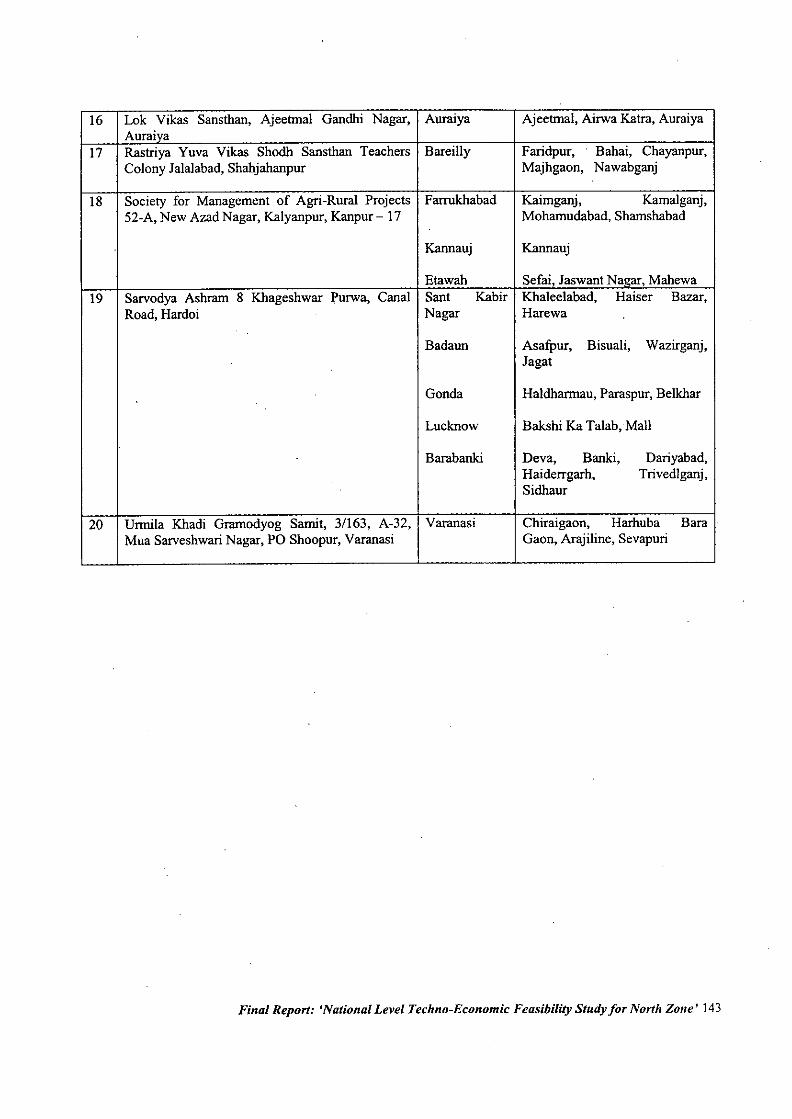
16 Lok Vikas Sansthan, Ajeetmal Gandhi Nagar, Auraiya Ajeetmal, Airwa Katra, AuraiyaAuraiva
17 Rastriya Yuva Vikas Shodh Sansthan Teachers Bareilly Faridpur, Bahai, Chayanpur,Colony Jalalabad, Shahjahanpur Majhgaon, Nawabganj
18 Society for Management of Agri-Rural Projects Farrukhabad Kaimganj, Kamalganj,52-A, New Azad Nagar, Kalyanpur, Kanpur - 17 Moharnudabad, Sharnshabad
Kannauj Kannauj
Etawah Sefai, Jaswant Nagar, Mahewa19 Sarvodya Ashram 8 Khageshwar purwa, Canal Sant Kabir Khalee1abad, Haiser Bazar,
Road, Hardoi Nagar Harewa
Badaun Asafpur, Bisuali, Wazirganj,Jagat
Gonda Haldharrnau, Paraspur, Belkhar
Lucknow Bakshi Ka Talab, Mall
Barabanki Deva, Banki, Dariyabad,Haiderrgarh, Trivedlganj,Sidhaur
20 Urmila Khadi Grarnodyog Sarnit, 3/163, A-32, Varanasi Chiraigaon, Harhuba BaraMua Sarveshwari Nagar, PO Shoopur, Varanasi Gaon, Arajiline, Sevapuri
Final Report: 'National Level Techno-Economic Feasibility Study for North Zone' 143
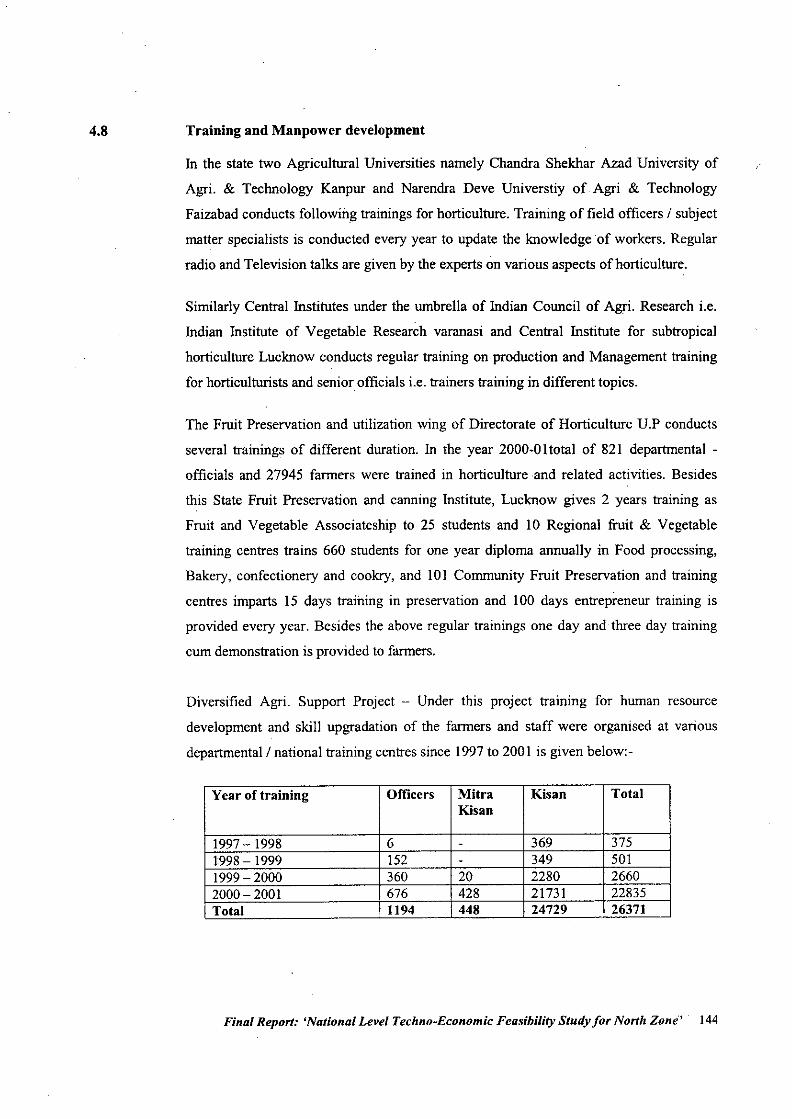
4.8 Training and Manpower development
In the state two Agricultural Universities namely Chandra Shekhar Azad University of
Agri. & Technology Kanpur and Narendra Deve Universtiy of Agri & Technology
Faizabad conducts following trainings for horticulture. Training of field officers / subject
matter specialists is conducted every year to update the knowledge 'of workers. Regular
radio and Television talks are given by the experts on various aspects of horticulture.
Similarly Central Institutes under the umbrella of Indian Council of Agri. Research i.e.
Indian Institute of Vegetable Research varanasi and Central mstitute for subtropical
horticulture Lucknow conducts regular training on production and Management training
for horticulturists and senior officials i.e. trainers training in different topics.
The Fruit Preservation and utilization wing of Directorate of Horticulture U.P conducts
several trainings of different duration. In the year 2000-0 ltotal of 821 departmental -
officials and 27945 farmers were trained in horticulture and related activities. Besides
this State Fruit Preservation and canning Institute, Lucknow gives 2 years training as
Fruit and Vegetable Associateship to 25 students and 10 Regional fruit & Vegetable
training centres trains 660 students for one year diploma annually in Food processing,
Bakery, confectionery and cookry, and 101 Community Fruit Preservation and training
centres imparts 15 days training in preservation and 100 days entrepreneur training is
provided every year. Besides the above regular trainings one day and three day training
cum demonstration is provided to farmers.
Diversified Agri. Support Project - Under this project training for human resource
development and skill upgradation of the farmers and staff were organised at various
departmental/national training centres since 1997 to 2001 is given below:-
Year oftraining Officers Mitra Kisan TotalKisan
1997 - 1998 6 - 369 3751998 - 1999 152 - 349 5011999 - 2000 360 20 2280 26602000- 2001 676 428 21731 22835Total 1194 448 24729 26371
Final Report: 'National Level Techno-Economic Feasibility Study for North Zone' 144
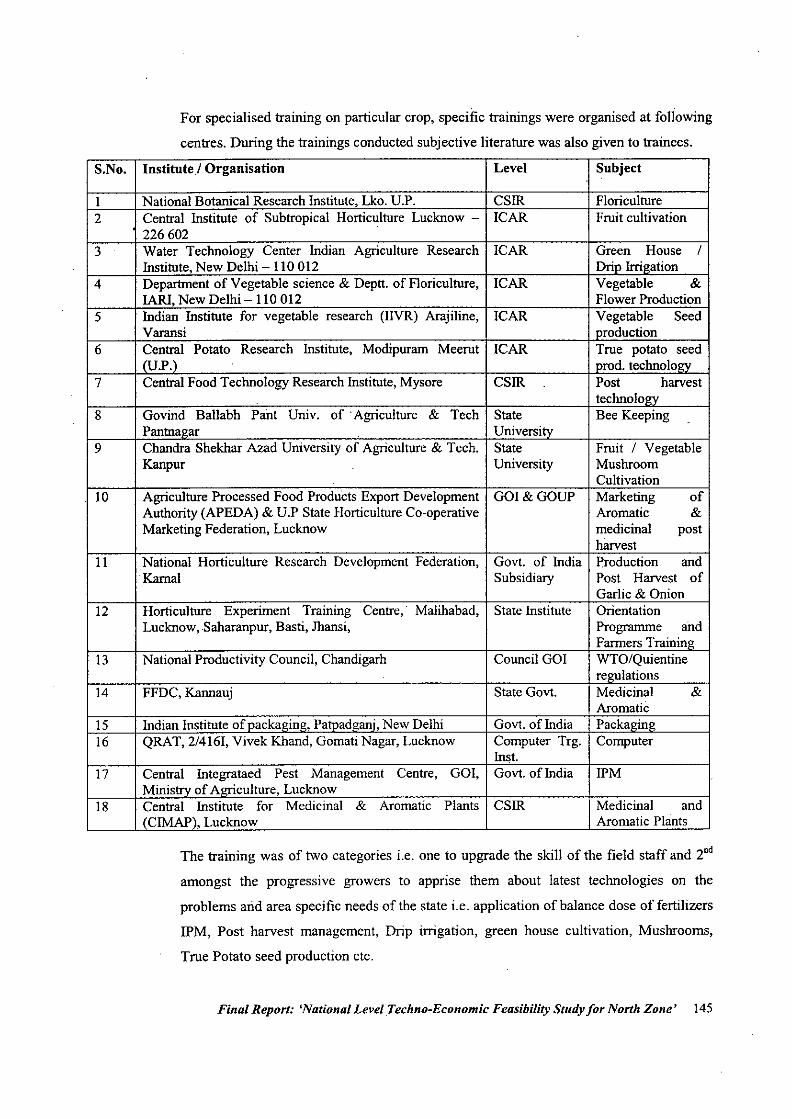
For specialised training on particular crop, specific trainings were organised at following
centres. During the trainings conducted subjective literature was also given to trainees.
S.No. InstitutelOrganisation Level Subject
I National Botanical Research Institute, Lko. U.P. CSIR Floriculture2 Central Institute of Subtropical Horticulture Lucknow - ICAR Fruit cultivation
2266023 Water Technology Center Indian Agriculture Research ICAR Green House 1
Institute, New Delhi - I 10 012 Drip Irrigation4 Department of Vegetable science & Deptt. of Floriculture, ICAR Vegetable &
JAR!, New Delhi - 110 012 Flower Production5 Indian Institute for vegetable research (INR) ArajiIine, ICAR Vegetable Seed
Varansi production6 Central Potato Research Institute, Modipurarn Meerut ICAR True potato seed
m.p.) nrod. technology7 Central Food Technology Research Institute, Mysore CSIR Post harvest
technology8 Govind Ballabh Pant Univ. of .Agriculture & Tech State Bee Keeping
Pantnagar University9 Chandra Shekhar Azad University of Agriculture & Tech. State Fruit 1 Vegetable
Kanpur University MushroomCultivation
10 Agriculture Processed Food Products Export Development GO! & GOUP Marketing ofAuthority (APEDA) & U.P State Horticulture Co-operative Aromatic &Marketing Federation, Lucknow medicinal post
harvest11 National Horticulture Research Development Federation, Gov!. of India Production and
Kamal Subsidiary Post Harvest ofGarlic & Onion
12 Horticulture Experiment Training Centre, Malihabad, State Institute OrientationLucknow, Saharanpur, Basti, Jhansi, Progranune and
Farmers Training13 National Productivity Council, Chandigarh Council GO! WTOIQuientine
. reQulations14 FFDC, Kauuauj State Gov!. Medicinal &
Aromatic15 Indian Institute of packaging, Patpadganj, New Delhi Gov!. of India Packaging16 QRAT, 2/4161, Vivek Khand, Gomati Nagar, Lucknow Computer Trg. Computer
Inst.17 Central Integrataed Pest Management Centre, GO!, Gov!. of India IPM
Ministry of Agriculture, Lucknow18 Central Institute for Medicinal & Aromatic Plants CSIR Medicinal and
(CIMAP), Lucknow Aromatic Plants
The training was of two categories i.e. one to upgrade the skill of the field staff and 2nd
amongst the progressive growers to apprise them about latest technologies on the
problems and area specific needs of the state i.e. application of balance dose of fertilizers
!PM, Post harvest management, Drip irrigation, green house cultivation, Mushrooms,
True Potato seed production etc.
Final Report: 'National LevelTechno-Economic FeasibilityStudyfor North Zone' 145
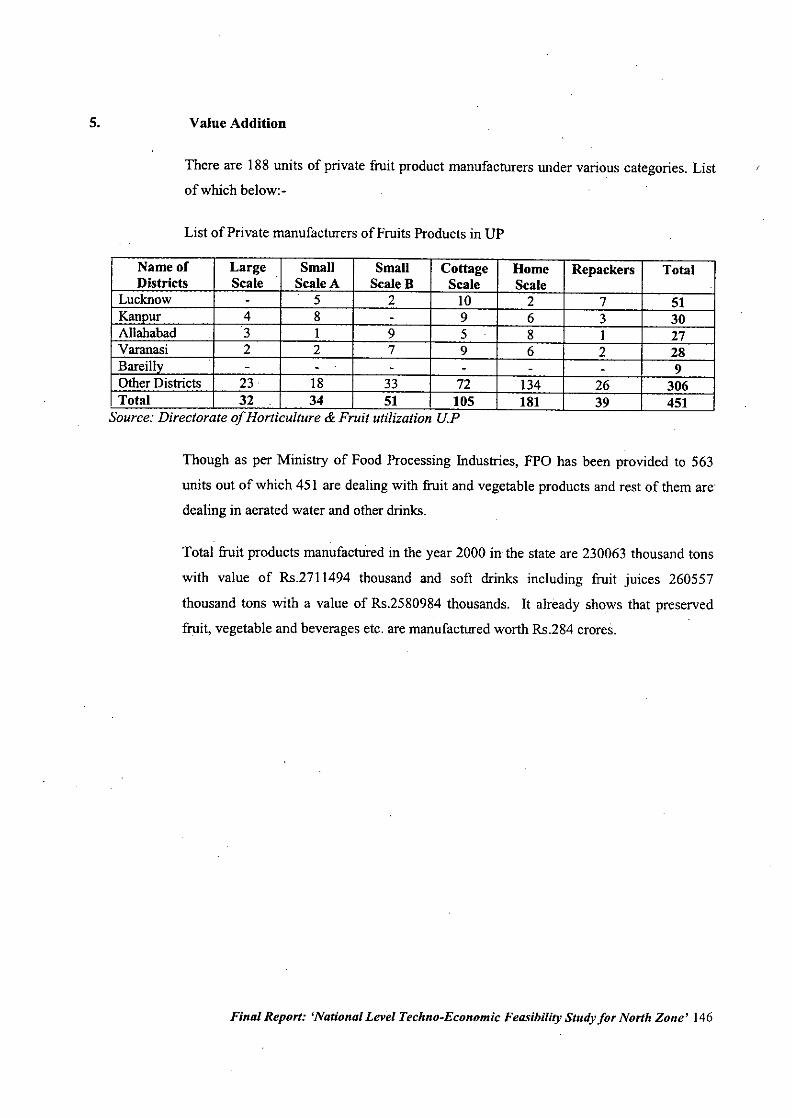
5. Value Addition
There are 188 units of private fiuit product manufacturers under various categories. Listof which below:-
List of Private manufacturers of Fruits Products in UP
Name of Large SmalI SmalI Cottage Home Repaekers TotalDistricts Scale ScaleA ScaleB Scale Scale
Lucknow - 5 2 10 2 7 51Kanour 4 8 - 9 6 3 30AlIahabad 3 I 9 5 8 1 27Varanasi 2 2 7 9 6 2 28Bareillv - - - - - - 9OtherDistricts 23 18 33 72 134 26 306Total 32 34 51 105 181 39 451
Source: Directorate of Horticulture & Fruit utilization u.p
Though as per Ministry of Food Processing Industries, FPO has been provided to 563
units out of which 451 are dealing with fiuit and vegetable products and rest of them are.
dealing in aerated water and other drinks.
Total fiuit products manufactUredin the year 2000 in the state are 230063 thousand tons
with value of Rs.2711494 thousand and soft drinks including fiuit juices 260557
thousand tons with a value of Rs.2580984 thousands. It already shows that preserved
fiuit, vegetable and beverages etc. are manufactured worth Rs.284 crores.
Final Report: 'National Level Techno-Economic Feasibility Study for North Zone' 146
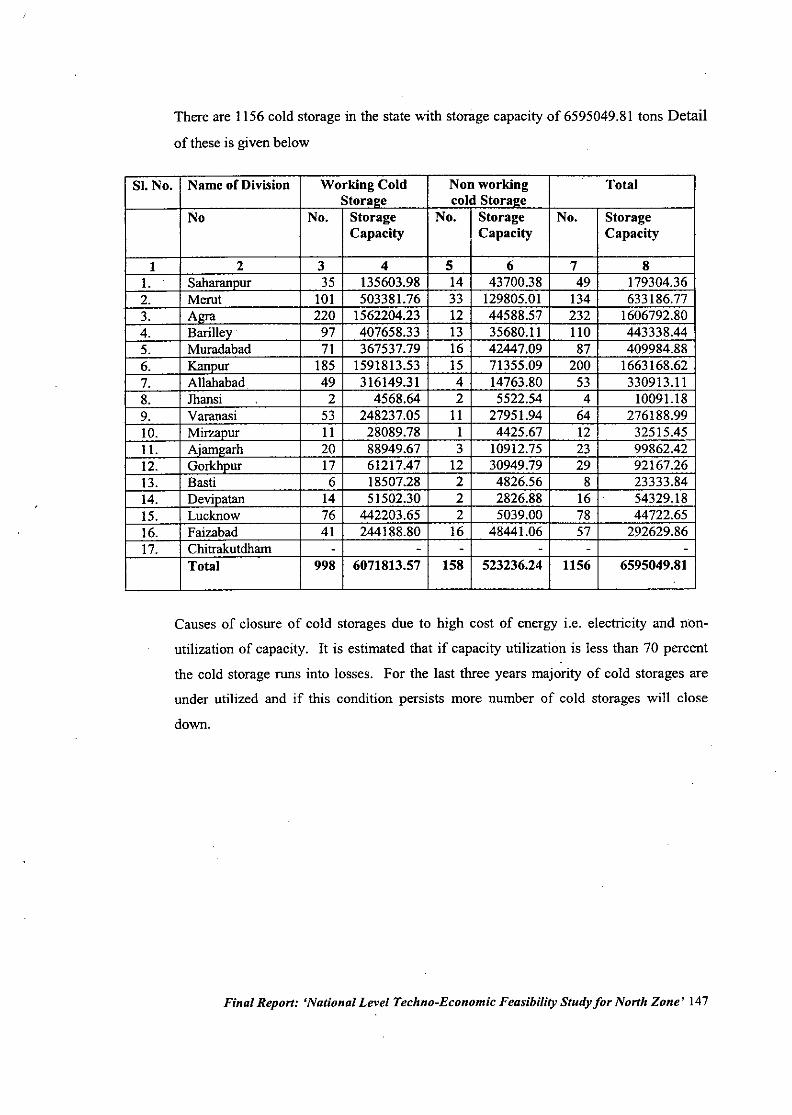
There are 1156 cold storage in the state with storage capacity of 6595049.81 tons Detail
of these is given below
SI.No. Name of Division Working Cold Non working TotalStoraee cold Stora ••e
No No. Storage No. Storage No. StorageCapacity Capacity Capacity
1 2 3 4 5 6 7 8I. Saharanpur 35 135603.98 14 43700.38 49 179304.362. Merut 101 503381.76 33 129805.01 134 633186.773. Aera 220 1562204.23 12 44588.57 232 1606792.804. Barilley. 97 407658.33 13 35680.11 110 443338.445. Muradabad 71 367537.79 16 42447.09 87 409984.886. Kanpur 185 1591813.53 15 71355.09 200 1663168.627. Allahabad 49 316149.31 4 14763.80 53 330913.118. Jhansi 2 4568.64 2 5522.54 4 10091.189. Varanasi 53 248237.05 11 27951.94 64 276188.9910. Mirzapur 11 28089.78 1 4425.67 12 32515.45II. Ajarngarh 20 88949.67 3 10912.75 23 99862.4212. Gorkhpur 17 61217.47 12 30949.79 29 92167.2613. Basti 6 18507.28 2 4826.56 8 23333.8414. Devioatan 14 51502.30 2 2826.88 16 54329.1815. Lucknow 76 442203.65 2 5039.00 78 44722.6516. Faizabad 41 244188.80 16 48441.06 57 292629.8617. Chitrakutdharn - - - - - -
Total 998 6071813.57 158 523236.24 1156 6595049.81
Causes of closure of cold storages due to high cost of energy i.e. electricity and non-
utilization of capacity. It is estimated that if capacity utilization is less than 70 percent
the cold storage runs into losses. For the last three years majority of cold storages are
under utilized and if this condition persists more number of cold storages will close
down.
Final Report: 'National Level Techno-Economic Feasibility Study for North Zone' 147
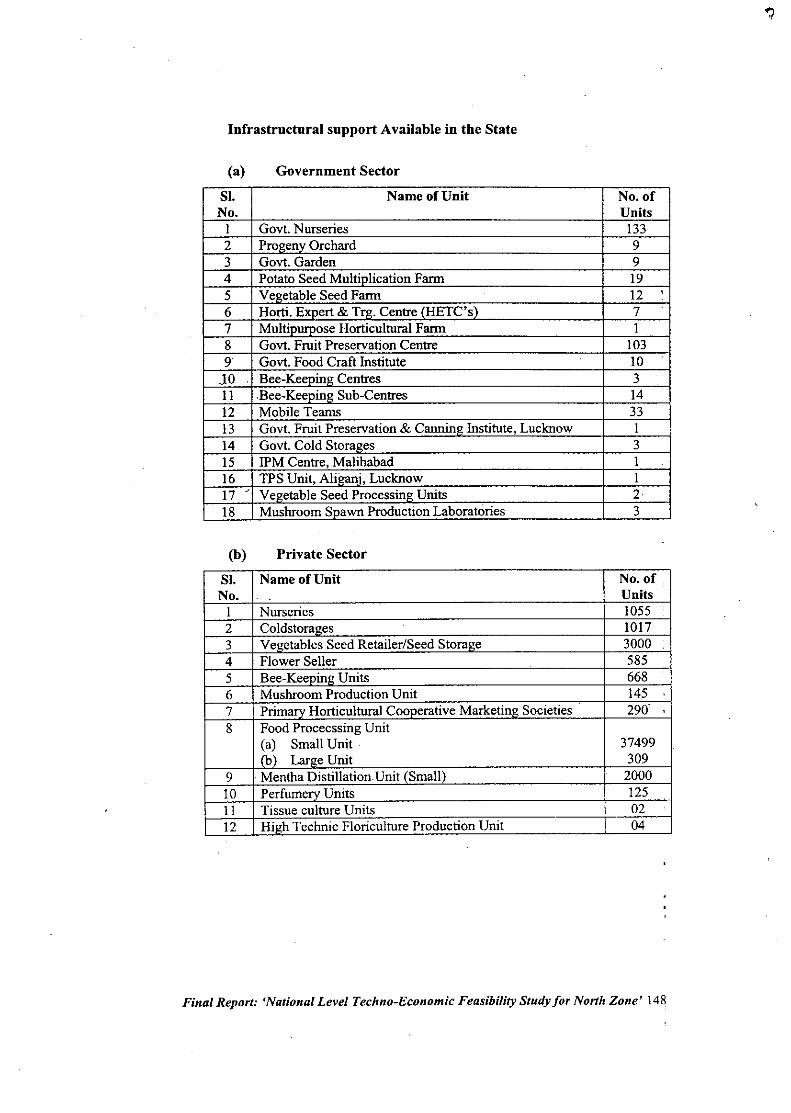
Infrastructural support Available in the State
(a) Government Sector
SI. Name of Unit No. ofNo. Units1 Gov!. Nurseries 1332 Prol!env Orchard 93 Gov!. Garden 94 Potato Seed Multinlication Farm 195 Vel!etable Seed Farm 12 ,6 Horti.Expert & Trl!. CentreIHETC's) 77 MultinUrDose Horticultura1 Farm 18 Gov!. Fruit Preservation Centre 1039 Gov!. Food Craft Institute 10JO Bee-Keeoinl! Centres 3 .
11 ,Bee-Keeninl! Sub-Centres 1412 Mobile Teams 3313 Gov!. Fruit Preservation & Cannin" Institute, Lucknow I14 Gov!. Cold Stora"es 315 !PM Centre, Malihabad 116 TPS Unit, Alil!ani, Lucknow I17 ' Ve"etable Seed Processin" Units 218 Mushroom Spawn Production Laboratories 3
(b) Private Sector
Sl. Name of Unit No. of •No. UnitsI Nurseries 1055 •2 Coldstoral!es
-:- 10173 Ve"etables Seed Retailer/Seed Stora"e 30004 Flower Seller 5855 Bee-Keeoinl! Units 6686 Mushroom Production Unit 1457 Primarv Horticultural Cooperative Marketing Societies . 2908 Food Procecssing Unit
(a) Small Unit 374990;) Larl!e Unit 309
9 . Mentha Distillation.Unit (Small\ 200010 Perfumerv Units 12511 Tissue culture Units 0212 Hil!h Technic Floriculture Production Unit 04
Final Report: 'National Level Techno-Economic Feasibility Study for North Zone' 148
6 Marketing
The price trend of last five years in Delhi wholesale market clearly indicates that mango
has most constant prices during last five years. The increase over wholesale and retail
price has changed by 2 and I percent only. Overall percentage of price rise in fruits is
14.25 percent with annual increase of 2.8 percent while in vegetables increase over last
five years is 10.1 percent with annual increase of 2 percent, which clearly shows that
during last five years there is only marginal increase in wholesale price except cabbage
and cauliflower where wholesale price has decreased by 8 and 32 percent.
In V.P. there are 3964 markets out of which 645 are wholesale market and 3322 rural
periodic markets. Out of these 265 are principal regulated markets and 380 sub yard
regulated markets for Agricultural produce and exclusively horticultural regulated
markets in KABAL tows (Kanpur, Agra, Bareilly, Allahabad and Lucknow) only.
The overall picture of important fruits and vegetable wholesale and retail prices in Delhi
are given in table -
The percentage of fruits arrival amongst the metro market shows that 58.4 percent comes
in Delhi while Chennai 5.3, Banglore 8.6, Mumbai 15.7 and Calcutta accounts for 12
percent while share of vegetables in 38.4, 10.9, 10.1, 22.6 and 18 percent. The overall
picture of fruits and vegetables in the metro is that Delhi market handles 48.4 percent
which is almost 50 percent and rest four metro markets arrival in 51.6 percent. The detail
is given in table:-
Final Report: 'National Level Techno-Economic Feasibility Study for North Zone' 149
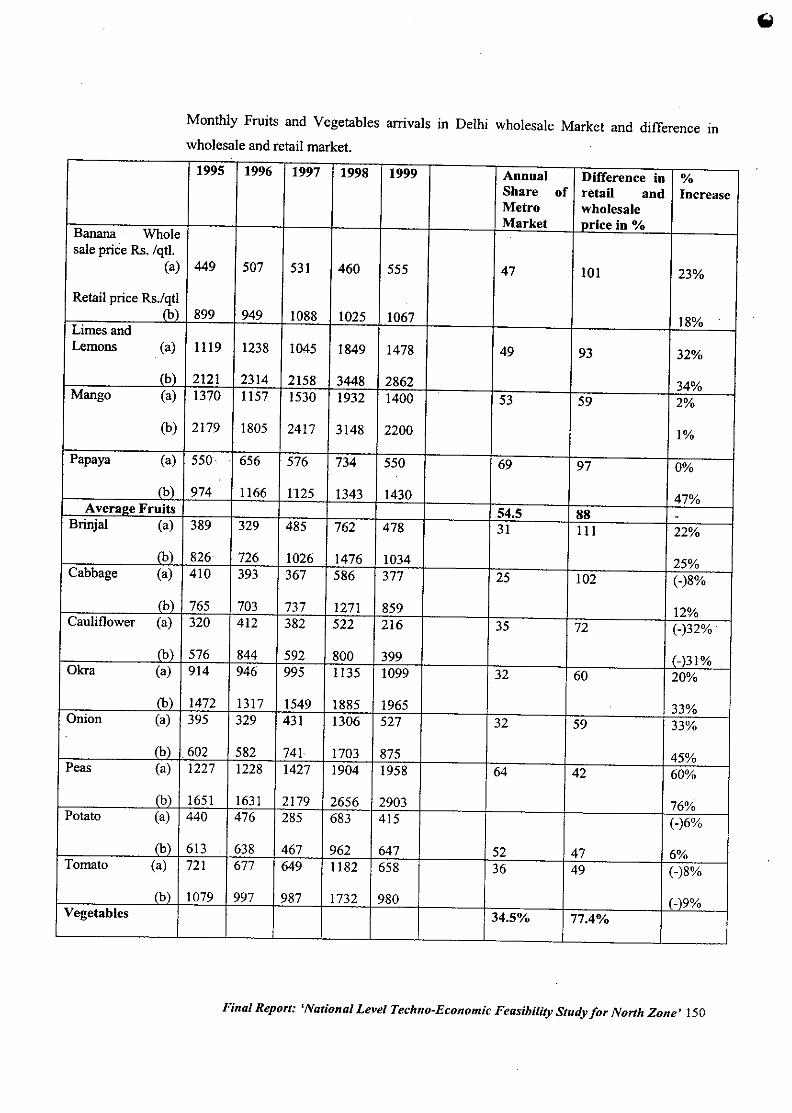
Monthly Fruitsand Vegetables arrivalsin Delhi wholesale Market and differenceinwholesaleand retailmarket.1995 1996 1997 1998 1999 Annual Difference in %
Share of retail and IncreaseMetro wholesaleMarket oriceio %Banana Whole
salepriceRs. /qtl.(a) 449 507 531 460 555 47 101 23%
RetailpriceRs.l%~899 949 1088 1025 1067 18%Limes and
Lemons (a) 1119 1238 1045 1849 1478 49 93 32%Ih) 2121 2314 2158 3448 2862 34%Mango (a) 1370 1157 1530 1932 1400 53 59 2%(b) 2179 1805 2417 3148 2200 1%
.Papaya (a) 550 656 576 734 550 69 97 0%Ih) 974 1166 1125 1343 1430 47%Avera!!eFruits 54.5 88 -Brinja1 (a) 389 329 485 762 478 31 III 22%Ih) 826 726 1026 1476 1034 25%Cabbage (a) 410 393 367 586 377 25 102 (-)8%Ih) 765 703 737 1271 859 12%Cauliflower (a) 320 412 382 522 216 35 72 (-)32% .Ih) 576 844 592 800 399 (-)31%Okra (a) 914 946 995 1135 1099 32 60 20%(b) 1472 1317 1549 1885 1965 33%Onion (a) 395 329 431 1306 527 32 59 33%Ih) 602 582 741 1703 875 45%Peas (a) 1227 1228 1427 1904 1958 64 42 60%(b) 1651 1631 2179 2656 2903 76%Potato (a) 440 476 285 683 415 (-)6%
.
Ib) 613 . 638 467 962 647 52 47 6%Tomato (a) 721 677 649 1182 658 36 49 (-)8%(b) 1079 997 987 1732 980 (-)9%Vegetables 34.5% 77.4%
Final Report: 'National Level Techno-Economic Feasibility Study for North Zone' 150
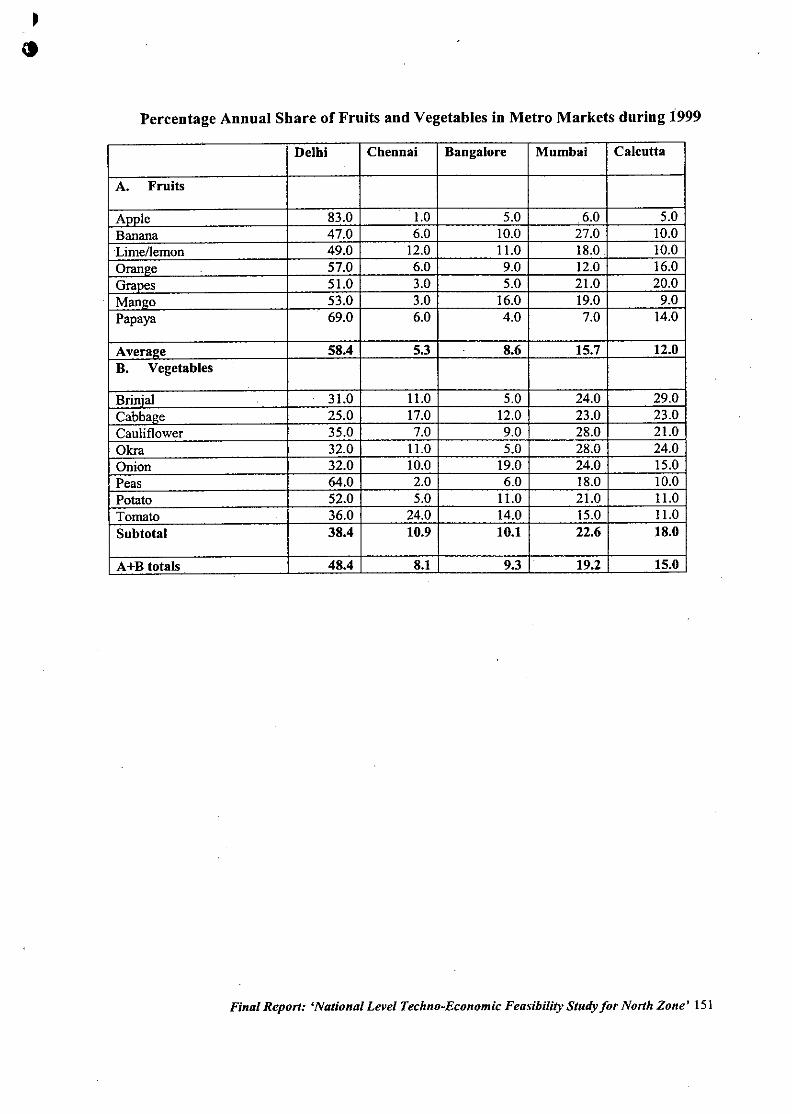
Percentage Annual Share of Fruits and Vegetables in Metro Markets during 1999
Delhi Chennai Bangalore Mumbai Calcutta
A. Fruits
AnnIe 83.0 1.0 5.0 6.0 5.0Banana 47.0 6.0 10.0 27.0 10.0Lime/lemon 49.0 12.0 11.0 18.0 10.0Oran"e 57.0 6.0 9.0 12.0 16.0Granes 51.0 3.0 5.0 21.0 20.0Mango 53.0 3.0 16.0 19.0 9.0Papaya 69.0 6.0 4.0 7.0 14.0
Averal!e 58.4 5.3 8.6 15.7 12.0B. Vegetables
Brinial . 31.0 11.0 5.0 24.0 29.0Cabbage 25.0 17.0 12.0 23.0 23.0Cauliflower 35.0 7.0 9.0 28.0 21.0Okra 32.0 11.0 5.0 28.0 24.0Onion 32.0 10.0 19.0 24.0 15.0Peas 64.0 2.0 6.0 18.0 10.0Potato 52.0 5.0 11.0 21.0 11.0Tomato . 36.0 24.0 14.0 15.0 11.0Subtotal 38.4 10.9 10.1 22.6 18.0
A+B totals 48.4 8.1 9.3 19.2 15.0
Final Report: 'National Level Techno-Economic Feasibility Study for North Zone' 151
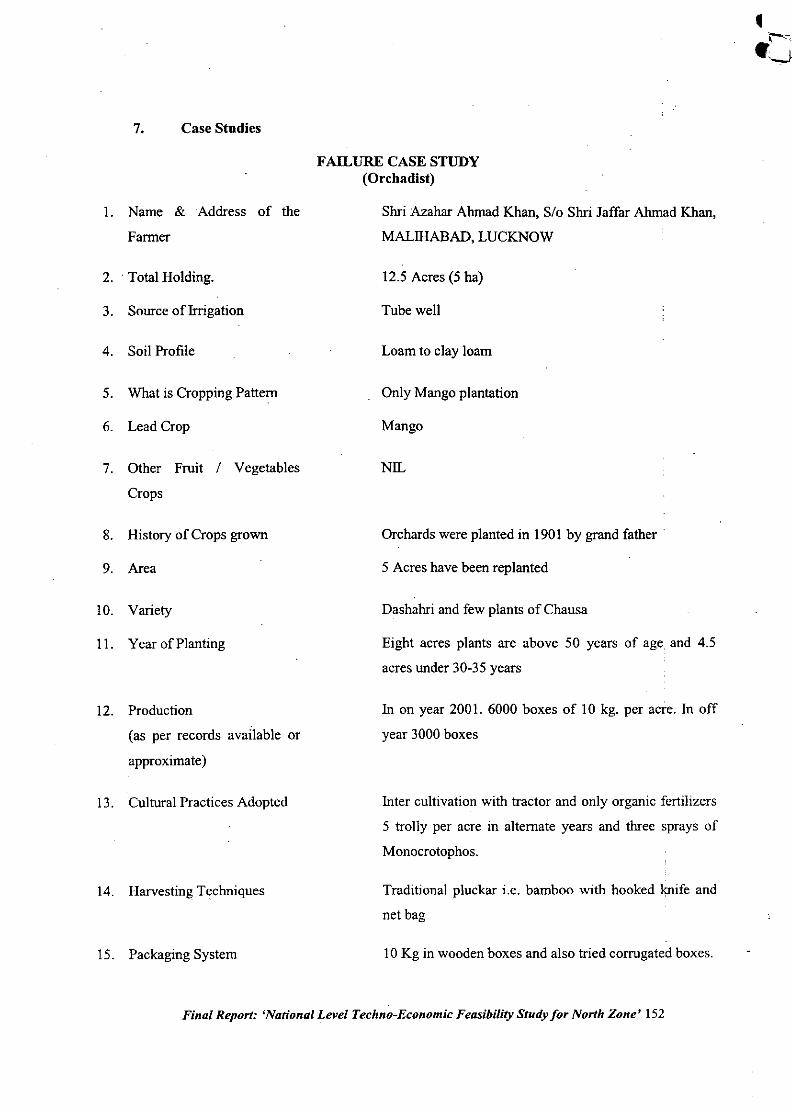
7. Case Studies
FAILURE CASE STUDY(Orchadist)
1. Name & Address of the
Farmer
2.. Total Holding.
3. Source of Irrigation
4. Soil Profile
5. What is Cropping Pattern
6. LeadCrop
7. Other Fruit / Vegetables
Crops
8. History of Crops grown
9. Area
10. Variety
II. Year of Planting
12. Production
(as per records available or
approximate)
13. Cultural Practices Adopted
14. Harvesting Techniques
15. Packaging System
Shri Azahar Ahmad Khan, S/o Shri Jaffar Ahmad Khan,
MALIHABAD, LUCKNOW
12.5 Acres (5 hal
Tube well
Loam to clay loam
Only Mango plantation
Mango
NIL
Orchards were planted in 1901 by grand father.
5 Acres have been replanted
Dashahri and few plants of Chausa
Eight acres plants are above 50 years of age, and 4.5
acres under 30-35 years
In on year 2001. 6000 boxes of 10 kg. per acre. In off
year 3000 boxes
Inter cultivation with tractor and only organic fertilizers
5 trolly per acre in alternate years and three sprays of
Monocrotophos.
Traditional pluckar i.e. bamboo with hooked knife and
net bag
10Kg in wooden boxes and also tried corrugated boxes.
Final Report: 'National Level Techno-Economic Feasibility Study for North Zone' 152
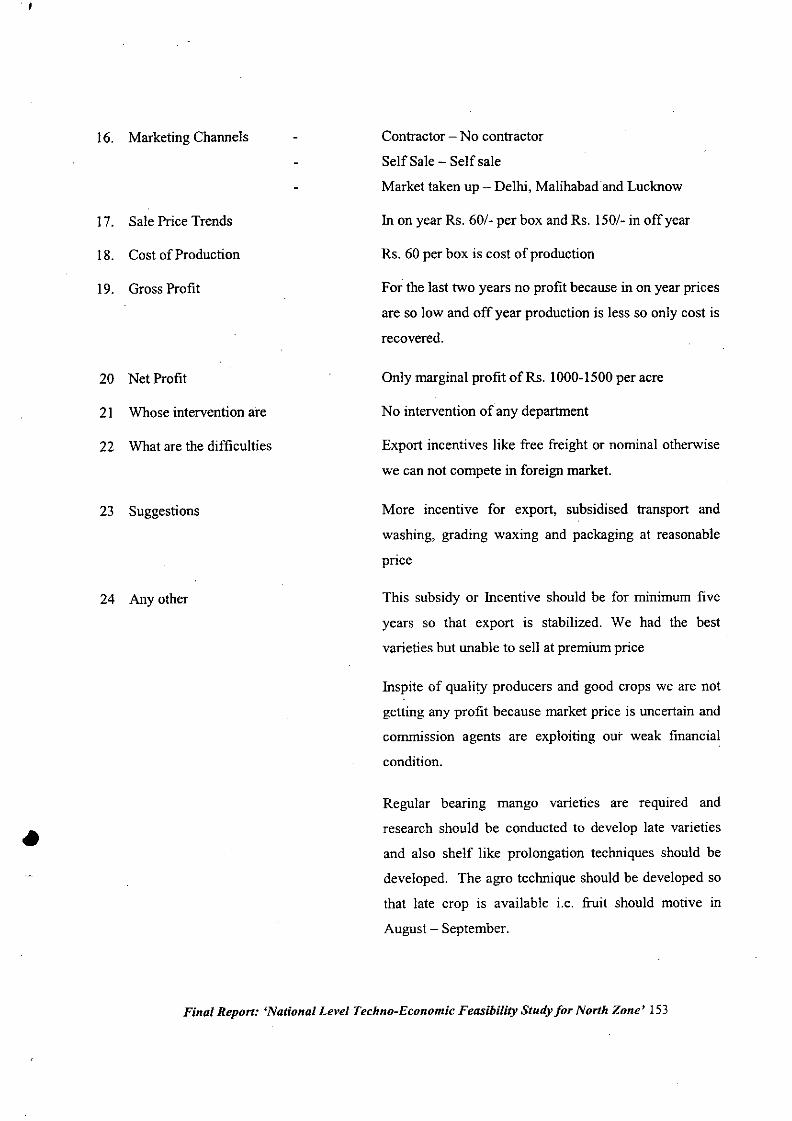
. I
•
16. Marketing Channels
17. Sale Price Trends
18. Cost of Production
19. Gross Profit
20 Net Profit
21 Whose intervention are
22 What are the difficulties
23 Suggestions
24 Any other
Contractor - No contractor
Self Sale - Self sale
Market taken up - Delhi, Malihabad and Lucknow
In on year Rs. 60/- per box and Rs. 150/- in off year
Rs. 60 per box is cost of production
For the last two years no profit because in on year prices
are so low and off year production is less so only cost is
recovered.
Only marginal profit of Rs. 1000-1500per acre
No intervention of any department
Export incentives like free freight or nominal otherwise
we can not compete in foreign market.
More incentive for export, subsidised transport and
washing, grading waxing and packaging at reasonable
pnce
This subsidy or Incentive should be for minimum five
years so that export is stabilized. We had the best
varieties but unable to sell at premium price
Inspite of quality producers and good crops we are not
getting any profit because market price is uncertain and
commISSIOnagents are exploiting out weak financial
condition.
Regular bearing mango varieties are required and
research should be conducted to develop late varieties
and also shelf like prolongation techniques should be
developed. The agro technique should be developed so
that late crop is available i.e. fruit should motive in
August - September.
Final Report: 'National Level Techno-Economic Feasibility Study for North Zone' 153
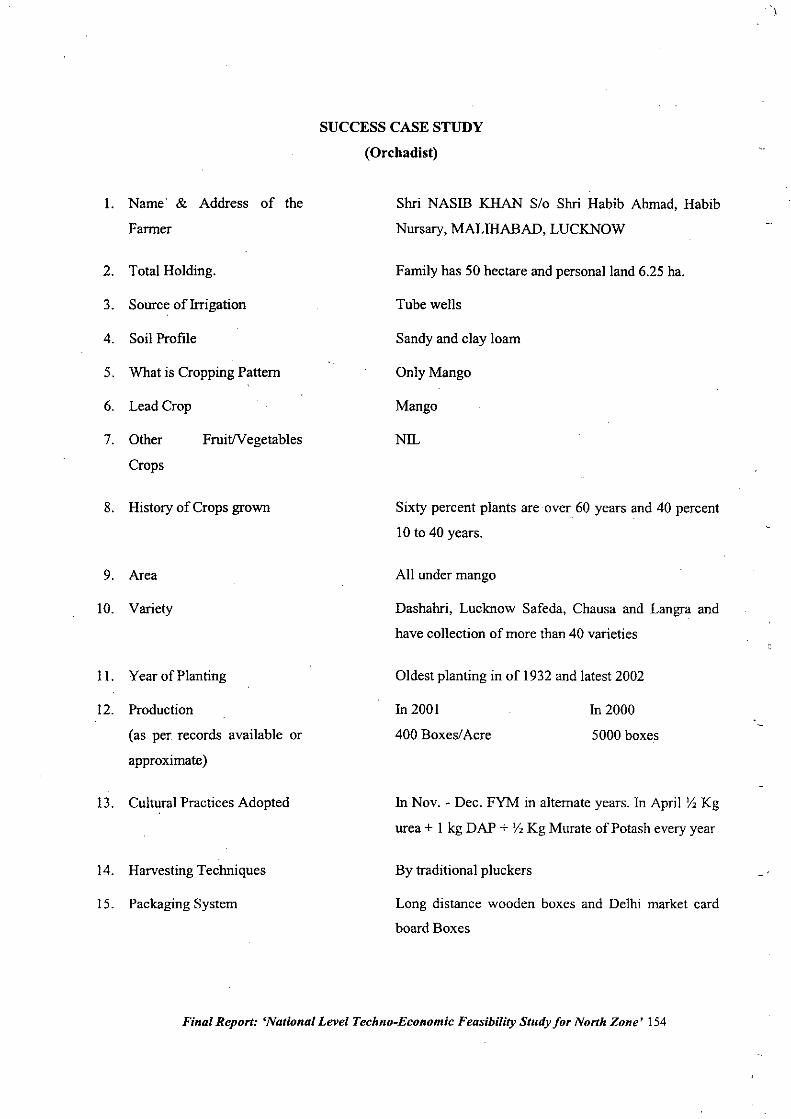
1. Name' & Address of the
Farmer
2. Total Holding.
3. Source of Irrigation
4. Soil Profile
5. What is Cropping Pattern
6. Lead Crop
7. Other FruitIVegetables
Crops
8. History of Crops grown
9. Area
10. Variety
II. Year of Planting
SUCCESS CASE STUDY
(Orcbadist)
Shri NASm KHAN S/o Shri Habib Ahmad, Habib
Nursary, MALlliABAD, LUCKNOW
Family has 50 hectare and personal land 6.25 ha.
Tube wells
Sandy and clay loam
Only Mango
Mango
NIL
Sixty percent plants are over 60 years and 40 percent
10 to 40 years.
All under mango
Dashahri, Lucknow Safeda, Chausa and Langra and
have collection of more than 40 varieties
Oldest planting in of 1932 and latest 2002
12. Production
(as per records available or
approximate)
In 2001
400 Boxes/Acre
In 2000
5000 boxes
13. Cultural Practices Adopted
14. Harvesting Techniques
15. Packaging System
In Nov. - Dec. FYM in alternate years. In April 1, Kg
urea + I kg DAP + Y,Kg Murate of Potash every year
By traditional pluckers
Long distance wooden boxes and Delhi market card
board Boxes
Final Report: 'Natianal Level Techno-Economic Feasibility Study for North Zone' 154
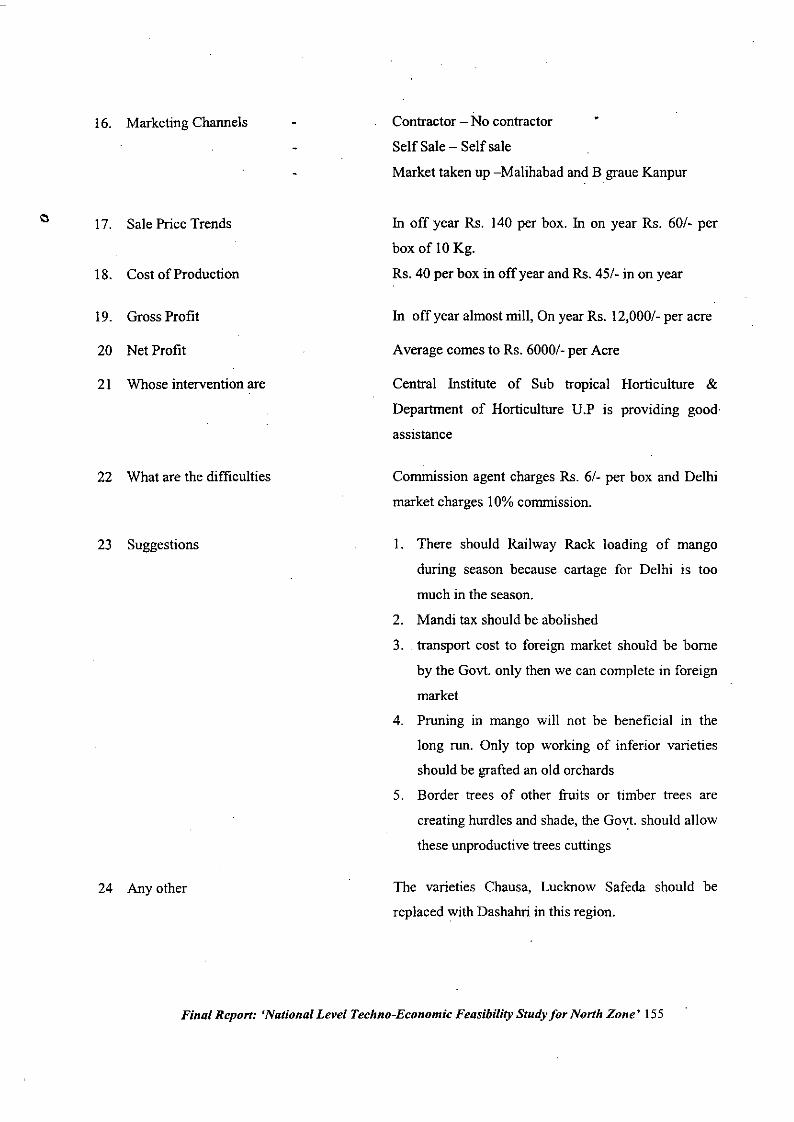
16. Marketing Channels
17. Sale Price Trends
18. Cost of Production
19. Gross Profit
20 Net Profit
21 Whose intervention are
22 What are the difficulties
23 Suggestions
24 Any other
Contractor - No contractor
Self Sale - Self sale
Market taken up -Malihabad and B graue Kanpur
In off year Rs. 140 per box. In on year Rs. 60/- per
box of 10Kg.
Rs. 40 per box in off year and Rs. 45/- in on year
In off year almost mill, On year Rs. 12,000/- per acre
Average comes to Rs. 6000/- per Acre
Central Institute of Sub tropical Horticulture &
Department of Horticulture U.P is providing good
assistance
Commission agent charges Rs. 6/- per box and Delhi
market charges 10%commission.
I. There should Railway Rack loading of mango
during season because cartage for Delhi is too
much in the season.
2. Mandi tax should be abolished
3. . transport cost to foreign market should be borne
by the Gov!. only then we can complete in foreign
market
4. Pruning in mango will not be beneficial in the
long run. Only top working of inferior varieties
should be grafted an old orchards
5. Border trees of other fruits or timber trees are
creating hurdles and shade, the Gov!. should allow
these unproductive trees cuttings
The varieties Chausa, Luckoow Safeda should be
replaced with Dashahri in this region.
Final Report: 'National Level Techno-Economic Feasibility Study for North Zone' 155
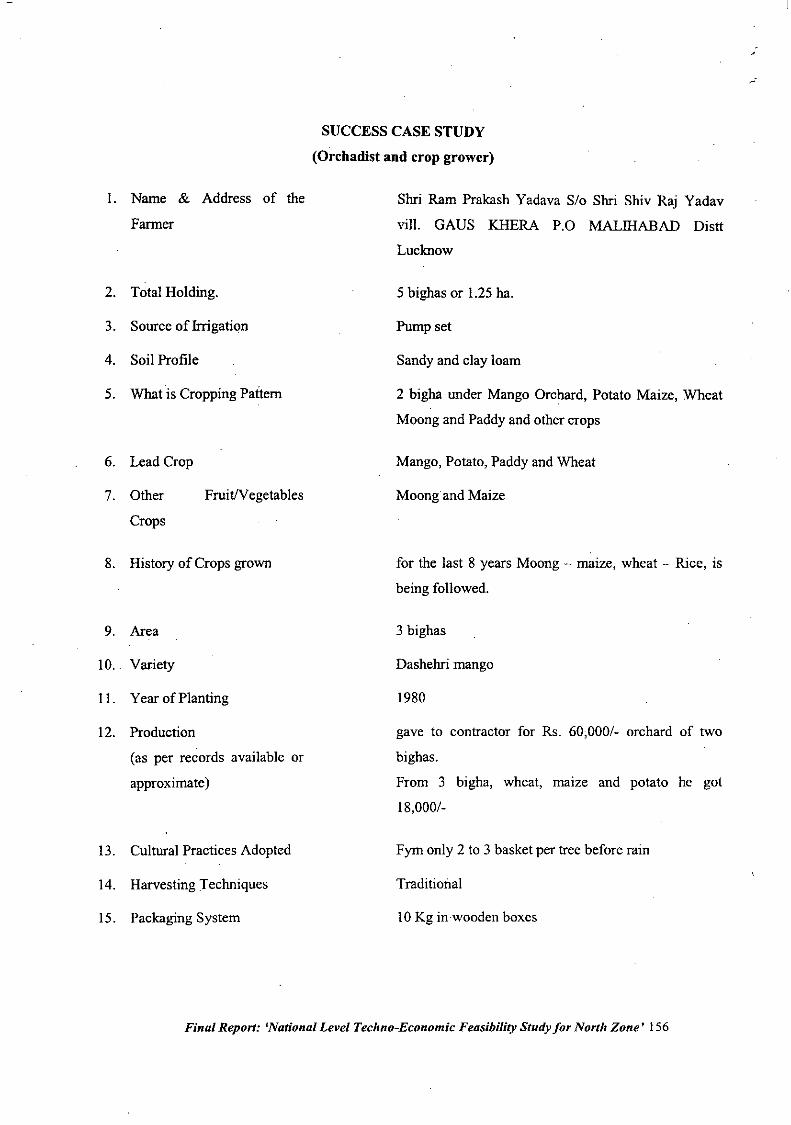
I. Name & Address of the
Farmer
2. Total Holding.
3. Source ofhrigation
4. Soil Profile
5. What is Cropping Pattern
6. Lead Crop
SUCCESS CASE STUDY
(Orchadist and crop grower)
Shri Ram Prakash Yadava S/o Shri Shiv ~aj Yadav
viII. GADS KHERA P.O MALIHABAD Distt
Lucknow
5 bighas or 1.25 ha.
Pump set
Sandy and clay loam
2 bigha under Mango Orchard, Potato Maize, Wheat
Moong and Paddy and other crops
Mango, Potato, Paddy and Wheat
7. Other
Crops
FruitIVegetables Moongand Maize
8. History of Crops grown
9. Area
10.. Variety
II. Year of Planting
12. Production
(as per records available or
approximate)
13. Cultural Practices Adopted
14. Harvesting Techniques
15. Packaging System
for the last 8 years Moong - maize, wheat - Rice, is
being followed.
3 bighas
Dashehri mango
1980
gave to contractor for Rs. 60,000/- orchard of two
bighas.
From 3 bigha, wheat, maIze and potato he got
18,000/-
Fym only 2 to 3 basket per tree before rain
Traditional
10 Kg inwooden boxes
Final Report: 'National Level Techno-Economic Feasibility Study for North Zone' 156
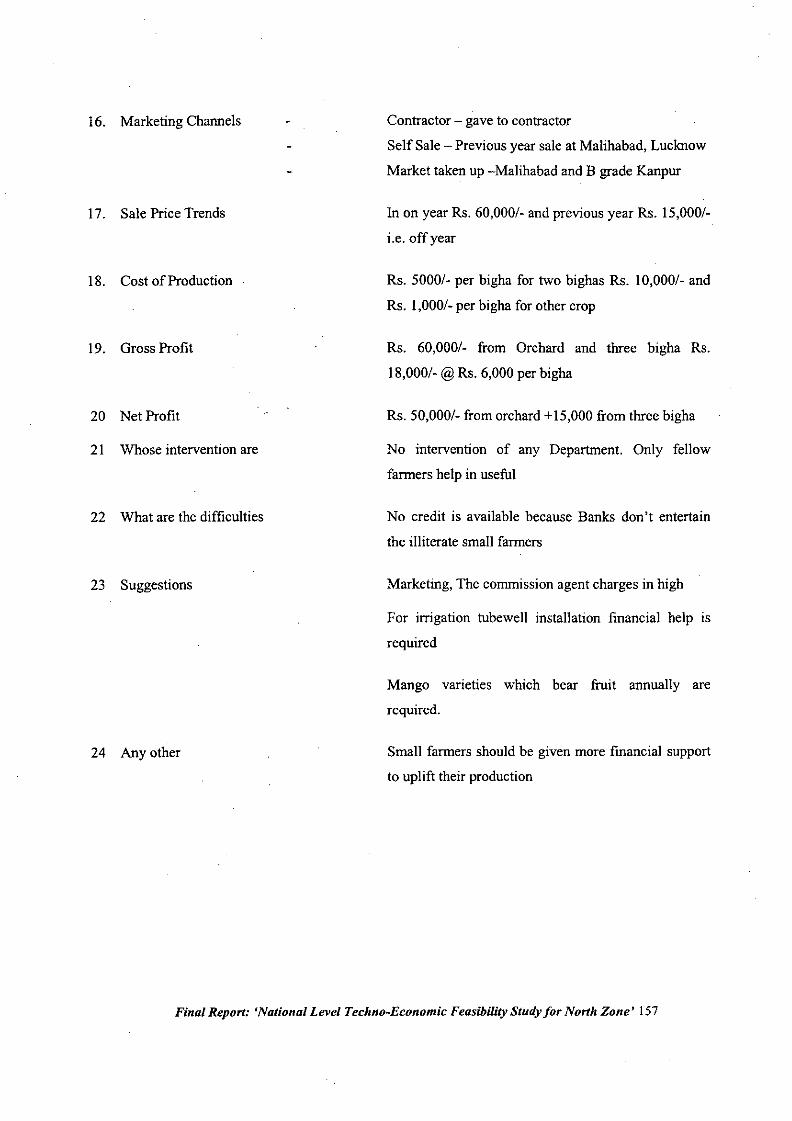
16. Marketing Channels
17. Sale Price Trends
18. Cost of Production
19. Gross Profit
20 Net Profit
21 Whose intervention are
22 What are the difficulties
23 Suggestions
24 Any other
Contractor - gave to contractor
Self Sale - Previous year sale at Malihabad, Lucknow
Market taken up -Malihabad and B grade Kanpur
In on year Rs. 60,000/- and previous year Rs. 15,000/-
i.e. off year
Rs. 5000/- per bigha for two bighas Rs. 10,000/- and
Rs. 1,000/- per bigha for other crop
Rs. 60,000/- from Orchard and three bigha Rs.
18,000/- @ Rs. 6,000 per bigha
Rs. 50,000/- from orchard +15,000 from three bigha
No intervention of any Department. Only fellow
farmers help in useful
No credit is available because Banks don't entertain
the illiterate small farmers
Marketing, The commission agent charges in high
For irrigation tubewell installation financial help IS
required
Mango varieties which bear fruit annually are
required.
Small farmers should be given more financial support
to uplift their production
Final Report: 'National Level Techno-Economic Feasibility Study for North Zone' 157
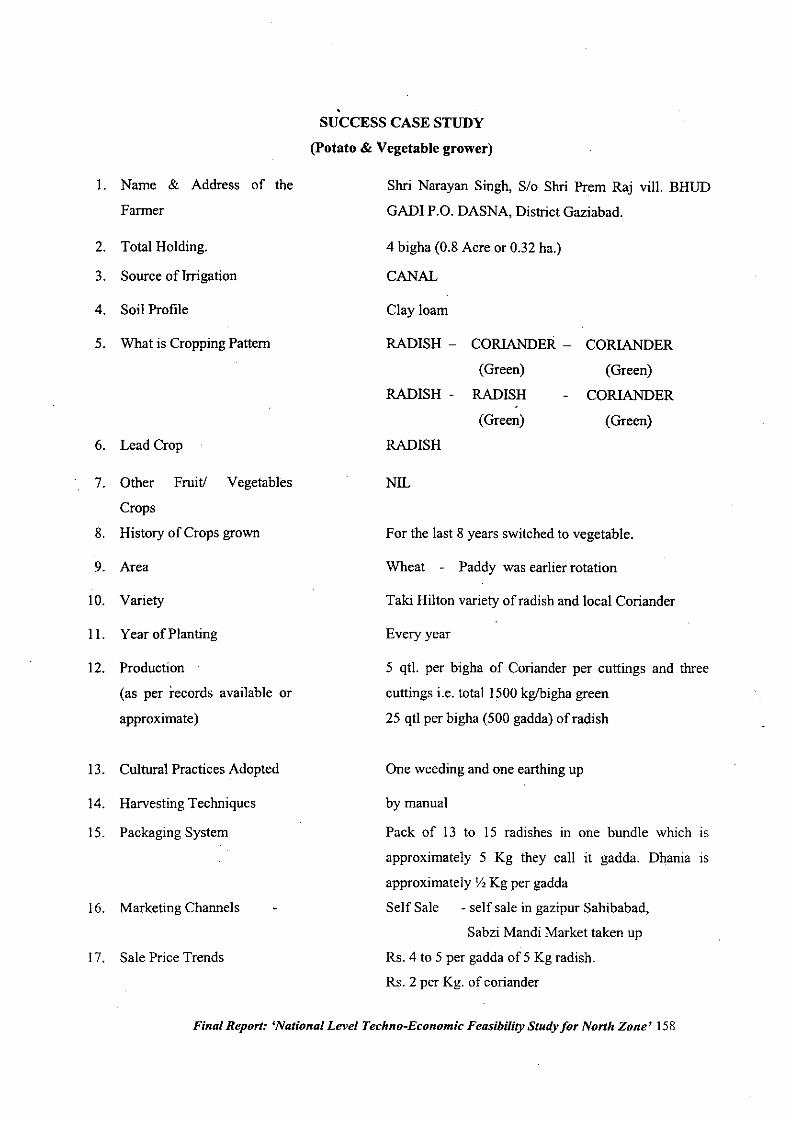
SUCCESS CASE STUDY
(potato & Vegetable grower)
Shri Narayan Singh, S/o Shri Prem Raj viII. BHUD
GADI P.O. DASNA, District Gaziabad.
4 bigha (0.8 Acre or 0.32 ha.)
CANAL
I. Name & Address of the
Farmer
2. Total Holding.
3. Source of Irrigation
4. Soil Profile
5. What is Cropping Pattern
Clay loam
RADISH - CORlANDER-
(Greeo)
RADISH - RADISH
(Green)
CORIANDER
(Green)
CORIANDER
(Greeo)
6. Lead Crop
7. Other Fruit! Vegetables
Crops
8. History of Crops grown
9. Area
10. Variety
II. Year of Planting
12. Production
(as per records available or
approximate)
13. Cultural Practices Adopted
14. Harvesting Techniques
15. Packaging System
16. Marketing Channels
17. Sale Price Trends
RADISH
NIL
For the last 8 years switched to vegetable.
Wheat - Paddy was earlier rotation
Taki Hilton variety of radish and local Coriander
Every year
5 qtl. per bigha of Coriander per cuttings and three
cuttings i.e. total 1500 kglbigha green
25 qtl per bigha (500 gadda) of radish
One weeding and one earthing up
by manual
Pack of 13 to 15 radishes in one bundle which is
approximately 5 Kg they call it gadda. Dhania is
approximately y, Kg per gadda
Self Sale - self sale in gazipur Sahibabad,
Sabzi Mandi Market taken up
Rs. 4 to 5 per gadda of 5 Kg radish.
Rs. 2 per Kg. of coriander
Final Report: 'National Level Techno-Economic Feasibility Study for North Zone' 158
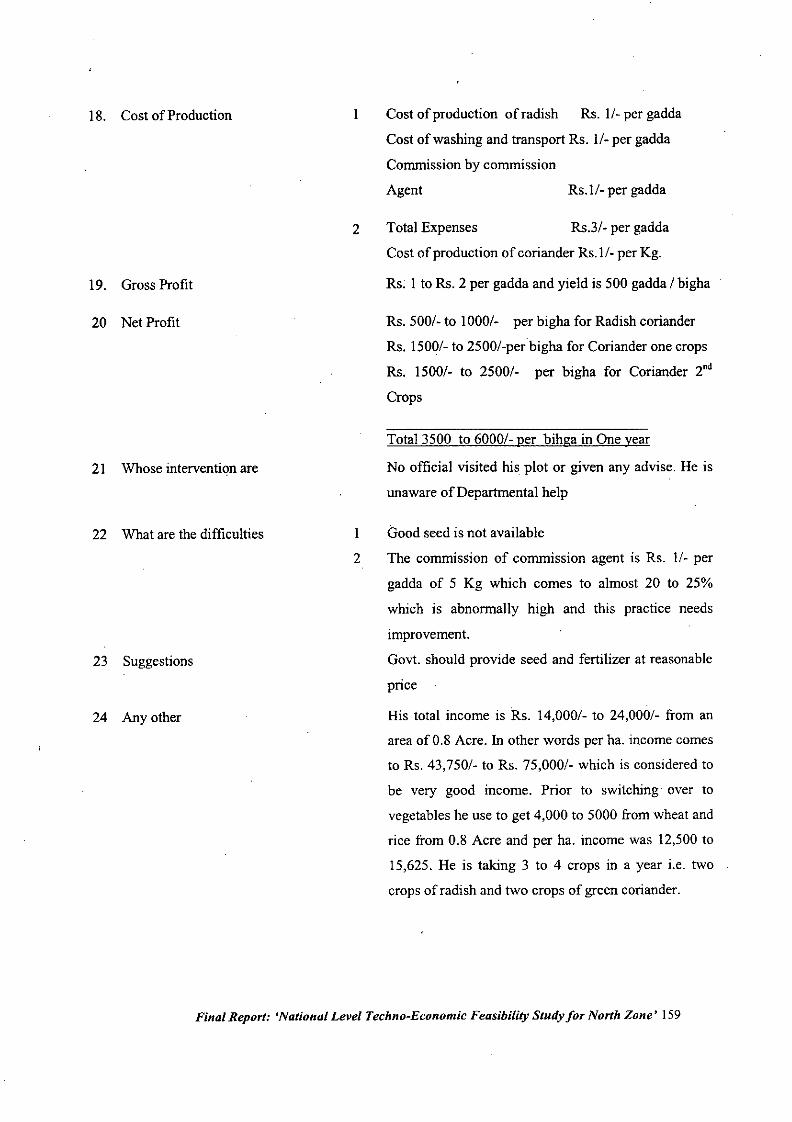
18. Cost of Production I Cost of production of radish Rs. 1/- per gadda
Cost of washing and transport Rs. 1/- per gadda
Commission by commission
Agent RS.I/- per gadda
19. Gross Profit
20 Net Profit
21 Whose intervention are
22 What are the difficulties
23 Suggestions
24 Any other
2
I
2
Total Expenses Rs.3/- per gadda
Cost of production of coriander RS.I/- per Kg.
Rs. I to Rs. 2 per gadda and yield is 500 gadda 1bigha
Rs. 500/- to 1000/- per bigha for Radish coriander
Rs. 1500/- to 2500/-per bigha for Coriander one crops
Rs. 1500/- to 2500/- per bigha for Coriander 2"d
Crops
Total 3500 to 6000/- per bihga in One year
No official visited his plot or given any advise. He is
unaware ofDepartrnental help
Good seed is not available
The commission of commission agent is Rs. 1/- per
gadda of 5 Kg which comes to almost 20 to 25%
which is abnormally high and this practice needs
improvement.
Gov!. should provide seed and fertilizer at reasonable
pnce
His total income is Rs. 14,000/- to 24,000/- from an
area of 0.8 Acre. In other words per ha. income comes
to Rs. 43,7501- to Rs. 75,000/- which is considered to
be very good income. Prior to switching over to
vegetables he use to get 4,000 to 5000 from wheat and
rice from 0.8 Acre and per ha. income was 12,500 to
15,625. He is taking 3 to 4 crops in a year i.e. two
crops of radish and two crops of green coriander.
Final Report: 'National Level Techno-Economic Feasibility Study for North Zone' 159
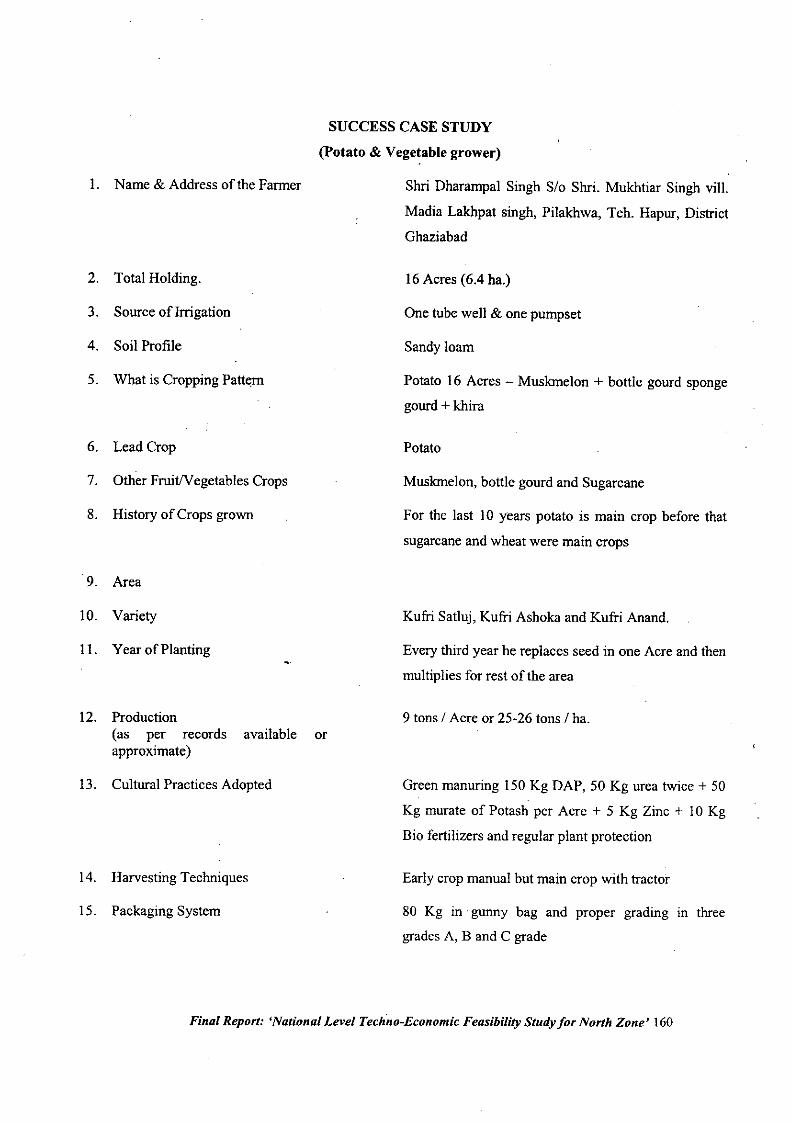
1. Name & Address of the Farmer
2. Total Holding.
3. Source of Inigation
4. Soil Profile
5. What is Cropping Patt~
6. Lead Crop
7. Other Fruit/Vegetables Crops
8. History of Crops grown
"9. Area
10. Variety
11. Year of Planting
SUCCESS CASE STUDY
(potato & Vegetable grower)
Shri Dharampal Singh S/o Shri. Mukhtiar Singh viII.
Madia Lakhpat singh, Pilakhwa, Teh. Hapur, District
Ghaziabad
16Acres (6.4 ha.)
One tube well & one pumpset
Sandy loam
Potato 16 Acres - Muskmelon + bottle gourd spongegourd + khira
Potato
Muskmelon, bottle gourd and Sugarcane
For the last 10 years potato is main crop before that
sugarcane and wheat were main crops
Kum Satluj, Kufri Ashoka and Kufri Anand.
Every third year he replaces seed in one Acre and then
multiplies for rest of the area
12. Production(as per records available orapproximate)
13. Cultural Practices Adopted
14. Harvesting Techniques
15. Packaging System
9 tons / Acre or 25-26 tons / ha.
Green manuring 150 Kg DAP, 50 Kg urea twice + 50
Kg murate of Potash per Acre + 5 Kg Zinc + 10 Kg
Bio fertilizers and regular plant protection
Early crop manual but main crop with tractor
80 Kg in" gunny bag and proper grading in threegrades A, Band C grade
Final Report: 'National Level Techno-Economic Feasibility Study for North Zone' 160
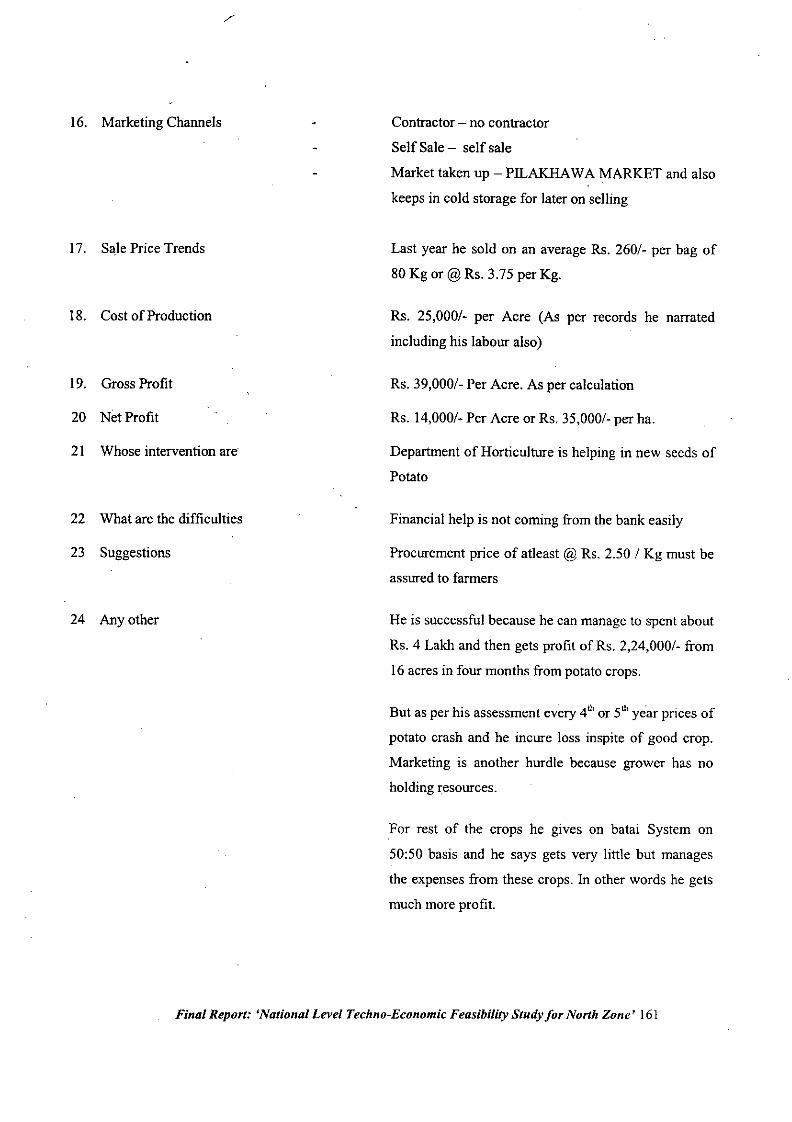
16. Marketing Channels
17. Sale Price Trends
18. Cost of Production
19. Gross Profit
20 Net Profit
21 Whose intervention are
22 What are the difficulties
23 Suggestions
24 Any other
Contractor - no contractor
Self Sale - self sale
Market taken up - PILAKHAWA MARKET and also
keeps in cold storage for later on selling
Last year he sold on an average Rs. 2601- per bag of
80 Kg or @Rs. 3.75 per Kg.
Rs. 25,0001- per Acre (As per records he narrated
including his labour also)
Rs. 39,0001- Per Acre. As per calculation
Rs. 14,0001- Per Acre or Rs. 35,0001- per ha.
Department of Horticulture is helping in new seeds of
Potato
Financial help is not coming from the bank easily
Procurement price of atleast @ Rs. 2.50 1Kg must be
assured to farmers
He is successful because he can manage to spent about
Rs. 4 Lakh and then gets profit of Rs. 2,24,0001- from
16 acres in four months from potato crops.
But as per his assessment every 4th or 5th year prices of
potato crash and he incure loss inspite of good crop.
Marketing is another hurdle because grower has no
holding resources.
For rest of the crops he gives on batai System on
50:50 basis and he says gets very little but manages
the expenses from these crops. In other words he gets
much more profit.
Final Report: 'National Level Techno-Economic Feasibility Study for North Zone' 161
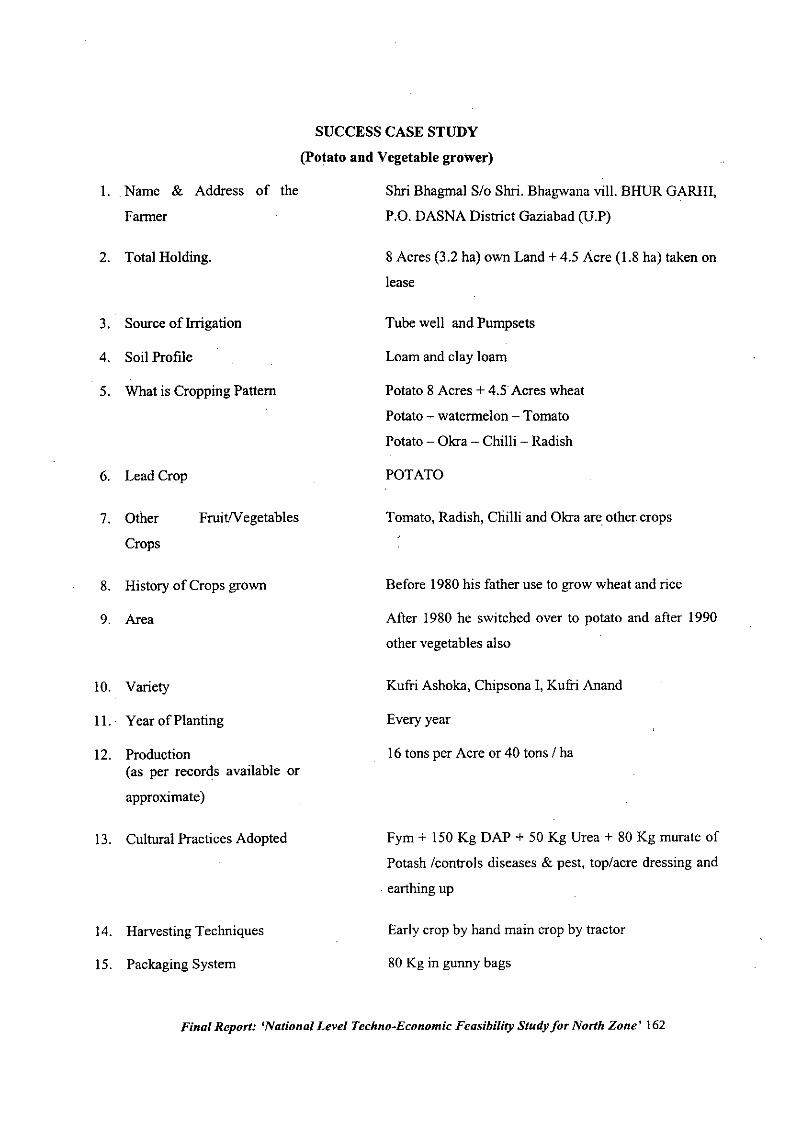
SUCCESS CASE STUDY
(potato and Vegetable grower)
I. .Name & Address of the
Farmer
2. Total Holding.
3. Source of Irrigation
4. Soil Profile
5. What is Cropping Pattern
6. Lead Crop
7. Other FruitIV egetables
Crops
8. History of Crops grown
9. Area
10. Variety
II. Year of Planting
12. Production(as per records available or
approximate)
13. Cultural Practices Adopted
14. Harvesting Techniques
15. Packaging System
Shri Bhagmal S/o Shri. Bhagwana viii. BHUR GARIU,
P.O. DASNA District Gaziabad (V.P)
8 Acres (3.2 hal own Land + 4.5 Acre (1.8 hal taken on
lease
Tube well and Pumpsets
Loam and clay loam
Potato 8 Acres + 45 Acres wheat
Potato - watermelon - Tomato
Potato - Olcra - Chilli - Radish
POTATO
Tomato, Radish, Cliilli and Olcra are other crops
Before 1980 his father use to grow wheat and rice
After 1980 he switched over to potato and after 1990
other vegetables also
Kufti Ashoka, Chipsona I, Kufti Anand
Every year
16 tons per Acre or 40 tons / ha
Fym + 150 Kg DAP + 50 KgVrea + 80 Kg murate of
Potash /conlrols diseases & pest, top/acre dressing and
earthing up
Early crop by hand main crop by lractor
80 Kg in gunny bags
Final Report: 'National Level Techno-Economic Feasibility Study for North Zone' 162
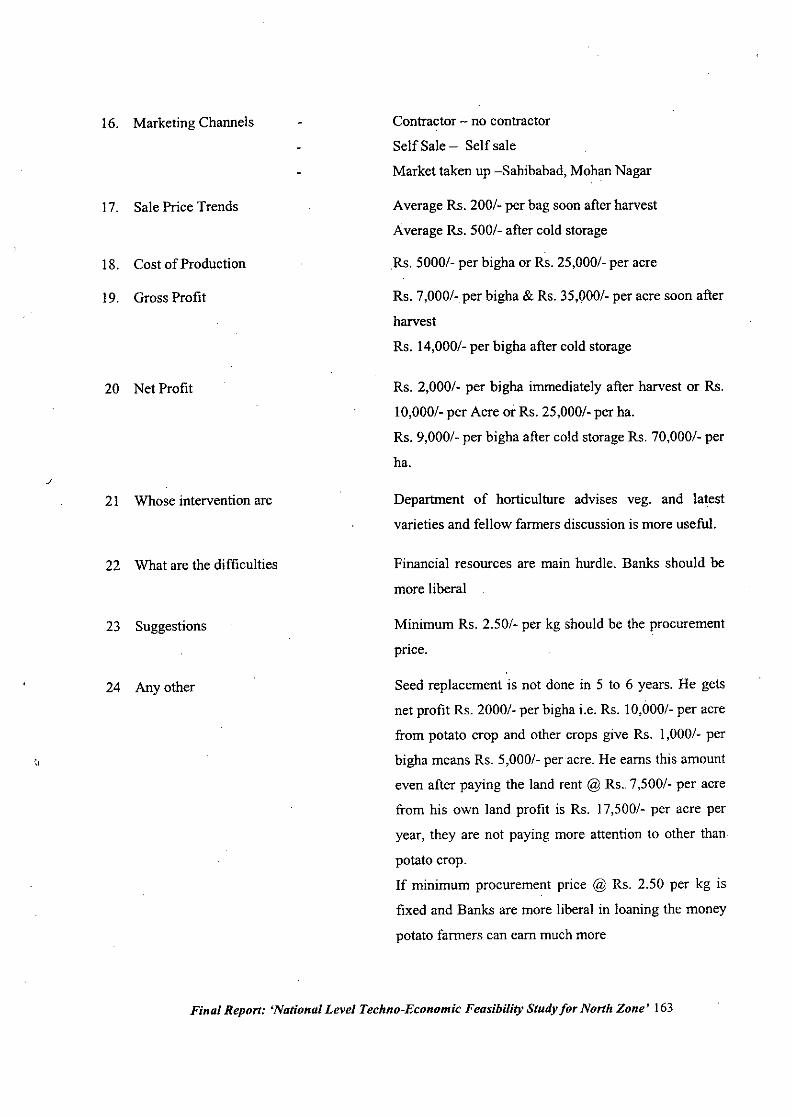
16. Marketing Channels
17. Sale Price Trends
18. Cost of Production
19. Gross Profit
20 Net Profit
21 Whose intervention are
22 What are the difficulties
23 Suggestions
24 Any other
Contractor - no contractor
Self Sale - Self sale
Market taken up -Sahibabad, Mohan Nagar
Average Rs. 200/- per bag soon after harvest
Average Rs. 500/- after cold storage
Rs. 5000/- per bigha or Rs. 25,000/- per acre
Rs. 7,0001- per bigha & Rs. 35,000/- per acre soon after
harvest
Rs. 14,000/- per bigha after cold storage
Rs. 2,000/. per bigha immediately after harvest or Rs.
10,000/- per Acre or Rs. 25,000/- per ha.
Rs. 9,0001- per bigha after cold storage Rs. 70,000/- per
ha.
Department of horticulture advises veg. and latest
varieties and fellow fanners discussion is more useful.
Financial resources are main hurdle. Banks should be
more liberal
Minimum Rs. 2.50/- per kg should be the procurement
price.
Seed replacement is not done in 5 to 6 years. He gets
net profit Rs. 2000/- per bigha i.e. Rs. 10,000/- per acre
from potato crop and other crops give Rs. 1,000/- per
bigha means Rs. 5,000/- per acre. He earns this amount
even after paying the land rent @ Rs ..7,500/- per acre
from his own land profit is Rs. 17,500/- per acre per
year, they are not paying more attention to other than
potato crop.
If minimum procurement price @ Rs. 2.50 per kg is
fixed and Banks are more liberal in loaning the money
potato fanners can earn much more
Final Report: 'National Level Techno-Economic Feasibility Study for North Zone' 163
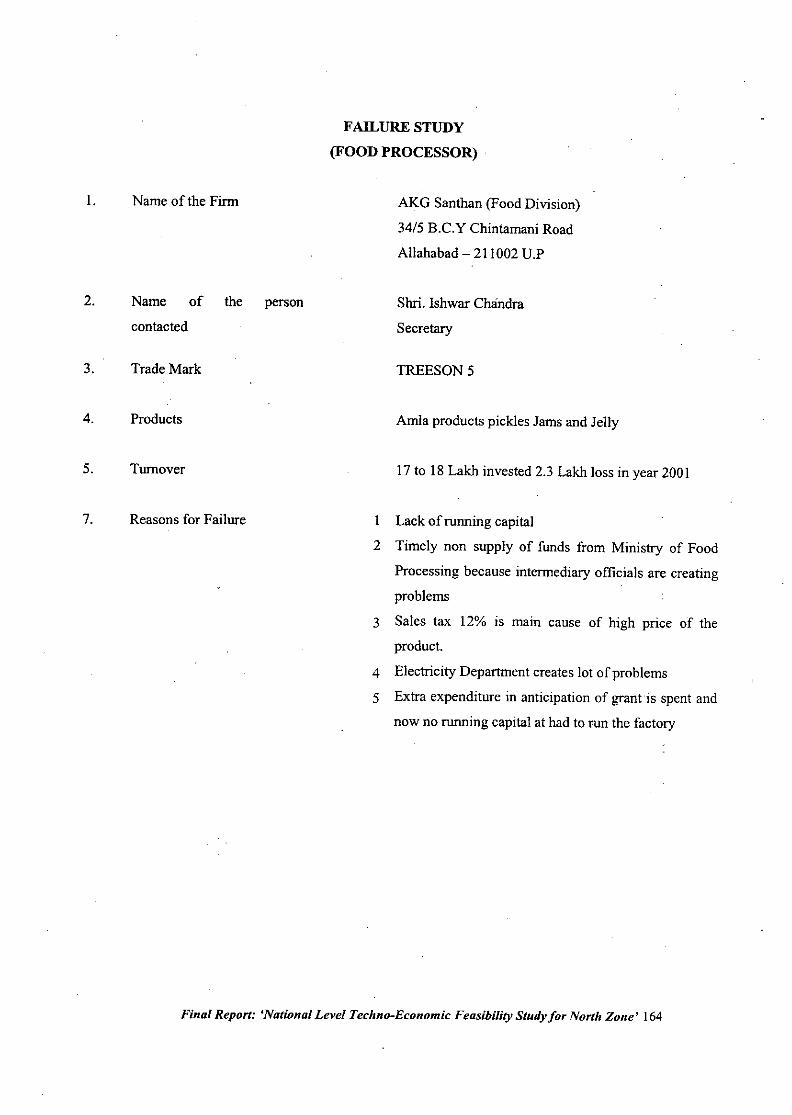
I.
2.
3.
4.
5.
7.
Name of the Firm
Name of the person
contacted
TradeMark
Products
Turnover
Reasons for Failure
FAILURE STUDY
(FOOD PROCESSOR)
AKG Santhan (Food Division)
34/5 B.c.y Chintamani Road
Allahabad - 211002 U.P
Shri. Ishwar Chandra
Secretary
TREESON 5
Amla products pickles Jams and Jelly
17 to 18 Lakb invested 2.3 Lakb loss in year 2001
I Lack of running capital
2 Timely non supply of funds from Ministry of Food
Processing because intermediary officials are creating
problems
3 Sales tax 12% is main cause of high price of the
product.
4 Electricity Department creates lot of problems
5 Extra expenditure in anticipation of grant is spent and
now no running capital at had to run the factory
Final Report: 'National Level Techno-Economic Feasibility Study for North Zone' 164
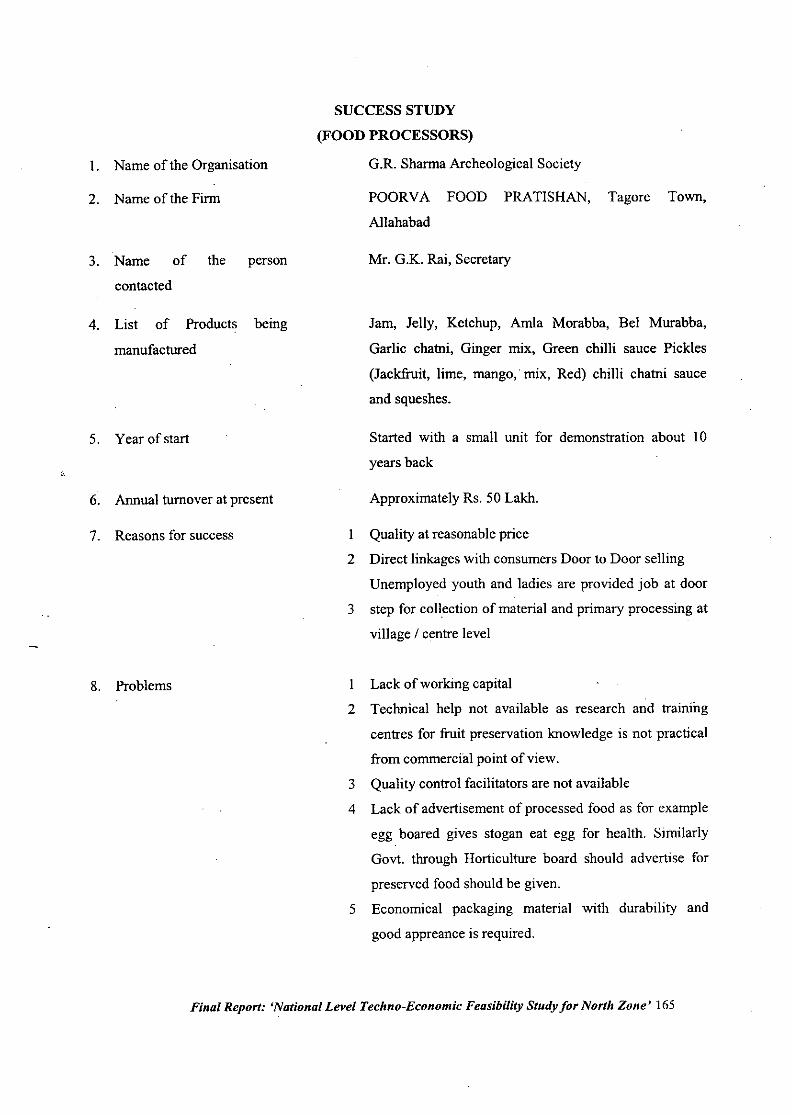
1. Name of the Organisation
2. Name of the Firm
3. Name of the person
contacted
4. List of Products being
manufactured
5. Year of start
6. Annual turnover at present
7. Reasons for success
8. Problems
SUCCESS STUDY
(FOOD PROCESSORS)
G.R. Sharma Archeological Society
POORVA FOOD PRATISHAN, Tagore Town,
Allahabad
Mr. G.K. Rai, Secretary
Jam, Jelly, Ketchup, Arnla Morabba, Bel Murabba,
Garlic chatni, Ginger mix, Green chilli sauce Pickles
(Jackfruit, lime, mango,' mix, Red) chilli chatni sauce
and squeshes.
Started with a small unit for demonstration about 10
years back
Approximately Rs. 50 Lakh.
I Quality at reasonable price
2 Direct linkages with consumers Door to Door selling
Unemployed youth and ladies are provided job at door
3 step for collection of material and primary processing at
village / centre level
I Lack of working capital
2 Technical help not available as research and training
centres for fruit preservation knowledge is not practical
from commercial point of view.
3 Quality control facilitators are not available
4 Lack of advertisement of processed food as for example
egg boared gives stogan eat egg for health. Similarly
Gov!. through Horticulture board should advertise for
preserved food should be given.
5 Economical packaging material with durability and
good appreance is required.
Final Report: 'National Level Techno-Economic Feasibility Study for North Zone' 165
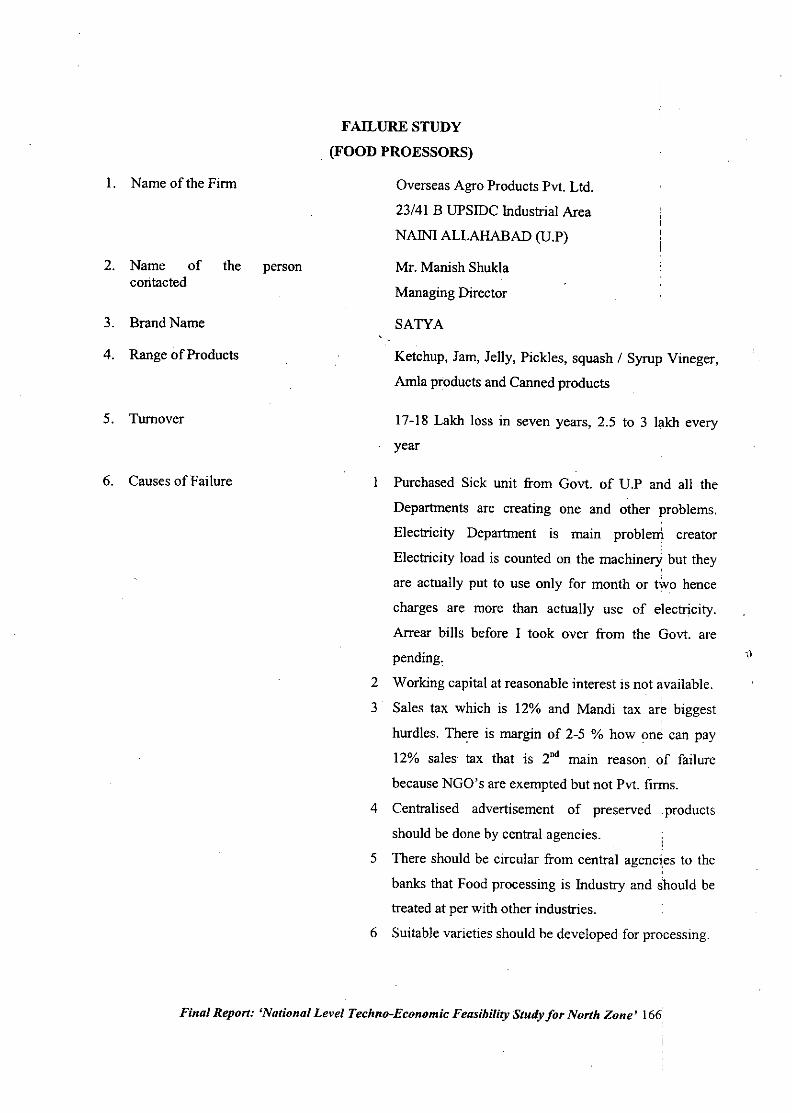
I. Name of the Finn
2. Name of the personcontacted
3. Brand Name
4. Range of Products
5. Turnover
6. Causes of Failure
FAILURE STUDY
(FOOD PROESSORS)
Overseas Agro Products Pvt. Ltd.
23/41 B UPSIDC Industrial Area
NAINI ALLAHABAD (V.P)
Mr. Manish Shukla
Managing Director
SATYA
Ketchup, Jam, Jelly, Pickles, squash / Syrup Vineger,
Amla products and Canned products
17-18 Lakh loss in seven years, 2.5 to 3 l;tkh every
year
Purchased Sick unit from GoY!. of u.p and all the
Departments are creating one and other problems.
Electricity Department is main problem creator
Electricity load is counted on the machinery but they
are actually put to use only for month or two hence
charges are more than actually use of electricity.
Arrear bills before I took over from the GoY!. are
pending.
2 Working capital at reasonable interest is not available.
3 Sales tax which is 12% and Mandi tax ar~ biggest,
hurdles. Th~re is margin of 2-5 % how one can pay
12% sales. tax that is 2'. main reason of failure
because NGO's are exempted but not Pvt. finns.
4 Centralised advertisement of preserved .products
should be done by central agencies.
5 There should be circular from central agencies to the
banks that Food processing is Industry and should be
treated at per with other industries.
6 Suitable varieties should be developed for processing.
1)
Final Report: 'National Level Techno-Economic Feasibility Study for North Zone' 166
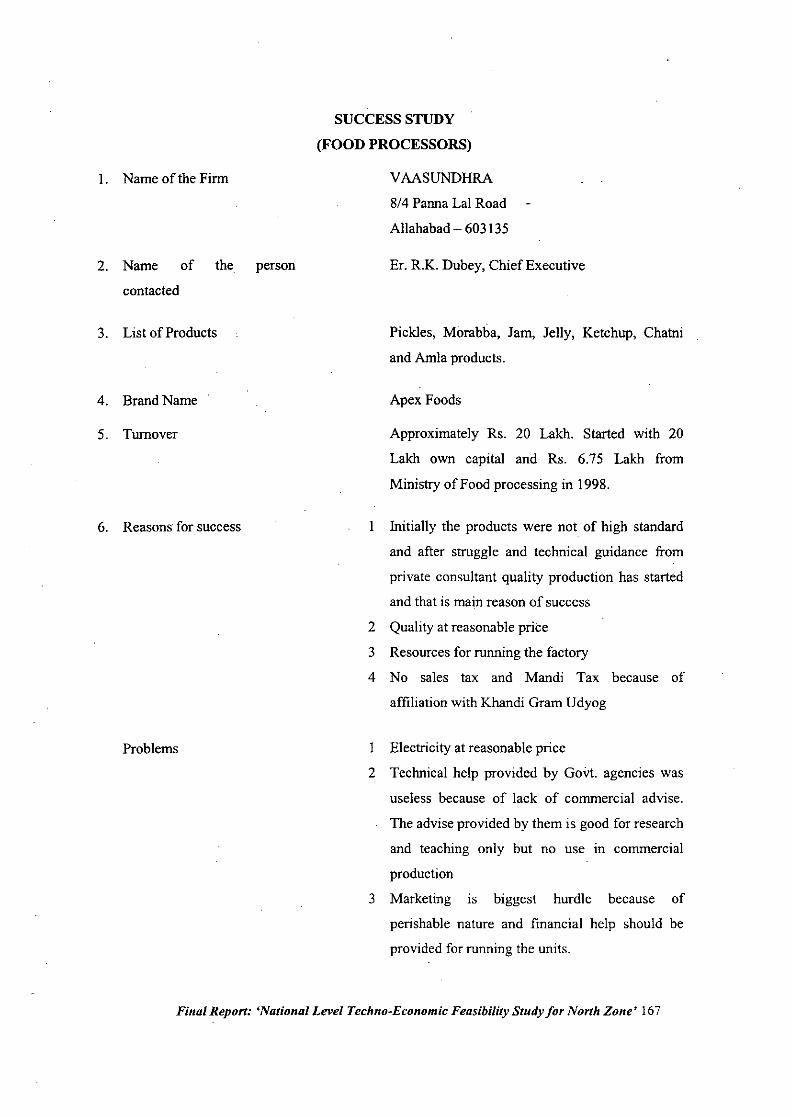
1. Name of the Firm
2. Name of the person
contacted
3. List of Products
4. Brand Name
5. Turnover
6. Reasons for success
Problems
SUCCESS STUDY
(FOOD PROCESSORS)
VAASUNDHRA
8/4 Panna Lal Road
Allahabad - 603135
Er. R.K. Dubey, Chief Executive
Pickles, Morabba, Jam, Jelly, Ketchup, Chatni
and Amla products.
Apex Foods
Approximately Rs. 20 Lakh. Started with 20
Lakh own capital and Rs. 6.75 Lakh from
Ministry of Food processing in 1998.
1 Initially the products were not of high standard
and after struggle and technical guidance from
private consultant quality production has started
and that is main reason of success
2 Quality at reasonable price
3 Resources for running the factory
4 No sales tax and Mandi Tax because of
affiliation with Khandi Gram Udyog
Electricity at reasonable price
2 Technical help provided by GoV!. agencies was
useless because of lack of commercial advise.
The advise provided by them is good for research
and teaching only but no use III commercial
production
3 Marketing IS biggest hurdle because of
perishable nature and financial help should be
provided for running the units.
Final Report: 'National Level Techno-Economic Feasibility Study for North Zone' 167
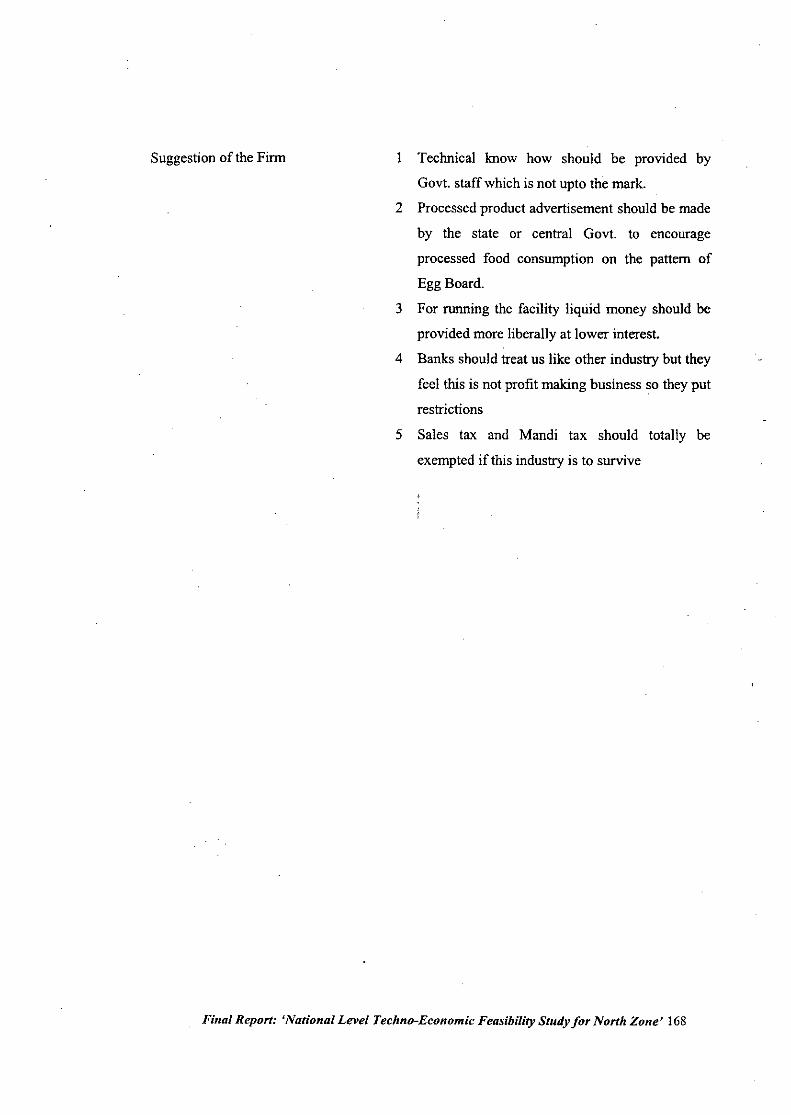
Suggestion of the Finn I Technical !mow how should be provided by
GoV!.staff which is not upto the mark.
2 Processed product advertisement should be made
by the state or central GoV!. to encourage
processed food consumption on the pattern of
Egg Board.
3 For running the facility liquid money should be
provided more liberally at lower interest.
4 Banks should treat us like other industry but they
feel this is not profit making business so they put
restrictions
5 Sales tax and Mandi tax should totally be
exempted if this industry is to survive
Final Report: 'National Level Techno-Economic Feasibility Study for North Zone' 168
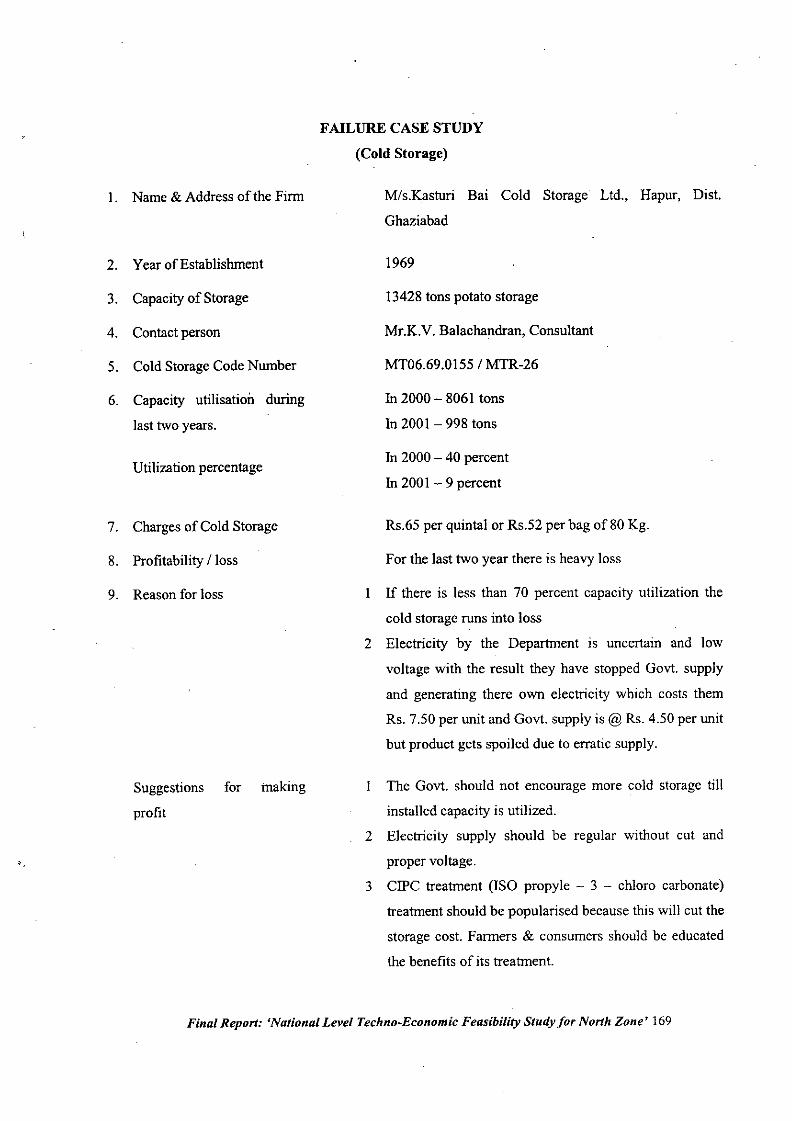
I. Name & Address of the Firm
2. Year of Establishment
3. Capacity of Storage
4. Contact person
5. Cold Storage Code Number
6. Capacity utilisation during
last two years.
Utilization percentage
7. Charges of Cold Storage
8. Profitability / loss
9. Reason for loss
Suggestions for making
profit
FAILURE CASE STUDY
(Cold Storage)
M/s.Kasturi Bai Cold Storage Ltd., Hapur, Dist.
Ghaziabad
1969
13428 tons potato storage
Mr.K.V. Balachandran, Consultant
MT06.69.0155 / MTR-26
In 2000 - 8061 tons
In 200 I - 998 tons
In 2000 - 40 percent
In 200I - 9 percent
RS.65per quintal or Rs.52 per bag of 80 Kg.
For the last two year there is heavy loss
I If there is less than 70 percent capacity utilization the
cold storage runs into loss
2 Electricity by the Department is uncertain and low
voltage with the result they have stopped Govt. supply
and generating there own electricity which costs them
Rs. 7.50 per unit and Govt. supply is @ Rs. 4.50 per unit
but product gets spoiled due to erratic supply.
The Govt. should not encourage more cold storage till
installed capacity is utilized.
2 Electricity supply should be regular without cut and
proper voltage.
3 CIPC treatment (ISO propyle - 3 - chloro carbonate)
treatment should be popularised because this will cut the
storage cost. Farmers & consumers should be educated
the benefits of its treatment.
Final Report: 'National Level Techno-Economic Feasibility Study for North Zone' 169
4 Electricity should be supplied on concessional rates.
This is the single reason that more than 200 cold
storages are closed down because of high cost of
running and under utilisation of the storage capacity.
5 Minimum price of potato at harvest time and after
storage should be fixed because number of time the
prices are so low that even cold storage and handling
charges are more than price of the product. It happenedin 1990 and 1999.
6 The grading and sorting must be done by the farmers
before storage otherwise it degrades the quality of wholeproduce.
Final Report: 'National Level Techno-Economic Feasibility Study for North Zone' 170
8.8.1.2
Regulatory Environment
Central Food Processing Laws
Prevention of Food Adulteration Act, 1954The Act is the basic statute intended to protect the common consumer against supply
of adulterated food and specifies different standards on various articles of food. The
standards are of minimum quality level intended for ensuring safety in the
consumption of these food items and for safeguarding against harmful impurities,
adulteration etc. The Central Committee for Food Standards under the Directorate
General of Health Services, Ministry of Health and Family Welfare is responsible for
operation of this Act. Provisions of the Act are mandatory and contravention of the
Rules can lead to both fme and imprisonment.
Essential Commodities Act, 1954A.number of Control Orders have been formulated under the provisions of this Act,
main objectives of which are to regulate manufacture, commerce and distribution of
essential commodities including food. These orders include B2 (a) Fruit Products
Order, 1955
• This order regulates manufacture and distribution of all fiuit and vegetable
products, sweetened aerated waters, vinegar and synthetic syrups.
Manufacture or relabelling of these products can be carried out only after obtaining a
valid license from the Ministry of Food Processing Industries.
Standards on Weights and Measures (packaged Commodities) Rules, 1977These Rules lay down certain obligatory conditions for all commodities in the packed
from with respect to their quantity declaration. These Rules are operated by the
Directorate of Weights and Measures under the Ministry of Food and Civil Supplies.
Export (Quality Control and Inspection) Act 1963Recently, Government have exempted agriculture and food products, fiuit products,
fiuit products, fish and fishery products from compulsory pre-shipment inspection,
provided the exporter has a firm letter from the overseas buyer stating that the
overseas buyer does not want pre-shipment inspection from any official Indian
Inspection Agencies
Constitutional Status:Article 48A of the Directive Principles of State Policy provides for the State's
commitment to protecting the environment and Article 51A(g) states that to protectFinal Report: 'National Level Techno-Economic Feasibility Study for North Zone' 171
and improve the natural environment shall be the fundamental duty of the citizens of
India.
(a) Regulatory Environment Protection Laws:.
Observation of the Directive Principles, the Union of India has enacted the
following major legislations:
a) The Environment (Protection) Act, 1986, which is the umbrella
Legislation
b) The Water (Prevention & Control of Pollution) Act, 1981, as amended in
1978 and 1988.
c) The Air (Prevention & Control of Pollution) Act, 1981, as amended in
1987. The above two Acts have been substantially amended in the recent
past and some of the most significant aspects of amendments are I. A
consent order is now valid for 15 years or till such time there is some
significant change in the process, whichever is earlier; 2. A consent
order cannot be provided provisionally and will be obtainable only when
all the pollution prevention requirements are adopted in toto; Action
under these two Acts are to be taken by the respective State Pollution
Control Boards.
d) The Forest Conservation Act, 1980
e) The Wildlife Preservation Act, 1982; extended to cover biosphere
resources and the Hazardous Wastes (Management & Handling) Rules,
1989.
f) Manufacture, Storage and Import of Hazardous Chemical Rules, 1989
g) Manufacture, Use, Import, Export and Storage or Hazardous Micro
organisms and Genetically Engineered Organism or Cell Rules, 1989, to
regulate the storage, use, trade, transport and disposal of hazardous
wastes
h) The Public Liability Insurance Act, 1991
i) The Motor Vehicles Act, 1939, amended in 1988, and
j) The Environment Tribunal Bill, 1992.
Final Report: 'National Level Techno-Economic Feasibility Study for North Zone' 172
(b) Promotional Policy Framework:
a) The National Forest Policy, 1988
b) The National Conservation Strategy and Policy (jf 1992.
c) The policy statement for abatement of pollution, 1992
d) The above policy statements complement the National Water
Policy and Factories Act, 1948, besides other related legislation
having a bearing on resources and economic activities
e) The national Housing Policy, 1988, the National Water Policy,
1987 and the National Land Use Policy, 1988, recognize the
importance of maintaining ecological balance.
(c) Organizational Structures of the Regulating Bodies for Environment
Management
The Ministry of Environment and Forests, created in 1986, is the nodal regulating
agency. The Ministry has four divisions:
a) Environment: The Central Pollution Control Board (CPCB) functions under it
and this Ministry is responsible for exercise of promotional and regulatory
functions under the Water, Air and Environment Protection Acts.
b) Forests and Wildlife: Wildlife preservation offices responsible for implementing
the Wildlife Protection Act, 1972 and the Regional Offices of the MOEF for
implementing the provisions of the Forest Conservation Act, 1980.
c) Ganga Project Directorate
d) National Afforestation and Eco-Development Board.
In addition to the above, there are various bodies and institutes under the MOEF or
working with it on other areas such as research, awareness drives etc. Other important
.Ministries and Departments of the Government of India looking after environment
protection include:
a) The Ministry of Rural Development - Regeneration ofbio-mass outside recorded
forest areas;
b) The Ministries of Power, Industry and Non Conventional Energy Sources -
Energy conservation and development of alternate sources of energy.
c) The Ministry of Water Resources - Monitoring of water quality and environment
impact assessment for water resource projects.
Final Report: 'National Level Techno-Economic Feasibility Study for North Zone' 173
d) The Ministries of Water Resources and Agriculture - watershed management;
e) The Ministry of Agriculture - soil conservation;
f) The Department of Biotechnology - technical support for ex-site conservationand bio safety;
g) The Ministry of Urban Development - Solid waste collection and disposal in 500
urban areas. State-level machinery:
All the state governments looking after environment and forests collectively.
Most of the states have State Pollution Control Boards (SPCBs) which have a
significant role to play in enforcing environmental management and pollution control
as required under different laws.
EXPORT PROCESSING ZONES
Certain areas have been designated as free trade or export processing zones.
• These zones provide basic infrastructural facilities like developed land, standard
design factory buildings, built-up sheds, roads, assured power and water supply
• Customs clearance facilities are offered within the zone at no extra charge while
facilities of banking, post offices and clearing agents are also available in the
Service Centres attached to each zone.
• Currently there are six such zones in operation, located at Kandla (Gujarat), Santa
Cruz (Bombay), Cochin (Kerala), Madras, Falta (Calcutta) and NOIDA (Delhi)
and a seventh zone at Vishakapatnam (Andhra Pradesh) is under implementation.
• All export processing zones except the one at Santa Cruz are open to the foodprocessing sector.
Benefits offered to Units in EPZ
The main advantages in setting up an unit in an Export Processing Zone or as an100%export oriented units are
• Full duty exemption on all imports;
• Tax holiday for any 5 consecutive years within 8 years from the commencementof production;
• Full exemption from sales tax and excise duty on all local purchases;
• Permission to convert all foreign exchange earnings at market determined rate;
and
• Permission to have upto 100% foreign equity.Final Report: 'National Level Techno-Economic Feasibility Study for North Zone' 174
8.1.3
Voluntary StandardsThere are two organisations dealing with the voluntary standardisation and
certification systems in food. Bureau of Indian Standards looks after standardisation
of processed foods and standardisation of raw agricultural produce falls under the
Directorate of Marketing and Inspection.
Bureau oflndian Standards (BIS)
The activities of BIS are two fold; formulation of Indian Standards in the processed
food sector and their implementation by promotion and through voluntary and third
party certification system.
• BIS has on record, standards for most of the processed foods; these standards in
general cover raw materials permitted and their quality parameters, hygienic
conditions under which the product is manufactured and packaging and labelling
requirements.
• Manufacturers complying with the standards laid down by BIS can obtain an 'lSI'
mark which can be exhibited on their product packages. BIS has identified certain
items like food colours/additives, vanaspati and containers for their packing, milk
powder and condensed milk for compulsory certification.
Directorate of Marketing and Inspection (DMI)The DMI enforces the Agricultural Produce (Grading and Marking). Act 1937. Under
this Act, Grade Standards are prescribed for agricultural and allied commodities,
which are koown as 'Agmark' Standards. Grading under the provisions of this Act is
voluntary. Manufactures who comply with standards laid down by DMI are allowed
to put 'Agmark' labels on their products.
State Laws
State Laws Regarding setting of Cold Storages in the State(a) Uttar Pradesh cold storage construction and operation rates under sector 44 of
1976 circulated Vide no. 3532/58 - I - 98 - 100 (28)/ 98 dated 16 - 10 - 1998.
The eleven conditions are specified for construction - operation and licence
renovation.(b) U.P Gov!. Horticulture and fruit utilisation - I No. 379/58 - I - 2001 - 100
(27)/ 90 dated 23 - 8 - 200I notification regarding renewal of licence for cold
storage.
Final Report: 'National Level Techno-Economic Feasibility Study for North Zone' 175
(c) U.P cold storage regulation Act 1976 (Gazette notification No. II of 1976)
Containing details of rules and regulations regarding grant of cold storage
licence, operational rules have 46 paras.
(d) U.P Gazette notification 17 of 1983 Vide No. 27071l7/Misc - l(ka) - 23
Dated 21 - 9 - 1983. Containing in paras with amended procedures for
construction, Operation and renewal of cold storage in U.P with ,all the
proformas.
(e) U.P Gov!, Horticultural and Fruit Utilisation Dept. - I No. 511/55 - I - 2000 -
100 (27)/95 dated Lucknow 31 - 5 - 2000 regarding first amendment of
granting licence for cold storage.
Final Report: 'National Level Techno-Economic Feasibility Study for North Zone' 176
8.1.5 Incentives and Schemes
Central Government Schemes
A. Commercial Crops - Under this disease free potato seed production and
distribution to growers so that production is increased. Under this scheme potato
seed multiplied and distributed to the farmers is given below.
Different Sta"e Potato Seed Produced in otl.Year Breeder Seed Foundation Foundation Truthfull Total
received in qtl. 1" Stage Dnd Stage Seed
1998-99 5130.40 22021 286 2713 250201999-00 7178.95 18263.35 1334.97 5745.3 25343.622000-01 8040.40 29136.25 - 3095.06 32231.31
There are 1013 cold storages with storage capacity of 64 Lakh tons. Out of these 1006 are
private, 5 under cooperative sector and 2 under State Government and total cold storage
capacity is 69 percent of production in the states
(i) Incentives
41 demonstrations in 20 districts for tuberlet production with central grant @ Rs.
500 per demonstration were conducted.
(il) Assistance in ornamental gardening
Flower production in 0.1 ha. land by marginal farmers, maintenance of public
parks were provided 50% of production cost or Rs. 60001- which ever is less.
Under this scheme 9.7, 11.01 and 7.95 ha. area in the year 1999,2000 and 2001
under parks were maintained.
(iii) Paan development scheme
Under this scheme for 200 sq. mt paan cultivation total assistance in the form of
Rs. 7501- for structure, 500 for demonstration, Rs. 1500/- for irrigation facility
and Rs. 500 for one sprayer is provided. Under this scheme following assistance
and achievement were made.
.. 1999-2000 2000-2001Units Rs. Units Rs.
Assistance Assistance1999-2000 For Structure construction 110 82500 74 55500
For demonstration 84 42000 100 50000For Irri2ation facilities 106 159000 67 100500Snraver distribution 25 12500 40 20000
Final Report: 'National Level Techno-Economic Feasibility Study for North Zone' 177
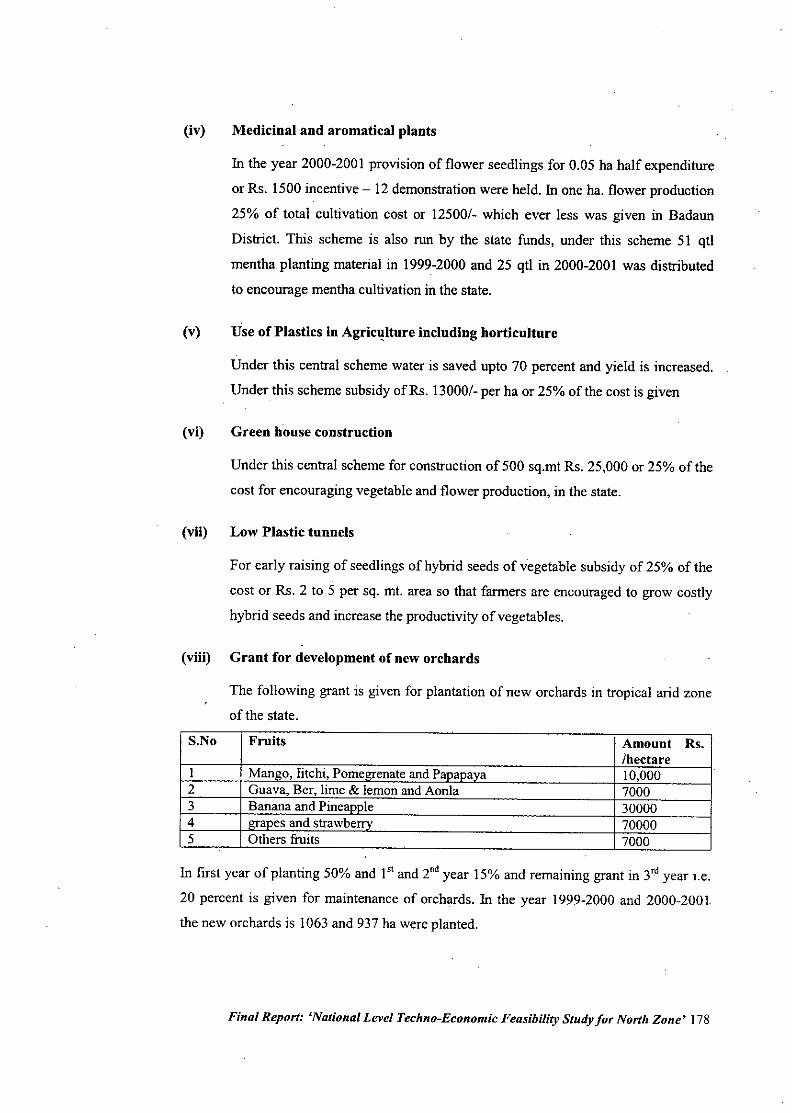
(iv) Medicinal and aromatical plants
In the year 2000-2001 provision of flower seedlings for 0.05 ha half expenditure
or Rs. 1500 incentive - 12demonstration were held. In one ha. flower production
25% of total cultivation cost or 125001- which ever less was given in Badaun
District. This scheme is also run by the state funds, under this scheme 51 qtl
mentha planting material in 1999-2000 and 25 qtl in 2000-200I was distributed
to encourage mentha cultivation in the state.
(v) Use of Plastics in Agric,!lture including horticulture
Under this central scheme water is saved upto 70 percent and yield is increased.
Under this scheme subsidy ofRs. 130001- per ha or 25% of the cost is given
(vi) Green house construction
Under this central scheme for construction of 500 sq.mt Rs. 25,000 or 25% of the
cost for encouraging vegetable and flower production, in the state.
(vii) Low Plastic tunnels
For early raising of seedlings of hybrid seeds of vegetable subsidy of 25% of the
cost or Rs. 2 to 5 per sq. mt. area so that farmers are encouraged to grow costly
hybrid seeds and increase the productivity of vegetables.
(viii) Grant for development of new orchards
The following grant is given for plantation of new orchards in tropical arid zoneof the state.
S.No Fruits Amount Rs.Ihectare
I Mango, litchi, PomefITenateand Paoaoaya 10,0002 Guava, Ber, lime& lemonandAonla 70003 Banana and Pineaoole 300004 grapes and strawberrv 700005 Others fruits 7000
In first year of planting 50% and I" and 2" year 15% and remaining grant in 3" year i.e.
20 percent is given for maintenance of orchards. In the year 1999-2000 and 2000-200 I.
the new orchards is 1063 and 937 ha were planted.
Final Report: 'National Level Techno-Economic Feasibility Study for North Zone' 178
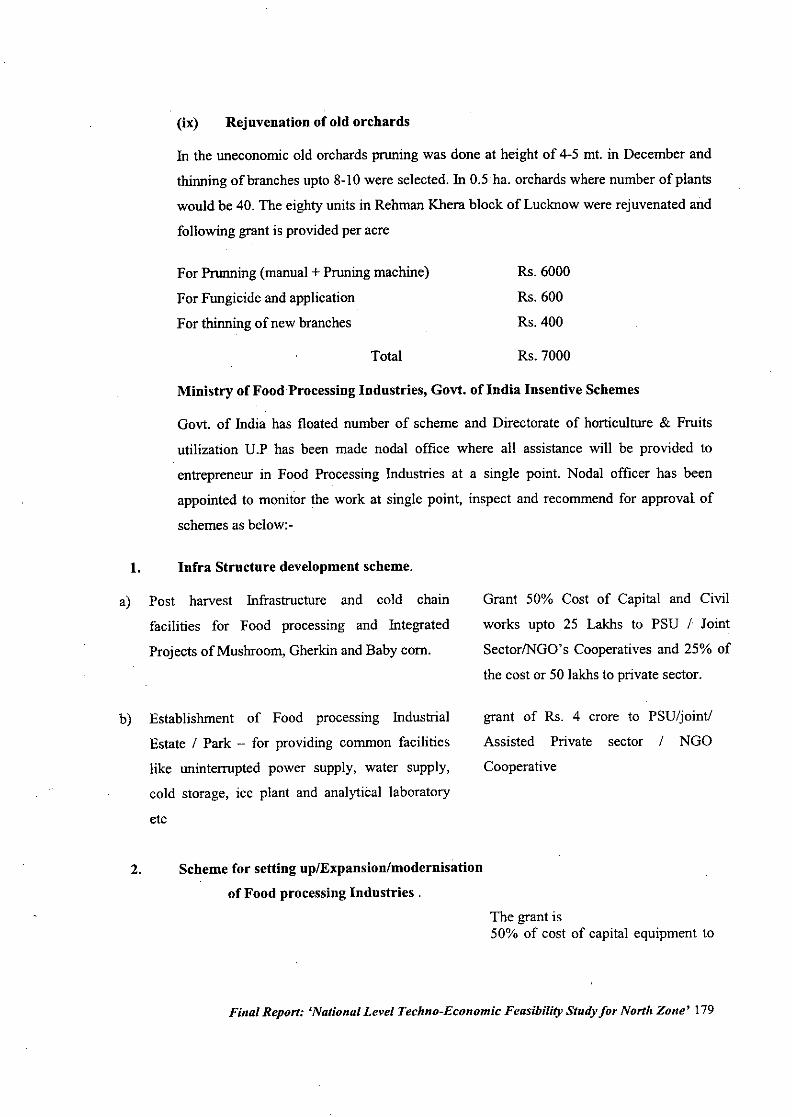
(ix) Rejuvenation of old orchards
In the uneconomic old orchards pruning was done at height of 4-5 mt. in December and
thinning of branches upto 8-10 were selected. In O.5ha. orchards where number of plants
would be 40. The eighty units in ReIunan Khera block of Lucknow were rejuvenated and
following grant is provided per acre
For Prunning (manual + Pruning machine)
For Fungicide and application
For thinning of new branches
Total
RS.6000
RS.600
RS.400
Rs. 7000
Ministry of Food Processing Industries, Gov!. of India Insentive Schemes
Gov!. of India has floated number of scheme and Directorate of horticulture & Fruits
utilization U.P has been made nodal office where all assistance will be provided to
entrepreneur in Food Processing Industries at a single point. Nodal officer has been
appointed to monitor the work at single point, inspect and recommend for approval of
schemes as beIow:-
I. Infra Structure development scheme.
a) Post harvest Infrastructure and cold chain
facilities for Food processing and Integrated
Projects of Mushroom, Gherkin and Baby corn.
b) EstablisIunent of Food processing Industrial
Estate I Park - for providing common facilities
like uninterrupted power supply, water supply,
cold storage, ice plant and analytical laboratory
etc
2. Scheme for setting uplExpansionimodernisation
of Food processing Industries.
Grant 50% Cost of Capital and Civil
works upto 25 Lakhs to PSU I Joint
SectorlNGO's Cooperatives and 25% of
the cost or 50 lakhs to private sector.
grant of Rs. 4 crore to PSU/jointi
Assisted Private sector I NGO
Cooperative
The grant is50% of cost of capital equipment to
Final Report: 'National Level Techno-Economic Feasibility Study for North Zone' 179
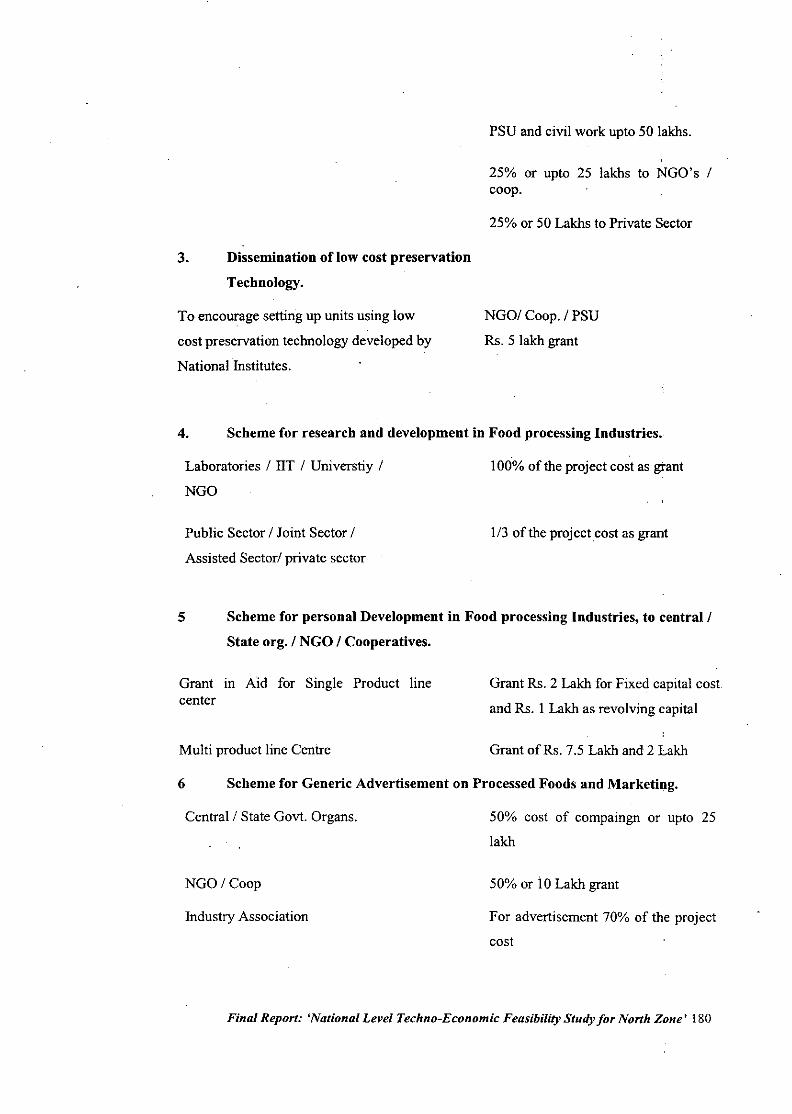
PSU and civil work upto 50 lakhs.
25% or upto 25 lakhs to NGO's /coop.
25% or 50 Lakhs to Private Sector
3. Dissemination of low cost preservation
Technology.
To encourage setting up units using low
cost preservation technology developed by
National Institutes.
NGO/ Coop. / PSU
Rs. 5 lakh grant
4. Scheme for research and development in Food processing Industries.
Laboratories / lIT / Universtiy /
NGO
Public Sector / Joint Sector /
Assisted Sector/ private sector
100% of the project cost as grant
1/3 of the projectcost as grant
5 Scheme for personal Development in Food processing Indnstries, to central /
State org. / NGO / Cooperatives.
Grant III Aid for Single Product linecenter
Multi product line Centre
Grant Rs. 2 Lakh for Fixed capital cost
and Rs. I Lakh as revolving capital
Grant of Rs. 7.5 Lakh and 2 Lakh
6 Scheme for Generic Advertisement on Processed Foods .andMarketing.
Central/State Gov!. Organs.
NGO/Coop
Industry Association
50% cost of compaingn or upto 25
lakh
50% or 10Lakh grant
For advertisement 70% of the project
cost
Final Report: 'National Level Techno-Economic Feasibility Study for North Zone' 180
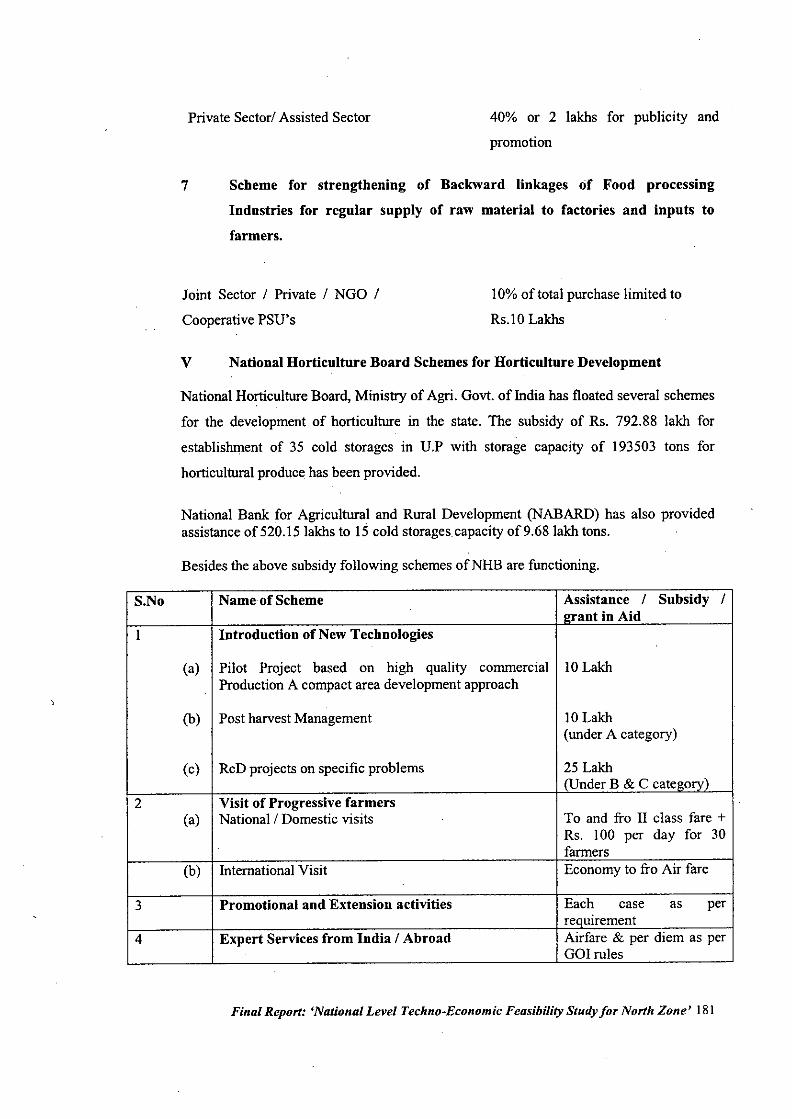
Private Sector!Assisted Sector 40% or 2 lakhs for publicity and
promotion
7 Scheme for strengthening of Backward linkages Of Food processing
Industries for regular supply of raw material to factories and inputs to
farmers.
Joint Sector! Private ! NGO !
Cooperative PSU's
10%of total purchase limited to
Rs.lO Lakhs
V National Horticulture Board Schemes for Horticulture Development
National Horticulture Board, Ministry of Agri. Gov!. of India bas floated several schemes
for the development of horticulture in the state. The subsidy of Rs. 792.88 lakh for
establishment of 35 cold storages in U.P with storage capacity of 193503 tons for
horticultural produce has been provided.
National Bank for Agricultural and Rural Development (NABARD) has also providedassistance of520.151akhs to 15 cold storages.capacity of9.68lakh tons.
Besides the above subsidy following schemes ofNHB are functioning.
S.No Name of Scheme Assistance ! Subsidy !"rant in Aid
I Introduction of New Tecbnologies
(a) Pilot Project based on high quality commercial 10LakhProduction A compact area development approach
(b) Post harvest Management 10Lakh(under A category)
(c) RcD projects on specific problems 25 Lakh!Under B & C category)
2 Visit of Progressive farmers(a) National! Domestic visits To and fro II class fare +
Rs. 100 per day for 30. farmers
(b) International Visit Economy to fro Air fare
3 Promotional and Extension activities Each case as perreauirement
4 Expert Services from India! Abroad Airfare & per diem as perGO! rules
Final Report: 'National Level Techno-Economic Feasibility Study for North Zone' 181
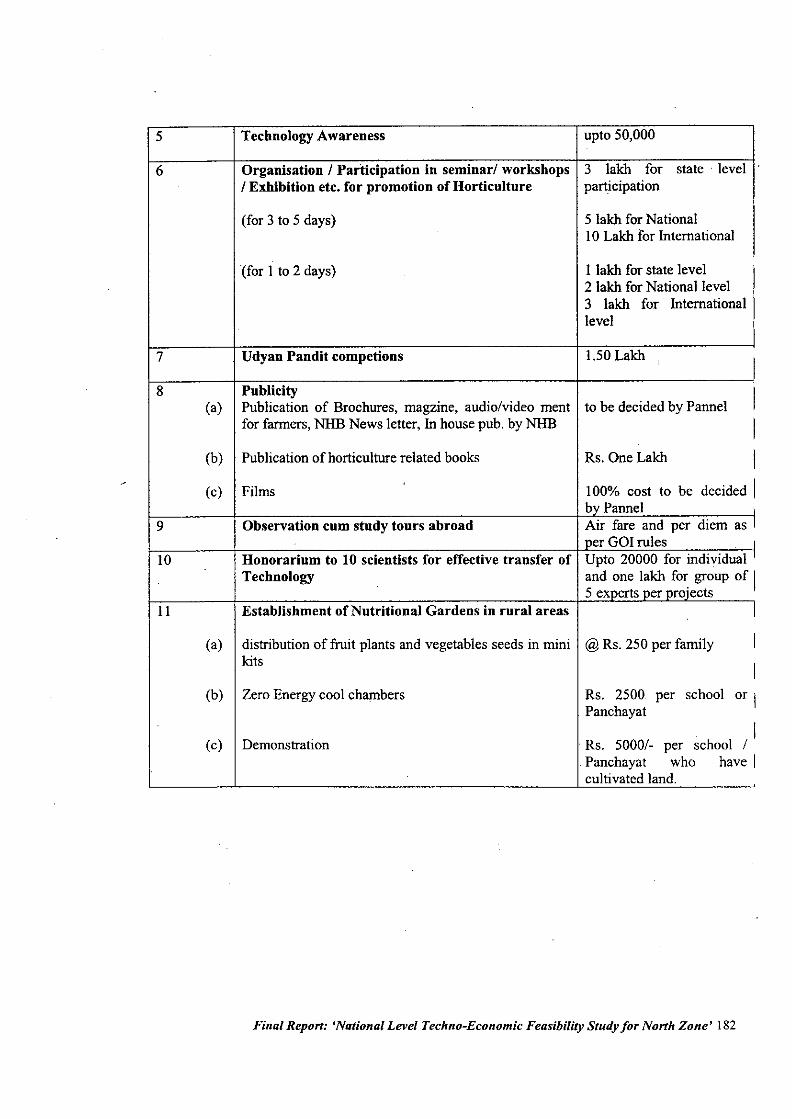
5 Technology Awareness upto 50,000
6 Organisation / Participation in seminar/ workshops 3 lakh for state . level/ Exhihition etc. for promotion of Horticulture participation
(for 3 to 5 days) 5 lakh for National10 Lakh for International
(for I to 2 days) I lakh for state level I2 lakh for National level ,
3 lakh for International Ilevel I
7 Udyan Pandit competions 1.50 Lakh I8 Publicity I(a) Publication of Brochures, magzine, audio/video ment to be decided by Pannel
for farmers, NHB News letter, In house pub. by NHB I(b) Publication of horticulture related books Rs. OneLakh I(c) Films 100% cost to be decided I
bv Pannel ,
9 Observation cum study tours abroad Air fare and per diem as lner GOr rules I
10 Honorarium to 10 scientists for effective transfer of Upto 20000 for individual I
Technology and one lakh for group of I5 experts per projects
II Establishment of Nutritional Gardens in rural areas I
(a) distribution of fruit plants and vegetables seeds in mini @ Rs. 250 per family Ikits
I(b) Zero Energy cool chambers Rs. 2500 per school or I
Panchayat
(c) DemonstrationI
Rs. 5000/- per school /Panchayat who have Icultivated land.
Final Report: 'National Level Techno-Economic Feasibility Study for North Zone' 182
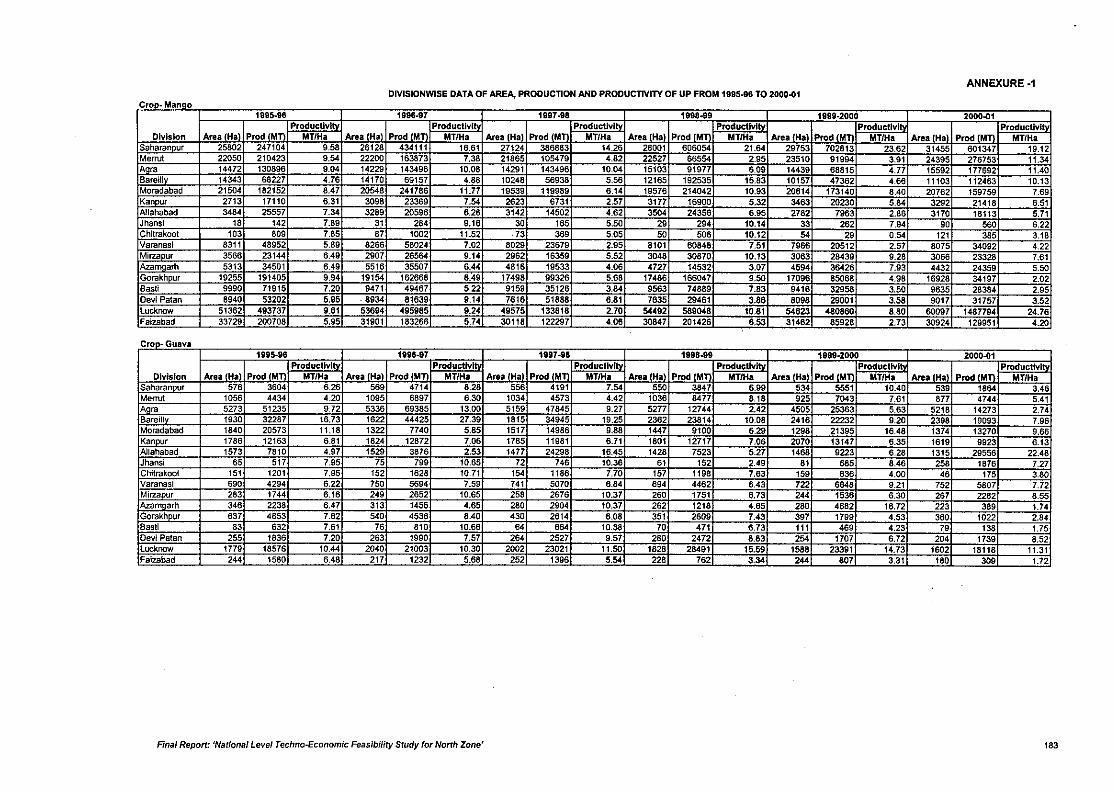
DIVISIONWISE DATA OF AREA,. PRODUCTION AND PRODUCTIVITY OF UP FROM 1995-96 TO 2000~1ANNEXURE .1
Cron-Manoo1995-96 1996-97 1997.98 1998--99 1999.2000 2000-01
Producllvl Productivl ProducUvi Productivity Produetlvl ProduclivDivision Area IHa Prod 1M MTlHa Atea (Ha Prod 1M MYtHa Area (Ha Prod 1M MTIHa Area (Ha Prod 1M MY/Ha AreatHa Prod 1M MTlHa •••••• (H. Prod IMTI MYtHa
Saharanour 25802 247104 9.58 26128 434111 16.61 27124 386883 14.26 28001 606054 21.64 29753 702813 23.62 31455 601347 19.12Me"", 22050 210423 9.54 22200 163873 7.38 21865 105479 4.82 22527 66554 2.95 23510 91994 3.91 24395 276753 11.34Am 14472 130896 9.04 14229 143496 10,08 14291 143498 10.04 15103 91977 6.09 14439 68815 4.77 15592 177692 11.40Bareill 14343 68227 4.76 14170 69157 4.88 10248 56938 5.56 12165 192535 15.83 10157 47362 4.66 11103 112463 10.13Moradabad 21504 182152 8.47 20548 241786 11.77 19539 119989 6.14 19576 214042 10.93 20614 173140 8.40 20762 159759 7.69Kanour 2713 17110 6.31 3098 23369 7.54 2623 6731 2.57 3177 16900 5.32 3463 20230 5.84 3292 21418 6.51Allahabad 3484 25557 7.34 3289 20596 6.26 3142 14502 4.62 3504 24356 6.95 2782 7963 2.86 3170 18113 5.71Jhansi 18 142 7.89 31 284 9.16 30 165 5.50 29 294 10.14 33 262 7.94 90 560 6.22Chilrakool 103 809 7.85 87 1002 11.52 .73 36' 5.05 50 506 10.12 54 29 0.54 121 385 3.18Varanasi 8311 48952 5.89 8266 58024 7.02 8029 23679 2.95 8101 60848 7.51 7965 20512 2.57 8075 34092 4.22Mirza ur 3565 23144 6.49 2907 26564 9.14 2962 16359 5.52 3048 30870 10.13 3063 28439 9.28 3065 23328 7.61Azamaarh 5313 34501 6.49 5516 35507 6.44 4816 19533 4.06 4727 14532 3.07 4594 36426 7.93 4432 24359 5.50Gorakhour 19255 191405 9.94 19154 162668 8.49 17498 99326 5.68 17486 166047 9.50 17096 85068 4.98 16928 34197 2.02Basti 9990 71915 7.20 9471 49467 5.22 9159 35126 3.84 9563 74889 7.83 9416 32958 3.50 9635 28384 2.95Oevl Patan 8940 53202 5.95 .8934 81639 9.14 7616 51888 6.81 7835 29481 3.88 8098 29001 3.58 9017 31757 3.52Lucknow 51362 493737 9.61 53694 495985 9.24 49575 133818 2.70 5«92 589048 10.81 54623 480860 8.80 60097 1487794 24.76Faizabad 33729 200708 5.95 31901 183266 5.74 30118 122297 4.06 30847 201426 6.53 31462 85928 2.73 30924 129951 4.20
Cron-Guava1995-98 199&-97 1997-98 1995..Q9 1999-2000 2000~1
Producllvl Producttvl Productivity Productlvlb Producttvl ProductivlDivision Area IHa Prod 1M MT/Ha Area IHa Prod 1M MT/Ha Area/Hal Prod /M MTlHa •••••• fH.I Prod fM MTlHa Area (Ha Prod tM MTlHa Area(Ha ProdlMTI MT/Ha
Saharan ur 576 3604 6.26 56' 4714 8.28 556 4191 7.54 550 3847 6.99 534 5551 10.40 539 1884 3.46Me"", 1056 4434 4.20 1095 6897 6.30 1034 4573 4.42 1036 8477 8.18 925 7043 7.61 877 4744 5.41A c. 5273 51235 9.72 5336 69385 13.00 5159 47845 9.27 5277 12744 2.42 4505 25363 5.63 5218 14273 2.74Bareillv 1930 32287 16.73 1622 44425 27.39 1815 34945 19.25 2362 23814 10.08 2416 22232 9.20 2398 19093 7.96Moradabad 1840 20573 11.18 1322 7740 5.85 1517 14986 9.88 1447 9100 6.29 1298 21395 16,48 1374 13270 9.66Kan ur 1786 12163 6.81 1824 12872 7.06 1785 11981 6.71 1801 12717 7.06 2070 13147 6.35 1619 9923 6.13Allahabad 1573 7810 4.97 1529 3876 2.53 1477 24298 16,45 1428 7523 5.27 1468 9223 6.28 1315 29556 22.48Jhansl 65 517 7.95 75 7" 10.65 72 746 10.36 61 152 2.49 81 685 8.46 258 1876 7.27Chilrakool 151 1201 7.95 152 1628 10.71 154 1186 7.70 157 1198 7.63 15. 636 4.00 45 175 3.80Varanasi 690 4294 6.22 750 5694 7.59 741 5070 6.84 694 4462 6.43 722 6845 9.21 752 5807 7.72Mirza ur 283 1744 6.16 249 2652 10.65 258 2676 10.37 260 1751 6.73 244 1536 6.30 267 2282 8.55kJJ .m 346 2238 6.47 313 1455 4.65 280 2904 10.37 262 1218 4.65 280 4682 16.72 223 389 1.74Gorakh ur 637 4853 7.62 540 4536 8.40 430 2614 6.08 351 2609 7.43 3.7 1799 4.53 360 1022 2.848asti 83 632 7.61 76 810 10.66 84 664 10.38 70 471 6.73 111 469 4.23 7' 138 1.75Devl Patan 255 1836 7.20 263 1990 7.57 264 2527 9.57 280 2472 8.83 254 1707 6.72 204 1739 8.52Lucknow 1779 18576 10.44 2040 21003 10.30 2002 23021 11.50 1828 28491 15.59 1588 23391 14.73 1602 18118 11.31Faizabad 244 1580 6.48 217 1232 5.68 252 1396 5.54 228 762 3.34 244 807 3.31 160 309 1.72
Final Report: 'National Level Techno-Economic Feasibility Study for North Zone' 183
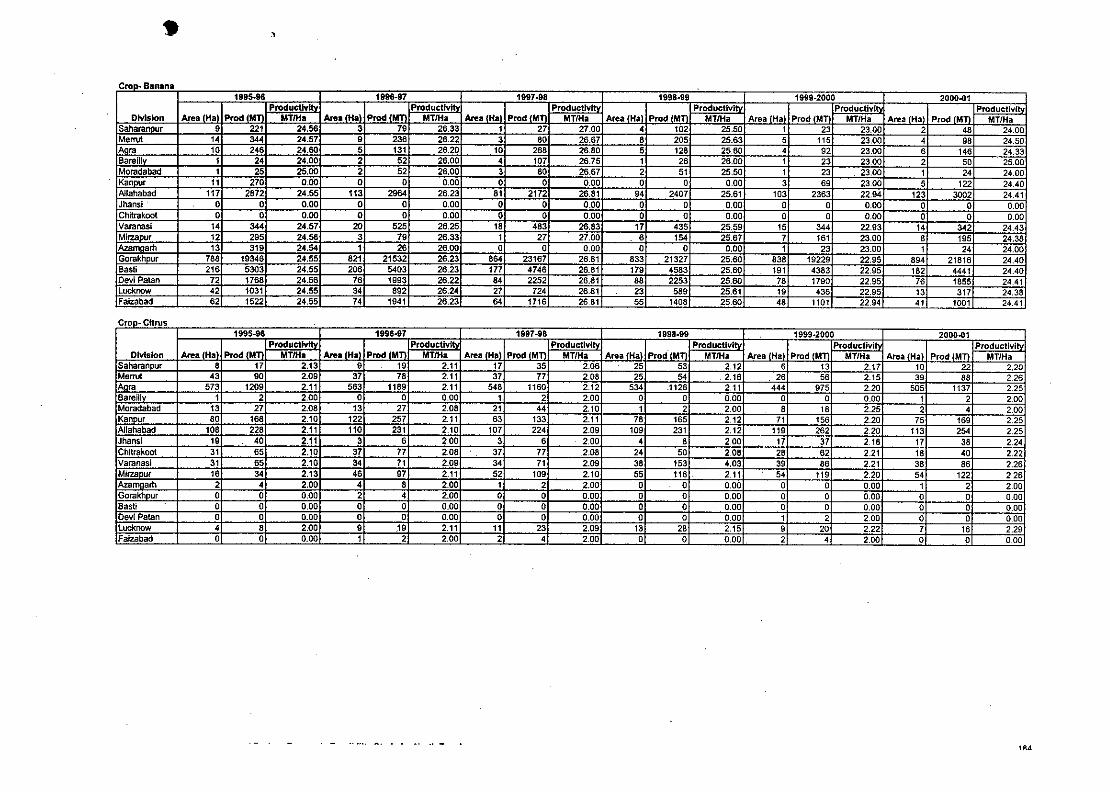
CroD8 Banana1995.96 1996-97 1997-98 1998-99 1999-2000 2000-01
Productiv Productiv ProducUvI Productlv! Productlv! Producti,,'Dtvlslon Area 'Ha Prod MTlHa Area fHal ProdfM MT/Ha Area lHa Prod lM MTtHa Area (Hal Prod (MY MY/Ha Area (Ha Prod (M MT/Ha Area (Ha Prod (Mn MYIHa
Saharan ur 9 221 24.56 3 79 26.33 1 27. 27.00 4 102 25.50 1 23 23.00 2 .8 24.00Me"'" 14 344 24.57 9 238 26.22 3 80 26.67 8 205 25.63 5 115 23.00 • 98 24.50
'" 10 2'6 24.60 6 131 26.20 10 268 26.80 5 128 25.60 • 92 23.00 6 148 24.33Bareiltv 1 24 24.00 2 52 26.00 4 107 26.75 1 26 26.00 1 23 23.00 2 50 25.00Moradabad 1 25 25.00 2 52 26.00 3 60 26.67 2 51 25.50 1 23 23.00 1 24 24.00Kan ur 11 270 0.00 0 0 0.00 0 0 0.00 0 0 0.00 3 69 23.00 5 122 24.40Allahabad 117 2872 24.55 113 2964 26.23 81 2172 26.81 94 2407 25.61 103 2363 22.94 123 3002 24.41Jhansi 0 0 0.00 0 0 0.00 0 0 0.00 0 0 0.00 0 0 0.00 0 0 0.00Chitrakoot 0 0 0.00 0 0 0.00 0 0 0.00 0 0 0.00 0 0 0.00 0 0 0.00Varanas! 14 344 24.57 20 525 26.25 18 483 26.83 17 435 25.59 15 344 22.93 14 342 24.43MirzaDur 12 295 24.58 3 79 26.33 1 27 27.00 6 154 25.67 7 161 23.00 8 195 24.38AzB am 13 319 24.54 1 26 26.00 0 0 0.00 0 0 0.00 1 23 23.00 1 24 24.00Gorakh ur 788 19346 24.55 821 21532 26.23 664 23167 26.81 833 21327 25.60 838 19229 22.95 694 21816 24.40Sasti 216 5303 24.55 206 5403 26.23 177 4746 26.81 179 4583 25.60 191 4383 22.95 162 4441 24.40Devi Patan 72 1768 24.56 76 1993 26.22 8. 2252 26.81 88 2253 25.60 78 1790 22.95 76 1855 24.41L""know '2 1031 24.55 34 692 26.24 27 72. 26.81 23 589 25.61 '9 436 22.95 13 317 24.38Faizabad 62 1522 24.55 74 1941 26.23 64 1716 26,81 55 1408 25.60 48 1101 22.94 41 1001 24.41
Cron-Citrus1995-96 1996.97 1997-98 1998-99 1999-2000 2000-01
Producttvlb Productlvlb Productlvl Productlvl Productivi ProductiviDivision Area IHa Prod 1M MT/Ha ArealHa ProdfM MTlHa Area IHal Prod 1M MT/Ha Area lHa Prod'lM MT/Ha Area (Hal Prod (M MT!Ha Area (Ha Prod IMn MT/Ha
Saharan ur 8 17 2.13 9 19 2.11 17 35 2.06 25 53 2.12 6 13 2.17 10 22 2.20Me"'" 43 90 2.09 37 78 2.11 37 77 2.08 25 54 .2.16 26 56 2.15 3. 86 2,26A", 573 1209 2.11 583 1189 2.11 548 1160 2.12 534 .1126 2.11 444 975 2.20 505 1137 2,25Sareill 1 2 2.00 0 0 0.00 1 2 2.00 0 0 0.00 0 0 0.00 1 2 2.00Moradabad 13 27 2.08 13 27 2.08 21 44 2.10 1 2 2.00 8 18 2.25 2 4 2.00Kan ur 60 '68 2.10 122 257 2.11 83 133 2.11 78 165 2.12 71 156 220 75 169 2.25Allahabad 106 228 2.11 110 231 2.10 107 224 2.09 '0. 231 2.12 119 262 2.20 113 254 2,25Jhansl 19 40 2.11 3 6 2,00 3 6 2,00 • 6 2,00 17 37 2,16 17 36 2.24Chltrakoot 31 65 2.10 37 77 2.08 37 77 2.08 24 50 2.08 26 62 2.21 18 40 2,22Varanasi 31 65 2.10 34 71 2.09 34 71 2.09 38 153 4.03 3. 66 2.21 38 66 2.26Mirza ur '6 34 2.13 • 6 97 2.11 52 10. 2.10 55 116 . 2.11 54 11• 2.20 5' 122 2,26AzB am 2 4 2.00 4 8 2.00 1 2 2.00 0 0 0.00 0 0 0.00 1 2 2.00Gorakh ur 0 0 0.00 2 4 2.00 0 0 0.00 0 0 0.00 0 0 0.00 0 0 0.00Sasti 0 0 0.00 0 0 0.00 0 0 0.00 0 0 0.00 0 a 0.00 0 0 0.00De,,1Patan 0 0 0.00 0 0 0.00 0 0 0.00 0 0 0.00 1 2 2.00 0 0 0.00Lucknow 4 8 2.00 9 .1. 2.11 11 23 2.09 13 26 2.15 • 20 2.22 7 16 2.29Faizabad 0 0 0.00 1 2 2.00 2 4 2.00 0 0 0.00 2 • 2.00 0 0 0.00
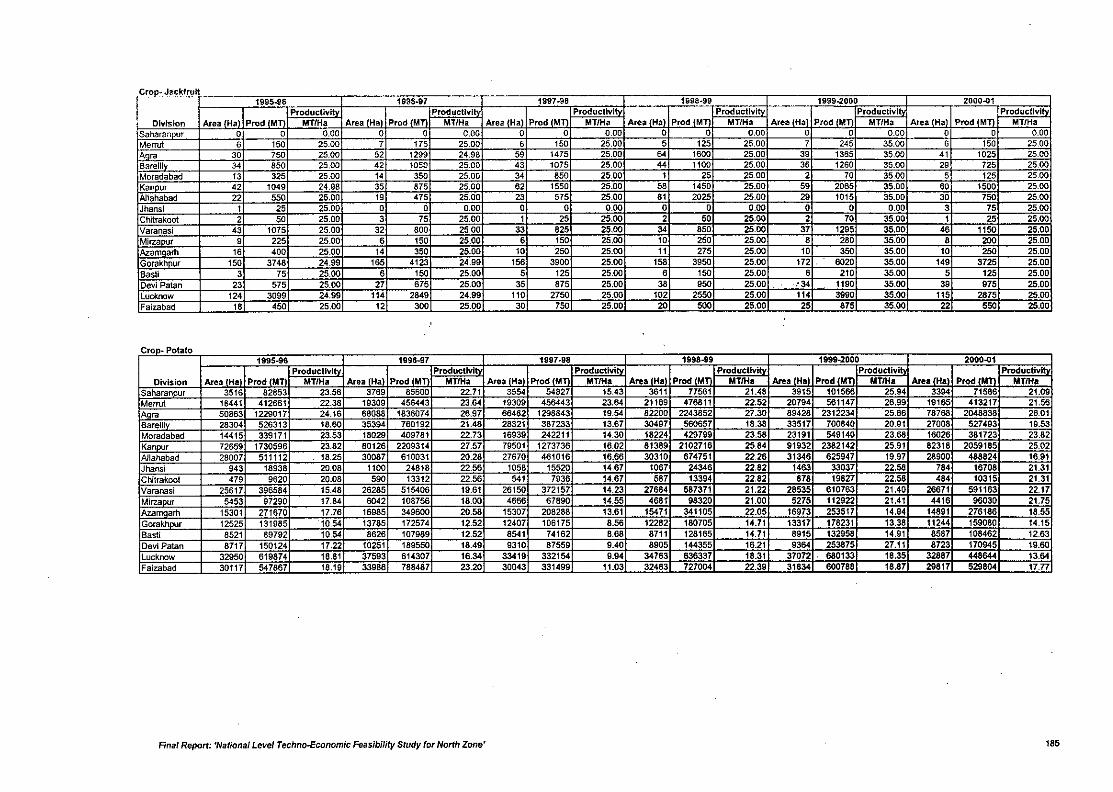
Crop. J2ckfrult1995.ll6 1995-97 1997.911 1998-99 1999-2000 2000..Q1
Productivl ProductlvlProd IMT
ProductiviArea IHa Prod (M
ProductlvlArea IHa Prod IMT
ProducUvlArea (Hal Prod IMT
Product!vlDivision Area fHa Prod 1M MYfHa Area (Ha Prod 1M MT/Ha Area IHa MT/Ha MT/Ha MT/Ha MT/Ha
Saharan ur 0 0 0.00 0 0 0.00 0 0 0.00 0 0 0.00 0 0 0.00 0 0 0.00Menu! 6 150 25.00 7 175 25.00 6 150 25.00 5 125 25.00 7 245 35.00 6 150 25.00
ca 30 750 25.00 52 1299 24.98 59 1475 25.00 64 1600 25.00 39 1365 35.00 41 1025 25.00Bareitl 34 850 25,00 42 1050 25.00 43 1075 25.00 44 1100 25.00 36 1260 35.00 29 725 25.00Moradabad 13 325 25.00 14 350 25.00 34 850 25.00 1 25 25.00 2 70 35.00 5 125 25.00Kanpur 42 1049 24.98 35 875 25.00 62 1550 25.00 58 1450 25.00 59 2065 35.00 60 1500 25.00Allahabad 22 550 25.00 19 475 25.00 23 575 25.00 81 2025 25.00 29 1015 35.00 30 750 25.00Jhansl 1 25 25.00 0 a 0.00 0 0 0.00 0 0 0.00 0 0 0.00 3 75 25.00Chitrakoot 2 50 25.00 3 75 25.00 1 25 25.00 2 50 25.00 2 70 35.00 1 25 25.00Varanasi 43 1075 25.00 32 800 25.00 33 825 25.00 34 850 25.00 37 1295 35.00 46 1150 25.00Mlaa r 9 225 25.00 6 150 25.00 6 150 25.00 10 250 25.00 8 280 35.00 8 200 25.00Azamgarh 16 400 25.00 14 350 25.00 10 250 25.00 11 275 25.00 10 350 35.00 10 250 25.00Gorakh ur 150 3748 24.99 165 4123 24.99 156 3900 25.00 158 3950 25.00 172 6020 35.00 149 3725 25.00Bastl 3 75 25.00 6 150 25.00 5 125 25.00 6 150 25.00 6 210 35.00 5 125 25.00Devi Patan 23 575 25.00 27 675 25.00 35 875 25.00 38 950 25.00 ,~34 1190 35.00 39 975 25.00Lucknow 124 3099 24.99 114 2849 24.99 110 2750 25.00 102 2550 25.00 114 3990 35.00 115 2875 25.00Faizabad 18 450 25.00 12 300 25.00 30 750 25.00 20 500 25.00 25 875 35.00 22 550 25.00
CroD. Potato1995-96 1998-97 1997.98 1998.99 1999-2000 2000-01
Productlvlh Productivl ProductlvlArea IHa Prod 1M
ProducUvi••••, IH,' Prod 1M
Productivl••••,'Hal
ProductlvDivision Area IHa Prod 1M MY/Ha Area 'Hal Prod 1M MTtHa Area IHa Prod (M MTtH. MytH. MYfHa Prod IMTl MYtH.
Saharan ur 3516 82853 23.56 3769 85600 22.71 3554 54827 15.43 3611 77561 21.48 3915 101568 25.94 3394 71586 21.09Merrut 18441 412661 22.38 19309 456443 23.64 19309 456443 23.64 21169 476811 22.52 20794 561147 26.99 19165 413217 21.56Aca 50863 1229017 24.16 68088 1836074 26.97 66482 1298843 19.54 82200 2243852 27.30 89428 2312234 25.86 78768 2048838 26.01Barelliv 28304 526313 18.60 35394 760192 21.48 28321 387233 13.67 30497 560657 18.38 33517 700840 20.91 27008 527493 19.53Moradabad 14415 339171 23.53 18029 409781 22.73 16939 242211 14.30 18224 429799 23.58 23191 549140 23.68 16026 381723 23.82Kan ur 72659 1730596 23.82 80126 2209314 27.57 79501 1273736 16.02 81389 2102716 25.84 91932 2382142 25.91 82318 2059185 25.02Allahabad 28007 511112 18.25 30087 610031 20.28 27670 461016 16.66 30310 574751 22.26 31345 525947 19.97 28900 488824 16.91Jhansi 943 18938 20.08 1100 24818 22.56 1058 15520 14.67 1067 24346 22.82 1463 33037 22.58 784 16708 21.31Chilrakool 479 9620 20.08 590 13312 22.56 541 7936 14.67 587 13394 22.82 878 19827 22.58 484 10315 21.31Varanasl 25617 396584 15.48 26285 515406 19.61 26150 372157 14.23 27684 587371 21.22 28535 610763 21.40 26671 591163 22.17Mirzaour 5453 97290 17.84 6042 108756 18.00 4666 67890 14.55 468f 98320 21.00 5275 112922 21.41 4416 96030 21.75AzamQar1l 15301 271670 17.76 16985 349600 20.58 15307 208288 13.61 15471 341105 22.05 16973 253517 14.94 14891 276186 18.55Gorakh ur 12525 131985 10.54 13785 172574 12.52 12407 106175 8.56 12282 180705 14.71 13317 178231 13.38 11244 159080 14.15Basti 8521 89792 10.54 8626 107989 12.52 8541 74162 8.68 8711 128165 14.71 8915 132958 14.91 8587 108462 12.63Devi Patan 8717 150124 17.22 10251 189550 18.49 9310 87559 9.40 8905 144355 16.21 9364 253875 27.11 8723 170945 19.60lucknow 32950 619874 18.81 37593 614307 16.34 3341. 332154 9.94 34763 636337 18.31 37072 680133 18.35 32887 448644 13.64Faizabad 30117 547867 18.19 33988 788487 23.20 30043 331499 11.03 32463 727004 22.39 31834 600788 18.87 29817 529804 17.77
Final Report: 'National Level Techno-Economic Feasibility Study for North Zone' 185
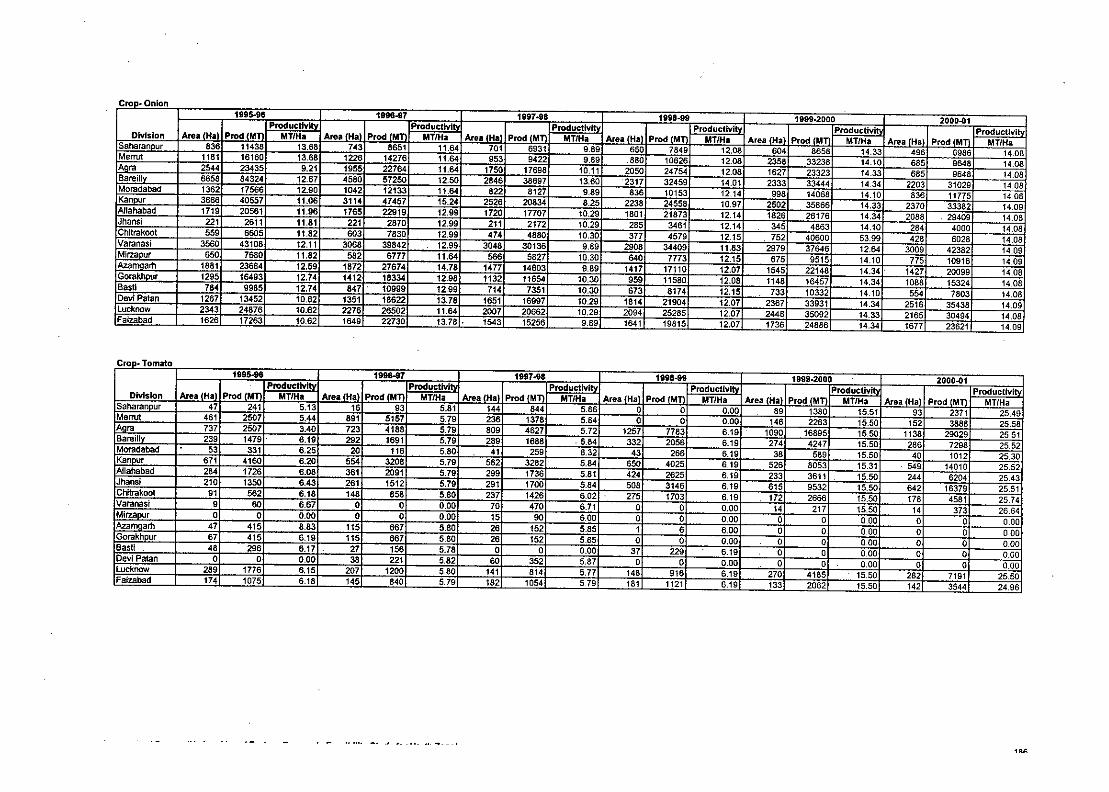
CroD~OnIDn1995-9'1 1996-97 1997-98 1998.99 1999.2000 2000~1
Pm.I'MProductJvlt\ _.'H.' Prod 1M
ProductlvlProd 1M
ProductlvArea (Ha'
Productiv'Area IHa Prod IM~
Productrvl Product/viDivision Area (Ha MT/HI MTlHa Area 'HI MTlHa Prod 1M MTIHI MT/Ha Area IHa Prod (Mn MT/HaSaharan ur 838 11438 13.68 743 8651 11.64 701 6931 9.89 650 7849 12.08 604 8658 14.33 496 6986 14,08Me"'" 1181 16160 13.68 1226 14276 11.64 953 9422 9.89 880 10626 12.08 2358 33238 14.10 685 9645 14.08Ara 2544 23435 9.21 1955 22764 11.64 1750 17698 10,11 2050 24754 12.08 1627 23323 14.33 685 9648 14.08Bareill 6658 84324 12.67 4580 57250 12,50 2846 38697 13.60 2317 32459 14.01 2333 33444 14,34 2203 31029 14.08Moradabad 1362 17566 12.90 1042 12133 11.64 822 8127 9.89 836 10153 12.14 998 14068 14.10 536 11775 14.08Kan ur 3668 40557 11.06 3114 47457 15.24 2526 20834 8.25 2238 24558 10.97 2502 35866 14.33 2370 33382 14.09Allahabad 1719 20561 11.96 1765 22919 12.99 1720 17707 10.29 1801 21873 12.14 1826 26176 14.34 2088 29409 14.08Jhansi 221 2611 11.81 221 2870 12.99 211 2172 10.29 285 3461 12.14 345 4863 14.10 284 4000 14.08Chltrakoot 559 6605 11.82 603 7830 12.99 474 4880 10.30 377 4579 12.15 752 40600 53.99 428 6028 14.08Varanasi 3560 43108 12.11 3068 39842 12,99 3048 30136 9.89 2908 34409 11.83 2979 37646 12,64 3009 42382 14.09Mirza ur 650 7680 11.82 582 6777 11.64 566 5827 10.30 640 7773 12.15 675 9515 14,10 775 10916 14.09Azamaarh 1881 23684 12.59 1872 27674 14.78 1477 14603 9.89 1417 17110 12.07 1545 22148 14.34 . 1427 20099 14,08Gorakh ur 1295 16493 12.74 1412 18334 12.98 1132 11654 10.30 959 11580 12.08 1148 16457 14.34 1088 15324 14.08Bastl 784 9985 12.74 847 . 10999 12,99 714 7351 10.30 673 8174 12.15 733 10332 14.10 554 7803 14.08Devi Patan 1267 13452 10.62 1351 18622 13.78 1651 16997 10.29 1814 21904 12.07 2367 33931 14.34 2516 35438 14.09Lucknow 2343 24876 10.62 2276 26502 11.64 2007 20662 10.29 2094 25285 12,07 2448 35092 14.33 2165 30494 14.08Faizabad 1626 17263 10.62 1649 22730 13.78 . 1543 15256 9.89 1641 19815 12.07 1736 24886 14.34 1677 23621 14.09
CroD~ Tomato1995-96 1996-87 1997-98 1998-89 1999-2000 2000-01. Produe:tfv Product Productlvlt\ Productlvl Productiv' ProductiVft';Division Area (Ha Prod 1M MT/Ha Area 'Ha Prod 1M MTIHa Area (Ha Prod 1M MTlHa Area IHa Prod (MT MTIHa Area fHa Prod fM MTlHa Area (Ha Prod fMn MTfHaSaharan ur 47 241 5.13 16 93 5.81 144 844 5.86 0 0 0.00 89 1380 15.51 93 2371 25.49Me"'" 461 2507 5.44 891 5157 5.79 236 1378 5.84 0 0 0.00 148 2263 15.50 152 3888 25.58ra 737 2507 3.40 723 4188 5.79 809 4627 5.72 1257 7783 6.19 1090 16895 15.50 1138 29029 25,51Bareill 239 1479. 6.19 292 1691 5.79 289 1688 .5.84 332 2056 6.19 274 4247 15.50 286 7298 25.52Moradabad 53 331 6.25 20 116 5.60 41 259 6.32 43 268 6.19 38 589 15.50 40 1012 25,30Kan ur 671 4160 6.20 554 3208 5.79 562 3282 5.84 650 4025 6.19 526 8053 15.31 549 14010 25.52Allahabad 284 1726 6.08 361 2091 5.79 299 1736 5.81 424 2625 6.19 233 3611 15.50 244 6204 25.43Jhansi 210 1350 6.43 261 1512 5.79 291 1700 5.84 508 3146 6.19 615 9532 15.50 642 16379 25.51Chitrakoot 91 562 6.18 148 658 5.80 237 1426 6.02 275 1703 6.19 172 2666 15.50 178 4581 25.74Varanasi 9 60 6.67 0 0 0.00 70 470 6.71 0 0 0.00 14 217 15,50 14 373 26.64Mirzaour 0 0 0.00 0 0 0.00 15 90 6.00 0 0 0.00 0 0 0.00 0 0 0.00Azamaartl 47 415 8.83 115 667 5.80 26 152 5.85 1 6 6,00 0 0 0,00 0 0 0,00Gorakh ur 67 415 6,19 115 667 5.80 26 152 5.65 0 0 0.00 0 0 0,00 0 0 0.00Bast! 48 296 6.17 27 156 5.78 0 0 0.00 37 229 6.19 0 0 0.00 0 0 0.00Devi Patan 0 0 0.00 38 221 5.82 60 352 5.87 0 0 0.00 0 0 0.00 0 0 0.00Lucknow 289 1776 6.15 207 1200 5.80 141 814 5.77 145 916 6.19 270 4185 15.50 282 7191 25.50Faizabad 174 1075 6.18 145 840 5.79 182 1054 5.79 151 1121 6.19 133 2062 15.50 142 3544 24,96
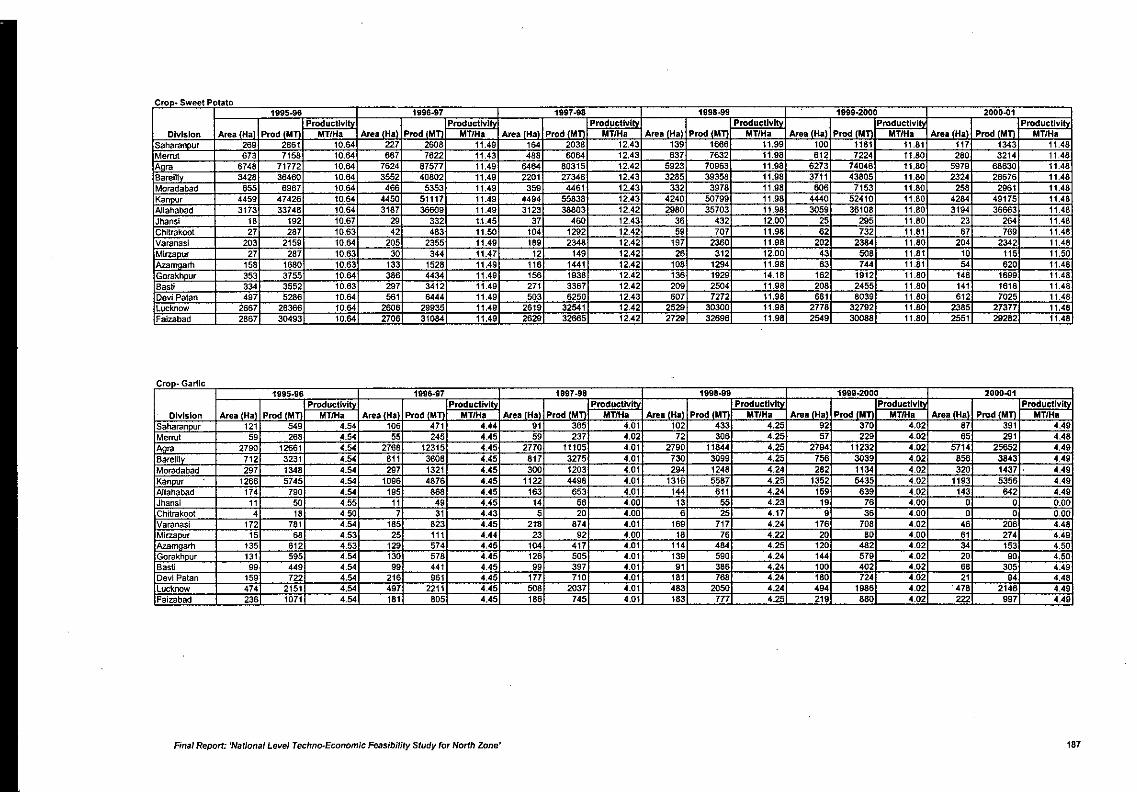
CrOD-Garllc1995-96 1996-97 1997-98 1998-99 1999-2000 2000-01
Productlvi Productivi Productlvi Productivity Productivib ProductlviDivision Area tHa Prod (M MYlHa Area (Ha) P,o. (Mn MTlHa Area (Ha Prod (M MTlHa Area (Ha Prod 1M MT/Ha Area (Ha P,,",IM MYlHa Area (Ha Prod 1M MT/Ha
Saharanpur 121 649 4.54 106 471 4.44 91 365 4.01 102 433 4.25 92 370 4.02 67 391 4.49Menu! 59 268 4.54 55 245 4.45 59 237 4.02 72 306 4.25 57 229 4.02 65 291 4.48Ani 2790 12661 4.64 2768 12315 4.45 2770 11105 4.01 2790 11844 4.25 2794 11232 4.02 5714 25652 4.49Bammv 712 3231 4.54 611 3606 4.45 617 3275 4.01 730 3099 4.25 756 3039 4.02 656 3843 4.49Moradabad 297 1346 4.64 297 1321 4.45 300 1203 4.01 294 1248 4.24 262 1134 4.02 320 1437 4.49Kan ur 1266 5745 4.64 1096 4876 4.45 1122 4498 4.01 1316 5587 4.25 1352 6435 4.02 1193 5356 4.49Allahabad 174 790 4.64 195 668 4.45 163 653 4.01 144 611 4.24 159 639 4.02 143 642 4.49Jhansi 11 50 4.55 11 49 4.45 14 56 4.00 13 65 4.23 19 76 4.00 0 0 0.00Chitrakoot 4 16 4.50 7 31 4.43 5 20 4.00 6 25 4.17 9 36 4.00 0 0 0.00Varanasi 172 761 4.64 185 623 4.45 2" 674 4.01 169 717 4.24 176 706 4.02 46 206 4.48Mirza ur 15 66 4.53 25 111 4.44 23 92 4.00 16 76 4.22 20 60 4.00 61 274 4.491= am 135 612 4.53 129 574 4.45 104 417 4.01 114 464 4.25 120 462 4.02 34 153 4.SOGorakh ur 131 595 4.54 130 576 4.45 126 505 4.01 139 590 4.24 144 579 4.02 20 90 4.50Sasti 99 449 4.64 99 441 4.45 99 397 4.01 91 366 4.24 100 402 4.02 66 305 4.49Dev] Patan 159 722 4.64 216 961 4.45 177 710 4.01 161 768 4.24 160 724 4.02 21 94 4.48Lucknow 474 2151 4.64 497 2211 4.45 S06 2037 4.01 463 2OSO 4.24 494 1986 4.02 . 478 2146 4.49Faizabad 236 1071 4.64 161 605 4.45 166 745 4.01 163 177 4.25 219 880 4.02 222 997 4.49
Crao. Sweet Potato1995-96 1996-97 1997-98 1998-99 1999-2000 2000-01
ProducllviArea (Ha\
ProductlvlProd fMTI
ProductlvlArea (Ha) p,od(Mn
Productivi"'ea (Ha' P,od (MTJ
Productivi"'ea (Ha\ P""' (Mn
ProductiviDivision Area (Ha Prod 1M MY/Ha Prod 1M MY1H. Area (Ha MY/Ha MT/Ha MYlHa MY/Ha
Saharanpur 269 2861 10.64 227 2606 11.49 164 2036 12.43 139 1666 11.99 100 1181 11.81 117 1343 11.48Merrut 673 7158 10.64 667 7622 11.43 466 6064 12.43 637 7632 11.98 612 7224 11.80 260 3214 11.48Ani 6748 71772 10.64 7624 87577 11.49 6464 80315 12.42 5923 70963 11.98 6273 74046 11.80 5979 68630 11.48Bareil1 3426 36460 10.64 3552 40802 11.49 2201 27348 12.43 3285 39358 11.98 3711 43805 11.80 2324 26676 11.48Moradabad 655 6967 10.64 466 5353 11.49 359 4461 12.43 332 3978 11.98 606 7153 11.80 256 2961 11.48Kan ur 4459 47426 10.64 4450 51117 11.49 4494 55838 12.43 4240 50799 11.98 4440 52410 11.80 4284 49175 11.48Allahabad 3173 33748 10.64 3187 36609 11.49 3123 38803 12.42 2980 35703 11.98 3069 36108 11.80 3194 36663 11.48Jhansl 16 192 10.67 29 332 1.1.45 37 460 12.43 36 432 12.00 25 295 11.80 23 264 11.48Chitrakoot 27 267 10.63 42 463 11.50 104 1292 12.42 59 707 11.98 62 732 11.81 67 769 11.48Varanasi 203 2159 10.64 205 2355 11.49 169 2346 12.42 197 2360 11.98 202 2384 11.80 204 2342 11.48Mirza ur 27 267 10.63 30 344 11.47 12 149 12.42 26 312 12.00 43 506 11.81 10 115 11.501= am 156 1680 10.63 133 1528 11.49 116 1441 12.42 106 1294 11.98 63 744 11.81 64 620 11.48Gorakh ur 353 3755 10.64 366 4434 11.49 156 1938 12.42 136 1929 14.18 162 1912 11.80 146 1699 11.48Basti 334 3552 10.63 297 3412 11.49 271 3367 12.42 209 2S04 11.98 206 2455 11.80 141 1616 11.48Devi Patan 497 5266 10.64 561 6444 11.49 503 6250 12.43 607 7272 11.98 661 8039 11.80 612 7025 11.48Lucknow 2667 26366 10.64 2606 29935 11.49 2619 32541 12.42 2529 30300 11.98 2778 32792 11.80 2385 27377 11.48Faizabad 2867 30493 10.64 2706 31084 11.49 2629 32665 12.42 2729 32696 11.98 2649 30066 11.80 2551 29282 11.48
Final Report: 'National Level Techno-Economic Feasibility Study for North Zone' 187
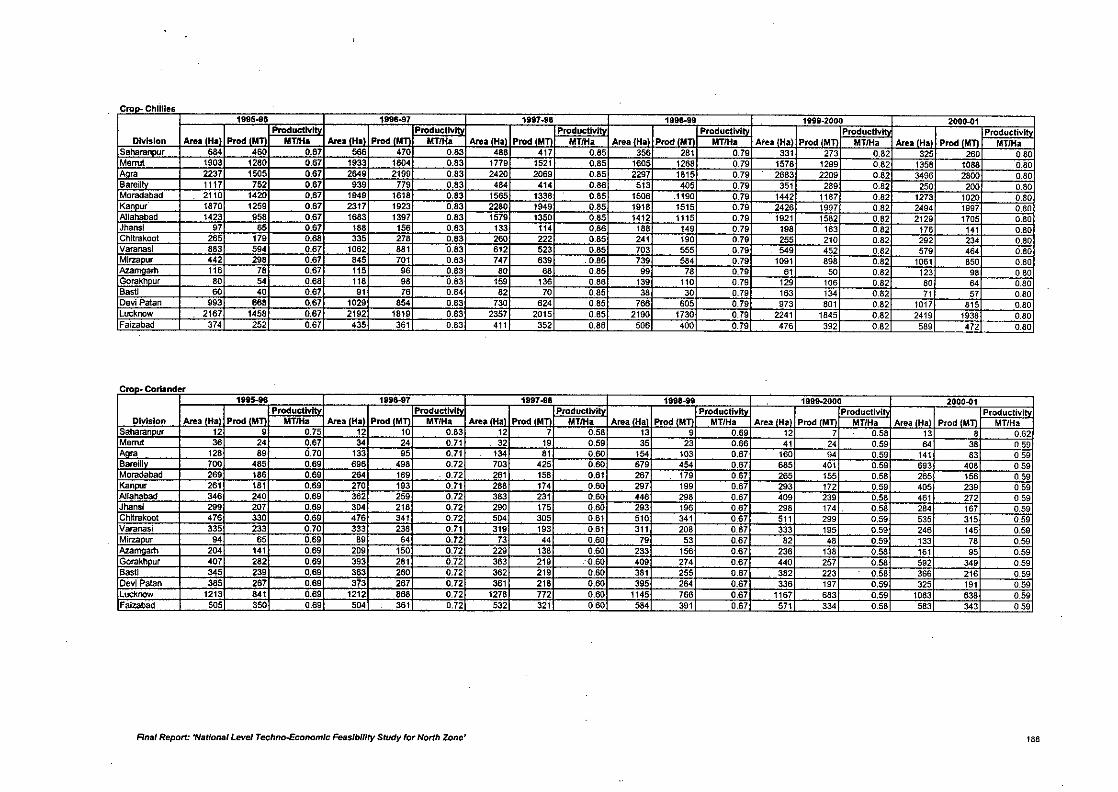
eroD. Chillies .
1995-9& 1996-97 1997.98 1998.99 1999.2000 2000-41Productlvl Productlvl Productlvl Producllvl PrDductlvl Productivl
Division Area IHa Prod (MTI MTtH. Are. {HI' P•••• (MTI MYlHa Arel (HI) Prod 1M MY/Ha Area fHa P•••• ,M MTlHa Atea (Ha Prod 1M MY/Ha Area (Ha Prod (M MT/HaSaharan r 684 460 0.67 566 470 0.83 488 417 0.85 358 281 0.79 331 273 0.82 325 260 0.80Memrt 1903 1280 0.67 1933 16{)4 0.83 1779 1521 0.85 '6{)5 1268 0.79 1578 1299 0.82 1358 1088 0.80Aara 2237 1505 0.67 2649 2199 0.83 2420 2069 0.85 2297 1815 0.79 2683 2209 0.82 3496 2800 0.80Bareill 1117 752 0.67 939 779 0.83 484 414 0.86 513 405 0.79 35' 289 0.82 250 200 0,80Maradabad 2110 1420 0.67 1949 1618 0.83 '565 1338 0.85 1506 1190 0.79 1442 1187 0.82 1273 1020 0.80Kanour 1870 1259 0.67 2317 1923 0.83 2280 1949 0.85 1918 1515 0.79 2426 1997 0,82 2494 1997 0.80Allahabad 1423 958 0.67 1683 1397 0.83 1579 1350 0.85 1412 1115 0.79 1921 1582 0.82 2129 1705 0.80Jhansl 97 65 0.67 '88 156 0.83 133 114 0.86 '88 14. 0.79 198 '63 0.82 '76 '41 0.80Chltrakaat 265 17. 0.68 335 278 0.83 260 222 0.85 241 '90 0.79 255 210 0.82 292 234 0.80Varanasi 883 594 0.67 1062 881 0.83 612 523 0.85 703 555 0.79 549 452 0.82 579 464 0.80MJrzaour 442 298 0.67 845 701 0.83 747 63. .0.86 739 584 0.79 1091 8.8 0.82 1061 850 0.80- am 116 78 0.67 115 96 0.83 80 68 0,85 99 78 0.79 6' 50 0.82 '23 98 0,80Gorakh ur 80 54 0.68 118 98 0.83 159 136 0.86 13. 110 0,79 '29 106 0,82 80 64 0.80Basti 6{) 40 0.67 91 76 0.84 82 70 0.85 38 30 0.79 '63 134 0,82 7' 57 0.80Oevi Patan "3 668 0.67 1029 854 0.83 730 624 0.85 766 605 0.79 .73 801 0.82 1017 8'5 0.80Lucknow 2167 1458 0.67 2192 1819 0.83 2357 2015 0,85 2190 1730 0.79 2241 1845 0.82 2419 1938 0.80Faizabad 374 252 0.67 435 36' 0.83 411 352 0.86 506 400 0.79 476 3.2 0.82 58. 472 0.80
Cron. Coriander1995-96 1996-81 1997-98 1998-99 1999.2000 2000-01
Productlv Productlvl Producllvib Productlvl Productivi ProductiviDivision Atea IHa Prod 1M MYIHa Area (Ha Prod 1M MY/Ha Area CHa Prod 1M MY/Ha Area CHa P",dIMTI MT/Ha Area IHa P",d 1M MT/Ha Area (Ha Prod (MTI MT/Ha
Saharan ur 12 • 0.75 12 10 0.83 12 7 0.58 13 9 0.69 '2 7 0.58 13 8 0.62Memrt 36 24 0.67 34 24 0.71 32 1. 0.59 35 23 0.66 41 24 0.59 64 38 0.59Aara 128 89 0.70 '33 '5 0.71 134 81 0.6{) 154 103 0.67 160 '4 0.59 '41 83 0,59Barem 700 485 0.69 6.6 4'8 0.72 703 425 0.60 67' 454 0.67 685 401 0.59 6.3 408 0,59Moradabad 26' 186 0.69 264 18. . 0.72 26' 158 0.61 267 '7' 0.67 265 155 0,58 265 156 0.59Ken , 261 181 0.69 270 193 0.71 288 174 0.60 297 '99 0.67 293 172 0.59 405 239 0.59Allahabad 346 240 0.69 362 25. 0.72 383 231 0.60 446 298 0.67 40. 23. 0.58 46' 272 0,59Jhansi 29. 207 0.69 304 218 0.72 2.0 175 0.6{) 2.3 "6 0.67 2.8 '74 0.58 284 '67 0.59Chltrakoot 476 330 0.69 476 341 0.72 504 305 0,61 510 34' 0.67 511 2•• 0.59 535 3'5 0.59Varanasi 335 233 0.70 333 238 0.71 31. '93 0.61 311 208 0.67 333 "5 0.59 246 145 0.59MirzaDur '4 65 0.69 8. 64 0.72 73 44 0.60 7' 53 0.67 82 48 0.59 '33 78 0.59- am 204 141 0.69 209 150 0.72 229 138 0.6{) 233 156 0.67 236 '38 0.58 '61 '5 0.59Gorakh ur 407 282 0.69 3.3 281 0.72 363 2" {l,60 40. 274 0.67 440 257 0.58 5.2 34. 0.59BasU 345 23' 0.69 363 260 0.72 382 2" 0.60 381 255 0.67 382 223 0.58 366 2'6 0.59Devl Patan 385 287 0.69 373 267 0.72 38' 218 0.60 3.5 264 0.67 336 "7 0,59 325 '" 0.59lucl<.now 1213 841 0.69 1212 858 0.72 1278 772 0.60 1145 766 0.67 1167 683 0,59 1083 638 0.59Faizabad 505 350 0.69 504 361 0,72 532 321 0.60 584 3" 0.67 571 334 0.58 583 343 0,59
Rnal Report: 'National Level Techno-Economic FeaSibility Study for North Zone' 188
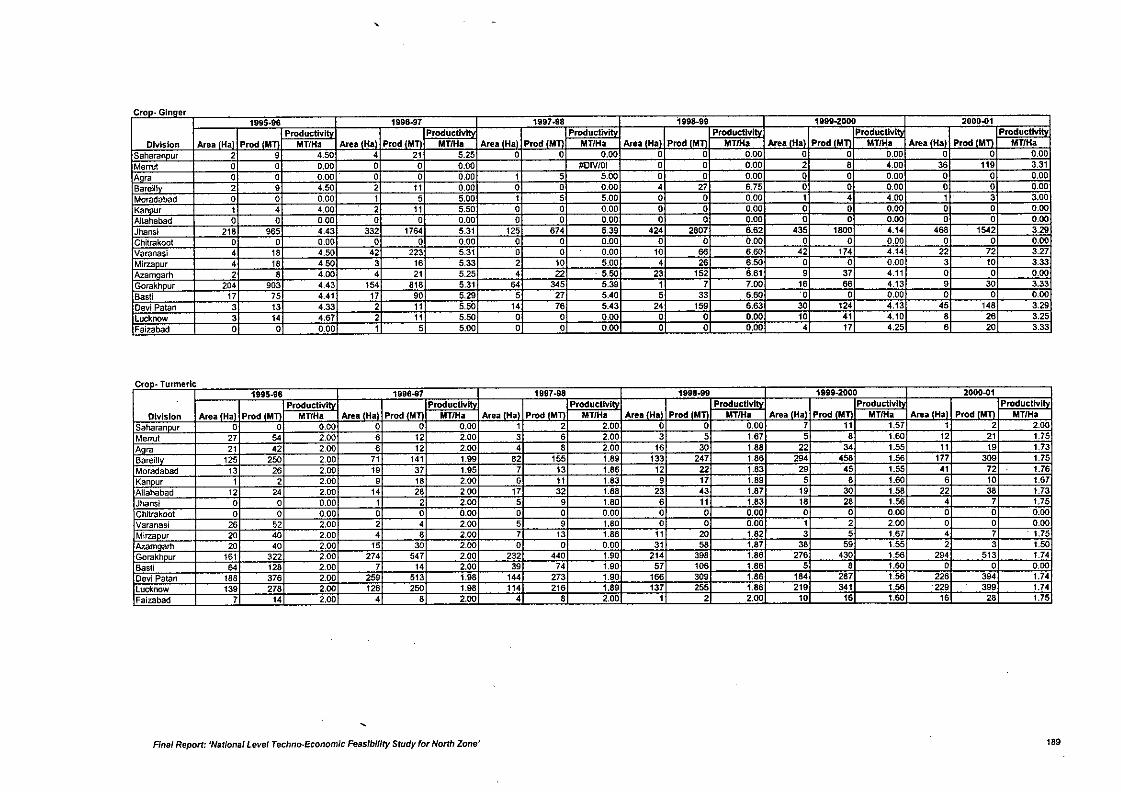
Cron. Ginner1995.96 1998.97 1997-98 1998.99 19951-2000 2000..Q1
Productivil't Productlvl Producliv"Area 'Ha Prod IMT
ProductlviAre.'H.' Prod 'M
ProductlvlArea (Ha P",d 1M
Productivtl:\Division Area {Ha Prod 1M MT/Ha Area lHa Prod 1M MT/Ha Area IHal Prod IMT MT/Ha MT/Ha MTlHa MT/Ha
Saharan ur 2 9 4.50 4 21 5.25 0 0 0.00 0 0 0.00 0 0 0.00 0 0 0.00Meerut 0 0 0,00 0 0 0.00 #DiV/01 0 0 0.00 2 8 4.00 38 119 3.31AQra 0 0 0.00 . 0 0 0.00 1 5 5.00 0 0 0.00 0 0 0.00 0 0 0.00Bareill 2 9 4.50 2 11 0.00 0 0 0.00 4 27 6.75 0 0 0.00 0 0 0.00Moradabad 0 0 0.00 1 5 5.00 1 5 5.00 0 0 0.00 1 4 4.00 1 3 3.00Kanpur 1 4 4.00 2 11 5.50 0 0 0.00 0 0 0.00 0 0 0.00 0 0 0.00Allahabad 0 0 0.00 0 0 0.00 0 0 0.00 0 0 0.00 0 0 0.00 0 0 0.00Jhansi 218 985 4.43 332 1784 5.31 125 874 5.39 424 2807 6.62 435 1800 •. 14 488 1542 3.29Chitrakoot 0 0 0.00 0 0 0.00 0 0 0.00 0 0 0.00 0 0 0.00 0 0 0.00Varanasi 4 18 4.50 ., 223 5.31 0 0 0.00 10 88 6.60 42 174 4.14 22 72 3.27Mirzaour 4 18 4.50 3 16 5.33 2 10 5.00 4 26 6.50 0 0 0.00 3 10 3.33Aza "h 2 8 4.00 4 21 5.25 4 22 . 5.50 23 152 6.61 9 37 4.11 0 0 0.00Gorakh ur 204 903 4.43 154 816 5.31 84 345 5.39 1 7 7.00 16 66 4.13 9 30 3.33Basti 17 75 4.41 17 90 5.29 5 27 5.40 5 33 6.60 '0 0 0.00 0 0 0.00Devi Patan 3 13 4.33 2 11 5.50 14 76 5.43 24 159 6.63 30 124 4.13 45 148 3.29
Lucknow 3 14 4.67 2 11 5.50 0 0 0.00 0 0 0.00 10 41 4.10 8 26 3.25Faizabad 0 0 0.00 1 5 5.00 0 0 0.00 0 0 0.00 4 17 4.25 6 20 3.33
CroD. Turmeric1995.98 1998-97 1997.98 1998-99 1999-2000 2000..Q1
Productlvl ProducUvArea 'Ha P",d IMT1
ProductlvlArea 'Ha Prod'M
Productlvih.Area 'Ha Prod'M
ProductlvlArea 'HI P<Od'MT1
ProductlvlDivision Area (H, Prod 1M MTIHa Area lHa Prod IMTl MT/Ha MT/HI MTtH. MTlHa MT/HI
Saharan ur 0 0 0.00 0 0 0.00 1 2 2.00 0 0 0.00 7 11 1.57 1 2 2.00
Merrul 27 54 2.00 6 12 2.00 3 6 2.00 3 5 1.67 5 6 1.60 12 21 1.75
Am 21 42 2,00 6 12 2.00 4 8 2.00 16 30 1.88 22 34 1.55 11 19 1.73Bareill 125 250 2,00 71 141 1.99 82 155 1.89 133 247 1.86 294 456 1.56 177 309 1.75Moradabad 13 26 2.00 19 37 1.95 7 13 1.86 12 22 1.83 29 45 1.55 41 72 1.76Kan ur 1 2 2.00 , 18 2.00 6 11 1.83 9 17 1.89 5 8 1.60 6 10 1.67Allahabad 12 24 2.00 14 28 2.00 17 32 1.88 23 43 1.87 19 30 1.56 22 38 1.73Jhansl 0 0 0,00 1 2 2.00 5 9 1.80 6 11 1.83 16 28 1.56 4 7 1.75Chitrakoot 0 0 0.00 0 0 0.00 0 0 0.00 0 0 0.00 0 0 0.00 0 0 0.00Varanasi 26 52 2,00 2 4 2.00 5 9 1.80 0 0 0.00 1 2 2.00 0 0 0.00Mirza ur 20 40 2.00 4 6 2.00 7 13 1.86 11 20 1.82 3 5 1.67 4 7 ' 1.75
Azamarh 20 40 2.00 15 30 2.00 0 0 0.00 31 56 1.87 38 59 1.55 2 3 1.50Gorakhpur 161 322 2.00 274 547 2.00 232 440 1.90 214 398 1.86 276 430 1.56 294 513 1.74Basli 84 128 2.00 7 14 2.00 39 74 1.90 57 106 1.86 5 8 1.60 0 0 0.00Devi Patan 186 376 2.00 259 513 1.98 144 273 1.90 166 30' 1.86 184 267 1.56 226 394 1.74lucknow 139 276 2.00 126 250 1.98 114 216 1.89 137 255 1.86 21' 341 1.56 '229 399 1.74
Faizabad 7 14 2.00 4 6 2.00 4 8 2.00 1 2 2.00 10 '6 1.60 16 28 1.75
Final Report: 'National Level TechncrEconomic Feasibility Study for North Zone' 189

!
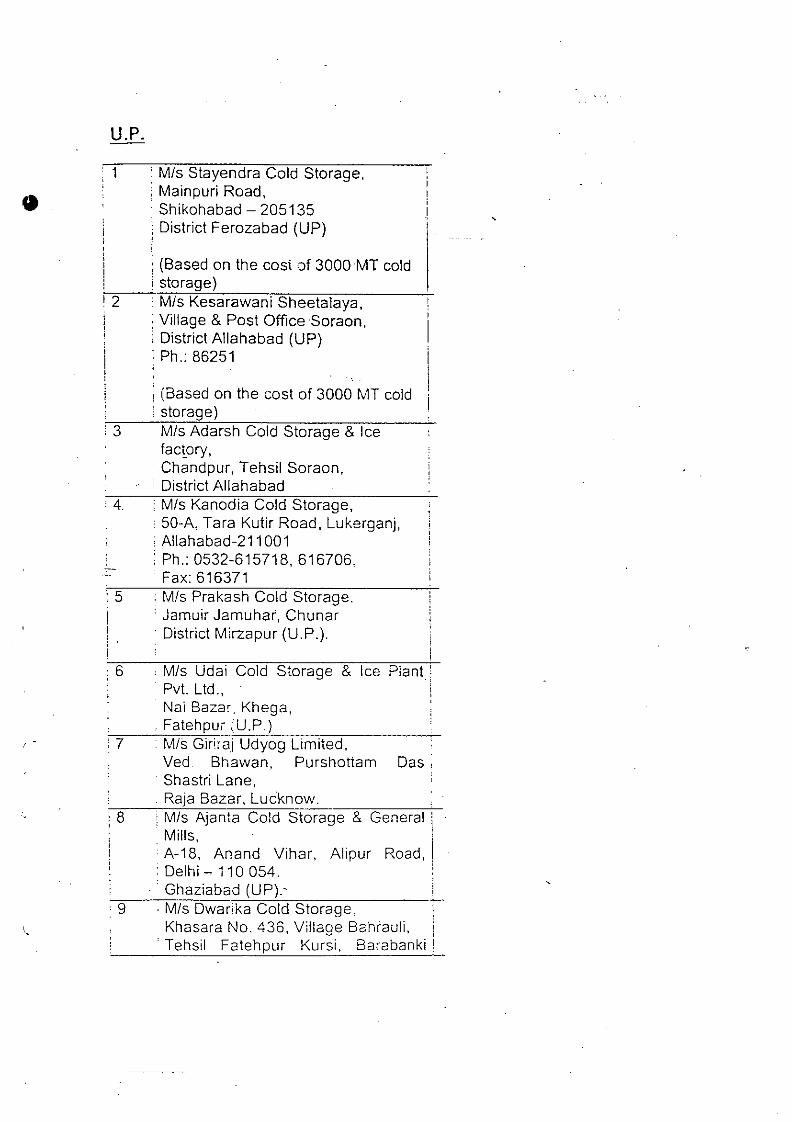
U.P.1
12!i
, Mis Stayendra Cold Storage,, Mainpuri Road,• Shikohabad - 205135i District Ferozabad (UP),i! (Based on the cost of 3000 MT coldi storage)• Mis Kesarawani Sheetalaya,: Village & Post OfficeSoraon,~District Allahabad (UP): Ph.: 86251
II
Plant:I,
, Mis Udai Cold Storage & Ice. Pvt. Ltd.,
Nai Bazar, Khega,. Fatehpu; :.U.P.). Mis Girir'ilj Udyog Limited,Ved Bhawan, Purshotiam Das,Shastri Lane,Raja Bazar, Lucknow,
I Mis Ajanta Cold Storage & GeneralMills,
• A-18, Anand Vihar, Alipur Road,: Delhi - 110054 .. Ghaziabad (UP).', Mis Dwarika Cold Storage.
Khasara No. 436, Village Bahrauli,. Tehsil Fatehpur Kursi, Barabanki
! (Based on the cost of 3000 MT cold. storage)
Mis Adarsh Cold Storage & Icefactory,Chandpur, Tehsil Soraon,District Allahabad
: Mis Kanodia Cold Storage,• 50-A, Tara Kutir Road, Lukerganj,, Allahabad-211 001• Ph.: 0532-615718, 616706.
Fax: 616371. Mis Prakash Cold Storage.• Jamuir Jamuhar, Chunar. District Mirzapur (U.P.).
9
:8,
:7
.6
;5
. 4.
:3
\.
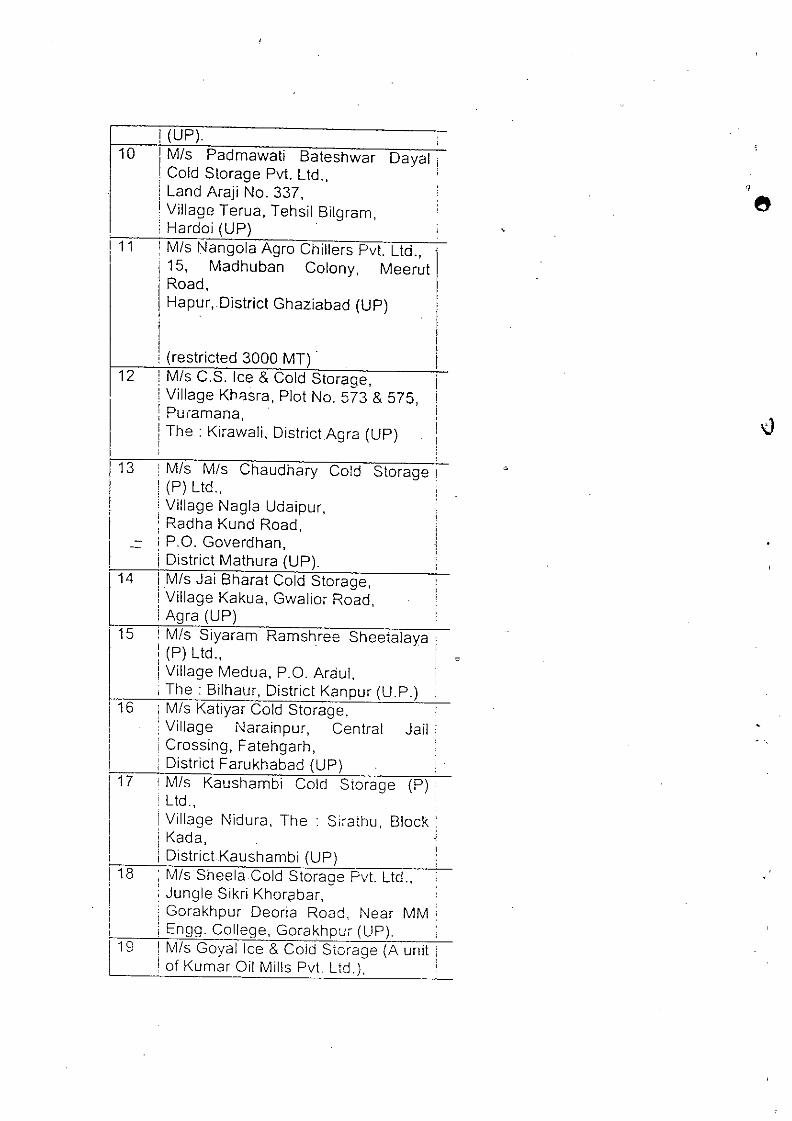
10
I 11I
! (UP).'I Mis Padmawati Bateshwar Dayal i• Cold Storage Pvt. Ltd.,! Land Araji No. 337,i Village Terua, Tehsil Bilgram,i Hardoi (UP): Mis Nangola Agro Chillers Pvt. Ltd., 'I115, Madhuban Colony, Meerut.
IRoad, IHapur,.District Ghaziabad (UP) I
I
II .; (restricted 3000 MT)
12 Mis C.S. Ice & Cold Storage,Village KhClsra, Plot No. 573 & 575,
, Pu,amana,! The: Kirawali, DistrictAgra (UP)!
113
I
14
. 15
!
1
16
II
I
1
17
iI! 18iiII
I 19I
i Mis Mis Chaudhary Cold Storage I(P) Ltd.,Village Nagla Udaipur,Radha Kund Road,P.O. Goverdhan,District Mathura (UP).Mis Jai Bharat Cold Storage,Village Kakua, Gwalior Road,Agra (UP)Mis Siyaram Ramshree Sheetalaya i(P) Ltd., !
Village Medua, P.O. Araul, .The: Bilhaur, District Kanpur (UP.)Mis Katiyar Cold Storage,Village Narainpur, Central Jail I,Crossing, Fatehgarh,District Farukhabad (UP)Mis Kaushambi Cold Siorage (P),Ltd,Village Nidura, The : Si~athu, Block:Kada, iDistricLKaushambi (UP) :M/sSheelaCold Storage Pvt. Ltd.,Jungle Sikri Khori3bar,Gorakhpur Deoria Road. Near MM ,Engg. College, Gorakhpur (UP).Mis Goyal Ice & Cold Storage (A unit iof Kumar Oil Mills Pvt. Ltd.), .
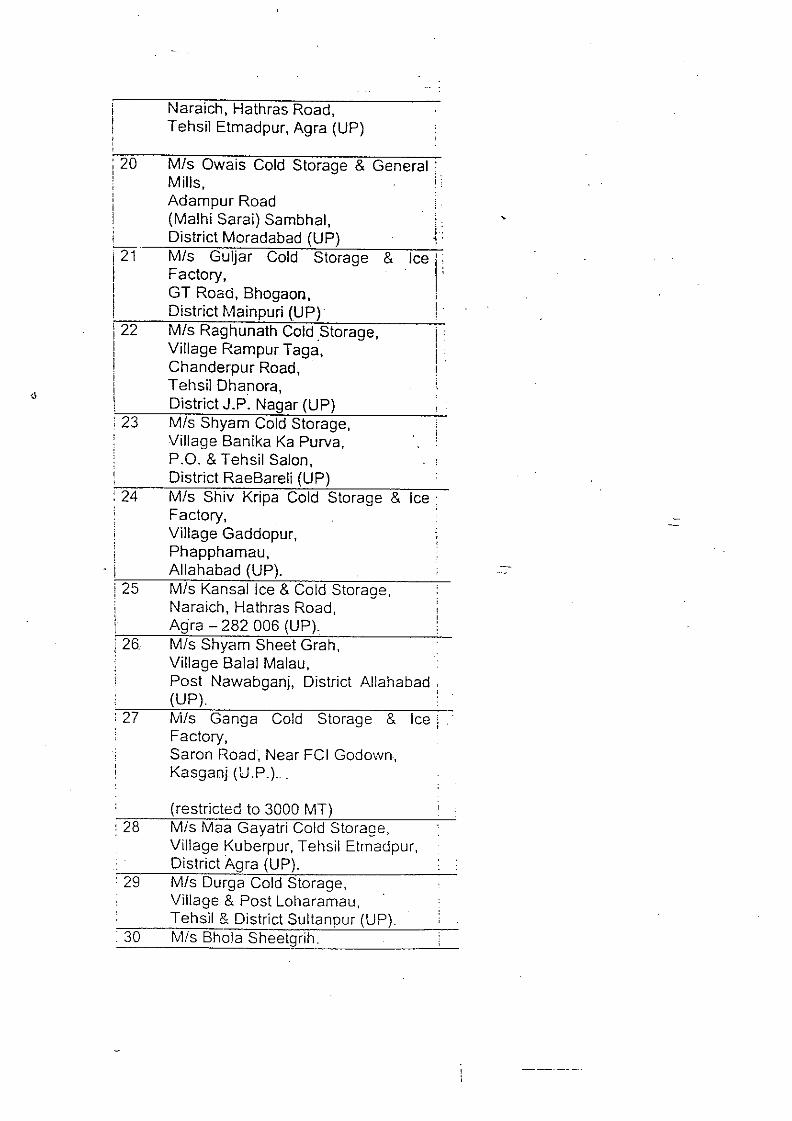
iI
I!
I:1 .
Ice I:;II
20
iI 21iI122
II,!:23
. i! 25
: 27
Naraich, Hathras Road,Tehsil Etmadpur, Agra (UP)
MIs Owais Cold Storage & General:Mills, i.
Adampur Road(Malhi Sarai) Sambhal,District Moradabad (UP)MIs Guljar Cold Storage &Factory,GT Road, BhogaOl1,District Mainpuri (UP)MIs Raghunath Cold Storage,Village Rampur Taga.Chanderpur Road,Tehsil Dhanora,District J.P. Nagar (UP)MIs Shyam Cold Storage,Village Banika Ka Purva,P.O. & Tehsil Salon,District RaeBareli (UP)MIs Shiv Kripa Cold Storage & Ice;Factory,Village Gaddopur,Phapphamau,Allahabad (UP) .MIs Kansallce & Cold Storage,Naraich, Hathras Road,Agra - 282 006 (UP).MIs Shyam Sheet Grah,Village Balal Malau,Post Nawabganj, District Allahabad:(UP). .MIs Ganga Cold Storage & IceFactory,Saran Hoad, Near FCI Godown,Kasganj (U.P.) ..
(restricted to 3000 MT): 28 Mis Maa Gayatri Cold Storage,
Village Kuberpur, Tehsil Etmadpur,District Agra (UP).
: 29 Mis Durga Cold Storage,Village & Post Loharamau,Tehsil & District Sultanpur (UP) .
. 30 Mis Bhola Sheetgrih.
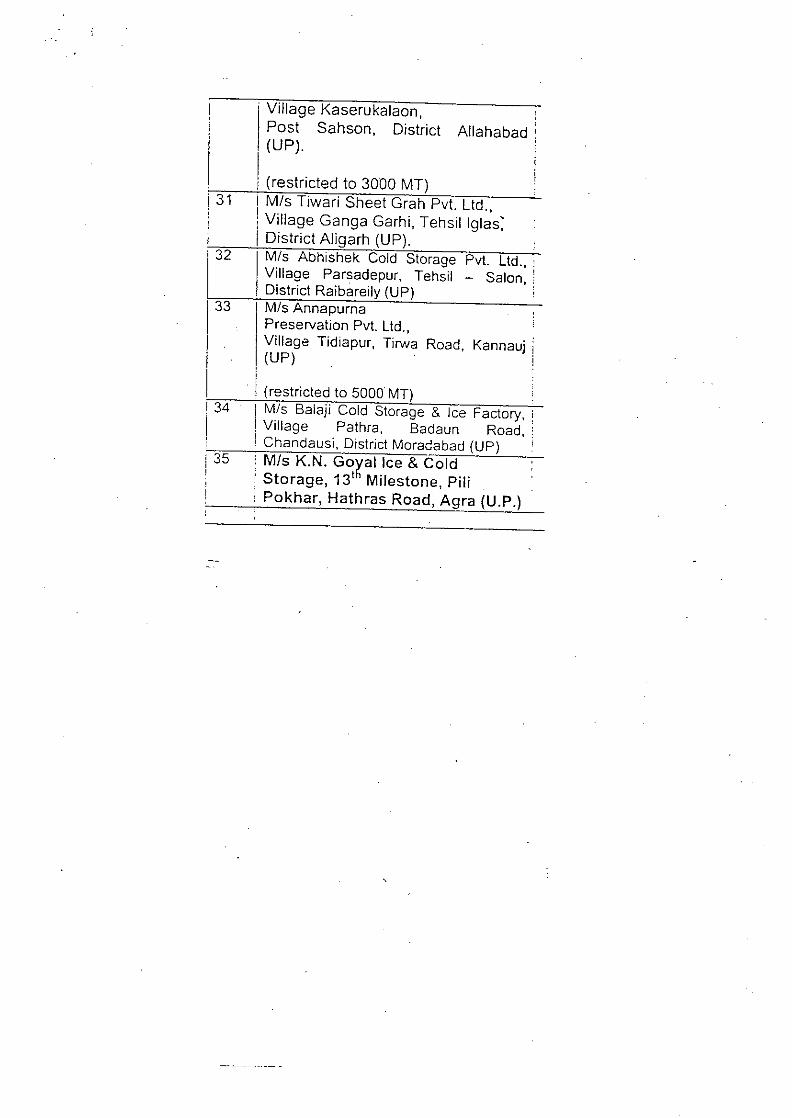
I
I! 31i!,Ii 32
33
I
I134
II 35,,
. Village Kaserukalaon,Post Sahson, District Allahabad:
. (UP).
I (restricted to 3000 MT)I Mis Tiwari Sheet Grah Pvt. Ltd.,! Village Ganga Garhi, Tehsil Iglas;i District Aligarh (UP).
Mis Abhishek Cold Storage Pvt. ltd., .Village Parsadepur, Tehsil - Salon,!District Raibareily (UP)
I Mis Annapurna :
I Preservation Pvt. Ltd., ;Village Tidiapur, Tirwa Road, Kannauj !
! (UP). . i. i
! (restricted to 5000 MT)i Mis Balaji Cold Storage & Ice Factory, ;! Village Pathra, Badaun Road, '! Chandausi, District Moradabad (UP) I
I Mis K.N. Go~al Ice & Cold: Storage, 131 Milestone, PiliI Pokhar, Hathras Road, Agra (U.P.)
PUNJAB
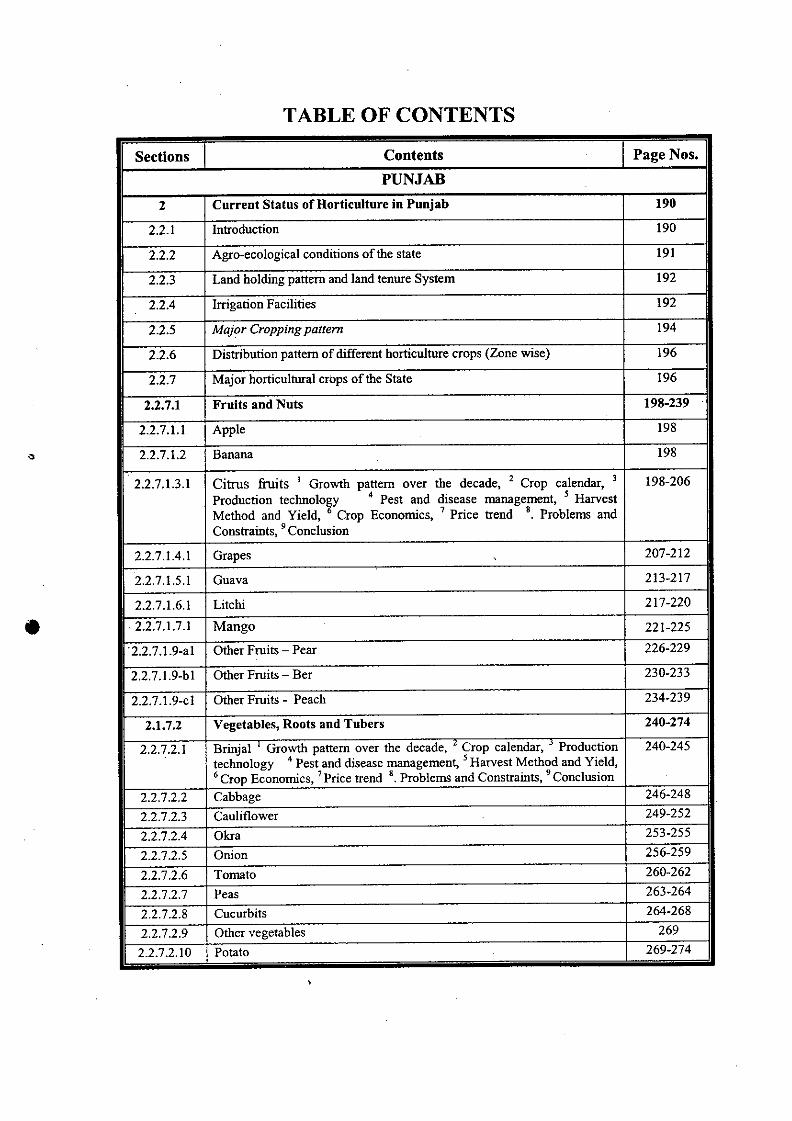
•
TABLE OF CONTENTS
Sections Contents Page Nos.
PUNJAB
2 Current Status of Horticulture in Punjab 190
2.2.1 Introduction 190
2.2.2 Agro-ecological conditions of the state 191
2.2.3 Land holding pattern and land tenure System 192
2.2.4 Irrigation Facilities 192
2.2.5 Major Cropping pattern 194
2.2.6 Distribution pattern of different horticulture crops (Zone wise) 196
2.2.7 Major horticultural crops of the State 196
2.2.7.1 Fruits and Nuts 198-239
2.2.7.1.1 Apple 198
2.2.7.1.2 Banana 198
2.2.7.1.3.1 Citrus fruits I Growth pattern over the decade, 2 Crop calendar, 3 198-206Production technolo¥y 4 Pest and disease management, 5 HarvestMethod and Yield, Crop Econontics, 7 Price trend '. Problems andConstraints, 9 Conclusion
2.2.7.1.4.1 Grapes 207-212
2.2.7.1.5.1 Guava 213-217
2.2.7.1.6.1 Litchi 217-220
.2.2.7.1.7.1 Mango 221-225
'2.2.7.1.9-al Other Fruits - Pear 226-229
2.2.7.1.9-bl Other Fruits - Ber 230-233
2.2.7.1.9-cl Other Fruits - Peach 234-239
2.1.7.2 Vegetables, Roots and Tubers 240-274
2.2.7.2.1 Brinjal' Growth pattern over the decade, ' Crop calendar, 3 Production 240-245technology 4 Pest and disease management,S Harvest Method and Yield,6 Crop Economics, 7 Price trend 8. Problems and Constraints, 9 Conclusion
2.2.7.2.2 Cabbage 246-248
2.2.7.2.3 Cauliflower 249.252
2.2.7.2.4 Okra 253-255
2.2.7.2.5 Onion 256-259
2.2.7.2.6 Tomato 260-262
2.2.7.2.7 Peas 263.264
2.2.7.2.8 Cucurbits 264-268
2.2.7.2.9 Other vegetables 269
2.2.7.2.10 Potato 269-274
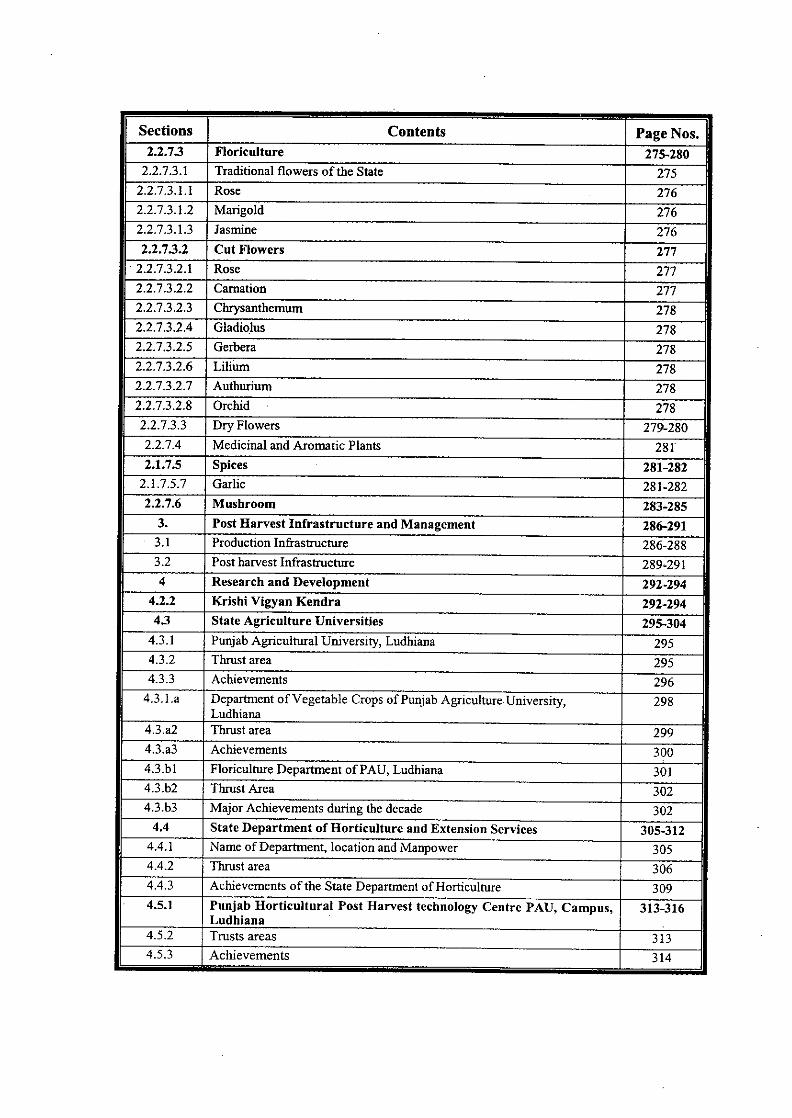
Sections Contents Page Nos.2.2.7.3 Floriculture 275-2802.2.7.3.1 Traditional flowers of the State 2752.2.7.3.1.1 Rose . 2762.2.7.3.1.2 Marigold 2762.2.7.3.1.3 Jasmine 2762.2.7.3.2 Cut Flowers 277
I. 2.2.7.3.2.1 Rose 2772.2.7.3.2.2 Carnation 2772.2.7.3.2.3 Chrysanthemum 2782.2.7.3.2.4 Gladiolus 2782.2.7.3.2.5 Gerbera 2782.2.7.3.2.6 Lilium 2782.2.7.3.2.7 Authurium 2782.2.7.3.2.8 Orchid 2782.2.7.3.3 Dry Flowers 279-2802.2.7.4 Medicinal and Aromatic Plants 2812.1.7.5 Spices 281-2822.1.7.5.7 Garlic 281-2822.2.7.6 Mushroom 283-2853. Post Harvest Infrastructure and Management 286-2913.1 Production1nfrastrucnrre 286-2883.2 Post harvest Infrastrucnrre 289"2914 Research and Development 292.294
4.2.2 Krishi Vigyan Kendra 292-2944.3 State Agriculture Universities 295-3044.3.1 Punjab Agriculnrral University, Ludhiana 2954.3.2 Thrust area 2954.3.3 Achievements 2964.3.l.a Department of Vegetable Crops of Punjab Agriculture. University, 298
Ludhiana4.3.a2 Thrust area 2994.3.a3 Achievements 3004.3.bl Floriculnrre Department ofPAU, Ludhiana 3014.3.b2 Thrust Area 3024.3.b3 Major Achievements during the decade 3024.4 8tate Department of Horticulture and Extension Services 305-3124.4.1 Name of Department, location and Manpower 3054.4.2 Thrust area 3064.4.3 Achievements of the State Department ofHorticulnrre 3094.5.1 Punjab Horticultural Post Harvest technology Centre PAU, Campus, 313-316
Ludhiana4.5.2 Trusts areas 3134.5.3 Achievements 314
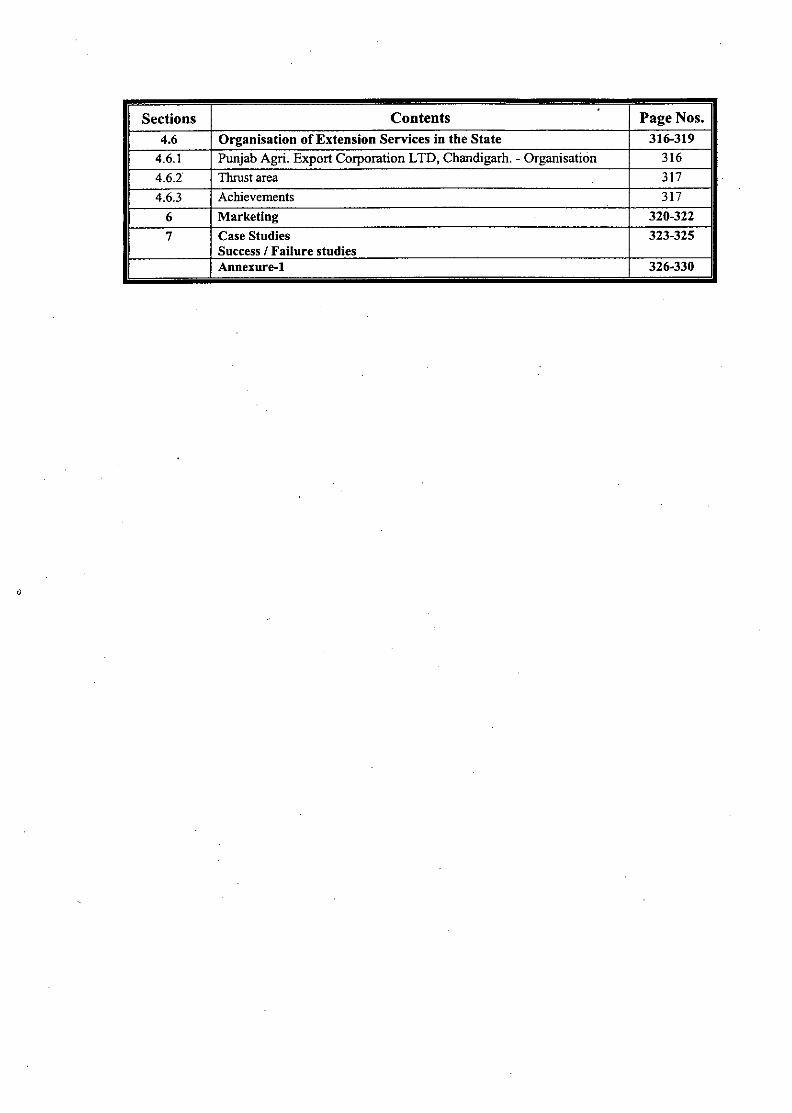
Sections Contents Page Nos.4.6 Organisation of Extension Services in the State 316-3194.6.1 Punjab Agri. Export Corporation LTD, Chandigarh. - Organisation 316
4.6.2 TIuust area 3!7
I 4.6.3 Achievements 317
6 Marketing 320-322
7 Case Studies 323-325Success I Failure studiesAnnexure-l 326-330

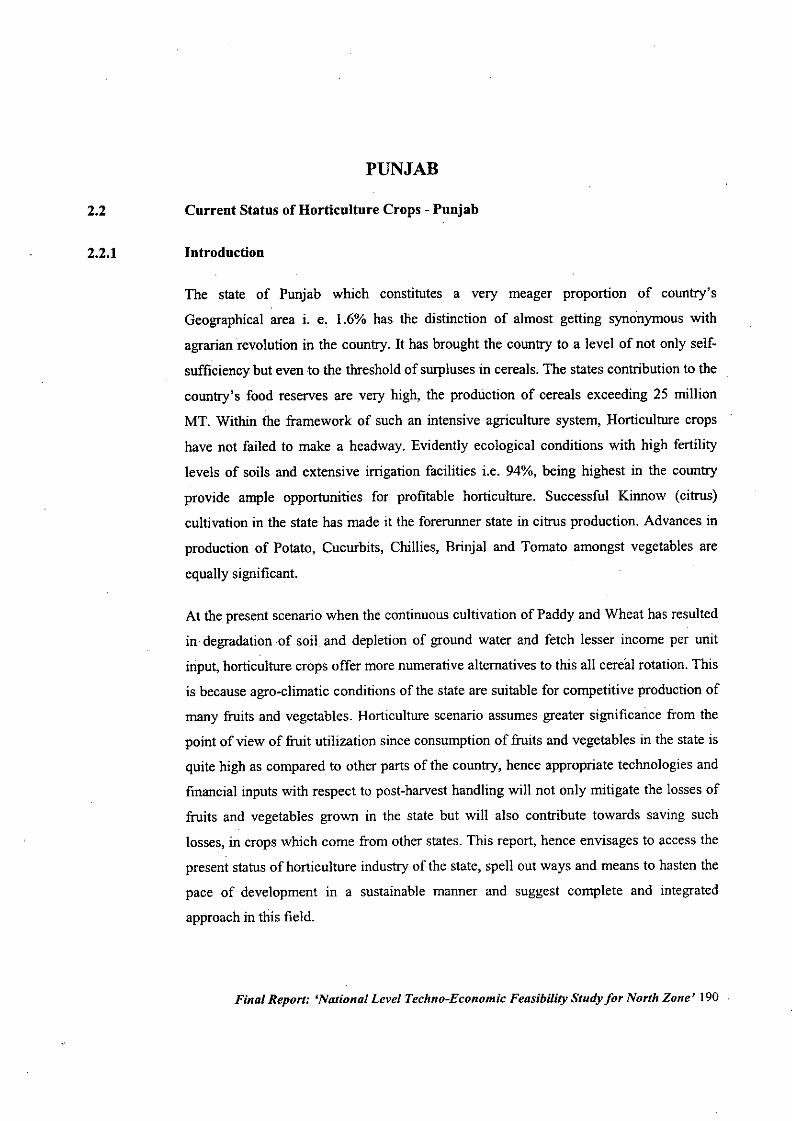
2.2
2.2.1
PUNJAB
Current Status of Horticulture Crops - Punjab
Introduction
The state of Punjab which constitutes a very meager proportion of country's
Geographical area i. e, 1.6% has the distinction of almost getting synonymous with
agrarian revolution in the country. It has brought the country to a level of not only self-
sufficiency but even to the threshold of surpluses in cereals. The states contribution to the
country's food reserves are very high, the production of cereals exceeding 25 million
MT. Within the framework of such an intensive agriculture system, Horticulture crops
have not failed to make a headway. Evidently ecological conditions with high fertility
levels of soils and extensive irrigation facilities i.e. 94%, being highest in the country
provide ample opportunities for profitable horticulture. Successful Kinnow (citrus)
cultivation in the state has made it the forerunner state in citrus production. Advances in
production of Potato, Cucurbits, Chillies, Brinjal and Tomato amongst vegetables are
equally sigoificant.
At the present scenario when the continuous cultivation of Paddy and Wheat has resulted
in. degradation .of soil and depletion of ground water and fetch lesser income per unit
input, horticulture crops offer more numerative alternatives to this all cere.alrotation. This
is because agro-climatic conditions of the state are suitable for competitive production of
many fruits and vegetables. Horticulture scenario assumes greater sigoificance from the
point of view of fruit utilization since consumption of fruits and vegetables in the state is
quite high as compared to other parts of the country, hence appropriate technologies and
financial inputs with respect to post-harvest handling will not only mitigate the losses of
fruits and vegetables grown in the state but will also contribute towards saving such
losses, in crops which come from other states. This report, hence envisages to access the
present status of horticulture industry of the state, spell out ways and means to hasten the
pace of development in a sustainable manner and suggest complete and integrated
approach in this field.
Final Report: 'National Level Techno-Economic Feasibility Study for North Zone' 190
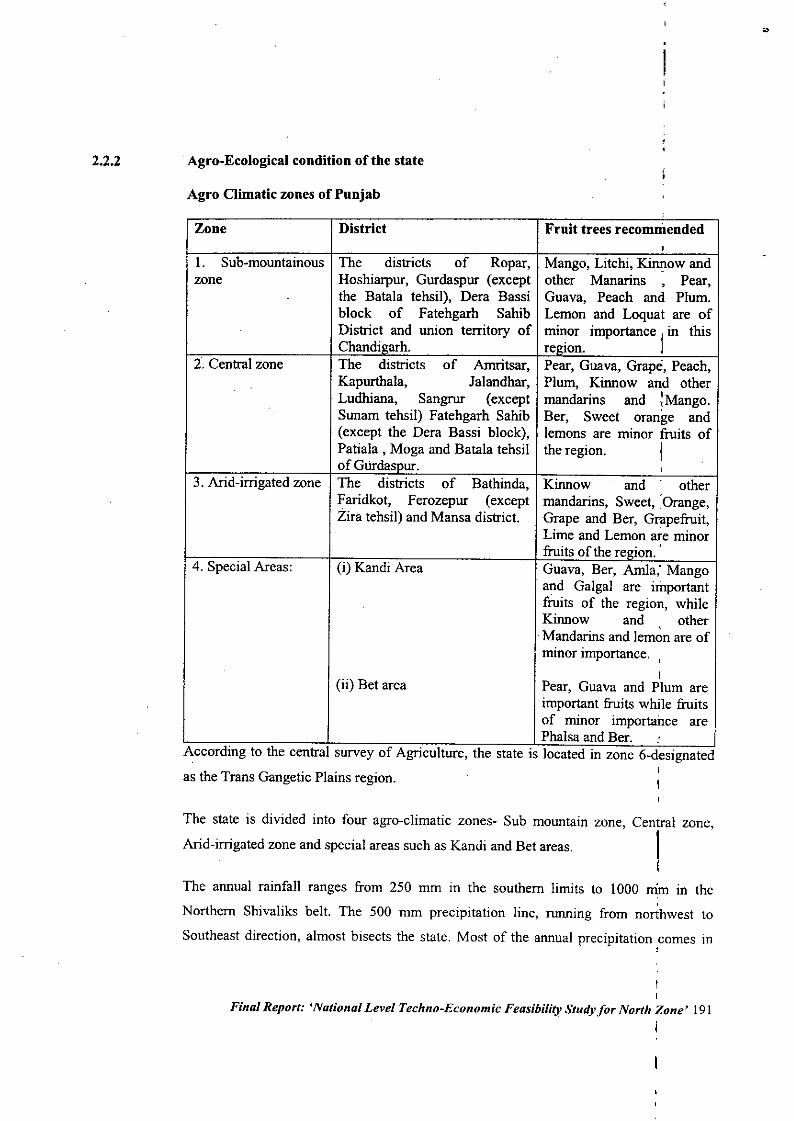
as the Trans Gangetic Plains region.
2.2.2 Agro-Ecological condition ofthe state
Agro Climatic zones of Pnnjab
Zone District Fruit trees recommended,
I. Sub-mountainous The districts of Ropar, Mango, Litchi, Kinnow andzone Hoshiarpur, Gurdaspur (except other Manarins , Pear,
the Batala tehsil), Dera Bassi Guava, Peach and Plum.block of Fatehgarh Sahib Lemon and Loquat are ofDistrict and union territory of minor importance I in thisChandigarh. region.
2. Central zone The districts of Amritsar, Pear, Guava, Grape, Peach,Kapurthala, Jalandhar, Plum, Kinnow and otherLudhiana, Sangrur (except mandarins and :Mango.Sunam tehsil) Fatehgarh Sahib Ber, Sweet orange and(except the Dera Bassi block), lemons are minor fruits ofPatiala , Moga and Batala tehsil the region. Iof Glirdaspur. ,
3. Arid-irrigated zone The districts of Bathinda, Kinnow . and otherFaridkot, Ferozepur (except mandarins, Sweet,: Orange,Zira tehsil) and Mansa district. Grape and Ber, Grapefruit,
Lime and Lemon are minorfruits of the region.
4. Special Areas: (i) Kandi Area Guava, Ber, AmIa; Mangoand Galgal are importantfruits of the region, whileKinnow and otherMandarins and lem~n are ofminor importance. ,
I(ii) Bet area Pear, Guava and Plum are
important fruits while fruitsof minor importance arePhalsa and Ber.
According to the central survey of Agriculture, the state is located in zone 6-designatedI
:ed_:::a::dd:::::n:::e:~~ a:~:-::~:a~~c:a::~s~n:~e~:::ain zone, cenr zone,
The annual rainfall ranges from 250 mm in the southern limits to 1000 mm m the
Northern Shivaliks belt. The 500 mm precipitation line, running from northwest to
Southeast direction, almost bisects the state. Most of the annual precipitation ,comes in
I
Final Report: 'National Level Techno-Economic Feasibility Study for North Zone' 191
I
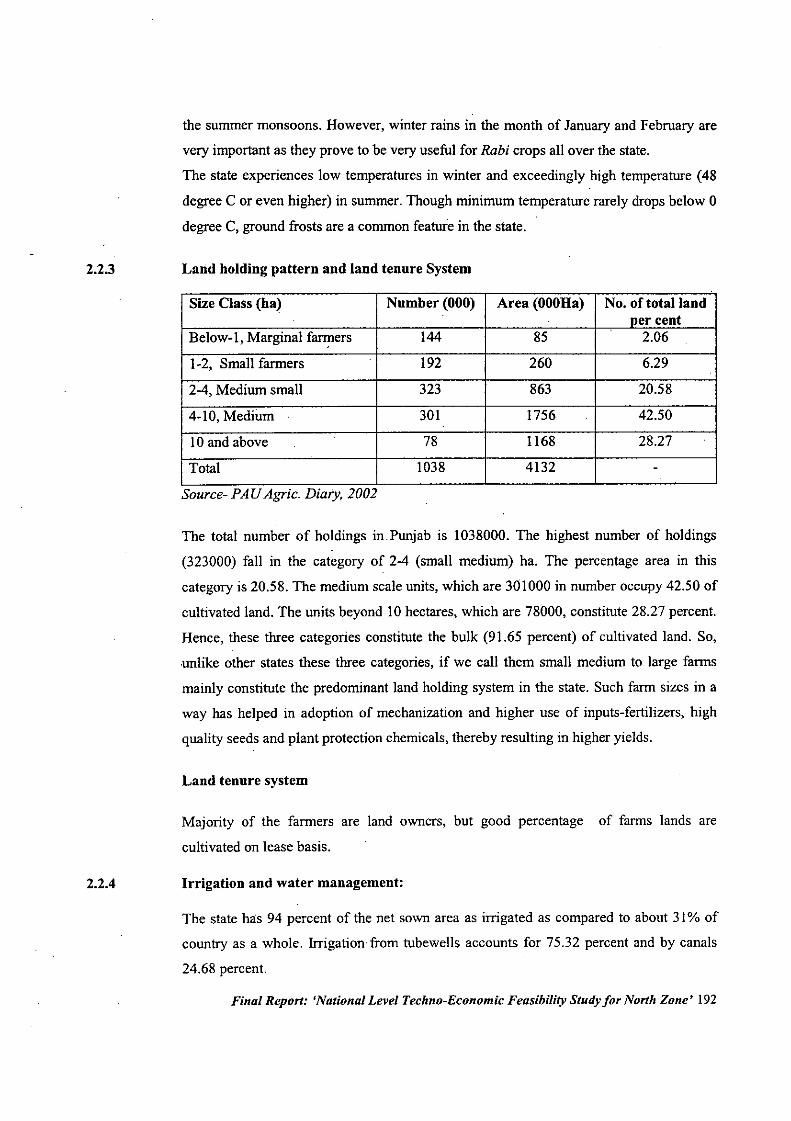
2.2.3
2.2.4
the summer monsoons. However, winter rains in the month of January and February are
very important as they prove to be very useful for Rabi crops all over the state.
The state experiences low temperatures in winter and exceedingly high temperature (48
degree C or even higher) in summer. Though minimum temperature rarely drops below 0
degree C, ground frosts are a common feature in the state.
Land holding pattern and land tenure System
Size Class (ha) Number (000) Area (OOOHa) No. of total landner cent
Below-I, Marginal f3fl!lers 144 85 2.06
1-2, Small farmers 192 260 6.29
2-4, Medium small 323 863 20.58
4-10, Medium 301 1756 42.50
10 and above . 78 1168 28.27
Total 1038 4132 -Source- PAU Agric. Diary, 2002
The total number of holdings in Punjab is 1038000. The highest number of holdings
(323000) fall in the category of 2-4 (small medium) ha. The percentage area in this
category is 20.58. The medium scale units, which are 301000 in number occupy 42.50 of
cultivated land. The units beyond 10 hectares, which are 78000, constitute 28.27 percent.
Hence, these three categories constitute the bulk (91.65 percent) of cultivated land. So,
.unlike other states these three categories, if we call them small medium to large farms
mainly constitute the predominant land holding system in the state. Such farm sizes in a
way has helped in adoption of mechanization and higher use of inputs-fertilizers, high
quality seeds and plant protection chemicals, thereby resulting in higher yields.
Land tenure system
Majority of the farmers are land owners, but good percentage of farms lands are
cultivated on lease basis.
Irrigation and water managemeut:
The state has 94 percent of the net sown area as irrigated as compared to about 31% of
country as a whole. Irrigation' from tubewells accounts for 75.32 percent and by canals
24.68 percent.
Final Report: 'National Level Techno-Economic Feasibility Study for North Zone' 192
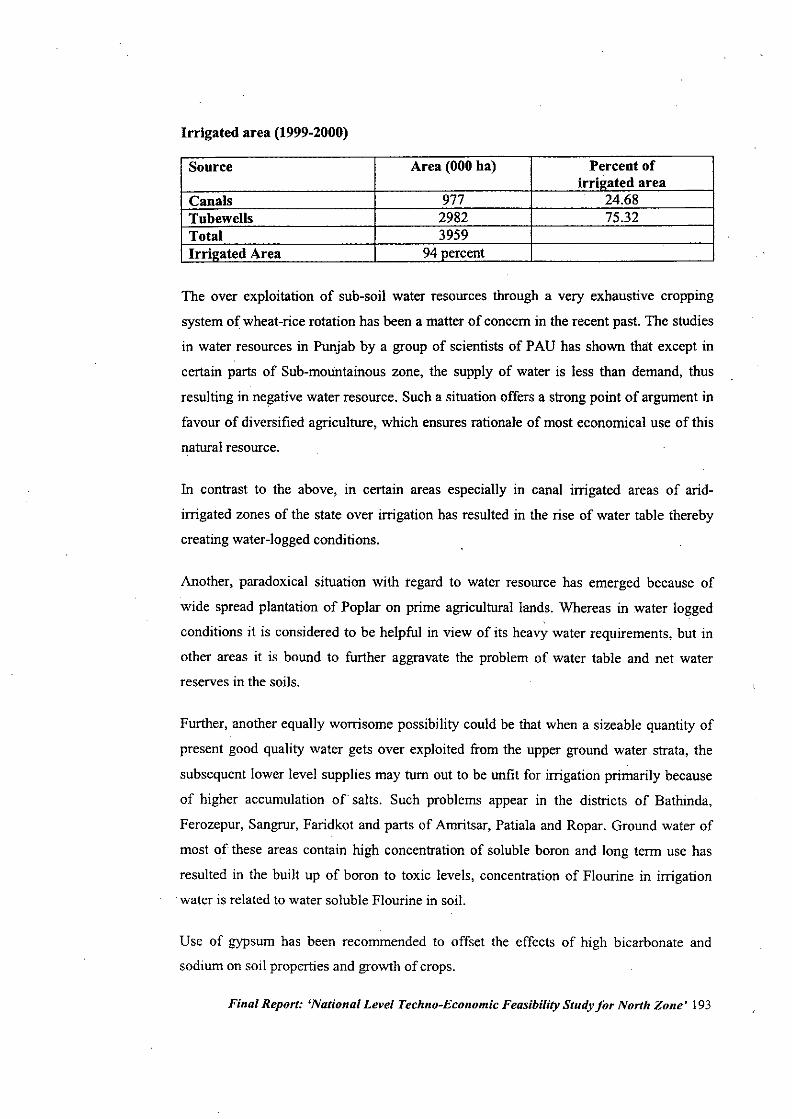
Irrigated area (1999-2000)
Source Area (000 ha) Percent ofirril!ated area
Canals 977 24.68Tubewells 2982 75.32Total 3959Irrigated Area 940ercent
The over exploitation of sub-soil water resources through a very exhaustive cropping
system of wheat-rice rotation has been a matter of concern in the recent past. The studies
in water resources in Punjab by a group of scientists of PAU has shown thlit except in
certain parts of Sub-mountainous zone, the supply of water is less than demand, thus
resulting in negative water resource. Such a situation offers a strong point of argument in
favour of diversified agriculture, which ensures rationale of most economical use of this
natural resource.
In contrast to the above, in certain areas especially in canal irrigated areas of arid-
irrigated zones of the state over irrigation has resulted in the rise of water table thereby
creating water-logged conditions.
Another, paradoxical situation with regard to water resource has emerged because of
wide spread plantation of Poplar on prime agricultural lands. Whereas in water logged
conditions it is considered to be helpful in view of its heavy water requirements, but in
other areas it is bound to further aggravate the problem of water table and net water
reserves in the soils.
Further, another equally worrisome possibility could be that when a sizeable quantity of
present good quality water gets over exploited from the upper ground water strata, the
subsequent lower level supplies may turn out to be unfit for irrigation primarily because
of higher accumulation of salts. Such problems appear in the districts of Bathinda,
Ferozepur, Sangrur, Faridkot and parts of Arnritsar, Patiala and Ropar. Ground water of
most of these areas contain high concentration of soluble boron and long term use has
resulted in the built up of boron to toxic levels, concentration of Flourine in irrigation
water is related to water soluble Flourine in soil.
Use of gypsum has been recommended to offset the effects of high bicarbonate and
sodium on soil properties and growth of crops.
Final Report: 'National Level Techno-Economic Feasibility Study for North Zone' 193
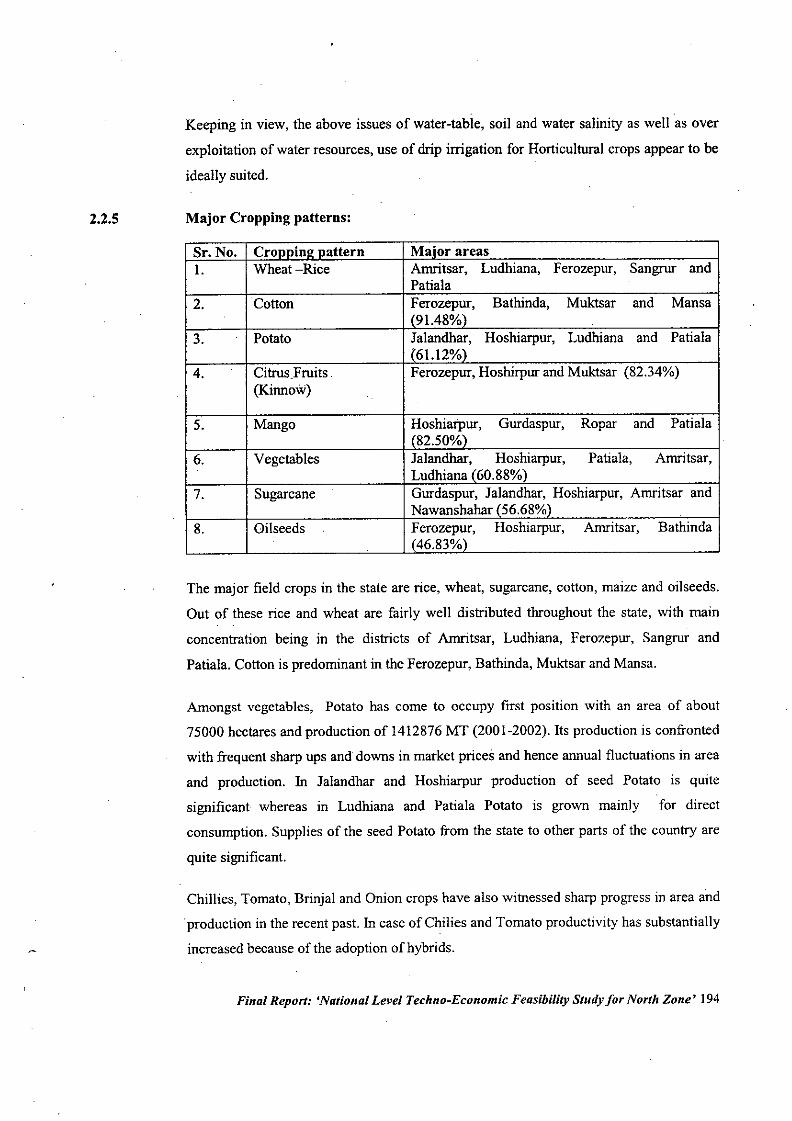
2.2.5
Keeping in view, the above issues of water-table, soil and water salinity as well as over
exploitation of water resources, use of drip irrigation for Horticultural crops appear to be
ideally suited.
Major Cropping patterns:
Sr. No. Cronninl! nattern Maior areasI. Wheat-Rice Arnritsar, Ludhiana, Ferozepur, Sangrur and
Patiala2. Cotton Ferozepur, Bathinda, Muktsar and Mansa
(91.48%)3. Potato Jalandhar, Hoshiarpur, Ludhiana and Patiala
(61.12%)4. Citrus.Fruits. Ferozepur, Hoshirpur and Muktsar (82.34%)
(Kinnow)
5. Mango Hoshiarpur, Gurdaspur, Ropar and Patiala(82.50%)
6. Vegetables Jalandhar, Hoshiarpur, Patiala, Amritsar,Ludhianaf60.88%)
7. Sugarcane Gurdaspur, Jalandhar, Hoshiarpur, Arnritsar andNawanshahar (56.68%)
8. Oilseeds Ferozepur, Hoshiarpur, Amritsar, Bathinda(46.83%)
The major field crops in the state are rice, wheat, sugarcane, cotton, maize and oilseeds.
Out of these rice and wheat are fairly well distributed throughout the state, with main
concentration being in the districts of Arnritsar, Ludhiana, Ferozepur, Sangrur and
Patiala. Cotton is predominant in the Ferozepur, Bathinda, Muktsar and Mansa.
Amongst vegetables, Potato has come to occupy first position with an area of about
75000 hectares and production of 1412876MT (2001-2002). Its production is confronted
with frequent sharp ups and downs in market prices and hence annual fluctuations in area
and production. In Jalandhar and Hoshiarpur production of seed Potato is quite
significant whereas in Ludhiana and Patiala Potato is grown mainly for direct
consumption. Supplies of the seed Potato from the state to other parts of the country are
quite significant.
Chillies, Tomato, Brinjal and Onion crops have also witnessed sharp progress in area and
'production in the recent past. In case of Chilies and Tomato productivity has substantially
increased because of the adoption of hybrids.
Final Report: 'National Level Techno-Economic Feasibility Study for North Zone' 194
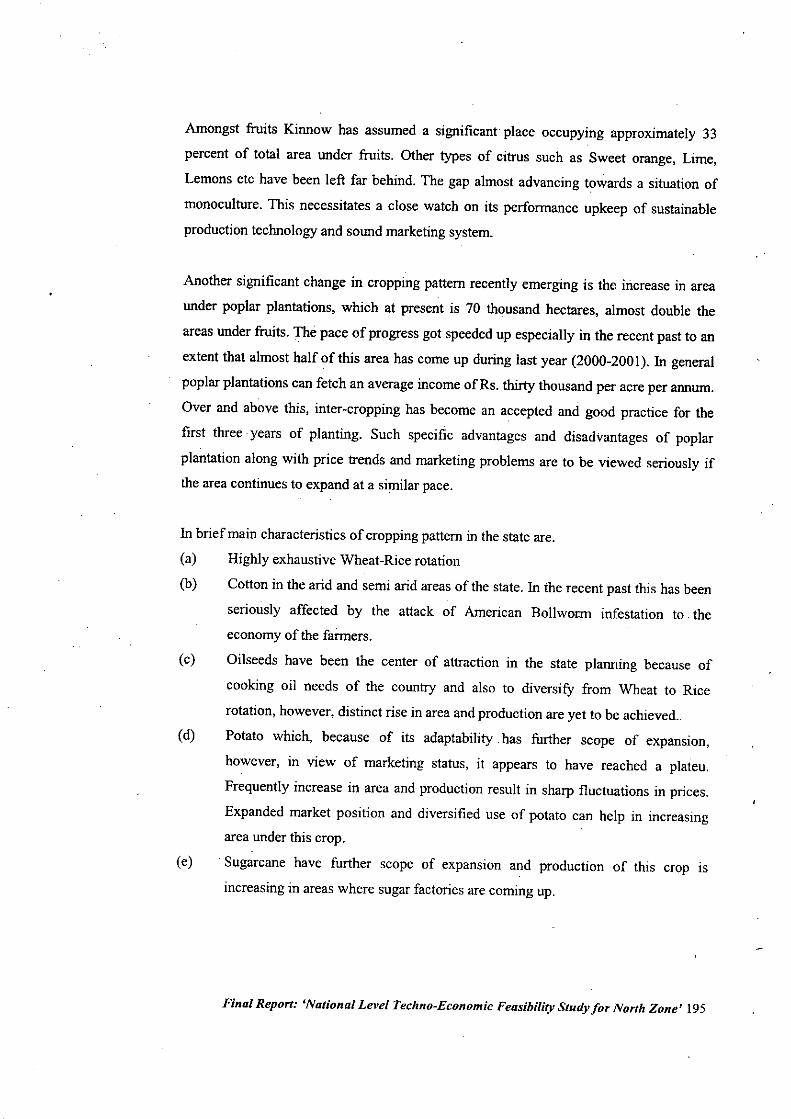
Amongst fruits Kinnow has assumed a significant place occupying approximately 33
percent of total area under fruits. Other types of citrus such as Sweet orange, Lime,
Lemons etc have been left far behind. The gap almost advancing towards a situation of
monoculture. This necessitates a close watch on its performance upkeep of sustainable
production technology and sound marketing system.
Another significant change in cropping pattern recently emerging is the increase in area
under poplar plantations, which at present is 70 thousand hectares, almost double the
areas under fruits. The pace of progress got speeded up especially in the recent past to an
extent that almost half of this area has come up during last year (2000-200 I). In.general
poplar plantations can fetch an average income of Rs. thirty thousand per acre per annum.
Over and above this, inter-cropping has become an accepted and good practice for the
first three years of planting. Such specific advantages and disadvantages of poplar
plantation along with price trends and marketing problems are to be viewed seriously ifthe area continues to expand at a similar pace.
In.brief main characteristics of cropping pattern in the state are.
(a) Highly exhaustive Wheat-Rice rotation
(b) Cotton in the arid and semi arid areas of the state. In.the recent past this has been
seriously affected by the attack of American Bollworm infestation to. theeconomy of the farmers.
(c) Oilseeds have been the center of attraction in the state planning because of
cooking oil needs of the country and also to diversify from Wheat to Rice
rotation, however, distinct rise in area and production are yet to be achieved..
(d) Potato which, because of its adaptability has further scope of expansion,
however, in view of marketing status, it appears to have reached a plateu.
Frequently increase in area and production result in sharp fluctuations in prices.
Expanded market position and diversified use of potato can help in increasingarea under this crop.
(e) Sugarcane have further scope of expansion and production of this crop IS
increasing in areas where sugar factories are coming up.
Final Report: 'National Level Techno-Economic Feasibility Study for North Zone' 195
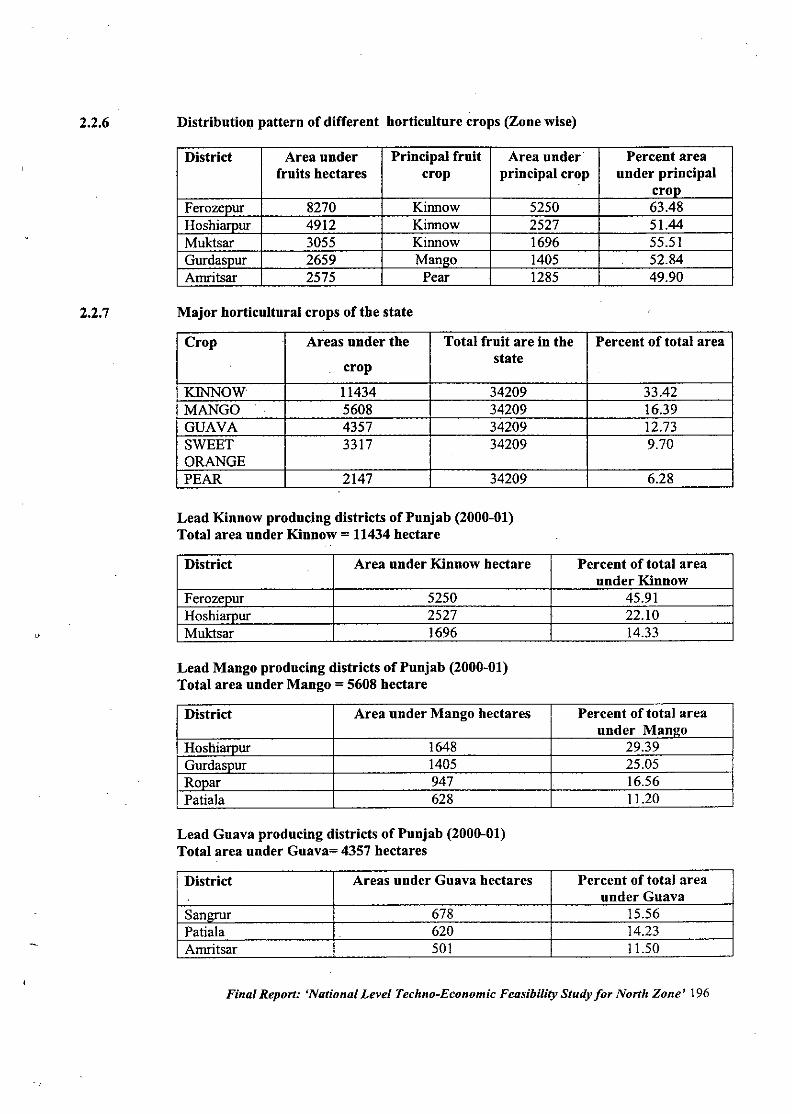
2.2.6 Distribution pattern of different horticulture crops (Zone wise)
District Area under Principal fruit Area under. Percent areafruits hectares crop principal crop under principal
cronFerozepur 8270 Kinnow 5250 63.48Hoshiarpur 4912 Kinnow 2527 51.44Muktsar 3055 Kinnow 1696 55.51Gurdaspur 2659 Mango 1405 52.84Amritsar 2575 Pear 1285 49.90
2.2.7 Major horticultural crops of the state
Crop Areas under the Total fruit are in the Percent of total areastatecrop
KINNOW. 11434 34209 33.42MANGO 5608 34209 16.39GUAVA 4357 34209 12.73SWEET 3317 34209 9.70ORANGEPEAR 2147 34209 6.28
Lead Kinnow producing districts of Punjab (2000-01)Total area under Kinnow = 11434 hectare
District Area under Kinnow hectare Percent of total areaunder Kinnow
Ferozepur 5250 45.91Hoshiarpur 2527 22.10Muktsar 1696 14.33
Lead Mango producing districts of Punjab (2000-01)Total area under Mango = 5608 hectare
District Area under Mango hectares Percent of total areaunder MaDlw
Hoshiarpur 1648 29.39Gurdaspur 1405 25.05Ropar 947 16.56Patiala 628 11.20
Lead Guava producing districts of Punjab (2000-01)Total area under Guava= 4357 hectares
District Areas under Guava hectares Percent of total areaunder Guava
Sangrur 678 15.56Patia1a 620 14.23Amritsar 501 11.50
Final Report: 'National Level Techno-Economic Feasibility Study for North Zone' 196
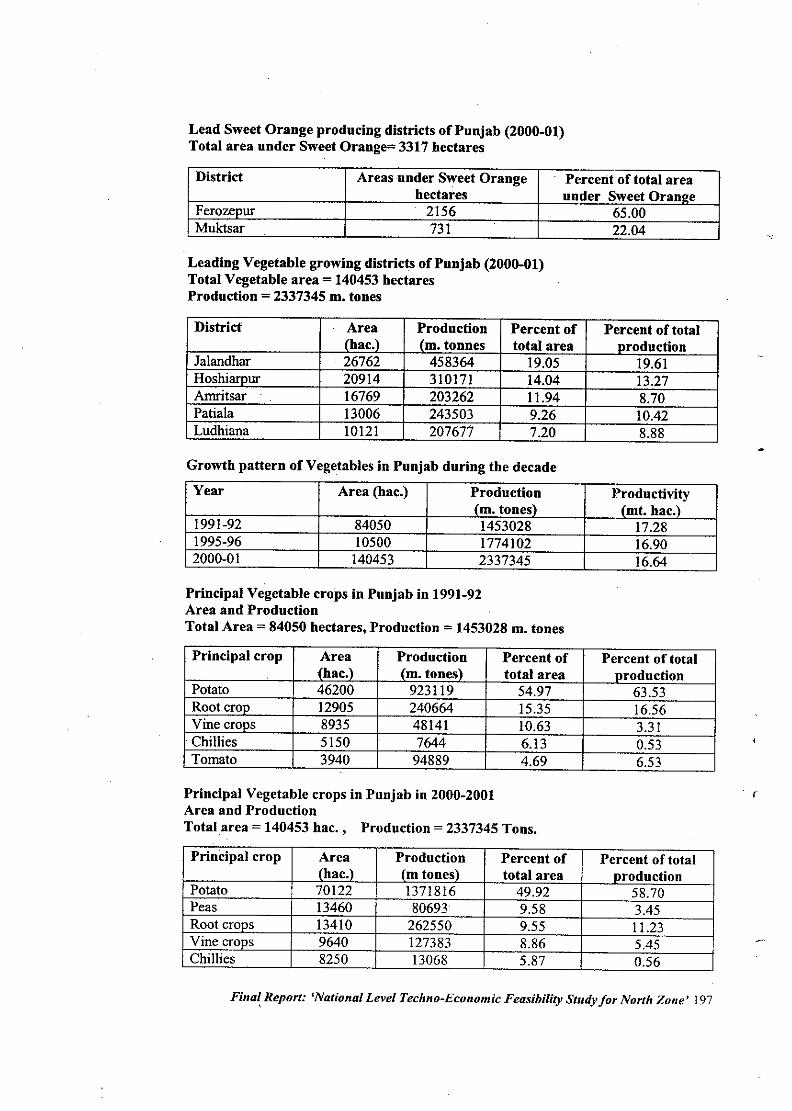
Lead Sweet Orange producing districts of Punjab (2000-01)Total area under Sweet Orange= 3317 hectares
District Areas under Sweet Orange Percent of total areahectares under Sweet Orange
Ferozenur 2156 65.00Muktsar 731 22.04
Leading Vegetable growing districts of Punjab (2000-01)Total Vegetable area = 140453 hectaresProduction = 2337345 ro. tones
District Area Production Percent of Percent of total(hac.) (ro. tonnes total area production
Jalandhar . 26762 458364 19.05 19.61Hoshiarour 20914 310171 14.04 1327Arnritsar 16769 203262 11.94 8.70Patiala 13006 243503 9.26 10.42Ludhiana 10121 207677 7.20 8.88
Growth pattern of Vegetables in Punjab during the decade
Year Area (hac.) Production Productivity(ro. tones) (rot. hac.)
1991-92 84050 1453028 17.281995-96 10500 1774102 16.902000-01 140453 2337345 16.64
Principal Vegetable crops in Punjab iu 1991-92Area and ProductionTotal Area = 84050 hectares, Production = 1453028 ro. tones
Principal crop Area Production Percent of Percent of total(hac.) (ro. tones) total area production
Potato 46200 923119 54.97 63.53Root crop 12905 240664 15.35 16.56Vine crops 8935 48141 10.63 3.31. Chillies 5150 7644 6.13 0.53Tomato 3940 94889 4.69 6.53
Principal Vegetable crops in Punjab iu 2000-2001Area and ProductiouTotal area = 140453 hac., Production = 2337345 Tons.
PrinCipal crop Area Production Percent of Percent of total(hac.) (ro tones) total area production
Potato 70122 1371816 49.92 58.70Peas 13460 80693 9.58 3.45Root croos 13410 262550 9.55 11.23Vine croos 9640 127383 8.86 5.45Chillies 8250 13068 5.87 0.56
Fina( Report: 'National Level Techno-Economic Feasibility Study for North Zone' 197
(
2.2.7.1
2.2.7.1.1
2.2.7.1.2
2.2.7.1.3
2.:Z.7.1.3.1
Fruits and Nnts
Apple
There is no area under Apples within the state and hence not covered.
Banana
There is no substantial area under Banana within the state and hence not covered.
Citrus - (Kinnow, Sweet oranges, limes to lemons)
Citrus fruits occupy third position after mango and banana in the production of fruits in
India. The state of Punjab which has much lower are a under citrus than many other states
has the credit of having achieved higher productivity (12.900) which is only second to the
productivity of these fruits in the state of Andhra Pradesh (13.5 mt. per hac.). This has
been possible because of the wide spread plantations of Kinnow. At one stage in sixties
and seventies when the citrus industry of the state was in very bad shape because of wide
spread decline of Sweet Orange varieties planted extensively in semi-arid and arid
regions of the state. At the stage it appeared certain that the cultivation of citrus fruits will
loose its significance in the state, but the introduction and instant spread of Kinnow
turned the situation in a positive direction. Presently (200I) citrus fruits occupying as
much as 45.07 percent of the total area under fruits in the state.
Growth pattern over last decade
The area under citrus fruits has steadily increased during the decade. The increase in area
and production has been primarily due to rapid increase in area under Kinnow. By the
year 2000-01 Kinnow has come to occupy over 74% of total area under citrus, about 22%
under Sweet Orange and the balance of 4% under Lime/lemon. It is primarily because of
this that citrus has become number are fruit in the state leaving Mango as a poor second.
The future trends indicate that percentage area under citrus is going to increase further.
Final Report: 'National Level Techno-Economic Feasibility Study for North Zone' 198
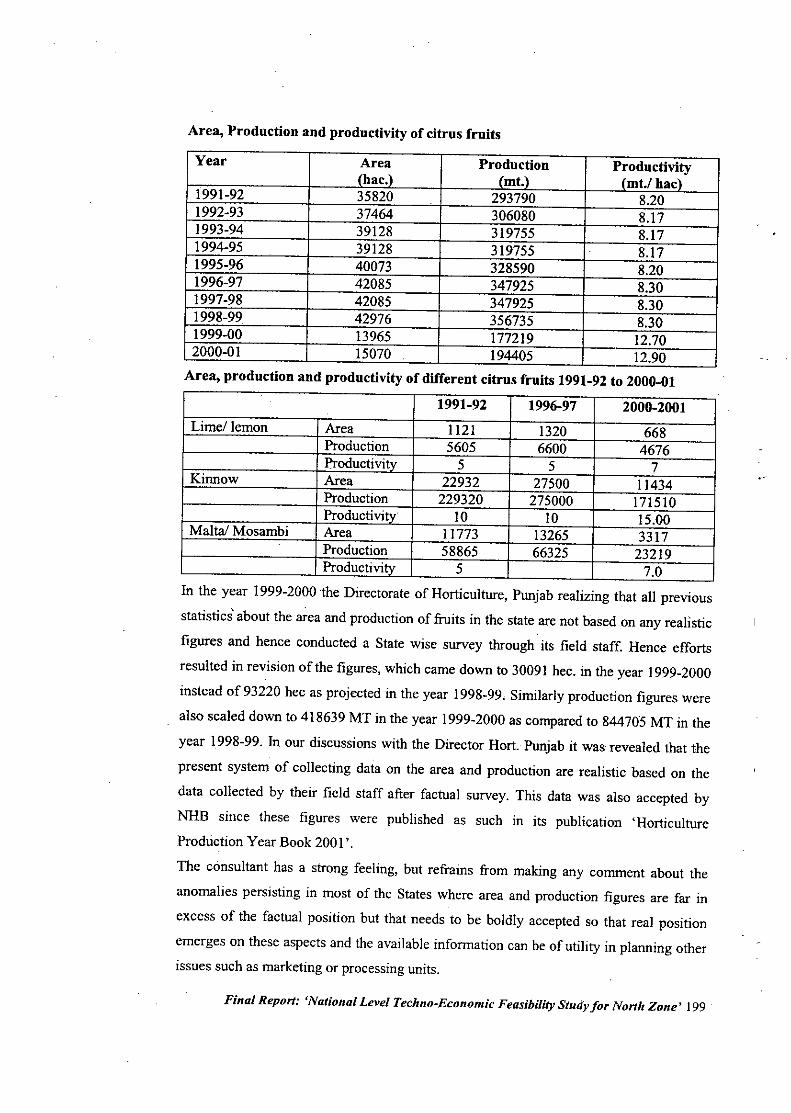
Area, Production and productivity of citrus fruits
Year Area Production Productivity(hac.) (mt.) (mt.l hac)
1991-92 35820 293790 8.201992-93 37464 306080 8.171993-94 39128 319755 8.171994-95 39128 319755 8.171995-96 40073 328590 8.201996-97 42085 347925 8.301997-98 42085 347925 8.301998-99 42976 356735 8.301999-00 13965 177219 12.702000-01 15070 194405 12.90Area, production and productivity of different citrus fruits 1991-92 to 2000-01
1991-92 1996-97 2000-2001Lime/ lemon Area 1121 1320 668
Production 5605 6600 4676Productivitv 5 5 7
Kinnow Area 22932 27500 11434Production 229320 275000 171510Productivitv 10 10 15.00
Malta! Mosambi Area 11773 13265 3317Production 58865 66325 23219Productivitv 5 7.0
In the year 1999-2000 the Directorate of Horticulture, Punjab realizing that all previous
statistics' about the ~ea and production of fruits in the state are not based on any realistic
figures and hence conducted a State wise survey through its field staff. Hence efforts
resulted in revision of the figures, which came down to 30091 hec. in the year 1999-2000
instead of 93220 hec as projected in the year 1998-99, Similarly production figures were
also scaled down to 418639 MT in the year 1999-2000 as compared to 844705 MT in the
year 1998-99. In our discussions with the Director Hort. Punjab it was revealed that the
present system of collecting data on the area and production are realistic based on the
data collected by their field staff after factual survey. This data was also accepted by
NHB since these figures were published as such in its publication 'HorticultureProduction Year Book 200I'.
The consultant has a strong feeling, but refrains from making any comment about the
anomalies persisting in most of the States where area and production figures are far in
excess of the factual position but that needs to be boldly accepted so that real position
emerges on these aspects and the available information can be of utility in planning otherissues such as marketing or processing units.
Final Report: 'National Level Techno-Economic Feasibility Study for North Zone' 199
2.2.7.1.3.2
2.2.7.1.3.3
Crop Calendar
Almost all citrus types are propagated by T-budding method. The time of budding in case
of Sweet Orange, Kinnow and grapefiuit as recommended by P.A.U. is during mid
February-March and again during August-September. The rootstock recoinmended is
rough lemon- Jathi Khalti. However, in case of Blood red and Mosambi varieties of
Sweet Orange, Cleopatra and Pectinifera rootstocks have been recommended.
Production Techuology
(a) Maudarins (Santra)
KinnowIntroduction - It has emerged as the prime fiuit of the state. It covers 74 percent of the
area under citrus and 33 percent of total area under fiuits in the state. Its productivity,
which at present is reported to be 15 MT per hectare, is the highest amongst citrus fiuits
in the country. The quality of this variety is also being widely accepted as a fresh fiuit,
however, it has not been found good for processing because ofbilterness, which develops
in the juice during processing.
Cultivars -(a) Local mandrin restricted in Gurdaspur, Hoshiarpur and Ropar districts.
(b) Sweet Orange: Musambi, Jaffa, Blood Red, Valencia
(c) Grape fiuit, Red Blush, Mash Seedless, Duncan and Foster. Good in production
especially in arid regions but is not much acceptable in the market.
(d) Lemon - Eureka and Baramasi - PAU selection I. Both these have not been
much commercialized through the second one has become a popular kitchen
garden tree.
(e) Punjab Galqal- This has been a popular lemon type because of its good
characters for pickle making. Mainly grown as stray seedlings in' the sub-
montane areas of Hoshiarpur, Ropar, Gurdaspur and Pathankot. Very useful plant
because of hardiness to cold while other limes and lemons are quite susceptible.
SeedlPlanting material-Almost all citrus types are propagated by T-budding method. The time of budding in case
of Sweet Orange, Kinnow and grapefiuit as recommended by P.A.U. is during mid
February-March and again during August-September. The rootstock recommended is
rough lemon- Jathi Khatti. However, in case of Blood red and Mosambi varieties of
Sweet Orange, Cleopatra and Pectinifera rootstocks have been recommended. As these
Final Report: 'National Level Techno-Economic Feasibility Study for North Zone' 200
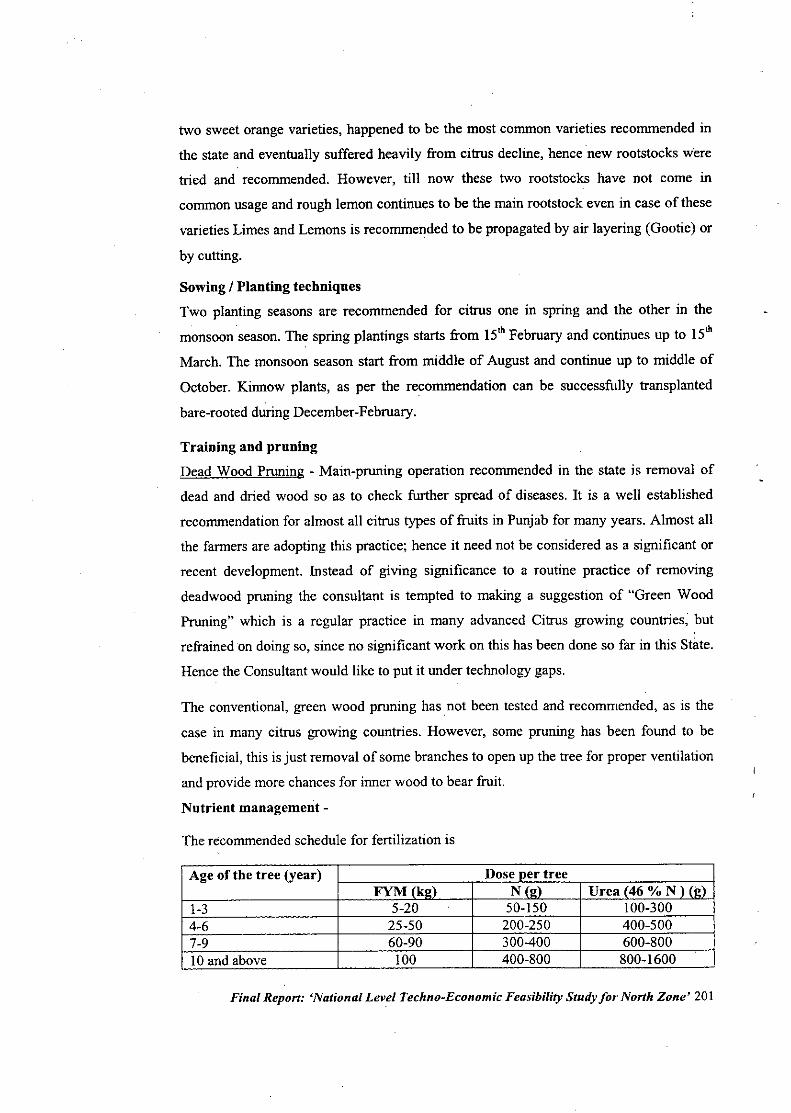
two sweet orange varieties, happened to be the most common varieties recommended in
the state and eventually suffered heavily from citrus decline, hence new rootstocks were
tried and recommended. However, till now these two rootstocks have not come in
common usage and rough lemon continues to be the main rootstock even in case of these
varieties Limes and Lemons is recommended to be propagated by air layering (Gootie) or
by cutting.
Sowing / Planting techniqnesTwo planting seasons are recommended for citrus one in spring and the other in the
monsoon season. The spring plantings starts from 15'h February and continues up to 15th
March. The monsoon season start from middle of August and continue up to middle of
October. Kinnow plants, as per the recommendation can be successfully transplanted
bare-rooted during December-February.
Training and pruningDead Wood Pruning - Main-pruning operation recommended in the state is removal of
dead and dried wood so as to check further spread of diseases. It is a well established
recommendation for almost all citrus types of fruits in Punjab for many years. Almost all
the farmers are adopting this practice; hence it need not be considered as a significant or
recent development. Instead of giving significance to a routine practice of removing
deadwood pruning the consultant is tempted to making a suggestion of "Green Wood
Pruning" which is a regular practice in many advanced Citrus growing countries; but
refrained on doing so, since no significant work on this has been done so far in this State.
Hence the Consultant would like to put it under technology gaps.
The conventional, green wood pruning has not been tested and recommended, as is the
case in many citrus growing countries. However, some pruning has been found to be
beneficial, this is just removal of some branches to open up the tree for proper ventilation
and provide more chances for inner wood to bear fruit.
Nutrient management -
The recommended schedule for fertilization is
Age of tbe tree (year) Dose per treeFYM(kQ) N (2) Urea (46 % N) (2)
1-3 5-20 50-150 100-3004-6 25-50 200-250 400-5007-9 60-90 300-400 600-80010 and above 100 400-800 800-1600
Final Report: 'National Level Techno-Economic Feasibility Study JOl' North Zone' 201
In place of urea, nitrogen can be supplied in the form of Ammonium sulphate (20.5 % N),
CAN (25% N), DAP (18% N).
FYM is to be applied during December. Nitrogen dose is to be splitted in two equal parts,
first half in February and the second half in April-May after fruit set.
For Kinnow, add 200 g phosphorous - 1.25 kg super phosphate per tree in addition to
above doses ofN. Zinc deficiency is prevalent and symptoms appear on fully mature new
leaves. This is rectified by spraying 0.3 percent zinc sulphate on spring flush in April -
May, summer flush in June and on late summer flush in August- September.
Water Management-
Young plants up to the age of 3-4 years are to be irrigated at weekly intervals, whereas
older tees be irrigated 2-3 weeks interval, depending upon climate, rainfall and type of
soil. Irrigation in February before sprouting, after fruit set in April and in the hot weather
is crucial for successful crop.
Intercultural operation -
Appropriate technologies for intercropping, weed control and control of pre-harvest fruit
drop have been recommended for successful cultivation of citrus. Thinning of fruits in
Kinnow is important as this variety tends to over bearing thereby affecting the size and
quality of fruit.
Harvesting and yield- Kinnow is to be harvested when the fruits develop proper colour
and acceptable T.S.S. acid ratio. The fruit in the periphery of the tree be harvested when
such ratio is 12:1, whereas the fruit in side the tree may be harvested when the ratio is
14:1. The best time for picking Kinnow fruits is from mid January to mid February.
Fruit, during harvesting operation is not to be pulled from the bra';ches but use clipper so
as to retain a non-protruding short fruit stalk (button).
Again the package of practice contains the general recommendation that the fruit should
not be pulled from the branches during harvesting as the skin from stem end can be
ruptured. Further the harvesting with the clippers is recommended retaining a non
protruding short fruit stocks (Button) which in packaging the damages the other fruits.
Final Report: 'National Level Techno-Economic Feasibility Study for North Zone' 202
2.2.7.1.3.4
The main issue instead of the above which still remains a understood problem is when to
harvest the fruit. The available recommendation of TSS / Acid Ratio (as mentioned in
the recommendation of PAD) is not well understood by the growers and not easy to
follow. The grower on the basis of his visual observations adjusts the harvesting time.
Pest and disease management
Citrus psylla, leaf miner, white fly, mite, leaf folder, bark eating caterpillar are the main
insect pests of citrus. The symptoms of their attack and control measures of each have
been worked out and are recommended. However the integrated spray schedule has to be
followed for the control of all pass and diseases.
Canker (bacterial disease), scab, gummosis, wither tip, stem and fruit rot, virus and virus-
like diseases such as greening, tristeza, exocertis, ring spot are quite serious disorders
making citrus production a difficult task. Like insect pest, there are control measures for
all these diseases but a regular integrated spray schedule is recommended to be followed
for keeping the tree healthy.
Method of Controlling Phytophathora foot rot: The control measure for this disease
stand included in the standard package of practice for Citrus.
Final Report: 'National Level Techno-Economic Feasibility Study for North Zone' 203
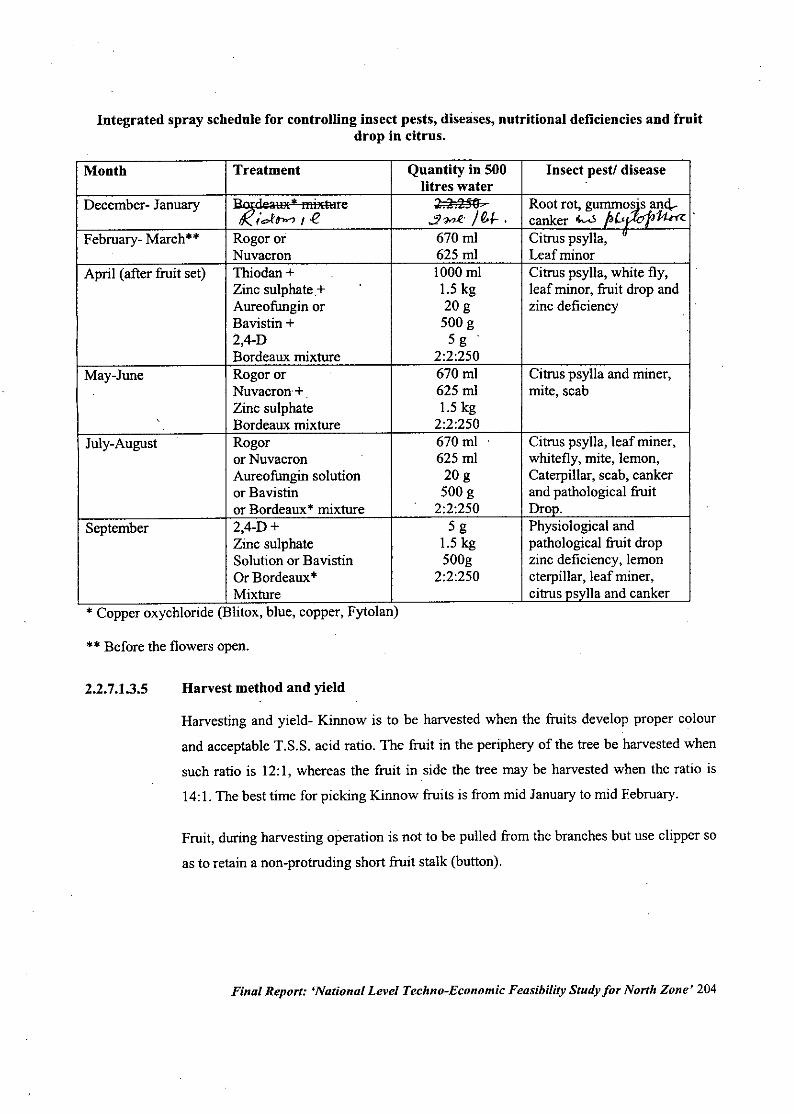
Integrated spray schedule for controlling insect pests, diseases, nutritional deficiencies and (ruitdrop in citrus.
Month Treatment Quantity in 500 Insect pestl diseaselitres water
December- January F~eaIlJE' miJEture 2.3.2$9"- Root rot, gu1&Mnq...,ot 8>r> , .e ,;2~' J~I-. canker ok.o.\ & ~
February- March" Rogoror 670 ml Citrus psylla, "Nuvacron 625 ml Leaf minor
April (after fruit set) Thiodan + 1000 ml Citrus psylla, white fly,Zinc sulphate + 1.5 kg leaf minor, fruit drop andAureofungin or 20 g zinc deficiencyBavistin + 500 g2,4-D 5 g .Bordeaux mixture 2:2:250
May-June Rogoror 670 ml Citrus psylla and miner,Nuvacron'+ 625 ml mite, scabZinc sulphate 1.5 kgBordeaux mixture 2:2:250
July-August Rogor 670ml Citrus psylla, leaf miner,or Nuvacron 625 ml whitefly, mite, lemon,Aureofungin solution 20 g Caterpillar, scab, cankeror Bavistin 500 g and pathological fruitor Bordeaux' mixture 2:2:250 Drop.
September 2,4-D + 5g Physiological andZinc sulphate 1.5 kg pathological fruit dropSolution or Bavistin 500g zinc deficiency, lemonOr Bordeaux' 2:2:250 cterpillar, leaf miner,Mixture citrus psylla and canker
, Copper oxychloride (Blitox, blue, copper, Fytolan)
" Before the flowers open.
2.2.7.1.3.5 Harvest method and yield
Harvesting and yield- Kinnow is to be harvested when the fruits develop proper colour
and acceptable T.S.S. acid ratio. The fruit in the periphery of the tree be harvested when
such ratio is 12:1, whereas the fruit in side the tree may be harvested when the ratio is
14: I. The best time for picking Kinnow fruits is from mid January to mid February.
Fruit, during harvesting operation is not to be pulled from the branches but use clipper so
as to retain a non-protruding short fruit stalk (button).
Final Report: 'National Level Techno-Economic Feasibility Study for North Zone' 204
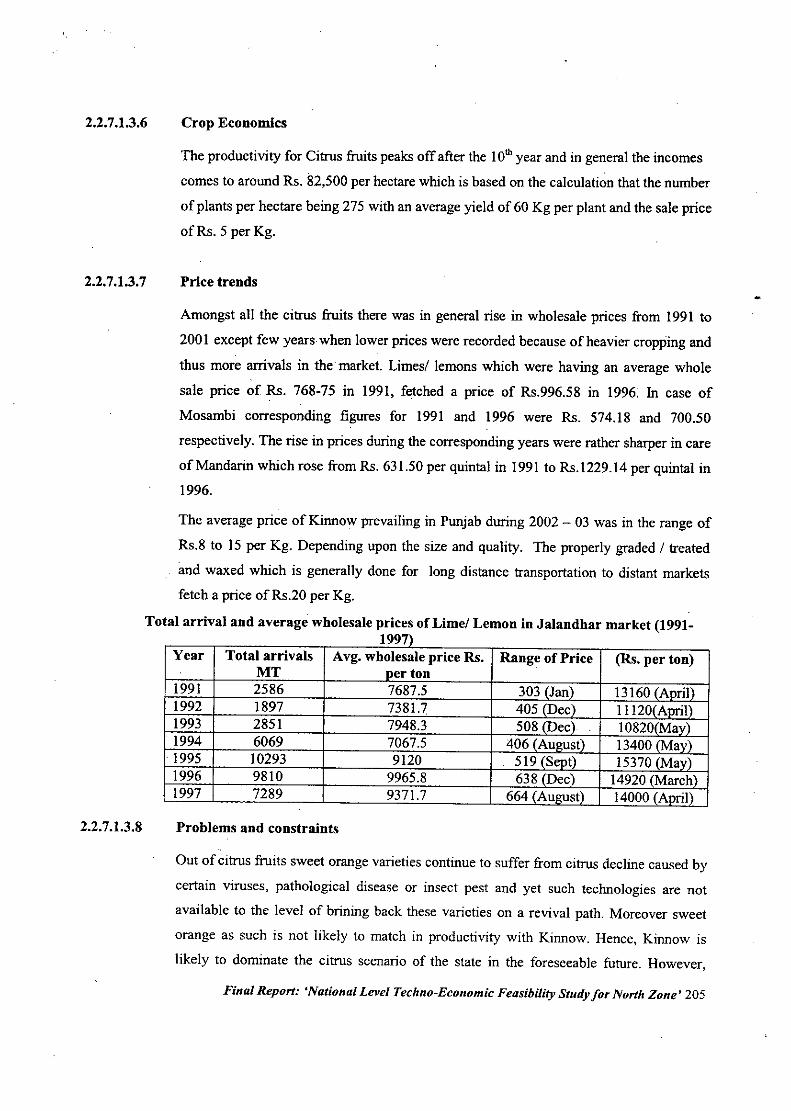
2.2.7.1.3.6 Crop Economics
The productivity for Citrus fruits peaks off after the lOthyear and in general the incomes
comes to around Rs. 82,500 per hectare which is based on the calculation that the number
of plants per hectare being 275 with an average yield of 60 Kg per plant and the sale price
ofRs. 5 per Kg.
2.2.7.1.3.7 Price trends
Amongst all the citrus fruits there was in general rise in wholesale prices from 1991 to
200 I except few years when lower prices were recorded because of heavier cropping and
thus more arrivals in the.market. Limesl lemons which were having an average whole
sale price of Rs. 768-75 in 1991, fetched a price of Rs.996.58 in 1996: In case of
Mosambi corresponding figures for 1991 and 1996 were Rs. 574.18 and 700.50
respectively. The rise in prices during the corresponding years were rather sharper in care
of Mandarin which rose from Rs. 631.50 per quintal in 1991 to RS.1229.14 per quintal in1996.
The average price of Kinnow prevailing in Punjab during 2002 - 03 was in the range of
RS.8 to IS per Kg. Depending upon the size and quality. The properly graded I treated
and waxed which is generally done for long distance transportation to distant marketsfetch a price of Rs.20 per Kg.
Total arrivalsMT25861897285160691029398107289
Year
1991199219931994.199519961997
Total arrival and average wholesale prices of Limel Lemon in Jalandhar market (1991-1997
Avg. wholesale price Rs. Range of Price (Rs. per ton)er ton7687.57381.77948.37067.591209965.89371.7
2.2.7.1.3.8 Problems and constraints
Out of citrus fruits sweet orange varieties continue to suffer from citrus decline caused by
certain viruses, pathological disease or insect pest and yet such technologies are not
available to the level of brining back these varieties on a revival path. Moreover sweet
orange as such is not likely to match in productivity with Kinnow. Hence, Kinnow is
likely to dominate the citrus scenario of the state in the foreseeable future. However,
Final Report: 'National Level Techno-Economic Feasibility Study for North Zone' 205
2.2.7.1.3.9
predominance of Kin now at the existing level or still at higher level as in visualized is not
going to remain without problems. Tree of Kinnow is also likely to be prone to decline if
full care and preventive measures are not regularly taken. This variety appears to have a
tendency of comparatively shorter productive life. This could be due partly because of
over productivity, starting bearing at an early age, higher seed content which is said to be
a sink for nutrients from the tree. High seed content is also a disadvantage from fresh
eating point of view as well as being an hindrance in processing. This variety is
otherwise, also unsuitable for processing because of the bitterness of juice which
develops during processing.
Limes and lemons have also not picked up well in the state because of their susceptibility
to certain diseases especially Canker which being a bacterial disease is not easy to
control. Only exception in this group has been Hill lemon-Gal gal which traditionally has
been used for home scale pickle making or is used for the preparation of citrus squash by
certain processing companies in the state but the product is sold generally under the name
Orange squash / lemon squash. The production of this variety has so far not assumed
great commercial significance in view of its limited market demand.
Conclusion
It is a welcome development that Kinnow has made the citrus Industry of the state a .
viable proposition because of its high productivity and good eating quality. However, still
such developments are to be closely watched so that its cultivation remains sustainable.
Since, this variety also is prone to many incurable viral disease like other citrus varieties,
required surveillance on its performance has to be regular. Most important step in this
direction has to be up gradation of nursery production programme in the state. Bud wood
used in the propagation has to be virus free and rootstock source has also to be true to
type and from identified! indexed mother trees.
Since increase.d area under this variety is going to result in more production, protocol for
post harvest handling of the fruits need further refinement. This has to match with efforts
to expand its market base both within the country as well as in the foreign markets.
Diversification in varietal situation has to be taken up intensively partly because of some
of the above reasons as well as to have expanded availability period especially earlier
than Kinnow since it is rather a late variety. This will avoid dependence on single variety
and will expand the availability period of fresh fruit.
Final Report: 'National Level TechnocEconomic Feasibility Study for North Zone' 206
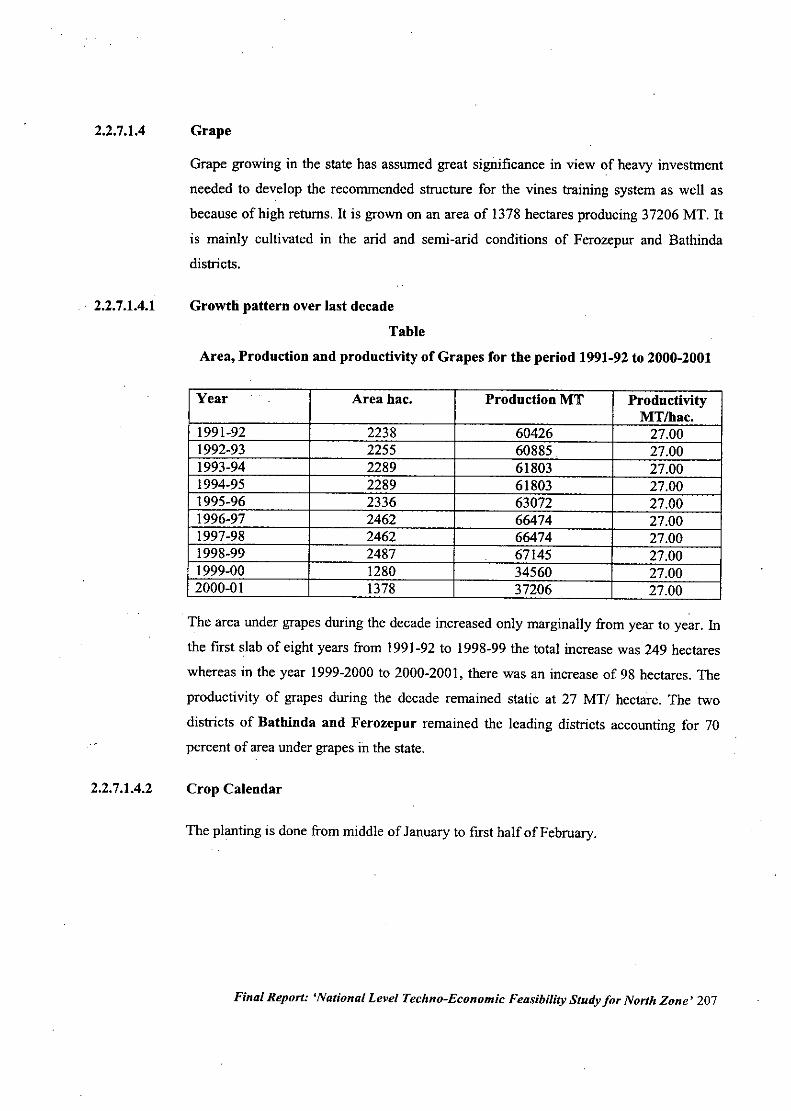
2.2.7.1.4
. 2.2.7.1.4.1
2.2.7.1.4.2
Grape
Grape growing in the state has assumed great significance in view of heavy investment
needed to develop the recommended structure for the vines training system as well as
because of high returns. It is grown on an area of 1378 hectares producing 37206 MT. It
is mainly cultivated in the arid and semi-arid conditions of Ferozepur and Bathinda
districts.
Growth pattern over last decade
Table
Area, Production and productivity of Grapes for the period 1991-92 to 2000-2001
Year Area hac. Production MT ProductivityMT/hac.
1991-92 2238 60426 27.001992-93 2255 60885. 27.001993-94 2289 61803 27.001994-95 2289 61803 27.001995-96 2336 63072 27.001996-97 2462 66474 27.001997-98 2462 66474 27.001998-99 2487 67145 27.001999-00 1280 34560 27.002000-01 1378 37206 27.00
The area under grapes during the decade increased only marginally from year to year. In
the first slab of eight years from 1991-92 to 1998-99 the total increase was 249 hectares
whereas in the year 1999-2000 to 2000-2001, there was an increase of 98 hectares. The
productivity of grapes during the decade remained static at 27 MT/ hectare. The two
districts of Bathinda and Ferozepur remained the leading districts accounting for 70percent of area under grapes in the state.
Crop Calendar
The planting is done from middle of January to first half of February.
Final Report: 'National Level Techno-Economic Feasibility Study for North Zone' 207
2.2.7.1.4.3 Production technology
Cultivars
Perlette
Predominant variety occupying about 90 percent of the acreage under grapes in the state.
It is seedless and early maturing.
Beauty Seedless
Early and seedless. Keeping quality is poor.
Flame Seedless
A seedless varietybut is not early maturing.
Propagation
Grape plants are propagated through, hard woodcuttings. The cuttings are prepared from
the pruning wood of selected vines, which are marked for bearing good crop. The
cuttings are made in the months of December- January.
Seed I Plauting Material
The planting distance recommended is 3 x 3 metres. The planting is done from middle of
January to first half of February.
Intercultural Operations-
Most common method of training of vines is the Bower system. A number of other
systems like Kniffen system (Vertical Trellis), Telephone system (Horiwntal Trellis) and
Head system were tried also but under the growing conditions of the state Bower system
of training was found to be successfuL The detailed stepwise development of vines on the
Bower system has been explained in the recommendations.
Impact of Quality Improvement Technology on cultivation
As per the discussions with Director Horticulture, Punjab, new technology is being
imparted by continuous demonstrations in production technology. The department lays
out 500 acres of technology demonstrators annually among the leading grape growers.
The results of demonstrations have shown a significant increase in receptiveness of this
technology. There is a perceptive change in the quality of fruits which can be seems on
the basis of the following indicators:
o Maturity period reduced by 7 - 10 days.
o Increase in TSS content in fruits from earlier 12-13 to 21-22.
o Change of fruit colour to golden yellow.
o Increase in berry size to twice its earlier size.
o Heavy reduction in the No. of small berries.
Final Report: 'National Level Techno-Economic Feasibility Study for North Zone' 208
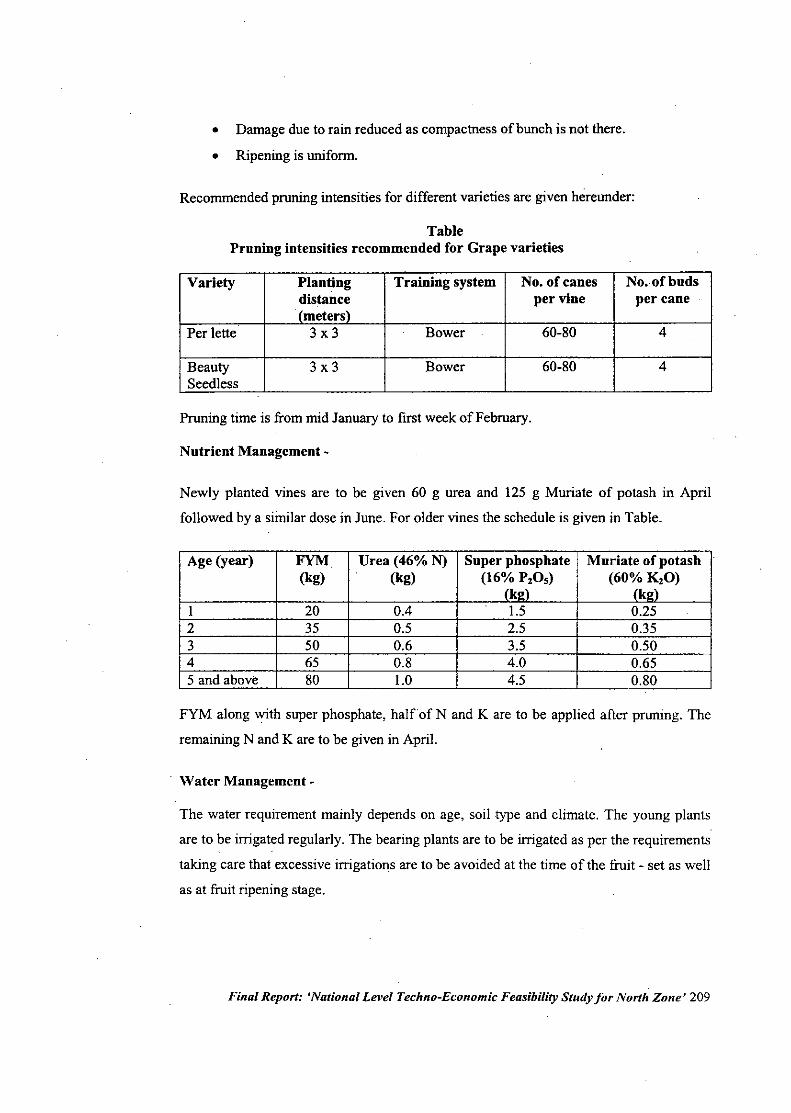
• Damage due to rain reduced as compactness of bunch is not there.
• Ripening is uniform.
Recommended pruning intensities for different varieties are given hereunder:
TablePruning intensities recommended for Grape varieties
Variety Planting Training system No. of canes NO•.ofbudsdistance per vine per cane.(meters)
Per lette 3x3 Bower 60-80 4
Beauty 3x3 Bower 60-80 4Seedless
Pruning time is from mid January to first week of February.
Nutrient Management.
Newly planted vines are to be given 60 g urea and 125 g Muriate of potash in April
followed by a siinilar dose in June. For older vines the schedule is given in Table.
Age (year) FYM Urea (46%N) Super phosphate Muriate of potash(kg) (kg) (16% P,O.) (60% K,O)
(kl!) (kl!)1 20 0.4 1.5 0.252 35 0.5 2.5 0.353 50 0.6 3.5 0.504 65 0.8 4.0 0.655 and above 80 1.0 4.5 0.80
FYM along with super phosphate, halfof Nand K are to be applied after pruning. The
remaining Nand K are to be given in April.
Water Management-
The water requirement mainly depends on age, soil type and climate. The young plants
are to be irrigated regularly. The bearing plants are to be irrigated as per the requirements
taking care that excessive irrigations are to be avoided at the time of the fruit - set as well
as at fruit ripening stage.
Final Report: 'National Level Techno-Economic Feasibility Study for North Zone' 209
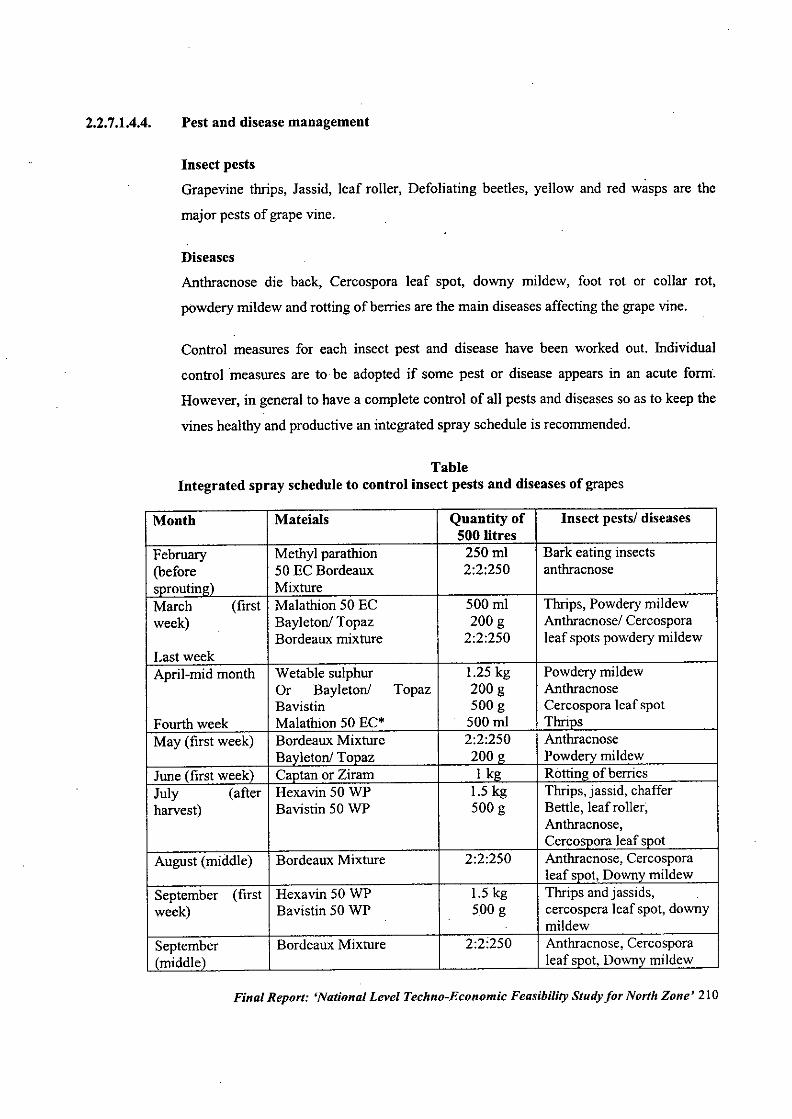
2.2.7.1.4.4. Pest and disease management
Insect pestsGrapevine thrips, Jassid, leaf roller, Defoliating beetles, yellow and red wasps are the
major pests of grape vine.
DiseasesAnthracnose die back, Cercospora leaf spot, downy mildew, foot rot or collar rot,
powdery mildew and rotting of berries are the main diseases affecting the grape vine.
Control measures for each insect pest and disease have been worked out. Individual
control measures are to be adopted if some pest or disease appears in an acute form.
However, in general to have a complete control of all pests and diseases so as to keep the
vines healthy and productive an integrated spray schedule is recommended.
TableIntegrated spray schedule to control insect pests and diseases of grapes
Month Mateials Quantity of Insect pests/ diseases500 litres
February Methyl parathion 250ml Bark eating insects(before 50 EC Bordeaux 2:2:250 anthracnosesorouting) MixtureMarch (first Malathion 50 EC 500 ml Thrips, Powdery mildewweek) Bayleton/ Topaz 200 g Anthracnose/ Cercospora
Bordeaux mixture 2:2:250 leaf spots powdery mildewLast weekApril-mid month Wetable sulphur 1.25 kg Powdery mildew
Or Bayleton/ Topaz 200 g AnthracnoseBavistin 500g Cercospora leaf spot
Fourth week Malathion 50 EC* 500 ml ThrinsMay (first week) Bordeaux Mixture 2:2:250 Anthracnose
Bavleton/ Topaz 200 <> PowderYmildewJune (first week) Cantan or Ziram I kg Rottin<>of berriesJuly (after Hexavin 50 WP 1.5 kg Thrips, jassid, chafferharvest) Bavistin 50 WP 500 g BettIe, leaf roller,
Anthracnose,Cercospora leaf spot
August (middle) Bordeaux Mixture 2:2:250 Anthracnose, Cercosporaleaf spot, Downv mildew
September (first Hexavin 50 WP 1.5 kg Thrips and jassids,week) Bavistin 50 WP 500 g cercospera leaf spot, downy
mildewSeptember Bordeaux Mixture 2:2:250 Anthracnose, Cercospora(middle) leaf spot, Downv mildew
Final Report: 'National Level Techno-Economic Feasibility Study for North Zone' 210
Bordeaux mixture should not be sprayed in mixture with other chemicals. Rest of the chemicals
indicated against a given spray is compatible and can, therefore, be mixed..
• In Perlette cultivars, carbaryl should prefer as it also looks after thinning of berries apart
from thrip control.
• Zinc. sulphate 3 kg plus 1.5 kg unslaked line should be sprayed if deficiency symptoms
appear.
2.2.7.1.4.5
2.2.7.1.4.6
2.2.7.1.4.7
Harvest Method and yield
Grapes are to be harvested when they are fully ripe. Repeated pickings are recommended
as the bunches do not ripen at the same time. The fruit yield per hectare in the state is 27
M. tones per hectare, which is highest in the county.
Crop economics
Currently the average yield of grapes in the State are pegged at 4-6 tons per hectare but
the data given for calculation of the economics for the crop by the DOH as shown an
average yield at 13.32 tons per hectare. The calculations have been made on the basis of
this figure and therefore the income thus generated from the crop comes to RS.6.66 lacs
per hectare from eighth year onwards with the cost of cultivation benched at RS.22.600/-
per hectare.
Price trends
Grapes appear to be the costliest fruit in Punjab markets. This could be due to its limited
cultivation in certain western and southern states- Maharashtra, Andhra Pradesh and
Karnataka, as well as due to its perishable nature, which results in more losses during
transit over long distance. However, reverse is true with regard to the lowest prices
during the year amongst most of the fruits, the range being Rs. 309 per quintal in1991
and highest in1995- Rs. 628 per quintal. However, such low prices are due to the
availability of locally grown grapes in the state, which is inferior in quality as compared
to the grapes of Maharashtra. This inference is drawn from the fact that during all the
years lowest prices prevailed in the month of June when only local grapes gets availableand Maharashtra grapes are over much earlier.
Final Report: 'National Level Techno-Economic Feasibility Study for North Zone' 211
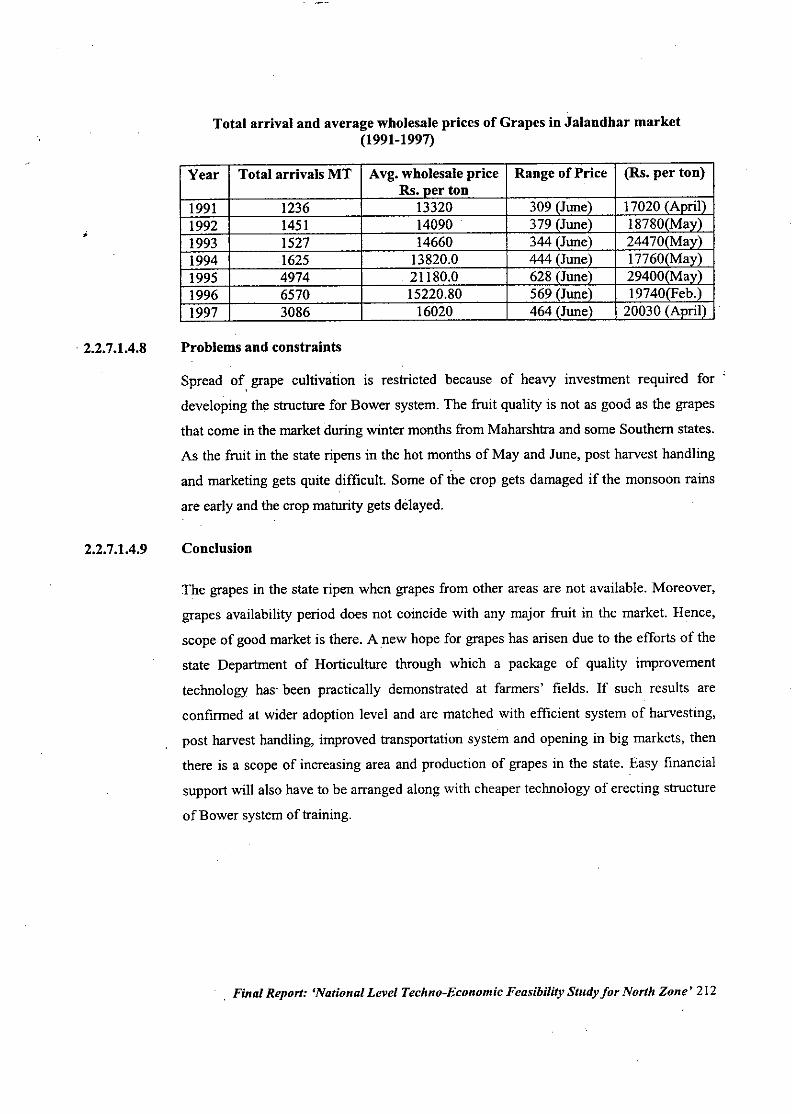
. 2.2.7.1.4.8
2.2.7.1.4.9
Total arrival and average wholesale prices of Grapes in Jalandhar market(1991-1997)
Year Total arrivals MT Avg. wholesale price Range of Price (Rs. per ton)Rs. ner ton
1991 1236 13320 309 (June) 17020 (April)1992 1451 14090 379 (June I8780(May)1993 1527 14660 344 (June 24470(May)1994 1625 13820.0 444 (June I7760(Mav)1995 4974 . 21180.0 628 (June 29400(Mav)1996 6570 15220.80 569 (June I9740(Feb.)1997 3086 16020 464 (June) 20030 (Anril)
Problems and constraints
Spread of, grape cultivation is restricted because of heavy investment required for
developing the structure for Bower system. The fruit quality is not as good as the grapes
that come in the market <luringwinter months from Maharshtra and some Southern states.
As the fruit in the state ripens in the hot months of May and June, post harvest handling
and marketing gets quite difficult. Some of the crop gets damaged if the monsoon rains
are early and the crop maturity gets delayed.
Conclusion
The grapes in the state ripen when grapes from other areas are not available. Moreover,
grapes availability period does not coincide with any major fruit in the market. Hence,
scope of good market is there. A new hope for grapes has arisen due to the efforts of the
state Department of Horticulture through which a package of quality improvement
technology has' been practically demonstrated at farmers' fields. If such results are
confirmed at wider adoption level and are matched with efficient system of harvesting,
post harvest handling, improved transportation system and opening in big markets, then
there is a scope of increasing area and production of grapes in the state. Easy financial
support will also have to be arranged along with cheaper technology of erecting structure
of Bower system of training.
. Final Report: 'National Level Techno-Economic Feasibility Study for North Zone' 212
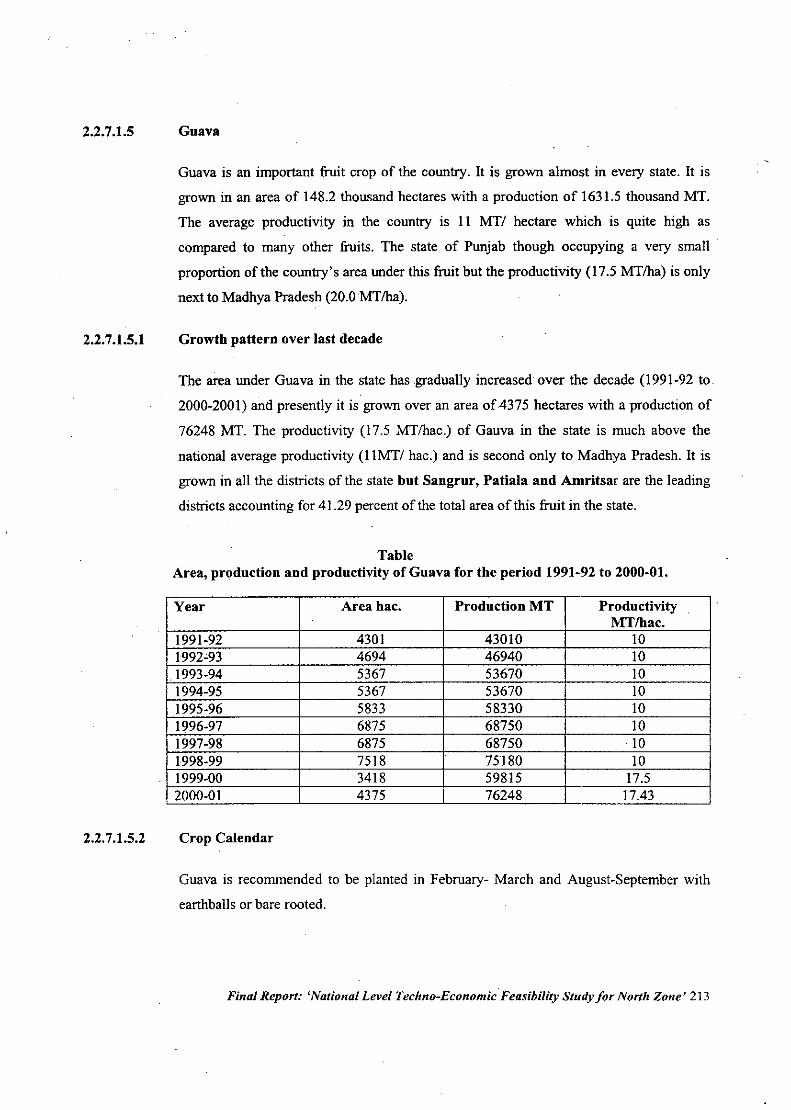
2.2.7.1.5
2.2.7.1.5.1
2.2.7.1.5.2
Guava
Guava is an important fruit crop of the country. It is grown almost in every state. It is
grown in an area of 148.2 thousand hectares with a production of 1631.5 thousand MT.
The average productivity in the country is 11 MT/ hectare which is quite high as
compared to many other fruits. The state of Punjab though occupying a very small
proportion of the country's area under this fruit but the productivity (17.5 MT/ha) is only
next to Madhya Pradesh (20.0MT/ha).
Growth pattern over last decade
The area under Guava in the state has ,gradually increased over the decade (1991-92 to,
2000-2001) and presently it is grown over an area of4375 hectares with a production of
76248 MT. The productivity (17.5 MT/hac.) of Gauva in the state is much above the
national average productivity (IIMT/ hac.) and is second only to Madhya Pradesh. It is
grown in all the districts of the state but Sangrur, Patiala aud Amritsar are the leading
districts accounting for 41.29 percent of the total area of this fruit in the state.
TableArea, production and productivity of Guava for the period 1991-92 to 2000-01.
Year Area hac. Production MT ProductivityMT/hac.
1991-92 4301 43010 101992'93 4694 46940 101993-94 5367 53670 101994-95 5367 53670 101995-96 5833 58330 101996-97 6875 68750 101997-98 6875 68750 101998-99 7518 75180 101999-00 3418 59815 17.52000-01 4375 76248 17.43
Crop Calendar
Guava is recommended to be planted in February- March and August-September with
earthballs or bare rooted.
Final Report: 'National Level Techno-EconomicFeasibility Study for North Zone' 213
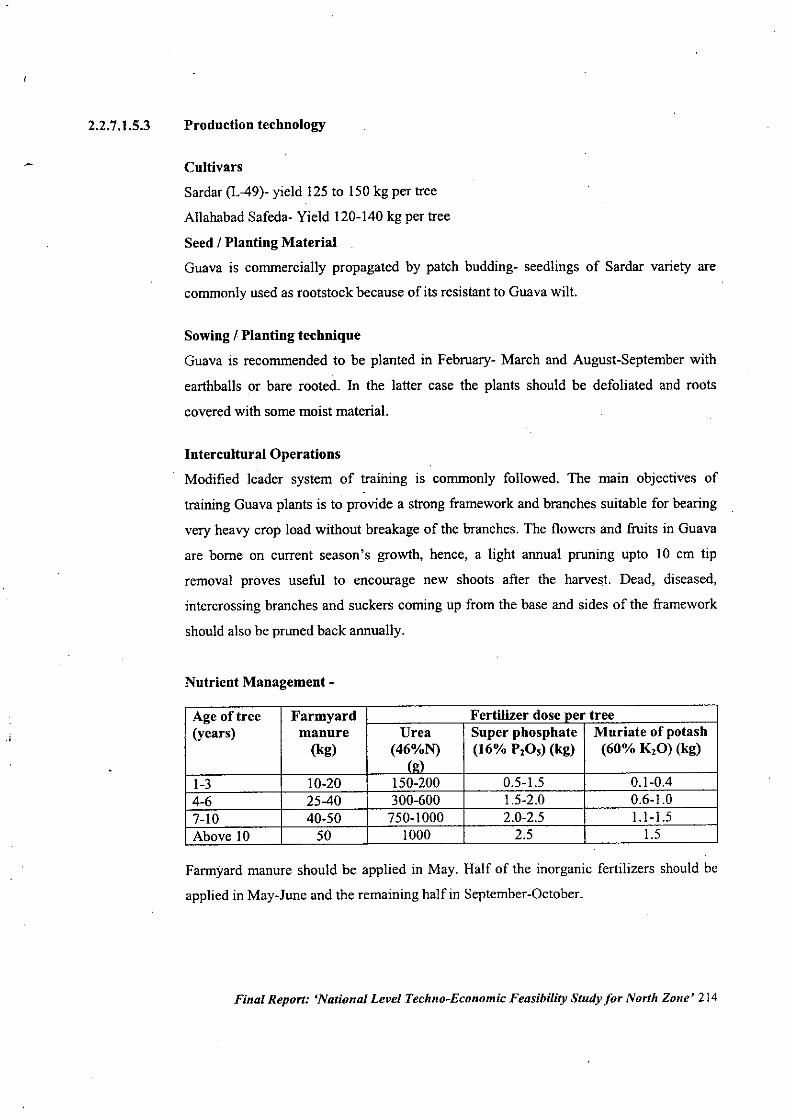
.;
2.2.7.1.5.3 Production techuology
Cultivars
Sardar (L-49)- yield 125 to ISO kg per tree
Allahabad Safeda- Yield 120-140 kg per tree
Seed I Planting Material
Guava is commercially propagated by patch budding- seedlings of Sardar variety are
commonly used as rootstock because of its resistant to Guava wilt.
Sowing I Planting technique
Guava is recommended to be planted in February- March and August-September with
earthballs or bare rooted. In the latter case the plants should be defoliated and roots
covered with some moist material.
Intercultural Operations
Modified leader system of training is commonly followed. The main objectives of
training Guava plants is to provide a strong framework and branches suitable for bearing
very heavy crop load without breakage of the branches. The flowers and fruits in Guava
are borne on current season's growth, hence, a light annual pruning upto 10 cm tip
removal proves useful to encourage new shoots after the harvest. Dead, diseased,
intercrossing branches and suckers coming up from the base and sides of the framework
should also be pruned back annually.
Nutrient Management -
Age of tree Farmyard Fertilizer dose ner tree(years) manure Urea Super phosphate Muriate of potash
(kg) (46%N) (16% P,O,) (kg) (60% K,O) (kg)(I!)
1-3 10-20 150-200 0.5-1.5 0.1-0.44-6 25-40 300-600 L5-2.0 0.6-1.07-10 40-50 750-1000 2.0-2.5 1.1-1.5Above 10 50 1000 2.5 1.5
Farmyard manure should be applied in May. Half of the inorganic fertilizers should be
applied in May-June and the remaining half in September-October.
Final Report: 'National Level Techno-Economic Feasibility Study for North Zone' 214
2.2.7.1.5.4
Zinc deficiency
It has been commonly noticed on Guava plants in the state. The affected plants produce
small leaves with yellowing or chlorosis in between the veins. The plant growth is
suppressed and the branches start dieing back. The deficiency is cured by spraying the
trees with Zinc sulphate- lime mixture- I kg of Zinc sulphate and 0.5 kg of unslaked lime
in J 00 litres of water. Two to three sprays of this mixture are recommended between June
to September.
Water Management
The young Guava plants need irrigation at weekly interval during summer months and 2
to 3 irrigations during winter months. Irrigation to bearing trees depends upon age, soil
type and climate. Normally such trees require irrigation for flowering and better fruit set
at an interval of 2 to 3 weeks during summer and at monthly intervals during winter.
Crop regulation
Guava gives two crops a year. Winter season crop is superior in quality than rainy season
crop, which may get infested with fruit flies. Hence crop regulation is required to get
winter crop. The P .A.U. has made the recommendations for this: .
i) Spray urea 10 percent or naphthalene acetic acid (NAA) @ 600 mg/litre during
May when maximum flowers have opened.
ii) Pruning of terminal portion of the shoots upto 20 and 30 cm in the second half of
April.
iii) Apply fertilizers during June to encourage growth in July-August for getting.
maximum flowering during August-September for winter season crop.
iv) Withhold irrigation during April-May.
Pest and disease management
Fruit fly is the most serious insect pest of Guava. This pest is more serious on rainy
season crop. The other important pest is shoot borer. For the control of fruit fly
recommendations include (a) the cleanliness especially the removal and destroying of
fallen infested fruits (b) Avoiding rainy season crops (c) Harvesting the fruits at a slightly
hard stage.
For the control of attack of shoot borer spray of Monocrotophos, Chloropyriphos and
Ekalux is recommended.
Final Report: 'National Level Techno-Economic Feasibility Study for North Zone' 215
2.2.7.1.5.5
2.1.7.1.5.6
2.2.7.1.5.7
2.2.7.1.5.8
Diseases
Wilth of Guava is very serious disease especially in heavy soils or wet conditions. The
control measured include (a) Plant Guava in a well drained soil (b) Drenching the soil in
the pit with formalin solution (c) Uprooting of affected trees (d) Using Sadar Guava (L
49) seedlings as rootstock. Fruit rot, anthracnose or dieback- control measures
recommended are (i) Avoid water to stand around the tree trunk (ii) Spray with Bliotox or
Captan (d) Cleaning the soil from any fallen and rotten fruits.
Harvest Method and yield
Guava fruit is recommended to be picked when it is mature but firm. The fruit change
colour from dark green to be greenish yellow. Guava yield is 17.5 MTlhac, which is
much higher than the national average of II MT/ hac.
Crop economics
Currently the average yield of Guava in the State are pegged at 17.5 tons per hectare. The
calculations have been made on the basis of this figure and therefore the income thus
generated from the crop comes to Rs.52,500 per hectare from tenth year onwards with the
cost of cultivation benched at Rs.3,200/- per hectare.
Price Trends
There is no regulated market price data available. However, the price trend for the
product has increased over the past decades and currently is being sold at around Rs.450
per quintal in the wholesale market of the State.
Problems and constraints
Guava wilt which results in mortality of plants both young and old is quite a serious
problem in the state. Remedial measures have been suggested but still the malady is not
completely cheked. Sardar (L-49) Guava seedlings have been found to be tolerant to this
disease. Further work on this disease is required to be undertaken. Fruit fly is the second
main problem in Guava. This pest is quite difficult to be controlled. Further efforts are
needed in this direction also.
Final Report: 'National Level Techno-Economic Feasibility Study for North Zone' 216
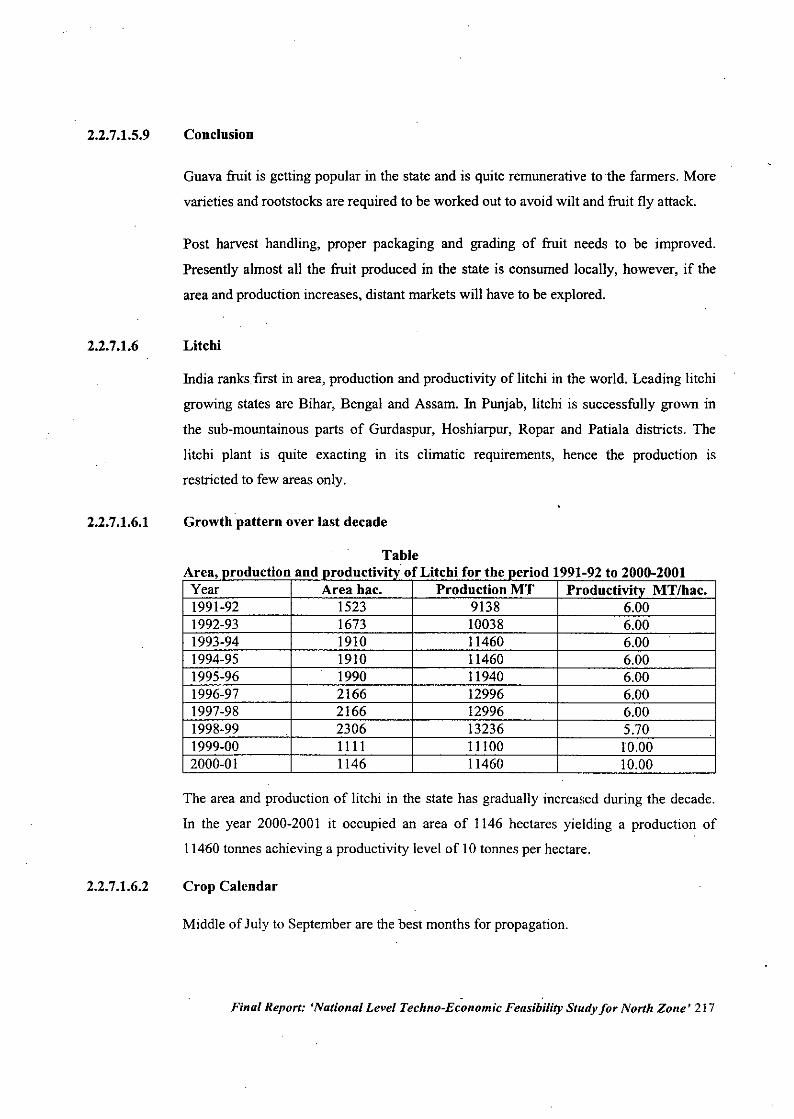
2.2.7.1.5.9
2.2.7.1.6
2.2.7.1.6.1
2.2.7.1.6.2
Conclusion
Guava fruit is getting popular in the state and is quite remunerative to the farmers. More
varieties and rootstocks are required to be worked out to avoid wilt and fruit fly attack.
Post harvest handling, proper packaging and grading of fruit needs to be improved.
Presently almost all the fruit produced in the state is consumed locally, however, if the
area and production increases, distant markets will have to be explored.
Litchi
India ranks.first in area, production and productivity of litchi in the world. Leading litchi
growing states are Bihar, Bengal and Assam. In Punjab, litchi is successfully grown in
the sub-mountainous parts of Gurdaspur, Hoshiarpur, Ropar and Patiala districts. The
litchi plant is quite exacting in its climatic requirements, hence the production is
restricted to few areas only.
Growth pattern over last decade
TableArea, production and productivity of Litchi for the period 1991-92 to 2000-2001Year Area hac. Production MT Productivity MT/hac.1991-92 1523 9138 6.001992-93 1673 10038 6.001993-94 1910 11460 6.001994-95 1910 11460 6.001995-96 1990 11940 6.001996-97 2166 12996 6.001997-98 2166 12996 6.001998-99 2306 13236 5.701999-00 IIII 11100 10.002000-01 1146 11460 10.00
The area and production of litchi in the state has gradually increased during the decade.
In the year 2000-2001 it occupied an area of 1146 hectares yielding a production of
11460 tonnes achieving a productivity level of 10 tonnes per hectare.
Crop Calendar
Middle of July to September are the best months for propagation.
Final Report: 'National Level Techno-Economic Feasibility Study for North Zone' 217
Sucking Mangoes
Another important varietal feature in the state is recommendation of seedling selections
GNI to GN7. Though these selections have not yet assumed commercial status in the true
sense but definitely hold good promise either straight way for cultivation or as useful
parental material in varietal improvement programmes.
Propagation
Side grafting has been found to be the most efficient method of propagation. It has
largely replaced the old difficult method of Inarching. The randomly selected seedlings
are used as rootstock. Best time of side grafting in Punjab is March to Sept. excluding
May and June- being dry and hot months.
Sowing I Planting techniques
Recommended planting time is (a) February- March (b) August- Sept. The later time is
preferred because weather is relatively cools down.
Recommended distance of planting is 9 x 9 metres for grafting varieties and lOx 10
metres for sucking types.
Pruning
No specific training or pruning is required for mango tree. Only recommended approach
is to space the main scaffold branches at 20-25 cm distance. No regular annual pruning is
required. However, after a period of 20-25 years when the tree grows very tall, the
fiuiting gets restricted to only the peripheral part, the tree has to be headed back to
invigorate the trees to increase productivity.
Final Report: 'National Level Techno-Economic Feasibility Study for North Zone" 222
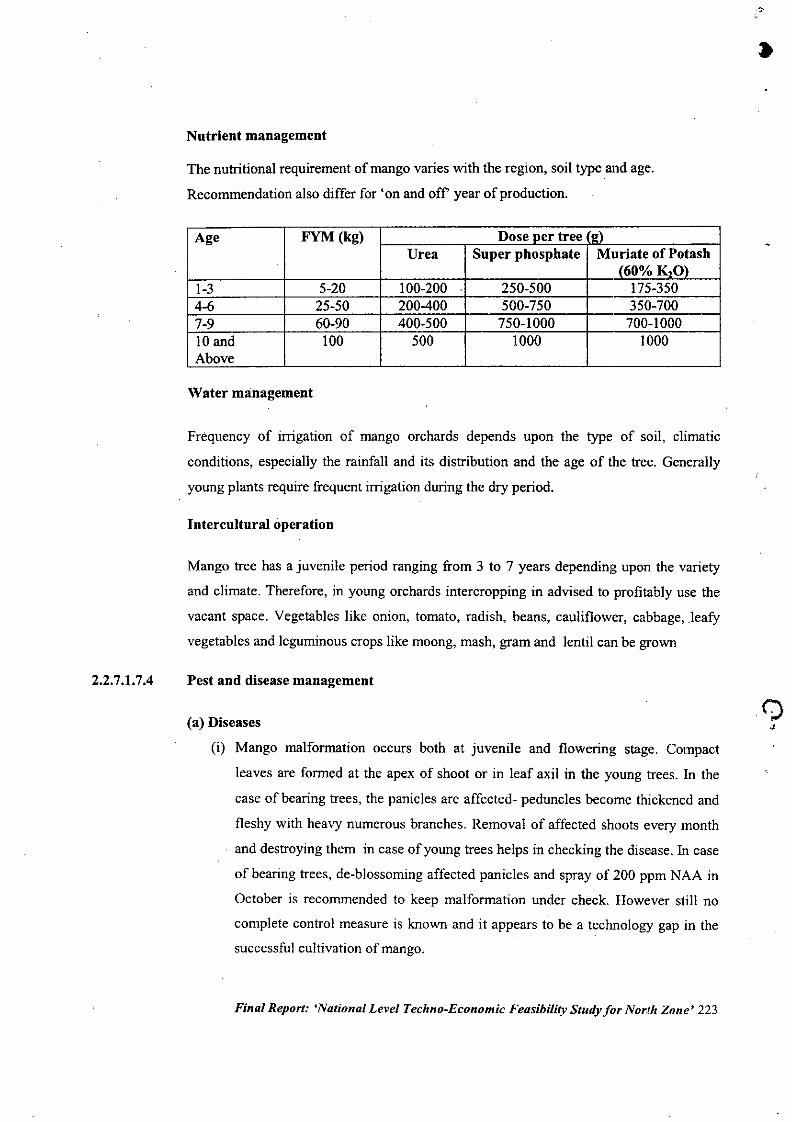
2.2.7.1.7.4
Nutrient management
The nutritional requirement of mango varies with the region, soil type and age.
Recommendation also differ for 'on and off year of production.
Age FYM (kg) Dose ner tree r,,)Urea Super phosphate Muriate of Potash
(60% K,Q)1-3 5-20 100-200 250-500 175-3504-6 25-50 200-400 500-750 350-7007-9 60-90 400-500 750-1000 700-100010 and 100 500 1000 1000Above
Water management
Frequency of irrigation of mango orchards depends upon the type of soil, climatic
conditions, especially the rainfall and its distribution and the age of the tree. Generally
young plants require frequent irrigation during the dry period.
Intercultural operation
Mango tree has a juvenile period ranging from 3 to 7 years depending upon the variety
and climate. Therefore, in young orchards intercropping in advised to profitably use the
vacant space. Vegetables like onion, tomato, radish, beans, cauliflower, cabbage, .leafY
vegetables and leguminous crops like moong, mash, gram and lentil can be grown
Pest and disease management
(a) Diseases
(i) Mango malformation occurs both at juvenile and flowering stage. Compact
leaves are formed at the apex of shoot or in leaf axil in the young trees. In the
case of bearing trees, the panicles are affected- peduncles become thickened and
fleshy with heavy numerous branches. Removal of affected shoots every month
and destroying them in case of young trees helps in checking the disease. In case
of bearing trees, de-blossoming affected panicles and spray of 200 ppm NAA in
October is recommended to keep malformation under check. However still no
complete control measure is known and it appears to be a teclmology gap in thesuccessful cultivation of mango.
Final Report: 'National Level Techno-Economic Feasibility Study for No~rh Zone' 223
.<)o
2.2.7.1.7.5
2.2.7.1.7.6
(ii) Black tip
This disorder is caused by smoke of brick kilns. Control measures include
spraying three times with 0.6 percent Borax before flowering, during flowering
and along with Bordeaux mixture (2:2:250) or 1.5 kg of Copper Oxychloride in
500 litres of water after fruit set.
In addition to these two diseases, mango is also affected by powdery mildew,
anthracnose or dieback, twig dieback or leaf blight and stem canker. All these
. maladies can be completely checked by adopting recommended practices.
(b) Insect pests
Important insect pests attacking mango are mealy bug, hoppers, scabs, stem borer, shoot
borer and red.ants. General cleanliness around the tree and physical barriers on the main
trunk of the tree are quite efficient remedial measures to control mealy bug. The other
serious pest of mango is hopper. It is kept under check by pruning old dense orchards
during winter. It is also advised to avoid too dense plantations. Chemical control by spray
of carboryl, melathion or Thiodan.
Recommendations for other insect pests are also available, regular adoption of such
sprays, keeps the mango trees from such pests.
For complete control of aforesaid diseases and insect pests on integrated spray schedule
has worked out.
Harvest Method and yield
Mango should be harv~sted with pedicel. Yield varies with the variety and the region.
The average productivity in the state has touched 10 MTIHA in the year 1999-2000 as
compared to 6 MTIHA in 1991-92.
Crop economics
It has been observed that after the IOth Year Mango plantation gives a steady income of
approximately Rs. 45,000 per hectare. The economics has been worked out on the basis
of about 100 plants in a hectare of land averaging a yield of 90 Kgs. keeping in mind the
estimated selling rate of Rs. 5 per Kg. and the expenditure incurred by the farmer of
about Rs. 4,425 per hectare. Thus the net cash flow per hectare to the farmer comes to
around Rs. 40,575 per hectare.
Final Report: 'National Level Techno-Economic Feasibility Study for North Zone' 224
2.2.7.1.7.7
2.2.7.1.7.8
2.2.7.1.7.9
2.2.7.1.8
Price trends
Average wholesale price of mango in general tended to increase annually. During the
decade. however. there were some overriding influence of 'off and 'on' year of
cropping. The decade started with an average wholesale price of Rs. 617.5 per quintal in
1991, which rose to Rs.1108.25 in 1996 and Rs. 1456.67 per quintal in 2000" The total
arrivals increased more than double in 1997 in comparison to 1991. TI,e comparison of
some of the important markets of the state showed that Ludlriana market registered the
highest arrival of fruits- 14023-2MT. In this market arrivals of mango were second onlyto Banana (26686.9).
The 'off and 'on' years of the mango crop significantly affect the arrivals and prices in
all the major markets of the country. The available price trends also indicate the sharp
influence of inflation from the I" three years of the decade 1991-93 as comparl:d the rest
of seven years whereas after this quantum jump in prices there was prevalent a stabilizing
factor maintaining the prices in the range of 1000 to 1100 rupees per quintal in theJalandhar market.
Problems and constraints
Alternate bearing and malformation especially in North-Western India still pme serious
problems. These are the two major technology gaps in the production of mango. Black tip
of mango, hoppers and mealy bugs, attacks are assuming significance in certain areas.
Protocol for harvest time, field handing, control of oozing sap at the harvest time thereby
causing black spots on the skin, grading and packaging standards one still imposing
problems in view of the facts that much of the fruit is harvested in the midslcof rainy •
seasons. Such situations are serious bottlenecks to expand accessibility and acceptabilityto foreign markets.
Conclusion
Since Mango is a minor crop in the State, it is suggested that preference should be given
to new hybrids and close planting i.e. high density orchard technique should be adoptedfor higher productivity.
Papaya
TIlls crop has not been considered for study as the area under this crop IS quite
insignificant within the state and no data is available regarding its production.
Final Report: 4National Level Techno-Economic Feasibility Study for North Zone' 225
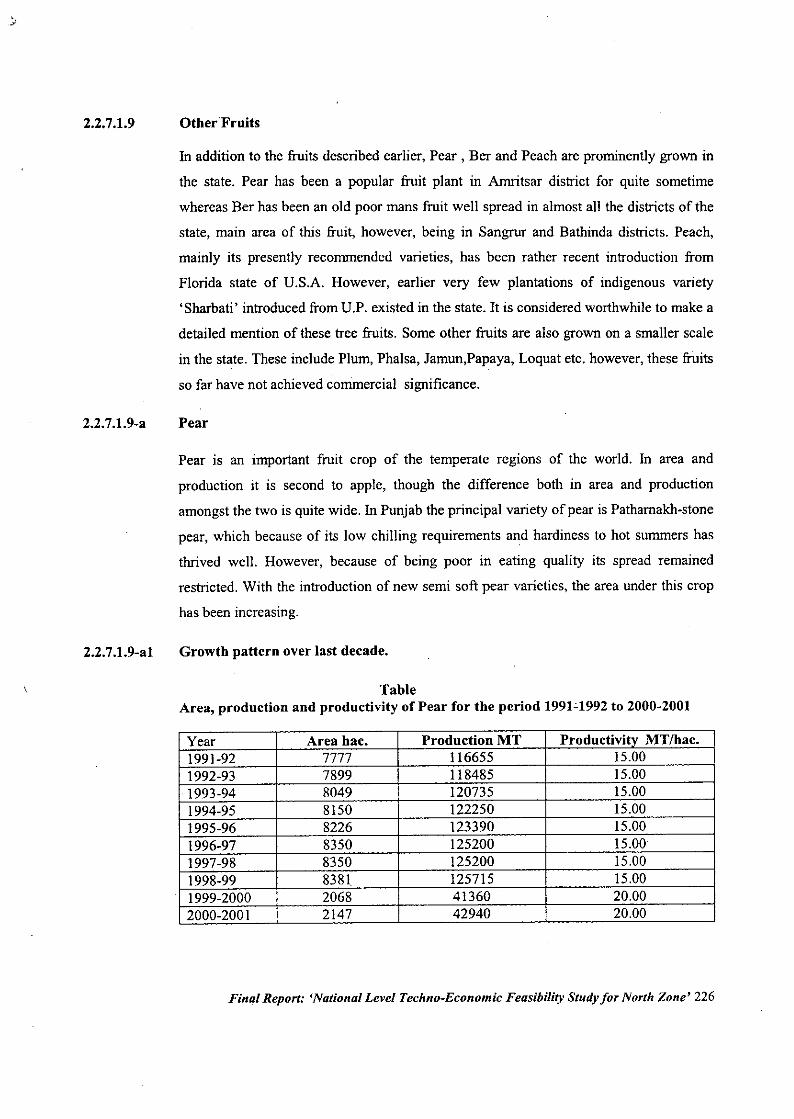
)
2.2.7.1.9 Other Fruits
In addition to the fiuits described earlier, Pear, Ber and Peach are prominently grown in
the state. Pear has been a popular fiuit plant in Amritsar district for quite sometime
whereas Ber has been an old poor mans fiuit well spread in almost all the districts of the
state, main area of this fiuit, however, being in Sangrur and Bathinda districts. Peach,
mainly its presently recommended varieties, has been rather recent introduction from
Florida state of U.S.A. However, earlier very few plantations of indigenous variety
'Sharbati' introduced from U.P. existed in the state. It is considered worthwhile to make a
detailed mention of these tree fiuits. Some other fiuits are also grown on a smaller scale
in the state. These include Plum, Phalsa, Jamun,Papaya, Loquat etc. however, these fiuits
so far have not achieved commercial significance.
2.2.7.1.9-a Pear
Pear is an important fiuit crop of the temperate regions of the world. In area and
production it is second to apple, though the difference both in area and production
amongst the two is quite wide. In Punjab the principal variety of pear is Pathamakh-stone
pear, which because of its low chilling requirements and hardiness to hot summers has
thrived well. However, because of being poor in eating quality its spread remained
restricted. With the introduction of new semi soft pear varieties, the area under this crop
has been increasing.
2.2.7.1.9-al Growth pattern over last decade.
TableArea, production and productivity of Pear for the period 1991c1992 to 2000-2001
Year Area bac. Production MT Productivity MT/hac.1991-92 7777 116655 15.001992-93 7899 118485 15.001993-94 8049 120735 15.001994-95 8150 122250 15.001995-96 8226 123390 15.001996-97 8350 125200 15.001997-98 8350 125200 15.001998-99 8381 125715 15.001999-2000 2068 41360 20.002000-2001 2147 42940 20.00
Final Report: 'National Level Techno-Economic Feasibility Study for North Zone' 226
2.2.7.1.9-a2
2.2.7.1.9-a3
The area under pare in the state during the decade has been sometimes static for few
years and then showing some increase. For instance, the years of 1999-2000 and 2000-
2001 showed same increase and also registered increase in productivity. Now at the end
of the decade it has come to occupy an area of2147 hectares with a production of 42940
tonnes.
Crop Calendar
The planting of pears is recommended to be done in the month of January and in no case
it is to be delayed closer to sprouting of the buds in February.
Productioir technology
Cultivars
Hard pear
Pathamakh- Good keepiog quality, stands transportation well. Matures in th,e last week
of July. Average yield 150 kg per tree.
Semi soft pear
Baggugosha matures in the first week of August and stands transportation weIl. Average
yield is 60 to 80 kg per tree.
Leconte
Matures in the first week of August. Average yield is 60-80 kg per tree.
Pnnjab Beauty
It is more juicy and sweeter than baggugosha and Ie conte. Fruits mature in third week of
July. The average yieldis 80 kg per plant.
Propagation
Pear is propagated either by cuttings, T-buddings or Tongue grafting. When propagated
through T-budding or Tongue grafting, Kainth (Pyrus pashia) is recommended to be used
as rootstock. Tongue grafting is done in December-January and T-budding in May-June.
Seed / Planting material
The planting of pears is recommended to be done in the month of January and in no case
it is to be delayed closerto sprouting of the buds in February.
Fi,!al Report: 'National Level Techno-Economic Feasibility Study jor North Zone' 227
Training and proning
The training system recommended for pear is modified leader system.
Pruning
The pear trees bear on spurs, which remain productive for about eight years. So pears
trees do not require pruning every year. Only in older trees dead wood and old crop
producting spurs are recommended to be pruned. Such pruning is done in January.
Thinning out and heading back of laterals may also be done to encourage the production
of more fjuiting spurs.
Nutrient Management
Age ofthe. Farmyard Dose per tree* fertilizer £I!)
tress (years) manure Urea Superphosphate Muriate of(kg) (46% N) (16% P,O.) potash
(60% K,O)1-3 10-20 100-300 200-600 150-4504-6 25-35 400-600 800-1200 600-9007-9 40-50 700-90 1400-1800 1050-135010 and above 50 1000 2000 1500
These nutrients can also be supplied from other fertilizers available in the market.
Note: All the farmyard manure; superphosphate and muriate of potash should be added in
December. Half of urea should be added in early February before flowering and other
half in April after the fruit set.
Water ManagementPear trees need irrigation after transplanting. In case of young trees, the interval of
irrigation may be 5 to 7 days in summer. Irrigation in rainy season should depend upon
frequency of rains. Even the old bearing trees need irrigation in summer months so that
the developing fruit attains good size.
Final Report: 'National Level Techno-Economic Feasibility Study for North Zone' 228
2.2.7.1.9-a4
2.2.7.1.9a5
2.2.7.1.9a.6
2.2.7.1.9a7
2.2.7.1.9a8
2.2.7.1.9-a9
Pest and disease management
(a) Insect pests: Hairy caterpillar, mite, leaf hopper and aphids, bark eating caterpillars
are the important pests of pear. Spray schedule for the control has been worked out and
recommended.
(b) Pear scab, shoot I phoma, fruit blight and bar canker, root rot and sapwood rot are the
diseases affecting pear plant. To check the spread of these diseases, the orchard is to be
kept clean of fallen leaves and fruits. For the control of these diseases spray sc:hedule has
been recommended.
Harvest Method and yield
Pear fruit is harvested at proper stage of maturity: The fruit should be picked by giving an
upward twist to the fruit so that the spurs are not damaged.
Crop economics
Based on the productivity levels of pears in the State of Punjab which is about 20 MT per
hectare the total income to the farmers works out at Rs.80,000/- per hectare at a selling
price of Rs.4/- per kg. The cost of maintenance of the orchard works out at Rs..3,OOO/- perhectare.
Price Trends
This is also a mmor crop in the State and there is no regulated market price data
available.
Problems and constraints
Long juveline period, limited market acceptability and phoma blight disease are the main
problems in the growing of pear plant.
Conclusion •For further spread of this fruit, its utilization over and above the fresh marke,t has to be
worked out. Its juice which is flavorless and colourless can usefully be used in fruit juice
blends. Further selection of soft pear types will also help in increasing area and •
production of this fruit.
Final Report: 'National Level Techno-Economic Feasibility Study for North Zone' 229
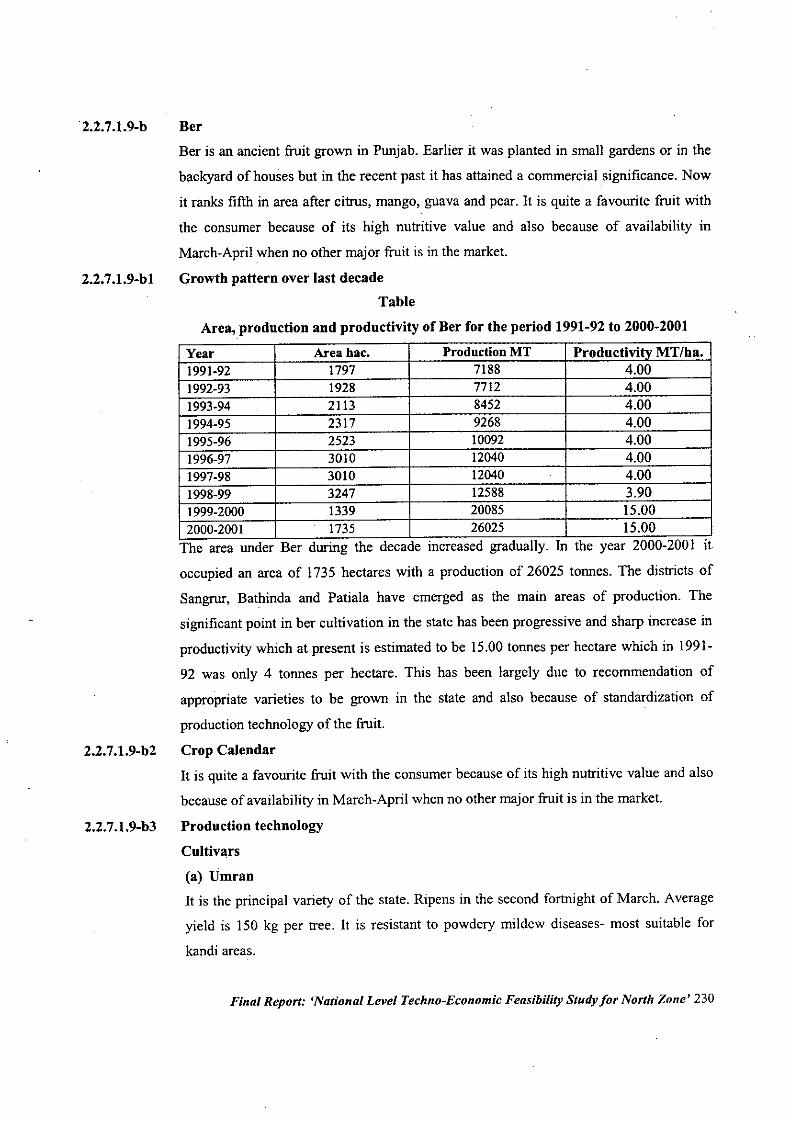
'2.2.7.1.9-b Ber
2.2.7.lo9-b1
2.2.7.lo9-b2
2.2.7.lo9-b3
Ber is an ancient fruit grown in Punjab. Earlier it was planted in small gardens or in the
backyard of houses but in the recent past it has attained a commercial significance. Now
it ranks fifth in area after citrus, mango, guava and pear. It is quite a favourite fruit with
the consumer because of its high nutritive value and also because of availability in
March-April when no other major fruit is in the market.
Growth pattern over last decadeTable
Area,production and productivity ofBer for the period 1991-92 to 2000-2001
Year Area hac. Production MT Productivity MT/ha.1991-92 1797 7188 4.001992-93 1928 7712 4.001993-94 . 2113 8452 4.001994-95 2317 9268 4.001995-96 2523 10092 4.001996-97 3010 12040 4.001997-98 3010 12040 4.001998-99 3247 12588 3.901999-2000 1339 20085 15.002000-2001 1735 26025 15.00
The area under Ber during the decade increased gradually. In the year 2000-2001 it
occupied an area of 1735 hectares with a production of 26025 tonnes. The districts of
Sangrur, Bathinda and Patiala have emerged as the main areas of production. The
significant point in ber cultivation in the state has been progressive and sharp increase in
productivity which at present is estimated to be 15.00 tonnes per hectare which in 1991-
92 was only 4 tonnes per hectare. This has been largely due to recommendation of
appropriate varieties to be grown in the state and also because of standardization of
production technology of the fruit.
Crop CalendarIt is quite a favourite fruit with the consumer because of its high nutritive value and also
because of availability in March-April when no other major fruit is in the market.
Production technology
Cultivars
(a) UmranIt is the principal variety of the state. Ripens in the second fortnight of March. Average
yield is 150 kg per tree. It is resistant to powdery mildew diseases- most suitable for
kandi areas.
Final Report: 'National Level Techno-Economic Feasibility Study for North Zone' 230
(b) KaithliRipens in the end of March. This variety is sometimes severely affected with powdery
mildew disease. Average yield is about 75 kg per tree.
(c) ZG-2
It is a mid season variety ripening in the end of March. Average yield is 150 kg per tree.
Less susceptible to powdery mildew disease.
(d) Wallaiti
It is an early variety and ripens during the first fortnight of March. Average yield is 114
kg per tree. Moderately susceptible to powdery mildew.
Propagati~nThe most common method of propagation of ber is shield or T-budding. The rootstock
used is the seedlings of Ziziphus mauritiana preferably Elongated Dehradun or
Coimbatore. Budding in ber is done during Jooe- September.
Planting
The budded. plants are usually transplanted during February- March or August -
September. The planting distance recommended is 7.5 x 7.5 metres in Square system.
Success of per plants in the field largely depends upon the proper digging from the
nursery with a good sized earthball so that the minimum roots are lost.
The ber plants can also be transplanted bare rooted with equal success. For this, lift the
plants from nursery in the usual manner from mid January to mid Februa~y and plant
them immediately. Defoliate the plantsjust before lifting them from the nursety.
Training and pruning
Training
The ber plant is recommended to be trained according to modified leader system.
Pruning
Pruning is'done during second fortnight of May when the trees are dormant light pruning
i.e. heading back of 25 percent previous years growth and severe pruning after every
four-five years is recommended.
Final Report: 'National Level Techno-Economic Feasibility Study for Non'h Zone' 231
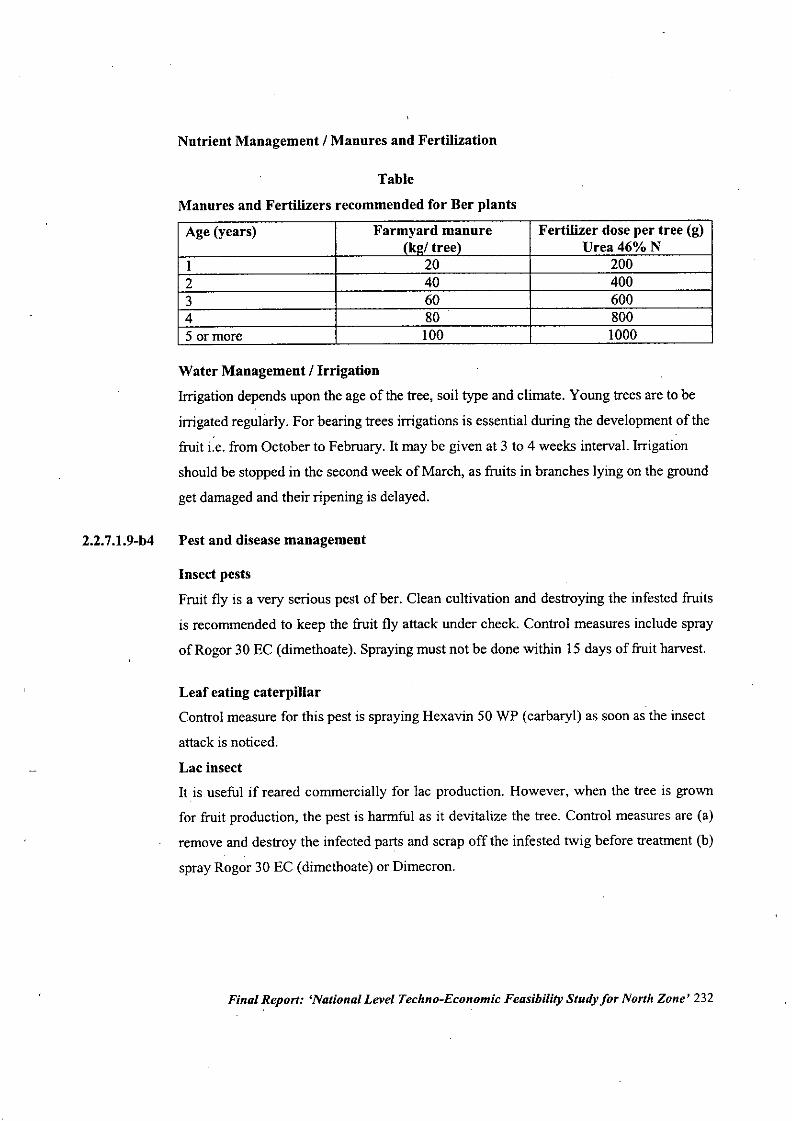
2.2.7.1.9-b4
Nutrient Management / Manures and Fertilization
Table
Manures and Fertilizers recommended for Ber plants
Age (years) Farmyard manure Fertilizer dose per tree (g)(kp/ tree) Urea46%N
I 20 2002 40 4003 60 6004 80 8005 or more 100 1000
Water Management / Irrigation
Irrigation depends upon the age of the tree, soil type and climate. Young trees are to be
irrigated regularly. For bearing trees irrigations is essential during the development of the
fruit i.e. from October to February. It may be given at 3 to 4 weeks interval. Irrigation
should be stopped in the second week of March, as fruits in branches lying on the ground
get damaged and their ripening is delayed.
Pest and disease management
Insect pests
Fruit fly is a very serious pest of ber. Clean cultivation and destroying the infested fruits
is recommended to keep the fruit fly attack under check. Control measures include spray
of Rogor 30 EC (dimethoate). Spraying must not be done within 15 days of fruit harvest.
Leaf eating caterpillar
Control measure for this pest is spraying Hexavin 50 WP (carbaryl) as soon as the insect
attack is noticed.
Lac insect
It is useful if reared commercially for lac production. However, when the tree is grown
for fruit production, the pest is harmful as it devitalize the tree. Control measures are (a)
remove and destroy the infected parts and scrap off the infested twig before treatment (b)
spray Rogor 30 EC (dimethoate) or Dimecron.
Final Report: 'National Level Techno-Economic Feasibility Study for North Zone' 232
2.2.7.1.9b5
Diseases
Powdery mildew is the most important disease of ber. This is controlled with the spray of
Wettable sulphur or Karathene in September (at flowering) and early October (fruit set)
and then again in end of October.
Leaf mould and leaf sot caused by Isariopsis and Phoma macrostoma. Spray with
Bozdenx mixture (2:2:250) or with Copper Oxychloride.
Harvestin~ and yield
The ber tree grows quickly and the first crop can be harvested within 2 to 3 years of
planting. The peak season for harvesting is mid March to mid-April. The fruit has to be
harvested when fully ripe. Since all the fruits on the tree do not ripen at the same time so
4 to 5 spot pickings are recommended.
The ber has a tendency of producing heavy yield. The average productivity in the state
has gone up as high as 15 tonnes per hectare.
2.2.7.1.9b.6 Crop economics
With the productivity at 15 MT per hectare for ber the income to the farmer works out at
Rs. 45,000/- per hectare at wholesale selling price of Rs. 3/- per kg. The cost of
maintenance works out to Rs. 3,000 per hectare.
2.2.7.1.9b7
2.2.7.1.9b8
2.2.7.1.9-b9
Price Trends
This is also a mmor crop m the State and there is no regulated market price data
available.
Problems and constraints
Attack of powdery mildew, difficult pruning process in the summer months, fruit fly
attack and lack of good soft varieties are the serious problems in the growing ofber.
Conclusion
This fruit crop in view of its wider climatic activity, hardiness to varying soil conditions,
thriving even under poor soil conditions, good keeping quality, short juvenile period, and
high nutritive value and high productivity can be grown on a larger area in the state.
Final Report: 'National Level Techno-Economic Feasibility Study for North Zone' 233
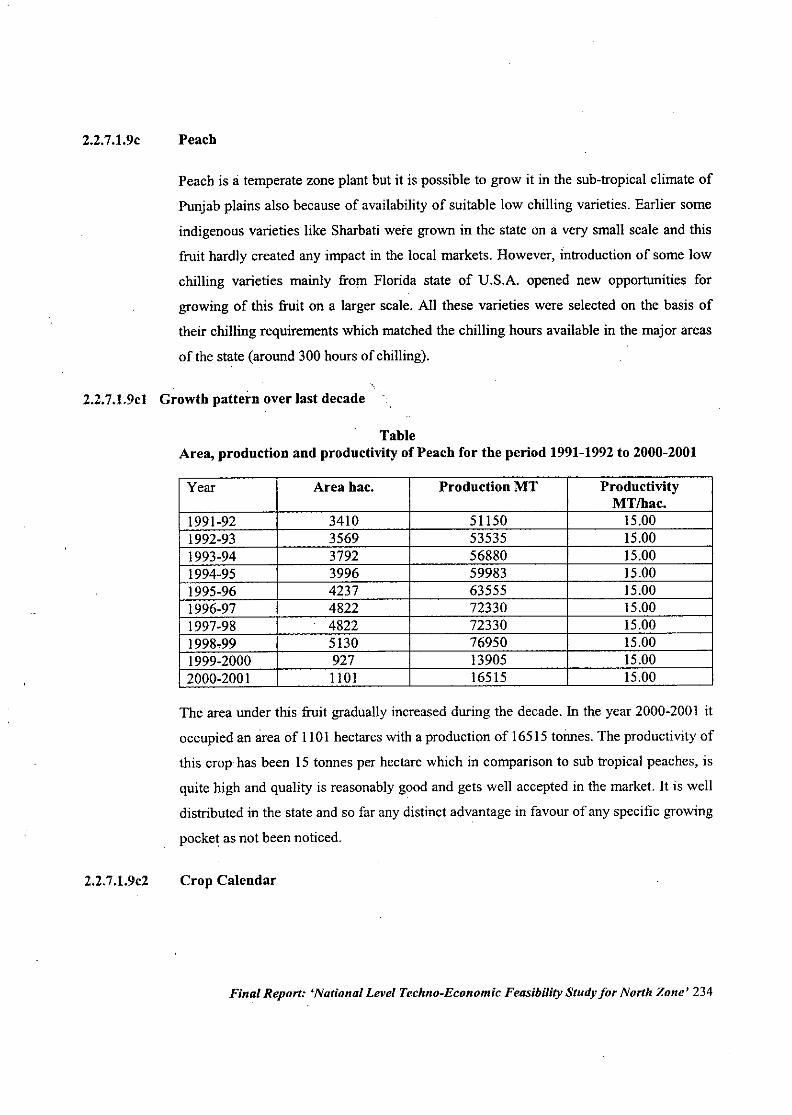
2.2.7.1.9c Peach
Peach is oj temperate zone plant but it is possible to grow it in the sub-tropical climate of
Punjab plains also because of availability of suitable low chilling varieties. Earlier some
indigenous varieties like Sharbati were grown in the state on a very small scale and this
fruit hardly created any impact in the local markets. However, introduction of some low
chilling varieties mainly from Florida state of U.S.A. opened new opportunities for
growing of this fruit on a larger scale. All these varieties were selected on the basis of
their chilling requirements which matched the chilling hours available in the major areas
of the state (around 300 hours of chilling).
2.2.7.1.9cI Growth pattern over last decade
TableArea, production and productivity of Peach for the period 1991-1992 to 2000-2001
Year Area hac. Production MT ProductivityMTlbac.
1991-92 3410 51150 15.001992-93 3569 53535 15.001993-94 3792 56880 15.001994-95 3996 59983 15.001995-96 4237 63555 15.001996-97 4822 72330 15.001997-98 4822 72330 15.001998~99 5130 76950 15.001999-2000 927 13905 15.002000-2001 1101 16515 15.00
The area under this fruit gradually increased during the decade. In the year 2000-2001 it
occupied an area of 110I hectares with a production of 16515 tonnes. The productivity of
this crop has been 15 tonnes per hectare which in comparison to sub tropical peaches, is
quite high and quality is reasonably good and gets well accepted in the market. It is well
distributed in the state and so far any distinct advantage in favour of any specific growing
pocket as not been noticed.
2.2.7.1.9c2 Crop Calendar
Final Report: 'National Level Techno-Economic Feasibility Study for North Zone' 234
2.2.7.1.9c3
Peach is planted in the orchard during winter when the plants are completely dormant.
The nursery plants should be free from the incidence of nematodes and crown galldisease. The best time of planting is in December- January
Production technology
Cultivars
Partap
It is the earliest maturing variety, third week of April. Flesh is yellow ~nd firm. It is a
free stone variety at full ripe stage. Average fruit yield is 70 kg per tree and fruit weightis 65-70g.
Flordaprince
It ripens in the fourth week of April. Flesh is yellow and firm, it is a free stone vari~ty.Average yield is 100 kg per tree and average fruit weight is 65-70g.
Sbane-e-Punjab
It ripens in the first week of May. Flesh is yellow and firm. It is free stone variety.Average yield is 70 kg per tree.
Earli Grande
It ripens in the first week of May about four days earlier than Shan-e-Punjab. The flesh;is
yellow and firm. It is a free stone variety. Fruit size is large (90g) and keeping quality isgood.
Kburmani
It ripens in the first week of June. Fruit is medium size (70 g). The flesh is white and soft.It is cling stone.
Final Report: 'National Level Techno-Economic Feasibility Study for North Zone' 235
Sharbati
It ripens in the end of June to first week of July. Flesh is white and juicy. Fruit is of
medium .size(70g). The yield is very high 100-120 kg per tree.
Propagation
The peach is commonly propagated by budding or grafting on seedling rootstocks.
Rootstock is raised from the seeds of Sharbati and Khurmani.
Best time of budding is the first week of May. Grafting is also successful in peach and
that is done during the dormant seasons.
Sowing I Planting techniqnes
Peach is planted in the orchard during winter when the plants are completely dormant.
The nursery plants should be free from the incidence of nematodes and crown gall
disease. The. best time of planting is in December- January. Plant to plant distance
recommended is 6.5 x 6.5 m in square system of planting.
Training and prnning
Training
Peach plant is trained according to modified leader system.
Pruning
Peach bears fruit on one year old branches. Pruning should be done by thinning out some
one year old shoots expected to bear fruit. Some heading back of old and unsuitably
placed branches should also be done. About 40 percent of one year old branches are
recommended to be thinned out to ensure proper tree growth and improve size and
quality. Best pruning time is January.
Fruit thinning
As peach is a heavy bearer, fruit thinning is recommended to increase fruit size and
quality. In Partap variety best time of fruit of thinning is second and third week of March
while in Shane-e-Punjab it is third to fourth week of March. So far in Punjab only hand
thinning is recommended.
Final Report: 'National Level Techno-Economic FeasilJilityStudy for North Zone' 236
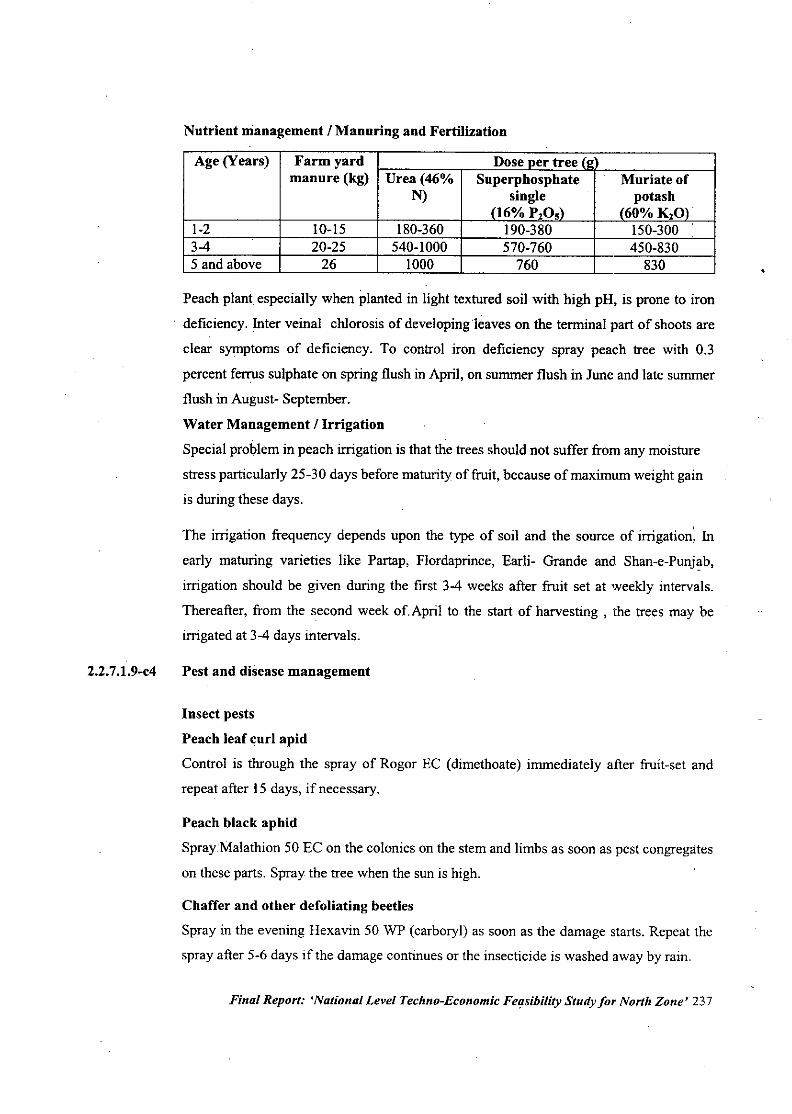
2.2.7.1.9-c4
Nutrient management / Manuring aud Fertilization
Age (Years) Farmyard Dose ner tree (emauure (kg) Urea (46% Superphosphate Muriate of
N) single . potash(l6% P2OS) (60%K2m.
1-2 10-15 180-360 190-380 150-3003-4 20-25 540-1000 570-760 450-8305 and above 26 1000 760 830
Peach plant especially when planted in light textured soil with high pH, is prone to iron
deficiency. Inter veinal cWorosis of developing.leaves on the terminal part of shoots are
clear symptoms of deficiency. To control iron deficiency spray peach tree with 0.3
percent ferrus sulphate on spring flush in April, on summer flush in June and late summer
flush in August- September.
Water Management / Irrigation
Special problem in peach irrigation is that the trees should not suffer from any moisture
stress particularly 25-30 days before maturity of fruit, because of maximum weight gain
is during these days.
The irrigation frequency depends upon the type of soil and the source of irrigation: In
early maturing varieties like Partap, Flordaprince, Earli- Grande and Shan-e-Punjab,
irrigation should be given during the first 3-4 weeks after fruit set at weekly intervals.
Thereafter, from the second week of.April to the start of harvesting, the trees may be
irrigated at 3-4 days intervals.
Pest and disease management
Insect pests
Peach leaf curl apid
Control is through the spray of Rogor EC (dimethoate) immediately after fruit-set and
repeat after 15 days, if necessary.
Peach black aphid
Spray Malathion 50 EC on the colonies on the stem and limbs as soon as pest congregates
on these parts. Spray the tree when the sun is high.
Chaffer and other defoliating beetles
Spray in the evening Hexavin 50 WP (carboryl) as soon as the damage starts. Repeat the
spray after 5-6 days if the damage continues or the insecticide is washed away by rain.
Final Report: 'National Level Techno-Economic Fe,!sibility Study for North Zone' 237
2.2.7.1.9c5
2.2.7.1.9c.6
2.2.7.1.9c7
Hairy caterpillar
Control measures include (a) Collect and destroy the egg masses and the young
caterpillars (a) spray Thiodan (endosulphan).
Peach fruitl1y
The attack is checked by (a) Planting early varieties i.e. Partap and Shan-e-Punjab (b) Do
not let the ripe fruit on the tree (c) Burry the infested fruits (d) Hoe the orchards in May
and June to expose the pupae which are present mostly at 4-6 cm depth.
Flat headed borer
Spray of chlorophyriphos 20 EC during February- March and September-October.
Diseases
Shot hole- Spray with Captan, Ziram or Thiram (0.2 %) at leaf full bud swelling stage.
Bacterial canker- Before the start of rains apply Mashobra paste after cleaning the
wound. Repeat the treatment on the new lesions.
Brown rot
(a) As collect and destroy the fruit mummies (b) cut and burn the infected twigs (c) spray
with Captan @ 0.2 % about three weeks before harvesting the fruits; and repeat the spray
at fortnightly interval after harvesting the fruits (d) avoid injury during picking (e) Select
healthy, unbruised fruits for marketing.
Harvest method and yield
Peach is a fragile fruit and it needs to be harvested early and should be harvested when it
attain the desired size. The average productivity in the State is around 10 tons per
hectare.
Crop economics
With the productivity at IS MT p~r hectare for ber the income to the farmer works out at
Rs. 75,000/- per hectare at wholesale selling price of Rs. 5/- per kg. The cost of
maintenance works out to Rs. 7,000 per hectare.
Price Trends
This is .also a minor crop in the State and there is no regulated market price data
available.
Final Report:. 'National Level Techno-Economic Feasibility Study for North Zone' 238
2.2.7.1.9c8
2.2.7.1.9c9
Problems and constraints
Attack of powdery mildew; difficult pruning process in the summer months, fruit' fly II
attack and lack of good varieties are the serious problems
Conclusions
This fruit crop in view of its wider climatic activity, hardiness to varying soil conditions,
thriving even under poor soil conditions, good keeping 'quality, short juvenile period, ;and
high nutritive value and high productivity can be grown on a larger,area in the state.
Final Report: 'National Level Techno-Economic Feasibility Study for North Zone' 239
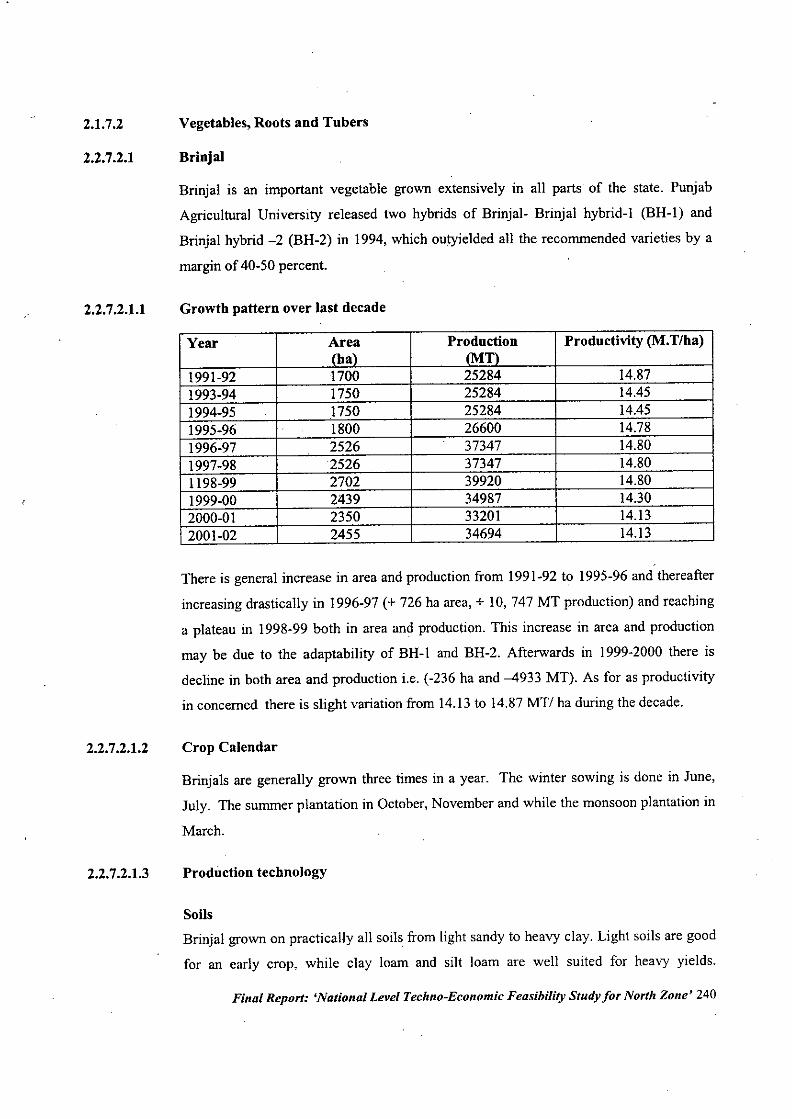
2.1.7.2
2.2.7.2.1
2.2.7.2.1.1
2.2.7.2.1.2
2.2.7.2.1.3
Vegetables, Roots and Tubers
Brinjal
Brinjal is an important vegetable grown extensively in all parts of the state. Punjab
Agricultural University released two hybrids of Brinjal- Brinjal hybrid-I (BH-I) and
Brinjal hybrid -2 (BH-2) in 1994, which outyielded all the recommended varieties by a
margin of 40-50 percent.
Growth pattern over last decade
Year Area Production Productivity (M.T/ha)(ha) lMT)
1991-92 1700 25284 14.871993-94 1750 25284 14.451994-95 1750 25284 14.451995-96 . 1800 26600 14.781996-97 2526 37347 14.801997-98 2526 37347 14.801198-99 2702 39920 14.801999-00 2439 34987 14.302000-01 2350 33201 14.132001-02 2455 34694 14.13
There is general increase in area and production from 1991-92 to 1995-96 and thereafter
increasing drastically in 1996-97 (+ 726 ha area, + 10, 747 MT production) and reaching
a plateau in 1998-99 both in area and production. This increase in area and production
may be due to the adaptability of BH-I and BH-2. Afterwards in 1999.2000 there is
decline in both area and production i.e. (-236 ha and --4933 MT). As for as productivity
in concerned there is slight variation from 14.13 to 14.87MTI ha during the decade.
Crop Calendar
Brinjals are generally grown three times in a year. The winter sowing is done in June,
July. The summer plantation in October, November and while the monsoon plantation in
March.
Production technology
SoilsBrinjal grown on practically all soils from light sandy to heavy clay. Light soils are good
for an early crop, while clay loam and silt loam are well suited for heavy yields.
Final Report: 'National Level Techno-Economic Feasibility Study for North Zone' 240
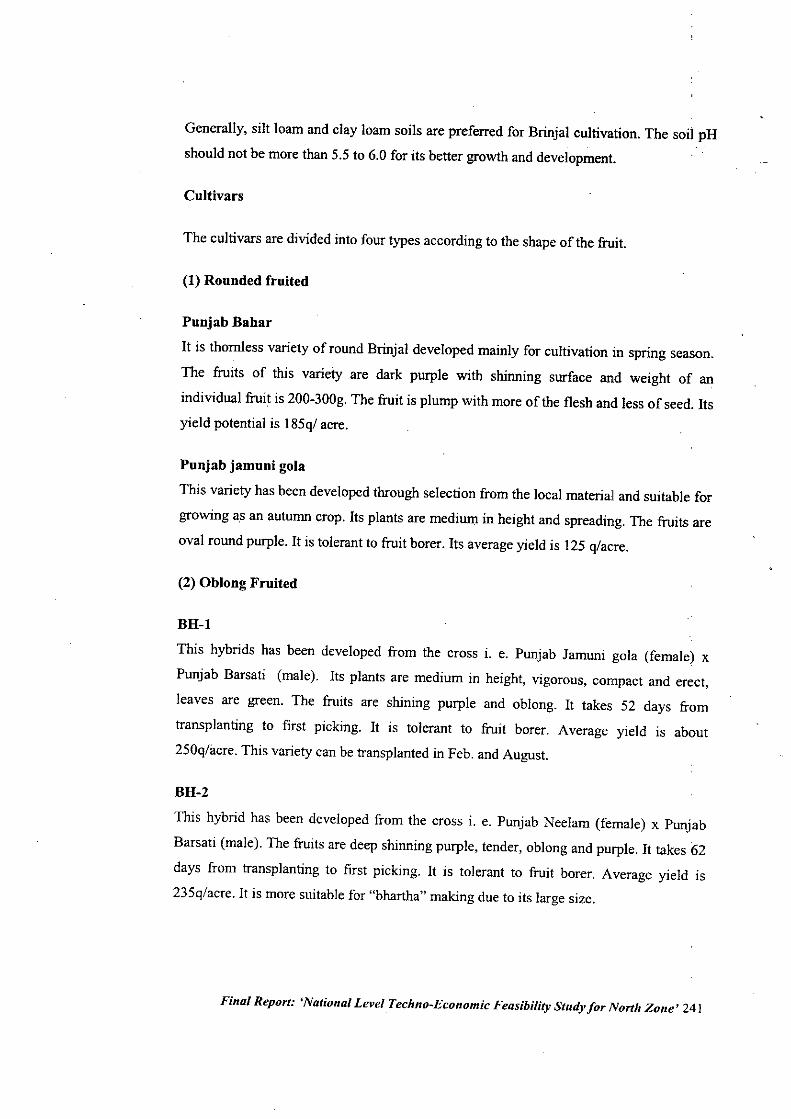
Generally, silt loam and clay loam soils are preferred for Brinjal cultivation. The soil pH
should not be more than 5.5 to 6.0 for its better growth and development.
Cultivars
The cultivars are divided into four types according to the shape of the fruit.
(1) Rounded fruited
Punjab Bahar
It is thornless variety of round Brinjal developed mainly for cultivation in spring season.
The fruits of this variety are dark purple with shinning surface and weight of an
individual fruit is 200-300g. The fruit is plump with more of the flesh and less of seed. Itsyield potential is 185q/ acre.
Punjab jamuni gola
This variety has been developed through selection from the local material and suitable for
growing as an autunm crop. Its plants are medium in height and spreading. The fruits are
oval round purple. It is tolerant to fruit borer. Its average yield is 125 q/ac,-e.
(2) Oblong Fruited
BH-l
This hybrids has been developed from the cross i. e. Punjab Jamuni gola (female) x
Punjab Barsati (male). Its plants are medium in height, vigorous, compact and erect,
leaves are green. The fruits are shining purple and oblong. It takes 52 days from
transplanting to first picking. It is tolerant to fruit borer. Average yield is about250q/acre. This variety can be transplanted in Feb. and August.
BH-2
This hybrid has been developed from the cross i. e. Punjab Neelam (female) x Punjab
Barsati (male). The fruits are deep shinning purple, tender, oblong and purple. It takes 62
days from transplanting to first picking. It is tolerant to fruit borer. Average yield is235q/acre. It is more suitable for "bhartha" making due to its large size.
Final Report: 'National Level Techno-Economic Feasibility Study for North Zone' 241
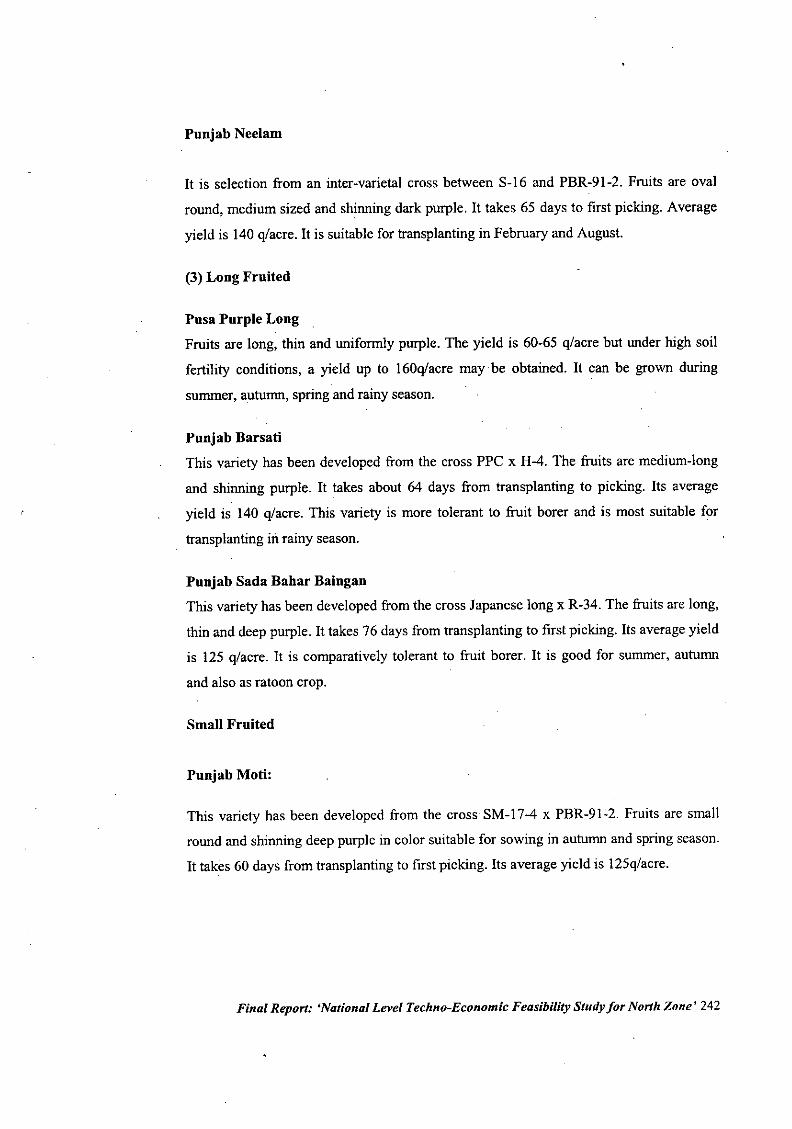
Punjab Neelam
It is selection from an inter-varietal cross between S-16 and PBR-91-2. Fruits are oval
round, medium sized and shinning dark purple. It takes 65 days to first picking. Average
yield is 140 q/acre. It is suitable for transplanting in February and August.
(3) Long Frnited
Pnsa Purple LongFruits are long, thin and uniformly purple. The yield is 60-65 q/acre but under high soil
fertility conditions, a yield up to 160q/acre may be obtained. It can be grown during
summer, auturrm, spring and rainy season.
Punjab BarsatiThis variety has been developed from the cross ppe x H-4. The fruits are medium-long
and shinning purple. It takes about 64 days from transplanting to picking. Its average
yield is 140 q/acre. This variety is more tolerant to fruit borer and is most suitable for
transplanting in rainy season.
Punjab Sada Bahar BainganThis variety has been developed from the cross Japanese long x R-34. The fruits are long,
thin and deep purple. It takes 76 days from transplanting to first picking. Its averageyield
is 125 q/acre. It is comparatively tolerant to fruit borer. It is good for summer, auturrm
and also as ratoon crop.
Small Fruited
Punjab Mati:
This variety has been developed from the cross SM-17-4 x PBR-91'2. Fruits are small
round and shinning deep purple in color suitable for sowing in auturrmand spring season.
It takes 60 days from transplanting to first picking. Its average yield is 125q/acre.
Final Report: 'National Level Techno-Economic Feasibility Study for North Zone' 242
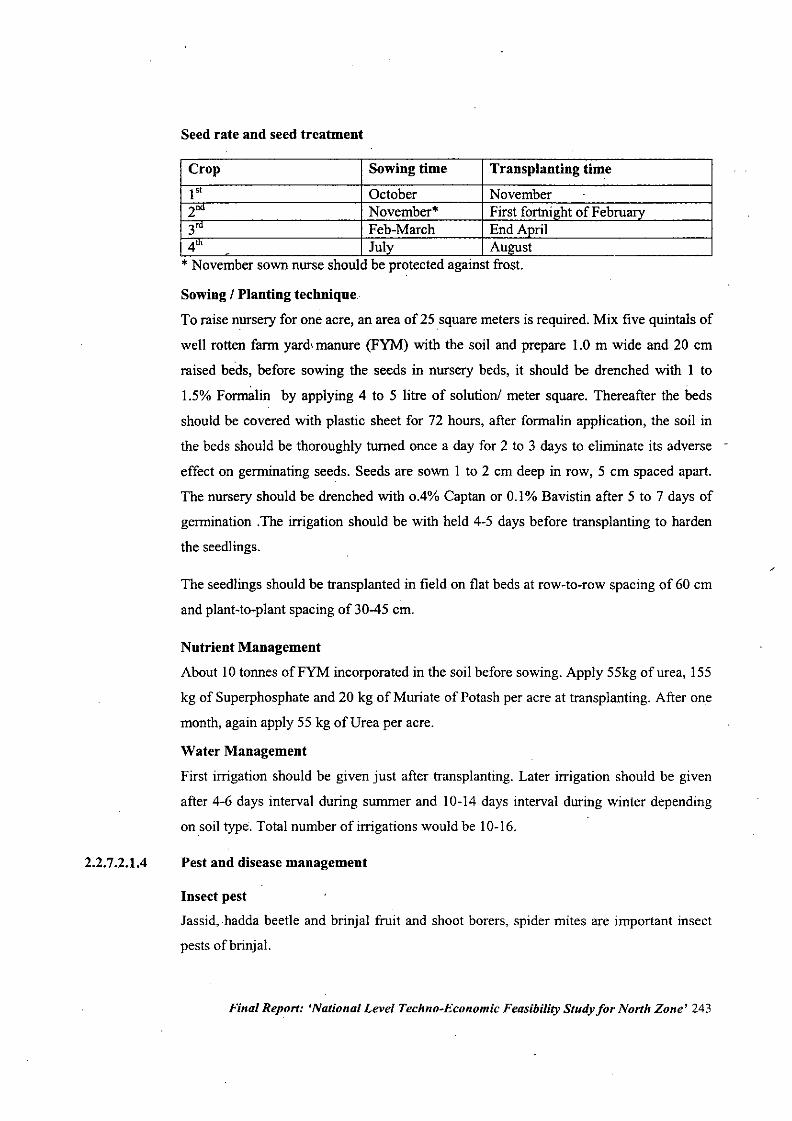
2.2.7.2.1.4
Seed rate and seed treatment
Crop Sowing time Transplanting time
1" October November2"" November* First fortnight of February3'. Feb-March End April4th - July August* November sown nurse should be protected against frost.
Sowing I Planting technique
To raise nursery for one acre, an area of 25 square meters is required. Mix five quintals of
well rotten farm yard, manure (FYM) with the soil and prepare 1.0 m wide and 20 cm
raised beds, before sowing the seeds in nursery beds, it should be drenched with 1 to
1.5% Formalin by applying 4 to 5 litre of solution! meter square. Thereafter the beds
should be covered with plastic sheet for 72 hours, after formalin application, the soil in
the beds should be thoroughly turned once a day for 2 to 3 days to eliminate its adverse
effect on germinating seeds. Seeds are sown I to 2 em deep in row, 5 em spaced apart.
The nursery should be drenched with 0.4% Caplan or 0.1% Bavistin after 5 to 7 days of
germination .The irrigation should be with held 4-5 days before transplanting to harden
the seedlings.
The seedlings should be transplanted in field on flat beds at row-to-row spacing of 60 em
and plant-to-plant spacing of 30-45 cm.
Nutrient Management
About 10 tonnes ofFYM incorporated in the soil before sowing. Apply 55kg of urea, 155
kg of Superphosphate and 20 kg of Muriate of Potash per acre at transplanting. After one
month, again apply 55 kg of Urea per acre.
Water Management
First irrigation should be given just after transplanting. Later irrigation should be given
after 4-6 days interval during summer and 10-14 days interval during winter depending
on soil type. Total number of irrigations would be 10-16.
Pest and disease management
Insect pest
Jassid,hadda beetle and brinjal fruit and shoot borers, spider mites are important insect
pests ofbrinjal.
Final Report: 'National Level Techno-Economic Feasibility Study for North Zone' 243
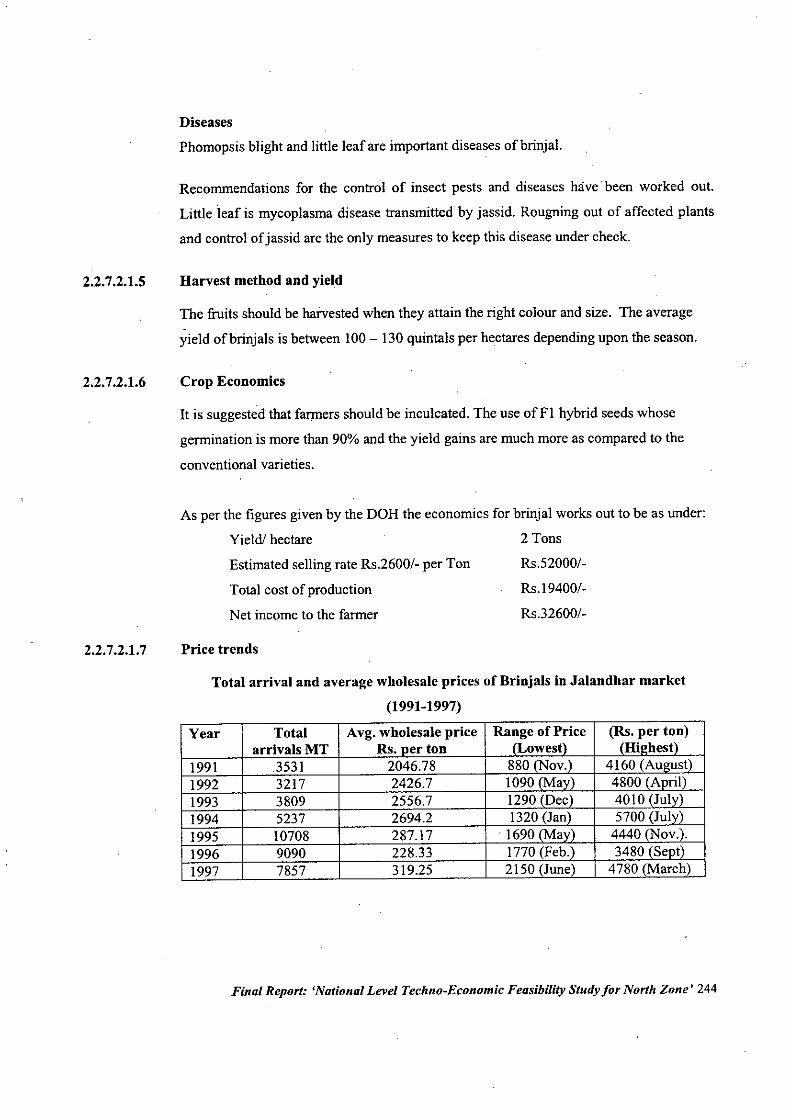
2.2.7.2.1.5
2.2.7.2.1.6
Diseases
Phomopsis blight and little leaf are important diseases ofbrinjal.
Recommendations for the control of insect pests and diseases have been worked out.
Little leaf is mycoplasma disease transmitted by jassid. Rougning out of affected plants
and control of jassid are the only measures to keep this disease under check.
Harvest method and yield
The fruits should be harvested when they attain the right colour and size. The average
yield ofbrinjals is between 100 - 130 quintals per hectares depending upon the season.
Crop Economics
It is suggested that farmers should be inculcated. The use ofFI hybrid seeds whose
germination is more than 90% and the yield gains are much more as compared to the
conventional varieties.
As per the figures given by the DOH the economics for brinjal works out to be as under:
2.2.7.2.1.7
Yield! hectare
Estimated selling rate RS.2600/- per Ton
Total cost of production
Net income to the farmer
Price trends
2 Tons
Rs.52000/-
Rs. I 9400/-
Rs.32600/-
Total arrival and average wholesale prices of Brinjals in Jalandhar market
(1991-1997)
Year Total Avg. wholesale price Range of Pricearrivals MT Rs. er ton owest
1991 .3531 2046.78 880 (Nov .1992 3217 2426.7 1090 (May)1993 3809 2556.7 1290 Dec1994 5237 2694.2 1320 (Jan)1995 10708 287.17 .1690 a1996 9090 228.33 1770 (Feb.1997 7857 319.25 2150 (June)
Final Report: 'National Level Techno-Economic Feasibility Study for North Zone' 244
2.2.7.2.1.8
2.2.7.2.1.9
Problems and constraints
Insect pests especially fruit and shoot borer, disease like little leaf caused by mycoplasma
transmitted through jassid are serious problems. The crop is sustained by the application
of many insecticides and fungicides, hence harmful rsidual effects of these especially insummer cops are harmful.
Conclusion
Development of varieties resistant to important pests and diseases are required.
Final Report: 'National Level Techno-Economic Feasibility StUdy for North Zone' 245
.2.2.7.2.2
2.2.7.2.2.1
2.2.7.2.2.2
2.2.7.2.2.3
Cabbage
Cabbage is an important leafy vegetable in India. The total production in the country is
56.171akh tones. The major cabbage growing states are D.P., Orissa, Bihar, Assam, West
Bengal, Maharashtra and Karnataka.
Growth pattern over last decade
Though an important crop from consumption point of view, it remained a crop being
grown in a limited scale in the state. It was only in 2000-2001, that this vegetable
established its identity, previously it being categorized amongst other vegetables. In the
year 2000-2001, it was grown on an area of 1210 hectares which is just 0.86 per cent of
the total area under vegetables. However, its productivity of 29.08 M.T. per hectare is
highest and compares favourably with that of West Bengal (29.6 MT/hac.), which is the
highest in the country.
The growth pattern over the decade is not available as it was grown on a small arc;aand
was just categorized amongst other vegetables.
Crop Calendar
September to October is the ideal planting time.
Production Technology
Cultivars
Pride oflndia
Early varietyIts head are round and medium sized. This variety has a potential of yielding 8 MT per
acre.
Drum Head-EarlyIt is also an early variety. Its heads are large, flat and pale green. Its yield potential is 15
to 25 MT per hee.
Final Report: 'National Level Techno-Economic Feasibility Study for North Zone' 246
2.2.7.2.2.4
2.2.7.2.2.5
2.2.7.2.2.6
Drum-Head late
It is a late variety. Its heads are large, flat and pale green. Its yield potential is 10 to 25
tonnes per hec.
Seed I Planting Material
September to October is the ideal planting time. Seed rate is 500-650 g per ha. Spacing of
plants at 45 x 45 cm or 60 x 45 cm are considered optimum.
Sowing I Planting techniques
Nutrient Management /Manures and Fertilizers
Its manurial requirements are the same as for cauliflower.
Water Management I Irrigation
First irrigation should be given immediately after transplanting. The subsequent
irrigations should be given at 10-15 days interval.
Pest and disease management
The insect pests and disease control recommendations of Cabbage are the same as for
cauliflower.
Harvest Method and Yield
Harvesting should be done as soon as the heads reach marketable size and become hard.
The heads should be properly packed and sent to market after cuttings stomps.
Crop economics
As per the figures given by the DOH the economics for Cabbage works out to be as
under:
Yield! hectare
Estimated selling rate Rs.20001- per Ton
Total cost of production
Net income to the fanner
35 Tons
Rs,700001-
RS.213001-
Rs.487001-
Final Report: 'National Level Techno-Economic Feasibility Study for North Zone' 247
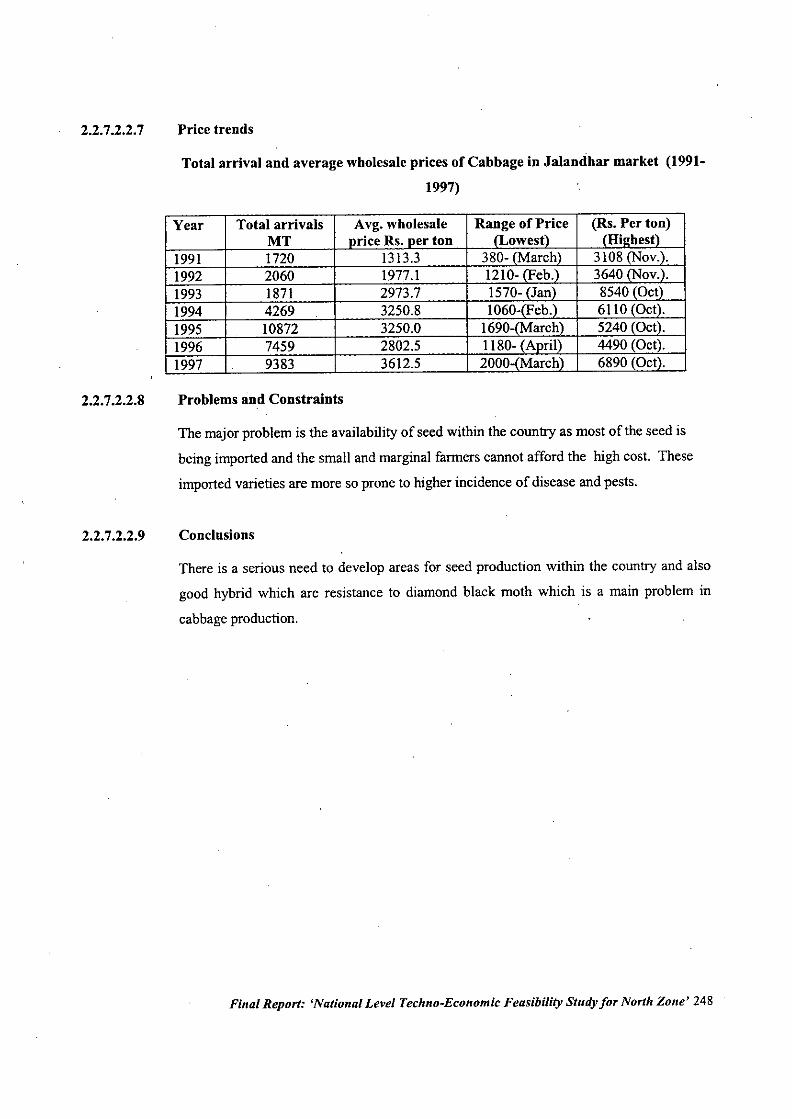
2.2.7.2.2.7 Price trends
Total arrival and average wholesale prices of Cabbage in Jalandhar market (1991-
1997)
Year
1991199219931994199519961997
Total arrivalsMT17202060187142691087274599383
Avg. wholesalerice Rs. er ton
1313.31977.12973.73250.83250.02802.53612.5
2.2.7.2.2.8
2.2.7.2.2.9
Problems and Constraints
The major problem is the availability of seed within the country as most of the seed is
being imported and the small and marginal farmers cannot afford the high cost. These
imported varieties are more so prone to higher incidence of disease and pests.
Conclusions
There is a serious need to develop areas for seed production within the country and also
good hybrid which are resistance to diamond black moth which is a main problem in
cabbage production.
Final Report: 'National Level Techno-Economic Feasibility Study for North Zone' 248
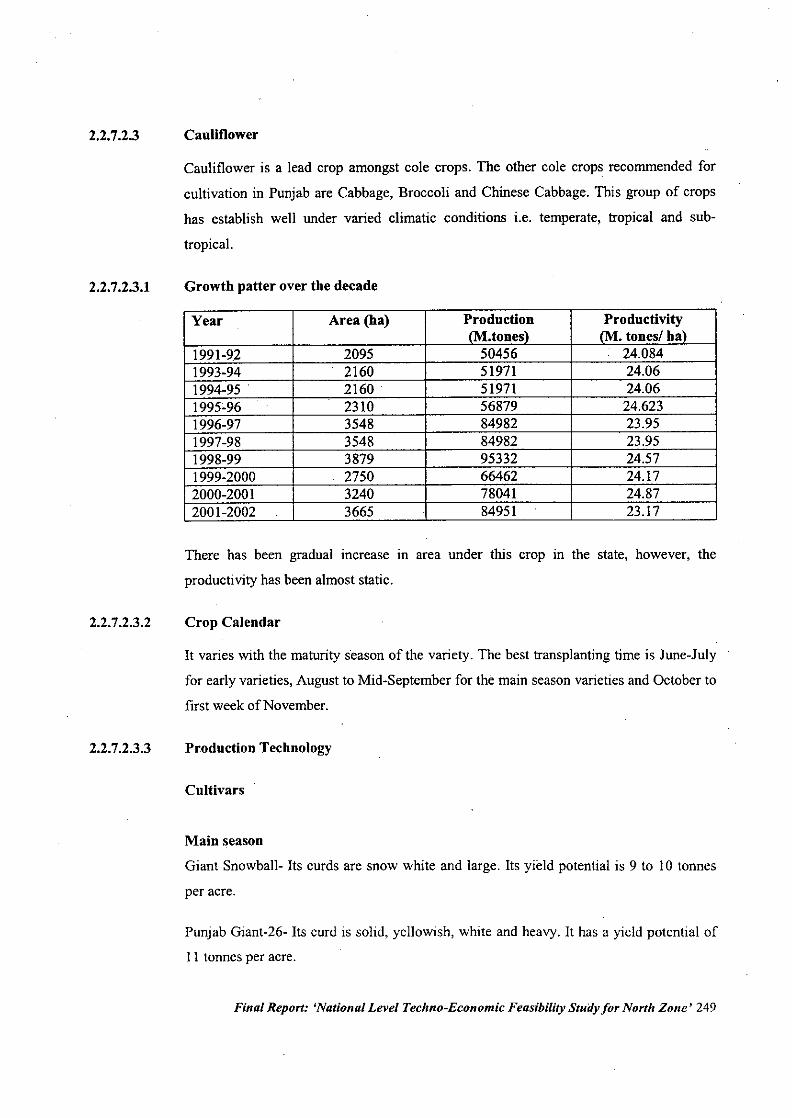
2.2.7.2.3
2.2.7.2.3.1
2.2.7.2.3.2
2.2.7.2.3.3
Cauliflower
Cauliflower is a lead crop amongst cole crops. The other cole crops recommended for
cultivation in Punjab are Cabbage, Broccoli and Chinese Cabbage. This group of crops
has establish well under varied climatic conditions i.e. temperate, tropical and sub-
tropical.
Growth patter over the decade
Year Area (ha) Production ProductivityIM.tones) 1M. tones/ ha)
1991-9.2 2095 50456 24.0841993-94 2160 51971 24.061994-95 . 2160 51971 24.061995c96 2310 56879 24.6231996-97 3548 84982 23.951997-98 3548 84982 23.951998-99 3879 95332 24.571999-2000 . 2750 66462 24.172000-2001 3240 78041 24.872001-2002 3665 84951 23.17
There has been gradual increase in area under this crop in the state, however, the
productivity has been almost static.
Crop Calendar
It varies with the maturity season of the variety. The best transplanting time is June-July
for early varieties, August to Mid-September for the main season varieties and October to
first week of November.
Production Technology
Cultivars
Main season
Giant Snowball- Its curds are snow white and large. Its yield potential is 9 to 10 tonnes
per acre.
Punjab Giant-26- Its curd is solid, yellowish, white and heavy. It has a yield potential of
11 tonnes per acre.
Final Report: 'National Level Techno-Economic Feasibility Study for North Zone' 249
2.2.7.2.3.4
Late Season
Pusa SnowbaU-lIts curd is compact, snow white and slightly raised in the center. Maturity is late by one
week than Pusa-Snowbal1-1. It has a yield potential of 22.5 tonnes per ha.
Seed / Planting material
Planting seasonIt varies with the matUrity season of the variety. The best transplanting time is June-July
for early varieties, August to Mid-September for the main season varieties and October to
first week of November.
Seed rateIt also varies with the matUrity period of the variety. The seed rate for main season and
late varieties is 600 g per acre, whereas, for early season varieties 1250 g seed is required.
SpacingFor main season crop the spacing recommended is 45 x 45 em and 40 x 30 em for early
and late season crops.
Nutrient Management / Manures and Fertilizers
Forty tones of F.Y.M. with 50 kg of N (110 kg of urea), 25 kg of P,O, (155 kg of
superphosphate) and 25 kg of K,O (40 kg of muriate of potash) is recommended for one
acre.
Water Management / IrrigationFirst irrigation should be given just after transplanting. Subsequent irrigations are given
at 7-8 days interval during summer and 10-15 days interval during winter depending
upon soil type and weather.
Pest and disease management
In case of early season crop (July-October) stem borer, Diamond back moth and tabacco
caterpillar are the main insect pests. Insecticide sprays have been recommended for these
pests. However, sprays are to be made only when the insect attack is severe enough to
Final Report: 'National Level Techno-Economic Feasibility Study for North Zone' 250
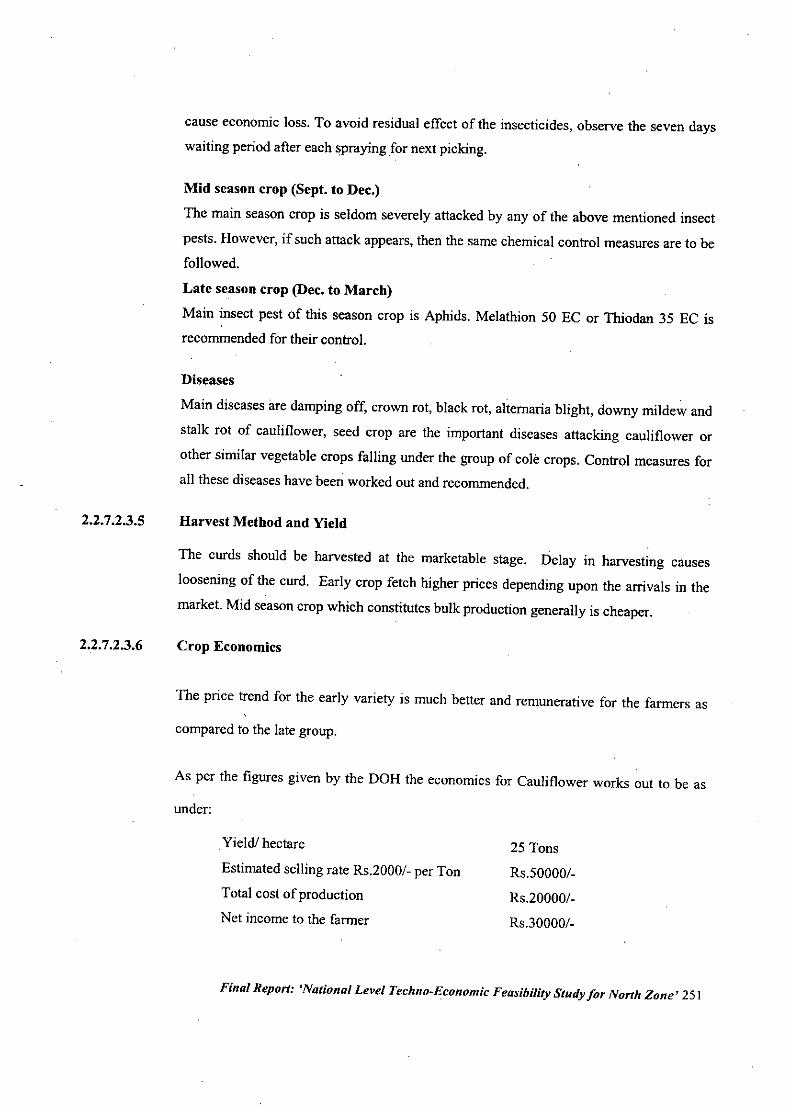
2.2.7.2.3.5
2.2.7.2.3.6
cause economic loss. To avoid residual effect of the insecticides, observe the seven days
waiting period after each spraying for next picking.
Mid season crop (Sept. to Dec.)
The main season crop is seldom severely attacked by any of the above mentioned insect
pests. However, if such attack appears, then the same chemical control measures are to be
followed.
Late season crop (Dec. to March)
Main insect pest of this season crop is Aphids. Melathion 50 EC or Thiodan 35 EC is
recommended for their control.
Diseases
Main diseases are damping off, crown rot, black rot, alternaria blight, downy mildew and
stalk rot of cauliflower, seed crop are the important diseases attacking cauliflower or
other similar vegetable crops falling under the group of cole crops. Control measures for
all these diseases have been worked out and recommended.
Harvest Method and Yield
The curds should be harvested at the marketable stage. Delay in harvesting causes
loosening of the curd. Early crop fetch higher prices depending upon the arrivals in the
market. Mid season crop which constitutes bulk production generally is cheaper.
Crop Economics
The price trend for the early variety is much better and remunerative for the farmers as
compared to the late group.
As per the figures given by the DOH the economics for Cauliflower works out to be as
under:
.Yield! hectare
Estimated selling rate Rs.2000/- per Ton
Total cost of production
Net income to the farmer
25 Tons
RS.50000/-
Rs.20000/-
RS.30000/-
Final Report: 'National Level Techno-Economic Feasibility Study for North Zone' 251
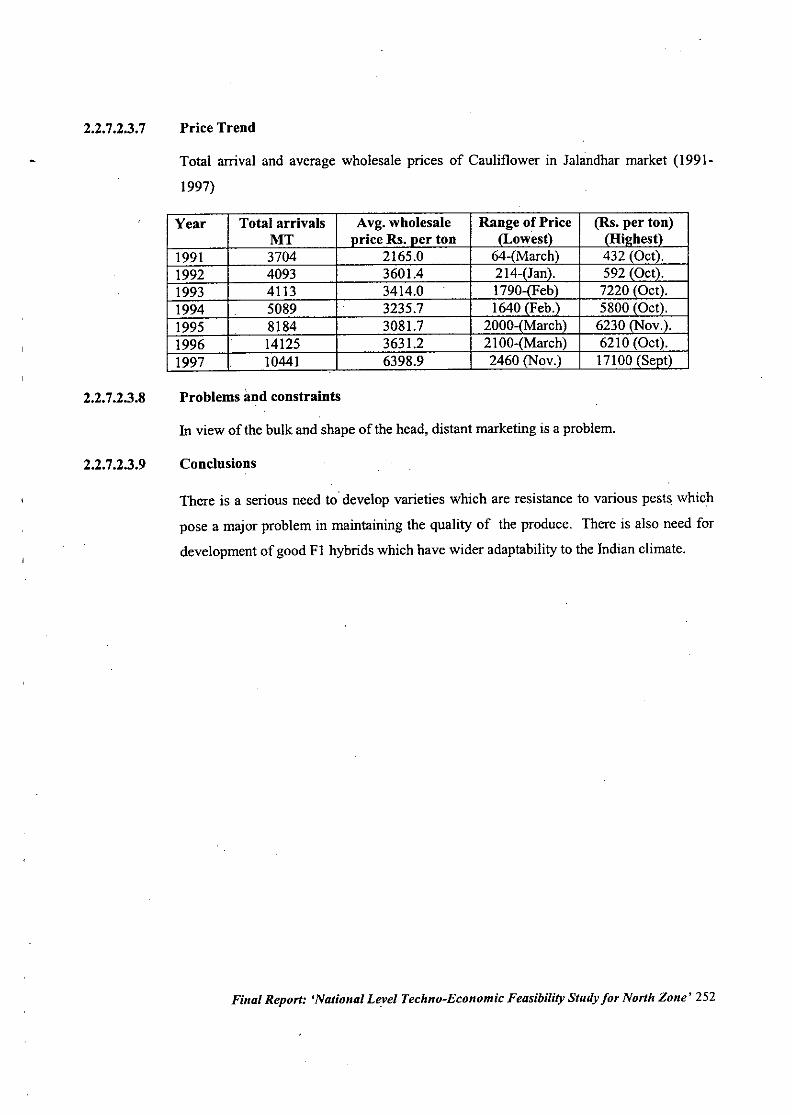
2.2.7.2.3.7 Price Trend
Total arrival and average wholesale prices of Cauliflower in Jalandhar market (1991-
1997)
Year
1991199219931994199519961997
Total arrivalsMT370440934113508981841412510441
Avg. wholesalerice Rs. er ton
2165.03601.43414.03235.73081.73631.26398.9
2.2.7.2.3.8
2.2.7.2.3.9
Problems IlDd constraints
In view of the bulk and shape of the head, distant marketing is a problem.
Conclusions
There is a serious need to' develop varieties which are resistance to various pests which
pose a major problem in maintaining the quality of the produce. There is also need for
development of good FI hybrids which have wider adaptability to the Indian climate.
Final Report: 'National Level Techno-Economic Feasibility Study for North Zone' 252
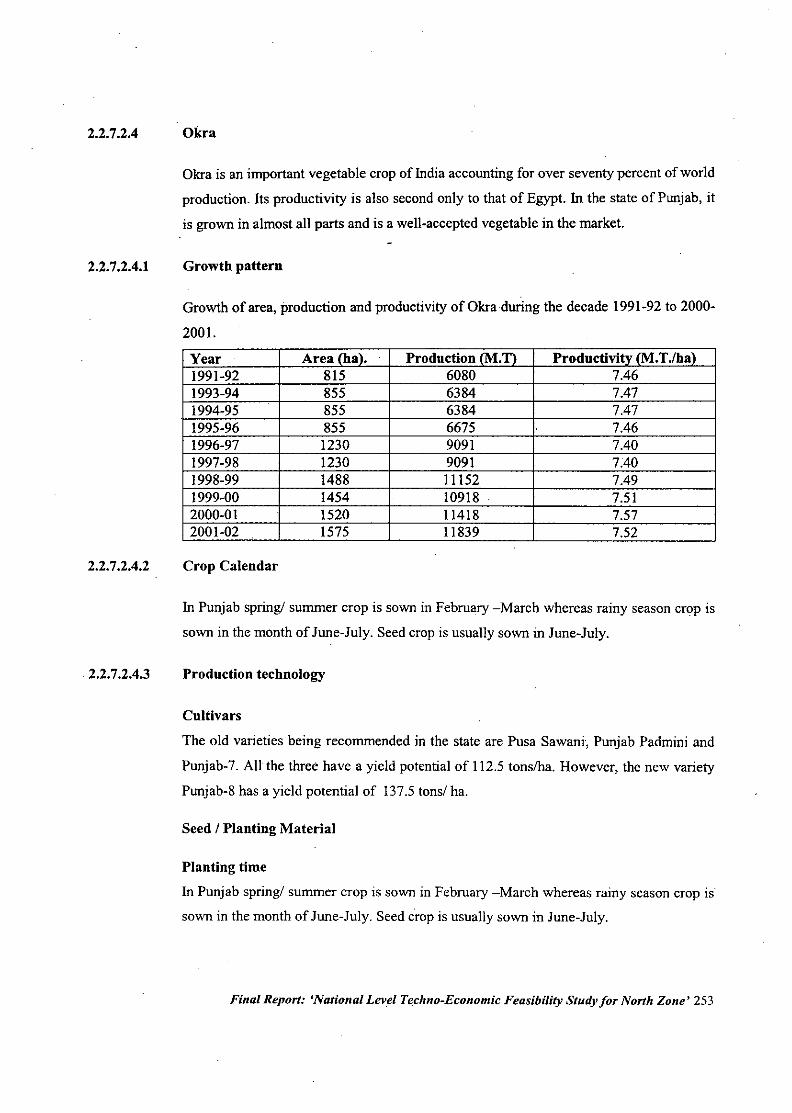
2.2.7.2.4
2.2.7.2.4.1
2.2.7.2.4.2
.2.2.7.2.4.3
Okra
Okra is an important vegetable crop of India accounting for over seventy percent of world
production. Its productivity is also second only to that of Egypt. In the state of Punjab, it
is grown in almost all parts and is a well-accepted vegetable in the market.
Growth pattern
Growth of area, production and productivity of Okra during the decade 1991-92 to 2000-
2001.
Year' Area (ha). . Production /M.T) Productivity /M.T.lha)1991-92 815 6080 7.461993-94 855 6384 7.471994-95 855 6384 7.471995-96 855 6675 7.461996-97 1230 9091 7.401997-98 1230 9091 7.401998-99 1488 11152 7.491999-00 1454 10918 7.512000-01 1520 11418 7.572001-02 1575 11839 7.52
Crop Calendar
In Punjab spring! summer crop is sown in February -March whereas rainy season crop is
sown in the month of June-July. Seed crop is usually sown in June-July.
Production technology
Cultivars
The old varieties being recommended in the state are Pusa Sawani, Punjab Padmini and
Punjab-7. All the three have a yield potential of 112.5 tons/ha. However, the new variety
Punjab-8 has a yield potential of 137.5 tonsl ha.
Seed I Planting Material
Planting time
In Punjab springl summer crop is sown in February -March whereas rainy season crop is
sown in the month of June-July. Seed crop is usually sown in June-July.
Final Report: 'National Level Techno-Economic Feasibility Study for North Zone' 253
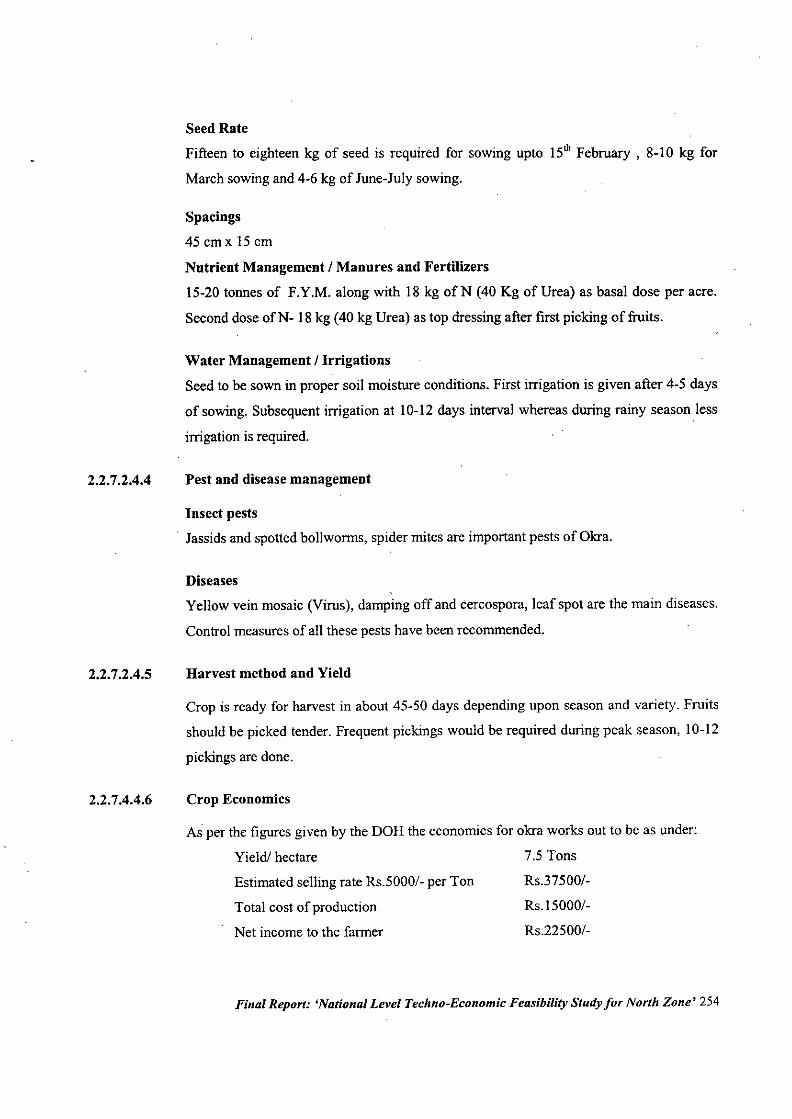
2.2.7.2.4.4
2.2.7.2.4.5
2.2.7.4.4.6
Seed Rate
Fifteen to eighteen kg of seed is required for sowing upto ISth February, 8-10 kg for
March sowing and 4-6 kg of June-July sowing.
Spacings
4S cmx IS em
Nutrient Management I Manures and Fertilizers
IS-20 tonnes of F.Y.M. along with 18 kg ofN (40 Kg of Urea) as basal dose per acre.
Second dose ofN-18 kg (40 kg Urea) as top dressing after first picking of fruits.
Water Management I Irrigations
Seed to be sown in proper soil moisture conditions. First irrigation is given after 4-S days
of sowing. Subsequent irrigation at 10-12 days interval whereas during rainy season less
irrigation is required.
Pest and disease management
Insect pests. Jassids and spotted bollworms, spider mites are important pests of Okra.
DiseasesYellow vein mosaic (Virus), damping off and cercospora, leaf spot are the main diseases.
Control measures of all these pests have been recommended.
Harvest method and Yield
Crop is ready for harvest in about 4S-S0 days depending upon season and variety. Fruits
should be picked tender. Frequent pickings would be required during peak season, 10-12
pickings are done.
Crop Economics
As per the figures given by the DOH the economics for okra works out to be as under:
Yield! hectare 7.S Tons
Estimated selling rate RS.SOOO/-per Ton Rs.37S00/-
Total cost of production RS.ISOOO/-
Net income to the farmer RS.22S00/-
Final Report: 'National Level Techno-Economic Feasibility Study for North Zone' 254
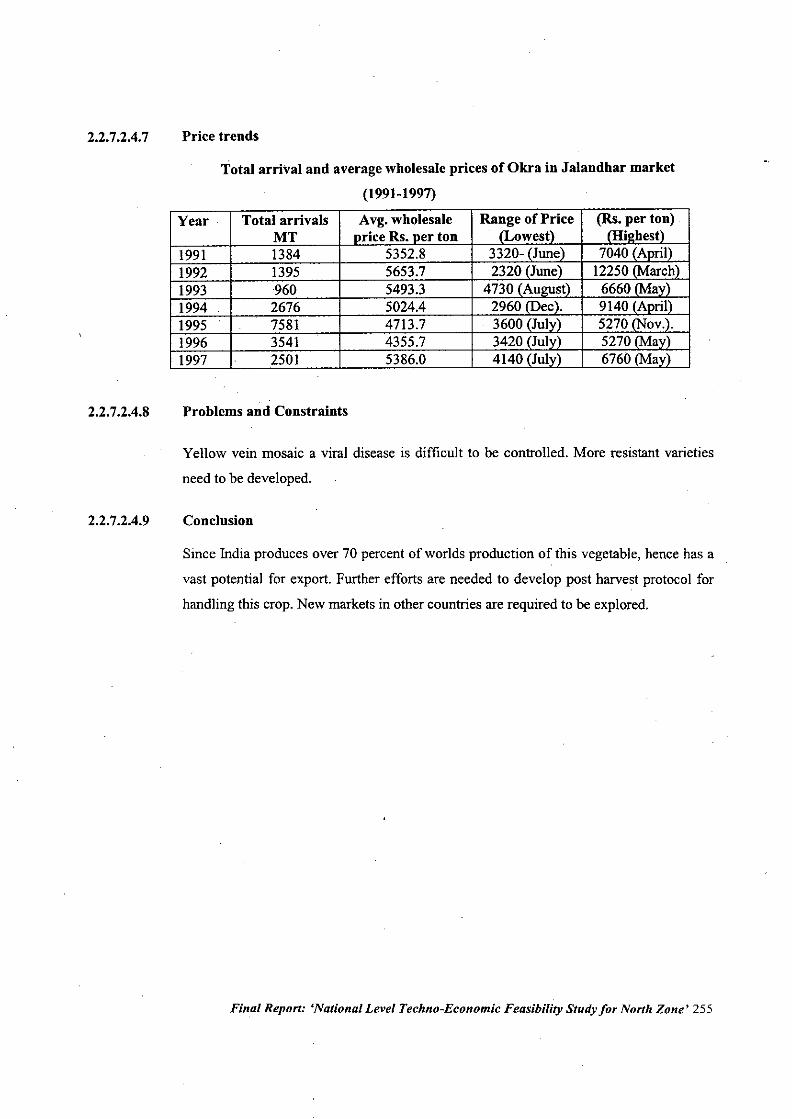
2.2.7.2.4.7 Price trends
Total arrival and average wholesale prices of Okra in Jalandhar market
(1991-1997)Year
1991199219931994199519961997
Total arrivalsMT138413959602676758135412501
Avg. wholesalerice Rs. er ton
5352.85653.75493.35024.44713.74355.75386.0
2.2.7.2.4.8
2.2.7.2.4.9
Problems and Constraints
Yellow vein mosaic a viral disease is difficult to be controlled. More resistant varieties
need to be developed.
Conclusion
Since India produces over 70 percent of worlds production of this vegetable, hence has a
vast potential for export. Further efforts are needed to develop post harvest protocol for
handling this crop. New markets in other countries are required to be explored.
Final Report: 'National Level Techno-Economic Feasibility Study for North Zone' 255
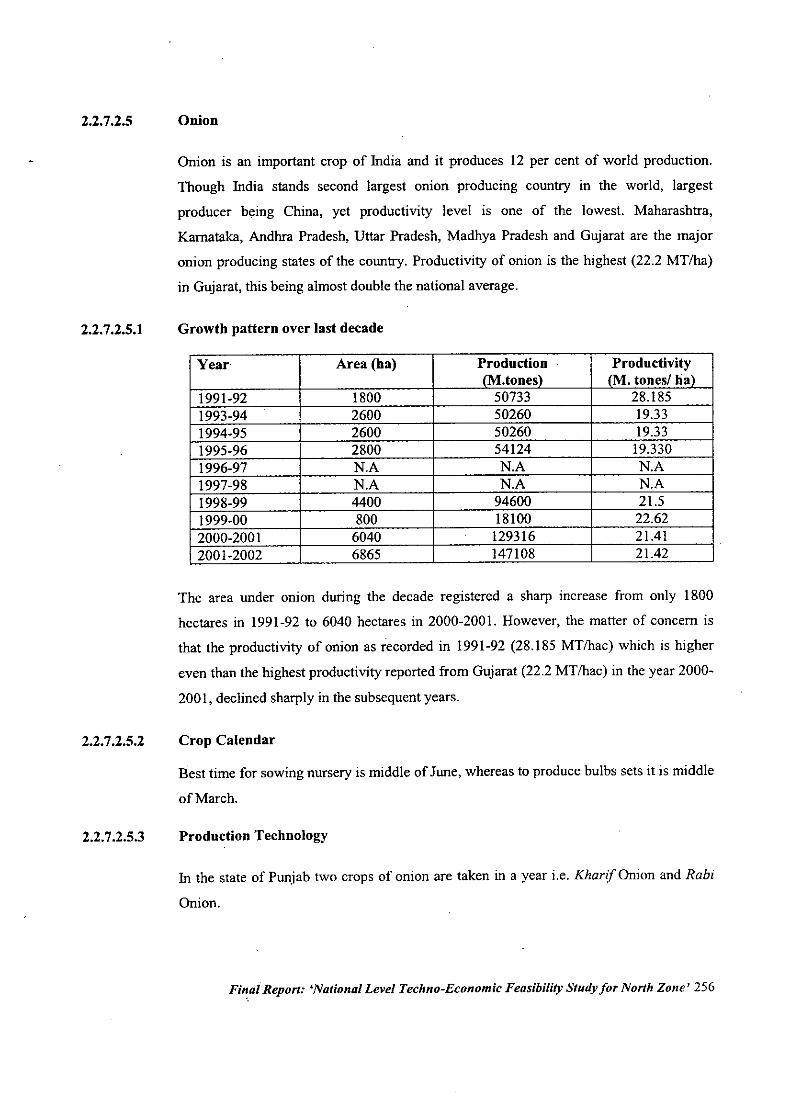
2.2.7.2.5
2.2.7.2.5.1
2.2.7.2.5.2
2.2.7.2.5.3
Onion
Onion is an important crop of India and it produces 12 per cent of world production.
Though India stands second largest onion producing country in the world, largest
producer being China, yet productivity level is one of the lowest. Maharashtra,
Karnataka, Andhra Pradesh, Uttar Pradesh, Madhya Pradesh and Gujarat are the major
onion producing states of the country. Productivity of onion is the highest (22.2 MTlha)
in Gujarat, this being almost double the national average.
Growth pattern over last decade
Year Area (ba) Production Productivity(M.tones) (M. tones! ha)
1991-92 1800 50733 28.1851993-94 2600 50260 19.331994-95 2600 50260 19.331995-96 2800 54124 19.3301996-97 N.A N.A N.A1997-98 N.A N.A N.A1998-99 4400 94600 21.51999-00 800 18100 22.622000-2001 6040 129316 21.412001-2002 6865 147108 21.42
The area under onion during the decade registered a sharp increase from only 1800
hectares in 1991-92 to 6040 hectares in 2000-2001. However, the matter of concern is
that the productivity of onion as recorded in 1991-92 (28.185 MTlhac) which is higher
even than the highest productivity reported from Gujarat (22.2 MTlhac) in the year 2000-
200 I, declined sharply in the subsequent years.
Crop Calendar
Best time for sowing nursery is middle of June, whereas to produce bulbs sets it is middle
of March.
Production Technology
In the state of Punjab two crops of onion are taken in a year i.e. Kharif Onion and Rabi
Onion.
Final Report: 'National Level Techno-Economic Feasibility Study for North Zone' 256
Seed I Planting Material
Kharif Onion
'Improved varieties
Agri Found Dark Red (ADR): The bulbs are medium large, deep, dark red with an
average yield of 30 tonnes per ha.
N-53
The bulbs are bell shaped, medium sized and very attractive. It has a potential of
producing a yield of 37.5 tonnes per ha
Sowing I Planting Techniqnes
Sowing time
Best time for sowing nursery is middle of June, whereas to produce. bulbs sets it is middle
of March.
Bnlb set techniqne
For kharif onion, to avoid failure of seedlings during June, planting with bulb sets is
economical. For this, sow 5 kg seed in .beds of 8 marla (200 sq.m) in middle of March.
Irrigate the seedlings twice a week in the last week of June, uproot the bulb sets and store
in a well ventilated dry sown in baskets. Plant these bulb sets in the field in second
fortnight of August. Bulb crops would be ready for harvesting by the end of November.
Nntrient Management I Mannres and Fertilizers
Add twenty tones of compost! F.Y.M with 40 kg of N (90 kg of urea and 160 kg of
CAN), 25 kg ofP20,- (125 kg of superphosphate) and 20 kg ofK20 (35 kg of Muriate of
Potash per acre). Apply whole F.Y.M. compost, P,O, and K20 and Y, N before
transplanting and remaining dose ofN as top dressing after 4 weeks of transplanting.
Transplanting
Nursery is ready for transplanting after 6 to 8 weeks of sowing. The seedlings are
transplanted in the first week of August- Close planting at 15 x 7.5 em is most conducive
t6 high yield.
Final Report: 'National Level Techno-Economic Feasibility Study for North Zone' 257
•Irrigation transplants are to be irrigated immediately after transplanting. Subsequently the
crop is irrigated as and when required .
Rabi Crop of Onion
Varieties
Punjab whiteThe bulbs are medium large, round with tight neck. Yield potential is 33.75 tonnes per
ha.
Punjab NaroyaBulbs are red, medium to large, round with close neck. Yield potential is 37.5 tonnes per
ha. This varieiy is resistant to purple blotch disease and tolerant to thrips and heliothis.
Punjab red roundBulbs are medium to large, shinning red, globular and thin necked. It is early maturing
and has a yield potential of 30 tonnes per ha.
Punjab 48Bulbs are medium, large, round and white. Yield potential is 27.5 tonnes per ha. It is
suitable for dehydration.
Punjab selectionBulbs medium to large, globular to red. Yield potential is 20 tonnes per ha.
Sowing / Planting Techniques
SowingSow nursery from mid October to mid November and transplant from the first week of
December to middle of January. Seed rate is 10 to 12kg per ha.
SpacingClose planting at 15 x 7.5 cm is most conducive to high yield.
Nutrient Management / Manures and FertilizersTwenty tones of compost, together with 40 kg ofN (90 kg of Urea), 20 kg ofP,O, and 20
kg of K,O (35 kg of Muriate of Potash) per acre is recommended. Whole of FYM, P,O,
Final Report: 'National Level Techno-Economic Feasibility Study for North Zone' 258
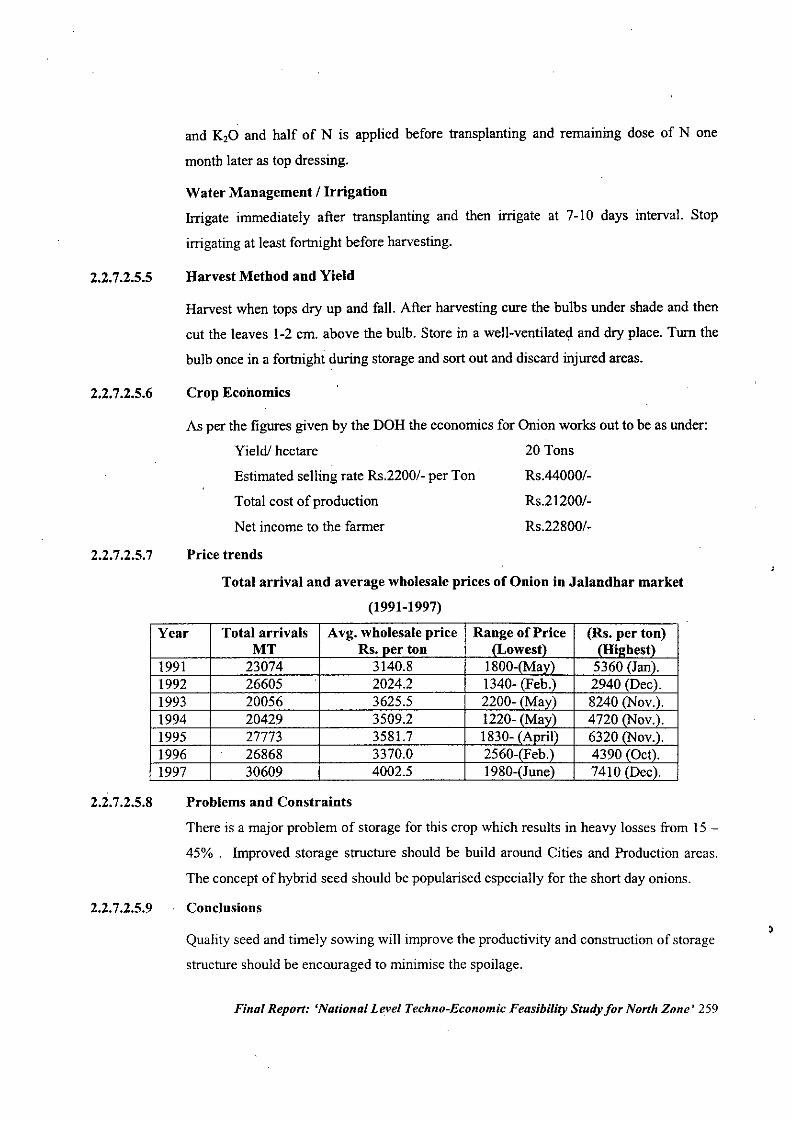
2.2.7.2.5.5
2.2.7.2.5.6
and K,O and half of N is applied before transplanting and remaining dose of None
month later as top dressing.
Water Management I Irrigation
Irrigate immediately after transplanting and then irrigate at 7-10 days interval. Stop
irrigating at least fortnight before harvesting.
Harvest Method and Yield
Harvest when tops dry up and fall. After harvesting cure the bulbs under shade and then
cut the leaves 1-2 cm. above the bulb. Store in a well-ventilated and dry place. Turn the
bulb once in a fortnight during storage and sort out and discard injured areas.
Crop Economics
As per the figures given by the DOH the economics for Onion works out to be as under:
Yield! hectare 20 Tons
2.2.7.2.5.7
Estimated selling rate RS.2200/- per Ton'
Total cost of production
Net income to the farmer
Price trends
RS.44000/-
Rs.21200/-
RS.22800/-
Total arrival and average wholesale prices of Onion in Jalandhar market
(1991-1997)Year
1991199219931994199519961997
Total arrivalsMT23074266052005620429277732686830609
Avg. wholesale priceRs. er ton3140.82024.23625.53509.23581.73370.04002.5
2.2.7.2.5.8
2.2.7.2.5.9
Problems and Constraints
There is a major problem of storage for this crop which results in heavy losses from 15 -
45%. Improved storage structure should be build around Cities and Production areas.
The concept of hybrid seed should be popularised especially for the short day onions.
Conclusions
Quality seed and timely sowing will improve the productivity and construction of storage
structure should be encouraged to minimise the spoilage.
Final Report: 'National Level Techno-Economic Feasibility Study for North Zone' 259
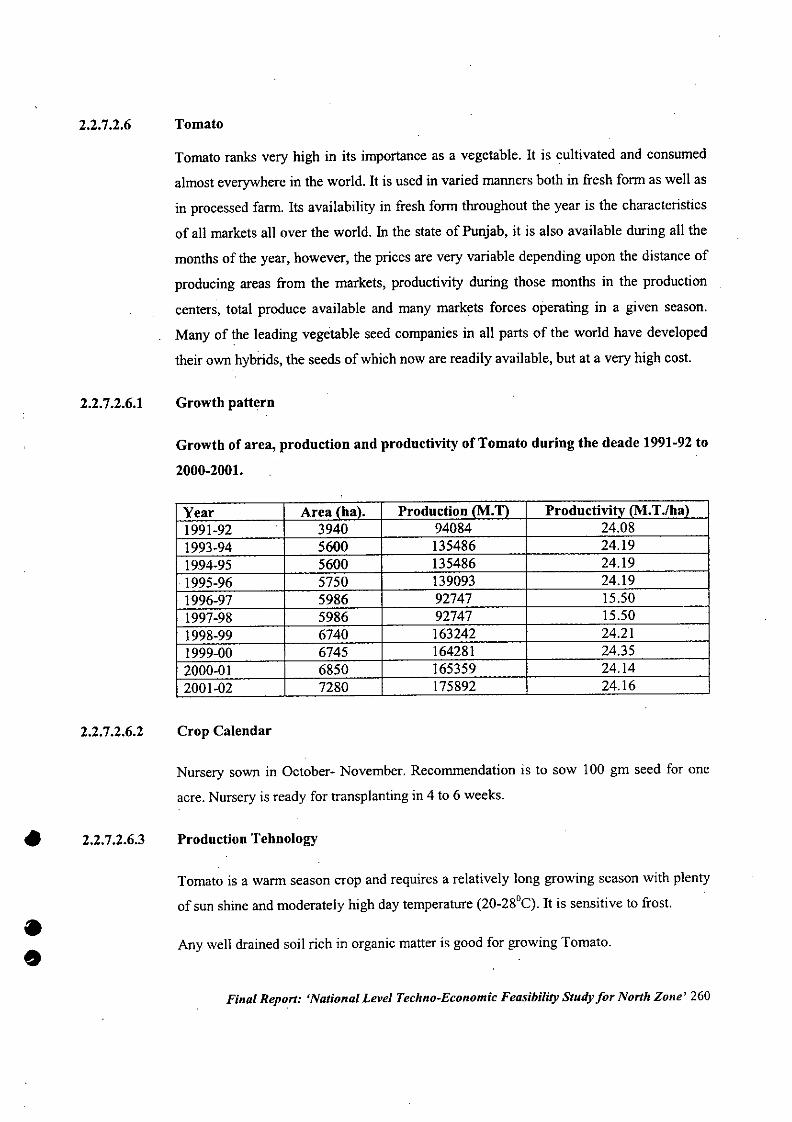
•••
2.2.7.2.6
2.2.7.2.6.1
2.2.7.2.6.2
2.2.7.2.6.3
Tomato
Tomato ranks very high in its importance as a vegetable. It is cultivated and consumed
almost everywhere in the world. It is used in varied manners both in fresh form as well as
in processed farm. Its availability in fresh form throughout the year is the characteristics
of all markets an over the world. In the state of Punjab, it is also available during an the
months of the year, however, the prices are very variable depending upon the distance of
producing areas from the markets, productivity during those months in the production
centers, total produce available and many markets forces operating in a given season.
Many of the leading vegetable seed companies in all parts of the world have developed
their own hybrids, the seeds of which now are readily available, but at a very high cost.
Growth pattern
Growth of area, production and productivity of Tomato during the deade 1991-92 to
2000-2001.
Year Area (ha). Production lM.n Productivitv lM.T.lha)1991-92 3940 94084 24.081993-94 5600 135486 24.191994-95 5600 135486 24.191995-96 5750 139093 24.191996-97 5986 92747 15.501997-98 5986 92747 15.501998-99 6740 163242 24.211999-00 6745 164281 24.352000-01 6850 165359 24.142001-02 7280 175892 24.16
Crop Calendar
Nursery sown in October- November. Recommendation is to sow 100 gm seed for one
acre. Nursery is ready for transplanting in 4 to 6 weeks .
Production Tehnology
Tomato is a warm season crop and requires a relatively long growing season with plenty
of sun shine and moderately high day temperature (20-28°C). It is sensitive to frost.
Any well drained soil rich in organic matter is good for growing Tomato .
Final Report: 'National Level Techno-Economic Feasibility Study for North Zone' 260
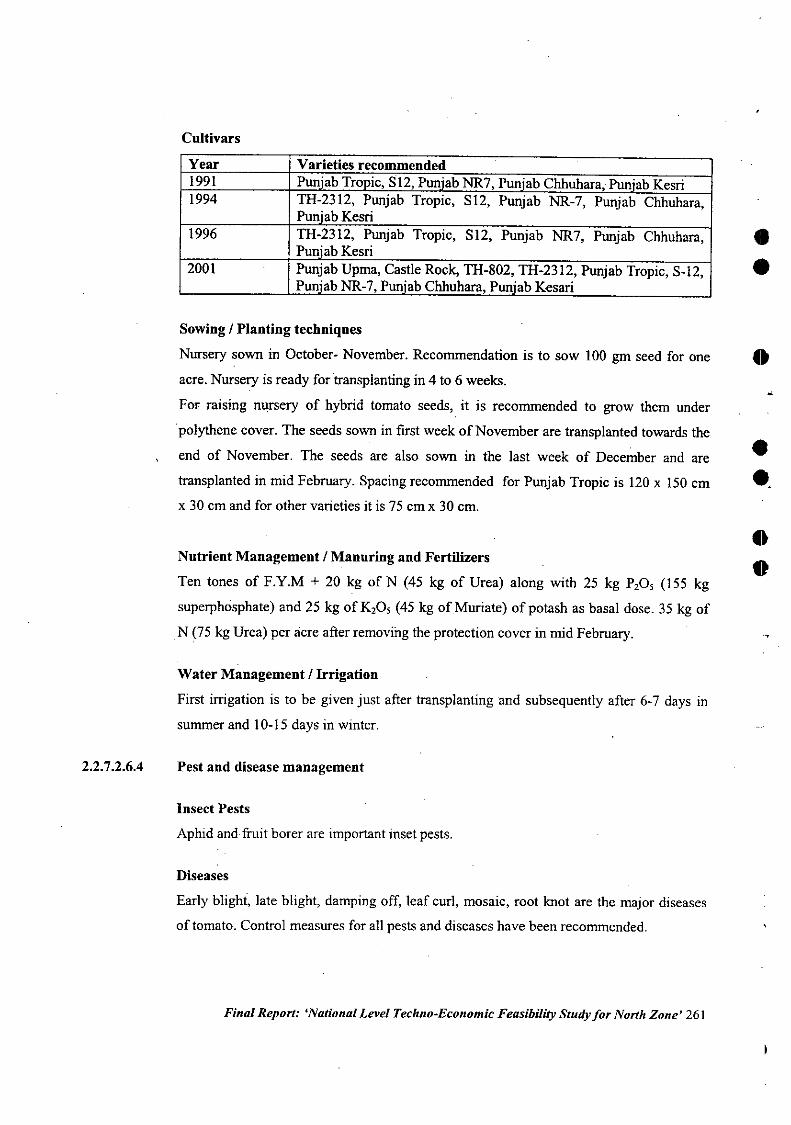
Cultivars
Year Varieties recommended1991 Punjab Tronic, S12, Puniab NR7, Punjab Chhuhara; Puniab Kesri1994 TH-2312, Punjab Tropic, S12, Punjab NR-7, Punjab Chhuhara,
Punjab Kesri1996 TH-2312, Punjab Tropic, S12, Punjab NR7, Punjab Chhuhara,
Punjab Kesti2001 Punjab Upma, Castle Rock, TH-802, TH-23 12, Punjab Tropic, S-12,
Puniab NR-7, Puniab Chhuhara, Punjab Kesari
••Sowing / Planting techniques
Nursery sown in October- November. Recommendation is to sow 100 gm seed for one •
acre. Nursery is ready for transplanting in 4 to 6 weeks.
2.2.7.2.6.4
For raising nursery of hybrid tomato seeds, it is recommended to grow them under
'polythene cover. The seeds sown in first week of November are transplanted towards the
end of November. The seeds are also sown in the last week of December and are
transplanted in mid February. Spacing recommended for Punjab Tropic is 120 x 150 cm
x 30 cm and for other varieties it is 75 cm x 30 cm.
Nutrient Management / Manuring and Fertilizers
Ten tones of F.Y.M + 20 kg of N (45 kg of Urea) along with 25 kg PzO, (155 kg
superphosphate) and 25 kg of KzO, (45 kg of Muriate) of potash as basal dose. 35 kg of
N (75 kg Urea) per acre after removing the protection cover in mid February.
Water Management / Irrigation
First irrigation is to be given just after transplanting and subsequently after 6-7 days in
summer and 10-15 days in winter.
Pest and disease management
Insect Pests
Aphid and fruit borer are important inset pests.
Diseases
Early blight, late blight, damping off, leaf curl, mosaic, root knot are the major diseases
of tomato. Control measures for all pests and diseases have been recommended.
Final Report: 'National Level Techno-Economic Feasibility Study for North Zone' 261
•e
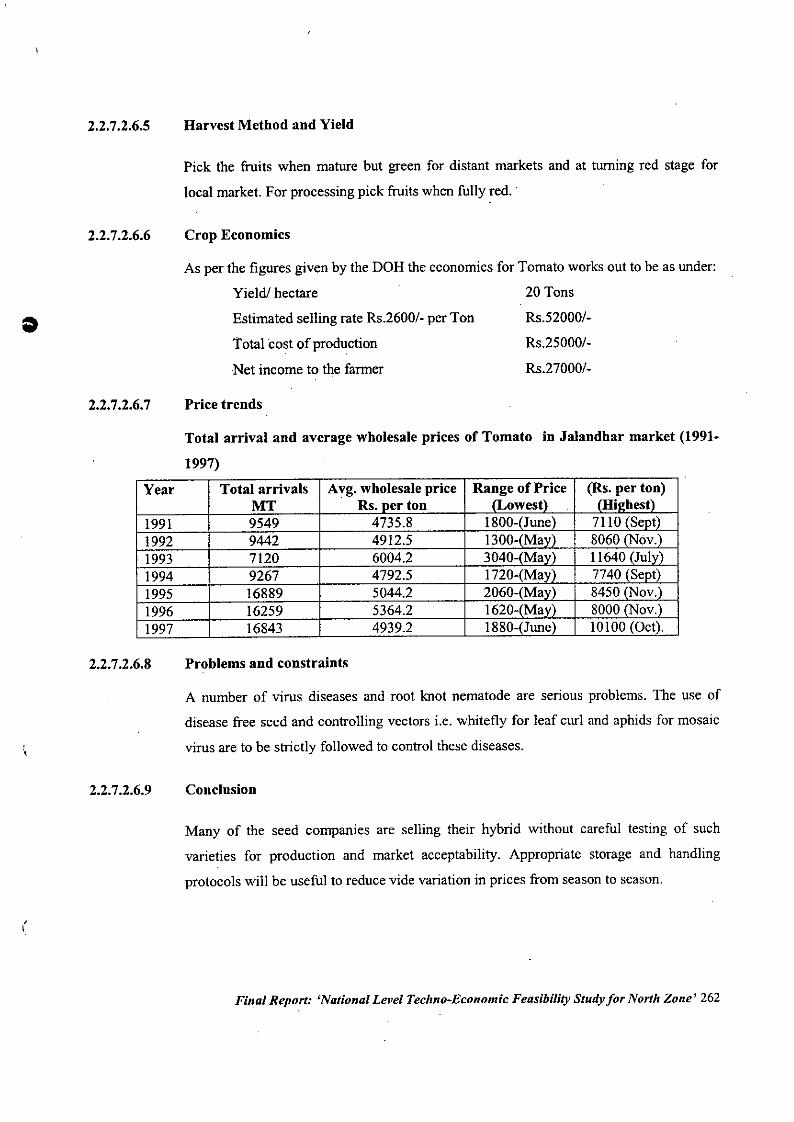
2.2.7.2.6.5
2.2.7.2.6.6
Harvest Method and Yield
Pick the fruits when mature but green for distant markets and at turning red stage for
local market. For processing pick fruits when fully red..
Crop Economics
As per the figures given by the DOH the economics for Tomato works out to be as under:
Yield! hectare 20 Tons
2.2.7.2.6.7
Estimated selling rate Rs.2600/- per Ton
Total cost of production
Net income to the farmer
Price trends
RS.52000/-
Rs.25000/.
RS.27000/.
Total arrival and average wholesale prices of Tomato in Jalandhar market (1991.
1997)
Year
1991199219931994199519961997
Total arrivalsMT9549944271209267168891625916843
Avg. wholesale priceRs. er ton4735.84912.56004.24792.55044.25364.24939.2
(
2.2.7.2.6.8
2.2.7.2.6.9
Problems and constraints
A number of virus diseases and root knot nematode are serious problems. The use of
disease free seed and controlling vectors i.e. whitefly for leaf curl and aphids for mosaic
virus are to be strictly followed to control these diseases.
Conclusion
Many of the seed companies are selling their hybrid without careful testing of such
varieties for production and market acceptability. Appropriate storage and handling
protocols will be useful to reduce vide variation in prices from season to season.
Final Report: 'National Level Techno-Economic Feasibility Study for North Zone' 262
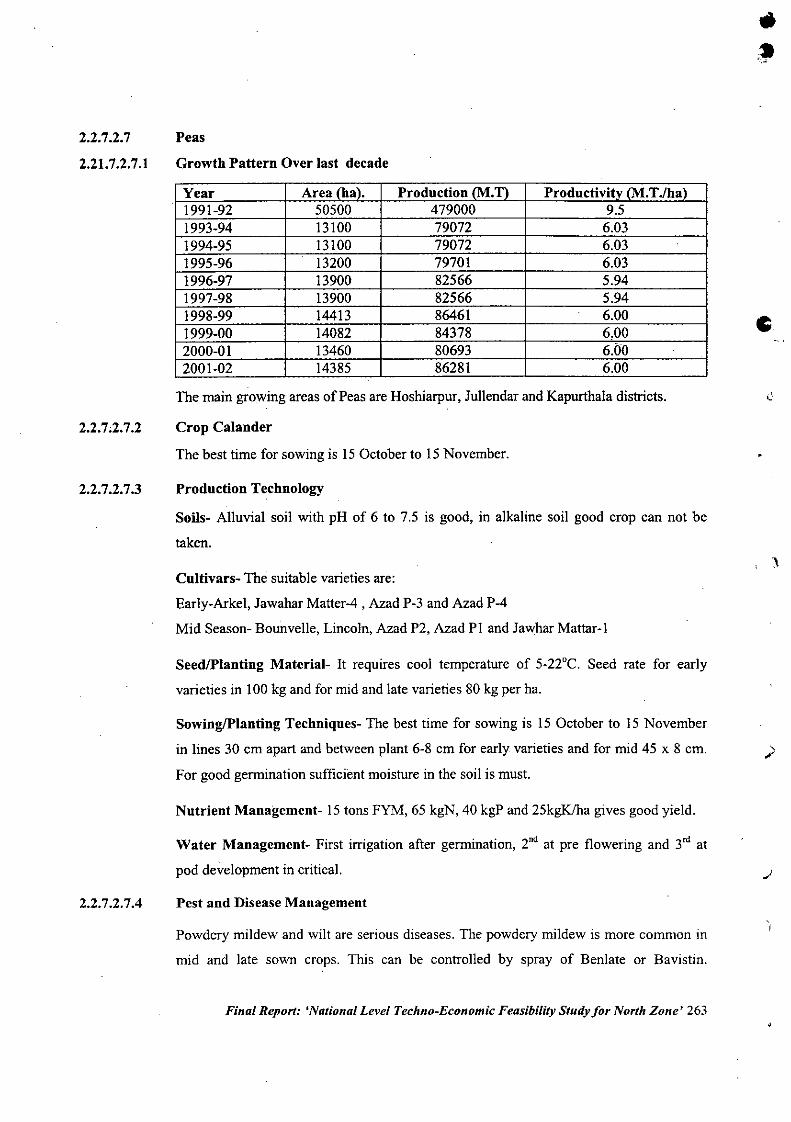
2.2.7.2.7
2.21.7.2.7.1
2.2.7.2.7.3
2.2.7.2.7.4
Peas
Growth Pattern Over last decade
Year Area (hal. Production (M.T) Productivitv lM.T./ha)1991-92 50500 479000 9.51993.94 13100 79072 6.031994-95 13100 79072 6.031995-96 13200 79701 6.031996.97 13900 82566 5.941997-98 13900 82566 5.941998-99 14413 86461 6.001999-00 14082 84378 6,002000-01 13460 80693 6.002001-02 14385 86281 6.00
The main growing areas of Peas are Hoshiarpur, Jullendar and Kapurthala districts.
Crop Calander
The best time for sowing is 15 October to 15 November.
Production Technology
Soils- Alluvial soil with pH of 6 to 7.5 is good, in alkaline soil good crop can not be
taken.
Cultivars. The suitable varieties are:
Early-Arkel, Jawahar Matter-4 , Azad P-3 and Azad P-4
Mid Season- Bounvelle, Lincoln, Azad P2, Azad PI and Jawhar Mattar-I
SeedIPlanting Material- It requires cool temperature of 5-22°C. Seed rate for early
varieties in 100 kg and for mid and late varieties 80 kg per ha.
SowingIPlanting Techniques- The best time for sowing is 15 October to 15 November
in lines 30 em apart and between plant 6-8 em for early varieties and for mid 45 x 8 em.
For good germination sufficient moisture in the soil is must.
Nutrient Management- 15 tons FYM, 65 kgN, 40 kgP and 25kgK/ha gives good yield.
Water Management- First irrigation after germination, 20d at pre flowering and 3'd at
pod development in critical.
Pest and Disease Management
Powdery mildew and wilt are serious diseases. The powdery mildew is more common in
mid and late sown crops. This can be controlled by spray of Benlate or Bavistin.
Final Report: 'National Level Techno-Economic Feasibility Study for North Zone' 263
c
; :I
,r
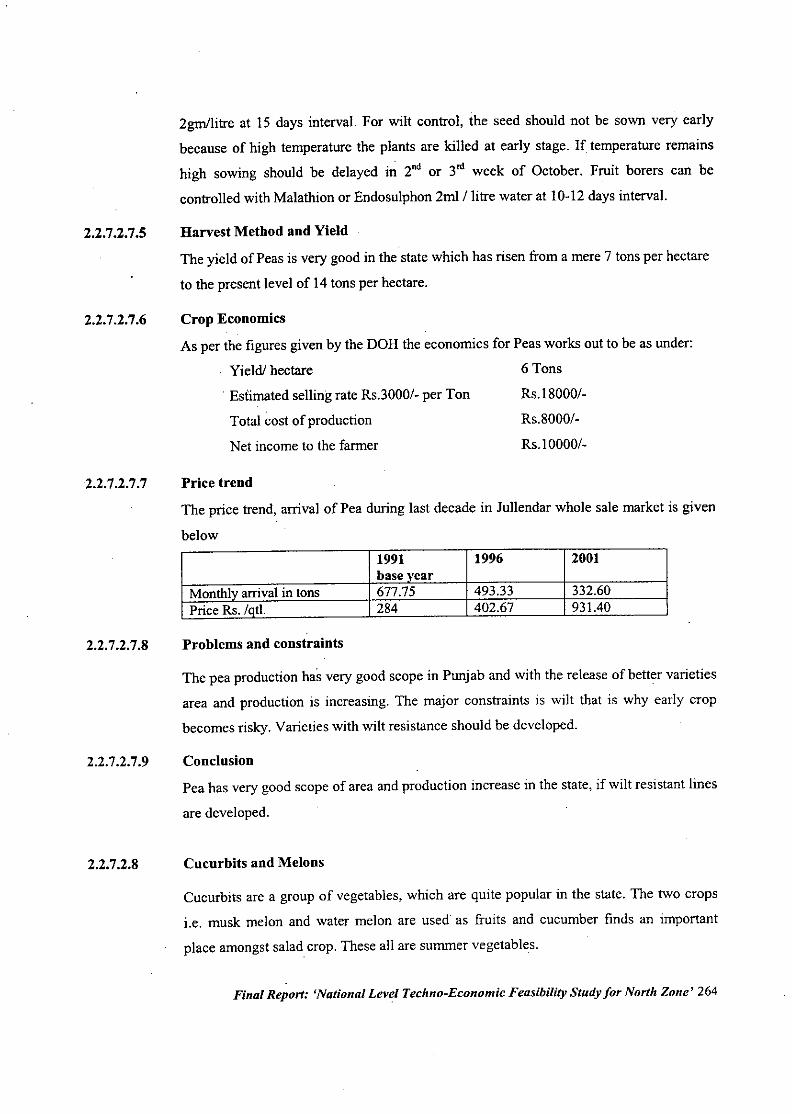
2.2.7.2.7.5
2.2.7.2.7.6
2gm1litre at 15 days interval. For wilt control, the seed should not be sown very early
because of high temperature the plants are killed at early stage. If temperature remains
high sowing should be delayed i~ 2nd or 3nl week of October. Fruit borers can be
controlled with Malathion or Endosulphon 2m! / litre water at 10-12 days interval.
Harvest Method and Yield
The yield of Peas is very good in the state which has risen from a mere 7 tons per hectare
to the present level of 14 tons per hectare.
Crop Economics
As per the figures given by the DOH the economics for Peas works out to be as under:
Yield! hectare 6 Tons
2.2.7.2.7.7
. Estimated selling rate Rs.3000/- per Ton
Total cost of production
Net income to the farmer
Price trend
Rs.l8000/-
RS.8000/-
Rs.10000/-
2.2.7.2.7.8
2.2.7.2.7.9
2.2.7.2.8
The price trend, arrival of Pea during last decade in Jullendar whole sale market is given
below1991 1996 2001base vear
Monthlvarrival in tons 677.75 493.33 332.60Price Rs. /qtl. 284 402.67 931.40
Problems and constraints
The pea production has very good scope in Punjab and with the release of better varieties
area and production is increasing. The major constraints is wilt that is why early crop
becomes risky. Varieties with wilt resistance should be developed.
Conclusion
Pea has very good scope of area and production increase in the state, if wilt resistant lines
are developed.
Cucurbits and Melons
Cucurbits are a group of vegetables, which are quite popular in the state. The two crops
i.e. musk melon and water melon are used. as fruits and cucumber finds an important
place amongst salad crop. These all are summer vegetables.
Final Report: 'National Level Techno-Economic Feasibility Study for North Zone' 264
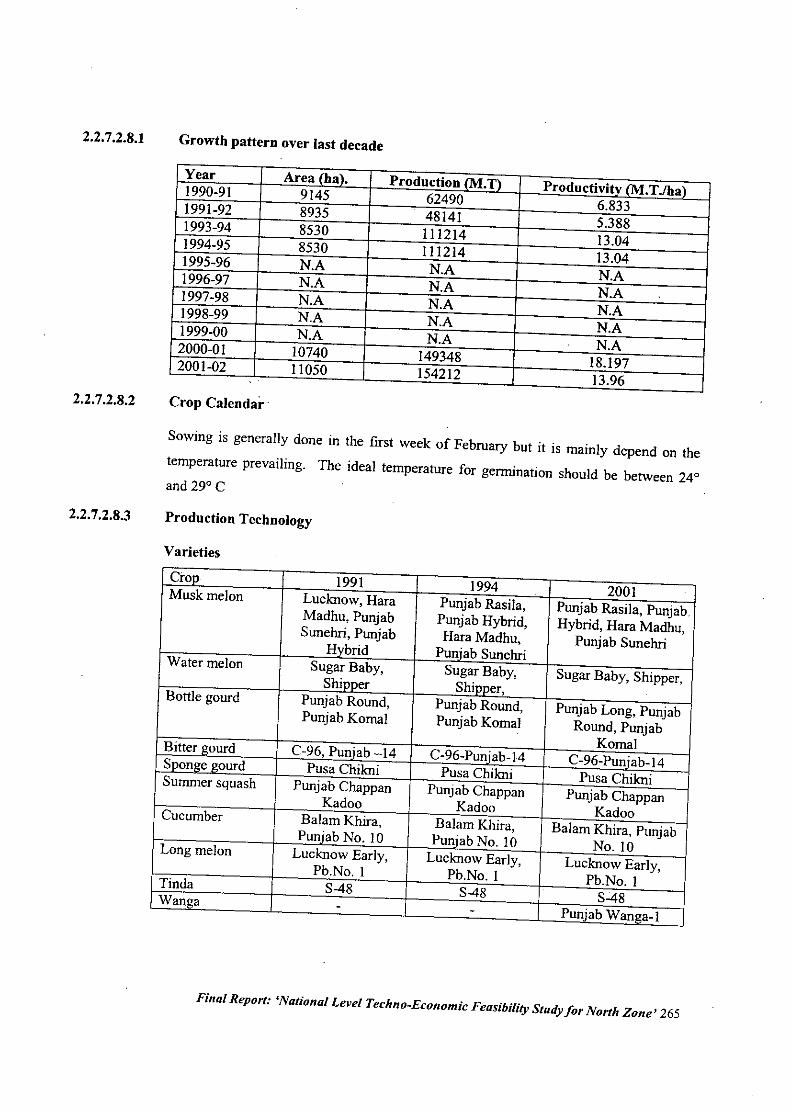
2.2.7.2.8.1
2.2.7.2.8.2
2.2.7.2.8.3
Growth pattern over last decade
Year Area (ha). Production (M.T) Productivity (M.T./ha)1990-91 9145 62490 6.8331991-92 8935 48141 5.3881993-94 8530 111214 13.041994-95 8530 111214 13.041995-96 N.A . N.A N.A1996-97 N.A N.A N.A1997-98 N.A N.A N.A1998-99 N.A N.A N.A1999-00 N.A N.A N.A2000-01 10740 149348 18.1972001-02 11050 154212 13.96
Crop Calendar.
Sowing is gcnerally done in the first week of February but it is mainly depend on the
temperature prevailing. The ideal temperature for germination should be between 240and 29° C
Production Technology
Varieties
Crop 1991 1994 2001Muskmelon Lucknow, Hara Punjab Rasila, Punjab Rasila, PunjabMadhu, Punjab Punjab Hybrid, Hybrid, Hara Madhu,Sunehri, Punjab Hara Madhu, Punjab SunehriHybrid Punjab SunehriWater melon Sugar Baby, Sugar Baby, Sugar Baby, Shipper,Shipper Shipper,Bottle gourd Punjab Round, Punjab Round, Punjab Long, PunjabPunjab Komal Punjab Komal Round, Punjab
KomalBitter gourd C-96, Puniab -14 C-96-Puniab-14 C-96-Punjab-14Soonge gourd Pusa Chikni Pusa Chikni Pusa ChikniSummer squash Punjab Chappan Punj ab Chappan Punjab ChappanKadoo Kadoo KadooCucumber Balam Khira, Balam Khira, Balam Khira, PunjabPunjab No. 10 Punjab No. 10 No. 10Long melon Lucknow Early, Lucknow Early, Lucknow Early,Pb.No. I Pb.No. I Pb.No.1Tinda S-48 S-48 S-48Wanga - - Punjab Wanga-1
Final Report: 'National Level Techno-Economic Feasibility Study for North Zone' 265
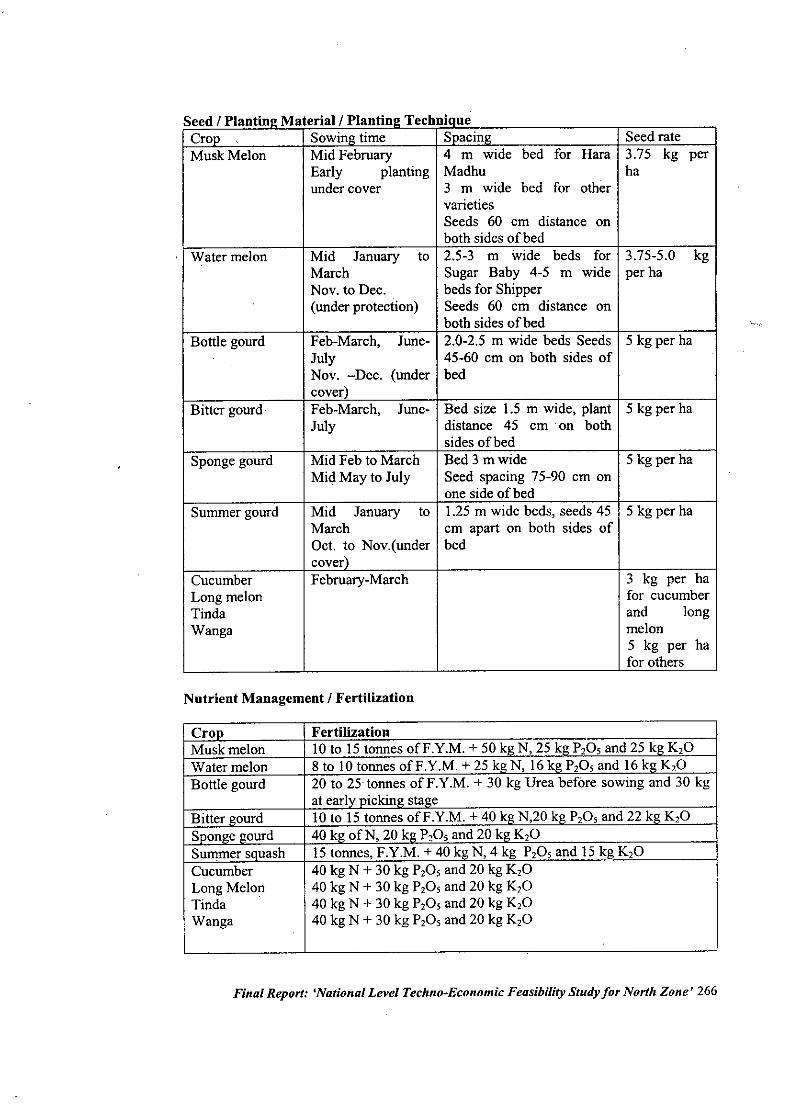
Seed I Plantinl! Material I PlantiDl' TechnioueCrop Sowing time Snacin" Seed rateMuskMelon Mid February 4 m wide bed for Hara 3.75 kg per
Early planting Madhu haunder cover 3 m wide bed for other
varietiesSeeds 60 cm distance onboth sides of bed
Watermelon Mid January to 2.5-3 m wide beds for 3.75-5.0 kgMarch Sugar Baby 4-5 m wide per haNov. to Dec. beds for Shipper(under protection) Seeds 60 em distance on
both sides of bedBottle gourd Feb-March, June- 2.0-2.5 m wide beds Seeds 5 kg per ha
July 45-60 cm on both sides ofNov. -Dec. (under bedcover)
Bitter gourd. Feb-March, June- Bed size 1.5 m wide, plant 5 kg per haJuly distance 45 cm on both
sides of bedSponge gourd Mid Feb to March Bed 3 mwide 5 kg per ha
Mid May to July Seed spacing 75-90 cm onone side of bed
Summer gourd Mid January to 1.25 m wide beds, seeds 45 5 kg per haMarch cm apart on both sides ofOct. to Nov.(under bedcover)
Cucumber February-March 3 kg per haLong melon for cucumberTinda and longWanga melon
5 kg per hafor others
Nutrient Management I Fertilization
eroMuskmelonWatermelonBottle gourd
Fertilization10 to 15 tonnes ofF.Y.M. + 50 k N, 25 k P,O, and 25 k K,O8 to 10 tonnes ofF.Y.M. + 25 k N, 16k P,O, and 16k K,O20 to 25 tonnes of F.Y.M. + 30 kg Urea before sowing and 30 kgat earl ickin sta e10 to 15 tonnes ofF.Y.M. +40 k N,20 k P,O, and 22 k K,O40 k ofN, 20 k P,O, and 20 k K,O15 tonnes, F.Y.M. + 40 k N, 4 kg P,O, and 15kg K,O40 kg N + 30 kg P,O, and 20 kg K,O40 kg N + 30 kg P,O, and 20 kg K,O40 kg N + 30 kg P,O, and 20 kg K,O40 kg N + 30 kg P,O, and 20 kg K,O
Final Repurt: 'National Level Techno-Economic Feasibility Study fur North Zune' 266
2.2.7.2.8.4
2.2.7.2.8.5
Water Management / Irrigation
In general first irrigation just after sowing. Subsequent irrigations depending upon
season. In summer season more frequent irrigations are required. In rainy season over
irrigation generally is harmful. Proper drainage during rainy season is required. Water
should not be allowed to touch the fruits. Generally 7 to 10 irrigations are requireddepending upon the crop and the season.
Pest and disease management
hnportant insect pests of cucurbits are red pumpkin beetle, Aphid and Jassid, Spider mite,
Fruit flies. hnportant disease include powdery mildew, downy mildew, collar rot,pythium rot, Alternaria blight, mosaic virus and root knot.
The spray schedule for all these insect pests and disease have been recommended.
Harvest Method and Yield
MuskMelon
Fruits on Hara Madhu to be harvested when turn yellow Other varieties to be harvested at
mature green stage for distant markets and at 'half slip' stage for local markets.
WaterMelon
Ready for harvest in 95-120 days of flowering. To be harvested when fruit is fully matureand sigo of maturity is drying of tendril.
Bottle Gourd
Crop ready in 60-70 days after sowing seed depending upon variety and season. Harvestonly tender to medium sized fruits.
Bitter Gourd
Crop is ready for harvesting in about 55-60 days after sowing depending upon variety andseason. Picking at 2 to 3 day interval.
Sponge Gourd
Crop is ready in about 70-90 days after sowing. Harvesting at 3 to 4 days interval.
Final Report: 'National Level Techno-Economic Feasibility Study for North Zone' 267
2.2.7.2.8.6
2.2.7.2.8.7
2.2.7.2.8.8
2.2.7.2.8.9
Summer Squash
Crop is ready for first picking 60-80 days after sowing depending upon variety and
season. Fruits become fit for harvesting after 7 days of fruit setting.
Cucumber
Crop is ready after 60-70 days of sowing
Long Melon
Crop is ready after 60-70 days of sowing
Tinda
Crop is ready after 60-70 days of sowing
Crop Economics
Authentic Data not available
Price Trend
No data on the price trend of any of the gourds is available.
Problems and Constraints
Since Melons are highly cross pollinated crops farmers should not use their own seed
every year.
Conclusions
Since most of the Cucurbits are cultivated along the river beds, there is a need to increase
the area under cultivation of these crops as there is a lot of availability of such areas.
Final Report: 'National Level Techno-Economic Feasibility Study for North Zone' 268
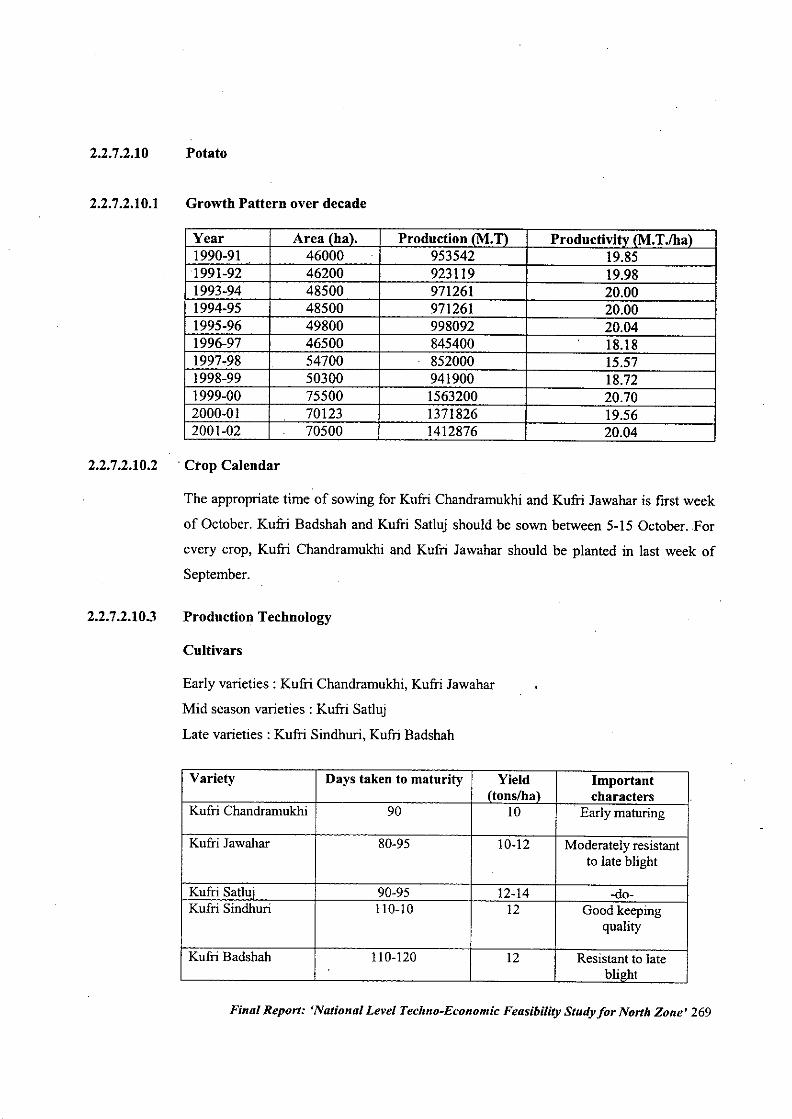
2.2.7.2.10 Potato
2.2.7.2.10.1 Growth Pattern over decade
Year Area (ha). Production (M.T) Productivity (M.T.lha)1990-91 46000 953542 19.851991-92 46200 923119 19.981993-94 48500 971261 20.001994-95 48500 971261 20.001995-96 49800 998092 20.041996-97 46500 845400 18.181997"98 54700 852000 15.571998-99 50300 941900 18.721999-00 75500 1563200 20.702000-01 70123 1371826 19.562001-02 70500 1412876 20.04
2.2.7.2.10.2 . Crop Calendar
The appropriate time of sowing for Kufri Chandramukhi and Kufri Jawahar is first week
of October. Kufri Badshah and Kufri Satluj should be sown between 5-15 October. For
every crop, Kufri Chandramukhi and Kufri Jawahar should be planted in last week of
September.
2.2.7.2.10.3 Production Technology
Cultivars
Early varieties: Kufri Chandramukhi, Kufri Jawahar
Mid season varieties: Kufri Satluj
Late varieties: Kufri Sindhuri, Kufri Badshah
Variety Days taken to maturity Yield ImportantItons/ha) characters
Kufri Chandramukhi 90 10 Early maturing
Kufri Jawahar 80-95 10-12 Moderately resistantto late blight
Kufri SaUui 90-95 12-14 -do-Kufri Sindburi 110-10 12 Good keeping
quality
Kufri Badshah 110-120 12 Resistant to lateblight
Final Report: 'National Level Techno-Economic Feasibility Study for North Zone' 269
Seed I Planting Material I Seed sonrce
Obtain the seed from a reliable source, preferably from a Government seed production
agency. It is beller to replace the seed every 3-4 years, because of using the same seed
year after year, there is increase in the number of viruses and the yield also reduces
progressively.
Field Preparation
Plough the field with a mould board or disc plough, followed by the disc harrow or the
tiller, depending upon the soil type. There should be proper drainage facility in the potato
field. Alkaline and Saline soils are not suitable for growing potatoes. In loamy sand soil,
discing alone is sufficient. If weeds or stubbles of the previous crop are not a problem,
potato can be grown with minimum tillage without loss in yield.
Sowing I Planting techniques I Seed rate and method of planting
After the field has been prepared well, mark rows with a row marker. A ridger should be
used for planting the crop manually. Semi automatic planters are recommended where
tractor power is available.
The quantity of seed used for planting depends upon its diameter. The tubers of about 30-
70g at the spacing of 55-60 cm between the rows and 20 cm between the tubers. In this
way, about 12 quintal tubers are sufficient for planting one acre. If the tuber of 100 gm
are used than these should be planted at spacing of about 30-40 cm. More than this size of
tuber can also be used but they should be cut before planting and each cut tubers should
at1east contain 2-3 eyes, weighed more than 25 gm and should be planted after 10'h
October. The cut tubers should be dipped in 0.25% Dithane M-45 solution for 5-10
minutes. Later on keep the treated seeds in a cool placel shade for 14-16 hours to dry
them and then use for planting in the field.
Seed preparation
The seed potatoes obtained from the cold store, can not be planted immediately. It should
first be dried with the help of blowers. Keep the treated seed in a cool placel shade
exposed in diffused sunlight for 8-10 days which initiates sprouting and helps the sprouts
to become strong. Keep the potatoes in basket or trays. If baskets or trays are not
Final Report: 'National Level Techno-Economic Feasibility Study for North Zone' 270
available then thepotatoes should be kept on the floor and the thickness of potatoes heaps
should not be more than 4 inches. Don't use the potati)es for sowing with poor sprouting
or with hairs.
Time of sowing
Different varieties have different time of sowing. The appropriate time of sowing for
Kufri Chandramukhi and Kufri Jawahar is ftrst week of October. Kufri Badshah and
Kufri Satluj should be sown between 5-15 October. For every crop, Kufri Chandramukhi
and Kufri Jawahar should be planted in last week of September. At that time, soil
temperature is low so there is more problem of rotting the tubers. To save the tubers from
rotting, use of mulching is highly beneficial. Mulching not only reduces the soil
temperature but also maintain humidity in the soil.
Nutrient management / Manures and Fertilizers
Twenty tonnes of farmyard manure or green manuring alongwith 50-60 kg N (50 kg for
early and 60 kg for late sown varieties), 20 kg P,Os and 40 kg K,O per acre should be
use. If the soil is sandy loam then drill all P and K and Y. N at sowing and the remaining
Nat 25-30 days after sowing i.e. at the time of earthing up.
Weed control and Earthing up
It is noticed that if at the time of sowing there is proper earthing up and weeds should be
destroyed by use of suitable chemical, then there is no effect of earthing up after sowing
on the yield of potato but if at the time of sowing, light earthing up is done then there is
need of later earthing up after 25-30 days of sowing. A double mould board plough or a
ridger should be used for earthing up. By this method, the number of green potatoes can
be reduced. :
For control of weeds use anyone of the following herbicides by dissolving in 250 litres
of water for one acre and spray within 10 days after sowing. At the time of using
herbicide, there should be proper moisture in the fteld.
I. Alachlore 1.0-2.0 kg / acre (Lasso 50% 2 to 2.4 litre)
2. Alachlor 0.5 kg lacre (Lasso 50% 1.0 liter) +Simazine 0.5 kg are (Tafazine 50 % 100g)
3. Pendimethalin 4'80-600 g1acre(Stomp 30 % I lit)
Final Report: 'National Level Techno-Economic Feasibility Study for North Zone' 271
2.2.7.2.10.3
2.2.7.2.1 0.4
If the weeds emerge in the field then parquet 240-300 g per are (Gramaxone 1.0-2.0 liter)
should be applied after IS days of sowing by dissolving in 250 litres of water.
Storage of Potato
After harvesting, cutted and mis-shapened rotted tubers should be removed. For home
consumption, the potatoes should be stored in cool and humid place with sufficient air
ventilation. High temperature results in high respiration rate of potatoes, which cause
heating and spoilage by rotting and sprouting. High humidity is desirable to avoid
excessive. shrinkage. For commercial use, the potatoes should be sorted, graded and
packed in perforated jute bags/ plastic mesh bags before storage, otherwise, black heart
symptoms will develop in the tubers. The local cold storage facilities should be available
for the.storage.ofpotato in large quantity and in the cold storage temperate ofO-4°C and
relative humidity of75-80% is required for long term storage.
Pest and disease management
Late blight of Potato is a common disease. Spray Mancozeb 0.2% at 15 days interval.
Use resistant varieties like kufri sutlej, kufri Badshah and kufri Ashoka. Early blight or
leaf spot complex is also serious. This is also controlled by mencozeb + 2% urea spray.
Mosaic and other virus diseases are also serious. The seeds should be replaced every 2-3
years and spray Monocrotophos or Dimethoate 0.02% to check aphids which spread the
disease. Tuber moth and cut worms are serious pests. The soil around plant should be
drenched with Carbaryl 50 wp (2kg/ha) or Endosulphan 25EC 1.25 lit/ha. Besides this,
Aphids, mites or tuber moth also damage which are controlled with monocrotophos
spray.
Harvest method and yield
The mature potatoes should not be allowed to remain in the soil which means harvesting
should not be delayed. After harvest potato should be surface dried and kept in shade for
10-15 days, graded and packed in gunny bags. The Yield of Potatoes is .comparatively
much better in the state varying between 15 to 30 tons per hectare. The variety wise yield
is as under:
Final Report: 'National Level Techno-Economic Feasibility Study for North Zone' 272
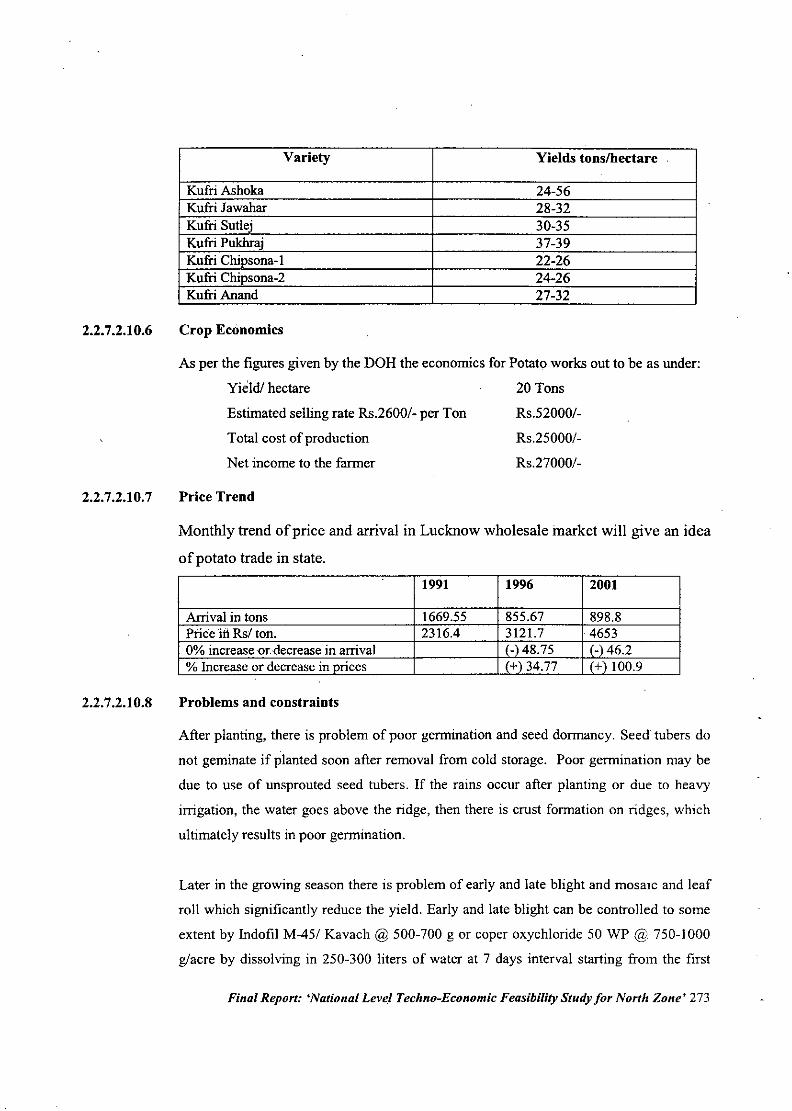
2.2.7.2.10.6
Variety Yields tons/hectare.
Kufri Ashoka 24-56Kufri Jawahar 28-32Kufri Sutlej 30-35Kufri Pukhraj 37-39Kufri Chipsona-I 22-26Kufri Chipsona-2 24-26Kufri Anand 27-32
Crop Economics
As per the figures given by the DOH the economics for Potato works out to be as under:
Yield! hectare 20 Tons
2.2.7.2.10.7
Estimated seIling rate Rs.2600/- per Ton
Total cost of production
Net income to the farmer
Price Trend
Rs.52000/-
Rs.25000/-
RS.27000/.
2.2.7.2.10.8
Monthly trend of price and arrival in Lucknow wholesale market will give an idea
of potato trade in state.
1991 1996 2001
Arrival in tons 1669.55 855.67 898.8Price in Rs/ ton. 2316.4 3121.7 46530% increase 'or:decrease in arrival (-)48.75 (-) 46.2% Increase or decrease in prices (+) 34.77 (+) 100.9
Problems and constraints
After planting, there is problem of poor germination and seed dormancy. Seed tubers do
not geminate if planted soon after removal from cold storage. Poor germination may be
due to use of unsprouted seed tubers. If the rains occur after planting or due to heavy
irrigation, the water goes above the ridge, then there is crust formation on ridges, which
ultimately results in poor germination.
Later in the growing season there is problem of early and late blight and mosaic and leaf
roll which significantly reduce the yield. Early and late blight can be controlled to some
extent by Indofil M-45/ Kavach @ 500-700 g or coper oxychloride 50 WP @ 750-1000
g1acre by dissolving in 250-300 liters of water at 7 days interval starting from the first
Final Report: 'National Level Techno-Economic Feasibility Study for North Zone' 273
2.2.7.2.10.9
week of November. But it is very difficult to control the viruses. We can produce the
virus free seeds through seed plot technique. Due to more problem of viruses, farmers are
advised not to use the same seed for more than 3 years.
By the use of tractor ,!perated diggers, large quantity of potato is wasted due to cut on the
surface of tubers by the blades of the diggers. Moreover, the cold storages meant for
potato seed have problem of irregular power supply leading to unnecessary wastage. The
high initial investment for large quantity of seeds is also the main constraint i.e farmers
use same seed year after year which ultimately reduce the yield due to increase in number
and concentration of viruses in the tubers.
COIiclusions
This crop has a tremendous scope of increasing area production and productivity. The
processing industries like chips, fingers and other product factories should be established.
Final Report: 'National Level Techno-Economic Feasibility Study for'North Zone' 274
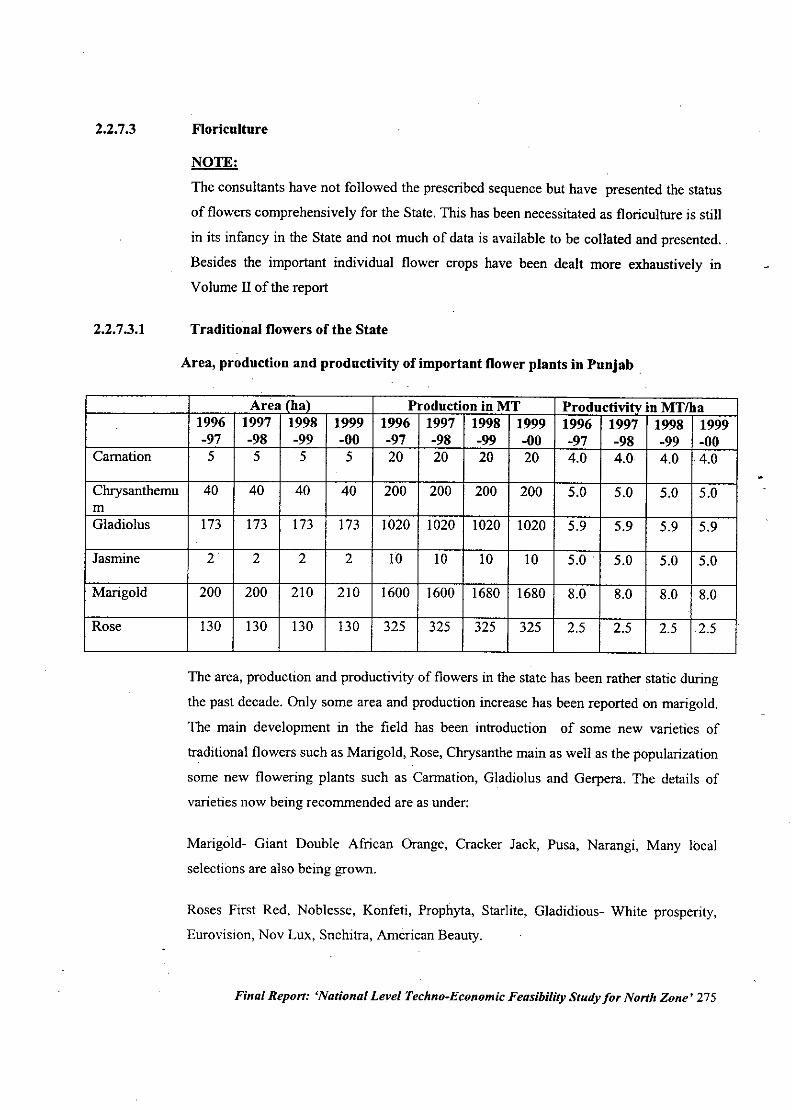
2.2.7.3
2.2.7.3.1
Floriculture
NOTE:
The consultants have not followed the prescribed sequence but have presented the status
of flowers comprehensively for the State. This has been necessitated as floriculture is still
in its infancy in the State and not much of data is available to be collated and presented.
Besides the important individual flower crops have been dealt more exhaustively inVolume II of the report
Traditional flowers of the State
Area, production and productivity of important flower plants in Punjab
Area (ha) Production in MT Productivity in MTfha1996 1997 1998 1999 1996 1997 1998 1999 1996 1997 1998 1999-97 -98 -99 -00 -97 -98 -99 -00 -97 -98 -99 -00
Carnation 5 5 5 5 20 20 20 20 4.0 4.0 4.0 4.0
Chrysanthemu 40 40 40 40 200 200 200 200 5.0 5.0 5.0 5.0rnGladiolus 173 173 173 173 1020 1020 1020 1020 5.9 5.9 5.9 5.9
.
Jasmine 2 2 2 2 10 10 10 10 5.0 5.0 5.0 5.0
Marigold 200 200 210 210 1600 1600 1680 1680 8.0 8.0 8.0 8.0
Rose 130 130 130 130 325 325 325 325 2.5 2.5 2.5 2.5
The area, production and productivity of flowers in the state has been rather static during
the past decade. Only some area and production increase has been reported on marigold.
The main development in the field has been introduction of some new varieties of
traditional flowers such as Marigold, Rose, Chrysanthe main as well as the popularization
some new flowering plants such as Carmation, Gladiolus and Gerpera. The details of
varieties now being recommended are as under:
Marigold- Giant Double African Orange, Cracker Jack, Pusa, Narangi, Many local
selections are also being grown.
Roses First Red, Noblesse, Konfeti, Prophyta, Starlite, Gladidious- White prosperity,Eurovision, Nov Lux, Snchitra, American Beauty.
Final Report: 'National Level Techno-Economic Feasibility Study for North Zone' 275
Chrysanthemum- Birbal Sohni, Baggi, Tatlam selction
Carnation- Scania, Arthur Sim, White Sim, William Sim.
Tube Rose- The Pearl
Technical information available
The research done at P.A.U. and H.A.U has yielded scientific information or gradiolus
chrysanthemum, marigold, carnation, roses, seed production etc. The recommendation
available in these crops, which could be utilized in production highest yieldlha. Some are
briefly described:
2.2.7.3.1.1. Ilose
As explained in the Production of Cut Flowers at Item NO."2.2.7.3.2.1"
2.2.7.3.1.2
2.2.7.3.1.3
Marigold
By making three plantings VIZ. July, September and February, the flowers can be
produced round the years. Seedlings are raised a month prior in raised nursery beds by
sowing 600 g seed per ha. The common varieties planted are : Giant Double African
Orange, Cracker Jack, Pusa Narangi etc. Field is prepared by incorporating 100 tons of
well rotten FYM, 200kg N, 100 kg P,Os and 100 kg K,Olha. Application of remaining
200 kg Nlha is applied after the month of transplanting. Flower production starts 60-70
days after transplanting. A good yield of 500, 600 , 200 qlha is obtained during rainy,
winter and summer plantings, respectively. Plants are commonly attacked by black leaf
spot disease which can be controlled by spraying .2% Dithane M-45.
Jasmine
Prospects
At present, gladiolus, tube rose and rose are main cut flowers, which are grown in these
two states for local markets only. The estimated areas under gladiolus, tube rose open
grown rose is about 80 ha. The area under greenhouse is about .10 ha. Domestic demand
of flowers is increasing @ 10% every years which can be judged by opening of several
retails outlets in various towns which are good indicator of increasing demand which
ultimate results in increased employment. Thus various further floriculture activities can
be started and reasonable diversification and increased prosperity of farmers can be
achieved. Various floricultural activities need further strengthening are:
Final Report: 'National Level Techno-Economic Feasibility Study for North Zone' 276
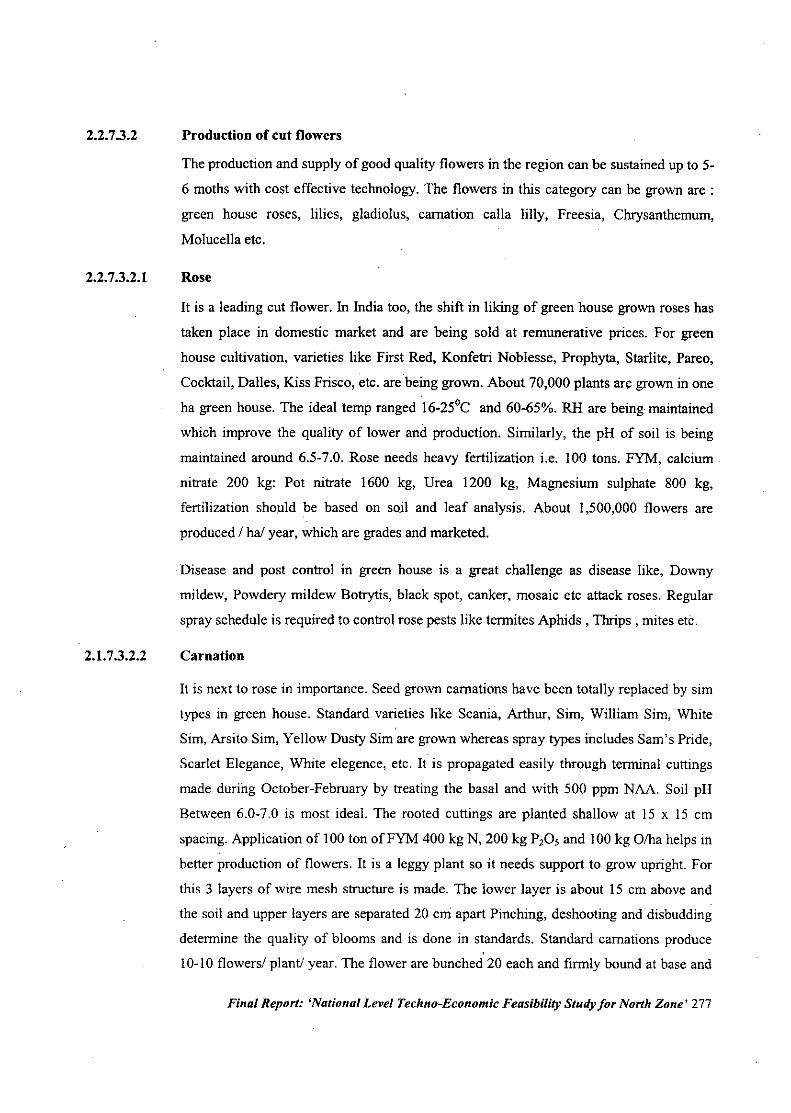
2.2.7.3.2 Production of cut flowers
The production and supply of good quality flowers in the region can be sustained up to 5-
6 moths with cost effective technology. The flowers in this category can be grown are:
green house roses, lilies, gladiolus, carnation calla lilly, Freesia, Chrysanthemum,
Molucella etc.
2.2.7.3.2.1 Rose
It is a leading cut flower. In India too, the shift in liking of green house grown roses has
taken place in domestic market and are being sold at remunerative prices. For green
house cultivation, varieties like First Red, Konfetri Noblesse, Prophyta, Starlite, Pareo,
Cocktail, Dalles, Kiss Frisco, etc. are being grown. About 70,000 plants are grown in one
ha green house. The ideal temp ranged 16-250C and 60-65%. RH are being maintained
which improve the quality of lower and production. Similarly, the pH of soil is being
maintained around 6.5-7.0. Rose needs heavy fertilization i.e. 100 tons. FYM, calcium.
nitrate 200 kg: Pot nitrate 1600 kg, Urea 1200 kg, Magnesium sulphate 800 kg,
fertilization sho.uld be based on so.il and leaf analysis. About 1,500,000 flowers are
produced / hal year, which are grades and marketed.
Disease and post control in green house is a great challenge as disease like, Downy
mildew, Powdery mildew Botrytis, black spot, canker, mosaic etc attack roses. Regular
spray schedule is required to control rose pests like termites Aphids, Thrips, mites etc.
2.1.7.3.2.2 Carnation
It is next to rose in importance. Seed grown carnations have been totally replaced by sim
types in green house. Standard varieties like Scania, Arthur, Sim, William Sim, White
Sim, Arsito Sim, Yellow Dusty Sim are grown whereas spray types includes Sam's Pride,
Scarlet Elegance, White elegence, etc. It is propagated easily through terminal cuttings
made during October-February by treating the basal and with 500 ppm NAA. Soil pH
Between 6.0-7.0 is most ideal. The rooted cuttings are planted shallow at IS x IS em
spacing. Application of 100 ton ofFYM 400 kg N, 200 kg PzO, and 100 kg Olba helps in
better production of flowers. It is a leggy plant so it needs support to grow upright. For
this 3 layers of wire mesh structure is made. The lower layer is about 15 em above and
the soil and upper layers are separated 20 em apart Pinching, deshooting and disbudding
determine the quality of blooms and is done in standards. Standard carnations produce
10-10 flowers/ plant! year. The flower are bunched 20 each and firmly bound at base and
Final Report: 'National Level Techno-Economic Feasibility Study for North Zone' 277
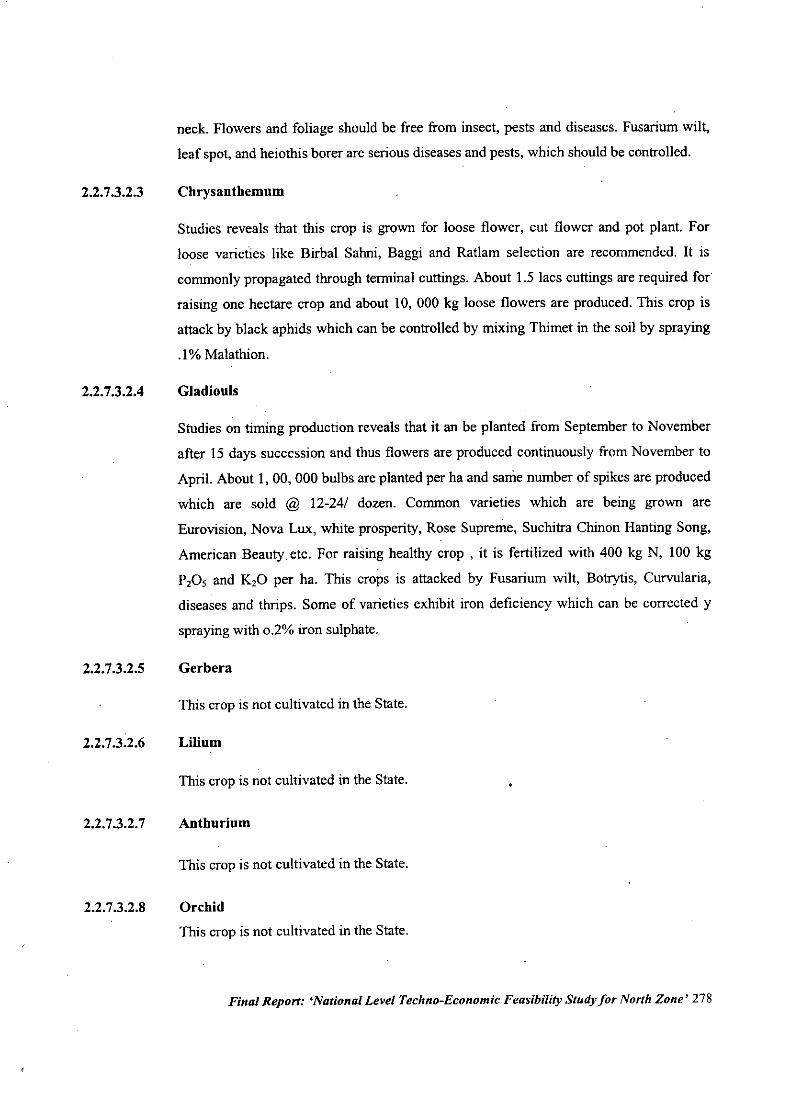
2.2.7.3.2.3
2.2.7.3.2.4
2.2.7.3.2.5
2.2.7.3.2.6
2.2.7.3.2.7
2.2.7.3.2.8
neck. Flowers and foliage should be free from insect, pests and diseases. Fusarium wilt,
leaf spot, and heiothis borer are serious diseases and pests, which should be controlled.
Chrysanthemum
Studies reveals that this crop is grown for loose flower, cut flower and pot plant. For
loose varietIes like Birbal Sahni, Baggi and Ratlam selection are recommended. It is
commonly propagated through terminal cuttings. About 1.5 lacs cuttings are required for
raising one hectare crop and about 10, 000 kg loose flowers are produced. This crop is
attack by black aphids which can be controlled by mixing Thimet in the soil by spraying
.1% Malathion.
Gladiouls
Studies on timing production reveals that it an be planted from September to November
after 15 days succession and thus flowers are produced continuously from November to
April. About 1, 00, 000 bulbs are planted per ha and same number of spikes are produced
which are sold @ 12-24/ dozen. Common varieties which are being grown are
Eurovision, Nova Lux, white prosperity, Rose Supreme, Suchitra Chinon Hanting Song,
American Beauty etc. For raising healthy crop, it is fertilized with 400 kg N, 100 kg
P,Os and K,O per ha. This crops is attacked by Fusarium wilt, Botrytis, Curvularia,
diseases and thrips. Some of varieties exhibit iron deficiency which can be corrected y
spraying with 0.2% iron sulphate.
Gerbera
This crop is not cultivated in the State.
Lilinm
This crop is not cultivated in the State.
Anthurium
This crop is not cultivated in the State.
Orchid
This crop is not cultivated in the State.
Final Repart: 'National Level Techno-Economic Feasibility Study for North Zone' 278
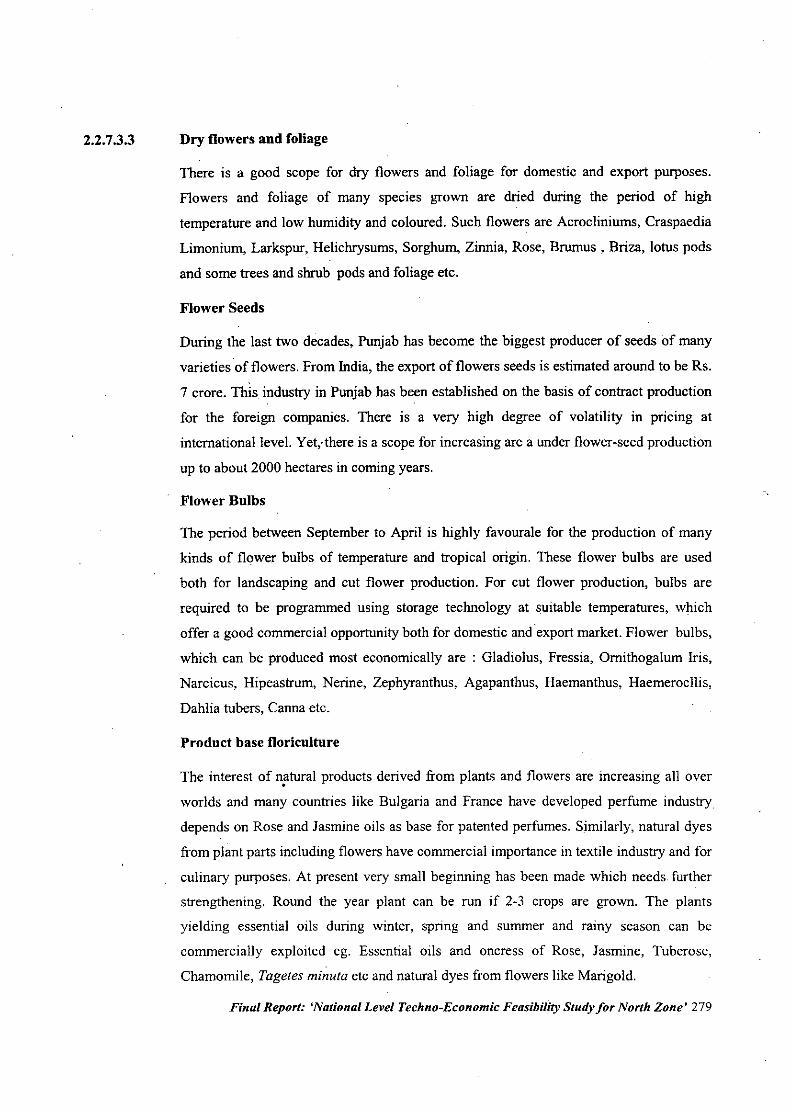
2.2.7.3.3 Dry flowers and foliage
There is a good scope for dry flowers and foliage for domestic and export purposes.
Flowers and foliage of many species grown are dried during the period of high
temperature and low humidity and coloured. Such flowers are Acrocliniums, Craspaedia
Limonium, Larkspur, Helichrysums, Sorghum, Zinnia, Rose, Brumus , Briza, lotus pods
and some trees and shrub pods and foliage etc.
Flower Seeds
During the last two decades, Punjab has become the biggest producer of seeds of many
varieties of flowers. From India, the export of flowers seeds is estimated around to be Rs.
7 crore. This industry in Punjab has been established on the basis of contract production
for the foreign companies. There is a very high degree of volatility in pricing at
international level. Yet,.there is a scope for increasing are a under flower-seed production
up to about 2000 hectares in coming years.
Flower Bulbs
The period between September to April is highly favourale for the production of many
kinds of flower bulbs of temperature and tropical origin. These flower bulbs are used
both for landscaping and cut flower production. For cut flower production, bulbs are
required to be programmed using storage technology at suitable temperatures, which
offer a good commercial opportunity both for domestic and'export market. Flower bulbs,
which can be produced most economically are : Gladiolus, Fressia, Ornithogalum Iris,
Narcicus, Hipeastrum, Nerine, Zephyranthus, Agapanthus, Haemanthus, Haemerocllis,
Dahlia tubers, Canna etc.
Product base floriculture
The interest of n!,tural products derived from plants and flowers are increasing all over
worlds and many countries like Bulgaria and France have developed perfume industry
depends on Rose and Jasmine oils as base for patented perfumes. Similarly, natural dyes
from plant parts including flowers have commercial importance in textile industry and for
culinary purposes. At present very small beginning has been made which needs further
strengthening. Round the year plant can be run if 2-3 crops are grown. The plants
yielding essential oils during winter, spring and summer and rainy season can be
commercially exploited ego Essential oils and oncress of Rose, Jasmine, Tuberose,
Chamomile, Tagetes minuta etc and natural dyes from flowers like Marigold.
Final Report: 'National Level Techno-Economic Feasibility Study for North Zone' 279
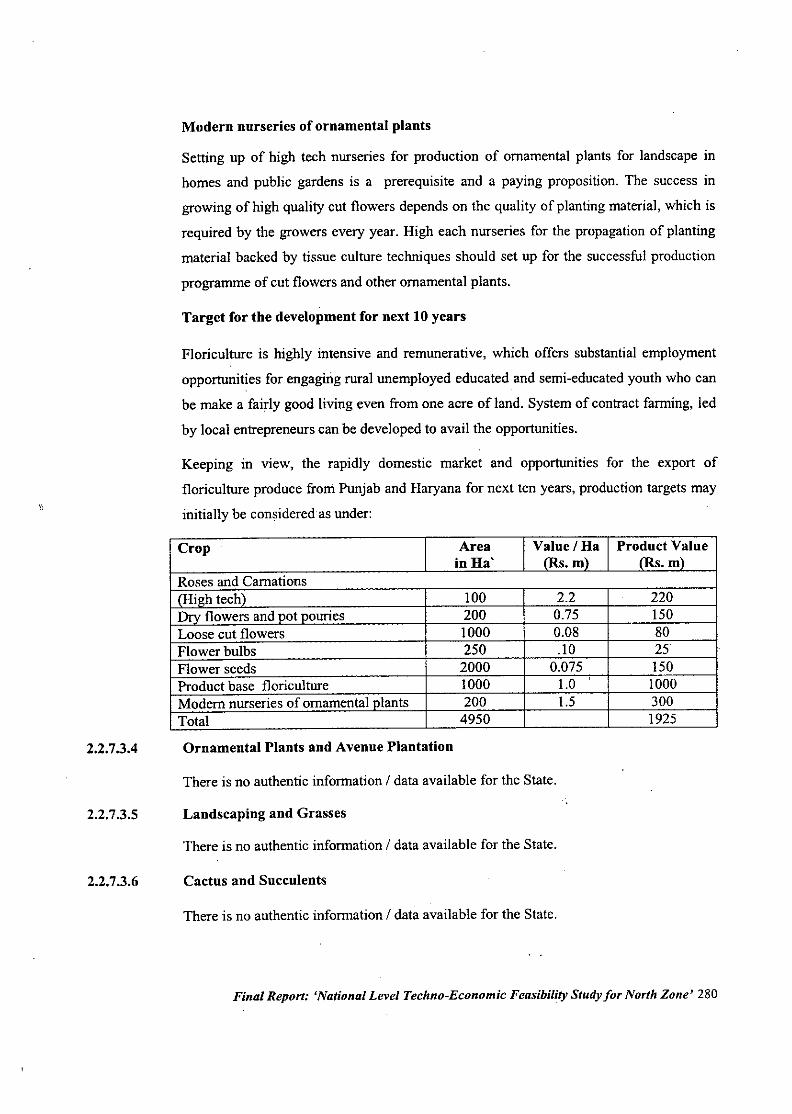
2.2.7.3.4
2.2.7.3.5
2.2.7.3.6
Modern nurseries of ornamental plants
Setting up of high tech nurseries for production of ornamental plants for landscape in
homes and public gardens is a prerequisite and a paying proposition. The success in
growing of high quality cut flowers depends on the quality of planting material, which is
required by the growers every year. High each nurseries for the propagation of planting
material backed by tissue culture techniques should set up for the successful production
programme of cut flowers and other ornamental plants.
Target for the development for next 10 years
Floriculture is highly intensive and remunerative, which offers substantial employment
opportunities for engaging rural unemployed educated and semi-educated youth who can
be make a fairly good living even from one acre of land. System of contract farming, led
by local entrepreneurs can be developed to avail the opportunities.
Keeping in view, the rapidly domestic market and opportunities for the export of
floriculture produce from Punjab and Haryana for next ten years, production targets may
initially be considered as under:
Crop Area Value I Ha Product Valuein Ha' IRs. m) IRs. m)
Roses and Carnations(High tech) 100 2.2 . 220Drv flowers and pot pouries 200 0.75 150Loose cut flowers 1000 0.08 80Flower bulbs 250 .10 25Flower seeds 2000 0.075 150Product base floriculture 1000 1.0 1000Modern nurseries of ornamental plants 200 1.5 300Total 4950 1925Ornamental Plants and Avenue Plantation
There is no authentic information I data available for the State.
Landscaping and Grasses
There is no authentic information I data available for the State.
Cactus and Succulents
There is no authentic information I data available for the State.
Final Report: 'National Level Techno-Economic Feasibility Study for North Zone' 280
2.2.7.4
2.2.7.5
2.2.7.5.7
2.2.7.5.7.1
2.2.7.5.7.2
2.2.7.5.7.3
Medicinal and Aromatic Plants
There is no authentic information / data available for the State.
Spices
Garlic
Common garlic (Allium sativum L.) and great headed garlic (Allium ampeloprasum L.)
in India is the second most widely cultivated Allium after onion. It has since long been
recogoized all over the world as a .valuable spice and remedy for various ailments. It has
a.high nutritive value. Recently there has been noticeable increase in area under garlic in
the state though the exact figures are not yet available.
Growth Pattern over last decade
Crop Calendar
Optimum time of sowing time is from last week of Sept. to the first week of October.
Production Technology
Improved varieties
Punjab Garlic-I, Garlic- 56-4
Seed / Planting material
Optimum timc of sowing time is from last week of Sept. to the first week of October.
Sowing / Planting techniques
Put the cloves at 3 to cm .depth. The sowing is done by kera method.
Spacing
Close planting at 15 cm between rows and 7.5 cm between plants is recommended.
Seed rate
225-250 kg of healthy cloves are needed for planting one acre of garlic.
Final Report: 'National Level Techno-Economic Feasibility Study for North Zone' 281
2.2.7.5.8.4
2.2.7.5.8.5
2.2.7.5.8.8
2.2.7.5.8.9
Nutrient management IManuring and Fertilizer. Twenty tones of F.Y.M. 50 kg N (100 kg Urea) and 25 kg Phosphorous (115 kg
superphosphate) is recommended. Apply nitrogen in three equal splits, 30,45 and 60 days
after sowing.
Water Management I IrrigationFirst irrigation is given immediately after planting. Subsequent irrigation are to be given
at 10-15 day interval depending upon soil type and weather conditions.
Pest and disease management
Garlic has the same insect pests and diseases as in onion. Similar plant protection
measures are recommended for this crop also.
Harvest method and yield
At maturity the tops dry. Stop irrigation atleast a fortnight before harvesting to prolong
storage life of bulhs. After harvesting cure the plants in a dry and shady places for 5-7
days- tie in small bundles to store in a well ventilated dry place. Sort act-bulbs with dried
cloves during storage.
Problem & constraints
Good varieties which meet the demands of the foreign markets and required planting
material have to be arranged.
Conclusion
Garlic demand both in the domestic market and foreign markets is increasing Punjab state
has a good potential of growing this crop in a large scale.
Final Report: 'National Level Techno-Economic Feasibility Study for North Zone' 282
2.2.7.6
2.2.7.6.1
2.2.7.6.2
2.2.7.6.2.1
2.2.7.6.2.2
2.2.7.6.2.3
Mushroom
Wild
No authentic information / data is available for the wild grown mushroom in the State.
Cultivated
Introduction
There are about 400 mushroom growing units in Punjab which harvest 6000-7000 tonnes
of fresh mushrooms annually. These units are mainly situated in the Districts of Patiala,
Ropar and Hoshiarpur.
Growth Pattern over last decade
No authentic data is available.However, about 6000 - 7000 tons are produced annually.
Crop Calendar
Appearance of mushrooms- small buttons of mushroom start appearing about two weeks
after casing and each one matures in 2-3 days. Mushroom should be picked daily just
before they open out.
Production Technology
Two types of production system for the production of mushroom are adopted in Punjab.
(a) Temperate Mushroom (Sept.- March - 2 crops)
Improved strains are S IT PAU Selection
Production of comport states in mid September. Three types of composting using wheat
straw, wheat straw along with paddy straw and wheat straw with biogas slurry are used.
Recommendations with regard to preparation of compost, filling and spawning, casing or
covenng, arrangement of trays have been made by P.A.U.
Appearance of mushrooms- small buttons of mushroom start appearing about two weeks
after casing and each one matures in 2-3 days.
Final Report: 'National Level Techno-Economic Feasibility Study for North Zone' 283
Picking
Mushroom should be picked daily just before they open out.
Packing and storage
Small pockets of 200 g each should be made in perforated polythene bags for marketing
as fresh mushrooms.
Yield
One square meter bed gives 8 kg of fresh mushroom in one season and its cost is Rs. 15-
16 to produce 1 kg of freshmushrooms.
(b) Tropical Mushrooms (April-August, 4 crops)
Paddy straw (not more than one year old o~ly is recommended in this).
Full details of preparation of bundles, lying of beds spawning and seeding, watering and
ventilation are provided by the PAU scientists. Small buttons start appearing after 7-9
days of supa spawning. They are ready to be picked on 10th day. Mushroom continue to
appear 15-20 days in flushes. 11 takes about one month to have one crop of this
mushroom and consequently four crops can be taken for the end of April to August.
Packing
Small packing of 200 g each should be made in perforated polythene bags for marketing.
This mushroom an be dried in shade or sun under natural climatic cpnditions.
Yield and economicsEach bed of 22 kg dry paddy straw yield 2.5-3 kg fresh mushroom in the above
mentioned period. lis cost of production varies from Rs. 9-10 per kg.
Dhingri (October- April, 3 crops) .The state department of Horticulture has taken up vigorously the cultivation of Dhingri in
the villages of local markets. This is one of the thrust areas of the department. Such
details have been given earlier under the Caption- Thrust areas of the state department of
Horticulture.
Material required include perforated polythene bags (having holes of I cm diameter at a
distance of 5 ern) cut paddy straw/ wheat straw, spawn and gunny thread varieties -
Final Report: 'National Level Techno-Economic Feasibility Study for North Zone' 284
2.2.7.6.2.4
2.2.7.6.2.5
2.2.7.6.2.7
2.2.7.6.2.8
2.2.7.6.2.9
Pleurotus florida (PF-5), Pleurtus Sayor- Caju (PSC-3) and Pleurotus Ostreatus (P02) can
be activated in October -March, Nov. to February and Dec. - January, respectively.
The detailed methodology of growing this mushroom has been recommended by P.A.D.
Yield --each crop will yield 400-500 g of fresh mushroom per kg dry straw.
Pest and disease management
Mushroom flies is the main pest of mushroom. The central measure consist of Nuvan
spray. Avoid direct spraying of beds, only the room walk, ceiling and window panes and
ceiling of the room are to be sprayed.
Harvest method and yield
One square meter bed gives 8 kg of fresh mushroom in one season and its cost is Rs. 15-
16 to produce 1 kg of fresh mushrooms.
Price trend
No authentic information / data is available.
Problems and Constraints
Supp}¥ of good quality spawn, maintaining hydienic conditions in the production room,
proper packaging and marketing are the main constraints. Conclusion market demand for
mushroom is fast increasing both in Indian markets as well as foreign markets. There is a
good scope for increasing production, however, production system has to be made
economically efficient to compete in foreign markets.
Conclusions
This is a need for steady supply of good quality spawn and training of the cultivators in
proper maintenance ofhygenic conditions in the production rooms. There is also a need
to control the humidity levels within the production area.
Final Report: 'National Level Techno-Economic Feasibility Study for North Zone' 285
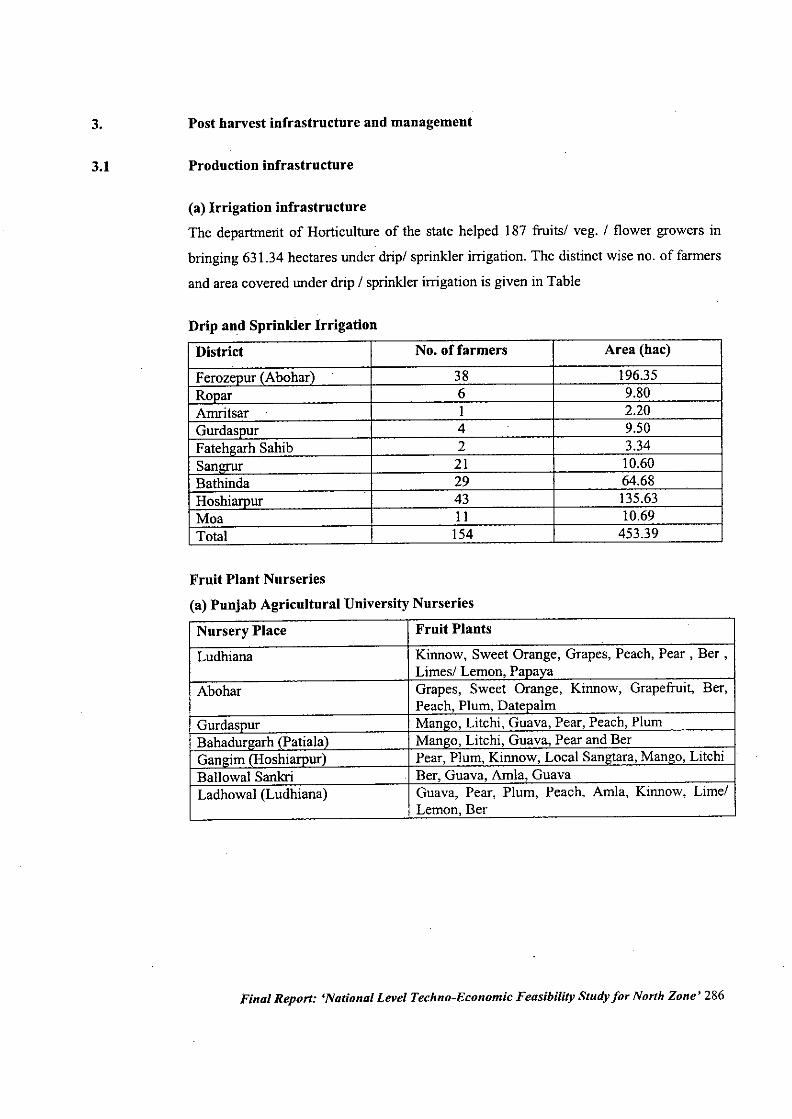
3.
3.1
Post harvest infrastructure and management
Production infrastructure
(a) Irrigation infrastructureThe departmeIit of Horticulture of the state helped 187 fruits/ veg. / flower growers in
bringing 631.34 hectares under drip/ sprinkler irrigation. The distinct wise no. of farmers
and area covered under drip / sprinkler irrigation is given in Table
Drip and Sprinkler Irrigation
District No. offarmers Area (hac)
Ferozeour (Abohar) 38 196.35Rooar 6 9.80Arnritsar I 2.20Gurdasnur 4 9.50Fatehgarh Sahib 2 3.34Sangrur 21 10.60Bathinda 29 64.68Hoshiamur 43 135.63Moa II 10.69Total 154 453.39
Fruit Plant Nurseries
(a) Punjab Agricultural University Nurseries
Nursery Place Fruit Plants
Ludhiana Kinnow, Sweet Orange, Grapes, Peach, Pear, Ber ,Limes/ Lemon, Pa a a
Abohar Grapes, Sweet Orange, Kinnow, Grapefruit, Ber,Peach, Plum, Date aimMan 0, Litchi, Guava, Pear, Peach, PlumMan 0, Litchi, Guava, Pear and BerPear, Plum, Kinnow, Local San ra, Man 0, LitchiBer, Guava, Amla, GuavaGuava, Pear, Plum, Peach, Amla, Kinnow, Lime/Lemon, Ber
Final Report: 'National Level Techno-Economic Feasibility Study for North Zone' 286
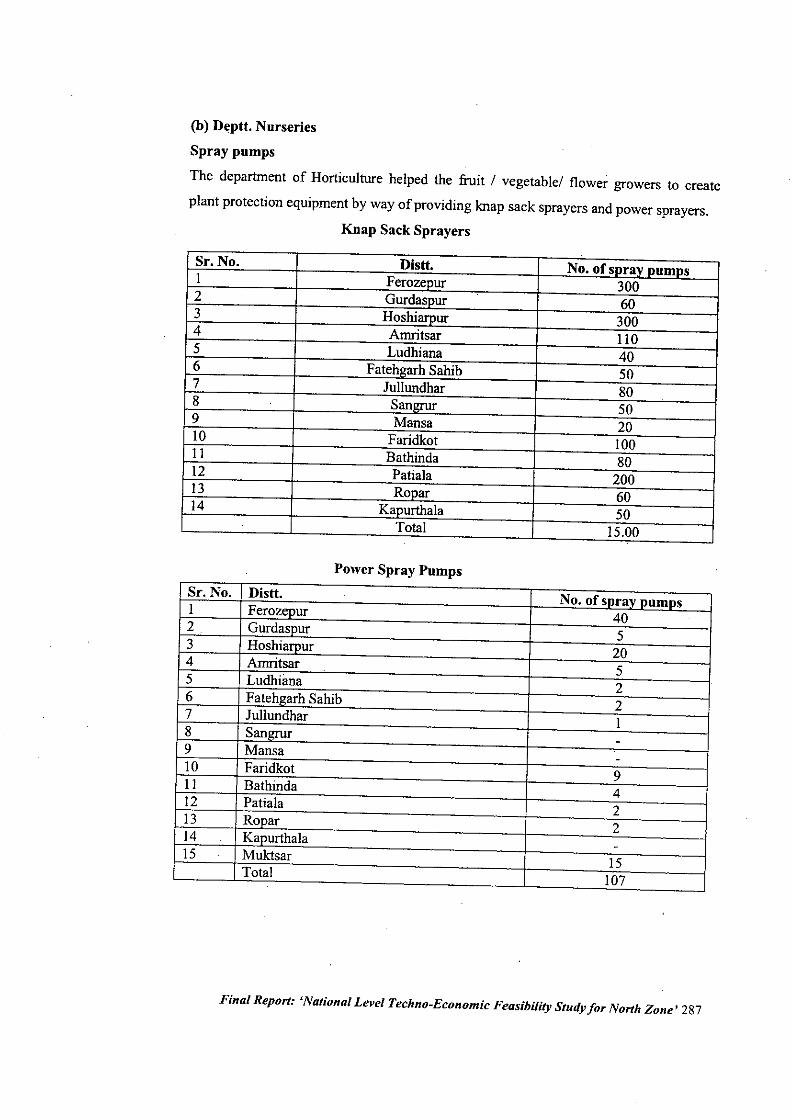
(b) Deptt. Nurseries
Spray pumps
The department of Horticulture helped the fruit / vegetable/ flower growers to create
plant protection equipment by way of providing knap sack sprayers and power sprayers.
Knap Sack Sprayers
Sr. No. Distt. No. of snrav DumpsI Ferozepur 3002 Gurdaspur 603 Hoshiarpur 3004 Amritsar 1105 Ludhiana 406 Fatehgarh Sahib 507 Jullundhar 808 Sangrur 509 Mansa 2010 Faridkot 10011 Bathinda 8012 Patiala 20013 Ropar 6014 Kapurthala 50
Total 15.00
Power Spray Pumps
Sr. No. Distt. No. of spray pumpsI Ferozepur 402 Gurdaspur 53 Hoshiarpur 204 Amritsar 55 Ludhiima 26 Fatehgarh Sahib 27 Jullundhar 18 Sangrur -9 Mansa -10 Faridkot 9II Bathinda 412 Patiala 213 Ropar 214 Kapurthala -15 Muktsar 15Total 107
Final Report: 'National Level Techno-Economic Feasibility Study fOT North Zone' 287
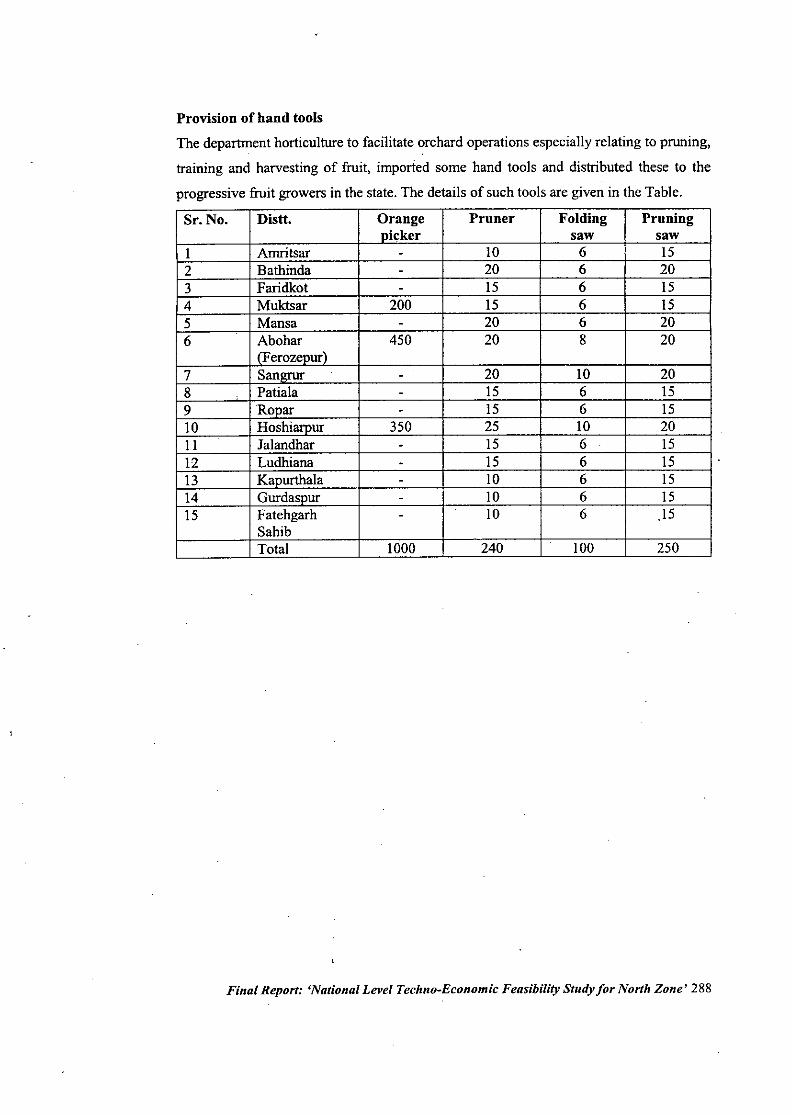
Provision of hand tools
The department horticulture to facilitate orchard operations especially relating to pruning,
training and harvesting of fruit, imported some hand tools and distributed these to the
progressive fruit growers in the state. The details of such tools are given in the Table.
Sr. No. Distt. Orange Pruner Folding Pruningnicker saw saw
I Amritsar - 10 6 IS2 Bathinda - 20 6 203 Faridkot - IS 6 IS4 Muktsar 200 IS 6 IS5 Mansa - 20 6 206 Abohar 450 20 8 20
(Ferozenur)7 SanlrrUT - 20 10 208 Patiala - IS 6 IS9 Ropar - IS 6 IS10 Hoshiarour 350 25 10 2011 Jalandhar - IS 6 IS12 Ludhiana - IS 6 IS13 Kanurthala - 10 6 IS14 Gurdasnur - 10 6 ISIS Fatehgarh - 10 6 .15
SahibTotal 1000 240 100 250
Final Report: 'National Level Techno-Economic Feasibility Study for North Zone' 288
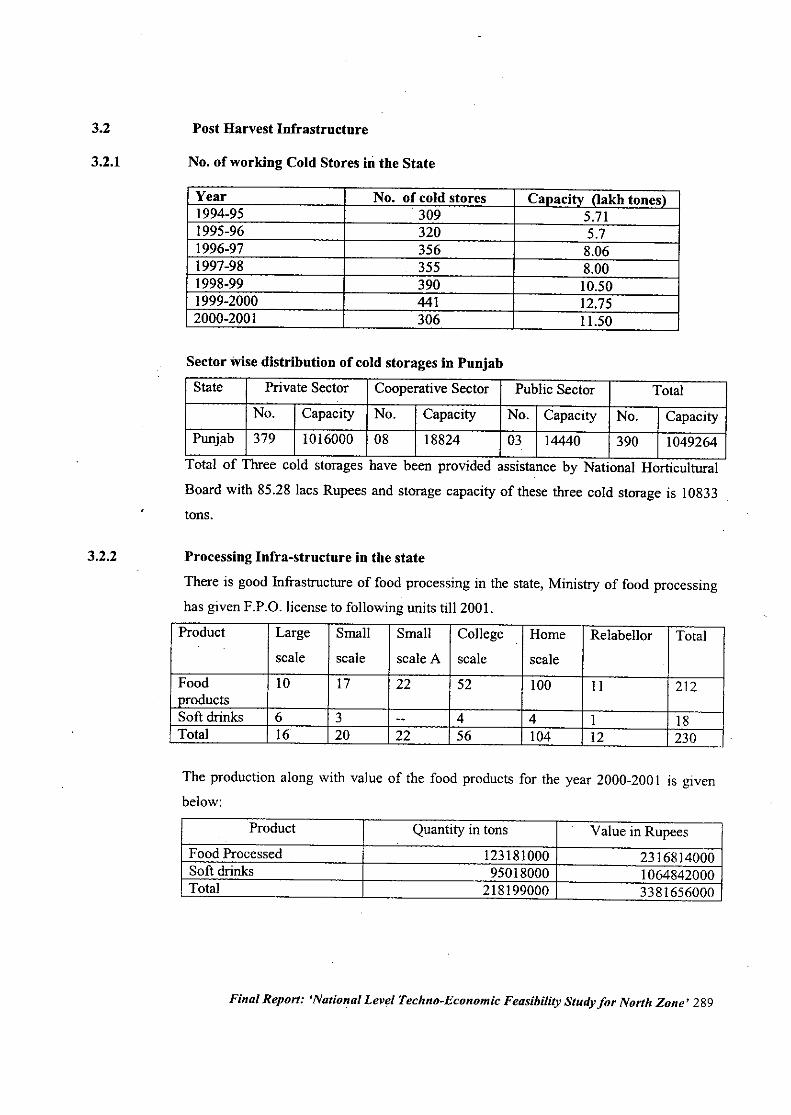
3.2 Post Harvest Infrastructure
3.2.1 No. of working Cold Stores hi the State
Year No. of cold stores Caoacitv (]akh tones)1994-95 309 5.711995-96 320 5.71996-97 356 8.061997-98 355 8.001998-99 390 10.501999-2000 441 12.752000-2001 306 11.50
Sector wise distribution of cold storages in Pnnjab
State Private Sector Cooperative Sector Public Sector TotalNo. Capacity No. Capacity No. Capacity No. Capacity
Punjab 379 1016000 08 18824 03 14440 390 1049264Total of Three cold storages have been provided assistance by National Horticultural
Board with 85.28 lacs Rupees and storage capacity of these three cold storage is 10833tons.
3.2.2 Processing Infra-structure in the state
There is good Infrastructure of food processing in the state, Ministry of food processinghas given F.P.O. license to following units till 2001.Product Large Small Small College Home Relabellor Total
scale scale scale A scale scaleFood 10 17 22 52 100 11 212
I productsSoft drinks 6 3 -- 4 4 I 18Total 16 20 22 56 104 12 230
The production along with value of the food products for the year 2000-200 I IS gIvenbelow:
Product Quantity in tons . Value in RupeesFood Processed 123181000 2316814000Soft drinks 95018000 1064842000Total 218199000 3381656000
Final Report: 'National Level Techno-Economic Feasibility Study for North Zone' 289
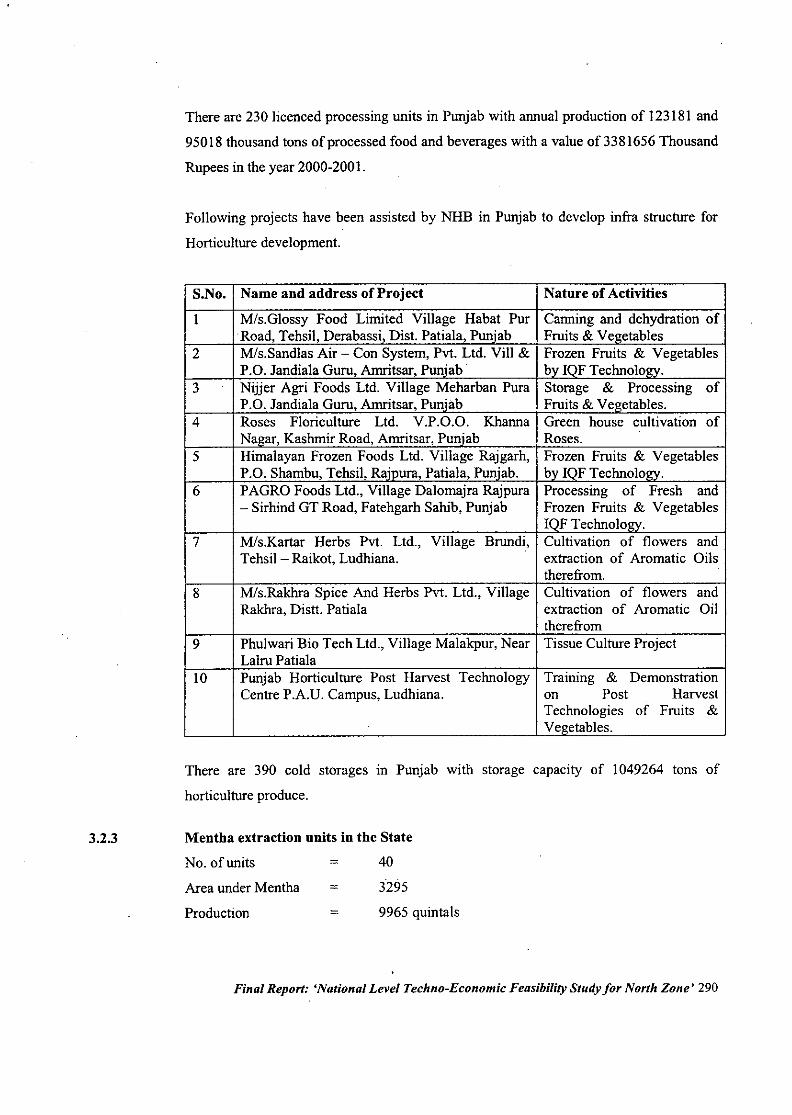
3.2.3
There are 230 licenced processing units in Punjab with annual production of 123181 and
95018 thousand tons of processed food and beverages with a value of3381656 Thousand
Rupees in the year 2000-2001.
Following projects have been assisted by NHB in Punjab to develop infra structure for
Horticulture development.
S.No. Name and address of Project Nature of Activities
I M/s.Glossy Food Limited Village Habat Pur Canning and dehydration ofRoad, Tehsil, Derabassi, Dist. Patiala, Puniab Fruits & Vegetables
2 M1s.Sandlas Air - Con System, Pvt. Ltd. Vill & Frozen Fruits & VegetablesP.O. Jandiala Guru, Amritsar, Puniab . bv IOF Technology.
3 . Nijjer Agri Foods Ltd. Village Meharban Pura Storage & Processing ofP.O. Jandiala Guru, Amritsar, Puniab Fruits & Vegetables.
4 Roses Floriculture Ltd. V.P.O.O. Khanna Green house cultivation ofNagar, Kashmir Road, Amritsar, Puniab Roses.
5 Himalayan Frozen Foods Ltd. Village Rajgarh, Frozen Fruits & VegetablesP.O. Shambu, Tehsil, Raipura, Patiala, Puniab. bv IOF Technology.
6 PAGRO Foods Ltd., Village Dalomajra Rajpura Processing of Fresh and- Sirhind GT Road, Fatehgarh Sahib, Punjab Frozen Fruits & Vegetables
IQF Technology.7 M/s.Karlar Herbs Pvt. Ltd., Village Brundi, Cultivation of flowers and
Tehsil - Raikot, Ludhiana. extraction of Aromatic Oilstherefrom.
8 M1s.Rakhra Spice And Herbs Pvt. Ltd., Village Cultivation of flowers andRakhra, Distt. Patiala extraction of Aromatic Oil
therefrom9 Phulwari Bio Tech Ltd., Village Malakpur, Near Tissue Culture Project
Lalru Patiala10 Punjab Horticulture Post Harvest Technology Training & Demonstration
Centre P.A.U. Campus, Ludhiana. on Post HarvestTechnologies of Fruits &Vegetables.
There are 390 cold storages in Punjab with storage capacity of 1049264 tons of
horticulture produce.
Mentha extraction units iu the State
No. of units
Area under Mentha
Production
=
=
=
40
3295
9965 quintals
Final Report: 'National Level Techno-Economic Feasibility Study for North Zone' 290
3.2.4
3.2.5
3.2.6
PAGREXCO has set up five mechanical sorting, waxing and grading centeres with
capacity of 2 MTs per hour for Kinnow in five citrus estates- Hoshiarpur-2, Badal- I,
Baliana- I, Tahhwatajalam. The cost of waxing is 50 paise per kg.
Two pre-cooling cum cold stores have been set up at Badal and Talwandi Saboo and
assisted co-operative cold store at Hoshiarpur. Pre-cooling cum cold store in private
section at Samana.
For creation of cold chain infrastructure in the state of Punjab 8 projects with investment
of around 2200 lakh have been approved by PAGREXCO with soft loam assistance of
Rs. 980 lakhs.
Final Report: 'National Level Techno-Economic Feasibility Study for North Zone' 291
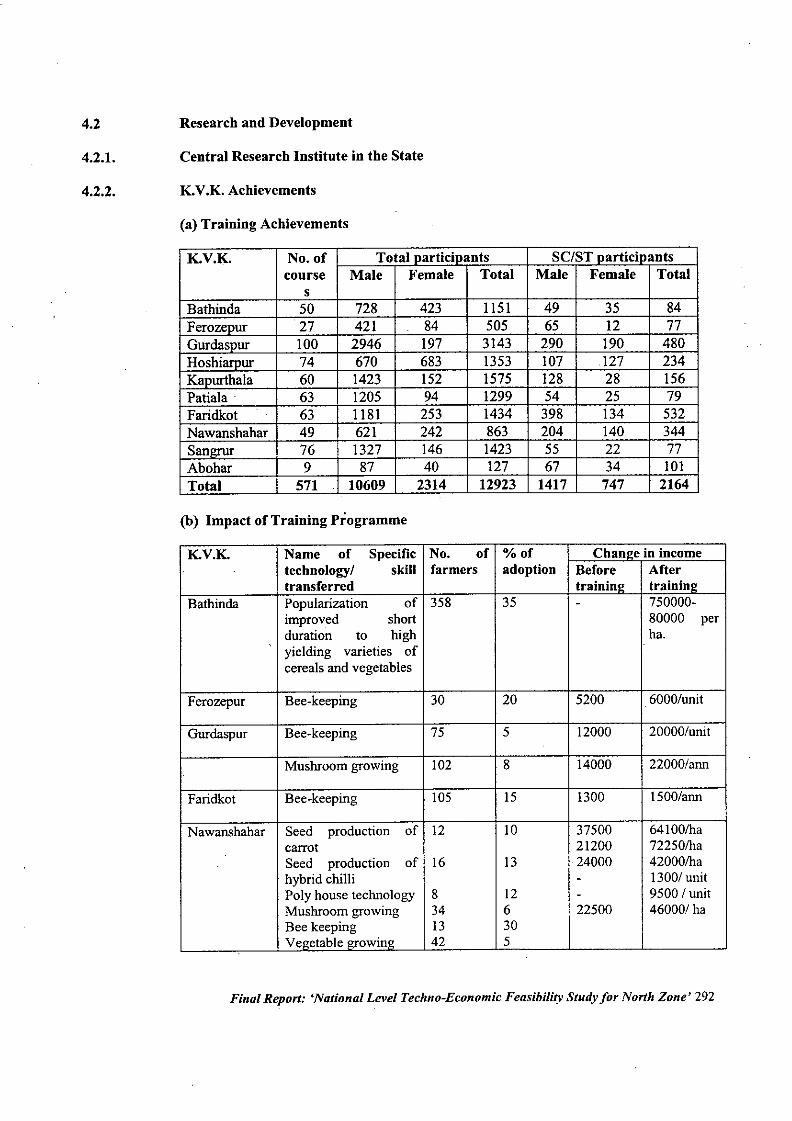
4.2 Research and Development
4.2.1. Central Research Institute in the State
4.2.2. K.V.K. Achievements
(a) Training Achievements
K.V.K. No. of Total oarticinaots SCIST oarticioantscourse Male Female Total Male Female Total
sBathinda 50 728 423 1151 49 35 84Ferozeour 27 421 84 505 65 12 77GurdaSDur 100 2946 197 3143 290 190 480Hoshiarpur 74 670 683 1353 107 127 234KaDurtha1a 60 1423 152 1575 128 28 156Patia1a . 63 1205 94 1299 54 25 79Faridkot 63 1181 253 1434 398 134 532Nawanshahar 49 621 242 863 204 140 344Sangrur 76 1327 146 1423 55 22 77Abohar 9 87 40 127 67 34 101Total 571 10609 2314 12923 1417 747 2164
(b) Impact of Training Programme
K.V.K. Name of Specific No. of %of Chan!!e in incometechnologyl skill farmers adoption Before Aftertransferred trainin!! trainin!!
Bathinda Popularization of 358 35 - 750000-improved shorl 80000 perduration to high ha.yielding varieties ofcereals and vegetables
Ferozepur Bee-keeping 30 20 5200 6000/unit
Gurdaspur Bee-keeping 75 5 12000 20000/unit
Mushroom growing 102 8 14000 22000/ann
Faridkot Bee-keeping 105 15 1300 l500/ann
Nawanshabar Seed production of 12 10 37500 64100lhacarrot 21200 722501haSeed production of 16 13 24000 42000lhahybrid chilli - 13001unitPoly house technology 8 12 - 9500 I unitMushroom growing 34 6 22500 460001 haBee keeping 13 30Ve"etable l>rowin" 42 5
Final Report: 'National Level Techno-Economic Feasibility Study for North Zone' 292
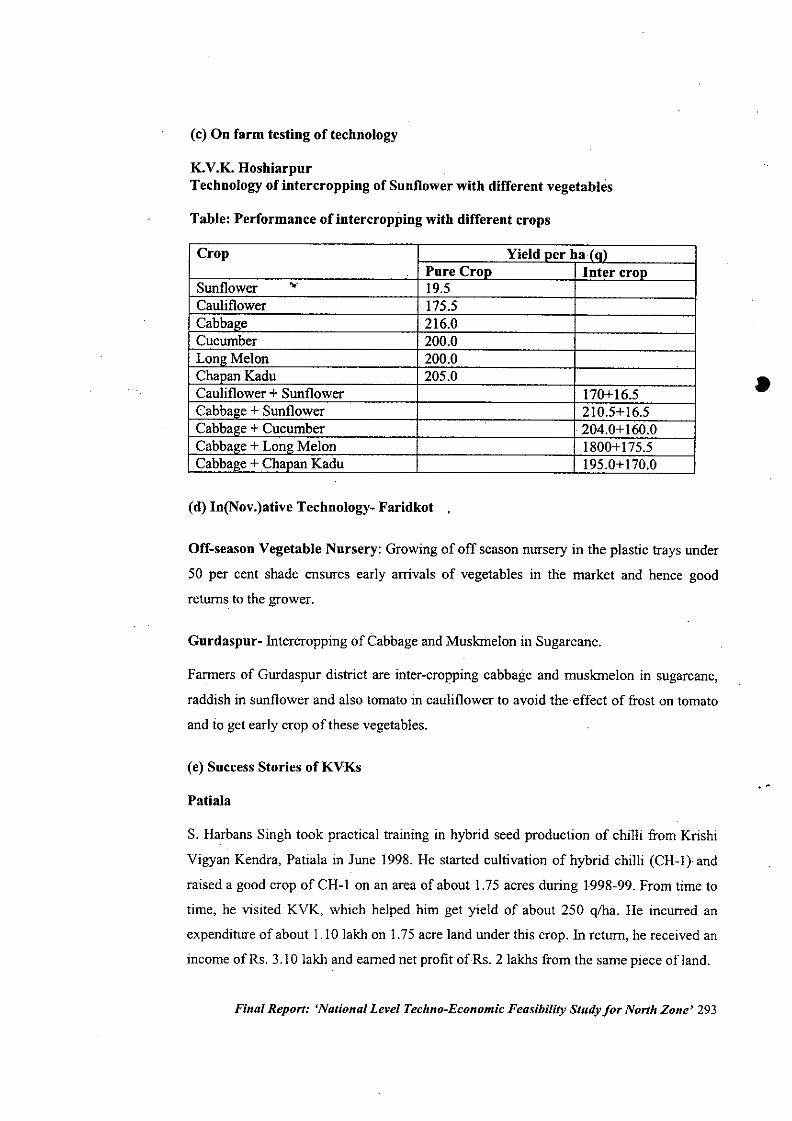
(c) On farm testing of technology
K.V.K. HoshiarpurTechnology of intercropping of Sunflower with different vegetables
Table: Performance of intercropping with different crops
Crop Yield Der ha(o)Pnre CroD Inter crOD
Sunflower ". 19.5Cauliflower 175.5Cabba!!e 216.0Cucumber 200.0Lon" Melon 200.0ChananKadu 205.0Cauliflower + Sunflower 170+16.5Cabba!!e+ Sunflower 210.5+ 16.5Cabbaie + Cucumber 204.0+ 160.0Cabba!!e+ Lon!!Melon 1800+175.5Cabba!!e+ Chanan Kadu 195.0+170.0
(d) In(Nov.)ative Technology- Faridkot .
Off-season Vegetable Nursery: Growing of off season nursery in the plastic trays under
50 per cent shade ensures early arrivals of vegetables in the market and hence good
returns to the grower.
Gurdaspur- Intercropping of Cabbage and Muskmelon in Sugarcane.
Farmers of Gurdaspur district are inter-cropping cabbage and muskmelon in sugarcane,
raddish in sunflower and also tomato in cauliflower to avoid the effect of frost on tomato
and io get early crop of these vegetables.
(e) Success Stories of KVKs
Patiala
S. Harbans Singh took practical training in hybrid seed production of chilli from Krishi
Vigyan Kendra, Patiala in June 1998. He started cultivation of hybrid chilli (CH-I) and
raised a good crop of CH-I on an area of about 1.75 acres during 1998-99. From time to
time, he visited KVK, which helped him get yield of about 250 q/ha. He incurred an
expenditure of about 1.10 lakh on 1.75 acre land under this crop. In return, he received an
income of Rs. 3.10 lakh and earned net profit ofRs. 2 lakhs from the same piece of land.
Final Report: 'National Level Techno-Economic Feasibility Study for North Zone' 293
•
..
He put three acres ofland under CH-I hybrid and spent about one lakh rupees to get net
return of Rs.2 lakhs in whole season. Simultaneously, he started raising parent lines of
CH-I hybrid to produce FI seed. He put half acre land under hybrid seed production and
four acre under chilli hybrid (CH-I). Upto September 2000, he earned Rs. 4.31 lakh
though sale of produce from four acre land. He incurred expenses of Rs. 1.70 lakh in
raising the crop. His net income from 4 acres comes to Rs. 2.61 lakh (Rs. 65000/- per
acre). Further, from the half acre area under hybrid seed production, he produced 25 kg
CH-I seed. Expenses in producing this seed were approximately Rs. 15000.At present,
prevailing rate ofCH-1 seed is Rs. 6000-7000 per kg (PAU has fixed rate ofCH-1 seed at
Rs. 6000/- per kg). He is very much satisfied with the rate ofremuneration and planning
to capture the seed market by the start of new season.
SANGRURSh. Nirmal Singh of village Dharamgarh Chhanna,Tehsil Sunam, Distt. Sangrur, has five
acres of land in which he grows paddy and wheat. The KVK scientists suggested him to
start some subsidiary occupation. After getting training at Krishi Vigyna Kendra during
February 1999, he started taking keen interest in mushroom. He decided to adopt
mushroom cultivation and visited National Centre for Mushroom Research and Training,
Chambaghat (Solan) along with KVK scientists. He started this profession during winter
of 1999 and succeeded to harvest 12 quintals of fresh mushroom per quintal of dry wheat
straw. He sold mushroom under the trade name of (Sidhu Mushroom) @ Rs. 60-70 per kg
of fresh mushroom and earned Rs. 60000 during the last winter season only. He is
encouraged very much with this profession and is in touch with the KVK scientists.
Final Report: 'National Level Techno-Economic Feasibility Study for North Zone' 294
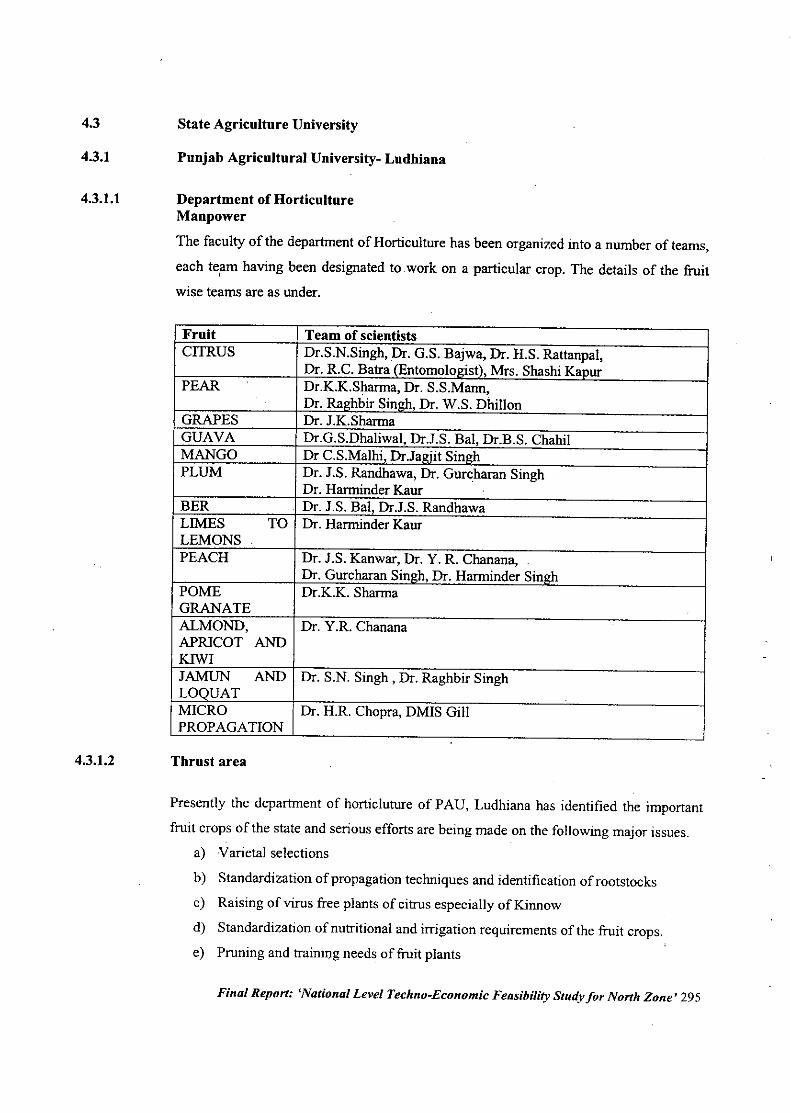
4.34.3.1
4.3.1.1
4.3.1.2
State Agriculture University
Punjab Agricultural University- Ludhiana
Department of HorticultureManpower
The faculty of the department of Horticulture has been organized into a number of teams,
each team having been designated to. work on a particular crop. The details of the fruit,wise teams are as under.
Fruit Team of scientistsCITRUS Dr.S.N.Singh, Dr. G.S. Bajwa, Dr. H.S. Rattanpal,
Dr. RC. Batra(Entomologjst), Mrs. Shashi KapurPEAR Dr.K.K.Sharma, Dr. S.S.Mann,
. Dr. Raghbir Singh, Dr. W.S. DhillonGRAPES Dr. J.K.SharmaGUAVA Dr.G.S.Dhaliwal, Dr.J.S. Bal, Dr.B.S. ChahilMANGO Dr C.S.Malhi, Dr.Jalriit Sinl!hPLUM Dr. J.S. Randhawa, Dr. Gurcharan Singh
Dr. Harminder KaurBER Dr. J.S. Bal, Dr.J.S. RandhawaLIMES TO Dr. Harminder KaurLEMONSPEACH Dr. J.S. Kanwar, Dr. Y. R. Chanana,
Dr. Gurcharan Singh, Dr. Harminder SinghPOME Dr.K.K. SharmaGRANATEALMOND, Dr. Y.R ChananaAPRICOT ANDKIWIJAMUN AND Dr. S.N. Singh, Dr. Raghbir SinghLOOUATMICRO Dr. H.R Chopra, DMIS GillPROPAGATION
Thrust area
Presently the department of horticluture of PAU, Ludhiana has identified the important
fruit crops of the state and serious efforts are being made on the following major issues.
a) Varietal selections
b) Standardization of propagation techniques and identification of rootstocks
c) Raising of virus free plants of citrus especially of Kinnow
d) Standardization of nutritional and irrigation requirements of the fruit crops.
e) Pruning and training needs of fruit plants
Final Report: 'National Level Techno-EcOllOmic Feasibility Study for North Zone' 295
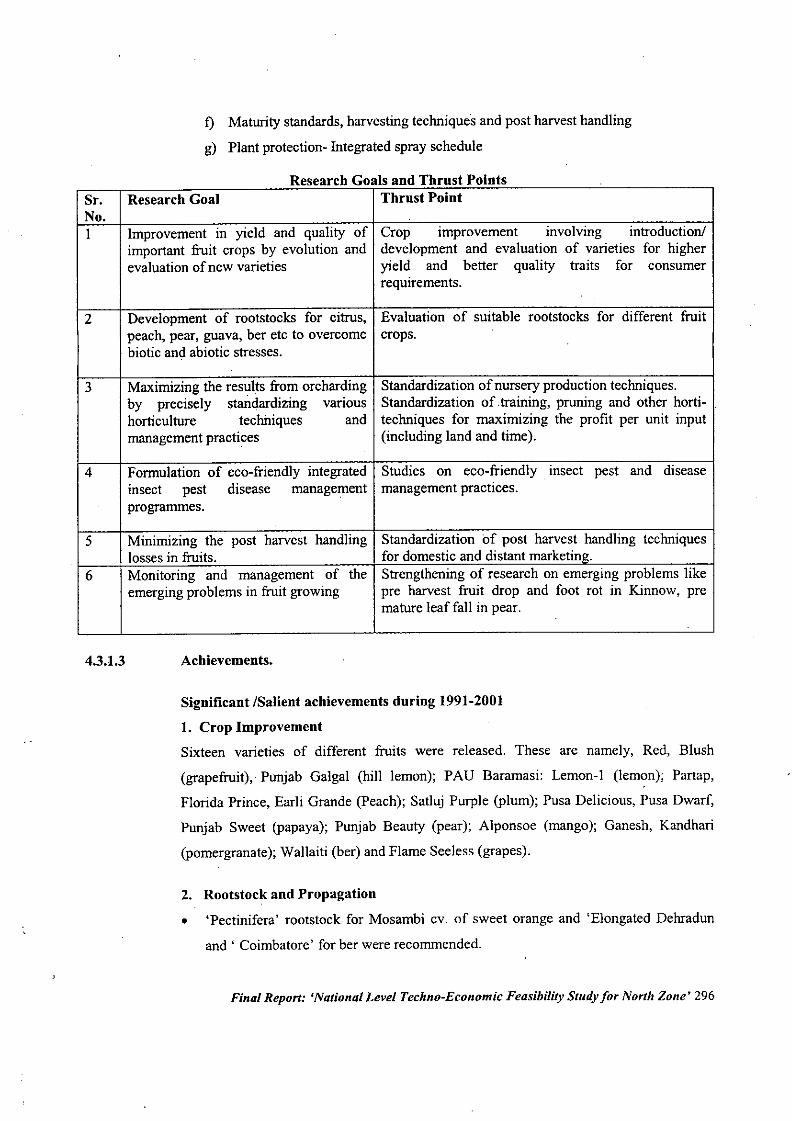
f) Maturity standards, harvesting techniques and post harvest handling
g) Plant protection- Integrated spray schedule
Research Goals and Thrust PointsSr. Research Goal Thrust PointNo.I Improvement in yield and quality of Crop improvement involving introduction!
important fruit crops by evolution and development and evaluation of varieties for higherevaluation of new varieties yield and better quality traits for consumer
requirements..
2 Development of rootstocks for citrus, Evaluation of suitable rootstocks for different fruitpeach, pear, guava, ber etc to overcome crops.biotic and abiotic stresses.
3 Maximizing the results from orcharding Standardization of nursery production techniques.by precisely standardizing various Standardization of. training, pruning and other horti-horticulture techniques and techniques for maximizing the profit per unit inputmanagement practices (including land and time).
.
4 Formulation of eco-friendly integrated Studies on eco-friendly insect pest and diseaseinsect pest disease management management practices.programmes.
5 Minimizing the post harvest handling Standardization of post harvest handling techniqueslosses in fruits. for domestic and distant marketing.
6 Monitoring and management of the Strengthening of research on emerging problems likeemerging problems in fruit growing pre harvest fruit drop and foot rot in Kinnow, pre
mature leaffall in pear.
4.3.1.3 Achievements.
Significant/Salient achievements during 1991-2001
1. Crop Improvement
Sixteen varieties of different fruits were released. These are namely, Red, Blush
(grapefruit), Punjab Galgal (hill lemon); PAU Baramasi: Lemon-I (lemon); Partap,
Florida Prince, Earli Grande (Peach); Satluj Purple (plum); Pusa Delicious, Pusa Dwarf,
Punjab Sweet (papaya); Punjab Beauty (pear); Alponsoe (mango); Ganesh, Kandhari
(pomergranate); Wallaiti (ber) and Flame Seeless (grapes).
2. Rootstock and Propagation
• 'Pectinifera' rootstock for Mosambi cv. of sweet orange and 'Elongated Dehradun
and' Coimbatore' for ber were recommended.
Final Report: 'National Level Techno-Economic Feasibility Study for North Zone' 296
• The technique for simultaneous grafting and rooting of plum and pear plants has been
standardized. It saves one-year period in nursery production.
• Clonal propagation of Kabul Green Gage plum and rooting of cutting of pomegranate
with 200 ppm IBA has given commercial success.
• The rooting medium of hyacinth for air-layering of litchi, lemon and guava has beenrecommended.
3. Transplanting
• Transplanting with partially defoliated bare-rooted plants of Kinnow and lemon
during December-February has been found to be equally successful as that with
earthballs. The former technique economises lifting and transport labour andexpenditure.
4. Canopy. Management
• The time and intensity of pruning have been standardized in ber and grape.
• The methods of rejuvenation of old orchards of pear, ber, mango and litchi have beenstandardized.
5. Nutrients management
• Two sprays of I% urea i)ave been found to improve the fruit quality of 'Perlette'grapes.
• The leaf sampling procedure for citrus has been recommended.
6. Weed Control
• The weed control with herbicides application has been found to be economicalmethod of pear, grape, citrus and ber orchards.
7. Yield and quality improvement
• The spray application of 2% Dormex for early npening of peach has beenrecommended.
• The spray of 10% urea in May effectively deblossomed rainy season bloom andresulted in high yield of winter season crop in guava.
• The fruit quality of 'Perlette' grape was improved with application of a package
technology comprising flower thinning, stem girdling and GA" application.
Final Report: 'National Level Techno-Economic Feasibility Study for North Zone' 297
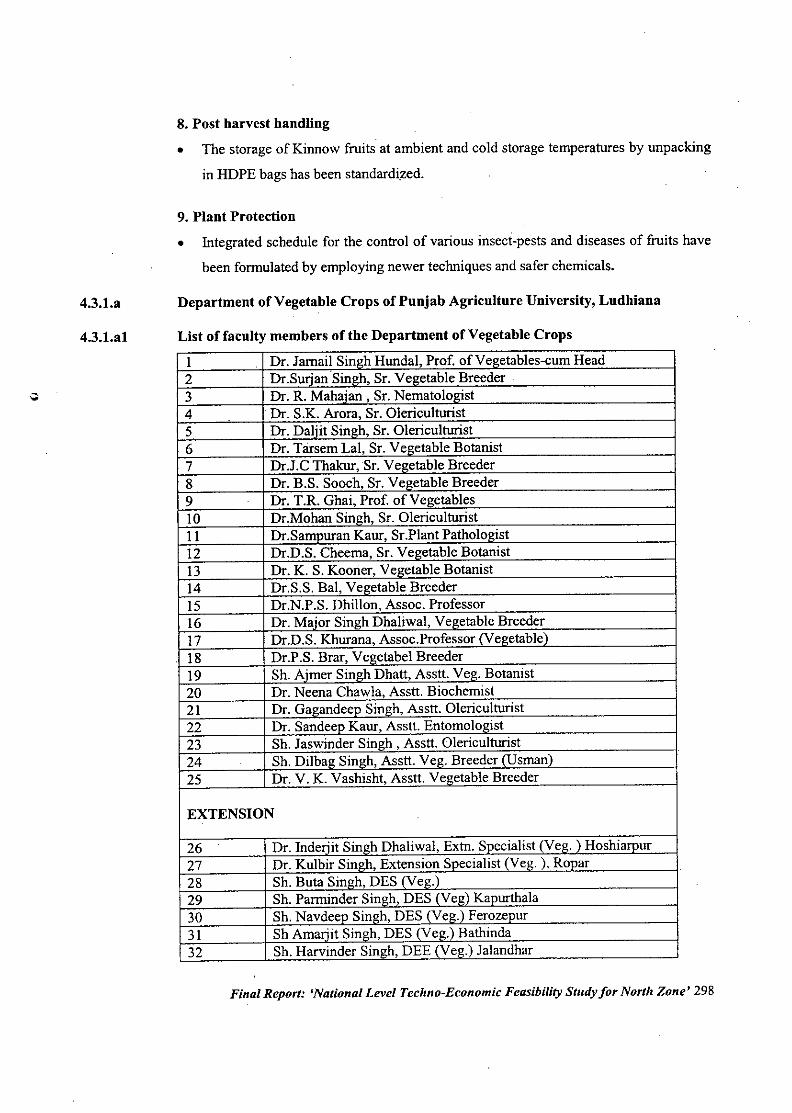
4.3.1.a
4.3.l.al
8. Post harvest handling
• The storage of Kinnow fruits at ambient and cold storage temperatures by unpacking
in HDPE bags has been standardi;zed.
9. Plant Protection
• Integrated schedule for the control of various insect-pests and diseases of fruits have
been formulated by employing newer techniques and safer chemicals.
Department of Vegetable Crops of Punjab Agriculture University, Ludhiana
List of faculty members of the Department of Vegetable Crops
I Dr. Jarnail Sinl!h Hundal, Prof. ofVel!etables-cum Head2 Dr.surianSingh, Sr. Vel!etable Breeder .3 Dr. R. Mahajan , Sr. Nematolol!ist4 . Dr. S.K. Arora, Sr. Olericulturist5 Dr. Daliit Singh, Sr. Olericulturist6 Dr. Tarsem Lal, Sr. Vegetable Botanist7 Dr.J.C Thakur, Sr. Vegetable Breeder8 Dr. B.S. Sooch, Sr. Vegetable Breeder9 Dr. T.R. Ghai, Prof. of Vegetables10 Dr.Mohan Sinl!h, Sr. OlericulturistII Dr.Sampuran Kaur, Sr.Plant Patholol!ist12 Dr.D.S. Cheema, Sr. Vel!etable Botanist13 Dr. K. S. Koorier, Vegetable Botanist14 Dr.S.S. Bal, Vegetable BreederIS Dr.N.P.S. Dhillon, Assoc. Professor16 Dr. Maior Singh Dhaliwal, Vel!etable Breeder17 Dr.D.S. Khurana, Assoc.Professor (Vel!etable)18 Dr.P .S. Brar, Vegetabel Breeder19 Sh. Aimer Singh Dhatt, Asstt. Veg. Botanist20 Dr. Neena Chawla, Asstt. Biochemist21 Dr. Ga"andeep Singh, Asstt. Olericulturist22 Dr. Sandeep Kaur, Asstt. Entomologist23 Sh. Jaswinder Singh, Asstt. Olericulturist24 Sh. Dilbal! Sinl!h, Asstt. Vel!. Breeder (Usman)25 Dr. V. K. Vashisht, Asstt. Vel!etable Breeder
EXTENSION
26 . Dr. Inderiit Singh Dhaliwal, Extn. Specialist (Ve". ) Hoshiamur27 Dr. Kulbir Sinl!h, Extension Specialist (Veg. ), Ronar28 Sh. Buta Sinl!h, DES (Vel!.)29 Sh. Parminder Sinl!h, DES (Veg) Kaourthala30 Sh. Navdeep Sinl!h, DES (Vel!.) Ferozeour31 Sh Amariit Singh, DES (Vel!.) Bathinda32 Sh. Harvinder Singh, DEE (Vel!.) Jalandhar
Final Report: 'National Level Techno-Economic Feasibility Study for North Zone' 298
4.3.1.a2 Thrust areas of Research ideutified by the Departmeut of Vegetable Crops, PAU,
Ludhiana
Development of new varieties
The department of vegetable crops have taken up breeding programme on a number of
vegetable crops. The main thrusts in selecting new varieties are improvement in quality,
suitability to export markets and processing. The specific issues taken up are:
Quality Improvement
1. Potato
To develop varieties with higher dry matter content- above 20 percent. Presently local
varieties have 16-17 percent of dry matter. Some of the new varieties such as Chipsona I
or 2 are having a higher content of dry matter. The second objective is have varieties
which are low in sugar content. The sugar content should not be more than 150 mIl 100
gms. Amino acid and phenols content should be low; Shape of the fruit for french mes
and fingers should be oblong and for chips it should be round.
2. Chilies
Low pungency, intense colour, oborasin cotent high. Some of the exotic varieties, which
have above characters get infected with virus under Punjab conditions.
3. Tomato
Higher total soluble solids content above 5 percent (local varieties have in general less
than 4), high Iycopine, weight of fruit should be 70-80 gm, egg shapes tomato are to be
preferred.
4. Onion
Higher dry matter content, higher T.S.S. while column for export. Yellow column for
salad. Small, compact neck, non-bolting type , better keeping quality.
5. Garlic
White colour, clove size big, increased shelf life.
6. Peas
Higher protein, dark green column, snow peas to be encouraged for export markets.
Final Report: 'National Level Techno-Economic Feasibility Study for North Zone' 299
4.3.1.a3
Disease! Insect pests resistant:
Chillies
Virus resistant, thrips and mites are also serious problems. Resistance to these pests and
diseases is being actively perused.
Tomato leaf curl virus, no resistance varieties have been developed as yet. Potato, late
blight, caused by virus- it is carried though seed.
Onion
Purple blotch more dangerous for seed crop. Thrips and stem of Phillim.
Garlic
Same as for onion.
Peas wilt early, Powdery mildew, rust.
Okra
Yellow vein mosaic, fruit borer.
Organic farming-Vegetable gram under sanitation conditions.
Hybrid seed production
Taken up in chilies, musk melon, brinjal. The state department of Horticulture has trained
many farmers for the.production of Brinjal seed.
Irrigation
The main thrust is to find out critical period when water is required. The studies are also
envisaged to find out critical period in important vegetables, when water is to be stopped
for the improvement of quality as well as storage life.
Achievements
During the decade twenty eight improved varieties including F I hybrids have been
released in the state. In tomato cv. TH 2312, TH S02, Castle Rock and Punjab Upma; in
chili cvs. ClI-l, CH-3, Punjab Surakh and Punjab Guchhedar, in muskmelon cvs Punjab
Rasila and MH 10; in brinjal cvs Punjab Moti, BH-I and BH-2,in Okra cvs, Punjab-S, in
caulifloer cvs.Pusa Snowball-I, in Broccoli cvs. Punjab broccoli-I, in Onion cvs. Punjab
Naroya, Punjab White and Pro-6; in Radish cvs. Pusa Himani and Punjab Pasand, in pea
Final Report: 'National Level Techno-Economic Feasibility Study for North Zone' 300
4.3.1.bl
cvs. Mithi Phali in Longmelon cvs. Punjab Longmelon-l, inWanga cv.Punjab Wanga-l,
in lettuce cvs Punjab Lettue-l, in sweet potato cv. PSP-I, in sponge gourd cv. PSG-I, in
ash gourd cv. PAG-3 have been released in the state. As far as production technology is
concerned, the production techniques of nursery raising under polyhouse, chemical weed
control in case of seed crops of onion, radish, carrot and turnip, optimum plant density in
case of chilli, have been included in the package of practices. Net house cultivation in
case of capsicum has been found to give income to the tune of Rs. 2.00-2.50 lakhs / acre
and produce is free of chemical residues. The hybrids developed in case of chilli have
shown their impact in the state's agricultural economy. fu case of chilli, hybrid CH-I is
being grown by about 200 farmers trained by the department in hybrid seed production
and the farmers are able to produce the seed of FI hybrid. As a result, the area under
chilli increased from 2900 ha during 1995"96 to 8250 ha during 2000-2001. The
experiments on growing vegetables under net house has a great potential in the
production of pesticide free vegetables and may promote export also. These techniques
have proved their sustainability as regard to their productivity.
Transfer of technology programme through Kisan Melas, Kisan Divas, Seminars,
Symposia, Agriculture / Horticultural Workshops, Press, Radio and Television have
shown their impact by increasing the production of vegetable crops and increasing the
area under vegetable crops. Imparting training to the farmers by the department regarding
hybrid seed production of chilies, tomato, muskmelon and brinjal have been
tremendously fruitful in transferring the technology to the vegetable growers. The
distribution of seeds of open-pollinated varieties/ hybrid and literature, field
demonstrations, field days at farmer's fields, training programmes at Regional stations
and Krishi Vigyan Kendras have been very successful in the adoption of new package of
practices and new hybridS! varieties. The adaptive research triilis on new varieties and
production technologies at the farmers fields have give the real feed back about the
problems faced by the vegetable growers in the state and helped the scientists to reorient
their research programme and objectives to achieve the thrust areas.
Floriculture Department ofPAU, Lndhiana
The department of floriculture and landscaping ofP.A.U. is the leading department with
well qualified staff and equipped with well-established research facilities consisting of
Final Report: 'National Level Techno-Economic Feasibility Study for North Zone' 301
4.3.l.b2
4.3.l.b3
green houses, modified structures and laboratories. If has projects fmancially supported
by I.C.A.R. and National Horticulture Board.
The scientific staff position is as under:
Professor = I
Associated Professor = 2
Assistant Professor 2
Research Scientists = .4
Thrust areas
The major thrust areas are (a, To standardize commercial varieties of important flowering
plants such as Roses, Teqetes- marigold,carnation, chrysamthemum, bulbous crops such
as Gladioli (b) To find out their agronomic requirements (c) Investigation in the seed set
potential of various high value flowering annals (d) Post-harvest packaging technology
(e) Production technology for Gerbera.
Achievements
Gladiolus
For timing production of cut flowers of gladiolus, it has been found that quality flowers
can be produced from end of October to April by adjusting planting from July to
December. Fertilizer trials conducted for three years revealed that 40 kg N, 109 P,O, and
20g/k 20 was found optimum for Snow Princess cv. In gladiolus first pair of leaves at S3
stage-6 leaf stage (73 days after planting) should be sampled for determination of N, P
and K nutrients in the plant. Studies on the removal of nutrients by gladiolus plants cv.
Sylvia revealed that 154 kg N, 10.5 kg P205 and 108 kg K20/ha was removed from the
soil. Studies on iron deficiency revealed that white coloured varieties exhibit more
deficiency than coloured varieties. SO white varieties should be sprayed 0.2% iron
sulphate at 24 leaf stage. Spacing trials revealed that 63 corms/sq/m for flower production
and 36 corms/sq/m for corm and cormel production were found optimum.
Studies on corm production from cormels exhibited that cormels of 1.25 cm size
produced flowering grade corm in two years. Experiments on the production of disease
free corms showed that corms of cv. Fidelo withstood hot water treatment of 57°C for 30
minutes and produced fairly disease free plants, soil drenching with 0.3% Bavistin and
Final Report: 'National Level Techno-Economic Feasibility Study for North Zone' 302
occasional soil upturning have shown encouraging results in checking fusarial wilt in
gladiolus cv. Oscar.
Carnation
Seven varieties of Margenrite type and 20 varieties of sim type were evaluated. High
flower production was .recorded from August and September plantings with good stem
length in comparison to earlier or late plantings. Yield of cut bloom varied from 180 to
720 depending upon time of planting when planted at a density of 36 Isq/m. However, the
yield of high quality saleable blooms (320 Isq/m) was obtained from September planting.
Experiments conducted at PAU have been shown clearly that sim carnations can be
raised as annual crop only. Ratoon crop is not very profitable.
Amongst macro nutrients, carnation responded to N only. The effects of P and K were
not significant. In case of Marguerite Scarlet , 40 g N/sq.m was found to be optimum
whereas 20 g N/sq.was found to be optimum for Margeurite White. In addition to this,
the basal dose of 5 kg well rotten farm yard manure, 10 g P,O, and 15 K,O is
recommended. Out of two sources ofN, Calcium ammonium Nitrate (CAN) was found to
be significantly better than urea. The application of N in three equal splits proved
significantly better for carnation crop than in single or applied in two doses. Therefore, it
emerged that 113of N full dose of P and K should be applied before transplanting of
seedlings, 1/3 of N one month after transplanting and remaining 1/3 one month after
se,condapplication. Highest number of flowers per unit area was observed under closest
spacing of 15 x I cm. Pinching the carnation plants three times i.e. 40, 60 and 80 days
delayed flowering and reduced the stem length. Single pinching (60 days after planting)
produced flowers on par with twice or thrice pinching. Regular disbudding was found to
improved flower size.
To determine the ideal time for making cuttings, these were made during different moths
and were rooted. High percentage of rooting was observed in cooler months i.e. October
to'February than summer months ie. April to August. Highest percentage of rooting
(83%) was recorded inll2 sand + Y, burnt rice husk medium. Unrooted cuttings of
carnation were successfully stored from April to September in the cold storage.
Successful carnation plantation were raised from stored cuttings.
Final Report: 'National Level Techno-Economic Feasibility Study for North Zone' 303
Marigold
Amongst varieties tried African Giant Double Orange was found to be a better
commercial variety. Application of 40 g Nand 20 g P,O, was found optimum dose for
highest flower production of marigold. Out of three spacings tried i.e. 40 x 30, 40 x 40
and 40 x 50, the spacing of 40 x 30 or 40 x 40 found to be optimum. Marigold plants
pinched 40 days after transplanting gave better yields especially in July and August Crop.
Pinched plants stood better in comparison to non-pinched. For meeting the demand of
flowers for longer period, the effect of 8 planting revealed that by planting in July, Oct.
and Feb. The flowers could be supplied fOT8 month from October to May. However,
November, March and April planting failed to yield commercial crops.
AsterIn aster application of 20 kg N and 109 P,O, was found to be optimum which revealed
1.56 kg /4 sq.m (15.6 q/acre) yield of loose flowers. The spacing of 20 x 20 cm was
found to be optimum which recorded highest flower yield (3.44 kg /4sq.m or 34.4 q/acre)
in comparison to other spacings.
Final Report: 'National Level Techno-Economic Feasibility Study for North Zone' 304

Ii:
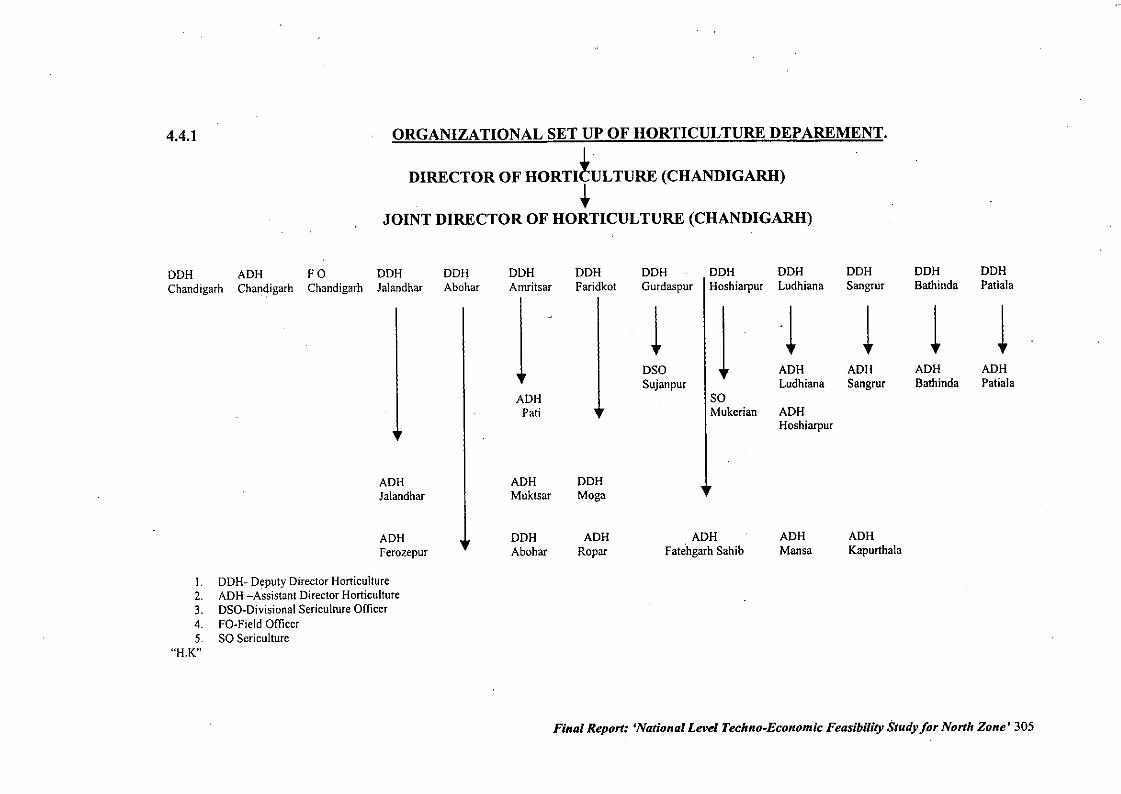
4.4.1 ORGANIZATIONAL SET UP OF HORTICULTURE DEPAREMENT.
DIRECTOR OF HORTI~ULTURE (CHANDIGARH)
tJOINT DIRECTOR OF HORTICULTURE (CHANDIGARH)
DDH ADH Fa DDH DDH DDH DDH DDH DDH DDH DDH DDH DDHChandigarh Chandigarh Chandigarh Jalandhar Abohar Amritsar Faridkot Gurdaspur Hoshiarpur Ludhiana Sangrur Bathinda Patiala
1 1 -1 1 1 1DSO ADH ADH ADH ADHSujanpur Ludhiana Sangrur Bathinda Patiala
ADH soPati Mukerian ADH
Hoshiarpur
ADHJalandhar
ADHFerozepur
I. DDH. Deputy Director Horticulture2. ADH -Assistant Director Horticulture3. DSO-Divisional Sericulture Officer4. FO.Field Officer5. SO Scrieulture
"H.K"
ADHMuktsar
DDHAbohar
DDHMoga
ADHRopar
ADHFatehgarh Sahib
ADHMansa
ADHKapurthala
Final Report: 'National Level Techno-Economic Feasibility Study for North Zone' 305

t~,
4.4.2 Thrust areas
The state department of Horticulture is the nodel department responsible for
overall development of horticulture in the state. The thrust areas taken up by the
department are Nursery Production.
Three model nurseries have been set up at Chauni Kalan (Hoshiarpur), Khiala
Bulanda (Hoshiarpur) and Gobindgarh (Abohar) to raise quality plants and disese
free plants. Initially, the target is to raise 60, 000 plants at each nursery in
polythene bags. Each model nursery will have a green house so as to produce
virus free plants of citrus
(a) Phytophthora control in citrus. Subsidy of Rs. 5000/- per hectare are given
for the treatment of the trees with ridomil fungicide
(b) Spray schedule of Kinnow trees is followed to keep them free from insect
pests.
(c) Grapes
Fro improvement in fruit qUality. The package includes pruning- keeping only
60.80 canes, brushing at flowering stage to keep only 125-150 flowers and
treatment with 40 ppm GA by dipping the bunch at flowering stage and repeating
the dip after 6 days. This is followed by girdling of the vine. For GA treatment
subsidy of Rs. 1400 is given per acre. Every year 500 acres are treated.
(d) Guava:
To stop rainy season crop by withholding water and spraying the trees with 10
percent urea in April. Resuming irrigation by 15'h May and. adding manure to
encourage winter crop.
(e) Peach
Manual thinning of fruit on five trees in each orchard is done by the staff of
horticulture department for demonstration purposes.
Mango: Demonstration in February-March by spraying Endosulfan for Aphid
control and Karathene or Bavistan for control of powdery mildew.
Final Report: 'National Level Techno-Economic Feasibility Study for North Zone' 306
Marketing
For increasing shelf life of fruits five grading and waxing centers are established
in the state. Distribution of plastic crates 50% subsidy..
Vegetables
In onion and garlic use of F.Y.M. and increased plant population. Peas for early
sowing increased seed rate of 60 kg per acre, for new field under peas applying
Rhizobium culture (making it available from microbiology department ofPAU.
Cauliflower
Early varieties to be planted on ridges.
Kharif onion
Planting to be done with bulb lets in August. Bulbelts to be raised by sowing
seeds in February and storing the bulblets till August.
Cucurbits
Protected cultivation, low tunnels of plastic, sowing of seed under tunnels inDecember or early January.
Capsicum, tomato and chilies also to be planted early under tunnels.
Cheap screen houses for raising nurseries of chillies and tomato.
Potato
Seed plot technique
To save from attack of white fly, aphids and jassids, the vegetative portion!
haulms is cut by 31" Dec., by this time tuber harvesting also starts.
Mushroom
Dhingri
Every HDO adopts two villages every year and encourages growing of Dhingri athome scale.
Final Report: 'National Level Techno-Economic Feasibility Study for North Zone' 307
Floriculture
To provide seeds and bulbs, two nurseries are established at Patiala and Doraha
(Ludhiana). One hundred demonstrations in two Kanal area each are organized
and. Former is given subsidy ofRs. 800 per plot.
Sericulture
To encourage sericulture, subsidy is given for rearing but the department has
built up a grainage center at Dalhousie (H.P.) to supply planting material.
Final Report: 'National Level Techno-Economic Feasibility Study for North Zone' 308
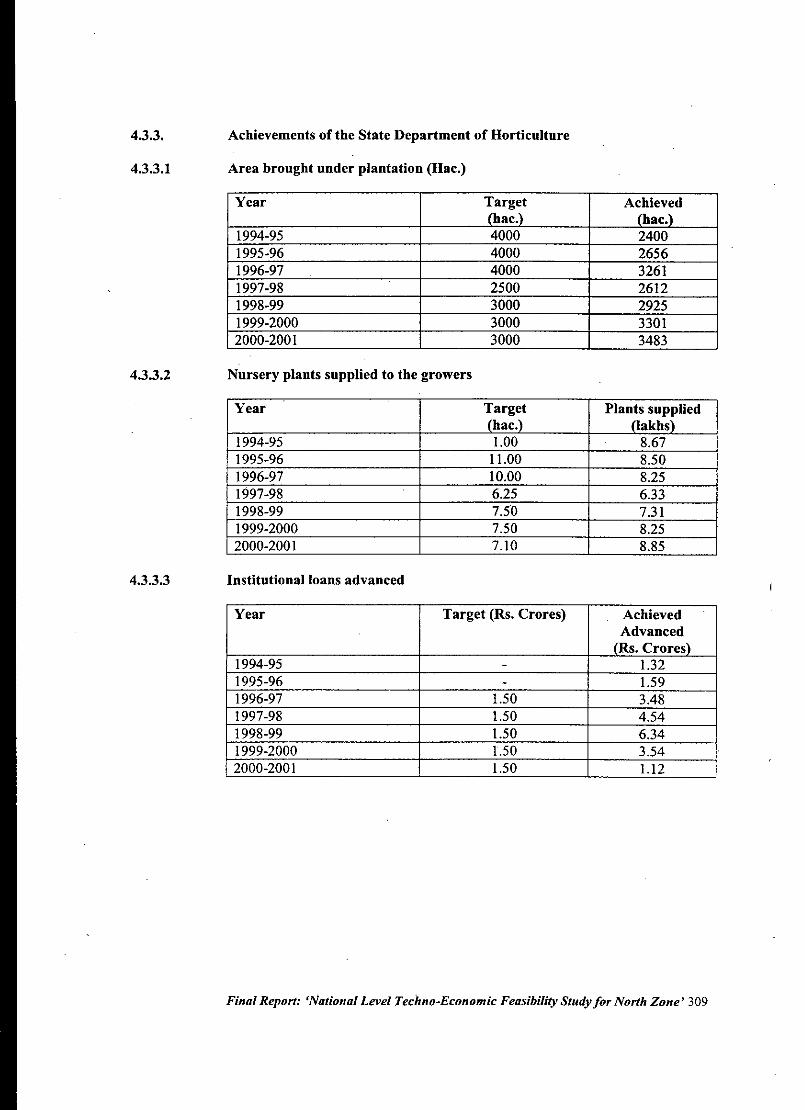
4.3.3.
4.3.3.1
4.3.3.2
4.3.3.3
Achievements of the State Department of Horticulture
Area brought under plantation (Hac.)
Year Target Achieved(hac.) (hac.)
1994-95 4000 24001995-96 4000 26561996-97 4000 32611997-98 2500 26121998-99 3000 29251999-2000 3000 33012000-2001 3000 3483
Nursery plants supplied to the growers
Year Target Plants supplied(hac.) (Jakbs)
1994-95 1.00 8.671995-96 11.00 8.501996-97 10.00 8.251997-98 6.25 6.331998-99 7.50 7.311999-2000 7.50 8.252000-2001 7.10 8.85
Institutional loans advanced
Year Target (Rs. Crores) AchievedAdvancedfRs. Crores)
1994-95 - 1.321995-96 - 1.591996-97 1.50 3.481997-98 1.50 4.541998-99 1.50 6.341999-2000 1.50 3.542000-2001 1.50 1.12
Final Report: '!VationalLevel Techno-Economic Feasibility Study for North Zone' 309
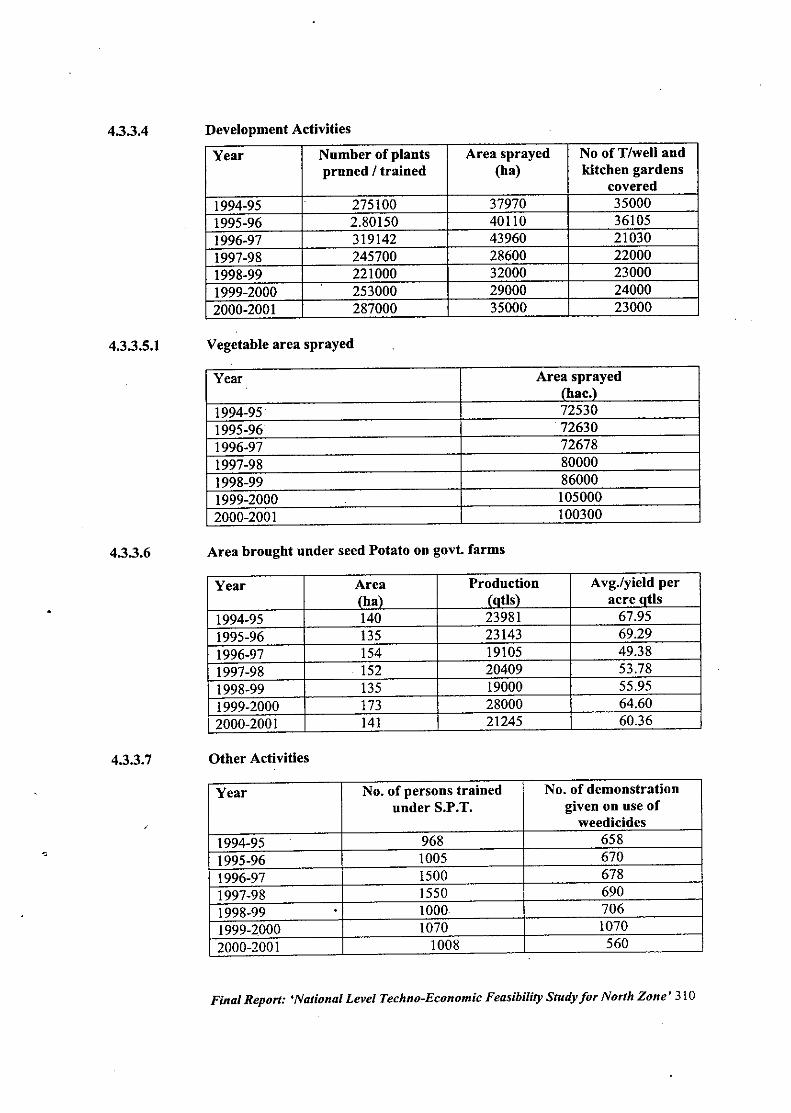
4.3.3.4
4.3.3.5.1
4.3.3.6
4.3.3.7
Development Activities
Year Number of plants Area sprayed No ofT/well andpruned / trained (ha) kitchen gardens
covered1994-95 275100 37970 350001995-96 2.80150 40110 361051996-97 319142 43960 210301997-98 245700 28600 220001998-99 221000 32000 230001999-2000 253000 29000 240002000-2001 287000 35000 23000
Vegetable area sprayed
Year Area sprayed(hac.)
1994-95 725301995-96 726301996-97 726781997-98 800001998-99 860001999-2000 1050002000-2001 100300
Area brought under seed Potato on govt. farms
Year Area Production Avg.lyield per(ha) (otIs) acre otIs
1994-95 140 23981 67.951995-96 135 23143 69.291996-97 154 19105 49.381997-98 . 152 20409 53.781998-99 135 19000 55.951999-2000 173 28000 64.602000-2001 141 21245 60.36
Other Activities
Year No. of persons trained No. of demonstrationunder S.P.T. given on use of
weedicides1994-95 968 6581995-96 1005 6701996-97 1500 6781997-98 1550 6901998-99 . 1000 7061999-2000 1070 10702000-2001 1008 560
Final Report: 'National Level Techno-Economic Feasibility Study for North Zone' 310
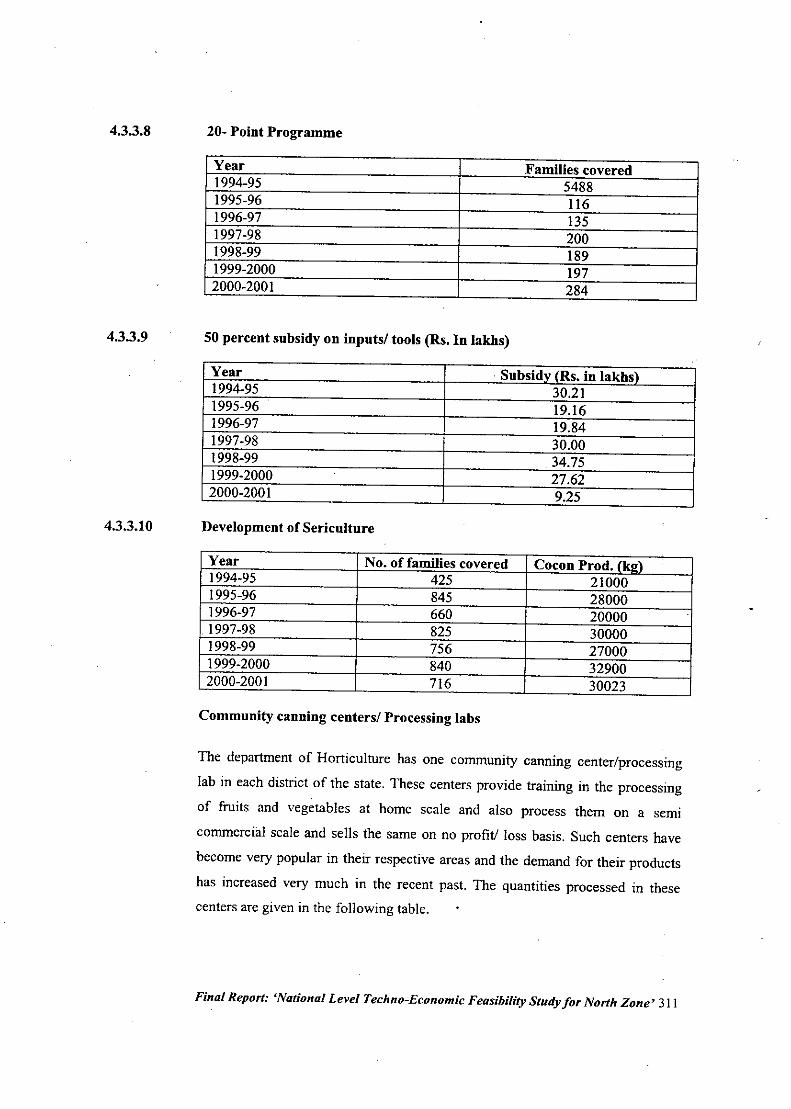
4.3.3.8
4.3.3.9
4.3.3.10
20- Point Programme
Year Families covered1994-95 54881995-96 1161996-97 1351997-98 2001998-99 1891999-2000 1972000-2001 284
50 percent snbsidy on inpnts/ tools (Rs. In 1akhs)
Year . Snbsidv lRs. in 1akhs)1994-95 30.211995-96 19.161996-97 19.841997-98 30.001998-99 .34.751999-2000 27.622000-2001 9.25
Development of Sericulture
Year No. of families covered Cocon Prod. (kl!)1994-95 425 210001995-96 845 280001996-97 660 200001997-98 825 300001998-99 756 27000 .
1999-2000 840 329002000-2001 716 30023
Community cauning centers/ Processing labs
The department of Horticulture has one community canning center/processing
lab in each district of the state. These centers provide training in the processing
of fruits and vegetables at home scale and also process them on a semi
commercial scale and sells the same on no profit! loss basis. Such centers have
become very popular in their respective areas and the demand for their products
has increased very much in the recent past. The quantities processed in these
centers are given in the following table.
Final Report: 'National Level Techno-Economic Feasibility Study for North Zone' 311
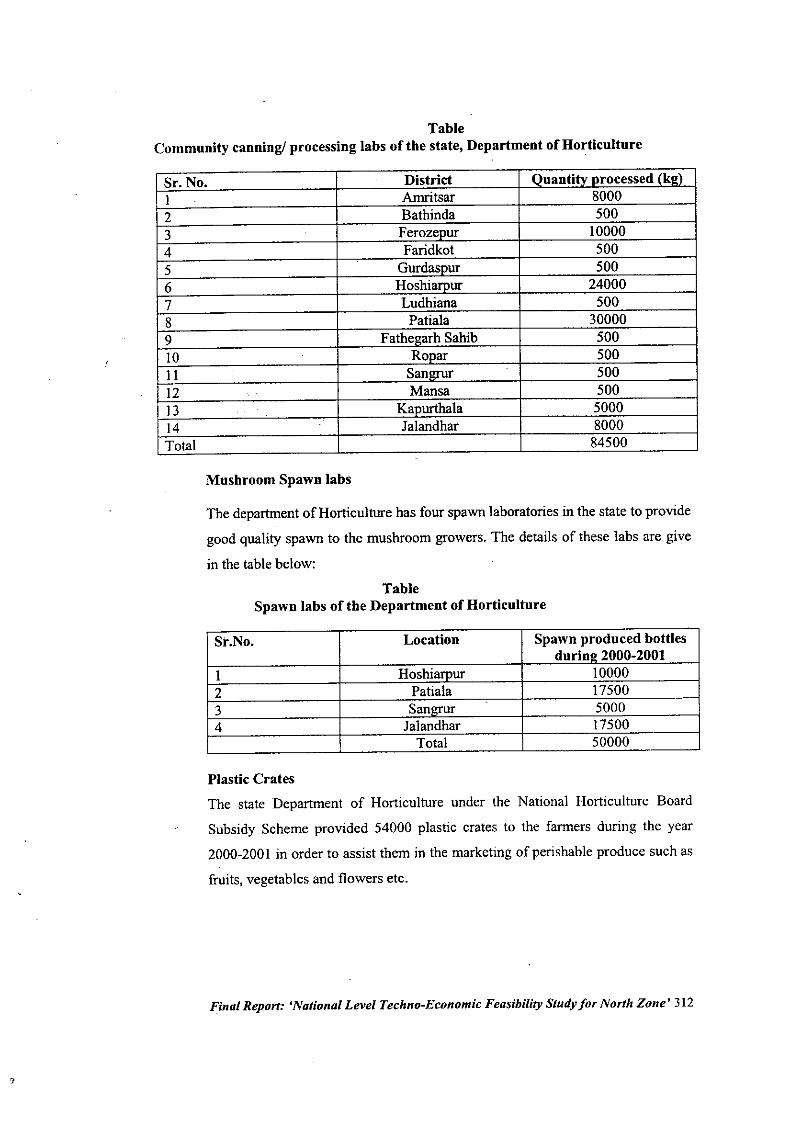
,
TableCommunity canning! processing labs of the state, Department of Horticulture
Sr. No. District Quantitv nrocessed (k!!)I Amritsar 80002 Bathinda 5003 Ferozenur 100004 Faridkot 5005 Gurdasour 5006 Hoshiarour 240007 Ludhiana 5008 Patiala . 300009 . Fathe!!arh Sahib 50010 Ronar 500II San= 50012 Mansa 50013 Kaourthala 500014
... Jalandhar 8000Total 84500
Mushroom Spawn labs
The department of Horticulture has four spawn laboratories in the state to provide
good quality spawn to the mushroom growers. The details of these labs are give
in the table below:
TableSpawn labs of the Department of Horticulture
St.No. Location Spawn produced bottlesdurin!! 2000-2001
I Hoshiarour 100002 Patiala 175003 Sanl!lUr 50004 Jalandhar 17500
Total 50000
Plastic CratesThe state Department of Horticulture under the National Horticulture Board
Subsidy Scheme provided 54000 plastic crates to the farmers during the year
2000-200I in order to assist them in the marketing of perishable produce such as
fruits, vegetables and flowers etc.
Final Repon: 'National Level Techno-Economic Feasibility Study for Nonh Zone' 312
4.5.1
4.5.2
Punjab Horticultural Post Harvest technology Centre
PAD, Campus, LudhianaThrust areas
1. To determine the specific needs of trainees for post-harvest information
services and training (trainers, extension workers, Mandi Board Officers,
farmers, traders, labourers, processors, self marketers and exporters)
2. To strengthen linkages between India and International post harvest
institutions in order to develop an up-to-date post harvest knowledge
base, plan collaborative applied, research projects can train the trainers in
methods of post harvest loss assessment, applied research
demonstrations. Centre administration and management and evaluationof project tasks.
3. To serve as a Centre of Post harvest information in order to disseminate
information by telephone, FAX, e-mail and written publications to all
interested parties.
4. To. provide training for university, government and private industry
trainers and extension workers in post-harvest technologies from harvest
through marketing (Training and Trainers courses).
5. To provide effective local training (taking into consideration education
level, literacy, gender and language variations) for farmers, traders and
self marketers in appropriate post harvest technologies from harvesting,
storage, transport to developing new marketing strategies.
6. To assist India's horticultural producers to become more market oriented
by providing information and demonstrations on cost effective post
harvest and direct marketing practices and assisting clients with project
appraisals when applying for funding from financial institutions for
investments in post harvest technology.
7. To provide laboratory services for private industry (pesticides residue,
quality parameters etc.) To assist the domestic horticultural industry to
achieve international standards and to set a benchmark for qualityproduce in India.
8. To facilitate the planning and implementation of needs-based research
and extension projects, both by applying to external funding (state
national and .international) and by providing grants through the Centre
Final Report: 'National Level Techno-Economic Feasibility Study for North Zone' 313
•4.5.3
for applied post harvest research and demonstrations on a competitive
basis for collaborative, efforts between university/ government and the
private horticultural Sector.
Achievements
1. Establishment of tbe Centre
(i) Post harvest laboratory
(a) Erection of pre-fabricated walk in-cold rooms/ degreening rooms
To modular type pre-fabricated walk in cold rooms, ripening and pre-cooling
chamber were received from Mis ..Blue Star Limited have been erected. The
performance of these chambers is under testing. The refiigeration units and
accessories such as CO, sensors, ethylene generator have been received and
installed. The storage for different fruits and vegetables are being
standardization, capacity I tone each of cool rooms.
(ii) Quality Analysis LaboratoryThe laboratory has now become fully operational to cater the needs of quality
analysis of foods to the clients on payment basis. Various clients are now,
approaching this center for tests on payment basis. In quality analysis laboratory
instruments like HPLC, GLC, table Centrifuge, UV-VIS. Spectrophotometer,
Moisture analyzer, Tissue Homoenizer, Digital Titrimeter, Freeze Drier, BOD
Incubator, Texture analyzer, Deep. freezer, water activity meter, Atomic
Absorption Spectrophotometer, Muffle furnace, pH meter. Viscometer, Hot plate
with magnetic stirrer have been acquired and installed.
(iii) Post-harvest Information center and library
Literature for the reference room in the form of books, manuals and journals
published in India and abroad has been purchased or down loaded from internet
sites are placed in the folders for use by the readers (Annexure A.)
2. Research ActivitiesDesign, fabrication and testing of a forced air pre-cooler: A forced air pre-cooler
to pre-cool fruits and vegetables in a batch of 50 kg was designed. This pre-
Final Report: 'National Level Techno-Economic Feasibility Study for North Zone' 314
cooler includes an insulated chamber of approximately IS m3 capacity,
refrigeration system to maintain temperatures in the range of O-SoC, a humidifier .
with humidistat for maintenance of high humidity (Above 90%) and a system for
air circulation which sucks air through the commodities loaded in plastic crates.
The fabrication was carried out by MIs Blue Stat Ltd. The preliminary testing of
the system on pre cooling of cauliflower was successfully carried out, however,
the system is to be tested on various summer fiuits and vegetables.
3. Storage studies of pear
An experiment on cold storage of pear was conducted. The pear fiuits cv. Pather
Nakh were pre-packed in perforated polythene bags and utilized in wooden
boxes. The second lot was packed in wooden boxes along with ne,¥spaper shreds.
The fiuits were stored in walk-in cold chambers maintained at O-loC and 90-9S%
RH. The observations on weight loss, TSS, acidity were recorded periodically. It
was observed that pear fiuits packed in perforated polythene bags can be stored
successfully with acceptable quality up to 3 months.
4. Studies on banana ripening
Mature bananas were either dipped in SOO ppm a.i. ethephon then maintained at
14AoC or kept in leakage tight (Blue Star supplied) ripening chamber at 14AoC
and exposed 100 ppm gas from ethylene generator operated for 8 hours. The
ethephon treated fiuits developed beautiful yellow colour on 6th day and had TSS
18.S"B, whereas fiuits exposed to ethylene gas developed acceptable yellow
colour after 12 days with TSS 18"B. However, the control fiuits did not develop
colour an remained greenish soft
In another experiment the mature banana fiuits were dip treated with ethephon @
12S, 2S0 and SOO ppm concentration for 2 minutes. The control fiuits were
dipped in water for 2 minutes. The fiuits were air dried and packed in plastic
crates and kept in cold storage maintained at 16.8°C and 90-9S per cent relative
humidity. It was observed that ethephon @ SOO ppm proved quite effective in
stimulating the ripening and colour of the fiuit. The fiuits developed beautiful
yellow colour on 6th day compared to control which greenish in colour.
Final Report: 'National Level Techno-Economic Feasibility Study for North Zone' 315
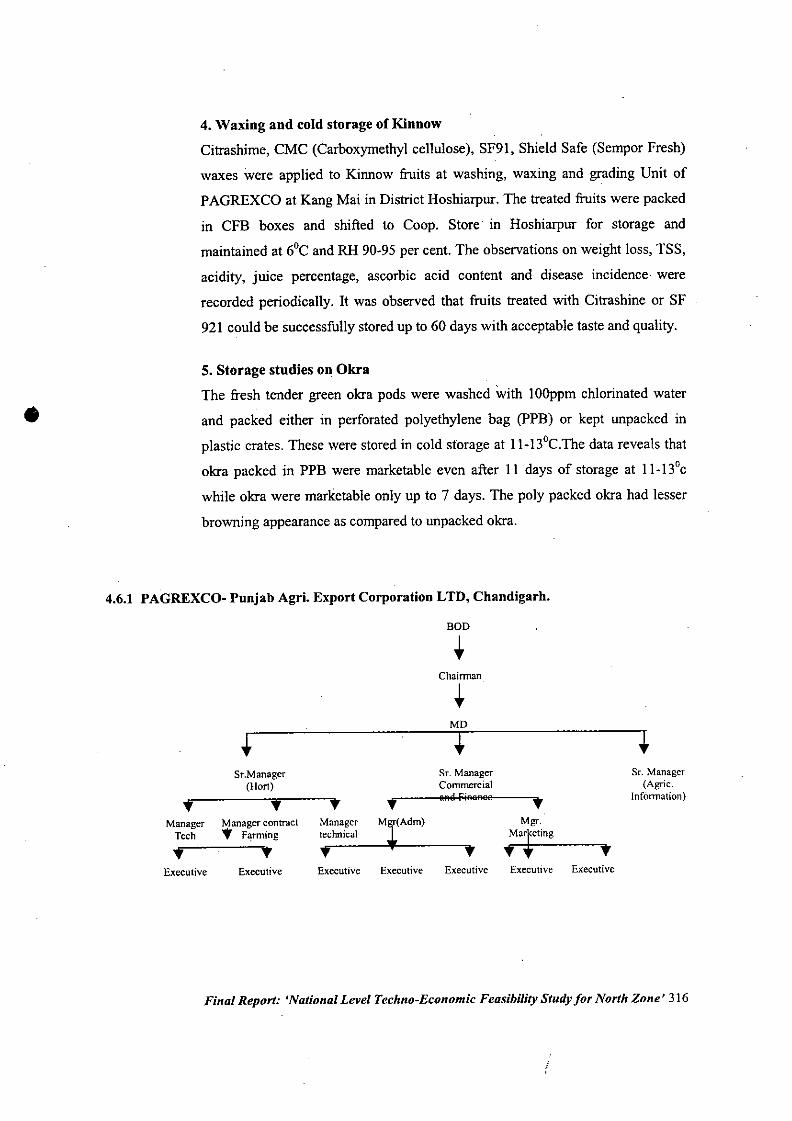
•
4. Waxing and cold storage of Kinnow
Citrashime, CMC (Carboxymethyl cellulose), SF91, Shield Safe (Sempor Fresh)
waxes were applied to Kinnow fruits at washing, waxing and grading Unit of
PAGREXCO at Kang Mai in District Hoshiarpur. The treated fruits were packed
in CFB boxes and shifted to Coop. Store' in Hoshiarpur for storage and
maintained at 6°C and RH 90-95 per cent. The observations on weight loss, TSS,
acidity, juice percentage, ascorbic acid content and disease incidence. were
recorded periodically. It was observed that fruits treated with Citrashine or SF
921 could be successfully stored up to 60 days with acceptable taste and quality.
5. Storage studies on OkraThe fresh tender green okra pods were washed with 100ppm chlorinated water
and packed either in perforated polyethylene bag (PPB) or kept unpacked in
plastic crates. These were stored in cold storage at 11-13oC.Thedata reveals that
okra packed in PPB were marketable even after II days of storage at II-13°c
while okra were marketable only up to 7 days. The poly packed okra had lesser
browning appearance as compared to unpacked okra.
4.6.1 PAGREXCO- Punjab Agri. Export Corporation LTD, Chandigarh.
BOD•Chairman•MD~----+
Executive
••ManagerTech
••Executive
Sr.Manager(Hort)
fManager contract.• F~rming
••Executive Executive Executive
Sr. ManagerCommercialBRe FiRsHss
Executive
••MgL
Martc_t_in_g_ ....n .•Executive
Sr. Manager(Agric.
Information)
Final Report: 'National Level Techno-Economic Feasibility Study for North Zone' 316
4.6.2
4.6.3
•
•
•
••
•
Thrust areasPromotion of Horticulture- commercial production and export
During last four years 9500 MTs ofkinnows were waxed. 7.5 lac CFB cartons
sold on subsidized rates and around Rs. 120 lacs released as subsidy. Around 200
MTs of Snow peas was exported to Australia! U.K/Holland.
AchievementsAssistance! Incentives for fresh! processed fruits and vegetables
Subsidy is being provided on packaging material, inland haulage, waxing and
grading pre cooling and cold storage and sea freight for promoting kinnow and
grape crops in distant! export markets.
For other fruits subsidy is being provided on packaging material, inland haulage,
post harvest treatment and pre-cooling-cum-cold-storage.
Frozen fruits and vegetables including frozen mushrooms Sweet Com, Baby
Com except Peas are also provided subsidy on inland reefer haulage for
marketing.
Import of seed! planting material for vegetables are also subsidized.
For exports of fresh vegetables subsidy is being provided on packaging material,
inland reefer freight, .air freight! sea freight. Also frozen fruits and vegetables
being exported are provided subsidy on.inland reefer haulage and sea freight.
For export of flowers subsidy is provided on packaging material and inland reefer
haulage.
Development oflnfrastructure for Post-Harvest Handling of Fruits and Vegetables by
PAGREXCO1. PAGREXCO has set up 5 Nos. Mechanical Sorting Waxing and Grading Centres with
capacity of 5 MTs per hour for kinnow in five Citrus Estates.
2. Two Pre-Cooling cum Cold Store have been set up at Badal and Talwandi Saboo and
assisted Co-operative Cold Store at Hoshiarpur.
3. Hydraulic pruners, horticultural tools, Improved spray pumps, internet facility have been
provided in Citrus Estates.4. Postharvest treatment, packaging development for Litchi carried out and trial exports
made to U.K and Gulf.
Final Report: 'National Level Techno-Economic Feasibility Study for North Zone' 317
Cold Chain Infrastructure
Corpus Fund
1. The State Government has created a Corpus Fund for creation of Cold Chain
Infreastructure in the State of Punjab and 8 projects with investment of around Rs.
2200 lacs have been approved with soft loan assistance of Rs. 980 lacs.
Food Parks
1) The first Food Park is being established in Punjab in District Fatehgarh Sahib at a
project cost of Rs. 15.10 crores. The Food Park will have central facitilies of
Automated Nursery Post Handing cum Grading Waxing. Pre Cooling cum Cold
Storage. Controlled Atmospheres Cold Storage and Service facitilies of Rand D
Labs. Agric Information Centre/ Training etc and would contract with around 1000
farmers in over 5000 acres in 50 km. Radius. PAGREXCO is now going ahead with
the implementation of the project as approved by the State Project Approval Board.
2) An Organic Food Park is proposed to be set up at Gobindwal Sahib District of
Kapurtala where 250 acres ofland is available for Organic farming.
3) 500 Refrigerated Outlets are proposed to be set up in major towns and blocks of the
state to provide the consumers quality food products to meet daily needs.
Agri Export Zone for Vegetables
1. Under the New EXIM policy of Government of India, PAGREXCO has signed a
Memorandum of Understanding with APEDA on October 29,2001 for setting up
of Agri Export Zone for vegetables covering the districts of Fatehgarh Sahib,
Sangrur, Patiil1a, Ludhiana and Ropar. The objective of the Agri Zone is to
provide financial assistance to the growers / exporters available from various
Central! State Government Agencies in a contiguous area through a single
agency. The State Government for implementing the project has declared
PAGREXCO as the Nodal Agency. The Agri Export Zone will utilize the
facilities being created under the food park.
Final Report: 'National Level Techno-Economic Feasibility Study for North Zone' 318
2. Trial exports to U.KJ Gulf have been initiated for fresh fruits and vegetables to
see the acceptability so that exports can be increased from the state under the
Brand of Punjab Produce. 19 consignments of fruits and vegetables from Punjab
have been exported to U.K. and Gulf comprising of Muskmelons, Litchi,
Mangoes, Okra, Karela, Arbi, Gren Chilii, Ghia Tinda etc. Presently 2-3
consignments of around 3.5 to 4 MTs are exported fruits vegetable of 50-60MTs.
3. Frozen peas 500 MTs to Saudi Arabia, Frozen Okra 17MTs and 20MTs Frozen
Green Gram have been exported to U.K. by processing unit located in AEZ.
Final Report: 'National Level Techno-Economic Feasibility Study for North Zone' 319
6 Marketing
The price trend of last five years in Delhi wholesale market clearly indicates that mango
has most constant prices during last five years. The increase over wholesale and retail
price has changed by 2 and I percent only. Overall percentage of price rise in fruits is
14.25 percent with annual increase of 2.8 percent while in vegetables increase over last
five years is 10.1 percent with annual increase of 2 percent, which clearly shows that
during last five years there is only marginal increase in wholesale price except cabbage
and cauliflower where wholesale price has decreased by 8 and 32 percent.
The overall picture of important fruits and vegetable wholesale and retail prices in
Delhi are given in table -
The percentage of fruits arrival amongst the metro market shows that 58.4 percent comes
in Delhi while Chennai 5.3, Banglore 8.6, Mumbai 15.7 and Calcutta accounts for 12
percent while share of vegetables in 38.4, 10.9, 10.1,22.6 and 18 percent. The overall
picture of fruits and vegetables in the metro is that Delhi market handles 48.4 percent
which is almost 50 percent and rest four metro markets arrival in 51.6 percent. The detail
is given in table:-
Final Report: 'National Level Techno-Economic Feasibility Study for North Zone' 320
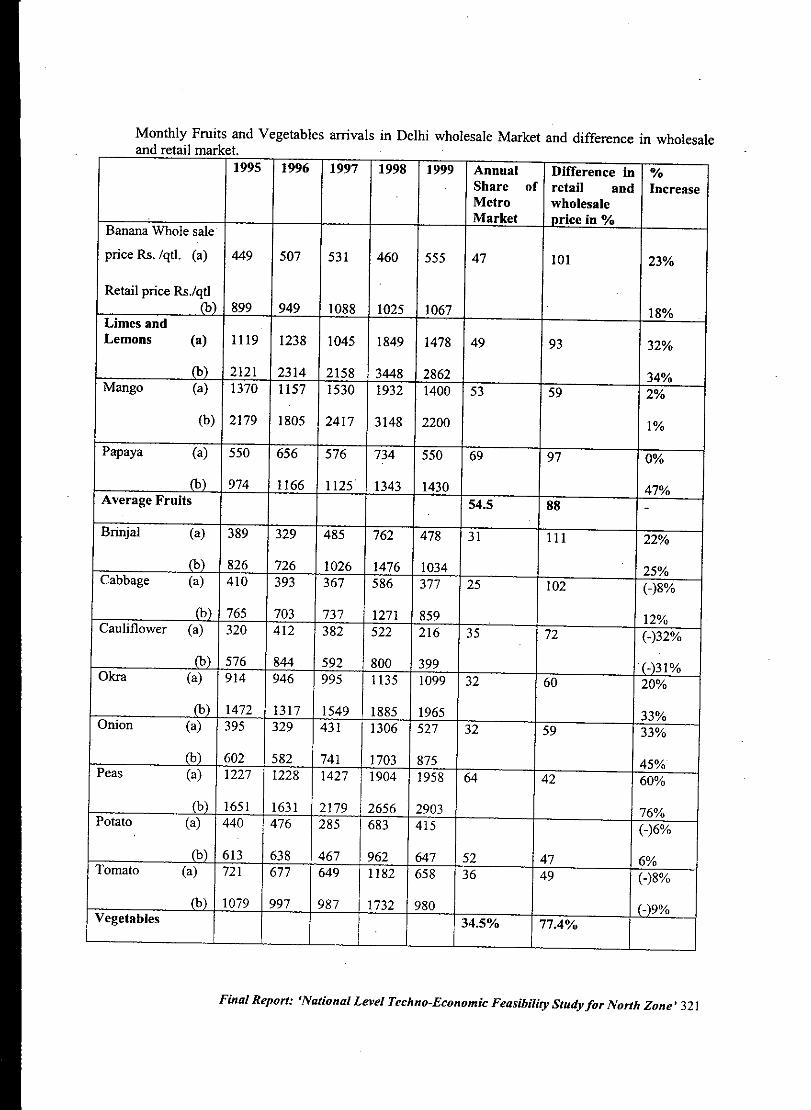
Monthly Fruits and Vegetables arrivals in Delhi wholesale Market and difference in wholesaleand retail market.
1995 1996 1997 1998 1999 Annual Difference in %Share of retail and IncreaseMetro wholesaleMarket price in 0/0
Banana Whole sale
price Rs. /qtl. (a) 449 507 531 460 555 47 101 23%Retail price Rs.lqtl
(b) 899 949 1088 1025 1067 18%Limes and .
Lemons (a) 1119 1238 1045 1849 1478 49 93 32%(b) 2121 2314 2158 3448 2862 34%
Mango (a) 1370 1157 1530 1932 1400 53 59 2%(b) 2179 1805 2417 3148 2200 1%
Papaya (a) 550 656 576 734 550 69 97 0%(b) 974 1166 1125 1343 1430 47%
Average Fruits 54.5 88 -.
Brinjal (a) 389 329 485 762 478 31 III 22%(b) 826 726 1026 1476 1034 25%Cabbage (a) 410 393 367 586 377 25 102 (-)8%(b) 765 703 737 1271 859 12%Cauliflower (a) 320 412 382 522 216 35 72 (-)32%(b) 576 844 592 800 399 (-)31%Okra (a) 914 946 995 1135 1099 32 60 20%
.
(b) 1472 1317 1549 1885 1965 33%Onion (a) 395 329 431 1306 527 32 59 33%(b) 602 582 741 1703 875 45%Peas (a) 1227 1228 1427 1904 1958 64 42 60%(b) 1651 1631 2179 2656 2903 76%Potato (a) 440 476 285 683 415 (-)6%(b) 613 638 467 962 647 52 47 6%Tomato (a) 721 677 649 1182 658 36 49 (-)8%(b) 1079 997 987 1732 980 (-)9%Vegetables 34.5% 77.4%,
!
Final Report: 'National Level Techno-Economic Feasibility Study for North Zone' 321
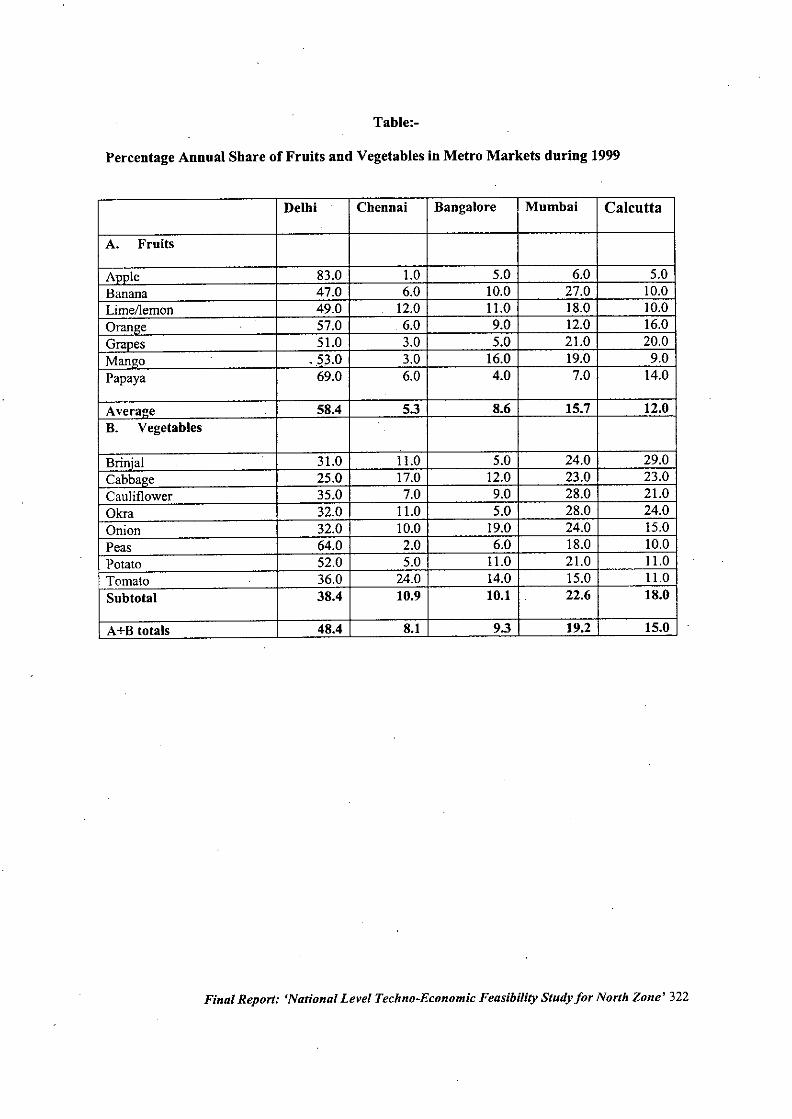
Table:-
Percentage Annual Sbare of Fruits and Vegetables in Metro Markets during 1999
Delhi Chennai Bangalore Mumbai Calcutta
A. Fruits
AnnIe 83.0 1.0 5.0 6.0 5.0Banana 47.0 6.0 10.0 27.0 10.0Lime/lemon 49.0 12.0 11.0 18.0 10.0Orange 57.0 6.0 9.0 12.0 16.0Grapes 51.0 3.0 5.0 21.0 20.0ManQo ..53.0 3.0 16.0 19.0 9.0Papaya 69.0 6.0 4.0 7.0 14.0
Average 58.4 5.3 8.6 15.7 12.0B. Vegetables
Brinia] 31.0 11.0 5.0 24.0 29.0CabbaQe 25.0 17.0 12.0 23.0 23.0Cauliflower 35.0 7.0 9.0 28.0 21.0Okra 32.0 11.0 5.0 28.0 24.0Onion 32.0 10.0 19.0 24.0 15.0Peas 64.0 2.0 6.0 18.0 10.0Potato 52.0 5.0 11.0 21.0 11.0Tomato 36.0 24.0 14.0 15.0 11.0Subtotal 38.4 10.9 10.1 22.6 18.0
A+B totals 48.4 8.1 9.3 19.2 15.0
Final Report: 'National Level Techno-Economic Feasibility Study for North Zone' 322
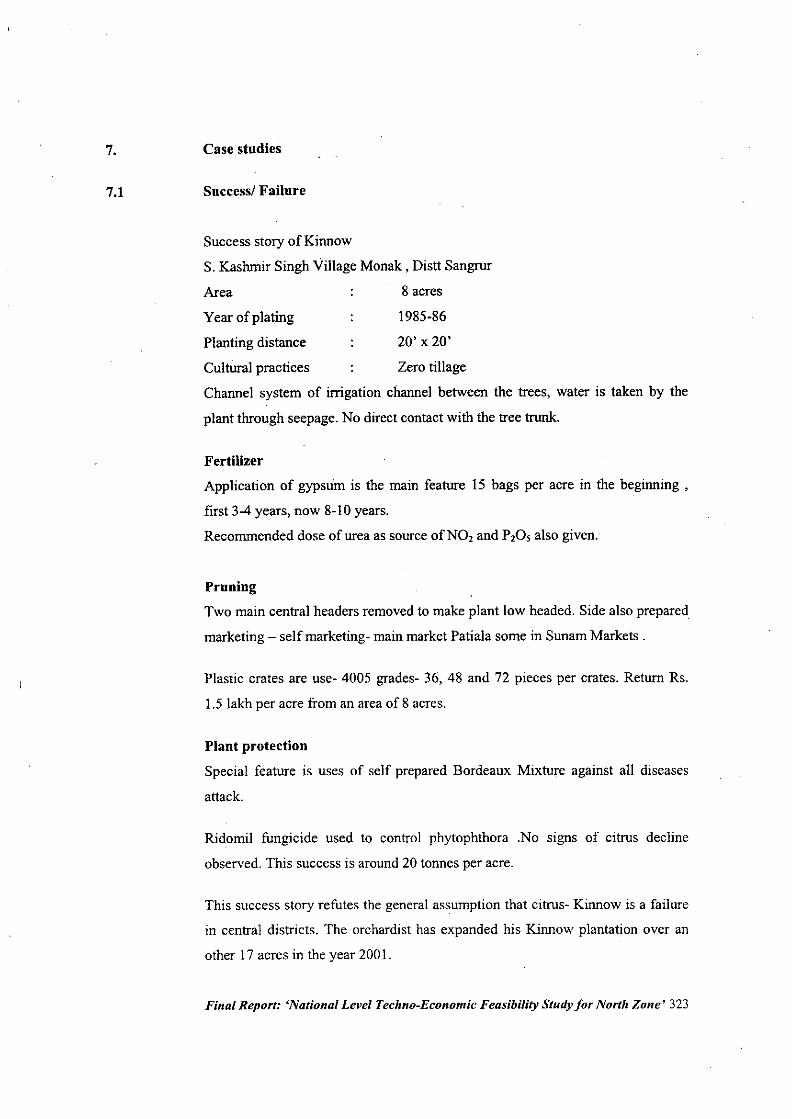
7.
7.1
Case studies
Success/ Failure
Success story ofKinnow
S. Kashmir Singh Village Monak , Distt Sangrur
Area 8 acres
Year of plating 1985-86
Planting distance 20' x 20'
Cultural practices Zero tillage
Channel system of irrigation channel between the trees, water is taken by the
plant through seepage. No direct contact with the tree trunk.
Fertilizer
Application of gypsum is the main feature IS bags per acre in the beginning,
first 3-4 years, now 8-10 years.
Recommended dose of urea as source ofN02 and P20, also given.
Pruning
Two main central headers removed to make plant low headed. Side also prepared
marketing - self marketing- main market Patiala some in Sunam Markets.
Plastic crates are use- 4005 grades- 36, 48 and 72 pieces per crates. Return Rs.
1.5 lakh per acre from an area of 8 acres.
Plant protection
Special feature is uses of self prepared Bordeaux Mixture against all diseases
attack.
Ridomil fungicide used to control phytophthora .No SIgnS of citrus decline
observed. This success is around 20 tonnes per acre.
This success story refutes the general assumption that citrus- Kinnow is a failure
in central districts. The orchardist has expanded his Kinnow plantation over an
other l7 acres in the year 200I.
Final Report: 'National Level Techno-Economic Feasibility Study for North Zone' 323
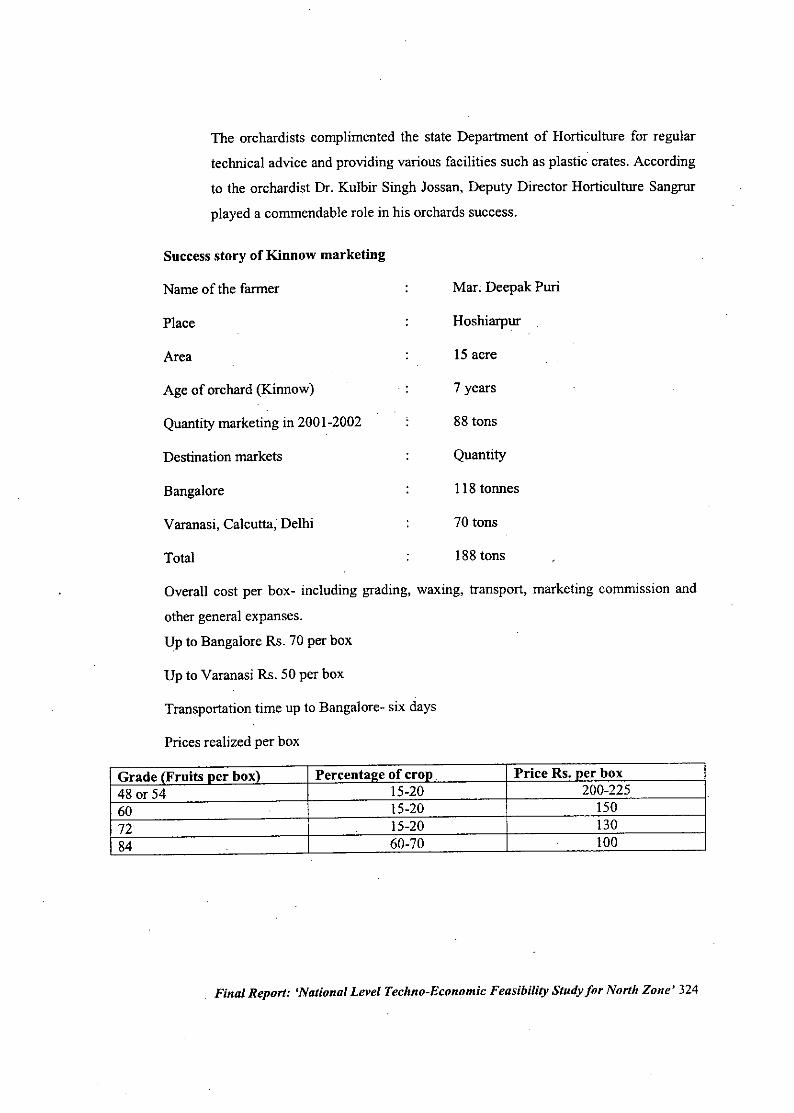
The orchardists complimented the state Department of Horticulture for regular
technical advice and providing various facilities such as plastic crates. According
to the orchardist Dr. Kulbir Singh Jossan, Deputy Director Horticulture Sangrur
played a commendable role in his orchards success.
Success story of Kinnow marketing
Name of the farmer
Place
Area
Age of orchard (Kinnow)
Quantity marketing in 2001-2002
Destination markets
Bangalore
Varanasi, Calcutta, Delhi
Total
Mar; Deepak POO
Hoshiarpur
15 acre
7 years
88 tons
Quantity
118 tonnes
70 tons
188 tons
Overall cost per box- including grading, waxing, transport, marketing commission and
other general expanses.
Up to Bangalore Rs. 70 per box
Up to Varanasi Rs. 50 per box
Transportation time up to Bangalore- six days
Prices realized per box
Grade (Fruits ner box) Percental!e of crOD Price Rs. ner box48 or 54 15-20 200.225
60 15-20 15072 15-20 13084 60-70 100
Final Report: 'National Level Techno-Economic Feasibility Study for North Zone' 324
1980-81
Tibbaland,noinigation
Beant Singh
Nangla Distt. Sangrur
6 acres
Success Story of Ber Orchard
Orchardist
Address
Area
Planting year
Land situation
First planting died
The farmers used an innovative method of inigation. He replanted the trees and
inigated the plants by fetching water in pitches loaded on a Behngi' He didthis for two years to make the plants successful.
Varieties planted- Umran, Gola-4, Sanuar-6. In the year 1994-95 the trees
became too close and yield was less. So in 1995-96, 5 to 6 trees ere headed back
up to 2.5 ft main limbs from the trunk. The yield and quality improved. Now in
2002 all plants given severe heading back pruning to rejuvenate the trees.
Average yield is about 200 kg per plant and 72 trees per acre, the productivity is
about 15 tons per acre. Average net returns quoted by the farmer are Rs. 50 to Rs.60000 per acre.
The orchardists mentioned that all the recommendations as per the advice of the
state department of Horticulture are regularly followed. The dehorning operation
was suggested and supervised by Dr. Kulbir Singh Jossan, Deputy Director ofHorticulture, Sangrur.
Final Report: 'National Level Techno-Economic Feasibility Study for North Zone' 325
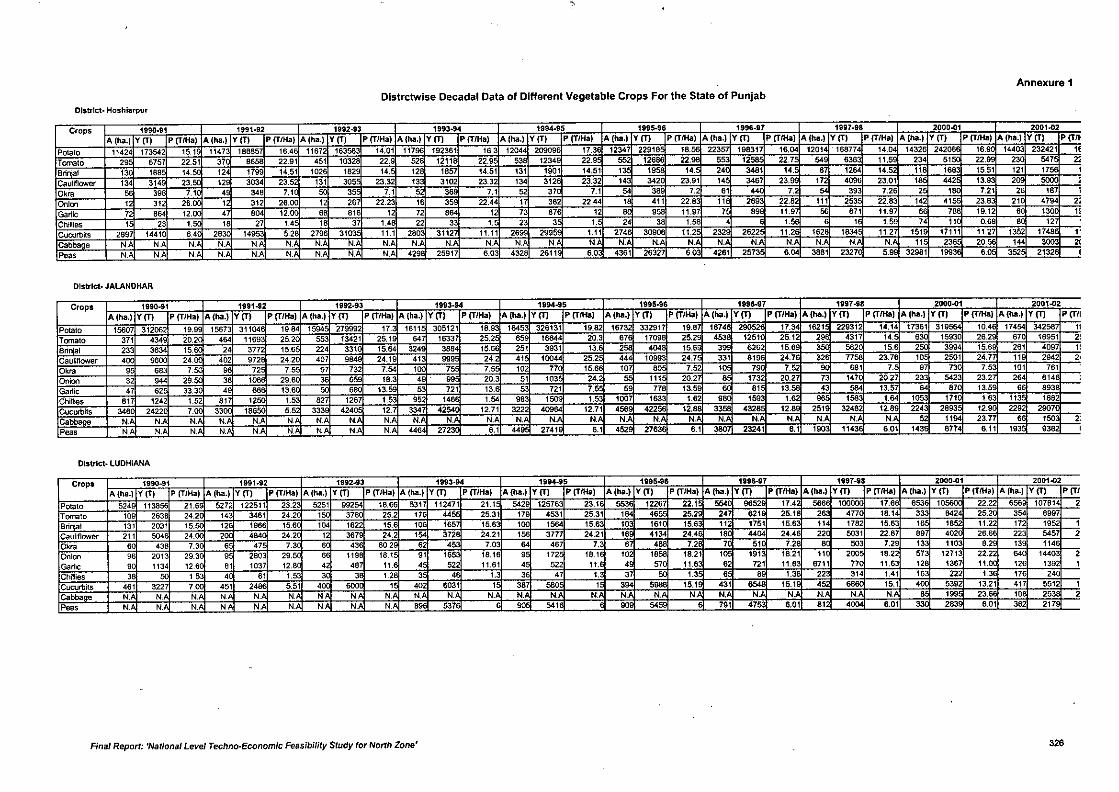
Dlstrctwlse Decadal Data of Different Vegetable Crops For the State of PunjabDistrIct. Hoshlarpur
Annexure 1
Crops 1990.91 1991.92 1992-93 1993.94 1994.95 1995-96 1996.97 19S17.98 2000-01 2001-02
A (ha.) Y(T) P (lIHa) A (ha.) Y (T) P (l/Ha) A (ha.) Y (T) P (lIHa) A (ha.) Y (T) P (T/Ha) Afha.) YITI P (TIHa) A (ha.) Y (T) P (l/Ha) Alha.) Y(T) P (TIHa) A (ha.) Y (T) P (T/Ha) Alha.) Y (T) P (T/HlI) Alha.) Y (T) P (T/~
Potalo 1142 173542 15.19 11473 16685 16.4 11672 16356 14.01 11796 192361 16.3 12044 2_ 17.36 12347 2291816~
2235 19631 16.04 1201 168774 14.04 14326 24206 16 14403 232421 "Tomato 29 6757 22.51 370 66 22.91 451 10328 22.9 529 1211 22.9 538 1234 22.9 552 12686 22. 1256 22.7 54 636 11.5 234 51 22.9 23 547 22
Bnn I 13 186 14. 124 1799 14.51 102 1829 14. 12 165 14.51 131 1901 14.51 13 19 14 24 3481 14. 67 1254 14.52 11 16i 15.51 121 17 1
Cauliflower 134 314 23. 129 3034 23.52 131 305 23.32 13 3102 23.3 134 312 23.32 14 342 23.91 14 348 23. 172 4096 23.01 16 442 13.9 2 500 ,Ok", 396 7.1 4 348 7.1 35 7.1 5 36 7.1 52 37 7.1 36 7.2 61 7.2 39 7.26 2 1 7,21 2 187 ,Onion 12 312 26.0 12 312 26.00 12 26 22.23 16 359 22.44 1 362 22,44 1 411 22,83 116 269 22.82 111 253 22.83 142 415 23,8 " 4794 22
Garlic 7 864 12.0 4 604 12. 66 616 12 72 664 12 73 67 12 6 9 11.9 7 69 11.9 56 671 11.97 7B 19.12 130 "Chillies 1 23 ,. 1 27 1.4 16 37 lA 22 3 1. 23 3 1. 24 36 1. 4 1. 16 1.5 74 11 0.68 8 12
Cucurt>its 2897 14410 6A 29 149 5.2 2796 3103 11.1 2803 3112 11.11 2699 2995 1.11 274 30906 11.2 232 2622 11.2 162 1634 11.27 151 17111 11.27 135 1748 l'Cabba e N N. N. N N N. N N. N. N. N. N. N N. N. N. N. N. N. N. N. N. N. N. 11 236 20. 144 300 2(
Peas N. N N. N. N. N. N. N.A N. 429 25917 6.03 4328 2611 6.0 4361 26327 6 4261 2573 6.04 3661 2327 5. 32981 1993 60 352 2132 (
DIstrict. JALANDHAR
Crops 1990-91 1991-92 1992.93 1993.94 1994.95 1995.96 1998-97 1997-98 2000-01 2001-02
Alha.) Y(T) P (TIHa) A (ha.) Y (T) P(T/HlI) A (ha.) Y (T) P (l/Ha) A (ha.) Y(T) P (T/Ha) A (ha.) Y(T) P (T1lia1 A (ha.) Y (T) P (T1Ka) Alha.) YITI P,(l/Ha) A (ha.l Y(T) P (T1Ha) A (ha.) Y (T) P (T1Ha) A (ha.) Y(T) P (TIl
Potato 15607 312062 19.99 15673 31104 19,84 1594 279992 17. 1611 305121 18.9 1645 326131 19.82 16732 332917 19.87 1674 29052 17.34 1621 229312 14,14 17361 318 10,46 17454 34256 11
Tomalo 371 4349 20.2 464 1169 25.2 553 13421 25,1 64 16337 25.2 659 1664 20,3 67 1709 25.29 453 1251 25.12 29 4317 14. 630 15930 26.2 67 16951 "Bnn I 233 363 15 2 3772 15.6 224 331 15. 324 386 15.66 251 3931 13. 256 404 15.6 3 626 15.6 3 562 15. 2 3994 15,6 261 4097 "Cauliflower 4 9600 24 402 972 24.2 407 964 24.19 41 999 24. 41 10044 25.2 1099 24.7 331 8196 24.7 32 77 23.76 10 2501 24,7 11 2942 2.
Ok", 9 663 7 72 7.5 97 732 7.54 1 75 7. 102 77 15.66 10 60 7.52 10 7 7.52 661 7. 97 73 7.5 101 761
Onion 32 944 29 36 10 29.6 3 65 18.3 49 99 20.3 51 103 24.2 111 20.2 6 17322ij7
73 147 20.27 233 5423 23.2 264 614
Gar1ic 47 62 33.3 49 66 13,6 660 13. 53 721 13. 53
41
7. 5 776 13.5 61 13. 43 13.5 64 67 13.5 66 693
Chimes 61 1242 1.52 617 12 1.53 82 1267 1. 952 146 154 963 ,. 1007 1633 1.62 96 159 ,. 96 156 1.64 1053 171 1.63 113 166
Cucurbils 346 2422 7. 3300 166 5.52 333 4240 12. 3347 4264 12.71 3222 12.71 456 42256 12.8 33 4328 12.6 251 32482 12.8 2243 2893 12.9 2292 2907
Cabba e N N. N N. N. N N.A N. N. N. N. N. N. N. N. N. N. N. N. N. N. N. N. N. 52 11 23.7 6 150 2:
Peas N.A N.A N N. N N N N. N 4464 2723 6.1 449 2741 6.1 452 2763 6.1 360 23241 6.1 1 1143 6.01 143 677 6.11 193 '36 ,
District. LUDHIANA
Crops 1990-91 1991.92 1992.93 1993.94 1994.95 1995-98 1996-97 1997.98 2000-01 2001-02
A {ha.) Y (T) P fTlHa) A (ha.) Y (T) P (T/Ha) A (ha.) Y (T) P (TfHa) A (ha.) YITI P (T/Ha) A (ha.) Y (T) IP (T'''') A (ha.) Y (T) P (T/Ha) Alha.) YITI P (TIHa) A (ha.) Y (T) P (T1Ha) A (ha.) Y(T) P fTlHa) Afha.) Y(T) P (TI
Potato 524 113856 21.6 5272 122511 23.23 5251 99254 18.66 5317 112471 21.1 642 125763 23.1 5536 12267 22.1 554 9652 17.4 566 100 17. 653 1056 22.22 656 10781 2
Tomato 10 2638 24.2 143 3461 24,2 1 3780 25.2 176 44 25,31 17' 4531 25.31 1 465 25.29 24 6" 25.18 2 477 18.1 3 642 25.2 364 6997
Bnn I 131 2031 15. 126 1966 15 104 1622 15. 106 165 15,6 100 1 15.63 103 161 15.6 112 1751 15.6 114 1782 15.63 16 1652 11.22 172 1952 1
Cauliflower 211 504 24. 2 464 24,2 12 3679 24,2 164 372 24,21 156 377 24.21 16 4134 24,4 16 4404 24,46 22 5031 22.87 697 402 26.66 223 545 2
0'"' 6 436 7.3 6 47 7.3 6 43 60,2 62 45 7.03 64 46 7.3 6 46 7.2 7 51 7.28 6 503 7,29 13 110 62 13 "'Onion 96 2013 29.3 9 2803 29. 6 1198 18.1 91 16. 18.16 , 172 18.1 10 16. 18,21 10 191 18.21 11 200 18,22 573 12713 22,22 64 1440 2
Go,", 9 1134 12,6 81 1037 12,8 42 497 11. 4 522 11.61 4 522 11. 4 57 11.6 62 721 11.6 6711 77 11.63 126 136 11.0 126 1392 1Chillies 3 1 4 61 1. 3 1.2 3 4 1.3 36 47 1. 3 1.3 6 6 1.3 22 314 1,41 16 22 136 17 240
Cucur1Jits 461 3227 7 451 24 5.51 4 500 1 402 6031 1 387 560 1 3 5 15.1 431 15.1 4 15.1 4 53' 13.21 41 5512 1
Cabba e N N. N N N. N N N N. N. N. N. N. N. N N. N. N. N. N. N. N. N N 6 199 23. 10 253 2
Peas N N. N N N. N. N N. N. 69 537 541 90 545 791 47 6.Q1 61 4 6.01 33 263 8.01 362 217
Final Report: 'NatIonal Level Techno.Economlc Feasibility Study for North Zone' 326
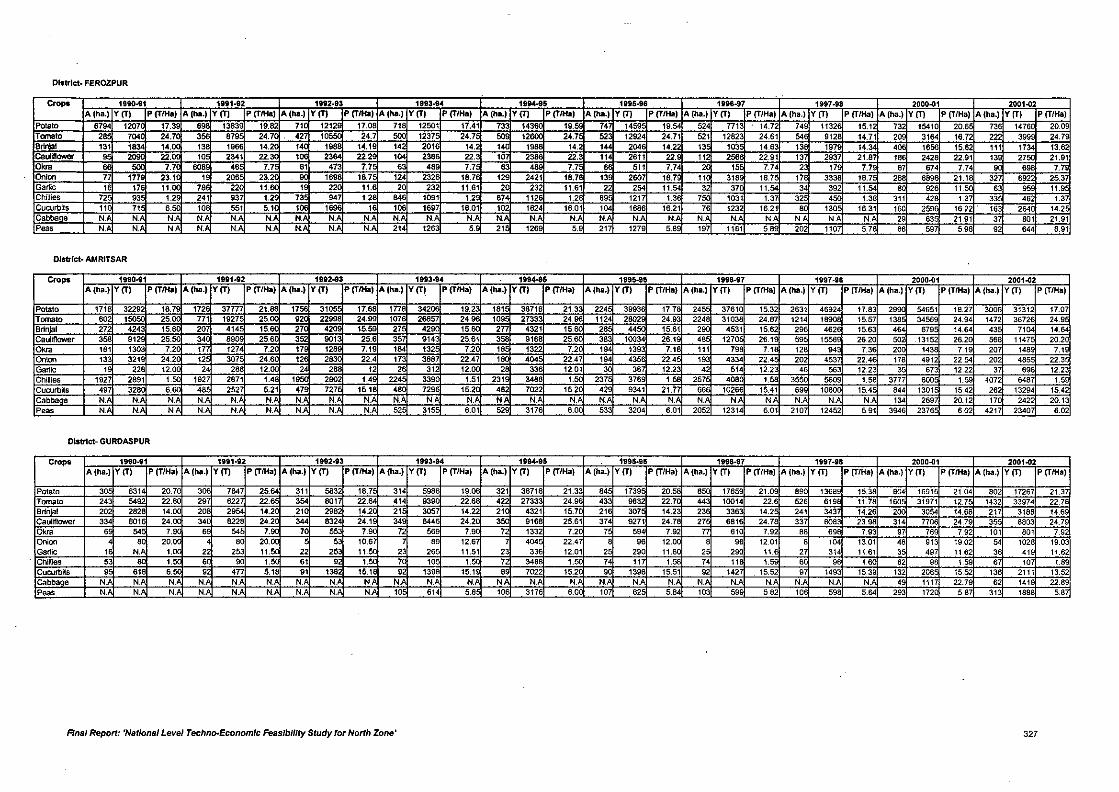
District. FEROZPUR
Crops 1990091 1191-92 1992.93 199309'" 19804095 1885096 11198.97 1997.98 2000-01 2001-02A (ha.) Y (T) P (TlHa) Alh •• ) YITI P (T1Ma) A (ha.) YITI P (TIKI) A (ha.)IY (TI P (T/Ha) A (h •• IIY (TI P (T1Ha1 A (ha.) Y ITI P (T/Ha) A (ha.) Y IT) P (TIHa) Alha.) YITI P (Tllial Alha.) Y ITI P (T/Ha) A (ha.1 Y ITI P (T/Ha)
Pota'o 6794 1207 17.39
~8
13839 19.82 71 1212 17.08 718 12501 17.41 733 143 10. 74 1459 19,54 524 7713 14.72 740 1132 15.12 73 15410 20.6 73 1476 20.09Tcmalo 28 704 2~ 870 24.7 42 105 24.7 1237 24.7 12 24.7 52 12924 24.71 521 1282 24.61 54 012 14.71 2 3164 16.72 222 399 24.7B 131
18 ''''.1966 14.2 14 108 ''''.1 14 201 14.2 14 1 14.2 1 204 14.22 13 103 14.63 13 107 14.34 4 1656 15.62 111 1734 13.6
ca•.•rfIower~22. 10 2341 22. 1 23 22.2 1 238 22. 10 2 22. 114 2611 22. 11 256 22,91 137 2937 21.87 18 2428 22.91 13 27 21,91
""'"7.7 608 48 7.7 81 47 7.7 6 48 7.7 48 7.7 511 7.74 2 15 7,74 2 17 7.79 87 874 7.74 896 7.7
On'on 177 23.1 1 206 23.2 160 18.7 124 232 18.7 129 2421 18.7 13 260 18.7 11 318 18,7 178 333 18.7 28 68' 21.18 32 692 25.37Garlic 1 176 11. 7" 22 11. 1 22 11. 20 232 11.61 2 232 11.61 22 254 11.54 32 37 11. 34 392 11.54 8 928 11. 63 , 11.9Chillies 72 93 1.2 241 93 1.2 7 947 12 646 1091 12 87 112 1.26 68 121 1.36 7 1031 1.37 32 4 1.36 311 42 13 33 462 13CUC\lrbits 11 71 6. 108 561 5.1 1 16 1 106 169 16.01 102 1624 16.01 104 1686 16.21 76 1232 16,21 8 130 16.31 160 259 16.22 163 2540 14.2Cabba e N. N. N. N. N. N N. N. N. N. N. N.A N. N. N. N.A N. N. N. N. N. N N N. 29 63 21,91 37 801 21.91Peas N. N N N. N. N. N. N. N. 214 126 5.' 21 126 5.9 217 1279 5.89 197 1161 58 202 110 5.7 86 597 5.9 92 644 8.91
District. AMRIT$AR
e.••• 1990-91 1991-92 1982093 1993-94 1994-95 1995.96 1998-97 1997.9S 2000-01 2001-02A (ha.) YITI P (T1Ha1 A (ha.) YITI P (T/Ha) A (ha.) Y IT) P (T/Hal A (ha.) Y(T! P (T1Ha) A (ha.) YIT) P (TlHa) A (ha.) Y IT) P (T/Ha) A (ha.1 YITI P (TfHa) A (ha.) YITI P (T/Hal Alha.) YITI P (TIHal A {ha.1 YITI P (T/Hal
Potato 171 3229218~
1726 37777 21.88 17 3105 17.66 tn8 3420 19.2 181 38716 21.3 224 3993 17,7 245 37610 15.32 2631 46924 17.83 2 54651 18.27 300 31312 17.07Tomato 60 156 25. 771 1927 25. " 22996
2~107 26857
2~109 2733 24 112 2802 24.9 224 31036 24.87 1214 18908 15.57 138 34569 24.94 1472 3672 24.9
Brlnal 27 424 15. 20 414 15. 27 420 16 27 429 15. 277 4321 15. 28 44 15.61 2 4531 15.62 29 462 15.63 46 679 14.64 43 71 14.64Cauliflower 356 912 25.50 34 680 25,6 352 901 25.6 35 914 25.61 356 9168 25. 383 10034 26.1 48 1270 26.1 59 15569 26,20 56 13152 26.2 568 1147 20,20,,", 191 13 7.2 17 127 7.2 17 128 7.19 164 132 7.2 18 13 7.2 194 139 7.1 111 798 7.1 128 9' 7.3 20 143 7.1 207 148 7.1Onion 133 321 24.2 12 307 24.6 12 283 22.4 17 3887 22.4 18 404 22.4 194 435 22.4 19 4334 22.4 20 453 22.4 178 4912 22,54 202 485 22.3Garlic 1 228
'~2 288 12. 2 28 12 2 31 12. 2 33 12,01 3 36 12.2 42 514 12.2 46 563 12.23 3 673 12,22 37 698 12,2
Chillies 1927 2891 1. 1927 2871 1.48 19 290 " 224 339 1.51 231 3488 1. 237 376 1. 257 408 1.58 3550 6809 1.88 3777 600 1.5 4072 648 1.5Cucurbils 497 328 6. 48 2527 5.21 47 727 15.1 48 729 15.2 482 7022 15.2 429 9341 21.77 66 10266 15.41 699 1080 15.4 644 1301 15,42 262 13294 15,42Cabba N. N. N.A N. N. N. N. N N. N.A N N.A N N N. N. N. N. N. N N N. N. N 134 269 20.12 17 2422 20.13Peas N N. N N N. N.A N. N. N. 52 315 6.01 52 3176 6.00 533 3204 6.01 205 12314 6.01 2107 12452 5,91 3946 2376 6,02 4217 23407 6.02
District. GURDASPUR
c•••• 1990-91 1911.12 1992-93 1993.94 11194095 1995.95 1998.97 1997.118 2000-01 2001-02A (ha.) YITI P (T1Ha) A (ha.) Y ITI P (TIHa) A (ha.) YIT) P (T1Ha) A (ha.) Y IT) P (TIHa) Alha.) Y ITI P (T1Ha) A (ha.) YITI P (T/Ha) A (ha.) Y ITI P (TfHa) A (ha.1 Y IT) P (T/Ha) A (ha.) YITI P (T1Ha) A (ha.) Y ITI P (TfHal
Potato 30 631 20.70 306 7647 25. 311 8832 18.7 314 5986 19.06 321 38718 21.3 64 1739 20. 8 1765 21.0 89 1368 15.38 80' 16916 21.04 80 17267 21.37T"",to 243 549 22.60 29 622 226 354 8017 22.64 414 93 22.68 422 2733 24.9 43 9832 22,7 44 10014 22.6 52 6198 11.76 160 31971 12.7 1432 33974 22.76Srin I 202 282 14,00 20 29 14.2 21 299 14.2 21 305 14.22 21 4321 15.7 216 307 14.2 23 336 14.2 241 343 14.26 2 3054 14.68 217 3188 14.6Cauliflower 334 801 24. 34 6228 24.2 344 8324 24.1 34 64'6 24.20 916 25.61 37 9271 24.7 27 681 24.78 337 8083 23.96 314 7706 24,79 35 6803 24.79
0""' 6 54 7. 69 54 7.9 7 553 79 72 569 7.90 72 1332 7.2 7 594 7.92 7 610 7.92 88 69 7.93 97 76 7,92 101 801 7,92Onion 8 20.UI. 4 8 20.UI
2~10.6 7 89 12.67 7 404 22.47 8 98 12.00 8 96 12.01 8 104 13,01 48 913 19,02 54 1028 19.03
Garlic 1 N. Ult 22 253 '~ 22 11.5 23 26 11.51 2 336 12.01 2 290 11.6 2 290 1\ 27 314 11,61 3 497 11,62 36 '19 11.62Chillies 53
~6 90 1. 61 92 ,. 7 10 I. 72 346 ,. 74 11 1.56 74 11 1. 60 9 1.6 62 98 1,59 67 107 1.69
Cucurblts 9 61 92 477 5.18 91 1382 15.1 92 1398 15.19 6 7022 15.2 90 1396 15.51 92 142 15.52 97 1493 15,39 132 206 15,52 136 2111 13.52Cabba e N. N. N. N. N N. N. N. N N. N. N. N N. N. N. N. N. N. N. N NA N.A N. , 1117 22.7 62 1419 22.89P",,' N. N N. N. N. N. N N. N. 10 614 5.6 106 3176 6.0 107 62 5.84 103 599 582 106 598 5.64 293 172 5.87 313 1888 5.8
Rnal Report: 'National Level Techno.-Economlc Feasibility Study for North Zone' 327
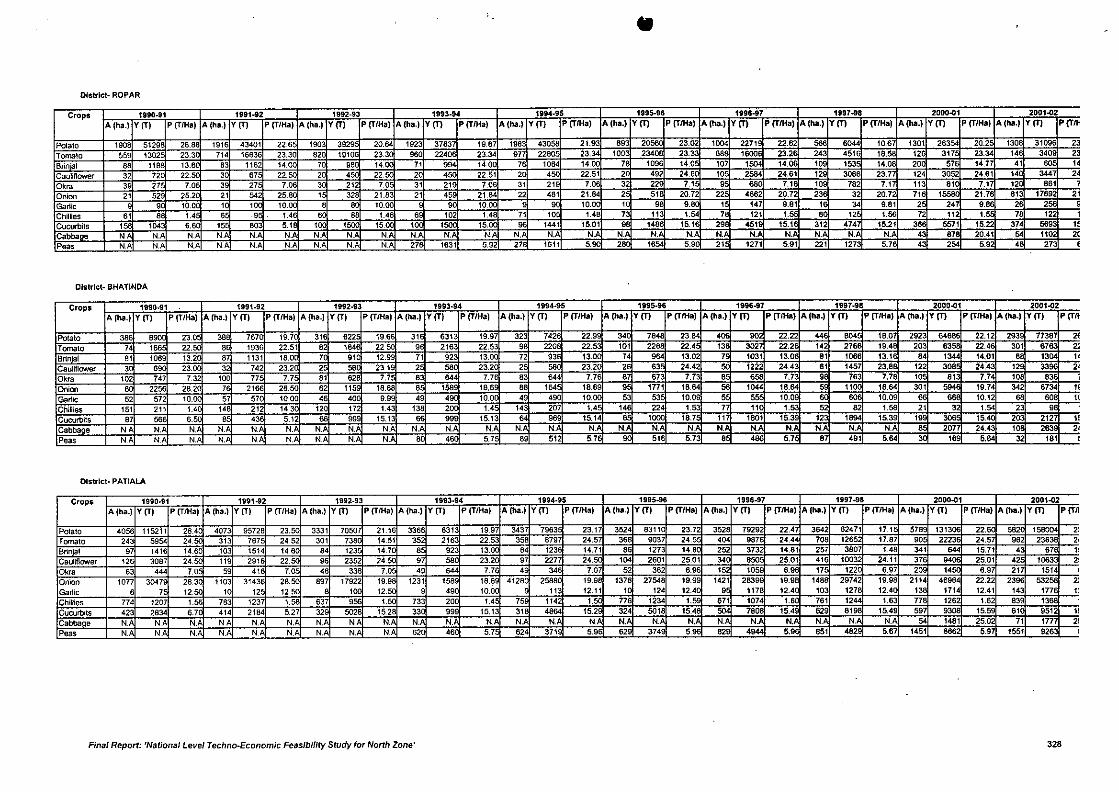
•District. ROPAR
33,,71,1
Crops 1990.91 1991.92 1992-93 1993.94 1i94.95 1995-96 ti9S.97 1997-98 2000-01 2001-02
A (ha.) Y[TI P (T/Ha) A (ha.) Y (TI P (TfHa) A (ha.) Y[TI P (TfHal A (ha.) Y[TI P (TfHa) A (ha.) Y[TI P (TIHa) A (ha.) Y[TI P (T/Ha) A (ha.) Y[TI P (T/Ha) A (ha.) Y[TI P (T/Ha) A (ha.) Y[TI P (TJHa) A (ha.) Y[TI P(T
Potato 1908 5129 26.8 1916 43401 22.6 1903 3929 20.64 1923 37637 19,67 1963 43058 21.93 893 20 23.02 1004 2271 22.62 6044 10.67 1301 26354 20.2 130 31096 2Tomalo 559 1302 23.3 714 16636 23.30 62 19106 23.3 960 224 23.34 977 2280 23. 100 2340 23. 68 1600 23.2 243 4516 18.58 12 317 23.34 146 340 2Brin' I 68 118 'H 8 1162 14.0 7 98 14 71 99 14.0 7 10 14.00 7 1096 14,0 107 1504 14. 10 153 14.08 20 57 14.77 41 60 1Cauliflower 32 77 22. 3 67 22. 2 4 22 2 4 22.51 2 4 22.51 2 492 24.6 10 2594 24.61 129 3066 23.77 124 3052 24.61 14 344 2Okrn 3 27 7. 3 27 7.06 3 212 7.0 31 21 7. 31 21 7.06 32 22 7.1 9 68 7.1 1 762 7.17 113 81 7.1 12 981Onion 21 52 25,2 21 542 25.60 1 328 21.83 21 45 21.64 22 481 21.84 2 51 20.72 22 4662 20.7 23 32 20.7 71 1 21.7 81 1769 2Gartic 90 10 1 1 10.00 8 8 10.00 9 10. 10 1 9 9.8 1 147 9.81 1 34 9.81 2 24 9.' 2 256Chillies 81 68 1.4 • 9 1.46 • " 1.46 • 10 1.48 71 10 1.48 7 113 1.54 7B 121 1. 12 1.56 7 11 1. 7B 122Cucurbits 1 104 ••• 1 '0 5.1 1 1 15 1 1 15 1441 15.01 9 1486 15.1 29. 451 15.1 312 4747 15.21 38 5671 15.22 374 "9 1Cabba e N N.A N.A N N. N. N. N. N N. N. N. N. N. N. N. N. N. N. N. N. N. N. N. 4 '7 20.41 54 110 2P•• , N.A N.A N.A N N.A NA N.A N N. 27 1631 5.92 27 1611 5. " 1854 5.9 21 1271 5.91 221 1273 5.76 4 254 5.' 4 273 ,
District. BHATINOA
Crops 1990.91 1991.92 1992.93 1993.94 1994.95 1995.96 1996.97 1997.98 2000..01 2001..02
A (ha.) Y(T) P (T/Ha) A (ha.l Y(T) P (TfHa) A (ha.) Y(T) P (T/Ha) A (ha.) Y(T) P (T/Ha) A (ha.) Y (T) P (T/Ha) A (ha.) Y(T) P (TlHa) A (ha.) Y[TI P (TIHa) Alita.) Y (TI P (TIHa) A (ha.) Y(T) P (T/Ha) A (I\a.) Y{T) P (Tn
Polato 386 890 23.0 38. 767 19,70 316 '22
'~31 631 19.97 323 7426 22.9 34 7848 23,8 4 902 22.22 446 .04 18.0 2923 64686 22.12 293 77387 H'
Tomato 74 166 22. • 1936 22,51 82 184 22 9 21. 22.53 9 220 22. 101 2268 22.4 13 302 22.2 142 276 19.4 203 63 22 301 ~87 "Brin'al 81 1069 13.2 87 1131 18,0 7 81 12. 71 923 13.00 72 93 13 74 964 13.02 7 1031 13.0 81 106 13.1 84 1344 14.01 • 13 f---f,CauliflOYlef 89 23.0 3 742 23,20 2 56 23.1 2 56 23.2 2 23.2 2 63 24.42 1222 24.4 81 1457 23.8 122 3013 24.4 12 33 2'Okrn 102 747 7.32 100 77 7.7 81 82 77 9 844 7.7 83 844 7.76 • 873 7.73 • '56 7.73 • 763 7.7 10 " 7.7 10. 83 ;Onion • 2256 28.20 7 216 ". 62 115 18.68 8 156 18,6 " 164 18,69 9 1771 18.64 1044 18.64 5 110 18.64 301 594 19.7 342 87 11Garlic 52 572 10. 57 57 10.00 48 40 9.99 49 4 10,0 49 490 10. 53 53 10. 10.09 10,09 10.12 " 60 1<Chillies 151 211 1.4 14 212 14 12 172 1.43 ". 20 1.4 14 207 1.4 14 224 1.53 77 11 1. 52 62 1.56 21 32 1.54 23 9Cucurblls 97 566 6. • 438 5.1 6 99 15.13 • 15.13 989 15.14 6 1000 18.7 117 1801 15.39 12 18 15.3 19 306 15.4 20 212 1!Gabba e N N.A N N. N. N. N. N. N. N. N. N. N. N. N. N. N. N. N. N. N. N. N. N. • 2077 24.43 1 283 2'Peas N N N N.A N N.A N N. N. • 46 5.7 89 512 5.7 516 5.73 • 4 5.7 • 491 5.64 3 189 5.64 32 181 ,
District. PATIALA
Crops 19110.91 1991.92 1992-93 1993.94 1994.95 1995.96 1996-97 1997-98 2000..01 2001-02A (ha.) Y(T) P (T/Ha) A (ha.) Y (TI P (TfHa) A {ha.) Y(T) P (TlHa) A (ha.) Y(T) P (TlHa) A (ha.) Y(T) P (TfHa) A (ha.) Y(T) P (TfHa) A (ha.) Y(T) P (T/Ha) AtM.) Y(T) P (TlHa) A (ha.) Y(T) P (T/Ha) A (ha.) Y(T) p(Tn
Potato 4056 115211 28,4 407 95728 "- 3331 7050 21.16 336 6313 19.97 343 7963 23.1 3524 83110 23.7 3528 79292 22,4 3642 62471 17.1 5789 131306 22. 562 156004 "Tomato 24 5954 24 313 767 24,52 301 738 14.51 352 2163 22.53 358 8797 24.5 38 9037 24,5 '04 9876 '24,44 70. 12652 17.87 90 2223 24.5 962 2363 2.Brinal 97 1416 14.6 J03 1514 14,8 84 123 14.7 • 923 13. 64 123 14.71 06 1273 14,8 252 3732 14.81 257 380 1.48 341 j 15.71 4 87 1!Cauliflower 12 3087 24. 119 291 22 " 2352 24 97 56 23.2 97 227 24. 104 2601 25.01 34 'SO 25.01 418 10032 24.11 37 94 25.01 42 1 "Okrn 63 444 7.0 59 41 7.0 4B 33. 7.0 49 7.76 4 346 7.07 52 382 '.9 152 105 .. 17 1220 6.97 20 14 '.9 21 151 ,Onion 1077 3047 28.3 1103 3143 ".> 897 17922 1;,~ 1231 1589 18.69 4128 256' 19.9 1378 27548 19.9 1421 2639 19.91 148 2974 19.98 2114 489 22.22 2396 532~ ZGarlic 6 7
'~1 12 12.5< 10< 12 9 49 10.00 113 12.11 1 124 12.4 9 1178 12.4 10 127 12.4 13 171 12.41 143 1776 1:
Chillies 774 1207 78 123 ,. 637 9 ,. 733 20 1.4 75 1142 ,. 776 1234 ,. 871 1074 1.' 781 12 1.63 77 126 1.62 839 13Cucurbits 423 2934 '.7 414 2184 5.27 32 S02 15.28 33 99 15.13 31 4864 15,2 324 5018 15.4 7808 15.4 829 .19 15.49 59 93013 15.59 61 951 "Cabba e N. N.A N. NA N.A N.A N. NA N. N. N. N. N. N N N. N. N. N N. N. N. N N. 1481 25.02 71 177 "Peas N N N. N. N.A N.A N.A N N. 62 480 5.7 62 371 59 62 374 5 " 4944 5. '" 4829 5.67 1451 ." 59 1061 92 ,
Final Report: 'National Level Techno-Economic Feasibility Study for North lone' 32'
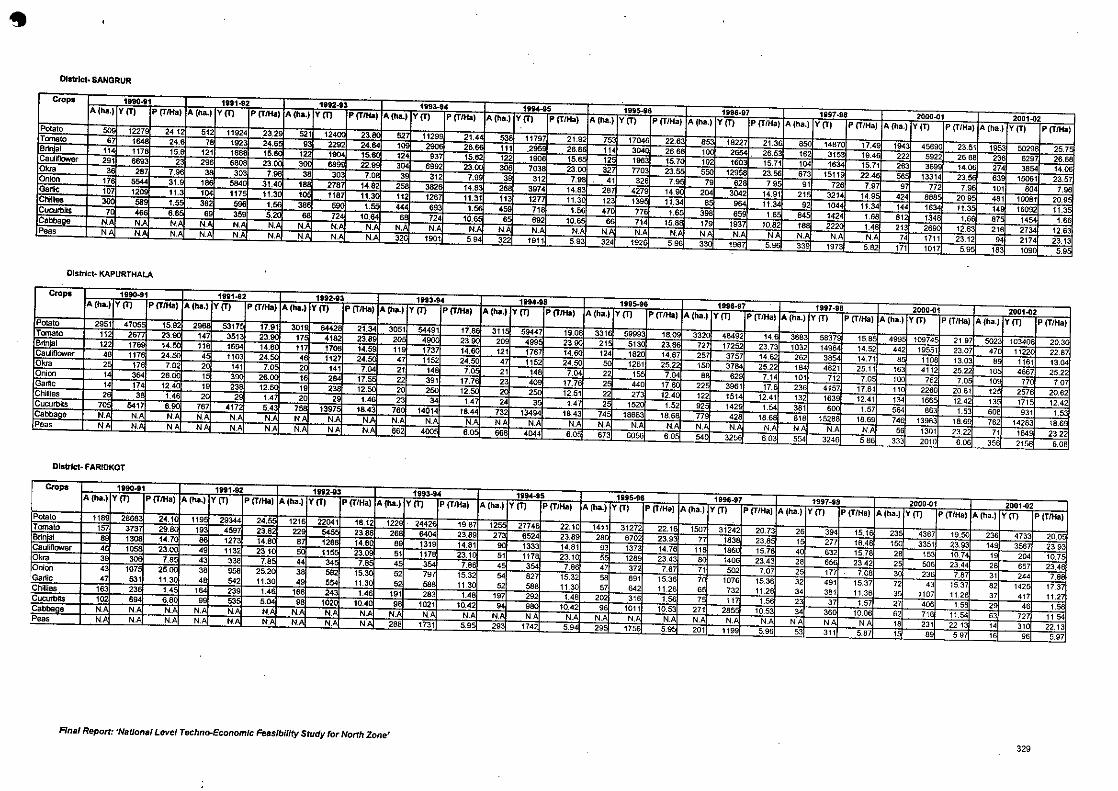
District. SANORUR
Crop. 1890..•1 1"1-82 1"2-13 1993.84 11M-85 1815 ..•6 1996.97 11197.98 2000-01 2001-02A (ha.1 Y(TI P (TlHal A (ha.1 YIT) P (T1Ha) A (ha.) Y(TI P (TfHal A (ha.) Y(TI IP ITIlta) A (ha.1 Y(TI P (T/Ha) A (ha.) YIT) P erlHa) A (ha.1 Y(TI P (TlHa) A (ha.) Y(TI P (T/HaJ A (ha.) V(TI P (TfHa) A (ha.) Y(TI P (T/HalPotato 1227 24,1 512 11924 23.2 521 12 23. 52 1129 21,4 538 11797 21,92 7 17046 22.63 8 18227 21.3 850 14870 11.49 194 45690 23.51 1953 5029 25.7
Tomato 6 164 24. 7 192 24.6 8 2292 24.64 1 2 26. 111 .295 26.6 11. 304 26. 1 26 26. '62 3153 19.4 222 5922 26,66 236 6297 26.68B ,I 11 117 15. 121 1888 15. 1 1 15. 12 93 15.6 122 190 15.6 12 '963 15.7 10 160 15.71 10. 1634 15.71 263 36 14.06 274 3854 14.06Cauliflower 291 6693 2 296 6808 23. 3 889 22. 304 6992 23.0 306 T03 23.0 32 770 23. 5 12958 23.56 673 1511 22.4 56 13314 23 63 1506' 23.570,"" 3 287 7.96 30 7.9
~30 7.0 39 312 7.99 3 31 7.9 41 326 7.9 79 62 79 91 726 7.97 97 772 7.96 101 804 7.96
Onion 17 554' 31. lB 584 31. 278 14.82 2 362 14.8 28 3974 14.83 26 • 27 14. 204 3042 14.91 21 3214 14,9 42. 988 209 .81 10081 20.9Ga'" 10 12 11. 1 117 11.3 119
'~112 1267 11.31 11 127 11.3 123 139 11.34 8 964 11.34 92 1044 11.34 144 1634 11.3 14 16092 11.3
Chmles 3 58 1.5 382 596 1. 38 5 1. 444 69 1. • 718 1.56 47 776 1.6 39 659 1.6 84 1424 1.68 812 '348 1.66 87 14 1.6Cueurblts 7 46 8 69 359 5.2 72' 10. 6 724 10.6 6 692 10.6 6 71. 15.8 17 1937 10.82 '88 222 1.48 213 269 12.63 216 2734 12.63Cab" N. N. N. N. N. N. N. N. N. N. N. N. N. N. N. N. N.A N.A N N. N N. N.A N 74 1111 23.12 94 2174 23.13P." N N. N. N.A N N. N N. N. 32 1901 5.9 322 1911 5.9 324 192 5.9 33 196 5.9 339 197 5.82 171 1017 5.9 183 109 5.9
District. KAPURTHALA
C"'Ps 1990.91 1"1.92 1992 ..•3 1"1.94 1194 ..•5 1195.96 1996.97 1997.98 2000-01 2001-02A (hil.) Y(TI P (TlHa) A(ha.) Y(T) P (T1Ha) A (Ita.) Y(TI P (T1Ha) A (hil.) Y IT) IP ITIlta) A (Ita.) Y(TI P (T/Ha) A (ha.) Y(TI P erlHal A (ha.l Y(TI P (T/HaJ A (hll.) Y(TI P (T/Hal A (hll.) Y(TI P (T/Hal A {ha.l Y(TI P (T/Ha)Potato 2951 4705
'~2 5317 17.91 301 64426 21.34 3051 64491 17.86 311 59447 19.08 3316 59993 18.0 332 48492 14. 368 5837 15.8 .99 10974 21,97 502 103408 20.3
Tomato 112 267 23. 147 351 23. 17 "92 23.8 20 • 23. 209 • 99 23 . 21 5130 23.8 72 17252 23.73 1032 14984 14.52 442 19551 23.07 47 1122 22,87Brin I 122 176 14. 116 1694 14.6 11 17 14.5 11 1737 14.6 121 176 14.6 12. 1820 14.67 257 3757 14,62 262 38 14,71 8 1108 13.03 6 1161 13,04Cauliflower 46 117 24. • 1103 24. • 1127 24. 47 1152 24.50 4 1152 24.50 1261 25.22 150 376 25.22 194 4621 25.11 163 4112 25,22 10 4667 25.220,"" 2 17 7.02 2 141 7.0 2 141 7.04 21 14 7.0 21 14 7. 22 15 7.04 6 62 7.14 101 712 7.0 100 762 7.0 10 77 7,07Onion 1 384 26. 1 39 26. 1 294 17.5 22 391 17.7 2 40 17.76 2 440 17,60 22 3961 17. 23 4157 17.61 11 226 20,61 12 2576 20.62Garlic 14 17 12.40 19 23 12. 1 236 12. 20 250 12.50 2 2 12.51 22 27 12.4 12 151 12.41 132 1639 12.41 134 166 12.42 13 171 12.42ChlUies 2 3 1.46 2 2 1. 20 29 1.4 2 34 1. 24 3 1.4 2 152 1.52 92 142 164 381 600 1.57 564 663 1.53 606 931 1.5Cucurblts 70 6417 6. 767 4172 5.43 7 1397 18.43 76 14014 18.44 73 13494 18.43 74 18683 18,6 77 426 18,6 616 15288 18,69 746 13963 18.6 762 14283 18.69Cabba e N. N. N N N N. N N. N. N. N. N. N N.A NA N N N.A N. N N.A N N.A N.A 56 1301 23,22 71 164 23,22P." NA N. NA NA N.A N.A N.A NA N.A 862 400 6.0 668 '04' 6.0 673 6066 6.0 64 3256 6,03 564 3246 5,86 333 201() 6,06 356 21S8 6.06
Disbict. FARIDKOT
emps 1190-91 1991-92 1982-93 1993-94 1194.115 111115-96 1996-97 1997.98 2000-01 2001-02A (ha.) YITI P (T/Hal A (ha.1 Y IT) P (T/Ha) A (ha.1 YITI P (T/Hal A (ha.) YITI P (T/Hal A (ha.1 YITI P (T/KllI Alba.) YITI P (T/Hal A (ha.) YITI P (T/Hal A (ha.) YITI P (TfHa) A (ha.l Y IT) P (TfHa) A (ha.l YITI P (TlHalPotato 1189 2866 24.1 119 29344 24. 121 22041 18.12 122 2442 19,87 12 2774 22.1 1411 31272 22.1 1507 31242 20.73 26 394 15.16 23 4387 19.50 236 4733 20.0
Tomato 15 373 29.8 19 459 23.82 22 23.88 26 6404 23.8 273 6524 23.8 26 6702 23.93 77 '8 23.8 , 277 16.48 160 3351 23.93 149 3567 23.9Srin I 8 'fi 14.7 1273 14.6 6 126 14.6 6 1319 14.61 90 1333 14.81 93 1373 14.76 11 166 15.7 40 632 15.78 26 153 10,7 19 20. 10,7CautiflaNer 46 10 23. • 1132 23,1 11 23. 51 1176 23.1 51 117 23,1 5 1289 23,4 8 1406 23.43 26 656 23.42 2 596 23,44 26 657 23.40,"" 3 3 7.8 43 336 7.8 44 34 7.8 • 354 7.86 • 354 7.86 47 372 7.6 71 502 7,07 2 177 7.08 3 23 7.87 31 244 7.88Onion • 107 25( 36 958 25.2 ~ 582 15.3 52 797 15.32 54 627 15.32 56 891 15.36 7 1076 15,36 32 .91 15,37 72 43 15,37 82 142 17.37'Garlic • 531 11.3 4 642 11.3 • 554 11.3 52 686 11,30 52 686 11.30 57 642 11.26 6 732 11,2 34 361 11.36 3 1107 11,2 37 417 11.27Chlllies 163 236 1.4 164 239 1.46 166 24 1.46 191 283 ,. 197 292 1.48 202 316 1.56 7 11 1.56 23 37 1.57 27 '06 1.68 2 46 1.58Cueurblts 10 6 6.8 9 53 5.04 9 102 10.4 98 1021 10.42 96 10.42 96 1011 10.53 271 285 10.53 34 36 10.0 62 716 11.54 6 72 11,54Cabba e N N. N. N.A N. N.A N. N.A N. N. N. N. N. N N.A N.A N. N. N. N. N NA N N 16 231 221 14 310 22.13P•• , N. N. N.A N N N N N.A N. 266 1731 5.9 293 1742 5,94 29 1756 5.9 201 1199 5.96 53 311 5.67 1 69 597 16 9 5,97
Rna' Report: 'Natlona' Level Techno-EconomIc Feaslbfllty Study for North Zone'
329
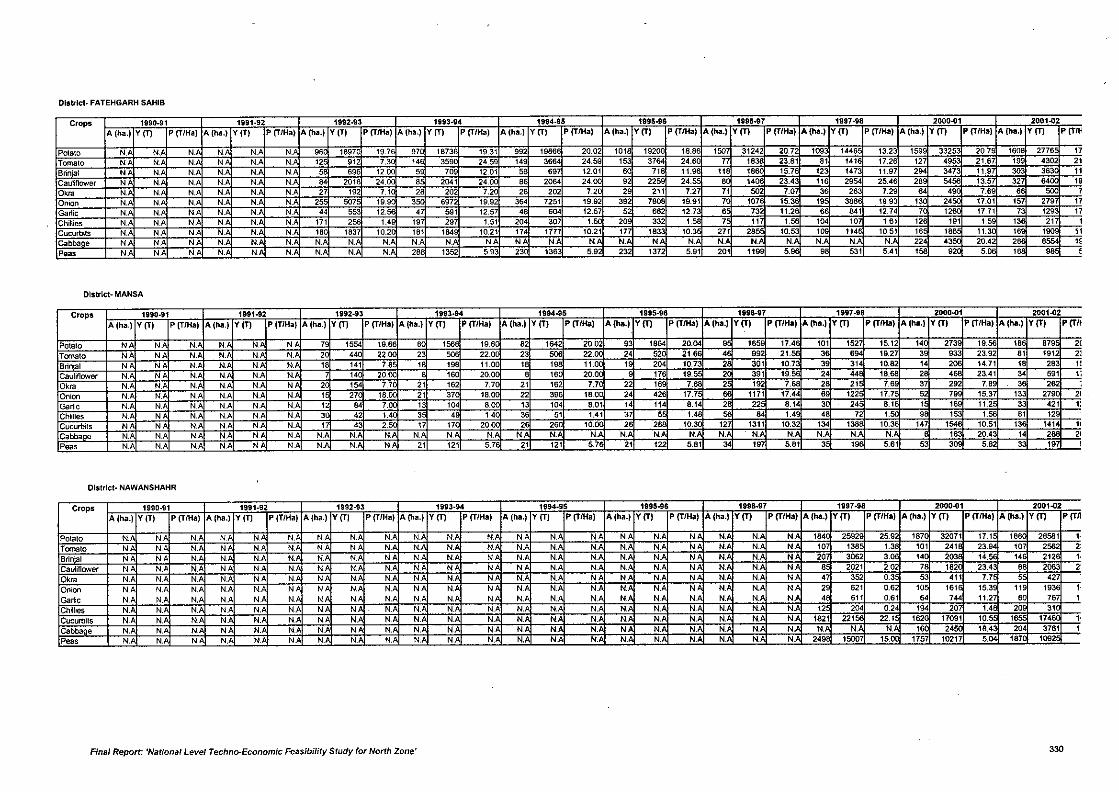
District. FATEHGARH SAHIB
Crops 1990.91 1i91.92 1992.93 1993.94 1994.95 1995-96 1i96.97 1997.98 2000~1 2001~2A (ha.) Y (T) P (T/Ha) A (ha.) Y(T) P (T/Ha) A (ha.) Y (T) P (T/Ha) A (ha.) Y (T) P (TfHa) A (ha.) Y(T) P (T/HaJ A (lIa.1 Y (T) P (T/Ha) A (ha.) Y(T) P (T/Ha) A (ha.) Y(T) P (TfHa) A (ha.) Y(T) P (TfHa) A (ha.) Y (T) P (TIH
Potato N NA N. N N.A N. 96 18970 19,7 97 1873 19,31 992 1986 20.02 1018 19200 18.86 150 31242 20.72 109 1446 13.2 159 3325 207 1608 2776 17Tomato NA N N. N N.A N. 12 912 7.3 \4 359 24.59 149 3664 24.59 1 37 24.6 18 23.81 at \41 17,26 127 49 21.67 199 4302 21Brin' I N N N.A N N. N. 5 696 12.00 59 70 12.01 5 69 12.01 6 71 11.9 118 18 15.76 12 1473 11.97 2 3473 11.9 303 36 11Caulinower N N N.A N.A N N. 64 201 24.0 6 2041 24.0 96 2064 24 92 225 24. 6 14 23.43 116 2954 25.46 26 5456 13.5 327
~0,", N. N N.A N.A N N.A 27 192
M26 202 7.20 26 202 72 2 211 7.27 71 502 7.0 3 263 7.29
2~
7.6 6279~Onion N. N N. N. N. N. 25 507 19 35 6972 19.92 364 7251 19.92 39 7808 19.91 7 107 15.3 19 3886 19,93 130 17.01 157
Garlic N. N. NA N N N " 553 12 4 591 12,57 46 604 12.5 5 662 12,7 6 732 11.2 6 641 12.74 7 12 17,71 7 129 17Chillies N. N.A N.A N N.A N.A 171 2 1.4 19 29 1,51 204 307 1. 20 332 ,. 7 11 1.66 104 10 161 12 191 1,59 13 217 1Cucurb(ts N. N.A N N N.A N 18 1837 10.2 18\ 184 10,21 174 1777 10.21 177 183 10.3 271 2. 10.53 1 114 10,51 16 186 11.3 16 1 11Cabba e N N N. N.A N. N. N. N. N. N N. N.A N N N N. N N.A N. N. N. N. N. N. 224 43 20.4 26 6554 "Peas N N.A N. N.A N N. N. N. N. 266 1352 5.93 23 136 5.92 232 1372 5.91 201 119 59 96 531 5.41 156 92 50 1 98 ,
DIstrIct. MANSA
Crops 1990.91 1991-92 1992.93 1993.94 1994.95 1995-96 1996.17 1997-98 2000~1 2001~2A (ha.) Y (T) PIT/Hal A (ha.) Y (T) P (TIHa) A (ha.) Y(T) P (TIHa) Alha.) Y(T) P (TIHa) A (ha.) Y (T) P (TIHa) A (ha.) Y(T) P (T/Ha) Alha.) Y(T} P (T/tIa) A (he.) Y (T) P (TfHa) Alha.) Y(T) P (TIHa) A (ha.) Y (T) P (Til
Potato N.A N N N N NA 7 1554 19.66 8 156 19,6 82 1842 20,02 93 1884 20.04 9 1659 17.4 tOl 1527 15.12 \4 273 19.56 18 879 "Tomato N N N.A N.A N N.A 2 440 22 23 22.0 23 506 22. 24 52 21 4 89 21. 3 694 19.2 3 , 23.92 81 191 2;
Brin 1 N N N.A N. N N 18 \41 7.8 18 198 11.0 1 19 11.0 1 204 10.7 2 301 10.7 3 314 10.82 \4 2 14.71 18 283 "Cauliflower N. NA N N NA N.A 7 \40 20.00 160 20.0 16 20 176 19.5 2 391 19. 2 '" 18.68 2 46 23.41 34 591 t;
Ok~ N.A N.A N N N. N 2 154 7.7 21 162 7.7 21 162 7.7 22 16 7.66 2 192 768 2 21 7.6 37 29 7.' 3 282 :Onion N.A N. N.A N.A N.A N 1 27 18. 21 37 18. 22 396 18.0 24 426 17.7 1171 17. 6 122 17.7 79 15.3 133 27 21Garlic N. N.A N N.A N N. 12 84 7.0 1 104 8 13 104 8.01 \4 114 8.14 2 22 8.14 3 24 8.16 1 16 11.2 3 421 "Chillies N.A N N.A N.A N N.A 3 42 1.4 3 4 1.4 36 51 1.41 3 5 1.48 84 1.4 4 72 1. 9' 153 1. 81 12Cucufbits NA N N. N N N. 1 43 2 17 17 20. 2 26 10. 2 2 10.3 12 1311 10,32 1 13 10.36 \4 154 10.51 13 \41 "Cabba e N N.A N.A N N N.A N.A N.A N. N N. N. N. N N. N. N. N. N. N. N. N. N. N. 16 20.43 1 2 21Peas N.A N.A N. N N N.A N. N N 21 121 5.7 21 121 5.7 21 122 5.81 19 5.81 3 19 5.61 3 58 19 ,
District. NAWANSHAHR
Crops 1990-91 1991.92 1992-93 1913.94 1994.95 1995-96 1996.97 1997.9a 2000~1 2001~2A (ha.1 V(T) P (TIHa) A (ha.) Y (T) P (T/Ha) A (ha.) Y(T) P(T/Ha) A (ha.) Y(T) P (TIHa) A (ha.) Y(T) P (T/Ha) A (ha.) Y(T) P (T/Ha) A (ha;) Y(T) P (T/Ha) A (ha.) Y(T) P (T/Ha) A (ha.) Y(T) P (TfHa) A (ha.) Y(T) P(T"
Potato N.A N N.A N.A N N.A N N.A N.A N N. N.A N.A N.A N N N.A N N. N. N 184 2592 25.92 187 32071 17.1 188 26581 ,.Tomalo N N. N.A NA N N. N.A NA N. N. N. N.A NA N. N. N. N.A N N.A N. N. 107 138 1.3 101 241 23.9 107 2562 2Brin' I N N N N N.A N N.A N.A N N N. N N.A N.A N. N. N. N N. N. N. 20 3062 3.06 \4 2 \4. \4 212 1.
Cauliflower N N.A N N N.A N N N.A N. N.A N N N.A N.A N. N. N.A N N N. N 8 2021 2.02 7 182 23.43 " 2063 2Ok~ NA N.A N N. N N.A N NA N N.A N N. N.A N.A N N N.A N N. N.A N 4 352 0.3 53 411 7.7 5 427Onion N.A N.A N N.A N.I NI N N.A N. "' N NI N. N. N.I N. N.A N N. N. N 2 621 0.62 10
1~~15.39 119 1936 1
Gartic N. N.A N. N.A N N N N.A N N.A N N N. N. N N. N. N. N. N. N. 4 611 0.61 84 11.27 60 76 1Chillies N. N.A N. N N.A N.A N N N N. N. N.A N. N. N. N. N. N. N. N. N. 12 204 0,24 194 20 " 20 31
CucurtJils N.A N. N. N N. N.A N N. N N. N. N. N N. N. N N. N. N. N. N. 1821 221 22.1 162 17091 10,5 16 174 l'Cabba e N. N N. N N. NA NA N N. N. N.A N N N. N. N N. N. N. N. N. N. N. N. 1 24 18.4 204 3761 1Peas N N. N N.A N. N.A N. N N.A N. N. N. N. N.A N. N. N. N. N. N. N. 249 1500 15. 1757 10217 5. 187 1092
Rnal Report: 'National Level Techno-Economic Feasibility Study for North Zone' 330

HARYANA

I,'
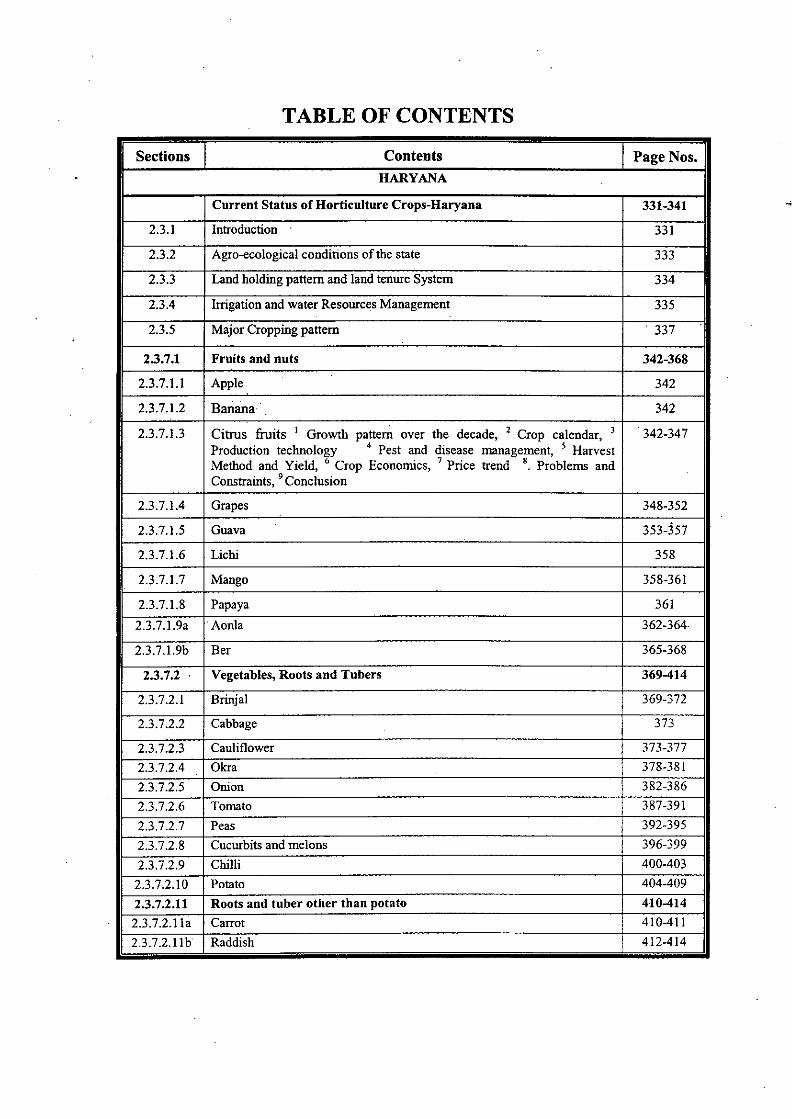
TABLE OF CONTENTS
Sections Contents Page Nos.HARYANA
Current Status of Horticulture Crops-Haryana 331-341
2.3.1 Introduction 331
2.3.2 Agro-ecological conditions of the state 333
2.3.3 Land holding pattern and land tenure System 334
2.3.4 Irrigation and water Resources Management 335
2.3.5 Major Cropping pattern 337
2.3.7.1 Frnits and nuts 342-368
2.3.7.1.1 Apple 342
2.3.7.1.2 Banana 342
2.3.7.1.3 Citrus fruits I Growth pattern over the decade, 2 Crop calendar, 3 342-347Production technology 4 Pest and disease management, 5 HarvestMethod and Yield, 6 Crop Econontics, 7 Price trend '. Problems andConstraints, 'Conclusion
2.3.7.1.4 Grapes 348-352
2.3.7.1.5 Guava 353-357
2.3.7.1.6 Lichi 358
2.3.7.1.7 Mango 358.361
2.3.7.1.8 Papaya 361
2.3.7.1.9a .Aoola 362-364.
2.3.7.1.9b Ber 365-368
2.3.7.2 . Vegetables, Roots and Tubers 369-414
2.3.7.2.1 Brinjal 369.372
2.3.7.2.2 Cabbage . 373
2.3.7.2.3 Cauliflower 373-377
2.3.7.2.4 Okra 378.381
2.3.7.2.5 Onion 382-386
2.3.7.2.6 Tomato 387-391
2.3.7.2.7 Peas 392-395
2.3.7.2.8 Cucurbits and melons 396.399
2.3.7.2.9 Chilli 400-403
2.3.7.2.10 Potato 404-409
2.3.7.2.11 Roots and tuber otber than potato 410-4142.3.7.2.l1a Carrot 410-411
2.3.7.2.l1b Raddish 412-414
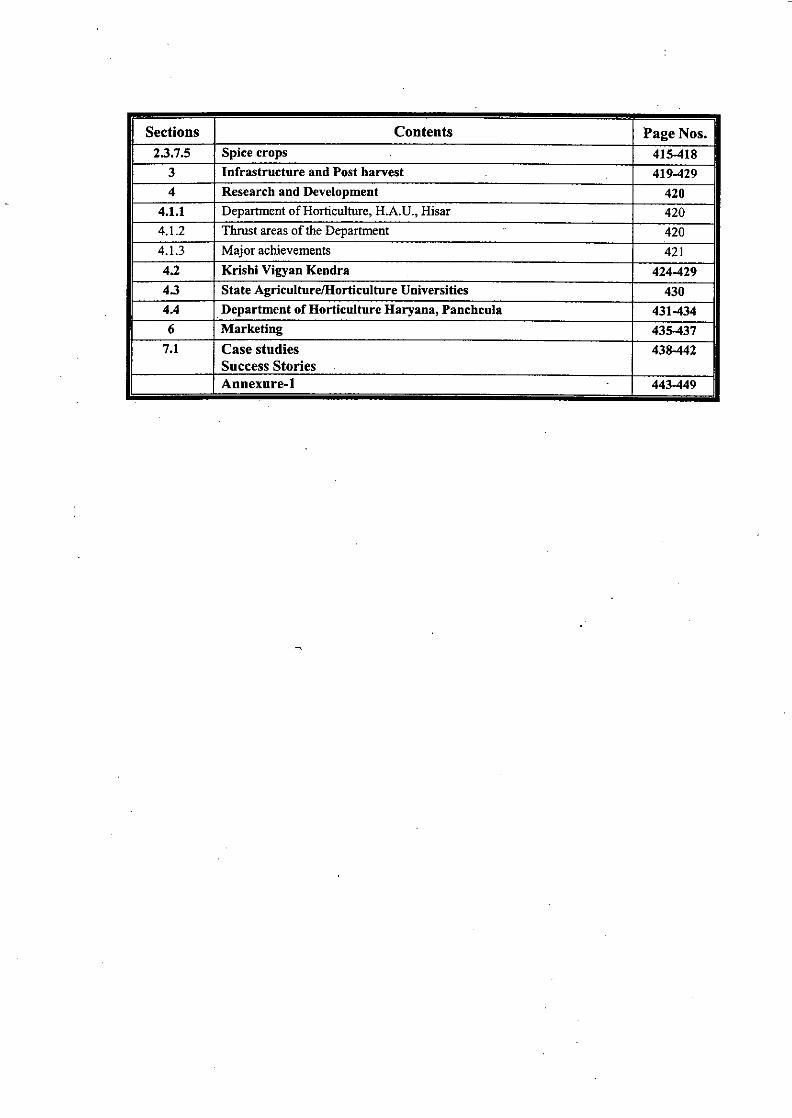
Sections Contents Page Nos.2.3.7.5 Spice crops 415-4183 Infras.tructure and Post harvest 419-4294 Research and Development 420
4.1.1 Department of Horticulture, H.A.U., Hisar 4204.1.2 Thrust areas of the Department 4204.1.3 Major achievements 4214.2 Krishi Vigyan Kendra . 424-4294.3 State AgriculturelHorticulture Universities 4304.4 Department of Horticulture Haryana, Panchcula 431-4346 Marketing 435-4377.1 Case studies 438-442
Success Stories .
Annexure-l 443-449
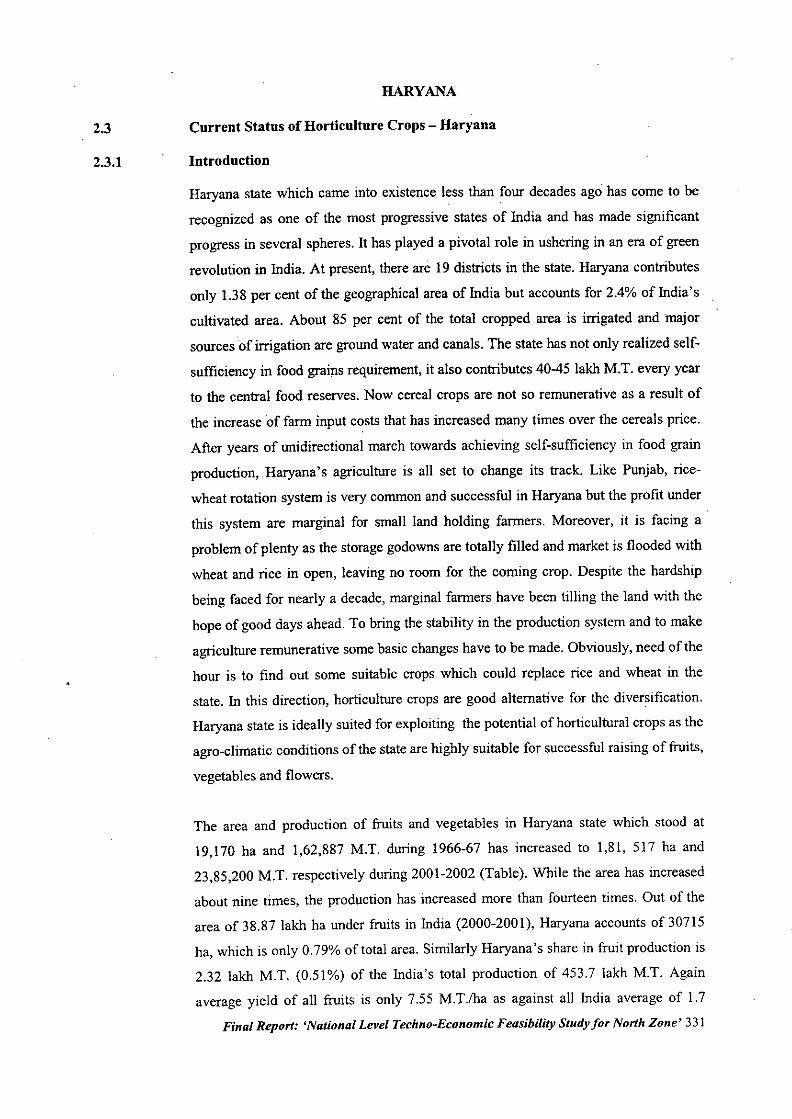
2.3
2.3.1
HARYANA
Current Status of Horticulture Crops - Haryana
Introduction
Haryana state which came into existence less than four decades ago has come to be
recognized as one of the most progressive states of India and has made significant
progress in several spheres. It has played a pivotal role in ushering in an era of green
revolution in India. At present, there are 19 districts in the state. Haryana contributes
only 1.38 per cent of the geographical area of India but accounts for 2.4% of India's
cultivated area. About 85 per cent of the total cropped area is irrigated and major
sources of irrigation are ground water and canals. The state has not only realized self-
sufficiency in food grains requirement, it also contributes 40-45 lakh M.T. every year
to the central food reserves. Now cereal crops are not so remunerative as a result of
the increase 'of farm input costs that has increased many times over the cereals price.
After years of unidirectional march towards achieving self-sufficiency in food grain
production, Haryana' s agriculture is all set to change its track. Like Punjab, rice-
wheat rotation system is very common and successful in Haryana but the profit under
this system are marginal for small land holding farmers. Moreover, it is facing a
problem of plenty as the storage godowns are totally filled and market is flooded with
wheat and rice in open, leaving no room for the coming crop. Despite the hardship
being faced for nearly a decade, marginal farmers have been tilling the land with the
hope of good days ahead. To bring the stability in the production system and to make
agriculture remunerative some basic changes have to be made. Obviously, need of the
hour is to find out some suitable crops which could replace rice and wheat in the
state. In this direction, horticulture crops are good alternative for the diversification.
Haryana state is ideally suited for exploiting the potential of horticultural crops as the
agro-climatic conditions of the state are highly suitable for successful raising of fruits,
vegetables and flowers.
The area and production of fruits and vegetables in Haryana state which stood at
19,170 ha and 1,62,887 M.T. during 1966-67 has increased to 1,81, 517 ha and
23,85,200 M.T. respectively during 2001-2002 (Table). While the area has increased
about nine times, the production has increased more than fourteen times. Out of the
area of 38.87 lakh ha under fruits in India (2000-2001), Haryana accounts of 30715
ha, which is only 0.79% of total area. Similarly Haryana's share in fruit production is
2.32 lakh MT. (0.51%) of the India's total production of 453.7 lakh M.T. Again
average yield of all fruits is only 7.55 M.T./ha as against all India average of 1.7
Final Report: 'National Level Techno-Economic Feasibility Study for North Zone' 331
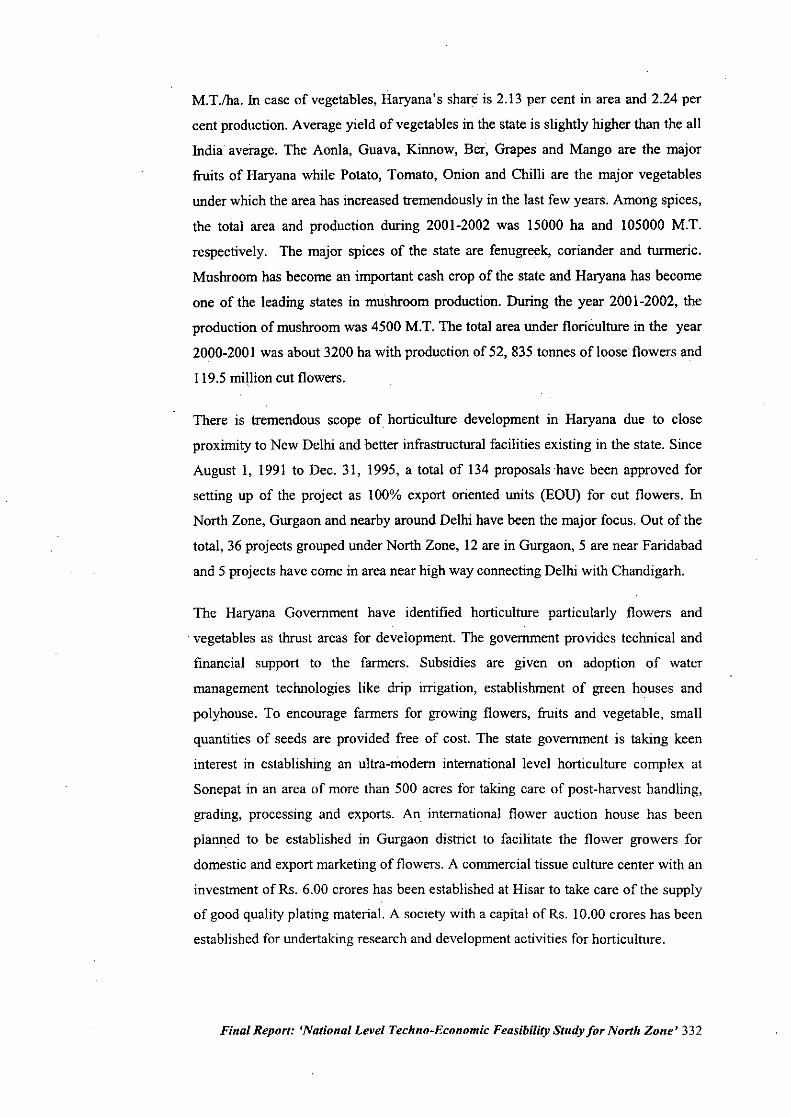
M.T.fha. In case of vegetables, Haryana's share is 2.13 per cent in area and 2.24 per
cent production. Average yield of vegetables in the state is slightly higher than the all
India average. The Aonla, Guava, Kinnow, Ber, Grapes and Mango are the major
fruits of Haryana while Potato, Tomato, Onion and Chilli are the major vegetables
under which the area has increased tremendously in the last few years. Among spices,
the total area and production during 2001-2002 was 15000 ha and 105000 M.T.
respectively. The major spices of the state are fenugreek, coriander and turmeric.
Mushroom has become an important cash crop ofthe state and Haryana has become
one of the leading states in mushroom production. During the year 2001-2002, the
production of mushroom was 4500 M.T. The total area under floriculture in the year
2000-200 I was about 3200 ha with production of 52, 835 tonnes of loose flowers and
119.5million cut flowers.
There is tremendous scope of horticulture development in Haryana due to close
proximity to New Delhi and better infrastructural facilities existing in the state. Since
August I, 1991 to Dec. 31, 1995, a total of 134 proposals have been approved for
setting up of the project as 100% export oriented units (EOU) for cut flowers. In
North Zone, Gurgaon and nearby around Delhi have been the major focus. Out of the
total, 36 projects grouped under North Zone, 12 are in Gurgaon, 5 are near Faridabad
and 5 projects have come in area near high way connecting Delhi with Chandigarh.
The Haryana Government have identified horticulture particularly flowers and
. vegetables as thrust areas for development. The government provides technical and
financial support to the farmers. Subsidies are given on adoption of water
management technologies like drip irrigation, establishment of green houses and
polyhouse. To encourage farmers for growing flowers, fruits and vegetable, small
quantities of seeds are provided free of cost. The state government is taking keen
interest in establishing an ultra-modem international level horticulture complex at
Sonepat in an area of more than 500 acres for taking care of post-harvest handling,
grading, processing and exports. An international flower auction house has been
planned to be established in Gurgaon district to facilitate the flower growers for
domestic and export marketing of flowers. A commercial tissue culture center with an
investment of Rs. 6.00 crores has been established at Hisar to take care of the supply
of good quality plating material. A society with a capital ofRs. 10.00 crores has been
established for undertaking research and development activities for horticulture.
Final Report: 'National Level Techno-Economic Feasibility Study for North Zone' 332
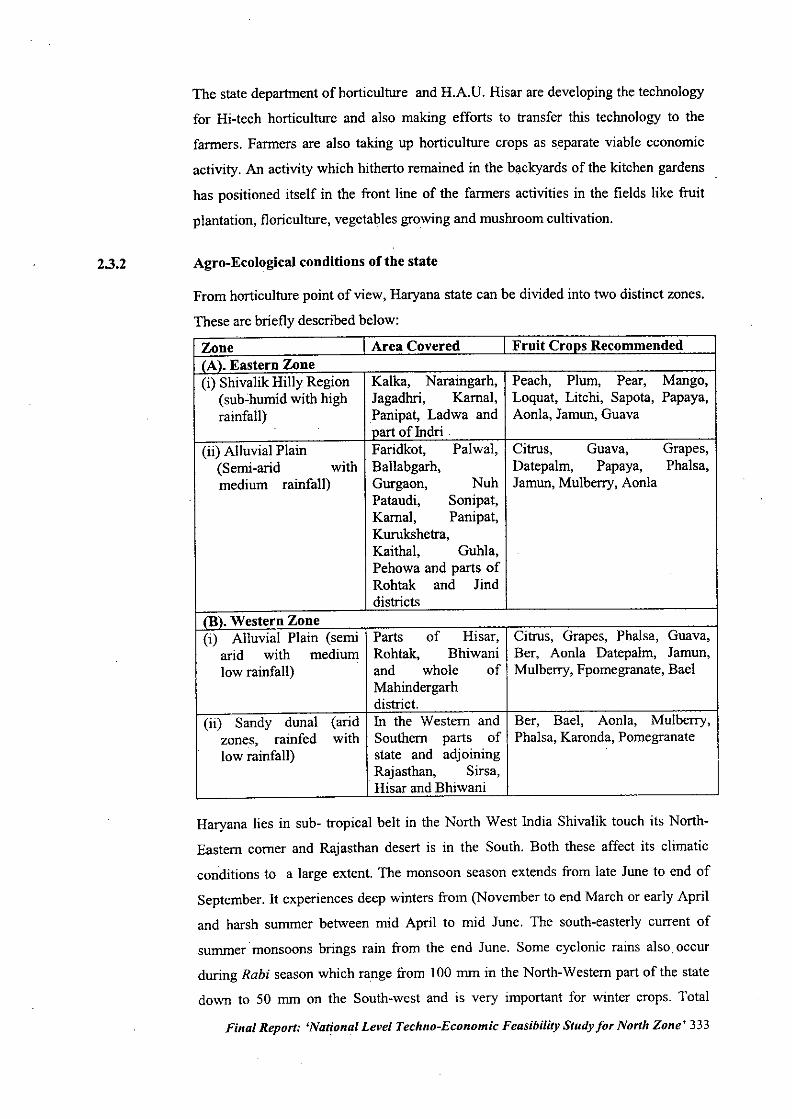
2.3.2
The state department of horticulture and H.A.U. Hisar are developing the technology
for Hi-tech horticulture and also making efforts to transfer this technology to the
farmers. Farmers are also taking up horticulture crops as separate viable economic
activity. An activity which hitherto remained in the backyards of the kitchen gardens
has positioned itself in the front line of the farmers activities in the fields like fruit
plantation, floriculture, vegetables growing and mushroom cultivation.
Agro-Ecological conditions of the state
From horticulture point of view, Haryana state can be divided into two distinct zones.
These are briefly described below:
Zone I Area Covered Fruit Crons Recommended(A), Eastern Zone(i) Shivalik Hilly Region Kalka, Naraingarh, Peach, Plum, Pear, Mango,(sub~humidwith high Jagadhri, Kamal, Loquat, Litchi, Sapota, Papaya,rainfall) Panipat, Ladwa and Aonla, Jamun, Guava
part of Indri(ii) Alluvial Plain Faridkot, Palwal, Citrus, Guava, Grapes,(Semi-arid with Ballabgarh, Datepalm, Papaya, Phalsa,medium rainfall) Gurgaon, Nuh Jamun, Mulberry, Aonla
Pataudi, Sonipat,Kamal, Panipat,Kurukshetra,Kaithal, Guhla,Pehowa and parts ofRohtak and Jinddistricts
(B). Western Zone(i) Alluvial Plain (semi Parts of Hisar, Citrus, Grapes, Phalsa, Guava,arid with medium Rohtak, Bhiwani Ber, Aonla Datepalm, Jamun,low rainfall) and whole of Mulberry, Fpomegranate, Bael
Mahindergarhdistrict.
(ii) Sandy dunal (arid In the Western and Ber, Bae1, Aonla, Mulberry,zones, rainfed with Southern parts of Phalsa, Karonda, Pomegranatelow rainfall) state and adjoining
Rajasthan, Sirsa,Hisar and Bhiwani
Haryana lies in sub- tropical belt in the North West India Shivalik touch its North-
Eastern comer and Rajasthan desert is in the South. Both these affect its climatic
conditions to a large extent. The monsoon season extends from late June to end of
September. It experiences deep winters from (November to end March or early April
and harsh summer between mid April to mid June. The south-easterly current of
summer monsoons brings rain from the end June. Some cyclonic rains also, occur
during Rabi season which range from 100 mm in the North-Western part of the state
down to 50 mm on the South-west and is very important for winter crops. Total
Final Report: 'National Level Techno-Economic Feasibility Study for North Zone' 333
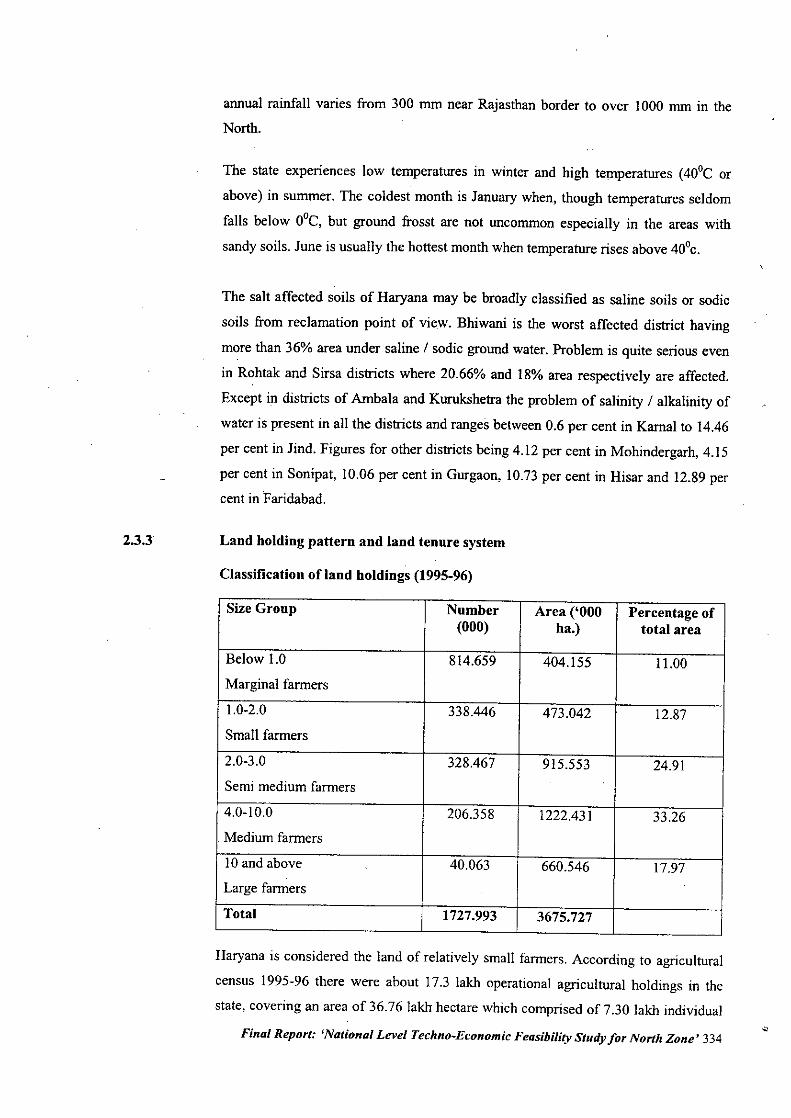
2.3.3
annual rainfall varies from 300 mm near Rajasthan border to over 1000 mm in theNorth.
The state experiences low temperatures in winter and high temperatures (40°C or
above) in Summer. The coldest month is January when, though temperatures seldom
falls below OOC,but ground frosst are not uncommon especially in the areas with
sandy soils. June is usually the hottest month when temperature rises above 40°c.
The salt affected soils of Haryana may be broadly classified as saline soils or sodic
soils from reclamation point of view. Bhiwani is the worst affected district having
more than 36% area under saline I sodic ground water. Problem is quite serious even
in Rohtak and Sirsa districts where 20.66% and 18% area respectively are affected.
Except in districts of Ambala and Kurukshetra the problem of salinity I alkalinity of
water is present in all the districts and ranges between 0.6 per cent in Kamal to 14.46
per cent in Jind. Figures for other districts being 4.12 per cent in Mohindergarh, 4.15
per cent in Sonipat, 10.06 per cent in Gurgaon, 10.73per cent in Hisar and 12.89 percent in Faridabad.
Land holding pattern and land tenure system
Classification oflaud holdings (1995-96)
Size Gronp Number Area ('000 Percentage of(000) ha.) total area
Below 1.0 814.659 404.155 11.00Marginal farmers
1.0-2.0 338.446 473.042 12.87Small farmers
2.0-3.0 328.467 915.553 24.91Semi medium farmers
4.0-10.0 206.358 1222.431 33.26Medium farmers
10 and above 40.063 660.546 17.97Large farmers
Total 1727.993 3675.727
Haryana is considered the land of relatively small farmers. According to agricultural
census 1995-96 there were about 17.3 lakh operational agricultural holdings in the
state, covering an area of 36.76 lakh hectare which comprised of 7.30 lakh individual
Final Report: 'National Level Techno-Economic Feasibility Study for North Zone' 334
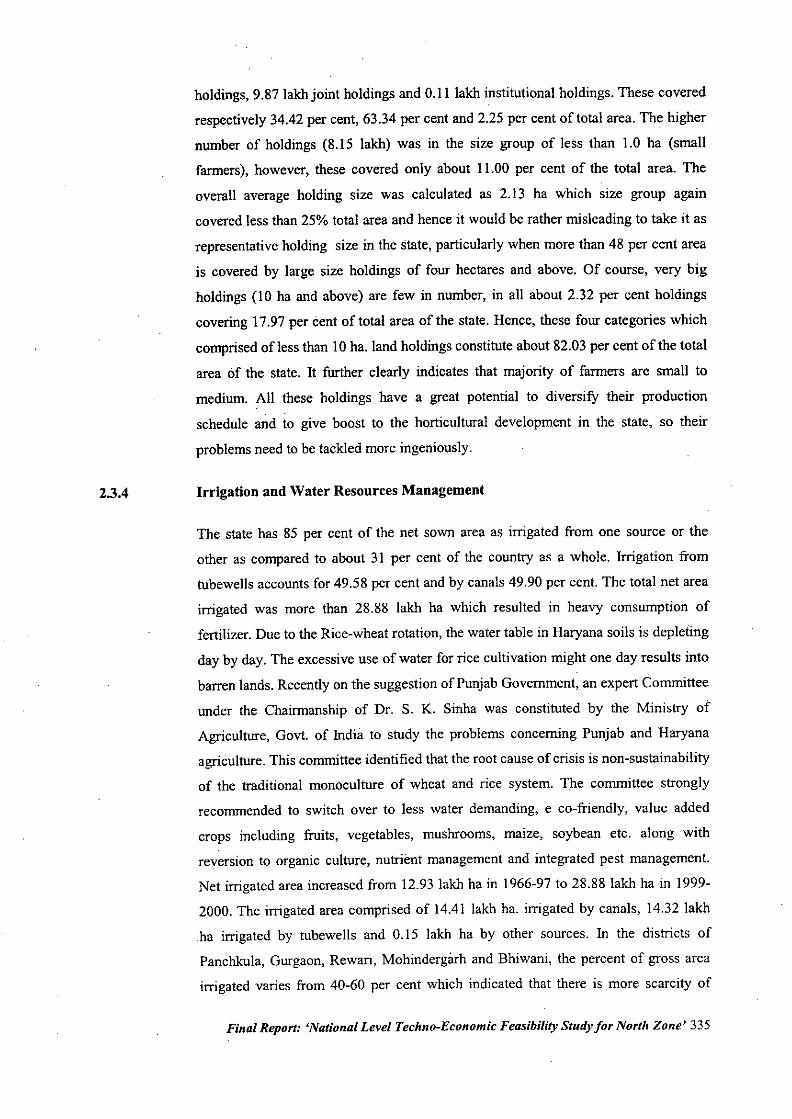
2.3.4
holdings, 9.87 lakh joint holdings and 0.11 lakh institutional holdings. These covered
respectively 34.42 per cent, 63.34 per cent and 2.25 per cent of total area. The higher
number of holdings (8.15 lakh) was in the size group of less than 1.0 ha (small
farmers), however, these covered only about 11.00 per cent of the total area. The
overall average holding size was calculated as 2.13 ha which size group again
covered less than 25% total area and hence it would be rather misleading to take it as
representative holding size in the state, particularly when more than 48 per cent area
is covered by large size holdings of four hectares and above. Of course, very big
holdings (10 ha and above) are few in number, in all about 2.32 per cent holdings
covering 17.97 per cent of total area of the state. Hence, these four categories which
comprised ofless than 10ha. land holdings constitute about 82.03 per cent of the total
area Of the state. It further clearly indicates that majority of farmers are small to
medium. All these holdings have a great potential to diversify their production
schedule and to give boost to the horticultural development in the state, so their
problems need to be tackled more ingeniously.
Irrigation and Water Resources Management
The state has 85 per cent of the net sown area as irrigated from one source or the
other as compared to about 31 per cent of the country as a whole. Irrigation from
tubewells accounts for 49.58 per cent and by canals 49.90 per cent. The total net area
irrigated was more than 28.88 lakh ha which resulted in heavy consumption of
fertilizer. Due to the Rice-wheat rotation, the water table in Haryana soils is depleting
day by day. The excessive use of water for rice cultivation might one day results into
barren lands. Recently on the suggestion of Punjab Government, an expert Committee
under the Chairmanship of Dr. S. K. Sinha was constituted by the Ministry of
Agriculture, Gov!. of India to study the problems concerning Punjab and Haryana
agriculture. This committee identified that the root cause of crisis is non-sustainability
of the traditional monoculture of wheat and rice system. The committee strongly
recommended to switch over to less water demanding, e co-friendly, value added
crops including fruits, vegetables, mushrooms, maize, soybean etc. along with
reversion to organic culture, nutrient management and integrated pest management.
Net irrigated area increased from 12.93 lakh ha in 1966-97 to 28.88 lakh ha in 1999-
2000. The irrigated area comprised of 14.41 lakh ha. irrigated by canals, 14.32 lakh
ha irrigated by tubewells and 0.15 lakh ha by other sources. In the districts of
Panchkula, Gurgaon, Rewari, Mohindergarh and Bhiwani, the percent of gross area
irrigated varies from 40-60 per cent which indicated that there is more scarcity of
Final Report: 'National Level Techno-Economic Feasibility Study for North Zone' 335
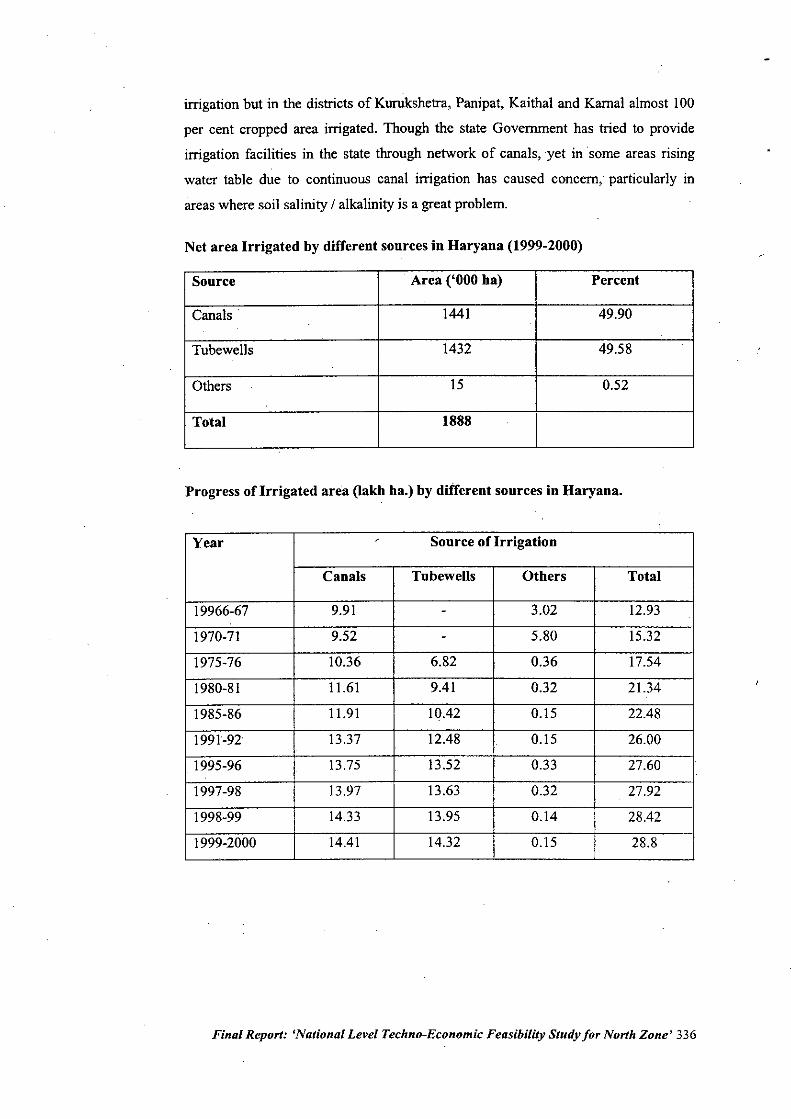
irrigation but in the districts of Kurukshetra, Panipat, Kaithal and Kamal almost 100
per cent cropped area irrigated. Though the state Government has tried to provide
irrigation facilities in the state through network of canals, yet in some areas rising
water table due to continuous canal irrigation has caused concern, particularly in
areas where soil salinity / alkalinity is a great problem.
Net area Irrigated by different sources in Haryana (1999-2000)
Source Area ('000 ba) Percent
Canals. 1441 49.90
Tubewells 1432 49.58
Others 15 0.52
Total 1888
Progress oflrrigated area (Iakh ba.) by different sources in Haryana.
Year , Source of Irrigation
Canals Tubewells Otbers Total
19966-67 9.91 - 3.02 12.93
1970-71 9.52 - 5.80 15.32
1975-76 10.36 6.82 0.36 17.54
1980-81 11.61 9.41 0.32 21.34
1985-86 11.91 10.42 0.15 22.48
1991-92 13.37 12.48 0.15 26.00
1995-96 13.75 13.52 0.33 27.60
1997-98 13.97 13.63 0.32 27.92
1998-99 14.33 13.95 0.14 28.42
1999-2000 14.41 14.32 0.15 28.8
Final Report: 'National Level Techno-Economic Feasibility Study for North Zone' 336
•
•
2.3.5 Major Cropping Pattern (1999-2000)
Sr. Crop Major AreasNo.I Rice Kaithal, Kamal, Jind, Kurukshetra, Sonipat, Ambala, Panipat,
Fatehgargh (77.8%)
2 Jowar Jhajjar, Rohtak, Faridabad, Gurgaon (81.3%)
3 Bajra Bhiwani, Mahendragarh, Fatehabad, Gurgaon, Rewari
(79.2%)
4 Maize Pacnhkula, Ambala, Yamunanagar (85.0%)
5 Wheat Sirsa, Jind, Hisar, Kaithal, Fatehabad, Kamal, Bhiwani.
(55.1%)
6 Barley Sirsa, Bhiwani, Hisar, Fatehbad, Jhajjar, Faridabad (75.0%)
7 Gram Bhiwani, Sirsa, Hisar, Mahendragar (77.8%)
8 Sugarcane Yamunagar, Kurukshetra, Ambala, Rohtak (63.0%)
9 Cotton Sirsa, Hisar, Fatehabad, Bhiwani, Jind (96.2%)
1"0 Rape & Bhiwani, Mahendragarh, Rewari, Gurgaon, Hisar, Sirsa
Mustard (85.0%)
II Potato Kurukshetra, Ambala, Yamunagar, Kamal, Panipat, Sonipat
(72.6%)
12 Onion Gurgaon, Sonipat, Panipat, Ambala (48.9%)
13 Cabbage & Panipat, Sonipat
Cauliflower
14 Vegetables Sonipat, Gurgaon, Panipat, Kamal, Kurukshetra, Ambala
(53.4%)
15 Aonla Gurgaoti, Sirsa, Namaul, Fatehabad, Ambala, Rewari (67.0%)
16 Citrus Sirsa, Hisar, Fatehbad (62.6%)
(Kinnow)
17 Grapes Sirsa, Hisar, Fatehabad (83.4%)
18 Mango Yamunnagar, Panchkula, Ambala (69.0%).
19 Fruits Yamunagar, Sirsa, Panchkula, Ambala, Hisar (50.8%)
Final Report: 'National Level Techno-Economic Feasibility Study for North Zone' 337
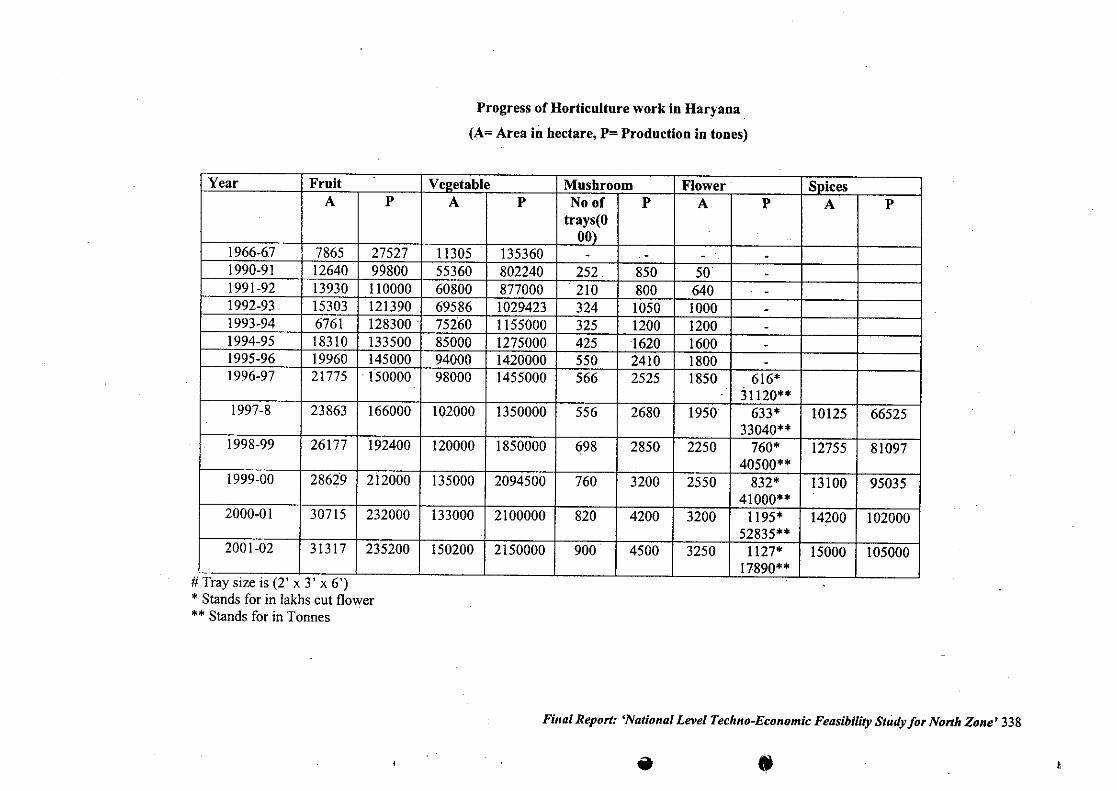
Progress of Horticulture work in Haryana .
(A= Area in hectare, P= Production in tones)
Year Fruit Ve!!etable Mushroom Flower. SpicesA P A P No of P A P A P
trays(O00)
1966-67 7865 27527 11305 135360 - - - -1990-91 12640 99800 55360 802240 252. 850 50 -1991-92 13930 110000 60800 877000 210 800 640 -1992-93 15303 121390 69586 1029423 324 1050 1000 -1993-94 6761 128300. 75260 1155000 325 1200 1200 -1994-95 18310 133500 85000 1275000 425 1620 1600 -1995-96 19960 145000 94000 1420000 550 2410 1800 -1996-97 21775 .150000 98000 1455000 566 2525 1850 616*
31120**1997-8 23863 166000 102000 1350000 556 2680 1950 633* 10125 66525
33040**1998-99 26177 192400 120000 1850000 698 2850 2250 760* 12755 81097
40500**1999-00 28629 212000 135000 2094500 760 3200 2550 832* 13100 95035
41000**2000-01 30715 232000 133000 2100000 820 4200 3200 1195* 14200 102000
52835**2001-02 31317 235200 150200 2150000 900 4500 3250 1127* 15000 105000
17890**# Tray size is (2' x 3' x 6')* Stands for in lakhs cut flower** Stands for in Tonnes
Final Report: 'National Level Techno-Economic Feasibility Study for North Zone' 338
• !
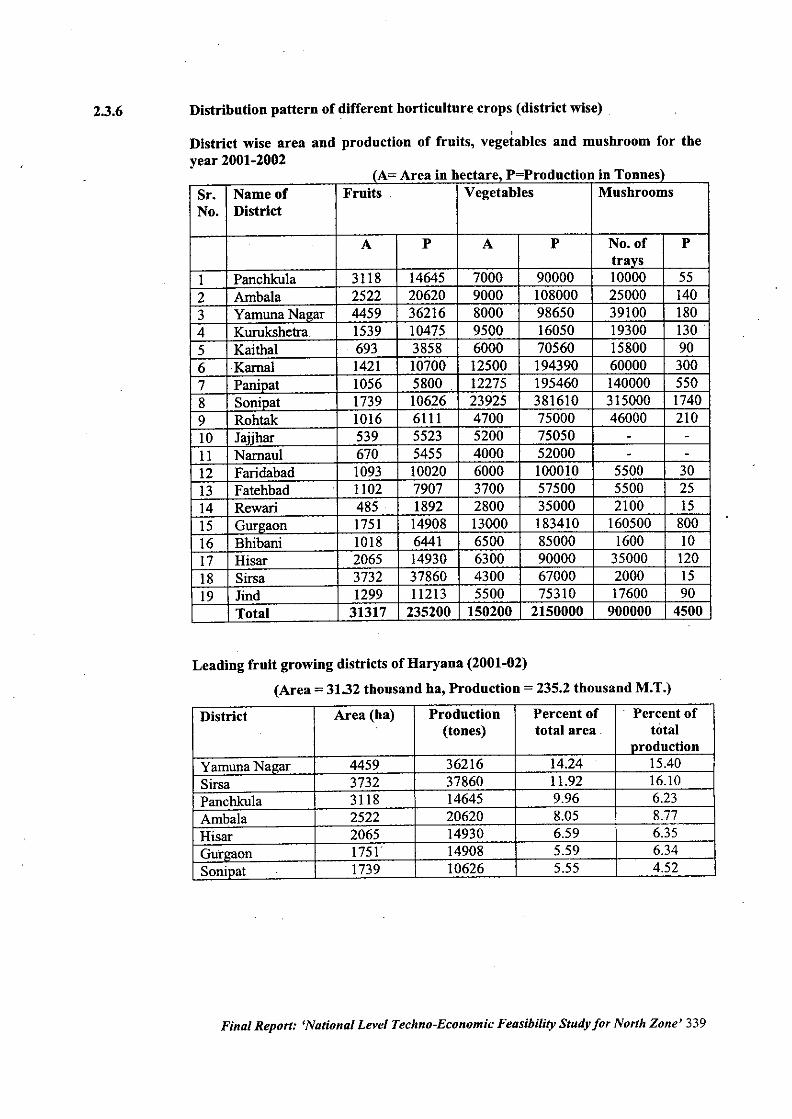
2.3.6 Distribution pattern of different horticulture crops (district wise)
(A= Area in hectare, P=Production in Tonnes)Sr. Name of Fruits. Vegetables MushroomsNo. District
A P A P No. of Ptravs
1 Panchku1a 3118 14645 7000 90000 10000 552 Amba1a 2522 20620 9000 108000 25000 1403 Yamuna Nagar 4459 36216 8000 98650 39100 1804 Kurukshetra. 1539 10475 9500 16050 19300 1305 Kaitha1 693 3858 6000 70560 15800 906 Kamal 1421 10700 12500 194390 60000 3007 Paninat 1056 5800 12275 195460 140000 5508 Soninat 1739 10626 23925 381610 315000 17409 Rohtak 1016 6111 4700 75000 46000 21010 Jaiihar 539 5523 5200 75050 - -11 Namau1 670 5455 4000 52000 - -12 Faridabad 1093 10020 6000 100010 5500 3013 Fatehbad 1102 7907 3700 57500 5500 2514 Rewari 485 1892 2800 35000 2100 1515 Gurgaon 1751 14908 13000 183410 160500 80016 Bhibani 1018 6441 6500 85000 1600 1017 Hisar 2065 14930 6300 90000 35000 12018 Sirsa 3732 37860 4300 67000 2000 1519 Jind 1299 11213 5500 75310 17600 90
Total 31317 235200 150200 2150000 900000 4500
,District wise area and production of fruits, vegetables and mushroom for theyear 2001-2002
Leading fruit growing districts of Haryana (2001-02)
(Area = 31.32 thousand ha, Production = 235.2 thousand M.T.)
District Area (ha) Production Percent of Percent of(tones) total area. total
nroductionYamuna Na"ar 4459 36216 14.24 15.40Sirsa 3732 37860 11.92 16.10Panchku1a 3118 14645 9.96 6.23Ambala 2522 20620 8.05 8.77Hisar 2065 14930 6.59 6.35GUI""aon 1751" 14908 5.59 6.34Soninat 1739 10626 5.55 4.52
Final Report: 'National Level Techno-Economic Feasibility Study for North Zone' 339
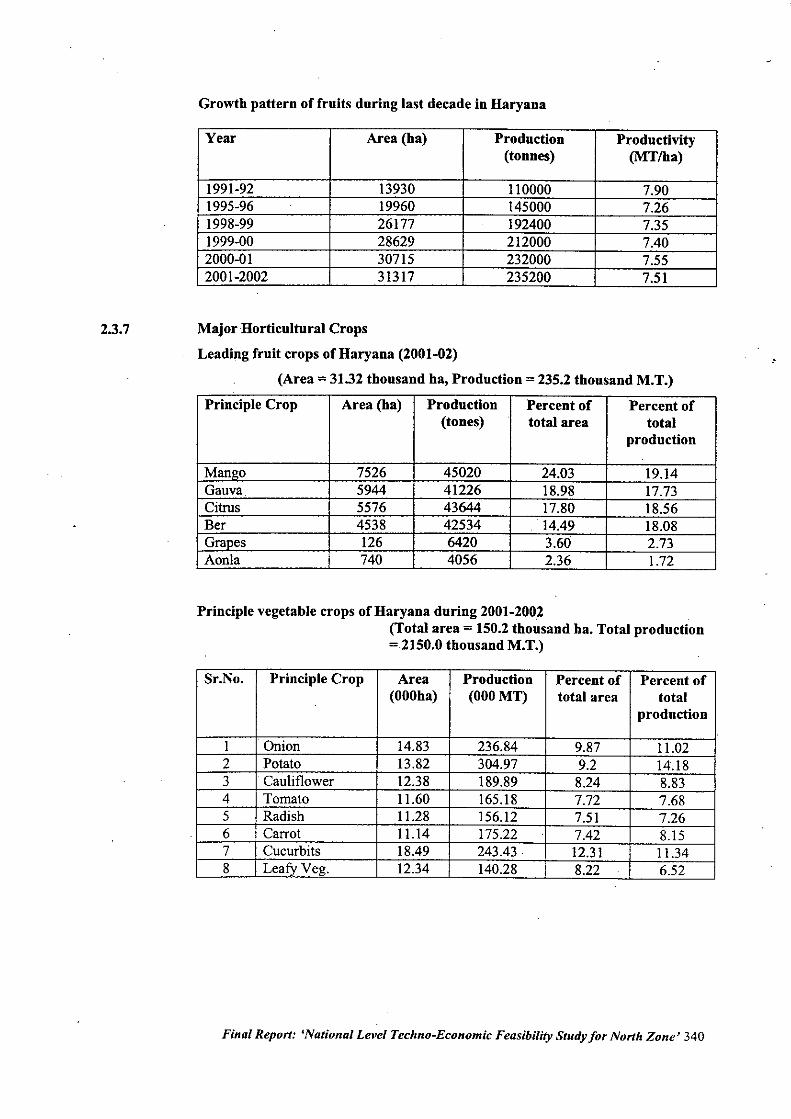
2.3.7
Growth pattern of fruits during last decade in Haryana
Year Area (ha) Prodnction Prodnctivity(tonnes) (MTlha)
1991-92 13930 110000 7.901995-96 19960 145000 7.261998-99 26177 . 192400 7.351999-00 28629 212000 7.402000-01 30715 232000 7.552001-2002 31317 235200 7.51
Major Horticultural Crops
Leading fruit crops of Haryana (2001-02)
(Area = 31.32 thousand ha, Production = 235.2 thousand M.T.)
Principle Crop Area (ha) Production Percent of Percent of(tones) total area total
production
Mango 7526 45020 24.03 19.14Gauva 5944 41226 18.98 17.73Citrus 5576 43644 17.80 18.56Ber 4538 42534 14.49 18.08GraDes 126 6420 3.60 2.73Aonla 740 4056 2.36 1.72
Principle vegetable crops of Haryana during 2001-2002(Total area = 150.2 thousand ha. Total production=2150.0 thousand M.T.)
Sr.No. Principle Crop Area Production Perceut of Perceut of(OOOha) (OOOMT) total area total
production
1 Onion 14.83 236.84 9.87 11.022 Potato 13.82 304.97 9.2 14.183 Cauliflower 12.38 189.89 8.24 8.834 Tomato 11.60 165.18 7.72 7.685 Radish 11.28 156.12 7.51 7.266 Carrot 1I.14 175.22 7.42 8.157 Cucurbits 18.49 243.43. 12.31 11.348 LeafyVeg. 12.34 140.28 8.22 . 6.52
Final Report: 'National Level Techno-Economic Feasibility Study for North Zone' 340
,
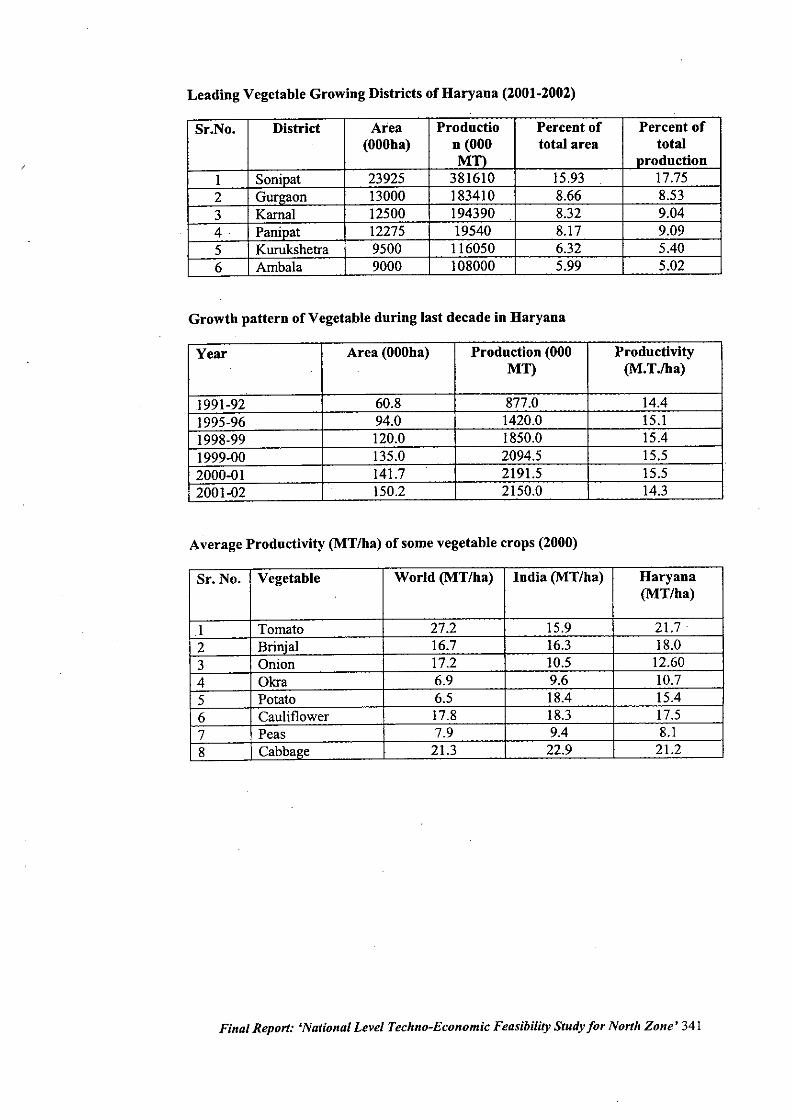
Leading Vegetable Growing Districts of Haryana (2001-2002)
Sr.No. District Area Productio Percent of Percent of(OOOba) n (000 total area total
!\in production1 Sonioat 23925 381610 15.93 17.752 GUrlraon 13000 183410 8.66 8.533 Kamal 12500 194390 8.32 9.044. Paninat 12275 19540 8.17 9.095 Kurukshetra 9500 116050 6.32 5.406 Amba1a 9000 108000 5.99 5.02
Growth pattern of Vegetable during last decade in Haryana
Year Area (OOOha) Production (000 Productivity. MT) (M.T./ha)
1991-92 60.8 877.0 14.41995-96 94.0 1420.0 15.11998-99 120.0 1850.0 15.41999.00 135.0 2094.5 15.52000-01 141.7 2191.5 15.52001-02 150.2 2150.0 14.3
Average Productivity (MT/ha) of some vegetable crops (2000)
Sr. No. Vegetable World (MT/ha) India (MT/ba) Haryana(MT/ha)
.1 Tomato 27.2 15.9 21.72 Brinia1 16.7 16.3 18.03 Onion 17.2 10.5 12.604 Okra 6.9 9.6 10.75 Potato 6.5 18.4 15.46 Cauliflower 17.8 18.3 17.57 Peas 7.9 9.4 8.18 Cabbal!e 21.3 22.9 21.2
Final Report: 'National Level Techno-Economic Feasibility Study for North Zone' 341
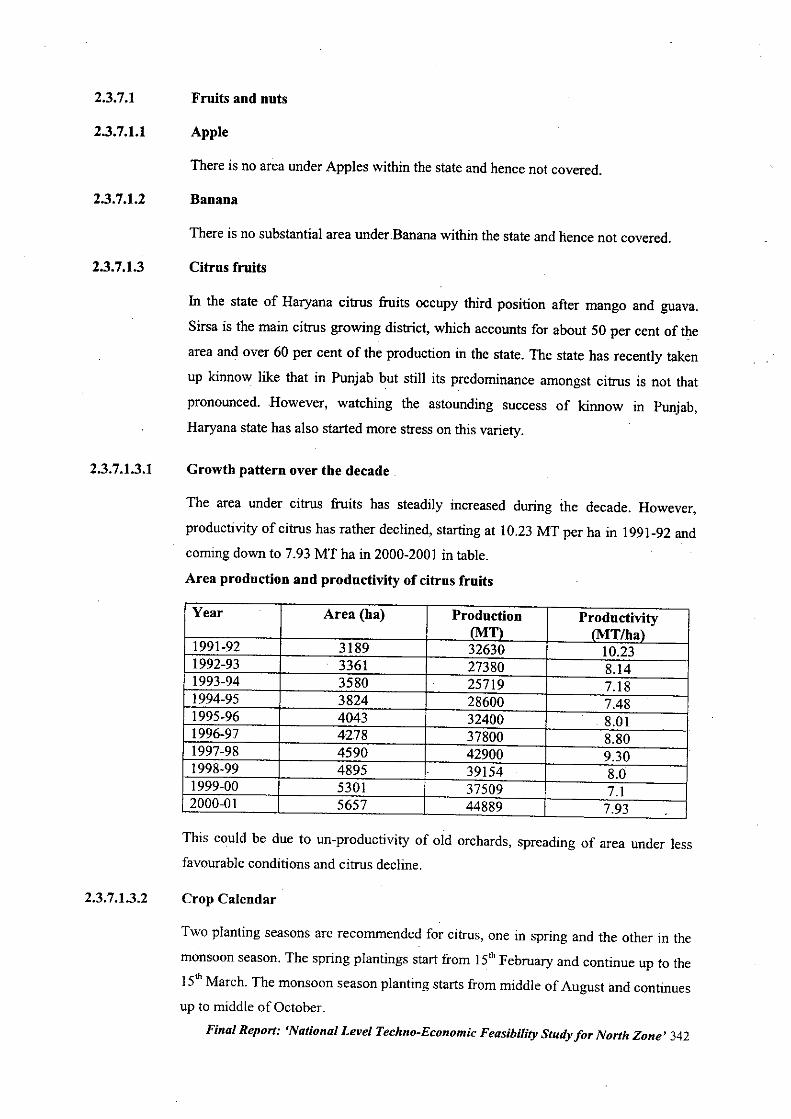
2.3.7.1
2.3.7.1.1
2.3.7.1.2
2.3.7.1.3
2.3.7.1.3.1
2.3.7.1.3.2
Fruits aud nuts
Apple
There is no area under Apples within the state and hence not covered.
Banana
There is no substantial area under.Banana within the state and hence not covered.
Citrus fruits
In the state of Haryana citrus fruits occupy third position after mango and guava.
Sirsa is the main citrus growing district, which accounts for about 50 per cent of the
area and over 60 per cent of the production in the state. The state has recently taken
up kinnow like that in Punjab but stilI its predominance amongst citrus is not that
pronounced. However, watching the astounding success of kinnow in Punjab,
Haryana state has also started more stress on this variety.
Growth pattern over the decade
The area under citrus fruits has steadily increased during ihe decade. However,
productivity of citrus has rather declined, starting at 10.23 MT per ha in 1991-92 and
coming down to 7.93 MT ha in 2000-2001 in table.
Area production and productivity of citrus fruits
Year Area (ha) Production ProductivityIMTI IMTlha)
1991-92 3189 32630 10.231992-93 3361 27380 8.141993-94 3580 25719 7.181994-95 3824 28600 7.481995-96 4043 32400 8.011996-97 4278 37800 8.801997-98 4590 42900 9.301998.99 4895 39154 8.01999-00 5301 37509 7.12000-01 5657 44889 7.93
This could be due to un-productivity of old orchards, spreading of area under less
favourable conditions and citrus decline.
Crop Calendar
Two planting seasons are recommended for citrus, one in spring and the other in the
monsoon season. The spring plantings start from 15th February and continue up to the
15thMarch. The monsoon season planting starts from middle of August and continues
up to middle of October.
Final Report: 'National Level Techno-Economic Feasibility Study for North Zone' 342
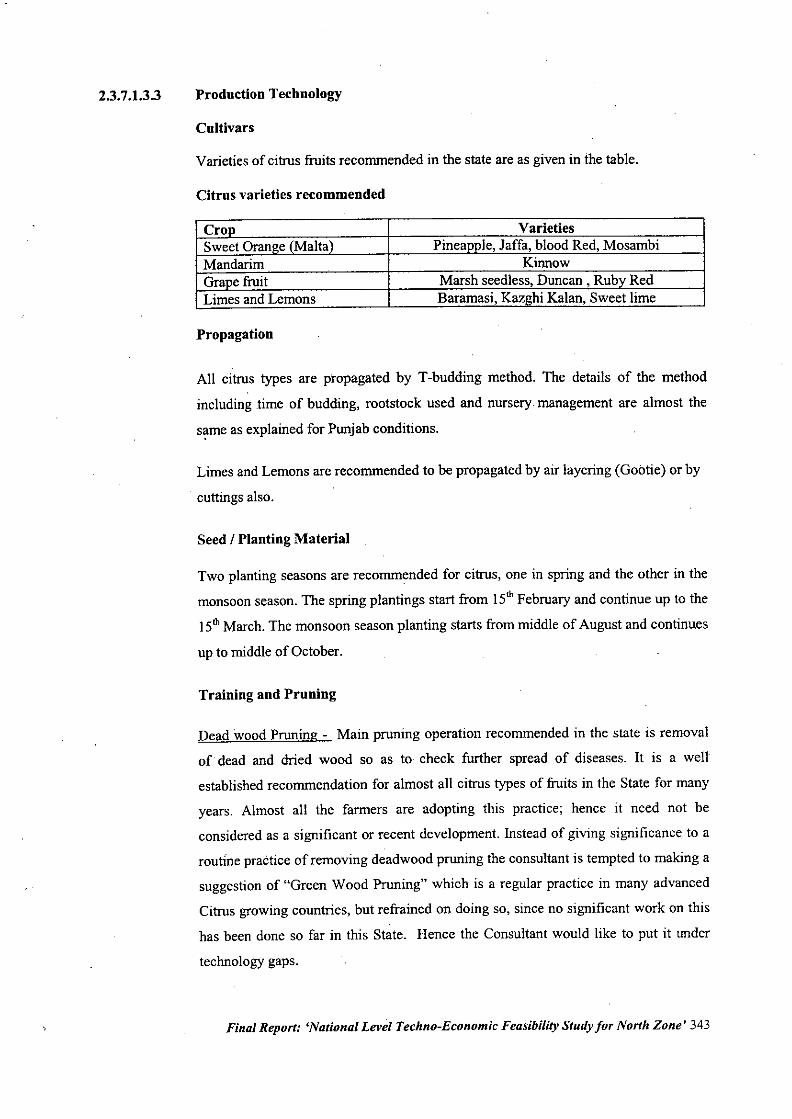
2.3.7.1.3.3 Production Technology
Cultivars
Varieties of citrus fruits recommended in the state are as given in the table.
Citrus varieties recommended
VarietiesPinea Ie, Jaffa, blood Red, Mosambi
KinnowMarsh seedless, Duncan, Rub RedBaramasi, Kaz hi Kalan, Sweet lime
Propagation
All citrus types are propagated by T -budding method. The details of the method
including time of budding, rootstock used and nursery. management are almost the
s~me as explained for Punjab conditions.
Limes and Lemons are recommended to be propagated by air layering (Goatie) or by
. cuttings also.
Seed I Planting Material
Two planting seasons are recommended for citrus, one in spring and the other in the
monsoon season. The spring plantings start from 15th February and continue up to the
15th March. The monsoon season planting starts from middle of August and continues
up to middle of October.
Training and Pruning
Dead wood Pruning - Main pruning operation recommended in the state is removal
of dead and dried wood so as to check further spread of diseases. It is a well
established recommendation for almost all citrus types of fruits in the State for many
years. Almost all the farmers are adopting this practice; hence it need not be
considered as a significant or recent development. Instead of giving significance to a
routine practice of removing deadwood pruning the consultant is tempted to making a
suggestion of "Green Wood Pruning" which is a regular practice in many advanced
Citrus growing countries, but refrained on doing so, since no significant work on this
has been done so far in this State. Hence the Consultant would like to put it under
technology gaps.
Final Report: 'National Level Techno-Economic Feasibility Study for North Zone' 343
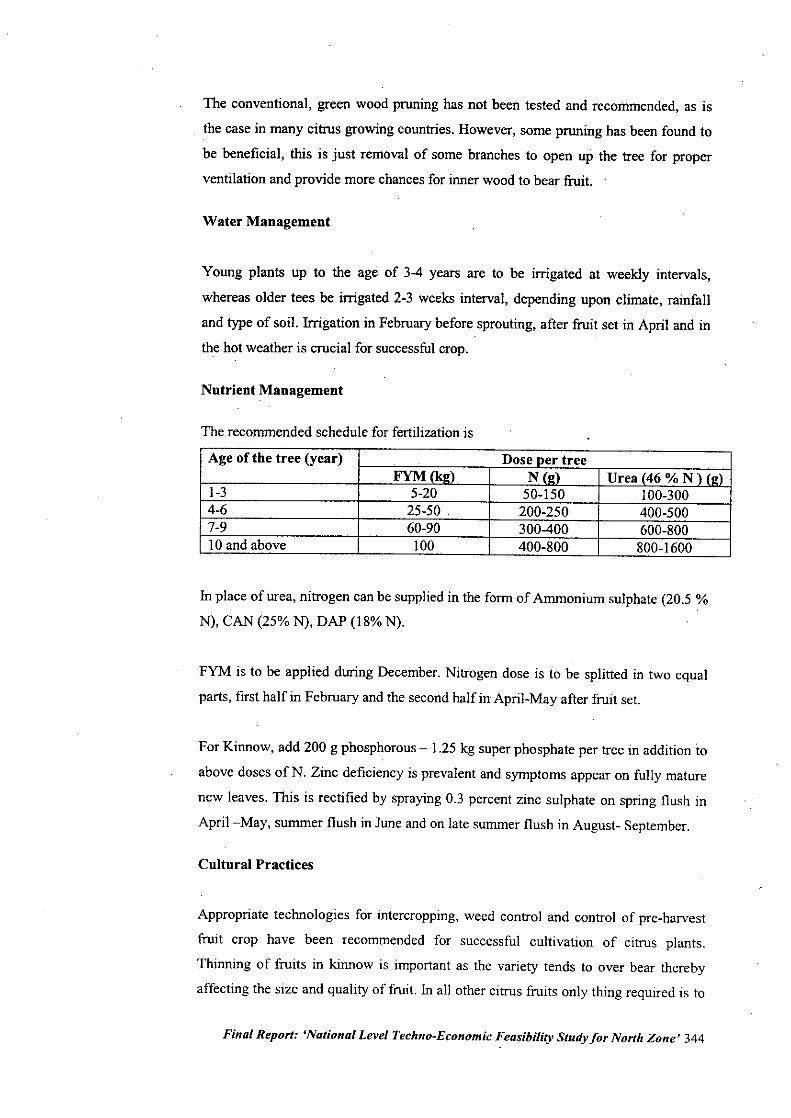
The conventional, green wood pruning has not been tested and recommended, as is
the case in many citrus growing countries. However, some pruning has been found to
be beneficial, this is just removal of some branches to open up the tree for proper
ventilation and provide more chances for inner wood to bear fruit.
Water Management
Young plants up to the age of 3-4 years are to be irrigated at weekly intervals,
whereas older tees be irrigated 2-3 weeks interval, depending upon climate, rainfall
and type of soil. Irrigation in February before sprouting, after fruit set in April and in
the hot weather is crucial for successful crop.
Nutrient Mauagement
The recommended schedule for fertilization is
Age of the tree (year) Dose oer treeFYM (kl() N (l!) Urea (46 % N ) (,d
1-3 5-20 50-150 100-3004-6 25-50 . 200-250 400-5007-9 60-90 300-400 600-80010 and above 100 400-800 800-1600
In place of urea, nitrogen can be supplied in the form of Ammonium sulphate (20.5 %N), CAN (25% N), DAP (18%N).
FYM is to be applied during December. Nitrogen dose is to be splitted in two equal
parts, first half in February and the second half in April-May after fruit set.
For Kinnow, add 200 g phosphorous - 1.25 kg super phosphate per tree in addition to
above doses ofN. Zinc deficiency is prevalent and symptoms appear on fully mature
new leaves. This is rectified by spraying 0.3 percent zinc sulphate on spring flush in
April-May, summer flush in June and on late summer flush in August- September.
Cultural Practices
Appropriate technologies for intercropping, weed control and control of pre-harvest
fruit crop have been recommended for successful cultivation of citrus plants.
Thinning of fruits in kinnow is important as the variety tends to over bear thereby
affecting the size and quality of fruit. In all other citrus fruits only thing required is to
Final Report: 'National Level Techno-Economic Feasibility Study for North Zone' 344
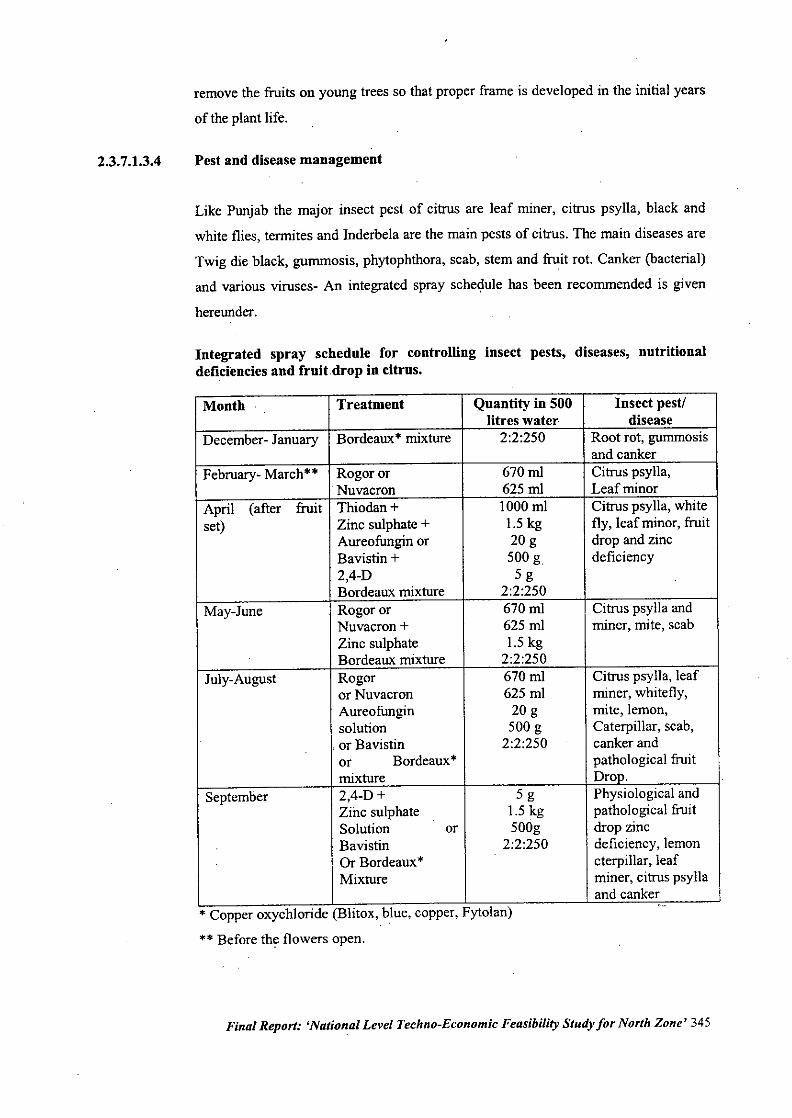
2.3.7.1.3.4
remove the fruits on young trees so that proper frame is developed in the initial years
of the plant life.
Pest and disease management
Like Punjab the major insect pest of citrus are leaf miner, citrus psylla, black and
white flies, termites and Inderbela are the main pests of citrus. The main diseases are
Twig die black, gummosis, phytophthora, scab, stem and fruit rot. Canker (bacterial)
and various viruses- An integrated spray schedule has been recommended is given
hereunder.
Integrated spray schedule for controlling insect pests, diseases, nutritionaldeficiencies and fruit.drop in citrus.
Month Treatment Quantity in 500 Insect pest!litres water disease
December- January Bordeaux. mixture 2:2:250 Root rot, gummosisand canker
February- March •• Rogoror 670ml Citrus psylla,Nuvacron 625 ml Leaf minor
April (after fruit Thiodan + 1000 ml Citrus psylla, whiteset) Zinc sulphate + 1.5 kg fly, leaf minor, fruit
Aureofungin or 20 g drop and zincBavistin + 500g deficiency2,4-D 5gBordeaux mixture 2:2:250
May-June Rogoror 670 ml Citrus psylla andNuvacron + 625 ml miner, mite, scabZinc sulphate 1.5 kgBordeaux mixture 2:2:250
July-August Rogor 670 ml Citrus psylla, leafor Nuvacron 625 ml miner, whitefly,Aureofungin 20 g mite, lemon,solution 500 g Caterpillar, scab,or Bavistin 2:2:250 canker andor Bordeaux. pathological fruitmixture OrOD.
September 2,4-D + 5g Physiological andZinc sulphate 1.5 kg pathological fruitSolution or 500g drop zincBavistin 2:2:250 deficiency, lemonOr Bordeaux. cterpillar, leafMixture miner, citrus psylla
and canker• Copper oxychloride (Blitox, blue, copper, Fytolan)
•• Before the flowers open.
Final Report: 'National Level Techno-Economic Feasibility Study for North Zone' 345
2.3.7.1.3.5
2.3.7.1.3.6
2.3.7.1.3.7
2.3.7.1.3.8
Harvest method and yield
Harvesting and yield- Kinnow is to be harvested when the fruits develop proper
colour and acceptable T.S.S. acid ratio. The fruit in the periphery of the tree be
harvested when such ratio is 12:1, whereas the fruit in side the tree may be harvested
when the ratio is 14:I. The best time for picking Kinnow fruits is from mid January to
mid February.
Again the package of practice contains the general recommendation that the fruit
should not be pulled from the branches during harvesting as the skin from stem end
can be ruptured. Further the harvesting with the clippers is recommended retaining a
non protruding short fruit stocks (Button) which in packaging the damages the other
fruits.
The main issue instead of the above which still remains a understood problem is when
to harvest the fruit. The available recommendation of TSS / Acid Ratio is not well
understood by the growers and not easy to folio\\". The grower on the basis of his
visual observations adjusts the harvesting time.
As in Punjab, kinnow yields are the heaviest amongst all citrus fruits- Average
healthy kinnow tree produces about 1000 to 1500 fruits.
Crop Economics
The productivity for Citrus fruits peaks off after the lOthyear and in general the
incomes comes to around Rs. 82,500 per hectare which is based on the calculation
that the number of plants per hectare being 275 with an average yield of60 Kg per
plant and the sale price of Rs. 5 per Kg.
Price trends in Major Market
The prices have been generally rising annually during the decade. Kinnow fruits have
started fetching higher prices than the sweet oranges or mandarins.
Problems and Constraints
The ove~all situation in Haryana is similar to that in Punjab. Sirsa has emerged as the
predominant citrus growing districts of Haryana. The situation is similar to arid
region of Punjab- Abohar belt. Hence the problem and constraints are the same.
Kinnow amongst citrus fruits is likely to dominate the citrus scenario of the state. In
Final Repart: 'National Level Techno-Economic Feasibility Study for North Zone' 346
2.3.7.1.3.9
fact, it will not be out of proportion to suggest that citrus growing areas of Punjab and
Haryana along with parts of Rajasthan should be grouped into one citrus growing
zone of the country so that common strategies for production and marketing are
developed collectively.
Conclusions
There is no protocol for post harvest handling of the fruits which needs further
refinement. There is also need for diversification in varietal situation to get better
yield levels.
Final Report: 'National Level Techno-Economic Feasibility Study for North Zone' 347
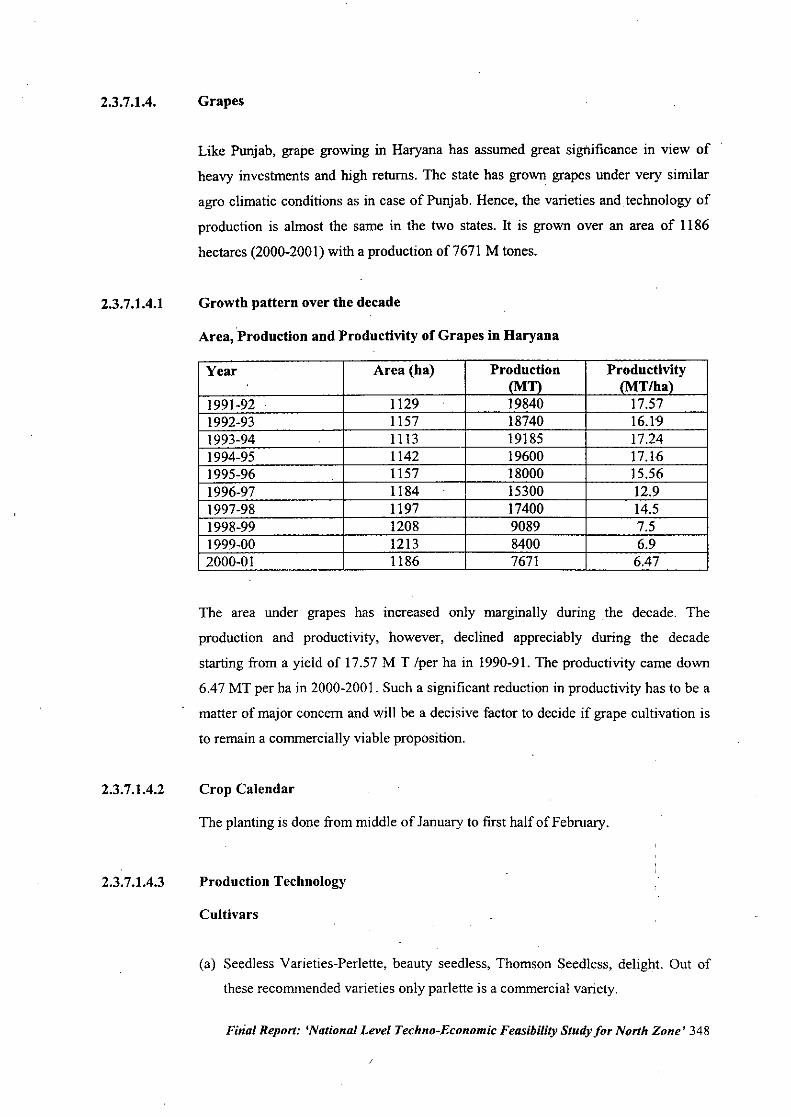
2.3.7.1.4.
2.3.7.1.4.1
2.3.7.1.4.2
2.3.7.1.4.3
Grapes
Like Punjab, grape growing in Haryana has assumed great significance in view of
heavy investments and high returns. The state has grown grapes under very similar
agro climatic conditions as in case of Punjab. Hence, the varieties and technology of
production is almost the same in the two states. It is grown over an area of 1186
hectares (2000-2001) with a production of7671 M tones.
Growth pattern over the decade
Area, .Production and Productivity of Grapes in Haryana
Year Area (ha) Prodnction Productivity(MT) (MT/ha)
1991-92 1129 . 19840 17.571992-93 1157 18740 16.191993-94 . 1113 19185 17.241994-95 1142 19600 17.161995-96 1157 18000 15.561996-97 1184 15300 12.91997-98 1197 17400 14.51998-99 1208 9089 7.51999-00 1213 8400 6.92000-01 1186 7671 6.47
The area under grapes has increased only marginally during the decade. The
production and productivity, however, declined appreciably during the decade
starting from a yield of 17.57 M T Iper ha in 1990-91. The productivity came down
6.47 MT per ha in 2000-200 I. Such a significant reduction in productivity has to be a
matter of major concern and will be a decisive factor to decide if grape cultivation is
to remain a commercially viable proposition.
Crop Calendar
The planting is done from middle of January to first half of February.
Production Technology
Cultivars
(a) Seedless Varieties-Per1ette, beauty seedless, Thomson Seedless, delight. Out of
these recommended varieties only parlette is a commercial variety.
Final Report: 'National Level Techno-Economic Feasibility Study for North Zone' 348
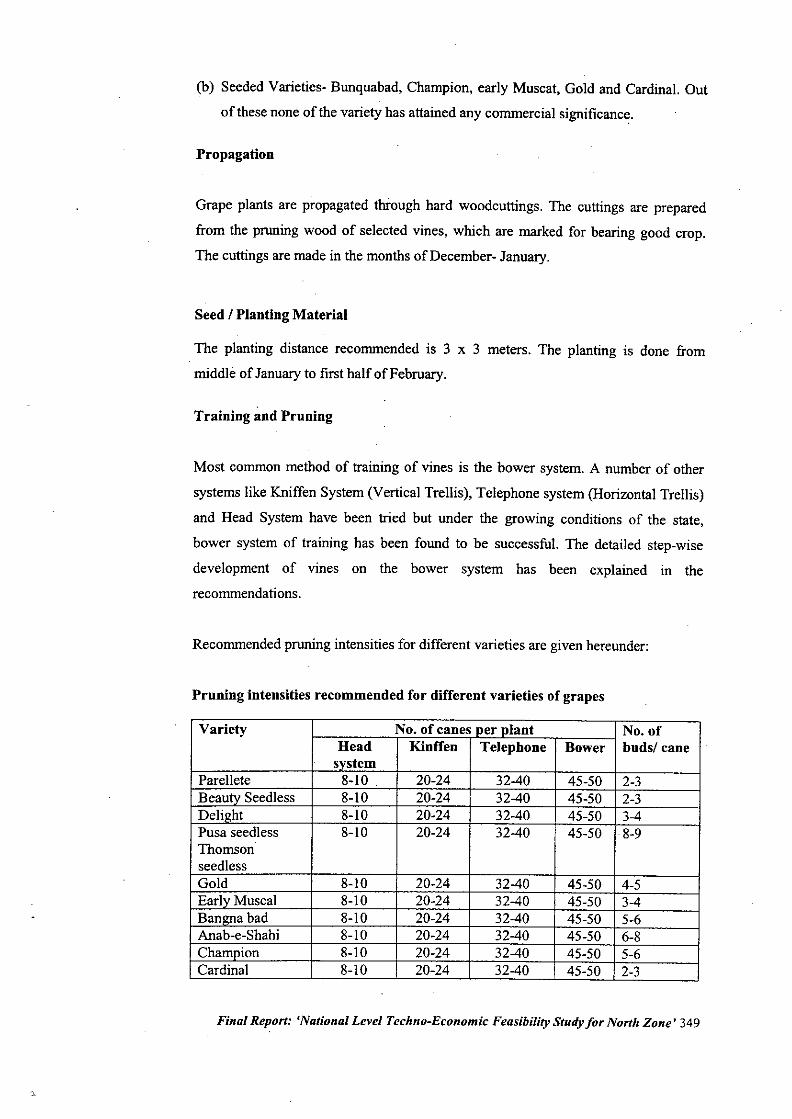
(b) Seeded Varieties- Bunquabad, Champion, early Muscat, Gold and Cardinal. Out
of these none of the variety has attained any commercial significance.
Propagation
Grape plants are propagated through hard woodcuttings. The cuttings are prepared
from the pruning wood of selected vines, which are marked for bearing good crop.
The cuttings are made in the months of December- January.
Seed! Planting Material
The planting distance recommended is 3 x 3 meters. The planting is done from
middle of January to first half of February.
Training and Pruning
Most common method of training of vines is the bower system. A number of other
systems like Kniffen System (Vertical Trellis), Telephone system (Horizontal Trellis)
and Head System have been tried but under the growing conditions of the state,
bower system of training has been found to be successful. The detailed step-wise
development of vines on the bower system has been explained in the
recommendations.
Recommended pruning intensities for different varieties are given hereunder:
Pruning intensities recommended for different varieties of grapes
Variety NO.ofcanesoerolant No. ofHead Kinffen Telephone Bower buds! canesvstem
Parellete 8-10 20-24 32-40 45-50 2-3Beauty Seedless 8-10 20-24 32-40 45-50 2-3Delight 8-10 20-24 32-40 45-50 3-4Pusa seedless 8-10 20-24 32-40 45-50 8-9ThomsonseedlessGold 8-10 20-24 32-40 45-50 4-5Early Muscal 8-10 20-24 32-40 45-50 3-4Bangna bad 8-10 20-24 32-40 45-50 5-6Anab-e-Shahi 8-10 20-24 32-40 45-50 6-8Champion 8-10 20-24 32-40 45-50 5-6Cardinal 8-10 20-24 32-40 45-50 2-3
Final Report: 'National Level Techno-Economic Feasibility Study for North Zone' 349
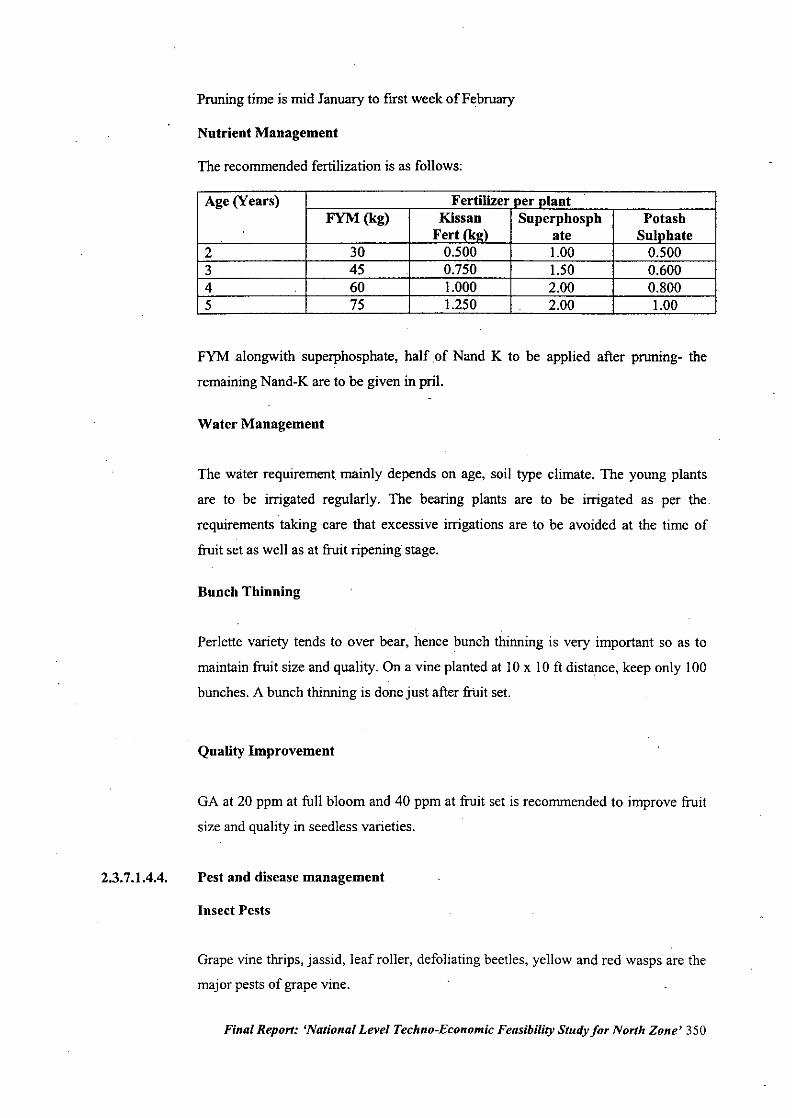
2.3.7.1.4.4.
Pruning time is mid January to first week of February
Nutrient Management
The recommended fertilization is as follows:
Age (Years) Fertilizer oer olantFYM(kg) Kissan Superphosph Potash
Fert (k,,) ate Sulohate2 30 0.500 1.00 0.5003 45 0.750 1.50 0.6004 60 1.000 2.00 0.8005 75 1.250 2.00 1.00
FYM .alongwith .superphosphate, half .of Nand K to be applied after pruning- the
remaining Nand-K are to be given in pril.
Water Management
The water requirement mainly depends on age, soil type climate. The young plants
are to be irrigated regularly. The bearing plants are to be irrigated as per the
requirements taking care that excessive irrigations are to be avoided at the time of
fruit set as well as at fruit ripening stage.
Bunch Thinning
Perlette variety tends to over bear, hence bunch thinning is very important so as to
maintain fruit size and quality. On a vine planted at lOx lOft distance, keep only 100
bunches. A bunch thinning is done just after fruit set.
Quality Improvement
GA at 20 ppm at full bloom and 40 ppm at fruit set is recommended to improve fruit
size and quality in seedless varieties.
Pest and disease management
Insect Pests
Grape vine thrips, jassid, leaf roller, defoliating beetles, yellow and red wasps are the
major pests of grape vine.
Final Report: 'National Level Techno-Economic Feasibility Study for North Zone' 350
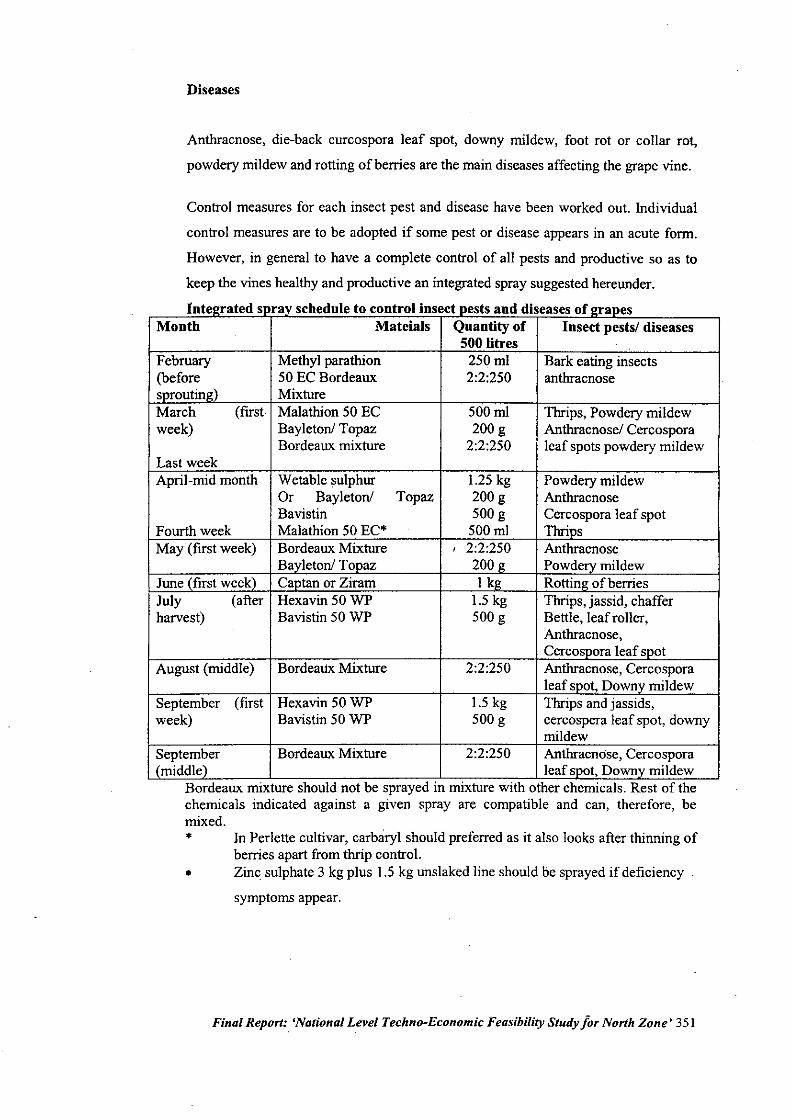
Diseases
Anthracnose, die-back curcospora leaf spot, downy mildew, foot rot or collar rot,
powdery mildew and rotting of berries are the main diseases affecting the grape vine.
Control measures for each insect pest and disease have been worked out. Individual
control measures are to be adopted if some pest or disease appears in an acute form.
However, in general to have a complete control of all pests and productive so as to
keep the vines healthy and productive an integrated spray suggested hereunder.
Intelrrated SE rav schedule to control insect oests and diseases of l!raoesMonth Mateials Quantity of Insect pests! diseases
500 IitresFebruary Methyl parathion 250ml Bark eating insects(before 50 EC Bordeaux 2:2:250 anthracnosesOTOutine:) MixtureMarch (first Malathion 50 EC 500ml "Thrips,Powdery mildewweek) Bayletonl Topaz 200 g Anthracnose! Cercospora
Bordeaux mixture 2:2:250 leaf spots powdery mildewLast weekApril-mid month Welable sulphur 1.25kg Powdery mildew
Or Bayletonl Topaz 200 g AnthracnoseBavistin 500 g Cercospora leaf spot
Fourth week Malathion 50 EC* 500ml "ThriosMay (first week) Bordeaux Mixture , 2:2:250 Anthracnose
Bavletonl Tooaz 200 g Powderv mildewJune-rflrstweek) Caolan or Ziram I ke: Rottine:of berriesJuly (after Hexavin 50 WP 1.5 kg "Thrips,jassid, chafferharvest) Bavistin 50WP 500 g Bettie, leaf roller,
Anthracnose,Cercosoora leaf spot
August (middle) BordeaUxMixture 2:2:250 Anthracnose, Cercosporaleaf spot, Downv mildew
September (first Hexavin 50 WP 1.5 kg "Thripsand jassids,week) Bavistin 50 WP 500 g cercospera leaf spot, downy
mildewSeptember Bordeaux Mixture 2:2:250 Anthracnose, Cercospora(middle) leaf spot, Downv mildew
Bordeaux mixture should not be sprayed in mixture with other chemicals. Rest of thechemicals indicated against a given spray are compatible and can, therefore, bemixed.* In Perlette cultivar, carbaryl should preferred as it also looks after thinning of
berries apart from tOOpcontrol.• Zinc sulphate 3 kg plus 1.5 kg unslaked line should be sprayed if deficiency
symptoms appear.
Final Report: 'National Level Techno-Economic Feasibility Study jor North Zone' 351
2.3.7.1.4.5
2.3.7.1.4.6
2.3.7.1.4.7
2.3.7.1.4.8
2.3.7.1.4.9
Harvest method and yield
Grapes are to be harvested when the fiuits are fully ripe. Repeated pickings are
recommended as the bunches do not ripen at the same time. The yield per ha isapproximately 16 to 17M tonnnes.
Crop Economics
Currently the average yield of grapes in the State are pegged at 4-6 tons per hectare
but the data given for calculation of the economics for the crop by the DOH as shown
an average yield at 13.32 tons per hectare. The calculations have been made on the
basis of this figure and therefore the income thus generated from the crop comes to
RS.6.66 lacs per hectare from eighth year onwards with the cost of cultivationbenched at RS.22.600/- per hectare.
Price trends and arrival
The price trends are almost similar as those as explained for Punjab since grapes from
Haryana are sold in the same markets as the grape from Punjab.
Problems and Constraints
Spread of grapes in Haryana is restricted because of heavy investment required for
developing the structure for Bower system. The fiuit quality is not as good as the
grapes, which come in the north fudian markets during winter months from
Maharashtra and some southern states. As the fiuit in the state ripen in the hot moths
of May and June, post harvest handling and marketing gets quite difficult- Some of
the crop gets damaged if the monsoon rains are early and the crop maturity getsdelayed.
Conclusion
The grape cultivation in Haryana is on the decline. The productivity has drastically
came down by about one third during the decade. IN the year 2000-200 I are and
production also was reached as compared to the previous year. On the existing
plantations there is a need to test the Israel technology of berry thinning, GA
application and girdling. If this package works, there could be some hope of revival
other wise further reduction in area and production will make grape growinguneconomical and will loose favour with the farmers.
Final Report: 'National Level Techno-Economic Feasibility Study for North Zone' 352
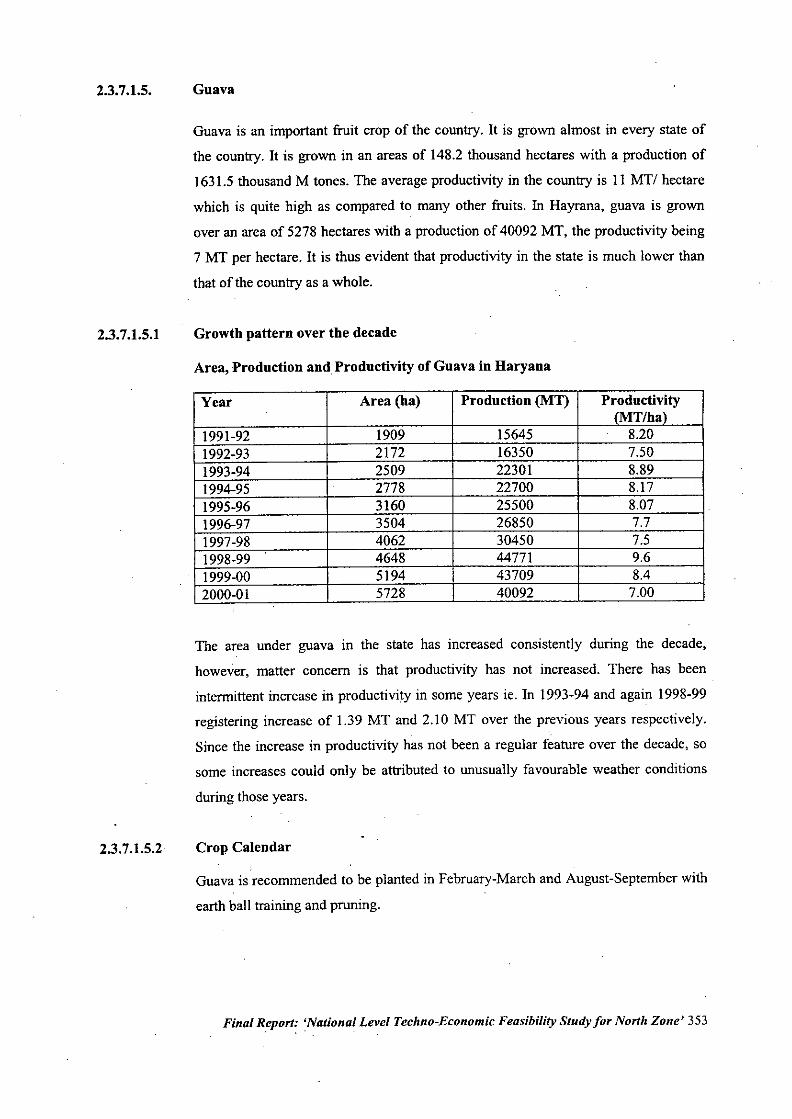
2.3.7.1.5.
2.3.7.1.5.1
2.3.7.1.5.2
Guava
Guava is an important fruit crop of the country. It is grown almost in every state of
the country. It is grown in an areas of 148.2 thousand hectares with a production of
1631.5 thousand M tones. The average productivity in the country is 11 MT/ hectare
which is quite high as compared to many other fruits. In Hayrana, guava is grown
over an area of 5278 hectares with a production of 40092 MT, the productivity being
7 MT per hectare. It is thus evident that productivity in the state is much lower than
that of the country as a whole.
Growth pattern over the decade
Area, Production and Productivity of Guava in Haryana
Year Area (ha) Production (MT) Productivity(MT/ha)
1991-92 1909 15645 8.201992-93 2172 16350 7.501993-94 2509 22301 8.891994-95 . 2778 22700 8.171995-96 3160 25500 8.071996-97 3504 26850 7.71997-98 4062 30450 7.51998-99 4648 44771 9.61999-00 5194 43709 8.42000-01 5728 40092 7.00
The area under guava in the state has increased consistently during the decade,
however, matter concern is that productivity has not increased. There has been
intermittent increase in productivity in some years ie. In 1993-94 and again 1998-99
registering increase of 1.39 MT and 2.10 MT over the previous years respectively.
Since the increase in productivity has not been a regular feature over the decade, so
some increases could only be attributed to unusually favourable weather conditions
during those years.
Crop Calendar
Guava is recommended to be planted in February-March and August-September with
earth ball training and pruning.
Final Report: 'National Level Techno-Economic Feasibility Study for North Zone' 353
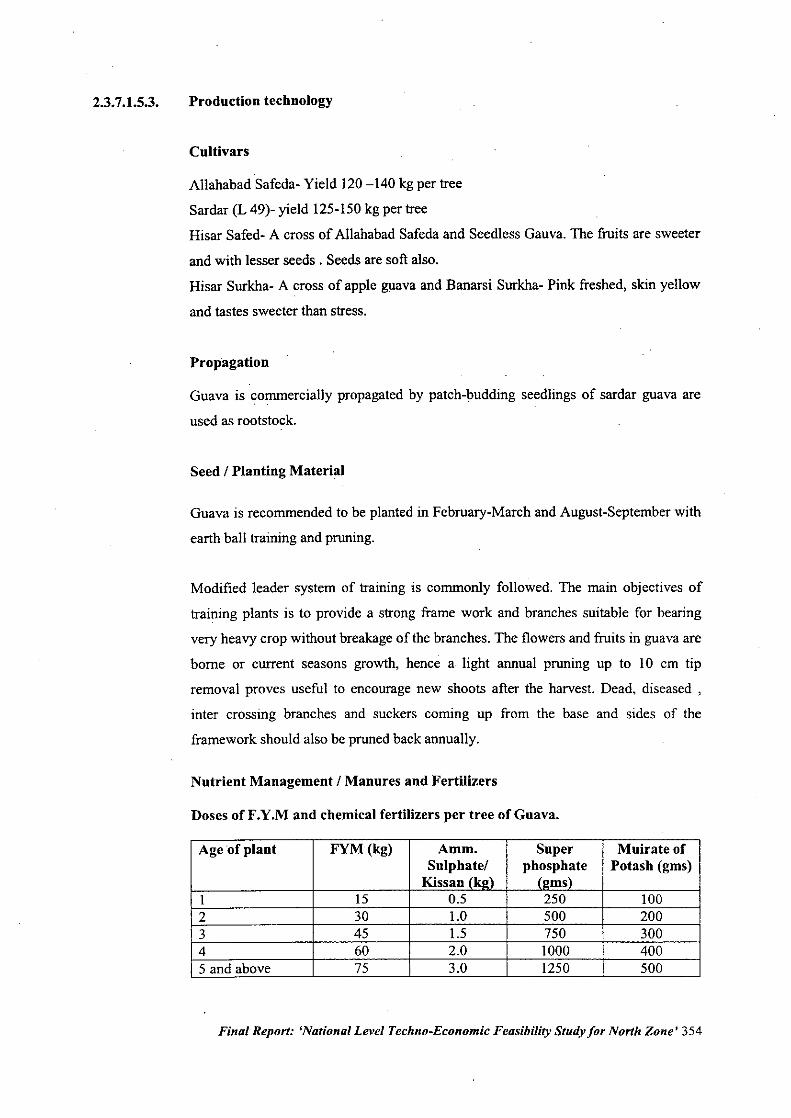
2.3.7.1.5.3. Production technology
Cultivars
Allahabad Safeda- Yield 120 -140 kg per tree
Sardar (L 49)-yield 125-150 kg per treeHisar Safed- A cross of Allahabad Safeda and Seedless Gauva. The fiuits are sweeter
and with lesser seeds. Seeds are soft also.
Hisar Surkha- A cross of apple guava and Banarsi Surkha- Pink freshed, skin yellow
and tastes sweeter than stress.
Propagation
Guava is commercially propagated by patch-budding seedlings of sardar guava are
used as rootstock.
Seed I Planting Material
Guava is recommended to be planted in February-March and August-September with
earth ball training and pruning.
Modified leader system of training is commonly followed. The main objectives of
training plants is to provide a strong frame work and branches suitable for bearing
very heavy crop without breakage of the branches. The flowers and fiuits in guava are
borne or current seasons growth, hence a light annual pruning up to 10 cm tip
removal proves useful to encourage new shoots after the harvest. Dead, diseased ,
inter crossing branches and suckers coming up from the base and sides of the
framework should also be pruned back annually.
Nutrient Management I Manures and Fertilizers
Doses of F.Y.M and chemical fertilizers per tree of Guava.
Age of plant FYM(kg) Amm. Snper Muirate ofSnlphatel phosphate Potash (gms)Kissan (kl!) (l!ins)
1 15 0.5 250 1002 30 1.0 500 2003 45 1.5 750 3004 60 2.0 1000 4005 and above 75 3.0 1250 500
Final Report: 'National Level Techno-Economic Feasibility Study for North Zone' 354
2.3.7.1.5.4
F. Y.M, half of super phosphate and sulphate of potash to be given in February and
the rest of the fertilizers in middle of July.
Zinc deficiency- It has been commonly noticed on guava plants in the state. The plant
growth is suppressed and the braches start dieing back. The deficiency is cured by
spraying the trees with Zinc sulphate- lime mixture- I kg of zinc sulphate and 0.5 kg
of unslaked lime in 100 litres of water. Two to tbree sprays of the mixture are
recommended between June to September.
Water Management
The young guava plants need irrigation at weekly interval during summer months and
2 to 3 irrigations during winter months. Irrigation to bearing trees depends upon age,
soil type and climate. Normally such trees, require irrigation for flowering and better
fruit set at an interval of 2 to 3 weeks during summer and at monthly intervals during
winter.
Sowing I Planting Techniques
Guava gives two crops a year, winter season crop is superior in quality than rainy
season crop, and is also infested with fruit flies. Hence crop regulation IS
recommended as follows.
(I) Spray urea ten percent or Napthalene acetic acid (NAA) @ 600 mg! litre
during March when maximum flowers have opened.
(2) Pruning of terminal portion of the shoots up to 20 and 30 cm in the second
half of April.
(3) Withhold irrigation in April- May
(4) Apply fertilizers during the encourage growth in July-August for getting
maximum flowering during August September for winter season crop.
Pest and disease management
Insects
Fruit fly is the most serious pest of guava. This pest is more serious in rainy season
crop. For the control of fruit fly recommendation incidence (a) cleanliness especially
the removal and destroying of fallen infested fruits (b) ploughing of field, during
Final Report: 'National Level Techno-Economic Feasibility Study for North Zone' 355
2.3.7.1.5.5
summer months (c) avoid rainy season crop (d) Harvest fiuits at slightly harder stage
(e) Spray of Melathion 50 EC when the attack is there (f) Do not harvest the fiuits for
five days from the date of spray.
The other important insect pest IS short borer. Spray of Monocrotophos,
Chlorpophyriphos or Ekalux is recommended to control this pest.
Diseases
Wilt of guava is very serious disease especially in heavy soils or wet conditions. The
control measures include (a) Plant guava in a well drained soil (b) drenching the soil
in the pit, prepared for planting the trees, with formation solution (e) uprooting of
affected trees (d) use of Sardar guava (Lha) seedlings as rootstock. Fruit rot,
anthracnose or dieback control measures recommended are (a) Avoid water to stand
around the tree trunk (b) Spray with Blitox or Captan (c) cleaning of the soil from any
fallen and rotten fiuits.
Harvest method and yield
Guava fiuit is recommended for harvest when it is fully mature but firm. The fiuit
change colour from dark green to greenish yellow. Guava yield in the state is 7.0
tonnes per hectare, which is much lower than the national average. Plants both young
and old are quite a serious problem for the state. Remedial measures have been
suggested but still the melody is not completely checked. Sardar ( L-49) Guava
seedling have been found to be tolerant to this disease. Further work on this disease is
required to be undertaken. Fruit fly is the second main problem in guava. This pest is
quite difficult to be controlled. Further research efforts are needed in this direction
also.
Guava fiuit is getting popular in the state and is quite remunerative to the farmers.
More varieties and rootstocks are required to be worked out to avoid wilt and fiuit fly.
Post harvest handling- proper packaging an grading of fiuit needs to be improved.
Presently almost all the fiuit produced in the states is consumed either locally or goes
to Delhi market.
Declining yield is a matter of concern and need to attend to both by researches as well
as developmental workers.
Final Report: 'National Level Techno-Economic Feasibility Study for North Zone' 356
2.3.7.1.5.6
2.3.7.1.5.7.
2.3.7.1.5.8.
2.3.7.1.5.9
Crop economics
Currently the average yield of Guava in the State is pegged at 17.5 tons per hectare.
The calculations have been made on the basis of this figure and therefore the income
thus generated from the crop comes to Rs.52,500 per hectare from tenth year onwards
with the cost of cultivation benched at Rs.3,200/- per hectare.
Price Trend
There is no regulated trend market price data available. However, the prices of
Guvava have increased drastically over the years and currently are pegged at RS.300-
450 per quintal in the wholesale market of the State.
Problems and constraints
Guava wilt, which results In high mortality of young plants, remains a serious
problem. fruitfly is quite difficult to be controlled and yet is a serious problem.
Conclusion
Guava is the crop, which has the prospects of engaging as a good fruit crop for
Haryana
Final Report: 'National Level Techno-Economic Feasibility Study for North Zone' 357
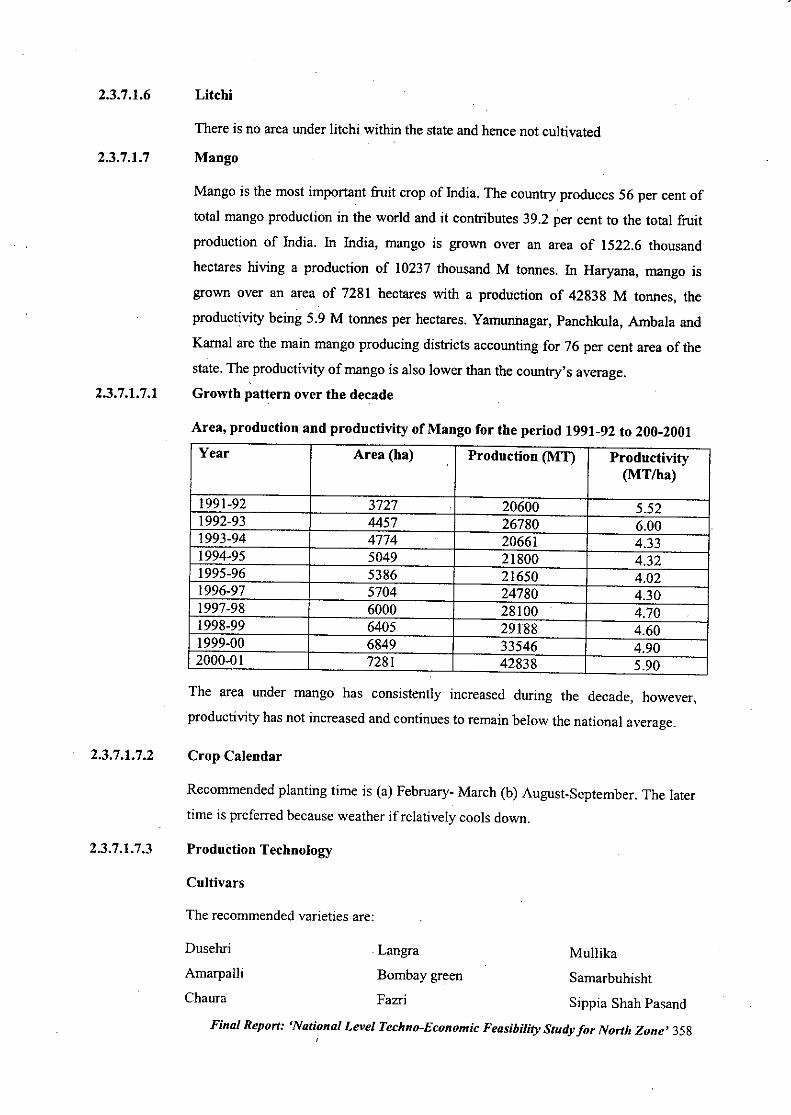
2.3.7.1.6
2.3.7.1.7
2.3.7.1.7.1
2.3.7.1.7.2
2.3.7.1.7.3
Litchi
There is no area under litchi within the state and hence not cultivated
Mango
Mango is the most important fruit crop of India. The country produces 56 per cent of
total mango production in the world and it contributes 39.2 per cent to the total fruit
production of India. In India, mango is grown over an area of 1522.6 thousand
hectares hiving a production of 10237 thousand M tonnes. In Haryana, mango is
grown over an area of 7281 hectares with a production of 42838 M tonnes, the
productivity being 5.9 M tonnes per hectares. Yamunnagar, Panchkula, Ambala and
Kamal are the main mango producing districts accounting for 76 per cent area of the
state. The productivity of mango is also lower than the country's average.
Growth pattern over the decade
Area, production and productivity of Mango for the period 1991-92 to 200-2001Year Area (ha) Production (MT) Productivity
(MTlha)
1991-92 3727 20600 5.521992-93 4457 26780 6.001993-94 4774 20661 4.331994-95 5049 21800 4.321995-96 5386 21650 4.021996-97 5704 24780 4.301997-98 6000 28100 4.701998-99 6405 29188 4.601999-00 6849 33546 4.902000-01 7281 42838 5.90
The area under mango has consistently increased during the decade, however,
productivity has not increased and continues to remain below the national average.
Crop Calendar
Recommended planting time is (a) February- March (b) August-September. The latertime is preferred because weather if relatively cools down.
ProduCtion Technology
Cultivars
The recommended varieties are:
Dusehri
Amarpalli
Chaura
.Langra
Bombay green
Fazri
Mullika
Samarbuhisht
Sippia Shah PasandFinal Report: 'National Level Techno-Economic Feasibility Study for North Zone' 358
Propagation
Side grafting has been found to be the most efficient method of propagation. It has
largely replaced the old, difficult method of inarching. The randomly selected
seedlings are used as rootstock. Best time of side grafting is March to September
excluding May and June being dry and hot months.
Seed I Planting Material
(a) Recommended planting time is (a) February- March (b) August-September. The
later time is preferred because weather if relatively cools down. Recommended
distance of planting is 9 x 9 meters for grafter varieties and 10 x 10 meters for
sucking types.
No specific training or pruning is required for mango. Only recommended approach
is to space the main scaffold branches at 20-25 em distance. No regular annual
pruning is required. However, after a period of 2-25 years, when the tree grows vary
tall, the fruiting gets restricted to only the peripheral part, the tree has to be headed
back to invigorate the trees to the increase the productivity.
Nutrient Management I Manuring and Fertilization
The nutritional requirement of mango varies with the region, soil type and age.
Recommendations also differed for on' and off year of production.
Water Management
Frequency of irrigation in mango orchards depends upon the type of soil, climatic
conditions, especially the rainfall and its distribution and the age of the tree.
Generally you11gplants require frequent irrigation during the dry period.
Intercultural Operation I Intercropping
Mango trees have a juvenile period ranging from 3 to 7 years depending upon the
variety and climate. Therefore, in young orchards intercropping in advised to
profitably use the vacancy space. Vegetables like onion, tomato, radish, beans,
cauliflower, cabbage, leafy vegetables and leguminous crops like moong, mash, gram
and lentil can be grown.
Final Report: 'National Level Techno-Economic Feasibility Study for North Zone' 359
2.3.7.1.7.4
2.3.7.1.7.5
Pest and disease management
(a) Diseases
(i) Mango malformation occurs both at juvenile and flowering stage. Compact leaves
are formed at the apex of shoot or in leaf exiting the young trees. In the case of
bearing trees, the panicles are affected- peduncles become thickened and flashy with
heavy numerous branches. Removal of affected shoots every month to destroy then in
case of young trees helps in checking this disease. In case of bearing trees,
debloosoming affected panicle and spray of 200 pmm NAA in October is
recommended to keep malformation under check. However, still no complete control
measure is known and it appears to be a technology gap in the successful cultivation
of mango. (ii) Black tip this disorder is caused by smoke of brick kilns. Control
measures include spraying three times with 0.6 per cent. Borax before flowering,
during flowering and alongwith Bordenx mixture (2:2: 250) or 1.5 kg of copper
oxychloride in 500 litres of water after fruit set.
In addition to these two disease, mango is also affected by powdery mildew,
Anthracnose or dieback, twig dieback a leaf blight and stem canker. All these
melodies can be completely checked by adopting recommended practices.
Insect Pests
Important insect pests attacking mango and mealy bug, hoppers, scabs, stem borer,
shoot borer and red rots. General chainless around the tree and physical barriers on
the main brick of the tree and quite efficient remedial measures to control mealy bug.
The other serious pests mango hopper is kept under check by pruning old dense
methods during winter. It is also ildvised to avoid too dense plantations. Chemical
control by the spray of carbaryl, melathion or Thiodan.
Recommendations for other insect pests are also available, regular adoption of such
sprays keeps the mango trees free from such pests.
Harvest method and yield
Mango should be harvested with pedicel yield varied with the variety and the region.
The average productivity in the state touched 10 MT/ha in the year 1999.2000 as
compared to MT/ha in 1991.92.
Final Report: 'National Level Techno-Economic Feasibility Study for North Zone' 360
2.3.7.1.7.6
2.3.7.1.7.7
2.3.7.1.7.8
2.3.7.1.7.9
2.3.7.1.8
Crop Economics
It has been observed that after the 10th Year Mango plantation gives a steady income
of approximately Rs. 45,000 per hectare. The economics has been worked out on the
basis of about 100 plants in a hectare of land averaging a yield of 90 Kgs. keeping in
mind the estimated selling rate of Rs. 5 per Kg. and the expenditure incurred by the
farmer of about Rs. 4,425/- per hectare. Thus the net cash flow per hectare to the
farmer comes to around Rs. 40,575 per hectare.
Price trends
The off and on years of the mango crop significant affect the arrivals and prices in all
the major markets of the country. The available price trends also indicate the sharp
influence of inflation from the first three years of the decade 1991-1993 as compared
the rest of the seven years where in after this quarter jump in prices, there was
prevalent a stabilizing factor maintaining the prices in the range of 100 to 1100 rupees
per quintal in the Jullundhar market.
Problems and Constraints
Alternate bearing and malformation especially in North Western India still pose
serious problems. There are the two major technology gaps in the production. of
mango. Black tip of mango, hoppers and mealy bugs, attacks are assume significance
in certain areas. Protocol for harvest, field handling, control of oozing sap at the
harvest time thereby causing black spots on the skin, grading and packaging standards
still are imposing problems in the vies of the facts that much of the fruit is hashing in
the midst of rains. Such a situations are serious bottlenecks to expand accessibility
and acceptability to foreign markets.
Conclusion
There is a need to come over the problems of alternate bearing andmalformed fruits
in Mangoes. These need to be looked into seriously as well as preference should be
given for cultivation of new varieties / hybrids of this crop under close plantation to
have higher density for increase productivity.
Papaya
There is no area under Apples within the state and hence not cultivated
Final Report: 'National Level Techno-Economic Feasibility Study for North Zone' 361
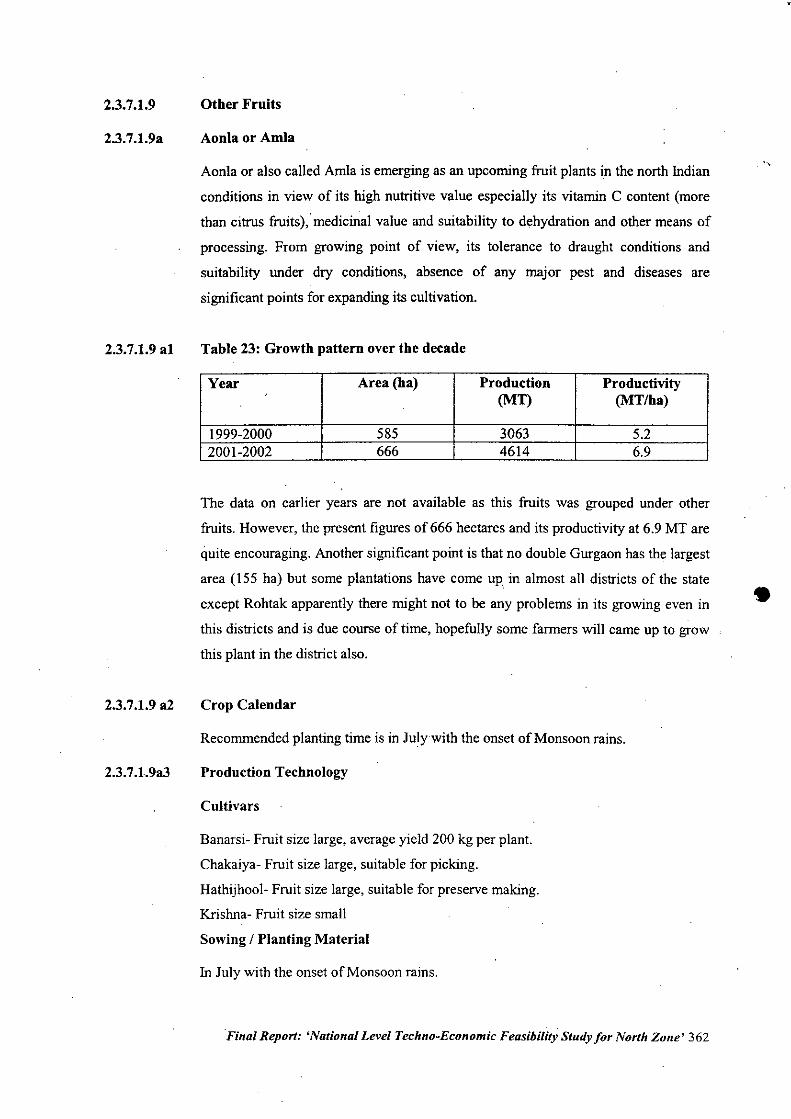
2.3.7.1.9
2.3.7.1.9a
2.3.7.1.9 a1
2.3.7.1.9 a2
2.3.7.1.9a3
Other Fruits
Aonla or Amla
Aonla or also called Arnla is emerging as an upcoming fruit plants in the north Indian
conditions in view of its high nutritive value especially its vitamin C content (more
than citrus fruits),medicinal value and suitability to dehydration and other means of
processing. From growing point of view, its tolerance to draught conditions and
suitability under dry conditions, absence of any major pest and diseases are
significant points for expanding its cultivation.
Table 23: Growth pattern over the decade
Year Area (ha) Production Productivity(MT) (MT/ha)
1999-2000 585 3063 5.22001-2002 666 4614 6.9
The data on earlier years are not available as this fruits was grouped under other
fruits. However, the present figures of 666 hectares and its productivity at 6.9 MT are
quite encouraging. Another significant point is that no double Gurgaon has the largest
area (ISS ha) but some plantations have come up in almost all districts of the state•except Rohtak apparently there might not to be any problems in its growing even in
this districts and is due course of time, hopefully some farmers will came up to grow
this plant in the district also.
Crop Calendar
Recommended planting time is in Julywith the onset of Monsoon rains.
Production Technology
Cultivars
Banarsi- Fruit size large, average yield 200 kg per plant.
Chakaiya- Fruit size large, suitable for picking.
Hathijhool- Fruit size large, suitable for preserve making.
Krishna- Fruit size small
Sowing I Planting Material
In July with the onset of Monsoon rains.
"FinalReport: 'National Level Techno-Economic Feasibility Study for North Zone' 362
•
•2.3.7.1.9a.4
2.3.7.1.9a5
2.3.7.1.9a.6
2.3.7.1.9a.7
Nutrient management 1Manuring and Pruning
FYM to be given at the time of 15 kg per year age of the tree, reaching up to 150 kg
at the age of ten years. One kg of Kissan and 2.5 kg of superphosphate are
recommended to be given .in February. Another one Kg of Kissan fertilizer to be
given in July.
Water Management 1Irrigation
Young plants are to given irrigation regularly till its establishes itself. Further
irrigations depends upon climate and soil conditions.
It is needless to say that its production technology needs specified up gradation and
refinement to exploit its full yield potential.
Pest and disease management
So far, inderbela spp, termites and betira typophora pests have been reported on
Aonla plants. Similar control measures are recommended for these pests as
recommended in other crops ..
Harvest method and yieldChange in seed colour from cremy white to brown is an indication of fruit maturity.
A tree may bear 2 - 3 quintals giving 1.5- 2.0 tons per hectare yield.
Crop economics
Aonla gives the best economics after the 10th year where the yield per plant is
estimated at 100 kg thus with 100 plants per hectare the yield level is 10 tons. Aonla
fetches an estimated market price Rs. 4/- per kg realizing the revenue of Rs; 40,000/-
per hectare. The estimated expenditure for maintenance of the Orchard comes to
around Rs. 4,3001-. Thus the net profit comes.to about Rs. 5,700/- per hectare.
Price trends
The prices of this fruit are gradually minimizing as the de~and is mmlmlzmg.
Sometimes, fresh fruits in the local market gets glut and prices are lowered to
uneconomic level.
Final Report: 'National Level Techno-Economic Feasibility Study for North Zone' 363
2.3.7.1.9a.6
2.3.7.1.9a.9
Problems and Constraints
Specific problems will emerge as its cultivation spreads. However, the problem of
long juvenile period has to be shortened. Right protocols for its post harvest handling
and processing technology have to be developed.
Conclusion
This crop has a good potential of growing over larger area. Both its nutritional. and
medicinal values will expand its market demand as the knowledge on such issues
spreads.
Final Report: 'National Levei Techno-Economic Feasibility Study for North Zone' 364
•
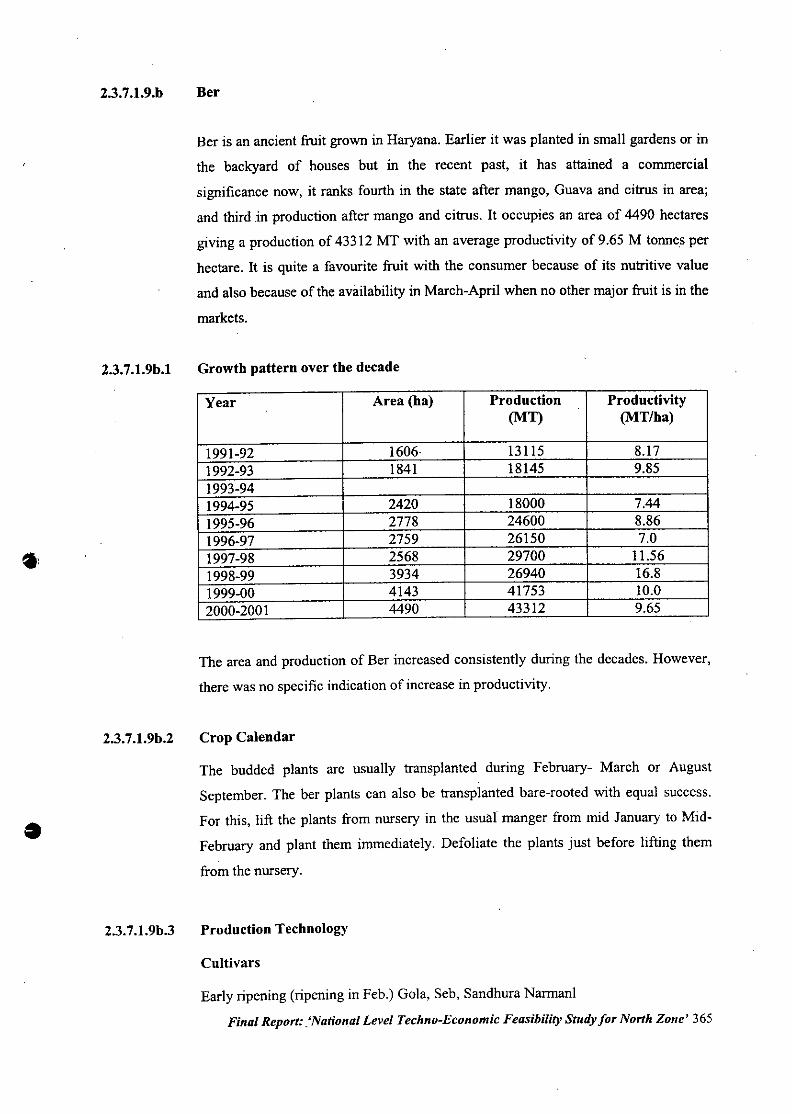
2.3.7.1.9.b Ber
Ber is an ancient fruit grown in Haryana. Earlier it was planted in small gardens or in
the backyard of houses but in the recent past, it has attained a commercial
significance now, it ranks fourth in the state after mango, Guava and citrus in area;
and third .in production after mango and citrus. It occupies an area of 4490 hectares
giving a production of 43312 MT with an average productivity of 9.65 M tonnes per
hectare. It is quite a favourite fruit with the consumer because of its nutritive value
and also because of the availability in March-April when no other major fruit is in the
markets.
•
2.3.7.1.9b.l
2.3.7.1.9b.2
2.3.7.1.9b.3
Growth pattern over the decade
Year Area (ha) Production Productivity(MT) (MT/ba)
1991-92 1606 13115 8.171992-93 1841 18145 9.851993-94 .
1994-95 2420 18000 7.441995-96 2778 24600 8.861996-97 2759 26150 7.01997-98 2568 29700 11.561998-99 3934 26940 16.81999-00 4143 41753 10.02000-2001 4490 43312 9.65
The area and production of Ber increased consistently during the decades. However,
there was no specific indication of increase in productivity.
Crop Calendar
The budded plants are usually transplanted during February- March or August
September. The ber plants can also be transplanted bare-rooted with equal success.
For this, lift the plants from nursery in the usual manger from mid January to Mid-
February and plant them immediately. Defoliate the plants just before lifting them
from the nursery.
Production Technology
Cultivars
Early ripening (ripening in Feb.) Gola, Seb, Sandhura Narmanl
Final Report: 'National Level Techno-Economic Feasibility Study for North Zone" 365
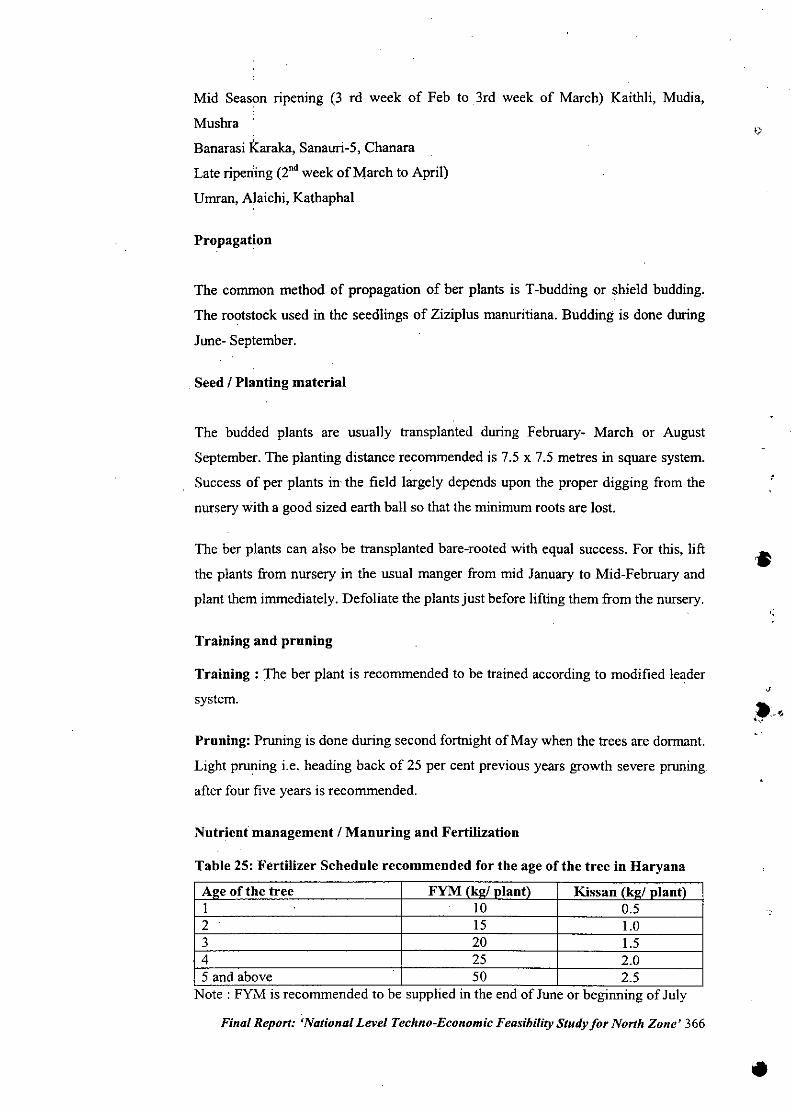
Mid Season ripening (3 rd week of Feb to 3rd week of March) Kaithli, Mudia,
Musbra '
Banarasi Karaka, Sanauri-5, Chanara
Late ripe~ing (2nd week of March to April)
Umran, Alaichi, Kathaphal
Propagation
The common method of propagation of ber plants is T-budding or shield budding.
The rootstock used in the seedlings of Ziziplus manuritiana. Budding is done during
June- September.
Seed / Planting material
The budded plants are usually transplanted during February- March or August
September. The planting distance recommended is 7.5 x 7.5 metres in square system.
Success of per plants in the field largely depends upon the proper digging from the
nursery with a good sized earth ball so that the minimum roots are lost.
The ber plants can also be transplanted bare-rooted with equal success. For this, lift
the plants' from nursery in the usual manger from mid January to Mid-February and
plant them immediately. Defoliate the plants just before lifting them from the nursery,
Training and pruning
Training: The ber plant is recommended to be trained according to modified leader
system.
Pruning: Pruning is done during second fortnight of May when the trees are dormant.
Light pruning i.e. heading back of 25 per cent previous years growth severe pruning
after four five years is recommended,
Nutrient management / Manuring and Fertilization
Table 25: Fertilizer Schedule recommended for the age of the tree in Haryana
Al!:eof the tree FYM (kl!:!plant) Kissan (kl!:/ plant)1 10 0,52 . 15 1.03 20 1.54 25 2.05 and above 50 2.5Note: FYM is recommended to be supplied in the end of June or beginning of July
Final Report: 'National Level Techno-Economic Feasibility Study for North Zone' 366
•
•
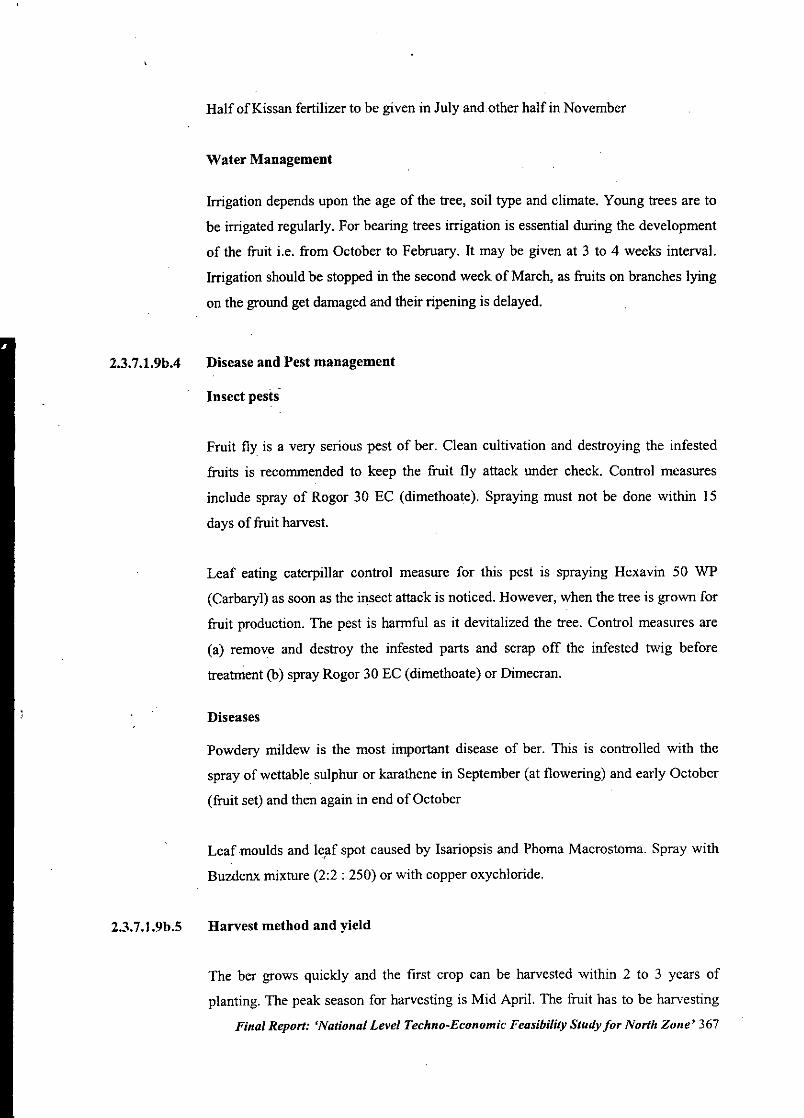
2.3.7.1.9b.4
2.3.7.1.9b.5
Half of Kissan fertilizer to be given in July and other half in November
Water Management
Irrigation depends upon the age of the tree, soil type and climate. Young trees are to
be irrigated regularly. For bearing trees irrigation is essential during the development
of the fruit i.e. from October to February. It may be given at 3 to 4 weeks interval.
Irrigation should be stopped in the second week of March, as fruits on branches lying
on the ground get damaged and their ripening is delayed.
Disease and Pest management
Insect pests
Fruit fly is a very serious pest of ber. Clean cultivation and destroying the infested
fruits is recommended to keep the fruit fly attack under check. Control measures
include spray of Rogor 30 EC (dimethoate). Spraying must not be done within 15
days of fruit harvest.
Leaf eating caterpillar control measure for this pest is spraying Hexavin 50 WP
(Carbaryl) as soon as the insect attack is noticed. However, when the tree is grown for
fruit production. The pest is harmful as it devitalized the tree. Control measures are
(a) remove and destroy the infested parts and scrap off the infested twig before
treatment (b) spray Rogor 30 EC (dimethoate) or Dimecran.
Diseases
Powdery mildew is the most important disease of ber. This is controlled with the
spray of wettable sulphur or karathene in September (at flowering) and early October
(fruit set) and then again in end of October
Leaf moulds and leaf spot caused by Isariopsis and Phoma Macrostoma. Spray with
Buzdenx mixture (2:2 : 250) or with copper oxychloride.
Harvest method and yield
The ber grows quickly and the first crop can be harvested within 2 to 3 years of
planting. The peak season for harvesting is Mid April. The fruit has to be harvesting
Final Report: 'National Level Techno-Economic Feasibility Study for North Zone' 367
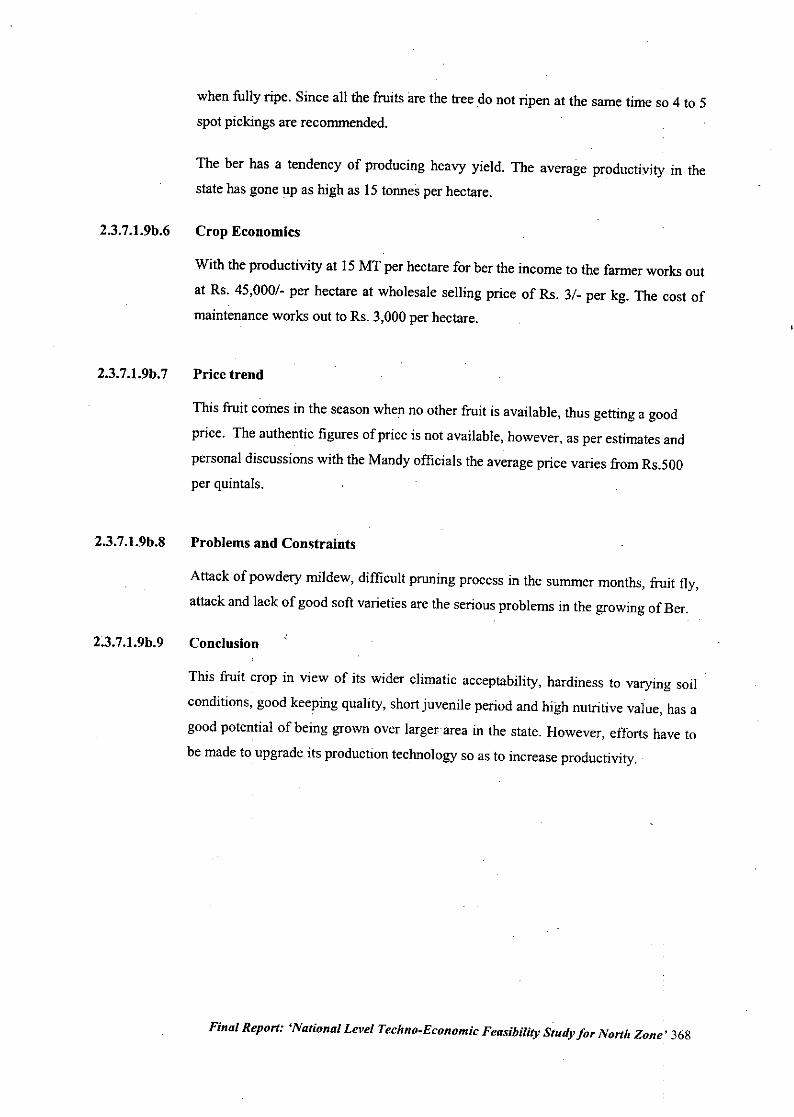
2.3.7.1.9b.6
2.3.7.1.9b.7
2.3.7.1.9b.8
2:3.7.1.9b.9
when fully ripe. Since all the fruits are the tree do not ripen at the same time so 4 to 5
spot pickings are recommended.
The ber has a tendency of producing heavy yield. The average productivity in the
state has gone up as high as 15 tonnes per hectare.
Crop Economics
With the productivity at 15 MT per hectare for ber the income to the farmer works out
at Rs. 45,000/- per hectare at wholesale selling price of Rs. 3/- per kg. The cost of
maintenance works out to Rs. 3,000 per hectare.
Price trend
This fruit comes in the season when no other fruit is available, thus getting a good
price. The authentic figures of price is not available, however, as per estimates and
personal discussions with the Mandy officials the average price varies from Rs.500
per quintals.
Problems and Constraints
Attack of powdery mildew, difficult pruning process in the summer months, fruit fly,
attack and lack of good soft varieties are the serious problems in the growing of Ber.
Conclusion
This fruit crop in view of its wider climatic acceptability, hardiness to varying soil
conditions, good keeping quality, short juvenile period and high nutritive value, has a
good potential of being grown over larger area in the state. However, efforts have to
be made to upgrade its production technology so as to increase productivity ..
Final Report: 'National Level Techno-Economic Feasibility Study for North Zone' 368
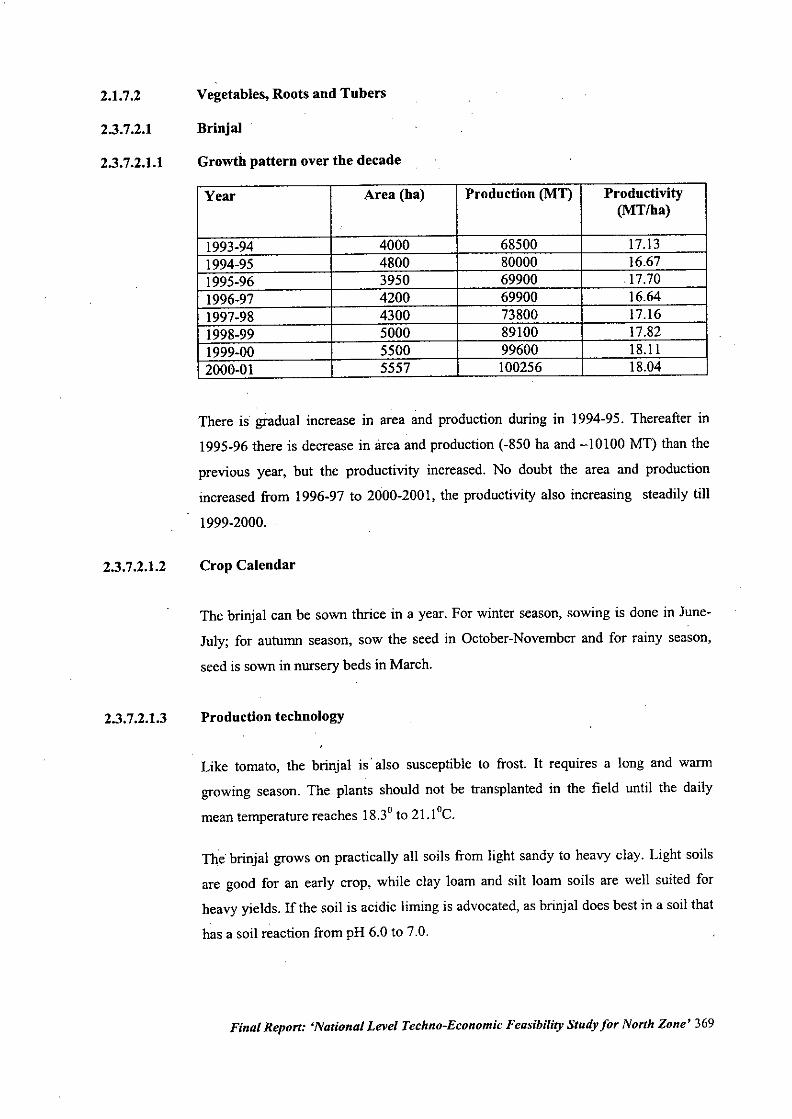
2.1.7.2
2.3.7.2.1
2.3.7.2.1.1
2.3.7.2.1.2
2.3.7.2.1.3
Vegetables, Roots and Tubers
Brinjal
Growth pattern over the decade
Year Area (ha) Production (MT) Productivity(MTlha)
.'
1993-94 4000 68500 17.131994-95 4800 80000 16.671995-96 3950 69900 .17.701996-97 4200 69900 16.641997-98 4300 73800 17.161998-99 5000 89100 17.821999-00 5500 99600 18.112000-01 5557 100256 18.04
There is gradual increase in area and production during in 1994-95. Thereafter in
1995-96 there is decrease in area and production (-850 ha and -10 I00 MT) than the
previous year, but the productivity increased. No doubt the area and production
increased from 1996-97 to 2000-2001, the productivity also increasing steadily till
1999-2000.
Crop Calendar
The brinjal can be sown thrice in a year. For winter season, sowing is done in June-
July; for autumn season, sow the seed in October-November and for rainy season,
seed is sown in nursery beds in March.
Production technology
Like tomato, the brinjal is' also susceptible to frost. It requires a long and warm
growing season. The plants should not be transplanted in the field until the daily
mean temperature reaches 18.30 to 21.loC.
The brinjal grows on practically all soils from light sandy to heavy clay. Light soils
are good for an early crop, while clay loam and silt loam soils are well suited for
heavy yields. If the soil is acidic liming is advocated, as brinjal does best in a soil that
has a soil reaction from pH 6.0 to 7.0.
Final Report: 'National Level Techno-Economic Feasibility Study for North Zone' 369
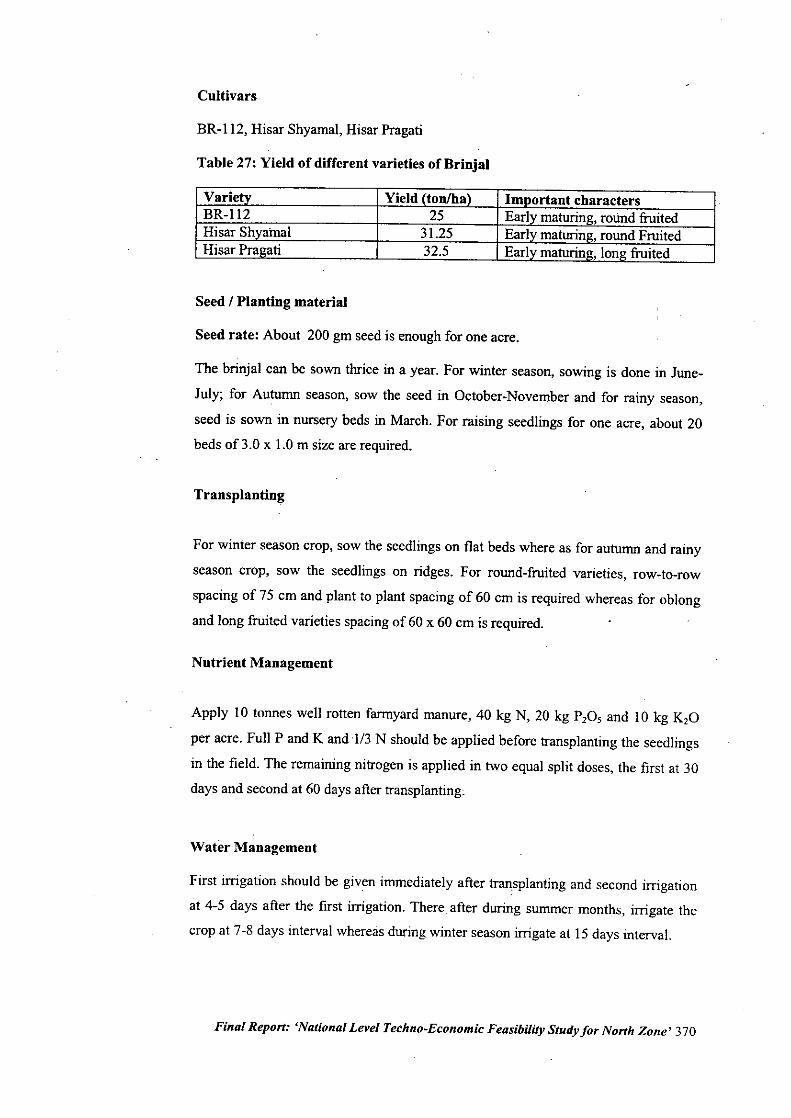
Cultivars
BR-112, Hisar Shyamal, Hisar Pragali
Table 27: Yield of different varieties of Brinjal
VariBR-112Hisar Sh ainalHisar PTa ali
Seed I Planting material
Seed rate: About 200 gm seed is enough for one acre.
The brinjal can be sown thrice in a year. For winter season, sowing is done in June-
July; for Autumn season, sow the seed in October-November and for rainy season,
seed is sown in nursery beds in March. For raising seedlings for one acre, about 20beds of 3.0 x 1.0m size are required.
Transplanting
For winter season crop, sow the seedlings on flat beds where as for autumn and rainy
season crop, sow the seedlings on ridges. For round-fruited varieties, row-to-row
spacing of 75 cm and plant to plant spacing of 60 cm is required whereas for oblong
and long fruited varieties spacing of 60 x 60 cm is required.
Nutrient Management
Apply 10 tonnes well rotten farmyard manure, 40 kg N, 20 kg P20, and 10 kg K20
per acre. Full P and K and .113 N should be applied before transplanting the seedlings
in the field. The remaining nitrogen is applied in two equal split doses, the first at 30days and second at 60 days after transplanting;
Water Management
First irrigation should be given immediately after tran,splantingand second irrigation
at 4-5 days after the first irrigation. Thereafter during summer months, irrigate the
crop at 7-8 days interval whereas during winter season irrigate at IS days interval.
Final Report: 'National Level Techno-Economic Feasibility Study for North Zone' 370
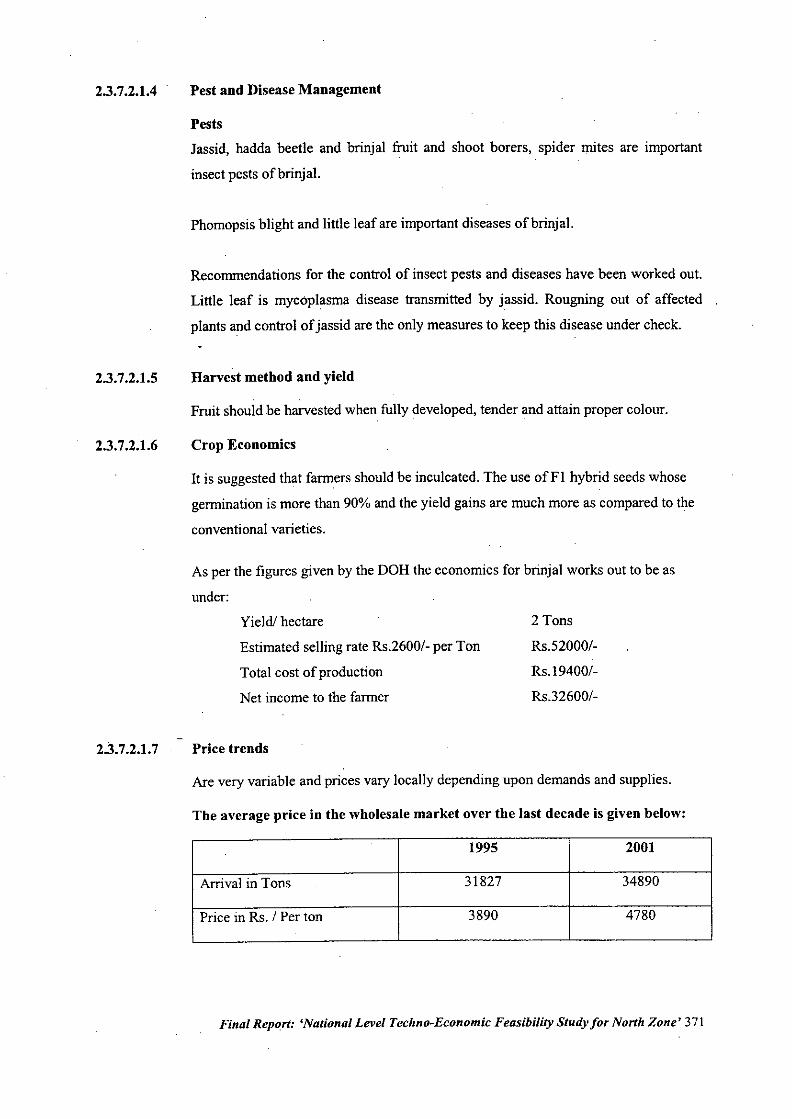
2.3.7.2.1.4
2.3.7.2.1.5
2.3.7.2.1.6
Pest and Disease Management
Pests
Jassid, hadda beetle and brinjal fruit and shoot borers, spider mites are important
insect pests ofbrinjal.
Phomopsis blight and little leaf are important diseases ofbrinjal.
Recommendations for the control of insect pests and diseases have been worked out.
Little leaf is mycoplasma disease transmitted by jassid. Rougning out of affected
plants and control of jassid are the only measures to keep this disease under check.
Harvest method and yield
Fruit should be harvested when fully developed, tender and attain proper colour.
Crop Economics
It is suggested that farmers should be inculcated. The use ofFI hybrid seeds whose
germination is more than 90% and the yield gains are much more as compared to the
conventional varieties.
As per the figures given by the DOH the economics for brinjal works out to be as
under:
2.3.7.2.1.7
Yield! hectare
Estimated selling rate RS.2600/- per Ton
Total cost of production
Net income to the farmer
Price trends
2 Tons
RS.52000/-
RS.19400/-
Rs.32600/-
Are very variable and prices vary locally depending upon demands and supplies.
The average price in the wholesale market over the last decade is given below:
1995 2001
Arrival in Tons 31827 34890
Price in Rs. / Per ton 3890 4780.
Final Report: 'National Level Techno-Economic Feasibility Study for North Zone' 371
2.3.7.2.1.8
2.3.7.2.1.9
Problems and constraints
The main problem in brinjal is fruit and shoot borer. About 25-40% of the fruits are
damaged by the attack of borer farmers use systemic chemicals at frequent intervals,
so there is a great problem of chemical residue in the fruit and most of our country's
export assignments are rejected at destination because of presence of chemical
residues. The other problem in brinjal is of phomopsis blight and long fruited
varieties are more susceptible to this problem. It can be managed to some extent by
use of seed and soil treatment with Captan or Thiram. But the little leaf of brinjal is
caused by mycoplasma like organisms (MLO) so is difficult to control but the
damage can be minimized by controlling its vector (jassid) with the sprays ofMelathion.
In Brinjal, there are 4 types of styles in the flowers i.e. psudo-short style, true short
style, medium style and long style. Flowers with only long and medium style bears
the fruits. Those with pseudo short style and true short style have rudimentary
ovaries, which do not develop into fruits i.e. problem of poor fruit set exists in brinjal.
Sprayings the crop with PCPA 50 ppm, 2,4-D 5 ppm and NAA 100ppm at full bloomstage of plants can increase the fruit set.
Conclusion
The development of varieties or hybrids resistant against fruit and shoot borer need to
develop. In this direction work on tansgenics is going on. This crop has a vast export
potential if the crop can be produced with the minimum use of insecticides!fungicides.
Final Report: 'National Level Techno-Economic Feasibility Study for North Zone' 372
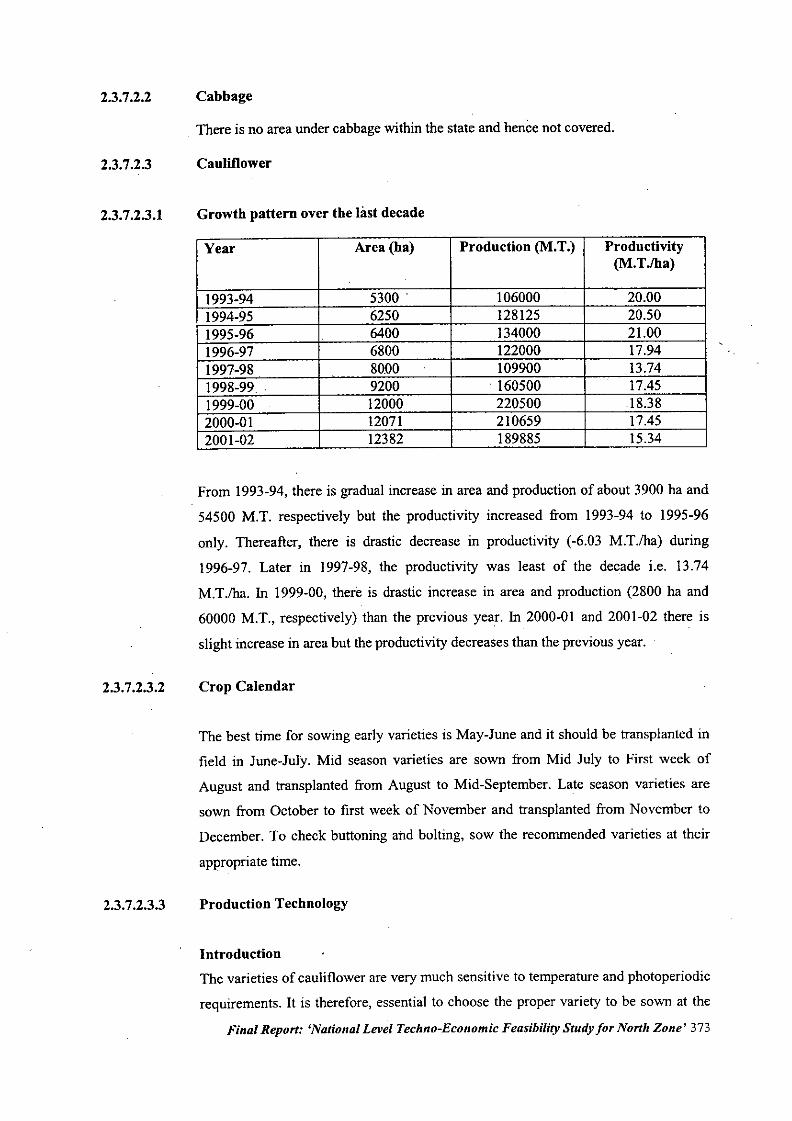
2.3.7.2.2
2.3.7.2.3
2.3.7.2.3.1
2.3.7.2.3.2
2.3.7.2.3.3
Cabbage
There is no area under cabbage within the state and hence not covered.
Cauliflower
Growth pattern over the last decade
Year Area (ha) Production (M.T.) Productivity(M.TJha)
1993-94 53.0.0 . 106.0.0.0.
2.0..0.01994-95 625.0 128125 2.0.5.01995-96 64.0.0 134.0.0.0 21..0.01996-97 68.0.0 122.0.0.0 17.941997-98 8.0.0.0 1.099.0.0 13.741998-99 .. 92.0.0 . 16.05.0.0 17.451999-.0.0 . 12.0.0.0 22.05.0.0 18.382.0.0.0-.01 12.071 21.0659 17.452.0.01-.02 12382 189885 15.34
From 1993-94, there is gradual increase in area and production of about 39.0.0ha and
545.0.0 M.T. respectively but the productivity increased from 1993-94 to 1995-96
only. Thereafter, there is drastic decrease in productivity (-6 ..03 M.T./ha) during
1996-97. Later in 1997-98, the productivity was least of the decade i.e. 13.74
M.T .fha. In 1999-.0.0, there is drastic increase in area and production (28.0.0 ha and
6.0.0.0.0M.T., respectively) than the previous year. In 2.0.0.0-.01and 2.0.01-.02there is
slight increase in area but the productivity decreases than the previous year.
Crop Calendar
The best time for sowing early varieties is May-June and it should be transplanted in
field in June-July. Mid season varieties are sown from Mid July to First week of
August and transplanted from August to Mid-September. Late season varieties are
sown from October to first week of November and transplanted from November to
December. To check buttoning and bolting, sow the recommended varieties at their
appropriate time.
Production Technology
Introduction
The varieties of cauliflower are very much sensitive to temperature and photoperiodic
requirements. It is therefore, essential to choose the proper variety to be sown at the
Final Report: 'National Level Techno-Economic Feasibility Study for North Zone' 373
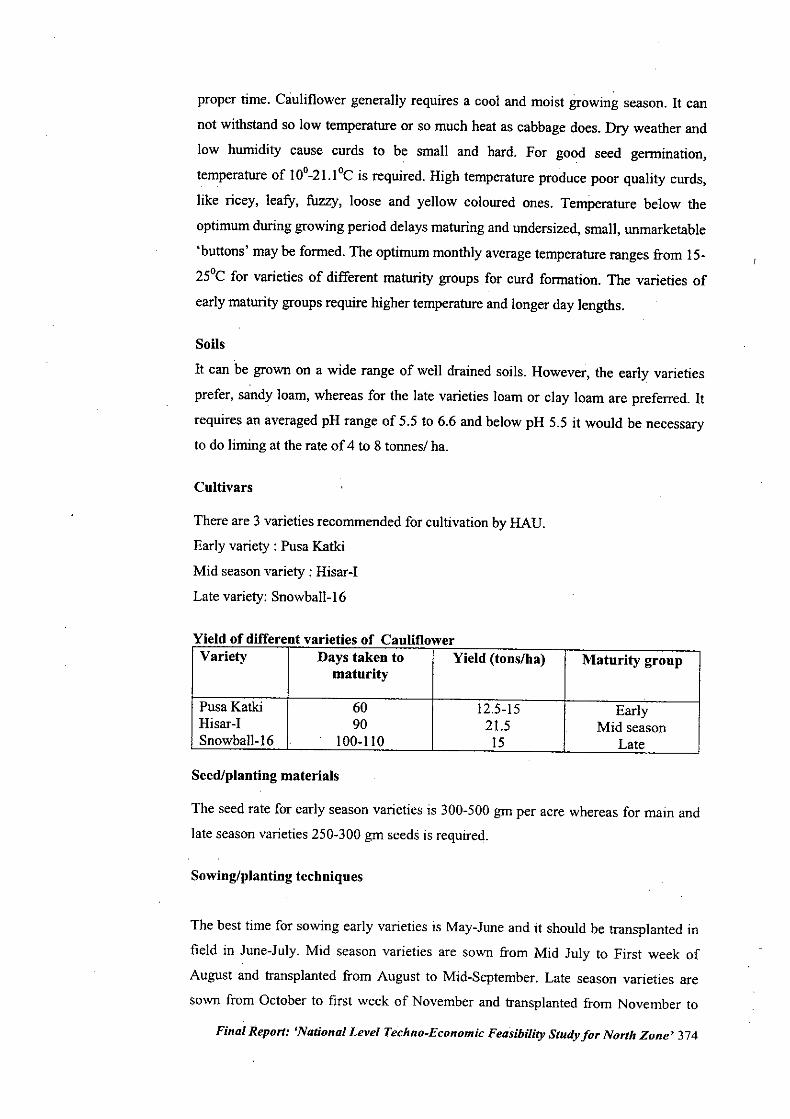
proper time. Cauliflower generally requires a cool and moist growing season. It can
not withstand so low temperature or so much heat as cabbage does. Dry weather and
low humidity cause curds to be small and hard. For good seed germination,
temperature of 10°-21.1°c is required. High temperature produce poor quality curds,
like ricey, leafy, fuzzy, loose and yellow coloured ones. Temperature below the
optimum during growing period delays maturing and undersized, small, unmarketable
'buttons' may be formed. The optimum monthly average temperature ranges from 15-
25°C for varieties of different maturity groups for curd formation. The varieties of
early maturity groups require higher temperature and longer day lengths.
Soils
It can be grown on a wide range of well drained soils. However, the early varieties
prefer, sandy loam, whereas for the late varieties loam or clay loam are preferred. It
requires an averaged pH range of 5.5 to 6.6 and below pH 5.5 it would be necessaryto do liming at the rate of 4 to 8 tonnes/ ha.
Cultivars
There are 3 varieties recommended for cultivation by HAD.
Early variety: Pusa Katki
Mid season variety: Hisar-I
Late variety: Snowball-16
Yield of different varieties of CauliflowerVariety Days taken to Yield (tons/ba) Maturity group
maturity
Pusa Katki 60 12.5-15 EarlyHisar-I 90 21.5 Mid seasonSnowball-16 100-110 15 Late
Seed/planting materials
The seed rate for early season varieties is 300-500 gm per acre whereas for main andlate season varieties 250-300 gm seeds is required.
Sowing/plantiug techniques
The best time for sowing early varieties is May-June and it should be transplanted in
field in June-July. Mid season varieties are sown from Mid July to First week of
August and transplanted from August to Mid-September. Late season varieties are
sown from October to first week of November and transplanted from November to
Final Report: 'National Level Techno-Economic Feasibility Study for North Zone' 374
December. To check buttoning and bolting, sow the recommended varieties at their
appropriate time.
Nursery Raising: For sowing early varieties prepare nursery beds for about 3 x I m
size, 15 cm below the ground level. About 15-20 beds are required to raise nursery
for one acre. For main and late season varieties, prepare beds 15 cm above the ground
level. Mix 2 cm layer of well rotten farmard manure in the beds before sowing. Sow
the seeds in rows and cover them with thin layer of well rotten farmyard manure. To
minimize mortality of early sown nursery and transplanted crop, apply heavy dose of
well rotten farmyard manure and irrigate frequently. Protect seedlings in the nursery
beds against sun stroke with Sarkanda thatch. Transplant seedlings in a cool 'wattar'
field in the afternoon and irrigate immediately.
Method of transplanting and spacing: Early season varieties are transplanted on the
ridges but main and late season varieties are transplanted on flat beds. To increase
number of beds in early sown varieties, ridges should be lightly irrigated 5-6 hours
before transplanting. The following spacing is recommended:
Early varieties: 45.x 30 cm
Mid season varieties: 60 x 60 cm
Late varieties :45 x 45 cm
Nutrient Management
Twenty tones offarmyard manure with 50 kg N (200 kg CAN or 110kg Urea), 20 kg
P,O, (120 kg of superphosphate) and 20 kg K,O (32 kg of muriate of potash) per acre
make the optimum fertilizer dose for all these varieties. Apply whole of farmyard
manure, P and K and 1/3N before transplanting. The remaining N is applied twice in
the standing crop at 4 weeks interval. Application of Zinc sulphate @ 8-10 kg; acre is
beneficial for this crop.
Water management
First. irrigation should be given just after transplanting. For early season varieties
irrigate at 5-6 days interval but for late season varieties, irrigate at 10-15 days
interval. At the time of curd formation there should be enough moisture in the field. If
the cauliflower is transplanted late then irrigate the field at short intervals.
Final Report: 'National Level Techno-Economic Feasibility Study for North Zone' 375
2.3.7.2.3.4
2.3.7.2.3.5
2.3.7.2.3.6
Pest and Disease Management
In case of early season crop (July-October) stem borer, Diamond back moth and
tobacco caterpillar are the main insect pests. Insecticide sprays have been
recommended for these pests. However, sprays are to be made only when the insect
attack is severe enough to cause economic loss. To avoid residual effect of the
insecticides, observe the seven days waiting period after each spraying for nextpicking.
Diseases
Main diseases are damping off, crown rot, black rot, alternaria blight, downy mildew
and stalk rot of cauliflower, seed crop are the important diseases attacking cauliflower
or other similar vegetable crops falling under the group of cole crops. Control
measures for all these diseases have been worked out and recommended
Pests
Mid season crop (Sept. to Dec.)
The main season crop is seldom severely attacked by any of the above-mentioned
insect pests. However, if such attack appears, then. the same chemical controlmeasures are to be followed.
Late season crop (Dec. to March)
Main insect pest of this season crop is Aphids. Melathion 50 EC or Thiodan 35 EC isrecommended for their control.
Harvest method and yield
Cauliflower should be harvested when the curd has attained the proper size, bright
color and compactness. Delay in harvesting causes loosening of the curd. Early
season varieties are harvested 60 to 80 days after transplanting, mid season after 90-
100 days and late season after 110-120days. The plant is cut off well below the curdso that the stub thus left protects the curd during transplant.
Crop Economics
The price trend for the early variety is much better and remunerative for the farmersas compared to the late group.
As per the figures given by the DOH the economics for Cauliflower works out to beas under:
Final Report: 'National Level Techno-Economic Feasibility Study for North Zone' 376
2.3.7.2.3.7
Yield! hectare
Estimated selling rate RS.2000/-per Ton
Total cost of production
Net income to the farmer
Price trends
25 Tons
RS.50000/-
RS.20000/-
RS.30000/-
2.3.7.2.3.8
2.3.7.2.3.9
Prices have seen an upward trend during this decade. 'Off season crop fetches higher
prices
Problems and constraints
There is main problem of physiological disorders in the cauliflower. The mam
physiological disorders are whiptail, browning, buttoning, blindness, fuzziness,
ricyness and leafyness. Whiptail occurs due to deficiency of molybdenum and
develops on very acidic soils. Whereas, Browning occurs due to deficiency of Boron
and develops on highly saline soils. Ricyness and Fuzziness appear due to
temperature. Fluctuations at the time of curd development. Blindness generally occurs
due to breakage of terminal bud or it may be eaten by insects or rodents. Leafyness is
due to inferior quality of seeds and unfavourable growing conditions (high
temperature). Moreover, there is a problem of yellowing of curds. The curd is
protected against sun burning and yellowing by covering the curd, which is known as
blanching.
At the seedling stage there is a problem of damping off. In the early season crop,
there is more problem of stem borer. Diamond back moth and hairy caterpillar. Late
season crop is more attacked by aphids. In main season crop, there is fewer problems
of insect pests but sometime incidence of tobacco caterpillar may become severe.
There is also a problem of downy mildew in cauliflower, which can be managed by
spraying indofil M-45.
Conclusion
Resistant varieties for pests with wider adaptability should be developed. F I hybrids
are becoming quite popular and the yield.levels are showing upward trends.
Final Report: 'National Level Techno-Economic Feasibility Study for North Zone' 377
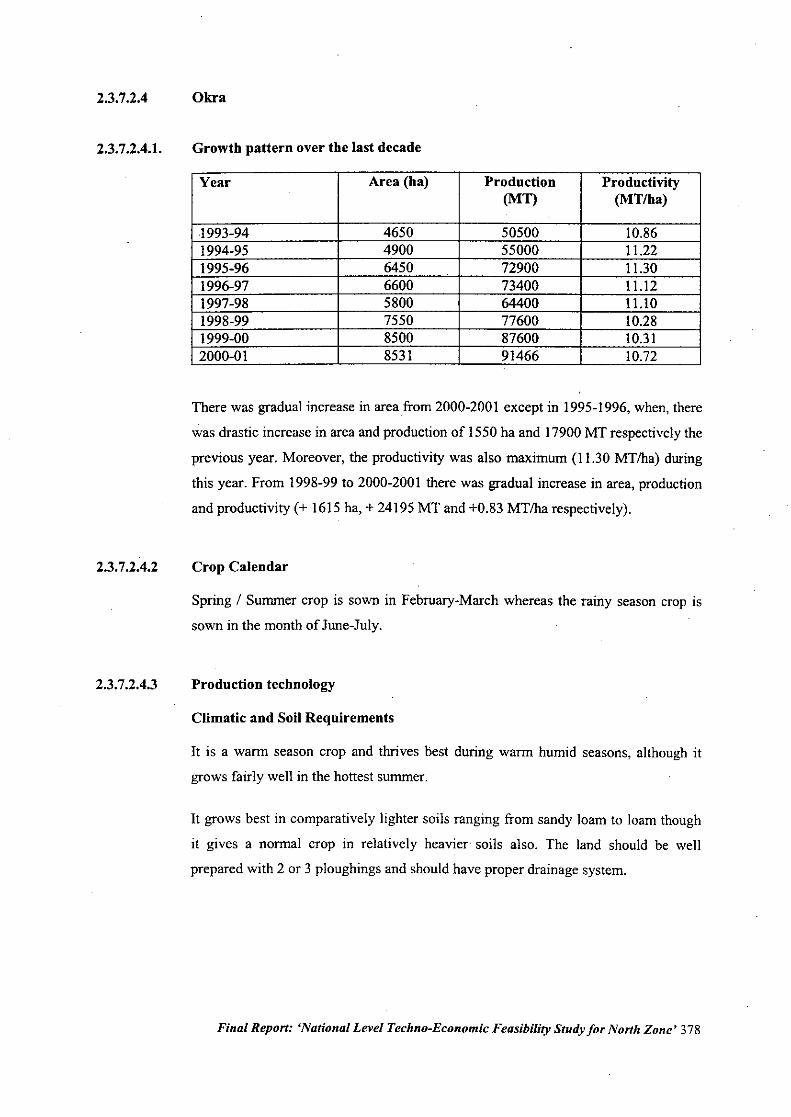
2.3.7.2.4
2.3.7.2.4.1.
2.3.7.2.4.2
2.3.7.2.4.3
Okra
Growth pattern over the last decade
Year Area (ha) Production Productivity(MT) (MTlha)
.
1993-94 4650 50500 10.861994-95 4900 55000 11.221995-96 6450 72900 11.301996-97 6600 73400 11.121997-98 5800 64400 11.101998-99 7550 77600 10.281999-00 8500 87600 10.312000-01 8531 91466 10.72
There was gradual increase in area from 2000-200 I except in 1995-1996, when, there
was drastic increase in area and production of 1550 ha and 17900MT respectively the
previous year. Moreover, the productivity was also maximum (11.30 MT/ha) during
this year. FroiD 1998-99 to 2000-2001 there was gradual increase in area, production
and productivity (+ 1615 ha, + 24195 MT and +0.83 MT/ha respectively).
Crop Calendar
Spring / Summer crop is sown in February-March whereas the rainy season crop is
sown in the month of June-July.
Production technology
Climatic and Soil Requirements
It is a warm season crop and thrives best during warm humid seasons, although it
grows fairly well in the hottest summer.
It grows best in comparatively lighter soils ranging from sandy loam to loam though
it gives a normal crop in relatively heavier. soils also. The land should be well
prepared with 2 or 3 ploughings and should have proper drainage system.
Final Report: 'National Level Techno-Economic Feasibility Study for North Zone' 378
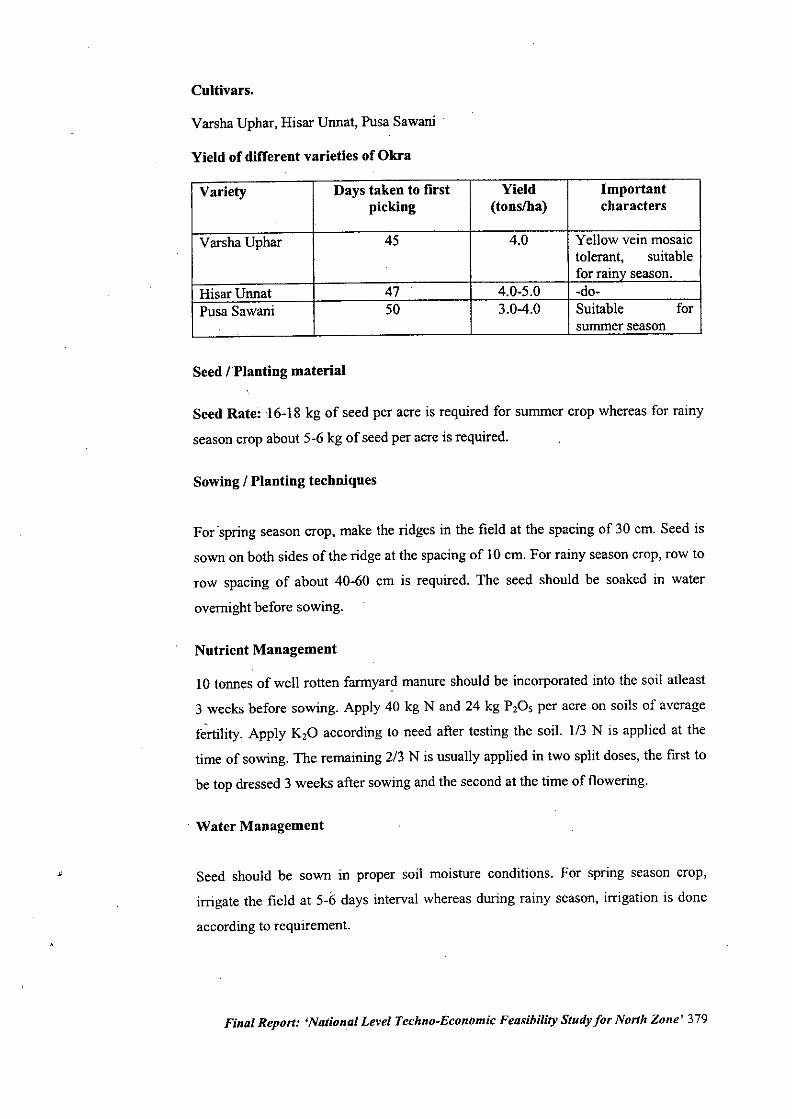
Cultivars.
Varsha Vphar, Hisar Vnnat, Pusa Sawani
Yield of different varieties of Okra
Variety Days taken to first Yield Importantpicking (tons/ha) characters
Varsha Vphar 45 4.0 Yellow vein mosaictolerant, suitablefor rainv season.
HisarVnnat 47 4.0-5.0 -do-Pusa Sawani 50 3.04.0 Suitable for
. summer season
Seed (Planting material
Seed Rate: '16-18 kg of seed per acre is required for summer crop whereas for rainy
season crop about 5-6 kg of seed per acre is required.
Sowing / Planting techniques
For'spring season crop, make the ridges in the field at the spacing of 30 cm. Seed is
sown on both sides of the ridge at the spacing of 10 cm. For rainy season crop, row to
row spacing of about 40-60 cm is required. The seed should be soaked in water
overnight before sowing.
Nutrient Management
10 tonnes of well rotten farmyard manure should be incorporated into the soil atleast
3 weeks before sowing. Apply 40 kg N and 24 kg P20S per acre on soils of average
fertility. Apply K,O according to need after testing the soil. 1/3 N is applied at the
time of sowing. The remaining 2/3 N is usually applied in two split doses, the first to
be top dressed 3 weeks after sowing and the second at the time of flowering.
. Water Management
Seed should be sown in proper soil moisture conditions. For spring season crop,
irrigate the field at 5-6 days interval whereas during rainy season, irrigation is doneaccording to requirement.
Final Repon: 'National Level Techno-Economic Feasibility Study for Nonh Zone' 379
2.3.7.2.3.4
2.3.7.3.4.5
2.3.7.3.4.6
2.3.7.3.4.7
2.3.7.3.4.8
Weed Control
Spray basalin 45% @ 3.5-4.0 mil liter of water, one day before sOWlng andincorporate itinto the soil (3-4 cm ) by harrowing.
Pest and Disease Management
Insect pests
Jassids and spotted bollworms, spider mites are important pests of Okra.
Diseases
Yellow vein mosaic (Virus), damping off and cercospora, leaf spot are the main
diseases. Control measures of all these pests have been recommended.
Harvest.method and yield
The fruit should be picked tender (before fibre development). The crop will be ready
for harvest in about 45-55 days depending upon season and variety. Varsha Uphar,variety should ~e harvested at one day interval during peak seas~n.
Crop Economibs,
As per the figures given by the DOH the economics for okra works out to be as! .
under: II
Yield! Hectare 7.5 TonsI
Estimat6d selling rate RS.5000/-per Ton Rs.37500/-I
Total cQstof production RS.15000/-
Net incdme to the farmer RS.22500/-I
Price trends
Since this crop ik consumed in all plants, hence local demands and supplies determine,
the prevailing pnces. Generally prices have been rising during the decades.I
i
Problems and <j:onstraints
There is poor ge'rminationof seeds in spring season crop (February planting) but this
problem can be isolved by soaking the seed for 24 hrs in water before sowing. The
main problem i~ Okra is of yellow vein mosaic virus (YVMV). The appearance of
YVMV also dePFndsupon climatic conditions. It is transmitted by white fly. There is
Final Report: 'National Level Techno-Economic Feasibility Study for North Zone' 380
2.3.7.3.4.9
no YVMV resistant variety. The YVMV resistance generally break in the variety
after 3-4 years. An important problem is of spotted bollworm and 10-25 % fruits are
damaged by this problem. In rainy season, there is problem of weed growth. If
weeding is not done frequently there is 30-40 per cent reduction in yield. The method
of harvesting also affects its quality. Rough method of handling generally injure the
pubescence on the ridges of okra pods, which ultimately increase more water loss and
blackening of ridges and finally reduce the market acceptability.
Conclusion
Okra has a vast potential as one of the foreign exchange earner crop and accounts for
about 60% of the export of fresh vegetables excluding potato, onion, garlic, etc. In
this direction hybrids are gaining more popularity. Till date there is no YUMV
resistant variety. Due to highly perishable nature of okra, there is more need of post
harvest management like cold storage and packaging by use of shrink warp consumer
packaging, Cold storage and refrigeration use can exploit the full potential of export.
Final Report: 'National Level Techno-Economic Feasibility Study for North Zone' 381
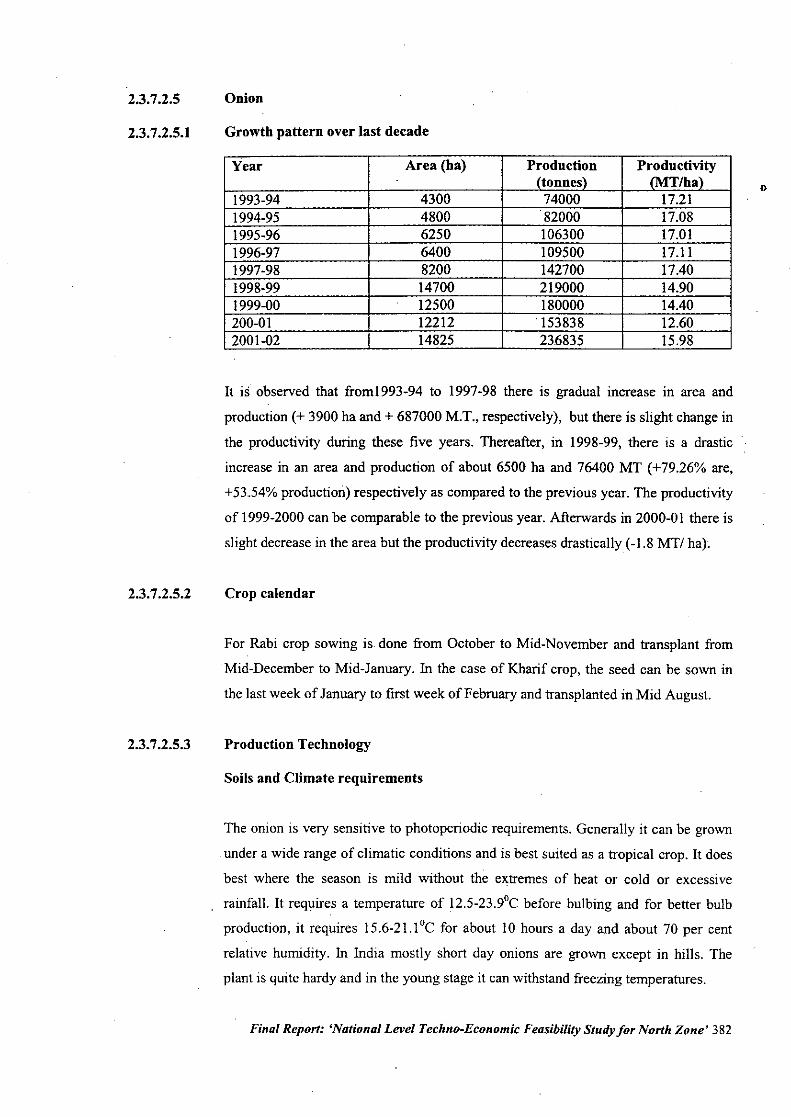
2.3.7.2.5
2.3.7.2.5.1
2.3.7.2.5.2
2.3.7.2.5.3
Onion
Growth pattern over last decade
Year Area (ha) Production Productivity(tonnes) (MT/ha)
1993-94 4300 74000 17.211994-95 4800 82000 17.081995-96 6250 106300 17.011996-97 6400 109500 17.111997-98 8200 142700 17.401998-99 14700 219000 14.901999-00 12500 180000 14.40200-01 12212 '153838 12.602001-02 14825 236835 15.98
It is observed that from1993-94 to 1997-98 there is gradual increase in area and
production (+ 3900 ha and + 687000 M.T., respectively), but there is slight change in
the productivity during these five years. Thereafter, in 1998-99, there is a drastic
increase in an area and production of about 6500 ha and 76400 MT (+79.26% are,
+53.54% production) respectively as compared to the previous year. The productivity
of 1999-2000 can be comparable to the previous year. Afterwards in 2000-01 there is
slight decrease in the area but the productivity decreases drastically (-1.8 MTI ha),
Crop calendar
For Rabi crop sowing is done from October to Mid-November and transplant from
Mid-December to Mid-January. In the case of Kharif crop, the seed can be sown in
the last week of January to first week of February and transplanted in Mid August.
Production Technology
Soils and Climate requirements
The onion is very sensitive to photoperiodic requirements. Generally it can be grown
under a wide range of climatic conditions and is best suited as a tropical crop. It does
best where the season is mild without the extremes of heat or cold or excessive
rainfall. It requires a temperature of 12.5-23.9°C before bulbing and for better bulb
production, it requires 15.6-21.loC for about 10 hours a day and about 70 per cent
relative humidity. In India mostly short day onions are grown except in hills. The
plant is quite hardy and in the young stage it can withstand freezing temperatures.
Final Report: 'National Level Techno-Economic Feasibility Study for North Zone' 382
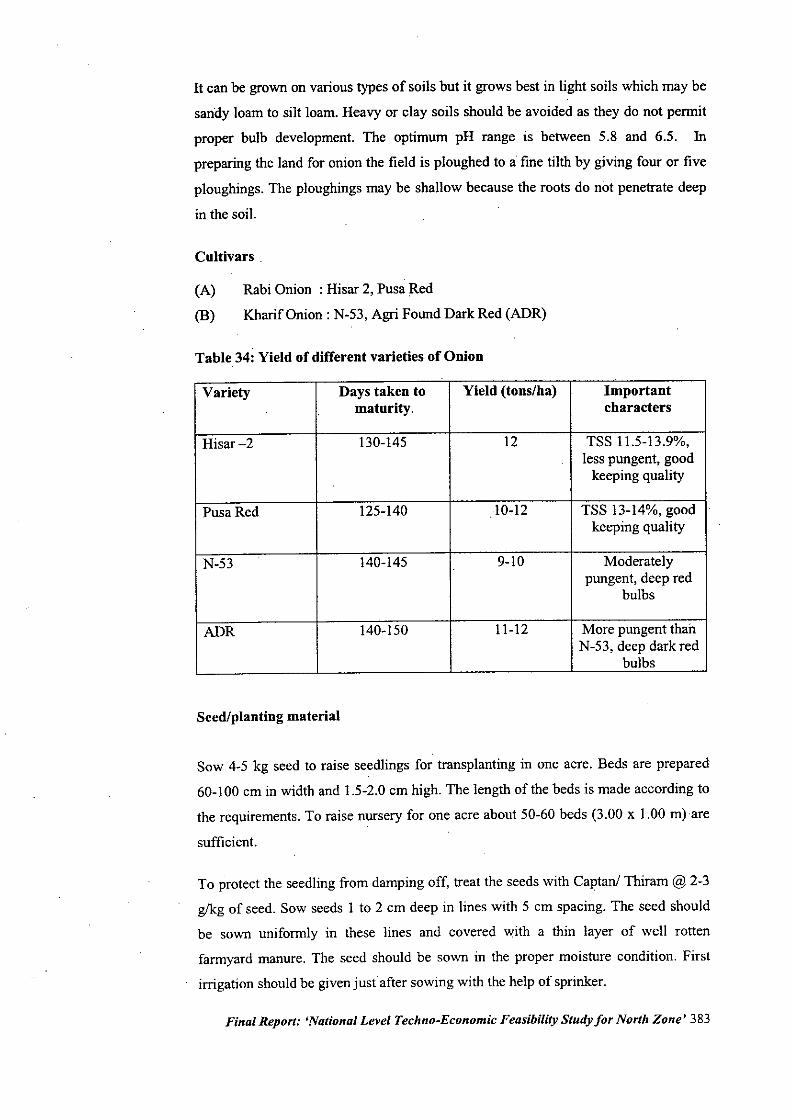
It can be grown on various types of soils but it grows best in light soils which may be
sandy loam to silt loam. Heavy or clay soils should be avoided as they do not permit
proper bulb development. The optimum pH range is between 5.8 and 6.5. In
preparing the land for onion the field is ploughed to a fine tilth by giving four or five
ploughings. The ploughings may be shallow because the roots do not penetrate deep
in the soil.
Cultivars .
(A) Rabi Onion : Hisar 2, Pusa Red
(B) Kharif Onion: N-53, Agri Found Dark Red (ADR)
Table 34: Yield of different varieties of Onion
Variety Days taken to Yield (tons/ha) Importantmaturity. characters
Hisar -2 130-145 12 TSS 11.5-13.9%,less pungent, good
keeping quality
PusaRed 125-140 10-12 TSS 13-14%, goodkeeping quality
N-53 140-145 9-10 Moderatelypungent, deep red
bulbs
ADR 140-150 11-12 More pungent thanN-53, deep dark red
bulbs
Seed/planting material
Sow 4-5 kg seed to raise seedlings for transplanting in one acre. Beds are prepared
60-100 cm in width and 1.5-2.0 cm high. The length of the beds is made according to
the requirements. To raise nursery for one acre about 50-60 beds (3.00 x 1.00 m)are
sufficient.
To protect the seedling from damping off, treat the seeds with Captan! Thiram @ 2-3
g/kg of seed. Sow seeds 1 to 2 cm deep in lines with 5 cm spacing. The seed should
be sown uniformly in these lines and covered with a thin layer of well rotten
farmyard manure. The seed should be sown in the proper moisture condition. First
irrigation should be given just after sowing with the help of sprinker.
Final Report: 'National Level Techno-Economic Feasibility Study for North Zone' 383
The nursery beds should be irrigated daily till the seeds germinate. To save the
nursery from damping off, drench the nursery beds with Thiram, Captan @ 2 g/ liter
of water after. an interval of 15 days. The seedling are ready for transplanting 6-8
weeks after sowing.
Sowing/planting techniques
For Rabi crop, sow nursery from October to Mid-November and transplant fromMid-
December to Mid-January. For Kharif crop, the seed can be sown in the last week of
January to first week of February and transplanted in Mid August. Kharif crop can
also be obtained from bulb sets which are transplanted in August to Mid-September.
The bulb sets are prepared by 'bulb set technique'.
Spacing: Close planting at 15 cm between rows and 10 cm between plants is most
conducive to high yields. After transplanting immediately give light irrigation to the
field.
Bulb-Set Technique: To grow kharif onion crop successfully and avoid failure of
seedlings during June, planting with bulb-set is economical. To raise bulb-sets, sow 5
kg seed in beds (80-100 beds of 3.0 x 1.0 m) in middle of March. Irrigate the
seedlings twice a week. In the last week of June, uproot the bulb sets and store in well
ventilated dry room in baskets. Plant these bulb-sets in the field in Mid August. to
September. Bulb crop would be ready for harvesting by the end of November to MidDecember.
Nutrient Management
Add 20 tonnes of compost! farmyard manure per acre at the time of field preparation.
Apply 50 kg N, 20 kg p,os, and 10 kg K,O per acre. Apply whole P,Os, K20 and Y,
N before transplanting and remaining dose of nitrogen in 2 splits at 30 days interval.
Intercultural operation
Water Management
Irrigated the seedings just after transplanting. Further irrigations depend upon soiltype and weather conditions ..Stock irrigations before harvest.
Final Report: 'National Level Techno-Economic Feasibility Study for North Zone' 384
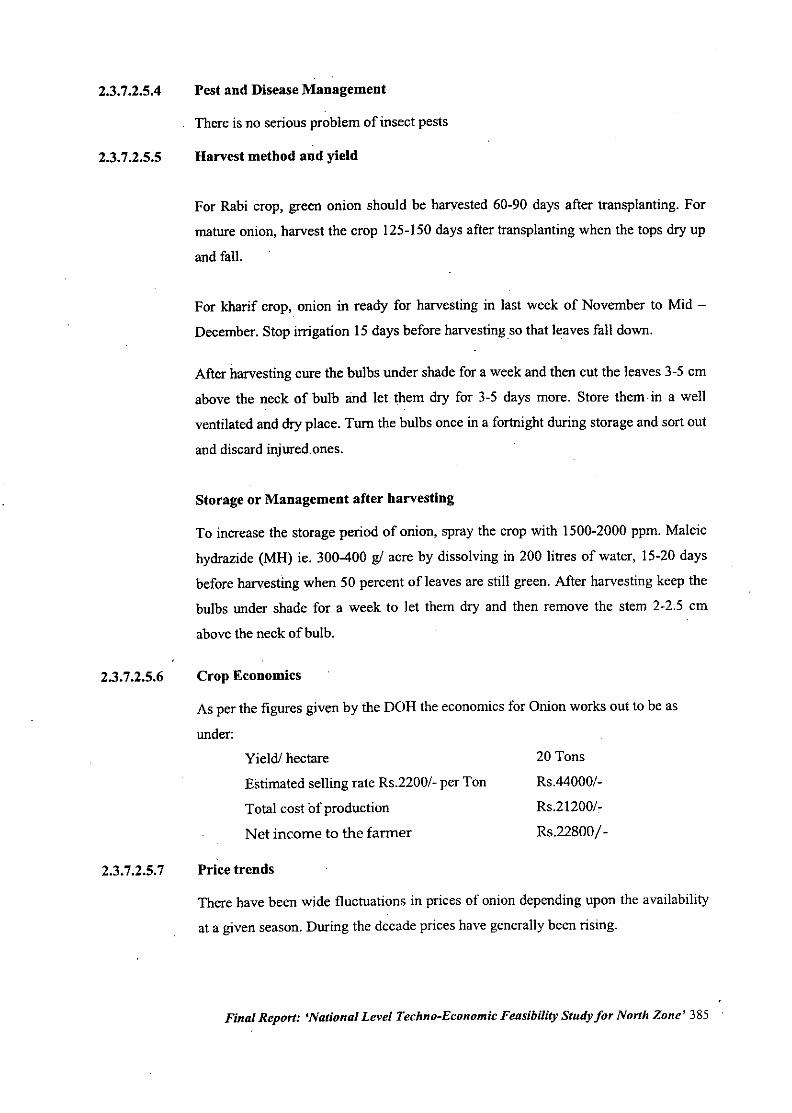
2.3.7.2.5.4
2.3.7.2.5.5
2.3.7.2.5.6
Pest and DiseaseManagement
There is no serious problem of insect pests
Harvest method and yield
For Rabi crop, green onion should be harvested 60-90 days after transplanting. For
mature onion, harvest the crop 125-150 days after transplanting when the tops dry up
and fall.
For kharif crop, onion in ready for harvesting in last week of November to Mid -
December. Stop irrigation 15 days before harvesting so that leaves fall down.
After harvesting cure the bulbs under shade for a week and then cut the leaves 3-5 cm
above the. neck of bulb and let them dry for 3-5 days more. Store them. in a well
ventilated and dry place. Turn the bulbs once in a fortnight during storage and sort out
and discard injured.ones.
Storage or Management after harvesting
To increase the storage period of onion, spray the crop with 1500-2000 ppm. Maleic
hydrazide (MH) ie. 300-400 g/ acre by dissolving in 200 litres of water, 15-20 days
before harvesting when 50 percent ofleaves are still green. After harvesting keep the
bulbs under shade for a week to let them dry and then remove the stem 2-2.5 cm
above the neck of bulb.
Crop Economics
As per the figures given by the DOH the economics for Onion works out to be as
under:
2.3.7.2.5.7
Yield! hectare
Estimated selling rate RS.2200/- per Ton
Total cost of production
Net income to the farmer
Price trends
20 Tons
Rs,44000/-
RS.2 I 200/-
RS.22800/-
There have been wide fluctuations in prices of onion depending upon the availability
at a given season. During the decade prices have generally been rising.
Final Report: 'National Level Techno-Economic Feasibility Study for North Zone' 385
2.3.7.2.5.8
2.3.7.2.5.9
Problems and constraints
Bolting in onion is the major problem. Rabi onion (December to May) require mild
temperature of 20-250C and long photoperiod for bulbing, and bulb development
takes place in high temperature conditions. On the other hand, kharif onion (August
to December) is produced in somewhat shorter day length and moderate temperature.
If bulbing and bulb development are coincided with the set in of low temperature,
bolting may take place. 'For this reason, when kharif onion is planted late and rabi
onion early, chances of bolting would be more.
During the growing season, there is also problem of purple blotch which normally
occurs under the favorable conditions of 28-30oC and 70-90% relative humidity. For
this reason, incidence of purple blotch is more in kharif onion than in rabi onion.
Silver top is another problem in onion which is caused by thrip. This problem starts
on foliage during February and at the time of flowering they are highly injurious
which ultimately impair seed production.
After harvesting, there is problem of bulb storage. Rabi onion harvested in summer
(late April - May) and stored in ambient condition of high temperature and high
humidity and in this condition bulb sprout very easily besides being rotten due to
fungal and bacterial diseases. At that time (Apnl- May) there is glut in the market
and many a times the prices crash down to the lowest i.e. proper storage is essential
for rabi onion. In case of kharif onion, harvesting of bulbs is done in winter ,md
consumed during winter and summer months, hence the problem of storage is not as
acute as in case of rabi crop.
Conclusion
There is a great potential of onion storage because when the rabi onion come in the
market (April- May) there is low market price due to bulk production of rabi season
crop. So focus on onion cold storage"need to be concentrated. In Haryana, onion
hybrids are not more liked by the farmers because of high cost of seeds and yields of
hybrids are at par with that of open pollinated varieties. Moreover, open pollinated
varieties have more shelflife. There is also need for onion processing.
Final Report: 'National Level Techno-Economic Feasibility Study for North Zone' 386
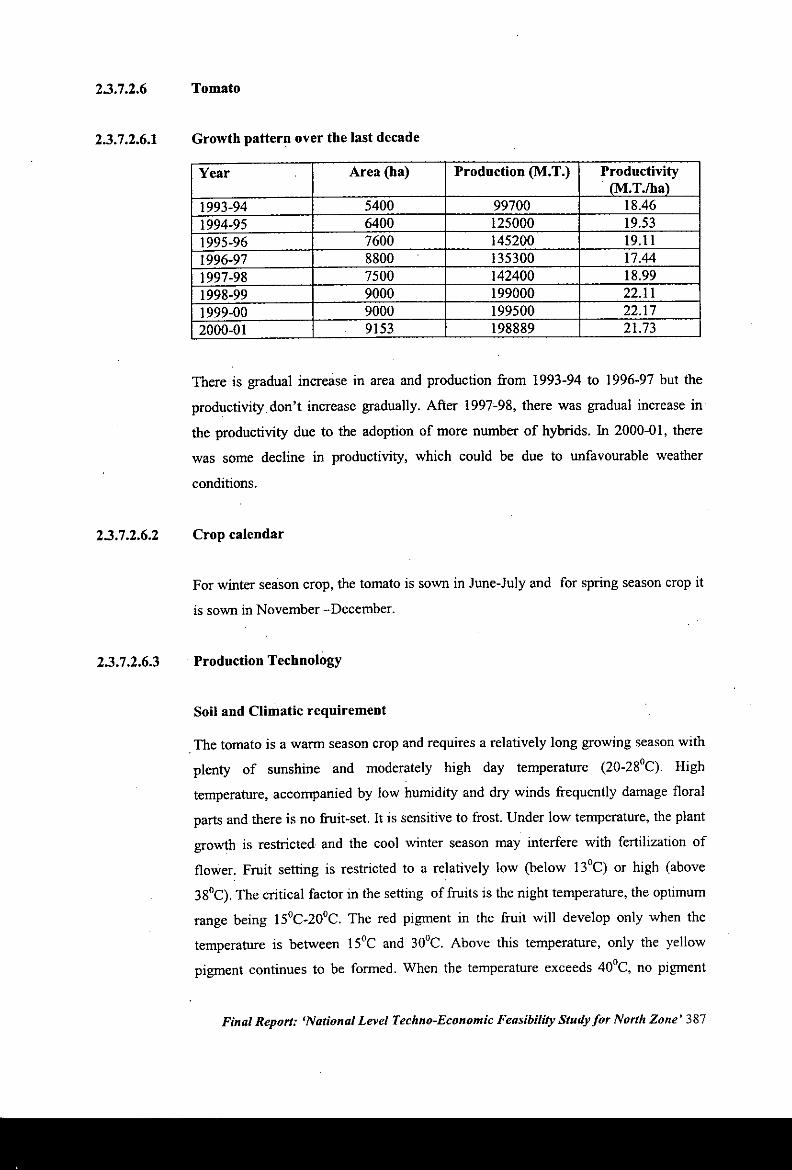
2.3.7.2.6
2.3.7.2.6.1
2.3.7.2.6.2
2.3.7.2.6.3
Tomato
Growth pattern over the last decade
Year Area (ha) Prodnction (M.T.) ProductivityIM.T./ha)
1993-94 5400 99700 18.461994-95 6400 125000 19.531995-96 7600 145200 19.111996-97 8800 135300 17.441997-98 7500 142400 18.991998-99 9000 199000 22.111999-00 9000 199500 22.172000-01 . 9153 198889 21.73
There is gradual increase in area and production from 1993-94 to 1996-97 but the
productivity don't increase gradually. After 1997c98, there was gradual increase in
the productivity due to the adoption of more number of hybrids. In 2000-0 I, there
was some decline in productivity, which could be due to unfavourable weather
conditions.
Crop calendar
For winter season crop, the tomato is sown in June-July and for spring season crop it
is sown in November -December .
. Production Technology
Soil and Climatic requirement
.The tomato is a warm season crop and requires a relatively long growing season with
plenty of sunshine and moderately high day temperature (20-28°C). High
temperature, accompanied by low humidity and dry winds frequently damage floral
parts and there is no fruit-set. It is sensitive to frost. Under low temperature, the plant
growth is restricted and the cool winter season may interfere with fertilization of
flower. Fruit setting is restricted to a relatively low (below 13°C) or high (above
38°C).The critical factor in the setting of fruits is the night temperature, the optimum
range being 15°C_20°C.The red pigment in the fruit will develop only when the
temperature is between 15°C and 30°C. Above this temperature, only the yellow
pigment continues to be formed. When the temperature exceeds 40°C, no pigment
Final Report: 'National Level Techno-Economic Feasibility Study for North Zone' 387
will be formed. The tomato withstands drought fairly well but fruits are subject to
blossom end rot and to growth cracks if moisture supply follows drought.
The tomato grows on practically all soils from light sandy to heavy clay. Light soils
are good for an early crop, while clay loam and silt loam soil are well suited for heavy
yields. If the soil is acidic liming is advocated, as tomatoes do best in a soil that has a
soil reaction from pR 6.0 to 7.0.
Cultivars
There are 3 varieties oftomato namely:
Risar Arun (Selection-7), Risar Lalit (N.T.-8) and Risar Lalima (Selection-18). All
these three varieties have yield potential of 120 quintals per acre. Risar Arun and
Risar lalima are early maturing varieties and ready for first picking about 70 days
after transplanting. Risar lalit is root knot resistant variety and recommended for
those areas where there is problem of root knot nematodes.
Seed/planting material
For winter season, crop about 400-500 gm and for spring season crop, about 200 gm
seed is enough for one acre.
SowingfPlanting techniques
For winter season crop, the tomato is sown in June-July and for spring season crop itis sown in November -December.
For preparation of tomato seedling, special care of nursery done especially during
rainy season, because there is more problem of damping off at that time..So the seed
should be sown on raised beds so that it can be.prevented from the adverse effects of
excessive rains. In this way for raising seedling for one acre about 40 beds (3.0 x 1.0
m) for winter season crop and 15beds for spring season crop as required.
Tomato seeds should be treated with Caplan or Thiram or Emisan @ 2.5 glkg of
seeds before sowing. For controlling damping off disease, drench the nursery plants
with 0.2% Captan/ Thiram (2g/ liter of water) after 5 to 7 days of germination andrepeat after 7 to 10days.
Final Report: 'National Level Techno-Economic Feasibility Study for North Zone' 388
2.3.7.2.6.4
After sowing the seed in the nursery, it should be covered with thin layer of well
rotten farmyard manure and watered with the sprinkler. To ensure successful growing
of healthy seedling, it is better to cover the nursery with sarkanda/ polyethylene film
till the seeds germinate and later on it should be removed. III summer months,
seedlings are normally ready for transplanting in 4 weeks but this process in winters
takes about 8-10 weeks. It is also necessary to regularly irrigate the nursery uproot
weeds and manage disease and insect pests.
Time oftransplanting and spacing: Transplant winter crop during July-August and
Spring crop during Mid-January in the field at the time of transplanting, seedling
normally contain 5-6 true leaves. Row to row spacing about 60 cm and plant to plant
spacing of about 45 cm is required. By planting two plants per bulls, there is increase
in tomato yield.
Nutrient and water management
Use of Growth regulators: To ensure ripening of tomato at high and low
temperature, spray the crop with 50 ppm para-chlorohenoxy acetic acid (PCPA) (10
gm PCPA) by dissolving in 200 Iitres of water at the time of flowering.
Pest and disease managementDamping off, Altemeria blight, Bacterial wilt, Leaf curl and Mosaic are important
diseases. Damping off, can be controlled by seed treatment with thiram 2g1kg seed
and rtursary bed treatment with Formalin or drenching with Mancozeb 0.25%.
Altemerea blight is controlled by Seed treatment with Thiram 2-5 g /kg. Seed and
spraying the crop with copper oxychloride 0.3% or Mancozeb at 10 days interval. For
Bacterial wilt use healthy seedlings and follow 3 years rotation. For leaf curl nursery
should be under nets and apply carbofuron in nursery @Ikg/ha. Further, spray of
Dimethoate 3-4 times at 10 days interval @1.6kg/ha to check white fly which spreads
the virus. For mosaic treat the seed with Trisodium phosphate followed by Sodium
hybochloride for 95 and 30 minutes to sterlize the nursery. The most common pests
are Fruit borer, Aphids and Thrips. For fruit borer IPM is necessary African marigold
should be planted 25 days before tomato transplanting. Spray Endosulphan 0.07%
after 28 and 35 days of transplanting.
Final Report: 'National Level Techno-Economic Feasibility Study for North Zone' 389
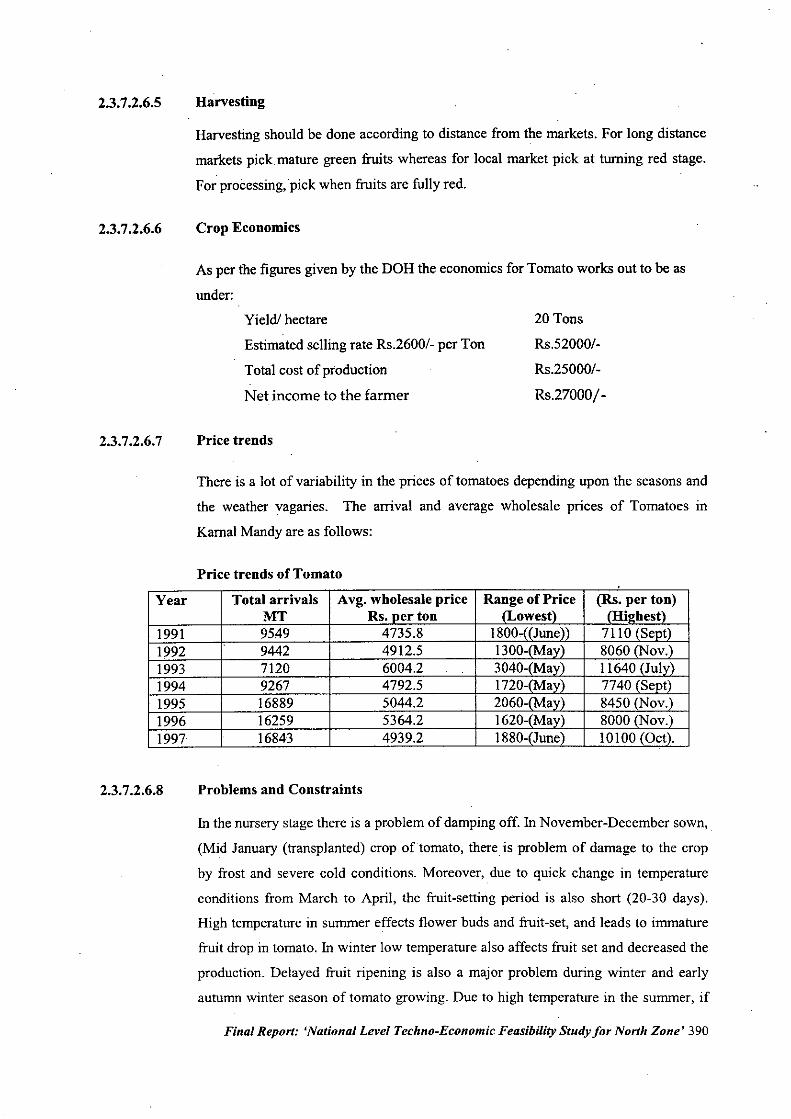
2.3.7.2.6.5
2.3.7.2.6.6
Harvesting
Harvesting should be done according to distance from the markets. For long distance
markets pick mature green fruits whereas for local market pick at turning red stage.
For processing, pick when fruits are fully red.
Crop Economics
As per the figures given by the DOH the economics for Tomato works out to be as
under:
2.3.7.2.6.7
Yield! hectare
Estimated selling rate Rs.2600/- per Ton
Total cost of production
Net income to the farmer
Price trends
20 Tons
Rs.52000/.
Rs.25000/-
Rs.27000/-
There is a lot of variability in the prices of tomatoes depending upon the seasons and
the weather vagaries. The arrival and average wholesale prices of Tomatoes in
Kamal Mandy are as follows:
Price trends of Tomato
Year
1991199219931994199519961997
Total arrivalsMT9549944271209267168891625916843
Avg. wholesale priceRs. erton4735.84912.56004.24792.55044.25364.24939.2
2.3.7.2.6.8 Problems and Constraints
In the nursery stage there is a problem of damping off. In November-December sown,.
(Mid January (transplanted) crop oftomato, there is problem of damage to the crop
by frost and severe cold conditions. Moreover, due to quick change in temperature
conditions from March to April, the fruit-setting period is also short (20-30 days).
High temperature in summer effects flower buds and fruit-set, and leads to immature
fruit drop in tomato. In winter low temperature also affects fruit set and decreased the
production. Delayed fruit ripening is also a major problem during winter and early
autumn winter season of tomato growing. Due to high temperature in the summer, if
Final Report: 'National Level Techno-Economic Feasibility Study for North Zone' 390
2.3.7.2.6.9
the tomato is exposed to high sun light than there is problem of sunscald. Much of the
summer crop is damaged if rains (monsoon sets in early)
The main problems during crop growth period is of root knot nematode and leaf curl
and mosaic viruses. Hisar lalit variety is highly resistant to root knot nematode and it
is advised to grow this leaf curl and mosaic viruses are managed to some extent by
controlling the vector by spraying the crop with Rogor or Metsystox @ Iml/litre of
water at 10 days intervals.
After harvesting, lot of produce get wasted due to lack of post harvest management
practices like precooling, cold storage, processing industry, in appropriate packaging
and transportation systems.
Conclusio,n
In Haryana, tomato crop can be exploited for maximizing yield and quality by
growing tomato hybrids in low tunnel polyhouses during winter. We can manage the
diseases to some extent but short time availability for fiuit setting don't allow even,
the hybrids to exploit their full potential.
Fin~l Report: 'National Level Te,chno-Economic Feasibility Study for North Zone' 391
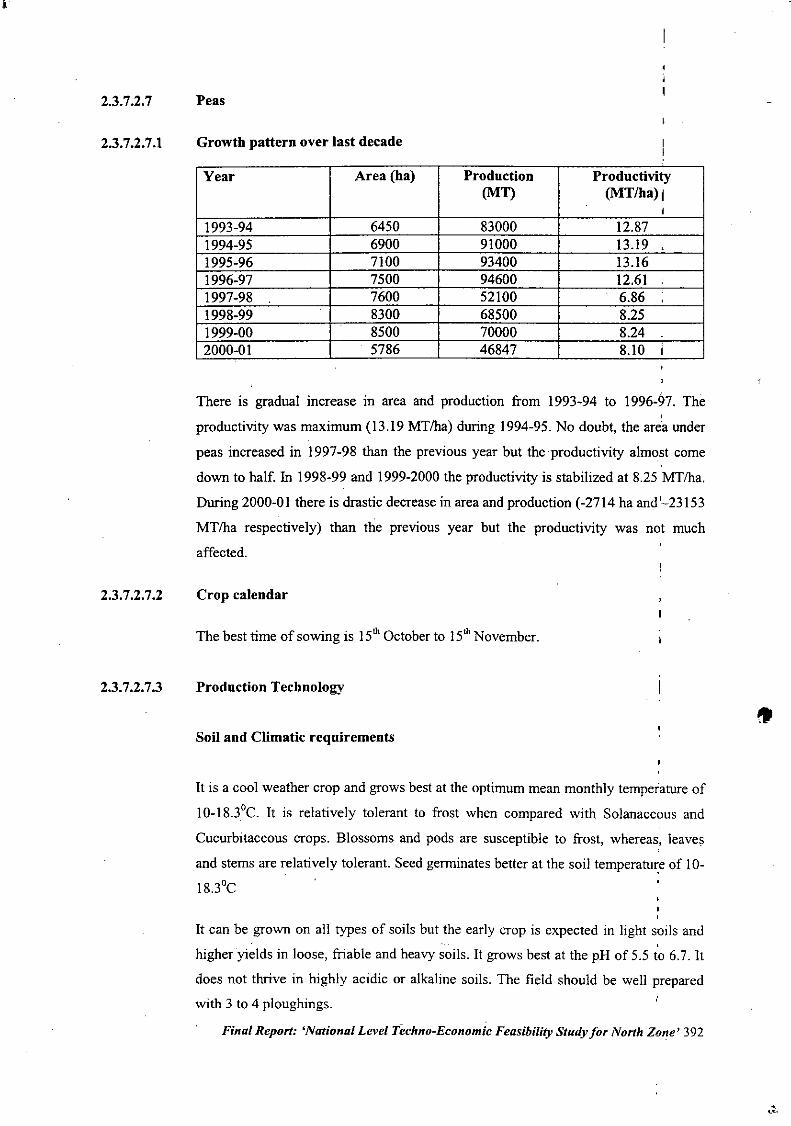
2.3.7.2.7
2.3.7.2.7.1
2.3.7.2.7.2
2.3.7.2.7.3
Peas
Growth pattern over last decade
Year Area (ha) Production Productivity(MT) (MT/ba) I,
1993-94 6450 83000 12.871994-95 6900 91000 13.191995-96 7100 93400 13.161996-97 7500-c- 94600 12.61 :1997-98 7600 52100 6.861998-99 8300 68500 8.251999-00 8500 70000 8.242000-01 . 5786 46847 8.10 I
There is gradual increase in area and production from 1993-94 to 1996-97. The,
productivity was maximum (13.19 MT/ha) during 1994-95. No doubt, the area under
peas increased in 1997-98 than the previous year but the productivity almost come
down to half. In 1998-99 and 1999-2000 the productivity is stabilized at 8.25 MT/ha.
During 2000-01 there is drastic decrease in area and production (-2714 ha and'-23153
MT/ha respectively) than the previous year but the productivity was not much
affected.
Crop calendar
The best time of sowing is 15thOctober to 15thNovember.
Production Techuology
Soil and Climatic requirements
It is a cool weather crop and grows best at the optimum mean monthly temperature of
1O-18.3°C. It is relatively tolerant to frost when compared with Solanaceous and
Cucurbitaceous crops. Blossoms and pods are susceptible to frost, whereas, leaves
and stems are relatively tolerant. Seed germinates better at the soil temperatu~eof 10-
18.30C
It can be grown on all types of soils but the early crop is expected in light soils and
higher yields in loose, friable and heavy soils. It grows best at the pH of5.5 to 6.7. It
does not thrive in highly acidic or alkaline soils. The field should be well prepared
with 3 to 4 ploughings.
Final Report: 'National Level Techno-Economic Feasibility Study for North Zone' 392
Cultivars
Arkel, PH-I, BonnevilleArkel and PH-I are early maturing varieties and take about 60-70 days from sowing
to marketable green pod stage whereas, Bonneville is suitable for late sowing and
takes about 100 days from sowing to marketable green pod stage. The yield potential
of Arkel, pH-l and Bonneville are 25-30 q/acre, 30-35 q/acre and 30 q/acre
respectively.
Seed/planting material
Seed rate is 75-100 kg per ha for early maturing varieties and 50-75 kg per ha for
main and late season varieties.
Sowing/planting techniques
Normally, in Northern plains of India, Pea is sown from Mid September to Mid
November. The early crop is sown from second fortnight of September to first week
of October. For late sowing end October to Mid-November is the appropriate time.
Method of sowing: Line x plant spacing should be 30-40 cm and 3-5 cm for main
season crop. For early sown varieties, the row to row spacing is 20-25 cm. In areas
where pea crop has not been sown earlier, it is advisable to treat the seed with
bacterial culture (Rhizobium leguminosarum) to ensure nodule formation and quick
growth. It increases the yield and quality of pods. The Rhizobium culture should be
mixed with 10% gur solution and rub this mixture thoroughly on the seeds to give
fine covering of the culture to every seed. Spread the seed in shade for drying and
plant it immediately afterwards.
Nutrient management
Apply 8 tonnes of well rotton farmyard, 15-20 days after sowing and incorporate well
in the soil. 12 kg Nand 20 kg P,O, is enough for one acre. Half dose of N and full
P,O, is applied before sowing and remaining Y,N is applied 4-6 weeks after sowing.
Water Management
Seed should be sown in proper soil moisture condition. First irrigation should be
given 15 days after sowing. Next irrigation be given at flowering and then at fruit set
Final Report: 'National Level Techno-Economic Feasibility Study for North Zone' 393
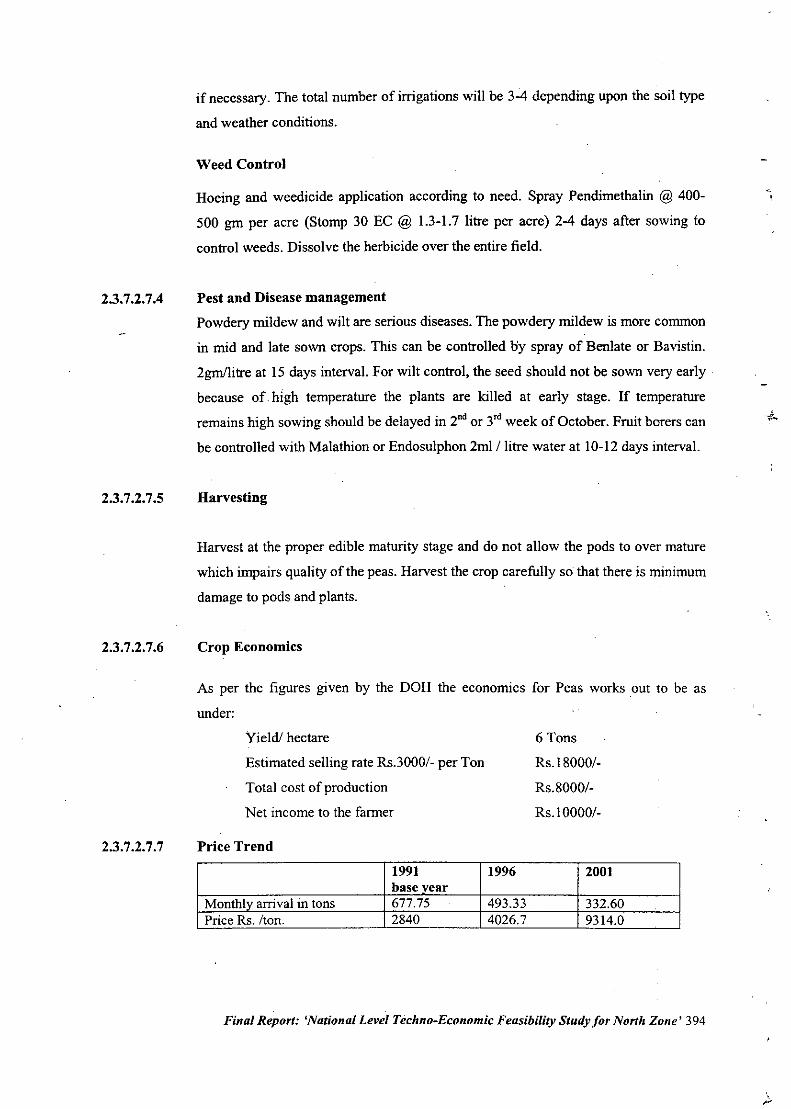
2.3.7.2.7.4
2.3.7.2.7.5
2.3.7.2.7.6
if necessary. The total number of irrigations will be 3-4 depending upon the soil type
and weather conditions.
Weed Control
Hoeing and weedicide application according to need. Spray Pendimethalin @ 400-
500 gm per acre (Stomp 30 EC @ 1.3-1.7 litre per acre) 2-4 days after sowing to
control weeds. Dissolve the herbicide over the entire field.
Pest and Disease management
Powdery mildew and wilt are serious diseases. The powdery mildew is more common
in mid and late sown crops. This can be controlled oy spray of Benlate or Bavistin.
2gm/litre at 15 days interval. For wilt control, the seed should not be sown very early
because of. high temperature the plants are killed at early stage. If temperature
remains high sowing should be delayed in 2nd or 3"' week of October. Fruit borers can
be controlled with Malathion or Endosulphon 2ml I litre water at 10-12 days interval.
Harvesting
Harvest at the proper edible maturity stage and do not allow the pods to over mature
which impairs quality of the peas. Harvest the crop carefully so that there is minimum
damage to pods and plants.
Crop Economics
As per the figures given by the DOH the economics for Peas works out to be as
under;
2.3.7.2.7.7
Yield! hectare
Estimated selling rate Rs.3000/- per Ton
Total cost of production
Net income to the farmer
Price Trend
6 Tons
Rs. I 8000/-
RS.8000/-
RS.IOOOO/-
1991 1996 2001base vear
Monthly arrival in tons 677.75 . 493.33 332.60Price Rs. Iton. 2840 4026.7 9314.0
Final Report: 'National Level Techno-Economic Feasibility Study for North Zone' 394
•
2.3.7.2.7.8
2.3.7.2.7.9.
Problems and Constraints
In the early crop of pea, there is a problem of wilt during September. At seedling
stage, pea stem fly sometimes cause serious damage. Sow the crop in second fortnight
of October to escape the damage of wilt and stem fly. The chemical treatment of seed
with Bavistin I g per kg of seeds is used as preventive measure to minimize the effect
of fruit fly and wilt. Pea leaf minor also cause serious damage during December-
March which can be managed by spraying Rogor 30 EC @ 4 ml/liter of water.
Powdery mildew and pea pod borer are other problems occurring during the growing
season. There is also the lack of processing industry in Haryana. Otherwise, there is
great scope of processing peas into durable products like dehydrated peas, frozen
shelled pea, canned peas etc.
Conclusion
Pea is highly self-pollinated crop so there is no need of hybrids for this crop and
farmers can save their seeds for next season planting. From early crop, high profits
can be earned. Inoculation of pea, seeds with Rhizobium culture can increase the
yield and quality of pods. There is great export potential for frozen shelled peas and
fresh edible podded peas .
Final Report: 'National Level Techno-Economic Feasibility Study for North Zone' 395
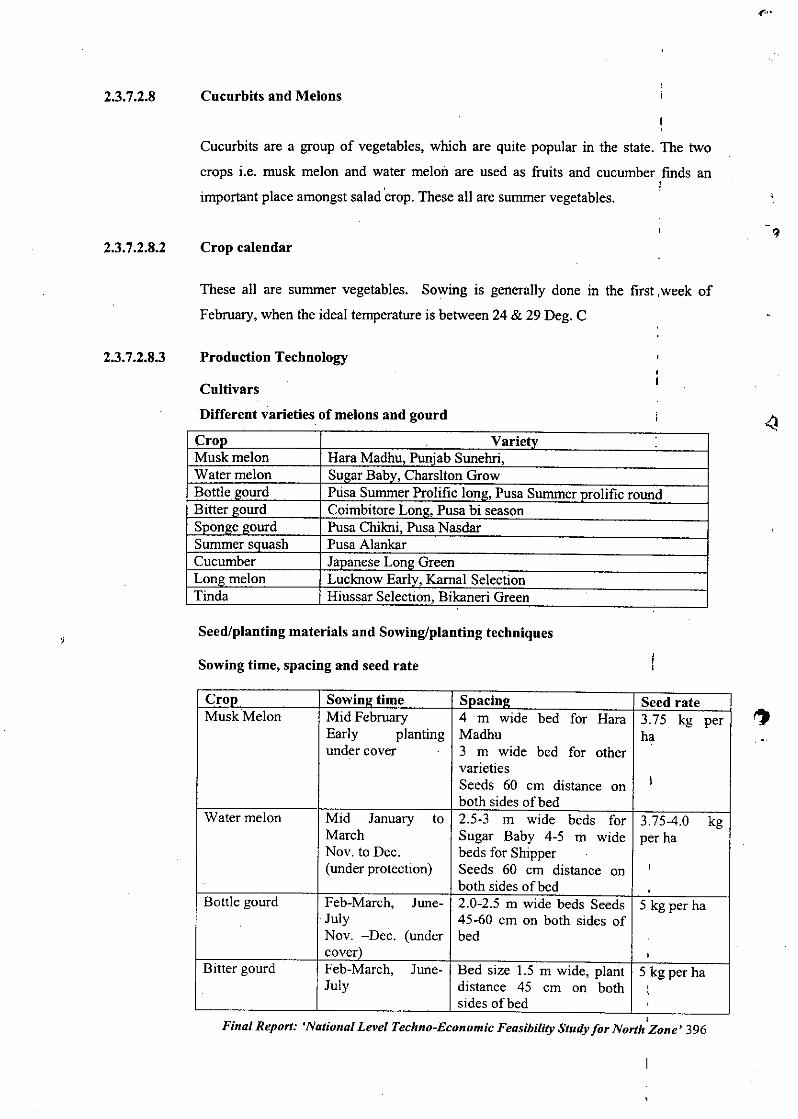
2.3.7.2.8
2.3.7.2.8.2
2.3.7.2.8.3
Cucurbits and Melons
Cucurbits are a group of vegetables, which are quite popular in the state. The two
crops i.e. musk melon and water melOll are used as fruits and cucumber finds an,important place amongst salad 'crop.These all are summer vegetables.
Crop calendar
These all are summer vegetables. Sowing is generally done in the first, week of
February, when the ideal temperature is between 24 & 29 Deg. C
Production Tecbnology
Cultivars
Different varieties of melons and gourd
Crop VarietyMuskmelon Hara Madhu, Puniab Sunehri,Watermelon Su"ar Babv, Charslton GrowBottle gourd Ptisa Summer Prolific long, Pusa Summer prolific roundBitter gourd Coimbitore Lon", Pusa bi seasonSponge gourd Pusa Chikni, Pusa NasdarSummer squash Pusa AlankarCucumber Jananese Long GreenLong melon Lucknow Earlv, Kamal SelectionTinda Hiussar Selection, Bikaneri Green
Seed/planting materials and Sowing/planting techniques
Sowing time, spacing and seed rate
Crop Sowin" time Spacinl! Seed rateMuskMelon Mid February 4 m wide bed for Hara 3.75 kg per
Early planting Madhu haunder cover 3 m wide bed for other
varietiesSeeds 60 cm distance on I
both sides of bedWatermelon Mid January to 2.5.3 m wide beds for 3.75-4.0 kg
March Sugar Baby 4.5 m wide per haNov. to Dec. beds for Shipper(under protection) Seeds 60 cm distance on I
, both sides of bedBottle gourd Feb.March, June. 2.0.2.5 m wide beds Seeds 5 kg per ha
,July 45-60 cm on both sides ofNov. -Dec. (under bedcover) ,
Bitter gourd Feb-March, June. Bed size 1.5 m wide, plant 5 kg per haJuly distance 45 cm on both ,,
sides of bed ,Final Report: 'National Level Techno-Economic Feasibility Study for NorthZone' 396
,r..•
..
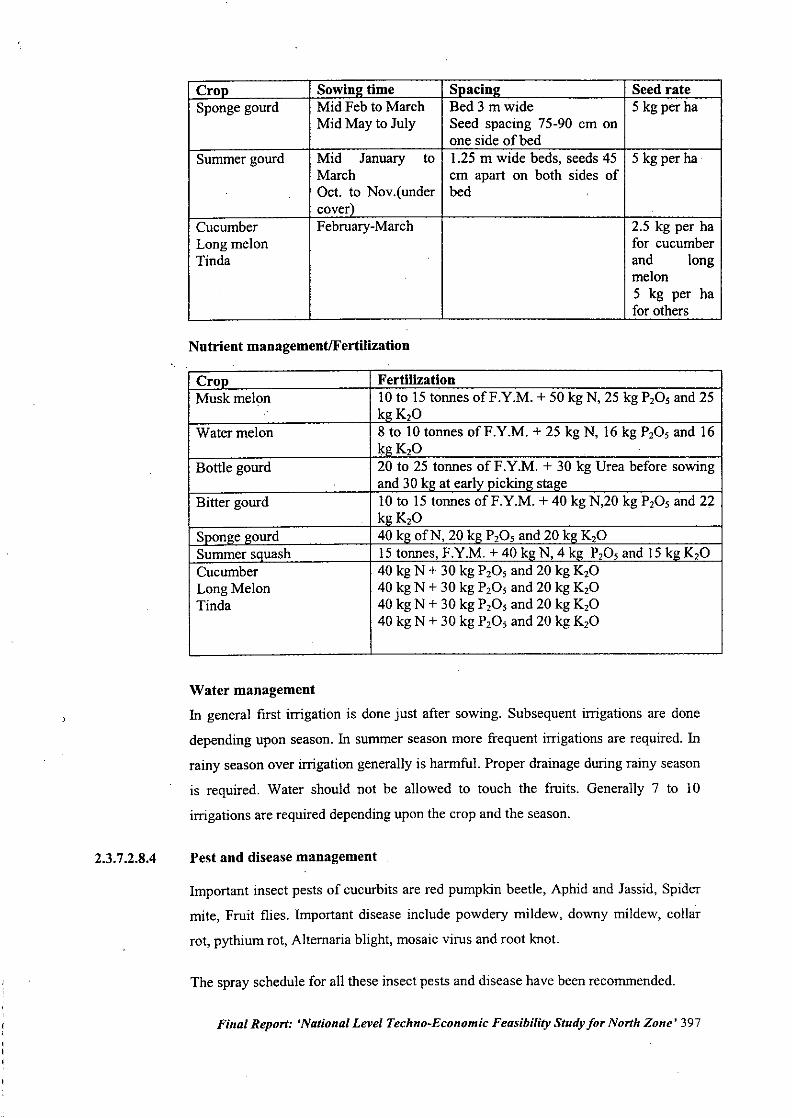
Cron Sowinl! time Snacin2 Seed rateSponge gourd Mid Feb to March Bed 3 m wide 5 kg per ha
Mid May to July Seed spacing 75-90 cm onone side of bed
Summer gourd Mid January to 1.25 m wide beds, seeds 45 5 kg per haMarch cm apart on both sides ofOct. to Nov.(under bedcover) .
Cucumber February-March 2.5 kg per haLong melon for cucumberTinda and long
melon5 kg per hafor others
Nutrient managementlFertilization
CroMuskmelon
Watermelon
Bottle gourd
Bitter gourd
S on e ourdSummer s uashCucumberLong MelonTinda
Fertilization10 to 15 tonnes ofF.Y.M. + 50 kg N, 25 kg P,O, and 25k K,O8 to 10 tonnes ofF.Y.M. + 25 kg N, 16 kg P,O, and 16k K,O20 to 25 tonnes ofF.Y.M. + 30 kg Urea before sowingand 30 k at earl ickin sta e10 to 15 tonnes ofF.Y.M. + 40 kg N,20 kg P,O, and 22k K,O40 k ofN, 20 k P,O, and 20 k K,O15 tonnes, F.Y.M. + 40 k N, 4 k P,O, and 15k K,O40 kg N + 30 kg P,O, and 20 kg K,O40 kg N + 30 kg P,O, and 20 kg K,O40 kg N + 30 kg P,O, and 20 kg K,O40 kg N + 30 kg P,O, and 20 kg K,O
2.3.7.2.8.4
Water managementIn general first irrigation is done just after sowing. Subsequent irrigations are done
depending upon season. In summer season more frequent irrigations are required. In
rainy season over irrigation generally is harmful. Proper drainage during rainy season
is required. Water should not be allowed to touch the fruits. Generally 7 to 10
irrigations are required depending upon the crop and the season.
Pest and disease management
Important insect pests of cucurbits are red pumpkin beetle, Aphid and Jassid, Spider
mite, Fruit flies. Important disease include powdery mildew, downy mildew, collar
rot, pythium rot, Alternaria blight, mosaic virus and root knot.
The spray schedule for all these insect pests and disease have been recommended.
Final Report: 'National Level Techno-Economic Feasibility Study for North Zone' 397
2.3.7.2.8.5
2~3.7.2.8.6
2.3.7.2.8.7
Harvesting
MuskMelon
Fruits on Hara Madhu to be harvested when turn yellow other varieties to be
harvested at mature green stage for distant markets and at 'half slip' stage for local
markets.
WaterMelon
Ready for harvest in 95-120 days of flowering. To be harvested when fruit is fully
mature and sign of maturity is drying of tendril.
Bottle Gourd
Crop ready in 60-70 days after sowing seed depending upon variety and season.
Harvest only tender to medium sized fruits.
Bitter Gourd
Crop is ready for harvesthlg in about 55-60 days after sowing depending upon variety
and season. Picking at 2 to 3 day interval.
Sponge Gourd
Crop is ready in about 70-90 days after sowing. Harvesting at 3 to 4 days interval.
Summer Squash
Crop is ready for first picking 60-80 days after sowing depending upon variety and
season. Fruits become fit for harvesting after 7 days of fruit setting.
Cucumber
Crop is ready after 60-70 days of sowing
Long Melon
Crop is ready after 60-70 days of sowing
Tinda
Crop is ready after 60-70 days of sowing
Crop Economics
Authentic Data not available
Price Trend
No data on the price trend of any of the gourds is available .
. Final Report: 'National Level Techno-Economic Feasibility Study for North Zone' 398
2.3.7.2.8.8
2.3.7.2.8.9
Problems and Constraints
Since Melons are highly cross pollinated crops farmers should not use their own seedevery year.
'Conclusions
Since most of the Cucurbits are cultivated along the river beds, there is a need to
increase the area under cultivation of these crops as there is a lot of availability of, such areas.,
Final Report: 'National Level Techno-Economic Feasibility Study for North Zone' 399
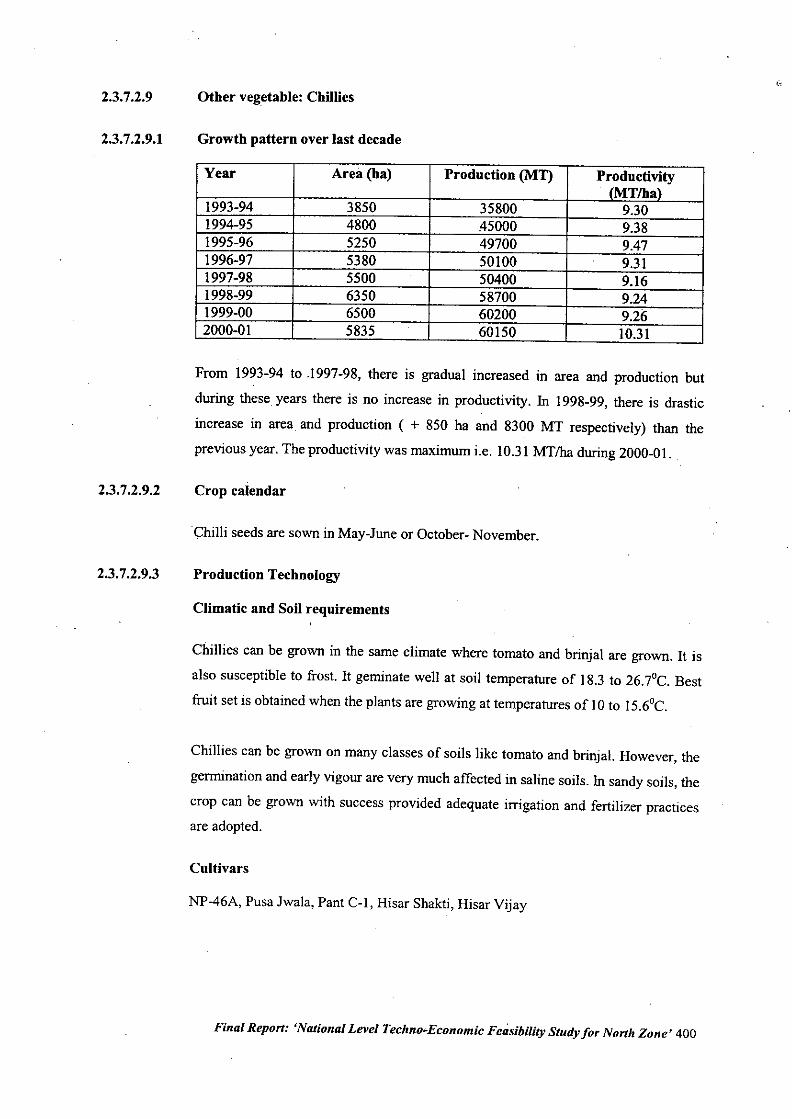
2.3.7.2.9
2.3.7.2.9.1
2.3.7.2.9.2
2.3.7.2.9.3
Other vegetable: Chillies
Growth pattern over last decade
Year Area (ha) Production (MT) Productivity(MTlha)
1993-94 3850 35800 9.301994-95 4800 ,45000 9.381995-96 5250 49700 9.471996-97 5380 50100 9.311997-98 5500 . 50400 9.161998-99 6350 58700 9.241999-00 6500 60200 9.262000-01 5835 60150 10.31
From 1993-94 to .1997-98, there is gradual increased in area and production but
during these years there is no increase in productivity. in 1998-99, there is drastic
increase in area and production ( + 850 ha and 8300 MT respectively) than the
previous year. The productivity was maximum i.e. 10.31MT/ha during 2000-01. .
Crop calendar
Chilli seeds are sown in May-June or October- November.
Production Technology
Climatic and Soil requirements
Chillies can be grown in the same climate where tomato and brinjal are grown. It is
also susceptible to frost. It geminate well at soil temperature of 18.3 to 26.7°C. Best
fruit set is obtained when the plants are growing at temperatures of I0 to 15.60C.
Chillies can be grown on many classes of soils like tomato and brinjal. However, the
germination and early vigour are very much affected in saline soils. in sandy soils, the
crop can be grown with success provided adequate irrigation and fertilizer practicesare adopted.
Cultivars
NP-46A, Pusa Jwala, Pant C-I, Hisar Shakti, Hisar Vijay
Final Report: 'National Level Techno.Economic Feasibility Study for North Zone' 400
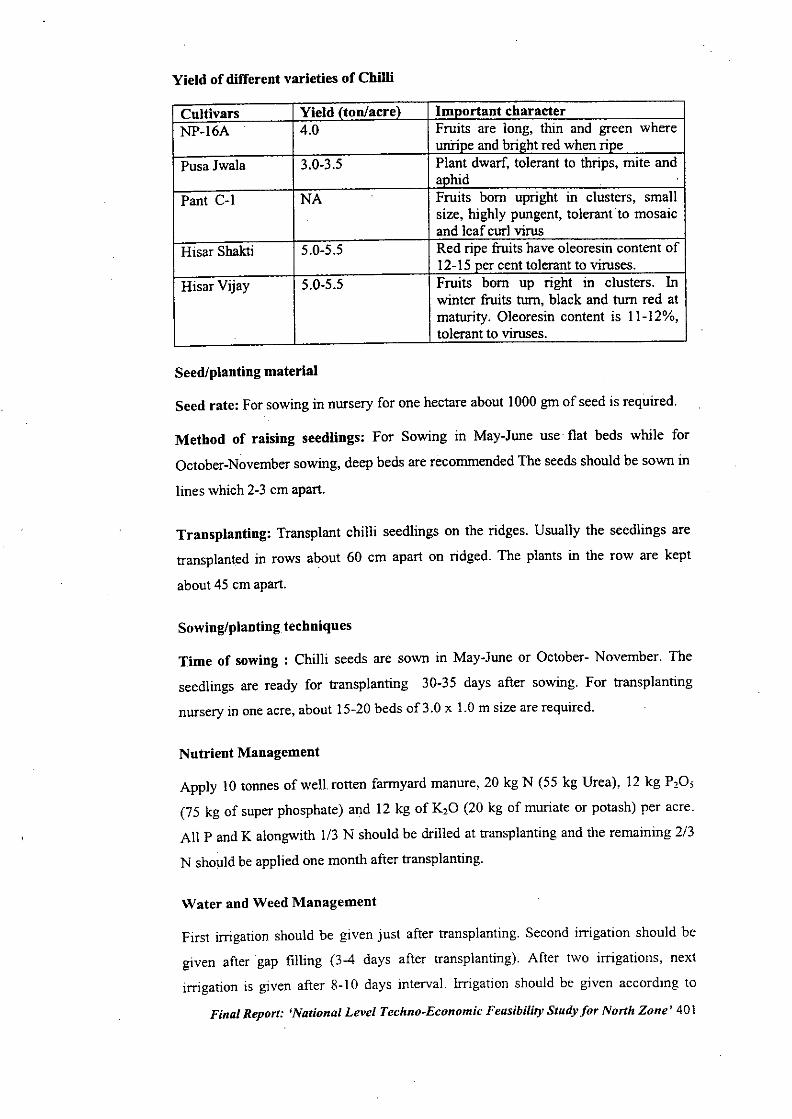
Yield of different varieties of Chilli
Cultivars Yield (ton/acre) Important characterNP-16A 4.0 Fruits are long, thin and green where
unripe and bright red when ripePusa Jwala 3.0-3.5 Plant dwarf, tolerant to thrips, mite and
aphidPant C-I NA Fruits born upright in clusters, small
size, highly pungent, tolerantto mosaicand leaf curl virus
Hisar Shakti 5.0-5.5 Red ripe fruits have oleoresin content of12-15 per cent tolerant to viruses.
HisarVijay 5.0-5.5 Fruits born up right 10 clusters. Inwinter fruits tum, black and tum red atmaturity. Oleoresin content is 11-12%,
. tolerant to viruses .
Seed/planting material
Seed rate: For sowing in nursery for one hectare about 1000 gm of seed is required.
Method of raising seedlings: For Sowing in May-June use flat beds while for
October-November sowing, deep beds are recommended The seeds should be sown in
lines which 2-3 em apart.
Transplanting: Transplant chilli seedlings on the ridges. Usually the seedlings are
transplanted in rows about 60 em apart on ridged. The plants in the row are kept
about 45 em apart.
Sowing/planting techniques
Time of sowing: Chilli seeds are sown in May-June or October- November. The
seedlings are ready for transplanting 30-35 days after sowing. For transplanting
nursery in one acre, about 15-20 beds of3.0 x 1.0m size are required.
Nutrient Management
Apply 10 toones of well. rotten farmyard manure, 20 kg N (55 kg Urea), 12 kg P,Os
(75 kg of super phosphate) and 12 kg of K,O (20 kg of muriate or potash) per acre.
All P and K alongwith 1/3 N should be drilled at transplanting and the remaining 2/3
N sh01,lldbe applied one month after transplanting.
Water and Weed Management
First irrigation should be given just after transplanting. Second irrigation should be
given after gap filling (3-4 days after transplanting). After two irrigations, next
irrigation is given after 8-10 days interval. Irrigation should be given according to
Final Report: 'National Level Techno-Economic Feasibility Study for North Zone' 401
,2.3.7.2.9.4
2.3.7.2.9.5
2.3~7;2.9.6
2.3.7.2.9.7
flowering and fruit set requirements. The first earthing up should be done 25-30 days
after transplanting. Second earthing up is done at the time of flowering. For the
control of weeds, spray the crop with Stomp 30 EC @ 130-175 liter per acre, 3-4 days
after transplanting.
Flowering and fruit drop
At the time of flowering and fruit setting in August - September, there is a problem
of flower and fruit crop. The temperature during early flowering stages of the crop is
very high, which induces lot of flower and fruit drop. Yield is considerably reduced
sometimes whole of the blossoms on a plant may get shed. To prevent this problem,
spray the crop with Planofix @ I mI / 4.5 Iitres water once at the time of flowering
and again 3 weeks after the first spray.
Pest and Disease Management
Virus resistant, thrips and mites are also serious problems. Resistance to these pests
and diseases is being actiyely perused.
Harvest method and yield
For local markets, pick the fruits when they are fully developed but still green and
shinning. For drying purpose, harvest the fruits at red ripe stage. About 0.75-1.0 tons
of dry red chilli can be obtained from one ha.
Crop Economics
Chilli yield is around 9 tons per hectare which is estimated to be sold at Rs. 8/- pcr
kg. Thus the income to the farmers comes to around Rs. 72,000/- per hectare with the
cost of production being around Rs. 8,000 per hectare. The net income to the farmer
is Rs. 64,000/- per hectare.
Price trends
The prices of Green Chillies varies a lot depending upon the availability and the
season. There is no authentic data available for monitoring the trend. However, in
our discussions with the Mandy officials, it was found to vary between Rs.5000 toRS.8000per tons.
Final Report: 'National Level Techno-Economic Feasibility Study for North Zone' 402
2.3.7.2.9.8
2.3.7.2.9.9
Problems and Constraints
In the nursery, there is main problem of damping off. The field used for transplanting
must have proper drainage facility for excess water. If there is not proper drainage
facility, then due to accumulation of excessive rain water, there is a problem of wilL
Sometimes there is also a problem of flower and fruit crop which can be managed by
spraying planofix@ I ml /4.5 litre of water. Fruit rot and die back are other problems
in Chilli which can be managed by spray of Indofil M45. Due to these problems, the
fruit bearing branches start drying soon after the fruit begins to ripe. The main
problem in ChiJlies is of viruses, (leaf curl and mosaic). It is very difficult to control
viruses but we can minimize their impact by control of vectors (whitefly in leaf curl
and aphid in mosaic). Another problem is the lack of processing industry in Haryana
which can do processing of chiJlies.
Conclusion .
Chilli is emerging as a good export item. During 1998-99, India exported near about
55750 tonnes of dry chilli worth Rs. 210.13 millions to different countries. At present
chiJli is exported in the form of dry powder or dry fruit but there is a great scope to
export chilli products in the form of chili paste, sauces, ketchup, pickles, oleoresin,
paprika etc. of high quality to compete in the international market. It can be logically
concluded that with large scale production of chilli, there will be a possibility that
market glut of the produce may arise. So the large scale adoption needs strong
support of planners for developing market infrastructure including the establishment
of chili processing units.
Final Report: 'National Level Techno-Economic Feasibility Study for North Zone' 403
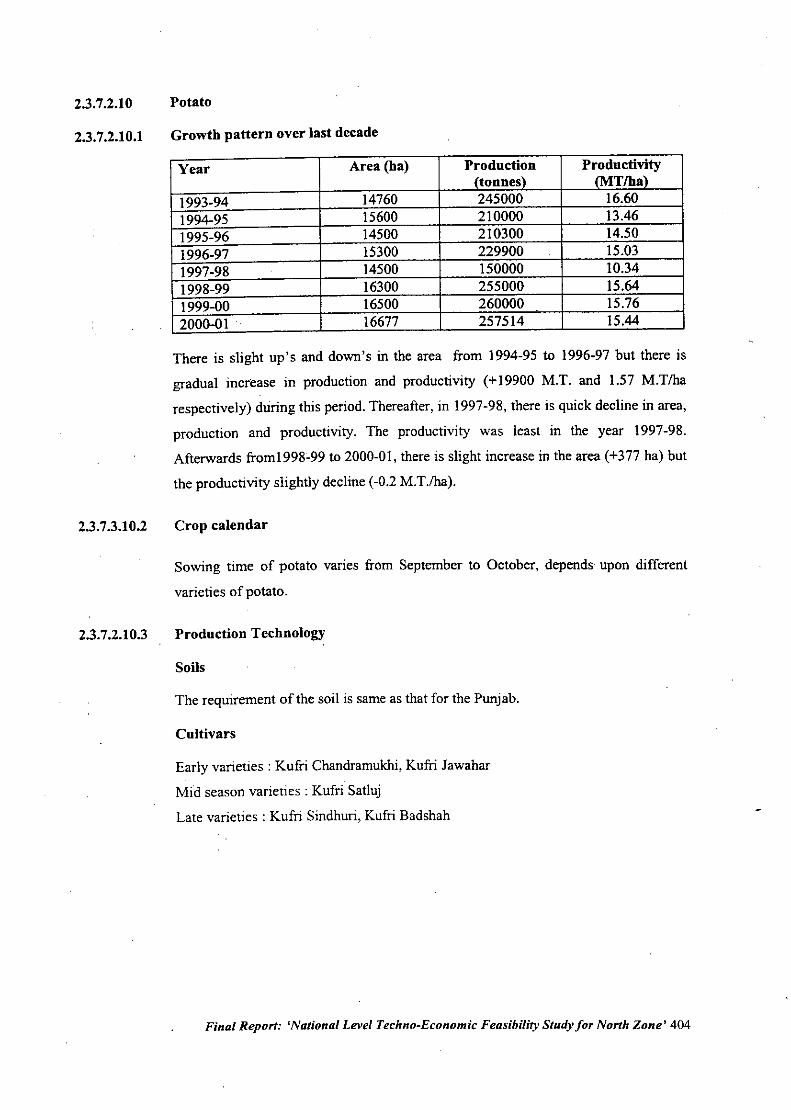
2.3.7.2.10
2.3.7.2.10.1
2.3.7.3.10.2
2.3.7.2.10.3
Potato
Growth pattern over last decade
Year Area (ha) Production Productivity(tonnes) (MTlha)
1993-94 14760 245000 16.601994-95 15600 210000 13.461995-96 14500 210300 14.501996-97 15300 229900 15.031997-98 14500 150000 10.341998-99 16300 255000 15.641999-00 16500 260000 15.762000-01 16677 257514 15.44
There is slight up's and down's in the area from 1994-95 to 1996-97 but there is
gradual increase in production and productivity (+19900 M.T. and 1.57 M.T/ha
respectively) during this period. Thereafter, in 1997-98, there is quick decline in area,
production and productivity. The productivity was least in the year 1997-98.
Afterwards from1998c99 to 2000-01, there is slight increase in the area (+377 hal but
the productivity slightly decline (-0.2 M.T./ha).
Crop calendar
Sowing time of potato varies from September to October, depends' upon different
varieties of potato.
Production Technology
Soils
The requirement of the soil is same as that for the Punjab.
Cultivars
Early varieties: Kufri Chandramukhi, Kufri Jawahar
Mid season varieties: Kufri Satluj
Late varieties: Kufri Sindhuri, Kufri Badshah
Final Report: 'National Level Techno-Economic Feasibility Study for North Zone' 404
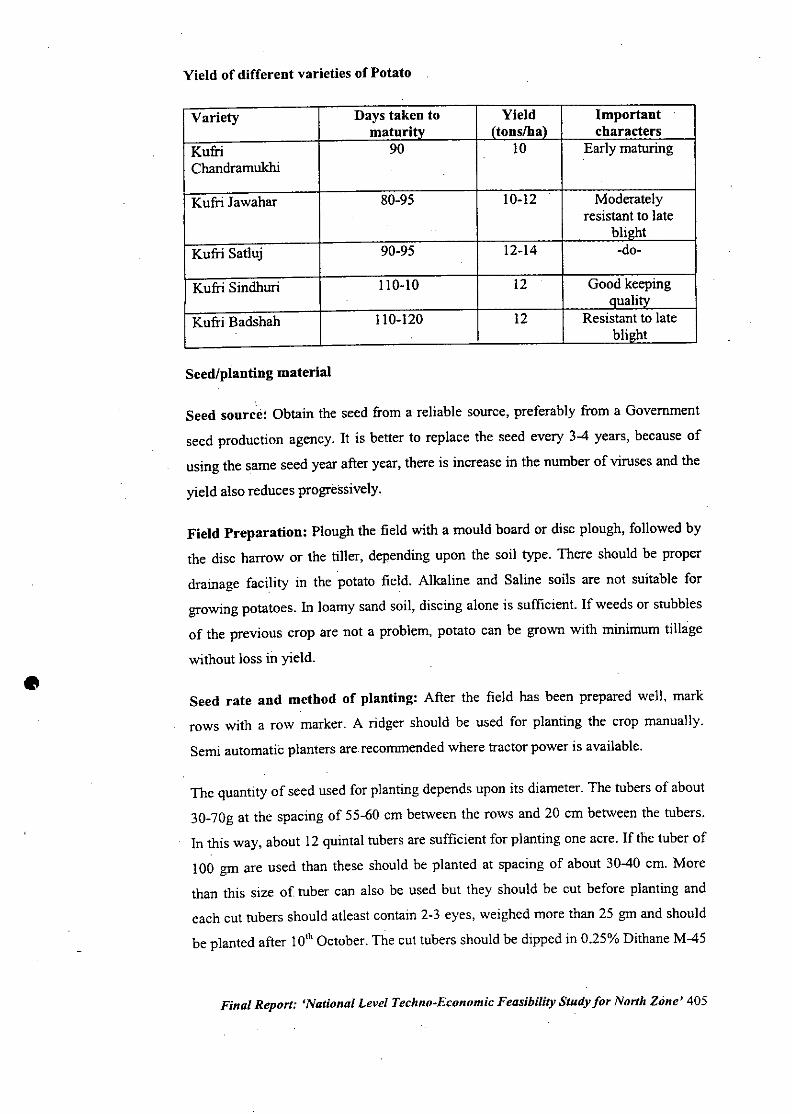
•
Yield of different varieties of Potato
Variety Days taken to Yield Importantmaturity (tons/ha) characters
Kufri 90 10 Early maturingChandramukhi
Kufri Jawahar 80-95 10-12 Moderatelyresistant to late
bli!!htKufri Sat1uj 90-95 12-14 -do-
Kufri Sindhuri 110-10 12. Good keepingaualitY
Kufri Badshah 110-120 12 Resistant to latebli"ht
Seed/planting material
Seed source: Obtain the seed from a reliable source, preferably from a Government
seed production agency. It is better to replace the seed every 3-4 years, because of
using the same seed year after year, there is increase in the number of viruses and the
yield also reduces progressively.
Field Preparation: Plough the field with a mould board or disc plough, followed by
the disc harrow or the tiller, depending upon the soil type. There should be proper
drainage facility in the potato field. Alkaline and Saline soils are not suitable for
growing potatoes. In loamy sand soil, discing alone is sufficient. If weeds or stubbles
of the previous crop are not a problem, potato can be grown with minimum tillage
without loss in yield .
Seed rate and method of planting: After the field has been prepared well, mark
rows with a row marker. A ridger should be used for planting the crop manually.
Semi automatic planters are recommended where tractor power is available.
The quantity of seed used for planting depends upon its diameter. The tubers of about
30-70g at the spacing of 55-60 cm between the rows and 20 cm between the tubers.
In this way, about 12 quintal tubers are sufficient for planting one acre. If the tuber of
100 gm are used than these should be planted at spacing of about 30-40 em. More
than this size of tuber can also be used but they should be cut before planting and
each cut tubers should at1eastcontain 2-3 eyes, weighed more than 25 gm and should
be planted after lOthOctober. The cut tubers should be dipped in 0.25% Dithane M-45
Final Report: 'National Level Techno-Economic Feasibility Study for North Zone' 405
solution for 5-10 minutes. Later on keep the treated seeds in a cool place/ shade for
14-16 hours to dry them and then use for planting in the field.
Seed preparation: The seed potatoes obtained from the cold store, can not be planted
immediately. It should first be dried with the help of blowers. Keep the treated seed in
a cool place/ shade exposed in diffused sunlight for 8-10 days which initiates
sprouting and helps the sprouts to become strong. Keep the potatoes in basket or
trays. Ifbaskets or trays are not available then the potatoes should be kept on the floor
and the thickness of potatoes heaps should not be more than 4 inches. Don't use the
potatoes for sowing with poor sprouting or with hairs.
Sowing/planting techniqnes
Time of sowing: Different varieties have different time of sowing. The appropriate
time of sowing for Kufri Chandramukhi and Kufri Jawahar is first week of October.
Kufri Badshah and Kufri Satluj should be sown between 5-15 October. For every
crop, Kufri Chandrarnukhi and Kufri Jawahar should be planted in last week of
September. At that time, soil temperature is low so there is more problem of rotting
the tubers. To save the tubers from rotting, use of mulching is highly beneficial.
Mulching not only reduces the soil temperature but also maintain humidity in the soil.
Nutrient management
Twenty tonnes of farmyard manure or green manuring alongwith 50-60 kg N (50 kg
for early and 60 kg for late sown varieties), 20 kg P20, and 40 kg K,O per acre
should be use. If the soil is sandy loam then drill all P and K and % N at sowing and ,
the remaining N at 25-30 days after sowing i.e. at the time of earthing up.
Weed control and Earthing up
It is noticed that if at the time of sowing there is proper earthing up and weeds should
be destroyed by use of suitable chemical, then there is no effect of earthing up after
sowing on the yield of potato but if at the time of sowing, light earthing up is done
then there is need of later earthing up after 25-30 days of sowing. A double mould
board plough or a ridger should be used for earthing up. By this method, the number
of green potatoes can be reduced.
Final Report: 'National Level Techno-Economic Feasibility Study for North Zone' 406
2.3.7.3.10.4
For control of weeds use anyone of the following herbicides by dissolving in 250
litres of water for one acre and spray within 10 days after sowing. At the time of
using herbicide, there should be proper moisture in the field.. ,
1. Alachlore 1.0-2.0 kg / acre (Lasso 50% 2 to 2.4 litre)
2. Alachlor 0.5 kg /acre (Lasso 50% 1.0 liter) +
Simazine 0.5 kg are (Tafazine 50 % 100g)
3. Pendimethalin 480-600 g/acre (Stomp 30 % I lit)
If the weeds emerge in the field then parquet 240-300 g per are (Gramaxone 1.0-2.0
liter) should be applied after 15 days of sowing by dissolving in 250 liters of water. .
Storage of Potato
After harVesting, cutted and mis-shapened rotted tubers should be removed. For home
consumption, the potatoes should be stored in cool and humid place with sufficient air
ventilation. High temperature results iii high respiration rate of potatoes, which cause
heating and spoilage by rotting and sprouting. High humidity is desirable to avoid
excessive shrinkage. For commercial use, the potatoes should be sorted, graded and
packed in perforated jute bags/ plastic mesh bags before storage, otherwise, black
heart symptoms wi1ldevelop in the tubers. The local cold storage facilities should be
available for the storage of potato in large quantity and in the cold storage temperate
of 0-4°C and relative humidity of 75-80% is required for long term storage..
Pest and Disease Management
Late blight of Potato is a common disease. Spray Mancozeb 0.2% at 15 days interval.
Use resistant varieties like kufri sutlej, kufii Badshah and kufri Ashoka. Early blight
or leaf spot complex is also serious. This is also controlled by mencozeb + 2% urea
spray. Mosaic and other virus diseases are also serious. The seeds should be replaced
every 2-3 years and spray Monocrotophos or Dimethoate 0.02% to check aphids
which spread the disease. Tuber moth and cut worms are serious pests. The soil
around plant should be drenched with Carbaryl 50 wp (2kg/ha) or Endosulphan 25EC
1.25 lit/ha. Besides this, Aphids, mites or tuber moth also damage which are
controlled with monocrotophos spray.
Final Report: 'National Level Techno-Economic Feasibility Study for North Zone' 407
2.3.7.3.10.5
2.3.7.3.10.6
Harvest Method and Yield
The mature potatoes should not be allowed to remain m the soil which means
harvesting should not be delayed. After harvest potato should be surface dried and
kept in shade for 10-15 days, graded and packed in gunny bags. The Yield of Potatoes
is comparatively much better in the state varying between 15 to 30 tons per hectare.
The variety wise yield is as under:
Variety Yields tons/hectare
Kufri Ashoka 24-56Kufri Jawahar . 28-32Kufri Sutlei . 30-35Kufri Pukhrai 37-39Kufri,Chinsona-I 22-26 .
Kufri Chiosona-2 24-26Kufri Anand 27.32
Crop Economks
As per the figures giv~n by the DOH the economics for Potato works out to be as
under:
2.3.7.2.10.7
Yield! hectare
Estimated selling rate RS.2600/.per Ton
Total cost of production
Net income to the farmer
Price trends
Price trends of potato over the last decade
25 Tons
RS.65000/-
Rs.35000/-
RS.30000/.
2.3.7.2.10.8
1991 2001
Arrival in tons 770.35 625Price in Rs/tons. 2316.4 4653
Prohlems and constraints
After planting, there is problem of poor germination and seed dormancy. Seed tubers
do not,geminate if planted soon after removal from cold storage. Poor germination
may be due to use of unsprouted seed tubers. If the rains occur after planting or due to
heavy irrigation, the water goes above the ridge, then there is crust formation onridges, which ultimately results in poor germination.
Later in the growing season there is problem of early and late blight and mosaic and
leaf roll which significantly reduce the yield. Early and late blight can be controlled
Final Report: 'National Level Techno-Economic Feasibility Study for North Zone' 408
2.3.7.2.10.9
to some extent by Indofil M-45/ Kavach @ 500-700 gm or coper oxychloride 50 WP
@ 750-1000 gm/acre by dissolving in 250-300 liters of water at 7 days interval
starting from the first week of November. But it is very difficult to control the
viruses. We can produce the virus free seeds through seed plot technique. Due to
more problem of viruses, farmers are advised not to use the same seed for more than
3 years.By the use of tractor operated diggers, large quantity of potato is wasted due to cut on
the surface of tubers by the blades of the diggers. Moreover, the cold storages meant
for potato seed have problem of irregular power supply leading to unnecessary
wastage. The high initial investment for large quantity of seeds is also the main
constraint i.e farmers use same seed year after year which ultimately reduce the yield
due to increase in number and concentration of viruses in the tubers.
Conclusion
This crop has a tremendous scope of increasing area production and productivity.
The processing industries like chips, fingers and other product factories should be
established.
Final Report: 'National Level Techno-Economic Feasibility Study for North Zone' 409
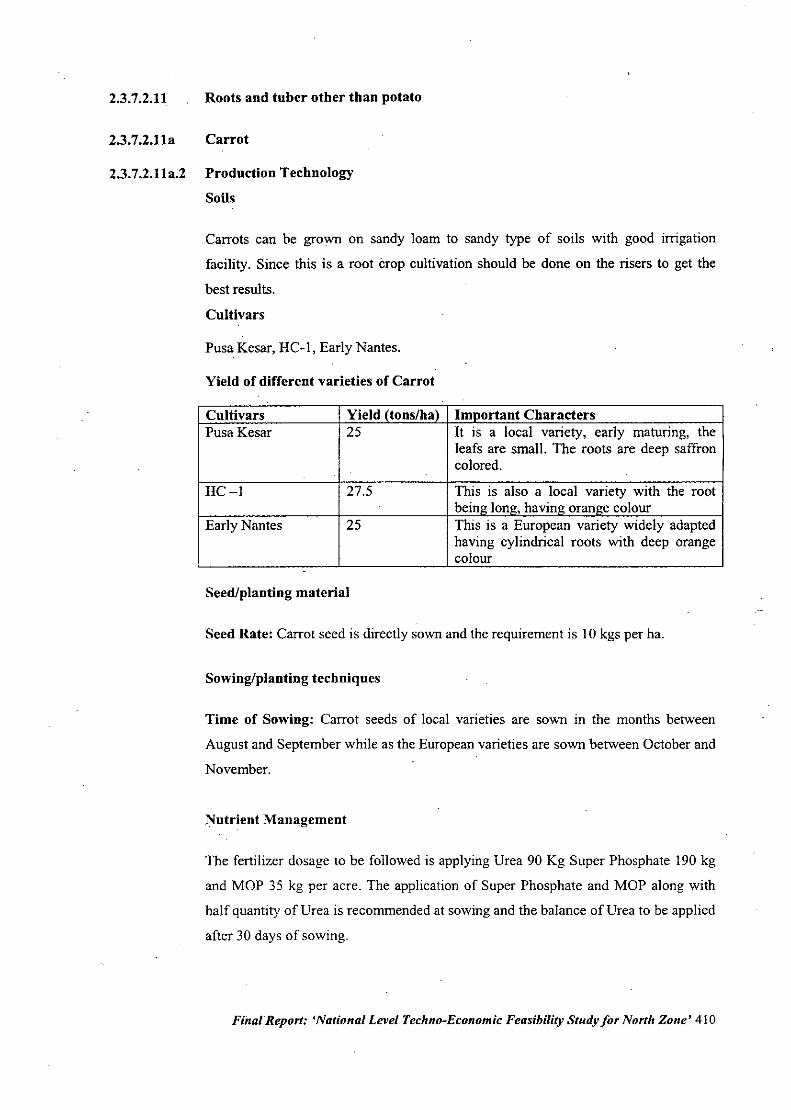
2.3.7.2.11 Roots and tuber other than potato
2.3.7.2.11a Carrot
2.3.7.2.11a.2 Production Technology
Soils
Carrots can be grown on sandy loam to sandy type of soils with good irrigation
facility. Since this is a root crop cultivation should be done on the risers to get the
best results.
Cultivars
Pusa Kesar, HC.I, Early Nantes.
Yield of different varieties of Carrot
CultivarsPusa Kesar
HC-I
Early Nantes
Yield25
27.5
25
1m orlant CharactersIt is a local variety, early maturing, theleafs are small. The roots are deep saffroncolored.
This is also a local variety with the rootbein Ion ,havin oran e colourThis is a European variety widely adaptedhaving cylindrical roots with deep orangecolour
Seed/planting material
Seed Rate: Carrot seed is directly sown and the requirement is 10 kgs per ha.
Sowing/planting techniques
Time of Sowing: Carrot seeds of local varieties are sown in the months between
August and September while as the European varieties are sown between October and
November.
Nutrient Management
The fertilizer dosage to be followed is applying Urea 90 Kg Super Phosphate 190 kg
and MOP 35 kg per acre. The application of Super Phosphate and MOP along with
half quantity of Urea is recommended at sowing and the balance of Urea to be applied
after 30 days of sowing.
FinalReport: 'National Lt!VelTechno-Economic Feasibility Study for North Zone' 410
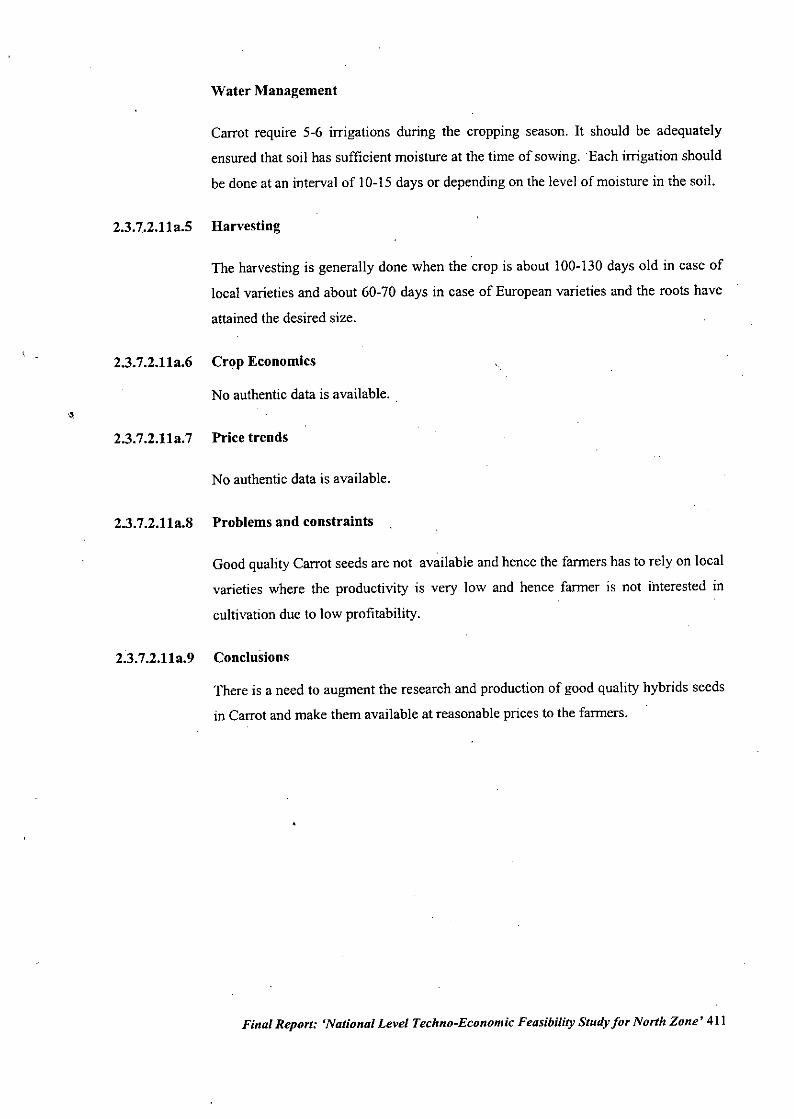
'.
Water Management
Carrot require 5-6 irrigations during the cropping season. It should be adequately
ensured that soil has sufficient moisture at the time of sowing.. Each irrigation should
be done at an interval of 10-15 days or depending on the level of moisture in the soil.
2.3.7.2.11a.5 Harvesting
The harvesting is generally done when the crop is about 100-130 days old in case of
local varieties and about 60-70 days in case of European varieties and the roots have
attained the desired size.
2.3.7.2.11a.6 Crop Economics
No authentic data is available.
2.3.7.2.11a.7 Price trends
No authentic data is available.
2.3.7.2.11a.8 Problems and constraints
Good quality Carrot seeds are not available and hence the farmers has to rely on local
varieties where the productivity is very low and hence farmer is not interested in
cultivation due to low profitability.
2.3.7.2.11a.9 Conclnsions
There is a need to augment the research and production of good quality hybrids seeds
in Carrot and make them available at reasonable prices to the farmers.
Final Report: 'National Level Techno-Economic Feasibility Study for North Zone' 411
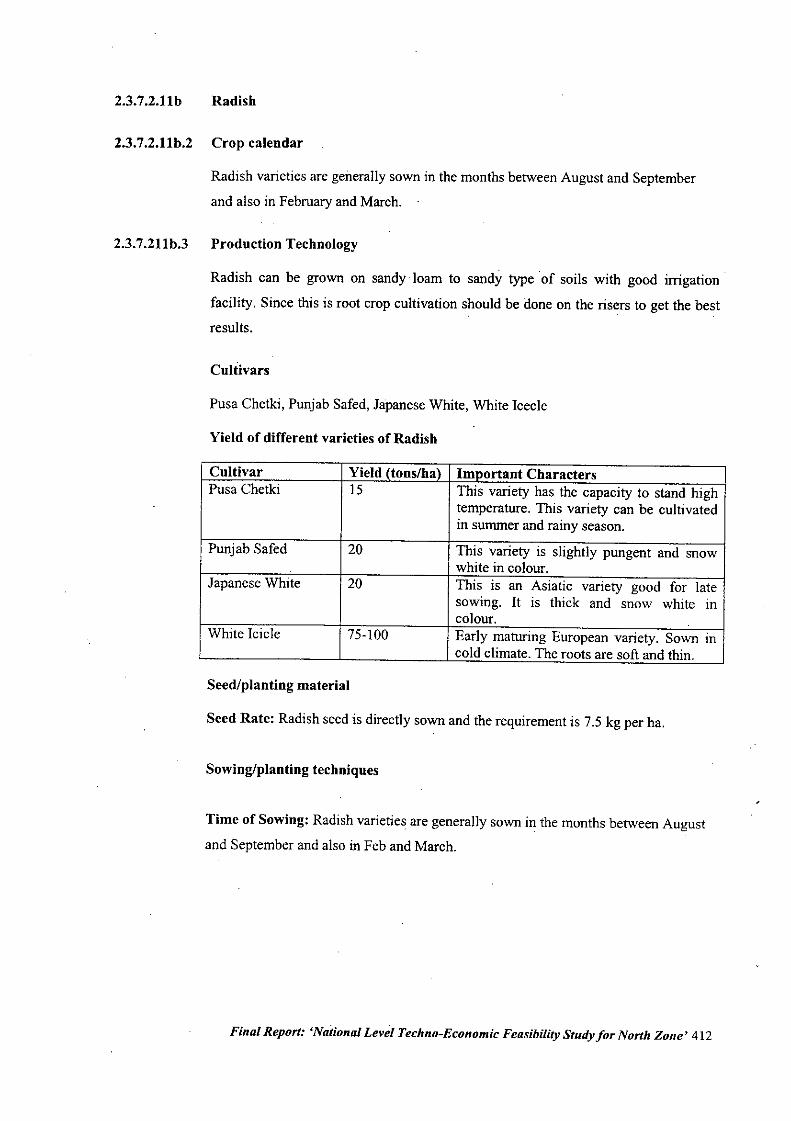
2.3.7.2.llb Radish
2.3.7.2.llb.2 Crop calendar
Radish varieties are generally sown in the months between August and September
and also in February and March.
2.3.7.211b.3 Production Technology
Radish can be grown on sandy loam to sandy type of soils with good irrigation
facility. Since this is root crop cultivation should be done on the risers to get the bestresults.
Cultivars
Pusa Chetki, Punjab Safed, Japanese White, White Icecle
Yield of different varieties of Radish
Cultivar Yield (tons/ha) Important CharactersPusa Chetki 15 This variety has the capacity to stand high
temperature. This variety can be cultivatedin summer and rainy season.
Punjab Safed 20 This variety is slightly pungent and snowwhite in colour.
Japanese White 20 This is an Asiatic variety good for latesowing. It is thick and snow white Incolour.
White Icicle 75-100 Early maturing European variety. Sown incold climate. The roots are soft and thin.
Seed/planting material
Seed Rate: Radish seed is directly sown and the requirement is 7.5 kg per ha.
Sowing/planting techniques
Time of Sowing: Radish varieties are generally sown in the months between Augustand September and also in Feb and March.
Final Report: 'Naiional Level Techno-Economic Feasibility Study for North Zone' 412
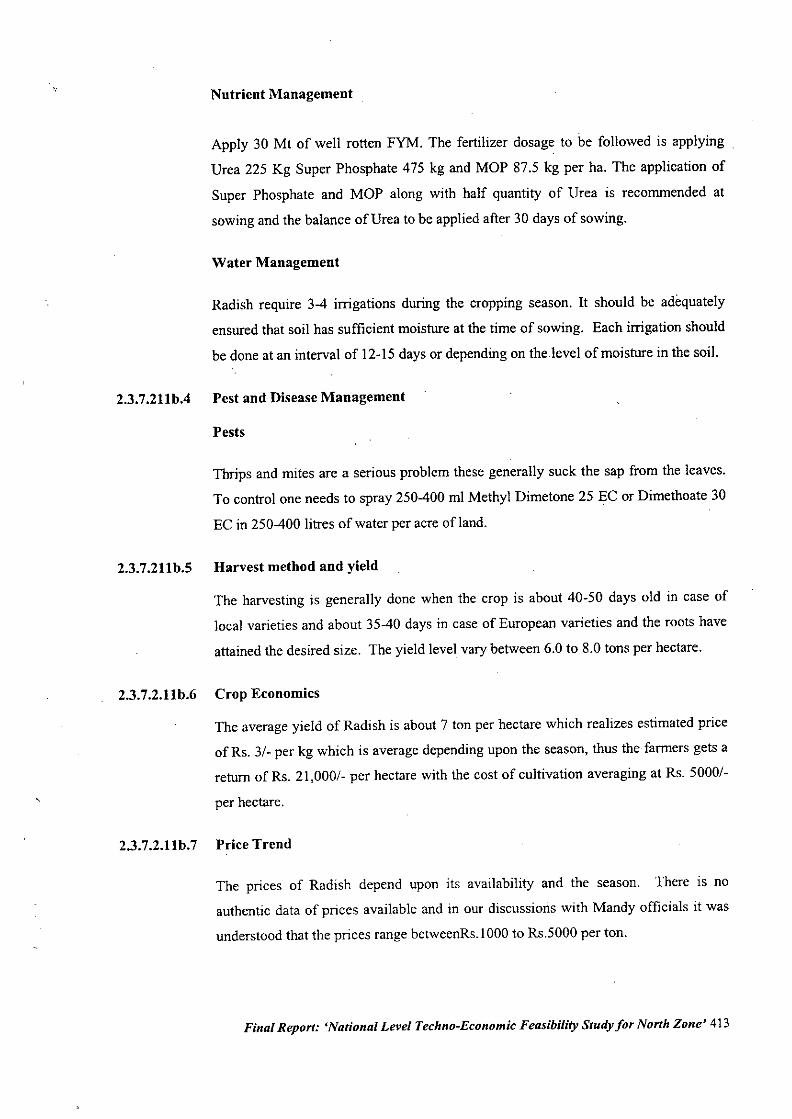
" Nutrient Management
Apply 30 Mt of well rotten FYM, The fertilizer dosage to be followed is applying
Urea 225 Kg Super Phosphate 475 kg and MOP 87.5 kg per ha, The application of
Super Phosphate and MOP along with half quantity of Urea is recommended at
sowing and the balance of Urea to be applied after 30 days of sowing,
Water Management
Radish require 3-4 irrigations during the cropping season, It should be adequately
ensured that soil has sufficient moisture at the time of sowing, Each irrigation should
be done at an interval of 12-15 days or depending on the level of moisture in the soiL
2.3.7.211bA Pest and Disease Management
Pests
Thrips and mites are a serious problem these generally suck the sap from the leaves,
To control one needs to spray 250-400 ml Methyl Dimetone 25 EC or Dimethoate 30
EC in 250-400 Iitres of water per acre of land,
2.3.7.211b.5 Harvest method and yield
The harvesting is generally done when the crop is about 40-50 days old in case of
local varieties and about 35-40 days in case of European varieties and the roots have
attained the desired size. The yield level vary between 6,0 to 8.0 tons per hectare,
2.3.7.2.11b.6 Crop Economics
The average yield of Radish is about 7 ton per hectare which realizes estimated price
ofRs. 3/- per kg which is average depending upon the season, thus the farmers gets a
return of Rs. 21,000/- per hectare with the cost of cultivation averaging at Rs. 5000/-
per hectare,
2.3.7.2.11b.7 Price Trend
The prices of Radish depend upon its availability and the season. There is no
authentic data of prices available and in our discussions with Mandy officials it was
understood that the prices range betweenRs.I 000 to RS.5000per ton,
Final Report: 'National Level Techno-Economic Feasibility Study for North Zone' 413
2.3.7.2.11b.8 Problems and constraints
There is a general problem of good quality authentic seeds being made available to
fanners. This needs to be redressed.
2.3.7.2.11b.9 Conclusions
The fluctuating prices needs to be addressed to as many a times the fanners run into
very high losses and hence desist from cultivating such crops. This trend needs to be
checked and corrective measures needed.
Final Report: 'National Level Techno-Economic Feasibility Study for North Zone' 414
,
2.3.7.5
2.3.7.5.1
2.3.7.5.2
2.3.7.5.3
2.3.7.5.3.1
2.3.7.5.3.2
2.3.7.5.3.3
Spice Crops
Large Cardamom
There is no area under cabbage within the state and hence not covered.
Small Cardamom
There is no area under cabbage within the state and hence not covered.
Coriander
Growth pattern over last decade
This is one of the most widely grown spice crop within the state. The area under this
crop has not been accounted for and hence the exact figures of area under cultivation
are not available.
Crop calendar
For leafYcrop the ideal sowing time is Oct to Dec and for seed production sowmg IS
recommended in November.
Production Technology
Cultivars
Namaul Selection, Pant Haritima, Hissar Anand.
Seed/planting material
Seed Rate: The seed rate recommended for coriander is about 10kgs per ha for seed
production purpose and 15kgs for leaf production.
Sowing/planting techniques
Sowiug Time: For leafy crop the ideal sowing time is October to December and for
seed production sowing is recommended in November.
MethOd of Sowing: It is recommended that the seed should be split into half before
sowingSpaciug: Planting should be done in rows 20-30 cms apart with plant to plant
distance of 20 cms.
Final Report: 'National Level Techno-Economic Feasibility Study for North Zone' 415
2.3.7.5.3.4
2.3.7.5.3.5
2.3.7.5.3.6
2.3.7.5.3.7
2.3.7.5.4
2.3.7.5.5
2.3.7.5.6
2.3.7.5.6.1
2.3.7.5.6.2
Nutrient management
About 8 MT of FYM should be along with 20 kg of Nitrogen and 20 kg phosporus.
Half the quantity of Nitrogen and whole of phosporus should be used as basal dose
and the balance of nitrogen 6-8 weeks of sowing.
Pest and disease Management
The major pest in coriander is the thrips, which suck the sap from the flowers and the
leaves. This can be controlled by spraying 120 ml cypermethin 10 EC in 200 litres of
water.
Harvest Method and Yield
A good crop gives seed yield of 10-14 qtl / ha.
Crop Economics
There is no authentic data on the crop economics.
Price Trend
There is no authentic data on the exact arrival and price trend in different markets of
the state.
Cumin
There is no area under cabbage within the state and hence not covered.
Fennel
There is no area under cabbage within the state and hence not covered.
Fenugreek
Growth pattern over last decade
The area under this crop has not been accounted for and hence the exact figures of
area under cultivation are not available.
Crop calendar
For leafy crop the ideal sowing time is Sept to Nov and for seed production sowing is
recommended in first fortnight of October.
Final Report: 'National Level Techno-Economic Feasibility Study for North Zone' 416
2.3.7.5.6.3
2.3.7.5.6.4
2.3.7.5.6.5
2.3.7.5.7
2.3.7.5.8
Production Technology
Cultivars
Pusa Early Bunching, Hissar Methi - 57 and Kasuri Methi.
Seed/planting materials
Seed Rate: The seed rate recommended for coriander is about 25 kg per ha for Kasuri
Methi the seed rate recommended is 7.5 kg per ha.
Sowing/planting techniques
Sowing Time: For leafy crop the ideal sowing time is Sept to Nov and for seed
production sowing is recommended in first fortnight of October.
Spacing: Planting should be done in rows 20-25 ems apart with plant-to-plant
distance of 10 ems.
Nutrient management
About 8 MT of FYM should be along with 25 kg of Nitrogen and 20 kg phosphorus.
Pest and disease Management
The major pest in Fenugreek is the mite, which suck the sap from the flowers and the
leaves. Spraying 300 ml Malathion 50 Ee in 200 litres of water can control this.
Harvesting method and yield
After every harvest irrigation should be done for regrowth. The yield level depends
on the number of cuttings taken.
Desi Methi - 28-32 qtls per acre for green leaves and seed 6-8 qtls per acre.
Kasuri Methi - 20-25 qtls per acre for green leaves and seed 2.5-3 qtls per acre.
Garlic
There is no area under Garlic within the state and hence not covered.
Ginger
There is no area under Ginger within the state and hence not covered.
Final Report: 'National Level Techno-Economic Feasibility Study for North Zone' 417
2.3.7.5.9
2.3.7.5.10
Pepper
There is no area under Pepper within the state and hence not covered.
Turmeric
There is no area under Turmeric within the state and hence not covered.
Final Report: 'National Level Techno-Economic Feasibility Study forNorth Zone' 418
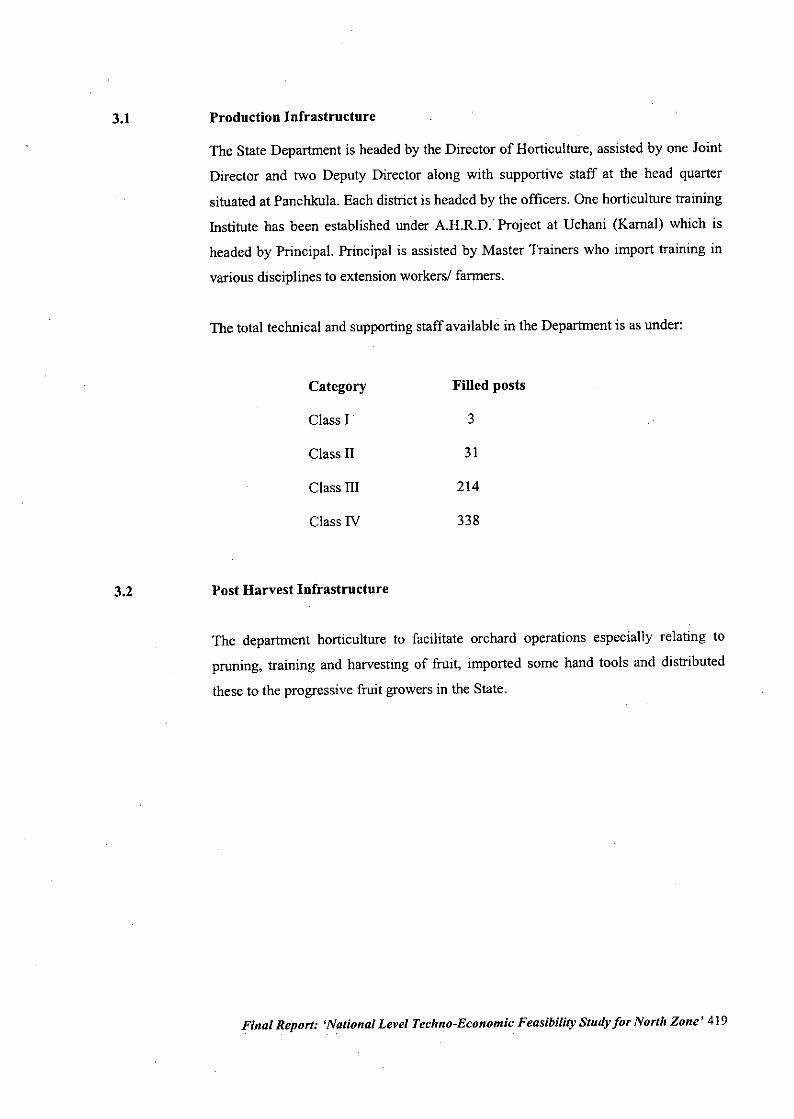
3.1 Production Infrastructure
The State Department is headed by the Director of Horticulture, assisted by one Joint
Director and two Deputy Director along with supportive staff at the head quarter
situated at Panchkula. Each district is headed by the officers. One horticulture training
Institute has been established under A.H.R.D. Project at Uchani (Kamal) which is
headed by Principal. Principal is assisted by Master Trainers who import training in
various disciplines to extension workers! farmers.
The total technical and supporting staff available in the Department is as under:
3.2
Category
Class 1 .
Class II
Class III
Class IV
Post Harvest Infrastructure
Filled posts
3
31
214
338
The department horticulture to facilitate orchard operations especially relating to
pruning, training and harvesting of fruit, imported some hand tools and distributed
these to the progressive fruit growers in the State.
Final Report: 'National Level Techno-Economic Feasibility Study for North Zone' 419
4.1
4.1.1
4.1.2
Central Research Institute in the State
Department of Horticulture, H.A.U., Hisar
Research priorities of the Department
I. Introduction, collection, characterization, conservation and evaluation of
horticultural biodiversity.
2. Geneticimprovement in fruit crops.
3. . Rapid multiplication of propagules of fruit crops.
4. Growth and development of horticultural crops under abiotic stresses.
5. Water management in fruit crops.
6. Development of different cropping systems in fruit crops.
7. . Integrated nutrient management and organic cultivation of fruit crops.
8. Development of planting models in fruit crops of arid and semi arid
ecosystem.
9. Develop technologies for better shelflife of horticultural crops.
10. Integrated .diseasemanagement in fruit crops.
Thrust areas of the Department
I. To introduce, collect, characterize, conserve and evaluate the biodiversity of
fruit crops under semi arid environment.
2. To utilize the available biodiversity and improve the target fruit crops such as
ber, aonla, guava, citrus fruits miscellaneous fruit crops and flower crops to
develop high quality and productive types having tolerance to biotic and abiotic
stresses.
3. To study the factors related to rapid multiplication of propagules in case of
established as well as new crops and problems related to their growth and
development.
4. To standardize agro-techniques with respect to efficient use of soul, water and
nutrients for increased productivity.
5. To standardize the technology of organic farming for fruit crops.
6. To standardize the intercropping systems in different fruit crops.
7. To develop post harvest technology package for extended use of the
Horticulture produce.
8. To develop integrated disease and pest management technologies for fruit
crops.
Final Report: 'National Level Techno-Economic Feasibility Study for North Zone' 420
4.1.3 Major achievements
Crop Improvement
I. In the development of appropriate citrus rootstocks, .F I seedlings were
maintained for further assessment. Ten new type of hybrids fruits have been
developed as a root stock resistant to citrus decline.
2. The chromosome number in cultivars urnran, kathaphal and four cvs. Of Gola
group viz. Gola Gurgaon No.3, Bahadurgarhia Gola, Dandan Gola and Kakrola
Gola was fount to be 2n= 48. The chromosome number in IlIaichi and three
wild forms viz. Desi-I, Desi-2, Desi-3, was noted as 2n-96, whereas in Jharber
it was 2n=72 Palynological investigations revealed that all species are
morphologically same and apeture of the pollen was 3- colporate. The size of
pollen was maximum (29.52 x 27.48 u) in Desi-I and minimum (19.32 x 18.42
u) in Kathaphal.
3. EMS gave dark green foliage and more height to the plant whereas colchicine
reduced the internodal length. The rooted plants of Jodhpur Red and Ganesh
were shifted to field for further observations.
4. The efforts have been. made to develop the protocol for in vitro clonal
multiplication of Lilium cv. Brunello, Dreamland and Prato. Bulb scale
explants have been found better as compared to shoot tip, leaf base and nodal
segments cultured on MS media. Work has been made to standardize the
method of transformation oflilium.
Crop Production
1. The number of panicles and total number of flowers increased with cultar
(Paclabutrazol) at 1000 and 2000 ppm in mango. The yield was also recorded
maximum with these treatments.
2. In aonla, bare rooted seedling treated with IDA 200 ppm showed more survival
percentage as compared to NAA 200 ppm. Seedling transplanted just after
uprooting from the nursery gave more success followed by time gap 24 hrs, 48
hrs and 72 hrs after taking from nursery.3. Percentage of success ofneneer grafting in mango was in July to September as
compared to the rest of the more moth of the year. Epicotyl grafting in manor
under Hisar condition is not successful.
4. Nitrogen experiment carried out to improve the yield and quality of citrus
species sweet orange (Jaffa) and mandarin (Kinnow) showed that addition of
Final Report: 'National Level Techno-Economic Feasibility Study for North Zone' 421
800 g N in Jaffa and 900 g N per plant in kinnow resulted in good growth,
higher number of fruits, higher juice and TSS in 5th year of bearing.
5. In an integrated nutrient management experiment on equal N basis in citrus cv.
Blood Red, there was almost same increase in growth (height and spread) in
treatments, where urea N was applied alone or in combination with 25 or 50%
N through F.Y.M. Increase in growth was minimum when whole N was applied
through F.Y.M.
6. It has been observed that in young orchards, cotton combined with cowpea in
kharid whereas mustard in rainy season can easily be taken as intercrops.
However, such crops can not be taken in the bearing orchard because of effect
and nutritional competition.
7. Phosphorous application @ 200 g P20S along with 500 g N per tree was found
optimum in terms of fruit retention, yield and quality of ber cv. Umran and
Gola.
8. There was a 50% decrement in plant height, plant girth and spread in sapota
when salinity from control to 15 dSm" ECe.
9. Guava seedlings and pomegranate cv. Jodhpur Red have been well established
in naturally occurring salt affected soil at the experimental orchard. Plant
height, girth, spread (EW) and spread (NS) in guava were maximum i.e 230.7,
17.6,217.6 and 210.5 cm, respectively, in normal good soil with polythene
lining and sand layer at bottom followed by heavy leached saline soil with
polythene lining and sand layer at the bottom i.e 212.5, 16.1, 190.8 and 181.2
cm, respectively. Similarly, in pomergranate also the plant height, girth, spread
(EW) and spread (NS) were maximum i.e. 227.6, 14.6, 146.6 and 161.5 cm,
respectively in normal good soil with polythene lining and sand layer at bottom
followed by heavy leached saline soil with polythene lining and sand layer at
the bottom i.e. 189.5, 12.8, 124.8 and 141.0 cm, respectively.
10. Karonda plants could be survive at 12, 16 and 20 dSm,1 Ece. Growth of the
plants reduced with increasing salinity1evel upto 8 dSm,1ECe.
II. The experiment of the effect of soil salinity on growth and development of
kinnow could not be successfully done because of heavy mortality of the
kinnow plants to see the effect of different sources of organic manures on
growth, yield and quality of marigold, cultivar, African Giant. The performance
of poultry manure with respect to growth, yield and quality of marigold was
judged the best followed by vermin compost and FYM. Neem cake was not
found much effective. All organic sources were found superior to organic
fertilizer urea.
Final Report: 'National Level Techno-Economic Feasibility Study for North Zone' 422
•
12. The studies on guava'wilt showed the presence of Fusarium and Pencillium in
wilted and healthy plants. Soil drenching of 30 g each of Bavistin, Blitox,
Captan and Redomil and injection of the solution containing 3 g of Bavistin,
Furadan, Streptocycline and 3 ml of m.onocrotophosper litre, the application of
micronutrient, gypsum, cytokinin, and GA could not stop the process of
wilting.
Post harvest technology
I. Different thickness of polythene was effective to reduce PLW of kinnow fruit
on all period of storage as compared to control. Minimum PLWand least
microbial decay were observed when the kinnow fruits were packed in 150
gauze polythene with leaf extract (1.72%) as compared to 18.85% in control
after 70 days of storage. All the polythene was effective to reduce the PLW up
to 77 days of storage but not the microbial decay as compared to control.
2. None of the bioextract was effective to check the PLW and microbial decay
during the storage of kinnow fruits. However, minimum PLW was observed in
the control fruits (10.70%) after 35 days of storage.
3. All the polythene was effective to reduce the physiological loss in weight of
guava fruit. However, rough polythene packed guava fruits among all the
polythenes had highest PLW (7.16%) whereas, maximum physiological loss in
weight was observed in the fruits packed in news paper. The decay loss was
also highest in the newspaper packed fruit (13.7%) after 6 days of storage.
4. The growth regulator such as GA, and kinetin @ 50 and 100 ppm were
effective to check the physiological loss in weight of guava cultivars L-49
(Sardar) in the beginning.of storage period up to 2nd days. However, in the later
period the storage of all the treatments were at par with control. The ripening
percent was reduced with the application of growth regulators.
5. The best quality dry flowers were obtained by embedding the fresh flowers in
silica gel kept in hot air oven at a temperature of 50GC for 48 hrs followed by
25:75: river sand; silical gel at the same temperature and duration. The second
media results in 25% reduction in the cost of media as compared to silica gel
alone.6. The guava pulp extracted by cold extraction had better color and organoleptic
quality. The RTS prepared from cold extracted pulp was found better
irrespective of varieties. The browning was observed minimum in L-49 and
maximum in Hisar Safeda.
Final Report: 'National Level Techno-Economic Feasibility Study for North Zone' 423
4.2
4.2.1
Plasticulture
1. The germination percentage of cauliflower was highest in 75% shade house
(78.2-85.5) followed by 50% shade house (70.0-74.5) and lowest in open (45.2-
.65.1) when nursery was raised in June and July months.
2. The germination percentage of bottlegourd was highest in polyhouse (80-90)
followed by low tunnel (72.5-80.0) and lowest in open (55-70). The days taken
for emergence were also less in polyhouse and low tunnel as compared to open.
The plant length was also more in polyhouse and low tunnel.
3. The fruit yield of capsicum was higher in polyhouse yield 255 gm as compared
to 145 gm per plant when gown in open.
Major constraints in researcb on fruits
I. Inadequate availability of true to type, healthy, plant material of superior
cultivars of fruit crops.
2. Large treats oflow and unproductive plantation need rejuvenation
3. Low productivity of fruit crops due to inferior genetic stocks and poor
management
4. Problems of salinity and water lodging in fruit crops.
5. Several chronoic production problems such as alternate bearing and
malformation in mango, guava and sapota wilt and citrus decline etc..
6. High incidence of pests and diseases
7. Heavy post harvest losses and low utilization on the processing sector
8. Acute shortage of infrastructure for post harvest processing, transport etc.
9. Unorganized marketing
10. Inadequate information about the economics of fruit crop.
Krisbi Vigyan Kendras in Haryana
There are twelve K.V.Ks in the state, eight are with H.A.U. Hisar, One with NDRI,
Kamal, one with Indian Agric. Research Institute, New Delhi and two with N.GDS.
The details of these KVKs and thrust areas are as follows.
NARPZONE-l
Kaithal, Panipat, Kamal, Kurukshetra, Sonipat, Ambala and Yamunanagar.
Final Report: 'National Level Techno-Economic Feasibility Study for North Zone' 424
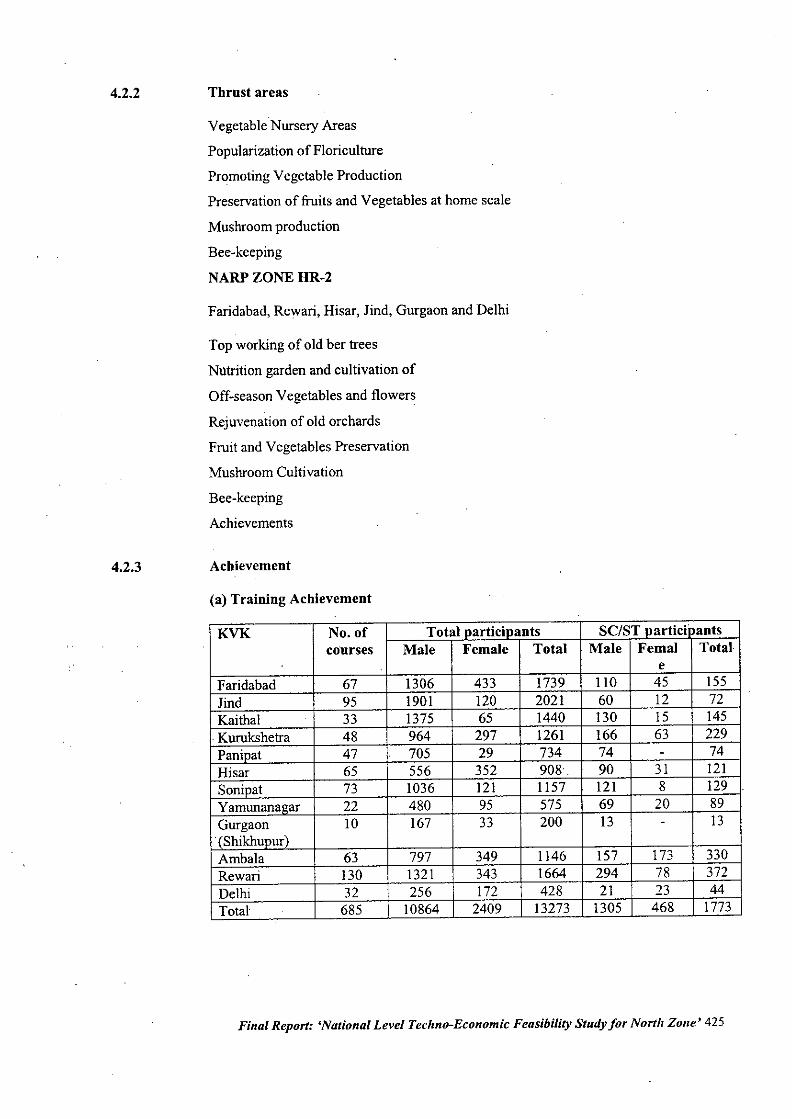
4.2.2 Thrust areas
Vegetable Nursery Areas
Popularization of Floriculture
Promoting Vegetable Production
Preservation of fruits and Vegetables at home scale
Mushroom production
Bee-keeping
NARP ZONE HR-2
Faridabad, Rewari, Hisar, Jind, Gurgaon and Delhi
Top working of old ber trees
Nutrition garden and cultivation of
Off-season Vegetables and flowers
Rejuvenation of old orchards
Fruit and Vegetables Preservation
Mushroom Cultivation
Bee-keeping
Achievements
4.2.3 Achievement
(a) Training Achievement
KVK No. of Total participants SC/ST partici antscourses Male Female Total Male Femal Total
eFaridabad 67 1306 433 1739 110 45 155Jind 95 1901 120 2021 60 12 72Kaithal 33 1375 65 1440 130 15 145Kurukshetra 48 964 297 1261 166 63 229Paninat 47 705 29 734 74 - 74Hisar 65 556 352 908. 90 31 121Sonipat 73 1036 121 1157 121 8 129Yamunanagar 22 480 95 575 69 20 89Gurgaon 10 167 33 200 13 - 13(Shikhupur)Ambala 63 797 349 1146 157 173 330Rewari 130 1321 343 1664 294 78 372Delhi 32 256 172 428 21 ?3 44Total 685 10864 2409 13273 1305 468 1773
Final Report: 'National Level Techno-Economic Feasibility Study for North Zone' 425
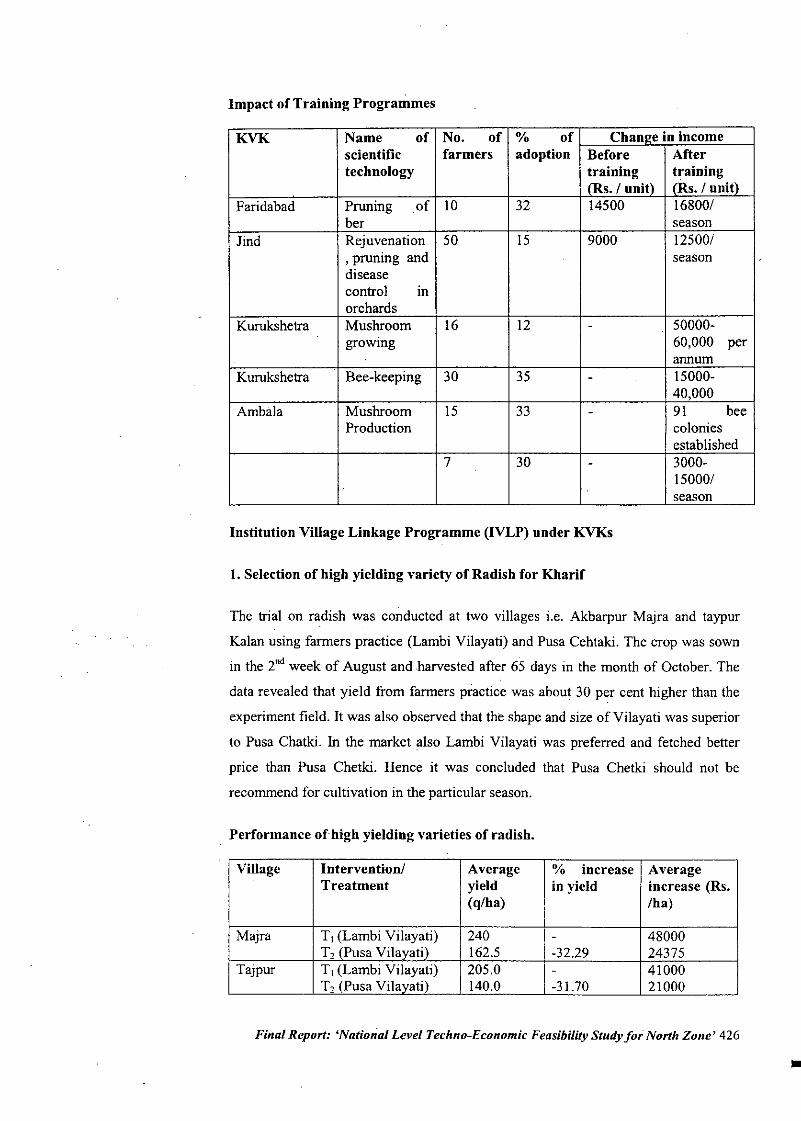
Impact of Training Programmes
KVK Name of No. of % of Chanl'e in incomescientific farmers adoption Before Aftertechnology training training
IRs. 1 unit) IRs. 1unit)Faridabad Pruning of 10 32 14500 168001
ber seasonlind Rejuvenation 50 15 9000 125001
, pruning and seasondiseasecontrol morchards
Kurukshetra Mushroom 16 12 - 50000-growmg 60,000 per
I annumKurukshetra Bee-keeping 30 35 - 15000-
40,000Ambala Mushroom 15 33 - 91 bee
Production coloniesestablished
7 30 - 3000-150001season
Institution Village Linkage Programme (IVLP) under KVKs
1. Selection of high yielding variety of Radish for Kharif
The trial on radish was conducted at two villages i.e. Akbarpur Majra and taypur
Kalan using farmers practice (Lambi Vilayati) and Pusa Cehtaki. The crop was sown
in the 2nd week of August and harvested after 65 days in the month of October. The
data revealed that yield from farmers practice was about 30 per cent higher than the
experiment field. It was also observed that the shape and size of Vilayati was superior
to Pusa Chatki. In the market also Lambi Vilayati was preferred and fetched better
price than Pusa Chetki. Hence it was concluded that Pusa Chetki should not be
recommend for cultivation in the particular season.
Performance of high yielding varieties of radish.
Village Intervention! Average % increase AverageTreatment yield in yield increase (Rs.
(q/ha) Iha)
Majra T, (Lambi Vilayati) 240 - 48000T2 (Pusa Vilavati\ 162.5 -32.29 24375
Tajpur T, (Lambi Vilayati) 205.0 - 41000T2 (Pusa Vilavati\ 140.0 -31.70 21000
Final Report: 'National Level Techno-Economic Feasibility Study fo': North Zone' 426
•
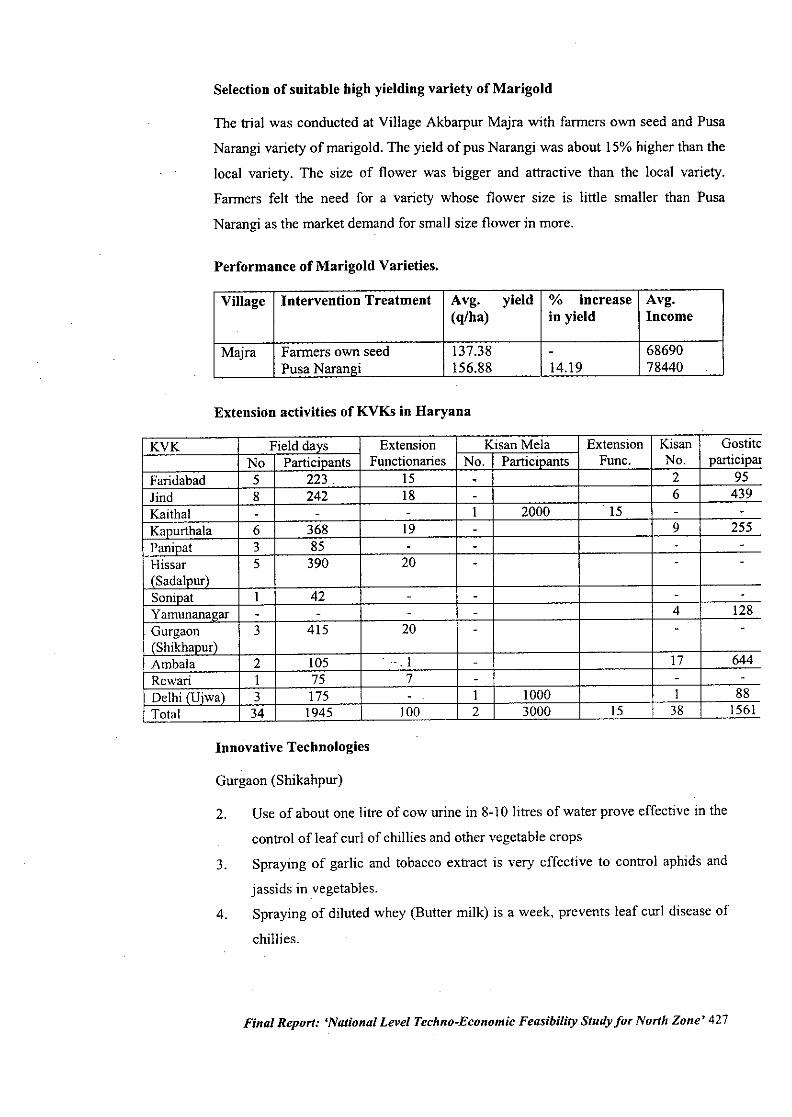
Selection of suitable high yielding variety of Marigold
The trial was conducted at Village Akbarpur Majra with farmers own seed and rusa
Narangi variety of marigold. The yield of pus Narangi was about 15% higher than the
local variety. The size of flower was bigger and attractive than the local variety.
Farmers felt the need for a variety whose flower size is little smaller than rusa
Narangi as the market demand for small size flower in more.
Performauce of Marigold Varieties.
Village Intervention Treatment Avg. yield % increase Avg.(q/ha) in yield Income
Majra Farmers own seed 137.38 - 68690rusa Narangi 156.88 14.19 78440
Extension activities of KVKs in Haryana
KVK Field davs Extension Kisan Mela Extension Kisan GostitcNo Particinants Functionaries No. Particinants Func. No. particip'"
Faridabad 5 223. 15 - 2 95lind 8 242 18 - 6 439Kaithal - - - I 2000 15 - -Kapurthala 6 368 19 - 9 255Paninat 3 85 - - - -Hissar 5 390 20 - - -(Sadalnur)Soninat I 42 - - - -Yamunanagar - - - - 4 128Gurgaon 3 415 20 - - -(Shikhanur)Ambala 2 105 . ". 1 - 17 644Rewari 1 75 7 - - -Delhi (Uiwa) 3 175 - 1 1000 I 88Total 34 1945 100 2 3000 15 38 1561
Innovative Technologies
Gurgaon (Shikahpur)
2. Use of about one litre of cow urine in 8-10 litres of water prove effective in the
control of leaf curl of chillies and other vegetable crops
3. Spraying of garlic and tobacco extract is very effective to control aphids and
jassids in vegetables.
4. Spraying of diluted whey (Butter milk) is a week, prevents leaf curl disease of
chillies.
Final Report: 'National Level Techno-Economic Feasibility Study for North Zone' 427
SONIPAT
I. Intercropping of marigold with radish and
2. Intercropping of dhaincha with sponge gourd brinjal results in quality vegetable
produce.
AMBALA
Leaves of date-Palm- Three to four leaves of date palm are fixed around the
samplings of fruit trees to protect the young plants from animals damage.
Final Report: 'National Level Techno-Economic Feasibility Study for North Zone' 428
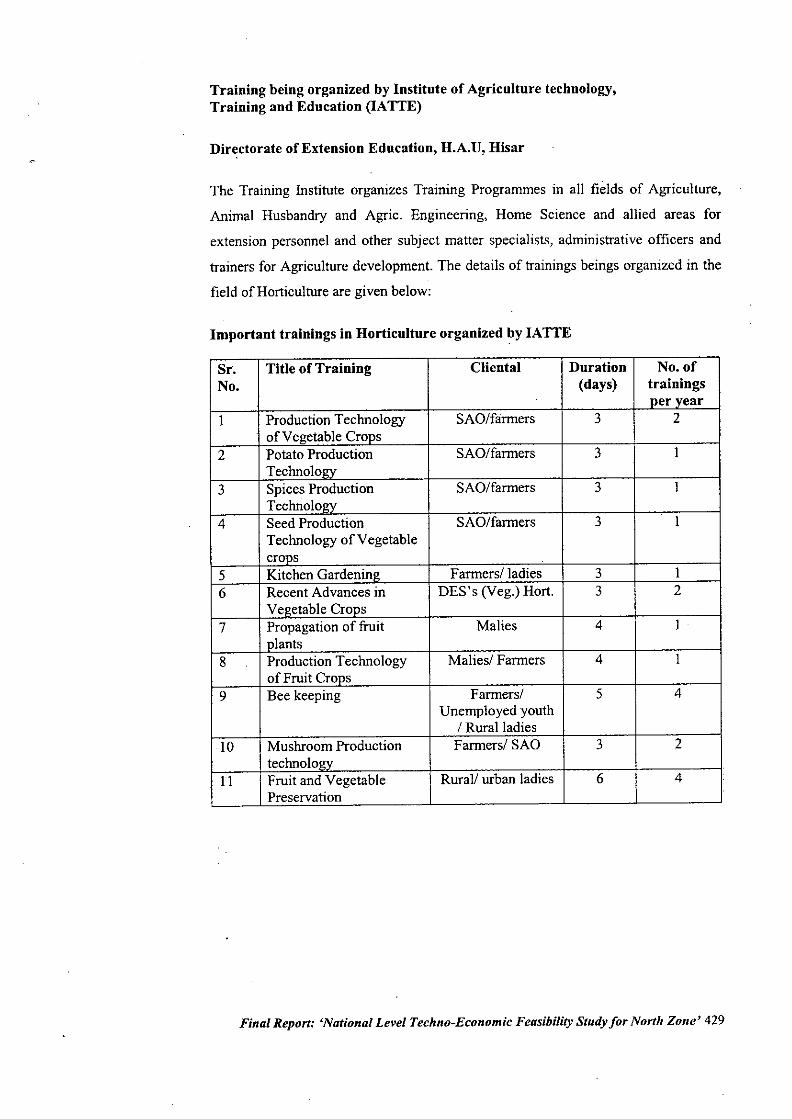
Training being organized by Institute of Agriculture techuology,Training and Education (IA TTE)
Directorate of Extension Education, H.A.V, Hisar
The Training Institute organizes Training Programmes in all fields of Agriculture,
Animal Husbandry and Agric. Engineering, Home Science and allied areas for
extension personnel and other subject matter specialists, administrative officers and
trainers for Agriculture development. The details of trainings beings organized in the
field of Horticulture are given below:
Important trainings in Horticulture organized by IATTE
Sr. Title of Training Cliental Duration No. ofNo. (days) trainings
Der yearI Production Technology SAO/farmers 3 2
of Vegetable CroDs2 Potato Production SAO/farmers 3 I
Technolol!V3 Spices Production SAO/farmers 3 I
Technolol!V4 Seed Production SAO/farmers 3 I
Technology of Vegetablecroos
5 Kitchen Gardeninl! Farmers/ ladies 3 I6 Recent Advances in DES's (Veg.) Hort. 3 2
Vegetable Croos7 Propagation of fruit Malies 4 I
olants8 Production Technology Malies/ Farmers 4 I
of Fruit Croos9 Bee keeping Farmers/ 5 4
Unemployed youth/ Rural ladies
10 Mushroom Production Farmers/ SAO 3 2technolol!V
II Fruit and Vegetable Rural/ urban ladies 6 4Preservation
Final Report: 'National Level Techno-Economic Feasibility Study for North Zone' 429
4.3 State AgriculturelHorticulture Universities
HS-IOI, H-102 and Hisar Lalit
PH-4, Hisar Shymal, Hisar Pragati
Hisar-I
Hisar Shakti and Hisar Vijay
Hisar Anand
Hisar Kirti
Hisar Sonali
Kamal Selection
Varsha Uphar, Hisar Unnat
Hisar-2
Hisar Kalitori
Coriander
Dolichos
Fenugreek
Longmelon
Okra
Onion
Ridgegourd
Tomato
Vegetable varieties released by University and popularized by University
Extension work
Brinjal
Cauliflower
Chilli
Varieties of vegetables tested in Coordinated projects.
Brinjal
Coriander
Fennel
Garlic
Hisar Jamuni
DH-36
HF'33, HF-39
HG-17,HG 19
Final Report: 'National Level Techno-Economic Feasibility Study for North Zone' 430
J
4.44.4.1
Department of Borticulture Baryana, Panchcula
Name of Station, location and manpower
The State Department is headed by the Director of Horticulture, assisted by one Joint
Director and two Deputy Director along with supportive staff at the head quarter
situated at PanchkiIla. Each district is headed by the officers. One horticulture'training
Institute has been established under A.H.R.D. Project at Uchani (Kamal) which is
headed by Principal. Principal is assisted by Master Trainers who import training in
various disciplines to extension workers! farmers.
The total technical and supporting staff available in the Department is as under:,
4.4.2
Category
Class I
Class II
ClassID
Class IV
Thrust areas
1. Area expansion
Filled posts
3
31
214
338
To activate this the department has planned to lay stress on (a) to create awareness
about the importance and economics of growing late cultural crops (b) Arrangement
of quality planting material, certified and hybrid seeds (c) Field demonstration on
horticultural crops (d) Popularizing drip irrigation.
2. Increasing productivity
(b) Introduction of high yielding varieties (b) Field trainings on training and pruning
of fruit plants (c) Qualitative upgradation of fruit plant nurseries and vegetable
seed farms.
3. Quality improvement
(a) Use of sulphate of Potash and C.A.N in Mango, grapes and other fruits and
vegetables to check chloride toxicity and improve quality.
Final Report: 'National Level Techno-Economic Feasibility Study for North Zone' 431
4.3.3
4. Generation of more income
(a) Introduction of new crops like strawberry, banana, aonla, aronate and medicinal
plants and exotic vegetables (b) cultivation of ginger and turmeric in Momi area of
Panchkula district (b) High value of vegetable seeds to be popularized by providing
25% subsidy on such seeds. (c) growing of off-season vegetable in poly-green houses.
5. Establishment of agro bases industries and employment generation
Clusters of various crops like fruits, vegetables, flowers, mushrooms and spices will
be identified and developed to establish agro based industries to generate more
employm~nt opportunities for rural masses.
6. Improvement of Nutritional status of Rural Masses
Fruit plants, vegetable seed minikits with Rs. 250 (Rs. 150/- for fruit plants and Rs.
100 for vegetable seeds) will be distributed under nutritional garden scheme to
improve the nutritional status of rural masses.
7. . Steps to check incidence of mango malformation
Mango malformation is a serious problem in the state. To over come this problem
special.companies to be launched in collaboration with H.A.U scientists in mango
growing districts of Ambala, Panchkula, Yamunagar, Kurukshetra, Kamal, Panipat
and Jind to minimize the effect of this disease.
Achievements of the Department of Horticulture
Nursery Production programme
For planting an annually, there is a requirement of approximately 3, 50, 000 fruit
plants. These are 25 Gov!. garden and Nurseries in the state to propagate fruit plants.
These nurseries have the capacity to produce 3.50 lakh plants- the registered private
nurseries are estimated to produce an equal number of nursery plants. Hence, the state
is quite will placed on this account. 1540 ha area under fruits has been uprooted up to
the year 2001-02.
Final Report: 'National Level Techno-Economic Feasibility Study for North Zone' 432

District Addl.Area Cumulative area ProductionPanchkula 167 . 3118 14645Amba1a 218 2522 20620Yamunanagar 305 4459 36216Kurukshetra 100 1539 10475Kaitha1 50 693 3858Kamal 120 1421 10700Panipat 74 1056 5800Sonipat 100 1739 10626Rothtak 50 1016 6111Faridabad 75 1093 10020Narmaul 80 670 5455Rewari 50 485 1892Gurgaon 142 1751 14908 .Bhiwani 88 1081 6441Hissar 108 2265 14930Sirsa 185 3732 37860lind 94 1299 11213Jhaiiar 61 539 5523Fatehabad 75 1102 7907Total 2140 31317 235200
The district wise achievements in fruit production for the year 2001-02 are asunder:
Table 55: Nursery wise income achievement for the year 2001-02
Name of Nursery Achievements forthe year 2001-02 (Rs.)
Piniore 969624FatehpUf 462834NabiPUf 613262Chhacchroli 463580Ratgal 410202Ladwa 464665Ram Nagar 431000Gharonda 687618Uchani 92180Sewakheri 250086Panchil!Viran 176134Cheeka 268100Pinangwan 269037Gurgaon 104200
Hansi 311818
Mayor. 381812
Barwa1a 452480
Bhuna 169925
lind 199424Kishanpura 1602210
Sirsa 61750Mane:iana 383747
Hodel 95430Shamgarh 591724
Final Report: 'National Level Techno-Economic Feasibility Study for North Zone' 433
Achievements under allied Extension Activities
Narne of district AchievementTop ranking I Training I Area sprayedbuddinl' Pruninl!
Ambala 7200 10000 4600Panchkula 1600 15000 8380Yamunana"ar 18700 19945 24835Kurukshetra 12239 9640 12247Kaithal 8000 9000 6575Kamal 16000 13615 19265Paniuat 9000 7200 7000Somoat 10850 8740 20192Rohtak 3150 5420 9780Faridabad 9760 14400 1100Narnanil 2670 4500 2800Rewan 2120 4000 2550Gumaon. 9100 18560 1620Bhiwani 3200 12500 4500Hisar 13000 28000 14000Sirsa 13000 24600 8050Jind 11000 11600 12000Jhaiian 4760 4420 8560Fatehabad 6500 30000 7050Total 178248 253139 177103Drip Irrigation
The department is popularized drip inigation since 1991-92. By the end of 2000-01
the total cumulative area under drip irrigation was 2700 hectares which was increased
to 2891 during 2001-02.
, Green House
Green house technology is. highly effective for the production of off-season
vegetables and flowers. A total of 177 green houses have been established till the end
of2001-02.
Horticulture credit
In the state rural development Banks and Commercial Banks are making the
Horticultural credit available to the farmers. The amount of Horticulture and credit
disbursed by the state rural development Banks during the year 2001-02 is gIVen
below.
Cropwise horticulture credit provided iu the State
Sr. No. Particulars Credit fRs. in lakhsl1 Beri Guava! Aonla 5.042 Medicinal plants 3.153 Graues 10.904 Floriculture 34.765 Strawberry 22.936 . Mushroom 154.52
i Total 231.30
Final Report: 'National Level Techno-Economic Feasibility Study/or North Zone' 434
•
6 Marketing.
The price trend of last five years in Delhi wholesale market clearly indicates that mango has
most constant prices during last five years. The increase over wholesale and retail price has
changed by 2 and I percent only. Overall percentage of price rise in fruits is 14.25 percent
with annual increase of 2.8 percent while in vegetables increase over last five years is 10.1
percent with annual increase of 2 percent, which clearly shows that during last five years there
is only marginal increase in wholesale price except cabbage and cauliflower where wholesale
price has decreased by 8 and 32 percent.
The overall picture of important fruits and vegetable wholesale and retail prices in Delhi are
given in table -
The percentage of fruits arrival amongst the metro market shows that 58.4 percent comes in
Delhi while Chennai 5.3, Banglore 8.6, Mumbai 15.7 and Calcutta accounts for 12 percent
while share of vegetables in 38.4,10.9,10.1,22.6 and 18percent. The overall picture of fruits
and vegetables in the metro is that Delhi market handles 48.4 percent which is almost 50
percent and rest four metro markets arrival in 51.6 percent. The detail is given in table:-
Final Report: 'National Level Techno-Economic Feasibility Study for North Zone' 435
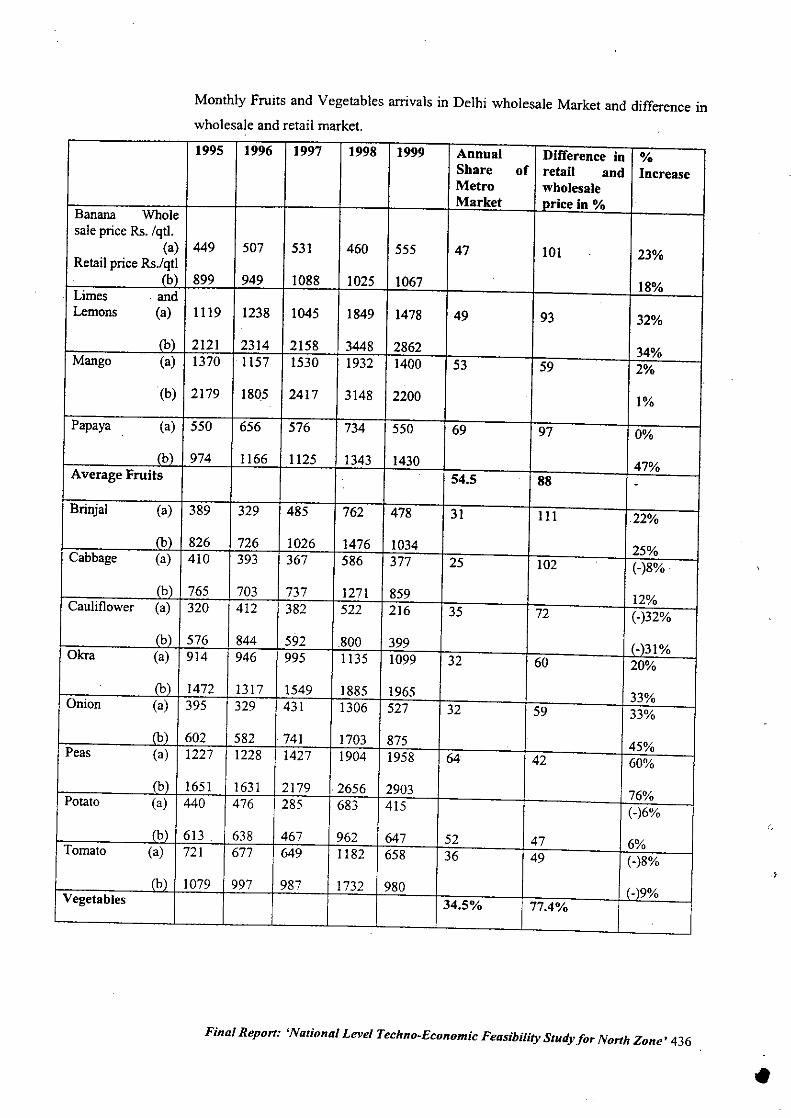
Monthly Fruits and Vegetables anivals in Delhi wholesale Market and difference in
wholesale and retail market.
1995 1996 1997 1998 1999 Annual Difference in %Share of retail and IncreaseMetro wholesaleMarket price in %
Banana Wholesale price Rs. Iqtl.
(a) 449 507 531 460 555 47 101 23%Retail price Rs.lqtl. (b) 899 949 1088 1025 1067 18%Limes . andLemons (a) 1119 1238 1045 1849 1478 49 93 32%
.
(b) 2121 2314 2158 3448 2862 34%Mango (a) 1370 1157 1530 1932 1400 53 59 2%
(b) 2179 18Q5 2417 3148 2200 1%
Papaya (a) 550 656 576 734 550 69 97 0%
(b) 974 1166 1125 1343 1430 47%Average Fruits 54.5 88 -Brinjal (a) 389 329 485 762 478 31 111 22%
(b) 826 726 1026 1476 1034 25%Cabbage (a) 410 393 367 586 377 25 102 (-)8%
(b) 765 703 737 1271 859 12%Cauliflower (a) 320 412 382 522 216 35 72 (-)32%
(b) 576 844 592 .800 399I (-)31%Okra (a) 914 946 995 1135 1099 32 60 20%
(b) 1472 1317 1549 1885 1965 33%Onion (a) 395 329 431 1306 527 32 59 33%
(b) 602 582 741 1703 875 45%Peas (a) 1227 1228 1427 1904 1958 64 42 60%
(b) 1651 1631 2179 2656 2903 76%Potato (a) 440 476 285 683 415 (-)6%
(b) 613 . 638 467 962 647 52 47 6%Tomato (a) 721 677 649 1182 658 36 49 (-)8%
(b) 1079 997 987 1732 980 (-)9%Vegetables 34.5% 77.4%
Final Report: 'National Level Techno-Economic Feasibility Study for North Zone' 436
. ,
•
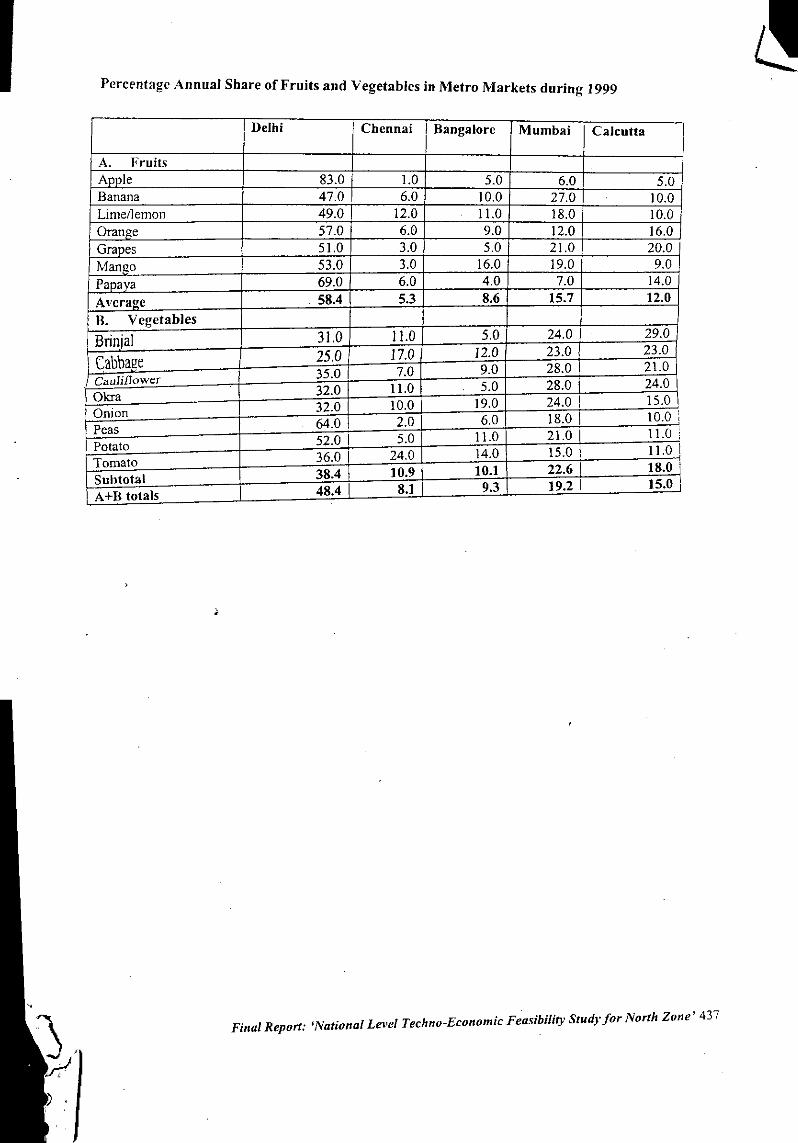
Percentage Annual Share of Fruits and Vegetables in Metro Markets during 1999
I Delhi Chennai I Bangalore Mumbai Calcutta 1A. FruitsApple 83.0 1.0 5.0Banana
6.0 5.047.0 6.0
LimelJemon10.0 27.0 . 10.0
49.0 12.0OranQe
. 11.0 18.0 10.057.0 6.0 9.0 12.0 I
GraDes 51.016.0
Mango3.0 5.0 21.0 20.0
53.0 3.0 16.0 19.0PaDaya
9.069.0 6.0 4.0 7.0 14.0
Avera!'e 58.4 5.3 8.6 15.7 12.0
B. Vegetables
BrinjaJ 31.0 11.0 5.0 24.0 I . 29.0
(,abbage 25.0 17.0 12.0 23.0 23.0
Cauliflower 35.0 7.0 9.0 28.0 21.0
Okra 32.0 11.0 5.0 28.0 24.0
Onion 32.0 10.0 19.0 24.0 15.0
Peas . 64.0 I 2.0 6.0 18.0 I 10.0
Potato 52.0 I 5.0 11.0 21.0 I 11.0
Tomato 36.0 24.0 14.0 15.0 I 11.0 I
Subtotal I 38.4 10.9 10.1 22.6 I 18.01
A+B totals I 48.4 8.1 9.3 19.2 15.01
Final Report: 'National Level Techno-Economic Feasibility Study/or North Zone' 437
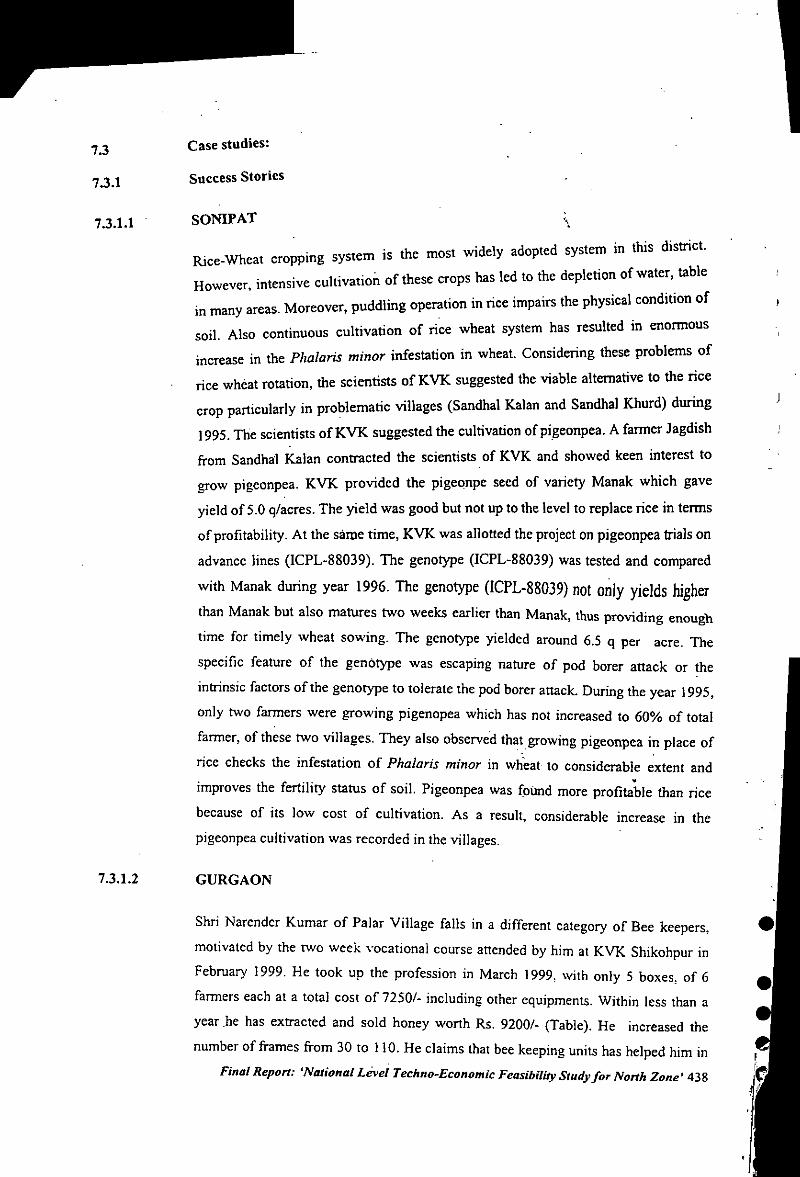
7.3 Case studies:
7.3.1 Success Stories
7.3.1.1 SONIPAT \
7.3.1.2
. system is the most widely adopted system m this district.Rice-Wheat croppmg blHowever, intensive cultivation of these crops has led to the depletio~ of water,. ta e
M Puddling operation in rice impairs the phYSicalcondItion ofin many areas. oreover,. . cultivation of ri~e wheat system has resulted in enormouSSOlI.Also continuous
. . th PI alaris minor infestation in wheat. Considering these problems ofIncrease In e 1 .
. h' t tan'on the scientists of KVK suggested the viable alternative to the ncenee w ea TO ,
crop particularly in problematic villages (Sandhal Kalan and Sandhal Khurd) duri.ng
1995.The scientists ofKVK suggested the cultivation ofpi,geonpea. A farmer Jagdlsh
fr Sandhal Kalan contracted the scientists of KVK and showed keen interest toom .grow pigeonpea. KVK provided the pigeonpe seed of variety Manak which gave
yield of 5.0 q/~cres.The yield was good but not up to the level to replace rice in terms
of profitability. At the sante time, KVK was allotted the project on pigeonpea trials on
advance lines (lCPL-88039). The genotype (ICPL-88039) was tested and compared
with Manak during year 1996. The genotype (ICPL-88039) not only yields higherthan Manak but also matures two weeks earlier than Manak, thus providing enougb
time for timely wheat sowing. The genotype yielded around 6.5 q per acre. The
specific feature of the genotype was escaping nature of pod borer attack or the
intrinsic factors of the genotype to tolerate the pod borer atJack. During the year 1995,
only two farmers were growing pigenopea which has not increased to 60% of total
farmer, of these two villages. They also observed that growing pigeonpea in place of
rice checks the infestation of Phalaris minor in wheat. to considerable extent and.improves the fertility status of soil. Pigeonpea was foimd more profitable than rice
because of its low cost of cultivation. As a result, considerable increase in thepigeonpea cultivation was recorded in the villages.
GURGAON
Shri Narender Kumar of Palar Village falls in a different category of Bee keepers,
motivated by the rwo week vocational course attended by him at KVK Shikohpur in
February 1999. He took up the profession in March 1999. with only 5 boxes. of 6
farmers each at a total COStof 7250/- including other equipments. Within less than a
year .he has extracted and sold honey worth Rs. 9200/- (Table). He increased the
number of frames from 30 to 110. He claims that bee keeping units has helped him in
Final Report: 'National Level Techno-Economic Feasibility Study for North Zone' 438
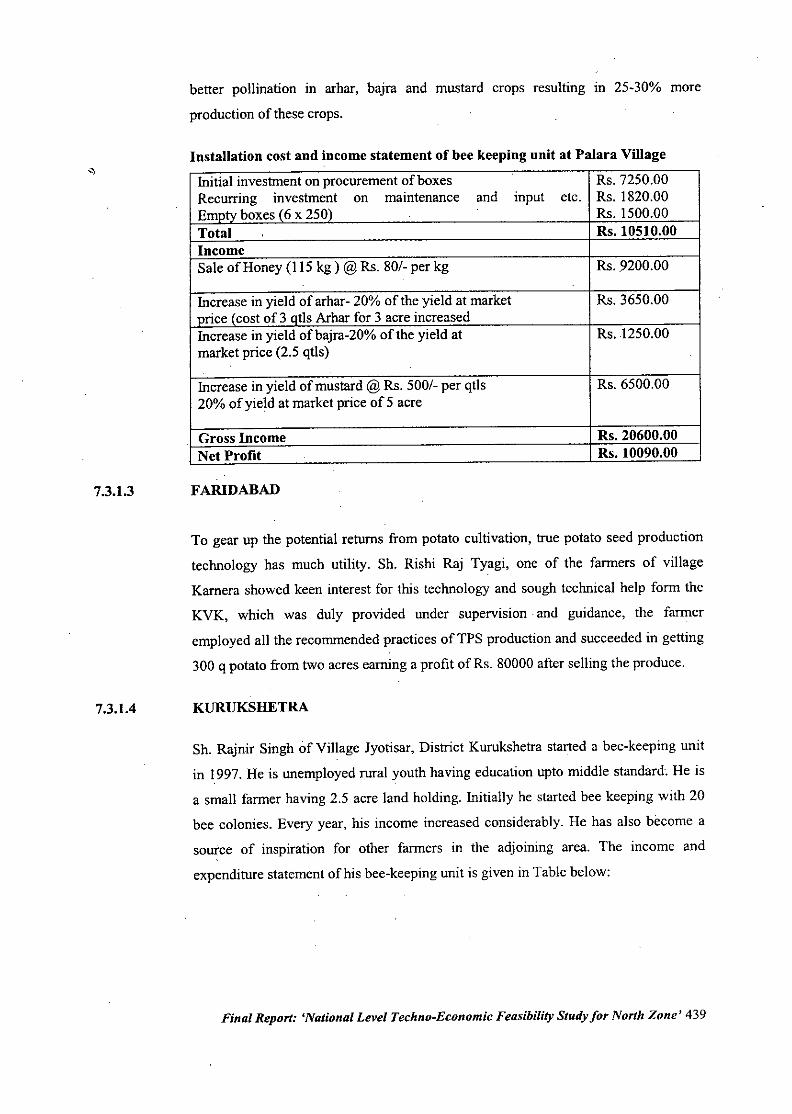
7.3.1.3
7.3.1.4
better pollination in arhar, bajra and mustard crops resulting m 25-30% more
production of these crops.
Installation cost and income statement of bee keeping unit at Palara Village
Initial investment on procurement of boxes RS.7250.00Recurring investment on maintenance and input etc. RS.1820.00Empty boxes (6 x 250) RS.1500.00Total RS.10510.00IncomeSale of Honey (115 kg) @Rs. 80/- per kg Rs . .9200.00
Increase in yield of arhar- 20% of the yield at market RS.3650.00mice (cost of 3 Qtls Arhar for 3 acre increasedIncrease in yield ofbajra-20% of the yield at RS.1250.00market price (2.5 qtls) .
.
Increase in yield of mustard @Rs. 500/- per qtls RS.6500.0020% of yield at market price of 5 acre
Gross Income Rs. 20600.00Net Profit Rs. 10090.00
FARIDABAD
To gear up the potential returns from potato cultivation, true potato seed production
technology has much utility. Sh. Rishi Raj Tyagi, one of the farmers of village
Kamera showed keen interest for this technology and sough technical help form the
KVK, which was duly provided under supervision and guidance, the farmer
employed all the recommended practices of TPS production and succeeded in getting
300 q potato from two acres earning a profit ofRs. 80000 after selling the produce.
KURUKSHETRA
Sh. Rajnir Singh of Village Jyotisar, District Kurukshetra started a bee-keeping unit
in 1997. He is unemployed rural youth having education upto middle standard. He is
a small farmer having 2.5 acre land holding. Initially he started bee keeping with 20
bee colonies. Every year, his income increased considerably. He has also become a
source of inspiration for other farmers in the adjoining area. The income and
expenditure statement of his bee-keeping unit is given in Table below:
Final Report: 'Na/ional Level Techno-Economic Feasibility Study for North Zone' 439
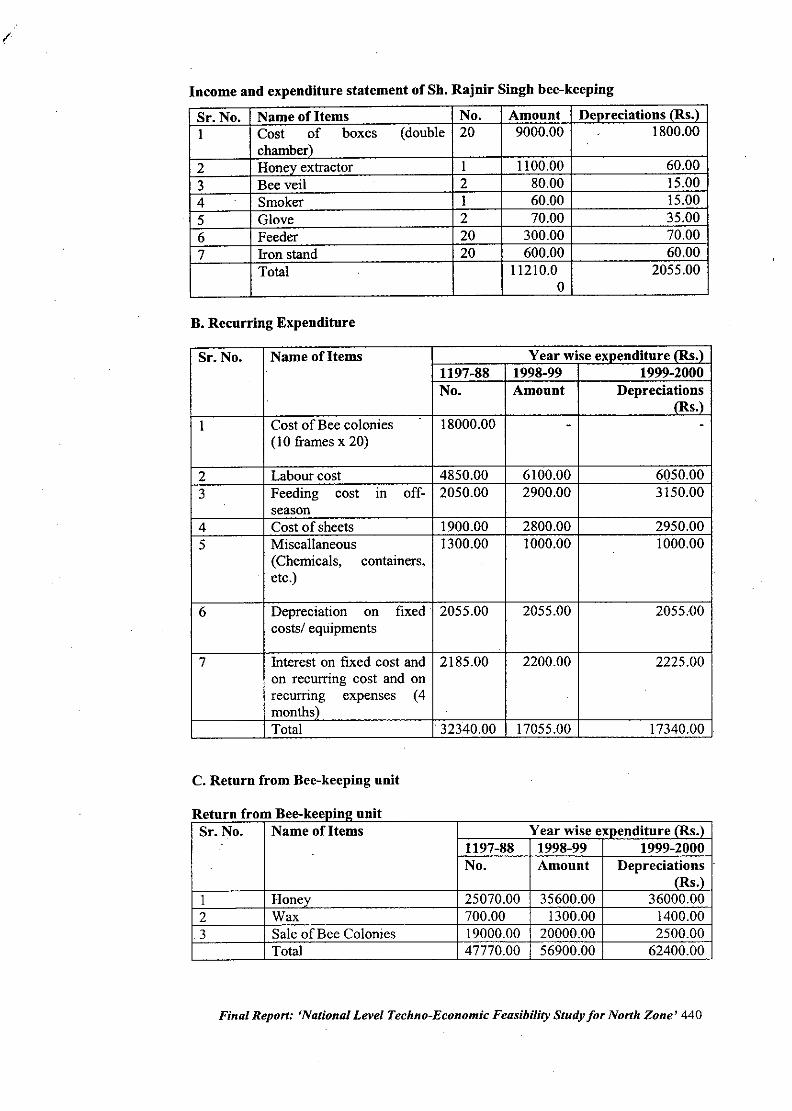
(
Income and expenditure statement of Sh. Rajnir Singh bee-keeping
Sr. No. Name of Items No. Amount Denreciations (Rs.)1 Cost of boxes (double 20 9000.00 1800.00
chamber)2 Honey extractor 1 1100.00 60.003 Bee veil 2 80.00 15.004 Smoker 1 60.00 15.005 Glove 2 70.00 35.006 Feeder 20 300.00 70.007 Iron stand 20 600.00 60.00
Total 11210.0 2055.000
B. Recurring Expenditure
Sr. No. Name ofltems Year wise exnenditure fRs.)1197-88 1998-99 1999-2000No. Amount Depreciations
(Rs.)1 Cost of Bee colonies 18000.00 - -
(10 frames x 20)
2 Labour cost 4850.00 6100.00 6050.003 Feeding cost m off- 2050.00 2900.00 3150.00
season4 Cost of sheets 1900.00 2800.00 2950.005 Miscallaneous 1300.00 1000.00 1000.00
(Chemicals, containers,etc.)
6 Depreciation on fixed 2055.00 2055.00 2055.00costs/ equipments
7 Interest on fixed cost and 2185.00 2200.00 2225.00on recurring cost and onrecurnng expenses (4 .
months)~Total .32340.00 17055.00 17340.00
C. Return from Bee-keeping unit
B kfeturn rom ee- eePID!! umtSr. No. Name of Items Year wise expenditure (Rs.)
1197-88 1998-99 1999-2000No. Amount Depreciations .
(Rs.)I Honev 25070.00 35600.00 36000.002 Wax 700.00 1300.00 1400.00
.3 Sale of Bee Colonies 19000.00 20000.00 2500.00Total 47770.00 56900.00 62400.00
R
Final Report: 'National Level Techno-Economic Feasibility Study for North Zone' 440
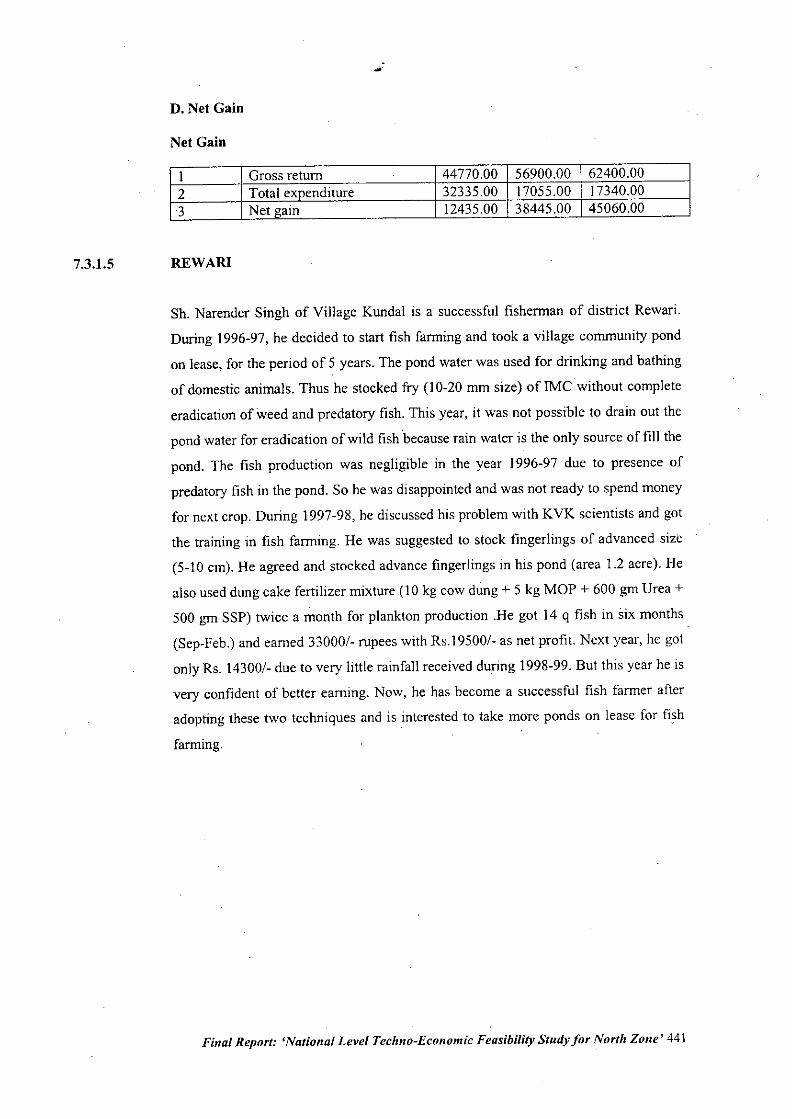
7.3.1.5
D. Net Gain
Net Gain
I Gross return 44770,00 56900,00 62400,002 Total exoenditure 32335,00 17055,00 17340,003 Net gain 12435,00 38445,00 45060,00
REWARI
Sh, Narender Singh of Village Kundal is a successful fisherman of district Rewari,
During 1996-97, he decided to start fish farming and took a village community pond
on lease, for the period of 5years, The pond water was used for drinking and bathing
of domestic animals, Thus he stocked fry (10-20 mm size) of IMC without complete
eradication of weed and predatory fish, This year, it was not possible to drain out the
pond water for eradication of wild fish 'because rain water is the only source of fill the
pond, The fish production was negligible in the year 1996-97 due to presence of
predatory fish in the pond, So he was disappointed and was not ready to spend money
for next crop, During 1997-98, he discussed his problem with KVK scientists and got
the training in fish farming, He was suggested to stock fingerlings of advanced size
(5-10 em), He agreed and stocked advance fingerlings in his pond (area 1.2 acre), He
also used dung cake fertilizer mixture (10 kg cow dung + 5 kg MOP + 600 gm Urea +500 gm SSP) twice a month for plankton production ,He got 14 q fish in six months
(Sep-Feb,) and earned 33000/- rupees with Rs,19500/- as net profit Next year, he got
only Rs, 14300/- due to very little rainfall received during 1998-99, But this year he is
very confident of better earning, Now, he has become a successful fish farmer after
adopting these two techniques and is interested to take more ponds on lease for fish
farming,
Final Report: 'National Level Techno-Economic Feasibility Study for North Zone' 441

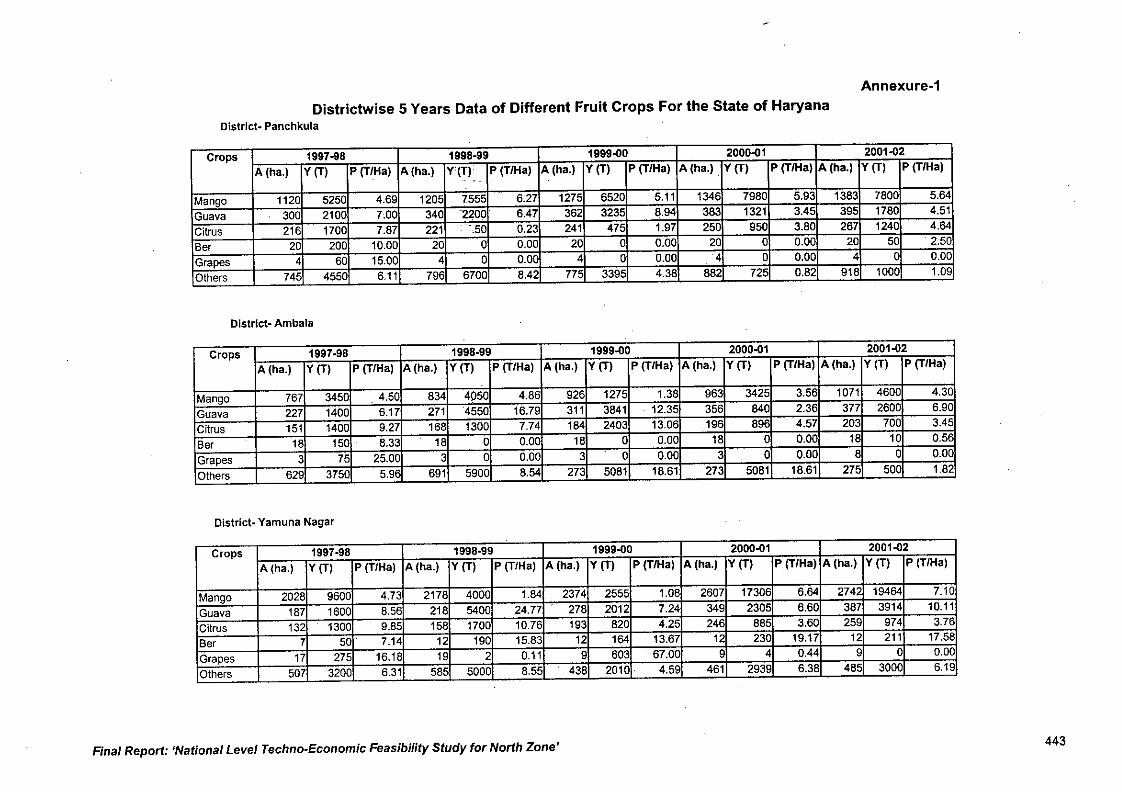
Districtwise 5 Years Data of Different Fruit Crops For the State of HaryanaDistrict .•Panch kula
Annexure-1
Crops 1997-98 1998-99 1999-00 2000-01 2001-02
A (ha.) Y (T) P (T/Ha) A (ha.) Y'(T)' . PIT/Hal A (ha.) Y (T) P (T/Ha) A (ha.) Y (T) P (T/Ha) A (ha.) Y (T) P (T/Ha)..
Mango 1120 5250 4.69 1205 7555 6:27 1275 6520 5.11 1346 7980 5.93 1383 7800 5.64
Guava 300 2100 7.00 340 '2200 6A7 362 3235 8.94 383 1321 3.45 395 1780 4.51
Citrus 216 1700 7.87 221 ',50 0.23 241 475 1.97 250 950 3.80 267 1240 4.64
Ber 20 200 10.00 20 a 0.00 20 a 0.00 20 a 0.00 20 50 2.50
Grapes 4 60 15.00 4 a 0.00 4 a 0.00 4 a 0.00 4 a 0.00
Others 745 4550 6.11 796 6700 8.42 775 3395 4.38 882 725 0.82 918 1000 1.09
District- Ambala
Crops 1997-98 1998-99 1999-00 2000-01 2001-02
A (ha.) Y (T) P (TlHa) A (ha.) Y (T) P (T/Ha) A (ha.) Y (T) P (T/Ha) A (ha.) Y (T) P (T/Ha) A (ha.) Y(T) P (T/Ha)
Mango 767 3450 4.50 834 4050 4.86 926 1275 1.38 963 3425 3.56 1071 4600 4.30
Guava 227 1400 6.17 271 4550 16.79 . 311 3841 . 12.35 356 840 2.36 377 2600 6.90
Citrus 151 1400 9.27 168 1300 7.74 184 2403 13.06 196 896 4.57 203 700 3A5
Ber 18 150 .. 8.33 18 a 0.00 18 0 0.00 18 a 0.00 18 10 0.56
Grapes 3 75 25.00 3 a 0.00 3 a 0.00 3 a 0.00 8 a 0.00
Others 629 3750 5.96 691 5900 8.54 273 5081 18.61 273 5081 18.61 275 500 1.82
District- Yamuna Nagar
Crops 1997-98 1998-99 1999-00 2000-01 2001-02
A (ha.) Y (T) P (T/Ha) A (ha.) Y (T) P (T/Ha) A (ha.) Y (T) P (T/Ha) A (ha.) Y (T) PIT/Hal A (ha.) Y (T) P (T/Ha)
Mango 2028 9600 4.73 2178 4000 1.84 2374 2555 1.08 2607 17306 6.64 2742 19464 7.10
Guava 187 1600 8.56 218 5400 24.77 278 2012 7.24 349 2305 6.60 387 3914 10.11
Citrus 132 1300 9.85 158 1700 10.76 193 820 4.25 246 885 3.60 259 974 3.78
Ber 7 50' 7.14 12 190 15.83 12 164 13.67 12 230 19.17 12 211 17.58
Grapes 17 275 16.18 19 2 0.11 9 603 67.00 9 4 OA4 9 a 0.00
Others 507 3200 6.31 585 5000 8.55 438 2010 4.59 461 2939 6.38 485 3000 6.19
Fina/ Report: 'Nationa/ Leve/ Techno-Economic Feasibility Study for North Zone' 443
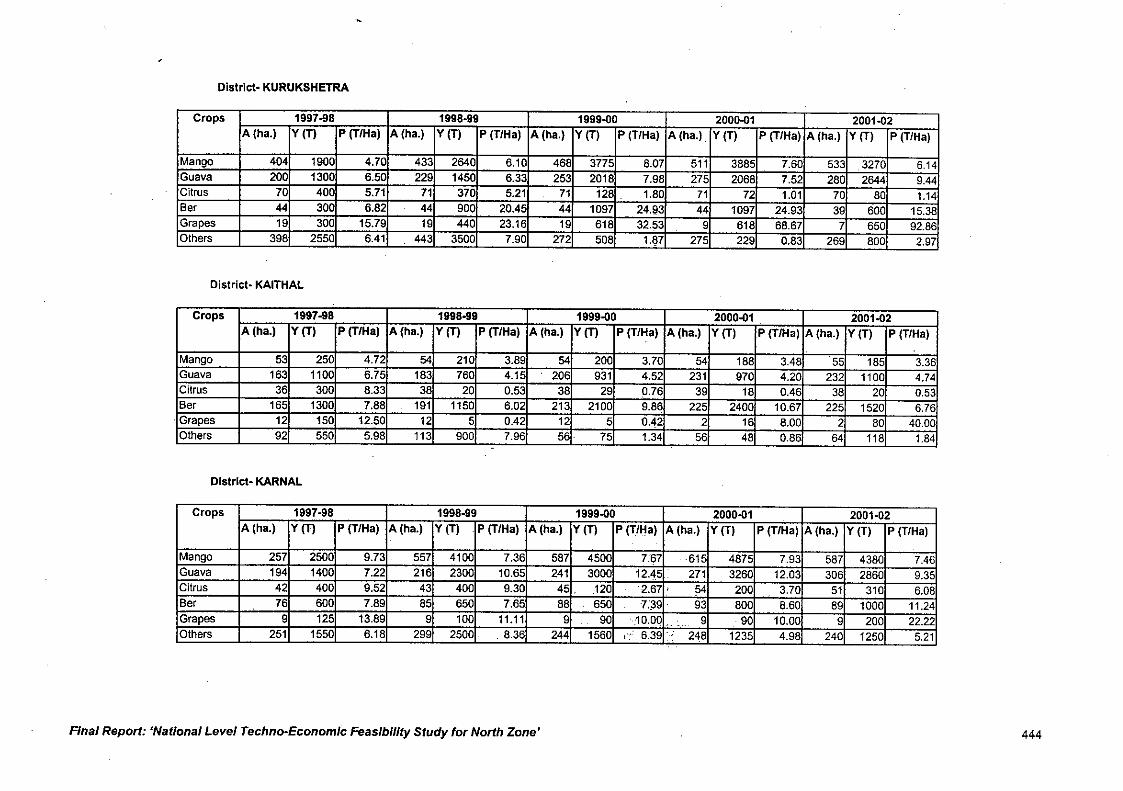
District. KURUKSHETRA
Crops 1997-98 1998-99 1999-00 2000-01 2001-02A (ha.) Y (T) P (TlHa) A (ha.) Y (T) P (T/Ha) A (ha.) Y (T) P (T/Ha) A (ha.L Y (T) P (T/Ha) A (ha.) Y (T) P (T/Ha)
Mango 404 1900 4.70 433 2640 6.10 468 3775 8.07 511 3885 7.60 533 3270 6.14Guava 200 1300 6.50 229 1450 6.33 253 2018 7.98 275 2068 7.52 280 2644 9.44Citrus 70 400 5.71 71 370 5.21 71 128 . 1.80 71 72 1.01 70 80 1.14Ber 44 300 6.82 44 900 20.45 44 1097 24.93 44 1097 24.93 39 600 15.38Grapes 19 300 15.79 19 440 23.16 19 618 32.53 9 818 68.67 7 650 92.86Others 398 2550 6.41 443 3500 7.90 272 508 1.87 275 229 0.83 269 800 2.97
District- KAITHAL
Crops 1997-98 1998.99 1999-00 2000-01 2001-02A (ha.) Y (T) P (T/Ha) A (ha.) Y (T) P (T/Ha) A (ha.) Y (T) P (T/Ha) A (ha.) Y (T) P (T/Ha) A (ha.) Y (T) P (T/Ha)
Mango 53 250 4.72 64 210 3.89 54 200 3.70 54 188 3.48 55 185 3.36Guava 163 1100 6.75 183 760 4.15 206 931 4.52 231 970 4.20 232 1100 4.74Citrus 36 300 8.33 38 20 0.53 38 29 0.76 39 18 0.46 38 20 0.53Ber 165 1300 7.88 191 1150 6.02 213 2100 9,86 225 2400 10.67 225 1520 6.76Grapes 12 150 12.50 12 5 0.42 12 5 0.42 2 16 8.00 2 80 40.00Others 92 550 5.98 113 900 7.96 56. 75 1.34 56 48 0.86 64 118 1.84
District- KARNAL
Crops 1997-98 1998-99 1999-00 2000-01 2001-02A (ha.) Y (T) P (T/Ha) A (ha.) Y (T) . P (T/Ha) A (ha.) Y (T) P (T/Ha) A (ha.) Y (T) P (T/Ha) A (ha.) Y (T) P (T/Ha)
. .
Mango 257 2500 9.73 557 4100 7.36 587 4500 7i67 615 4875 7.93 587 4380 7.46Guava 194 1400 7.22 216 2300 10.65 241 3000 12.45 271 3260 12.03 306 2860 9.35Citrus 42 400 9.52 43 400 9.30 45. 120 .2.67 ' 54 200 .. 3.70 51 310 6.08Ber 76 600 7.89 85 650 7.65 88 . 650 . n9. 93 800 8.60 89 1000 11.24Grapes 9 125 13.89 9 100 11.11 9 90 10.00 ,. 9 .90 10.00 9 200 22.22Others 251 1550 6.18 299 2500. .8.36 244 1560 I":': 6.39 ".:" 248 1235 4.98 240 1250 5.21
Final Report: 'National Level Techno-Economic Feasibility Study for North Zone' 444
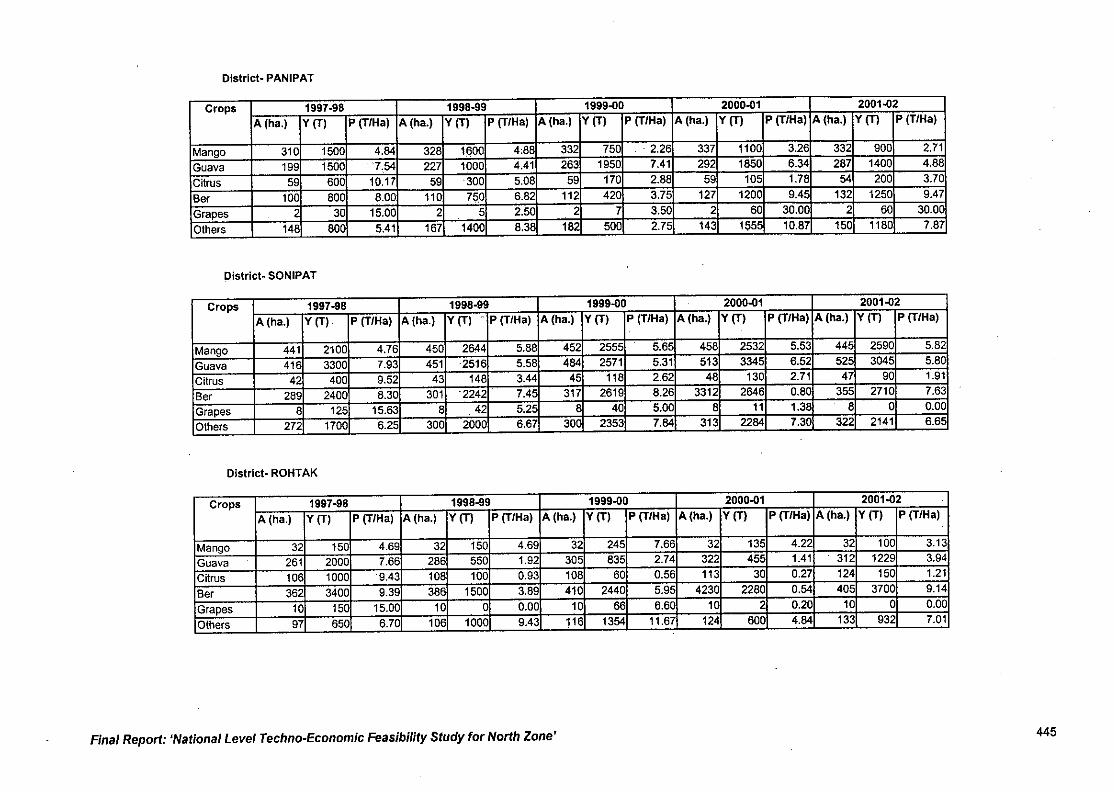
District. PANIPAT
Crops 1997-98 1998.99 1999-00 2000-01 2001-02
A (ha.) V (T) P (TIHa) A (ha.) V (T) P (T/Ha) A (ha.) V (T) P (T/Ha) A (ha.) V (T) P (T/Ha) A (ha.) V (T) P (T/Ha)
Mango 310 1500 4.84 328 1800 4,88 332 750 .2.28 337 1100 3.26 332 900 2.71
Guava 199 1500 '7..64 227 1000 4.41 263 1950 7.41 292 1850 6.34 287 1400 4.88
Citrus 59 600 10.17 59 300 5.08 59 170 2.88 59 105 1.78 64 200 3.70
Ber 100 800 8.00 110 750 6.82 112 420 3.75 127 1200 9.45 132 1250 9.47
Grapes 2 30 15.00 2 5 2.50 2 7 3.50 2 60 30.00 2 60 30.00
Others 148 800 5.41 167 1400 8.38 182 500 2.75 143 1555 10.87 150 1180 7.87
District. SONIPAT
Crops 1997-98 1998-99 1999-00 2000-01 2001-02
A (ha.) V (T) P (T/Ha) A (ha.) V(T) .. P (T/Ha) A (ha.) V (T) P (T/Ha) A (ha.) V (T) P (T/Ha) A (ha.) V (T) P (T/Ha)
Mango 441 2100 4.76 450 2844 5.88 452 2555 5.65 458 2532 5.53 445 2590 5.82
Guava 416 3300 7.93 451 ,2516 5.58 484 2571 5.31 513 3345 6.52 525 3045 5.80
Citrus 42 400 9.52 43 148 3.44 45 118 2.62 48 130 2.71 47 90 1.91
Ber 289 2400 8.30 301 '2242 . 7.45 317 2619 8.26 3312 2646 0.80 355 2710 7.63
Grapes 8 125 15.63 8 42 5.25 8 40 5.00 8 11 1.38 8 0 0.00
Others 272 1700 6.25 300 2000 6.67 300 2353 7.84 313 2284 7.30 322 2141 6.65
District. ROHTAK
Crops 1997-98 1998.99 1999-00 2000-01 2001-02
A (ha.) V (T) P (T/Ha) A (ha.) V (T) P (T/Ha) A (ha.) V (T) P (T/Ha) A (ha.) V (T) P (T/Ha) A (ha.) V (T) P (T/Ha)
Mango 32 150 4.69 32 150 4.69 32 245 7.66 32 135 4.22 32 100 3.13
Guava 261 2000 7.66 286 550 1.92 305 835 2.74 322 455 1.41 312 1229 3.94
Citrus 106 1000 '9.43 108 100 0.93 108 60 0.56 113 30 0.27 124 150 1.21
Ber 362 3400 9.39 386 1500 3.89 410 2440 5.95 4230 2280 0.64 405 3700 9.14
Grapes 10 150 15.00 10 0 0.00 10 66 6.60 10 2 0.20 10 0 0.00
Others 97 650 6.70 106 1000 9.43 116 1364 11.67 124 600 4.84 133 932 7.01
Final Report: 'National Leve' Techno-Economic Feasibility Study for North Zone' 445
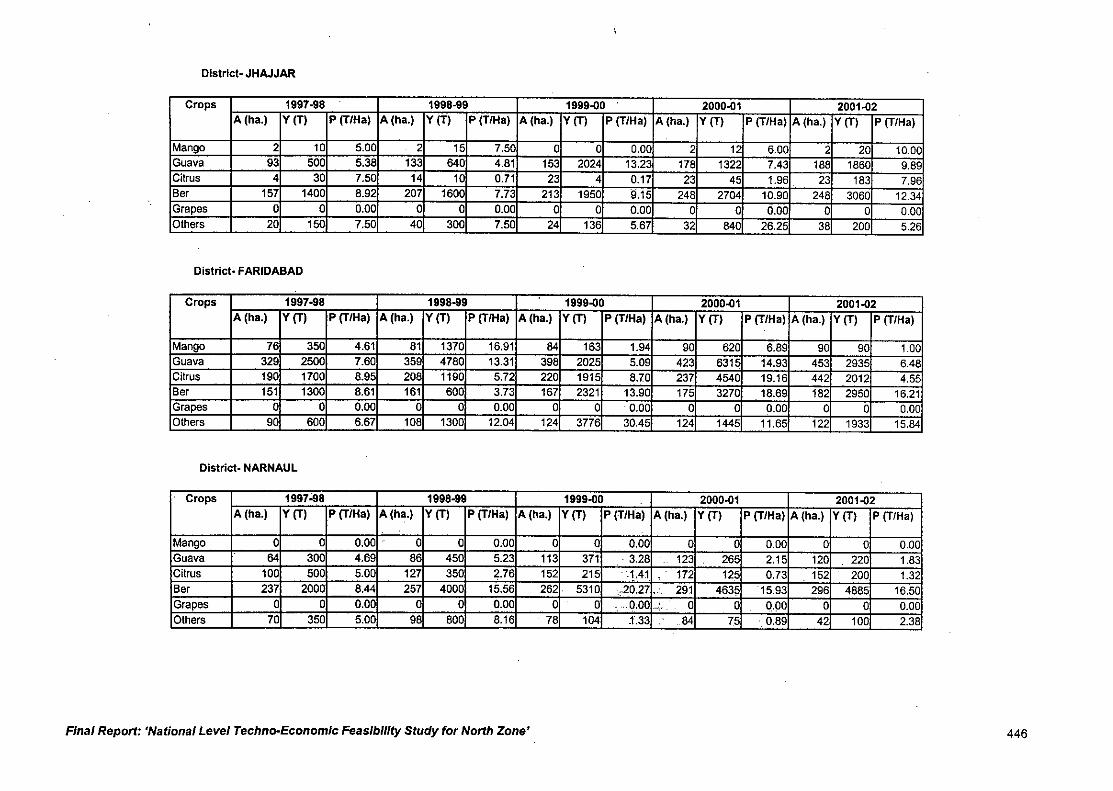
District. JHAJJAR
Crops 1997-98 1998-99 1999-00 2000-01 2001-02A (ha.) Y (T) P (T/Ha) A (ha.) Y (T) P (T/Ha) A (ha.) Y (T) P (T/Ha) A (ha.) Y (T) P (T/Ha) A (ha.) Y (T) P (T/Ha)
Mango 2 10 5.00 . 2 15 7.50 0 0 0.00 2 12 6.00 2 20 10.00Guava 93 500 5.38 133 640 4.81 153 2024 13.23 178 1322 7.43 188 1860 9.89Citrus 4 30 7.50 14 10 0.71 23 4 0.17 23 45 1.96 23 183 7.96Ber 157 1400 8.92 207 1600 7.73 213 1950 9.15 248 2704 10.90 248 3060 12.34Grapes 0 0 0.00 0 0 0.00 0 0 0.00 0 0 0.00 0 0 0.00Others 20 150 7.50 40 300 7.50 24 136 5.67 32 640 26.25 38 200 5.26
District. FARIDABAD
Crops 1997.98 1998-99 1999-00 2000-01 2001-02A (ha.) Y (T) P (T/Ha) A (ha.) Y (T) P (TIHa) A (ha.) Y (T) P (T/Ha) A (ha.) Y (T) P (T/Hal A (ha.) Y (Tl P (T/Ha)
Mango 76 350 4.61 81 1370 16.91 64 163 1.94 90 620 6.89 90 90 1.00Guava 329 2500 7.60 359 4780 13.31 398 2025 5.09 423 6315 14.93 453 2935 6.48Citrus 190 1700 8.95 208 1190 5.72 220 1915 8.70 237 4540 19.16 442 2012 4.55Ber 151 1300 8.61 161 600 3.73 167 2321 13.90 175 3270 18.89 182 2950 16.21Grapes 0 0 0.00 0 0 0.00 0 0 . 0.00 0 0 0.00 0 0 0.00Others 90 600 6.67 108 1300 12.04 124 3776 30.45 124 1445 11.65 122 1933 15.84
District- NARNAUL
Crops 1997;98 1998-99 1999-00 2000-01 2001-02A (ha.) Y (Tl P (TiHa) A (ha.) Y (Tl P (T/Ha) A (ha.) Y (T) P (T/Ha) A (ha.) Y (T) P (T/Ha) A (ha.) Y (T) P (TIHa)
Mango 0 0 0.00 0 0 0.00 0 0 0.00 0 0 0.00 0 0 0.00Guava 64 300 4.69 86 450 5.23 113 371 3.28 123 265 2.15 120 220 1.83Citrus 100 500 5.00 127 350 2.76 152 215 1.41 . 172 125 0.73 152 200 1.32Ber 237 2000 . 8.44 257 4000 15.56 262 5310 .. 20.27.c. 29.1 4635 15:93 296 4885 16.50Grapes 0 0 0.00 0 0 0.00 o . 0 ... 0.00 • 0 0 0.00 0 0 0.00Others 70 350 5.00 98 800 8.16 78 104 .1.33 .84 7.5 .0.89 42 100 2.38
Final Report: 'National Level Techno-EconOmic Feasibility Study for North Zone' 446
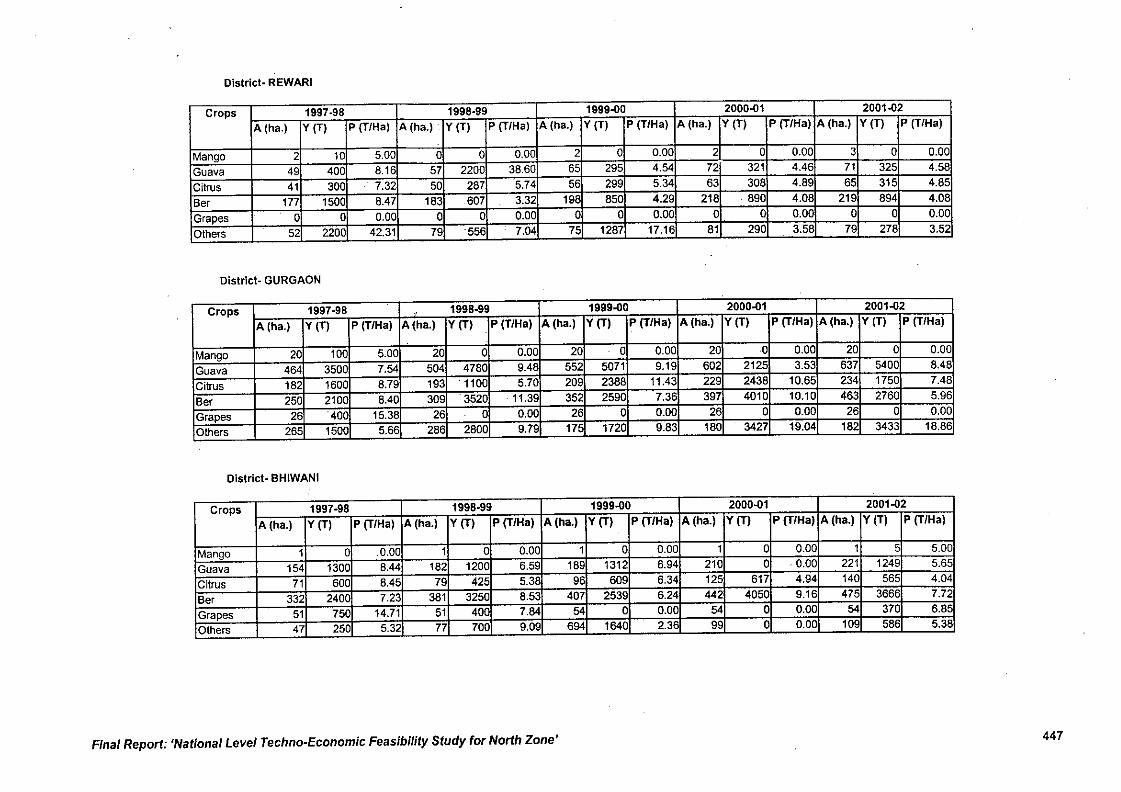
District- REWARI
Crops 1997-98 1998-99 1999-00 2000-01 2001-02
A (ha.) Y (T) P (T/Ha) A (ha.) " Y (T) P (T/Ha) A (ha.) Y (T) P (T/Ha) A (ha.) Y (T) P (T/Ha) A (ha.) Y (T) P (T/Ha)
Mango 2 10 5.00 a a 0.00 2 0 0.00 2 0 0.00 3 0 0.00
Guava 49 400 8.16 57 2200 38.60 65 295 4.54 72 321 4.46 71 325 4.58
Citrus 41 300 ." 7.32 50 287 5.74 56 299 5.34 63 308 4.89 65 315 4.85
Be. 177 1500 8.47 183 607 3.32 198 850 4.29 218 .890 4.08 219 894 4.08
Grapes 0 0 0.00 0 0 0.00 0 0 0.00 0 0 0.00 0 0 0.00
Others 52 2200 42.31 79 556 7.04 75 1287 17.16 81 290 3.58 79 278 3.52
District- GURGAON
Crops 1997-98 ., 1998-99 1999-00 2000-01 2001-02
A (ha.) Y (T) P (T/Ha) A {ha.) Y (T) P (T/Ha) A (ha.) Y (T) P (T/Ha) A (ha.) Y (T) P (T/Ha) A (ha.) Y (T) P (T1Ha)
Mango 20 100 5.00 20 0 0.00 20 0 0.00 20 0 0.00 20 0 0.00
Guava 464 3500 7.54 504 4780 9.48 552 5071 9.19 602 2125 3.53 637 5400 8.48
Citrus 182 1600 8.79 193 '1100 5.70 209 2388 11.43 229 2438 10.65 234 1750 7.48
Ber 250 2100 8.40 309 3520 .11.39 352 2590 7.36 397 4010 10.10 463 2760 5.96
Grapes 26 400 15.38 26 " 0 0.00 26 a 0.00 26 a 0.00 26 0 0.00
Others 265 1500 5.66 286 2800 9.79 175 1720 9.83 180 3427 19.04 182 3433 18.86
District- BHIWANI
Crops 1997-98 1998-99 1999-00 2000-01 2001-02
A (ha.) Y(T) P (T/Ha) A (ha.) Y (T) P (T/Ha) A (ha.) Y (T) P (T/Ha) A (ha.) Y (T) P (T/Ha) A (ha.) Y (T) P (T/Ha).
Mango 1 0 .0.00 1 a 0.00 1 a 0.00 1 a 0.00 1 5 5.00
Guava 154 1300 8.44 182 1200 6.59 189 1312 6.94 210 a . 0.00 221 1249 5.65
Citrus 71 600 8.45 79 425 5.38 96 609 6.34 125 617 4.94 140 565 4.04
Ber 332 2400 7.23 381 3250 8.53 407 2539 6.24 442 4050 9.16 475 3666 7.72
Grapes 51 750 14.71 51 400 7.84 54 a 0.00 54 a 0.00 54 370 6.85
Others 47 250 5.32 77 700 9.09 694 1840 2.36 99 a 0.00 109 586 5.38
Fina' Report: 'National Level Techno-Economic Feasibility Study for North Zone' 447
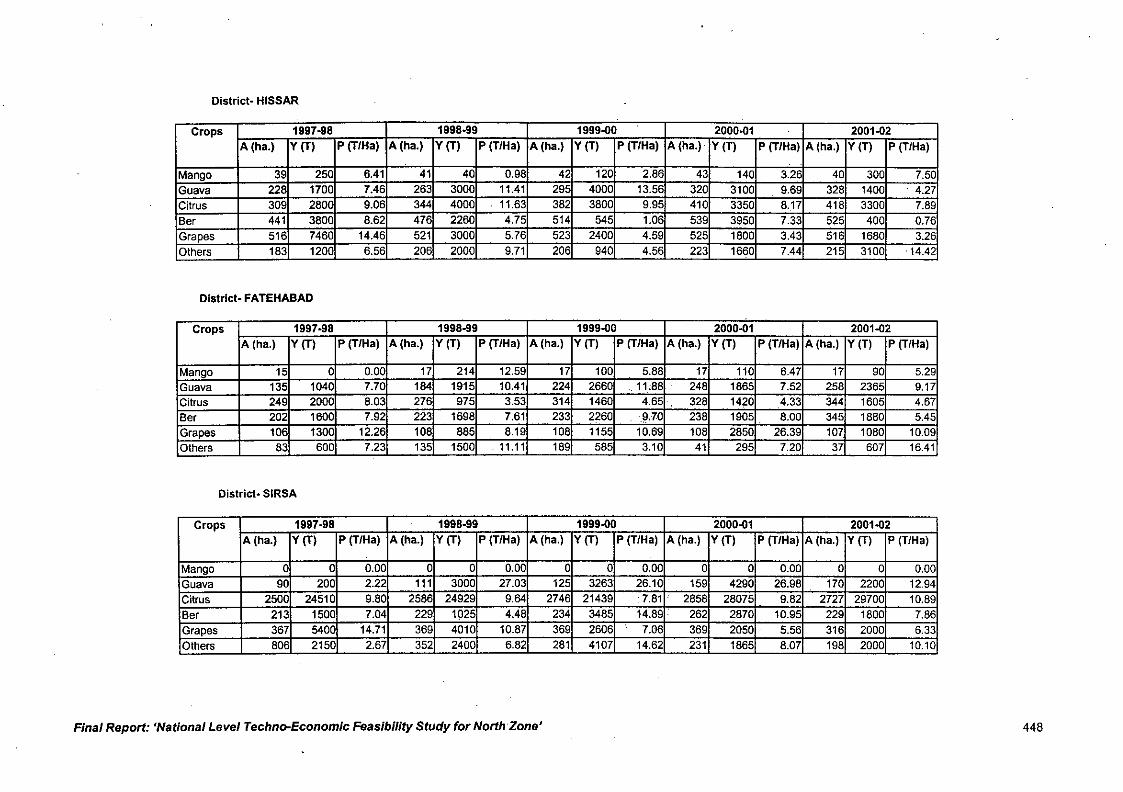
District- HISSAR
Crops 1997-98 1998-99 1999-00 2000.01 2001-02A (ha.) Y (T) P (TlHa) A (ha.) Y (T) P (T/Ha) A (ha.) Y (T) P (T/Ha) A (ha.) Y (T) P (T/Ha) A (ha.) Y (T) P (TtHa)
Mango 39 250 6.41 41 40 0.98 42 120 2.86 43 140 3.26 40 300 7.50Guava 228 1700 7.46 263 3000 11.41 295 4000 13.56 320 3100 9.69 328 1400 . 4.27Citrus 309 2800 9.06 344 4000 . 11.63 382 3800 9.95 410 3350 8.17 418 3300 7.89Ber 441 3800 8.62 476 2260 4.75 514 545 1.06 539 3950 7.33 525 400 0.76Grapes 516 7460 14.46 521 3000 5.76 523 2400 4.59 525 1800 3.43 516 1680 3.26Others 183 1200 6.56 206 2000 9.71 206 940 4.56 223 1660 7.44 215 3100 .14.42
District. FATEHABAD
Crops 1997.98 1998-99 1999-00 2000-01 2001-02A (ha.) Y (T) P (T/Ha) A (ha.) Y (T) P (T/Ha) A (ha.) Y (T) P (T/Ha) A (ha.) Y (T) P (T/Ha) A (ha.) Y(T) P (TtHa)
Mango 15 0 0.00 17 214 12.59 17 100 5.88 17 110 6.47 17 90 5.29Guava 135 1040 7.70 184 1915 10.41 224 2660 .1L88 248 1865 7.52 258 2365 9.17Citrus 249 2000 8.03 276 975 3.53 314 1460 4.65. 328 1420 4.33 344 1605 4.67Ber 202 1600 7.92 223 1698 7.61 233 2260 9.70 238 1905 8.00 345 1880 5.45Grapes 106 1300 12.26 108 885 8.19 108 1155 10.69 108 2850 26.39 107 1080 10.09Others 83 600 7.23 135 1500 . 11.11 189 585 3.10 41 295 7.20 37 607 16.41
District. SIRSA
Crops 1997.98 1998-99 1999-00 2000-01 2001-02A (ha.) Y (T) P (T/Ha) A (ha.) Y (T) P (T/Ha) A (ha.) Y (T) P (T/Ha) A (ha.) Y (T) P (T/Ha) A (ha.) Y (T) P (T/Ha)
Mango 0 0 0.00 0 0 0.00 0 0 0.00 0 0 0.00 0 0 0.00Guava 90 200 2.22 111 3000 27.03 125 3263 26.10 159 4290 26.98 170 2200 12.94Citrus 2500 24510 9.80 2586 24929 9.64 2746 21439 7.81 . 2858 28075 9.82 2727 29700 10.89Ber 213 1500 7.04 229 1025 4.48 234 3485 14.89. 262 2870 10.95 229 1800 7.86Grapes 367 5400 14.71 369 4010 10.87 369 2606 7.08 369 2050 5.56 316 2000 6.33Others 806 2150 2.67 352 2400 6.82 281 4107 14.62 231 1865 8.07 198 2000 10.10
Final Report: 'National Level Techno-Economic Feasibility Study for North Zone' 448
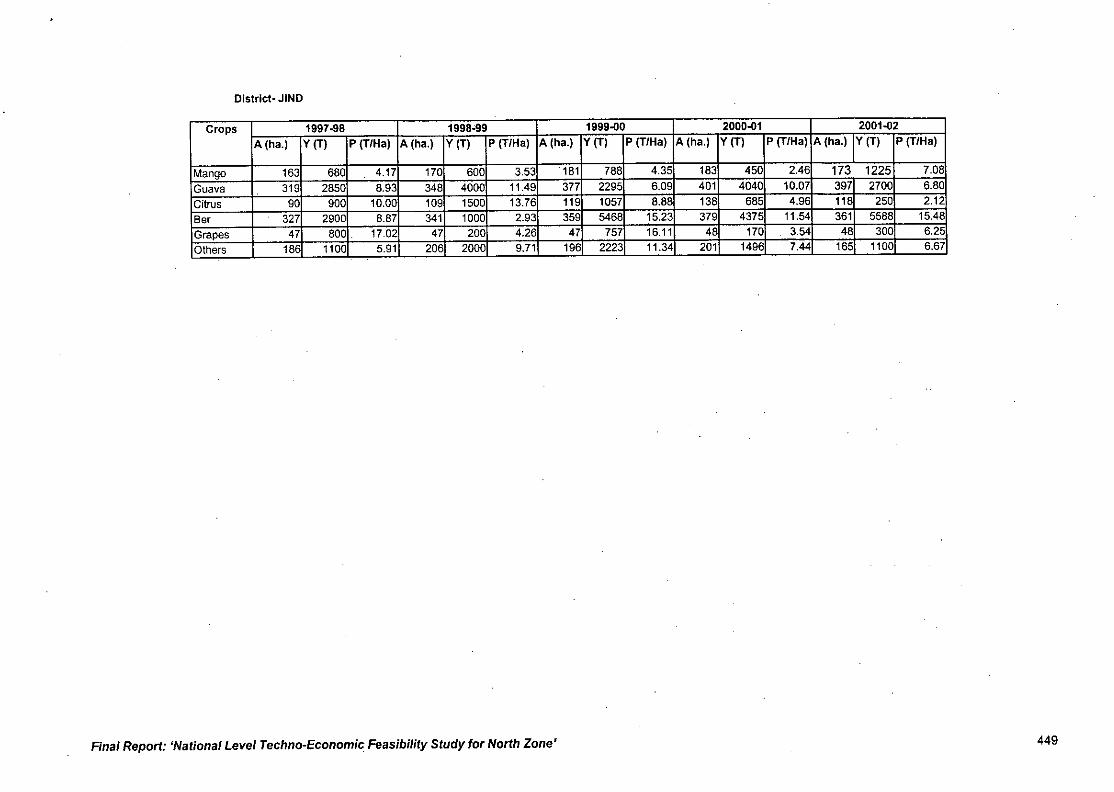
District- JIND
Crops 1997-98 1998'99 1999-00 2000-01 2001-02
A (ha.) Y (T) P (TIHa) A (ha.) Y(T) P (T/Ha) A (ha.) Y (T) P (T/Ha) A (ha.) Y (T) P (T/Ha) A (ha.) Y (T) P (T/Ha).
Mango 163 680 4.17 170 600 3.53 181 788 4.35 183 450 2.46 173 1225 7.08
Guava 319 2850 8.93 348 4000 11.49 377 2295 6.09 401 4040 10.07 397 2700 6.80
Citrus 90 900 10.00 109 1500 13.76 119 1057 8.88 138 685 4.96 118 250 2.12
Ber .. 327 2900 8.87 341 1000 2.93 359 5468 15.23 379 4375 11.54 361 5588 15.48
Grapes 47 800. 17.02 47 200 4.26 47 757 16.11 48 170 3.54 48 300 8.25
Others 186 1100 5.91 206 2000 9.71 196 2223 11.34 201 1496 7.44 165 1100 6.67
Final Report: 'National Level Techno-Economic Feasibility Study for North Zone' 449

DELHI.

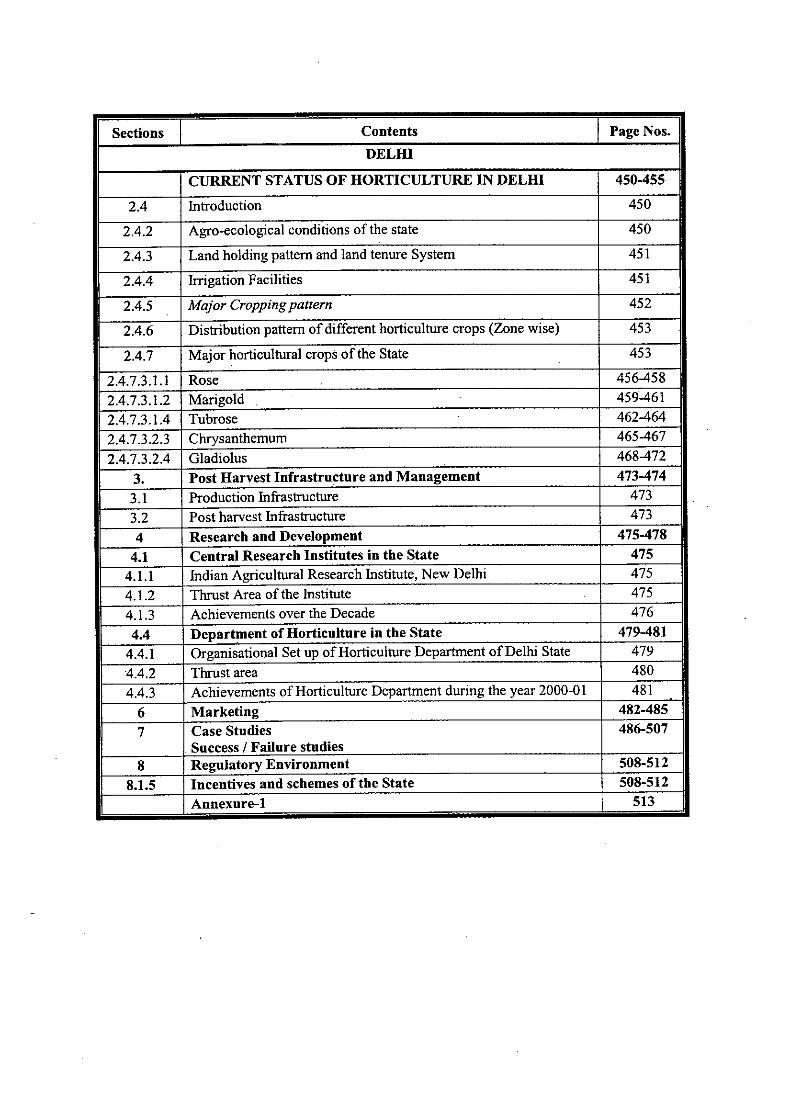
Sections Contents Page Nos.DELffi
CURRENT STATUS OF HORTICULTURE IN DELffi 450-455
2.4 Introduction 450
2.4.2 Agro-ecological conditions of the state 450
2.4.3 Land holding pattern and land tenure System 451
2.4.4 Irrigation Facilities 451
2.4.5 Major Cropping pattern 452
2.4.6 Distribution pattern of different horticulture crops (Zone wise) 453
2.4.7 Major horticultural crops of the State 453.
2.4.7.3.1.1 Rose 456-4582.4.7.3.1.2 Marigold . 459-4612.4.7.3.1.4 Tubrose 462-4642.4.7.3.2.3 Chrysanthemum 465-4672.4.7.3.2.4 Gladiolus 468-472
3. Post Harvest Infrastructure and Management 473-4743.1 Production Infrastructure 4733.2 Post harvest Infrastructure 4734 Research and Development 475-4784.1 Central Research Institutes in the State 4754.1.1 Indian Agricultural Research Institute, New Delhi 4754.1.2 Thrust Area of the Institute 4754.1.3 Achievements over the Decade 4764.4 Department of Horticulture in the State 479-4814.4.1 Organisational Set up of Horticulture Department of Delhi State 4794.4.2 Thrust area 4804.4.3 Achievements of Horticulture Department during the year 2000-0I 4816 Marketing 482-4857 Case Studies 486-507
Success I Failure studies8 Regulatory Environment 508-512
8.1.5 Incentives and schemes of the State 508-512Annexure-l 513

•
DELHI
2.4 Current Status of Horticulture Crops - Delhi
2.4.1 Introduction
The total geographical area of Delhi is 1485 sq. kilometer out of which 695 is under city
and 790 Ian. under runl areas. Delhi being capital of India and cosmopolitan nature of the
population which is 1.20 crores there is demand of all types of fruits, vegetables and very
.heavy demand of flowers. Owing to high cost of land more and more agricultural land is
being converted into commercial and residential purposes and whatever land is available
for cultivation is being put to high value cash crops cultivation like flowers and vegetables
and area under fruits is declining or static in the last decade. At present area under fruitis
1000 ha with production of 10,000 tons and vegetable area is 41,200 ha with production
7,25,000 tons with productivity of 17.6 tons per ha. and area under flower is 4056 ha. with
production of 25,007 tons loose flowers. More and more farmers are switching over to
vegetable and flower production because of higher productivity and more returns;
2.4.2 Agro ecological condition of the State.
The climate of Delhi is tropical with well demarcated winter and summers. The coldest
months are December - January and hottest June - July with minimum temperature 6.7
during winters and 38.8 summers. Annual rainfall is 694 mm restricted in July to
September only. The soils are mostly loam and clay loams with patches of saline and
alkaline soils.
Meteorological data of Delhi is presented in table - 1.
Final Report: 'National Level Techno-Economic Feasibility Study for North Zone' 450
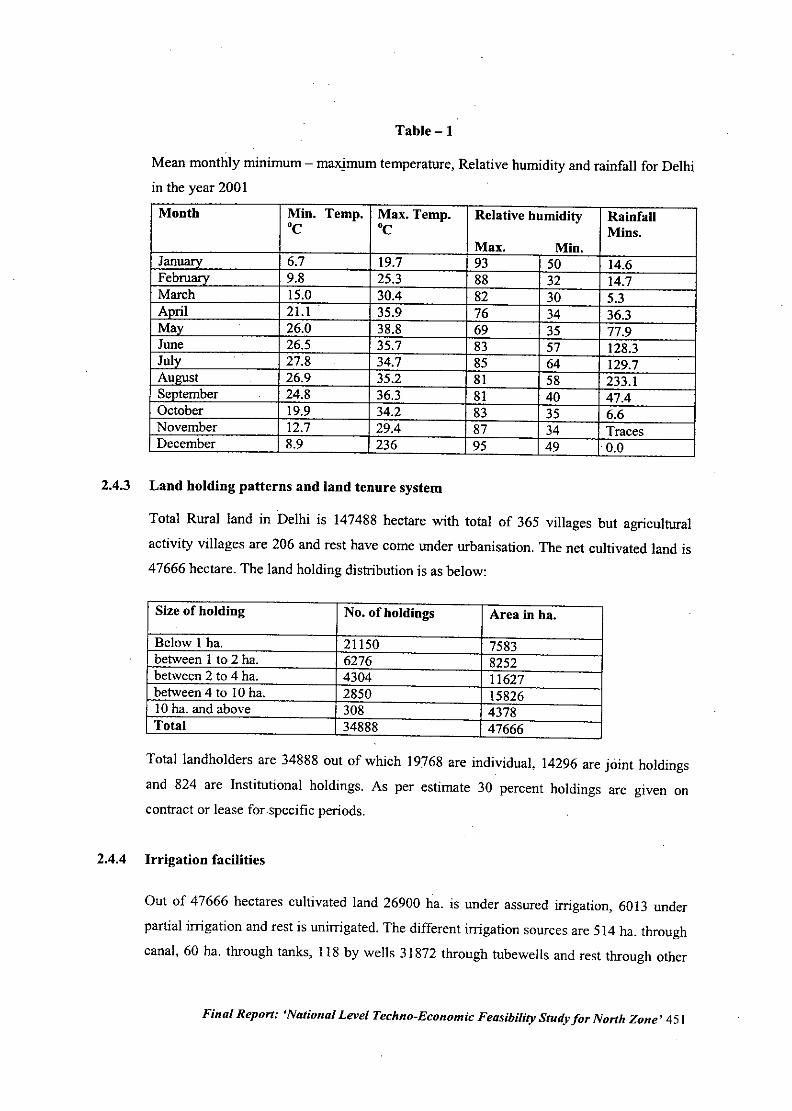
TabIe-I
Mean monthly minimum - maximum temperature, Relative humidity and rainfall for Delhi
in the year 200 I
Month Min. Temp. Max. Temp. Relative humidity Rainfall'c 'c Mins.
Max. Min.Jan~ 6.7 19.7 93 50 14.6Febmarv 9.8 25.3 88 32 14.7March 15.0 30.4 82 30 5.3Aori! 21.1 35.9 76 34 36.3Mav 26.0 38.8 69 . 35 77.9June 26.5 35.7 83 57 128.3JulV 27.8 . 34.7. 85 64 129.7Ammst 26.9 35.2 81 58 233.1Sentember 24.8 36.3 81 40 47.4October 19.9 34.2 83 35 6.6November 12.7 29.4 87 34 TracesDecember 8.9 236 95 49 0.0
2.4.3 Land holding patterns and land tennre system
Total Rural land in Delhi is 147488 hectare with total of 365 villages but agricultural
activity villages are 206 and rest have come under urbanisation. The net cultivated land is
47666 hectare. The land holding distribution is as below:
Size of holding No. of holdings Area in ha..
Below I ha. 21150 7583between I to 2 ha. 6276 8252between 2 to 4 ha. 4304 11627between 4 to 10 ha. 2850 1582610 ha. and above 308 4378Total 34888 47666
Total landholders are 34888 out of which 19768 are individual, 14296 are joint holdings
and 824 are Institutional holdings. As per estimate 30 percent holdings are given on
contract or lease for .specific periods.
2.4.4 Irrigation facilities
Out of 47666 hectares cultivated land 26900 ha. is under assured irrigation, 6013 under
partial irrigation and rest is unirrigated. The different irrigation sources are 514 ha. through
canal, 60 ha. through tanks, 118 by wells 31872 through tubewells and rest through other
Final Report: 'National Level Techno-Economic Feasibility Study for North Zone' 451
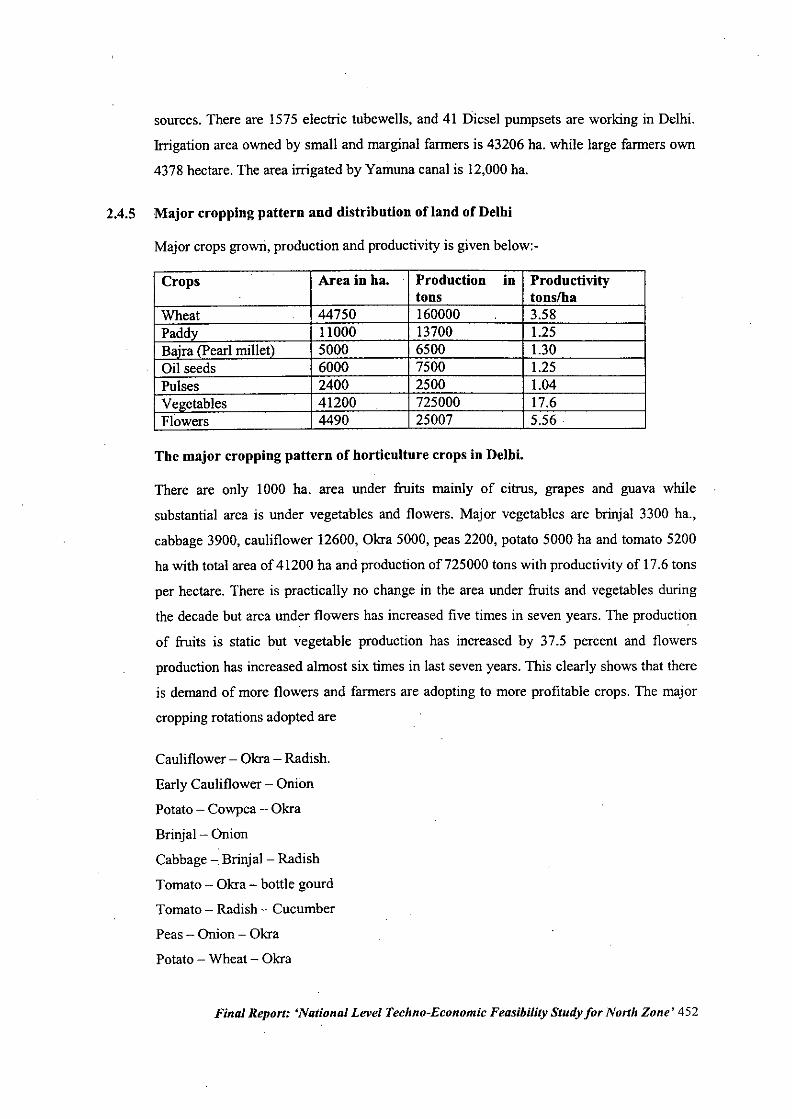
sources. There are 1575 electric tubewells, and 41 Diesel pumpsets are working in Delhi.
Irrigation area owned by small and marginal farmers is 43206 ha. while large farmers own
4378 hectare. The area irrigated by Yamuna canal is 12,000ha.
2.4.5 Major cropping pattern and distribution of land of Delhi
Major crops growri,production and productivity is given below:-
Crops Area in ha. Production in Productivitytons tonslha
Wheat 44750 160000 3.58Paddy 11000 13700 1.25Baira (pearl millet) 5000 6500 1.30Oil seeds . 6000 7500 1.25Pulses 2400 2500 1.04Vegetables 41200 725000 17.6Flowers 4490 25007 5.56.
The major cropping pattern of horticulture crops in Delhi.
There are only 1000 ha. area under fruits mainly of citrus, grapes and guava while
substantial area is under vegetables and flowers. Major vegetables are brinjal 3300 ha.,
cabbage 3900, cauliflower 12600, Okra 5000, peas 2200, potato 5000 ha and tomato 5200
ha with total area of 41200 ha and production of 725000 tons with productivity of 17.6 tons
per hectare. There is practically no change in the area under fruits and vegetables during
the decade but area under flowers has increased five times in seven years. The production
of fruits is static but vegetable production has increased by 37.5 percent and flowers
production has increased almost six times in last seven years. This clearly shows that there
is demand of more flowers and farmers are adopting to more profitable crops. The major
cropping rotations adopted are
Cauliflower - Okra - Radish.
Early Cauliflower - Onion
Potato - Cowpea - Okra
Brinjal - Onion
Cabbage - Brinjal- Radish
Tomato - Okra - bottle gourd
Tomato - Radish - Cucumber
Peas - Onion - Okra
Potato - Wheat - Okra
Final Report: 'National Level Techno-Economic Feasibility Study for North Zone' 452
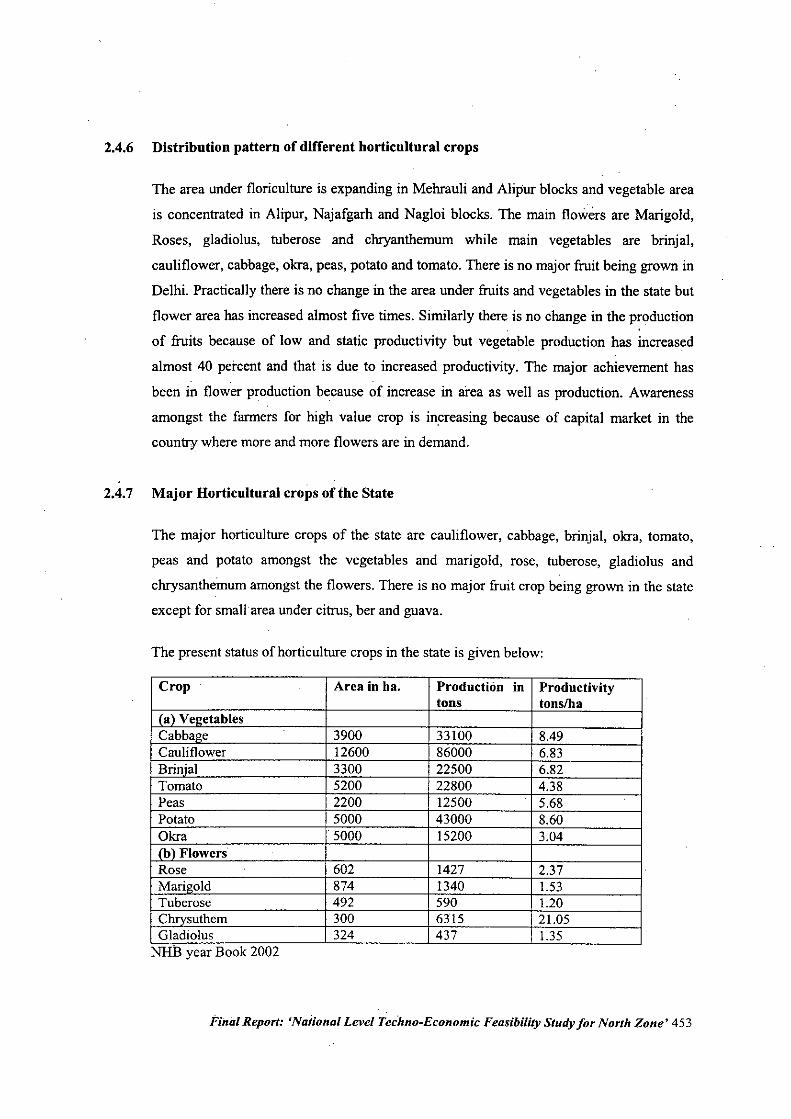
2.4.6 Distribution pattern of different horticultural crops
The area under floriculture is expanding in Mehrauli and Alipur blocks and vegetable area
is concentrated in Alipur, Najafgarh and Nagloi blocks. The main flowers are Marigold,
Roses, gladiolus, tuberose and chryanthemum while main vegetables are brinjal,
cauliflower, cabbage, okra, peas, potato and tomato. There is no major fruit being grown in
Delhi. Practically there is no change in the area under fruits and vegetables in the state but
flower area has increased almost five times. Similarly there is no change in the production
of fruits because of low and static productivity but vegetable production has increased
almost 40 percent and that is due to increased productivity. The major achievement has
been in flower production because of increase in area as well as production. Awareness
amongst the farmers for high value crop is increasing because of capital market in the
country where more and more flowers are in demand.
2.4.7 Major Horticultural crops of the State
The major horticulture crops of the state are cauliflower, cabbage, brinjal, okra, tomato,
peas and potato amongst the vegetables and marigold, rose, tuberose, gladiolus and
chrysanthemum amongst the flowers. There is no major fruit crop being grown in the state
except for small area under citrus, ber and guava.
The present status of horticulture crops in the state is given below:
Crop Area in ha. Production in Prodnctivitytons tonslha
(a'Ve ••etablesCabbal>e 3900 33100 8.49Cauliflower 12600 86000 6.83Brinial 3300 22500 6.82Tomato 5200 22800 4.38Peas 2200 12500 5.68Potato 5000 43000 8.60Okra "5000 15200 3.04I {h' Flowers .
Rose 602 1427 2.37Maril>old 874 1340 1.53Tuberose 492 590 1.20~suthem 300 6315 21.05Gladiolus 324 437 1.35NHB year Book 2002
Final Reporf: 'Naiional Level Techno-Economic Feasibility S(udy for Norfh Zone' 453
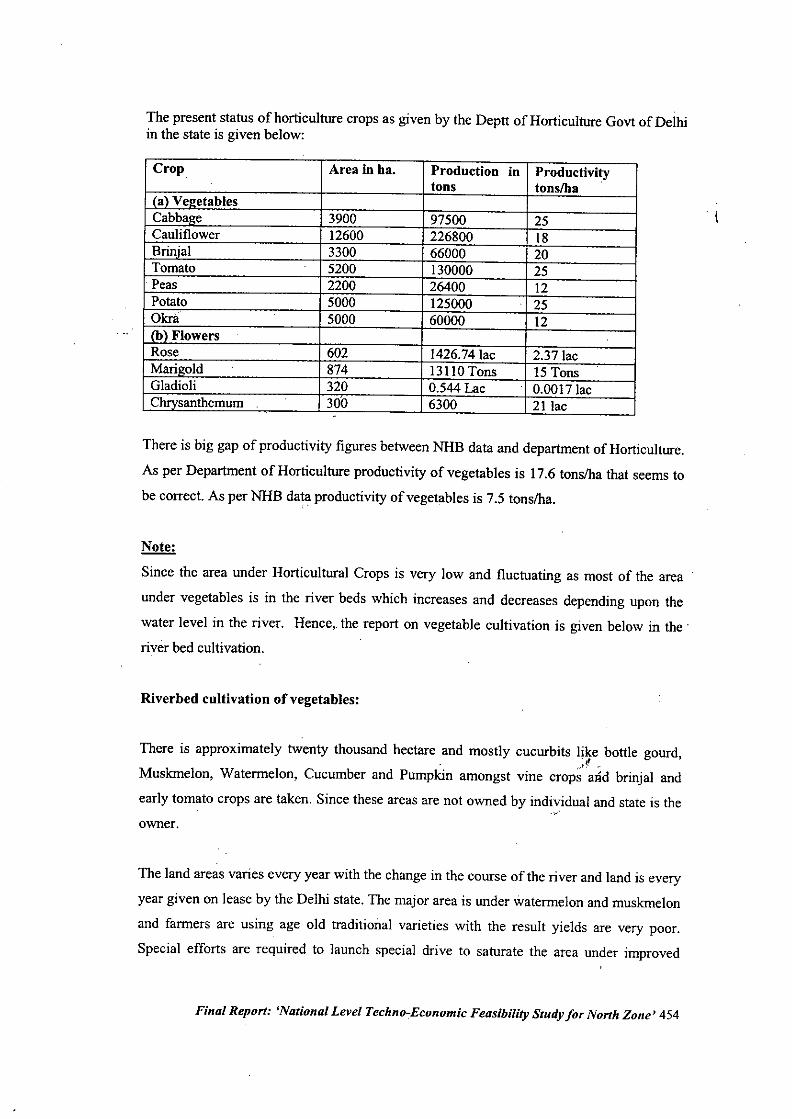
The present status of horticulture crops as given by the Dept! of Horticulture GoY!of Delhiin the state is given below:
Crop Area in ha. Production in Productivitytons tons/ha
(a) Ve!!etablesCabbage 3900 97500 25Cauliflower 12600 226800 18Brinial 3300 66000 20Tomato 5200 130000 25Peas 2200 26400 12Potato 5000 125000 25Okrii 5000 60000 12(b) FlowersRose 602 1426.74lac 2.37 lacMarigold 874 13110Tons 15TonsGladioli 320 0.544 Lac 0.0017 lacChrysanthemum 300 6300 21 lac
There is big gap of productivity figures between NHB data and department of Horticulture.
As per Department of Horticulture productivity of vegetables is 17.6 tonslha that seems to
be correct. As per NHB data productivity of vegetables is 7.5 tonslha.
Note:
Since the area under Horticultural Crops is very low and fluctuating as most of the area
under vegetables is in the river beds which increases and decreases depending upon the
water level in the river. Hence, the report on vegetable cultivation is given below in the.river bed cultivation.
Riverbed cultivation of vegetables:
There is approximately twenty thousand hectare and mostly cucurbits like bottle gourd,. ,~i.!.'
Muskmelon, Watermelon, Cucumber and Pumpkin amongst vine crops aad brinjal and
early tomato crops are taken. Since these areas are not owned by individual and state is theowner.
The land areas varies every year with the change in the course of the river and land is every
year given on lease by the Delhi state. The major area is under watermelon and muskmelon
and farmers are using age old traditional varieties with the result yields are very poor.
Special efforts are required to launch special drive to saturate the area under improved
Final Report: 'National Level Techno~Economic Feasibility Study for North Zone' 454
\
varietieslhybrids. The area is mostly very sandy and heavy dose of organic manure is to be
applied deep in trenches.
The cultivation practice is entirely difficult. Early in spring or late winters in the month of
December trenches toward north south are dug I to 2 ft deep and filled with compost and
soil and trenches are not filled entirely but upto 6 inches below the surface and sarkanda
grass shield is given toward East-west to save early crop from winters. Seed is germinated
in petri dishes or wet gunny cloth and sown 2-3 inches deep in the trench previously
watered. Since these re lot of pathogen and soil borne diseases seed must be treated with
captaf. Initially water is to be given second and third day and once plants are established
there is no need. of irrigation because roots absorb water from the sub soil, which has
enough moisture. The crops are ready by end of February which is off-season crop and
farmers get very good price but total seed is less but this is compensated by high prices.
Problems of cut flowers productiou in Poly houses
This is highly capital-intensive farmers most of the projects running around Delhi are
facing problems of selling the flowers at remunerative prices. All such projects are using
foreign technology, which is not cost effective for Indian market. If the produce is exported
only then they may profit. Delhi's climate is extremely hot which involves lowering of
temperature and increasing humidity, which in turn is a costly affair. These projects can be
more successful where temperatures of moderate like Bangalore in South India and Pune in
West India where less energy is required to maintain desired temperature.
The development of indigenous varieties and technologies need to be taken up which may
prove cost effective under our conditions.
Final Report: 'National Level Techno-Economic Feasibility Study for North Zone' 455
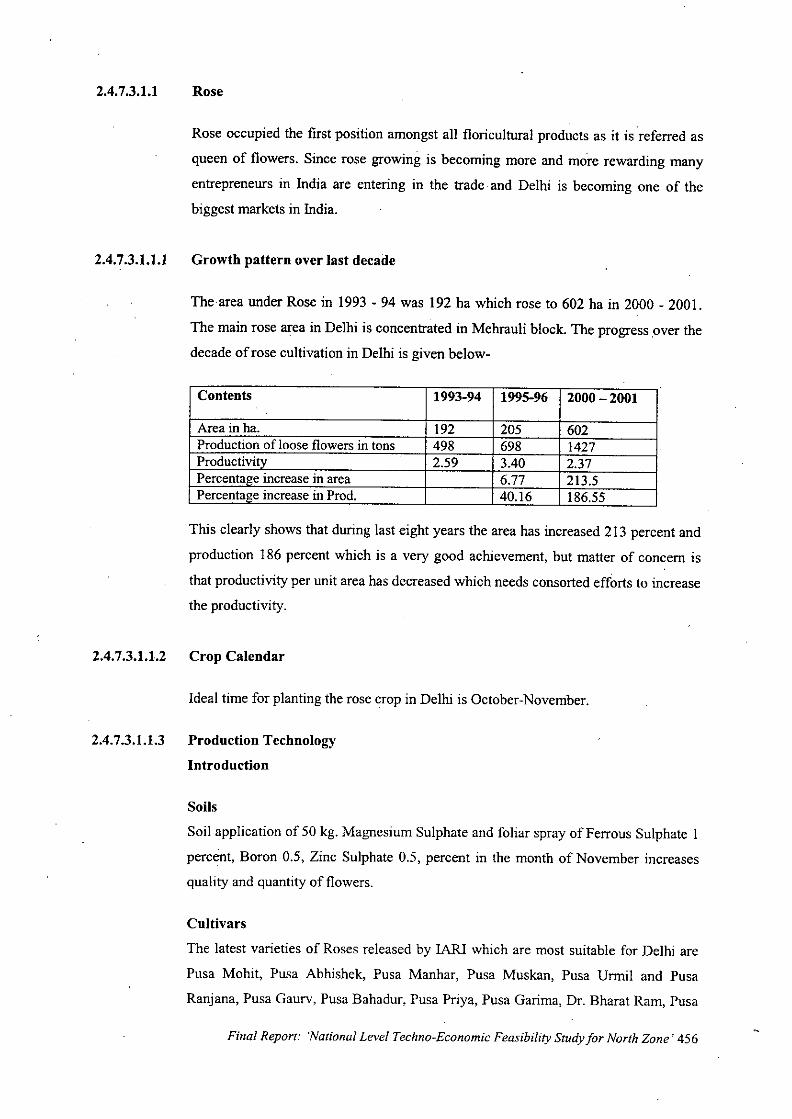
2.4.7.3.1.1 Rose
Rose occupied the first position amongst all floricultural products as it is referred as
queen of flowers. Since rose growing is becoming more and more rewarding many
entrepreneurs in India are entering in the trade. and Delhi is becoming one of the
biggest markets in India.
2.4.7.3.1.1.1 Growth pattern over last decalle
The area under Rose in 1993 • 94 was 192 ha which rose to 602 ha in 2000 - 200 I.
The main rose area in Delhi is concentrated in Mehrauli block. The progress over the
decade of rose cultivation in Delhi is given below-
Contents 1993-94 1995-96 2000 -2001
Area in ha. 192 205 602Production of loose flowers in tons 498 698 1427Productivity 2.59 3.40 2.37Percentage increase in area 6.77 213.5Percentage increase in Prod. 40.16 186.55
This clearly shows that during last eight years the area has increased 213 percent and
production 186 percent which is a very good achievement, but matter of concern is
that productivity per unit area has decreased which needs consorted efforts to increase
the productivity.
2.4.7.3.1.1.2 Crop Calendar
Ideal time for planting the rose crop in Delhi is October-November.
2.4.7.3.1.1.3 Production Technology
Introduction
Soils
Soil application of 50 kg. Magnesium Sulphate and foliar spray of Ferrous Sulphate I
percent, Boron 0.5, Zinc Sulphate 0.5, percent in the month of November increases
quality and quantity of flowers.
Cultivars
The latest varieties of Roses released by IAR1 which are most suitable for Delhi are
Pusa Mohit, Pusa Abhishek, Pusa Manhar, Pusa Muskan, Pusa Urmil and Pusa
Ranjana, Pusa Gaurv, Pusa Bahadur, Pus a Priya, Pusa Garima, Dr. Bharat Ram, Pusa
Final Report: "National Level Techno-Economic Feasibility Study for North Zone' 456
Baramashi, Pusa Virangana, Pusa Pitambar, Mother Teresa, Preyasi, Raktima,
Shryasi, Chitra, Dr. Benjamin Pal, Dr. PS Bhatnagar Lahar, Mansi and climbing
Sadabahar. The rose budded on Rosa Indica variety, Odorata gives excellent results
and best time of planting Roses in Delhi in October - November.
Nutrient Management
The manure requirement is 50 gm mixture per plant having Urea, Single Super
Phosphate and Potassium Sulphate in the ratio of 1:3:2 each time thrice i.e. first at
pruning, second at the end of December and third in the end of February and FYM 8 -
10 kg just after pruning. If the growth is slow, foliar feeding of Urea two part
dihydrogen ammonium Phosphate one part Potassium Phosphate one and Potassium
Nitrate one part. Three gms of this mixture per litre water is sprayed along with 1.5
gm Tepol or liquid soap at ten days interval. A mixture of Manganese Sulphate one
part, Chelated iron one part and Borax 1/4 part, one gram of this mixture in liter of
water is sprayed once in two months
Intercultural Operation
Pruning at 45 cm height from the ground during mid October to mid November gives
maximum yield.
2.4.7.3.1.1.4 Pests and diseases management
Diseases
Die back, Powdery mildew, Black spot, Stem blight, Alternaria leaf spot and Wilt are
major diseases. Spray of Captof, Thiram, Bavistin 2 gm/ Litre controls most of the
. diseases and Fungicides should be alternatively used. Jassids.
Pests
Mites are main insects and Metasystox 2 ml / litre water controls. The cut ends after
pruning should be pasted with any copper fungicide.
2.4.7.3.1.1.5 Harvest method and Yield
The flowers should be cut at tight bud stage when one or two outer petals startunfurling.
Final Report: 'National Level Techno-Economic Feasibility Study for North Zone' 457
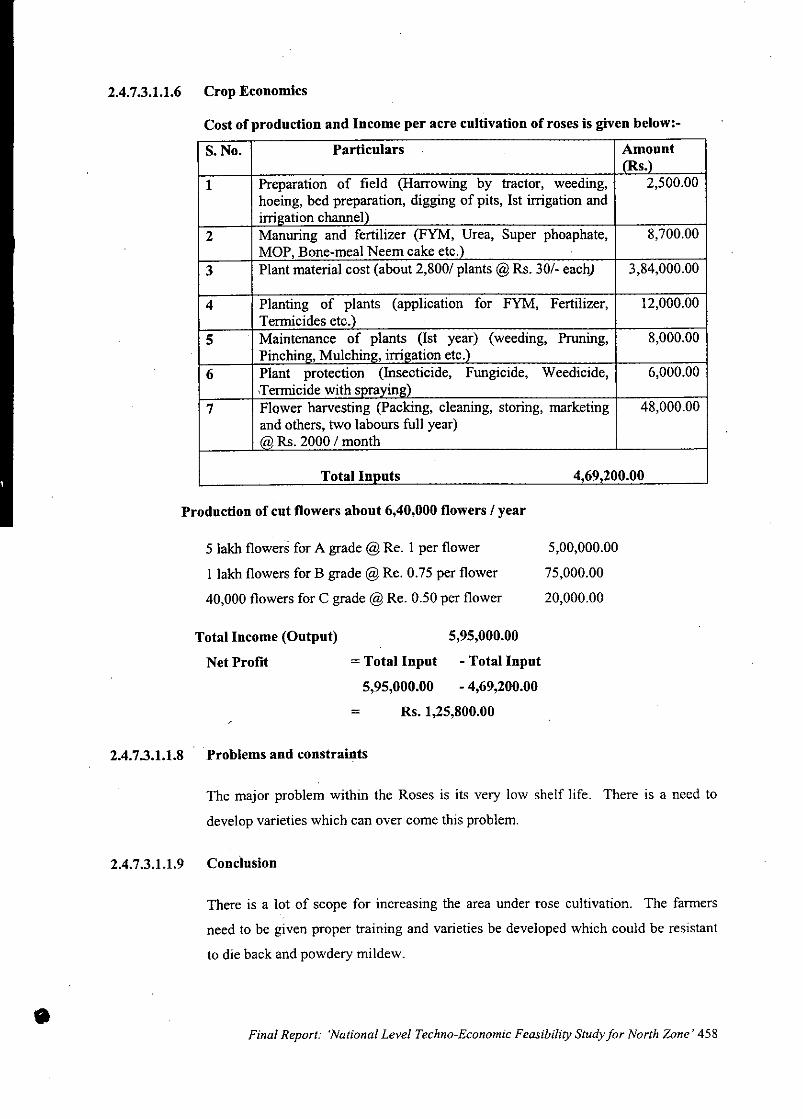
2.4.7.3.1.1.6 Crop Economics
Cost of production and Income per acre cultivation of roses is given below:-
S. No. Particulars Amount
1 Preparation of field (Harrowing by tractor, weeding,hoeing, bed preparation, digging of pits, 1st irrigation andirri ation channel
2 Manuring and fertilizer (FYM, Urea, Super phoaphate, 8,700.00MOP, Bone-meal Neem cake etc.
3 Plant material cost (about 2,8001 plants @ Rs. 30/- each) 3,84,000.00
4 Planting of plants (application for FYM, Fertilizer, 12,000.00Termicides etc.
5 Maintenance of plants (1st year) (weeding, Pruning, 8,000.00Pinchin , Mulchin , irri ation etc.
6 Plant protection (Insecticide, Fungicide, Weedicide, 6,000.00,Termicide with ra'n
7 Flower harvesting (Packing, cleaning, storing, marketing 48,000.00and others, two labours full year)
Rs. 2000 1month
Totalln uts
Production of cut flowers about 6,40,000 flowers 1year
5 lakh flowers for A grade @ Re. 1 per flower
1 lakh flowers for B grade @ Re. 0.75 per flower
40,000 flowers for C grade @ Re. 0.50 per flower
4,69,200.00
5,00,000.00
75,000.00
20,000.00
Total Income (Output)
Net Profit
5,95,000.00
= Total Input - Total Input
5,95,000.00 - 4,69,200.00
= Rs. 1,25,800.00
•
2.4.7.3.1.1.8 Problems and constraints
The major problem within the Roses is its very low shelf life. There is a need to
develop varieties which can over come this problem.
2.4.7.3.1.1.9 Conclusion
There is a lot of scope for increasing the area under rose cultivation. The farmers
need to be given proper training and varieties be developed which could be resistant
to die back and powdery mildew .
Final Report: 'National Level Techno-Economic Feasibility Study for North Zone' 458
2.4.7.3.1.2 Marigold (Tagefs Sp)
2.4.7.3.1.2.2 Crop calendar
Summer crop sowing in 2nd week of February while for rainy season crop sowing is done in
first week of June. September is best tim~ for winter crop.
2.4.7.3.1.2.3 Production Technology
Cnltivars
Two species namely African Marigold (Targets erecta) and French marigold are
commercially grown. African marigold is tall about 1m height with broad leaves, globular
flowers of yellow, orange and white shades and French marigold with 20-60cm height,
profuse branching at the base and small yellow and tinged red flowers.
Pusa Narangi and Pusa Basanti are varieties developed by lARI other common imported
varieties are Apricot, Burpee's Miracle, White, Cracker Jack, Crown of Gold, Cupid,
Double Eagle, Double Bloom, Fire Glow,Giant Sunset, Golden Age, Golden Climax Giant,
Golden Jublee Happiness and yellow climax of African types and Dainty merietta, Sunny
and Tetra Ruffled Red of single French type and Bolero, Bonita Burpee's Gold Nugget
Butter scotch, Cupid yellow, Fiesta, Goldie, Tangarine and Pigmy of Double French types.
There are FI hybrids varieties like Apollo, Marietta, Legion of Honour, Sunny and TetraRuffled Red.
Seed/planting material
Seed rate is 800 gm to I kg per ha.,
Sowing/planting techniques
For summer crop sowing in 2nd week of February while for rainy season crop sowing is
done in first week of June. September is best time for winter crop. African varieties are
planted at 40x40 cm and French types 30x30 cm.
Nutrient management
In addition to FYM, 200 kg Nand 80 Kg P and K. All P and K before Transplanting while
nitrogen in 3 to 4 split doses. It is better if 2% urea is sprayed twice at 15 days iriterval. If
proper care is taken yield of 20.22 tons of African type and 10-12 tons of French type per
ha. loose flowers can be obtained.
Final Report: 'National Level Techno-Economic Feasibility Study for North Zone' 459
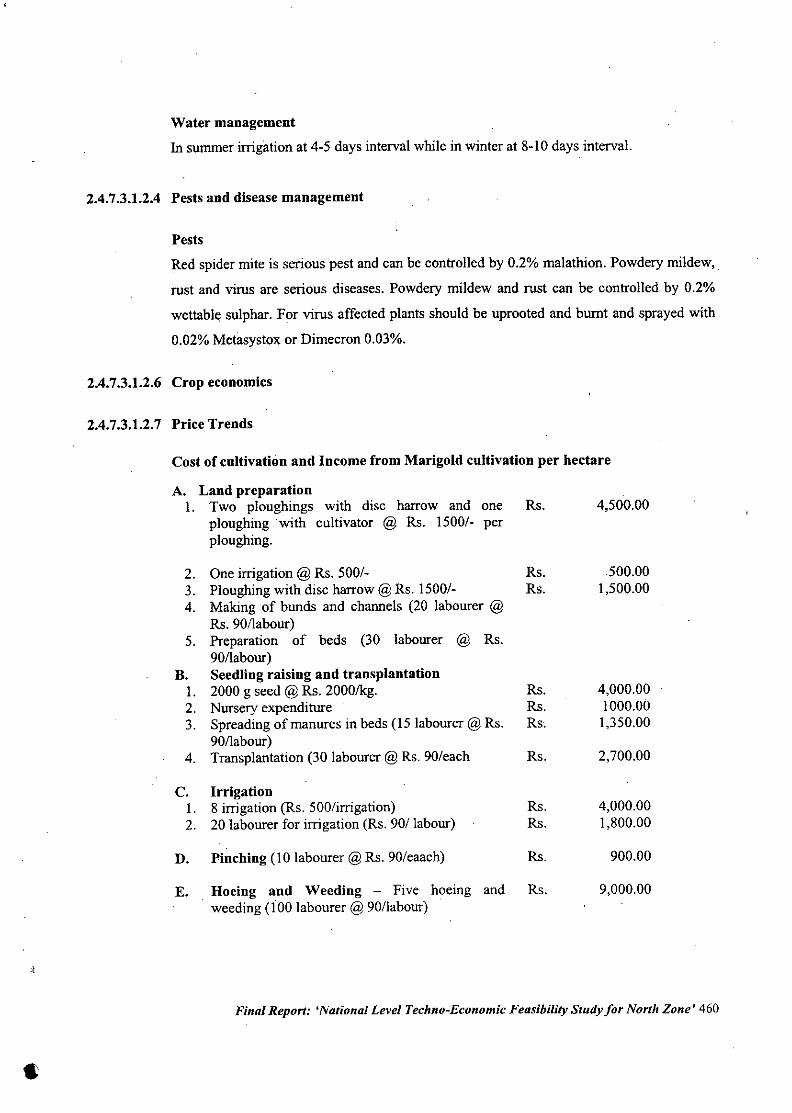
Water managementIn summerirrigationat 4-5 days intervalwhile in winter at 8-10days interval.
2.4.7.3.1.2.4 Pests and disease management
PestsRed spidermite is serious pest and can be controlledby 0.2%malathion. Powderymildew,.
rust and virus are serious diseases. Powdery mildew and rust can be controlled by 0.2%
wettable sulphar. For virus affected plants should be uprooted and burnt and sprayedwith
0.02%Metasystoxor Dimecron0.03%.
2.4.7.3.1.2.6 Crop economics
2.4.7.3.1.2.7 Price Trends
Cost of cnltivation and Income from Marigold cultivation per hectare
A. Land preparation1. Two ploughings with disc harrow and one Rs.ploughing with cultivator @ Rs. 1500/- perploughing.
2. One irrigation@Rs. 500/- Rs.3. Ploughingwith disc harrow@Rs. 1500/- Rs.4. Making of bunds and channels (20 labourer @Rs. 90/labour)
5. Preparation of beds (30 labourer @ Rs.90/labour)
B. Seedling raising and transplantationI. 2000 g seed@Rs. 2000/kg. Rs.2. Nursery expenditure Rs.3. Spreadingof manures in beds (15 labourer@Rs. Rs.90/labour)
4. Transplantation(30 labourer@ Rs. 90/each Rs.
C. Irrigation1. 8 irrigation(Rs. 500/irrigation) Rs.2. 20 labourer for irrigation (Rs. 90/ labour) Rs.
D. Pinching (10 labourer@Rs. 90/eaach) Rs.
E. Hoeing and Weeding - Five hoeing and Rs.weeding (100 labourer@ 90/labour)
4,500.00
500.001,500.00
4,000.001000.001,350.00
2,700.00
4,000.001,800.00
900.00
9,000.00
•Final Report: 'National Level Techno-Economic Feasibility Study for North Zone' 460
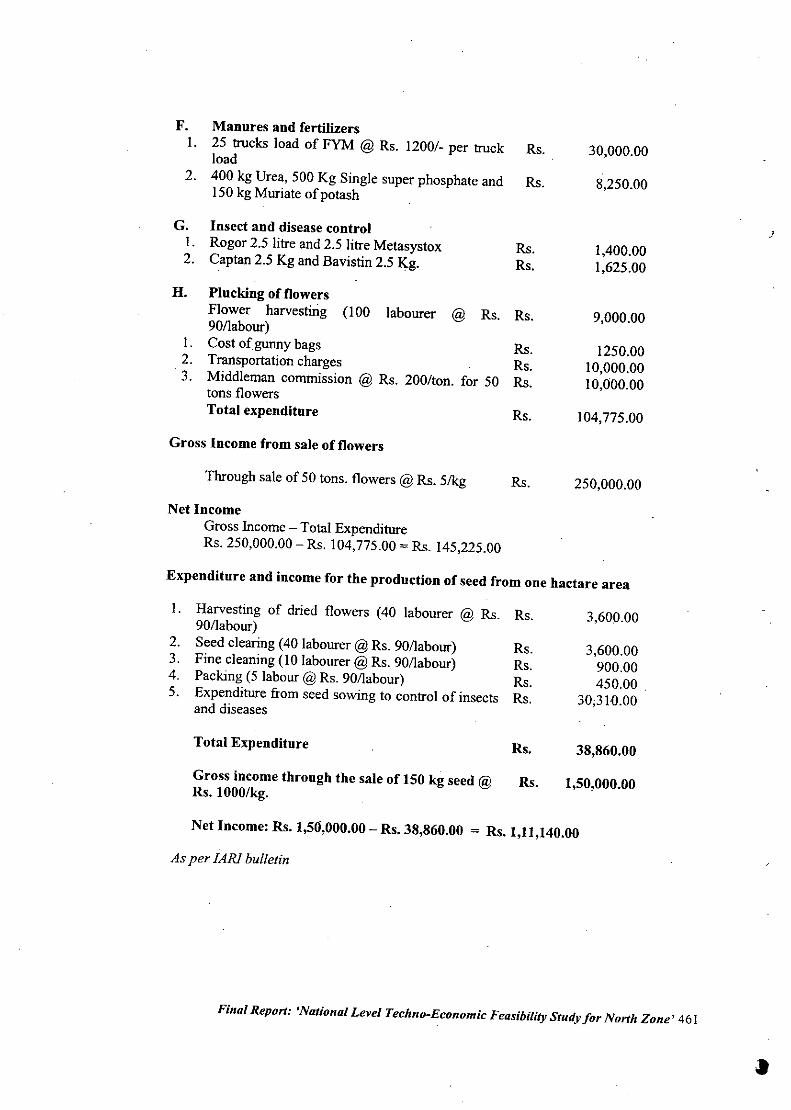
F. Manures aud fertilizersI. 25 trucks load of FYM @ Rs. 1200/- per truck Rs.
load2. 400 kg Urea, 500 Kg Single super phosphate and Rs.
150 kg Muriate of potash
30,000.00
8,250.00
G. Insect and disease controlI. Rogor 2.5 litre and 2.5 litre Metasystox2. Captan 2.5 Kg and Bavistin 2.5 Kg.
Rs.Rs.
1,400.001,625.00
J
H. Plucking of flowersFlower harvesting (100 labourer @ Rs. Rs.90llabour)
I. Cost of gunny bags Rs.2. Transportation charges Rs.3. Middleman commission @ Rs. 200/ton. for 50 Rs.
tons flowersTotal expenditure Rs.
Gross Income from sale of flowers
9,000.00
1250.0010,000.0010,000.00
104,775.00
Through sale of 50 tons. flowers @ Rs. 5/kg
Net IncomeGross Income - Total ExpenditureRs. 250,000.00 - Rs. 104,775.00 = Rs. 145,225.00
Rs. 250,000.00
Expenditure and income for the production of seed from one hactare area
I. Harvesting of dried flowers (40 labourer @ Rs. Rs. 3,600.0090/labour)2. Seed clearing (40 labourer@Rs. 90llabour) Rs. 3,600.003. Fine cleaning (10 labourer@ Rs. 90llabour) Rs. 900.004. Packing (5 labour @ Rs. 90llabour) Rs. 450.00 .5. Expenditure from seed sowing to control of insects Rs. 30;310.00and diseases
Total Expenditure Rs. 38,860.00
Gross income through the sale of 150 kg seed @ Rs. 1,50,000.00Rs. lOOO/kg.
Net Income: Rs. 1,5ll,000.00 - Rs. 38,860.00 = Rs.l,11,140.00
As per JAR! bulletin
Final Report: 'National Level Techno-Economic Feasibility Study for North Zone' 461
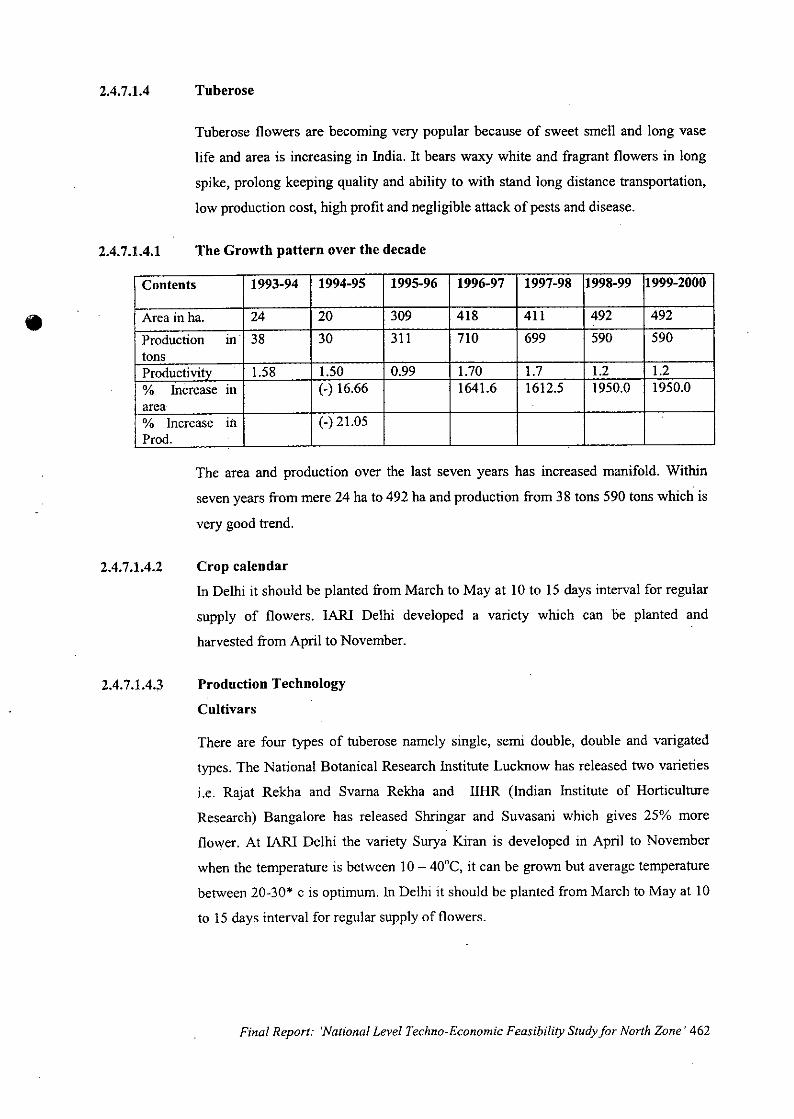
2.4.7.1.4
2.4.7.1.4.1
Tuberose
Tuberose flowers are becoming very popular because of sweet smell and long vase
life and area is increasing in India. It bears waxy white and fragrant flowers in long
spike, prolong keeping quality and ability to with stand long distance transportation,
low production cost, high profit and negligible attack of pests and disease.
The Growth pattern over the decade
•Contents 1993-94 1994-95 1995-96 1996-97 1997-98 1998-99 1999-2000
Area in ha. 24 20 309 418 411 492 492
Production III 38 30 311 710 699 590 590tonsProductivity 1.58 1.50 0.99 1.70 1.7 1.2 1.2% Increase in (-) 16.66 1641.6 1612.5 1950.0 1950.0area .
% Increase in (-) 21.05Prod.
The area and production over the last seven years has increased manifold. Within
seven years from mere 24 ha to 492 ha and production from 38 tons 590 tons which is
very good trend.
2.4.7.1.4.2
2.4.7.1.4.3
Crop calendarIn Delhi it should be planted from March to May at 10 to 15 days interval for regular
supply of flowers. IAR1 Delhi developed a variety which can be planted and
harvested from April to November.
Production Technology
Cultivars
There are four types of tuberose namely single, semi double, double and varigated
types. The National Botanical Research Institute Lucknow has released two varieties
i.e. Rajat Rekha and Svarna Rekha and IllIR (Indian Institute of Horticulture
Research) Bangalore has released Shringar and Suvasani which gives 25% more
flower. At IAR1 Delhi the variety Surya Kiran is developed in April to November
when the temperature is between 10 - 40°C, it can be grown but average temperature
between 20-30* c is optimum. In Delhi it should be planted from March to May at 10
to 15 days interval for regular supply of flowers.
Final Report: 'National Level Techno-Economic Feasibility Study for North Zone' 462
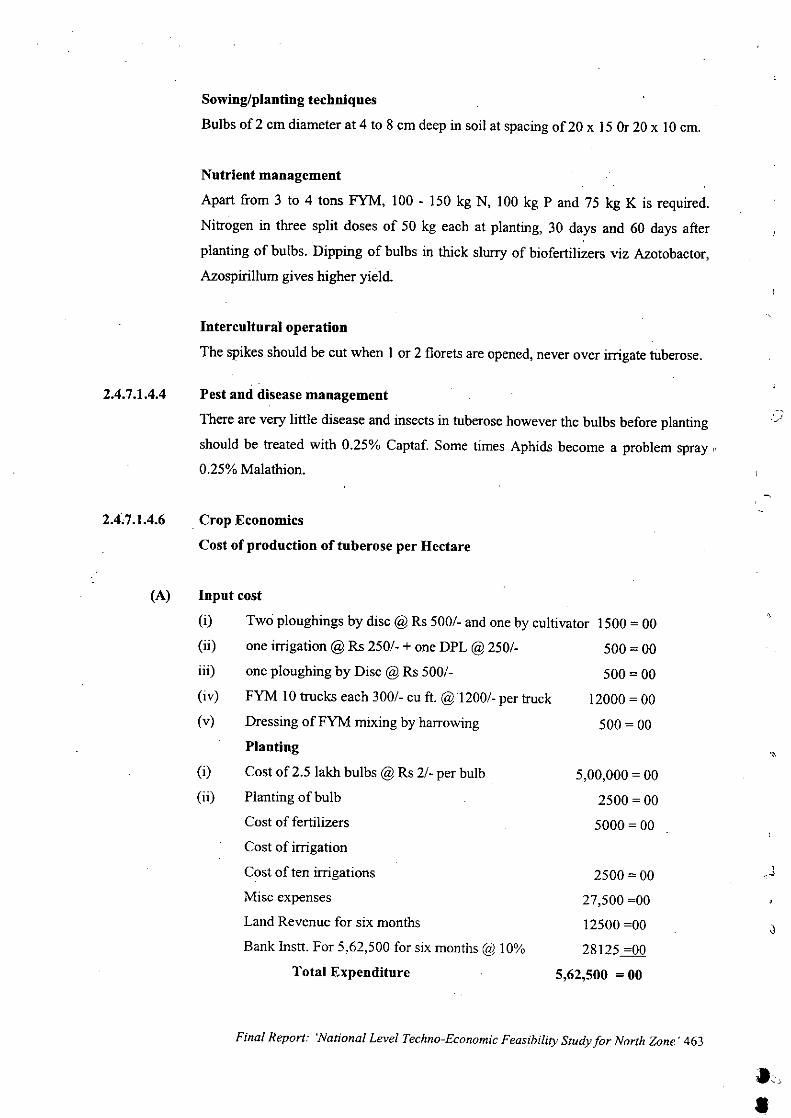
Sowing/planting techniques
Bulbs of 2 cm diameter at 4 to 8 cm deep in soil at spacing of 20 x 15 Or20 x 10 em.
Nutrient management
Apart from 3 to 4 tons FYM, 100 - 150 kg N, 100 kg P and 75 kg K is required.
Nitrogen in three split doses of 50 kg each at planting, 30 days and 60 days after
planting of bulbs. Dipping of bulbs in thick slurry of biofertilizers viz Azotobactor,
AzospirilJum gives higher yield.
Intercultural operation
The spikes should be cut when I or 2 florets are opened, never over irrigate tuberose.
2.4.7.1.4.4 Pest and disease management
There are very little disease and insects in tuberose however the bulbs before planting
should be treated with 0.25% Captaf. Some times Aphids become a problem spray,.
0.25% Malathion.
2.4~7.1.4.6 . Crop Economics
Cost of production of tuberose per Hectare
1500 = 00
500 = 00
500 =00
12000 = 00
500 = 00
5,00,000 = 00
2500 = 00
5000 = 00
Input cost
(i) Two ploughings by disc @ Rs 500/- and one by cultivator
(ii) one irrigation @ Rs 250/- + one DPL @ 250/-
iii) one ploughing by Disc @ Rs 500/-
(iv) FYM 10 trucks each 300/- cu ft. @1200/-pertruck
(v) Dressing ofFYM mixing by harrowing
Planting
Cost of 2.5 lakh bulbs @ Rs 2/- per bulb
Planting of bulb
Cost of fertilizers
(i)
(ii)
(A)
Cost of irrigation
Cost of ten irrigations
Misc expenses
Land Revenue for six months
Bank Instt. For 5,62,500 for six months @ 10%
Total Expenditure
2500 = 00
27,500 =00
12500 =00
28125 =00
5,62,500 = 00
Final Report: 'National Level Techno-Economic Feasibility Study for North Zone' 463
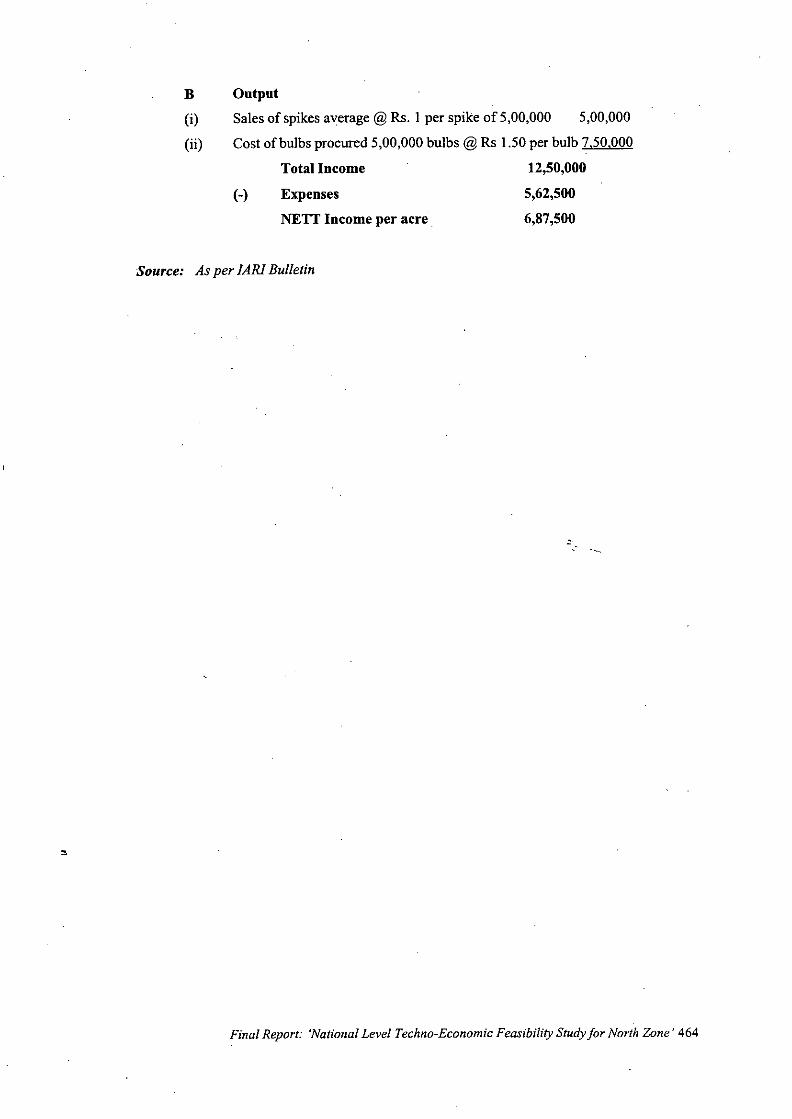
B Output(i) Salesof spikesaverage@ Rs. I per spike of 5,00,000 5,00,000
(ii) Cost ofbulbsprocured5,00,000bulbs@ Rs 1.50per bulb 7.50,000
Total Income 12,50,000
(-) Expenses 5,62,500
NETT Income per acre 6,87,500
Source: As per JARl Bulletin
Final Report: 'National Level Techno-Economic Feasibility Study for North Zone' 464
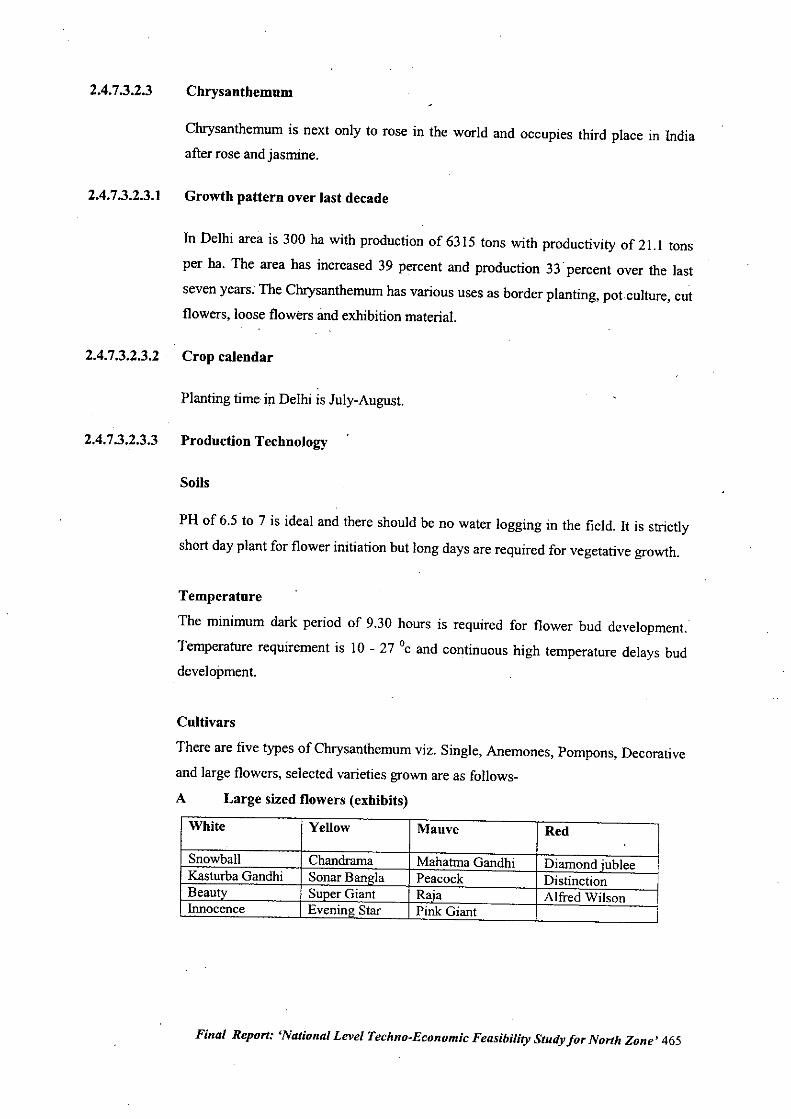
2.4.7.3.2.3
2.4.7.3.2.3.1
Chrysanthemum
Chrysanthemum is next only to rose in the world and occupies third place in India
after rose and jasmine.
Growth pattern over last decade
In Delhi area is 300 ha with production of 6315 tons with productivity of 21.1 tons
per ha. The area has increased 39 percent and production 33' percent over the last
seven years. The Chrysanthemum has various uses as border planting, pot culture, cut
flowers, loose flowers and exhibition materia!.
2.4.7.3.2.3.2 Crop calendar
Planting time in Delhi is July-August.
2.4.7.3.2.3.3 Production Technology
Soils
PH of 6.5 to 7 is ideal and there should be no water logging in the field. It is strictly
short day plant for flower initiation but long days are required for vegetative growth.
Temperature
The minimum dark period of 9.30 hours is required for flower bud development.
Temperature requirement is 10 - 27 °c and continuous high temperature delays bud
development.
Cultivars
There are five types of Chrysanthemum viz. Single, Anemones, Pompons; Decorative
and large flowers, selected varieties grown are as follows-
A Large sized flowers (exhibits)
White Yellow Mauve RedI.
Snowball Chandrama Mahatma Gandhi Diamond iublee ,I
Kasturba Gandhi Sonar Ban"Ia Peacock Distinction IBeauty SuoerGiant Raia Alfred Wilson IInnocence Evenin" Star Pink Giant i
Final Report: 'National Level Techno-Economic Feasibility Study for North Zone' 465
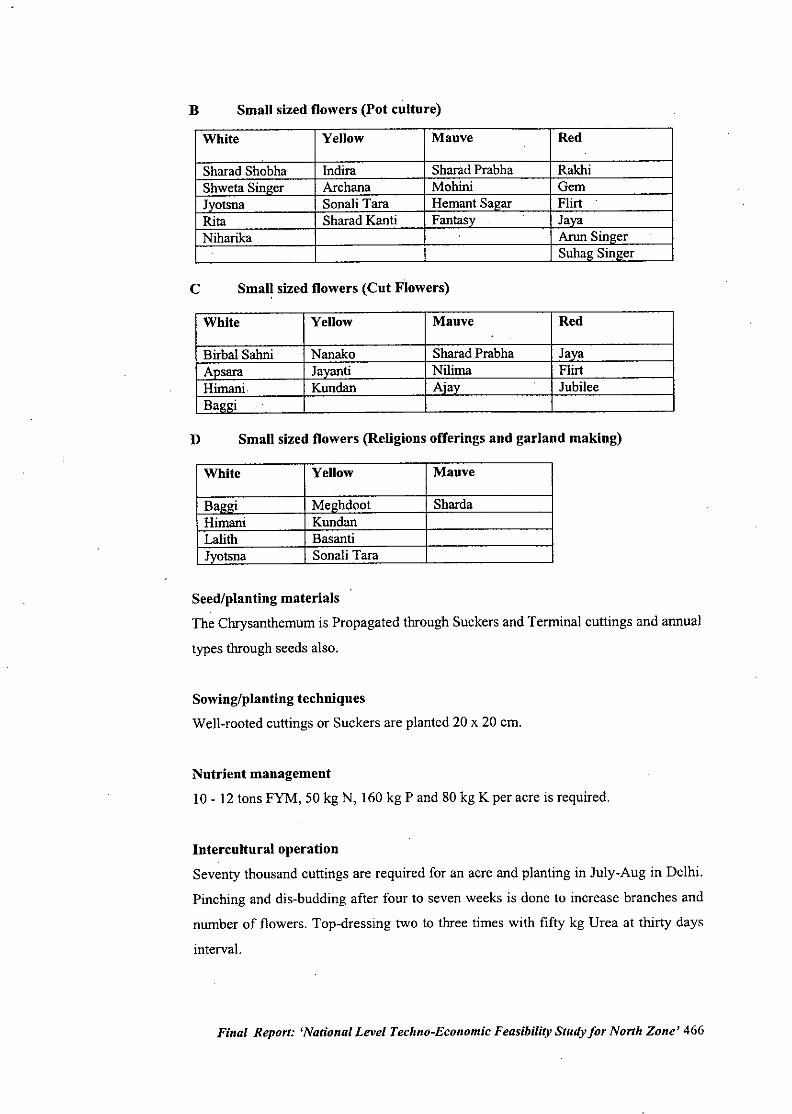
B Small sized flowers (pot culture)
White Yellow Mauve Red
Sharad Shobha Indira Sharad Prabha RakhiShweta Sin"er Archana Mohini GemJvotsna Sonali Tara Hemant Sa"ar FlirtRita Sharad Kanti Fantasv JayaNiharika Amn Singer
Suba" Sin"er
C Small sized flowers (Cut Flowers)
White Yellow Mauve Red.
Birbal Sahni Nanako Sharad Prabha JayaAnsara Javanti Nilirna FlirtHimani Kundan Aiav JubileeBaggi ..
D Small sized flowers (Religions offerings and garland making)
White Yellow Mauve
Ba""i Me"hdoot ShardaHimani KundanLalith BasantiJyotsna Sonali Tara
Seed/planting materials
The Chrysanthemum is Propagated through Suckers and Terminal cuttings and annual
types through seeds also.
Sowing/planting techniques
Well-rooted cuttings or Suckers are planted 20 x 20 em.
Nutrient management
10 - 12 tons FYM, 50 kg N, 160 kg P and 80 kg K per acre is required.
Intercultural operation
Seventy thousand cuttings are required for an acre and planting in July-Aug in Delhi.
Pinching and dis-budding after four to seven weeks is done to increase branches and
number of flowers. Top-dressing two to three times with fifty kg Urea at thirty days
interval.
Final Report: 'National Level Techno-Economic Feasibility Study for North Zone' 466
2.4.7.3.2.3.4 Pest and disease management
Diseases
Saptoria Spot or black spot, powdery mildew are main diseases. 0.2% Zeneb or
Diathene M-45 and for Powdery Mildew Karathane controls the disease
2.4.7.3.2.3.6 Crop economics
The average cost of.cultivation is Rs 22500 to 37500 per ha and net return is around
62500/- to 1,25,0001- per ha.
2.4.7.3.2.3.8 ProbleD!s and constraints
The important precautions in cultivation of Chrysanthemum are-
I. It is a hardy plant but very sensitive to water- logging.
2. Planting date should be adjusted so that plants are exposed to long days during
vegetative phase and short days for flowering.
3. It required seventy to ninety percent relative humidity for better growth.
Final Report: 'National Level Techno-Economic Feasibility Study for North Zone' 467
2.4.7.3.2.4 Gladiolus
Gladiolus is becoming more and more popular because of varying shades of colours
and long keeping quality of spikes. The optimum temperature for growing gladiolus
is 19_23°C day temperature and 15_18°C night temperature and below 6° C cause
frost injury. The spike length(around 1m), no. of florets(more than 16), number of
florets open at a time(6-7), size of the florets (10 cm and more), good attractive color,
long lasting quality on the plant and in the vase and good multiplication ability of
corms and cormlets are main features for selection of variety. The important
commercial varieties are classified in time taken for flowering and colours (given in
brackets).
2.4.7.3.2.4.2 Crop Calendar
September to October is best time for planting in Delhi.
2.4.7.3.2.4.3 Production Technology
SoilsPH range is 6 to 7 and this crop is sensitive to alkaline soils and pollution of
brickclins for cut flower production.
Cultivars
(Mauve), Pusa
white Friendship
Mayur
red) and
Melody(Pink),Friendship (pink), George Mazure (Pink),
Happy End (Orange), Morning kiss (white), Rose Supreme
(Pink), Sancerre (white), Snow Princes (White) and
Suryakiran (Pink).
Bis-Bis (Brick red), Patricia (Deep red), Ratna Butterfly
(OrangelPink), Rose spire (Pink), Suchitra (Pink), Vinks
glory (yellow I), Yellowstone (yellow) and Neelum
(Mauve).
Hunting Song (orange),
Suhagin(red), Sylvia (carrot
(white)
Early
Late
Mid Season
Final Report: 'National Level Techno-Economic Feasibility Study for North Zone' 468
Sowing/planting techniques
September to October is best time for planting in Delhi. The Sylvia variety is hardly
and can be planted round the year. The bulbs are planted 30-40 X 15-20 cm between
rows and plants and 10-15 cm deep is soil. The planting should be scattered at 10-15
days interval for regular supply of cut flowers. 125000 to 150000 bulbs are requiredfor one ha.
Nutrient management.
For better crop, field should be green manured during rainy season and apply 5-10 kg
FYM + 50 gm bone meal + 50 gm Nand 20 gm each of P and K per sq. mt.
Intercnltural operation
After 45-50 days of planting earthing up is f!lust.
Water management
The watering is done at 10-15 days interval.
2.4.7.3.2.4.4 Pest and disease management
Disease
The most common disease are Fussasuim wilt, Curvularia blight and Botritis blight,
The corns should be treated with Bavistin or Benlate 5gllit of water for 3 minutes and
regular spray at 10-15 days interval prevents these diseases.
Pests
Aphids, thrips and cut worms are serious pests, nematodes are also serious problem.
Roger, Metasystox and malathion should be sprayed alternatively at 15 days interval.
The corms before storing should be dusted with BHC or DDT and stored at 4.4 to 6°C.
2.4.7.3.2.4.5 Harvest method and Yield
The spikes should be cut above the four leaves from the base after first floret hasopened and should be kept in water.
Final Report: 'National Level Techno-Economic Feasibility Study for North Zone' 469
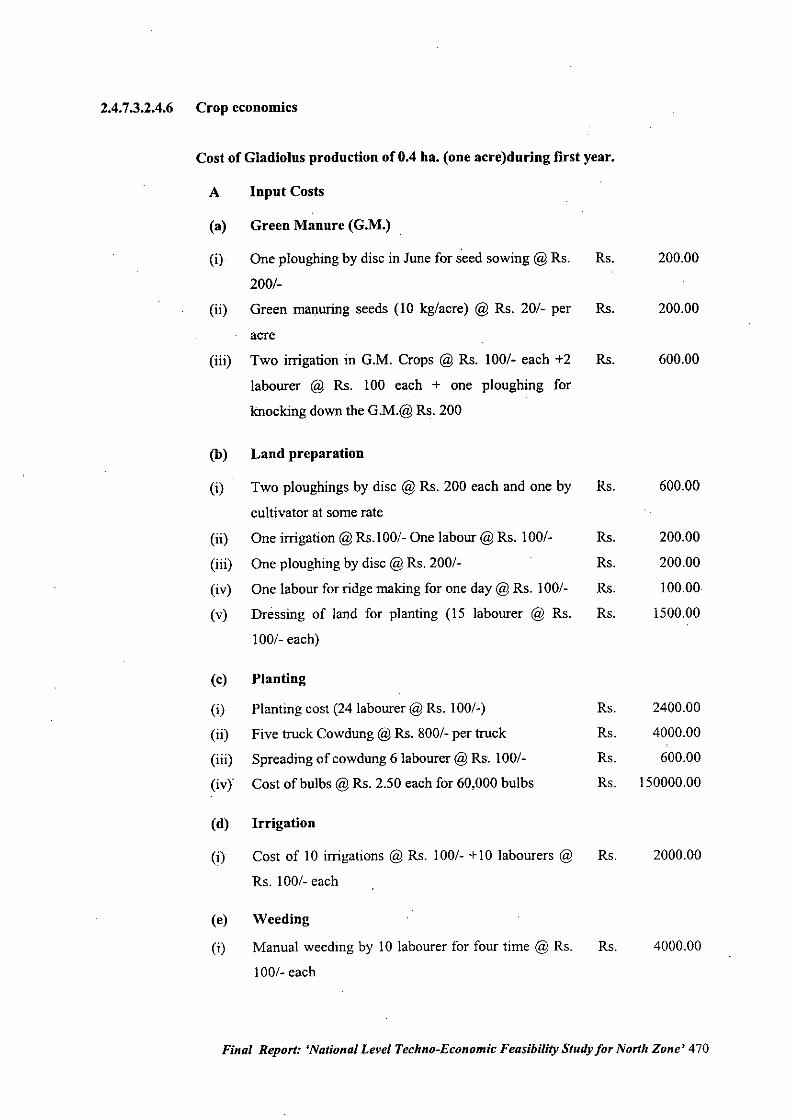
2.4.7.3.2.4.6 Crop economics
Cost of Gladiolns production of 0.4 ha. (one acre)during first year.
A Input Costs
(a) Green Manure (G.M.)
(i) One ploughing by disc in June for seed sowing @ Rs. Rs. 200.00
200/-
(ii) Green manuring seeds (10 kg/acre) @ Rs. 20/- per Rs. 200.00
acre
(iii) Two irrigation in G.M. Crops @ Rs. 100/- each +2 Rs. 600.00
labourer @ Rs. 100 each + one ploughing for
knocking down the G.M.@Rs. 200
(b) Land preparation
(i) Two ploughings by disc @ Rs. 200 each and one by Rs. 600.00
cultivator at some rate
(ii) One irrigation @Rs.IOOI-Onelabour@Rs. 100/. Rs. 200.00
(iii) One ploughing by disc @ Rs. 200/- Rs. 200.00
(iv) One labour for ridge making for one day @ Rs. 1001- Rs. 100.00
(v) Dressing of land for planting (15 labourer @ Rs. Rs. 1500.00
100/- each)
(c) Planting
(i) Planting cost (24 labourer @Rs. 100/-) Rs. 2400.00
(ii) Five truck Cowdung @ Rs. 8001- per truck Rs. 4000.00
(iii) Spreading of cowdung 6 labourer @ Rsc 1001- Rs. 600.00
(iv) Cost of bulbs @ Rs. 2.50 each for 60,000 bulbs Rs. 150000.00
(d) Irrigation
(i) Cost of 10 irrigations @ Rs. 100/- +10 labourers @ Rs. 2000.00
Rs. 1001- each
(e) Weeding
(i) Manual weeding by 10 labourer for four time @ Rs. Rs. 4000.00
100/. each
Final Report: 'National Level Techno-Economic Feasibility Study for North Zone' 470
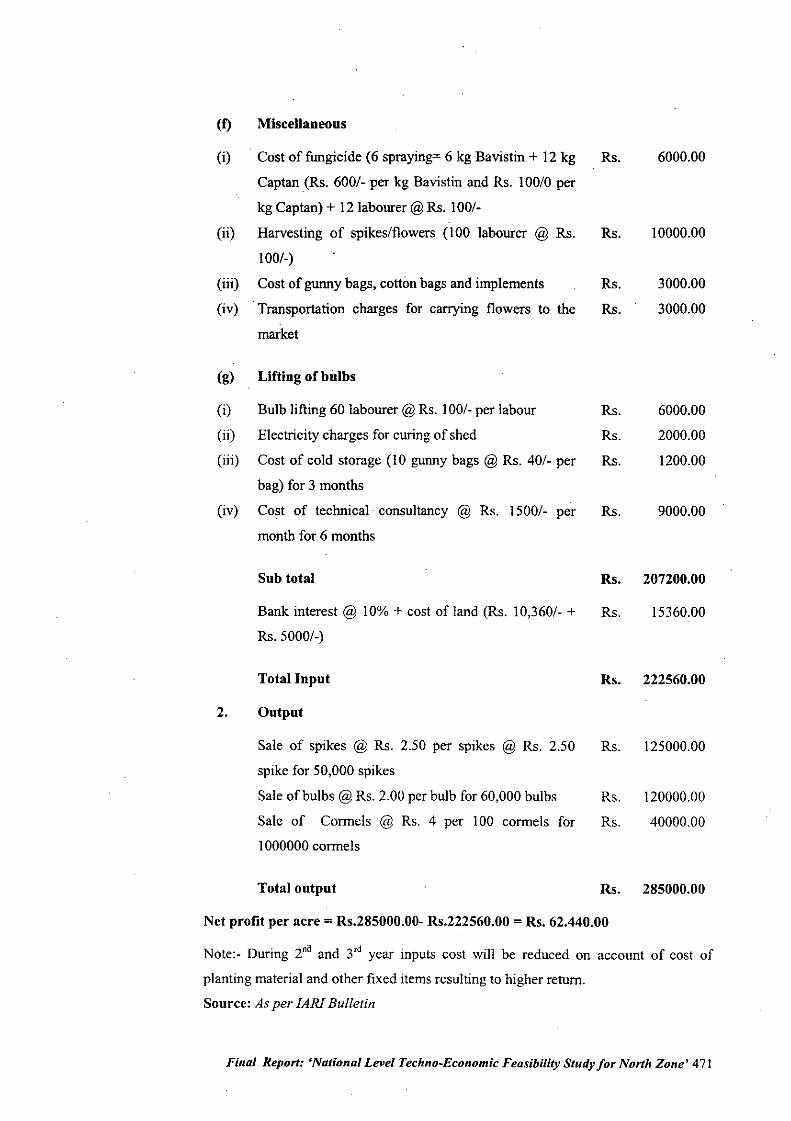
(1) Miscellaneous
(i) . Cost offungicide (6 spraying= 6 kg Bavistin + 12 kg
Captan (Rs. 600/- per kg Bavistin and Rs. 100/0 per
kg Captan) + 12 labourer @Rs. 100/-
(ii) Harvesting of spikes/flowers (100 labourer @ Rs.
100/-)
(iii) Cost of gunny bags, cotton bags and implements
(iv) Transportation charges for carrying flowers to the
market
Rs.
Rs.
Rs.
Rs.
6000.00
10000.00
3000.00
3000.00
(g) Lifting of bulbs
(i) Bulb lifting 60 labourer @ Rs. 100/-per labour
(ii) Electricity charges for curing of shed
(iii) Cost of cold storage (10 gunny bags @ Rs. 40/- per
bag) for 3 months
(iv) Cost of technical consultancy @ Rs. 1500/- per
month for 6 months
Rs. 6000.00
Rs. 2000.00
Rs. 1200.00
Rs. 9000.00
Sub total Rs. 207200.00
Bank interest @ 10% + cost of land (Rs. 10,360/- + Rs. 15360.00
Rs.5000/-)
Total Input
2. Output
Sale of spikes @ Rs. 2.50 per spikes @ Rs. 2.50
spike for 50,000 spikes
Sale of bulbs @ Rs. 2.00 per bulb for 60,000 bulbs
Sale of Cormels @ Rs. 4 per 100 cormels for
1000000 cormels
Total output
Rs. 222560.00
Rs; 125000.00
Rs. 120000.00
Rs. 40000.00
Rs. 285000.00
Net profit per acre = RS.285000.00- Rs.222560.00 =Rs. 62.440.00
Note:- During 2'" and 3'd year inputs cost will be reduced on account of cost of
planting material and other fixed items resulting to higher return.
Source: As per JAR! Bulletin
Final Report: 'National Level Techno-Economic Feasibility Study for North Zone' 471
2.4.7.3.2.4.7 Price TrendsThe prices prevailing in the Delhi market for Gladioli is around RS.2.50 per spike.
2.4.7.3.2.4.8 Problem and constraints
The export market needs to be strengthened for development of this crop in the State.
2.4.7.3.2.4.9 . ConclusionIt has to be ensured that good quality corms are made available to the farmers for
commercial cultivation for better market acceptability.
2.4.7.6 Problems of Mushroom cultivation
The high-tech projects are capital incentive and highly temperature and
humidity controlled atmosphere. Only these controlled production houses
grow mushroom for at least 250-280 days in a year. The small-scale
mushroom producers are seasonal in nature i.e. from September-October to
February months. Only those production farms who has marketing tie-ups
within the country and abroad are successful because marketing at
remunerative prices are assured but small scale growers some time mcur
heavy losses because of its perishable nature and very low shelf life.
Final Report: 'National Level Techno-Economic Feasibility Study for North Zone' 472
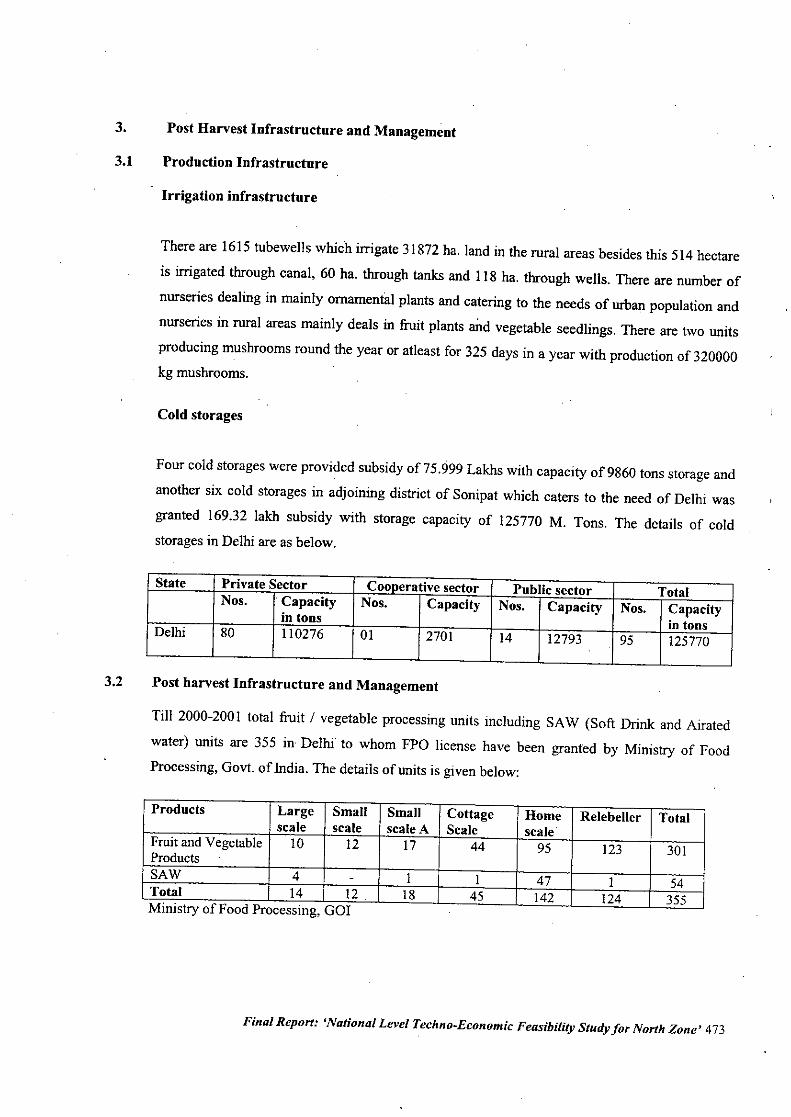
3. Post Harvest Infrastructure and Management
3.1 Production Infrastructure
Irrigation iufrastructure
There are 1615 tubewells which irrigate 31872 ha.land in the rural areas besides this 514 hectare
is irrigated through canal, 60 ha. through tanks and 118 ha. through wells. There are number of
nurseries dealing in mainly ornamental plants and catering to the needs of urban population and
nurseries in rural areas mainly deals in fruit plants and vegetable seedlings. There are two units
producing mushrooms round the year or atleast for 325 days in a year with production of 320000kg mushrooms.
Cold storages
Four cold storages were provided subsidy of75.999 Lakhs with capacity of 9860 tons storage and
another six cold storages in adjoining district of Sonipat which caters to the need of Delhi was
granted 169.32 lakh subsidy with storage capacity of 125770 M. Tons. The details of coldstorages in Delhi are as below.
State Private Sector Coonerative sector Public sector TotalNos. .Capacity Nos. Capacity Nos. Capacity Nos. Capacityin tons in tonsDelhi 80 110276 01 2701 14 12793 95 125770.
3.2 Post harvest Infrastructure and Management
Till 2000-200 I total fruit / vegetable processing units including SAW (Soft Drink and Airated
water) units are 355 in Delhi to whom FPO license have been granted by Ministry of FoodProcessing, Gov!. of India. The details of units is given below:
Ministry of Food Processmg, Gar
Products Large Small Small Cottage Home Relebeller Totalscale scale scaleA Scale scaleFruit and Vegetable 10 12 17 44 95 123 301ProductsSAW 4 - 1 1 47 1 54Total 14 12 . 18 45 142 124 355
Final Report: 'National Level Techno-Economic Feasibility Study for North Zone' 473
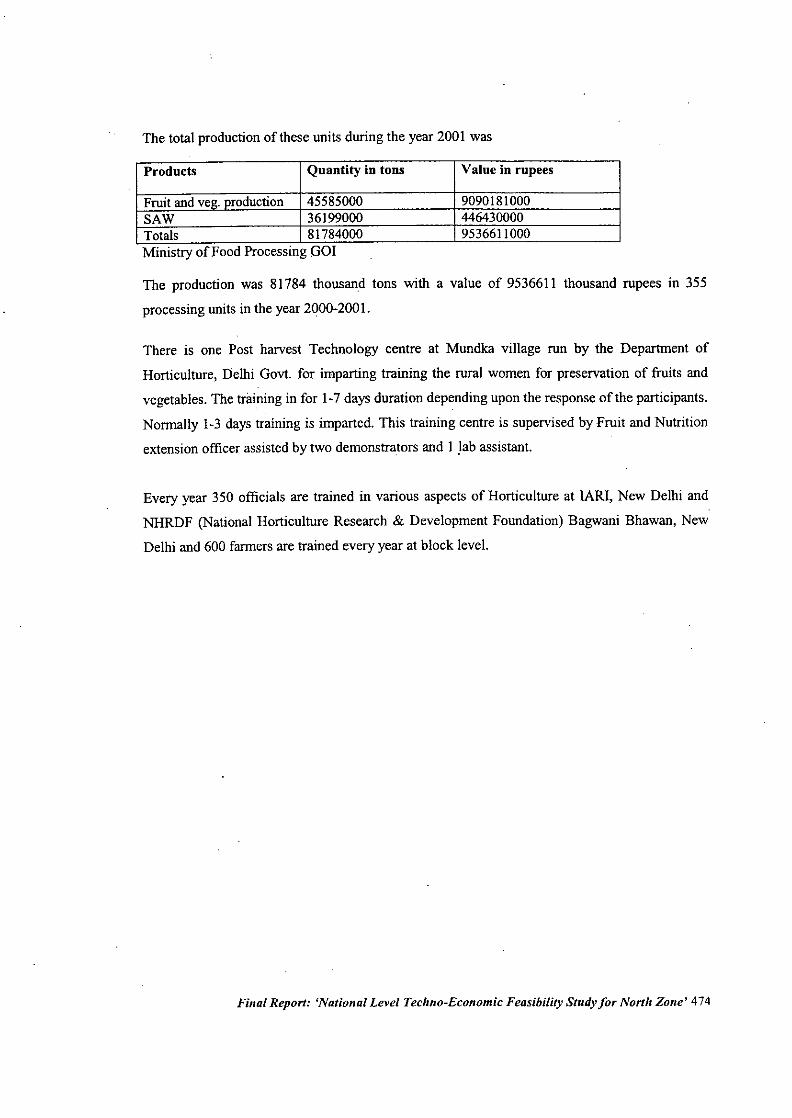
The total production ofthese units during the year 2001 was
Products Quautity in tons Value in rupees
Fruit and veg. oroduction 45585000 9090181000SAW 36199000 446430000Totals 81784000 9536611000Ministry of Food Processing 001
The production was 81784 thousand tons with a value of 9536611 thousand rupees in 355
processing units in the year 2000-2001.
There is one Post harvest Technology centre at Mundka village run by the Department of
Horticulture, Delhi Govt. for imparting training the rural women for preservation of fruits and
vegetables. The training in for 1-7 days duration depending upon the response of the participants.
Normally 1-3 days training is imparted. This training centre is supervised by Fruit and Nutrition
extension officer assisted by two demonstrators and I Jab assistant.
Every year 350 officials are trained in various aspects of Horticulture at IARI, New Delhi and
NHRDF (National Horticulture Research & Development Foundation) Bagwani Bhawan, New
Delhi and 600 farmers are trained every year at block level.
Final Report: 'National Level Techno-Economic Feasibility Study for North Zone' 474
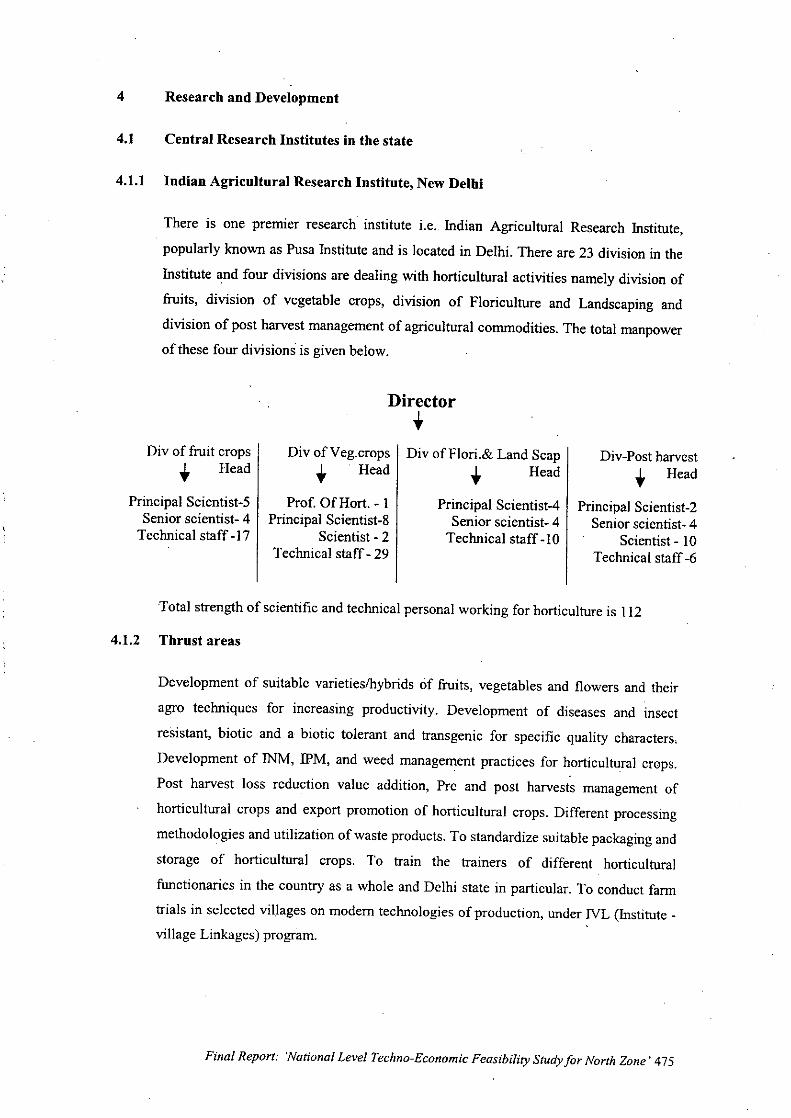
4 Research and Development
4.1 Central Research Institutes in the state
4.1.1 Indian Agricultural Research Institute, New Delhi
There is one premier research institute i.e.. Indian Agricultural Research Institute,
popularly known as Pusa Institute and is located in Delhi. There are 23 division in the
Institute and four divisions are dealing with horticultural activities namely division of
fruits, division of vegetable crops, division of Floriculture and Landscaping and
division of post harvest management of agricultural commodities. The total manpowerof these four divisions is given below.
Director
••Div of fruit crops
.• Head
Principal Scientist-5Senior scientist- 4Technical staff -17
Div ofVeg.crops.• Head
Prof. Of Hort. - 1Principal Scientist-8
Scientist - 2Technical staff - 29
Div of Flori.& Land Scap.• Head
Principal Scientist-4Senior scientist- 4Technical staff -10
Div-Post harvest.• Head
Principal Scientist-2Senior scientist- 4
Scientist - 10Technical staff -6
Total strength of scientific and technical personal working for horticulture is 112
4.1.2 Thrust areas
Development of suitable varietieslhybrids of fruits, vegetables and flowers and their
agro techniques for increasing productivity. Development of diseases and insect
resistant, biotic and a biotic tolerant and transgenic for specific quality characters.
Development of INM, ll'M, and weed management practices for horticultural crops.
Post harvest loss reduction value addition, Pre and post harvests management of
horticultural crops and export promotion of horticultural crops. Different processing
methodologies and utilization of waste products. To standardize suitable packaging and
storage of horticultural crops. To train the trainers of different horticultural
functionaries in the country as a whole and Delhi state in particular. To conduct farm
trials in selected villages on modem technologies of production, under IVL (Institute _village Linkages) program.
Final Report: 'National Level Techno-Economic Feasibility Study for North Zone' 475
4.1.3 Achievementsover the last decade
New hybrids of mango Pusa Arunima and Pusa Surya which are regular bearing and
suitabie for export. Grape Pusa Urvashi an early maturing and seedless and Pusa
Navrang for Juice. Application of 1.5% Dormex (49 % aj hydrogen cynamide) just
after pruning hastens maturity of berry by 16 days in Pusa seedless and 12 days in
Beauty seedless varieties. Troyer citrangehas been identified as dwarfing root stock for
Kinnow for high density planting. Aneoploid No. 82 in guava is a dwarfing root stock
of Guava for Allahabad Safeda again for high density plantings.
In vegetables number of varieties/ hybrids namely Pusa Early synthetic and Pusa,
hybrid-2 in Cauliflower, Pusa Sharad and Pusa Ageti in tropical Cabbage, Pusa hybrid
1,2 and 4 of Tomato and varieties Pusa sheetal, Pusa- uphaar and Pusa Sada bahar, In
Brinjal Pusa hybrid 5, 6 and 9 and varieties Pusa uttam, Pusa Upkar, Pusa ankur and
Pusa Bindu, Pusa Madhvi in Onion, Pusa A-4 in Okra, Pusa Sem 2 and 3 in Dolichos
bean, Pusa Sumeet in broad beans, Pusa Navin and Pusa Sandesh in bottleguord and
hybrids in Cucurbits namely Pusa hybrid-I in Bittergourd Pusa hybrid-3 of bottle
gourd, Pusa hybrid -I and Pusa Vikas in pumpkin, Pusa lal Chanlai in Amaranth, Pus
Bharti in palak and Pusa Bathua-I of chenopodium are some of the important varieties
developed in vegetables' during the decade, Beside these agrotechniques for Cucumber,
Tomato, Capsicum and summer Squash under low cost polyhouse have standardized
Post harvest technology of curing of Potato and checking sprouting has been
standardized. Prepacking of Cauliflower and broccoli ;with cling film of 50 micron
extends storage life. Kharif Onion production technology through sets in northern
India, low cost polyhouse technology for raising off season! early nursery of
Solanaceous and Cucurbitaceous crops. Standardized technology for Cauliflower and
radish cultivation round the year, Technology of sex modification in cucurbits to
increase productivity. Hybrid seed production technology in Tomato and Cucurbits and
growing early tomato crop under north Indian conditions has been standardized.
To summarize the work of last ten years 23 vegetable varieties, 12 F, hybrids, 4
resistant varieties for biotic stress, 5 hybrids for abiotic stress, seven varieties with high
nutritive value, four varieties for Industry and four suitable varieties for export have
been developed in the division of vegetable crops.
In Floriculture 24 varieties of rose (Mother Teresa, Preyasi, Rakitma, Shreyasi. Dr.
Benjamin Pal, Dr. S.S Bhatnagar, Lohar, Mansi, Climbing Sadabahar,Gaurav, Bahadur,
Priya, Garima, Dr. Bharat Ram, Barahmasi. Virangana, Pitamber, Mohit, Manhar,
Muskan, Urmil and Ranjana) Twenty- nine varieties of Gladiolus (Dhanvantri, Neelam,
Sanjeevani, Surya Kiran, Anjali, Archana, Vandana. Shringarika, Shagun, Gunjan,
Final Report:. 'National Level Techno-Economic Feasibility Study for North Zone' 476
Shweta, , Vandana, Shringarika, Shagun, Gunjan, Kamini, Lohit, Mohini, Rang Mahal,
Sunayana Sunayana Swapnil, Swarnima and Urmil) Eleven varieties in holy-hock
(Apricot Supreme, Postal Pink, Pink Beauty, yellow Beauty, Dulhar, Deepika, Gauri,
Holly-hock Gulabi, Krishna, Lalima and Shweta) Two in Marigold (Pusa Narangi
Gainda and Pusa Basanti Gainda) and Surya Kiran of Amaryllis.
Major technologies developed by the division of Floricnlture are -
(i) Rose stock namely Rosa-indica variety Odorata as best root stock.
(ii) The planting time of rose is best in October- November in northern India.
(iii) Soil application of 50 kg Magnesium Sulphate and foliar spray of Ferrous
Sulphate one persent, Boron 0.5 percent and Zinc Sulpphate 0.5 Percent in the
month of November increases the quality and quantity of flowers.
(iv) Pruning of roses 45 em above the ground in October- November gIves
maximum yield.
(v) December pruning for Damask rose for extraction good quality perfumes.
(vi) Multicolored Gladioli variety can be planted from September to November
however, best results are in second week of October planting.
(vii) Spray or dip treatment of Gladiolus corms in GA.3 1000 ppm improves
sprouting and improves other physiological characters.
(viii) Spacing of 20 x 20 em at depth of 5 to 8 em and corm size 4.6 to 5 em
(diameter) results in production of more quality flower spikes, corma and
cormels.
(ix) Benzyl Amino Purine @ 0.5 mg / one and NAA @ 1.5 mg / one litre in MS
media for microppropagation is better for better for shoot proliferation in
carnation.
(x) Under protected cultivation of roses, %0 ppm of Salieylic acid nad CGA n-
24570 (Bion) are effecttive against powdry mildew in roses.
(xi) Calcium nitrate 1000 to 2000 ppm solution, prolongs shelf life of cut rose
variety Rakthagandca.
(xii) Application of 150 ppm N,; 150 ppm K.2 0 and.60 ppm P,O, through irrigation
water gives more flower incarnation.
In post harvest technology- Innovation of zero energy cool chamber, development of
ventilated corrugated fibre board boxes (CFB) for packaging of mango, control of
Potato sprouting by spraying CIPC, standardization of simple rapid and direct.
Calorimetric method for estimation of carotenoids pigments in mango, isolation and
identification of the authocyanin pigment namely. Cyanidin-3 glucase and delphiniden-
Final Report: 'National Level Techno-Economic Feasibility Study for North Zone' 477
3 glucase from phalsa, utilization of indigenous fruits viz: bael, jamun and phalsa
preparation of various beverages of commercial importance, Standardization of fruits
based carbonated drinks. Standardization of technique of cryogenic freezes of Mango
slices having quality attributes of fresh Mango. Standardization of steeping method for
the preservation fresh vegetables and raw Mango slices by using various food
additives, Preservation of different vegetables by caustic fermentation and.evaluation
of their nutritional and microbial quality. And utilization of waste potato for starch
extraction and converting it to sugar are some of the important. contributions in
horticulture during the last decade. Popular books and bulletins on various aspects are
published for the benefit of farmers and students.
Final Report: 'National Level Techno-Economic Feasibility Study for North Zone' 478
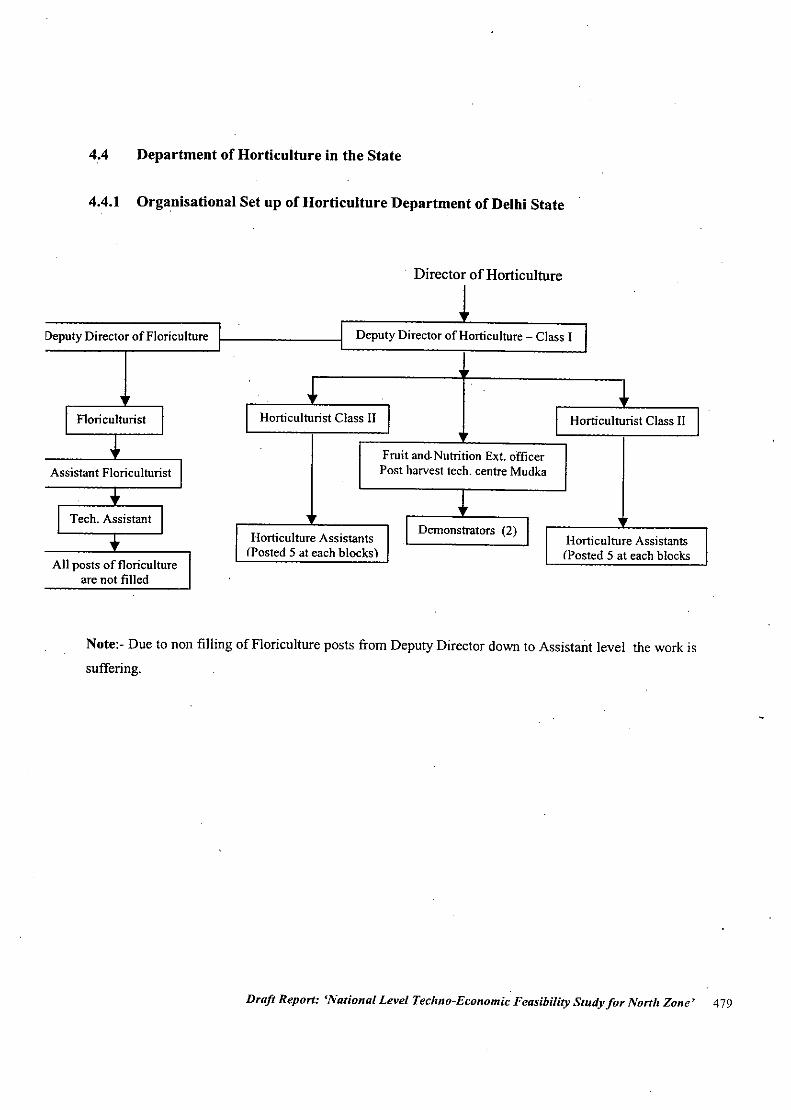
4.4 Department of Horticulture in the State
4.4.1 Organisational Set up of Horticulture Department of Delhi State
Director of Horticulture
Deputy Director of Floriculture Deputy Director of Horticulture - Class I
All posts of floricultureare not filled
Horticulture Assistants(Posted 5 at each blocks)
Fruit and.Nutrition Ext. officerPost harvest tech. centre Mudka
Horticulture Assistants(Posted 5 at each blocks
Note:- Due to non filling of FloricuIture posts from Deputy Director down to Assistant level the work is
suffering.
Draft Report: 'National Level Techno-Economic Feasibility Study for North Zone' 479
The structure of Horticulture Department in Delhi State is pretty bad because of three
horticulturists only one is working in Horticulture and rest of the two are lookingafter legal cases
and miscellaneous work. The Horticulture Department requires strengthening on top priority.
Block Development officers are almost non agriculturist officers with the result on Horticulture/
Agriculture development is suffering.
. 4.4.2 Thrust area
Since the cultivated land is shrinking in the capital of India. The fanning have to be more
lucerative by cultivation of high value crops to earnmore profit. To achieve this goals farmers are
advised to grow flowers and hybrid vegetables and good success have been made during the
decade. The productivity of vegetables has increased from 11.4 tons to 17.6 tons per ha. While
production of flowers has increased six times mainly due to increase in the area. The other thrust
area is more and more use of plastics by way of polyhouses, low tunnels, drip and sprinkler
irrigation to produce quality flower in large areas.
4.4.3 Achievements of Horticulture Department during the year 2000-2001 are:
The area under flowers have been brought to 4145 hectares with a production of 25007 tons of
loose flowers and vegetable production has been 725000 tons with productivity of 17.6 tonslha.
The ornamental plants numbering 1.41 lakhs were produced and distributed in rural areas.
Community park of 0.4 hectare was developed in rural area in the gram sabha land and 66,000
trees were planted in a community land. The farmers have become more cautions about the high
Tech. adoption and switching over the area to flower and hybrid vegetable production to get
maximum income Horticulture staff of the Directorate is being trained regularly at Indian
Agricultural Research Institute to update knowledge about latest varieties and Technologies.
Following schemes and incentives are provided to the farmers.
I
2
3 (i)
Name of the Scheme
Distribution of bulbs of ornamental crops like gladiolus,tubrose and chryanthemum, flower seeds and seedlings
Cultivation of traditional flowers in one acre
Development of Infrastructure like fencing, installation of
tubewell etc.
Assistance Amount
@ Rs. 25,000/-Acre
@Rs. 15,0001- Acre
@ Rs. 25,0001- Perfamily
Final Report: 'National Level Techno-Economic Feasibility Study for North Zone' 480
(ii) Post Harvest Management facility development Rs. 15,000/- per
family
4. Extension and training
(i) Vocational training to rural youth and women
(ii) Development of Kitchen garden and ornamental gardens in schools
5. Post Management of Flowers
6. To establish modem outlets for flower sale
7. Development of horticulture through plasticulture I.e. erection of polyhouses,Agronet sheds, Drip irrigation, low plastic tunnels and Demonstration
8. Development of Mushroom and popularization ofwormi compost and Beekeeping
Final Report: 'National Level Techno-Economic Feasibility Study for North Zone' 481
6. Marketing
Local Consumption
Fruits
Amongst fruits Mango arrivals in Delhi market are the largest followed by those of Apple and
Banana, In fact Banana which is the second largest fruit of the country registers much lower
arrivals than Apple probably because of the fact that much of Banana trade has been
diversified to destination markets. This trend in direct approach to destination markets has
also started appearing in Apple where the arrival has gradually decreased during the decade.
Except these two crops i.e. Apple and Banana in case of all other fruit crops the arrival has
gradually increased during the decade. The increase being spectacular in case of Citrus where
the increase is over three fold (1875.25 to 6023.58 tons) Arrival of Grapes and Papayas
almost doubled where as in case of Mango it was slightly less than double. As regards to price
fluctuations, Banana continued to be the cheapest fruit. The price rise has been more steep in
Apple (almost three times) and the least rise in Papaya.
Vegetables
Tomato is by far the largest commodity amongst Vegetables. It retained such position inspite
of twenty- percent decrease in arrivals in 2000 as compared to those in 1996. Cabbage is the
second largest commodity with respect to the quantity arriving in Delhi market, it registered
sharp increase of arrivals during the decade, the increase being more than three times. The
gradual increase in arrival of Brinjal registered about fifty percent increase over the decade.
Cauliflower has been another commodity which registered appreciable increase in arrival,
Okra inspite of the fact that in a span of last five years of the decade, its arrival increased
almost three fold and remained the last one as for as quantity of arrivals in Delhi market are
concerned. The prices of all Vegetables increased during the decade. Cabbage remained the
lowest increase vegetable whereas Peas remained the costliest vegetables throughout the
decade. The rise.in prices was the sharpest in case ofBrinjal whereas the price was the lowest
in Okra. The situation with regards to its lowest arrivals and the least price index rise could be
due to the fact that this vegetable is almost grown in each province and is marketed only in
local markets. The present status of Mandi, is given at page 378, monthly arrival, whole sale
price of different fruits and vegetables in Delhi wholesale markets and trend during the last
decade is given in table 1 and 2.
Final Report: 'National Level Techno-Economic Feasibility Study for North Zone' 482
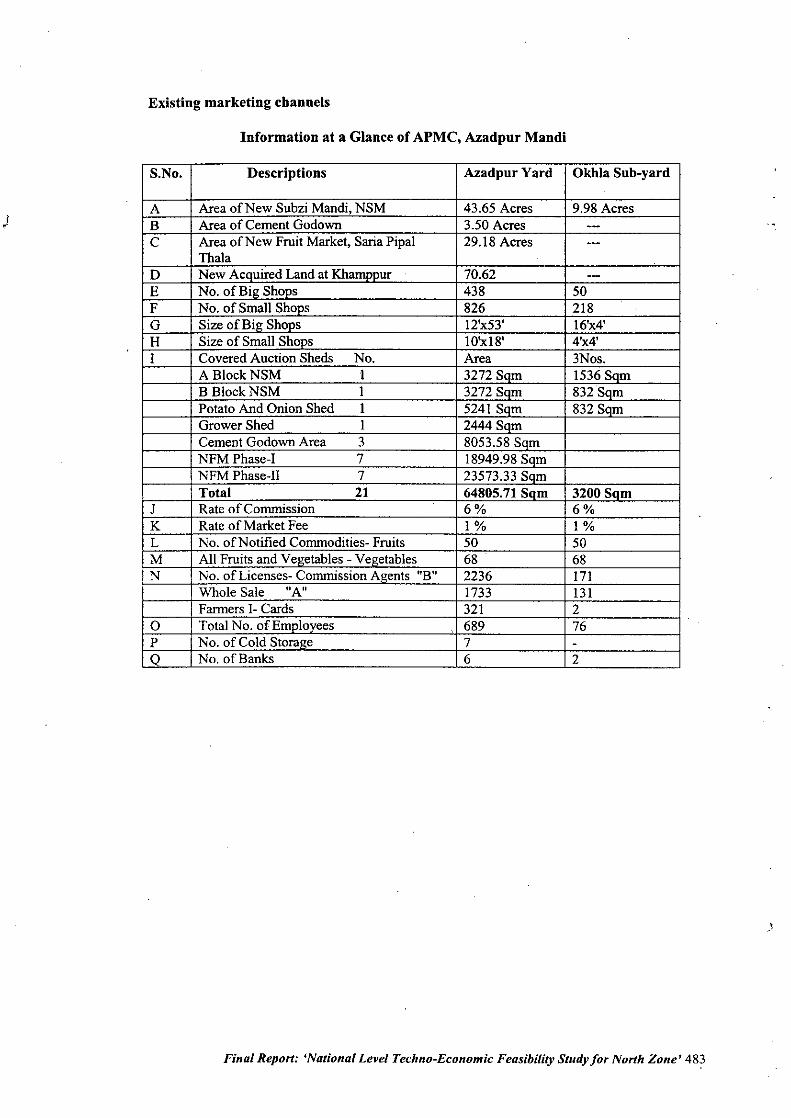
Existing marketing channels
Information at a Glance of APMC, Azadpur Mandi
S.No. Descriptions Azadpur Yard Okhla Sub-yard
A Area of New Subzi Mandi, NSM 43.65 Acres 9.98 AcresB Area of Cement Godown 3.50 Acres -C Area of New Fruit Market, Saria Pipal 29.18 Acres ---
Thala .
D New Acquired Land at Khamoour 70.62 ---E No. of Big Shoos 438 50F No. of Small Shops 826 218G Size of Big Shops 12'x53' 16'x4'H Size of Small Shoos 10'xI8' 4'x4'1 Covered Auction Sheds No. Area 3Nos.
A BlockNSM I 3272 Som 1536 SomB BlockNSM I 3272 Som 832SomPotato And Onion Shed I 5241 Som 832 SqmGrower Shed I 2444 SqmCement Godown Area 3 8053.58 80mNFM Phase-I 7 18949.988omNFM Phase-II 7 23573.33 80mTotal 21 64805.71 8Qm 3200 SQm
J Rate of Commission 6% 6%K Rate of Market Fee 1% 1%L No. of Notified Commodities- Fruits 50 50M All Fruits and Vegetables - Vegetables 68 68N No. of Licenses- Commission Agents "B" 2236 171
Whole Sale itA" 1733 131Farmers 1-Cards 321 2
0 Total No. of Employees 689 76P No. of Cold Storage 7 -Q No. of Banks 6 2
Final Report: 'National Level Techno-Economic Feasibility Study for North Zone' 483
)
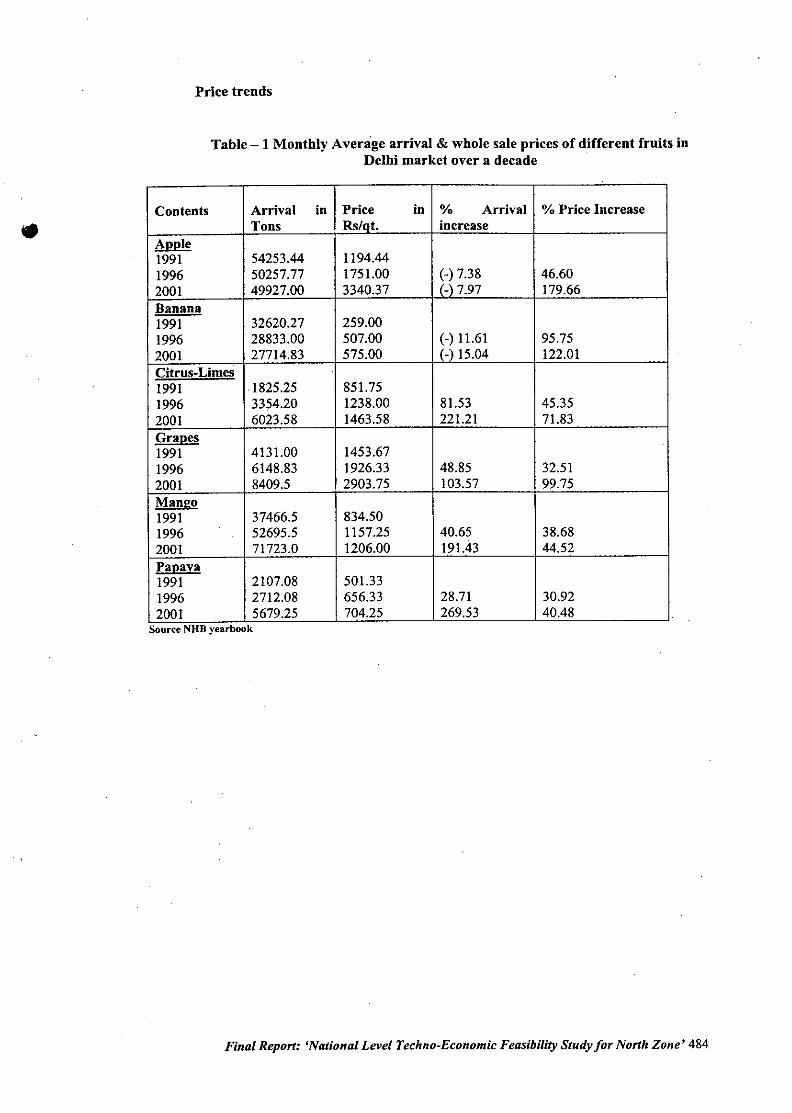
Price trends
Table - 1 Monthly Average arrival & whole sale prices of different fruits inDelhi market over a decade
Contents Arrival in Price in % Arrival 0/0 Price IncreaseTons Rs/ot. increase
Apple1991 54253.44 1194.441996 50257.77 1751.00 (-) 7.38 46.602001 49927.00 3340.37 i-) 7.97 179.66Banana1991 32620.27 259.001996 28833.00 507.00 (-) 11.61 95.752001 27714.83 575.00 i-) 15.04 122.01CitrusCLimes1991 1825.25 851.751996 3354.20 1238.00 81.53 45.352001 6023.58 1463.58 221.21 71.83Grapes1991 4131.00 1453.671996 6148.83 1926.33 48.85 32.512001 8409.5 2903.75 103.57 99.75Mango1991 37466.5 834.501996 52695.5 1157.25 40.65 38.682001 71723.0 1206.00 191.43 44.52Papaya1991 2107.08 501.331996 2712.08 656.33 28.71 30.922001 5679.25 704.25 269.53 40.48
Soul'"ceNUB yearbook
Final Report: 'National Level Techno-Economic Feasibility Study for North Zone' 484
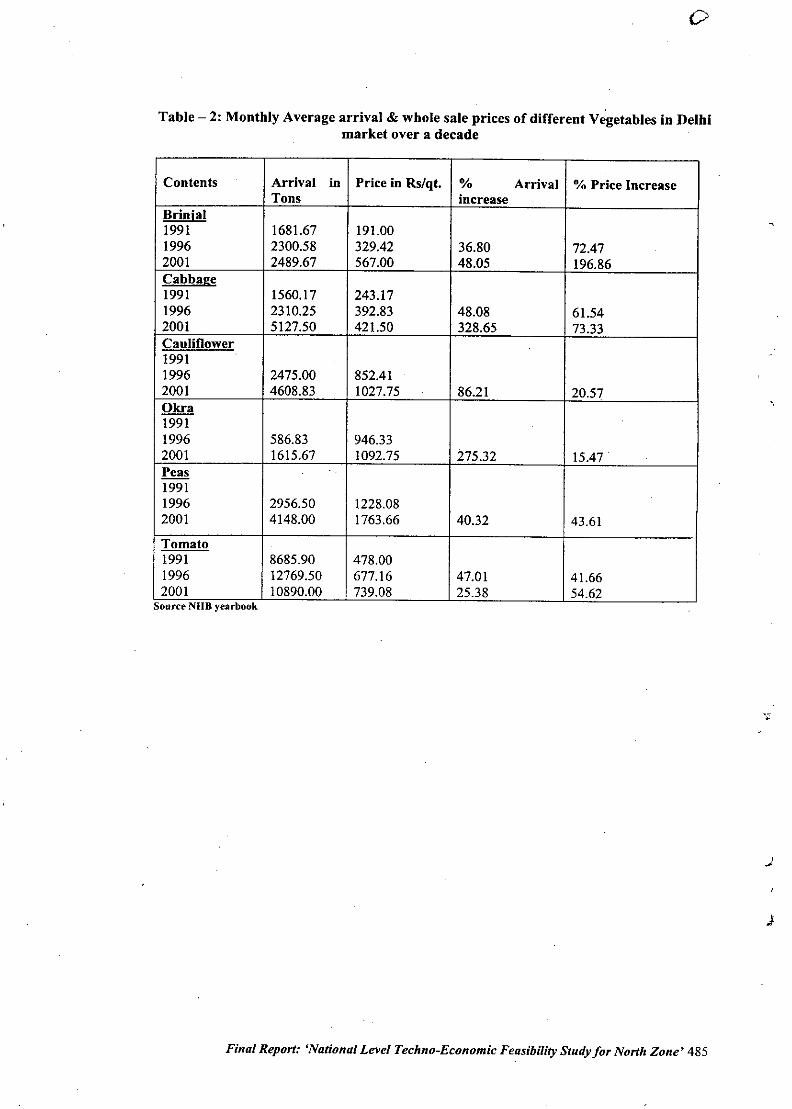
o
Table - 2: Monthly Average arrival & whole sale prices of different Vegetables in Delhimarket over a decade
Contents Arrival in Price in Rs/qt. % Arrival 0/0 Price IncreaseTons increase .
Brinjal1991 1681.67 191.001996 2300.58 329.42 36.80 72.472001 2489.67 567.00 48.05 196.86Cabbage1991 1560.17 243.171996 2310.25 392.83 48.08 61.542001 5127.50 421.50 328.65 73.33Cauliflower19911996 2475.00 852.412001 4608.83 1027.75 . 86.21 20.57Okra19911996 586.83 946.332001 1615.67 1092.75 275.32 15.47.Peas19911996 2956.50 1228.082001 4148.00 1763.66 40.32 43.61
Tomato1991 8685.90 478.001996 12769.50 677.16 47.01 41.662001 10890.00 739.08 25.38 54.62
Source NUB yearbook
Final Report: 'National Level Techno-Economic Feasibility Study for North Zone' 485
)
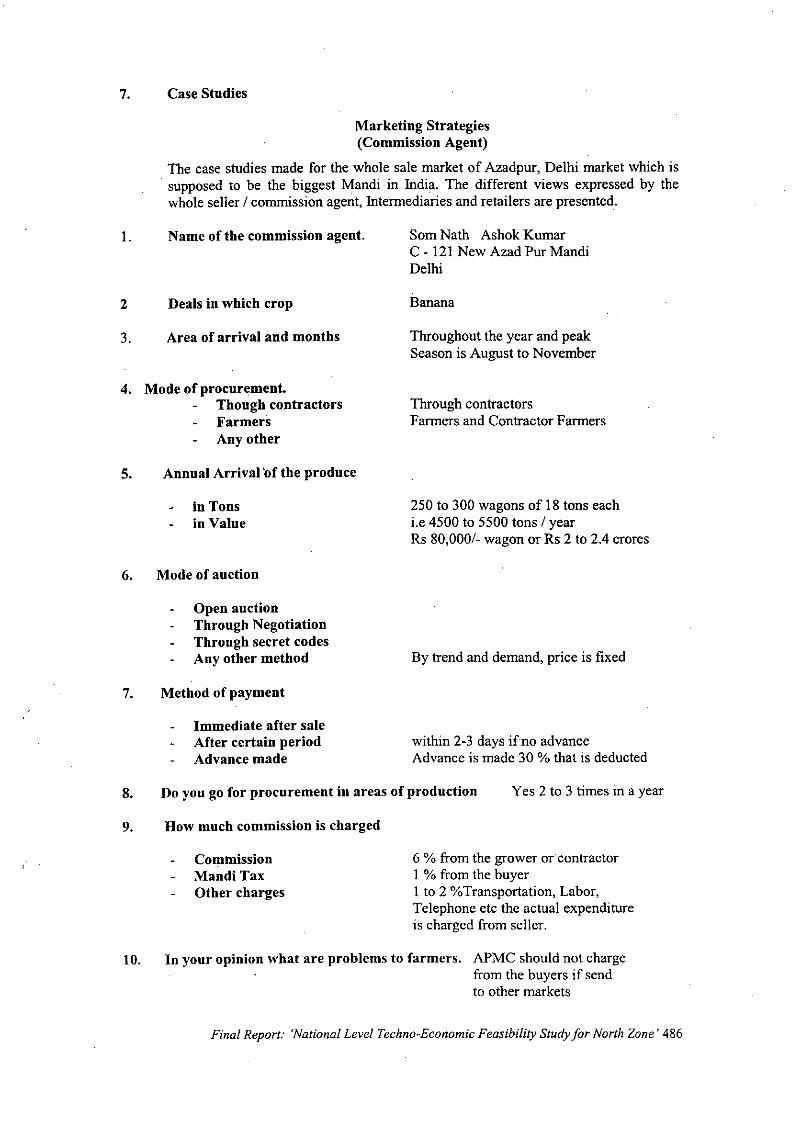
7. Case Studies
Marketing Strategies(Commission Agent)
The case studies made for the whole sale market of Azadpur, Delhi market which is. supposed to be the biggest Mandi in India. The different views expressed by thewhole seller / commission agent, Intermediaries and retailers are presented.
1.
2
3.
Name of the commission agent.
Deals in which crop
Area of arrival and months
SomNath Ashok KumarC - 121New Azad Pur MandiDelhi
Banana
Throughout the year and peakSeason is August to November
4. Mode of procurement.Though contractorsFarmersAny other
5. Annual Arrival 'of the produce
in Tonsin Value
6. Mode of auction
Open auctionThrough NegotiationThrough secret codesAny other method
7. Method of payment
Immediate after saleAfter certain periodAdvance made
Through contractorsFarmers and Contractor Farmers
250 to 300 wagons of 18 tons eachi.e 4500 to 5500 tons / yearRs 80,000/- wagon or Rs 2 to 2.4 crores
By trend and demand, price is fixed
within 2-3 days ifno advanceAdvance is made 30 % that is deducted
8. Do you go for procurement in areas of production Yes 2 to 3 times in a year
9. How much commission is charged
CommissionMandi TaxOther charges
6 % from the grower or contractorI % from the buyerI to 2%Transportation, Labor,Telephone etc the actual expenditureis charged from seller.
10. In your opinion what are problems to farmers. APMC should not chargefrom the buyers if sendto other markets
Final Report: 'National Level Techno-Economic Feasibility Study for North Zone' 486
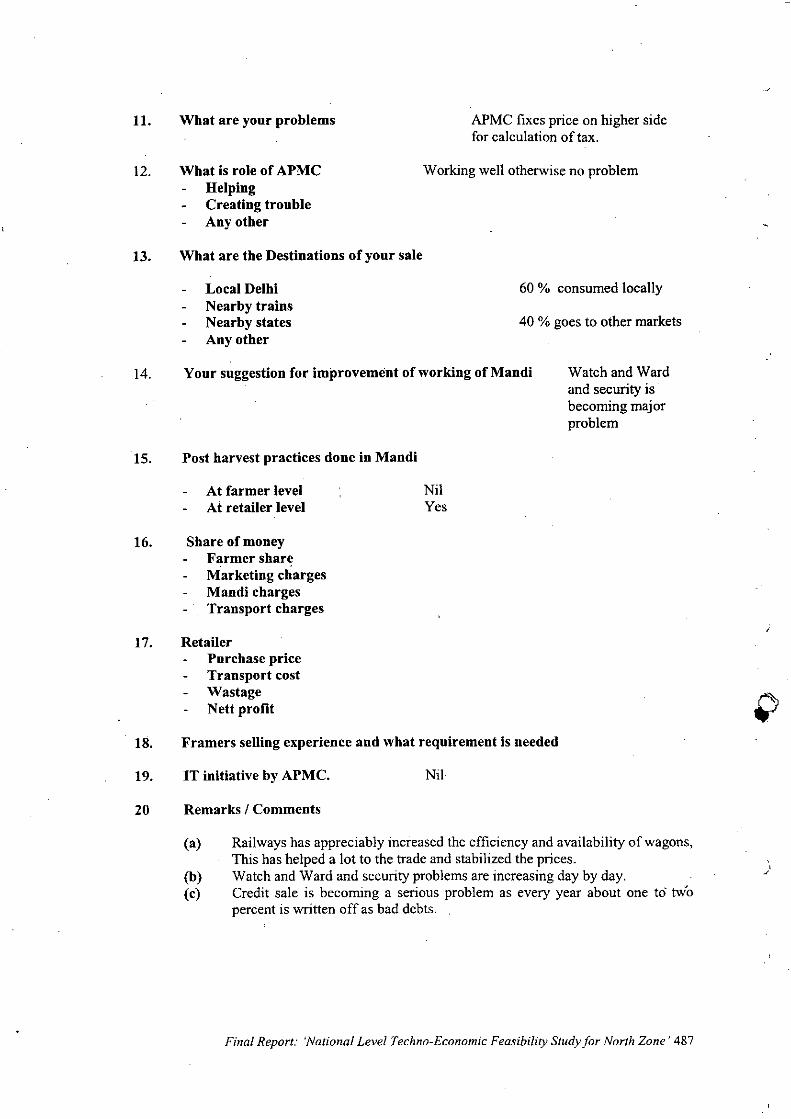
11.
12.
What are your problems
What is role of APMCHelpingCreating troubleAny other
APMC fixes price on higher sidefor calculation of tax,
Working well otherwise no problem
13. What are the Destinations of your sale
Local DelhiNearby trainsNearby statesAny other
60 % consumed locally
40 % goes to other markets
14. Your suggestion for improvement of working of Mandi Watch and Wardand security isbecoming majorproblem
15. Post harvest practices done in Mandi
At farmer levelAt retailer level
16. Share of moneyFarmer shareMarketing chargesMandi chargesTransport charges
17. RetailerPurchase priceTransport costWastageNett profit
NilYes
18. Framers selling experience and what requirement is needed
19. IT initiative by APMC. Nil
20 Remarks I Comments
(a)
(b)(c)
Railways has appreciably increased the efficiency and availability of wagons,This has helped a lot to the trade and stabilized the prices.Watch and Ward and security problems are increasing day by day,Credit sale is becoming a serious problem as every year about one to tWopercent is written off as bad debts.
Final Report: 'National Level Techno-Economic Feasibility Study for North Zone' 487
,j
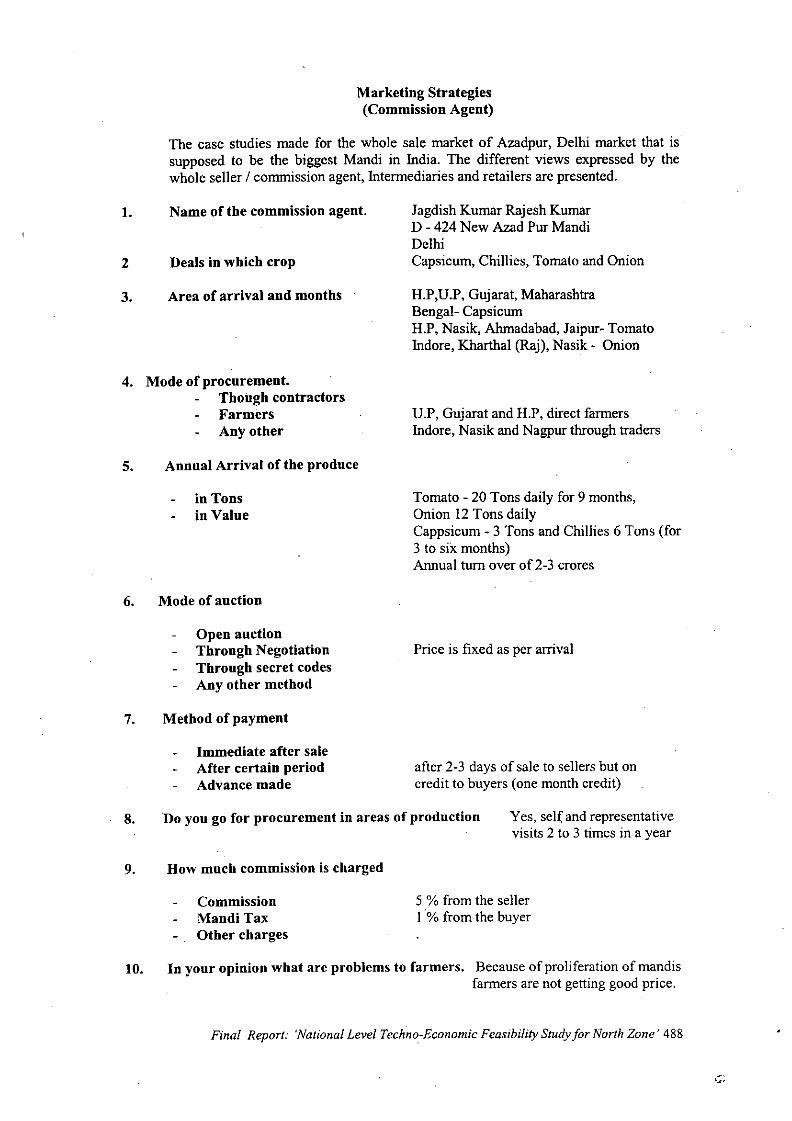
Marketing Strategies(Commission Agent)
The case studies made for the whole sale market of Azadpur, Delhi market that issupposed to be the biggest Mandi in India. The different views expressed by thewhole seller / commission agent, Intermediaries and retailers are presented.
1.
2
3.
Name of the commission agent,
Deals in which crop
Area of arrival and months
Jagdish Kumar Rajesh KumarD - 424 New Azad Pur MandiDelhiCapsicum, Chillies, Tomato and Onion
H.P,V.P, Gujarat, MaharashtraBengal- CapsicumH.P, Nasik, Ahmadabad, Jaipur- TomatoIndore, Kharthal (Raj), Nasik - Onion
4. Mode of procurement.Though contractorsFarmersAny other
5. Annual Arrival of the produce
in Tonsin Value
6. Mode of auction
Open auctionThrough NegotiationThrough secret codesAny other method
7. Method of payment
Immediate after saleAfter certain periodAdvance made
V.P, Gujarat and H.P, direct farmersIndore, Nasik and Nagpur through traders
Tomato - 20 Tons daily for 9 months,Onion 12 Tons dailyCappsicum - 3 Tons and Chillies 6 Tons (for3 to six months)Annual turn over of 2-3 crores
Price is fixed as per arrival
after 2-3 days of sale to sellers but oncredit to buyers (one month credit)
8. Do you go for procurement in areas of production Yes, self and representativevisits 2 to 3 times in a year
9. How much commission is charged
CommissionMandi TaxOther charges
5 % from the sellerI% from the buyer
10. In your opinion what are problems to farmers. Because of proliferation of mandisfarmers are not getting good price,
Final Report: 'National Level Techno-Economic Feasibility Study for North Zone' 488
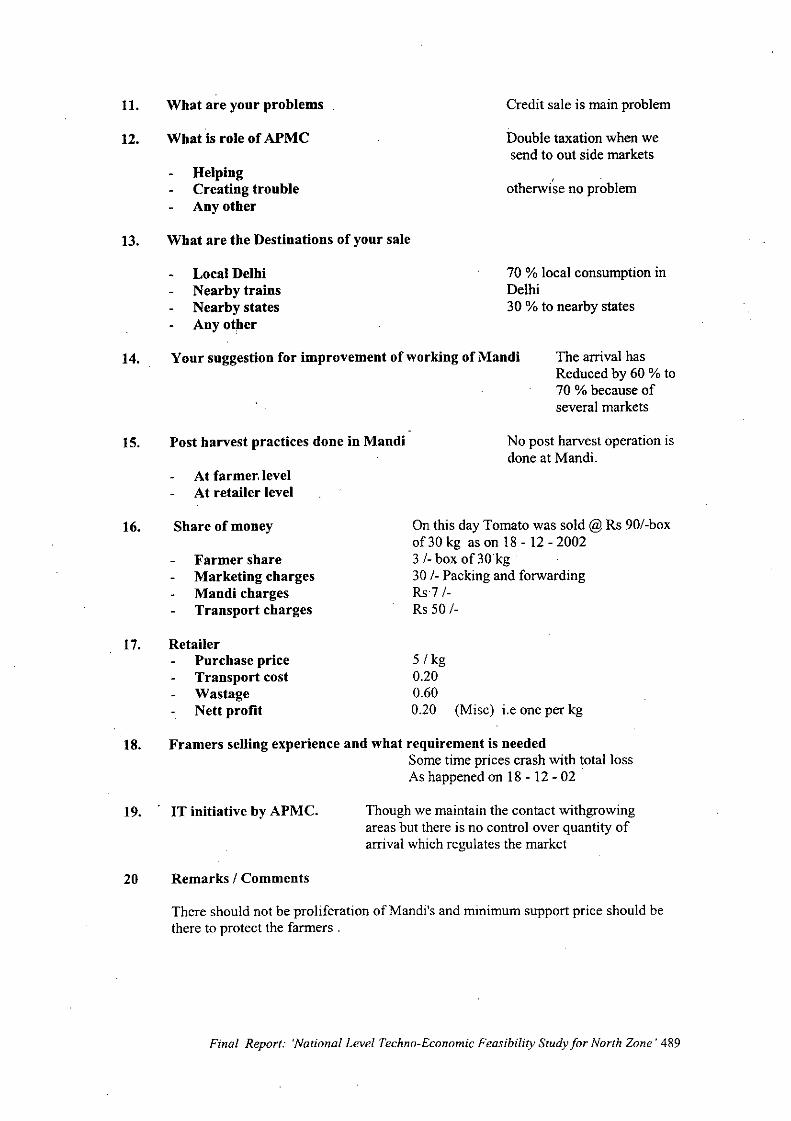
11.
12.
What are your problems
What is role of APMC
HelpingCreating troubleAny other
Credit sale is main problem
Double taxation when wesend to out side markets
otherwise no problem
13. What are the Destinations of your sale
Local DelhiNearby trainsNearby statesAny other
70 % local consumption inDelhi30% to nearby states
14. Your suggestion for improvement of working of Mandi The arrival hasReduced by 60% to70 % because ofseveral markets
15.
16.
17.
Post harvest practices done in Mandi
At farmer,levelAt retailer level
Share of money
Farmer shareMarketing chargesMandi chargesTransport charges
RetailerPurchase priceTransport costWastageNett profit
No post harvest operation isdone at Mandi.
On this day Tomato was sold @ Rs 90/-boxof30 kg as on 18 - 12 - 20023 1- box of 30 kg301- Packing and forwardingRs7 I-Rs 50 1-
5/kg0.200.600.20 (Mise) i.e one per kg
18. Framers selling experience and what requirement is neededSome time prices crash with total lossAs happened on 18 - 12 - 02
19. . IT initiative by APMC.
20 Remarks I Comments
Though we maintain the contact withgrowingareas but there is no control over quantity ofarrival which regulates the market
There should not be proliferation of Mandi's and minimum support price should bethere to protect the farmers.
Final Report: 'National Level Techno-Economic Feasibility Study for North Zone' 489
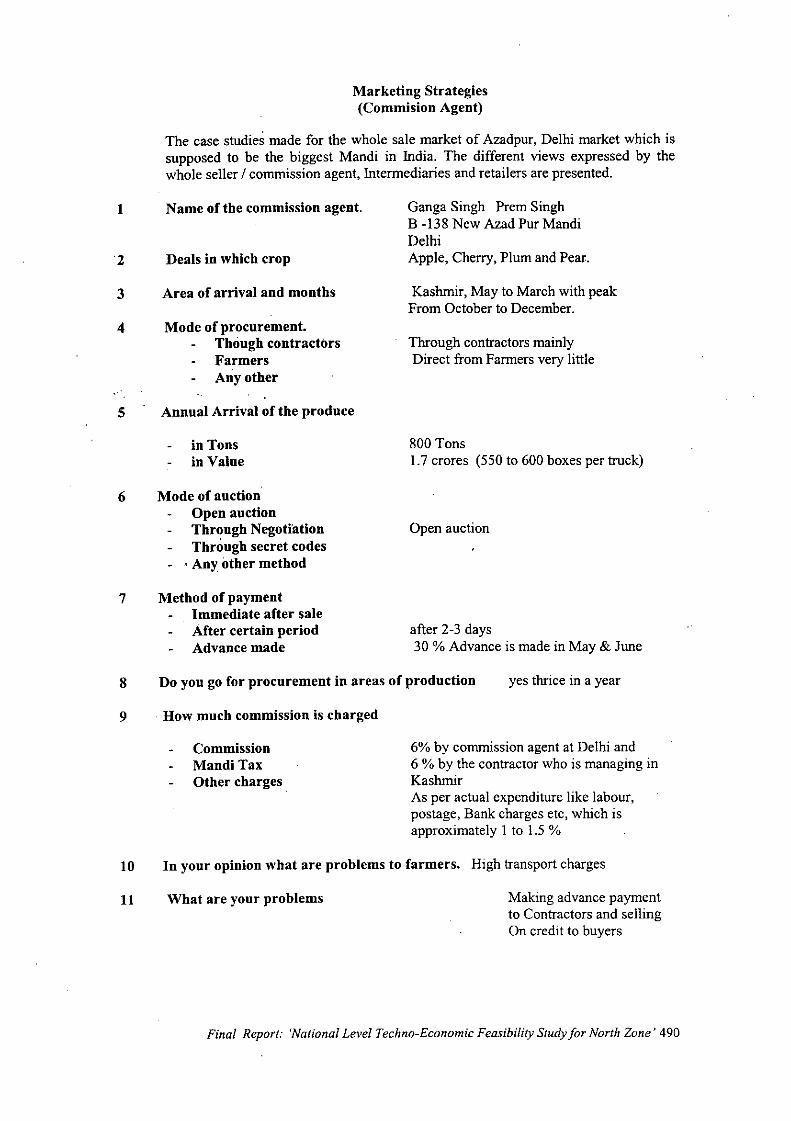
Marketing Strategies(Commision Agent)
The case studies made for the whole sale market of Azadpur, Delhi market which issupposed to be the biggest Mandi in India. The different views expressed by thewhole seller / commission agent, Intermediaries and retailers are presented.
1
2
3
4
Name of the commission agent.
Deals in which crop
Area of arrival and months
Mode of procurement.Though contractorsFarmersAny other
Ganga Singh Prem SinghB -138 New Azad Pur MandiDelhiApple, Cherry, Plum and Pear.
Kashmir, May to March with peakFrom October to December.
Through contractors mainlyDirect from Farmers very little
5 Annual Arrival of the produce
in Tonsin Value
800 Tons1.7 crores (550 to 600 boxes per truck)
6
7
Mode of auctionOpen auctionThrough NegotiationThrough secret codes. Any other method
Method of paymentImmediate after saleAfter certain periodAdvance made
Open auction
after 2-3 days30 % Advance is made in May & June
8 Do you go for procurement in areas of production yes thrice in a year
9 How much commission is charged
CommissionMandi TaxOther charges.
6% by commission agent at Delhi and6 % by the contractor who is managing inKashmirAs per actual expenditure like labour,postage, Bank charges etc, which isapproximately I to 1.5 %
10 In your opinion what are problems to farmers. High transport charges
11 What are your problems Making advance paymentto Contractors and sellingOn credit to buyers
Final Report: 'National Level Techno-Economic Feasibility Study for North Zone' 490
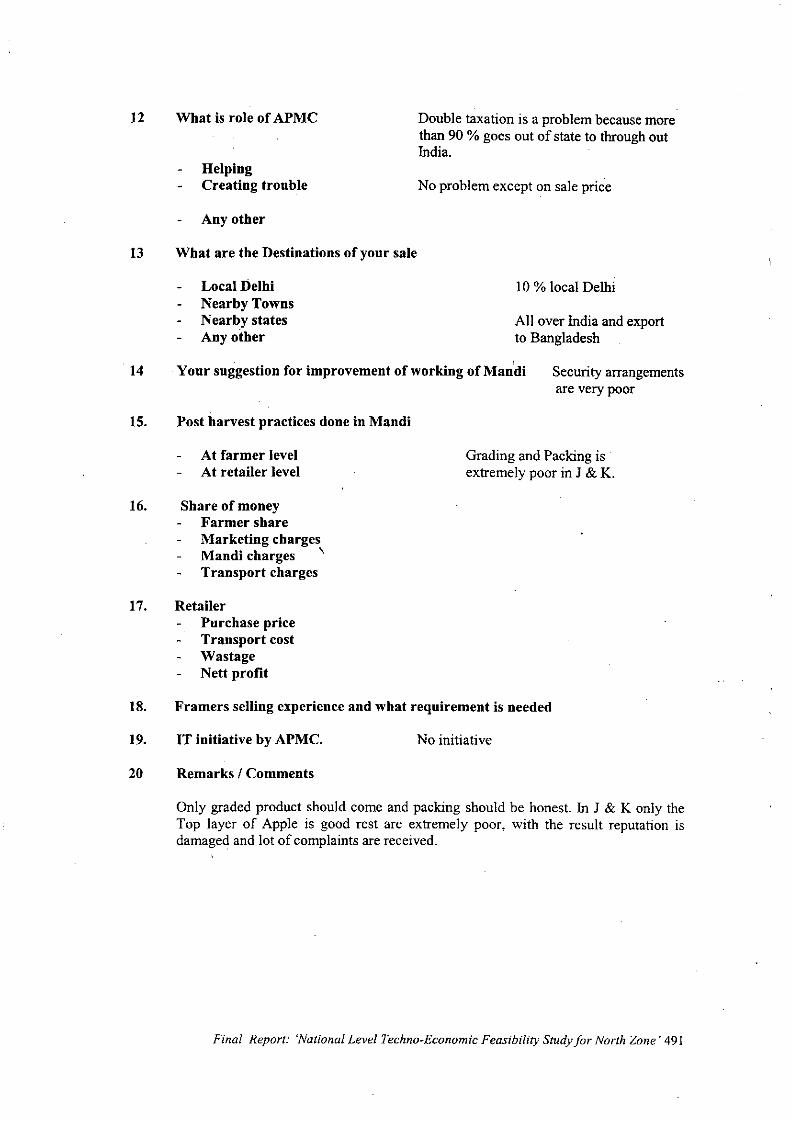
12 What is role of APMC
HelpingCreating trouble
Any other
Double taxation is a problem because morethan 90 % goes out of state to through outIndia.
No problem except on sale price
13 What are the Destinations of your sale
Local DelhiNearby TownsNearby statesAny other
10 % local Delhi
All over India and exportto Bangladesh
14 Your suggestion for improvement of working of Man'di Security arrangementsare very poor
15. Post harvest practices done in Mandi
At farmer levelAt retailer level
16. Share of moneyFarmer shareMarketing chargesMandicharges 'Transport charges
17. RetailerPurchase priceTransport costWastageNett profit
Grading and Packing isextremely poor in J & K.
18. Framers selling experience and what requirement is needed
19. IT initiative by APMC. No initiative
20 Remarks / Comments
Only graded product should come and packing should be honest. In J & K only theTop layer of Apple is good rest are extremely poor, with the result reputation isdamaged and lot of complaints are received.
Final Report: 'National Level Techno-Economic Feasibility Study for North Zone' 491
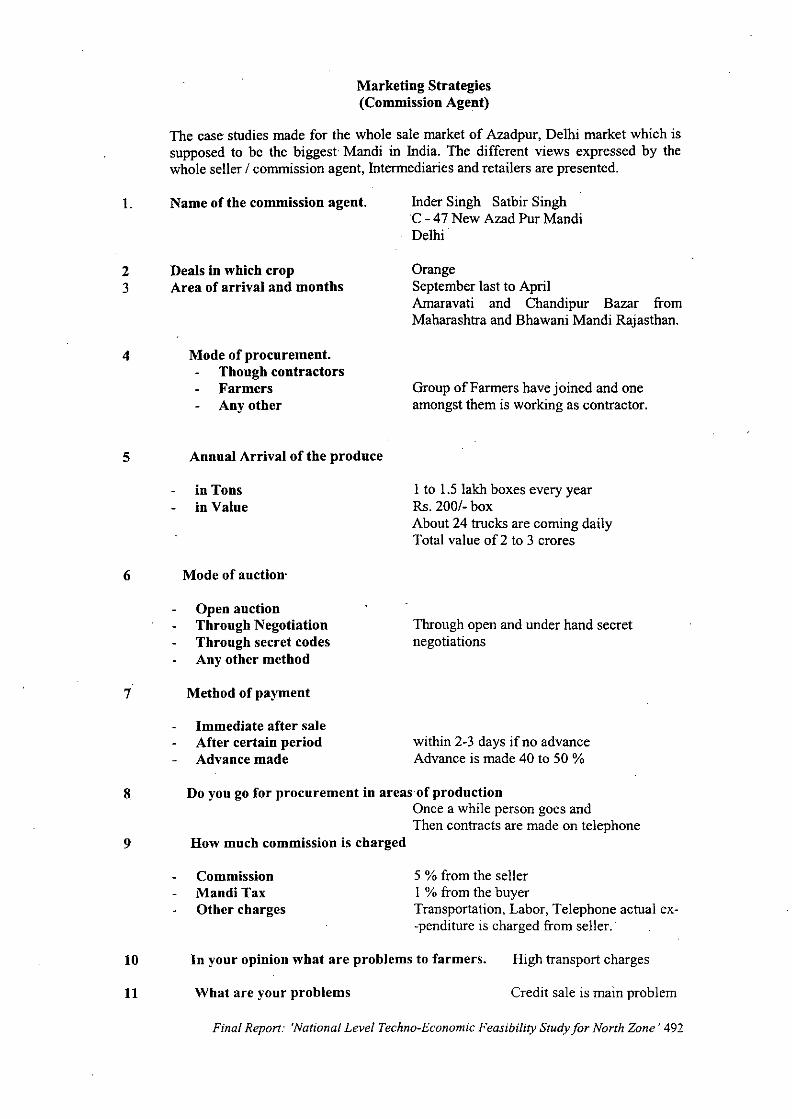
Marketing Strategies(Commission Agent)
The case studies made for the whole sale market of Azadpur, Delhi market which issupposed to be the biggest Mandi in India. The different views expressed by thewhole seHer / commission agent, Intermediaries and retailers are presented.
1.
23
4
Name of the commission agent.
Deals in which cropArea of arrival and months
Mode of procurement.Though contractorsFarmersAny other
Inder Singh Satbir SinghC - 47 New Azad Pur MandiDelhi
OrangeSeptember last to AprilAmaravati and Chandipur Bazar fromMaharashtra and Bhawani Mandi Rajasthan.
Group of Farmers have joined and oneamongst them is working as contractor.
5 Annual Arrival of the produce
in Tonsin Value
6 Mode of auction'
Open auctionThrough NegotiationThrough secret codesAny other method
7 Method of payment
Immediate after saleAfter certain periodAdvance made
I to 1.5 lakh boxes every yearRs. 200/- boxAbout 24 trucks are coming dailyTotal value of 2 to 3 crores
Through open and under hand secretnegotiations
within 2-3 days ifno advanceAdvance is made 40 to 50 %
8 Do you go for procurement in areas. of prodnctionOnce a while person goes andThen contracts are made on telephone
9 How much commission is charged
CommissionMandiTaxOther charges
5 % from the seHerI % from the buyerTransportation, Labor, Telephone actual ex--penditure is charged from seHer.
10
11
In your opinion what are problems to farmers,
What are your problems
High transport charges
Credit sale is main problem
Final Report: 'National Level Techno-Economic Feasibility Study for North Zone' 492
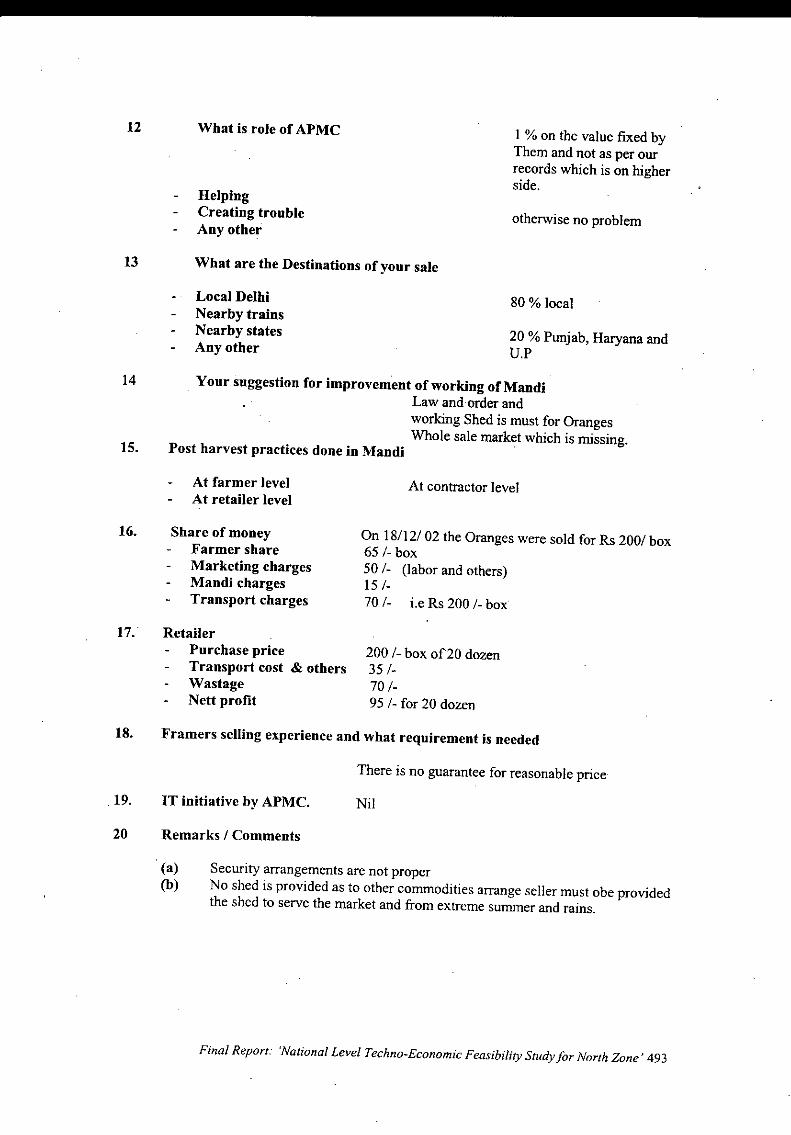
12 What is role of APMC
HelpingCreating troubleAny other
I % on the value fixed byThem and not as per ourrecords which is on higherside.
otherwise no problem
13 What are the Destinations of your sale
Local DelhiNearby trainsNearby statesAny other
80 % local
20 % Punjab, Haryana andU.P
14 Your suggestion for improvement of working of MandiLaw and order andworking Shed is must for OrangesWhole sale market which is missing.
15. Post harvest practices done in Mandi .
16.
17.
At farmer levelAt retailer level
Share of moneyFarmer shareMarketing chargesMandi chargesTransport charges
RetailerPurchase priceTransport cost & othersWastageNett profit
At contractor level
On 18/12/ 02 the Oranges were sold for Rs 200/ box65/- box50/- (labor and others)15/-70/- i.e Rs 200 /- box
200/- box of20 dozen35/-70/-95 /- for 20 dozen
18. Framers selling experience and what requirement is needed
There is no guarantee for reasonable price
19. IT initiative by APMC. Nil
20 Remarks / Comments
(a) Security arrangements are not proper(b) No shed is provided as to other commodities arrange seller must obe provided
the shed to serve the market and from extreme summer and rains.
Final Report: 'National Level Techno-Economic Feasibility Study for North Zone' 493
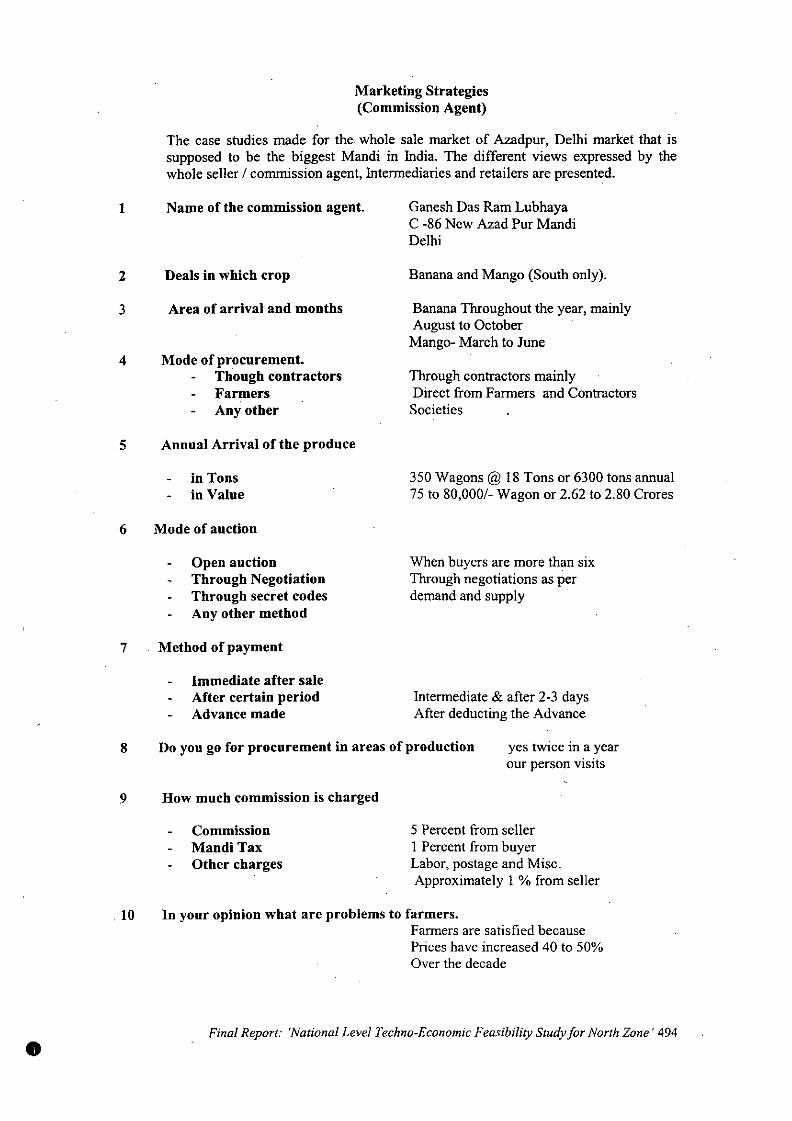
Marketing Strategies(Commission Agent)
The case studies made for the whole sale market of Azadpur, Delhi market that issupposed to be the biggest Mandi in India. The different views expressed by thewhole seller / commission agent, Intermediaries and retailers are presented.
1
2
3
4
Name of the commission agent.
Deals in which crop
Area of arrival and months
Mode of procurement.Though contractorsFarmersAny other
Ganesh Das Ram LubhayaC -86 New Azad Pur MandiDelhi
Banana and Mango (South only).
Banana Throughout the year, mainlyAugust to OctoberMango- March to June
Through contractors mainlyDirect from Farmers and ContractorsSocieties
5 Aunual Arrival of the produce
in Tonsin Value
6 Mode of auctiou
Open auctionThrough NegotiationThrough secret codesAuy other method
7 Method of payment
Immediate after saleAfter certain periodAdvance made
350 Wagons @ 18 Tons or 6300 tons annual75 to 80,000/- Wagon or 2.62 to 2.80 Crores
When buyers are more than sixThrough negotiations as perdemand and supply
Intermediate & after 2-3 daysAfter deducting the Advance
8 Do you go for procurement in areas of production yes twice in a yearour person visits
9 How much commission is charged
CommissionMandi TaxOther charges
5 Percent from sellerI Percent from buyerLabor, postage and Misc.Approximately 1% from seller
•
lOIn your opinion what are problems to farmers.Farmers are satisfied becausePrices have increased 40 to 50%Over the decade
Final Report: 'National Level Techno-Economic Feasibility Study for North Zone' 494
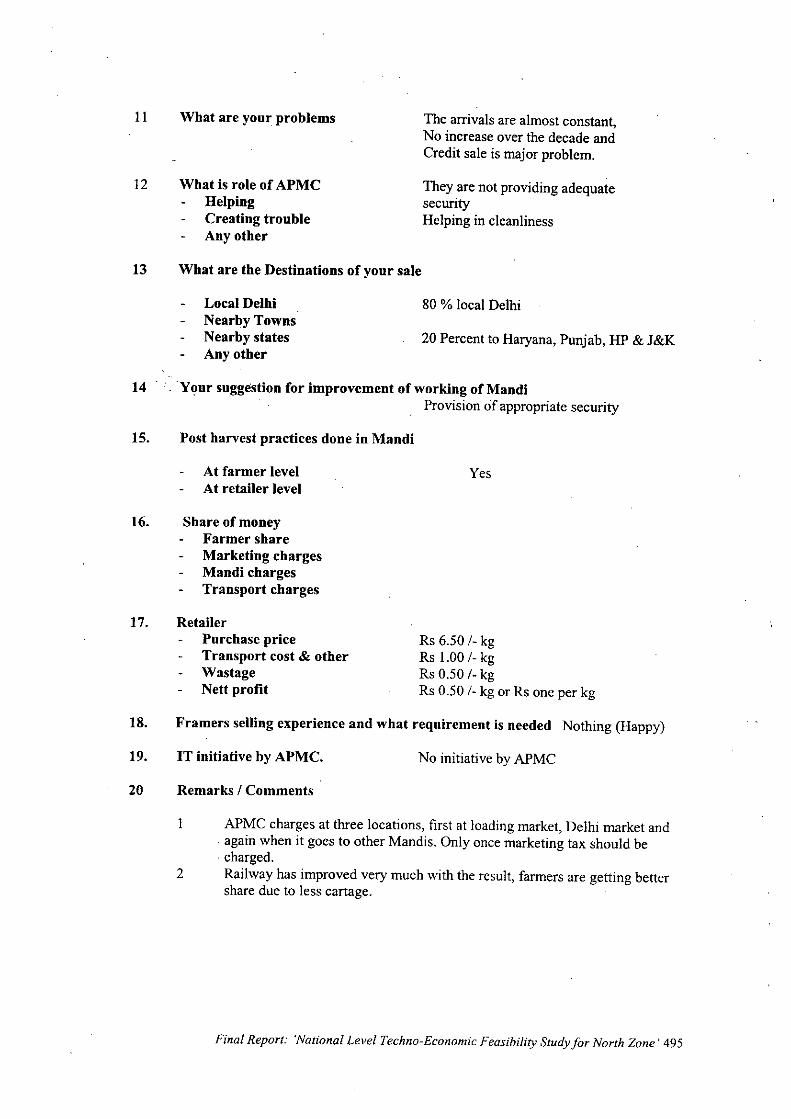
11
12
What are your problems
What is role of APMCHelpingCreatiug troubleAny other
The arrivals are almost constant,No increase over the decade andCredit sale is major problem.
They are not providing adequatesecurityHelping in cleanliness
13 What are the Destinations of your sale
Local DelhiNearby TownsNearby statesAny other
80 % local Delhi
20 Percent to Haryana, Punjab, HP & J&K
14 'Your suggestion for improvement of working ofMandiProvision of appropriate security
15. Post harvest practices done in Mandi
At farmer levelAt retailer level
16. Share of moneyFarmer shareMarketing chargesMandi chargesTransport charges
Yes
17. RetailerPurchase priceTrausport cost & otherWastageNett profit
Rs 6.50 /. kgRs 1.00 /- kgRs 0.50 /. kgRs 0.50 /- kg or Rs one per kg
18. Framers selling experience and what requiremeut is needed Nothing (Happy)
19. IT iuitiative by APMC. No initiative by APMC
20 Remarks / Comments
APMC charges at three locations, first at loading market, Delhi market and. again when it goes to other Mandis. Only once marketing tax should becharged.
2 Railway has improved very much with the result, farmers are getting bettershare due to less cartage.
Final Report: 'National Level Techno-Economic Feasibility Study for North Zone' 495
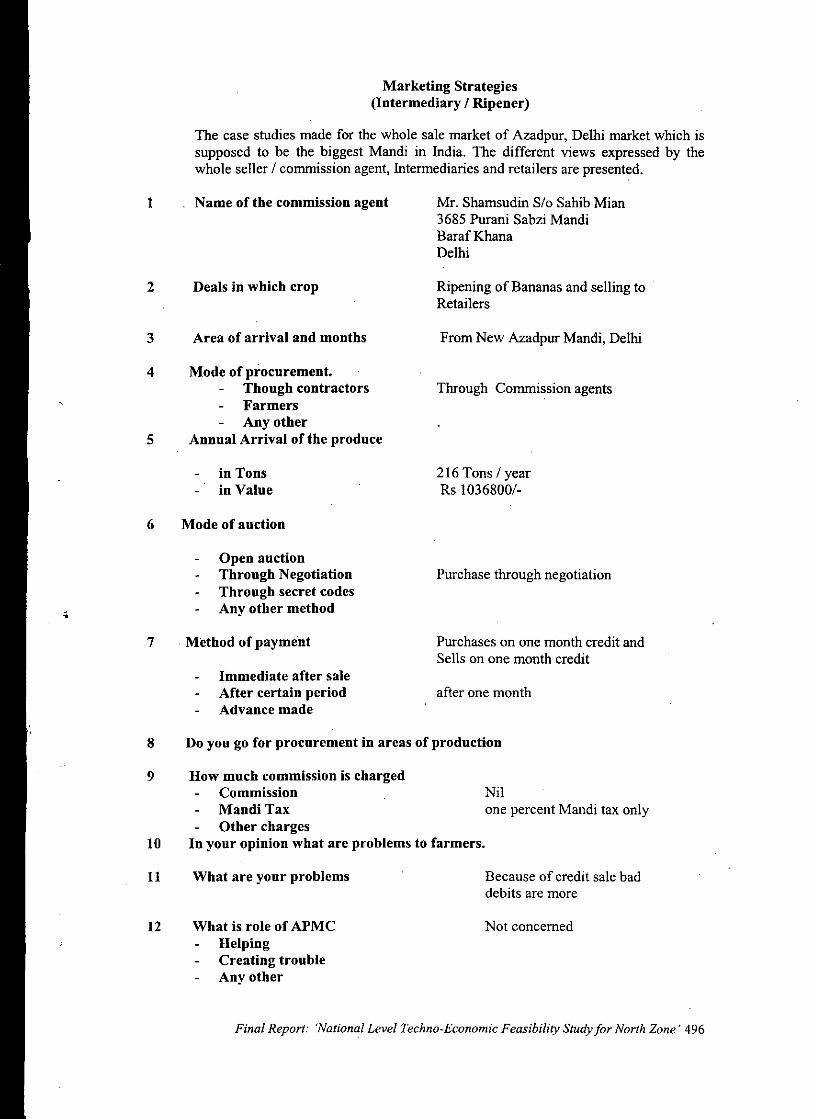
8 Do you go for procurement in areas of production
Marketing Strategies(Intermediary 1Ripener)
Final Report: 'National Level Techno-Economic Feasibility Study for North Zone' 496
Because of credit sale baddebits are more
Not concerned
Nilone percent Mandi tax only
From New Azadpur Mandi, Delhi
Through Commission agents
216 Tons 1yearRs 10368001-
after one month
Purchase through negotiation
Ripening of Bananas and selling toRetailers
Purchases on one month credit andSells on one month credit
Mr. Shamsudin S/o Sahib Mian3685 Purani Sabzi MandiBarafKhanaDelhi
Immediate after saleAfter certain periodAdvance made
Open auctionTbrougb NegotiationTbrougb secret codesAny otber metbod
The case studies made for the whole sale market of Azadpur, Delhi market which issupposed to be the biggest Mandi in India. The different views expressed by thewhole seller 1 commission agent, Intermediaries and retailers are presented.
Name oftbe commission agent
Area of arrival and montbs
in Tonsin Value
Deals in wbicb crop
Wbat is role of APMCHelpingCreating troubleAny otber
Wbat are your problems
Mode of procurement.Tbougb contractorsFarmersAny otber
Annual Arrival of tbe produce
How mucb commission is cbargedCommissionMandi TaxOtber cbarges
In your opinion wbat are problems to farmers.
Metbod of payment
2
7
9
4
11
1
3
6 Mode of auction
12
5
10
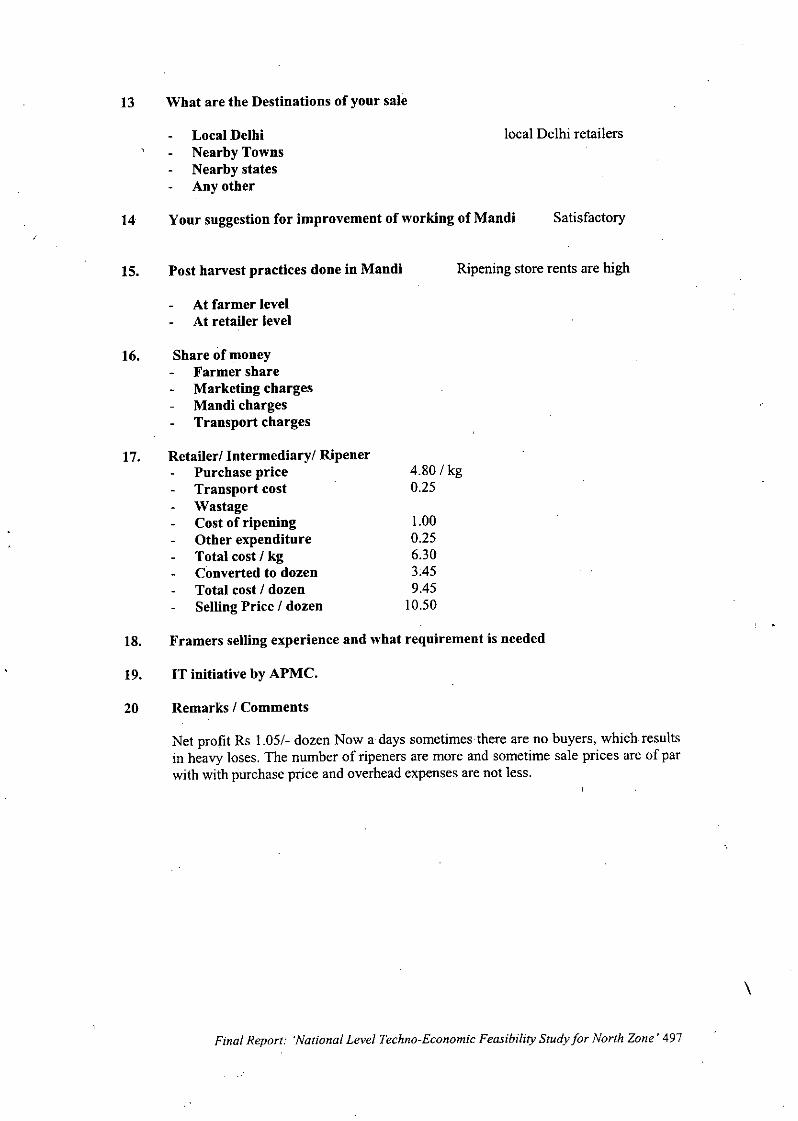
13 What are the Destinations of your sale
Local DelhiNearby TownsNearby statesAny other
local Delhi retailers
14 Your suggestion for improvement of working ofMandi Satisfactory
15. Post harvest practices done in Mandi
At farmer levelAt retailer level
Ripening store rents are high
16. Share of moneyFarmer shareMarketing chargesMandi chargesTransport charges
17. Retailerl Intermediaryl RipenerPurchase priceTransport costWastageCost of ripeningOther expenditureTotal cost 1kgConverted to dozenTotal cost 1dozenSellingPrice 1 dozen
4.801 kg0.25
1.000.256.303:459:4510.50
18. Framers selling experience and what requirement is needed
19. IT initiative by APMC.
20 Remarks 1Comments
Net profit Rs 1.051- dozen Nowadays sometimes there are no buyers, which resultsin heavy loses. The number of ripeners are more and sometime sale prices are of parwith with purchase price and overhead expenses are not less.
Final Report: 'National Level Techno-Economic Feasibility Study for North Zone' 497
\
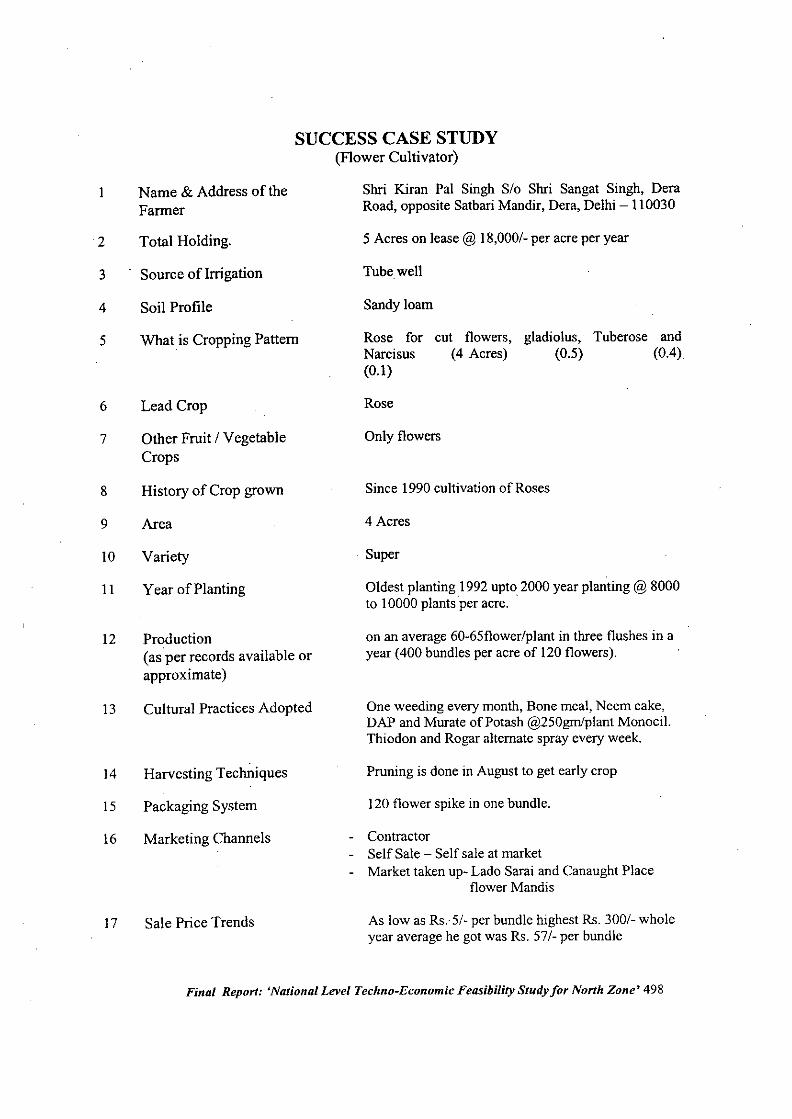
2
3
4
Name & Address of theFarmer
Total Holding.
Source ofIrrigation
Soil Profile
SUCCESS CASE STUDY(Flower Cultivator)
Shri Kiran Pal Singh Sio Shri Sangat Singh, DeraRoad, opposite Satbari Mandir, Dera, Delhi -110030
5 Acres on lease @ 18,0001- per acre per year
Tube well
Sandy loam
5 What is Cropping Pattern Rose forNarcisus(0.1)
cut flowers, gladiolus, Tuberose and(4 Acres) (0.5) (0.4)
6
7
8
9
IO
II
12
13
14
15
16
17
Lead Crop
Other Fruit I VegetableCrops
History of Crop grown
Area
Variety
Year of Planting
Production(as per records available orapproximate)
Cultural Practices Adopted
Harvesting Techniques
Packaging System
Marketing Channels
Sale Price Trends
Rose
Only flowers
Since 1990 cultivation of Roses
4 Acres
Super
Oldest planting 1992 upto 2000 year planting @ 8000to 10000 plants per acre. .
on an average 60-65flower/plant in three flushes in ayear (400 bundles per acre of 120 flowers).
One weeding every month, Bone meal, Neem cake,DAP and Murate of Potash @250gmlplantMonocil.Thiodon and Rogar alternate spray every week.
Pruning is done in August to get early crop
120 flower spike in one bundle.
- Contractor- Self Sale - Self sale at market
Market taken up' Lado Sarai and Canaught Placeflower Mandis
As low as RS..5/. per bundle highest Rs. 3001- wholeyear average he got was Rs. 571- per bundle
Final Report: 'National Level Techno-Economic Feasibility Study for North Zone' 498
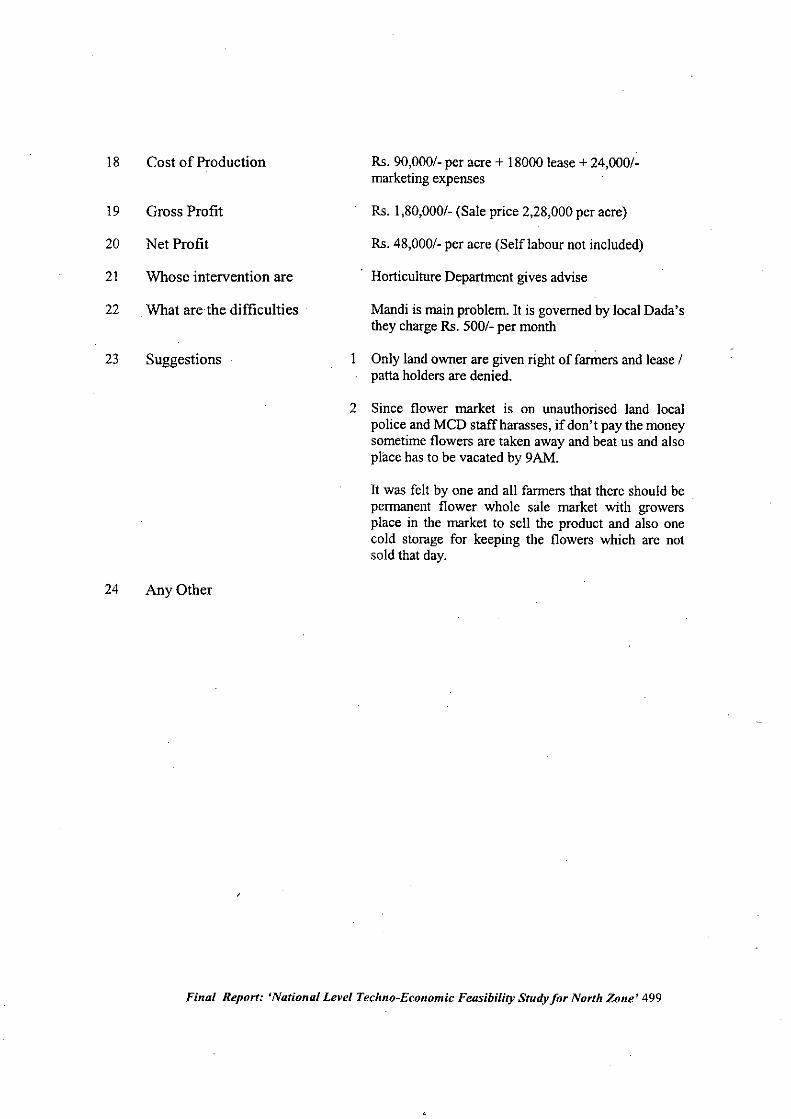
18 Cost of Production Rs. 90,000/- per acre + 18000 lease + 24,000/-marketing expenses
19 Gross Profit Rs. 1,80,000/- (Sale price 2,28,000 per acre)
20 Net Profit Rs. 48,000/- per acre (Selflabour not included)
21 Whose intervention are Horticulture Department gives advise
22 What are the difficulties Mandi is main problem. It is governed by local Dada'sthey charge Rs. 500/- per month
23 Suggestions I Only land owner are given right of farmers and lease /patta holders are denied.
2 Since flower market is on unauthorised land localpolice and MeD staff harasses, if don't pay the moneysometime flowers are taken away and beat us and alsoplace has to be vacated by 9AM.
It was felt by one and all farmers that there should bepermanent flower whole sale market with growersplace in the market to sell the product and also onecold storage for keeping the flowers which are notsold that day.
24 Any Other
Final Report: 'National Level Techno-Economic Feasibility Study for North Zone' 499
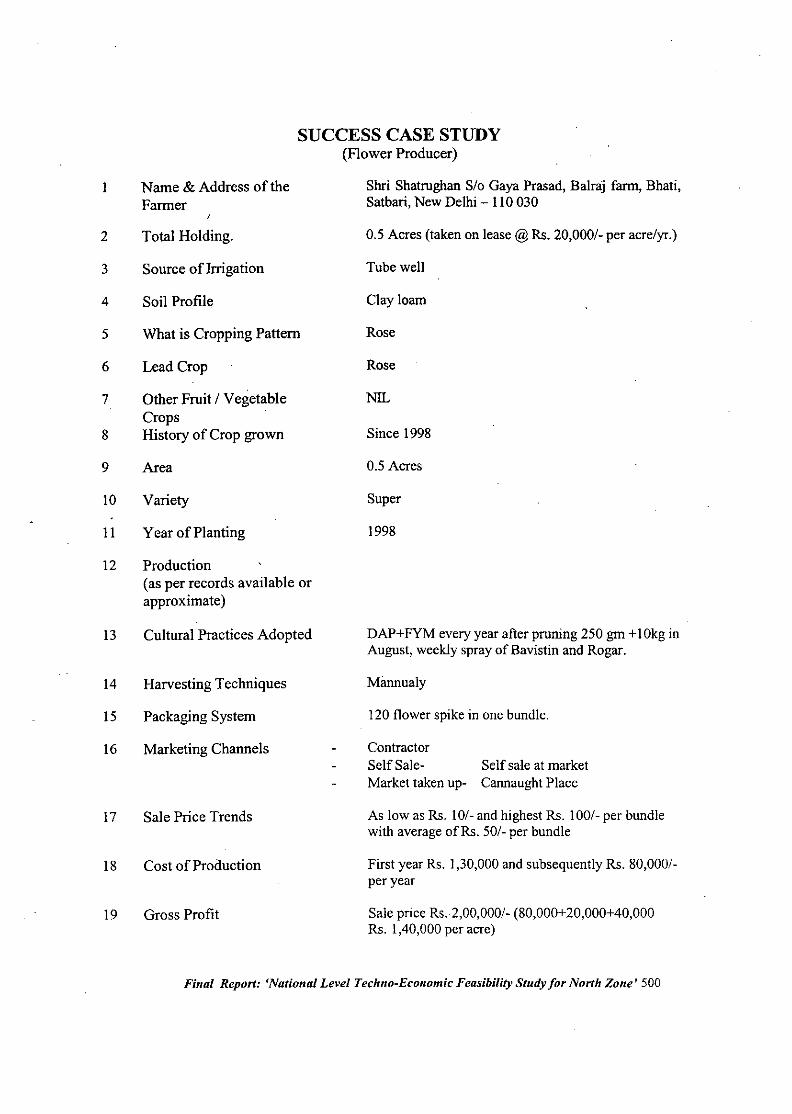
2
3
4
Name & Address of theFarmer
Total Holding.
Source ofInigation
Soil Profile
SUCCESS CASE STUDY(Flower Producer)
Shri Shatrughan S/o Gaya Prasad, Balnij farm, Bhati,Satbari, New Delhi - 110 030
0.5 Acres (taken on lease @ Rs. 20,000/- per acre/yr.)
Tube well
Clay loam
5
6
7
8
9
10
11
What is Cropping Pattern
Lead Crop
Other Fruit / VegetableCropsHistory of Crop grown
Area
Variety
Year of Planting
Rose
Rose
NIL
Since 1998
0.5 Acres
Super
1998
12 Production(as per records available orapproximate)
13
14
15
Cultural Practices Adopted
Harvesting Techniques
Packaging System
DAP+FYM every year after pruning 250 gm + IOkg inAugust, weekly spray of Bavistin and Rogar.
Mimnualy
120 flower spike in one bundle.
16 Marketing Channels ContractorSelf Sale-Market taken up-
Self sale at marketCannaught Place
17
18
19
Sale Price Trends
Cost of Production
Gross Profit
As low as Rs. 10/- and highest Rs. 100/- per bundlewith average ofRs. 501- per bundle
First year Rs. 1,30,000 and subsequently Rs. 80,000/-per year
Sale price Rs.2,00,0001- (80,000+20,000+40,000Rs. 1,40,000 per acre)
Final Report: 'National Level Techllo-Economic Feasibility Study for North ZOlle' 500
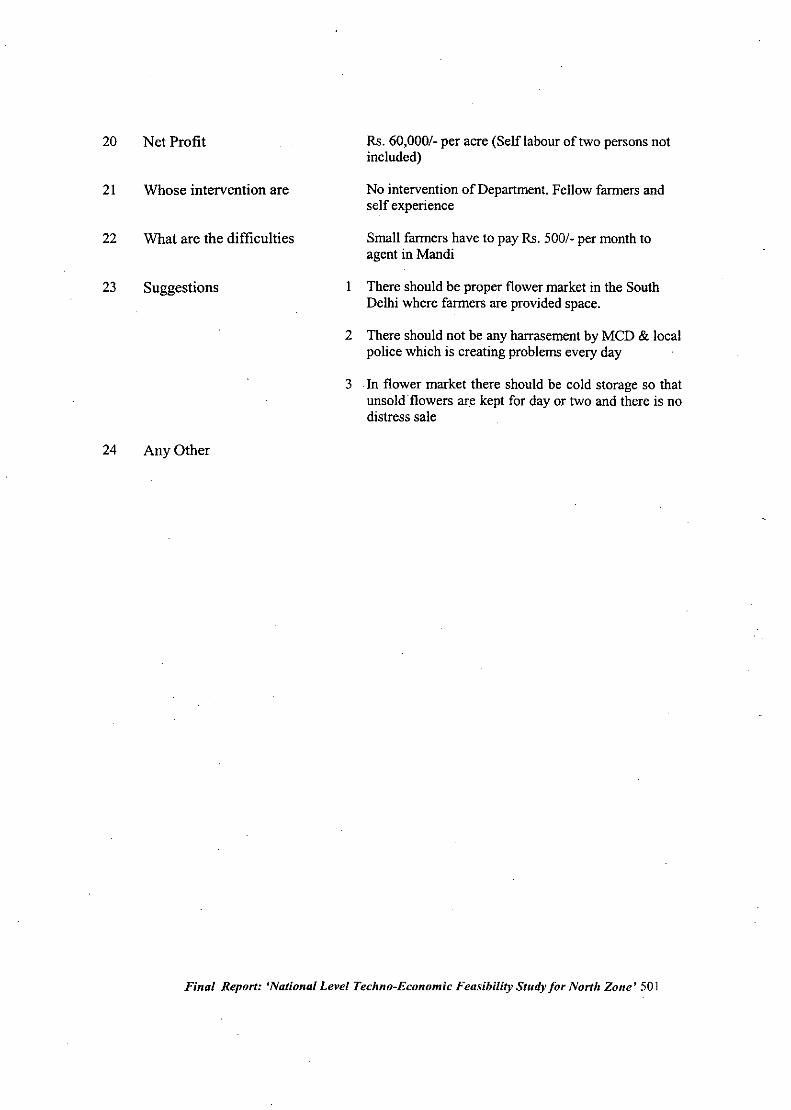
20 Net Profit Rs. 60,000/- per acre (Selflabour of two persons notincluded)
21 Whose intervention are No intervention of Department. Fellow farmers andself experience
22 What are the difficulties Small farmers have to pay Rs. 500/- per month toagent in Mandi
23 Suggestions I There should be proper flower market in the SouthDelhi where farmers are provided space.
2 There should not be any harrasement by MCD & localpolice which is creating problems every day
3 .In flower market there should be cold storage so thatunsold .flowers are kept for day or two and there is nodistress sale
24 Any Other
Final Report: 'National Level Techno~EconomicFeasibility Study for North Zone' 501
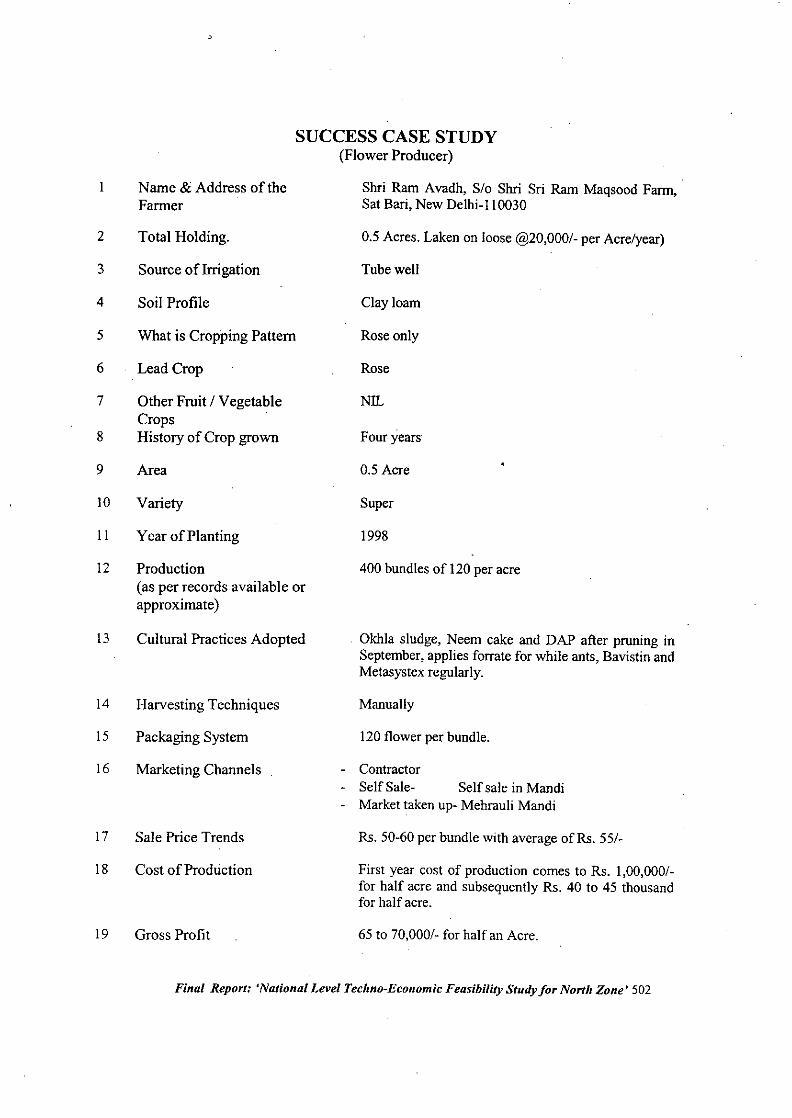
2
3
4
Name & Address of theFarmer
Total Holding.
Source ofIrrigation
Soil Profile
SUCCESS CASE STUDY(Flower Producer)
Shri Ram Avadh, Slo Shri Sri Ram Maqsood Farm,Sat Bari, New Delhi-I 10030
0.5 Acres. Laken on loose @20,0001- per Acre/year)
Tube well
Clay loam
5
6
7
8
9
10
II
12
13
14
15
16
17
18
19
What is Cropping Pattern
Lead Crop
Other Fruit / VegetableCropsHistory of Crop grown
Area
Variety
Year of Planting
Production(as per records available orapproximate)
Cultural Practices Adopted
Harvesting Techniques
Packaging System
Marketing Channels
Sale Price Trends
Cost of Production
Gross Profit
Rose only
Rose
NIL
Four years
0.5 Acre
Super
1998
400 bundles of 120 per acre
. Okhla sludge, Neem cake and DAP after pruning inSeptember, applies forrate for while ants, Bavistin andMetasystex regularly.
Manually
120 flower per bundle.
- ContractorSelf Sale- Self sale in MandiMarket taken up- Mehrauli Mandi
Rs. 50-60 per bundle with average ofRs. 55/-
First year cost of production comes to Rs. 1,00,0001-for half acre and subsequently Rs. 40 to 45 thousandfor half acre.
65 to 70,0001- for half an Acre.
Final Report: 'National Level Techno-Economic Feasibility Study for North Zone' 502
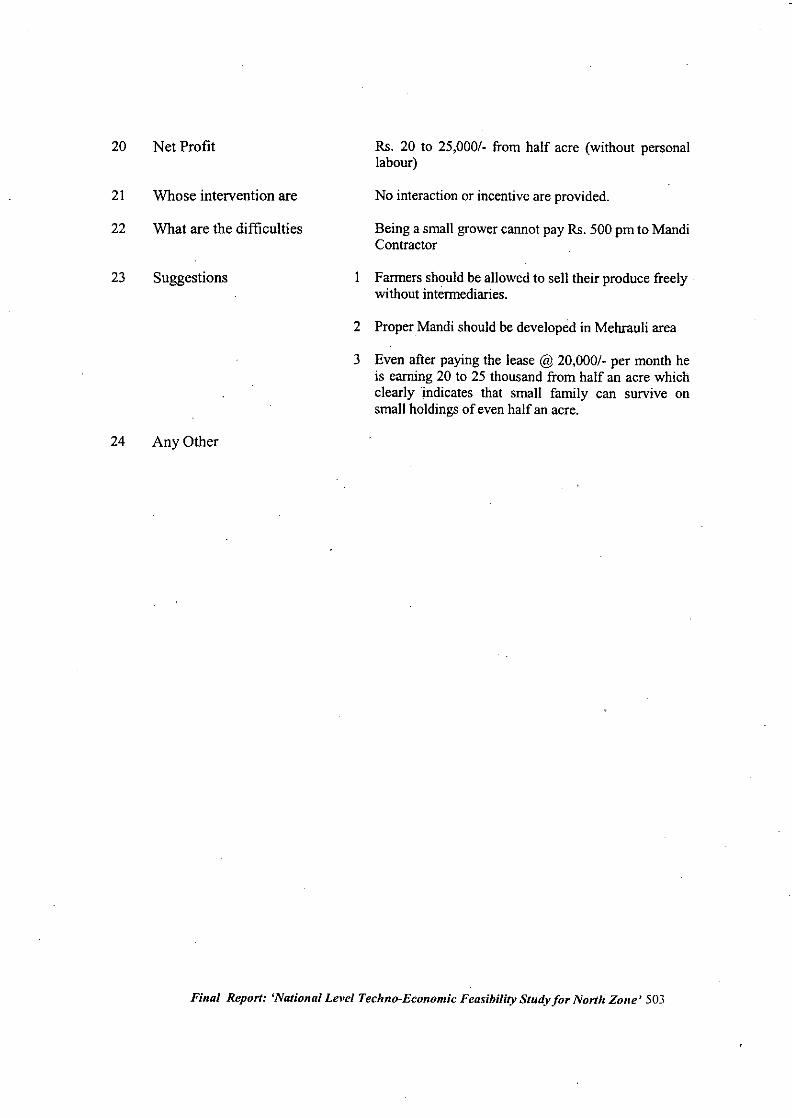
Final Report: 'National Level Techno-Economic Feasibility Study for North Zone' 503
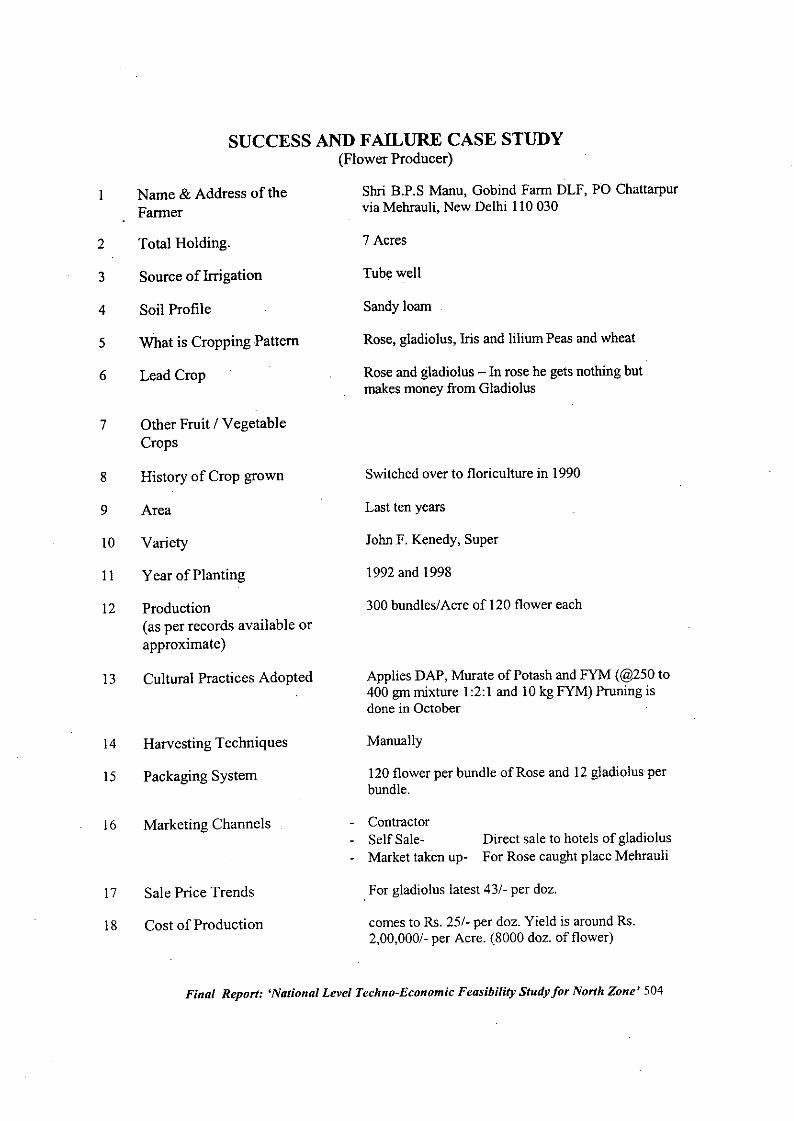
SUCCESS AND FAILURE CASE STUDY(Flower Producer)
I
2
3
4
5
6
Name & Address oftheFarmer
Total Holding.
Source of Irrigation
Soil Profile
What is Cropping Pattern
Lead Crop
Sbri RP.S Manu, Gobind Farm DLF, PO Chattarpurvia Mehrauli, New Delhi 110 030
7 Acres
Tube well
Sandy loam
Rose, gladiolus, Iris and lilium Peas and wheat
Rose and gladiolus - In rose he gets nothing butmakes money from Gladiolus
7 Other Fruit I VegetableCrops
8
9
10
11
12
13
14
15
History of Crop grown
Area
Variety
Year of Planting
Production(as per records available orapproximate)
Cultural Practices Adopted
Harvesting Techniques
Packaging System
Switched over to floriculture in 1990
Last ten years
John F. Kenedy, Super
1992 and 1998
300 bundles/Acre of 120 flower each
Applies DAP, Murate of Potash and FYM (@250to400 gm mixture I :2:1 and 10 kg FYM) Pruning isdone in October
Manually
120 flower per bundle of Rose and 12 gladiolus perbundle.
16 Marketing Channels ContractorSelf Sale-
- Market taken up-Direct sale to hotels of gladiolusFor Rose caught place Mehrauli
17
18
Sale Price Trends
Cost of Production
For gladiolus latest 43/- per doz.
comes to Rs. 25/- per doz. Yield is around Rs.2,00,000/-per Acre. (8000 doz. of flower)
Final Report: 'National Level Techno-EcOllomic Feasibility Study for North Zone' 504
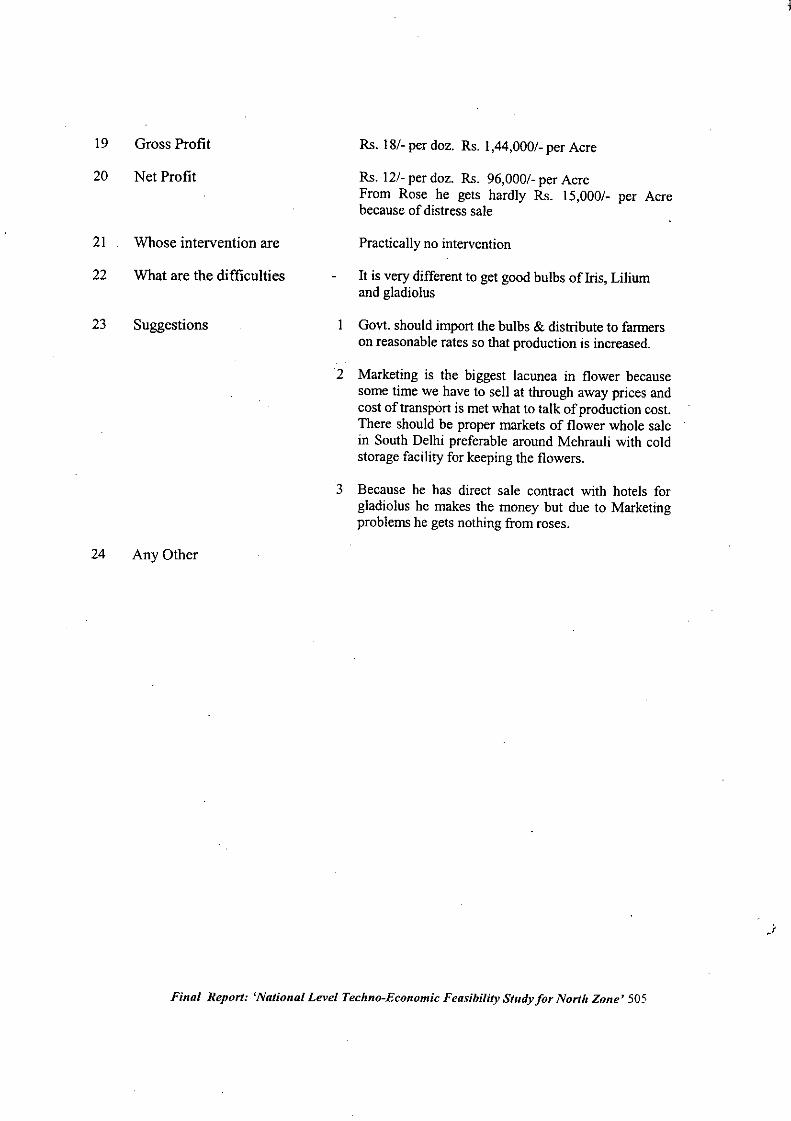
Final Report: 'National Level Techno-Economic Feasibility Study for North Zone' 505
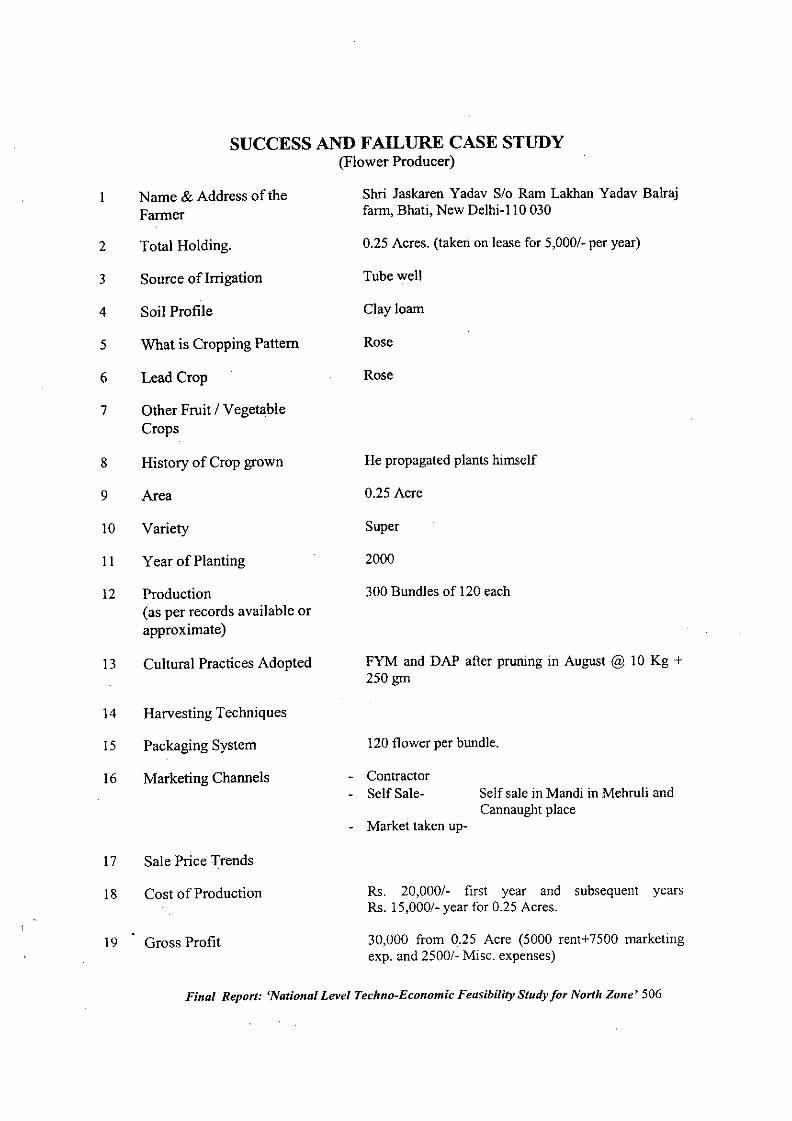
SUCCESS AND FAILURE CASE STUDY(Flower Producer)
2
3
4
5
Name & Address of theFarmer
Total Holding.
Source ofInigation
Soil Profile
What is Cropping Pattern
Shri Jaskaren Yadav S/o Ram Lakhan Yadav Balrajfarm, Bhati, New Delhi-I 10 030
0.25 Acres. (taken on lease for 5,000/- per year)
Tube well
Clay loam
Rose
6 Lead Crop
7 Other Fruit! VegetableCrops
Rose
8
9
10
II
12
13
History of Crop grown
Area
Variety
Year of Planting
Production(as per records available orapproximate)
Cultural Practices Adopted
He propagated plants himself
0.25 Acre
Super
2000
300 Bundles of 120 each
FYM and DAP after pruning in August @ 10 Kg +250 gm
14 Harvesting Techniques
15 Packaging System 120 flower per bundle.
16 Marketing Channels - Contractor- Self Sale-
Market taken up-
Self sale in Mandi in Mehruli andCannaught place
17 Sale Price Trends
18
19
Cost of Production
Gross Profit
Rs. 20,000/- first year and subsequent yearsRs. 15,000/- year for 0.25 Acres.
30,000 from 0.25 Acre (5000 rent+ 7500 marketingexpo and 2500/- Misc. expenses)
Final Report: 'National Level Techno-Economic Feasibility Study for North Zone' 506
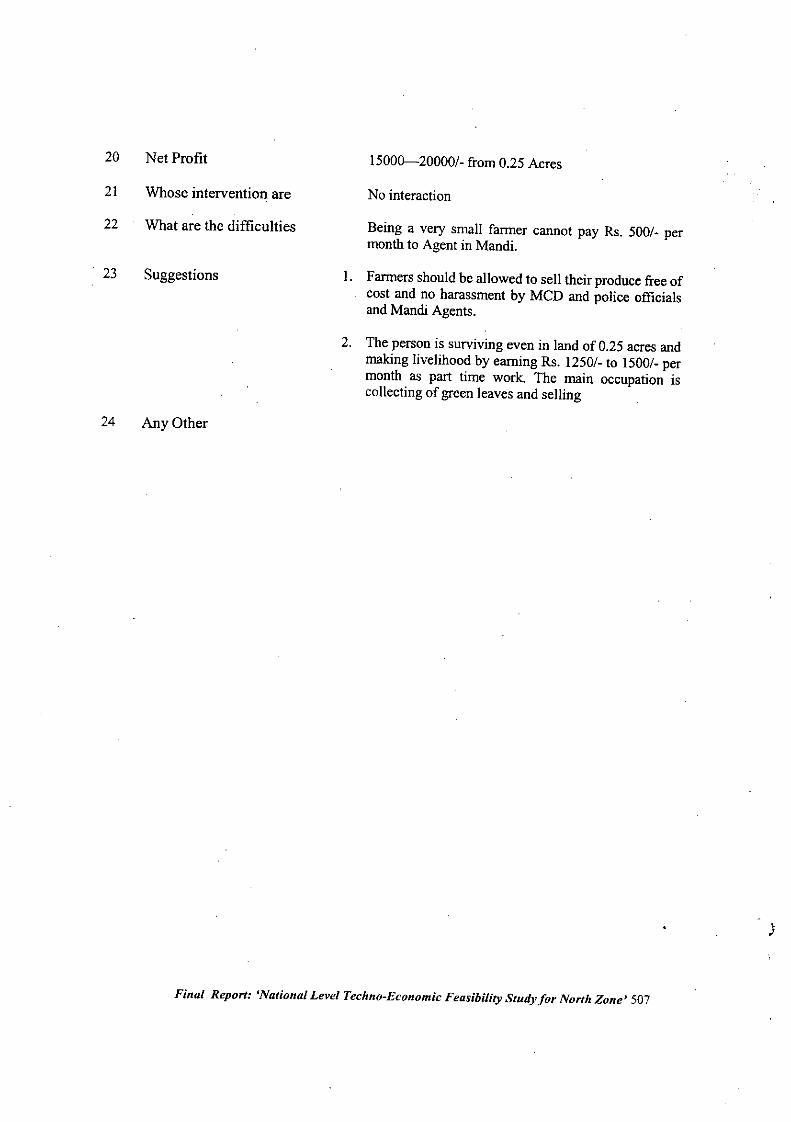
20 Net Profit 15000--20000/- from 0.25 Acres
21 Whose intervention are No interaction
22 What are the difficulties Being a very small farmer cannot pay Rs. 500/- permonth to Agent in Mandi.
23 Suggestions I. Farmers should be allowed to sell their produce free ofcost and no harassment by Men and police officialsand Mandi Agents.
2. The person is surviving even in land of 0.25 acres andmaking livelihood by earning Rs. 1250/- to 1500/- permonth as part time work. The main occupation iscollecting of green leaves and selling
24 Any Other
Final Report: 4Nat;onal Level Techno-Economic Feasibility Study for North Zone' 507
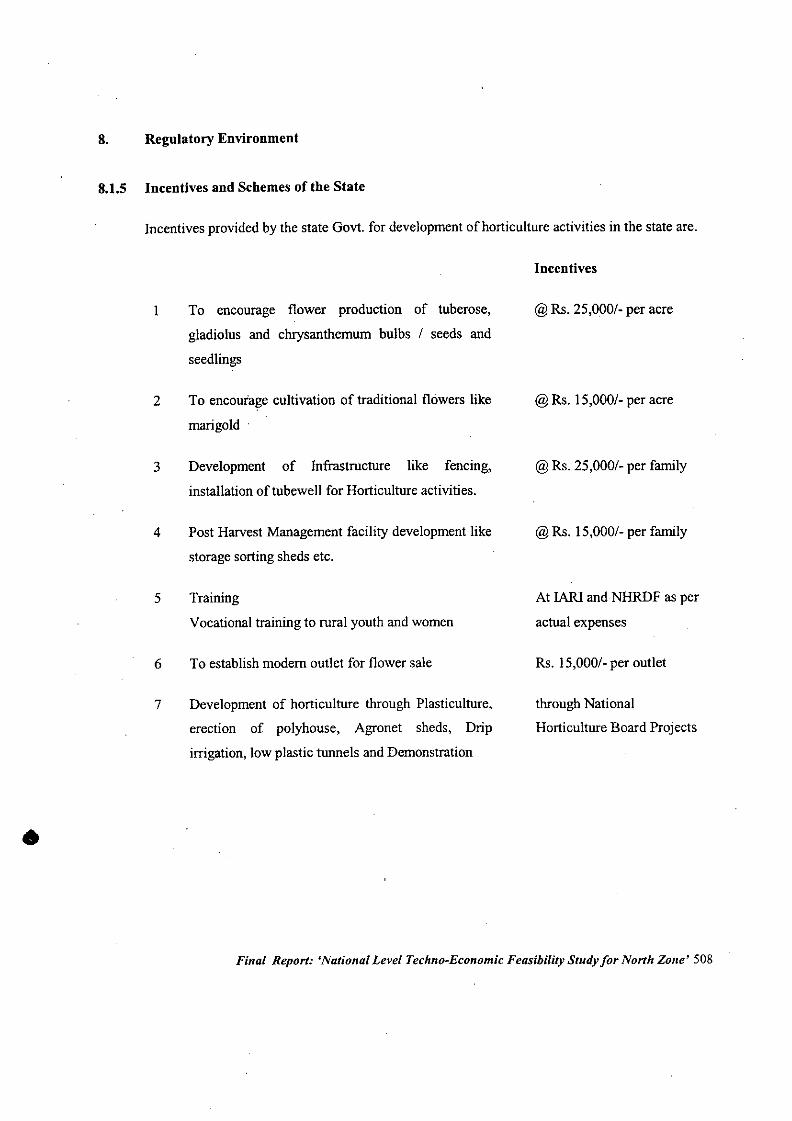
8. Regulatory Environment
8.1.5 Incentives and Schemes of the State
Incentives provided by the state Gov!. for development of horticulture activities in the state are.
Incentives
•
I
2
3
4
5
6
7
To encourage flower production of tuberose,
gladiolus and chrysanthemum bulbs / seeds and
seedlings
To encourage cultivation of traditional flowers like
marigold
Development of Infrastructure like fencing,
installation of tubewell for Horticulture activities.
Post Harvest Management facility development like
storage sorting sheds etc.
Training
Vocational training to rural youth and women
To establish modem outlet for flower sale
Development of horticulture through Plasticulture,
erection of polyhouse, Agronet sheds, Drip
irrigation, low plastic tunnels and Demonstration
@ Rs. 25,000/- per acre
@Rs. 15,000/- per acre
@ Rs. 25,000/- per family
@Rs. 15,000/- per family
At JAR] andNHRDF as per
actual expenses
Rs. 15,000/- per outlet
through National
Horticulture Board Projects
Final Report: 'National Level Techno-Economic Feasibility Study for North Zone' 508
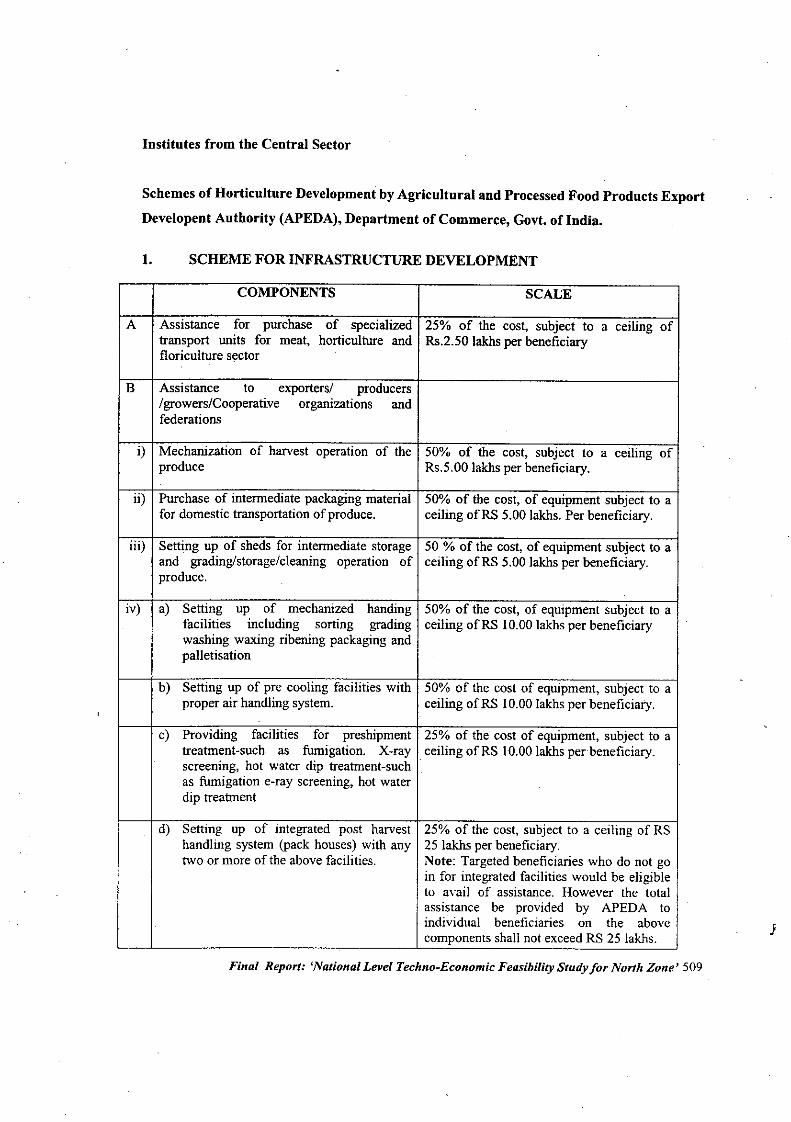
Institutes from tbe Central Sector
Scbemes of Horticulture Development by Agricultural and Processed Food Products Export
Developent Autbority (APEDA), Department of Commerce, Govt. of India.
1. SCHEME FOR INFRASTRUCTURE DEVELOPMENT
COMPONENTS SCALE
A Assistance for purchase of specialized 25% of the cost, subject to a ceiling oftransport units for meat, horticulture and Rs.2.50 lakhs per beneficiaryfloriculture sector
B Assistance to exporters/ producers/growers/Cooperative organizations andfederations
i) Mechanization of harvest operation of the 50% of the cost, subject to a ceiling ofproduce Rs.5.00 lakhs per beneficiary.
ii) Purchase of intermediate packaging material 50% of the cost, of equipment subject to afor domestic transportation of produce. ceiling ofRS 5.00 lakhs. Per beneficiary.
iii) Setting up of sheds for intermediate storage 50 % of the cost, of equipment subject to aand grading/storage/cleaning operation of ceiling ofRS 5.00 lakhs per beneficiary.produce.
iv) a) Setting up of mechanized handing 50% of the cost, of equipment subject to afacilities including sorting grading ceiling ofRS 10.00 lakhs per beneficiarywashing waxing ribening packaging andpalletisation
b) Setting up of pre cooling facilities with 50% of the cost of equipment, subject to aproper air handling system. ceiling ofRS 10.00 lakhs per beneficiary.
c) Providing facilities for preshipment 25% of the cost of equipment, subject to atreatment-such as fumigation. X-ray ceiling ofRS 10.00 lakhs per beneficiary.screening, hot water dip treatment-suchas fumigation e-ray screening, hot waterdip treatment
d) Setting up of integrated post harvest 25% of the cost, subject to a ceiling of RShandling system (pack houses) with any 25 lakhs per beneficiary.two or more of the above facilities. Note: Targeted beneficiaries who do not go
in for integrated facilities would be eligibleto avail of assistance. However the totalassistance be provided by APEDA toindividual beneficiaries on the abovecomponents shall not exceed RS 25 lakhs.
Final Report: 'National Level Techno-Economic Feasibility Study for North Zone' 509
j
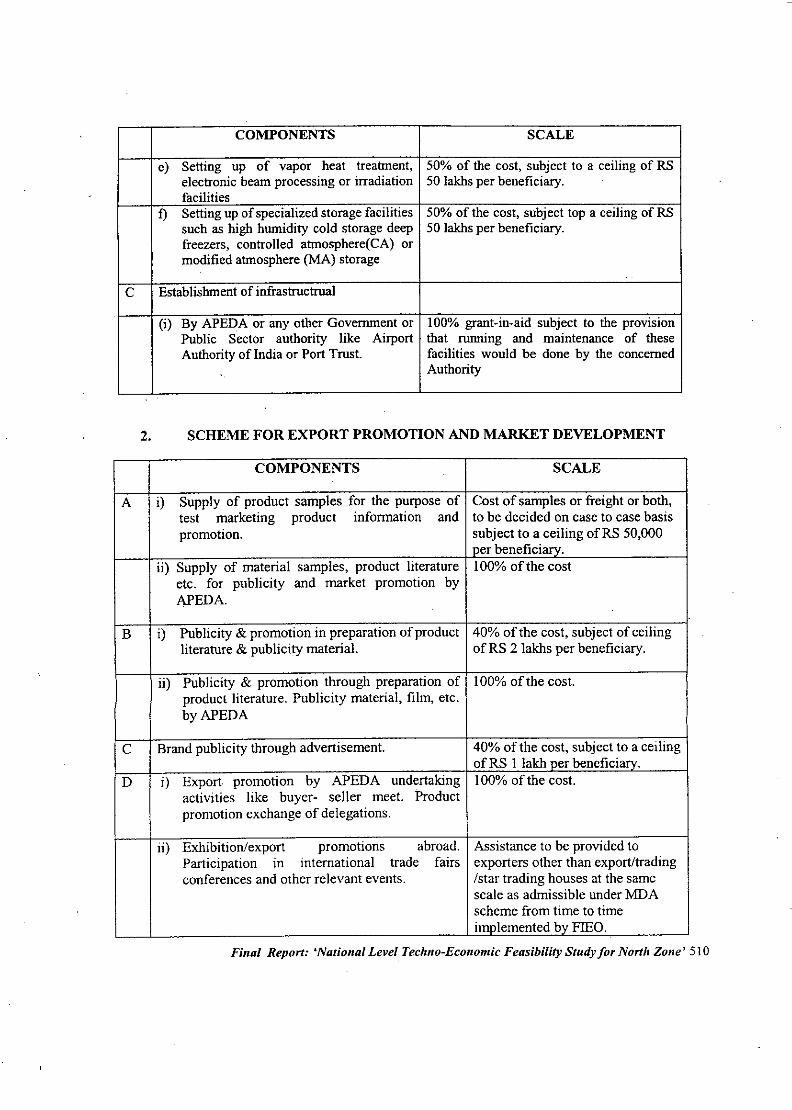
COMPONENTS SCALE
e) Setting up of vapor heat treatment, 50% of the cost, subject to a ceiling of RSelectronic beam processing or irradiation 50 lakhs per beneficiary.facilities
f) Setting up of specialized storage facilities 50% of the cost, subject top a ceiling of RSsuch as high humidity cold storage deep 50 Jakhs per beneficiary.freezers, controlled atmosphere(CA) ormodified atmosphere (MA) storage
.
C Establishment of infrastructrual
(i) By APEDA or any other Government or 100% grant-in-aid subject to the provisionPublic Sector authority like Airport that running and maintenance of theseAuthority of India or Port Trust. facilities would be done by the concerned
Authority
2. SCHEME FOR EXPORT PROMOTION AND MARKET DEVELOPMENT
COMPONENTS SCALE
A i) Supply of product samples for the purpose of Cost of samples or freight or both,test marketing product information and to be decided on case to case basispromotion. subject to a ceiling ofRS 50,000
ner beneficiarY.ii) Supply of material samples, product literature 100% ofthe cost
etc. for publicity and market promotion byAPEDA.
B i) Publicity & promotion in preparation of product 40% of the cost, subject of ceilingliterature & publicity material. of RS 2 lakhs per beneficiary.
ii) Publicity & promotion through preparation of 100% of the cost.product literature. Publiciry material, film, etc.byAPEDA
C Brand publicity through advertisement. 40% of the cost, subject to a ceilingofRS I lakh oer beneficiary.
D i) Export. promoti on by APEDA undertaking 100% of the cost.activities like buyer- seller meet. Productpromotion exchange of delegations.
ii) Exhibition/export promotions abroad. Assistance to be provided toParticipation 10 international trade fairs exporters other than export/tradingconferences and other relevant events. Istar trading houses at the same
scale as admissible under MDAscheme from time to timeimolemented by FlEO.
Final Report: -National Level Techno-Economic Feasibility Study for North Zone' 510
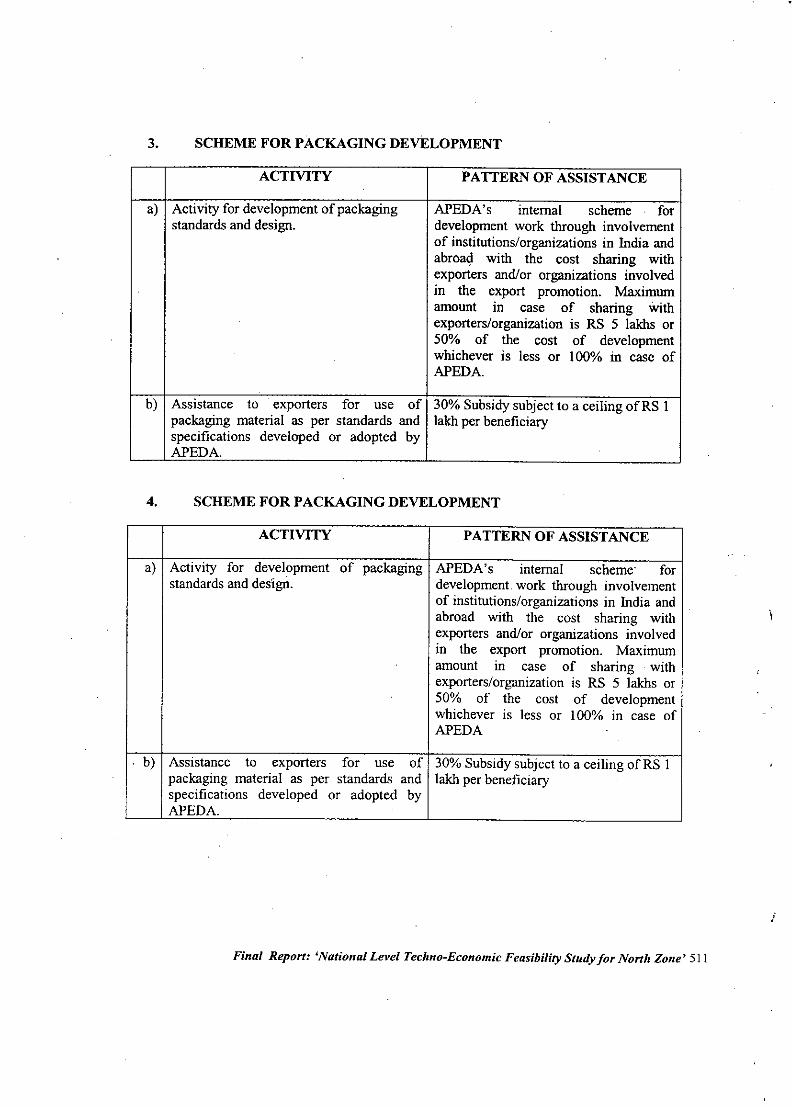
3. SCHEME FOR PACKAGING DEVELOPMENT
ACTIVITY PATTERN OF ASSISTANCE
a) Activity for development of packaging APEDA's internal scheme forstandards and design. development work through involvement
of institutions/organizations in India andabroa~ with the cost sharing withexporters and/or organizations involved
. in the export promotion. Maximumamount in case of sharing Withexporters/organization is RS 5 lakhs or50% of the cost of developmentwhichever is less or 100% in case ofAPEDA.
b) Assistance to exporters for use of 30% Subsidy subject to a ceiling ofRS Ipackaging material as per standards and lakb per beneficiaryspecifications developed or adopted byAPEDA.
4. SCHEME FOR PACKAGING DEVELOPMENT
ACTIVITY PATTERN OF ASSISTANCE
a) Activity for development of packaging APEDA's internal scheme' forstandards and design. development work through involvement
of institutions/organizations in India andabroad with the cost sharing withexporters and/or organizations involvedIII the export promotion. Maximumamount III case of sharing withexporters/organization is RS 5 lakhs or50% of the cost of developmentwhichever is less or 100% in case ofAPEDA
b) Assistance to exporters for use of 30% Subsidy subject to a ceiling ofRS Ipackaging material as per standards and lakh per beneficiaryspecifications developed or adopted byAPEDA.
Final Report: 4National Level Techno-Economic Feasibility Study for North Zone' 511
j
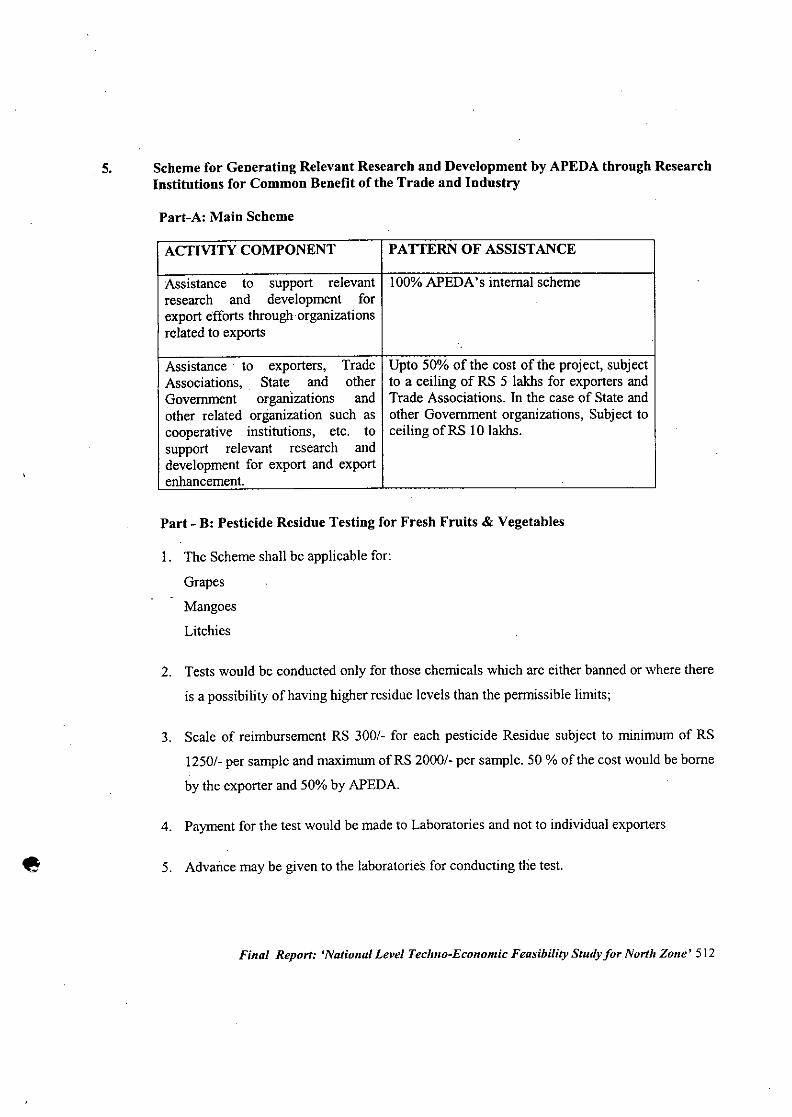
5. Scheme for Generating Relevant Research and Development by APEDA through ResearchInstitutious for Common Benefit of the Trade and Industry
Part-A: Main Scheme
ACTIVITY COMPONENT PATTERN OF ASSISTANCE
Assistance to support relevant 100% APEDA's internal schemeresearch and development forexport efforts through organizationsrelated to exports
Assistance to exporters, Trade Upto 50% of the cost of the project, subjectAssociations, State and other to a ceiling of RS 5 lakhs for exporters andGovernment organizations and Trade Associations. In the case of State andother related organization such as other Government organizations, Subject tocooperative institutions, etc. to ceiling of RS 10 lakhs.support relevant research anddevelopment for export and exportenhancement.
Part - B: Pesticide Residue Testing for Fresh Fruits & Vegetables
1. The Scheme shall be applicable for:
Grapes
Mangoes
Litchies
2. Tests would be conducted only for those chemicals which are either banned or where there
is a possibility of having higher residue levels than the permissible limits;
3. Scale of reimbursement RS 300/- for each pesticide Residue subject to minimum of RS
1250/- per sample and maximum ofRS 2000/- per sample. 50 % of the cost would be borne
by the exporter and 50% by APEDA.
4. Payment for the test would be made to Laboratories and not to individual exporters
5. Advance may be given to the laboratories for conducting the test.
Final Report: 'National Level Techno-Economic Feasibility Study for North Zone' 512

...••... j,
, ,
t
)
)
j
ao
J
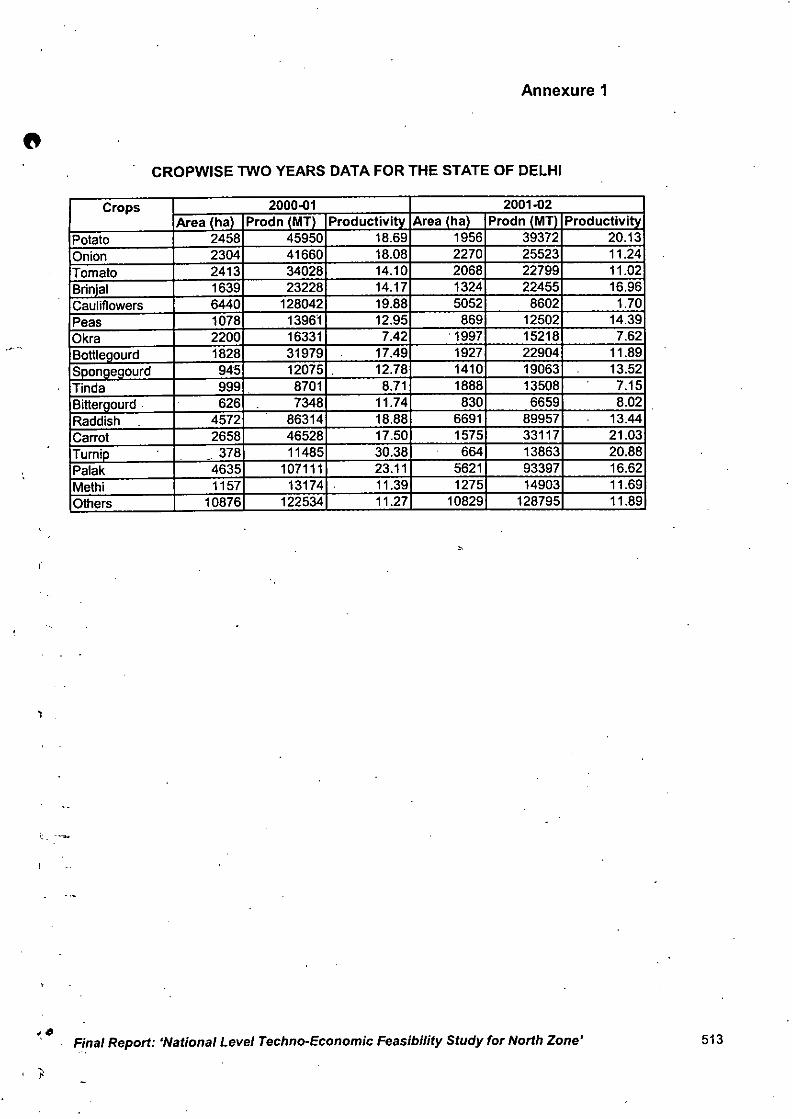
1
Annexure 1
CROPWISE TWO YEARS DATA FOR THE STATE OF DELHI
Crops 2000.01 2001.02Area /hal Prodn /MTl Productivitv Area /hal Prodn (MT Productivil\l
Potato 2458 45950 18.69 1956 39372 20.13Onion 2304 41660 18.08 2270 25523 11.24Tomato 2413 34028 14.10 2068 22799 11.02Brinial 1639 23228 14.17 1324 22455 16.96Cauliflowers 6440 128042 19.88 5052 8602 1.70Peas 1078 13961 12.95 869 12502 14.39Okra 2200 16331 7.42 "1997 15218 7.62Botlleaourd 1828 31979 17.49 1927 22904 11.898Donoeaourd 945 12075 " 12.78 1410 19063 13.52Tinda 999 8701 8.71 1888 13508 7.15Bitleraourd " 626 7348 11.74 830 6659 8.02Raddish 4572 86314 18.88 6691 89957 13.44Carrot 2658 46528 17.50 1575 33117 21.03TumiD 378 11485 30.38 . 664 13863 20.88
,"
Palak 4635 107111 23.11 5621 93397 16.62Methi 1157 13174 11.39 1275 14903 11.69Others 10876 122534 11.27 10829 128795 11.89
Final Report: 'National Level Techno-Economic Feasibility Study for North Zone' 513

.',\
'J
. "
( ."t
j
'j
'--"'~.J,j
'1'