Vulnerability mapping: approaches from continental to local scales
25
Vulnerability mapping: approaches from continental to local scales Lelys Bravo de Guenni * , Raúl Ramirez , Elvin Barreto and Isabel Llatas Universidad Simón Bolívar, Caracas, Venezuela *e-mail:[email protected]
Transcript of Vulnerability mapping: approaches from continental to local scales

Vulnerability mapping: approaches from continental to local scales
Lelys Bravo de Guenni*, Raúl Ramirez , Elvin Barreto and Isabel Llatas Universidad Simón Bolívar, Caracas, Venezuela *e-mail:[email protected]

Acknowledgements
• Water System Analysis Group of the University of New Hampshire led by Prof. Charles Vörösmarty
• Graduate students Jhan Rodríguez and Pedro Sequera from the Statistics graduate program. Universidad Simon Bolivar, Caracas-Venezuela

Contents
• The role of the scale in vulnerability mapping
• Geophysical and socioeconomic data sets: From global to local scales
• Vulnerability quantification process
• Conclusions

The vulnerability concept (after Downing, et al., 1999)
Vulnerability: is the degree of loss (from 0 to 100 percent) resulting from a potentially damaging phenomenon. It depends on the capacity of a person, a group or a component of a natural system to resist and/or to recover from and/or to cope with the impacts of an adverse event
Risk: is the expected losses (of lives, person injured, property damage and/or disruption of economical activity) due to a particular hazard for a particular location and time period. In other words, risk can be expressed as R= Vulnerability x Pr(Hazard), i.e., the expected losses due to a particular hazard
Note: In Disease Mapping Analysis: Risk = Vulnerability

Focus at the Continental scale
• What changes in precipitation characteristics and population growth for South America have occurred in recent years?
• What are the implications of these changes for population exposure, vulnerability and risk to rainfall anomalies in South America?
• How can we assess the marginal contributions of precipitation and population changes to population vulnerability and risk?
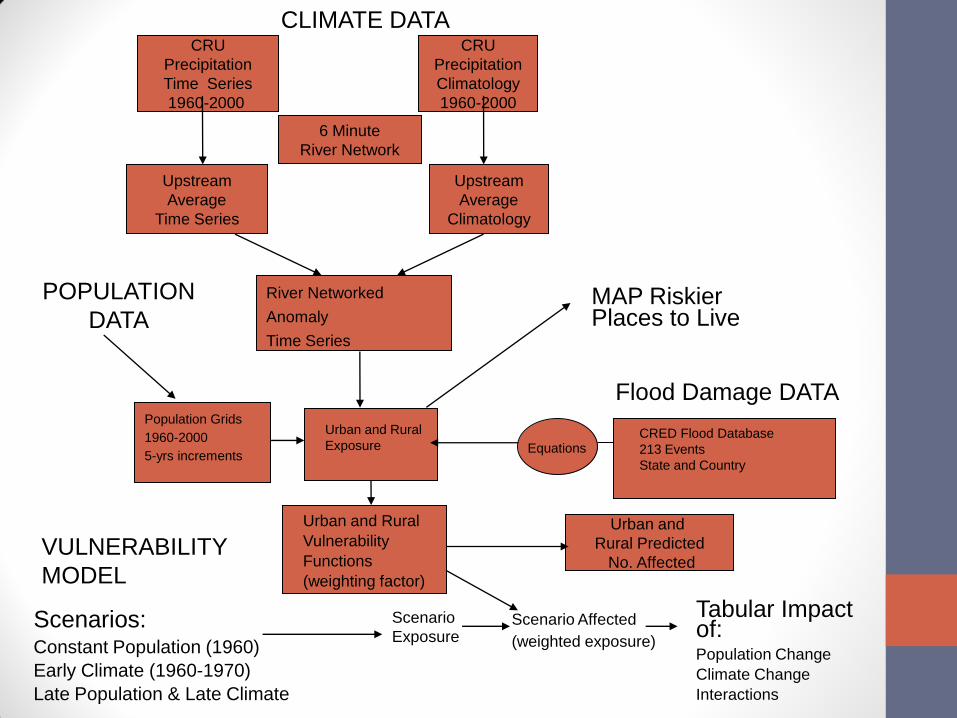
Scenarios: Constant Population (1960)
Early Climate (1960-1970)
Late Population & Late Climate
Tabular Impact of: Population Change
Climate Change
Interactions
CRU
Precipitation
Time Series
1960-2000
CRU
Precipitation
Climatology
1960-2000
Urban and
Rural Predicted
No. Affected
Population Grids
1960-2000
5-yrs increments
MAP Riskier Places to Live
Flood Damage DATA
6 Minute
River Network
Upstream
Average
Time Series
Upstream
Average
Climatology
River Networked
Anomaly
Time Series
Urban and Rural
Exposure CRED Flood Database
213 Events
State and Country
Urban and Rural
Vulnerability
Functions
(weighting factor)
Scenario
Exposure Scenario Affected
(weighted exposure)
Equations
CLIMATE DATA
POPULATION
DATA
VULNERABILITY
MODEL

NETWORKED PRECIPITATION DATA
FOR SOUTH AMERICA
Monthly precipitation time series and
monthly rainfall climatologies (1960-
2000) from the Climate Research Unit
(CRU) monthly grided data set were
coupled to the 6 min. South America
Simulated Topological River Network to
produce Networked Rainfall Time Series
by calculating the average precipitation
on contributing grid cells upstream any
given cell.
6 min Simulated Topological
River Network for South America
(Fekete et al., 2001)

NETWORKED PRECIPITATION CLIMATOLOGIES

Population centers with River Networked Rainfall Anomaly for April 1999.

0 1 2 3 4 5
05000
00
1500
000
2500
000
anom oly
Number of people affected by rainfall anomaly category using the “count back” method
Rainfall Anomaly Category
Cu
mu
lati
ve E
xpo
sure
(m
illio
ns)

Vulnerability Model

Area: 916.445 km2
Population Density: 23,95 inhab./km2
Views from Vargas State: Event, Dec. 1999

Motivation of the Problem at the National Level
• The main objectives of this research are to have a
better knowledge of population vulnerability to hydrometeorological related hazards in Venezuela, enabling its spatial analisys for more and better interregional and district comparisons.
MAIN OBJECTIVE MAPPING VULNERABILITY

Events Data Set Map of total number of affected during the period 1960-2000
Total affected per district

Events Data Set
Map of total number of events in the period 1960-2000
Total Events per Distric for the period (1960-2000)
Total Events per Distric
0
1 - 3
4 - 10
11 - 18
19 - 33
´

Areal Model for Vulnerability We consider the variable as following a Poisson distribution of the form:
).(~ iii RREPoisY
iY
•Yi is the number of people affected in the district i •Ei is the expected number of people affected. This value is calculated as Ei = ni x p*, where ni is the average number of people living in district i and p* is the national proportion of affected calculated from all observations •RRi is the relative risk calculated as pi/p*, where pi is the proportion of people affected (to be estimated). •The value of RRi is the quantity of interest and pi is the vulnerability as defined before.
If RRi >> 1 the district i has a Relative Risk greater than the National Mean
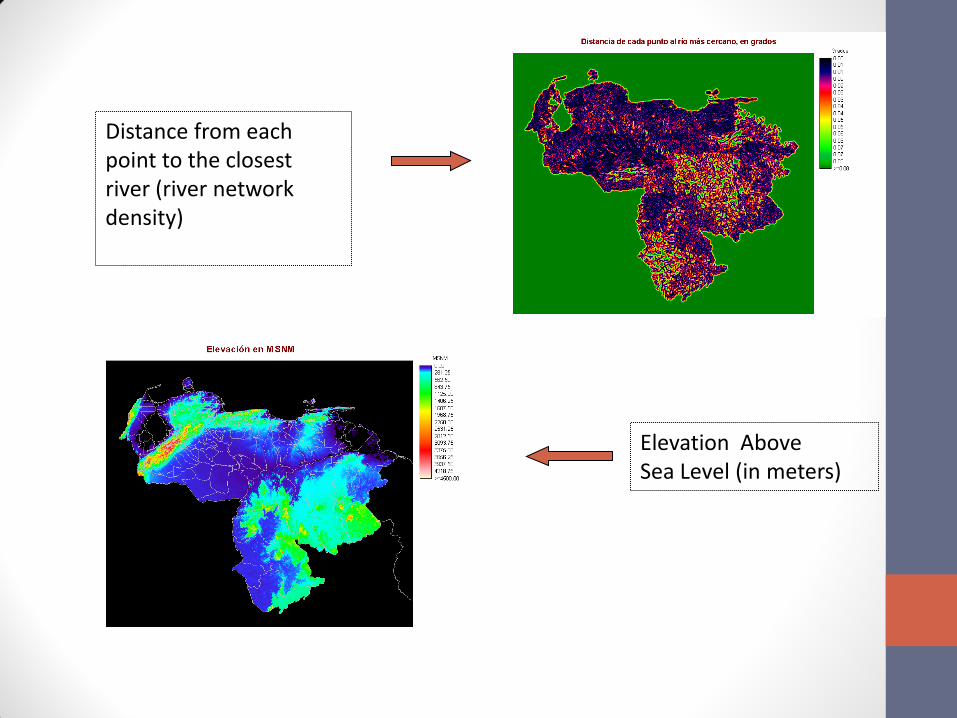
Elevation Above Sea Level (in meters)
Distance from each point to the closest river (river network density)

MODEL FIT OBSERVED AFFECTED
Mean values of the posterior predictive distribution of people affected
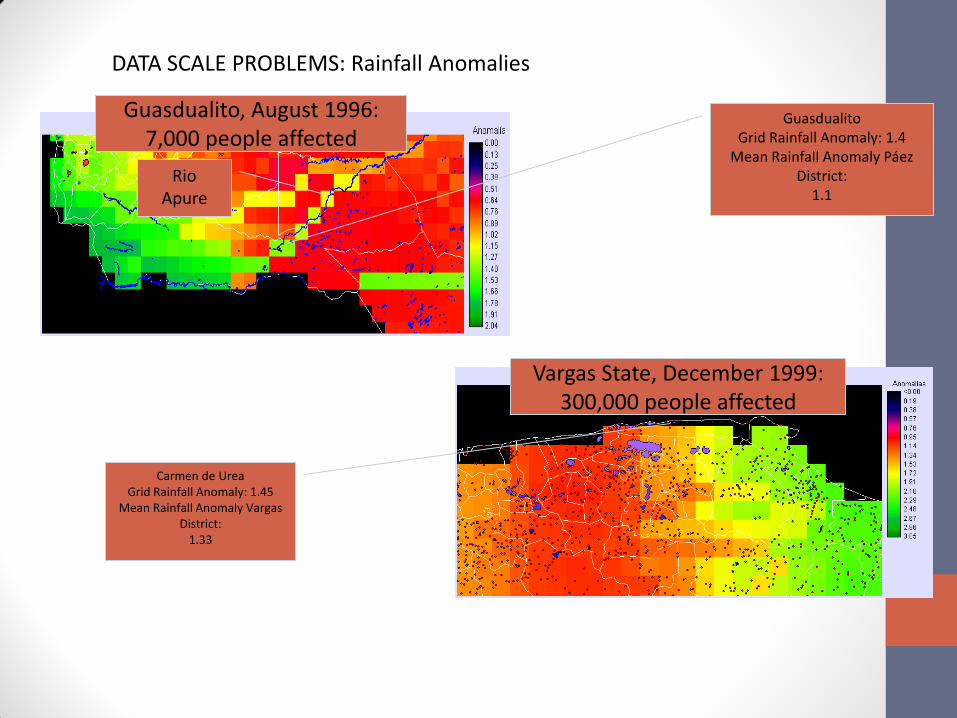
DATA SCALE PROBLEMS: Rainfall Anomalies
Guasdualito Grid Rainfall Anomaly: 1.4
Mean Rainfall Anomaly Páez District:
1.1
Guasdualito, August 1996: 7,000 people affected
Rio Apure
Vargas State, December 1999: 300,000 people affected
Carmen de Urea Grid Rainfall Anomaly: 1.45
Mean Rainfall Anomaly Vargas District:
1.33

Local scale: Community based early warning system
• The problem and the location
• Adaptation and Mitigation Measures to Hidrometeorological extremes
• Components of the Early Warning System
• Experiences with the Community

Study Area: 15,000 inhabitants, located 45 min away from Caracas
Naiguatá Camurí Grande

Community based early warning system: Example
of Camurí Grande and Naiguatá Basins
For each community the following tasks are developed:
Evaluation of existing hazards
General information about mitigation measures
Establishing a local risk task force
Developing a local risk and emergency plan
To define the role of the community
Communal early warning system tools (portable radios, alarms,
communal rain and water level gages)
Promotion activities (workshops, posters, fliers, broadcasting etc.)
Simulations (evacuation drill)

Community based hazard map: Camurí Grande

Community based hazard map: Naiguatá

Conclusions