Vortex shedding as a precursor of turbulent electrical activity in cardiac muscle
7
Biophysical Journal Volume 70 March 1996 1105-1111 1 Vortex Shedding as a Precursor of Turbulent Electrical Activity in Cardiac Muscle Candido Cabo, Arkady M. Pertsov, Jorge M. Davidenko, William T. Baxter, Richard A. Gray, and Jose Jalife Department of Pharmacology, SUNY Health Science Center at Syracuse, Syracuse, New York 13210 USA ABSTRACT In cardiac tissue, during partial blockade of the membrane sodium channels, or at high frequencies of excitation, inexcitable obstacles with sharp edges may destabilize the propagation of electrical excitation waves, causing the formation of self-sustained vortices and turbulent cardiac electrical activity. The formation of such vortices, which visually resembles vortex shedding in hydrodynamic turbulent flows, was observed in sheep epicardial tissue using voltage-sensitive dyes in combination with video-imaging techniques. Vortex shedding is a potential mechanism leading to the spontaneous initiation of uncontrolled high-frequency excitation of the heart. INTRODUCTION The rhythmic contraction of the heart is triggered by elec- trochemical waves of excitation that originate in the sinus node and propagate through the atria and ventricles. Multi- ple anatomical obstacles that are present in the normal heart (e.g., orifices of the caval veins, aorta, pulmonary artery, and coronary arteries perfusing the myocardial wall) nor- mally do not affect the stable propagation of such waves over wide parameter ranges. Here we demonstrate that, under certain critical conditions, inexcitable obstacles may destabilize propagation, causing the formation of self-sus- tained vortices and uncontrolled high-frequency excitation of cardiac tissue. The formation of such vortices, which visually resembles vortex shedding in hydrodynamical sys- tems (Tritton, 1977), was observed in thin slices of sheep ventricular epicardial muscle using a voltage-sensitive probe in combination with video-imaging techniques (Davi- denko et al., 1992). The parameter range for instability was estimated numerically with an ionic model of cardiac mus- cle (Luo and Rudy, 1991). Instabilities were observed after 75% blockade of sodium channel conductance and at high frequencies of excitation (close to the propagation limit). Wavefront instabilities resulting from interaction with im- permeable barriers have been reported previously for ge- neric numerical models of excitable media (Panfilov and Pertsov, 1982; Pertsov et al., 1990; Mikhailov, 1990; Win- free, 1989; Panfilov and Keener, 1993; Agladze et al., 1994; Starobin et al., 1995) and observed experimentally in chem- ically excitable media (Agladze et al., 1984, 1994; Nagy- Ungvarai et al., 1992; Markus et al., 1994; Zhabotinsky et al., 1993; Toth et al., 1994; Graham et al., 1994). Here we Received for publication 25 May 1995 and in final form 12 December 1995. Address reprint requests to Dr. Arkady Pertsov, Department of Phar- macology, SUNY Health Science Center, 766 Irving Avenue, Syracuse, NY 13210. Tel.: 315-464-7949; Fax: 315-464-8000; E-mail: pertsov@ sunbird.pharm.hscsyr.edu. C 1996 by the Biophysical Society 0006-3495/96/03/1105/07 $2.00 provide the first experimental demonstration of such insta- bilities in a biological system. MATERIALS AND METHODS Computer simulations To simulate wave propagation in cardiac tissue we used a two-dimensional cable model with Luo and Rudy (1991) kinetics: (SvRx)(Vm)xx + (Sj? )(Vm)yy = Cm(Vm)t + Iion, where Im is the total transmembrane current (pLA/cm2), S, is the surface- to-volume ratio (2000 cm-'), RiX is the intracellular resistivity in the x (longitudinal) direction (0.5 kfQ cm), Riy is the intracellular resistivity in the y (transverse) direction (4.5 kQ cm), Vm is the transmembrane poten- tial, Iion is the total ionic membrane current (QA/cm2; Luo-Rudy equa- tions), and Cm is the membrane capacitance (1 gF/cm2). The directional difference in intracellular resistivity was imposed to match the anisotropy of myocardial tissue (i.e., directional dependency of the propagation ve- locity). An inexcitable obstacle was simulated by electrically uncoupling nodes at both sides of a barrier (non-flow boundary conditions at the barrier). To integrate the two-dimensional cable equation, an explicit forward Euler scheme was used with a spatial discretization step of 25 J,m and a time integration step of 2 us. The array consisted of 600 X 300 nodes in the x and y directions, respectively. Non-flux boundary conditions were applied at the boundary of the domain. Experimental preparations Young sheep weighing 15 to 25 kg were anesthetized with sodium pento- barbital. The chest was opened through an anterior midline incision, and the heart was excised and placed in warm oxygenated Tyrode's solution. Thin slices (thickness 0.5 mm) of ventricular epicardial muscle were cut with a dermatome. Suitable preparations of about 20 mm by 20 mm were placed in a recording chamber and superfused with oxygenated Tyrode's solution (370C) containing diacetyl-monoxime (15 mM) to abolish con- tractility. Tissues were stained with the fluorescent voltage-sensitive probe DI-4-ANEPPS (15 ,uM; Molecular Probes, Eugene, OR). Video-imaging techniques (Davidenko et al., 1992) were used to record the excitation waves as fluorescence changes proportional to changes in transmembrane potential. Fluorescence was excited at 490 ram and recorded at 645 nm with a CCD video camera (Cohu series 6500) at a rate of 60 frames/s. The images of an area of approximately 20 X 20 mm (400 X 200 pixels) were acquired for 1-2 s by a 16-Mbyte video board (dynamic range, 8 bits) connected to a Pentium PC and stored on an optical disc. To extract the 1105
-
Upload
citytech-cuny -
Category
Documents
-
view
2 -
download
0
Transcript of Vortex shedding as a precursor of turbulent electrical activity in cardiac muscle

Biophysical Journal Volume 70 March 1996 1105-1111 1
Vortex Shedding as a Precursor of Turbulent Electrical Activity inCardiac Muscle
Candido Cabo, Arkady M. Pertsov, Jorge M. Davidenko, William T. Baxter, Richard A. Gray, and Jose JalifeDepartment of Pharmacology, SUNY Health Science Center at Syracuse, Syracuse, New York 13210 USA
ABSTRACT In cardiac tissue, during partial blockade of the membrane sodium channels, or at high frequencies ofexcitation, inexcitable obstacles with sharp edges may destabilize the propagation of electrical excitation waves, causing theformation of self-sustained vortices and turbulent cardiac electrical activity. The formation of such vortices, which visuallyresembles vortex shedding in hydrodynamic turbulent flows, was observed in sheep epicardial tissue using voltage-sensitivedyes in combination with video-imaging techniques. Vortex shedding is a potential mechanism leading to the spontaneousinitiation of uncontrolled high-frequency excitation of the heart.
INTRODUCTION
The rhythmic contraction of the heart is triggered by elec-trochemical waves of excitation that originate in the sinusnode and propagate through the atria and ventricles. Multi-ple anatomical obstacles that are present in the normal heart(e.g., orifices of the caval veins, aorta, pulmonary artery,and coronary arteries perfusing the myocardial wall) nor-mally do not affect the stable propagation of such wavesover wide parameter ranges. Here we demonstrate that,under certain critical conditions, inexcitable obstacles maydestabilize propagation, causing the formation of self-sus-tained vortices and uncontrolled high-frequency excitationof cardiac tissue. The formation of such vortices, whichvisually resembles vortex shedding in hydrodynamical sys-tems (Tritton, 1977), was observed in thin slices of sheepventricular epicardial muscle using a voltage-sensitiveprobe in combination with video-imaging techniques (Davi-denko et al., 1992). The parameter range for instability wasestimated numerically with an ionic model of cardiac mus-cle (Luo and Rudy, 1991). Instabilities were observed after75% blockade of sodium channel conductance and at highfrequencies of excitation (close to the propagation limit).Wavefront instabilities resulting from interaction with im-permeable barriers have been reported previously for ge-neric numerical models of excitable media (Panfilov andPertsov, 1982; Pertsov et al., 1990; Mikhailov, 1990; Win-free, 1989; Panfilov and Keener, 1993; Agladze et al., 1994;Starobin et al., 1995) and observed experimentally in chem-ically excitable media (Agladze et al., 1984, 1994; Nagy-Ungvarai et al., 1992; Markus et al., 1994; Zhabotinskyet al., 1993; Toth et al., 1994; Graham et al., 1994). Here we
Received for publication 25 May 1995 and in final form 12 December1995.Address reprint requests to Dr. Arkady Pertsov, Department of Phar-macology, SUNY Health Science Center, 766 Irving Avenue, Syracuse,NY 13210. Tel.: 315-464-7949; Fax: 315-464-8000; E-mail: [email protected] 1996 by the Biophysical Society0006-3495/96/03/1105/07 $2.00
provide the first experimental demonstration of such insta-bilities in a biological system.
MATERIALS AND METHODS
Computer simulationsTo simulate wave propagation in cardiac tissue we used a two-dimensionalcable model with Luo and Rudy (1991) kinetics:
(SvRx)(Vm)xx + (Sj? )(Vm)yy = Cm(Vm)t + Iion,
where Im is the total transmembrane current (pLA/cm2), S, is the surface-to-volume ratio (2000 cm-'), RiX is the intracellular resistivity in the x(longitudinal) direction (0.5 kfQ cm), Riy is the intracellular resistivity inthe y (transverse) direction (4.5 kQ cm), Vm is the transmembrane poten-tial, Iion is the total ionic membrane current (QA/cm2; Luo-Rudy equa-tions), and Cm is the membrane capacitance (1 gF/cm2). The directionaldifference in intracellular resistivity was imposed to match the anisotropyof myocardial tissue (i.e., directional dependency of the propagation ve-locity). An inexcitable obstacle was simulated by electrically uncouplingnodes at both sides of a barrier (non-flow boundary conditions at thebarrier). To integrate the two-dimensional cable equation, an explicitforward Euler scheme was used with a spatial discretization step of 25 J,mand a time integration step of 2 us. The array consisted of 600 X 300 nodesin the x and y directions, respectively. Non-flux boundary conditions wereapplied at the boundary of the domain.
Experimental preparationsYoung sheep weighing 15 to 25 kg were anesthetized with sodium pento-barbital. The chest was opened through an anterior midline incision, andthe heart was excised and placed in warm oxygenated Tyrode's solution.Thin slices (thickness 0.5 mm) of ventricular epicardial muscle were cutwith a dermatome. Suitable preparations of about 20 mm by 20 mm wereplaced in a recording chamber and superfused with oxygenated Tyrode'ssolution (370C) containing diacetyl-monoxime (15 mM) to abolish con-tractility. Tissues were stained with the fluorescent voltage-sensitive probeDI-4-ANEPPS (15 ,uM; Molecular Probes, Eugene, OR). Video-imagingtechniques (Davidenko et al., 1992) were used to record the excitationwaves as fluorescence changes proportional to changes in transmembranepotential. Fluorescence was excited at 490 ram and recorded at 645 nm witha CCD video camera (Cohu series 6500) at a rate of 60 frames/s. Theimages of an area of approximately 20 X 20 mm (400 X 200 pixels) wereacquired for 1-2 s by a 16-Mbyte video board (dynamic range, 8 bits)connected to a Pentium PC and stored on an optical disc. To extract the
1105

Volume 70 March 1996
voltage-dependent signal, digital subtraction of the background fluores-cence (prefiltering spatial resolution 100 ,um) and spatial filtering wereperformed (conical filter with a radius of 4 pixels, post-filtering spatialresolution 400 ,um).
An inexcitable barrier was created by making a linear cut perpendicularto one of the borders of the tissue slice using fine scissors. A healing-overperiod of half an hour was allowed after the cut was made. From histo-logical and immunocytochemical studies it was estimated that the extent ofdamaged cells beyond the cut was about 100 ,um (Cabo et al., 1994).Therefore, the barrier can be considered a sharp corner because its radius(100 ,um) is smaller than other relevant dimensions (wave front width0.5-1 mm). Excitation waves were initiated by electrical stimulation de-livered through Ag-AgCl electrodes (diameter, 0.2 mm) with an amplitudethree times the threshold value. In addition to the optical recordings,transmembrane potentials were continuously recorded using glass micro-electrodes filled with 3 M KCI and connected to a microprobe system(model 705; World Precision Instruments, New Haven, CT).
The effect of the barrier on propagation was studied at normal excit-ability during superfusion of the slices of epicardial tissue with Tyrode'ssolution (control) and at low excitability (5 experiments) by adding thesodium channel blocker tetrodotoxin (TTX) (15 ,uM) to the perfusate. Theoptical recordings were made before TTX superfusion (control), 5 minafter initiation of the TTX superfusion for a period of 30 min, and 15 minafter the initiation of the wash-out. Ten experiments were performed tostudy the effects of the barrier on propagation at various interstimulusintervals in preparations superfused with normal Tyrode's solution (normalexcitability). Stimulation was applied to the tissue using trains of 10-15stimuli at interstimulus intervals that ranged between 500 ms (control) andthe shortest interval that resulted in 1:1 propagation. The changes in criticalradius for propagation with interstimulus interval were estimated in sevenadditional experiments using the method described below.
Relevant parameters
To relate the mechanism of the instabilities observed in myocardial tissueto similar instabilities in other excitable media, the critical ratio R,IW(Pertsov et al., 1983) was estimated both computationally and experimen-tally. Here Rcr is the critical radius for excitation and W is the width of thewave front. Rcr characterizes the minimum area that has to be excited toinitiate a propagating wave and is similar to the liminal length (Rushton,1937), but for a two-dimensional excitable medium. In computer simula-tions, Rcr was measured after removing the anisotropy of the medium byrescaling the governing two-dimensional cable equation (i.e., in an isotro-pic medium). Rcr was defined as the minimum radius, such that depolar-ization to 30 mV of a circle with such a radius resulted in a propagatingwave (Cabo et al., 1994). The width of the wave front, W, was defined asthe spatial extent of tissue having an inward sodium current during prop-agation of a planar wave.
Experimentally, Rcr was estimated indirectly from measurements of thecritical width of an isthmus. Computer simulations show that such anestimate is in good agreement with the measurements of R, describedabove. For details on the experimental protocol see Cabo et al. (1994).Briefly, the width of the isthmus was gradually decreased until propagationthrough it failed. The minimum width of the isthmus (d) sufficient forpropagation was used as an estimate of Rcr (Rcr = d/2). The frequencydependence of Rcr was estimated (n = 7) by measuring the criticalfrequency (i.e., the frequency of stimulation at which propagation throughthe isthmus failed) for varying widths of the isthmus. The isthmus wasoriented perpendicular to fiber orientation.
The width of the wave front W was estimated indirectly by multiplyingthe duration of the action potential upstroke derived from microelectroderecordings and the velocity of propagation derived from the optical record-ings. Upstroke duration was estimated at 10% to 90% of the amplitude.Validation of measurements of conduction velocity from the optical re-
cordings is given elsewhere (Cabo et al., 1994). As stated above, during our
measurements of Rcrp the isthmus w,as usually oriented perpendicular to thefiber orientation. Accordingly, to obtain Rcr/W independently of anisot-ropy, W was estimated for transverse propagation.
RESULTS
In Fig. 1, we present examples of stable propagation duringthe diffraction of an excitation wave at the edge of a barrierin a computer simulation (Fig. 1 a) and an experimentalpreparation of isolated cardiac tissue (Fig. 1 b). In each case,
a wave initiated by electrical stimulation beneath the barrierpropagated from left to right. The horizontal velocity ofpropagation (longitudinal to fiber orientation) was 0.40 m/s,and the vertical velocity (transverse to fiber orientation) was0.12 m/s. Such values are typical of our experimental prep-
arations (longitudinal velocity, 0.38 ± 0.07 m/s, n = 7;transverse velocity 0.095 ± 0.026 m/s, n = 7). As a con-
sequence of the anisotropy, the wave had an elliptical shapeand different wavefront widths in the longitudinal and trans-verse directions. After initiation, the wave circumnavigatedthe barrier (yellow) without detaching from it or from theboundary of the domain, and proceeded to excite the me-
dium behind the barrier (no "shadow"). Such a pattern ischaracteristic of excitable media (Pertsov et al., 1990;Panfilov and Keener, 1993; Agladze et al., 1994;Zhabotinsky et al., 1993; Toth et al., 1994; Graham et al.,1994; Cabo et al., 1994) but is very different from wave
aT7.5mm
18(ms) 32
b
32 (m)
FIGURE 1 Diffraction of excitation waves at the edge of an imperme-able barrier in a computer model (a) and in a thin slice of sheep epicardialtissue (b). In each panel, two sequential snapshots are presented. The wave
front is shown in red. Gray levels show relative values of transmembranepotential (white, maximal depolarization; black, resting potential). Animpermeable barrier is shown in yellow. In the computer simulations, thewave was initiated by depolarizing an area with a radius of 1.25 mm to 30mV (asterisk). In the experiments, the wave was initiated by electricalstimulation at the place indicated by the asterisk with a frequency of 2.4Hz. Numbers below each frame indicate the time after application of thestimulus. In both computer and biological experiments, a propagating waveturns around the edge of the barrier, with the wave front remaining attachedto the boundary. The wave front shown in a represents the spatial extent oftissue with an inward sodium current. The wave front shown in b was
obtained as the difference between of two sequential snapshots of activityand represents the displacement of the wave front during the last 16 ms. Todetect the edge of the wave front at each frame, a pixel was considered"depolarized" if its optical signal was above 50% of its maximum value.
1106 Biophysical Journal

Turbulent Electrical Activity
FIGURE 2 Detachment of the wave-front from the edge of a barrier (precur-sor of turbulence) at a reduced maxi-mum sodium conductance (gNa).Notations are the same as in Fig 1. (a)Computer model: gNa was reduced to25% the value in Fig. 1 a. The wave wasinitiated by depolarizing an area havinga radius of 1.25 mm to 30 mV. (b)Epicardial tissue: gNa was reduced byperfusion with the sodium channelblocker tetrodotoxin (TTX, 15 ,uM).
diffraction in conservative systems where the barrier createsa "shadow."The development of instabilities in both computer and
biological experiments is illustrated in Fig. 2. The same
experimental protocol as that in Fig. 1 was repeated in thesame preparation after reduction of excitability by Na chan-nel blockade. In the model, this was accomplished by re-
ducing maximum sodium conductance (gNa) to 25% of thenominal value; in the experiment, a similar effect was
achieved by superfusion with 15 ,uM TTX. The diffractionpattern changed dramatically. After reaching the edge, thewavefront detached from the barrier and formed a vortex ina manner visually similar (although by a different mecha-nism) to the separation of the main stream from a body inhydrodynamical systems, where there is subsequent eddyformation during turbulence (Tritton, 1977). The detach-ment occurred at 26 ms in the computer simulations (Fig. 2a) and at 32 ms in the experiments (Fig. 2 b). After losingcontact with the barrier the free end of the wave frontmoved at an angle down toward the lower boundary andmade a turn near the right border. The maximum separationof the wavefront from the barrier was about 5-6 mm andcould be reliably detected experimentally. After TTX wash-out, wavefront detachment was reversed and the dynamicsexpected for the normal tissue were restored.
I
In the computer simulations, a further decrease in sodiumconductance to '22% normal resulted in shrinking of thewavefront and subsequent annihilation of the wave withoutvortex formation (Fig. 3). A similar effect has been reportedfor chemically excitable media (Nagy-Ungvarai et al.,1992). In cardiac tissue the parameter range for the occur-
rence of this phenomenon is very narrow (there is no prop-
agation at <20% normal gNa). Experimental detachment ofthe wavefront and subsequent annihilation were observedusing TTX superfusion, when the preparation was stimu-lated at intervals close to the refractory period. (High fre-quency forcing prevents complete recovery of the Na chan-nels from previous excitation, thus allowing for very finetuning of gNa.)
Overall, the values of gNa at which detachment was
observed in computer simulations (20-30% normal gNa;see Fig. 6 a) were consistent with our TTX experiments.Indeed, our estimates indicate that 15 ,uM TFX reduced thesodium conductance to approximately 32 ± 5% (n = 4) ofthe normal value. Such estimates were based on the assump-tion (Cohen et al., 1984) that action potential upstrokevelocity obtained using conventional microelectrode tech-niques is proportional to gNa.
Detachment and vortex formation could also be observedduring high-frequency electrical stimulation, close to the
1mm
zu (ms) 44 70
FIGURE 3 Annihilation of a propagating wave after the detachment of the wavefront from the edge of the barrier in the computer model. The maximumsodium conductance (gNa) was reduced to 22% the normal value (Fig. 1 a). The wave was initiated by depolarizing an area with a radius of 2.5 mm to30 mV. Notations are the same as in Fig. 1.
a
26 (mn)b
120
T7.5mm
7mm
22.4
Cabo et al. 1107

Biophysical Journal
a
I-15 mm
-I
I --I
210AFF
100 ms1I ... ..I-1--
turbulenceb
112 (IRs)
240) 256
FIGURE 4 Formation of a vortex as a result of high-frequency stimulation after detachment from the edge of the barrier. (a) Time course of fluorescencechanges at two points located in front of and behind the barrier (2 and 1). A train of 10 stimuli with a frequency of 10 Hz was applied at the site indicatedby the asterisk. Tics show time of stimulation. Bar indicates time of recording in b. The shadowed region represents the time of uncontrolled electricalactivity caused by the vortex in the absence of external stimulation. (b) Illustration of how the detached wave (last stimulated beat) curled and developeda counterclockwise rotating spiral wave. Notations are the same as in Fig. 1. Numbers under each frame indicate time after the last stimulus of the train.
limit for 1:1 propagation, without any pharmacologicallyinduced sodium channel blockade. However, our observa-tions suggest that, for vortex formation to occur under theseconditions, the required interval between stimuli (7) shouldnot exceed by more than 10% (Tmin = 104 + 11 ms, T =114 ± 16 ms, n = 10) the minimum possible intervalbetween propagating waves determined by the recoverytime of the tissue (refractory period, Tmin). In Fig. 4 we
illustrate the formation of a vortex as a result of a train of 10stimuli with an interstimulus interval of 100 ms. In Fig. 4 ait is shown that the vortex persisted for an appreciable timeafter stimulation was stopped. In Fig. 4 b, frame-by-frameanalysis shows the detachment of the wavefront from theedge of the barrier and subsequent vortex formation. In thiscase, the vortex developed 160 ms after the last stimulus inthe train. Note that wavefronts initiated by the rotating
1108 Volume 70 March 1996

Turbulent Electrical Activity
15 mm a 47
3-
0
LE
1-
u (ms) 0FIGURE 5 Formation of a "vortex street" behind the barrier as a resultof sequential detachment of the waves from the edge of the barrier.Notations are the same as in Fig. 1. The snapshots illustrate the formationof a pair of vortices during high-frequency stimulation (8.33 Hz). Propa-gation is from the bottom to the top.
vortex do not detach from the barrier (frames 176-192 ms).This is a consequence of the fact that the period of rotationof the spiral (140 ± 19 ms, n = 10) is larger than the periodof the external stimulation (114 ± 16 ms, n = 10) requiredfor its initiation. A similar pattern was observed in all nineof the other experiments in which spirals were formedbehind the barrier. This is in good agreement with similarexperiments in chemically excitable media (Agladze et al.,1994).The sequential detachment of waves from the barrier
during high-frequency stimulation resulted in a pattern sim-ilar to vortex shedding in hydrodynamics. Fig. 5 illustratestwo counterclockwise vortices formed behind the barrier(propagation is from bottom to top) during stimulation at aninterstimulus interval of 120 ms. Such a pattern visuallyresembles the so-called vortex street that is establishedbehind a cylinder immersed in a fluid (Tritton, 1977) duringflows with critical values of the Reynolds' number. How-ever, it should be pointed out that, despite their similarities,the underlying mechanisms responsible for the patternsobserved during "turbulence" in excitable media and hydro-dynamics are completely different from each other.We found that, similar to experimental observations in
chemically excitable media (Nagy-Ungvarai et al., 1992), incardiac tissue the detachment and "turbulent" activity cor-related with an increase in the ratio Rcr/W (see Methods fordefinitions). Specifically, detachment and turbulence oc-curred at Rcr/W close to or greater than 1. In Fig. 6 a wehave plotted Rcr/W as a function of gNa as calculated in thecomputer simulations. At normal gNa (100%), Rcr/W wasless than 1. The plot shows a sharp increase in Rcr/W whengNa approaches 35% of the normal value. Rcr/W becamegreater than 1 between 20% and 30% of the normal value ofgNa. This was the range where detachment was observedcomputationally, which agrees with the observations withother excitable media (Pertsov et al., 1983). A similar cor-
b
0
0
000
00 0 0
0 20 40 60% gNa
3-
0:CE
1-
c
0 0
80 100
00
00
0
00
0
088
O 8J - ----- 1
0 100 200 300
BCL (msec)
0
400 500
FIGURE 6 Parameter range for detachment and vortex shedding.(a) Ratio of the critical radius (Rcr) and the width of the wave front (W) asa function of gNa (computer simulations). Detachment occurred whenRcr/W > 1 (shaded area). The lower limit for planar propagation was 18%gNa. For a given gNa, Rcr was measured in a continuous (no barrier)isotropic medium as the minimum radius such that depolarization of acircle with that radius to 30 mV resulted in a propagating wave. W is thespatial extent of tissue with an inward sodium current at a certain time. Whad a value of 0.4 mm, which did not change with gNa. The values of gNaat which detachment occurred were independent of the anisotropic ratio.(b) Illustration of the values of RcrlW obtained for different interstimulusintervals. The values of Rcr (cumulative results of seven experiments) werenormalized to the mean value of W (0.64 ± 0.18 mm, n = 16) obtained atdifferent interstimulus intervals in two experiments. W did not changesignificantly for different interstimulus intervals (see Discussion). Theshaded area corresponds to the range of interstimulus intervals (90-130ms) at which voxtex shedding occurred (10 experiments).
relation between Rcr/W and vortex shedding was observedin the experimental preparations at high stimulation fre-quencies (Fig. 6 b). Rcr/W became greater than 1 at inter-stimulus intervals shorter than 150 ms, which was close to
IIT --- -I
Cabo et al. 1109
'N
Volume 70 March 1996
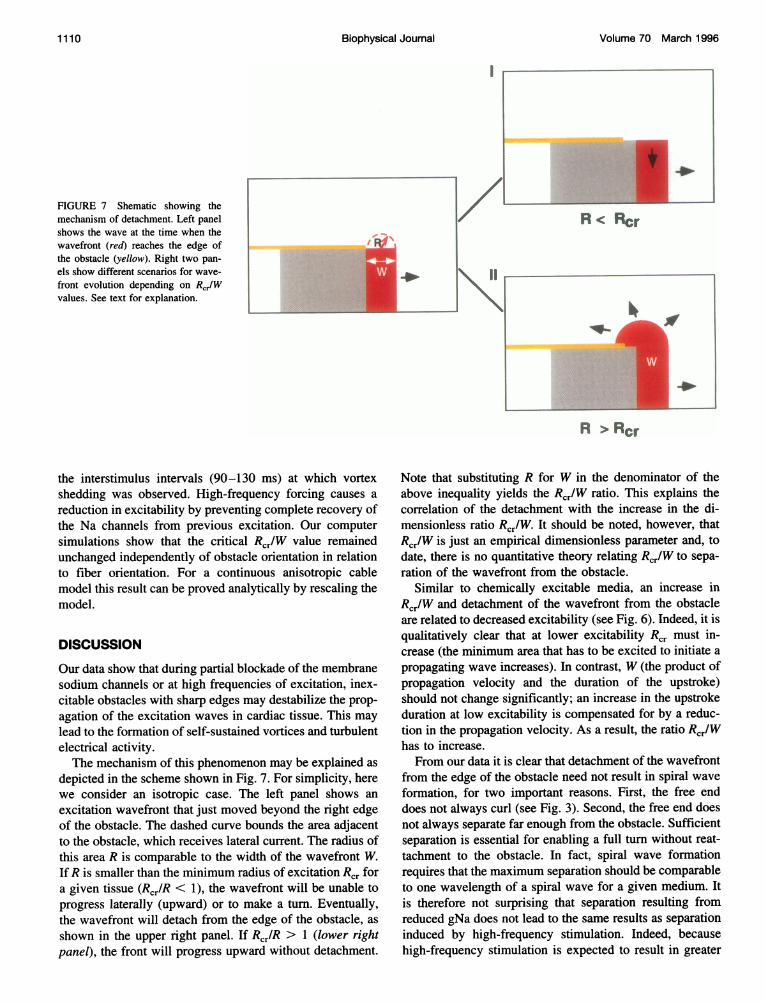
FIGURE 7 Shematic showing themechanism of detachment. Left panelshows the wave at the time when thewavefront (red) reaches the edge ofthe obstacle (yellow). Right two pan-els show different scenarios for wave-front evolution depending on Rcr/Wvalues. See text for explanation.
the interstimulus intervals (90-130 ms) at which vortexshedding was observed. High-frequency forcing causes areduction in excitability by preventing complete recovery ofthe Na channels from previous excitation. Our computersimulations show that the critical Rcr/W value remainedunchanged independently of obstacle orientation in relationto fiber orientation. For a continuous anisotropic cablemodel this result can be proved analytically by rescaling themodel.
DISCUSSION
Our data show that during partial blockade of the membranesodium channels or at high frequencies of excitation, inex-citable obstacles with sharp edges may destabilize the prop-agation of the excitation waves in cardiac tissue. This maylead to the formation of self-sustained vortices and turbulentelectrical activity.The mechanism of this phenomenon may be explained as
depicted in the scheme shown in Fig. 7. For simplicity, herewe consider an isotropic case. The left panel shows anexcitation wavefront that just moved beyond the right edgeof the obstacle. The dashed curve bounds the area adjacentto the obstacle, which receives lateral current. The radius ofthis area R is comparable to the width of the wavefront W.IfR is smaller than the minimum radius of excitation Rcr fora given tissue (RcrlR < 1), the wavefront will be unable toprogress laterally (upward) or to make a turn. Eventually,the wavefront will detach from the edge of the obstacle, asshown in the upper right panel. If RcrlR > 1 (lower rightpanel), the front will progress upward without detachment.
R< Rcr
R > Rcr
Note that substituting R for W in the denominator of theabove inequality yields the Rcr/W ratio. This explains thecorrelation of the detachment with the increase in the di-mensionless ratio RcrlW. It should be noted, however, thatRcr/W is just an empirical dimensionless parameter and, todate, there is no quantitative theory relating Rcr/W to sepa-ration of the wavefront from the obstacle.
Similar to chemically excitable media, an increase inRcr/W and detachment of the wavefront from the obstacleare related to decreased excitability (see Fig. 6). Indeed, it isqualitatively clear that at lower excitability Rcr must in-crease (the minimum area that has to be excited to initiate apropagating wave increases). In contrast, W (the product ofpropagation velocity and the duration of the upstroke)should not change significantly; an increase in the upstrokeduration at low excitability is compensated for by a reduc-tion in the propagation velocity. As a result, the ratio Rcr/Whas to increase.From our data it is clear that detachment of the wavefront
from the edge of the obstacle need not result in spiral waveformation, for two important reasons. First, the free enddoes not always curl (see Fig. 3). Second, the free end doesnot always separate far enough from the obstacle. Sufficientseparation is essential for enabling a full turn without reat-tachment to the obstacle. In fact, spiral wave formationrequires that the maximum separation should be comparableto one wavelength of a spiral wave for a given medium. Itis therefore not surprising that separation resulting fromreduced gNa does not lead to the same results as separationinduced by high-frequency stimulation. Indeed, becausehigh-frequency stimulation is expected to result in greater
Biophysical Journal1110
I
4 AP,

Cabo et al. Turbulent Electrical Activity 1111
abbreviation of action potential duration and wavelengththan gNa decrease, separation resulting from high-frequency stimulation would be expected to yield spiralwaves more frequently than that resulting from gNadecrease.The demonstration in myocardial tissue of wave instabil-
ities that are similar to those described in generic models ofexcitable media and in autocatalytic chemical reactions, andthat resemble patterns of hydrodynamical turbulent flow, ismuch more than just an interesting illustration of the uni-versality of nature. Turbulent propagation and formation ofvortices in the heart are thought to be a cause of arrhythmiasand sudden cardiac death (Moe and Abildskov, 1959;Krinsky, 1984; Winfree, 1994). Vortex shedding indicates apossible mechanism for the spontaneous initiation of thesearrhythmias. We hypothesize that inexcitable thin scleroticpatches and fibrotic tissue, commonly found in elderlypatients and diseased heart (Janse and Wit, 1989), providean appropriate substrate for vortex formation by the inter-action of electrical wavefronts with obstacles.
We thank Drs. Jacques Beaumont, Mario Delmar, James P. Keener,Michael Vinson, and Arthur T. Winfree for carefully reading the manu-script and offering helpful suggestions, and JoAnne G. Getchonis and JiangJiang for technical assistance.
This work was supported by the National Institutes of Health and theAmerican Heart Association.
REFERENCES
Agladze, K., J. P. Keener, S. C. Muller, and A. Panfilov. 1994. Rotatingspiral waves created by geometry. Science. 264:1746-1748.
Agladze, K., V. I. Krinsky, and A. M. Pertsov. 1984. Chaos in thenon-stirred Belousov-Zhabotinsky reaction is induced by interaction ofwaves and stationary dissipative structures. Nature. 308:834-835.
Cabo, C., A. M. Pertsov, W. T. Baxter, J. M. Davidenko, R. A. Gray, andJ. Jalife. 1994. Wave-front curvature as a cause of slow conduction andblock in isolated cardiac muscle. Circ. Res. 75:1014-1028.
Cohen, C. J., B. P. Bean, and R. W. Tsien. 1984. Maximal upstrokevelocity as an index of available sodium conductance. Comparison ofmaximal upstroke velocity and voltage clamp measurements of sodiumcurrent in rabbit Purkinje fibers. Circ. Res. 54:636-651.
Davidenko, J. M., A. M. Pertsov, R. Salomonsz, W. Baxter, and J. Jalife.1992. Stationary and drifting spiral waves of excitation in isolatedcardiac muscle. Nature. 355:349-351.
Foerster, P., S. C. Muller, and B. Hess. 1988. Curvature and propagationvelocity of chemical waves. Science. 241:685-687.
Graham, M. D., I. G. Kevrekidis, K. Asakura, J. Lauterbach, K. Krischer,H.-H. Rotermund, and G. Ertl. 1994. Effects of boundaries on patternformation: catalytic oxidation of CO on platinum. Science. 264:80-82.
Janse, M. J., and A. L. Wit. 1989. Electrophysiological mechanisms ofventricular arrhythmias resulting from myocardial ischemia and infarc-tion. Physiol. Rev. 69:1049-1169.
Keener, J. P. 1991. An eikonal-curvature equation for action potentialpropagation in myocardium. J. Math. Biol. 29:629-651.
Krinsky, V. I. 1984. Self-Organization: Autowaves and Structures Far fromEquilibrium. Springer, Berlin.
Luo, C.-H., and Y. Rudy. 1991. A model of the ventricular cardiac actionpotential: depolarization, repolarization, and their interaction. Circ. Res.68:1501-1526.
Markus, M., G. Kloss, and I. Kusch. 1994. Disordered waves in a homo-geneous, motionless excitable medium. Nature. 371:402-404.
Mikhailov, A. S. 1990. Foundations of Synergetics I. Springer, Berlin.Moe, G. K., and J. A. Abildskov. 1959. Atrial fibrillation as a self-
sustaining arrhythmia independent of focal discharge. Am. HeartJ. 58:59-70.
Nagy-Ungvarai, Z., A. M. Pertsov, B. Hess, and S. C. Muller. 1992. Lateralinstabilities of a wavefront in the Ce-catalized Belousov-Zhabotinskyreaction. Phys. D. 61:205-212.
Panfilov, A., and J. P. Keener. 1993. Effects of high frequency stimulationon cardiac tissue with an inexcitable obstacle. J. Theor. Bio. 163:439-448.
Panfilov, A., and A. M. Pertsov. 1982. Mechanism of spiral wave initiationin active media connected with critical curvature phenomenon. Biofizika.27:868-888.
Pertsov, A. M., E. A. Ermakova, and E. E. Shnol. 1990. On the diffractionof autowaves. Phys. D. 44:178-190.
Pertsov, A. M., A. V. Panfilov, and F. U. Medvedeva. 1983. Instability ofautowaves in excitable media associated with the phenomenon of criticalcurvature. Biofizika. 28:100-102.
Rushton, W. A. H. 1937. Initiation of the propagated disturbance. Proc. R.Soc. Lond. B Bio. Sci. 124:210-243.
Starobin, J. M., Y. I. Zilberter, E. M. Rusnak, and C. F. Starmer. 1995.Wavelet formation in excitable cardiac tissue: the role of wavefront-obstacle interactions in initiating high-frequency fibrillatory-like ar-rhythmias. Biophys. J. In press.
Toth, A., V. Gaspar, and K. Showalter. 1994. Signal transmission inchemical systems: propagation of chemical waves through capillarytubes. J. Phys. Chem. 98:522-531.
Tritton, D. J. 1977. Physical Fluid Dynamics. Van Nostrand Reinhold,Berkshire, England. 21-27.
Winfree, A. T. 1989. Electrical instability in cardiac muscle: phase singu-larities and rotors. J. Theor. Bio. 138:353-405.
Winfree, A. T. 1994. Electrical turbulence in three-dimensional heartmuscle. Science. 266:1003-1006.
Zhabotinsky, A. M., M. D. Eager, and I. R. Epstein. 1993. Refraction andreflection of chemical waves. Phys. Rev. Lett. 71:526-1529.
Zykov, V. S. 1988. Simulations of Wave Processes in Excitable Media.Manchester University Press, Manchester.