Voluntary run training but not estradiol deficiency alters the tibial bone-soleus muscle functional...
46
Voluntary Run Training But Not Estradiol Deficiency Alters the Tibial Bone:Soleus Muscle Functional Relationship in Mice Gordon L. Warren 1 , Amy L. Moran 2 , Harry A. Hogan 3 , Angela S. Lin 4 , Robert E. Guldberg 4 , and Dawn A. Lowe 2 1 Division of Physical Therapy, Georgia State University, Atlanta, GA 2 Department of Physical Medicine and Rehabilitation, University of Minnesota, Minneapolis, MN 3 Department of Mechanical Engineering, Texas A&M University, College Station, TX 4 Institute for Bioengineering and Bioscience, Georgia Institute of Technology, Atlanta, GA Running head: Voluntary Running Alters the Bone:Muscle Relationship Contact information: Gordon L. Warren, PhD Division of Physical Therapy P.O. Box 4019 Georgia State University Atlanta, GA 30302-4019 Phone: (404) 413-1255 Fax: (404) 413-1230 Email: [email protected] Page 1 of 46 Articles in PresS. Am J Physiol Regul Integr Comp Physiol (September 19, 2007). doi:10.1152/ajpregu.00569.2007 Copyright © 2007 by the American Physiological Society.
Transcript of Voluntary run training but not estradiol deficiency alters the tibial bone-soleus muscle functional...

Voluntary Run Training But Not Estradiol Deficiency Alters the Tibial Bone:Soleus
Muscle Functional Relationship in Mice
Gordon L. Warren1, Amy L. Moran2, Harry A. Hogan3, Angela S. Lin4, Robert E. Guldberg4, and
Dawn A. Lowe2
1Division of Physical Therapy, Georgia State University, Atlanta, GA
2Department of Physical Medicine and Rehabilitation, University of Minnesota, Minneapolis, MN
3Department of Mechanical Engineering, Texas A&M University, College Station, TX
4Institute for Bioengineering and Bioscience, Georgia Institute of Technology, Atlanta, GA
Running head: Voluntary Running Alters the Bone:Muscle Relationship
Contact information: Gordon L. Warren, PhD
Division of Physical Therapy
P.O. Box 4019
Georgia State University
Atlanta, GA 30302-4019
Phone: (404) 413-1255
Fax: (404) 413-1230
Email: [email protected]
Page 1 of 46Articles in PresS. Am J Physiol Regul Integr Comp Physiol (September 19, 2007). doi:10.1152/ajpregu.00569.2007
Copyright © 2007 by the American Physiological Society.

2
Abstract
The study’s objective was to investigate how estrogen deficiency and run training affect the tibial
bone:soleus muscle functional relationship in mice. Female mice were assigned into one of two
surgical conditions, ovariectomy (OVX) or sham ovariectomy (Sham), and one of two activity
conditions, voluntary wheel running (Run) or sedentary (Sed). To determine if differences
observed between OVX and Sham conditions could be attributed to estradiol (E2), additional
OVX mice were supplemented with E2. Tibial bones were analyzed for their functional
capacities, ultimate load and stiffness. Soleus muscles were analyzed for their functional
capacities, maximal isometric tetanic force (Po) and peak eccentric force. The ratios of bone
functional capacities to those of muscle were calculated. The bone functional capacities were
affected by both surgical condition and activity but more strongly by surgical condition. Ultimate
load and stiffness for the Sham condition were 7-12% greater than those for OVX (p=0.002)
while only stiffness was greater for Run compared to Sed (9%; p=0.015). The muscle functional
capacities were affected by both surgical condition and activity but in contrast to the bone, the
muscle was more affected by activity. Po and peak eccentric force were 10-21% greater for Run
compared to Sed (p≤0.016) while only Po was greater in Sham compared to OVX (7%; p=0.011).
The bone:muscle ratios of functional capacities were affected by activity but not by surgical
condition or E2 supplementation. Thus, a mismatch of bone:muscle function occurred in mice
that voluntarily ran on wheels, irrespective of estrogen status.
Keywords: biomechanics, functional capacity, exercise, estrogen
Page 2 of 46

3
Introduction
A stress fracture is defined as a skeletal defect caused by repetitive application of a stress
that is less than that required to fracture a bone in a single loading but more than that from which
a bone can fully recover. A stress fracture may however worsen until a frank fracture occurs. The
incidence of stress fractures is rare in the general population but the annual incidence may be as
high as 20% in young athletes and military recruits (8). There is a marked gender difference in
the risk of developing a stress fracture. In the U.S. Armed Forces, the risk is 2-10 times greater in
women (6, 17, 25). The gender difference may be related to low estrogen levels often observed
in active, young women, particularly those with female athlete triad. Stress fracture incidence is
3.3-fold greater in female college athletes without regular menses compared to those with (22).
Other evidence that estrogen may play a role comes from observations that the use of oral
contraceptives decreases stress fracture risk (2, 29). Another important risk factor for stress
fractures is the volume of exercise performed by an individual. There is a clear association
between increased volume of exercise, in particular running, and the increased risk of stress
fracture (5, 12, 16, 19, 23, 24, 35).
The physiological mechanism underlying the cause of stress fractures is uncertain. Most
believe that the cause of stress fractures is due to interaction of bone with its attached or adjacent
musculature. However, there is debate whether the forces produced by the muscles actually
induce the bone injury or protect the bone from injurious externally-applied forces. Devas (7)
hypothesized that stress fractures are due to the pull of muscle on the bone. He suggested that
stress fractures resulting from training do so because muscles can adapt more rapidly than can
bones. Muscular strength increases during training before the bones can adapt and the stronger
muscles apply forces that overstress the bone. This hypothesis is supported by observations that
Page 3 of 46

4
the rate of stress fractures is elevated by 2-3 weeks into a training program with the peak
incidence occurring at 5-8 weeks (11, 31), a time course similar to that for the rapid, early
adaptations seen in muscle strength during training (20). On the other hand, Feingold and Hame
(8) and others (3, 10) have hypothesized that muscle can act as a shock absorber during activities
when high external forces are applied upon the body, e.g., foot strike during running. Contraction
of muscle during these activities can decrease the cortical bending strain experienced by bone,
thus protecting the bone. In this theory, stress fractures result when the muscle’s functional
capacity is decreased, e.g., from fatigue, injury, or atrophy, and is thus less able to protect the
bone.
There is minimal direct evidence to support either of these two theories. Both of the
above theories hinge on a mismatch occurring between the functional capacities of a bone and its
adjacent musculature. The former theory depends on the muscle becoming relatively strong
compared to the bone whereas the latter theory depends on the muscle becoming relatively weak
compared to the bone. We are not aware of any data from human studies directly supporting
either of these two possibilities and the data from animal studies are sparse. We have previously
reported that the functional relationship between muscle and bone is not disturbed by one stress
fracture risk factor, i.e., estrogen deficiency, at least when studied in young, growing mice over a
short period (37) or when the deficiency is combined with a high-force resistance training
program (14). However, in this latter study, the training program had minimal effects on either
bone or muscle. Though not directly relevant to conditions associated with stress fractures, we
have found that the bone:muscle functional relationship can be altered. During the recovery of
rats from one month of greatly reduced muscle and bone loading, the muscle becomes relatively
Page 4 of 46

5
strong compared to the bone during the second week of recovery and remains so for 6-10 weeks
(1).
The objective of this study was to investigate the independent and combined effects of
two major risk factors for stress fractures, i.e., prolonged estrogen deficiency and run training, on
the tibial bone:soleus muscle functional relationship in young adult, female mice. We
hypothesized that because of the more rapid adaptability of muscle to exercise training, the
bone:muscle functional relationship would be altered in favor of the muscle, at least for the early
portion of the run training period. To our knowledge, this is the first study of the bone:muscle
functional relationship following run training, either by itself or in combination with estrogen
deficiency.
Methods
Animals. Three-month old, female C57BL/6 mice (n=99) were purchased from the
National Institute on Aging aging colony. Mice were initially housed 4-5 per cage on a 12:12-
hour light:dark cycle at 20-23 oC. Mice were given phytoestrogen-free rodent chow (2019 Teklad
Global 19% Rodent Diet; Harland Teklad, Madison, WI) and water ad libitum. After 2 weeks,
the mice were housed individually. Animal care and use procedures were approved by the
University of Minnesota institutional animal care and use committee and complied with
guidelines set by the American Physiological Society. Data for some of these mice have been
published previously. Some of the soleus muscle properties for 44 mice used in the present study
were published by Moran et al. (26). Likewise, the voluntary wheel running data for 23 mice
were published by Gorzek et al. (13).
Page 5 of 46
6
Experimental design. Mice were randomly assigned into one of two surgical conditions,
i.e., ovariectomy (OVX) or sham ovariectomy (Sham) and one of two activity conditions, i.e.,
voluntary wheel running (Run) or sedentary (Sed). Voluntary wheel running was used as
opposed to motorized treadmill running because of the greater distances generally covered with
the former as well as that training mode being considered less stressful on the animal. The Sed
condition meant that a mouse was housed in a standard mouse cage (30 x 18 x 13 cm) without
access to a running wheel. Mice from the four combinations of conditions were randomly
assigned into one of two time points for sacrifice, i.e., 30 days (30d) or 60 days (60d) after OVX
or Sham surgery. The 30d time point was chosen because it was thought to reflect a time when a
muscle adaptation but not a bone adaptation could have occurred whereas it was anticipated that
by the 60d time point both muscle and bone adaptations would have occurred. The eight groups
of mice and their numbers were as follows: OVX+30d Run (n=8), OVX+30d Sed (n=7),
OVX+60d Run (n=12), OVX+60d Sed (n=12), Sham+30d Run (n=6), Sham+30d Sed (n=8),
Sham+60d Run (n=8), and Sham+60d Sed (n=8).
To determine if any differences observed between the OVX and Sham conditions could
be attributed to the hormone, estradiol (E2), additional mice were ovariectomized and
supplemented with E2 beginning 30 days after ovariectomy. Half of these mice were randomly
assigned to the Run condition and the other half to the Sed condition. These mice were sacrificed
after 30 days of supplementation, i.e., 60 days after the OVX surgery. The two groups of mice
and their numbers were as follows: OVX+E2+60d Run (n=12) and OVX+E2+60d Sed (n=12).
An additional group of OVX mice with access to running wheels was supplemented with
tamoxifen, an E2 analog (OVX+Tamoxifen+60d Run; n=6). Unlike E2, which has antioxidant
and membrane-stabilizing properties (33), tamoxifen is thought to exert its effect only by binding
Page 6 of 46

7
to E2 receptors. A similar response between the OVX+Tamoxifen+60d Run and OVX+E2+60d
Run groups in muscle and bone functional capacities and in the bone:muscle ratios of those
capacities would indicate that an E2 effect is mediated via the E2 receptor.
Surgical procedures. OVX and Sham surgical procedures were conducted when the mice
were 3.75-4 months old. The procedures were done as previously described (13, 26, 27). In brief,
mice were anesthetized via inhalation of 1.75% isoflurane mixed with O2 at a flow rate of 200
ml/min. Under aseptic conditions, bilateral ovariectomy was performed through two dorsal
incisions between the iliac crest and lower ribs. The abdominal muscle wall incisions were
closed using 6-0 silk suture and skin incisions were closed with 7-mm wound clips. Following
recovery from the anesthetic, each mouse was administered 0.15 µg of buprenorphine
subcutaneously as an analgesic. Sham operations were done similarly to the OVX procedure
except the ovaries were not excised.
E2 and tamoxifen supplementation were administered using 60-day time-release pellets
(Innovative Research of America; Sarasota, FL) implanted subcutaneously. While a mouse was
under isoflurane anesthesia, a pellet was inserted through a ~3-mm incision on the dorsal aspect
of the neck. Each E2 pellet contained a total of 0.18 mg of 17β-estradiol so that the mice received
~3 µg/day. This dosage was based off our previous work and was designed to elicit a plasma E2
concentration in OVX mice similar to that observed in a young, intact female mouse, i.e., ~20
pg/ml (30). For OVX mice receiving tamoxifen supplementation, each pellet contained a total of
5 mg of tamoxifen that was released over 60 days. For OVX mice not receiving E2 or tamoxifen
supplementation, a placebo pellet was implanted that contained the same matrix as the E2 and
tamoxifen pellets.
Page 7 of 46
8
Voluntary wheel running. Exercise wheels (Prevue Mouse Wheel; Pets Warehouse,
Copiague, NY) were mounted to the tops of standard mouse cages. The wheels were 11 cm in
diameter with a 5-cm wide running surface. A digital magnetic counter was attached to each
wheel and interfaced to a microprocessor (PIC16F877A Development Board, Custom Computer
Systems, Inc.; Brookfield, WI), which was capable of storing the number of revolutions per 24-
hour period for 8 days. The Run mice were allowed to acclimate to the running wheels for one
week prior to the OVX or Sham surgery. Four to five days following the surgery, the mice were
re-introduced to the wheels.
To estimate the activity levels of sedentary mice, the average daily distance covered in a
cage was measured using activity monitors (Activity Monitors, Med Associates; St. Albans, VT),
which employ three sets of infrared beams that detect movement in the x, y, and z planes. Data
were recorded for 8 OVX+60d Sed and 8 OVX+E2+60d Sed mice over 24 hours during the last
1-2 days before being sacrificed. Prior to the measurements, mice were placed in mock activity
chambers for 24 hours to acclimate to the new environment. Mock chambers were exactly the
same as the activity monitor chambers except there were no infrared beams.
Tissue harvest. At the time of sacrifice, a mouse was anesthetized using sodium
pentobarbital (100 mg/kg). The left soleus muscle was then excised for measurement of in vitro
contractility as described below. Blood from the inferior vena cava was collected into a
heparinized 1-ml syringe and then centrifuged to collect plasma. The plasma sample was frozen
in liquid N2 and stored at -80 oC until the time the E2 concentration was assayed as described
below. Following blood collection, the mouse was killed by exsanguination and the left tibia was
dissected free. The tibia was placed in vial containing phosphate-buffered saline and stored at -
Page 8 of 46

9
80 oC until micro-computed tomography (micro-CT) of the tibial mid-diaphysis was done as
described below.
Determination of soleus muscle in vitro contractility and total protein content. Of the
lower-leg muscles, the soleus muscle was chosen for study for two reasons. For one, its strength
is known to be manipulated by both E2 (26) and run training (38). Second, it is the most
metabolically active muscle in the lower leg during rest and up to moderate-speed locomotion in
rodents (21) and thus one would presume that its functional capacity would normally be matched
to that of the adjacent tibial bone.
The isolated soleus muscle preparation used to assess contractile function has been
described in detail previously (26-28, 36). After being mounted in a glass chamber at optimal
muscle length (Lo), the muscle equilibrated in Krebs-Ringer buffer (pH 7.4) for 15 min at 25 oC.
Maximal isometric tetanic force (Po) was then determined by stimulating the muscle for 400 ms
with 0.5-ms pulses at 120 Hz and 150 V (Grass-Telefactor S48 stimulator with SIU-5 stimulus
isolation unit; Warwick, RI). Force production by the muscle was recorded using a servomotor
(Aurora Scientific 300B-LR; Aurora, ON, Canada) interfaced to a computer via an interface
board (Keithley KPCI-3108; Cleveland, OH) and software (Capital Equipment Corp. TestPoint
version 6.0; Billerica, MA). The stimulation was done twice with 2 min between trials. The
highest peak force for the two trials was considered the Po. Three min after the second isometric
stimulation, the muscle began a series of 10 eccentric contractions. For these contractions, the
muscle were passively shortened to 0.9 Lo over 3 s and then stimulated for 133 ms as the muscle
lengthened to 1.1 Lo at 1.5 Lo/s; the muscle was then passively shortened back to Lo. There were
3 min in between eccentric contractions. The highest single force produced during the series of
contractions was considered the peak eccentric force. This usually occurred on the first or second
Page 9 of 46
10
eccentric contraction of the protocol. Peak eccentric force was not obtained for 8 of the 99
muscles studied; for two, this was because of technical problems and for six, i.e., the
OVX+Tamoxifen+60d Run mice, another set of measurements was substituted.
Following the eccentric contraction protocol, the muscle was removed from the glass
chamber and it was trimmed, blotted dry, weighed, and frozen in liquid N2. The muscle was
stored at -80 oC until total protein content was assayed. For measurement of total protein content,
a muscle was homogenized in 10 mM phosphate buffer (pH 7.0). Sodium dodecyl sulfate was
added to a final volume of 0.01% to solubilize myofibrils. Muscle homogenates were assayed in
triplicate for total noncollagenous protein content using the bicinchoninic acid protein assay with
albumin standards (Pierce Biotechnology; Rockford, IL). Total protein content assays were not
performed on muscles from OVX+Tamoxifen+60d Run mice because they were used for another
purpose.
To provide an estimate of muscle quality, Po was normalized by total protein content per
muscle fiber length instead of by physiological cross-sectional area of the muscle. This was done
because OVX increases muscle fluid content which makes the physiological cross-sectional area
artifactually large (26, 27). Thus, Po normalized by physiological cross-sectional area is
inaccurate and is not reported.
Micro-CT of tibial mid-diaphysis. A micro-CT system (Scanco Medical µCT 40;
Basserdorf, Switzerland) was used to non-destructively image and quantify the morphology and
volumetric bone mineral density (vBMD) of each excised tibia. The scanner was set to a voltage
of 55 kVp and a current of 145 µA and the bones scanned using a 16-µm voxel size with a 200-
ms integration time. Fifty 2D slices were obtained at the mid-diaphysis, the portion of the bone
subjected to load during the three-point bending mechanical test (described below). Cortical
Page 10 of 46

11
cross-sectional area, cortical wall thickness, principal cross-sectional moments of inertia (CSMI),
and vBMD were determined for each slice and then averaged across the 50 slices. Because the
minimum principal CSMI (CSMImin) best corresponded to the CSMI about the bone bending axis
during the 3-point bending test (described below), only it was analyzed statistically. After
completion of imaging, the bones were re-frozen in phosphate-buffered saline and stored at -80
oC until the time they underwent mechanical testing.
Mechanical testing of tibial mid-diaphysis. The procedures used to assess the functional
capacities of the mouse tibia have been described in detail previously (14, 37). After thawing to
room temperature, the medial-lateral periosteal diameter of the tibia at mid-diaphysis was
measured using calipers. Tibial bone functional and intrinsic material properties were then
determined by a three-point bending test on an Instron 1125 machine at the mid-diaphysis. The
tibia was placed lateral side down on a nonadjustable set of supports (1 cm apart) and quasi-static
loading was applied to the medial surface of the tibia midway between the lower supports at a
displacement rate of 5.08 mm/min. Bones were placed lateral side down to create the most stable
position possible during testing. Displacement of the Instron crosshead was measured by a linear
variable differential transformer and the applied load was measured by a load cell with 0.05-N
resolution. The load and displacement analog outputs were sampled at 10 Hz using a computer
and software (Laboratory Technologies LabTech Notebook Pro version 8.01; Wilmington, MA).
The load-displacement curves were analyzed using a custom-written TestPoint program.
The program defined ultimate load as the highest load obtained prior to fracture (Fig. 1A). Once
the data point in the load-displacement curve corresponding to the occurrence of ultimate load
was determined, deflection and energy absorbed to ultimate load were calculated. For
determination of stiffness, the program searched the linear portion of the load-displacement
Page 11 of 46

12
curve prior to fracture for the highest slope; for a portion of the curve to be considered as having
the highest slope, it had to contain a minimum of 15 data points and the correlation of load and
displacement in that region had to exceed 0.99.
Intrinsic material properties for the tibia were estimated using classical beam theory.
Ultimate stress was calculated using the equation: ultimate stress = (UL.d.L)/(8.CSMImin), where
UL, d, and L are ultimate load, medial-lateral periosteal diameter, and bottom support span
length (1 cm), respectively. Modulus of elasticity was calculated using the equation: modulus of
elasticity = (k.L3)/(48.CSMImin), where k equals stiffness.
Calculation of bone:muscle functional relationships. The functional capacity
measurements considered most important for bone, i.e., ultimate load and stiffness, were divided
by those for muscle, i.e., Po and peak eccentric force. These bone:muscle ratio calculations were
done on an animal by animal basis, meaning that if an animal did not have measurements for
both its tibial bone and soleus muscle the ratio was not calculated.
Plasma E2 analysis. Plasma samples from mice in the OVX (n=21 out of 39), OVX+E2
(n=16 out of 24), and Sham (n=14 out of 30) groups were randomly selected for analysis of E2
concentration. As described previously (26), the plasma E2 concentration was determined using
commercially-available enzyme-linked immunosorbent assays (Diagnostic Systems Labs DSL-
10-4300; Webster, TX or Immuno Biological Laboratories RE50241; Minneapolis, MN). The
Immuno Biological Laboratories kit was used only because of a recall on the Diagnostic Systems
Labs kit and it was used for ~25% of the assays.
Statistical analyses. To analyze the effects of surgical condition (OVX vs. Sham),
activity (Run vs. Sed), and time of sacrifice after surgery (30d vs. 60d), 3-way ANOVAs were
utilized. When an interaction was found to be significant, Holm-Sidak post-hoc tests were used
Page 12 of 46

13
to determine which combination of conditions were different from another. To analyze the
effectiveness of E2 supplementation, the OVX+E2 mice were compared against OVX and Sham
mice also sacrificed at the 60d time point; thus, 2-way AVOVAs were used with one factor being
condition (OVX+E2 vs. OVX vs. Sham) and the other activity (Run vs. Sed). When a condition
main effect or interaction was found to be significant, Holm-Sidak post-hoc tests were used. To
compare the effect of tamoxifen supplementation to that of E2, i.e., OVX+Tamoxifen+60d Run
vs. OVX+E2+60d Run, t-tests were used; when assumptions of normality and/or equal variance
were violated, Mann-Whitney U tests were substituted. Differences among OVX+E2, OVX, and
Sham mice in plasma E2 concentration and daily running distance were analyzed using one-way
ANOVAs and Holm-Sidak post-hoc tests; when assumptions of normality and/or equal variance
were violated, Kruskal-Wallis tests along with Dunn's multiple comparison post hoc tests were
substituted. To determine if the often-observed abnormal bone mechanical test responses
occurred in one group of mice more than another, Chi-square tests were employed. Statistical
analyses were performed using SigmaStat version 3.5 (Systat Software; Point Richmond, CA)
with an α level of 0.05. Values are reported as means (SD) except when comparisons among
combinations of conditions are reported. In these exceptions, the values are expressed as least-
square-mean values (SD) or relative changes between least-square-mean values.
Results
Effectiveness of surgical and activity manipulations. The effectiveness of the OVX
surgeries and E2 supplementation were assessed by plasma E2 concentration. Plasma E2
concentrations for OVX, OVX+E2, and Sham mice were 8.3 (3.9), 28.9 (9.3), and 18.1 (6.4)
Page 13 of 46

14
pg/ml, respectively. The OVX value was significantly less than those of the other two groups and
there was no significant difference between the OVX+E2 and Sham values.
The effectiveness of the voluntary wheel run training was assessed by the average daily
distance covered. Because the time between surgery and sacrifice had no effect on the daily
distance ran by the OVX and Sham mice, the 30d Run and 60d Run groups for each type of mice
were collapsed and compared to the OVX+E2+60d Run mice. The average daily distance ran by
the OVX, OVX+E2, and Sham mice in the Run groups were 1.45 (1.21), 2.91 (2.39), and 7.35
(2.83) km, respectively, with the only significant differences being between the Sham mice and
the other two groups. The daily distance covered during normal cage activity by the Sed mice
was markedly less. The OVX+60d Sed and OVX+E2+60d Sed mice on average covered 0.44
(0.09) and 0.61 (0.23) km, respectively, every 24 h and these values were not significantly
different (p=0.072); data were not obtained for Sham Sed mice.
Effect of surgical condition and activity at 30- and 60-d post-surgery
Comparing body weights among OVX+30d Run, OVX+30d Sed, OVX+60d Run,
OVX+60d Sed, Sham+30d Run, Sham+30d Sed, Sham+60d Run, and Sham+60d Sed groups
indicated that there was a significant effect of surgical condition, but not for activity. OVX mice
weighed 17% more than did Sham mice (Table 1).
Tibial bone. In general, the functional capacities of the tibial bone were affected by both
surgical condition and activity but more strongly by surgical condition. Ultimate load was
however only affected by surgical condition (p=0.002). Ultimate load for Sham mice was 7%
greater than that for OVX mice (Fig. 2A). For stiffness, there were both significant surgical
condition (p=0.002) and activity (p=0.015) effects and these effects were independent of each
Page 14 of 46

15
other, i.e., no significant interaction. Stiffness for Sham mice was 12% greater than that for OVX
mice while it was 9% greater for Run mice compared to Sed mice (Fig. 2B). For energy absorbed
to ultimate load, there was a significant effect of activity (p<0.001) with the Sed mouse bones
absorbing 25% more energy than those for the Run mice (Table 1). The greater energy
absorption by the Sed mice can be explained mostly by a greater deflection to ultimate load for
those mice. This effect was statistically significant only for the Sham mice however. The
deflection for the Sham Sed mice was 34% greater than that for the Sham Run mice whereas the
Sed vs. Run difference for the OVX mice was only 10% (n.s.). The greater deflection and energy
absorbed to ultimate load for the Sed mice appears to be related to a partial failure of the
proximal lateral tibia occurring early in many mechanical tests (Fig. 1B). The partial failures
appeared as a splintering of the bone that was located 3-4 mm away from the eventual failure
site, which was commonly at the center of the span beneath the upper load contact. These partial
failures were much more likely (p=0.014) to occur in tests of bones from Sed mice (51% of the
mechanical tests for those bones) compared to Run mice (25%). It is important to point out that
these partial failures had no adverse effect on the ultimate load measured for those bones. There
was no significant difference observed in ultimate load between bones with and without the
partial failures (11.50 (0.99) vs. 11.41 (0.96); p=0.71).
Micro-CT-determined properties reflecting the size and geometry of the tibial mid-
diaphysis were affected by surgical condition but not activity (Table 1). There was a significant
effect of surgical condition on both cortical wall thickness and cortical cross-sectional area but
only for mice sacrificed at the 60d time point; at this time point, these measures were 11-15%
greater for the Sham mice compared to OVX mice. For CSMImin, there was a significant effect of
surgical condition (p=0.004) with the value for the Sham condition being 10% greater.
Page 15 of 46

16
Intrinsic material properties, which reflect bone quality, were modestly affected by
surgical condition or activity (Table 1). For vBMD, there was a small but significant effect of
surgical condition (p=0.005). Bones from Sham mice had a 1.3% greater vBMD than that of
OVX mice. There was also a significant effect of activity but only at the 30d time point.
Unexpectedly, vBMD at that time point was 2.4% greater for Sed mice compared to Run mice.
Ultimate stress was affected by surgical condition effect (p=0.048) with the value for OVX mice
bones being 4% greater than that for Sham. On the other hand, the modulus of elasticity was not
affected by surgical condition but was by activity, and then, only at the 30d time point; the value
at that time point for the Run condition was 21% greater compared to that for the Sed condition.
Soleus muscle. The functional capacities of the soleus muscle were affected by both
surgical condition and activity but in contrast to the tibia, the soleus muscle was more strongly
affected by activity. For Po, there were both significant surgical condition (p=0.011) and activity
(p<0.001) effects and these effects were independent of each other. Po was 9% greater for Sham
mice compared to OVX mice and 21% greater for Run mice compared to Sed mice (Fig. 3A).
For peak eccentric force, there was no surgical condition effect, only an activity effect (p=0.016).
Peak eccentric force was 10% greater in the Run condition compared to Sed (Fig. 3B).
The properties reflecting muscle size, i.e., extrinsic properties, were somewhat
contradictory (Table 2). There was a significant surgical condition effect on soleus muscle
weight (p<0.001) but contrary to what one might predict from the Po data above, muscle weight
was greater for the OVX condition by 14%. This is most likely due to an increased fluid content
in those muscles as previously described (26, 27). There was also a significant effect of activity
at the 60d time point with the muscles from Run mice weighing 18% more than those from Sed
mice. For total protein content, there was no effect of surgical condition (p=0.637) but there was
Page 16 of 46

17
a significant activity effect (p<0.001); total protein content in muscles from Run mice was 14%
greater than that from Sed mice. For the property reflecting muscle quality, i.e., maximal
isometric tetanic force normalized to total protein content per fiber length, there was a significant
surgical condition effect (p=0.047) with the Sham condition being greater by 14% compared to
OVX (Table 2). There was no effect of activity on normalized Po.
Bone:muscle functional relationships. The ratio of tibial bone ultimate load to soleus
muscle Po within an animal was not affected by surgical condition but was by activity (p<0.001);
the ratio was higher for the Sed condition compared to the Run condition, i.e., 70.4 (10.2) vs.
57.1 (10.2) (Fig. 4). The statistical findings were the same for the ratios of ultimate load to peak
eccentric force and stiffness to Po with no effect of surgical condition but a significant activity
effect (p≤0.036); the ratios were 11-12% higher for the Sed condition (Table 2). There were no
statistically significant effects on the ratio of bone stiffness to peak eccentric force.
Effect of E2 supplementation
E2 supplementation delivered via the slow-release pellets was totally effective in
restoring the bone and muscle functional capacities of OVX mice to those like for Sham mice
(Fig. 5 and 6; Tables 3 and 4). There were only three measures, all bone measures, for which the
OVX+E2 mice did not respond exactly like Sham mice, i.e., CSMImin, vBMD, and ultimate
stress. For CSMImin, the OVX+E2 value was intermediate to those for the OVX and Sham groups
and not significantly different from either group (compare Tables 1 and 3); however, the Sham
value was significantly greater than the OVX value. E2 supplementation was ineffective in
restoring vBMD. vBMD for the OVX+E2 mice was significantly less than that of the Sham mice
(compare Tables 1 and 3). In fact, vBMD for the OVX+E2 mice was less than or the same as that
Page 17 of 46

18
for the OVX mice. For ultimate stress, the OVX+E2 bones behaved more like OVX bones than
Sham bones (compare Tables 1 and 3). The OVX+E2 ultimate stress value was significantly
greater than the Sham value but was not different from the OVX value. As for the bone:muscle
functional relationships analyses presented above under Effect of surgical condition and activity
at 30- and 60-d post-surgery, these were found to be affected only by activity (Fig. 7, Table 4).
There were no differences among OVX+E2, OVX, and Sham mice.
Comparison of tamoxifen and E2 supplementation
In contrasting the OVX+Tamoxifen+60d Run and OVX+E2+60d Run groups, no
significant differences were found between the tamoxifen and E2 supplementation in the bone or
muscle functional capacities or in the ratios of those capacities (Fig. 5, 6, and 7; Tables 3 and 4).
There were only three bone measures for which the two groups differed significantly on, i.e.,
cortical wall thickness, vBMD, and ultimate stress. Cortical wall thickness and vBMD for the
tamoxifen-supplemented mice were greater by 8% and 4%, respectively. On the other hand,
ultimate stress was higher for the E2-supplemented mice by 7%.
Discussion
Five main findings resulted from this study. First, the effect of surgical condition on bone
functional capacity was greater than that of activity. There was no significant effect of activity on
ultimate load and its effect on bone stiffness was relatively small compared to that of surgical
condition. Second, the effect of surgical condition on muscle functional capacity was less than
that of activity. There was no significant effect of surgical condition on peak eccentric force and
its effect on maximal isometric tetanic force was less than half that of activity’s. Third, the ratio
Page 18 of 46
19
of bone functional capacity to that of muscle was only affected by activity. This is because
surgical condition’s effects on the two tissues were relatively the same so that the effects
canceled each other out when one measure was divided by the other. For example, ultimate load
and maximal isometric tetanic force for Sham mice were greater than those for OVX mice by
similar percentages, i.e., 7% and 9%, respectively. Conversely, activity improved bone
functional capacities marginally (i.e., 0-9%) while improving muscle’s more substantially (i.e.,
10-21%) resulting in reduced bone:muscle ratios. Fourth, the functional differences observed
between Sham and OVX mice can be attributed to E2. E2 supplementation given to OVX mice
restored muscle and bone functional capacities to Sham levels and resulted in bone:muscle
functional relationships like those for Sham and OVX mice. Finally, there were no differences
between tamoxifen- and E2-supplemented OVX mice observed in muscle and bone functional
capacities. We interpret this to indicate that E2’s effects on muscle and bone function are
probably mediated via E2 receptors and not via its antioxidant or cell membrane-stabilizing
properties because there is no evidence for tamoxifen-related antioxidant or membrane effects.
This study’s findings indicate that the means by which E2 improves the functional
capacity of bone differs from that for muscle. E2 improved ultimate load and stiffness by an
effect on bone size and geometry and not via an effect on bone tissue quality. E2 increased
cortical wall thickness, cortical bone cross-sectional area, and CSMImin but had no beneficial
effect on any measure of bone quality, i.e., ultimate stress, elastic modulus, or vBMD. It was
surprising that there was no beneficial effect of E2 supplementation on bone mineral density.
This might be explained by the relatively short period of supplementation used in this study, i.e.,
30 days but E2 supplementation at a slightly lower dosage over a shorter duration (24 days) has
been demonstrated to increase vBMD in the femora of mice (32). On the other hand, the means
Page 19 of 46

20
by which E2 enhanced muscle functional capacities, specifically maximal isometric tetanic force,
appears to have been by improving muscle quality and not by increasing muscle size. In fact, E2
supplementation to OVX mice resulted in smaller muscles compared to OVX mice supplemented
with placebo pellets. There was also no effect of E2 supplementation on total protein content,
another indicator of muscle size. Though the effect of E2 supplementation on normalized Po did
not quite reach significance (p=0.052), the percentage difference between OVX+E2 and OVX
(19%) suggests, along with the muscle weight and total protein content data, that E2
supplementation enhanced muscle quality. This enhancement is in accord with our previous
studies that showed muscle and myosin quality were detrimentally altered from the loss of
ovarian hormones (27) and favorably affected in ovariectomized mice supplemented with E2
(26).
The data from this study also indicate that activity affects bone and muscle but differently
from E2. Though the effects of activity on bone functional capacities were less than those of E2,
those effects appeared to have been mediated by an improvement in bone quality and not by
altered extrinsic properties. Activity had no effect on cortical wall thickness, cortical bone cross-
sectional area, or CSMImin but did increase the elastic modulus, at least at the 30d time point. An
increased elastic modulus could explain the activity-elicited increase in stiffness that was
observed. Activity’s effect on the energy absorbed and deflection to ultimate load also appears to
have been mediated via an effect on bone quality. Bones from mice that exercised on the running
wheels were less likely to undergo a partial failure of the proximal lateral tibia during
mechanical testing. This suggests a qualitative difference between bones from Run and Sed
mice. However, it is possible that bone size and/or geometry in the proximal lateral tibia region
may have differed between the two groups of mice. We only assessed bone size and geometry in
Page 20 of 46

21
the mid-diaphysis. As a final comment on this topic, even though the occurrence of a partial
failure was associated with an increase in energy absorbed and deflection to ultimate load, it is
not obvious that this is a beneficial change in bone function. Somewhat unexpectedly, activity
had a small but significant adverse effect on bone mineral density. vBMD was 2.3% less for
bones from Run mice compared to Sed mice at the 30d time point and vBMD for OVX+E2+60d
Run mice was 2.7% less than that for the OVX+E2+60d Sed mice. Similar findings have been
reported for the femora of male mice following 3 weeks of treadmill run training (34) and the rat
tibia following intensive run training (4). Despite our findings, there is no evidence that the
lower vBMD in the Run mice had any detrimental effect on bone function. For muscle, activity
had a strong effect on functional capacity that appears to be explained mostly by an effect on
muscle size. Total protein content and muscle weight were greater for the Run mice. These
findings are consistent with other reports of soleus muscle hypertrophy in response to wheel
running by rodents (38, 39).
For all of the activity effects observed on muscle and bone, there was only one where the
magnitude of the effect was dependent on the surgical condition, i.e., deflection to ultimate load.
This is remarkable when considering that there was great variability (5-fold) among the OVX,
OVX+E2, and Sham groups in the daily distance ran on the running wheels. The data suggest that
running as little as 1.45 km daily on average, the amount ran by the OVX mice, is sufficient to
induce the activity effects observed on the two tissues. When this number is contrasted against
the distance normally covered in a cage by Sed mice in a day, i.e., ~0.5 km, the minimum
amount of additional activity necessary for an effect is even more impressive. However, it should
be pointed out that one cannot equate distances covered in a running wheel to those in a standard
cage. The metabolic costs and forces exerted per km are most likely different. Furthermore, for
Page 21 of 46

22
the Run mice, we do not know the distance covered in their cage while not in the running wheel.
It may have been greater or less than that for the Sed mice during normal cage activity. As a final
comment, the observation that activity’s effect on most bone measures was statistically
independent of E2 status is noteworthy. It has been argued that the E2 alters the
mechanosensitivity of bone as well as the remodeling threshold (9, 15). Superficially, it appears
that our data do not support either of these hypotheses. However, for the mice with access to
running wheels, the Sham mice were much more active than were the OVX mice yet had similar
activity effects on bone. This could be explained if the presence of E2 offset the greater activity
in the Sham mice by decreasing the mechanosensitivity of bone.
The impact and limitations of the present study’s findings are as follows. The present
study’s data confirm our previous findings (14, 37) using younger mice that E2 deficiency does
not induce a bone:muscle functional capacity mismatch. However, bone:muscle functional
capacity mismatches can occur using a physiologically-relevant run training regimen in female
mice. Though with voluntary wheel running, the muscle became relatively strong compared to
the bone, there is no evidence that this did or would lead to a stress fracture or other skeletal
injury. Bone function for the Run mice was the same as or higher than that for the Sed mice.
There is a need for follow-up studies to investigate the relationships of tibial bone function to
those of the posterior and anterior crural muscle groups and not just one muscle in response to
voluntary wheel running. These two muscle groups probably account for most of the forces
exerted on the tibia and absorbed from the tibia. The use of voluntary wheel running could also
be considered a limitation of our study particularly in regards to modeling stress fractures that
occur in women in the U.S. Armed Forces. For this situation, forced treadmill running by mice
may be more applicable. Alternatively, loaded wheel running causes different muscle adaptations
Page 22 of 46

23
relative to unloaded, i.e., minimal-resistance, wheel running (18) as was used in our study and
loaded wheel running would likely result in greater bone adaptations as well since the peak
strains experienced by bone would presumably be higher.
Perspectives and Significance. Bones and muscles are biomechanically linked. Thus,
evaluating bone-muscle as a functional unit is valuable, particularly in situations where one or
both of the tissues are adversely or beneficially affected. The results of our study indicate that E2
status equally affects the functional capacities of bone and its associated muscle but that run
training may have greater beneficial effects on muscle than bone leading to a mismatch in the
functional properties of the two linked tissues. This mismatch did not appear to be detrimental in
this short term study but the outcomes of more prolonged periods of mismatching are not known
and need to be investigated. Future studies also need to investigate if and when bone functional
capacity catches up to that of muscle during longer duration wheel running in mice. One would
speculate that the longer a bone:muscle functional capacity mismatch exists, the greater the
chance for occurrence of a stress fracture. Finally, there is a need to test whether having a
relatively strong muscle compared to the bone is detrimental or beneficial when the two tissues
are subjected to a standardized set of intense and/or prolonged loadings, e.g., running at a high
speed over a prolonged period over consecutive days.
Page 23 of 46

24
Acknowledgements
We thank Sarah Greising, Rachel Landisch, and Steven Nelson for assistance on this project.
Grants
The research was supported by National Institutes of Health (NIH) Grants AG-20990 and AG-
25861 to D. A. Lowe, and A. L. Moran was supported by NIH Training Grant T32-AR-07612
and a University of Minnesota Dissertation Grant.
Page 24 of 46

25
References
1. Allen MR, Hogan HA, and Bloomfield SA. Differential bone and muscle recovery
following hindlimb unloading in skeletally mature male rats. J Musculoskelet Neuronal Interact
6: 217-225, 2006.
2. Barrow GW and Saha S. Menstrual irregularity and stress fractures in collegiate female
distance runners. Am J Sports Med 16: 209-216, 1988.
3. Boden BP and Speer KP. Femoral stress fractures. Clin Sports Med 16: 307-317, 1997.
4. Bourrin S, Genty C, Palle S, Gharib C, and Alexandre C. Adverse effects of
strenuous exercise: a densitometric and histomorphometric study in the rat. J Appl Physiol 76:
1999-2005, 1994.
5. Brunet ME, Cook SD, Brinker MR, and Dickinson JA. A survey of running injuries in
1505 competitive and recreational runners. J Sports Med Phys Fitness 30: 307-315, 1990.
6. Burr DB. Bone, exercise, and stress fractures. Exerc Sport Sci Rev 25: 171-194, 1997.
7. Devas M. Stress fractures. New York: Churchill Livingstone, 1975.
8. Feingold D and Hame SL. Female athlete triad and stress fractures. Orthop Clin North
Am 37: 575-583, 2006.
9. Frost HM. On the estrogen-bone relationship and postmenopausal bone loss: A new
model. J Bone Miner Res 14: 1473-1477, 1999.
10. Fullerton LR, Jr. Femoral neck stress fractures. Sports Med 9: 192-197, 1990.
11. Giladi M, Ahronson Z, Stein M, Danon YL, and Milgrom C. Unusual distribution and
onset of stress fractures in soldiers. Clin Orthop Relat Res: 142-146, 1985.
Page 25 of 46
26
12. Gilchrist J, Jones BH, Sleet DA, and Kimsey CD. Exercise-related injuries among
women: strategies for prevention from civilian and military studies. MMWR Recomm Rep 49: 15-
33, 2000.
13. Gorzek JF, Hendrickson KC, Forstner JP, Rixen JL, Moran AL, and Lowe DA.
Estradiol and tamoxifen reverse ovariectomy-induced physical inactivity in mice. Med Sci Sports
Exerc 39: 248-256, 2007.
14. Hubal MJ, Ingalls CP, Allen MR, Wenke JC, Hogan HA, and Bloomfield SA. Effects
of eccentric exercise training on cortical bone and muscle strength in the estrogen-deficient
mouse. J Appl Physiol 98: 1674-1681, 2005.
15. Jarvinen TL, Kannus P, and Sievanen H. Estrogen and bone--a reproductive and
locomotive perspective. J Bone Miner Res 18: 1921-1931, 2003.
16. Jones BH, Cowan DN, and Knapik JJ. Exercise, training and injuries. Sports Med 18:
202-214, 1994.
17. Jones BH, Thacker SB, Gilchrist J, Kimsey CD, Jr., and Sosin DM. Prevention of
lower extremity stress fractures in athletes and soldiers: a systematic review. Epidemiol Rev 24:
228-247, 2002.
18. Konhilas JP, Widegren U, Allen DL, Paul AC, Cleary A, and Leinwand LA. Loaded
wheel running and muscle adaptation in the mouse. Am J Physiol Heart Circ Physiol 289: H455-
465, 2005.
19. Koplan JP, Powell KE, Sikes RK, Shirley RW, and Campbell CC. An epidemiologic
study of the benefits and risks of running. JAMA 248: 3118-3121, 1982.
20. Kraemer WJ, Fleck SJ, and Evans WJ. Strength and power training: physiological
mechanisms of adaptation. Exerc Sport Sci Rev 24: 363-397, 1996.
Page 26 of 46

27
21. Laughlin MH and Armstrong RB. Muscle blood flow during locomotory exercise.
Exerc Sport Sci Rev 13: 95-136, 1985.
22. Lloyd T, Triantafyllou SJ, Baker ER, Houts PS, Whiteside JA, Kalenak A, and
Stumpf PG. Women athletes with menstrual irregularity have increased musculoskeletal
injuries. Med Sci Sports Exerc 18: 374-379, 1986.
23. Macera CA, Pate RR, Powell KE, Jackson KL, Kendrick JS, and Craven TE.
Predicting lower-extremity injuries among habitual runners. Arch Intern Med 149: 2565-2568,
1989.
24. Marti B, Vader JP, Minder CE, and Abelin T. On the epidemiology of running
injuries. The 1984 Bern Grand-Prix study. Am J Sports Med 16: 285-294, 1988.
25. McClure SK, Adams JE, and Dahm DL. Common musculoskeletal disorders in
women. Mayo Clin Proc 80: 796-802, 2005.
26. Moran AL, Nelson SA, Landisch RM, Warren GL, and Lowe DA. Estradiol
replacement reverses ovariectomy-induced muscle contractile and myosin dysfunction in mature
female mice. J Appl Physiol 102: 1387-1393, 2007.
27. Moran AL, Warren GL, and Lowe DA. Removal of ovarian hormones from mature
mice detrimentally affects muscle contractile function and myosin structural distribution. J Appl
Physiol 100: 548-559, 2006.
28. Moran AL, Warren GL, and Lowe DA. Soleus and EDL muscle contractility across the
lifespan of female C57BL/6 mice. Exp Gerontol 40: 966-975, 2005.
29. Myburgh KH, Hutchins J, Fataar AB, Hough SF, and Noakes TD. Low bone density
is an etiologic factor for stress fractures in athletes. Ann Intern Med 113: 754-759, 1990.
Page 27 of 46
28
30. Nelson JF, Felicio LS, Osterburg HH, and Finch CE. Altered profiles of estradiol and
progesterone associated with prolonged estrous cycles and persistent vaginal cornification in
aging C57BL/6J mice. Biol Reprod 24: 784-794, 1981.
31. Protzman RR and Griffis CG. Stress fractures in men and women undergoing military
training. J Bone Joint Surg Am 59: 825, 1977.
32. Samuels A, Perry MJ, Gibson R, and Tobias JH. Effects of combination therapy with
PTH and 17β-estradiol on long bones of female mice. Calcif Tissue Int 69: 164-170, 2001.
33. Subbiah MT, Kessel B, Agrawal M, Rajan R, Abplanalp W, and Rymaszewski Z.
Antioxidant potential of specific estrogens on lipid peroxidation. J Clin Endocrinol Metab 77:
1095-1097, 1993.
34. Wallace JM, Rajachar RM, Allen MR, Bloomfield SA, Robey PG, Young MF, and
Kohn DH. Exercise-induced changes in the cortical bone of growing mice are bone- and gender-
specific. Bone 40: 1120-1127, 2007.
35. Walter SD, Hart LE, McIntosh JM, and Sutton JR. The Ontario cohort study of
running-related injuries. Arch Intern Med 149: 2561-2564, 1989.
36. Warren GL, Hayes DA, Lowe DA, Williams JH, and Armstrong RB. Eccentric
contraction-induced injury in normal and hindlimb-suspended mouse soleus and EDL muscles. J
Appl Physiol 77: 1421-1430, 1994.
37. Warren GL, Lowe DA, Inman CL, Orr OM, Hogan HA, Bloomfield SA, and
Armstrong RB. Estradiol effect on anterior crural muscles-tibial bone relationship and
susceptibility to injury. J Appl Physiol 80: 1660-1665, 1996.
Page 28 of 46

29
38. Widrick JJ, Fuchs R, Maddalozzo GF, Marley K, and Snow C. Relative effects of
exercise training and alendronate treatment on skeletal muscle function of ovariectomized rats.
Menopause 14: 528-534, 2007.
39. Wineinger MA, Abresch RT, Walsh SA, and Carter GT. Effects of aging and
voluntary exercise on the function of dystrophic muscle from mdx mice. Am J Phys Med Rehabil
77: 20-27, 1998.
Page 29 of 46

30
Figure Legends
Fig. 1 - Representative load-displacement data obtained during 3-point bending mechanical tests
of two tibial bones. A: data obtained during a test without a partial failure of the bone
prior to the occurrence of ultimate load. The procedures for determining ultimate load,
stiffness, energy to ultimate load, and deflection to ultimate load are illustrated. B: data
obtained during a test in which a partial failure occurred.
Fig. 2 - Effect of surgical condition (OVX vs. Sham), activity (Run vs. Sed), and time of
sacrifice after surgery (30 days vs. 60 days) on ex vivo measurements of tibial bone
ultimate load (panel A) and stiffness (panel B). OVX: ovariectomy. Sham: sham
ovariectomy. Run: mice given access to running wheels. Sed: mice housed in standard
cages. Values are means (SD). Statistically significant effects (p<0.05) are indicated
above the bars in each panel.
Fig. 3 - Effect of surgical condition (OVX vs. Sham), activity (Run vs. Sed), and time of
sacrifice after surgery (30 days vs. 60 days) on in vitro contractile properties of soleus
muscles. A: maximal isometric tetanic force (Po). B: peak eccentric force. Values are
means (SD). Statistically significant effects (p<0.05) are indicated above the bars in
each panel.
Fig. 4 - The ratio of bone ultimate load to muscle maximal isometric tetanic force as a function
of surgical condition (OVX vs. Sham), activity (Run vs. Sed), and time of sacrifice after
surgery (30 days vs. 60 days). Values are means (SD) and are unitless. Statistically
significant effects (p<0.05) are indicated above the bars.
Fig. 5 - Effects of E2 and tamoxifen supplementation on ex vivo measurements of tibial bone
ultimate load (panel A) and stiffness (panel B). All measurements were made on bones
Page 30 of 46

31
taken from mice sacrificed 60 days after surgery. Values are means (SD). For the six
leftmost bars, statistically significant effects (p<0.05) among those groups are indicated
above the bars. There were no significant differences between OVX+Tamoxifen+60d
Run and OVX+E2+60d Run groups.
Fig. 6 - Effects of E2 and tamoxifen supplementation on in vitro contractile properties of soleus
muscles. A: maximal isometric tetanic force (Po). B: peak eccentric force. All
measurements were made on muscles taken from mice sacrificed 60 days after surgery.
Values are means (SD). For the six leftmost bars, statistically significant effects
(p<0.05) among those groups are indicated above the bars. Peak eccentric force
measurements were not made on muscles from OVX+Tamoxifen+60d Run mice. n.s.:
not significant.
Fig. 7 - The ratio of bone ultimate load to muscle maximal isometric tetanic force as a function
of E2 and tamoxifen supplementation. Values are means (SD) and are unitless. For the
six leftmost bars, statistically significant effects (p<0.05) among those groups are
indicated above the bars. There were no significant differences between
OVX+Tamoxifen+60d Run and OVX+E2+60d Run groups.
Page 31 of 46

32Table 1. Effect of surgical condition and activity at 30- and 60-d post-surgery on mouse weight and tibial bone properties.
Sham+30d
Run
Sham+30d
Sed
Sham+60d
Run
Sham+60d
Sed
OVX+30d
Run
OVX+30d
Sed
OVX+60d
Run
OVX+60d
Sed
Statistical findings
Mouse weight (g) 20.9 (0.9) 21.6 (1.4) 22.8 (0.8) 22.9 (1.4) 22.9 (1.1) 25.0 (1.4) 28.7 (3.5) 26.5 (3.1) OVX > Sham
60d Run > 30d Run
60d Run > 30d Sed
60d Sed > 30d Run
Tibial bone
Energy to ultimate
load (mJ)
2.25 (0.26) 2.83 (0.48) 2.16 (0.41) 3.16 (0.56) 2.06 (0.42) 2.56 (0.64) 2.54 (0.61) 2.72 (0.56) Sed > Run
Deflection to
ultimate load (mm)
0.33 (0.04) 0.43 (0.03) 0.33 (0.04) 0.46 (0.03) 0.33 (0.09) 0.40 (0.08) 0.40 (0.10) 0.41 (0.06) Sham Sed > Sham Run
Sham Sed > OVX Run
OVX Sed > Sham Run
Cortical wall
thickness (mm)
0.200
(0.006)
0.199
(0.009)
0.213
(0.013)
0.207
(0.005)
0.190
(0.011)
0.194
(0.011)
0.183
(0.030)
0.183
(0.009)
Sham 60d > OVX 60d
Sham 30d > OVX 60d
Sham 60d > OVX 30d
Cortical cross-
sectional area
(mm2)
0.574
(0.028)
0.573
(0.034)
0.618
(0.040)
0.603
(0.024)
0.539
(0.033)
0.555
(0.038)
0.552
(0.022)
0.548
(0.032)
Sham 60d > OVX 60d
Sham 60d > Sham 30d
Sham 60d > OVX 30d
Page 32 of 46

33CSMImin (102.mm4) 5.10 (0.57) 5.08 (0.48) 5.64 (0.74) 5.59 (0.76) 4.42 (0.50) 5.01 (0.78) 4.91 (0.49) 5.19 (0.72) Sham > OVX
60d > 30d
vBMD
(mg hydroxyapatite
/cm3)
1367 (13) 1410 (21) 1439 (25) 1427 (22) 1370 (23) 1392 (46) 1412 (16) 1399 (22) Sham > OVX
30d Sed > 30d Run
60d Run > 30d Run
60d Sed > 30d Run
60d Run > 30d Sed
Ultimate stress
(MPa)
311 (18) 292 (25) 272 (17) 277 (23) 314 (17) 307 (32) 297 (25) 283 (29) OVX > Sham
30d > 60d
Elastic modulus
(GPa)
19.6 (1.9) 17.0 (2.1) 17.5 (1.9) 16.9 (2.0) 20.1 (2.1) 15.8 (2.2) 17.8 (2.9) 16.3 (1.8) 30d Run > 30d Sed
30d Run > 60d Run
30d Run > 60d Sed
Values are means (SD). The Statistical findings column indicates the significant (p<0.05) main effects and interactions of surgical condition (OVX
vs. Sham), activity (Run vs. Sed), and time of sacrifice after surgery (30 days vs. 60 days), OVX: ovariectomy. Sham: sham ovariectomy. Run: mice
given access to running wheels. Sed: mice housed in standard cages. 30d: sacrificed 30 days after surgery. 60d: sacrificed 60 days after surgery.
Page 33 of 46

34Table 2. Effect of surgical condition and activity at 30- and 60-d post-surgery on soleus muscle and bone:muscle properties.
Sham+30d
Run
Sham+30d
Sed
Sham+60d
Run
Sham+60d
Sed
OVX+30d
Run
OVX+30d
Sed
OVX+60d
Run
OVX+60d
Sed
Statistical findings
Soleus muscle
Muscle weight (mg) 7.78 (0.39) 6.82 (0.58) 8.76 (0.41) 7.18 (0.23) 8.53 (1.24) 8.30 (0.79) 9.59 (0.83) 8.43 (0.84) OVX > Sham
60d Run > 60d Sed
60d Run > 30d Run
60d Run > 30d Sed
Total protein content
(mg)
1.43 (0.06) 0.97 (0.18) 1.43 (0.25) 1.05 (0.20) 1.44 (0.14) 1.07 (0.21) 1.39 (0.32) 1.10 (0.16) Run > Sed
Normalized Po
(N.cm/mg)
0.122
(0.021)
0.148
(0.038)
0.128
(0.030)
0.131
(0.031)
0.106
(0.020)
0.112
(0.045)
0.119
(0.032)
0.128
(0.030)
Sham > OVX
Bone:muscle
Ultimate load / peak
eccentric force
32.0 (4.0) 35.2 (4.0) 31.8 (6.2) 34.4 (6.4) 29.1 (4.0) 35.5 (8.2) 33.8 (6.9) 36.3 (10.3) Sed > Run
Stiffness / Po (mm-1) 217 (30) 240 (41) 233 (51) 276 (45) 219 (28) 240 (80) 233 (42) 246 (48) Sed > Run
Stiffness / peak
eccentric force (mm-1)
125 (19) 126 (20) 128 (29) 130 (31) 115 (14) 121 (47) 129 (29) 129 (41) n.s.
Page 34 of 46

35Values are means (SD). The Statistical findings column indicates the significant (p<0.05) main effects and interactions of surgical condition (OVX
vs. Sham), activity (Run vs. Sed), and time of sacrifice after surgery (30 days vs. 60 days), OVX: ovariectomy. Sham: sham ovariectomy. Run: mice
given access to running wheels. Sed: mice housed in standard cages. 30d: sacrificed 30 days after surgery. 60d: sacrificed 60 days after surgery. n.s.:
no significant effects or interactions.
Page 35 of 46

36Table 3. Effect of E2 and tamoxifen supplementation on mouse weight and tibial bone properties.
OVX+E2+
60d Run
OVX+E2+
60d Sed
OVX+
Tamoxifen+
60d Run
Statistical findings for comparisons
among OVX+E2+60d, OVX+60d and
Sham+60d groups
Statistical findings for comparison
of OVX+Tamoxifen+60d Run
against OVX+E2+60d Run
Mouse weight (g) 24.0 (1.8) 23.0 (1.8) 23.9 (1.6) OVX > OVX+E2
OVX > Sham
n.s.
Tibial bone
Energy to ultimate
load (mJ)
2.76 (0.48) 3.10 (0.61) 2.39 (0.22) Sed > Run n.s.
Deflection to ultimate
load (mm)
0.37 (0.05) 0.44 (0.07) 0.34 (0.03) OVX+E2+60d Sed > OVX+E2+60d Run
Sham+60d Sed > Sham+60d Run
n.s.
Cortical wall thickness
(mm)
0.223
(0.013)
0.221
(0.028)
0.240
(0.015)
OVX+E2 > OVX
Sham > OVX
OVX+Tamoxifen+60d Run >
OVX+E2+60d Run
Cortical cross-
sectional area (mm2)
0.623
(0.035)
0.621
(0.047)
0.646
(0.021)
OVX+E2 > OVX
Sham > OVX
n.s.
CSMImin (102.mm4) 5.40 (0.63) 5.42 (0.50) 5.37 (0.25) Sham > OVX n.s.
vBMD
(mg hydroxyapatite
/cm3)
1366 (19) 1404 (25) 1421 (15) OVX+60d Run > OVX+E2+60d Run
Sham+60d Run > OVX+60d Run
Sham+60d Sed > OVX+60d Sed
OVX+Tamoxifen+60d Run >
OVX+E2+60d Run
Page 36 of 46
37OVX+E2+60d Sed > OVX+E2+60d Run
Sham+60d Run > OVX+E2+60d Run
Sham+60d Sed > OVX+E2+60d Sed
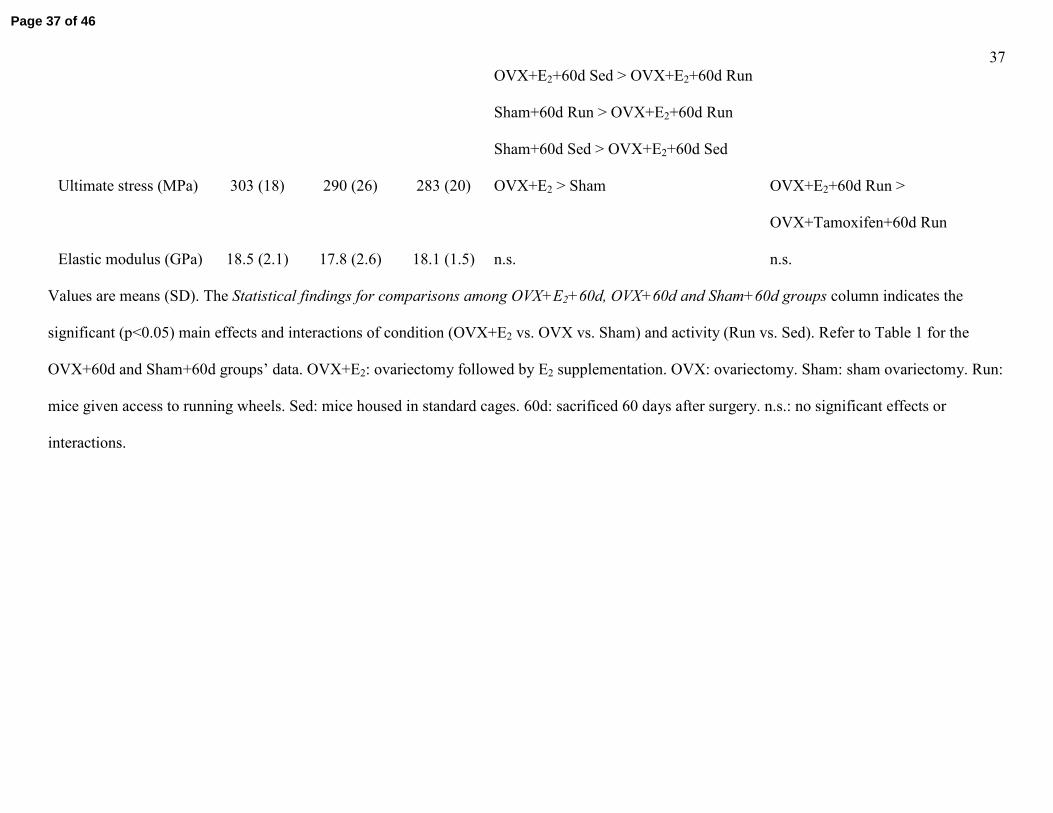
Ultimate stress (MPa) 303 (18) 290 (26) 283 (20) OVX+E2 > Sham OVX+E2+60d Run >
OVX+Tamoxifen+60d Run
Elastic modulus (GPa) 18.5 (2.1) 17.8 (2.6) 18.1 (1.5) n.s. n.s.
Values are means (SD). The Statistical findings for comparisons among OVX+E2+60d, OVX+60d and Sham+60d groups column indicates the
significant (p<0.05) main effects and interactions of condition (OVX+E2 vs. OVX vs. Sham) and activity (Run vs. Sed). Refer to Table 1 for the
OVX+60d and Sham+60d groups’ data. OVX+E2: ovariectomy followed by E2 supplementation. OVX: ovariectomy. Sham: sham ovariectomy. Run:
mice given access to running wheels. Sed: mice housed in standard cages. 60d: sacrificed 60 days after surgery. n.s.: no significant effects or
interactions.
Page 37 of 46

38Table 4. Effect of E2 and tamoxifen supplementation on soleus muscle and bone:muscle properties.
OVX+E2+
60d Run
OVX+E2+
60d Sed
OVX+
Tamoxifen+
60d Run
Statistical findings for comparisons
among OVX+E2+60d, OVX+60d and
Sham+60d groups
Statistical findings for comparison of
OVX+Tamoxifen+60d Run against
OVX+E2+60d Run
Soleus muscle
Muscle weight (mg) 8.70 (0.93) 7.32 (0.63) 9.10 (0.79) OVX > OVX+E2
OVX > Sham
Run > Sed
n.s.
Total protein content
(mg)
1.27 (0.29) 1.07 (0.14) - Run > Sed -
Normalized Po
(N.cm/mg)
0.148 (0.032) 0.145 (0.029) - n.s. (p=0.052 for surgical condition
effect)
-
Bone:muscle
Ultimate load / peak
eccentric force
33.0 (6.2) 36.6 (5.4) 34.1 (4.9) n.s. n.s.
Stiffness / Po (mm-1) 225 (22) 260 (45) 235 (29) Sed > Run n.s.
Stiffness / peak
eccentric force (mm-1)
126 (25) 135 (24) 132 (19) n.s. n.s.
Page 38 of 46

39Values are means (SD). The Statistical findings for comparisons among OVX+E2+60d, OVX+60d and Sham+60d groups column indicates the
significant (p<0.05) main effects and interactions of condition (OVX+E2 vs. OVX vs. Sham) and activity (Run vs. Sed). Refer to Table 2 for the
OVX+60d and Sham+60d groups’ data. OVX+E2: ovariectomy followed by E2 supplementation. OVX: ovariectomy. Sham: sham ovariectomy. Run:
mice given access to running wheels. Sed: mice housed in standard cages. 60d: sacrificed 60 days after surgery. n.s.: no significant effects or
interactions. Total protein content measurements were not made on muscles from OVX+Tamoxifen+60d Run mice and thus normalized Po cannot be
calculated for that group.
Page 39 of 46

0.0 0.2 0.4 0.6 0.8 1.0 1.2
Displacement (mm)
0
2
4
6
8
10
12
14Lo
ad (N
)
Ulti
mat
e lo
ad
Deflection toultimate load
Shaded area = Energy absorbed to ultimate load
Slope of line = Stiffness
A
0.0 0.3 0.6 0.9 1.2 1.5 1.8
Displacement (mm)
0
2
4
6
8
10
12
14
Load
(N)
Partial failure
B
Page 40 of 46

30 days 60 days 30 days 60 days0
3
6
9
12
15U
ltim
ate
load
(N)
Run Sed
Sham OVX
Sham > OVX
30 days 60 days 30 days 60 days0
10
20
30
40
50
60
Stif
fnes
s (N
/mm
)
Sham OVX
Sham > OVXRun > Sed
A
B
Page 41 of 46

30 days 60 days 30 days 60 days0
50
100
150
200
250M
axim
al is
omet
ric te
tani
c fo
rce
(mN
)
Run Sed
Sham OVX
Sham > OVXRun > Sed
30 days 60 days 30 days 60 days0
100
200
300
400
500
Pea
k ec
cent
ric fo
rce
(mN
)
Sham OVX
Run > Sed
A
B
Page 42 of 46

30 days 60 days 30 days 60 days0
20
40
60
80
100U
ltim
ate
load
/ m
axim
al is
omet
ric te
tani
c fo
rce
Run Sed
Sham OVX
Sed > Run
Page 43 of 46

Sham OVX OVX+E OVX+0
3
6
9
12
15U
ltim
ate
load
(N)
Run Sed
Sham > OVX, OVX+E2 > OVX
2 Tamoxifen
Sham OVX OVX+E OVX+0
10
20
30
40
50
60
Stif
fnes
s (N
/mm
)
2
Sham > OVX, OVX+E2 > OVX
Tamoxifen
A
B
Page 44 of 46

Sham OVX OVX+E OVX+0
50
100
150
200
250M
axim
al is
omet
ric te
tani
c fo
rce
(mN
)
Run Sed
OVX+E2 > OVXRun > Sed
2 Tamoxifen
Sham OVX OVX+E OVX+0
100
200
300
400
500
Pea
k ec
cent
ric fo
rce
(mN
)
n.s.
2 Tamoxifen
A
B
Page 45 of 46

Sham OVX OVX+E OVX+0
20
40
60
80
100U
ltim
ate
load
/ m
axim
al is
omet
ric te
tani
c fo
rce
Run Sed
Sed > Run
2 Tamoxifen
Page 46 of 46