
Volume 2 - Sarawak Energy
581
-
Upload
khangminh22 -
Category
Documents
-
view
1 -
download
0
Transcript of Volume 2 - Sarawak Energy


Appendix 1.2.1
DOE’s PEIA Approval Letter and Approval Conditions for Existing Tg.
Kidurong Power Station


Appendix 1.2.2
DOE’s PEIA Approval Letter and Approval Conditions for Tg. Kidurong Combined Cycle Gas Turbine (CCGT)
Block 1

LAMPIRAN A - Conditions of Approval EIA Report for Environmental Impact Assessment (EIA) for The
Proposed Tanjung Kidurong Combined-Cycle Power Plant, Bintulu, Sarawak
COMPLIANCE
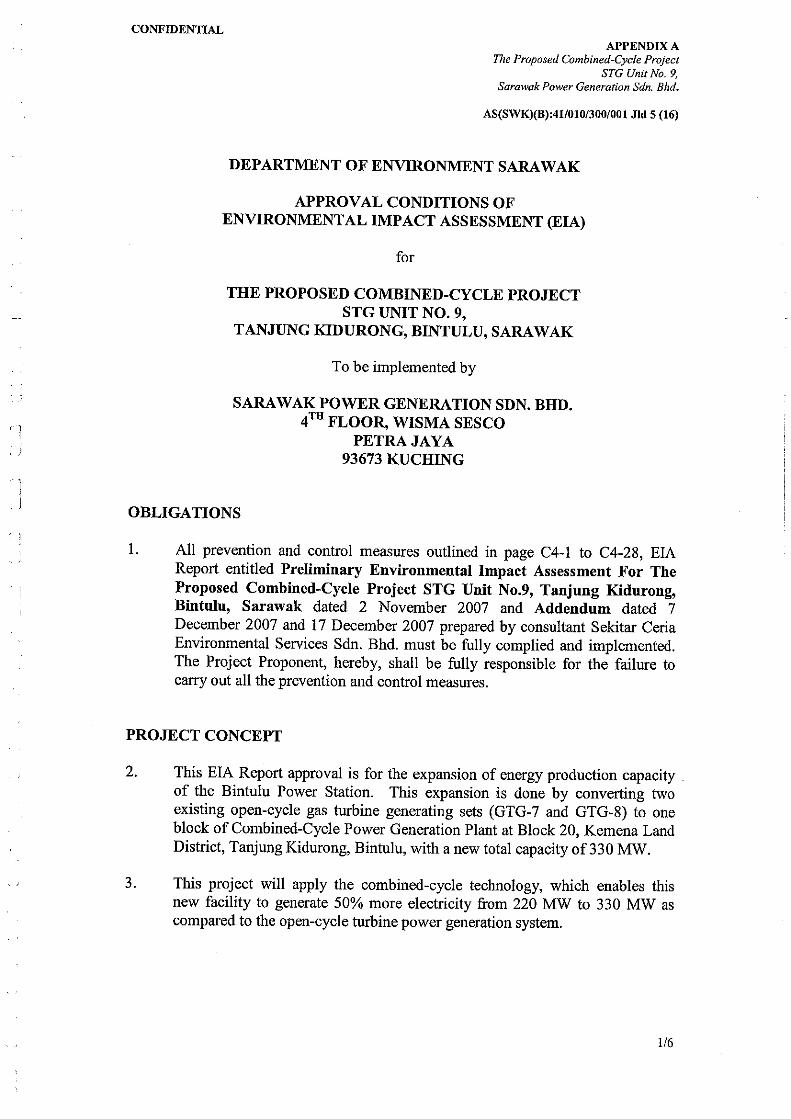
1. All the preventive and control measures stated in the Environmental
Impact Assessment (EIA) Report and Additional Information Documents
(hereafter will be referred as EIA Report), prepared by EIA consultant which
is Chemsain Konsultant Sdn Bhd. shall be fully executed and complied:-
1.1 Two Volume of EIA Report which were submitted through letter with
reference, CK/EV103/618/0773/15 dated 16 November 2015 titled:
(i) Volume 1 – “Environmental Impact Assessment (EIA) For The
Proposed Tanjung Kidurong Combined-Cycle Power Plant,
Bintulu, Sarawak and
(ii) Volume 2 – “Environmental Impact Assessment (EIA) For The
Proposed Tanjung Kiduring Combined-Cycle Power Plant,
Bintulu, Sarawak (Appendices)
1.2 Additional informations which has been submitted are as follows:- (i) Additional Information titled “Environmental Impact Assessment
(EIA) For The Proposed Tanjung Kidurong Combined-Cycle Power Plant, Bintulu, Sarawak’ which were submitted through letter with reference, CK/EV103/618/0855/15 dated 8 December 2015.
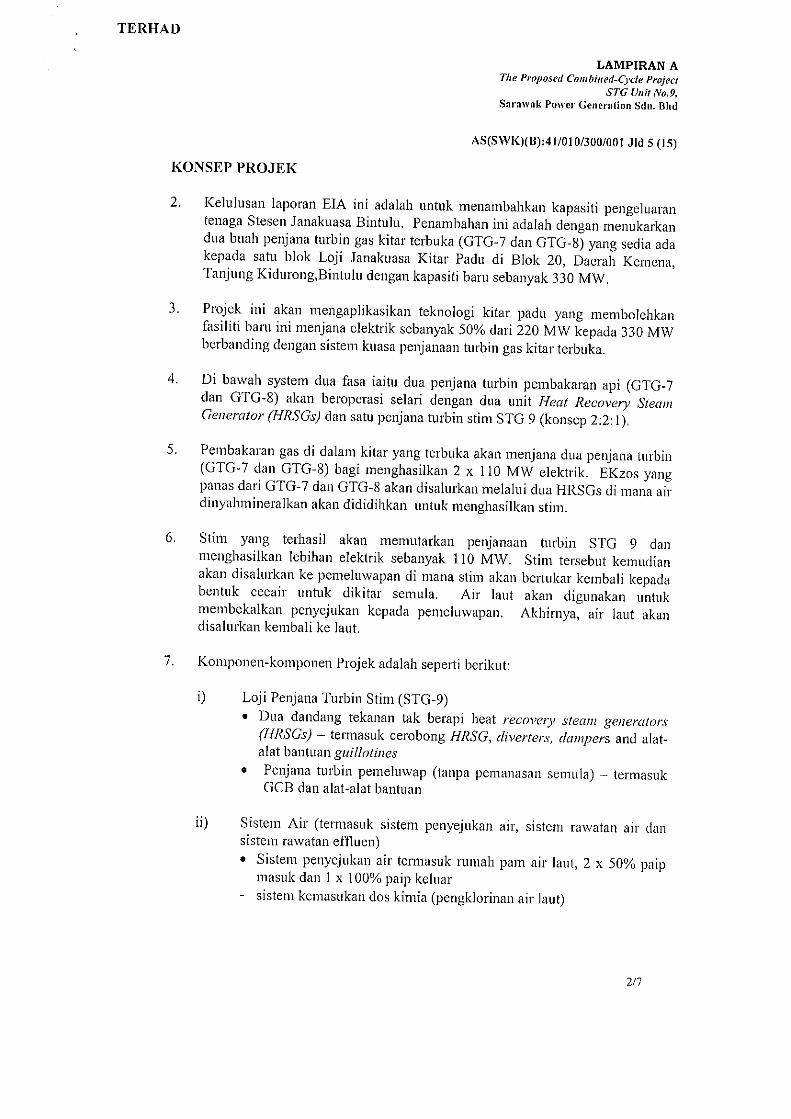
PROJECT CONCEPT
2. The EIA Report Approval is only for the construction of Gas Turbine Combined-Cycle Power Plant, Class F (GT Unit 10) and Steam Turbine (ST, Unit 11), indicated in Figure 2.2.1: Project Location, page C2-3 in the EIA Report and located at the following coordinates:-
Corner Latitude (N) Longitude(E)
1 03º 17’ 8.05” 113º 5’ 31.18”
2 03º 17’ 16.95” 113º 5’ 47.29”
3 03º 17’ 19.24” 113º 5’ 24.91”
4 03º 17’ 25.08” 113º 5’ 35.32”
5 03º 17’ 44.19” 113º 5’ 24.64”
6 03º 17’ 47.20” 113º 5’ 29.98”
3. Project development is limited to Gas Turbine Combined-Cycle Power Plant,
Class F (GT Unit 10) and Steam Turbine (ST, Unit 11) using natural gas with a
power capacity of 440 MW. The usage of Diesel as alternative fuel must be
notified in writing to Department of Environment Sarawak (DOE) first.
4. The design basis and the layout plan of the proposed project shall be as
specific as in Figure 2.4.1: Site Layout Plan, page C2-5 and Figure 2.4.2:
Project Layout Plan page C2-6 in the EIA Report titled “Environmental
Impact Assessment (EIA) For The Proposed Tanjung Kidurong Combined-
LAMPIRAN A - Conditions of Approval EIA Report for Environmental Impact Assessment (EIA) for The
Proposed Tanjung Kidurong Combined-Cycle Power Plant, Bintulu, Sarawak
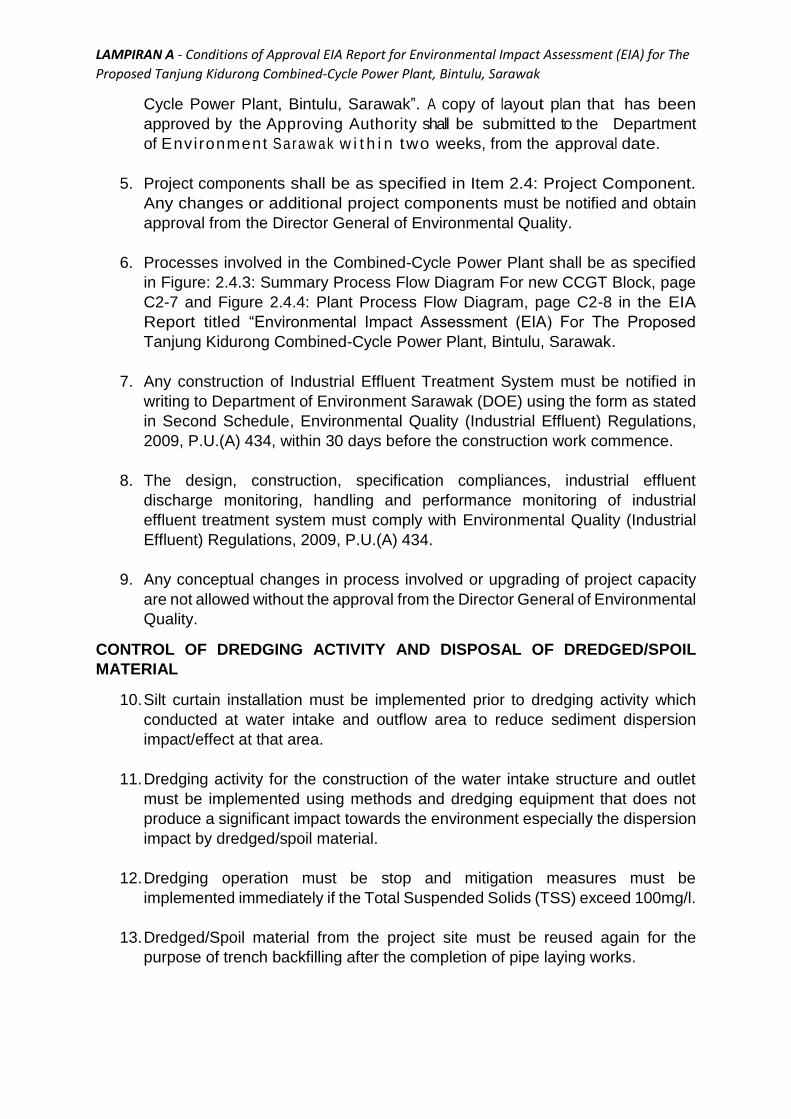
Cycle Power Plant, Bintulu, Sarawak”. A copy of layout plan that has been
approved by the Approving Authority shall be submitted to the Department
of Environment Sarawak w i t h i n two weeks, from the approval date.
5. Project components shall be as specified in Item 2.4: Project Component.
Any changes or additional project components must be notified and obtain
approval from the Director General of Environmental Quality.
6. Processes involved in the Combined-Cycle Power Plant shall be as specified
in Figure: 2.4.3: Summary Process Flow Diagram For new CCGT Block, page
C2-7 and Figure 2.4.4: Plant Process Flow Diagram, page C2-8 in the EIA
Report titled “Environmental Impact Assessment (EIA) For The Proposed
Tanjung Kidurong Combined-Cycle Power Plant, Bintulu, Sarawak.
7. Any construction of Industrial Effluent Treatment System must be notified in
writing to Department of Environment Sarawak (DOE) using the form as stated
in Second Schedule, Environmental Quality (Industrial Effluent) Regulations,
2009, P.U.(A) 434, within 30 days before the construction work commence.
8. The design, construction, specification compliances, industrial effluent
discharge monitoring, handling and performance monitoring of industrial
effluent treatment system must comply with Environmental Quality (Industrial
Effluent) Regulations, 2009, P.U.(A) 434.
9. Any conceptual changes in process involved or upgrading of project capacity
are not allowed without the approval from the Director General of Environmental
Quality.
CONTROL OF DREDGING ACTIVITY AND DISPOSAL OF DREDGED/SPOIL
MATERIAL
10. Silt curtain installation must be implemented prior to dredging activity which
conducted at water intake and outflow area to reduce sediment dispersion
impact/effect at that area.
11. Dredging activity for the construction of the water intake structure and outlet
must be implemented using methods and dredging equipment that does not
produce a significant impact towards the environment especially the dispersion
impact by dredged/spoil material.
12. Dredging operation must be stop and mitigation measures must be
implemented immediately if the Total Suspended Solids (TSS) exceed 100mg/l.
13. Dredged/Spoil material from the project site must be reused again for the
purpose of trench backfilling after the completion of pipe laying works.

LAMPIRAN A - Conditions of Approval EIA Report for Environmental Impact Assessment (EIA) for The
Proposed Tanjung Kidurong Combined-Cycle Power Plant, Bintulu, Sarawak
COASTAL CONTROL
14. Coastal Hydraulic Study must be approved by the Department of Irrigation and
Drainage Sarawak (JPS) first before the project commencement. All the
approval conditions issued by the JPS on the project implementation must be
strictly adhered.
MARINE WATER CONTROL AND MONITORING
15. Any discharge of industrial effluent produced by this project including
contaminated storm water, must be treated in the industrial effluent treatment
system and comply with Standard B in Fifth Schedule and Seventh
Schedule of the Environmental Quality (Industrial Effluent) Regulations, 2009,
P.U.(A) 434. Sampling location and frequency of the monitoring must be
approved by the Department of Environment Sarawak.
16. Marine water monitoring shall be carried out during the period of construction
and operation of the project. Marine water quality shall be compared with
“Malaysian Marine Water Quality Criteria and Standards” by Department of
Environment (DOE). Marine water quality monitoring program, monitoring
location and sampling frequency must be submitted to DOE Sarawak for
approval before implementation.
17. The increment of sea water temperature at discharge location shall not more
than ± 2ºC above maximum ambient temperature according to ASEAN Marine
Water Quality Criteria. Continuous monitoring of the temperature changes at
the discharge location must be conducted. Sampling frequency must first be
approved by DOE Sarawak.
WATER QUALITY CONTROL AND MONITORING
18. Any runoff discharge from the project site to the outside boundaries of project
site during earthwork and construction shall not contain following parameters:-
(i) Turbidity exceeding 250 Nephelometric Turbidity Unit (NTU); and
(ii) Total Suspended Solids (TSS) exceeding 50mg/L
19. Temporary toilet facilities that meet the specifications set by Ministry of Health
or Department of Sewerage Services shall be provided in the workers camp
throughout the construction period.
20. Domestic sewage from worker quarters or site office shall be treated to
comply with the Standard B in Second Schedule (Regulation 7) of the
Environmental Quality (Sewage) Regulations, 2009 P.U. (A) 432 before being
discharged into inland water bodies.
LAMPIRAN A - Conditions of Approval EIA Report for Environmental Impact Assessment (EIA) for The
Proposed Tanjung Kidurong Combined-Cycle Power Plant, Bintulu, Sarawak
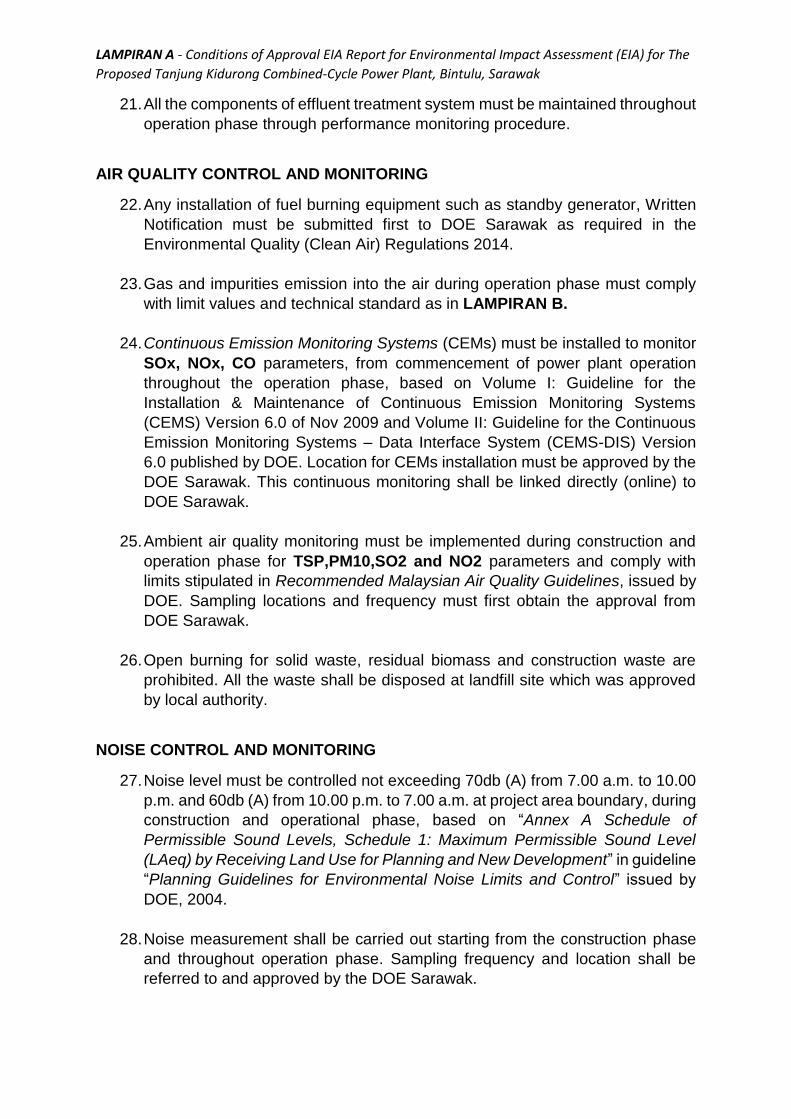
21. All the components of effluent treatment system must be maintained throughout
operation phase through performance monitoring procedure.
AIR QUALITY CONTROL AND MONITORING
22. Any installation of fuel burning equipment such as standby generator, Written
Notification must be submitted first to DOE Sarawak as required in the
Environmental Quality (Clean Air) Regulations 2014.
23. Gas and impurities emission into the air during operation phase must comply
with limit values and technical standard as in LAMPIRAN B.
24. Continuous Emission Monitoring Systems (CEMs) must be installed to monitor
SOx, NOx, CO parameters, from commencement of power plant operation
throughout the operation phase, based on Volume I: Guideline for the
Installation & Maintenance of Continuous Emission Monitoring Systems
(CEMS) Version 6.0 of Nov 2009 and Volume II: Guideline for the Continuous
Emission Monitoring Systems – Data Interface System (CEMS-DIS) Version
6.0 published by DOE. Location for CEMs installation must be approved by the
DOE Sarawak. This continuous monitoring shall be linked directly (online) to
DOE Sarawak.
25. Ambient air quality monitoring must be implemented during construction and
operation phase for TSP,PM10,SO2 and NO2 parameters and comply with
limits stipulated in Recommended Malaysian Air Quality Guidelines, issued by
DOE. Sampling locations and frequency must first obtain the approval from
DOE Sarawak.
26. Open burning for solid waste, residual biomass and construction waste are
prohibited. All the waste shall be disposed at landfill site which was approved
by local authority.
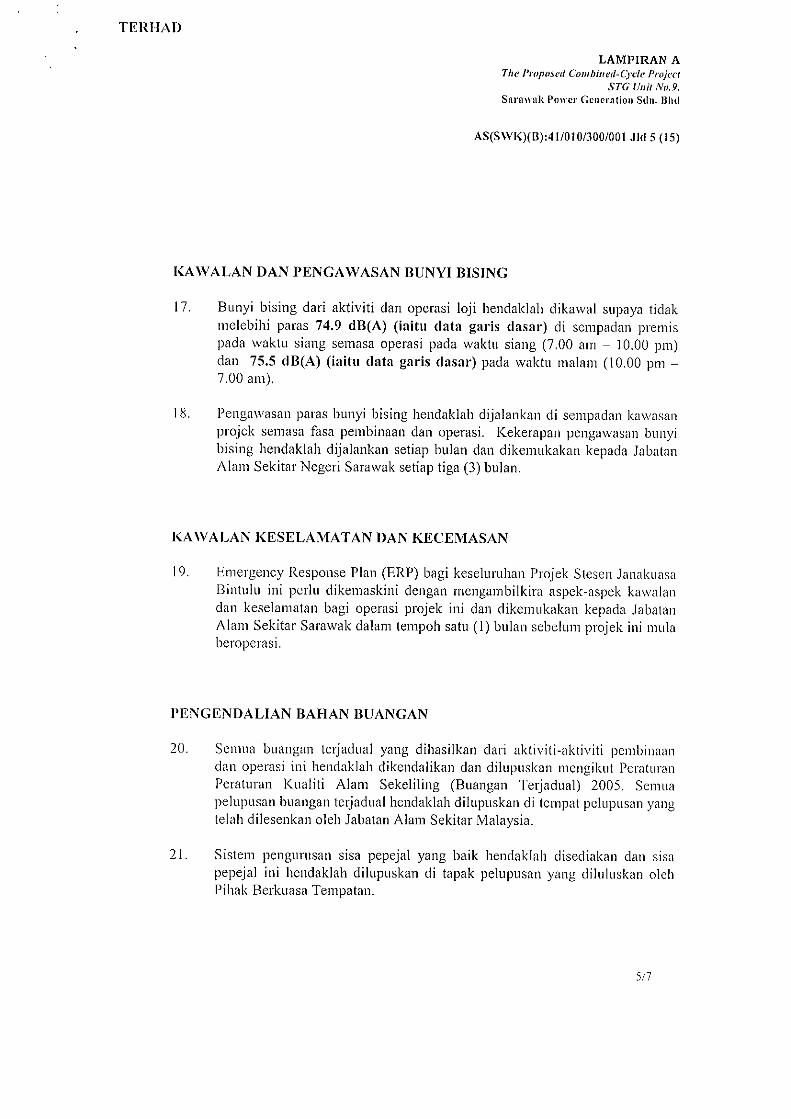
NOISE CONTROL AND MONITORING
27. Noise level must be controlled not exceeding 70db (A) from 7.00 a.m. to 10.00
p.m. and 60db (A) from 10.00 p.m. to 7.00 a.m. at project area boundary, during
construction and operational phase, based on “Annex A Schedule of
Permissible Sound Levels, Schedule 1: Maximum Permissible Sound Level
(LAeq) by Receiving Land Use for Planning and New Development” in guideline
“Planning Guidelines for Environmental Noise Limits and Control” issued by
DOE, 2004.
28. Noise measurement shall be carried out starting from the construction phase
and throughout operation phase. Sampling frequency and location shall be
referred to and approved by the DOE Sarawak.

LAMPIRAN A - Conditions of Approval EIA Report for Environmental Impact Assessment (EIA) for The
Proposed Tanjung Kidurong Combined-Cycle Power Plant, Bintulu, Sarawak
MANAGEMENT OF RAW MATERIALS, CHEMICALS, PETROLEUM PRODUCTS
AND WASTE MATERIAL
29. Handling and management of raw materials must be conducted in a goof
condition.
30. Bund must be built surrounding any chemical storage tanks or petroleum
tanks. The bund must be built to meet a minimum of 110% capacity of
the largest tank in the bunded area. The base of the tank must be
concreted and facilities to pump back any spillage in the bund must b e
p r o v i d e d .
31. All scheduled wastes as listed in the First Schedule (Regulation 2),
Environmental Quality (Scheduled Wastes) Regulations, 2005 P.U. (A) 158 shall
be properly managed in accordance with the rules stated in this Regulations.
Scheduled wastes shall be disposed, treated or recovered in licensed
premises approved by the Department of Environment.
32. Solid waste management system shall be provided and disposal to any
waterways is strictly prohibited.
SECURITY AND EMERGENCY CONTROL
33. Emergency Response Plan (ERP) for ‘on-site’ and ‘off-site’ must be prepared
to encounter any unforeseen accident and incident. ERP must be prepared
after consulting the Fire and Rescue Department, Royal Malaysian Police,
Department of Safety and Health and Local Authorities. Overall ERP to
encounter any unforeseen incidents and Contingency Plan regarding closure
and discontinuation of the project in an emergency situation must be submitted
to DOE Sarawak and relevant involved parties within one month before the
project start operation and updated from time to time as required.
34. Sea traffic safety control shall be ensured by installing adequate safety control
devices within the project area, especially during dredging work is carried out.
Any requirement and condition from related authorities such as Malaysian
Marine Department must be complied.
CLOSURE AND REHABILITATION PROJECT PLAN
35. If the project could not be completed or terminated, Project Proponent or
Contractors which involved in this project are responsible for the rehabilitation
in term of public safety and environment (air impact, water impact, soil
contamination etc,).
36. Project Proponent shall submit a notice in writing to the DOE Sarawak
immediately after the project proponent decided to end/complete the project
either in earthwork phase, construction or operation, which contained:-

LAMPIRAN A - Conditions of Approval EIA Report for Environmental Impact Assessment (EIA) for The
Proposed Tanjung Kidurong Combined-Cycle Power Plant, Bintulu, Sarawak
(i) Closure/termination project’s date
(ii) Commitment from Project Proponent or Responsible Party on
rehabilitation of project site in term of public safety and environmental.
Closure Plan shall be submitted to DOE Sarawak and fully executed
before the project terminated.
37. Detailed closure plan including project site stabilization works, contaminated
soil rehabilitation, equipment and machineries dismantling process, site clean-
up work, environmental monitoring or any appropriate rehabilitation measures
proposed shall be prepared and submitted for approval to DOE Sarawak before
the project is fully terminated.
ENVIRONMENTAL MANAGEMENT PLAN (EMP)
38. Environmental Management Plan (EMP) outlining all of the actions taken in
complying with the EIA Report approval conditions and the proposed mitigation
measures in EIA Report shall be prepared and approved prior to construction
phase and operational phase commencement. This EMP shall be prepared
according to the format in LAMPIRAN C and submitted to DOE Sarawak for
approval and shall be reviewed and updated from time to time as required.
ENVIRONMENTAL AUDIT
39. Environmental audit for the project as required under Seksyen 33A,
Environmental Quality Act, 1974 shall be implemented accordance to
Environmental Audit Guidance Manual, issued by DOE by a third party which
is auditor registered with DOE as follows:-
i. Early phase before the earthworks and construction began. Audit
criteria shall include documents such as EMP and other relevant
approval, and installation of control measures such as silt curtain
etc, shall first be submitted for approval to DOE Sarawak;
ii. Dredging and construction phase once in every four (4) months or as
instructed by DOE Sarawak, starting from the date of commencement
to the completion of construction. (Auditors must have CESSWI
certificate – Certified Erosion, Sediment and Storm Water Instructor or
equivalents); and
iii. Operation phase every once per year throughout the operation phase.
40. All costs of environmental audit shall be borne by the Project Proponent.

LAMPIRAN A - Conditions of Approval EIA Report for Environmental Impact Assessment (EIA) for The
Proposed Tanjung Kidurong Combined-Cycle Power Plant, Bintulu, Sarawak
REPORTING
41. The following reports shall be submitted to the Department of Environment
Sarawak consisting of:
i. Summary report of work progress for earth work and construction
including photographs shall be submitted using EIA Form 1-08 as in
LAMPIRAN D, within 90 days from the approval date of this EIA Report.
This information must be submitted once in every three (3) months until
the completion of the construction works
ii. The report of EIA approval conditions compliance which shows all
approval conditions have been complied with and the mitigation and
control measures have been implemented as specified under
Section 34A(7), Environmental Quality Act, 1974 using the EIA Form
2-08 as in LAMPIRAN E. This information must be submitted once in
every three (3) months commencing from dredging, construction and
operation phase.
iii. Monitoring and evaluation of marine water quality, marine sediments and
marine biology reports shall be submitted once in every three (3) months
commencing from dredging, construction and operation phase.
iv. Monitoring reports of air quality for emission of gas and air impurities
from chimney once in every three (3) months.
v. Monitoring and Evaluation report of ambient air quality once in every
three (3) months.
vi. Monitoring and Evaluation report of noise once in every three (3)
months.
vii. Monitoring and Evaluation report of industrial effluent quality once (1)
per month.
ADMINISTRATION
42. The Project Proponent must include all the EIA repor t approval conditions
and recommendations by EIA consultant as specified in the EIA report as
part of the terms of agreement in the tender and contractual agreement
to any contractor or sub-contractor who involved in the Project
implementation.
43. A copy of the EIA report approval conditions report, together with any copies
of documents that are part of the approval conditions shall be displayed and
can be seen clearly in the management office.
44. A competent Environmental Officer (EO) who will be fully responsible on matters
related to environmental management and implementation of all mitigation
measures shall be elected. The name, title and contact details of the officer
has to be submitted to the Department of Environment Sarawak, not
later than fourteen (14) days before the earthworks and construction work

LAMPIRAN A - Conditions of Approval EIA Report for Environmental Impact Assessment (EIA) for The
Proposed Tanjung Kidurong Combined-Cycle Power Plant, Bintulu, Sarawak
begin. Among the duties of EO is to ensure effective implementation of mitigation
measures, good housekeeping and other matters related to environmental
management. The responsibility of the EO are as below:-
i. EARTHWORK AND CONSTRUCTION STAGES
a) To supervise the erosion and sediment control work on site accordance to
erosion and sediment control plan ( ESCP ) and environmental management
plan (EMP);
b) To update daily site reports;
c) To update rainfall records;
d) To take and record Rain Gauge readings;
e) To carry out daily inspection on the pollution control measures including
structures of Best Management Practices ( BMPs ) for erosion and sediment
control ( including perimeter drain, check dam, silt trap, wash trough, slope
protection and others);
f) To conduct site meeting once every two (2) weeks with Project Proponent
and contractors;
g) To conduct turbidity in-situ parameter measurement at the discharge point
within 30 minutes after rain. If the rain continues for more than 24 hours, the
measurement should be carried out once per day. (Failure to comply with these
conditions should be recorded with strong and reasonable reason).
*Note: EO for erosion and sediment control must possess CESSWI certificate
(Certified Erosion, Sediment and Storm Water Instructor) or equivalent qualifications.
Equivalent qualifications should be consulted first to DOE Sarawak.
ii. OPERATION STAGE
To ensure all measures implemented effectively, ensuring the practice of good
housekeeping and others related to environmental management
45. The project proponent shall comply with the instructions and additional
conditions imposed from time to time by the Director General of Environmental
Quality or his representative.
46. The Project Proponent shall notify in writing to the Department of Environment
Sarawak shall there any changes or transfer of p ro j e c t ownership within
30 days from the changes or transfer of ownership’s date. The requirement
to comply with the EIA report approval conditions has to be included in the
sales and purchase/ transfer of ownership agreement to the new owner.
47. Good housekeeping shall be practiced all the time within project site.

LAMPIRAN B
VALUES AND TECHNICAL STANDARD (ACCORDANCE TO ACTIVITY OR INDUSTRY)
A. HEAT AND POWER GENERATION


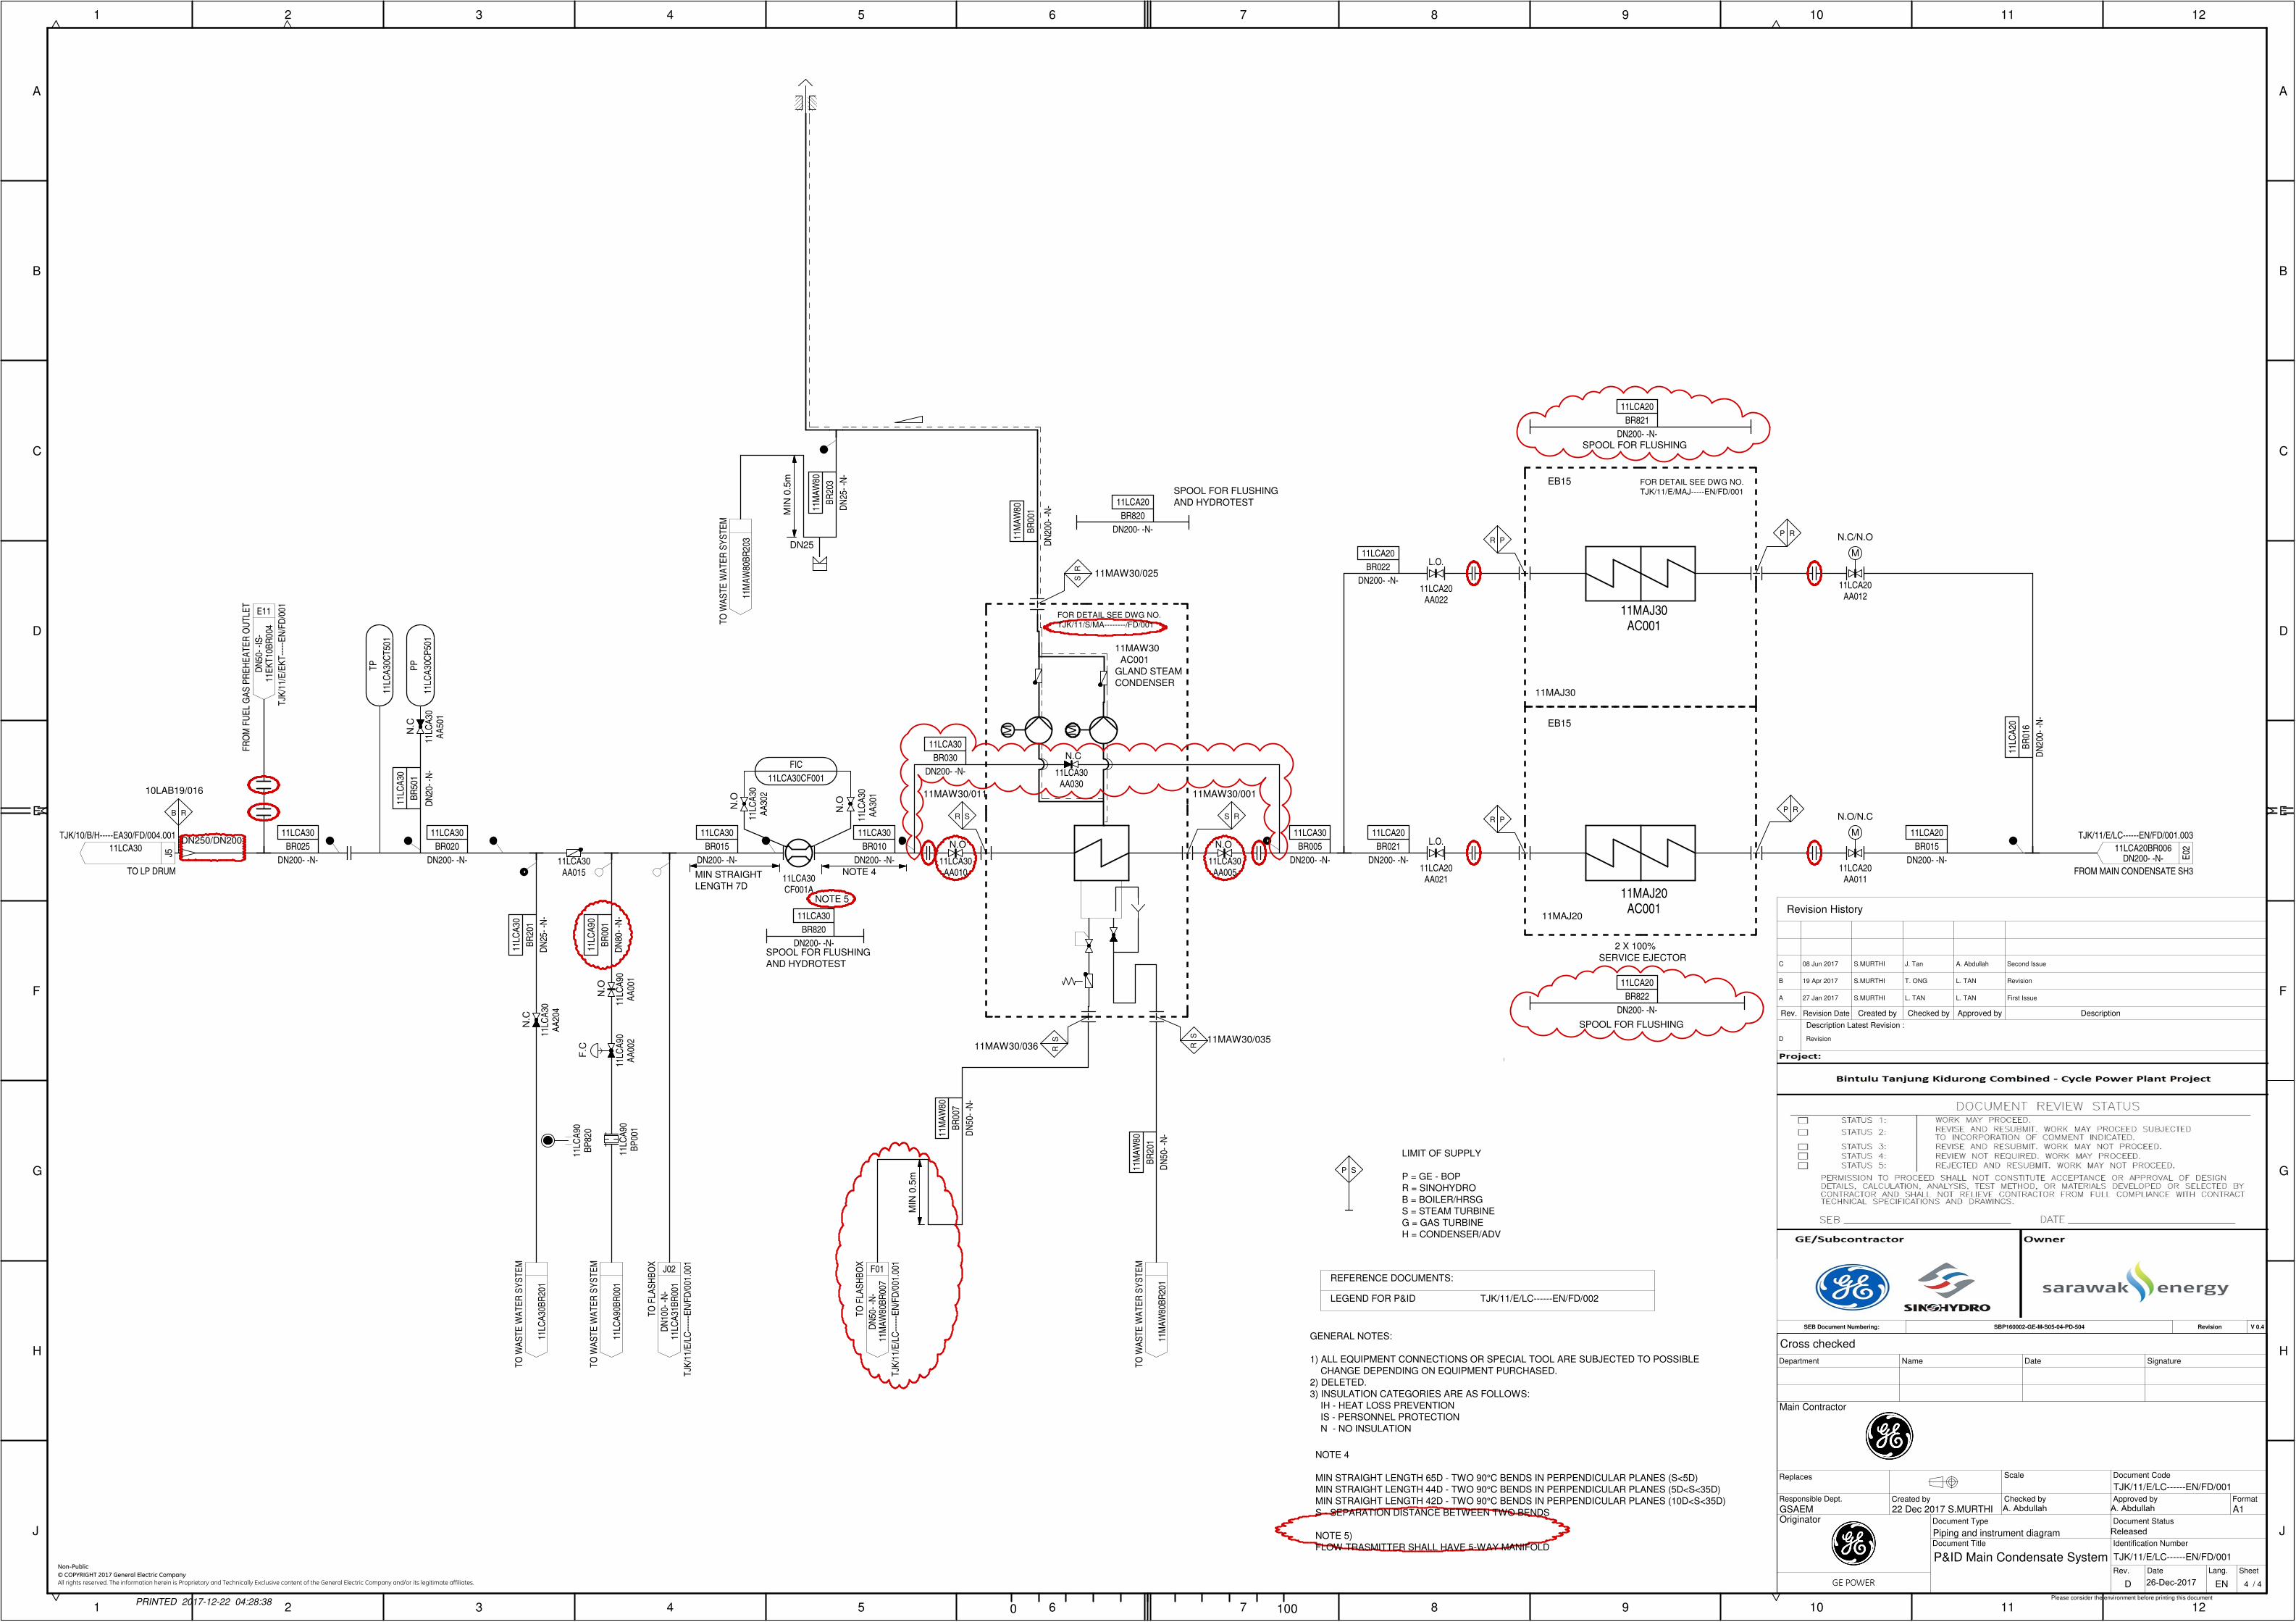
Appendix 3.3.1
Piping and Instrumentation Diagram (P&ID) for the Main Condensate System

PRINTED 2017-12-22 04:28:18
{ODF2}{ODF1}
1 / 4
Please consider the environment before printing this document
22 Dec 2017 S.MURTHI
Document Type
P&ID Main Condensate System
Document Code
Originator
Main Contractor
Checked byCreated by
Piping and instrument diagram
D
TJK/11/E/LC------EN/FD/001
GSAEM A1
TJK/11/E/LC------EN/FD/001
EN
Format
SheetLang.DateRev.
Document Title Identification Number
Document Status
Approved byResponsible Dept.
Replaces Scale
{ODF3}
GE POWER
Date
Cross checked
Department Name Signature
{CCD1}
{CCD2}
{CCN1}
{CCN2}
{CCDA1}
{CCDA2}
{CCS1}
{CCS2}
Revision History
{OD}{OL}
{RL4}
{DS1}
{DS2}
{DS3}
{AP0}
{AP1}
{AP2}
{AP3}
{CK0}
{CK1}
{CK2}
{CK3}
{CB0}
{CB1}
{CB2}
{CB3}
{DS4}{AP4}{CK4}{CB4}
{RL0}
{RL1}
{RL2}
{RL3}
{RD0}
{RD1}
{RD2}
{RD3}
{RD4}
Description Latest Revision :
{ODF}
{ODL}
{RD0}
D Revision
08 Jun 2017
19 Apr 2017
A. Abdullah
L. TAN
L. TANS.MURTHI
S.MURTHI
S.MURTHI
L. TAN
J. Tan
T. ONG
A
C
B
Second Issue
Revision
27 Jan 2017 First Issue
DescriptionRev. Revision Date Created by Checked by Approved by
SBP160002-GE-M-S05-04-PD-504 Revision V 0.4SEB Document Numbering:
All rights reserved. The information herein is Proprietary and Technically Exclusive content that is solely owned by General Electric Company and/or its affiliates. Thus, it is beingprovided with the explicit expectation of restricted and privileged use. All recipients of this information shall be deemed to have agreed not to make duplications, reproductions ofany nature by any means, modifications, disclosures, or use any portion of this material; except as is expressly authorized in writing by the General Electric Company, and/or itslegitimate affiliates.
© COPYRIGHT 2017 General Electric Company
Non-Public
E
J
H
1 2
G
F
3 4 5 60
D
C
B
A
1 2 3 4 5 6
E
100 7 8 9 10 11 12
J
H
G
F
7 8 9 10
D
C
11 12
B
A
LIMIT OF SUPPLY
P = GE - BOP
R = SINOHYDRO
B = BOILER/HRSG
S = STEAM TURBINE
G = GAS TURBINE
H = CONDENSER/ADVB
R2
01
11
MA
G0
2
DN
10
0-
-N-
BR
20
2
11
MA
G0
2
DN
10
0-
-N-
BR001
11LCP30
DN80- -N-
BR001
11LCP32
DN50- -N-
BR
00
1
11
LC
P3
1
DN
80
- -N
-
BR
00
1
11
LC
A3
1
DN
10
0-
-N-
BR011
11LCA31
DN100- -N-
BR820
11LCP32
DN50- -N-
BR
20
1
11
LC
A3
1
DN
25
- -N
-
BR
82
0
11
LC
P3
1
DN
80
- -N
-
BR
82
0
11
LC
A3
1
DN
10
0-
-N-
HOTWELL
BR401
11LCP30
OD14"- -N-
BR321
11MAG02
DN25- -N-
BR322
11MAG02
DN25- -N-
BR312
11MAG02
DN25- -N-
BR302
11MAG02
DN25- -N-
BR301
11MAG02
DN25- -N-
BR311
11MAG02
DN25- -N-
MAIN CONDENSER
D1
211MAJ01BR001
DN200- -N-
TO AIR REMOVAL SYSTEM
TJK/11/E/MAJ-----EN/FD/001
D1
1 11MAJ02BR001
DN200- -N-
TO AIR REMOVAL SYSTEM
TJK/11/E/MAJ-----EN/FD/001
11MAG02
BB001
A09
11
LC
A0
1B
R0
05
DN
40
0-
-N-
TO
MA
IN C
ON
DE
NS
AT
E S
YS
TE
M S
H2
TJK
/11
/E/L
C--
----
EN
/FD
/00
1.0
02
A09
11
LC
A0
2B
R0
05
DN
40
0-
-N-
TO
MA
IN C
ON
DE
NS
AT
E S
YS
TE
M S
H2
TJK
/11
/E/L
C--
----
EN
/FD
/00
1.0
02
11LCA01
BR751
11LCA02
BR751
A10
11
MA
G0
2B
R2
01
DN
10
0-
-N-
TO
MA
IN C
ON
DE
NS
AT
E S
YS
TE
M S
H2
TJK
/11
/E/L
C--
----
EN
/FD
/00
1.0
02
11MAG04
AC001
.
.
G7
MA
G0
1
FR
OM
LP
TU
RB
INE
11
/TJK
/S/M
A--
----
EN
/FD
/00
1.0
02
TIA
11MAG04CT001PP
11MAG01CP501
PP
11MAG01CP502PP
11MAG01CP503
PP
11MAG01CP504PP
11MAG01CP505
PP
11MAG01CP506
/K5/K6
/E2
11PAB30BR001
11PAB20BR001
11PAB40BR001
11PAB10BR001
11M
AG
02
BB
002
11M
AG
02
BB
003
11M
AG
02
BB
004
LI
11
MA
G0
2C
L0
01
LICZA
11MAG02CL002
LICZA
11MAG02CL003
LICZA
11MAG02CL004
HS
11M
AC
10/0
11
B0
5 11LCE11BR005
DN25- -N-
FROM MAIN CONDENSATE SYSTEM SH3
TJK/11/E/LC------EN/FD/001.003
/E4
/Q1
/E3
11
LC
A3
1
AA
00
2
SP
11
LC
A3
1
AA
00
1
11
LC
A3
1
AA
00
3
11
LC
A3
1
BP
00
1
11
LC
A3
1
BP
82
0
HR
HR
HRHR
B0
511LCB30BR201
DN25- -N-
CONDENSATE PUMP VENTING
TJK/11/E/LC------EN/FD/001.002
/Q2
11
LC
A3
1
AA
01
2
11
LC
A3
1
AA
20
1
/G2
/L8
/L7
HR
RH
HR
/G1
D1
1 11MAJ03BR001
DN300- -N-
TO AIR REMOVAL SYSTEM
TJK/11/E/MAJ-----EN/FD/001
RH
11LCP32
BP001
/O7
11
LC
P3
1
BP
00
1
11
LC
P3
1
BP
82
0
F7
11MAW15BR012
FROM GLAND STEAM
TJK/11/S/MA------EN/FD/001.002
/R13
11LCE11
AA00111LCE11
BP001
11LCE11
BP820
11LCP30
AA401
B1
2 11LCP30BR401
TO SAMPLING SYSTEM
TJK/90/W/MBH35EB55z/FD/001
H0
5 11MAW80BR007
DN50- -N-
GLAND STEAM CONDENSER DRAIN
TJK/11/E/LC------EN/FD/001.004
/L1
/L2
/L3
/L4
/L5
/L6
11MAG02
AA301
11MAG02
AA302
11MAG02
AA341
11MAG02
AA342
11MAG02
AA311
11MAG02
AA312
11MAG02
AA321
11MAG02
AA322
H R
HR
H R
HR
H R
HR
H R
HR
H R
HR
H R
HR
H R
PR
H R PR
HR
11LCP32
AA00211LCP32
AA001
11
LC
P3
1
AA
00
1
11LCP32
BP820
/W3
/W1
/W4
/W5
/W6
E5 11MAN20
FROM IP BYPASS
TJK/11/E/MAN20---EN/FD/001
E711MAN10
FROM LP BYPASS
TJK/11/E/MAN10---EN/FD/001
11
LC
A3
1B
R2
01
TO
WA
ST
E W
AT
ER
SY
ST
EM
11LCP30BR001
FROM DEMIN WATER DISTRIBUTION SYSTEM
/P1
/A2
/B1
/A1
/W2
/B2
/C5
T20
/P6
/P5
/P4
/P3
/P2
/N3
/E1
/N2
/N1
11MAG01
AC001
11
LC
P3
1
AA
00
2
HR
H S
TIA
11MAG01CT003
TIA
11MAG01CT004
TIA
11MAG01CT005
T13
T14
T15
RH
PIA
11MAG04CP001P13
HR
H04
11
LC
A3
1B
R0
01
DN
10
0-
-N-
CE
P R
EC
IRC
UL
AT
ION
TJK
/11
/E/L
C--
----
EN
/FD
/00
1.0
04
L.O
.
11
LC
P3
1
AA
00
4
L.C
.
11
MA
G0
2
AA
20
2
L.C
.
11
MA
G0
2
AA
20
1
H0
9 11MAJ40BR425
DN50- -IS-
FROM AIR INJECTOR
TJK/11/E/MAJ-----EN/FD/001
L.O.
11LCP32
AA003
11
LC
P3
2
AA
30
1
11
LC
P3
2
AA
30
2
FIC
11LCP32CF001
11
LC
P3
1
CF
00
1A
FIC
11
LC
P3
1C
F0
01
11LCP31
AA301
11LCP31
AA302
11LCP32
CF001A
GENERAL NOTES:
1) ALL EQUIPMENT CONNECTIONS OR SPECIAL TOOL ARE SUBJECTED TO POSSIBLE
CHANGE DEPENDING ON EQUIPMENT PURCHASED.
2) DELETED.
3) INSULATION CATEGORIES ARE AS FOLLOWS:
IH - HEAT LOSS PREVENTION
IS - PERSONNEL PROTECTION
N - NO INSULATION
NOTE 4)
SAMPLING / DOSING LINE SIZES TO BE ADVISED BY SINOHYDRO.
NOTE 5)
CONDENSER AND SAMPLING SKID ARE LOCATED AT A DISTANCE FROM ONE ANOTHER.
THEREFORE SAMPLING TAPPING LOCATION IS TO BE BASED ON MOST COST EFFECTIVE
AND FEASIBLE LOCATION.
NOTE 6)
VALVES CONNECTED TO CONDENSER SHALL BE ABLE TO PREVENT AIR LEAKING INTO CONDENSER.
NOTE 7)
ROOT VALVE AND FITTING CONNECTED TO CONDENSER SYSTEM IS SWAGELOK OR EQUIVALENT
QUALITY TO PREVENT AIR LEAKING TO THE CONDENSER AND LEVEL TRANSMITTER.
REFERENCE DOCUMENTS:
LEGEND FOR P&ID TJK/11/E/LC------EN/FD/002
SPOOL FOR FLUSHING
AND HYDROTEST
FLASHBOX
Check (v)
SP
OO
L F
OR
FLU
SH
ING
AN
D H
YD
RO
TE
ST
SP
OO
L F
OR
FLU
SH
ING
AN
D H
YD
RO
TE
ST
FOR DETAIL SEE DWG NO.
TJK/11/H/MAG01-CA10/EA/001
V1 V2 V3
K8 K9 K10
/C1
/C3
B01
MIN
. 1 M
HE
IGH
T
NOTE 5
N.O
N.O N.O
N.O
N.O
N.O
N.O
N.O
F.C
N.O
N.O
N.O
F.C
NOTE 7
N.C
N.O
N.O
N.O
N.C F.O
N.O
N.O
N.O
N.O
A.�Abdullah A.�Abdullah
Released
26-Dec-2017

PRINTED 2017-12-22 04:28:25
{ODF2}{ODF1}
2 / 4
Please consider the environment before printing this document
22 Dec 2017 S.MURTHI
Document Type
P&ID Main Condensate System
Document Code
Originator
Main Contractor
Checked byCreated by
Piping and instrument diagram
D
TJK/11/E/LC------EN/FD/001
GSAEM A1
TJK/11/E/LC------EN/FD/001
EN
Format
SheetLang.DateRev.
Document Title Identification Number
Document Status
Approved byResponsible Dept.
Replaces Scale
{ODF3}
GE POWER
Date
Cross checked
Department Name Signature
{CCD1}
{CCD2}
{CCN1}
{CCN2}
{CCDA1}
{CCDA2}
{CCS1}
{CCS2}
Revision History
{OD}{OL}
{RL4}
{DS1}
{DS2}
{DS3}
{AP0}
{AP1}
{AP2}
{AP3}
{CK0}
{CK1}
{CK2}
{CK3}
{CB0}
{CB1}
{CB2}
{CB3}
{DS4}{AP4}{CK4}{CB4}
{RL0}
{RL1}
{RL2}
{RL3}
{RD0}
{RD1}
{RD2}
{RD3}
{RD4}
Description Latest Revision :
{ODF}
{ODL}
{RD0}
D Revision
08 Jun 2017
19 Apr 2017
A. Abdullah
L. TAN
L. TANS.MURTHI
S.MURTHI
S.MURTHI
L. TAN
J. Tan
T. ONG
A
C
B
Second Issue
Revision
27 Jan 2017 First Issue
DescriptionRev. Revision Date Created by Checked by Approved by
SBP160002-GE-M-S05-04-PD-504 Revision V 0.4SEB Document Numbering:
All rights reserved. The information herein is Proprietary and Technically Exclusive content of the General Electric Company and/or its legitimate affiliates.© COPYRIGHT 2017 General Electric Company
Non-Public
E
J
H
1 2
G
F
3 4 5 60
D
C
B
A
1 2 3 4 5 6
E
100 7 8 9 10 11 12
J
H
G
F
7 8 9 10
D
C
11 12
B
A
BR
00
5
11
LC
A0
1
DN
40
0-
-N-
BR
00
5
11
LC
A0
2
DN
40
0-
-N-
BR
01
0
11
LC
A0
1
DN
25
- -N
-
BR
01
1
11
LC
A0
1
DN
50
- -N
-
BR
01
0
11
LC
A0
2
DN
25
- -N
-
BR
01
1
11
LC
A0
2
DN
50
- -N
-
EB20
BR005
11LCA12
DN200- -N-
BR005
11LCA11
DN200- -N-
BR
01
0
11
LC
A1
1
DN
10
0-
-N-
BR
01
0
11
LC
A1
2
DN
10
0-
-N-
BR
20
1
11
LC
A1
2
DN
25
- -N
-
BR
20
1
11
LC
A1
1
DN
25
- -N
-
BR201
11LCB10
DN25- -N-
BR201
11LCB20
DN25- -N-
BR
20
1
11
LC
B3
0
DN
25
- -N
-
EB20
EB20
EB20
BR001
11LCW31
DN25- -N-
BR001
11LCW32
DN25- -N-
BR
30
1
11
LC
A2
0
DN
20
- -N
-
BR
20
2
11
LC
A0
1
DN
15
0-
-N-
BR010
11LCA13
DN100- -N-
BR006
11LCA02
DN400- -N-
BR006
11LCA01
DN400- -N-
BR201
11LCA01
DN25- -N-
BR
20
1
11
LC
A0
2
DN
25
- -N
-
BR202
11LCA02
DN150- -N-
BR820
11LCA01
DN400- -N-
BR820
11LCA02
DN400- -N-
BR005
11LCA20
DN250- -N-
BR
00
1
11
LC
W2
0
DN
25
- -N
-
BR
20
3
11
LC
A0
1
DN
25
- -N
-
BR
20
3
11
LC
A0
2
DN
25
- -N
-
G06
11
LC
A0
1B
R0
05
DN
40
0-
-N-
FR
OM
MA
IN C
ON
DE
NS
AT
E S
YS
TE
M S
H1
TJK
/11
/E/L
C--
----
EN
/FD
/00
1.0
01
G06
11
LC
A0
2B
R0
05
DN
40
0-
-N-
FR
OM
MA
IN C
ON
DE
NS
AT
E S
YS
TE
M S
H1
TJK
/11
/E/L
C--
----
EN
/FD
/00
1.0
01 H07
11
MA
G0
2B
R2
01
DN
10
0-
-N-
FR
OM
MA
IN C
ON
DE
NS
AT
E S
YS
TE
M
TJK
/11
/E/L
C--
----
EN
/FD
/00
1.0
01
TP
11
LC
A0
1C
T5
01
TP
11
LC
A0
2C
T5
01
L.O
.
11
LC
A0
2
AA
00
1
L.O
.
11
LC
A0
1
AA
00
1
11LCA01
AA010
11LCA02
AA010
11
LC
A0
2
AA
20
1
11
LC
A0
1
AA
20
1
DPIAZ
11LCA01CP001
11LCB10
11LCB20
11LCB10
AP001
11LCB20
AP001
DPIAZ
11LCA02CP001
11
LC
A1
1
AA
01
2
11LCA11
AA002
M
11LCA13
BP012
11LCA13
BP812
11LCA12
AA002
M
11
LC
A1
2
AA
01
2
11
LC
A1
2
AA
20
1
11
LC
A1
1
AA
20
1
E1
211LCA20BR005
DN250- -N-
TO MAIN CONDENSATE SYS SH3
TJK/11/E/LC------EN/FD/001.003
11LCA01
BR752
11LCA02
BR752
11LCB10
AA201
11LCB20
AA201
D0
311LCB30BR201
DN25- -N-
TO FLASHBOX
TJK/11/E/LC------EN/FD/001.001
11
MA
G0
2
AA
20
31
1M
AG
02
BP
20
1
11LCA01AT001
11LCA02AT001
SP
11LCA11
AA001
11LCA12
AA001
11LCW32
AA001
PIC
SA
11
LC
A2
0C
P0
01
11
LC
A2
0
AA
30
1T
I
11
LC
A2
0C
T0
01
001002
001002001002
003 004
001002
003 004
DN 250/DN 200
11LCW31
AA001
R P
003
003
11LCA01
AA202
11LCA02
AA202
11
LC
A0
2B
R2
02
TO
WA
ST
E W
AT
ER
SY
ST
EM
11
LC
A0
2B
R0
11
TO
WA
ST
E W
AT
ER
SY
ST
EM
11
LC
A0
1B
R2
02
TO
WA
ST
E W
AT
ER
SY
ST
EM
11
LC
A0
1B
R0
11
TO
WA
ST
E W
AT
ER
SY
ST
EM
11MAG02BR201
TO WASTE WATER SYSTEM
M~
M~
RP
RP
PR RP
PR
PRPR
PR
PR
PR RP
PR P R
C0
5 11LCW20BR001
DN25- -N-
FROM MAIN CONDENSATE SYSTEM SH3
TJK/11/E/LC------EN/FD/001.003
PR
RP
FOR DETAIL SEE DWG NO.
TJK/11/E/LC----EB20/FD/001
GENERAL NOTES:
1) ALL EQUIPMENT CONNECTIONS OR SPECIAL TOOL ARE SUBJECTED TO POSSIBLE
CHANGE DEPENDING ON EQUIPMENT PURCHASED.
2) DELETED.
3) INSULATION CATEGORIES ARE AS FOLLOWS:
IH - HEAT LOSS PREVENTION
IS - PERSONNEL PROTECTION
N - NO INSULATION
NOTE 4)
VALVES CONNECTED TO CONDENSER SHALL BE ABLE TO PREVENT AIR LEAKING
INTO CONDENSER.
NOTE 5)
NON-SLAMMING CHECK VALVE.
NOTE 6)
MIN. RECOMMENDED DISTANCE : 2 X D (32")
REFERENCE DOCUMENTS:
LEGEND FOR P&ID TJK/11/E/LC------EN/FD/002
MA
X 0
.5M
MA
X 0
.5M
LIMIT OF SUPPLY
P = GE - BOP
R = SINOHYDRO
B = BOILER/HRSG
S = STEAM TURBINE
G = GAS TURBINE
H = CONDENSER/ADV
CONDENSATE EXTRACTION PUMPS
11LCB10/20 AP001
Rated Flow 537 m3/h
Rated Head 202 m
Motor Power 425kW
2 x 100 %
N.O
N.O
NOTE 5
DN50/DN25
DN50/DN25
SPOOL FOR
FLUSHING
NOTE 5
SPOOL FOR
FLUSHING
N.O/N.C
N.C/N.O
N.O N.O
N.C
N.C
N.C
N.C
N.C
N.O N.O
N.C
N.C
N.C
N.C
N.0
FOR DETAIL SEE DWG NO.
TJK/11/E/LC----EB20/FD/001
NOTE 6
NOTE 6
DN
150/D
N25
DN
150/D
N25
A.�Abdullah A.�Abdullah
Released
26-Dec-2017

PRINTED 2017-12-22 04:28:32
{ODF2}{ODF1}
3 / 4
Please consider the environment before printing this document
22 Dec 2017 S.MURTHI
Document Type
P&ID Main Condensate System
Document Code
Originator
Main Contractor
Checked byCreated by
Piping and instrument diagram
D
TJK/11/E/LC------EN/FD/001
GSAEM A1
TJK/11/E/LC------EN/FD/001
EN
Format
SheetLang.DateRev.
Document Title Identification Number
Document Status
Approved byResponsible Dept.
Replaces Scale
{ODF3}
GE POWER
Date
Cross checked
Department Name Signature
{CCD1}
{CCD2}
{CCN1}
{CCN2}
{CCDA1}
{CCDA2}
{CCS1}
{CCS2}
Revision History
{OD}{OL}
{RL4}
{DS1}
{DS2}
{DS3}
{AP0}
{AP1}
{AP2}
{AP3}
{CK0}
{CK1}
{CK2}
{CK3}
{CB0}
{CB1}
{CB2}
{CB3}
{DS4}{AP4}{CK4}{CB4}
{RL0}
{RL1}
{RL2}
{RL3}
{RD0}
{RD1}
{RD2}
{RD3}
{RD4}
Description Latest Revision :
{ODF}
{ODL}
{RD0}
D Revision
08 Jun 2017
19 Apr 2017
A. Abdullah
L. TAN
L. TANS.MURTHI
S.MURTHI
S.MURTHI
L. TAN
J. Tan
T. ONG
A
C
B
Second Issue
Revision
27 Jan 2017 First Issue
DescriptionRev. Revision Date Created by Checked by Approved by
SBP160002-GE-M-S05-04-PD-504 Revision V 0.4SEB Document Numbering:
All rights reserved. The information herein is Proprietary and Technically Exclusive content of the General Electric Company and/or its legitimate affiliates.© COPYRIGHT 2017 General Electric Company
Non-Public
E
J
H
1 2
G
F
3 4 5 60
D
C
B
A
1 2 3 4 5 6
E
100 7 8 9 10 11 12
J
H
G
F
7 8 9 10
D
C
11 12
B
A
BR
00
5
11
LC
E1
0
DN
50
- -N
-
BR
20
1
11
LC
E1
0
DN
25
- -N
-
BR
20
2
11
LC
E1
0
DN
25
- -N
-
BR021
11MAW16
DN25- -N-
BR301
11LCE10
DN20- -N-
BR302
11LCE10
DN20- -N-
BR
01
0
11
LC
E1
0
DN
50
- -N
-
BR
40
1
11
LC
A2
0
OD
14
- -N
-
BR
40
2
11
LC
A2
0
OD
14
- -N
-
BR005
11LCE11
DN25- -N-
BR006
11LCA20
DN200- -N-
BR
00
5
11
LC
E0
1
DN
15
0-
-N-
BR820
11MAW16
DN25- -N-
BR
00
1
11
LC
W1
0
DN
25
- -N
-
BR
30
1
11
LC
W1
0
DN
20
- -N
-
BR002
11LCW10
DN25- -N-
BR
30
2
11
LC
W1
0
DN
20
- -N
-
BR
20
1
11
LC
W1
0
DN
25
- -N
-
BR
00
3
11
LC
W1
0
DN
25
- -N
-
BR001
11LCW20
DN25- -N-
BR
20
9
11
LC
W2
0
DN
25
- -N
-
BR
21
0
11
LC
W2
0
DN
80
- -N
-
BR
30
1
11
LC
W2
0
DN
20
- -N
-
D0
111LCA20BR005
DN250- -N-
FROM MAIN CONDENSATE SYSTEM SH2
TJK/11/E/LC------EN/FD/001.002
11LCE10AT001
D0
1 11LCE11BR005
DN25- -N-
TO FLASHBOX ATTEMPERATION
TJK/11/E/LC------EN/FD/001.001
DP
IA
11
LC
E1
0C
P0
01
C11
11
MA
N1
1B
R0
05
DN
25
- -N
-
TO
LP
TU
RB
INE
BY
PA
SS
TJK
/11
/E/M
AN
10
---E
N/F
D/0
01
001
002
003
004
SP
J1 11MAW16BR021
TO STEAM TURBINE
TJK/11/S/MA------EN/FD/001.002
R S
11MAW15/030
11LCE10
AA301
11LCE10
AA302
C12
11
MA
N2
1B
R0
05
DN
15
0-
-N-
TO
IP
TU
RB
INE
SY
ST
EM
TJK
/11
/E/M
AN
20
---E
N/F
D/0
01
E1
211LCA20BR006
DN200- -N-
TO MAIN CONDENSATE SYSTEM SH4
TJK/11/E/LC------EN/FD/001.004
11
LC
A2
0
AA
40
1
B4
11
LC
A2
0B
R4
01
TO
SA
MP
LIN
G S
YS
TE
M
TJK
/90
/W/M
BH
35
EB
55
z/F
D/0
01
11
LC
A2
0
AA
40
2
B5
11
LC
A2
0B
R4
02
TO
SA
MP
LIN
G S
YS
TE
M
TJK
/90
/W/M
BH
35
EB
55
z/F
D/0
01
DN 200/DN 250
E4
90
QC
A4
1B
R0
01
FR
OM
AM
MO
NIA
DO
SIN
G
TJK
/90
/W/L
FN
---E
B5
0/F
D/0
01
11
LC
E1
0B
R2
01
TO
WA
ST
E W
AT
ER
SY
ST
EM
11
LC
W1
0
AA
00
4
11
LC
W1
0
AA
30
1
11
LC
W1
0
AA
30
2
DPIA
11LCW10CP001
11LCW10AT001
11
LC
W1
0B
R2
01
TO
WA
ST
E W
AT
ER
SY
ST
EM
11LCW10
AA00111LCW10
AA002
11LCW10
AA003
11LCW10
001002
11LCW10
AA006
11LCW20
AA001
11
LC
W2
0B
R2
10
TO
WA
ST
E W
AT
ER
SY
ST
EM
11
LC
W2
0
AA
30
1
PIA
11
LC
W2
0C
P0
01
B0
3
11LCW20BR001
DN25- -N-
TO MAIN CONDENSATE SYSTEM SH2
TJK/11/E/LC------EN/FD/001.002
GENERAL NOTES:
1) ALL EQUIPMENT CONNECTIONS OR SPECIAL TOOL ARE SUBJECTED TO POSSIBLE
CHANGE DEPENDING ON EQUIPMENT PURCHASED.
2) DELETED.
3) INSULATION CATEGORIES ARE AS FOLLOWS:
IH - HEAT LOSS PREVENTION
IS - PERSONNEL PROTECTION
N - NO INSULATION
REFERENCE DOCUMENTS:
LEGEND FOR P&ID TJK/11/E/LC------EN/FD/002
LIMIT OF SUPPLY
P = GE - BOP
R = SINOHYDRO
B = BOILER/HRSG
S = STEAM TURBINE
G = GAS TURBINE
H = CONDENSER/ADV
NOTE 4
NOTE 4)
PIPING DOWNSTREAM OF DUPLEX FILTER SHALL BE STAINLESS STEEL.
OD
14-
-N-
SPOOL FOR FLUSHING
N.O
N.O
N.O
N.O
PRESSURE REDUCING SKID
MA
X 0
.5M
N.O
N.C
N.C
N.O N.O
A.�Abdullah A.�Abdullah
Released
26-Dec-2017
PRINTED 2017-12-22 04:28:38
{ODF2}{ODF1}
4 / 4
Please consider the environment before printing this document
22 Dec 2017 S.MURTHI
Document Type
P&ID Main Condensate System
Document Code
Originator
Main Contractor
Checked byCreated by
Piping and instrument diagram
D
TJK/11/E/LC------EN/FD/001
GSAEM A1
TJK/11/E/LC------EN/FD/001
EN
Format
SheetLang.DateRev.
Document Title Identification Number
Document Status
Approved byResponsible Dept.
Replaces Scale
{ODF3}
GE POWER
Date
Cross checked
Department Name Signature
{CCD1}
{CCD2}
{CCN1}
{CCN2}
{CCDA1}
{CCDA2}
{CCS1}
{CCS2}
Revision History
{OD}{OL}
{RL4}
{DS1}
{DS2}
{DS3}
{AP0}
{AP1}
{AP2}
{AP3}
{CK0}
{CK1}
{CK2}
{CK3}
{CB0}
{CB1}
{CB2}
{CB3}
{DS4}{AP4}{CK4}{CB4}
{RL0}
{RL1}
{RL2}
{RL3}
{RD0}
{RD1}
{RD2}
{RD3}
{RD4}
Description Latest Revision :
{ODF}
{ODL}
{RD0}
D Revision
08 Jun 2017
19 Apr 2017
A. Abdullah
L. TAN
L. TANS.MURTHI
S.MURTHI
S.MURTHI
L. TAN
J. Tan
T. ONG
A
C
B
Second Issue
Revision
27 Jan 2017 First Issue
DescriptionRev. Revision Date Created by Checked by Approved by
SBP160002-GE-M-S05-04-PD-504 Revision V 0.4SEB Document Numbering:
All rights reserved. The information herein is Proprietary and Technically Exclusive content of the General Electric Company and/or its legitimate affiliates.© COPYRIGHT 2017 General Electric Company
Non-Public
E
J
H
1 2
G
F
3 4 5 60
D
C
B
A
1 2 3 4 5 6
E
100 7 8 9 10 11 12
J
H
G
F
7 8 9 10
D
C
11 12
B
A
BR
00
1
11
MA
W8
0
DN
20
0-
-N-B
R2
03
11
MA
W8
0
DN
25
- -N
-
BR
00
7
11
MA
W8
0
DN
50
- -N
-
BR010
11LCA30
DN200- -N-
BR020
11LCA30
DN200- -N-
BR
50
1
11
LC
A3
0
DN
20
- -N
-
BR820
11LCA30
DN200- -N-
BR
20
1
11
MA
W8
0
DN
50
- -N
-
BR
20
1
11
LC
A3
0
DN
25
- -N
-
BR025
11LCA30
DN200- -N-
BR820
11LCA20
DN200- -N-
BR015
11LCA20
DN200- -N-
BR
01
6
11
LC
A2
0
DN
20
0-
-N-
BR022
11LCA20
DN200- -N-
BR021
11LCA20
DN200- -N-
BR005
11LCA30
DN200- -N-
BR015
11LCA30
DN200- -N-
EB15
EB15
BR
00
1
11
LC
A9
0
DN
80
- -N
-
BR821
11LCA20
DN200- -N-
BR822
11LCA20
DN200- -N-
BR030
11LCA30
DN200- -N-
SP
MM
11LCA30
CF001A
FIC
11LCA30CF001
11
LC
A3
0
AA
30
1
11
LC
A3
0
AA
30
2
11
LC
A9
0
BP
82
0
11
LC
A3
0
AA
20
4
E0
211LCA20BR006
DN200- -N-
FROM MAIN CONDENSATE SH3
TJK/11/E/LC------EN/FD/001.003
11LCA20
AA011
M
11LCA20
AA012
ML.O.
11LCA20
AA022
L.O.
11LCA20
AA021
PR
PR
F01
11
MA
W8
0B
R0
07
DN
50
- -N
-
TO
FL
AS
HB
OX
TJK
/11
/E/L
C--
----
EN
/FD
/00
1.0
01
11LCA30
AA015
11
MA
W8
0B
R2
01
TO
WA
ST
E W
AT
ER
SY
ST
EM
11
LC
A3
0B
R2
01
TO
WA
ST
E W
AT
ER
SY
ST
EM
11
MA
W8
0B
R2
03
TO
WA
ST
E W
AT
ER
SY
ST
EM
11MAJ20
AC001
11MAJ30
AC001
11MAJ30
11MAJ20
TP
11
LC
A3
0C
T5
01
11
LC
A3
0
AA
50
1
PP
11
LC
A3
0C
P5
01
E11
11
EK
T1
0B
R0
04
DN
50
- -I
S-
FR
OM
FU
EL
GA
S P
RE
HE
AT
ER
OU
TL
ET
TJK
/11
/E/E
KT
----
-EN
/FD
/00
1
11
LC
A9
0
AA
00
1
11
LC
A9
0
AA
00
21
1L
CA
90
BP
00
1
11
LC
A9
0B
R0
01
TO
WA
ST
E W
AT
ER
SY
ST
EM
J02
11
LC
A3
1B
R0
01
DN
10
0-
-N-
TO
FL
AS
HB
OX
TJK
/11
/E/L
C--
----
EN
/FD
/00
1.0
01
RB
10LAB19/016
J511LCA30
TO LP DRUM
TJK/10/B/H-----EA30/FD/004.001
RP
RPRS
11MAW30/001
11LCA30
AA005
11LCA30
AA010
SR
11MAW30/011
11LCA30
AA030
SR11MAW30/036
SR
11MAW30/035
SR
11MAW30/025
GENERAL NOTES:
1) ALL EQUIPMENT CONNECTIONS OR SPECIAL TOOL ARE SUBJECTED TO POSSIBLE
CHANGE DEPENDING ON EQUIPMENT PURCHASED.
2) DELETED.
3) INSULATION CATEGORIES ARE AS FOLLOWS:
IH - HEAT LOSS PREVENTION
IS - PERSONNEL PROTECTION
N - NO INSULATION
REFERENCE DOCUMENTS:
LEGEND FOR P&ID TJK/11/E/LC------EN/FD/002
LIMIT OF SUPPLY
P = GE - BOP
R = SINOHYDRO
B = BOILER/HRSG
S = STEAM TURBINE
G = GAS TURBINE
H = CONDENSER/ADV
DN25
MIN
0.5
m
FOR DETAIL SEE DWG NO.
TJK/11/S/MA--------/FD/001
NOTE 4MIN STRAIGHT
LENGTH 7D
SPOOL FOR FLUSHING
AND HYDROTEST
11MAW30
AC001
GLAND STEAM
CONDENSER
SPOOL FOR FLUSHING
AND HYDROTEST
NOTE 4
MIN STRAIGHT LENGTH 65D - TWO 90°C BENDS IN PERPENDICULAR PLANES (S<5D)
MIN STRAIGHT LENGTH 44D - TWO 90°C BENDS IN PERPENDICULAR PLANES (5D<S<35D)
MIN STRAIGHT LENGTH 42D - TWO 90°C BENDS IN PERPENDICULAR PLANES (10D<S<35D)
S - SEPARATION DISTANCE BETWEEN TWO BENDS
NOTE 5)
FLOW TRASMITTER SHALL HAVE 5-WAY MANIFOLD
FOR DETAIL SEE DWG NO.
TJK/11/E/MAJ-----EN/FD/001
2 X 100%
SERVICE EJECTOR
DN250/DN200
F.C
NOTE 5
SPOOL FOR FLUSHING
SPOOL FOR FLUSHING
N.C/N.O
N.O/N.C
N.C
N.O
N.C
N.C
N.ON.ON
.ON.O
MIN
0.5
m
A.�Abdullah A.�Abdullah
Released
26-Dec-2017

Appendix 3.4.1
Approval of the Hydrological Study by DID


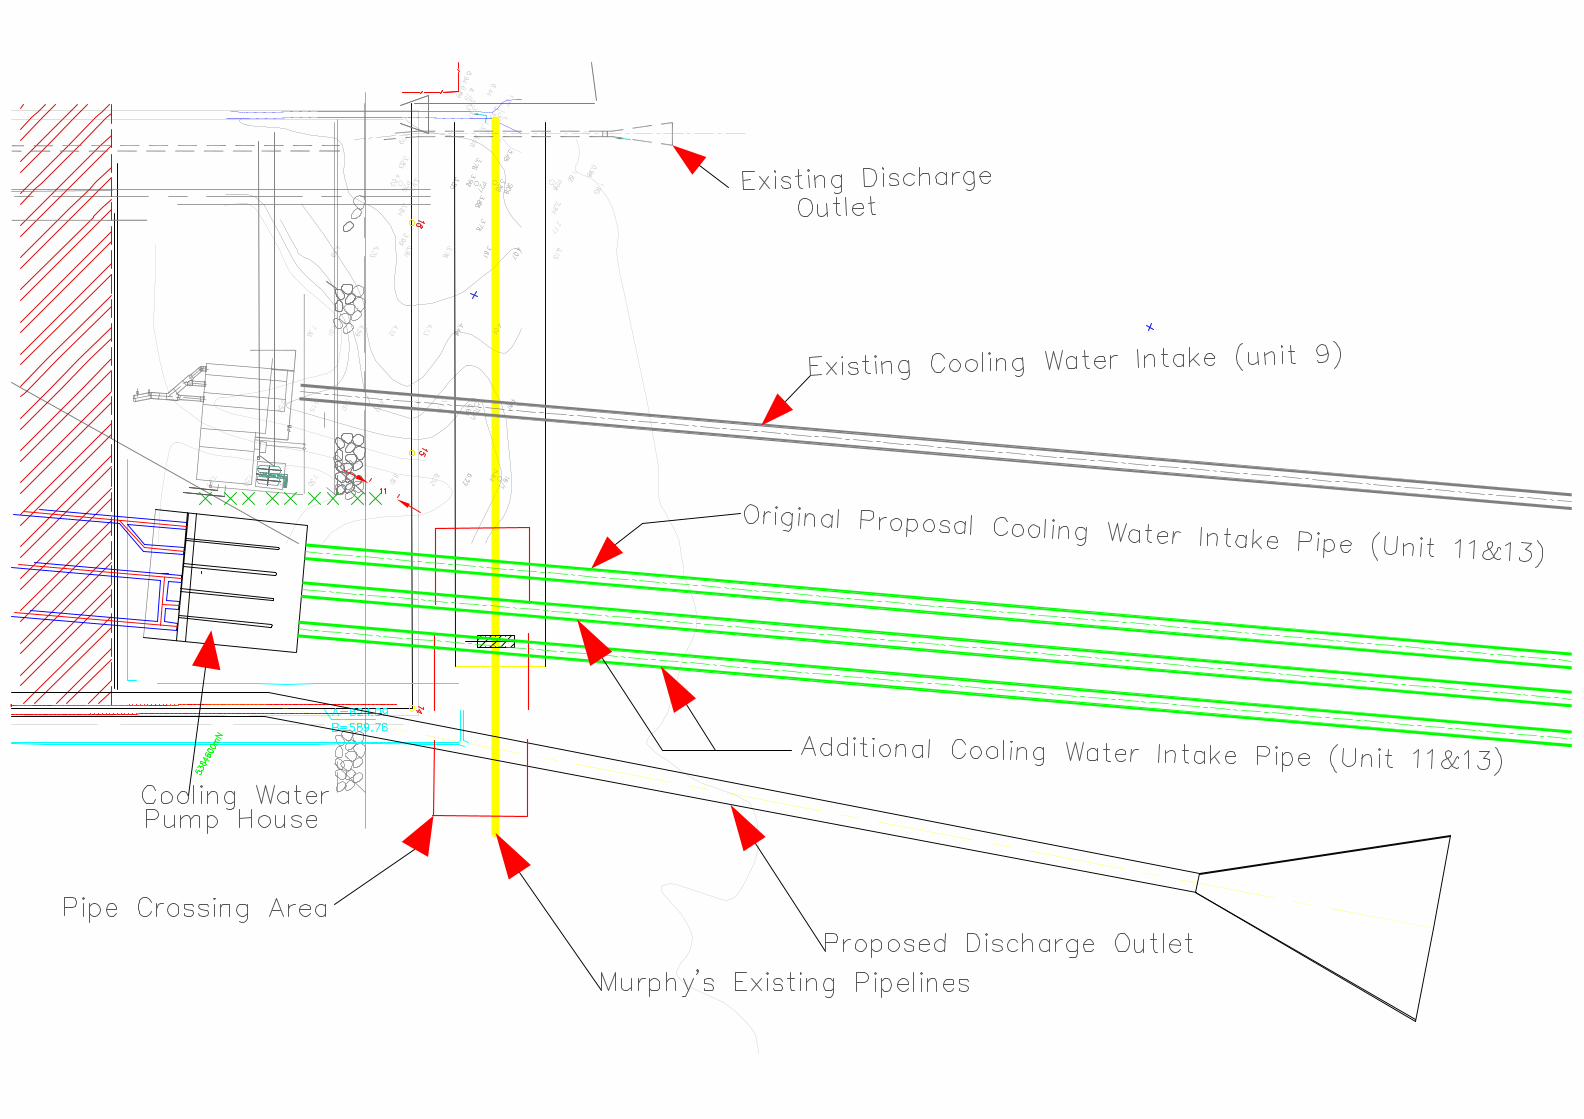
Appendix 3.4.2
Agreement for the Crossing of Pipeline with Murphy

}H
1a a
Fq[
5; r
H E
I
llEE
iiEtE
Elt
tH
'; B
E S
E-o
H
.: r
o -a
t6
E
E g
El=
;
o' r
'r
r=
h ol
H^ t?S
lof
16-
olo ll lp l.r lo l=
n m @ -{ 4, o -{ m o
rE0
P=
3
uJ{a
oLv| 3E
5'o{ =
D*2 O
e *6 !- Ytr
,O
Ft= E
9oO i8 E
3=
l! e=tr
,a ar a! m ! o € m 7t ! E z -{ ! v o tn (.l e z a ti I c z { I Fr c
-{14
a! il gi
sJJ
J6 -E(D
oJ e
683
-icL
.3S .)
46-
f3A
cLo
.<-
q
ag ?o 1^ fN) ;g gE -6 arO
O{r
E.+
(DL (,.<
q6 +O
tl=
=(D
Ovt
cL
6' -
.r?6 a-
6i
o(D
otte
nio
lDa
=4 do
")-
R
g"e
E(.
)Ir
t ts
68 E=
'a0
a()
o.D
<r
(D O_
j:
=E
+=
'-
J ('DO
-! Ea
L- 3.<
oo fc *1
o c 2. f al o o 3
n.I
oT'.l
a 3-
E e
=o
!,qd
A
E E
Y1
R 9
fl8I
qS E
\UJ +
ocn'
E"
X=
i X
a.S
p!
O
orO
A)J Y
rg(l
Orr
3.
S.
.dB
-ot T E
- o = o
tJt z.
z v
lp
o;4,
=rP
=*-
rd *
-Etl-
=_<
=P
oDO
-+<
r;=
+e
E'F
qF
\oQ
t
@;
9,oi
: c\
u' oo ^9Ets nro
=(o =':
6= { T
-{{
++
{ or
ori^
oo
t, @
@-
NN
o { u@
ar 5
@-5
@o =
AU
o a@
fr @
6s o J =

o { m 0 o o .Tt N o o
tnE
ex
7
sE s*
E*
Ei
7fi z
7 E
€a
Ha
BE
5;
ui
ieY
FY
- OU
o n m m =m z {!x H
i!-
{ if,o n o o g z o o .n

v -t o r m (, N) a o v m m m z -{ I o -l I m o 7 o (t)
U' z o
iv)
6m=
ET
DS
aoo
69.
.;o 3 qq
a='
o a
5
+B
i@
:oj
aaq
Ba=
'Ev
338
E9P
e f;
'x
9 =
>o
,aE
f
{-r
0 E
od
= q
if,..
E
]flt,l
.loo
oi_.
nsv
3,
=5
c,p.
!E
+ == dE =
.O)o Eq
*H l 83 =.o
={
!, N
dg-{
)C
(5
' (Y
++
s6@
Eo)
C aaE
oqd
oo o- o).*
EA rE
3ry
Egs
E
-g=
aro-
+o
Y
6 =
'lB
€B
fr.{
E
8Eo
H a
gr*
.o=
'm
o:ra
i(.
, sD
I =
.E
. t=
=a e3 €
_o-
s8 OJ
o0)
sA oo o+ {6 9-'
=d
=a
o! oo og.
a5
=C v ! I E. t g 5 o 0l f .L o m o p. tt g o o a o 2. , Gt
aat e o 3 o ,

v o c { m o 1I 3 ! m ra =41
]II J
U' f
TI
>9 oir s, o o 9, z o ! o z {
v o o - d o c 0) U'
0) 0) o f o o-
=C 7 ! E E.
E 9. : o t 3 CL U'
m tr E.
E o = a o o a o t2,
f Gt
GI a o = o (/)


Appendix 3.4.3
Written Engagement with PETRONS for the Crossing of Pipeline


T: + 03 - 2331 5000Email: [email protected]
Dear Sir,
BINTUIU TANJUNG KTDURONG COMBTNED-CYCLE POWER PIANT PROJECT (UN|T-1o, UNrr-l1)CONTRACT NO: SBP160002-C01-WK01- Additional Cooling Water Pipe Crossings Below Existing Petronas Carigali S/B ("PCSB") & Murphy
OilGas Pipelines
Reference is made to the meeting held on Thursday, 12th October 2OL7 in Bintulu.
We would like to notifo PCSB that due to developments in the Bintulu Tanjung Kidurong Combined Cycle
Power Plant Project, Sarawak Energy intends to construct additional two (2) Cooling Water Pipes for its
Cooling Water Pump House, which leads to an additional two (2) points of crossing at the existing gas
pipeline along the shoreline. We attached herewith the revised pipe crossing layout for Schedule A of
the agreement.
Thus, based on the existing Pipeline Crossing Agreement dated 17th May 2Ot7 ("PLCA") between
Sarawak Energy and Petronas Carigali Sdn. Bhd. ('PCSB'), the said two (2) additional pipes are construed
as "Future Crossings" under Article 12 and is subject to a separate agreement.
We had during the said meeting indicated that we are amenable to either a separate agreement or a
new agreement with similar terms for all four (4) crossings which will supersede the existing PLCA and
with retrospective effect.
Please furnish us with the initial draft for our perusal and approval.
PCSB's support and cooperation on the matter is highly appreciated.
Thank you.
RESTRICTED
SEB Power Sdn Bhd (rrscsrs-u)A Subsidiary of Sarawak Energy Berhad
SBP 150002/c01WK01/2017-00s/cKL/d nb1't November 2OL7
En. Norrizam bin MohamadPETRONAS CARIGALI SDN BHD
Menara Petronas,No.2, Lorong Belia,
88100 Kota Kinabalu,Sabah
Chua Kim LeongProject Director, Tg KidurongCombined Cycle Power Plant Project
Sarawak Energr Berhad (007199-D)Menara Sarawak Energy,No. l, The lsthmus, 93050 Kuching,Sarawak, Malaysia
T +6082 388 388F +6082 344 433www.sarawakene rgy.com.my

sarawa energy
Contract Appendix E - Employer's Technical Requirements
ATTACHMENT E.16 PIPE CROSSING SPECIFICATION BY EXISTING GAS PIPE OWNER
ARTICLE 5
PROCEDURES FOR INSTALLATION OF THE CROSSING PIPELINE &STRUCTURES
PETRONAS Carigali agrees to SEB installing the Crossing Pipeline &
Structures over and below the Crossed Pipeline in accordance with the
procedures as provided in Schedule B to the extent necessary for SEB's
installation activities in connection with the Crossing Pipeline & Structures.
Upon request from SEB, PETRONAS Carigali shall provide the latest available
position of the Crossed Pipeline and SEB shall, at its own cost, carry out all
surveys necessary to establish the actual position of the Crossed Pipeline at
the Crossing Points to the reasonable satisfaction of PETRONAS Carigali.
Such surveys to be carried out by SEB shall be carried out not less than three
(3) months prior to the Commencement Date, unless othenuise agreed in
writing by PETRONAS Carigali.
SEB shallgive PETRONAS Carigali not less than thirty (30) days'written notice
of its intention to start the installation activities with a further written notice to
be given fourteen (14) days before the Commencement Date of such
installation activities. SEB shallthereafter provide daily progress reports during
the period of the installation activities.
PETRONAS Carigali shall use all reasonable efforts to ensure that any work to
be carried out on the Crossed Pipeline prior or during the execution of the SEB
Work, if any, shall be carried out in a manner that the installation activities in
the Right of Way may be carried on without delay or interruption.
SEB shall provide PETRONAS Carigali with the route of the Crossing Pipeline
& Structures in the vicinity of the Crossed Pipeline by providing:
Bintulu Tanjung Kidurong Combined Cycle Power Plant Project (Unit-10, Unit-11) (Contract Reference
5.1
5.2
5.3
5.4
5.5
Ref. No. S8P160002-C01-WK01) 15
sarawa energy
Contract Appendix E - Employer's Technical Requirements
the coordinates/locations within forty-eight (48) hours after the
installation of the Crossing Pipeline & Structures in the Right of Way;
and
the charted information as soon as practicable after the Completion
Date.
As soon as reasonably practicable after the completion of the SEB Work, SEB
shall at its own expense, carry out a post crossing survey of the Crossing Points
and of the Crossed Pipeline and the Crossing Pipeline & Structures within two
hundred (200) metres of the Crossing Points.
Following the completion of SEB Work, SEB shall submit to PETRONAS
Carigali, at its own cost, detailed report of the design, construction and
installation of the crossing, including a set of composite "as built' drawings
showing the position and route of the Crossing Pipeline & Structures within two
hundred (200) metres of the Crossing Points.
Pursuant to Article 5.7, SEB shall also provide PETRONAS Carigali with copies
of information, material, data and documentation (including, but not limited to,
reports, charts, drawings, photographs and records) connected with or arising
out of the post crossing survey together with a written report of the condition of
the Crossing Points which shall include full details on the condition and nature
of the protection material separating the Crossed Pipeline from the Crossing
Pipeline & Structures.
The composite "as built" drawings and the result of the survey carried out by
SEB after the completion of SEB Work shall be reviewed for acceptance by
PETRONAS Carigali. Upon acceptance by PETRONAS Carigali, the
composite "as built" drawings and the result of the survey shall be the
conclusive evidence of the condition of the Crossed Pipeline and the Crossing
Pipeline & Structures at the Crossing Points, subject to Article 4.6.
5.10 SEB shall identify and record the final coordinates of the Crossing Points.
Bintulu Tanjung Kidurong Combined Cycle Power Plant Project (Unit-10, Unit-11) (Contract ReferenceRef. No. S8P160002-C01-WK01) 16
(a)
(b)
5.6
5.7
5.8
5.9

sarawa energy
Contract Appendix E - Employer's Technical Requirements
5.11 lf damage is caused to the Crossed Pipeline within the Right of Way resulting
from the SEB's installation of the Crossing Pipeline & Structures, PETRONAS
Carigali shall as soon as practicable repair the damage to the Crossed Pipeline.
The direct and actual total cost of such repair or work of the Crossed Pipeline
Cable carried out by PETRONAS Carigali shall be solely borne by SEB.
5.12 lf (a) SEB makes unapproved changes to the approved procedures or (b) the
SEB deviates from the approved procedures when carrying out Work, or (c) if,
in the reasonable opinion of PETRONAS Carigali there is a serious risk of
damage to the Crossed Pipeline as a result of Work carried out by SEB in
connection with the installation of the Crossing Pipeline & Structures, then in
the case of (a) or (b) or (c), PETRONAS Carigali after in consultation with SEB
shall take appropriate action to prevent such damage. Any such action after
consultation with SEB, shall be carried out by PETRONAS Carigali after the
completion of SEB Work. The cost shall be determined and mutually agreed by
the Parties and shall be paid by SEB.
END OF ARTICLE 5
Bintulu Tanjung Kidurong Combined Cycle Power Plant Project (Unit-10, Unit-11) (Contract ReferenceRef. No. S8P160002-C01-WK01) L7

6.1
6.2
ARTICLE 6SURVEYS
A Party intending to carry out a survey within the Right of Way shall give written
notice to the other Party before the survey commences. The Parties may
consider joint surveys and/or costsharing if practical. The Parties shall make
freely available to each other the results of all surveys carried out for the
purpose of this Agreement.
The "as found" condition of the Crossed Pipeline shall be the condition of the
Crossed Pipeline prior to the commencement of the SEB Work. The "as found"
condition of the Crossed Pipeline shall be determined by survey carried out by
SEB prior to the commencement of the SEB Work. The results of the survey
shall be reviewed by PETRONAS Carigali and in the absence of manifest error,
accepted by both Parties to be the conclusive evidence of the "as found"
condition of the Crossed Pipeline.
SEB shall ensure that standard onshore pipeline maintenance routines and
inspections of the Crossing Points are performed as required. SEB shall notify
PETRONAS Carigali of any anomaly detected during the said inspection as
soon as reasonably practicable. ln the event either Party requires maintenance
or repair work to be carried out, the Parties shall meet to discuss and agree on
the scope and methodology of such maintenance or repair work.
PETRONAS Carigali shall notify SEB of any anomaly detected during its
pipeline inspection activities on the Crossed Pipeline and shall advise SEB of
any major maintenance activity on the Crossed Pipeline which may affect the
integrity of the Crossing Pipeline & Structures at the Crossing Points.
END OF ARTICLE 6
Bintulu Tanjung Kidurong Combined Cycle Power Plant Project (Unit-10, Unit-11) (Contract ReferenceRef. No. SBP160002-C01-WK01) 18
6.3
6.4
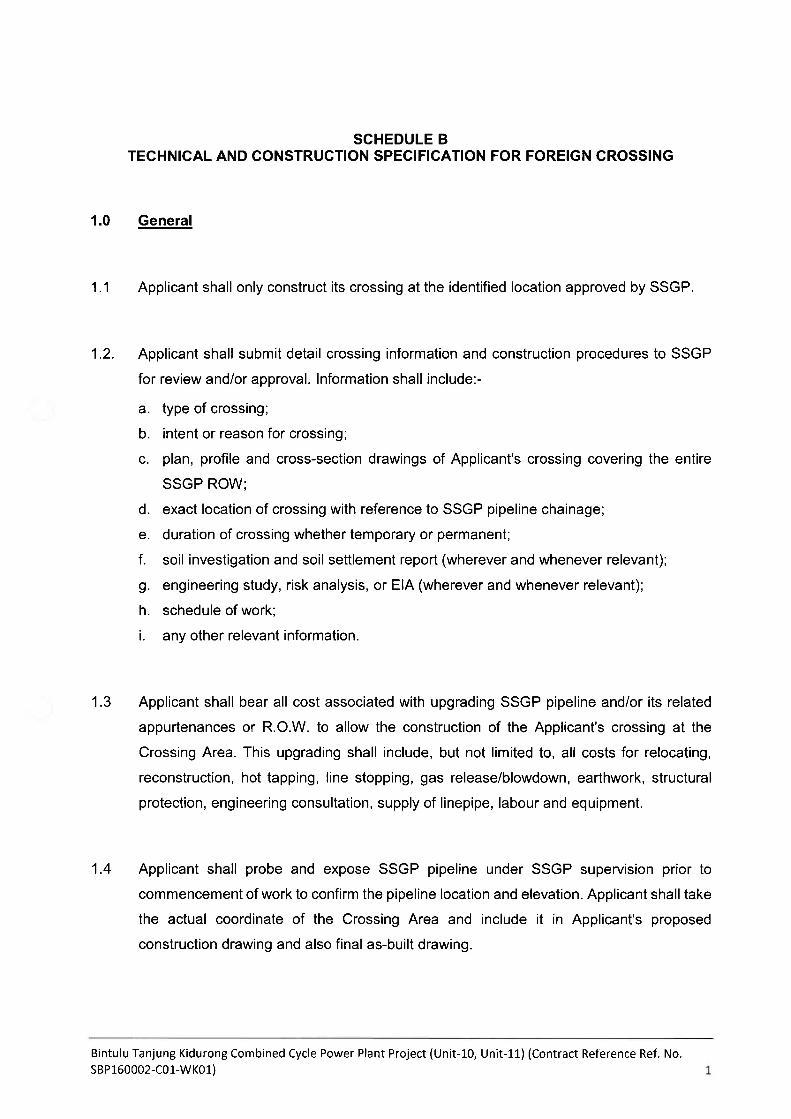
SCHEDULE BTEGHNIGAL AND CONSTRUCTION SPEC!FIGATION FOR FOREIGN CROSSING
1.0 General
1.1 Applicant shall only construct its crossing at the identified location approved by SSGP.
1.2. Applicant shall submit detail crossing information and construction procedures to SSGP
for review and/or approval. lnformation shall include:-
a. type of crossing;
b. intent or reason for crossing;
c. plan, profile and cross-section drawings of Applicant's crossing covering the entire
SSGP ROW;
d. exact location of crossing with reference to SSGP pipeline chainage;
e. duration of crossing whether temporary or permanent;
f. soil investigation and soil settlement report (wherever and whenever relevant);
g. engineering study, risk analysis, or EIA (wherever and whenever relevant);
h. schedule of work;
i. any other relevant information.
1.3 Applicant shall bear all cost associated with upgrading SSGP pipeline and/or its related
appurtenances or R.O.W. to allow the construction of the Applicant's crossing at the
Crossing Area. This upgrading shall include, but not limited to, all costs for relocating,
reconstruction, hot tapping, line stopping, gas release/blowdown, earthwork, structural
protection, engineering consultation, supply of linepipe, labour and equipment.
1.4 Applicant shall probe and expose SSGP pipeline under SSGP supervision prior to
commencement of work to confirm the pipeline location and elevation. Applicant shall take
the actual coordinate of the Crossing Area and include it in Applicant's proposed
construction drawing and also final as-built drawing.
Bintulu Tanjung Kidurong Combined Cycle Power Plant Project (Unit-10, Unit-11) (Contract Reference Ref. No.
sBP160002-C01-WK01)
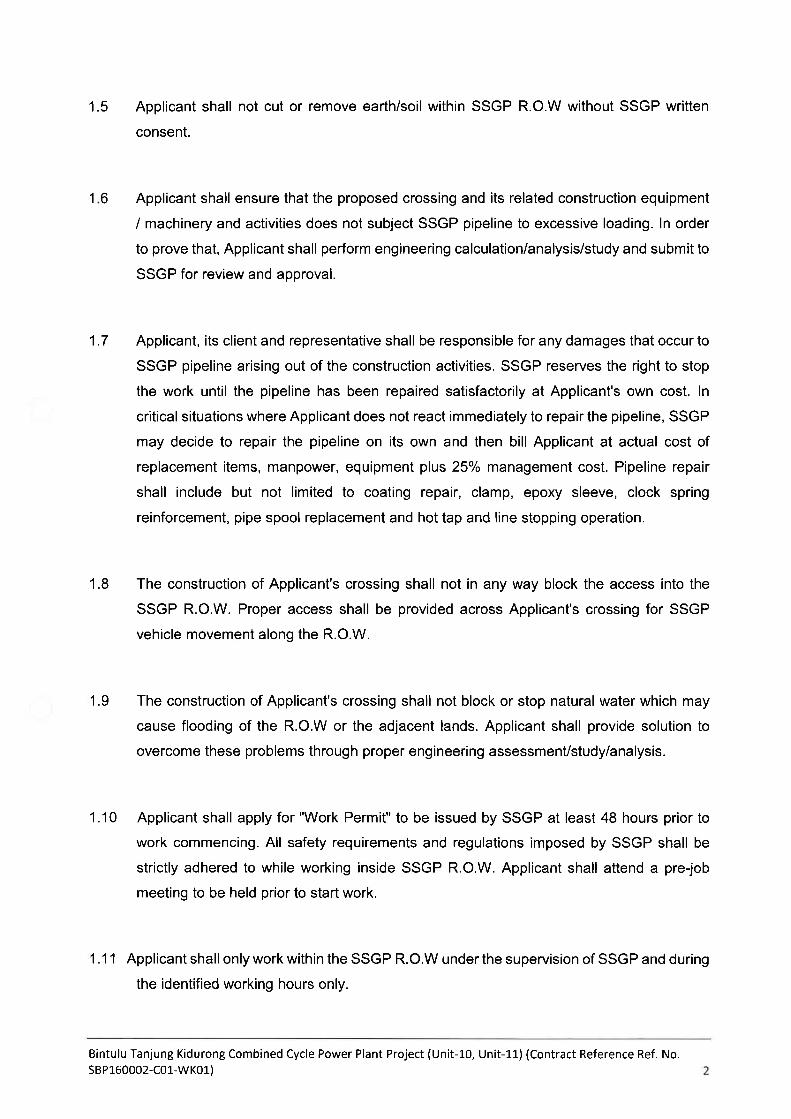
1.5 Applicant shall not cut or remove earth/soil within SSGP R.O.W without SSGP written
consent.
Applicant shall ensure that the proposed crossing and its related construction equipment
/ machinery and activities does not subject SSGP pipeline to excessive loading. ln order
to prove that, Applicant shall perform engineering calculation/analysis/study and submit to
SSGP for review and approval.
Applicant, its client and representative shall be responsible for any damages that occur to
SSGP pipeline arising out of the construction activities. SSGP reseryes the right to stop
the work until the pipeline has been repaired satisfactorily at Applicant's own cost. ln
critical situations where Applicant does not react immediately to repair the pipeline, SSGP
may decide to repair the pipeline on its own and then bill Applicant at actual cost of
replacement items, manpower, equipment plus 25o/o management cost. Pipeline repair
shall include but not limited to coating repair, clamp, epoxy sleeve, clock spring
reinforcement, pipe spool replacement and hot tap and line stopping operation.
The construction of Applicant's crossing shall not in any way block the access into the
SSGP R.O.W. Proper access shall be provided across Applicant's crossing for SSGP
vehicle movement along the R.O.W.
The construction of Applicant's crossing shall not block or stop natural water which may
cause flooding of the R.O.W or the adjacent lands. Applicant shall provide solution to
overcome these problems through proper engineering assessmenUstudy/analysis.
1.10 Applicant shall apply for "Work Permit" to be issued by SSGP at least 48 hours prior to
work commencing. All safety requirements and regulations imposed by SSGP shall be
strictly adhered to while working inside SSGP R.O.W. Applicant shall attend a pre-job
meeting to be held prior to start work.
1 .11 Applicant shall only work within the SSGP R.O.W under the supervision of SSGP and during
the identified working hours only.
Bintulu Tanjung Kidurong Combined Cycle Power Plant Project (Unit-10, Unit-11) (Contract Reference Ref. No.
s8P160002-C01-WK01)
16
1.7
1.8
1.9

1.12 Applicant shall reinstate and re-turf SSGP R.O.W affected by the construction of Applicant's
crossing to the satisfaction of SSGP.
1.13 Applicant shall install :-
a. Standard SSGP warning marker at both sides of the crossing.
b. Cathodic Protection Test Posts for road, railroad, steel pipes, and High Voltage
Transmission lines.
1.14 Applicant shall perform joint final inspection with SSGP upon completion of the
construction activity.
1.15 Applicant shall submit as-built drawing/s of the crossing covering the whole SSGP R.O.W
within 30 days after completion of the work.
1 .16 SSGP shall not be liable and shall be indemnified against any damages or losses whether
to property or life occurring as a result of Applicant's crossing.
1.17 Applicant, its client and representative shall be responsible for any damage that occur to
SSGP pipeline arising out of the operation of Applicant's crossing and shall bear all costs
incurred to repair such damage.
1 .18 SSGP in the course of maintaining its pipeline integrity may have to excavate and perform
inspection, repair or other works on its pipeline within the Crossing Area. SSGP will do its
best to inform Applicant prior to such work. ln executing the work, SSGP will exercise
extreme care to avoid damages to Applicant's crossing. SSGP, however, shall not be
liable for any damage that may occur to Applicant's crossing arising out of the work.
1.19 Applicant shall not construct any new crossing, widening, and modification across SSGP
R.O.W without prior approval of SSGP, which consent shall not be unreasonably withheld.
1.20 Applicant shall allow and provide access for SSGP, SSGP contractors and adjacent
landowners to enter and perform work on the R.O.W which is within the crossing area or
Bintulu Tanjung Kidurong Combined Cycle Power Plant Project (Unit-10, Unit-11) (Contract Reference Ref. No.
sBP160002-C01-WK01)

blocked by the crossing area. Applicant shall not impose any access charges, toll, or
performance bond to any of these parties.
1.21 Applicant shall allow:
a. PETRONAS, its subsidiaries and associate companies,
b. Other Applicants constructing new foreign crossings, and any private companies
or Government bodies which have permits from SSGP to access, enter and
perform work in the R.O.W areas which are within the Crossing Area or blocked
by the crossing area. Any type of guarantee, performance bond or compensation
for damages to Applicant's structure shall be discussed and agreed between
Applicant and the respective parties without the need of SSGP intervention.
2.0 Drain Grossinq
2.1 The clear distance between SSGP pipeline and Applicant's drain shall be determined as
follows and shall extend the full width of SSGP R.O.W:-
a. For earth drain of width not exceeding 1000mm and depth not exceeding 1000mm,
clearance shall be 900mm.
b. For earth drain of width exceeding 1000mm or depth exceeding 1000mm,
clearance shall be 1200mm.
c. For concrete drain of width not exceeding 1000mm or depth not exceeding
1000mm, clearance shall be 300mm.
d. For concrete drain of width exceeding 1000m or depth exceeding 1000 mm,
clearance shall be 600mm.
e. For culvert crossing over SSGP pipeline, the condition stated for concrete drain
crossing shall be used:
i. For culvert crossing under SSGP pipeline, clearance shall be 300mm.
2.2 SSGP pipeline shall be reasonably protected from future dredging or settlement of the
drain structure. Applicant shall propose and design a proper protection for SSGP pipeline
and submit to SSGP for review and approval.
Bintulu Tanjung Kidurong Combined Cycle Power Plant Project (Unit-10, Unit-11) (Contract Reference Ref. No.sBP160002-C01-WK01)

2.3 SSGP pipeline must be reasonably protected from possible movement of pipeline in soft
soil area. Due to this, SSGP may require a rubber padding material be installed between
the pipeline and the drain or culvert. This case is normally encountered whenever a
culvert crosses under SSGP pipeline.
2.4 ln cases where it is justified by Applicant and accepted by SSGP that the clearance stated
in ltem 6.1 cannot be met, SSGP will consider reducing the clearance provided the
Applicant considers installing a reinforced concrete slab or rubber padding or a
combination of both between SSGP pipeline and Applicant's drain.
2.5 lf the construction of Applicant's drains crossing results in blocking future access to SSGP
ROW, Applicant shall construct an access bridge (for a standard 4WD vehicle) or provide
a reasonable alternative for SSGP.
3.0 Pipeline Crossinq
3.1 Applicant's pipeline shall cross SSGP pipeline with minimum clearance of 600 mm.
3.2 Applicant shall cross under SSGP pipeline only.
3.3 Applicant may cross over and above SSGP pipeline provided the following conditions:
a. difficult soil condition,
b. very large diameter (>36 inch),
c. not enough existing pipe cover,
d. product is water or any non-toxic and nonflammable gas or liquid,
e. Applicant willingness to protect aboveground items against vehicle damage and
install access bridge for SSGP vehicle (standard 4 wheel drive).
3.4 Applicant's pipeline shall be able to withstand the load of vehicle normally used for SSGP
pipeline maintenance. SSGP shall not be responsible for any damage that may occur to
Applicant's pipe due to vehicles crossing over the pipe.
Bintulu Tanjung Kidurong Combined Cycle Power Plant Project (Unit-10, Unit-11) (Contract Reference Ref. No.
sBP160002-C01-WK01)
3.5 All working pits constructed for pipeline crossings installed using Horizontal Directional
Drilling, Pipe Jacking, Boring, Microtunnelling or similar methods, shall be installed outside
SSGP ROW.
4.0 Blasting Near PGB-TOD Pipeline
4.1. The intensity of the ground vibrations emanating from the blasting point measured at the
nearest point on the ground above SSGP pipeline shall be limited to the following:
a. Energy ratio of 1.0, or
b. Resultant single amplitude of 0.0152mm and resultant particle velocity of 50mm
per second.
4.2 Applicant shall perform trial blasting at a safe distance away from the pipeline or at other
places to confirm that the explosive design and arrangement will not exceed the limits
stated in item 9.1.
4.3 lf the limits in item 9.1 are exceeded during actual blasting, then Applicant shall, together
with SSGP, perform inspection on the pipeline within 50m distance from where the limits
were breached. The inspection shall include as a minimum, complete excavation and
exposure of the pipeline, visual inspection for gouges, dents, buckles or ovalities, and
NDT on welds for cracks. lf the results of the inspection indicate any damages that exceed
the requirement of the codes and standards, refer to item 1.7 for further details.
Piling Near PGB-TOD Pipeline5.0
5.1 As much as possible, piling should be avoided inside SSGP R.O.W, however if further
engineering calculations/assessmenUstudy prevails that piling is required, Applicant shall
follow the conditions stated below:-
a. The intensity of the ground vibrations emanating from the piling point measured at
the nearest point on the ground above SSGP pipeline shall be limited to the
following:-
Bintulu Tanjung Kidurong Combined Cycle Power Plant Project (Unit-10, Unit-11) (Contract Reference Ref. No.
S8P160002-C01-WK01) 6

Energy ratio of 1.0, or
Resultant single amplitude of 0.0152mm and resultant particle velocity of ground
at 50mm per second.
b. Piling method, configuration and distance from SSGP pipeline shall be adjusted to
suit the above requirement.
5.2 The arrangement of piling shall be confirmed to be safe from possible danger of piling
hitting the pipe, and not affecting SSGP pipeline cathodic protection system and future
pipe laying activities. ln addition, Applicant shall perform cathodic protection mitigation
study or such study for SSGP pipeline as a result Applicant's piling. Applicant shall perform
all mitigation measures recommended by the mitigation study.
ln general, the arrangement shall use the following rules:
Clear distance between Applicant's piles and edge 1 m minimum
of SSGP pipeline
Gap between piles along the pipeline 1 m minimum
Gap provided for future pipeline to pass through 3 m minimum
Applicant shall seek SSGP advice and concurrence prior to designing its piling.
5.3. No permanent steel piling is allowed within 20m away from SSGP pipeline to ensure
SSGP cathodic protection system is not disturbed.
5.4 Permanent markers shall be installed at nearest point to SSGP pipeline indicating distance
from the piles.
5.5 lf the piling is in row configuration, Applicant shall provide marker at every 10 meter
distance. The design of the marker shall be submitted to SSGP for review and approval.
Bintulu Tanjung Kidurong Combined Cycle Power Plant Project (Unit-10, Unit-11) (Contract Reference Ref. No.
s8P160002-C01-WK01)

6.0 Material Specifications
6.1 Test Post
6.1.1 The test posts used shall be of such a design that there will be no exposed metallic
surfaces such as Zap Gard Cathodic Protection test station or equivalent.
6.1.2 The test facility shall be provided with terminals such that up to five separate cables can
be terminated and up to four of these may be electrically bonded together.
6.1.3 The test station shall be fitted with a lockable cap coloured orange.
6.1.4 The test post support body shall be made of PVC with thickness of minimum 10 mm.
6.2 Cables and Warninq Marker
6.2.1 All DC cables shall be single core multiple stranded copper 300/500 volt grade to BS
6004:1984
6.2.2 Monitoring cables shall be 16 mm2 PVC/PVC black.
6.3 Permanent Reference Gell
6.3.1 The permanent reference cell shall be Stelth2 Model SRE-O07-CUY.
6.4 Other Materials
Bintulu Tanjung Kidurong Combined Cycle Power Plant Project (Unit-10, Unit-11) (Contract Reference Ref. No.
s8P160002-C01-WK0r,) 8

6.4.1 CONTRACTOR shall responsible to prepare all necessarily items needed to complete the
installation of CADWELD and test post installation.
END OF SCHEDULE B
Bintulu Tanjung Kidurong Combined Cycle Power Plant Project (Unit-10, Unit-11) (Contract Reference Ref. No.
sBP160002-C01-WK01)

Appendix 3.4.4
Heat Balance Diagram

For information
only!HEAT BALANCE DIAGRAM
Format:
Pressure
Mass flow
Temperature
Enthalpy
P
M
T
H
Lang:Doc: Sheet: No of Sh:
bar
kg/s
°C
kJ/kg
E
GSGG
2017-01-13/16:42:29
Fuel: Natural Gas
RH 85.00 [%]
Tanjung Kidurong CCPP
T_AMB 33.0 [°C]
100% CCPP Load - MCL - Design Ambient Conditions
GT Data: TJK-11-G-MB------EN-CA-001-en / Case 1 / Col D
P_AMB 1.011 [bar]
Approved:
Drawn:
Checked:
H. Ahlmann
Revision:
G. Moore
T. Maniyan
G. Moore
1GP002635_001
Rev.1© ALSTOM 2017. All rights reserved. Information contained in this document is indicative only. No representation or warranty is given or should be relied on that it is complete or correct or will apply to any particular project. This will depend on the technical and commercial circumstances. It is provided without liability and is subject to change without notice. Reproduction, use or disclosure to third parties, without express written authority, is strictly prohibited.
GA
GA
W
W
D
D
S
S
GB
GB
GSC
G
C
C
M 15.19
T 20.0
P 1.011
T 33.0
RH 85.00
Q 705524
B
B
To HRSG
P 138.346
PF 0.85
To Steam
Air Ejector
To Condensate
From Steam
Air Ejector
T 150.0
From CRH
T 645.2
M 596.59
H 732.0
2.80
T 60.0
P 33.249
T 578.5
H 3631.2
M 102.22
M 0.00
OTC
To OTC
From OTC
T 37.9
T 31.0
M 8986.73
VOL 8.80
G
From Cold
Reheat
To Gas
Preheater
From Gas
Preheater
T 41.0
M 111.28
P 4.996
T 294.3
H 3052.8
M 7.28
FUEL: Natural Gas
T 227.6
M 6.15
P 36.550
T 379.1
H 3171.2
M 0.00
T 227.6
M 6.15
T 264.9
M 15.35
T 477.7
M 15.35
T 42.1
M 111.24
T 60.0
M 6.15
P 1.011
T 80.6
P 35.720
T 378.4
H 3171.2
M 92.20
COMBINED CYCLE PERFORMANCES
M 0.10
P 36.550
T 379.1
H 3171.2
M 92.20
P 4.703
T 293.9
H 3052.8
M 7.28
M 0.10
P 0.077
T 40.7
H 2410.4
M 110.85
Make-UpM 0.00
M 0.09
GT_Output 257908
ST_Output 163707
Gross_Output 421615
Gross_Heat_Rate 6024
Gross_Efficiency 59.76
kW Elec.
kJ/kWh
kW Elec.
kW Elec.
%
P 32.574
T 578.2
H 3631.2
M 102.22
P 144.427
T 586.2
H 3552.1
M 93.94
P 141.033
T 585.0
H 3552.1
M 93.94
DIRECT
COOLING
LHV 46457
[-]
M 6.15
kJ/kg
From Gland
Steam System
By-Pass Stack Exhaust
HRSG Exhaust
Fuel
chanping.pang
Oval
chanping.pang
Line
chanping.pang
Oval
chanping.pang
Line
chanping.pang
Oval
chanping.pang
Line
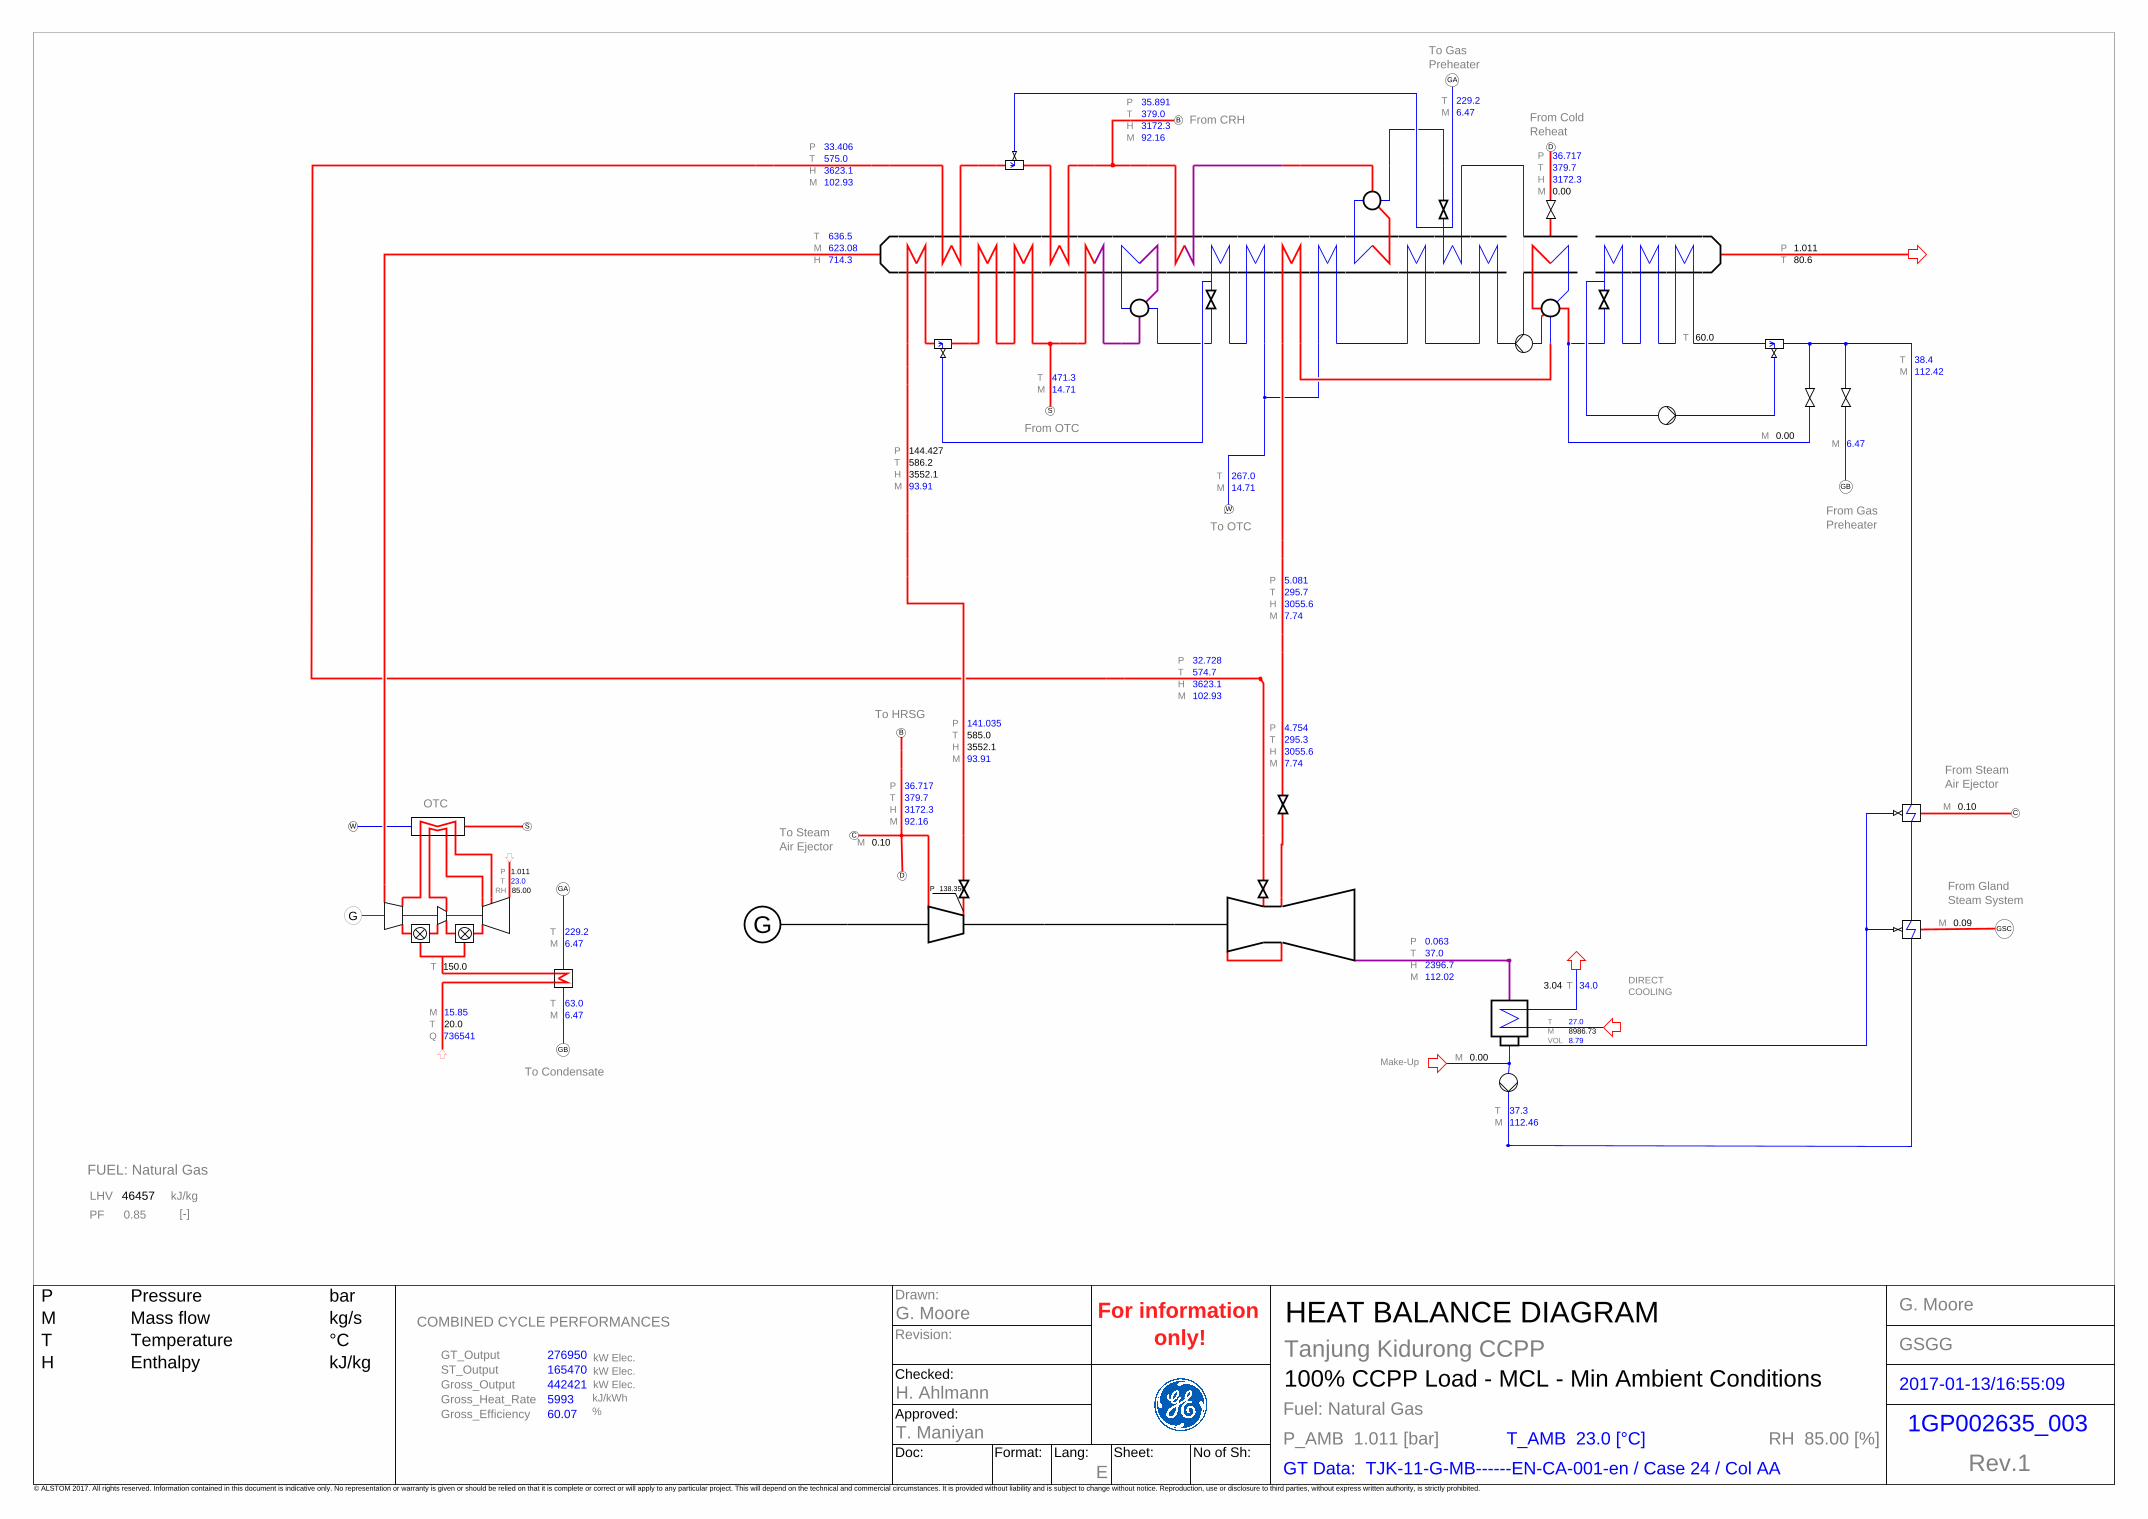
For information
only!HEAT BALANCE DIAGRAM
Format:
Pressure
Mass flow
Temperature
Enthalpy
P
M
T
H
Lang:Doc: Sheet: No of Sh:
bar
kg/s
°C
kJ/kg
E
GSGG
2017-01-13/16:55:09
Fuel: Natural Gas
RH 85.00 [%]
Tanjung Kidurong CCPP
T_AMB 23.0 [°C]
100% CCPP Load - MCL - Min Ambient Conditions
GT Data: TJK-11-G-MB------EN-CA-001-en / Case 24 / Col AA
P_AMB 1.011 [bar]
Approved:
Drawn:
Checked:
H. Ahlmann
Revision:
G. Moore
T. Maniyan
G. Moore
1GP002635_003
Rev.1© ALSTOM 2017. All rights reserved. Information contained in this document is indicative only. No representation or warranty is given or should be relied on that it is complete or correct or will apply to any particular project. This will depend on the technical and commercial circumstances. It is provided without liability and is subject to change without notice. Reproduction, use or disclosure to third parties, without express written authority, is strictly prohibited.
GA
GA
W
W
D
D
S
S
GB
GB
GSC
G
C
C
M 15.85
T 20.0
P 1.011
T 23.0
RH 85.00
Q 736541
B
B
To HRSG
P 138.350
PF 0.85
To Steam
Air Ejector
To Condensate
From Steam
Air Ejector
T 150.0
From CRH
T 636.5
M 623.08
H 714.3
3.04
T 60.0
P 33.406
T 575.0
H 3623.1
M 102.93
M 0.00
OTC
To OTC
From OTC
T 34.0
T 27.0
M 8986.73
VOL 8.79
G
From Cold
Reheat
To Gas
Preheater
From Gas
Preheater
T 37.3
M 112.46
P 5.081
T 295.7
H 3055.6
M 7.74
FUEL: Natural Gas
T 229.2
M 6.47
P 36.717
T 379.7
H 3172.3
M 0.00
T 229.2
M 6.47
T 267.0
M 14.71
T 471.3
M 14.71
T 38.4
M 112.42
T 63.0
M 6.47
P 1.011
T 80.6
P 35.891
T 379.0
H 3172.3
M 92.16
COMBINED CYCLE PERFORMANCES
M 0.10
P 36.717
T 379.7
H 3172.3
M 92.16
P 4.754
T 295.3
H 3055.6
M 7.74
M 0.10
P 0.063
T 37.0
H 2396.7
M 112.02
Make-UpM 0.00
M 0.09
GT_Output 276950
ST_Output 165470
Gross_Output 442421
Gross_Heat_Rate 5993
Gross_Efficiency 60.07
kW Elec.
kJ/kWh
kW Elec.
kW Elec.
%
P 32.728
T 574.7
H 3623.1
M 102.93
P 144.427
T 586.2
H 3552.1
M 93.91
P 141.035
T 585.0
H 3552.1
M 93.91
DIRECT
COOLING
LHV 46457
[-]
M 6.47
kJ/kg
From Gland
Steam System

For information
only!HEAT BALANCE DIAGRAM
Format:
Pressure
Mass flow
Temperature
Enthalpy
P
M
T
H
Lang:Doc: Sheet: No of Sh:
bar
kg/s
°C
kJ/kg
E
GSGG
2017-01-13/16:55:24
Fuel: Natural Gas
RH 85.00 [%]
Tanjung Kidurong CCPP
T_AMB 35.5 [°C]
100% CCPP Load - MCL - Max Ambient Conditions
GT Data: TJK-11-G-MB------EN-CA-001-en / Case 36 / Col AM
P_AMB 1.011 [bar]
Approved:
Drawn:
Checked:
H. Ahlmann
Revision:
G. Moore
T. Maniyan
G. Moore
1GP002635_002
Rev.1© ALSTOM 2017. All rights reserved. Information contained in this document is indicative only. No representation or warranty is given or should be relied on that it is complete or correct or will apply to any particular project. This will depend on the technical and commercial circumstances. It is provided without liability and is subject to change without notice. Reproduction, use or disclosure to third parties, without express written authority, is strictly prohibited.
GA
GA
W
W
D
D
S
S
GB
GB
GSC
G
C
C
M 14.99
T 20.0
P 1.011
T 35.5
RH 85.00
Q 696224
B
B
To HRSG
P 138.193
PF 0.85
To Steam
Air Ejector
To Condensate
From Steam
Air Ejector
T 150.0
From CRH
T 648.1
M 588.00
H 738.2
2.70
T 60.0
P 33.166
T 579.8
H 3634.2
M 101.88
M 0.00
OTC
To OTC
From OTC
T 39.9
T 33.0
M 8986.73
VOL 8.81
G
From Cold
Reheat
To Gas
Preheater
From Gas
Preheater
T 42.9
M 110.86
P 4.975
T 293.6
H 3051.5
M 7.21
FUEL: Natural Gas
T 227.1
M 6.06
P 36.461
T 378.9
H 3171.0
M 0.00
T 227.1
M 6.06
T 264.2
M 15.40
T 479.3
M 15.40
T 44.0
M 110.82
T 59.1
M 6.06
P 1.011
T 80.9
P 35.631
T 378.2
H 3171.0
M 92.11
COMBINED CYCLE PERFORMANCES
M 0.10
P 36.461
T 378.9
H 3171.0
M 92.11
P 4.687
T 293.3
H 3051.5
M 7.21
M 0.10
P 0.085
T 42.6
H 2421.0
M 110.43
Make-UpM 0.00
M 0.09
GT_Output 252249
ST_Output 162370
Gross_Output 414618
Gross_Heat_Rate 6045
Gross_Efficiency 59.55
kW Elec.
kJ/kWh
kW Elec.
kW Elec.
%
P 32.493
T 579.5
H 3634.2
M 101.88
P 144.269
T 586.2
H 3552.3
M 93.85
P 140.877
T 585.0
H 3552.3
M 93.85
DIRECT
COOLING
LHV 46457
[-]
M 6.06
kJ/kg
From Gland
Steam System

For information
only!HEAT BALANCE DIAGRAM
Format:
Pressure
Mass flow
Temperature
Enthalpy
P
M
T
H
Lang:Doc: Sheet: No of Sh:
bar
kg/s
°C
kJ/kg
E
GSGG
2017-01-13/16:48:08
Fuel: Natural Gas
RH 85.00 [%]
Tanjung Kidurong CCPP
T_AMB 33.0 [°C]
90% CCPP Load - Design Conditions
GT Data: TJK-11-G-MB------EN-CA-001-en / Case 6 / Col I
P_AMB 1.011 [bar]
Approved:
Drawn:
Checked:
H. Ahlmann
Revision:
G. Moore
T. Maniyan
G. Moore
1GP002635_016
Rev.0© ALSTOM 2017. All rights reserved. Information contained in this document is indicative only. No representation or warranty is given or should be relied on that it is complete or correct or will apply to any particular project. This will depend on the technical and commercial circumstances. It is provided without liability and is subject to change without notice. Reproduction, use or disclosure to third parties, without express written authority, is strictly prohibited.
GA
GA
W
W
D
D
S
S
GB
GB
GSC
G
C
C
M 13.78
T 20.0
P 1.011
T 33.0
RH 85.00
Q 640319
B
B
To HRSG
P 125.428
PF 0.85
To Steam
Air Ejector
To Condensate
From Steam
Air Ejector
T 150.0
From CRH
T 639.1
M 555.08
H 723.8
2.56
T 60.0
P 30.208
T 579.4
H 3635.8
M 92.73
M 0.00
OTC
To OTC
From OTC
T 37.3
T 31.0
M 8986.73
VOL 8.80
G
From Cold
Reheat
To Gas
Preheater
From Gas
Preheater
T 40.2
M 101.37
P 4.592
T 289.6
H 3044.2
M 7.02
FUEL: Natural Gas
T 224.2
M 5.51
P 33.211
T 380.5
H 3180.9
M 0.00
T 224.2
M 5.51
T 261.5
M 12.10
T 488.8
M 12.10
T 41.4
M 101.33
T 54.0
M 5.51
P 1.011
T 79.8
P 32.460
T 379.9
H 3180.9
M 83.25
COMBINED CYCLE PERFORMANCES
M 0.10
P 33.211
T 380.5
H 3180.9
M 83.25
P 4.298
T 289.2
H 3044.2
M 7.02
M 0.10
P 0.073
T 39.9
H 2417.4
M 100.98
Make-UpM 0.00
M 0.08
GT_Output 231710
ST_Output 148377
Gross_Output 380087
Gross_Heat_Rate 6065
Gross_Efficiency 59.36
kW Elec.
kJ/kWh
kW Elec.
kW Elec.
%
P 29.595
T 579.1
H 3635.8
M 92.73
P 130.939
T 586.1
H 3564.1
M 84.83
P 127.863
T 585.0
H 3564.1
M 84.83
DIRECT
COOLING
LHV 46457
[-]
M 5.51
kJ/kg
From Gland
Steam System

For information
only!HEAT BALANCE DIAGRAM
Format:
Pressure
Mass flow
Temperature
Enthalpy
P
M
T
H
Lang:Doc: Sheet: No of Sh:
bar
kg/s
°C
kJ/kg
E
GSGG
2017-01-13/16:47:56
Fuel: Natural Gas
RH 85.00 [%]
Tanjung Kidurong CCPP
T_AMB 33.0 [°C]
80% CCPP Load - Design Ambient Conditions
GT Data: TJK-11-G-MB------EN-CA-001-en / Case 9 / Col L
P_AMB 1.011 [bar]
Approved:
Drawn:
Checked:
H. Ahlmann
Revision:
G. Moore
T. Maniyan
G. Moore
1GP002635_017
Rev.0© ALSTOM 2017. All rights reserved. Information contained in this document is indicative only. No representation or warranty is given or should be relied on that it is complete or correct or will apply to any particular project. This will depend on the technical and commercial circumstances. It is provided without liability and is subject to change without notice. Reproduction, use or disclosure to third parties, without express written authority, is strictly prohibited.
GA
GA
W
W
D
D
S
S
GB
GB
GSC
G
C
C
M 12.42
T 20.0
P 1.011
T 33.0
RH 85.00
Q 576794
B
B
To HRSG
P 114.832
PF 0.85
To Steam
Air Ejector
To Condensate
From Steam
Air Ejector
T 150.0
From CRH
T 650.0
M 503.08
H 736.9
2.36
T 60.0
P 27.881
T 581.0
H 3641.5
M 85.45
M 0.00
OTC
To OTC
From OTC
T 36.8
T 31.0
M 8986.73
VOL 8.80
G
From Cold
Reheat
To Gas
Preheater
From Gas
Preheater
T 39.5
M 92.92
P 4.164
T 284.2
H 3034.2
M 5.97
FUEL: Natural Gas
T 218.6
M 5.02
P 30.613
T 382.3
H 3190.0
M 0.00
T 218.6
M 5.02
T 256.5
M 9.41
T 481.6
M 9.41
T 40.7
M 92.89
T 49.6
M 5.02
P 1.011
T 77.4
P 29.930
T 381.8
H 3190.0
M 75.91
COMBINED CYCLE PERFORMANCES
M 0.10
P 30.613
T 382.3
H 3190.0
M 75.91
P 3.931
T 283.9
H 3034.2
M 5.97
M 0.10
P 0.071
T 39.2
H 2423.9
M 92.56
Make-UpM 0.00
M 0.08
GT_Output 202778
ST_Output 135886
Gross_Output 338664
Gross_Heat_Rate 6131
Gross_Efficiency 58.71
kW Elec.
kJ/kWh
kW Elec.
kW Elec.
%
P 27.315
T 580.8
H 3641.5
M 85.45
P 119.872
T 586.0
H 3573.8
M 77.38
P 117.059
T 585.0
H 3573.8
M 77.38
DIRECT
COOLING
LHV 46457
[-]
M 5.02
kJ/kg
From Gland
Steam System
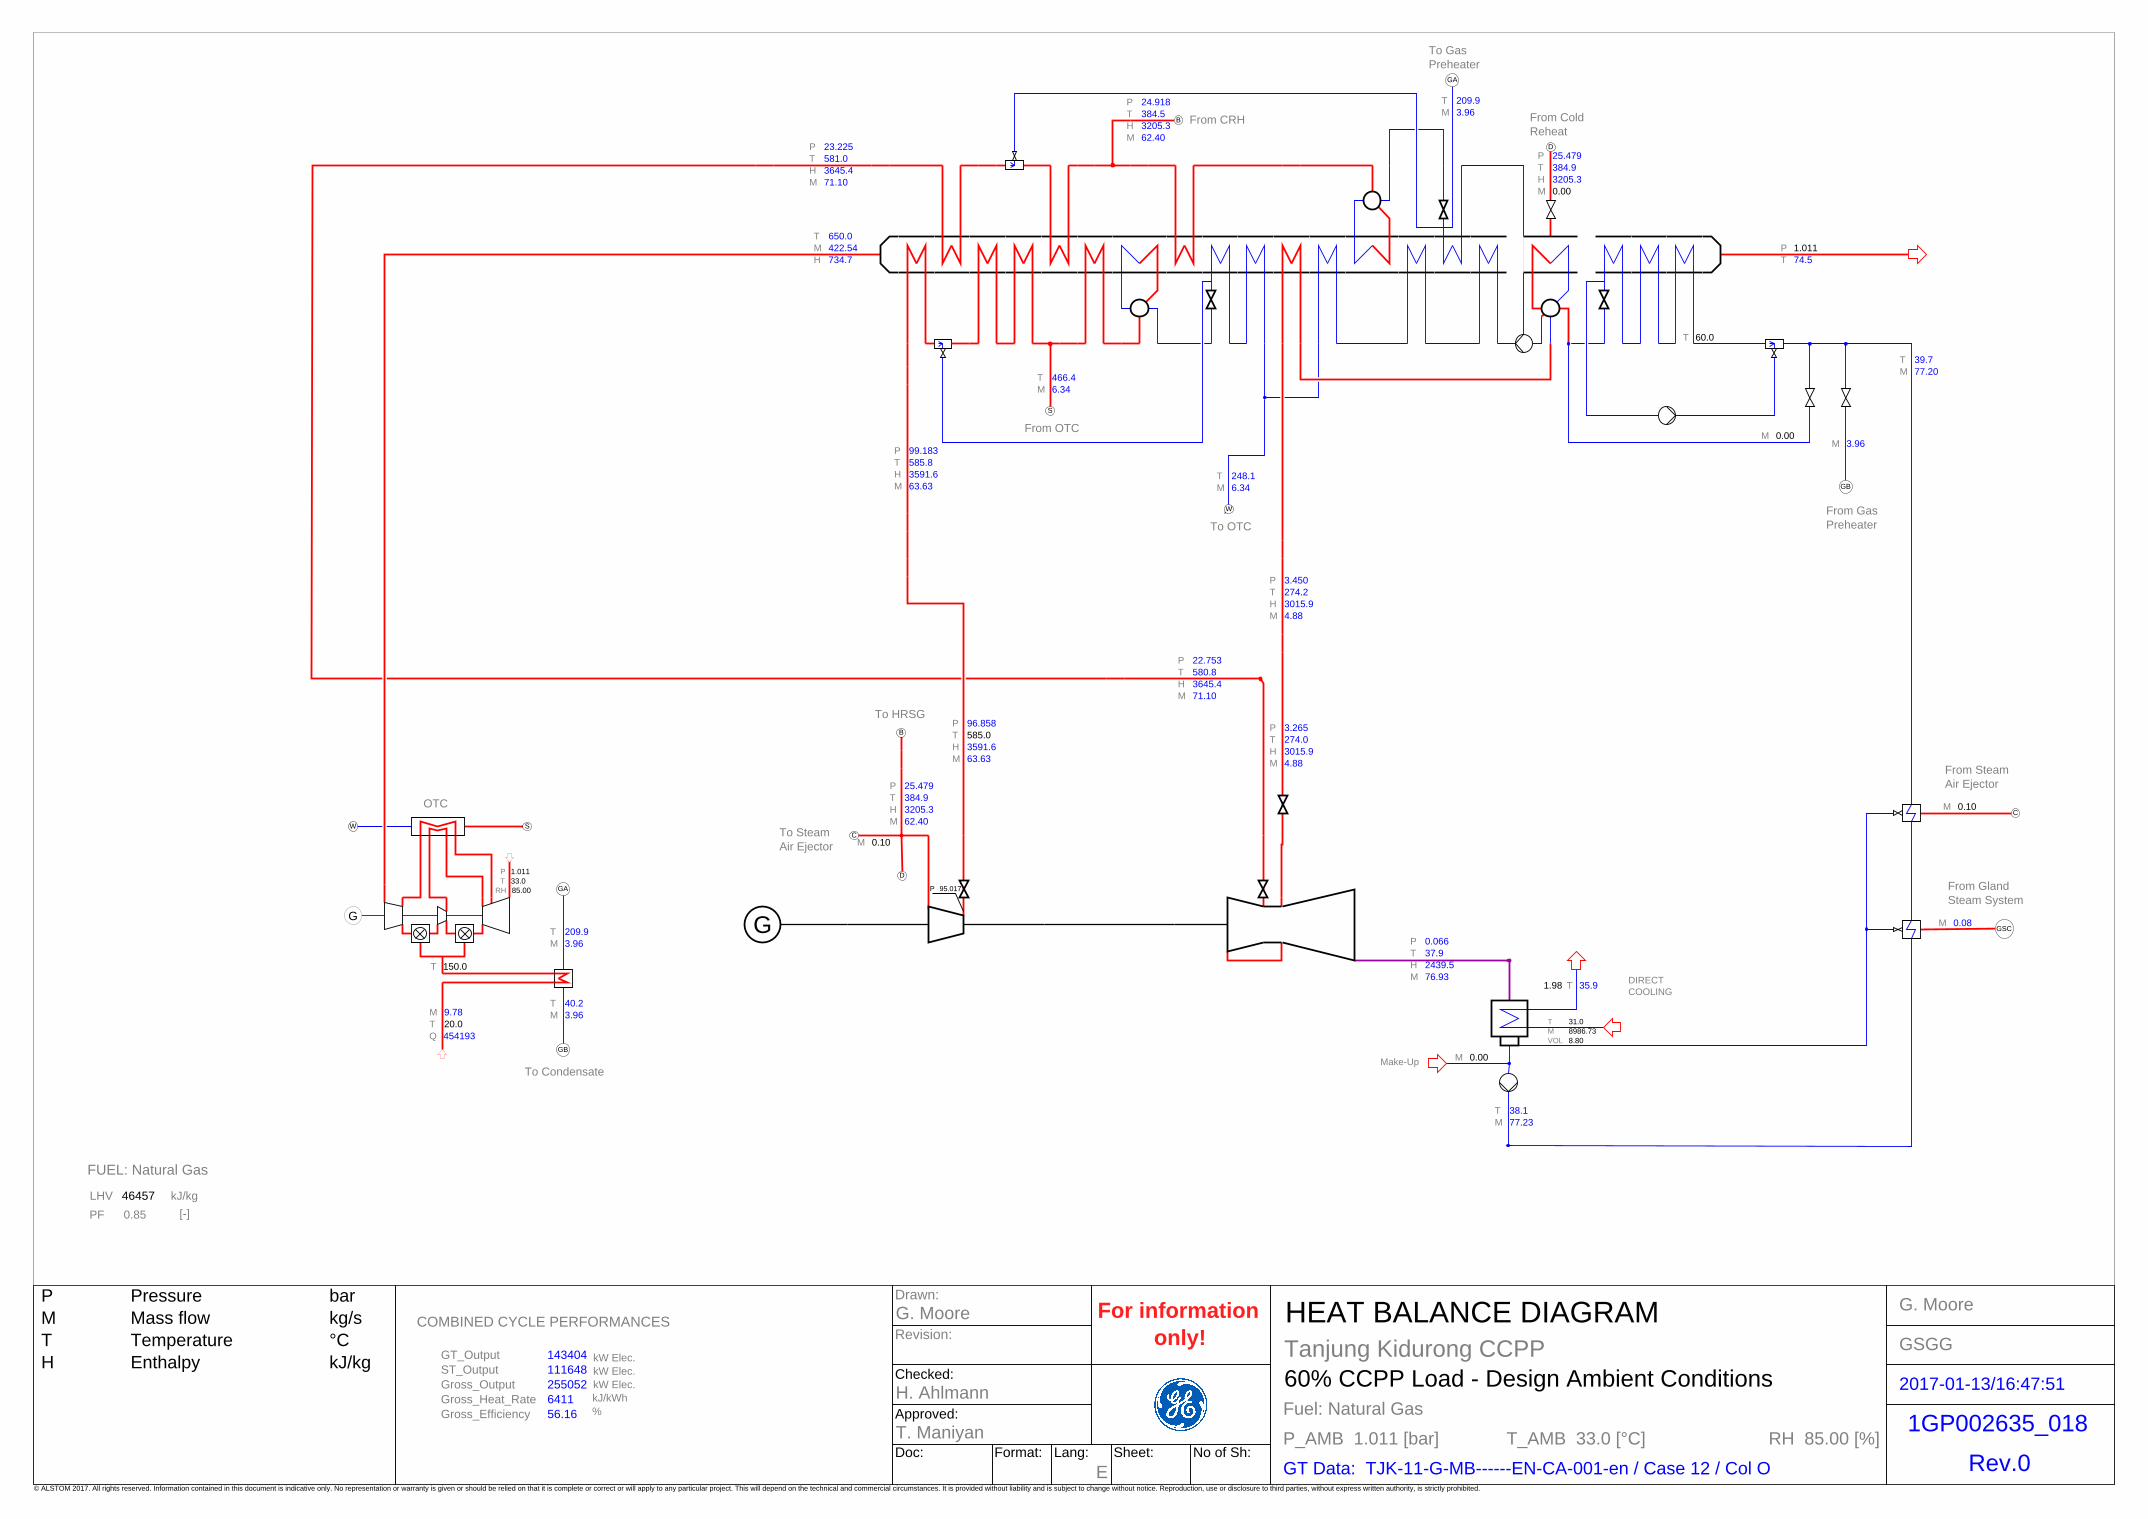
For information
only!HEAT BALANCE DIAGRAM
Format:
Pressure
Mass flow
Temperature
Enthalpy
P
M
T
H
Lang:Doc: Sheet: No of Sh:
bar
kg/s
°C
kJ/kg
E
GSGG
2017-01-13/16:47:51
Fuel: Natural Gas
RH 85.00 [%]
Tanjung Kidurong CCPP
T_AMB 33.0 [°C]
60% CCPP Load - Design Ambient Conditions
GT Data: TJK-11-G-MB------EN-CA-001-en / Case 12 / Col O
P_AMB 1.011 [bar]
Approved:
Drawn:
Checked:
H. Ahlmann
Revision:
G. Moore
T. Maniyan
G. Moore
1GP002635_018
Rev.0© ALSTOM 2017. All rights reserved. Information contained in this document is indicative only. No representation or warranty is given or should be relied on that it is complete or correct or will apply to any particular project. This will depend on the technical and commercial circumstances. It is provided without liability and is subject to change without notice. Reproduction, use or disclosure to third parties, without express written authority, is strictly prohibited.
GA
GA
W
W
D
D
S
S
GB
GB
GSC
G
C
C
M 9.78
T 20.0
P 1.011
T 33.0
RH 85.00
Q 454193
B
B
To HRSG
P 95.017
PF 0.85
To Steam
Air Ejector
To Condensate
From Steam
Air Ejector
T 150.0
From CRH
T 650.0
M 422.54
H 734.7
1.98
T 60.0
P 23.225
T 581.0
H 3645.4
M 71.10
M 0.00
OTC
To OTC
From OTC
T 35.9
T 31.0
M 8986.73
VOL 8.80
G
From Cold
Reheat
To Gas
Preheater
From Gas
Preheater
T 38.1
M 77.23
P 3.450
T 274.2
H 3015.9
M 4.88
FUEL: Natural Gas
T 209.9
M 3.96
P 25.479
T 384.9
H 3205.3
M 0.00
T 209.9
M 3.96
T 248.1
M 6.34
T 466.4
M 6.34
T 39.7
M 77.20
T 40.2
M 3.96
P 1.011
T 74.5
P 24.918
T 384.5
H 3205.3
M 62.40
COMBINED CYCLE PERFORMANCES
M 0.10
P 25.479
T 384.9
H 3205.3
M 62.40
P 3.265
T 274.0
H 3015.9
M 4.88
M 0.10
P 0.066
T 37.9
H 2439.5
M 76.93
Make-UpM 0.00
M 0.08
GT_Output 143404
ST_Output 111648
Gross_Output 255052
Gross_Heat_Rate 6411
Gross_Efficiency 56.16
kW Elec.
kJ/kWh
kW Elec.
kW Elec.
%
P 22.753
T 580.8
H 3645.4
M 71.10
P 99.183
T 585.8
H 3591.6
M 63.63
P 96.858
T 585.0
H 3591.6
M 63.63
DIRECT
COOLING
LHV 46457
[-]
M 3.96
kJ/kg
From Gland
Steam System
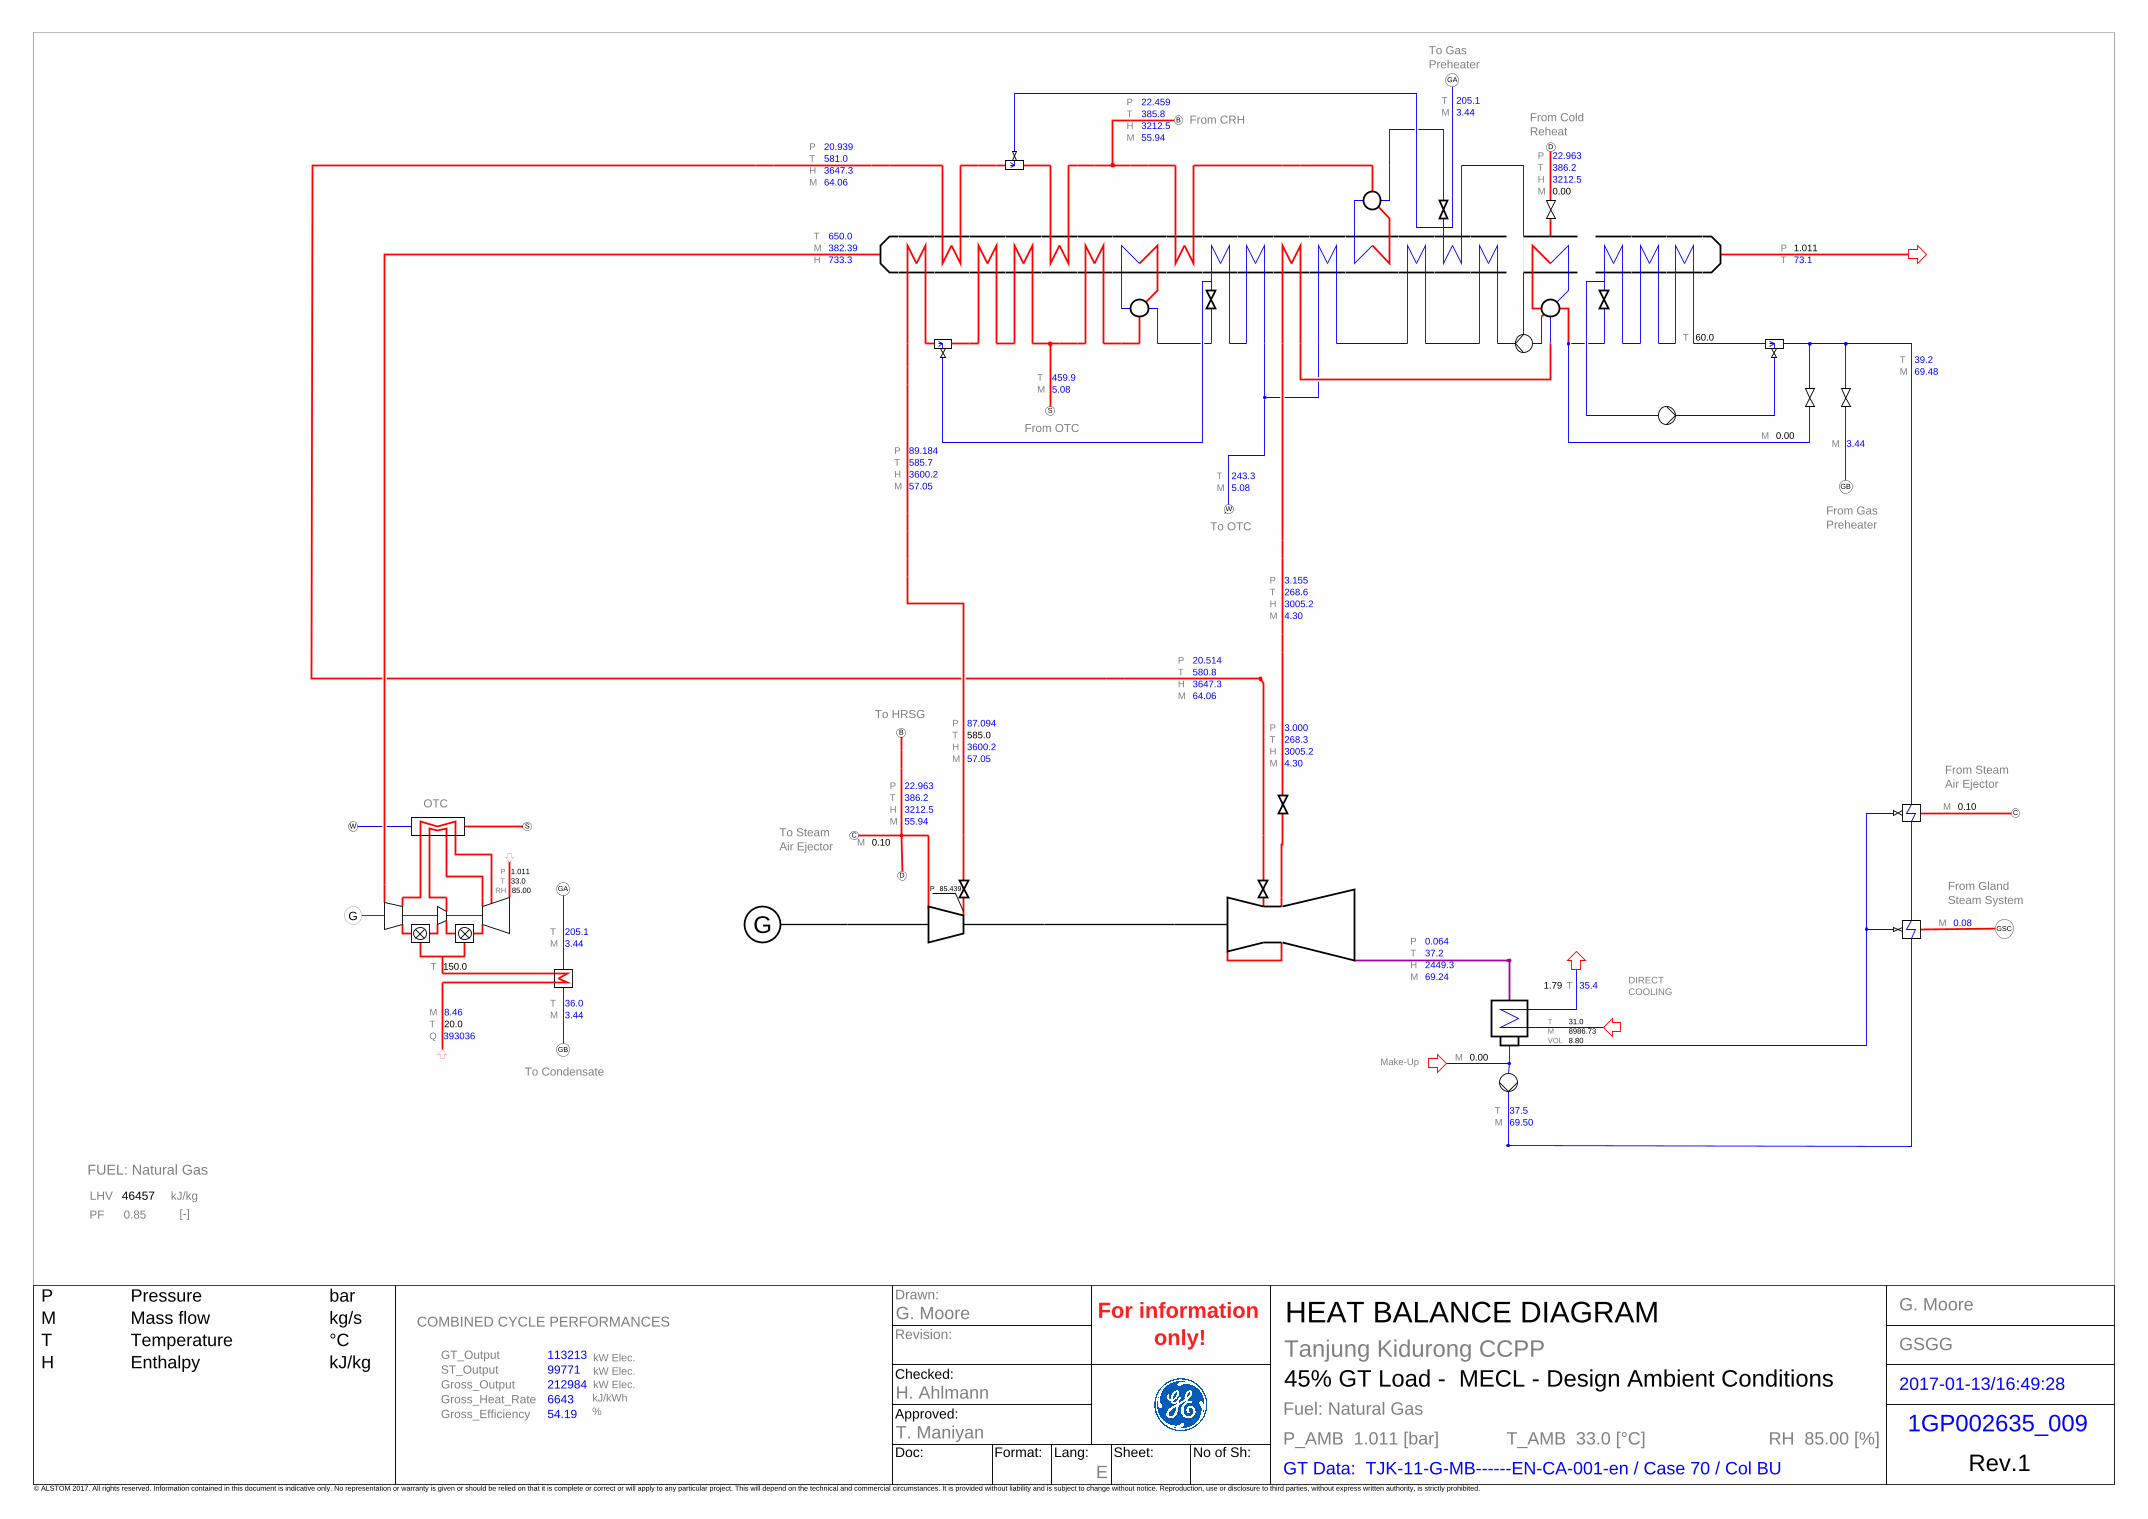
For information
only!HEAT BALANCE DIAGRAM
Format:
Pressure
Mass flow
Temperature
Enthalpy
P
M
T
H
Lang:Doc: Sheet: No of Sh:
bar
kg/s
°C
kJ/kg
E
GSGG
2017-01-13/16:49:28
Fuel: Natural Gas
RH 85.00 [%]
Tanjung Kidurong CCPP
T_AMB 33.0 [°C]
45% GT Load - MECL - Design Ambient Conditions
GT Data: TJK-11-G-MB------EN-CA-001-en / Case 70 / Col BU
P_AMB 1.011 [bar]
Approved:
Drawn:
Checked:
H. Ahlmann
Revision:
G. Moore
T. Maniyan
G. Moore
1GP002635_009
Rev.1© ALSTOM 2017. All rights reserved. Information contained in this document is indicative only. No representation or warranty is given or should be relied on that it is complete or correct or will apply to any particular project. This will depend on the technical and commercial circumstances. It is provided without liability and is subject to change without notice. Reproduction, use or disclosure to third parties, without express written authority, is strictly prohibited.
GA
GA
W
W
D
D
S
S
GB
GB
GSC
G
C
C
M 8.46
T 20.0
P 1.011
T 33.0
RH 85.00
Q 393036
B
B
To HRSG
P 85.439
PF 0.85
To Steam
Air Ejector
To Condensate
From Steam
Air Ejector
T 150.0
From CRH
T 650.0
M 382.39
H 733.3
1.79
T 60.0
P 20.939
T 581.0
H 3647.3
M 64.06
M 0.00
OTC
To OTC
From OTC
T 35.4
T 31.0
M 8986.73
VOL 8.80
G
From Cold
Reheat
To Gas
Preheater
From Gas
Preheater
T 37.5
M 69.50
P 3.155
T 268.6
H 3005.2
M 4.30
FUEL: Natural Gas
T 205.1
M 3.44
P 22.963
T 386.2
H 3212.5
M 0.00
T 205.1
M 3.44
T 243.3
M 5.08
T 459.9
M 5.08
T 39.2
M 69.48
T 36.0
M 3.44
P 1.011
T 73.1
P 22.459
T 385.8
H 3212.5
M 55.94
COMBINED CYCLE PERFORMANCES
M 0.10
P 22.963
T 386.2
H 3212.5
M 55.94
P 3.000
T 268.3
H 3005.2
M 4.30
M 0.10
P 0.064
T 37.2
H 2449.3
M 69.24
Make-UpM 0.00
M 0.08
GT_Output 113213
ST_Output 99771
Gross_Output 212984
Gross_Heat_Rate 6643
Gross_Efficiency 54.19
kW Elec.
kJ/kWh
kW Elec.
kW Elec.
%
P 20.514
T 580.8
H 3647.3
M 64.06
P 89.184
T 585.7
H 3600.2
M 57.05
P 87.094
T 585.0
H 3600.2
M 57.05
DIRECT
COOLING
LHV 46457
[-]
M 3.44
kJ/kg
From Gland
Steam System

For information
only!HEAT BALANCE DIAGRAM
Format:
Pressure
Mass flow
Temperature
Enthalpy
P
M
T
H
Lang:Doc: Sheet: No of Sh:
bar
kg/s
°C
kJ/kg
E
GSGG
2017-01-13/16:48:03
Fuel: Fuel Oil
RH 85.00 [%]
Tanjung Kidurong CCPP
T_AMB 33.0 [°C]
100% CCPP Load - FO - Design Ambient Conditions
GT Data: TJK-11-G-MB------EN-CA-001-en / Case 183 / Col GD
P_AMB 1.011 [bar]
Approved:
Drawn:
Checked:
H. Ahlmann
Revision:
G. Moore
T. Maniyan
G. Moore
1GP002635_400
Rev.0© ALSTOM 2017. All rights reserved. Information contained in this document is indicative only. No representation or warranty is given or should be relied on that it is complete or correct or will apply to any particular project. This will depend on the technical and commercial circumstances. It is provided without liability and is subject to change without notice. Reproduction, use or disclosure to third parties, without express written authority, is strictly prohibited.
GA
GA
W
W
D
D
S
S
GB
GB
GSC
G
C
C
M 17.21
T 30.0
P 1.011
T 33.0
RH 85.00
Q 730263
B
B
To HRSG
P 124.849
PF 0.85
To Steam
Air Ejector
To Condensate
From Steam
Air Ejector
T 30.0
From CRH
T 606.6
M 594.85
H 698.4
2.41
T 40.9
M 0.00
P 30.245
T 557.8
H 3586.9
M 94.32
M 95.93
OTC
To OTC
From OTC
T 36.9
T 31.0
M 8986.73
VOL 8.80
G
From Cold
Reheat
To Gas
Preheater
From Gas
Preheater
T 39.6
M 95.96
P 2.190
T 123.1
H 2710.4
M 0.00
FUEL: Fuel Oil
T 227.3
M 0.00
P 33.210
T 367.0
H 3149.4
M 1.91
T 227.3
M 0.00
T 268.2
M 13.03
T 489.8
M 13.03
T 40.9
M 95.93
T 227.3
M 0.00
P 1.011
T 133.0
P 32.501
T 366.4
H 3149.4
M 81.97
COMBINED CYCLE PERFORMANCES
M 0.10
P 33.210
T 367.0
H 3149.4
M 81.97
P 2.190
T 123.1
H 2710.4
M 0.00
M 0.10
P 0.071
T 39.3
H 2396.9
M 95.59
Make-UpM 0.00
M 0.08
GT_Output 247588
ST_Output 142630
Gross_Output 390218
Gross_Heat_Rate 6737
Gross_Efficiency 53.44
kW Elec.
kJ/kWh
kW Elec.
kW Elec.
%
P 29.629
T 557.5
H 3586.9
M 94.32
P 130.329
T 569.5
H 3521.9
M 85.48
P 127.271
T 568.4
H 3521.9
M 85.48
DIRECT
COOLING
LHV 42434
[-]
M 0.00
kJ/kg
From Gland
Steam System

For information
only!HEAT BALANCE DIAGRAM
Format:
Pressure
Mass flow
Temperature
Enthalpy
P
M
T
H
Lang:Doc: Sheet: No of Sh:
bar
kg/s
°C
kJ/kg
E
GSGG
2017-01-13/16:49:07
Fuel: Fuel Oil
RH 85.00 [%]
Tanjung Kidurong CCPP
T_AMB 33.0 [°C]
90% CCPP Load - FO - Design Ambient Conditions
GT Data: TJK-11-G-MB------EN-CA-001-en / Case 184 / Col GE
P_AMB 1.011 [bar]
Approved:
Drawn:
Checked:
H. Ahlmann
Revision:
G. Moore
T. Maniyan
G. Moore
1GP002635_401
Rev.0© ALSTOM 2017. All rights reserved. Information contained in this document is indicative only. No representation or warranty is given or should be relied on that it is complete or correct or will apply to any particular project. This will depend on the technical and commercial circumstances. It is provided without liability and is subject to change without notice. Reproduction, use or disclosure to third parties, without express written authority, is strictly prohibited.
GA
GA
W
W
D
D
S
S
GB
GB
GSC
G
C
C
M 15.70
T 30.0
P 1.011
T 33.0
RH 85.00
Q 666202
B
B
To HRSG
P 116.003
PF 0.85
To Steam
Air Ejector
To Condensate
From Steam
Air Ejector
T 30.0
From CRH
T 613.1
M 546.73
H 706.0
2.22
T 40.3
M 0.00
P 27.866
T 566.9
H 3609.7
M 86.32
M 87.79
OTC
To OTC
From OTC
T 36.5
T 31.0
M 8986.73
VOL 8.80
G
From Cold
Reheat
To Gas
Preheater
From Gas
Preheater
T 39.0
M 87.82
P 2.190
T 123.1
H 2710.4
M 0.00
FUEL: Fuel Oil
T 223.5
M 0.00
P 30.607
T 375.0
H 3173.1
M 2.09
T 223.5
M 0.00
T 264.0
M 10.42
T 486.2
M 10.42
T 40.3
M 87.79
T 223.5
M 0.00
P 1.011
T 132.1
P 29.948
T 374.5
H 3173.1
M 75.10
COMBINED CYCLE PERFORMANCES
M 0.10
P 30.607
T 375.0
H 3173.1
M 75.10
P 2.190
T 123.1
H 2710.4
M 0.00
M 0.10
P 0.069
T 38.7
H 2411.0
M 87.48
Make-UpM 0.00
M 0.08
GT_Output 221591
ST_Output 132083
Gross_Output 353675
Gross_Heat_Rate 6781
Gross_Efficiency 53.09
kW Elec.
kJ/kWh
kW Elec.
kW Elec.
%
P 27.298
T 566.7
H 3609.7
M 86.32
P 121.102
T 579.1
H 3555.2
M 78.67
P 118.256
T 578.1
H 3555.2
M 78.67
DIRECT
COOLING
LHV 42434
[-]
M 0.00
kJ/kg
From Gland
Steam System

For information
only!HEAT BALANCE DIAGRAM
Format:
Pressure
Mass flow
Temperature
Enthalpy
P
M
T
H
Lang:Doc: Sheet: No of Sh:
bar
kg/s
°C
kJ/kg
E
GSGG
2017-01-13/16:49:32
Fuel: Fuel Oil
RH 85.00 [%]
Tanjung Kidurong CCPP
T_AMB 33.0 [°C]
80% CCPP Load - FO - Design Ambient Conditions
GT Data: TJK-11-G-MB------EN-CA-001-en / Case 185 / Col GF
P_AMB 1.011 [bar]
Approved:
Drawn:
Checked:
H. Ahlmann
Revision:
G. Moore
T. Maniyan
G. Moore
1GP002635_402
Rev.0© ALSTOM 2017. All rights reserved. Information contained in this document is indicative only. No representation or warranty is given or should be relied on that it is complete or correct or will apply to any particular project. This will depend on the technical and commercial circumstances. It is provided without liability and is subject to change without notice. Reproduction, use or disclosure to third parties, without express written authority, is strictly prohibited.
GA
GA
W
W
D
D
S
S
GB
GB
GSC
G
C
C
M 14.15
T 30.0
P 1.011
T 33.0
RH 85.00
Q 600595
B
B
To HRSG
P 108.659
PF 0.85
To Steam
Air Ejector
To Condensate
From Steam
Air Ejector
T 30.0
From CRH
T 630.0
M 491.69
H 727.1
2.04
T 39.8
M 0.00
P 25.690
T 580.3
H 3641.6
M 78.85
M 80.21
OTC
To OTC
From OTC
T 36.1
T 31.0
M 8986.73
VOL 8.80
G
From Cold
Reheat
To Gas
Preheater
From Gas
Preheater
T 38.4
M 80.24
P 2.190
T 123.1
H 2710.4
M 0.00
FUEL: Fuel Oil
T 218.1
M 0.00
P 28.224
T 379.5
H 3187.9
M 2.63
T 218.1
M 0.00
T 257.9
M 8.18
T 477.8
M 8.18
T 39.8
M 80.21
T 218.1
M 0.00
P 1.011
T 130.9
P 27.609
T 379.0
H 3187.9
M 69.28
COMBINED CYCLE PERFORMANCES
M 0.10
P 28.224
T 379.5
H 3187.9
M 69.28
P 2.190
T 123.1
H 2710.4
M 0.00
M 0.10
P 0.067
T 38.1
H 2429.1
M 79.93
Make-UpM 0.00
M 0.08
GT_Output 192376
ST_Output 122824
Gross_Output 315200
Gross_Heat_Rate 6860
Gross_Efficiency 52.48
kW Elec.
kJ/kWh
kW Elec.
kW Elec.
%
P 25.167
T 580.1
H 3641.6
M 78.85
P 113.450
T 585.9
H 3579.4
M 73.26
P 110.776
T 585.0
H 3579.4
M 73.26
DIRECT
COOLING
LHV 42434
[-]
M 0.00
kJ/kg
From Gland
Steam System

For information
only!HEAT BALANCE DIAGRAM
Format:
Pressure
Mass flow
Temperature
Enthalpy
P
M
T
H
Lang:Doc: Sheet: No of Sh:
bar
kg/s
°C
kJ/kg
E
GSGG
2017-01-13/16:49:25
Fuel: Fuel Oil
RH 85.00 [%]
Tanjung Kidurong CCPP
T_AMB 33.0 [°C]
60% CCPP Load - FO - Design Ambient Conditions
GT Data: TJK-11-G-MB------EN-CA-001-en / Case 186 / Col GG
P_AMB 1.011 [bar]
Approved:
Drawn:
Checked:
H. Ahlmann
Revision:
G. Moore
T. Maniyan
G. Moore
1GP002635_403
Rev.0© ALSTOM 2017. All rights reserved. Information contained in this document is indicative only. No representation or warranty is given or should be relied on that it is complete or correct or will apply to any particular project. This will depend on the technical and commercial circumstances. It is provided without liability and is subject to change without notice. Reproduction, use or disclosure to third parties, without express written authority, is strictly prohibited.
GA
GA
W
W
D
D
S
S
GB
GB
GSC
G
C
C
M 11.28
T 30.0
P 1.011
T 33.0
RH 85.00
Q 478506
B
B
To HRSG
P 91.640
PF 0.85
To Steam
Air Ejector
To Condensate
From Steam
Air Ejector
T 30.0
From CRH
T 630.0
M 418.62
H 724.0
1.73
T 39.0
M 0.00
P 21.616
T 581.0
H 3646.7
M 66.24
M 67.40
OTC
To OTC
From OTC
T 35.3
T 31.0
M 8986.73
VOL 8.80
G
From Cold
Reheat
To Gas
Preheater
From Gas
Preheater
T 37.3
M 67.42
P 2.190
T 123.1
H 2710.4
M 0.00
FUEL: Fuel Oil
T 210.5
M 0.00
P 23.732
T 380.7
H 3199.0
M 2.70
T 210.5
M 0.00
T 250.0
M 5.87
T 466.6
M 5.87
T 39.0
M 67.40
T 210.5
M 0.00
P 1.011
T 129.4
P 23.220
T 380.3
H 3199.0
M 57.66
COMBINED CYCLE PERFORMANCES
M 0.10
P 23.732
T 380.7
H 3199.0
M 57.66
P 2.190
T 123.1
H 2710.4
M 0.00
M 0.10
P 0.063
T 37.0
H 2446.8
M 67.16
Make-UpM 0.00
M 0.08
GT_Output 136421
ST_Output 102353
Gross_Output 238774
Gross_Heat_Rate 7214
Gross_Efficiency 49.90
kW Elec.
kJ/kWh
kW Elec.
kW Elec.
%
P 21.176
T 580.8
H 3646.7
M 66.24
P 95.683
T 585.8
H 3594.6
M 61.51
P 93.426
T 585.0
H 3594.6
M 61.51
DIRECT
COOLING
LHV 42434
[-]
M 0.00
kJ/kg
From Gland
Steam System

For information
only!HEAT BALANCE DIAGRAM
Format:
Pressure
Mass flow
Temperature
Enthalpy
P
M
T
H
Lang:Doc: Sheet: No of Sh:
bar
kg/s
°C
kJ/kg
E
GSGG
2017-01-13/16:50:00
Fuel: Fuel Oil
RH 85.00 [%]
Tanjung Kidurong CCPP
T_AMB 33.0 [°C]
45% GT Load - MECL - FO - Design Ambient Conditions
GT Data: TJK-11-G-MB------EN-CA-001-en / Case 211 / Col HF
P_AMB 1.011 [bar]
Approved:
Drawn:
Checked:
H. Ahlmann
Revision:
G. Moore
T. Maniyan
G. Moore
1GP002635_404
Rev.0© ALSTOM 2017. All rights reserved. Information contained in this document is indicative only. No representation or warranty is given or should be relied on that it is complete or correct or will apply to any particular project. This will depend on the technical and commercial circumstances. It is provided without liability and is subject to change without notice. Reproduction, use or disclosure to third parties, without express written authority, is strictly prohibited.
GA
GA
W
W
D
D
S
S
GB
GB
GSC
G
C
C
M 9.97
T 30.0
P 1.011
T 33.0
RH 85.00
Q 423249
B
B
To HRSG
P 83.816
PF 0.85
To Steam
Air Ejector
To Condensate
From Steam
Air Ejector
T 30.0
From CRH
T 630.0
M 384.80
H 722.3
1.59
T 38.7
M 0.00
P 19.749
T 581.0
H 3648.3
M 60.49
M 61.55
OTC
To OTC
From OTC
T 34.9
T 31.0
M 8986.73
VOL 8.80
G
From Cold
Reheat
To Gas
Preheater
From Gas
Preheater
T 36.8
M 61.57
P 2.190
T 123.1
H 2710.4
M 0.00
FUEL: Fuel Oil
T 206.5
M 0.00
P 21.673
T 381.3
H 3204.0
M 2.70
T 206.5
M 0.00
T 245.9
M 4.91
T 461.4
M 4.91
T 38.7
M 61.55
T 206.5
M 0.00
P 1.011
T 128.7
P 21.208
T 380.9
H 3204.0
M 52.39
COMBINED CYCLE PERFORMANCES
M 0.10
P 21.673
T 381.3
H 3204.0
M 52.39
P 2.190
T 123.1
H 2710.4
M 0.00
M 0.10
P 0.061
T 36.5
H 2456.7
M 61.34
Make-UpM 0.00
M 0.08
GT_Output 111415
ST_Output 92924
Gross_Output 204338
Gross_Heat_Rate 7457
Gross_Efficiency 48.28
kW Elec.
kJ/kWh
kW Elec.
kW Elec.
%
P 19.347
T 580.8
H 3648.3
M 60.49
P 87.516
T 585.7
H 3601.6
M 56.15
P 85.451
T 585.0
H 3601.6
M 56.15
DIRECT
COOLING
LHV 42434
[-]
M 0.00
kJ/kg
From Gland
Steam System

Appendix 3.5.1
Specification for Natural Gas
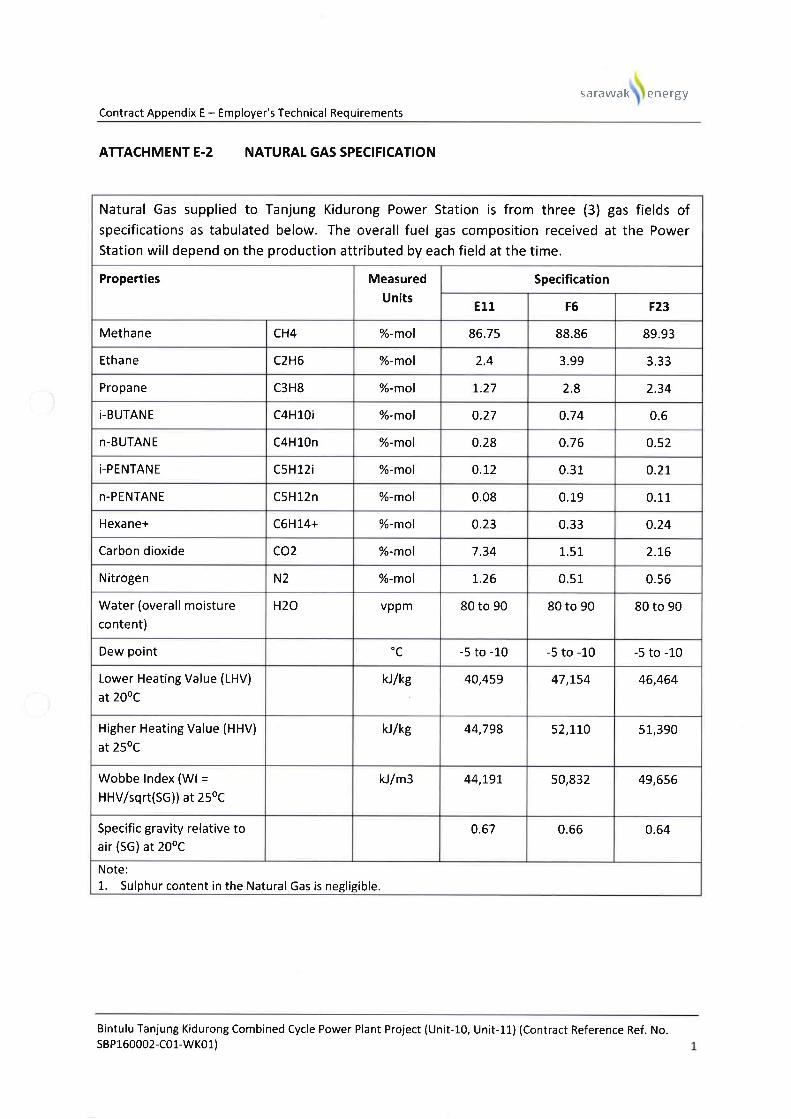
sarawak energy
Contract Appendix E - Employer's Technical Requirements
ATTACHMENT E.2 NATURAL GAS SPECIFICATION
Bintulu Tanjung Kidurong Combined Cycle Power Plant Project (Unit-10, Unit-11) (Contract Reference Ref. No.s8P160002-C01-WK01)
Natural Gas supplied to Tanjung Kidurong Power Station is from three (3) gas fields ofspecifications as tabulated below. The overall fuel gas composition received at the Power
Station will depend on the production attributed by each field at the time.
Properties Measured
Units
Specification
E11 F6 F23
Methane CH4 %-mol 86.75 88.85 89.93
Ethane C2H6 o/o-mol 2.4 3.99 3.33
Propane c3H8 o/o-mol t.27 2.8 2.34
i-BUTANE c4HL0i o/o-mol 0.27 o.74 0.6
n-BUTANE C4H 10n o/o-mol 0.28 0.76 0.52
i-PENTANE c5H 12i %-mol o.t2 0.31 o.21.
n-PENTANE C5H12n %-mol 0.08 0.19 0.11
Hexane+ C6H14+ o/o-mol 0.23 0.33 0.24
Carbon dioxide co2 %-mol 7.34 1.51 2.16
Nitrogen N2 o/o-mol L.26 0.51 0.56
Water (overall moisture
content)
H20 vppm 80 to 90 80 to 90 80 to 90
Dew point 'c -5 to -L0 -5 to -10 -5 to -10
Lower Heating Value (LHV)
at 20oC
kUke 40,459 47,L54 46,454
Higher Heating Value (HHV)
at 25oC
kUke 44,798 52,tLO 51,390
Wobbe lndex (Wl=HHV/sqrt(SG)) at 25oC
kJlm3 44,L91. 50,832 49,656
Specific gravity relative toair (SG) at 20oC
o.67 0.56 0.64
Note:L. Sulphur content in the Natural Gas is negligible.

sarawa energy
Contract Appendix E - Employer's Technical Requirements
Bintulu Tanjung Kidurong Combined Cycle Power Plant Project (Unit-10, Unit-11) (Contract Reference Ref. No.
s8P150002-C01-WK01)
Further to the Natural Gas specifications of the three (3) gas fields, the following values are to be used for
design and performance guarantees.
Design Fuel Gas
Properties Measured Units Value
Methane cH4 Yo-mol 89.93
Etha ne c2H5 o/o-lYlOl 3.33
Propa ne c3 H8 Yo-mol 2.34
i.BUTANE c4H10i %-mol o-60
n-BUTANE C4H10n %-mol o.52
i-PENTANE c5H12i %-mol o.21
n-PENTANE C5H12n Y"-mol o.11
Hexane+ C6H14+ o/o-tnol o.24
Carbon dioxide co2 o/o-lnOl 2.76
Nitrogen N2 %-mol 0.s6
Particulate size 11m max 10
Particulate quantity ppm max 3
Oil mist/vapour Negligible
Hydrocarbon dewpoint .c max72.78
Hydrocarbon dewpoint bar 49.3
Trace Metals:
Sodium and Potassium Na +K ppm max 0.5
Lead Pb ppm max 1
Magnesium Mig ppm max 2
Calcium Ca ppm max 2
Lower Heating Value @2o.c KJIKE 46,464
Fuel Gas Pressure barg 55
Fuel GasTemperature -c 20

Appendix 3.5.2
Specification for Diesel Oil

sarawak energyContract Appendix E - Employer's Technical Requirements
ATTACHMENT E-3 DIESEL OIL SPECIFICATION
Bintulu Tanjung Kidurong Combined Cycle Power Plant Project (Unit-10, Unit-11) (Contract Reference Ref. No.s8P160002-C01-WK01)
Diesel Oil from local fuel suppliers supplied to Tanjung Kidurong Power Station is as tabulatedbelow.
Properties Test Method Measured
Units
Specification Typical
Value
Trade Name Shell Diesoline
Density @ 15"C ASTM D4052 ke/ max.0.81
max.0.87
0.84
Cetane Number ASTM D61.3 min.49 52
Kinematic Viscosity @ 40'C ASTM D445 cSt min. 1.5 3.0
max.5.8
Sulphur ASTM D4294 %wt 0.0s <0.05
Water ASTM D95 o/o Y 0.05 <0.05
Sediment ASTM D473 %wt 0.01 <0.0L
Carbon Residue, Conradson (on 10%
bottom)ASTM D4530 %wt max.0.2 <0.2
Ash ASTM D482 %wt 0.01 <0.01
Flash Point, PMCC ASTM D93 "C min.50 74
Pour Point ASTM D97 oc Max. 15 0
Copper Corrosion (3hr/100"C) ASTM D13O "c max. L
Distillation @95%v recovery ASTM D86 "c Max.370
Distillation:
Recovered at 300"C %v min.40
Recovered at 357'C %v min.85
Gross Calorific Value ASTM D4868 MJ/kc To be calculated foreach batch
45
Sodium + Potassium (Na + K) tP288 ppm Shelldoes nots limitspecific metal
contents, however,
typical values are as
stated.
<0.4
Lead (Pb) rP288 ppm <0.01
Vanadium (V) rP288 ppm <0.09
Calcium (Ca) tP288 ppm <0.1

sarawa energy
Contract Appendix E - Employer's Technical Requirements
Bintulu Tanjung Kidurong Combined Cycle Power Plant Project (Unit-10, Unit-11) (Contract Reference Ref. No.
sBP160002-C01-WK01)
Note:
1. Shell Diesoline exceeds MS123:2005 (Euro llM)standards
2. Only Shell specification limit values are guaranteed. Typical values are obtained from result ofsample testing. Typical values are for information only and may change if Shell Diesoline product
conditions differ.
Further to the Diesel oil specification as provided by the local fuel supplier the following values are to be
used for design and performance guarantees.
Design FuelOil
Properties Measured Units Value
Carbon Yowt 86
Hydrogen o/oWt 13.94
Sulphur Yowt 0.05
Ash Yowt 0.01
Lower Heating Value @30"C MJ/kg 42.434
Fuel OilTemperature oc 30

Appendix 3.6.1
Overall Noise Protection Method

GE POWER Gas Power Systems
Identification Number:
TJK/00/M/----------/DO/101 Rev.
A Date
09.03.2018 Lang.
En Sheet
5/29
© COPYRIGHT 2018 General Electric Company GE CLASS II (INTERNAL CRITICAL) All rights reserved. The information herein is Proprietary and Technically Exclusive content of the General Electric Company and/or its legitimate affiliates.
Areas within acoustical enclosures.
Safety valves in operation
Emergency diesel generator set
Other abnormal operating conditions
Equipment failures and unit trip
3. PRESUMPTIONS FOR THE NOISE PREDICTION CALCULATION
Presumptions for the noise prediction calculation are:
Climatic Conditions: 33°C,85 % rel. humidity, 3.0 m/s wind speed.
Height of the stacks: 60 m for Main Stack, 40 m for bypass stack.
Layout No: TJK‐00‐W‐001b‐‐‐003‐GA‐001‐EN‐A‐GENERAL LAYOUT OF PLANT &
TJK‐00‐W‐001b‐‐‐003‐GA‐002‐EN‐A‐GENERAL LAYOUT OF PLANT.
4. NOISE CONTROL REQUIREMENTS
4.1. Gas Turbine Building
4.1.1. Cladding
The gas turbine building walls and roof must provide a minimum sound reduction index Rw = 26 dB, with the following sound transmission loss spectrum:
Frequency/oct 31 Hz 63 Hz 125 Hz 250 Hz 500 Hz 1 kHz 2 kHz 4 kHz 8 kHz
TL / dB 4 8 15 18 23 25 30 35 38
Furthermore, the cladding of gas turbine building has to be designed with a sound absorbing inner liner (minimum 50 mm mineral wool or 50 mm Heraklith or adequate products) in order to obtain a sufficient absorption area inside the building and to limit the noise level build‐up due to reflecting sound. At least 70% of the total wall area shall be absorbent.
4.1.2. Ventilation Equipment
Roof Fans
The total sound power level of all roof fans including noise emitted by the Gas turbine unit shall not exceed:
Sound Power Level Pref. = 10‐12W
f / oct 31 Hz 63 Hz 125 Hz 250 Hz 500 Hz 1 kHz 2 kHz 4 kHz 8 kHz A
dB 115 117 113 113 110 103 98 95 91 111
In addition, the surface sound pressure level (free field conditions) inside the gas turbine building will not exceed 82 dB(A) at a distance of 1 m from each indoor fan sleeve.
Air Intake Louvers
No acoustical measures are necessary, standard weather protection only.
chanping.pang
Rectangle

GE POWER Gas Power Systems
Identification Number:
TJK/00/M/----------/DO/101 Rev.
A Date
09.03.2018 Lang.
En Sheet
6/29
© COPYRIGHT 2018 General Electric Company GE CLASS II (INTERNAL CRITICAL) All rights reserved. The information herein is Proprietary and Technically Exclusive content of the General Electric Company and/or its legitimate affiliates.
4.1.3. Gas Turbine Unit
The combustion turbine, the exhaust diffuse including manhole to bearing No 1 and the air intake manifold shall be equipped with an acoustical enclosure.
The unattenuated sound power level of the gas turbine including diffuser and air intake manifold is:
Sound Power Level Pref. = 10‐12W
f / oct 31 Hz 63 Hz 125 Hz 250 Hz 500 Hz 1 kHz 2 kHz 4 kHz 8 kHz A
dB 106 108 110 112 112 122 121 119 113 127
The surface sound pressure level at a distance of 1 m from the enclosure of the gas turbine unit (free field conditions) will not exceed:
Surface Sound Pressure Level (free field conditions) pref. = 2x10‐5Pa
f / oct 31 Hz 63 Hz 125 Hz 250 Hz 500 Hz 1 kHz 2 kHz 4 kHz 8 kHz A
dB 98 97 96 80 72 70 67 62 58 82
4.1.4. Gas Turbine Generator
The generator of the gas turbine unit (type TOP AIR) located indoor, shall be equipped with an acoustical enclosure in order to maintain the noise limits.
The unattenuated sound power level of one generator is:
Sound Power Level Pref. = 10‐12W
f / oct 31 Hz 63 Hz 125 Hz 250 Hz 500 Hz 1 kHz 2 kHz 4 kHz 8 kHz A
dB 104 116 121 114 113 113 110 107 101 118
The sound power level of the generator enclosure including ventilation shall not exceed:
Sound Power Level Pref. = 10‐12W
f / oct 31 Hz 63 Hz 125 Hz 250 Hz 500 Hz 1 kHz 2 kHz 4 kHz 8 kHz A
dB 112 114 113 99 93 88 88 84 80 100
The maximum surface sound pressure level (free field conditions) at a distance of 1m from the generator and 1.5m above ground or personnel platform will not exceed 85 dB(A). To reach this level and to avoid stationary wave a complete sound enclosure shall be provided.
4.1.5. Gas Turbine Auxiliaries – Fuel Gas Control Block
For the fuel gas control valve block, sound absorbing walls have to be used on both accessible sides (long sides in direction of combustion turbine and in direction of lube oil system). Furthermore, the double floor between fuel gas block and combustion turbine enclosure has to be lined with a sound absorbing material (see also HZX‐VB 8307).
Alternatively, to the fuel gas control valve block sound absorbing walls, the entire auxiliary system (auxiliary block and control valve block) may be enclosed.
4.1.6. Gas Turbine Air Inlet Duct (indoor part)
The maximum surface sound pressure level (free field conditions) of the air inlet duct (indoor part) at a distance of 1 m will be limited to 85 dB(A).

GE POWER Gas Power Systems
Identification Number:
TJK/00/M/----------/DO/101 Rev.
A Date
09.03.2018 Lang.
En Sheet
7/29
© COPYRIGHT 2018 General Electric Company GE CLASS II (INTERNAL CRITICAL) All rights reserved. The information herein is Proprietary and Technically Exclusive content of the General Electric Company and/or its legitimate affiliates.
4.1.7. Other Gas Turbine building indoor equipment
The maximum surface sound pressure level (free field conditions) at a distance of 1m from all equipment other than mentioned above located inside the Turbine building, will be limited to 85 dB(A).
Low noise type control valves and acoustic insulation on blowdown tank and related downstream pipes should be necessary to achieve this requirement.
4.2. Steam Turbine Building
4.2.1. Cladding
The steam turbine building walls and roof must provide a minimum sound reduction index Rw = 26 dB, with the following sound transmission loss spectrum:
Frequency/oct 31 Hz 63 Hz 125 Hz 250 Hz 500 Hz 1 kHz 2 kHz 4 kHz 8 kHz
TL / dB 4 8 15 18 23 25 30 35 38
Furthermore, the cladding of steam turbine building has to be designed with a sound absorbing inner liner (minimum 50 mm mineral wool or 50 mm Heraklith or adequate products) in order to obtain a sufficient absorption area inside the building and to limit the noise level build‐up due to reflecting sound. At least 70% of the total wall area shall be absorbent.
4.2.2. Ventilation Equipment
Roof Fans
The total sound power level of all roof fans including noise emitted by the Steam turbine unit (Average sound pressure level of 101 dB(A) inside the Steam turbine building during steam turbine bypass operation) shall not exceed:
Sound Power Level Pref. = 10‐12W
f / oct 31 Hz 63 Hz 125 Hz 250 Hz 500 Hz 1 kHz 2 kHz 4 kHz 8 kHz A
dB 115 117 113 113 110 103 98 95 91 111
In addition, the surface sound pressure level (free field conditions) inside the steam turbine building will not exceed 82 dB(A) at a distance of 1 m from each indoor fan sleeve.
Air Intake Louvers
No acoustical measures are necessary, standard weather protection only.
4.2.3. Steam Turbine Unit
The steam turbine, have to fulfil the requirement of a surface sound pressure level of 85 dB(A) at 1 m distance during the continuous base load operation, Therefore, no additional measures are necessary.
4.2.4. Main Condenser
The maximum sound power level emitted by each condenser set shall be limited to:
Sound Power Level Pref. = 10‐12W
f / oct 31 Hz 63 Hz 125 Hz 250 Hz 500 Hz 1 kHz 2 kHz 4 kHz 8 kHz A
dB 113 113 121 108 107 105 104 102 99 112
The condenser walls thickness must be designed in order that the emitted sound pressure level (free field conditions) at any point 1 m distance from the equipment will not exceed 85 dB(A) during normal operation.

GE POWER Gas Power Systems
Identification Number:
TJK/00/M/----------/DO/101 Rev.
A Date
09.03.2018 Lang.
En Sheet
8/29
© COPYRIGHT 2018 General Electric Company GE CLASS II (INTERNAL CRITICAL) All rights reserved. The information herein is Proprietary and Technically Exclusive content of the General Electric Company and/or its legitimate affiliates.
4.2.5. Steam Turbine Generator
The generator of the Steam turbine unit which is located indoor shall be equipped with an acoustical enclosure in order to maintain the noise limits.
The unattenuated sound power level of the generator is:
Sound Power Level Pref. = 10‐12W
f / oct 31 Hz 63 Hz 125 Hz 250 Hz 500 Hz 1 kHz 2 kHz 4 kHz 8 kHz A
dB 104 116 121 114 113 113 110 107 101 118
The sound power level of the steam turbine generator enclosure including ventilation shall not exceed:
Sound Power Level Pref. = 10‐12W
f / oct 31 Hz 63 Hz 125 Hz 250 Hz 500 Hz 1 kHz 2 kHz 4 kHz 8 kHz A
dB 114 117 112 100 94 89 88 83 79 100
The maximum surface sound pressure level (free field conditions) at a distance of 1m from the generator and 1.5m above ground or personnel platform will not exceed 85 dB(A). To reach this level and to avoid stationary wave a complete sound enclosure shall be provided.
4.2.6. Condensate Pumps
The total sound power level of each vertical Condensate extraction pump set (2 x 100%) shall be limited to:
Sound Power Level Pref. = 10‐12W
f / oct 31 Hz 63 Hz 125 Hz 250 Hz 500 Hz 1 kHz 2 kHz 4 kHz 8 kHz A
dB 93 93 98 101 99 98 96 88 79 103
In addition, the surface sound pressure level at 1 m distance (free field conditions) will not exceed 85 dB(A).
4.2.7. Service ejector
The sound power level of the insulated service ejector (2x100%) shall be limited to :
Sound Power Level Pref. = 10‐12W
f / oct 31 Hz 63 Hz 125 Hz 250 Hz 500 Hz 1 kHz 2 kHz 4 kHz 8 kHz A
dB 107 102 100 96 85 83 89 93 93 98
In addition, the surface sound pressure level (free field conditions) at 1 m distance will not exceed 85 dB(A).
4.2.8. Other Steam Turbine building indoor equipment
The maximum surface sound pressure level (free field conditions) at a distance of 1m from all equipment other than mentioned above located inside the Turbine building, will be not exceed to 85 dB(A).
In particular, low noise type control valves and acoustic insulation on blowdown tank and related downstream pipes should be necessary to achieve this requirement.

GE POWER Gas Power Systems
Identification Number:
TJK/00/M/----------/DO/101 Rev.
A Date
09.03.2018 Lang.
En Sheet
9/29
© COPYRIGHT 2018 General Electric Company GE CLASS II (INTERNAL CRITICAL) All rights reserved. The information herein is Proprietary and Technically Exclusive content of the General Electric Company and/or its legitimate affiliates.
4.3. Flue Gas System
4.3.1. Basic Data
The sound power level at the gas turbine exhaust amounts to:
Sound Power Level Pref. = 10‐12W
f / oct 31 Hz 63 Hz 125 Hz 250 Hz 500 Hz 1 kHz 2 kHz 4 kHz 8 kHz A
dB 135 133 133 134 137 142 140 147 122 150
Due to high frequency attenuation mechanism in the turbulent flow, the sound power downstream the exhaust diffuser will be reduced.
For the design of the GT exhaust duct, diverter damper and the transition duct to the HRSG, the following sound power level shall be considered:
Sound Power Level Pref. = 10‐12W
f / oct 31 Hz 63 Hz 125 Hz 250 Hz 500 Hz 1 kHz 2 kHz 4 kHz 8 kHz A
dB 135 133 133 134 137 142 136 139 106 145
4.3.2. General Requirement for the Exhaust System
Pure tones (as per ISO‐1996‐2) generated by the exhaust system itself are not permitted. The requirements below includes the noise generated by steam blow down as well as noise generated by the steam flow for the relevant part of the piping (pipes close to the HRSG inlet duct are part of the HRSG inlet duct,…)
4.3.3. Outdoor Spool Section & Diverter valve
The sound power level of outdoor spool section and diverter valve between the turbine building and the bypass stack shall not exceed.
Sound Power Level Pref. = 10‐12W
f / oct 31 Hz 63 Hz 125 Hz 250 Hz 500 Hz 1 kHz 2 kHz 4 kHz 8 kHz A
dB 114 113 109 110 104 105 96 97 73 109
In addition, the surface sound pressure level in free field conditions at a distance of 1 m will not exceed 85 dB(A). at any point at a height of 1.5 m above the ground level or personnel platforms.
4.3.4. GT Bypass System (Simple Cycle Operation)
During operation in simple Cycle, the maximum sound power level emitted into the Bypass Stack, upstream to the silencer, by gas turbine exhaust amounts to:
Sound Power Level Pref. = 10‐12W
f / oct 31 Hz 63 Hz 125 Hz 250 Hz 500 Hz 1 kHz 2 kHz 4 kHz 8 kHz A
dB 151 145 142 140 142 152 146 144 143 155
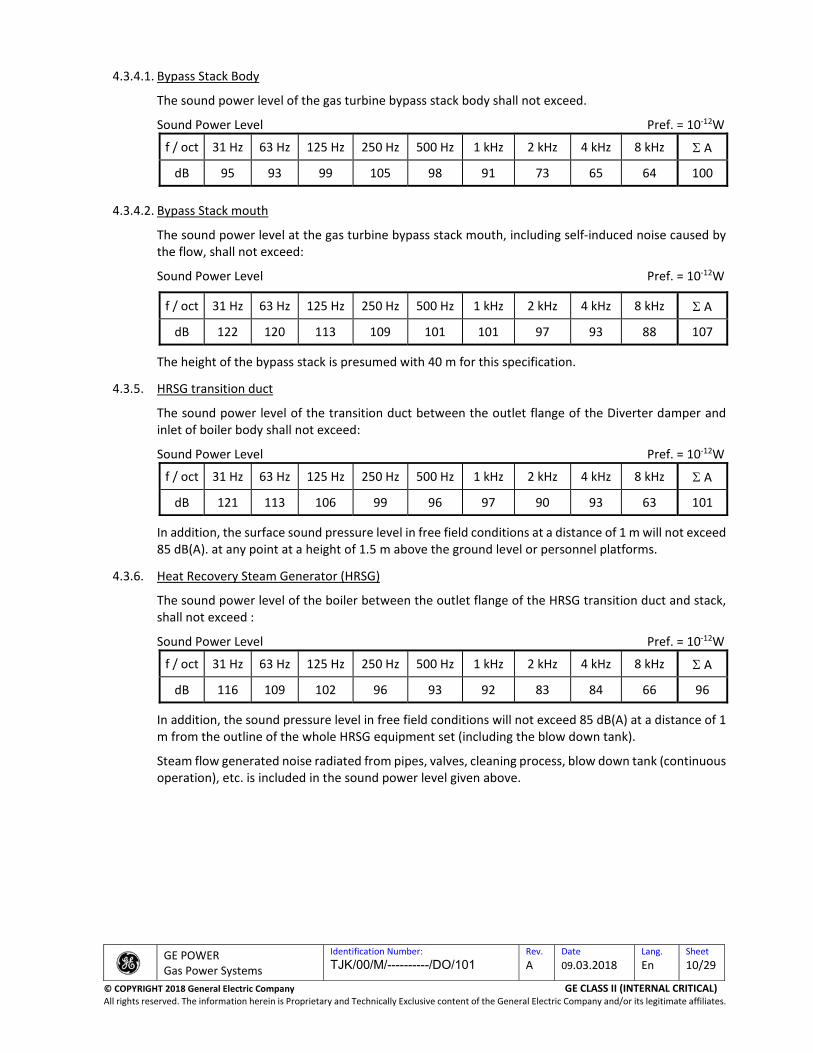
GE POWER Gas Power Systems
Identification Number:
TJK/00/M/----------/DO/101 Rev.
A Date
09.03.2018 Lang.
En Sheet
10/29
© COPYRIGHT 2018 General Electric Company GE CLASS II (INTERNAL CRITICAL) All rights reserved. The information herein is Proprietary and Technically Exclusive content of the General Electric Company and/or its legitimate affiliates.
4.3.4.1. Bypass Stack Body
The sound power level of the gas turbine bypass stack body shall not exceed.
Sound Power Level Pref. = 10‐12W
f / oct 31 Hz 63 Hz 125 Hz 250 Hz 500 Hz 1 kHz 2 kHz 4 kHz 8 kHz A
dB 95 93 99 105 98 91 73 65 64 100
4.3.4.2. Bypass Stack mouth
The sound power level at the gas turbine bypass stack mouth, including self‐induced noise caused by the flow, shall not exceed:
Sound Power Level Pref. = 10‐12W
f / oct 31 Hz 63 Hz 125 Hz 250 Hz 500 Hz 1 kHz 2 kHz 4 kHz 8 kHz A
dB 122 120 113 109 101 101 97 93 88 107
The height of the bypass stack is presumed with 40 m for this specification.
4.3.5. HRSG transition duct
The sound power level of the transition duct between the outlet flange of the Diverter damper and inlet of boiler body shall not exceed:
Sound Power Level Pref. = 10‐12W
f / oct 31 Hz 63 Hz 125 Hz 250 Hz 500 Hz 1 kHz 2 kHz 4 kHz 8 kHz A
dB 121 113 106 99 96 97 90 93 63 101
In addition, the surface sound pressure level in free field conditions at a distance of 1 m will not exceed 85 dB(A). at any point at a height of 1.5 m above the ground level or personnel platforms.
4.3.6. Heat Recovery Steam Generator (HRSG)
The sound power level of the boiler between the outlet flange of the HRSG transition duct and stack, shall not exceed :
Sound Power Level Pref. = 10‐12W
f / oct 31 Hz 63 Hz 125 Hz 250 Hz 500 Hz 1 kHz 2 kHz 4 kHz 8 kHz A
dB 116 109 102 96 93 92 83 84 66 96
In addition, the sound pressure level in free field conditions will not exceed 85 dB(A) at a distance of 1 m from the outline of the whole HRSG equipment set (including the blow down tank).
Steam flow generated noise radiated from pipes, valves, cleaning process, blow down tank (continuous operation), etc. is included in the sound power level given above.

GE POWER Gas Power Systems
Identification Number:
TJK/00/M/----------/DO/101 Rev.
A Date
09.03.2018 Lang.
En Sheet
11/29
© COPYRIGHT 2018 General Electric Company GE CLASS II (INTERNAL CRITICAL) All rights reserved. The information herein is Proprietary and Technically Exclusive content of the General Electric Company and/or its legitimate affiliates.
4.3.7. Stack Body
The sound power level of the HRSG stack body including self‐induced noise caused by the flow shall not exceed:
Sound Power Level Pref. = 10‐12W
f / oct 31 Hz 63 Hz 125 Hz 250 Hz 500 Hz 1 kHz 2 kHz 4 kHz 8 kHz A
dB 101 101 104 106 96 94 84 84 82 101
In addition, the sound pressure level in free field conditions at a distance of 1 m from the HRSG stack will not exceed 85 dB(A) max. at any point at a height of 1.5 m above the ground level or personnel platforms.
4.3.8. Stack mouth
The sound power level at the HRSG stack mouth, including self‐induced noise caused by the flow, shall not exceed.
Sound Power Level Pref. = 10‐12W
f / oct 31 Hz 63 Hz 125 Hz 250 Hz 500 Hz 1 kHz 2 kHz 4 kHz 8 kHz A
dB 125 125 122 119 115 110 90 87 85 116
The height of the stack is presumed with 60 m for this specification. In case of the stack height will be below 60 m, this specification would be invalid.
4.4. Air Inlet System
4.4.1. Basic Data
The sound power level at the GT compressor inlet with an air intake manifold equipped with an absorbing inner liner, amounts to:
Sound Power Level Pref. = 10‐12W
f / oct 31 Hz 63 Hz 125 Hz 250 Hz 500 Hz 1 kHz 2 kHz 4 kHz 8 kHz A
dB 114 117 120 122 126 143 140 139 137 147
4.4.2. Air Inlet Cross Section
The sound power level at the air inlet cross section including self‐induced noise caused by the flow through silencer, filter and weather protection, shall not exceed the following spectrum:
Sound Power Level Pref. = 10‐12W
f / oct 31 Hz 63 Hz 125 Hz 250 Hz 500 Hz 1 kHz 2 kHz 4 kHz 8 kHz A
dB 107 114 113 106 97 103 94 99 105 109
4.4.3. Gas Turbine Air Intake Duct (outdoor part)
To achieve the far field noise requirements and to prevent a pure tone generation, the air intake silencer has to be located inside the Gas Turbine Hall. In this case, the sound emissions of the air intake duct outdoor section and filter house walls should not exceed the following spectrum:

GE POWER Gas Power Systems
Identification Number:
TJK/00/M/----------/DO/101 Rev.
A Date
09.03.2018 Lang.
En Sheet
12/29
© COPYRIGHT 2018 General Electric Company GE CLASS II (INTERNAL CRITICAL) All rights reserved. The information herein is Proprietary and Technically Exclusive content of the General Electric Company and/or its legitimate affiliates.
Sound Power Level Pref. = 10‐12W
f / oct 31 Hz 63 Hz 125 Hz 250 Hz 500 Hz 1 kHz 2 kHz 4 kHz 8 kHz A
dB 90 87 80 81 81 103 93 83 72 104
4.5. Transformers
4.5.1. Main Transformers
The sound power level of each step‐up transformer unit must be below:
Sound Power Level Pref. = 10‐12W
f / oct 31 Hz 63 Hz 125 Hz 250 Hz 500 Hz 1 kHz 2 kHz 4 kHz 8 kHz A
dB 105 107 107 104 104 98 93 88 81 104
In addition to the requirement given above, the surface sound pressure level (free field conditions) at a distance of 1 m from the duct, will not exceed 85 dB(A).
4.5.2. Unit / Service / Auxiliary Transformers
The sound power level emitted by each station service transformer shall be limited to:
Sound Power Level Pref. = 10‐12W
f / oct 31 Hz 63 Hz 125 Hz 250 Hz 500 Hz 1 kHz 2 kHz 4 kHz 8 kHz A
dB 95 88 93 92 88 81 81 76 73 90
4.6. Feedwater Pump
The feedwater pumps will be located outdoor.
The sound power level of each feedwater pump set (2X100%) shall not exceed:
Sound Power Level Pref. = 10‐12W
f / oct 31 Hz 63 Hz 125 Hz 250 Hz 500 Hz 1 kHz 2 kHz 4 kHz 8 kHz A
dB 104 102 107 110 109 106 108 102 96 113
In addition to the requirement given above the surface sound pressure level at a distance of 1 m to the equipment will not exceed 85 dB(A). To achieve this level, an acoustic enclosure has to be foreseen on the pumps and coupling parts.
The surface sound pressure level at 1m from feedwater recirculation pumps will not exceed 85dB(A)
4.7. OTC
The sound power level emitted by one OTC shall be limited to:
Sound Power Level Pref. = 10‐12W
f / oct 31 Hz 63 Hz 125 Hz 250 Hz 500 Hz 1 kHz 2 kHz 4 kHz 8 kHz A
dB 91 86 90 95 92 88 87 88 88 96
In addition, the surface sound pressure level (free field conditions) at a distance of 1 m will not exceed 85 dB(A).

GE POWER Gas Power Systems
Identification Number:
TJK/00/M/----------/DO/101 Rev.
A Date
09.03.2018 Lang.
En Sheet
13/29
© COPYRIGHT 2018 General Electric Company GE CLASS II (INTERNAL CRITICAL) All rights reserved. The information herein is Proprietary and Technically Exclusive content of the General Electric Company and/or its legitimate affiliates.
4.8. GT Fin fan coolers
The total sound power level of the GT fin fan cooler shall not exceed:
Sound Power Level Pref. = 10‐12W
f / oct 31 Hz 63 Hz 125 Hz 250 Hz 500 Hz 1 kHz 2 kHz 4 kHz 8 kHz A
dB 121 119 116 112 111 106 102 96 93 112
In addition, the average sound pressure at a distance of 1 m from equipment will not exceed 85 dB(A) in free field conditions.
4.9. Dump condensing Module
4.9.1. Feedwater pump (1*100%, 3000 rpm, 200 kW)
The total sound power level emitted by the feedwater pump set (motor+coupling+pump) shall not exceed the following:
Sound Power Level Pref. = 10‐12W
f / oct 31 Hz 63 Hz 125 Hz 250 Hz 500 Hz 1 kHz 2 kHz 4 kHz 8 kHz A
dB 85 84 89 91 92 92 89 84 79 96
In addition, the surface sound pressure level (free field conditions) at 1 m distance from the equipment will not exceed 85 dB(A).
These noise limits can be achieved without acoustic protection (to be confirmed by supplier).
4.9.2. Air Cooled Condenser (3 fans of 55 kW)
The fans deck is supposed to be located at 8m above ground. Nearest personal access is supposed to be at a platform situated at least 4m below the nearest fan sleeve.
4.9.2.1. Air Inlet
The total (i.e. the 3 fans as a sum) sound power level emitted by the air‐cooled condenser at the air inlet should not exceed:
Sound Power Level Pref. = 10‐12W
f / oct 31 Hz 63 Hz 125 Hz 250 Hz 500 Hz 1 kHz 2 kHz 4 kHz 8 kHz A
dB 109 107 105 100 95 92 89 84 80 99
In addition, the surface sound pressure level (free field conditions) at 3 m distance from the air inlets will not exceed 85 dB(A).
4.9.2.2. Air outlet
The total (i.e. the 3 fans as a sum) sound power level emitted by the air‐cooled condenser at the air outlet should not exceed:
Sound Power Level Pref. = 10‐12W
f / oct 31 Hz 63 Hz 125 Hz 250 Hz 500 Hz 1 kHz 2 kHz 4 kHz 8 kHz A
dB 105 103 101 96 92 89 86 81 77 95
These noise limits can be achieved with low noise fans.

GE POWER Gas Power Systems
Identification Number:
TJK/00/M/----------/DO/101 Rev.
A Date
09.03.2018 Lang.
En Sheet
14/29
© COPYRIGHT 2018 General Electric Company GE CLASS II (INTERNAL CRITICAL) All rights reserved. The information herein is Proprietary and Technically Exclusive content of the General Electric Company and/or its legitimate affiliates.
4.10. Cooling water pumps
The total sound power level of one cooling water pump shall not exceed each:
Sound Power Level Pref. = 10‐12W
f / oct 31 Hz 63 Hz 125 Hz 250 Hz 500 Hz 1 kHz 2 kHz 4 kHz 8 kHz A
dB 83 84 91 94 97 100 99 93 84 104
In addition, the surface sound pressure level at a distance of 1 m to the pump will be below 85 dB(A).
4.11. Demineralization plant.
The equipment of the demineralised water production plant will be housed inside a building, which will limit the noise emissions towards the outdoor environment.
The sound transmission losses for the wall and roof cladding of this building shall not be less than:
Frequency/oct 31 Hz 63 Hz 125 Hz 250 Hz 500 Hz 1 kHz 2 kHz 4 kHz 8 kHz
TL / dB 1 4 10 15 19 24 25 30 30
A standard 0.7 mm thick steel sheet cladding shall be sufficient to achieve these attenuations.
For all the equipment located inside the building (pumps, blowers, filter units, cells…), the surface sound pressure level (free field conditions) at a distance of 1 m from each equipment will not exceed 85 dB(A).
No acoustical measures but standard weather protection only are necessary for the air intake louvers.
4.12. Other miscellaneous pumps
The total sound power level of Service water pump (2x100%) and Potable water pump (2x100%) and pumps in Storm water basin (2x100%) area shall not exceed each:
Sound Power Level Pref. = 10‐12W
f / oct 31 Hz 63 Hz 125 Hz 250 Hz 500 Hz 1 kHz 2 kHz 4 kHz 8 kHz A
dB 87 89 91 91 89 87 85 77 75 92
In addition, the surface sound pressure level at a distance of 1 m to the coolers will be below 85 dB(A).
4.13. Ventilation in other buildings
For all the buildings other than mentioned above, as well as for the gas turbine electrical modules, the sound power level emitted by each ventilation unit towards the outdoor environment, shall not exceed
Sound Power Level Pref. = 10‐12W
f / oct 31 Hz 63 Hz 125 Hz 250 Hz 500 Hz 1 kHz 2 kHz 4 kHz 8 kHz A
dB 84 86 85 90 88 86 81 71 69 90
In addition, the surface sound pressure level (free field conditions) will not exceed 85 dB(A) at 1 m distance from each ventilation fan.
No acoustical measures but standard weather protection only is necessary for the air intake louvers.

GE POWER Gas Power Systems
Identification Number:
TJK/00/M/----------/DO/101 Rev.
A Date
09.03.2018 Lang.
En Sheet
15/29
© COPYRIGHT 2018 General Electric Company GE CLASS II (INTERNAL CRITICAL) All rights reserved. The information herein is Proprietary and Technically Exclusive content of the General Electric Company and/or its legitimate affiliates.
4.14. ELECTROCHLORINATION PLANT
The equipment of the electro chlorination plant will be housed inside a building, which will limit the noise emissions towards the outdoor environment.
The sound transmission losses for the wall and roof cladding of this building shall not be less than:
Frequency/oct 31 Hz 63 Hz 125 Hz 250 Hz 500 Hz 1 kHz 2 kHz 4 kHz 8 kHz
TL / dB 1 4 10 15 19 24 25 30 30
A standard 0.7 mm thick steel sheet cladding shall be sufficient to achieve these attenuations.
For all the equipment located inside the building (pumps, blowers, filter units, cells…), the surface sound pressure level (free field conditions) at a distance of 1 m from each equipment shall not exceed 82 dB(A).
In addition, the surface sound pressure level (free field conditions) will not exceed 85 dB(A) at a distance of 1 m to each ventilation unit.
No acoustical measures but standard weather protection only is necessary for the air intake louvers.
4.15. Doors & Gates
The doors and gates of all buildings shall be provided with a minimum sound reduction index Rw = 18dB.
4.16. Other Outdoor Equipment
All other equipment will be equipped with acoustical measures in order to maintain a surface sound pressure level of 85 dB(A) (ref 2.x10‐5.Pa) at a distance of 1 m from the equipment /equipment enclosure and 1.5m above ground level.
5. TRANSIENT AND EXCEPTIONAL NOISE SOURCES
5.1. Atmospheric drain silencer
The max sound power level at the vent opening of the Atmospheric drain silencer, shall not exceed 106 dB(A) (ref 1 pW).
In addition, the Atmospheric drain silencer line and its connected pipe must be equipped with acoustic insulation, in order that the surface sound pressure level (free field conditions) at a distance of 1 m, will not exceed 95 dB(A).
5.2. Start Up Ejector
The total sound power level of the start‐up ejector including blow out opening shall not exceed:
Sound Power Level Pref. = 10‐12W
f / oct 31 Hz 63 Hz 125 Hz 250 Hz 500 Hz 1 kHz 2 kHz 4 kHz 8 kHz A
dB 92 92 96 106 103 97 98 97 90 106
In addition, the start‐up ejector line and its connected pipe must be equipped with acoustic insulation, in order that the surface sound pressure level (free field conditions) at a distance of 1 m, will not exceed 95 dB(A).

GE POWER Gas Power Systems
Identification Number:
TJK/00/M/----------/DO/101 Rev.
A Date
09.03.2018 Lang.
En Sheet
16/29
© COPYRIGHT 2018 General Electric Company GE CLASS II (INTERNAL CRITICAL) All rights reserved. The information herein is Proprietary and Technically Exclusive content of the General Electric Company and/or its legitimate affiliates.
5.3. Safety Valves and Power Operated Relief Valves
Noise emitted by each Pressure Safety Valve and its entire exhaust system (piping, silencer, and other components) shall not exceed the following levels, when measured at any point at 1m distance from the equipment :
- Maximum sound pressure level (free field condition) : 115 dB(A)
- Maximum instantaneous noise pressure level : 140 dB(C)
5.4. Steam Turbine bypass system
The surface sound pressure level (free field conditions) emitted by the components of the steam turbine bypass system, including the dump tubes, shall not exceed 105 dB(A) at a minimum distance of 1 m from the equipment, or at the nearest normally accessible platform.
This value will be achieved by suitable acoustic insulation on the valve bodies and connected downstream pipes up to the condenser, including the water spray manifold.
5.5. Fuel Gas blow out after GT shutdown
The noise emission of the fuel gas blow out after shut GT shutdown shall be reduced by orifices to a maximum sound power level of 105 dB(A) (ref 1 pW).
5.6. Other Vent Systems & Plant Intermittent Operation
Any other atmospheric vent system, including drains and other systems operating during Plant start‐up and intermittent operations (e.g. steam blow down vents, vacuum breaker valve vents, …), shall be fitted with suitable silencer, if necessary, in order to limit the surface sound pressure level (free field conditions) emitted during transient operations to 95 dB(A) at a minimum distance of 1 m from each vent outlet.
In addition, the blowdown tanks and their connected pipes must be equipped with acoustic insulation, in order that their surface sound pressure level (free field conditions) at a distance of 1 m, does not exceed 95 dB(A).
5.7. Transient operations and intermittent noise
The recommendations from international specialist organizations, i.e. Occupational Safety and Health Association (OSHA for short term exposure, noise levels shall not exceed the limit as stipulated in the Occupational Safety & Health Administration (OSHA) standard.
Referring to our above table, the expected noise level for Transient operations and intermittent noise are as per below table.

GE POWER Gas Power Systems
Identification Number:
TJK/00/M/----------/DO/101 Rev.
A Date
09.03.2018 Lang.
En Sheet
17/29
© COPYRIGHT 2018 General Electric Company GE CLASS II (INTERNAL CRITICAL) All rights reserved. The information herein is Proprietary and Technically Exclusive content of the General Electric Company and/or its legitimate affiliates.
Transient operations and intermittent noise Expected Sound Pressure Level
Atmospheric drain silencer vent opening Surface sound pressure level (free field conditions) of 95 dB(A) at 1meter distance
Start‐up ejector including blow out opening Surface sound pressure level (free field conditions) of 95 dB(A) at 1meter distance.
Each Pressure Safety Valve and its entire exhaust system (piping, silencer, and other components)
Maximum sound pressure level (free field condition) of 115dB(A) at 1m distance from the equipment
Steam turbine bypass system, including the dump tubes
Surface sound pressure level (free field conditions) of 105 dB(A) at a minimum distance of 1 m from the equipment
Fuel gas blow out after shut GT shutdown Surface sound pressure level (free field conditions) of 95 dB(A) at 1meter distance.
Any other atmospheric vent system, including drains and other systems operating during Plant start‐up and intermittent operations (e.g. steam blow down vents, vacuum breaker valve vents, …)
Surface sound pressure level (free field conditions) of 95 dB(A) at 1meter distance
6. RESULTS
The equivalent continuous A‐weighted sound pressure level emitted by the power plant at base load operation, including the ambient background noise at identified receptors as per “5. MoM Boundary Noise Meeting DOE 01032017” during day time and night time are tabulated below.
Table 1: Sound pressure levels emitted by the whole Bintulu Tanjung Kidurong Power Station block 1 during combined cycle operation at base load (including ambient background noise) during day time.
Noise Sampling point
Guarantee noise values as per MOM 5. MoM Boundary Noise Meeting DOE 01032017 dB(A)
Average day time Background Noise level dB(A)
Power Plant's noise level dB(A)
Background Noise level+ Power Plant's noise level dB(A)
N1 74.9 72.6 53.1 72.6
N2 74.9 70.6 56.4 70.7
N3 80.0 75.5 54.2 75.5
N4 75.0 66.1 55.9 66.5
N5 75.0 64.1 69.3 70.4
N6 74.9 66.2 56.4 66.6
chanping.pang
Rectangle

Appendix 3.8.1
SPA Application Letter for CCGT Block 1


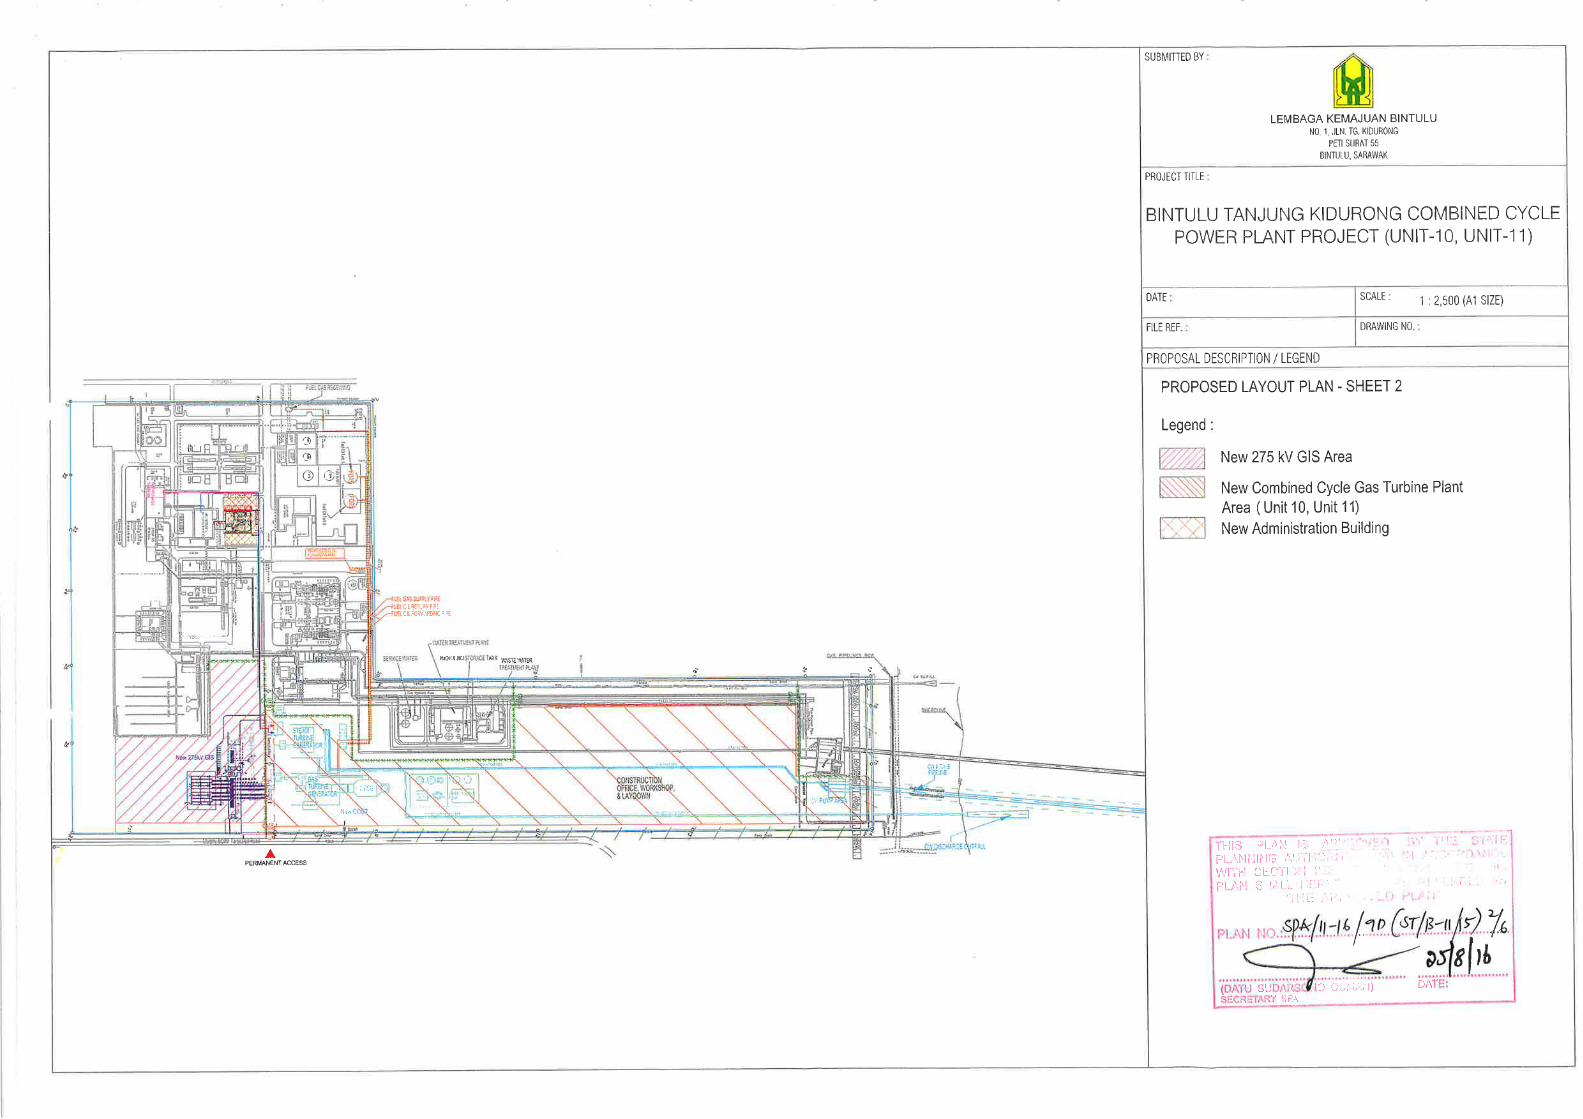


Appendix 3.8.2
SPA Approval Letter for CCGT Block 2

sarawak~energy
Our ref: SBP-170001/LAND/AL/hk
27 NOV 2017General ManagerBINTULU DEVELOPMENT AUTHORITYWisma BintuluNo.1 Jalan Tanjung Kidurong97000 Bintulu
Dear Sir
TG. KIDURONG COMBINED-CYCLE POWER PLANT PROJECT (UNIT 12 & 13) at Lot 76 Block 20Kemana Land District, Bintulu.
Due to the rapid development of energy-intensive industries under Sarawak Corridor of RenewalEnergy (SCORE), Sarawak Energy Berhad is building additional power plants to meet the powerdemand and to enhance the reliability and security of power supply in the State of Sarawak.
With this planning in view, Sarawal< Energy Berhad is currently looking into the construction of anadditional block of Combined-cycle Gas Turbine Power Plant with a capacity of 400MW. The site forthis additional capacity is being proposed within the boundary of the existing Tg. Kidurong PowerStation at Lot 76 Block 20 Kemena Land District, Bintulu.
The construction of the proposed project is expected to commence as early as 2nd Quarter 2018 withthe intention of having the plant to be fully operational in 4~h Quarter 2020.
Appended, please find the Siting Application Form with the following necessary documents for yourkind attention -
Appendix A. Project Brief of the Proposed Power PlantAppendix B. Land Title of the existing Tg. Kidurong Power PlantAppendix C. Proposed layout plan of the Proposed Power PlantAppendix D. Cadastral Plan
Your favourable consideration would be greatly appreciated.
Thankyou.
Yours sincerelyfor §ARAWAK ENERGY BERHAD
Chief Executive OfficerSEB Power Sdn Bhd
Sarawak Energy Berhad (007199-D)Menara Sarawak Energy,No. 1, The Isthmus, 93050 Kuching,Sarawak, Malaysia
T +6082 388 388F +6082 344 433www.sarawakenergy.com.my

SITING APPLICATION FORM
1. Name of Project Proposed Bintulu Tanjung Kidurong Combined-Cycle PowerPlant Project (Unit 12, Unit 13)
2. Applicant : Sarawak Energy Berhad
3. Contact Person : Chua Yaw Chiang Tel No.: 082-388388/ 019-8197997
4. Area Required : 11.25 ha (approximate)
5. Total Scheme Value : RM1.5 billion
6. Amount of fund approved in the N/A Malaysia Plan
7. Amount of Fund Available Now : RM1.5 billion
8. Project Justification and description of Project Components
The construction of the new Bintulu Tanjung Kidurong Combined-Cycle Power Plant (Unit 12 &Unit 13) is to meet the growing power requirements of the energy-intensive industries underSarawak Corridor of Renewable Energy (SCORE) and to enhance the reliability and security ofpower supply in the State of Sarawak in Malaysia. The project is scheduled to commence inls~ Quarter of 2018 and targeted to complete by 4~11 Quarter of 2020.
Attachments: Appendix A : Project Brief
9. Reason for selecting the site
The ideal power plant location is situated within the existing compounds of the Bintuiu TanjungKidurong Power Plant where all the necessary infrastructures are readily available includingthe gas supply receiving station. The proposed power plant is to be built on the land registeredunder Syarikat SESCo Bhd for the same purpose.
Attachment: Appendix B : Land Title
Signature Designation : Chief Executive Officer(SEB Power Sdn Bhd)
lName Of Officer : James Ung Date : 4/14.»
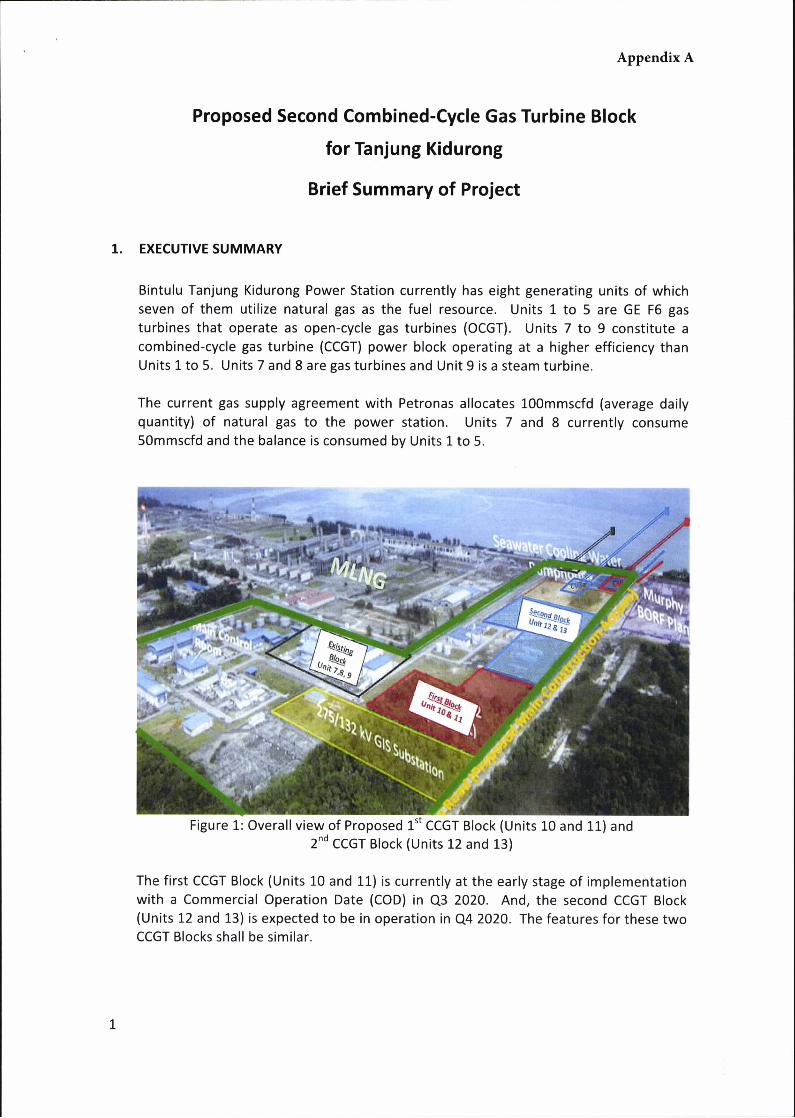
Appendix A
Proposed Second Combined-Cycle Gas Turbine Block
for Tanjung Kidurong
Brief Summary of Project
1. EXECUTIVE SUMMARY
Bintulu Tanjung Kidurong Power Station currently has eight generating units of whichseven of them utilize natural gas as the fuel resource. Units 1 to 5 are GE F6 gasturbines that operate as open-cycle gas turbines (OCGT). Units 7 to 9 constitute acombined-cycle gas turbine (CCGT) power block operating at a higher efficiency thanUnits 1 to 5. Units 7 and 8 are gas turbines and Unit 9 is a steam turbine.
The current gas supply agreement with Petronas allocates 100mmscfd (average dailyquantity) of natural gas to the power station. Units 7 and 8 currently consume50mmscfd and the balance is consumed by Units 1 to 5.
Figure 1: Overall view of Proposed 1.St CCGT Block (Units 10 and 11) and2nd CCGT Block (Units 12 and 13)
The first CCGT Block (Units 10 and 11) is currently at the early stage of implementationwith a Commercial Operation Date (COD) in 03 2020. And, the second CCGT Block(Units 12 and 13) is expected to be in operation in Q4 2020. The features for these twoCCGT Blocks shall be similar.
•ri
f#
Unit líñi1 Ek;
4
Fit-
.4 i1
1

CONCEPT ENGINEERING
The 2nd CCGT Block shall be located between the existing cooling water supply pipeline(for Unit 9) and the cooling water lines for the 1st CCGT Block with the GTG, HRSG andSTG to be arranged in parallel with the need for diversion of the existing cooling watersupply pipeline (for Unit 9) as shown in Figure 2.
Integrated Cooling1st CCGT Block .î 1 2nd CCGT Block A Water Pump House Î
- i-I. --- --11 2- ID -î'-1
11- 71 LAA
i . 4246E= 3==- r« ÙTco / n . ål 1.- ì \
AL: ù> ·0, ,-.=0 --A'11 % /...11. --~1117
-2.-hi_Ell-~LiZIES T-ZIZZ -'---/-.'7---tr ··' -/ I__~' iï-ï~ -4-
Figure 2: Layout for the 2nd CCGT Block
2.
Nj
4.1
LI ''- f k
31

3. PROJECT TIMELINE
Proposed 2nd Block Bintulu Tg. Kidurong Combined-Cycle Power Plant Project
Year 2017 2018 2019 2020 2021Quarter 21314 1121314 1121314 1121314 1121314
Initiation
ConceptDG3V
Pre-Engineering 3......Elli
Execution(Block 2)
CCGT COD Q4/2020
Rev. 2017.06.28

22:ñ'E :
cž Ž
8 31
EN ,
h .=
3 8i
-2 n
E8
, 880S
' .#
B-.:
ir·-1,É
i •7
N?4 - :aï.0 i 8/ 1 r i E
5 1%
i .
5 21 3 1% : :I
1.1 --
m.
-- I
.
I G
2 3,
21 0
g 8.4R B..
/2 .1 1 i0 4 ï£
:i
15%81511./64014:(D
I
ci..
2E
£1152:
e
:B
44-1'
liä/i ~:Ewšë i·S.2 : iš
Š g Š Ž:.2
; A:0' ~'''~ ~~:~ F8 Ë
43 5&
3=
':* .22 :8 2/0 111 *08
1·13 12 15:äi
. .te ·-r 0
:42?þtl Mil 3 8 4
§ 11*U 1:5-ELã
:KET mýt #11 î
í- itiíå}.2-3
@ 9~
/.6
6-4.J +:BEN:,C i0ïíl~íïš N b
ve,In
m A 0
O
1 8
01 2 6 1 3
332 428§ 944 ..10
44·..
ró
3 -
8 4 ·"8) : ·: w:+1
: 8-44 4~ 6 ro '21
15 .(1}: . 8 9
5 3
6 0m
N &
Erd 12 ê
.0 z
i! i 8 it; i.c:
i M i.91 'íl :El ß '0
i v ·2 gßý3 -:fî 1 E ~ å -8 ·
N -1 iü}M ®18 0
8.64: a tš E . 6
fs ß í š K.3 s
E:
~98 =2I R 2 2 al
. .C
u .2 .2 š .E
yìñ
i8
ië* 4
44 0 4
i 2 ·S 09
1 E
:3 2
W e z
.c; w g
i~ßi.ß~irl i~~111~ :â
ß lž
\
<*23- :ŽŽIZ21\ --
tžl ëk\~9 ZLË W 1 Ÿtílt'ŠH.ì-štal 511.%
%
3 BŠ
ø:. 1 ß·% 1
M. O :. M
1 8 .., ·-
FE! 52 Fri ide
t-.4 - âîr--1 ¤M
R 411% i
1 4 .ç, 08 9
3 i.c ~ .š iä Š~ til fi
: ·2 Z ····
i° i*, iy E i.íi i 3 0 0
8 I @t, í .1 Š Ul: 0, Æ
ll :-ØP-M -~- -0, N :.â ríal,ØMR.:miN -23~1 1
ß., ÌŽ} i I
.2 M INE ä 12 Rigií .Ñ e®ä r '8 - i Š
:.0: [O m ·rl ..1
·9*
;:3~+J .4 01 0 0
M M 451; 71-8- 4 2* f =-i ·4·=1 1-ši :1 6*jž#igfü=ß °>225~ æ %44 1 +1 1 3 1 ~ 1 8% re lù- 1 11 Þ Pifì P .5~ iši i ü:· M -g ,¤ 3. 3I
· ·C
· ·rh
- ·01)
r[3 4-1
34
ér--
5 0 .1 U
tr m * lê Œ) 0E
.w Ší i -3 1 115 6 -
6:ii '93 1 31 4
EM Ki D ili m -11 1 13 :3 -3
98 2 8 11 4 1 :tS:I°:0 41:è-i:AH u þt z o
P 11 04, E -2 Ni# 3
i~ ~Wi rrí Sžžt Zil.
er] 3
d
ã ß Ní@i g g --lig 2 i¿ 1 -æ âl 1-4-~ 8 EZ-Ë As
* -:....4.i
:
0
Appendix BL.&S..9/
Ë8
ANDNNETH
Zzizž-12_k_nøki_en-thE--Fëšístration of
. r
1 71-2
. 9% 13

0Z0·rl4[Ó0·r-144•el04-J î0)
.rí ' ·|2
,-4 •ö
\6 1--0
0
51t-flu-~(D8 Z
85
S ~f ~~'IJ
U I1
: 'i
16 11
1 0118 /
Ì23
!1
1i

//..../'....
.''
I
0 /,3
0>,L~
* f 4.
~ 31. lž-/1.
448
'Ý
, 1
.'4: rr
ý j
///
4.
-2>- -
ì,/
-~--
íí.í.
\F- ,
- 7 \
ì. 0\
7/. 4
1 111 /
1...NP
..7
411
'.-04
4-L«
; ý
' .7
2
- ..:ÝA
K....~1
I.ŽTŽ
* Ž 0
4%49
.- /
/ /
m \l
é)- 1
,1 ,tr/
8 4
-i'*70
.1~7
5«
0/
/:
k-EX
'\0
Cy.Øš
žy\N/
.í»74
,4045 -
--1 éý»
f '~.
15 x \\ 4
. '4*
FL<&
-24:
. íí-/96
8*,4
1-
,·ti-
fýž·
- ~
-C<
12~
«~
' '
t\\~
~0~
.4, d
últs
-í
3 -i~Ýå
·. ~- · /
il q
,ribS
Ž*í. .
#»2
1©44 \
, ,
. Asè
rpì
4 - - /
:-4
0
y
i -~- í/~
iê> ,
1 /
//./\2-*1 2<
%.í>»..
,<\
è. .
/'221
\ A
.04' 19
© 4.-eý
>é &O
Ý-:
+X
Ý°'
»,
sti X
. I óú
>Ú .6
,+I'
/
I~ f.í .
.#24 @
ì.
#
3->
N /
-T
18 031UINBAS
rž zC*
D 0
-1 0 R 0 CD * -1 C 2 CD -0 0, g C -4
0 =
-0 -
0kc
a
D
==
CO
A
0/rn
-CJ
532
_1
CD
.ÉD
N -00
5
ro Z
c.n
o
C)
5- C¤ g aZ CD 0 0 3 U g. 0 Ž. CD G) 3} -1 C B CD -0 E C
Z-0 -
10C á E
m JO
-1-0 Z
Z-7
:2 85
JO mOÔ bî E
Š SŠ C G
)ŠO
710
CŽzm
~ 010
CA) 4
vO
txJ 5 -0
.F
C/) % 14 X
0/
59 *Ž ŽC ŠZ ŠØ
E
0 *!Pueddg
/-Ií-=
..~
CED
C> B
4á
\* 1
\\ Ý\Ž
r m

Appendix 4.2.1
Topographical Survey Plan of Project Site (Onshore)


Appendix 4.2.2
Topographical and Bathymetry Survey Plan of Project Site (Offshore)
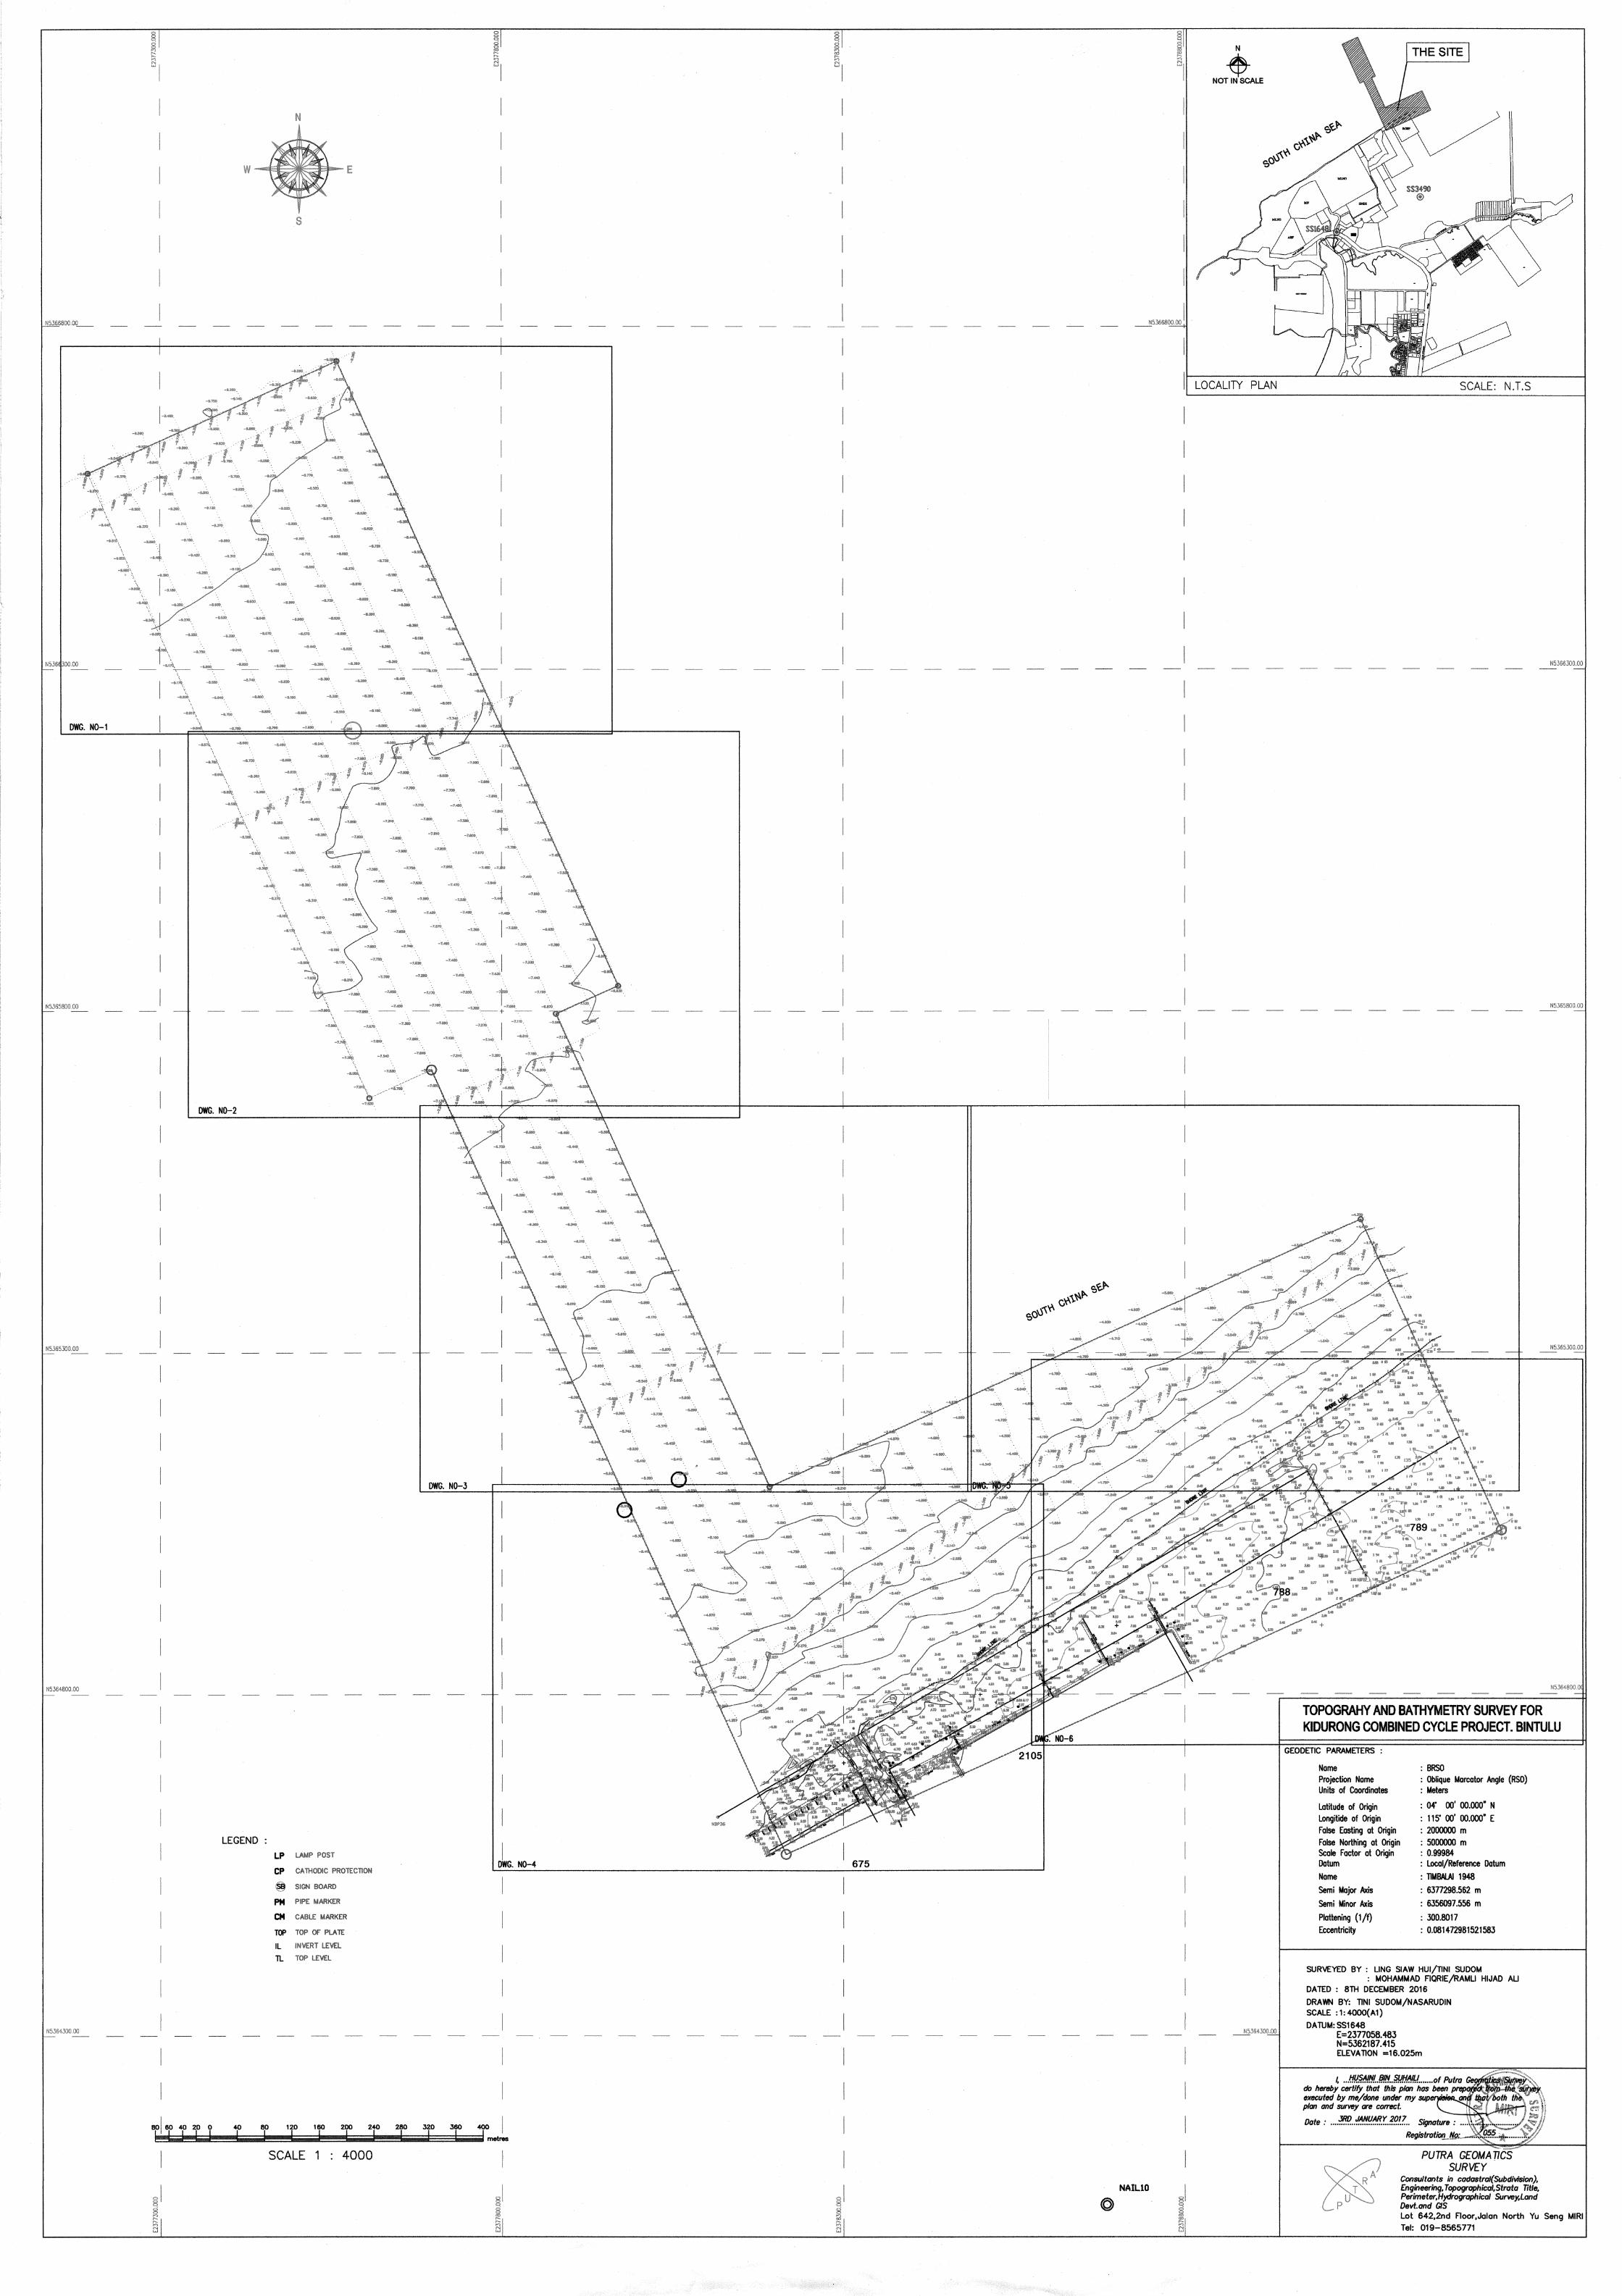

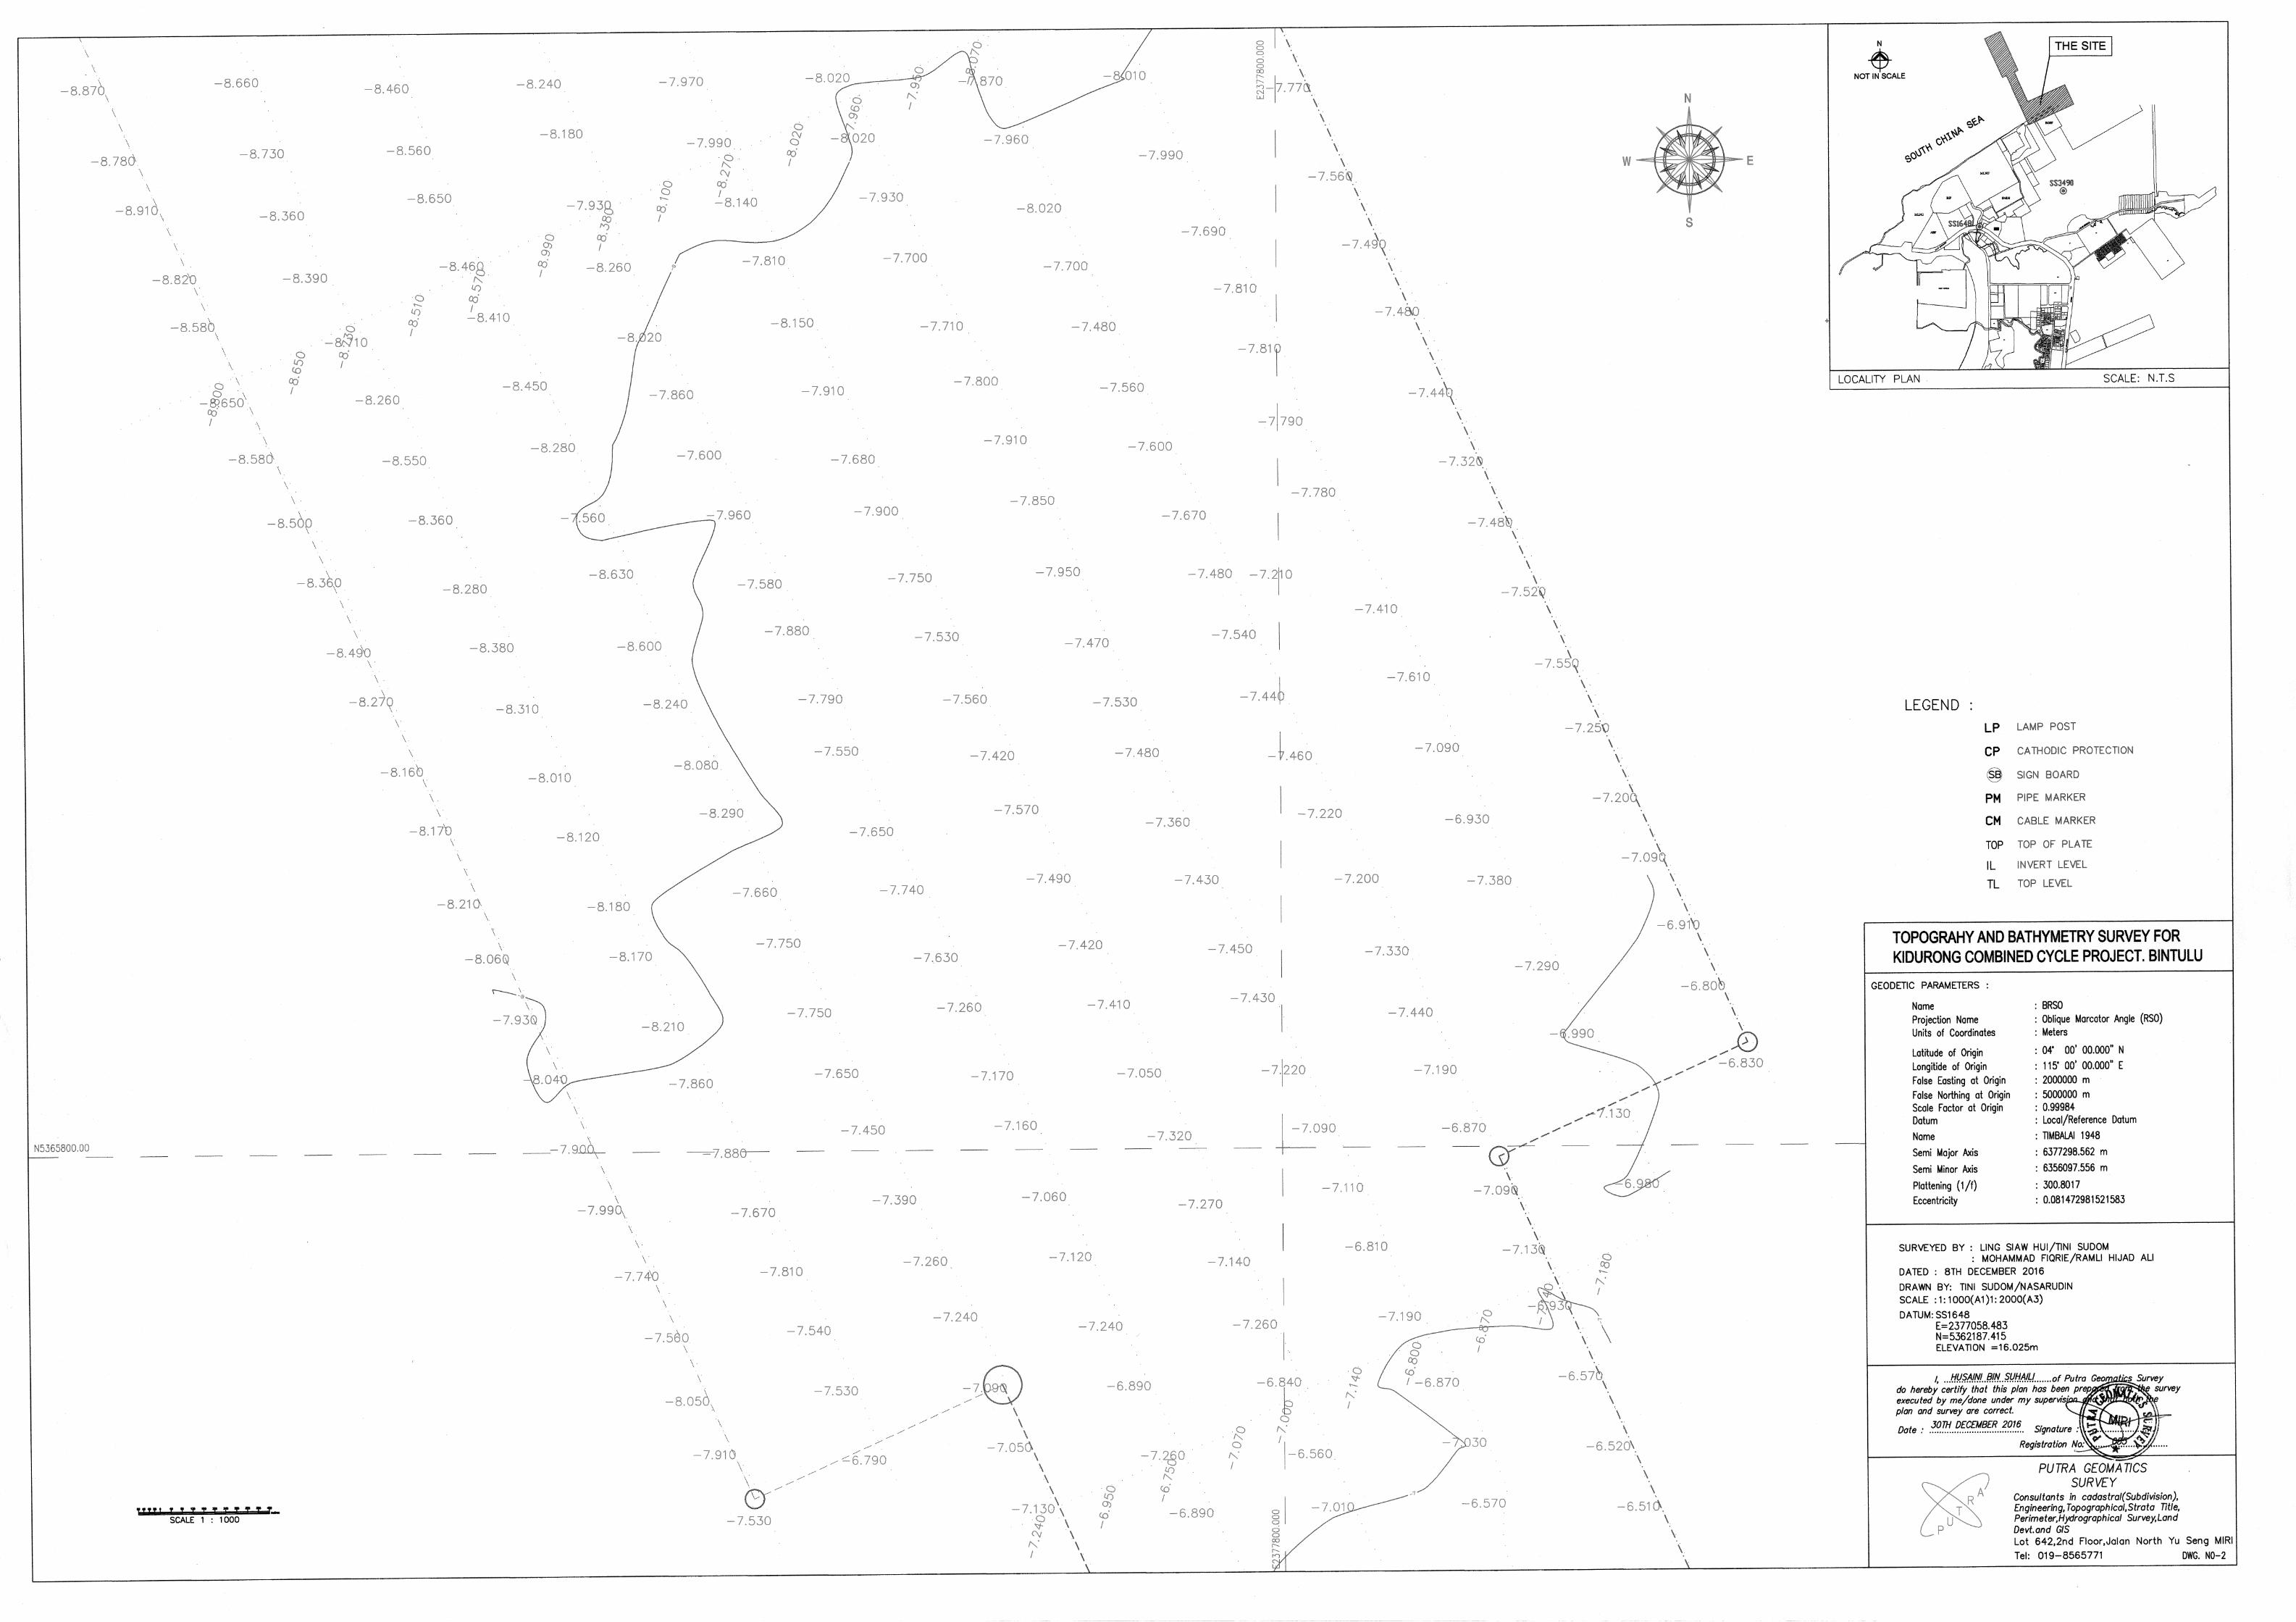
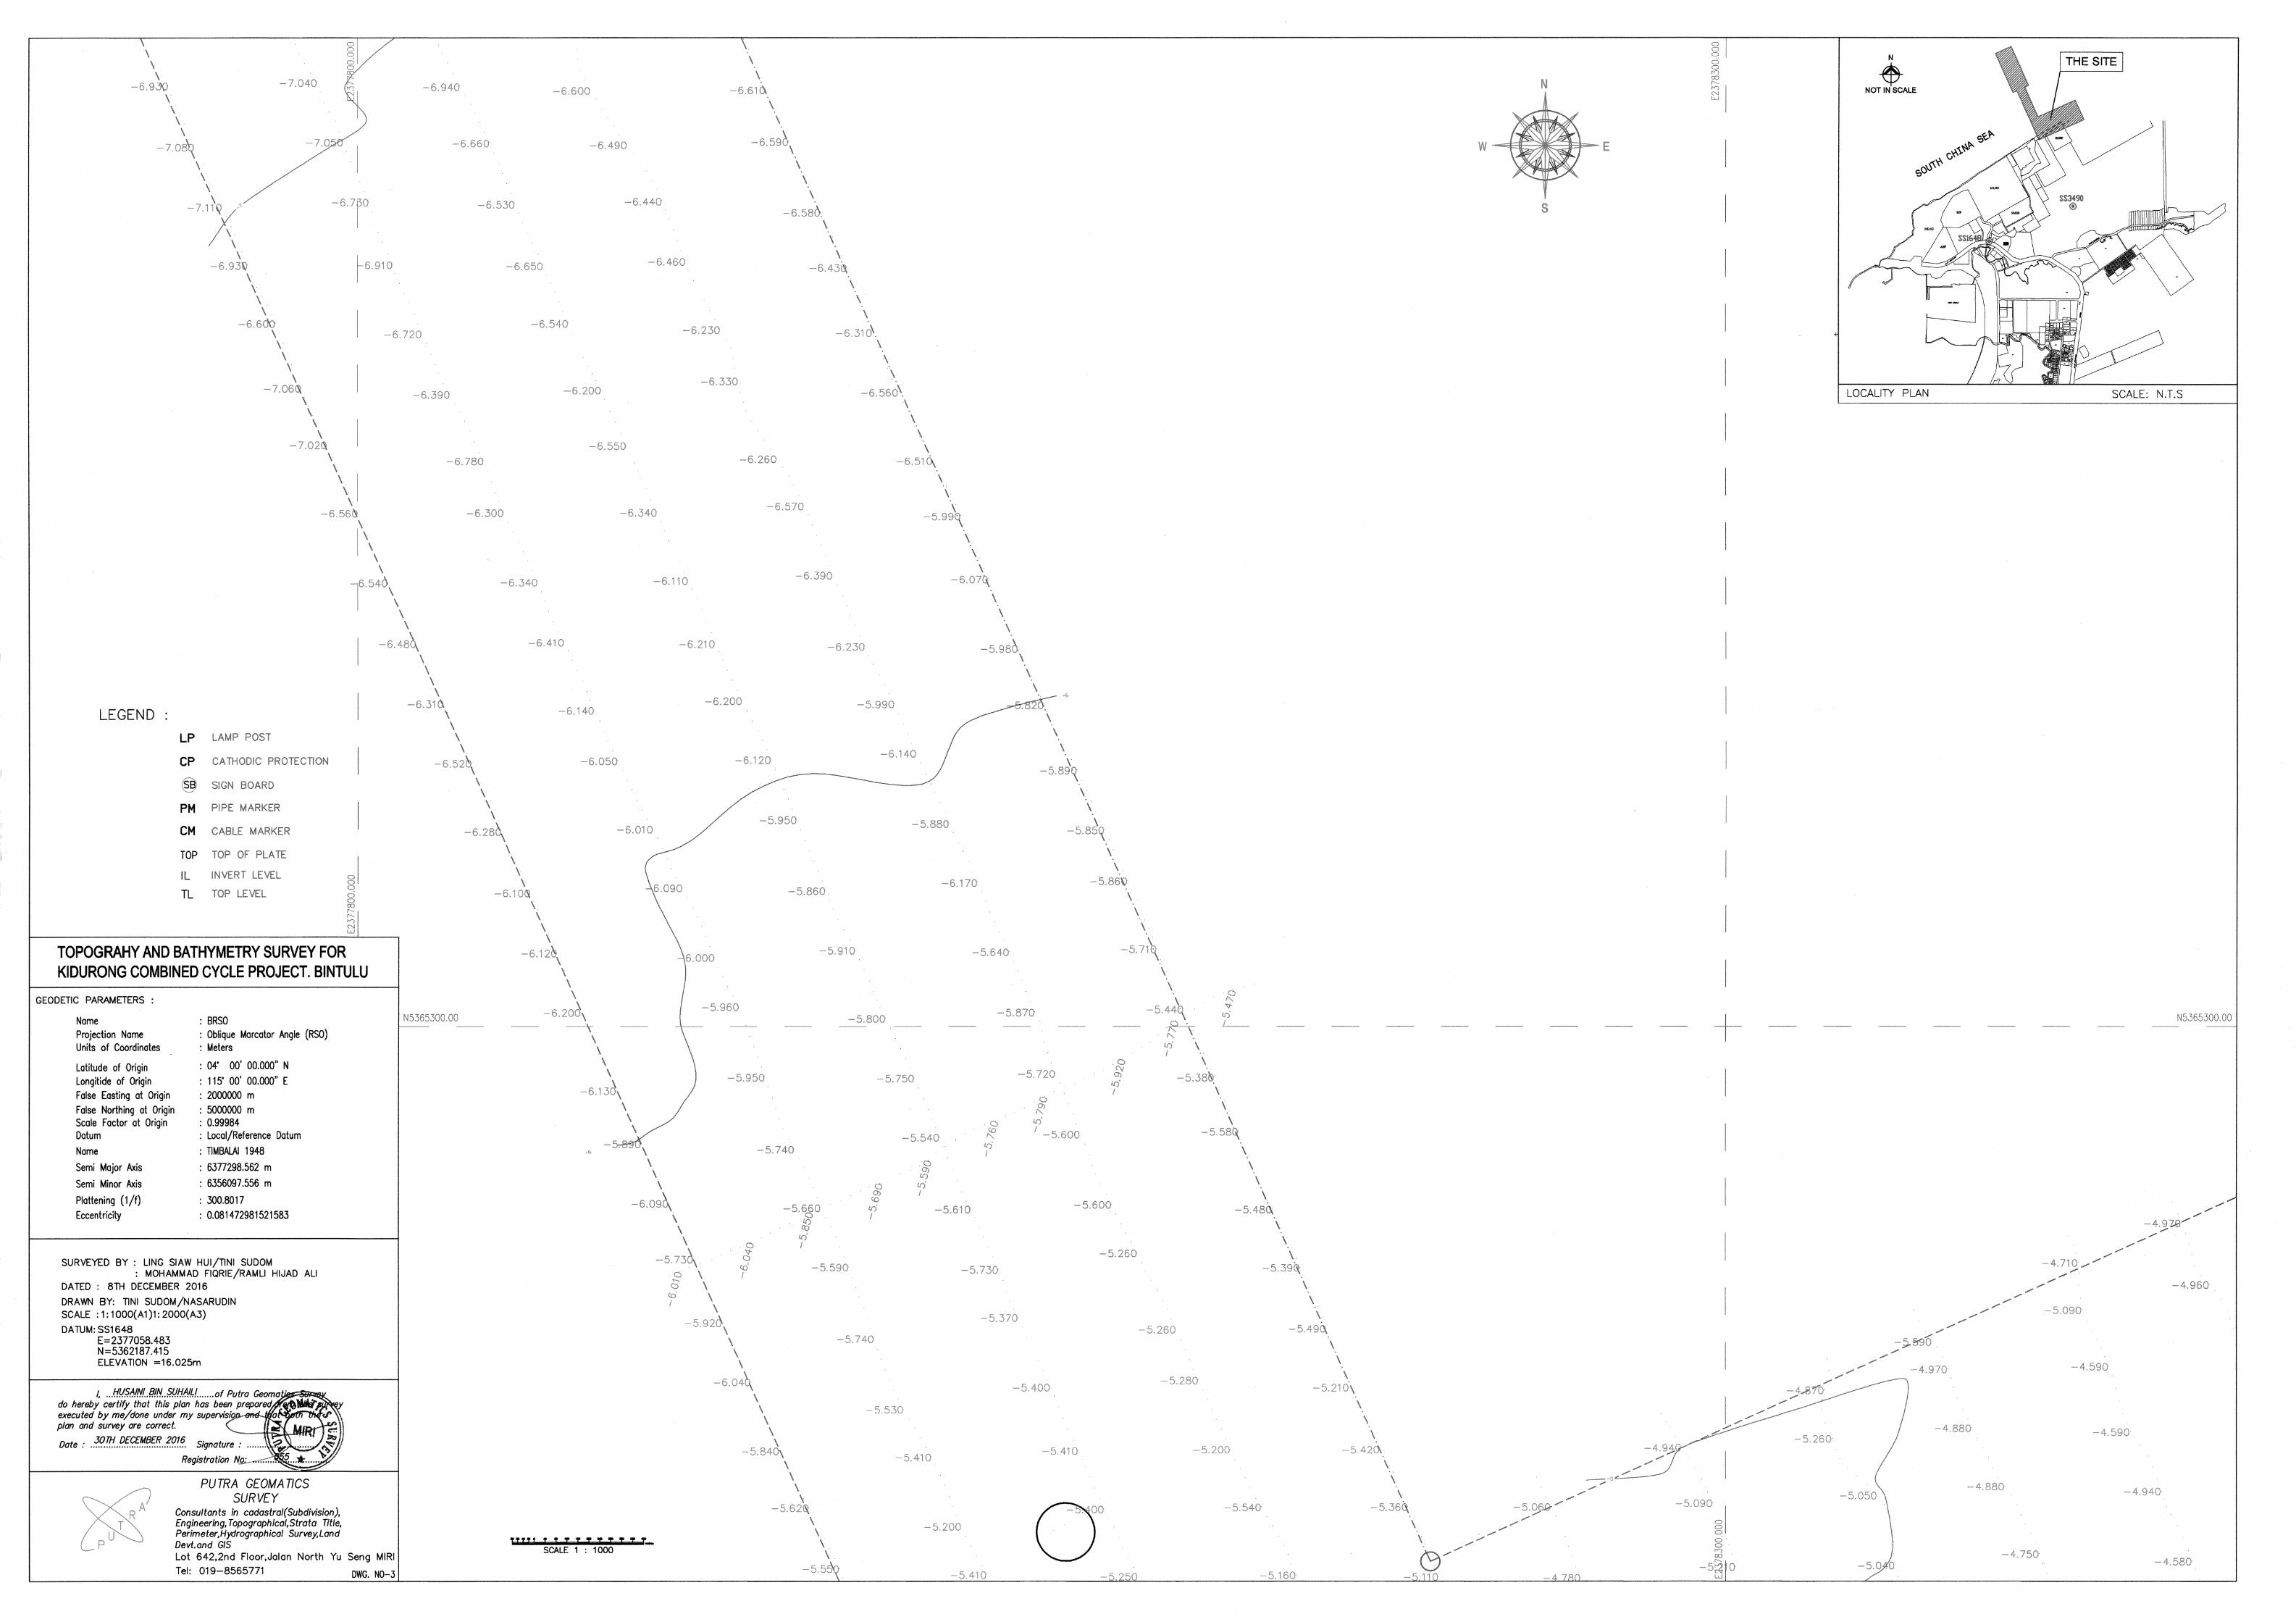

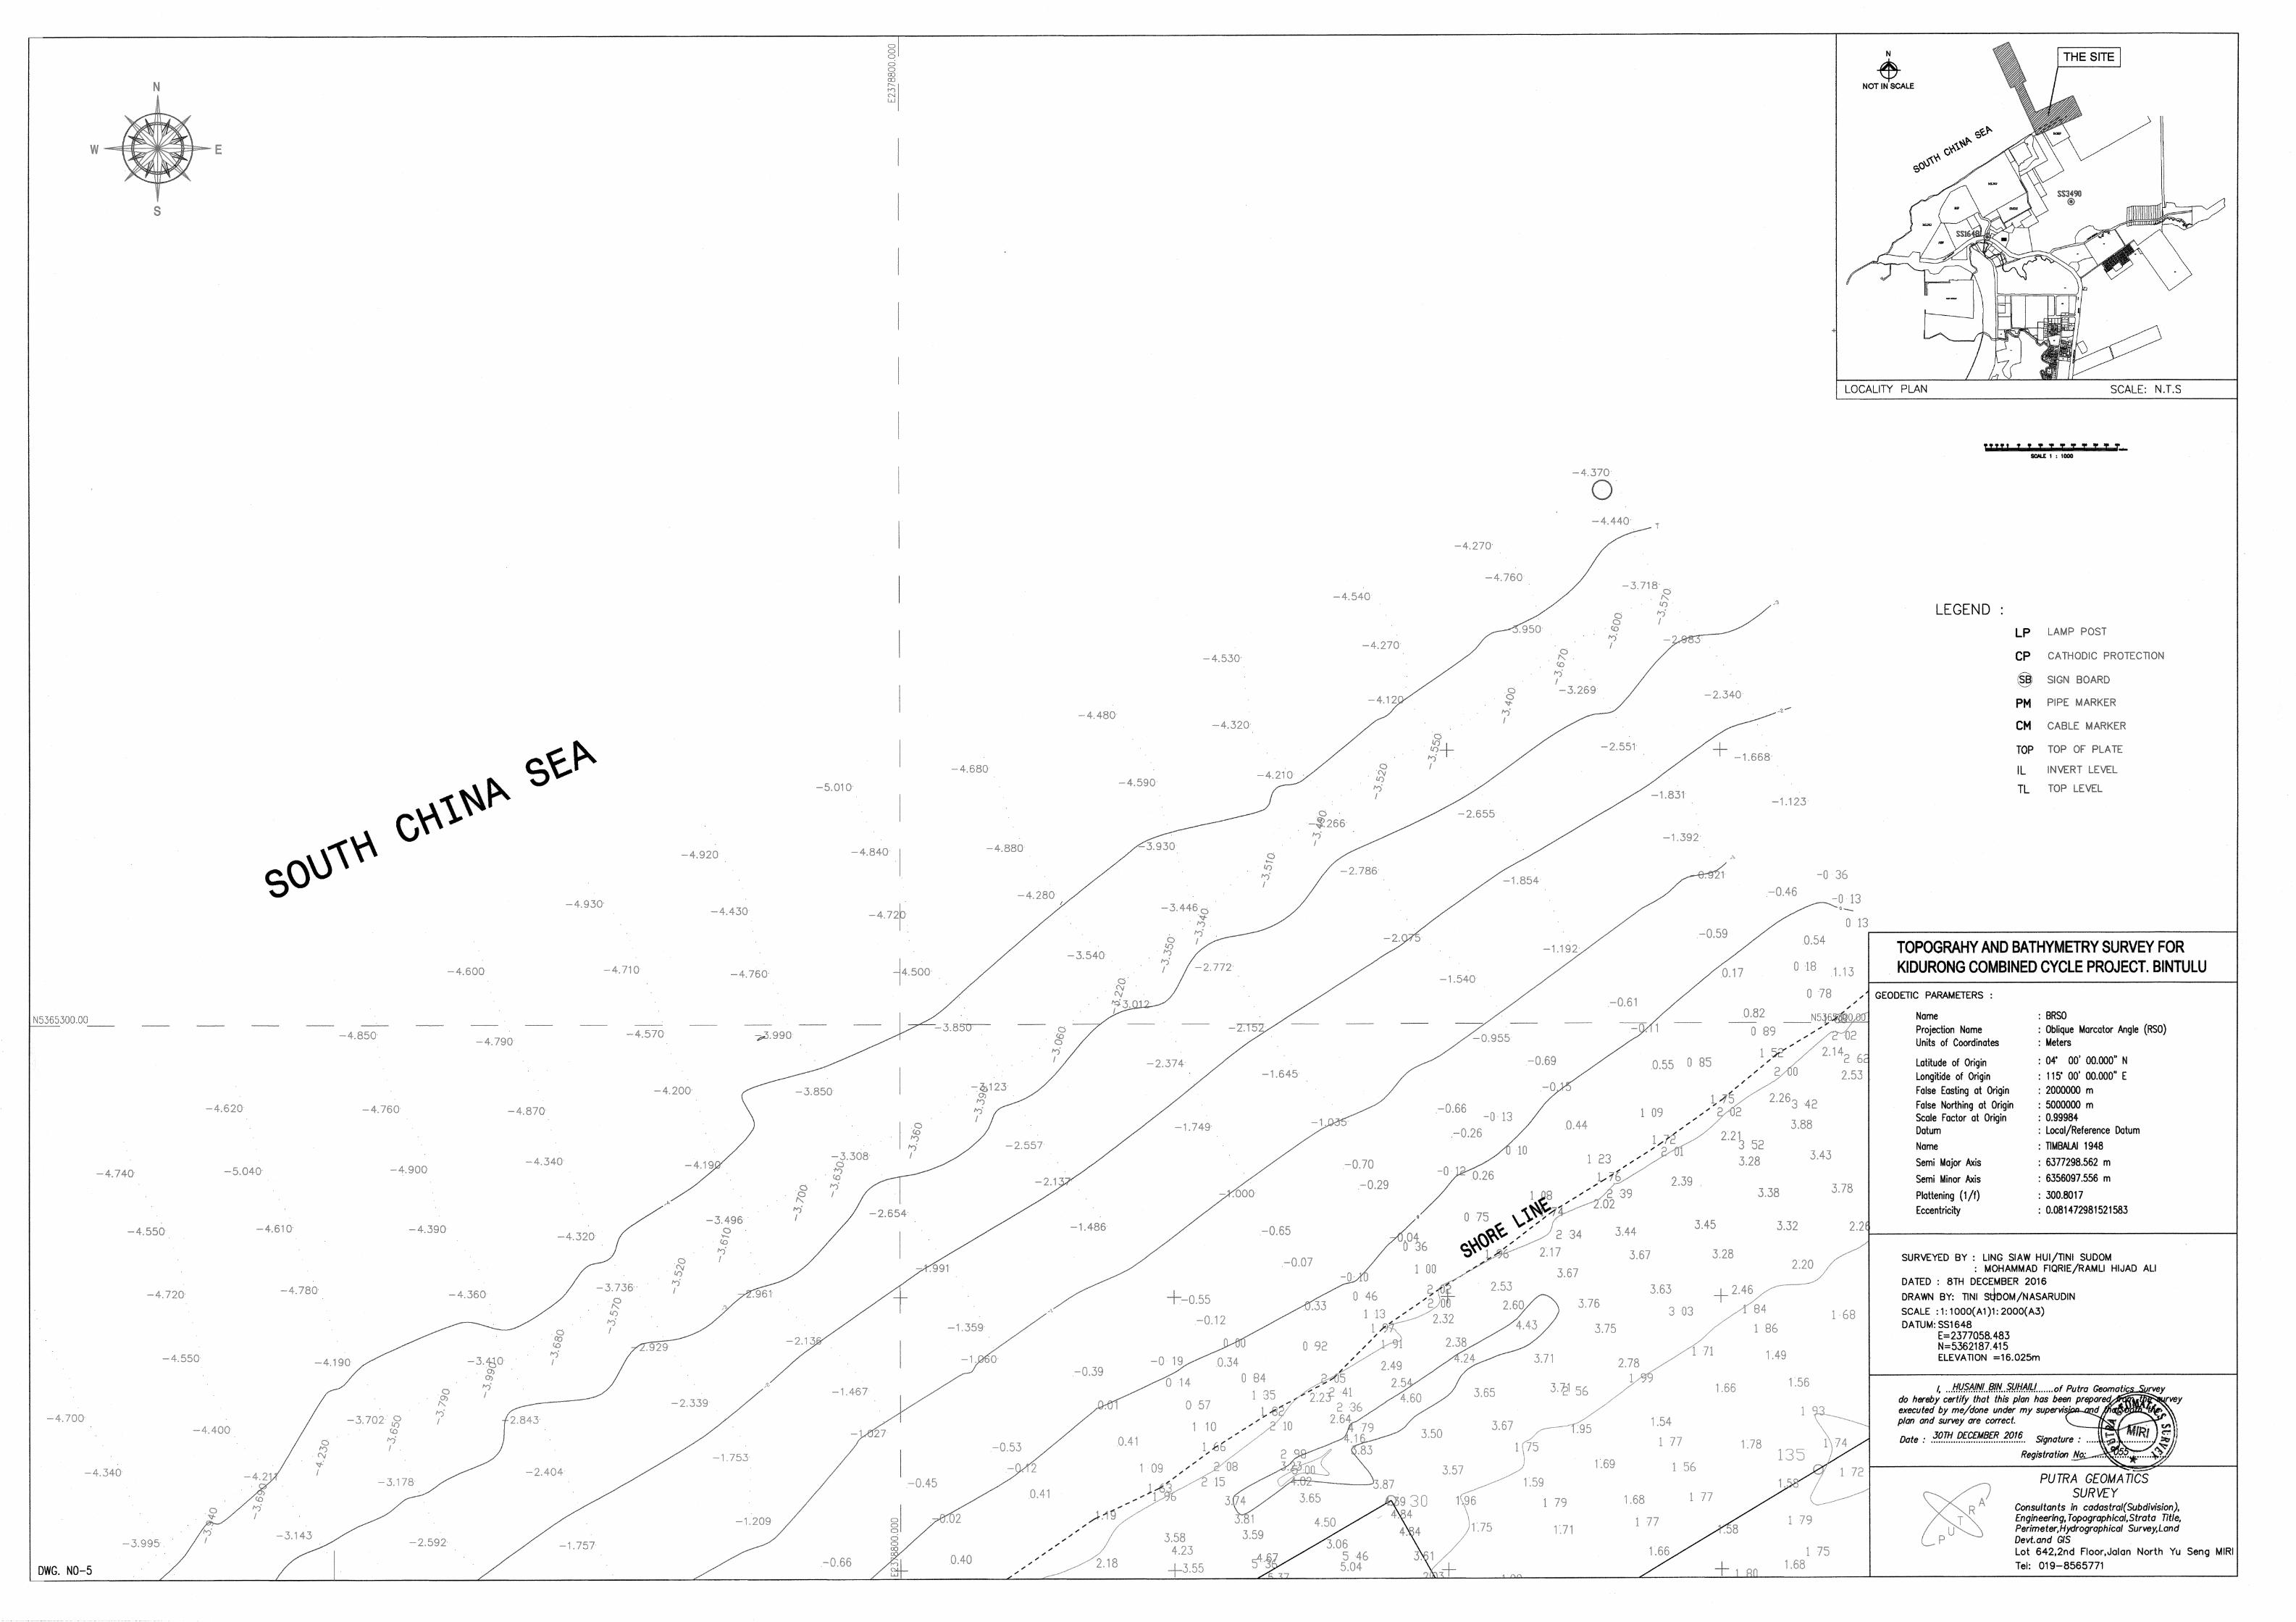


Appendix 4.2.3
Borehole Log Results

N
E
BH2380.00
BH2390.00
BH2400.00
BH2410.00
BH2450.00
BH2460.00
BH240a0.00
BH241a0.00
BH241b0.00
user
Typewritten Text
BH238
user
Typewritten Text
BH240
user
Typewritten Text
BH239
user
Typewritten Text
BH241
user
Typewritten Text
BH242
user
Typewritten Text
BH243
user
Typewritten Text
BH245
user
Typewritten Text
BH246
user
Typewritten Text
BH244
user
Oval
user
Oval
user
Oval
user
Oval
user
Oval
user
Oval
user
Oval
user
Oval
user
Oval


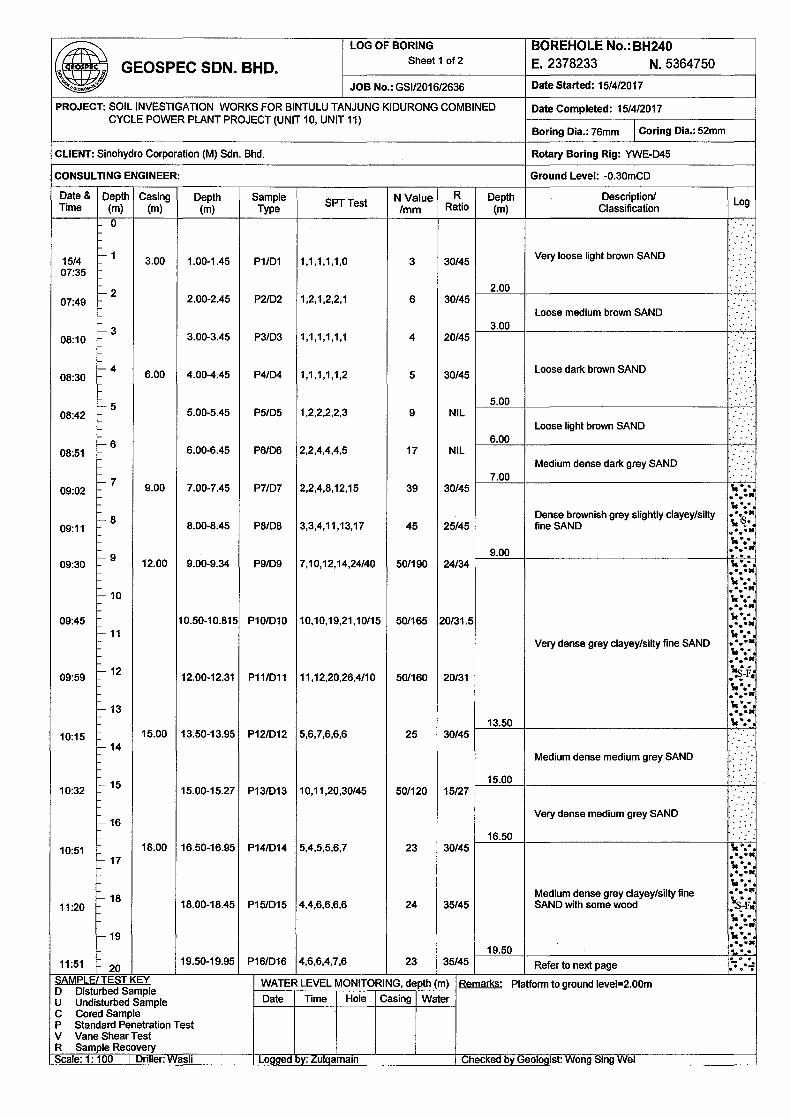


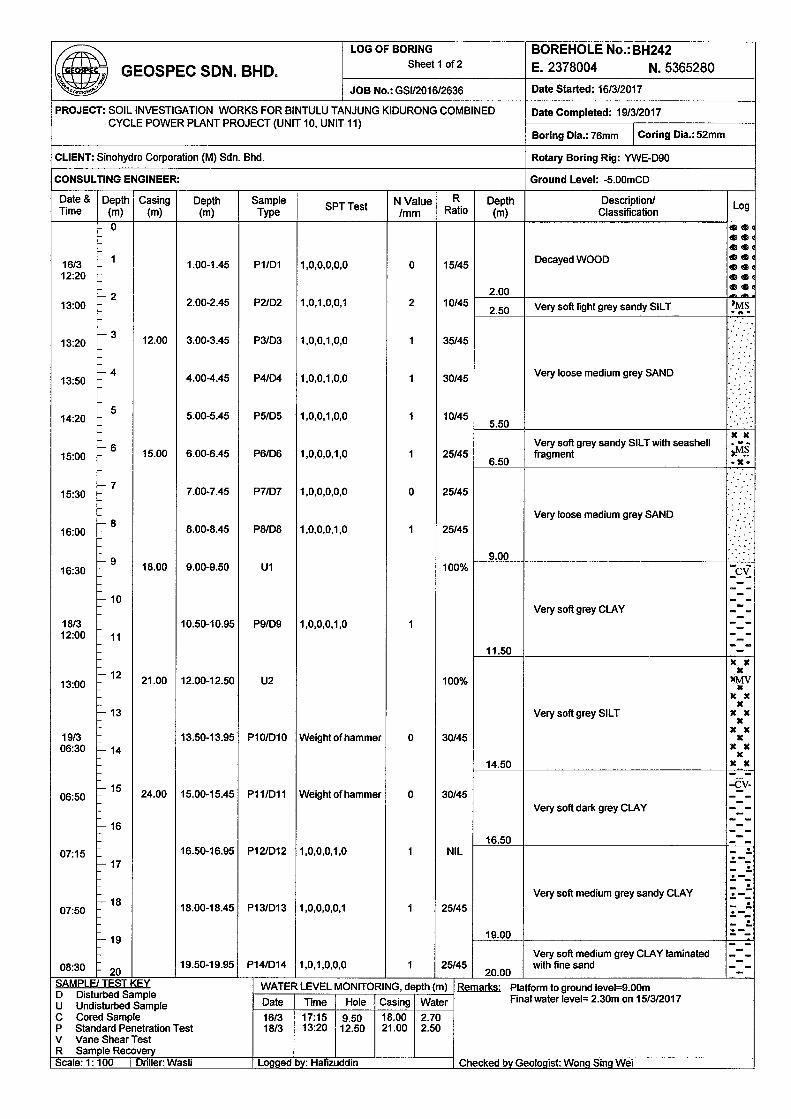


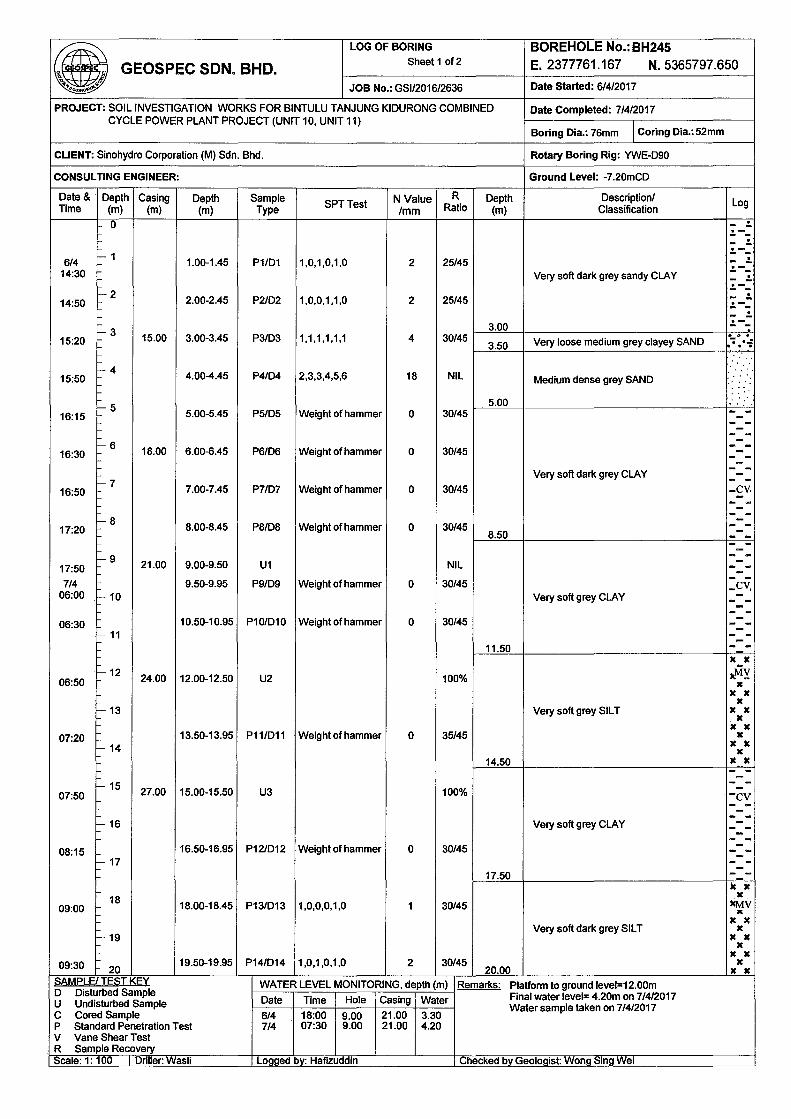


Appendix 4.2.4
Surface Water Test Report


Appendix 4.2.5
National Water Quality Standards for Malaysia (NWQSM)

NATIONAL WATER QUALITY STANDARDS (NWQS) FOR MALAYSIA
Parameters Classes
Units I IIA IIB III IV V
Ammoniacal-N. mg/l 0.1 0.3 0.3 0.9 2.7 >2.7
BOD mg/l 1 3 3 6 12 >12
COD mg/l 10 25 25 50 100 >100
DO mg/l 7 5-7 5-7 3-5 3 <1
pH 6.5-8.5 6-9 6-9 5-9 5-9 -
Colour TCU 15 150 150 - - -
Elec. Cond mhos/cm
1000 1000 - - 6000 -
Floatables N N N - - -
Odour N N N - - -
Salinity* % 0.5 1 - - 2 -
Taste N N N - - -
Tot. Diss. Sol.* mg/l 500 1000 - - 4000 -
Tot. Susp. Sol. mg/l 25 50 50 150 300 >300
Temperature ºC - Normal ±2 - Normal ±2 - -
Turbidity NTU 5 50 50 - - -
F. Coliform** counts/100ml
10 100 400 5000
(20000)ε
5000 (20000)ε
Total Coliform counts/100ml
100 5000 5000 5000 5000 5000
Al mg/l ENL - - (0.06) 0.5 -
As mg/l ENL 0.05 0.4 (0.05) 0.1 >IV
Ba mg/l ENL 1 - - - >IV
Cd mg/l ENL 0.01 0.01* (0.001) 0.01 >IV
Cr(IV) mg/l ENL 0.05 1.4 (0.05) 0.1 >IV
Cr(III) mg/l ENL - 2.5 - - >IV
Cu mg/l ENL 1 - - 0.2 >IV
Hardness mg/l ENL 250 - - - >IV
Ca mg/l ENL - - - - >IV
Mg mg/l ENL - - - - >IV
Na mg/l ENL - - - 3 SAR >IV
K mg/l ENL - - - - >IV
Fe mg/l ENL 0.3 1 - 1(leaf) 5(others)
>IV
Pb mg/l ENL 0.05 0.02* (0.01) 5 >IV
Mn mg/l ENL 0.1 0.1 - 0.2 >IV
Hg mg/l ENL 0.001 0.004 (0.0001) 0.002 >IV
Ni mg/l ENL 0.05 0.9* - 0.2 >IV
Se mg/l ENL 0.01 0.25 (0.04) 0.02 >IV
Ag mg/l ENL 0.05 0.0002 - - >IV
Sn mg/l ENL NR 0.004 - - >IV
U mg/l ENL NR - - - >IV
Zn mg/l ENL 5 0.4* - 2 >IV
B mg/l ENL 1 - (3.4) 0.8 >IV
Cl mg/l ENL 200 - - 80 >IV
Cl2 mg/l ENL - - (0.02) - >IV
CN mg/l ENL 0.02 0.06 (0.02) - >IV
F mg/l ENL 1.5 10 - 1 >IV
NO2 mg/l ENL 0.4 0.4 (0.03) 5 >IV
NO3 mg/l ENL 7 - - -
P mg/l ENL 0.2 0.1 - - >IV
Silica mg/l ENL 50 - - - >IV
SO4 mg/l ENL 250 - - - >IV
S mg/l ENL 0.05 - (0.001) - >IV
CO2 mg/l ENL - - - - >IV
Gross- Bq/l ENL 0.1 - - - >IV
Gross- Bq/l ENL 1 - - - >IV
Ra-226 Bq/l ENL <0.1 - - - >IV

Parameters Classes
Units I IIA IIB III IV V
Sr-90 Bq/l ENL <0.1 - - - >IV
CCE g/l ENL 500 - - - >IV
MBAS/BAS g/l ENL 500 5000 (200) - -
O & G (mineral) g/l ENL 40;NF N - - -
O & G (emulsified edible)
g/l ENL 7000;N N - - -
PCB mg/l ENL 0.1 6 (0.05) - -
Phenol g/l AB 10 - - - -
Aldrin / Dieldrin g/l AB 0.2 0.2 (0.01) - -
BHC g/l AB 2 9 (0.1) - -
Chlordane g/l AB 0.08 2 (0.02) - -
t-DDT g/l AB 0.1 1 (0.01) - -
Endosulfan g/l AB 10 - - - -
Heptachlor / Epoxide
g/l AB 0.05 0.9 (0.06) - -
Lindane g/l AB 2 3 (0.04) - -
2,4-D g/l AB 70 450 - - -
2,4,5-T g/l AB 10 160 - - -
2,4,5-TP g/l AB 4 850 - - -
Paraquat g/l AB 10 1800 - - -
N = Free from floatable materials/debris or No objectionable odour, or No objectionable taste.
* = Related parameters, only one recommended for use
** = Geometric mean
ε = Maximum not to be exceeded
AB = Absent
ENL = Expected Natural Level
@ = Maximum (unbracketed) and 24-hr average (bracketed) concentrations
CLASS USES
I Represents water body of excellent quality. Standards are set for the conservation of natural
environment in its undisturbed state. Water bodies such as those in the national park areas, fountainheads, and in high land and undisturbed areas come under this category where strictly no discharge of any kind is permitted. Water bodies in this category meets the most stringent requirements for human health and aquatic life protection.
IIA/IIB Represents water bodies of good quality. Most existing raw water supply sources come under
this category. In practice, no body contact activity is allowed in this water for prevention of portable human pathogens. There is a need to introduce another class for water bodies not used for water supply but of similar quality which may be referred as Class IIB. The determination of Class IIB standard is based on criteria for recreational use and protection of sensitive aquatic
species.
III Is defined with the primary objective of protecting common and moderately tolerant aquatic
species of economic value. Water under this classification may be used for water supply with extensive/advance treatment. This class of water is also defined to suit livestock drinking needs.
IV Defines water quality required for major agricultural irrigation activities which may not cover minor
applications to sensitive crops.
V Represents other water which do not meet any of the above uses.

Appendix 4.2.6
Marine Water Test Report


Appendix 4.2.7
Malaysia Marine Water Quality Criteria and Standard (MWQCS)
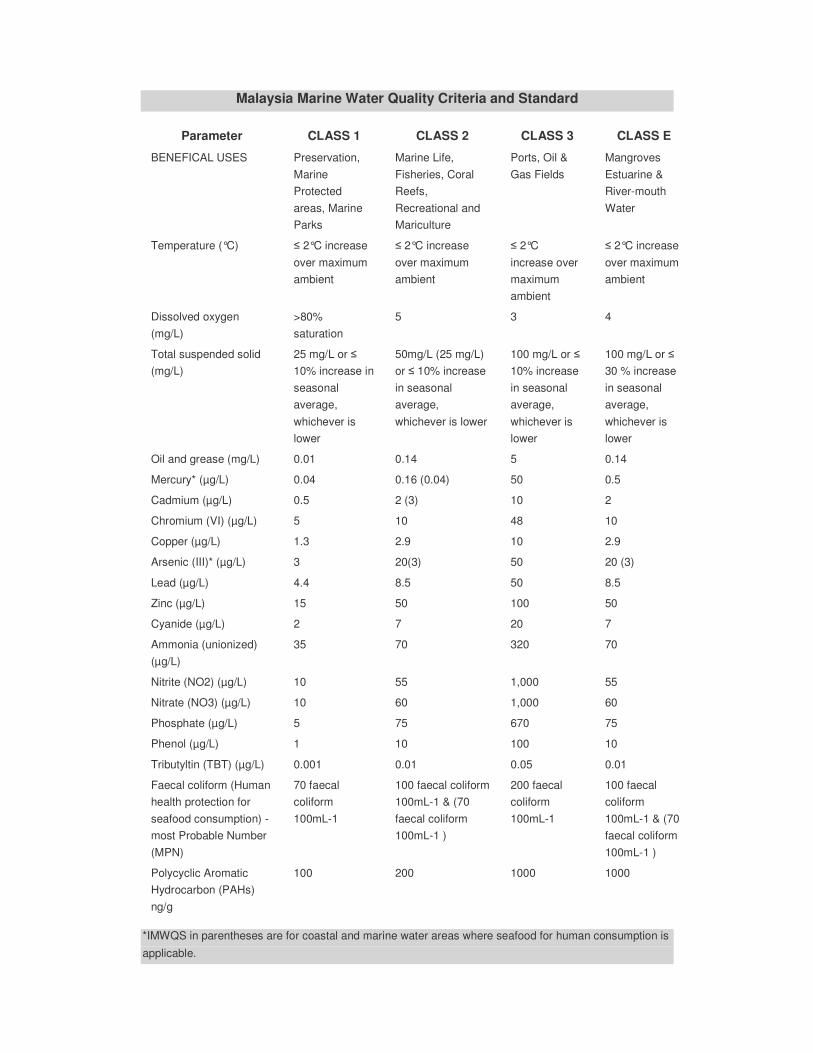
Malaysia Marine Water Quality Criteria and Standard
Parameter CLASS 1 CLASS 2 CLASS 3 CLASS E
BENEFICAL USES Preservation,
Marine
Protected
areas, Marine
Parks
Marine Life,
Fisheries, Coral
Reefs,
Recreational and
Mariculture
Ports, Oil &
Gas Fields
Mangroves
Estuarine &
River-mouth
Water
Temperature (°C) ≤ 2°C increase
over maximum
ambient
≤ 2°C increase
over maximum
ambient
≤ 2°C
increase over
maximum
ambient
≤ 2°C increase
over maximum
ambient
Dissolved oxygen
(mg/L)
>80%
saturation
5 3 4
Total suspended solid
(mg/L)
25 mg/L or ≤
10% increase in
seasonal
average,
whichever is
lower
50mg/L (25 mg/L)
or ≤ 10% increase
in seasonal
average,
whichever is lower
100 mg/L or ≤
10% increase
in seasonal
average,
whichever is
lower
100 mg/L or ≤
30 % increase
in seasonal
average,
whichever is
lower
Oil and grease (mg/L) 0.01 0.14 5 0.14
Mercury* (µg/L) 0.04 0.16 (0.04) 50 0.5
Cadmium (µg/L) 0.5 2 (3) 10 2
Chromium (VI) (µg/L) 5 10 48 10
Copper (µg/L) 1.3 2.9 10 2.9
Arsenic (III)* (µg/L) 3 20(3) 50 20 (3)
Lead (µg/L) 4.4 8.5 50 8.5
Zinc (µg/L) 15 50 100 50
Cyanide (µg/L) 2 7 20 7
Ammonia (unionized)
(µg/L)
35 70 320 70
Nitrite (NO2) (µg/L) 10 55 1,000 55
Nitrate (NO3) (µg/L) 10 60 1,000 60
Phosphate (µg/L) 5 75 670 75
Phenol (µg/L) 1 10 100 10
Tributyltin (TBT) (µg/L) 0.001 0.01 0.05 0.01
Faecal coliform (Human
health protection for
seafood consumption) -
most Probable Number
(MPN)
70 faecal
coliform
100mL-1
100 faecal coliform
100mL-1 & (70
faecal coliform
100mL-1 )
200 faecal
coliform
100mL-1
100 faecal
coliform
100mL-1 & (70
faecal coliform
100mL-1 )
Polycyclic Aromatic
Hydrocarbon (PAHs)
ng/g
100 200 1000 1000
*IMWQS in parentheses are for coastal and marine water areas where seafood for human consumption is
applicable.

Appendix 4.2.8
Seabed Sediment Test Report


Appendix 4.2.9
The National Oceanic and Atmospheric Administration (NOAA) Sediment
Quality Guidelines
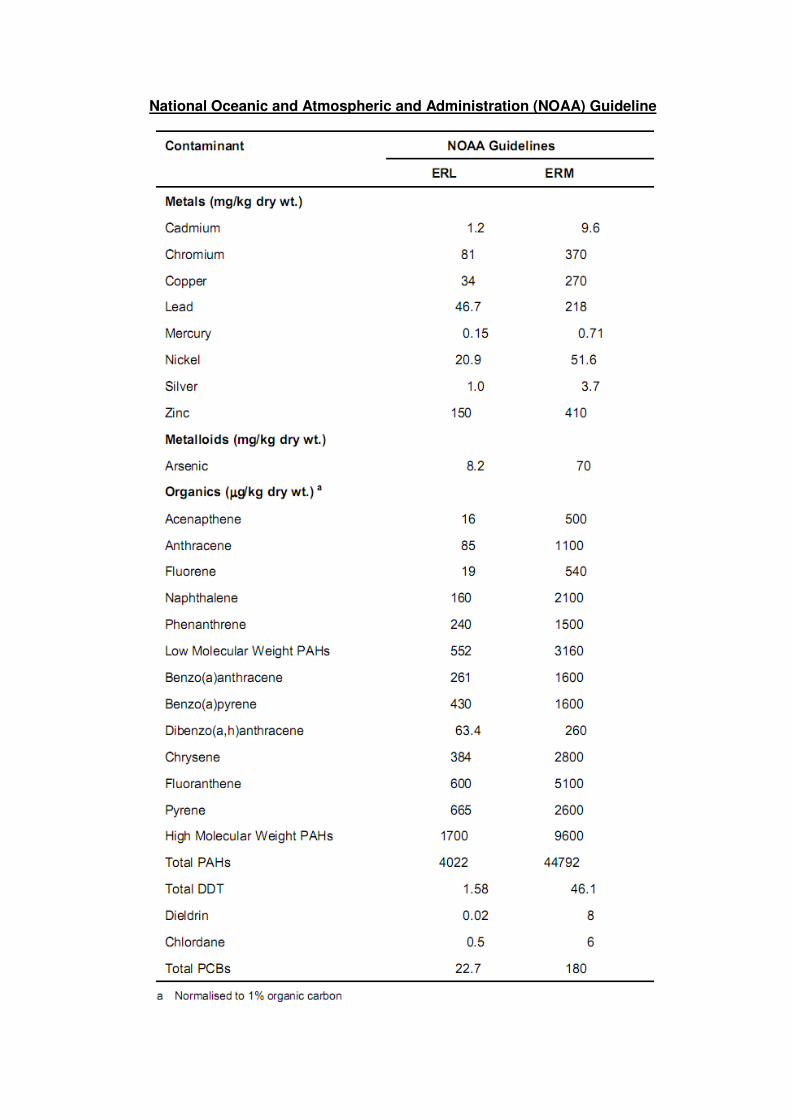
National Oceanic and Atmospheric and Administration (NOAA) Guideline


Appendix 4.2.10
Ambient Air Test Report


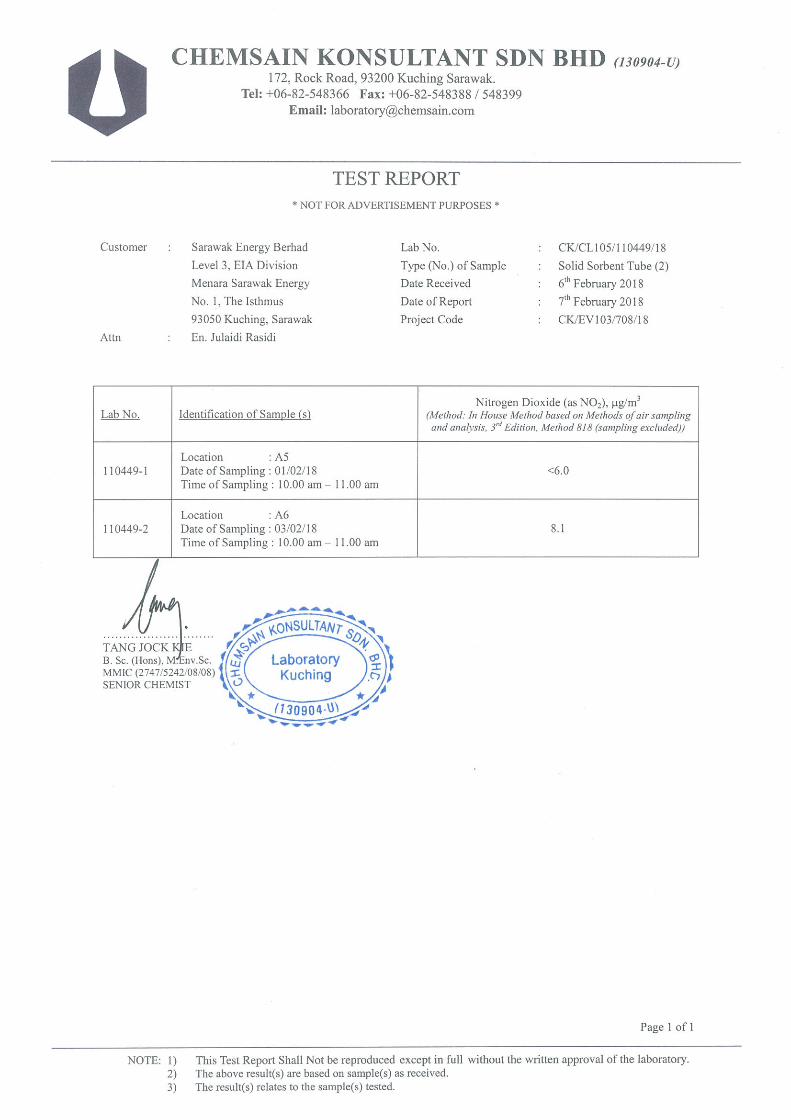

Appendix 4.2.11
Malaysia Ambient Air Quality Standard (MAAQS), 2013

MALAYSIAN AMBIENT AIR QUALITY STANDARDS, 2013
i) Particulate matter with size less than 10 micron (PM10)
Average Time Unit Existing Guidelines
Interim Target (IT)- 2 (2015)
Interim Target (IT) - 2 (2018)
Standard (2020)
1 Year μg/m3 50 50 45 40
24 Hours μg/m3 150 150 120 100
ii) Particulate matter with size less than 2.5 micron (PM2.5)
Average Time Unit Existing Guidelines
Interim Target (IT)- 2 (2015)
Interim Target (IT) - 2 (2018)
Standard (2020)
1 Year μg/m3 - 35 25 15
24 Hours μg/m3 - 75 50 35
iii) Sulfur Dioxide (SO2)
Average Time Unit Existing Guidelines
Interim Target (IT)- 2 (2015)
Interim Target (IT) - 2 (2018)
Standard (2020)
1 Hour μg/m3 350 350 300 250
24 Hours μg/m3 105 105 90 80
iv) Carbon Monoxide (CO)
Average Time Unit Existing Guidelines
Interim Target (IT)- 2 (2015)
Interim Target (IT) - 2 (2018)
Standard (2020)
1 Hour μg/m3 35 35 35 30
24 Hours μg/m3 10 10 10 10
v) Nitrogen Dioxide (NO2)
Average Time Unit Existing Guidelines
Interim Target (IT)- 2 (2015)
Interim Target (IT) - 2 (2018)
Standard (2020)
1 Hour μg/m3 320 320 300 280
24 Hours μg/m3 75 75 75 70
vi) Ground-level Ozone (O3)
Average Time Unit Existing Guidelines
Interim Target (IT)- 2 (2015)
Interim Target (IT) - 2 (2018)
Standard (2020)
1 Year μg/m3 200 200 200 180
8 Hours μg/m3 120 120 120 100

Appendix 4.2.12
World Health Organization (WHO) Ambient Air Quality Guidelines

Environmental, Health, and Safety Guidelines GENERAL EHS GUIDELINES: ENVIRONMENTAL
AIR EMISSIONS AND AMBIENT AIR QUALITY
APRIL 30, 2007 4
WORLD BANK GROUP
Ambient Air Quality
General Approach Projects with significant5,6 sources of air emissions, and potential
for significant impacts to ambient air quality, should prevent or
minimize impacts by ensuring that:
• Emissions do not result in pollutant concentrations that reach
or exceed relevant ambient quality guidelines and standards9
by applying national legislated standards, or in their absence,
the current WHO Air Quality Guidelines10 (see Table 1.1.1),
or other internationally recognized sources11;
• Emissions do not contribute a significant portion to the
attainment of relevant ambient air quality guidelines or
standards. As a general rule, this Guideline suggests 25
percent of the applicable air quality standards to allow
5 Significant sources of point and fugitive emissions are considered to be general sources which, for example, can contribute a net emissions increase of one or more of the following pollutants within a given airshed: PM10: 50 tons per year (tpy); NOx: 500 tpy; SO2: 500 tpy; or as established through national legislation; and combustion sources with an equivalent heat input of 50 MWth or greater. The significance of emissions of inorganic and organic pollutants should be established on a project-specific basis taking into account toxic and other properties of the pollutant. 6 United States Environmental Protection Agency, Prevention of Significant Deterioration of Air Quality, 40 CFR Ch. 1 Part 52.21. Other references for establishing significant emissions include the European Commission. 2000. “Guidance Document for EPER implementation.” http://ec.europa.eu/environment/ippc/eper/index.htm ; and Australian Government. 2004. “National Pollutant Inventory Guide.” http://www.npi.gov.au/handbooks/pubs/npiguide.pdf 7 World Health Organization (WHO). Air Quality Guidelines Global Update, 2005. PM 24-hour value is the 99th percentile. 8 Interim targets are provided in recognition of the need for a staged approach to achieving the recommended guidelines. 9 Ambient air quality standards are ambient air quality levels established and published through national legislative and regulatory processes, and ambient quality guidelines refer to ambient quality levels primarily developed through clinical, toxicological, and epidemiological evidence (such as those published by the World Health Organization). 10 Available at World Health Organization (WHO). http://www.who.int/en 11 For example the United States National Ambient Air Quality Standards (NAAQS) (http://www.epa.gov/air/criteria.html) and the relevant European Council Directives (Council Directive 1999/30/EC of 22 April 1999 / Council Directive 2002/3/EC of February 12 2002).
additional, future sustainable development in the same
airshed. 12
At facility level, impacts should be estimated through qualitative or
quantitative assessments by the use of baseline air quality
assessments and atmospheric dispersion models to assess
potential ground level concentrations. Local atmospheric, climatic,
and air quality data should be applied when modeling dispersion,
protection against atmospheric downwash, wakes, or eddy effects
of the source, nearby13 structures, and terrain features. The
dispersion model applied should be internationally recognized, or
comparable. Examples of acceptable emission estimation and
dispersion modeling approaches for point and fugitive sources are
12 US EPA Prevention of Significant Deterioration Increments Limits applicable to non-degraded airsheds.
Table 1.1.1: WHO Ambient Air Quality Guidelines7,8
Averaging Period
Guideline value in µg/m3
Sulfur dioxide (SO2) 24-hour
10 minute
125 (Interim target-1) 50 (Interim target-2)
20 (guideline) 500 (guideline)
Nitrogen dioxide (NO2) 1-year 1-hour
40 (guideline) 200 (guideline)
Particulate Matter PM10
1-year
24-hour
70 (Interim target-1) 50 (Interim target-2) 30 (Interim target-3)
20 (guideline)
150 (Interim target-1) 100 (Interim target-2) 75 (Interim target-3)
50 (guideline) Particulate Matter PM2.5
1-year
24-hour
35 (Interim target-1) 25 (Interim target-2) 15 (Interim target-3)
10 (guideline)
75 (Interim target-1) 50 (Interim target-2)
37.5 (Interim target-3) 25 (guideline)
Ozone 8-hour daily maximum
160 (Interim target-1) 100 (guideline)

Appendix 4.2.13
Ambient Noise Result

Session Report 17-Nov-17
Information Panel
Company Name Sarawak Energy Berhad
Description CK/EV103-708/17
Location N1 (Day Time)
Start Time 17-Nov-17 7:00:00 AM
Stop Time 17-Nov-17 10:00:00 PM
Run Time 15:00:00
Model Type SoundPro DL
Comments Nearby plant operation, insects, etc.
Summary Data Panel
Description Meter Value Description Meter Value
Leq 1 61.7 dB Lpk 1 84.1 dB
Lmax 1 75.4 dB Lmin 1 56.5 dB
L10 1 63.7 dB L90 1 58.8 dB
Mntime 1 17-Nov-17 12:24:58 PM
Mxtime 1 17-Nov-17 10:17:47 AM
Rtime 1 15:00:00 Dose 1 0.3 %
Exchange Rate 1 3 dB Weighting 1 A
Response 1 FAST Bandwidth 1 OFF

Statistics Chart
N1D - 24hrs: Sta s cs Chart
Statistics Table
dB: 0.0 0.1 0.2 0.3 0.4 0.5 0.6 0.7 0.8 0.9 %
56: 0.00 0.00 0.00 0.00 0.00 0.00 0.00 0.00 0.00 0.01 0.01
57: 0.01 0.01 0.02 0.03 0.04 0.06 0.09 0.13 0.18 0.24 0.83
58: 0.34 0.44 0.58 0.72 0.90 1.06 1.26 1.47 1.66 1.89 10.32
59: 2.13 2.38 1.63 2.28 2.31 2.29 2.24 2.14 2.02 1.84 21.26
60: 1.70 1.58 1.48 1.41 1.36 1.30 1.25 1.23 1.20 1.17 13.68
61: 1.16 1.15 1.14 1.11 1.08 1.04 1.02 1.01 1.01 1.02 10.74
62: 1.06 1.14 0.80 1.13 1.21 1.31 1.43 1.55 1.74 1.91 13.28
63: 2.06 2.22 2.32 2.38 2.40 2.39 2.31 2.16 1.98 1.79 22.00
64: 1.57 1.34 1.13 0.93 0.74 0.57 0.43 0.32 0.24 0.16 7.44
65: 0.11 0.07 0.03 0.03 0.02 0.01 0.01 0.00 0.00 0.00 0.30
66: 0.00 0.00 0.00 0.00 0.00 0.00 0.00 0.00 0.00 0.00 0.04
67: 0.00 0.00 0.00 0.00 0.00 0.00 0.00 0.00 0.00 0.00 0.03
68: 0.00 0.00 0.00 0.00 0.00 0.00 0.00 0.00 0.00 0.00 0.02
69: 0.00 0.00 0.00 0.00 0.00 0.00 0.00 0.00 0.00 0.00 0.02
70: 0.00 0.00 0.00 0.00 0.00 0.00 0.00 0.00 0.00 0.00 0.01
71: 0.00 0.00 0.00 0.00 0.00 0.00 0.00 0.00 0.00 0.00 0.01
72: 0.00 0.00 0.00 0.00 0.00 0.00 0.00 0.00 0.00 0.00 0.01
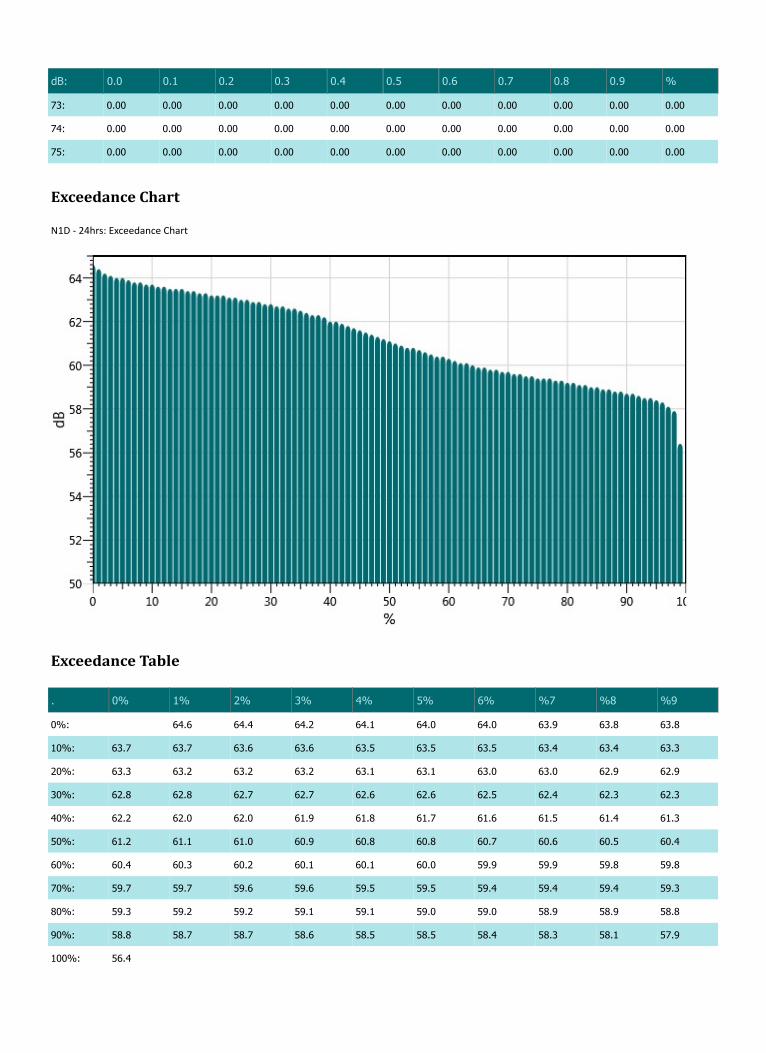
73: 0.00 0.00 0.00 0.00 0.00 0.00 0.00 0.00 0.00 0.00 0.00
74: 0.00 0.00 0.00 0.00 0.00 0.00 0.00 0.00 0.00 0.00 0.00
75: 0.00 0.00 0.00 0.00 0.00 0.00 0.00 0.00 0.00 0.00 0.00
Exceedance Chart
N1D - 24hrs: Exceedance Chart
Exceedance Table
. 0% 1% 2% 3% 4% 5% 6% %7 %8 %9
0%: 64.6 64.4 64.2 64.1 64.0 64.0 63.9 63.8 63.8
10%: 63.7 63.7 63.6 63.6 63.5 63.5 63.5 63.4 63.4 63.3
20%: 63.3 63.2 63.2 63.2 63.1 63.1 63.0 63.0 62.9 62.9
30%: 62.8 62.8 62.7 62.7 62.6 62.6 62.5 62.4 62.3 62.3
40%: 62.2 62.0 62.0 61.9 61.8 61.7 61.6 61.5 61.4 61.3
50%: 61.2 61.1 61.0 60.9 60.8 60.8 60.7 60.6 60.5 60.4
60%: 60.4 60.3 60.2 60.1 60.1 60.0 59.9 59.9 59.8 59.8
70%: 59.7 59.7 59.6 59.6 59.5 59.5 59.4 59.4 59.4 59.3
80%: 59.3 59.2 59.2 59.1 59.1 59.0 59.0 58.9 58.9 58.8
90%: 58.8 58.7 58.7 58.6 58.5 58.5 58.4 58.3 58.1 57.9
100%: 56.4
dB: 0.0 0.1 0.2 0.3 0.4 0.5 0.6 0.7 0.8 0.9 %

Logged Data Chart
N1D - 24hrs: Logged Data Chart
Logged Data Table
Date/Time Leq-1 Lmax-1 Lmin-1 Lpk-1
17-Nov-17 7:05:00 AM 61.3 63.2 59.2 76.5
7:10:00 AM 61.2 62.8 59.3 76.4
7:15:00 AM 61.1 63 59.3 75.4
7:20:00 AM 61.4 63.1 58.9 76.3
7:25:00 AM 61.3 63.4 59.3 76.1
7:30:00 AM 61.2 63.9 59.1 75.4
7:35:00 AM 61 63 58.7 76.2
7:40:00 AM 61.2 63.1 59.1 76.4
7:45:00 AM 61 63.2 59 75.5
7:50:00 AM 60.6 62.8 58.6 75.6
7:55:00 AM 60.6 62.6 58.4 75.3
8:00:00 AM 60.7 67.2 58.3 78.6
8:05:00 AM 60.7 62.9 58.7 76.3
8:10:00 AM 60.8 62.7 58.9 76
8:15:00 AM 60.7 63.2 58.8 76
8:20:00 AM 60.7 62.6 58.8 75.4
8:25:00 AM 60.4 62.3 58.6 75.4
8:30:00 AM 60.1 62.6 58 74.7
8:35:00 AM 59.7 62 57.3 78.6
8:40:00 AM 59.4 62.8 57.5 75.1
8:45:00 AM 59 61.7 56.9 75.1

8:50:00 AM 59.1 61.1 57.6 77.3
8:55:00 AM 59 61.4 56.7 74.8
9:00:00 AM 58.9 61.2 56.7 73.9
9:05:00 AM 59 61.2 56.9 73.8
9:10:00 AM 59.2 61 57.5 74.6
9:15:00 AM 59.2 61.2 57.2 73.4
9:20:00 AM 59.7 61.9 57.5 76.3
9:25:00 AM 59.2 61.1 57.2 73.7
9:30:00 AM 60.3 62.3 57.7 77.1
9:35:00 AM 60.4 61.9 58.5 77.5
9:40:00 AM 59.4 61.9 57.2 76.6
9:45:00 AM 58.4 59.9 56.8 72.5
9:50:00 AM 58.5 60 57 73.4
9:55:00 AM 58.3 60.1 56.9 72.6
10:00:00 AM 58.7 60.3 57.3 73.4
10:05:00 AM 58.7 60.1 57.2 73
10:10:00 AM 62.3 72.7 57.4 81.9
10:15:00 AM 58.9 60.3 57.6 73.5
10:20:00 AM 63.2 75.4 57.7 84.1
10:25:00 AM 59.5 61.4 58.1 74.2
10:30:00 AM 59.8 61.3 58.4 74.2
10:35:00 AM 60.1 62.4 58.4 74.7
10:40:00 AM 59.7 61.6 58 74.6
10:45:00 AM 59.7 61.2 58.2 73.9
10:50:00 AM 59.7 61.1 58.2 74.2
10:55:00 AM 59.8 61.4 58 74.4
11:00:00 AM 59.8 61.3 58.3 74
11:05:00 AM 59.8 61.5 58.4 74.6
11:10:00 AM 59.6 61.4 58.1 73.9
11:15:00 AM 59.6 61.2 58 74.9
11:20:00 AM 59.4 60.8 57.8 74.3
11:25:00 AM 59.4 62.1 58 75.7
11:30:00 AM 59.6 61.8 58.1 74.1
11:35:00 AM 59.6 61.1 58 74.9
11:40:00 AM 59.6 61.7 58 74.4
11:45:00 AM 59.5 62 57.7 75
11:50:00 AM 59.6 65.1 58 78.2
11:55:00 AM 59.7 61.3 57.9 74.1
12:00:00 PM 59.8 62.3 58.2 76.6
Date/Time Leq-1 Lmax-1 Lmin-1 Lpk-1

12:05:00 PM 60.5 62.6 57.9 76.5
12:10:00 PM 60.4 62.6 57.8 77
12:15:00 PM 60.3 62.7 57.3 77.5
12:20:00 PM 58.7 60.9 56.6 73.9
12:25:00 PM 58.2 61.2 56.5 73.4
12:30:00 PM 58.6 60.8 56.5 75.5
12:35:00 PM 59.2 61.2 57.2 73.5
12:40:00 PM 59.2 64.2 57.4 75.2
12:45:00 PM 59.4 61.1 57.7 73.8
12:50:00 PM 59.3 60.8 57.4 74
12:55:00 PM 59.4 61.1 57.7 74.1
1:00:00 PM 59.4 62.2 58 75.6
1:05:00 PM 59.2 60.7 57.5 73.5
1:10:00 PM 59 63.1 57.3 74.4
1:15:00 PM 59 61 57.4 73.6
1:20:00 PM 59.1 62.3 57.6 76.5
1:25:00 PM 59.1 62.4 57.5 73.8
1:30:00 PM 59 60.9 57.2 73.7
1:35:00 PM 59 60.7 57.2 73.9
1:40:00 PM 59.1 61 57.5 73.7
1:45:00 PM 59.5 61.3 58 73.5
1:50:00 PM 59.6 61.3 58 74.6
1:55:00 PM 60 61.9 58.5 74.9
2:00:00 PM 60.5 62.2 59 76.3
2:05:00 PM 59.9 62.7 58 74.9
2:10:00 PM 59.7 61.7 57.6 74.5
2:15:00 PM 60.1 62.2 57 75.3
2:20:00 PM 60 62.4 57.8 75
2:25:00 PM 60.3 62.3 58.1 74.9
2:30:00 PM 60.4 63.1 58.3 76.2
2:35:00 PM 60.7 64 58.9 80.9
2:40:00 PM 61.1 63.4 59 75.9
2:45:00 PM 61.1 63.2 59.2 75.5
2:50:00 PM 61.5 63.5 59.4 76.6
2:55:00 PM 61.9 63.8 59.5 76.2
3:00:00 PM 62 64.2 60 76.7
3:05:00 PM 62.5 64.4 60.8 76.7
3:10:00 PM 62.2 66 59.1 78.2
3:15:00 PM 61.5 66.2 59.2 78.3
Date/Time Leq-1 Lmax-1 Lmin-1 Lpk-1
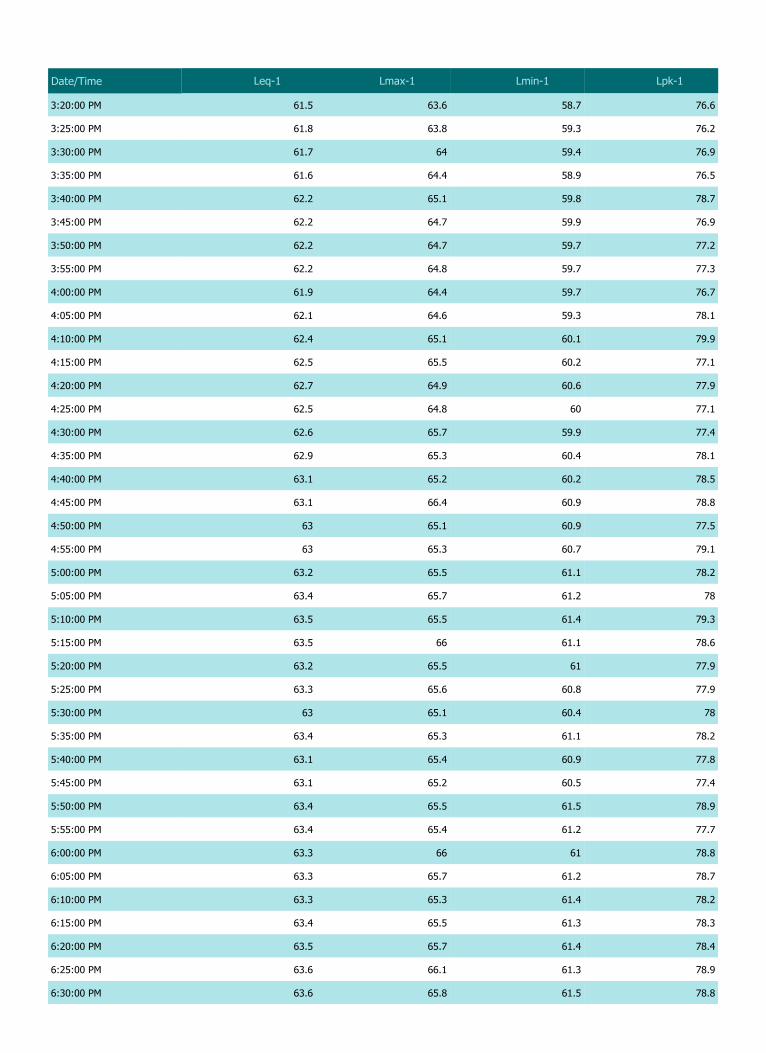
3:20:00 PM 61.5 63.6 58.7 76.6
3:25:00 PM 61.8 63.8 59.3 76.2
3:30:00 PM 61.7 64 59.4 76.9
3:35:00 PM 61.6 64.4 58.9 76.5
3:40:00 PM 62.2 65.1 59.8 78.7
3:45:00 PM 62.2 64.7 59.9 76.9
3:50:00 PM 62.2 64.7 59.7 77.2
3:55:00 PM 62.2 64.8 59.7 77.3
4:00:00 PM 61.9 64.4 59.7 76.7
4:05:00 PM 62.1 64.6 59.3 78.1
4:10:00 PM 62.4 65.1 60.1 79.9
4:15:00 PM 62.5 65.5 60.2 77.1
4:20:00 PM 62.7 64.9 60.6 77.9
4:25:00 PM 62.5 64.8 60 77.1
4:30:00 PM 62.6 65.7 59.9 77.4
4:35:00 PM 62.9 65.3 60.4 78.1
4:40:00 PM 63.1 65.2 60.2 78.5
4:45:00 PM 63.1 66.4 60.9 78.8
4:50:00 PM 63 65.1 60.9 77.5
4:55:00 PM 63 65.3 60.7 79.1
5:00:00 PM 63.2 65.5 61.1 78.2
5:05:00 PM 63.4 65.7 61.2 78
5:10:00 PM 63.5 65.5 61.4 79.3
5:15:00 PM 63.5 66 61.1 78.6
5:20:00 PM 63.2 65.5 61 77.9
5:25:00 PM 63.3 65.6 60.8 77.9
5:30:00 PM 63 65.1 60.4 78
5:35:00 PM 63.4 65.3 61.1 78.2
5:40:00 PM 63.1 65.4 60.9 77.8
5:45:00 PM 63.1 65.2 60.5 77.4
5:50:00 PM 63.4 65.5 61.5 78.9
5:55:00 PM 63.4 65.4 61.2 77.7
6:00:00 PM 63.3 66 61 78.8
6:05:00 PM 63.3 65.7 61.2 78.7
6:10:00 PM 63.3 65.3 61.4 78.2
6:15:00 PM 63.4 65.5 61.3 78.3
6:20:00 PM 63.5 65.7 61.4 78.4
6:25:00 PM 63.6 66.1 61.3 78.9
6:30:00 PM 63.6 65.8 61.5 78.8
Date/Time Leq-1 Lmax-1 Lmin-1 Lpk-1
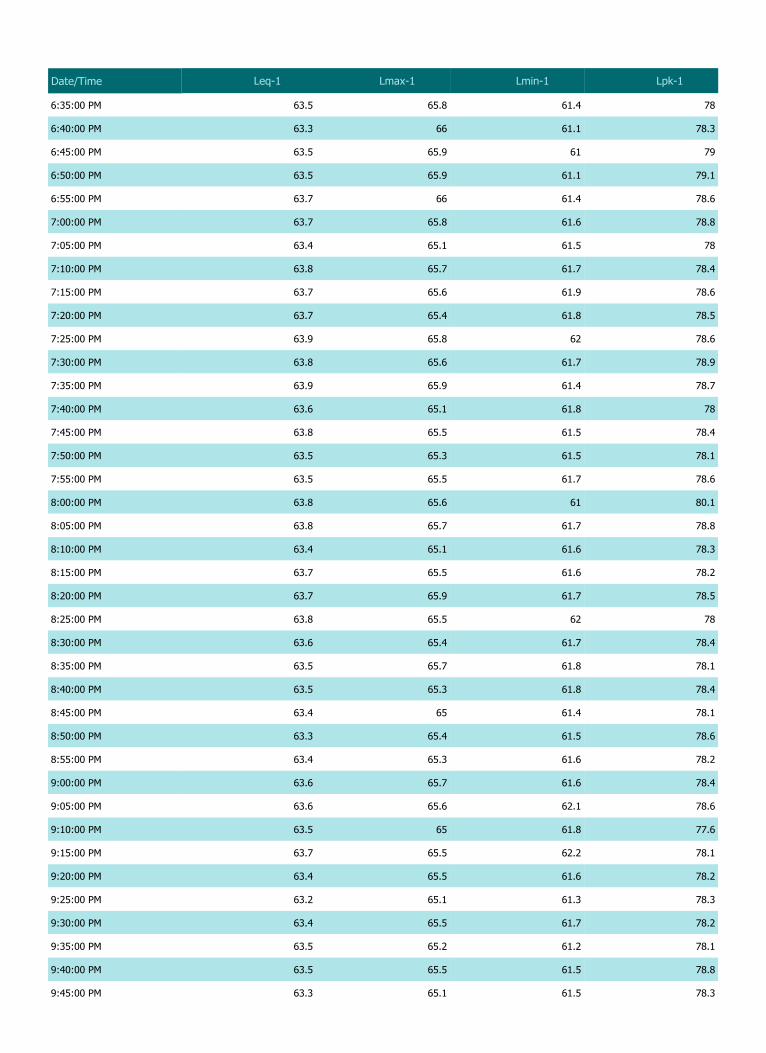
6:35:00 PM 63.5 65.8 61.4 78
6:40:00 PM 63.3 66 61.1 78.3
6:45:00 PM 63.5 65.9 61 79
6:50:00 PM 63.5 65.9 61.1 79.1
6:55:00 PM 63.7 66 61.4 78.6
7:00:00 PM 63.7 65.8 61.6 78.8
7:05:00 PM 63.4 65.1 61.5 78
7:10:00 PM 63.8 65.7 61.7 78.4
7:15:00 PM 63.7 65.6 61.9 78.6
7:20:00 PM 63.7 65.4 61.8 78.5
7:25:00 PM 63.9 65.8 62 78.6
7:30:00 PM 63.8 65.6 61.7 78.9
7:35:00 PM 63.9 65.9 61.4 78.7
7:40:00 PM 63.6 65.1 61.8 78
7:45:00 PM 63.8 65.5 61.5 78.4
7:50:00 PM 63.5 65.3 61.5 78.1
7:55:00 PM 63.5 65.5 61.7 78.6
8:00:00 PM 63.8 65.6 61 80.1
8:05:00 PM 63.8 65.7 61.7 78.8
8:10:00 PM 63.4 65.1 61.6 78.3
8:15:00 PM 63.7 65.5 61.6 78.2
8:20:00 PM 63.7 65.9 61.7 78.5
8:25:00 PM 63.8 65.5 62 78
8:30:00 PM 63.6 65.4 61.7 78.4
8:35:00 PM 63.5 65.7 61.8 78.1
8:40:00 PM 63.5 65.3 61.8 78.4
8:45:00 PM 63.4 65 61.4 78.1
8:50:00 PM 63.3 65.4 61.5 78.6
8:55:00 PM 63.4 65.3 61.6 78.2
9:00:00 PM 63.6 65.7 61.6 78.4
9:05:00 PM 63.6 65.6 62.1 78.6
9:10:00 PM 63.5 65 61.8 77.6
9:15:00 PM 63.7 65.5 62.2 78.1
9:20:00 PM 63.4 65.5 61.6 78.2
9:25:00 PM 63.2 65.1 61.3 78.3
9:30:00 PM 63.4 65.5 61.7 78.2
9:35:00 PM 63.5 65.2 61.2 78.1
9:40:00 PM 63.5 65.5 61.5 78.8
9:45:00 PM 63.3 65.1 61.5 78.3
Date/Time Leq-1 Lmax-1 Lmin-1 Lpk-1

9:50:00 PM 63.3 65.6 61.9 78
9:55:00 PM 63.3 65 61.7 78.3
10:00:00 PM 63.1 65 61.5 77.8
Date/Time Leq-1 Lmax-1 Lmin-1 Lpk-1
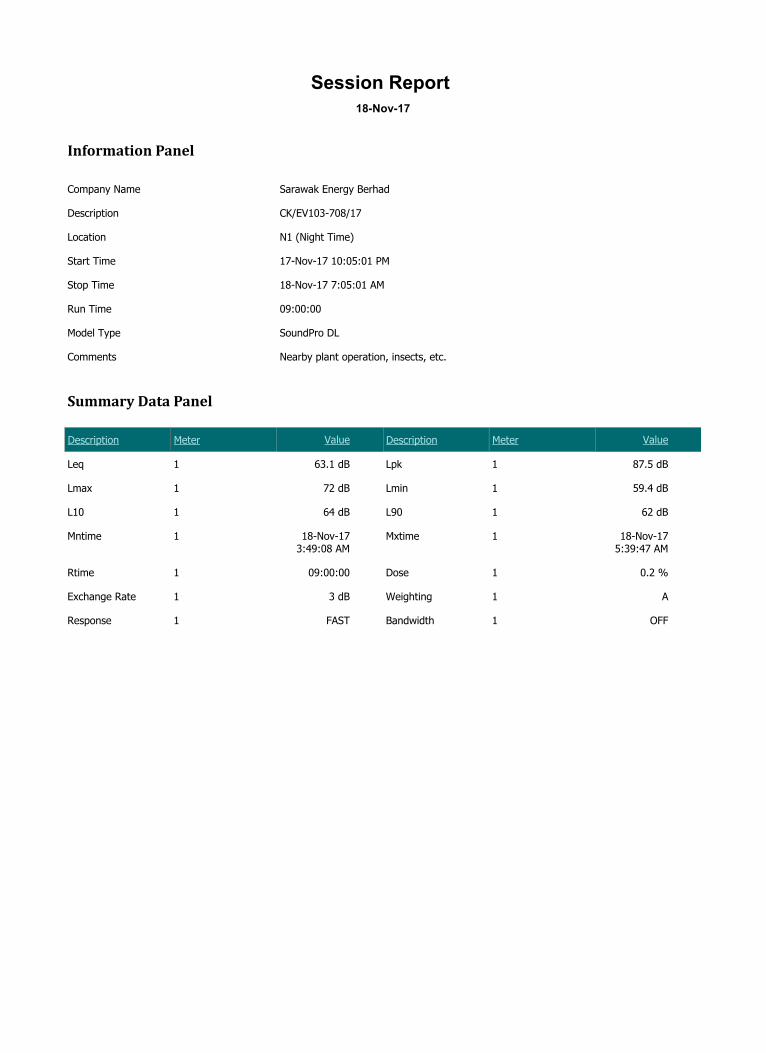
Session Report 18-Nov-17
Information Panel
Company Name Sarawak Energy Berhad
Description CK/EV103-708/17
Location N1 (Night Time)
Start Time 17-Nov-17 10:05:01 PM
Stop Time 18-Nov-17 7:05:01 AM
Run Time 09:00:00
Model Type SoundPro DL
Comments Nearby plant operation, insects, etc.
Summary Data Panel
Description Meter Value Description Meter Value
Leq 1 63.1 dB Lpk 1 87.5 dB
Lmax 1 72 dB Lmin 1 59.4 dB
L10 1 64 dB L90 1 62 dB
Mntime 1 18-Nov-17 3:49:08 AM
Mxtime 1 18-Nov-17 5:39:47 AM
Rtime 1 09:00:00 Dose 1 0.2 %
Exchange Rate 1 3 dB Weighting 1 A
Response 1 FAST Bandwidth 1 OFF

Statistics Chart
N1N - 24hrs: Sta s cs Chart
Statistics Table
dB: 0.0 0.1 0.2 0.3 0.4 0.5 0.6 0.7 0.8 0.9 %
59: 0.00 0.00 0.00 0.00 0.00 0.00 0.00 0.00 0.00 0.00 0.01
60: 0.00 0.00 0.01 0.01 0.01 0.02 0.02 0.04 0.06 0.09 0.26
61: 0.13 0.18 0.26 0.34 0.49 0.66 0.84 1.11 1.41 1.73 7.16
62: 2.10 2.56 1.95 2.78 3.07 3.34 3.65 3.95 4.28 4.59 32.27
63: 4.87 5.10 5.20 5.22 5.13 4.91 4.59 4.22 3.78 3.32 46.35
64: 2.83 2.37 1.93 1.57 1.23 0.94 0.74 0.58 0.44 0.34 12.96
65: 0.26 0.19 0.10 0.10 0.08 0.06 0.04 0.03 0.03 0.02 0.92
66: 0.01 0.01 0.01 0.01 0.01 0.01 0.00 0.00 0.00 0.00 0.07
67: 0.00 0.00 0.00 0.00 0.00 0.00 0.00 0.00 0.00 0.00 0.01
68: 0.00 0.00 0.00 0.00 0.00 0.00 0.00 0.00 0.00 0.00 0.00
69: 0.00 0.00 0.00 0.00 0.00 0.00 0.00 0.00 0.00 0.00 0.00
70: 0.00 0.00 0.00 0.00 0.00 0.00 0.00 0.00 0.00 0.00 0.00
71: 0.00 0.00 0.00 0.00 0.00 0.00 0.00 0.00 0.00 0.00 0.00
72: 0.00 0.00 0.00 0.00 0.00 0.00 0.00 0.00 0.00 0.00 0.00

Exceedance Chart
N1N - 24hrs: Exceedance Chart
Exceedance Table
. 0% 1% 2% 3% 4% 5% 6% %7 %8 %9
0%: 64.9 64.6 64.5 64.4 64.3 64.2 64.1 64.1 64.0
10%: 64.0 64.0 63.9 63.9 63.8 63.8 63.8 63.8 63.7 63.7
20%: 63.7 63.7 63.6 63.6 63.6 63.6 63.5 63.5 63.5 63.5
30%: 63.4 63.4 63.4 63.4 63.4 63.3 63.3 63.3 63.3 63.3
40%: 63.2 63.2 63.2 63.2 63.2 63.2 63.1 63.1 63.1 63.1
50%: 63.1 63.0 63.0 63.0 63.0 63.0 62.9 62.9 62.9 62.9
60%: 62.9 62.8 62.8 62.8 62.8 62.7 62.7 62.7 62.7 62.7
70%: 62.6 62.6 62.6 62.6 62.5 62.5 62.5 62.4 62.4 62.4
80%: 62.4 62.3 62.3 62.3 62.2 62.2 62.1 62.1 62.0 62.0
90%: 62.0 61.9 61.9 61.8 61.8 61.7 61.6 61.5 61.4 61.2
100%: 59.3

Logged Data Chart
N1N - 24hrs: Logged Data Chart
Logged Data Table
Date/Time Leq-1 Lmax-1 Lmin-1 Lpk-1
17-Nov-17 10:10:01 PM 63.1 64.8 61.2 78.1
10:15:01 PM 63.3 65.1 61.8 77.7
10:20:01 PM 63.4 65 61.8 77.5
10:25:01 PM 63.4 65 61.5 77.8
10:30:01 PM 63.5 65.1 61.6 77.7
10:35:01 PM 63.5 65.4 61.8 78.1
10:40:01 PM 63.3 65.2 61.8 78.9
10:45:01 PM 63.4 65.1 61.9 78.4
10:50:01 PM 63.4 65.1 61.7 78.2
10:55:01 PM 63.5 65.1 61.7 78.1
11:00:01 PM 63.3 65.1 61.6 78.2
11:05:01 PM 63.4 65.1 61.9 78.3
11:10:01 PM 63.6 65.5 62 79.6
11:15:01 PM 63.7 65.1 61.9 79.5
11:20:01 PM 63.6 65.2 61.5 79.1
11:25:01 PM 63.2 65 61.3 79.9
11:30:01 PM 63.4 65.2 61.6 78.7
11:35:01 PM 63.7 65.4 61.6 79.1
11:40:01 PM 63.9 65.7 61.9 79
11:45:01 PM 63.8 65.5 62 78.2
11:50:01 PM 63.4 65.1 61.5 77.9

11:55:01 PM 63.5 65.3 61.7 79.1
18-Nov-17 12:00:01 AM 63.6 65.1 62 78.4
12:05:01 AM 63.5 65.3 61.8 78.2
12:10:01 AM 63.1 64.2 61.8 78.7
12:15:01 AM 63.3 65.1 61.9 78.5
12:20:01 AM 63.5 65.2 61.8 78.2
12:25:01 AM 63.5 65.2 61.6 78.6
12:30:01 AM 63.4 65 61.6 77.6
12:35:01 AM 63.4 64.8 62 77.5
12:40:01 AM 63.6 65.4 61.6 78.4
12:45:01 AM 63.5 66 61.8 78.8
12:50:01 AM 63.8 65.3 62.3 78.3
12:55:01 AM 63.7 65.3 62 78.3
1:00:01 AM 63.8 65.3 62.5 78.3
1:05:01 AM 63.2 64.8 61.7 77.2
1:10:01 AM 63.5 64.8 61.9 78.8
1:15:01 AM 63.6 65.1 61.8 78.4
1:20:01 AM 63.4 65.3 61.9 77.8
1:25:01 AM 62.8 64.2 61.2 77.4
1:30:01 AM 63.1 65.3 61.6 78.5
1:35:01 AM 63.2 65.2 61.4 77.6
1:40:01 AM 63 65.1 61.5 78.2
1:45:01 AM 62.9 64.4 61.5 77.4
1:50:01 AM 63.6 65 62.1 78.3
1:55:01 AM 63.2 64.6 61.9 78
2:00:01 AM 63.6 65.4 61.9 78.1
2:05:01 AM 63.1 65.1 61.2 79.1
2:10:01 AM 63.4 65.8 61.3 78.7
2:15:01 AM 63.3 64.8 61.9 78.3
2:20:01 AM 63.5 65.6 61.7 78.4
2:25:01 AM 64 66.2 62.1 79.3
2:30:01 AM 63.9 65.9 61.8 78.7
2:35:01 AM 63.8 65.9 61.8 78.9
2:40:01 AM 63.5 65.6 61.6 78.5
2:45:01 AM 63.9 66.2 61.6 79.2
2:50:01 AM 64.2 66.8 61.9 80.7
2:55:01 AM 63.8 66.5 61.3 79.2
3:00:01 AM 63.5 66 61.2 78.2
3:05:01 AM 63.8 67 61.2 79.6
Date/Time Leq-1 Lmax-1 Lmin-1 Lpk-1

3:10:01 AM 63.4 66 61.2 78.5
3:15:01 AM 62.9 64.9 61.3 77.2
3:20:01 AM 62.7 64.1 61.3 76.7
3:25:01 AM 62.6 64 61.2 77
3:30:01 AM 62.4 64.3 61 76.9
3:35:01 AM 62.2 63.5 60.7 76.7
3:40:01 AM 61.9 64.2 60.3 76.6
3:45:01 AM 62.7 66 60.1 78.2
3:50:01 AM 62.1 64.4 59.4 77.8
3:55:01 AM 62.3 64.7 60.5 77.1
4:00:01 AM 62.5 64 60.8 76.9
4:05:01 AM 62.3 64.4 60.5 77.8
4:10:01 AM 62.7 65.3 60.7 77
4:15:01 AM 62.6 64.8 60.5 77.3
4:20:01 AM 62.5 64.4 60.5 77.5
4:25:01 AM 62.4 63.6 60.9 77.1
4:30:01 AM 61.8 63.5 59.9 75.9
4:35:01 AM 62.2 64.6 60.3 78
4:40:01 AM 62.4 64.4 60.2 77.1
4:45:01 AM 62.3 64.8 60.4 77.2
4:50:01 AM 62.6 65 60.7 77.2
4:55:01 AM 62.9 67 61 80.9
5:00:01 AM 62.5 65.2 60.7 77.3
5:05:01 AM 62.2 63.9 60.8 77.4
5:10:01 AM 62.8 65.9 61.3 78.6
5:15:01 AM 63.3 65.7 61.7 79.2
5:20:01 AM 63 65.8 61.4 77.9
5:25:01 AM 62.4 64.3 61.1 77.3
5:30:01 AM 62.4 64.6 60.9 77.1
5:35:01 AM 63.3 65.7 61.5 77.9
5:40:01 AM 64.2 72 62 87.5
5:45:01 AM 64.2 69.3 61 84.2
5:50:01 AM 63.7 65.8 61.8 79.1
5:55:01 AM 63.8 66.6 61.5 79.3
6:00:01 AM 63.6 65.3 61.8 79.8
6:05:01 AM 63.6 65.6 62 77.9
6:10:01 AM 63.4 65.5 61.8 79.3
6:15:01 AM 62.6 64.4 61.4 77.3
6:20:01 AM 63 66.5 61.3 78.7
Date/Time Leq-1 Lmax-1 Lmin-1 Lpk-1

6:25:01 AM 63.1 65.7 61.7 77.9
6:30:01 AM 63 65.3 61.7 79.7
6:35:01 AM 63 65 61.6 79.3
6:40:01 AM 63 64.5 61.3 77.6
6:45:01 AM 62.4 64.3 59.9 77.3
6:50:01 AM 62.2 64.6 60.3 77
6:55:01 AM 62.1 63.9 60.7 76.4
7:00:01 AM 62.1 63.8 60.7 76.5
7:05:01 AM 62 63.6 60.7 76
Date/Time Leq-1 Lmax-1 Lmin-1 Lpk-1
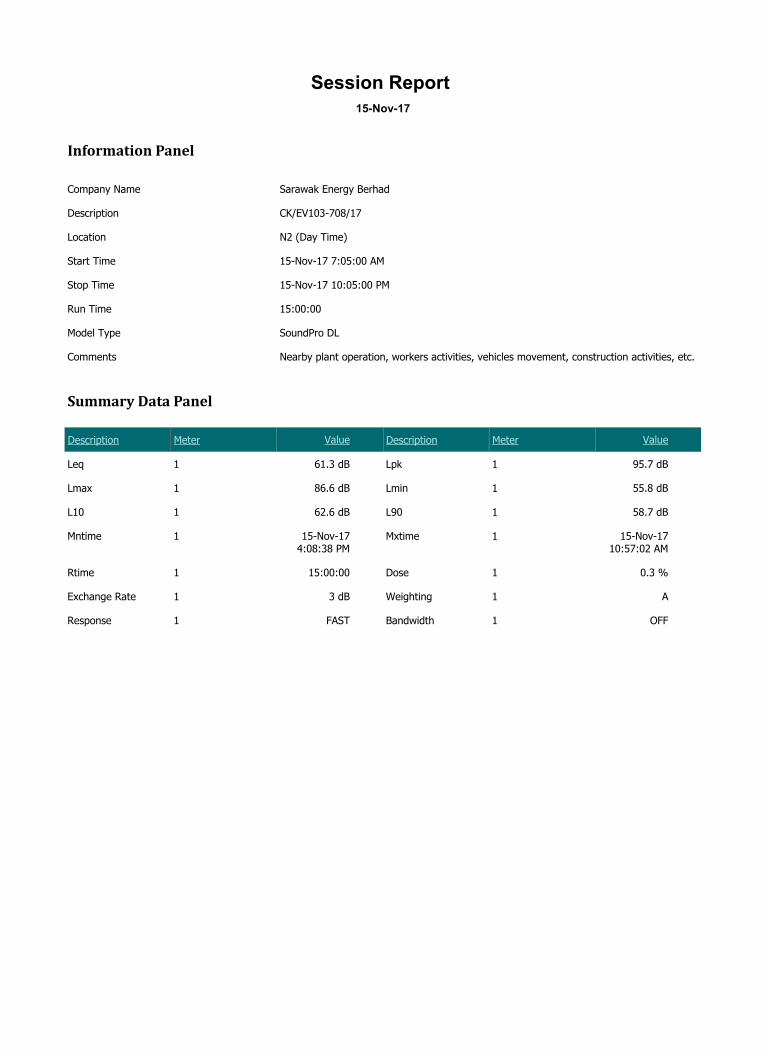
Session Report 15-Nov-17
Information Panel
Company Name Sarawak Energy Berhad
Description CK/EV103-708/17
Location N2 (Day Time)
Start Time 15-Nov-17 7:05:00 AM
Stop Time 15-Nov-17 10:05:00 PM
Run Time 15:00:00
Model Type SoundPro DL
Comments Nearby plant operation, workers activities, vehicles movement, construction activities, etc.
Summary Data Panel
Description Meter Value Description Meter Value
Leq 1 61.3 dB Lpk 1 95.7 dB
Lmax 1 86.6 dB Lmin 1 55.8 dB
L10 1 62.6 dB L90 1 58.7 dB
Mntime 1 15-Nov-17 4:08:38 PM
Mxtime 1 15-Nov-17 10:57:02 AM
Rtime 1 15:00:00 Dose 1 0.3 %
Exchange Rate 1 3 dB Weighting 1 A
Response 1 FAST Bandwidth 1 OFF

Statistics Chart
N2D - 24hrs: Sta s cs Chart
Statistics Table
dB: 0.0 0.1 0.2 0.3 0.4 0.5 0.6 0.7 0.8 0.9 %
55: 0.00 0.00 0.00 0.00 0.00 0.00 0.00 0.00 0.00 0.00 0.00
56: 0.00 0.00 0.00 0.00 0.00 0.01 0.01 0.01 0.02 0.02 0.07
57: 0.04 0.05 0.06 0.09 0.12 0.16 0.20 0.24 0.31 0.39 1.65
58: 0.46 0.58 0.69 0.80 0.93 1.08 1.28 1.48 1.71 1.98 10.98
59: 2.29 2.62 1.83 2.60 2.74 2.88 2.99 3.10 3.17 3.24 27.47
60: 3.29 3.32 3.34 3.28 3.22 3.08 2.96 2.76 2.55 2.30 30.10
61: 2.07 1.84 1.64 1.44 1.28 1.17 1.07 0.99 0.95 0.96 13.42
62: 0.99 0.99 0.67 0.89 0.89 0.89 0.88 0.85 0.82 0.78 8.66
63: 0.74 0.69 0.62 0.55 0.50 0.45 0.38 0.32 0.26 0.22 4.74
64: 0.19 0.17 0.15 0.12 0.10 0.09 0.09 0.08 0.07 0.07 1.12
65: 0.06 0.06 0.04 0.05 0.05 0.04 0.04 0.04 0.04 0.04 0.46
66: 0.03 0.03 0.03 0.03 0.03 0.03 0.02 0.02 0.03 0.02 0.28
67: 0.02 0.02 0.02 0.02 0.02 0.02 0.02 0.02 0.02 0.02 0.20
68: 0.02 0.02 0.02 0.02 0.02 0.02 0.01 0.01 0.01 0.01 0.16
69: 0.01 0.01 0.01 0.01 0.01 0.01 0.01 0.01 0.01 0.01 0.10
70: 0.01 0.01 0.01 0.01 0.01 0.01 0.01 0.01 0.01 0.01 0.10
71: 0.01 0.01 0.01 0.01 0.01 0.01 0.01 0.01 0.01 0.01 0.08

72: 0.01 0.01 0.01 0.01 0.01 0.01 0.01 0.01 0.01 0.01 0.07
73: 0.01 0.01 0.01 0.01 0.01 0.01 0.01 0.01 0.01 0.01 0.07
74: 0.01 0.01 0.01 0.01 0.01 0.01 0.01 0.01 0.01 0.01 0.07
75: 0.01 0.01 0.01 0.01 0.01 0.01 0.00 0.01 0.01 0.00 0.06
76: 0.00 0.00 0.00 0.01 0.00 0.01 0.01 0.01 0.01 0.01 0.05
77: 0.00 0.01 0.01 0.00 0.00 0.00 0.00 0.00 0.00 0.00 0.04
78: 0.00 0.00 0.00 0.00 0.00 0.00 0.00 0.00 0.00 0.00 0.03
79: 0.00 0.00 0.00 0.00 0.00 0.00 0.00 0.00 0.00 0.00 0.02
80: 0.00 0.00 0.00 0.00 0.00 0.00 0.00 0.00 0.00 0.00 0.00
81: 0.00 0.00 0.00 0.00 0.00 0.00 0.00 0.00 0.00 0.00 0.00
82: 0.00 0.00 0.00 0.00 0.00 0.00 0.00 0.00 0.00 0.00 0.00
83: 0.00 0.00 0.00 0.00 0.00 0.00 0.00 0.00 0.00 0.00 0.00
84: 0.00 0.00 0.00 0.00 0.00 0.00 0.00 0.00 0.00 0.00 0.00
85: 0.00 0.00 0.00 0.00 0.00 0.00 0.00 0.00 0.00 0.00 0.00
86: 0.00 0.00 0.00 0.00 0.00 0.00 0.00 0.00 0.00 0.00 0.00
Exceedance Chart
N2D - 24hrs: Exceedance Chart
Exceedance Table
. 0% 1% 2% 3% 4% 5% 6% %7 %8 %9
0%: 67.1 64.6 63.8 63.5 63.3 63.1 62.9 62.8 62.7
dB: 0.0 0.1 0.2 0.3 0.4 0.5 0.6 0.7 0.8 0.9 %

10%: 62.6 62.4 62.3 62.2 62.1 62.0 61.9 61.8 61.7 61.6
20%: 61.5 61.4 61.3 61.2 61.2 61.1 61.0 61.0 60.9 60.9
30%: 60.8 60.8 60.8 60.7 60.7 60.6 60.6 60.6 60.5 60.5
40%: 60.5 60.4 60.4 60.4 60.3 60.3 60.3 60.2 60.2 60.2
50%: 60.1 60.1 60.1 60.1 60.0 60.0 60.0 59.9 59.9 59.9
60%: 59.8 59.8 59.8 59.8 59.7 59.7 59.7 59.6 59.6 59.6
70%: 59.5 59.5 59.5 59.4 59.4 59.4 59.3 59.3 59.2 59.2
80%: 59.2 59.1 59.1 59.0 59.0 58.9 58.9 58.9 58.8 58.8
90%: 58.7 58.6 58.6 58.5 58.4 58.3 58.2 58.1 57.9 57.6
100%: 55.7
Logged Data Chart
N2D - 24hrs: Logged Data Chart
Logged Data Table
Date/Time Leq-1 Lmax-1 Lmin-1 Lpk-1
15-Nov-17 7:10:00 AM 62.3 63.5 61 77.4
7:15:00 AM 63.3 69.3 61.1 82
7:20:00 AM 63.2 66.6 61.7 80.9
7:25:00 AM 62.9 65.1 61 78.8
7:30:00 AM 62.7 66.3 61 78.8
7:35:00 AM 62.9 65.8 61.3 78
7:40:00 AM 62.8 64.5 60.7 77.5
7:45:00 AM 62.5 64.2 60.9 77
7:50:00 AM 62.8 66.1 60.9 78.8
7:55:00 AM 62.8 69.7 61.1 80.7
8:00:00 AM 62.9 70.9 61.2 86.1
8:05:00 AM 63.2 77.1 61.4 90.1
8:10:00 AM 62.5 66.1 61 79.1
8:15:00 AM 63.3 65.9 60.8 80.4
8:20:00 AM 63.2 65.3 60.8 78.4
. 0% 1% 2% 3% 4% 5% 6% %7 %8 %9

8:25:00 AM 62.4 64.6 59.9 79.6
8:30:00 AM 62.7 71.9 59.5 80.8
8:35:00 AM 62.3 64.6 60.3 77
8:40:00 AM 62 64.1 59.8 77.3
8:45:00 AM 62.6 64.7 59.8 77.6
8:50:00 AM 62.9 77.6 60.8 91.5
8:55:00 AM 62.4 65.2 60.1 80.5
9:00:00 AM 62.6 67 59.6 81.7
9:05:00 AM 61.9 68.9 59.1 81.9
9:10:00 AM 62.2 69.3 59 84.2
9:15:00 AM 62.7 70 59.6 88.2
9:20:00 AM 63.4 71.2 58.9 83.5
9:25:00 AM 60.9 62.8 58.7 75.6
9:30:00 AM 62.4 76 59.1 92.1
9:35:00 AM 62.6 68.3 59.1 81.1
9:40:00 AM 61 65.9 57.8 79.6
9:45:00 AM 61.5 72.3 57.6 84.4
9:50:00 AM 62.1 70 58.9 81.3
9:55:00 AM 61.6 65.8 59.2 78.1
10:00:00 AM 68.2 81.2 60.3 87.3
10:05:00 AM 73.4 82.8 59.5 88.9
10:10:00 AM 66.4 77.9 58.6 85.8
10:15:00 AM 62 69.3 58.5 81.7
10:20:00 AM 60.2 63.5 58.3 75.4
10:25:00 AM 60.8 63.2 58.8 75.8
10:30:00 AM 60.2 65 58.2 83.2
10:35:00 AM 60.9 65.2 58.3 77.2
10:40:00 AM 60.2 67.5 57.8 78.9
10:45:00 AM 59.8 67.7 57.6 79.8
10:50:00 AM 60.7 71.9 58.3 85.6
10:55:00 AM 60.2 63.7 57.8 76.4
11:00:00 AM 68.4 86.6 58.5 95.7
11:05:00 AM 63.5 77.6 57.7 89.2
11:10:00 AM 59.4 61.7 57.5 75.6
11:15:00 AM 59.2 61.3 57.1 74.5
11:20:00 AM 58.9 61.4 56.5 73.9
11:25:00 AM 59.1 61.5 56.7 74
11:30:00 AM 59 61.2 56.9 73.4
11:35:00 AM 59.1 61.9 57.4 74.1
Date/Time Leq-1 Lmax-1 Lmin-1 Lpk-1
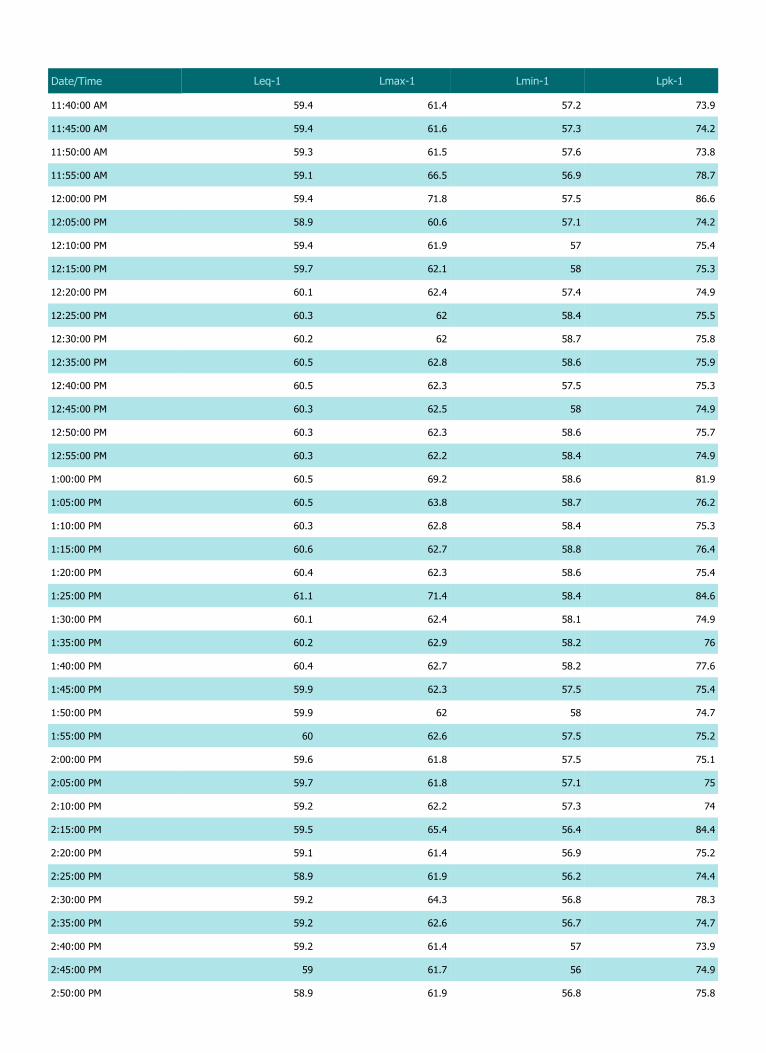
11:40:00 AM 59.4 61.4 57.2 73.9
11:45:00 AM 59.4 61.6 57.3 74.2
11:50:00 AM 59.3 61.5 57.6 73.8
11:55:00 AM 59.1 66.5 56.9 78.7
12:00:00 PM 59.4 71.8 57.5 86.6
12:05:00 PM 58.9 60.6 57.1 74.2
12:10:00 PM 59.4 61.9 57 75.4
12:15:00 PM 59.7 62.1 58 75.3
12:20:00 PM 60.1 62.4 57.4 74.9
12:25:00 PM 60.3 62 58.4 75.5
12:30:00 PM 60.2 62 58.7 75.8
12:35:00 PM 60.5 62.8 58.6 75.9
12:40:00 PM 60.5 62.3 57.5 75.3
12:45:00 PM 60.3 62.5 58 74.9
12:50:00 PM 60.3 62.3 58.6 75.7
12:55:00 PM 60.3 62.2 58.4 74.9
1:00:00 PM 60.5 69.2 58.6 81.9
1:05:00 PM 60.5 63.8 58.7 76.2
1:10:00 PM 60.3 62.8 58.4 75.3
1:15:00 PM 60.6 62.7 58.8 76.4
1:20:00 PM 60.4 62.3 58.6 75.4
1:25:00 PM 61.1 71.4 58.4 84.6
1:30:00 PM 60.1 62.4 58.1 74.9
1:35:00 PM 60.2 62.9 58.2 76
1:40:00 PM 60.4 62.7 58.2 77.6
1:45:00 PM 59.9 62.3 57.5 75.4
1:50:00 PM 59.9 62 58 74.7
1:55:00 PM 60 62.6 57.5 75.2
2:00:00 PM 59.6 61.8 57.5 75.1
2:05:00 PM 59.7 61.8 57.1 75
2:10:00 PM 59.2 62.2 57.3 74
2:15:00 PM 59.5 65.4 56.4 84.4
2:20:00 PM 59.1 61.4 56.9 75.2
2:25:00 PM 58.9 61.9 56.2 74.4
2:30:00 PM 59.2 64.3 56.8 78.3
2:35:00 PM 59.2 62.6 56.7 74.7
2:40:00 PM 59.2 61.4 57 73.9
2:45:00 PM 59 61.7 56 74.9
2:50:00 PM 58.9 61.9 56.8 75.8
Date/Time Leq-1 Lmax-1 Lmin-1 Lpk-1

2:55:00 PM 59.3 61.5 57.1 74.5
3:00:00 PM 59.7 62.5 56.7 74.5
3:05:00 PM 59.4 61.9 56.8 75.8
3:10:00 PM 59.6 62.4 56.9 79
3:15:00 PM 59.9 61.7 57.8 74.6
3:20:00 PM 59.5 61.9 57.4 75.7
3:25:00 PM 59.3 61.6 57.2 74.6
3:30:00 PM 61 75.6 57.2 89.3
3:35:00 PM 59.9 64.4 57.5 76.2
3:40:00 PM 61.5 80 57.6 92.9
3:45:00 PM 59.8 68.5 57.2 81.3
3:50:00 PM 61 70.5 57.2 86
3:55:00 PM 60.8 71.9 56.9 87.9
4:00:00 PM 60.1 73.7 56.1 88.7
4:05:00 PM 59 62.5 56.3 76.5
4:10:00 PM 61.1 75.8 55.8 90.7
4:15:00 PM 59.4 68.6 56.3 83.7
4:20:00 PM 59.1 65.3 56.7 74.6
4:25:00 PM 62.6 75.3 56.9 81.7
4:30:00 PM 59.5 65.5 56.6 76.5
4:35:00 PM 58.9 62.3 56.2 78.4
4:40:00 PM 59.1 66.1 56.6 78.5
4:45:00 PM 58.8 61 56.4 75
4:50:00 PM 58.9 61.6 56.6 77.2
4:55:00 PM 58.9 61.3 56.8 73.9
5:00:00 PM 58.8 62.1 56.7 74.6
5:05:00 PM 59.3 61.9 57.6 74.2
5:10:00 PM 59.4 62.6 57.2 74.7
5:15:00 PM 59.5 61.5 56.9 75.2
5:20:00 PM 59.7 62 57.6 76.3
5:25:00 PM 59.5 62 57.6 74.9
5:30:00 PM 59.9 62.4 57.9 75.1
5:35:00 PM 60.3 62.3 58.7 74.9
5:40:00 PM 60.3 63.9 57.8 75.6
5:45:00 PM 59.9 63.2 57.8 75.6
5:50:00 PM 60.5 65.9 58.3 78.7
5:55:00 PM 59.9 65.4 57.6 75.8
6:00:00 PM 60.3 62.5 58.1 75.6
6:05:00 PM 60.6 62.7 57.5 77.2
Date/Time Leq-1 Lmax-1 Lmin-1 Lpk-1

6:10:00 PM 60.4 63 58.3 77.5
6:15:00 PM 60.4 62.6 58.1 75.2
6:20:00 PM 60.2 62.9 58.1 75.2
6:25:00 PM 60.4 62.6 58.3 75.3
6:30:00 PM 60.2 62.2 58.3 75.8
6:35:00 PM 60.6 64.3 57.9 79.8
6:40:00 PM 60.3 63.7 58.1 78.6
6:45:00 PM 60.5 63.3 58.3 77.9
6:50:00 PM 60.5 63.7 58 78.5
6:55:00 PM 60.4 63.4 58.1 77
7:00:00 PM 60.6 63.1 58.3 77.1
7:05:00 PM 60.4 63 57.9 76.2
7:10:00 PM 60.2 62.5 57.4 76.3
7:15:00 PM 60.2 62.3 56.9 75.6
7:20:00 PM 59.9 62.6 57.4 75.6
7:25:00 PM 60.3 62.9 57.8 76.3
7:30:00 PM 60.2 62.8 56.4 76.4
7:35:00 PM 60.4 63.3 58.7 75.7
7:40:00 PM 60.5 62.5 58 75.7
7:45:00 PM 60.2 62.1 58.5 75.5
7:50:00 PM 60.3 62.6 58.1 74.6
7:55:00 PM 60.6 63 58.5 76.3
8:00:00 PM 60 62 57.4 75.6
8:05:00 PM 60.3 64 58.1 76.7
8:10:00 PM 60.1 62.2 57.9 74.8
8:15:00 PM 60.4 62.7 58.4 75.6
8:20:00 PM 60.4 63 58.1 76.2
8:25:00 PM 60.2 62.1 58.4 75.1
8:30:00 PM 60.4 62.2 58.5 74.7
8:35:00 PM 60.5 62.5 58.7 75.8
8:40:00 PM 60.5 62.5 58.7 75.2
8:45:00 PM 60.7 63.2 58.4 75.6
8:50:00 PM 60.5 62.3 58.6 75.2
8:55:00 PM 60.6 62.6 58.7 75.8
9:00:00 PM 60.6 62.6 58.5 76
9:05:00 PM 61 62.8 59.3 76.3
9:10:00 PM 61 63 58.8 75.5
9:15:00 PM 60.7 62.6 58.9 76
9:20:00 PM 60.8 65 58.8 77.6
Date/Time Leq-1 Lmax-1 Lmin-1 Lpk-1

9:25:00 PM 60.7 62.4 59.1 75.1
9:30:00 PM 60.7 62.6 59 75.6
9:35:00 PM 60.9 62.3 59.2 75.8
9:40:00 PM 60.8 62.8 58.7 76
9:45:00 PM 60.7 62.3 58.8 75.3
9:50:00 PM 60.7 65 58.6 77.8
9:55:00 PM 60.4 62.2 58.5 75.3
10:00:00 PM 60.5 62.3 58.5 74.7
10:05:00 PM 60.4 62.2 58.7 75.7
Date/Time Leq-1 Lmax-1 Lmin-1 Lpk-1

Session Report 15-Nov-17
Information Panel
Company Name Sarawak Energy Berhad
Description CK/EV103-708/17
Location N2 (Night Time)
Start Time 14-Nov-17 10:00:00 PM
Stop Time 15-Nov-17 7:00:00 AM
Run Time 09:00:00
Model Type SoundPro DL
Comments Nearby plant operation, insects, etc.
Summary Data Panel
Description Meter Value Description Meter Value
Leq 1 62.8 dB Lpk 1 83 dB
Lmax 1 69 dB Lmin 1 60.2 dB
L10 1 63.5 dB L90 1 61.8 dB
Mntime 1 15-Nov-17 1:18:44 AM
Mxtime 1 15-Nov-17 6:24:29 AM
Rtime 1 09:00:00 Dose 1 0.2 %
Exchange Rate 1 3 dB Weighting 1 A
Response 1 FAST Bandwidth 1 OFF

Statistics Chart
N2N - 24hrs: Sta s cs Chart
Statistics Table
dB: 0.0 0.1 0.2 0.3 0.4 0.5 0.6 0.7 0.8 0.9 %
60: 0.00 0.00 0.00 0.00 0.00 0.01 0.01 0.03 0.06 0.09 0.20
61: 0.13 0.20 0.29 0.42 0.61 0.86 1.20 1.61 2.09 2.68 10.09
62: 3.34 4.13 3.19 4.65 5.04 5.42 5.73 5.90 6.01 5.95 49.36
63: 5.77 5.40 4.95 4.47 3.95 3.42 2.88 2.34 1.86 1.43 36.47
64: 1.08 0.81 0.59 0.43 0.30 0.21 0.14 0.09 0.06 0.04 3.75
65: 0.02 0.02 0.01 0.01 0.01 0.01 0.00 0.00 0.00 0.00 0.08
66: 0.00 0.00 0.00 0.00 0.00 0.00 0.00 0.00 0.00 0.00 0.02
67: 0.00 0.00 0.00 0.00 0.00 0.00 0.00 0.00 0.00 0.00 0.01
68: 0.00 0.00 0.00 0.00 0.00 0.00 0.00 0.00 0.00 0.00 0.01
69: 0.00 0.00 0.00 0.00 0.00 0.00 0.00 0.00 0.00 0.00 0.00

Exceedance Chart
N2N - 24hrs: Exceedance Chart
Exceedance Table
. 0% 1% 2% 3% 4% 5% 6% %7 %8 %9
0%: 64.2 64.0 63.9 63.8 63.8 63.7 63.7 63.6 63.6
10%: 63.5 63.5 63.5 63.4 63.4 63.4 63.3 63.3 63.3 63.3
20%: 63.2 63.2 63.2 63.2 63.2 63.1 63.1 63.1 63.1 63.1
30%: 63.0 63.0 63.0 63.0 63.0 62.9 62.9 62.9 62.9 62.9
40%: 62.9 62.8 62.8 62.8 62.8 62.8 62.8 62.7 62.7 62.7
50%: 62.7 62.7 62.7 62.6 62.6 62.6 62.6 62.6 62.6 62.5
60%: 62.5 62.5 62.5 62.5 62.4 62.4 62.4 62.4 62.4 62.4
70%: 62.3 62.3 62.3 62.3 62.3 62.2 62.2 62.2 62.2 62.2
80%: 62.1 62.1 62.1 62.0 62.0 62.0 62.0 61.9 61.9 61.9
90%: 61.8 61.8 61.8 61.7 61.7 61.6 61.6 61.5 61.4 61.2
100%: 60.1

Logged Data Chart
N2N - 24hrs: Logged Data Chart
Logged Data Table
Date/Time Leq-1 Lmax-1 Lmin-1 Lpk-1
14-Nov-17 10:05:00 PM 62.8 68 61.3 81.1
10:10:00 PM 62.1 64.1 60.8 76.4
10:15:00 PM 62.6 64.3 61.3 78.1
10:20:00 PM 62.9 65.2 61.3 78.7
10:25:00 PM 63.2 64.9 61.6 77.7
10:30:00 PM 63.6 65 62.1 78.7
10:35:00 PM 63.4 65 62.1 78.5
10:40:00 PM 63.5 64.8 62.1 78
10:45:00 PM 63.4 65 62 77.7
10:50:00 PM 63.5 64.9 61.8 78.4
10:55:00 PM 63.5 65 62.1 78.6
11:00:00 PM 63.6 64.9 62.1 77.8
11:05:00 PM 63.3 65.3 61.7 78
11:10:00 PM 63.4 65.3 61.8 78
11:15:00 PM 63.6 65.2 62.1 78.3
11:20:00 PM 63.5 65.4 61.8 78.2
11:25:00 PM 63.5 65.2 61.9 78.3
11:30:00 PM 63.4 64.8 62.1 79.2
11:35:00 PM 63.3 65 61.9 78.5
11:40:00 PM 63.1 64.6 61.5 78.2
11:45:00 PM 63.3 64.9 61.7 78.2
11:50:00 PM 63.1 64.9 61.6 77.9
11:55:00 PM 63.4 64.9 62.1 78.9
15-Nov-17 12:00:00 AM 63.3 64.9 62 78.5
12:05:00 AM 63.4 65.2 61.3 77.9
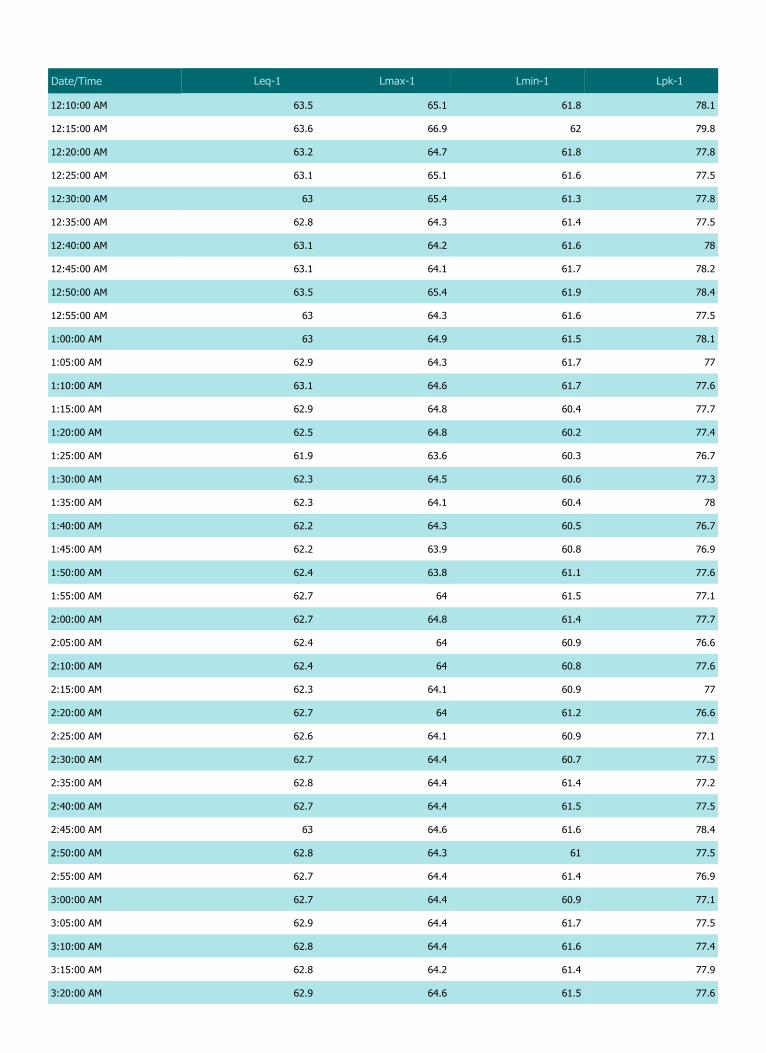
12:10:00 AM 63.5 65.1 61.8 78.1
12:15:00 AM 63.6 66.9 62 79.8
12:20:00 AM 63.2 64.7 61.8 77.8
12:25:00 AM 63.1 65.1 61.6 77.5
12:30:00 AM 63 65.4 61.3 77.8
12:35:00 AM 62.8 64.3 61.4 77.5
12:40:00 AM 63.1 64.2 61.6 78
12:45:00 AM 63.1 64.1 61.7 78.2
12:50:00 AM 63.5 65.4 61.9 78.4
12:55:00 AM 63 64.3 61.6 77.5
1:00:00 AM 63 64.9 61.5 78.1
1:05:00 AM 62.9 64.3 61.7 77
1:10:00 AM 63.1 64.6 61.7 77.6
1:15:00 AM 62.9 64.8 60.4 77.7
1:20:00 AM 62.5 64.8 60.2 77.4
1:25:00 AM 61.9 63.6 60.3 76.7
1:30:00 AM 62.3 64.5 60.6 77.3
1:35:00 AM 62.3 64.1 60.4 78
1:40:00 AM 62.2 64.3 60.5 76.7
1:45:00 AM 62.2 63.9 60.8 76.9
1:50:00 AM 62.4 63.8 61.1 77.6
1:55:00 AM 62.7 64 61.5 77.1
2:00:00 AM 62.7 64.8 61.4 77.7
2:05:00 AM 62.4 64 60.9 76.6
2:10:00 AM 62.4 64 60.8 77.6
2:15:00 AM 62.3 64.1 60.9 77
2:20:00 AM 62.7 64 61.2 76.6
2:25:00 AM 62.6 64.1 60.9 77.1
2:30:00 AM 62.7 64.4 60.7 77.5
2:35:00 AM 62.8 64.4 61.4 77.2
2:40:00 AM 62.7 64.4 61.5 77.5
2:45:00 AM 63 64.6 61.6 78.4
2:50:00 AM 62.8 64.3 61 77.5
2:55:00 AM 62.7 64.4 61.4 76.9
3:00:00 AM 62.7 64.4 60.9 77.1
3:05:00 AM 62.9 64.4 61.7 77.5
3:10:00 AM 62.8 64.4 61.6 77.4
3:15:00 AM 62.8 64.2 61.4 77.9
3:20:00 AM 62.9 64.6 61.5 77.6
Date/Time Leq-1 Lmax-1 Lmin-1 Lpk-1

3:25:00 AM 63 64.5 61.6 77.7
3:30:00 AM 62.9 64.3 61.7 78.3
3:35:00 AM 63 64.9 61.6 77.2
3:40:00 AM 63 64.7 61.7 77.5
3:45:00 AM 63 64.4 61.4 77.6
3:50:00 AM 63 64.5 61.5 78.6
3:55:00 AM 62.8 64.2 61.4 78.3
4:00:00 AM 63 64.4 61.7 78.3
4:05:00 AM 63 64.4 61.6 77.5
4:10:00 AM 63 64.8 61.5 78.3
4:15:00 AM 62.7 64.2 61.1 77.2
4:20:00 AM 62.5 63.8 61.2 77.2
4:25:00 AM 62.8 63.9 61.6 76.9
4:30:00 AM 62.8 67.1 61.1 83
4:35:00 AM 62.4 65.8 61 81.4
4:40:00 AM 62.4 64.8 60.9 78.9
4:45:00 AM 62.3 64 60.8 78.8
4:50:00 AM 62.3 64.4 60.3 78.2
4:55:00 AM 62.6 64.7 61 77.6
5:00:00 AM 62.5 64.2 61 77.4
5:05:00 AM 62.6 64.4 61.3 77.8
5:10:00 AM 62.8 64.4 61.3 76.9
5:15:00 AM 62.7 64.3 61.5 76.8
5:20:00 AM 62.8 64.3 61.6 77.2
5:25:00 AM 62.9 64.4 61.7 77.3
5:30:00 AM 63 64.3 61.7 77.5
5:35:00 AM 63 64.5 61.7 77.3
5:40:00 AM 63.2 64.5 61.8 77.7
5:45:00 AM 62.4 64.2 61 78.2
5:50:00 AM 62.2 63.5 60.9 76.5
5:55:00 AM 62.4 65.1 61 78.7
6:00:00 AM 62.3 63.6 60.9 76.5
6:05:00 AM 62.2 63.5 61.1 76.6
6:10:00 AM 62 63.2 60.5 76.8
6:15:00 AM 62.1 63.5 60.4 76.5
6:20:00 AM 62.1 63.5 60.9 76.3
6:25:00 AM 62.3 69 60.4 81.3
6:30:00 AM 61.9 63.4 60.6 76.5
6:35:00 AM 62.2 63.6 60.9 77.1
Date/Time Leq-1 Lmax-1 Lmin-1 Lpk-1

6:40:00 AM 62 63.2 60.6 76.5
6:45:00 AM 62 67 60.4 79.9
6:50:00 AM 62.2 63.3 60.6 76.4
6:55:00 AM 62.4 64.9 61 78.1
7:00:00 AM 62.7 65.3 61.5 77.3
Date/Time Leq-1 Lmax-1 Lmin-1 Lpk-1

Session Report 22-Nov-17
Information Panel
Company Name Sarawak Energy Berhad
Description CK/EV103-708/17
Location N3 (Day Time)
Start Time 22-Nov-17 7:00:00 AM
Stop Time 22-Nov-17 10:00:00 PM
Run Time 15:00:00
Model Type SoundPro DL
Comments Nearby plant operation, human activities, vehicles movement, etc.
Summary Data Panel
Description Meter Value Description Meter Value
Leq 1 69.2 dB Lpk 1 101.3 dB
Lmax 1 94.9 dB Lmin 1 66.1 dB
L10 1 69.8 dB L90 1 67.3 dB
Mntime 1 22-Nov-17 4:55:46 PM
Mxtime 1 22-Nov-17 8:14:18 AM
Rtime 1 15:00:00 Dose 1 1.6 %
Exchange Rate 1 3 dB Weighting 1 A
Response 1 FAST Bandwidth 1 OFF

Statistics Chart
N3D - 24hrs: Sta s cs Chart
Statistics Table
dB: 0.0 0.1 0.2 0.3 0.4 0.5 0.6 0.7 0.8 0.9 %
66: 0.00 0.00 0.00 0.00 0.00 0.01 0.04 0.09 0.21 0.43 0.80
67: 0.78 1.29 1.94 2.68 3.44 4.15 4.77 5.27 5.62 5.74 35.69
68: 5.52 4.99 3.22 3.01 2.76 2.58 2.61 2.66 2.73 2.67 32.75
69: 2.53 2.35 2.23 2.16 2.19 2.26 2.32 2.37 2.31 2.19 22.89
70: 1.94 1.61 1.25 0.90 0.61 0.37 0.22 0.12 0.06 0.04 7.11
71: 0.02 0.02 0.01 0.01 0.01 0.01 0.01 0.01 0.01 0.01 0.11
72: 0.00 0.00 0.00 0.00 0.00 0.00 0.00 0.00 0.00 0.00 0.04
73: 0.00 0.00 0.00 0.00 0.00 0.00 0.00 0.00 0.00 0.00 0.03
74: 0.00 0.00 0.00 0.00 0.00 0.00 0.00 0.00 0.00 0.00 0.01
75: 0.00 0.00 0.00 0.00 0.00 0.00 0.00 0.00 0.00 0.00 0.02
76: 0.00 0.00 0.00 0.00 0.00 0.00 0.00 0.00 0.00 0.00 0.03
77: 0.00 0.00 0.00 0.00 0.00 0.00 0.00 0.00 0.00 0.00 0.02
78: 0.00 0.00 0.00 0.00 0.00 0.00 0.00 0.00 0.00 0.00 0.02
79: 0.00 0.00 0.00 0.00 0.00 0.00 0.00 0.00 0.00 0.01 0.03
80: 0.00 0.01 0.01 0.00 0.01 0.01 0.01 0.01 0.01 0.01 0.06
81: 0.01 0.01 0.01 0.01 0.01 0.01 0.01 0.01 0.01 0.01 0.06
82: 0.01 0.01 0.01 0.01 0.01 0.01 0.01 0.01 0.01 0.01 0.07
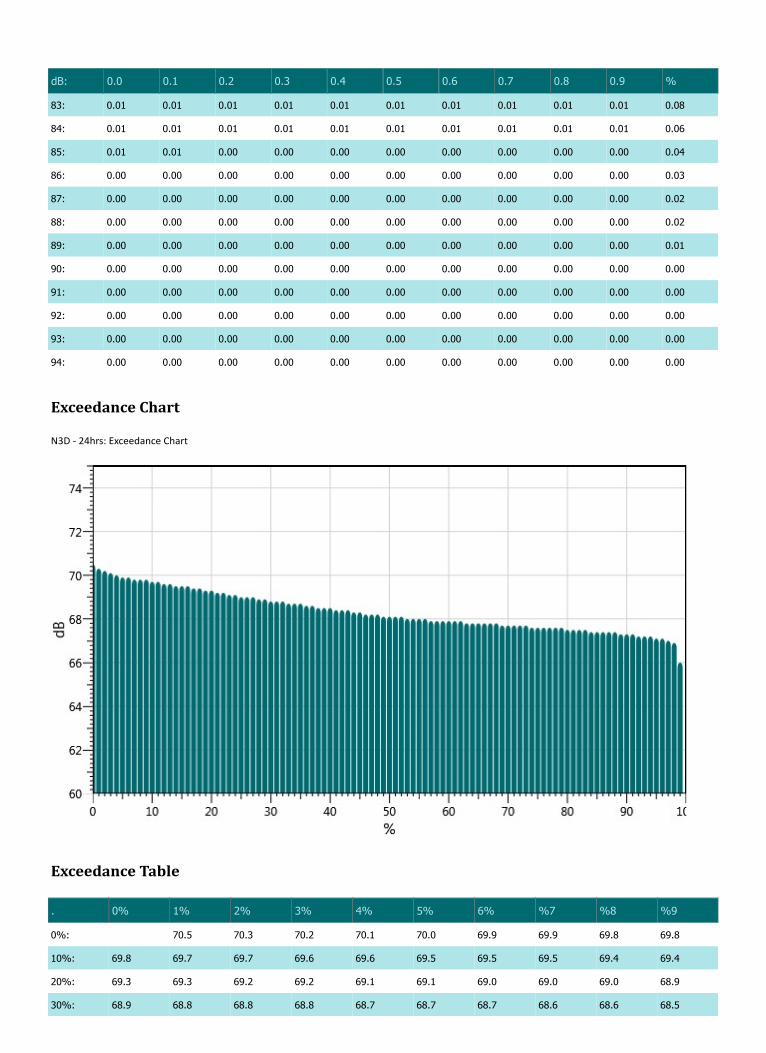
83: 0.01 0.01 0.01 0.01 0.01 0.01 0.01 0.01 0.01 0.01 0.08
84: 0.01 0.01 0.01 0.01 0.01 0.01 0.01 0.01 0.01 0.01 0.06
85: 0.01 0.01 0.00 0.00 0.00 0.00 0.00 0.00 0.00 0.00 0.04
86: 0.00 0.00 0.00 0.00 0.00 0.00 0.00 0.00 0.00 0.00 0.03
87: 0.00 0.00 0.00 0.00 0.00 0.00 0.00 0.00 0.00 0.00 0.02
88: 0.00 0.00 0.00 0.00 0.00 0.00 0.00 0.00 0.00 0.00 0.02
89: 0.00 0.00 0.00 0.00 0.00 0.00 0.00 0.00 0.00 0.00 0.01
90: 0.00 0.00 0.00 0.00 0.00 0.00 0.00 0.00 0.00 0.00 0.00
91: 0.00 0.00 0.00 0.00 0.00 0.00 0.00 0.00 0.00 0.00 0.00
92: 0.00 0.00 0.00 0.00 0.00 0.00 0.00 0.00 0.00 0.00 0.00
93: 0.00 0.00 0.00 0.00 0.00 0.00 0.00 0.00 0.00 0.00 0.00
94: 0.00 0.00 0.00 0.00 0.00 0.00 0.00 0.00 0.00 0.00 0.00
Exceedance Chart
N3D - 24hrs: Exceedance Chart
Exceedance Table
. 0% 1% 2% 3% 4% 5% 6% %7 %8 %9
0%: 70.5 70.3 70.2 70.1 70.0 69.9 69.9 69.8 69.8
10%: 69.8 69.7 69.7 69.6 69.6 69.5 69.5 69.5 69.4 69.4
20%: 69.3 69.3 69.2 69.2 69.1 69.1 69.0 69.0 69.0 68.9
30%: 68.9 68.8 68.8 68.8 68.7 68.7 68.7 68.6 68.6 68.5
dB: 0.0 0.1 0.2 0.3 0.4 0.5 0.6 0.7 0.8 0.9 %

40%: 68.5 68.5 68.4 68.4 68.4 68.3 68.3 68.2 68.2 68.2
50%: 68.1 68.1 68.1 68.1 68.0 68.0 68.0 68.0 67.9 67.9
60%: 67.9 67.9 67.9 67.9 67.8 67.8 67.8 67.8 67.8 67.8
70%: 67.7 67.7 67.7 67.7 67.7 67.6 67.6 67.6 67.6 67.6
80%: 67.6 67.5 67.5 67.5 67.5 67.4 67.4 67.4 67.4 67.4
90%: 67.3 67.3 67.3 67.2 67.2 67.2 67.1 67.1 67.0 66.9
100%: 66.0
Logged Data Chart
N3D - 24hrs: Logged Data Chart
Logged Data Table
Date/Time Leq-1 Lmax-1 Lmin-1 Lpk-1
22-Nov-17 7:05:00 AM 70.1 71.1 69 84.5
7:10:00 AM 70 71.1 68.9 84.5
7:15:00 AM 70 71.2 69 84.3
7:20:00 AM 70.2 71.2 69.1 84.6
7:25:00 AM 70.1 71.1 69.1 85.1
7:30:00 AM 70.1 71.1 69.2 85.1
7:35:00 AM 70.3 71.5 69.3 84.6
7:40:00 AM 70 71 69 85.1
7:45:00 AM 69.9 70.9 69 83.9
7:50:00 AM 70 70.9 69 84.4
7:55:00 AM 70 73.3 69.1 85.5
8:00:00 AM 69.7 70.9 68.8 83.9
8:05:00 AM 69.8 70.9 68.7 84.2
. 0% 1% 2% 3% 4% 5% 6% %7 %8 %9

8:10:00 AM 69.8 70.8 68.9 83.9
8:15:00 AM 72.3 94.9 68.9 101.3
8:20:00 AM 69.9 70.7 68.8 86
8:25:00 AM 69.9 70.8 68.9 84.7
8:30:00 AM 70 71.9 68.9 84.7
8:35:00 AM 69.9 71.1 68.8 84.3
8:40:00 AM 69.7 70.8 68.7 84
8:45:00 AM 69.7 70.8 68.6 84.9
8:50:00 AM 69.7 71.2 68.6 84.7
8:55:00 AM 69.7 74.7 68.5 87.1
9:00:00 AM 69.6 71.5 68.5 85.1
9:05:00 AM 69.6 73.4 68.5 85.3
9:10:00 AM 69.5 76 68.3 89.3
9:15:00 AM 69.4 71.6 68.3 84.1
9:20:00 AM 69.3 70.4 68.2 83.4
9:25:00 AM 69.4 70.5 68.3 83.9
9:30:00 AM 69.3 72.7 68.3 84.2
9:35:00 AM 69.4 76.2 68.1 89
9:40:00 AM 69.3 73.5 68.1 87.2
9:45:00 AM 69 71.9 67.9 84.5
9:50:00 AM 68.8 72 67.7 86.6
9:55:00 AM 68.9 71 67.9 87.4
10:00:00 AM 75.5 89.5 67.5 95.6
10:05:00 AM 81.7 91.9 67.5 97.2
10:10:00 AM 78 90 67.1 97.2
10:15:00 AM 68 69.3 67 83.2
10:20:00 AM 68 69.5 66.9 82.3
10:25:00 AM 67.9 69.7 66.7 82.6
10:30:00 AM 67.8 70 66.5 83.1
10:35:00 AM 67.8 71.8 66.2 88.9
10:40:00 AM 68.2 69.6 66.8 82.9
10:45:00 AM 68.2 71 66.8 84.2
10:50:00 AM 67.8 69.9 66.7 82.8
10:55:00 AM 67.9 69.3 66.7 82.7
11:00:00 AM 68.2 72 67.1 83
11:05:00 AM 68.4 71.4 67.4 83.5
11:10:00 AM 68.6 72 67.6 83.2
11:15:00 AM 68.5 69.9 67.6 82.5
11:20:00 AM 68.6 70.7 67.7 83.9
Date/Time Leq-1 Lmax-1 Lmin-1 Lpk-1

11:25:00 AM 68.7 71.5 67.6 84.2
11:30:00 AM 68.9 72.3 67.9 85.1
11:35:00 AM 68.9 71.8 67.9 84.5
11:40:00 AM 68.9 70 68 85.1
11:45:00 AM 69 71.4 67.9 83.7
11:50:00 AM 68.9 70 67.8 83.6
11:55:00 AM 69.1 70.6 68 84.7
12:00:00 PM 68.9 72 67.8 84.1
12:05:00 PM 68.8 71.7 67.9 83.2
12:10:00 PM 68.8 69.8 67.6 82.8
12:15:00 PM 68.8 69.9 67.7 83.1
12:20:00 PM 68.7 69.8 67.8 82.9
12:25:00 PM 68.8 69.8 67.8 83.5
12:30:00 PM 68.7 69.7 67.7 82.9
12:35:00 PM 68.8 70.1 67.8 83.9
12:40:00 PM 69 70.1 68.1 84.1
12:45:00 PM 68.9 70 67.9 83.6
12:50:00 PM 68.9 70 67.9 83.9
12:55:00 PM 68.8 69.9 67.9 83.3
1:00:00 PM 68.8 69.9 67.9 83.7
1:05:00 PM 68.8 71.1 67.7 82.9
1:10:00 PM 68.7 69.8 67.6 83.5
1:15:00 PM 68.7 69.7 67.7 82.9
1:20:00 PM 69.4 70.8 67.6 84.3
1:25:00 PM 69.5 70.6 68.5 83.9
1:30:00 PM 69.6 70.6 68.5 83.8
1:35:00 PM 69.6 71.4 68.7 86.1
1:40:00 PM 69.7 72.7 68.7 85.2
1:45:00 PM 69.9 73.2 68.5 85.4
1:50:00 PM 69.8 75.3 68.5 89.1
1:55:00 PM 69.6 72 68.5 84.2
2:00:00 PM 69.5 71.3 68.4 84.2
2:05:00 PM 69.5 73.4 68.3 85.4
2:10:00 PM 69.4 77.7 68.1 89.3
2:15:00 PM 69.2 72.2 68.3 87.5
2:20:00 PM 69.1 72.2 68.1 85.8
2:25:00 PM 69.2 78.7 67.7 92.1
2:30:00 PM 69 70.3 68 83.4
2:35:00 PM 68.5 70.1 67.4 83.2
Date/Time Leq-1 Lmax-1 Lmin-1 Lpk-1
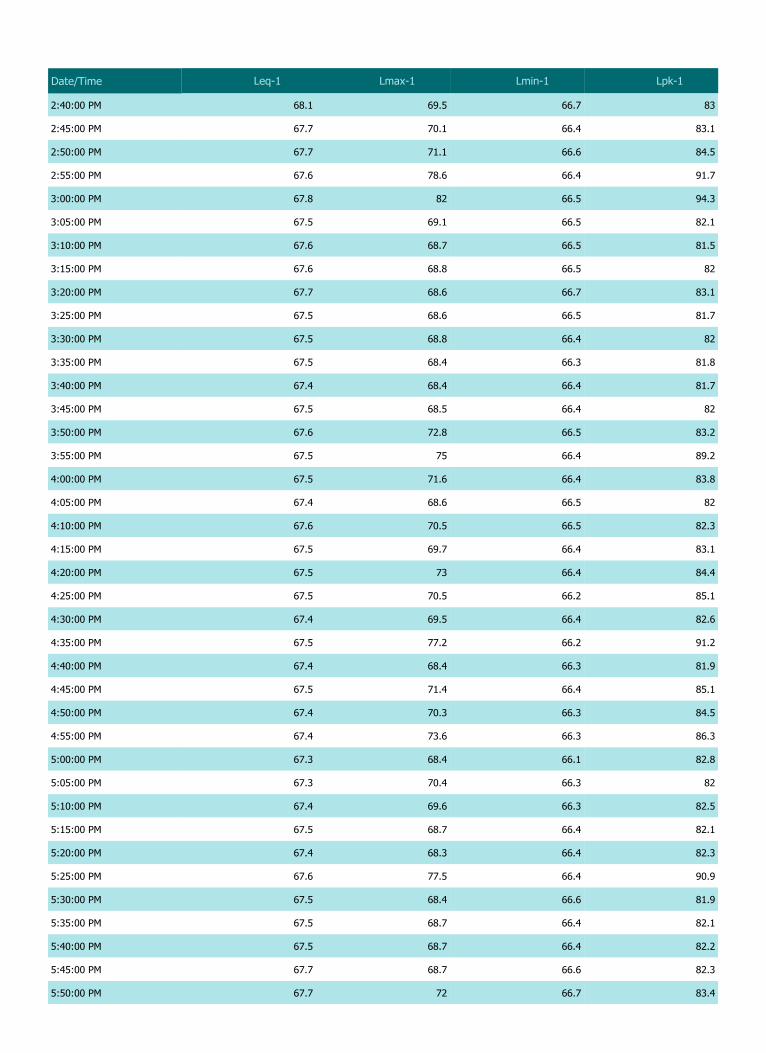
2:40:00 PM 68.1 69.5 66.7 83
2:45:00 PM 67.7 70.1 66.4 83.1
2:50:00 PM 67.7 71.1 66.6 84.5
2:55:00 PM 67.6 78.6 66.4 91.7
3:00:00 PM 67.8 82 66.5 94.3
3:05:00 PM 67.5 69.1 66.5 82.1
3:10:00 PM 67.6 68.7 66.5 81.5
3:15:00 PM 67.6 68.8 66.5 82
3:20:00 PM 67.7 68.6 66.7 83.1
3:25:00 PM 67.5 68.6 66.5 81.7
3:30:00 PM 67.5 68.8 66.4 82
3:35:00 PM 67.5 68.4 66.3 81.8
3:40:00 PM 67.4 68.4 66.4 81.7
3:45:00 PM 67.5 68.5 66.4 82
3:50:00 PM 67.6 72.8 66.5 83.2
3:55:00 PM 67.5 75 66.4 89.2
4:00:00 PM 67.5 71.6 66.4 83.8
4:05:00 PM 67.4 68.6 66.5 82
4:10:00 PM 67.6 70.5 66.5 82.3
4:15:00 PM 67.5 69.7 66.4 83.1
4:20:00 PM 67.5 73 66.4 84.4
4:25:00 PM 67.5 70.5 66.2 85.1
4:30:00 PM 67.4 69.5 66.4 82.6
4:35:00 PM 67.5 77.2 66.2 91.2
4:40:00 PM 67.4 68.4 66.3 81.9
4:45:00 PM 67.5 71.4 66.4 85.1
4:50:00 PM 67.4 70.3 66.3 84.5
4:55:00 PM 67.4 73.6 66.3 86.3
5:00:00 PM 67.3 68.4 66.1 82.8
5:05:00 PM 67.3 70.4 66.3 82
5:10:00 PM 67.4 69.6 66.3 82.5
5:15:00 PM 67.5 68.7 66.4 82.1
5:20:00 PM 67.4 68.3 66.4 82.3
5:25:00 PM 67.6 77.5 66.4 90.9
5:30:00 PM 67.5 68.4 66.6 81.9
5:35:00 PM 67.5 68.7 66.4 82.1
5:40:00 PM 67.5 68.7 66.4 82.2
5:45:00 PM 67.7 68.7 66.6 82.3
5:50:00 PM 67.7 72 66.7 83.4
Date/Time Leq-1 Lmax-1 Lmin-1 Lpk-1

5:55:00 PM 67.7 68.8 66.8 81.9
6:00:00 PM 67.7 68.8 66.6 82.9
6:05:00 PM 67.7 68.7 66.7 82.1
6:10:00 PM 67.8 68.7 66.8 82.1
6:15:00 PM 67.8 68.9 66.7 82.5
6:20:00 PM 67.9 69 66.9 82.6
6:25:00 PM 68 69.1 66.9 82.2
6:30:00 PM 67.9 69 66.9 82.4
6:35:00 PM 67.9 68.9 66.8 81.9
6:40:00 PM 67.9 69.1 66.7 82.6
6:45:00 PM 67.9 69 66.9 82.4
6:50:00 PM 68 69.4 66.9 82.9
6:55:00 PM 68 68.9 67 82.7
7:00:00 PM 68 69.1 67 82.4
7:05:00 PM 68 69.2 66.8 82.6
7:10:00 PM 68 69.4 66.8 82.6
7:15:00 PM 68.1 69.5 67 82.4
7:20:00 PM 67.9 69 66.7 81.8
7:25:00 PM 68.1 69.4 66.9 83
7:30:00 PM 68.1 69.2 67.1 82.7
7:35:00 PM 68 69.2 66.8 82.3
7:40:00 PM 68 69 66.8 82.2
7:45:00 PM 68.1 69.5 67.1 82.6
7:50:00 PM 67.9 69.2 66.8 82.4
7:55:00 PM 68 68.9 66.8 81.9
8:00:00 PM 67.9 69 66.8 82.1
8:05:00 PM 67.9 69.2 66.7 82
8:10:00 PM 67.8 68.8 66.6 82.7
8:15:00 PM 68 69.2 66.9 82.2
8:20:00 PM 68 69.5 67 83
8:25:00 PM 68.1 69.2 66.9 83.1
8:30:00 PM 68 68.9 66.7 82.3
8:35:00 PM 68 69.2 67.1 83
8:40:00 PM 68 69.2 67 81.9
8:45:00 PM 68 69.3 67 83.3
8:50:00 PM 68 69.2 67 82.8
8:55:00 PM 68.1 69 67.1 82.7
9:00:00 PM 68 69.2 67.1 82.7
9:05:00 PM 68 69.3 67.1 82.1
Date/Time Leq-1 Lmax-1 Lmin-1 Lpk-1

9:10:00 PM 68 69.2 67 82.6
9:15:00 PM 68 69.1 67 82.5
9:20:00 PM 68 69.4 66.9 82.4
9:25:00 PM 68 69.5 66.9 82.2
9:30:00 PM 67.9 68.9 66.8 82.4
9:35:00 PM 68 69 66.9 82.4
9:40:00 PM 67.9 69 66.9 82.6
9:45:00 PM 68 68.9 66.9 82.2
9:50:00 PM 68.1 69.1 67 82.3
9:55:00 PM 68 69 66.9 82
10:00:00 PM 68.1 69.3 66.8 83
Date/Time Leq-1 Lmax-1 Lmin-1 Lpk-1

Session Report 23-Nov-17
Information Panel
Company Name Sarawak Energy Berhad
Description CK/EV103-708/17
Location N3 (Night Time)
Start Time 22-Nov-17 10:05:01 PM
Stop Time 23-Nov-17 7:05:01 AM
Run Time 09:00:00
Model Type SoundPro DL
Comments Nearby plant operation, human activities, vehicles movement, etc.
Summary Data Panel
Description Meter Value Description Meter Value
Leq 1 68.6 dB Lpk 1 88.3 dB
Lmax 1 73.7 dB Lmin 1 66.6 dB
L10 1 69.2 dB L90 1 67.9 dB
Mntime 1 23-Nov-17 5:42:18 AM
Mxtime 1 23-Nov-17 2:04:39 AM
Rtime 1 09:00:00 Dose 1 0.8 %
Exchange Rate 1 3 dB Weighting 1 A
Response 1 FAST Bandwidth 1 OFF
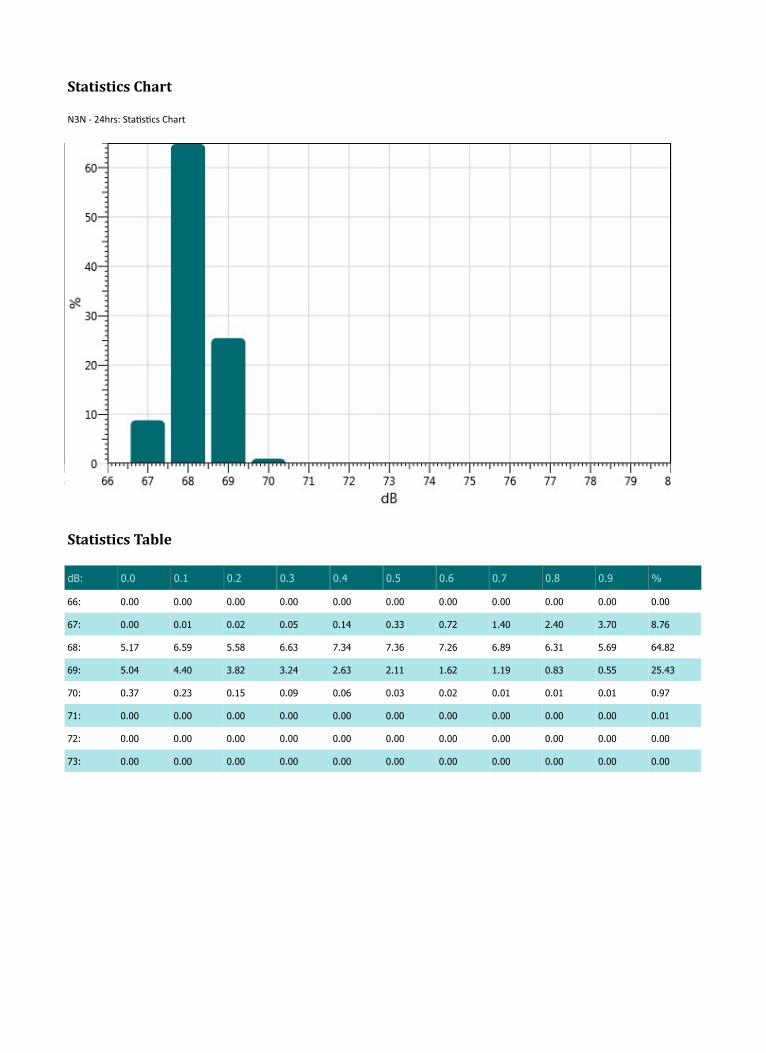
Statistics Chart
N3N - 24hrs: Sta s cs Chart
Statistics Table
dB: 0.0 0.1 0.2 0.3 0.4 0.5 0.6 0.7 0.8 0.9 %
66: 0.00 0.00 0.00 0.00 0.00 0.00 0.00 0.00 0.00 0.00 0.00
67: 0.00 0.01 0.02 0.05 0.14 0.33 0.72 1.40 2.40 3.70 8.76
68: 5.17 6.59 5.58 6.63 7.34 7.36 7.26 6.89 6.31 5.69 64.82
69: 5.04 4.40 3.82 3.24 2.63 2.11 1.62 1.19 0.83 0.55 25.43
70: 0.37 0.23 0.15 0.09 0.06 0.03 0.02 0.01 0.01 0.01 0.97
71: 0.00 0.00 0.00 0.00 0.00 0.00 0.00 0.00 0.00 0.00 0.01
72: 0.00 0.00 0.00 0.00 0.00 0.00 0.00 0.00 0.00 0.00 0.00
73: 0.00 0.00 0.00 0.00 0.00 0.00 0.00 0.00 0.00 0.00 0.00

Exceedance Chart
N3N - 24hrs: Exceedance Chart
Exceedance Table
. 0% 1% 2% 3% 4% 5% 6% %7 %8 %9
0%: 69.8 69.7 69.6 69.5 69.5 69.4 69.4 69.3 69.3
10%: 69.2 69.2 69.2 69.2 69.1 69.1 69.1 69.0 69.0 69.0
20%: 69.0 69.0 68.9 68.9 68.9 68.9 68.9 68.8 68.8 68.8
30%: 68.8 68.8 68.8 68.7 68.7 68.7 68.7 68.7 68.7 68.6
40%: 68.6 68.6 68.6 68.6 68.6 68.6 68.5 68.5 68.5 68.5
50%: 68.5 68.5 68.5 68.4 68.4 68.4 68.4 68.4 68.4 68.4
60%: 68.3 68.3 68.3 68.3 68.3 68.3 68.3 68.3 68.2 68.2
70%: 68.2 68.2 68.2 68.2 68.1 68.1 68.1 68.1 68.1 68.1
80%: 68.0 68.0 68.0 68.0 68.0 68.0 68.0 67.9 67.9 67.9
90%: 67.9 67.9 67.8 67.8 67.8 67.7 67.7 67.7 67.6 67.5
100%: 66.5

Logged Data Chart
N3N - 24hrs: Logged Data Chart
Logged Data Table
Date/Time Leq-1 Lmax-1 Lmin-1 Lpk-1
22-Nov-17 10:10:01 PM 68 68.8 67 82.4
10:15:01 PM 68 68.8 67.1 82.2
10:20:01 PM 68 68.9 67.1 83.3
10:25:01 PM 68 69.1 67.2 83
10:30:01 PM 68.1 69.1 67.1 82.4
10:35:01 PM 68 69 67.2 82.6
10:40:01 PM 68.1 69.1 67 83.3
10:45:01 PM 68.1 69.1 67.1 82.4
10:50:01 PM 68.1 69.3 67.3 82.9
10:55:01 PM 68.1 69.1 67.1 82.6
11:00:01 PM 68 69.2 67 82.5
11:05:01 PM 68.1 69.2 67.3 82.4
11:10:01 PM 68.3 69.6 67.2 82.9
11:15:01 PM 68.1 69.1 67.2 82.4
11:20:01 PM 68.1 69 67.3 82
11:25:01 PM 68 69.1 67.1 82.2
11:30:01 PM 68.1 69 67.2 82.3
11:35:01 PM 68 69.1 67.1 82.6
11:40:01 PM 68 68.9 66.9 82.2
11:45:01 PM 68.2 69.1 67.4 81.8
11:50:01 PM 68.2 69.1 67.4 83.4

11:55:01 PM 68.3 69.5 67.4 82.6
23-Nov-17 12:00:01 AM 68.5 69.4 67.7 83.3
12:05:01 AM 68.3 69.4 67.2 82.6
12:10:01 AM 68 69 66.9 82.7
12:15:01 AM 68.3 69.4 67.2 82.8
12:20:01 AM 68.3 69.5 67.3 82.4
12:25:01 AM 68.4 69.7 67.5 83.2
12:30:01 AM 68.5 69.6 67.5 82.9
12:35:01 AM 68.4 69.6 67.4 82.3
12:40:01 AM 68.4 69.5 67.2 84
12:45:01 AM 68.5 69.4 67.5 82.7
12:50:01 AM 68.7 69.8 67.7 83.4
12:55:01 AM 68.7 69.9 67.7 82.9
1:00:01 AM 68.7 69.9 67.8 83
1:05:01 AM 68.5 69.7 67.5 82.6
1:10:01 AM 68.4 69.5 67.3 83.1
1:15:01 AM 68.5 69.8 67.3 82.5
1:20:01 AM 68.7 69.9 67.6 82.8
1:25:01 AM 68.8 70 67.7 83.1
1:30:01 AM 68.9 70.1 67.7 83.8
1:35:01 AM 68.8 70.3 67.7 83.8
1:40:01 AM 68.8 70.2 67.7 83.9
1:45:01 AM 68.9 70.3 67.8 83.2
1:50:01 AM 68.8 70.2 67.7 82.9
1:55:01 AM 69.1 70.5 67.6 83.5
2:00:01 AM 69.2 70.7 67.8 83.4
2:05:01 AM 69.1 73.7 67.8 88.3
2:10:01 AM 68.8 70.4 67.4 83
2:15:01 AM 69.2 71 67.9 83.7
2:20:01 AM 69.2 70.8 67.7 84.2
2:25:01 AM 69 70.4 67.8 83.5
2:30:01 AM 69.1 71.4 67.6 83.6
2:35:01 AM 69.5 71.2 68 84.5
2:40:01 AM 69.5 71.4 68.2 84.2
2:45:01 AM 69.2 70.6 67.4 83.4
2:50:01 AM 69.3 70.5 68.1 84.1
2:55:01 AM 69.3 70.6 68 83.6
3:00:01 AM 69.4 70.8 68.1 84.4
3:05:01 AM 69.4 70.8 68.1 83.8
Date/Time Leq-1 Lmax-1 Lmin-1 Lpk-1

3:10:01 AM 69.4 70.6 68.4 83.7
3:15:01 AM 69.2 70.7 68 83.8
3:20:01 AM 69.1 70.4 67.9 84
3:25:01 AM 69.3 70.6 68.1 83.7
3:30:01 AM 69.2 70.6 68.1 83.4
3:35:01 AM 69.4 70.6 68.2 84.2
3:40:01 AM 69.1 70.2 67.9 84.1
3:45:01 AM 69.2 70.2 68.2 83.8
3:50:01 AM 69.3 71.1 67.9 83.3
3:55:01 AM 68.8 70.6 67.6 82.7
4:00:01 AM 68.8 70.1 67.3 84.3
4:05:01 AM 68.8 70.5 67.5 84.5
4:10:01 AM 68.5 69.6 67.4 82.4
4:15:01 AM 68.5 69.9 67.4 83
4:20:01 AM 68.8 69.8 67.7 83.2
4:25:01 AM 68.4 69.4 67.1 82.7
4:30:01 AM 68.5 69.8 67.4 82.9
4:35:01 AM 68.7 70.1 67.7 82.9
4:40:01 AM 68.7 69.7 67.7 83.8
4:45:01 AM 68.7 69.9 67.7 82.6
4:50:01 AM 68.6 69.6 67.6 82.4
4:55:01 AM 68.4 69.8 67 82.6
5:00:01 AM 68.6 69.7 67.2 83.5
5:05:01 AM 68.8 70 67.8 83.4
5:10:01 AM 68.7 70 67.3 83.5
5:15:01 AM 68.5 69.7 67.1 83.4
5:20:01 AM 68.4 70 67.4 82.5
5:25:01 AM 68.2 69.2 67.1 84.1
5:30:01 AM 68.3 69.7 67.3 82.8
5:35:01 AM 68.2 69.3 67 82.9
5:40:01 AM 68.3 69.4 67.1 83.1
5:45:01 AM 68.2 69.4 66.6 82.3
5:50:01 AM 69 70.8 67.7 83.7
5:55:01 AM 68.5 69.7 67.3 83.1
6:00:01 AM 68.8 70 67.5 83.4
6:05:01 AM 68.9 70.2 67.5 83.4
6:10:01 AM 68.9 70.3 67.8 84
6:15:01 AM 68.9 70.2 67.8 83.5
6:20:01 AM 68.9 70 67.6 83.6
Date/Time Leq-1 Lmax-1 Lmin-1 Lpk-1

6:25:01 AM 68.7 69.9 67.5 83.9
6:30:01 AM 68.6 70 67.7 83.5
6:35:01 AM 68.6 69.8 67.5 83.6
6:40:01 AM 68.4 69.5 67.5 83.2
6:45:01 AM 68.5 69.7 67.4 82.7
6:50:01 AM 68.7 69.9 67.6 83.1
6:55:01 AM 68.7 70.3 67.6 83.2
7:00:01 AM 68.6 69.7 67.4 83.3
7:05:01 AM 68.5 69.5 67.5 83.9
Date/Time Leq-1 Lmax-1 Lmin-1 Lpk-1

Session Report 21-Nov-17
Information Panel
Company Name Sarawak Energy Berhad
Description CK/EV103-708/17
Location N4 (Day Time)
Start Time 21-Nov-17 7:05:01 AM
Stop Time 21-Nov-17 10:05:01 PM
Run Time 15:00:00
Model Type SoundPro DL
Comments Nearby plant operation, workers activities, construction activities, insects, etc.
Summary Data Panel
Description Meter Value Description Meter Value
Leq 1 59.9 dB Lpk 1 98.2 dB
Lmax 1 79.8 dB Lmin 1 55 dB
L10 1 61 dB L90 1 57.2 dB
Mntime 1 21-Nov-17 12:05:33 PM
Mxtime 1 21-Nov-17 4:41:47 PM
Rtime 1 15:00:00 Dose 1 0.2 %
Exchange Rate 1 3 dB Weighting 1 A
Response 1 FAST Bandwidth 1 OFF

Statistics Chart
N4D - 24hrs: Sta s cs Chart
Statistics Table
dB: 0.0 0.1 0.2 0.3 0.4 0.5 0.6 0.7 0.8 0.9 %
55: 0.00 0.00 0.00 0.00 0.00 0.00 0.00 0.01 0.02 0.04 0.08
56: 0.07 0.13 0.13 0.25 0.36 0.49 0.64 0.81 1.00 1.18 5.07
57: 1.40 1.61 1.82 2.01 2.20 2.37 2.48 2.58 2.63 2.68 21.78
58: 2.66 2.61 2.53 2.46 2.35 2.24 2.13 2.03 1.93 1.88 22.83
59: 1.91 2.00 1.36 1.93 2.05 2.17 2.26 2.34 2.41 2.37 20.80
60: 2.35 2.27 2.16 2.01 1.88 1.72 1.58 1.43 1.27 1.14 17.81
61: 1.01 0.90 0.82 0.74 0.67 0.60 0.53 0.47 0.41 0.37 6.52
62: 0.33 0.30 0.17 0.20 0.18 0.15 0.13 0.12 0.11 0.10 1.80
63: 0.09 0.09 0.08 0.08 0.07 0.07 0.06 0.06 0.06 0.06 0.72
64: 0.05 0.05 0.05 0.05 0.05 0.05 0.05 0.05 0.05 0.05 0.51
65: 0.05 0.06 0.04 0.05 0.05 0.05 0.05 0.05 0.05 0.05 0.49
66: 0.05 0.05 0.05 0.04 0.04 0.04 0.04 0.04 0.04 0.04 0.42
67: 0.04 0.03 0.04 0.03 0.03 0.03 0.03 0.03 0.03 0.03 0.33
68: 0.03 0.04 0.03 0.03 0.03 0.03 0.03 0.03 0.03 0.03 0.29
69: 0.02 0.02 0.02 0.02 0.02 0.02 0.02 0.02 0.01 0.02 0.20
70: 0.02 0.01 0.02 0.02 0.01 0.02 0.02 0.01 0.01 0.01 0.15
71: 0.01 0.01 0.01 0.01 0.01 0.01 0.01 0.01 0.01 0.01 0.10

72: 0.01 0.01 0.01 0.01 0.01 0.01 0.00 0.00 0.00 0.00 0.05
73: 0.00 0.00 0.00 0.00 0.00 0.00 0.00 0.00 0.00 0.00 0.03
74: 0.00 0.00 0.00 0.00 0.00 0.00 0.00 0.00 0.00 0.00 0.02
75: 0.00 0.00 0.00 0.00 0.00 0.00 0.00 0.00 0.00 0.00 0.01
76: 0.00 0.00 0.00 0.00 0.00 0.00 0.00 0.00 0.00 0.00 0.01
77: 0.00 0.00 0.00 0.00 0.00 0.00 0.00 0.00 0.00 0.00 0.01
78: 0.00 0.00 0.00 0.00 0.00 0.00 0.00 0.00 0.00 0.00 0.00
79: 0.00 0.00 0.00 0.00 0.00 0.00 0.00 0.00 0.00 0.00 0.00
Exceedance Chart
N4D - 24hrs: Exceedance Chart
Exceedance Table
. 0% 1% 2% 3% 4% 5% 6% %7 %8 %9
0%: 67.4 65.0 63.2 62.3 61.9 61.6 61.4 61.3 61.1
10%: 61.0 60.9 60.8 60.7 60.7 60.6 60.5 60.5 60.4 60.3
20%: 60.3 60.2 60.2 60.1 60.1 60.0 60.0 60.0 59.9 59.9
30%: 59.8 59.8 59.7 59.7 59.7 59.6 59.6 59.5 59.5 59.4
40%: 59.4 59.4 59.3 59.3 59.2 59.1 59.1 59.0 59.0 58.9
50%: 58.9 58.8 58.8 58.7 58.7 58.6 58.6 58.5 58.5 58.4
60%: 58.4 58.3 58.3 58.2 58.2 58.2 58.1 58.1 58.0 58.0
70%: 58.0 57.9 57.9 57.9 57.8 57.8 57.7 57.7 57.7 57.6
dB: 0.0 0.1 0.2 0.3 0.4 0.5 0.6 0.7 0.8 0.9 %
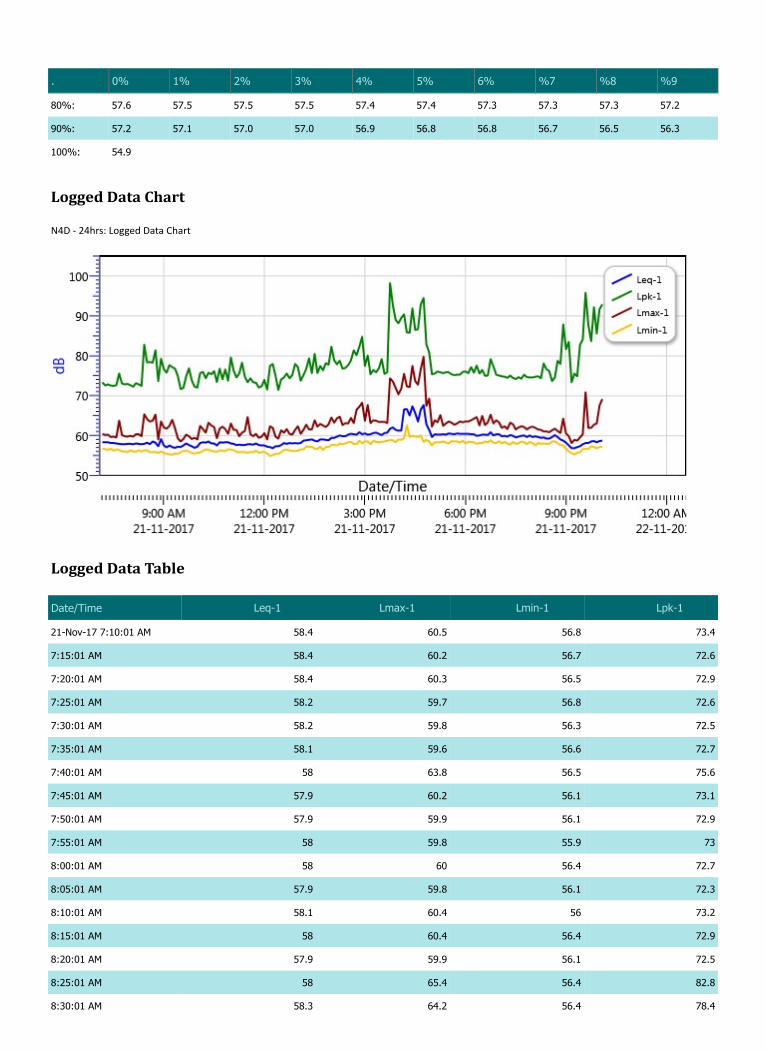
80%: 57.6 57.5 57.5 57.5 57.4 57.4 57.3 57.3 57.3 57.2
90%: 57.2 57.1 57.0 57.0 56.9 56.8 56.8 56.7 56.5 56.3
100%: 54.9
Logged Data Chart
N4D - 24hrs: Logged Data Chart
Logged Data Table
Date/Time Leq-1 Lmax-1 Lmin-1 Lpk-1
21-Nov-17 7:10:01 AM 58.4 60.5 56.8 73.4
7:15:01 AM 58.4 60.2 56.7 72.6
7:20:01 AM 58.4 60.3 56.5 72.9
7:25:01 AM 58.2 59.7 56.8 72.6
7:30:01 AM 58.2 59.8 56.3 72.5
7:35:01 AM 58.1 59.6 56.6 72.7
7:40:01 AM 58 63.8 56.5 75.6
7:45:01 AM 57.9 60.2 56.1 73.1
7:50:01 AM 57.9 59.9 56.1 72.9
7:55:01 AM 58 59.8 55.9 73
8:00:01 AM 58 60 56.4 72.7
8:05:01 AM 57.9 59.8 56.1 72.3
8:10:01 AM 58.1 60.4 56 73.2
8:15:01 AM 58 60.4 56.4 72.9
8:20:01 AM 57.9 59.9 56.1 72.5
8:25:01 AM 58 65.4 56.4 82.8
8:30:01 AM 58.3 64.2 56.4 78.4
. 0% 1% 2% 3% 4% 5% 6% %7 %8 %9

8:35:01 AM 57.9 63.6 55.9 78.5
8:40:01 AM 58.6 63.8 55.9 78.3
8:45:01 AM 58.3 65.3 56 81.4
8:50:01 AM 57.4 59.1 55.7 73.7
8:55:01 AM 59.2 63.6 56.1 79.3
9:00:01 AM 57.6 62.1 55.7 76.7
9:05:01 AM 57.1 61.8 55.5 75.8
9:10:01 AM 57.6 62.5 55.4 77.7
9:15:01 AM 57.2 64 55.3 77.2
9:20:01 AM 57 61.9 55.6 76.8
9:25:01 AM 57.3 59.4 55.5 75
9:30:01 AM 57.2 58.6 55.9 71.7
9:35:01 AM 57.6 59.2 56.2 72
9:40:01 AM 58.1 60.3 56.3 74.9
9:45:01 AM 57.7 59.9 56.1 76.9
9:50:01 AM 57.4 59.2 55.7 73.9
9:55:01 AM 57 59.5 55.6 72.3
10:00:01 AM 57.3 59.1 55.8 72.1
10:05:01 AM 58.2 62.5 55.8 75.7
10:10:01 AM 58.4 61.7 56.3 76
10:15:01 AM 58.3 60.8 56.6 74.4
10:20:01 AM 58.6 63.3 56.5 75.8
10:25:01 AM 58.1 62.6 56.3 75.4
10:30:01 AM 58.1 62.2 56.1 76.2
10:35:01 AM 57.6 59.4 56 73.5
10:40:01 AM 58.4 61.8 56.4 76.8
10:45:01 AM 58.3 62.3 56.3 74.2
10:50:01 AM 58.4 61.7 56.2 76.6
10:55:01 AM 58.4 60.5 56.6 73.8
11:00:01 AM 58.1 63.1 56.6 79.6
11:05:01 AM 58 61.5 56.4 76.3
11:10:01 AM 57.7 61.5 56 74.6
11:15:01 AM 57.8 59.9 55.9 75.6
11:20:01 AM 57.7 60.8 56 78.3
11:25:01 AM 57.7 61.2 55.9 74.8
11:30:01 AM 57.9 64.7 55.8 73.4
11:35:01 AM 57.9 60.4 56 74.4
11:40:01 AM 57.8 59.9 55.9 73.4
11:45:01 AM 58.1 60.5 56.3 73.3
Date/Time Leq-1 Lmax-1 Lmin-1 Lpk-1
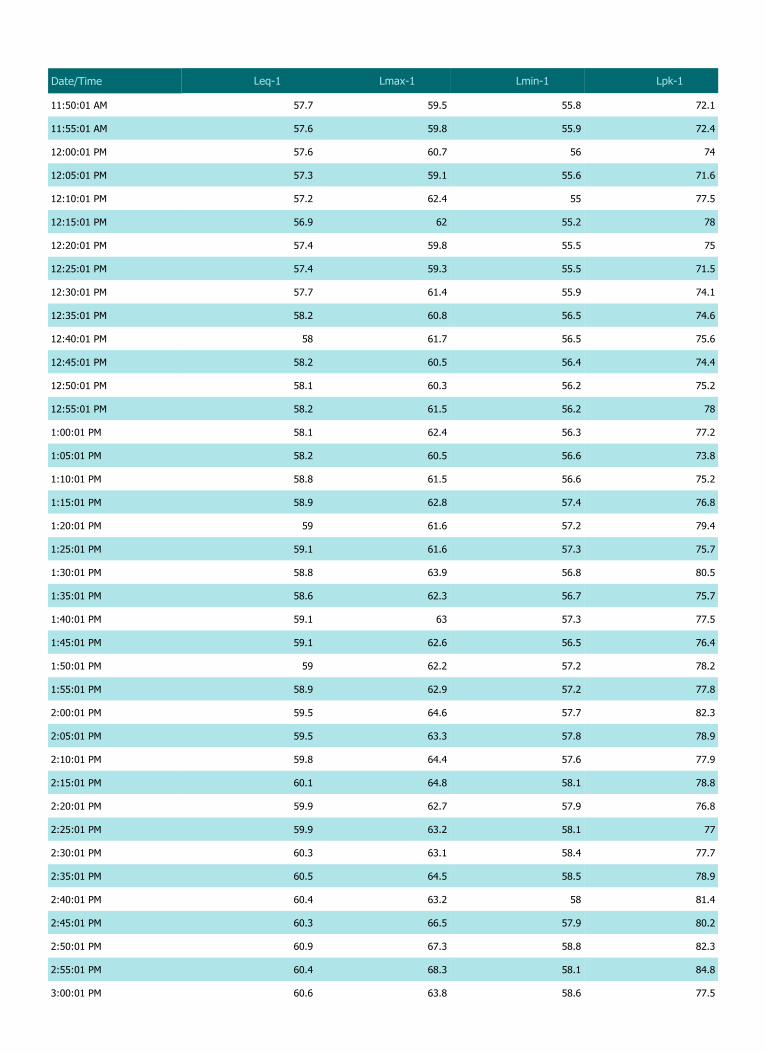
11:50:01 AM 57.7 59.5 55.8 72.1
11:55:01 AM 57.6 59.8 55.9 72.4
12:00:01 PM 57.6 60.7 56 74
12:05:01 PM 57.3 59.1 55.6 71.6
12:10:01 PM 57.2 62.4 55 77.5
12:15:01 PM 56.9 62 55.2 78
12:20:01 PM 57.4 59.8 55.5 75
12:25:01 PM 57.4 59.3 55.5 71.5
12:30:01 PM 57.7 61.4 55.9 74.1
12:35:01 PM 58.2 60.8 56.5 74.6
12:40:01 PM 58 61.7 56.5 75.6
12:45:01 PM 58.2 60.5 56.4 74.4
12:50:01 PM 58.1 60.3 56.2 75.2
12:55:01 PM 58.2 61.5 56.2 78
1:00:01 PM 58.1 62.4 56.3 77.2
1:05:01 PM 58.2 60.5 56.6 73.8
1:10:01 PM 58.8 61.5 56.6 75.2
1:15:01 PM 58.9 62.8 57.4 76.8
1:20:01 PM 59 61.6 57.2 79.4
1:25:01 PM 59.1 61.6 57.3 75.7
1:30:01 PM 58.8 63.9 56.8 80.5
1:35:01 PM 58.6 62.3 56.7 75.7
1:40:01 PM 59.1 63 57.3 77.5
1:45:01 PM 59.1 62.6 56.5 76.4
1:50:01 PM 59 62.2 57.2 78.2
1:55:01 PM 58.9 62.9 57.2 77.8
2:00:01 PM 59.5 64.6 57.7 82.3
2:05:01 PM 59.5 63.3 57.8 78.9
2:10:01 PM 59.8 64.4 57.6 77.9
2:15:01 PM 60.1 64.8 58.1 78.8
2:20:01 PM 59.9 62.7 57.9 76.8
2:25:01 PM 59.9 63.2 58.1 77
2:30:01 PM 60.3 63.1 58.4 77.7
2:35:01 PM 60.5 64.5 58.5 78.9
2:40:01 PM 60.4 63.2 58 81.4
2:45:01 PM 60.3 66.5 57.9 80.2
2:50:01 PM 60.9 67.3 58.8 82.3
2:55:01 PM 60.4 68.3 58.1 84.8
3:00:01 PM 60.6 63.8 58.6 77.5
Date/Time Leq-1 Lmax-1 Lmin-1 Lpk-1

3:05:01 PM 60.3 67.7 58.6 80.1
3:10:01 PM 60.4 63.2 57.9 75.4
3:15:01 PM 60.7 63.9 58.8 76.5
3:20:01 PM 60.8 63.8 58.5 75.9
3:25:01 PM 60.5 63.5 58.4 76.9
3:30:01 PM 60.2 63.5 58.5 79.2
3:35:01 PM 60.7 63.5 58.6 75.5
3:40:01 PM 60.8 63.2 58.8 75.9
3:45:01 PM 61.8 74.4 58.9 98.2
3:50:01 PM 62.1 73.6 58.9 92.7
3:55:01 PM 61.5 72 58.4 89
4:00:01 PM 61.3 70.4 59.1 88.2
4:05:01 PM 61.3 71.8 59 89.5
4:10:01 PM 66.6 75.5 59.4 90.4
4:15:01 PM 66.7 72.4 62.7 85.9
4:20:01 PM 65.1 72.2 59.7 85.8
4:25:01 PM 67.4 77.5 60 91.9
4:30:01 PM 65.7 73.7 59.8 86.5
4:35:01 PM 63.6 72.8 59.7 86.7
4:40:01 PM 66.6 76.7 60.1 92.9
4:45:01 PM 67.7 79.8 58.5 94.5
4:50:01 PM 62.9 67.5 59 82.9
4:55:01 PM 61.5 69.3 58.6 80.9
5:00:01 PM 59.7 62.3 57.6 75.4
5:05:01 PM 60.4 63.9 58.4 75.6
5:10:01 PM 60.3 63.4 58.4 76.1
5:15:01 PM 60.3 65.2 58.4 75.9
5:20:01 PM 60.4 62.5 58.6 75.7
5:25:01 PM 60.3 63.1 58.3 75.9
5:30:01 PM 60.6 63.6 58.1 75.9
5:35:01 PM 60.5 63.3 58.7 75.4
5:40:01 PM 60.4 62.8 58.6 75.2
5:45:01 PM 60.6 63.1 58.6 75.3
5:50:01 PM 60.5 63.6 58.3 75.3
5:55:01 PM 60.5 63.4 58.8 76
6:00:01 PM 60.5 63.6 58.1 76.1
6:05:01 PM 60.5 63.6 58.5 75.7
6:10:01 PM 60.4 63.9 58.5 77.2
6:15:01 PM 60.4 64.3 58.4 75.8
Date/Time Leq-1 Lmax-1 Lmin-1 Lpk-1
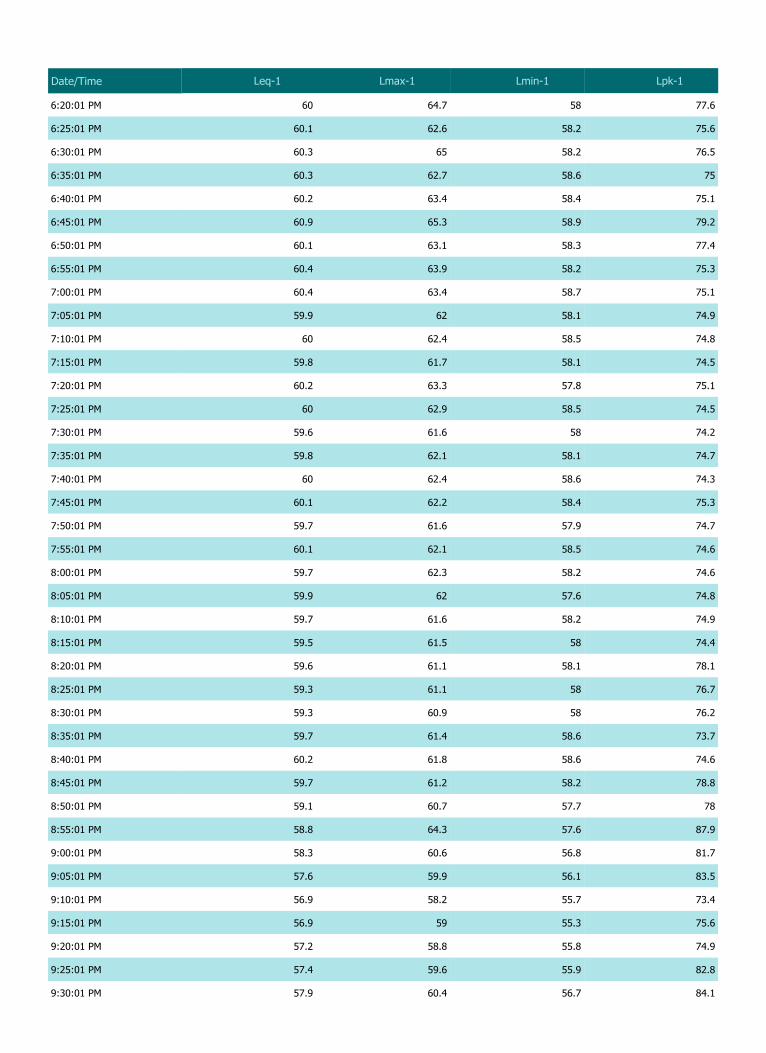
6:20:01 PM 60 64.7 58 77.6
6:25:01 PM 60.1 62.6 58.2 75.6
6:30:01 PM 60.3 65 58.2 76.5
6:35:01 PM 60.3 62.7 58.6 75
6:40:01 PM 60.2 63.4 58.4 75.1
6:45:01 PM 60.9 65.3 58.9 79.2
6:50:01 PM 60.1 63.1 58.3 77.4
6:55:01 PM 60.4 63.9 58.2 75.3
7:00:01 PM 60.4 63.4 58.7 75.1
7:05:01 PM 59.9 62 58.1 74.9
7:10:01 PM 60 62.4 58.5 74.8
7:15:01 PM 59.8 61.7 58.1 74.5
7:20:01 PM 60.2 63.3 57.8 75.1
7:25:01 PM 60 62.9 58.5 74.5
7:30:01 PM 59.6 61.6 58 74.2
7:35:01 PM 59.8 62.1 58.1 74.7
7:40:01 PM 60 62.4 58.6 74.3
7:45:01 PM 60.1 62.2 58.4 75.3
7:50:01 PM 59.7 61.6 57.9 74.7
7:55:01 PM 60.1 62.1 58.5 74.6
8:00:01 PM 59.7 62.3 58.2 74.6
8:05:01 PM 59.9 62 57.6 74.8
8:10:01 PM 59.7 61.6 58.2 74.9
8:15:01 PM 59.5 61.5 58 74.4
8:20:01 PM 59.6 61.1 58.1 78.1
8:25:01 PM 59.3 61.1 58 76.7
8:30:01 PM 59.3 60.9 58 76.2
8:35:01 PM 59.7 61.4 58.6 73.7
8:40:01 PM 60.2 61.8 58.6 74.6
8:45:01 PM 59.7 61.2 58.2 78.8
8:50:01 PM 59.1 60.7 57.7 78
8:55:01 PM 58.8 64.3 57.6 87.9
9:00:01 PM 58.3 60.6 56.8 81.7
9:05:01 PM 57.6 59.9 56.1 83.5
9:10:01 PM 56.9 58.2 55.7 73.4
9:15:01 PM 56.9 59 55.3 75.6
9:20:01 PM 57.2 58.8 55.8 74.9
9:25:01 PM 57.4 59.6 55.9 82.8
9:30:01 PM 57.9 60.4 56.7 84.1
Date/Time Leq-1 Lmax-1 Lmin-1 Lpk-1

9:35:01 PM 58.2 70.9 56.8 95.8
9:40:01 PM 58.2 62 56.7 87.7
9:45:01 PM 58.6 62 57.4 83.7
9:50:01 PM 58.7 62.8 57.2 92.2
9:55:01 PM 58.4 63.1 56.9 85.6
10:00:01 PM 58.7 67.6 57.2 91.7
10:05:01 PM 58.8 69.2 57.3 92.9
Date/Time Leq-1 Lmax-1 Lmin-1 Lpk-1

Session Report 21-Nov-17
Information Panel
Company Name Sarawak Energy Berhad
Description CK/EV103-708/17
Location N4 (Night Time)
Start Time 20-Nov-17 10:00:00 PM
Stop Time 21-Nov-17 7:00:00 AM
Run Time 09:00:00
Model Type SoundPro DL
Comments Nearby plant operation, workers activities, construction activities, insects, etc.
Summary Data Panel
Description Meter Value Description Meter Value
Leq 1 60.1 dB Lpk 1 101.9 dB
Lmax 1 75.2 dB Lmin 1 55.9 dB
L10 1 61.8 dB L90 1 58.1 dB
Mntime 1 20-Nov-17 11:43:57 PM
Mxtime 1 21-Nov-17 1:09:40 AM
Rtime 1 09:00:00 Dose 1 0.1 %
Exchange Rate 1 3 dB Weighting 1 A
Response 1 FAST Bandwidth 1 OFF

Statistics Chart
N4N - 24hrs: Sta s cs Chart
Statistics Table
dB: 0.0 0.1 0.2 0.3 0.4 0.5 0.6 0.7 0.8 0.9 %
55: 0.00 0.00 0.00 0.00 0.00 0.00 0.00 0.00 0.00 0.00 0.00
56: 0.00 0.00 0.00 0.00 0.01 0.01 0.01 0.02 0.04 0.05 0.15
57: 0.08 0.11 0.16 0.23 0.33 0.45 0.60 0.79 1.01 1.24 5.01
58: 1.48 1.74 1.97 2.17 2.36 2.49 2.58 2.67 2.75 2.82 23.02
59: 2.99 3.21 2.17 2.97 3.05 3.07 3.04 2.99 2.92 2.81 29.21
60: 2.63 2.45 2.25 2.05 1.89 1.76 1.66 1.62 1.58 1.58 19.48
61: 1.57 1.56 1.56 1.51 1.46 1.43 1.36 1.28 1.22 1.11 14.06
62: 1.02 0.92 0.57 0.67 0.60 0.53 0.48 0.42 0.39 0.35 5.94
63: 0.31 0.27 0.25 0.22 0.20 0.18 0.17 0.15 0.14 0.12 2.01
64: 0.11 0.11 0.10 0.08 0.08 0.07 0.06 0.06 0.06 0.04 0.78
65: 0.04 0.03 0.02 0.02 0.02 0.02 0.02 0.01 0.01 0.01 0.23
66: 0.01 0.01 0.01 0.01 0.01 0.01 0.01 0.01 0.00 0.00 0.07
67: 0.00 0.00 0.00 0.00 0.00 0.00 0.00 0.00 0.00 0.00 0.02
68: 0.00 0.00 0.00 0.00 0.00 0.00 0.00 0.00 0.00 0.00 0.01
69: 0.00 0.00 0.00 0.00 0.00 0.00 0.00 0.00 0.00 0.00 0.00
70: 0.00 0.00 0.00 0.00 0.00 0.00 0.00 0.00 0.00 0.00 0.00
71: 0.00 0.00 0.00 0.00 0.00 0.00 0.00 0.00 0.00 0.00 0.00

72: 0.00 0.00 0.00 0.00 0.00 0.00 0.00 0.00 0.00 0.00 0.00
73: 0.00 0.00 0.00 0.00 0.00 0.00 0.00 0.00 0.00 0.00 0.00
74: 0.00 0.00 0.00 0.00 0.00 0.00 0.00 0.00 0.00 0.00 0.00
75: 0.00 0.00 0.00 0.00 0.00 0.00 0.00 0.00 0.00 0.00 0.00
Exceedance Chart
N4N - 24hrs: Exceedance Chart
Exceedance Table
. 0% 1% 2% 3% 4% 5% 6% %7 %8 %9
0%: 63.9 63.3 62.9 62.6 62.4 62.2 62.1 62.0 61.9
10%: 61.8 61.7 61.6 61.5 61.5 61.4 61.3 61.2 61.2 61.1
20%: 61.0 61.0 60.9 60.9 60.8 60.7 60.7 60.6 60.5 60.5
30%: 60.4 60.4 60.3 60.3 60.2 60.2 60.1 60.1 60.0 60.0
40%: 59.9 59.9 59.9 59.8 59.8 59.8 59.7 59.7 59.7 59.6
50%: 59.6 59.6 59.5 59.5 59.5 59.4 59.4 59.4 59.3 59.3
60%: 59.3 59.2 59.2 59.2 59.1 59.1 59.0 59.0 59.0 58.9
70%: 58.9 58.9 58.8 58.8 58.8 58.7 58.7 58.7 58.6 58.6
80%: 58.6 58.5 58.5 58.4 58.4 58.4 58.3 58.3 58.2 58.2
90%: 58.1 58.1 58.0 58.0 57.9 57.8 57.8 57.7 57.5 57.3
100%: 55.8
dB: 0.0 0.1 0.2 0.3 0.4 0.5 0.6 0.7 0.8 0.9 %

Logged Data Chart
N4N - 24hrs: Logged Data Chart
Logged Data Table
Date/Time Leq-1 Lmax-1 Lmin-1 Lpk-1
20-Nov-17 10:05:00 PM 59.5 61 57.8 73.7
10:10:00 PM 58.3 60 56.6 72.9
10:15:00 PM 58.4 59.9 57 73.1
10:20:00 PM 58 61.2 56 73.2
10:25:00 PM 58.4 59.9 56.8 73.1
10:30:00 PM 58.9 61.5 57.3 73.9
10:35:00 PM 58.9 60.6 57.4 73.7
10:40:00 PM 59 61 57.9 73.3
10:45:00 PM 59.2 61.3 57.8 73.9
10:50:00 PM 59 60.4 57.5 73.4
10:55:00 PM 58.9 60.8 57.3 73.2
11:00:00 PM 58.4 60.1 57 73.3
11:05:00 PM 58.5 60.6 57.3 73.7
11:10:00 PM 58.3 59.6 57 73.2
11:15:00 PM 58.1 60.6 56.5 73.6
11:20:00 PM 58.2 59.8 57 72.5
11:25:00 PM 58.3 59.9 57 73
11:30:00 PM 58.8 60.7 57.3 74.3
11:35:00 PM 59.1 61.5 57.7 74.6
11:40:00 PM 58.5 61.4 56.6 74.9
11:45:00 PM 57.9 60.4 55.9 73.3

11:50:00 PM 58.5 60.5 56.2 73.6
11:55:00 PM 59.1 60.4 56.7 73.8
21-Nov-17 12:00:00 AM 59.4 60.9 57.5 74.5
12:05:00 AM 59.6 61.3 58 73.7
12:10:00 AM 59.9 63 57.5 75.9
12:15:00 AM 60.1 61.8 57.8 74.5
12:20:00 AM 59.6 64.5 57.8 84.3
12:25:00 AM 59.9 63.2 57.7 78.5
12:30:00 AM 60.6 63.4 58.7 90.1
12:35:00 AM 60.2 66.5 58.2 78.4
12:40:00 AM 61.1 66.9 58.2 92.7
12:45:00 AM 61 64.9 59 90.7
12:50:00 AM 60.3 64.9 58.2 87.6
12:55:00 AM 60.5 66.4 58.9 92.7
1:00:00 AM 60 62.3 58.5 82.7
1:05:00 AM 59.9 65 58.3 87.9
1:10:00 AM 62.4 75.2 58.9 101.9
1:15:00 AM 62.6 69.6 60.5 93.5
1:20:00 AM 63.4 72.1 59.7 99.4
1:25:00 AM 61.6 65.5 59.6 90
1:30:00 AM 61.1 63.1 59.6 86.5
1:35:00 AM 61.5 65.5 59.5 92.3
1:40:00 AM 63.1 70 60.9 92.9
1:45:00 AM 62.3 69.1 60 93.6
1:50:00 AM 61 63.4 59.4 82.4
1:55:00 AM 61.5 63.8 59.8 80.9
2:00:00 AM 61.1 63.8 59.4 76
2:05:00 AM 61.6 64.3 59.9 86.1
2:10:00 AM 61.4 65.9 59.6 82.5
2:15:00 AM 61.3 63.3 59.6 86
2:20:00 AM 61.4 65.6 59.3 88.3
2:25:00 AM 62.1 68 60.2 91.5
2:30:00 AM 62.5 67.3 60.5 92.6
2:35:00 AM 63.8 70.3 60.9 93.7
2:40:00 AM 62.3 66.3 60.2 89.6
2:45:00 AM 61.2 63.8 59.5 85.4
2:50:00 AM 62.4 72.3 60.1 95.4
2:55:00 AM 62.1 68.2 60.3 90.1
3:00:00 AM 61.5 66.1 59.4 85.7
Date/Time Leq-1 Lmax-1 Lmin-1 Lpk-1
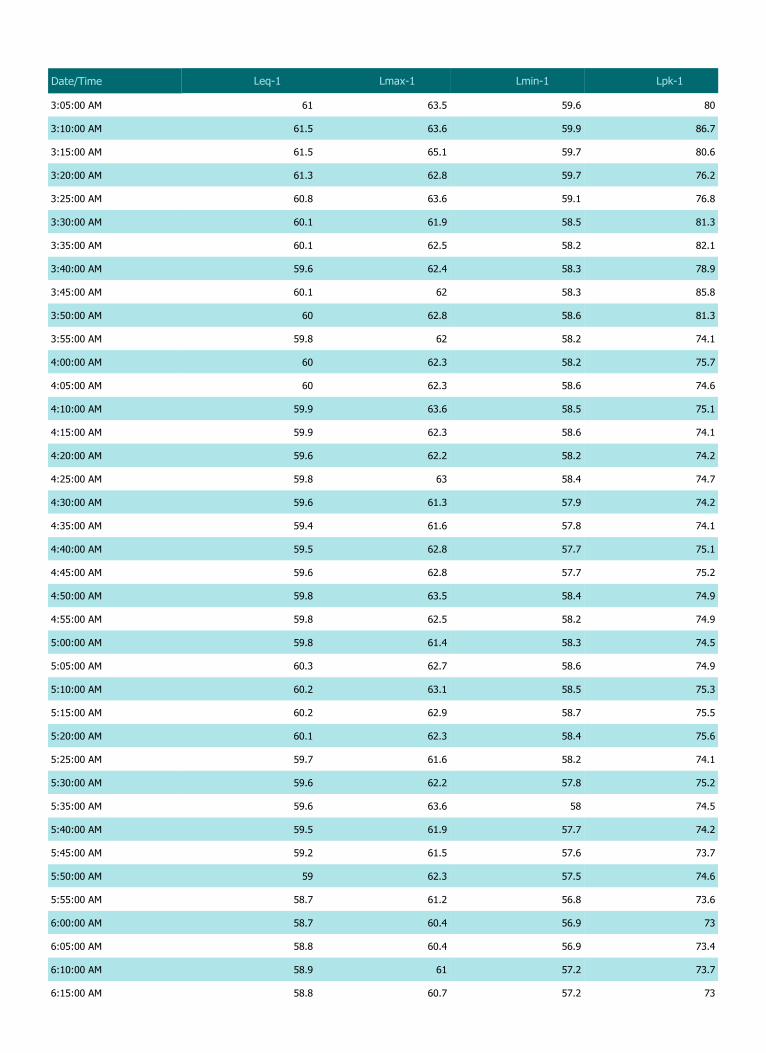
3:05:00 AM 61 63.5 59.6 80
3:10:00 AM 61.5 63.6 59.9 86.7
3:15:00 AM 61.5 65.1 59.7 80.6
3:20:00 AM 61.3 62.8 59.7 76.2
3:25:00 AM 60.8 63.6 59.1 76.8
3:30:00 AM 60.1 61.9 58.5 81.3
3:35:00 AM 60.1 62.5 58.2 82.1
3:40:00 AM 59.6 62.4 58.3 78.9
3:45:00 AM 60.1 62 58.3 85.8
3:50:00 AM 60 62.8 58.6 81.3
3:55:00 AM 59.8 62 58.2 74.1
4:00:00 AM 60 62.3 58.2 75.7
4:05:00 AM 60 62.3 58.6 74.6
4:10:00 AM 59.9 63.6 58.5 75.1
4:15:00 AM 59.9 62.3 58.6 74.1
4:20:00 AM 59.6 62.2 58.2 74.2
4:25:00 AM 59.8 63 58.4 74.7
4:30:00 AM 59.6 61.3 57.9 74.2
4:35:00 AM 59.4 61.6 57.8 74.1
4:40:00 AM 59.5 62.8 57.7 75.1
4:45:00 AM 59.6 62.8 57.7 75.2
4:50:00 AM 59.8 63.5 58.4 74.9
4:55:00 AM 59.8 62.5 58.2 74.9
5:00:00 AM 59.8 61.4 58.3 74.5
5:05:00 AM 60.3 62.7 58.6 74.9
5:10:00 AM 60.2 63.1 58.5 75.3
5:15:00 AM 60.2 62.9 58.7 75.5
5:20:00 AM 60.1 62.3 58.4 75.6
5:25:00 AM 59.7 61.6 58.2 74.1
5:30:00 AM 59.6 62.2 57.8 75.2
5:35:00 AM 59.6 63.6 58 74.5
5:40:00 AM 59.5 61.9 57.7 74.2
5:45:00 AM 59.2 61.5 57.6 73.7
5:50:00 AM 59 62.3 57.5 74.6
5:55:00 AM 58.7 61.2 56.8 73.6
6:00:00 AM 58.7 60.4 56.9 73
6:05:00 AM 58.8 60.4 56.9 73.4
6:10:00 AM 58.9 61 57.2 73.7
6:15:00 AM 58.8 60.7 57.2 73
Date/Time Leq-1 Lmax-1 Lmin-1 Lpk-1
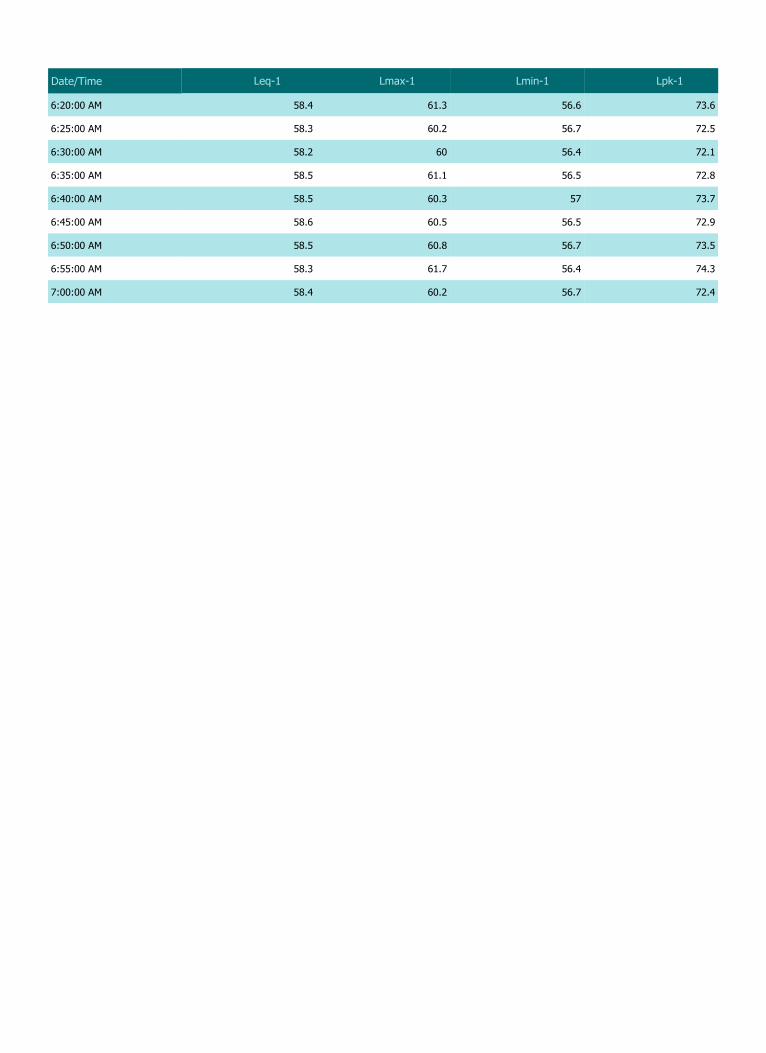
6:20:00 AM 58.4 61.3 56.6 73.6
6:25:00 AM 58.3 60.2 56.7 72.5
6:30:00 AM 58.2 60 56.4 72.1
6:35:00 AM 58.5 61.1 56.5 72.8
6:40:00 AM 58.5 60.3 57 73.7
6:45:00 AM 58.6 60.5 56.5 72.9
6:50:00 AM 58.5 60.8 56.7 73.5
6:55:00 AM 58.3 61.7 56.4 74.3
7:00:00 AM 58.4 60.2 56.7 72.4
Date/Time Leq-1 Lmax-1 Lmin-1 Lpk-1
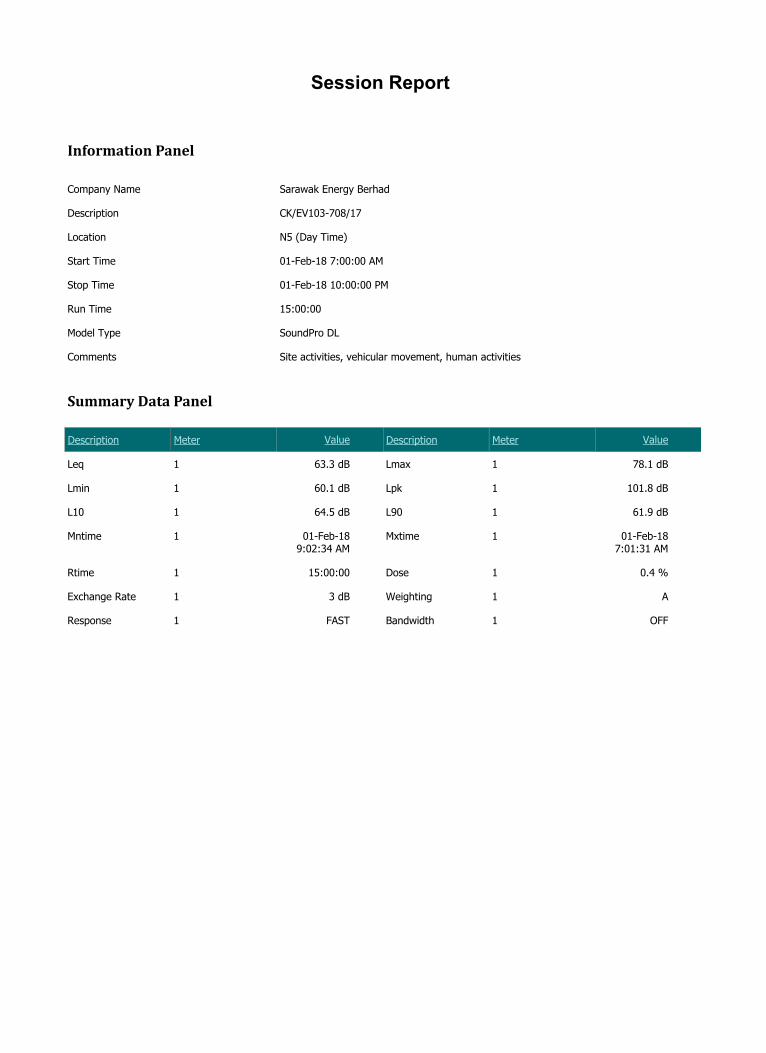
Session Report
Information Panel
Company Name Sarawak Energy Berhad
Description CK/EV103-708/17
Location N5 (Day Time)
Start Time 01-Feb-18 7:00:00 AM
Stop Time 01-Feb-18 10:00:00 PM
Run Time 15:00:00
Model Type SoundPro DL
Comments Site activities, vehicular movement, human activities
Summary Data Panel
Description Meter Value Description Meter Value
Leq 1 63.3 dB Lmax 1 78.1 dB
Lmin 1 60.1 dB Lpk 1 101.8 dB
L10 1 64.5 dB L90 1 61.9 dB
Mntime 1 01-Feb-18 9:02:34 AM
Mxtime 1 01-Feb-18 7:01:31 AM
Rtime 1 15:00:00 Dose 1 0.4 %
Exchange Rate 1 3 dB Weighting 1 A
Response 1 FAST Bandwidth 1 OFF

Statistics Chart
N5D - 24hrs: Sta s cs Chart
Statistics Table
dB: 0.0 0.1 0.2 0.3 0.4 0.5 0.6 0.7 0.8 0.9 %
60: 0.00 0.00 0.00 0.00 0.00 0.00 0.01 0.02 0.04 0.06 0.13
61: 0.10 0.17 0.28 0.42 0.62 0.87 1.18 1.53 1.95 2.41 9.52
62: 2.89 3.47 2.63 3.83 4.21 4.58 4.89 5.13 5.32 5.34 42.28
63: 5.21 4.94 4.55 4.06 3.50 2.95 2.44 2.00 1.60 1.31 32.55
64: 1.09 0.93 0.82 0.74 0.70 0.66 0.63 0.60 0.57 0.53 7.27
65: 0.49 0.46 0.29 0.36 0.34 0.32 0.31 0.30 0.29 0.29 3.44
66: 0.28 0.28 0.28 0.28 0.27 0.26 0.26 0.26 0.24 0.23 2.65
67: 0.21 0.19 0.17 0.16 0.13 0.12 0.11 0.10 0.09 0.09 1.38
68: 0.07 0.06 0.04 0.04 0.04 0.04 0.03 0.03 0.03 0.03 0.41
69: 0.02 0.02 0.02 0.02 0.01 0.01 0.01 0.01 0.01 0.01 0.16
70: 0.01 0.01 0.01 0.01 0.01 0.01 0.01 0.01 0.01 0.01 0.10
71: 0.01 0.01 0.01 0.00 0.01 0.01 0.01 0.00 0.00 0.00 0.05
72: 0.00 0.00 0.00 0.00 0.00 0.00 0.00 0.00 0.00 0.00 0.02
73: 0.00 0.00 0.00 0.00 0.00 0.00 0.00 0.00 0.00 0.00 0.02
74: 0.00 0.00 0.00 0.00 0.00 0.00 0.00 0.00 0.00 0.00 0.01
75: 0.00 0.00 0.00 0.00 0.00 0.00 0.00 0.00 0.00 0.00 0.00
76: 0.00 0.00 0.00 0.00 0.00 0.00 0.00 0.00 0.00 0.00 0.00

77: 0.00 0.00 0.00 0.00 0.00 0.00 0.00 0.00 0.00 0.00 0.00
78: 0.00 0.00 0.00 0.00 0.00 0.00 0.00 0.00 0.00 0.00 0.00
Exceedance Chart
N5D - 24hrs: Exceedance Chart
Exceedance Table
. 0% 1% 2% 3% 4% 5% 6% %7 %8 %9
0%: 67.6 66.9 66.5 66.1 65.8 65.4 65.2 64.9 64.7
10%: 64.5 64.4 64.2 64.1 64.0 63.9 63.8 63.7 63.7 63.6
20%: 63.6 63.5 63.5 63.4 63.4 63.4 63.3 63.3 63.3 63.3
30%: 63.2 63.2 63.2 63.2 63.1 63.1 63.1 63.1 63.0 63.0
40%: 63.0 63.0 63.0 62.9 62.9 62.9 62.9 62.9 62.9 62.8
50%: 62.8 62.8 62.8 62.8 62.7 62.7 62.7 62.7 62.7 62.6
60%: 62.6 62.6 62.6 62.6 62.5 62.5 62.5 62.5 62.5 62.4
70%: 62.4 62.4 62.4 62.4 62.3 62.3 62.3 62.3 62.2 62.2
80%: 62.2 62.2 62.1 62.1 62.0 62.0 62.0 62.0 61.9 61.9
90%: 61.9 61.8 61.8 61.7 61.7 61.6 61.6 61.5 61.4 61.2
100%: 60.0
dB: 0.0 0.1 0.2 0.3 0.4 0.5 0.6 0.7 0.8 0.9 %

Logged Data Chart
N5D - 24hrs: Logged Data Chart
Logged Data Table
Date/Time Leq-1 Lmax-1 Lmin-1 Lpk-1
01-Feb-18 7:01:00 AM 65.4 67.3 63.6 80
7:02:00 AM 65 76.8 63.3 98.2
7:03:00 AM 65 68.7 63.2 85.6
7:04:00 AM 65 73.5 63.6 87.4
7:05:00 AM 65.8 74.2 63.7 92
7:06:00 AM 66.2 77 63.6 93.9
7:07:00 AM 64.3 68.3 62.9 82
7:08:00 AM 64.8 70 63.2 83.4
7:09:00 AM 64.8 67 63.7 80
7:10:00 AM 64.1 67 62.9 83.2
7:11:00 AM 64.2 67.8 63 84.3
7:12:00 AM 64.9 70.4 63.7 85.9
7:13:00 AM 65.2 73.3 63.7 88.4
7:14:00 AM 65 68.4 63.3 87.7
7:15:00 AM 67.8 70.9 63.3 82.9
7:16:00 AM 67.3 70.5 63.4 82.5
7:17:00 AM 64.5 67.6 63.3 79
7:18:00 AM 64.6 71.1 63 82
7:19:00 AM 64.7 67.5 63.6 78.6
7:20:00 AM 65.6 67.9 63.5 80.5
7:21:00 AM 64.7 69.2 63.6 84.1

7:22:00 AM 65.5 68.3 63.5 86
7:23:00 AM 66.7 69.3 63.8 80.9
7:24:00 AM 65.8 72.6 63.2 85
7:25:00 AM 66.2 76.2 62.8 91.1
7:26:00 AM 64.8 73.2 62.7 87.3
7:27:00 AM 64.5 71 63.2 81
7:28:00 AM 65.5 69.1 63.8 81.3
7:29:00 AM 65.1 69.4 63.8 85.4
7:30:00 AM 66.1 71.7 63.5 83.2
7:31:00 AM 66.5 76.5 63.5 90.5
7:32:00 AM 67.4 75 63.8 89.3
7:33:00 AM 64.8 68.4 63.3 83.9
7:34:00 AM 64.8 73 63.4 84.5
7:35:00 AM 64.9 67.2 63.2 80.7
7:36:00 AM 64.4 66 63.3 78.6
7:37:00 AM 66 72.6 63.3 85.3
7:38:00 AM 65.2 68.3 62.7 81.1
7:39:00 AM 64 69.1 62.7 82.3
7:40:00 AM 65.7 70 62.3 84
7:41:00 AM 66.7 70.3 63.3 86.8
7:42:00 AM 65 67.7 63.3 79.7
7:43:00 AM 66.1 68.5 63.7 80.1
7:44:00 AM 66.5 68.9 63.5 82.3
7:45:00 AM 65.4 69.3 63.2 81.2
7:46:00 AM 64.6 67.3 63.2 80
7:47:00 AM 66.3 68.4 63.3 80.7
7:48:00 AM 66.5 68.4 62.6 81.8
7:49:00 AM 63.6 64.9 62.5 77.7
7:50:00 AM 64.7 67.9 62.5 80.4
7:51:00 AM 66.2 67.9 63 81.2
7:52:00 AM 66.1 69 62.9 83.9
7:53:00 AM 67.1 70.3 64.9 82.8
7:54:00 AM 64.3 67.9 61.8 81
7:55:00 AM 62.7 65.6 61.4 78.5
7:56:00 AM 63 64.6 61.3 79.5
7:57:00 AM 62 63.4 61.1 76.1
7:58:00 AM 62.1 63.2 60.8 75.7
7:59:00 AM 62.2 63.5 60.8 77
8:00:00 AM 62.3 65.4 61.1 78
Date/Time Leq-1 Lmax-1 Lmin-1 Lpk-1

8:01:00 AM 62.2 63.4 61.1 76.3
8:02:00 AM 62.4 63.8 60.6 76.9
8:03:00 AM 62 63.6 60.7 76.3
8:04:00 AM 62 63.1 60.8 75.7
8:05:00 AM 62 62.9 60.7 76.1
8:06:00 AM 61.8 63 60.6 76
8:07:00 AM 62 63.5 60.7 76.2
8:08:00 AM 62.1 63.4 60.9 76.8
8:09:00 AM 62.2 63.5 61.2 75.8
8:10:00 AM 62 62.9 60.8 75.8
8:11:00 AM 62.1 63.6 60.6 76
8:12:00 AM 62.1 63.3 60.9 77.1
8:13:00 AM 62 63.2 60.7 75.9
8:14:00 AM 62.4 64.1 61.1 76.4
8:15:00 AM 62.2 63.7 60.9 77.2
8:16:00 AM 62 63.2 60.8 75.8
8:17:00 AM 62 63.5 61 76.9
8:18:00 AM 62.3 64.2 60.9 76.3
8:19:00 AM 62 63.7 60.9 76
8:20:00 AM 61.7 63 60.3 76.1
8:21:00 AM 62.1 63.5 60.4 76.8
8:22:00 AM 62.1 63.8 60.4 76.2
8:23:00 AM 62.5 64.3 61.2 76.8
8:24:00 AM 62.6 64.2 61.1 75.8
8:25:00 AM 62.1 63.5 60.8 76.3
8:26:00 AM 62.1 64.2 60.5 76.6
8:27:00 AM 62.1 63.5 60.7 76.2
8:28:00 AM 62 63.5 60.5 76
8:29:00 AM 62.2 63.8 61 76
8:30:00 AM 62.2 64 61.1 77
8:31:00 AM 61.8 63.2 60.1 76.9
8:32:00 AM 62.3 63.9 61.1 77.8
8:33:00 AM 62.1 63.5 60.7 76.6
8:34:00 AM 62 63.5 60.4 76.1
8:35:00 AM 61.9 63.4 60.3 76.8
8:36:00 AM 61.9 63.1 60.8 76.7
8:37:00 AM 62.1 63.4 61 76.6
8:38:00 AM 61.9 63.2 60.5 75.9
8:39:00 AM 62 63.5 60.7 75.6
Date/Time Leq-1 Lmax-1 Lmin-1 Lpk-1

8:40:00 AM 62 63.2 60.7 76.1
8:41:00 AM 62.2 64.2 60.8 76.4
8:42:00 AM 62.4 64.1 60.7 76.6
8:43:00 AM 62.3 63.4 61 76.4
8:44:00 AM 62 63.2 60.6 76.2
8:45:00 AM 61.9 63.3 60.4 75.6
8:46:00 AM 61.9 63.5 60.3 75.3
8:47:00 AM 62 63.5 60.8 75.7
8:48:00 AM 61.9 63.6 60.4 75.4
8:49:00 AM 61.7 62.7 60.6 75.5
8:50:00 AM 62 63.1 60.7 75.8
8:51:00 AM 61.7 63 60.4 76.5
8:52:00 AM 62.1 63.6 60.8 76.5
8:53:00 AM 62.1 63.6 60.7 75.9
8:54:00 AM 62.3 63.6 61 76.1
8:55:00 AM 62 63.6 60.8 75.7
8:56:00 AM 62 63.2 60.6 75.4
8:57:00 AM 61.9 63.9 60.6 75.8
8:58:00 AM 61.7 63.2 60.4 75.9
8:59:00 AM 62 63.4 60.8 76.3
9:00:00 AM 61.9 63.1 60.6 75.4
9:01:00 AM 61.8 63.3 60.5 75.4
9:02:00 AM 62 63.6 60.5 76.4
9:03:00 AM 61.6 63.1 60.3 76.3
9:04:00 AM 62 63.1 60.9 75.7
9:05:00 AM 62.1 63.6 60.7 75.7
9:06:00 AM 62 63.9 60.8 76.5
9:07:00 AM 61.9 63.2 60.8 75.8
9:08:00 AM 61.9 63.6 60.4 76.8
9:09:00 AM 62.1 63.3 60.8 76.5
9:10:00 AM 62.1 63.3 60.6 77.5
9:11:00 AM 62.1 63.4 60.6 76.1
9:12:00 AM 62.2 64 60.4 77.5
9:13:00 AM 62.1 63.7 60.5 76.1
9:14:00 AM 63.5 70.3 61 82.4
9:15:00 AM 66.3 69.5 61.8 81.8
9:16:00 AM 62.9 66.3 61.6 78
9:17:00 AM 63 64.7 61.8 76.8
9:18:00 AM 63.2 64.2 62 77.3
Date/Time Leq-1 Lmax-1 Lmin-1 Lpk-1

9:19:00 AM 63.3 68.6 61.8 81.7
9:20:00 AM 63.2 66 62.1 77.6
9:21:00 AM 63.6 69.7 62.1 83.4
9:22:00 AM 63 65.2 61.5 77
9:23:00 AM 62.9 64.6 61.9 77.7
9:24:00 AM 62.7 65.9 61.4 77.9
9:25:00 AM 63 68.2 61.7 81
9:26:00 AM 62.9 64.6 61.9 77.5
9:27:00 AM 63 68.6 61.6 82.1
9:28:00 AM 63.1 68.7 61.8 83.3
9:29:00 AM 62.9 66.3 61.5 89.5
9:30:00 AM 62.6 64.2 61.6 77.2
9:31:00 AM 62.9 66.5 61.8 82.4
9:32:00 AM 63.3 66.1 62.1 84.6
9:33:00 AM 63 64.8 61.9 77.1
9:34:00 AM 63.4 69.8 61.9 80.8
9:35:00 AM 63.5 70.8 62 83.6
9:36:00 AM 62.7 66 61.6 79
9:37:00 AM 63.1 75.7 61.2 91
9:38:00 AM 63 64.3 62 78.9
9:39:00 AM 63.1 70 61.8 84.8
9:40:00 AM 63.2 65.6 62 87.8
9:41:00 AM 63.1 64.4 61.7 77.9
9:42:00 AM 63 67.2 61.8 85.2
9:43:00 AM 62.9 64.2 61.9 77.9
9:44:00 AM 63 64.7 61.6 77.9
9:45:00 AM 63.3 64.7 62.1 78.2
9:46:00 AM 63 64.9 61.9 76.9
9:47:00 AM 63.3 65 62 77.2
9:48:00 AM 63.1 66 61.9 78.5
9:49:00 AM 66.1 76.7 62.3 92.9
9:50:00 AM 65 76.3 61.7 91
9:51:00 AM 63.1 66.7 61.7 80.9
9:52:00 AM 65.6 68.1 61.5 80.4
9:53:00 AM 66.3 68.1 63.6 81.5
9:54:00 AM 64.5 67.3 61.9 79.8
9:55:00 AM 64.5 67.3 61.7 79.8
9:56:00 AM 64.4 66.5 62.1 80.2
9:57:00 AM 66.6 73.1 61.9 84.6
Date/Time Leq-1 Lmax-1 Lmin-1 Lpk-1
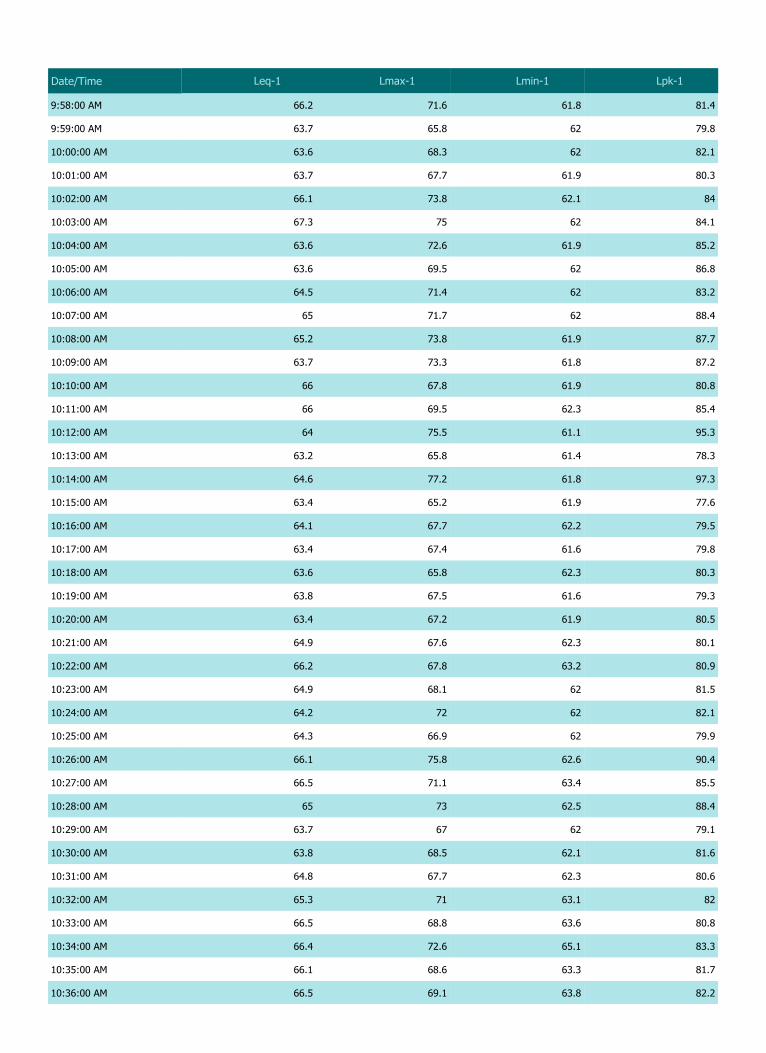
9:58:00 AM 66.2 71.6 61.8 81.4
9:59:00 AM 63.7 65.8 62 79.8
10:00:00 AM 63.6 68.3 62 82.1
10:01:00 AM 63.7 67.7 61.9 80.3
10:02:00 AM 66.1 73.8 62.1 84
10:03:00 AM 67.3 75 62 84.1
10:04:00 AM 63.6 72.6 61.9 85.2
10:05:00 AM 63.6 69.5 62 86.8
10:06:00 AM 64.5 71.4 62 83.2
10:07:00 AM 65 71.7 62 88.4
10:08:00 AM 65.2 73.8 61.9 87.7
10:09:00 AM 63.7 73.3 61.8 87.2
10:10:00 AM 66 67.8 61.9 80.8
10:11:00 AM 66 69.5 62.3 85.4
10:12:00 AM 64 75.5 61.1 95.3
10:13:00 AM 63.2 65.8 61.4 78.3
10:14:00 AM 64.6 77.2 61.8 97.3
10:15:00 AM 63.4 65.2 61.9 77.6
10:16:00 AM 64.1 67.7 62.2 79.5
10:17:00 AM 63.4 67.4 61.6 79.8
10:18:00 AM 63.6 65.8 62.3 80.3
10:19:00 AM 63.8 67.5 61.6 79.3
10:20:00 AM 63.4 67.2 61.9 80.5
10:21:00 AM 64.9 67.6 62.3 80.1
10:22:00 AM 66.2 67.8 63.2 80.9
10:23:00 AM 64.9 68.1 62 81.5
10:24:00 AM 64.2 72 62 82.1
10:25:00 AM 64.3 66.9 62 79.9
10:26:00 AM 66.1 75.8 62.6 90.4
10:27:00 AM 66.5 71.1 63.4 85.5
10:28:00 AM 65 73 62.5 88.4
10:29:00 AM 63.7 67 62 79.1
10:30:00 AM 63.8 68.5 62.1 81.6
10:31:00 AM 64.8 67.7 62.3 80.6
10:32:00 AM 65.3 71 63.1 82
10:33:00 AM 66.5 68.8 63.6 80.8
10:34:00 AM 66.4 72.6 65.1 83.3
10:35:00 AM 66.1 68.6 63.3 81.7
10:36:00 AM 66.5 69.1 63.8 82.2
Date/Time Leq-1 Lmax-1 Lmin-1 Lpk-1

10:37:00 AM 64.7 66.9 63 79.8
10:38:00 AM 64.8 67.5 62.9 80.6
10:39:00 AM 64 68.9 62.7 80.6
10:40:00 AM 64.4 71.5 62.6 86.1
10:41:00 AM 65.8 69.8 63.1 84.6
10:42:00 AM 65.1 72.1 62.5 85.1
10:43:00 AM 64.9 68 61.8 82.9
10:44:00 AM 66.6 72.7 63.9 86.8
10:45:00 AM 66.4 71.8 62.7 84.7
10:46:00 AM 63.2 73.2 61.9 91.8
10:47:00 AM 64.8 74.6 61.8 89.7
10:48:00 AM 64.6 76.1 62 90.8
10:49:00 AM 65.2 72.2 62.7 86.5
10:50:00 AM 63.8 72.4 62.1 87.2
10:51:00 AM 65.3 67.5 62.5 80.3
10:52:00 AM 64.1 66.1 62.3 82.3
10:53:00 AM 64.3 69 62.4 81.7
10:54:00 AM 63.8 66.5 62.1 81
10:55:00 AM 64.2 66.6 62.4 80.1
10:56:00 AM 64.7 68.3 63.2 81.2
10:57:00 AM 65.2 68.2 62.8 82.1
10:58:00 AM 63.3 67.3 61.2 79.7
10:59:00 AM 63.2 65.2 62.1 77.7
11:00:00 AM 63.1 67.2 61.8 82.5
11:01:00 AM 63.6 66.9 61.6 82.3
11:02:00 AM 63.2 68.4 61.1 82.9
11:03:00 AM 62.7 64.6 61.5 78.1
11:04:00 AM 63.1 72.6 61.4 85.5
11:05:00 AM 62.7 65.1 61.5 79.8
11:06:00 AM 62.7 67.6 61.2 79.4
11:07:00 AM 62.3 68.8 60.8 82.8
11:08:00 AM 62.4 67 61.2 84.7
11:09:00 AM 63 65.6 61.5 79.3
11:10:00 AM 63.4 65.3 61.9 83.9
11:11:00 AM 63.6 68.3 62 85
11:12:00 AM 63.3 67.7 61.8 79.7
11:13:00 AM 63.4 70.9 62.3 87.1
11:14:00 AM 62.7 64.7 61.6 76.2
11:15:00 AM 62.6 65.8 61.3 79.2
Date/Time Leq-1 Lmax-1 Lmin-1 Lpk-1
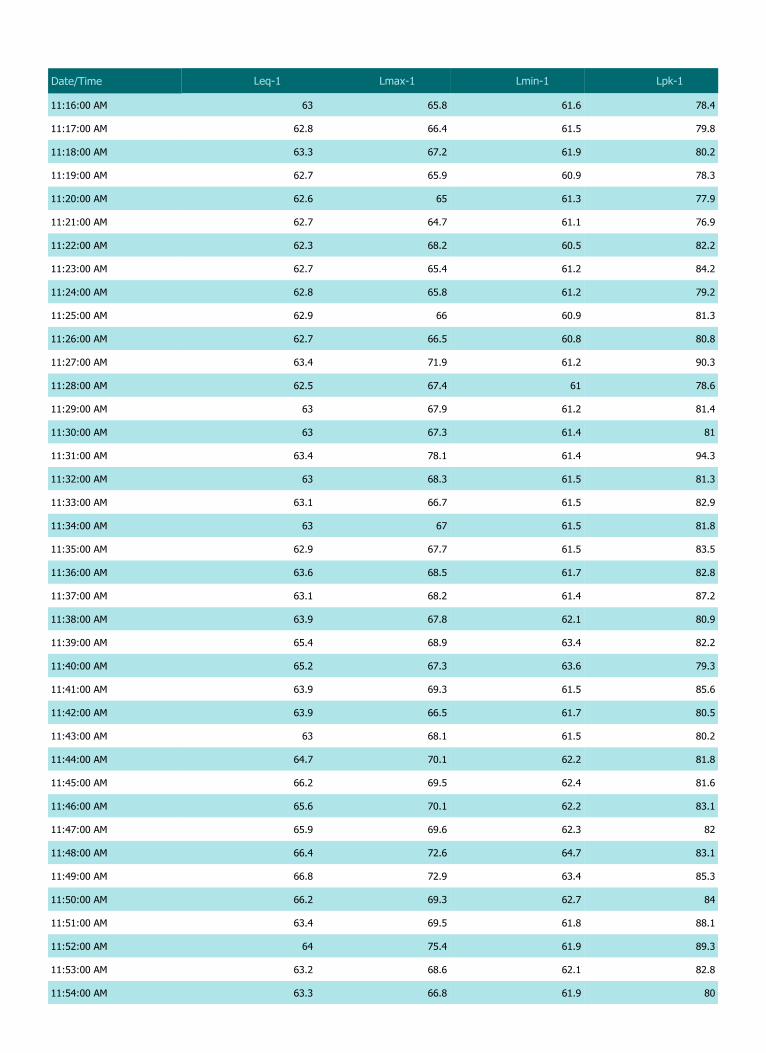
11:16:00 AM 63 65.8 61.6 78.4
11:17:00 AM 62.8 66.4 61.5 79.8
11:18:00 AM 63.3 67.2 61.9 80.2
11:19:00 AM 62.7 65.9 60.9 78.3
11:20:00 AM 62.6 65 61.3 77.9
11:21:00 AM 62.7 64.7 61.1 76.9
11:22:00 AM 62.3 68.2 60.5 82.2
11:23:00 AM 62.7 65.4 61.2 84.2
11:24:00 AM 62.8 65.8 61.2 79.2
11:25:00 AM 62.9 66 60.9 81.3
11:26:00 AM 62.7 66.5 60.8 80.8
11:27:00 AM 63.4 71.9 61.2 90.3
11:28:00 AM 62.5 67.4 61 78.6
11:29:00 AM 63 67.9 61.2 81.4
11:30:00 AM 63 67.3 61.4 81
11:31:00 AM 63.4 78.1 61.4 94.3
11:32:00 AM 63 68.3 61.5 81.3
11:33:00 AM 63.1 66.7 61.5 82.9
11:34:00 AM 63 67 61.5 81.8
11:35:00 AM 62.9 67.7 61.5 83.5
11:36:00 AM 63.6 68.5 61.7 82.8
11:37:00 AM 63.1 68.2 61.4 87.2
11:38:00 AM 63.9 67.8 62.1 80.9
11:39:00 AM 65.4 68.9 63.4 82.2
11:40:00 AM 65.2 67.3 63.6 79.3
11:41:00 AM 63.9 69.3 61.5 85.6
11:42:00 AM 63.9 66.5 61.7 80.5
11:43:00 AM 63 68.1 61.5 80.2
11:44:00 AM 64.7 70.1 62.2 81.8
11:45:00 AM 66.2 69.5 62.4 81.6
11:46:00 AM 65.6 70.1 62.2 83.1
11:47:00 AM 65.9 69.6 62.3 82
11:48:00 AM 66.4 72.6 64.7 83.1
11:49:00 AM 66.8 72.9 63.4 85.3
11:50:00 AM 66.2 69.3 62.7 84
11:51:00 AM 63.4 69.5 61.8 88.1
11:52:00 AM 64 75.4 61.9 89.3
11:53:00 AM 63.2 68.6 62.1 82.8
11:54:00 AM 63.3 66.8 61.9 80
Date/Time Leq-1 Lmax-1 Lmin-1 Lpk-1

11:55:00 AM 64.2 74.8 62 90
11:56:00 AM 67.5 76.7 62 91.9
11:57:00 AM 64.4 67.9 61.9 81
11:58:00 AM 63.7 69.9 61.9 80.5
11:59:00 AM 63.2 66.1 61.8 82
12:00:00 PM 64.7 67.7 62.1 80.4
12:01:00 PM 65.1 74.8 62.5 88
12:02:00 PM 64.2 71.6 62.1 84.6
12:03:00 PM 63.2 66.2 61.8 78.9
12:04:00 PM 63.1 70.4 61.8 83.3
12:05:00 PM 62.9 64.9 61.8 77.6
12:06:00 PM 63 69.4 61.6 82.7
12:07:00 PM 64.5 67.7 61.6 81.3
12:08:00 PM 67.1 73.9 62.1 83.5
12:09:00 PM 67.5 72.6 61.8 83.9
12:10:00 PM 63.1 66.8 61.1 80.2
12:11:00 PM 64.9 67.2 62.2 79.9
12:12:00 PM 64.4 74.2 61.6 90.9
12:13:00 PM 62.9 66.2 61.3 80.4
12:14:00 PM 63 67.9 61 78.8
12:15:00 PM 67.2 70.8 64.4 85
12:16:00 PM 65.7 68.4 61.7 81
12:17:00 PM 64.6 67.4 61.5 81.2
12:18:00 PM 63 71 61.4 84.9
12:19:00 PM 62.9 67.7 61.4 80.6
12:20:00 PM 64.6 72.4 61.6 87.7
12:21:00 PM 63.9 66.5 61.8 78.3
12:22:00 PM 65.3 68.2 61.7 80.1
12:23:00 PM 64 67.8 61.8 79.8
12:24:00 PM 68.5 76.6 62.6 90.8
12:25:00 PM 64.1 68.7 60.9 80.7
12:26:00 PM 63.6 68.8 61.8 80.7
12:27:00 PM 64.8 67.6 61.2 80.6
12:28:00 PM 64.1 69.7 61.6 81
12:29:00 PM 66.4 69.8 64.4 86.2
12:30:00 PM 65.1 69.1 62 83.7
12:31:00 PM 65.7 67.4 61.9 79.7
12:32:00 PM 63.2 73.5 61.3 85.4
12:33:00 PM 63.1 66.7 61.5 80.5
Date/Time Leq-1 Lmax-1 Lmin-1 Lpk-1

12:34:00 PM 62.4 65.3 60.7 77.7
12:35:00 PM 63.6 68.6 60.8 81.5
12:36:00 PM 63.4 72.3 61.8 93
12:37:00 PM 63 65 61.8 78.9
12:38:00 PM 63.5 66.4 61.8 78.7
12:39:00 PM 62.4 67.3 61 82.5
12:40:00 PM 62.2 64.5 60.9 76.6
12:41:00 PM 62.3 67.4 60.3 80.4
12:42:00 PM 62.2 64.6 60.9 77
12:43:00 PM 62.1 64 60.4 77.8
12:44:00 PM 62.5 64.9 60.9 77.4
12:45:00 PM 62.5 65.8 61 82.9
12:46:00 PM 62.4 65.7 60.8 79.5
12:47:00 PM 62.1 66.2 60.6 78.9
12:48:00 PM 62.2 65.2 60.8 77.1
12:49:00 PM 61.9 64.5 60.7 76.6
12:50:00 PM 62.3 68.3 60.9 86.3
12:51:00 PM 62.4 65.4 60.8 81.8
12:52:00 PM 62.6 65.4 61.2 79
12:53:00 PM 62.1 64.9 60.6 76.7
12:54:00 PM 62.2 69.2 60.6 82.4
12:55:00 PM 62.6 66.9 61.2 82.6
12:56:00 PM 62.2 65.9 61.1 77.3
12:57:00 PM 62.3 66.7 60.6 83.8
12:58:00 PM 62.7 67.2 61.2 82.7
12:59:00 PM 62.5 66.5 60.5 79.8
1:00:00 PM 62.2 65.1 60.4 80.4
1:01:00 PM 62.2 67 60.9 82.1
1:02:00 PM 62.1 66.1 60.7 84
1:03:00 PM 62.4 65 60.9 83.5
1:04:00 PM 62.3 67.8 60.4 81.5
1:05:00 PM 63 72 60.8 84.9
1:06:00 PM 62.3 66.9 60.8 80.8
1:07:00 PM 62.6 66.2 61.2 86.6
1:08:00 PM 62.5 67.6 60.9 84.9
1:09:00 PM 62.3 67.4 61 82.6
1:10:00 PM 62.5 67.5 61 84.3
1:11:00 PM 62.8 66.1 61 82.4
1:12:00 PM 62.7 68.6 61 85.1
Date/Time Leq-1 Lmax-1 Lmin-1 Lpk-1

1:13:00 PM 62.6 68.8 60.8 84
1:14:00 PM 62.5 67.7 61 80.2
1:15:00 PM 62.7 66.7 60.7 78.3
1:16:00 PM 62.7 65.9 60.7 80.1
1:17:00 PM 62.7 65.9 61.1 79.1
1:18:00 PM 62.3 65.8 60.7 83.7
1:19:00 PM 62.5 65.9 61.2 83.2
1:20:00 PM 62.3 64 60.9 77.6
1:21:00 PM 62.3 64.4 60.8 79.2
1:22:00 PM 62.5 71.4 60.7 87.6
1:23:00 PM 62.2 68 60.4 82.7
1:24:00 PM 62.4 69.2 60.3 86.1
1:25:00 PM 62.3 67.8 60.5 82.5
1:26:00 PM 64 72.1 61.2 86
1:27:00 PM 62 64.8 60.8 81
1:28:00 PM 64.1 68.2 62.2 81.5
1:29:00 PM 63.6 68.9 60.9 82
1:30:00 PM 63.8 68.6 61.4 84.3
1:31:00 PM 64.7 67.1 63 79.9
1:32:00 PM 62.8 67.1 61 85
1:33:00 PM 62.3 63.8 60.9 76.2
1:34:00 PM 62.5 72.6 60.8 86.4
1:35:00 PM 62.9 73.8 60.8 86.2
1:36:00 PM 62.1 71.2 60.7 81.8
1:37:00 PM 62 64.6 60.6 78.2
1:38:00 PM 61.9 64.9 60.7 78.9
1:39:00 PM 62.6 75 61.2 89.9
1:40:00 PM 62 64.3 60.9 76.8
1:41:00 PM 62.1 67.3 60.6 81.1
1:42:00 PM 62.1 68.5 60.7 81.5
1:43:00 PM 62.1 63.9 60.5 76.1
1:44:00 PM 62.1 64.5 61 77.7
1:45:00 PM 61.9 64.3 60.7 76
1:46:00 PM 62.1 69.8 60.7 84.2
1:47:00 PM 62.6 67.2 61.4 79.6
1:48:00 PM 62.5 65.2 60.8 76.7
1:49:00 PM 62.4 66.7 60.8 78.7
1:50:00 PM 62.5 69.2 61.1 81.8
1:51:00 PM 62.1 69.2 60.8 83.5
Date/Time Leq-1 Lmax-1 Lmin-1 Lpk-1

1:52:00 PM 62.6 67.5 61 80.6
1:53:00 PM 62.3 66.2 60.5 80.3
1:54:00 PM 62.7 68 61.3 83
1:55:00 PM 62.9 71.4 61 86.3
1:56:00 PM 63.2 71.1 61.6 85.8
1:57:00 PM 62.8 67.8 61.2 83.3
1:58:00 PM 63 65.6 61.4 77.8
1:59:00 PM 62.5 64.5 61.1 76.6
2:00:00 PM 62.6 69.6 61.1 81.3
2:01:00 PM 64.3 69.1 61.6 81.9
2:02:00 PM 64.3 67.3 61.9 80.2
2:03:00 PM 64 70.6 61.5 87.1
2:04:00 PM 62.9 67.9 61 81.1
2:05:00 PM 63.1 66.4 61 81.2
2:06:00 PM 62.9 65.9 61 87.4
2:07:00 PM 62.4 64.3 60.9 78.3
2:08:00 PM 63 67.6 61.4 81.6
2:09:00 PM 62.9 68.2 61.2 83.1
2:10:00 PM 62.9 65 60.6 81.2
2:11:00 PM 62.9 65.9 61.2 81.1
2:12:00 PM 62.6 64.3 61.3 76.4
2:13:00 PM 62.5 64.5 61.2 78.1
2:14:00 PM 62.8 72.8 60.8 86.4
2:15:00 PM 62.8 67.9 61.2 86.7
2:16:00 PM 62.3 66.6 61.1 78.1
2:17:00 PM 62.5 66 61.1 80.7
2:18:00 PM 62.3 65.2 61 77.7
2:19:00 PM 62.3 65.3 60.9 80.9
2:20:00 PM 62.4 64.4 60.9 76.5
2:21:00 PM 62.3 64.4 61.2 76.7
2:22:00 PM 62.3 63.7 60.8 76.5
2:23:00 PM 62.2 63.8 60.8 78.5
2:24:00 PM 62.9 72.6 60.8 86.9
2:25:00 PM 62.5 64.2 61.1 76.4
2:26:00 PM 62.6 66.6 60.8 80.9
2:27:00 PM 62.8 64.9 61.3 77.4
2:28:00 PM 62.4 64.4 61.2 81
2:29:00 PM 62.7 64.9 61.6 82.2
2:30:00 PM 62.7 65.2 61.6 78.3
Date/Time Leq-1 Lmax-1 Lmin-1 Lpk-1

2:31:00 PM 62.9 65.9 61.4 78.6
2:32:00 PM 62.7 64.2 61.6 76.9
2:33:00 PM 62.5 64.6 61 78.9
2:34:00 PM 62.2 64.3 60.8 76.3
2:35:00 PM 62.7 64.3 61.4 76.9
2:36:00 PM 62.4 64.1 61 83.8
2:37:00 PM 62.4 64.3 60.9 76.7
2:38:00 PM 62.6 65.6 61 77.5
2:39:00 PM 62.5 63.9 61.4 76.8
2:40:00 PM 62.1 63.4 61.1 77.4
2:41:00 PM 62.6 64.4 60.8 76.2
2:42:00 PM 62.4 64.4 60.9 83.4
2:43:00 PM 62.8 66.1 61.5 88.8
2:44:00 PM 62.6 63.9 61.3 77.3
2:45:00 PM 62.8 64.7 60.9 77.8
2:46:00 PM 63 65.6 61.2 80.1
2:47:00 PM 62.5 64.6 60.9 77.5
2:48:00 PM 62.5 64.8 61 78.8
2:49:00 PM 62.8 64.5 61.5 79.4
2:50:00 PM 63.1 64.7 61.9 77.4
2:51:00 PM 62.8 64.3 61.3 76.9
2:52:00 PM 63 64.3 61.3 79.6
2:53:00 PM 62.8 64.2 61.2 78.9
2:54:00 PM 62.7 64 61.3 76.8
2:55:00 PM 62.9 64.1 61.7 76.3
2:56:00 PM 62.8 64.8 61.5 77.5
2:57:00 PM 62.6 66.1 61.2 78.5
2:58:00 PM 62.6 68.4 60.9 83.5
2:59:00 PM 62.8 70.5 60.9 83.7
3:00:00 PM 62.8 66.9 61.2 81.6
3:01:00 PM 62.8 67.7 61.2 82.5
3:02:00 PM 62.8 65.3 61 77.1
3:03:00 PM 62.6 63.7 61.1 76.8
3:04:00 PM 63 64.5 61.6 79
3:05:00 PM 62.6 63.8 61.5 76
3:06:00 PM 63 67.5 61.6 80.1
3:07:00 PM 62.7 65 61.3 77.1
3:08:00 PM 62.7 65 61.3 77.1
3:09:00 PM 63.2 67.4 61.8 84.5
Date/Time Leq-1 Lmax-1 Lmin-1 Lpk-1

3:10:00 PM 63.1 69.8 61.1 85
3:11:00 PM 62.8 65.8 61.5 79.1
3:12:00 PM 63 69 61.2 83.2
3:13:00 PM 63.6 77.2 61.6 90.5
3:14:00 PM 63.1 64.9 61.2 77.4
3:15:00 PM 62.7 66.1 61.5 80
3:16:00 PM 63 67.9 61.1 81.5
3:17:00 PM 63.3 67.3 61.6 81.8
3:18:00 PM 62.8 64.7 61.5 77.4
3:19:00 PM 62.8 64.7 61.2 77.1
3:20:00 PM 62.6 64.3 61.1 76.4
3:21:00 PM 63.2 65 61.5 77.3
3:22:00 PM 63 65 61.6 77.5
3:23:00 PM 63 65 61.2 77.1
3:24:00 PM 62.6 65.4 60.9 77.7
3:25:00 PM 62.4 65 61 76.7
3:26:00 PM 63.1 65.6 61.5 78
3:27:00 PM 63.1 66.7 61.3 80.6
3:28:00 PM 63.1 69 61.1 82.2
3:29:00 PM 62.8 66.3 61.4 78.4
3:30:00 PM 62.9 65.8 61.7 77.7
3:31:00 PM 63.1 65.2 61.5 77.3
3:32:00 PM 62.6 63.9 61.2 76.3
3:33:00 PM 63 64.9 61 76.7
3:34:00 PM 62.5 65.2 61.1 78.5
3:35:00 PM 62.8 64.7 61.5 77.5
3:36:00 PM 62.6 64.5 61.2 84
3:37:00 PM 62.8 64.8 61.6 77.5
3:38:00 PM 62.7 64.3 60.9 77.4
3:39:00 PM 63.3 65.2 61.2 77.6
3:40:00 PM 62.7 64.3 61 79.8
3:41:00 PM 62.9 64.5 61.2 76.9
3:42:00 PM 62.8 65 61.5 83.7
3:43:00 PM 62.6 65.9 61.2 78
3:44:00 PM 62.6 67.7 61.1 80.9
3:45:00 PM 62.7 64.7 61.2 77.2
3:46:00 PM 63.4 70.1 61.5 85.8
3:47:00 PM 63.1 71.6 61 84.6
3:48:00 PM 62.9 65.3 61.7 78
Date/Time Leq-1 Lmax-1 Lmin-1 Lpk-1

3:49:00 PM 62.7 65.1 61.3 79.6
3:50:00 PM 63.1 65.9 61.7 77.9
3:51:00 PM 63 64.9 61.7 82.9
3:52:00 PM 62.7 65 61.5 79.8
3:53:00 PM 62.9 65.3 61.5 79.4
3:54:00 PM 62.9 67.6 61.6 80.8
3:55:00 PM 62.6 65.2 60.8 80.5
3:56:00 PM 62.3 68.1 60.9 86.1
3:57:00 PM 62.8 72.5 60.9 93.9
3:58:00 PM 62.3 73 60.3 96.1
3:59:00 PM 62.9 69.4 60.7 91.6
4:00:00 PM 62.6 68.1 61.4 82.8
4:01:00 PM 62.9 69.3 61.1 87.4
4:02:00 PM 62.8 65.3 61.6 79.9
4:03:00 PM 62.9 65.9 61.3 80.5
4:04:00 PM 62.9 64.8 61.3 77.1
4:05:00 PM 62.9 66.9 61.5 81.6
4:06:00 PM 63.1 69.7 61.5 83.4
4:07:00 PM 62.6 68 61.1 80.7
4:08:00 PM 63.1 67.4 61.5 82.2
4:09:00 PM 62.7 64.2 61.3 77.3
4:10:00 PM 63 67.2 61.4 81.7
4:11:00 PM 62.9 64.9 61.7 77.1
4:12:00 PM 62.9 65.1 61.5 76.6
4:13:00 PM 62.6 64 61.4 76.4
4:14:00 PM 63.1 66 61.6 79.7
4:15:00 PM 62.5 64.1 60.7 77.1
4:16:00 PM 62.6 64.8 61 76.8
4:17:00 PM 62.8 64.5 61 78
4:18:00 PM 62.2 63.7 61 77
4:19:00 PM 62.6 68 60.9 85.5
4:20:00 PM 62.5 63.9 60.6 76.5
4:21:00 PM 63.1 65.3 61.3 79.9
4:22:00 PM 62.8 70 61.2 85.7
4:23:00 PM 62.9 64.4 61.4 77.2
4:24:00 PM 63.1 65 62 77.3
4:25:00 PM 62.8 64.9 61.2 77.1
4:26:00 PM 62.9 64.6 61.4 77
4:27:00 PM 63.1 66.4 62 81.5
Date/Time Leq-1 Lmax-1 Lmin-1 Lpk-1

4:28:00 PM 63 64.8 61.4 77
4:29:00 PM 62.7 64.7 61.5 76.2
4:30:00 PM 62.5 66.7 61.3 79.9
4:31:00 PM 62.6 63.7 61.3 76
4:32:00 PM 62.9 64.8 61.7 77.2
4:33:00 PM 63.2 67.6 61.5 80
4:34:00 PM 63.2 68.2 61.6 80.9
4:35:00 PM 63.1 70.9 61.7 86.2
4:36:00 PM 62.9 73.5 60.9 87.6
4:37:00 PM 63.2 71 61.6 83.8
4:38:00 PM 63.3 66.9 61.9 78.4
4:39:00 PM 62.8 67 61.3 77.3
4:40:00 PM 62.9 66.7 61.3 77.6
4:41:00 PM 62.6 64.4 61.4 76.8
4:42:00 PM 62.8 64.9 61.2 77.1
4:43:00 PM 62.6 64.7 61.1 77
4:44:00 PM 62.9 64.7 61.5 77.7
4:45:00 PM 62.8 65.5 61.7 78.2
4:46:00 PM 62.8 64.3 61.5 77.6
4:47:00 PM 62.8 64.2 61.4 77
4:48:00 PM 62.8 64.8 61.3 76.7
4:49:00 PM 62.7 64.4 61.6 76.7
4:50:00 PM 62.6 65.8 61.2 78.7
4:51:00 PM 63.3 68 61.6 91.9
4:52:00 PM 63 65.3 61.1 79.4
4:53:00 PM 63.1 65.3 61.6 77.5
4:54:00 PM 63.2 66.9 61.3 83.1
4:55:00 PM 62.9 68.3 61.2 87.6
4:56:00 PM 63.1 70.8 61.5 82.9
4:57:00 PM 63.1 65.5 61.6 79.1
4:58:00 PM 62.8 65 61.5 76.2
4:59:00 PM 62.5 65.1 61 79.9
5:00:00 PM 62.6 64.4 60.9 76.7
5:01:00 PM 62.7 64.3 61.5 76.8
5:02:00 PM 62.8 64.9 61.6 80.9
5:03:00 PM 62.6 64.1 61.3 76.3
5:04:00 PM 62.3 67 60.9 82.4
5:05:00 PM 62.5 65.9 60.8 78.7
5:06:00 PM 62.6 64.1 61.1 76.8
Date/Time Leq-1 Lmax-1 Lmin-1 Lpk-1

5:07:00 PM 62.8 64.5 61.3 77.6
5:08:00 PM 62.8 65.3 61.3 77.4
5:09:00 PM 62.7 64.6 61.1 77.8
5:10:00 PM 62.5 63.9 61.1 76.5
5:11:00 PM 62.8 67.1 60.5 81
5:12:00 PM 62.8 65.2 61.2 77
5:13:00 PM 62.9 64.9 61.7 79.6
5:14:00 PM 62.8 70.1 61.2 83
5:15:00 PM 62.5 64.2 61.2 77.7
5:16:00 PM 62.7 67.7 61.2 82.6
5:17:00 PM 62.9 66.8 61.5 81.3
5:18:00 PM 62.9 65.9 60.8 80.9
5:19:00 PM 62.7 65.7 61.3 80.2
5:20:00 PM 62.8 65.4 61.4 77.2
5:21:00 PM 62.6 65.5 61.1 78.5
5:22:00 PM 62.7 65.5 61.2 77.9
5:23:00 PM 62.6 64.5 61.3 77.8
5:24:00 PM 62.8 67.9 61.2 81.8
5:25:00 PM 63.1 70.3 60.9 83.7
5:26:00 PM 63 66.1 61.4 78.5
5:27:00 PM 63.4 70.1 61.5 83.2
5:28:00 PM 63.1 66.8 61.4 78.1
5:29:00 PM 62.1 63.5 60.9 76.7
5:30:00 PM 63 65.2 61.5 79.4
5:31:00 PM 63 64.7 61.4 79.2
5:32:00 PM 63.3 68.5 61.5 81.6
5:33:00 PM 63.4 72.8 61.6 89.2
5:34:00 PM 63 64.4 61.7 77.5
5:35:00 PM 62.9 66.9 61.1 80.6
5:36:00 PM 62.9 70.1 61.2 84.5
5:37:00 PM 62.5 64 60.9 76.7
5:38:00 PM 62.8 65.1 61.3 76.9
5:39:00 PM 63.4 71.9 61.2 95.5
5:40:00 PM 63.3 75 61.1 101.8
5:41:00 PM 62.7 67.3 61 91.2
5:42:00 PM 62.7 64.2 61.4 77
5:43:00 PM 63 64.6 61.6 76.4
5:44:00 PM 62.8 65.2 61.4 77.1
5:45:00 PM 62.1 63.4 60.7 75.9
Date/Time Leq-1 Lmax-1 Lmin-1 Lpk-1

5:46:00 PM 62.5 64 61.1 76.6
5:47:00 PM 62.5 64.4 60.7 77.3
5:48:00 PM 62.4 64.5 60.6 76.2
5:49:00 PM 62.4 71 60.8 90.2
5:50:00 PM 62.7 65.7 61.2 81.3
5:51:00 PM 62.4 63.6 60.6 76
5:52:00 PM 62.4 64 60.7 77.5
5:53:00 PM 62.7 64.5 61.2 76.7
5:54:00 PM 62.6 64.5 61.2 76.9
5:55:00 PM 62.7 64.5 61.3 78.6
5:56:00 PM 62.6 64.9 61.4 84.1
5:57:00 PM 62.3 63.6 61.2 79.8
5:58:00 PM 62.5 63.7 61.1 76.2
5:59:00 PM 62.7 64.1 61.3 77.6
6:00:00 PM 62.7 64.1 61.6 76.8
6:01:00 PM 62.7 63.9 61.6 77.5
6:02:00 PM 62.7 64 61.7 76.8
6:03:00 PM 62.8 64.7 61.2 76.9
6:04:00 PM 63.1 64.5 61.8 77.4
6:05:00 PM 62.9 64.7 61.8 76.5
6:06:00 PM 63.2 65 61.5 78.3
6:07:00 PM 63 64.6 61.8 76.8
6:08:00 PM 63 64.1 61.6 76.8
6:09:00 PM 62.6 64.1 61.3 76.8
6:10:00 PM 62.5 63.9 61.4 76.9
6:11:00 PM 63.4 64.8 61.7 77
6:12:00 PM 63.1 64.3 61.7 77.4
6:13:00 PM 62.9 64.1 61.7 76.5
6:14:00 PM 62.7 64 61.7 76.4
6:15:00 PM 62.8 64.1 61.7 76.9
6:16:00 PM 62.9 64.2 61.7 76.5
6:17:00 PM 62.9 64.2 61.7 77.5
6:18:00 PM 62.5 63.7 61.6 76.7
6:19:00 PM 63.1 64.4 61.7 77.2
6:20:00 PM 62.9 63.9 61.5 76.8
6:21:00 PM 62.9 64.1 61.8 76.7
6:22:00 PM 62.8 63.9 61.6 76.9
6:23:00 PM 63.2 64.4 62.1 77.3
6:24:00 PM 63.2 64.2 62.2 77.2
Date/Time Leq-1 Lmax-1 Lmin-1 Lpk-1

6:25:00 PM 62.8 64 61.3 76.5
6:26:00 PM 62.9 64.1 61.6 77
6:27:00 PM 63.1 65 61.9 77
6:28:00 PM 63 64 61.6 77
6:29:00 PM 62.9 64.1 61.8 76.7
6:30:00 PM 63.5 65.2 61.9 78.4
6:31:00 PM 63.3 65.3 61.6 77.7
6:32:00 PM 63.1 64.8 61.8 76.8
6:33:00 PM 63.6 65.5 61.8 79.1
6:34:00 PM 62.7 64 61.7 76.5
6:35:00 PM 63.1 64.3 62 76.7
6:36:00 PM 62.8 64.1 61.8 77
6:37:00 PM 63.2 64.3 61.9 77.1
6:38:00 PM 62.8 64.4 61.7 76.7
6:39:00 PM 62.9 64 62 77.2
6:40:00 PM 62.8 63.8 61.9 76.5
6:41:00 PM 63.1 64.3 62 77.3
6:42:00 PM 63 64.1 61.7 77.3
6:43:00 PM 63 64.2 62 78
6:44:00 PM 62.9 64.1 61.8 77.2
6:45:00 PM 62.9 63.8 62.1 76.7
6:46:00 PM 63 64.3 62 76.9
6:47:00 PM 63.3 64.4 62 76.9
6:48:00 PM 63.2 64.7 62 77.8
6:49:00 PM 63 64.6 61.8 77.1
6:50:00 PM 63.2 64.3 61.9 77.9
6:51:00 PM 63.2 64.5 61.9 77.5
6:52:00 PM 63 64.3 61.9 77
6:53:00 PM 63.3 65 61.9 78.1
6:54:00 PM 62.9 63.8 61.9 76.2
6:55:00 PM 63 64.6 61.3 77.1
6:56:00 PM 63.3 64.6 62.3 77.2
6:57:00 PM 63.1 64.5 61.6 77
6:58:00 PM 62.9 64.1 61.9 76.9
6:59:00 PM 63.4 65 61.9 77.6
7:00:00 PM 63.1 65.4 61.6 77.8
7:01:00 PM 63.7 65.2 62.5 78.5
7:02:00 PM 63.2 64.6 62 77.2
7:03:00 PM 63.4 64.8 62.2 77.2
Date/Time Leq-1 Lmax-1 Lmin-1 Lpk-1

7:04:00 PM 63.3 64.5 62.2 77.2
7:05:00 PM 63.1 64.3 61.9 77.7
7:06:00 PM 63 64.3 61.9 77.4
7:07:00 PM 63.1 64.4 61.8 77.2
7:08:00 PM 63.2 64.4 62.1 77.3
7:09:00 PM 63.5 65 61.9 77.6
7:10:00 PM 63 63.9 62 76.7
7:11:00 PM 63.1 64.2 62 76.4
7:12:00 PM 63.2 64.5 62.1 77.3
7:13:00 PM 62.8 64.1 61.7 78
7:14:00 PM 62.9 64.6 61.8 77.9
7:15:00 PM 63 64.2 61.8 77.2
7:16:00 PM 63.2 64.8 61.9 77.2
7:17:00 PM 62.9 64.3 61.9 77.1
7:18:00 PM 62.8 64.3 61.9 77.1
7:19:00 PM 62.8 64 61.6 76.2
7:20:00 PM 63.1 64.7 61.7 77
7:21:00 PM 62.9 64.4 61.8 77.2
7:22:00 PM 62.8 64.1 61.6 76.6
7:23:00 PM 62.9 64.2 61.6 77
7:24:00 PM 63.1 64.3 61.6 80.1
7:25:00 PM 62.9 64.5 61.6 77
7:26:00 PM 62.9 64.2 61.6 77.7
7:27:00 PM 63.1 66.5 61.9 90.3
7:28:00 PM 63 64.4 62 87
7:29:00 PM 63.2 64.7 61.9 86.8
7:30:00 PM 63.1 64.2 62 77.8
7:31:00 PM 63.1 64.8 61.8 76.4
7:32:00 PM 63.1 64.4 62 77.1
7:33:00 PM 62.9 64.1 61.8 76.8
7:34:00 PM 63 64.5 61.5 77.2
7:35:00 PM 63 64.4 61.8 76.6
7:36:00 PM 63 64.5 61.8 77.6
7:37:00 PM 63 64.6 61.7 77.9
7:38:00 PM 62.9 64.4 61.7 77.3
7:39:00 PM 63 64.3 61.6 77.4
7:40:00 PM 62.9 63.9 61.9 76.4
7:41:00 PM 62.9 64.7 61.8 76.4
7:42:00 PM 62.8 64.6 61.5 76.5
Date/Time Leq-1 Lmax-1 Lmin-1 Lpk-1

7:43:00 PM 62.6 63.9 61.3 76.6
7:44:00 PM 62.7 64.3 61.5 76.6
7:45:00 PM 63 64.4 61.8 78.2
7:46:00 PM 62.8 64.1 61.7 76.4
7:47:00 PM 62.9 64.4 61.9 76.9
7:48:00 PM 63 64.5 61.9 78.6
7:49:00 PM 62.9 63.9 61.8 77.7
7:50:00 PM 62.9 64.4 61.9 77.2
7:51:00 PM 62.9 64 61.9 77.8
7:52:00 PM 63 64.2 62.1 77.1
7:53:00 PM 62.9 64.1 61.7 77
7:54:00 PM 62.9 64.2 61.7 76.7
7:55:00 PM 63 64.7 61.5 77.2
7:56:00 PM 62.9 64.2 61.8 76.9
7:57:00 PM 63 64.2 61.7 76.9
7:58:00 PM 63.1 64.3 62.1 77.4
7:59:00 PM 62.9 63.9 62 77.2
8:00:00 PM 63.2 64.6 61.9 78.2
8:01:00 PM 63.2 64.8 61.7 77
8:02:00 PM 62.9 64.2 61.5 77.1
8:03:00 PM 63 64.4 61.9 77.3
8:04:00 PM 63.1 64.6 61.7 76.8
8:05:00 PM 63 64.3 62 76.6
8:06:00 PM 63 64.4 61.8 76.6
8:07:00 PM 62.9 64 61.7 77
8:08:00 PM 62.9 64.4 61.6 76.7
8:09:00 PM 62.8 64.8 61.6 79.6
8:10:00 PM 62.9 64 61.9 76.6
8:11:00 PM 62.9 64 61.7 76.4
8:12:00 PM 63.2 64.4 62.1 77.7
8:13:00 PM 63 64.2 61.9 76.7
8:14:00 PM 62.9 64.5 61.7 77.6
8:15:00 PM 62.9 64.2 61.6 77
8:16:00 PM 63 64.6 61.8 77.7
8:17:00 PM 62.9 64.3 61.6 77.2
8:18:00 PM 63.1 64.8 61.9 77.6
8:19:00 PM 63.3 64.9 61.8 77.4
8:20:00 PM 62.9 64.5 61.7 76.7
8:21:00 PM 62.8 64.2 61.6 77.1
Date/Time Leq-1 Lmax-1 Lmin-1 Lpk-1

8:22:00 PM 63.1 64.6 61.8 77.2
8:23:00 PM 62.8 64.4 61.3 77.8
8:24:00 PM 62.9 64.2 61.7 76.5
8:25:00 PM 63.1 64.5 61.9 77.1
8:26:00 PM 62.9 64.4 61.9 76.8
8:27:00 PM 62.9 64.2 62 76.7
8:28:00 PM 63.1 64.7 61.9 77.4
8:29:00 PM 63 64.1 61.9 77.8
8:30:00 PM 63 64.4 62 77.3
8:31:00 PM 63 64.8 62 77.2
8:32:00 PM 63.2 64.4 61.7 77.5
8:33:00 PM 63 64.2 61.8 76.9
8:34:00 PM 63.1 64.6 62 76.8
8:35:00 PM 63.1 64.4 61.8 77.3
8:36:00 PM 63 64.2 61.7 77.3
8:37:00 PM 63.1 64.6 61.9 76.8
8:38:00 PM 63.2 64.2 62.2 77.1
8:39:00 PM 63.1 64.3 61.9 77.3
8:40:00 PM 63.2 64.8 62 77.8
8:41:00 PM 63.1 64.8 62 77.2
8:42:00 PM 63.2 64.8 61.8 77
8:43:00 PM 63 64.1 62.2 78.2
8:44:00 PM 63 64.1 61.8 77.8
8:45:00 PM 63.2 64.6 62.1 77.8
8:46:00 PM 63.1 64.1 62.1 77.1
8:47:00 PM 63.1 64.3 62 77.5
8:48:00 PM 63 64.4 61.8 77
8:49:00 PM 63.1 64.2 62.1 77.1
8:50:00 PM 63.1 64.4 62.1 77.5
8:51:00 PM 63.2 64.3 62 76.8
8:52:00 PM 63.2 64.6 62 77.4
8:53:00 PM 63.2 64.3 62 77.5
8:54:00 PM 63.2 64.6 62.1 77.7
8:55:00 PM 63.2 64.4 62.1 77
8:56:00 PM 63.2 64.5 61.9 77.1
8:57:00 PM 63.2 65.7 62.4 77.4
8:58:00 PM 63.2 64.4 62.2 77.1
8:59:00 PM 63.3 64.3 62.2 76.7
9:00:00 PM 62.9 64 61.8 76.6
Date/Time Leq-1 Lmax-1 Lmin-1 Lpk-1

9:01:00 PM 63.1 64.1 62 77.3
9:02:00 PM 63.2 64.3 62 76.8
9:03:00 PM 63.2 64.4 62.2 77.2
9:04:00 PM 63.2 64.3 62 76.6
9:05:00 PM 63.5 64.7 62.1 77.3
9:06:00 PM 63.3 64.6 62.1 77.3
9:07:00 PM 63.3 64.4 62.3 77.5
9:08:00 PM 63.3 64.7 62.1 77.4
9:09:00 PM 63.1 64.5 62.1 77.9
9:10:00 PM 63.4 64.8 62.1 77.2
9:11:00 PM 63.3 64.5 62.2 77.2
9:12:00 PM 63.1 64.5 62 77
9:13:00 PM 63.1 64.5 61.8 77.6
9:14:00 PM 63.2 64.5 62 77.3
9:15:00 PM 63.3 64.6 62 77.2
9:16:00 PM 63.3 64.5 62.3 77.3
9:17:00 PM 63.3 64.5 62.2 76.7
9:18:00 PM 63.2 64.4 62 77.2
9:19:00 PM 63.5 64.6 62.5 77.4
9:20:00 PM 63.3 64.6 62.2 77
9:21:00 PM 63.5 64.6 62.3 77.5
9:22:00 PM 63.3 64.4 62.4 76.9
9:23:00 PM 63.4 64.4 62.4 78.2
9:24:00 PM 63.4 64.7 62.1 77.4
9:25:00 PM 63.3 64.6 62.3 78.2
9:26:00 PM 63.4 64.7 62.4 78.4
9:27:00 PM 63.3 64.4 62 76.6
9:28:00 PM 63.3 64.4 61.8 76.8
9:29:00 PM 63.2 64.4 62 76.9
9:30:00 PM 63.3 64.4 62.1 76.8
9:31:00 PM 63.4 64.5 62.4 77.6
9:32:00 PM 63.4 64.7 62.4 76.8
9:33:00 PM 63.3 64.4 62.4 77.4
9:34:00 PM 63.2 64.7 62.1 77.7
9:35:00 PM 63 64.2 62 77.2
9:36:00 PM 63.2 64.2 62 76.5
9:37:00 PM 63.2 64.2 62.2 77.5
9:38:00 PM 63.2 64.2 62.2 77.6
9:39:00 PM 63.2 64.2 62.1 76.8
Date/Time Leq-1 Lmax-1 Lmin-1 Lpk-1
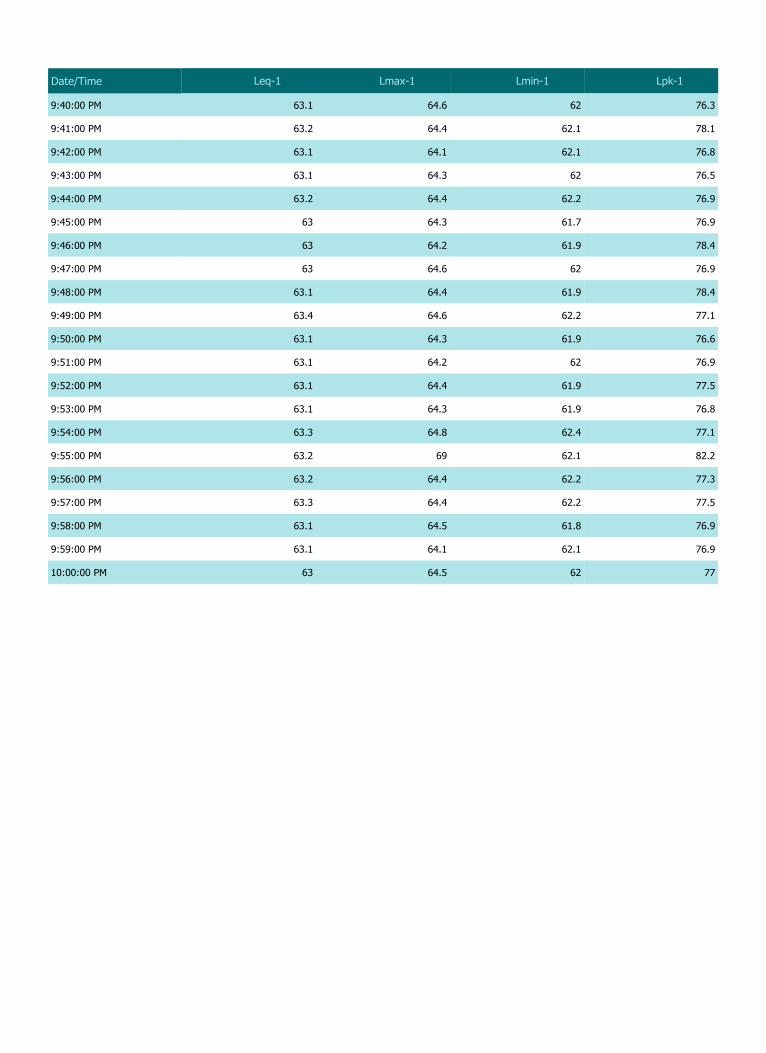
9:40:00 PM 63.1 64.6 62 76.3
9:41:00 PM 63.2 64.4 62.1 78.1
9:42:00 PM 63.1 64.1 62.1 76.8
9:43:00 PM 63.1 64.3 62 76.5
9:44:00 PM 63.2 64.4 62.2 76.9
9:45:00 PM 63 64.3 61.7 76.9
9:46:00 PM 63 64.2 61.9 78.4
9:47:00 PM 63 64.6 62 76.9
9:48:00 PM 63.1 64.4 61.9 78.4
9:49:00 PM 63.4 64.6 62.2 77.1
9:50:00 PM 63.1 64.3 61.9 76.6
9:51:00 PM 63.1 64.2 62 76.9
9:52:00 PM 63.1 64.4 61.9 77.5
9:53:00 PM 63.1 64.3 61.9 76.8
9:54:00 PM 63.3 64.8 62.4 77.1
9:55:00 PM 63.2 69 62.1 82.2
9:56:00 PM 63.2 64.4 62.2 77.3
9:57:00 PM 63.3 64.4 62.2 77.5
9:58:00 PM 63.1 64.5 61.8 76.9
9:59:00 PM 63.1 64.1 62.1 76.9
10:00:00 PM 63 64.5 62 77
Date/Time Leq-1 Lmax-1 Lmin-1 Lpk-1

Session Report
Information Panel
Company Name Sarawak Energy Berhad
Description CK/EV103-708/17
Location N5 (Night Time)
Start Time 01-Feb-18 10:03:00 PM
Stop Time 02-Feb-18 7:03:00 AM
Run Time 09:00:00
Model Type SoundPro DL
Comments Vehicular movement, human activities, windblow.
Summary Data Panel
Description Meter Value Description Meter Value
Leq 1 63.9 dB Lmax 1 89.5 dB
Lmin 1 60.7 dB Lpk 1 115.8 dB
L10 1 64.4 dB L90 1 62.5 dB
Mntime 1 02-Feb-18 6:51:16 AM
Mxtime 1 02-Feb-18 12:57:42 AM
Rtime 1 09:00:00 Dose 1 0.3 %
Exchange Rate 1 3 dB Weighting 1 A
Response 1 FAST Bandwidth 1 OFF
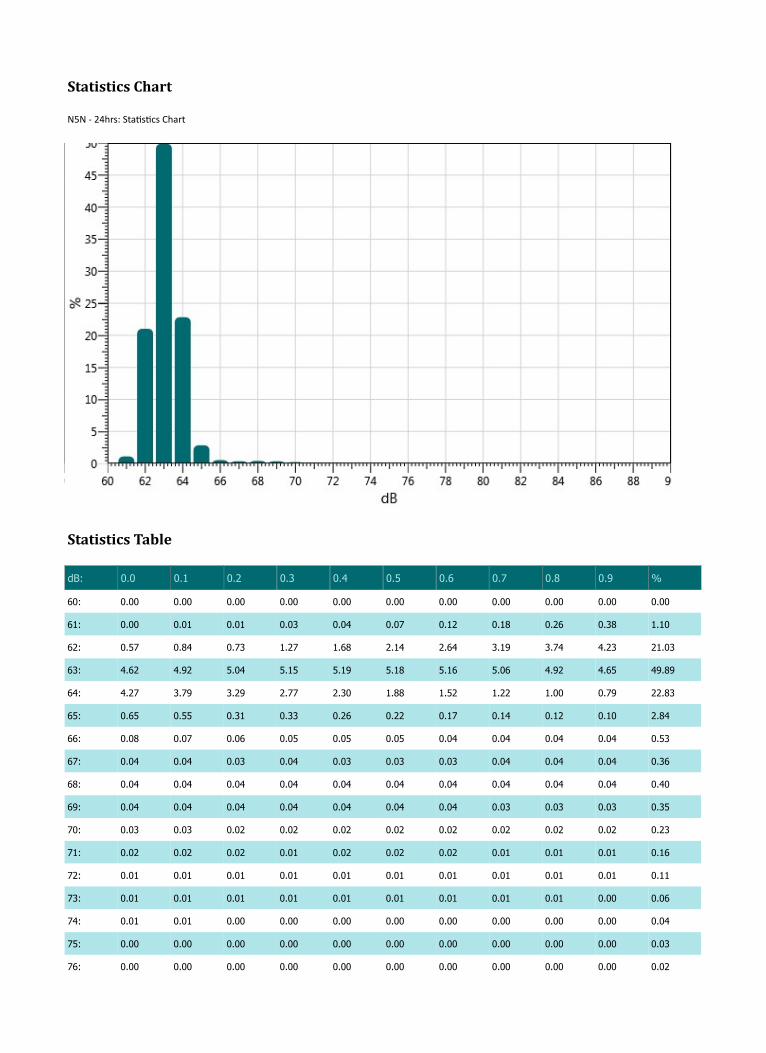
Statistics Chart
N5N - 24hrs: Sta s cs Chart
Statistics Table
dB: 0.0 0.1 0.2 0.3 0.4 0.5 0.6 0.7 0.8 0.9 %
60: 0.00 0.00 0.00 0.00 0.00 0.00 0.00 0.00 0.00 0.00 0.00
61: 0.00 0.01 0.01 0.03 0.04 0.07 0.12 0.18 0.26 0.38 1.10
62: 0.57 0.84 0.73 1.27 1.68 2.14 2.64 3.19 3.74 4.23 21.03
63: 4.62 4.92 5.04 5.15 5.19 5.18 5.16 5.06 4.92 4.65 49.89
64: 4.27 3.79 3.29 2.77 2.30 1.88 1.52 1.22 1.00 0.79 22.83
65: 0.65 0.55 0.31 0.33 0.26 0.22 0.17 0.14 0.12 0.10 2.84
66: 0.08 0.07 0.06 0.05 0.05 0.05 0.04 0.04 0.04 0.04 0.53
67: 0.04 0.04 0.03 0.04 0.03 0.03 0.03 0.04 0.04 0.04 0.36
68: 0.04 0.04 0.04 0.04 0.04 0.04 0.04 0.04 0.04 0.04 0.40
69: 0.04 0.04 0.04 0.04 0.04 0.04 0.04 0.03 0.03 0.03 0.35
70: 0.03 0.03 0.02 0.02 0.02 0.02 0.02 0.02 0.02 0.02 0.23
71: 0.02 0.02 0.02 0.01 0.02 0.02 0.02 0.01 0.01 0.01 0.16
72: 0.01 0.01 0.01 0.01 0.01 0.01 0.01 0.01 0.01 0.01 0.11
73: 0.01 0.01 0.01 0.01 0.01 0.01 0.01 0.01 0.01 0.00 0.06
74: 0.01 0.01 0.00 0.00 0.00 0.00 0.00 0.00 0.00 0.00 0.04
75: 0.00 0.00 0.00 0.00 0.00 0.00 0.00 0.00 0.00 0.00 0.03
76: 0.00 0.00 0.00 0.00 0.00 0.00 0.00 0.00 0.00 0.00 0.02

77: 0.00 0.00 0.00 0.00 0.00 0.00 0.00 0.00 0.00 0.00 0.01
78: 0.00 0.00 0.00 0.00 0.00 0.00 0.00 0.00 0.00 0.00 0.01
79: 0.00 0.00 0.00 0.00 0.00 0.00 0.00 0.00 0.00 0.00 0.01
80: 0.00 0.00 0.00 0.00 0.00 0.00 0.00 0.00 0.00 0.00 0.01
81: 0.00 0.00 0.00 0.00 0.00 0.00 0.00 0.00 0.00 0.00 0.00
82: 0.00 0.00 0.00 0.00 0.00 0.00 0.00 0.00 0.00 0.00 0.00
83: 0.00 0.00 0.00 0.00 0.00 0.00 0.00 0.00 0.00 0.00 0.00
84: 0.00 0.00 0.00 0.00 0.00 0.00 0.00 0.00 0.00 0.00 0.00
85: 0.00 0.00 0.00 0.00 0.00 0.00 0.00 0.00 0.00 0.00 0.00
86: 0.00 0.00 0.00 0.00 0.00 0.00 0.00 0.00 0.00 0.00 0.00
87: 0.00 0.00 0.00 0.00 0.00 0.00 0.00 0.00 0.00 0.00 0.00
88: 0.00 0.00 0.00 0.00 0.00 0.00 0.00 0.00 0.00 0.00 0.00
89: 0.00 0.00 0.00 0.00 0.00 0.00 0.00 0.00 0.00 0.00 0.00
Exceedance Chart
N5N - 24hrs: Exceedance Chart
Exceedance Table
. 0% 1% 2% 3% 4% 5% 6% %7 %8 %9
0%: 68.9 66.4 65.4 65.0 64.9 64.7 64.6 64.6 64.5
10%: 64.4 64.4 64.3 64.3 64.2 64.2 64.2 64.1 64.1 64.1
20%: 64.0 64.0 64.0 64.0 63.9 63.9 63.9 63.9 63.8 63.8
dB: 0.0 0.1 0.2 0.3 0.4 0.5 0.6 0.7 0.8 0.9 %

30%: 63.8 63.8 63.8 63.7 63.7 63.7 63.7 63.7 63.6 63.6
40%: 63.6 63.6 63.6 63.5 63.5 63.5 63.5 63.5 63.4 63.4
50%: 63.4 63.4 63.4 63.3 63.3 63.3 63.3 63.3 63.3 63.2
60%: 63.2 63.2 63.2 63.2 63.1 63.1 63.1 63.1 63.1 63.0
70%: 63.0 63.0 63.0 63.0 62.9 62.9 62.9 62.9 62.8 62.8
80%: 62.8 62.8 62.8 62.7 62.7 62.7 62.6 62.6 62.6 62.6
90%: 62.5 62.5 62.4 62.4 62.3 62.3 62.2 62.1 62.0 61.8
100%: 60.6
Logged Data Chart
N5N - 24hrs: Logged Data Chart
Logged Data Table
Date/Time Leq-1 Lmax-1 Lmin-1 Lpk-1
01-Feb-18 10:04:00 PM 63.2 65 62 76.7
10:05:00 PM 63.1 64.6 62 77.2
10:06:00 PM 63 64.2 61.6 77.7
10:07:00 PM 62.8 63.9 61.8 76.5
10:08:00 PM 62.9 64 61.7 76.5
10:09:00 PM 63 64.3 61.8 76.8
10:10:00 PM 62.9 64.2 61.9 77.4
10:11:00 PM 62.8 64.1 61.7 76.4
10:12:00 PM 63 64.5 61.9 77.1
10:13:00 PM 62.9 64.5 61.9 77.5
10:14:00 PM 62.8 64 61.8 77.7
10:15:00 PM 63 64.5 61.7 76.8
. 0% 1% 2% 3% 4% 5% 6% %7 %8 %9

10:16:00 PM 62.9 64.7 61.7 77.3
10:17:00 PM 63.2 64.8 61.9 77.5
10:18:00 PM 62.9 64.2 61.8 77.4
10:19:00 PM 63 64.2 61.9 78.6
10:20:00 PM 63 64.5 61.9 76.9
10:21:00 PM 62.8 64 61.7 76.8
10:22:00 PM 62.8 64 61.7 77.2
10:23:00 PM 62.9 64.6 61.8 76.6
10:24:00 PM 63.1 64.3 62.1 76.8
10:25:00 PM 63.1 64.4 61.9 76.9
10:26:00 PM 63.1 64.3 61.8 76.7
10:27:00 PM 63 64 62 77
10:28:00 PM 63 64.5 61.8 77
10:29:00 PM 63 64.2 61.8 76.8
10:30:00 PM 62.8 63.9 61.6 77.5
10:31:00 PM 63.1 64.3 62 76.7
10:32:00 PM 63.2 64.6 62.1 78
10:33:00 PM 63.1 64.4 62 76.7
10:34:00 PM 63.1 64.9 61.6 77.6
10:35:00 PM 63.1 64.6 61.8 77.1
10:36:00 PM 63.1 64.4 62 77.3
10:37:00 PM 62.8 64.1 61.6 77.2
10:38:00 PM 63 65.3 61.7 76.9
10:39:00 PM 63.1 64.6 61.8 77.9
10:40:00 PM 62.9 64.1 61.8 76.7
10:41:00 PM 63 64.3 61.8 77.8
10:42:00 PM 63.1 64.5 61.9 77.3
10:43:00 PM 62.9 64.6 61.9 77.1
10:44:00 PM 62.9 64 61.7 76.9
10:45:00 PM 63.1 64.5 62 77.1
10:46:00 PM 63.3 64.9 62.1 77.6
10:47:00 PM 63 64.8 61.7 77.3
10:48:00 PM 63.2 64.2 62.2 77.8
10:49:00 PM 63.1 64.3 62 77.2
10:50:00 PM 62.9 64.6 61.2 77.6
10:51:00 PM 62.8 64.4 61.8 76.7
10:52:00 PM 62.9 64 61.6 76.9
10:53:00 PM 63 64.3 61.8 77.7
10:54:00 PM 62.9 64.2 61.7 76.4
Date/Time Leq-1 Lmax-1 Lmin-1 Lpk-1

10:55:00 PM 63.1 64.5 61.8 76.7
10:56:00 PM 62.9 64.3 61.9 76.9
10:57:00 PM 63.2 64.6 62 78.1
10:58:00 PM 63.2 64.2 62.2 77.2
10:59:00 PM 62.9 64.1 61.8 77.2
11:00:00 PM 62.8 63.8 61.6 76.8
11:01:00 PM 63 64 62.1 77.3
11:02:00 PM 62.9 64.4 62 76.8
11:03:00 PM 62.9 64 62 76.1
11:04:00 PM 63 64.2 62 78.1
11:05:00 PM 63.1 64.6 61.8 76.5
11:06:00 PM 63.1 64.4 61.7 77.1
11:07:00 PM 62.9 64 62 77.5
11:08:00 PM 63.3 75.5 61.6 98.3
11:09:00 PM 62.9 73.2 61.6 94.7
11:10:00 PM 63.1 64.6 61.8 76.8
11:11:00 PM 62.8 64.3 61.8 76.5
11:12:00 PM 63.2 64.8 61.5 77.3
11:13:00 PM 63.1 64.2 62.1 77.3
11:14:00 PM 63.1 64.5 61.9 76.8
11:15:00 PM 63.2 64.4 61.9 77
11:16:00 PM 63 64.5 61.8 77
11:17:00 PM 63.1 64.3 62 76.5
11:18:00 PM 63 63.9 62 76.6
11:19:00 PM 63 64.1 62 76.9
11:20:00 PM 62.9 64 61.9 76.6
11:21:00 PM 63 64.4 61.9 77.6
11:22:00 PM 62.8 64 62 77.3
11:23:00 PM 62.8 64 61.9 77
11:24:00 PM 63 64.3 62.1 77
11:25:00 PM 63.1 64.4 62.1 77.6
11:26:00 PM 63 64.2 62 77
11:27:00 PM 63 64 62 77
11:28:00 PM 62.8 63.8 61.9 77.8
11:29:00 PM 62.9 63.9 61.9 76.4
11:30:00 PM 63 64.2 62.2 76.8
11:31:00 PM 63.1 64.3 62.2 77.2
11:32:00 PM 63 64 62.1 78
11:33:00 PM 62.9 64.1 62 76.9
Date/Time Leq-1 Lmax-1 Lmin-1 Lpk-1
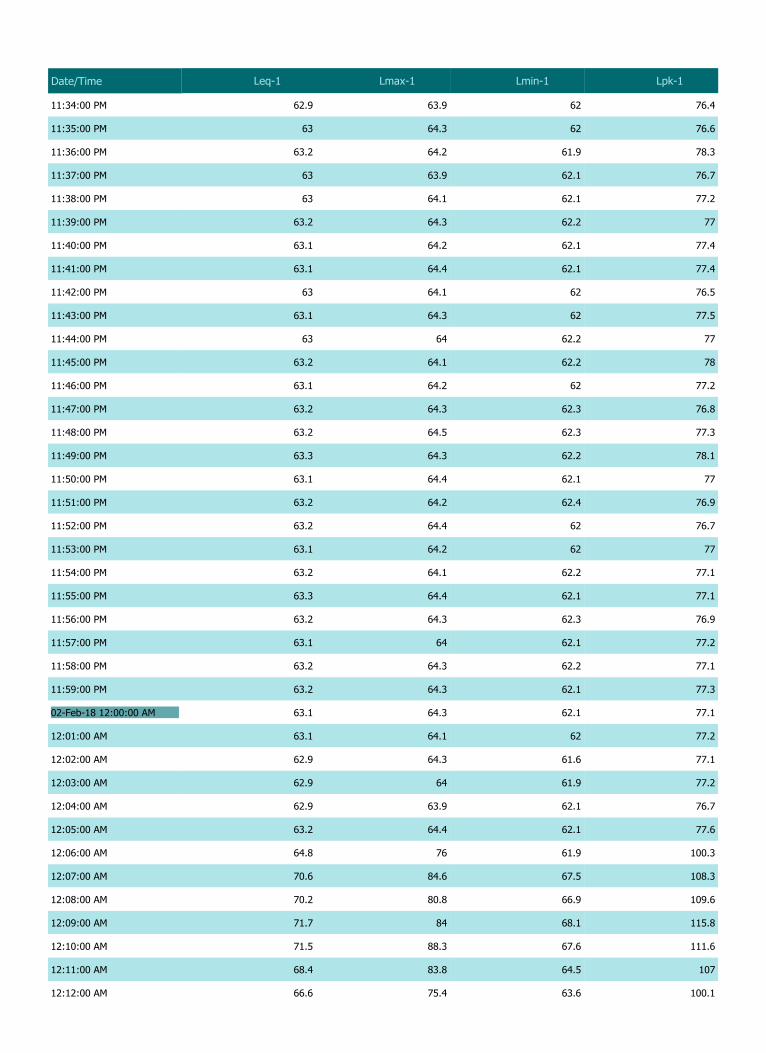
11:34:00 PM 62.9 63.9 62 76.4
11:35:00 PM 63 64.3 62 76.6
11:36:00 PM 63.2 64.2 61.9 78.3
11:37:00 PM 63 63.9 62.1 76.7
11:38:00 PM 63 64.1 62.1 77.2
11:39:00 PM 63.2 64.3 62.2 77
11:40:00 PM 63.1 64.2 62.1 77.4
11:41:00 PM 63.1 64.4 62.1 77.4
11:42:00 PM 63 64.1 62 76.5
11:43:00 PM 63.1 64.3 62 77.5
11:44:00 PM 63 64 62.2 77
11:45:00 PM 63.2 64.1 62.2 78
11:46:00 PM 63.1 64.2 62 77.2
11:47:00 PM 63.2 64.3 62.3 76.8
11:48:00 PM 63.2 64.5 62.3 77.3
11:49:00 PM 63.3 64.3 62.2 78.1
11:50:00 PM 63.1 64.4 62.1 77
11:51:00 PM 63.2 64.2 62.4 76.9
11:52:00 PM 63.2 64.4 62 76.7
11:53:00 PM 63.1 64.2 62 77
11:54:00 PM 63.2 64.1 62.2 77.1
11:55:00 PM 63.3 64.4 62.1 77.1
11:56:00 PM 63.2 64.3 62.3 76.9
11:57:00 PM 63.1 64 62.1 77.2
11:58:00 PM 63.2 64.3 62.2 77.1
11:59:00 PM 63.2 64.3 62.1 77.3
02-Feb-18 12:00:00 AM 63.1 64.3 62.1 77.1
12:01:00 AM 63.1 64.1 62 77.2
12:02:00 AM 62.9 64.3 61.6 77.1
12:03:00 AM 62.9 64 61.9 77.2
12:04:00 AM 62.9 63.9 62.1 76.7
12:05:00 AM 63.2 64.4 62.1 77.6
12:06:00 AM 64.8 76 61.9 100.3
12:07:00 AM 70.6 84.6 67.5 108.3
12:08:00 AM 70.2 80.8 66.9 109.6
12:09:00 AM 71.7 84 68.1 115.8
12:10:00 AM 71.5 88.3 67.6 111.6
12:11:00 AM 68.4 83.8 64.5 107
12:12:00 AM 66.6 75.4 63.6 100.1
Date/Time Leq-1 Lmax-1 Lmin-1 Lpk-1

12:13:00 AM 63.8 65 62.8 85.7
12:14:00 AM 63.4 64.8 62.5 78.2
12:15:00 AM 63.5 64.4 62.6 78.1
12:16:00 AM 63.3 64.4 62.4 77.9
12:17:00 AM 63.2 64.4 62.1 77.1
12:18:00 AM 63.4 64.5 62.4 78.3
12:19:00 AM 63.3 64.2 62.3 77.3
12:20:00 AM 63.2 64.3 62.3 77.3
12:21:00 AM 63.2 64.3 62.3 77.6
12:22:00 AM 63 64.1 62.1 76.7
12:23:00 AM 62.9 64.1 61.7 76.6
12:24:00 AM 63.2 64.3 62.1 77
12:25:00 AM 63 64.2 61.9 77.3
12:26:00 AM 63.1 64.5 62.1 77.4
12:27:00 AM 63.1 64.4 62 76.8
12:28:00 AM 63.2 64.2 62.1 77.1
12:29:00 AM 63.2 64.4 62.2 77
12:30:00 AM 63.4 64.3 62.2 76.9
12:31:00 AM 63.4 64.3 62.5 77.6
12:32:00 AM 63.4 64.5 62.4 77.6
12:33:00 AM 63.3 64.7 62.4 77
12:34:00 AM 63.2 64.3 62.2 77.9
12:35:00 AM 63.2 64.3 62.3 77.5
12:36:00 AM 63.3 65.3 62.3 77.6
12:37:00 AM 63.3 64.4 62.4 77.4
12:38:00 AM 63.3 64.6 62.3 77.4
12:39:00 AM 63.5 64.8 62.5 77.6
12:40:00 AM 63.3 64.4 62.5 77.3
12:41:00 AM 63.3 64.5 62.3 77.4
12:42:00 AM 63.3 65.4 62.3 77.1
12:43:00 AM 63.4 64.5 62.4 76.5
12:44:00 AM 63.4 64.8 62.5 78.3
12:45:00 AM 63.5 64.6 62.3 78.3
12:46:00 AM 63.4 65.3 62.5 78.5
12:47:00 AM 63.4 64.5 62.4 78
12:48:00 AM 63.5 64.5 62.4 77.8
12:49:00 AM 63.4 64.5 62.5 77.2
12:50:00 AM 63.4 64.5 62.6 78.6
12:51:00 AM 63.6 66.2 62.6 77.8
Date/Time Leq-1 Lmax-1 Lmin-1 Lpk-1

12:52:00 AM 63.4 64.8 62.5 77.1
12:53:00 AM 63.5 64.5 62.6 77.8
12:54:00 AM 63.4 64.4 62.3 77.1
12:55:00 AM 63.7 64.9 62.5 82.7
12:56:00 AM 68.2 81.7 63.6 107.3
12:57:00 AM 68.9 82 64.6 108.6
12:58:00 AM 72.7 89.5 65.1 113
12:59:00 AM 72.9 85.8 63 114.6
1:00:00 AM 63.8 65 62.6 84.7
1:01:00 AM 63.4 64.5 62.1 77.3
1:02:00 AM 63.7 64.7 62.5 77.4
1:03:00 AM 63.7 64.8 62.7 77.3
1:04:00 AM 63.9 65.2 62.8 78
1:05:00 AM 63.4 64.7 62.1 77.5
1:06:00 AM 63.6 65 62.7 77.1
1:07:00 AM 63.6 65 62.5 76.9
1:08:00 AM 63.4 64.6 62.4 77.8
1:09:00 AM 63.5 64.6 62.6 77.3
1:10:00 AM 63.9 65.1 62.4 78.5
1:11:00 AM 63.6 64.7 62.3 77.1
1:12:00 AM 63.3 65.3 62.1 77.5
1:13:00 AM 63.5 64.6 62.2 77.1
1:14:00 AM 63.5 64.6 62.5 76.9
1:15:00 AM 63.2 64.3 62.3 77.8
1:16:00 AM 63.4 64.5 62.5 77.9
1:17:00 AM 63.4 64.4 62.3 77
1:18:00 AM 63.4 64.4 62.5 77.7
1:19:00 AM 63.5 64.6 62.3 77.5
1:20:00 AM 63.5 64.4 62.2 76.9
1:21:00 AM 63.7 64.7 62.7 77.3
1:22:00 AM 63.3 64.5 62.3 77.4
1:23:00 AM 63.3 65 62.2 77.1
1:24:00 AM 63.4 64.4 62.4 77.6
1:25:00 AM 63.2 64.2 62.3 76.8
1:26:00 AM 63.2 64.5 62.4 77.8
1:27:00 AM 63.3 64.7 62.1 77.4
1:28:00 AM 63.1 64.2 62 78.8
1:29:00 AM 63.1 64.2 62.2 77.3
1:30:00 AM 63.3 64.4 62.3 77.9
Date/Time Leq-1 Lmax-1 Lmin-1 Lpk-1

1:31:00 AM 63.2 64.1 62 76.8
1:32:00 AM 63 63.9 62.1 77.3
1:33:00 AM 63.1 64.1 62.1 77.8
1:34:00 AM 63 64.3 61.9 76.9
1:35:00 AM 63.1 64.4 62.1 77.2
1:36:00 AM 63.2 64.2 62.1 76.7
1:37:00 AM 63.2 64.7 62.2 77.6
1:38:00 AM 63.4 64.4 62.4 77.3
1:39:00 AM 63.4 64.6 62.2 77.4
1:40:00 AM 63.5 64.6 62.4 77.8
1:41:00 AM 63.5 64.5 62.6 77.4
1:42:00 AM 63.6 64.7 62.5 77
1:43:00 AM 63.6 64.4 62.5 77.7
1:44:00 AM 63.6 64.5 62.7 77.8
1:45:00 AM 63.5 64.6 62.7 77.5
1:46:00 AM 63.5 64.6 62.5 76.8
1:47:00 AM 63.5 64.5 62.6 77.4
1:48:00 AM 63.4 64.4 62.5 78.3
1:49:00 AM 63.4 64.4 62.6 78
1:50:00 AM 63.6 64.5 62.5 79.6
1:51:00 AM 63.5 64.5 62.6 77.6
1:52:00 AM 63.7 64.8 62.8 77.9
1:53:00 AM 63.6 64.6 62.4 77.1
1:54:00 AM 63.6 64.5 62.7 77.1
1:55:00 AM 63.6 64.6 62.7 78.1
1:56:00 AM 63.7 64.7 62.7 77
1:57:00 AM 63.6 64.6 62.6 76.8
1:58:00 AM 63.6 64.6 62.6 77.8
1:59:00 AM 63.7 64.7 62.6 78.1
2:00:00 AM 63.8 64.6 62.8 77.2
2:01:00 AM 63.9 65 62.9 78.4
2:02:00 AM 63.7 64.7 62.6 77
2:03:00 AM 63.8 65 63 77.7
2:04:00 AM 63.7 64.6 62.9 77.4
2:05:00 AM 63.7 64.9 62.6 77.6
2:06:00 AM 63.8 64.9 62.7 79.2
2:07:00 AM 63.9 64.9 62.8 77.6
2:08:00 AM 63.9 64.8 63.1 77.6
2:09:00 AM 63.9 65.1 62.9 78.1
Date/Time Leq-1 Lmax-1 Lmin-1 Lpk-1

2:10:00 AM 63.8 64.8 62.8 78.5
2:11:00 AM 63.8 64.6 63 77
2:12:00 AM 63.9 64.9 63.1 77.8
2:13:00 AM 63.8 64.8 62.9 77.6
2:14:00 AM 63.8 64.9 62.9 77.5
2:15:00 AM 63.9 64.9 62.7 77.6
2:16:00 AM 63.8 64.8 62.7 77.4
2:17:00 AM 63.8 65 62.6 77.5
2:18:00 AM 63.9 64.9 63 77.5
2:19:00 AM 63.8 64.8 62.9 78
2:20:00 AM 63.8 64.8 62.8 78.4
2:21:00 AM 63.8 64.6 62.9 77.5
2:22:00 AM 63.7 64.7 62.7 77.4
2:23:00 AM 63.8 64.8 62.9 78.2
2:24:00 AM 63.7 64.5 62.5 77.8
2:25:00 AM 63.6 64.5 62.5 78
2:26:00 AM 63.6 64.7 62.7 77.7
2:27:00 AM 63.7 64.7 62.4 78.1
2:28:00 AM 63.7 64.7 62.5 78.2
2:29:00 AM 63.5 64.6 62.5 76.9
2:30:00 AM 63.5 64.4 62.4 77
2:31:00 AM 63.5 64.6 62.6 76.9
2:32:00 AM 63.5 64.6 62.4 77.6
2:33:00 AM 63.6 65 62.4 76.7
2:34:00 AM 63.6 64.8 62.4 77.9
2:35:00 AM 63.8 65.1 62.7 77
2:36:00 AM 63.5 64.4 62.4 77.9
2:37:00 AM 63.6 65.1 62.5 77.8
2:38:00 AM 63.6 65 62.7 77.5
2:39:00 AM 63.7 65 62.7 77
2:40:00 AM 63.6 65.1 62.6 76.8
2:41:00 AM 63.9 65.4 62.7 78.1
2:42:00 AM 63.7 65.4 62.6 78.3
2:43:00 AM 64 65.2 63 77.6
2:44:00 AM 63.9 65.1 62.9 77.7
2:45:00 AM 63.9 65.3 62.9 77.8
2:46:00 AM 64 65.5 62.9 77.8
2:47:00 AM 64 65.1 62.9 77.6
2:48:00 AM 63.9 65 62.9 77.4
Date/Time Leq-1 Lmax-1 Lmin-1 Lpk-1

2:49:00 AM 64 65.2 62.7 77.3
2:50:00 AM 64.2 66 63 78.2
2:51:00 AM 64.4 71.5 63.1 83.8
2:52:00 AM 64.1 64.9 63.2 78.5
2:53:00 AM 64.2 66.4 63 79.3
2:54:00 AM 64.2 65.2 63.1 77.2
2:55:00 AM 64.2 65.7 63.3 79.1
2:56:00 AM 64.3 70.6 63.3 87.5
2:57:00 AM 64 69 63.1 81.5
2:58:00 AM 64.2 71.4 63.1 85.6
2:59:00 AM 63.9 65 62.9 78.1
3:00:00 AM 63.8 65.7 62.9 78.4
3:01:00 AM 64 67.1 63 79
3:02:00 AM 63.9 68.2 63 88.1
3:03:00 AM 64.1 65.5 63 78.5
3:04:00 AM 63.7 65.1 62.7 78.1
3:05:00 AM 63.8 65 62.9 78
3:06:00 AM 64 66.5 63 81.8
3:07:00 AM 63.9 65.7 63.1 77.8
3:08:00 AM 63.9 65.4 62.9 78.3
3:09:00 AM 64 65.1 62.7 79.5
3:10:00 AM 64.1 67.8 62.8 80.5
3:11:00 AM 63.9 67.6 62.8 78.5
3:12:00 AM 63.7 65 62.8 79.1
3:13:00 AM 63.7 65 62.8 77.8
3:14:00 AM 64.1 65.9 62.8 78.2
3:15:00 AM 63.8 65.2 62.8 78.7
3:16:00 AM 63.7 64.8 62.5 77.5
3:17:00 AM 63.9 65.3 62.8 77.8
3:18:00 AM 63.8 67.7 62.7 81
3:19:00 AM 63.8 69.1 62.5 81.8
3:20:00 AM 63.8 67.4 62.7 85.5
3:21:00 AM 63.9 65.5 62.8 77.9
3:22:00 AM 63.9 67 62.9 80.1
3:23:00 AM 63.8 66.5 62.6 80.7
3:24:00 AM 63.8 67.6 62.7 80.6
3:25:00 AM 63.8 67.2 62.7 80.8
3:26:00 AM 63.8 67.1 62.8 79.5
3:27:00 AM 63.8 68.5 62.5 84.8
Date/Time Leq-1 Lmax-1 Lmin-1 Lpk-1

3:28:00 AM 64.1 70.9 62.8 85
3:29:00 AM 64.2 67.2 63.1 79.6
3:30:00 AM 64.6 70.2 63.2 85.3
3:31:00 AM 64.4 69.5 63.2 82.5
3:32:00 AM 64.1 68.4 63.1 86.3
3:33:00 AM 64.2 65.6 63.2 78.6
3:34:00 AM 64.1 70.6 62.8 83.2
3:35:00 AM 64.1 67.4 62.9 81.1
3:36:00 AM 63.9 65.3 62.7 78.5
3:37:00 AM 64.2 69.3 62.9 82.4
3:38:00 AM 64.2 71.9 63 89.7
3:39:00 AM 64.2 68.5 62.9 82.9
3:40:00 AM 64 65.3 63.2 78.2
3:41:00 AM 64.3 67.1 63 79.7
3:42:00 AM 64.1 69.5 62.9 89.3
3:43:00 AM 64.1 66.5 62.9 79.9
3:44:00 AM 64 67.9 62.7 79.7
3:45:00 AM 63.9 68.1 62.8 84.8
3:46:00 AM 63.9 66.2 62.7 78.6
3:47:00 AM 64.2 70.7 62.9 83.8
3:48:00 AM 63.9 65.7 62.8 78.9
3:49:00 AM 63.8 67.7 62.6 80.1
3:50:00 AM 64.3 70 62.9 82.2
3:51:00 AM 64.3 68 63 82.1
3:52:00 AM 64.2 69.3 62.9 83.3
3:53:00 AM 65 73.9 62.9 88.7
3:54:00 AM 65.5 74.4 62.9 94.7
3:55:00 AM 65.8 76.9 62.8 91.1
3:56:00 AM 66.1 75.8 62.6 96.5
3:57:00 AM 64.3 74.7 62.7 88.8
3:58:00 AM 64.3 68.8 62.8 83.5
3:59:00 AM 64.4 70.3 63.1 84.6
4:00:00 AM 64.1 67.5 63 83.3
4:01:00 AM 64.4 69.3 63.3 84.6
4:02:00 AM 64.5 67.2 63.3 80.1
4:03:00 AM 64.5 66.2 63.3 79.3
4:04:00 AM 64.2 68.8 63.1 83.5
4:05:00 AM 64.7 71.1 63.3 89.5
4:06:00 AM 64.4 68.9 63.1 81.9
Date/Time Leq-1 Lmax-1 Lmin-1 Lpk-1

4:07:00 AM 64.4 68.2 63.5 79.6
4:08:00 AM 64.1 68.2 63.1 82.7
4:09:00 AM 64.1 68.1 63 84.5
4:10:00 AM 63.8 65.3 62.4 78.4
4:11:00 AM 63.9 67.2 62.8 78.5
4:12:00 AM 64 67.3 63 78.7
4:13:00 AM 64.2 68.6 63 81.1
4:14:00 AM 64.2 67.9 63.2 80.4
4:15:00 AM 64.2 66.5 63.1 80.1
4:16:00 AM 64.2 65.9 62.9 78.3
4:17:00 AM 64 65.1 63.1 78.1
4:18:00 AM 64.2 70.6 63 82.7
4:19:00 AM 64.2 65.3 63.1 77.8
4:20:00 AM 64.2 65.9 63.1 78.6
4:21:00 AM 64.5 68.8 63.2 81.9
4:22:00 AM 64.1 65.5 62.9 77.9
4:23:00 AM 64.1 67.5 62.8 82.2
4:24:00 AM 63.8 65.9 62.8 82
4:25:00 AM 64 66.1 62.9 79.1
4:26:00 AM 64.2 69.9 62.8 81.7
4:27:00 AM 64 68.8 62.9 80.6
4:28:00 AM 64.5 71.1 62.8 84.4
4:29:00 AM 64.3 70.3 63 83.8
4:30:00 AM 64.2 69.7 62.9 82.5
4:31:00 AM 64.1 65.9 62.9 80.4
4:32:00 AM 64.2 65.5 63.2 79.2
4:33:00 AM 64.7 66.2 63.6 80.3
4:34:00 AM 64.3 65.7 63.1 79.5
4:35:00 AM 64.3 66.8 62.9 79
4:36:00 AM 64.6 71 63.2 85.4
4:37:00 AM 64.2 66.4 62.9 80.1
4:38:00 AM 64.3 66.7 63.1 78.6
4:39:00 AM 64.1 66 63 78.5
4:40:00 AM 64.1 70.8 62.7 82.9
4:41:00 AM 64.5 71.1 63 88.8
4:42:00 AM 64.2 69.3 62.8 82
4:43:00 AM 64.4 69.6 63 82.2
4:44:00 AM 64.9 74.4 63.1 88.9
4:45:00 AM 64.5 70.1 63.3 83.2
Date/Time Leq-1 Lmax-1 Lmin-1 Lpk-1

4:46:00 AM 64.2 68.6 63.1 82.8
4:47:00 AM 64.9 71.9 63.3 86.7
4:48:00 AM 64.9 75.2 63.5 87.1
4:49:00 AM 64.4 69.8 63.2 83
4:50:00 AM 64.5 70.3 63.3 84.3
4:51:00 AM 64.2 67 63.1 79.6
4:52:00 AM 64.9 67.3 63.6 80.1
4:53:00 AM 65.7 75.5 63.6 86.2
4:54:00 AM 64.5 69.1 63.1 82.4
4:55:00 AM 64.4 67.7 63 79.8
4:56:00 AM 64.2 66.6 62.8 79.5
4:57:00 AM 64.4 69 63.1 85.6
4:58:00 AM 64.4 65.8 63.2 77.9
4:59:00 AM 64.6 67.8 63 81.6
5:00:00 AM 64.7 68.5 63.6 80.3
5:01:00 AM 64.7 69.8 62.8 82.5
5:02:00 AM 64.3 69.6 62.9 81.5
5:03:00 AM 64.4 66.9 63 79.9
5:04:00 AM 64.6 67.5 63.1 80.4
5:05:00 AM 64.9 70 63.6 83.1
5:06:00 AM 64.8 72 63.2 84
5:07:00 AM 64.8 71.8 63.3 86.8
5:08:00 AM 64.9 69.9 63.6 85.5
5:09:00 AM 65 72.7 63.6 85.9
5:10:00 AM 64.5 74.2 62.7 89.4
5:11:00 AM 64.7 70.8 63.3 85.9
5:12:00 AM 64.6 69 63.2 81.8
5:13:00 AM 65.1 73.1 63.3 86
5:14:00 AM 64.8 68.9 63.3 80.2
5:15:00 AM 64.7 71.9 63.4 85.3
5:16:00 AM 64.7 69 63.1 80.5
5:17:00 AM 65.1 70.8 63.4 83.2
5:18:00 AM 64.7 69.2 63 81.1
5:19:00 AM 64.3 66.9 62.9 82
5:20:00 AM 64.2 66.1 62.9 80.6
5:21:00 AM 64.2 65.5 62.7 79
5:22:00 AM 65.2 75.6 62.9 87.3
5:23:00 AM 65.5 77.5 62.9 91.9
5:24:00 AM 64.9 67.3 63.4 79.3
Date/Time Leq-1 Lmax-1 Lmin-1 Lpk-1

5:25:00 AM 64.9 68.5 63.1 80.7
5:26:00 AM 65.1 67.4 63.6 80.2
5:27:00 AM 63.9 66.2 61.8 80.1
5:28:00 AM 64.5 66.3 62.4 78.9
5:29:00 AM 65.2 68.8 63.3 81.7
5:30:00 AM 64.5 66.6 63 79.2
5:31:00 AM 64.3 66.2 62.7 79.2
5:32:00 AM 64.7 66.4 62.9 80.8
5:33:00 AM 64.6 67 63.1 80.2
5:34:00 AM 64.5 66.7 62.9 82.8
5:35:00 AM 64 65.6 62.4 78.5
5:36:00 AM 63.7 65.5 62.2 80.9
5:37:00 AM 64.1 65.5 62.8 78.5
5:38:00 AM 63.9 66.9 62.5 80.7
5:39:00 AM 63.5 75.3 62.3 104.1
5:40:00 AM 63.8 66.5 62.1 78.6
5:41:00 AM 63.6 72.3 61.7 85.4
5:42:00 AM 63.2 66.9 61.6 79.3
5:43:00 AM 63 64.7 61.7 78
5:44:00 AM 62.9 71.8 61.6 85.9
5:45:00 AM 63.3 71.7 61.4 84.9
5:46:00 AM 63.4 72 61.9 86.8
5:47:00 AM 63.2 70.8 61.5 84.7
5:48:00 AM 63.1 70.8 61.4 85.1
5:49:00 AM 63.3 66.4 61.9 84.1
5:50:00 AM 63.3 65.6 61.8 78.5
5:51:00 AM 62.8 68.7 61.7 84.9
5:52:00 AM 63.2 71.7 61.5 84.8
5:53:00 AM 64.1 69.4 61.8 83.2
5:54:00 AM 63.9 71.7 62.2 85.7
5:55:00 AM 63 68.5 61.8 82.5
5:56:00 AM 63.4 70.9 62 83.8
5:57:00 AM 63.5 70 62.1 82.3
5:58:00 AM 63.1 69.7 61.8 82.9
5:59:00 AM 63.2 67.2 61.9 80.2
6:00:00 AM 62.8 64.8 61.3 77
6:01:00 AM 63 69.1 61.3 82.8
6:02:00 AM 63.3 66.8 61.9 79.9
6:03:00 AM 62.9 65 61.6 77.2
Date/Time Leq-1 Lmax-1 Lmin-1 Lpk-1

6:04:00 AM 63.1 68.2 62 79.2
6:05:00 AM 62.9 64.7 61.6 77.1
6:06:00 AM 63.1 67.9 61.2 82.1
6:07:00 AM 62.9 68.7 61.3 82.9
6:08:00 AM 62.9 67.3 61.6 83
6:09:00 AM 63 67 61.7 83.1
6:10:00 AM 63.5 66.7 61.7 78.6
6:11:00 AM 63.6 65.2 61.9 77.5
6:12:00 AM 63.2 67.5 61.8 80.8
6:13:00 AM 62.8 64.5 61.7 77.4
6:14:00 AM 62.7 64.5 61.5 76.8
6:15:00 AM 62.6 66 61.2 80.3
6:16:00 AM 63.4 65.9 61.7 79.5
6:17:00 AM 63 65.5 61.7 77.7
6:18:00 AM 63.2 66.9 61.1 80.4
6:19:00 AM 63 65.2 61.3 78.9
6:20:00 AM 63 76.3 60.9 90.6
6:21:00 AM 62.4 64.8 61.2 76.5
6:22:00 AM 62.9 65.6 61.7 81.1
6:23:00 AM 62.9 68.9 60.8 81.7
6:24:00 AM 62.8 73.1 61.2 85.7
6:25:00 AM 62.6 64.8 61.4 77.1
6:26:00 AM 62.7 65 61.1 77.9
6:27:00 AM 62.8 70.7 61.2 85.6
6:28:00 AM 62.4 64.1 61.1 77.3
6:29:00 AM 62.7 64.1 61.7 77.1
6:30:00 AM 62.8 65.4 61.6 78.2
6:31:00 AM 63 69.6 61.5 83.6
6:32:00 AM 62.9 68.5 61.2 81.1
6:33:00 AM 62.9 66.8 61.1 79.3
6:34:00 AM 62.6 64.4 60.9 77.4
6:35:00 AM 62.4 68.9 60.9 82.4
6:36:00 AM 62.9 65.6 61.2 79.5
6:37:00 AM 62.7 65.7 61 80.7
6:38:00 AM 62.4 64.4 60.9 76.7
6:39:00 AM 62.6 64.4 61.5 76.8
6:40:00 AM 62.4 64.1 60.9 76.4
6:41:00 AM 62.6 64.5 60.8 77.9
6:42:00 AM 62.8 65 61.4 77.4
Date/Time Leq-1 Lmax-1 Lmin-1 Lpk-1

6:43:00 AM 62.7 65.1 61.3 78.8
6:44:00 AM 62.4 64 61 76.1
6:45:00 AM 62.3 66.5 60.9 79.4
6:46:00 AM 62.6 65.9 61.3 81.3
6:47:00 AM 62.9 67.1 61.5 81.9
6:48:00 AM 62.7 71.4 61.3 83.3
6:49:00 AM 63 68.3 61.3 83.9
6:50:00 AM 63.2 74.2 61.3 92.2
6:51:00 AM 62.7 72 61.1 84.7
6:52:00 AM 63.1 71.5 60.7 85.8
6:53:00 AM 62.7 66.9 61.5 81.6
6:54:00 AM 62.9 68 61.1 82.1
6:55:00 AM 63.2 67.8 61.6 83
6:56:00 AM 62.6 68.8 60.9 85.2
6:57:00 AM 62.9 70.4 60.8 83.9
6:58:00 AM 62.8 70.9 61 85.8
6:59:00 AM 62.5 65 61 82.5
7:00:00 AM 62.6 65 61.3 78.5
7:01:00 AM 62.7 66.9 61.5 83.5
7:02:00 AM 62.6 65.9 61.1 82.3
7:03:00 AM 62.9 68.8 60.9 85
Date/Time Leq-1 Lmax-1 Lmin-1 Lpk-1

Appendix 4.2.14
DOE’s The Planning Guidelines for Noise Limits and Control, 2007

THE PLANNING GUIDELINES FOR ENVIRONMENTAL NOISE LIMITS AND CONTROL10
Receiving Land Use Day Time Night Time Category 7.00 am - 10.00 pm 10.00 pm - 7.00 am
Noise Sensitive Areas, 50 dBA 40 dBA Low Density Residential, Institutional (School, Hospital), Worship Areas.
Suburban Residential 55dBA 45 dBA (Medium Density) Areas, Public Spaces, Parks, Recreational Areas.
Urban Residential (High 60 dBA 50 dBA Density) Areas, Designated Mixed Development Areas (Residential - Commercial).
Commercial Business 65 dBA 55 dBA Zones
Designated Industrial 70 dBA 60 dBA Zones
ANNEX A SCHEDULE OF PERMISSIBLE SOUND LEVELS
SCHEDULE 1
MAXIMUM PERMISSIBLE SOUND LEVEL (LAeq) BY RECEIVING LAND USE FOR PLANNING AND NEW DEVELOPMENT
ANNEX A • Schedule 1

11THE PLANNING GUIDELINES FOR ENVIRONMENTAL NOISE LIMITS AND CONTROL
LAeq LAeq LAeq + 3 dBA
Receiving Land Use Day Time Night Time Category 7.00 am - 10.00 pm 10.00 pm -7.00am
Noise Sensitive Areas, L90 + 10 dBA L90 + 5 dBA Low Density Residential
Suburban and Urban L90 + 10 dBA L90 + 10 dBA Residential Areas
Commercial, Business L90 + 10 dBA L90 + 10 dBA
Industrial L90 + 10 dBA L90
+ 10 dBA
Existing Levels New Desirable Levels Maximum Permissible Levels
SCHEDULE 2
L90 is the measured ninety percentile sound level for the respective time period of the existing areas of interest in the absence of the proposed new development.
SCHEDULE 3
MAXIMUM PERMISSIBLE SOUND LEVEL (LAeq) TO BE MAINTAINED AT THE EXISTING NOISE CLIMATE
MAXIMUM PERMISSIBLE SOUND LEVEL (LAeq) OF NEW DEVELOPMENT (ROADS, RAILS, INDUSTRIAL) IN AREAS OF EXISTING
HIGH ENVIRONMENTAL NOISE CLIMATE
ANNEX A • Schedule 2,3

Appendix 4.2.15
DOE’s Permissible Maximum Noise Limit


Appendix 4.4.1
Survey Questionnaire

No.
1
Soal-selidik ini adalah bertujuan untuk mendapatkan maklumat-maklumat asas serta pendapat
penduduk mengenai projek Proposed Tg. Kidurong Combined Cycle Power Plant Project (Unit 12
& 13), Bintulu Division, Sarawak.
PENGENALAN: LATAR BELAKANG PROJEK
Projek ini adalah untuk pembinaan Blok 400 MW Combined Cycle Gas Turbine (CCGT) di Tanjung Kidurong,
Bintulu. Projek itu akan menyaksikan kemajuan baharu teknologi turbin gas yang lebih efisien dalam kitaran
padu gas menggantikan turbin yang sedia ada di Stesen Janakuasa Tanjung Kidurong, Bintulu.
Blok CCGT baharu itu akan dibina di dalam kawasan Stesen Janakuasa Tanjung Kidurong, Bintulu,
bersebelahan dengan CCGT Block 1. Projek ini dijangka siap pada Suku 4, 2020, dan kuasa elektrik yang
dihasilkan akan disalurkan kepada pengguna projek-projek SCORE.
Chemsain Konsultant Sdn Bhd (Syarikat Perunding Alam Sekitar) sedang menjalankan kajian kesan alam
sekitar yang mungkin timbul akibat daripada pembinaan dan operasi loji ini.
Kerana loji yang berkenaan terletak berdekatan dengan kawasan petempatan kekal ini, Chemsain ingin
mendapatkan maklumat sosio-ekonomi serta pendapat/pandangan penduduk tentang projek yang
dicadangkan ini.
Kami amat menghargai kerjasama anda untuk mengisi borang ini. Sila kembalikan borang yang siap diisi
kepada wakil Chemsain iaitu En. Benji Jihen, atau En. Elvinson Rosedy.

No.
2
A: Latar Belakang Responden
Sila isi tempat kosong atau tanda ✓ di mana sesuai.
1. Nama Kampung/Perumahan: ____________________________________________________
2. Tempat Asal (berasal dari mana?): ______________________________________________________
3. Berapa lama anda telah menetap di sini? ____________________________________
4. Adakah anda ketua keluarga? a. Ya b. Tidak
5. Umur/Usia:
18 – 24 tahun 45 – 54 tahun
25 – 34 tahun 55 – 64 tahun
35 – 44 tahun 65 tahun dan ke atas
6. Jantina: a. Lelaki b. Perempuan
7. Bangsa: a. Melayu b. Iban c. Bidayuh d. Lain-lain: ____________________
8. Agama: _________________________
9. Apakah tahap pendidikan saudara:
a. Tidak pernah ke sekolah e. Kolej & Institut
b. Darjah 1 sehingga 6 f. Univerisiti
c. Tingkatan 1 sehingga 3 g. Lain-Lain: _______________________________
d. Tingkatan 4 sehingga 6
10. Apakah pekerjaan dan punca pendapatan utama anda?
a. Pekerja kilang berdekatan
b. Makan gaji dengan sektor swasta di luar bidang perkilangan
c. Kerja sendiri termasuk perniagaan/bisnes
d. Kakitangan Kerajaan/Awam
e. Petani
f. Surirumah
g. Tidak bekerja/ menganggur
h. Bersara
i. Lain-lain, nyatakan: _________________________________________________________
B: Latar Belakang Isirumah
11. Berapa buah keluarga yang tinggal bersama dalam rumah ini? ______
12. Senaraikan orang yang menetap dalam rumah ini * (termasuk responden). Sila tuliskan/nyatakan
bilangan mengikut umur ahli keluarga.
Umur Jumlah Lelaki Perempuan Tidak tinggal di rumah
1 – 14
15 – 24
25 – 34
35 – 64
65+
Jumlah besar
*Termasuk mereka yang tinggal di luar tetapi bukan secara tetap dan juga mereka yang bersekolah di luar. Mereka ini akan balik ke rumah kalau tidak menpunyai perkerjaan atau tidak bersekolah lagi.

No.
3
13. Perkerjaan/Kegiatan/Peranan semua anggota isirumah. Sila tuliskan/nyatakan bilangan.
Sektor pekerjaan/ Kegiatan/Peranan
Lelaki Perempuan Jumlah Tempat kerja/sekolah/ tinggal & Bilangan
(Jika bukan di kampong/ perumahan)
Pembinaan/buruh
Kerja kilang
Berniaga/business
Pembantu jualan/ supermarket; restoran dll.
Sektor swasta
Sektor awam
Petani
Menganggur/sedang mencari kerja
Pencen/bersara
Suri rumah
Tua/cacat/sakit
Bersekolah
Anak kecil
Jumlah besar
14. Tahap pencapaian tertinggi pendidikan semua anggota isirumah yang bekerja atau sedang mencari
kerja (tidak termasuk yang sudah bersara). Sila tuliskan/nyatakan bilangan.
Tahap sekolah Lelaki Perempuan Jumlah
Tidak pernah bersekolah
Darjah 1 sehingga 6
Tingkatan 1 sehingga 3
Tingkatan 4 sehingga 6
Kolej/Institut (Sjil kemahiran/ vokasional/teknikal/Diploma)
Ijazah/Universiti
Lain-lain:
Jumlah
15. Pendapatan bulanan isirumah (pendapatan semua orang yang tinggal dalam rumah ini):
Sektor pekerjaan Jumlah (RM)
Gaji/Upah/Komisen/Bonus
Perniagaan/Kerja sendiri
Pertanian/Kebun
Hasil hutan/ Sungai/ Laut
Pemberian anak/anggota keluarga
Sewaan/Dividen
Lain-lain:
Jumlah besar

No.
4
C. Survei Pendapat Bahagian ini bertujuan untuk mengumpulkan pandangan dan pendapat saudara/saudari tentang Projek ini. Sila ambil maklum bahawa semua pendapat yang diutarakan adalah sulit dan akan hanya dilaporkan dalam bentuk statistik dan tidak boleh dikaitkan dengan orang atau individu tertentu.
16. Pernahkah anda mendengar mengenai projek ini?
a. Ya b. Tidak
17. Jika Ya, daripada siapa/dari mana anda mendengarnya?
TV/radio Taklimat rasmi di kampung
Surat khabar sanak saudara/kawan
Pejabat Daerah/agensi kerajaan Lain-lain _______________________________________
18. Pada pendapat anda, adakah projek ini membawa manfaat kepada penduduk sekitar?
a. Ya b. Tidak c. Tidak pasti
19. Jika Ya, apakah kebaikan-kebaikan ini pada pendapat anda? __________________________________
20. Berdasarkan pengetahuan dan fahaman anda, adakah saudara merasa bimbang Projek ini terletak berdekatan?
a. Ya b. Tidak c. Tidak kisah d. Tidak pasti
21. Sekiranya Ya, apakah kebimbangan anda (contoh: kesesakan lalu lintas, habuk, bising, lain lain).
22. Adakah anda sebarang komen atau soalan tambahan tentang Projek ini?
23. Sila nilaikan kualiti alam sekitar dan kemudahan awam di kampong/kawasan kediaman anda sekarang. Tik (✓ ) ruang yang berkenaan.
Faktor alam sekitar,
Kemudahan awam
Kualiti alam sekitar, Tik (✓ )
Baik Memuskan Tidak memuaskan
Sangat tidak memuaskan
Tidak pasti
Udara
Air
Bunyi
Ketenteraman
Pemandangan
Jalan raya
Keselamatan awam
TAMAT. Banci diperiksa: ___________________ Tarikh diperiksa: ________________

Appendix 5.3.1
Coastal Hydraulic Study

Sarawak Energy Berhad
February 2018
The Proposed
Bintulu Tanjung Kidurong
Combined Cycle Power
Plant Project (Unit 9 - 13),
Bintulu Division, Sarawak
Hydraulic Study
DR. NIK & ASSOCIATES SDN. BHD.
No. 22 & 24, Jalan Wangsa Delima 6, Seksyen 5, Pusat Bandar Wangsa Maju (KLSC), 53300 Kuala Lumpur
T 603 4145 8888 F 603 4145 8877

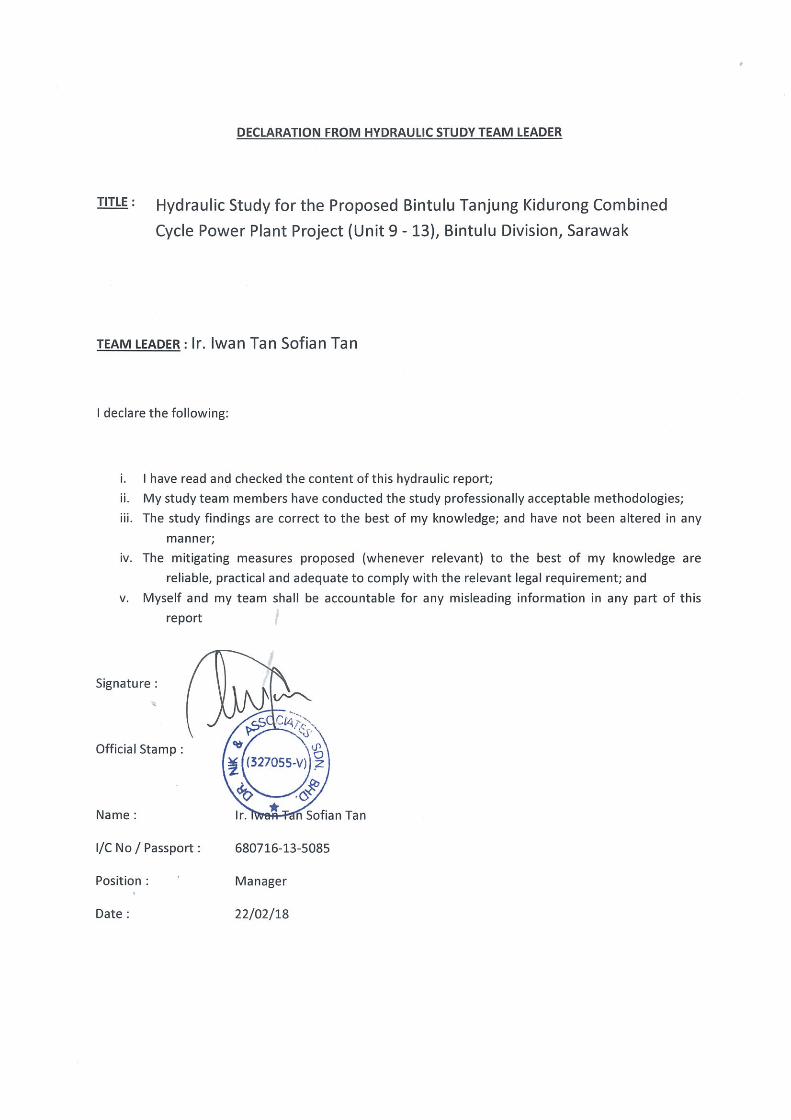

Document Verification
Rev Date Description Prepared by Reviewed by Approved by
1 26/02/2018 For submission to
JPS FHKA ITST ITST
Document Distribution
Distribution Data Type Number of Copies
Sarawak Energy Berhad Hard & Soft 1
Jabatan Pengairan & Saliran Malaysia. Hard & Soft 5 + 1
Dr Nik & Associates Sdn. Bhd. Hard 1
Dr. Nik & Associates Sdn. Bhd. (327055-V)
No.22 & 24 Jalan Wangsa Delima 6 Kuala Lumpur Suburban Centre (KLSC) Section 5 Pusat Bandar Wangsa Maju 53300 Kuala Lumpur Tel: +603 4145 8866 http://www.drnik.com.my Fax: +603 4145 8877 This report takes into account the particular instructions and requirements of our client for their sole and specific
use. It is not intended for and should not be relied upon by any third party and no responsibility is undertaken to
any third party.
© Dr. Nik & Associates Sdn. Bhd.
Dr. Nik & Associates Sdn. Bhd. i
CONTENTS
Chapter 1
Introduction 1.1 Introduction 1-1 1.2 Project Proponent 1-3 1.3 Hydraulic Study Consultant 1-4 1.4 Report Presentation 1-4
Chapter 2
Site Assessment and Meteo-Marine Condition
2.1 Introduction 2-1 2.2 Location 2-1 2.3 Site and Surrounding Areas 2-2 2.4 Main Geographical Features 2-11 2.4.1 Offshore and Nearshore Conditions 2-11 2.5 Environmental Forces 2-12 2.5.1 Tides 2-12 2.5.2 Currents 2-14 2.5.3 Winds 2-16 2.5.4 Waves 2-19 2.5.5 Seabed Sediment Sampling 2-24 2.5.6 Water Sampling 2-27 2.5.7 Seawater Temperature 2-29 2.6 Environmentally Sensitive Areas (ESAs) 2-31
Chapter 3
Project Description and Study Approach
3.1 Introduction 3-1 3.2 Project Description 3-1 3.3 Construction Methodology 3-7 3.3.1 Trench Excavation and Temporary 3-8 Disposal 3.3.2 Pipeline Laying and Backfilling 3-9 3.4 Impact Assessment Approach 3-9 3.4.1 Type of Impact 3-9 3.4.2 Potential Long-term Impact 3-10 3.4.2.1 Water Levels and Current Flow 3-10 3.4.2.2 Waves 3-10 3.4.2.3 Thermal and Chlorine Dispersion 3-10 3.4.3 Potential Temporary Impact 3-10 3.4.3.1 Water Levels and Current Flow 3-11 3.4.3.2 Waves 3-11 3.4.3.3 Sediment Spill Dispersion 3-11 3.4.3.4 Sediment Transport 3-11 3.4.4 Modelling Scenarios 3-11 3.4.5 Climatic Condition and Simulation Periods 3-13

Hydraulic Study for the Proposed Bintulu Tanjung Kidurong Combined Cycle
Power Plant Project (Unit 9 - 13)
ii Dr. Nik & Associates Sdn. Bhd.
Chapter 4
Hydrodynamics
4.1 Introduction 4-1 4.2 MIKE 21 HD 4-1 4.3 Model Setup 4-1 4.4 Boundary Conditions 4-3 4.5 Design Simulation Period 4-4 4.6 Calibration and Verification 4-4 4.6.1 Water Levels 4-5 4.6.2 Currents 4-8 4.7 Results 4-11 4.7.1 Existing Condition 4-11 4.7.2 “With Project” Condition 4-16 4.7.3 Period of No Activity During 4-19
Construction 4.8 Findings 4-23
Chapter 5
Waves
5.1 Introduction 5-1 5.2 MIKE 21 NSW 5-1 5.3 Boundary Conditions 5-1 5.4 Model Setup 5-2 5.5 Model Results 5-2 5.5.1 Existing Condition 5-2 5.5.2 ‘With Project’ Condition 5-4 5.5.3 Period of No Activity During Construction 5-6 5.6 Findings 5-9
Chapter 6
Thermal Plume and Chlorine Dispersion
6.1 Introduction 6-1 6.2 Regulations 6-1 6.3 MIKE 21 AD 6-2 6.4 Model Setup 6-2 6.5 Design Simulation Period 6-3 6.6 Thermal Plume Dispersion 6-3 6.6.1 Existing Condition 6-3 6.6.2 ‘With Project’ Condition 6-12 6.7 Chlorine Dispersion 6-23 6.7.1 Existing Condition 6-23 6.7.2 ‘With Project’ Condition 6-26 6.8 Findings 6-30
Chapter 7
Sediment Spill Dispersion
7.1 Introduction 7-1 7.2 MIKE 21 MT 7-1 7.3 MIKE 21 MT 7-2 7.4 Model Setup 7-3 7.5 Sediment Spill Rate 7-3 7.6 Design Simulation Period 7-4 7.7 Results 7-4 7.7.1 Sediment Spill during Backfilling 7-14 Operation

Hydraulic Study
Table of Contents
Dr. Nik & Associates Sdn. Bhd. iii
7.8 Findings 7-14
Chapter 8
Sediment Transport
8.1 Introduction 8-1 8.2 MIKE 21 ST 8-1 8.3 Model Setup 8-1 8.4 Model Results 8-2 8.5 Findings 8-6
Chapter 9
Proposed Mitigation Measures
9.1 Introduction 9-1 9.2 Monitoring System During Construction 9-1 9.3 Temporary Offshore Disposal Area 9-1 9.4 Post-construction Survey 9-2 9.5 Water Quality Monitoring 9-4
Chapter 10
Conclusion
10.1 Introduction 10-1 10.2 Site Assessment 10-1 10.3 Project Description 10-2 10.4 Hydrodynamics 10-3 10.5 Waves 10-4 10.6 Thermal and Chlorine Dispersion 10-4 10.7 Sediment Plume Dispersion 10-4 10.8 Sediment Transport 10-5 10.9 Mitigation Measures 10-6
References
Appendix Layout Plan

Hydraulic Study for the Proposed Bintulu Tanjung Kidurong Combined Cycle
Power Plant Project (Unit 9 - 13)
iv Dr. Nik & Associates Sdn. Bhd.
TABLES
Table 1.1 Report presentation Table 2.1 Tidal datum levels for Bintulu Port, Sarawak Table 2.2 Water level and current measurement locations Table 2.3 Coordinates of seabed sampling stations Table 2.4 Soil classification and median grain size (D50) for collected seabed
sediment samples Table 2.5 Coordinates of water sampling stations Table 2.6 Analysed TSS at the water sampling stations Table 2.7 List ESAs within 10 km radius of the Project area Table 3.1 Coordinates of the intake and outfall structures Table 3.2 Design specifications for proposed intake and outfall Table 3.3 Construction schedule for intake and outfall Table 3.4 Specifications for the trenching and disposal works Table 4.1 NRMSD for current speed and direction at ADCP1 and ADCP2 Table 4.2 Changes in current speeds due to Project implementation at the ESAs
within the vicinity of the Project area (Northeast Monsoon condition) Table 4.3 Changes in maximum water levels due to Project implementation at the
ESAs within the vicinity of the Project area (Northeast Monsoon condition)
Table 4.4 Changes in current speeds during period of no activity during construction at the ESAs within the vicinity of the Project area (Northeast Monsoon condition)
Table 4.5 Changes in maximum water levels during period of no activity during construction at the ESAs within the vicinity of the Project area (Northeast Monsoon condition)
Table 5.1 Parameters applied at local wave model boundary Table 5.2 Changes in significant wave height at the ESAs within the vicinity of the
Project area with Project implementation (Northeast Monsoon condition) Table 5.3 Changes in significant wave height at the ESAs within the vicinity of the
Project area during period of no activity during construction (Northeast Monsoon condition)
Table 6.1 Malaysian Marine Water Quality Criteria and Standard (MMWQCS) Table 6.2 Input data for MIKE 21 AD simulations Table 6.3 Excess temperature extracted at the ESAs for simulations with low
ambient temperature during the Northeast Monsoon condition Table 6.4 Excess temperature extracted at the ESAs for simulations with high
ambient temperature during the Northeast Monsoon condition Table 6.5 Excess temperature extracted at the ESAs for simulations with low
ambient temperature during the Southwest Monsoon condition Table 6.6 Excess temperature extracted at the ESAs for simulations with high
ambient temperature during the Southwest Monsoon condition Table 6.7 Residual chlorine concentration extracted at the ESAs (Northeast
Monsoon condition)
Hydraulic Study
Table of Contents
Dr. Nik & Associates Sdn. Bhd. v
Table 6.8 Residual chlorine concentration extracted at the ESAs (Southwest Monsoon condition)
Table 7.1 Impact severity categories for suspended sediment concentration Table 7.2 Impact severity categories for sedimentation Table 7.3 Daily production and spill rates of one cutter suction dredger during
dredging and disposal cycle Table 7.4 Excess suspended sediment concentration at the ESAs within the vicinity
of the Project area during construction without mitigation Table 8.1 Changes in sediment transport capacity at the ESAs within the vicinity of
the Project area during period of no activity during construction (Northeast Monsoon condition)
Table 9.1 Coordinates for boundary of proposed pre- and post-construction survey extent
Table 9.2 Coordinates of proposed water quality monitoring locations
Table 10.1 Construction schedule for intake and outfall

Hydraulic Study for the Proposed Bintulu Tanjung Kidurong Combined Cycle
Power Plant Project (Unit 9 - 13)
vi Dr. Nik & Associates Sdn. Bhd.
FIGURES
Figure 1.1 Overall view of the proposed new intake and outfall structures for the
CCGT Unit 9, Block 1 (Units 10 and 11) and Block 2 (Units 12 and 13) Figure 2.1 Project site located within Bintulu Port harbour limit Figure 2.2 Landuse within a 5 km radius of the Project site Figure 2.3 Project site and surrounding areas Figure 2.4 Coastline north of Sungai Likau river mouth Figure 2.5 Coastline condition south of Sungai Likau river mouth Figure 2.6 Coastline condition about 6.5 km northeast of Project site Figure 2.7 Coastline in front of Kampung Nelayan Batu Mandi located about 5 km
northeast of Project site Figure 2.8 Rocky coastline condition about 3.4 km northeast of Project site Figure 2.9 Coastline condition about 2 km northeast of Project site Figure 2.10 Coastline immediately northeast of Project site Figure 2.11 Coastline condition northeast of the power plant Figure 2.12 Coastline condition at the Project site (facing southwest) Figure 2.13 Gentle-sloping beach at the Project site Figure 2.14 Wave condition during site visit Figure 2.15 Coastline northeast of the power plant’s outfall Figure 2.16 Tree trunks found on the beach adjacent to the power plant’s outfall Figure 2.17 Rocks protecting the outfall located on the beach in front of power plant Figure 2.18 Coastline southwest of the power plant’s outfall Figure 2.19 Gentle-sloping beach fronting a rock revetment at the MLNG plant
adjacent to the power plant Figure 2.20 Coastline protected by rock revetment at MLNG plant Figure 2.21 Coastline protected by rock revetment at MLNG plant about 0.8 km
northeast of Tanjung Kidurong headland Figure 2.22 Rocky coastline protected at Tanjung Kidurong headland Figure 2.23 Coastline (left) adjacent to Bintulu Port’s northern breakwater (right) Figure 2.24 Interpolated bathymetry data within and around Project site Figure 2.25 Water level measurement locations Figure 2.26 Measured water levels Figure 2.27 Time series plot for current measurement at ADCP1 Figure 2.28 Time series plot for current measurement at ADCP2 Figure 2.29 Rose plots for current measurement at ADCP1 (top) and ADCP2
(bottom) Figure 2.30 Offshore wind and wave extraction locations Figure 2.31 Annual offshore wind roses off Project site Figure 2.32 Seasonal offshore wind roses Figure 2.33 Wind rose at Bintulu Airport based on measurement in November and
December 2017 Figure 2.34 Annual offshore wave roses off the Project area Figure 2.35 Seasonal offshore wave roses at the Project area Figure 2.36 Time series plot for wave measurement at ADCP1 Figure 2.37 Time series plot for wave measurement at ADCP2
Hydraulic Study
Table of Contents
Dr. Nik & Associates Sdn. Bhd. vii
Figure 2.38 Rose plots for wave measurements at ADCP1 (left) and ADCP2 (right) Figure 2.39 Location of seabed sampling stations Figure 2.40 Examples of collected seabed sediment samples Figure 2.41 Location of water sampling stations Figure 2.42 In-situ temperature measurements at ADCP1 Figure 2.43 In-situ temperature measurements at ADCP2 Figure 2.44 Condenser water inlet temperature at the existing power plant Figure 2.45 ESAs within 10 km radius of the Project area Figure 3.1 Aerial view of proposed Tg. Kidurong Power Plant’s expansion Figure 3.2 Overview of the proposed intake and outfall structures for the Tg.
Kidurong Combined Cycle Power Plant Figure 3.3 Details of the proposed intake structures Figure 3.4 Cross section of the trench for the proposed intake pipelines Figure 3.5 Details of the proposed outfall structure Figure 3.6 Overview of construction method for the proposed intake structure Figure 3.7 Location of proposed intake and outfall pipelines with respect to the
temporary disposal area (indicated in red) Figure 3.8 Addition of balancing weight onto the pipelines Figure 3.9 Model bathymetries for existing condition, ‘with Project’ condition and
Period of no activity during construction Figure 4.1 Nested regional model bathymetries Figure 4.2 Nested local model bathymetries Figure 4.3 Position of open boundaries for the regional model Figure 4.4 Position of open boundaries for the local model Figure 4.5 Location of tidal stations Figure 4.6 Regional model validation: Comparison between predicted and simulated
water levels Figure 4.7 Local model validation: Comparison between measured and simulated
water levels Figure 4.8 Model calibration: Comparison between measured and simulated current
speed and direction at ADCP1 and ADCP2 Figure 4.9 Model verification: Comparison between measured and simulated current
speed and direction at ADCP1 and ADCP2 Figure 4.10 Flow pattern during peak ebb and flood condition: Existing condition
(Northeast Monsoon condition) Figure 4.11 Flow pattern during peak ebb and flood condition: Existing condition
(Inter-monsoon condition) Figure 4.12 Flow pattern during peak ebb and flood condition: Existing condition
(Southwest Monsoon condition) Figure 4.13 Mean and maximum current speeds plots: Existing condition Figure 4.14 Mean and maximum current speed plots: “With Project” condition Figure 4.15 Difference in mean and maximum current speed plots: “With Project”
condition vs. existing condition Figure 4.16 Close-up view of bathymetry during period of no activity during
construction Figure 4.17 Mean and maximum current speed plots: Period of no activity during
construction Figure 4.18 Difference in mean and maximum current speed plots: Period of no
activity during construction Figure 5.1 Significant wave height: Existing condition

Hydraulic Study for the Proposed Bintulu Tanjung Kidurong Combined Cycle
Power Plant Project (Unit 9 - 13)
viii Dr. Nik & Associates Sdn. Bhd.
Figure 5.2 Significant wave height: “With Project” condition Figure 5.3 Difference in significant wave height: “With Project” condition vs. existing
condition Figure 5.4 Significant wave height: During construction Figure 5.5 Difference in significant wave height: During construction vs. existing
condition Figure 6.1 Simulations with low ambient temperature: Mean excess temperature for
existing condition Figure 6.2 Simulations with low ambient temperature: Maximum excess temperature
for existing condition Figure 6.3 Simulations with low ambient temperature: Contours for probability
exceedance of 2°C rise of temperature for existing condition Figure 6.4 Simulations with low ambient temperature: Contours for probability
exceedance of 3°C rise of temperature for existing condition Figure 6.5 Simulations with high ambient temperature: Mean excess temperature for
existing condition Figure 6.6 Simulations with high ambient temperature: Maximum excess
temperature for existing condition Figure 6.7 Simulations with high ambient temperature: Contours for probability
exceedance of 2°C rise of temperature for existing condition Figure 6.8 Simulations with high ambient temperature: Contours for probability
exceedance of 3°C rise of temperature for existing condition Figure 6.9 Simulations with low ambient temperature: Mean excess temperature for
‘with Project’ condition Figure 6.10 Simulations with low ambient temperature: Maximum excess temperature
for ‘with Project’ condition Figure 6.11 Simulations with low ambient temperature: Contours for probability
exceedance of 2°C rise of temperature for ‘with Project’ condition Figure 6.12 Simulations with low ambient temperature: Contours for probability
exceedance of 3°C rise of temperature for ‘with Project’ condition Figure 6.13 Simulations with high ambient temperature: Mean excess temperature for
‘with Project’ condition Figure 6.14 Simulations with high ambient temperature: Maximum excess
temperature for ‘with Project’ condition Figure 6.15 Simulations with high ambient temperature: Contours for probability
exceedance of 2°C rise of temperature for ‘with Project’ condition Figure 6.16 Simulations with high ambient temperature: Contours for probability
exceedance of 3°C rise of temperature for ‘with Project’ condition Figure 6.17 Mean residual chlorine dispersion for existing condition Figure 6.18 Maximum residual chlorine dispersion for existing condition Figure 6.19 Mean residual chlorine dispersion for ‘with Project’ condition Figure 6.20 Maximum residual chlorine dispersion for ‘with Project’ condition Figure 7.1 Location of dredging and disposal operations Figure 7.2 Mean and maximum excess suspended sediment concentration for
Section 1 Figure 7.3 Percentage of time exceedance of suspended sediment concentration
above 5 and 10 mg/L for Section 1 Figure 7.4 Percentage of time exceedance of suspended sediment concentration
above 25 and 50 mg/L for Section 1

Hydraulic Study
Table of Contents
Dr. Nik & Associates Sdn. Bhd. ix
Figure 7.5 Mean and maximum excess suspended sediment concentration for Section 2
Figure 7.6 Percentage of time exceedance of suspended sediment concentration above 5 and 10 mg/L for Section 2
Figure 7.7 Percentage of time exceedance of suspended sediment concentration above 25 and 50 mg/L for Section 2
Figure 7.8 Mean and maximum excess suspended sediment concentration for Section 3
Figure 7.9 Percentage of time exceedance of suspended sediment concentration above 5 and 10 mg/L concentration for Section 3
Figure 7.10 Percentage of time exceedance of suspended sediment concentration above 25 and 50 mg/L concentration for Section 3
Figure 8.1 Average sediment transport capacity for Northeast Monsoon condition Figure 8.2 Difference (existing condition vs. period of no construction) in average
sediment transport capacity for Northeast Monsoon condition Figure 8.3 Locations for extraction of sediment discharge profiles (denoted by the
red lines) Figure 8.4 Method in calculating the volume of sediment trapped inside the
excavated trench, Q Figure 9.1 Proposed pre- and post-construction survey extent Figure 9.2 Proposed water quality monitoring locations for the Project Figure 10.1 Location of proposed intake and outfall pipelines with respect to the
temporary offshore disposal area Figure 10.2 Location of dredging and disposal operations

Chapter 1
INTRODUCTION
Dr. Nik & Associates Sdn. Bhd. 1-1
INTRODUCTION
1.1 Introduction
Sarawak Energy Berhad (hereafter known as “the Client”) intends to construct new intake and outfall structures for the Tanjung Kidurong Combined Cycle Power Plant (CCGT). The Project components (Figure 1.1) are as follows: a) A new plant consisting of Block 1 (Units 10 and 11) and Block 2 (Units 12
and 13) is constructed within the vicinity of the existing plant. A set of intake and outfall will be installed to support the once-through cooling system for both blocks. The intake and the outfall pipelines are 1,450 m and 320 m from the pumphouse respectively; and
b) Relocation of the existing intake (Unit 9) to a new location that is parallel to the intake of Block 1 and Block 2. The existing outfall will remain functional.
Raw sea water supplied by the proposed intake subsea structure will be pumped into the power plant to cool the condenser units. The cooling water system is designed to be a once-through water supply system. The water exiting from the Heat Recovery Steam Generator (HRSG) as blowdown water will undergo cooling and neutralisation process prior to being discharged to the sea via the outfall structure.
Chapter 1

Hydraulic Study for the Proposed Bintulu Tanjung Kidurong Combined Cycle
Power Plant Project (Unit 9 - 13)
1-2 Dr. Nik & Associates Sdn. Bhd.
Figure 1.1 Overall view of the proposed new intake and outfall structures for the CCGT Unit
9, Block 1 (Units 10 and 11) and Block 2 (Units 12 and 13)

Hydraulic Study
Chapter 1 | Introduction
Dr. Nik & Associates Sdn. Bhd. 1-3
For a coastal development project such as this, it is important to carry out a hydraulic study to ensure that the Project is implemented successfully and to address possible environmental impacts due to the development. The main thrust of the hydraulic study shall be numerical modelling. The hydraulic study adheres to the “Guidelines for Preparation of Coastal Engineering Hydraulic Study and Impact Evaluations’ (JPS, 2001) and JPS’ 2013 circular regarding additional requirements for the guidelines’ [JPS ref. no. (45) dlmPPS.14/2/23 Jld.2]. In the study, an assessment of oceanographic and coastal conditions within and around the Project site is initially done to determine the existing marine environment. Subsequently, an analysis is carried out to predict potential changes to be expected in the study area in lieu of the “with Project” and during construction conditions through extensive numerical modelling simulations. Results obtained from the model simulations are used for impact assessment of the coastal region within the study area due to Project implementation during construction and operation stages. Recommendations for adequate mitigating measures to minimise potential negative impacts on the environment are then proposed. DR. NIK & ASSOCIATES SDN BHD (DNASB), an MS ISO 9001 certified engineering consulting company specialising in hydraulics, environmental and coastal engineering, was engaged to conduct the hydraulic study for this Project.
1.2 Project Proponent The address and contact information for the Project Proponent is as follows: Sarawak Energy Berhad, Level 4, South Wing, No.1, The Isthmus, 93050 Kuching, Sarawak. Contact person : Haji Johari Atok (Senior Manager, EIA) Telephone : 082-388388 Facsimile : 082-330708 E-mail : [email protected]

Hydraulic Study for the Proposed Bintulu Tanjung Kidurong Combined Cycle
Power Plant Project (Unit 9 - 13)
1-4 Dr. Nik & Associates Sdn. Bhd.
1.3 Hydraulic Study Consultant This hydraulic study was carried out by Dr. Nik & Associates Sdn. Bhd. The address and contact information is as follows: Dr. Nik & Associates Sdn. Bhd., No. 22 & 24, Jalan Wangsa Delima 6, Section 5, Pusat Bandar Wangsa Maju (KLSC), 53300 Kuala Lumpur.
Contact person : Ir. Iwan Tan Sofian Tan Telephone : 03-4145 8888 Facsimile : 03-4145 8877 E-mail : [email protected]
1.4 Report Presentation The contents of the report are shown in Table 1.1.
Table 1.1 Report presentation
Chapter Description
1 Introduction A brief introduction, scope of works and content of the report is
given
2 Site Assessment Description of the Project site and its surrounding areas, meteo-marine conditions based on field data collection and secondary data with literature review
3 Project Description and Study Approach
A description of the Project and the overall assessment approach is described
4 Hydrodynamics Assess water levels and current flow utilising a hydrodynamic numerical model
5 Waves Assess wave propagation using a wave simulation model
6 Thermal Plume and Chlorine Dispersion
Assess dispersion of the cooling water and chlorine discharged from the existing and proposed outfalls
7 Sediment Spill Dispersion
Assess extent and magnitude of suspended sediment dispersion during dredging works
8 Sediment Transport Assess potential impact due to Project implementation
9 Mitigation Measures Appropriate mitigating measures are proposed to alleviate potential impacts
10 Conclusion An overall summary of the findings are presented
References A list of references used in preparing the report is given

Chapter 2
SITE ASSESSMENT
AND METEO-MARINE
CONDITION

Dr. Nik & Associates Sdn. Bhd. 2-1
SITE ASSESSMENT AND METEO-MARINE CONDITION
2.1 Introduction Findings from the site assessment and results from the field investigation works are discussed in this chapter. This information complements the Consultant’s general knowledge of the area and data gathered from reports, publications and personal communications. A visit to the site was done in November 2017. This involved about 15 km of the coastline between Bintulu Port (south) and Sungai Likau river mouth (north). Field data including current, water level, seabed and water samples were collected in November 2017. The information obtained forms the basis for the study.
2.2 Location The Project site is about 5 km northeast of Bintulu Port. Figure 2.1 shows the harbour limit for Bintulu Port in the form of a semi-circle from 03° 08.40'N, 112° 57.87'E to 03° 19.74'N, 112° 54.60'E. The Project site is situated within the harbour limit. The Project site is bounded by the headlands of Tanjung Kidurong and Tanjung Payung.
Chapter 2

Hydraulic Study for the Proposed Bintulu Tanjung Kidurong Combined Cycle
Power Plant Project (Unit 9 - 13)
2-2 Dr. Nik & Associates Sdn. Bhd.
Source: MAL741
Figure 2.1 Project site located within Bintulu Port harbour limit
2.3 Site and Surrounding Areas The land use within a 5 km radius of the Project site is illustrated in Figure 2.2. Figure 2.3 shows the Project area and its surroundings around the Project site.

Hydraulic Study
Chapter 2 | Site Assessment and Meteo-Marine Condition
Dr. Nik & Associates Sdn. Bhd. 2-3
So
urc
e:
Che
msain
Kon
sultan
t S
dn
. B
hd.,
201
8
Fig
ure
2.2
Land
use
with
in a
5 k
m r
adiu
s o
f th
e P
roje
ct site

Hydraulic Study for the Proposed Bintulu Tanjung Kidurong Combined Cycle
Power Plant Project (Unit 9 - 13)
2-4 Dr. Nik & Associates Sdn. Bhd.
Figure 2.3 Project site and surrounding areas
Sungai Likau is located about 10 km northeast of the Project site. The coastline immediately north of the river mouth appears to be eroding as evidenced by fallen trees and a high scarp (Figure 2.4). The coastline south of the river mouth is stable; casuarinas vegetate the backshore (Figure 2.5). The coastline located about 6.5 km northeast of the Project site is also stable (Figure 2.6). Vegetation has been cleared to make way for Kampung Nelayan Batu Mandi, a settlement along the coastline about 5 km from the Project site (Figure 2.7).
Figure 2.4 Coastline north of Sungai Likau river mouth
Project site

Hydraulic Study
Chapter 2 | Site Assessment and Meteo-Marine Condition
Dr. Nik & Associates Sdn. Bhd. 2-5
Figure 2.5 Coastline condition south of Sungai Likau river mouth
Figure 2.6 Coastline condition about 6.5 km northeast of Project site
Figure 2.7 Coastline in front of Kampung Nelayan Batu Mandi located about 5 km northeast
of Project site

Hydraulic Study for the Proposed Bintulu Tanjung Kidurong Combined Cycle
Power Plant Project (Unit 9 - 13)
2-6 Dr. Nik & Associates Sdn. Bhd.
The coastline is rocky and sandy about 3.4 and 2 km northeast of Project site respectively (Figures 2.8 and 2.9). The coastline immediately northeast of the power plant is relatively straight, gentle-sloping and stable (Figures 2.10 and 2.11). The Bintulu Onshore Receiving Facility (BORF) is sited inland of the beach. The plant is owned by Murphy Sarawak Oil Co. Ltd.
Figure 2.8 Rocky coastline about 3.4 km northeast of Project site
Figure 2.9 Coastline condition about 2 km northeast of Project site
Figure 2.10 Coastline immediately northeast of Project site
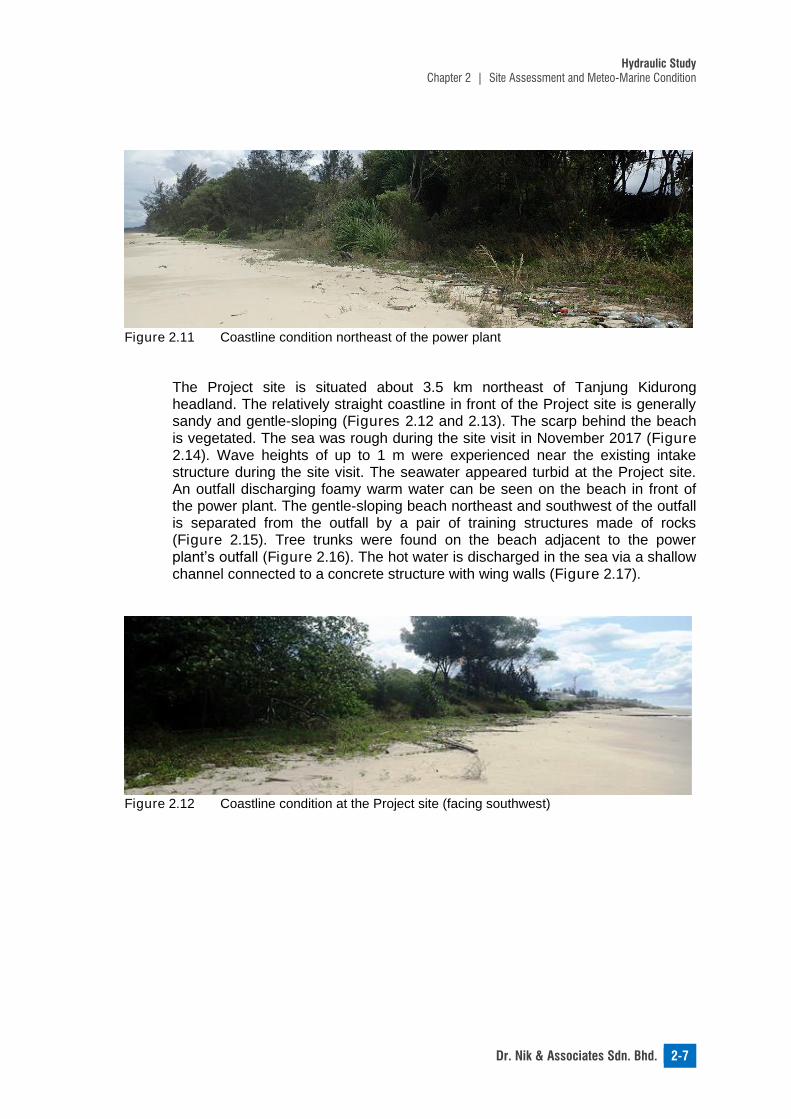
Hydraulic Study
Chapter 2 | Site Assessment and Meteo-Marine Condition
Dr. Nik & Associates Sdn. Bhd. 2-7
Figure 2.11 Coastline condition northeast of the power plant
The Project site is situated about 3.5 km northeast of Tanjung Kidurong headland. The relatively straight coastline in front of the Project site is generally sandy and gentle-sloping (Figures 2.12 and 2.13). The scarp behind the beach is vegetated. The sea was rough during the site visit in November 2017 (Figure 2.14). Wave heights of up to 1 m were experienced near the existing intake structure during the site visit. The seawater appeared turbid at the Project site. An outfall discharging foamy warm water can be seen on the beach in front of the power plant. The gentle-sloping beach northeast and southwest of the outfall is separated from the outfall by a pair of training structures made of rocks (Figure 2.15). Tree trunks were found on the beach adjacent to the power plant’s outfall (Figure 2.16). The hot water is discharged in the sea via a shallow channel connected to a concrete structure with wing walls (Figure 2.17).
Figure 2.12 Coastline condition at the Project site (facing southwest)

Hydraulic Study for the Proposed Bintulu Tanjung Kidurong Combined Cycle
Power Plant Project (Unit 9 - 13)
2-8 Dr. Nik & Associates Sdn. Bhd.
Figure 2.13 Gentle-sloping beach at the Project site
Figure 2.14 Wave condition during site visit
Figure 2.15 Coastline northeast of the power plant’s outfall

Hydraulic Study
Chapter 2 | Site Assessment and Meteo-Marine Condition
Dr. Nik & Associates Sdn. Bhd. 2-9
Figure 2.16 Tree trunks found on the beach adjacent to the power plant’s outfall
Figure 2.17 Rocks protecting the outfall located on the beach in front of power plant
Petronas’ Malaysian Liquefied Natural Gas (MLNG) facility is located adjacent to the power plant. A rock revetment protects much of the plant’s coastline (Figures 2.18 to 2.20). Scarps are evident along the stretch of coastline that is unprotected. A rock revetment protects much of the coastline at the MLNG plant that extends towards Tanjung Kidurong headland (Figures 2.21 and 2.22). The coastline is rocky adjacent to Bintulu Port’s northern breakwater (Figure 2.23).
Figure 2.18 Coastline southwest of the power plant’s outfall

Hydraulic Study for the Proposed Bintulu Tanjung Kidurong Combined Cycle
Power Plant Project (Unit 9 - 13)
2-10 Dr. Nik & Associates Sdn. Bhd.
Figure 2.19 Gentle-sloping beach fronting a rock revetment at the MLNG plant adjacent to
the power plant
Figure 2.20 Coastline protected by rock revetment at MLNG plant
Figure 2.21 Coastline protected by rock revetment at MLNG plant about 0.8 km northeast of
Tanjung Kidurong headland
Figure 2.22 Rocky coastline protected at Tanjung Kidurong headland

Hydraulic Study
Chapter 2 | Site Assessment and Meteo-Marine Condition
Dr. Nik & Associates Sdn. Bhd. 2-11
Figure 2.23 Coastline (left) adjacent to Bintulu Port’s northern breakwater (right)
2.4 Main Geographical Features
2.4.1 Offshore and Nearshore Conditions The offshore bathymetry of the Project site is generally governed by the degree of exposure to the wave climate and presence of nearby features such as headlands. A survey conducted in December 2016 is used to ascertain the current bed condition within the immediate vicinity of the Project site. The survey data was supplemented with bathymetric data from Sarawak Nautical chart no. SAR 1 (published in 2009), SAR 401 (published in 2016) and SAR 402 (published in 2013) and most of the offshore bathymetry data is provided by CMAP. The interpolated bathymetry data is shown in Figure 2.24 where it can be seen that the seabed contours are relatively parallel near the coastline.
Figure 2.24 Interpolated bathymetry data within and around Project site

Hydraulic Study for the Proposed Bintulu Tanjung Kidurong Combined Cycle
Power Plant Project (Unit 9 - 13)
2-12 Dr. Nik & Associates Sdn. Bhd.
2.5 Environmental Forces
2.5.1 Tides Water level variation within and around the Project site is mainly due to astronomical tides. The tidal and non-tidal processes play a major role in driving forces of dynamics along the South China Sea. River discharges and local meteorological conditions (e.g. wind) play a minor role compared to the tidal and ocean forcing. These driving forces and the local bathymetry form the local hydrodynamics. Tidal information from the Malaysian Tide Tables 2017 published by the National Hydrographic Centre (NHC) for Bintulu Port (a standard port) was referred to (Table 2.1). The tides are mixed but predominantly diurnal. The maximum, mean high water and mean low water tidal range are 2.57, 1.96 and 1.20 m respectively.
Tidal Levels m CD
Highest Astronomical Tide (HAT) 2.57
Mean Higher High Water (MHHW) 2.50
Mean Lower High Water (MLLW) 2.12
Mean Sea Level (MSL) 1.52
Mean Higher Low Water (MHLW) 0.92
Mean Lower Low Water (MLLW) 0.54
Lowest Astronomical Tide (LAT) 0.00
Source: NHC, 2017
In-situ water level measurements were carried out using two stationary Acoustic Doppler Current Profilers (ADCPs) at the locations shown in Figure 2.25 and Table 2.2. The tidal measurements were done from 9th until 30th November 2017. The recorded water levels are shown in Figure 2.26. The maximum tidal range was about 1.5 and 1 m during spring and neap period respectively during the measurement duration. The tidal measurements are used to validate the hydrodynamic model, MIKE 21 HD.
Table 2.1 Tidal datum levels for Bintulu Port, Sarawak

Hydraulic Study
Chapter 2 | Site Assessment and Meteo-Marine Condition
Dr. Nik & Associates Sdn. Bhd. 2-13
Figure 2.25 Water level measurement locations
Location Coordinates
Longitude (E) Latitude (N)
ADCP1 113⁰ 4' 49.4'' 3⁰ 18' 23.3''
ADCP2 113⁰ 5' 26.2'' 3⁰ 18' 46.0''
Table 2.2 Water level and current
measurement locations

Hydraulic Study for the Proposed Bintulu Tanjung Kidurong Combined Cycle
Power Plant Project (Unit 9 - 13)
2-14 Dr. Nik & Associates Sdn. Bhd.
Figure 2.26 Measured water levels
2.5.2 Currents Sediments are moved in the littoral zone under the action of tides, currents and waves. Coastal currents exert significant influence on the movements of marine sediments and pollutants. Wave-generated long-shore surface currents are primary current-types that occur in the coastal waters. In-situ measurements of current speed and direction were done at the same locations of the tidal measurements (Figure 2.30) using ADCPs. Current speed and direction were measured at every 1 m cells. Time series of current and water levels measured by both ADCPs are presented in Figures 2.27 and 2.28. The rose plots for current measured are shown in Figure 2.29. It can be deduced from the measurements that the current speed ranges from 0 to 0.8 m/s with dominant directions of 60 and 240°N. The current measurements are used to validate the hydrodynamic model, MIKE 21 HD.

Hydraulic Study
Chapter 2 | Site Assessment and Meteo-Marine Condition
Dr. Nik & Associates Sdn. Bhd. 2-15
Figure 2.27 Time series plot for current measurement at ADCP1
Figure 2.28 Time series plot for current measurement at ADCP2
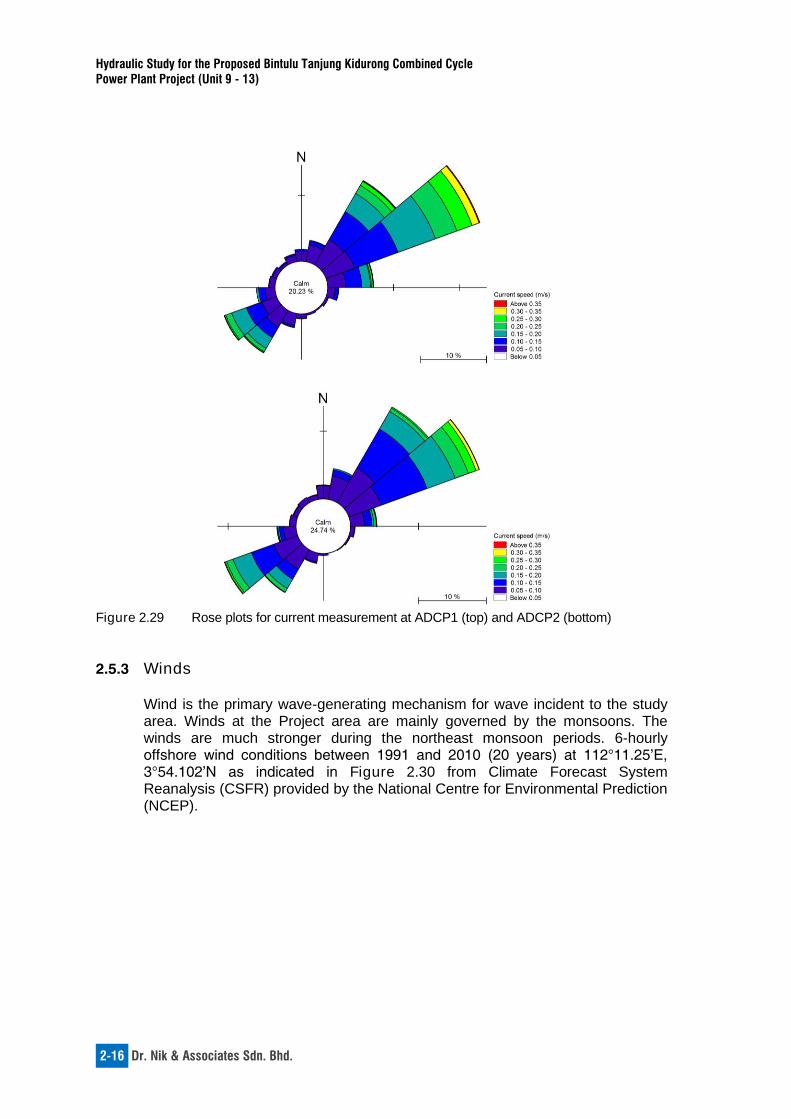
Hydraulic Study for the Proposed Bintulu Tanjung Kidurong Combined Cycle
Power Plant Project (Unit 9 - 13)
2-16 Dr. Nik & Associates Sdn. Bhd.
Figure 2.29 Rose plots for current measurement at ADCP1 (top) and ADCP2 (bottom)
2.5.3 Winds
Wind is the primary wave-generating mechanism for wave incident to the study area. Winds at the Project area are mainly governed by the monsoons. The winds are much stronger during the northeast monsoon periods. 6-hourly offshore wind conditions between 1991 and 2010 (20 years) at 112°11.25’E, 3°54.102’N as indicated in Figure 2.30 from Climate Forecast System Reanalysis (CSFR) provided by the National Centre for Environmental Prediction (NCEP).

Hydraulic Study
Chapter 2 | Site Assessment and Meteo-Marine Condition
Dr. Nik & Associates Sdn. Bhd. 2-17
Figure 2.30 Offshore wind and wave extraction locations
The annual offshore wind rose is shown in Figure 2.31. Based on the annual wind rose, the dominant wind directions are predominantly from the northeastern and southwestern sectors. Calm periods (wind speeds of less than 2 m/s) occur about 15% of the time annually. Seasonal wind roses for both locations are shown in Figure 2.32.
Figure 2.31 Annual offshore wind roses off Project site

Hydraulic Study for the Proposed Bintulu Tanjung Kidurong Combined Cycle
Power Plant Project (Unit 9 - 13)
2-18 Dr. Nik & Associates Sdn. Bhd.
a) Northeast Monsoon b) Inter-monsoon (April and October)
c) Southwest Monsoon
Figure 2.32 Seasonal offshore wind roses
The general meteorological situation off the Project site between November and March implies that winds blow mainly from northeast to southwest at an average speed of about 4 to 8 m/s respectively. The winds blow mainly from the southwest from May to September (Southwest Monsoon) at an average speed of about 2 to 6 m/s respectively. Percentage of wind speed of less than 2 m/s is highest (about 22%) in inter-monsoon period. Wind measurement (speed and direction) for November and December 2017 at Bintulu Airport (113° 01’ 29” E, 3° 07’ 12” N) was procured from the Malaysian Meteorological Department. The measurement has a temporal resolution of 1 hr. Measurements were made at an elevation of 24.29 m MSL. For modelling purposes, the measurements were converted to 10 m MSL wind speed using the wind profile power law. A roughness parameter of 0.0024 (indicating open terrain with smooth surface) was adopted. The wind rose is shown in Figure 2.33. The rose plot shows that wind primarily comes from the northwest and southeast (landward) during the measurement period. Wind speed of up to 7 m/s from the northwest was observed. The highest wind speed was only up to 4 m/s from the southeast due to the effect of landmass.
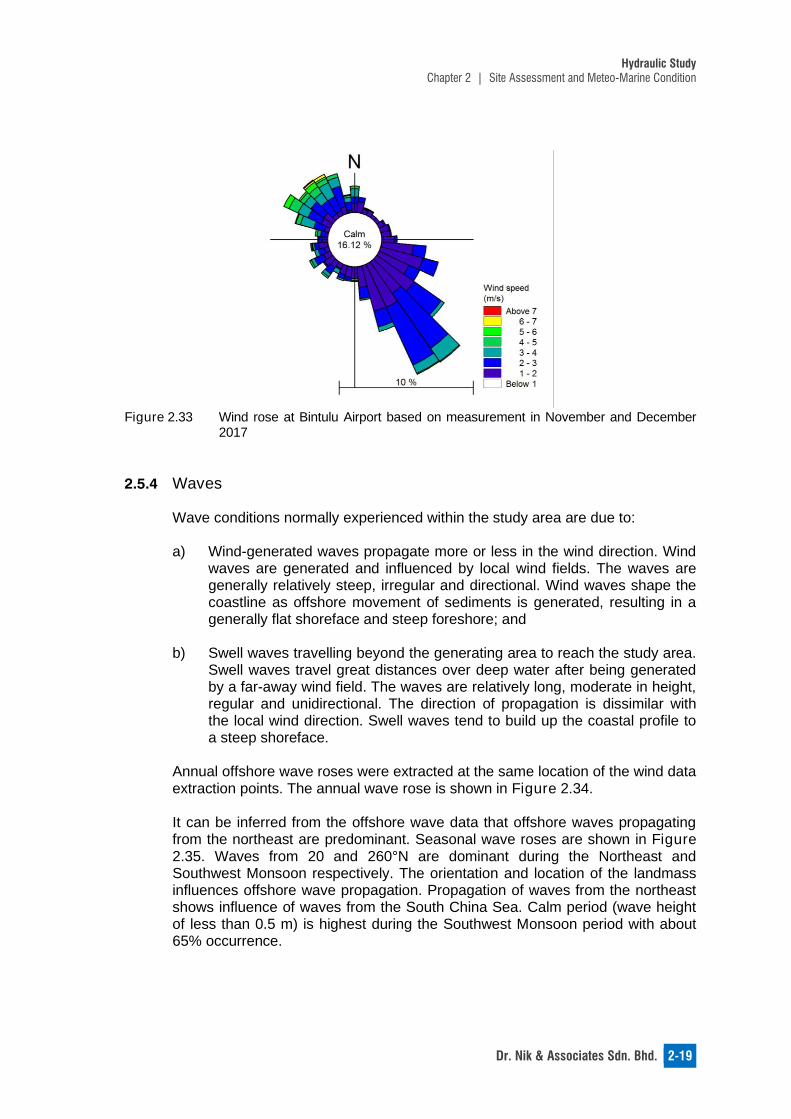
Hydraulic Study
Chapter 2 | Site Assessment and Meteo-Marine Condition
Dr. Nik & Associates Sdn. Bhd. 2-19
Figure 2.33 Wind rose at Bintulu Airport based on measurement in November and December
2017
2.5.4 Waves Wave conditions normally experienced within the study area are due to: a) Wind-generated waves propagate more or less in the wind direction. Wind
waves are generated and influenced by local wind fields. The waves are generally relatively steep, irregular and directional. Wind waves shape the coastline as offshore movement of sediments is generated, resulting in a generally flat shoreface and steep foreshore; and
b) Swell waves travelling beyond the generating area to reach the study area.
Swell waves travel great distances over deep water after being generated by a far-away wind field. The waves are relatively long, moderate in height, regular and unidirectional. The direction of propagation is dissimilar with the local wind direction. Swell waves tend to build up the coastal profile to a steep shoreface.
Annual offshore wave roses were extracted at the same location of the wind data extraction points. The annual wave rose is shown in Figure 2.34. It can be inferred from the offshore wave data that offshore waves propagating from the northeast are predominant. Seasonal wave roses are shown in Figure 2.35. Waves from 20 and 260°N are dominant during the Northeast and Southwest Monsoon respectively. The orientation and location of the landmass influences offshore wave propagation. Propagation of waves from the northeast shows influence of waves from the South China Sea. Calm period (wave height of less than 0.5 m) is highest during the Southwest Monsoon period with about 65% occurrence.
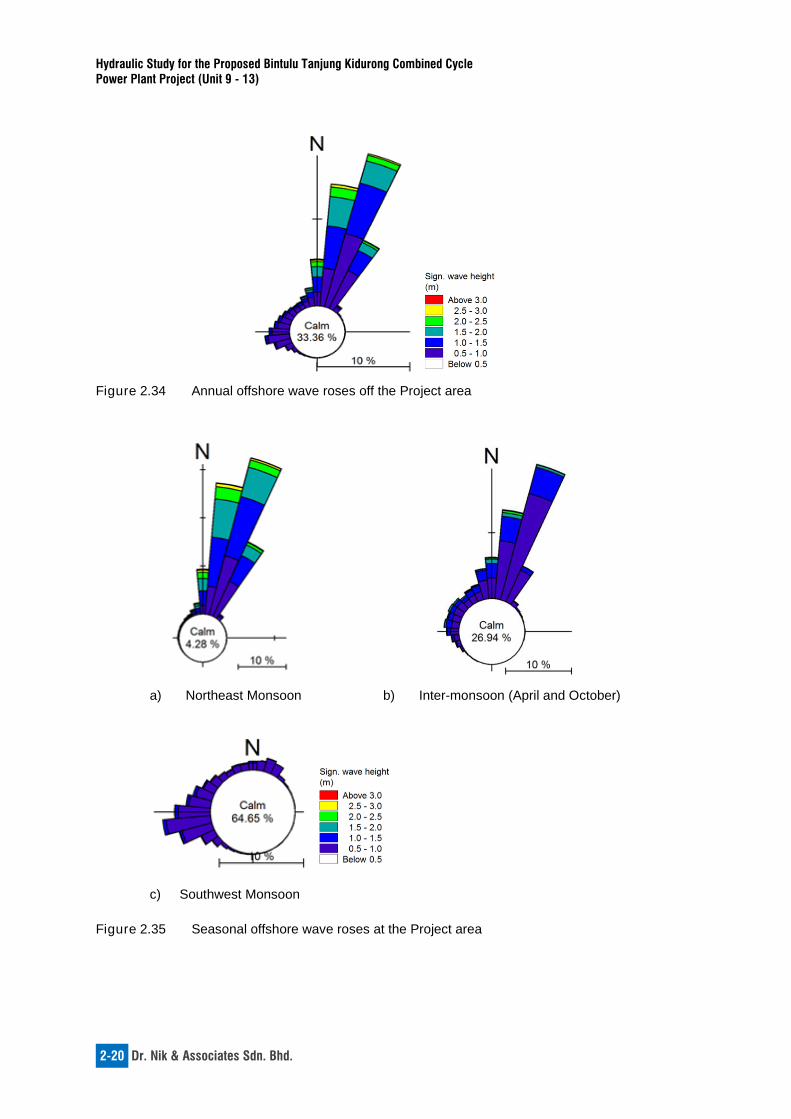
Hydraulic Study for the Proposed Bintulu Tanjung Kidurong Combined Cycle
Power Plant Project (Unit 9 - 13)
2-20 Dr. Nik & Associates Sdn. Bhd.
Figure 2.34 Annual offshore wave roses off the Project area
a) Northeast Monsoon b) Inter-monsoon (April and October)
c) Southwest Monsoon
Figure 2.35 Seasonal offshore wave roses at the Project area

Hydraulic Study
Chapter 2 | Site Assessment and Meteo-Marine Condition
Dr. Nik & Associates Sdn. Bhd. 2-21
The two ADCPs were also set up to measure waves at the study area. Waves were measured at 1 Hz intervals, which is equivalent to 1 s. The parameters measured include significant wave height, average wave height, peak wave period, mean wave period, mean wave direction and also peak wave direction. The measurement shows relatively high wave heights as the measurement were taken during the Northeast monsoon period. The time series plots for wave measurements (i.e. wave height, period and direction) are shown in Figures 2.36 and 2.37. Figure 2.38 shows the wave rose during the measurement period for both ADCPs. It can be observed during the measurement period that significant wave height (Hm0) of up to 1.5 m can occur with relatively long wave period (Tp) reaching 10 s. The dominant incoming waves are from 320 to 350°N.

Hydraulic Study for the Proposed Bintulu Tanjung Kidurong Combined Cycle
Power Plant Project (Unit 9 - 13)
2-22 Dr. Nik & Associates Sdn. Bhd.
Figure 2.36 Time series plot for wave measurement at ADCP1
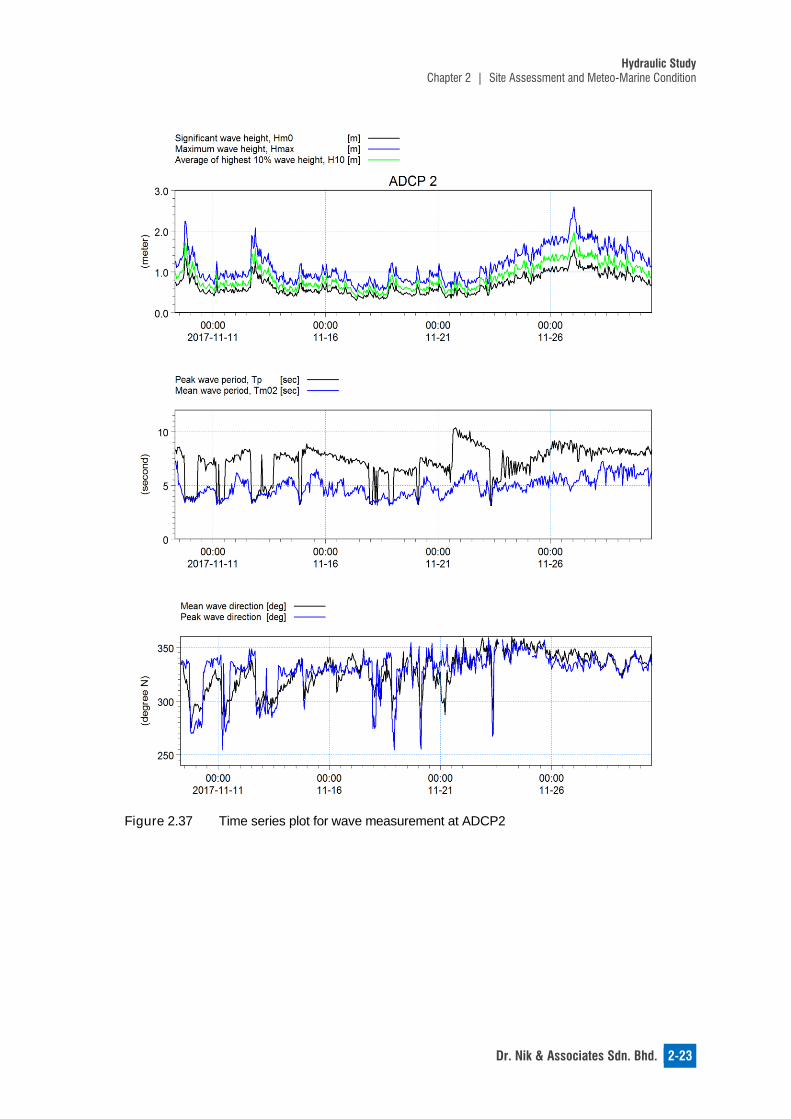
Hydraulic Study
Chapter 2 | Site Assessment and Meteo-Marine Condition
Dr. Nik & Associates Sdn. Bhd. 2-23
Figure 2.37 Time series plot for wave measurement at ADCP2

Hydraulic Study for the Proposed Bintulu Tanjung Kidurong Combined Cycle
Power Plant Project (Unit 9 - 13)
2-24 Dr. Nik & Associates Sdn. Bhd.
Figure 2.38 Rose plots for wave measurements at ADCP1 (left) and ADCP2 (right)
2.5.5 Seabed Sediment Sampling Seabed sediment samples were collected at 15 locations using a Van Veen grab sampler. Sediment samples were taken to determine their grain sizes as well as the percentages of fine sediment. The samples were analysed by Soilpro Technical Services Sdn. Bhd. The results will be used for sediment transport modelling as well as sediment plume dispersion. Figure 2.39 shows the sampling locations. The coordinates for the seabed sampling stations are presented in Table 2.3. Results for the analysis of the seabed samples are tabulated in Table 2.4.

Hydraulic Study
Chapter 2 | Site Assessment and Meteo-Marine Condition
Dr. Nik & Associates Sdn. Bhd. 2-25
Figure 2.39 Location of seabed sampling stations
Table 2.3 Coordinates of seabed sampling stations
Station Coordinate (in WGS 84)
Station Coordinate (in WGS 84)
Longitude (E) Latitude (N) Longitude (E) Latitude (N)
gs1 113° 4’ 00.2” 3° 17’ 32.5” gs9 113° 5’ 54.5” 3° 13’ 14.4”
gs2 113° 4’ 23.2” 3° 17’ 50.4” gs10 113° 6’ 11.6” 3° 18’ 35.9”
gs3 113° 4’ 33.8” 3° 17’ 47.7” gs11 113° 6’ 18.9” 3° 19’ 00.4”
gs4 113° 4’ 56.3” 3° 17’ 36.2” gs12 113° 6’ 37.5” 3° 18’ 46.2”
gs5 113° 5’ 09.6” 3° 17’ 58.6” gs13 113° 6’ 41.2” 3° 19’ 06.7”
gs6 113° 5’ 36.7” 3° 17’ 59.2” gs14 113° 3’ 39.6” 3° 16’ 37.8”
gs7 113° 5’ 32.1” 3° 18’ 23.2” gs15 113° 3’ 48.8” 3° 17’ 0.5”
gs8 113° 5’ 49.5” 3° 13’ 40.2”

Hydraulic Study for the Proposed Bintulu Tanjung Kidurong Combined Cycle
Power Plant Project (Unit 9 - 13)
2-26 Dr. Nik & Associates Sdn. Bhd.
Table 2.4 Soil classification and median grain size (D50) for collected seabed sediment samples
Station Soil Classification (%)
D50 (mm) Clay Silt Sand Gravel
GS1 7 44 49 0 0.0623
GS2 36 63 1 0 0.0055
GS3 17 34 49 0 0.0609
GS4 18 82 0 0.2144
GS5 19 43 38 0 0.0338
GS6 16 83 1 0.2234
GS7 26 50 24 0 0.0198
GS8 23 55 22 0 0.0288
GS9 20 39 41 0 0.0409
GS10 23 49 28 0 0.2402
GS11 17 51 32 0 0.0495
GS12 5 25 70 0 0.1655
GS13 27 46 27 0 0.0245
GS14 3 41 56 0 0.0870
GS15 27 71 2 0 0.0134
Based on the analysed results of the seabed samples, it can be deduced that the seabed sediment around the Project area is a combination of silt and sand. The D50 for all the stations is very fine sand based on Wentworth Size Class soil classification. Figure 2.40 shows seabed samples taken at site.
a) GS2 b) GS10
Figure 2.40 Examples of collected seabed sediment samples

Hydraulic Study
Chapter 2 | Site Assessment and Meteo-Marine Condition
Dr. Nik & Associates Sdn. Bhd. 2-27
2.5.6 Water Sampling Water samples were collected at four stations to determine the Total Suspended Sediments (TSS) concentration within and around the Project area. The samples were collected using a van Dorn sampler at two depths i.e. 0.2D and 0.8D, where D is the height of the water column. The samples were analysed at Chemsain Konsultant Sdn. Bhd.’s laboratory. The results will be used to establish as the model’s baseline condition for TSS concentration. Figure 2.41 shows the sampling locations. Table 2.5 shows the coordinates of the water sampling stations. Based on the TSS results (Table 2.6), the water quality at the study area falls between Class 1 and Class 2 of the Malaysia Marine Water Quality and Standard. Station WS1 showed the highest TSS levels among all the stations. This could be due to its location being relatively near BCOT’s outlet. WS2, which is the station slightly offshore of the existing discharge outlet of Tanjung Kidurong Power Plant shows TSS levels of up to 35.5 mg/L. Relatively lower TSS levels were detected at station WS3 although it is located near a small stream outlet. The lowest TSS levels were recorded at WS4. This is probably due to its relatively offshore location.
Figure 2.41 Location of water sampling stations

Hydraulic Study for the Proposed Bintulu Tanjung Kidurong Combined Cycle
Power Plant Project (Unit 9 - 13)
2-28 Dr. Nik & Associates Sdn. Bhd.
Station Coordinate (in WGS1984)
Longitude (E) Latitude (N)
WS1 113⁰ 4' 45.93'' 3⁰ 17' 24.33''
WS2 113⁰ 5' 17.57'' 3⁰ 17' 55.15''
WS3 113⁰ 6' 06.43'' 3⁰ 18' 27.77''
WS4 113⁰ 4' 45.93'' 3⁰ 17' 24.33''
Table 2.6 Analysed TSS at the water sampling stations
Station Period Tidal Phase Depth (m) TSS (mg/L)
WS1
Spring
Flood 0.2D 24.3
0.8D 25.0
Ebb 0.2D 54.5
0.8D 52.5
Neap
Flood 0.2D 19.5
0.8D 22.0
Ebb 0.2D 12.8
0.8D 20.0
WS2
Spring
Flood 0.2D 15.5
0.8D 17.0
Ebb 0.2D 35.5
0.8D 24.5
Neap
Flood 0.2D 22.0
0.8D 20.0
Ebb 0.2D 15.0
0.8D 20.5
WS3
Spring
Flood 0.2D 14.5
0.8D 21.0
Ebb 0.2D 19.5
0.8D 25.0
Neap
Flood 0.2D 14.0
0.8D 14.5
Ebb 0.2D 20.5
0.8D 14.5
WS4
Spring
Flood 0.2D 21.5
0.8D 17.0
Ebb 0.2D 22.5
0.8D 16.0
Neap
Flood 0.2D 16.5
0.8D 19.0
Ebb 0.2D 15.0
0.8D 12.5
Table 2.5
Coordinates of water sampling stations

Hydraulic Study
Chapter 2 | Site Assessment and Meteo-Marine Condition
Dr. Nik & Associates Sdn. Bhd. 2-29
2.5.7 Seawater Temperature
The seawater temperature was measured in-situ using a YSI 556 MPS multi-parameter device at the Project area at 1 m depth intervals at the locations where the ADCPs were deployed. Measurements were done over a 24-hr cycle during spring and neap periods (Figures 2.42 and 2.43). The seawater temperature ranged from about 29 to 31°C based on the measurements. Surface temperature during daytime was generally up to about 1°C higher than the seawater temperature at the bottom of the water column. A relatively similar range of temperature was observed at both measurement locations.
Figure 2.42 In-situ temperature measurements at ADCP1

Hydraulic Study for the Proposed Bintulu Tanjung Kidurong Combined Cycle
Power Plant Project (Unit 9 - 13)
2-30 Dr. Nik & Associates Sdn. Bhd.
Figure 2.43 In-situ temperature measurements at ADCP2
Seawater temperature measured at the existing intake from January 2016 to December 2017 was provided by the Client (Figure 2.44). The lowest water temperature of 28.3°C was recorded in February 2016. The highest water temperature of 31.5°C was recorded in July 2017.

Hydraulic Study
Chapter 2 | Site Assessment and Meteo-Marine Condition
Dr. Nik & Associates Sdn. Bhd. 2-31
Figure 2.44 Condenser water inlet temperature at the existing power plant
2.6 Environmentally Sensitive Areas (ESAs)
Information on Environmentally Sensitive Areas (ESAs) was obtained from Chemsain Konsultant Sdn. Bhd. These areas are within 10 km radius of the Project area. The identified ESAs are illustrated in Figure 2.45 and tabulated in Table 2.7.

Hydraulic Study for the Proposed Bintulu Tanjung Kidurong Combined Cycle
Power Plant Project (Unit 9 - 13)
2-32 Dr. Nik & Associates Sdn. Bhd.
Source: Chemsain Konsultant Sdn. Bhd., 2018
Figure 2.45 ESAs within 10 km radius of the Project area
Table 2.7 List of ESAs within 10 km radius of the Project area
ID Description Distance from Project Area (km)
1 Existing intake -
2 New intake -
3 Kampung Nelayan Batu Mandi 5
4 Bintulu Port 5
5 Similajau National Park marine extension 5
6 Batu Likau 8
7 Batu Mandi 10
Source: Chemsain Konsultant Sdn. Bhd., 2018

Chapter 3
PROJECT DESCRIPTION
AND STUDY APPROACH

Dr. Nik & Associates Sdn. Bhd. 3-1
PROJECT DESCRIPTION AND STUDY APPROACH
3.1 Introduction This chapter describes the marine-related activities associated with the Project, which includes trenching and temporary disposal, pipe jacking, pipe-laying as well as backfilling. This chapter also provides an introduction to the impact assessment approach as well as the basis and methodology of the numerical modelling works carried out for impact assessment.
3.2 Project Description
The existing Tg. Kidurong combined cycle gas turbine (CCGT) power plant generates 450 MW of electricity. The Balingian Power Plant with 600 MW (expected commercial operation in 2018) and Tg. Kidurong Power Plant’s Block 1 (Unit 11) generating 413 MW (expected commercial operation in 2020) have been fully allocated to forecast Sarawak Corridor of Renewable Energy (SCORE) Phase 1 development. Due to the postponement of the Samalaju CCGT project, the Client has initiated an additional CCGT Block 2 (Units 12 and 13 generating 413 MW) adjacent to Block 1 at Tg. Kidurong. This is required to support the SCORE Phase 2 development before Samalaju CCGT project and Baleh hydroelectric power (HEP) dam (expected commercial operation in 2024) comes online. The study evaluates the impact of both the proposed Blocks 1 and 2 developments (Figure 3.1).
Chapter 3

Hydraulic Study for the Proposed Bintulu Tanjung Kidurong Combined Cycle
Power Plant Project (Unit 9 - 13)
3-2 Dr. Nik & Associates Sdn. Bhd.
Source: SEB, 2017
Figure 3.1 Aerial view of proposed Tg. Kidurong Power Plant’s expansion
The power plant's existing intake is to be relocated parallel to the new intake structures for Block 1 and 2 as illustrated in Figure 3.2. In total, there will be three pipelines located at 1.45 km seawards of the pump house. An additional outfall is sited 320 m seawards of the plant. The existing intake structure will be dismantled after the new intake is constructed. The existing outfall at the beach will still be operational after the development. The coordinates of the existing and proposed structures are shown in Table 3.1.

Hydraulic Study
Chapter 3 | Project Description and Study Approach
Dr. Nik & Associates Sdn. Bhd. 3-3
Figure 3.2 Overview of the proposed intake and outfall structures for the Tg. Kidurong Combined Cycle Power Plant

Hydraulic Study for the Proposed Bintulu Tanjung Kidurong Combined Cycle
Power Plant Project (Unit 9 - 13)
3-4 Dr. Nik & Associates Sdn. Bhd.
Structure Coordinates
Latitude (N) Longitude (E)
Existing intake 3° 18.00' 113° 5.33'
Existing outfall 3° 17.75' 113° 5.39'
Existing intake (relocated) 3° 18.45' 113° 5.15'
Proposed intake 3° 18.46' 113° 5.17'
Proposed intake 3° 18.46' 113° 5.18'
Proposed outfall (offshore end) 3° 17.94' 113° 5.43'
Three water intake chambers will be installed with the plant expansion. The details of the proposed intake structure are shown in Figure 3.2. The intake chambers will be located on the seabed, 1.45 km away from the pump house. The intakes will be buried at about 5.0 m below seabed. The intake chambers are circular glass-fibre reinforced plastics (GRP) structure with diameter of 8.8 m as shown in Figure 3.3. A 2.5 m inner diameter HDPE pipeline connects each water intake chamber to supply sea water to the pump house. Each pipe is about 1.45 km long. The pipelines will be buried with a cover of 1.5 m below seabed level (Figure 3.4).
Table 3.1 Coordinates of the intake and outfall structures

Hydraulic Study
Chapter 3 | Project Description and Study Approach
Dr. Nik & Associates Sdn. Bhd. 3-5
a) Plan layout of the proposed intake structures
b) Typical cross-sectional view of the intake chamber
Source: Sinohydro,2018 Figure 3.3 Details of the proposed intake structures

Hydraulic Study for the Proposed Bintulu Tanjung Kidurong Combined Cycle
Power Plant Project (Unit 9 - 13)
3-6 Dr. Nik & Associates Sdn. Bhd.
Source: Sinohydro, 2018
Figure 3.4 Cross section of the trench for the proposed intake pipelines
The proposed outfall structure is a 3.5 m diameter GRP pipe and 320 m in length. The proposed outfall structure utilises five diffusers operating simultaneously at the offshore end of the structure (Figure 3.5). The diffusers are about 1.6 m wide and protrude 2.5 m above the seabed. The diffusers are spaced at 10 m intervals. The outfall pipeline is buried with a cover of 1.5 m below seabed level.
Source: Sinohydro, 2018
Figure 3.5 Details of the proposed outfall structure
The design specifications for the proposed intake and outfall are described in Table 3.2.
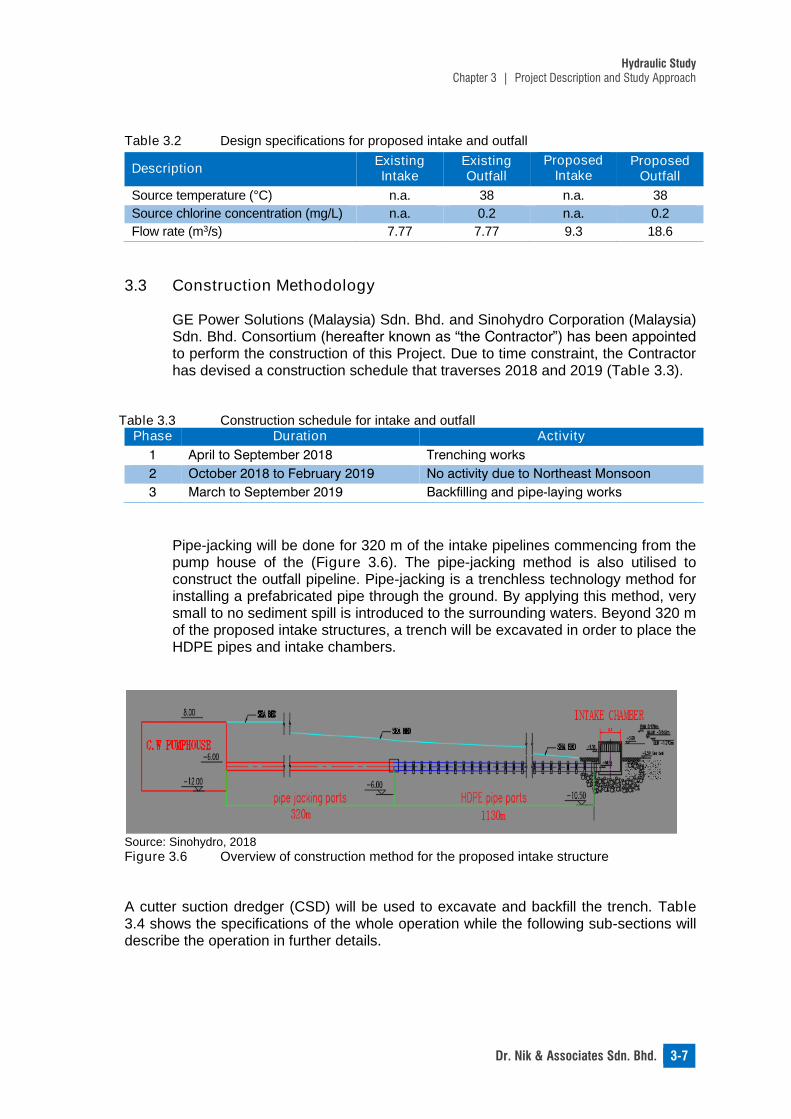
Hydraulic Study
Chapter 3 | Project Description and Study Approach
Dr. Nik & Associates Sdn. Bhd. 3-7
Table 3.2 Design specifications for proposed intake and outfall
Description Existing Intake
Existing Outfall
Proposed Intake
Proposed Outfall
Source temperature (°C) n.a. 38 n.a. 38
Source chlorine concentration (mg/L) n.a. 0.2 n.a. 0.2
Flow rate (m3/s) 7.77 7.77 9.3 18.6
3.3 Construction Methodology
GE Power Solutions (Malaysia) Sdn. Bhd. and Sinohydro Corporation (Malaysia) Sdn. Bhd. Consortium (hereafter known as “the Contractor”) has been appointed to perform the construction of this Project. Due to time constraint, the Contractor has devised a construction schedule that traverses 2018 and 2019 (Table 3.3).
Table 3.3 Construction schedule for intake and outfall Phase Duration Activity
1 April to September 2018 Trenching works
2 October 2018 to February 2019 No activity due to Northeast Monsoon
3 March to September 2019 Backfilling and pipe-laying works
Pipe-jacking will be done for 320 m of the intake pipelines commencing from the pump house of the (Figure 3.6). The pipe-jacking method is also utilised to construct the outfall pipeline. Pipe-jacking is a trenchless technology method for installing a prefabricated pipe through the ground. By applying this method, very small to no sediment spill is introduced to the surrounding waters. Beyond 320 m of the proposed intake structures, a trench will be excavated in order to place the HDPE pipes and intake chambers.
Source: Sinohydro, 2018
Figure 3.6 Overview of construction method for the proposed intake structure
A cutter suction dredger (CSD) will be used to excavate and backfill the trench. Table 3.4 shows the specifications of the whole operation while the following sub-sections will describe the operation in further details.
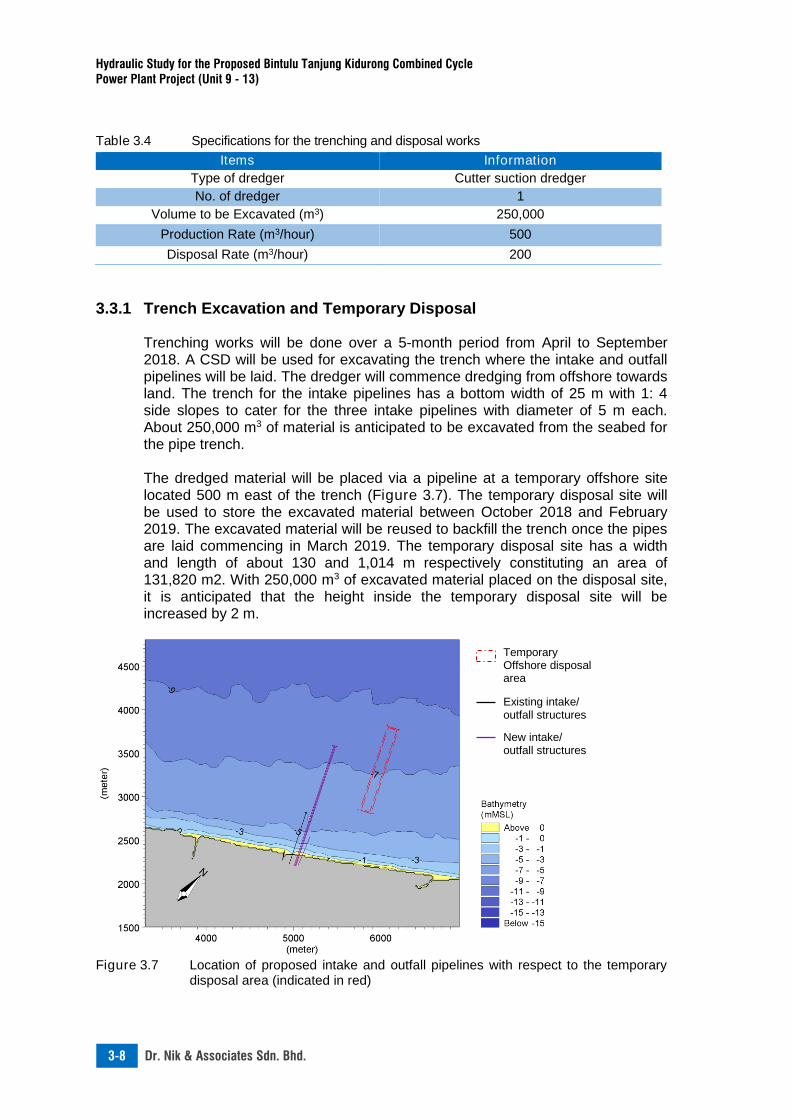
Hydraulic Study for the Proposed Bintulu Tanjung Kidurong Combined Cycle
Power Plant Project (Unit 9 - 13)
3-8 Dr. Nik & Associates Sdn. Bhd.
Table 3.4 Specifications for the trenching and disposal works
Items Information
Type of dredger Cutter suction dredger
No. of dredger 1
Volume to be Excavated (m3) 250,000
Production Rate (m3/hour) 500
Disposal Rate (m3/hour) 200
3.3.1 Trench Excavation and Temporary Disposal
Trenching works will be done over a 5-month period from April to September 2018. A CSD will be used for excavating the trench where the intake and outfall pipelines will be laid. The dredger will commence dredging from offshore towards land. The trench for the intake pipelines has a bottom width of 25 m with 1: 4 side slopes to cater for the three intake pipelines with diameter of 5 m each. About 250,000 m3 of material is anticipated to be excavated from the seabed for the pipe trench. The dredged material will be placed via a pipeline at a temporary offshore site located 500 m east of the trench (Figure 3.7). The temporary disposal site will be used to store the excavated material between October 2018 and February 2019. The excavated material will be reused to backfill the trench once the pipes are laid commencing in March 2019. The temporary disposal site has a width and length of about 130 and 1,014 m respectively constituting an area of 131,820 m2. With 250,000 m3 of excavated material placed on the disposal site, it is anticipated that the height inside the temporary disposal site will be increased by 2 m.
Figure 3.7 Location of proposed intake and outfall pipelines with respect to the temporary disposal area (indicated in red)
Existing intake/ outfall structures
New intake/ outfall structures
Temporary Offshore disposal area
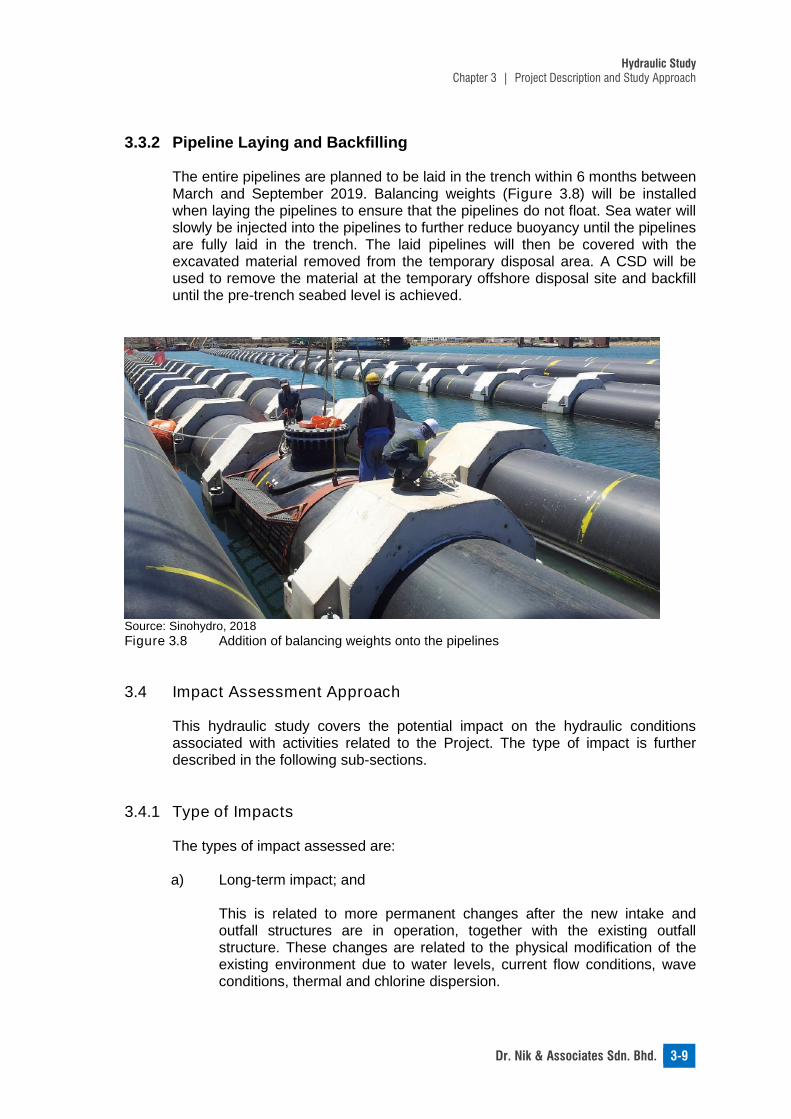
Hydraulic Study
Chapter 3 | Project Description and Study Approach
Dr. Nik & Associates Sdn. Bhd. 3-9
3.3.2 Pipeline Laying and Backfilling
The entire pipelines are planned to be laid in the trench within 6 months between March and September 2019. Balancing weights (Figure 3.8) will be installed when laying the pipelines to ensure that the pipelines do not float. Sea water will slowly be injected into the pipelines to further reduce buoyancy until the pipelines are fully laid in the trench. The laid pipelines will then be covered with the excavated material removed from the temporary disposal area. A CSD will be used to remove the material at the temporary offshore disposal site and backfill until the pre-trench seabed level is achieved.
Source: Sinohydro, 2018
Figure 3.8 Addition of balancing weights onto the pipelines
3.4 Impact Assessment Approach This hydraulic study covers the potential impact on the hydraulic conditions associated with activities related to the Project. The type of impact is further described in the following sub-sections.
3.4.1 Type of Impacts
The types of impact assessed are: a) Long-term impact; and
This is related to more permanent changes after the new intake and outfall structures are in operation, together with the existing outfall structure. These changes are related to the physical modification of the existing environment due to water levels, current flow conditions, wave conditions, thermal and chlorine dispersion.
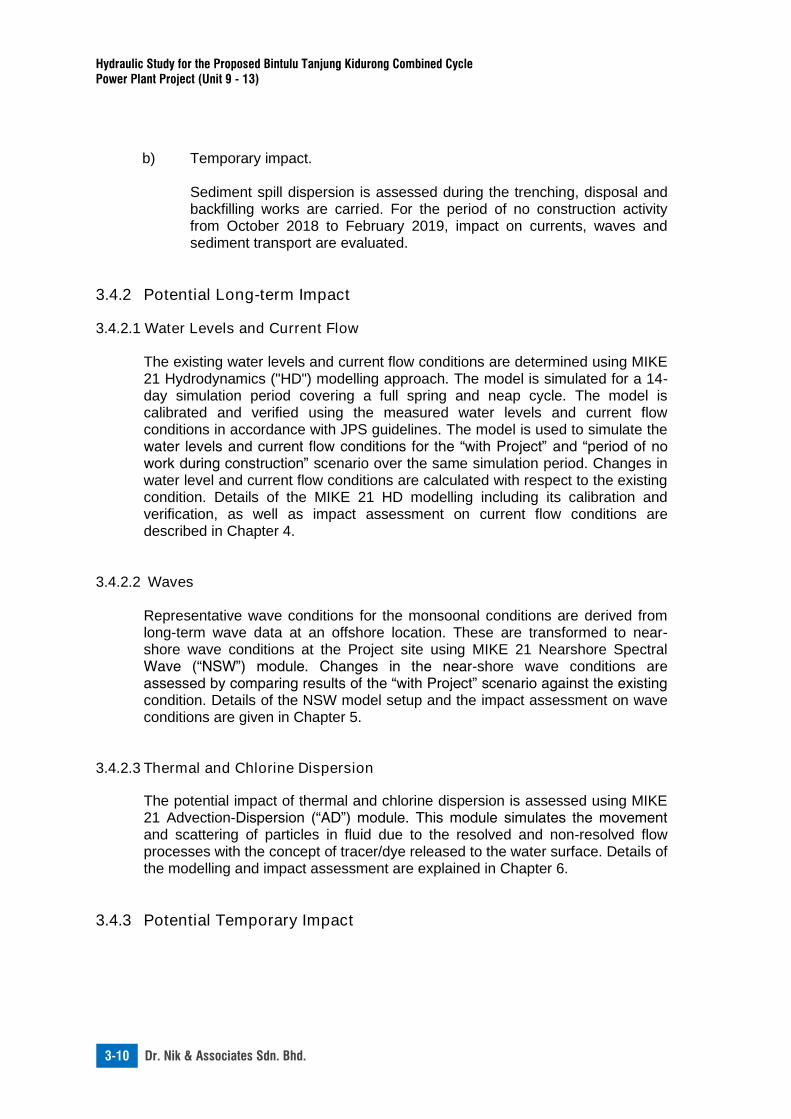
Hydraulic Study for the Proposed Bintulu Tanjung Kidurong Combined Cycle
Power Plant Project (Unit 9 - 13)
3-10 Dr. Nik & Associates Sdn. Bhd.
b) Temporary impact.
Sediment spill dispersion is assessed during the trenching, disposal and backfilling works are carried. For the period of no construction activity from October 2018 to February 2019, impact on currents, waves and sediment transport are evaluated.
3.4.2 Potential Long-term Impact
3.4.2.1 Water Levels and Current Flow
The existing water levels and current flow conditions are determined using MIKE 21 Hydrodynamics ("HD") modelling approach. The model is simulated for a 14-day simulation period covering a full spring and neap cycle. The model is calibrated and verified using the measured water levels and current flow conditions in accordance with JPS guidelines. The model is used to simulate the water levels and current flow conditions for the “with Project” and “period of no work during construction” scenario over the same simulation period. Changes in water level and current flow conditions are calculated with respect to the existing condition. Details of the MIKE 21 HD modelling including its calibration and verification, as well as impact assessment on current flow conditions are described in Chapter 4.
3.4.2.2 Waves
Representative wave conditions for the monsoonal conditions are derived from long-term wave data at an offshore location. These are transformed to near-shore wave conditions at the Project site using MIKE 21 Nearshore Spectral Wave (“NSW”) module. Changes in the near-shore wave conditions are assessed by comparing results of the “with Project” scenario against the existing condition. Details of the NSW model setup and the impact assessment on wave conditions are given in Chapter 5.
3.4.2.3 Thermal and Chlorine Dispersion
The potential impact of thermal and chlorine dispersion is assessed using MIKE 21 Advection-Dispersion (“AD”) module. This module simulates the movement and scattering of particles in fluid due to the resolved and non-resolved flow processes with the concept of tracer/dye released to the water surface. Details of the modelling and impact assessment are explained in Chapter 6.
3.4.3 Potential Temporary Impact

Hydraulic Study
Chapter 3 | Project Description and Study Approach
Dr. Nik & Associates Sdn. Bhd. 3-11
3.4.3.1 Water Levels and Current Flow
During the period of no activity during Northeast Monsoon (October 2018 to February 2019), the existing current flow is predicted to be modified with deepening of the seabed from the trenching work and depth-reduction at the temporary disposal ground. The impact to current flow during the period of no activity is assessed using the current flow model.
3.4.3.2 Waves
The existing wave pattern is predicted to be altered with deepening of the seabed at the trench and depth reduction at the temporary disposal ground during the Northeast Monsoon. The impact in wave condition is assessed using the nearshore wave model.
3.4.3.3 Sediment Spill Dispersion During construction, there will be sediment spills from the trenching and disposal activities. The model simulations determine the movement and dispersion of the excess suspended sediment concentration associated with the plumes generated from these activities. The potential temporary impact of these activities is represented by the level of suspended sediment concentration as well as the eventual fate of the re-suspended sediment. Details of the model set up and the temporary impact assessment on sediment transport are given in Chapter 7.
3.4.3.4 Sediment Transport
The potential impact to sediment transport is assessed using MIKE 21 Sand Transport (“ST”) module. This module is chosen to simulate the sediment transport pattern during the Northeast Monsoon condition in which the transport is mostly governed by waves. The hydrodynamic and wave modelling results are used to drive the sand transport model. The module is also used to evaluate the stability of the trench during the period of no activity. Details of the modelling and impact assessment on sediment transport are given in Chapter 8.
3.4.4 Modelling Scenarios Three model bathymetries are setup for the impact assessment. The local model incorporating the survey data (representing the existing condition) are reproduced for the ‘with Project’ and ‘during construction’ scenarios (Figure 3.9). For the ‘with Project’ condition, there is very slight change in bathymetry, i.e. +4.5 m at the intake chambers and +2 m at the outfall diffusers. The period of no activity during construction is simulated with the trench fully excavated by 5 m and the bed level of temporary disposal ground is raised by 2 m.
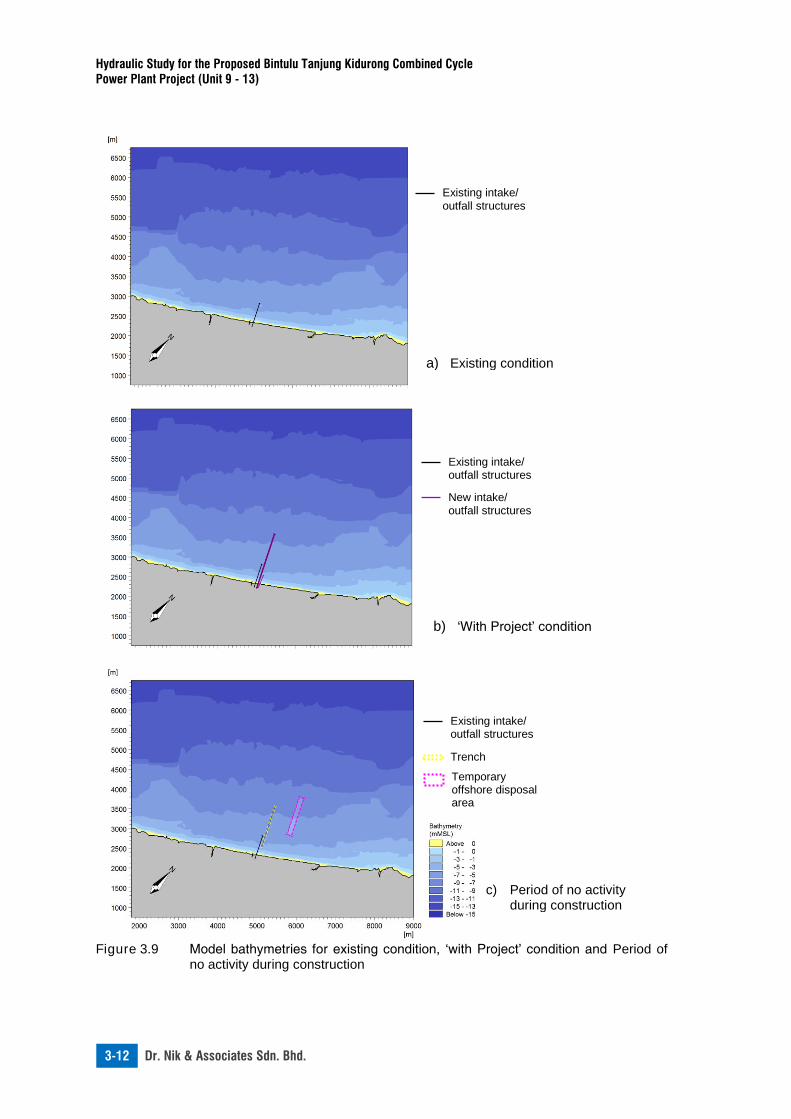
Hydraulic Study for the Proposed Bintulu Tanjung Kidurong Combined Cycle
Power Plant Project (Unit 9 - 13)
3-12 Dr. Nik & Associates Sdn. Bhd.
Figure 3.9 Model bathymetries for existing condition, ‘with Project’ condition and Period of
no activity during construction
a) Existing condition
b) ‘With Project’ condition
Existing intake/ outfall structures
Existing intake/ outfall structures
New intake/ outfall structures
c) Period of no activity during construction
Existing intake/ outfall structures
Trench
Temporary offshore disposal area

Hydraulic Study
Chapter 3 | Project Description and Study Approach
Dr. Nik & Associates Sdn. Bhd. 3-13
3.4.5 Climatic Conditions and Simulation Periods
The hydrodynamic model simulation period is simulated over a 17-days period including a 3-day warm-up period to include a full spring and neap cycle. The warm-up period is allocated to avoid initial numerical instabilities during the simulation period. The thermal and chlorine dispersion modelling is simulated over a slightly longer period i.e. 31-days including a 3-day warm-up period to ensure model’s stability. Simulations for the hydrodynamic model were carried out for three scenarios to simulate typical monsoon conditions in Malaysia, i.e. Northeast and Southwest Monsoons and the inter-monsoon period. The Northeast Monsoon condition represents meteorological condition during the November to March period. The Southwest Monsoon condition represents meteorological conditions during May to September. Seasonal conditions are highly variable where the Northeast Monsoon conditions will also be representative of some occurrences happening outside the Northeast Monsoon period. This is also applicable for the Southwest Monsoon and inter-monsoon conditions. As such, the monsoonal scenarios are applied in general terms. The monsoonal conditions are represented by the representative wind conditions, derived from wind data extracted from the Climate Forecast System Reanalysis (CFSR) for 20 years from 1991 to 2010. The data is extracted at the location offshore of the Project area as shown in Section 2.5.3 and the representative speed condition are as described below: a) Inclusion of wind blowing constantly from 30°N at 5.0 m/s to simulate
Northeast Monsoon condition; and b) Inclusion of wind blowing constantly from 240°N at 3.9 m/s representing
the inter-monsoon or transitional period; and c) Inclusion of wind blowing constantly from 250°N at 3.9 m/s to simulate
Southwest Monsoon condition.

Chapter 4
HYDRODYNAMICS

Dr. Nik & Associates Sdn. Bhd. 4-1
HYDRODYNAMICS
4.1 Introduction
Modelling of water flow and current patterns constitutes the basis of the coastal engineering study. Impact due to the proposed development is studied. Modelling of sediment transport and dispersion processes is carried out once the flows are properly modelled. MIKE 21 HD was used for this study.
4.2 MIKE 21 HD
MIKE 21 HD is the basic module of the MIKE 21 system. It provides the hydrodynamic basis for computations performed in most of the other modules. It simulates water level fluctuations and flows in response to a variety of forcing functions in lakes, estuaries, bays and coastal areas. The water levels and flows are resolved on a rectangular grid covering the area of interest when provided with bathymetry, bed resistance coefficients, wind and wave fields and hydrographic boundary conditions.
4.3 Model Setup
“Setting up the model” means transforming real world events and data into a format that can be understood by the numerical model. All data collected have to be resolved on the spatial grid selected including the time-step required. The bathymetry data for the model setup is based on Sarawak Navigation Charts, CMAP digital chart as well as a survey of around the Project site. The bathymetry data was then transformed into a MIKE 21-readable format. A survey in the vicinity of the Project area was incorporated within the model bathymetry. The nesting capability of MIKE 21 HD was applied to describe the area of interest. This permits a model extent that encompasses regional scale processes. Multiple model domains of varying grid resolutions were used. All grids were dynamically linked and solved simultaneously. The regional, intermediate, medium and fine grid models were nested. A specific model for the study area was constructed, i.e. the local model. The model utilised water levels and fluxes from the regional nested model. The smaller domain and higher grid resolution assists in impact assessment. For regional model, three nested model bathymetry domains with varying resolutions i.e. 1,215, 405 and 135 m were setup as illustrated in Figure 4.1. Two nested model bathymetry domains with resolutions of 45 and 15 m were setup as the local model (Figure 4.2).
Chapter 4

Hydraulic Study for the Proposed Bintulu Tanjung Kidurong Combined Cycle
Power Plant Project (Unit 9 - 13)
4-2 Dr. Nik & Associates Sdn. Bhd.
Figure 4.1 Nested regional model bathymetries
Figure 4.2 Nested local model bathymetries
Regional Model
Medium Grid Model
Fine Grid Model
Local Model

Hydraulic Study
Chapter 4 |Hydrodynamics
Dr. Nik & Associates Sdn. Bhd. 4-3
Sufficient details of the bathymetry and nearshore area within the study area need to be well-represented within the numerical model. A review done on the source of data used in producing each chart revealed that surveys done as far back as 1951 were used to map the nearshore area. Although recent information was also incorporated into each chart, these updates were localised in nature, e.g. relating to dredging, rough layout of coastal development, wrecks, etc. A survey was considered necessary in order to ascertain the current bed and nearshore levels. Bathymetry of the study area was updated in the local model where data from a survey done in December 2016 was integrated. The local model that incorporates the survey data (representing the existing condition) are reproduced for the “with Project” and for the period of no activity during construction scenarios. The model bathymetries are shown in Figure 3.9.
Bed resistance is used to ensure that the model is capable of replicating the measured conditions as much as possible. A constant value for bottom friction can be assigned over the model area. Otherwise, a map with varying values is specified as a function of depth or on a point by point basis. For this case, similar Manning number of 40 m1/3/s was used for all models. Simulations for the hydrodynamic model were carried out for the scenarios and seasonal conditions as described in Section 3.4.5.
4.4 Boundary Conditions The regional model contains four open boundaries. The boundary conditions are water levels generated based on the established tidal constituents extracted from MIKE 21’s Global Tide Model. Figure 4.3 shows the position of each open boundary (represented by red lines).
Figure 4.3 Position of open boundaries for the regional model

Hydraulic Study for the Proposed Bintulu Tanjung Kidurong Combined Cycle
Power Plant Project (Unit 9 - 13)
4-4 Dr. Nik & Associates Sdn. Bhd.
The local model is driven by water level condition transferred from the regional model. This allows more detailed flow condition to the local model, given the relatively coarse spatial resolution of the Global Tide Model. The red lines in Figure 4.4 indicate the position of each open boundary in the local model.
Figure 4.4 Position of open boundaries for the local model
4.5 Design Simulation Period
A design simulation period of 17 days was selected to correspond with typical spring-neap conditions during the year. The simulation included three days as a “warm up” period.
4.6 Calibration and Verification
Model verification is a process where primary governing conditions of the model are adjusted to represent as much as possible measured data from the calibration period. This is also known as model validation. The main governing conditions affecting performance of the hydrodynamic model are boundary conditions, bathymetry, bed resistance and eddy viscosity. Water levels were used to validate the regional model. Validation of the local model was done using water levels and currents.
In order to assess the deviation between measured and predicted or simulated data, a normalised root mean square deviation (NRMSD) is used to measure the differences between values predicted by a model and measured or predicted values. The NRMSD is the root mean square deviation (RMSD) divided by the range of predicted or measured values in which the RMSD is defined as the square root of the mean square error.
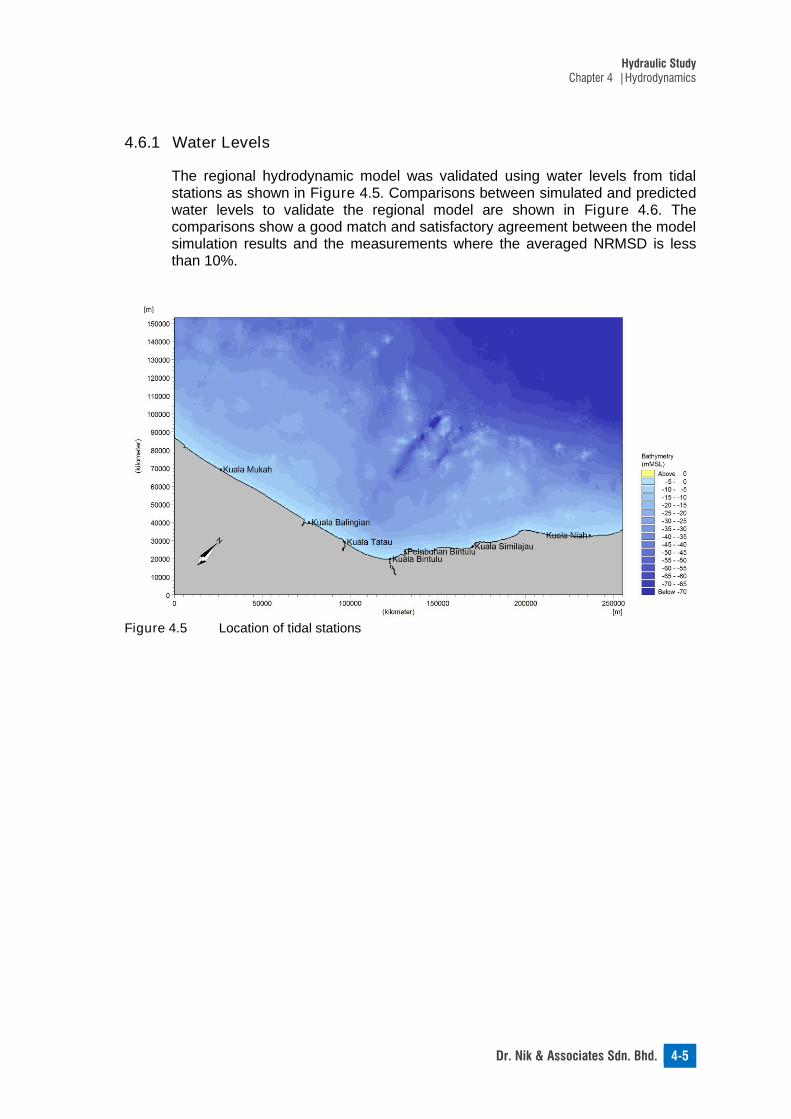
Hydraulic Study
Chapter 4 |Hydrodynamics
Dr. Nik & Associates Sdn. Bhd. 4-5
4.6.1 Water Levels
The regional hydrodynamic model was validated using water levels from tidal stations as shown in Figure 4.5. Comparisons between simulated and predicted water levels to validate the regional model are shown in Figure 4.6. The comparisons show a good match and satisfactory agreement between the model simulation results and the measurements where the averaged NRMSD is less than 10%.
Figure 4.5 Location of tidal stations
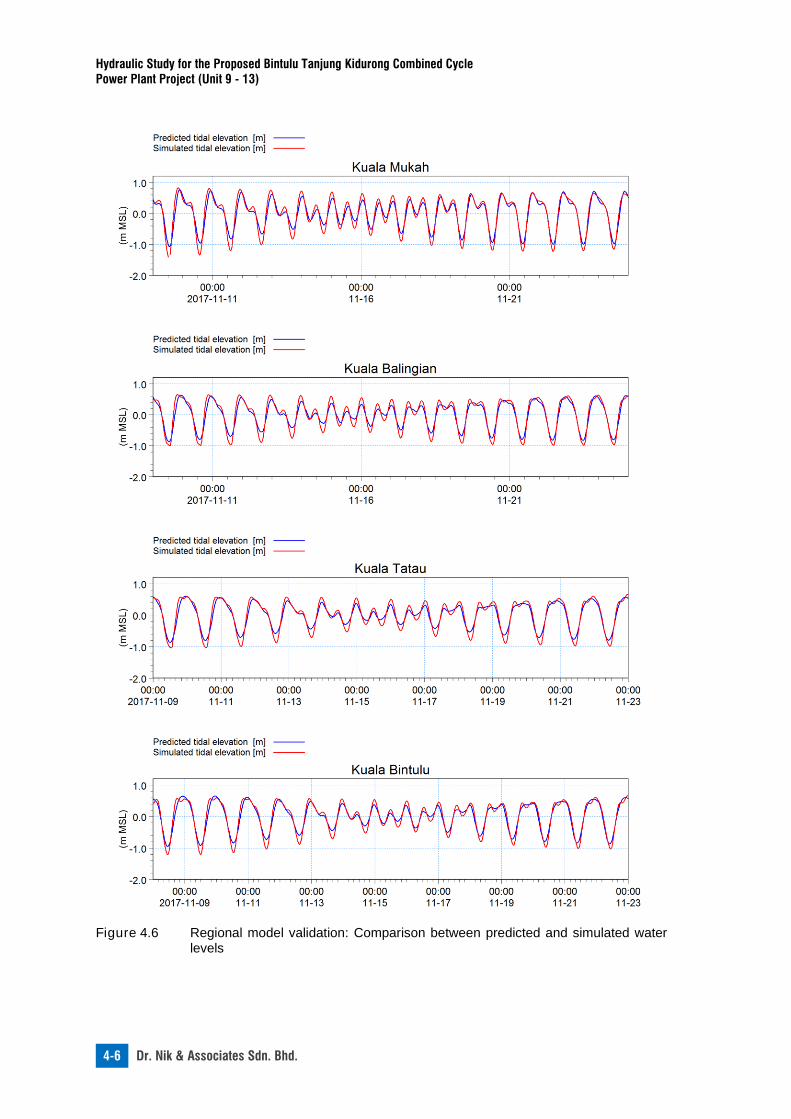
Hydraulic Study for the Proposed Bintulu Tanjung Kidurong Combined Cycle
Power Plant Project (Unit 9 - 13)
4-6 Dr. Nik & Associates Sdn. Bhd.
Figure 4.6 Regional model validation: Comparison between predicted and simulated water
levels

Hydraulic Study
Chapter 4 |Hydrodynamics
Dr. Nik & Associates Sdn. Bhd. 4-7
Figure 4.6 (cont’d) Regional model validation: Comparison between predicted and
simulated water levels
For the local hydrodynamic model, comparisons between simulated and measured water levels based on measurements taken during field data collection at the two ADCP locations are shown in Figure 4.7.

Hydraulic Study for the Proposed Bintulu Tanjung Kidurong Combined Cycle
Power Plant Project (Unit 9 - 13)
4-8 Dr. Nik & Associates Sdn. Bhd.
Figure 4.7 Local model validation: Comparison between measured and simulated water
levels
The extracted water levels from the model simulation compared well with the measured water levels during the 14-day measurements (covering spring and neap period) with NRMSD indicated as follows: a) 7% for ADCP 1; and b) 6% for ADCP 2. These values are below the acceptable deviation of 10% specified in JPS’ 2013 guidelines.
4.6.2 Currents
Current measurements made during the fieldwork were compared with currents extracted from the modelling results. Results of the model calibration (spring period) and verification (neap period) are shown in Figures 4.8 and 4.9 respectively.

Hydraulic Study
Chapter 4 |Hydrodynamics
Dr. Nik & Associates Sdn. Bhd. 4-9
Figure 4.8 Model calibration: Comparison between measured and simulated current speed
and direction at ADCP1 and ADCP2

Hydraulic Study for the Proposed Bintulu Tanjung Kidurong Combined Cycle
Power Plant Project (Unit 9 - 13)
4-10 Dr. Nik & Associates Sdn. Bhd.
Figure 4.9 Model verification: Comparison between measured and simulated current speed
and direction at ADCP1 and ADCP2

Hydraulic Study
Chapter 4 |Hydrodynamics
Dr. Nik & Associates Sdn. Bhd. 4-11
An acceptable agreement between the measurements and model simulation results is considered to be achieved when the simulated current speeds and directions were comparable with the measured data, complying with JPS requirements for numerical modelling works. Given that the measurement was conducted in the Northeast Monsoon period, the values are still within the acceptable deviation specified in the JPS’ 2013 guidelines as summarised in Table 4.1.
Table 4.1 NRMSD for current speed and direction at ADCP1 and ADCP2
Location
NRMSD
Model Calibration (Spring period) Model Verification (Neap period)
Speed (%) Direction (°) Speed (%) Direction (°)
ADCP 1 15 18 16 18
ADCP 2 19 20 15 14
Irregularities in the comparison of current speed and direction at the Project area may still occur. The measurements were conducted fronting an open coastline that is influenced by prevailing winds. Wind condition is driven in the local model by applying a wind map procured from Global Forecast System (GFS) produced by the National Centre for Environmental Prediction (NCEP) in the first half of the simulation period when the sea condition is rough due to stormy conditions. Time series of wind measured at Bintulu Airport purchased from Meteorological Department of Malaysia were used for the second half of the simulation period. It was not feasible to use wind condition at Bintulu Airport during stormy conditions due to landmass effect.
4.7 Results
4.7.1 Existing Condition Peak flood and ebb flow currents around the Project area for each monsoonal condition are shown in Figures 4.10 to 4.12. Currents within the South China Sea flow towards the southwest during flood flow. The currents reverse during ebb flow. Mean and maximum current speed plots for seasonal conditions are shown in Figure 4.13. The mean and maximum current speed within the Project area is generally up to 0.1 and 0.2 m/s respectively for the Northeast Monsoon condition. Current speed is highest in the vicinity of the existing outfall with mean and maximum speed of above 0.4 and 0.55 m/s respectively. The overall current speeds at the Project area are relatively lower during the inter-monsoon and Southwest Monsoon conditions.

Hydraulic Study for the Proposed Bintulu Tanjung Kidurong Combined Cycle
Power Plant Project (Unit 9 - 13)
4-12 Dr. Nik & Associates Sdn. Bhd.
a) Spring period: Flood flow
b) Spring period: Ebb flow
Figure 4.10 Flow pattern during peak ebb and flood condition: Existing condition (Northeast Monsoon condition)
Existing intake/ outfall structures
Existing intake/ outfall structures

Hydraulic Study
Chapter 4 |Hydrodynamics
Dr. Nik & Associates Sdn. Bhd. 4-13
a) Spring period: Flood flow
b) Spring period: Ebb flow
Figure 4.11 Flow pattern during peak ebb and flood condition: Existing condition (inter-monsoon condition)
Existing intake/ outfall structures
Existing intake/ outfall structures

Hydraulic Study for the Proposed Bintulu Tanjung Kidurong Combined Cycle
Power Plant Project (Unit 9 - 13)
4-14 Dr. Nik & Associates Sdn. Bhd.
a) Spring period: Flood flow
b) Spring period: Ebb flow
Figure 4.12 Flow pattern during peak ebb and flood condition: Existing condition (Southwest Monsoon condition)
Existing intake/ outfall structures
Existing intake/ outfall structures

Hydraulic Study
Chapter 4 |Hydrodynamics
Dr. Nik & Associates Sdn. Bhd. 4-15
a) Northeast Monsoon condition: Mean current speed c) Inter-monsoon condition: Mean current speed e) Southwest Monsoon condition: Mean current speed
b) Northeast Monsoon condition: Maximum current speed d) Inter-monsoon condition: Maximum current speed f) Southwest Monsoon condition: Maximum current speed
Figure 4.13 Mean and maximum current speeds plots: Existing condition
Existing intake/ outfall structures
Existing intake/ outfall structures

Hydraulic Study
Chapter 4 |Hydrodynamics
Dr. Nik & Associates Sdn. Bhd. 4-16
4.7.2 “With Project” condition
Identifying hydrodynamic impact due to the Project is done by assessing changes that occur with respect to the existing condition. This is done by obtaining mean and maximum current speeds with implementation of the proposed intake and outfall structures. The changes introduced by the “with Project” condition with respect to the existing condition are then analysed. Mean and maximum current speed plots for the “with Project” condition as well as current speed difference plots during each monsoonal condition are shown in Figures 4.14 and 4.15. From the analysis, it can be deduced that the proposed Project creates localised changes to current flow patterns. These changes are primarily a result of additional flow from the source (outfall) and sink (intake) introduced into the Project area and slight reduction in depth at the intake and outfall structures. This causes flow acceleration and deceleration within the Project site. It is predicted during the Northeast Monsoon condition that the mean and maximum current speed increases by up 0.1 m/s at the intake head extending approximately 150 and 300 m to the west of the proposed intake and outfall structures respectively. During the Southwest and inter-monsoon conditions, the increase is less than 0.05 m/s for mean speed while an increase in maximum speed of up to 0.1 m/s is predicted extending approximately 300 m to the east of the proposed intake and outfall structures as influenced by the prevailing wind direction.

Hydraulic Study
Chapter 4 |Hydrodynamics
Dr. Nik & Associates Sdn. Bhd. 4-17
a) Northeast Monsoon condition: Mean current speed c) Inter-monsoon condition: Mean current speed e) Southwest Monsoon condition: Mean current speed
b) Northeast Monsoon condition: Maximum current speed d) Inter-monsoon condition: Maximum current speed f) Southwest Monsoon condition: Maximum current speed
Figure 4.14 Mean and maximum current speed plots: “With Project” condition
New intake/ outfall structures
New intake/ outfall structures
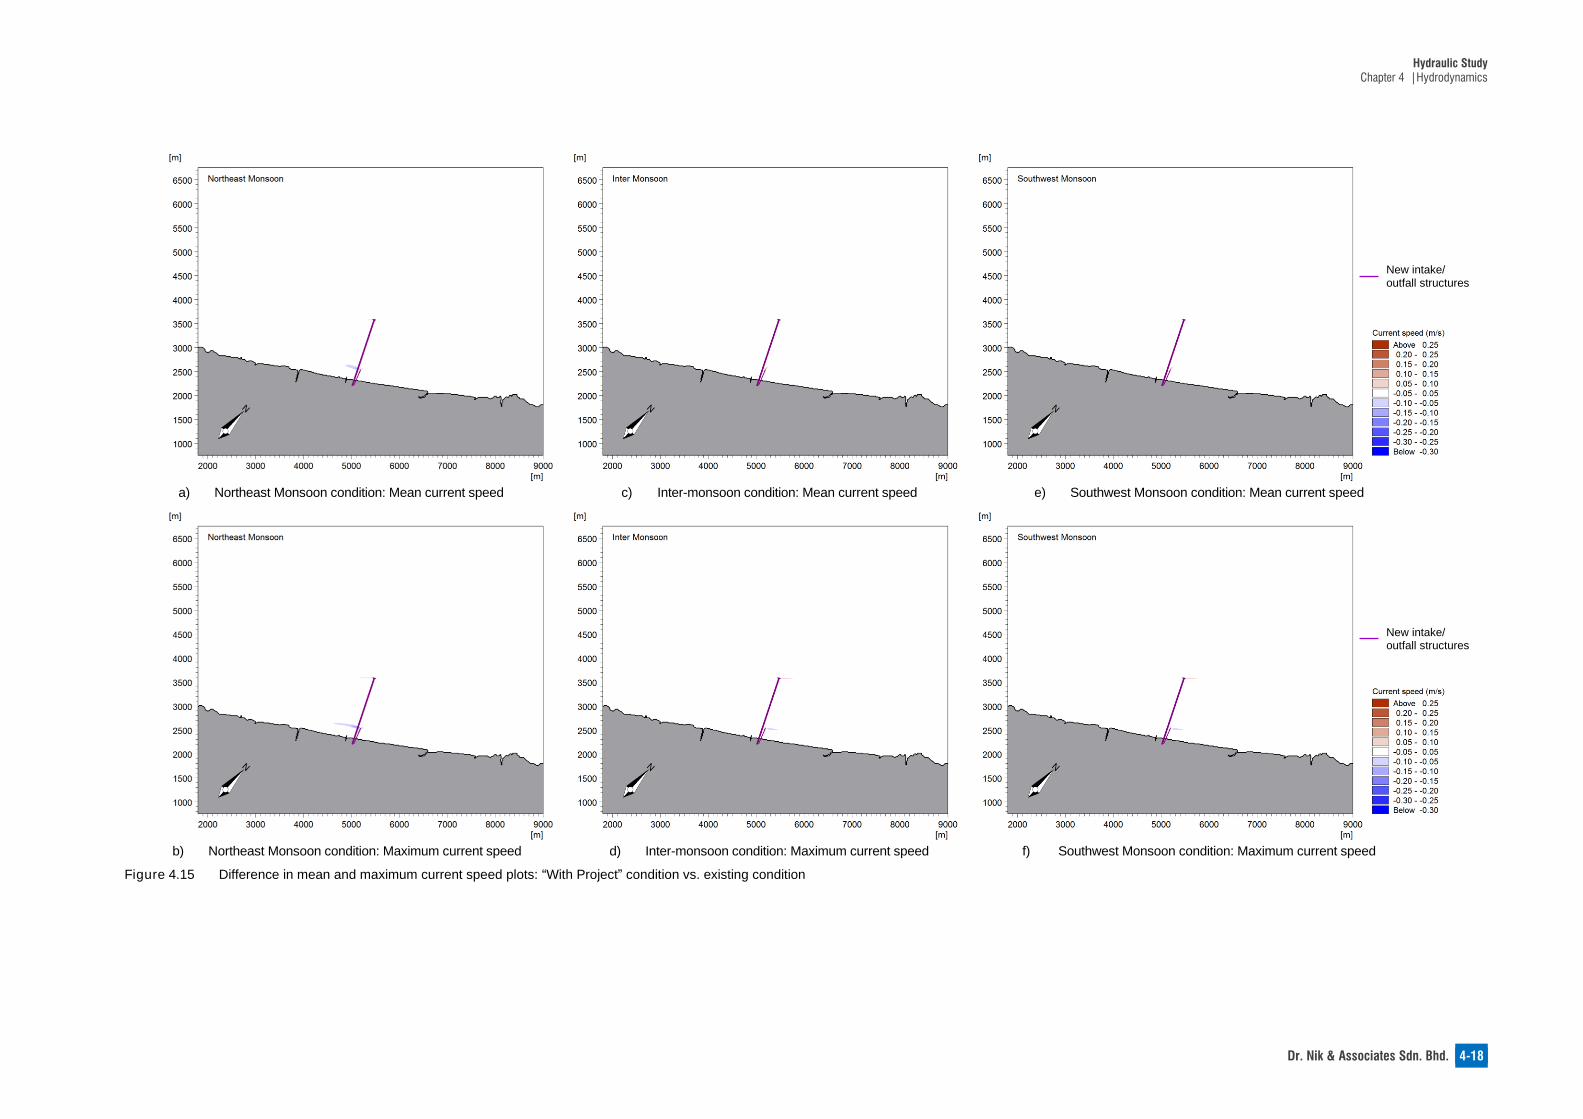
Hydraulic Study
Chapter 4 |Hydrodynamics
Dr. Nik & Associates Sdn. Bhd. 4-18
a) Northeast Monsoon condition: Mean current speed c) Inter-monsoon condition: Mean current speed e) Southwest Monsoon condition: Mean current speed
b) Northeast Monsoon condition: Maximum current speed d) Inter-monsoon condition: Maximum current speed f) Southwest Monsoon condition: Maximum current speed
Figure 4.15 Difference in mean and maximum current speed plots: “With Project” condition vs. existing condition
New intake/ outfall structures
New intake/ outfall structures

Hydraulic Study
Chapter 4 |Hydrodynamics
Dr. Nik & Associates Sdn. Bhd. 4-19
Table 4.2 shows the predicted changes in current speeds at the identified ESAs for the Northeast Monsoon condition, where the current speed difference is higher compared to other monsoon conditions. The Project is not expected to create any changes in current speed at the ESAs locations except at the new intake where the mean and maximum current speed increases by 40 and 20% respectively due to the sink from the new intake. Table 4.3 shows the predicted changes in maximum water levels at the identified ESAs for the Northeast Monsoon condition. No impact in water levels is predicted at all the ESAs.
Table 4.2 Changes in current speeds due to Project implementation at the ESAs within the vicinity of the Project area (Northeast Monsoon condition)
ID Description
Existing With Project Difference (%)
Mean Speed (m/s)
Max Speed (m/s)
Mean Speed (m/s)
Max Speed (m/s)
Mean Speed
Max Speed
1 New intake 0.15 0.26 0.21 0.31 +40 +20
2 Kampung Nelayan Batu Mandi
0.11 0.13 0.11 0.13 0 0
3 Similajau National Park marine extension
0.13 0.23 0.13 0.23 0 0
4 Bintulu Port 0.08 0.21 0.08 0.21 0 0
5 Batu Likau 0.13 0.27 0.13 0.27 0 0
6 Batu Mandi 0.12 0.22 0.12 0.22 0 0
Table 4.3 Changes in maximum water levels due to Project implementation at the ESAs within the vicinity of the Project area (Northeast Monsoon condition)
ID Description Max surface Elevation (m MSL)
Difference (%) Existing With Project
1 New intake 0.67 0.67 0
2 Kampung Nelayan Batu Mandi
0.68 0.68 0
3 Similajau National Park marine extension
0.68 0.68 0
4 Bintulu Port 0.59 0.59 0
5 Batu Likau 0.60 0.60 0
6 Batu Mandi 0.60 0.60 0
4.7.3 Period of No Activity During Construction It is anticipated that there will be impact in terms of current speed caused by changes in bathymetry due to the trenching works to lay the intake pipelines and presence the temporary disposal ground. A close-up view of bathymetry during period of no activity during construction is shown in Figure 4.16.

Hydraulic Study for the Proposed Bintulu Tanjung Kidurong Combined Cycle
Power Plant Project (Unit 9 - 13)
4-20 Dr. Nik & Associates Sdn. Bhd.
Figure 4.16 Close-up view of bathymetry during period of no activity during construction
Identifying the temporary impacts in current speed and water level is done by assessing changes that occur with respect to the existing condition. This, in turn, is done by analysing the change in mean and maximum current speed and maximum surface elevation with respect to the existing condition. Figures 4.17 and 4.18 present the mean, maximum and the differences in current speed during this period. The trench may cause mean and maximum current speed reduction of up to 0.1 m/s of during the Northeast Monsoon condition but less than 0.05 m/s during the inter-monsoon condition. The presence of the excavated material at the temporary disposal ground is predicted to increase the mean and maximum current speed by less than 0.05 and 0.1 m/s respectively. The changes in current speed for all monsoonal conditions are localised.
Temporary Offshore disposal area

Hydraulic Study
Chapter 4 |Hydrodynamics
Dr. Nik & Associates Sdn. Bhd. 4-21
a) Northeast Monsoon condition: b) Northeast Monsoon condition: c) Inter-monsoon condition: d) Inter-monsoon condition:
Mean speed Maximum speed Mean speed Maximum speed
Figure 4.17 Mean and maximum current speed plots: Period of no activity during construction
a) Northeast Monsoon condition: b) Northeast Monsoon condition: c) Inter-monsoon condition: d) Inter-monsoon condition:
Mean speed Maximum speed Mean speed Maximum speed
Figure 4.18 Difference in mean and maximum current speed plots: Period of no activity during construction
Temporary Offshore disposal area
Existing intake/ outfall structures
Temporary Offshore disposal area
Existing intake/ outfall structures

Hydraulic Study
Chapter 4 |Hydrodynamics
Dr. Nik & Associates Sdn. Bhd. 4-22
Tables 4.4 and 4.5 show the predicted changes in mean and maximum current speed and surface elevation at the ESAs for the Northeast Monsoon condition. The Project is not expected to create any changes in current speed at the ESAs locations except at the existing intake where the mean and maximum current speed reduces by 20 and 22% due to deepening of seabed at the trench. There are insignificant changes in current speed and water levels expected at other ESAs during this period.
Table 4.4 Changes in current speeds during period of no activity during construction at the
ESAs within the vicinity of the Project area (Northeast Monsoon condition)
ID Description
Existing During
Construction Difference (%)
Mean Speed (m/s)
Max Speed (m/s)
Mean Speed (m/s)
Max Speed (m/s)
Mean Speed
Max Speed
1 Existing intake 0.15 0.23 0.12 0.18 -20 -22
2 Kampung Nelayan Batu Mandi
0.11 0.13 0.11 0.13 0 0
3 Similajau National Park
marine extension 0.13 0.23 0.13 0.23 0 0
4 Bintulu Port 0.08 0.21 0.08 0.21 0 0
5 Batu Likau 0.13 0.27 0.13 0.27 0 0
6 Batu Mandi 0.12 0.22 0.12 0.22 0 0
Table 4.5 Changes in maximum water levels during period of no activity during construction at the ESAs within the vicinity of the Project area (Northeast Monsoon condition)
ID Description Max surface Elevation (m MSL)
Difference (%) Existing With Project
1 Existing intake 0.67 0.67 0
2 Kampung Nelayan Batu Mandi
0.68 0.68 0
3 Similajau National Park marine extension
0.68 0.68 0
4 Bintulu Port 0.59 0.59 0
5 Batu Likau 0.60 0.60 0
6 Batu Mandi 0.60 0.60 0

Hydraulic Study for the Proposed Bintulu Tanjung Kidurong Combined Cycle
Power Plant Project (Unit 9 - 13)
4-23 Dr. Nik & Associates Sdn. Bhd.
4.8 Findings The simulated existing mean and maximum current speed within the Project area is generally up to 0.1 and 0.2 m/s respectively. Current speed is highest in the vicinity of the existing outfall with mean and maximum speed of above 0.4 and 0.55 m/s respectively. The overall current speeds at the Project area are relatively lower during the inter-monsoon and Southwest Monsoon conditions. During the period of no activity, the presence of the trench may cause mean and maximum current speed reduction of up to 0.1 m/s of for the Northeast Monsoon condition. The presence of the excavated material at the temporary disposal ground is predicted to increase the mean and maximum current speed by less than 0.05 and 0.1 m/s respectively. However, these changes are temporary as the trench will be backfilled with the material placed at the temporary disposal ground once the pipelines are laid beginning in March 2019. There are insignificant changes in current speed during this period at the ESAs locations. Upon Project implementation, it is predicted that the mean and maximum current speed increases by up 0.1 m/s at the intake head extending approximately 150 and 300 m to the west of the proposed intake and outfall structures for the Northeast Monsoon condition. The Project is not expected to create any changes in current speed at any of the ESAs locations except at the existing and new intake. The changes in current speeds are localised during the period of no activity during construction and upon Project implementation. There are insignificant changes in water levels expected for both scenarios at the ESAs locations.

Chapter 5
WAVES

Dr. Nik & Associates Sdn. Bhd. 5-1
WAVES
5.1 Introduction An appraisal of wave conditions at the Project site assists in determining the impact of waves on the surrounding vicinity of the Project area. The assessment of wave conditions at the Project area and the impact in terms of wave conditions are performed via two-dimensional wave modelling using MIKE 21 Nearshore Spectral Waves (MIKE21 NSW).
5.2 MIKE 21 NSW MIKE 21 NSW is a wind-wave model describing propagation, growth, decay and transformation of wind generated waves and also swells in coastal areas. The model inputs include bathymetry, wave conditions along the offshore model boundary, bottom roughness, water level and breaking parameters. The generated model output comprises of significant wave height, mean wave direction, mean wave period, wave velocity components and also wave radiation stresses.
5.3 Boundary Conditions Offshore wave data has been obtained from the regional wave model to determine the boundary condition to drive the nearshore wave model. Offshore wave data was extracted at depths around -15 m MSL and analysed to obtain representative wave conditions to simulate the nearshore wave patterns. Table 5.1 tabulates the analysed parameters that are used to drive wave to nearshore for each monsoonal condition.
Table 5.1 Parameters applied at local wave model boundary
Condition Significant wave height (Hm0, m)
Mean wave period (Tm,s)
Mean wave direction (°N)
Northeast Monsoon 1.2 4.5 20
Inter-monsoon 0.8 3.5 20
Southwest Monsoon 0.5 3.0 270
Chapter 5

Hydraulic Study for the Proposed Bintulu Tanjung Kidurong Combined Cycle
Power Plant Project (Unit 9 - 13)
5-2 Dr. Nik & Associates Sdn. Bhd.
5.4 Model Setup A local wave model similar to the finest domain of the hydrodynamic model has been set up. The local model has a rectilinear grid resolution of 15 x 3.75 m which is considered adequate to resolve the nearshore wave processes. Simulations were carried out for the existing, “with Project” and during construction conditions for all monsoonal conditions. The results are compared and the impact on the wave conditions in the vicinity of the Project area is assessed
5.5 Model Results
5.5.1 Existing Condition Significant wave height plots for each monsoonal condition during existing condition are shown in Figure 5.1. It can be inferred from the results that north-easterly waves are dominant during Northeast and inter-monsoon conditions. North-westerly waves are present during Southwest Monsoon condition but at relatively low wave heights. The waves during all monsoonal conditions are slightly oblique to the coastline. During the Northeast Monsoon condition, wave height of up to 1 m reaches the existing intake location. Wave heights are up to 0.7 and 0.5 m during the inter-monsoon and Southwest Monsoon condition respectively at the same location.

Hydraulic Study
Chapter 5 |Waves
Dr. Nik & Associates Sdn. Bhd. 5-3
a) Northeast Monsoon condition
b) Inter-monsoon condition
Figure 5.1 Significant wave height: Existing condition
Existing intake/
outfall
structures
Existing intake/
outfall
structures
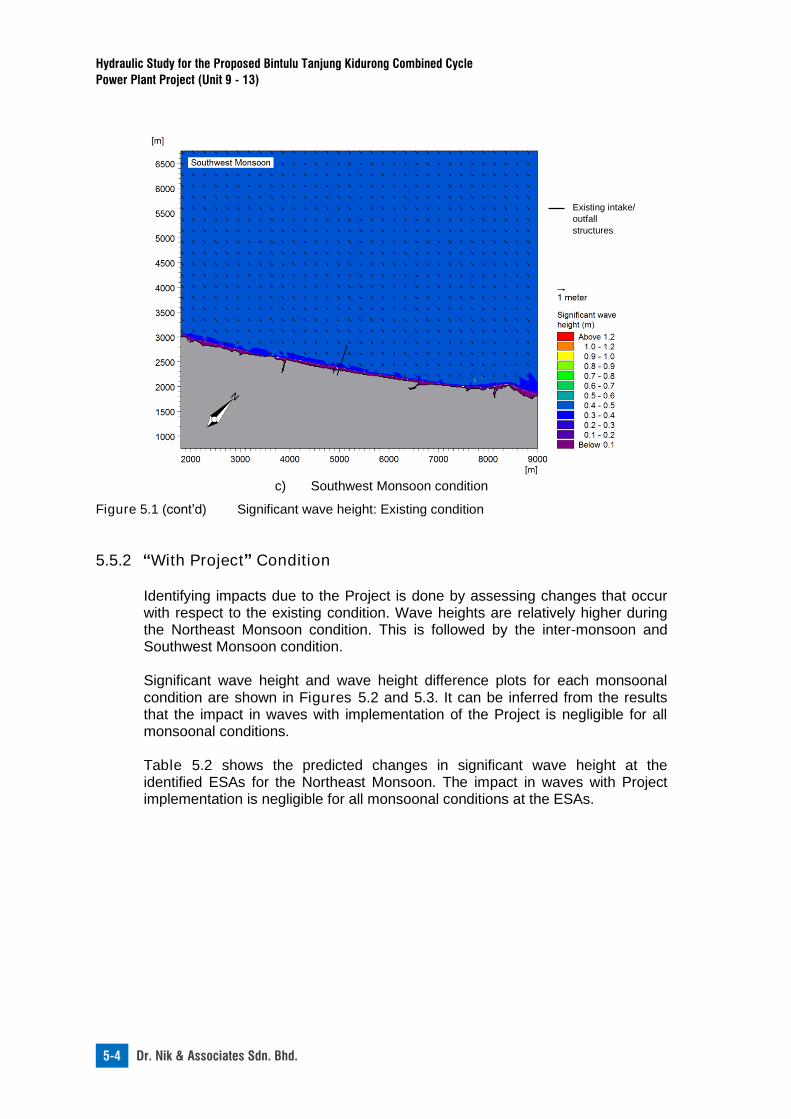
Hydraulic Study for the Proposed Bintulu Tanjung Kidurong Combined Cycle
Power Plant Project (Unit 9 - 13)
5-4 Dr. Nik & Associates Sdn. Bhd.
c) Southwest Monsoon condition
Figure 5.1 (cont’d) Significant wave height: Existing condition
5.5.2 “With Project” Condition
Identifying impacts due to the Project is done by assessing changes that occur with respect to the existing condition. Wave heights are relatively higher during the Northeast Monsoon condition. This is followed by the inter-monsoon and Southwest Monsoon condition. Significant wave height and wave height difference plots for each monsoonal condition are shown in Figures 5.2 and 5.3. It can be inferred from the results that the impact in waves with implementation of the Project is negligible for all monsoonal conditions. Table 5.2 shows the predicted changes in significant wave height at the identified ESAs for the Northeast Monsoon. The impact in waves with Project implementation is negligible for all monsoonal conditions at the ESAs.
Existing intake/
outfall
structures

Hydraulic Study
Chapter 5 |Waves
Dr. Nik & Associates Sdn. Bhd. 5-5
a) Northeast Monsoon condition b) Inter-monsoon condition c) Southwest Monsoon condition
Figure 5.2 Significant wave height: “With Project” condition
a) Northeast Monsoon condition b) Inter-monsoon condition c) Southwest Monsoon condition
Figure 5.3 Difference in significant wave height: “With Project” condition vs. existing condition
New intake/
outfall
structures
New intake/
outfall
structures

Hydraulic Study
Chapter 5 |Waves
Dr. Nik & Associates Sdn. Bhd. 5-6
Table 5.2 Changes in significant wave height at the ESAs within the vicinity of the Project area with Project implementation (Northeast Monsoon condition)
ID Description Significant Wave Height (m)
Existing With Project Difference (%)
1 New intake 1.0 1.0 0
2 Kampung Nelayan Batu Mandi 0.6 0.6 0
3 Similajau National Park marine extension
1.2 1.2 0
4 Bintulu Port 0.6 0.6 0
5 Batu Likau 1.2 1.2 0
6 Batu Mandi 0.9 0.9 0
5.5.3 Period of No Activity During Construction Identifying the temporary impact in waves is done by assessing changes during the period of no marine construction activity that occur from October 2018 to February 2019 with respect to the existing condition (Figures 5.4 and 5.5). The period traverses from the inter-monsoon (October) to the Northeast Monsoon (November to February) condition. It is anticipated that the trench and temporary disposal ground may cause reduction of up to 0.3 m of wave height during Northeast Monsoon condition. Wave height reduction is less than 0.1 and 0.05 m during inter-monsoon and Southwest Monsoon condition respectively. The changes are localised. The magnitude of change is highest at the trench and temporary disposal ground. The wave height reduction of 0.1 m during the Northeast Monsoon covers about 0.5 km of the coastline fronting the plant.

Hydraulic Study for the Proposed Bintulu Tanjung Kidurong Combined Cycle
Power Plant Project (Unit 9 - 13)
5-7 Dr. Nik & Associates Sdn. Bhd.
a) Northeast Monsoon condition
b) Inter-monsoon condition
Figure 5.4 Significant wave height: During construction
Temporary
Offshore disposal
area
Existing intake/
outfall
structures
Temporary
Offshore disposal
area
Existing intake/
outfall
structures

Hydraulic Study
Chapter 5 |Waves
Dr. Nik & Associates Sdn. Bhd. 5-8
a) Northeast Monsoon condition
b) Inter-monsoon condition
Figure 5.5 Difference in significant wave height: During construction vs. existing condition
Temporary
Offshore disposal
area
Existing intake/
outfall
structures
Temporary
Offshore disposal
area
Existing intake/
outfall
structures
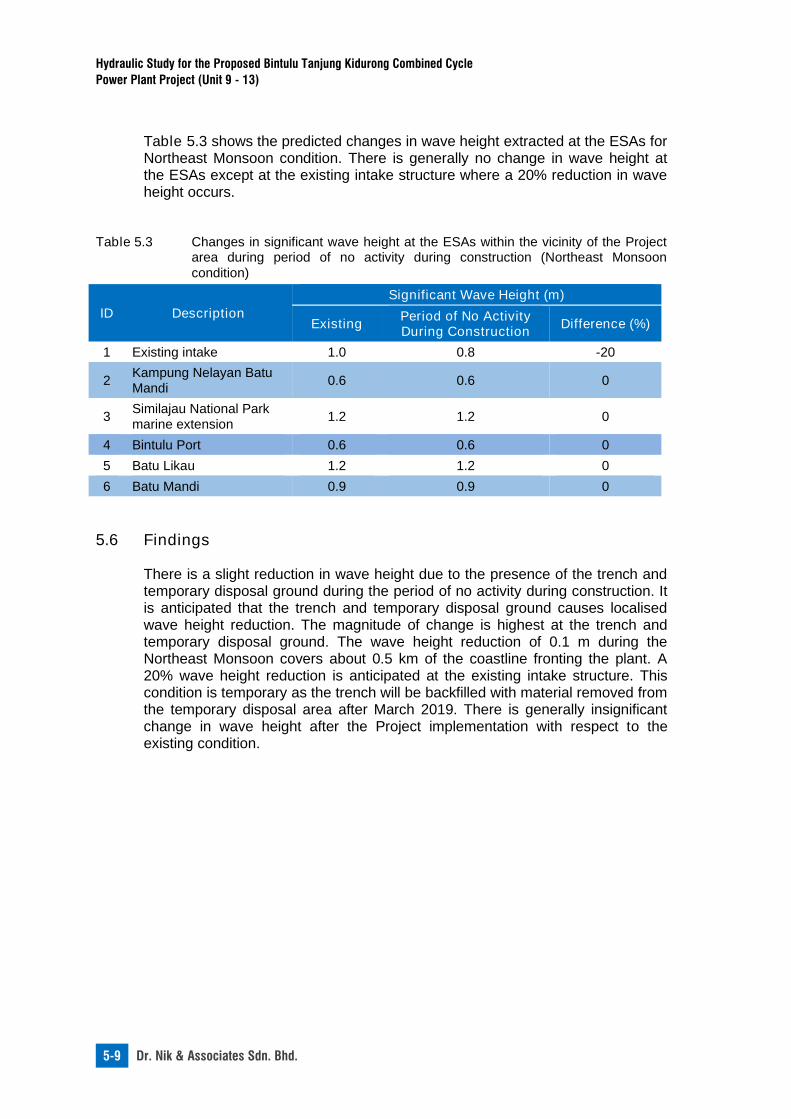
Hydraulic Study for the Proposed Bintulu Tanjung Kidurong Combined Cycle
Power Plant Project (Unit 9 - 13)
5-9 Dr. Nik & Associates Sdn. Bhd.
Table 5.3 shows the predicted changes in wave height extracted at the ESAs for Northeast Monsoon condition. There is generally no change in wave height at the ESAs except at the existing intake structure where a 20% reduction in wave height occurs.
Table 5.3 Changes in significant wave height at the ESAs within the vicinity of the Project area during period of no activity during construction (Northeast Monsoon
condition)
ID Description
Significant Wave Height (m)
Existing Period of No Activity During Construction
Difference (%)
1 Existing intake 1.0 0.8 -20
2 Kampung Nelayan Batu Mandi
0.6 0.6 0
3 Similajau National Park marine extension
1.2 1.2 0
4 Bintulu Port 0.6 0.6 0
5 Batu Likau 1.2 1.2 0
6 Batu Mandi 0.9 0.9 0
5.6 Findings There is a slight reduction in wave height due to the presence of the trench and temporary disposal ground during the period of no activity during construction. It is anticipated that the trench and temporary disposal ground causes localised wave height reduction. The magnitude of change is highest at the trench and temporary disposal ground. The wave height reduction of 0.1 m during the Northeast Monsoon covers about 0.5 km of the coastline fronting the plant. A 20% wave height reduction is anticipated at the existing intake structure. This condition is temporary as the trench will be backfilled with material removed from the temporary disposal area after March 2019. There is generally insignificant change in wave height after the Project implementation with respect to the existing condition.

Chapter 6
THERMAL PLUME AND
CHLORINE DISPERSION

Dr. Nik & Associates Sdn. Bhd. 6-1
.
THERMAL PLUME AND CHLORINE DISPERSION
6.1 Introduction Simulations to assess the recirculation of cooling water from the proposed power plant expansion are performed. The excess temperature that can occur due to the heat discharge is evaluated. The dispersion of chlorine that is discharged together with the heated water at the outfall is also investigated. Simulations for the cooling water recirculation study and chlorine dispersion were done using MIKE 21 AD.
6.2 Regulations The Department of Environment (DOE) has produced the Malaysian Marine Water Quality Criteria and Standard (MMWQCS) that regulates the Malaysian marine water quality. Table 6.1 provides information extracted from the MMWQCS for temperature increase for the various classes of marine water. The Project site is classified under ports, oil and gas field vicinity (Class 3). Based on the table, any activity conducted in a Class 3 area should not cause the temperature of the seawater to increase more than 2°C above the maximum ambient seawater temperature.
Table 6.1 Malaysian Marine Water Quality Criteria and Standard (MMWQCS)
Parameter Class 1 Class 2 Class 3 Class E
Beneficial Uses
Preservation, marine protected areas, marine parks
Marine life, fisheries, coral reefs, recreational and mariculture
Ports, oil & gas fields
Mangroves estuarine & river mouth water
Temperature (°C)
<2 increase over maximum
ambient
<2 increase over maximum ambient
<2 increase over maximum
ambient
<2 increase over maximum
ambient
Source: DOE, 2015
The ‘Environmental, Health, and Safety Guidelines for Thermal Power Plants’ Draft for Second Public Consultation) prepared by the International Finance Corporation (IFC) of the World Bank Group in 2017 states that:
Chapter 6

Hydraulic Study for the Proposed Bintulu Tanjung Kidurong
Combined Cycle Power Plant Project (Unit 9 - 13)
6-2 Dr. Nik & Associates Sdn. Bhd.
“The effluent should result in a temperature change of no more than 3°C at the edge of a scientifically established mixing zone which takes into account ambient water quality, receiving water use, potential receptors, and assimilative capacity.” The World Bank Group has also specified in its ‘Pollution Prevention and Abatement Handbook – Thermal Power: Guidelines for New Plants’ that: “Where the mixing zone is not defined, use 100 m from the point of discharge when there are no sensitive aquatic ecosystems within this distance.” The United States Environmental Protection Agency (USEPA) stated in its ‘Assessment of the Effects of Chlorinated Seawater from Power Plants on Aquatic Organisms’ that toxic effect caused by Chlorine concentration towards marine organisms in seawater is 0.5 ppm. The IFC’s ‘Environmental, Health, and Safety Guidelines for Thermal Power Plants’ that the maximum concentration total residual chlorine is 0.2 mg/L.
6.3 MIKE 21 AD MIKE 21 AD is the advection-dispersion module of MIKE 21. The module solves the two-dimensional, depth-integrated transport equation of the advection-dispersion type for dissolved or suspended substances when provided with the flow field from MIKE 21 HD. It simulates the spreading of dissolved or suspended substances subject to advection and dispersion processes in lakes, estuaries and coastal regions. The features include linear decay and heat dissipation to the atmosphere.
6.4 Model Setup Simulations of the thermal plumes and chlorine dispersion apply similar model domains to the current flow model. MIKE 21 AD simulations were carried out for the existing and ‘with Project’ conditions for all monsoonal conditions. A summary of the input data for the simulation is shown in Table 6.2. Both the existing and proposed outfalls have similar outfall temperature and excess chlorine concentration of 38°C and 0.2 mg/L.
Table 6.2 Input data for MIKE 21 AD simulations
Description Existing Intake
Existing Outfall
Proposed Intake
Proposed Outfall
Outfall temperature (°C) n.a. 38 n.a. 38
Excess chlorine concentration (mg/L)
n.a. 0.2 n.a. 0.2
Flow rate (m3/s) 7.77 7.77 9.3 18.6
n.a. –not applicable

Hydraulic Study
Chapter 6 | Thermal Plume and Chlorine Dispersion
Dr. Nik & Associates Sdn. Bhd. 6-3
Seawater temperature at the Project site was recorded from January 2016 to December 2017. The measurements were made at the existing condenser water inlet temperature. The information was provided by the Client as basis of the site’s ambient seawater temperature. Simulations for low ambient temperature takes into account the lowest recorded seawater temperature of 28.3°C. The simulations with high ambient temperature utilises the highest recorded temperature of 31.5°C. Chlorine was simulated as a conservative substance in which the ambient concentration was set to zero.
6.5 Design Simulation Period
A design simulation period covering a 31-day period was adopted. It includes a 3-day 'warm-up' period.
6.6 Thermal Plume Dispersion 6.6.1 Existing Condition
The results are in the form of depth-averaged temperature, which is more conservative than the temperature in any single model layer as practically, water from various depths in the water column will inevitably be mixed. Plots of contours of mean and maximum excess temperature as well as plots for the probability of exceedance for 2 and 3°C rise in temperature are presented in: (a) Figures 6.1 to 6.4 for simulations with low ambient seawater temperature;
and (b) Figures 6.5 to 6.8 for simulations with high ambient seawater temperature. It can be observed that the plume disperses southwest during the Northeast Monsoon condition. The plume extends northeast during the Southwest and inter-monsoon conditions due to the prevailing wind directions. The plume concentration is much smaller in magnitude during the Northeast Monsoon condition due to higher wind speed that aids the advection and spreading process of the outfall discharge. Simulations with a low ambient temperature during the Northeast Monsoon condition show that a plume with mean excess temperature of at least 0.5°C disperses up to 2.5 km southwest of the outfall. For the Southwest and inter-monsoon conditions, the plume extends up to 8 km northeast. For maximum excess temperature of the same value, the plume extends 4 km southwest during the Northeast Monsoon condition and 10 km during the Southwest and inter-monsoon conditions. The areal extent where 2°C is exceeded by at least 5% of time is about 1.5 km during the Northeast Monsoon and 2 km during the Southwest and inter-monsoon conditions. The extent reduces to 0.5 km and 1 km during the Northeast Monsoon and Southwest/inter-monsoon conditions for excess temperature of 3°C for the same percentage of exceedance.

Hydraulic Study for the Proposed Bintulu Tanjung Kidurong
Combined Cycle Power Plant Project (Unit 9 - 13)
6-4 Dr. Nik & Associates Sdn. Bhd.
a) Northeast Monsoon condition
b) Inter-Monsoon condition
c) Southwest Monsoon condition
Figure 6.1 Simulations with low ambient temperature: Mean excess temperature for existing
condition
Existing intake/ outfall structures
Existing intake/ outfall structures
Existing intake/ outfall structures

Hydraulic Study
Chapter 6 | Thermal Plume and Chlorine Dispersion
Dr. Nik & Associates Sdn. Bhd. 6-5
a) Northeast Monsoon condition
b) Inter-Monsoon condition
c) Southwest Monsoon condition
Figure 6.2 Simulations with low ambient temperature: Maximum excess temperature for
existing condition
Existing intake/ outfall structures
Existing intake/ outfall structures
Existing intake/ outfall structures

Hydraulic Study for the Proposed Bintulu Tanjung Kidurong
Combined Cycle Power Plant Project (Unit 9 - 13)
6-6 Dr. Nik & Associates Sdn. Bhd.
a) Northeast Monsoon condition
b) Inter-Monsoon condition
c) Southwest Monsoon condition
Figure 6.3 Simulations with low ambient temperature: Contours for probability exceedance
of 2°C rise of temperature for existing condition
Existing intake/ outfall structures
Existing intake/ outfall structures
Existing intake/ outfall structures

Hydraulic Study
Chapter 6 | Thermal Plume and Chlorine Dispersion
Dr. Nik & Associates Sdn. Bhd. 6-7
a) Northeast Monsoon condition
b) Inter-Monsoon condition
c) Southwest Monsoon condition
Figure 6.4 Simulations with low ambient temperature: Contours for probability exceedance of 3°C rise of temperature for existing condition
Simulations with a high ambient temperature during the Northeast Monsoon condition indicate that a plume with mean excess temperature of at least 0.5°C disperses up to 2 km away. The plume extends up to 5 km from the outfall for the Southwest and inter-monsoon conditions. For maximum excess temperature of the same value, the plume extends 4 km southwest during the Northeast Monsoon condition and 8 km during the Southwest and inter-monsoon conditions. The areal extent where 2°C is exceeded by at least 5% of time is about 0.6 km during the Northeast Monsoon and 1 km during the Southwest and inter-monsoon conditions. The extent where 3°C is exceeded by at least 5% of time is about 0.2 km during the Northeast Monsoon and 0.3 km during the Southwest and inter-monsoon conditions.
Existing intake/ outfall structures
Existing intake/ outfall structures
Existing intake/ outfall structures

Hydraulic Study for the Proposed Bintulu Tanjung Kidurong
Combined Cycle Power Plant Project (Unit 9 - 13)
6-8 Dr. Nik & Associates Sdn. Bhd.
a) Northeast Monsoon condition
b) Inter-Monsoon condition
c) Southwest Monsoon condition
Figure 6.5 Simulations with high ambient temperature: Mean excess temperature for
existing condition
Existing intake/ outfall structures
Existing intake/ outfall structures
Existing intake/ outfall structures

Hydraulic Study
Chapter 6 | Thermal Plume and Chlorine Dispersion
Dr. Nik & Associates Sdn. Bhd. 6-9
a) Northeast Monsoon condition
b) Inter-Monsoon condition
c) Southwest Monsoon condition
Figure 6.6 Simulations with high ambient temperature: Maximum excess temperature for
existing condition
Existing intake/ outfall structures
Existing intake/ outfall structures
Existing intake/ outfall structures

Hydraulic Study for the Proposed Bintulu Tanjung Kidurong
Combined Cycle Power Plant Project (Unit 9 - 13)
6-10 Dr. Nik & Associates Sdn. Bhd.
a) Northeast Monsoon condition
b) Inter-Monsoon condition
c) Southwest Monsoon condition
Figure 6.7 Simulations with high ambient temperature: Contours for probability exceedance
of 2°C rise of temperature for existing condition
Existing intake/ outfall structures
Existing intake/ outfall structures
Existing intake/ outfall structures

Hydraulic Study
Chapter 6 | Thermal Plume and Chlorine Dispersion
Dr. Nik & Associates Sdn. Bhd. 6-11
a) Northeast Monsoon condition
b) Inter-Monsoon condition
c) Southwest Monsoon condition
Figure 6.8 Simulations with high ambient temperature: Contours for probability exceedance
of 3°C rise of temperature for existing condition
Existing intake/ outfall structures
Existing intake/ outfall structures
Existing intake/ outfall structures

Hydraulic Study for the Proposed Bintulu Tanjung Kidurong
Combined Cycle Power Plant Project (Unit 9 - 13)
6-12 Dr. Nik & Associates Sdn. Bhd.
6.6.2 ‘With Project’ Condition
Plots of contours of mean and maximum excess temperature as well as plots for the probability of exceedance for 2 and 3°C rise in temperature are presented in: (a) Figures 6.9 to 6.12 for simulations with low ambient seawater temperature;
and (b) Figures 6.13 to 6.16 for simulations with high ambient seawater
temperature. Simulations with a low ambient temperature during the Northeast Monsoon condition show that a plume with mean excess temperature of at least 0.5°C disperses up to 5.5 km southwest of the outfall. For the Southwest and inter-monsoon conditions, the plume extends up to 13 km northeast. For maximum excess temperature of the same value, the plume extends 7 km southwest during the Northeast Monsoon condition and 14 km during the Southwest and inter-monsoon conditions. The areal extent from the new outfall where 2°C is exceeded by at least 5% of time is about 0.7 km during the Northeast Monsoon condition and 3 km during the Southwest and inter-monsoon conditions. The increase of 3°C from the new outfall with the same percentage exceedance extends to about 0.2 and 0.6 km during the Northeast Monsoon and Southwest/inter-monsoon condition respectively. Simulations with a high ambient temperature during the Northeast Monsoon condition indicate that a plume with mean excess temperature of at least 0.5°C disperses up to 5 km away. The plume extends up to 10 km for the Southwest and inter-monsoon conditions. For maximum excess temperature of the same value, the plume extends 7 km southwest during the Northeast Monsoon condition and 14 km during the Southwest and inter-monsoon conditions. The areal extent from the new outfall where 2°C is exceeded by at least 5% of time is about 0.2 and 0.6 km during the Northeast Monsoon and Southwest/inter-monsoon condition respectively. The increase of 3°C from the new outfall with the same percentage exceedance has a spread of up to 30 m from the outfall for all monsoonal conditions.

Hydraulic Study
Chapter 6 | Thermal Plume and Chlorine Dispersion
Dr. Nik & Associates Sdn. Bhd. 6-13
a) Northeast Monsoon condition
b) Inter-Monsoon condition
c) Southwest Monsoon condition
Figure 6.9 Simulations with low ambient temperature: Mean excess temperature for ‘with Project’ condition
New intake/ outfall structures
New intake/ outfall structures
New intake/ outfall structures

Hydraulic Study for the Proposed Bintulu Tanjung Kidurong
Combined Cycle Power Plant Project (Unit 9 - 13)
6-14 Dr. Nik & Associates Sdn. Bhd.
a) Northeast Monsoon condition
b) Inter-Monsoon condition
c) Southwest Monsoon condition Figure 6.10 Simulations with low ambient temperature: Maximum excess temperature for
‘with Project’ condition
New intake/ outfall structures
New intake/ outfall structures
New intake/ outfall structures

Hydraulic Study
Chapter 6 | Thermal Plume and Chlorine Dispersion
Dr. Nik & Associates Sdn. Bhd. 6-15
a) Northeast Monsoon condition
b) Inter-Monsoon condition
c) Southwest Monsoon condition
Figure 6.11 Simulations with low ambient temperature: Contours for probability exceedance
of 2°C rise of temperature for ‘with Project’ condition
New intake/ outfall structures
New intake/ outfall structures
New intake/ outfall structures

Hydraulic Study for the Proposed Bintulu Tanjung Kidurong
Combined Cycle Power Plant Project (Unit 9 - 13)
6-16 Dr. Nik & Associates Sdn. Bhd.
a) Northeast Monsoon condition
b) Inter-Monsoon condition
c) Southwest Monsoon condition
Figure 6.12 Simulations with low ambient temperature: Contours for probability exceedance
of 3°C rise of temperature for ‘with Project’ condition
New intake/ outfall structures
New intake/ outfall structures
New intake/ outfall structures

Hydraulic Study
Chapter 6 | Thermal Plume and Chlorine Dispersion
Dr. Nik & Associates Sdn. Bhd. 6-17
a) Northeast Monsoon condition
b) Inter-Monsoon condition
c) Southwest Monsoon condition
Figure 6.13 Simulations with high ambient temperature: Mean excess temperature for ‘with
Project’ condition
New intake/ outfall structures
New intake/ outfall structures
New intake/ outfall structures

Hydraulic Study for the Proposed Bintulu Tanjung Kidurong
Combined Cycle Power Plant Project (Unit 9 - 13)
6-18 Dr. Nik & Associates Sdn. Bhd.
a) Northeast Monsoon condition
b) Inter-Monsoon condition
c) Southwest Monsoon condition
Figure 6.14 Simulations with high ambient temperature: Maximum excess temperature for
‘with Project’ condition
New intake/ outfall structures
New intake/ outfall structures
New intake/ outfall structures

Hydraulic Study
Chapter 6 | Thermal Plume and Chlorine Dispersion
Dr. Nik & Associates Sdn. Bhd. 6-19
a) Northeast Monsoon condition
b) Inter-Monsoon condition
c) Southwest Monsoon condition
Figure 6.15 Simulations with high ambient temperature: Contours for probability exceedance
of 2°C rise of temperature for ‘with Project’ condition
New intake/ outfall structures
New intake/ outfall structures
New intake/ outfall structures

Hydraulic Study for the Proposed Bintulu Tanjung Kidurong
Combined Cycle Power Plant Project (Unit 9 - 13)
6-20 Dr. Nik & Associates Sdn. Bhd.
a) Northeast Monsoon condition
b) Inter-Monsoon condition
c) Southwest Monsoon condition
Figure 6.16 Simulations with high ambient temperature: Contours for probability exceedance
of 3°C rise of temperature for ‘with Project’ condition
Tables 6.3 and 6.4 show the predicted excess temperature extracted at the locations of the ESAs during the Northeast Monsoon. It can be observed that there is no change in mean and maximum excess temperature at all of the ESAs including the new intake after Project implementation.
New intake/ outfall structures
New intake/ outfall structures
New intake/ outfall structures

Hydraulic Study
Chapter 6 | Thermal Plume and Chlorine Dispersion
Dr. Nik & Associates Sdn. Bhd. 6-21
Table 6.3 Excess temperature extracted at the ESAs for simulations with low ambient
temperature during the Northeast Monsoon condition
ID Description
Excess Temperature (°C) Difference (%)
Existing With Project
Mean Maximum Mean Maximum Mean Maximum
1 New intake 0 0 0 0 0 0
2 Kampung Nelayan Batu Mandi
0 0 0 0 0 0
3 Similajau National Park marine extension
0 0 0 0 0 0
4 Bintulu Port 0 0 0 0 0 0
5 Batu Likau 0 0 0 0 0 0
6 Batu Mandi 0 0 0 0 0 0
Table 6.4 Excess temperature extracted at the ESAs for simulations with high ambient
temperature during the Northeast Monsoon condition
ID Description
Excess Temperature (°C) Difference (%)
Existing With Project
Mean Maximum Mean Maximum Mean Maximum
1 New intake 0 0 0 0 0 0
2 Kampung Nelayan Batu Mandi
0 0 0 0 0 0
3 Similajau National Park marine extension
0 0 0 0 0 0
4 Bintulu Port 0 0 0 0 0 0
5 Batu Likau 0 0 0 0 0 0
6 Batu Mandi 0 0 0 0 0 0
Tables 6.5 and 6.6 present the predicted excess temperature extracted at the locations of the ESAs during the Southwest Monsoon. It can be deduced that there is no change in mean excess temperature at all of the ESAs after Project implementation. It is anticipated that there an increase in maximum excess temperature of 0.5 and 0.3°C increase above low and high ambient temperature respectively at the waters fronting Kampung Nelayan Batu Mandi. This represents a 2 and 1% increase over the low and high ambient temperature respectively. However, there is no change in maximum excess temperature at the other ESAs after Project implementation.

Hydraulic Study for the Proposed Bintulu Tanjung Kidurong
Combined Cycle Power Plant Project (Unit 9 - 13)
6-22 Dr. Nik & Associates Sdn. Bhd.
Table 6.5 Excess temperature extracted at the ESAs for simulations with low ambient
temperature during the Southwest Monsoon condition
ID Description
Excess temperature (°C) Difference (%)
Existing With Project
Mean Maximum Mean Maximum Mean Maximum
1 New intake 0 0 0 0 0 0
2 Kampung Nelayan Batu Mandi
0 1.3 0 1.8 0 +2
3 Similajau National Park marine extension
0 0 0 0 0 0
4 Bintulu Port 0 0 0 0 0 0
5 Batu Likau 0 0 0 0 0 0
6 Batu Mandi 0 0 0 0 0 0
Table 6.6 Excess temperature extracted at the ESAs for simulations with high ambient
temperature during the Southwest Monsoon condition
ID Description
Excess temperature (°C) Difference (%)
Existing With Project
Mean Maximum Mean Maximum Mean Maximum
1 New intake 0 0 0 0 0 0
2 Kampung Nelayan Batu Mandi
0 0.9 0 1.2 0 +1
3
Similajau National Park marine extension
0 0 0 0 0 0
4 Bintulu Port 0 0 0 0 0 0
5 Batu Likau 0 0 0 0 0 0
6 Batu Mandi 0 0 0 0 0 0

Hydraulic Study
Chapter 6 | Thermal Plume and Chlorine Dispersion
Dr. Nik & Associates Sdn. Bhd. 6-23
6.7 Chlorine Dispersion
6.7.1 Existing Condition
Figures 6.17 and 6.18 present the plots of mean and maximum residual chlorine dispersion. It can be observed that the chlorine residual concentration plume disperses to the southwest for the Northeast Monsoon condition and to the northeast for the Southwest and inter-monsoon conditions. The plume concentration is much smaller in magnitude during the Northeast Monsoon condition due to higher wind speeds that aid the advection and spreading process of the outfall discharge. The mean residual chlorine concentration dispersion of above 0.05 and 0.1 ppm is about 1.5 km and generally less than 0.8 km respectively for all monsoonal conditions. The maximum residual chlorine concentration dispersion of above 0.05 ppm is up to 9.5 km for the Southwest and inter-monsoon conditions and 5 km for Northeast Monsoon condition. The spread for maximum residual chlorine concentration of above 0.1 ppm is predicted to be up to 5.5 and 3.5 km for Southwest/inter-monsoon and Northeast Monsoon condition respectively.

Hydraulic Study for the Proposed Bintulu Tanjung Kidurong
Combined Cycle Power Plant Project (Unit 9 - 13)
6-24 Dr. Nik & Associates Sdn. Bhd.
a) Northeast Monsoon condition
b) Inter-monsoon condition
c) Southwest Monsoon condition
Figure 6.17 Mean residual chlorine dispersion for existing condition
Existing intake/ outfall structures
Existing intake/ outfall structures
Existing intake/ outfall structures

Hydraulic Study
Chapter 6 | Thermal Plume and Chlorine Dispersion
Dr. Nik & Associates Sdn. Bhd. 6-25
a) Northeast Monsoon condition
b) Inter-monsoon condition
c) Southwest Monsoon condition Figure 6.18 Maximum residual chlorine dispersion for existing condition
Existing intake/ outfall structures
Existing intake/ outfall structures
Existing intake/ outfall structures

Hydraulic Study for the Proposed Bintulu Tanjung Kidurong
Combined Cycle Power Plant Project (Unit 9 - 13)
6-26 Dr. Nik & Associates Sdn. Bhd.
6.7.2 ‘With Project’ Condition
The plots of mean and maximum residual chlorine dispersion for all monsoonal conditions are illustrated in Figures 6.19 and 6.20. The mean residual chlorine concentration dispersion of above 0.05 and 0.1 ppm is about 1.5 km and generally less than 0.8 km respectively for all monsoonal conditions. The maximum residual chlorine concentration dispersion of above 0.05 ppm is up to 9.5 km for the Southwest and inter-monsoon conditions and 5.5 km for Northeast Monsoon condition. The spread for maximum residual chlorine concentration of above 0.1 ppm is predicted to be up to 7 and 3 km for Southwest/inter-monsoon and Northeast Monsoon condition respectively.

Hydraulic Study
Chapter 6 | Thermal Plume and Chlorine Dispersion
Dr. Nik & Associates Sdn. Bhd. 6-27
a) Northeast Monsoon condition
b) Inter-monsoon condition
c) Southwest Monsoon condition Figure 6.19 Mean residual chlorine dispersion for ‘with Project’ condition
New intake/ outfall structures
New intake/ outfall structures
New intake/ outfall structures

Hydraulic Study for the Proposed Bintulu Tanjung Kidurong
Combined Cycle Power Plant Project (Unit 9 - 13)
6-28 Dr. Nik & Associates Sdn. Bhd.
a) Northeast Monsoon condition
b) Inter-monsoon condition
c) Southwest Monsoon condition
Figure 6.20 Maximum residual chlorine dispersion for ‘with Project’ condition
Tables 6.7 and 6.8 show the extracted values for residual chlorine concentration at the ESAs during the Northeast and Southwest Monsoon conditions. It can be inferred that the impact of residual chlorine concentration introduced by the new outfall is insignificant at all ESA locations.
New intake/ outfall structures
New intake/ outfall structures
New intake/ outfall structures

Hydraulic Study
Chapter 6 | Thermal Plume and Chlorine Dispersion
Dr. Nik & Associates Sdn. Bhd. 6-29
Table 6.7 Residual chlorine concentration extracted at the ESAs (Northeast Monsoon condition)
ID Description
Residual Chlorine Concentration (ppm)
Difference (%) Existing With Project
Mean Maximum Mean Maximum Mean Maximum
1 New intake 0 0 0 0 0 0
2
Kampung Nelayan Batu
Mandi 0 0 0 0 0 0
3
Similajau National Park marine extension
0 0 0 0 0 0
4 Bintulu Port 0 0 0 0 0 0
5 Batu Likau 0 0 0 0 0 0
6 Batu Mandi 0 0 0 0 0 0
Table 6.8 Residual chlorine concentration extracted at the ESAs (Southwest Monsoon condition)
ID Description
Residual Chlorine Concentration (ppm)
Difference (%) Existing With Project
Mean Maximum Mean Maximum Mean Maximum
1 New intake 0 0 0 0 0
2 Kampung Nelayan Batu Mandi
0.1 0 0.1 0 0
3
Similajau National Park marine extension
0 0 0 0 0
4 Bintulu Port 0 0 0 0 0
5 Batu Likau 0 0 0 0 0
6 Batu Mandi 0 0 0 0 0

Hydraulic Study for the Proposed Bintulu Tanjung Kidurong
Combined Cycle Power Plant Project (Unit 9 - 13)
6-30 Dr. Nik & Associates Sdn. Bhd.
6.8 Findings
Temperature gradient plays a significant role where discharging in lower ambient temperature (higher gradient) causes higher excess temperature compared to discharging in higher ambient temperature (lower gradient). The horizontal extent of the thermal plume where 2°C is exceeded by at least 5% of time is relatively similar with the existing condition. As the Project area is located within an open sea, heat dissipation is considered relatively good. There is no change in mean excess temperature at the identified ESA locations. However, there could be an increase of 0.5 and 0.3°C in maximum excess temperature above low and high ambient seawater temperature at the waters fronting Kampung Nelayan Batu Mandi during the Southwest Monsoon. This is not expected to negatively impact the village as the coastline has been disturbed and the waters are primarily used for navigation. No impact in seawater temperature is predicted at the other ESAs. The residual chlorine disperses to the southwest for the Northeast Monsoon condition and to the northeast for the Southwest and inter-monsoon conditions. The plume is influenced by the net current flow pattern. With the discharge from the new outfall, it can be observed that the residual chlorine dispersion’s extent and magnitude is relatively similar with the existing condition.

Chapter 7
SEDIMENT SPILL
DISPERSION

Dr. Nik & Associates Sdn. Bhd. 7-1
SEDIMENT SPILL DISPERSION
7.1 Introduction An environmental concern of the Project is the potential spilling of fine sediments into the sea from the dredging and disposal activities that generate a sediment plume that could reach the ESAs. This has been investigated via sediment spill dispersion modelling. The purpose of the sediment dispersion study is to determine the spatial and temporal concentration as well as the direction of the suspended sediments concentrations. These factors are assessed to determine the potential impact to the surroundings. This forms the input for assessment on the potential impact on marine biology, water quality and other sensitive receptors in the vicinity of the Project area.
7.2 MIKE 21 MT For the purpose of this Study, the impact assessment criteria recommended by PIANC (2010) have been used. The World Association for Waterborne Transport Infrastructure (PIANC) has jointly developed with the United Nations Environment Program (UNEP) guidelines for implementation of best practice methodology in environmental assessment and environmental management for dredging and port construction activities around coral reefs and their associated communities. Table 7.1 and Table 7.2 show the tolerable limits of excess suspended sediment and sedimentation rate respectively. These tolerable limits for coral organisms constitute a conservative indicator of potential stresses that is added on other natural receptors. For the assessment of the sediment plume dispersion results, tolerable limits associated with the “slight impact” category have been adopted.
Chapter 7

Hydraulic Study for the Proposed Bintulu Tanjung Kidurong Combined Cycle
Power Plant Project (Unit 9-13)
7-2 Dr. Nik & Associates Sdn. Bhd.
Table 7.1 Impact severity categories for suspended sediment concentration
Category Definition Description
No impact Excess suspended sediment concentration (SSC) > 5 mg/L for less than 5% of the time
Changes are significantly below physical detection level and below reliability of numerical models, so that no change to the quality or
functionality of the receptor will occur.
Slight impact
▪ Excess SSC > 5 mg/L for less than 20% of the time
▪ Excess SSC >10 mg/L for less than 5% of the time
Changes can be resolved by numerical models, but are difficult to detect in the field as they are associated with changes that cause stress, not mortality, to marine ecosystems. Slight impacts may be recoverable once the stress factor has been removed.
Minor impact
▪ Excess SSC > 5 mg/L for more than 20% of the time
▪ Excess SSC > 10 mg/L for
less than 20% of the time
Changes can be resolved in the numerical models are likely to be detected in the field as localised mortalities, but to a spatial scale that is unlikely to have any secondary consequences.
Moderate impact
▪ Excess SSC > 10 mg/L for more than 20% of the time
▪ Excess SSC > 25 mg/L for more than 5% of the time
Changes can be resolved by numerical models and are detectable in the field. Moderate impacts are expected to be locally significant.
Major impact
▪ Excess SSC > 25 mg/L for more than 20% of the time
▪ Excess SSC > 100 mg/L for more than 1% of the time
Changes are detectable in the field and are likely to be related to complete habitat loss. Major impacts are likely to have secondary influences on other ecosystems.
Source: PIANC, 2010
Table 7.2 Impact severity categories for sedimentation
Severity Definition Description
No impact Sedimentation < 0.05kg/m2/day (<1.7mm/14days)
Slight impact Sedimentation <0.1kg/m2/day (<3.5mm/14 days)
Minor impact Sedimentation <0.2kg/m2/day (<7.0mm/14 days)
Moderate impact Sedimentation <0.5kg/m2/day (<17.5mm/14 days)
Major impact Sedimentation >0.5kg/m2/day (>17.5mm/14 days)
Source: PIANC, 2010
7.3 MIKE 21 MT This Study is carried out using MIKE21 MT, a two-dimensional mud transport model. The model uses the output from the hydrodynamic model, MIKE 21 HD. MIKE 21 MT is used to study transport, deposition, erosion, dispersion and consolidation of cohesive sediments under the influence of tides and currents. This model is capable of resolving horizontal spatial variation of water depths. It takes into account the changes in the flow field or wave conditions in two dimensions. The model setup is based on available information from previous studies, field data collected, surveys and general scientific literature.

Hydraulic Study Chapter 7 | Sediment Spill Dispersion
Dr. Nik & Associates Sdn. Bhd. 7-3
7.4 Model Setup
Sediment plume originating from the dredging and disposal operations are simulated. The model uses similar model domain with the hydrodynamic model. The simulations are conducted for Southwest Monsoon condition when the dredging and disposal works will be conducted. The dredging and disposal operation is simulated for three sections to represent the impact for the whole dredging operation as the dredger starts operating from offshore, dredging towards nearshore. The simulated dredging or disposal spill point is represented by a single source point located at the middle of each section in Figure 7.1.
Figure 7.1 Location of dredging and disposal operations
7.5 Sediment Spill Rate
The sediment spill rate used in the model is based on the volume of material dredged by a cutter suction dredger (CSD). The dredged material is transferred via a pipeline to the temporary offshore disposal ground as described in Chapter 3. The daily production and spill rates of the dredging operation are given in Table 7.3. The model assumes that the dredging operation is conducted continuously for a period of 12 hrs daily i.e. from 7:00 a.m. to 7:00 p.m.
Existing intake/ outfall structures
Temporary offshore disposal area
Proposed intake/outfall structures

Hydraulic Study for the Proposed Bintulu Tanjung Kidurong Combined Cycle
Power Plant Project (Unit 9-13)
7-4 Dr. Nik & Associates Sdn. Bhd.
Table 7.3 Daily production and spill rates of one cutter suction dredger during dredging and
disposal cycle
Description Value Source
Volume to be excavated (m3) 250,000 Contractor
Sediment density (kg/m3) 1,540 Analysis of seabed samples
Percentage of fines (%) 60 Analysis of seabed samples Percentage of spill from drag
head (%) 2 DID guidelines (2001)
Percentage of spill during disposal (%)
20 DID guidelines (2001)
Dredging production rate (m3/hour)
500 Contractor
Disposal rate (m3/hour) 200 Contractor
Daily spilled volume (tonnes) 444 Calculation
7.6 Design Simulation Period
A design simulation period covering a 17-day period was adopted. It includes a 3-day 'warm-up' period.
7.7 Results The sediment spill dispersion modelling results are presented in the forms of mean, maximum and exceedance plots for 5, 10, 25 and 50 mg/L concentration as shown in Figures 7.2 to 7.10. It is observed that the plume extends dominantly to the northeast as influenced by the wind direction during the Southwest Monsoon. The model also predicts that the extent and concentration of suspended sediment is fairly similar for all sections. The mean and maximum excess suspended sediment dispersion is about 2.5 and 5.5 km from the source at the dredging site respectively for suspended sediment concentration of more than 5 mg/L. The mean and maximum plume excursion for concentration of more than 10 mg/L is up to about 1.5 and 4.5 km respectively from the source. The exceedance probability for 5 mg/L exceeding more than 10% of the time has a spread of about 4 km from the spill source at the disposal area and 3.5 km from source at the trench. The exceedance probability for 10 mg/L exceeding more than 10% of the time would have a spread of about 3.5 km at the disposal area and 2 km at the trench. The extent for 25 mg/L reduces significantly for the same exceedance time, i.e. up to 2 and 0.6 km for sediment spill at the disposal ground and trench respectively. For 50 mg/L concentration, the extent for the same time exceedance is about 1.5 km from the disposal area but is very localised at the trench.

Hydraulic Study Chapter 7 | Sediment Spill Dispersion
Dr. Nik & Associates Sdn. Bhd. 7-5
a) Mean
b) Maximum
Figure 7.2 Mean and maximum excess suspended sediment concentration for Section 1
Existing intake/ outfall structures
Temporary offshore disposal area
Trench
Existing intake/ outfall structures
Temporary offshore disposal area
Trench

Hydraulic Study for the Proposed Bintulu Tanjung Kidurong Combined Cycle
Power Plant Project (Unit 9-13)
7-6 Dr. Nik & Associates Sdn. Bhd.
a) Exceedance of 5 mg/L
b) Exceedance of 10 mg/L
Figure 7.3 Percentage of time exceedance of suspended sediment concentration above 5 and 10 mg/L for Section 1
Existing intake/ outfall structures
Temporary offshore disposal area
Trench
Existing intake/ outfall structures
Temporary offshore disposal area
Trench

Hydraulic Study Chapter 7 | Sediment Spill Dispersion
Dr. Nik & Associates Sdn. Bhd. 7-7
a) Exceedance of 25 mg/L
b) Exceedance of 50 mg/L
Figure 7.4 Percentage of time exceedance of suspended sediment concentration above 25 and 50 mg/L for Section 1
Existing intake/ outfall structures
Temporary offshore disposal area
Trench
Existing intake/ outfall structures
Temporary offshore disposal area
Trench

Hydraulic Study for the Proposed Bintulu Tanjung Kidurong Combined Cycle
Power Plant Project (Unit 9-13)
7-8 Dr. Nik & Associates Sdn. Bhd.
a) Mean
b) Maximum
Figure 7.5 Mean and maximum excess suspended sediment concentration for Section 2
Existing intake/ outfall structures
Temporary offshore disposal area
Trench
Existing intake/ outfall structures
Temporary offshore disposal area
Trench

Hydraulic Study Chapter 7 | Sediment Spill Dispersion
Dr. Nik & Associates Sdn. Bhd. 7-9
a) Exceedance of 5 mg/L
b) Exceedance of 10 mg/L
Figure 7.6 Percentage of time exceedance of suspended sediment concentration above 5 and 10 mg/L for Section 2
Existing intake/ outfall structures
Temporary offshore disposal area
Trench
Existing intake/ outfall structures
Temporary offshore disposal area
Trench

Hydraulic Study for the Proposed Bintulu Tanjung Kidurong Combined Cycle
Power Plant Project (Unit 9-13)
7-10 Dr. Nik & Associates Sdn. Bhd.
a) Exceedance of 25 mg/L
b) Exceedance of 50 mg/L
Figure 7.7 Percentage of time exceedance of suspended sediment concentration above 25 and 50 mg/L for Section 2
Existing intake/ outfall structures
Temporary offshore disposal area
Trench
Existing intake/ outfall structures
Temporary offshore disposal area
Trench

Hydraulic Study Chapter 7 | Sediment Spill Dispersion
Dr. Nik & Associates Sdn. Bhd. 7-11
a) Mean
b) Maximum
Figure 7.8 Mean and maximum excess suspended sediment concentration for Section 3
Existing intake/ outfall structures
Temporary offshore disposal area
Trench
Existing intake/ outfall structures
Temporary offshore disposal area
Trench

Hydraulic Study for the Proposed Bintulu Tanjung Kidurong Combined Cycle
Power Plant Project (Unit 9-13)
7-12 Dr. Nik & Associates Sdn. Bhd.
a) Exceedance of 5 mg/L
b) Exceedance of 10 mg/L
Figure 7.9 Percentage of time exceedance of suspended sediment concentration above 5 and 10 mg/L concentration for Section 3
Existing intake/ outfall structures
Temporary offshore disposal area
Trench
Existing intake/ outfall structures
Temporary offshore disposal area
Trench

Hydraulic Study Chapter 7 | Sediment Spill Dispersion
Dr. Nik & Associates Sdn. Bhd. 7-13
a) Exceedance of 25 mg/L
b) Exceedance of 50 mg/L
Figure 7.10 Percentage of time exceedance of suspended sediment concentration above 25 and 50 mg/L concentration for Section 3
Existing intake/ outfall structures
Temporary offshore disposal area
Trench
Existing intake/ outfall structures
Temporary offshore disposal area
Trench
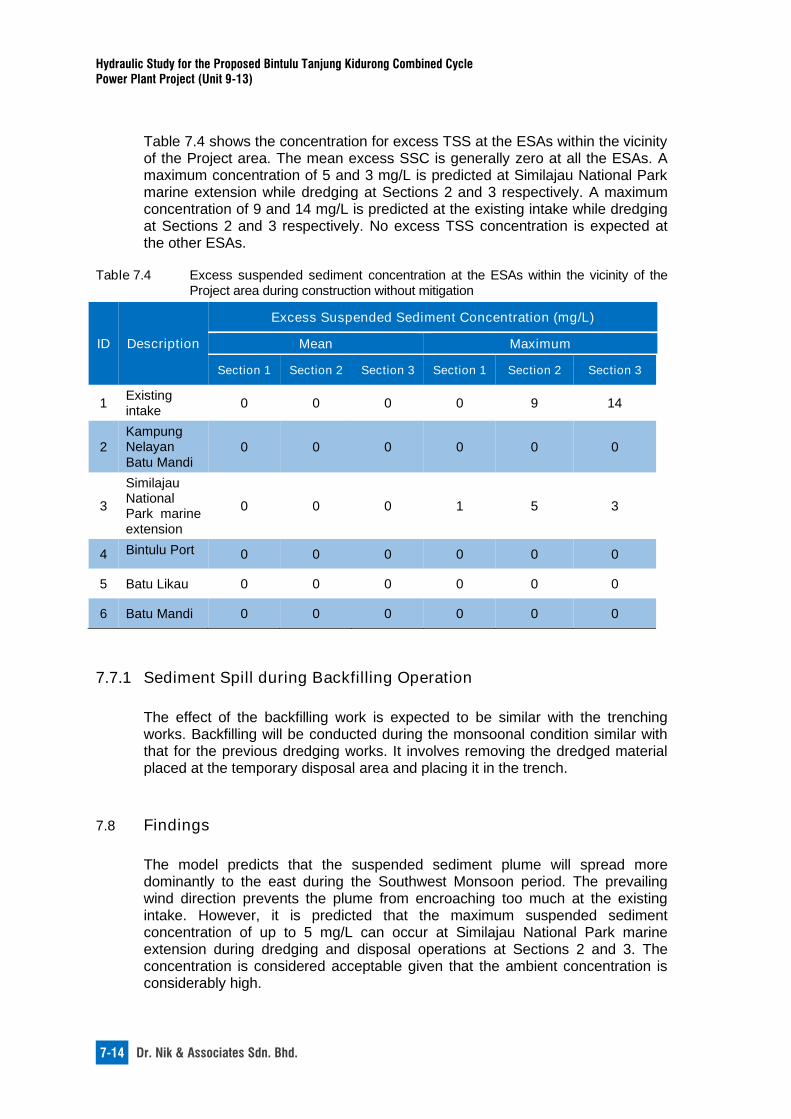
Hydraulic Study for the Proposed Bintulu Tanjung Kidurong Combined Cycle
Power Plant Project (Unit 9-13)
7-14 Dr. Nik & Associates Sdn. Bhd.
Table 7.4 shows the concentration for excess TSS at the ESAs within the vicinity of the Project area. The mean excess SSC is generally zero at all the ESAs. A maximum concentration of 5 and 3 mg/L is predicted at Similajau National Park marine extension while dredging at Sections 2 and 3 respectively. A maximum concentration of 9 and 14 mg/L is predicted at the existing intake while dredging at Sections 2 and 3 respectively. No excess TSS concentration is expected at the other ESAs.
Table 7.4 Excess suspended sediment concentration at the ESAs within the vicinity of the
Project area during construction without mitigation
ID Description
Excess Suspended Sediment Concentration (mg/L)
Mean Maximum
Section 1 Section 2 Section 3 Section 1 Section 2 Section 3
1 Existing intake
0 0 0 0 9 14
2
Kampung Nelayan
Batu Mandi 0 0 0 0 0 0
3
Similajau National Park marine extension
0 0 0 1 5 3
4 Bintulu Port 0 0 0 0 0 0
5 Batu Likau 0 0 0 0 0 0
6 Batu Mandi 0 0 0 0 0 0
7.7.1 Sediment Spill during Backfilling Operation
The effect of the backfilling work is expected to be similar with the trenching works. Backfilling will be conducted during the monsoonal condition similar with that for the previous dredging works. It involves removing the dredged material placed at the temporary disposal area and placing it in the trench.
7.8 Findings
The model predicts that the suspended sediment plume will spread more dominantly to the east during the Southwest Monsoon period. The prevailing wind direction prevents the plume from encroaching too much at the existing intake. However, it is predicted that the maximum suspended sediment concentration of up to 5 mg/L can occur at Similajau National Park marine extension during dredging and disposal operations at Sections 2 and 3. The concentration is considered acceptable given that the ambient concentration is considerably high.

Chapter 8
SEDIMENT TRANSPORT
Dr. Nik & Associates Sdn. Bhd. 8-1
SEDIMENT TRANSPORT
8.1 Introduction An appraisal of sediment transport conditions at the Project area is done to determine the impact in sediment transport. Though it is highly unlikely that the proposed sufficiently-spaced intake and outfall structures to pose any permanent changes in sediment transport capacity when they fully operate, the period of no activity (October 2018 to February 2019) is expected to cause temporary impact. It is estimated that 250,000 m3 of sediment will be excavated from the trench to place the intake pipelines. From the seabed sediment sampling done (as shown in Table 2.4), approximately 60% of each sediment sample is classified as fine sediment. It is predicted that 20% of fine sediment from the total volume of excavated sediment will be spilled during trenching and temporary disposal works. Although the fine sediment could settle into the trench, such deposition is unlikely to consolidate enough in a way that it could affect the invert level of the pipelines. Therefore, the sediment transport during this period will be evaluated via two-dimensional modelling using MIKE 21 Non-cohesive Sediment Transport (MIKE21 ST) module.
8.2 MIKE 21 ST MIKE 21 ST is a module that calculates the rate of non-cohesive sediment transport for pure currents or combined action of waves and currents, which in the Project area, is the latter. MIKE21 ST utilises the simulated flow conditions from the current flow model and the wave pattern from the nearshore wave model. The model inputs include current flow and nearshore wave modelling results, typical median sediment size (D50) and average sediment gradation.
8.3 Model Setup A local wave model similar to the finest domain of the hydrodynamic model has been setup. The local model has a rectilinear grid resolution of 15 m, which is considered adequate to resolve the nearshore sediment transport processes. Simulations were carried out for the period of no activity during construction for Northeast Monsoon condition, which coincides with the period of highest wave activity at the Project site. The impact in terms of sediment transport capacity in the vicinity of the Project area is assessed.
Chapter 8

Hydraulic Study for the Proposed Bintulu Tanjung Kidurong Combined Cycle
Power Plant Project (Unit 9 - 13)
8-2 Dr. Nik & Associates Sdn. Bhd.
8.4 Model Results The sediment transport capacity plots for Northeast Monsoon condition for the existing condition and the period of no construction is shown in Figure 8.1. The change in sediment transport capacity is shown in Figure 8.2. The north-easterly waves cause the sediment to be transported from east to west. The sediment transport capacity where the trench and the temporary disposal area are located is between 500 and 1,000 m3/year/m. It is relatively smaller compared to the nearshore transport, which is typically about 5,000 to 10,000 m3/year/m. The deepening of the seabed due to the trench excavation and the increase in bed level at the temporary offshore disposal area causes sediment transport capacity to be decreased significantly. This especially occurs at the nearshore area, i.e. about 1 km to the west and 0.7 km to the east of the existing intake structure. The predicted reduction of sediment transport capacity is highest near the Project area. It also causes the transport capacity further west (in front of PETRONAS’ LNG Complex) to increase by up to 2,000 m3/year/m. The area is currently protected by a rock revetment that is able to withstand erosion. However, the localised increase and decrease in sediment transport is temporary. The normal sediment transport will return to its original pattern after the trench is backfilled.

Hydraulic Study
Chapter 8 | Sediment Transport
Dr. Nik & Associates Sdn. Bhd. 8-3
a) Existing condition
b) During period of no construction
Figure 8.1 Average sediment transport capacity for Northeast Monsoon condition
Temporary offshore disposal area
Existing intake/ outfall structures
Existing intake/ outfall structures

Hydraulic Study for the Proposed Bintulu Tanjung Kidurong Combined Cycle
Power Plant Project (Unit 9 - 13)
8-4 Dr. Nik & Associates Sdn. Bhd.
Figure 8.2 Difference (existing condition vs. period of no construction) in average sediment
transport capacity for Northeast Monsoon condition
Table 8.1 shows the predicted changes in sediment transport capacity extracted at the ESAs for Northeast Monsoon condition. There is generally no change in sediment transport capacity at the ESAs except at the existing intake structure where a 97% reduction in in sediment transport capacity occurs.
Table 8.1 Changes in sediment transport capacity at the ESAs within the vicinity of the
Project area during period of no activity during construction (Northeast Monsoon
condition)
ID Description
Sediment Transport Capacity (m3/year/m)
Existing Period of No Activity During Construction
Difference (%)
1 Existing intake 680 20 -97
2 Kampung Nelayan Batu Mandi
4,660 4,660 0
3 Similajau National Park marine extension
1,200 1,200 0
4 Bintulu Port 10 10 0
5 Batu Likau 25 25 0
6 Batu Mandi 50 50 0
Temporary offshore disposal area
Existing intake/ outfall structures

Hydraulic Study
Chapter 8 | Sediment Transport
Dr. Nik & Associates Sdn. Bhd. 8-5
Sediment discharge is extracted from the two-dimensional simulation results at two profiles as indicated in red in Figure 8.3. From the extracted sediment discharges, the volume of sediment that is trapped inside the trench is calculated by subtracting the incoming and outgoing sediment moving from both east and west of the extraction profiles as illustrated in Figure 8.4. It is predicted that about 200,000 m3 of sediment can settle inside the trench during this period.
Figure 8.3 Locations for extraction of sediment discharge profiles (denoted by the red lines)
Figure 8.4 Method in calculating the volume of sediment trapped inside the excavated
trench, Q
Temporary offshore disposal area

Hydraulic Study for the Proposed Bintulu Tanjung Kidurong Combined Cycle
Power Plant Project (Unit 9 - 13)
8-6 Dr. Nik & Associates Sdn. Bhd.
8.5 Findings There will unlikely be any significant change in sediment transport once the properly-installed intake and outfall structures are operational. For the period of no activity during construction between October 2018 and February 2019, the trench and temporary offshore disposal area could cause sedimentation at the coastline within 1 km radius surrounding the Project area. It can also lead to deficit of sediment supply to the western coastline (1 to 3 km to the west of the existing intake structure) with an erosion potential. It is not expected to affect the ESAs except the existing intake structure. Sediment placed at the temporary disposal ground and the surrounding area can also move towards and settle within the excavated trench during this period. The trench needs to be re-dredged prior to pipeline laying work due to the sedimentation occurring in the trench. The existing sediment transport regime would return to its original pattern after the backfilling work is completed.

Chapter 9
PROPOSED MITIGATION
MEASURES

Dr. Nik & Associates Sdn. Bhd. 9-1
PROPOSED MITIGATION MEASURES
9.1 Introduction Several mitigation measures can be implemented to reduce impacts caused by the proposed development. Measures are also recommended to address potential impact to the surrounding during and after construction.
9.2 Monitoring System During Construction A monitoring system may be applied during construction to address the uncertainties that may occur in hydraulic study and design. Two online turbidity sensors can be installed to the northeast and southwest of the existing intake structure. An ADCP can be deployed near the existing intake. The online monitoring is to be established at the onset of the marine construction works. Works are to be temporarily stopped when values recorded by the sensors reach the trigger value. Work can resume after the measured values fall below the trigger value.
9.3 Temporary Offshore Disposal Area
Measures have to be taken by the contractor when removing and transferring the dredged material at the temporary disposal area. Only the dredged material initially deposited at the disposal area may be removed. The contractor shall not remove more material than that initially placed at the temporary disposal area during the backfilling process.
Chapter 9
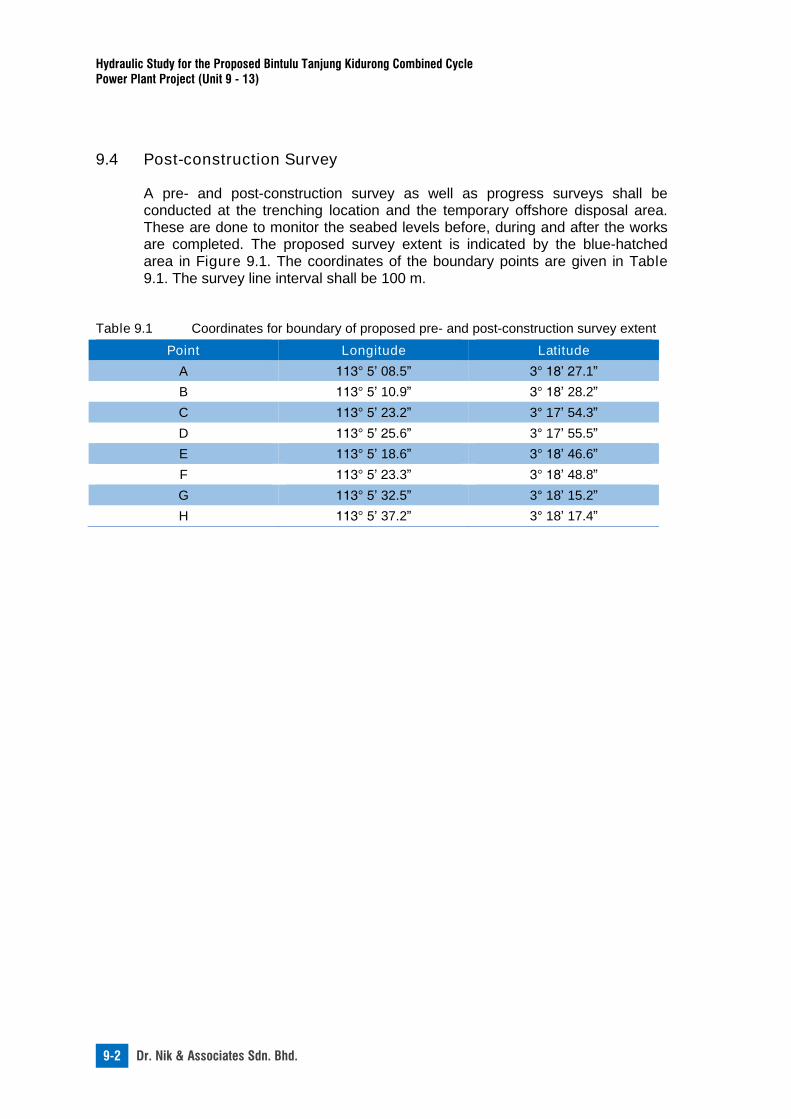
Hydraulic Study for the Proposed Bintulu Tanjung Kidurong Combined Cycle
Power Plant Project (Unit 9 - 13)
9-2 Dr. Nik & Associates Sdn. Bhd.
9.4 Post-construction Survey
A pre- and post-construction survey as well as progress surveys shall be conducted at the trenching location and the temporary offshore disposal area. These are done to monitor the seabed levels before, during and after the works are completed. The proposed survey extent is indicated by the blue-hatched area in Figure 9.1. The coordinates of the boundary points are given in Table 9.1. The survey line interval shall be 100 m.
Table 9.1 Coordinates for boundary of proposed pre- and post-construction survey extent
Point Longitude Latitude
A 113° 5’ 08.5” 3° 18’ 27.1”
B 113° 5’ 10.9” 3° 18’ 28.2”
C 113° 5’ 23.2” 3° 17’ 54.3”
D 113° 5’ 25.6” 3° 17’ 55.5”
E 113° 5’ 18.6” 3° 18’ 46.6”
F 113° 5’ 23.3” 3° 18’ 48.8”
G 113° 5’ 32.5” 3° 18’ 15.2”
H 113° 5’ 37.2” 3° 18’ 17.4”

Hydraulic Study
Chapter 9 | Proposed Mitigation Measure
Dr. Nik & Associates Sdn. Bhd. 9-3
Figure 9.1 Proposed pre- and post-construction survey extent
A B
C
D
E
F
G
H
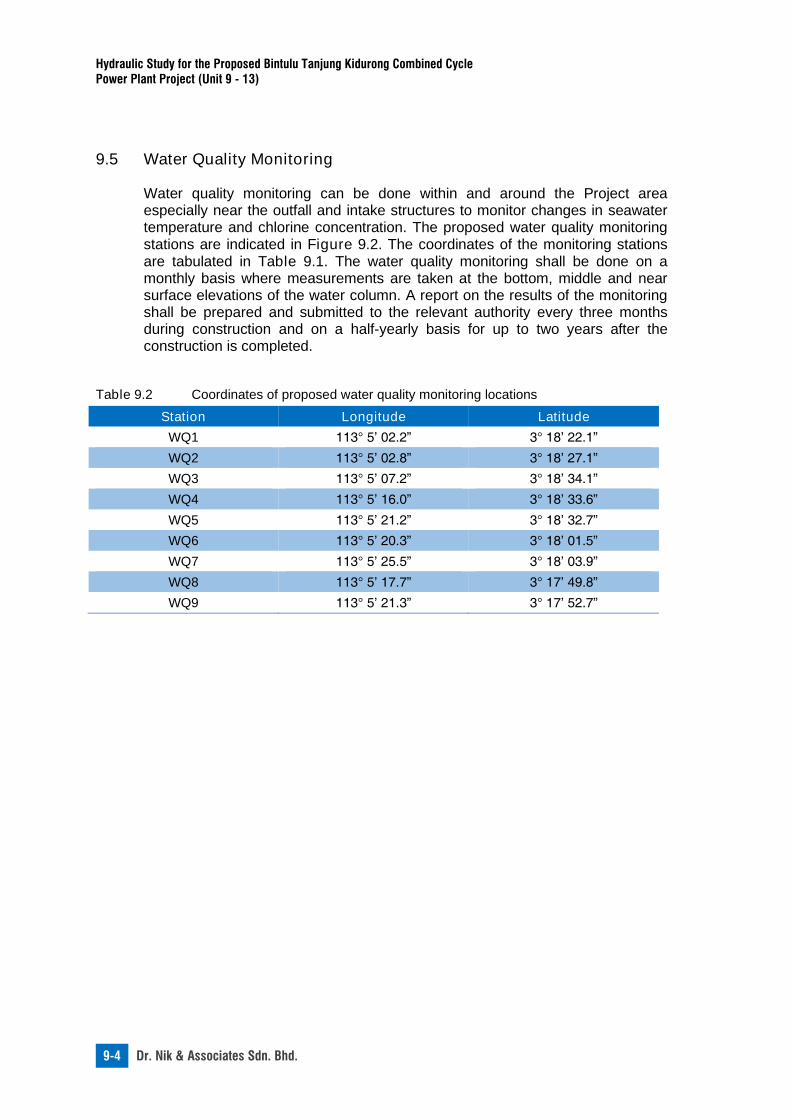
Hydraulic Study for the Proposed Bintulu Tanjung Kidurong Combined Cycle
Power Plant Project (Unit 9 - 13)
9-4 Dr. Nik & Associates Sdn. Bhd.
9.5 Water Quality Monitoring Water quality monitoring can be done within and around the Project area especially near the outfall and intake structures to monitor changes in seawater temperature and chlorine concentration. The proposed water quality monitoring stations are indicated in Figure 9.2. The coordinates of the monitoring stations are tabulated in Table 9.1. The water quality monitoring shall be done on a monthly basis where measurements are taken at the bottom, middle and near surface elevations of the water column. A report on the results of the monitoring shall be prepared and submitted to the relevant authority every three months during construction and on a half-yearly basis for up to two years after the construction is completed.
Table 9.2 Coordinates of proposed water quality monitoring locations
Station Longitude Latitude
WQ1 113° 5’ 02.2” 3° 18’ 22.1”
WQ2 113° 5’ 02.8” 3° 18’ 27.1”
WQ3 113° 5’ 07.2” 3° 18’ 34.1”
WQ4 113° 5’ 16.0” 3° 18’ 33.6”
WQ5 113° 5’ 21.2” 3° 18’ 32.7”
WQ6 113° 5’ 20.3” 3° 18’ 01.5”
WQ7 113° 5’ 25.5” 3° 18’ 03.9”
WQ8 113° 5’ 17.7” 3° 17’ 49.8”
WQ9 113° 5’ 21.3” 3° 17’ 52.7”
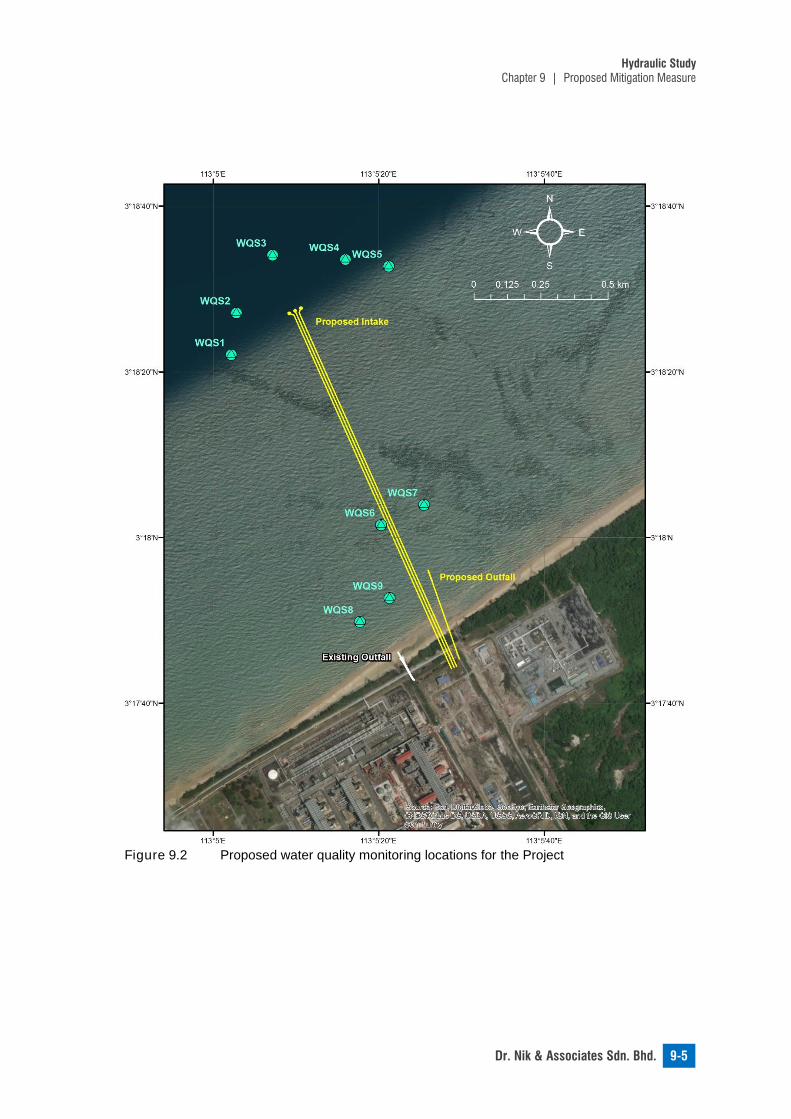
Hydraulic Study
Chapter 9 | Proposed Mitigation Measure
Dr. Nik & Associates Sdn. Bhd. 9-5
Figure 9.2 Proposed water quality monitoring locations for the Project

Chapter 10
CONCLUSION

Dr. Nik & Associates Sdn. Bhd. 10-1
CONCLUSION
10.1 Introduction Sarawak Energy Berhad intends to relocate the existing intake structure and at the same time construct new intake and outfall structures for the Tanjung Kidurong Combined Cycle Power Plant. The Project components are: a) A new plant consisting of Block 1 (Units 10 and 11) and Block 2 (Units 12
and 13) is constructed within the vicinity of the existing plant. A set of intake and outfall will be installed to support the once-through cooling system for both blocks. The intake and the outfall pipelines are 1,450 m and 320 m from the pumphouse respectively; and
b) Relocation of the existing intake (Unit 9) to a new location that is parallel to the intake of Block 1 and Block 2. The existing outfall will remain functional.
10.2 Site Assessment The Project site is located within the harbour limit about 5 km northeast of Bintulu Port. It is bounded by the headlands of Tanjung Kidurong and Tanjung Payung. The bathymetric survey conducted in December 2016 shows that the nearshore seabed contours are relatively parallel with the coastline. The tides at the Project area are mixed but predominantly diurnal. The mean high water tidal range is 1.96 m. The maximum current speed measured during November 2017 field campaign was less than 0.4 m/s, indicating the current speeds at the Project area are generally low. The period of measurement also coincided with the Northeast Monsoon. Long-term statistics of offshore wind shows that wind typically blows from northeast and southwest, characterised by the monsoonal conditions. Wind speed can reach up to 12 m/s especially during monsoonal condition. Wind-generated waves at the Project area typically propagates from the northeast, influenced by the wind and fetch directions. Offshore wave heights could reach up to 3 m during the Northeast Monsoon. Smaller waves of less than 0.5 m are notable outside the monsoon season. Seabed samples taken in and around the Project area shows that the seabed is composed of a combination of sand and fine sediments (clay and silt). Water quality at the Project area falls between Class 1 and Class 2 of the Malaysia Marine Water Quality and Standard based on the collected water samples. The measured seawater temperature ranged from 29 to 31°C over the water column with higher temperature observed during the daytime.
Chapter 10

Hydraulic Study for the Proposed Bintulu Tanjung Kidurong Combined Cycle
Power Plant Project (Unit 9 - 13)
10-2 Dr. Nik & Associates Sdn. Bhd.
Six ESAs were identified by the environmental consultant. These consisted of the plant’s existing/new intake, coastal village, marine park, coral reefs and harbour area.
10.3 Project Description The power plant’s existing intake structure is to be relocated and two new intake structures will be constructed. In total, there will be three intake outlets located 1.45 km seawards of the pump house. An additional outfall is sited 320 m seawards of the plant. The existing intake structure will cease to operate after the new intake is functional. The existing outfall at the beach will still be operational after the development. The proposed outfall will be discharging treated blowdown water at 38°C with 0.2 ppm chlorine concentration. The contractor has devised a construction schedule that traverses 2018 and 2019 due to time constraint (Table 10.1). Pipe-jacking will be done for 320 m of the intake pipelines commencing from the pump house and the entire outfall pipeline. Beyond 320 m of the proposed intake structures, a trench will be excavated in order to place the HDPE pipes and intake chambers.
Table 10.1 Construction schedule for intake and outfall Phase Duration Activity
1 April to September 2018 Trenching and temporary disposal works
2 October 2018 to February 2019 No activity due to Northeast Monsoon
3 March to September 2019 Backfilling works
A cutter suction dredger will be used to excavate the trench. The dredger will commence dredging from offshore towards land. About 250,000 m3 of material is anticipated to be excavated. The dredged material will be placed via a pipeline at a temporary offshore disposal area located 500 m east of the trench (Figure 10.1). The temporary disposal area will be used to store the excavated material between October 2018 and February 2019. The excavated material will be reused to backfill the trench once the pipes are laid commencing in March 2019. The temporary disposal site has a width and length of about 130 and 1,014 m respectively. The seabed at the temporary disposal area is anticipated to rise by 2 m.

Hydraulic Study
Chapter 10 | Conclusion
Dr. Nik & Associates Sdn. Bhd. 10-3
Figure 10.1 Location of proposed intake and outfall pipelines with respect to the temporary offshore disposal area
10.4 Hydrodynamics Assessment of the impacts in terms of current flow and water level utilised the calibrated and verified model based on measured currents and water levels. The simulated existing mean and maximum current speed within the Project area is generally up to 0.1 and 0.2 m/s respectively. Current speed is generally stronger during the Northeast Monsoon. Relatively weak current is predicted outside of the Northeast Monsoon period. The changes in current speeds are localised during the period of no activity during construction and upon Project implementation. There are insignificant changes in water levels expected for both scenarios at the identified ESAs. With Project implementation, it can be deduced that the proposed Project creates only localised changes to current flow patterns. The Project is not expected to create any changes in current speed at the ESAs except at the existing intake where the mean and maximum current speed increases by 40 and 20% respectively. During the period of no activity, the presence of the trench may cause mean and maximum current speed reduction of up to 0.1 m/s for the Northeast Monsoon condition. The presence of the excavated material at the temporary disposal area is predicted to increase the mean and maximum current speed by less than 0.05 and 0.1 m/s respectively. However, these changes are temporary as the trench will be backfilled with the material placed at the temporary disposal area once the pipelines are laid beginning in March 2019. There are insignificant changes in current speed during this period at the ESAs.
Existing intake/ outfall structures
New intake/ outfall structures
Temporary Offshore disposal area
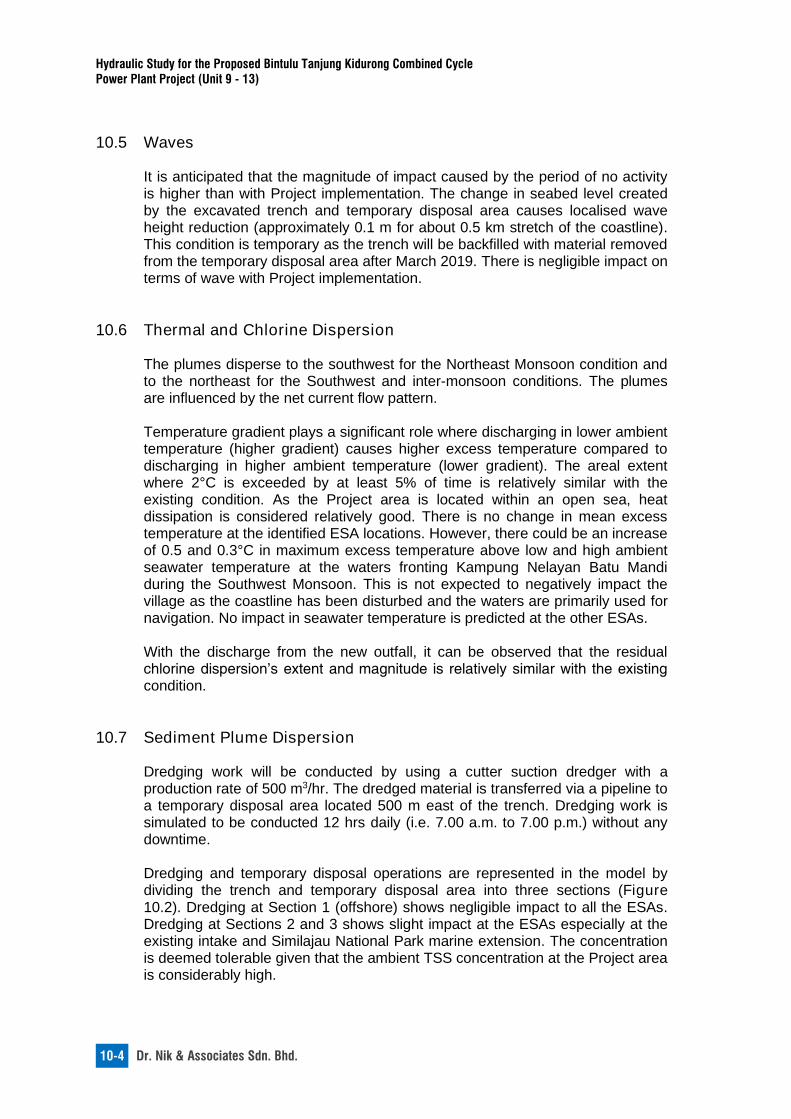
Hydraulic Study for the Proposed Bintulu Tanjung Kidurong Combined Cycle
Power Plant Project (Unit 9 - 13)
10-4 Dr. Nik & Associates Sdn. Bhd.
10.5 Waves It is anticipated that the magnitude of impact caused by the period of no activity is higher than with Project implementation. The change in seabed level created by the excavated trench and temporary disposal area causes localised wave height reduction (approximately 0.1 m for about 0.5 km stretch of the coastline). This condition is temporary as the trench will be backfilled with material removed from the temporary disposal area after March 2019. There is negligible impact on terms of wave with Project implementation.
10.6 Thermal and Chlorine Dispersion The plumes disperse to the southwest for the Northeast Monsoon condition and to the northeast for the Southwest and inter-monsoon conditions. The plumes are influenced by the net current flow pattern. Temperature gradient plays a significant role where discharging in lower ambient temperature (higher gradient) causes higher excess temperature compared to discharging in higher ambient temperature (lower gradient). The areal extent where 2°C is exceeded by at least 5% of time is relatively similar with the existing condition. As the Project area is located within an open sea, heat dissipation is considered relatively good. There is no change in mean excess temperature at the identified ESA locations. However, there could be an increase of 0.5 and 0.3°C in maximum excess temperature above low and high ambient seawater temperature at the waters fronting Kampung Nelayan Batu Mandi during the Southwest Monsoon. This is not expected to negatively impact the village as the coastline has been disturbed and the waters are primarily used for navigation. No impact in seawater temperature is predicted at the other ESAs. With the discharge from the new outfall, it can be observed that the residual chlorine dispersion’s extent and magnitude is relatively similar with the existing condition.
10.7 Sediment Plume Dispersion Dredging work will be conducted by using a cutter suction dredger with a production rate of 500 m3/hr. The dredged material is transferred via a pipeline to a temporary disposal area located 500 m east of the trench. Dredging work is simulated to be conducted 12 hrs daily (i.e. 7.00 a.m. to 7.00 p.m.) without any downtime. Dredging and temporary disposal operations are represented in the model by dividing the trench and temporary disposal area into three sections (Figure 10.2). Dredging at Section 1 (offshore) shows negligible impact to all the ESAs. Dredging at Sections 2 and 3 shows slight impact at the ESAs especially at the existing intake and Similajau National Park marine extension. The concentration is deemed tolerable given that the ambient TSS concentration at the Project area is considerably high.

Hydraulic Study
Chapter 10 | Conclusion
Dr. Nik & Associates Sdn. Bhd. 10-5
Figure 10.2 Location of dredging and disposal operations
The model predicts that the suspended sediment plume will spread more dominantly to the east during the Southwest Monsoon period. The prevailing wind direction prevents the plume from encroaching too much at the existing intake. However, it is predicted that the maximum suspended sediment concentration of up to 14 mg/L occurs at the existing intake when dredging at Section 2 and 3. The concentration is considered acceptable given that the ambient concentration is considerably high.
10.8 Sediment Transport The presence of the intake and outfall structures is not anticipated to induce changes to sediment transport upon Project implementation. For the period of no activity during construction between October 2018 and February 2019, the trench and temporary offshore disposal area could cause sedimentation at the coastline within 1 km radius surrounding the Project area. It can also lead to deficit of sediment supply to the western coastline (1 to 3 km to the west of the existing intake structure) with an erosion potential. It is not expected to affect the ESAs except the existing intake structure. Sediment placed at the temporary disposal ground and the surrounding area can also move towards and settle within the
Existing intake/ outfall structures
Temporary offshore disposal area
Proposed intake/outfall structures

Hydraulic Study for the Proposed Bintulu Tanjung Kidurong Combined Cycle
Power Plant Project (Unit 9 - 13)
10-6 Dr. Nik & Associates Sdn. Bhd.
excavated trench during this period. The trench needs to be re-dredged prior to pipeline laying work due to the sedimentation occurring in the trench. The existing sediment transport regime would return to its original pattern after the backfilling work is completed.
10.9 Mitigation Measures
Several measures are proposed in mitigating the impacts introduced by the Project especially that the construction work involves re-handling of dredged material. The measures suggested are monitoring system during construction where online turbidity sensors and an ADCP is installed near the existing intake structure. The Client is also responsible to mitigate coastal erosion caused by the proposed development, in which the level of protection is to be accounted for in the engineering design. The Contractor has to ensure that no over-dredging to be made while dredging the disposed material and a post-construction survey is also recommended to validate that. Water quality monitoring is also proposed to be conducted on a monthly basis within and around the Project area to monitor changes in seawater temperature and chlorine concentration.

REFERENCES
Dr. Nik & Associates Sdn. Bhd. R-1
REFERENCES DHI Water & Environment (M) Sdn. Bhd. 2017. Tg. Kidurong Power Plant (Unit 9 to 13).
Kuala Lumpur. Sinohydro Corporation (M) Sdn. Bhd. Dinescu, S., Andras, A. 2008. Environmental Friendly Equipment and Technology for
Underground Civil Excavations. Annals of the University of Petroşani, Mechanical Engineering, 10.
Dr. Nik & Associates Sdn. Bhd. 2015. Thermal Plume Modelling for the Proposed Bintulu Tg. Kidurong Combined Cycle Power Plant. Kuala Lumpur. Sarawak Energy Berhad.
Department of Irrigation and Drainage, Malaysia (DID). 1997. Garispanduan JPS 1/97:
Guidelines on Erosion Control for Development Projects in the Coastal Zone.
Kuala Lumpur: DID
Department of Irrigation and Drainage, Malaysia (DID). 2001. Guidelines for Preparation of Coastal Engineering Hydraulic Study and Impact Evaluation (for Hydraulic Studies using Numerical Models). Fifth Edition. Kuala Lumpur: DID.
Department of Irrigation and Drainage, Malaysia (DID). Keperluan Tambahan Bagi Permodelan Hidrodinamik Untuk Permohonan Pembangunan Di Hadapan Garis Pantai. Letter Ref. No. (45) dlm PPS.14/2/23 Jld.2 dated 11th June 2013.
International Finance Corporation. World Bank Group. May/June 2017. Environmental,
Health and Safety Guidelines for Thermal Power Plants.
National Hydrographic Centre (NHC), Royal Malaysian Navy, Tide Tables for Malaysia 2017. Port Klang: NHC.
PIANC. 2010. Dredging and Port Construction Around Coral Reefs. Report no. 108.
Sinohydro Corporation (M) Sdn. Bhd. 2018. Method Statement of Maritime Pipeline Excavation and Laying Rev. A. SEB Power Sdn. Bhd.
Sinohydro Corporation (M) Sdn. Bhd. 2018. Method Statement of Pipe Jacking for Main Cooling Water Piping. SEB Power Sdn. Bhd.
World Bank Group. 1999. Pollution Prevention and Abatement Handbook 1998: Toward
Cleaner Production.

APPENDIX


Appendix 5.4.1
Marine Traffic Risk Assessment (MTRA) for Proposed Cooling Water Intake at Tanjung Kidurong, Bintulu,
Sarawak

Marine Traffic Risk Analysis (MTRA) for
Proposed Cooling Water Intake Pipeline at
Tanjung Kidurong, Bintulu, Sarawak
Final Report
Prepared for
Sinohydro Corporation (M) Sdn Bhd April 2018
providing maritime solutions

THIS DOCUMENT WAS PRODUCED IN ACCORDANCE WITH KASI’S MS ISO 9001:2008 STANDARDS
providing maritime solutions
Marine Traffic Risk Analysis (MTRA) Study for the
Proposed Cooling Water Intake Pipeline at Tanjung
Kidurong, Bintulu, Sarawak
Final Report
Prepared by
Name: Low Hui Jin
Position: Senior Simulation Engineer
Signature:
Reviewed by
Name: Tan Seng Leong
Position: Simulation Manager
Signature:
Approved by
Name: Benjamin Nair
Position: Executive Director │ Marine Consultant
Signature:
KASI (Malaysia) Sdn Bhd (T48597-H)
Suite 8, 10th
Floor, Wisma Perindustrian, Jalan Istiadat,
Likas, 88400 Kota Kinabalu, Sabah, Malaysia
Tel: +6 088 259 229 Fax: +6 088 237 554

This document, and any associated files, is intended only for the use of the individual or entity to which it is addressed and may contain information that is confidential, subject to copyright or constitutes a trade secret. If you are not the intended recipient you are hereby notified that any dissemination, copying or distribution of this document, or files associated with this document, is strictly prohibited. If you have received this document in error, please notify us immediately. We do not accept liability for any corruption, delay, interception or unauthorized amendment of the document or their consequences.
© KASI (Malaysia) Sdn Bhd
providing maritime solutions
DOCUMENT CONTROL SHEET
Project Title Marine Traffic Risk Analysis (MTRA) Study for the Proposed Cooling Water Intake Pipeline at Tanjung Kidurong, Bintulu, Sarawak
Document Type Final Report
File Code SCSB 01/17
Document No. FR – 05.MC02.18.SCSB
Revision No. 0
Date 4th April 2018
Distribution Format of Submission No. of Copies
Sinohydro Corporation (M) Sdn Bhd Hardcopy 2
Record of Issue
STATUS REV PREPARED REVIEWED APPROVED DATE REMARKS
Draft 00 LHJ TSL BN 02.04.18 First Issue
Final 00 LHJ TSL BN 04.04.18 -
Marine Traffic Risk Analysis (MTRA) Study for the Proposed Cooling Water Intake Pipeline at Tanjung Kidurong, Bintulu, Sarawak
Final Report
Page 4 of 40
Table of Contents
Executive Summary ..................................................................................................................... 9
1.0 Introduction ...................................................................................................................... 10
1.1 Background.............................................................................................................. 10
1.2 Project Overview ..................................................................................................... 11
1.3 General Layout of the Proposed Cooling Water Intake Pipeline ............................. 11
1.4 Objective of the MTRA Study .................................................................................. 12
1.5 Scope of Work ......................................................................................................... 12
1.6 Methodology of MTRA Study ................................................................................... 13
2.0 Data Collection ................................................................................................................. 14
2.1 Project Site .............................................................................................................. 14
2.1.1 General Layout of Cooling Water System ................................................................. 15
2.1.2 Pipe Trench Excavation ............................................................................................ 16
2.1.3 Seabed Obstruction and Pipeline / Cable Spans ...................................................... 17
2.2 Marine Traffic Flow at Bintulu Port .......................................................................... 18
2.2.1 Commercial Vessel ................................................................................................... 18
2.2.2 Anchorage Areas ...................................................................................................... 19
2.2.3 Transportation of HDPE Pipes to Bintulu Port .......................................................... 19
2.2.4 Storage of HDPE Pipes in Bintulu Port ..................................................................... 20
2.2.5 Transportation and Installation of Weight Balancing Block ....................................... 21
2.2.6 Installation of Weight Balancing Block and Connection of HDPE Pipes ................... 22
2.2.7 Transportation of HDPE Pipelines to Project Site ..................................................... 23
2.3 Environmental Conditions ........................................................................................ 24
2.3.1 Wind .......................................................................................................................... 24 2.3.2 Wave ......................................................................................................................... 25
2.4 Construction Vessels ............................................................................................... 26
2.5 Construction Schedule ............................................................................................ 26
3.0 Risk Analysis .................................................................................................................... 27
3.1 Considerations for Desktop Review of Risks to Marine Traffic in the Region ......... 27
3.2 Risk Analysis using Hazard Identification (HAZID) ................................................. 27
3.3 HAZID Process ........................................................................................................ 27
3.3.1 Use of a Risk Matrix .................................................................................................. 28
3.3.2 HAZID Team ............................................................................................................. 29
3.3.3 HAZID Workshop Results ......................................................................................... 30
3.3.4 HAZID Workshop Findings ....................................................................................... 35
4.0 Risk Mitigation Measures ................................................................................................ 36
4.1 Proposed Risk Mitigation Measures for Construction Activities at Project Site ...... 36
4.1.1 Construction Vessel Crew ......................................................................................... 36

Marine Traffic Risk Analysis (MTRA) Study for the Proposed Cooling Water Intake Pipeline at Tanjung Kidurong, Bintulu, Sarawak
Final Report
Page 5 of 40
4.1.2 Weather Conditions .................................................................................................. 36
4.1.3 Emergency and Contingency Plans .......................................................................... 36
4.1.4 Construction Area ..................................................................................................... 36
4.1.5 Construction Vessels ................................................................................................ 37
4.2 Proposed Risk Mitigation Measures for Transportation Activities ........................... 37
4.2.1 Construction Vessel Crew ......................................................................................... 37
4.2.2 Weather Conditions .................................................................................................. 37 4.2.3 Emergency and Contingency Plans .......................................................................... 37
4.2.4 Construction Vessels for Transportation of Weight Block ......................................... 37
4.2.5 Construction Vessels for Transportation of HDPE Pipeline ...................................... 38
4.3 Anchoring of Cutter Suction Dredger ...................................................................... 38
4.4 Storage of HDPE Pipes in Bintulu Port ................................................................... 38
4.5 Installation Works of Weight Balancing Blocks and Connection Works for HDPE Pipes ........................................................................................................................ 38
4.6 Proposed Marine Traffic Management Plan ............................................................ 38
4.7 Proposed Marine Tower Beacons for Intake Pipeline ............................................. 39
4.8 Proposed Anchoring Prohibited Corridor for Intake Pipeline ................................... 39
5.0 Conclusion ....................................................................................................................... 40

Marine Traffic Risk Analysis (MTRA) Study for the Proposed Cooling Water Intake Pipeline at Tanjung Kidurong, Bintulu, Sarawak
Final Report
Page 6 of 40
LIST OF APPENDICES
Appendix A Methodology of Risk Assessment
Appendix B Risk Assessment for Cooling Water Intake Pipeline by Sinohydro
LIST OF FIGURES
Figure 1: Location of the project site.............................................................................................................. 10 Figure 2: General layout of the proposed cooling water intake pipeline (Source: General Layout (with
bathy).jpg, received on 7th
February from Sinohydro) ..................................................................... 11 Figure 3: Study Methodology ......................................................................................................................... 13 Figure 4: Ariel photograph of cooling water pump house and proposed cooling water intake pipeline (source:
Sinohydro) ....................................................................................................................................... 14 Figure 5: Location of cooling water pump house and proposed cooling water intake pipeline (source:
Sinohydro) ....................................................................................................................................... 15 Figure 6: General layout of cooling water system (source: PowerPoint for HDPE Pipeline Transportation,
Storage and Assembly received on 12th
February 2018 from Sinohydro) ....................................... 15 Figure 7: Proposed anchor boundary for the cutter suction dredger (source: PowerPoint for HDPE Pipeline
Transportation, Storage and Assembly received on 12th
February 2018 from Sinohydro) .............. 16 Figure 8: Existing submarine pipelines and cable in the vicinity of the project site (source: Marine Chart SAR
401, dated 30th December 2016) ..................................................................................................... 17
Figure 9: Number of vessel calls at Bintulu Port from year 2012 to 2016 (source: BPSB) ............................ 18 Figure 10: Anchorage areas within Bintulu Port Harbour Limit (source: Marine Chart SAR 401, dated 30
th
December 2016) ............................................................................................................................. 19 Figure 11: Designated storage area for HDPE pipes (source: PowerPoint for HDPE Pipeline Transportation,
Storage and Assembly received on 12th
February 2018 from Sinohydro) ....................................... 20 Figure 12: Securing of pipe at designated storage area (source: PowerPoint for HDPE Pipeline
Transportation, Storage and Assembly received on 12th
February 2018 from Sinohydro) .............. 20 Figure 13: Proposed barge route for transportation of weight balancing blocks (source: PowerPoint for HDPE
Pipeline Transportation, Storage and Assembly received on 12th
February 2018 from Sinohydro) 21 Figure 14: Example of installation of weight balancing block (source: PowerPoint for HDPE Pipeline
Transportation, Storage and Assembly received on 12th
February 2018 from Sinohydro) .............. 22 Figure 15: Proposed location for installation of weight balancing blocks and connection of pipes (source:
Sinohydro) ....................................................................................................................................... 22 Figure 16: Proposed transportation route for HDPE pipelines transportation to the project site (source:
PowerPoint for HDPE Pipeline Transportation, Storage and Assembly received on 12th
February
2018 from Sinohydro) ...................................................................................................................... 23 Figure 17: Annual wind rose (1953 – 2013) at Bintulu Bintulu (source: Regular Wave Height and Period.pdf,
received on 7th
February 2018 from Sinohydro) .............................................................................. 25 Figure 18: HAZID process flow ...................................................................................................................... 27 Figure 19: Proposed locations of light beacon provided by Client (source: Dwg no. FA08271S-, received on
8th
March 2018 from Sinohydro) ...................................................................................................... 39

Marine Traffic Risk Analysis (MTRA) Study for the Proposed Cooling Water Intake Pipeline at Tanjung Kidurong, Bintulu, Sarawak
Final Report
Page 7 of 40
LIST OF TABLES
Table 1: Berthing facilities and capacities of Bintulu Port (Source: BPSB) .................................................... 18 Table 2: Occurrence of wind direction and speed at Bintulu (source: Regular Wave Height and Period.pdf,
received on 7th
February 2018 from Sinohydro) .............................................................................. 24 Table 3: Summary of wind data Bintulu (source: Regular Wave Height and Period.pdf, received on 7
th
February 2018 from Sinohydro) ...................................................................................................... 24 Table 4: Specifications of construction vessels (source: Sinohydro) ............................................................. 26 Table 5: Planned construction schedule (source: PowerPoint for HDPE Pipeline Transportation, Storage and
Assembly received on 12th
February 2018 from Sinohydro)............................................................ 26 Table 6: Frequency Index (FI) ....................................................................................................................... 28 Table 7: Severity Index (SI) ........................................................................................................................... 28 Table 8: Risk Matrix ....................................................................................................................................... 29
Marine Traffic Risk Analysis (MTRA) Study for the Proposed Cooling Water Intake Pipeline at Tanjung Kidurong, Bintulu, Sarawak
Final Report
Page 8 of 40
ABBREVIATIONS
BPA Bintulu Port Authority
BPSB Bintulu Port Sdn Bhd
CCGT Combined Cycle Gas Turbine
COLREGS Collision Regulations
CPA Closest Point of Approach
FI Frequency Index
HAZID Hazard Identification
HDPE High Density Polyethylene
KASI KASI (Malaysia) Sdn Bhd
km Kilometres
LOA Length Overall
m Metre
mm Millimetre
MTRA Marine Traffic Risk Analysis
PIP Pre Incident Plan
SI Severity Index
Sinohydro Sinohydro Corporation (M) Sdn Bhd
t Tonnes
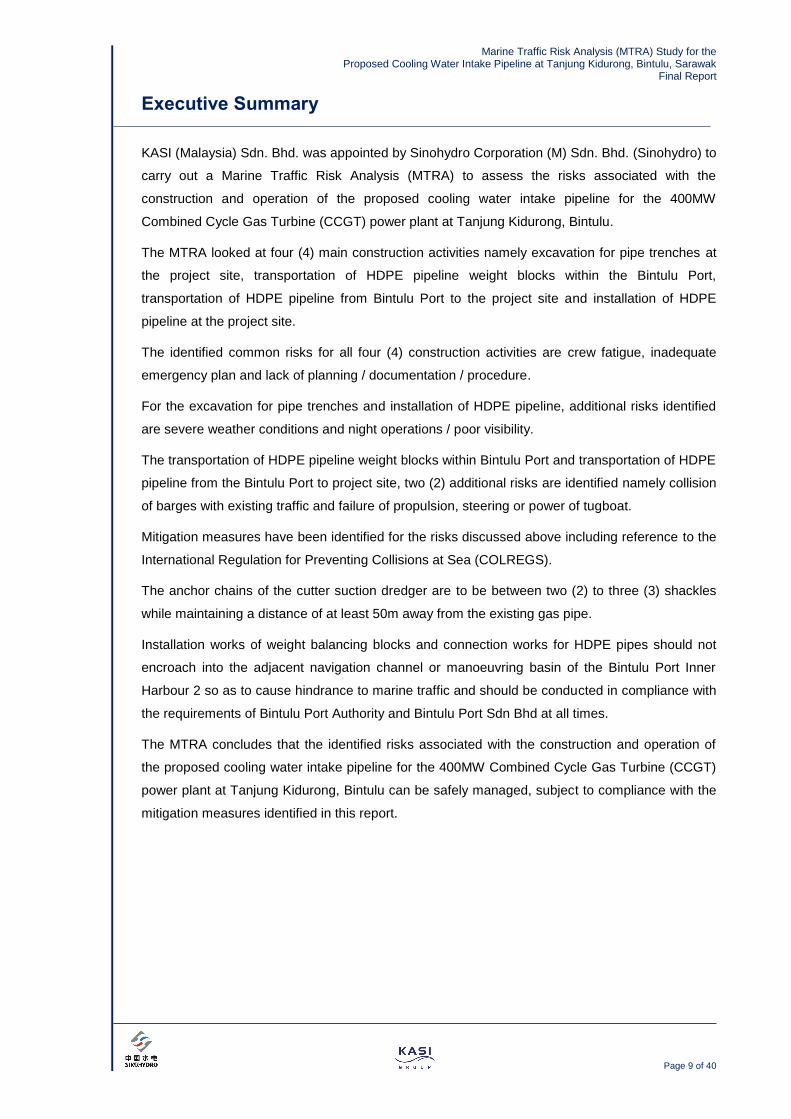
Marine Traffic Risk Analysis (MTRA) Study for the Proposed Cooling Water Intake Pipeline at Tanjung Kidurong, Bintulu, Sarawak
Final Report
Page 9 of 40
Executive Summary
KASI (Malaysia) Sdn. Bhd. was appointed by Sinohydro Corporation (M) Sdn. Bhd. (Sinohydro) to
carry out a Marine Traffic Risk Analysis (MTRA) to assess the risks associated with the
construction and operation of the proposed cooling water intake pipeline for the 400MW
Combined Cycle Gas Turbine (CCGT) power plant at Tanjung Kidurong, Bintulu.
The MTRA looked at four (4) main construction activities namely excavation for pipe trenches at
the project site, transportation of HDPE pipeline weight blocks within the Bintulu Port,
transportation of HDPE pipeline from Bintulu Port to the project site and installation of HDPE
pipeline at the project site.
The identified common risks for all four (4) construction activities are crew fatigue, inadequate
emergency plan and lack of planning / documentation / procedure.
For the excavation for pipe trenches and installation of HDPE pipeline, additional risks identified
are severe weather conditions and night operations / poor visibility.
The transportation of HDPE pipeline weight blocks within Bintulu Port and transportation of HDPE
pipeline from the Bintulu Port to project site, two (2) additional risks are identified namely collision
of barges with existing traffic and failure of propulsion, steering or power of tugboat.
Mitigation measures have been identified for the risks discussed above including reference to the
International Regulation for Preventing Collisions at Sea (COLREGS).
The anchor chains of the cutter suction dredger are to be between two (2) to three (3) shackles
while maintaining a distance of at least 50m away from the existing gas pipe.
Installation works of weight balancing blocks and connection works for HDPE pipes should not
encroach into the adjacent navigation channel or manoeuvring basin of the Bintulu Port Inner
Harbour 2 so as to cause hindrance to marine traffic and should be conducted in compliance with
the requirements of Bintulu Port Authority and Bintulu Port Sdn Bhd at all times.
The MTRA concludes that the identified risks associated with the construction and operation of
the proposed cooling water intake pipeline for the 400MW Combined Cycle Gas Turbine (CCGT)
power plant at Tanjung Kidurong, Bintulu can be safely managed, subject to compliance with the
mitigation measures identified in this report.

Marine Traffic Risk Analysis (MTRA) Study for the Proposed Cooling Water Intake Pipeline at Tanjung Kidurong, Bintulu, Sarawak
Final Report
Page 10 of 40
1.0 Introduction
1.1 Background
Sarawak Energy Sdn Bhd is developing a 400MW Combined Cycle Gas Turbine (CCGT) power
plant behind the existing Kidurong power station. The project site is located at Kidurong Industrial
district, Bintulu, Sarawak. The CCGT power plant includes the construction of a cooling water
system together with its associated water intake and outfall pipelines.
The Engineering Procurement & Construction (EPC) contractor for the above project is GE-
Sinohydro consortium comprising of four (4) companies namely, GE Power Solutions (Malaysia)
Sdn Bhd, GE (Switzerland) GmbH, Sinohydro Corporation (M) Sdn Bhd, and Sinohydro
Corporation Ltd (China).
KASI (Malaysia) Sdn Bhd (KASI) was appointed by Sinohydro Corporation (M) Sdn Bhd
(Sinohydro) to carry out a Marine Traffic Risk Analysis (MTRA) to assess the risks associated
with the construction and operation of the proposed cooling water intake pipeline.
The location of the proposed cooling water intake pipeline is approximately 7km away from
Bintulu Port and is shown in Figure 1 below.
Figure 1: Location of the project site
Project Site
Bintulu Port
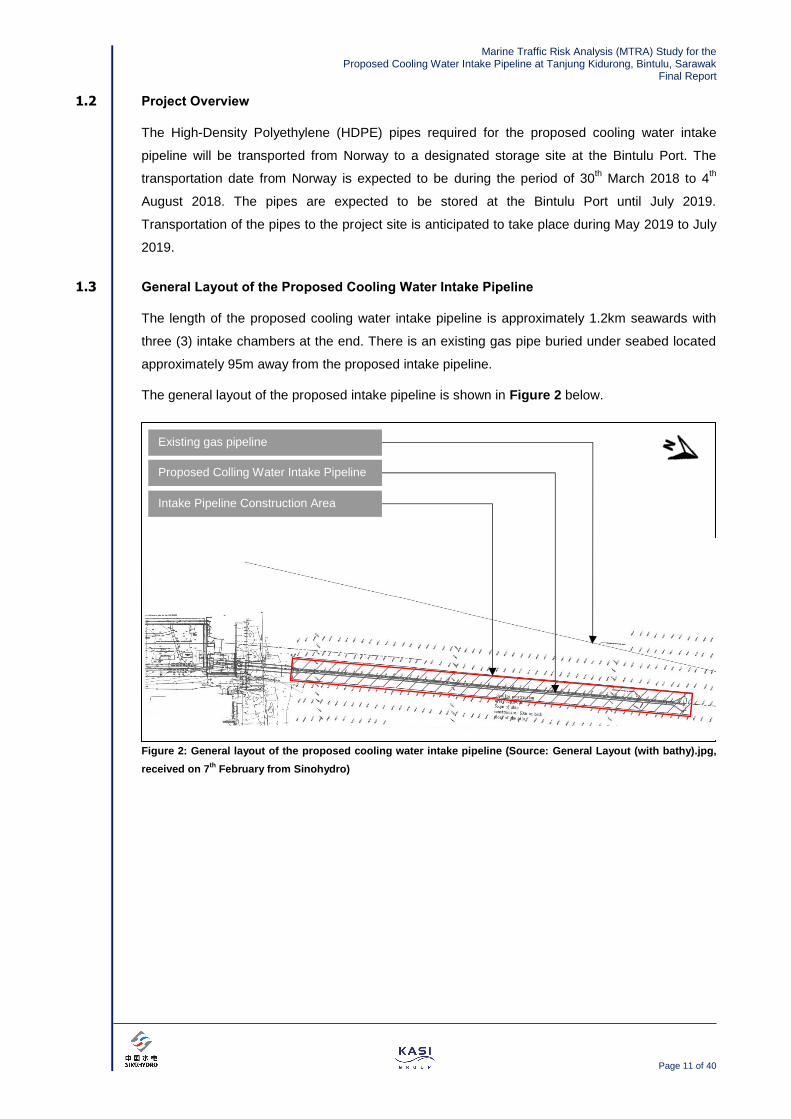
Marine Traffic Risk Analysis (MTRA) Study for the Proposed Cooling Water Intake Pipeline at Tanjung Kidurong, Bintulu, Sarawak
Final Report
Page 11 of 40
1.2 Project Overview
The High-Density Polyethylene (HDPE) pipes required for the proposed cooling water intake
pipeline will be transported from Norway to a designated storage site at the Bintulu Port. The
transportation date from Norway is expected to be during the period of 30th March 2018 to 4
th
August 2018. The pipes are expected to be stored at the Bintulu Port until July 2019.
Transportation of the pipes to the project site is anticipated to take place during May 2019 to July
2019.
1.3 General Layout of the Proposed Cooling Water Intake Pipeline
The length of the proposed cooling water intake pipeline is approximately 1.2km seawards with
three (3) intake chambers at the end. There is an existing gas pipe buried under seabed located
approximately 95m away from the proposed intake pipeline.
The general layout of the proposed intake pipeline is shown in Figure 2 below.
Figure 2: General layout of the proposed cooling water intake pipeline (Source: General Layout (with bathy).jpg,
received on 7th
February from Sinohydro)
Proposed Colling Water Intake Pipeline
Existing gas pipeline
Intake Pipeline Construction Area

Marine Traffic Risk Analysis (MTRA) Study for the Proposed Cooling Water Intake Pipeline at Tanjung Kidurong, Bintulu, Sarawak
Final Report
Page 12 of 40
1.4 Objective of the MTRA Study
The key objectives of the MTRA are as follows:
Assess the level of risk to marine traffic due to the construction and operation of the
proposed cooling water intake pipeline;
Recommend measures to mitigate the identified risk.
1.5 Scope of Work
The proposed scope of work for the Marine Traffic Risk Analysis (MTRA) is as follows:
An assessment of the cooling water intake pipeline layout and pipe laying method will be
carried out taking the following factors into consideration:
o Method of pipe laying
o Details of pipe laying barge and support craft (if applicable)
o Marine traffic flow, i.e. the volume and types of vessels, in the vicinity of the
proposed pipeline route
o Estimated duration of pipe laying operations and work plan
o Seabed obstructions and pipeline / cable spans along the proposed pipeline
route
o Anchoring and fishing zones in the vicinity of the pipeline
o Proposed pipeline protection measures
Once the above details regarding the pipeline layout, method, etc. have been
established, a risk assessment will be carried out to determine navigational risks during
the construction and operational phases of the pipeline.
Appropriate risk mitigation measures will be recommended to reduce the level of risks
associated with the construction and post-construction stages, covering the following:
o Marine traffic management plan including mobilization to site through Bintulu Port
and the provision of appropriate safety measures by the contractor
o Anchoring prohibited corridor for the pipeline route
o Notices to Mariners and relevant authorities
A report incorporating the above information will be produced for the purpose of obtaining
necessary approvals from Bintulu Port Sdn Bhd and the Sarawak Rivers Board.
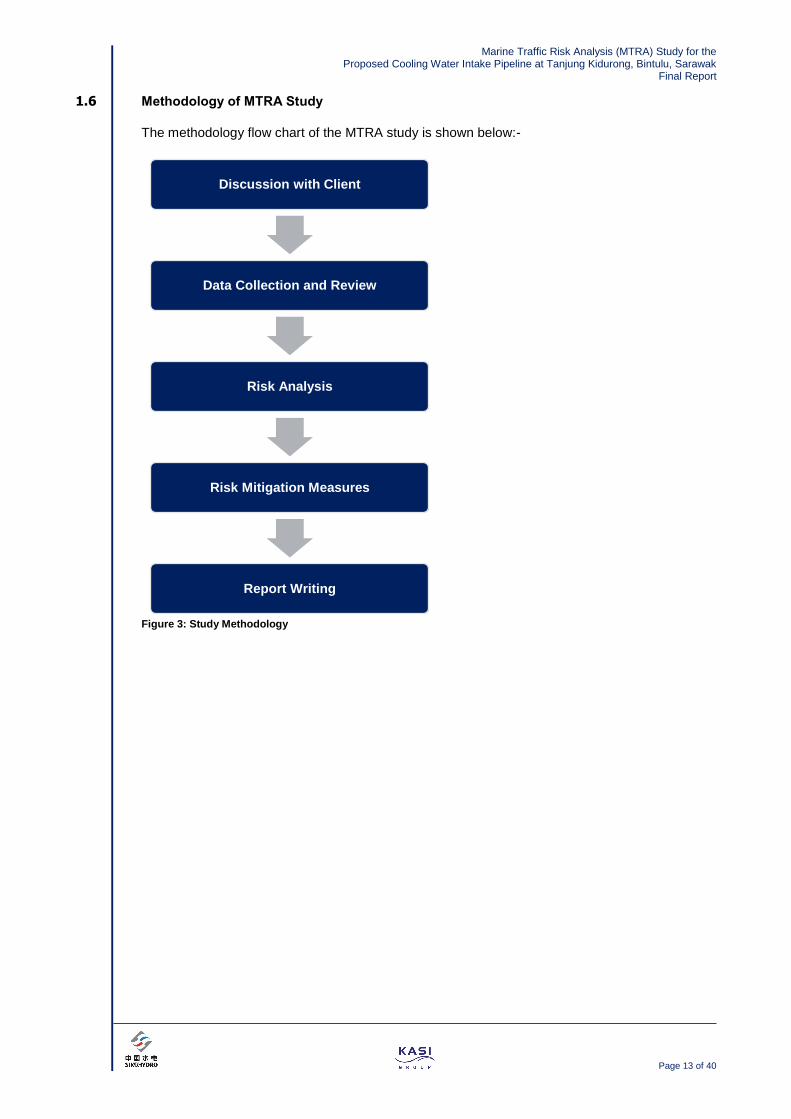
Marine Traffic Risk Analysis (MTRA) Study for the Proposed Cooling Water Intake Pipeline at Tanjung Kidurong, Bintulu, Sarawak
Final Report
Page 13 of 40
1.6 Methodology of MTRA Study
The methodology flow chart of the MTRA study is shown below:-
Figure 3: Study Methodology
Discussion with Client
Data Collection and Review
Risk Analysis
Risk Mitigation Measures
Report Writing
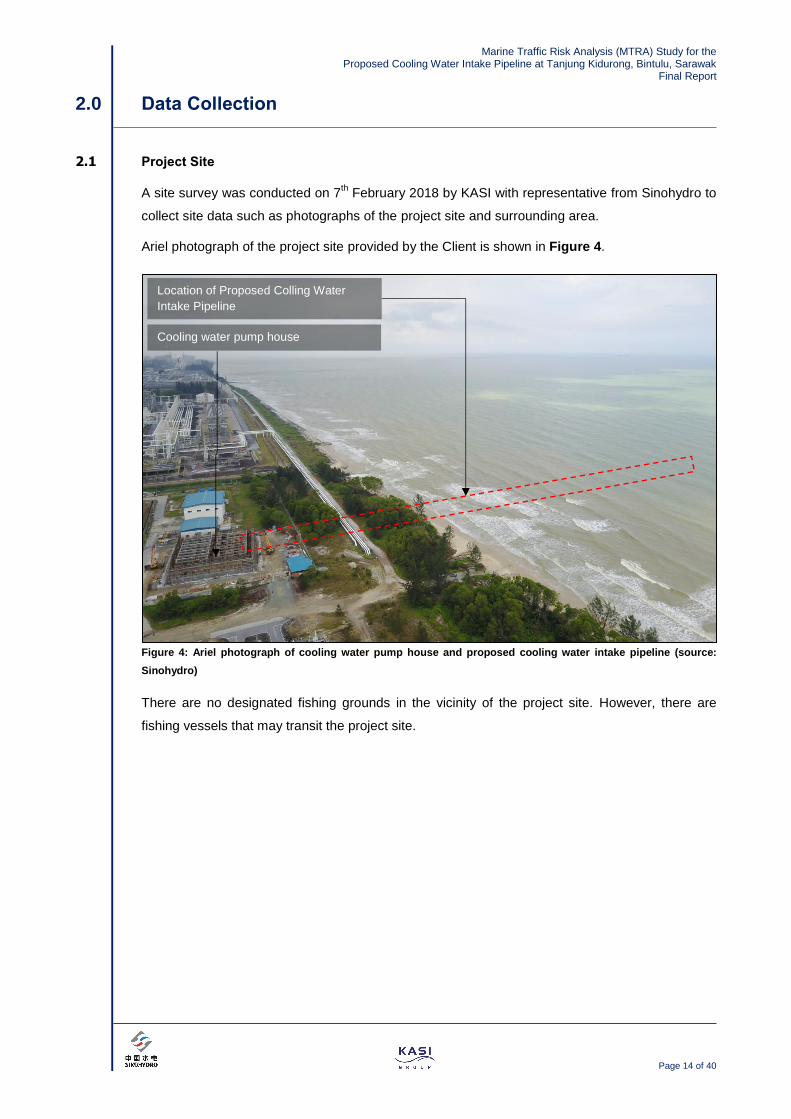
Marine Traffic Risk Analysis (MTRA) Study for the Proposed Cooling Water Intake Pipeline at Tanjung Kidurong, Bintulu, Sarawak
Final Report
Page 14 of 40
2.0 Data Collection
2.1 Project Site
A site survey was conducted on 7th February 2018 by KASI with representative from Sinohydro to
collect site data such as photographs of the project site and surrounding area.
Ariel photograph of the project site provided by the Client is shown in Figure 4.
Figure 4: Ariel photograph of cooling water pump house and proposed cooling water intake pipeline (source:
Sinohydro)
There are no designated fishing grounds in the vicinity of the project site. However, there are
fishing vessels that may transit the project site.
Location of Proposed Colling Water
Intake Pipeline
Cooling water pump house

Marine Traffic Risk Analysis (MTRA) Study for the Proposed Cooling Water Intake Pipeline at Tanjung Kidurong, Bintulu, Sarawak
Final Report
Page 15 of 40
2.1.1 General Layout of Cooling Water System
The cooling water system is shown in Figure 5. It is divided into three (3) parts namely:
Cooling water pump house
Cooling water intake pipeline
Cooling water intake chamber
Figure 5: Location of cooling water pump house and proposed cooling water intake pipeline (source: Sinohydro)
The cooling water intake pipeline part is further divided into two (2) parts, pipe jacking part and
High-Density Polyethylene (HDPE) pipeline part as shown in Figure 6 below. The laying of the
HDPE pipeline section requires excavation work, pipe laying and backfilling.
Figure 6: General layout of cooling water system (source: PowerPoint for HDPE Pipeline Transportation, Storage
and Assembly received on 12th
February 2018 from Sinohydro)
Location of Proposed Colling Water
Intake Pipeline
Cooling water pump house
Water Outfall Pipeline
Drop Well

Marine Traffic Risk Analysis (MTRA) Study for the Proposed Cooling Water Intake Pipeline at Tanjung Kidurong, Bintulu, Sarawak
Final Report
Page 16 of 40
2.1.2 Pipe Trench Excavation
The excavation work of the pipe trench will be carried out using cutter suction dredger. The
anchor boundary of the dredger provided by Client is proposed to be 500m away from the
construction vessel as shown below:
Figure 7: Proposed anchor boundary for the cutter suction dredger (source: PowerPoint for HDPE Pipeline
Transportation, Storage and Assembly received on 12th
February 2018 from Sinohydro)

Marine Traffic Risk Analysis (MTRA) Study for the Proposed Cooling Water Intake Pipeline at Tanjung Kidurong, Bintulu, Sarawak
Final Report
Page 17 of 40
2.1.3 Seabed Obstruction and Pipeline / Cable Spans
Based on marine chart SAR 401, there are a total of nine (9) submarine pipelines and one (1)
submarine cable located in the vicinity of the project site as shown in Figure 8 below. The
nearest submarine pipeline is located approximately 95m away from the proposed cooling water
intake pipeline.
Figure 8: Existing submarine pipelines and cable in the vicinity of the project site (source: Marine Chart SAR 401,
dated 30th
December 2016)
Existing submarine pipelines
Existing submarine cable
Project Site
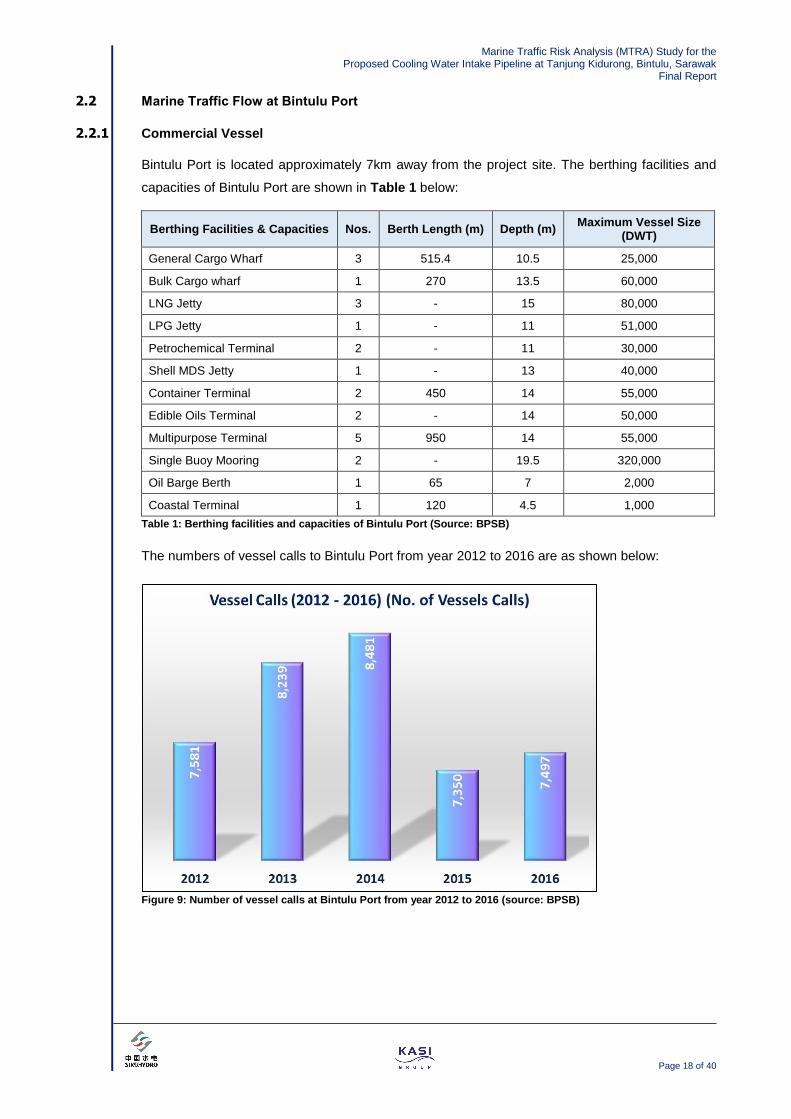
Marine Traffic Risk Analysis (MTRA) Study for the Proposed Cooling Water Intake Pipeline at Tanjung Kidurong, Bintulu, Sarawak
Final Report
Page 18 of 40
2.2 Marine Traffic Flow at Bintulu Port
2.2.1 Commercial Vessel
Bintulu Port is located approximately 7km away from the project site. The berthing facilities and
capacities of Bintulu Port are shown in Table 1 below:
Berthing Facilities & Capacities Nos. Berth Length (m) Depth (m) Maximum Vessel Size
(DWT)
General Cargo Wharf 3 515.4 10.5 25,000
Bulk Cargo wharf 1 270 13.5 60,000
LNG Jetty 3 - 15 80,000
LPG Jetty 1 - 11 51,000
Petrochemical Terminal 2 - 11 30,000
Shell MDS Jetty 1 - 13 40,000
Container Terminal 2 450 14 55,000
Edible Oils Terminal 2 - 14 50,000
Multipurpose Terminal 5 950 14 55,000
Single Buoy Mooring 2 - 19.5 320,000
Oil Barge Berth 1 65 7 2,000
Coastal Terminal 1 120 4.5 1,000
Table 1: Berthing facilities and capacities of Bintulu Port (Source: BPSB)
The numbers of vessel calls to Bintulu Port from year 2012 to 2016 are as shown below:
Figure 9: Number of vessel calls at Bintulu Port from year 2012 to 2016 (source: BPSB)
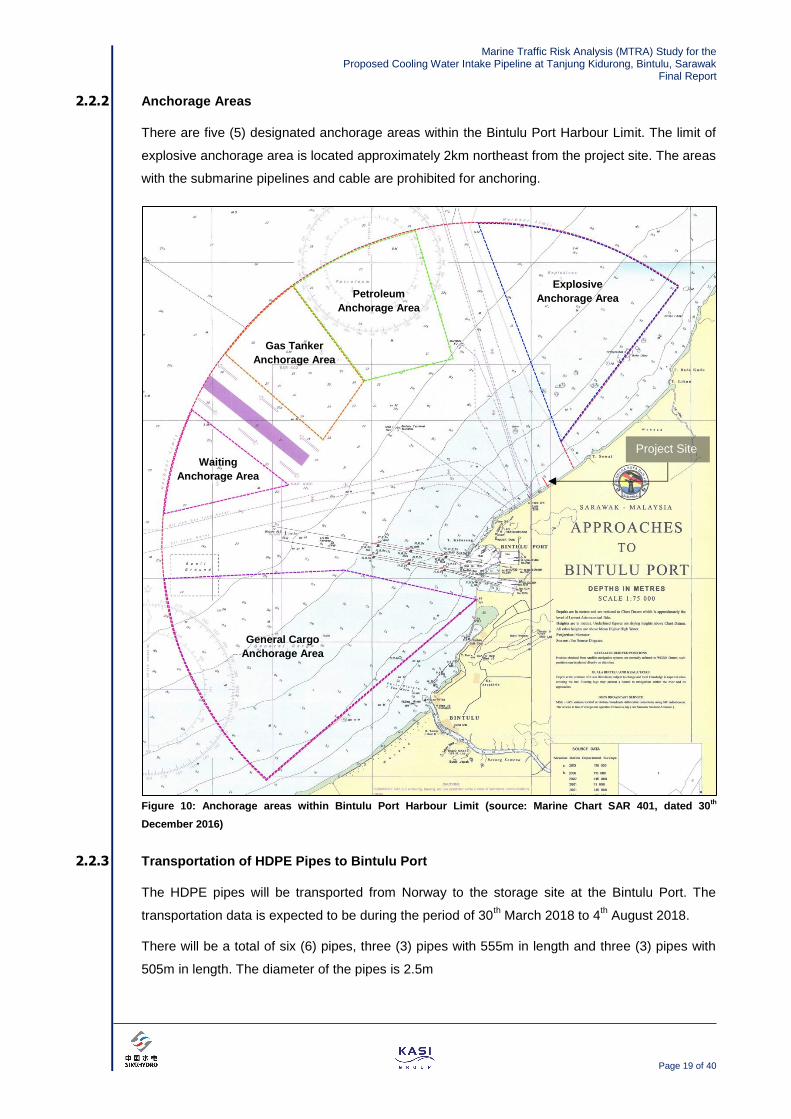
Marine Traffic Risk Analysis (MTRA) Study for the Proposed Cooling Water Intake Pipeline at Tanjung Kidurong, Bintulu, Sarawak
Final Report
Page 19 of 40
2.2.2 Anchorage Areas
There are five (5) designated anchorage areas within the Bintulu Port Harbour Limit. The limit of
explosive anchorage area is located approximately 2km northeast from the project site. The areas
with the submarine pipelines and cable are prohibited for anchoring.
Figure 10: Anchorage areas within Bintulu Port Harbour Limit (source: Marine Chart SAR 401, dated 30
th
December 2016)
2.2.3 Transportation of HDPE Pipes to Bintulu Port
The HDPE pipes will be transported from Norway to the storage site at the Bintulu Port. The
transportation data is expected to be during the period of 30th March 2018 to 4
th August 2018.
There will be a total of six (6) pipes, three (3) pipes with 555m in length and three (3) pipes with
505m in length. The diameter of the pipes is 2.5m
Project Site
Explosive
Anchorage Area Petroleum
Anchorage Area
Gas Tanker
Anchorage Area
Waiting
Anchorage Area
General Cargo
Anchorage Area

Marine Traffic Risk Analysis (MTRA) Study for the Proposed Cooling Water Intake Pipeline at Tanjung Kidurong, Bintulu, Sarawak
Final Report
Page 20 of 40
2.2.4 Storage of HDPE Pipes in Bintulu Port
The pipes will be stored at a designated area in Bintulu Port as shown in Figure 11 below. The
pipes will be firmly anchored to fixed piles with nylon cables (see Figure 12). Warning buoys will
be installed surrounding the pipes to alert other port users.
It is expected that the HDPE pipelines will be stored in Bintulu Port until July 2019.
Figure 11: Designated storage area for HDPE pipes (source: PowerPoint for HDPE Pipeline Transportation,
Storage and Assembly received on 12th
February 2018 from Sinohydro)
Figure 12: Securing of pipe at designated storage area (source: PowerPoint for HDPE Pipeline Transportation,
Storage and Assembly received on 12th
February 2018 from Sinohydro)

Marine Traffic Risk Analysis (MTRA) Study for the Proposed Cooling Water Intake Pipeline at Tanjung Kidurong, Bintulu, Sarawak
Final Report
Page 21 of 40
2.2.5 Transportation and Installation of Weight Balancing Block
The weight balancing block will be fabricated in Bintulu and is to be transferred to Bintulu Port
Inner Harbour 1 by road transport from the proposed pre-casting yard. The marine traffic route for
the weight balancing block between Inner Harbour 1 and Inner Harbour 2 is shown in Figure 13
below.
Barge and tugboat will be used to transport the weight balancing block. There will be a total of
825 sets of weight balancing block and 17 barge trips are planned to transport 50 sets of weight
block each time.
Figure 13: Proposed barge route for transportation of weight balancing blocks (source: PowerPoint for HDPE
Pipeline Transportation, Storage and Assembly received on 12th
February 2018 from Sinohydro)
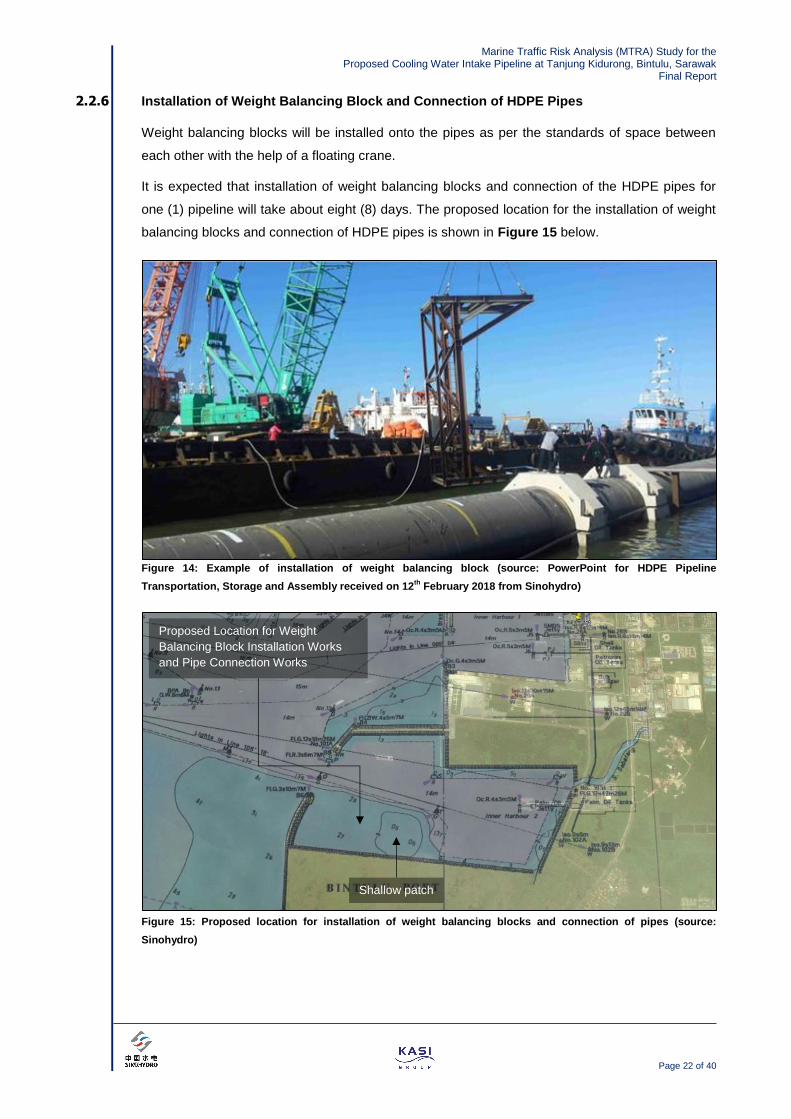
Marine Traffic Risk Analysis (MTRA) Study for the Proposed Cooling Water Intake Pipeline at Tanjung Kidurong, Bintulu, Sarawak
Final Report
Page 22 of 40
2.2.6 Installation of Weight Balancing Block and Connection of HDPE Pipes
Weight balancing blocks will be installed onto the pipes as per the standards of space between
each other with the help of a floating crane.
It is expected that installation of weight balancing blocks and connection of the HDPE pipes for
one (1) pipeline will take about eight (8) days. The proposed location for the installation of weight
balancing blocks and connection of HDPE pipes is shown in Figure 15 below.
Figure 14: Example of installation of weight balancing block (source: PowerPoint for HDPE Pipeline
Transportation, Storage and Assembly received on 12th
February 2018 from Sinohydro)
Figure 15: Proposed location for installation of weight balancing blocks and connection of pipes (source:
Sinohydro)
Proposed Location for Weight
Balancing Block Installation Works
and Pipe Connection Works
Shallow patch

Marine Traffic Risk Analysis (MTRA) Study for the Proposed Cooling Water Intake Pipeline at Tanjung Kidurong, Bintulu, Sarawak
Final Report
Page 23 of 40
2.2.7 Transportation of HDPE Pipelines to Project Site
The HDPE pipelines will be transported to project site after the preparatory works such as
installation of weight balancing blocks, connections of the pipes, etc. has been completed. The
HDPE pipelines will be towed by one (1) 300HP tugboat and two (2) 45HP mooring crafts to the
project site. The tugboat is used for towing and the mooring crafts are used to control the
direction and line handling.
Bintulu Port will be informed seven (7) days in advance of the HDPE pipeline transportation date
in order to make announcement to other vessels. It is expected that the HDPE pipe transportation
will take about eight (8) hours. There will be a total of three (3) HDPE pipelines to be transported
to the project site.
The proposed transportation route for the HDPE pipelines is shown in Figure 16 below:
Figure 16: Proposed transportation route for HDPE pipelines transportation to the project site (source:
PowerPoint for HDPE Pipeline Transportation, Storage and Assembly received on 12th
February 2018 from
Sinohydro)

Marine Traffic Risk Analysis (MTRA) Study for the Proposed Cooling Water Intake Pipeline at Tanjung Kidurong, Bintulu, Sarawak
Final Report
Page 24 of 40
2.3 Environmental Conditions
2.3.1 Wind
The annual wind data at Bintulu provided by Client was extracted from Jabatan Meteorology
Malaysia from year 1950 to 2013. The percentage frequencies of occurrence for concurrent wind
direction and speed within the specified ranges are shown in Table 2 below.
Percentage Frequencies of Occurrence for Concurrent Wind Direction and Speed Within Specified Ranges (%)
Direction Wind Speed Range (m/s)
0.3 – 1.5 1.6 – 3.3 3.4 – 5.4 5.5 – 7.9 8.0 – 10.7 >10.7 Total Mean Speed
Calm - - - - - - 17.1 -
Variable 0 0 0 0 0 0 0 -
N 2.5 2.8 1.2 0.1 0 0 6.6 2.2
NE 1.4 0.5 0.1 0 0 0 1.9 1.3
E 7.8 3.6 0.1 0 0 0 11.6 1.3
SE 10 2.7 0.1 0 0 0 12.8 1.1
S 3 0.8 0 0 0 0 3.8 1.1
SW 1.4 0.7 0.2 0 0 0 2.3 1.6
W 2 2.3 0.7 0 0 0 5.1 2.1
NW 3.1 5.1 2.1 0.1 0 0 10.4 2.3
Table 2: Occurrence of wind direction and speed at Bintulu (source: Regular Wave Height and Period.pdf,
received on 7th
February 2018 from Sinohydro)
The summary of the wind data is as follows:
Variables Summary Values
Prevailing Direction Calm
Mean Speed 1.2 m/s
Direction of Maximum Gust 80°
Maximum Gust Speed 25.6 m/s
Direction of Maximum Speed 80°
Maximum Speed 25.6 m/s
Table 3: Summary of wind data Bintulu (source: Regular Wave Height and Period.pdf, received on 7th
February
2018 from Sinohydro)

Marine Traffic Risk Analysis (MTRA) Study for the Proposed Cooling Water Intake Pipeline at Tanjung Kidurong, Bintulu, Sarawak
Final Report
Page 25 of 40
Figure 17: Annual wind rose (1953 – 2013) at Bintulu Bintulu (source: Regular Wave Height and Period.pdf,
received on 7th
February 2018 from Sinohydro)
2.3.2 Wave
According to the wave data provided by the Client, the maximum wave height recorded from year
2000 to 2014 is 2m.
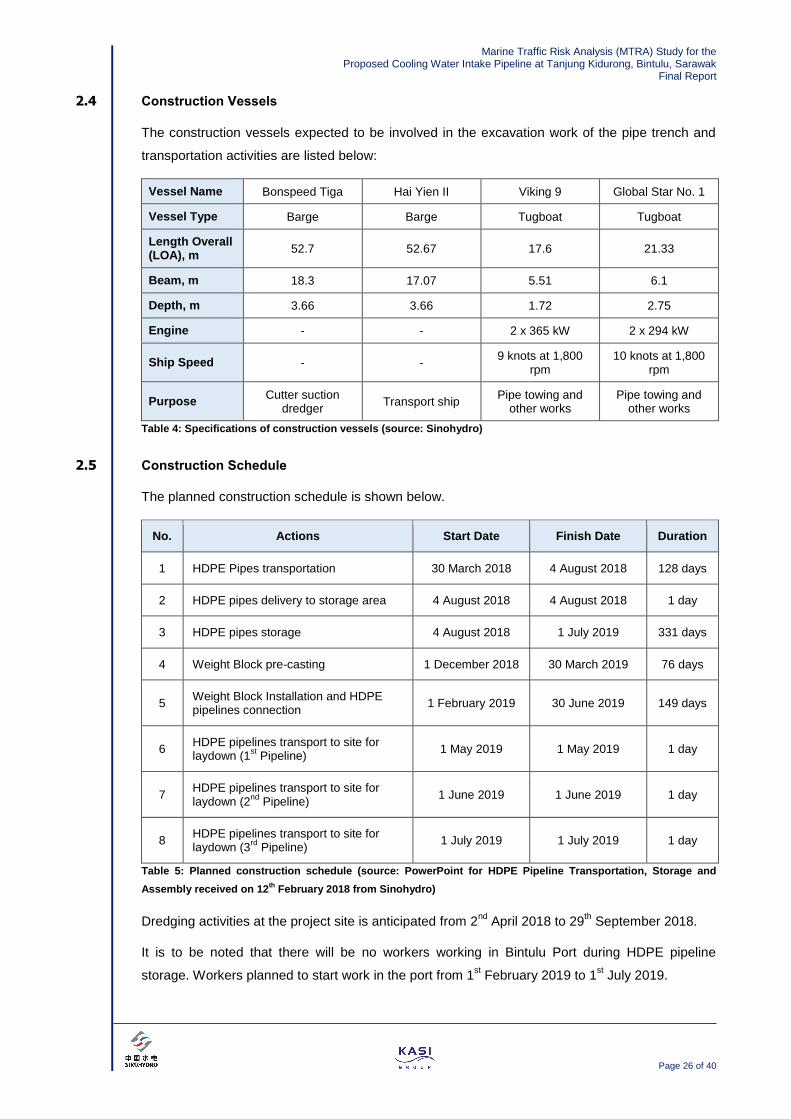
Marine Traffic Risk Analysis (MTRA) Study for the Proposed Cooling Water Intake Pipeline at Tanjung Kidurong, Bintulu, Sarawak
Final Report
Page 26 of 40
2.4 Construction Vessels
The construction vessels expected to be involved in the excavation work of the pipe trench and
transportation activities are listed below:
Vessel Name Bonspeed Tiga Hai Yien II Viking 9 Global Star No. 1
Vessel Type Barge Barge Tugboat Tugboat
Length Overall (LOA), m
52.7 52.67 17.6 21.33
Beam, m 18.3 17.07 5.51 6.1
Depth, m 3.66 3.66 1.72 2.75
Engine - - 2 x 365 kW 2 x 294 kW
Ship Speed - - 9 knots at 1,800
rpm 10 knots at 1,800
rpm
Purpose Cutter suction
dredger Transport ship
Pipe towing and other works
Pipe towing and other works
Table 4: Specifications of construction vessels (source: Sinohydro)
2.5 Construction Schedule
The planned construction schedule is shown below.
No. Actions Start Date Finish Date Duration
1 HDPE Pipes transportation 30 March 2018 4 August 2018 128 days
2 HDPE pipes delivery to storage area 4 August 2018 4 August 2018 1 day
3 HDPE pipes storage 4 August 2018 1 July 2019 331 days
4 Weight Block pre-casting 1 December 2018 30 March 2019 76 days
5 Weight Block Installation and HDPE pipelines connection
1 February 2019 30 June 2019 149 days
6 HDPE pipelines transport to site for laydown (1
st Pipeline)
1 May 2019 1 May 2019 1 day
7 HDPE pipelines transport to site for laydown (2
nd Pipeline)
1 June 2019 1 June 2019 1 day
8 HDPE pipelines transport to site for laydown (3
rd Pipeline)
1 July 2019 1 July 2019 1 day
Table 5: Planned construction schedule (source: PowerPoint for HDPE Pipeline Transportation, Storage and
Assembly received on 12th
February 2018 from Sinohydro)
Dredging activities at the project site is anticipated from 2nd
April 2018 to 29th September 2018.
It is to be noted that there will be no workers working in Bintulu Port during HDPE pipeline
storage. Workers planned to start work in the port from 1st February 2019 to 1
st July 2019.
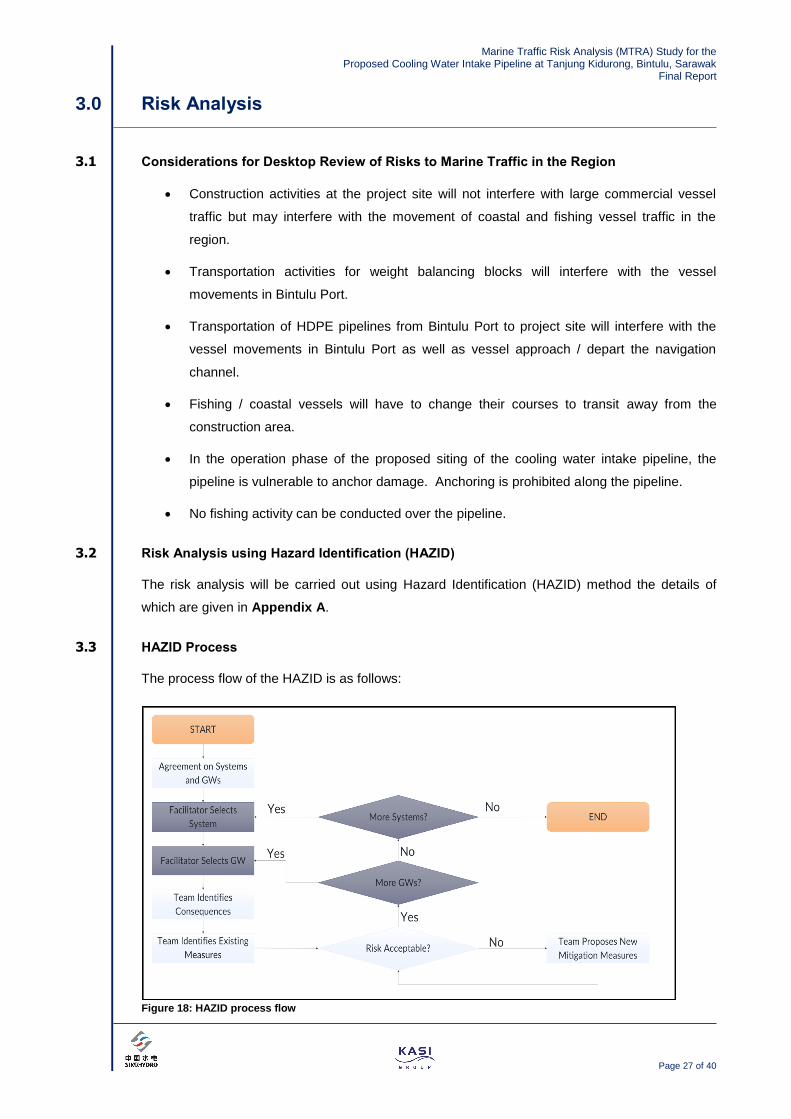
Marine Traffic Risk Analysis (MTRA) Study for the Proposed Cooling Water Intake Pipeline at Tanjung Kidurong, Bintulu, Sarawak
Final Report
Page 27 of 40
3.0 Risk Analysis
3.1 Considerations for Desktop Review of Risks to Marine Traffic in the Region
Construction activities at the project site will not interfere with large commercial vessel
traffic but may interfere with the movement of coastal and fishing vessel traffic in the
region.
Transportation activities for weight balancing blocks will interfere with the vessel
movements in Bintulu Port.
Transportation of HDPE pipelines from Bintulu Port to project site will interfere with the
vessel movements in Bintulu Port as well as vessel approach / depart the navigation
channel.
Fishing / coastal vessels will have to change their courses to transit away from the
construction area.
In the operation phase of the proposed siting of the cooling water intake pipeline, the
pipeline is vulnerable to anchor damage. Anchoring is prohibited along the pipeline.
No fishing activity can be conducted over the pipeline.
3.2 Risk Analysis using Hazard Identification (HAZID)
The risk analysis will be carried out using Hazard Identification (HAZID) method the details of
which are given in Appendix A.
3.3 HAZID Process
The process flow of the HAZID is as follows:
Figure 18: HAZID process flow

Marine Traffic Risk Analysis (MTRA) Study for the Proposed Cooling Water Intake Pipeline at Tanjung Kidurong, Bintulu, Sarawak
Final Report
Page 28 of 40
3.3.1 Use of a Risk Matrix
If deemed necessary by the HAZID Facilitator or Team, a risk matrix can be deployed to assist in
the determination of a conclusion. KASI uses the risk matrix (Table 8) extracted from Revised
Guidelines for Formal Safety Assessment (FSA) For Use In The IMO Rule-Making Process,
published by International Maritime Organization (IMO). The risk matrix is a function of frequency
of event occurrence (see Table 6) against the consequence of the event occurrence (see Table
7).
Frequency Index (FI)
FI Severity Definition F (per ship year)
7 Frequent Likely to occur once per month on one ship. 10
5 Reasonably probable
Likely to occur once per year in a fleet of 10 ships, i.e. likely to occur a few times during the ship’s life.
0.1
3 Remote Likely to occur once per year in a fleet of 1,000 ships, i.e. likely to occur in the total life of several similar ships. 10
-3
1 Extremely remote
Likely to occur once in the lifetime (20 years) of a world fleet of 5,000 ships. 10
-5
Table 6: Frequency Index (FI)
Severity Index (SI)
SI Severity Effects of Human Safety Effects on Ship S (Equivalent
fatalities)
1 Minor Single or minor injuries Local equipment damage 0.01
2 Significant Multiple or severe injuries Non-severe ship damage 0.1
3 Severe Single fatality or multiple severe injuries
Severe damage 1
4 Catastrophic Multiple fatalities Total loss 10
Table 7: Severity Index (SI)

Marine Traffic Risk Analysis (MTRA) Study for the Proposed Cooling Water Intake Pipeline at Tanjung Kidurong, Bintulu, Sarawak
Final Report
Page 29 of 40
Risk Index (RI)
FI Frequency
Severity Index (SI)
1 2 3 4
Minor Significant Severe Catastrophic
7
Frequent
8 9 10 11
6 7 8 9 10
5
Reasonably Probable
6 7 8 9
4 5 6 7 8
3
Remote
4 5 6 7
2 3 4 5 6
1 Extremely Remote 2 3 4 5
Intolerable
As Low As Reasonably Practicable (ALARP)
Negligible
Table 8: Risk Matrix
3.3.2 HAZID Team
Datuk Captain Walter J. Nair (Facilitator)
Benjamin Nair
Captain Bo Caspersen
Tan Seng Leong
Low Hui Jin

Marine Traffic Risk Analysis (MTRA) Study for the Proposed Cooling Water Intake Pipeline at Tanjung Kidurong, Bintulu, Sarawak
Final Report
Page 30 of 40
3.3.3 HAZID Workshop Results
The following list of Systems (Key Prescribed Activities, see Appendix A) was adopted during
the workshop:
Excavations for pipe trenches
Transportation of HDPE pipeline weight block within Bintulu Port
Transportation of HDPE pipeline from Bintulu Port to project site
Installation of HDPE pipeline
The list of ‘What-if’ scenarios (see Appendix A) identified during the workshop is shown below:
Severe weather conditions (such as Sumatra Squall)
Collision of construction / transportation vessel with other vessels
Communication issues/failure (language, misunderstanding etc., including failure to communicate the start of operations, emergency plan, etc.)
Night operations / Poor visibility
Failure of propulsion, steering or power of construction vessels
Crew fatigue
Inadequate emergency plan
Lack of planning / documentation / procedure
The HAZID results (risk and mitigation measures captured) are shown below in HAZID
Worksheets #1, #2, #3 and #4 for the above identified four (4) activities.

Marine Traffic Risk Analysis (MTRA) Study for the Proposed Cooling Water Intake Pipeline at Tanjung Kidurong, Bintulu, Sarawak
Final Report
Page 31 of 40
HAZID Worksheet #1
System : Excavations for pipe trenches
#
What if? Consequences Initial Probability / Frequency Index (FI)
Consequence / Severity Index (SI)
Initial Risk Index (RI)
*Mitigation Measures Recommendations Responsible Residual
Risk Index (RI)
Guideword i.e. the failure under analysis
Description of the consequences of the possible impact of the cause
Description of the current mitigation measures in place
Description of the recommendation(s) that could be in place Description of the responsible(s) of the recommendation(s)
a) Severe weather conditions 1. Delay operation
2. Increased risk of collision
5 2 7 - 1. Define weather operation thresholds
2. Check weather forecast at the start of each work day
3. Monitor weather throughout each working day and stop work if
weather operation thresholds are exceeded
4. Develop and implement a contingency plan
Contractor 5
b) Collision of construction vessels with local vessels (particularly fishing boats)
1. Damage to vessel
2. Man overboard
3. Delay of operations
4. Loss of life
1 3 4 - 1. Notice to Mariners to be issued regarding restricted navigation areas
2. Watch keeping with chaser boat patrol near the construction area
3. The construction vessel displays the navigation lights and
navigation shapes, configures the VHF telephones, sets up
specially-assigned persons to listen for 24 hours, and keeps an
uninterrupted lookout according to the International Regulations for
Preventing Collisions at Sea (COLREGS)
4. Develop and implement a contingency plan
5. Develop emergency response plans and ensure proper briefings
are provided to construction crews
Contractor / Authority 3
c) Communication issues / failure (language, misunderstanding etc., including failure to communicate the start of operations, emergency plan, etc.)
1. Delay operation
2. Injury/Accident
3. Damage to vessel
4. Man overboard
2 1 3 - 1. Use licensed crew (with adequate maritime certificates)
2. Conduct appropriate training for crews whenever new vessel
crews are employed
3. Employ key personnel that able to communicate in English / Malay
Contractor 2
d) Night operations / Poor visibility 1. Accident
2. Increased risk of collision (see “Collision”)
3. Delay operation
6 1 7 1. There shall be
sufficient lighting
around the operation
area during night
construction
2. To protect safety of
night navigation,
construction and
mooring, the ship
shall be assigned
with full-time safety
officers
1. The construction vessel displays the navigation lights and navigation shapes, configures the VHF telephones, sets up specially-assigned persons to listen for 24 hours, and keeps an uninterrupted lookout according to the International Regulations for Preventing Collisions at Sea (COLREGS)
2. Use search lights and communication / warning signals
3. Develop proper communication procedures such as set up control
centre with manned telephone system available whenever
construction activities are on-going
4. Develop and implement a contingency plan
5. Increase watch keeping during construction works
Contractor 4
e) Failure of propulsion, steering or power of construction vessel
1. Delay operation
2. Increased risk of collision (see “Collision”)
2 1 3 - 1. Carry out proper maintenance
2. Develop and implement a contingency plan
Contractor 2
f) Crew fatigue 1. Accident
2. Injury
5 2 7 - 1. Conduct appropriate training for crews whenever there are new
vessel crews
2. Prepare proper manpower arrangements (i.e. shift)
3. Ensure proper first-aid availability on board construction vessels
Contractor 4
h) Inadequate emergency plan 1. Inadequate response
2. Injury/Death
3. Damage to assets
4. Delay operation
3 4 7 - 1. Conduct emergency drills
2. Develop and implement a contingency plan
Contractor 3
i) Lack of planning / documentation / procedure
1. Inadequate response
2. Delay operation
3 3 6 - 1. Conduct appropriate training for crews whenever new vessel crews are employed
Contractor 3
Note (*): See Client’s Risk Assessment in Appendix B.

Marine Traffic Risk Analysis (MTRA) Study for the Proposed Cooling Water Intake Pipeline at Tanjung Kidurong, Bintulu, Sarawak
Final Report
Page 32 of 40
HAZID Worksheet #2
System : Transportation of HDPE pipeline weight block within Bintulu Port
#
What if? Consequences Initial
Probability / Frequency
Index (FI)
Consequence / Severity Index (SI)
Initial Risk Index (RI)
Mitigation Measures Recommendations Responsible
Residual Risk
Index (RI) Guideword i.e. the failure under analysis
Description of the consequences of the possible impact of the cause
Description of the current mitigation measures in place
Description of the recommendation(s) that could be in place Description of the responsible(s) of the recommendation(s)
a) Severe weather conditions 1. Delay operation 2 1 3 - 1. Follow Port Standard Operating Procedure
2. Check weather forecast prior to movement
3. Develop and implement a contingency plan
Contractor 2
b) Collision of barges with existing traffic
1. Damage to vessel
2. Man overboard
3. Delay of operations
4. Loss of life
4 3 7 - 1. Schedule vessel movements with Marine Services of BPSB as
there should be no other movements within the Port while the
tow is in progress. However, it should be noted that priority will
always be given to LNG vessel operations.
2. Develop and implement a contingency plan
Contractor / Port
Operator
5
c) Communication issues / failure (language, misunderstanding etc., including failure to communicate the start of operations, emergency plan, etc.)
1. Delay operation
2. Injury/Accident
3. Damage to vessel
4. Man overboard
2 3 5 - 1. Use licensed crew (with adequate maritime certificates)
2. Conduct appropriate training for crews whenever new vessel
crews are employed
3. Employ key personnel that able to communicate in English / Malay
Contractor 3
d) Night operations / Poor visibility 1. Accident
2. Increased risk of collision (see “Collision”)
3. Delay operation
3 1 4 - 1. Proper communication between barge and Marine Services of
BPSB
2. Develop and implement a contingency plan
Contractor 3
e) Failure of propulsion, steering or power of tugboat
1. Delay operation
2. Increased risk of collision (see “Collision”)
3 3 6 - 1. Carry out proper maintenance
2. Develop and implement a contingency plan
Contractor 5
f) Crew fatigue 1. Accident
2. Injury
6 2 8 - 1. Conduct appropriate training for crews whenever there are
new vessel crews
2. Prepare proper manpower arrangements (i.e. shift)
3. Ensure proper first-aid availability on board construction vessels
Contractor 4
h) Inadequate emergency plan 1. Inadequate response
2. Injury/Death
3. Damage to assets
4. Delay operation
3 3 6 - 1. Conduct emergency drills
2. Develop and implement a contingency plan
Contractor 3
i) Lack of planning / documentation / procedure
1. Inadequate response
2. Delay operation
3 3 6 - 1. Conduct appropriate training for crews whenever new vessel crews are employed
Contractor 3

Marine Traffic Risk Analysis (MTRA) Study for the Proposed Cooling Water Intake Pipeline at Tanjung Kidurong, Bintulu, Sarawak
Final Report
Page 33 of 40
HAZID Worksheet #3
System : Transportation of HDPE pipeline from Bintulu Port to project site
#
What if? Consequences Initial
Probability / Frequency
Index (FI)
Consequence / Severity Index (SI)
Initial Risk Index (RI)
Mitigation Measures Recommendations Responsible
Residual Risk
Index (RI) Guideword i.e. the failure under analysis
Description of the consequences of the possible impact of the cause
Description of the current mitigation measures in place
Description of the recommendation(s) that could be in place Description of the responsible(s) of the recommendation(s)
a) Severe weather conditions 1. Delay operation 2 1 3 - 1. Follow Port Standard Operating Procedure
2. Check weather forecast prior to movement
3. Develop and implement a contingency plan
Contractor 2
b) Collision of barges with existing traffic
1. Damage to vessel
2. Man overboard
3. Delay of operations
4. Loss of life
4 3 7 - 1. Schedule vessel movements with Marine Services of BPSB as
there should be no other movements within the Port and
channel while the tow is in progress. However, it should be
noted that priority will always be given to LNG vessel
operations.
2. Develop and implement a contingency plan
Contractor / Port
Operator
5
c) Communication issues / failure (language, misunderstanding etc., including failure to communicate the start of operations, emergency plan, etc.)
1. Delay operation
2. Injury/Accident
3. Damage to vessel
4. Man overboard
2 3 5 - 1. Use licensed crew (with adequate maritime certificates)
2. Conduct appropriate training for crews whenever new vessel
crews are employed
3. Employ key personnel that able to communicate in English / Malay
Contractor 3
d) Night operations / Poor visibility 1. Accident
2. Increased risk of collision (see “Collision”)
3. Delay operation
3 1 4 - 1. Proper communication between barge and Marine Services of
BPSB
2. Develop and implement a contingency plan
Contractor 3
e) Failure of propulsion, steering or power of tugboat
1. Delay operation
2. Increased risk of collision (see “Collision”)
3 3 6 - 1. Carry out proper maintenance
2. Develop and implement a contingency plan
Contractor 5
f) Crew fatigue 1. Accident
2. Injury
6 2 8 - 1. Conduct appropriate training for crews whenever there are
new vessel crews
2. Prepare proper manpower arrangements (i.e. shift)
3. Ensure proper first-aid availability on board construction vessels
Contractor 4
h) Inadequate emergency plan 1. Inadequate response
2. Injury/Death
3. Damage to assets
4. Delay operation
3 3 6 - 1. Conduct emergency drills
2. Develop and implement a contingency plan
Contractor 3
i) Lack of planning / documentation / procedure
1. Inadequate response
2. Delay operation
3 3 6 - 1. Conduct appropriate training for crews whenever new vessel crews are employed
Contractor 3

Marine Traffic Risk Analysis (MTRA) Study for the Proposed Cooling Water Intake Pipeline at Tanjung Kidurong, Bintulu, Sarawak
Final Report
Page 34 of 40
HAZID Worksheet #4
System : Installation of HDPE pipeline
#
What if? Consequences Initial Probability / Frequency Index (FI)
Consequence / Severity Index (SI)
Initial Risk Index (RI)
*Mitigation Measures Recommendations Responsible Residual
Risk Index (RI)
Guideword i.e. the failure under analysis
Description of the consequences of the possible impact of the cause
Description of the current mitigation measures in place
Description of the recommendation(s) that could be in place Description of the responsible(s) of the recommendation(s)
a) Severe weather conditions 1. Delay operation
2. Increased risk of collision
5 2 7 - 1. Define weather operation thresholds
2. Check weather forecast at the start of each work day
3. Monitor weather throughout each working day and stop work if
weather operation thresholds are exceeded
4. Develop and implement a contingency plan
Contractor 5
b) Collision of construction vessels with local vessels (particularly fishing boats)
1. Damage to vessel
2. Man overboard
3. Delay of operations
4. Loss of life
1 3 4 - 1. Notice to Mariners to be issued regarding restricted navigation areas
2. Watch keeping with chaser boat patrol near the construction area
3. The construction vessel displays the navigation lights and
navigation shapes, configures the VHF telephones, sets up
specially-assigned persons to listen for 24 hours, and keeps an
uninterrupted lookout according to the International Regulations for
Preventing Collisions at Sea (COLREGS)
4. Develop and implement a contingency plan
5. Develop emergency response plans and ensure proper briefings
are provided to construction crews
Contractor / Authority 3
c) Communication issues / failure (language, misunderstanding etc., including failure to communicate the start of operations, emergency plan, etc.)
1. Delay operation
2. Injury/Accident
3. Damage to vessel
4. Man overboard
2 1 3 - 1. Use licensed crew (with adequate maritime certificates)
2. Conduct appropriate training for crews whenever new vessel
crews are employed
3. Employ key personnel that able to communicate in English / Malay
Contractor 2
d) Night operations / Poor visibility 1. Accident
2. Increased risk of collision (see “Collision”)
3. Delay operation
6 1 7 1. There shall be
sufficient lighting
around the operation
area during night
construction
2. To protect safety of
night navigation,
construction and
mooring, the ship
shall be assigned
with full-time safety
officers
1. The construction vessel displays the navigation lights and navigation shapes, configures the VHF telephones, sets up specially-assigned persons to listen for 24 hours, and keeps an uninterrupted lookout according to the International Regulations for Preventing Collisions at Sea (COLREGS)
2. Use search lights and communication / warning signals
3. Develop proper communication procedures such as set up control
centre with manned telephone system available whenever
construction activities are on-going
4. Develop and implement a contingency plan
5. Increase watch keeping while during construction works
Contractor 4
e) Failure of propulsion, steering or power of construction vessel
1. Delay operation
2. Increased risk of collision (see “Collision”)
2 1 3 - 1. Carry out proper maintenance
2. Develop and implement a contingency plan
Contractor 2
f) Crew fatigue 3. Accident
4. Injury
5 2 7 - 4. Conduct appropriate training for crews whenever there are new
vessel crews
5. Prepare proper manpower arrangements (i.e. shift)
6. Ensure proper first-aid availability on board construction vessels
Contractor 4
h) Inadequate emergency plan 1. Inadequate response
2. Injury/Death
3. Damage to assets
4. Delay operation
3 4 7 - 1. Conduct emergency drills
2. Develop and implement a contingency plan
Contractor 3
i) Lack of planning / documentation / procedure
1. Inadequate response
2. Delay operation
3 3 6 - 1. Conduct appropriate training for crews whenever new vessel crews are employed
Contractor 3
Note (*): See Client’s Risk Assessment in Appendix B.

Marine Traffic Risk Analysis (MTRA) Study for the Proposed Cooling Water Intake Pipeline at Tanjung Kidurong, Bintulu, Sarawak
Final Report
Page 35 of 40
3.3.4 HAZID Workshop Findings
The identified common risks (risk level of 6 and above) for all four (4)) construction activities
(excavations for pipe trenches, transportation of HDPE pipeline weight block within Bintulu Port,
transportation of HDPE pipeline from Bintulu Port to project site, and installation of HDPE
pipeline) are given below:
Crew fatigue
Inadequate emergency plan
Lack of planning / documentation / procedure
For the Excavations for pipe trenches and installation of HDPE pipeline, an additional risk (risk
level of 6 and above) was identified as given below.
Severe weather conditions
Night Operations/Poor Visibility
For the transportation of HDPE pipeline weight block within Bintulu Port and transportation of
HDPE pipeline from Bintulu Port to project site, two (2) additional risks (risk level of 6 and above)
were identified as given below.
Collision of barges with existing traffic
Failure of propulsion, steering or power of tugboat
Proposed risk mitigation measures arising from the HAZID Workshop are detailed in Chapter 4.0.

Marine Traffic Risk Analysis (MTRA) Study for the Proposed Cooling Water Intake Pipeline at Tanjung Kidurong, Bintulu, Sarawak
Final Report
Page 36 of 40
4.0 Risk Mitigation Measures
4.1 Proposed Risk Mitigation Measures for Construction Activities at Project Site
Mitigation measures for risks described in HAZID Worksheets #1 (excavations for pipe trenches)
and #4 (Installation of HDPE pipeline) are categorised as shown below.
4.1.1 Construction Vessel Crew
Use licensed crew (with adequate maritime certificates)
Conduct appropriate training for crews whenever new vessel crews are employed
Employ key personnel that are able to communicate in English / Malay
Develop proper communication procedures to include set up of a control centre with
manned telephone system available whenever construction activities are on-going
Prepare manpower arrangements (i.e. shift)
Conduct emergency drills
4.1.2 Weather Conditions
Define weather operation thresholds
Check weather forecast and tide tables at the start of each working day for operational
planning
Monitor weather throughout each working day and stop work if weather operation
thresholds are exceeded
4.1.3 Emergency and Contingency Plans
Develop and implement a contingency plan that includes credible Pre-Incident Plan
(PIPs)
Develop emergency response plans based on credible PIPs and ensure briefings are
provided to construction crews
4.1.4 Construction Area
Put in place watch keeping with chaser boat patrol near the construction area during
construction period
Notice to Mariners to be issued regarding restricted navigation areas

Marine Traffic Risk Analysis (MTRA) Study for the Proposed Cooling Water Intake Pipeline at Tanjung Kidurong, Bintulu, Sarawak
Final Report
Page 37 of 40
4.1.5 Construction Vessels
The construction vessels to have in place safety measures in accordance to the
International Regulations for Preventing Collisions at Sea (COLREGS) such as
navigation lights and navigation shapes, configured VHF telephones, 24 hours control
centre with especially-assigned persons that keeps an uninterrupted lookout on the
construction activities.
Use search lights and communication / warning signals in severe weather / poor visibility
conditions
Carry out proper maintenance
Ensure proper first-aid availability on board construction vessels
4.2 Proposed Risk Mitigation Measures for Transportation Activities
Mitigation measures for risks described in HAZID Worksheets #2 (transportation of HDPE pipeline
weight block within Bintulu Port) and #3 (transportation of HDPE pipeline from Bintulu Port to
project site) are categorised as shown below.
4.2.1 Construction Vessel Crew
Use licensed crew (with adequate maritime certificates)
Conduct appropriate training for crews whenever new vessel crews are employed
Employ key personnel that are able to communicate in English / Malay
Proper communication between barge and Marine Services of BPSB
Prepare manpower arrangements (i.e. shift)
Conduct emergency drills
4.2.2 Weather Conditions
Follow Port Standard Operating Procedure
Check weather forecast prior to movements
4.2.3 Emergency and Contingency Plans
Develop and implement a contingency plan that includes credible Pre Incident Plan
(PIPs)
4.2.4 Construction Vessels for Transportation of Weight Block
Schedule vessel movements with Marine Services of BPSB as there should be no other
movements within the Port while the tow is in progress. However, it should be noted that
priority will always be given to LNG vessel operations.
Carry out proper maintenance
Ensure proper first-aid availability on board construction vessels

Marine Traffic Risk Analysis (MTRA) Study for the Proposed Cooling Water Intake Pipeline at Tanjung Kidurong, Bintulu, Sarawak
Final Report
Page 38 of 40
4.2.5 Construction Vessels for Transportation of HDPE Pipeline
Schedule vessel movements with Marine Services of BPSB as there should be no other
movements within the Port and channel while the tow is in progress. However, it should
be noted that priority will always be given to LNG vessel operations.
Carry out proper maintenance
Ensure proper first-aid availability on board construction vessels
Ensure proper hand over of towed objects to site crew and to inform Marine Services of
BPSB once handover is completed
4.3 Anchoring of Cutter Suction Dredger
The anchor chains of the cutter suction dredger are to be between two (2) to three (3) shackles
while maintaining a distance of at least 50m away from the existing gas pipe.
4.4 Storage of HDPE Pipes in Bintulu Port
While the HDPE pipes are being stored at Inner Harbour 2, Bintulu Port, the following actions
should be taken:
Install sufficient lighting on the HDPE pipes to ensure that the pipes are visible to other
port users during night and low visibility situations.
Ensure the anchor piles are sufficient to keep the HDPE pipes in place securely during
storage.
Perform daily checks on the anchor piles and report to BPSB.
Ensure that there is a standby support tug at all time in case the HDPE pipes need to be
repositioned quickly.
4.5 Installation Works of Weight Balancing Blocks and Connection Works for HDPE Pipes
The above activity should not encroach into the adjacent navigation channel or manoeuvring
basin of the Bintulu Port Inner Harbour 2 so as to cause hindrance to marine traffic and should be
conducted in compliance with the requirements of Bintulu Port Authority (BPA) and Bintulu Port
Sdn Bhd (BPSB) at all times.
4.6 Proposed Marine Traffic Management Plan
The proposed marine traffic management plan for the construction vessels for transportation of
weight block and HDPE pipeline is as follows:
1. Schedule vessel movements with Marine Services of as there should be no other
movements within the Port and / or channel while the tow is in progress.
2. Vessels to display appropriate navigation lights and navigation shapes as well as
configure VHF telephones.
3. Maintain uninterrupted communication with Marine Services of BPSB during
transportation period.
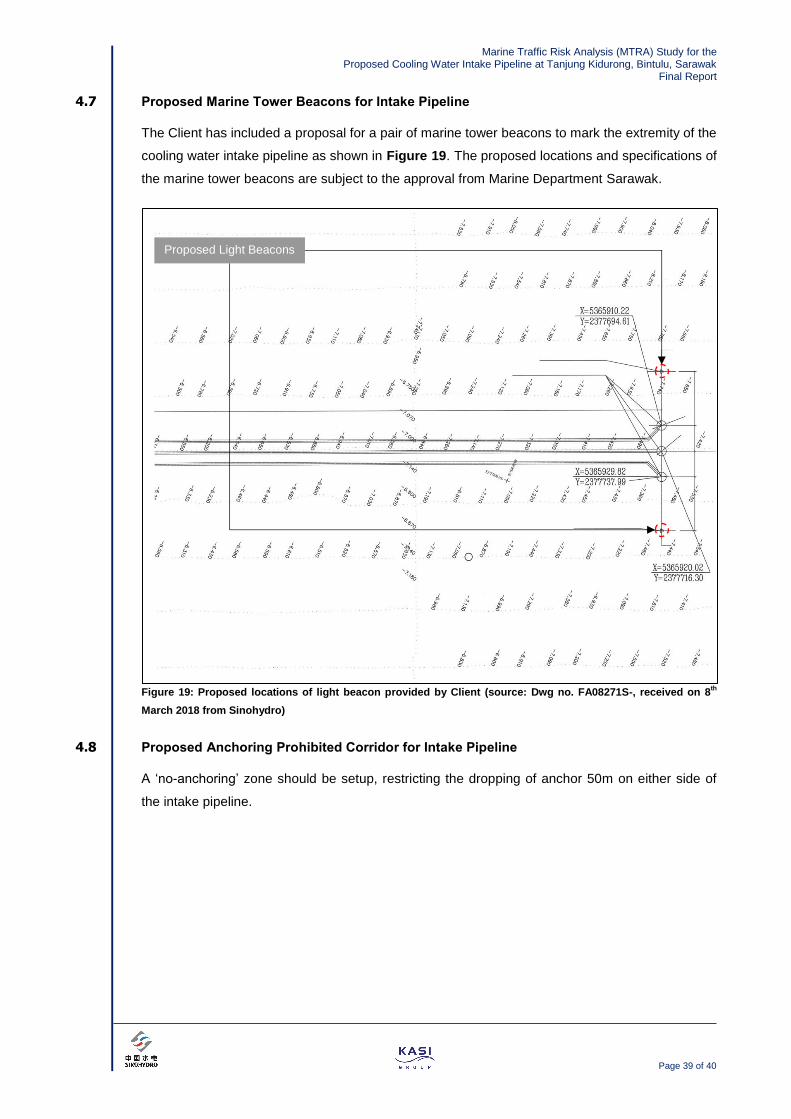
Marine Traffic Risk Analysis (MTRA) Study for the Proposed Cooling Water Intake Pipeline at Tanjung Kidurong, Bintulu, Sarawak
Final Report
Page 39 of 40
4.7 Proposed Marine Tower Beacons for Intake Pipeline
The Client has included a proposal for a pair of marine tower beacons to mark the extremity of the
cooling water intake pipeline as shown in Figure 19. The proposed locations and specifications of
the marine tower beacons are subject to the approval from Marine Department Sarawak.
Figure 19: Proposed locations of light beacon provided by Client (source: Dwg no. FA08271S-, received on 8
th
March 2018 from Sinohydro)
4.8 Proposed Anchoring Prohibited Corridor for Intake Pipeline
A ‘no-anchoring’ zone should be setup, restricting the dropping of anchor 50m on either side of
the intake pipeline.
Proposed Light Beacons

Marine Traffic Risk Analysis (MTRA) Study for the Proposed Cooling Water Intake Pipeline at Tanjung Kidurong, Bintulu, Sarawak
Final Report
Page 40 of 40
5.0 Conclusion
The objective of the MTRA is to assess the level of risk to marine traffic due to the construction
and operation of the proposed cooling water intake pipeline.
The MTRA looked at four (4) main construction activities namely excavation for pipe trenches at
the project site, transportation of HDPE pipeline weight blocks within the Bintulu Port,
transportation of HDPE pipeline from Bintulu Port to the project site and installation of HDPE
pipeline at the project site.
The identified common risks for all four (4) construction activities are crew fatigue, inadequate
emergency plan and lack of planning / documentation / procedure.
For the excavation for pipe trenches and installation of HDPE pipeline, additional risks identified
are severe weather conditions and night operations / poor visibility.
The transportation of HDPE pipeline weight blocks within Bintulu Port and transportation of HDPE
pipeline from the Bintulu Port to project site, two (2) additional risks are identified namely collision
of barges with existing traffic and failure of propulsion, steering or power of tugboat.
Mitigation measures have been identified for the risks discussed above including reference to the
International Regulation for Preventing Collisions at Sea (COLREGS).
The anchor chains of the cutter suction dredger are to be between two (2) to three (3) shackles
while maintaining a distance of at least 50m away from the existing gas pipe.
Installation works of weight balancing blocks and connection works for HDPE pipes should not
encroach into the adjacent navigation channel or manoeuvring basin of the Bintulu Port Inner
Harbour 2 so as to cause hindrance to marine traffic and should be conducted in compliance with
the requirements of Bintulu Port Authority and Bintulu Port Sdn Bhd at all times.
The MTRA concludes that the identified risks associated with the construction and operation of
the proposed cooling water intake pipeline for the 400MW Combined Cycle Gas Turbine (CCGT)
power plant at Tanjung Kidurong, Bintulu can be safely managed, subject to compliance with the
mitigation measures identified in this report.
-END OF DOCUMENT-

Marine Traffic Risk Analysis (MTRA) Study for the Proposed
Cooling Water Intake Pipeline at Tanjung Kidurong, Bintulu, Sarawak
Appendix A – Methodology of Risk Assessment
Appendix A
Methodology of Risk Assessment

Marine Traffic Risk Analysis (MTRA) Study for the Proposed
Cooling Water Intake Pipeline at Tanjung Kidurong, Bintulu, Sarawak
Appendix A – Methodology of Risk Assessment
1.0 Methodology of Risk Assessment
1.1 Identification of Systems
There is no fixed rule to define a System. Ideally, a System should be as small as possible, to
provide a more accurate assessment of each component, but this will result in a lot of repetition
and can take too much time. However, if a system is too large, it will make the whole HAZID less
accurate.
In order to meet the objectives of the MRA, each System was defined as a construction stage that
will be performed during the Process.
1.2 Identification of Guide Words (GWs)
GWs are, in general, failure, miss-operations, human error or external events that could happen
during the Process. These are keys to properly assessing the likely deviations from the normal
state of operations.
In the first stage of the workshop, the team was encouraged to raise „What-if‟ questions to jointly
identify and evaluate what might go wrong in the envisaged System. The associated hazards of the
„What-if‟ scenarios were discussed at a later stage of the workshop.
1.3 Discussion of Identified Systems and Hazards
Identification of Potential Failure Events
After the Team agreed on the list of Systems and GWs / „What-if‟ scenarios, as shown in Capter,
the HAZID Facilitator selected a System to be discussed and will then run through the list of GWs,
discussing with the team if that GW is applicable to that System and if it is, further discuss the
potential consequences of such an event.
In shorter terms, the HAZID Facilitator will ask the Team “What happens if GW happens during this
System?”
Consequence Analysis
The Team then identified and evaluated each hazard to determine the potential consequences,
taking into account:
Impact on personnel (safety issues)
Impact on operation
At this stage, the consequences are assessed not considering the existing mitigation measures in
place.

Marine Traffic Risk Analysis (MTRA) Study for the Proposed
Cooling Water Intake Pipeline at Tanjung Kidurong, Bintulu, Sarawak
Appendix A – Methodology of Risk Assessment
Analysis of Existing Mitigation Measures
Once the „baseline‟ consequences have been identified, the Team will then assess existing
mitigation measures in place to prevent the event from occurring or to reduce the consequences if
the event does happen.
Mitigation measures are defined as devices, procedures or other means that can prevent or
mitigate the consequences of a failure event. These measures must be fully independent from the
potential „failure event‟.
Acceptability of Risk
At this stage, the Team will define whether the discussed failure event / risk is acceptable or not
acceptable.
In order to facilitate the process, the Team is asked to choose from three possible conclusions:
i. The System is adequately protected against this failure event;
ii. The System is not adequately protected against this failure event;
iii. A final conclusion cannot be drawn, deeper analysis is necessary.
In Case (i), the HAZID Facilitator will move to the next GW or System.
In Case (ii), the Team will discuss the modification of existing measures or the addition of new
mitigation measures.
In Case (iii) or in a situation of Case (ii) where additional measures cannot be determined, the
HAZID Facilitator will make a note that a dedicated study will have to be conducted to address that
particular „failure event‟.
Marine Traffic Risk Analysis (MTRA) Study for the Proposed
Cooling Water Intake Pipeline at Tanjung Kidurong, Bintulu, Sarawak
Appendix B – Risk Assessment of Cooling Water Intake Pipeline by Sinohydro
Appendix B
Risk Assessment of Cooling Water Intake Pipeline by Sinohydro

Marine Traffic Risk Analysis (MTRA) Study for the Proposed
Cooling Water Intake Pipeline at Tanjung Kidurong, Bintulu, Sarawak
Appendix B – Risk Assessment of Cooling Water Intake Pipeline by Sinohydro
Risk Assessment of Cooling Water Intake Pipeline by Sinohydro
Maritime operation risk analysis has been carried out according to information provided by Client.
A total of 13 risks have been identified and the proposed preventive measures are proposed as
follows:
No. Item Possible Damages Evitable Or Not
Preventive Measures
1 Ship operation and departure from berth
Mooring rope breakage (severe wear or uneven stress) due to fault in mooring coordination; personal injuries due to standing in mooring rope circle or striding over mooring rope
Yes 1. Wear working clothes, safety helmet and protective gloves tidily.
2. During mooring, the operator shall keep a safe distance from the drum, operate at a safe location and follow the commands.
3. During mooring operation, ensure close fore-aft coordination and timely adjust the rope stress.
2 Collision avoidance between ships
Passing-by ships failing to avoid the anchor rope of the working ship; damage to ship equipment
Yes 1. During construction, deck watchmen shall pay attention to the movement of surrounding ships, to prevent the anchor rope of the working ship from being interfered by propellers of passing-by ships or approaching auxiliary vessels.
3 Dredge operation
Mechanical collision; personal injuries
Yes 1. During dredge equipment operation, nobody shall stand within its operating radius; the driver operating the grab must give a signal prior to starting up the dredge.
4 Ship navigation under bad visibility
Ship collision and grounding due to lack of observation in heavy fog, stormy conditions
Yes 1. Ship driver shall learn and master relevant marine navigation rules, correctly understand and grasp the requirements in combination of the ship features.
2. The captain and the driver shall fully understand the water depth, weather, tide, navigation marks, obstacles and other characteristics of the navigation area.
3. In case of bad visibility, the driver shall immediately take measures such as reducing speed, intensifying the observation and stopping the sailing, and report it to the captain.
5 Ship navigation or construction at night
Collision or formation of an urgent situation due to failure to distinguish buildings from sailing ships as a result of influence by background light at night
Yes 1. There shall be sufficient lighting around the operation area during night construction.
2. To protect safety of night navigation, construction and mooring, the ship shall be assigned with full-time safety officers.
6 Ship navigation in stormy waves or defence against typhoons
Ship getting out of control or water entering the ship due to violent storms and waves as well as bad condition of watertight facilities
Yes 1. Carry out inspections before a windstorm to ensure water tightness and smooth drainage of the ship, and take fixing and ballasting measures for emergency preparedness.
2. During sailing in violent storms and waves, it is required to take different operation measures according to the ship type, stability and draft, sea area and other specific situations, so as to reduce the ship roll and mitigate the wave impact till the sea restores calm. Alternatively, take positive measures to sail away from the stormy sea area.
7 Ship mooring operation
Ship dragging and collision due to influence by water flow, water depth and geological tide
Yes 1. Carry out mooring properly to avoid dragging.
2. For typhoon resistance, the means of mooring shall be reported to the management department

Marine Traffic Risk Analysis (MTRA) Study for the Proposed
Cooling Water Intake Pipeline at Tanjung Kidurong, Bintulu, Sarawak
Appendix B – Risk Assessment of Cooling Water Intake Pipeline by Sinohydro
8 Operation in enclosed ship cabin
Operator asphyxia, poisoning or explosion and fire disaster due to lack of oxygen or existence of carbon monoxide and explosive mixed gases in the cabin
Yes 1. Prior to operation, it is required to measure the concentration of oxygen in the operating ambient air, and entering the workplace is allowed only when the oxygen content is higher than 18% and the carbon dioxide content is not higher than 2%. Operators shall be provided with safety education.
2. Personnel entering the oxygen-deficient workplace to rescue people must wear isolation-type respirators and carry out rescuing with the cooperation of special persons.
3. Seal off the place and post up signs at its entrance to avoid entering by mistake.
9 Loading and unloading of ship fuel oil and lubricating oil
Fire disaster, explosion and environmental pollution caused by flammable and explosive substances
Yes 1. The supplier and the receiver are responsible for pollution prevention and fire protection of oil supply facilities or ships as well as personal safety during the operation.
2. During oil reception, guarantee proper anti-pollution measures for ships to avoid fire disasters and personal accidents.
10 Ship lifting operation
Failure to fasten the safety belt, object falling from a high altitude
Yes 1. During derrick or machine maintenance, it is required to stop the ship and hang the “No Starting” sign; the operation site shall be under supervision by specially-assigned personnel.
2. Operators at heights shall wear helmets and corresponding labor protection equipment, recheck and confirm the rigidity and availability of such equipment, keep concentrated, fasten the safety belt and wear no leather gloves during operation.
11 Crew’s life Smoking, electric shock, fire disaster
Yes 1. No smoking in the cabin.
2. Appliance switches, lighting, ventilation and heating equipment in the cabin shall be kept in good condition, and attention shall be paid to loose electric plugs and hot electric wires.
3. Prohibit the use of high-power electrical appliances.
12 Outboard operation
Falling into water and drowning failure to wear the life jacket
Yes 1. Always wear the life jacket correctly during outboard operation.
2. No outboard operation while sailing.
13 Diver’s operation Underwater harm due to insufficient air supply and delayed communication between underwater and overwater personnel
Yes 1. Before underwater operation, the diver shall carefully check and confirm the safety performance and intactness of diving equipment.
2. The diver must follow the diving rules and prevent the diving equipment from being broken by obstacles during underwater operation.
3. During underwater operation, the diver shall keep in touch with the overwater correspondent. In case of failure of the contact phone, the signal rope. In case of failure of both the phone and the signal rope, the diver can use the air supply pipe for contact and shall get out of water immediately.
4. For underwater installation, the diver can enter the operation point only after the to-be-installed object is put in place and completely motionless. The overwater operator can be informed of lifting up the hook only after the diver unfastens the hook and leaves the operation area.

Appendix 5.6.1
Consequence Modelling Result

QRA for Proposed Combined Cycle Power Plant (Unit 12 & 13)
Tanjung Kidurong Power Plant, Bintulu
38
February 2018
Pool Fire Small
Ref Scenarios Fatality
Probability
Weather
Condition
1F
Weather
Condition
3C
Weather
Condition
5D
Downwind
Distance
Downwind
Distance
Downwind
Distance
2
IS02_DO_GTB2_L_PF_S_1 1.00 Not
reachable
Not
reachable
Not
reachable
IS02_DO_GTB2_L_PF_S_0.5 0.50 26.54 26.60 26.96
IS02_DO_GTB2_L_PF_S_0.03 0.03 52.87 63.58 68.21
14
IS14_DO_PIPEFOT5GTB1_L_PF_S_1 1.00 Not
reachable
Not
reachable
Not
reachable
IS14_DO_PIPEFOT5GTB1_L_PF_S_0.5 0.50 21.86 23.64 24.43
IS14_DO_PIPEFOT5GTB1_L_PF_S_0.03 0.03 46.00 55.79 59.85
15
IS15_DO_PIPEFOT5GTB2_L_PF_S_1 1.00 Not
reachable
Not
reachable
Not
reachable
IS15_DO_PIPEFOT5GTB2_L_PF_S_0.5 0.50 24.35 25.09 25.59
IS15_DO_PIPEFOT5GTB2_L_PF_S_0.03 0.03 49.50 59.86 64.30
16
IS16_DO_PIPEFOT6GTB1_L_PF_S_1 1.00 Not
reachable
Not
reachable
Not
reachable
IS16_DO_PIPEFOT6GTB1_L_PF_S_0.5 0.50 21.43 23.46 24.27
IS16_DO_PIPEFOT6GTB1_L_PF_S_0.03 0.03 45.42 55.06 59.03
17
IS17_DO_PIPEFOT6GTB2_L_PF_S_1 1.00 Not
reachable
Not
reachable
Not
reachable
IS17_DO_PIPEFOT6GTB2_L_PF_S_0.5 0.50 24.04 24.86 25.46
IS17_DO_PIPEFOT6GTB2_L_PF_S_0.03 0.03 49.03 59.35 63.75

QRA for Proposed Combined Cycle Power Plant (Unit 12 & 13)
Tanjung Kidurong Power Plant, Bintulu
39
February 2018
Pool Fire Medium
Ref Scenarios Fatality
Probability
Weather
Condition
1F
Weather
Condition
3C
Weather
Condition
5D
Downwind
Distance
Downwind
Distance
Downwind
Distance
2
IS02_DO_GTB2_L_PF_M_1 1.00 Not
reachable
Not
reachable
Not
reachable
IS02_DO_GTB2_L_PF_M_0.5 0.50 76.84 74.50 73.16
IS02_DO_GTB2_L_PF_M_0.03 0.03 134.70 155.00 166.00
14
IS14_DO_PIPEFOT5GTB1_L_PF_M_1 1.00 Not
reachable
Not
reachable
Not
reachable
IS14_DO_PIPEFOT5GTB1_L_PF_M_0.5 0.50 24.36 26.18 27.02
IS14_DO_PIPEFOT5GTB1_L_PF_M_0.03 0.03 48.59 58.94 63.62
15
IS15_DO_PIPEFOT5GTB2_L_PF_M_1 1.00 Not
reachable
Not
reachable
Not
reachable
IS15_DO_PIPEFOT5GTB2_L_PF_M_0.5 0.50 27.01 27.92 28.71
IS15_DO_PIPEFOT5GTB2_L_PF_M_0.03 0.03 52.37 63.77 69.12
16
IS16_DO_PIPEFOT6GTB1_L_PF_M_1 1.00 Not
reachable
Not
reachable
Not
reachable
IS16_DO_PIPEFOT6GTB1_L_PF_M_0.5 0.50 23.89 25.88 26.66
IS16_DO_PIPEFOT6GTB1_L_PF_M_0.03 0.03 47.97 58.14 62.64
17
IS17_DO_PIPEFOT6GTB2_L_PF_M_1 1.00 Not
reachable
Not
reachable
Not
reachable
IS17_DO_PIPEFOT6GTB2_L_PF_M_0.5 0.50 26.67 27.66 28.41
IS17_DO_PIPEFOT6GTB2_L_PF_M_0.03 0.03 51.86 63.11 68.42

QRA for Proposed Combined Cycle Power Plant (Unit 12 & 13)
Tanjung Kidurong Power Plant, Bintulu
40
February 2018
Pool Fire Catastrophic
Ref Scenarios Fatality
Probability
Weather
Condition
1F
Weather
Condition
3C
Weather
Condition
5D
Downwind
Distance
Downwind
Distance
Downwind
Distance
2
IS02_DO_GTB2_L_PF_C_1 1.00 Not
reachable
Not
reachable
Not
reachable
IS02_DO_GTB2_L_PF_C_0.5 0.50 157.30 157.80 158.20
IS02_DO_GTB2_L_PF_C_0.03 0.03 255.50 294.00 319.30
14
IS14_DO_PIPEFOT5GTB1_L_PF_C_1 1.00 Not
reachable
Not
reachable
Not
reachable
IS14_DO_PIPEFOT5GTB1_L_PF_C_0.5 0.50 17.21 18.79 19.76
IS14_DO_PIPEFOT5GTB1_L_PF_C_0.03 0.03 41.49 51.84 56.71
15
IS15_DO_PIPEFOT5GTB2_L_PF_C_1 1.00 Not
reachable
Not
reachable
Not
reachable
IS15_DO_PIPEFOT5GTB2_L_PF_C_0.5 0.50 20.01 21.82 23.08
IS15_DO_PIPEFOT5GTB2_L_PF_C_0.03 0.03 45.45 57.87 63.94
16
IS16_DO_PIPEFOT6GTB1_L_PF_C_1 1.00 Not
reachable
Not
reachable
Not
reachable
IS16_DO_PIPEFOT6GTB1_L_PF_C_0.5 0.50 16.74 18.58 19.47
IS16_DO_PIPEFOT6GTB1_L_PF_C_0.03 0.03 40.86 50.99 55.71
17
IS17_DO_PIPEFOT6GTB2_L_PF_C_1 1.00 Not
reachable
Not
reachable
Not
reachable
IS17_DO_PIPEFOT6GTB2_L_PF_C_0.5 0.50 19.67 21.57 22.93
IS17_DO_PIPEFOT6GTB2_L_PF_C_0.03 0.03 44.93 57.22 63.22

QRA for Proposed Combined Cycle Power Plant (Unit 12 & 13)
Tanjung Kidurong Power Plant, Bintulu
41
February 2018
Jet Fire Small
Ref Scenarios Fatality
Probability
Weather
Condition
1F
Weather
Condition
3C
Weather
Condition
5D
Downwind
Distance
Downwind
Distance
Downwind
Distance
1
IS01_NG_GTB2_V_JF_S_1 1.00 Not
reachable
Not
reachable
Not
reachable
IS01_NG_GTB2_V_JF_S_0.5 0.50 11.20 11.04 10.88
IS01_NG_GTB2_V_JF_S_0.03 0.03 13.07 12.87 12.66
2
IS02_DO_GTB2_L_JF_S_1 1.00 7.17 5.90 4.92
IS02_DO_GTB2_L_JF_S_0.5 0.50 7.64 6.89 6.52
IS02_DO_GTB2_L_JF_S_0.03 0.03 9.46 8.66 8.25
3
IS03_NG_MSB1_V_JF_S_1 1.00 11.55 11.46 11.28
IS03_NG_MSB1_V_JF_S_0.5 0.50 14.54 14.46 14.36
IS03_NG_MSB1_V_JF_S_0.03 0.03 16.94 16.74 16.51
4
IS04_NG_MSB2_V_JF_S_1 1.00 11.55 11.46 11.28
IS04_NG_MSB2_V_JF_S_0.5 0.50 14.54 14.46 14.36
IS04_NG_MSB2_V_JF_S_0.03 0.03 16.94 16.74 16.51
5
IS05_NG_GCB1_V_JF_S_1 1.00 Not
reachable
Not
reachable
Not
reachable
IS05_NG_GCB1_V_JF_S_0.5 0.50 8.53 8.42 8.34
IS05_NG_GCB1_V_JF_S_0.03 0.03 10.25 10.08 9.90
6
IS06_NG_GCB2_V_JF_S_1 1.00 Not
reachable
Not
reachable
Not
reachable
IS06_NG_GCB2_V_JF_S_0.5 0.50 8.53 8.42 8.34
IS06_NG_GCB2_V_JF_S_0.03 0.03 10.25 10.08 9.90
7
IS07_NG_PIPEBLGRS_V_JF_S_1 1.00 14.94 14.99 15.03
IS07_NG_PIPEBLGRS_V_JF_S_0.5 0.50 18.08 18.01 17.93
IS07_NG_PIPEBLGRS_V_JF_S_0.03 0.03 21.04 20.81 20.57
8
IS08_NG_PIPEBLGRSB1_V_JF_S_1 1.00 14.94 14.99 15.03
IS08_NG_PIPEBLGRSB1_V_JF_S_0.5 0.50 18.08 18.01 17.93
IS08_NG_PIPEBLGRSB1_V_JF_S_0.03 0.03 21.04 20.81 20.57
9
IS09_NG_PIPEBLGRSB2_V_JF_S_1 1.00 14.94 14.99 15.03
IS09_NG_PIPEBLGRSB2_V_JF_S_0.5 0.50 18.08 18.01 17.93
IS09_NG_PIPEBLGRSB2_V_JF_S_0.03 0.03 21.04 20.81 20.57
10
IS10_NG_PIPEGRSFGRSB1_V_JF_S_1 1.00 14.94 14.99 15.03
IS10_NG_PIPEGRSFGRSB1_V_JF_S_0.5 0.50 18.08 18.01 17.93
IS10_NG_PIPEGRSFGRSB1_V_JF_S_0.03 0.03 21.04 20.81 20.57
11
IS11_NG_PIPEGRSFGRSB2_V_JF_S_1 1.00 14.94 14.99 15.03
IS11_NG_PIPEGRSFGRSB2_V_JF_S_0.5 0.50 18.08 18.01 17.93
IS11_NG_PIPEGRSFGRSB2_V_JF_S_0.03 0.03 21.04 20.81 20.57
12
IS12_NG_PIPEFGRSHRSGB1_V_JF_S_1 1.00 14.94 14.99 15.03
IS12_NG_PIPEFGRSHRSGB1_V_JF_S_0.5 0.50 18.08 18.01 17.93
IS12_NG_PIPEFGRSHRSGB1_V_JF_S_0.03 0.03 21.04 20.81 20.57
13
IS13_NG_PIPEFGRSHRSGB2_V_JF_S_1 1.00 14.94 14.99 15.03
IS13_NG_PIPEFGRSHRSGB2_V_JF_S_0.5 0.50 18.08 18.01 17.93
IS13_NG_PIPEFGRSHRSGB2_V_JF_S_0.03 0.03 21.04 20.81 20.57
14 IS14_DO_PIPEFOT5GTB1_L_JF_S_1 1.00 7.47 6.14 5.24
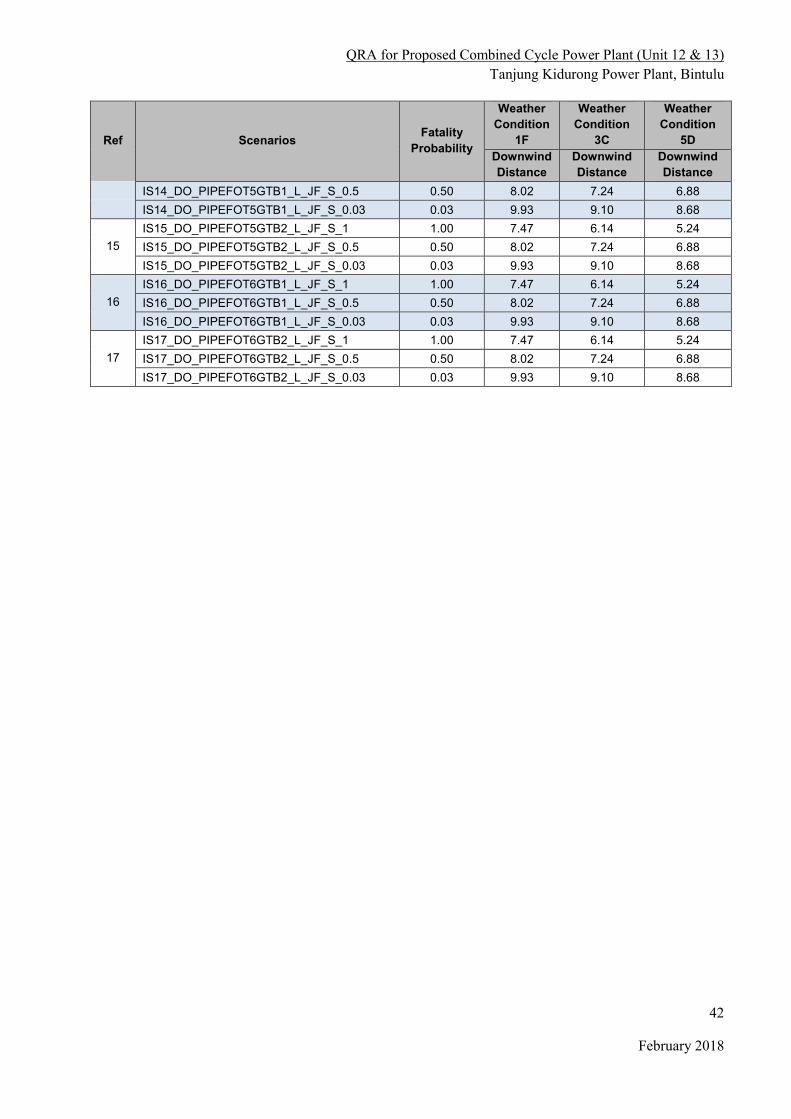
QRA for Proposed Combined Cycle Power Plant (Unit 12 & 13)
Tanjung Kidurong Power Plant, Bintulu
42
February 2018
Ref Scenarios Fatality
Probability
Weather
Condition
1F
Weather
Condition
3C
Weather
Condition
5D
Downwind
Distance
Downwind
Distance
Downwind
Distance
IS14_DO_PIPEFOT5GTB1_L_JF_S_0.5 0.50 8.02 7.24 6.88
IS14_DO_PIPEFOT5GTB1_L_JF_S_0.03 0.03 9.93 9.10 8.68
15
IS15_DO_PIPEFOT5GTB2_L_JF_S_1 1.00 7.47 6.14 5.24
IS15_DO_PIPEFOT5GTB2_L_JF_S_0.5 0.50 8.02 7.24 6.88
IS15_DO_PIPEFOT5GTB2_L_JF_S_0.03 0.03 9.93 9.10 8.68
16
IS16_DO_PIPEFOT6GTB1_L_JF_S_1 1.00 7.47 6.14 5.24
IS16_DO_PIPEFOT6GTB1_L_JF_S_0.5 0.50 8.02 7.24 6.88
IS16_DO_PIPEFOT6GTB1_L_JF_S_0.03 0.03 9.93 9.10 8.68
17
IS17_DO_PIPEFOT6GTB2_L_JF_S_1 1.00 7.47 6.14 5.24
IS17_DO_PIPEFOT6GTB2_L_JF_S_0.5 0.50 8.02 7.24 6.88
IS17_DO_PIPEFOT6GTB2_L_JF_S_0.03 0.03 9.93 9.10 8.68

QRA for Proposed Combined Cycle Power Plant (Unit 12 & 13)
Tanjung Kidurong Power Plant, Bintulu
43
February 2018
Jet Fire Medium
Ref Scenarios Fatality
Probability
Weather
Condition
1F
Weather
Condition
3C
Weather
Condition
5D
Downwind
Distance
Downwind
Distance
Downwind
Distance
1
IS01_NG_GTB2_V_JF_M_1 1.00 31.50 32.29 32.93
IS01_NG_GTB2_V_JF_M_0.5 0.50 38.89 39.15 39.38
IS01_NG_GTB2_V_JF_M_0.03 0.03 46.42 46.31 46.18
2
IS02_DO_GTB2_L_JF_M_1 1.00 14.86 12.61 12.29
IS02_DO_GTB2_L_JF_M_0.5 0.50 17.81 16.44 15.91
IS02_DO_GTB2_L_JF_M_0.03 0.03 22.04 20.72 20.16
3
IS03_NG_MSB1_V_JF_M_1 1.00 38.54 39.79 41.16
IS03_NG_MSB1_V_JF_M_0.5 0.50 48.66 49.28 49.87
IS03_NG_MSB1_V_JF_M_0.03 0.03 58.90 58.98 59.03
4
IS04_NG_MSB2_V_JF_M_1 1.00 38.54 39.79 41.16
IS04_NG_MSB2_V_JF_M_0.5 0.50 48.66 49.28 49.87
IS04_NG_MSB2_V_JF_M_0.03 0.03 58.90 58.98 59.03
5
IS05_NG_GCB1_V_JF_M_1 1.00 25.05 25.50 25.95
IS05_NG_GCB1_V_JF_M_0.5 0.50 30.98 31.21 31.43
IS05_NG_GCB1_V_JF_M_0.03 0.03 36.79 36.72 36.62
6
IS06_NG_GCB2_V_JF_M_1 1.00 25.05 25.50 25.95
IS06_NG_GCB2_V_JF_M_0.5 0.50 30.98 31.21 31.43
IS06_NG_GCB2_V_JF_M_0.03 0.03 36.79 36.72 36.62
7
IS07_NG_PIPEBLGRS_V_JF_M_1 1.00 47.08 48.76 50.26
IS07_NG_PIPEBLGRS_V_JF_M_0.5 0.50 59.35 60.05 60.72
IS07_NG_PIPEBLGRS_V_JF_M_0.03 0.03 72.21 72.28 72.31
8
IS08_NG_PIPEBLGRSB1_V_JF_M_1 1.00 47.08 48.76 50.26
IS08_NG_PIPEBLGRSB1_V_JF_M_0.5 0.50 59.35 60.05 60.72
IS08_NG_PIPEBLGRSB1_V_JF_M_0.03 0.03 72.21 72.28 72.31
9
IS09_NG_PIPEBLGRSB2_V_JF_M_1 1.00 47.08 48.76 50.26
IS09_NG_PIPEBLGRSB2_V_JF_M_0.5 0.50 59.35 60.05 60.72
IS09_NG_PIPEBLGRSB2_V_JF_M_0.03 0.03 72.21 72.28 72.31
10
IS10_NG_PIPEGRSFGRSB1_V_JF_M_1 1.00 47.08 48.76 50.26
IS10_NG_PIPEGRSFGRSB1_V_JF_M_0.5 0.50 59.35 60.05 60.72
IS10_NG_PIPEGRSFGRSB1_V_JF_M_0.03 0.03 72.21 72.28 72.31
11
IS11_NG_PIPEGRSFGRSB2_V_JF_M_1 1.00 47.08 48.76 50.26
IS11_NG_PIPEGRSFGRSB2_V_JF_M_0.5 0.50 59.35 60.05 60.72
IS11_NG_PIPEGRSFGRSB2_V_JF_M_0.03 0.03 72.21 72.28 72.31
12
IS12_NG_PIPEFGRSHRSGB1_V_JF_M_1 1.00 47.08 48.76 50.26
IS12_NG_PIPEFGRSHRSGB1_V_JF_M_0.5 0.50 59.35 60.05 60.72
IS12_NG_PIPEFGRSHRSGB1_V_JF_M_0.03 0.03 72.21 72.28 72.31
13
IS13_NG_PIPEFGRSHRSGB2_V_JF_M_1 1.00 47.08 48.76 50.26
IS13_NG_PIPEFGRSHRSGB2_V_JF_M_0.5 0.50 59.35 60.05 60.72
IS13_NG_PIPEFGRSHRSGB2_V_JF_M_0.03 0.03 72.21 72.28 72.31
14
IS14_DO_PIPEFOT5GTB1_L_JF_M_1 1.00 15.51 13.23 12.86
IS14_DO_PIPEFOT5GTB1_L_JF_M_0.5 0.50 18.71 17.24 16.65
IS14_DO_PIPEFOT5GTB1_L_JF_M_0.03 0.03 23.14 21.74 21.11

QRA for Proposed Combined Cycle Power Plant (Unit 12 & 13)
Tanjung Kidurong Power Plant, Bintulu
44
February 2018
Ref Scenarios Fatality
Probability
Weather
Condition
1F
Weather
Condition
3C
Weather
Condition
5D
Downwind
Distance
Downwind
Distance
Downwind
Distance
15
IS15_DO_PIPEFOT5GTB2_L_JF_M_1 1.00 15.51 13.23 12.86
IS15_DO_PIPEFOT5GTB2_L_JF_M_0.5 0.50 18.71 17.24 16.65
IS15_DO_PIPEFOT5GTB2_L_JF_M_0.03 0.03 23.14 21.74 21.11
16
IS16_DO_PIPEFOT6GTB1_L_JF_M_1 1.00 15.51 13.23 12.86
IS16_DO_PIPEFOT6GTB1_L_JF_M_0.5 0.50 18.71 17.24 16.65
IS16_DO_PIPEFOT6GTB1_L_JF_M_0.03 0.03 23.14 21.74 21.11
17
IS17_DO_PIPEFOT6GTB2_L_JF_M_1 1.00 15.51 13.23 12.86
IS17_DO_PIPEFOT6GTB2_L_JF_M_0.5 0.50 18.71 17.24 16.65
IS17_DO_PIPEFOT6GTB2_L_JF_M_0.03 0.03 23.14 21.74 21.11

QRA for Proposed Combined Cycle Power Plant (Unit 12 & 13)
Tanjung Kidurong Power Plant, Bintulu
45
February 2018
Jet Fire Catastrophic
Ref Scenarios Fatality
Probability
Weather
Condition
1F
Weather
Condition
3C
Weather
Condition
5D
Downwind
Distance
Downwind
Distance
Downwind
Distance
1
IS01_NG_GTB2_V_JF_C_1 1.00 Not
reachable
Not
reachable
Not
reachable
IS01_NG_GTB2_V_JF_C_0.5 0.50 Not
reachable
Not
reachable
Not
reachable
IS01_NG_GTB2_V_JF_C_0.03 0.03 Not
reachable
Not
reachable
Not
reachable
2
IS02_DO_GTB2_L_JF_C_1 1.00 Not
reachable
Not
reachable
Not
reachable
IS02_DO_GTB2_L_JF_C_0.5 0.50 Not
reachable
Not
reachable
Not
reachable
IS02_DO_GTB2_L_JF_C_0.03 0.03 Not
reachable
Not
reachable
Not
reachable
3
IS03_NG_MSB1_V_JF_C_1 1.00 Not
reachable
Not
reachable
Not
reachable
IS03_NG_MSB1_V_JF_C_0.5 0.50 Not
reachable
Not
reachable
Not
reachable
IS03_NG_MSB1_V_JF_C_0.03 0.03 Not
reachable
Not
reachable
Not
reachable
4
IS04_NG_MSB2_V_JF_C_1 1.00 Not
reachable
Not
reachable
Not
reachable
IS04_NG_MSB2_V_JF_C_0.5 0.50 Not
reachable
Not
reachable
Not
reachable
IS04_NG_MSB2_V_JF_C_0.03 0.03 Not
reachable
Not
reachable
Not
reachable
5
IS05_NG_GCB1_V_JF_C_1 1.00 Not
reachable
Not
reachable
Not
reachable
IS05_NG_GCB1_V_JF_C_0.5 0.50 Not
reachable
Not
reachable
Not
reachable
IS05_NG_GCB1_V_JF_C_0.03 0.03 Not
reachable
Not
reachable
Not
reachable
6
IS06_NG_GCB2_V_JF_C_1 1.00 Not
reachable
Not
reachable
Not
reachable
IS06_NG_GCB2_V_JF_C_0.5 0.50 Not
reachable
Not
reachable
Not
reachable
IS06_NG_GCB2_V_JF_C_0.03 0.03 Not
reachable
Not
reachable
Not
reachable
7
IS07_NG_PIPEBLGRS_V_JF_C_1 1.00 Not
reachable
Not
reachable
Not
reachable
IS07_NG_PIPEBLGRS_V_JF_C_0.5 0.50 Not
reachable
Not
reachable
Not
reachable
IS07_NG_PIPEBLGRS_V_JF_C_0.03 0.03 Not
reachable
Not
reachable
Not
reachable
8
IS08_NG_PIPEBLGRSB1_V_JF_C_1 1.00 Not
reachable
Not
reachable
Not
reachable
IS08_NG_PIPEBLGRSB1_V_JF_C_0.5 0.50 Not
reachable
Not
reachable
Not
reachable
IS08_NG_PIPEBLGRSB1_V_JF_C_0.03 0.03 Not
reachable
Not
reachable
Not
reachable

QRA for Proposed Combined Cycle Power Plant (Unit 12 & 13)
Tanjung Kidurong Power Plant, Bintulu
46
February 2018
Ref Scenarios Fatality
Probability
Weather
Condition
1F
Weather
Condition
3C
Weather
Condition
5D
Downwind
Distance
Downwind
Distance
Downwind
Distance
9
IS09_NG_PIPEBLGRSB2_V_JF_C_1 1.00 Not
reachable
Not
reachable
Not
reachable
IS09_NG_PIPEBLGRSB2_V_JF_C_0.5 0.50 Not
reachable
Not
reachable
Not
reachable
IS09_NG_PIPEBLGRSB2_V_JF_C_0.03 0.03 Not
reachable
Not
reachable
Not
reachable
10
IS10_NG_PIPEGRSFGRSB1_V_JF_C_1 1.00 Not
reachable
Not
reachable
Not
reachable
IS10_NG_PIPEGRSFGRSB1_V_JF_C_0.5 0.50 Not
reachable
Not
reachable
Not
reachable
IS10_NG_PIPEGRSFGRSB1_V_JF_C_0.03 0.03 Not
reachable
Not
reachable
Not
reachable
11
IS11_NG_PIPEGRSFGRSB2_V_JF_C_1 1.00 Not
reachable
Not
reachable
Not
reachable
IS11_NG_PIPEGRSFGRSB2_V_JF_C_0.5 0.50 Not
reachable
Not
reachable
Not
reachable
IS11_NG_PIPEGRSFGRSB2_V_JF_C_0.03 0.03 Not
reachable
Not
reachable
Not
reachable
12
IS12_NG_PIPEFGRSHRSGB1_V_JF_C_1 1.00 Not
reachable
Not
reachable
Not
reachable
IS12_NG_PIPEFGRSHRSGB1_V_JF_C_0.5 0.50 Not
reachable
Not
reachable
Not
reachable
IS12_NG_PIPEFGRSHRSGB1_V_JF_C_0.03 0.03 Not
reachable
Not
reachable
Not
reachable
13
IS13_NG_PIPEFGRSHRSGB2_V_JF_C_1 1.00 Not
reachable
Not
reachable
Not
reachable
IS13_NG_PIPEFGRSHRSGB2_V_JF_C_0.5 0.50 Not
reachable
Not
reachable
Not
reachable
IS13_NG_PIPEFGRSHRSGB2_V_JF_C_0.03 0.03 Not
reachable
Not
reachable
Not
reachable
14
IS14_DO_PIPEFOT5GTB1_L_JF_C_1 1.00 Not
reachable
Not
reachable
Not
reachable
IS14_DO_PIPEFOT5GTB1_L_JF_C_0.5 0.50 Not
reachable
Not
reachable
Not
reachable
IS14_DO_PIPEFOT5GTB1_L_JF_C_0.03 0.03 Not
reachable
Not
reachable
Not
reachable
15
IS15_DO_PIPEFOT5GTB2_L_JF_C_1 1.00 Not
reachable
Not
reachable
Not
reachable
IS15_DO_PIPEFOT5GTB2_L_JF_C_0.5 0.50 Not
reachable
Not
reachable
Not
reachable
IS15_DO_PIPEFOT5GTB2_L_JF_C_0.03 0.03 Not
reachable
Not
reachable
Not
reachable
16
IS16_DO_PIPEFOT6GTB1_L_JF_C_1 1.00 Not
reachable
Not
reachable
Not
reachable
IS16_DO_PIPEFOT6GTB1_L_JF_C_0.5 0.50 Not
reachable
Not
reachable
Not
reachable
IS16_DO_PIPEFOT6GTB1_L_JF_C_0.03 0.03 Not
reachable
Not
reachable
Not
reachable
17 IS17_DO_PIPEFOT6GTB2_L_JF_C_1 1.00 Not
reachable
Not
reachable
Not
reachable

QRA for Proposed Combined Cycle Power Plant (Unit 12 & 13)
Tanjung Kidurong Power Plant, Bintulu
47
February 2018
Ref Scenarios Fatality
Probability
Weather
Condition
1F
Weather
Condition
3C
Weather
Condition
5D
Downwind
Distance
Downwind
Distance
Downwind
Distance
IS17_DO_PIPEFOT6GTB2_L_JF_C_0.5 0.50 Not
reachable
Not
reachable
Not
reachable
IS17_DO_PIPEFOT6GTB2_L_JF_C_0.03 0.03 Not
reachable
Not
reachable
Not
reachable

QRA for Proposed Combined Cycle Power Plant (Unit 12 & 13)
Tanjung Kidurong Power Plant, Bintulu
48
February 2018
Flash Fire Small
Ref Scenarios Fatality
Probability
Weather
Condition
1F
Weather
Condition
3C
Weather
Condition
5D
Downwind
Distance
Downwind
Distance
Downwind
Distance
1
IS01_NG_GTB2_V_FF_S_LFL LFL Not
reachable
Not
reachable
Not
reachable
IS01_NG_GTB2_V_FF_S_1/2 LFL ½ LFL Not
reachable
Not
reachable
Not
reachable
3
IS03_NG_MSB1_V_FF_S_LFL LFL Not
reachable
Not
reachable
Not
reachable
IS03_NG_MSB1_V_FF_S_1/2 LFL ½ LFL Not
reachable
Not
reachable
Not
reachable
4
IS04_NG_MSB2_V_FF_S_LFL LFL Not
reachable
Not
reachable
Not
reachable
IS04_NG_MSB2_V_FF_S_1/2 LFL ½ LFL Not
reachable
Not
reachable
Not
reachable
5
IS05_NG_GCB1_V_FF_S_LFL LFL Not
reachable
Not
reachable
Not
reachable
IS05_NG_GCB1_V_FF_S_1/2 LFL ½ LFL Not
reachable
Not
reachable
Not
reachable
6
IS06_NG_GCB2_V_FF_S_LFL LFL Not
reachable
Not
reachable
Not
reachable
IS06_NG_GCB2_V_FF_S_1/2 LFL ½ LFL Not
reachable
Not
reachable
Not
reachable
7
IS07_NG_PIPEBLGRS_V_FF_S_LFL LFL Not
reachable
Not
reachable
Not
reachable
IS07_NG_PIPEBLGRS_V_FF_S_1/2 LFL ½ LFL Not
reachable
Not
reachable
Not
reachable
8
IS08_NG_PIPEBLGRSB1_V_FF_S_LFL LFL Not
reachable
Not
reachable
Not
reachable
IS08_NG_PIPEBLGRSB1_V_FF_S_1/2 LFL ½ LFL Not
reachable
Not
reachable
Not
reachable
9
IS09_NG_PIPEBLGRSB2_V_FF_S_LFL LFL Not
reachable
Not
reachable
Not
reachable
IS09_NG_PIPEBLGRSB2_V_FF_S_1/2 LFL ½ LFL Not
reachable
Not
reachable
Not
reachable
10
IS10_NG_PIPEGRSFGRSB1_V_FF_S_LFL LFL Not
reachable
Not
reachable
Not
reachable
IS10_NG_PIPEGRSFGRSB1_V_FF_S_1/2
LFL ½ LFL
Not
reachable
Not
reachable
Not
reachable
11
IS11_NG_PIPEGRSFGRSB2_V_FF_S_LFL LFL Not
reachable
Not
reachable
Not
reachable
IS11_NG_PIPEGRSFGRSB2_V_FF_S_1/2
LFL ½ LFL
Not
reachable
Not
reachable
Not
reachable
12
IS12_NG_PIPEFGRSHRSGB1_V_FF_S_LFL LFL Not
reachable
Not
reachable
Not
reachable
IS12_NG_PIPEFGRSHRSGB1_V_FF_S_1/2
LFL ½ LFL
Not
reachable
Not
reachable
Not
reachable
13
IS13_NG_PIPEFGRSHRSGB2_V_FF_S_LFL LFL Not
reachable
Not
reachable
Not
reachable
IS13_NG_PIPEFGRSHRSGB2_V_FF_S_1/2
LFL ½ LFL
Not
reachable
Not
reachable
Not
reachable

QRA for Proposed Combined Cycle Power Plant (Unit 12 & 13)
Tanjung Kidurong Power Plant, Bintulu
49
February 2018
Flash Fire Medium
Ref Scenarios Fatality
Probability
Weather
Condition
1F
Weather
Condition
3C
Weather
Condition
5D
Downwind
Distance
Downwind
Distance
Downwind
Distance
1 IS01_NG_GTB2_V_FF_M_LFL LFL 20.25 16.75 16.58
IS01_NG_GTB2_V_FF_M_1/2 LFL 1/2 LFL 20.25 16.75 16.58
3 IS03_NG_MSB1_V_FF_M_LFL LFL 24.05 29.33 29.53
IS03_NG_MSB1_V_FF_M_1/2 LFL 1/2 LFL 24.05 29.33 29.53
4 IS04_NG_MSB2_V_FF_M_LFL LFL 24.05 29.33 29.53
IS04_NG_MSB2_V_FF_M_1/2 LFL 1/2 LFL 24.05 29.33 29.53
5
IS05_NG_GCB1_V_FF_M_LFL LFL Not
reachable
Not
reachable
Not
reachable
IS05_NG_GCB1_V_FF_M_1/2 LFL 1/2 LFL Not
reachable
Not
reachable
Not
reachable
6
IS06_NG_GCB2_V_FF_M_LFL LFL Not
reachable
Not
reachable
Not
reachable
IS06_NG_GCB2_V_FF_M_1/2 LFL 1/2 LFL Not
reachable
Not
reachable
Not
reachable
7 IS07_NG_PIPEBLGRS_V_FF_M_LFL LFL 30.16 39.15 39.41
IS07_NG_PIPEBLGRS_V_FF_M_1/2 LFL 1/2 LFL 30.16 39.15 39.41
8 IS08_NG_PIPEBLGRSB1_V_FF_M_LFL LFL 36.49 39.33 40.19
IS08_NG_PIPEBLGRSB1_V_FF_M_1/2 LFL 1/2 LFL 36.49 39.33 40.19
9 IS09_NG_PIPEBLGRSB2_V_FF_M_LFL LFL 39.46 39.33 40.19
IS09_NG_PIPEBLGRSB2_V_FF_M_1/2 LFL 1/2 LFL 39.46 39.33 40.19
10 IS10_NG_PIPEGRSFGRSB1_V_FF_M_LFL LFL 41.11 39.33 40.19
IS10_NG_PIPEGRSFGRSB1_V_FF_M_1/2 LFL
1/2 LFL 41.11 39.33 40.19
11 IS11_NG_PIPEGRSFGRSB2_V_FF_M_LFL LFL 41.11 39.33 40.19
IS11_NG_PIPEGRSFGRSB2_V_FF_M_1/2 LFL
1/2 LFL 41.11 39.33 40.19
12 IS12_NG_PIPEFGRSHRSGB1_V_FF_M_LFL LFL 40.85 39.33 40.19
IS12_NG_PIPEFGRSHRSGB1_V_FF_M_1/2 LFL
1/2 LFL 40.85 39.33 40.19
13 IS13_NG_PIPEFGRSHRSGB2_V_FF_M_LFL LFL 38.61 39.33 40.19
IS13_NG_PIPEFGRSHRSGB2_V_FF_M_1/2 LFL
1/2 LFL 38.61 39.33 40.19

QRA for Proposed Combined Cycle Power Plant (Unit 12 & 13)
Tanjung Kidurong Power Plant, Bintulu
50
February 2018
Flash Fire Catastrophic
Ref Scenarios Fatality
Probability
Weather
Condition
1F
Weather
Condition
3C
Weather
Condition
5D
Downwind
Distance
Downwind
Distance
Downwind
Distance
1 IS01_NG_GTB2_V_FF_C_LFL LFL 32.92 33.45 34.83
IS01_NG_GTB2_V_FF_C_1/2 LFL 1/2 LFL 32.92 33.45 34.83
3 IS03_NG_MSB1_V_FF_C_LFL LFL 4.23 4.29 4.42
IS03_NG_MSB1_V_FF_C_1/2 LFL 1/2 LFL 4.23 4.29 4.42
4 IS04_NG_MSB2_V_FF_C_LFL LFL 4.23 4.29 4.42
IS04_NG_MSB2_V_FF_C_1/2 LFL 1/2 LFL 4.23 4.29 4.42
5 IS05_NG_GCB1_V_FF_C_LFL LFL 10.87 11.08 11.48
IS05_NG_GCB1_V_FF_C_1/2 LFL 1/2 LFL 10.87 11.08 11.48
6 IS06_NG_GCB2_V_FF_C_LFL LFL 10.87 11.08 11.48
IS06_NG_GCB2_V_FF_C_1/2 LFL 1/2 LFL 10.87 11.08 11.48
7 IS07_NG_PIPEBLGRS_V_FF_C_LFL LFL 5.00 5.06 5.21
IS07_NG_PIPEBLGRS_V_FF_C_1/2 LFL 1/2 LFL 5.00 5.06 5.21
8 IS08_NG_PIPEBLGRSB1_V_FF_C_LFL LFL 6.90 7.01 7.21
IS08_NG_PIPEBLGRSB1_V_FF_C_1/2 LFL 1/2 LFL 6.90 7.01 7.21
9 IS09_NG_PIPEBLGRSB2_V_FF_C_LFL LFL 8.43 8.57 8.82
IS09_NG_PIPEBLGRSB2_V_FF_C_1/2 LFL 1/2 LFL 8.43 8.57 8.82
10 IS10_NG_PIPEGRSFGRSB1_V_FF_C_LFL LFL 19.36 19.69 20.39
IS10_NG_PIPEGRSFGRSB1_V_FF_C_1/2 LFL
1/2 LFL 19.36 19.69 20.39
11 IS11_NG_PIPEGRSFGRSB2_V_FF_C_LFL LFL 20.82 21.18 21.95
IS11_NG_PIPEGRSFGRSB2_V_FF_C_1/2 LFL
1/2 LFL 20.82 21.18 21.95
12 IS12_NG_PIPEFGRSHRSGB1_V_FF_C_LFL LFL 9.57 9.73 10.02
IS12_NG_PIPEFGRSHRSGB1_V_FF_C_1/2 LFL
1/2 LFL 9.57 9.73 10.02
13 IS13_NG_PIPEFGRSHRSGB2_V_FF_C_LFL LFL 7.91 8.03 8.27
IS13_NG_PIPEFGRSHRSGB2_V_FF_C_1/2 LFL
1/2 LFL 7.91 8.03 8.27
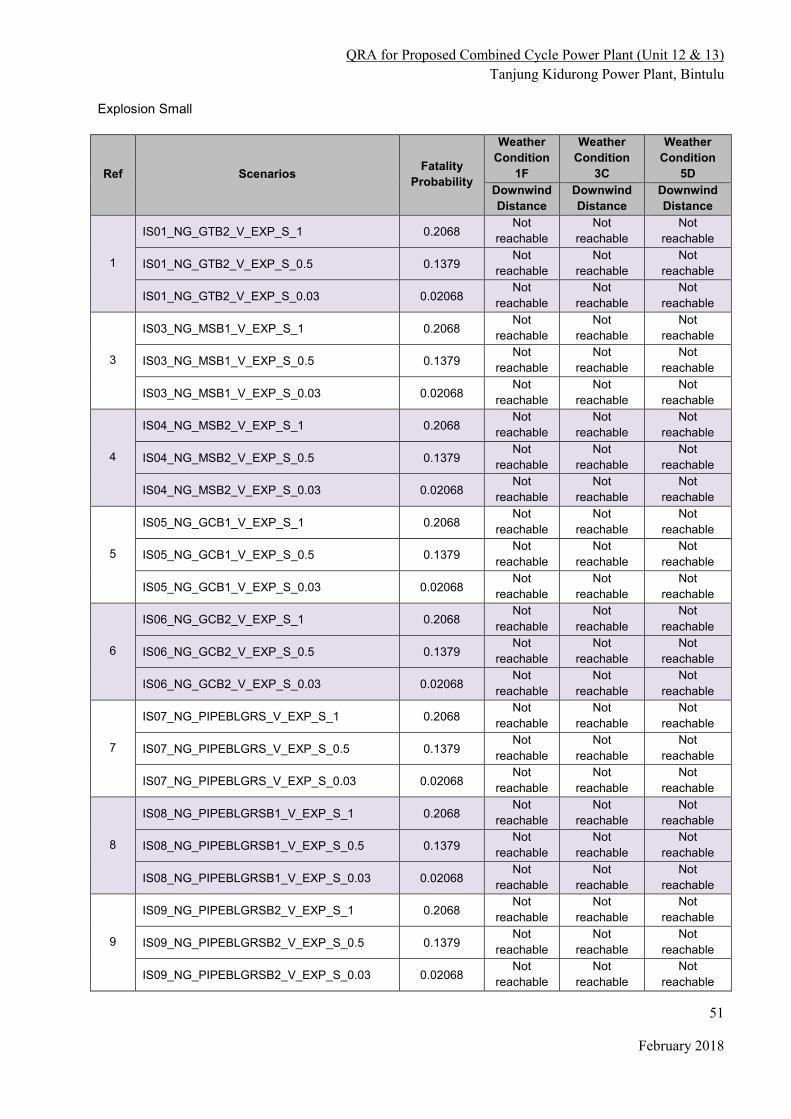
QRA for Proposed Combined Cycle Power Plant (Unit 12 & 13)
Tanjung Kidurong Power Plant, Bintulu
51
February 2018
Explosion Small
Ref Scenarios Fatality
Probability
Weather
Condition
1F
Weather
Condition
3C
Weather
Condition
5D
Downwind
Distance
Downwind
Distance
Downwind
Distance
1
IS01_NG_GTB2_V_EXP_S_1 0.2068 Not
reachable
Not
reachable
Not
reachable
IS01_NG_GTB2_V_EXP_S_0.5 0.1379 Not
reachable
Not
reachable
Not
reachable
IS01_NG_GTB2_V_EXP_S_0.03 0.02068 Not
reachable
Not
reachable
Not
reachable
3
IS03_NG_MSB1_V_EXP_S_1 0.2068 Not
reachable
Not
reachable
Not
reachable
IS03_NG_MSB1_V_EXP_S_0.5 0.1379 Not
reachable
Not
reachable
Not
reachable
IS03_NG_MSB1_V_EXP_S_0.03 0.02068 Not
reachable
Not
reachable
Not
reachable
4
IS04_NG_MSB2_V_EXP_S_1 0.2068 Not
reachable
Not
reachable
Not
reachable
IS04_NG_MSB2_V_EXP_S_0.5 0.1379 Not
reachable
Not
reachable
Not
reachable
IS04_NG_MSB2_V_EXP_S_0.03 0.02068 Not
reachable
Not
reachable
Not
reachable
5
IS05_NG_GCB1_V_EXP_S_1 0.2068 Not
reachable
Not
reachable
Not
reachable
IS05_NG_GCB1_V_EXP_S_0.5 0.1379 Not
reachable
Not
reachable
Not
reachable
IS05_NG_GCB1_V_EXP_S_0.03 0.02068 Not
reachable
Not
reachable
Not
reachable
6
IS06_NG_GCB2_V_EXP_S_1 0.2068 Not
reachable
Not
reachable
Not
reachable
IS06_NG_GCB2_V_EXP_S_0.5 0.1379 Not
reachable
Not
reachable
Not
reachable
IS06_NG_GCB2_V_EXP_S_0.03 0.02068 Not
reachable
Not
reachable
Not
reachable
7
IS07_NG_PIPEBLGRS_V_EXP_S_1 0.2068 Not
reachable
Not
reachable
Not
reachable
IS07_NG_PIPEBLGRS_V_EXP_S_0.5 0.1379 Not
reachable
Not
reachable
Not
reachable
IS07_NG_PIPEBLGRS_V_EXP_S_0.03 0.02068 Not
reachable
Not
reachable
Not
reachable
8
IS08_NG_PIPEBLGRSB1_V_EXP_S_1 0.2068 Not
reachable
Not
reachable
Not
reachable
IS08_NG_PIPEBLGRSB1_V_EXP_S_0.5 0.1379 Not
reachable
Not
reachable
Not
reachable
IS08_NG_PIPEBLGRSB1_V_EXP_S_0.03 0.02068 Not
reachable
Not
reachable
Not
reachable
9
IS09_NG_PIPEBLGRSB2_V_EXP_S_1 0.2068 Not
reachable
Not
reachable
Not
reachable
IS09_NG_PIPEBLGRSB2_V_EXP_S_0.5 0.1379 Not
reachable
Not
reachable
Not
reachable
IS09_NG_PIPEBLGRSB2_V_EXP_S_0.03 0.02068 Not
reachable
Not
reachable
Not
reachable
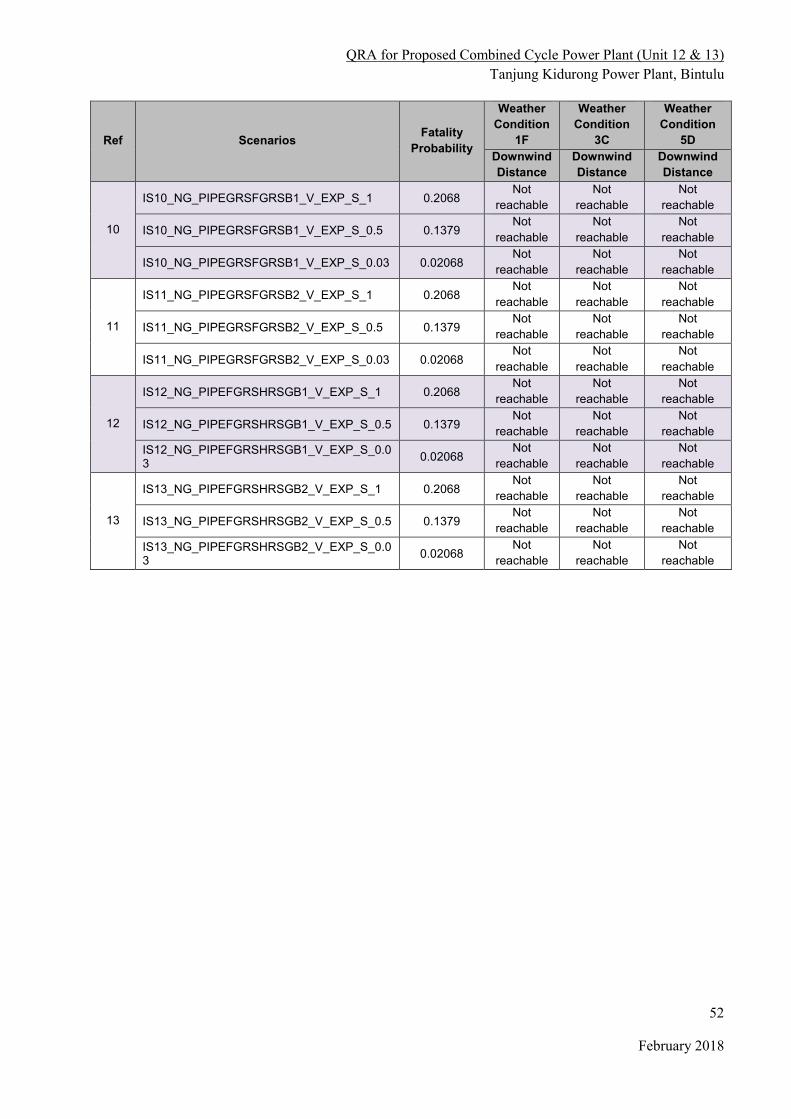
QRA for Proposed Combined Cycle Power Plant (Unit 12 & 13)
Tanjung Kidurong Power Plant, Bintulu
52
February 2018
Ref Scenarios Fatality
Probability
Weather
Condition
1F
Weather
Condition
3C
Weather
Condition
5D
Downwind
Distance
Downwind
Distance
Downwind
Distance
10
IS10_NG_PIPEGRSFGRSB1_V_EXP_S_1 0.2068 Not
reachable
Not
reachable
Not
reachable
IS10_NG_PIPEGRSFGRSB1_V_EXP_S_0.5 0.1379 Not
reachable
Not
reachable
Not
reachable
IS10_NG_PIPEGRSFGRSB1_V_EXP_S_0.03 0.02068 Not
reachable
Not
reachable
Not
reachable
11
IS11_NG_PIPEGRSFGRSB2_V_EXP_S_1 0.2068 Not
reachable
Not
reachable
Not
reachable
IS11_NG_PIPEGRSFGRSB2_V_EXP_S_0.5 0.1379 Not
reachable
Not
reachable
Not
reachable
IS11_NG_PIPEGRSFGRSB2_V_EXP_S_0.03 0.02068 Not
reachable
Not
reachable
Not
reachable
12
IS12_NG_PIPEFGRSHRSGB1_V_EXP_S_1 0.2068 Not
reachable
Not
reachable
Not
reachable
IS12_NG_PIPEFGRSHRSGB1_V_EXP_S_0.5 0.1379 Not
reachable
Not
reachable
Not
reachable
IS12_NG_PIPEFGRSHRSGB1_V_EXP_S_0.03
0.02068 Not
reachable
Not
reachable
Not
reachable
13
IS13_NG_PIPEFGRSHRSGB2_V_EXP_S_1 0.2068 Not
reachable
Not
reachable
Not
reachable
IS13_NG_PIPEFGRSHRSGB2_V_EXP_S_0.5 0.1379 Not
reachable
Not
reachable
Not
reachable
IS13_NG_PIPEFGRSHRSGB2_V_EXP_S_0.03
0.02068 Not
reachable
Not
reachable
Not
reachable
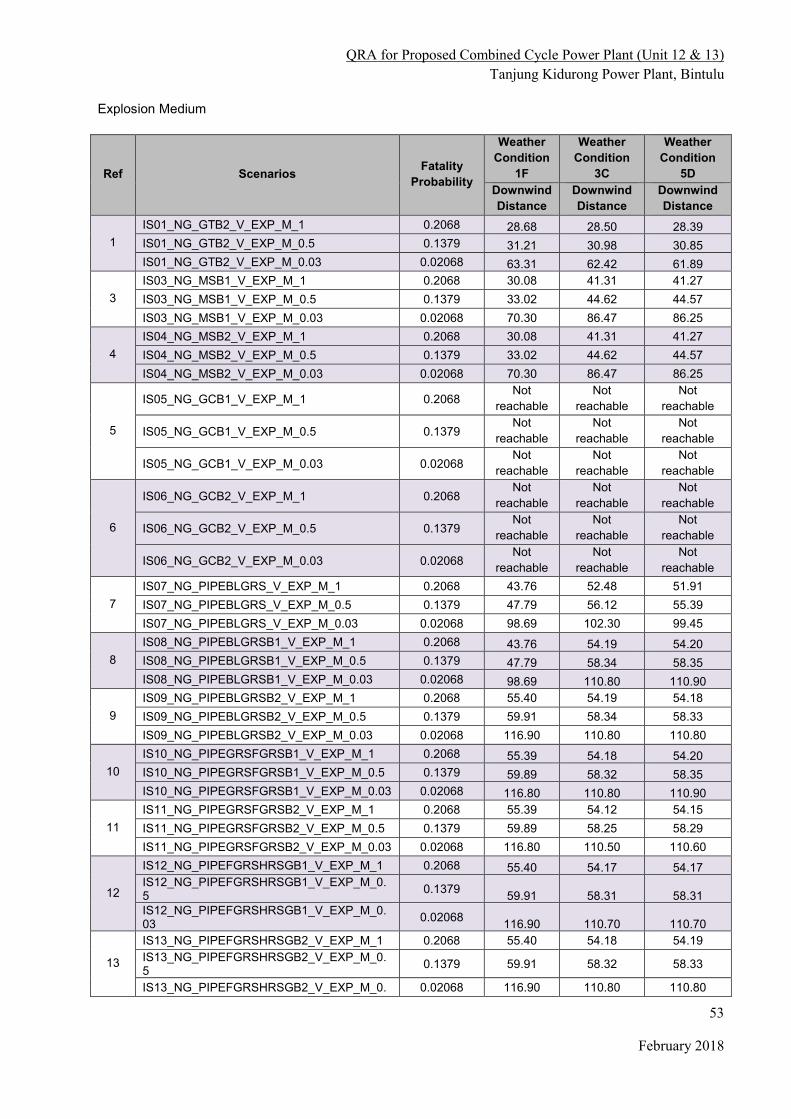
QRA for Proposed Combined Cycle Power Plant (Unit 12 & 13)
Tanjung Kidurong Power Plant, Bintulu
53
February 2018
Explosion Medium
Ref Scenarios Fatality
Probability
Weather
Condition
1F
Weather
Condition
3C
Weather
Condition
5D
Downwind
Distance
Downwind
Distance
Downwind
Distance
1
IS01_NG_GTB2_V_EXP_M_1 0.2068 28.68 28.50 28.39
IS01_NG_GTB2_V_EXP_M_0.5 0.1379 31.21 30.98 30.85
IS01_NG_GTB2_V_EXP_M_0.03 0.02068 63.31 62.42 61.89
3
IS03_NG_MSB1_V_EXP_M_1 0.2068 30.08 41.31 41.27
IS03_NG_MSB1_V_EXP_M_0.5 0.1379 33.02 44.62 44.57
IS03_NG_MSB1_V_EXP_M_0.03 0.02068 70.30 86.47 86.25
4
IS04_NG_MSB2_V_EXP_M_1 0.2068 30.08 41.31 41.27
IS04_NG_MSB2_V_EXP_M_0.5 0.1379 33.02 44.62 44.57
IS04_NG_MSB2_V_EXP_M_0.03 0.02068 70.30 86.47 86.25
5
IS05_NG_GCB1_V_EXP_M_1 0.2068 Not
reachable
Not
reachable
Not
reachable
IS05_NG_GCB1_V_EXP_M_0.5 0.1379 Not
reachable
Not
reachable
Not
reachable
IS05_NG_GCB1_V_EXP_M_0.03 0.02068 Not
reachable
Not
reachable
Not
reachable
6
IS06_NG_GCB2_V_EXP_M_1 0.2068 Not
reachable
Not
reachable
Not
reachable
IS06_NG_GCB2_V_EXP_M_0.5 0.1379 Not
reachable
Not
reachable
Not
reachable
IS06_NG_GCB2_V_EXP_M_0.03 0.02068 Not
reachable
Not
reachable
Not
reachable
7
IS07_NG_PIPEBLGRS_V_EXP_M_1 0.2068 43.76 52.48 51.91
IS07_NG_PIPEBLGRS_V_EXP_M_0.5 0.1379 47.79 56.12 55.39
IS07_NG_PIPEBLGRS_V_EXP_M_0.03 0.02068 98.69 102.30 99.45
8
IS08_NG_PIPEBLGRSB1_V_EXP_M_1 0.2068 43.76 54.19 54.20
IS08_NG_PIPEBLGRSB1_V_EXP_M_0.5 0.1379 47.79 58.34 58.35
IS08_NG_PIPEBLGRSB1_V_EXP_M_0.03 0.02068 98.69 110.80 110.90
9
IS09_NG_PIPEBLGRSB2_V_EXP_M_1 0.2068 55.40 54.19 54.18
IS09_NG_PIPEBLGRSB2_V_EXP_M_0.5 0.1379 59.91 58.34 58.33
IS09_NG_PIPEBLGRSB2_V_EXP_M_0.03 0.02068 116.90 110.80 110.80
10
IS10_NG_PIPEGRSFGRSB1_V_EXP_M_1 0.2068 55.39 54.18 54.20
IS10_NG_PIPEGRSFGRSB1_V_EXP_M_0.5 0.1379 59.89 58.32 58.35
IS10_NG_PIPEGRSFGRSB1_V_EXP_M_0.03 0.02068 116.80 110.80 110.90
11
IS11_NG_PIPEGRSFGRSB2_V_EXP_M_1 0.2068 55.39 54.12 54.15
IS11_NG_PIPEGRSFGRSB2_V_EXP_M_0.5 0.1379 59.89 58.25 58.29
IS11_NG_PIPEGRSFGRSB2_V_EXP_M_0.03 0.02068 116.80 110.50 110.60
12
IS12_NG_PIPEFGRSHRSGB1_V_EXP_M_1 0.2068 55.40 54.17 54.17 IS12_NG_PIPEFGRSHRSGB1_V_EXP_M_0.5
0.1379 59.91 58.31 58.31
IS12_NG_PIPEFGRSHRSGB1_V_EXP_M_0.03
0.02068 116.90 110.70 110.70
13
IS13_NG_PIPEFGRSHRSGB2_V_EXP_M_1 0.2068 55.40 54.18 54.19
IS13_NG_PIPEFGRSHRSGB2_V_EXP_M_0.5
0.1379 59.91 58.32 58.33
IS13_NG_PIPEFGRSHRSGB2_V_EXP_M_0. 0.02068 116.90 110.80 110.80

QRA for Proposed Combined Cycle Power Plant (Unit 12 & 13)
Tanjung Kidurong Power Plant, Bintulu
54
February 2018
Ref Scenarios Fatality
Probability
Weather
Condition
1F
Weather
Condition
3C
Weather
Condition
5D
Downwind
Distance
Downwind
Distance
Downwind
Distance
03

QRA for Proposed Combined Cycle Power Plant (Unit 12 & 13)
Tanjung Kidurong Power Plant, Bintulu
55
February 2018
Explosion Catastrophic
Ref Scenarios Fatality
Probability
Weather
Condition
1F
Weather
Condition
3C
Weather
Condition
5D
Downwind
Distance
Downwind
Distance
Downwind
Distance
1
IS01_NG_GTB2_V_EXP_C_1 0.2068 128.30 128.10 126.60
IS01_NG_GTB2_V_EXP_C_0.5 0.1379 157.10 156.80 154.90
IS01_NG_GTB2_V_EXP_C_0.03 0.02068 520.90 519.60 512.30
3
IS03_NG_MSB1_V_EXP_C_1 0.2068 16.41 16.47 16.33
IS03_NG_MSB1_V_EXP_C_0.5 0.1379 18.28 18.36 18.17
IS03_NG_MSB1_V_EXP_C_0.03 0.02068 41.98 42.27 41.57
4
IS04_NG_MSB2_V_EXP_C_1 0.2068 16.41 16.47 16.33
IS04_NG_MSB2_V_EXP_C_0.5 0.1379 18.28 18.36 18.17
IS04_NG_MSB2_V_EXP_C_0.03 0.02068 41.98 42.27 41.57
5
IS05_NG_GCB1_V_EXP_C_1 0.2068 42.90 43.11 42.70
IS05_NG_GCB1_V_EXP_C_0.5 0.1379 52.51 52.79 52.25
IS05_NG_GCB1_V_EXP_C_0.03 0.02068 174.20 175.20 173.20
6
IS06_NG_GCB2_V_EXP_C_1 0.2068 42.90 43.11 42.70
IS06_NG_GCB2_V_EXP_C_0.5 0.1379 52.51 52.79 52.25
IS06_NG_GCB2_V_EXP_C_0.03 0.02068 174.20 175.20 173.20
7
IS07_NG_PIPEBLGRS_V_EXP_C_1 0.2068 Not
reachable
Not
reachable
Not
reachable
IS07_NG_PIPEBLGRS_V_EXP_C_0.5 0.1379 Not
reachable
Not
reachable
Not
reachable
IS07_NG_PIPEBLGRS_V_EXP_C_0.03 0.02068 Not
reachable
Not
reachable
Not
reachable
8
IS08_NG_PIPEBLGRSB1_V_EXP_C_1 0.2068 Not
reachable
Not
reachable
Not
reachable
IS08_NG_PIPEBLGRSB1_V_EXP_C_0.5 0.1379 Not
reachable
Not
reachable
Not
reachable
IS08_NG_PIPEBLGRSB1_V_EXP_C_0.03 0.02068 Not
reachable
Not
reachable
Not
reachable
9
IS09_NG_PIPEBLGRSB2_V_EXP_C_1 0.2068 Not
reachable
Not
reachable
Not
reachable
IS09_NG_PIPEBLGRSB2_V_EXP_C_0.5 0.1379 Not
reachable
Not
reachable
Not
reachable
IS09_NG_PIPEBLGRSB2_V_EXP_C_0.03 0.02068 Not
reachable
Not
reachable
Not
reachable
10
IS10_NG_PIPEGRSFGRSB1_V_EXP_C_1 0.2068 50.14 51.53 77.92
IS10_NG_PIPEGRSFGRSB1_V_EXP_C_0.5 0.1379 61.88 63.67 94.85
IS10_NG_PIPEGRSFGRSB1_V_EXP_C_0.03 0.02068 210.40 217.30 309.10
11
IS11_NG_PIPEGRSFGRSB2_V_EXP_C_1 0.2068 86.98 79.29 82.12
IS11_NG_PIPEGRSFGRSB2_V_EXP_C_0.5 0.1379 106.60 96.63 100.30
IS11_NG_PIPEGRSFGRSB2_V_EXP_C_0.03 0.02068 354.30 315.90 330.00
12
IS12_NG_PIPEFGRSHRSGB1_V_EXP_C_1 0.2068 Not
reachable
Not
reachable
Not
reachable
IS12_NG_PIPEFGRSHRSGB1_V_EXP_C_0.5 0.1379 Not
reachable
Not
reachable
Not
reachable
IS12_NG_PIPEFGRSHRSGB1_V_EXP_C_0.03
0.02068 Not
reachable
Not
reachable
Not
reachable

QRA for Proposed Combined Cycle Power Plant (Unit 12 & 13)
Tanjung Kidurong Power Plant, Bintulu
56
February 2018
Ref Scenarios Fatality
Probability
Weather
Condition
1F
Weather
Condition
3C
Weather
Condition
5D
Downwind
Distance
Downwind
Distance
Downwind
Distance
13
IS13_NG_PIPEFGRSHRSGB2_V_EXP_C_1 0.2068 Not
reachable
Not
reachable
Not
reachable
IS13_NG_PIPEFGRSHRSGB2_V_EXP_C_0.5 0.1379 Not
reachable
Not
reachable
Not
reachable
IS13_NG_PIPEFGRSHRSGB2_V_EXP_C_0.03
0.02068 Not
reachable
Not
reachable
Not
reachable

Appendix 5.6.2
Failure Frequency

QRA for Proposed Combined Cycle Power Plant (Unit 12 & 13)
Tanjung Kidurong Power Plant, Bintulu
58
February 2018
No Section ID Hole Size
Total Failure
Rate
Immediate Ignition
Immediate Ignition
Frequency
Delayed Ignition 1
Delayed Ignition 1
Frequency
Delayed Ignition 2
Delayed Ignition 2
Frequency
Un-ignited / Toxic
Frequency
Pool Fire + Pool Fire
1
IS01_NG_GTB2_V S 4.32E-04 Jet Fire 4.32E-07 Explosion 1.56E-07 Flash Fire 3.73E-06 4.28E-04 0.00E+00
IS01_NG_GTB2_V M 2.54E-04 Jet Fire 8.89E-06 Explosion 1.07E-06 Flash Fire 7.82E-06 2.36E-04 0.00E+00
IS01_NG_GTB2_V C 1.43E-05 Jet Fire 2.57E-06 Explosion 5.15E-07 Flash Fire 1.20E-06 1.00E-05 0.00E+00
2
IS02_DO_GTB2_L S 4.32E-04 Jet Fire 6.48E-06 Pool Fire 6.48E-06 - 0.00E+00 4.19E-04 0.00E+00
IS02_DO_GTB2_L M 2.54E-04 Jet Fire 3.81E-06 Pool Fire 3.81E-06 - 0.00E+00 2.46E-04 0.00E+00
IS02_DO_GTB2_L C 1.43E-05 Pool Fire 6.86E-07 Pool Fire 4.58E-07 - 0.00E+00 1.32E-05 1.14E-06
3
IS03_NG_MSB1_V S 7.10E-05 Jet Fire 2.49E-06 Explosion 2.98E-07 Flash Fire 2.19E-06 6.60E-05 0.00E+00
IS03_NG_MSB1_V M 4.98E-05 Jet Fire 1.74E-06 Explosion 2.09E-07 Flash Fire 1.53E-06 4.63E-05 0.00E+00
IS03_NG_MSB1_V C 1.05E-05 Jet Fire 1.05E-08 Explosion 3.79E-09 Flash Fire 9.09E-08 1.04E-05 0.00E+00
4
IS04_NG_MSB2_V S 7.10E-05 Jet Fire 2.49E-06 Explosion 2.98E-07 Flash Fire 2.19E-06 6.60E-05 0.00E+00
IS04_NG_MSB2_V M 4.98E-05 Jet Fire 1.74E-06 Explosion 2.09E-07 Flash Fire 1.53E-06 4.63E-05 0.00E+00
IS04_NG_MSB2_V C 1.05E-05 Jet Fire 1.05E-08 Explosion 3.79E-09 Flash Fire 9.09E-08 1.04E-05 0.00E+00
5
IS05_NG_GCB1_V S 1.09E-02 Jet Fire 1.09E-05 Explosion 3.92E-06 Flash Fire 9.42E-05 1.08E-02 0.00E+00
IS05_NG_GCB1_V M 5.25E-04 Jet Fire 1.84E-05 Explosion 2.21E-06 Flash Fire 1.62E-05 4.88E-04 0.00E+00
IS05_NG_GCB1_V C 2.37E-04 Jet Fire 8.30E-06 Explosion 9.95E-07 Flash Fire 7.30E-06 2.20E-04 0.00E+00
6
IS06_NG_GCB2_V S 1.09E-02 Jet Fire 1.09E-05 Explosion 3.92E-06 Flash Fire 9.42E-05 1.08E-02 0.00E+00
IS06_NG_GCB2_V M 5.25E-04 Jet Fire 1.84E-05 Explosion 2.21E-06 Flash Fire 1.62E-05 4.88E-04 0.00E+00
IS06_NG_GCB2_V C 2.37E-04 Jet Fire 8.30E-06 Explosion 9.95E-07 Flash Fire 7.30E-06 2.20E-04 0.00E+00
7 IS07_NG_PIPEBLGRS_V S 4.90E-05 Jet Fire 1.71E-06 Explosion 2.06E-07 Flash Fire 1.51E-06 4.56E-05 0.00E+00

QRA for Proposed Combined Cycle Power Plant (Unit 12 & 13)
Tanjung Kidurong Power Plant, Bintulu
59
February 2018
No Section ID Hole Size
Total Failure
Rate
Immediate Ignition
Immediate Ignition
Frequency
Delayed Ignition 1
Delayed Ignition 1
Frequency
Delayed Ignition 2
Delayed Ignition 2
Frequency
Un-ignited / Toxic
Frequency
Pool Fire + Pool Fire
IS07_NG_PIPEBLGRS_V M 3.44E-05 Jet Fire 1.20E-06 Explosion 1.44E-07 Flash Fire 1.06E-06 3.20E-05 0.00E+00
IS07_NG_PIPEBLGRS_V C 7.26E-06 Jet Fire 7.26E-09 Explosion 2.61E-09 Flash Fire 6.27E-08 7.19E-06 0.00E+00
8
IS08_NG_PIPEBLGRSB1_V S 1.20E-04 Jet Fire 4.19E-06 Explosion 5.02E-07 Flash Fire 3.68E-06 1.11E-04 0.00E+00
IS08_NG_PIPEBLGRSB1_V M 8.39E-05 Jet Fire 2.94E-06 Explosion 3.52E-07 Flash Fire 2.58E-06 7.80E-05 0.00E+00
IS08_NG_PIPEBLGRSB1_V C 1.77E-05 Jet Fire 6.20E-07 Explosion 7.45E-08 Flash Fire 5.46E-07 1.65E-05 0.00E+00
9
IS09_NG_PIPEBLGRSB2_V S 2.13E-04 Jet Fire 7.46E-06 Explosion 8.95E-07 Flash Fire 6.56E-06 1.98E-04 0.00E+00
IS09_NG_PIPEBLGRSB2_V M 1.49E-04 Jet Fire 5.23E-06 Explosion 6.27E-07 Flash Fire 4.60E-06 1.39E-04 0.00E+00
IS09_NG_PIPEBLGRSB2_V C 3.16E-05 Jet Fire 1.10E-06 Explosion 1.33E-07 Flash Fire 9.72E-07 2.94E-05 0.00E+00
10
IS10_NG_PIPEGRSFGRSB1_V S 2.31E-03 Jet Fire 8.08E-05 Explosion 9.69E-06 Flash Fire 7.11E-05 2.15E-03 0.00E+00
IS10_NG_PIPEGRSFGRSB1_V M 1.62E-03 Jet Fire 5.66E-05 Explosion 6.80E-06 Flash Fire 4.98E-05 1.51E-03 0.00E+00
IS10_NG_PIPEGRSFGRSB1_V C 3.42E-04 Jet Fire 1.20E-05 Explosion 1.44E-06 Flash Fire 1.05E-05 3.18E-04 0.00E+00
11
IS11_NG_PIPEGRSFGRSB2_V S 2.85E-03 Jet Fire 9.98E-05 Explosion 1.20E-05 Flash Fire 8.78E-05 2.65E-03 0.00E+00
IS11_NG_PIPEGRSFGRSB2_V M 2.00E-03 Jet Fire 7.00E-05 Explosion 8.40E-06 Flash Fire 6.16E-05 1.86E-03 0.00E+00
IS11_NG_PIPEGRSFGRSB2_V C 4.22E-04 Jet Fire 1.48E-05 Explosion 1.77E-06 Flash Fire 1.30E-05 3.93E-04 0.00E+00
12
IS12_NG_PIPEFGRSHRSGB1_V S 4.70E-04 Jet Fire 1.64E-05 Explosion 1.97E-06 Flash Fire 1.45E-05 4.37E-04 0.00E+00
IS12_NG_PIPEFGRSHRSGB1_V M 3.29E-04 Jet Fire 1.15E-05 Explosion 1.38E-06 Flash Fire 1.01E-05 3.06E-04 0.00E+00
IS12_NG_PIPEFGRSHRSGB1_V C 6.96E-05 Jet Fire 2.44E-06 Explosion 2.92E-07 Flash Fire 2.14E-06 6.47E-05 0.00E+00
13 IS13_NG_PIPEFGRSHRSGB2_V S 2.76E-04 Jet Fire 9.67E-06 Explosion 1.16E-06 Flash Fire 8.51E-06 2.57E-04 0.00E+00
IS13_NG_PIPEFGRSHRSGB2_V M 1.94E-04 Jet Fire 6.78E-06 Explosion 8.14E-07 Flash Fire 5.97E-06 1.80E-04 0.00E+00

QRA for Proposed Combined Cycle Power Plant (Unit 12 & 13)
Tanjung Kidurong Power Plant, Bintulu
60
February 2018
No Section ID Hole Size
Total Failure
Rate
Immediate Ignition
Immediate Ignition
Frequency
Delayed Ignition 1
Delayed Ignition 1
Frequency
Delayed Ignition 2
Delayed Ignition 2
Frequency
Un-ignited / Toxic
Frequency
Pool Fire + Pool Fire
IS13_NG_PIPEFGRSHRSGB2_V C 4.09E-05 Jet Fire 1.43E-06 Explosion 1.72E-07 Flash Fire 1.26E-06 3.81E-05 0.00E+00
14
IS14_DO_PIPEFOT5GTB1_L S 1.77E-03 Jet Fire 2.65E-05 Pool Fire 2.65E-05 - 0.00E+00 1.72E-03 0.00E+00
IS14_DO_PIPEFOT5GTB1_L M 1.24E-03 Jet Fire 1.86E-05 Pool Fire 1.86E-05 - 0.00E+00 1.20E-03 0.00E+00
IS14_DO_PIPEFOT5GTB1_L C 2.62E-04 Pool Fire 1.26E-05 Pool Fire 8.38E-06 - 0.00E+00 2.41E-04 2.10E-05
15
IS15_DO_PIPEFOT5GTB2_L S 2.42E-03 Jet Fire 3.63E-05 Pool Fire 3.63E-05 - 0.00E+00 2.35E-03 0.00E+00
IS15_DO_PIPEFOT5GTB2_L M 1.70E-03 Jet Fire 2.55E-05 Pool Fire 2.55E-05 - 0.00E+00 1.65E-03 0.00E+00
IS15_DO_PIPEFOT5GTB2_L C 3.58E-04 Pool Fire 1.72E-05 Pool Fire 1.15E-05 - 0.00E+00 3.30E-04 2.87E-05
16
IS16_DO_PIPEFOT6GTB1_L S 1.66E-03 Jet Fire 2.48E-05 Pool Fire 2.48E-05 - 0.00E+00 1.61E-03 0.00E+00
IS16_DO_PIPEFOT6GTB1_L M 1.16E-03 Jet Fire 1.74E-05 Pool Fire 1.74E-05 - 0.00E+00 1.13E-03 0.00E+00
IS16_DO_PIPEFOT6GTB1_L C 2.45E-04 Pool Fire 1.18E-05 Pool Fire 7.85E-06 - 0.00E+00 2.26E-04 1.96E-05
17
IS17_DO_PIPEFOT6GTB2_L S 2.30E-03 Jet Fire 3.46E-05 Pool Fire 3.46E-05 - 0.00E+00 2.24E-03 0.00E+00
IS17_DO_PIPEFOT6GTB2_L M 1.62E-03 Jet Fire 2.42E-05 Pool Fire 2.42E-05 - 0.00E+00 1.57E-03 0.00E+00
IS17_DO_PIPEFOT6GTB2_L C 3.41E-04 Pool Fire 1.64E-05 Pool Fire 1.09E-05 - 0.00E+00 3.14E-04 2.73E-05

Appendix 7.1.1
Environment, Occupational Safety and Health Policy


Appendix 7.3.1
Examples of BMPs Design

CHECK DAM
FRONT VIEW
SECTION
CHECK DAM AND SAND BAG BARRIERS

SEDIMENT TRAP'S CROSS SECTION DETAILS