
Vol. 1 - World Bank Documents
183
RESTRiCTED CA4 Vol. 1 This report wos prepored for use within the Bank and its affiliated organizalions. | They do not accept responsibility for its accuracy or completeness. The report may l not be published nor may it be quoted as representing their views. INTERNATIONAL BANK FOR RECONSTRUCTION AND DEVELOPMENT INTERNATIONAL DEVELOPMENT ASSOCIATION CURREN T ECONOMIC POSITION AND PROSPECTS OF GUYANA (in two volumes) r-\-, r- m VOLUME I ! MAIN REPORT i l -, ; '. Lu . October 1, 1970 Central America and Caribbean Departmnent Public Disclosure Authorized Public Disclosure Authorized Public Disclosure Authorized Public Disclosure Authorized Public Disclosure Authorized Public Disclosure Authorized Public Disclosure Authorized Public Disclosure Authorized Public Disclosure Authorized Public Disclosure Authorized Public Disclosure Authorized Public Disclosure Authorized Public Disclosure Authorized Public Disclosure Authorized Public Disclosure Authorized Public Disclosure Authorized Public Disclosure Authorized Public Disclosure Authorized Public Disclosure Authorized Public Disclosure Authorized Public Disclosure Authorized Public Disclosure Authorized Public Disclosure Authorized Public Disclosure Authorized Public Disclosure Authorized Public Disclosure Authorized Public Disclosure Authorized Public Disclosure Authorized Public Disclosure Authorized Public Disclosure Authorized Public Disclosure Authorized Public Disclosure Authorized
-
Upload
khangminh22 -
Category
Documents
-
view
1 -
download
0
Transcript of Vol. 1 - World Bank Documents
RESTRiCTED
CA4Vol. 1
This report wos prepored for use within the Bank and its affiliated organizalions. |They do not accept responsibility for its accuracy or completeness. The report may lnot be published nor may it be quoted as representing their views.
INTERNATIONAL BANK FOR RECONSTRUCTION AND DEVELOPMENT
INTERNATIONAL DEVELOPMENT ASSOCIATION
CURREN T ECONOMIC POSITION
AND PROSPECTS
OF
GUYANA
(in two volumes)
r-\-, r- mVOLUME I !
MAIN REPORT i l -, ; '.
Lu .
October 1, 1970
Central America and Caribbean Departmnent
Pub
lic D
iscl
osur
e A
utho
rized
Pub
lic D
iscl
osur
e A
utho
rized
Pub
lic D
iscl
osur
e A
utho
rized
Pub
lic D
iscl
osur
e A
utho
rized
Pub
lic D
iscl
osur
e A
utho
rized
Pub
lic D
iscl
osur
e A
utho
rized
Pub
lic D
iscl
osur
e A
utho
rized
Pub
lic D
iscl
osur
e A
utho
rized
Pub
lic D
iscl
osur
e A
utho
rized
Pub
lic D
iscl
osur
e A
utho
rized
Pub
lic D
iscl
osur
e A
utho
rized
Pub
lic D
iscl
osur
e A
utho
rized
Pub
lic D
iscl
osur
e A
utho
rized
Pub
lic D
iscl
osur
e A
utho
rized
Pub
lic D
iscl
osur
e A
utho
rized
Pub
lic D
iscl
osur
e A
utho
rized
Pub
lic D
iscl
osur
e A
utho
rized
Pub
lic D
iscl
osur
e A
utho
rized
Pub
lic D
iscl
osur
e A
utho
rized
Pub
lic D
iscl
osur
e A
utho
rized
Pub
lic D
iscl
osur
e A
utho
rized
Pub
lic D
iscl
osur
e A
utho
rized
Pub
lic D
iscl
osur
e A
utho
rized
Pub
lic D
iscl
osur
e A
utho
rized
Pub
lic D
iscl
osur
e A
utho
rized
Pub
lic D
iscl
osur
e A
utho
rized
Pub
lic D
iscl
osur
e A
utho
rized
Pub
lic D
iscl
osur
e A
utho
rized
Pub
lic D
iscl
osur
e A
utho
rized
Pub
lic D
iscl
osur
e A
utho
rized
Pub
lic D
iscl
osur
e A
utho
rized
Pub
lic D
iscl
osur
e A
utho
rized
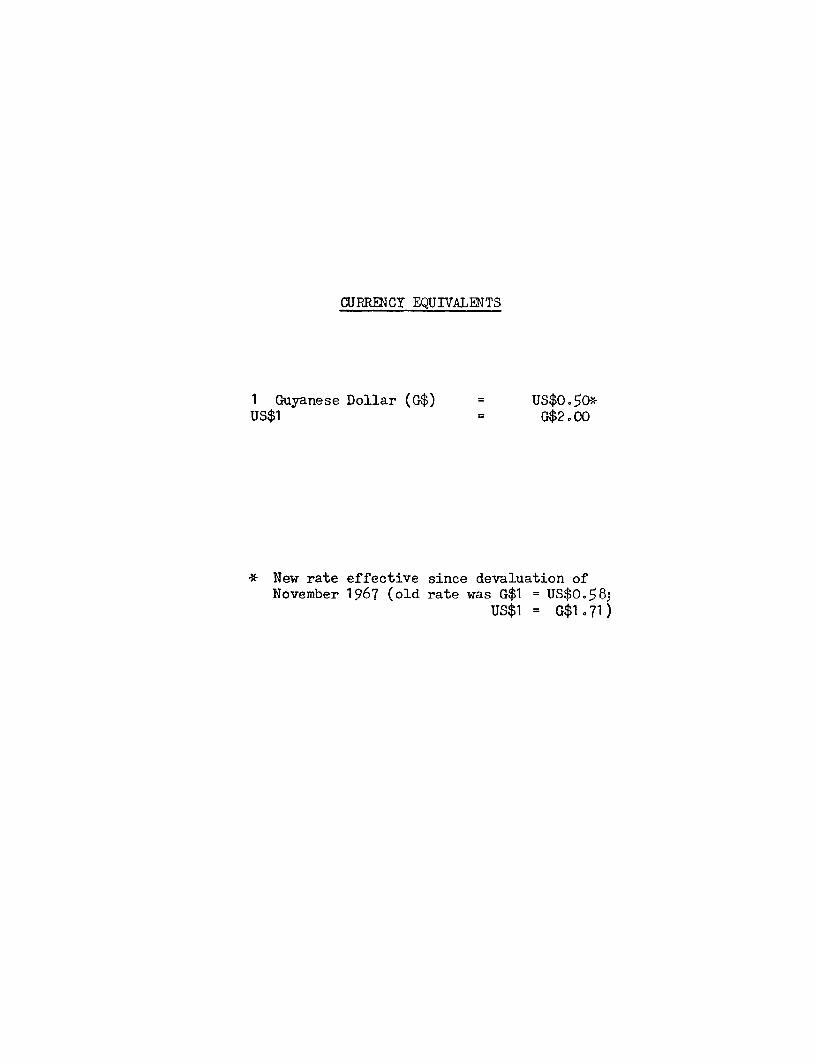
CJRRENCY EQUIVALENTS
1 Guyanese Dollar (G$) = US$0n50*US$1 = G$2000
* New rate effective since devaluation ofNovember 1967 (old rate was G$1 = US$0-R:
US$1 = G$1071)
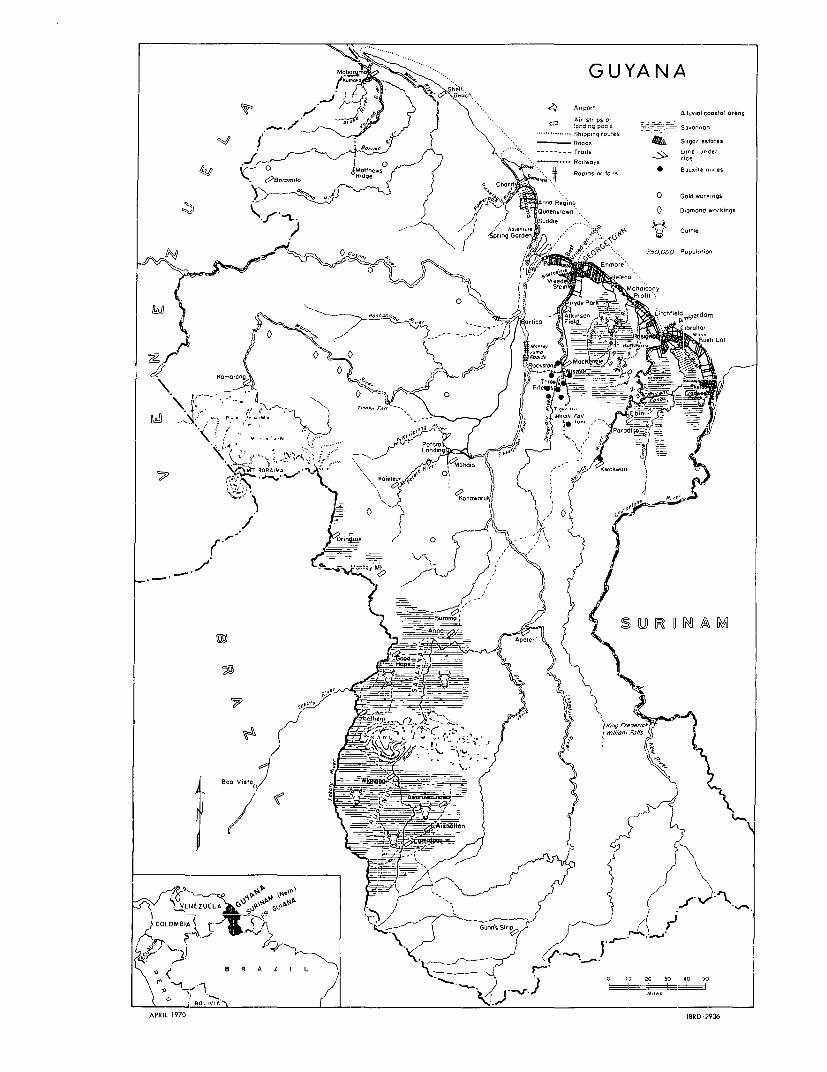
GUYANAS5~~~~~~ll.~"p '
| Mc.bor~~'½ iI2 ->, .... GUY N A5
S,nu i7 ;y It . 4 d Alluviol costal oreas
* . Shi~~~~~~~~~~~~1ppin,g rodes
Roads A Sugar tstates
Bui,irrJ . 4 > Trgils .- L--,d -nder
| D ROp,dS O8c cml s o Ridge < / taC clwcR s * Wlpuxite mines
| , alaen,tO Redgie ° char ~ GSold wortirrgs
0 0r-em- d O.rkiegs
|drie Garde : Cattle
0
0 P.,
,~~~~~~~u.,* ~~~~~~~~~~~~~~~~~' E~ ~ ~ b,l.
r- 50 uaOt Fa
S Potoro ~ ~ ~ ~ ~ ~ ~ ~ ~ ~ ~~~~~~~~ o
xi -~~~~~~~~~~~,
. . .M. .......
I~ ~ ~ ~ ~ , 08 77 _n 1
\ DCU| WS t CI ,¢
- A=. R
Boa Vista. -t----=
/~~~~I~ ~~~l I L , t)1y" 1\1 X-1 C 1l~ ~ ~ ~ ~~~~~~ ~ ~~~~~~~~~ ~ -l Sane' StriA S\
X oOMBID A |t
t 9 ( B R A Z _
APRIL 1970 IBRD-2936

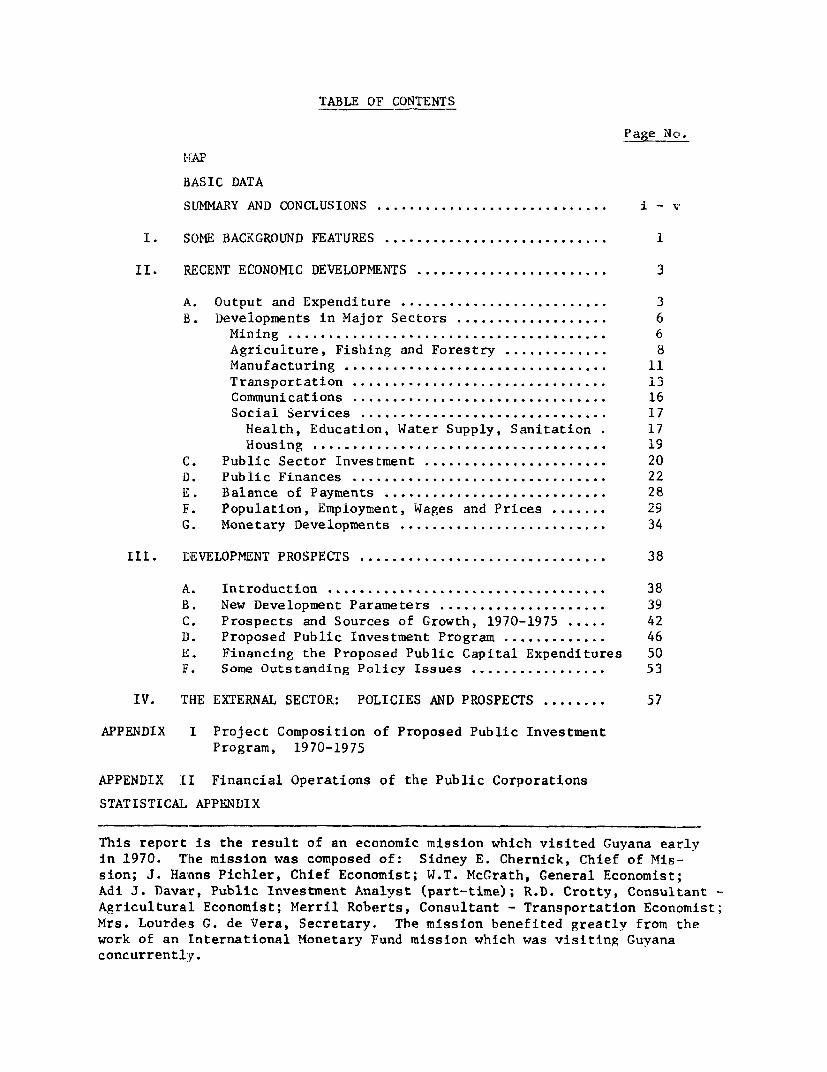
TABLE OF CONTENTS
P age No.
BASIC DATA
SUMMARY AND CONCLUSIONS ............................. i v
I. SOME BACKGROUND FEATURES ..... ....................... 1
II. RECENT ECONOMIC DEVELOPMENTS ........................ 3
A. Output and Expenditure. 3B. Developments in Major Sectors ................... 6
Mining ........................................ 6
Agriculture, Fishing and Forestry .... ......... 8Manufacturing ....... .......................... 11Transportation ...... .......................... 13Communications ...... .......................... 16
Social Services ............................... 17
Health, Education, Water Supply, Sanitation . 17Housing ..................................... 19
C. Public Sector Investment ....................... 20D. Public Finances ................................ 22E. Balance of Payments ............................ 28
F. Population, Employment, Wages and Prices ....... 29G. Monetary Developments .......................... 34
III. DEVELOPMENT PROSPECTS ............................... 38
A. Introduction ................................... 38
B. New Development Parameters ..................... 39
C. Prospects and Sources of Growth, 1970-1975 ..... 42D. Proposed Public Investment Program .... ......... 46E. Financing the Proposed Public Capital Expenditures 50F. Some Outstanding Policy Issues .... ............. 53
IV. THE EXTERNAL SECTOR: POLICIES AND PROSPECTS .57
APPENDIX I Project Composition of Proposed Public Investment
Program, 1970-1975
APPENDIX II Financial Operations of the Public Corporations
STATISTICAL APPENDIX
This report is the result of an economic mission which visited Guyana early
in 1970. The mission was composed of: Sidney E. Chernick, Chief of Mis-
sion; J. Hanns Pichler, Chief Economist; W.T. McGrath, General Economist;
Adi J. Davar, Public Investment Analyst (part-time); R.D. Crotty, Consultant -
Agricultural Economist; Merril Roberts, Consultant - Transportation Economist;
Mrs. Lourdes G. de Vera, Secretary. The mission benefited greatly from the
work of an International Monetary Fund mission which was visiting Guyana
concurrently.

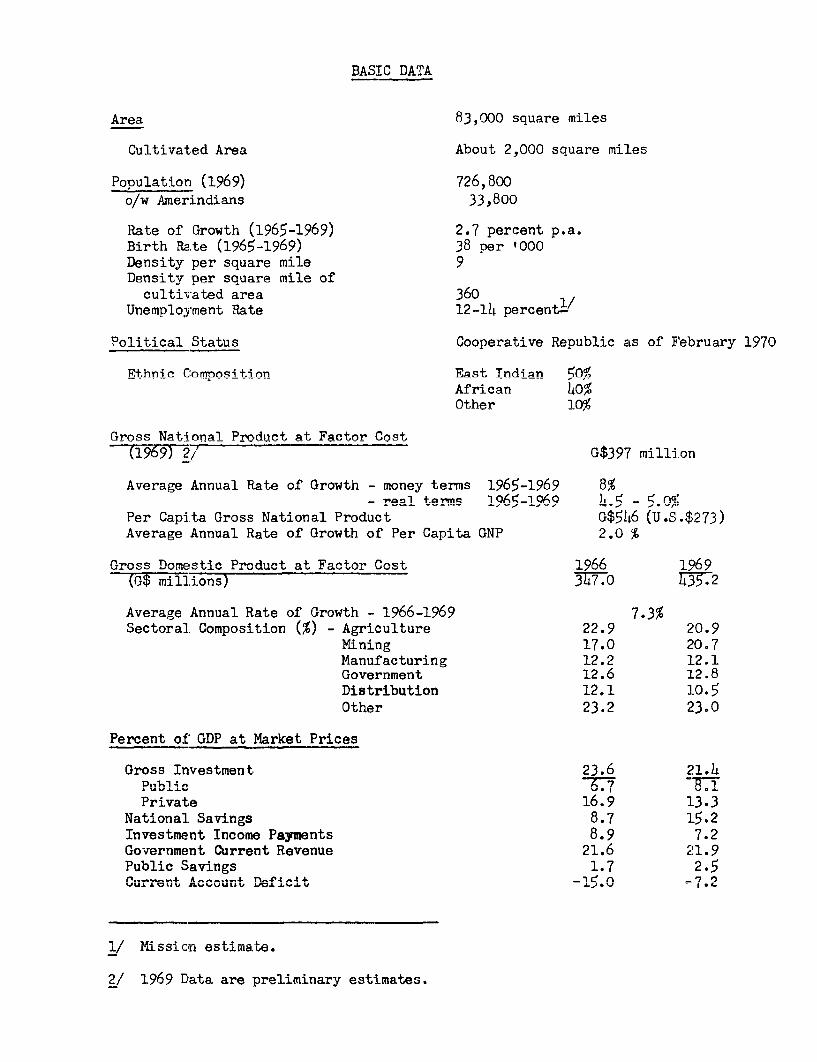
BASIC DATA
Area 83,000 square miles
Cultivat.ed Area About 2,000 square miles
Population (1969) 726,800o/w Amerindians 33,800
Rate of Growth (1965-1969) 2.7 percent p.a.Birth Rate (1965-1969) 38 Der '000Density per square mile 9Density Der sauare mile of
cultivated area 360Unemnlovment Rate 12-lLt percentlY
Pol i ti cal Status Coonerative Republic as of February 1970
Et.hnic Comnosi tion East Tndian qoa,African 0Other 109
Gross Nati.onal Prniduct at Factor Cost(1969)27- G$397 million
Average Annual Rate of Growth - money terms 1965-1969 8%l-rea -mn 1965-1969 ) _ 5. nq
Per Capita Gross National Product G$546 (U.S.$273)Average Annual Rate of Growth of Per Ca-it-a r-NP 2.0
Gross Dome!stic Product at Factor Cost 96l6(G$ millions) 377.0 735.2
Average Annual Rate of Growth - 1966-1969 7.3%Sectoral. r-coMposition (%) A- raculture 22.9 ... 20.9
Mining 17.0 20.7Manufacturing 12.2 12.1Government 12.6 12.8Distribution 12.1 10=5Other 23.2 23.0
Percent of' GD? at Market Prices
Gross Investment, 23.6 21.4
Private 16.9 13.3Nat+onal S-4- R 7 1 1f 9
Investment Income Payments 8.9 7.2G-overni,cot Current R. -J - LJP evenue 2.1.6 21 .9Public Savings 1.7 2.5CAU LI .k L L J. . U_LJur..rent Account ='L -,fif -. = 7.02
1/ us9i nj estimatUe.
2/ i969 Dlata are preliminary estimates.
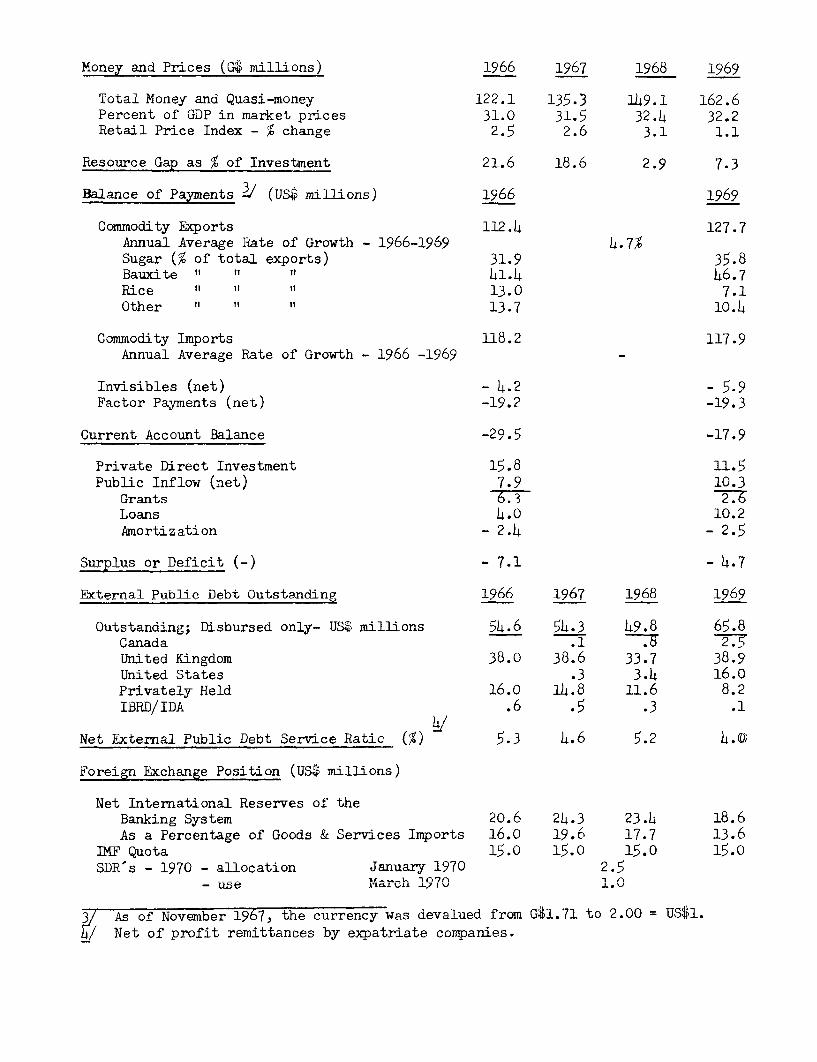
Money and Prices (G(P millions) 1966 1967 1968 1969
Total Money and Quasi-money 122.1 135.3 149.1 162.6Percent of GDP in market prices 31.0 31.5 32.4 32.2Retail Price Index - % change 2.5 2.6 3.1 1.1
Resource Gap as % of Investment 21.6 18.6 2.9 7.3
Balance of Payments dJ (US,$ millions) 1966 1969
Commodity Exports 112.4 127.7Annual Average Rate of Growth - 1966-1969 4.7%Sugar (% of total exports) 31.9 35.8Bauxite " " f 41.h 46.7Rice if it Et 13.0 7.1Other it tt it 13.7 10.4
Commodity Imports 118.2 117.9Annual Average Rate of Growth - 1966 -1969
Invisibles (net) - 4.2 - 5.9Factor Payments (net) -19.2 -19.3
Current Account Balance -29.5 -17.9
Private Direct Investment 15.8 11.5Public Inflow (net) 7.9 10.3
Grants 6.3 2.6Loans 4.0 10.2Amortization - 2.4 - 2.5
Surplus or Deficit -) - 7.1 - 4 *.7
External Publie. Debt Ouitstanding 1966 1967 1968 1969
Oustanding; TisbhirqPt onlv- IT5S$ millionn 5h6 5L h J,9.8 65.8Canada .1. 27UTnited Kingdom 35=o 386 33.7 38=9United States .3 3.4 16.0Pt-j,trivatelyvr T-leld 1A6 1JA.8 11.6 8.2IBRD/IDA .6 .5 .3 .1
Net External Public Debt Service Ratic (X) 5.3 4.6 5.2 4.0
Foreign Exchange Position (US$ millions)
Net International Reserves of theBarll-4 ng Systemr,n A 2, .3 2. 1 AAs a Percentage of Goods & Services Imports 16.0 19.6 17.7 13.6
QrE uota 15, .0 15,,. 0 -L,.0 1.oSDR' s - 1970 - allocation January 1970 2.5
- use J-l-u± V. V
oAs f November 1967, the currency was devalued frm G-$1.71 to 2.00 - US$1.Net of profit remittances by expatriate companies.

Standn-by Agreemeints:
Fiebruary 13, l967 - r-ebruary 12, 1968 US 7.5 mi.February 15, 1968 - February 14, 1969 Us$ .0 m.March 29, 1969 - March 28, 1970 US$ 4.0 m.April 6, 1970 - April 5, 1971 Us$ 3. m.
International Relations
Member of CARIFTAMember of Commonwealth and Siterling BlocNot a member of OAS or IDB

SUMMARY AND CONCLUSIONS
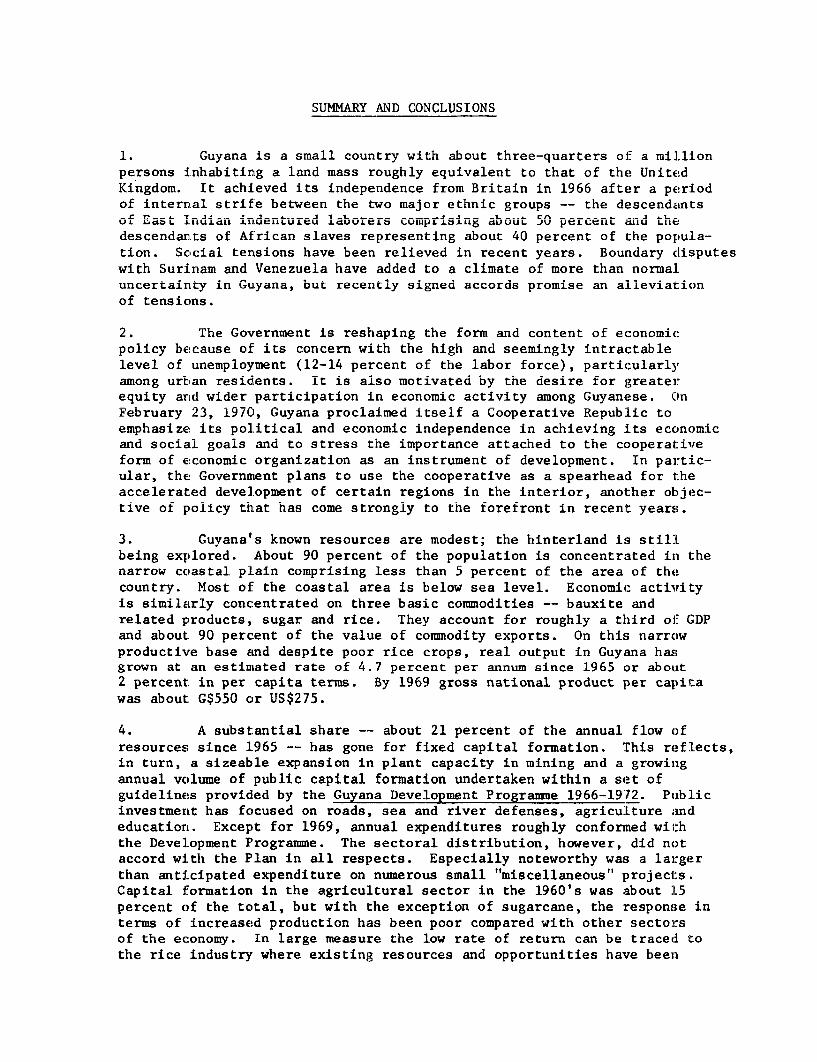
1. Guyana is a n.. 4 st.all county w-aih, about th ree-quarters oi- a m4lLiUonpersons inhabiting a land mass roughly equivalent to that of the UnitedrA.rLgoUru. IL achLiLeveu LLs inUepenudence fLror Britain iLn 1D966 after a periodof internal strife between the two major ethnic groups -- the descendZntsof. £.4ast Indian iLnd.enturedU ULab'orers comprisLng abJout .0J percent andu thLeidescendants of African slaves representing about 40 percent of the popula-tiLno. Saocieal tensiLons hnave 'lebee relieved 'in recent years. nouniuary disputeswith Surinam and Venezuela have added to a climate of more than normal.uncertairLty in Guyana, but recently signed accords promise an alleviationof tensions.
2. The Government is reshaping the form and content of economicpolicy because of its concern with the high and seemingly intractablelevel of unemployment (12-14 percent of the labor force), particularlyamong urtban residents. It is also motivated by the desire for greaterequity and wider participation in economic activity among Guyanese. OnFebruary 23, 1970, Guyana proclaimed itself a Cooperative Republic toemphasize its political and economic independence in achieving its economicand social goals and to stress the importance attached to the cooperat:iveform of e!conomic organization as an instrument of development. In partic-ular, the Government plans to use the cooperative as a spearhead tor theaccelerated development of certain regions in the interior, another objec-tive ofi policy that has come strongly to the forefront in recent years.
3. Guyana's known resources are modest; the hinterland is stillbeing explored. About 90 percent of the population is concentrated in thenarrow ccoastal plain comprising less than 5 percent of the area of thecountry. Most of the coastal area is below sea level. Economic activrityis similarly concentrated on three basic commodities -- bauxite andrelated products, sugar and rice. They account for roughly a third o0( GDPand about: 90 percent of the value of commodity exports. On this narrowproductive base and despite poor rice crops, real output in Guyana hasgrown at an estimated rate of 4.7 percent per annum since 1965 or about2 percent in per capita terms. By 1969 gross national product per capitawas about: G$550 or US$275.
4. A substantial share -- about 21 percent of the annual flow ofresources since 1965 -- has gone for fixed capital formation. This reflects,in turn, a sizeable expansion in plant capacity in mining and a growingannual volume of public capital formation undertaken within a set ofguidelines provided by the Guyana Development Programme 1966-1972. Publicinvestment has focused on roads, sea and river defenses, agriculture andeducation. Except for 1969, annual expenditures roughly conformed withthe Development Programme. The sectoral distribution, however, did notaccord with the Plan in all respects. Especially noteworthy was a largerthan anti.cipated expenditure on numerous small "miscellaneous" projecl:s.Capital l-ormation in the agricultural sector in the 1960's was about 1L5percent of the total, but with the exception of sugarcane, the response interms of increased production has been poor compared with other sectorsof the economy. In large measure the low rate of return can be traced tothe rice industry where existing resources and opportunities have been
- ii -
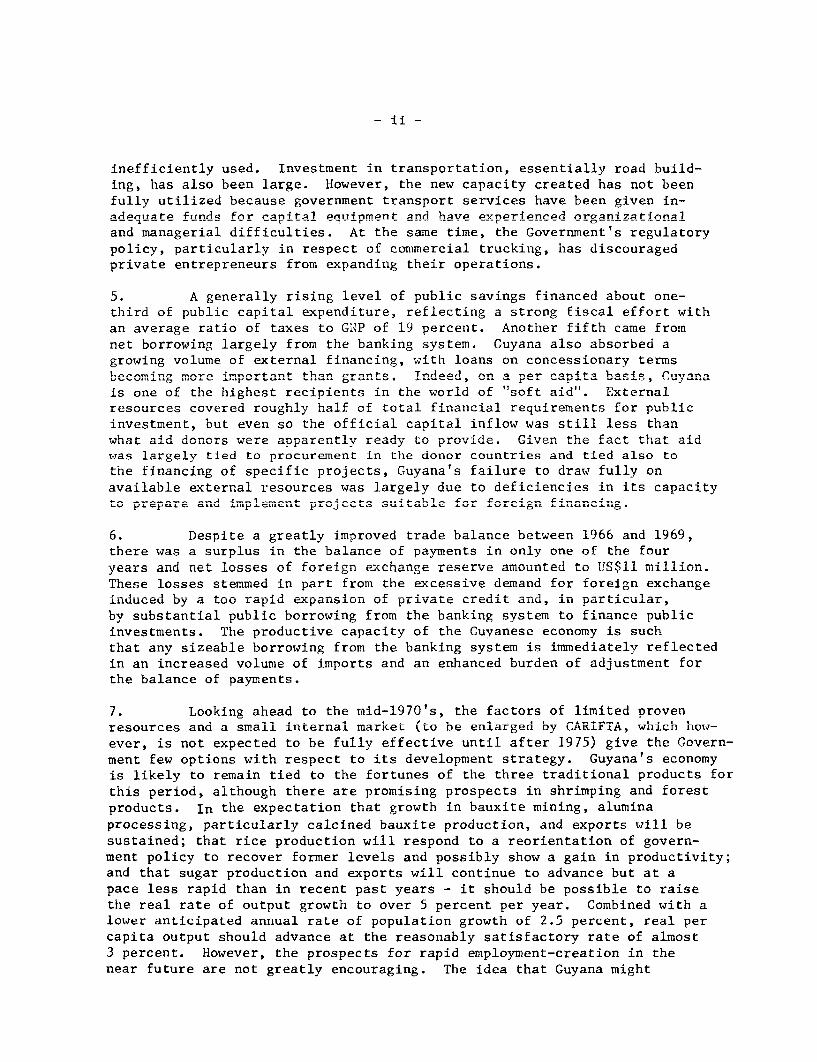
inefficiently used. Investment in transportation, essentially road build-ing, has aiqo been large. However. the new canacitv created hag not hbenfully utilized because government transport services have been given in-adpeutArp furnds fnr apnital PeqTipment and hnve experienned organizaionnaland managerial difficulties. At the same time, the Government's regulatorypolicy, particlrly.q1- in repcznrt of connimrrinl t-rucikincg, has- discoragedqC&,
private entrepreneurs from expanding their operations.
5. A generally rising level of public savings financed about one-third of ptbhlir rcaitl - -xpnnditiire reflecting a strong fisca1 offcort- with
an average ratio of taxes to GNP of 19 percent. Another fifth came fromnet borrowing largely from the banking system.. Guyana also absorbed agrowing volume of external financing, with loans on concessionary termsbecoming more important thasn grants. Indeed, nn a pnr capni4f bass4 r- i..n,n
is one of the highest recipients in the world of "soft aid". Externalresources covered roughly half of total financi-al requi ------ t- for -ublicinvestment, but even so the official capital inflow was still less thanwhat aid don.ors were apparently Aea-y to pAovde. Given t act that aid
was largely tied to procurement in the donor countries and tied also tothe f4nancing of specific projects, Cuyan-'s failu-r to d-ra fully nn
-I'. A -LaI.I - .k -yL.LL'. -jJA.iJ , UaU- - _t.A .L_. '0
available external resources was largely due to deficiencies in its capacity'lo prepare and _ im1plement project's suitable for foreign fina-nci-ng.LU pA ofa C Cht _LIj _. CI L I. _A _J _'.. _O _ _I t.C . C v. _ vk £ _ _ A v. C.L~L A .A.IIah . L _1IaAV. Des>pite a greatly ±LALIkJLUVtU LLCU" LJCL.LCaLs uCLWrcCL v.LvJ aL- A.V.J
there was a surplus in the balance of payments in only one of the fouryears and netL. lUosses of fCoreiIgn e.hcil Lange reserve amounted LLiht. LU U$. r.± Il ion.
These losses stemmed in part from the excessive demand for foreign exchangeinduced by a too rapid expansion of private credit and, in particular,by substantial public borrowing from the banking system to finance publicinvestments. The producti-ve capacity of the Guyanese ecULUny is s-uchthat any sizeable borrowing from the banking system is immediately reflectedin an increased volume of imports and an enhanced burden of adjustment forthe balance of payments.
7. Looking ahead to the mid-1970's, the factors of limited provenresources and a small internal market (to be enlarged by CARIFTA, which how-ever, is not expected to be fully effective until after 1975) give the Govern-ment few options with respect to its development strategy. Guyana-s economyis likely to remain tied to the fortunes of the three traditional products forthis period, although there are promising prospects in shrimping and forestproducts. In the expectation that growth in bauxite mining, aluminaprocessing, particularly calcined bauxite production, and exports will besustained; that rice production will respond to a reorientation of govern-ment policy to recover former levels and possibly show a gain in productivity;and that sugar production and exports will continue to advance but at apace less rapid than in recent past years - it should be possible to raisethe real rate of output growth to over 5 percent per year. Combined with alower anticipated annual rate of population growth of 2.5 percent, real percapita output should advance at the reasonably satisfactory rate of almost3 percent. However, the prospects for rapid employment-creation in thenear future are not greatly encouraging. The idea that Guyana might
- iii -
encourage sellecti4ve i, .ig-titon of exarened mi..ers fro.. the m'ore der.sely
populated Caribbean islands should, therefore, be carefully considered inI. CJuiaLUI Lu LLL .CJ UOjJC Lvy=W: vLU CIlpIyLLICILL .LLL .AA>u4 LUL >.
U. The Governu.ent Lis now prepariLng a co,.prehensive uevelopmuent planfor the 1970's, which is to include an enhanced economic role for coopera-tives as well as a WuclI expandedU diU'rect goverr[enit partiLcLpat'lon 'inproductive activities. The mission has outlined a public investment programto 1975 wnich, it is hoped, will assist the Government in formuiating itsown longer-range plan; however, it does not take account of the far reachingchanges in economic organization whicn tne Government seeks to incroduce.The public investment program proposed in this report is viewed as a keyelement in the future of the economy and calls for a doubling in tne annuairate of expenditure by 1975. The higher rate of public capital formationwill thus take up the anticipated slack in private investment faced withlimited opportunitiespand an uncertain investment climate. The broad stra-tegy is to expand ituimodernize the basic infrastructure in those sectorswith the greatest productive or cost-saving potential (agriculture, fishing,power, communications and air transport) and at the same time to augmentsignificantly the stock of capital in education, health, sanitationand housing. Although financial resource and administrative capacityconstraints inevitably limit what can be done in pursuit of these objectives,they do not seem so severe as to preclude such an ambitious program. Indeed,one of the assumptions underlying the mission's approach in formulating theproposed program for 19/U-1975 rests on the expectation that, over the nextfew years, there will be a sharp upward shift in the level of public savingsgiving Guyana access to a greater volume of domestic financial resourcesfrom this source than it has ever marshalled in the past. The CentralGovernment's current surplus should rise sharply as a result of new taxmeasures introduced in the 1970 Budget and the termination of tax conces-sions granted in the mid 1960's. At the same time, the newly establishedNational Insurance Scheme should contribute substantially to a much higherlevel of public savings, averaging 5.3 percent of CDP a year. At thislevel, it should be unnecessary to borrow from the banking system, thusavoiding potentially deleterious consequences for the balance of payments.The issue of additional fiscal measures is not likely to arise before 1973.
9. The projections have assumed that central government expenditureswill grow at the annual rate of about 7 percent in real terms. The under-lying expectation is that the Government will exercise restraint andintroduce economies in spending. It should be borne in mind, however,that at the margin, where capital projects promise less than a reasonablerate of return, a more efficient use of resources would be to substitutenon-capital development expenditures so as to enhance the efficientutilization of capital already in place. This might include, for example,expanded extension services in agriculture, improvement in the "quality"of teaching in schools and the "quality" of services in hospitals andclinics. The consequence of such a substitution would be reflected in areduced level of public savings. A possible side benefit of such expen-ditures would arise to the extent that professionally trained Guyaneseare dissuaded from emigrating abroad by the provision of more attractivework opportunities at home.
- iv -
10. A second assumDtion is the continued willin2ness of the Govern-ment, already in receipt of a high level of per capita aid, to draw uponthe sizeable volume of external financial resources (of the order ofG$50-60 million annually) that bilateral aid donors and internationalagencieA are annarentlv ready to provide. Thus, aLmost 60 npercent ofgross capital requirements are expected to be financed from abroad,essentiallv from the United States; the United KinainTcom CGanaid and the
IBRD/IDA. On this basis, the financing plan shows a surplus in everyyear excepting 1974 and 1975 when modest cieficits appear. Covering these
deficits will require additional fiscal measures if the high levels ofpubhl ic investment ar to he maint2inedL
11. Theprop d propo program of public capital expenditure should raisethe share of public capital formation in GDP to an annual average of12 percent for the next six years as m--posed to about 7 percent for the
latter half of the 1960's. Compared with the earlier 1966-1972 Plan,,.b44~~~4- 4., ~~~~ ~ ~ 4 aA far 1O~7 7O1Q1 l" - -- --- -.* 1- e m4_to; :|4r shA' i_ s e torAl - emp 4i popo ise fo 1 90 vn_1 GX1-{n _6-_
culture, including livestock development, forestry and fishing and seaAeflpenses, wh1-ile the percentage allocations to transportation anA omluiUCI CIL~~~Ct~~ , WLL~L.C ILiL CL at.jaLIJL L~..JL .taLIL LU LAILIU
cation, power and development finance have been reduced. Within the trans-portation sector, the come 1-ti4 of -a m
4ar r-ad bulldingprorarm -is in
sight and the mission has recommended that increased emphasis be given toat airnd water transport, m.odes which seem. to bDe particularly -ie t A
Guyana's needs. In comparison with the actual distribution of publicinve beti ween 4. 'd a--A 1.,2 the- p------- pA or.,. a------ -11 - - lL
relative shares to agriculture and the social services such as health andaitatiLoL hoL u[ UCbL UdevCelopJr,,CLLL L anIU rUral. water uLpAly. The
miscellaneous category of expenditure has been sharply reduced.
12. On the basis of information presently available, the publicL[LV1t4bL&i1t4LLL PLU5LWL dl UUL-JA-ICU U LLIUILL.Lbb~LULL Llab dabi6LCULL=L CL .LLW CLUIULU1II.LU
priority to hinterland development. The vision of extensive agriculturalsettlements anu massive natural resource exploitation is, wLth few excep-tions, not supported by hard analysis of economic feasibility. Indeed,interior agricultural developinent on a large scale wouldu ave to contendwith such powerful negative economic factors as relatively poor soils,high land preparation costs, additional requirements for economic andsocial infrastructure and high cost transportation. Continued explorationand experimentation would seem for now to be the appropriate focus ofpolicy. Any project which comes forward should of course be judged onits merits, but it is the mission's impression that there are better pros-pects for agricultural investment in other areas of Guyana closer to thecoast where there is no shortage of good land near commercial markets; whatare needed are capital and skills to develop it more productively. Inrecognition of the strong non-economic motives for interior development,however, the mission has included modest public capital outlays in theproposed investment program for on-going pilot agricultural settlementprojects such as that at Mathews Ridge, continued resource explorationsand some further work on the road to link Georgetown with the Brazilianborder.
13. The outlook for manufacturing or industrial development is notencouragingR; Guyana's comparative advantage lies rather in natural resourcedevelopment. Theres is the possibility of some major resource-based invest-ments (e.g. in forestry), although such developments cannot be expected tomake more than a minor direct contribution towards resolving the problemof unemployment. In this respect, there is the longer-term prospect thatsome lines of primary production will support resource transformationactivities which are more labor-intensive.
14. The deveLopment targets proposed for the period 1970-1975 arechallenging ones indeed. Their achievement depends on stimulating an in-creased generation of income in agriculture, fishing and forestry, possiblywithin the context of the expandecl market offered by CARIFTA. In thisrespect the private sector could be expected to play a crucial role. Italso depends on the Government's development effort within the public sectorwhich the experience of the last five years would judge to have been com-mendable. Economic "management" fIor the next few years must include thevigorous pursuit of certain measures among which the following are mostimportant:
a) the strengthening of the project preparation, coordinationand execution functions of the public sector;
b) the improvement of tax administration and collection;
c) the exploitation of agricultural resources includingfishing and forestry and in particular: leaving the sugarproducing sector undisturbed since it enjoys a comparativeadvantage in world markets; reorienting policy in riceproduction to favor increasing investment only where therate of return promises to be high and stimulating the moreefficient utilization of existing resources through a betterrice growing technology, an improved water control systemand the rational pricing of water, liberalizing and ration-alizing the land market, the provision of credit, a revisedprice structure to encourage the production and timelydelivery of higher quality grades and facilitating thedevelopment of efficient marketing services.
15. The balance of payments projections, including an expectedsustained growth in traditional exnorts and a much larger growth in imrortsinduced by the enlarged volume of public investment, should produce a sur-plus in all but the last year of the period. This outcome hinges onsuccessfully carrying out the public investment program as proposed and.in drawing nn Available foreign financino. But the he2v incre2sed hnr'row-ing over the coming six years, assuming a continuation of the presentmix of foreign assistanre, will hp reflerted in agrowing debpht- corl7it ratio
rising from 3.8 percent in 1970 to 4.5 percent in 1975 and 6.1 percent in1979. If external borrowina were aed to hb bad on "coAnventional
terms" (i.e. 20 year life, 7 percent interest and a 5 year grace periocd) thedeb t s e rvi c e ram-tio-n wuld - 1 - ti -ple~ bt- .7 en 19?70 ta nd 19)79 Q veni it-I sondll
policies, substantial assistance on concessional terms will be requirecl duringthe cof..ing decade to help Guy-aa achleve its --s.o.J. and social goals

I. SOME BACKGROUND FEATURES
i. ,Guyana is a tropical country situated on the northeasterncoast of South America. With an area of 83,000 square miles, it is byfar the largest of the Commonwealth Caribbean group of countries. Firstsettled by the Dutch in the 17th century, the territory was ceded to GreatBritain at the turn of the l9th century and ultimately achieved independencein 1966. Thus, inclependent economic management and decision making inGuyana is a feature of quite recent origin.
2. An important legacy of the Dutch was the system of protectionand water control introduced along the low-lying coastal lands. Oncedrained and irrigated, the coastal plain with its clay soils was ideallysuited for growing sugarcane. The exploitation of this resource by meansof a plantation system employing African slave and, later, East Indianindentured labor, became the dominant influence in shaping Guyana's econ-omic and social development. In more recent years the exploitation ofrich bauxite resources and the growing of rice have been added to sugarcaneas the major sources of output. On the average, over the last few yearsthe three products together accounted for almost a third of Gross DomesticProduct and as much as 88 percent of the total value of exports.
3. Of the almost three-quarters of a million inhabitants, halftrace their origin to East Indian indentured laborers, while another 40percent are descendants of African slaves. Relating the population toland area yields an overall population density of only 9 persons persquare mile. This obscures the fact, however, that the cultivable arearepresents only about 3 percent of the country's land mass with the resultthat more than 90 percent of the population is found within a narrow ribbonof settlements along a hundred mile stretch of coastline and extending upto a depth of 20 miles inland. Here the population density is of the orderof 360 persons per square mile and more akin to the ratio found in theother major Commonwealth Caribbean countries. The spatial distributionof population in Guyana has important implications for the size andcomposition of its infrastructure.
4. Rich alluvial soils are found along Guyana's coastal strip, butthe hinterLand's natural resource endowment has yet to be fully evaluated.From what is known so far, it appears on the whole to be poor. T'hereare small P3ockets of good soils in the interior, but they are inaccessiibleand costly to clear. Large areas of the hinterland are covered by tropicalforests and these have been exploited on a small scale to produce lumberand related products. The heterogeneity of species and the small size oftrees, however, have so far inhibited the large-scale development of thisresource. Geologically, Guyana forms part of the pre-cambrian shield whichin other parts of the hemisphere has yielded large quantities of minerals.This fact has attracted intensive mineral exploration, but new depositsof commerc:Lal value have yet to be found.
5. Guyana's Dolitical and social history over the nast decade hasbeen a stormy one, particularly in the years before independence. Theunderlving cause of social tension has been the antagonism between thetwo major ethnic groups - Guyanese of African descent on the one hand and
-2-
those of East Indian -orign onl -he otmr. A somewhat --reter measure ofstability has been achieved in the last few years since the People'sNlational Congress Party has grown to do.inate the L1.f.4- -ta - - -cen a to
form the Government either through coalitions or on its own. The woundsopened b-.y overt, - hnost4144-ies in the early 1960's have been gra lly b,-.-,14
There remains, nevertheless, an undercurrent of antagonism between theracial groups wLL.i.ch ILL continues . to affect locall investrvent aversely. T1his
influence on the investment climate, however, is probably outweighed atpresent bly thI'e enhanced dAegree ofll politi*4call stabl-tfwic Gyaa a
k-'1.
COCLA I.. LILC CIkL1~~~~~~~~~~~~~~~~~~~~~~~~~~~~~~~~~~1[t.CU UC5J. CC Lii pLIL.L L .Lt.at 0 5..aLitt4. Ly WLL.L 54L1 ania LLa~~~~~~~~~~~~~~~~~~~~~~~~~~~~~~~~~~~~~~~~~~~~~~~~~~~~~~~~~~~~~~~.LJ.6L ~~ ,WI L4 c G ya a '
achieved in recent years.
6. Another factor affecting the course of Guyana's economic develop-tenLt hIas beten tLLhe dispute over bLoundarite wit WI_ - and V CLenez a. Of
the two, the dispute with Venezuela has been the more troublesome. Asidefrom Ithe LICreLaSed diplomatic activity engendUered by the boundary issue,Guyana's reaction has been to channel a larger volume of resources to itsarmed forces and to push for a fastler pace of inLteriOr Settle emelnt thancould be justified on economic grounds alone. 1/ The very recent attenua-tion of the dispute is likely to have a salutory economic impact on tneinvestment climate and in preventing the diversion of scarce resourcesaway from pressing aevelopment needs.
7. Guyana became a Cooperative Republic on February 23, i970. Thedeclaration of a republic is intended to emphasize the country's statusof political independence and the concomitant need for it to work out itsown destiny without reliance on external assistance. The choice of theepithet "CooDerative" reflects the Government's disenchantment with privateenterpreneurship as the instrument of social and economic development, andits opting for cooperation as a supplementary, if not a substitute torce.This new policy thrust is motivated in part by an estimated 12-14 percentunemployment rate concentrated in urban areas, in part by the philosophydescribed by the Guyanese in such terms as "self-help" and "small man"participation in the economic life of the country and in part by the desireto develop the interior of Guyana. Indeed, cooperatives are expected toform a major third sector in the economy in addition to public and privateactivity.
8. Development efforts in Guyana thus must overcome the currentchallenges of a limited range of natural resources, a potential threat ofinundation by the sea, internal social tensions and the restoration ofrelations with some of its neighbors. Yet one cannot escape the impressionof a strong determination among Guyanese in all walks of life to meet thesechallenges and so secure a faster rate of social and economic progress.
1/ Recently an agreement with Surinam for Renewed "economic cooperation"has been signed. An agreement with Venezuela, calling for a twelveyear "moratorium" on claims to the disputed area, was signed on June 18,1970. The protocol incorporating the agreement with Venezuela is sub-iect to parliamentary ratification in both countries.
II. RECENT ECONOMIC DEVELOPMENTS
A. Output and Expenditure
9. An approximate estimate puts annual average GDP growth in realterms since 1965 at 4.5 - 5 percent, which is reasonably satisfactory whencompared with the longer-term trend rate of growth of somewhat less than4.5 percent since the mid-fifties. 1/ Further, allowing for the net annualincrease in population of 2.7 percent, real per capita output advanced atan annual average rate of about 2 percent over the past four years. Bythe end of 1969, per capita GNP (at factor cost) amounted to G$546 orUS$273 million; the equivalent values in terms of national income percapita were G$507 or US$254.
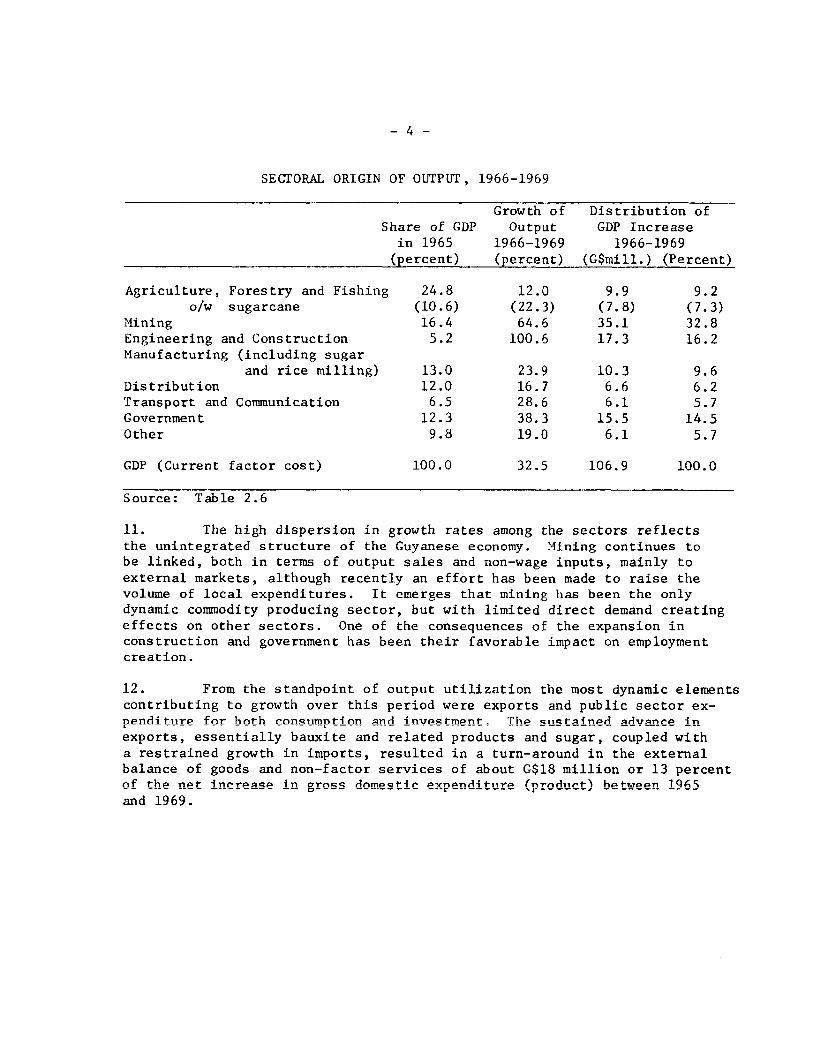
10. The improvement in the overall growth in output, however, hasbeen narrowly based on mining, engineering and construction. These sectors,which accounted for about one-fifth of value-added in 1965, grew much morerapidly than output as a whole. Of the G$106 million absolute increasein GDP (at current factor cost) between 1965 and 1969, G$52 million, oralmost half, was contributed by mining and construction. Most disappointingwas the performance in agriculture, forestry and fishing which in 1965represented a quarter of total GDP. Since that year, value-addedc grew byonly 12 percent and the sector contributed less than 10 percent of the netincrease in GDP recorded over the five year period. Wlat is more, noneof the major products of this primary producing sector displayed a rate ofgrowth which could be described as "dynamic". As for Guyana's two stapleagricultural crops, sugarcane production advanced modestly while the valueof rice output actually declined.
1/ The estimate of real output growth for 1965-1969 is derived from arough measure of price changes in aggregate GDP. Since officialprice deflators for the national accounts are not available forthis period, the subsequent discussion is in terms of data incurrent prices.
- 4 -
SECTORAL ORIGIN OF OUTPUT, 1966-1969
Growth of Distribution ofShare of GDP Output GDP Increase
in 1965 1966-1969 1966-1969(percent) (percent) (G$mill.) (Percent)
Agriculture, Forestry and Fishing 24.8 12.0 9.9 9.2o/w sugarcane (10.6) (22.3) (7.8) (7.3)
Mining 16.4 64.6 35.1 32.8Engineering and Construction 5.2 100.6 17.3 16.2Manufacturing (including sugar
and rice milling) 13.0 23.9 10.3 9.6Distribution 12.0 16.7 6.6 6.2Transport and Communication 6.5 28.6 6.1 5.7Government 12.3 38.3 15.5 14.5Other 9.8 19.0 6.1 5.7
GDP (Current factor cost) 100.0 32.5 106.9 100.0
Source: Table 2.6
11. The high dispersion in growth rates among the sectors reflectsthe unintegrated structure of the Guyanese economy. Mining continues tobe linked, both in terms of output sales and non-wage inputs, mainly toexternal markets, although recently an effort has been made to raise thevolume of local expenditures. It emerges that mining has been the onlydynamic commodity producing sector, but with limited direct demand creatingeffects on other sectors. One of the conseauences of the expansion inconstruction and government has been their favorable impact on employmentcreation.
12. From the standnoint of outntut utilization the most dynamic elementscontributing to growth over this period were exports and public sector ex-nenditure for hoth consu-mption and invePtmPnt= The s,istainpeid dvanncP in
exports, essentially bauxite and related products and sugar, coupled witha restrained growth in iTmnorts- rPesui1te-d in a tiirn-arnind in the evti-ernalbalance of goods and non-factor services of about G$18 million or 13 percentof the net increase in gross domestic xnpenditu,re (prnoduct) bhetween 1965
and 1969.
- 5 -
UTILIZATION OF OUTPUT, 1966-1969
Share of GDP Growth of Expend. Distribution of GDPin 1965 1966-1969 Tnrren-c 1966-19469
(Percent) (Percent) (G$million)(Percent)
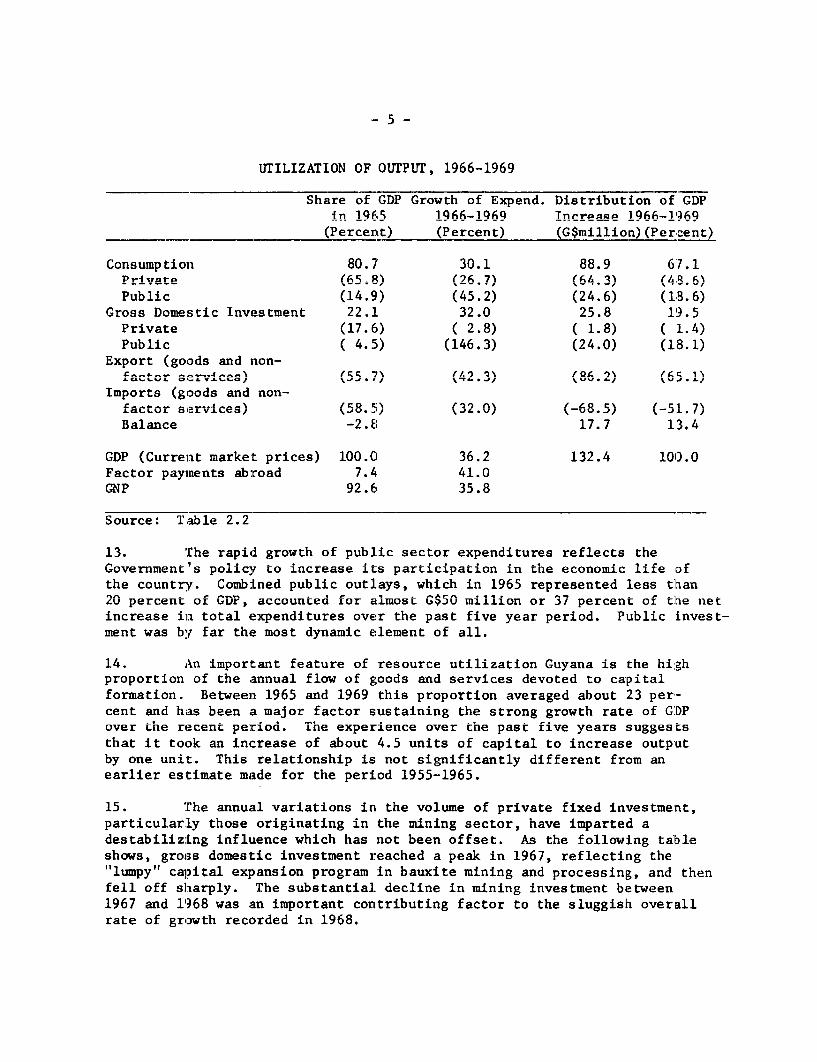
Consumptioll 80.7 30.1 88.9 67.1Private (65.8) (26-7) (64.3) (4.B.6)Public (14.9) (45.2) (24.6) (18.6)
Gross Domestic Investment 22.1 32.0 25.8 19.5Private (17.6) ( 2.8) ( 1.8) ( 1.4)Pu b ic A. 4.) (146A.3)AN t (24. (J 1 .1)
Export (goods and non-factor s;rvices) (5.7) * (Q42 ( ) (65.1)
Imports (goods and non-factor sirvices\ (58o.5 (3.0 (=6.5)o (-51.-7\LA.L.L L ~ LVA..U %1.JJ.'/ V.S.~ / \ UV a# .A.f
Balance -2.8 17.7 13.4
GDP (Current market prices) 100.0 36.2 132.4 100.0-? L 1.1 Aractor pa-yirLents aubroad 7.4- '+.L.0
GNP 92.6 35.8
Source: Table 2.2
13. The rapid growth of public sector expenditures reflects theGovernment's policy to increase it:s participation in the economic life Dfthe country. Combined public outlays, which in 1965 represented less than20 percent of GDr, accounted for almost G$50 million or 37 percent of tLhe nerincrease in total expenditures over the past five year period. Public invest-ment was by far the most dynamic element of all.
14. An important feature of resource utilization Guyana is the highproportion of the annual flow of goods and services devoted to capitalformation. Between 1965 and 1969 this proportion averaged about 23 per-cent and has been a major factor sustaining the strong growth rate of GDPover the recent period. The experience over tne past five years suggeststhat it took an increase of about 4.5 units of capital to increase outputby one unit. This relationship is not significantly different from anearlier esitimate made for the period 1955-1965.
15. Che annual variations in the volume of private fixed investment,particularly those originating in the mining sector, have imparted adestabilizing influence which has not been offset. As the following tableshows, gross domestic investment reached a peak in 1967, reflecting the"lumpy" capital expansion program in bauxite mining and processing, and thenfell off sharply. The substantial decline in mining investment between1967 and 1968 was an important contributing factor to the sluggish overallrate of growth recorded in 1968.
- 6 -
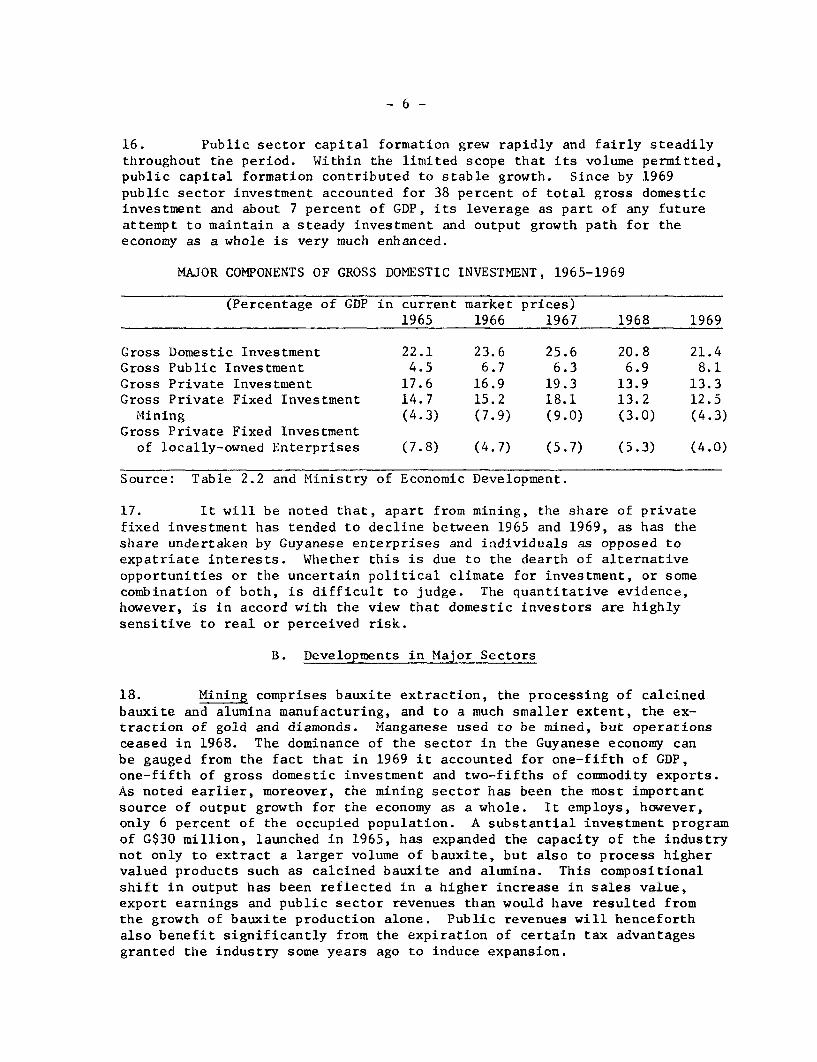
16. Public sector capital formation grew rapidly and fairly steadilythroughout the period. Within the limited scope that its volume permitted,public capital formation contributed to stable growth. Since by 1969public sector investment accounted for 38 percent of total gross domesticinvestment and about 7 percent of GDP, its leverage as part of any futureattempt to maintain a steady investment and output growth path for theeconomy as a whole is very much enhanced.
MAJOR COMPONENTS OF GROSS DOMESTIC INVESTMENT, 1965-1969
(Percentage of GDP in current market prices)1965 1966 1967 1968 1969
Gross Domestic Investment 22.1 23.6 25.6 20.8 21.4Gross Public Investment 4.5 6.7 6.3 6.9 8.1Gross Private Investment 17.6 16.9 19.3 13.9 13.3Gross Private Fixed Investment 14.7 15.2 18.1 13.2 12.5
;4ining (4.3) (7.9) (9.0) (3.0) (4.3)Gross Private Fixed Investment
of locally-owned Enterprises (7.8) (4.7) (5.7) (5.3) (4.0)
Source: Table 2.2 and Ministry of Economic Development.
17. It will be noted that, apart from mining, the share of privatefixed investment has tended to decline between 1965 and 1969, as has theshare undertaken by Guyanese enterprises and individuals as opposed toexpatriate interests. Whether this is due to the dearth of alternativeopportunities or the uncertain political climate for investment, or somecombination of both, is difficult to judge. The quantitative evidence,however, is in accord with the view that domestic investors are highlysensitive to real or perceived risk.
B. Developments in Major Sectors
18. Mining comprises bauxite extraction, the processing or caicinedbauxite and alumina manufacturing, and to a much smaller extent, the ex-traction of gold and diamonds. Manganese used to be mined, but operationsceased in 1968. The dominance of the sector in the Guyanese economy canbe gauged from the fact that in 1969 it accounted for one-fifth of GDP,one-fifth of gross domestic investment and two-fifths of commodity exports.As noted earlier, moreover, the mining sector has been the most importantsource of output growth for the economy as a whole. It employs, however,only 6 percent of the occupied population. A substantial investment programof G$30 million, launched in 1965, has expanded the capacity of the industrynot only to extract a larger volume of bauxite, but also to process highervalued products such as calcined bauxite and alumina. This compositionalshift in output has been reflected in a higher increase in sales value,export earnings and public sector revenues than would have resulted fromthe growth of bauxite production alone. Public revenues will henceforthalso benefit significantly from the expiration of certain tax advantagesgranted the industry some years ago to induce expansion.
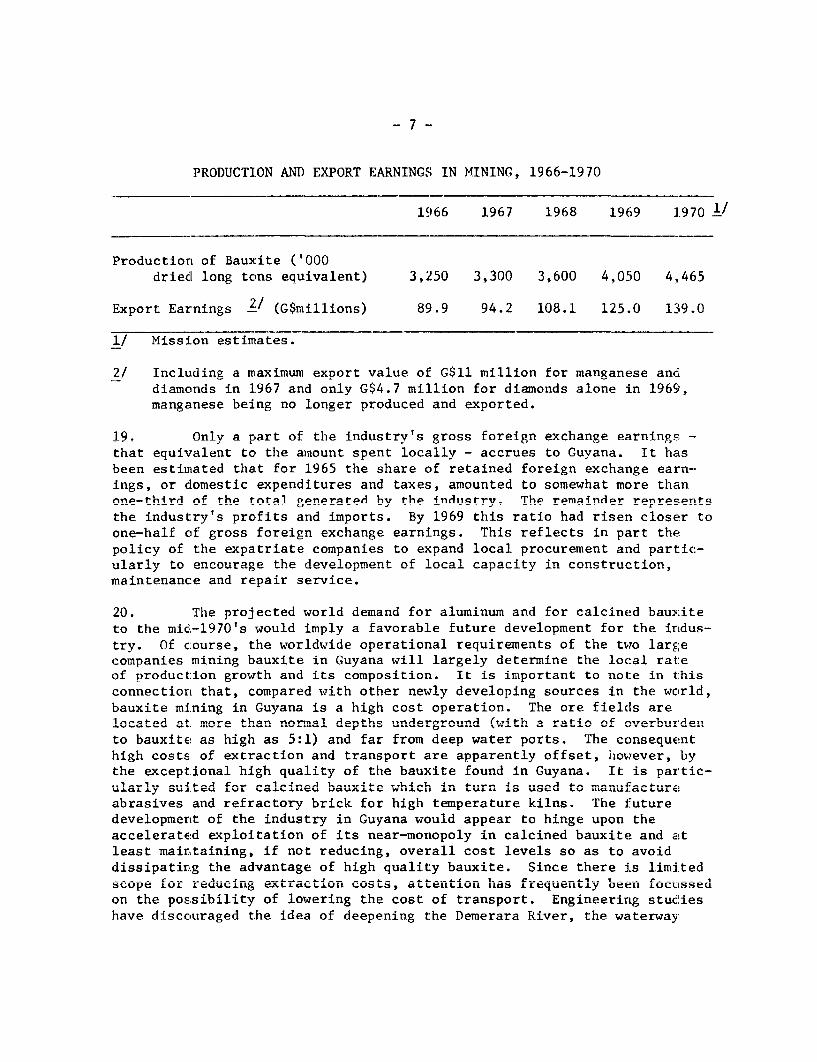
PRODUCTION AND EXPORT EARNINGS IN MINING, 1966-1970
1966 1967 1968 1969 J.970 1/
Production of Bauxite ('000driedl long tons equivalent) 3,250 3,300 3,600 4,050 4,465
Export Earnings 21 (G$millions) 89.9 94.2 108.1 125.0 139.0
1/ Mission estimates.
2/ Including a maximum export value of G$11 million for manganese anddiamonds in 1967 and only G$4.7 million for diamonds alone in 1969,man2anese being no longer produced and exported.
19. Only a nart of the industrv's gross foreign exchange earning5; -
that equivalent to the amount spent locally - accrues to Guyana. It hasbeen estimated that for 1965 the share of retained foreign exchange earn-
ings, or domestic expenditures and taxes, amounted to somewhat more thanone-third of the t:otal generated by the indt,strv. The remainder represents
the industry's profits and imports. By 1969 this ratio had risen closer toone-h:alf ,if grossc: foreign exrchancrg earnincgs This reflects in npart thE!
policy of the expatriate companies to expand local procurement and part:ic-ularly to encourage the development of lnocl rcapaity in cnnQtruc1tion,maintenanc:e and repair service.
20. The projected world demand for aluminum and for calcined bauxiteto the midA-197n's wo,.1r in.? a favorabl fuit-ure deverloment. fo-r t-he 4rAt uc-
try. Of course, the worldwide operational requirements of the two largec44, pan-4- mininf 4., in h1uya- -1l 1 rgely Aotorn.oin h the loc31 r-te
of production growth and its composition. It is important to note in thisconnection that, compared W.t-ith nf-otr new.,lxt Adevrolorpng sources in theo vcarAld
bauxite mining in Guyana is a high cost operation. The ore fields arelocated at. more than nortaal depths underground (with a ratio of overburdeno
to bauxite as high as 5:1) and far from deep water ports. The consequenthigh, cost-s, of extraction and transport are apparently offset, 'ho-wever, bythe exceptional high quality of the bauxite found in Guyana. It is partic-ularly suited 4or calcined bauxite which in turn is useA to manufactureabrasives and refractory brick for high temperature kilns. The futuredevelopment of the industry in Guana would appear to hinge upon theaccelerated exploitation of its near-monopoly in calcined bauxite and a!t
dissipating the advantage of high quality bauxite. Since there is limitedscope for reducing exLtractdLon costS, attention h'Ias f'requently been focussedon the possibility of lowering the cost of transport. Engineering studieshave uiscciuraged the idea of deepening the Demerara River, the waterway
-8-
used to transport mining supplies, bauxite and related products of DEMBA,±'one of the two bauxite interests in Guyana. On the other hand, proposalshave been made to dredge the bars at the mouth and up to 24 miles inland ofthe Berbice River. If this were feasible, transport costs on the exportsof the other bauxite interest, Reynolds Guyana Mines Ltd., would be reducedsignificantly. It could, in turn, contribute in an important way to thecontinued growth of the mining industry.
21. The search for new deposits of minerals other than bauxite hiasbeen intense, but much detailed ground survey work remains to be done toconfirm the existence of commercially exploitable deposits. The UNDP hassponsored aerial geophysical and mineral surveys covering part of thecountry, wqhile private U.S. and Canadian companies have explored variousareas for uranium and gold in particular. The UNDP supported surveys arelikely to continue in collaboration with the Guyana Geological Survey.
22. Agriculture, including fishing and forestrv, accounts for abouta fifth of GDP, provides about half of the country's exports, and engagesabout a third of the labor force. Sugarcane in turn accounts for nearlyhalf of agricultural output and employs about one-third of the agriculturalwork force. Rice is the second most important agricultural product.
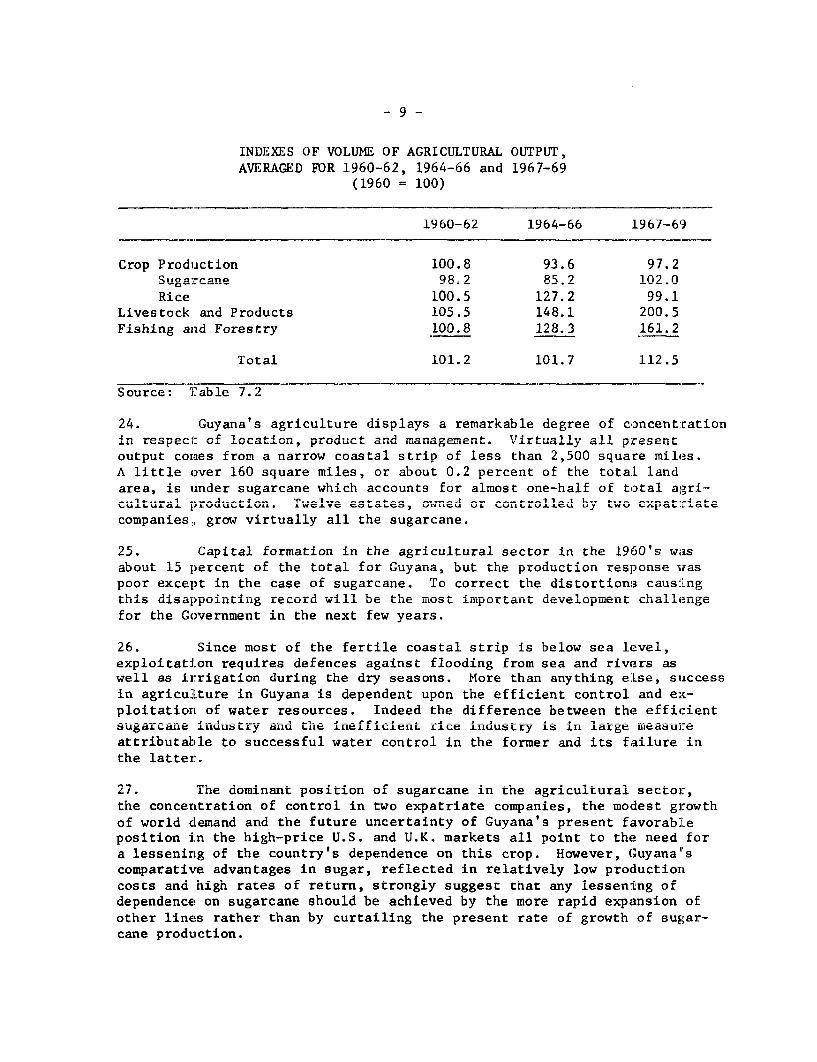
23. The volume of agricultural production increased about 1.5 per-cent per annum during the 1960's compared with an annual growth rate ofpopulation of almost 3 percent and about 4.5 percent for GDP in realterms. This slow advance in agricultural output was due mainly to thefailure of crop production. Sugarcane output, after a serious setback inthe mid-1960's due to civil strife, has been expanding fairly rapidlysince then. Rice production in contrast suffered little during the periodof unrest, but has declined seriously during recent, more settled years.The poor performance of rice production occurred despite a heavy investmentin the industry. The decline of both acreage and yields in recent yearsmay be attributed to policies regarding land settlement, tenure and titletransfer arrangements, water pricing and other matters affecting agricul-tural development (see paragraphs 45-64 in Annex I).
1/ The Demerarn Rauxite Gnomnpny Ltd - incornorated in Guyana, is awholly-owned subsidiary of the Aluminium Company of Canada, Ltd.
-9-
INDEXES OF VOLUME OF AGRICULTURAL OUTPUT,AVERAGED FOR 1960-62, 1964-66 and 1967-69
(1960 = 100)
1960-62 1964-66 1967-69
Crop Production 100.8 93.6 97.2Sugarcane 9.2 85.2 1020
Rice 100.5 127.2 99.1Livestock and Products 105.5 148.1 200.5Fishing and Forestry 100.8 128.3 161.2
Total 101.2 101.7 112.5
Source: Table 7.2
24. Guyana's agriculture displays a remarkable degree of concentrationin .-espect of location, proluct anu m..anage.ent. L.Viually a.. presentoutput comaes from a narrow coastal strip of less than 2,500 square miles.A littl- e over 160 square .M,i"es, or about 0.2 percent of the total land,Li. A. -L.LL± ~L .LVVJ 3M 0~ ILL. ctu ~JL aLJJU '..' %.1 UJ. LLL ~ tJI0. .L LLU
area, is inder sugarcane which accounts for almost one-half of total agri-cu'ltural productior.. "we've estates, ownedI or contro'lledI by Iwo expatriateu.LU04.jA. u U -.L'JL 4.6 ~ JVA~U L.L L A.LLU 'J W J i.p L 0L
companies, grow virtually all the sugarcane.
25. Capital formation in the agricultural sector in the 1960's wasaboutL 1 percent of thLle Loa Lfor Guyana, bUut the production response waspoor except in the case of sugarcane. To correct the distortions caus:LngL' ' disappointin ULU Wg reor Uw LL' t IhUe L ±II[IUtLdltL UeveUopurLLL e Lit ch tllen
for the Government: in the next few years.
26. Since most of the fertile coastal strip is below sea level,exploitation requires defences against flooding from sea and rivers aswell as irrigation during the dry seasons. More than anything else, successI_ ___ I n/ J__ .__ _ __ __ --- _ t_ _ros _ sl __ __ ____' __ .___-Iii agricuJLturte n1 GuyanLa is duepe LnUdentL upon thIe efLLIcIenL cO nLrol anIU --;L-
ploitatiorn of water resources. Indeed the difference between the efficientsugarcaLne industry and the inefficient rice industry is in large measureattributable to successful water control in the former and its failure inthe latter.
27. The dominant position of sugarcane in tne agricuiturai sector,the concerntration of control in two expatriate companies, the modest growthof world demand and the future uncertainty of Guyana's present favorableposition in the high-price U.S. and U.K. markets all point to the need fora lessening of the country's dependence on this crop. However, (;uyana'scomparative advantages in sugar, reflected in relatively low productioncosts and high rates of return, strongly suggest that any lessening ofdependence! on sugarcane should be achieved by the more rapid expansion ofother lines rather than by curtailing the present rate of growth of sugar-cane production.
- 10 -
28. The problems confronting the rice industry are deep-rooted andcomplex. They essentially stem from the inefficient use of existingresources and opportunities rather than from a dearth of these. Many ofthe occupants of government settlement lands were selected without regardto their aptitude or interest in farming. Moreover, rent controls militateagainst an efficient allocation and optimum use of land among growers. Therecovery from rice-growers of only a small proportion of the cost of watercontrol (irrigation and drainage) deprives the controlling authority ofthe resources necessarv to fulfill its functions effectively. At the sametime, an inappropriate price for an input as important as water leadsto its uneconomic use by rice farmers. Inadequate water control in turnhinders the introduction of a better technology, based on fertilizerand higher yielding varieties, which tends to be profitable only undergood growing conditions.
29. The average price obtained by Guyana for its rice exports hasdepended upon the distribution of sales as between markets under bilateralagreements with generally favorable price terms and "free markets" whereaverage prices are lower. For example, exports to CARIFTA markets in 1968were 58,000 tons at an average price of roughly US$23 per ton higher thanGuyana realized in "free markets". The value of this concession to Guyanain that year was, therefore, about US$1.3 million. Until 1966, Guyanarealized a higher price for its rice exports than the world average. Withthe loss of the Cuban market in 1965 and a simultaneous substantial in-crease in domestic production a larger volume of sales was shifted to"free markets" and the average export price dropped below the averagefor other exporting countries. An important factor influencing the loweraverage export price obtained in "free markets" is the relatively lowquality of Guyana's rice. The aspect of quality also poses some threat toGuyana's favorable position in CARIFTA markets. The adoption of policies,including improved differential price incentives covering rice grades andthe timing of delivery, to improve the quality of rice Rrown in Guyana, isan urgent requirement if rice exports are to be expanded and average pricesraised. At the present time, rice-growers are paid a price which on theaverage reflects the value of their product on the marginal "free market".An improvement in rice qualitv which is reflected in higher "free market"prices and is achived at a cost less than the increased value of the rice,would mAke nossihbl a higher nrice tn growers.
30. Little ciir'cs has been achipvpd so far in devlnoping crOpSother than sugarcane and rice. This has been largely due to the technicaldifficulty of growing such crops on the tiifficul t, frnequently water-loggedcoastal clays and, to an important extent, to the prevalence of praediallarcen.y.
31. PCrtl a npArndutin 4-n th) manctnl bah ore for lhon hfnninawrn
mainly by an inadequate institutional framework. Herds, for the mostpart s..all anA generally owned by rice f-r..ers, are grazed cnn.nunally onpastures which are badly overstocked. There is little incentive for the
- 11 -
individual owner to follow accepted husbandry practices in breeding, indisease and parasite control, and in nutrition. Any attempt by such smallindividual cattleowners to limit numbers in line with available grazingwould benefit them little, since it would merely leave more grazing forthe cattle of other owners. Development is further hampered by prevalentlarceny of stock and, where pastures are individually held, by trespass.
32. Although DoultrV Droduction has exnanded, neither it nor Digproduction can make a larger contribution to the economy until domesticsources of feedstuffs are more abundantlv available. But there are diffi-cult technological and economic problems involved in increasing the localproduction of feedstuffs.
33. Forests; which cover 80 nercent of the countrv; provide the basisfor only 1.5 percent of the GDP. Stands of the more valuable species, suchas cyreenheart tiutd for lmnbher are nearlv exhaniqtec1 in the a.rCe;qih1e
areas because of intensive selective exploitation. Continued exploitationrequires depner, more roRtlv penetration of the i,1n0le The eat-;h1iqhmPntof a proposed pulping plant and the perfection of a process of timber-imnregnation Qhnlld make it feasih1e to expnlnit- wider rance of encriesand could radically alter the economics of forest exploitation in Guyana.
34. Guyana's participation in the shrimping industry, which hasdeveloped I anidly Nff tha northeast oanst of onilth Amperica in recent years,has for the most part been confined to the provision of on-shore facilitiesfor foreign-otm.ed shri.mping trawlers. Such expansion of Guyana's fishingfleet as has occurred has been almost entirely for shrimping and with theva-st majorlt- of the vessels foreign-o .ed. The trawl fsigidsrhas been largely neglected.
35. Among the remaining producing sectors, manufacturing (includingsugar and ri.ce processing) is the most .mportar.t, L o- u g ar.o n d -
12 percent to GDP in 1969. l/ Sugar and rice milling accounted for about43 percent of this totlal. Wi.h1 t*h exc n of rm, .luber anA some drugand related products, most of the remainder is destined for the localm.arket. Thse smlall s-ize of: the local market coupled wid- relatirvely low-
fll*Lr'~ .. .L1 A .L 04( '4. a & "I .J.'0L . mA L . '.Jj . -LU WL LII A L L1. L~ 4.'.JW
per capita levels of income have inhibited the development of manufacture£or UllomesLtLc consumpUtionJ cI1U a'gvenI vuyoana' 'ULocat I, rsource elnlUoWmUeiIt
and the industrial heritage of the colonial period, the possibilities ofmanufLacturing Lfor export h1ave Ueeni even Luore unfavorable.
1/ This figure also includes the value-added of private power generationwhich, although not shown separately in the official accounts, isknown to be less than 1.5 percent of total output and represents aneven smaller share of private fixed capital formation.
36. The target set out in the Guyana Development Program 1966-1972was to double industrial production over the plan period. Il fact thegrowth in output between 1966 and 1969 for the sector as a whole was only12.6 percent - mucn less than the growLh In total output and far Oelow theplanned rate of expansion. Sugar and rice milling advanced more rapidlythan the remainder of the sector.
37. The level of fixed capital formation in manufacturing rose fromG$8.7 million in 1966 to G$9.8 million in 1969 or an increase of 11 percentover the period, thus according with the output experience. A decilne inthe industry's level of fixed investment is expected for 1970, reflectingthe completion of two fairly large enterprises last year.
38. The growth in manufacturing output and investment, sluggish as itwas, owes something to the Government's continuing efforts to promoteindustrial development thirough special incentive measures. These includeincome tax holidays for up to 10 years; accelerated depreciation of invest-ment; and duty free imports of raw materials, building materials andmachinery. These policies, as well as other promotional measures suclh asthe establishment of industrial parks, are the responsibility of the GuyanaDevelopment Corporation. From its inception in 1964 through 1969, appli-cations received by the GDC for concessions in manufacturing involved aplanned capital expenditure of G$36 million, about a third of this totalhaving been registered in 1969 in lumbering. It was also expected that,as a direct consequence of the planned capital expenditures, some 2,800new jobs would be created. Within the limited scope for industrial devel-opment, the GDC seems to have performed a useful promotional role.
39. The GDC also administers the Private Investment Fund establishedin late 1966 with the participation of the USAID which supplied the equiva-lent of half the total fund of G$6 million, while the Government was tofurnish the other half over a five-year period. The PIF lends up toG$425,000 at 7.5 percent interest per annum for 10 years, and is intendedto support the establishment and expansion of industries. By the end of1969, G$3.4 million had been provided in credits; about a third of thiswas for fishing and shrimping. Until 1969, the purposes of the Fund werenot being fully realized. The difficulty stemmed from the fact thatconditions offered by the PIF were hardly distinguishable from thoseprovided by the commercial banks, which are the commissioned agents ofthe Fund. Since the banks were required to apply traditional criteria inevaluating applications for credit and accept the risk on all loans made,they frequently chose to provide financial support from their own resourcesrather than drawing from the PIF. A further drawback is the requirementthat imports of equipment financed by PIF loans be procured only in theUnited States. With the increased upward pressure on interest rates andthe credit restraints imposed on commercial banks in 1969 (see paras. 98and 103 below). the concessionary terms of PIF funds were more sharnlvrevealed and the rate of lending from the Fund increased.
- 13 -
40. The advent of CARIFTA will raise the effective size of Guyana'smarket almost five-fold. At the same time there will be an attenpt toharmonize industrial incentives granted by the various member countries.Inter-country competition in the past has frequently led to excessiveconcessions. Even when these new favorable features are added to theGovernment's direct promotional efforts, the near-term prospects for rapidgrowth in industrial production are not encouraging. For the lorLger termthere is the more hopeful prospect that some lines of primary productionwill support resource transformation activities in canning, tanning andleather, glass fabrication (using the extensive deposits of white silicasands), pulp and paper and processed lumber products. But these possibil-ities are still on the horizon.
41. Apart from limitations of market, management skills and naturalresources hampering industrial development, the private sector as a wholeseems to lack dynamism. The explanation in part is related to the uncer--tain climate faced by those ethnic groups which generate a good part ofprivate sector savings available for investment. The Government's newstress on cooperatives, and its insistence on eauity participation in sometypes of enterprise, are factors which for the time being contribute tco anunsettled private investment climate.
42. The structure of Guvana's transDortation svstem reflects thedominance in the economy of bauxite, sugar and rice. In respect of allthree commodities. transportation is an especiallv intimate component ofthe production process and the resulting pattern of traffic flows arerelatively simnle. The countrv's settlement natterns; whereby built-unareas are concentrated along the coast and major rivers, also makes forsimnp]e lovisitiral reqnirements Finally, the water nrientatinn o!f theeconomy, wthereby all the major rivers flow into the Atlantic and lowelevatinns enahle navigable canals to be cut readily, cnsnat-itutsc -nimportant transportation element. Despite the large area, these influetncesareatlv simnlifv the transnnrt nrnhlem in Giuyana
43. An imnnnrtant fenature nf trnsnport- nrganiztfion in Guyana is the
responsibility assumed by producing companies (as distinguished fromtranspnro tatin ram,n
4aCa -a4 onnrnf- l - 1
4n- a 1 nF4taivly ; ponpart on Aof
r--F Wr--^ ~s rr -na vt...LJ nat6 .. -tS-- .
the countiy's transportation infrastructure and operating requirements.This helps. ea,lain the relatively smhall contri'Dution of aabout. 6 percentthat the transport and communications sector proper makes to GDP. Manyimportarnt transportratio4 n operfatlor,s a aeoA..n-te- by na- transr
prises. This condition extends beyond the three major commodity producingareas to include some of the larger wholesale an.d retail merchan.:ts as wrellUas the Guyana Marketing Corporation. The appropriation of much of thetrar.sportation market in thils wtay hLas restrained th_efull d 3evelopment cic.. . G Aa.JLLCL±ULL nalt nc .. ,n Ln.La Wa tia .caLLJ. c -LaI .L UL. U L~.LIjJ L .~I A.
a commercial carrier system. Additional inhibiting factors are the furnish-ing of sub' est;c for t s ation services Uy LLIt L,OVeXLlnIULIL WU a reg.-
latory policy effected largely in the form of control over entry to theIndustry.
- 14 -
44. Private commercial operations are largely confined to road and airservices. The latter annarentlv meet a real need iijudging from their favor-able financial results. Licensed commercial cars doubled between 1965 and1969 and rertified cirrier husies rose from 40 to 70 over the same neriod.Licensed commercial trucks increased in number from 300 to 418 but stillconstitute 2 small1 fraction of regmistered triuck irn 1969. There is insinuffi-cient information on commercial trucking operations to help explain thenronpenitv for nronrietnrv trannportation. One posslbility is t-hat commer-cial services are not able to meet the needs efficiently; another is theregulation of entry into the industry by the Govern ment.
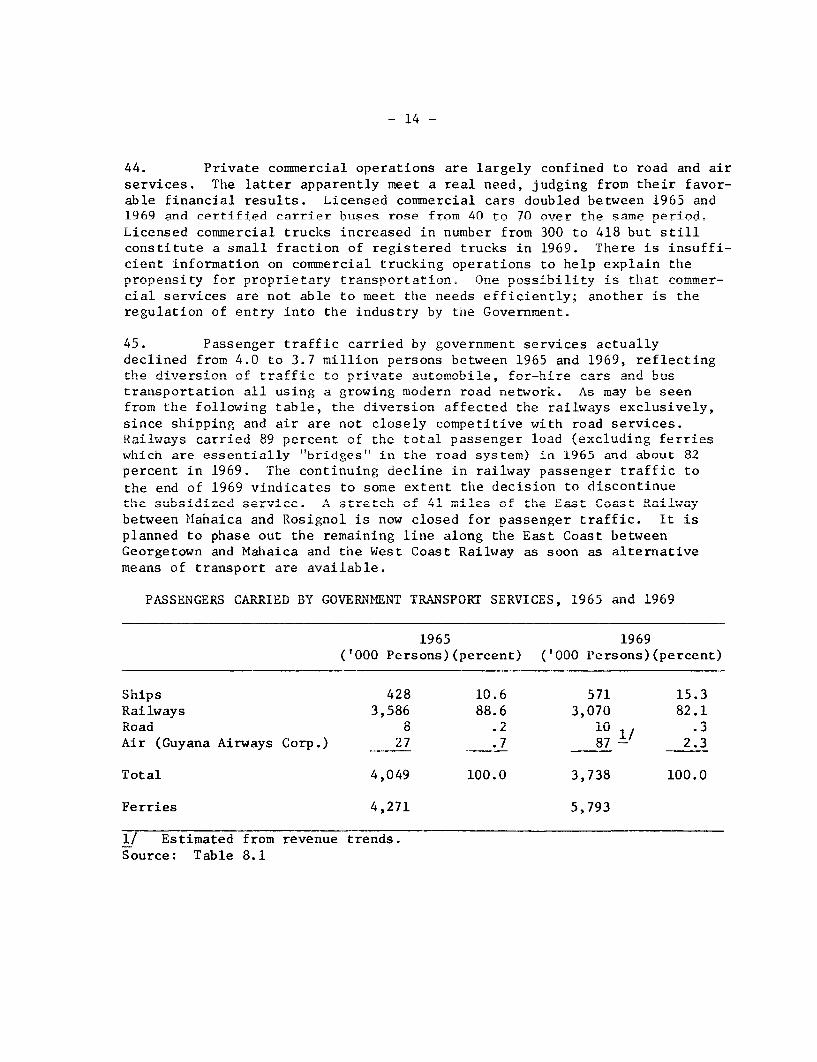
45. Passenger traffic carried by government services actually
declined from 4.0 to 3.7 million persons between 1965 and 1969, reflectingthe diversion of traffic to private au,tonMr..i 1, for-hire cars and bustransportation all using a growing modern road network. As may be seenfrom the following table, the diversion affected the railways exclusively,since shipping and air are not closely competitive with road services.Ra41 -- -ca 4rriA 89 percent of the total -assenoer load (excluding ferries
which are essentially "bridges" in the road system) in 1965 and about 82percent in 1969. The cotinu-4g Adeclin in rai-a passenger traffic to
the end of 1969 vindicates to some extent tihe decision to discontinue"le subsidized servlice. A stretch oft 41 .ies or t1he 'as, Coast Railwaybetween Mahaica and Rosignol is now closed for passenger traffic. It ispLanned 'Lo phase out theU LL LV=1iLaAAI.LkLr, -LL1t.LU±J1k L1t- Fd- L Un lnaogL Uthe ELtWbe en
Georgetown and Mahaica and the West Coast Railway as soon as alternativerImeans of traLLsport are availauLe.
PASSENGERS CARRIED BY GOSVTER1ENT T1RAN SPOR SER-VICES, 1965 and 1969
1965 1969('000 Persons)(percent) ('000 Persons)(percent)
Ships 428 10.6 571 IRailways 3,586 88.6 3,070 82.1Road 8 .2 1U 1/ *3Air (Guyana Airways Corp.) 27 .7 87 - 2.3
Total 4,049 100.0 3,738 100.0
Ferries 4,271 5,793
1/ Estimated from revenue trends.Source: Table 8.1
- 15 -
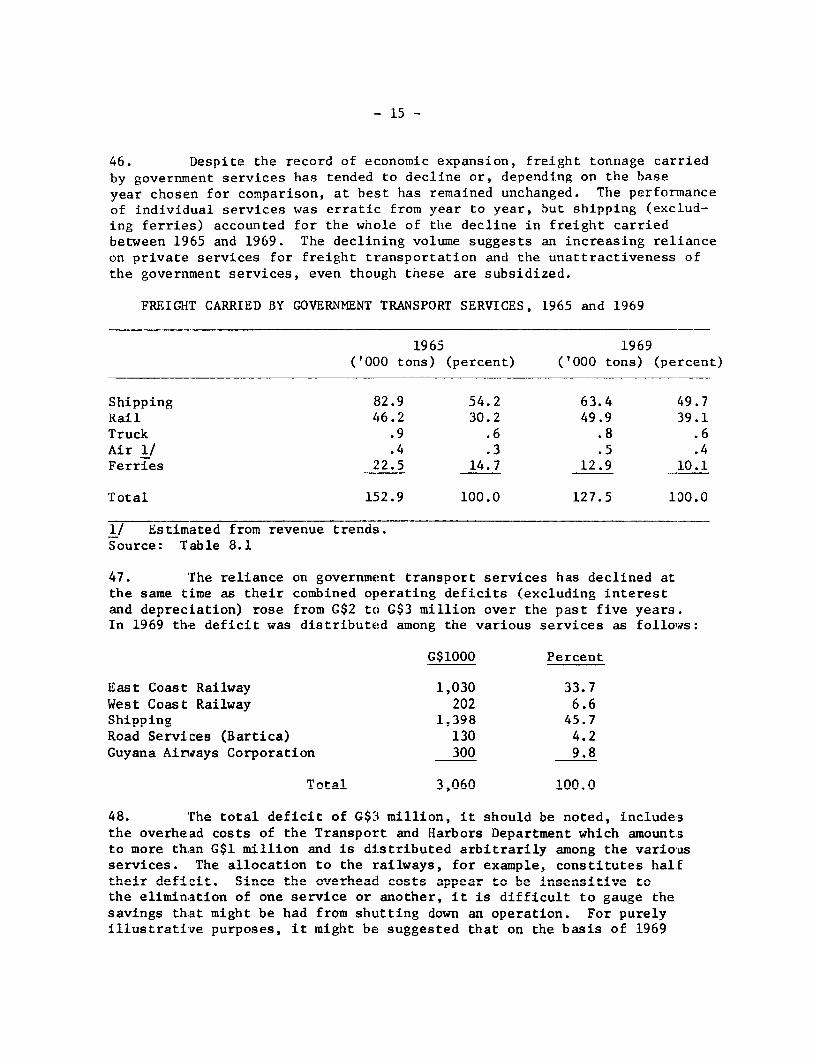
46. Despite the record of economic expansion, freight tonnage carriedby government services has tended to decline or, depending on the baseyear chosen for comparison, at best has remained unchanged. The pertormanceof individual services was erratic from year to year, but shipping (exclud-ing ferries) accounted for the whole of the decline in freight carriedbetween 1965 and 1969. The declining volume suggests an increasing relianceon private services for freight transportation and the unattractiveness ofthe government services, even though these are subsidized.
FREIGHLT CARRIED BY GOVERNMENT TRANSPORT SERVICES, 1965 and 1969
1965 1096.L 9U.J .L 9UJ~
('000 tons) (percent) ('000 tons) (percent)
Shipping 82.9 54.2 63.4 49.7Rail 46.2 30.2 49.9 39.1Truck .9 .6 .8 .6Air l/ .4 .3 .5 .4Ferries 22.5 14.7 12.9 10.1
Total 152.9 100.0 127.5 1100.0
1/ Estimated from revenue trends.Source: Table 8.1
47. The reliance on government transport services has declined atthe same time as their combined operating deficits (excluding interestand depreciation) rose from G$2 to G$3 million over the past five years.In 1969 the deficit was distributed amonR the various services as follows:
G$1000 Percent
East Coast Railway 1,030 33.7West Coast Railway 202 6.6Shipping 1,398 45.7Road Services (Bartica) 130 4.2Guvana Airwavq CAnrnoranti r00 Q-R
Total 3,060 100.0
48- rhe torita! dfic-it of r$3q mnillionn, it shouild be- not-edr, inc-luds
the overhead costs of the Transport and Harbors Department which amountsto more than G'$ million and is distributed a.-bitrarily among the variousservices. The allocation to the railways, for example, constitutes halftheir deficit. Since the ovemrhead costs appear to be insensitive tothe elimination of one service or another; it is difficult to gauge thesavings that mlg.1 ht- be 0 ha from shutting down ar. operation. Ivor purelyillustrative purposes, it might be suggested that on the basis of 1969
operations and taking into account the surpluses generated by the ferries(G$ .350 Jrillion) and harbor services (G$l million) abandonLng the operationsof the Transport and liarbors Department would yield gross savings of G$1.7m illion 'or tiLe GoverLmfent.
49. With growing deficits in the face of declining logisticai res-ponsibility, government transport services appear to drain rather thannourish the econormLy. Specifically, government transport managementis weak, rates are generally high and operating costs appear excessive incomparison with those incurred by private services.
50. While there is no measure of traffic carried in non-governmentaloperations, indirect evidence permits a rough estimate of the role ofgovernment services. Compared with the tonnage generated by the majormining and agricultural activities, government freight traffic is minuscule.Considering the requirements ot manutacturing, however, crude estimatesindicate that government tonnage may comprise not more than 20 percent ofthe total. The passenger carrying role of public services is stronger.Similar estimates suggest that government services supply roughly 40 per-cent of total passenger travel.
51. The Government has not explicitly enunciated a transport policy,crucial as it is for investment guidelines and management effectiveness.There hlas been a strong propensity for the government to operate transportservices in all modes over and above the provision of infrastructure thatthe public sector normallv undertakes. Over the 1966 to 1969 period,government capital expenditures on transport amounted to G$53 millionor 36 percent of total capital outlays. Of this sum, much the largestshare - G$42 million - for road construction and improvement was primarilydesigned to link the major centers of population and the producing areasof the country. Less than G$10 million were devoted to the various trans-port services, mostly the airwavs while the railways, soon to be abandoned,received only a small amount. Capital expenditures on othertransport operations appear to have been inordinately small in relation tothe volume of services performed, and the need to at least maintain capitalintact. This helps explain the operating deficiencies in road services andshipping.
52. Internal communications, comprising telephonic, telegraphic andradio transmission, have been badly neglected in Guyana. The capacity ofthe telephone system has long since been exhausted, leaving a growingunsatisfied demand and an overloaded system that is prone to frequentmalfunctioning. Besides the diseconomies that the scarcitv of telephoneservice has induced, it has also turned this instrument of communicationinto a highly-valued symbol of social status. The Guyana TelecommunicationCorporation, organized in March 1967 as an autonomous public enterprise,operates 18 exchanges throughout the country and provides service to 7,000telephone subscribers at rates established in 1960. There is thus one
- 17 -
telephone per 100 persons or 1.7 per 100 persons if phone extensions arealso considered. Communications with interior settlements are based onan antiquated manually operated Mlorse Code system and a network of highfrequency radio stations. Capital expenditure in these services haveaveraged only G$5 million a year since 1967. A large part of this sumwas devoted to introducing a limited telex system in Georgetown.
53. In sharp contrast to the deficient internal system, externalcommunicat:ions are highly developed. Through the Cable and Wire:Less Com-pany, Guyana is tied into the world-wide communications network. Plansfor expancling and modernizing the internal communications system wereprepared in 1966 and 1967, but are only now beginning to be implemented.The program calls for a capital expenditure of G$17 million over the nextthree years and will add eight telephone exchanges in the major areas ofsettlement: and upgrade the interior communications system. The bulk ofthe financing requirements will be provided by suppliers of equipment,while the small remainder will be self-generated by the Corporation, whichin 1968 and 1969 recorded a small net operating surplus. (See AppendixII - Financial Opetrations of the public Corporations.)
54. The above review of recent nerformance in transport and communi-cations reveals some serious deficiencies in the Government's serviceoperations; regulatory measures and capital expenditure nrogram. Whatappears tco be required is a thorough critical review of all facets ofgovernment: transport onerations and nolicies. A ma'or obiective would beto redefine operational criteria - to continue to operate subsidized trans-nort qervices only where thi4 meets clear Peonomir or socril niirnpoePSuch a review is almost certain to reveal the need for organizationalreform, improved management derisinn makinga hbtter information anid aninvestment: program based on a considered strategy for the sector as awhol, andri wahirch fits well into the overa1l deveopment fram.ework.
55. In the various social services, - health, education, .wtater supplyand sanitaLtion - little or no improvement over the past five years hashpen evident Rouighly a third of eurrerlt gouprnmpnt pYnPnditi1rPcs is srpnt
on these services, largely on education. But since 1966 the growth inthpir nllrirntinn has been Iess rnnid than total ouInitlays= rnnitnl epndrBi-
ture averaiged only G$5.5 million a year, and of this sum the constructionof tHo Tln.7aiorya4 tx, n^f 2117o,,no MhQanvoAf tQtrz:t4!2ol OIIoMV Tn vie- f tho
backlog of needs and the increasing demands emanating from population andincome gro,wth, the star.ardA of social -4rvices, with tho psie4l excet 4.on
of education, has remained unchanged, and it is even doubtful whether t:hecapital st-cl, 4-i ths4 sect-r has been .aintained 4ntact.
56 The 1-literscy rate in. Guyana (83 pcent as of '1960) is c.LpauaL±vc-
ly high, reflecting the ready availability of basic education, even thoughd4eficicencies in -ibe quallifcations of teachers, -le existence of all-ageUA .J J. A IL LAJ ~ I L .Ld.L JI.. L±JL & L .I L LiiL LLL J. LL L~ LI . L
schools as departments of primary schools, limited access to secondaryschiooJLs andU overcrLowdUi[ng in priL ,ary schLoUUl aLe pLUr.iLnetIL Lt&LU. Be:cause

- 18 -
the present curricula bear only a remote relation to the economic and socialdevelopment needs of the country, the Government in January 1968 launchedi a
major program to restructure and expand the educational system. It isess-tially a4 a t the wrnAinal elimlnatinn of all-age schnoolc an t-h
creation of a comprehensive system of education at the secondary level.T+- 4s anticipated that by. 19a73 tnher ba4 fo-r -.. Ii n aFwFa;eTt *1 -. EO aL L..L -J L~ ---OI * vy Mt . i LI _S L <>7>v;-Litv2L UL - A J '. 6. z
have been laid. An IBRD/IDA loan is helping to finance the program whilethe United Kinbdom.l and Canad-a -4e aiti at the- level ofuniversity
education.
57. The improvement in health standards that occurred in the 1950'sandIU thI.e Lirst LLa.LL oLf L.Lie 19U60's was largely related to the eradi.ationof malaria. Crude death rates were reduced sharply by almost one half, while
lnifLarit mortalityy £ e±.L LJ3 5JJ percentL. Sma uLa.Ller auu± ddiL tional. JAL V t rulmn t s took
place in the past five years:
CHANGES IN HEALTH STANDARDS AND SERVICES, 1965 AND 1969
1965 1969
Crude death rate (per 1000) 8.2 8.1
Infant 11ortality rate (per 1000) 48 , 40Doctors (per 10,000) 2.3 -! 2.1General Hospital beds (per 1000) 3.2 3.0
1/ 1967.Source: Ministry of Health; United Nations, compendium of Social
Statistics 1967; and World Health Organization, FourthReport on the World Health Situation, April 1970.
The crude death rate has remained stable at its already low level whileinfant mortality continued to decline. The 1969 infant mortality rate islow in comparison with the average for Latin American countries, but isnevertheless onsidered by the G.vanese authorities to be unacceptably highand susceptible to further reduction. The shortage of doctors and generalhosnital hbds onntinuips to he acute; while the incidence of endemic diseases
has remained high. The control of typhoid in recent years has much improved,but there ic alwas t-hp thrpat nf a fulllcale enidpmic of this and otherwater-borne diseases so long as present low standards of sanitation in bothurban and rural areas persist. Of growina rnncern is the hioh incidenee of
malnutrition, particularly among children in rural areas. Nutritionaldeficiencies were the indicated cause of almr.st 30 percent of Ad.aths recorded
in the under five age group. A Ministry of Health sample survey in 1969found that 62 percer.t of the children under five years were suffering f-omvarying degrees of protein malnutrition.
- 19 -
58. A serious handicap in dealing with health issues has been theabsence of information and the consequent formulation of policy on thebasis of imperfect knowledge. While certain problem areas such asmalnutrition can be readily defined, their magnitude and the appropriatecorrective or preventive measures required can only be guessed. A pre-investment study of all facets of health, especially the provision ofservices outside the main centers of Georgetown and New Amsterdam, isbadly needed.
59. Since many of the endemic diseases in Guyana are water-borne.their control and eventual eradication are related to water supply andsanitation. Outside of Georgetown water sunnlv is limited- and. where itexists in rural areas, is often polluted. Approximately 30 percent ofthe rural notable water sunnlv is nrovided and maintained hv the SugarIndustries Labor Welfare Fund Committee, while 60 percent comes from theMinistryv nf nf WnorkR 1 Hvdr1r:lircz nnd S,innIv Thp Mini;trv -npndc nhni,rG$800,000 a year on both current and capital account and includes an elementnf suhbsid:lzat-inn s.inre rural water userq contrihbut-e little tow,.ards thecost. This sum has not permitted services to be maintained properly let
alone expanded, and as aresult…prcpt onum.to. <fle. Further-more, it is estimated that consumer waste together with leakages from the-n-tiquated system. produce losses of about two-thirds of the total outp:tof the rural water system.
60. If anything, sanitation facilities are even more inadequate andthe problem of sew:erage dlsposal in Georgetow has becom--e acute. nly13 perceni: of the population live in houses connected to a sewerage system.Poor disposal fac.lities lncludingope roadside drains frequently res;;lt
A. .JtJt tL&J9~o .3 tO. L. .j i.t O *lt..tS tA L,JCL* tjtO,i tA.M L.110 I.3. £ 9 AL&L..Ly LOC5UALL
in the contamination of potable water supplies.
61. The provision of adequate supplies of potable water and sanit:ationfracilites are imp-ran t e'l e r ents ox: prvntvrmdcnei Gyna ht LLJ. A.L ±00- ; t c& L UI 9L LllLFvIOLL O J. PLtOVLLL.L V= ULtCU±LU±L ±11 UY 01LC0. L. LI=
control ol typhoid, filaria, gastro-enteritis, dysentery and parasitic-diseases clepend h1eavily on im.proved st.-andard of envrometa ------ itat.o-_,n.
The improvement in rural water supply and a study on sanitation needsleading tol a progr-am of action ,merit high priority.
U4 . iUUs-IIg lUI costuct . U&l UULIr, LIM 11 LC170U tJ [LLZb dVCL:uttU dULUUL 4ULIV
new units a year, the vast majority having been built on private account.Since the curreat housilng gap is estimateu by the Guyanese autnoritiesat 24,000 units, and annual family formation may be of the order of2,700, a much stepped-up annual rate of construction is needed ir presenthousing standards are to be raised. A housing investment guarantee ofG$8 miilion has recently been furnished by the USAID to support the cons-truction of over 1000 new units. At the same time the Commonwealth Devel-opment Corporation and the Trades Union Council have raised their plannedrate of housing construction. The prospect is that the rate of housingconstruction will rise by about a third in the next few years. The antici-pated higher rate of house building will just about cover the annual in-
- 1) u
crease in demand for housing, leaving the backlog unaffected. Judgingfrom the large number of applications for the low-cost housing units thatcome onto the market, the most pressing need is housing for lower-incomegroups. While public agencies, cooperatives and trade unions have imple-mented programs on a modest scale to help meet these needs, there is scopefor enlarged government participation in the form of a public housing dev-elopment. The program might best focus on alleviating the housing shortagein the major urban areas, where the social benefits are likely to be great-est.
63. Mortgage money should be more readily available following thenew legislation which exempts housing investment income from taxation;raises the required percentage of local investments by insurance companiesto 95 percent of their statutory funds and other reserves; and providesgovernment mortgage guarantees. A program for self-help and hire-purchasehousing is administered by the Ministry of Housing but the total number ofunits constructed has been less than 100 per year.
64. The National Insurance and Social Security Scheme came intoforce in October 1969. When fully operative, it will provide benefitscovering old age, injury, invalidity, survivors (widows and orphanedchildren), sickness, maternity and funeral charges to almost all personsunder contract of service (i.e., other than self-employed) between the agesof 18 and 65. It applies to both the public and the private sector.Premiums for the scheme amount to 7-8 percent of insurable wages withemployers paying some 60 percent and employees the remainder. The Scheme,which began to pay benefits for workers compensation as of January 1, 1970,is an equitable and well-integrated system and should improve the averagelevel of social welfare. It will also affect the level of public savingsfavorably in the early 1970's (see paragraph 78), because payments fromthe Scheme are expected to be modest during this period.
C. Public Sector Investment
65. The Guyana Development Programme 1966-1972 proposed a govern-ment investment program totalling G$295 million at 1966 prices for theseven-year period. 1/ The major thrust of the program was to build upthe economy's infrastructure - transport and roads in particular, seadefenses, power and telecommunications. Actual government investment tothe end of 1969 amounted to G$140 million at 1966 prices; while publiccorporations accounted for additional capital expenditures of the orderof G$5 million. The annual level of expenditure between 1966 and 1968roughly conformed to the anticiDated annual phasing, but that for 1969fell short of the planned increase.
1/ The program was reviewed by an IBRD Economic Mission in 1966. Theirrecommendations were accepted by the Government and the revised Planserved as the basis for discussion at the first Aid Donors Conferencein 1967 (see IBRD Report WH 169d, 1967).
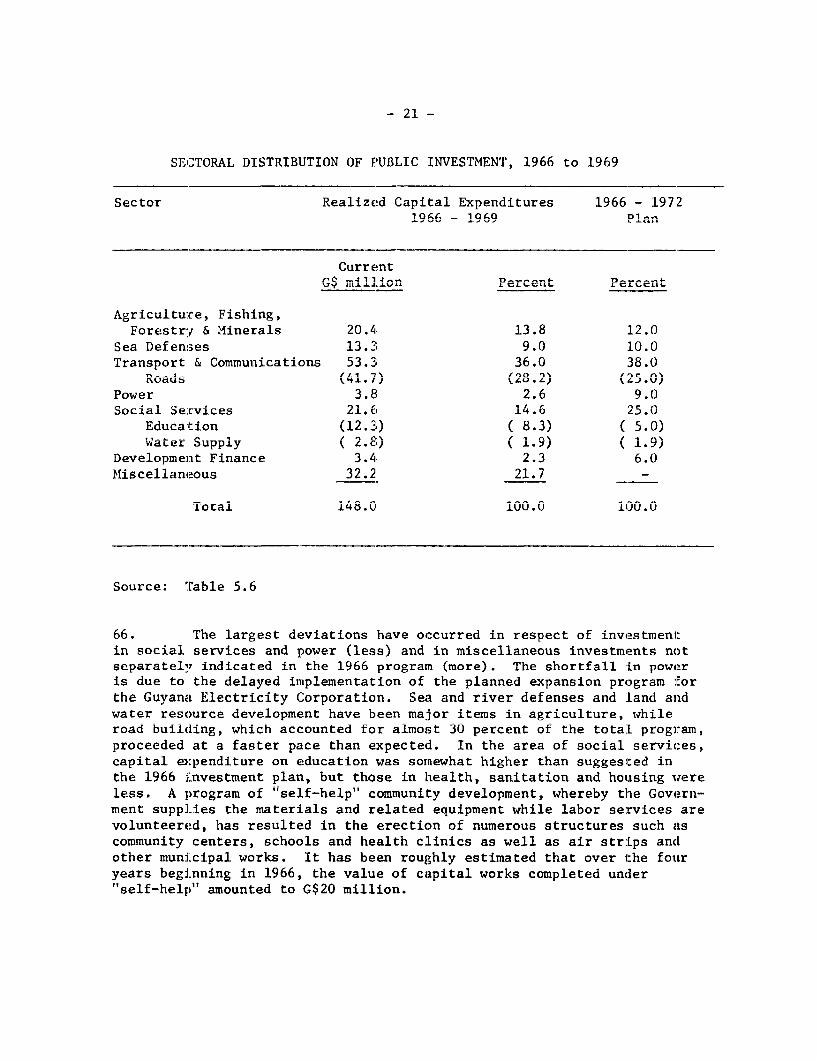
- 21 -
SECTORAL DISTRIBUTION OF F'UBLIC INVESTMENT, 1966 to 1969
Sector Realized Capital Expenditures 1966 - 19721966 - 1969 Plan
CurrentG$ m4 l]ion4 P0ercent _ ercent,
AgricLu Lure, CsrDin.Lng,
Forestry & Minerals 20.4 13.8 12.0Sea Defen, 13.3 9 .0 10i.0
Transport & Communications 53.3 36.0 38.0Road's (41#-.7) (2B .2)I (2.0)v
Power 3.8 2.6 9.0Social Services 21.6 14.6 L5.0
Education (12.3) ( 8.3) ( 5.0)Water Supply ( 2.8) ( 1.9) ( 1.9)
Development Finance 3.4 2.3 6.0Miscellaneous 32.2_ 2;.7__-
Total 148.0 100.0 100.0
Source: Table 5.6
66. The largest deviations have occurred in respect of investmenl:in social services and power (less) and in miscellaneous investments notseparatelv indicated in the 1966 program (more). The shortfall in poweris due to the delayed implementation of the planned expansion program iforthe Guyanc Electricity Corporation. Sea and river defenses and land andwater resource development have been major items in agriculture, whileroad builCing, which accounted for almost 30 percent of the totaL program,proceeded at a faster pace than expected. In the area of social services,capital expenditure on education was somewhat higher than suggested inthe 1966 investment plan, but those in health, sanitation and housing wereless. A program of "self-help" community development, whereby the Govern-ment supplies the materials and related equipment while labor services arevolunteered, has resulted in the erection of numerous structures such ascommunity centers, schools and health clinics as well as air strips andlother municipal works. It has been roughly estimated that over the fouryears beginning in 1966, the value of capital works completed under"self-help" amounted to G$20 million.
- 22 -
67. Judging from the year to year increases in capital expendituresand the nature of some of the projects completed, Guyana has demonstrateda growing technical and engineering capacity in several lines of activity.On the other hand, the high proportion of expenditure in the miscellaneouscategory reflects continuing administrative weaknesses in identifying,preparing and executing effectively some of the more complex nortions ofthe investment program, including particularly projects potentially suitablefor external financing. As these difficulties caused delays in the nroiectsin question, the need to keep up employment dependent on public sectorinvestment tended to lead to small scale and lower nrioritv nublic works.
68. Tn the extent that the 1966 npublic' investment plan is stillrelevant today to Guyana's needs and priorities, the sectoral investmentnnttern fnr thp nexzt few years wn 1 t he ewnertert tn PTmnhqzi7. Penendnit,ire
in power and telecommunication, social services other than education,financing industrial development, nnd the rediition or elimination ofinvestment on items in the miscellaneous category. Generally, the originaltargets for infrastructural development are far from being met in the areaof power and telecommunications and some social services. These consider-ations are taken intn acroun t in the niihlir inxves tment program proposedfor 1970-1975. (See Chapter III.)
D. Public Finances
69. The Central Government accounts for more than 90 percent oftottal expenditures ofl th.e pubilic sector. rThe rest consists ofl th-e
L~JLJ. 4~jJLIU LUJ ~ JL ~&~ LLA ~ L.J L. ~ 11~ L LU L4 L 1J£ IL
municipalities of Georgetown and iNew Amsterdam, agencies governing some90 villages and Merinudian settLerLents, aniud a 1IUI,U. 0f pUblic enterprises
organized as statutory boards or public corporations. (See Appendix II.)To a large extent, the public corporations are financially dependent onthe Central Government which covers their operating losses through budgetsubventions, and finances their capital formation through loans andadvances or by guaranteeing the corporations' external loans.
70. During 1966-1968, the Central Government's financial positionimproved considerably with the doubling of the current surplus (see accom-panying table). The improvement stemmed from additional tax measuresintroduced in those years, which helped raise revenues by 20 percent. Atthe same time current expenditures over this period rose by only 14 percent.Current account savings in 1969, however, dropped back sharply below the1966 level, as revenues increased by 6 percent, while current expenditurerose by 14 percent. The lag in revenue growth in 1969 occurred despite
- 23 -
new tax measures such as a defense levy, a consumption tax designed tocompensate for losses of import duties on CARIFTA products and an advancecompany tax payment in 1969 on 1969 tax liability under the P.A.Y.E. ("PayAs You Earn") system. The lag in receipts is attributable in part to thedelays in implementing the new fiscal measures and in part to deticienciesin tax administration and collection machinery. The inordinately largeincrease Ln current expenditures is broadly distributed; it includesgeneral administration items such as the strengthening of the country'sdefense forces and its diplomatic representation abroad and a specialsalary increase awarded to the civil service.
71. The 1970) Budget marks a new departure in the area of taxationand its overall impact is expected to raise tax revenues significantly.,Of the expected G$19 million absolute increase in tax receipts, about athird will, come from new tax measures. Other sources of increased taxrevenue include the extension of the consumption tax which should yieldG$1 million, the continued advance payments under P.A.Y.E., and a substantiallyraised tax liability for some major companies whose initial investmentallowances terminate this year. The tax measures in the 1970 Budget aremainly in the area of company and business taxation. If the proposals arefully realized, the share of company tax in total tax revenue will be raisedto 24 percent as compared with 17.3 percent in 1969. The budget also callsfor the lowering of personal income taxation.
72. The major new elements of the 1970 Budget (a) raise the effectiveburden of taxation from 45 percent to 61 percent for commercial companies(i.e., where more than 75 percent of their income is derived from trading)and 51.25 percent for non-commercial enterprises; (b) limit deductionsfor foreign head office expenses to one percent of annual sales for non-commercial companies and one-half of one percent in the case of commercialfirms; (c) increase the tax on insurance companies and require that aspecific proportion of their funds be invested in government securities;(d) increase license fees on vehicles, commercial banks and agents forforeign non-life insurance companies and taxes on film distributors. Inthe area of tax administration, a system of self-assessment is introducedfor returns other than companies and appeals for review of assessments aremade more costly so as to prevent frivolous appeals and delays in taxpayments. Allowing for relief in personal income taxes, the missionestimates ithat the net gain from the new taxes will be around G$6 milliDn.Their effect will be to shift the tax structure in a way which increases thereliance for revenue on consumption and company taxes and reduces dependenceupon taxation of foreign trade. The new budget proposals are complex andmay cause difficulties of definition and interpretation when implemented.If their full effect is to be registered soon, the legislation settingout the details of the new tax proposals must be introduced promptly.Similarlv. the reauired improvement in administration and tax colLectionmachinery should not be delayed.

1/Central Government Current Budget Operations 1966 - 1970
2/
1966 1967 1968 1969 1970(GS, mi=llion)
Current Revenue 85.2 92.9 102.6 108.8 128.0Tax P.venue (73= ') (n0 7) (90.2) (95.3) (i) -0)
Current Exp)en tIures 79.7 ,l.6 90.9 103.6 115.0Subsh_i_d e (s2) (2.8) (3.2) (h.0) (3 7)
Interest on Pub.Debt(6.5) (7.8) (10.5) (lo.6) (10.7)Current SuIrplus 55 1 .3 11.7 5. 13.0
Cu. ent Re~venue 21.6 A 1 7 22. 218 23Tax Revenue (18.5) (18.8) (19.6) (19.1) (21.0)
Current E-,Oer.f- n0 19.0 10 7 0II) 0 21?
3T'sidies - (0.8) (0.6) (0.7) (0.8) (0.7)Inltere st on P1ub0.1Deb--It- ( i 2 N/ (l.s") (2.3)) (2.) I (2.) n
Current Surplus 1.4 2.6 2.6 1.0 2.h
1/ The fiscal year coincides witn the calendar year.B/ Budget EstiGmates revised by tJhe Mi^ssion to include Ln a'owancefor civil service wage increases, higher than estimated tax returnsfrom corrpanies and ot,her mrinJUor adjustm1ents.
3/ Corporations and farmers.
Source: Table 5.1
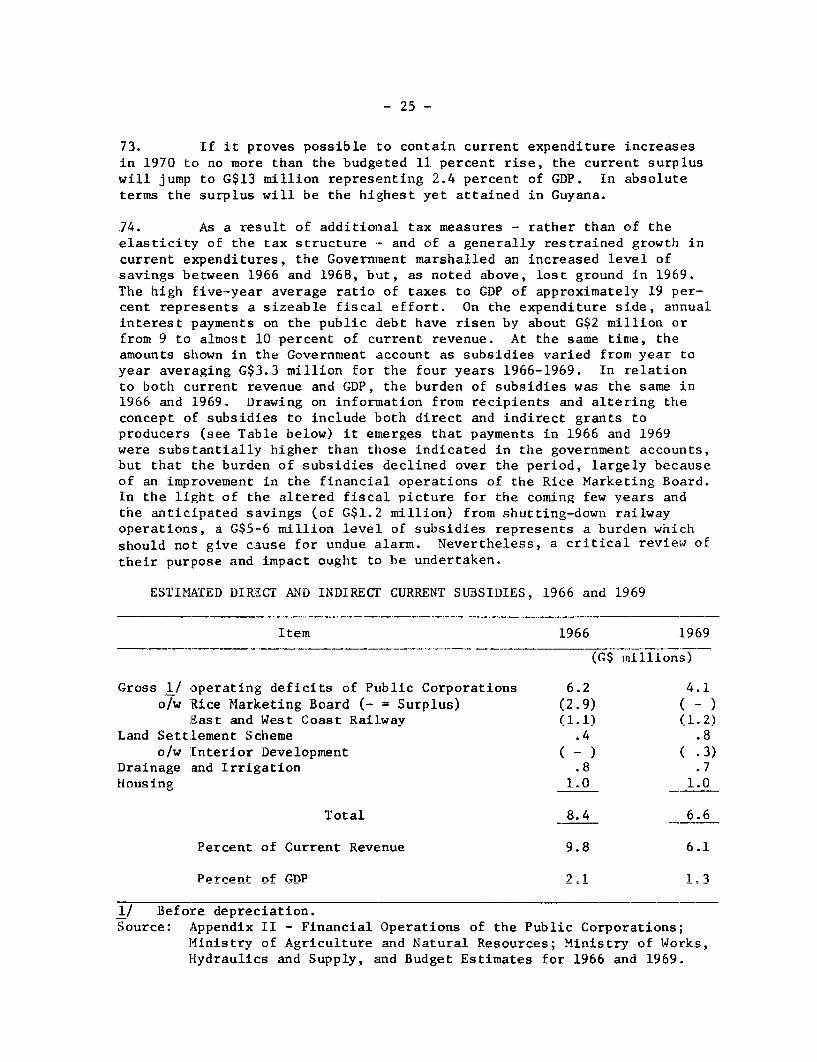
- 25 -
73. If it proves possible to contain current expenditure increasesin 1970 to no more than the budgeted 11 percent rise, the current surpluswill jump to G$13 million representing 2.4 percent of GDP. In absoluteterms the surplus will be the highest yet attained in Guyana.
.74. As a result of additional tax measures - rather than of theelasticity of the tax structure - and of a generally restrained growth incurrent expenditures, the Government marshalled an increased level ofsavings between 1966 and 1968, but, as noted above, lost ground in 1969.The high five-year average ratio of taxes to GDP of approximately 19 per-cent represents a sizeable fiscal effort. On the expenditure side, annualinterest payments on the public debt have risen by about G$2 million orfrom 9 to almost 10 percent of current revenue. At the same time, theamounts shown in the Government account as subsidies varied from year toyear averaging G$3.3 million for the four years 1966-1969. In relationto both current revenue and GDP, the burden of subsidies was the same in.1966 and 1969. Drawing on information from recipients and altering theconcept of subsidies to include both direct and indirect grants toproducers (see Table below) it emerges that payments in 1966 and 1969were substantially higher than those indicated in the government accounts,but that the burden of subsidies declined over the period, largely becauseof an improvement in the financial operations of the Rice Marketing Board.In the light of the altered fiscal picture for the coming few years andthe anticipated savings (of G$1.2 million) from shutting-down railwayoperations, a G$5-6 million level of subsidies represents a burden whichshould not give cause for undue alarm. Nevertheless, a critical review oftheir purpose and impact ought to be undertaken.
ESTIMATED DIRECT AND INDIRECT' CURRENT SUBSIDIES, 1966 and 1969
item 1966 i969
(GS millions)
Gross 1/ operating deficits of Public Cornorations 6.2 4.1o/w Rice Marketing Board (- Surplus) (2.9) ( _ )
East and West Coast Railway (1.1) (1.2)Land Settlement Scheme .4 .8
o/w Interior Develonment (-) (.3)Drainage and Irrigation .8 .7Housing 1.0 1.0
Total 8.4 6.6
Percent of Current Revenue 9.8 6.1
PeFtrpnt nf (,nP 2=1 1 A
_! Bepfnore depreciitoinnSource: Appendix II - Financial Operations of the Public Corporations;
14inistryuof Agriciltutro and Natural Resources; Ministry of Works,Hydraulics and Supply, and Budget Estimates for 1966 and 1969.
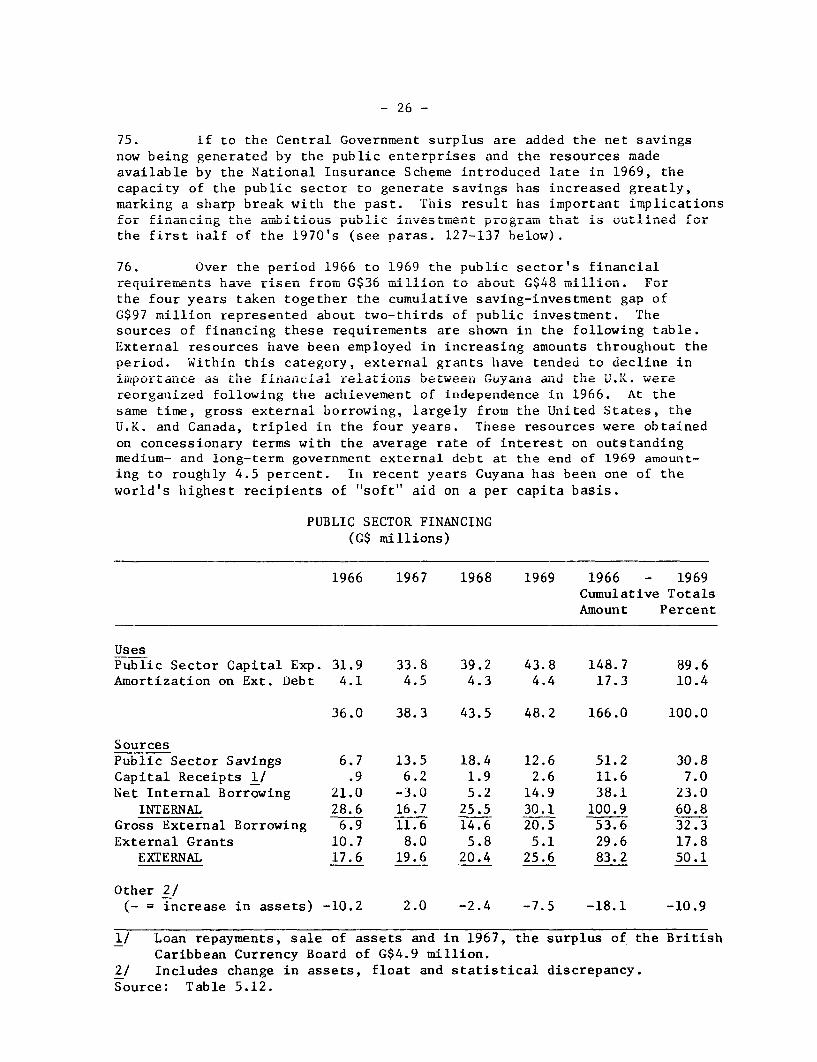
- 26 -
75. If to the Central Government surplus are added the net savingsnow beMing rgrenMe_raCt~ed bDy the puli-ntrrie and the resources mua eiILJW U ~~~~~~~~~ ~~ £ ~~~~~L~~U uy~~) LA&_ p UALJL.L. L% ~L ~A . ~ c U L-LL A 3UA. ~ *AL
available by the National Insurance Scheme introduced late in 1969, theLcapaL. Ly of. Lith pub .LcL setoLJ. LU generate sAavlng Lha LLsnceaseu greAaLJ.y
marking a sharp break with the past. This result has important implicationsfCor financ-ing the ambitious public investment prgalthat is .. 14 outine fr-I.U L A. A.I±LL LLL dWL.L L ±UU~ AU).L A.V~ LU P L p LU L CULL L LI l L .1.L U L.UL LJL MU 1. .
the first half of the 1970's (see paras. 127-137 below).
76. Over the period 1966 to 1969 the public sector's financialrequirements ha C1ve-- r i s enIL'cr01 frorl G$.6 milli :on to about,G$4 r L/.,illi on. Forr~~~4uLL .11~~~~LLL~~~ 1LdV~~~ L L~~~~LI L LL.JIII ~~~~~39JU LLU. .L±.A.ULI LU ~~~~~~~~~LJUUL 0.94_U IIIVLJL.J..LULLI *L L£
the four years taken together the cumulative saving-investment gap ofQ7 mili'on represented about two-Lhirds oU pubi1c Inve s itment. T LLt
sources of financing these requirements are shown in the following table.£~ALULI~± UbUULCeb LdV~ UUII U[p±U~!U LLI .LILULUUdb.Lly, clULLPUULLL LIILLPUrLILUL Lilt=Elxternal' resources Lhave bUeen, emp'loe in inceain ertt Uhoghu the
period. Within this category, external grants have tended to decline in±Himportance as tLhCe financial reLatiLons bUetweeri GUuyarna ad te UL.I . werereorganized following the achievement of independence in 1966. At thesame time, gross external borrowing, largely from the United States, theU.K. and Canada, tripled in the four years. These resources were obtainedon concessionary terms with the average rate of interest on outstandingmedium- and long-term government external debt at the end of 1969 amount-ing to rougnly 4.5 percent. In recent years Guyana nas been one of theworld's highest recipients of "soft" aid on a per capita basis.
PUBLIC SECTOR FINANCING(G$ millions)
1966 1967 1968 1969 1966 - 1969Cumulative TotalsAmount Percent
UsesPubllc Sector Capital Exp. 31.9 33.8 39.2 43.8 148.7 89.6Amortization on Ext. Debt 4.1 4.5 4.3 4.4 17.3 10.4
36.0 38.3 43.5 48.2 166.0 100.0
SourcesPublic Sector Savings 6.7 13.5 18.4 12.6 51.2 30.8Capital Receipts 1/ .9 6.2 1.9 2.6 11.6 7.0Net Internal Borrowing 21.0 -3.0 5.2 14.9 38.1 23.0
INTERNAL 28.6 16.7 25.5 30.1 100.9 60.8Gross External Borrowing 6.9 11.6 14.6 20.5 53.6 32.3External Grants 10.7 8.0 5.8 5.1 29.6 17.8
EXTERNAL 17.6 19.6 20.4 25.6 83.2 50.1
Other 2/(- = increase in assets) -10.2 2.0 -2.4 -7.5 -18.1 -10.9
1/ Loan repayments, sale of assets and in 1967, the surplus of the BritishCaribbean Currency Board of G$4.9 million.
2/ Includes change in assets, float and statistical discrepancy.Source: Table 5.12.
- 27
77. Internal sources of finance varied in amount from year to year.The inordinately large capital receipt of G$4.9 million in 1967 on disso-lution of the British Caribbean Currency Board explains the bulge in thatcategory of financing in that year. Net internal borrowing (largely fromthe banking system) has apparentLy been resorted to whenever requirementscould not be met from other sources. By 1969 net borrowing from the publichad declined significantly as a source of financing. (See Table 5.12).But the 1970 budget proposes new regulations for the insurance companies,particularly those in life insurance, which would give the Government accessto a substantial proportion of savings mobilized by the private companies.
78. Public sector savings have contributed an unevenlv increasingamount to financing requirements. Part of the uneveness was due to thedrop in the Central Government surplus in 1969. Savings generated bypublic corporations rose substantially from G$1.2 million in 1966 to apeak of G;6.7 million in 1968 and fell off in the following year to G$.5.6million. These wide swings in public corporation savings are largely dueto the changing fortunes of the Rice Marketing Board (see Table 5.12).The National Insurance Scheme contributed G$1.8 million in 1969 havinggone into onperation only in Septemher of that vear. The Scheme has onpnedup an important new source of funds, since it is envisaged that the buLkof the snntial suir plus would be invested in government ser-r--es= Tn -970,the Scheme is expected to generate a surplus approaching G$10 million. By1Q72j this5 Sm will drop to an annnual level of G$6 millin a ensin sandother payrnents mount.
79. In 1966 public sector savings represented 1.7 percent of GDP; in1969 the ai-ii>o st:dA at of- percent and for 1970, partly because of l.agagedrevenue eifects, it is estimated that it will almost reach 6 percent. Theproceeds from the Na4tional In sur-ancee Scheme accountn fot r a major snare of
the growth in savings. The improvement in public sector finances and thefavorable prospects -ver the -ear future augur well for a bettez baOlacein financing Guyan,a's development program since they suggest that internalborrowing fro m the bankin,4g sstem can h r e duced subst-ant1iall
80. ,A importa.t constraintt theat has advereyUicinvestment program and its financing has been the capacity to plan inve!st:-1UCLIL cuLU e UpeaILrLeyX pL= C cU LUIV MplUemnL pJLecJtsLL . Isb iLnUdLLcateU eaL.L.Lt:LX
administrative weaknesses have led to lags in in the preparation andimlementation I.of Lthe more complex, externallyfina jJLnJce pr cL L.This
was further reflected in Guyana's inability to absorb more than 60 percentof L thLLe estimated voULUe OL exterr,al resources tbLat was potentially avai-dL1
able to it from bilateral donors and international agencies. The majorresponsibility for public investment planning and coordination is asig.e.dU
to a small group in the Ministry of Economic Development. Dedicated asthey are, their small numbers and limited range of expertise have been over-taxed. Moreover, administrative weaknesses in some Ministries and agenciesof the Government have adversely arfected tne execution or tne presentpublic investment program. Frequent changes in key personnel have compound-ed the difficulty. Fortunately, the deficiency in these important areasof administration 'has been recogn:Lzed by the public authorities and efforts
- 28 -
are being made to increase the professional capacity of the variousMinistries and public corporations. The removal of this serious adminis-trative constraint is indispensable if Guyana's development is not to behampered by unwarranted low levels of investments induced by an inabilityto absorb external funds.
E. Balance of Payments
81. Guyana is a small open economy with ratios of commodity exportsand imports to GDP in the neighborhood of 50 percent. Its major tradingpartners are Canada, the U.S.A. and the United Kingdom. Guyana imports awide range of products with machinery and transport equipment and manufac-tures constituting the major categories. It also imports an average ofabout US$17 million worth of food a year or roughly 16 percent of totalimports. Exports of sugar, rice and bauxite together account for over 90percent of commodity shipments abroad. Beginning in the mid-1960's, goodsugar crops combined with an increase in average price obtained throughenlarged shipments under the U.S. quota and buoyant exports of bauxiteand related products helped raise the value of exports by US$24 millionover the four years to 1969, or an increase of 23 percent. The decline inexports in 1968 was mainly due to real factors affecting production in themajor export industries - unseasonal rains impeding bauxite extraction andtechnical difficulties in alumina Drocessin2. labor unrest in sugar andpoor harvests in rice. The sharp decline in imports in 1968 reflects thecompletion of the maior exDansion program in mining and- to a limitedextent, the impact of devaluation from G$1.71 to G$2.00 per US$ in late1967. Since about a third of Guyana's trade is with qterling blockcountries, and the rate remained unchanged vis-a-vis sterling, the effectof the dpuvliation on the hblanrP of payments was modespt Rirp - vnxorts
in 1969 continued to suffer from adverse conditions in rice productionnnd artuailly fell hv US$4 million in rhat year
82. Tho extent of non.-resident recsou,rce ruo.rs-hiin in Guyana is
reflected in the high outflow on account of factor payments, whichcontributes substantially to the current account deficit. The expatriatemining and sugar companies account for most of the payments which in 1969rose b- about one-fifth (US$ mill. ov4e114- the 196Q level. Th1,4s sh
J ~ ~~~.L \_ Y y -I 1r1-J.. L., .r~ - - -.fl& c.-Lj.
rise reflects improved production and sales in the sugar industry andincreased earnings and interest paymuents in muining sent abroad.
83. D~esp-ite the imro-ln i. tevsbl rd ccut heblrcliJ~j. L~ LLLC ._LUIJJIL)VV 11=LL L. A.L1. L.LIt V.LM1.LU .LC L LCdUC dLUt;UL&L L -Lt: UdJ..dJL1U_
of payments recorded deficits in both 1968 and 1969 and foreign exchangereseres delEnedby atotalof Uv.5 ,ill'on 'or the two years co-mbined.reser4ves Ue±lineU by a tota.L oLE USY90 .J mIU..L±L I) £1L11 WUyILC01iI.
The relatively reduced levels of private capital inflows in 1968 and1969, (following the completion of thle expdansLoi pLUgriam i1n mi'ni1ng), andU theincreased factor payments outflow in 1969 help to account for the deficits,but a large unexpiained item - errors and omissions - remains. By the endof 1969, net foreign exchange reserves amounted to the equivalent of somethree months' commodity imports.
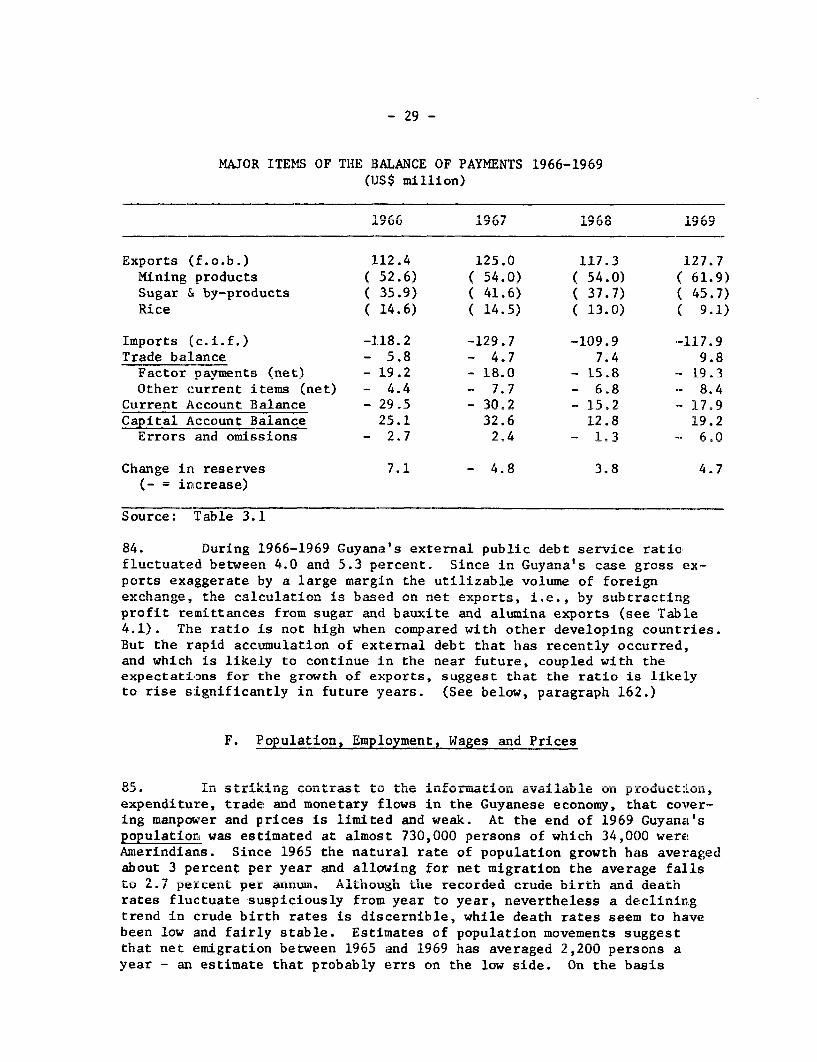
- 29 -
MAJOR ITEMS OF THE BALANCE OF PAYMENTS 1966-1969(US$ million)
1967 1701 1700 1L969
Exports (f.o.b.) 112.4 125.0 117.3 127.7Mining products ( 52.6) ( 54.0) ( 54.0) ( 61.9)Sugar & by-products ( 35.9) ( 41.6) ( 37.7) ( 45.7)Rice ( 14.6) ( 14.5) ( 13.0) ( 9.1)
Imports (c.i.f.) -118.2 -129.7 -109.9 -117.9Trade balance - 5.8 - 4.7 7.4 9.8
Factor payments (net) - 19.2 - 18.0 - 15.8 -- 19.3Other current items (net) - 4.4 - 7.7 - 6.8 8.4
Current Account Balance - 29.5 - 30.2 - 15.2 - 17.9Capital Account Balance 25.1 32.6 12.8 19.2
Errors and omissions - 2.7 2-4 - 1A3 6=0
Channge irt reserves 7-1 - 4=8 3 4=7(- = increase)
Source: Table 3.1
84. During 1966-1969 Guyana's external public debt service ratiafluct-iintpu i td twanL 4.0 a.nid 5.3 ' rAcent. Since in Guyana's gross ex-
ports exaggerate by a large margin the utilizable volume of foreignexchange, the ca lcualation -is bna on netf- I i.e., by subtractingprofit remittances from sugar and bauxite and alumina exports (see Table4.1). The ratio is not high when compared with other developing countries.But the rapid accumulation of external debt that has recently occurred,ar which 4il s 1likeLy to continue 4n the ,.ear future, coup'led with theW*% W,SA.%.1 I 1 * CK L) LO'. COAJL,I.U,A -ILU 6tL &,~=L LU LULC , %LUUjJXCU WA. LUU L*AV
expectations for the growth of exports, suggest that the ratio is likelyto rise s:Lgnificantly in future years. (See below, -- - 16
F. Population, Employment, Wages and Prices
85. In str-ikng contrast to the 'nforu-atior. availiable -on prouduct-JrLUL,UJ.LL n stil.N.L1 LJL L.~b L. LIL ±1L LLL.LULd~±U~O LUL~UI
expenditure, trade and monetary flows in the Guyanese economy, that cover-ing manpmer and prices 's "I>ted ardi weak. 't the end' of 99Gua,'.LL ZIiUL 1U kL±~ .L .L.L1ILLLU ~LU WedF.. IL LLI ~Iu 1 1707 %jUy6LlcL b
population was estimated at almost 730,000 persons of which 34,0()0 were!mer'Lnd'U'ans. Since 1965 the r.aturaL rate of population growtn has averaged
about 3 percent per year and allowing for net migration the average fallsto 2.7 pexcent per annum. Although the recorded crude birtn and deatnrates fluctuate suspiciously from year to year, nevertheless a decliningtrend in crude birth rates is discernible, while death rates seem to havebeen low and fairly stable. Estimates of population movements suggestthat net emigration between 1965 and 1969 has averaged 2,200 persons ayear - an estimate that probably errs on the low side. On the basis
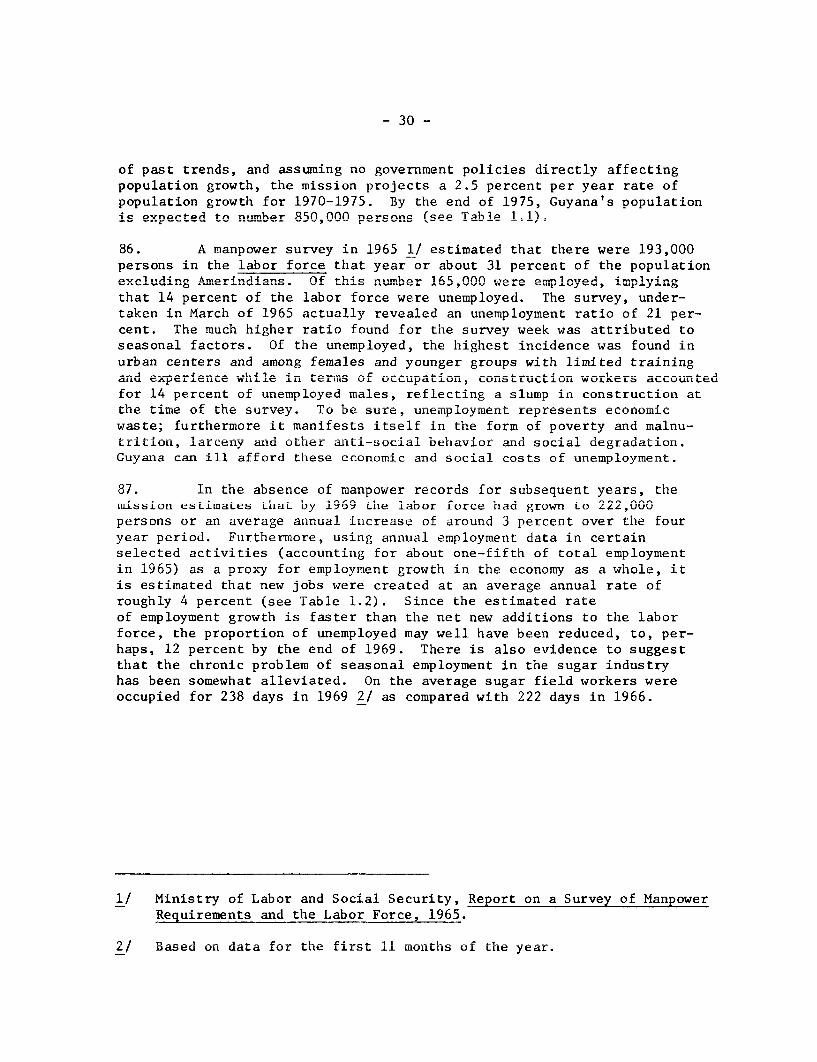
- 30 -
of past trends, and assuming no government policies directly affectingnonulalti-n arwt-h the miccinn nrni,-rt'4 2 9- c nprront npr X7:r rnte nf
population growth for 1970-1975. By the end of 1975, Guyana's populationic expnoete tn nimbher 85, n on s nacnnc (sep Tahle 1.1).
86. A manpower survey inr 1965 / estimated that there w-ere 1'93,0
persons in the labor force that year or about 31 percent of the populationexcludi,A4ng A-~
4n4 n hian.mnr1 r?ln 1nXOA4 mn1,4 exclding.^m.rindans.Of this number. 165,000 were err.ployed, imp. ly ing
that 14 percent of the labor force were unemployed. The survey, under-taken in March of 1965 actually revealed an une,m.ploy,.ent r--4- of ')1
cent. The much higher ratio found for the survey week was attributed toseasonala factors. Of thLVe unem.pl-yed, the- highe4s -nci -new foundA i
urban centers and among females and younger groups with limited traininga:nd1 ex-erience while Jin terms of occupation, construction work-ers accounteduLAt ~A)L £ LLL WI.J. .LLILL � LAL_ L.UpiLLI ULL ULUL WUNL LLUi,
for 14 percent of unemployed males, reflecting a slump in construction atthLe time of the survey. lo be sure, uneiip'loyeiient represerits econUomLucwaste; furthermore it manifests itself in the form of poverty and malnu-trLtion, larceny and other anti-social behavior and social degradation.Guyana can ill afford these economic and social costs of unemployment.
87. In the absence of manpower records for subsequent years, theumssion estimates that by 1969 the labor force had grown to 222,000persons or an average annual increase of around 3 percent over the fouryear period. Furthermore, using annual employment data in certainselected activities (accounting for about one-fifth of total employmentin 1965) as a proxy for employment growth in the economy as a whole, itis estimated that new jobs were created at an average annual rate ofroughly 4 percent (see Table 1.2). Since the estimated rateof employment growth is faster than the net new additions to the laborforce, the proportion of unemployed may well have been reduced, to, per-haps, 12 percent by the end of 1969. There is also evidence to suggestthat the chronic problem of seasonal employment in the sugar industryhas been somewhat alleviated. On the average sugar field workers wereoccupied for 238 days in 1969 2/ as compared with 222 days in 1966.
1/ Ministry of Labor and Social Security, Report on a Survey of ManpowereqUiLLUnLLLs and thlIe LaIboL FrLe;, L7VJ.
o/ Dased ort uata Lfor the "Lirst 1L1 L months ofU thie year.
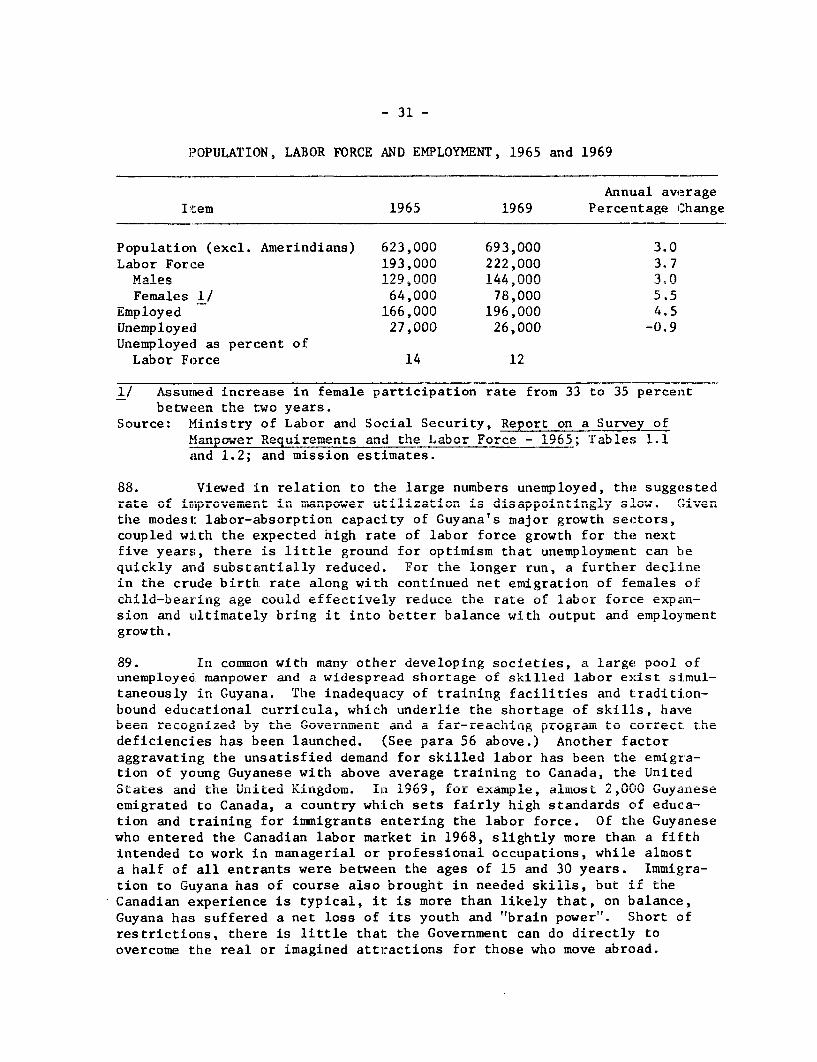
- 31 -
POPULATION; LABOR FORCE AND EMPLOYMENT. 1965 and 1969
Annual averageIitem 1965 1969 Percentage Change
Ponulation (pxcl. Amerindians) 623-000 693I000 3.0Labor Force 193,000 222,000 3.7
Mal e 129,000 144,000 3.0
Females 1/ 64,000 78,000 5.5Employed 1660-nn 196 000 4,5Unemployed 27,000 26,000 -0.9UnepD,loye,t as pnercevnt of
Labor Force 14 12
1/ Assurned increase in female participation rate from 33 to 35 percentbetween the t,wo years.
Source: Ministry of Labor and Social Security, Report on a Survey ofMlanpower Requirements and the Labo Force =1965; Tables 1.1amd 1.2; and mission estimates.
88. Viewed in relation to the large numbers unemployed, the suggestedratle cof 4ir,provem.erit -in 4-pwe -1-zto s iapitnlyso.tieJa~ I.IJ V i L.L ~LLL UIKLL&UW%-A #_L . t.%L ~01 AL0 ajJ
1U±tL L%±Li9r4.y .LUWW %. LI L
the modest: labor-absorption capacity of Guyana's major growth sectors,coupzeu WJ. Lwi Llie eAjxpcJ-lU *ighi LrLa o'L LaUU L'or LL o LrUW gro w UL LLor t LnAL
five years, there is little ground for optimism that unemployment can bequickly anid substantially reduucedU. F or thle 'Longer run, a further declinein the crude birth rate along with continued net emigration of females ofchild-beUariug age could effectively red.uce the rate of labor force expLn-sion and ultimately bring it into better balance with output and employmentgrowth.
89. In common with many other developing societies, a large pool ofunemployed manpower and a widespread shortage of skilled labor exist simul-taneously in Guyana. A.Ile iLnadUequacy of traiLniLng facilities andU tradition-
bound educational curricula, which underlie the shortage of skills, haveb-een recogniwzed by the 'overnruent and' a far-reachingpogal ocorc the
L~ViJ~ LIy Lai '4VLIUILWU a-LciiLg. PL0LdULc1 LULU VLcLt:fL;Lt
deficiencies has been launched. (See para 56 above.) Another factoraggravating the unsatisfied demand for skilled labor has been the! emigra-tion of young Guyanese with above average training to Canada, the UnitedStates and the United Kingdom. In 1969, for example, almost 2,000 Guyaneseemigrated to Canada, a country whLch sets fairly high standards of educa-tion and training for immigrants entering the labor force. Of the Guyanesewho entered the Canadian labor market in 1968, slightly more than a fifthintended to work in managerial or professional occupations, while almosta half of all entrants were between the ages of 15 and 30 years. Immigra-tion to Guyana has of course also brought in needed skillS, DUt ir tneCanadian experience is typical, it is more than likely that, on balance,Guyana has suffered a net loss of its youth and "'brain power"'. Short ofrestrictions, there is little that the Government can do directly toovercome the real or imagined attractions for those who move abroad.
- 32 -
Nevertheless, for highly trained personnel, at least, the provision ofchallenging work opportunities and a stimulating environment at homecan sometimes outweigh salary advantages to be gained abroad. It would bedesirable to explore systematically possible indirect government measuresto slow down the emigration of skilled Guyanese, especially in the fieldsof teaching and nursing.
90. Collective bargaining agreements are the main source of wageinformation in Guyana. Among the maior industries for which bargainingcontracts are recorded, wage increases have varied widely over the pastfour years. The largest average annual increases in wages occurred inmining, motor transport and waterfront operations. Of particular interestis the fact that wage and salarv scales in the nublic service have remainedunchanged for the past four years so that the negotiations for an increasein 1970 nre Penprtpd to resitlt in a suihbtantia1 iiunward rpvisinn of t-hpcivil service salary and wage structure. 1/ Since the Government's basepay rate~ is in. effec~t the couint-ry's miniwmum uage, any upward revisionwould have important ramifications for wage levels in other sectors.Collective wnae agreementR in the hiuilding tradesq and bautxito will lqn
be renegotiated in 1970. These factors, combined with a well organizedtradne -union movement cover-ring a,lmoQt nne-t-hird of t-he lbhnor force, allpoint to a significant upward movement in wage levels in 1970. New legis-lation governing trade disputes is likely to be introduced in 1970, butits impact on wage costs is expected to be insignificant.
91. Price movements in Guyana are measured by a monthly consumerprice index, based on a 1956 market- bkt for working class familIesearning G$200 per month or less. Separate rural and urban indexes areco.mbined to-- form. a national 4ndex. The 4index is seriously d-eficient- inits coverage since it embraces only a small and declining share of totalconsumers ar.d does not- give adequatewegtothcnsminofmprdcommodities, the prices of which have risen substantially in recent years.The indexes as presently .co L AJ.p suggest --n8 ar.nual a g incresseapproaching 2.5 percent since 1965.
1/ The increase in wages and salaries in 1969 was an "interim" paymentpending further negotiations and did not affect the basic ratestructure.
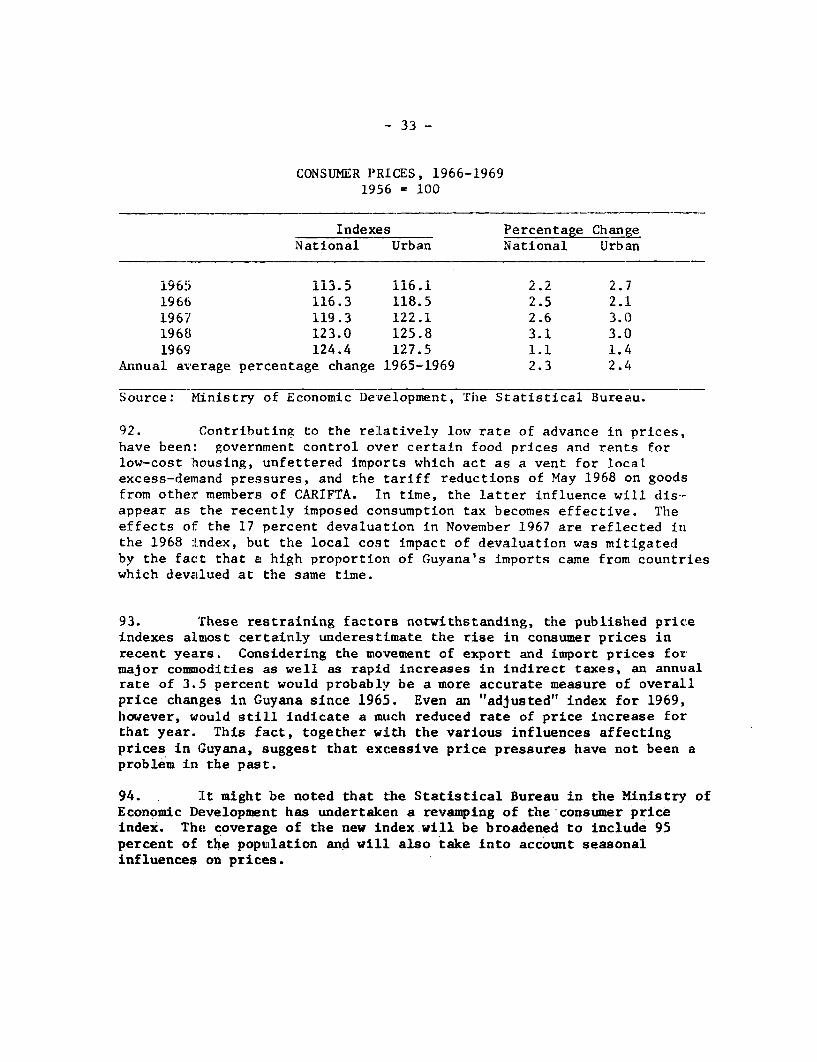
CONSUMER PRICES, 1966-19691956 = 100
Indexes Percentage ChangeNational Urban National Urban
1965 113.5 116.1 2.2 2.71966 116.3 118.5 2.5 2.11967 119.3 122.1 2.6 3.01968 123.0 125.8 3.1 3.01969 124.4 127.5 1.1 1.4
Annual average percentage change 1965-1969 2.3 2.4
Source: Ministry of Economic Development, The Statistical Bureau.
92. Contributing to the relatively low rate of advance in prices,have been: government control over certain food prices and rents forlow-cost housing, unfettered imports which act as a vent for localexcess-demand pressures, and the tariff reductions of May 1968 on goodsfrom other members of CARIFTA. In time, the latter influence will dis--appear as the recently imposed consumption tax becomes effective. Theeffects oi- the 17 percent devaluation in November 1967 are reflected inthe 1968 iLndex, but the local cost impact of devaluation was mitigatedby the fact that a high proportion of Guyana's imports came from countrieswhich devalued at the same time.
93. These restraining factors notwithstanding, the published priceindexes almost certainly underestimate the rise in consumer prices inrecent years. Considering the movement of export and import prices formajor commodities as well as rapid increases in indirect taxes, an annualrate of 3.5 percent would probably be a more accurate measure of overallprice changes in Guyana since 1965. Even an "adjusted" index for 1969,however, would still indicate a much reduced rate of price increase forthat year. This fact, together with the various influences affectingprices in G,uyana, suggest that excessive price pressures have not been aproblem in the past.
94. It might be noted that the Statistical Bureau in the Ministry ofEconomic Development has undertaken a revamping of the consumer priceindex. The coverage of the new index will be broadened to include 95percent of the population and will also take into account seasonalinfluences on prices.
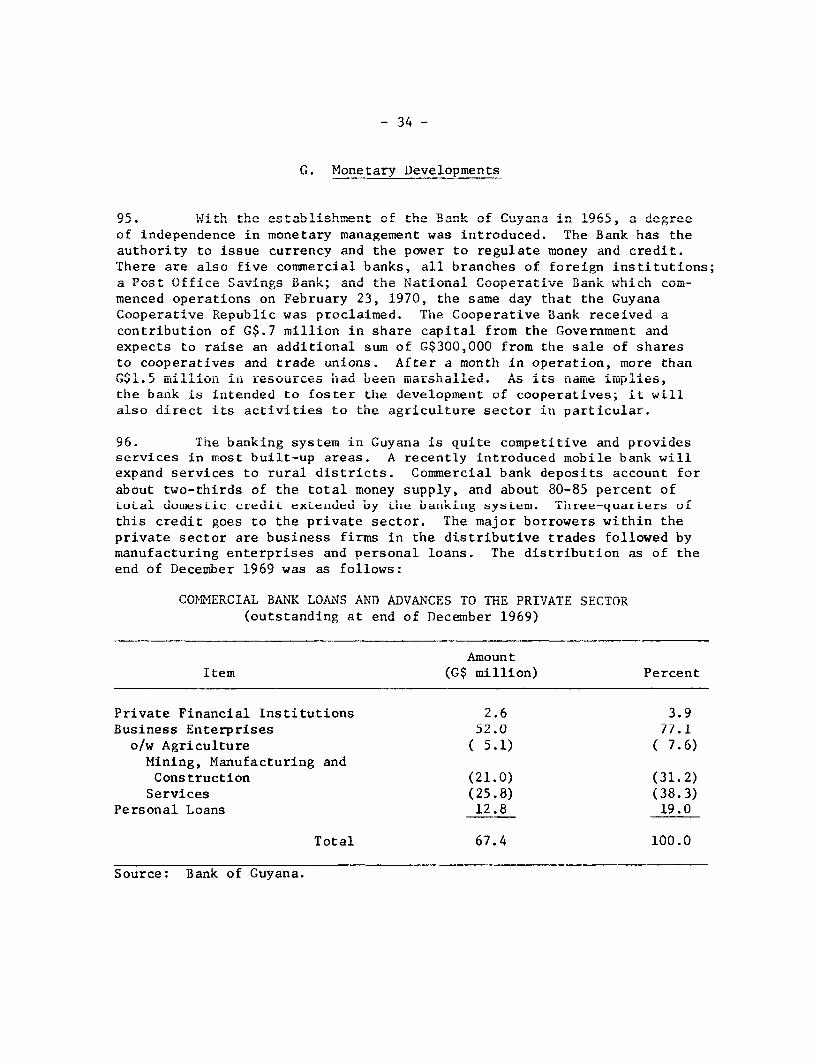
- 34 -
G. Monetary Developments
95. With. the establishment of the Bank of Guya 4i 1O96, a -----
of independence in monetary management was introduced. The Bank has theC LLsA A. t.. k .LO IS t. .AA. A. 9tL. Ctl9 _.I _J A. t.*,J -A. A T ai. wt a OlAt I. _V A.U 4tA h. o r i t -_ , *_ -4 Q1 _ - _ _- -; __LL L _u;s Wb 4| A V s; _*u L
There are also five commercial banks, all branches of foreign institutions;aPlost Offi.:ce Savings Bank; and the National Cooperative Bank which com=a .J L LJ.A. £±. . aVLIL, IJ aLis a u LII i1 aL.Lt L %.. J!C L.J.V LI AI WL&L. LII
menced operations on February 23, 1970, the same day that the GuyanaCJooperative Republi. was proclaim...ed. ThLe Cooperaive Bank received acontribution of G$.7 million in share capital from the Government andexpects to raise an additional sud m ofU G$300,000 from thLe sa'le of shares
to cooperatives and trade unions. After a month in operation, more thanG1 L MLLi. ULI roc11 LhUaULb been marshalled. As Lits Lldi .LUIlj.JLiCS
the bank is intended to foster the development of cooperatives; it willalso direct its activiltles to tle agrlculture sector in parLicular.
96. Tne banking system in Guyana is quite competitive and providesservices in most built-up areas. A recently introduced mobile bank willexpand serv'ces to rural dlstricts. Comercial bank dt---p-ts - for
about two-thirds of the total money supply, and about 80-85 percent oftotal domestic credit extended by the banking system. Three-quarters of
this credit goes to the private sector. The major borrowers within theprivate sector are business firms in the distributive trades foliowed bymanufacturing enterprises and personal loans. The distribution as of theend of December 1969 was as roliows:
CUOMlEARLAL DBANK LOUPdN ANID ADVANCES 1U THE PKIVALT SECTUK
(outstanding at end of December 1969)
AmountItem (G$ million) Percent
Private Financial Institutions 2.6 3.9Business Enterprises 52.0 77.1
o/w Agriculture ( 5.1) ( 7.6)Mining, Manufacturing andConstruction (21.0) (31.2)
Services (25.8) (38.3)Personal Loans 12.8 19.0
Total 67.4 100.0
Source: Bank of Guyana.
- 35 -
Agriculture, excluding the sugar estates, received only 8 percent of aLlcredit ext:ended to the private sector. These were essentially short-termcredits based on crop liens. Judging from an analysis of some 5,000 termand real estate loans (excluding overdrafts) outstanding at the end ofDecember 1968, 12 percent by number of 'Loans and 48 percent by amount wererenavable over a neriod extendin2 beyond four years. For an insignificantnumber of loans, the period of repayment extended beyond seven years. Lifeinsurance compannfes- the Guyana Credit Cornoration and building sorietiesprovide longer term loans but mainly for real estate and construction.
97. Until 1969, the Bank of Guyana exercised indirect control overcredit tincra-iinna nf cnmmercial ahnks -nd finanrcial intl-orm oirior in t-heform of sp-ecified minimum liquid asset ratios. However, the sharp increaseof 46 percent in the -mouint nf credit etoneoA to the private sectorbetween the end of 1967 and the middle of 1969 induced a shift to instru-ments of direct control. Thus for 1969, corercial bank credit expansionto the private sector was to be no greater than the percentage increase intotal dep_s its. In -horhoI. the eeguidelnes were exceeded largely becauseof transitional difficulties in adjusting to the new requirements in thes4x-mo^nth period4 NeverFhooQce 1-h f-ho anA ,_ 1QOO t 0 0 ,e-criA4t
.. _. r _-.. - 7 L -- -- --- -- -.' -v -.. - .. j --- s- w v s _c v
expansion had moderated and it appeared that the credit controls had takenhold.
OR. The guidelines set for the co.Uerclal bank-s do not apply tolending to the public sector which continues to be guided by the require-ment of a mi-n-imum. rati-o be.ween 14iquid assets and l4abl- ities. Bleca-ase
mULI UL IJ.A.LLWUU LOL.Lt, U~ W~~L .L49 UA. L.O t dLU L.L.LdU.L LA.L.L~ I. LiJ~
of its weakened financial position in 1969, the Central Government obtainedalmosftl G$1 illion in new credit froru the bankin -yCr te euto.L00 %YJ- LI±LL±LLUILL LI WLL U.LL. L U IU LL UcIL&M.I.L1 system LI kLII( LUbU±L Ul
borrowing G$14.4 million from the Bank of Guyana and repayments of aboutG$1. milon to the couuLIia tbanks)5.UI rerse n anepnso f40%Y L. J .L±±L LI LU LIIZ: UUU;L1[CL .;A LJCLLM.iLJ Lt:PLe5teLILL±Ig IL X diSU L '0
percent for the year.
99. For the banking system as a whole the expansion of credit forthLlet1 thr e e years Decembler 1965r to necerwer 196AZO abu qale hLII~~ LLIL LLb IJ I.ILU L .L7uJ Li IJ L~ILJCL .L70O JUbL JIUUUL t!uJ.L.Lt:U LIIe
growth of deposits and currency so that net foreign assets remained vir-tually uU-Lc'-age'. IrL 1-69, however, bank credit expanded by G$ 24 mill:;o
with the public sector accounting for 60 percent of the expansion, whilebank domesjtic liabilities advanced by only G$i4 million. The differencewas covered by a G$10 million reduction in net foreign assets of thebanking system.
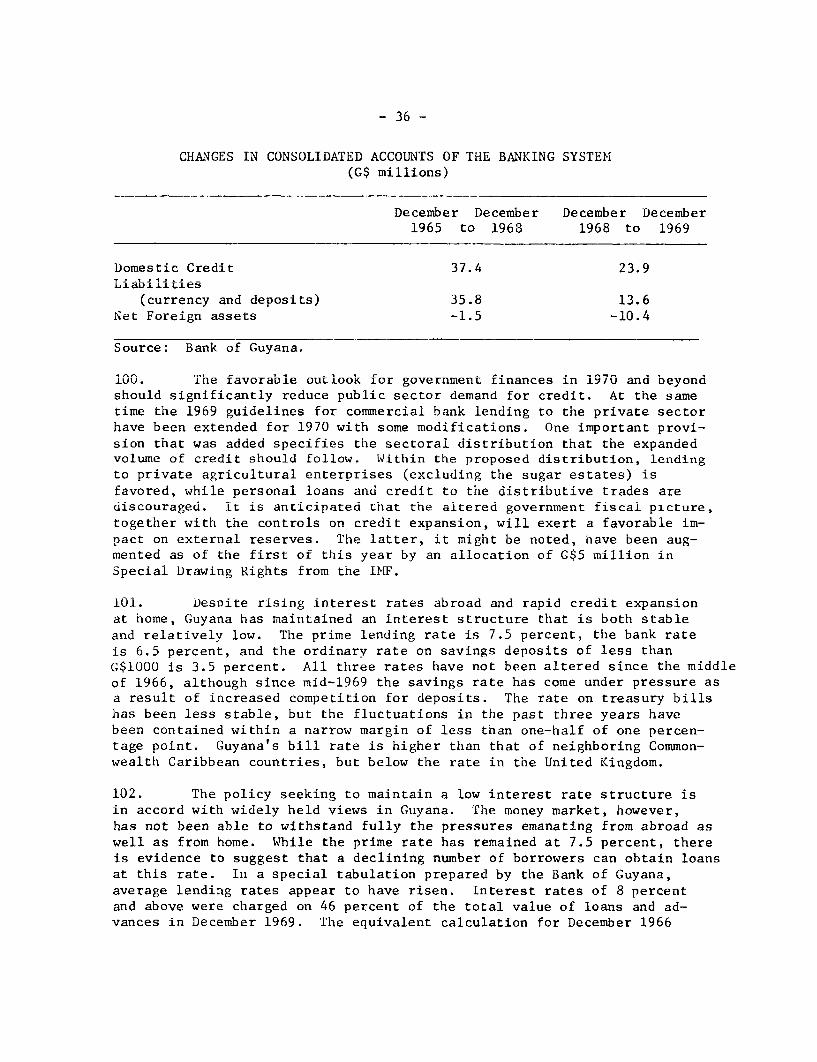
- 36 -
('1l AMO C' T'kl (flML'C1_T T flA'fLt'f A r1r'f%TThI'1'C A"r mIVIL 1)ATTXfl AMV TM(' L'vovCnTGES~~~~~1%1.%J1L IN CONOLI<TE OtOuT8O nEBUIPNG" 01Y3JT(G$ millions)
December December December December1965 to 1968 1968 to 1969
Domestic Credit 37.4 23.9L .L UIX.L Le s
(currency and deposits) 35.8 13.6Net Foreign assets -1.5 -10.4
Source: Bank of Guyana.
100. The favorabie outlook for government finances in i970 and beyondshould significantly reduce public sector demand for credit. At the sametime the 1969 guidelines for commercial bank lending to the private sectorhave been extended for 1970 with some modifications. One important provi-sion that was added specifies the sectoral distribution that the expandedvolume of credit should follow. Within the proposed distribution, lendingto private agricultural enterprises (excluding the sugar estates) isfavored, while personal loans and credit to the distributive trades arediscouraged. It is anticipated that the altered government fiscal picture,together with the controls on credit expansion, will exert a favorable im-pact on external reserves. The latter, it might be noted, have been aug-mented as of the first of this year by an allocation of G$5 million inSpecial Drawing Rights trom the IMF.
1Ol. Despite rising interest rates abroad and rapid credit expansionat home, Guyana has maintained an interest structure that is both stableand relatively low. The prime lending rate is 7.5 percent, the bank rateis 6.5 percent, and the ordinary rate on savings deposits of less thanG$1000 is 3.5 percent. All three rates have not been altered since the middleof 1966, although since mid-1969 the savings rate has come under pressure asa result of increased competition for deposits. The rate on treasury billshas been less stable, but the fluctuations in the past three years havebeen contained within a narrow margin of less than one-half of one percen-tage point. Guyana's bill rate is higher than that of neighboring Common-wealth Caribbean countries, but below the rate in the United Kingdom.
102. The policy seeking to maintain a low interest rate structure isin accord with widely held views in Guyana. The money market, however,has not been able to withstand fully the pressures emanating from abroad aswell as from home. While the prime rate has remained at 7.5 percent, thereis evidence to suggest that a declining number of borrowers can obtain loansat this rate. In a special tabulation prepared by the Bank of Guyana,average lending rates appear to have risen. Interest rates of 8 percentand above were charged on 46 percent of the total value of loans and ad-vances in December 1969. The equivalent calculation for December 1966
-- 37 -
was only 36 percent. Furthermore, the upward drift in average lendingrates is consistent with the increased borrowing by commercial banksfrom their head of:Eices to supplement local resources.
103. The review of recent monetary developments leads to the generalimnressinn that monetary managemernt on the whole has been satisfactorv.This impression is supported by the fact that under the four standbyagreements enteredi intn with the TMF since 1967, Guyann has never madeany purchases. There are grounds, however, for questioning the appro-ntri:tpn cQ nf tho evictina lpevl and t-riintiirp nf intprPat ratpes Athoroughgoing review of interest rates, with the possible objective anuipw ard reviio4 n, sb.lA be urdertaker..
- 38 -
III. DEVELOPMENT PROSPECTS
A. Introduction
104. Guyana's economic and social goals were originally set out inlate 1965 in the Guyana Development Programme 1966-1972. The aim was toincrease "the gap between the percentage annual population increase inthe nercentage annual rate of economic growth so that by 1972; the economv,on a modest estimate should be growing at the rate of 5 or 6 percent perannum"- I Concern for the high level of tinemnloyment was reflect-ed inproposals to encourage labor-intensive production. Since at that time,the outlook for siugar and rire was iniudepd to he bleak, the s trategy calledfor the diversification of output through import-substitution; expandingnrnd,uction of heef, hbnna,n,q minernl,T and fnresqt nronduct; nnd initinting
the processing of aluminum. The related public investment program alsoset n c-hanllnn-Iina tnroot scinrce the nron-nnced a- nniiu1 tye,mo of eanpita1 oi,rut-
lay was double the highest level previously attained.
105. In spite of more buoyant sugar exports than had been expected,durng the frst four years of th-ie plan -- -io -- t-put growt.h and public
investment fell somewhat short of the targets. The structure of outputhas evn,r4=npcA 1-ttla n. nin nlltorntirn ,nrd tho 101701 of irnpImn,Vment,
judging from crude estimates, appears to have been reduced only slightly.This e nce is mnt surprising in view of -ha fact tiat tii ma
40r
source of growth of the economy was mining, an activity with a relativelylow labor content and which, moreover, has not required large publicinfrastructure investments.
106. In 1970, Guyana is just past mid-course in its seven-yearUeve'lopment program. ThiLLs may well bue aIr aLpproprLate mLotenLt to askd
whether the program still provides a relevant framework for the firstLa.Ll oU the 197Y0' S. apecifically, accourit LIdas to 'De taken of the obUstac'Leswhich have impeded development in the recent past (see Chapter II above)as well as any new development parameters, incluuing altereu public objec-tives or policies. In this connection it may be noted that the Governmenthas recently formed a Planning Team, inciuding representatives from theprivate sector and the trade union movement, to draw up a ten year pers-pective plan for the 1971-1980 period. It is rurther proposed to prepareseparate five-year plans with detailed project priorities and publicinvestment recommendations covering the period i97i-i975. The new planis to be finished by the end of 1970 and will then supersede the 1966-1972development plan. Since the Planning Team will be treating - more exhaus-
1/ Rt- Hon L.F-S. Rurnham; Prime Minister, in the Preface to the Plan.
- 39 -
tively to bes sure - issues similar to the ones that are discussed below,the mission's outline of an appropriate development strategy and a relatedpublic investment program should be regarded as tentative and subject toalteration when the new plan is completed.
B. New Development Parameters
107. 1) CARIFTA. Guyana's entry into the Caribbean Free TradeAssociation in 1966 enhanced its agricultural export potential. SinceCARIFTA members generally may only import agricultural products fromoutside the Association when all internal sources of supply are exhausted,CARIFTA offers Guyana a five-fold market increase at protected marketprices. The cost of this advantage is the reduced capacity to protectpresent and future Guyana-based secondary industry against those CARIFTApartners which have a comparative iadvantage or an early start in thissector of activity. Whether Guyana can take advantage of the enhancedpotential for agricultural exports in the near future is an open question.Currently it is a net importer of beef and meat products; rice producticn,while promising, will require substantially different public policies toprosper; and the poor results from efforts to increase and diversifyagricultural crops are not encouraging. If adequate levels of productioncan be attained, the advantage of CARIFTA is most likely to affect theexports of livestock, rice, and, possibly, forest products, but not muchbefore the middle 1970's.
108. 2) Interior Development. Such factors as the high populationdensity along the coast, the large numbers of urban unemployed, theterritorial claims of two neighbors to a large portion of the sparselyinhabited remaining land area, and the vision of the "frontier" as adevelopment stimulus similar to that experienced in North America orSiberia have combined to reorient government policy in favor of develop-ment of the interior. Until now, government efforts to develop andpopulate the interior have been concentrated on a few selected areas,the most important of which is Mathews Ridge - the abandoned site of themanganese mine. (See Volume II - Agriculture in Guyana, paras. 154-158.)Expenditure! on Mathews Ridge to date has mainly been for land clearance.Little farming has taken place there as yet. Most of the former mine-workers have been employed in clearing land to accommodate themse:Lves aswell as neuw settlers. It is intended to use the land for growing feed-stuffs and vegetables. Another major project is the building of a roughly400 mile all-weather road to connect Georgetown with the Brazilian border.Security considerations have also stimulated the expansion of country-wide air transnort services and telecommunications. An Interior Develop-ment Corporation is to be established to coordinate programs designed toopen hinterland areas for settlement. The currpnt and ranital outlaysimplied in the policy are not available as yet, but it is estimatedthat thp roAd on Brazil rou,ld roqt- a mtiih a8 rA'fl mmillion (Or ITS$25million equivalent), or even more depending upon the route and the standardof construction that- is uIt-imat-ely ,,,hosen.
109. From what is presently known of the hinterland's resources, thepr to sp eAc t s f r.. 0 nLA _. A1 A a . i i A _ i L .a .u .. _e are nAt e ua. n. _
About seven-eighths of the interior is covered by tropical forests, theeconom.ic value of which re.mains to be ascertained . Tn~-e rem,ainder consistslargely of savannah whose economic potential at present is low. There areof course a few exceptionrs, -I,c as -c 4t rning in and a-4 the4 Rupu=
nuni and Ebini districts and small gold and diamond mining in scatteredpLaces. But tLhe Rupununi's beef indust ry is Iupporte b-y ac -- ---- t
subsidy on air transportation (small as this item is in production cost);the output of gold and diamonds is only G$4-5 rmlillion a yfear and declining;and the Ebini is still essentially a pilot project. Relatively poor soils,high initial land preparation costs, i/ additional economic and social in-frastructure needs and difficult and costly transportation are powerfulfactors to be surmounted in achieving the efficient development of agricui-ture in the interior.
110. From the strictly economic point of view, interior developmentwould seem to be an extremely risky national investment with a low pro-bability of payoff. It is the mission's impression that, with the excep-tion of a few projects, resources diverted to interior development arelikely to yield a higher economic rate of return if invested in the coastalregion or those immediately behind the coast. 1/ In this sense, tne newpolicy would involve certain economic costs. Should expansion in theinterior entail activity that is more labor-intensive than would be expectedfrom investment elsewhere and hence exert a more than proportionate impacton reducing the existing pool of unemployed and under-utilized manpowerresources, the economic costs would to this extent be lowered. The pros-pects are doubtful, however, that this will be the case. Naturally,security considerations and/or political and social necessities may bejudged by the Government of Guyana to outweigh the economic costs. Inthis event, however, it should be considered whether these aims cannotbe met by a policy of experimentation through carefully designed pilotprojects so that interior development expenditures are held below levelswhich would jeopardize the regular public investment program.
111. 3) Cooperative Development. The cooperative movement, which in1969 numbered some 800 societies with a membership of more than 60,000, hasa long history in Guyana. Thrift and credit unions are the most numerous,but cooperatives function in a wide range of economic activities. The
1/ A rough estimate for the Mathews Ridge area suggests that the costof cleaLring CaIL-L acre thLere is at "least twice as ritucLi as thlat fLor
marginal land development on the coast.
- 41 -
related ideas of "self-help" and "community development" are also long-standing features of Guyanese society. What is new, however, is the muchincreased role which the Government has assigned to the cooperatives as aninstrument of social and economic development. Cooperatives are expectedto provide the main. thrust for the development of the interior and are intime to form a major third sector in the economy in addition to public andprivate activity. In preparing the new 1971-1980 perspective plan, theplanning Team is asked to consider how the three sectors might work togetherin a mutually beneficial way.
112. In recognition of the shortage of managerial skills to guide a.complex organization such as the cooperative, steps have been taken toexpand training in this field. For example, it is now required that all.students at the University of Guyana must successfully complete a course.of studies on cooperatives before a degree can be awarded. Moreover,since the traditional producers' cooperatives, particularly in agriculture,have not been very successful, the Government has indicated its readinessto experiment with different forms of cooperative organization. The ob-iective is to evolve forms which provide for strong professional manage-ment and which best suit local conditions.
113. 4) Government Participation in Economic Activity. The Governm:entin Guyana accounts for about a quarter of the total annual flow of incomegenerated in the economy. Measured in terms of expenditure, therefore,the deqree of government participation in the economy is fairly hi.gh. Feln-ing to explain the role of government in Guyana are such factors as thenecessitv nf having to nrotect most of its cultlvable land area from thesea, the desire to maintain relatively high standards of public services,suc-h as Pdtiration inherited from the colonial nast- and thp eornnnmv' heavy reliance on the exploitation of natural resources where infrastruc-ture requirem.ents are relatively h:igh Two additional rlated 4inflienraa
may be noted. The first is the narrowness of the economic base wherebyeconomic advance is pre-ariously depende uponn three primary products. Thesecond is the less than dynamic performance of the private sector outsideof natural resources xnlo-itationn As a onseqntipnce the rnvnernment has
been impelled not only to provide the basic infrastructure needed foreconomTir and snrial deveulnment hut- ton e-ncirouag ane eYn nartirgt-Itpa in. a
wide range of economic activities for purposes of diversification and
114. Sir.ce t*he ,.av1r4nr 4n f:luenc Asades4crbed above have undergone:
little or no change, it is anticipated that the Government's participation4i ecnomi4 aci
4 , e..41 ...4 1 *tn 4n^pvnafa 4 n t-hi al-., 107f' -o0 -it4t4r-
ularly in respect of public capita:l formation. Thus the share of public.capit-al for.ain in fflYD . 4i-i in 1969 ----- 8 ercn t- 4i pr e4--n t- o ri
4s
to 12 percent in 1975, while current government revenues are expected toi.ncrease from. 22 percent to 924 percent of GnDP over thLe same period.. F
thermore, the Government has recently announced its intention of partici-pating, iLn the for. of equity, iLn resource-based enterprLises. Fo. a

- 42 -
new enterprises which propose to exploit the natural resources of Guyana,the Government will take a 51 percent equity share; on existing enterprisesin resource exploitation, the degree of government participation is to benegotiated. Wnat is not yet clear is the policy towards enterprises en-gaged in productive activity not directly related to resource exploitation,nor what form participation will take either in terms of financial contrib-utions or of management.
115. The extent of participation in financing its own capital outlayshas long been an issue of concern to the Government. For the 1966-1969period, as indicated above, roughly 50 percent of public capital outlayswere financed by loans and grants from abroad. The public investmentprogram for 1970-1975 proposed below, anticipates an even higher shareof external financing. The desire to rely more on local and less on foreignresources for Guyana's economic development has been expressed often andvigorouslv by npblicb authorities- 1, This attittiud rpflpets both a strongsense of national pride and disenchantment with the procedural requirementssurrotindiing external loan negotiations and di slhrQPmPnts, as wel1 1 ns fthplimitations on procurement. It has to be recognized, however, that becauseof the high import content of public investment in Guyana and because ofthe limited resource base suitable for exports, the foreign exchange gapis liltimt-tp1v the kyv f£artor in determining thp 1ue1 of Pwt-Prnq1 renurreneeds.
G. The Prospects and Sourrcs of Growth, 1970-1975
116. The fundamental factors of limited resource endowment andinternal market size prescribe the possible options available for formu-lating a development strategy for Guyana. In broad terms, therefore,an annronriat-P Qtratcgy ralls fnr thei continuied intensive exnlolitraion of
mineral and agricultural resources. Within the latter sector, sugar pro-duction might be left to respond to world market forces but policies toimprove productivity in rice production and expand livestock and shrimpfishing should be vigorously pursued. An enl-ged p c 114 invest-mnt prog-gram covering both economic and social capital is desirable both to en-
hanc theprodctiv caaci y oftb.ee.oou.. as wellas o offset +-he ex-IS O- L.= L LUC p I.. t.JU Ut.. LA.. VC .O= JtA 4.y. ' -2A fl CL.JZtSJ an w i. an .4 I t LO. I. I*C
pected slack rate of growth in the private sector outside mining and agri-cu'Lture. An iUaportant tactLicaL e1leu-,ent i1n fostering lfuture dUeve'Lopmentis the need for improving economic management in selected areas of govern-rment administration andu operatiors. 'ilere is ever-y reason toLU cU[Lonir.Uesurveying and exploring Guyana's hinterland for minerals and evaluating
1/ See for example the Cooperative Republic Budget, 1970, NationalAssembly of Guyana, 22nd December, 1969, p. 21.
- 43 -
forest resources. 1/ The mission has serious doubts that resources divertedto developing agriculture in the interior will yield economic benefits inexcess of the economic costs. Nevertheless, a limited probe in the directionof interior development might be contemplated without excessive strain onthe economy.
117. Most challenging of all is the formulation of that element ofstrategy dealing with the crushing problem of unemployment. Since theengine of growth in the economy will be provided by bauxite and agriculture,the prospects for rapid employment-creation in the near future are neces-sarily limited. On the other hand, the expanded public investment programshould exert a favorable direct and indirect impact on employment (seeparas. 123 and 124 below).
118. Looking ahead within this framework for development, the missionhas projected an average rate of growth in real output of 5.4 percent iaerannum over the next six years. Since the net annual increase in populationis expected to fall to around 2.5 percent, per capita real output wouldadvance ait an average annual rate approaching 3 percent a year. This wouldmark a distinct improvement over past experience.
119. As in the past period, mining and construction are expected toprovide the major impetus to growth in the first half of the 1970's.The minings sector is likely to contribute almost a quarter of the cumula-tive increase in real GDP. The projected growth in construction is veryhigh, reflecting the planned public investment program as well as ananticipated building boom in housing and other private construction. Thissector will account for a fifth of the projected increase in output.Agriculture as a whole is expected to grow more slowly than the GDP averageand hence its share in total output will fall.
1/ In May 1969, a forestry lease covering 1.1 million acres in the WestDemezara region was granted to Litton Forest Products Ltd., a GUYr na-incorporated subsidiary of Litton Industrial Development Corporation,U.S=A. The lease rllQ fnr a minim,,m inuvatment of G$460 million Iythe end of 1974, including the establishment of a 300 tons/day pulpml 1 1 qirnP nrP1imninNrV ttPCt h.up hDpn ane-:n..Ang t-hre is thp
possibility that the project may be implemented on an even largerscale. The establishment of this pro4ect, imply4ng a breakthroughin utilizing Guyana's extensive heterogenous forest stands, wouldcontribute Sniflcanttly to the economic growth of the countr,y Theuncertainty still surrounding this development, however, has promptedthe mission to exclude it from consideration in this report.
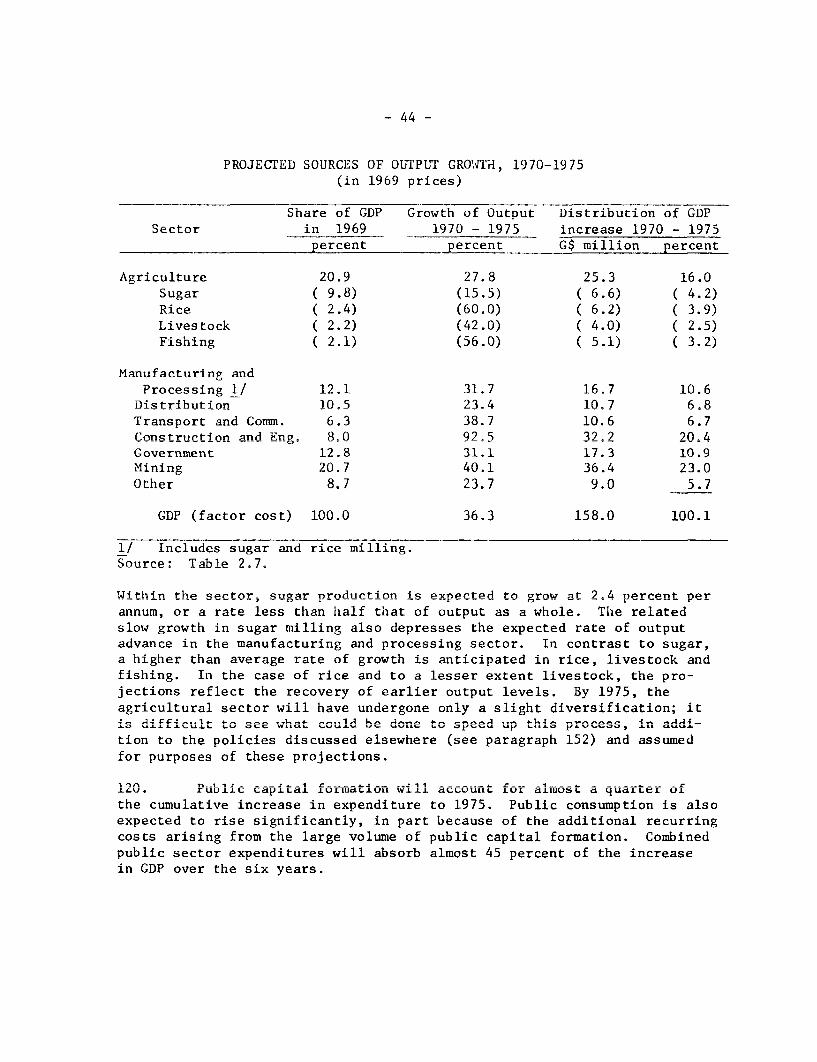
- 44 -
PROJECTED SOURCES OF OUTPUT GROWTH, 1970-1975(in 1969 prices)
Share of GDP Growth of Output Distribution of GDPSector in 1969 1970 - 1975 increase 1970 - 1975
percent percent G$ million percent
Agriculture 20.9 27.8 25.3 16.0Sugar ( 9.8) (15.5) ( 6.6) ( 4.2)Rice ( 2.4) (60.0) ( 6.2) ( 3.9)Livestock ( 2.2) (42.0) ( 4.0) ( 2.5)Fishing ( 2.1) (56.0) ( 5.1 ( 3.2)
Manufacturing andProcessing 1/ 12.1 31.7 16.7 10.6
Distribution 10.5 23.4 10.7 6.8Transport and Comm. 6.3 38.7 10.6 6.7(Gons triiro-inn and Eno . 80 92-5 32.2 20. 4Government 12.8 31.1 17.3 10.9Minine 20.7 40.1 36.4 23.0Other 8.7 23.7 9.0 5.7
GDP (factor cost) 100.0 36.3 158.0 100.1
1/ Includes sugar and rice milling.Soturre: Tahle 2.7.
Within tho Sprtnr, sulgar prndurtinn is epencted tn grow at 2.4 nprcent perannum, or a rate less than half that of output as a whole. The relatedslow growth in sugar milling also denresses tho eox-petai rate of outputadvance in the manufacturing and processing sector. In contrast to sugar,a higher than averaoe rate of grow th is anticipated in rice, livestock anmdfishing. In the case of rice and to a lesser extent livestock, the pro-
pcnti-nn re-flect trh- ro ecovery -f eri output levels. By 1975, the
agricultural sector will have undergone only a slight diversification; iti0s tdiffiLcult to see what coulA be done to speeA up tIhs process, in azdd-
tion to the policies discussed elsewhere (see paragraph 152) and assumedLor purposes o0f these proJections.
120.~ Publi c aptal 'or.-L,ation will accour,t fcor alruost a quarter of-L IC ruUJ.Lc cpLd LL J. LU LLUI WL ..L ~CULL L0 aius qaLLuthe cumulative increase in expenditure to 1975. Public consumption is alsoexpected to rise signiLfLcantly, Lin parL ecause Of tne addiLLonal recurringcosts arising from the large volume of public capital formation. Combinedpublic sector expenditures will absorb almost 45 percent of tne increasein GDP over the six years.
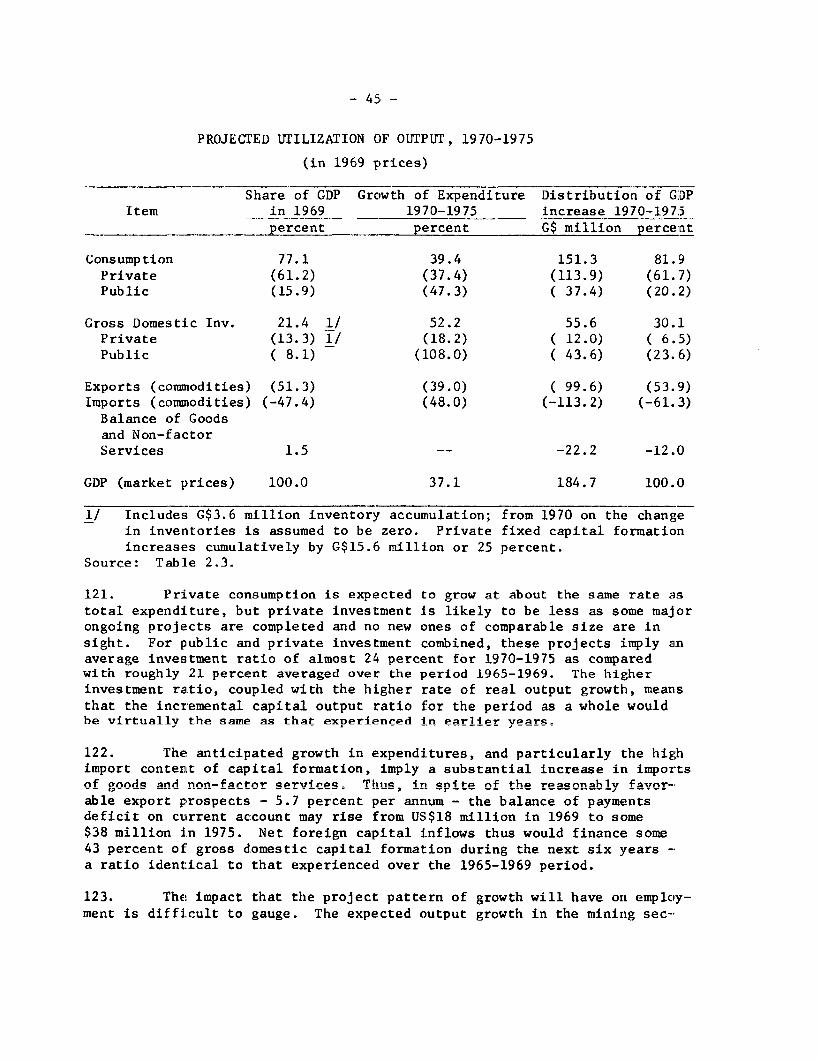
- 45 -
PROJECTEID UTILIZATION OF OUTPUT, 1970-1975
(in 1969 prices)
Share of GDP Growth of Expenditure Distribution of GDPItem in 1969 1970-1975 increase 1970-197.5
__________ __percent percent G$ million percent
Consumption 77.1 39.4 151.3 81.9Private (61.2) (37.4) (113.9) (61.7)Public (15.9) (47.3) ( 37.4) (20.2)
Gross Domestic Inv. 21.4 1/ 52.2 55.6 30.1Private (13.3) 1/ (18.2) ( 12.0) ( 6.5)Public ( 8.1) (108.0) ( 43.6) (23.6)
Exports (commodities) (51.3) (39.0) ( 99.6) (53.9)Imports (commodities) (-47.4) (48.0) (-113.2) (-61.3)
Balance of Goodsand Non-factorServices 1.5 -- -22.2 -12.0
GDP (market prices) 100.0 37.1 184.7 100.0
1/ Includes G$3.6 million inventory accumulation; from 1970 on the changein inventories is assumed to be zero. Private fixed capital formationincreases cumulatively by G$15.15 million or 25 percent.
Source: Table 2.3.
121. Private consumntion is exoected to grow at about the same rate astotal expenditure, but private investment is likely to be less as some majoronaoina nroiects are completed and no new ones of romnarable size are insight. For public and private investment combined, these projects imply anaverage investment rntio of almnot 24 nprcpnt for 1970-1Q75 raTomnaredwith roughly 21 percent averaged over the period 1965-1969. The higherinvestment ratio counled with the higher rate of real outnut Vrowth- means
that the incremental capital output ratio for the period as a whole wouldbe virtually the same as that experienced in earlier years.
122. The antirinated grnwth in expnenditiires, and nart-icuularly t-he hiQh
import content of capital formation, imply a substantial increase in importsof goods and non-factor services= Thus in npit-e of t-he reasonably favor-
able export prospects - 5.7 percent per annum - the balance of paymentsdeficit- on cuirrent- account mny rise from US$IR million in 1Q6Q tn some
$38 million in 1975. Net foreign capital inflows thus would finance some43 percer.t of gross domestic capitial fnvm^.ai-4 duri4ng the next slx years -.
a ratio ident:ical to that experienced over the 1965-1969 period.
123. The impact that the project pattern of growth will have on employ-.ent iS AdiFff.i.cul to- -a-g ruh ----- ted outputn tUhe .ini;;g sc-
- 46 -
tor will not create a large volume of new employment opportunities. Thegrowth in agriculture is expected to come largely from more intensive ex-ploitation and institutional reforms. Consequently, its impact on employ-ment will be limited. Perhaps the most hopeful source of employment growthis the expected boom in engineering and construction, an activity that isrelatively labor-intensive. The expansion of the public sector, apartfrom its direct influence on construction, should favorably affect employ-ment growth as it implies an expansion in public services. The projectedrise in per capita incomes might be expected to induce a rise also in thedemand for privately supplied services, generally a highly labor-intensiveset of activities.
124. In the absence of the required data, it is not possible to quan-tify the expected changes in employment and unemployment. It should benoted, however, that the growth in the labor force over the period 1970-1975 is affected by the high birth rates recorded in the 1950's. On thisbasis, and ignoring net emigration, net additions to the labor force in thenext six years are likely to be large. The impact of the declining birthrate on the labor force will not be felt until the 1980's.
D. Proposed Public Investment Program
125. The continued growth of the Guyanese economy will depend cruciallyon a higher level of public sector capital expenditures. The broad stra-tegy underlying the recommended public investment program is to expand and,perhaps even more important, to modernize the basic infrastructure in thoseareas which have the ereatest productive potential. At the same time itis proposed that the meagre stock of capital in education, health,sanitation and hotising he exnanded significantlv. It would be a hollowachievement indeed, if economic advance in terms of output and income perhead were ton h acrompannid by dpelinini st2ndards nf snricl amenitfies.
What is more, the failure to translate economic growth in a form visible tothe broad stat of the popula tion wJhosea- av'niae 1i welTa 1hl beo the nation-
al average is a potential source of social conflict and upheaval. Althoughresource constraints inevitably put so.me limit- on what can be done an thepursuit of these objectives, they do not seem so severe as to precludesuch a strategy 1 The realism of the t -a t e Ad e pend_ mr on h gorW\1-i W L<sZ. , s LIs - E O1- V ~ -LU L11o Los W;C s I&- ^ -L& 11.; V-rb-
with which the Government will mobilize potentially available externalresources = by exp , p'-j- -planning, p- - - - aration- and exec.utl =
and on its ability to avoid the use of resources for purposes inconsistentWitl the above oJLectLves.
I12. TI he expanded ar.d improved proluctlve capacity that resul's fromu
the public investment program will, for the most part, affect output andino. in the subsequent period; the fruits of the expanded social nfa.LncomeL Lin LLI bU4UL IL LL UU Li .LLUA. Lb U LIL ALuU bL±d JAL. Ld
structure will be largely reaped in the longer-run. Apart from the expectedchlange 'in prouuctUive capacdi.tv - thle essential purpose of invest.1L.er. - th
- 47 -
sizable increase in the annual volume of public capital formation (averagingabout 12 percent of GDP) will add significantly to the current generationof income. It will be consistent with a viable balance of payments, how-ever, only if the expenditure pattern includes a large number of projectsfor which external financing can be obtained and which yield, in the longrun, substantial gains in exchange earning ability.
127. The level and composition of the public investment program pro-posed by the mission has been determined by an assessment of the require-ments for continued output growth, by an inventory of ongoing projects andby an estimate of the colume of financial resources that is likely to beavailable. 1/ It is predicated on the belief that the administrativecapacity of those ministries responsible for executing the program can andwill be greatly strengthened in the years immediately ahead. As for theproject content, the mission has drawn on proposals from the Ministry ofEconomic Development, individual investing ministries and the public corp-orations. It is important to stress, however, that the Government hasreserved judgnment on the level and content of the investment programoutlined here, pending the completion of its own development plan. Mostof the suggested items covered the three-year period ending in 1972, theterminal date of the soon to be superseded Guyana Development Program 1966-1972. The proposed 1970-1975 public, investment program compiled by themission is a mixture of government proposals of varying degree of firmnessevaluated by the mission's own view of requirements. The Government's newPlan, now being prepared, may well result in a somewhat different publicinvestment pattern and a different priority ordering of projects. For1970-1972, the prograim draws heavily on government proposals as of early1970, whereas the mission's suggestions figure more prominently in thelater years. For the six year period about 40 percent of the recommendedtotal outlay can be roughly categorized as mission proposals. (See Tables5.9, 5.10 ancl 5.11.) The project content of the program is described insome detail in Appendix I.
128. For the period 1970 to 1975, the proposed program calls for anaverage level. of capital expenditure of G$77 million a year. This is morethan double t:he average for 1966 to 1969, and 83 percent higher than therecommendations contained in the 1966-1972 plan. The annual phasing ofexpenditures suggests that outlays will be particularly large in the earlieryears. (See Table 5.8). The inordinately high increase of 36 percent incapital expenditures between 1969 and 1970, is due to a convergence ofexpenditures for ongoing prolects, 2/ and a very large increase in invest-ment by the public corporations. Clearly, an ambitious public investmentprogram is being proposed. Its sectoral allocation of capital expenditurefor 1970-1975 is indicated in the following table:
1/ It does not take into account the financial resources that will berequired to implement the Government ' recently announced policy ofequitv narticination in certain enterprises.
2/ Information at hand as of July 1970, suggests that there has beensome slippage in the rate of disbursements for the rice modernizationprogram so that the expected increase in capital expenditures for1970 is probably overestimated.
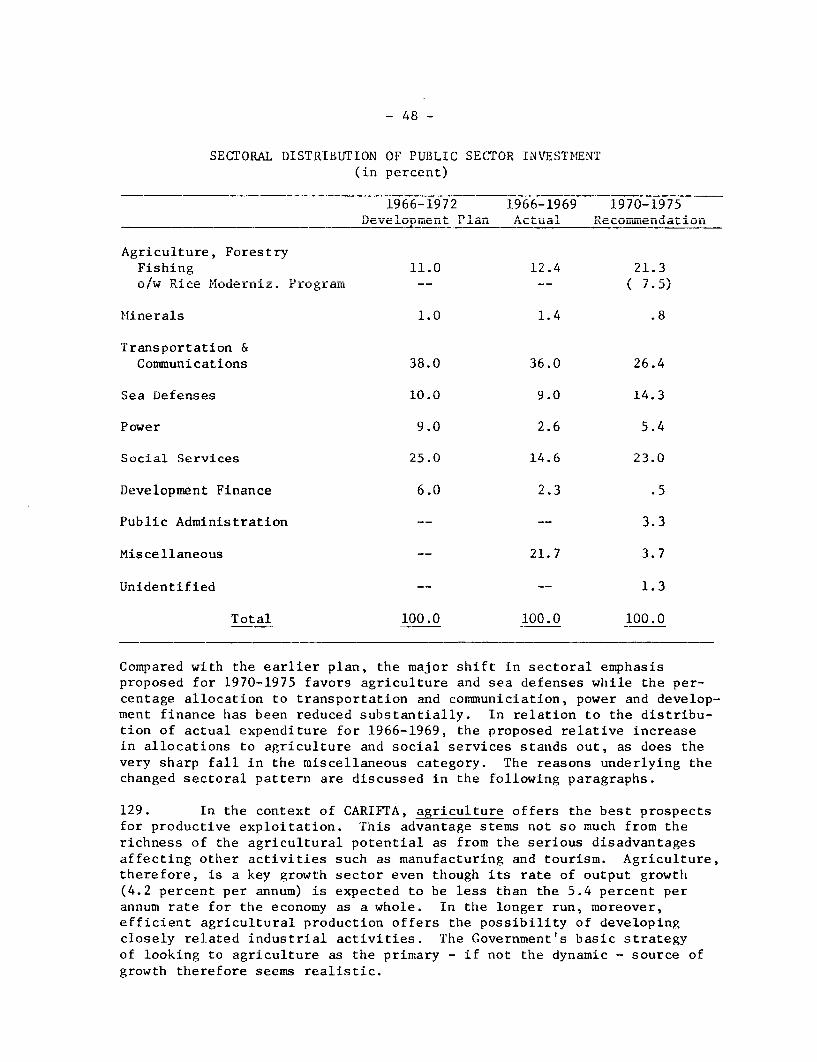
- 48 -
CUCt-rAD AT TNT C!TO)T 0 T rrTc~ f%h tO 0TT2T Tr,' QVr(T'CfND TNI?rulr'cFXt'MTr'
(in percent)
1966-1972 1966-1969 1970-1975Developmlent P'lan AIctual Re co i-Lendation.
tAgriculture, ForestryFishing 11.0 12.4 21.3o/w Rice UModerniz. Program -- -- (.
iViine rals 1. 1.4 .0
Transportation &Communications 38.0 36.0 26.4
Sea Defenses 10.0 9.0 14.3
Power 9.0 2.6 5.4
Social Services 25.0 14.6 23.0
Development Finance 6.0 2.3 .5
Public Administration -- -- 3.3
Miscellaneous -- 21.7 3.7
Unidentified -- -- 1.3
Total 100.0 100.0 100.0
Compared with the earlier plan, the major shift in sectoral emphasisproposed for 1970-1975 favors agriculture and sea defenses while the per-centage allocation to transportation and communiciation, power and develop-ment finance has been reduced substantially. In relation to the distribu-tion of actual expenditure for 1966-1969, the proposed relative increasein allocations to agriculture and social services stands out, as does thevery sharp fall in the miscellaneous category. The reasons underlying thechanged sectoral pattern are discussed in the following paragraphs.
129. In the context of CARIFTA, agriculture offers the best prospectsfor productive exploitation. This advantage stems not so much from therichness of the agricultural potential as from the serious disadvantagesaffecting other activities such as manufacturing and tourism. Agriculture,therefore, is a key growth sector even though its rate of output growth(4.2 percent per annum) is expected to be less than the 5.4 percent perannum rate for the economy as a whole. In the longer run, moreover,efficient agricultural production offers the possibility of developingclosely related industrial activities. The Government's basic strategyof looking to agriculture as the primary - if not the dynamic - source ofgrowth therefore seems realistic.
- 49 -
130. Within the sector, allocations to livestock and fishing reflectthe promising opportunities in those activities while the sum allotted toforestry is intended for surveying, research and development with the ob-jective of increasing the economic value and exploitation of existingresources. For rice cropping, inputs other than capital are importantrequirements of the recovery of output and improved productivity. (SeeVolume II - Agriculture in Guyana.) The ongoing rice storage and millingprogram, financed in part by USAID, represents 35 percent of the totalexpenditure proposed for this sector. The remaining capital expendituresproposed by the mission are largely intended for the rehabilitation and,where possible, the extension of certain existing land settlement schemesand supervised agricultural credit toward financing inputs for farm dev-elopment. The proposed focus thus is on intensive exploitation togetherwith some expansion in acreage. Research and training are also viewedas importan,t requirements in the sector.
131. In transportation the ongoing and planned road buildingprogram should provide Guyana by 1975 with a fairly complete network con-necting the major settlements and producing areas along the coast. Theanticipated consequence is a reduction in transport costs. Allowance hasalso been made for a start on the road to Brazil as well as for feederroads to link developing areas to main arterial roads. At the same time,the mission recommends an increased emphasis on air and water transport,modes which seem to be particularly suitable to Guyana's needs. Sums havebeen allotted for replacement and modernization of equipment in govern-ment-operated transport facilities. Equally important, however, is theneed to improve the organization and economic management of the variousoperations.
132. Provision is made in the expenditure program for undertaking thelong delayed expansion and improvement in the internal telecommunicationssystem covering all areas of the country. With the end of the major roaLdbuilding program in sight, the phasing out of the railways and a start onshifting to air and more efficient forms of water transport, the foreseenabsolute amount of annual outlays is identical (G$13.3 million a year) tothat recorded during 1966-1969. The percentage share of this sectorwill decline, however, because of the expansion of the investmentprogram as a whole. The possibility of dredging the Berbice River bars hasnot been irncluded in the public program. This is because the feasibilit:ystudy Dresentlv available is inadeauate as a basis for iudging the economicvalue of the proposal while the sources of financing and distribution ol'benefits are still open questions.
133. I'he relatively high nriority assianed to social canital reflectsthe pressing needs in education, health, housing, water supply and sanita-tin = An esnpee1alv l aggravating fartor has heen the hacklno of rpali re-ments built: up in most of these areas from 1966 to 1969, when investment:fell chort of exectatons oiut-linpd in the 1966-1972 Plan; The nrronosedexpenditure in education, it may be noted, is largely based on ongoing
- 50 -
proJ LLc t s well W a.L s db4 e poUJCLteU pL-OUgram connecte[Ud to tLU LeI. I L tLh Lit: i
sion's view that investment in these areas will yield sizeable socialbenefits within the 1970-1975 period and in the longer-run will raise theproductive capacity of the population.
134. The proposed investment in the power sector covers plans forexpanded generating capacity as well as extended transmission and distrib-ution facilities within the coastal area. The expansion is in line withthe projected growth in demand for power. The reduced percentage alloca-tion of public investment to power, when compared to the proposals in1966, reflects the altered expectations regarding hydroelectric powerdevelopment. In late 1966 consideration was being given to a hvdroelectricpower project, part of the output of which was to be used for aluminum smelt-ing. Feasibility studies conducted since then have cast doubt on the favor-able cost estimates originally calculated and hence on the economic valueof the project.
135. Of the remaining sectors, capital expenditures on sea defensesare the most important. The capital expenditure included for mineral isintended to follow-up the UNDP sponsored mineral survey and permits furtherground exploration. This activity is an essential element in the compila-tion of a resource inventory for Guyana to serve as a basis for explora-tion and development. in view of the limited prospects tor industrialgrowth, the percentage share of total public sector investment allotedto development finance is small. l/ The National Cooperative Bank andGuyana Development Corporation are the executing agencies. The funds forthe GDC are intended to support feasibility studies and pilot projects.The public administration category includes capital outlays destined forsuch items as fire fighting and law enforcement equipment, interior devel-opment and experimentation with cooperative forms of organization whilemiscellaneous includes expenditures not readily allocated to specific sec-tors. In the last year of the period, allowance also has been made foras yet unidentified development projects.
E. Financing the Proposed Public Capital Expenditures
136. The public sector investment program outlined above calls for anaverage annual volume of expenditure of about G$77 million, rising fromG$59 million in 1970 to G$88 million in 1975. The public corporations willaccount for an average outlay of G$9 million a year or about 12 percent ofpublic sector investment. For the six year period as a whole some G$461million will be spent with most of this amount representing gross additionsto Guyana's capital stock. Adding amortization of external debts, thecumulative financing requirements for the 1970-1975 period will amount toG$487 million. (See accompanying table.)
1/ In the light of the Government's recently announced policy of equityparticipation in certain enterprises capitai expenditures in thiscategory may be much higher than the sum allotted here.

PRO:POSED FINANCING OF PUBLIC INVESTMENT PROGRAM 1970-1975
(G$ million in prices of 1969)
Cumu-lative Totals
1969_ 1970 1971 1972 1973 1974 1975 1970 1975Actual Amount Percent
Uses
Publilc Sector Capital Expend. 4L3.01 50.7 09.8 77.7 80.4 8O.2 00.3 401.1 y4.6
o/w Public Corp. ( 2.7)1 ( v.3) (12.7) ( 8.8) (12.5) ( 7.6) ( 3.8) ( 53.7) (11.k )
Amortization on External Debt 4.4 4.9 4.2 3.3 3.9 4.7 5.3 26.3 5.4
TOTAL 48.2 63.6 74.0 81.0 84.3 90.9 93.6 487.4 100.o
Resources
Public Sector Savings 12.6 | 30.4 29.6 32.6 37.4 31.4 31.1 192.1 39L.l
Capital Receipts 2.6 | 1.0 1.0 1.0 1.0 1.0 1.0 6.o 1.2
Net Internal Borrowing 14.9 3.9 - 1.1 - 1.4 - 0.3 2.0 2.0 5.1 1.1
INTERNAL 30.1 _ | 3 29.6 32.2 38.1 34.0 34.1 2.2 2L..
Gross External Borrowing 20.5 33. 43.1 47.0 45.3 48.4 48.1 265.3 54..
External Grants 5.1 I 5.0 5.0 5.0 5.0 5.0 5.0 30.0 6.1.
EXTERNAL 25.6 | 38.4 48.1 5A 503 O53.4 531 295.3 60.6
1/ - 6Other- (-increase in assets) - 7.5 -10.1 - 3.6 - 3.2 - 4.1 3.5 6.4 - 11.1 -2.3
I _ _ _
1/ Includes changes in assets, float and statistical discrepancy
Source: Appendix Table 5.13
- 52 -
137. It was noted earlier that beginning in 1970. the volume of publicsector savings will rise substantially above the levels recorded in thelatter half of the 1960's, with the peak level occurring in 1973. Theupward shift in savings capacity is due to a combination of proposed newtax measures, the termination of tax concessions granted in the 1960's,growing surpluses generated by some of the public corporations, and theadvent of the National Insurance Scheme which will provide a new andsubstantial flow of savings over the next few years. At the same time,current coverninent exnenditures are expected to rise by almost 50 nercentover the six-year period. The projection takes account of anticipatedrising debt charges and tihe increased voltime and 7
,annlitvy; of nnhlicservices that the much enlarged public investment program will engender.It is also ansuimed that the expansion of the defense forces and dinlomatic
representation abroad in the years before 1970 will not recur on the sames-_ale As a onenqnence of rhese *onsiderntions tihe expe-_ted volunime of
public sector savings in relation to GDP will average 5.3 percent for the1970-1975 period as comnpared with 3.5 prrcent frr the years 1966 to 1969.In relation to public sector investment, public savings are expected tocover 42 percent, (39 percent if debt a---ortization is.- ..inlued lo ' asavings investment gap of G$269 million. At 58 percent, this is a rathersrnalle po rop~ortion t-har. that- rec.,~orde in t-he late 1960's.
138. Lt tl etJIC contribution is expected from. domestic borrowing, m.aiCnl&ybecause private sector savings are far from abundant. The cumulativetotal of 0G$5.1 ,,II 4on is largely attr,butable to publiccrprtin, h
Central Government accounting for only G$1.7 million of net internalborrowing_ in- 19070.- This -repres-ents the deposits of: gvernm,ent securitiesUUV .UL W ~Li
6~Lki J . tLLO J ._V 'Li_ LO LL&~ tpoLL U L ua Va A. LiI6L L. 3 UA. 4. ~ L. O
which life insurance companies are now required to make following the1n I U LUU 6Ag L . .X 4.0 exeCL Les '"a' 'liA Cenrl. * a oVCermlelIniL Wil no ' L Iiave
to resort to borrowing from the banking system. Altogether domesticresources will1 provide ab-out Al percent of total cap-,-'eure.ensr.~~3UuLL~3 W.L.LJ. JAU4U OL~U L~ t4 JLL~I Ut UL . LOjJ LO4. MU. iii
139 Is 'or financi;al resources originating abrad -_ -s expected__~_A.-J~ * 1t U. £IOlAd. A._ 3UUILt3 UA45LiO.i U LUOU .LL L.3
that Guyana will draw more heavily on the amounts potentially availableLiidi iiOOur:s ua| eei& pU3L1 4.L LLit: Ld * . L3L0LL d.A. dbUWUU LU LtiId.LL O 1 tLLi
level of G$5 million a year throughout the period and will, therefore,contribute about U percent of' reLqLuieULm1LLS. PiUCLI Lilth mUOt iLuportant
external sources will be gross borrowing from the United States, theUnited Klnlgdom, Canada and the IBRD/IDA. Suppliers' credits should repre-sent a very small share of the total. the volume of gross disbursementsshould rise from G$33 million in 1970 to G$48 million in 1975.
140. Since modest overall financing surpluses in 1970-1973 cnange toa deficit in 1974-1975, some additional financing resources may have to befound if the proposed level of public capital expenditure is to be main-tained. Possible alternatives are new fiscal measures to raise the levelof public savings or internal borrowing trom the public. The latterpotential source of financing, it will be noted, has been prescribed only for1970. It should not prove difficult to tap one or even both of the alter-native sources for additional resources to cover the relativelv small
financing gap in 1974 and 1975.
- 53 -
141. Overall, the proposed proportion of 64 percent ot externalfinancing of public capita31 expenditures can be compared with the estimated56 percent cf 1966-1969. 1' The financing plan proposed here is based onexpectations similar to those held in the mid-1960's, namely that availableexternal resources will be more fully utilized. The expectation adlded fcor1970-1975 is; that the much larger volume of public savings will make itunnecessary to borrow from the banking system in Guyana, so that a somewhatmore dynamic private sector growth may at least become possible.
142. It: is often suggested by Guyanese authorities that bilateraldonors in their aid and lending operations have not always allowed suffi--cient lead t:ime for project preparation and further, have channelled the:irfunds into activities which did not always coincide with the highestpriority investment needs of the country. W4hatever may be the merits ofthese specii-ic suggestions, there is no doubt that the preparation ofprojects and the coordination of external aid can be improved. In pursuLtof this objective the mission has attempted, in Tables 5.9, 5.10 and 5.11and Appendix I, to detail the project content of the public investment prog-ram along with a preliminary estimate of the foreign exchange component.Further, it specifies the date of commitment required and a tentativephasing of .lisbursements. With this information, highly tentative as itis in many respects, it may become easier for aid donors and lenders toprepare their lending programs employing the machinery of the aid coordi-nation meetings and within a proposed framework of requirements for Guyana'sdevelopment. However, it is to be regarded as no more than indicative untilthe Government's new development plan is completed.
143. Since the estimated foreign exchange component of the programis high - close to two-thirds of total public investment - the publicaccounts will be in reasonable balance if only the foreign exchange com-ponent is covered by the loans which can be attached to projects suitablefor external financing. This is also a consequence of the high proportionof the total program that can be defined in terms of discrete projects towhich external lenders can attach financing. If a key assumption aboutthe structure of public investments - that the "miscellaneous" categoryloses importance - proves over-optimistic, then foreign exchange costfinancing for the remaining attachable projects will not be sufficient toprevent disequilibria both in the public finances and in the balance ofpayments.
F. Some Outstanding Policy Issues
144. The projections and proposals described above set challengingaPvp1nnmpnt tsaroaPtg fnr Gytivnna 'hpfr nrthipupmpnt hinoc nn thp adnrnt1ri,of certain public policies which are reviewed systematically below.
1/ See text tables on pages 26 and 51.
- 54 -
145. In the area of economic management and administration, referencehas been made to specific measures which should be adopted. Foremost inimportance among these is the need to strengthen the staff - both numbersand expertise - that will be responsible for executing the much enlargedpublic investment program. The tax measures introduced in 1970 Budgetare complex and their effective implementation calls for improved staff-ing as well as collection and administration machinery. Over and abovemanpower requirements, however, a review of the tax structure includingtne possible disincentive effects of the steeply progressive rates onpersonal income seems warranted. Since revenues generated in response tochanges in national income and output have been less than expected, aprogressive tax structure more responsive to the growth of output andincome could help avoid the necessity for frequent changes in rates andin the base of taxation. It is hoped that the Fiscal Review Commissioncurrently at work will contribute to the adoption of a reformed system, sincethe issue of some new fiscal measures to cover the financing gap may wellarise by 1973.
146. The expected large increase in public sector savings will onlybe realized if the Government adheres to its stated policy to keep a tightrein on the growth of current expenditures. In the face of growing demandson the public purse, interior development for example, the policy of ex-penditure restraint will be strongly tested. It should be recognized,however, that any reduction in the projected share of public sector savingsmay jeopardize the level and composition of the investment program oraffect adversely the balance of payments or both.
147. A review of the transport sector reveals some important weaknessesin the organization and management of the government services, especiallyair services, coastal shipping and road transport. It calls for a criticalreview of all aspects of Rovernment transport operations and policies withthe ultimate objective of reducing the fiscal drain. This should includethe possibility of withdrawing from some operations in favor of privateenterprise or cooperatives so long as public transport goals are notsacrificed.
148 TIn genpral, the incrrpacin role of gxnvernment in the economy makesit all the more important that public decision-making be rational. This,in turn. renuires a denendahle range and nqialitv of statistirnl information
as well as the application of analytical techniques such as cost-benefitanalysis which help to identify the consequences of alternative policies.
149. The pessimistic outlook for manufacturing or industrial develop-ment in Guyana is based, in part, on good economic reasons; more difficultto evaluate, however, is the role of the 'climate" for private investment.Aspects of government policies which favor cooperatives and which call forequity participation to the extent of 51 ------ Ltin n enteps exloit-
ing natural resources, are factors which probably affect adversely many

- 55 -
private investment decisions. What seems to be missing are the details ofthe public participation policy setting out the "rules of the game" forprivate entetrprise activity.
150. Public policy in agriculture is clearly of prime importance(for details see Volume II - Agriculture in Guvana). The uncertairLty ofGuyana's sugar quotas in the United Kingdom and United States markets and.the domination of the industry by forei2n concerns has led the Governmentto turn away from sugar in its agricultural sector priorities. As longas this attitude does not interfere with nresent effiripnt onprationni itposes no major problem since the industry is not dependent on major govern-mpnt investTypntq or qervires IJhat should eh Perhpwped however, is; offic'iAl
action to divert larLd presently under sugar to other uses. For even ifCGuyana lost its proterted markets or if the world market sugar price fell,or both, Guyana would remain a relatively efficient sugar producer. Alessenina of the dornminnrn of siuawr shouiild onnly pursued by stimulatinc
other agriculture to grow at a faster rate, rather than by attempt:Lng tocurtail the modest rate of acreage expansion planned by individual canefarmers.
151. The improvement of output and productivity in rice requires areo r i entatio n of -ovrern.ment policyI to favor more the efficient uti at4.o4,s,
of existing resources and to raise the rate of return on additional increasesin investment. it is hoped that the current research pr o- wIl r4o1d1 u
a rice grow:Lng technology better suited to the Guyanese farmer's abilityand the level of extension services possible so that qu31ity -a_ yields
might be raised. The poor results from the past investments in the riceindustry can, be reversed by an. Imaproved water control system,, a pricingpolicy which allocates to users the true costs of water control, liberal:Lz--ing anA ratLonalizi;;g th1e lanA m¢arlket, -le provision of credit to credit=ALL~a&. i a L .Lf,a L..L L 6LIL %A&& L L. , Ll L. V ~IJLL L U.LU±L .L #_ ~U.L L.
worthy farmers, a revised price structure to encourage the production andti.L.elLy UdeLLveLy of iL.L;1iLgh quality grades, andu facilitating thLie developmeLtof efficient marketing services.
152. It has already been noted that the large number of unemployed hasbleen one of' th1e motivatingc lactors in -le aloption of -le cooperatwve asu~L uA ~ J ~&&L -rnL.V L.LI A. L.L'- L 6 .LL L1 au~ L-.LJL aL LAL %..Lv~a
an instrument for development. The idealis to attract the unemployed intogroUD activity whiere, wLitL goverrLuuent support, thLey can partLciLpate as co-proprietors in productive work. The cooperative is a complex organization-al form w`L'_h calls for rLdanagerial skills whiich are on(ly now being developedin Guyana. Nevertheless, viewed as an attack on the problem of unemploy-ment, the cooperative idea is an Lineresting experiment.
153. The Government's expressed desire to pursue tne counEry's econo-mic and social development goals in its own way and on its own resourcesis understandable. And these goals rightly reflect high ambitions and as-
pirations. What should be clearly understood is that a necessary conditionfor achieving the ambitious goals is a substantial increase in the capitai
- 56 -
stock of the country, its modernization and allocation to the most produc-tive lines of activity. This implies a far reaching npublic investmentprogram. The Government should succeed in marshalling a large volume ofdomePtir rpeouircrp - mTainlv in the form of inrrpeaqpd nnhlir savings - to
help finance this program, but given Guyana's incapacity to produce locallymost of the reiired canital equipment and bh,ilding matprials that tne
public capital expenditures will engender, tnese items must be importedand paid for in foreign exchangen Additional ovrhann,e will hb needed tn
support the resulting niginer level of consumer demand. External borrowingand grants - resources which nre ava ilable to Cuyannn in co.m.parati Tly
generous amounts and on concessionary terms - can help provide the foreignexchange. Erxternal sources of fi ,Jr--arn, make it k ossibl tnc i ss a tStan n
larger public investment program and avoid the deleterious consequences forti,ao 1,o n Ion no nf oromrnoF tor n .. n, 1A one mm 4 f Anmno oc4t;V o, mo a rni molo ran V O
*t~~~~~~~~-^2J-- if - F '- s- -vs _ __ _
used for financing. Thus a trade-off is clear. The choice will be betweena significant improvem-ent in the capital stock and faster output growth,supported by external grants and loans, or a slower growth potential builtmainly or exclusively on domestic. res-ource molbi&lza0L..L-
- 57 -
IV. THE EXfERNAL SECTOR: POLICIES AND PROSPECTS
Pat. PerformnLce
15 4.I LL w U .LULjLUV=iJ LIA LI U £JLIL. ThUJ. LUere was a marked i in te balance of i trdeduring the latter half of the 1960's. This was the result of a strong 10perceLt per year growth in the vaLue ofk coLIioU ity ex-ports co-upleu witLh a7 percent annual rate of advance in the value of imports. Net factor pay-ments abroad increased almost as quickly as exports over this period wit.na particularly sharp rise recorded in 1969. The year to year movementsin the current account deficit were uneven, but the tendency was distinctlytoward a lower deficit; the balance was highest in 1966 with a US$31 mil-lion outflow and by 1969 had been reduced to an outflow of US$18 million.
155. Despite the improvement in the balance of commodity tracie andthe current account balance since 1966, Guyana experienced a net loss offoreign exchange reserves amounting to US$!1 million. 1! During thisperiod, 1967 was the only year in which a balance of payments surplus wasrecorded. This occurred largely because of substantial direct privatecapital inflows associated with the expansion of mining capacity. Thiswas also the only year in which the Central Government did not have toresort to net internal borrowing from the banking system to cover a short-fall in financing public capital expenditures. Indeed, a net repaymentto the banking system was recorded in that year. Part of the weakness inthe balance of payments suggested by the net loss of foreign exchange re-serves can be traced to the much expanded public borrowing from the bankingsystem to finance public investment. Between December 1965 and December1969 domestic credit outstanding doubled; that attributable to the CentralGovernment, however, increased by almost 3-1/2 times. Had it been possiblefor the Government to utilize more of the external resources that wereavailable, the current account deficits, in 1968 and 1969 at least, mighthave been fully financed and the loss in foreign exchange reservesmoderated if not avoided. The balance of payments projections to 1975suggest that, overall, the prospects for improvement are reasonably good.
The Current Account
156. It is anticipated that the continuous improvement in the visibletrade balance recorded since 1965 will taper off in 1970 and 1971, and thendecline more or less steadily to 1975. The changes in the trade balancereflect an expected growth of commodity imports at the annual averagerate of 6.8 percent or a rate in excess of the 5.7 percent per annum growth
±1 Ths1E excludes teh revaluation of reserves consequent upon the
November 1967 devaluation of sterling. The loss on this accountis estimated at US$4 million.
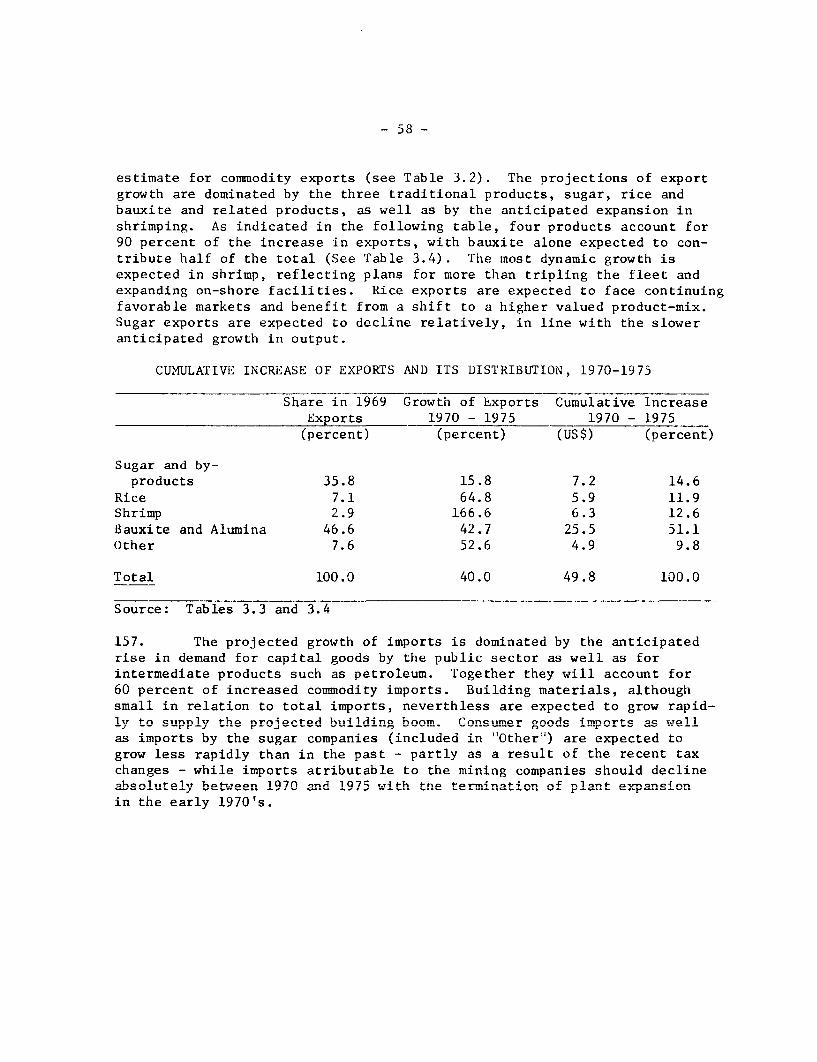
- 58 -
estimate for commodity exports (see Table 3.2). The projections of exportgrowth are dominated by the three traditional products, sugar, rice andbauxite and related products, as well as by the anticipated expansion inshrimping. As indicated in the following table, four products account for90 percent of the increase in exports, with bauxite alone expected to con-tribute half of the total (See Table 3.4). The most dynamic growth isexpected in shrimp, reflecting plans for more than tripling the fleet andexpanding on-shore facilities. Rice exports are expected to face continuingfavorable markets and benefit from a shift to a higher valued product-mix.Sugar exports are expected to decline relatively, in line with the sloweranticipated growth in output.
CUMULATIVE INCREASE OF EXPORTS AND ITS DISTRIBUTION, 1970-1975
Share in 1969 Growth of Exports Cumulative IncreaseExports 1970 - 1975 1970 - 1975(percent) (percent) (US$) (percent)
Sugar and by-products 35.8 15.8 7.2 14.6
Rice 7.1 64.8 5.9 11.9Shrimp 2.9 166.6 6.3 12.6Bauxite and Alumina 46.6 42.7 25.5 51.1Other 7.6 52.6 4.9 9.8
Total 100.0 40.0 49.8 100.0
Source: Tables 3.3 and 3.4
157. The projected growth of imports is dominated by the anticipatedrise in demand for canital goodA by the nublic sector as well as forintermediate products such as petroleum. Together they will account for60 nprcpnt nf inrrpnqpd onimonditv imnnrtr Rtiildinc, mntprinIs l nlthmich
small in relation to total imports, neverthless are expected to grow rapid-I,y to ciinnlu the i.roicted bu4 ilding h-A n ,Coom. onncmvr goodsA imnnorts me well-J '-_ rr-J -_..e--- -- - -
as imports by the sugar companies (included in "Other') are expected togrow less rapidly tha. 4i- th,a pst - pa-rtl-y ac a reQiult of the rercnt tav
changes - while imports atributable to the mining companies should declineabsolute!, beeen 1970 arnd 1975 with the termination of plant expansionin the early 1970's.
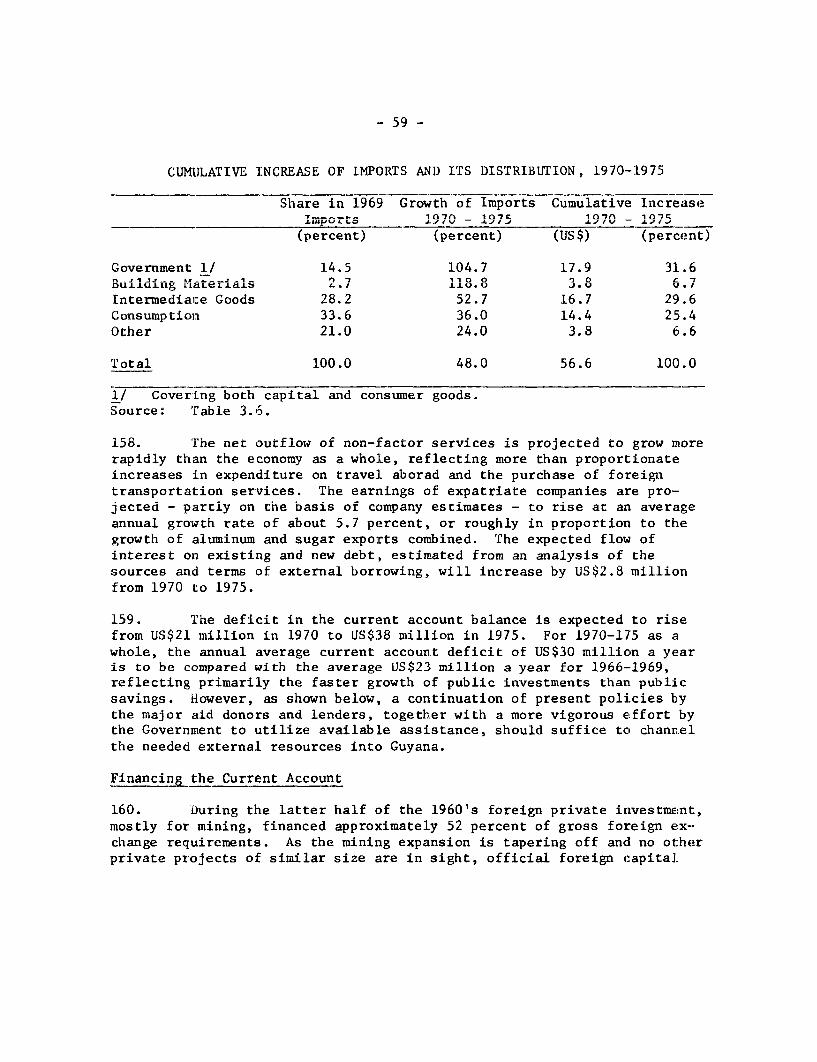
- 59 -
CUMLtLATIVE INCREASE OF IMPORTS AND ITS DISTRIBUTION, 1970-1975
Share in 1969 Growth of Imports Cumulative IncreaseT------ 10T- 1975 107n = 1075
(percent) (percent) (US$) (percent)
Government 1/ 14.5 104.7 17.9 31.6- I I .Ai J 1is ) ? 110 0 ) 0 C '7
DUL.LU.Ld5L7 Materials 2.7 18.8 0 6.7
Intermediace Goods 28.2 52.7 16.7 29.6C on s iaip t i'L orn1 . Jo-4 36 1 2 54
Other 21.0 24.0 3.8 6.6
Total 100.0 48.0 56.6 100.0
1/ Covering both capital and consumer goods.Source: iaDie J.o.
158. The net outflow of non-factor services is projected to grow morerapidly than the economy as a whole, reflecting more than proportionateincreases in expenditure on travel aborad and the purchase of foreigntransportation services. The earnings of expatriate companies are pro-jected - partly on the basis of company estimates - to rise at an averageannual growth rate of about 5.7 percent, or roughly in proportion to thegrowth of aluminum and sugar exports combined. The expected tlow otinterest on existing and new debt, estimated from an analysis of thesources and terms of external borrowing, will increase by US$2.8 millionfrom 1970 to 1975.
159. The deficit in the current account balance is expected to risefrom US$21 million in 1970 to US$38 million in 1975. For 1970-175 as awhole, the annual average current account deficit of US$30 million a yearis to be compared with the average US$23 million a year for 1966-1969,reflecting primarily the faster growth of public investments than publicsavings. However, as shown below, a continuation of present policies bythe major aid donors and lenders, together with a more vigorous effort bythe Government to utilize available assistance, should suffice tco channelthe needed, external resources into Guyana.
Financing the Current Account
160. During the latter half of the 1960's foreign private investment,mostly for mining, financed approximately 52 percent of gross foreign ex-change requirements. As the mining expansion is tapering off and no otherprivate projects of similar size are in sight, official foreign capital
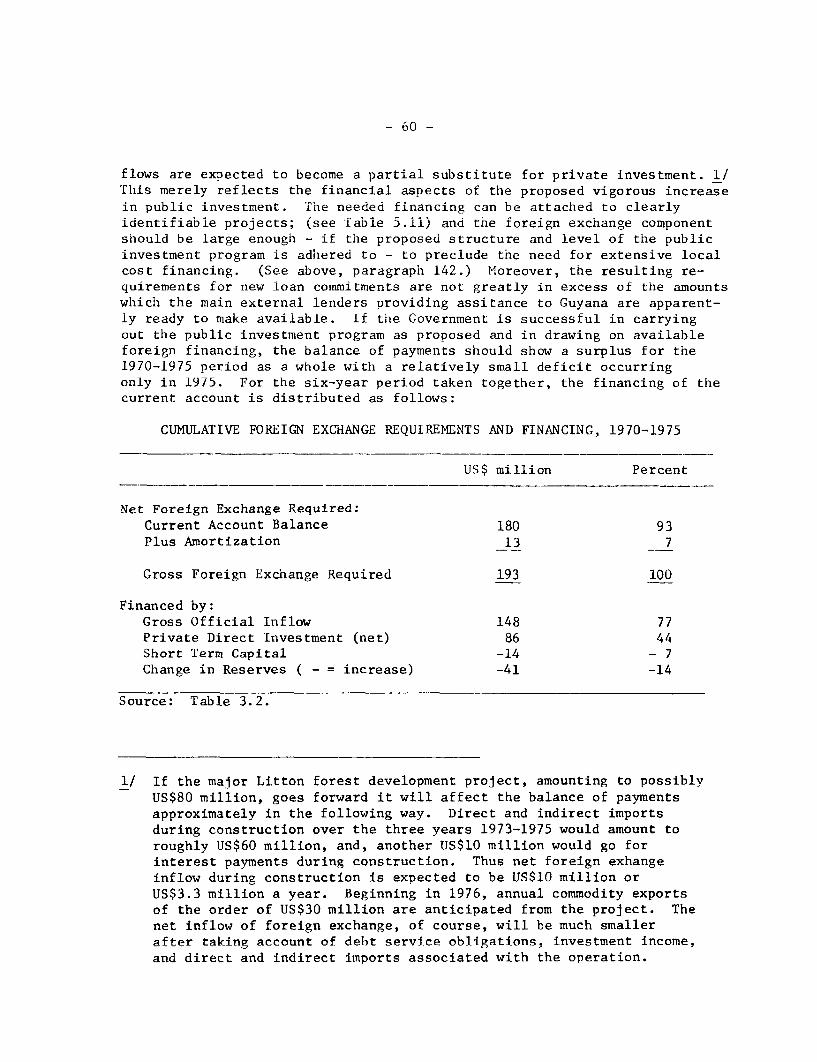
- 60 -
flows are expected to become a partial substitute for private investment. 1/This merely reflects the financial aspects of the proposed vigorous increasein public investment. The needed financing can be attached to clearlyidentifiable projects; (see Tabie 5.11) and the foreign exchange componentshould be large enough - if the proposed structure and level of the publicinvestment program is adhered to - to preclude the need for extensive localcost financing. (See above, paragraph 142.) Moreover, the resulting re-quirements for new loan commitments are not greatly in excess of the amountswhich the main external lenders providing assitance to Guyana are apparent-ly ready to make available. if the Government is successtul in carryingout the public investment program as proposed and in drawing on availableforeign financing, the balance of payments should show a surplus for the1970-1975 period as a whole withi a relatively small deficit occurringonly in 1975. For the six-year period taken together, the financing of thecurrent account is distributed as follows:
CUMULATIVE FOREIGN EXCHANGE REQUIREMENTS AND FINANCING, 1970-1975
US$ million Percent
Net Foreign Exchange Required:
Current Account Balance 180 93Plus Amortization 13 7
Gross Foreign Exchange Required 193 100
Financed by:Gross Official Inflow 148 77Private Direct Investment (net) 86 44Short Term Capital -14 - 7Change in Reserves ( - = increase) -41 -14
Source: Table 3.2.
1/ If the major Litton forest development project, amounting to possiblyUS$80 million, goes forward it will affect the balance of paymentsapproximately in the following way. Direct and indirect importsduring construction over the three years 1973-1975 would amount toroughly US$60 million, and. another US$10 million would Ro forinterest payments during construction. Thus net foreign exhangeinflow during construction is expected to be US$10 million orUS$3.3 million a year. Beginning in 1976, annual commodity exportsof the order of US$30 million are anticipated from the proiect. Thenet inflow of foreign exchange, of course, will be much smallerafter takina account of debt service obligations. investment income,and direct and indirect imports associated with the operation.
- 61 -
Debt Service
161. Guyana obtains external financial assistance from the UnitedKingdom,T Us,th, UniteA t Ga-rnadi the TIRBn andi IA. These resourcesare made available on concessionary terms; the average interest rate ondebt outsta-nding ics about 4.5 percent with an averag,e repayment periodof 24 years. On the basis of a calculation which takes account of foreignexchange earnings which should actuallybe avaIlable to Guyana - i.e., netof profit remittances - the debt service ratio for 1970-1975 is expectedto change from 3.8 percent in 19-69 to 4-5 percent i-n 1975.
162. The hea, extren-al -rrnuring over the COm4 - si y4 n s however,~fl=~& LLS~ .. ~.- T - 4L1 .UL*Sb -~4 Lf7 -
will be reflected in growing debt service requirements subsequent to1975, rising from TUS8 M..41 4 o in that yeaz to US$13 m4llion 4n 10709(See Table 4.2). To evaluate this trend, the balance of payments hasbDeen projecteA to - 107 0 s9uming a .o s h i o . e of trade 4.,
ua,ylJ u..a. L.t S I . accQUW-6L 5 o.u A.W L UjJ~V V,U UL,a,OAL%~ -JJ LL QIA- 51L.
the latter 1970's as a result of a sustained export growth combined withalower rate of i 4ncrease in Irn.ports since -le "big push"' in public Invest-.L.J~ L. A.LJ. ILL.~ L LL[1 .J ) A.LL.. L.L& ULA. pu 1& A.LI L AU LA.. L .IVOL.
ment is not expected to reproduced in the second-half of the decade. (SeeTablle 13.2). Thi-us, in relationL to tbe expected growth of net export receiptsA. C&U I. .J r* I I. ib L IL±JLU LLLL AI LLU ILW LiU I_~ L~~ LL LL A~L
beyond 1975, the debt service ratio may rise to 6 percent in 1979. Thisis ir,dicated in the first colun of the accoup-ayng tablUe. T lie rapiu.Ly
growing service obligation on the external debt, together with an expectedtiUW UUL SLadUy dUt LtlULdLiul. . in t Xe dlal:ce of payments to 19,9 , uIU L ±n.
the importance of economic policies of the general character outlined inthis report, and in particular those which will have a favorable impact onthe balance of payments. Key ingredients of a viable development strategyare the achievement of the high target level of public savings, the revitai-ization of rice production and exports and the improvement of capacity toabsorb external financial resources to finance the proposed ievel andcomposition of public capital expenditure.
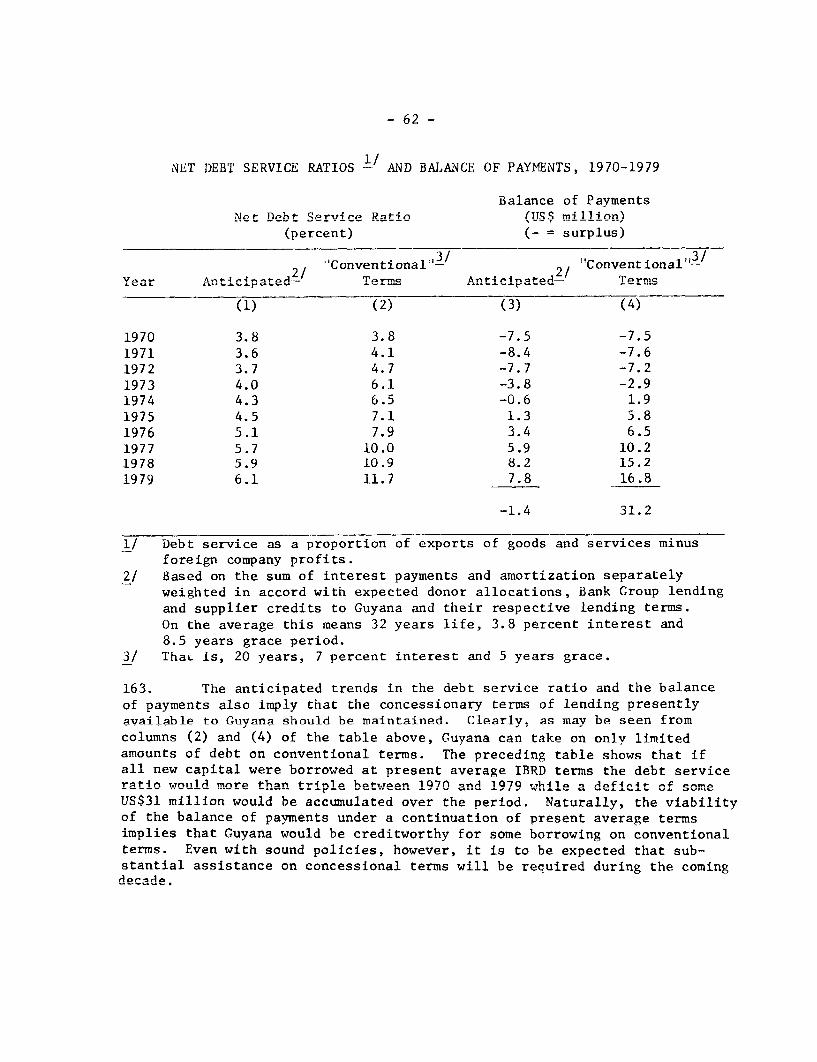
- 62 -
NET DEBT SERVICE RATIOS -i AND BALANCE OF PAYMENTS, 1970-1979
Balance of PaymentsNet Debt Service Ration (ITS million)
(percent) (- = surplus)
4.2/ 'Conventional'- 2/ "Conventional-'3/Yeaz Anticipated--Termc Ant-ic t Termc
(1) (2) (3) (4)
1970 3.8 3.8 -7.5 -7.51971 3.6 4.1 -8.4 -7.61972 3.7 4.7 -7.7 -7.21973 4.0 6.1 -3.8 -2.91974 4.3 6.5 -0.6 1.91975 4.5 7.1 1.3 5.81976 5.1 7.9 3.4 6.51977 5.7 10.0 5.9 10.21978 5.9 10.9 8.2 15.21979 6.1 11.7 7.8 16.8
-1.4 31.2
1/ Debt service as a proportion of exports of goods and services minusforeign company profits.
2/ Based on the sum of interest payments and amortization separatelyweighted in accord with expected donor allocations, Bank Group lendingand supplier credits to Guyana and their respective lending terms.On the average this means 32 years life, 3.8 percent interest and8.5 years grace period.
3/ That is, 20 years, 7 percent interest and 5 years grace.
163. The anticipated trends in the debt service ratio and the balanceof payments also imply that the concessionary terms of lending presentlyavailable to Guvana should be maintained. Clearly, as may be seen from
columns (2) and (4) of the table above, Guyana can take on only limitedamounts nf dbht on co'nventional term-s. The preceding table shows that ifall new capital were borrowed at present average IBRD terms the debt serviceratio would more than tripnle betwen 1070 ndA 107Q wh41e A d 4efcit of some
US$31 million would be accumulated over the period. Naturally, the viabilityof the balance of payments under a continuation of present average terms
implies that Guyana would be creditworthy for some borrowing on conventionalterms. Even with sound policies, however, it is to bue expected that substantial assistance on concessional terms will be required during the comingde A,e

APPENDIX IPage 1
PROJECT COMPOSITION OF THE PROPOSED PUBLIC INVESTMENT PROGRAM, 1970-1975
'rhis annpndix dpqcrihpn in snme detail the niihlir ranital expendynA-
itures proposed for the 1970-1975 period as summarized in Table 5.8. T.a-hles 5;9 5.10n and 511 senprante the nrngram into nrAnnnape 1nn11v finsnne-ri
X ~~~~- r -r--r- -r-- r---------. ----------projects, externaLly financed ongoing projects and new projects to whichnational f:inancing might-h hp ttrahed, repncrtiuvly. In view of the newdevelopment plan being prepared by the Government, the projects describedbelow shou:!d not- No t-aken ton reflect- tdefinit-iue officiaml fde-cisin>.
BesiAdes sea deAfoenses, tal for uya., t-h pT,rorprose 1Q70-1Q7'S
public investment expenditures are distributed among three major categories:transportalion and coo= unicattions (26 percent of total); agriculture, ftre.s-try and fisheries (21 percent); and social services (23 percent). Thelevel of public investm1ent, as discussed in the economi4 c report, could norbe maintained without the substantial foreign assistance, which, on thebDas4s of p;-esent lbndi4.ng, will b-e avaialable 'or financ-ing public irvsaet
UQa~O ~ FJ.~aLAL .L~LtJ.LL 5 ~ W . U va I~ I I iL.L L~± fPu ±L L .LLLV-_ LAIM-1.16
Moreover, t:he assistance will be available, on the whole, at concessionaryt e-nns . A 4U.1 1 .. #1oi*. -1,4 0 o
4ioi. .1
tCI tIE A-l t UX.L utilization of ts a8sis40tance will not olny ralse outJpul:and employment in the 1970-1975 period, but also improve the quality oflife inf;:rryas£L.LL ALII L IULCL ytcl
T.he items designated under the headlng "Government Program" areessentially proposals presented to the mission by the Ministry of EconomicDevelopmeni: in early 1970. n soine instances these have been rev:seu onthe basis of information obtained from individual ministries on projectcosts and expenditure phasing. The suDsequent government decision toprepare a new development plan for 1971-1975, however, may well result iLnan alteratL: -O1 0of p1-oJec prLtLe.JC
"he locally financed expenditures listed in Table 5.9, eitnerbecause of their size or content, do not seem likely to attract foreign& _ L . 1._ 1. J. , _ _ ._ J £I ._ J _ _ _ _._ _ - -_ - -L±ita1ncIIg cilthLiOug`I 6 U±L.L LULL 4LtIIUCL Udly b L.± a l.llU an11 ULonUgoig rU plannIedproject in Table 5.9 that would conform to its lending policies andinterests. saule 5.10 iLsts on ongoing projects for wnicn foreign finanic--ing had been secured prior to January 1, 1970. The amount of foreignfinancing indicated for each of the proposed new projects (TaDie 5.11) isequivalent to the mission's estimate of the import content of the projectslisted. No aiilowance has been made for local currency financing. Incases where bilateral lenders or international agencies have taken underconsideration a potential project, they have been listed as a possibiesource of iinancial assistance. Such a notation, however, does not implythat an actual commitment has been made nor that one is forthcoming.
1. Drainage and Irrigation
The Government has prepared tentative plans for drainage works,irrigation and water conservancy amounting to G$40 million between 1970and 1977. Since the future growth of the agricultural sector depends asmuch on institutional and policy changes (see Volume II - Agriculture in
k,ftrr.1piILA A
Page 2
Guyana) as on public investment, satisfactory rates of return for landrehabilitation and development will only occur if the policy changes whichare urgently needed accompany public investment that aims at more intensiveuse of presently cultivated land.
The Government's program as it presently stands still lacks aspecific project content and has not been evaluated with respect to priorityranking and expected rates of return. Utilizing the Halcrow Land Develop-ment and Improvement Study 1/ as a basis for project planning, the missionhas divided the program into four components for project planning purposesexclusive of the modest 1970 expenditure for ongoing minor works.
Phase I might include Jacobs Lust/Catherina, Golden Grove/Victoria,Aliki and Garden Grove. Towards the end of Phase I (1973) a feasibilitystudy could begin on a new program that might incorporate the establishmentof a small farmer irrigation and drainage scheme at Jackson Creek/LittleMoleson and the gradual rehabilitation of Boerasirie (including West DemeraraConservancy), Vergenoegen/Bonasika and Brandwagt-Sari in 1974 and 1975. Afeasibility study of Phase I should be started in 1971. A USAID financedfeasibility study for the rehabilitation and expansion of the Black Bushand Tapakuma land schemes is scheduled to be started shortly. The projectwould include, along with land rehabilitation, supervised agriculturalcredit and demonstration crop rotation farming. If it proves viable, theproject could be a model for future rehabilitation schemes. G$3 millionhas been included for the provision of drainage and ground water irrigationin the Abary Triangle based on a UNDP survey of ground water resources. Abilateral feasibility study commitment should be sought in 1971 for thisproject.
2. Rice
Apart from drainage and irrigation, the focus of public invest-ment in rice is on the large ongoing USAID storage and research programs,which will be completed by late 1972 or early 1973. However, recentinformation suggests that there will be some delay in executing the program.G$3.0 million of the G$35 million project is for the development of theMARDS Rice Research Institute and the balance for the provision of additionalpaddy drying and storage facilities and for improvements to the Guyana RiceCorporation's rice mills. The additional drying and storage facilities,all to be operated by G.R.C., will provide a readier market for paddy atharvest by facilitating the storage of paddy rather than the more perish-able milled rice and hence result in a superior final product and highermarket prices. This program will only realize its full potential if thepolicy measures, set out in detail in Volume II - Agriculture in Guyana, areintroduced so that production increases will materialize. Thpeps in turn,
1/ Sir William Halcrow and Partners, An appraisal on Behalf of theGovernment of Guyana of Schemes for Land Development and LandImprovement on the Coastlands of Guyana for initiation in 1968,'Ministry of Overseas Development, U.K. May 1968.
APPENDIX IPage 3
should result in an increased demand for drying and storage facilities. Themission has included G$300,000 per year after 1972 to support continuingresearch at the MARDS. Part of the financial requirements are to beobtained from a levy on production. Upon completion of the present USAIDmodernization program in 1973, a reassessement of the needs in the riceindustry might be undertaken to ascertain the appropriate volume andpattern of subsequent public investment needs in this sub-sector.
3. Livestock
The growth in livestock output in the 1960's has been disappoint-ing even thouah Guyana has some good grazing land. Government recentlysubmitted a livestock development program for IDA financing. If the prog-ram nroves viahle and Ruecessful- a Phase II extension of the nrogram in1974/75 is visualized. The importation of breeding stock and semen on amodest earle is ineliudepd in Phase T of t-hp nrniot-t-
4= Mark et-i nc
The (yivAna MarketinQ Gnrnoration plane a G$3.3 million xparnsnir,nprogram that includes the purchase of equipment for poultry and vegetable.nrnroceing, feed mTxninp, rnld stnrage facilitipc nnd a milk recnnstiit-ionplant. Although the investments are to commence in 1970, much of the re-niiired eniuinment might be suitable for bilateral financing in 1971 and1972. The Rice Marketing Board hopes to add to their rice processing and.packaging, equipment during 1970-72 and the mission ha aAAeA a scndnA phaseto this program beyond 1972 in the light of the projected expansion inr. ro nonnr*c
5. Surveysnc and Mapping
Tn. 19661, Governm.ent ent"ered Ainto a. agreem,en- w-it lanadAa to5.l. u U J ~ U,~ L u 1_L u ~L L.LL L 11- ~ ~ IL LW. L.& L., L %A L~
execute a topographic mapping program at a cost of G$5.7 million to aidinte-dntifica4ion. Wnd ev_aluation of interior resurces * Since wete
conditions cover the tropical forests of Guyana are not ideal for continuclusaerial photcgrap.y, only about 4I0 percent ofU theOLO phLoULU 6raphy had Ubeen c.=JIL
pleted by the end of 1969. The cost to complete the program is estimatedatL G$31.0 8 91..lilcon ar,d the misslon assu-umes that the life of the loan will beaL ' aJ J £L±J .L±.JL vII. LisLM- .AILa.JJZ a u ~ LaL~ lI ±L.L.L J U L L L .LI LL .L.±LP
extended for this purpose.
The need for the efficient utilization of existing cultivatedlar.di Guyna, includin.g a r o.al lan' transfer - -us discussein Volume II - Agriculture in Guyana, highlights the need to complete thegeodetic coitro'L net,Ww_rLK suppleumLented by low altit.uUe photograsUeErLc surv.eyb.
This program should induce a more rapid rate of land registration which intur-n would J.aCtLLaLe thLe transfer oiL land o-wership. Furthermore, iL woulG
aid the implementation of the proposed land tax which is designed to en-courage the efficient use of land. This program snouid be foilowed in1973-74 by a cadastral survey to provide a consistent basis for land evaiL-uation.
APPENDIX IPage 4
The UNDP has indicated its willingness to help improve mappreparation and reproduction in the Cartographic Section. This requiresa survey building and appropriate equipment in what might become aCartographic Center. This project might be suitable for either bilateralor UNDP financing, with a commitment by 1972 for construction to begin in1973.
6. Other Agriculture
A G$1.2 million crop research and development program on 14 cropsis planned by the Minsitry of Agriculture during 1970-72. The missionsuggests phasing this expenditure over the 1970-75 period with effortsbeing concentrated on only a few items. Foreign exchange expenditurewould be involved for the importation of machinery and seed and projectformulation should be completed in 1971 so that bilateral financing couldbe attached in time. The Government's 1970-72 plan for G$700,000 to bespent on extension training has been increased to G$1.5 million for the1970-75 period which would include field personnel, demonstration plots,extension training and an expansion of the facilities of the Guyana Schoolof Agriculture. This program envisages a substantial enlargement ofextension services. The foreign financing component is intended fortechnical assistance, agricultural training abroad and equipment.
Agricultural Credit has traditionally been scarce in Guyana,since the commercial banks have been reluctant to channel a substantialportion of their lending to a sector with relatively high risk and admin-istrative costs. The performance of the Guyana Credit Corporation, whichwas to have supplied a good part of agricultural credit requirements, hasbeen disappointing having sustained losses on account of bad debts. Thenew Guyana National Cooperative Bank is expected to partially fill thisvoid but its resources will not be sufficient to satisfy the need forincreased agricultural credit. To secure higher rice yields, capitalimprovements on the farm as well as improved methods will be required.These in turn call for a supervised credit program that cannot be adequatelyundertaken by an existing financial institution. The mission thereforerecommends that a feasibility/organizational study be undertaken to developan agricultural credit institution or to incorporate a supervised agricul-tural credit window in the Guyana National Cooperative Bank based onoperational policies that will attract foreign financial assistance. Thedevelopment of such an institution could well be integrated with the prev-iously discussed land develoDment and rehabilitation schemes scheduled tobegin in 1972.
7. Forestry
The Forestry Industries Survey conducted by the UNDP terminatesin 1970. As a result of the survey, an inventory of 8 million acres ofGuyana's forests will have been prepared. A continuation of this programis e_ -_pcted tno novner tihe rem.aini4 ng 1 0 mi _1 Ion ac_r_es -, -, n t-e_stim-aed cos tof G$1.5 million, possibly financed by a second UNDP grant. The value of
APPENDIX I
Page 5
the forest i.nventory completed to date has been demonstrated in the form ofhegt-ened iLerst in the e r -- i--tio of these resources. Wt-h t1 -heexisting technical experience of Phase I, it should be possible to com-maence Phase !I by late 1971. The Government pla.s to undert.ak a n ,acre pilot afforestation project along the Timehri-MacKenzie Highway
. . zng 1e n n r ft.. grow-n sp e Oj1C A.L0 _, A L A L A.l - n.4 A
and exotic. A bilateral commitment to finance the foreign exchange shareof thlifs pro-ect wil. b e reMqui red AU iUn 1971 i n o rdAU er L tACo CO-..ULIen UceL p ll C.Lt aOt iLOn-S
by early 1972.
Information on the composition of Guyana's forests gained fromtIIe 'orest J nLvte[LLUL)f &ELU J.dVULdUCtL LIUL LUI LI~ Li LIUIULIu uI LLithe foes iivr;r rdfvrbe results 'roml research conducted on the-treatment of Guyana timber should provide a basis for a Forest ProductsPre-InIvestmLnt Stud, wh ich wouLU in[vestigate the- mst pro UsiUg uCLIlUUbabove noted of exploiting this resource. The exact nature of the studyshoul-d be couilngeni: upon the iinuings of the forestry industries survey,which is to be completed shortly. Forestry research and developmentefLorts in iLhe past have been diffused and uncoordinated. A pre-investmintstudy would provide better guidelines for the direction of requiredresearch expenditures and would incorporate tne pianned researcn proposa:Lsof the Ministry of Agriculture. This study would also determine the typeof forest-based industries best suited to Guyana's endowment and endeavorto attract private enterprise into establishing production facilities inGuyana. Uibrr or bilateral sponsorsnip of tne study snould be sougiht in1971. The need for future public investment in this sector should emergefrom the study and G$500,000 has been included in the last two years ofthe program for as yet unidentified investments.
P:Lans to expand the Guyana Timber Manufacturing Plant involvinga G$i.9 miiLion investment have been proposed by the Ministry of EconomicDevelopment. Funds for a limited expansion of GTMP will be provided bythe uNDP Special Fund in conjunction with their Forestry Industries Survey.A major investment in GTMP prior to the completion of the proposed Foresi:Products Pre-Investment Study, however, would seem to be premature.
8. Fishingl
The Government plans for 1970-72 include a number of small-scale projects such as the construction of a wharf in Georgetown, construc--tion of rural landing sites at Rosignol and Skeldon, improvements to theOnverwagt fi sh station, and technical assistance for modernizing redsnapper fishing. An interim report of the FAO Caribbean Fisheries Studypoints to opportunities for the expansion of trawl fishing along thenorth-eastern coast of South America. Although the local demand for fishis not sufficient to support a major expansion of fishing in Guyana,CARIF1A holdls out some prospect for a marlcet for fresh and dried fish.An exceptional opportunity may exist for Guyana itself to exploit shrimp:Lnalong the coast rather than merely providing on-shore facilities for
ArPENDIX IPage 6
foreign-owned fleets which land their catches in Guyana. The Guyana Devel-opment Corporation and the Commonwealth Development Corporation are interestedin the formation of an indigenous Guyanese shrimping fleet and if such aproject is shown to be viable, it may be suitable tor external financing.
A pre-investment study of Guyana's trawl and shrimp tishingpotential should begin as soon as possible. Bilateral assistance forthe pre-investment study should be committed in 1971. G$700,000 has beenincluded in 1973 and 1974 for a three-boat trawl fleet as recommended inthe FAO report and G$5.9 million is allotted (on a preliminary costestimate of G$200,000 per boat) for a shrimping fleet project for 1974/75.
9. Sea Defenses
The Government of Guyana prepared a sea defenses program for1968-79 with G$33.5 million assigned to cover the first phase to be com-pleted by 1972. Financing of the first phase is being aided by the UnitedKingdom and the IBRD, but by the end of 1969 only G$6.9 million had beenspent, mostly for local procurement. The United Kingdom is financingclose to 90 percent of their portion of Phase I and the IBRD two-thirds.Besides actual construction, Phase I includes hydrographic equipment, watertransport equipment, rock quarrying and a wharf. The Ministry of Works andHydraulics estimates that G$30.5 million rather than G$28.4 will be neces-sary to complete Phase I by early 1973. In 1972, work is expected tocommence on the Georgetown Protective and Supplementary Works at anestimated cost of G$12 million. These works are required to protectGeorgetown against cyclical erosion foreseen for 1973-74 and the NEDECOstudy financed under the IBRD Phase I loan is to determine the mostappropriate economic method of defense. The total cost of Phase II isestimated at G$25 million and is scheduled to start in late 1972 and tobe completed in 1976.
10. Mineral Surveys
The UNDP Mineral Survey covering a part of the interior, wascompleted in 1969 and ground follow-up of 40 percent of the anomaliesidentified has taken place. Follow-up explorations on the remaininganomalies should commence as soon as external financing, which appearssuitable for a bilateral donor, can be secured. The Government of Guyanahas made a request to Canada for aid in geophysical air and ground surveysin areas not covered by the UNDP survey. The Government had hoped tospend G$3.8 million between 1970-72 on these two surveys but the missionsuggests that this expenditure be phased over a longer time period sinceit is unlikely that an external financing commitment can be obtained untillate 1971.
APPENDIX IPage 7
11. Power
Public investment in power failed to keep pace with needs inthe latter half of the 1960's. The Guyana Electricity Corporation nowplans to install 66 KV transmission lines, expand transmission and dis-tribution lines to all the coastal areas of Guyana and add generatingcapacity at: a cost estimated in early 1970, of G$25.1 million. TheGovernment raised tariffs in February 1970 for the first time since 1961,but it is doubtful whether the increased revenue will fully match the cashflow required to finance the capital investment program. An initial start: onthe program was made in 1969 but the exac:t nature and phasing of the ex-.pansion has: not been decided. G$600,000 was spent in 1969 and anotherG$2 million is to be spent in 1970. GEC is now preparing the details of itsexpansion program which may involve expenditures of substantially greatermagnitude t:han G$25.1 million when the investment needs up to 1975 are moreprecisely cdetermined.
12. Air Services
Based on the view that air transport is the most appropriatemode for linking most of Guyana's interior settlements with the coastaltowns, G$17.7 million has provisionally been added to the Government's1970-72 investment program. To furnish adequate air transport servicein Guyana by 1975, approximately G$24.5 million will be necessary foraircraft and facilities. This investment should yield a satisfactoryfinancial return provided that air transport rates are raised to covertotal costs.
Besides the two new aircraft to be delivered this year, G$5.2million has been included for the purchase of additional aircraft in1972, 1974 and 1975. Pilot training and modern communications facilities?control and air safety equipment may require as much as G$4.5 million. Anadditional investment during 1970 and 1971 in hangars and workshops isneeded for the present volume of air traffic. The sum of G$900,000 hasbeen added to the Government's proposal of G$300,000 for the constructionand upgrading of interior airstrips. Because of the large local costcomponent of this expenditure, it has been included in the list of locallyfinanced projects. The increased volume of international flight trafficat Timehri airport by 1974-75 will probably require the construction ofa new aircraft parking apron and expanded workshop facilities. Withincreased domestic air traffic. both passenger and cargo, the establishmentof an Airdrome at Ogle or possibly Mocha close to Georgetown would relievea laree Dart of the load on Timehri. In addition, it would largelveliminate the time-consuming shuttle between Georgetown and Timehri fordomestic nansengers. The mission has included GS5 million for the exnansinnof Ogle/Mocha facilities. A feasibility study should commence in 1971to dptermine the viability of the nroner-t and if so; its annronrinte sarleand location. Preliminary engineering in 1973 could be followed byconstruction in 1Q74-75.
APPENDIX IPage 8
13. Railways
During 1970-72, the Government scheduled investments of G$825,000in equipment, rolling stock and the rehabilitation of way bridges andbuildings. The mission has reduced this figure to G$200,000 to coverminimum safety requirements only, in view of the planned phasing out ofthe railways as the new parallel coastal roads are completed.
14. Water Transport
A locally financed expenditure of G$l million on the Demeraraand Berbice ferry terminals has been proposed by the Government. Inaddition, the Harbors Department is allocated G$200,000 for harbor equip-ment. The mission has added an additional G$800,000 for the 1972-1975neriod to renlace antiauated equinment. Georgetown harbor reouires adredger to clear presently blocked channels and harbor berths for which(G2 million is t-hp Pstim2tpd cost= Rathpr than uindprtakP rcost-lv repairsto existing coastal steamers, a cost/benefit evaluation should be under-taken in 1971 to determine whether barges and tugs might nerform the samefunctions more economically and G$2.5 million is included for their con-StrLiCtion or nrociirement eommpnrino in I972
Prennrntoinnc nre iinriprtau fnr rnrl imnronupmpntc nn hnth sides
of the Demerara river (see Number 15 below) but the most appropriatempthod of river rrossing hna yet to he determined- The mission therefore
proposes that a feasibility study be prepared on the most economic methodof crossing the r pver prior to construction of the ad4a.ent- sections ofthe roads. G$300,000 has been earmarked for this study in 1972 butbilateral financing for it should be sought i4n 1071 The expected needfor enlarged wharf facilities in Georgetown during the latter 1970's isreflected in the provision of funds for a feasibility study during 1974and 1975, including preliminary engineering if necessary.
15. Roads
During 1966-69, road construction accounted for 28 percent oftotal1 public investment expendi'tures. In -Ile 1970-75 propose' publicLULeJ jJUJ.A. .1.L.V ~U1~ &-~IULLC. ILAL L I UI J PLkuC~ ~UUL.LLinvestment program outlined in Table 5.8, G$70 million is provided forroadus accounting fLor percent of totaJL pub'LiLc investmLent Ze-A-penditures.
As the major road building program moves toward completion, the relativepriority of roau investment in Guyanla Will UeCliLnU. iVeVehLneleSs, many
important projects are still to be completed. Two of the roads - NewAmsterdam/Crabwood Creek and Parika/Uitvlugt are being partially financedby USAID and are already underway. Portions of Georgetown to Rosignol arebeing resurfaced by force account. Tne Government plans to reconstruct21 miles of the Mocha branch road into Timehri but foreign financing hasyet to be secured. Feasibility studies financed by Canada are currentlyunderway for three road projects (Charity-Siupenaan/Uitvlugt-Vreed-en-hoop/Vreed-en-hoop-Potasi and Canal Roads). Construction of these roads, it
APPENDIX IPage 9
shown to be feasible, might be financed by the IBRD. Construction shouldget underway in 1972 and be completed in 1975. Feasibility studies arebeing undertaken for major improvements to the approaches to Georgetown andNew Amsterdam that may result in sizeable new road proiects in 1973-75,possibly financed by USAID. Feeder roads to connect existing settlementswith the main arterial road network are allotted GS2 million although thei=rexact locations are yet to be determined.
Interior. The Government's decision to proceed with a 400 mileall-weather road linkfing Georgetown to the Brazilian border is reflectedin the investment program in four initial phases. The total cost of thernod i8 petinmated at G$0O million hut this will usltimatelv depennd *non
design standards. During 1970-75 it would seem possible to complete aboul:one-t-hird- of the road (ns far nC Mahdi4) witthnout- serionlvv rnomnrnmiTsiingother public investment projects with a higher economic priority. Afeasibility stiudy in'luuding nreliminarv en4ineering is now being done by
USAID on the Wismar to Rockstone leg. However, the exact alignment isstill to be dete-rmIned. A farr-u cor-ti,'e will probbhlu he the methodselected for crossing the Essequibo River at or near Rockstone. Phase II4 ,,,l ...Aac, A -1m rvf ,,nyq v-o ,A fviw i -he West b n'n .nf t-hp Voc iii hn rityrincludes 8-Le of new road from the West --. k of theEseubrirto Mile 34 oE the Bartica-Potaro Road and approximately 60 miles of up-grading f-om M4le 3A to- Mahdja. A b commitmen for a feas4ibli4y,
and detailed engineering study of this phase should be secured by 1971 sothat * cntution can start in 107- and thus provide for the continuou
utilization of the equipment and labor set free by the completion ofA. LO.0 as .e T U .TN U:, ng PhOase TTT .5 f as. 1,*~... .LLL5) fLL 9LySL.Lay VL.L~ aL.A CL.4tA4.A1PhaseI. Duiag hai3eIII,feeblityar. pre'iunar,y engineering stud4_s
could be conducted oni the remainder of the proposed road to determineopti..um ai;.t;1dsgn standards. A1ltough -le upgrading of tleL.J LIUU AJ..L iLUSLL J .LLU LA~ .L CL ILAO. UA * £,.L -L A LU,L L.&& U.J~ ~ U±I. UJ.. LIL1
Bartica-to-MLle 34 sitretch of the Bartica-Potaro road is not part of theproposedu roal to Brazil, t Ali, t as bleern iLncludedU as a fLorce accour.t expendit.u
to join the Wismar-to-Mile 34 portion of the interior road and thus linkDartica to Georgetownl bUy roaU. Lt is expCeULtU LLItL LIMh k7UVt-IUteIIt W.Ll
build this road simultaneously with the Wismar-Rockstone-Mile 34 road.
From the expected phasing of road construction during 1970-75,it emerges that in 1971 approximately G$4 miullion will be spent as opposedto G$12 million in 1970 and G$11 million in 1972. This drop in expendituresrIUards ari interim per:iod be-Wee,L thLLe ComUpletion. Of ongoing Ud O cUstrulcti.Lon
and the start of new projects. It is anticipated that the very much expandedlevel UL CUSLLrUCLU jUL ULLIfo ter public WULKs W'll eL.tasilUy lbU Lth tem-
porary excess of construction manpower set free by the road program in.LV I L.
16. Communications
Telecommunications facllities in Guyana have seriously laggedbehind demand for many years. A G$16.7 million expansion program wasstarted in 1969 by the Guyana Telecoumunications Corporation with suppliersfinancing approximately 90 percent at a 5-1/2 percent interest rate. Itis scheduled to be completed in 1972; G$3.8 million has been included toextend the program beyond 1972.
APPENDIX IPage 10
17. Water Supply
Three out of four Guyanese live outside of Georgetown or NewArmsteruam} aid three-quarters of tilese rural inhabitants live in a ribbonof settlements along the coastal strip or in the Wismar/MacKenzie area.The vast majority do not have access to a potable water supply and forthose few that do, it is inadequate. Unhygienic rural water supplyrepresents a health hazard due to the potentiai of a fuli scaie epidemicof various water-born diseases that are prevalent in Guyana. A 1969 pre-feasibility study for the improvement and extension of pure water supplyhas identified a G$45 million project - phased over the period 1969-77 -that would provide an adequate water supply for an additional one out oftwo Guyanese. The study recommends the establishment of a water supplyand sanitation corporation to implement the program and establish a pricingsystem that will recover its costs. The Corporation has yet to be estab-lished but Phase IA has been started with USAID financial support andPhase IB is scheduled to begin in 1971 with Canadian assistance. The 1969-77 program consists of five phases of which Phase II should be implementedduring the 1972-74 period and Phase III in 1974-76 but only if the watersupply and sanitation corporation has been established on a satisfactorybasis. Bilateral financing commitments should be sought in 1971 forPhase II and 1973 for Phase III. The total 1970-75 cost of Phases I - IIIis expected to be approximately G$28 million. The condition of George-town's water supply is generally good but the expansion of the city bound-aries with the establishment of Greater Georgetown, has included severalrural areas with inadequate water supply. G$700,000 will be necessary tobring these areas up to the standard of Georgetown.
18. Health and Sanitation
The formulation of the Government's investment program in healthwill be determined from the recommendations of the National Health Plancurrently being prepared by the Ministry of Health. As a result, capitalexpenditures of only G$600,000 in 1970 had been approved for urgent hos-pital improvements and equipment. The program that the mission has formu-lated for health, for the most part, is the result of priorities whichexisted in 1966 and as yet have not been realized. The control of typhoid,filaria, gastro-enterities, dysentery and parasitic diseases dependsheavily on environmental sanitation. To ascertain the effects of presentsewerage disposal systems on such diseases, an investigation into therelationship of environmental sanitation and health hazards in Guyana wouldclarify the direction that public efforts to control endemic diseases shouldtake. The provision and distribution of medical treatment services in Guyanais inadequate with respect to hospital and health clinic services but aquantified estimate of the need and the geographical distribution of theseservices has not been systematically evaluated. A survey of healthfacilities and requirements would indicate whether and to what extentregional hospitals should be upgraded and determine the role of stationary
aPPENDIX IPage 11
and mobile health clinics in the overall Drovision of health facilities.The mission has allocated G$500,000 for these two studies which shouldbegin by late 1971. The results of these two studies may very well alterthe investment expenditures proposed for 1970-75.
The sum of G$1.4 million represents an estimate of equipment andhpalth rlinic facili-tv requirements of which G$400-000 is expected to beprovided by bilateral aid in 1970. The long-delayed and urgently neededrprenst-riu-t1ann nf thp (enrpetnwn HosDital should he undertaken. The feasi-
bility study, including siting, design and engineering will be time consuming.If ontril,-1-tion is l:o hp crnnmptptd hv 1Q76, the studyv shou1ld commencer bylate 1971 al: the lat:est. The estimated cost for a modern fully equipped700 bed hospital is G$14 mi llfion An additionnal r,2 million is nrovirded
for the maintenance and extension of rural hospitals.
The problem of refuse and sewage disposal is becoming acute inGeorgetown and a proposal to build an incinerator for G$2 millon. i n1973-74 is included, possibly with United Kingdom financing. The construc-+.ion of a m"o-ern sewerage syste-n for greater Georf,etoM.n w4ill nvnobahlxr ho
the only way to eliminate a serious potential health hazard and G$10.5millior-.o hLas blueen providAed starting with a feasliynnen su *n
1972.
19. Education
The 1970-75 investment program in education comprises proposalsby the Ministry of Educat'on fior 1970-72 and the mission's estimate ofrequirements for 1973-75. These should be reviewed when the next phase ofthe Guyana Education Development Program is drawn up.
A, G$20 million program with iBRD/IDA financing support waslaunched in 1969 an,d extends to 1974. It includes construction andequipment ior a primary teacher training college, 5 mLLultilateral t.uU.darschools and the conversion of two existing schools to the multilateralform. Bilatteral donors are providing fellowships and advisors for theproject and a tentative provision has been made for Phase II of thispxogram to comnmence in 19974-75/J WLll U1dLaLdr dalasLstance. AppLUroildcaey)
G$1 million remains to be spent on the construction of the University olGuyana -whic:h has been supported by United Kingdom and Canadian aid*. Theanticipated need for expansion of facilities by 1975 has been reflected inarn a Locatlon o01 G4,00,000 for that year. The Conbstrucction 01 Llte INeW
Amsterdan l'echnical. Institute should be completed in 1971 with Canadianfinancial support. G$1 million has been included for student loans forthe 1970-75 period in contrast to the proposal contained in the 1970-72Government Program for G$1.3 million ror student loans. The latter amountseems to be too high.
A rPErNUDIX IPage 12
The purchase of school sites and teachers' housing is expectedto cost G$400,000 in 1970-71, while primary and secondary school construc-tion and equipment during the three years 1970-72 will require G$1.3million. External financing has not been secured for the latter. Ifbilateral support is to be obtained, discussions with a view to obtaininga commitment must commence this year. The mission has added G$2.5 millionas a very rough estimate of primary and secondary school investment re-quirements beyond i972 (Phase II).
20. Housing and Urban Development
The housing gap in Guyana is conservatively estimated at 24,000units by the Ministry of Economic Development. This gap will widen atthe present construction rate of approximately 2,000 units per year. TheMinistry of Housing during 1970-72 plans a modest start on eliminatingthis gap by investing G$1.4 million in the purchase and development ofland for low-cost housing and G$1.5 million in the construction of 300hire purchase units. Additionally, a proposal exists to put all proceedsfrom the sale of lands and/or houses in Government Housing Estates intoa special revolving fund for the purpose of house building. ApproximatelyG$500,000 per year may be in the fund but since the proposal has not beenfully approved, it has not been included in the public investment program.G$1.9 million has been requested by the Ministry of Housing to aid self-help housing construction during 1970-72 but this allocation has also notbeen approved. The G$l million for urban development represents a numberof urban infrastructure projects in Georgetown, Wismar/Christianburg,Lodge Village and La Penitence Village plus equipment for the Ministry ofHousing. Although this item appears in the locally financed projects table,the construction of urban roads and drains and equipment for the Ministryof Housing may be suitable for some bilateral financing.
The 1970-72 program of the Ministry of Housing is an active butsmall scale one when compared to the substantial backlog of housing require-ments in Guyana and the need to provide new housing for approximately2,700 new families to be formed annually during the first half of the1970's. A much larger low-cost housing program is needed and the missionrecommends that design work should commence in 1971 on a low-cost apart-ment housing scheme of approximately 2,000 units. G$9.0 million is themission's estimate of its cost with construction starting in late 1973.This program could be conducted in urban areas such as Georgetown, MacKenzieand New Amsterdam.
21. Development Finance
In 1970, the Government invested G$S800,000 in the New GuyanaNational Cooperative Bank. Industrial Development Expenditures representthe Government's share of ongoing industrial huilding construction andinvestments through the Guyana Development Corporation and the Government'scAntrih,lo-inn to the Private Tnvpetment Fund,. Plans exist for the improve-
ment of tourist sites on a small scale. G$l million has been added to the
APPEND:[X IPaop 13
1973-75 program in support of the C;DC's operations in fostering resourcebased industry. If thLe dem.and for loans fror.. -he PIF rem.ains high 4n the
coming years, a replenishment of the PIF's resources may be warranted.TiP -s category of expenditure m.,a b-e augm..ented as a consequence of the- Go-"A. L L± J. C L A. EAp 4LU LS. L CLC aSLLU CL a AL O 9A LLC tL ~ ~ I
ernment's new policy in favor of equity participation in enterprises. Att' _ _ _ - _4 A A 1A A 4 r ::_1, I 44Q
XI Lb ZS Lclg"5 ILUWlVC L , L L ±L,- ivLIPUOO&LLC LU M 4ULI .XL LULC 6 .1 AL=a,,LLA.a4.
22. PD,,Vl4,A A-,,,4 " 4 4
Included in the category Ta,- Order -anDensarvriu
items of equipment and buildings for the police, fire, prison and welfareservices, wh ich. will require appro,Jmatelly G$500,000' per year A.The iIiss1has added G$l million per year for additional expenditures in these cate-
gori.e f I J3 I=. Recent developmLents related to the border quest'Lons
with Surinam and Venezuela may decrease the capital expenditure require-ments for defense.
Local Government expenditures represent capital grants and loansto local governing councils and the construction of buildings for newlyestablished local governing councils. The expanded role of cooperativesin Guyana will involve research into the organization and management ofcooperatives and G$100,000 per year has been included by the mission.With the anticipated establishment: of the Interior Development Corporation,the sum of G$4.0 million has been provided to cover pilot agriculturalsettlements in the hinterland. The expenditure in 1970 for interioragricultural development is significantly above the annual rate otexpenditure proposed here. Included under "Other" is equipment for publicagencies.
23. Miscellaneous
A continuing program of bilateral and UN agencies to supplytechnical support, training and equipment has amounted to over G$l millionin past years and will likely increase In coming years. Unidentitiedpre-investment and feasibility studies financed by bilateral and multi-lateral agencies are also included in this category.

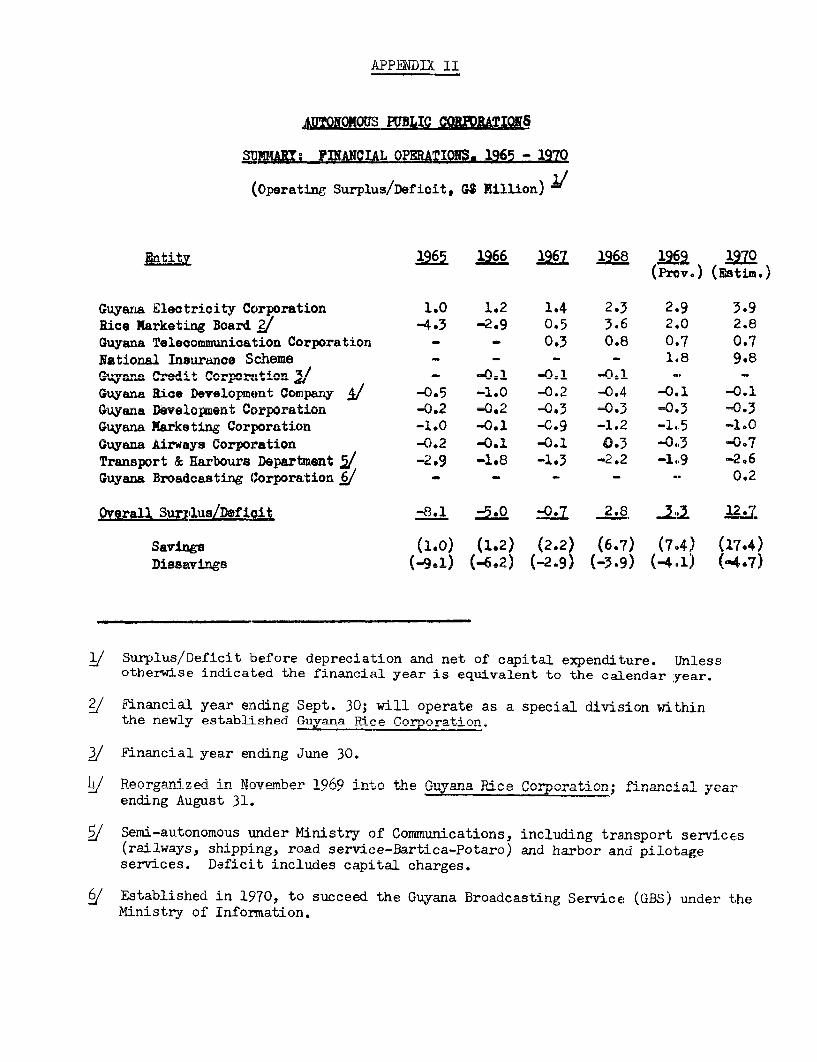
Arr"IwlQUONOM WETLTh! PnRMRA'rTOWS5
_uVo A TVAUflTAT OPRA TNo IO5 - lurwLflJL& . A AJJ44,00I 4.^AJLh AJLl J. ,W 65J ~
%vperating USuLus/ve 26, W* AiJ..LoL±ULIJ
Rntitv 196 .Y96 16 1968 1966 1970(Prov.) (Estim.)
Guyana Electricity Corporation 1.0 1.2 1.4 2.3 2.9 3.9Rice Marketing Board 2;1 -4.3 -2.9 0.5 3.6 2.0 2.8auvanA Talenommunication Cornoration - - 0.3 0.8 0.7 0.7National Insurance Scheme - - - - 1.8 9.8
{_ .s,., .... ^ e Ai + f s.+ie% - -01 _ 0.1 _ _. _
Guyana Rice Developmfent Company &/ -0.5 -1.0 -0.2 -0.4 -0.1 -0.1%ruyana M'vvlopment CoorporatiOrn'. -n. -i. -5 -z -. 3Guyana Marketing Corporation -1.0 -C0.1 -0.9 -1.2 -1..5 -1.0Guyana Airways Corporation -0.2 -u. -. 1 i 0.3 -0,3 -VD7
Transport & Harbours Department / -2.9 -1.8 -1.3 -2.2 -1.,9 -2o6Guyana Broadcasting Corporation §/ - - - - 0.2
Overall Su2)1us/Deficit -8.1 -0.7 2.8, 33 M2.
Savings (1.0) (1.2) (2.2) (6.7) (7,4) (17.4)Dni avinos (-Q.1? (-6.2) (-2.9) (-3.9) (-4.1) (-4.7)
1/ Surnlus/Dflf7ict bhfore depnrec-i2tion nnd nat. of c.apita-- e-dmture. 'Jn-le3otherwise indicated the financial year is equivalent to the calendar year.
/ TFinancial year ending Sept. 30; will operate as a special division withinthe newl;y established Giivana ceorpnor2tion.
3/ Rinancial year ending June 30.
LI Reoar ni7zed in NuVT.m.hPr 1 6 9Q intro t.he Gl1yan. P;ce Pnv-rn"n+4n fin "cia ear- - -, .~~--- .j - uJ.sfls, --- -a L y~LaLt
ending August 31.
i/ Semi-autonomous under Ministry of Communications, including transport services(railways, shipping, road servace-art+waicaPotaro) nd harbor and pilotageservices. Deficit includes capital charges.
g/ Established in 1970, to succeed the Guyana Broadcasting Service (GBS) under theMinistry of' Info-ma+vion.
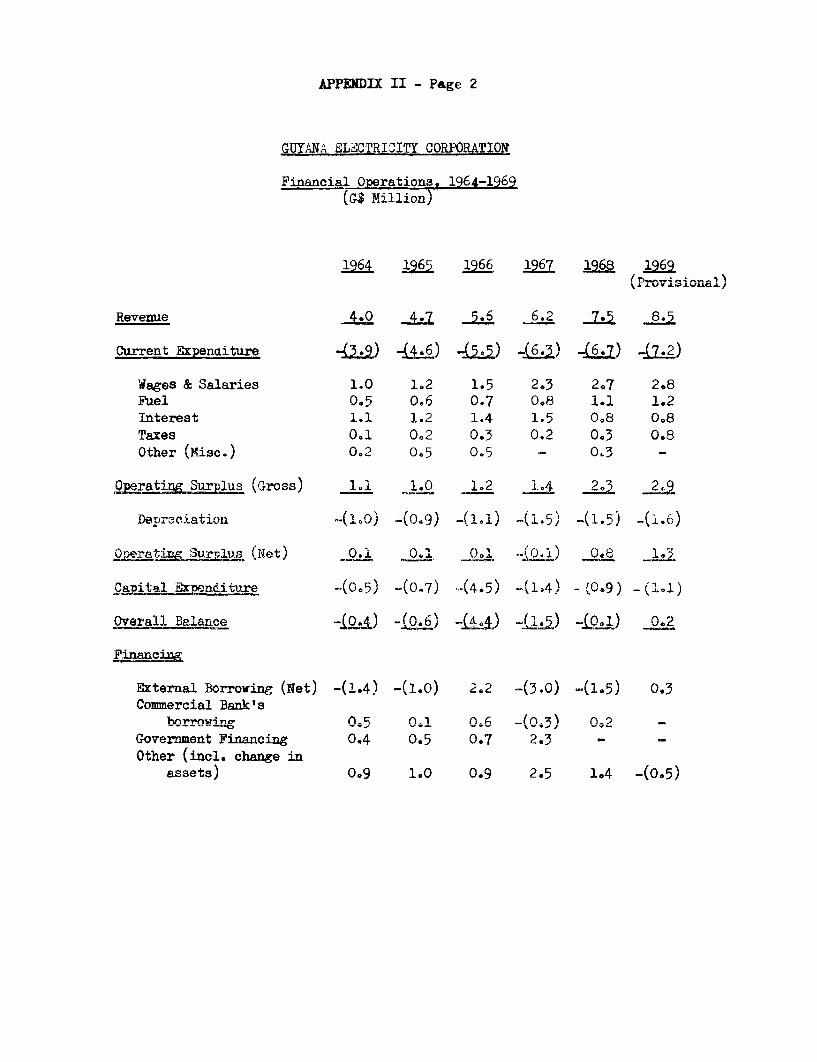
APPENDIX II - Page 2
GUYANA ELECTRICITY CORPORATION
Financial Operations. 1964-1969(GS Million)
1964 1965 1966 1967 1968 1969
Revenue 4.0 4.7 5.6 6.2 77 8.5
Current Expenditure 4J2 44±5) .- 5.5) (6.3) ( .7) -7.2)
Wages & Salaries 1.0 1.2 1.5 2,3 2.7 2.8Fuel 0.5 0.6 0.7 0.8 1.1 1.2Interest 1.1 1.2 1.4 1.5 0.8 008Taxes 0.1 0.2 0.3 0.2 0.3 0.8Other (Misc.) 0.2 0.5 05 - 03 -
Qrate Surplus (Gross) li 1.0 1.2 _IA 23 29
Depreesiation 4(10) -(0.9) -(1.1) -(1.5) 4(i5) -(1.6)
Oper:_ta gASQE1US (Net) 0.1 0.2 0.1 J-0.i) 0.8 1.5
Ogit-iial Expenditure -(0.5) -(0.7) -(4.5) '(1.4) - f(O.9) - (1.1)
Overall Balance *--A) -(.6 ) --iSA) -2) - O 01) 0.2
Financing
External Borrowin- (Net) -(1.4) -(i.o) 2.2 -(3.0) -(1i.) 0.3Commercial Bank's
hOrrowing 0_5 0.1 0.6 -(0.3) 0G2 _Government Financing 0.4 0.5 0.7 2.3 - -
(Inc. L %-;ar,=inassets) 0.9. 095 146e Xassets) 0.9 1o0 0.9 2.5 1.4 -(0.5)
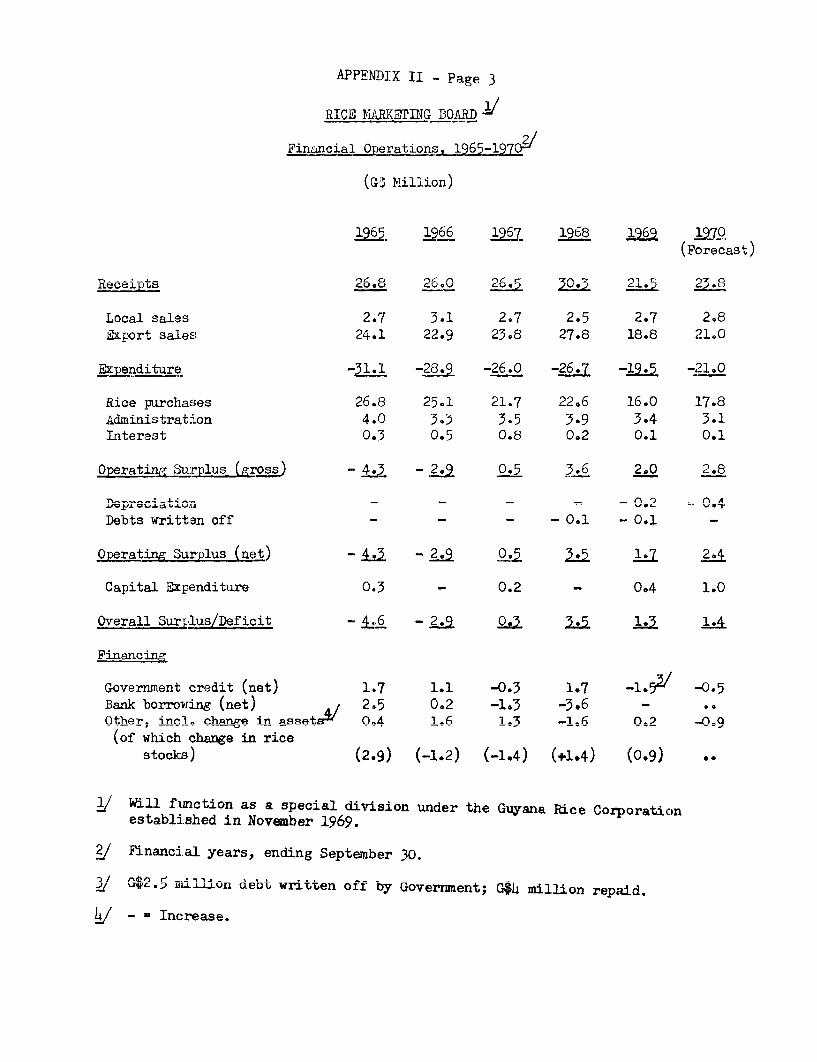
APPENDI]X II - Page 3
RICE N IRKETING BOARD /
Financial-Operations. 1965-1970 /
(G3 Million)
2965 1966 1967, 1970
Local sales 2.7 3.1 2e7 2.5 2.7 2.8&port saleEs 24.1 22.9 23.8 27.8 18.8 21.0
Expenditure -Q : -23* -26.0 -26.7 --21.0
Rice purchases 26.8 25.1 21.7 22.6 16.0 17.8Administration 4.0 3.) 3.5 3.9 3.4 3.1Interast 0.3 0.5 0.8 0.2 0.1 0.1
Oprecratio :.aA - ..3 - -0 =- Debts written off - - - 0.1 0.1 -
Operating Surplus (net) - 2.3 - 0.5 1.7 24
Capital Expenditure 0.3 - 0.2 - 0.4 1.0
Overall Surp,lus/Deficit -0 136 _ 14
Financing
Government credit (net) 1.7 1.1 -0.3 1.7 -1.5 " -0.5Bank borrowing (net) / 2D5 0.2 -1.3 -3.6 _Other; ohnnge in qasseta 1 1.3 -106 00.9(of which change in rice
sto <]) (2.3) (-1.2) (-1.4) -1.4 A (0.9 ) .
g/ Will frmction as a special division umder the Guyana Rice Corporation4 1 -1. . .* - 'I--- -~ --
establi.shed in November Lyoy.
?/ .inanci.l 'y-ars, ending September 30.
/ G$2.52 IIU..LLLon deDt written off t)y Govermnent; G$4 million repaid.
/ - Increase.
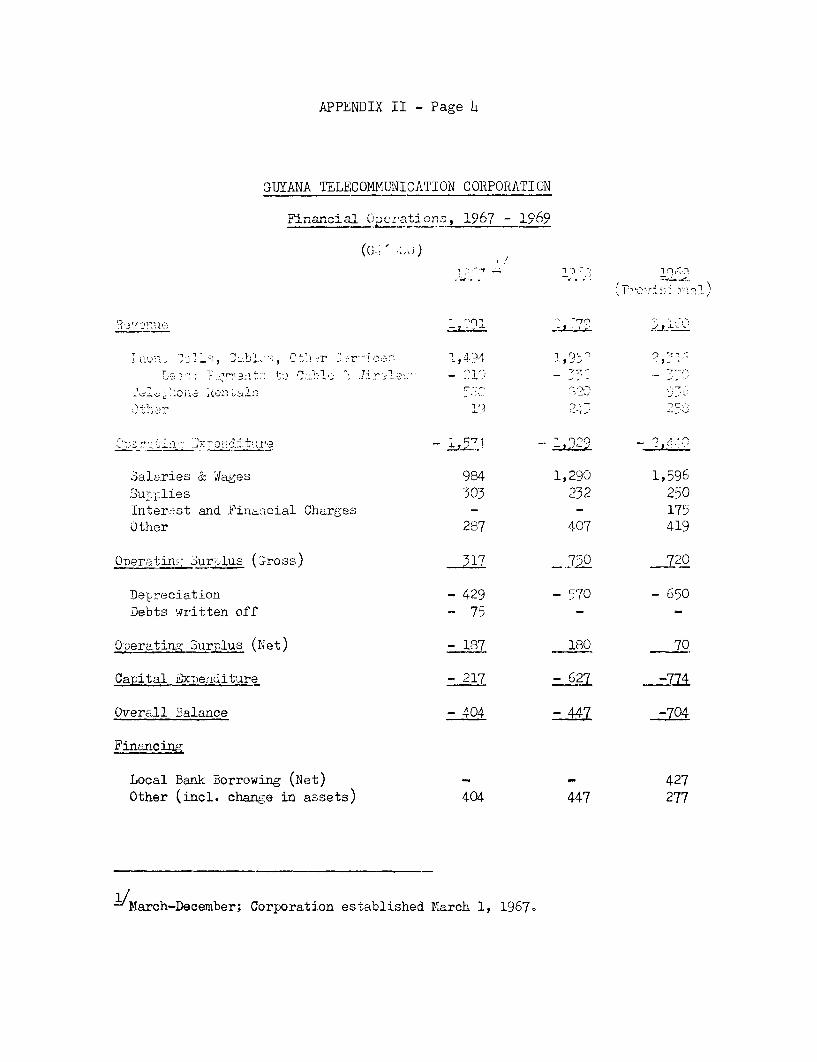
APPENDIX II - Page 4
rl TrVA'JTA 'PTTF1Tr)lMTTTrvAhrrT(-iKr 1OPOAATTlM
-~~~~~~~~~7 \~~~4 ~ ~ ' 7 - .j
15 -tr 2?1, '.7-'7r - ,,
Salaries & ;faes 934 1,290 1,596Sul:.lies 303 232 250Inter._st and Finar-icial Charges - - 175Other 287 407 419
ODerating 3ur lus (aross) 317 750° 720
Dr,rnip ti on - 429 -570 - 650Debts written off - 75 - -
Operating Surplus (Net) - 137 180 70
Capital txuenditure - 217 =_527 -774
Overall 3alance - 404 - 447 -704
Financing
Local Bank 3orrowing (Net) - - 427Other (incl. change in assets) 404 447 277
1 March-December; Corporation established March 1, 1967.
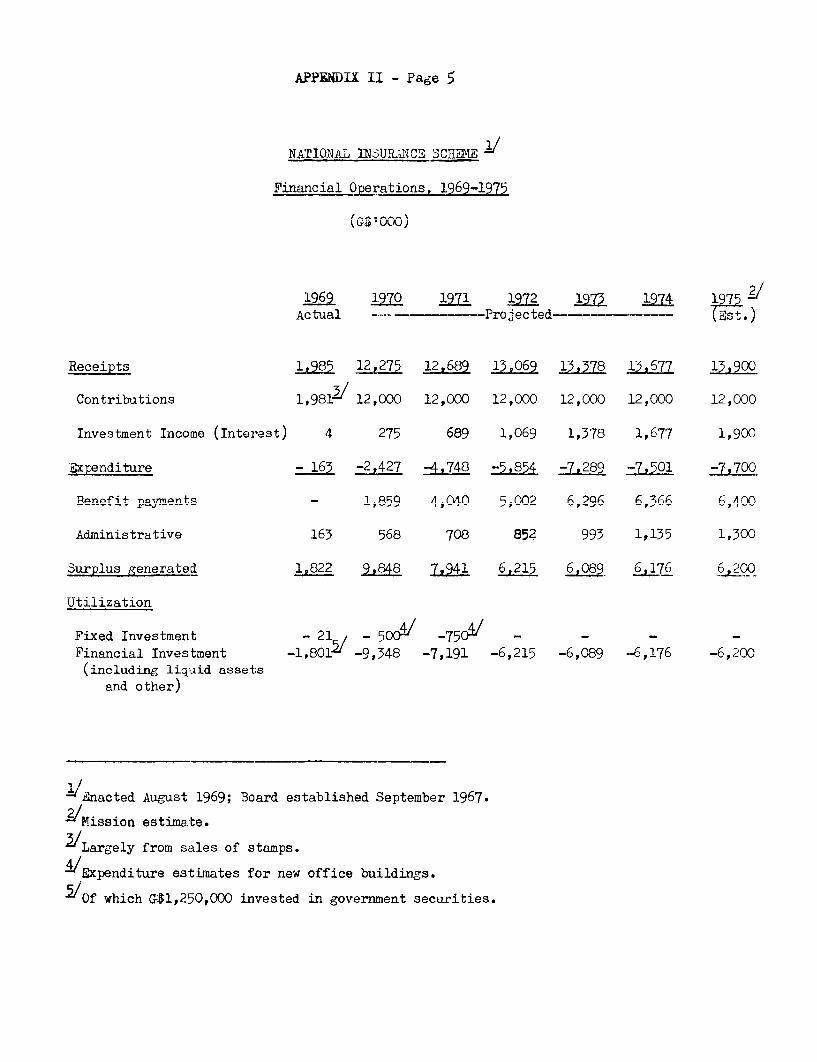
APPENDIX II - Page 5
NMATTONC,A TNT,URTjM-- S-fTT7FR
IV LIAI.-±OU.--C.L V .L7U tLUL7
1969 12-0 1971 1972 1973 1974 1975'- - -4 -A l-a .L I % 5 0__A.; l _ _ _ _L-- - --
Receipts 11985 12,275 12,689 13,069 13,378 13,677 13,900
Contributions 1,9813" 12,000 12,000 12,000 12,000 12,000 12,000
Investment Income (Interest) 4 275 689 1,069 1,378 1,677 1,900
Exrenditure - 163 -2,427 -4.748 -5.854 -7.289 -7.501 -7.700
Benefit payments - 1859 AX'OA 5,002 6, 6Q,3 A AmY)
A,-lni 4s turav 4163 568 7n8 a5 993 1,3 3n
Surplus generate' 1,o22 0 01° ° 7, 6 , I w
Utilization
Al AlFixed Investment - 21 - 500u -750' _ _ -
Financial Investment -1,801` -9,348 -7,191 -6,215 -6,089 *-6,176 -6,200(including liquid assets
and other)
2'&nacted August 1969; Board established September 1967.
/Mission estimate.
;I/Lnrgelv from -1.q of stomnmp.
4/ Expenditure estimates for new office buildings.
/ Of which G31,250,000 invested in government securities.
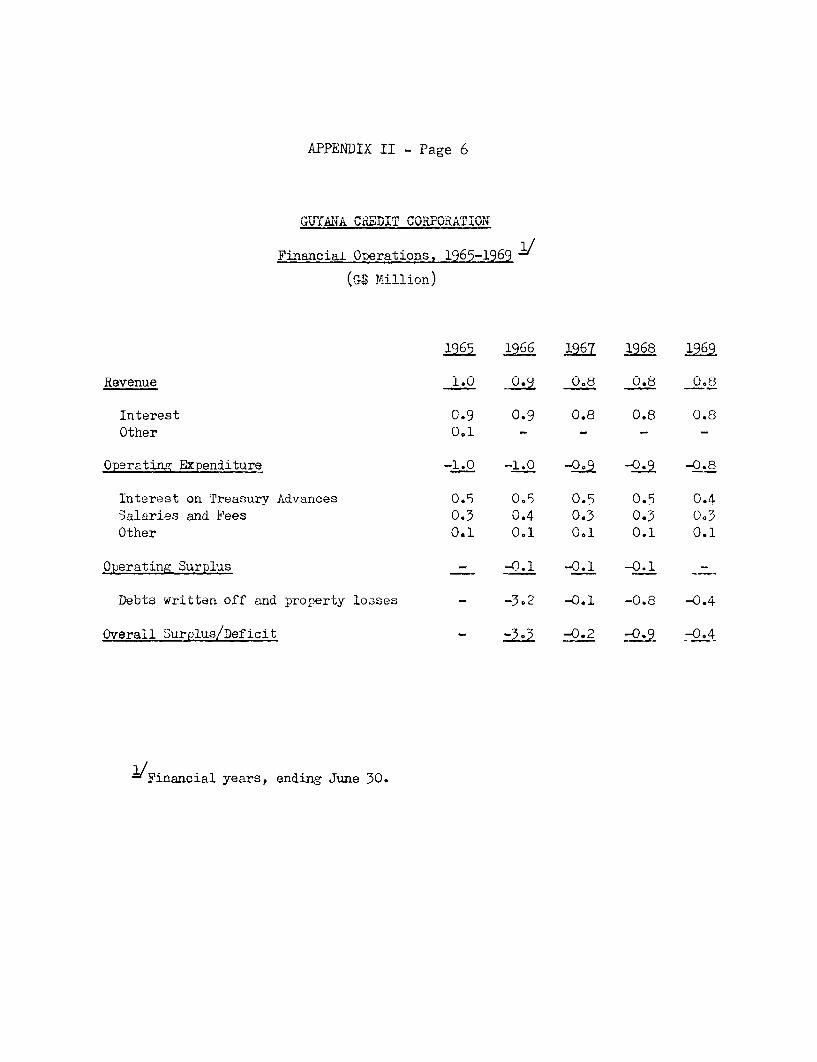
APPENDIX II - Page 6
Gt'YsANA C-RED-IT--CO-O-rv.RaTION~4
Financial Uperations, 1965-1969
ifl0 i96 i96 i98 i96
Revenue 1.0 0.9 0.8 0.8 0,8
Interest 0.9 0.9 0.8 0.8 0.8Other 0.1 - - - -
Operating Expenditure -1.0 -1.0 -Oa -O.9 -0.8
Interest on Treasury Advances 0.5 0.5 0.5 0.5 0.4
Salaries and Fees 0.3 0.4 0.3 0.3 0.3Other 0.1 0=1 001 0=1 0n1
0OperatinIg; Sur.- p lus -Q- . _.
betis written of and property l3oses - -2. --U.J -U.O -uS.4
Overall Surplus/Deficit _ n -0.2 -v.9 -0.4
'/Financial years, ending June 30.
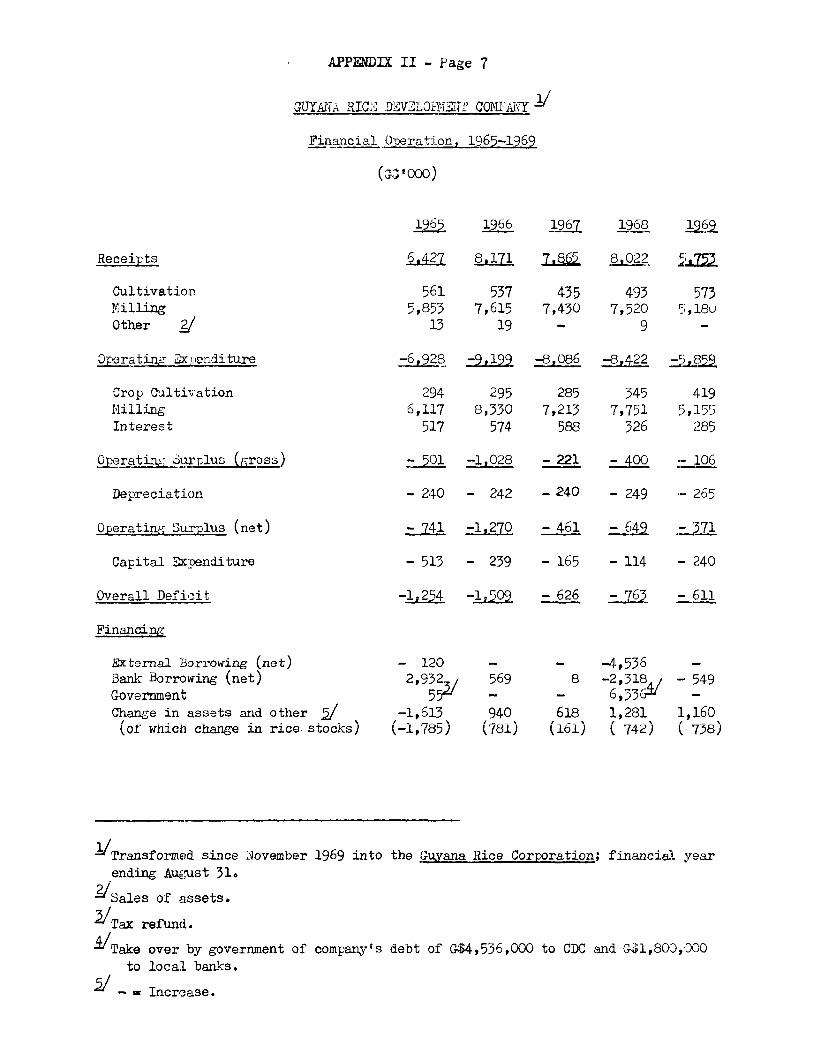
ArPPNDIXV II - Page 7
GUYANIA RICE D VLOL0YJI'T CO IANY j/
Financial Operation, 1_96-1969
( aq, 000 )
1965 1966 1967 1968 a6l
Receipts 6.427 8.171 Z.§a -8,022 i.7zm
Cultivation 561 537 435 493 573!MTilling 5,853 7,615 7,430 7,520 r' .180Other / 13 19 - 9 -
OPerating Qx1:enditure -6,928 -9,199 -8,086 -8,422 -5,852
Crop Cultivation 294 295 285 345 419ki. 114 6 11'7 I 30 7,2 7 ' ,I751 r; U 15
Interest 517 574 588 326 285
Operatinjbuzwrplus (gross) - 501 -1,028 - 221 - 400 106
Depreciation - 240 - 242 - 240 - 249 -265
Operating Surplus (net) - 741 -1,270 - 461 _ 649 -j_71
Capital Dx-enditure - 513 - 239 - 165 - 114 - 240
Chvnpr l l TPfi {-i t. -1 ?2) _I . A - 76S - hl I
Dcternal Borrowing (net) - 120 Bank Borrowing (net) 2,9323/ 569 8 -2,3184/ - 549Government - -5
Change in assets ald other / -1,613 940 618 1,281 1,160(of which change in rice stocks) (-1,785) (78i) (k6l) ( 742) ( 758)
- Transformed since November 1969 into the Guyana Rice Corporation; financial year
ending August 31.
2 Sales of assets.
21Tax refund.4/-- -- - -T'ae over by government of company's debt of Gb4,536,uub to UvCD and G4X,bu3,uuu
to local banks.
- G Increase.
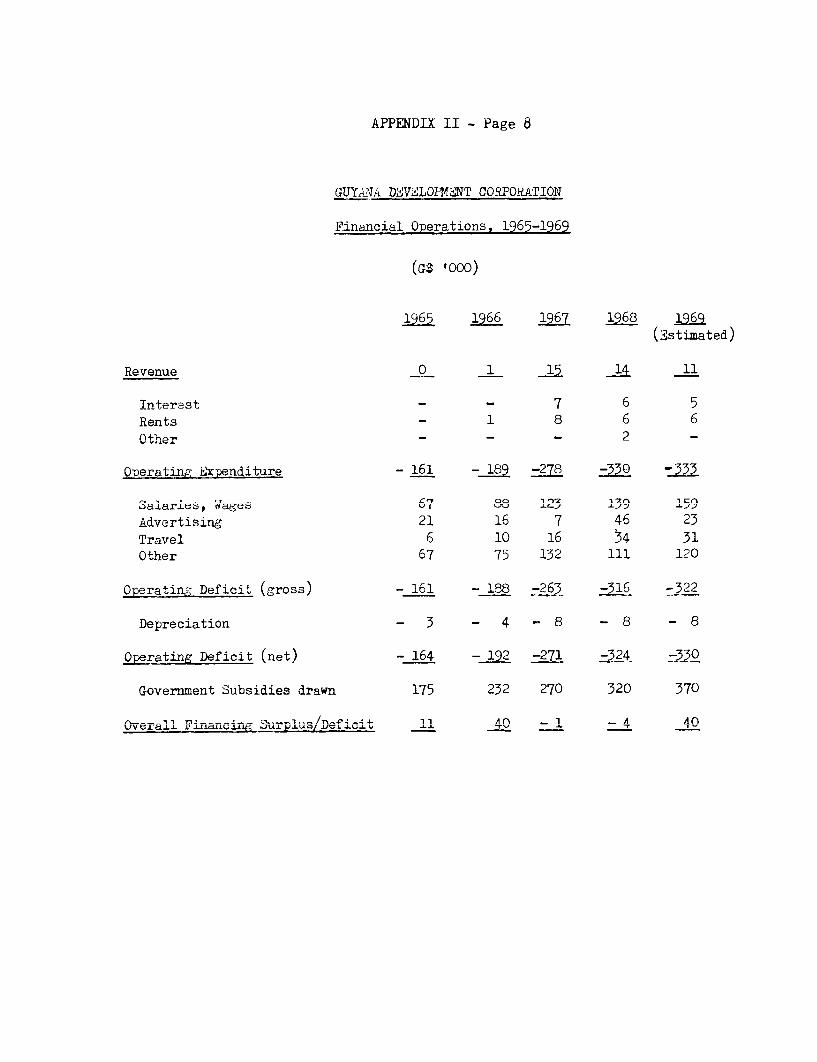
APP'MnTY TT Page k
GUYZNA DSVELGOYN-T CORPORATION
Financial Operations, 1965-1969
(GS '000)
1965 1966 1967 1968 1969(3stimated)
Revenue 0 1 15> 11
Interest - - 7 6 5
Rents - 1 8 6 6
Other - - - 2 -
Operating E Apenditure I i - 1RQ -278 -W3) -53
Salaries, "'ages 67 88 123 13 1,9
Advertising 21 16 7 46 23Travel 6 10 16 34 31Other 67 75 132 111 120
Operating Deficit (gross) - 161 -188 -26 -316 -922
Depreciation - 3 - 4 - 8 - 8 - 8
Onerating Deficit (net) - 164 -192 271 -324 -330
Govit-rnmant Rn+ hqitii d'nwn 17E 232 270 320 370
vverall IT%-.P 4 - 1 1 Ar I - A AO£ ±1eraLJ .U1JLLL .IJliz 4.I.L 1 *1*'A-'~
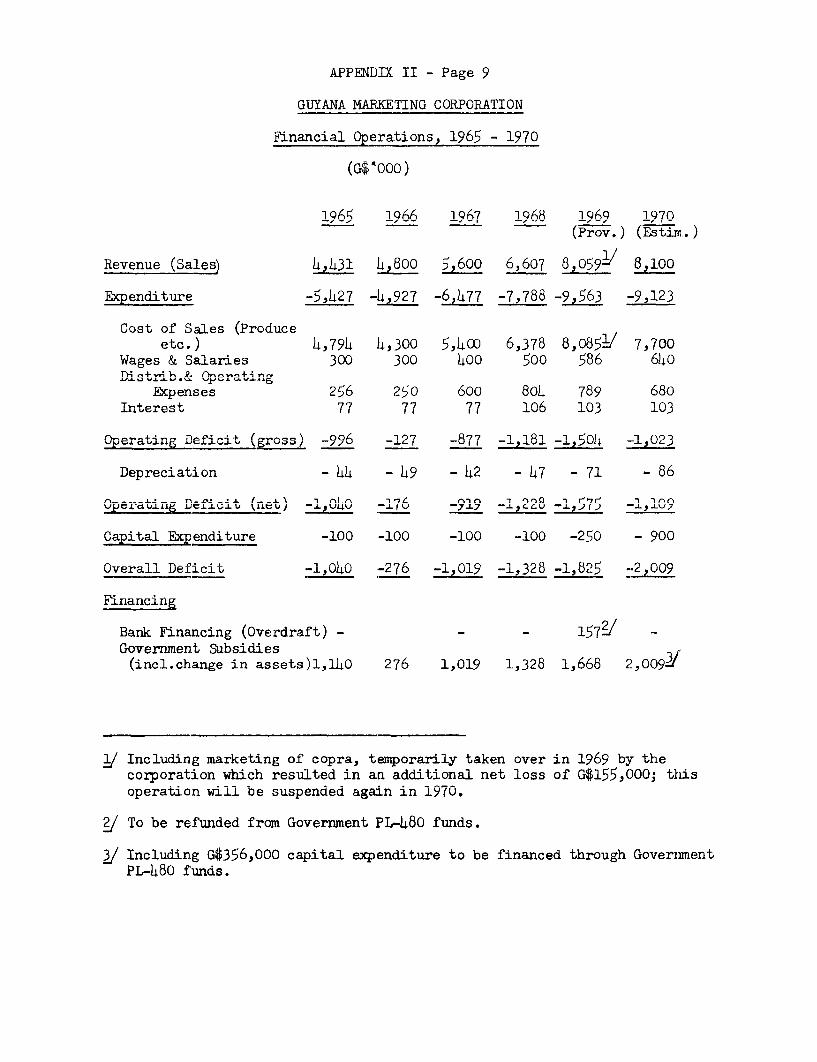
APPENDIX II - Page 9
GUYANA MARKETING CORPORATION
Financial Operations, 1965 - 1970
(G$ 4000)
1QA< 1QAA 1A7 IOR8 19QQ 1970
(Prov.) (Estin.)
Revenue (Sales) 4,431 4,800 5,600 6,607 8 j059'/ 8,100
Expenditure -5,427 -14,927 -6,477 -7,788 -9,563 -9,123
Cost of Sales (Produceetc,) 4, 17019 1. 5nn 6, 37n A 17 8 R nl/ 7,700
Wages & Salaries 300 300 400 500 586 640
Expenses 256 250 600 804 789 680Ir.teres+v 77 77 77 106 103 103
eres U + I. VII Ina-
Operating neficit (gross) -996 -2 -877 -1, -1,504 1
n 'a 4- 4.. in 1.') .7 '71.L prec-Lf ,La±LL 44 47 4c- 41 -i
1% L I . ...4 -1 /Iin i'- -I1 1l 'IO ,n - I yr' 1 -innOperati 'el DfcJt I(, k:U) -1,V4V f1 -919.; -122 -1,57 7,0
Capital Ecpenditure -100 -100 -100 -100 -250 - 900
uverall DelciLc -1L,U4U c L -1,09' -1,328 -±,8O5 -2,0U0
rinancing
BanK Financing (Overdraft) - - - 1'72/ -
Government Subsidies 3(incl.change in assets)1,l4O 276 1,019 1,328 1,668 2,009-
y Including marketing of copra, temporarily taken over in 1969 by thecorporation which resulted in an additional net loss of G$155,000; thisoperation wi-l be suspended again in 1970.
T To be refunded from Government PL-,40U funds.
J Including G$356,000 capital expenditure to be financed through GovernmentPL-480 funds.
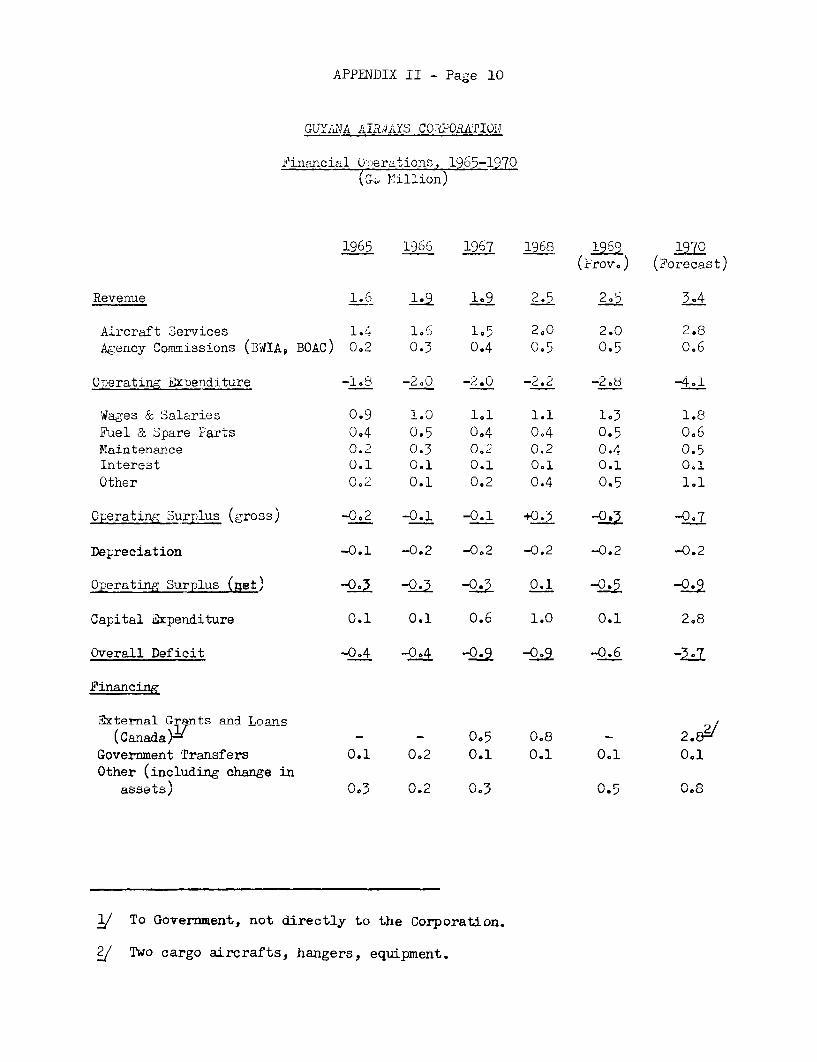
APPENDIX II - Page 10
GJJYANA AIRiJhYS uuOZOtATIOW
Financial Opjerations, 1965-1l70( G' . lillion)
1969 1966 1967 1968 196q 1970
(Irov.) (Forecast)
Revenue 1.6 1.9 19 235 2.5 34
Aircraft Services 1.4 106 1.5 2,0 2.0 2.8Agency Clo=issions (Bia BOAC) 02 0.3 04 C0
Operating Exienditure -1.8 -2.U -2.0 -2. -2.8 -4.1
'Wages & Salaries 0.9 1.0 1l1 1.1 1.3 1.8
Fuel & Spare Parts 0.4 0.5 0.4 0.4 0.5 0.6Maintenance 0.2 0.3 0. 0.2 0.4 0.5Interest 0.1 0.1 0.1 0.1 0.1 0,1
Other 0.2 0.1 0.2 0.4 0.5 1.1
Operating Surplus (gross) -0,2 -0.1 -0.1 +0.3 2-O. k007
Depreciation -0.1 -0.2 -0.2 -0.2 -0.2 -0.2
Operating Surplus (net' -O.k -03 -2 0.1 -O.°
Capital axpenditure 0.1 0.1 0.6 1.0 0.1 2.8
Overall Deficit -0.4 -0.4 -L-1 -°*9 -0.6 -3
Financing
External Grants and Tnqn-
(Canada)F Oe- 0.5 0.8Gove-. ent Tr.nsfers 0,1 0.2 0.1 0.1 0. 0.1Other (including change in
assets) v V- 0 2 Oe -' -07
To Government, not directly to the Corporation.
Two cargo aircrafts, hangers, equipment.
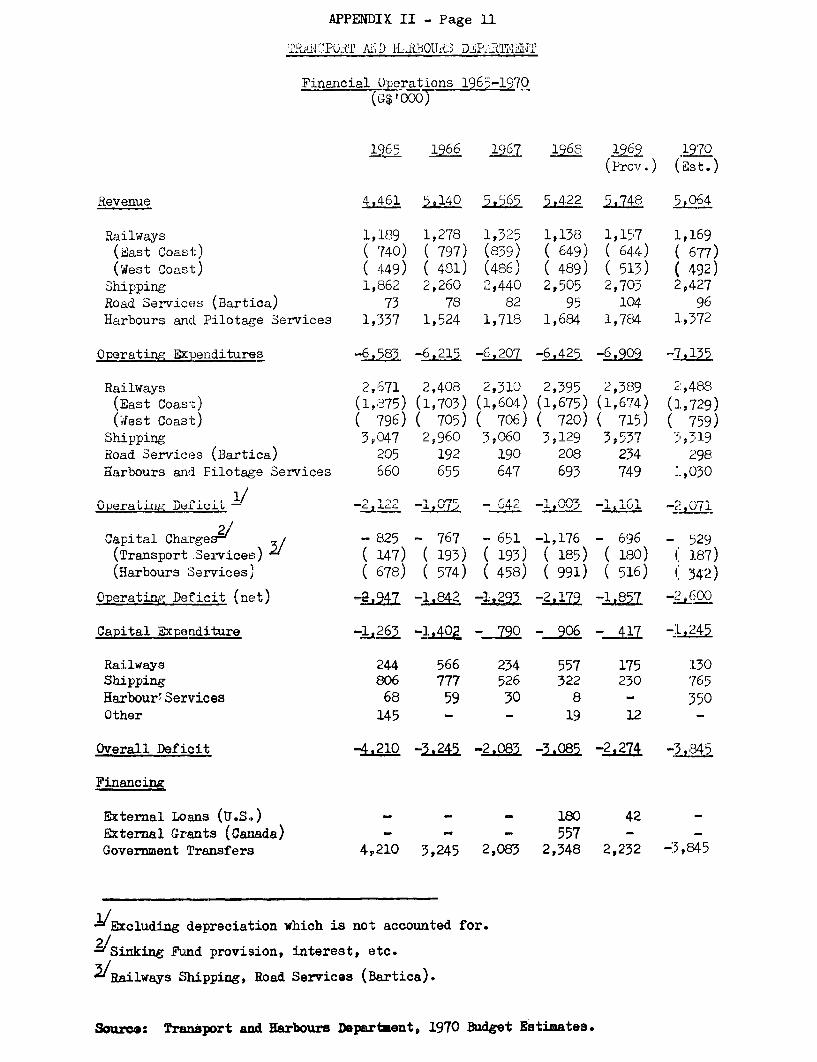
APPENDIX II - Page 11
2Th8PO. ? AjLTD i2B0OU:i3 D3P_T,i7T
Financial Operations 1965-1970ta$Cooo)
965 1966 1967 1968 1969 _197
(prov-) (Est.)
Revenue 4,4 5,140 5.565 5,422 5,748 5,2 6 4
Railways 1,189 1,278 1,3Ž5 1,138 1,157 1,169( $as- a ( 740)o ( 797)v\ (839) ( 649),\ ( 644-) ( 677,)
(West Coast) ( 449) ( 481) (486) ( 489) ( 513) ( 492)Shipping 1,862 2,260 2,440 2,505 2,705 2,427Road Services (Bartica) 73 78 82 95 104 96Harbours andc Pilotage Services 1,337 1,524 1,718 1,684 1,784 1,372
Operating J&penditures -6,583 6 215 -6,207 -6,425 -7
Railways 2,671 2,408 2,310 2,395 2,389 2,488(East Coast) (1.875) (1.703) (1,604) (1,675) (1,674) (1.729)(;Jest Coast) ( 796) ( 705) ( 706) ( 720) ( 715) ( 759)
Shippini nJM7 2i960 3;060 3;12q 3;537 1;319Road Services (Bartica) 205 192 190 208 234 298U.arb,ours and 41 0 age Q-e4 rc 660 65 64 693 7A4 1, rz3
J..Ld.±U.L4.L.~ d I . L .L±'JL.dV 1V4A. -1 '-'347)IPt./ j
Operatiun DeL'iCit - -- j l - UC2 -I 1i,l± -,u7i
Capital Charges - 825 - 767 - 651 -1,176 - 696 - ;29
(Transport Services) ( 147) ( 193) ( 193) ( 185) ( 180) ( 187)(Harbours Services) ( 678) ( 574) ( 458) ( 991) ( 516) 3 342)
Operating Te-fi-; 4 e__) OA'7 -1 PA C) -10 --23 .170 -1 PCZ7 - nn
________________ I ~ ~ ~ ~ ~ ~~~~~II± A. L, "nr nn A I~. -' )A
Capital Z-apendibure -_tg L4A-70~~47-L.4
Railways 244 566 234 557 175 i3Shipping 806 777 526 322 230 765
Harbour, Services 68 59 30 8 - 350Other 145 - - 19 12 -
Overall Deficit -4.210 - -2.083 -j,08 -2,274 -,845
Financinw
R eralLo Tns (U.=S ) _ - - _sn 4.2&ternal Grants (Canada) - - - 557 - -
~~ 4'-..... ~~~~~~~~~~A 5>10~ O)A C S) r,; ) 'AA~ R 9A 3-ArGove-.yent Transfers420 325 203 238 222 -j4
-L/Excluding depreciation which is not accounted for.9/
Sinking Ftmd provision, interest, etc.
~/-41n)l__ C-1pp;A_ 'DoA Se.ce (-tiC4-Suc LL.LuJyALpr.LZ L1.UL%. " LV.LB.dW BJO.Lates.
Source: Truulport and Harbours DepaLrtent, 1970 &adget Estimates.

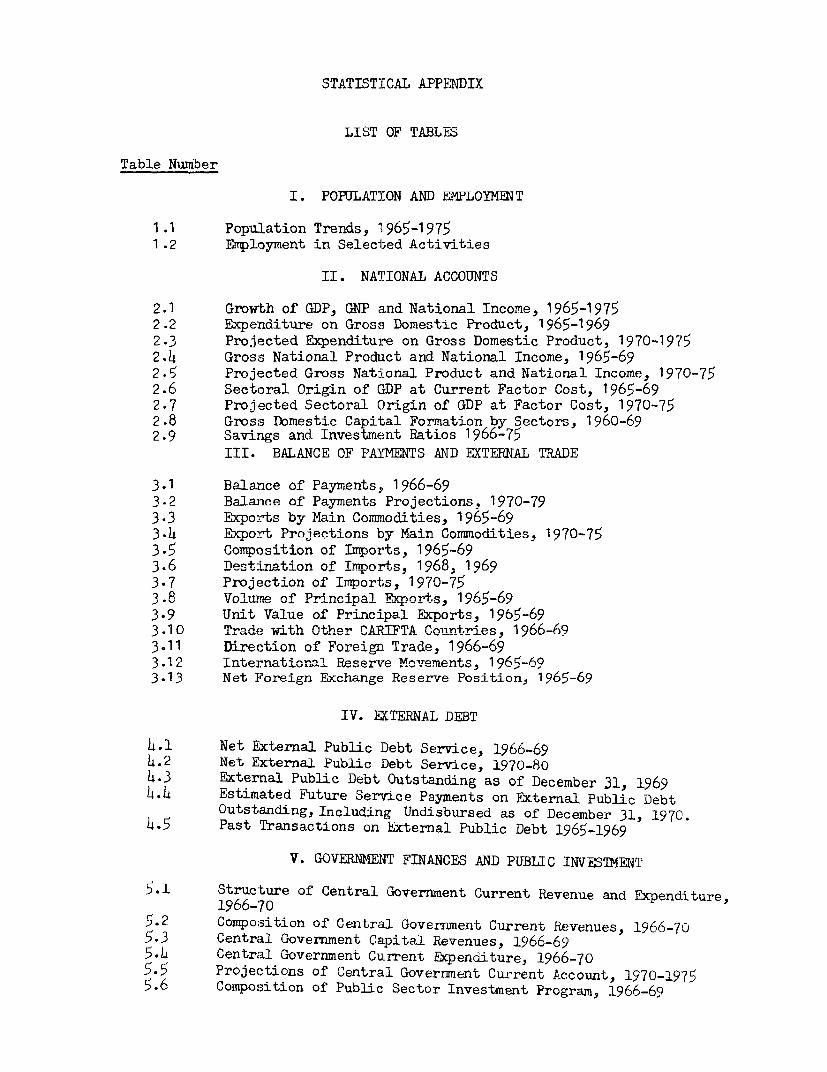
STATISTICAL APPENDIX
LIST OF TABLES
Table Number
I. POPULATION AND EMPLOYMENT
1.1 Population Trends, 1965-19751.2 Employment in Selected Activities
II. NATIONAL ACCOUNTS
2.1 Growth of GDP, GNP and National Income, 1965-19752.2 Expenditure on Gross Domestic Product, 1965-19692.3 Projected Expenditure on Gross Domestic Product, 1970-19752.4 Gross National Product and National Income, 1965-692.5 ProjeDcted Gross National Product and National Income, 1970-752.6 Sectoral Origin of GDP at Current Factor Cost, 1965-692.7 Projected Sectoral Origin of GDP at Factor Cost, 1970-752.8 Gross Domestic Capital Formation by Sectors, 1960-692.9 Savings and Investment Ratios 1966-75
III. BALANCE OF PArMENTS AND EXTERNAL TRADE
3.1 Balance of Payments, 1966-693.2 Balance of Payments Projections, 1970-793.3 Expozrts by Main Conmmodities, 1965-69A3.4 .xnortI Projections by Main Commodities. 1970-753.5 Composition of Imports, 1965-693.6 Destin+Antn of Inports, 1968, 19693.7 Projection of Imports, 1970-753.8 Vol,me of Principal Txport.s, 1965-693.9 Unit Value of Principal Exports, 1965-693.10 Trade -ith Other CARIFTA Countries, 1966-693.11 Direction of Foreign Trade, 1966-693.12 IIT-ernationll P-e- Movemen.ts?965-6Q3.13 Net Foreign Exchange Reserve Position, 1965-69
IV. EXTERNAL DEBT
4.1 Net External Public Debt Service, 1966-694.2 Net External Public Debt Service, 1970-804.3 External Public Debt Outstanding as of December 31, 19694.h Estimated Future Service Payments on External Public Debt
Outstanding, Including Undisbursed as of December 31, 197C.4.5 Past Iransactions on E1xternal Public Debt 1965-1969
V. GOVERNMNNT FINANCES AND PUBIJC INVITMENT
5.1 Struc ture of Central Goverrnent Current Revenue and Expenditure,1966-'70
5.2 Composition of Central Government Current Revenues, 1966-705.3 Central Government CLpital Revenues, 1966-695.1; Central Government Current Expenditure, 1966-705.5 Projections of Central Goverrnment Current Account, 1970-19755.6 Composition of Public Sector Investment Program, 1966-69
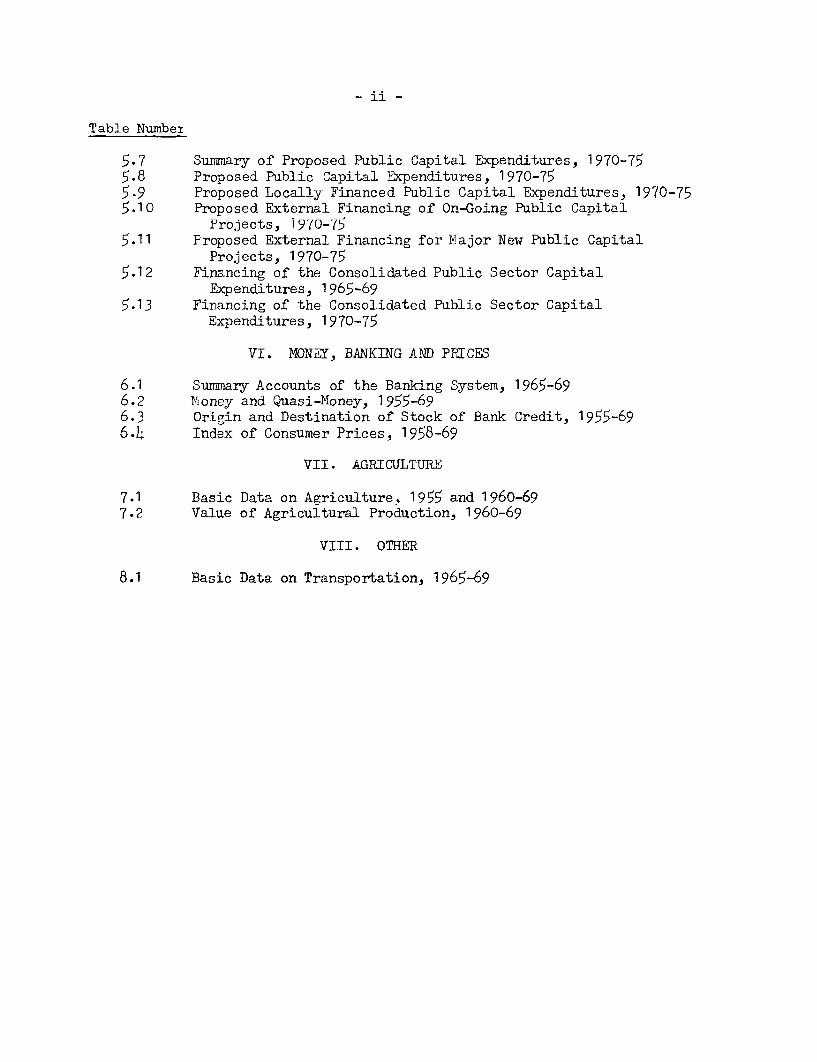
Table Numbei
5.7 Summary of Proposed Public Capital Expenditures, 1970-755.8 Proposed Public Capital Expenditures, 1970-755.9 Proposed Locally Financed Public Capital Expenditures, I(u-7s5.10 Proposed External Financing of On-Going Public Capital
Projects, 1970-755.11 Proposed External Financing for Major New Public Capital
Projects, 1970-755.12 Financing of the Consolidated Public Sector Capital
Expenditures, 1965-695.13 Financing of the Consolidated Public Sector Capital
Expenditures, 1970-75
VI. MONEY, BANKING A.D PRICES
6.1 Summary Accounts of the Banking System, 1965-696.2 Money and Quasi-Money, 1955-696.3 Origin and Destination of Stock of Bank Credit, 1955-696.4 Index of Consumer Prices, 1958-69
VII. AGRICULTURE
7.1 Basic Data on Agriculture, 1955 and 1960-697.2 Value of Agricultural Production, 1960-69
VIII. OTHER
8.1 Basic Data on Transportation, 1965-69
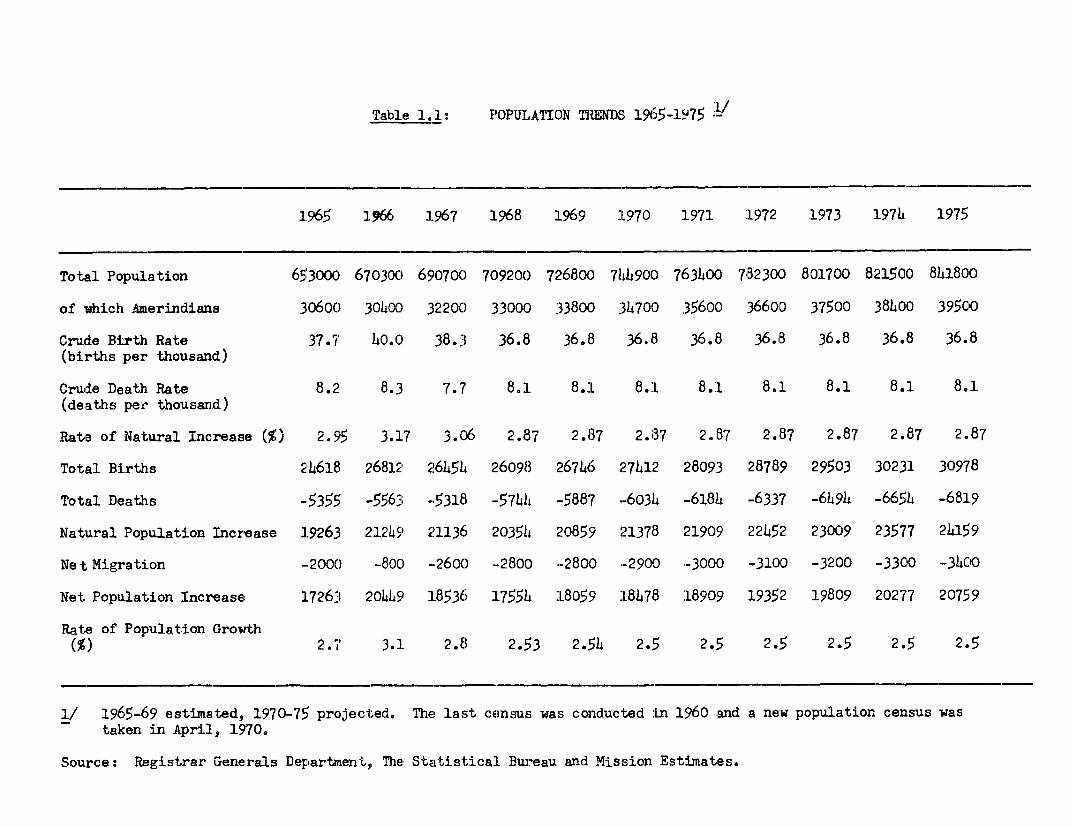
Table 1.1: POPUI.ATION TRENDS 196 5-1!?75
1965 1)966 1 967 1968 1969 1970 1L971 1972 1973 197T 1975
Total Population 653000 670300 6c90700 709200 72.6800 7l4490( 763h00 782300 801700 821500 841800
of which Amerindians 3,060) 30hm 32200 3300() 33800 34700 35600 36600 37500 384)00 39500
Cruide Birth Rate 37.7 40.0 38.3 36.8 36.8 36.13 36.,8 36.B 36.8 36.8 36.8(births per thousand)
Crude Death Rate 8.2 8.31 7.7 8.]L 8.:L 38.L 8.1 8.1 8.1 8.1 8.1(deaths per thousand)
Rates of Natural Increase () 2.595 3.17 3.(6 2.87 2.87 2.87 2.87 2.87 2.87 2.87 2.87
Total Births 214618 26812 2664514 26098 267 46 27412 :28093 28789 29503 30231 30978
Total Deaths -5355 -.5563 -.5318 --57L44 -5887 -60314 -61814 -6337 -6L194 -6654t -6819
Natural Population Increase 19263 21249 " 21136 20354 20859 21378 :21909 22452 23009 23577 24159
Ne t, Migration -.2000 -80C) -.2600 -.2800 -2800 -2900 -3000 -3100 -3200 -3300 -34.CtO
Net Population Increase 1726,3 20449 18536 JL7551, :L805'3 :81478 :18909 19352 19809 20277 20759
Rate of Population Growrth(%) 2. 7_ 3.1, 2. 8 2. 53 2.'il 2.15 2.5 2.5 2.5 2.5 2.5
1/ 1965-69 estimated, 1970-75 projected. The last c6nsus was coniducted in 1960 and a new population census wastaken in April, 1970.
Source: Registrar Generals Department,, The Statistical Bureau and Mission Estimates.
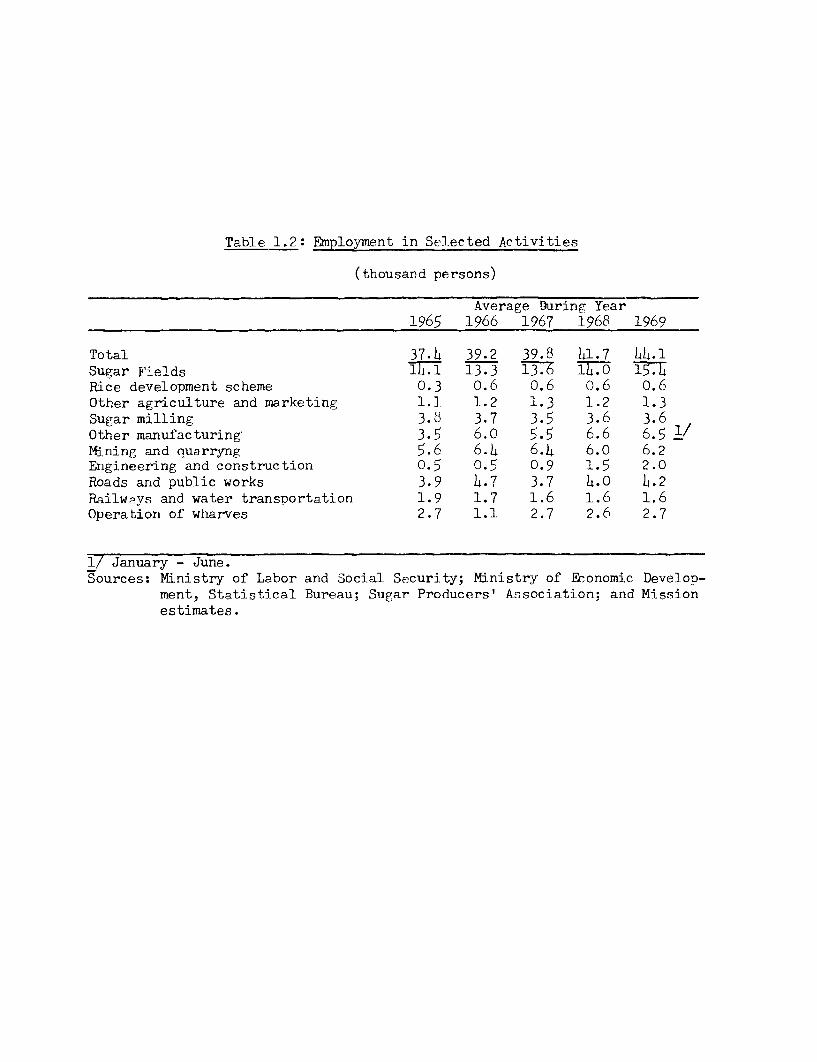
Table 1.2: Employment in Selected Activities
(thousand persons)
Average During Year1965 1966 1967 1968 1969
Total 37.4 39.2 39.8 4l.7 44.1Sugar Fields lLi.l 13.3 1L3. 17.O T15hRice development scheme 0.3 0.6 0.6 0.6 0.6Other agriculture and marketing 1.1 1.2 1.3 1.2 1.3Sugar milling 3.8 3.7 3.5 3.6 3.6Other manufacturing 3.5 6.0 5.5 6.6 6.5Mining and quarryng 5.6 6.L 6.h 6.0 6.2Engineering and construction 0.5 0.5 0.9 1.5 2.0Roads and public works 3.9 h.7 3.7 h.0 4.2Railways and water transportation 1.9 1.7 1.6 1.6 1.6Operation of wharves 2.7 1.1 2.7 2.6 2.7
1/ January - June.Sources: Ministry of Labor and Social Security; Ministry of Economic Develop-
ment. Stntistical Bureau: Sugar Producers' Association; and Missionestimates.

,seo-cad 696-1 TxT 9.1? GuoFT-*soaCod 5L,6i-oL(-[ fsea-rad qua-zano 9-e -+e?P 06T9-5i96-1
£ t~C. r <? S t - : 6ort>'' , V : ' i / v 7j(Z 5 r ot -~ .0, *le -I;7
r, . t 1?*t, 8 - t, <1 * +- G (? 1 1 * ,: r -r * -0 l C > s 2 * C,) .. 1|qj ^_aT T| cr ca 0 JI'D C.-) '' a r:
I 5 6M14 l6,c Svat 5'9 svs~~~t-7^);dXe <4C *71?(' it";i°r TO OrD
rv~~~~~~~~~~~~~~~~~1 Ic r<) 7 5 (Dlt gS < v cr |tor
£~~~~~~~~~~~~~~~~~~~~1 C" 7 'J, ' C C5 50 Og S S<(i)U o 9
cl,~~~~~~~~~~~~( 6 "! -' -S
~ t0VT7 Tjl 1 ~ri 7E'? 78 [;,9-y ',-, '!9t7 ,lf iqj- CO01¢msJ:srr; rrr->ro l- Lt-c C Jl fl loo 7 q7/'-7 - %
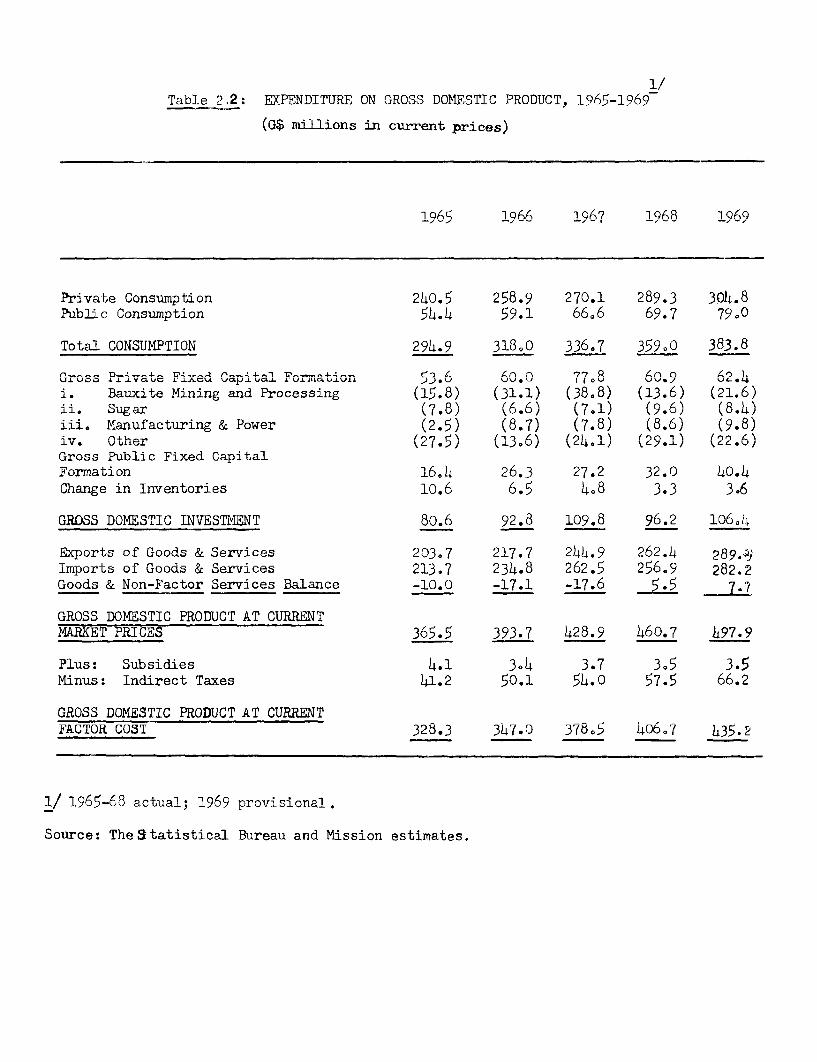
1/Table 2.2: EXPENDITURE ON GROSS DOMESTIC PRODUCT, 1965-1969
(C.c .41-Al 1-1ion CurLui± u prices)
I Q(-'~ 1966A 1967 IQ68R 196
Priva-te Consumpption 240.5 258.9 270.1 289.3 304.8,>>b' c Conswm,. ri 54. I 5 9.1 AA A AO 7 70 0
rTo4- -.,1 rnTQTTrDrTTT )ml. n 3180 -322A 7 if90 n(1 8R2 A.LoU Ld.L v ll..IJ.ul1 va- 74 7.4 )-LUo0 _),Jo I .LJi'J/.''.-
~ D4~4-- P4.--A 0~-.4 4-,.1 ~4-4,-~- rTh in 0rC\r 77 A Ar AO 1.rGross Pri vale 4-xed4 rapi 'r .~~ Forimation 531 k.V0@0 70 60* 6204
i. Bauxite Mining and Processing (15.8) (31.1) (38.8) (13.6) (21.6)-i-i. 6 (.U) \U.U/ i I ,6LI k7.u) k.A4/
iii. Manufacturing & Power (2.5) (8.7) (7.8) (8.6) (9.8)iv. Other (27.5) (13.6) /'2l ') (29'1 (22Im 6)Gross Public Fixed CapitalcF x m, a n 160 4 03 7 O 2 0 C 0 I. I.
Change in Inventories 10.6 6.5 4.8 3.3 3.6
GROSS DOMESTIC INVESTMENT 80.6 92.8 109.8 96.2 1060.
Exports of Goods & Services 203.7 217.7 244.9 262.4 289.AWImports of Goods & Services 213.7 234.8 262.5 256.9 282.2Goods & Non-Factor Services Balance -10.0 -17.1 -17.6 5.5 7
GROSS DOMESTIC PRODUCT AT CURRENTaP ET PRTCES 365.f 5 393.7 428.9 460.7 h97.9
Plus: Subsidies 4.1 3.4 3.7 365 36 5Minus: Indirect Taxes 41.2 50.1 54.0 57.5 66.2
GROSS DOMESTIC PRODUCT AT CURRENTFACTOR COST 328.3 347.0 378.5 406.7 435.2
1/ 1965-68 actual; 1969 provisional.
Source: The Statistical Bureau and Mission estimates.
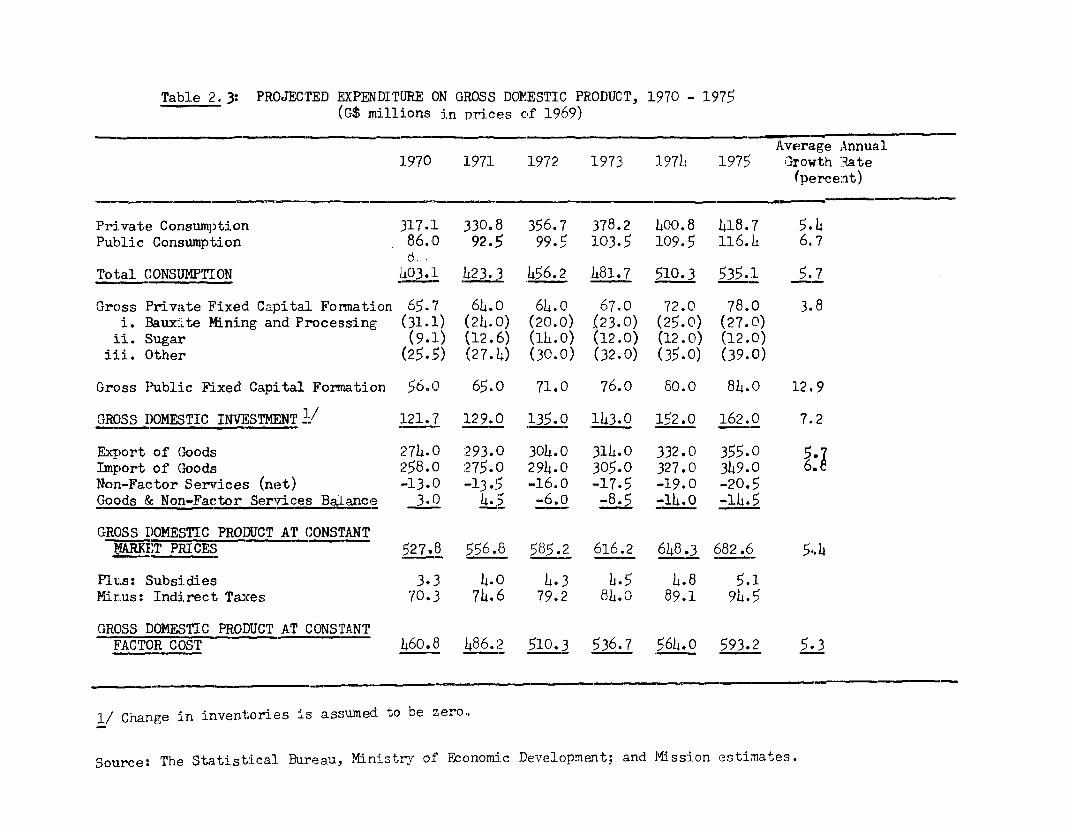
Table 2. 3: PROJECTED EXPENDIT'URE ON GROSS DOMESTIC PRODUCT, 1970 - 1975(G$ millions in prices of 1969)
Average Annual1970 1971 1972 1973 197T 1975• Growrth Rate
(percent)
Private Consump)tioni 317.1 330.8 356.7 378.2 400.8 418.7 5.,4Public Consumption 86.0O 92.5 99.5 103.5 109.5 116. L 6.,7
Total CONSUMPTION 403.1 423.3 _ h56.2 481.7 510.3 535.1 5.7
Gross Private Fixed Capital Formation 65.7 64.0 64.0 67.0 72.0 78.0 3.8i. Bauxite Mining and Processing (31.1) (24.0) (20.0) (23.0) (25.0!) (27.0)
ii. ';ugar (9.1) (12.6) (1lL.O) (12.0) (12.0) (12.0)iii. Other (25.-5) (27.4) (30.0) (32-0) (35-0) (39.0)
Gross Publ,ic FRLxed CapiLtal Forination 56.0 65.o 71.0 76.0 80.0 84.0 12.,9
GROSS I)OMESTIC INVESTHD,NT ]/ 121.7 129.0 135.0 143.0 152.0 162.0 7.2
Export of (Goods 27)4-.0 :293.0 304.0 314.0 332.0 355.0 5.7Import of Goods ;758.0 275.0 29)4.0 305.0 327.0 349.0 6.eNon-Factor Services (net) *-13.0 -13.5 -16.0 -17.5 -19.0 -20.5Goods & Non-Factor Services Balance 3.0 4.,5 -6.o -8.5 -1h.0 -14.5
GROSS DOMESTIC PRO]DUCT AT CONSTANTtIARKET PRICES 527.8 556.8 585.2 616.2 6)48.3 682.6 5-4
Plus: Subsidies, 3.3 4. 0 4.3 4.5 4.8 5.1Minus: Indirect Taxes 70.3 714.6 79.2 8)4.0 89.1 94.5
GROSS DOMESTIC PROI)UCT AT CtONSTANTFACTOR COST 'h60.o8 )486.2 ,510.3 536.7 564. o 593.2 5.3
1/ Change in inventories is assumed to be zero.
Source: The Statistical Bureau, Ministr-y of Sconomic Development; and Mqission estiLates.
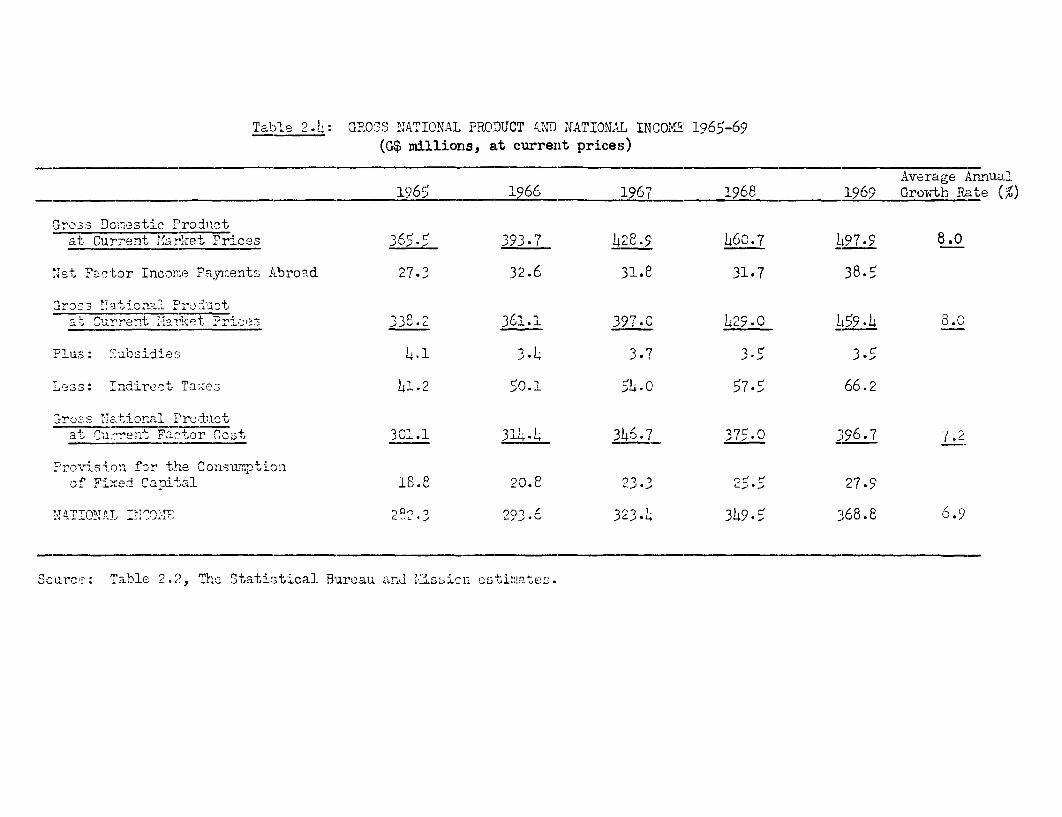
Table 2 GR: GFsOSS INATITONAL PRODUCT OND NATIONAL INCOHE 1965-69(G$i millions, ztt culrrent prices)
Average Anrual1L965 1966 1967 1968 19659 Growth late (%)
Gro3s Dcr.3estic P ro3ictat Current Mket -Iri`ces ' 393.7 42. S60.7 7 97.6 8.0
i.et Fnctor Incomne Pa-,.nerit Abroad 27.3 32.6 31.8 31.7 38.'
at Cirrent, Th'ket Prb ................ >, ,38. 367.i 39G'.2 4 )5361.1 397. 8.0
Plus: SThsidi4.1 3-L 373
rLess: Indirc' Ta-;c'i3 !1 .2 50.1 54.C 57. 66.2
Cruz, .s ,.7atinornal Prod1nctat C-arent Fa. tor Cost 301.1 31LL 346.7 37.0 396.7 7.2
?rovis.aon for the Coasuwmptionof F,ixed Canital 18.8 20.8 23.3 226 27.S
1ATON'T : vCf 2Q,.3 293.6 323-.L 3 L45 368. 6.9
Scurc;-: T^'able 2.2), e Statir 3tical Bureau an.L Zsslcn estimates.
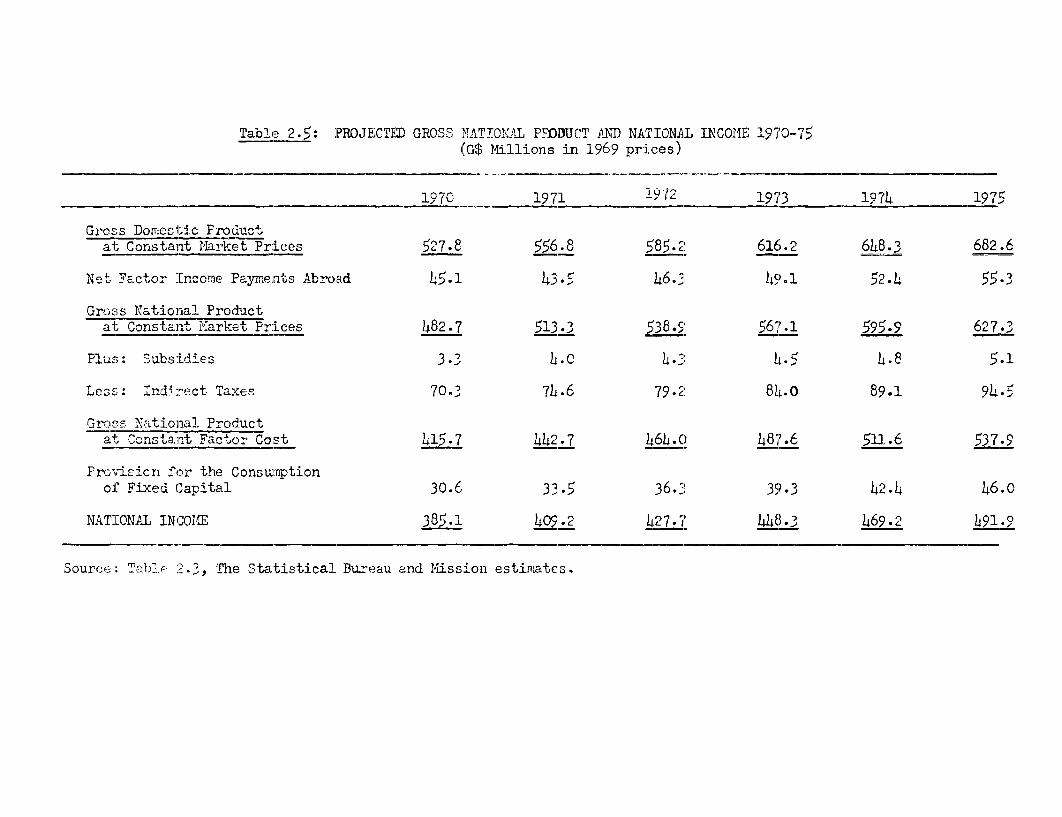
Table 2.15: ]PROJECTED GRODSS NATTMIAL PYlDBUCT P1D NATIONAL INCOHIF. 1970-7'5(G$ 1ill-ions in 1L969 prices)
1D7O 1971 w72 19 73 19Th. 1975
Groa;s DomceS,tic Froduc1ta1; ConiStant M1,rket Prices 527.8 556.8 585.2 616.2 61h8.3 682.6
Net Factor Income Payment-s Abroad 435.l 3.5 46.3 45).1 52.4 55.3
Gros-s Na.tional P?roductat- ConstaLnt narke:t Pr.ices 482.7 513.3 538.9 567.1 595.9 627.,
Plus : Subs:Ldies 3 .3 4.c 4 . 14.5 14.8 5.1
Less: Indirect Taxes 70.3 74.6 79.2 814.0 89.1 914.5
Gross National Y'rodluctat Constant Fazfctor Cost 415.7 442.7 4614.0) 487.6 5:11.6 537.9
Pro-xdicirc --or the Consumptionof Fixed (Capi-tal 30.6 33.5 36.-3 39.3 142.4 46.0
NATIONAL INICOME 385.1 1409.2 427. 1 448.3 46S92 491.9
Source.:: T:.}>,: 2.3, The Statistical Bi=eau and Mission estimates.
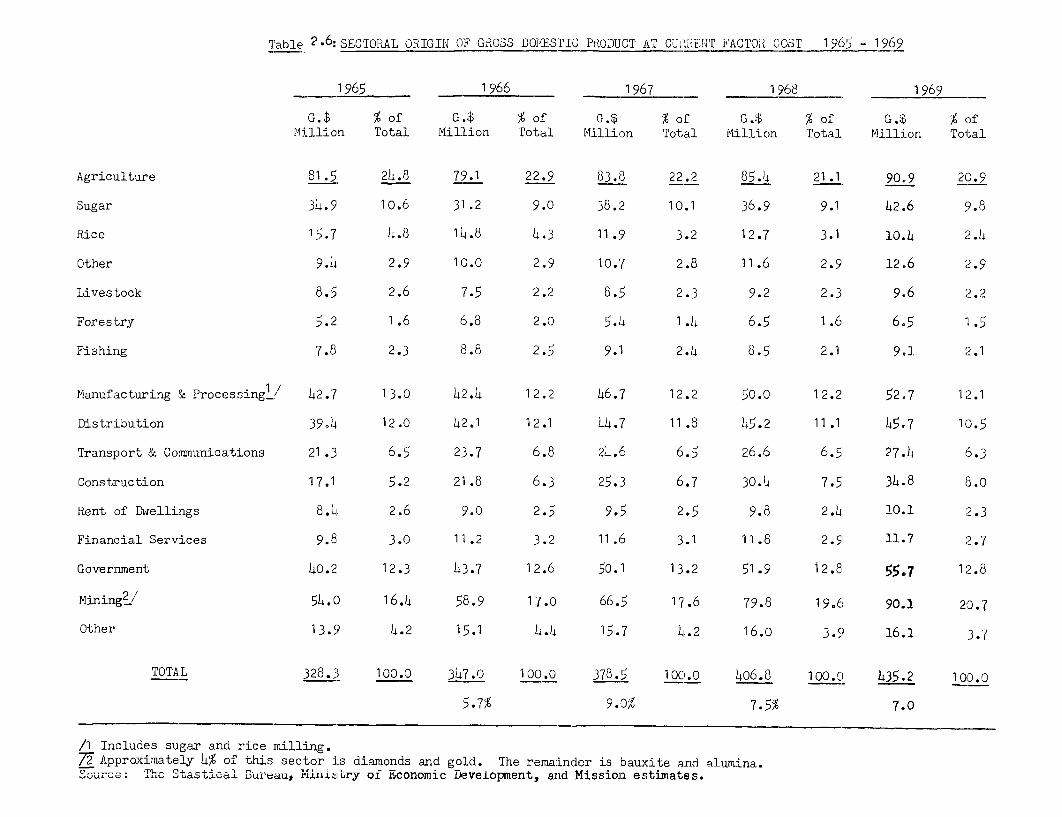
Table ?-6- SECTORAL ORIGIN OF GROSS DO1PZSTIC P'RODUCT AT CU,LRENT _FACTOR COST 1 965 - 1 969
1 965 1 966 1 967 1_968 1 969
G.$ %' of' G.$ % of G.$ % of G.$ %of G.$ % ofMillion Total Mil:Lion Total Million Total Million Total Million Total
Agriculture 81.5 24,.8 79.1 22.9 83. 8 22.2 85.4 21 .1 90. 9 20.9
Sugar 34.9 10o.6 31.2 9.0 38.2 10.1 36.9 9.1 42.6 9.8
Rice 15.7 4.8 114.8 4.3 11. 3.2 1 2.7 3.1 10.4 2.4
Other 9.4 2.9 1(0.0 2.9 10.7 2.8 11.6 2.9 12.6 2.9
Lives-tock 8.5 2.6 7.5 2.2 8.5 2.3 9.2 2.3 9.6 2.2
Forestry 5.2 1 ,,6 6.8 2.0 5 .4 1.4 6.5 1.6 6.5 1.5
Fishing 7.8 2,3 8.8 2.5 9.,l 2.4 8.5 2.1 9.2. 2.1
Manufacturing 3 Processingb/ 42.7 13,,O 462.4 12.2 46.7 12.2 50.0 12.2 52.7 12.1
EistrLbution 39,4 12,0 42.1 12.1 44.7 11.8 65.2 11.1 45.7 1(.5
Transport & ComnuniLcations 21 .3 6.,5 23.7 6.8 24.6 6.5 26.6 6.5 27-1 6.3
Construction 17.1 5.2 21.8 6.3 25.3 6.7 30.4 7.5 34.8 8.0
Rent of Drellings 8.4 2,6 9.0 2.5 9.5 2.5 9.8 2.4 1-0.2 2.3
Financial Services 9.8 3,O 11.2 3.2 11.6 3.1 11.8 2.9 11.7 2.7
Government 40.2 12,.3 43.7 12.6 50.1 13.2 51.9 12.8 55. 12.8
Mining 2 / 54() 16.4 58.9 17.0 66.5 17.6 79.8 19.6 90.1 20.7
Other 13.9( 4.2 15.1 4.4 15.7 4.2 16.0 3-9 16.1 3.7
TOTAL 328. 3 100.0 347.0 100.0 378.5 1i0o.0 4o6.8 100.0 435.2 1o0.o
5.7% 9.0% 7.5% 7.0
/1 Includes sugar and rice milling./ Approximately 4% of this sec-tor is diamonds and gold. The remainder is bauxite and alifrLuria.
Sourc '.he Stastical E.w'au,q Minit,Fry of Economic DVveiopment, and Mission estimates.
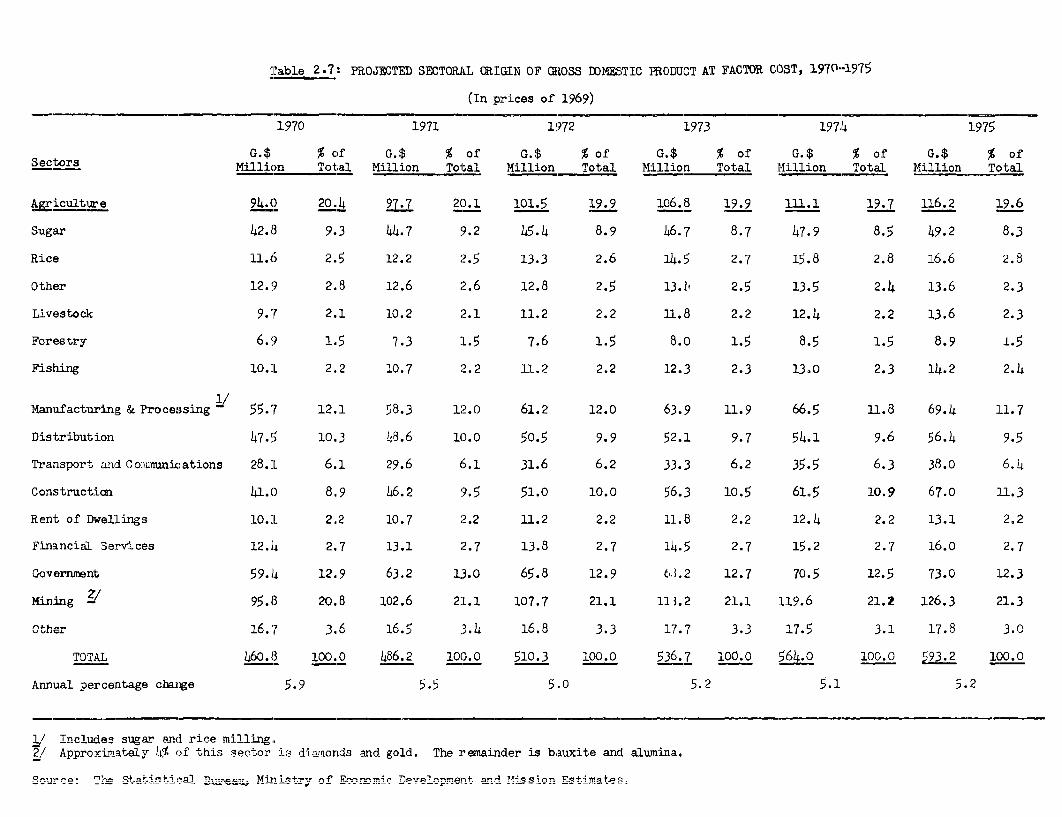
Table 2.7: PROJECTED SE,CTOCURL CRIGIN OF GitOSS DOME3,TIC INODUCT AT FACTOR COST, 1970.1975
(In prices of 1969)
1970 19711 1972 1973 197,4 1975
G. $ % c°f G.$ % of Cr.$ % of G.$ % of G.5 % of G.$ % ofSectors Million Total Million Total Million Total Million Total Million Total Million Total
&Eicult,ure 94.(o 20.4 97.7 20.1 lC'l.5 19.9 l)6.8 19.9 111.1 19.7 1165.2 19.6
Sugar 42.8 9.3 44.7 93.2 45.4 8.9 46.7 8.7 47.9 8.5 49.2 8.3
Rice 11.6 2.5 12.2 2'.5 13.3 2.6 14.5 2.'7 15.8 2.8 16.6 2.8
Other 12.'9 2.8 12.6 2.6 12.8 2.5 13.1, 2.5 13.5 2.4 13.6 2.3
Livestock 9.7 2.1 10.2 2.1 11.2 2.2 11.8 2.2 12.4 2.2 13.6 2.3
Forestry 6.9 1.5 7.3 1-5 7.6 1.5 8.0 1.5 8.5 1.5 83.9 1.5
Fishing 10.1 2.2 10.7 2.2 11.2 2.2 12.3 2.3 13.0 2.3 1,4.2 2.4
Manufacturinig & Processing - 55.7 12.1 58.3 12.0 61.2 12.0 63.9 11.9 66.5 11.8 69.4 1L1.7
Distribution 47.5 10.3 48.6 10.0 50.5 9.9 52.1 9.7 54.1 9.6 516.4 9.5
Transport and Cowimimnications 28.:1 6.1 29.6 6.1 31.6 6.2 33.3 6.;2 35.5 6.3 313.0 6.4
Constructicm 4L.() 8.9 46.2 9.5 51.0 10.0 56.3 10.5 61.5 10.9 67.0 11.3
Rent of DweIlLings l0.:L 2.2 10.7 2.2 11.2 2.2 11.8 2.2 12.4 2.2 13.1 2.2
Financial Services 12.4 2.7 13.1 ;2.7 13.8 2.7 14.5 2.7 15.2 2.7 16.0 2.7
Governinjt 59. 4 12.9 63.2 L3.0 65.8 12.9 63.2 12.7 70.5 12.5 73.0 12.3
Mining Z/ 95.83 20.8 102.6 21.1 lC7.7 21.1 11.3.2 21.1 119.6 21.2 126.3 21.3
Other 16.7 3.6 16.5 3.4 16.8 3.3 17.7 3.3 17.5 3.1 17.8 3.0
TOTAL 460.8 100.0 486.2 10(.0 510.3 100.0 536.7 100.0 564.0 10lo.0 293.2 100.0
Annual percentage change 5.9 5.5 5.0 5.2 5.1 5.2
1/ Includes sugar and rice milling.Z/ Approxima-tely -l54 of this sebctor i3 dia-ornds aind gold. The remainder is bauxite ancd alunina.
So rc~ne- The- '-ntisnjm1 cf^ e Ministry ' Rf EtrynmA. EDfvlfAi%ment -rdfI;- n Eirn
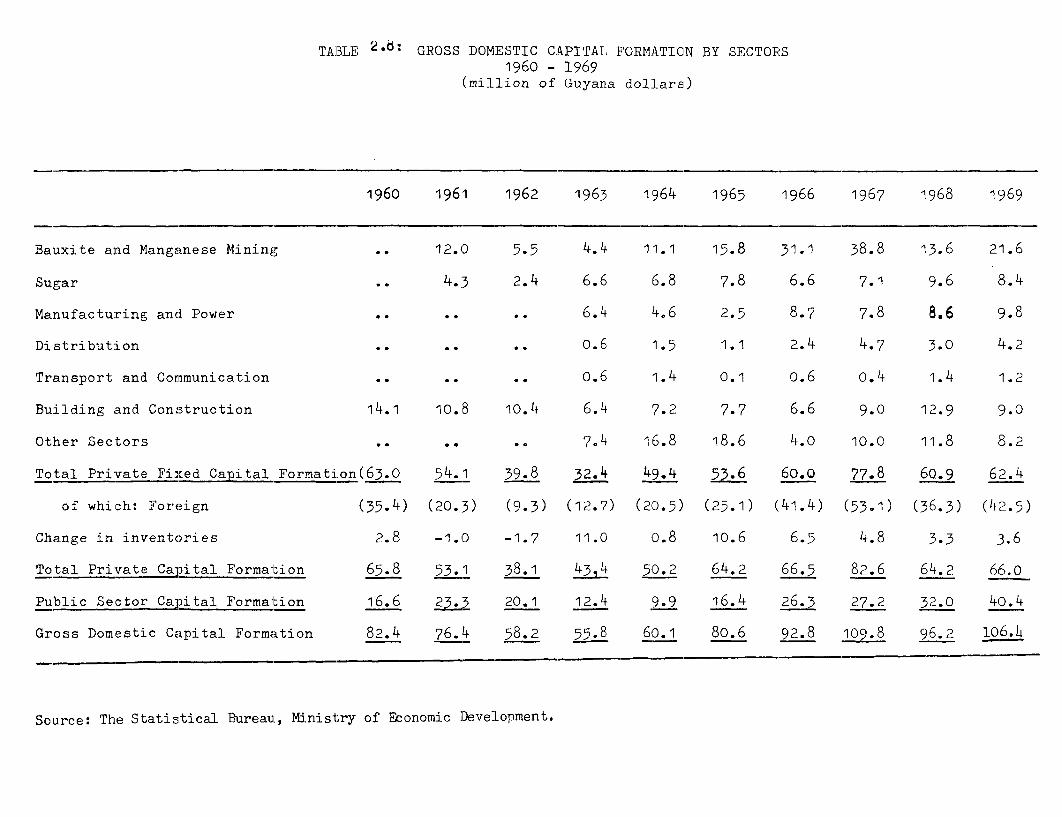
TABLE 2o6b GROSS DOMESTIC CAPITAL FORMATION BY SECTORS1960 - 1969
(million of Guyana dol:lars)
1960 1961 1962 19,63 1964 1965 1966 1967 1968 1969
Bauxite and Manganese Mining .. 12.0 5.5 4-.4 11.1 15.8 31.1 38.8 13.6 21.6
Sugar *- 4.- 2.4 6.6 6.8 7.8 6.6 7.1 9.6 8.4
Manufacturing ancd Power .. .. .. 6.4 4.6 2.5 8.7 7.8 8.6 9.8
Distribution .. .. .. o.6 1.5 1.1 2.4 4.7 3.0 4.2
Transport and Communication .. .. .. o .6 1.4 0.1 0.6 o.4 1.4 1.2
Building and Construction 14.1 10.8 10.,4 6.4 7.2 7.7 6.f, 9.0 12.9 9.0
Other Sectors .. .. .. 7.4 16.8 18.6 4.o 10.0 11.8 8.2
Total Private Fixed Capital Formation(6 3.0 54.1 39.,8 32I-4 49.4 '+-6 6o.o 77.,8 60.9 62.4
of which: Foreign (35.4) (20.3) (9.,3) (12.7) (20.5) (25.1) (41.4) (53.1) (36.3) (42.5)
Change in inventories 2.8 -1.0 -1.7 11.0 o.8 10.6 6.5 4.8 3.3 3.6
Total Private Capital Formation 65.8 53.1 38,,1 47j4 50.2 64.2 66., 82.6 64.2 66.o
Public Sector_Capital Formation 16.6 23.3 20.1 12,.4 9.9 16.4 26.3 27.2 32.0 40.4
Gross Domestic Capital Formation 82.4 76.4 58.2 55 .8 60.1 80.6 92.8 109.8 96.2 106.L
Source: The Statistical Bureau, MIinistry of Economic Development.
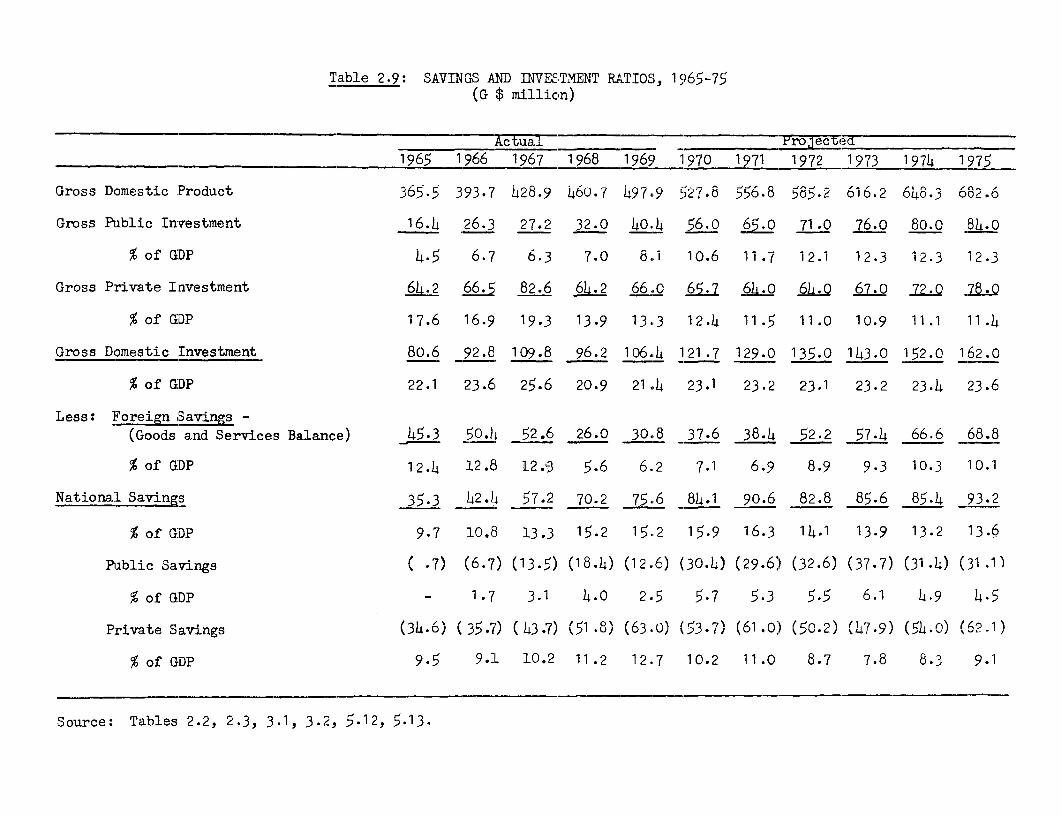
Table 2.9: SAVINGS AND INVESTMENT RATIOS', 1 965-75(G $ million)
…TtTI) roec tfed
- _ _ 1965 1966 15,67 1968 196 9 1970 1971 1 972 1973 1974 15975
Gross Domestic 'Produ-ct 365.5 393.7 428.9 460.7 497 ,y9 527.8 555.8 585 .2 616.2 6448.3 682.6
Gross Public Investment 16.4 26.3 2l7.2 32.0 40.,4 56.0 65 o 2 .0 76.0 80.0 4.0
% of GDP 4.5 6.7 6.3 7i.0 8.1 10.6 11.7 12,.1 12.3 12.3 12.3
Gross Private Investment 64.2 66.5, 82.6 6L± 66.0 L1 6 .61Q0 6,7.0 72.L 78.0
% of GDP 17.6 16.9 19.3 13.9 13.,3 12.14 11.5 11'.0 10.9 11.1 11.4
Gross Domestic Investment 80.6 92.8 109.8 96.2 106.,4 121.'7 129.0 135 .0 143.0 152.0 162.0
% of G:DP 22.1 23.6, 25.6 20C.9 21 .4 23.1 23.2 2:3.1 23.2 23.4 23.6
Less: Foreian Savings -(Goods and Services Balance) 45.3 50.1, _,2.6 26.0 30.8 37.6 38.4 5:2.2 57.4 66.6 68.8
% of G:DP 12.4 12.8 L2.9 5.6 6.2 7.1 6.9 8.9 9.3 10.3 10.1
Nat-iona:l Savings 35.3 42.1 5 7.2 70C.2 75.6 841i1 90.6 8:2.8 85.6 85.4 93.2
% of G:DP 9.7 10.8 13.3 1',.2 15.2 15.39 16.3 14.1 13.9 13.2 13.6
Piblic Savings ( .7) (6.7) (13.5) (1E8.4) (12.6) (30.4) (29.6) (32.6) (37.7) (31.,4) (31 .1)
% of G:DP - 1.7 3.1 4.0 2.,5 5 .7 5.3 15.5 6.1 4. 9 4.5
P:rivate Savings (34-46) ( 35.-7) ( 143.7) (51 .8) (63..0) (53.7) (61 .0) (50.2) (47.9) (54.0) (62.1)
% of GDP 9.5 9.'L 10.2 11.2 12.7 10.2 11.0 8.7 7.8 8-3 9.1
Sou:rce: Tables 2.2, 2.3, 3.1, 3.2, 5.12, 5.13.

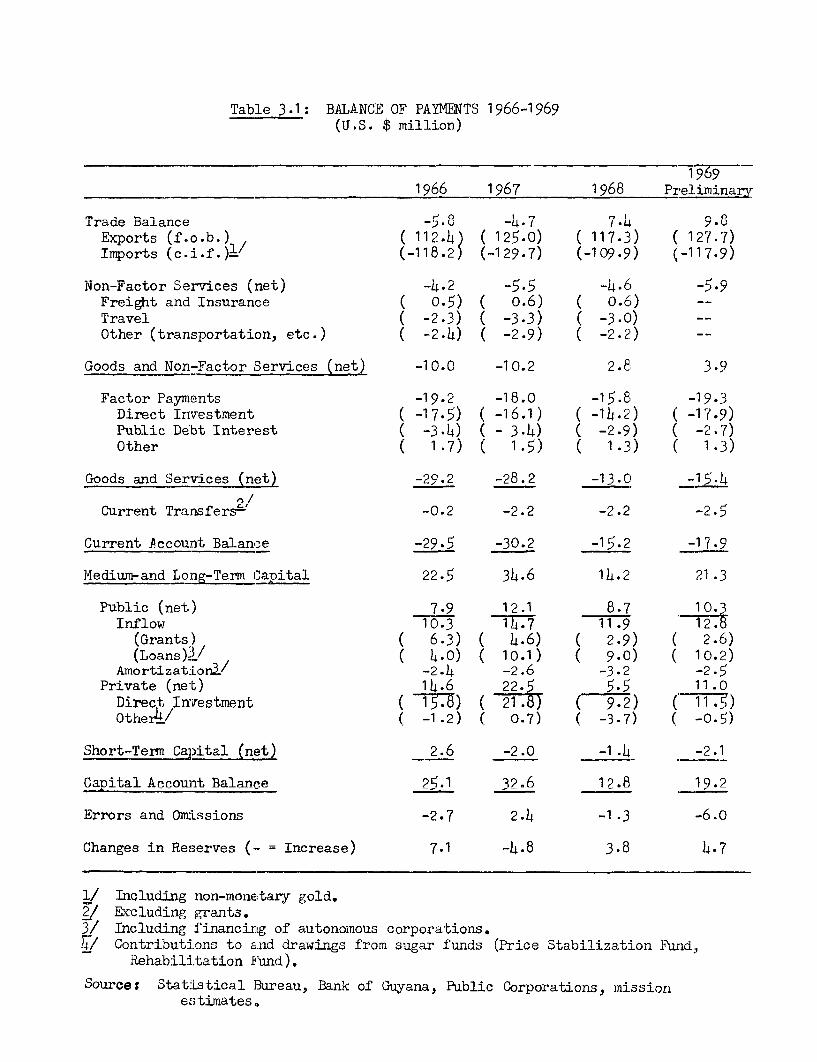
Table 3.1: BALANC:E OF PAYMENTS 1966-1969/TT t' db I 'I-.A(U .SJ. $ milllon)
19691966 1967 1968 Preliminary
Trade Balance -- 47 .L 9.Exports (f.o.b.) (1124. 1250) 117.3) ( 1277)Imports (c.i.f.)(/ k-1-i-2J (-129-7) 09-5
Non-Factor Services (net) -4.2 -5.5 -4.6 -5.9Freight and Insurance ( 0-5) ( 0.6) ( °.6) Travel ( -2.3) ( -3.3) ( -3.0) --
Other (transportation, etc.) ( -2.4) ( -2.9) ( -2.2) --
Goods and Non-Factor Services (net) -10.0 -10.2 2.8 3.9
Factor Payments -19.2 -18.0 -15.8 -19.3Direct Investment ( -17.5) ( -16.1) ( -1b.2) ( -17.9)Public De'bt Interest ( -3.4) ( - 3.4) ( -2.9) ( -2.7)Other ( 1.7) ( 1-5) ( 1-3) ( 1.3)
Goods and Services (nes -29.2 -28.2 -13.0 _15.4
Current Tra:nsfers-' -0.2 -2.2 -2.2 -2.5
Current Account Balance -29.5 -30.2 -15.2 -17.9
Medium-and Long-Term il 22.5 34.6 14.2 21.3
Public (net) 7.9 12.1 8.7 10.3Inflow 10.3 -T17T7 11.9
(Grants) ( 6.3) ( 4.6) ( 2.9) ( 2.6)(Loans)3/ ( 4.0) ( 10.1) ( 9.0) ( 10.2)
Amortizationl/ -2.4 -2.6 -3.2 -2.5Private (net) 14.6 22.5 5.5 11.0
Direct Investment ( T7T) ( 21.) ( 9-2) ( 11.5)Othe4/ ( -1.2) ( 0.7) ( -3.7) ( -0.5)
Short-Term Caipital (net) 2.6 -2.0 -1.4 -2.1
Capital Aceount Balance 2q.1 32.6 12.8 19.2
Errors and OmtLssions -2.7 2.1, -1-3 -6.o
Changes in Re.er.ves (-- = 7,1 -4=8 347
g/ Including non-monetary gold.9/ ERccluding g=rants.3/ Including financing of autonomous corporations.7/ Contributi.ons to and drawngs fro. sugar funds (Price Stabilizat-lon F-d4
Rehabilitation Fund).
Source: StatiLstical Bureau, Bank of Guyana, Pablic Corporations, missionestimates.
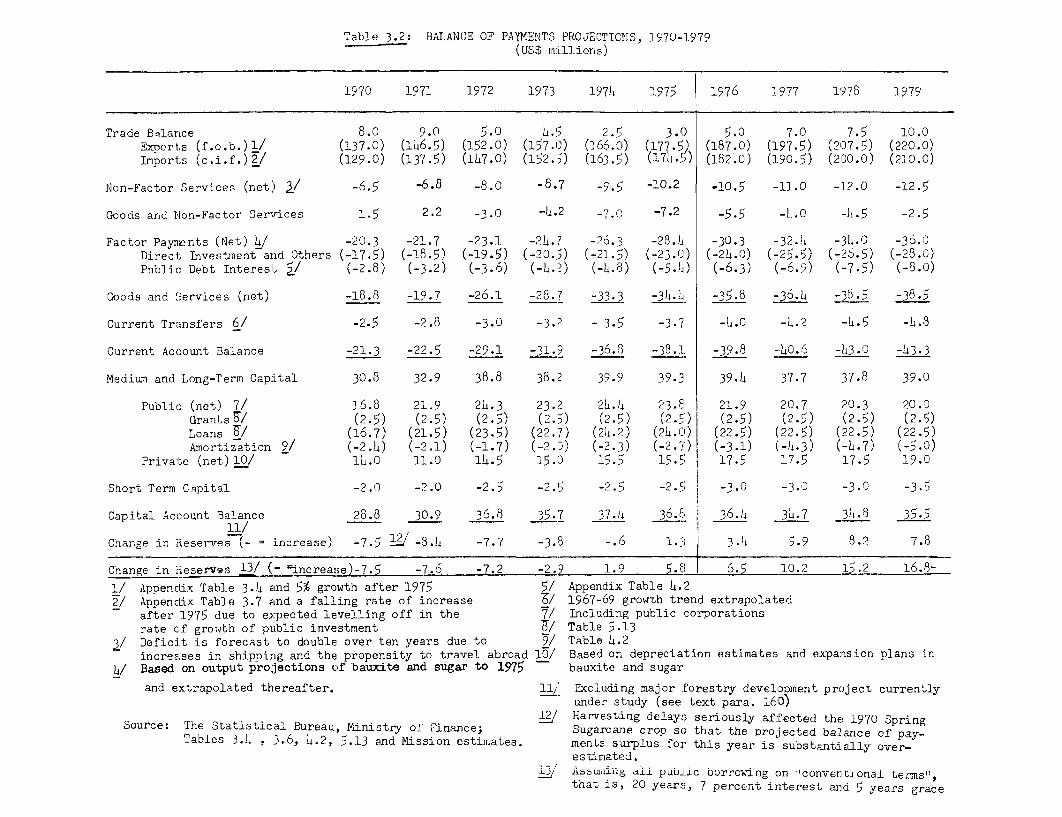
Tabl]e 3.2: EIALAN(CE OF PAYrIENTS PROJECTIONS, :L970-1979(US$ millions)
197() 1971 1972 1973 1976 ,1975 1976 1977 1978 1979
Trade Blarance 8.0 9.0 5.0 L.( 2 .5 3.0 5.0 7.0 7.5 10.0Exoorts (f.o.b.)l/ (137.0) (146.5) (152.0) (157.0) (166.0) (177.5) (187.0) (197.5) (207.5) (220.0)Imports (c.i.f.)2/ (129.0) (137.5) (147.0) (5) (1) (163.5) (170. ) (182.0) (190.5) (200.0) (210.0)
Non-Factor Services (net,) / -6.5 -6.8 -8.0 -8.7 g9.c5 -10.2 .*10.5 -11.0 -12.0 -12.5
Goods and Non-Factor Servrices 1.5 2.2 -3.0 -4.2 -7.0C -7.2 -5.5 -11.o -6.5 2.5
Factor Paynents (Net) L/ -20.3 -21.7 -23.1 -24.7 -26. 3 -28.h ..30.3 -32.4 -36.0 -36.CDirect; Investment and Others (-17.5) (-18.5) (-19.5) (2-20.) (-21.5;) (-23.0) (-24.0) (-25.5) (-26.5) (-8.0()Public Debt Interest 5/ (-2.8) (-3.2) (-3.6) (-6 '2) (-4.8) (-5.)) (-6.3) (-6.9') (-7.5) (-.o)
Goods and Services (net) -18.8 -19.7 -26.1 -28Q.7 -33.3 ' -34. .l .35.8 -36.4 -38.5 -38.5
Current Transfers 6/ -2,56 -2,8 -3.0 -3.2 - 3.5 -3.7 -4.0 -4.2 -4.5 -4.8
Current Account Balance -21.3 -22,.5 -29.1 -31.9 -36.8 -381.1 -39.8 -0.6 4-3.D -13.3
Maedirn and Long-Term Cap:ital 30.8 32.,9 38.8 38.2 39.q 39-3 39.4 37-7 37.8 :39.0
Public (net) 7/ 16.8 21.9 24.3 23.2 24.6 23.,a8 21.9 20.7 20.3 20.0Grants5/ (2-5) (2 5) (2-5) (2.5) (2.5;) (2.5) (2.5) (2-5) (2.5, (2.5)Loans / (16.7) (21.5) (23.5) (22.7) (24.2') (26.0) (22.5) (22.5,) (22.5) (22 .5)Amortization 9/ (-2.4) (-2.1) (-1.7) (-2.0) (-2.,3) (-2.7) (-3.1) (-64.3) (-4.7, (.-5.o)
Private (net) l1/ 14.0 11.0 14.5 15.0 15.,5 15. 17.5 17.5 17.5 1L9.0
Short Term Capital -2.0 -2,.0 -2.5 -2.5 -2.5 -2.5 ; -3.0 -3.0 -3-0 -3.5
Capital Account Balance 28.8 30,.9 36.8 35.7 37. u 36.8l 36.___ _317 _3,4.3 35.5
Change in Reserves (- increase) -7.5 31' -3.64 -7.7 -3.8 -. 1.l| 3.)4 5.9 8.2 7.8
Change in =leserves 13/ (- =increase)-7.5 -7. 72 -2.9 1.9 _ 6 10.2 6 5
l/ AppencLix Table 3.4 and 5% growth after 1975 5/ Appendix Table 4.22/ Appenclix Table 3.7 and a falling rate of increase / 1967-69 growth trend eIxtrapolated
after 1975 due to expected levelling off in the 7/ Including public corporationsrate of growth of public investment 7/ Table 5.13
3/ Deficit is forecast to double over ten years due to 9/ Table 4.2increases in shipping and the propensity tc travel abroacd 10/ Based on depreciation estimates and expansion plans in
4/ Based on oatput projections cf bainxite and sugar to 1975 - bauxite and sugar
and extrapolated thereafter. / Excluding major forestry development project currentlyrunder study (see text para. 160D)
Ss Harvesting delays seriously affected thej 1970 SpringSource: The StatiLstical Bureau, Ministry of Finance; Sugarcane crop so that the pro-jected balance of pay-
Tables 3.6 , 3.6, 6.2, 5.13 and Mission estimates. menits surplus for this year is substantially over-
estimated.< ' ds:,u,-,-li a | pLiLX.Lc brrowing on 11cDnventional terms"t ,
that is, 20 years, 7 percent interest and 5 years grace
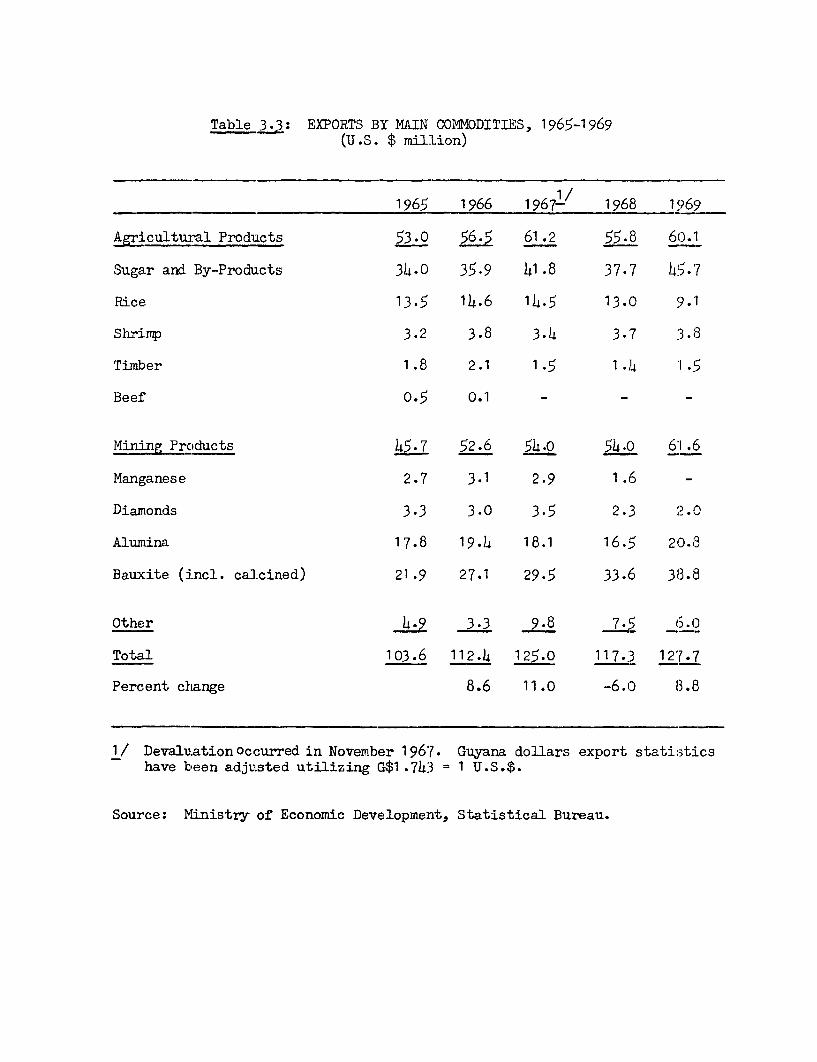
rITa,b e , ELDAD'DB 12V MATVN nnVWnnTMTT1 I E, 1965-1 n6n
(U.S. $ million)
1965 1966 1967- 1 968 19?69
Agricultural Products 53.0 56.5 61.2 55.8 60.1
Sugar and By-Products 34.0 35.9 41.8 37.7 45.7
Rice 13.5 14.6 14.5 13.0 '3.1
Shrimp 3.2 3.8 3.4 3.7 3.8
Timber 1.8 2.1 1.5 1.4 1.5
Beef 0.5 0.1 - - -
Mining Products 45.7 52.6 54.0 54. 0 61 .6
Manganese 2.7 3.1 2.9 1.6 -
Diamonds 3.3 3.0 3.5 2.3 2.0
Alumina 17.8 19.4 18.1 16.5 20.8
Bauxite (incl. calcined) 21.9 27.1 29.5 33.6 38.8
Other 4.9 3.3 9.8 7-5 6.0
Total 103.6 112.h 125.0 117.:3 127.7
Percent change 8.6 11.0 -6.0 8.8
1/ Devaluation Occurred in November 1967. Guyana dollars export statisticshave been adjusted utilizing G$1.743 = 1 U.S.$.
Source: Ministrv of Economic Development. Statistical Bureau.
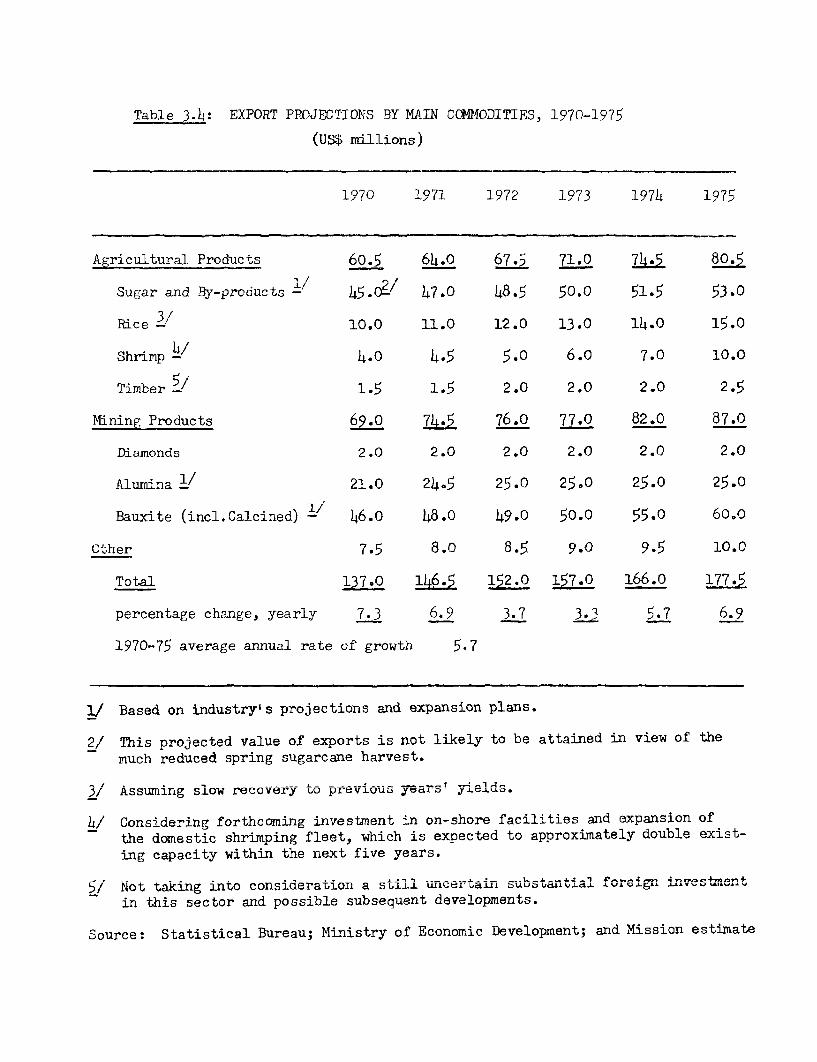
Table 3.4: EXPORT PROJECTIONS BY MAIN CCd4ODITIES, 1970-1975
(US$ millions)
1970 1971 1972 1973 1974 1975
Agricultural Products 60.5 64.0 6 71.0 745 805
Sugar and By-products 5 45.0-/ 47.0 48.5 50.0 51.5 53.0
Rice -/ 10.0 11.0 12.0 13.0 14.0 15.0
Shr-imp _i/ 4.0 465 5.0 6.0 7.0 10.0
Timber/ 1. 165 2.0 2.0 2.0 2.5
Mining Products 69.0 YL.5 76.0 77.0 82.0 87.0
Diamonds 2.0 2.0 2.0 2.0 2.0 2.0
Alunina -/ 21.0 24e5 25.0 25.0 25.0 25.0
Bauxite (incl.Calcined) -i 46.o 48.0 49.0 50.0 55.0 60.0
Cther 7.5 8.0 8.s 9.0 9.5 10.0
Total 137.0 146.5 152.0 157.0 166.0 177.5
percentage change, yearly 7.3 6.9 3.7 3.3 5.7 6.9
1970-75 average annual rate of growth 5.7
1/ Based on industryls projections and expansion plans.
2/ This projected value of exports is not likely to be attained in view of the
mucn reduced spring sugarczne harvest.
3/ Assuming slow recovery to pre-vious years yields.
4/ Considering fortncomu.ng Investuinent i on-shore facilltlUs 4 d 4 - of
the domestic shrimping fleet, which is expected to approximately double exist-ing capacity within the next Live years.
5/ Not taking into consideration a stl±l unrtaiuba l fPoreign
in this sector and possible subsequent developments.
Source: Statistical Bureau; Ministry of Economic Development; and Mission estimate

Table 35: COM1POSITION OF IMPORTS, 1965-1969(US$ millions)
1969
1965 1966 1967 1968 Estimate.
Consumer Goods 31.2 31.5L.2 .7
Food 18.1 19.5 19.3 17.7
Beverages and Tobacco 1.1 1.2 1.1 L.O
Manufacturers 10.2 11.7 12.2 10.3
Private motor car,s 1.8 2.3 1.9 2.2
Raw Materials and Intermediate Goods LO 50. 51_7 U24 L
Crude Materials 0.7 0.7 1.6 0.8
Aninal, Vegetable Oils andi Fats 1.5 1.0 1.0 1..
Fuels and Lubricants 9.4 9.6 10.4 10.
Chemicals 10.7 11.8 10.9 1o).6
Manufacturers 25.0 26.9 27.8 26.5
M.achinerv ndi Trans,)rn-ta+frmnn Phuipinmnt 26.8 32.7 L2.5 28.6 28.7
Miscellaneous - o.8 1.0 o).6
TOTAL 105.3 118.2 129.7 105L.8 117.9
Source: The Bank of' Gayana, and Mission estimates.
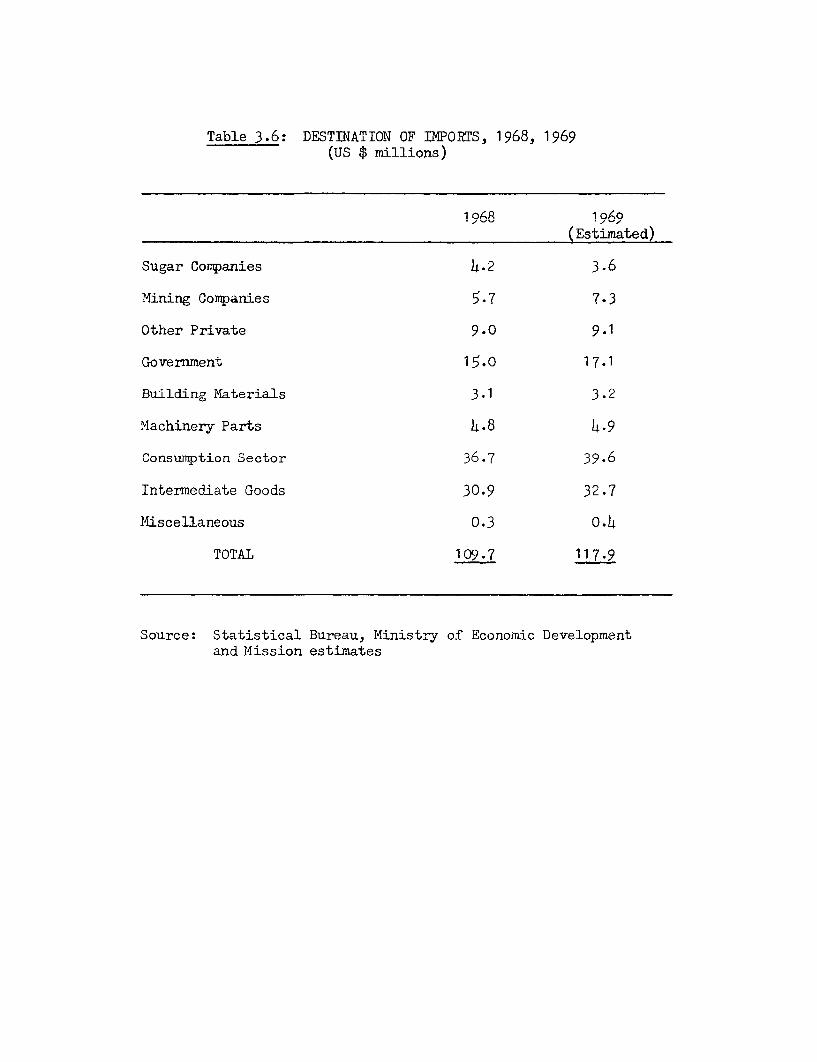
Table 3.6: DESTINATION OF IMPORTS, 1968, 1969(TTS .t mil Ilisons)
(Estimated)
Sugar Companies 4.2 3.6
Mining Companies 5.7 7.3
Other Private 9.0 9.1
Government 15.0 17.1
Building Materials 3.1 3.2
Machinery Parts 4.8 4.9
Consumption Sector 36.7 39.6
Intermediate Goods 30.9 32.7
Miscellaneous 0.3 0.4
TOTAL 109.7 117.9
Source: Statistical Bureau, Ministry of Economic Developmentand Mission estimates
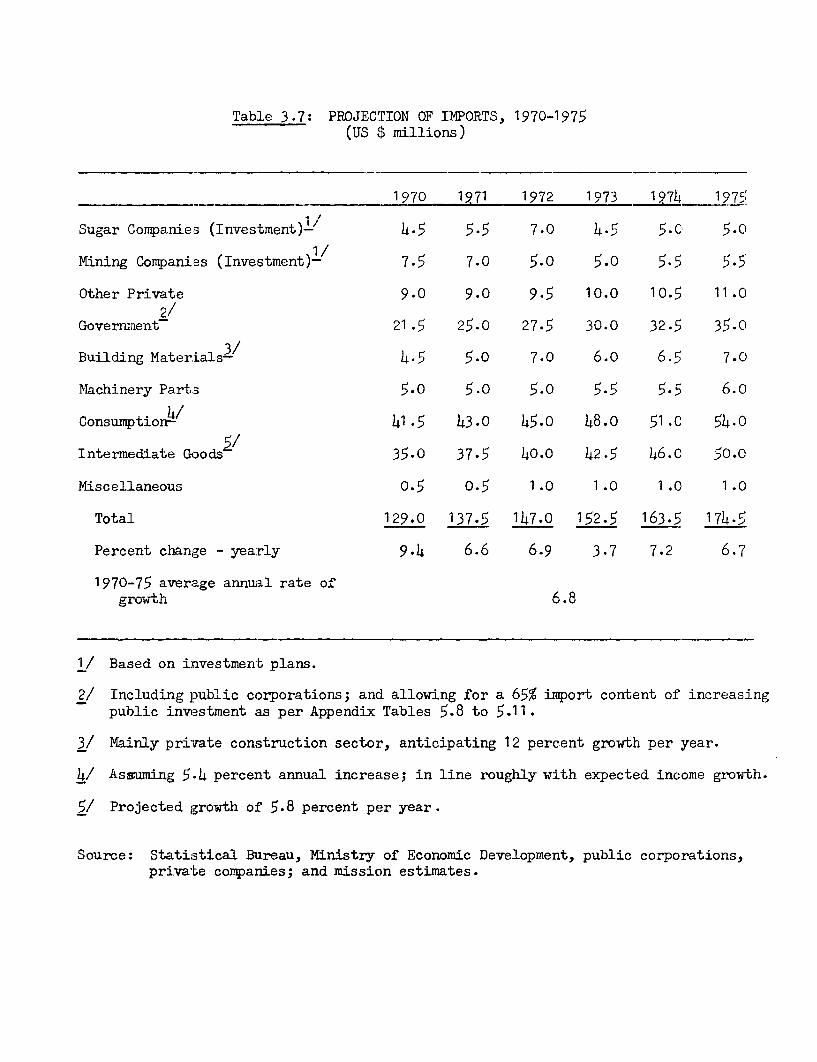
Table 3.7: PROJECTION OF IMPORTS, 1970-1975(US $ millions)
1970 1971 1972 1973 1974 1975
Sugar Companies (Investment)-/ 4.5 5.5 7.0 4.5 5-C 5.0
Mining Companies (Investment)-' 7.5 7.0 5.0 5.0 5.5 5.5
Other Private 9.0 9.0 9.5 10.0 10.5 11.02/
Government 21.5 25.0 27.5 30.0 32.5 35.0
Building Materials3/ 4.5 5.0 7.0 6.0 6.5 7-0
Machinery Part.s 5-0 5.0 5.0 5.5 5-5 6.0
Consumption-i 41.5 43.0 45.0 148.0 51.C 54.0
Intermediate Goods~ 35.0 37.5 140.0 42.5 46.C 50.0
Miscellaneous 0.5 0.5 1.0 1.0 1.C0 1.0
Total 129.0 137.5 147.0 152.5 163.5 174.5
Percent change - yearly 9.14 6.6 6.9 3.7 7.2 6.7
1970-75 average annual rate of~4-l..gi-uw U. 8 u
1/ Based on investment plans.
el ncu-d -n gp u-u-i - c- tp. .r- - - -A .Lnu a'0 n 1 a -1
2/ Including p-ublic CrporatiOlls; and allowing ior a 6576 irnport, conuent of increasigpublic inm3stment as per Appendix Tables 5.8 to 5.11.
3/ Mainly private construction sector-, anticipating 12 percent growth per year.
4/ Asmuning 5.4 percent annual increase; in line roughly with expected income growth.
5/ Projected growth of' 5.8 percent per year.
Source: Statistical Bureau, Ministry of Economic Development, public corporations,private companies; and mission estimates.
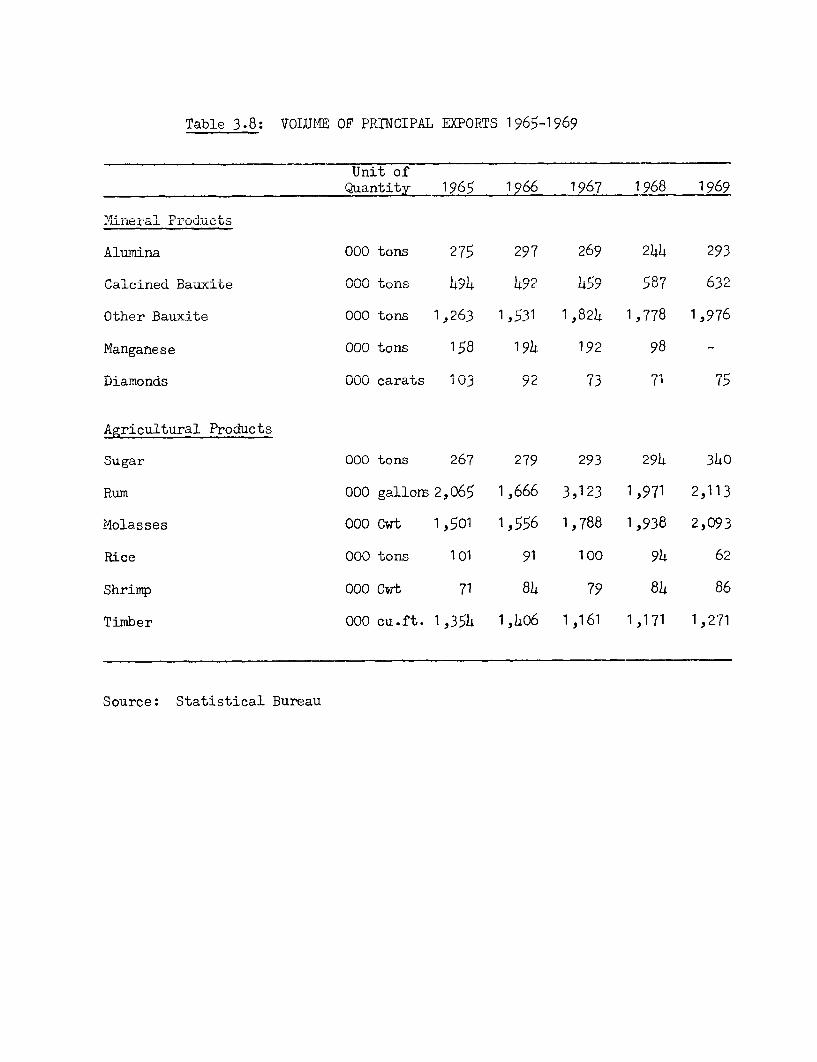
Table 3.8: VOTUMI FT PrThTJTrTAT. PYPOPCT 1 95199QO
Unit of>r.dIit,Uy 1 965 1 94 1 Q67 I 948 10o6
IIl neral ProductIs
An-- -_ : 5) _ An77 Ot O.. OrliiLarL JUU ULr riS LI ) L7 1 L. L4 L4
-, ~~~~l (~~~~f~~~#\n 4.- -I& 1. nI. )' LrCn f '74Calcined Ba-uxite 00u Uof1s 49Y4 472 49)7 632)
Other Bauxite 000 toris 1,263 1,53I 1,824 1,778 1,976
Mxanganese 000 tons 158 194 192 98 _
Diamonds 000 carats 103 92 73 71 75
Agricultural Products
Sugar 000 tons 267 279 293 294 340
Rum 000 gallors 2,065 1,666 3,123 1,971 2,113
Molasses 000 Cwt 1,501 1,556 1,788 1,938 2,093
Rice 000 tons 101 91 100 94 62
Shrimp 000 Cwt 71 84 79 84 86
Timber 000 cu.ft. 1,354 1,)406 1,161 1,171 1,271
Source: Statistical Bureau
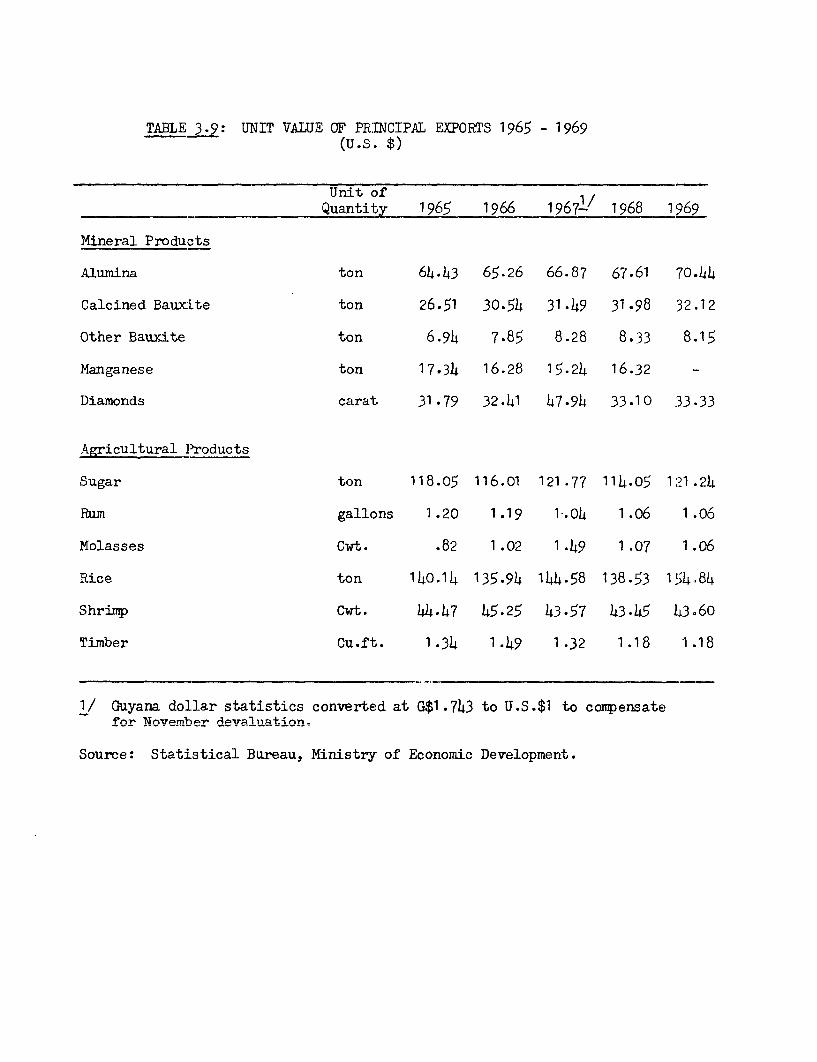
rABLt 3.9: u.NIT VAJUL U ur- ±Ut.UIfAL trukT 150965 - 1969
(U.S. $)
Unit ofQuantity 1965 1966 19671/ 1968 1969
Mineral Products
Alumina ton 64.43 65.26 66.87 67.61 70.44
Calcined Bauxite ton 26.51 30.54 31.49 31.98 32.12
Other Bauxite ton 6.94 7.85 8.28 8.33 8.15
Manganese ton 17.34 16.28 15.24 16.32 -
Diamonds carat, 31.79 32.41 47.94 33.10 .33.33
Agricultural Products
Sugar ton 118.05 116.01 121.77 114.05 121.24
fZun gallons 1.20 1.19 1.-04 1.06 1.06
Molasses Cwt. .82 1.02 1.49 1.07 1 .06
Rice ton 140.14 135.94 144.58 138.53 15 4.84
Shrimp Cwt. 44.47 45.25 43.57 43.45 43.60
Timber Cu.ft- 1.34 1.49 1.32 1.18 1.18
1/ Guyana dollar statistics converted at G$1.743 to U.S.$1 to compensatefo0r Novemh..br Adevaluaiio+nn-
Source: Statistical Bureau, Ministy of Econonifc. D prent.
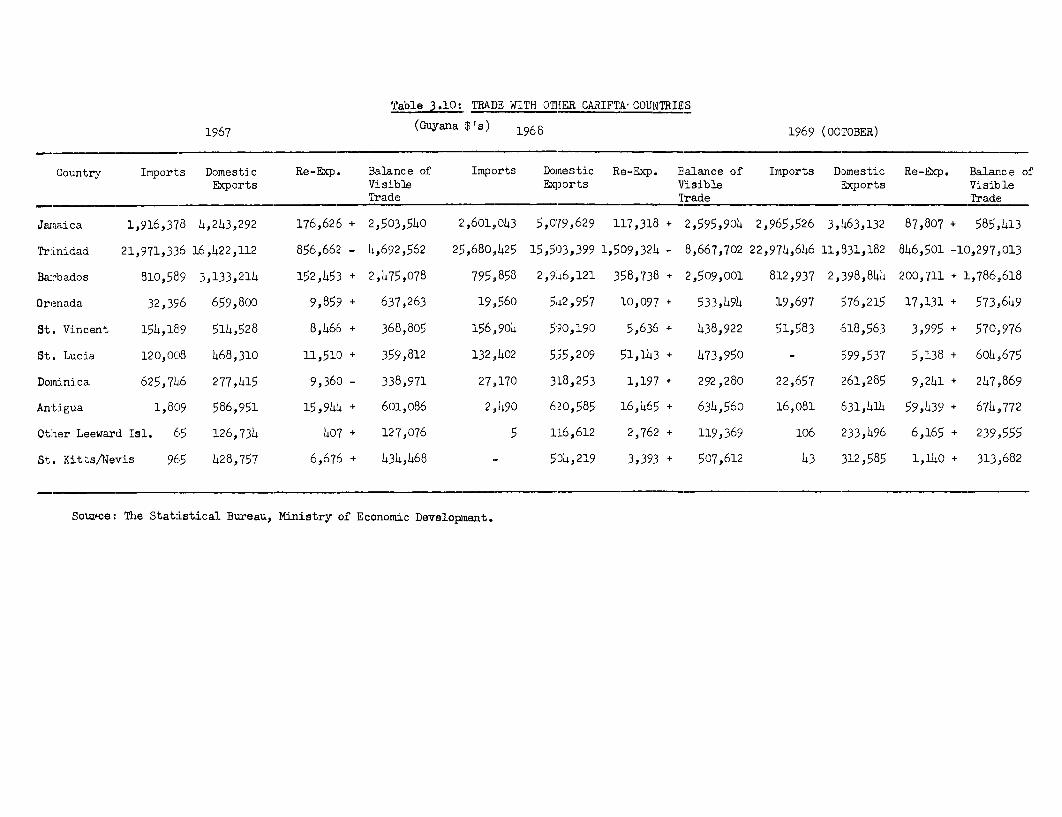
Table 3.10: TRADE WITH OTHER CARIFTA' COUNTRIES
1.967 (Guyana $'s) 19368 1969 (OCTOBER)
Country Imports Domestic Re-Exp. Balance of Imports Domestic Re-Exp. Balance of Imports Domestic Re-Exp. Balance oi'Exports Visible Exports Visible Exports Visible
Trade Trade Trade
Jamaica 1,916,378 4,243,292 1-76,626 + 2,503,540 2,601o,043 5,0o79,629 117,318 + 2,595,904 2,965,526 3,463,132 87,807 + 585,413
Trinidad 21,971,336 16,422,112 8156,66:2 - 4,692,562 2';,680,425 15,503,399 1,509,324 - 8,667,702 22,974,64h6 11,831,182 846,501 -10,297,013
Barbados 810,589 3,133,214 1152,453 + 2,475,078 795,858 2,9146,121 358,738 + 2,509,001 8:L2,937 2,398,844 200,71.1 + ],786,618
Grenada 32,396 659,800 9,859 + 637,263 19,560 5142,957 10,097 + 533,494 1L9,697 576,215 17,131 + 573,649
St. Vincent 154,189 514,',28 8,465 + 368,805 156,904 590,190 5,636 + 438,922 51,583 618,563 3,9S5 + 570,,976
St. Lucia 120,008 468,:310 11,510 + 359, 812 132.,402 5,55,209 51,143 + 473,950 - 599,537 5,138 + 604h,675
Dominica 625,746 277,l15 9,360 - 338,971 27.,170 318,253 1,197 + 292,280 22,657 261,285 9,2h1 + 247,869
Antigua 1,809 586,951 I.5,944 + 601,086 2,490 620,585 16,465 + 634,56o 1L6,081 331,414 59,439 + 674h,772
Other Leeward Isl. 65 126,734 407 + 127',076 5 116,612 2,762 + 1159,369 106 233,496 6,165 + 239,555
St. Kitts/Nevis 965 428,757 6,676 + 434,468 50L4,219 3,393 + 507,612 43 312,585 1,l4O + 313,682
Souvnce: The Statistical Bureau, Ministry of Econonmlc DeVelopment.
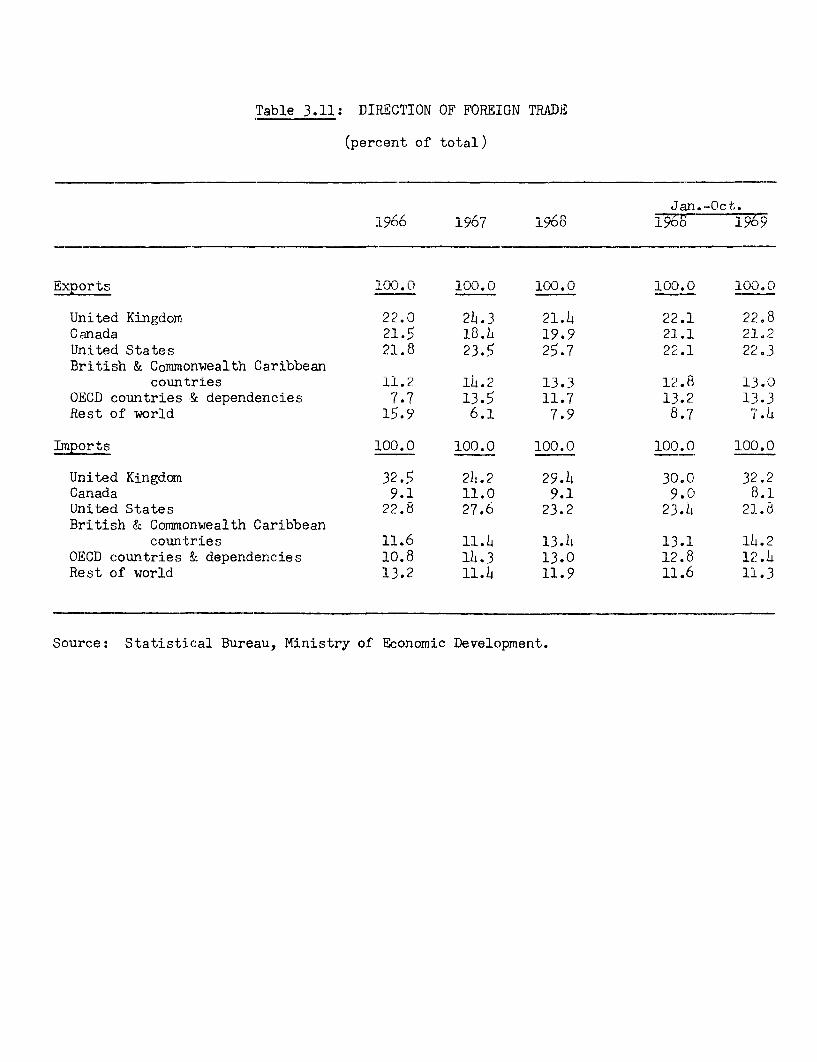
Table 3.11: DIRECTION OF FOREIGN TRADE
(percent of total)
Jan.-Oct.li966 IYor 1967 lyo8 yoo 0
Exports .iOO. 1 0 0. 1 00.0 0uu. u 0 0UU.u
United Kingdom 22.0 24.3 21.4 22.1 2208Canada 21.5 18.h 19.9 21.1 21.2united States 21.8 23.S 25.7 22.1 22.3British & Commonwealth Caribbean
countries 11.2 14.2 13.3 12.8 13.0OECD countries & dependencies 7.7 13.5 11.7 13.2 13.3Rest of world 15.9 6.1 7.9 8.7 7.4
lnports .LOO.0 100.0 100.0 100.0 100).0
United Kingdom 32.5 24.2 29.4 30.0 32.2Canada 9.1 11.0 9.1 9.0 8.1United States 22.8 27.6 23.2 23.4 21.8British & Commonwealth Caribbean
countries 11.6 11.4 13.4! 13.1 14.2OECD countries i dependencies 10.8 1l.3 13.0 12.8 12.)Rest of world 13.2 11.4 11.9 11.6 11.3
Source: Statistical Bureau, Ministry of Economic Development.
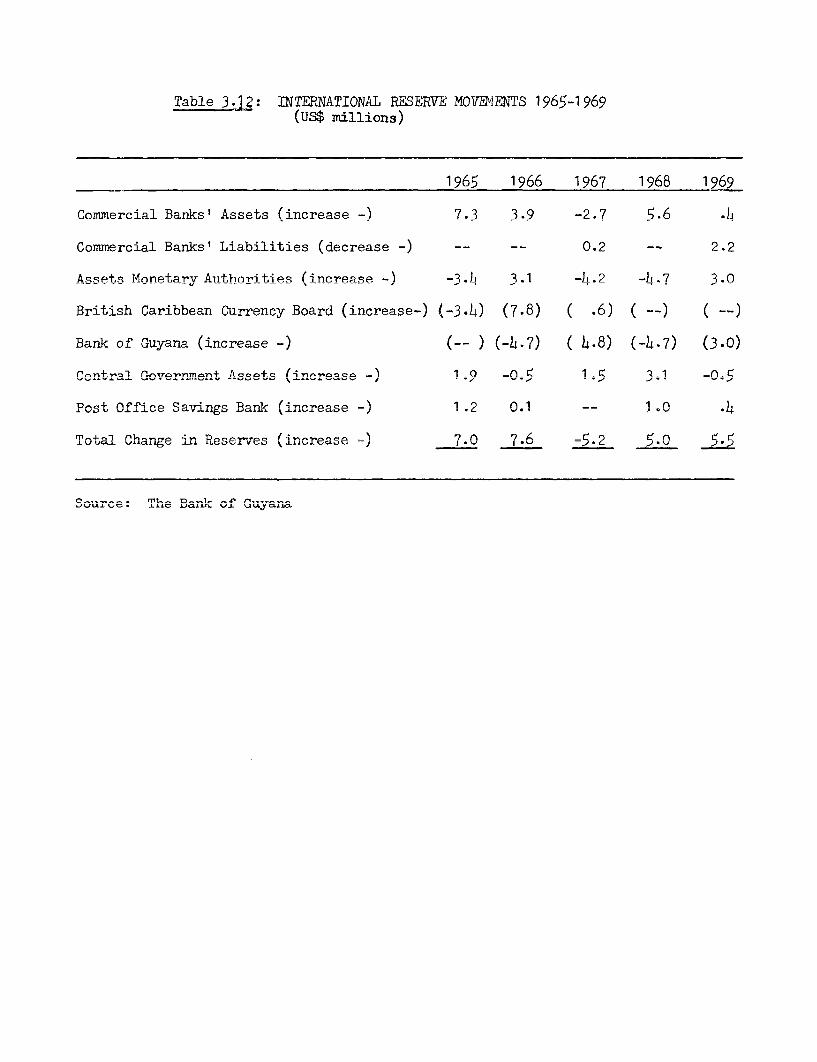
Table 3.L2: INTERNATIONAL RESERVE MOVEMENTS 1965-1969(US$ millions)
1965 1966 1967 1968 1969
Commercial Banks' Assets (increase -? 7.3 3.9 -2.7 5.6 .L
Commercial Banks' Liabilities (decrease -? -- -- 0.2 -- 2.2
Assets Monetarv Authorities (increase -) -3-.i 3.1 -L.2 -4.7 3.0
British Carihhpan Cnrrpnc.v Bnard (increase-) t-3.),) (7.8) ( .6) ( -- ) ( -- )
,R,nk of' r-Tm-xrn-np (lrncre2se -)(-)(47) ( -) (47) (3,0)
Central C-over.nm.ent+ Assets (increa -) 1.9 - 1.5 3.111r+ 0st;n slT 'P:<.lel-rC]| 1. t9 As1 _ (1
* D-VW1a -- -- -- *, A i s d_ -- .- - I . '14 +Tosta Chane Jains Bank-- (increase =) 7.2 0.1 5-0SoUrce: kIdL1Z, L ILUD~- V CJ .LiJUJ. - I G yar
.L II JJd.ILfLX. _j. JUIAJY J
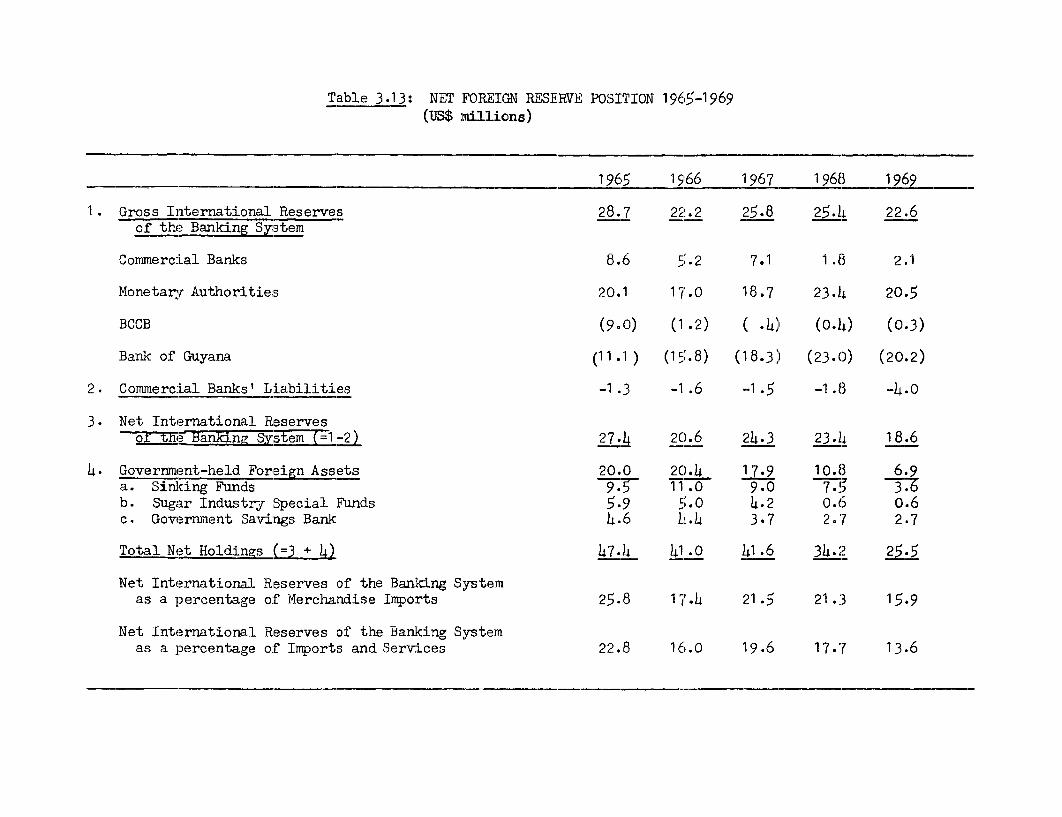
Table 3.13: 'NET FOREIGN RESERVE POSITION 1965-1969-(US$ millions)
_ _________________ ____ _ 19965 1966 1967 1968 1 969
1. Gross Interiational Reserves 28.7 22.2 25.8 25.4 22.6of the Bakig Sstem
Commercial ]3anks 8.6 .2 7.1 1 .8 2.1
Monetary Au-thorities 20.1 17.0 18.7 23.h4 20.5
BCCB (9.0) (1 .2) ( .14) (0.14) (0-3)
Bank of Guyana (11.1) (15 .8) (18.3) (23.-0) (20.2)
2 Commnercial Banks ' Liabilities -1.3 -1 .6 --1 .5 -1 .8 -4.0
3. Net Interna-tional Reserves70.-1=thea;i; =yst-em7i-2) 27.4 2C).6 214.3 23.14 18.6
4. Government-held Foreign Assets 20.0 2C).4 17.9 10.38 6.9a. Sinking Funds 9j7 11 *.0 9.0 7 *.v 3 ;7b. Sugar Indus try Special Funds 5.9 5'.0 4.2 0.6 O.6c. Government Savings Bank 4.6 14.4 3.7 2. 7 2.7
Total Net Holdi:ngs (3+ 4) 47.4 41.0 l14.6 34-.2 255
Net International Reserves of the Banking Systemas a percentage of Merchandise Imports 25.8 1 7.4 21.5 21.3 15.9
Net International Reserves of the Banking Systemas a percentage of Irnports and Services 22.8 16f.0 19.6 17.7 13.6

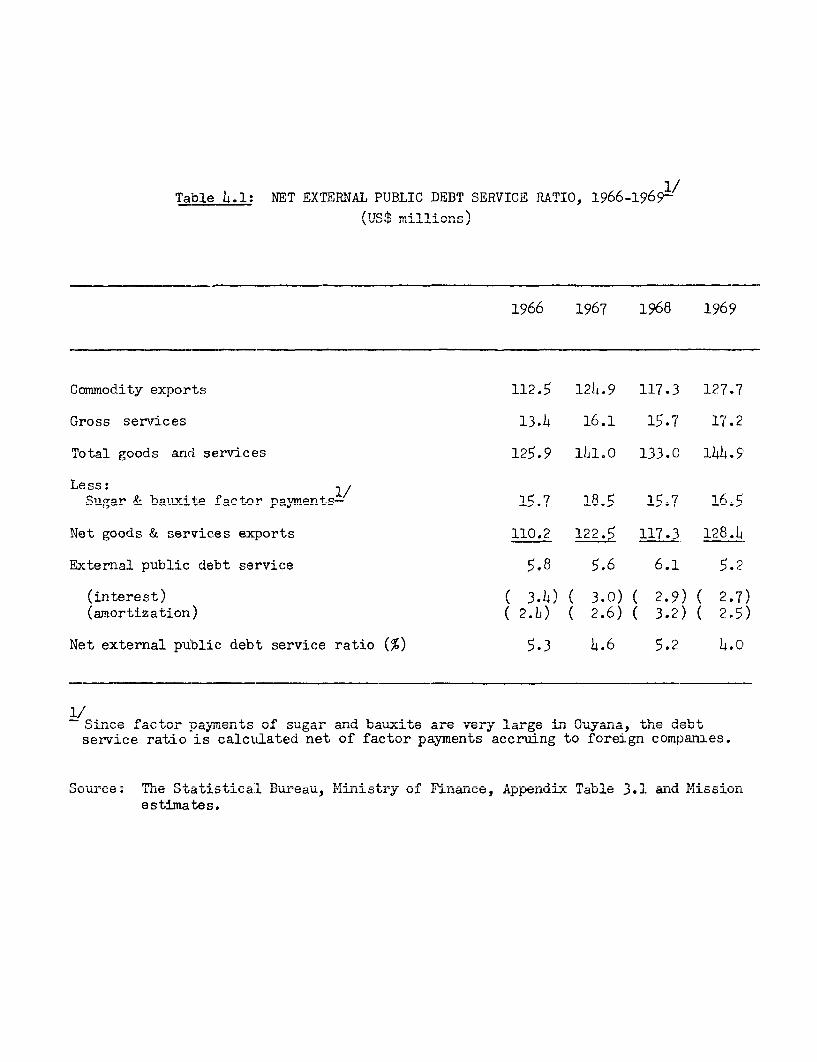
I /
Table 4.1: NET EXTERNAL PUBLIC DEBT SERVICE RATIO, 1966-1969-'
1966 1967 1968 1969
Commodity exports 112.5 12h.9 117.3 127.7
Gross services 13.4 16.1 15.7 17.2
Total goods anci services 125.9 111.0 133.0 144.5
Less: 1/Sugar & bauxrifp fnrtnr pavments- 15.7 18.5 15.7 16.5
Net goods R services e-,portsI 110 .° 199 117 . 189.
External public debt se:rvice c.8 6.1 5.2
(interest)~~~~~~~~~~~~~~~~~~~~~- (2 3!)( .0) (29) 9 27)
(amortization) ( 2.b) ( 2.6) ( 3.2) ( 2.5)
Net external public debt service ratio (%) 5.3 4.6 5.2 4.0
e.1A. .LdA.'% VI 1Jt.L Y* U .JJL4 UD VJ. J.L 0U,C1 C LJcCULA.-L %, C21 V V± Ul. ~L d _L 1.." ULLAjYdCA LLd, UIIU U LJ
service ratio is calculated net of factor payments accruing to foreign companies.
~JUULLe 11t~C) ~L~L i~±a± DI~au ~±lJ_l_l'AY UVi r±iilaiLU~, A.jJ~UlU±_A lao±LU ).J. WlU rj.Jbbi.LUISource: ' e Statistica. l Bure- ar. nestimates.
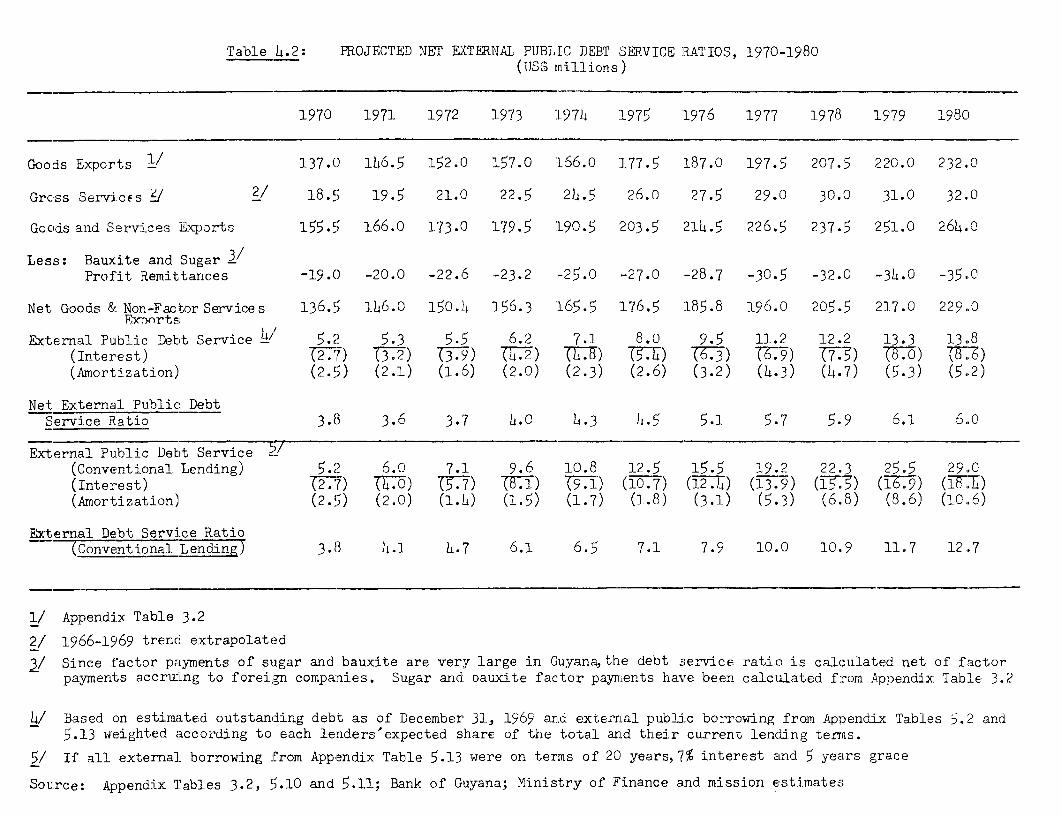
Table 4.2: PROJECTED NET E{TERNAL ]PUBLIC DEBT SERVICE 'RATIOS, 1970-1980(I'S$ millions)
1970 1971 1L972 1L973 :L974 1975 '1976 1977 1978 1979 1980
Goods Exports 1/ 137.( -L6.5 :L52.0 1L57.0 '166.o L77.5 187.0 197.5 207.5 220.0 232.0
Gross Services A/ 2/ 18.'5 19.5 21.0 22. l 24.5 26.0 27.5 29.0 30.0 31.0 32.0
Goods and Services Exports 155.5 1]66.0 173.0 1L79.15 'L90.5 203.5 21h.5 226.5 237.5 251.0 264.0
Less: Bauxite and Sugar 3/Prof'it Remittances -19.0 *-20.( -22.6 -23.2 -25.0 -27.0 -28.7 -30.5 -32.0 -34.0 -35.0C
Net Goods & Non-Factor Services 136.5 -Lh6.0 L50. :4 156.3 '165.5 176.5 185.8 196.0 205.5 217.0 229.0ThcpLrts
External Public Debt Service 5 5.2 5.'3 5.-5 6.2 7.1 8.0 9.5 11.2 12.2 13.3 13.8
(Interest)~~~~~~ 7 .7 (3 -2) 3 T) 7 7) T c7) T5 7) 777D 79) 77) 7 0) 7 ,5)(Amortization) (2. 5) (2.:L) (1.6) (2.0I) (2.3) (2.6) (3.2) (4-3) (4-7) (5-3) (5.2)
Net External Public DebtService Ratio 3.38 3.65 3.7 4.C L.3 L 5.1 5.7 5.9 6.1 60Q
External Public Debt Service (Conventional Lending) 5.2 6.0 7.1 9.6 10.8 12.5 15.5 19.2 22.3 25.5 29.0(Interest) 2 77) T7. (D (57) T1T) T91 ) (TOT7) (-2. T) (1-3.9) (177 IT (T9 (1-7:i)(Amortization) (2.5) (2.0) (l.a) (1.5) (1.7) (1.8) (3.1) (5.3) (6.8) (8.6) (1.06)
External Debt Service Ratioconventicnal Lending) 3.18 hL.1 h.7 6.1 6.5 7.1 7.9 10.0 10.9 11.7 12.7
1/ Appendix Table 3.2
2/ 1966-15969 trendc extrapolated
3/ SirLce factor payments of sugar and bauxite are very large in Guyana, the debt serv.ice ratio is calculated net of factorpayments accruiLng -to foreign companies. Sugar and Dauxite factor payments have been calculated from Appendix Table 3.2
4/ Based on estimated outstanding debt as of December 31, 1969 and exte<lTal public borroviing fromn Appendix Tables 5.2 and5.13 weighted according to each lenders'expected share of the total and their current lending terTs.
5/ If all external borrowing from Appendix Ta'ble 5.13 were on terms of 20 years, 7% interest and 5 years grace
Source: Appendix Tables 3.2, !5.10 and 5.1:1; Bank of Guyana; Ministry of Finance and mission erstimyates
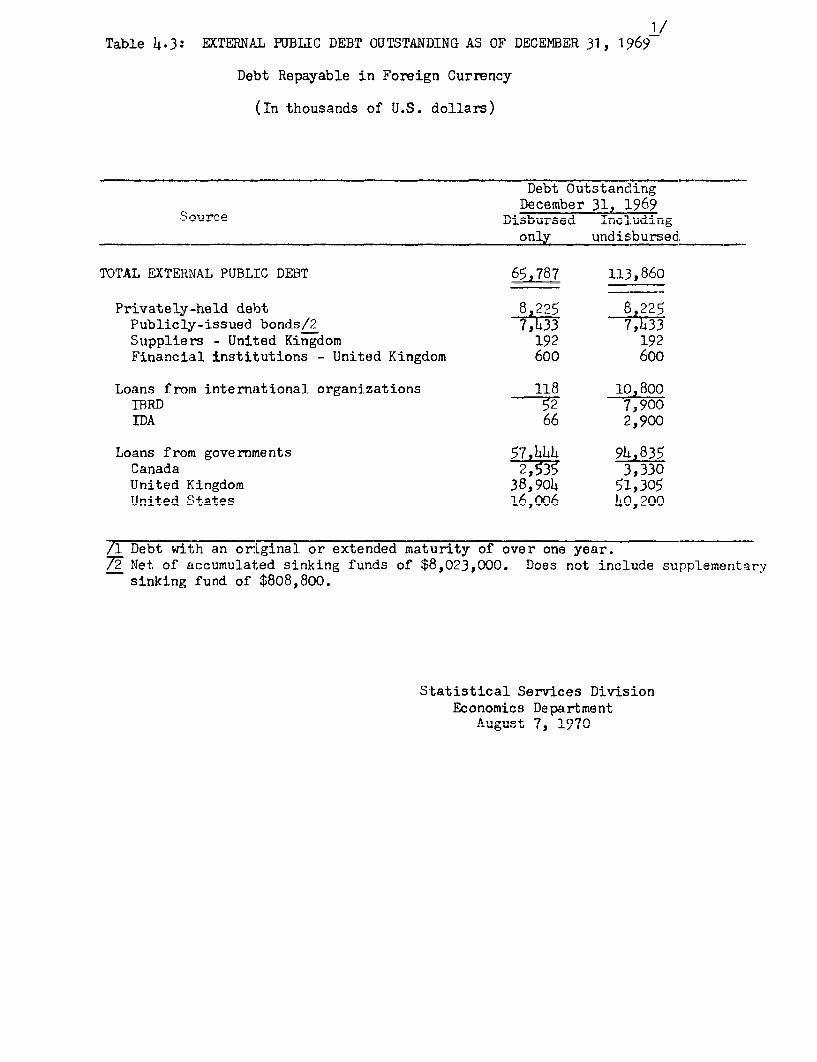
1 /
Table 4.3: EXTERNAL PUBLIC DEBT OUTSTANDING AS OF DECEMBER 31, 1969
Debt Repayable in Foreign Currency
(In thousands of U.S. dollars)
Debtuu uUsUanciurg
December 31, 1969Source Disbursed Including
only undisbursed _
TOTAL EXTERNAL PUBLIC DEBT 65,787 113,860
Privately-held debt 8.225 8.225Publicly-issued bonds/2 7,M 7Suppliers - United Kingdom 192 192Financial institutions - United Kingdom 600 600
Loans from international organizations 118 10,800TBRD 57, 7.900IDA 66 2,900
Loans from governrnents 57 444 94,835
United Kingdom 38,904 51,305TlnitPed St+2te -, ACio200
/1 Debt with an or-iginal or extended maturity of over one year.7i Net of .accumulated sinkng funds of $8,023,000. Does not include supplementary
sinking fund of $808,800.
Statistic-al Se~rA-c Division
Economics DepartmentAuu,.,-,. 7 1070(' . I.1~
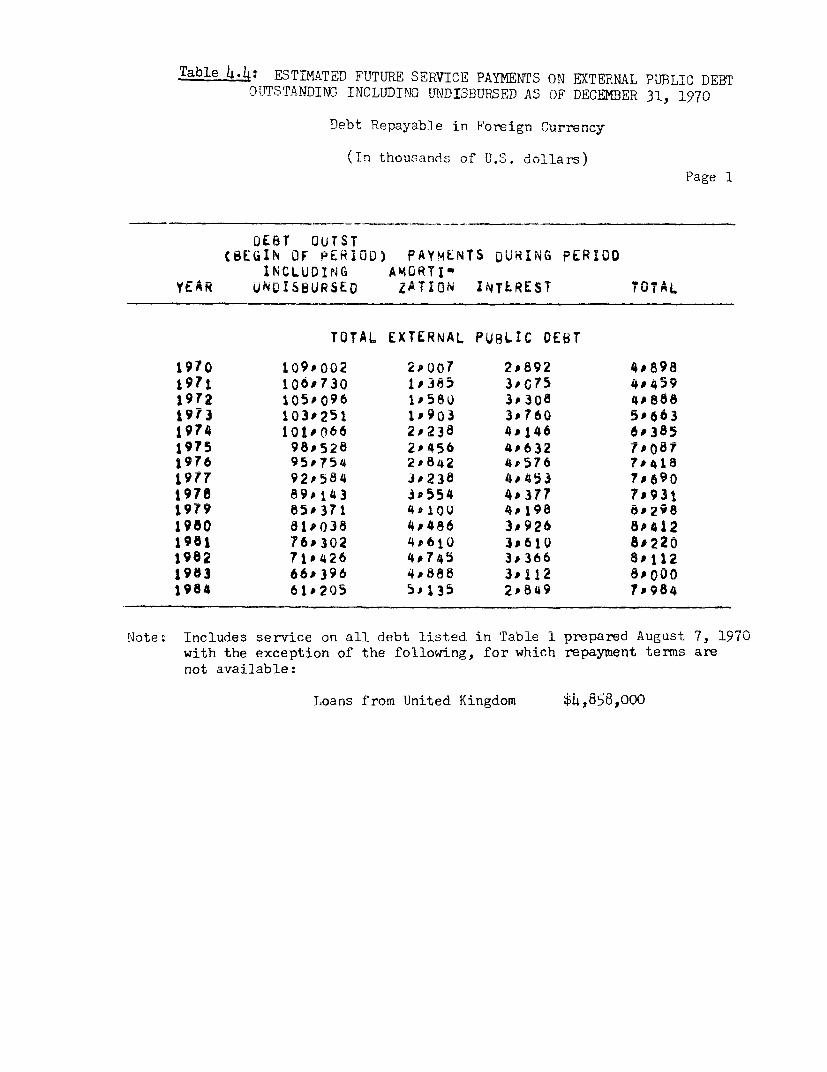
Table 4-4: ESTIMATED FUTURE SERVICE PAYMENTS ON EXTERNAL PUBLIC DEBTOUTSTANDING INCLUDING UNDISBUPRSED AS OF DECEMBER 31, 1970
Debt Repayable Jn Fo.mIgn "urm.,ncy
(In Ut-housands o,f U.S. * U-dIl
Page 1
DEBT OUTST(BEGIN OF PERIOD) PAY9iCNTIa DURING PERICO
INCLUDING AMORTI'YEAR UNDiSBURSED ZATiON INTEREST TOTAL
TOTAL EXTERNAL PUeLIC DEBT
1970 1090002 29007 2&892 4,8981971 106730 1J385 3'PG75 4,04591972 105J096 1P580 3,308 408881973 1030251 10903 3*760 56631974 101,066 2,238 4u146 6,3851975 980528 2'456 4#632 7JOB81976 95P754 2'842 4*576 7D41819t7 92,584 JP238 4J453 ro690
1978 89#j43 3e554 40377 7'93119?9 85'371 49100 4,198 8,2981980 81P038 4#486 3,926 8P4121981 76D302 4P610 3,610 892201982 710426 4,745 3,366 801121983 66,396 4,888 3J112 8o0001984 61#205 5'135 2P849 7,984
Note: Includes service on all debt listed in Table 1 prepared August 7, 1970with the exception of the following, for which repayment terms arenot available:
Loans from United Kingdom $4,858,o0o
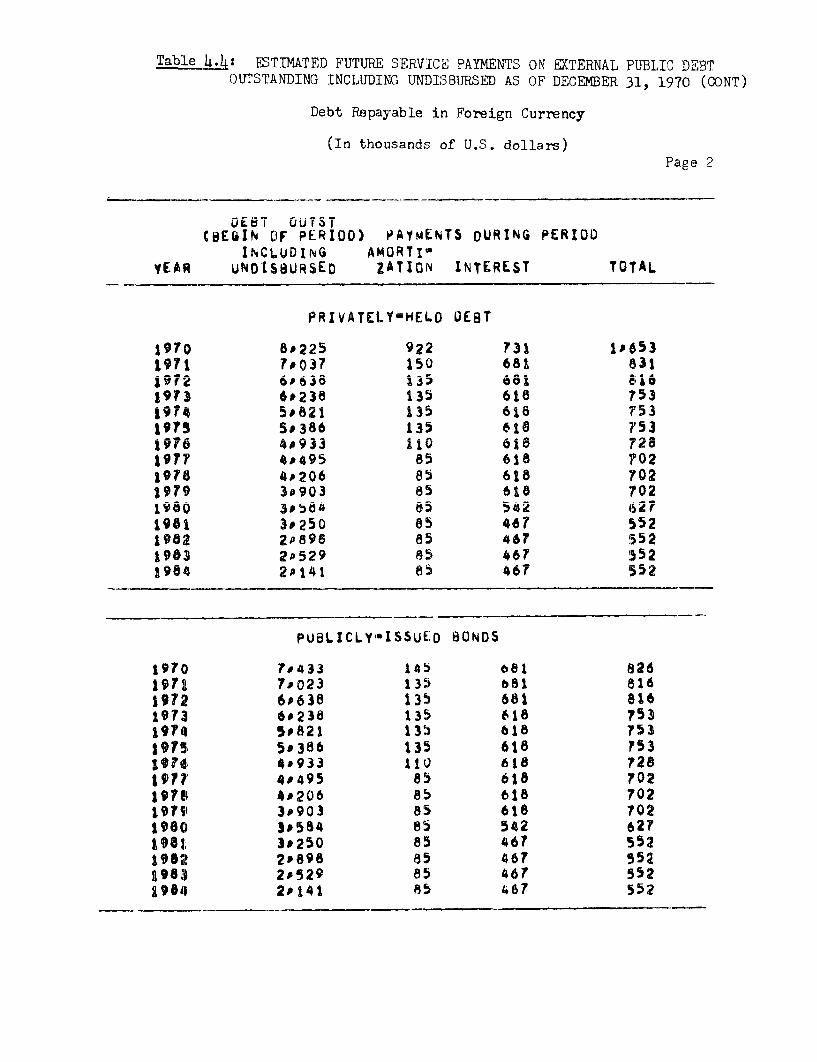
Tale f r£)I.UThklMIJ -ruUlUn SLERVIU tAIMLANTZ UON tATftt(NAL PuBL.C DE;BT
OUT'STANDING INCLUDING UNDISBURSED AS OF DECEMBER 31, 1970 (CONT)
Debt Repayable in Foreign Currency
(In thousands of U.S. dollars)Page 2
CeEQIN OF PERIOD) PAYMENTS oURtNG PERIODINCLUDINL A -fn on vXi
YEAR UNDISaURSED ZATION INTEREST TOTAL
PRIVATELYHELO OEUT
i9;0 8#225 92 r;?i iioS3D1971 7,037 150 681 631i9?2 6#638 i35 681 oi61973 68238 135 618 7531974 1#e21 i35 618 7531975 5,386 135 618 753j9?6 4D933 110 618 728197? 4,495 85 618 70219rB 4#206 85 618 7021979 3D903 85 618 7021980 30584 85 542 62?1961 30250 8s 467 5521952 20898 55 467 5521983 20529 85 467 5521984 2P141 d5 467 552
PUBLICLY-ISSUEDO BONDS
1970 7.433 145 681 82619r1 7#023 135 b81 81619T2 6.638 135 681 8161973 6.238 135 618 7531974 5,821 135 618 7531975, 50386 135 618 75319474 4.933 Ito 618 72810'?? 4#495 85 618 70219781 4,206 85 618 702t1979 3.903 85 618 702198O 3p584 85 542 62?1961 30250 85 467 552198t 20898 85 467 55219813 2,529 85 46r 5521964 2.141 85 467 552

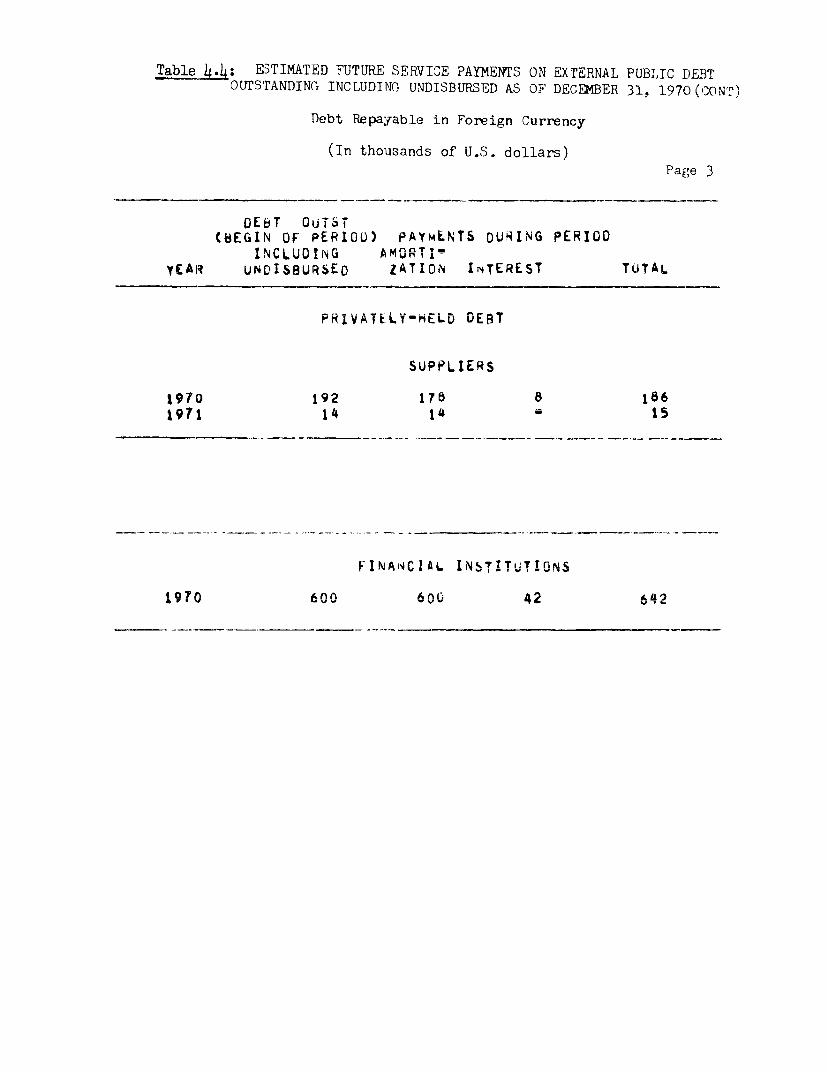
Table 1-: ESTIMATED `UTURE SERVI'E PAYMENTS ON EXTERNAL PUBLIC DEBTOuTrSrANDING INCLUDIlK UNDISBURSED AS OF DECEMBER 31. 1970 (CO NT)
Debt Repayable in Foreign Currency
(In thousands of U.S. dollars)Page 3
OEbT OUTSr(BEGIN OF PERIOL) PAYNENTS DURING PERIOD
V..,n ~ ~ ~ ~ u I' ;v'NCLUDiNG Ar,1wRl ;'
YEARI uNrIS8URSEO ZATION INTEREST TUTAL
PRIVATELY"HELD DEpT
SUPPLIERS
1970 192 175 8 1861971 14 14 ' ;S
F0INANCIA INATT TiTCN
1 970 600 600; 42 642
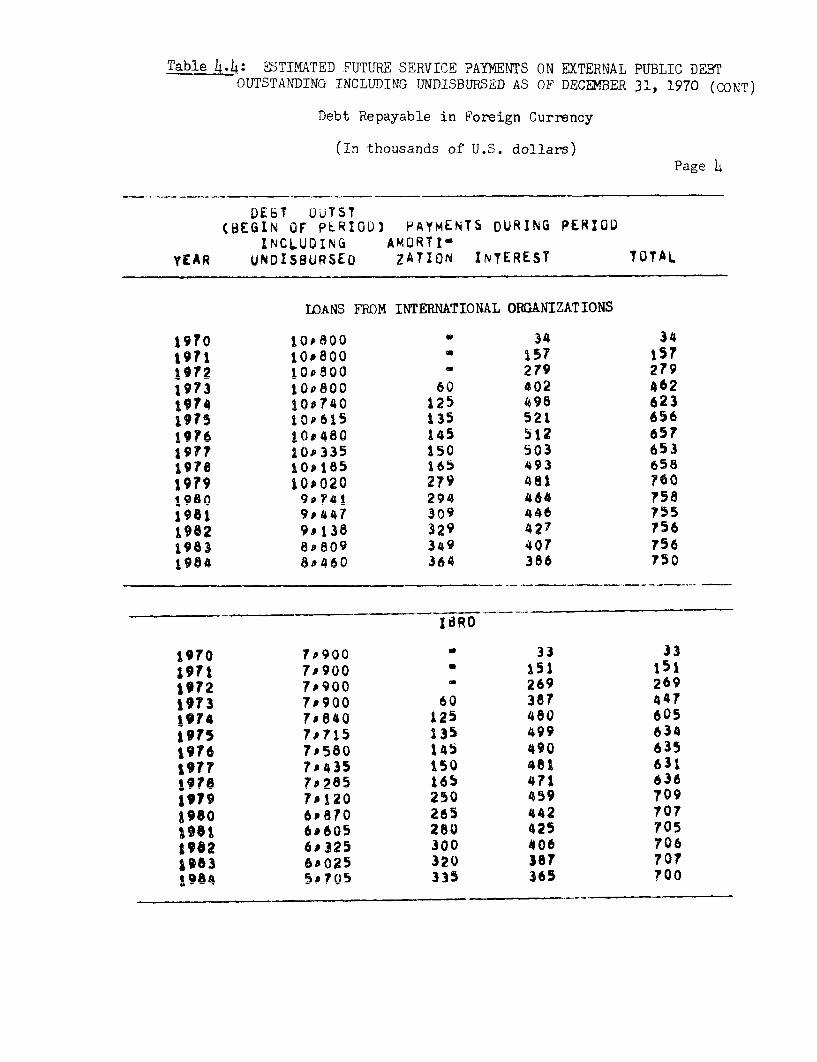
Table 4.4: ESTIMATED FUTURE SERVICE PAYMENTS ON EXTERNAL PUBLIC DEBTOUTSTANDING INCLUDING UNDISBURSED AS OF DECEMBER 31, 1970 (CONT)
Debt Repayable in Foreign Currency
(In thousands of U.S. dollars)Page L
DEbT UUTST(BEGIN OF PERIOD) PAYmENTS DURING PERIOD
INCLUDING AMORTI'YEAR UNDoSsURSED ZATION INTEREST TOTAL
TOANS FROM INTERNATIONAL ORGANIZATIONS
197O 10P800 0 34 34S9?1 jO.800 157 1S?1972 109800 279 27919?3 10,800 60 402 462* 9?4 ?0.740 125 498 623i975 1O,615 135 521 6561976 10.4BO 145 512 65729?? 10,335 IS0 503 6531978 10,185 165 493 658
1979 10*020 279 481 T601980 9o741 294 464 7581981 9,4147 309 446 755t1982 9,138 329 427 7561983 8,809 349 407 7561984 8'460 364 386 750
I6RD
1970 7.900 - 33 33SON 7.900 * 151 1511972 7.900 269 26919T3 7J900 60 38? 4471974 7J840 125 480 605j97S 7. 715 135 499 634
1976 7.580 145 490 6351977 7.435 ISO 481 6311978 7,205 165 471 636i919 7.120 250 459 709l9oa 68R70 265 442 707196e 6.605 280 425 705#902 6,j125 300 406 706
1983 65025 320 38T 707SA 90405 gos335 365 ?00
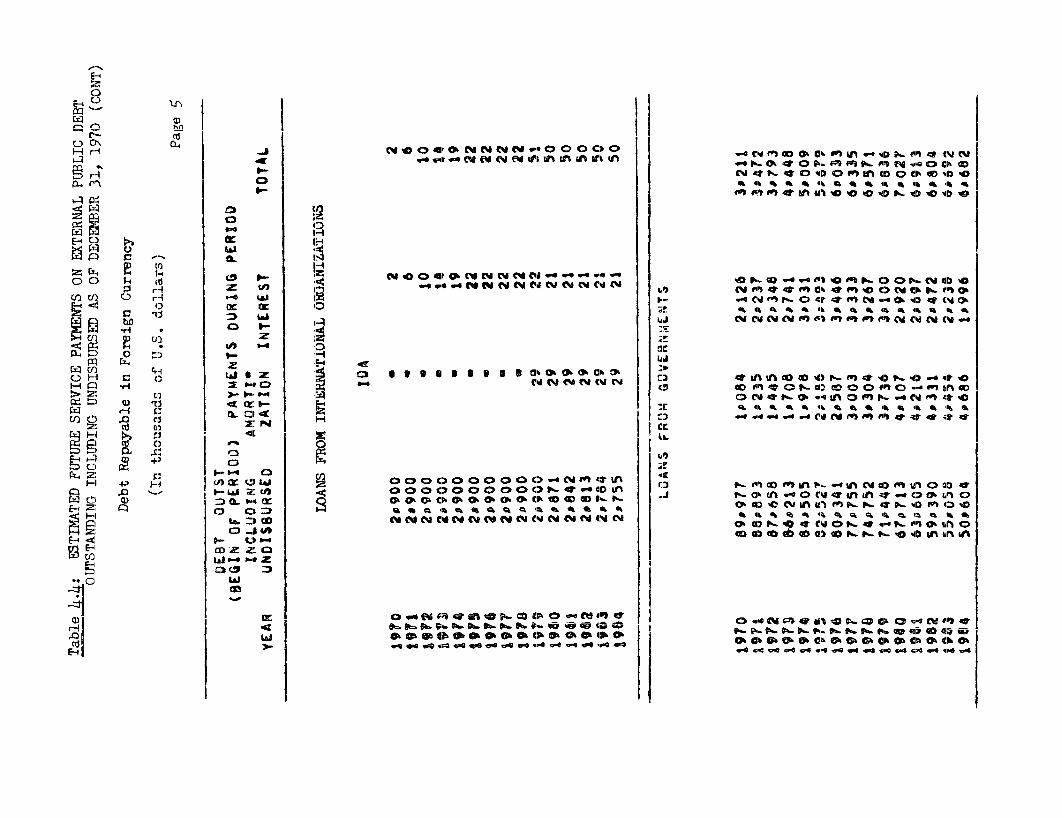
E-4
H~~~~~~~~~~~~- Crl 'Ci 430 1 4st 43 M CM fW cm 0. _e O O O) O eNt a 8C tl- ? r ~~~~~~~~~~~~~~~~4 *1> <t d 141 cm IN 6W1 eW Irk in let tfWtt Cy f" 03 Cfi Cl? O- PWp -0 4D Pl 6 4W °V Mh
-~~~~~~~~~~~~~~~~0 P. Ok _ 9> g 0 ik.f f%1 6b, fP CM .g C) C; CD
a. i 2 cm AtP-' r4 4 pkt oa p 0'0>;~~~~~~~~~~~~~~~~~- 416 4i ok 41 'S 1 , 1 %ok
> D J_q | 4.e WI tUl 10 %0 14 P- 0N Vi ND lsc > 7t*r*wa' ,<°
p i UAt -t<! E<
Ew C) Ql4 Cm OC Q 4i PktI V o M M.3X t>I , + W_ |o V;~ CM t;>i O41 ea OM tO O OO CQ CM F-. co .4 ; tv' a MF P-l tn0 CtP Yl C-4 do D no
i i, tZ -> t efi s N a N sw ees CY fw Cwt et <Nt N tM e e t> tu ia 0 oD e F. r e_ so stD un tam t tq " F- C)4r d, qq C- O- CIP 4D4t C (7
4~~~~~~~~~~~~~~ o
LI 4: WA 04 4L Qk 41 ft _k 4L s , 4k 41k IL sk d *de Cw kt r
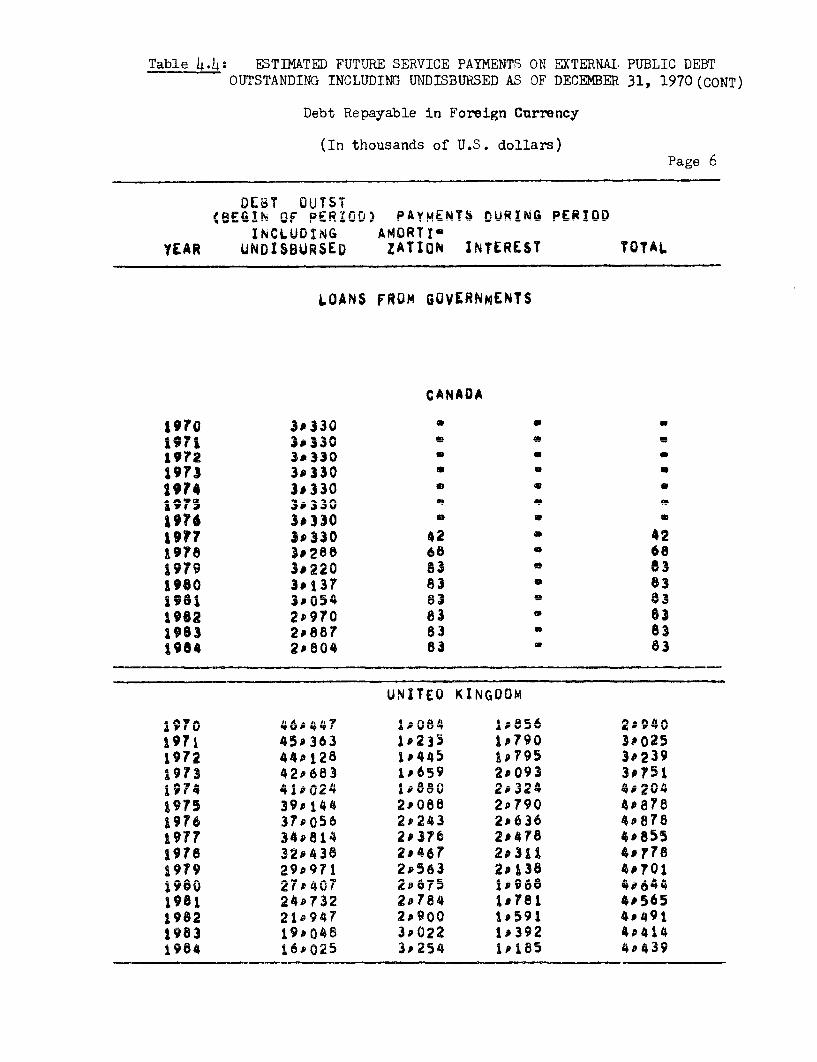
TaDble 4.4.* ESTIMATED FUTURE SERVICF. PAYr1ENTS O'N nTERNAL PbU-LIG DEu1v
OUTSTANDING INCLUDING UNDISBURSED AS OF DECEMBER 31, 1970 (CONT)
Debt Repayable in Foreign Currency
(In thousands of U.S. dollars)Page 6
DEBT OUTST(AEGTN nF PERniD) PAYMENTS OURING PERIOD
INCLUDING AMORTIOVSAD UND!§n!iRFn 7ATInN INTEREST TOTAL
LOANS FROM GUVERNMENTS
CANADA
19?2 3.330 S o
1972 3.330 l a a;AW 99 3J 3 0
1974 3.330 ° a
a97 5 3. 330 S *9 T If, ,*j 3 30 4
1978 3.0288 68 68virv 3*220 v3 W 0
1900 3.137 83 * 83i9os ;PF4 v3 - n3
1902 2.970 83 ° 031963 2P887 B31984 2o804 83 * 83
ttL .m .d ..fll
'IN s TQ E 0I K ; G u M
1971 45o363 1.235 1,790 3.025ir 7244i28; 4F* & 4 5 5 r v IF.
1973 42A683 1,659 2.093 3,751
1975 39.144 2.*088 2P790 4.878~~~~S A ~~~~~~~~~~~~~ ^I £51 AAe,.I
19?6 37j,056 6s4013*j d 2pU3' 4#pOofg1977 34a81lA 2.376 2.478 4.855i9;8 32P430 2#467 2,3iA 407&1979 29.971 2s563 2.138 4.7011900 27o407 2CV75 1r368 406441981 24D732 278e4 1I781 4.565t982 2i9947 2.900 1.591 4#4911983 19.048 3.022 1,392 404141984 16e025 3D254 i.185 4D439
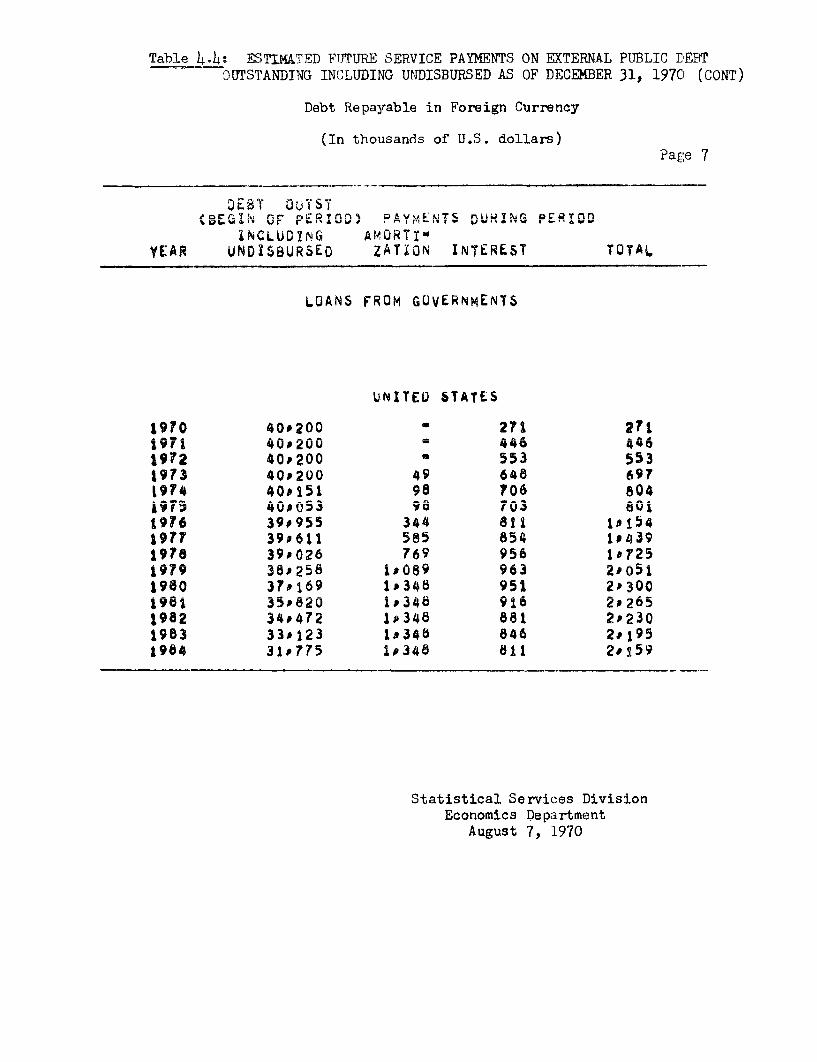
Table Ei! FSTTMATTEM FITTrTMF SERVICE TPAYMENTS ONP EXTERNAT. PTIRLT TERTOUrSSTANDING INCLUDING UNDISBURSED AS OF DECEMBER 31, 1970 (CONT)
Debt Repayable in Foreign Currency
(In thousands of U.S. dollars)Pagte 7
0 E SY O u TSY'?0C"T! r,-r mC TrVn11 DA u m rz miiypur OTkynn%p %4' yr r ~ rak. . r."-j
INCLU07NG AM~ORTiUr 1. a g u w1w Q0 mV - f. I O* a $m I -TN * I -
ISPOANS FROM GUvERNmENTS
UNITEV STATES
1970 40.200 271 271191i 4.0200 446 c.41972 40.200 553 553i9;3 40,200 49 648 69719O4 40.151 98 706 6i04iir5 40,053 95 703 e1Oi1976 39,955 344 811 101541977 39o611 585 854 iJ4391978 39.026 769 956 1.7251979 380258 1,089 963 2.05i1980 37,169 1*348 951 2#3001961 35o820 1#348 916 202651982 34,472 1,348 881 2.2301983 33J123 1,346 846 2.1951984 31.775 1,348 811 2.159
Statistical Services DivisionEconomics Deoartment
August 7, 1970

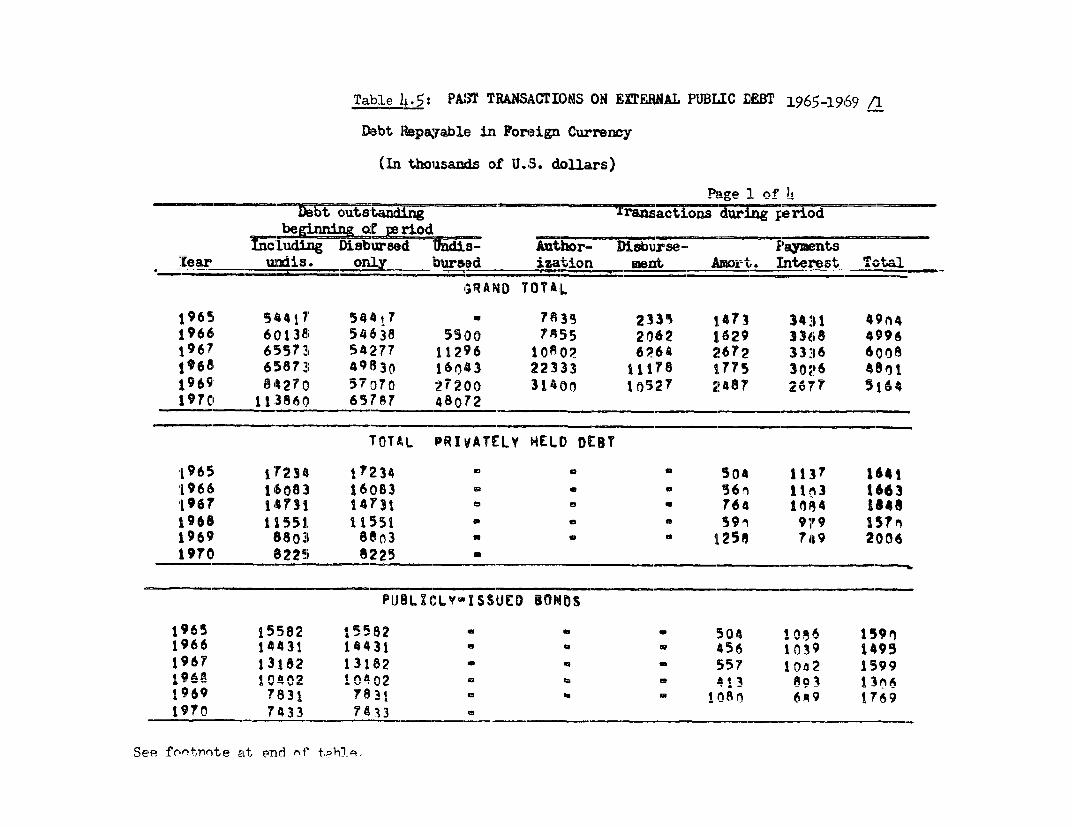
Table 1 .5: PAST TAWCTI00S ON EXERNAL PUBLIC E;BT 1965-1969 /1
Wbit Repayable in Foreign Currency
(In thousanis of U.,S. dollars)
Pmage 1 of 4>b usa' TransaLctjTnis dur.ng e reicid
-!EKnni o: 'riod_ _ _ ____luding .DisbUrsed G Unthor- EdLsburse- Payments
.Year wunis. only Dur&s isation. Mont Amor-,. 3.nrest Total -
iGRAND TOTAIL
jl965 54417' 54'417 ' 783 2335 1473 34111 49m411966 601381 54638 55so 7955 2062 1629 3368 4996œL967 655573 54277 112'96 10806 6264 2672 3336 60o811968, 658731 491830 16 n43 22333 1il78 1775 30?o6 4*811969 84270 5t37o 272DO 314O ifo527 2286 267T 5#6 4'1970 1 1 386C 65787 48072
TOTAL LPRIvATE'LY HELD DE UT
:L965i 17234 1 7234 5 a a 504 1137 1641196d 16083 16063 4 956i 11e3 1663'1967' 1731. 14Y31 * 764 1184 1848.l96l 11551 11551 D _ S 9 9F9 157S:1969 838031 88o3 1258 *79 2006:1970 8225 8225
PUBLCLY-$ISSUED BONOIS
1965 1 F55 82 1,5582 e - 504 1056 15191966 14431 14431 4 56 1039 1*1951967 13182 13182 5 - 557 10o12 159949bR 2nhI rAo1 A3 OAo 13!A
1969 7831 to31 e 1080 6A9 1'691970 7433 7433 1
See fontrnrte ELt end r' t,nbl -.
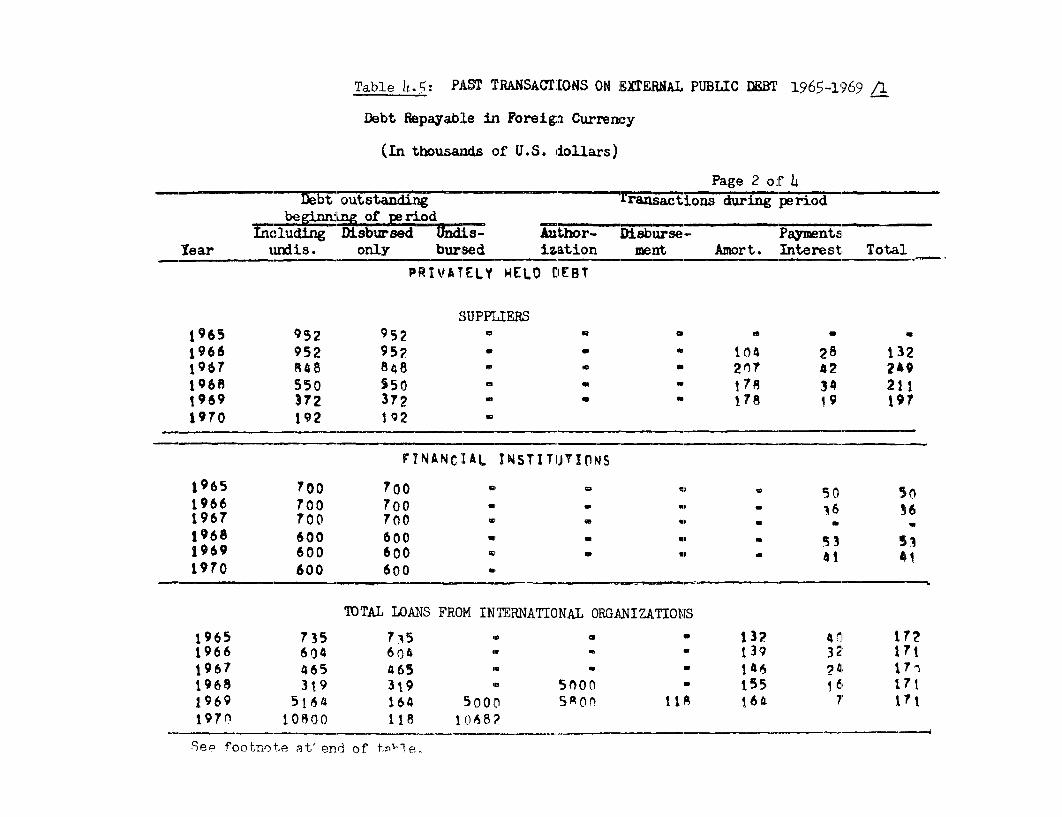
Table 14.5: PjAT TRANSACTIONS ON EXTERNAL PUBLIC DEBT 196$5-1969 /1
Debt flepayabLe in Foreiga Currency
(In thousands of U.S. doLLars)
Page 2 o:F 4z153t oodtl3tamw trrisactions during period
ofnfn pe, rioolIncludd Ufig Disbursed IJnd8L- Author- .Disburse- Paynents
Year urKdis. onl3y bursed ization ment Amort. Interest, Total_
PRI[VATELY HEI., CIEBT
SUPPLIERSI 9155 O'52 952 0 0 U 0 '1956 91 9 5 1(4 28 132l9157 8 48 848 2(17 42 2*919168 550 50 ' 178 34 21119159 3r2 372 lia 18 9 197190ro 192 192 s
FTNANCI(AL INSTITliTIONS
1965 700 7O0 o s o0 5i1966 700 7C0 - 6 361967 700 70 .1968 600 600 3 *i31969 600 600 4- 1970 600 600
TOT.AL LOANS FROM INTERNATIONAL ORGANIZATIOt;S
19,65 735 7 5 0 go 132? 14 21966 o0 4 604 l a U 139 32' 17119167 4I65 465 i n 146 24 1T I19,68 3'19 3419 - 5O0 155 16d 1711969 51 64 16S4 Soo 5^0n 1 1R 164 7 1TI1917n 10f80o l118 10682
.See footnote st' end of tp1l P..
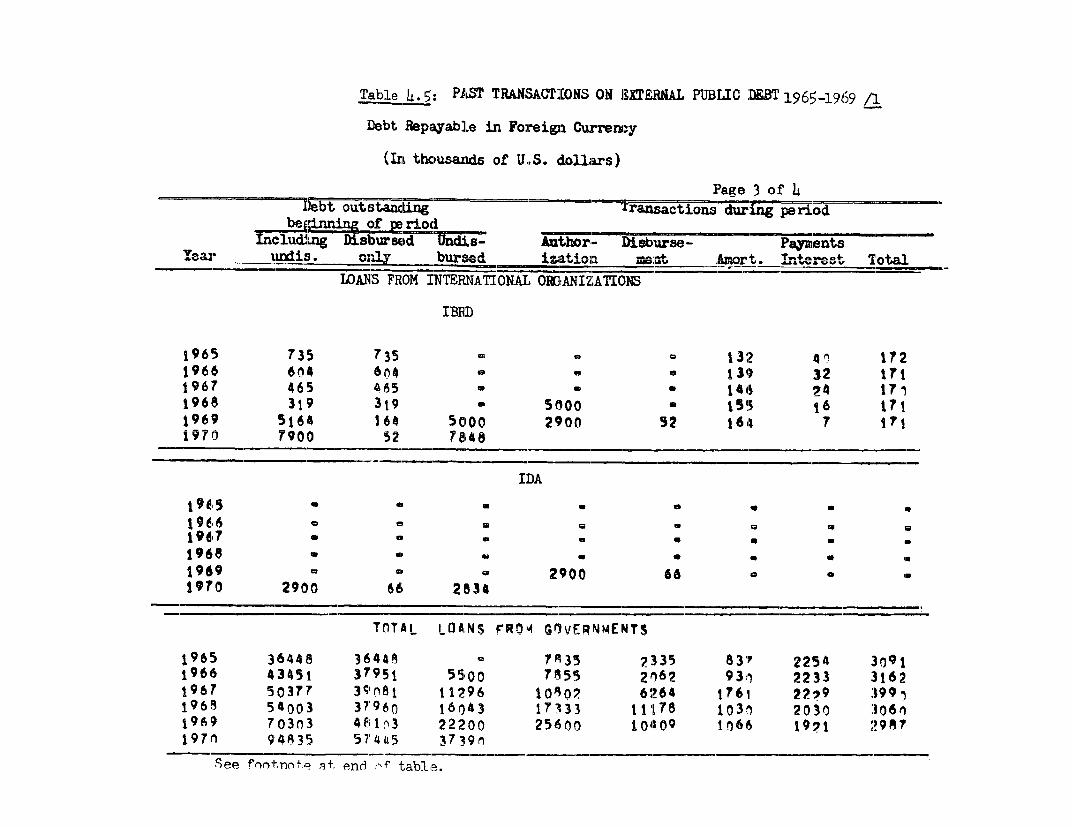
Table L..5: PAM l'RANSACTIONS ON I 1TERNAL PUB'LIC DEBT 1965-1969 /1L
Debt Repayabl.e in Foreign Cuwrrem.y
(In thousands of U.S. dolars)
_Page 3 ol 1'
b S~~Out rriod
IncludiLng Disbzursed - sburse-tsYear uzi4. on4 bur:d 6 0tiorn LV Amart. 7trSt Total.
LOANS FROM INTERNATIONAIL ORG,ANIZATIONS
IB1D
19615 735 735 3 2 4 17219616 6n4 604 - 139 32 1ll1967 465 465 e e 140 24 1711968 319 3t9 * 5000 15'5 6 1711969 5164 164 5 eoo 2900 2 1614 7 17ii97' 7900 52 78148
I:DA
1965 a *5 q
1966 Q e e
1968 - * * *
1969 2900 66 e en191'0 2900 66i 2B34
TnTAL LOA,NS FR0i1 GIrVER"NENTS
19615 36448 36448 7 ̀135 2335 83" 2254 3o9119616 4345l 37951 55iO0 7Pi55 20162 93i1 2233 3162
1967 50377 39108I 11296 1o8o ? 6:2i64 1761 22,9 l9911968 54oo3 3796O 160*3 17'q33 11178 1030 2030 3o
1969 703 03 4El1o3 22200 250Soto IO1AQ 10656 195?1 2987197( 9,4835 57'4 5 37319o
.See fontno',e t, end3 ,, < -tabl e.
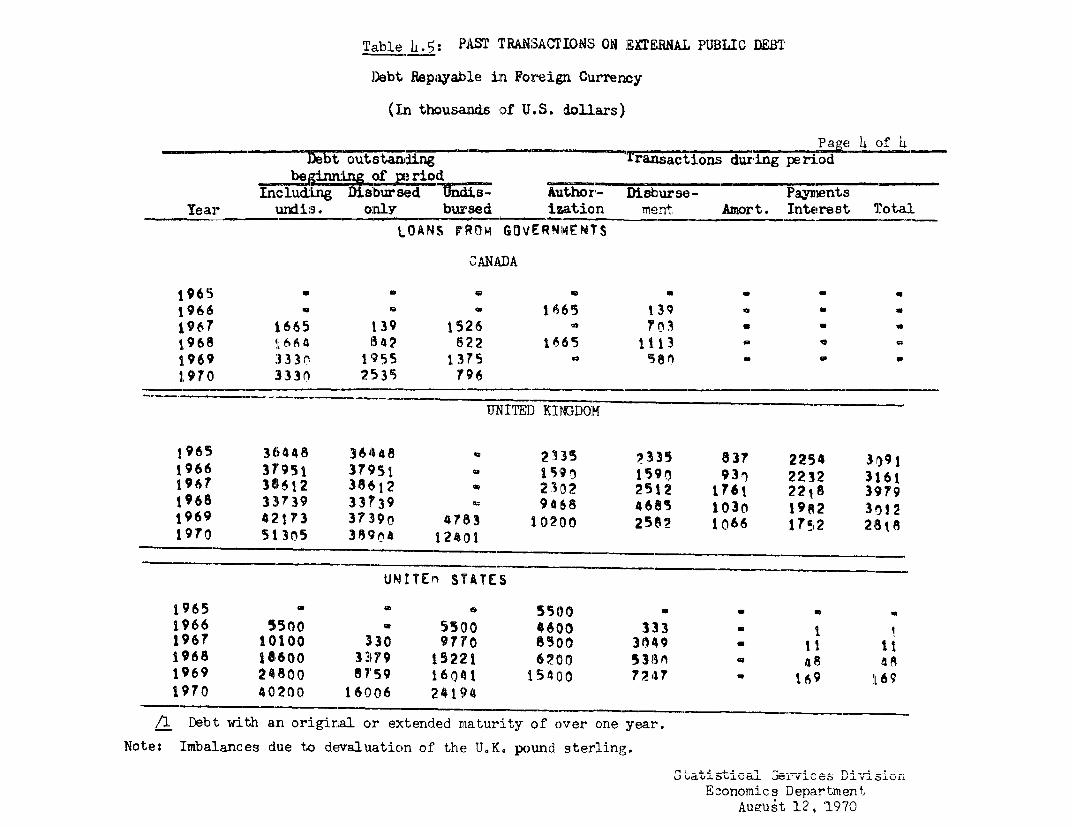
Table h. '5: PAS TRANSACTIONS ON Eff&RNAL PUBLIC DEBT
Debt Repayable in Foreign Currerncy
(Bi thusands of U.S. dollars)
Paeb 14 of 4
Jetout stam±ing TransactTions during peri.odbeginn:Ln of pe rioid
Includ&Lng Dislbursed Udis- Auhor- Disburse - Paynients-Year luiXlis. onIly bursed ization Irent Amort. Interest T'otal
LOANS FVROM G0vERN1IENlrS
CANADA
19 6 5 ,.1966 - 1"65 t3 a -1967 1665 '139 1526 ?om l -
1968 1L664 1542 822 1665 1113 c
9969 333r 1 955 1375 e -51970 : 333l 21535 796
UNITEID KINGDO]M
1965 36448 36448 2335 7335 837 2254 3191
1966 3T951 37>951 i59t 1590 93 22312 31611967 361612 386 12 2302 2512 1761 2218 397 91968 311739 331739 9468 468 5 1030 1982 3 lj121969 42173 37390 4 713 10200 2502 1066 175i2 218 8
1970 51305 389m4 12401
UNITEr, ST'ATES
1965 a a 550 1966 515o - 55(0 4*60 333 ; ¶
1967 10100 3130 9710 8S00 3n49 - 11 111968 16a600 3379 15221 6200 538n 48 48
1969 24800 67'59 160111 15400 7247 , 1J69 1169
1970 40200 16006 241 94
/1 Debt with an origiral or extended maturity of over one year.
Note: Imbalances dlue to devaluation of' the USK. pound sterling.
Economics DepartmentAuiukt 12,-1970
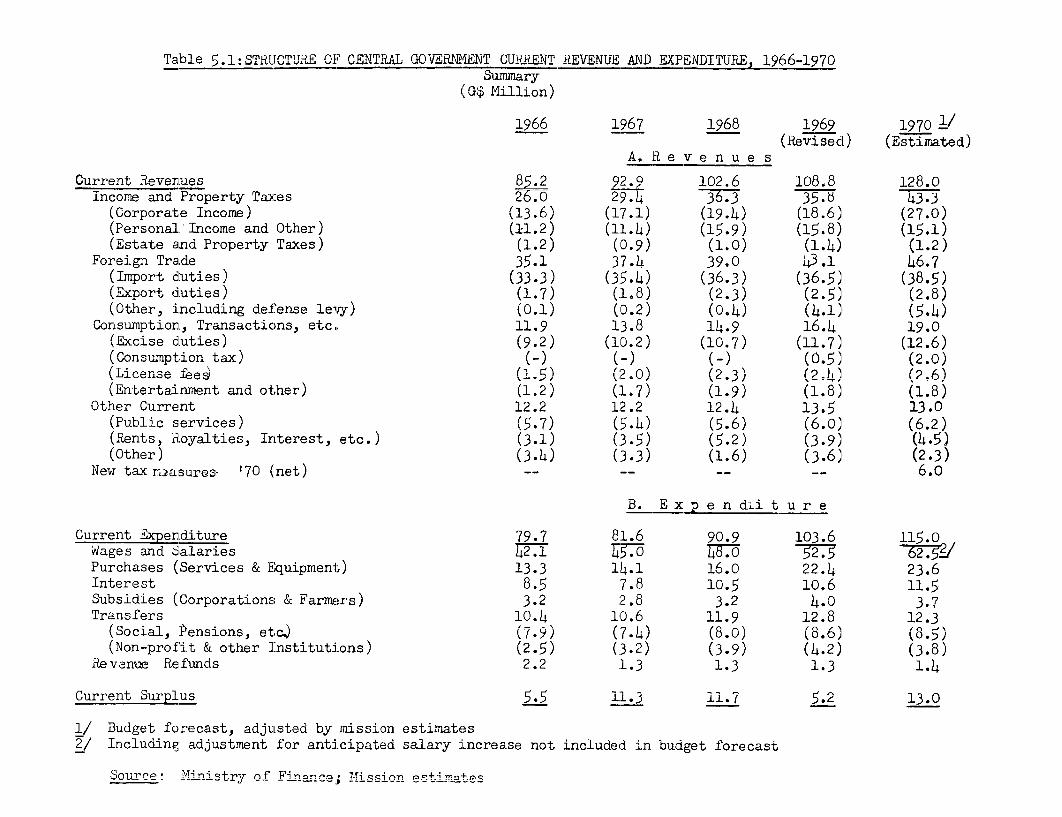
Table 5.l STRUCTIUTRE OF CENTRAL G0VERMENT CURRENT REVENUE AND EXPENDITURE, 1966-1970Siumma,ry
(IG$ Mi llon)
1966 1967 1968 1969 1.970 1/(Revised) (Estimated)
A. R e v e n u e s
Current Revenues 85.2 92.9 102.6 108.8 128.0Income and Property Taxes 2670 29.4 36.3 35.b 43.,
(Corporate Income) (1:3.6) (17.1) (19-4) (18.6) (27.0)(Personal Income and Other) (I:L.2) (1'1-4) (15-9) (15.8) (15.])(Estate and Property Taxes) (L.2) (10.9) (1.0) (1.4) (1. 2)
Foreign Trade 35 .1 37.4 39.0 43.1 46.'(Import d:uties) (33.3) (35.4) (36.3) (36.5) (38.5,)(Export duties) (1.7) (1.8) (2.3) (2-5) (2.8)(Other, including defense levy) (0.1) (0.2) (0.4) (4.1) (5. 4)
Consumption, Transactions, etc. 11.9 13.8 14.9 16.4 19.()(Excise dLuties) (.2) (1C0.2) (10.7) (11.7) (12.6)(Consumption tax) (-) (-) (_) (0.5) (2.0)(License e (L.5) 0)(23) (2-4) (2.6)(Entertainment and other) (1L.2) (1.7) (1-9) (1.8) (1.8)
Other Current 12.2 1:2.2 12.4 13.5 13. (Public services) (5.7) (5.L) (5.6) (6.0) (6.2')(Rents, Royalties, InterE!st, etc,) (3.1) (3.5) (5.2) (3.9) (4.5)(Other) (3.4) (3.3) (1.6) (3.6), (2.3)
New tax ri;asur'es- 70 (net) -- -- -- 6.0
B. E x p e n d;i t u r e
Current Expenditure 79.7 81.6 90.9 103.6 115.0Wages and Salaries 4Ž.1 1 i;75 n 62.'2Purchases (Services & Equipment) 1:3.3 1,4.1 16.0 22.4 23.6Interest 8-5 7.8 10.5 10.6 11.5Subsidies (Corporations & Farmers) :3.2 :2.8 3.2 4.0 3.7Transfers 1(.4 10.6 11.9 12.8 12.3
(Social, Pensions, etcj (7.9) (7.4) (8.0) (8.6) (8.,)(Non-prof'it & other Institutions) (2.5) (3.2) (3.9) (4.2) (3.8)
Revaniue Refunds 2.2 1.3 1.3 1.3 1.14
Current Surplus 5.5 11.3 11.7 '.2 13.0
1/ Budget forecast, adjusted by mission estimates2/ Including adjustment for anticipated salary increase not inc:Luded in budget forecast
S.__n.r-< Mni qi+.ry of c' P P- TI-i ezp n?, oRm mn+
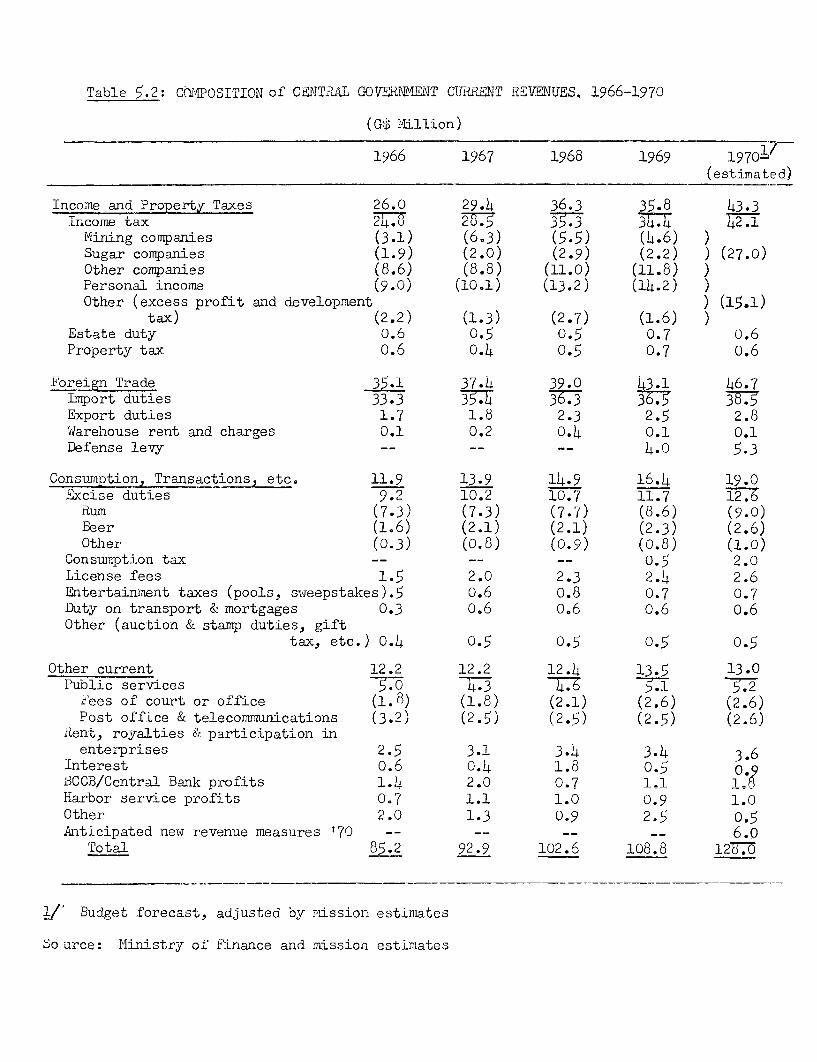
TableT5.2: C-rtIWTrNT OfC\-NTrP? AT G 1TTUrnP l1TTPP77%T¶ PT9TTvTr 19 o6-19 7n
1966 -L7 1 96'7 1968Q 196 -'9e 1 7-
(estimated)
Income and Property Taxes 26.0 29.4 36.3 35.8 43.3Income tax 2f4v 2°.5 35.3 344 42.1Mining companies (3.1) (6.3) (5.5) (4.6) )Sugar companies (1.9) (2.0) (2.9) (2.2) ) (27.0)Other companies (8.6) (8.8) (11.0) (11.8) )Personal income (9.0) (10.1) (13.2) (14.2) \Other (excess profit and development ) (15.1)
tax) (2.2) (1.3) (2.7) (1.6) )Estate duty 0.6 0.5 0.5 0.7 0.6Property tax 0.6 0.4 0.5 0.7 o.6
Foreign Trade 35.1 37.4 39.0 43.1 46.7Import duties 33.3 3633 38* 5Export duties 1.7 1.8 2.3 2.5 2.8Warehouse rent and charges 0.1 0.2 0.4 0.1 0.1Defense levy -- -- -- 4.0 5.3
Consuxiption, Transactions, etc. 11.9 13.9 14.9 16.4 19.0Excise duties 9.2 10.2 10.7 11.7 12.6Rum (7.3) (7.3) (7.7) (8.6) (9.0)Beer (1.6) (2.1) (2.1) (2.3) (2.6)Other (0.3) (0.8) (0-9) (0.8) (1.0)
Consumption tax -- -- -- 0.5 2.0License fees 1.5 2.0 2.3 2.4 2.6Entertaimnent taxes (pools, sweepstakes).5 o.6 0.8 0.7 0.7Duty on transport & mortgages 0.3 0.6 0.6 0.6 0.6Other (auction & stamp duties, gift
tax, etc.) 0.4 0.5 0.5 0.5 0.5
Other current 12.2 12.2 12.4 13.5 13.0Public services 7.0 4 .3 5.1 5.2
Fees of court or office (1.8) (1.8) (2.1) (2.6) (2.6)Post office & telecomxmunications (3.2) (2.5) (2.5) (2.5) (2.6)
Rent, royalties & participation inenterprises 2.5 3.1 3.4 3. IL6
Interest 0.6 0.4 1.8 0.5 0.BCCB/Central Bank profits 1.4 2.0 0.7 1.1 1.Harbor service profits 0.7 1.1 1.0 0.9 1.0Other 2.0 1.3 0.9 2.5 0.5Anticipated new revenue measures '70 -- -- -- -- 6.o
Tcot.l 85.2 92?I9 102.6 108,8 l27 -
1 r Rc c 1 fn-r'or s + nry 1i;nA ce r mi i o i o4-c nLn noc:
X^ Il^^ - Mi n; o+. r .^f' t~~~~~~~~~~~~~~~~~~i';n^ a 1F.L.i o .^J.n AJ± m+^o11. L
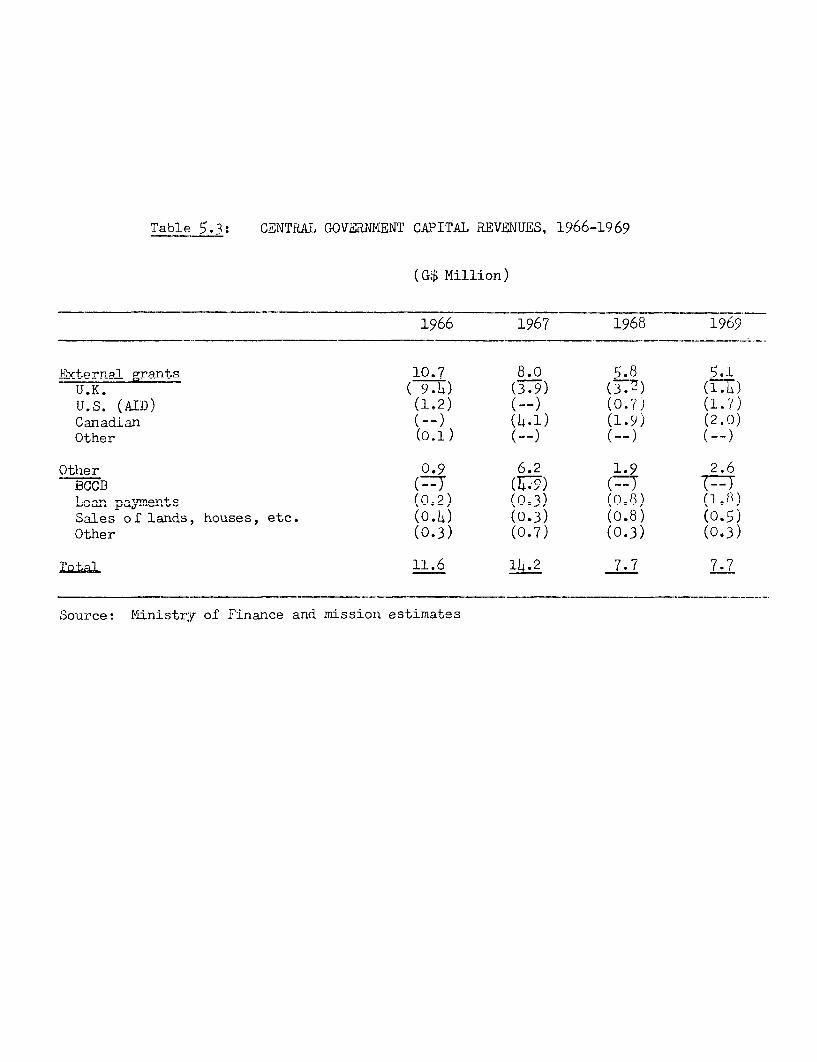
Table 5.3: CENTRAL GOVERNMENT CAPITAL REVENUES, 1966-1969
(G$ Million)
1966 1967 1968 1969
Ey1-.ernnl grants 10.7 8.0 5.8 5.1U.K. (T -) (3T9) (77) (IT)IT R (ATn) (1.2) (--) (O.?) (1.7)Canadian (--) (4-1) (1.9) (2.0jOther (.)(- -)(-
Otlh-r 0.9 6.2 1.9 2.6BCCB ( Y (1w) (Y 7T,-an ,- rm,en+ (0.2) (0X3) (0 8) ___
Sales of lands, houses, etc. (0,4) (0.3) (0.8) (0.5)Other (0.3) (0.7) (0.3) (0.3)
rtp -' 11A6 9 7.7 7 7
Source: Ministr;y of Finance and mission estimates
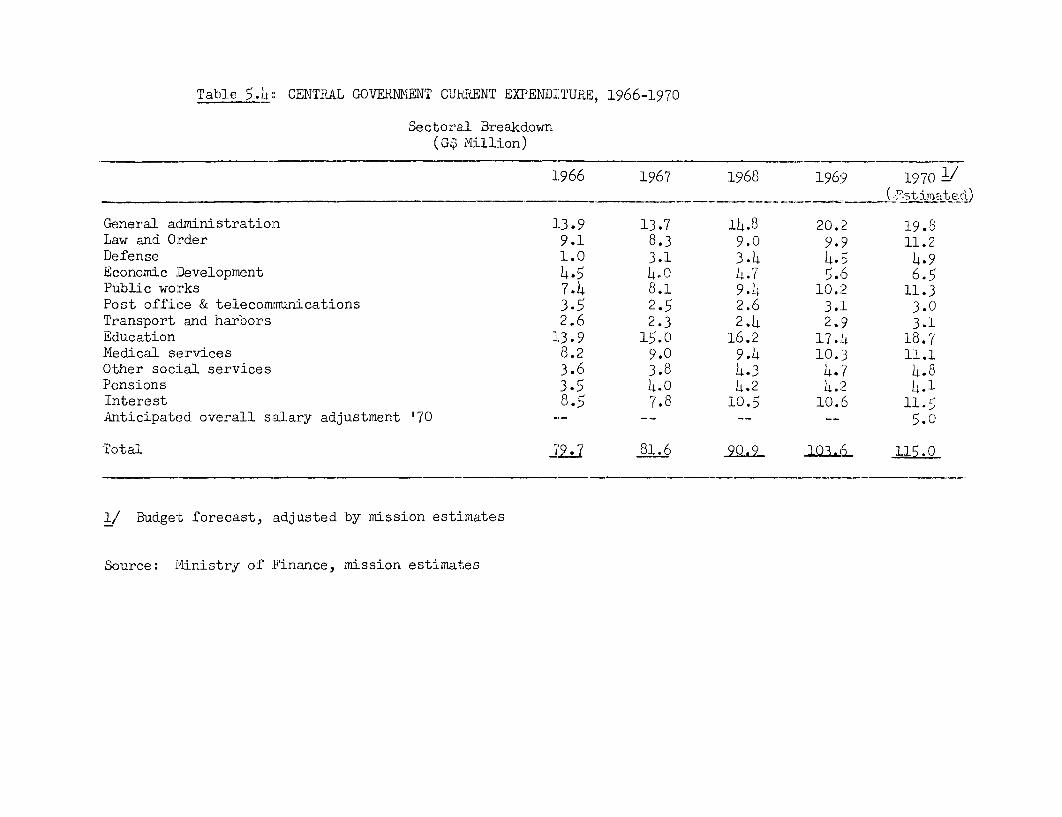
Table 5.h: CENTRAL GOVERNMENT CU±dRENT EX'ENDI:TUiUE,, 1c966-1]970
Sectoral Breakdown(GQ Million)
1.966 11967 1968 1969 1970 1/____ ____ _ _ _ _ - _ _ _ _ - - ~~~ ~~~~~~~~~~~~~( .F'sti!ni atet
General administration 1.3.9 13.7 14.8 20.2 19.8Law and O;rder 9.1 8.3 9.0 9.9 11.2Defense 1.0 3.1 3.4 4.5 4.9Economic Development 4.5 4l0 4.7 5.6 6.5Public works 7.4 8.1 9 . 10. 2 11.3Post office & telecommunications 3.5 2.5 2.6 3.1 3.0Transport and harbors 2.6 2-3 2.4 2.9 3.1Education 133.9 1', .0 16.2 17. 4 18.7Medical services 8.2 9.0 9.4 10.3 11.1Ot;her soc:Lal services 3.6 :3.8 4.3 4.7 4.8Pensions 3.5 4I. 0 4.2 4.'2 4.1Interest 8.5 '7.8 10.5 10.6 11.5'AnticiLpated overa:ll s,alar;y adjustment ' 7 0 -- - 7 -- 5.0
Total 7 81-.6 9 _LQ 115.0O
18/ Budget forecast, adjusted by mission estimates
Source: M4inistry of Finance, mission, estimates

Table 5.5: PROJECTIONS OF CENTRAL GOVERNMENT CURRENT ACCOUNT, 19770-1975(G$ millions in prices of 1969)
Average annual1969 197C) 1,971 197 2 1973 1974 1975 growth rate
Actual (percent)
Current expenditure 10,3.6 115.0 125.%0 L30.'5 136 -.0 l414.0o 152.9 6.
Wages and salariesV/ 52.5 62. 5 69.o 71.5 75,.0 78.0 81.0 ( 7.14)Debt charges 10.6 ll.5 12.0 12.,7 1:3.0 13.5 1,4.5 ( 5.14)Transfers and subsidies-/ 16.8 16.0 1 16.0 16.5 17.0 17.5 19.0 ( 2.0)Other 23.7 25.0) 28.0 29.18 3i.0 35.0 38.4 ( 8.4)
Current revenue 108.8 128. C) 1391.0 14s9.5 156.0 156.15 1614.0 7.
Customs and ex se3. 59.5 65.7 69.0 72.14 7X5.0 77.2 79.5 ( 5-0)Inland revenue-. 35.8 49,.3 51.5 60.6 614.5 62.8 68.0 (11.2)Othier revenue5/ 1_3.5 13.C) 15.5 16.5 16 .5 16.5 16.5 ( 3-.4)
Current surplus 5.2 13.0 11L.0 19.0 20.0 12.15 11.1
1/ Based on an expected expansion and upgrading of the public serrice.
2/ Allowing for a stable level of transfers, a decrease in railway subsidies but an increase in subsidized housing andland development schemes.
3/ Based on projected import levels and yields of excise taxes, with an allowance made for duty-free CARIFTA tradLe.
b/ including the elasticity of' the new tax structure and the comp:Letion in 19T7h of the shift to the PAYE system.
5/ Includes an estimated increase fronn the rice industry beginming in 1971, when the rice modernization program willhave begun to take effelct.
Source: M4inistry of Finance and missiL on estimates.
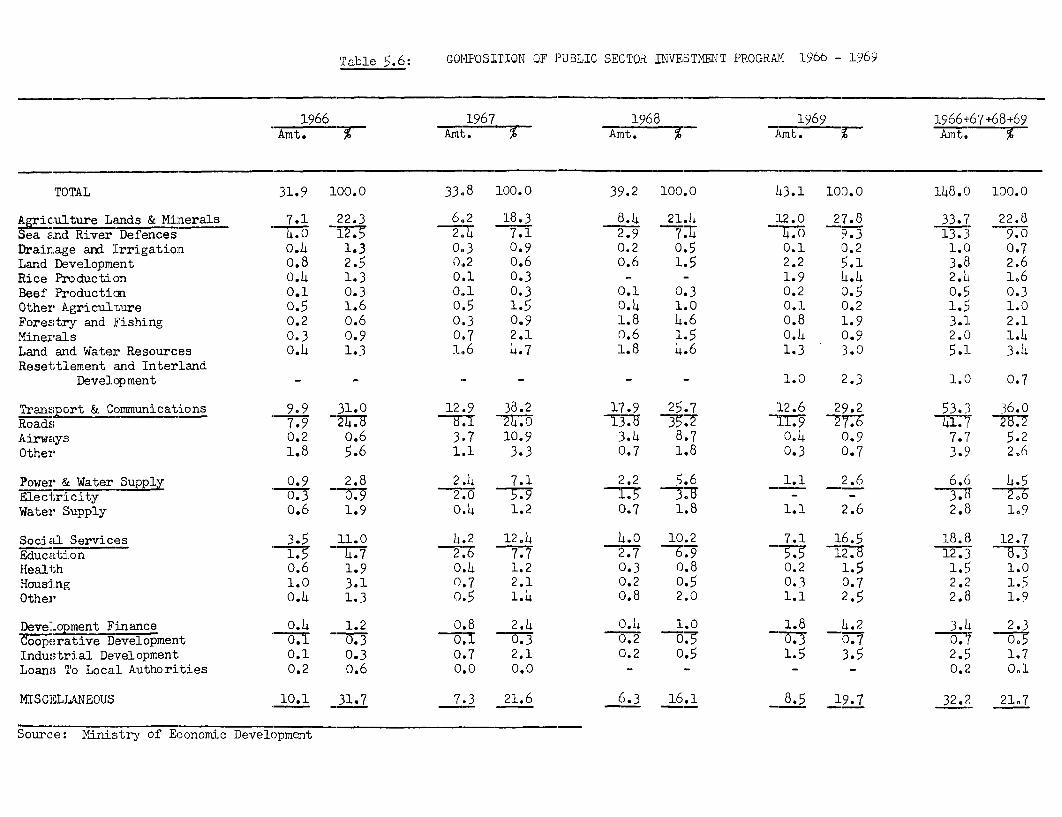
Table 5-65: COMPOS];ION 3F PUBLIC SECTOR INVESTMRIT PROGRAM 1966 - 1969
1966 1967 1968 _ 1569 1966+-67+68+69Amt. % Amt. %. Arat. % Ut ~Amt. %
TOTAL 31.95 100.0 33.8 100.0 39.2 100.0 4,3.1 100.0 148.0 100.0
Agriculture Lands & Minerals 7.1 22.3 6.2 18.3 8.4 21.4 1L2.0 27.8 33.7 22.8Sea and River Defences -. (5 12.5 2.-T 7.i 2.9 7.7 b4.0 9.3 13.3 9.0])rainage arnd Irrigation 0.4 1.3 0,3 0.9 0.2 0.5 0.1 0.2 1.0 0.7Land Development o.8 2.5 0.2 0.65 0.6 1.5 2.2 5.1 3,8 2.6Rice Production 0.lI 1.3 0.1 0.3 - 1.9 4.4 2.4 1i6]3eef Production 0.1 0.3 0,1 0.3 0.1 0.3 0.2 0.5 0.'; 0.3Other Agriculteure 0.6 1.6 0.5 16 0.4 1.0 0.1 0.2 1.'; 1.0Forestry and Fishing 0.2 o.6 0.3 0.9 :L.8 4.6 0.8 1.9 3.1 2.1Minerals 0.3 0.9 0.7 2.1 0.6 1.5 0.4 0.9 2.0 1.4Land and Water Resources 0.4I 1.3 1-6 4.7 L.8 4.6 1.3 3.0 5.1 3.4iResettlement and Interland
DevelopmenLt - - - - - 1.0 2.3 1.( 0.7
Transiport & Communications 9.9 31.0 12.9 38.2 17.9 25.7 12.6 29.2 53.3 36.0Roads 7.9, -71 =7 -770 -77-7 73 9 -7-7 T 41.? i 2.
Airways 0.2 o.6 3.7 10.9 :3.4 8.7 0.4 0.9 7-7 5.2Other 1. 8 5.6 1.1 3.3 (.7 1.8 0.3 0.7 3.9 2D6
Power & Water Supply 0. ° 2.8 2.4 7.1 2.2 5.6 1.1 2.6 6.6 4.5Electoricity O.,' 0.9 2'. ~~579 r 0.3 - '1- -
Water Supply o.6 1.9 0.4 1.2 0.7 1.8 1.1 2.6 2.8 1D9
Social Serviceas 3.', 11.0 4.2 12.4 14.0 10.2 7.1 16.5 18.8 12.7Education -1'7 4.7 -2 7 7.7 2 .7 -;.9 5.5 127. 12.3 3THealth 0. b 1.9 0.4 1.2 (D03 0.8 0.2 1.5 1 1.0Housing 1.( 3.1 0.7 2.1 0.2 0.5 0.3 0.7 2.2 1.5Other 0.4 1.3 0.5 1.4 0.8 2.0 1.1 2.5 2.8 1.9
DeveLopment Finance 0.4 1.2 0.8 2.4 0.4 1.0 1.8 4.2 3.4 2.3
Cooperative Development o 30.3 . - 03 07 0.Industrial Development O.L 0.3 0.7 2.1 0.2 0.5 1.5 3.5 2.6 1.7Loans To Local Authorities 0.2 o.6 0.0 0.0 - - - - 0.2 001
MISCELL.A'EOUS 10.:1 31.7 7.3 21.6 6.3 16.1 865 19.7 32.2 2107
Source: Ministry of Economic Development

Table 5.7: SUNMARY OF PROPOSED PUB'LIC CAPITAL EXP1ENDITURES 1970-75
_ _ _ _- - - ~ Total Percentage ofSector 1969/ 1 970 1 971 1972 1973 1974 1975 1970-75 Total
Agriculture, Forestry and Fis ira 6.6 13.6 20.0 19-5 12.7 15.1 17-5 98.4 21.3
Agriculture 5.8 13.5 19.6 17.-9 11.6 13.2 12.0 87.8 19.C)Forestry .8 .1 *.3 1.4 .7 .5 .5 3.5Fishing .1 . 2 .4 1.4 5.0 7.1
Sea Defenses 4.0 6.15 12.0 13.7 12 11.2 8.9 66.2 14.3
Mineral Surveys .4 *7 1.3 1.4 .4 3-8 .E
Power 2.0 1.,2 5.7 10.0 5.6 24.5 5.4
Transportation ancl ComluniLcations 12.6 24-9 15.13 17.,8 17.8 21.3 24.3 121.9 26.4
Air Services .4 7.6 1 .5 3.1 2.0 4.2 6.1 2L.5 5 3'Railways .I .I .2Water Transport .l4 .2 3.0 1.0 1.1 1.6 7.3 1.6Roads :11.9 12.:3 3.-7 10.7 14.8 15.3 13.5 70.3 15-2Comrmn.nications .3 4.-5 10.3 1 .0 .7 3.1 19.6 4.3
Social ServiceIs 8.2 5-1 15-2 14.81 19.1 26.0 25.5 105.7 23.0
W'ater Supply 1.1 1.'5 7.:3 5.15 4.9 5.2 4.5 28.9 6.3Health and Sanitation .2 .ls .1 1.2 6.8 11.0 10.9 30.4 6.6Education 5.5 2 .7 6.3 6.3 6.1 6.1 5.6 33.1 7.2Housing and UPrban Development 1.4 .! 1-5 1.8 1 .3 3.7 4.5 13.3 2.95
Development Finance 1.5 1 3 *.2 !3 .3 .3 2.5 .5Public Admiinistration 1.3 2 .4 2.14 2 .6S 2.6 2.5 2.6 15.1 3.3Miscellaneous 8.5 2.9 3.1 2-7 2.7 2.8 2.8 17.0 3.7
Unidentified FProjetcts 6.0 6.0o 1 .3
Total i43 .1 58.7 69.8 77.7 80.4 86.2 88.3 461. 1 00.0
1/' aceApal.5
Source: Appendix Table 5. 8

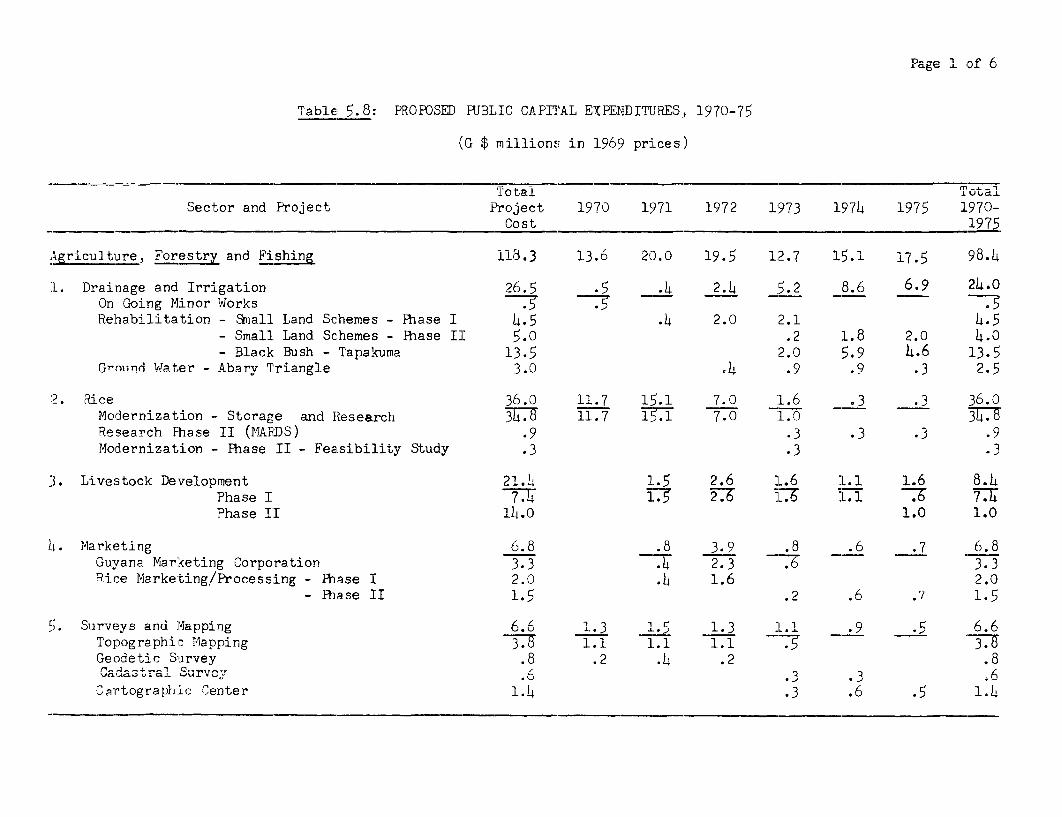
Page 1 of' 6
Table 5.8: PROPOfSED PUBLIC CAPI'AL EXPENDITURES, 1970-71
(G $ millions in 1969 prices)
Tot2U1 loual
Sector and Project Project 1970 1971 1972 1973 1974 1975 1970-Cost 1975
hgriculture, Forestry and Fishing 118.3 13.6 20.0 19.5 12.7 15.1 17.5 98.4.
:1. :Drainage and Irrigation 26.5 .5 .4 2.4 _5.2 8.6 6.9 24.0On Going Minor Works .7 -7 . 5Rehabilitation - cnall L-and SchemeIs - Fhasse I 4.5 .4 2.0 2.1 4.5
- Small, Land Schemes - Phase II 5.0 .2 1.8 2.0 4.0- Black Bush - Tapakruma 13.5 2.0 5.9 4.6 13.5
Grou-ind Water - Abary Triangle 3.,O .4 .9 .9 .3 2.5
2. Rice 36.0 11.7 15.1 '7.0 1.6 .3 .3 36.0Modernization - Storage and Research 3 15 11.7 13T 3. 1.0Research Fhase II (MAFDS) .9 .3 .3 .3 .9Modernization - Fhase II - Feasibility Study .3 .3 .3
3. live,stock Development 21.L15 .6 6 :L.l L.6 8.4Phase I 7. W1 ei.6 6 7Phase II 14.0 1L.O 1.0
Lh. Marketing 6.8 .8 3-9 .8 .6 .7 6.8Guyana Marketi:ng Corporation 3.3 .4 2.3 3.3Rice Marketing/Processing - Fhase I 2.0 .h 1.6 2.0
- hase II 1.5 .2 .6 .7 1.5
,. Survteys and Mapping 6.6 1.3 1. 1.3 _L.1 .9 _5 6.6Topographic Mapping 3.7 1.1 1.1 1.1 -- -- 3'7TGeodetiLc, Survey .8 .2 .4 .2 .8
Cartograph-jic Ceenter 1.4 .3 .6 .5 1.4
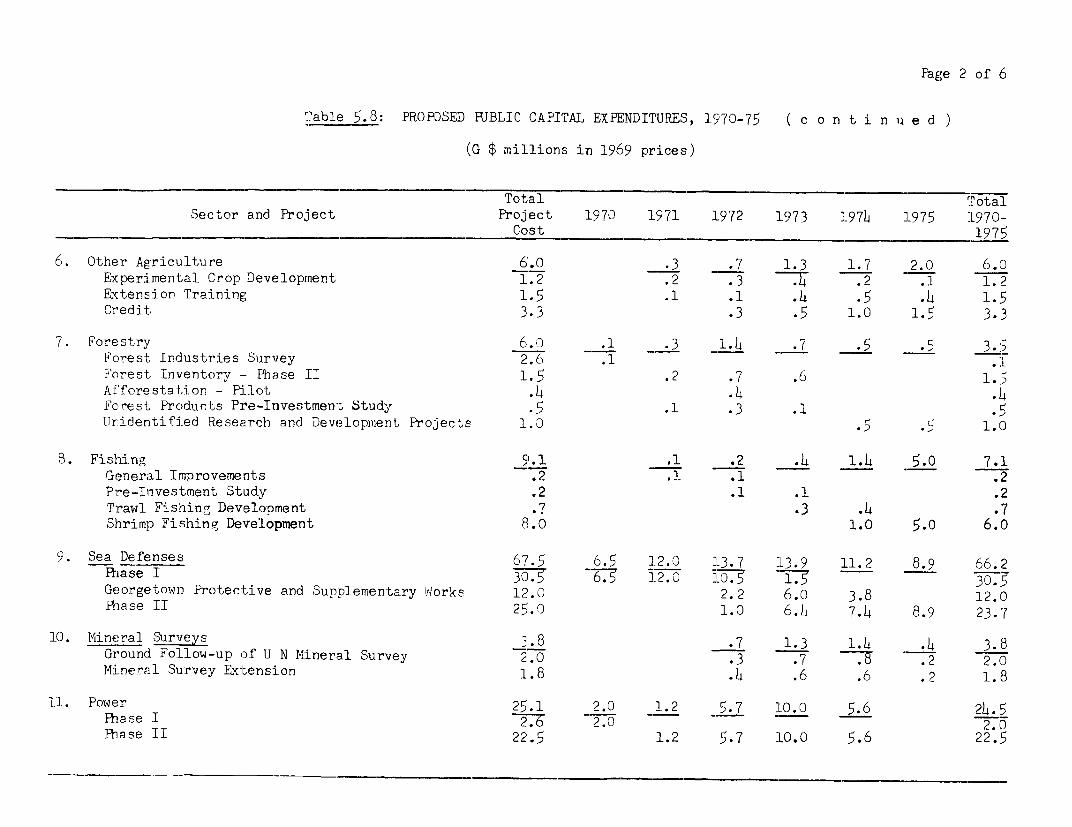
Page 2 of 6
Table 5.8: PROPOSED RPBLIC CAPITAL EXPENDITURES, 15970-75 ( c o n t i n u e d )
(G $ millions in 1969 prices)
Total TotaLSector and Pro,ject Project 1970 1971 1972 1.973 19T 1]975 1L970.-
Cost 19715
6. Other Agriculture 6.0 .3 .7 1.3 1.7 2.0 6.oExperimental Crop Development 1.2 .2 .3 T .2 .1 1.2Extension Training 1.5 .1 .1 .4 .5 .4 1..5Credit, 3.3 .3 .5 1.0 1.5 3.3
7. Forestry 6.o .1 .3 1. 4 .7 .5 .5 3.5Forest, Inclustries Survey 2.6 .1Forest, Inventory -- Phase II 1.5 .2 .7 .6 1.5Afforestation - Pi-lot .4 .4 .14Forest, Products Pre-Investment Study *5 .1 .3 .1llridentified Research and Development Projects 1.0 .5 .5 1.0
S. Fishing C9.1 .1 .2 .4 1.4 5.0 7.1General Improvements .2 .1 .1 .2Pre-Investment Study .2 .1 .1 .2Trawl Fishing Development .7 .3 .14 .7Shrimp Fishing Development 8 .0 1.0 5.0 6.0
9. Sea Defenses 67'.5 6.5 12.0 13.7 L3.9 11.2 8.9 66.2Phase I 30. 5 12.0 1 05 30.1 Georgetown Protective and Supplementary iWorks 12.0 2.2 6.0 3.8 12.0Riase II 25'. 0 1.0 6.14 7.4 8.9 23.7
L0. Mineral Surveys 3.8 .7 1.3 1.14 .14 3.8
Ground FoLlow--up of UJ N Mineral Survey 2.0 .3 .7 2 2.0Mineral Survey Extension 1.8 .14 .6 .6 .2 1.8
11. Power 25.1 2.0 1.2 5.7 10. 0 5.6 24.5Phase I 27 2.0 2.0Phase II 22.5 1.2 5.7 10.0 5.6 22.5
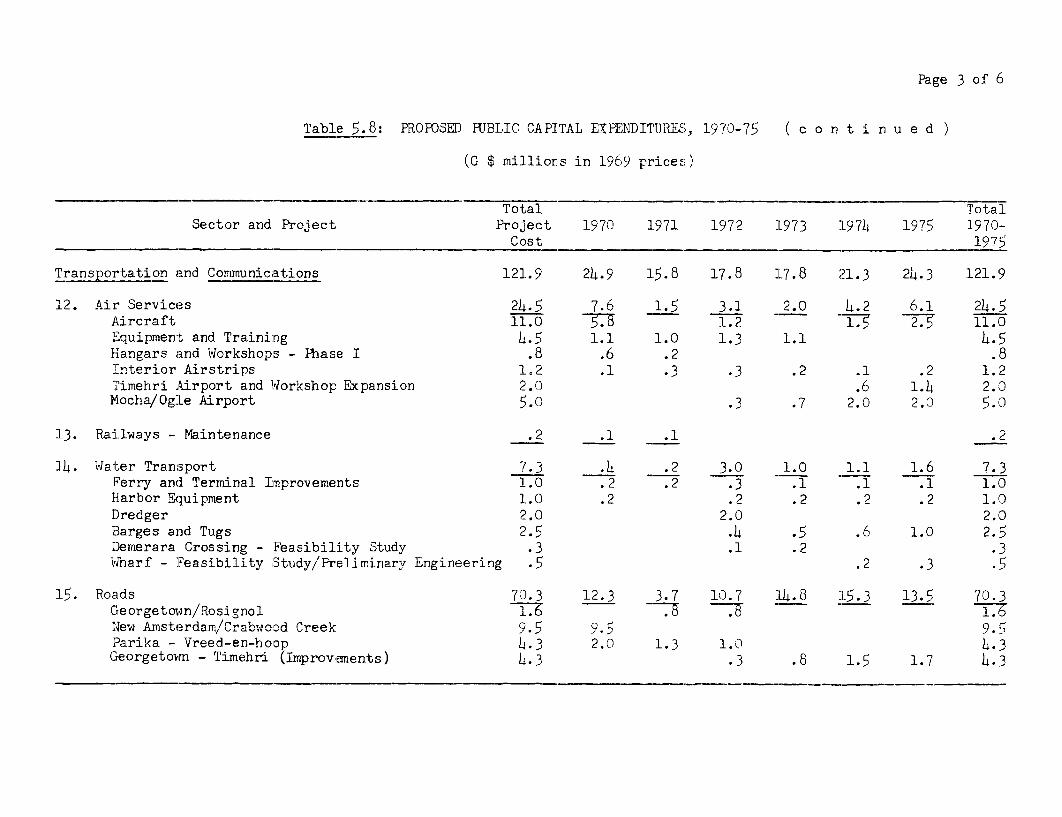
PagJe 3 of 6
Table 5.8: PROFOSED FUBLIC CAPITAL EXPENDITURES', 1970-75 ( c o n t i n u e d )
(G $ millions in 1969 prices- )
Total TotalSector and Project Project 1970 1971 1]972 1973 1L974 :1975 1970-
Cost 1975
Transportation and Communicatio:ns 121.9 24.9 1.5. 8 1]7. 8 L7 . 8 21. 3 24.3 121.9
12. Air Services 24.5 7.6 1.5 3.1 2.0 4.2 6.1 24. 5Aircraft 11.0 -. -1.2 11. 0Equipment and Traini:ng 4.5 1.1 1.0 1.3 1.1 4.5Hangars and W.Torkshops - Phase I .8 .6 .2 .8Interior Airstrips 1.2 .1 .3 .3 .2 .1 .2 1.2Timehri Airport and Workshop Expansion 2.0 .6 1.4 2.0Mocha./Og:Le Airport 5.0 .3 .7 2.0 2.0 5. 0)
13. Railways - Maintenance . 2 .1 .1 . 2
14. Water Transport 7.3 .4 .2 3.0 1.0 1.1 1.6 7.3Ferry and Terminal ITmprovements 1.0 .2 .2 .3 .1 .1 .1 1.0Harbor Equipment 1.0 .2 .2 .2 .2 .2 1.0Dredger 2.0 2.0 2.0Barges and Tugs 2.5 .4 .5 .6 1.0 2.5I)emerara Crossing - Feas:ibility Study .3 .1 .2 .3Wharf - Feasibil:ity Stud;y/Prelirrinar;y Engineering .5 .2 .3 .5
15. Roads 70.3 12.3 3.7 10.7 L4.8 L5.3 :13.5 70.3Georgetown/Rosi g:nol 1 7 .8 1.65New Amsterdan/Crabwood Creek 9.5 9.5 9. 5Parika - Vreed-en-hoop L.3 2. 0 1.3 1.0 4. 3Georgetown - Timehri (Improv,-ments) 4.3 . 3 .8 1.5 1.7 4.3
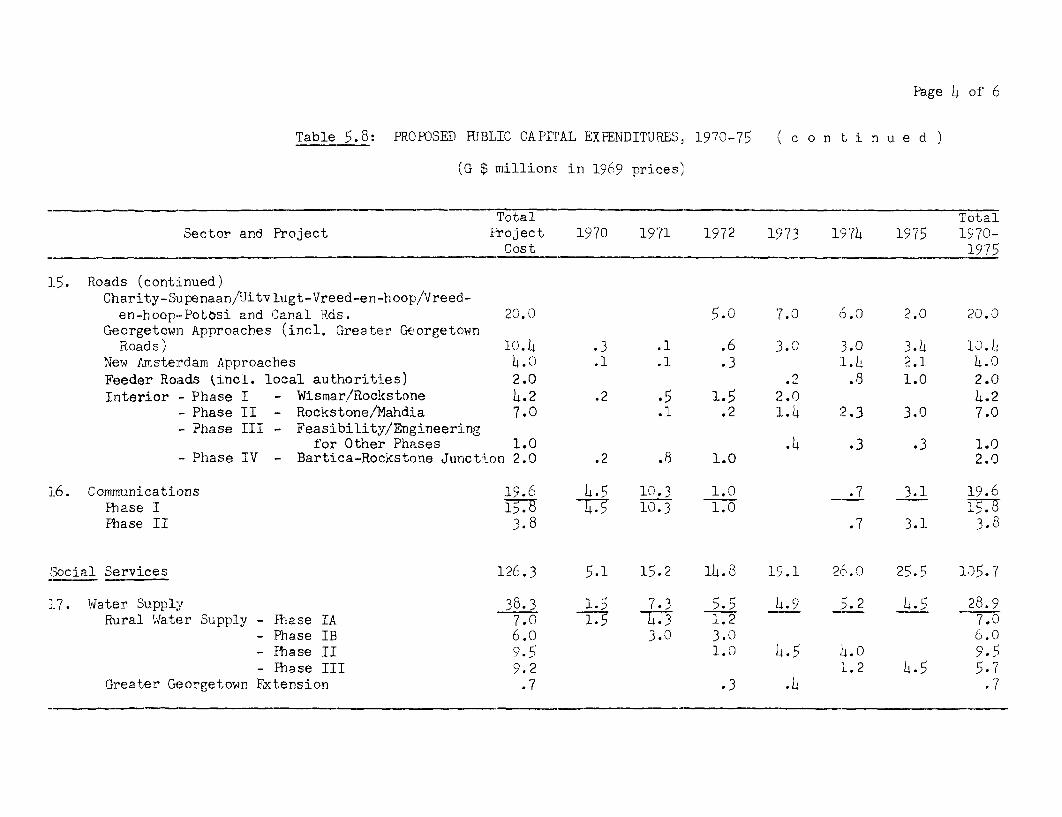
Page 4 of 6
Table 5.8: FPROKSED RFBLIC CAPITAL EXPENDITURES, 19 70-7'5 f c o n t i n u B d
(G $ millions in 19695 prices'
Total TotalSector and Project Project 1970 1971 1972 1973 19 74 1975 1970-
Cost 1975
1]5. Roads (continued)Charit.y-Suapenaan/lJitv lugt-Vreed-en-hoop/Vreed -
en-hoop--PoLosi and. Canal Rds. 20.0 .0 7.0 6.0 2.0 20.0Georgetown Ap'Droaches (incl. Greater Georgetown
Roads) 10.4 .3 .1 .6 :3.0 .3.0 3.4 10.L New Amsterdam Approaches 4.0 .1 .1 .3 .1.4 2.1 4.0Feeder Roads kincl. local authorities) 2.0 .2 .8 1.0 2.0Interior - Phase I - Wismar/Rockstone 4.2 .2 *5 L.5 2.0 4.2
- Phase II - Rockstone/Mah.dia 7.0 .1 .2 L.{4 2.3 3.0 7.0- Phase III - Feasibility/Engineering
for Other Phases 1.0 .L4 .3 .3 1.0- Phase IV - Bartica-Rockstone Junction 2.0 .2 .8 L.0 2.0
16. Communications 19.6 4 .5 10.3 1.O .7 3.1 19.6Fnase I TY7 77 10. 3 L.0 i.Phlase II 3.8 .7 3.1' 3.8
Social Services 126.3 5.1 15.2 14.8 1 .1. 26.0) 25.5 105.7
17. Water Supply 38.3 1.5 7.3 5.5 l.9 _5.2 ,L4.5 28.9Rural Water Supply - Phase IA 7.0 1- T.3 L.2 7.0
- Phase IB 6.0 3.0 3.0 6.0- Phase II 9.5 1L.O 1J.5 14.0 9.5- Fhase III 9.2 1. 2 4.5 5.7
Greater Georgetown Extension .7 .3 .4 .7
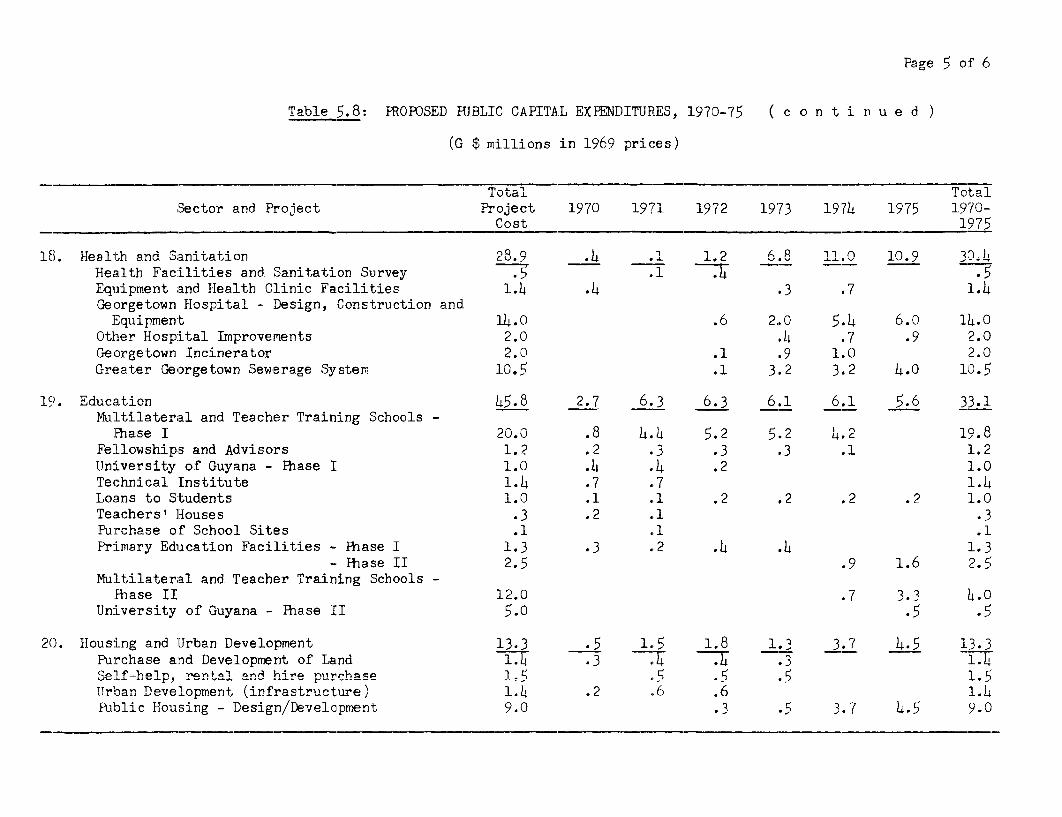
Page 5 of 6
Table 5.8: PROPOSED FUBLIC CAPITAL EXPENDITURES, 1970-75 ( c o n t i n u e d
(G $ millions in 1969 prices)
'oS a-. TotalSector and Project Project 1910 1971 1972 1973 1974 1975 1970-
Cost 1975
18. Health and. Sanitation 28.9 .r. 1.2 6.5 11.0 10.9 30.)Health Fac:ilit:ies and Sanitation Survey .5 .1 .5
Equipment and lHealth Clinic Facilities 1.4 .4 .3 .7 1.4Georgetown Hospital - Design, Construction and.
EIquipment 1L4.0 .6 2.0 5.4 6.0 114.0Other Hospital Improvements 2.0 C14 .7 .9 2.0Georgetown Incinerator 2.0 .1 .9 1.0 2.0Greater Georgetown Sewerage System 10.5 .1 3.2 3.2 4.0 10.5
19. Education 45. 8 2.7 6.,3 6.3 6.1 6.1 5.6 33.1Mu:tilateral a:nd Teacher Training Schools -
Phase I 20.0 .8 4.,4 5.2 5.2 4.2 19.8Fe:Llowships and Advisors 1.2 .2 .,3 .3 .3 .1 1.2University of' Guyana - Phase I 1.0 . 4 .14 .2 1.0Technical Institute 1. 4 .7 .7 1.4Loans to Stude:nts 1.0 .1 .1 .2 .2 .2 .2 1.0Teachers I Houses I; .2 .1 .3Purchase of Sc:hool Sites .1. 1 .1Primary Education Facilities - Phase I 1.3 .3 .2 .,4 .14 1.3
- Fhase II 2.5; .9 1.6 2.5Multilateral and. Teacher Training Schools -
.Phase II 12.0 .7 3.3 4.0University of lauyana - Phase II 5.0 .5 .5
20. HousiLng and Urban Development 13.3 .5 1.5 1.8 1.3 3.7 4.5 13.3Purchase and Development of Land T . .3 T .3 1Se:Lf-help, rental and hire purchase 1.5 . .5 .5 1.5Urban Development (infrastructu3re 1 1 .2 .6 .6 1.4Public Housing - Design/Develcpmert 9.0 .3 .5 3.7 4.5 9.0
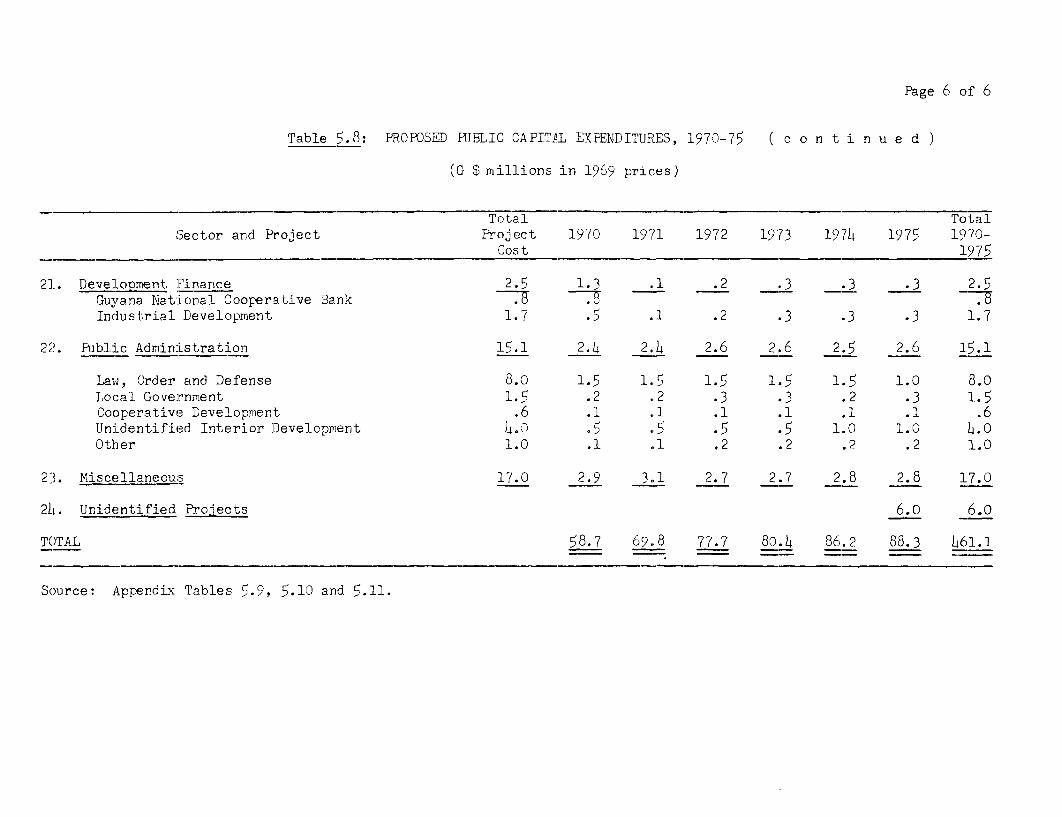
Page 6 of 6
Table 5.8: PROPOSED KIJBLITC CAPITAL EXPEND1ITURES, 1970-75 ( c o n t i n u e d
(G $ millions in 1969 prices)
Total TotalSector and Project Prtoject 1970 19 71 19'72 1973 1974 1975 1970-
Cost, 1975
21. Development Finance 2. E) 1. 3 l,1 .2 _,3 .3 .3 2.5Guyana Nat-Lona:l Cooperative Bank . ,7Inclustrial Developiment 1.7 .5 .1 .2 .3 .3 .3 1.7
22. Public AdminiLstration 15.1 2.4 2.,4 2.6 2.6 2.5 2.6 15.1
Law, aOder and Defense 8.0 1.,5 1.5 1.,5 1.5 1.5 1.0 8.0Local Government 1.5 ..2 .2 ,.3 .3 .2 .3 1.5Cooperative De-velopment .6 . 1 ..1 .1 .1 1 .1 .6Unidentified Interior Development .C) .,5 .5 .5 .5 1.0 1.0 h.0Other 1.C) .,1 Il1 .2 .2 .2 .2 1.0
23. Miscellaneous 17.C) 2.9 3,,1 2,.7 2.7 2.8 2.8 17.0
2Li. Unidentified. Projects 6.o 6.0
TOTAL 58,7 69.,8 77.7 8o. b 86.2 88.3 461.1
Source: Appendix Tables 5.9, 5.10 and 5.11.
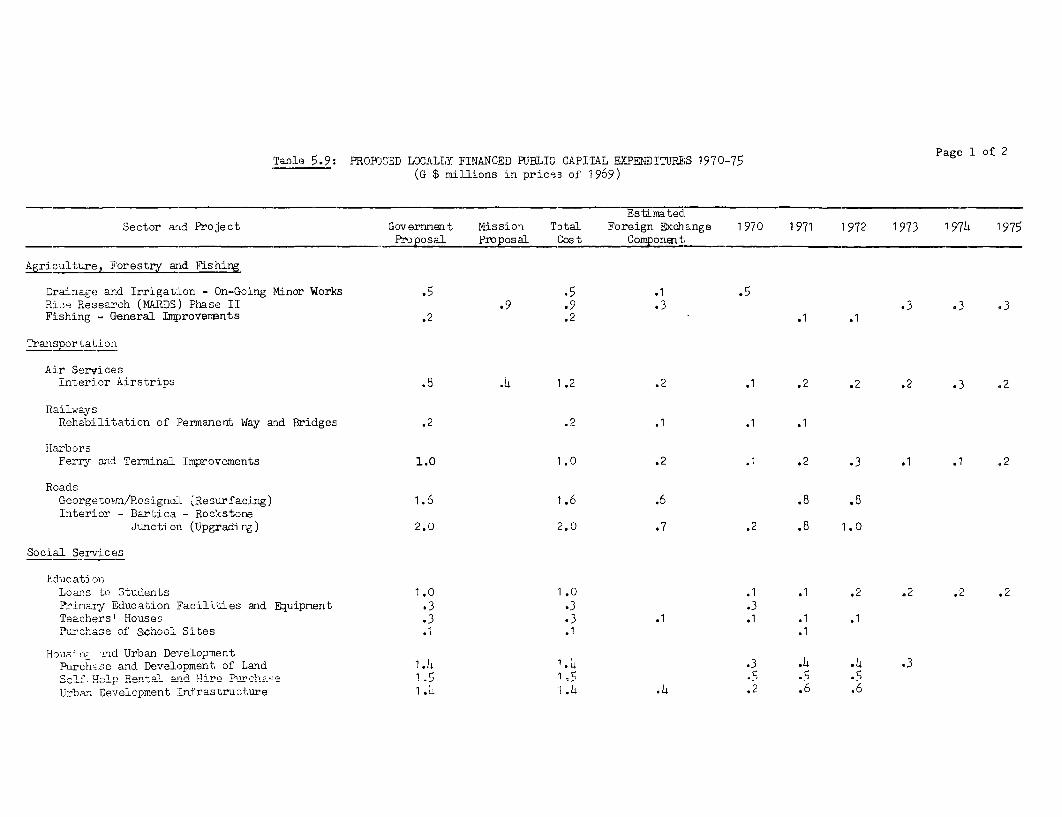
Table 5.9: PRO)E>SMD LOCALLY FINANCED RJBLIC CAPIT.AL EXPENDITUREIS 19770-75 Page 1 of 2(G $ millions in prices of 1969)
EstUjmated.Sector and Project GoverrTent Mission Total Foreign. Ecch_nge 1970 1971 1972 1973 1 974 1975
____________,al _oposa_l Cost Component,
Agriculture, For esy id Fis hing
Draina.ge and IrrigatiLon - On-Going Minor Works r .5 .1
Ric- Research (MARDS) Phase II .9 .9 .3 *3 .3 .3Fishing - G-eneralL I)roveirsnts .2 .2 .1 .1
Transportation,
Air Services
Interior Airstrips . 4 .L 1.2 .2 .1 .2 .2 .2 .3 .2
Railways
Rehabilitation of Permanent 'Way arid Bridges .2 .2 .1 .1 .1
Harbors
Ferry anrI Termwinal Improvements 1.0 1.0 .2 .1 .2 .3 1 1 ..2
Roads
Georgeto.wn/Rosignol. 'Resurfacing) 1.6 1.6 .6 .8 .8Interior - Bartica - RozXstone
Junctioni (Upgrading) 2.0 2.0 .7 .2 .8 1.0
Social Services
Educ ati on
Loans So Students 1.( 1.0 .1 .1 .2 .,2 .2 .2
Priirary Educat;ion Facili.ies and Equipment .3 .3 .3Teachers' Houses .3 .3 .1 .1 .1 .1Purchase of sShool Sites .1 .1 .1
HoU3 - c-._ d arl Urban Development
Purch.se and Development of Land 1.14 1.4 .3 .4 .4 .34U-~T Hslp ~ R l- T4i B 1 t. 1 ., .5 .5
Urb,n Developmrent :Infrastructure 1 .4 I 4 .4 .2 .6 6
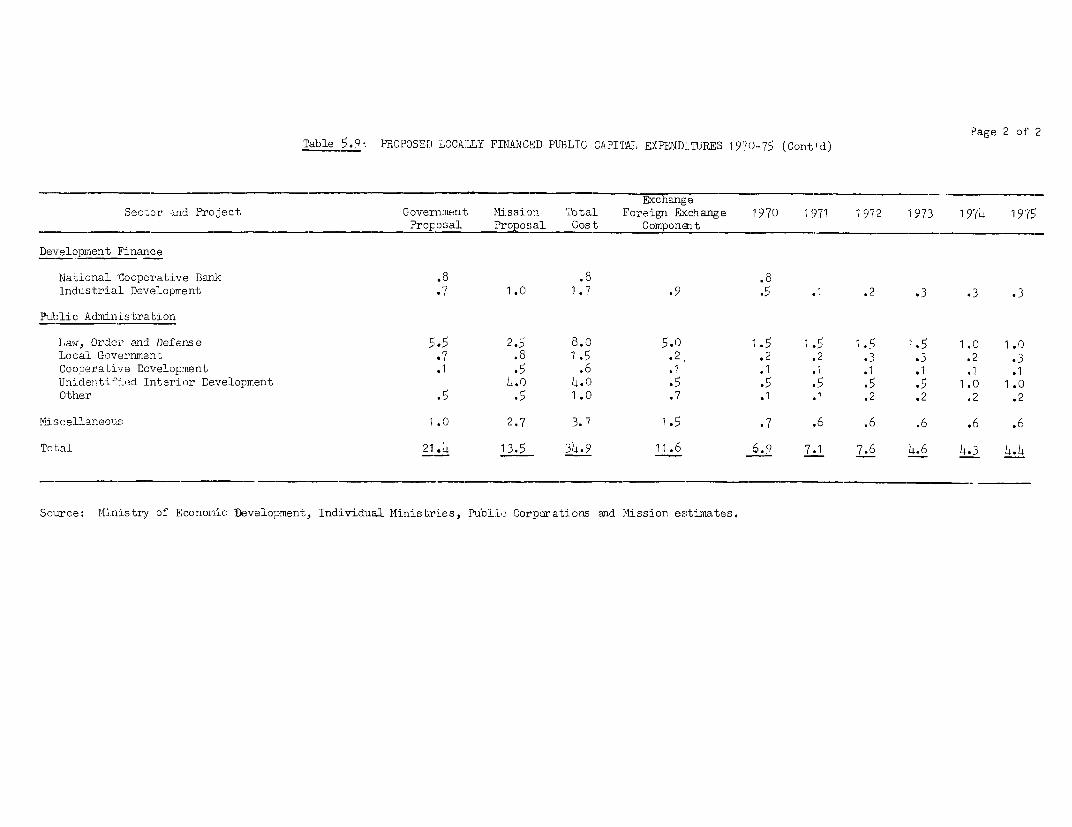
.Page 2 of' 2
Table 5.9 PROPOSED LOCA:LLY FINANCED PUBLIC CAPITAL EXPENDITURES 1970-75 (Cont'd)
ExchangeSector a-d Project Government Mission Total Foreign Exchange 1970 1'971 1972 1973 1 974 197';
_____-~____ _Proposal Pro2o al Cost Component __ __
Derelopment 'Finance
National 'Cooperative Bark .8 .8 .8Industrial Development .7 1.0 1.7 .9 .5 .1 .2 .3 .3 .3
Public Administration
Law, Order and Defense 56 2.5 8.0 5.0 1.5 1. 1 1.5 1.0 1.0
Loca:L Government .7 .8 1.5 .2 .2 .2 .3 .3 .2 .3Cooperative Development .1 .5 .6 .1 .1 .1 .1 .1 .1 .1Unidentif'icd Interior Development 4.o 4.0 .5 .5 .5 .5 .5 1.0 1.0
Other .5 .5 1.0 .7 .1 .1 .2 .2 .2 .2
Miscellaneous 1.0 2.7 3.7 1.5 .7 .6 .6 .6 .,6 .6
Tot,al 21.4 13.5 34.9 11.6 6.9 7.1 7.6 4.6 4,3 4 .4
Source: Ministry of EconomiLc T)evelopment, Individual Ministries, Public Corporations and Mission estimates.
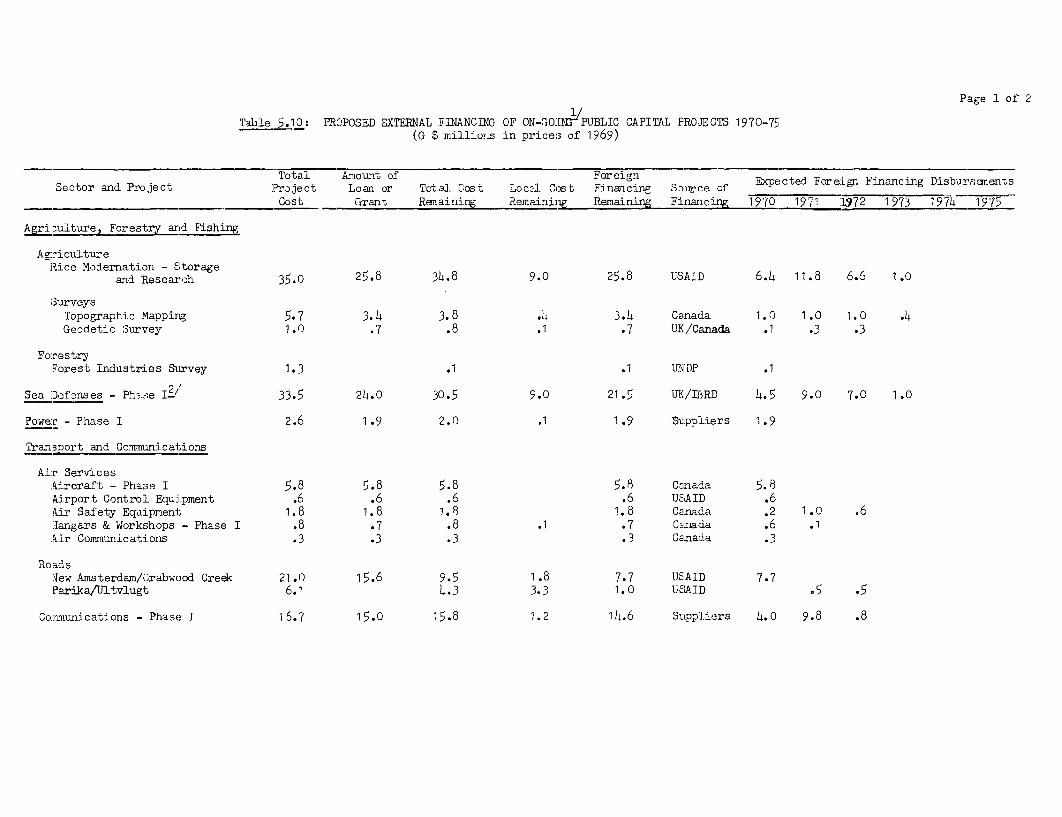
Page 1 of 2
Table 5.10: PRDPOSED EXTERNAL FINANCING OF ON-GO:IM-"P1JBLIC CAPITAL PROJECTS 1970-75(G $ mil.lions in prices of 1969)
Tota.l Amount of ForeignSector and Project Pro .je t Loan or Total. Cost Loc-l Cost Financing Soimrce of Expected Foeign Financing Disbursements
________ Cost Grant Remaining RemainiW Remaining Financi.ng 1970 19P L,72 1973 1974 19797
Agri ulture, Forestry and Fishing
AgricultureRice Modernaticn - Storage
ani Research 35.0 25.8 34.8 9.0 25.8 USAID 6.4 11.8 6.6 1.0
SurveysTopographic Mapping 5.7 3.4 3.8 .4 3.4 Canada 1.0 1.0 1.0 .4Geodetic 3urvey 1.0 .7 .8 .1 .7 UK/Canada .1 .3 .3
Fo:restr;yForest Industries Survey 1.3 .1 .1 UNlJP .1
Sea :Defsrses - Ph' ie I2/ 33.5 24.0 30.5 9.0 21.5 UK/Dn3RD 4.5 9.0 7-0 1.0
Power - Phase I 2.6 1.9 2.0 .1 1.9 EBppliers 1.9
Transporti and ComTannications
Air ServicesAircraft - Phase I 5.8 5.8 5.8 5.8 Canada 5.8Airport Control Equipment .6 .6 .6 .6 USAID .6.Air Safety Equiipment 1.8 1.8 1.8 1.8 Caenada .2 1.0 .6Hangars & Workshops - Phase I .8 .7 .8 .1 .7 C.anada .6 .1Air Communications .3 .3 .3 .3 CaLnada .3
Roads.New Amsterdam/Crabwood Creek 21.0 15 .6 9.5 1.8 7.7 USAID 7.7Parika/Ultvlugt 6.1 4.3 3.3 1.0 USAID .5 .5
Communications - Phase I 16.7 1,.0 15.8 1.2 i4.6 Suppliers 4.o 9.8 .8
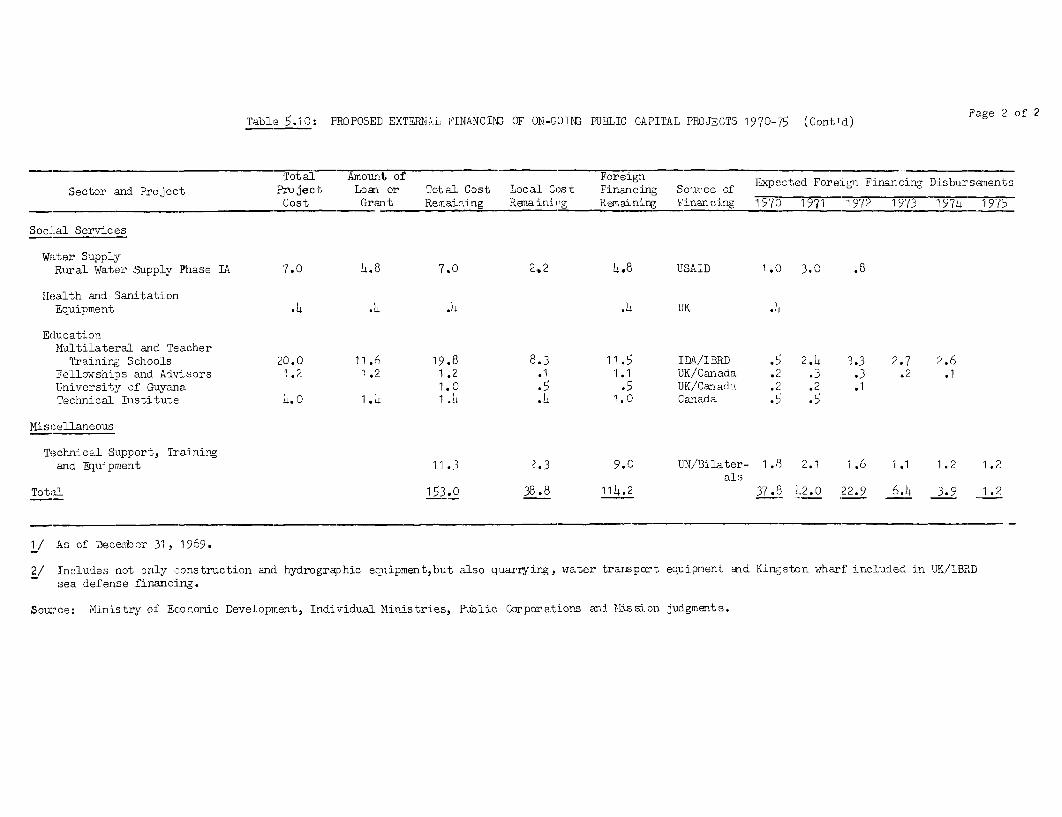
Table 5.10: PROPOSED EXTERl;iAr i'LNANCEl\Z OF ON-GOIN PUBLIC CAP'ITAL PROJECTS '1970-75 (Cont'd) Page 2 of 2
Total Amount of Foreign Expected Foreign Financing DisbursenertSSector and Project Pr j3ct Loan or Total Cost Local Cost FinancinA Source of
Cost Grant Renaining Recainilig Remainirng Financi ng 1970 19T71 T972 1973 19774 19 i
Soci-al Services
Water Suppl;yRural Water Supply Phase IA 7.0 4.8 7.0 2.2 4.8 USAID 1.0 3,0 .8
Health and SanitationEquipment .4 .4 .4 .4 UK It
Educat:ionMaltilateral and Teacher
Training Schools 20.0 11.6 19.8 8.3 11.5 IDA/IEBRD .5 2.4 3.3 2.7 2.6Fellowshi.ps and Advisors 1.2 1.2 1.2 .1 .1 UK/Canada .2 .3 .3 .2 .1Universit;y of Guyana 1.0 .5 .5 UK/Canadli. .2 .2 .1Technlical Institute 4.0 1.4 1 .4 .4 1. 0 Canada .5 .5
Miscellaneous
Technical S-apport, Trainirgand 'Equipment 11.3 2.3 9.0 UN/13ilater- 1.8 2.1 1.6 1.1 1.2 1.2
alsTotal 153.0 38.8 114.2 37.8 42.0 22.9 6.4 3.9 1.2
1/ As of Decerber 31, 1969.,
2/ Inclades not only construction and hyd:rographic eqrLiFpment,but also quarrying, water trarnsport equipment ancd KiiLnston wharf included in :K/IBERDsea defense financing.
Souwce: Ministry of Econoirc Developmnent, Individual Min.istries, Public Corporations and Missicn judgments.
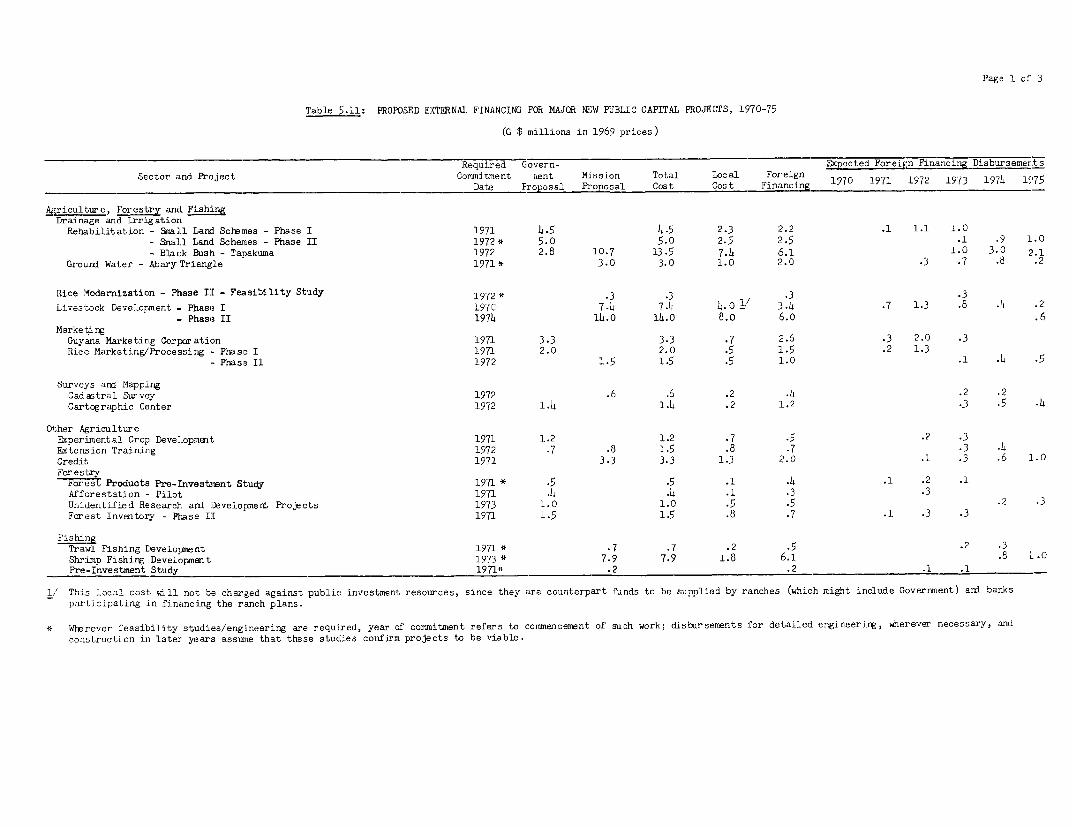
Page 1 of 3
Table 5.11: PROPOSED E:ITERNAL FINANCING FOR MAJOR NEW PUBLIC CAPITAL PROJECTS, 1970-75
(G $ millions in 1969 prices)
Required Govern- xected Foreig nancing DisbursementsSeCtor aLnd Project Commitment sent MiLssion Total Loc al For-eign
Date Proposal Proposal Cost Cost Financing 1970 1971 1972 1973 1974 1975
Agriculture, Forestry andl Fish:iDrainage and Irrig atiorn
Rehabilitation - Small Lani Scirrmes - Phase I 1971 4.5 4.5 2.3 2.2 .1 1.1 1.0- Small Land Schemes - Phase II 1972* 5.0 5.0 2.5 2.5 .1 .9 1.0- Black Bush - Tapakuma 1972 2.8 10.7 13.5 7.4 65.1 1.0 3.0 2.1
Ground Water - Abary Triangle 1971* 3.0 3.0 1.0 2.0 .3 .7 *o .2
Rice Modernization - Phase II - Fea3sibility Study 1972 * .3 .3 .3 .3Livestock Development - Phase I 1970 73-4 7-4 4-° % 3.4 *7 1.3 .8 .4 .2
-- Phase II 1974 14.0 14.0 8.o 6.0 .6Marke ti ng
Guyana Marketing Corporation 1971 3.3 3.3 .7 ,2.6 .3 2.0 .3Rice Marketing/Processing - Phase I 1971 2.0 2.0 .5 I1.5 .2 1.3
- Phase II 1972 1.5 1.5 .5 1.0 .1 .14 .5
Surveys and MappingCadastral Survey 1972 .6 .6 .2 .4 .2 .2Cartographic Center 1972 1.4 1.4 .2 1.2 .3 .5 .4
Other AgricultureExperimental Crop Development 1971 1.2 1.2 .7 .5 .2 .3Extension Trainirng 1972 .7 .8 1.5 .8 .7 .3 .4Credit; 1971 3.3 3.3 1.3 2.0 .1 .3 .6 1.0For es-try
77-3-7 Products Pre-Investeent Study 1971* .5 .5 .1 .4 .1 .2 .1Afforestation - Pilot; 1971 .4 .4 .1 .3 .3Unidentified Research and Development Projects 1973 1.0 1.0 .5 .5 .2 .3Forest Inventory - Phlase II 1971 1.5 1.5 .8 .7 .1 .3 .3
Fis hingETrawl Fishing Development 1971 .7 .7 .2 .5 .2 13Shrimp Fishirg Development 1973 7.9 7.9 1.8 6.1 .8 4.0Pre.-Investment Study 1971* .2 _ .2 .1 .1 -
1/ This local cost, wll not be charged against public investment resources, since they ELre counterpart funds to be supplied by ranches (which might include Government) and banksparticipating in financing the ranch plans.
* Wierever feasibility studies/engineering are required, year of' commitment refers to commencement of such work; disbursements f'or detailed engireering, wherever necessary, andconstruction in later years assume that these stuCies confirm projects to be viable.
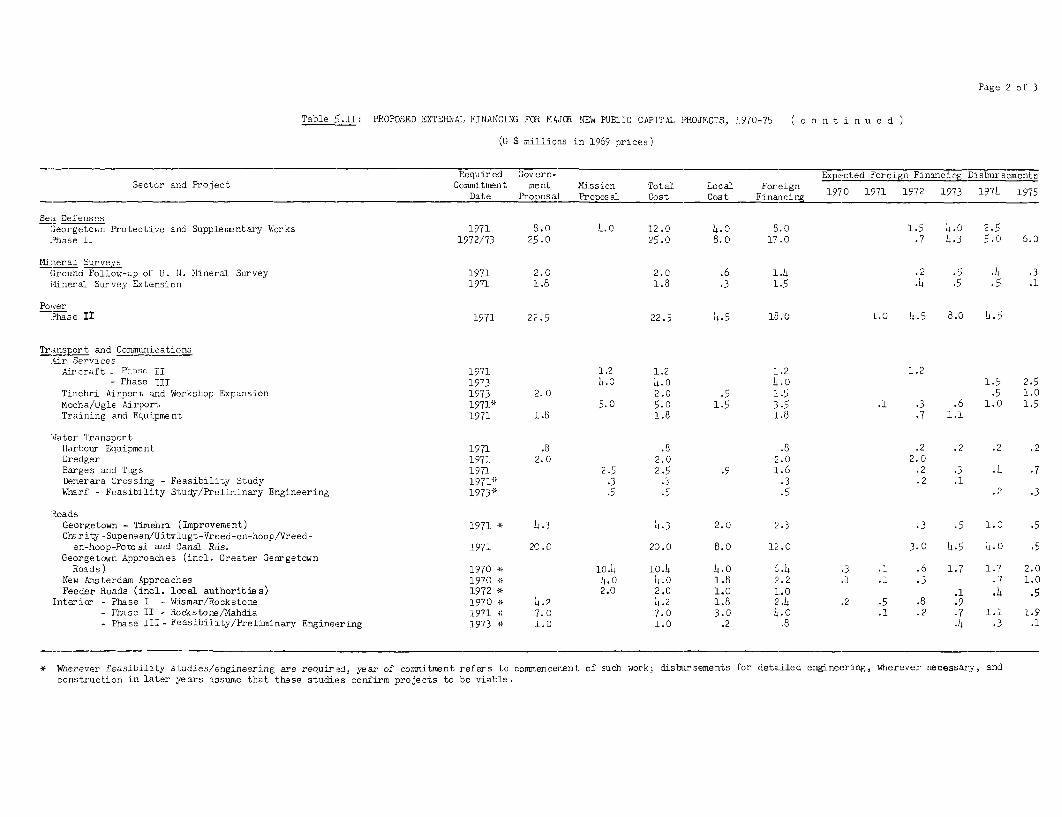
Page 2 of 3
Table '5.11: PROPOSED EYTERNAL FINANCING FCR MAJOR NEW PUBLIC CAPITAL P'ROJECTS, 1970-75 ( c o n t i n u e d
(G $ millions in 1969 prices),
Requir ed Govern- Expected Foreign Finsncing DisbursementsSector anid Project Commitment ment Mission Total Local Foreign 1970 1971 ?972 1973 1975 1975
Date Pr-oposaL Prop)osal Cost Cost Finanicing 9 91 172 17 9L 9
Sea DefensesGeorgetown Protective and Supplerentary Works 1971 8.0 4.0 22.0 I.o 8.0 1.5 4.0 2.cPhase II 1972/73 25.0 25.0 8.0 17.0 .7 4.3 5.C) 6.0
Mineral SurveysGround Follow-up of U. N. Mineral Survey 1971 2.0 2.0 .6 1.4 .2 .j .4 3Mineral Survey Extension 1971 1.8 1.8 .3 1.5 .4 .5 .5 1
PowerPhase II 1971 22.5 22.5 4.5 18.0 1.0 5.5 8.0 5.5
Transport and Commuriications4ir Services
Aircraft - Phiase II 1971 1.2 1.2 1.2 1.2- Phase III 1973 5.0 4.0 4.0 1.5 2.5
Timehri Airport and Workshop Expansion 1973 2.0 2.0 .5 1.5 1.0Mocha/Ogle Airport 19714 5.0 5.0 1.5 3.5 .1 .3 .6 1.( 1.5Training and Equipment 1971 1.8 1.8 1.8 .7 1.1
Wlater TransportHarbour Equipme nt 1971 .8 .8 .8 .2 .2 .2 .2Dredger 1971 2.0 2.0 2.0 2.0Barges and Tugs 1971 2.5 2.5 .9 1.6 .2 .3 .Is .7Demerara Crossing - Feasibility Study 1971*S .3 .3 .3 .2 .1Wharf - Feasibility Study/Preliminary Engineering 1973* .5 .5 .5 *2 .3
RoadsGeorgetown - Tinlehri (Improvement) 1971 * 4.3 4.3 2.0 2.3 .3 .5 1.0( .5Charity -Supenaar/Uitv.Lugt-Vreed-en-hooF,/Vreecd-
en-hoop-Potosi and Canal Rds. 1971 20.0 20.0 B.o 12.0 3.0 4.5 4-0 .5Georgetown Approaches (incl. Greater Georgetown
Roads) 1970 * 10.4 10.4 [.0 6.5 .3 .1 .6 1.7 1.7 2.0New Amsterdam Approaches 1970 * 4.0 4.0 1.8 2.2 .1 .1 .3 .7 1.0Feeder RoaLds (ineel. 10cal authoritie s) 1972 * 2.0 2.0 1.0 1.0 .1 .Is .5
Interior - P'hase I - Wismar/Rockstone 1970 * 5.2 4.2 1.8 2.5 .2 .5 .8 .9- F'hase II - Rockstor.e/Mahdia 1971 * 7.0 7.0 3.0 4.0 .1 .2 .7 1.1 1.9- P'hase III- Feasibility/Prelimrnary Engineering 1973 * 1.0 1.0 .2 .8 .4 *3 .1
* Wherever feasibility studies/engineering are required, year of commitment refers to co(mencement of such work; disbursements for detailed engineering, wherever necessary, andconstruction in later years assume that these studies confirm projects to be viabDle.
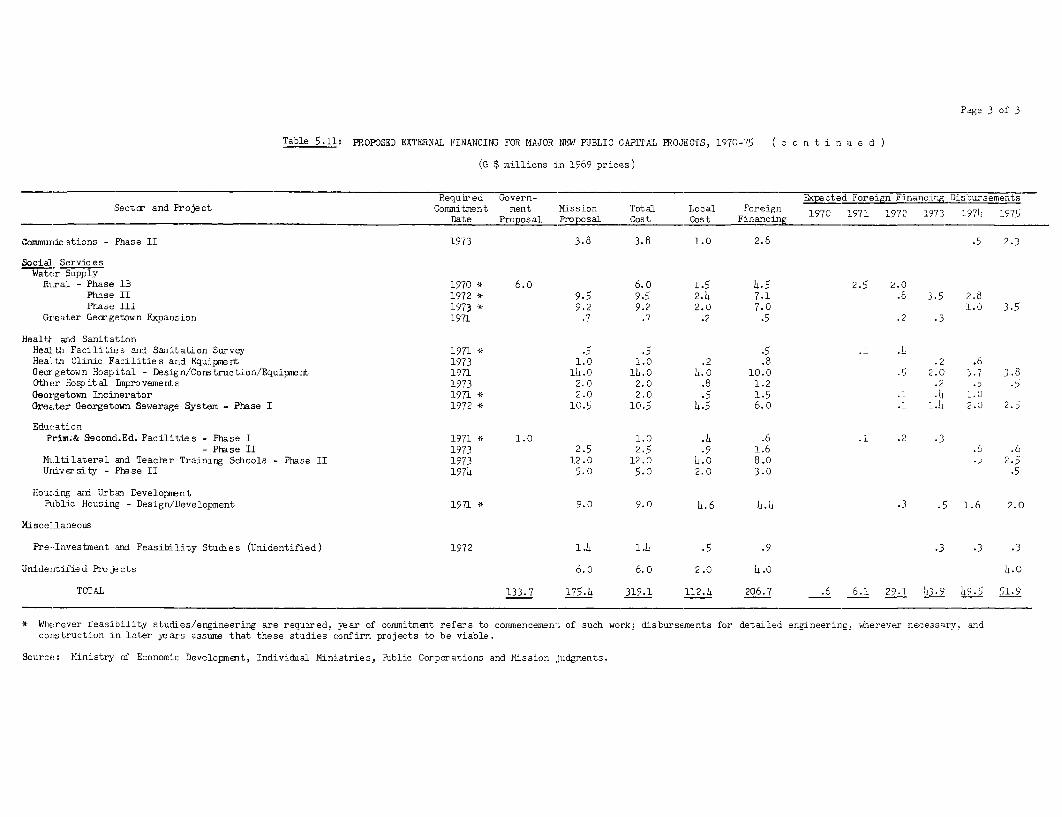
Page 3 of 3
Table 5.11: POPROSED EXTERNAL FINANCING FOR MAJOR NEW PUBLIC CAPiTAL PROJEWCTS, 1970-75 ( c o n t i n u e dl
(G $ millions in 1969 prices)
Required Govern- Rcpected ForET Ff illl i ursementsSector and Froject. Comitment ment Mission Total Local Floreign 1970 1971 1972 1973 1976 1975
_ __ CLDa-te Proposal Pposal Cost Cost Financing -1970 1971 -1972 1973 1-____1975
Communic ations - Phase II 1973 3.cl 3.8 1.0 2.8 5 2.3
Social ServiLcesWater Supply
RuLral - Phase IB 1970 * 6.o 6.o 1.5 4.5 2.5 2.0Phase II 19'72 * 9.'5 9.5 2.4 7.1 .8 3.5 2.8Phase III 1973 * 9.2) 9.2 2.0 7.0 L.0 3.5
Greater Georgetown Expansion 1971 .7' .7 .2 .5 .2 .3
Health and SanitationHealth Facilities and Sanitation Survey 19'71 * .5' .5 .5 .1 .LHealth Clinic Facilities and Equipment 1973 1.0 1.0 .2 .8 2 .6Oeorgetown Hospital - Design/Conrtraction/Equioment 19'71 1i.0 16.0 6.0 10.0 .5 2.0 3.7 3.8Other Hosr ital ImaprovemertE 1973 2.0 2.0 .8 1.2 .2 .5 *5Georgetowl Incinlerator 1971 a 2.0 2.0 .5 1.5 .1 .4 L.OGreater Georgetown Sewerage System - Phase I 1972 * 10.5 10.5 4.5 6.0 .1 -.4 2.0 2.5
EducationPrim.& Second.Ed. Facilities - Phase I 19'71 * 1.0 1.0 .4 .6 .1 .2 .3
- Phase II 1973 2.5j 2.5 .9 1.6 .6 .6Multilateral and Teacher TrainLng Schools - Phase II 1973 12.0 12.0 4.0 8.0 *5 2.5University - Phase II 1974 5-0 5.0 2.0 3.0 .5
Housing and Urban DevelopmentPEublic Housing - Sesign/Development 1971 9.( 9.0 L.6 4.4 J .5 l.6 2.0
Miscel laneous
Pre--Investment and Feasibility Stuudies (Unidentified) 1972 1.6 1. .5 .9 .3 .3 .3
Unidentified Pro je-cts 6.0 6.0 2.0 4.0 6.0
TOTA-L 133.7 175.I 319.1 112.4 206.7 .6 6.1 29.1] 3.9 69-5 51.9
* Wherever feasibility studies/engineering are required, vear of commitment refers to commerncement. of such work; disbursements for detailed engineerirg. wherever necessary. andconlstruction in later years assume that these studies confirn projects to be viable.
Source: Ministry of Economic Development, Individual Ministries, Public Corporations and MiEsion judgments.

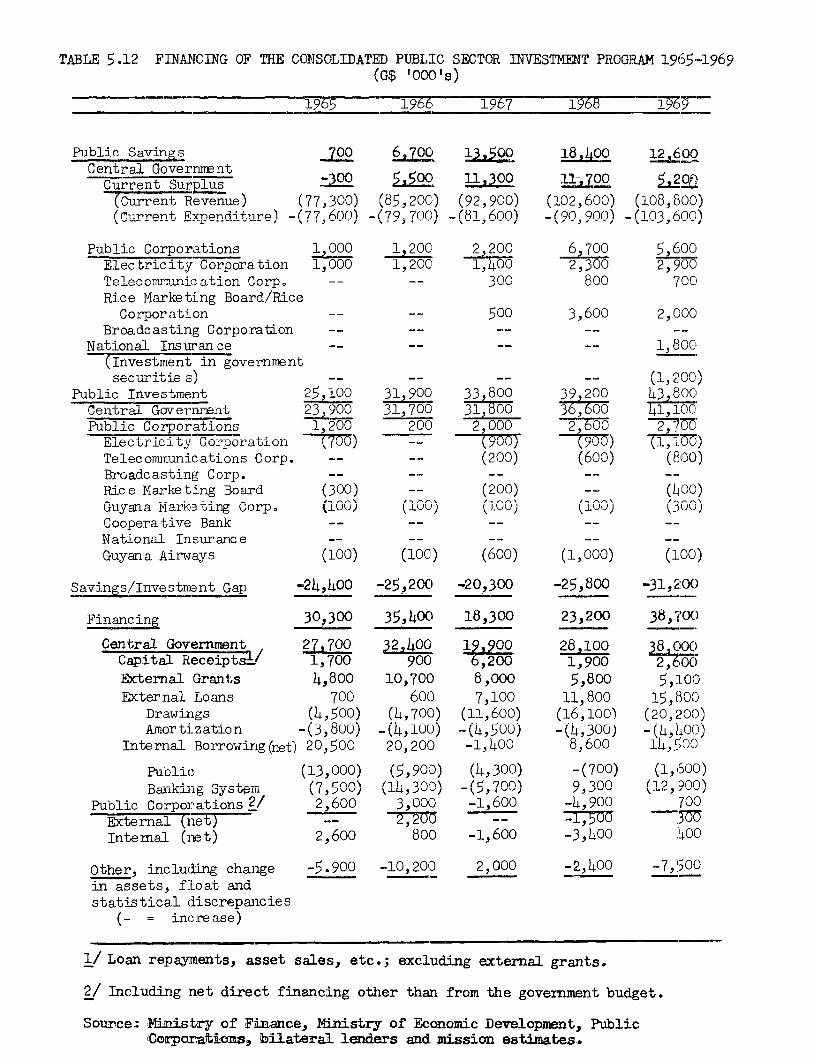
TARLE 5.12 F [TL!cGTNG OF Ti GCNSO UA.TED PTTLPTT . SW.TCr. TNV.qSTMiT PRnPpAm 1965-1969(G$ 'OOO's)
1965 1966 1967 1967 196T7
Public Sqvinps ,700 6.700 1a 00 18iiAm -i9 -Aor
Central Governmentrlurre nt 52ir52n
(Current Revenue) (77,300) (85,200) (92,900) (102,600) (108,800)
('Current Expenditure) -(77,600)n -(79,700) -(81,0nn) -(90cn-nn) -(103,600)
Public Corporations 1,000 nnC 2,200 6,700 5,6
Electricity Corporation 1,000 1,200 1,400 2,300 2,900Telecommun1ic ation Corp0 == -- 300 800 70C'
Rice Marketing Board/Rice(Corporati,OI1 ==rn ==n 500nn 36 2
Broadcasting Corporation -- -- - __ =_
National. Irr&c 1,800rJ'JTd.U..LU -IJ,J. .i-J - It .LLtA - -- .. tJ..t
(Investment in governnentsecu.iiUie Ui -- -- -- k C\ vv
Public Investment 25,100 31,900 33 800 39 200 43 80CICentbral Go-vernument 23go900IU- ~L uv -U 31,70C 41,80 3660 rvUu
Public Corporations 1P200 200 2 000 2600 2,700- - -- - - -- -4~~~~~~~~~~~~~~r -- ,- -77,
Electricity Corpora'U'lon 0(Uu) -- tyuu) I00u,,
Telecommunications Corp. -- -- (200) (600) (800)Broadcasting Corp. ---- -- --
Rice Marketing Board (300) -- (200) -- (OC0)Guyana Marketing Corp. (100) (10U) (100\) (0\) (300)Cooperative Bank -- __ __ -- __
National Insurance -- -- -_ _- --
Guyana Airways (100) (100) (600) (1,000) (100)
Savings/Investment Gap -24,400 -25,200 -20,300 -25,800 -31,20)
Financing 303000 35,400 18,300 23,200 38,,"(Y
Central Government 27700 32400 9 28,100 1400Cqpi+^5 Receiptslt 1,~~~~~700 32900 v,L38,90 cvu
External Grants 4,800 10,700 8,000 5,800 5,LOO
External Loans 700 600 7,100 11,800 15,O50Drawings (4,500) (4,700) (11,600) (16,100) (20,200)Amortization -(3,800) -(4,100) -(4,500) -(4,300) -(4,400)
Internal Borrowing(net) 20,500 20,200 -1,400 8,600 14,500
Public (13,000) (5,900) (4,300) -(700) (1,600)Ban -i 07 r'r rn\ ( I I, .7Cr~ o J), - 7flC 0 O (1Q Qflfl'
Banlll Sy wrr.l (,500) "--,J 0l)- =(5",70 I,0 -- J /00Public Corporations 2/ 2,600 3,000 -1,600 -4,900 '700
External (net -- c-- -
Internal (net) 2,600 800 -1,600 -3,400 400
Other, inclu(ing change -5.900 -10,200 2,000 -2,400 -7,500
in assets, f:Loat andstatistical discrepanlcies
= increase)
1/ Loan repayments, asset sales, etc.; excluding external grants.
2/ Including net direct financing other than from the government budget.
Source. Ministry of Finance, MinistrJ of Economic Development, Public{:Ot> +- -< ' l e A^sd^ 8_fi^


Table 5.13: PROJECTED FINANCING OF THE CONSOLIDATED PUBLIC SECTOR CAPITAL EXPENDITURES 1970-75(G $ millions in prices of 1969)
Actual- Total1969 - 1970 1971 1972 1973 1974 1975 1970-75
Consolidated Public Savings 12.6 30.4 29.6 32.6 37.4 31.4 31.1 192.1Central r fl}4. 5.2 13.0 14.0 1.0 20.5 119.6
(Current Revenue) 718 16280)1/ (13.0', (iUTL) (l70) (l) (164.0)(Current Expenditure)J (103.6) 115.0) (125.0) (13(.5) (136.0) (14L.0) (152.9)
Public Corporations 5.6 1 7.6 7.7 8.5 11.2 12.3 13.8 61.1Electricity Corporation 2.9 3940 770 4-5 4- 5.70 25-9le'Lecorme-ianicatilons Corp. 1.3 3.0 3.5 3.5 12.-
Rice Corporation/RMB 2.0 2.8 3.0 3.0 3.5 4.0 5.0 21.3Broadcasting Corporation .2 .2 .2 .2 .3 .3 1 .J
National Insurance 1.8 9.8 7.9 6.1 6.2 6.2 6.2 42.4
Plublic investment 43.O 50-. 79.8 77.7 800.4 86.2 00.3 4DI6.1Central Government 41.2 50.4 57.1 68.9 67.9 78.6 84.5 1407.14Piiblic Gornoratinns 2.6 8 3 12.7 T-8 7-6 .' -=7
Electricity Corporat:ion 1.1 2.0 1.2 -.7 10.0 7Telecommunications Corp .8 14.5 10.3 1.0 .7 3.1 19.6Broadcasting Corporal-ion .5 .1 .1 .7Rice Marketing Board .4 .4 1 .6 .2 .6 .7 3-5Guyana Ma.keting Co-p. 'a *. -) 3 . 3 -
Cooperative Bank 8 .,3National Insurance * 5 .8 1.3
Savings/Investment Gap 31.2 28.3 40.2 45.1 43.0 55.2 57.2 269.0
Financing 38.7 i 38.4 43.8 48.3 47.1 51.7 50.8 280.1Central Government 38.0 1 30.3 33.6 L41.1 39.0 Lh.3 )16.o 234.3
External Grants 5 - 5.0 7.0 7 30.0External Loans (nEt) 15.8 22.6 27.6 35.1 33.0 38.3 40.0 196.6
Drawings / (20.2)1(27-5) (31.8) (38.-4) (36-9) (1430) (45.3) (222.9)Amortizatiotn' -(4-14) 14.9) -114-2) -( 3.3) -( 3.9) 4( .7) -( 5-3) -( 26.3)
Internal Borrowing 14.5 1 .7Canital Reneints5/ 2.6 f 1.0 1.0 1.0 1.0 1.0 1.0 6.0
Public Corporations6 / .7 8.1 10.2 7.2 8.1 7.4 I4.8 45.8External (gross)7/ .3 5.9 8.63 -4 72Internal (net) .4 2.2 -1.i -1.4 -. 3 2.0 2.0 3.i4
9- rlus (=) or Deficit 7-3 -3-- 6=14 =1c.
1/ Retvised estimates, including adjustments for new revenue measures (G$6.0 millions) and additional revenues frofrcompanies (G$5.0 millions). See Table 5.5.
2/ From Table 5.5.
a/ Tnncl,in pubhlic copoaios
4/ From anticipated new ILnsurance company legislation.7/ Loan rna_mentsj Inttp.ripq. ete.; excluding external grants.i, Guyana Airways Corporation is included under Central Government.1/ Amortization is included under Central Goverrnment except in 1969.
Source: Mn--istr-y of Finance, Ministry of Economic Deve1opmInt. PTblirc Coporations, Bilateral lenders.Tables 4.3, 5.10, 5.11 and Mission estimates.

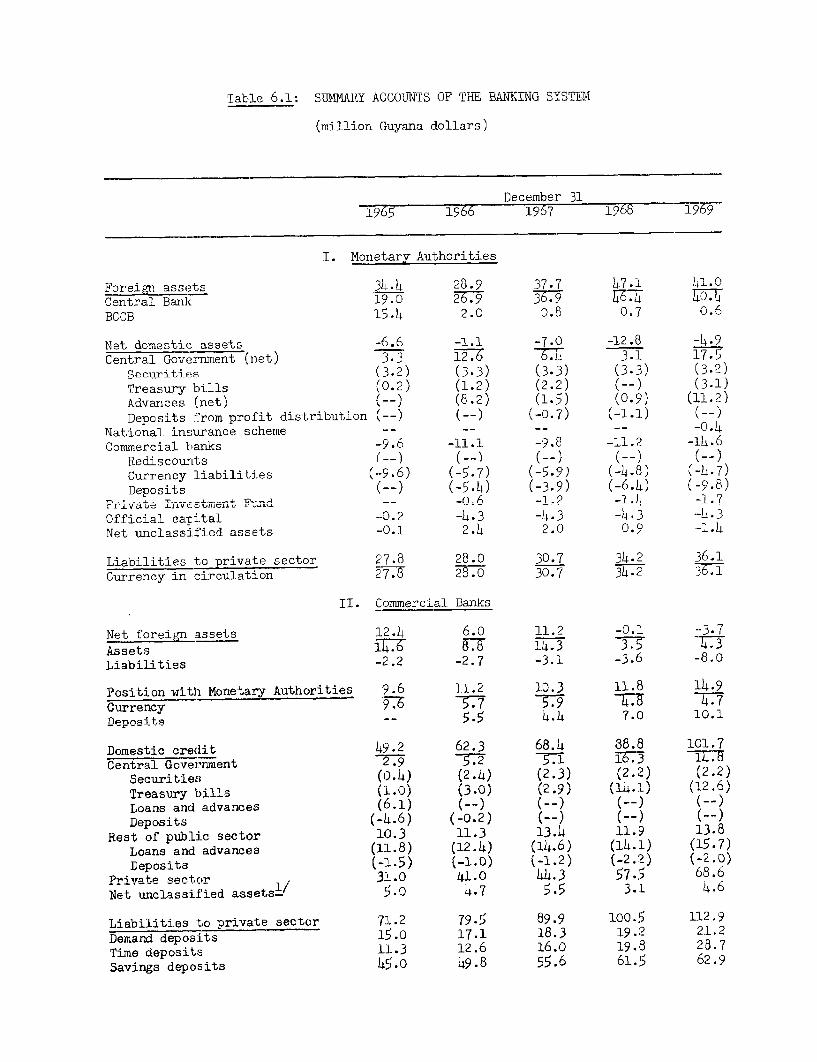
Table 6.1: SUMMARY ACCOUNTS OF TI-E BAANKTNG 5StTEM
kICllIl±uf Gu-tyar,a uullars)
December 311965 1966 1967 1968 1969
I. Monetary Authorities
Foreign assets 34-4 28.9 37.7 47.1 41.0
Central Bank 19.0 2C77 36.9 40.4f 1. 0 n 0 R n07 0.6
BCT,; i 4 -
1et- dmesti assets -6.6 -1.1 -7.0 -12.3 -4.9
Central Government (net) 3.3 12- 3.1 1Senwri ties (3.2) (3.3) (3.3) (3.3) (3.2)
Treasury bills (0.2) (1.2) (2.2) (--) (3-1)
Advances (net) (--) (8.2) (1.5) (0.9) (11.2)
Deposits from profit distribution (--) (--) (-0.7) (-i.1)
National insurance scheme -- -- -- -- -0.4Commercial banks -9.6 -11.1 -9.6 -11.2 -14.6
Rediscounts -- ) (-) (--) (--)-)
Currency liabilities (-96) (-.7) (-5.9) (-6.8) (-7)
Deposits Cc-) (-5.4) (-3.9) (-6.4) (-9.8)
Private Investment Ftxnd -1 -076 -1.2 -1.4 -1.7
Official capital --0.2 -4.3 -4.3 -4.3 -4.3
Net ,ncl asi fiJe-i a-nssets -- 0.1 2.1 2.0 0.9 -1.4
Liabilities to private sector 27.8 28.0 30.7 34.2 36.1
Currency in circulation 27.8 28.0 30.7 34.2 36.1
II. Commercial Banks
Net foreign assets 12.4 6.0 11.2 -0.1 -=3-7
Assets 14.6 8.8 14.3 4 3Liabilities . -2.2 .6
Position with Mornetary Aut.hnri tis 9.6 11.2 10.3 11.8 14.9
Currency 937 5.7 5.9 4.7
flnnnsi ts- 5.5 4.4 7.0 10.1
Domestic credit 49.2 62.3 68.4 88.8 101.7
Central Government 2.9 5.2 5.1 io.3 ±4.0
Securities (0.4) (2-4) (2.3) (2.2) (2.2)
Treasury bills (1.0) (3-0) (2.9) (16.1) (12.6)
Loans and advances (6.1) (--) (--) (--) (--)
Deposits (-4.6) (=0.2) (-_) (--) (--)
Rest of public sector 10.3 11.3 13.4 11.9 13.8
Loans and advanes (i-iAL) (12.L) (14.6) (14.1) (15-7)
Deposits (-1.5) (-1.0) (-1.2) (-2.2) (-2.0)
Private qeentnbr . 31.0 41.0 4.3 57.5 68.6
Net unclassified assetsY 5.o 4.7 5.5 3.1 4.6
Liabilities t,o private sector 71.2 79.5 89.9 100.5 1i2.9
Demand deposits 15.0 17.1 18.3 19.2 2.1.2
Time deposits 11.3 12.6 16.0 19.8 28.7Savings deposits 45.0 49.8 55.6 61.5 62.9
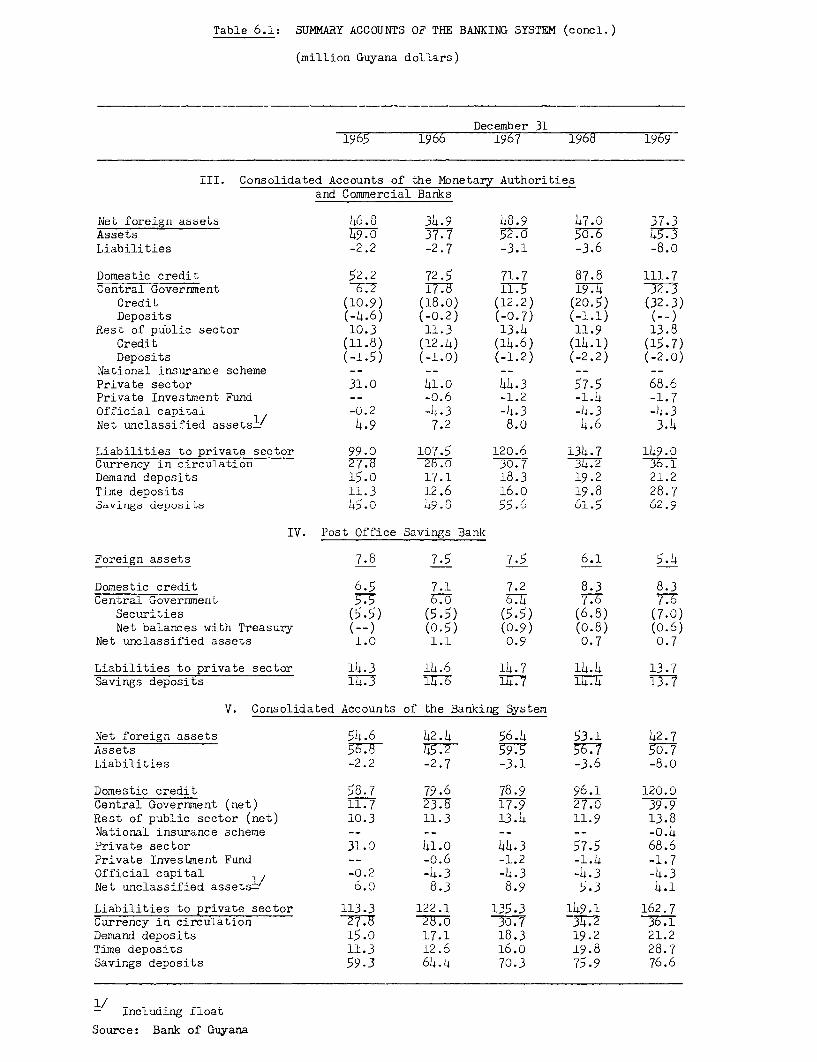
(million Guyana dollars)
196 Decera-ber 31 9d 161965 1966 1967 1960 1969
III. Consolidated Accounts of the Monetary Authoritiesand Commercial Banks
Net foreign assets 46.8 34.9 48.9 47.0 37.3Assets 49.o 37.7 52.0 50.6 45.
Domestic credit 52.2 72.5 71.7 87.8 111.7Central Government 67TT -11.5 19.4 32.3
Credit (10.9) (18.0) (12.2) (20.5) (32.3)Deposits (-4.6) (-0.2) (-0.7) (-1.1) (--)
Rest of Dublic sector 10.3 11.3 13.4 11.9 13.8Credit (11.8) (12.4) (14.6) (14.1) (15.7Deposits (-1.5) (-1.0) (-1.2) (-2.2) (-2.0)
National insurance scheme -- -- -- -- --
Private sector 31.0 41.0 44.3 57.5 68.6Private Investment Fund -- -o.6 -1.2 -1.4 -1.7Official capital -0.2 -4.3 -4.3 -4.3 -4.3Net unclassified assetsl/ 4.9 7.2 8.o 4.6 3.4
Liabilities to private sector 99.0 107.5 120.6 134.7 149.0Currency in circulation 27 9 77.-o 30.7 34.2 36.1Demand deposits 15.0 17.1 18.3 19.2 21.2Time deposits 11.3 12.6 16.0 19.8 28.7Savings deposits 45.0 49.8 55.6 61.5 62.9
TV Post Oflfirp Snvings Rnnk
Foreign assets 7.8 7.5 7.5 6.1 5.4
Domestic credit 6.5 7.1 7.2 8.3 8.3Central Government . (.u o.4 t.( [.0
Securities (5.5) (5.5) (5.5) (6.8) (7.0)Net balances with TreasR (-) (0.5) (0-9) (0.8) (0.6)
Net unclassified assets 1.0 1.1 0.9 0.7 0.7
Liabilities to private sector 14.3 14.6 14.7 14.4 13.7Savings deposits 14.7 1f247 14.4 T137
V. Consolidated Accounts of the Banking System
Net foreign assets 54.6 42.4 56.4 53.1 42.7Assets 56.o 15E77- 59.5 36T7 50.7Liabilities -2.2 -2.7 -3.1 -3.6 -8.0
Domestic credit 58.7 79.6 78.9 96.1 120.0Central Government (net) 11.7 TT 17.9 27.0 39.9Rest of public sector (net) 10. 1131.,A191.National insurance scheme -- -- -- -- -o.4Private sector 31.0 41.0 44.3 57.5 68.6Private Investmnent Fund -- -o.6 -1.2 -1.4 -1.7Official capital 1/ -0.2 -4.3 -4.3 -4.3 -4.3Net unclassified assets_' 6.0 8.3 8.9 5.3 4.1
Liabilities to private sector 113.3 122.1 135.3 149.1 162.7Currency in circulation 30.7 34.2 36.1Demand deposits 15.0 17.1 18.3 19.2 21.2Time deposits 11.3 12.6 16.0 19.8 28.7Savings deposits 59.3 64.4 70.3 75.9 76.6
i Including float
Source: Bank of Guyana
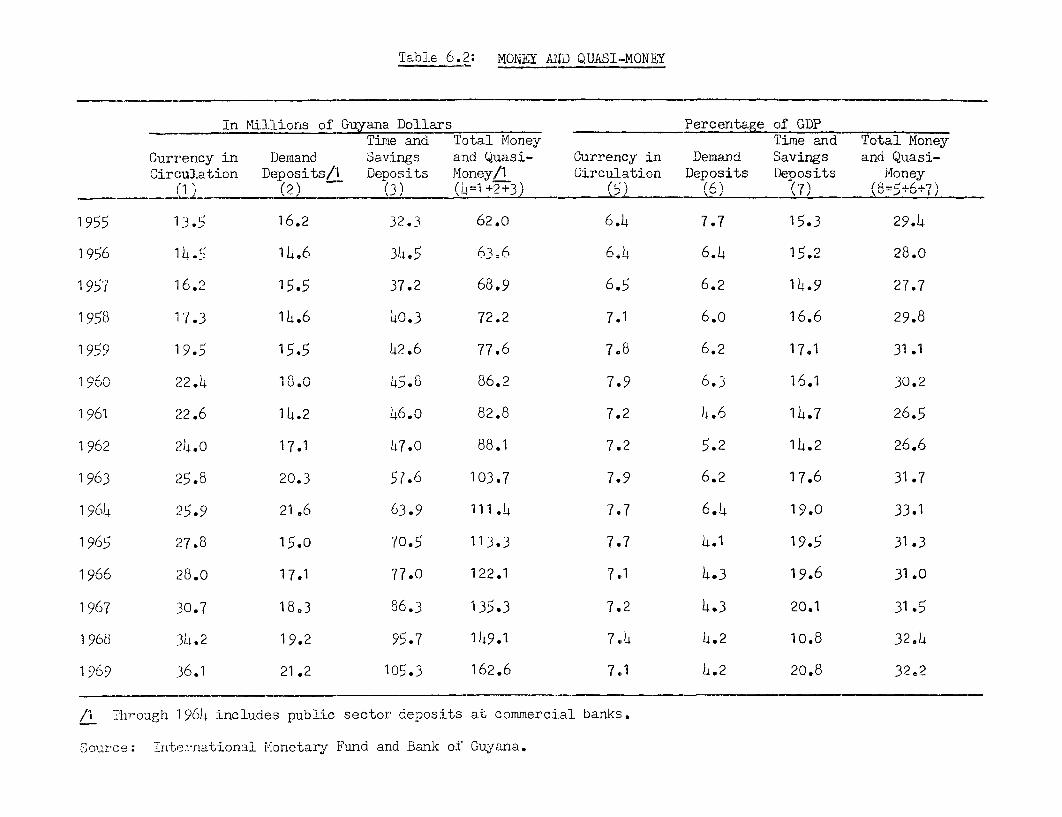
Table 6.2: MONIY ANiD QUASI -MONEY
In Millions of Guyana Dollars Percentage of GDP'Time and Total Money l'ime and Total Money
Currency in Demand Savings and Quasi- Currency in Demanid Savings and Quasi-Circulation Deposits/L Deposits Money/l Circulation Deposits Deposits Money
(1 ) (2') (3) (~~~~~~~~~~1 +2+3) ~ (0 (6) ~ (7 ~ L
1955 13.5 16.2 32.3 62.0 6.4 7.7 15.3 29.4
1956 1L. 1L.6 3405 63;6 6.4 6.4 15,,2 28.0
1957 16.2 15.5 37.2 68.9 6.5 6.2 14,,9 2'7.7
1958 17.3 14.6 40.3 72.2 7.1 6.o 16.6 29.8
1959 19.5 15.5 42.6 77.6 7.8 6.2 17,,1 31.1
1960 22.4 18.J 45.8 86.2 7.9 6.3 16,1 30.2
1 961 '22.6 1 4.2? 46'.0 82.8 7.2 4.6 14,,7 26.5
1962 24.o 17.1 477.0 88.1 7.2 5.2 14.,2 26.6
1963 25.8 20.3 5'7.6 103.7 7.9 6.2 17.46 31.7
1964 25.9 21.6 63.9 111.4 7.7 6.4 19,,0 33.1
1965 27.8 15.0 70.5 113.3 7.7 4,1 194,5 31.3
1966 28.0 17.1 77.0 122.1 7.1 4.3 19,,6 31 .0
1967 30.7 183 86.3 135.3 7.2 4.,3 20,1 31.5
1963 434.2 19.2 95.7 149.1 7.4 4,,2 10,.8 32.4
1969 36.1 21.2 105.3 162.6 7.1 4.,2 20,8 32.2
/1 Trllough '19604 inc ludes public sector deposits at comrmercial banks.
rource: Irute.-riational Monetary Fund and Bank of Guyana.

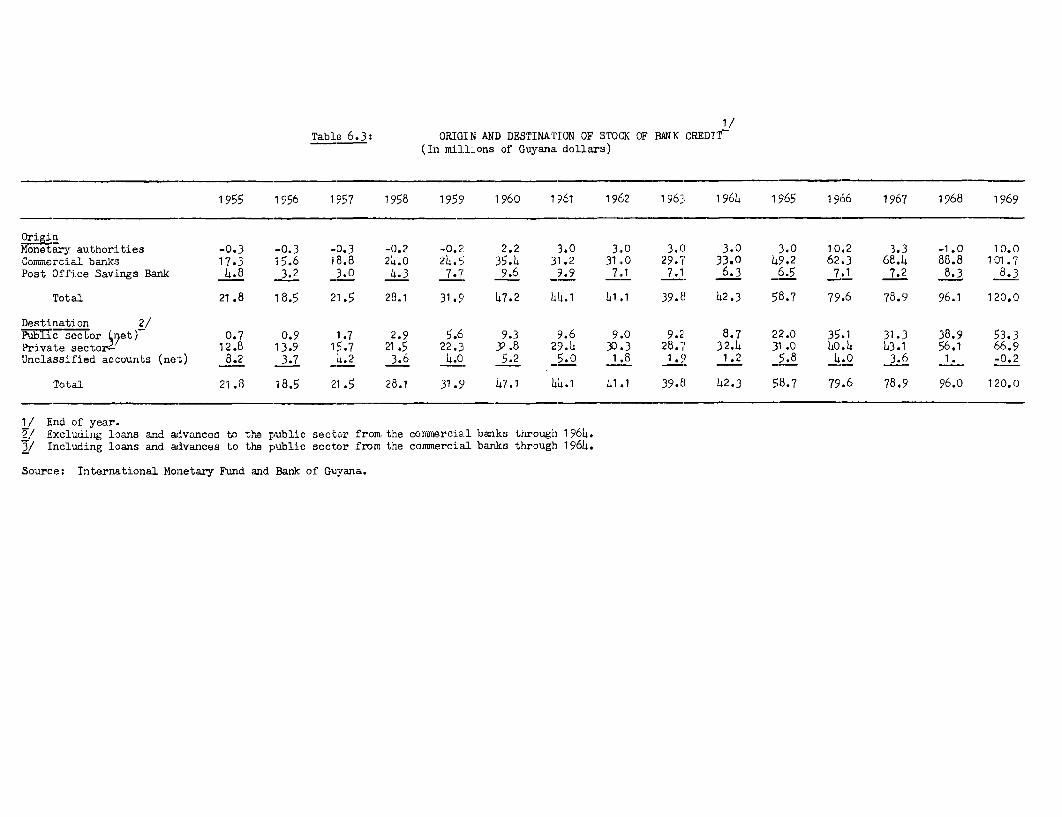
1/Table 6.3: ORIGIN AND DESTINATION OF STOCK OF BANK CREDIt
(In millf.ons of Guyana dollars)
1 955 1956 1957 1958 1955' 1960 1961 1962 1596, 1964 1965 1966 196 7 1968 1969
OriginMonetary authorities -0. 3 -0.3 -0.3 -0,,2 -0.2 2.2 3.0 3,,0 3-0 3.0 3.0 10.2 3.3 -1.0 10.0Comm.,lercial ba.ks 17.i3 1 5.6 lo.8 24,,0 23.5 35.L 31.2 31,0 29.7' 33.0 49.2 62.3 68.4 88.8 1C1.7Post Office Savings Bank 4. El 3.2 3.0 4-,3 7.7 9.6 9.9 7.,1 7.1 6.3 6.5 7.1 7.2 8.3 8.3
Total 21.8 18.5 21.5 28,.1 31.9' 47.2 44.1 41,.1 39.8 42.3 58.7 79.6 78.9 96.1 120.0
Destination 2/Public secFor Oet) 0.7 0.9 1.7 2.9 5.6 9.3 9.6 9.0 9.2 8.7 22.0 35.1 31. 3 38.9 53.3Private sector-' 12.E 13.9 15.7 21,,5 22.3 32.8 29.4 30 .3 28. 7 32.4 31.0 40.4 43.1 56.1 66.9Unclassified accounts (net) 8.2, 3.7 4.2 3,6 4.0 5.2 5.0 1.8 1.9 1.2 5.8 4.0 3. 6 1. -0.2
Total 21.8 18.5 21.5 28.1 31.9 47.1 44.1 41.1 39.8 42.3 58.7 79.6 78.9 96.0 120.0
1/ End of year.2/ Excluding loans and advances to the public sector from. the comariercial banks through 1 964.3/ Including loans and advances to the public sector from the conriercial barks through 1964.
Source: International Monetary Funcd and Ban}k of Guyana.
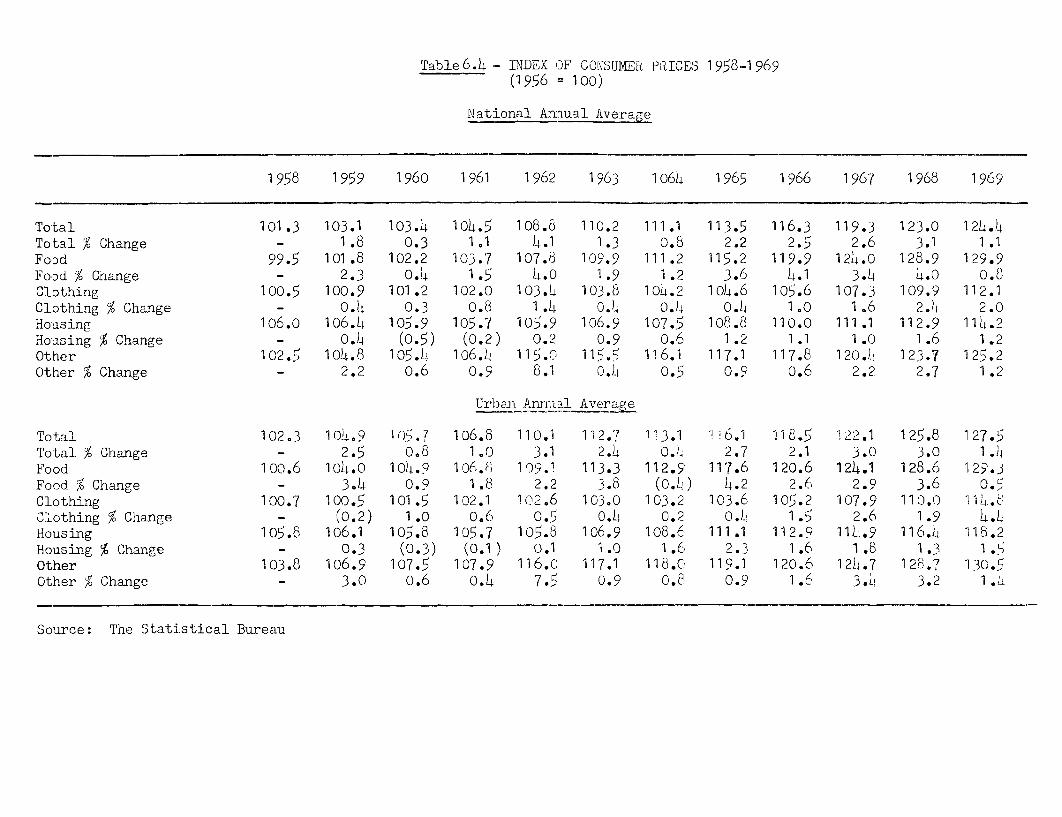
Table 6.4 - INDEX OF C0NSU1MEi. PRICES 1 958-1 969(1956 = 100)
National Annual Aver:a
1958 1959 11960 '1961 l962 1963 10614 1965 1966 1967 1968 1969
Total 1C01.3 10)3.1 1(3.4 104.5 108.8 110.2 111.1 113.5 116.3 119.,3 123..0 124.!4Total *% Change - 1.8 0.3 101 4.1 1.3 o.8 2.2 2.5 2.6 3.1 1.1Food c99.5 10)1.8 102.2 103.7 107.8 109.9 111.2 115.2 119.59 124.0C 128.9 129.9Food % Change - 2.3 O.14 1.5 4.0 1.9 1.2 3.6 14.1 3.4 4.0 0.8Clothing 1C)0.5 100.9 101.2 102.0 103.4 103.8 10L.2 10)4.6 105.6 107.3 109.9 112.11Clothing % Change - 0.4 0.3 0.8 1.1 0o.4 0.14 0.4 100 1.6 2.LI 2.0Housing 1C)6.0 10o6.4 105.9 1I05.7 105.9 106.9 107.5 108.8 110.0 111.1 112.9 114.2Housing % Change - 0.14 (0.5) (0.2) 0.2 0.9 o.6 1.2 1.1 1.0 1.6 1.2Other 102.5 1014.8 105.1. 106.1 115.0 115.5 116.1 117.1 117.8 120.L 123.7 125.2Other % Change - 2.2 o.6 0.9 8.1 o.14 0.5 0.9 0.6 2.2 2. 7 1 .2
Urban Annual A verage
Total 102.3 1 ()1t9 I105 7 106.8 110.1 112.'7 fl3.1 1i6.1 118.5 '22.1 125.8 1i27.',Total % Change - 2.5 o.8 1.0 3.1 2.14 O.1 2..7 2.1 3.0 3.( 1.14Food 10)0.6 10)14.0 10)i,9 106.8', 10t9.1 113.3 112.59 117.6 120.6 124.1 128.6 1123,Food % Change - 3.4 0.9 1.8 2.2 3.8 (0.14) 4.2 2.6 2.'3 3.6 0.'Clothing 100.7 1(0.5 101.5 102.1 102.6 103,0 103.2 103.6 105.2 107.9 110.0 I 11 I'4.Clothing % Change - (0.2) 1.0 o.6 0.5 0.14 0.2 0.14 1.5 2.6 1.9 14.1Housing 105.8 106.1 105.8 105.7 105.8 106.9 108.6 111.1 11 2.9 111L.9 116.14 '118.2Housing % Change - 0.3 (0.3) (0.1 ) 0.1 1.0 1.6, 2 1 .6 1 8 1.3 1.5Other 103.8 106.9 107.5 107.9 116.C 117.1 118.0 119.1 120.6 12L.14 128.I7 '130.5.Other % Change - 3.0 o.6 o.4 7.5 0.9 0.8 0.q 1.f 3.1 3.2'2_
Source: T'he Statistical I3ureau
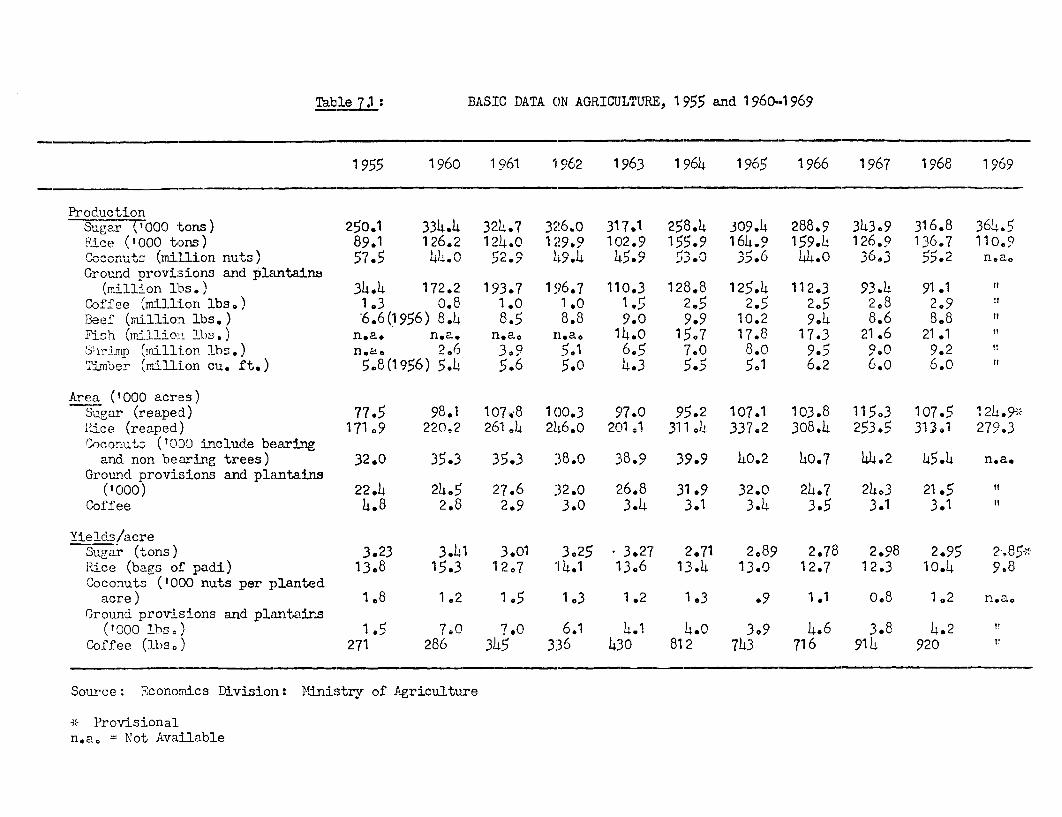
Table 7,1 : BASIC DATA ON AGRICULTURE}, 1955 and l 960--i 969
1955 '1960 1961 1 962 1963 1964 1965 1966 19567 1968 1969
ProductionSug,ar:7(t00 tons) 250.1 334.4 324.7 326.0 317.1 258.4 309.4 288.9 343.9 316.8 364.5Rice (t000 tons) 851.1 126.2 124.0 129.Q 1 02.9 155.9 164.l 159.4 126.9 136.7 110.9O-conutS (r4 1li4on nuet3s J7. ,21.o 29 L9l 4s 30 3v le d> 52 nGround provisions and plantainr
(mllion 11bs.) 34.4 172.2 193.7 1 96.7 110.3 128.8 125*4 112.*3 93:.4 91 .1Coffee (million lLbs. 1 .3 0.8 1.0 1.0 1.5 2.5 2.5 2.5 2.8 2.9Beef (million lbs.) -6.6(1956) 8.4 8.5 8.8 9.0 9.9 10.2 9.4 8.68I;ish (millioll lbs.) n.a. .n.a. n.aO n.aO 14.0 157 1'7.8 17.3 21.6 21.1Ehrimnp (:lnillion :Lbs.) n.a. 2.6 3.9 5.1 6.5 7.0 8.0 9.50 9.2Timber (mill:ion cu. ift.) 5e8(1956) 5.4 5.6 5.0 4.3 5.5 501 6.2 6.0 6.0
Area ('000 acres)Sugar (reaped) 77.5 98.1 107*8 100.3 517.0 95.2 107.1 103.8 115.3 107. 5 124.9*Race (reaped) 171o9 220.2 24 246.0 201.1 311.4 337.2 308.4 253.5 31 31 279.3Coconuts ('01. include bearing
and non bearing trees) 32.0 35.3 35.3 38.0 38.9 39.9 40.2 40.7 414.2 4c5.4 n.a.Ground provisions and plantains
('000) 22.4 24.5 :27.6 32.0 26.8 31.9 32.0 24.7 24.3 21.5 ttCoffee 4.8 2.8 2.9 3.0 3.4 3.1 3.4 3.5 3.1 31 t
Yields/acreSugar (tons) 3.23 3.41 3.01 3.25 3.27 2.71 2,89 2.78 2.98 2.95 2 85*Rice (bags of padi) 13.8 15.3 12,7 14.1 13.6 13.4 13,0 1:2.7 12.3 10.4 9.8Coconuts ('000 nuts per plan1ed
acre) 1.8 1.2 1.5 1.3 1.2 1.3 .9 1.1 0.8 1o2 n.a.Ground provilsions and plantains
(tOQ0 nh ..; 7.0 7.0 6.1 ),.I 309 3.8 I
Coffee (lbs.) 271 286 345 336 430 812 743 7165 9114 920
Scource: Economics Divisionl : Ministry of Agriculture
* Provisionaln.a. = Not Available
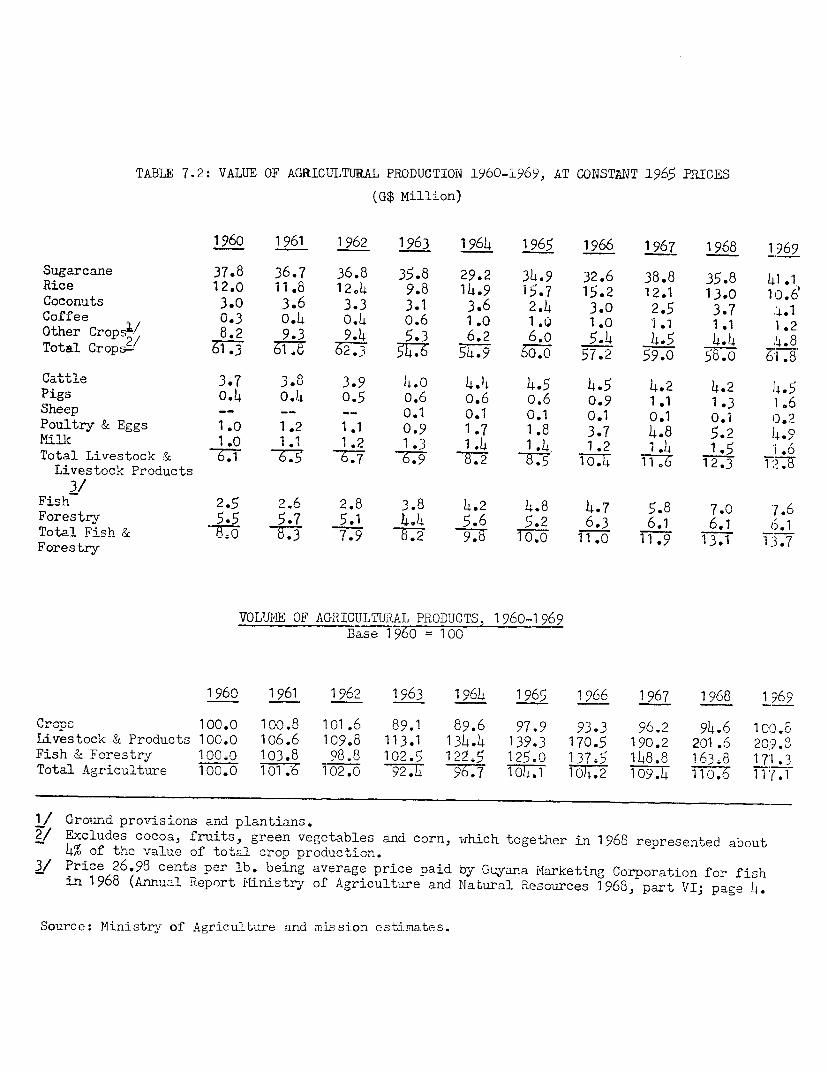
TABLE 7.2: VALUE OF AGRICULTURAL PRODUCTION 1960-1969, AT CONSTANT 1965 PRICES
(G$ Million)
1960 1961 1962 1963 1964 1965 1966 1967 1968 1969
Sugarcane 37.8 36.7 36.8 35.8 29.2 34.9 32.6 38.8 35.8 41.1Rice 12.0 11.8 12.4 9.8 14.9 15.7 15.2 12.1 13.0 10.6Coconuts 3.0 3.6 3.3 3.1 3.6 2.4 3.0 2.5 3.7 ,>.lCoffee 0.3 0.4 0.4 0.6 1.0 1.0 1.0 1.1 1.1 1.2Other Crops;/ 8.2 9.3 9.4 5.3 6.2 6.o 5.4 4.5 4.4 4*8Lotai. urops- o1 . 3 oi. o2. 3 54.6 5 4 .9 ou.72 9.0 58.0 6l.8
Cat +vle 3.7 3.8 3.9 4.0 4.4 4.5 4.5 4.2 4.2 4.5Pigs 0.4 0.4 0.5 0.6 o.6 o.6 0.9 1.1 1.3 l.6S he e p -- -- 0.1 0.1 0 .1 0 .1 0 .1 0.1
Poultry & Eggs 1.0 1.2 1.1 0.9 1.7 1.8 3.7 4.8 5.2 40.9,Mll, 1.O l.t 1.2 ~~~~~~~~~~~1,3 1. . 1.4 .4 .5 i .6
Total Livestock & 6.1 6.7 -C;> 8.2 T. 10.FT T1.6 12.3 T 7ULivest-ck Products
3/Fish 2.5 2.6 2.8 3.8 4.2 4. 7 5.8 7.0 7.6Forestry 5.5 5.7 5.1 4,4 5.6 5.2 6.3 6.1 6.1 6.1Total Fish & T. 8. 7.9 8. -g 10 11.0 11.9 13.1 1x.Forestry
VOLUME OF AGRICULTURAL PRODUCTS, 1960-1969BDase 1 9, = 100
1960 1961 1962 1 1964 1965 1966 1967 1968 169Q
Crops 100.0 100.8 101.6 89.1 89.6 97.9 93,3 96.2 94.,6 100. 8Livestock & Products 100.0 106.6 109,8 113.1 134.4 139.3 170.5 190.2 201.6 209.°Fish & Forest.y 100,0 103.8 98.8 102.5 122.5 125.0 137.5 148.8 16348 171.3Total Agriculture 100.0 101 .6 102.0 92.4 96.7 104.1 104.2 109.4 110 1 T7.1
',/ roun.d pro-visions andu p-lantlans.-2/ Excludes cocoa, fruits, green vegetables and corn, which together in 1968 represented about
l% of the value of total crop production.3/ Price 26.98 cents per lb. being average price paid by Guyana Marketing Corporation for fish
in 1968 (Annual Report i.nistry of A ric u,1t+-e and Natur,al Resources 1968, part VT; page 4.
Source: Ministry of Agriculture and mission estimates.
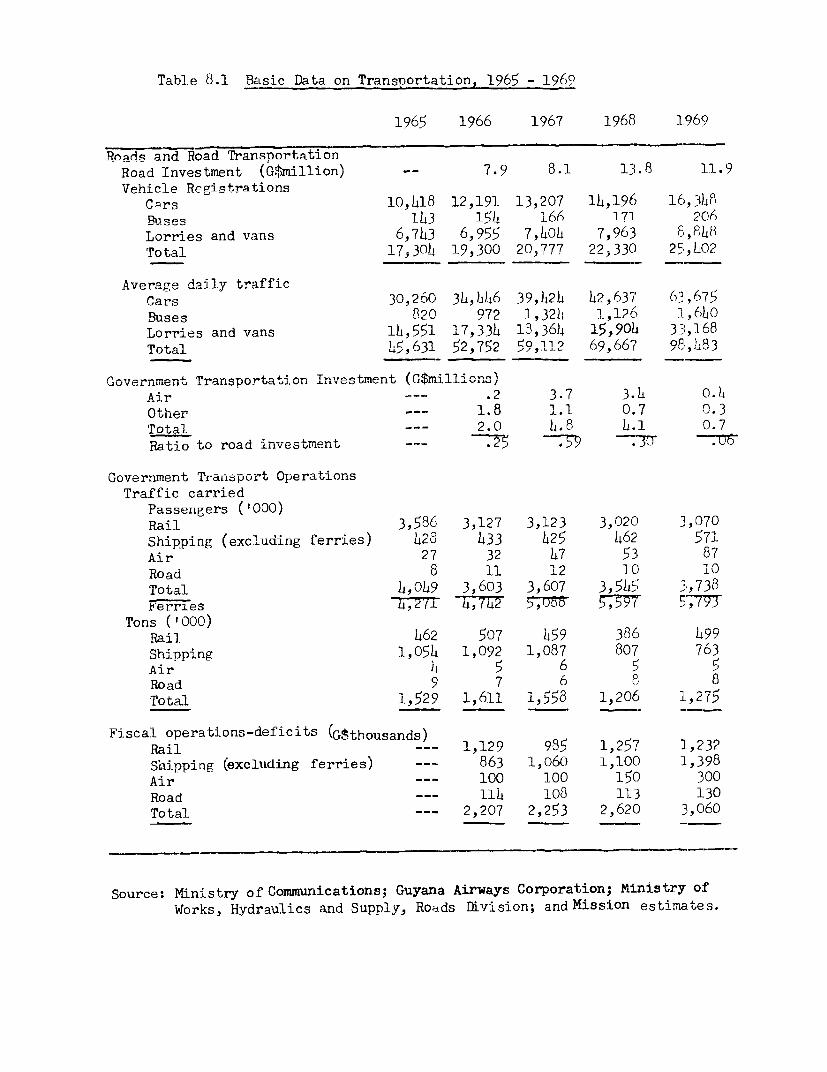
Table 8.1 Basic Data on Transportation, 1965 - 1969
1965 1966 1967 1968 1.969
Roads and Road TransportationRoad Investment (G$million) -- 7.9 8.1 13.8 11.9Vehi cle Regi strati ons
C-rs 10,418 12,191 13,207 14,196 160,3)4BLseR s3 43 1-54 166 171 ?06Lorries and vans 6,743 6,955 7,l0l 7,963 8,8LhTotal 17;304 193300 20;777 22,330 2[;Jn02
Aver-ae daily trafficCars 30,260 34,446 39,h2)4 )42,637 63 ,675Buses 820 972 1,32Lt 1,126 1,614OLorries and vans 1,h551 17,3341 18,364 15,9014 33,168Total L,631 52,752 59,1'92 AO op.
1overnimen' rr ans*ortati on T nvestmet (G$milli
Air --- .2 3.7 3.L 0.4Ote --- 1.8 1.1 0.7O.Other . -L .L U.' I
Total --- 2.0 h .8 o.1 0.7Ratio to road i-nvestIIt, - a... -47 *
Guove rui-Lent Transport UperationsTraffic carried
Passengers ('0 00)Rail 3,586 3,127 3,123 3,020 3,070Shipping (exciuding ferries) 428n.33 h4 e62 5471Air 27 32 47 53 87Road 8 l1 12 UC; 10Total hA0h9 3,603 3,607 3,5Lh5 3,738werries L4,Z( L4,L42 5, UoO 5,597 ;)
Tons ('000)Rail 462 507 459 386 499Shipping 1,051 1,092 1,087 807 763Air L4 5 6Road 9 7 6 8 8Total 1,529 1,611 i,58 1,206 1,275
Fiscal operations-deficits (G$thousands)Rail -- 1,129 985 1,257 1,232Siaipping (excluding ferries) 863 1,060 1,100 1,398Air --- 100 100 150 300Road h11) 108 113 130Total 2,207 2,253 2,620 3,060
Source: Ministry of Communications; Guyana Airways Corporation; Ministry ofWorks, Hydraulics and Supply, RoAds Mvision; and Mission estimates.