Voice Coil - Jan. to Dec. 2011 Consolidated - Pearl HiFi
422
VOLUME 24, ISSUE 3 JANUARY 2011 ® IN THIS ISSUE INDUSTRY NEWS AND DEVELOPMENTS TEST BENCH 6 1 Wavecor Full-Range Driver and Eminence Guitar Speaker By Vance Dickason SPOTLIGHT ACOUSTIC PATENTS INDUSTRY WATCH 20 22 26 30 Products & Services Index ALMA Asia 2010 By Mike Klasco and Nora Wong, Menlo Scientific Industry News and Developments By Vance Dickason 2011 NAMM Show—Take It to Eleven! Shades of “This is Spinal Tap,” the theme of the 2011 NAMM (National Association of Music Merchants) show, is Take It to Eleven! As in the past several years, the Winter NAMM Show takes place at the Anaheim Convention Center, Anaheim, Calif. (Photo 1) from January 13-16. 85,000 persons are expected to attend (about 70% the size of CES!), with something over 1500 exhibitors. A partial list of exhibitors from the 2010 NAMM Show includes Audix Corporation, B & C Speakers, Bag End Loudspeakers, Carvin Corp., Celestion, Electro-Voice, Eminence Speaker LLC, Equator Audio Research, Fender Musical Instruments Corp., Fishman, Focal Professional, Galaxy Audio, Gem Sound, JBL Professional, Jensen Speakers, Mackie, Neutrik USA, P. Audio System Co., Ltd., Peavey Electronics, Phil Jones Bass, Roland Corporation U.S., Samson Technologies Corp., Selenium Loudspeakers, SLS Audio, SWR Bass Amplification, Vox Amplification, and Yamaha Corporation of America. For more, visit www.namm.org. Wavecor’s full-range driver. See p. 6. ALMA Asia report, p. 20. By James Croft By Vance Dickason PHOTO 1: The Anaheim Convention Center. iver and er 0 Products & Ser
-
Upload
khangminh22 -
Category
Documents
-
view
0 -
download
0
Transcript of Voice Coil - Jan. to Dec. 2011 Consolidated - Pearl HiFi

V O L U M E 2 4 , I S S U E 3 J A N U A R Y 2 0 1 1
®
IN THIS ISSUEINDUSTRY NEWS AND DEVELOPMENTS
TEST BENCH6
1
Wavecor Full-Range Driver and Eminence Guitar SpeakerBy Vance Dickason
SPOTLIGHT
ACOUSTIC PATENTS
INDUSTRY WATCH
20
22
26
30 Products & Services Index
ALMA Asia 2010By Mike Klasco and Nora Wong, Menlo Scientific
Industry News and DevelopmentsBy Vance Dickason
2011 NAMM Show—Take It to Eleven!Shades of “This is Spinal Tap,” the theme of the 2011
NAMM (National Association of Music Merchants) show,
is Take It to Eleven! As in the past several years, the Winter
NAMM Show takes place at the Anaheim Convention
Center, Anaheim, Calif. (Photo 1) from January 13-16.
85,000 persons are expected to attend (about 70% the
size of CES!), with something over 1500 exhibitors. A
partial list of exhibitors from the 2010 NAMM Show
includes Audix Corporation, B & C Speakers, Bag End
Loudspeakers, Carvin Corp., Celestion, Electro-Voice,
Eminence Speaker LLC, Equator Audio Research, Fender
Musical Instruments Corp., Fishman, Focal Professional,
Galaxy Audio, Gem Sound, JBL Professional, Jensen
Speakers, Mackie, Neutrik USA, P. Audio System Co., Ltd.,
Peavey Electronics, Phil Jones Bass, Roland Corporation
U.S., Samson Technologies Corp., Selenium Loudspeakers,
SLS Audio, SWR Bass Amplification, Vox Amplification,
and Yamaha Corporation of America. For more, visit
www.namm.org.
Wavecor’s full-range
driver. See p. 6.
ALMA Asia report,
p. 20.
By James Croft
By Vance Dickason
PHOTO 1: The Anaheim
Convention Center.
iver and er
0 Products & Ser


Create your 21st century loudspeakers at a company built for the 21st century. Create the most application-specific loudspeakers possible, while getting the exact and consistent sound you want.
No company offers more than MISCO.MISCO has significantly expanded its loudspeaker design, engineering, and manufacturing facilities to include the following: Design Engineering Capabilities
• CAD capabilities including magnetic system modeling and 3D design software• Complete audio measurements and power testing• Audio Amplifier design and assembly, including DSP• Metal and Plastic fabrication for prototyping
Manufacturing Capabilities• Custom magnetizers capable of charging large neodymium
magnet assemblies• Automated and robotic adhesive dispensing• Kanban systems of inventory management• Lean manufacturing flow of product• Hundreds of off-the-shelf designs from miniature speakers
through 21” woofers
Quality Control• End-of-line testing with Soundcheck by Listen, Inc• Corporate quality system based on ISO 9001
4” Midrange Driver #JC4MR-8AFeatures high sensitivity, cast aluminum basket, and high strength Abaca cone.
8” High performance, mid-range driver # LC86-6AFeatures high sensitivity with low distortion.
Hear the difference!Our product line expands significantly
in early 2011!
Contact us with your speaker designs. Email us at [email protected], call us at 1-800-276-9955, or visit us at miscospeakers.com

4 VOICE COIL
Old Signals, New TricksThe following item appeared this month in the audiobytz
newsletter by David Ranada:
“Ian Chan, a design engineer for Stanford Research
Systems, describes in a recent paper, Sine Chirps for Measuring
Impulse Response, how a rapidly logarithmically swept sine
wave (about a half second to cover the audio range) can be
used to rapidly get information about a system while having
other advantages. One of these is a low crest factor. Noise and
similar signals (like the pseudo-random noise in an MLS sig-
nal) can have a high crest factor, which is the ratio of the peak
level to the RMS level of the signal. Chan cites an MLS signal
filtered to have a pink spectrum as having a crest factor of 11
to 12dB, which clearly requires greater headroom from an
amplifier driving a speaker under test than a sine-wave chirp,
with its crest factor of 4dB and a naturally pink spectrum.
“But one of the more interesting abilities of a chirp is that
it can probe for distortion performance of things like filters.
Chan shows this graph [Fig. 1] of the impulse response
of a chirp fed through an elliptical low-pass filter (calcu-
lated using the facilities incorporated in Stanford Research
test equipment, naturally) has the distortion components
emerging, in reverse harmonic order, before the distortion-
free main impulse at time zero. Another thing you can do
with chirps is to “equalize” their spectrum to stress a certain
area of the audio spectrum or to mimic the signal distri-
bution in program material. But equalization in this case
doesn’t mean filtration of the chirp signal but of changing
the amount of time the chirp spends sweeping through
the frequencies of interest (a variable speed sweep, in other
words). The Chan article goes into further details on these
characteristics and includes both formulas and methods for
generating and analyzing chirps.”
You can subscribe to the bi-weekly audiobytz newsletter
at www.audioxpress.com/audiobytz/index.htm. Also, you
can download the entire Sine Chirps for Measuring Impulse
Response article at www.eetimes.com.
China Blocks Neo ShipmentsSaudi Arabia controls the oil, and China controls rare
earths, such as neodymium. China, which has been blocking
shipments of crucial rare earth minerals to Japan in October,
has quietly in November halted some shipments of those
materials to the US and Europe. Rare-earth prices have surged
as much as sevenfold as China in July reduced its second-
half export quota by 72% to ensure domestic supply of the
mineral used in laptops, missile-guidance systems, and hybrid
cars. The cuts have spurred companies including Glencore
International AG and Molycorp Inc. to plan to restart and
develop mines outside of China. China mines 95% of the
world’s rare earth elements, which have broad commercial
and military applications, and are vital to the manufacture of
products as diverse as cellphones, large wind turbines, guided
missiles, and, for our industry, loudspeaker motors.
Live-Versus Recorded Listening Tests Don’t WorkI’ve been meaning to comment on this for several
months. This title appeared in Sean Olive’s blog, Audio
Musings, in July. Basically, Sean catalogs the history of live/
recorded demonstrations beginning with Edison’s Diamond
Disk Phonograph series of events. This is worth checking
out, but here is Sean’s conclusion:
“In reviewing the history of live-versus-reproduced tests,
most have been performed as elaborate sales and marketing
demonstrations designed to fool listeners into believing that
a product sounded much better and more accurate than it
actually was. While live-versus-recorded tests have proven
their merit as an effective marketing and sales tool, they
have not yet proven themselves as a serious method for sci-
entific experiments intended to advance our psychoacoustic
Voice Coil, (ISSN 1521-091X), the Periodical of the Loudspeaker Industry, is published on the 25th of each month by Audio Amateur Incorporated, PO Box 876, Peterborough, NH 03458-0876 USA, (603) 924-9464, FAX (603) 924-9467.
Copyright 2010 by Audio Amateur Incorporated. All rights reserved. Quotation from Voice Coil is forbidden without written permission of the publisher.
Publisher - Edward T. Dell, Jr.Editor - Vance Dickason (E-mail [email protected])Contributing Editor - Richard Honeycutt
Vice PresidentKaren Hebert
Dennis Brisson .............Assistant PublisherRichard Surrette ...........Editorial AssistantLaurel Humphrey.........Marketing DirectorJason Hanaford ............Graphics DirectorSharon LeClair .............Customer ServiceMike Biron ..................Shipping Manager
SUBMISSIONSSend all press releases and information to Voice Coil Editorial Dept., PO Box 876, Peterborough, NH 03458, or FAX us material at (603) 924-9467, e-mail [email protected].
ADVERTISING
Please direct display advertising inquiries to: Peter Wostrel, Account Manager, Strategic Media Marketing, USA, 978-281-7708, FAX 603-924-9467, Toll-free 800-454-3741, e-mail [email protected].
Please direct classified and artwork inquiries to: Janet Hensel, Advertising Coordinator, Voice Coil, PO Box 876, Peterborough, NH 03458, USA, 603-924-7292, FAX 603-924-6230, e-mail [email protected].
Qualified subscriptions to Voice Coil run for 1 year. Renew annually on-line at www.audioXpress.com/magsdirx/voxcoil/vcqual.htm
Subscriptions to Voice Coil are available in printed and digital versions. To subscribe to the digital version, please visit our website
at www.audioXpress.com and complete a qualification form. When you qualify, you will receive an email confirming your subscription. Each month you will receive an email with a link to the current issue.
Printed subscriptions are currently available to US and Canadian individuals who have completed a qualification form and fit the criteria for qualification. For those overseas, the cost of a printed subscription is $150.00 per year. Please contact customer service or order your subscription on-line at www.audioXpress.com.
FIGURE 1: Measured electrical impulse response of an elliptical low-pass
filter with log-sine chirp.
JANUARY 2011 5
understanding of music recording and reproduction.
“The reason for this, I believe, is that live-versus-recorded
tests do not adequately control important listening test nui-
sance variables, a prerequisite for accurate, reliable and scien-
tifically valid results. It is not entirely coincidental, that (to my
knowledge) none of the live-versus-recorded tests to date have
produced a single scientific publication or new psychoacous-
tic knowledge. Hopefully, you now understand why I don’t
conduct live-versus-recorded loudspeaker listening tests.”
For more, visit Sean’s blog at http://seanolive.blogspot.com.
New Drivers from Tang BandTang Band has announced its last new driver releases for
2010 as follows:
25-1933S: 25mm fabric dome, low Fo, low distortion, back
chamber with short ring design.
W1-1925S: mini full range, low Fo = 200Hz. OD = 25mm,
with neo motor design.
W6-1936S: 6.5″ high power subwoofer, flat aluminum cone,
neo motor shallow mount design, with reinforced nylon frame.
WQ-1858: 12″ aluminum subwoofer, 500W RMS power
handling, Fo = 20Hz,
X-max = 13mm (one way), with heatsink.
For more, visit the Tang Band website www.tb-speaker.com.
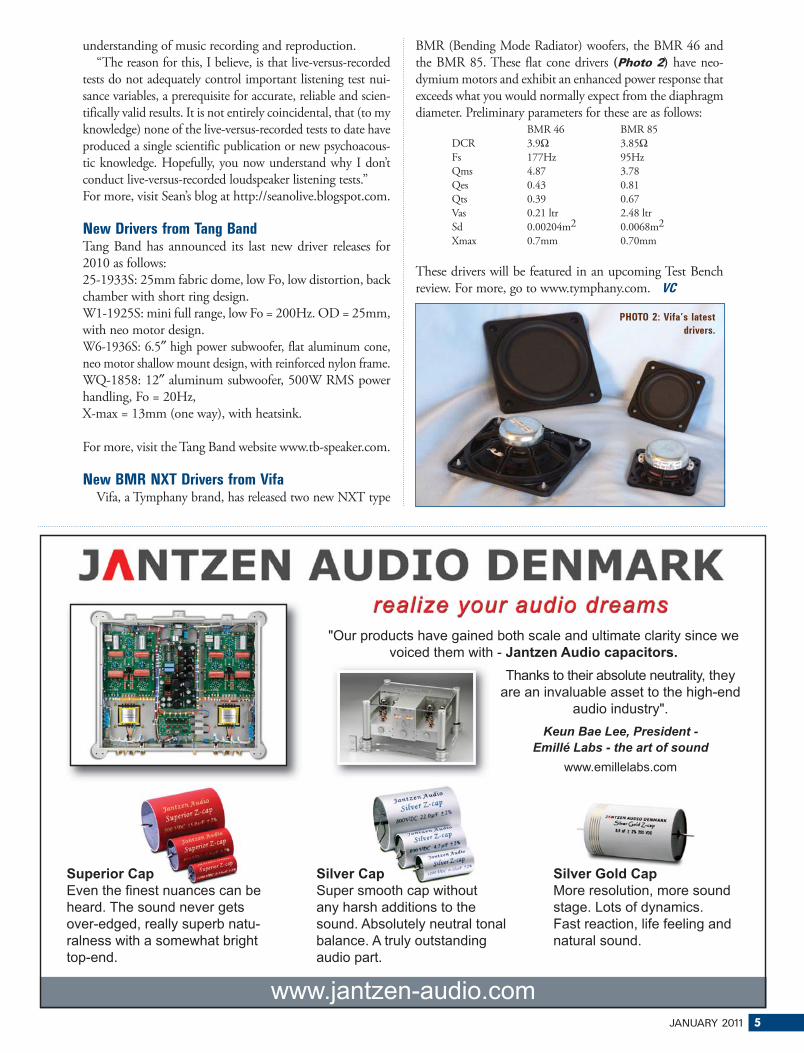
New BMR NXT Drivers from VifaVifa, a Tymphany brand, has released two new NXT type
BMR (Bending Mode Radiator) woofers, the BMR 46 and
the BMR 85. These flat cone drivers (Photo 2) have neo-
dymium motors and exhibit an enhanced power response that
exceeds what you would normally expect from the diaphragm
diameter. Preliminary parameters for these are as follows: BMR 46 BMR 85
DCR 3.9Ω 3.85ΩFs 177Hz 95Hz
Qms 4.87 3.78
Qes 0.43 0.81
Qts 0.39 0.67
Vas 0.21 ltr 2.48 ltr
Sd 0.00204m2 0.0068m2
Xmax 0.7mm 0.70mm
These drivers will be featured in an upcoming Test Bench
review. For more, go to www.tymphany.com. VC
"Our products have gained both scale and ultimate clarity since we
voiced them with - Jantzen Audio capacitors.
Superior Cap
Even the finest nuances can be
heard. The sound never gets
over-edged, really superb natu-
ralness with a somewhat bright
top-end.
Silver Cap
Super smooth cap without
any harsh additions to the
sound. Absolutely neutral tonal
balance. A truly outstanding
audio part.
Silver Gold Cap
More resolution, more sound
stage. Lots of dynamics.
Fast reaction, life feeling and
natural sound.
www.jantzen-audio.com
Thanks to their absolute neutrality, they
are an invaluable asset to the high-end
audio industry".
Keun Bae Lee, President -Emillé Labs - the art of sound
www.emillelabs.com
PHOTO 2: Vifa’s latest
drivers.
6 VOICE COIL
Test Bench
Wavecor Full-Range Driver and Eminence Guitar SpeakerBy Vance Dickason
�his month’s driver submissions are both unique, but
from nearly opposite ends of the transducer spectrum.
From Wavecor, a 2.75″ diameter full-range driver intended
for high-quality multimedia and lifestyle (iPod docking sta-
tions) products—the FR070WA01; and, from Eminence,
a new and extremely clever variable Bl 12″ diameter guitar
speaker—the Maverick.
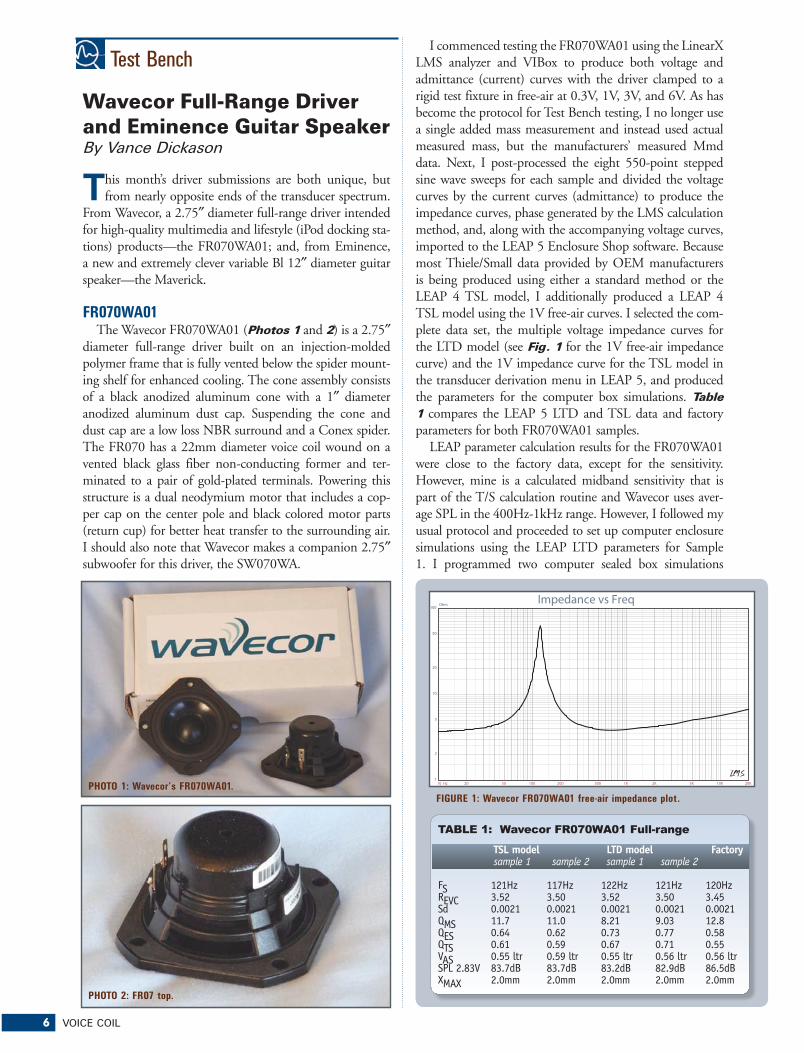
FR070WA01The Wavecor FR070WA01 (Photos 1 and 2) is a 2.75″
diameter full-range driver built on an injection-molded polymer frame that is fully vented below the spider mount-ing shelf for enhanced cooling. The cone assembly consists of a black anodized aluminum cone with a 1″ diameter anodized aluminum dust cap. Suspending the cone and dust cap are a low loss NBR surround and a Conex spider. The FR070 has a 22mm diameter voice coil wound on a vented black glass fiber non-conducting former and ter-minated to a pair of gold-plated terminals. Powering this structure is a dual neodymium motor that includes a cop-per cap on the center pole and black colored motor parts (return cup) for better heat transfer to the surrounding air. I should also note that Wavecor makes a companion 2.75″subwoofer for this driver, the SW070WA.
I commenced testing the FR070WA01 using the LinearX LMS analyzer and VIBox to produce both voltage and admittance (current) curves with the driver clamped to a rigid test fixture in free-air at 0.3V, 1V, 3V, and 6V. As has become the protocol for Test Bench testing, I no longer use a single added mass measurement and instead used actual measured mass, but the manufacturers’ measured Mmd data. Next, I post-processed the eight 550-point stepped sine wave sweeps for each sample and divided the voltage curves by the current curves (admittance) to produce the impedance curves, phase generated by the LMS calculation method, and, along with the accompanying voltage curves, imported to the LEAP 5 Enclosure Shop software. Because most Thiele/Small data provided by OEM manufacturers is being produced using either a standard method or the LEAP 4 TSL model, I additionally produced a LEAP 4 TSL model using the 1V free-air curves. I selected the com-plete data set, the multiple voltage impedance curves for the LTD model (see Fig. 1 for the 1V free-air impedance curve) and the 1V impedance curve for the TSL model in the transducer derivation menu in LEAP 5, and produced the parameters for the computer box simulations. Table 1 compares the LEAP 5 LTD and TSL data and factory parameters for both FR070WA01 samples.
LEAP parameter calculation results for the FR070WA01 were close to the factory data, except for the sensitivity. However, mine is a calculated midband sensitivity that is part of the T/S calculation routine and Wavecor uses aver-age SPL in the 400Hz-1kHz range. However, I followed my usual protocol and proceeded to set up computer enclosure simulations using the LEAP LTD parameters for Sample 1. I programmed two computer sealed box simulations
10 Hz 20 50 100 200 500 1K 2K 5K 10K 20K
Ohm
1
2
5
10
20
50
100Impedance vs Freq
TSL model LTD model Factory sample 1 sample 2 sample 1 sample 2
FS 121Hz 117Hz 122Hz 121Hz 120Hz REVC 3.52 3.50 3.52 3.50 3.45 Sd 0.0021 0.0021 0.0021 0.0021 0.0021QMS 11.7 11.0 8.21 9.03 12.8 QES 0.64 0.62 0.73 0.77 0.58 QTS 0.61 0.59 0.67 0.71 0.55 VAS 0.55 ltr 0.59 ltr 0.55 ltr 0.56 ltr 0.56 ltr SPL 2.83V 83.7dB 83.7dB 83.2dB 82.9dB 86.5dB XMAX 2.0mm 2.0mm 2.0mm 2.0mm 2.0mm
����������� ����������������������
FIGURE 1: Wavecor FR070WA01 free-air impedance plot.
PHOTO 1: Wavecor’s FR070WA01.
PHOTO 2: FR07 top.
JANUARY 2011 7
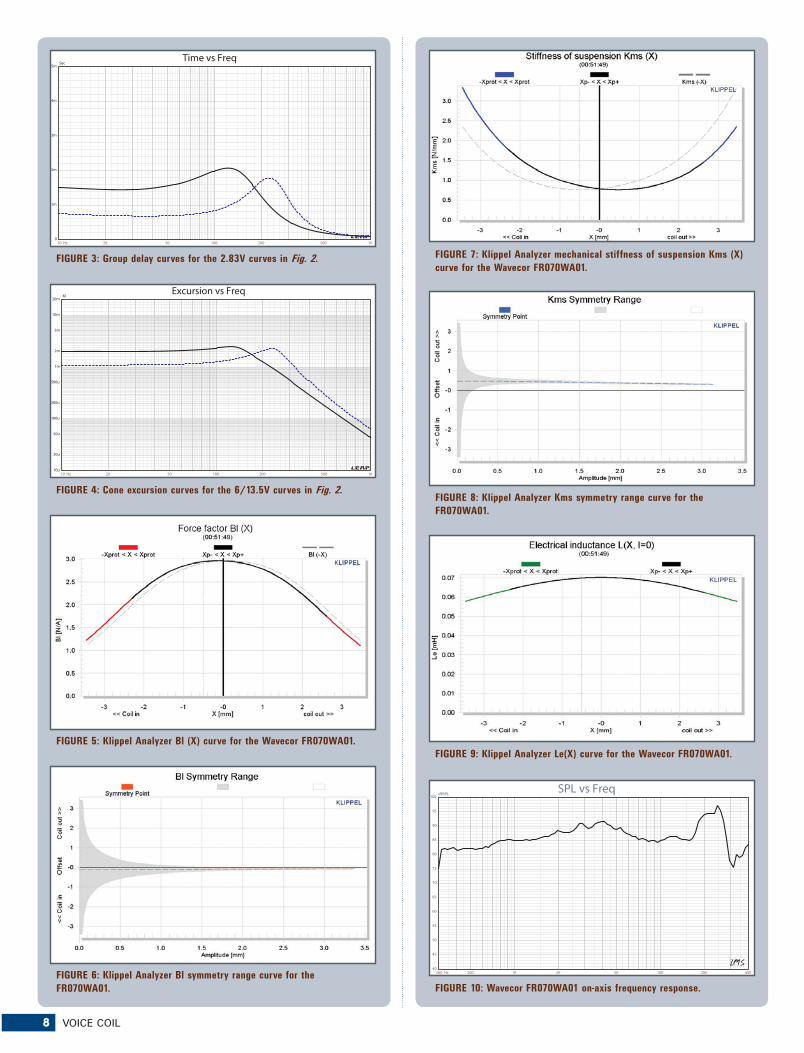
into LEAP, a 60 in3 Butterworth alignment and a 10 in3 Chebychev type alignment. Figure 2 displays the results for the Wavecor full-range driver in the two sealed box simula-tions at 2.83V and at a voltage level high enough to increase cone excursion to Xmax + 15% (2.3mm). This produced a F3 frequency of 133Hz with a box/driver Qtc of 0.72 for the 60 in3 sealed enclosure and –3dB = 205Hz with a Qtc = 1.0 for the 10 in3 simulation. Increasing the voltage input to the simulations until the maximum linear cone excursion was reached resulted in 92.5dB at 6V for the larger sealed enclo-sure simulation and 100.5dB with a 13.5V input level for the smaller sealed enclosure (see Figs. 3 and 4 for the 2.83V group delay curves and the 6/13.5V excursion curves).
Klippel analysis for the Wavecor 2.75″ full-range (our analyzer is provided courtesy of Klippel GmbH), and testing performed by Pat Turnmire, Red Rock Acoustics, produced the Bl(X), Kms(X), and Bl and Kms symmetry range plots given in Figs. 5-8. The Bl(X) curve (Fig. 5) is relatively broad and symmetrical, especially for a short Xmax 2.75″ diameter driver. Looking at the Bl symmetry plot (Fig. 8), this curve shows a trivial 0.11mm coil-in offset at the rest position that decreases to 0.09mm at the physical 2.0mm Xmax of the driver.
Figures 7 and 8 show the Kms(X) and Kms symmetry range curves for the Wavecor full-range driver. The Kms(X) curve is definitely very symmetrical, and has a very minor forward (coil-out) offset of less than 0.5mm at the rest posi-tion. FR070 displacement limiting numbers calculated by
the Klippel analyzer were XBl at 82% Bl = 1.7mm and for XC at 75% Cms minimum was 1.1mm, which means that the compliance is the most limiting factor for the prescribed distortion level of 10%.
Figure 9 gives the inductance curve Le(X) for the FR070WA01. Inductance will typically increase in the rear direction from the zero rest position as the voice coil covers more pole area; however, the FR070 inductance stays most-ly constant as the coil moves in due to the copper shorting ring. The inductance variation is only 0.05mH from the in and out Xmax positions, which is very good.
Next I mounted the FR070 in an enclosure which had a
FIGURE 2: FR070WA01 computer box simulations (A = sealed 1 at 2.83V;
B = sealed 2 at 2.83V; C = sealed 1 at 6V; D = sealed 2 at 13.5V).
10 Hz 20 50 100 200 500 1K
dBSPL
55
60
65
70
75
80
85
90
95
100
105
SPL vs Freq
DC
BA
8 VOICE COIL
10 Hz 20 50 100 200 500 1K
M
10u
20u
50u
100u
200u
500u
1m
2m
5m
10m
20m
Excursion vs Freq
10 Hz 20 50 100 200 500 1K
Sec
0
1m
2m
3m
4m
5m
Time vs Freq
300 Hz 500 1K 2K 5K 10K 20K 40K
dBSPL
40
45
50
55
60
65
70
75
80
85
90
95
100SPL vs Freq
FIGURE 3: Group delay curves for the 2.83V curves in Fig. 2. FIGURE 7: Klippel Analyzer mechanical stiffness of suspension Kms (X)
curve for the Wavecor FR070WA01.
FIGURE 8: Klippel Analyzer Kms symmetry range curve for the
FR070WA01.
FIGURE 9: Klippel Analyzer Le(X) curve for the Wavecor FR070WA01.
FIGURE 10: Wavecor FR070WA01 on-axis frequency response.
FIGURE 4: Cone excursion curves for the 6/13.5V curves in Fig. 2.
FIGURE 5: Klippel Analyzer Bl (X) curve for the Wavecor FR070WA01.
FIGURE 6: Klippel Analyzer Bl symmetry range curve for the
FR070WA01.
JANUARY 2011 9
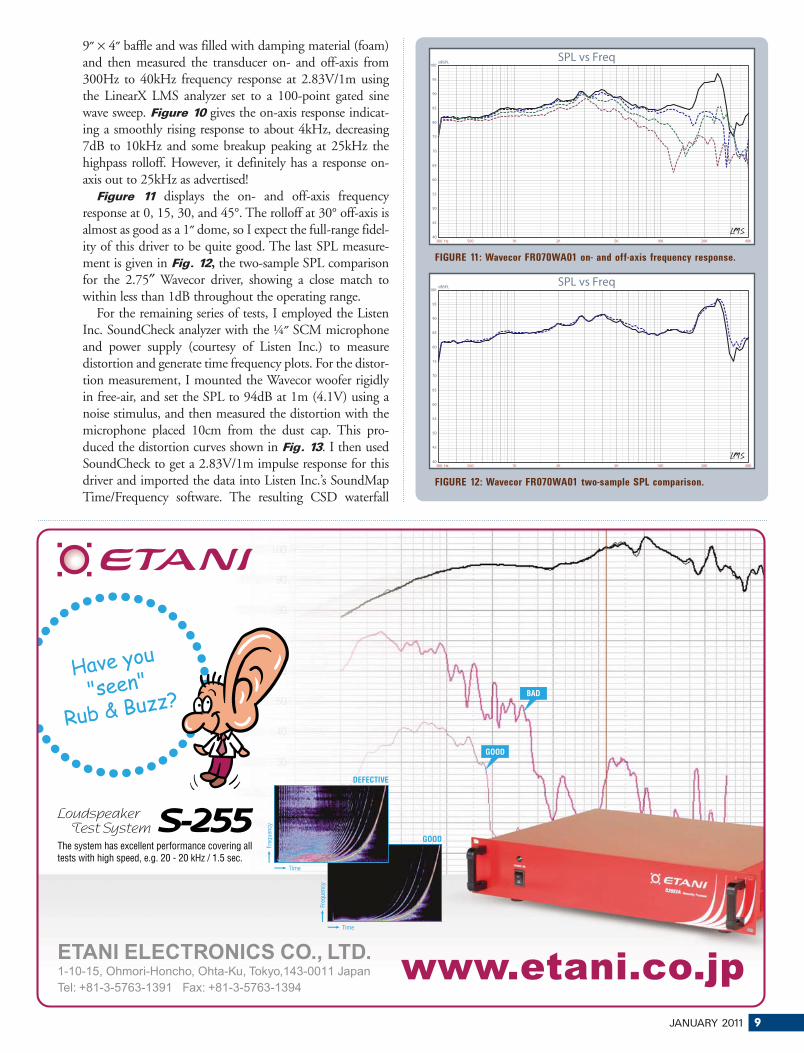
9″ × 4″ baffle and was filled with damping material (foam) and then measured the transducer on- and off-axis from 300Hz to 40kHz frequency response at 2.83V/1m using the LinearX LMS analyzer set to a 100-point gated sine wave sweep. Figure 10 gives the on-axis response indicat-ing a smoothly rising response to about 4kHz, decreasing 7dB to 10kHz and some breakup peaking at 25kHz the highpass rolloff. However, it definitely has a response on-axis out to 25kHz as advertised!
Figure 11 displays the on- and off-axis frequency response at 0, 15, 30, and 45°. The rolloff at 30° off-axis is almost as good as a 1″ dome, so I expect the full-range fidel-ity of this driver to be quite good. The last SPL measure-ment is given in Fig. 12, the two-sample SPL comparison for the 2.75″ Wavecor driver, showing a close match to within less than 1dB throughout the operating range.
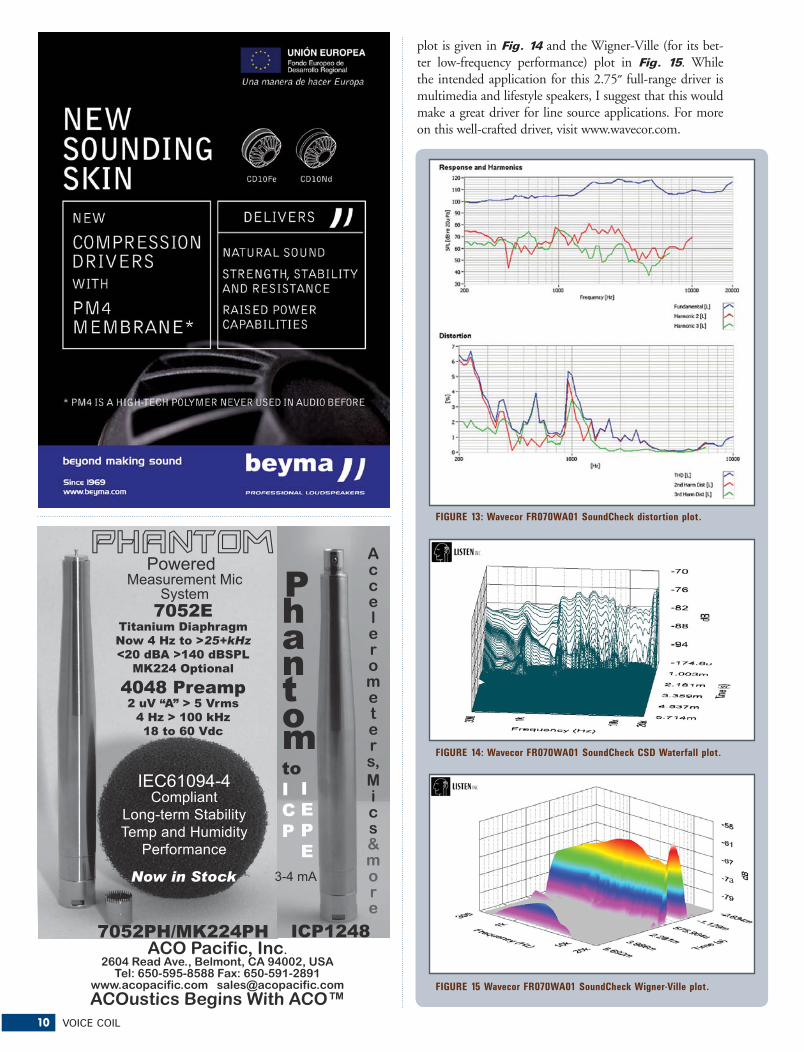
For the remaining series of tests, I employed the Listen Inc. SoundCheck analyzer with the ¼″ SCM microphone and power supply (courtesy of Listen Inc.) to measure distortion and generate time frequency plots. For the distor-tion measurement, I mounted the Wavecor woofer rigidly in free-air, and set the SPL to 94dB at 1m (4.1V) using a noise stimulus, and then measured the distortion with the microphone placed 10cm from the dust cap. This pro-duced the distortion curves shown in Fig. 13. I then used SoundCheck to get a 2.83V/1m impulse response for this driver and imported the data into Listen Inc.’s SoundMap Time/Frequency software. The resulting CSD waterfall
300 Hz 500 1K 2K 5K 10K 20K 40K
dBSPL
40
45
50
55
60
65
70
75
80
85
90
95
100SPL vs Freq
300 Hz 500 1K 2K 5K 10K 20K 40K
dBSPL
40
45
50
55
60
65
70
75
80
85
90
95
100SPL vs Freq
FIGURE 11: Wavecor FR070WA01 on- and off-axis frequency response.
FIGURE 12: Wavecor FR070WA01 two-sample SPL comparison.
10 VOICE COIL
plot is given in Fig. 14 and the Wigner-Ville (for its bet-ter low-frequency performance) plot in Fig. 15. While the intended application for this 2.75″ full-range driver is multimedia and lifestyle speakers, I suggest that this would make a great driver for line source applications. For more on this well-crafted driver, visit www.wavecor.com.
����������� ������������������������ ����������������
��� ��!�"!�!"#!##�$�% ��!�"!�&"�#�&'''����(����������)���)*���(����������+)��)���, )�-�.����/
�������
� ��!�"!����
��#��$%&'����$
�������
��#����(!��(�"�)(�* ���"+�,���$-�!��.�������/���0���.����0�1��
&'����2*!(����
������� �"*���3�4�5�.�#�3�"6�
��$-�.�����7$-���!��8��30�
��� �����
������0�����0)�1�)2���0��
����
������
���� ����������������
������
������������� ����
!�"���������#� ���$������ �%��� ���
���&������
FIGURE 13: Wavecor FR070WA01 SoundCheck distortion plot.
FIGURE 14: Wavecor FR070WA01 SoundCheck CSD Waterfall plot.
FIGURE 15 Wavecor FR070WA01 SoundCheck Wigner-Ville plot.
JANUARY 2011 11
MaverickI don’t often examine MI (Musical Instrument) speakers;
in fact, the last guitar speakers I had in Test Bench were the 12″ Eminence Red Fang (Eminence’s answer to the Celestion G12 alnico Blue “Dog” used in early Vox AC-30 guitar amps) and the 10″ Eminence BP102 bass guitar/PA speaker—these were the first guitar speakers featured in 17 years of publication. However, a totally unique new guitar speaker from Eminence was just too interesting to pass up: the 12″ Maverick, from the Eminence Patriot series that uses their new FDM technology (Flux Density Modulation). Before explaining Eminence patent pend-ing FDM technology, readers may not be aware of certain techniques artists use to get some of the unique sounds out of a guitar amplifier and speaker. Basically, you need to understand that tube guitar amplifiers sound different at different volume levels.
When a guitar tube amplifier is turned up to 10 on the volume control (11 for Spinal Tap), and tubes are at maximum output (gee, with the plates starting to glow), you get some really desirable distortion characteristics that have become the signature of blues and rock guitar play-ing. The problem comes into play when you just want to practice in your living room, or when you are in the studio. Playing that loud just isn’t necessarily comfortable in those situations, so guitarists needed a way to stress the tubes in a guitar amp, but not be loud. A power attenuator, which has been on the market for many years, is electrically connected between the tube amplifier and the speaker to attenuate the high voltage output of a tube amp and decrease the volume of the speaker. Examples of these guitar toys are the Marshall Power Break and the THD Hot Plate attenuators. That said, the new Eminence FDM technology is essen-tially a tricked-out guitar speaker that accomplishes the same task, turning down the volume of the speaker when the amp is turned up loud. If you look at Photos 3 and 4, you see that the speaker has a knob located behind the back plate that is labeled FULL VOLUME turned full right, and MAX ATTENUATION turned full left.
As you can guess, this very clever invention somehow controls the Bl of the speaker, and even though I know exactly how it is doing this, and because this invention is still patent pending, I’m going to leave it to you readers to figure it out on your own.
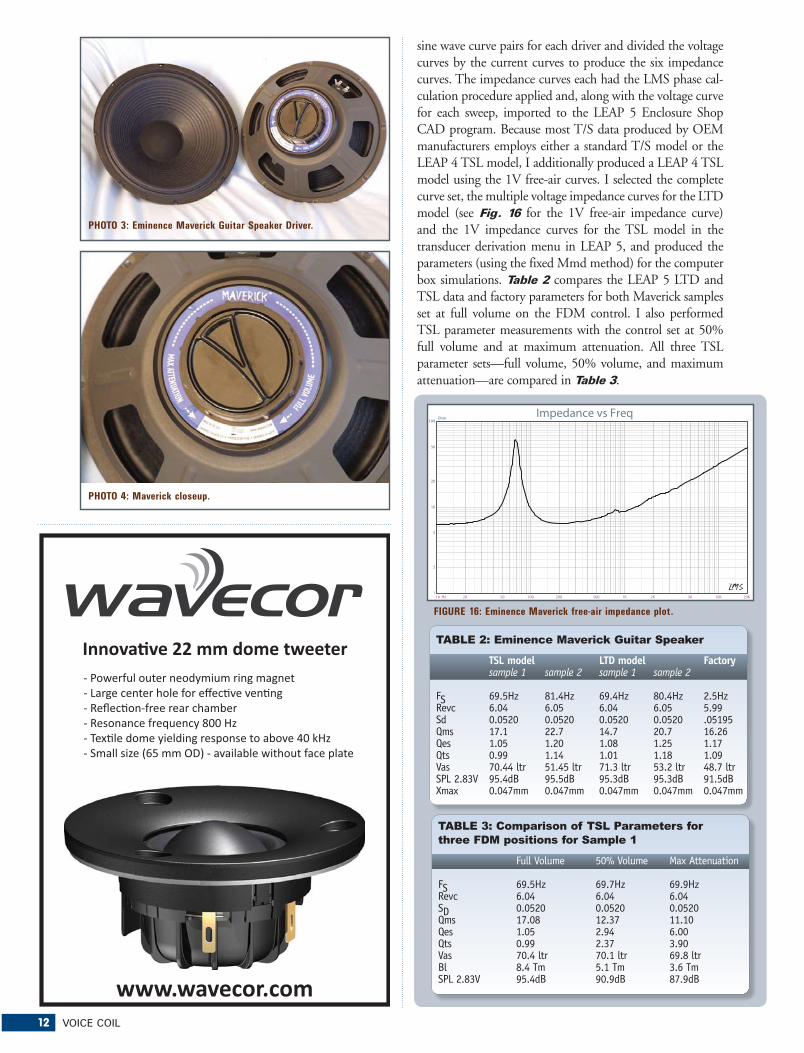
Disregarding the FDM control knob, the Eminence Maverick is a typical guitar speaker constructed on a stamped frame. The cone assembly consists of an uncoated and ribbed paper cone with an integrated M-shaped paper surround, and a 3.5″ diameter Zurette porous cloth dust cap. Remaining compliance is provided by an elevated cloth spider. The cone assembly is driven by a 1.75″ voice coil using round copper wire wound on a non-conducting poly-imide former. Powering all this is a 38 oz. 130mm × 19mm ferrite magnet, sandwiched between the black coated plates.
Setting up for the initial test protocol, I clamped the driv-er to a rigid test fixture in free-air, and then generated both voltage and admittance (current) curves at 1V, 3V, 6V, 10V, and 15V. I processed all ten 10Hz-20kHz 550-point stepped
ENGINEERED TO PERFORM...
...THE BEAUTY OF MUSIC.
��&'(�� �)����*�� (�� �)����*��
��������
����������������������� ������������������ ������������������� �� ������� ������������������������
���������� ������ ������� ����������������
� �� ��� �!�"��#�� ����" !� ��$ !����� ������%���&&�
$2�29���$��12:+)�)�3���1;
���;
��������
��������������� �����!����"#$� ����������"������%��������� ��� ����� ��������� � �����! �� "#"#$$ � ����� � �� ��""� ��� ��� %%����
��� +��� ��������������������
�������������� ��������� �!�"��
+
������ �������������������������������
*��� �&*��� ��&'��� �&*��
& � �������� ���'�(��������MUNDORF • ������������� ������
��������� ������ �� � ����� ��)*�������� ������������
'!����!$� ������� �'�# !����$�
(���� ��)�* ���� �
��,��-$�-.�$,�.�/-,��,�
& & �� ��������� ��� ''� �(��������� MUNDORF • ������ ����������� � �����
������
��������� �������
���
�����������
� � �����
�
������������������������&&&&&&&&&&'(�� �)���
����������������������� ������������������ ������������������� �� ������� ����������� �� ��� �����
;
�����������,��-$�-.�$,�.�/---,��,
2010 We Celebrate
Our 25 Anniversary - With You!
12 VOICE COIL
sine wave curve pairs for each driver and divided the voltage curves by the current curves to produce the six impedance curves. The impedance curves each had the LMS phase cal-culation procedure applied and, along with the voltage curve for each sweep, imported to the LEAP 5 Enclosure Shop CAD program. Because most T/S data produced by OEM manufacturers employs either a standard T/S model or the LEAP 4 TSL model, I additionally produced a LEAP 4 TSL model using the 1V free-air curves. I selected the complete curve set, the multiple voltage impedance curves for the LTD model (see Fig. 16 for the 1V free-air impedance curve) and the 1V impedance curves for the TSL model in the transducer derivation menu in LEAP 5, and produced the parameters (using the fixed Mmd method) for the computer box simulations. Table 2 compares the LEAP 5 LTD and TSL data and factory parameters for both Maverick samples set at full volume on the FDM control. I also performed TSL parameter measurements with the control set at 50% full volume and at maximum attenuation. All three TSL parameter sets—full volume, 50% volume, and maximum attenuation—are compared in Table 3.
������ ��!!�������"�����
"""#"������#���
�������������� ���������� ����� ������������ ���������������������� � ���������� ������������������������ � ������� ���� �!"��#�$��������������� �����%� ������������& �'!"��(�������"��)*+����,-.������������������������%����
TSL model LTD model Factory sample 1 sample 2 sample 1 sample 2 FS 69.5Hz 81.4Hz 69.4Hz 80.4Hz 2.5Hz Revc 6.04 6.05 6.04 6.05 5.99 Sd 0.0520 0.0520 0.0520 0.0520 .05195Qms 17.1 22.7 14.7 20.7 16.26 Qes 1.05 1.20 1.08 1.25 1.17 Qts 0.99 1.14 1.01 1.18 1.09 Vas 70.44 ltr 51.45 ltr 71.3 ltr 53.2 ltr 48.7 ltr SPL 2.83V 95.4dB 95.5dB 95.3dB 95.3dB 91.5dB Xmax 0.047mm 0.047mm 0.047mm 0.047mm 0.047mm
���������"(� �� �&�� �(�7�9�(!���1* �7 �
Full Volume 50% Volume Max Attenuation
FS 69.5Hz 69.7Hz 69.9HzRevc 6.04 6.04 6.04SD 0.0520 0.0520 0.0520Qms 17.08 12.37 11.10Qes 1.05 2.94 6.00Qts 0.99 2.37 3.90Vas 70.4 ltr 70.1 ltr 69.8 ltrBl 8.4 Tm 5.1 Tm 3.6 TmSPL 2.83V 95.4dB 90.9dB 87.9dB
������<���"*��(6����=��1������" ! �6�=���! � ��)&�*�6(!(��6�=���1�"*� ��
10 Hz 20 50 100 200 500 1K 2K 5K 10K 20K
Ohm
1
2
5
10
20
50
100Impedance vs Freq
PHOTO 3: Eminence Maverick Guitar Speaker Driver.
PHOTO 4: Maverick closeup.
FIGURE 16: Eminence Maverick free-air impedance plot.

JANUARY 2011 13
Thiele/Small parameter results for the Eminence 12″ woofer were close to the factory data, with some variance in between my two samples, but the FS/Qt ratios are close. Please note that the SPL difference is due to two different calculation methods. The LEAP 5 SPL data is a calculated number that is intended to represent mid band sensitivity. Eminence sensitivities are expressed as the average output across the usable frequency range when applying 1W/1m into the nominal impedance, (2.83V/8Ω, 4V/16Ω, and so on), which is perhaps a more accurate presentation of overall sensitivity of a driver than the calculated sensitivity method. Either way, it is less of an issue with a guitar speaker than essentially a full-range speaker that does not use a crossover.
In Table 3, which compares the TSL parameter calcula-tions with the FDM knob set at full volume, 50% volume, and maximum attenuation, both SPL and Bl decrease as the knob is advanced to maximum attenuation, while the Qts increases. The substantial amount of attenuation is the key to what makes this unconventional technique do exactly what a guitar player is looking for, a way to decrease volume of the woofer when a tube amplifier is turned up.
I next proceeded to program computer enclosure simula-tions using the LEAP LTD parameters for Sample 1 using a different technique that I normally apply in this circum-stance. Because many guitar speakers are used in open back cabinets, I decided to use a typical cabinet size and simulate the speaker in full-space with a flat baffle equal to the area of the front baffle of the guitar amplifier baffle plus the distance
to the open back part of the enclosure. For this example, I used the measurements from a Fender Deluxe reverb, a single 12″ speaker guitar amp. This yielded a total baffle area of 34″ × 27″, which is what I used for the first simulation (LEAP 5 will simulate almost any possible baffle and box configura-tion). For the second simulation I assumed this same guitar amp to have a closed back. This volume was roughly equal to half of a dual 12″ closed back Fender BandMaster cabinet, or about a 2ft3 closed box with 25% fiberglass fill material. Figure 17 depicts the results for the Maverick in the 34″ × 27″ flat baffle and the 2ft3 sealed box at both 2.83V and an arbitrary 10V, mostly since this is an equal hung (coil length is the about the same as the gap) configuration.
10 Hz 20 50 100 200 500 1K
dBSPL
65
70
75
80
85
90
95
100
105
110
115
SPL vs Freq
DC
B
A
FIGURE 17: Eminence Maverick computer box simulations (A = sealed at
2.83V; B = vented at 2.83V; C = sealed at 10V; D = vented at 10V).
14 VOICE COIL
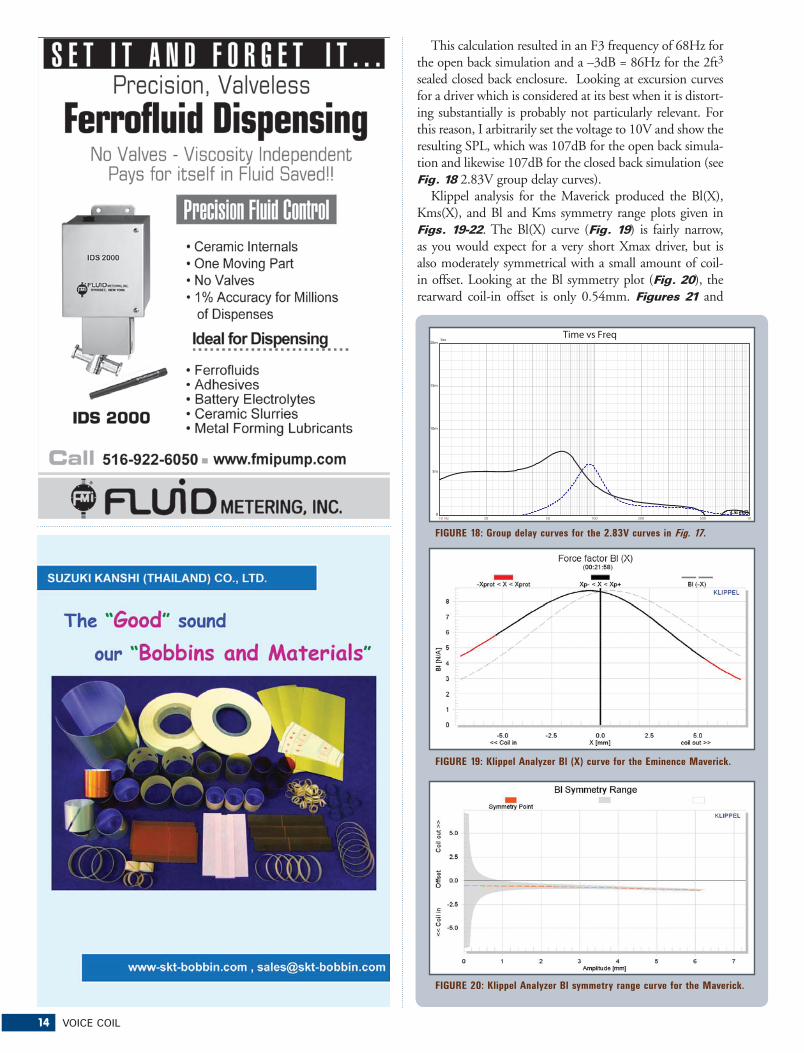
This calculation resulted in an F3 frequency of 68Hz for the open back simulation and a –3dB = 86Hz for the 2ft3 sealed closed back enclosure. Looking at excursion curves for a driver which is considered at its best when it is distort-ing substantially is probably not particularly relevant. For this reason, I arbitrarily set the voltage to 10V and show the resulting SPL, which was 107dB for the open back simula-tion and likewise 107dB for the closed back simulation (see Fig. 18 2.83V group delay curves).
Klippel analysis for the Maverick produced the Bl(X), Kms(X), and Bl and Kms symmetry range plots given in Figs. 19-22. The Bl(X) curve (Fig. 19) is fairly narrow, as you would expect for a very short Xmax driver, but is also moderately symmetrical with a small amount of coil-in offset. Looking at the Bl symmetry plot (Fig. 20), the rearward coil-in offset is only 0.54mm. Figures 21 and
10 Hz 20 50 100 200 500 1K
Sec
0
5m
10m
15m
20m
Time vs Freq
FIGURE 18: Group delay curves for the 2.83V curves in Fig. 17.
FIGURE 19: Klippel Analyzer Bl (X) curve for the Eminence Maverick.
FIGURE 20: Klippel Analyzer Bl symmetry range curve for the Maverick.

JANUARY 2011 15
22 give the Kms(X) and Kms symmetry range curves. The Kms(X) curve is very symmetrical with also an extremely very small amount of coil-out offset. Looking at the Kms symmetry range curve, there is only 0.15mm offset at rest out to 4mm. Displacement limiting numbers calculated by the Klippel analyzer for the Maverick guitar speaker showed XBl at 82% Bl = 2.4mm, and for XC at 75% Cms minimum was 4.1mm, which means that the Bl is the most limiting factor at the prescribed distortion level of 10%. Figure 23 gives the inductance curves Le(X). Inductance will typically increase in the rear direction from the zero rest position as the voice coil covers more pole area, which is what you see with the Maverick.
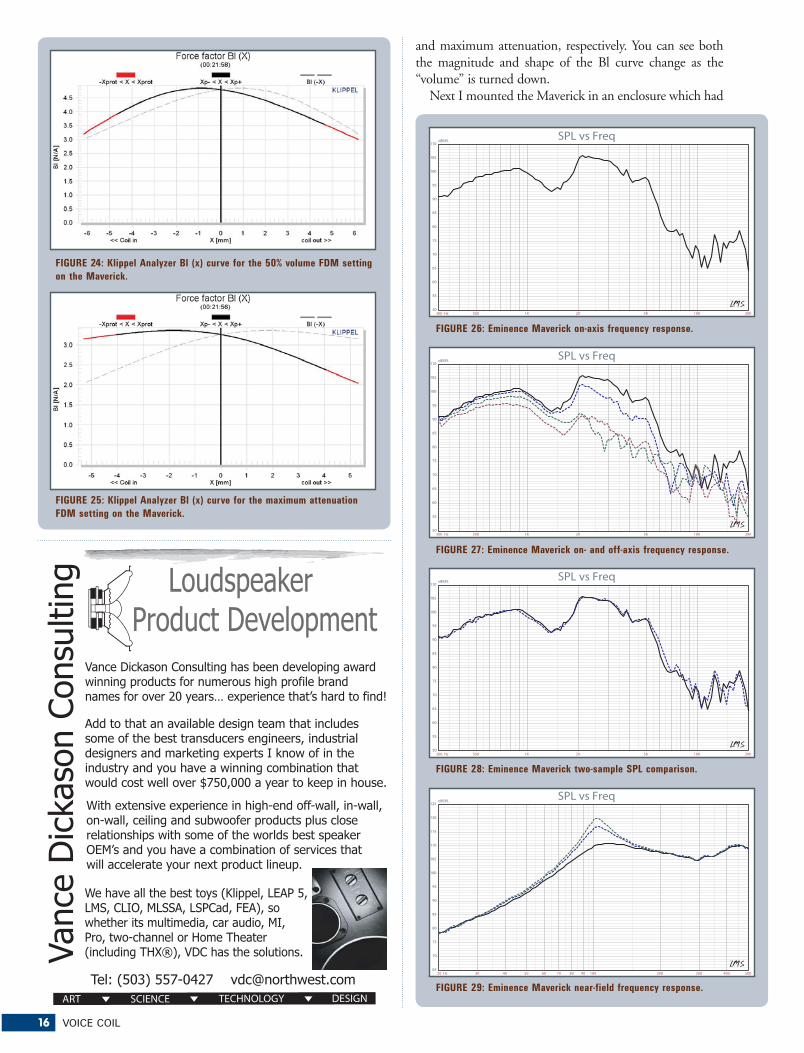
Patrick also performed Klippel measurements with the FDM knob set at 50% and at maximum attenuation. Figures 24 and 25 show the Bl(X) curves for 50% volume
FIGURE 21: Klippel Analyzer mechanical stiffness of suspension Kms (X)
curve for the Eminence Maverick.
FIGURE 22: Klippel Analyzer Kms symmetry range curve for the Maverick.
FIGURE 23: Klippel Analyzer Le(X) curve for the Eminence Maverick.
16 VOICE COIL
and maximum attenuation, respectively. You can see both the magnitude and shape of the Bl curve change as the “volume” is turned down.
Next I mounted the Maverick in an enclosure which had
��������������������� �������������������������
���������������� !���"�������#������������������������
$ ��
��#
%�!
����
&���
���%�
' �
�
$ ����#%�! ����&������%�'�� ��)�����������%�'� � ����%��%�'����������(�������������%'�����(%���)� ���� ����(����������*� ��+��,���%������� �-��� ������(%��.�
/%����,����%����,���%�����%���%'� �����(( � ��0�%� � ��0��� � ��0���%�%�'� �����)���(�������������������������� �%����%����%���������(������������)������� !���123-�� ���*���� ��� ����)%� �%����(�����%������ ���%��� ������ ���*������,�����������%�����
/��� ��� �������)������*���4�%����0��25"��0�360�&�710�3�6650��6"& �0�825�0������������%�������%���% 0�� �� ��%�0�370�"��0���� �� ��������9������� �����%�����%�'��9:;�0�$#&�� �����������%����
5�������� �� �� � %� )������%'���� ���� ��%��������������(�����)������ �����������'%�����0�%������% �����%'����� ���� �!��%�'��,������7�!�����(�%������%������*� ���*���� ��� ��%��%�'����)%� �%����� �����������������������<��0� �*� �����!����%��������
300 Hz 500 1K 2K 5K 10K 20K
dBSPL
50
55
60
65
70
75
80
85
90
95
100
105
110SPL vs Freq
300 Hz 500 1K 2K 5K 10K 20K
dBSPL
50
55
60
65
70
75
80
85
90
95
100
105
110SPL vs Freq
300 Hz 500 1K 2K 5K 10K 20K
dBSPL
50
55
60
65
70
75
80
85
90
95
100
105
110SPL vs Freq
20 Hz 30 40 50 60 70 80 90 100 200 300 400 500
dBSPL
65
70
75
80
85
90
95
100
105
110
115
120
125SPL vs Freq
FIGURE 24: Klippel Analyzer Bl (x) curve for the 50% volume FDM setting
on the Maverick.
FIGURE 25: Klippel Analyzer Bl (x) curve for the maximum attenuation
FDM setting on the Maverick.
FIGURE 26: Eminence Maverick on-axis frequency response.
FIGURE 27: Eminence Maverick on- and off-axis frequency response.
FIGURE 28: Eminence Maverick two-sample SPL comparison.
FIGURE 29: Eminence Maverick near-field frequency response.
JANUARY 2011 17
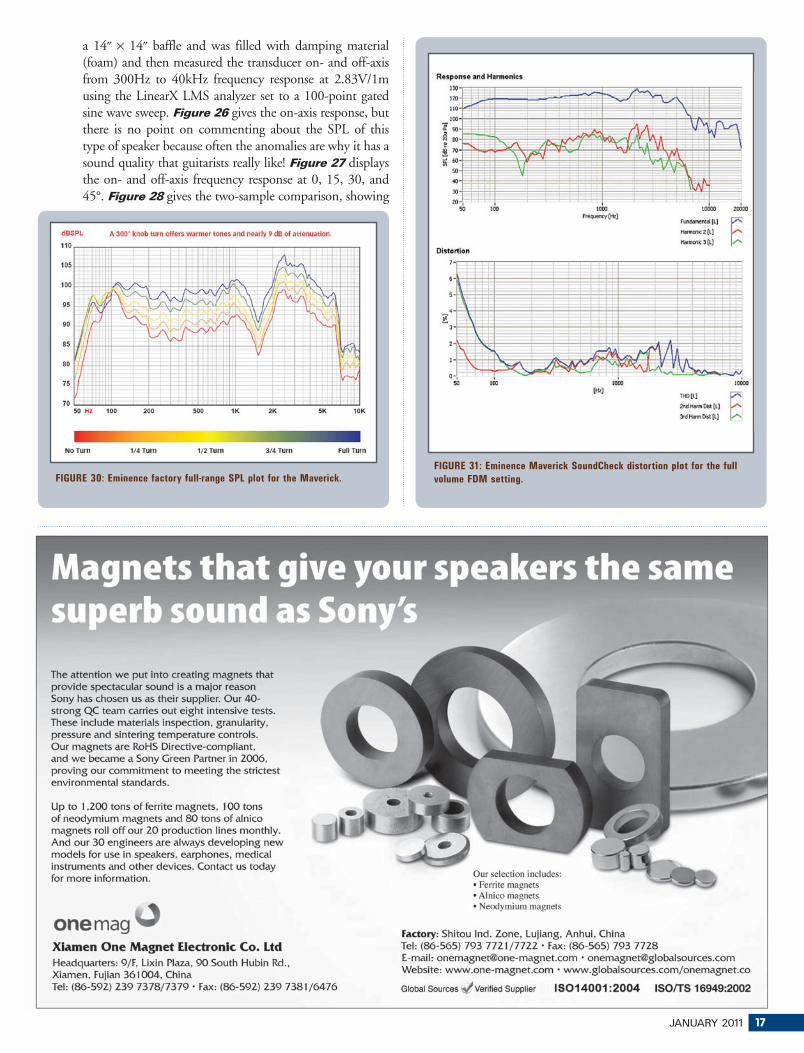
a 14″ × 14″ baffle and was filled with damping material (foam) and then measured the transducer on- and off-axis from 300Hz to 40kHz frequency response at 2.83V/1m using the LinearX LMS analyzer set to a 100-point gated sine wave sweep. Figure 26 gives the on-axis response, but there is no point on commenting about the SPL of this type of speaker because often the anomalies are why it has a sound quality that guitarists really like! Figure 27 displays the on- and off-axis frequency response at 0, 15, 30, and 45°. Figure 28 gives the two-sample comparison, showing
FIGURE 30: Eminence factory full-range SPL plot for the Maverick.
FIGURE 31: Eminence Maverick SoundCheck distortion plot for the full
volume FDM setting.
18 VOICE COIL
������������ ����� �� ������� ���� ���������������������������������������������������� �����!������������ ���� ���� ���������������"���������#�"������"���������"�������������� ��$�����"����$����%����"&��������"�����������'(�����������$$����������!����������'����'���
)*���&+��������#�������������,��������-��������!���%���"����,����������� ����� "�&�����..���������&��%���"����,������������ ��������&�����$����$����� "����"$��������/��$�������'�$�,������������������!�����������#������������"� ����������"&�������!����&���"� ����0����������������� ����$����"�������'���������"�1����$��������"���'����&�����,���"���&��'����"������234����&������������������$��� "��������!����������&�����&��%�������"����,��������������"������,��%����������'���� �����������'����������������� ��&�����������������$����#������$������&����"&����������"$����������"�����������&����������"����1����������%�������������� ������
����������������������������������� � ��!�"�� ������������������ 5+6+7 ��������������8�/99-9�)-3*:.��;��<�=��
#$��"�%&� �'�
���������� �������������������������������������������������������
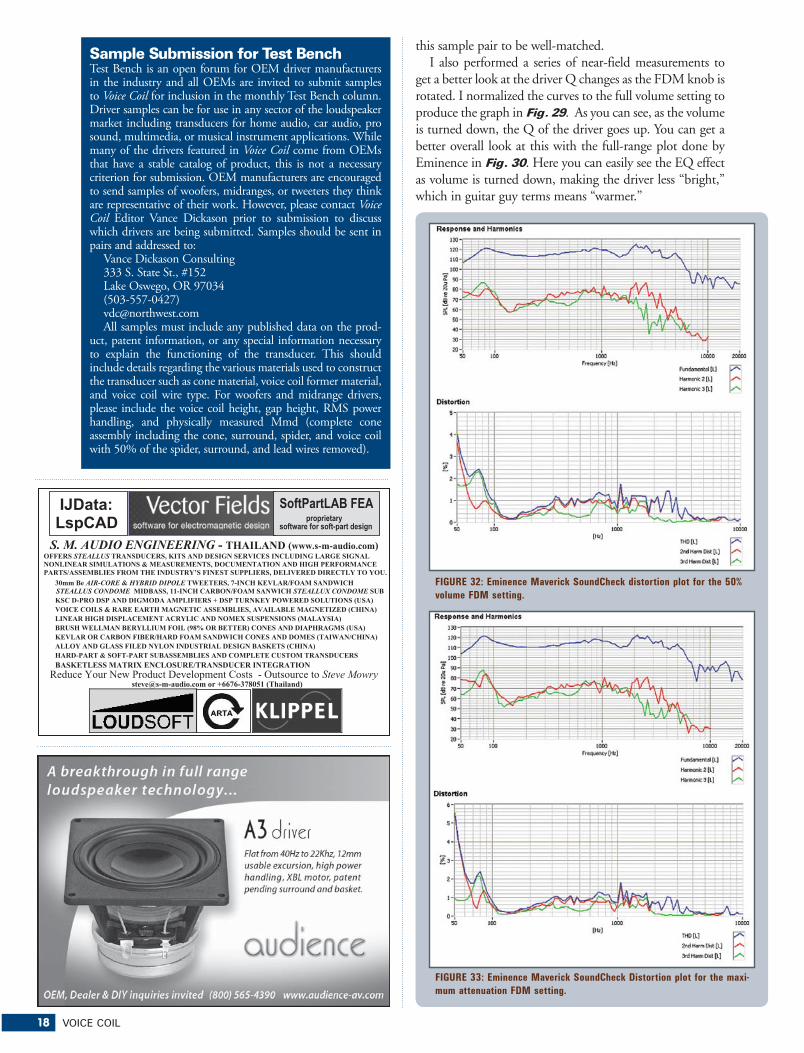
this sample pair to be well-matched.I also performed a series of near-field measurements to
get a better look at the driver Q changes as the FDM knob is rotated. I normalized the curves to the full volume setting to produce the graph in Fig. 29. As you can see, as the volume is turned down, the Q of the driver goes up. You can get a better overall look at this with the full-range plot done by Eminence in Fig. 30. Here you can easily see the EQ effect as volume is turned down, making the driver less “bright,” which in guitar guy terms means “warmer.”
Sample Submission for Test BenchTest Bench is an open forum for OEM driver manufacturers in the industry and all OEMs are invited to submit samples to Voice Coil for inclusion in the monthly Test Bench column. Driver samples can be for use in any sector of the loudspeaker market including transducers for home audio, car audio, pro sound, multimedia, or musical instrument applications. While many of the drivers featured in Voice Coil come from OEMs that have a stable catalog of product, this is not a necessary criterion for submission. OEM manufacturers are encouraged to send samples of woofers, midranges, or tweeters they think are representative of their work. However, please contact Voice Coil Editor Vance Dickason prior to submission to discuss which drivers are being submitted. Samples should be sent in pairs and addressed to:
Vance Dickason Consulting333 S. State St., #152Lake Oswego, OR 97034(503-557-0427)[email protected] samples must include any published data on the prod-
uct, patent information, or any special information necessary to explain the functioning of the transducer. This should include details regarding the various materials used to construct the transducer such as cone material, voice coil former material, and voice coil wire type. For woofers and midrange drivers, please include the voice coil height, gap height, RMS power handling, and physically measured Mmd (complete cone assembly including the cone, surround, spider, and voice coil with 50% of the spider, surround, and lead wires removed).
FIGURE 32: Eminence Maverick SoundCheck distortion plot for the 50%
volume FDM setting.
FIGURE 33: Eminence Maverick SoundCheck Distortion plot for the maxi-
mum attenuation FDM setting.

JANUARY 2011 19
For the remaining series of tests, I employed the SoundCheck analyzer with the Listen Inc. ¼″ SCM micro-phone and power supply to measure distortion and generate time frequency plots. For the distortion measurement, I mounted the Eminence guitar speaker rigidly in free-air, and set the SPL to 104dB at 1m (5.8V) using a noise stimulus, and then measured the distortion with the microphone placed 10cm from the dust cap. This produced the distortion curves shown in Fig. 31 for the full-volume setting. Figures 32 and 33 give the distortion plots for the 50% volume setting and the maximum attenuation setting, respectively. I then used SoundCheck to get a 2.83V/1m impulse response for this driver and imported the data into Listen Inc.’s SoundMap Time/Frequency software. The resulting CSD waterfall plot is given in Fig. 34 and the Wigner-Ville plot in Fig. 35. I hope you enjoyed looking at this very unique and clever driver from Eminence. For more information on this and other Eminence Pro drivers, visit www.eminence.com. VC
From our first ferrofluid-based manufacturing solutions in the 1970s, Ferrotec’s ferrofluid products have been recognized for their unparalleled quality and performance. Whenwe introduced Ferrosound® ferrofluid for audio speakers in the 70’s, Ferrosound quickly became the gold standard for audio speaker enhancement, and we’re continually innovating to keep pace with advances in speaker performance.
Ferrotec’s success rate is unmatched—Ferrotec® audio fluids stay in the air gap of speakers better, offering a host of benefits.
© 2007 Ferrotec (USA) Corp. Ferrotec, Ferrosound and the Ferrotec logo are registered trademarks of the Ferrotec Corporation.
With standard and custom options that optimize viscosity and magnetic properties for most speaker sizes and configurations, Ferrotec can work with you to specify the right solution for your unique requirements.
To learn more about Ferrosound solutions, visit our website at www.ferrotec.com or call us at 800-258-1788.
• Higher speaker production yields• Extended speaker life
• Superior sound quality• Reduced power compression
Ferrofluid
Voice Coil
30 years and millions of speakers later,customers still depend on Ferrotec
Using Ferrofluid to fill air gaps
in speakers, centers the assembly
and reduces the need for tight
tolerances. Ferrofluid also acts
as a vibration damper and an
excellent heat dissipation medium.
®
FIGURE 34: Eminence Maverick SoundCheck CSD Waterfall plot.
FIGURE 35: Eminence Maverick SoundCheck Wigner-Ville plot.

20 VOICE COIL
Spotlight
ALMA Asia 2010By Mike Klasco and Nora Wong, Menlo Scientific
�ctober is a hectic time for me—an international trade
show marathon. In past years the Audio Engineering
Society exhibition was held at the start of October, but thank-
fully this year was moved to November in San Francisco.
Taitronics in Taiwan starts October 11, the Asia World-Expo,
a Global Sourcing show at the Hong Kong airport conven-
tion center, Oct. 12, and the Hong Kong Electronics Fair
on Hong Kong Island on Oct.13. ALMA’s Asia Symposium
“East Meets West: Best Practices for Improving Profit” was in
Shenzhen on the weekend of Oct. 16 and 17.
You would think all of our readers have heard of
ALMA—but with Voice Coil having over 3000 readers and
ALMA having fewer than 300 members, maybe a brief
overview is in order. ALMA International is a global trade
association dedicated to improving the design and manu-
facture of loudspeakers. It covers the industry vertically,
from parts to raw drivers to amplified speaker systems, and
covers all markets including automotive, professional, com-
mercial, consumer audio, and multimedia. Actively expand-
ing ALMA’s membership to Asia makes sense because most
speakers designed in the US are produced in Asia. I think
it also makes sense to expand ALMA’s vision to earphones,
headphones, and microphones.
ALMA is more than just an industry get-together before
CES in Vegas. ALMA achievements include setting techni-
cal standards for the industry, arranging symposia featuring
technical training, paper presentations, round-table discus-
sions, and a trade show and networking opportunities.
ALMA publishes a newsletter titled “ALMA News.”
The China program for the October 16 and 17
Symposium was organized by Carol Bousquet and Jennifer
Nee, General Manager of Phase Design and also ALMA’s
VP Asia. Gray-haired readers may remember Carol from
her years at Ferrofluidics (now Ferrotec). Carol pushed to
join ALMA, and back in the early 1990s, I remember some
effort was made to keep women out of ALMA—but Carol
is quite persistent and effective and she ended up on the
board of directors. Now the ghost of ALMA past has gotten
revenge as Carol is again the Executive Director of ALMA.
Phase Design, Phil Bunch’s Shenzhen-based QC and
product development organization, provided the “on-
the-ground” team. Jennifer Nee deserves special mention
for her efforts. Jennifer did much of the planning and
follow-up as well as coordination with CEAD, the Chinese
equivalent of ALMA. CEAD helped organize, participated,
and exhibited. This is a valuable and productive collabora-
tion—especially for setting up creditable standards. About
60 engineers attended from the Chinese speaker industry;
also a half dozen exhibitors—mostly showing test and
simulation tools. Another exhibitor was the International
Electro-Acoustic Buyers Guide, a monthly (Chinese language)
magazine that is similar to a Chinese language Voice Coil
magazine. Test gear and software exhibitors included Etani
(Japan), Klippel, Listen, Loudsoft, and Prism.
Saturday’s presentations included a talk on Green Audio
by Mr. Liu Qingyuan, GGEC chief engineer and CEAD’s
representative on Green Audio. This presentation was the
first report on green materials for use in loudspeaker design,
an official collaboration between CEAD and ALMA.
Simon Woollard of Prism gave a presentation titled Same
Speaker, Different Data. Simon discussed the mechanisms
that can lead to measurement discrepancies and how stan-
dardized practices and comprehensive documentation can
keep you out of trouble.
Prof. Dr. Wolfgang Klippel followed with his talk on air
leaks and turbulent noise. The existing detection techniques
are not sensitive enough because usually the leak noise has
low energy. He presented a new measurement technique
more sensitive than the ear. Tom Ho, of S&V Samford
Instruments, presented a paper by Steve Temme, Pascal
Brunel, and Brian Fallon of Listen (makers of the Sound
Check analyzer). The focus was on rub and buzz, and its
generation by program material bass content and an improp-
erly functioning voice coil. His presentation explained how
to implement an accurate perceptual rub & buzz technique
for production line use, using a stepped-sine-stimulus easy
limit setting and good immunity to background noise.
In the afternoon, Jennifer Nee presented a paper on com-
mercialization, citing how China-based manufacturers can
better perceive the wants and needs of their clients and dis-
cussing whether both sides are actually focused on the same
factors and concerns, and if not, how to improve the process.
Another paper from Phase Group was by Myrna Du on
Best Practices for Improving Profit. Myrna discussed how
implementing a cost-cutting program without fully consid-
ering the effects may not be the path to improved profit.
She noted that the best practices to achieve the correct and
effective implementation of quality systems requirements
can cut waste and more directly control loss—which would
result in enhanced profit.
The panel discussion “East Meets West: Best Practices
for Improving Profit” was chaired by Eric Chu with pan-
elists Rich Little of Tymphany, Mike Klasco from Menlo
Scientific, and Phil Bunch, Phase Group. Also provided was
a training tutorial by Richard Little on Transducer Motor
Design. The focus was magnetic circuits, magnet materials,
thermal effects, and thermal demagnetization ranging in
PHOTO 1: The ALMA Asia Symposium.

JANUARY 2011 21
scope from basic theory to computational techniques.
Mike Klasco gave a talk on Everything You Wanted
to Know but Were Afraid to Ask Your Customer. Mike
discussed what his perspective is as the “fly on the wall”
after one side leaves the negotiation. There are times when
each side’s view of the meeting makes you wonder whether
everyone was in the same meeting.
Peter Larsen of LoudSoft presented a talk on Loudspeaker
System Design. Peter has left his mark on so many of the
great and classic-sounding speaker drivers. He brought to
ALMA Asia an introduction to his popular System Design
course. This full-day course, offered at the ALMA Winter
Symposium, has always been very popular and generally
sells out well in advance.
Last, Geoff Hill, a brand-new ALMA member jumping in
feet-first, gave the final paper on Application of Six Sigma to
the Loudspeaker Industry. Six Sigma seeks to improve quality
by identifying and removing the causes of defects and mini-
mizing variability. In his presentation, Geoff demonstrated a
practical methodology that can be applied to ASCII measure-
ment data of drivers or tweeters, showing how measurements
on data from a small sample can be used to predict the perfor-
mance of a much larger production run, illustrating problems
objectively so they can be solved cost-effectively.
The ALMA Asia Symposium was a much focused
gathering coupled with very useful networking for those
attending. For more, visit www.almainternational.org. VC
22 VOICE COIL
Acoustic Patents By James Croft
�he following loudspeaker-related patents were filed
primarily under the Office of Patent and Trademarks
classification 181 for acoustical devices and 381 for electri-
cal-signal processing systems and HO4R for international
patents. This also includes new patent applications that are
published in the Patent Application Journal.
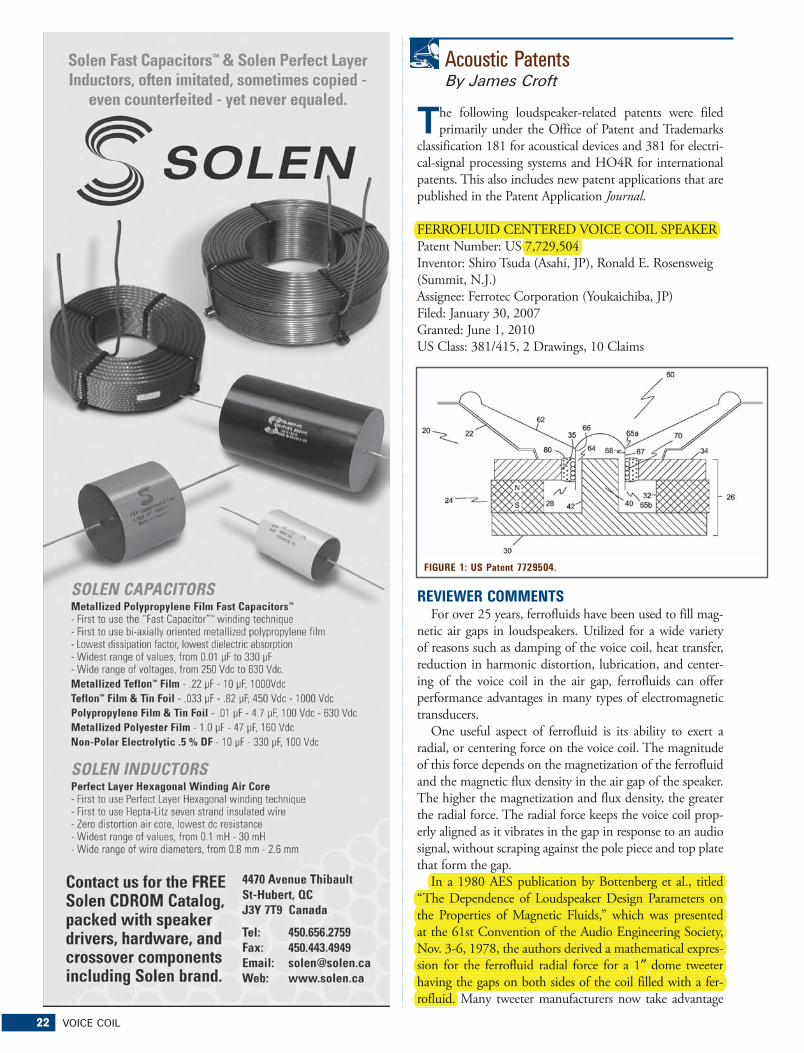
FERROFLUID CENTERED VOICE COIL SPEAKER
Patent Number: US 7,729,504
Inventor: Shiro Tsuda (Asahi, JP), Ronald E. Rosensweig
(Summit, N.J.)
Assignee: Ferrotec Corporation (Youkaichiba, JP)
Filed: January 30, 2007
Granted: June 1, 2010
US Class: 381/415, 2 Drawings, 10 Claims
REVIEWER COMMENTS For over 25 years, ferrofluids have been used to fill mag-
netic air gaps in loudspeakers. Utilized for a wide variety
of reasons such as damping of the voice coil, heat transfer,
reduction in harmonic distortion, lubrication, and center-
ing of the voice coil in the air gap, ferrofluids can offer
performance advantages in many types of electromagnetic
transducers.
One useful aspect of ferrofluid is its ability to exert a
radial, or centering force on the voice coil. The magnitude
of this force depends on the magnetization of the ferrofluid
and the magnetic flux density in the air gap of the speaker.
The higher the magnetization and flux density, the greater
the radial force. The radial force keeps the voice coil prop-
erly aligned as it vibrates in the gap in response to an audio
signal, without scraping against the pole piece and top plate
that form the gap.
In a 1980 AES publication by Bottenberg et al., titled
“The Dependence of Loudspeaker Design Parameters on
the Properties of Magnetic Fluids,” which was presented
at the 61st Convention of the Audio Engineering Society,
Nov. 3-6, 1978, the authors derived a mathematical expres-
sion for the ferrofluid radial force for a 1″ dome tweeter
having the gaps on both sides of the coil filled with a fer-
rofluid. Many tweeter manufacturers now take advantage
FIGURE 1: US Patent 7729504.
FERROFLUID CENTERED VOICE COIL SPEAKER
7,729,504
In a 1980 AES publication by Bottenberg et al., titled
“The Dependence of Loudspeaker Design Parameters on
the Properties of Magnetic Fluids,” which was presented
at the 61st Convention of the Audio Engineering Society,
Nov. 3-6, 1978, the authors derived a mathematical expres-
1″ ″sion for the ferrofluid radial force for a dome tweeter
having the gaps on both sides of the coil filled with a fer-
rofluid.

JANUARY 2011 23
of the centering force of ferrofluid by filling the gap on
both sides of the coil and rendering unnecessary any other
mechanical centering device, such as a spider.
Unfortunately, particularly in long excursion woofers,
the use of ferrofluid in the air gap can be problematic.
The air gap is connected to a cavity between the speaker
magnet and various components of the magnetic structure.
Ferrofluid in the air gap acts like an O-ring seal between
the voice coil and the magnetic structure. The cavity is
essentially sealed off from the air space in front of the top
plate. As the voice coil moves or as the temperature rises,
the air pressure within this cavity tends to be elevated. If the
pressure builds up to a point where it exceeds the pressure
capacity of the ferrofluid O-ring seal, the air bursts through
the seal and relatively large amounts of the ferrofluid may
then flow out or be blown out of the gap.
Many prior art attempts have been made to use ferro-
fluid to replace the centering spider in woofers, tweeters,
and midranges. US Pat. No. 5,335,287 to Athanas utilizes
specially designed vented passages formed in the magnet
assembly to prevent internal pressure from building up
and forcing out the ferrofluid. US Pat. No. 4,414,437,
to Trauernicht, et al. discloses a similar solution adding a
plurality of vents around the voice coil, allowing it to at
least equalize the pressure from one side of the voice coil
gap to the other.
It is the goal of the present invention to provide an
audio speaker that uses ferrofluid for centering a voice coil
without the need for equalizing vent openings or the use of
a mechanical centering device such as a spider while using
a ferrofluid that has low volatility and lower magnetization
than previously required for high excursion woofers.
This is achieved by having the magnetic fluid disposed
in an annular gap only between one side of a voice coil
and one surface of the annular gap. The magnetic fluid is
positioned in the space on the side of the voice coil having
the higher magnetic flux density. Another important aspect
of the present invention is the requirement to prevent the
migration of the magnetic fluid from one side of the voice
coil to the other which is partially achieved by extending
the length of the voice coil former and moving any venting
holes in the voice coil former farther from the area where
the ferrofluid resides.
The magnetic gap may be thought of as having a gap
portion of greater magnetic field strength that diminishes
across the gap to a gap portion of reduced magnetic field
strength. The magnetic fluid will naturally reside in a gap
portion of higher magnetic field. The magnetic fluid, how-
ever, will migrate to a gap portion of lower magnetic field
located at the corners of the pole piece that is situated in the
lower magnetic field unless the gap portions are separated.
The tubular form of the voice coil of the present invention
is structured to maintain gap portion separation and pre-
vent magnetic fluid migration.
In a preferred version of the invention, the magnetic
fluid is placed between the outer surface of the voice coil
and the inner surface of the annular top plate. This position
provides a larger centering force than the minimal center-
24 VOICE COIL
ing force provided in audio speakers of the prior art where
the magnetic fluid is placed on both sides of the voice coil.
The magnetic fluid used in the present invention has a
magnetization preferably in the range of about 100 to about
600 Gauss. The choice of magnetization depends on the
magnetic fluid that is most suited to achieve an adequate
centering force. For instance, audio speakers with high
excursion voice coils and low magnetic field require mag-
netic fluids with higher magnetization values. Audio speak-
ers with low excursion voice coils and high magnetic field
require magnetic fluids with lower magnetization values.
The key aspect of the present invention is that, regardless
of the speaker design, the magnetic fluid is always added to
the portion of the magnetic gap on the side of the voice coil
having the higher magnetic flux density and that the other
side remains open to relieve pressure. I am unaware of any
currently successful implementations of ferrofluid to long
excursion woofers. If this approach can improve matters
in that regard, it would seem to be quite valuable. The fact
that the assignee of the invention is a vendor for ferrofluid,
and ferrofluid applications, would suggest that they would
probably provide free or low-cost licenses for the technology
to those that acquire their ferrofluid from Ferrotec.
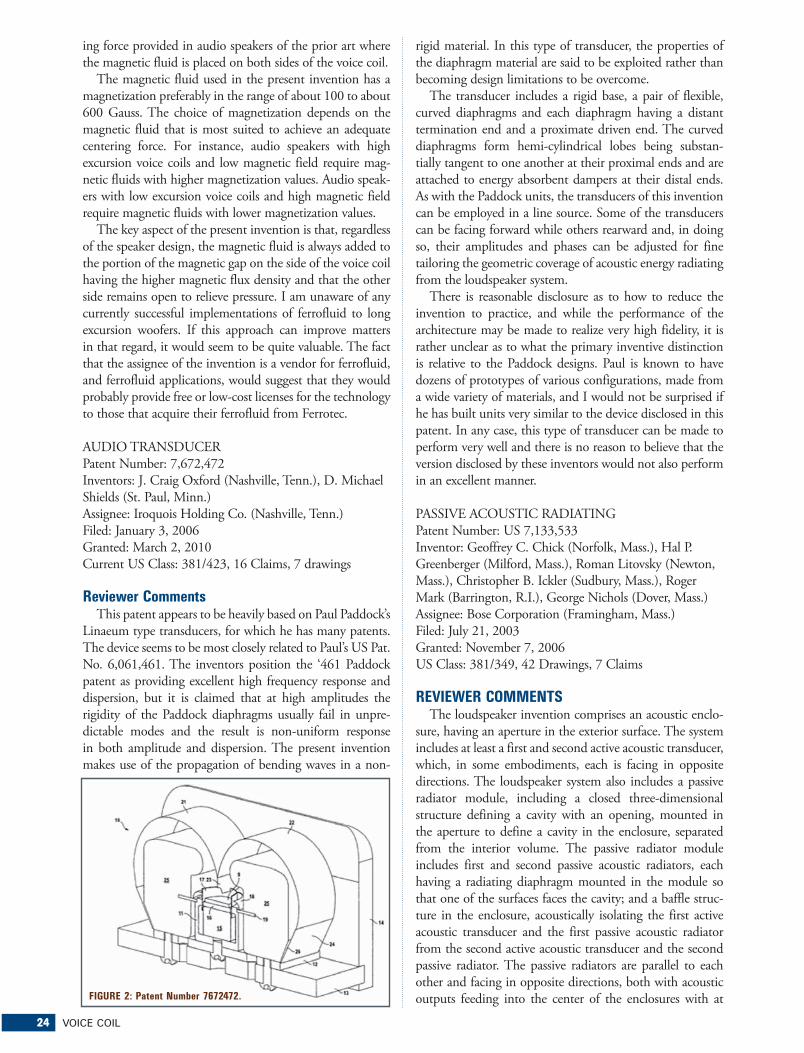
AUDIO TRANSDUCER
Patent Number: 7,672,472
Inventors: J. Craig Oxford (Nashville, Tenn.), D. Michael
Shields (St. Paul, Minn.)
Assignee: Iroquois Holding Co. (Nashville, Tenn.)
Filed: January 3, 2006
Granted: March 2, 2010
Current US Class: 381/423, 16 Claims, 7 drawings
Reviewer CommentsThis patent appears to be heavily based on Paul Paddock’s
Linaeum type transducers, for which he has many patents.
The device seems to be most closely related to Paul’s US Pat.
No. 6,061,461. The inventors position the ‘461 Paddock
patent as providing excellent high frequency response and
dispersion, but it is claimed that at high amplitudes the
rigidity of the Paddock diaphragms usually fail in unpre-
dictable modes and the result is non-uniform response
in both amplitude and dispersion. The present invention
makes use of the propagation of bending waves in a non-
rigid material. In this type of transducer, the properties of
the diaphragm material are said to be exploited rather than
becoming design limitations to be overcome.
The transducer includes a rigid base, a pair of flexible,
curved diaphragms and each diaphragm having a distant
termination end and a proximate driven end. The curved
diaphragms form hemi-cylindrical lobes being substan-
tially tangent to one another at their proximal ends and are
attached to energy absorbent dampers at their distal ends.
As with the Paddock units, the transducers of this invention
can be employed in a line source. Some of the transducers
can be facing forward while others rearward and, in doing
so, their amplitudes and phases can be adjusted for fine
tailoring the geometric coverage of acoustic energy radiating
from the loudspeaker system.
There is reasonable disclosure as to how to reduce the
invention to practice, and while the performance of the
architecture may be made to realize very high fidelity, it is
rather unclear as to what the primary inventive distinction
is relative to the Paddock designs. Paul is known to have
dozens of prototypes of various configurations, made from
a wide variety of materials, and I would not be surprised if
he has built units very similar to the device disclosed in this
patent. In any case, this type of transducer can be made to
perform very well and there is no reason to believe that the
version disclosed by these inventors would not also perform
in an excellent manner.
PASSIVE ACOUSTIC RADIATING
Patent Number: US 7,133,533
Inventor: Geoffrey C. Chick (Norfolk, Mass.), Hal P.
Greenberger (Milford, Mass.), Roman Litovsky (Newton,
Mass.), Christopher B. Ickler (Sudbury, Mass.), Roger
Mark (Barrington, R.I.), George Nichols (Dover, Mass.)
Assignee: Bose Corporation (Framingham, Mass.)
Filed: July 21, 2003
Granted: November 7, 2006
US Class: 381/349, 42 Drawings, 7 Claims
REVIEWER COMMENTS The loudspeaker invention comprises an acoustic enclo-
sure, having an aperture in the exterior surface. The system
includes at least a first and second active acoustic transducer,
which, in some embodiments, each is facing in opposite
directions. The loudspeaker system also includes a passive
radiator module, including a closed three-dimensional
structure defining a cavity with an opening, mounted in
the aperture to define a cavity in the enclosure, separated
from the interior volume. The passive radiator module
includes first and second passive acoustic radiators, each
having a radiating diaphragm mounted in the module so
that one of the surfaces faces the cavity; and a baffle struc-
ture in the enclosure, acoustically isolating the first active
acoustic transducer and the first passive acoustic radiator
from the second active acoustic transducer and the second
passive radiator. The passive radiators are parallel to each
other and facing in opposite directions, both with acoustic
outputs feeding into the center of the enclosures with at FIGURE 2: Patent Number 7672472.
JANUARY 2011 25
least one large slot opening to the external environment.
The first and second passive acoustic radiators are mounted
in the acoustic enclosure in parallel so that they are driven
mechanically out of phase with each other by the active
acoustic driver or drivers.
Essentially, the system is designed such that the passive
radiators mechanically cancel each other out and minimize
vibration, in the same manner that many woofer systems
have opposing active woofers arranged to cancel mechani-
cal vibrations. Additional embodiments based on the same
concept incorporate three-sided and six-sided enclosures
with active drivers mounted on the surfaces facing outward
and the passive acoustic radiators mounted on the surface
facing inward to a common chamber that exits through an
aperture to the external environment, with this structure
also providing mechanical cancellation of vibrations.
All of these arrangements should be effective at vibration
cancellation as intended, but it is unclear what the advan-
tage is of having the passive acoustic radiators facing inward
to a central exit chamber. Essentially, because of “wasting”
the cabinet volume with an internal open chamber that
doesn’t contribute to performance, this makes the enclosure
larger than competitive devices that would have the passive
radiators facing outward and utilizing the enclosure volume
much more efficiently, while still effectively providing the
mechanical vibration cancellation function. The central
aperture that the passive acoustic devices radiate into can
increase the acoustic mass of the passive radiator, but again
in a manner that seems to make for less efficient enclosure
volume, as opposed to just adding physical mass directly to
the diaphragms.
It would appear that the innovation is for the purpose of
realizing some unique packaging for novel appearance, or
for hiding the passive radiators, such as is expressed in the
Bang and Olufsen BeoLab 11, which uses a similar central
aperture with the drivers facing each other and radiating
out through a slot around the periphery to achieve a very
stylish package. It will be interesting when this technology
gets incorporated into the assignee’s (Bose) products to see
whether it is somehow leveraged to some significant acousti-
cal advantages. VC
�
� � � � � � � � � � � � �
�� ����
� ��� � � � � � � � � �
��������������������������������� ��!�������"
�������� ��� ��� ������� �� � ���� �� ��������� �� ������������� �� ���� ������ �� � �������� ��������� �������������������� �� � ����������� ������������� ������� ��������������� �� ����� �� � � ������ ���������� �������� �� � ������� �� ��������������������������������!�����������"##$��� ����������������%
FIGURE 3: US Patent 7133533.
26 VOICE COIL
Industry WatchBy Vance Dickason
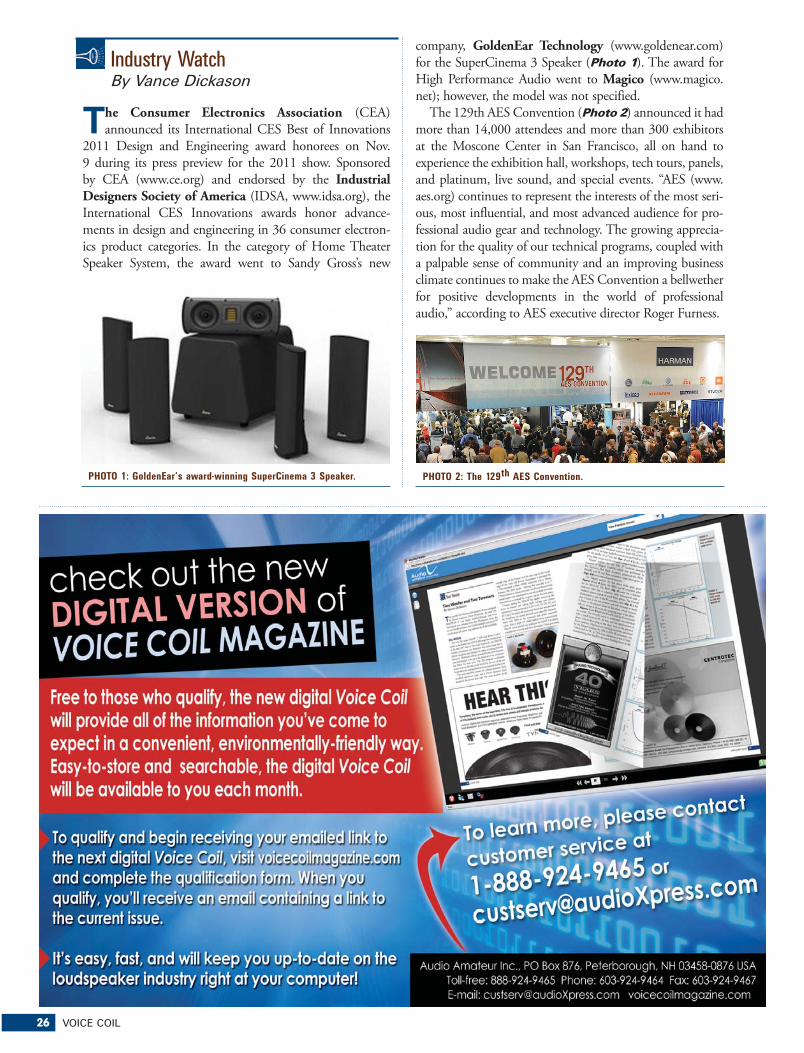
�he Consumer Electronics Association (CEA)
announced its International CES Best of Innovations
2011 Design and Engineering award honorees on Nov.
9 during its press preview for the 2011 show. Sponsored
by CEA (www.ce.org) and endorsed by the Industrial Designers Society of America (IDSA, www.idsa.org), the
International CES Innovations awards honor advance-
ments in design and engineering in 36 consumer electron-
ics product categories. In the category of Home Theater
Speaker System, the award went to Sandy Gross’s new
company, GoldenEar Technology (www.goldenear.com) for the SuperCinema 3 Speaker (Photo 1). The award for
High Performance Audio went to Magico (www.magico.
net); however, the model was not specified.
The 129th AES Convention (Photo 2) announced it had
more than 14,000 attendees and more than 300 exhibitors
at the Moscone Center in San Francisco, all on hand to
experience the exhibition hall, workshops, tech tours, panels,
and platinum, live sound, and special events. “AES (www.
aes.org) continues to represent the interests of the most seri-
ous, most influential, and most advanced audience for pro-
fessional audio gear and technology. The growing apprecia-
tion for the quality of our technical programs, coupled with
a palpable sense of community and an improving business
climate continues to make the AES Convention a bellwether
for positive developments in the world of professional
audio,” according to AES executive director Roger Furness.
PHOTO 1: GoldenEar’s award-winning SuperCinema 3 Speaker. PHOTO 2: The 129th AES Convention.
JANUARY 2011 27
Hisco (www.hiscoinc.com) has opened a new Canadian
division, HiscoCan, Inc., located in the greater Toronto
area. It will service the Canadian electronics assembly and
industrial markets and adds yet another stocking location
to the Hisco family. Hisco was founded in the 1940s as
Houston Industrial Supply Company. The original com-
pany changed hands numerous times until 1970, when
Paul Merriman purchased the business for the sum of $1.
In 1971, the company that we know today was incorpo-
rated as HISCO, an employee-owned company. During
the 35 years since Hisco was established, their supplier base
has grown to include 3M™, Alpha Metals, Momentive Performance Materials, Henkel Loctite, Brady USA,
Panduit, and Intermec.
Harman International (www.harman.com) posted its
fourth consecutive quarterly net profit during its 2011 fis-
cal first quarter following four consecutive quarterly losses,
with net income hitting $27 million on a GAAP basis
compared to a year-ago $10 million net loss. Sales for the
first quarter ending September rose 12% to $837 million,
or 19% excluding the effects of currency fluctuations, with
operating income rising to $43 million compared to a
year-ago $4 million loss. Automotive OEM sales accounted
for 72.5% of total sales during the quarter. The company’s
OEM and professional-audio divisions posted operating
incomes of $36 million and $25 million, respectively, but
the consumer division posted zero operating income com-
pared to a year-ago operating income of $1 million, all on
a GAAP basis. Consumer division net sales rose worldwide
by 3% in the first quarter to $86 million, or by 9% when
currency fluctuations are excluded.
In the full 2010 fiscal year and fiscal fourth quarter, the
consumer division posted sales gains and narrower operat-
ing losses. Fourth-quarter sales rose 15% to $81 million,
and the division’s operating loss narrowed to $11 million
from $15 million. For the full year, sales rose 5% to $373
million, and the operating loss narrowed to $5 million from
$49 million. Harman’s overall first-quarter results mark four
consecutive quarters of year-on-year improvement in both
top line and profitability.
The CEDIA Expo trade show will reduce the number
of exhibit days to three from four in 2011 by eliminating
Sunday from the schedule, CEDIA said in citing exhibitor
feedback. The exhibit floor will be open from Thursday,
Sept. 8, through Saturday, Sept. 10, although education
programs will still begin on Wednesday, Sept. 7. The asso-
ciation hasn’t yet decided the number of days over which it
will offer education sessions, a spokeswoman said. During
the 2010 show, four days of education were offered from
Wednesday through Saturday.
CEDIA (www.cedia.net) has released a survey of installer
trends. The average net profit margin of electronic systems
contractors who are CEDIA members dropped to 3.5% in
2009 from 2007’s 6.8% despite rising gross margins, CEDIA
#�$ ���$������%������ ���������!�� �������&� �&'���!��!&���������'�%�(�&�����)����������%���('�����������&������� ���� ������ �*�������'�%�(���������%� ��+��������&����&&&������,����'����*��������%� �$����,�'�*������&���
To start your free subscription, simply visit our website at www.audioXpress.com and provide your email address.
Audio Amateur Inc. Toll-free: 888-924-9465 Phone: 603-924-9464 Fax: 603-924-9467
It’s here!

28 VOICE COIL
found in its latest member
survey. CEDIA also found
that the average project size
declined only slightly from
2007 levels to $32,000
and that overall employ-
ment fell by less than 5%,
although average staffing
levels for field technicians
declined by 24%. In 2009,
the average revenues of the
surveyed contractors were
$1,107,000, and the con-
tractors’ two largest gross-
income generators contin-
ued to be distributed-A/V
systems and home theater/
media room installations.
The percentage contribu-
tion of each segment, how-
ever, declined slightly from
2007 (Fig. 1).
In 2009, distributed-
A/V systems accounted for an average 24% of installer reve-
nues, down from 2007’s 26%. Likewise, home theater/media
room installs accounted for 24% of revenue in 2009, down
from 27% in 2007. On the other hand, revenues from system
integration rose as a percent of revenues to 13% from 12%.
For its 2009 calendar-year survey, taken in 2010, CEDIA also
began to break out several product segments for the first time
rather than fold them into the “other” category. As a result,
CEDIA found that service and recurring revenue accounted
for an average 5% of installer revenue in 2009, with IT ser-
vices accounting for 2% and central vacuum accounting for
1%. The survey also details other business benchmarks, best
practices, and trend analysis based on company information
provided in such categories as strategic and business planning,
financial performance and management, operations, and
staffing and compensation.
Consumer confidence in the overall economy improved in
October, according to the latest figures released by CEA and
CNET. The CEA-CNET Index also shows confidence in
consumer spending on technology is down slightly from last
month. The CEA-CNET Index of Consumer Expectations
(ICE) increased for the third straight month to 167.1 in
October. The ICE, which measures consumer expectations
about the broader economy, rose 3.7 points but remains
down seven points from this time last year. The CEA-CNET
of Consumer Technology Expectations (ICTE) is down from
last month. The ICTE, which measures consumer expecta-
tions about technology spending, fell 1.6 points to 79.3.
ICTE remains at the same level as one year ago.
CEA’s 17th Annual CE Holiday Purchase Patterns Study
shows that interest in electronics this Christmas season
will be at an all-time high. Consumers will spend $232 on
CE gifts, up 5% from last year and the highest level since
CEA began tracking holiday spending. Nearly a third of
consumers’ total gift budgets will be allocated to CE. The
study found consumers will spend an average of $1,412 this
holiday, including $750 on gifts. Notebook/laptop com-
puters, the iPad, and eReaders are among the most desired
gifts this year. The CEA-CNET Indexes comprise the ICE
and ICTE, both of which are updated on a monthly basis
through consumer surveys. New data is released on the
fourth Tuesday of each month. CEA and CNET have been
tracking index data since January 2007. To find current and
past indexes, charts, methodology, and future release dates,
log on to www.CEACNETindexes.org.
iPod/iPhone/iPad docking stations have been growing
in popularity for several years now. However, the last month
saw a rash of new product releases in this category from
loudspeaker companies:
Speaker maker Monitor Audio (www.monitoraudio.
co.uk) will enter the tabletop-radio market in the US with
first-quarter shipments of a tabletop FM/Internet radio
with integrated iPod/iPhone dock. The AirStream 20 ($449
suggested) (Photo 3) incorporates FM tuner, front-facing
dock, and Wi-Fi, which enables streaming of thousands of
Internet radio stations and music stored on a networked
PC. The new model is compatible with all iPod/iPhone
models, including the latest iPhone 4, the company said.
The AS20 features a low-resonance aluminum chassis,
touch-sensitive menu buttons on top, a top-mounted con-
trol dial, and two full-range drivers designed and voiced by
the British-owned company.
Stillwater added to its Kicker line of iPod/iPhone-docking
speaker systems with its most compact model to date. The
iKick100 is available exclusively through Crutchfield’s website
(www.crutchfield.com) for $149. The 3.3″ × 8.8″ iKick100
complements three larger, higher-power models from Kicker.
The new model features dual 2″ speakers, full-function remote,
flared port to extend bass output, and a DSP-controlled amp
tuned for maximum output and sonic performance. A backlit,
capacitive touchscreen controls volume. An auxiliary-input
jack is available to connect other-brand MP3 players. An
adjustable rear support attachment keeps 4G iPhones and
fourth-generation and later iPods stable while docked, and a
USB port charges cellphones and other external devices. The
company offers three other iPod speaker systems and speaker
systems for Microsoft’s Zune and Zune HD.
Spectra Merchandising (www.spectraint.com), under
FIGURE 1: Graph of installer revenue sources.
PHOTO 3: Monitor Audio’s Airstream 20.

JANUARY 2011 29
the Jensen brand, is adding its first iPad-docking speaker
system, first three-piece music system with iPod/iPhone
dock, and first iPod/iPhone docking system with wireless
speakers. All are certified as made for iPod and iPhone.
The JiMS-260i ($149.99 suggested) (Photo 4) is the
three-piece system, which features CD player, FM tuner
with 10 presets, and iPod/iPhone dock. The system, which
can be wall-mounted or placed on a table, lets users wake
up to radio, CD, or iPod/iPhone music. Other features
include four preset EQ settings, programmable memory,
remote, and blue backlighting around the CD door. It also
features video line-out for playing videos from your iPod
or iPhone on a television. An aux in jack connects to other
music sources.
Altec Lansing (www.AltecLansing.com) joined a hand-
ful of companies offering iPad-docking speaker systems, but
the company expects a lot more competitors to enter the
market in the coming months. The company also said it is
considering the development of docking speakers for other
tablets that look like “serious contenders” in the market,
product manager Steve Schlangen told TWICE. Docking
speaker systems for smartphones other than the iPhone
are also under consideration, he said. Altec’s first model,
available in Apple stores, is the AC-only Octiv Stage at a
suggested price of $149.
Bang & Olufsen (www.bang-olufsen.com) entered the
iPod/iPhone-docking speaker market at the very high end
with a $999 model that also docks with iPads. Other dock-
ing speaker systems at the high end include an iPad-docking
SpeakerCraft system with CD player and FM tuner (www.
speakercraft.com), a $599 model from Bowers & Wilkins (www.bowers-wilkins.com), and a $599 model from Bose
(www.Bose.com). The latter two lack CD and tuner. B&O’s
BeoSound 8 (Photo 5) is available in Bang & Olufsen
stores. The one-piece tabletop system features an aluminum
chassis, included remote, and your choice of six grille col-
ors. One version will feature a white back panel, and the
other will feature a black back panel. The system has a dock
on top with a back bracket to prop up a docked device.
A three-position switch optimizes audio performance for
wall mounting, corner placement on a flat surface, and
freestanding placement on a flat surface. The system’s cone-PHOTO 4: Jensen’s JiMS-260i.

30 VOICE COIL
shaped speakers feature circular grilles that face forward and
enclosures that taper back to a smaller diameter. The sys-
tem’s frequency response is said to be 38Hz to 24,000Hz.
Yamaha (www.yamaha.com) added a new model to its
selection of iPod-docking systems. The company, which
entered the docking-speaker market in 2009, offers a variety
of single-chassis and three-piece systems, some with FM
tuner and some with FM tuner and CD player. The new
model is the single-chassis PDX-31 with dock on top ($169
suggested). It lacks tuner or CD player but is certified for
use with iPhones and iPods. It also features a stereo mini
jack input for connection to other-brand MP3 players and
to other audio devices. VC
Advertiser Categories Page
ACO Pacific .............................. K,N ...................10
Acustica Beyma ...................... D ......................10
Audience ............................... B,C,H ...............18
B & C Speaker S.p.a. ............... D ...................CV2
Beston Technology Corporation D .....................23
BMS Speakers GmbH ................ D .....................15
Earthworks Audio Products ....... K,N ..................13
Etani Electronics Co.,Ltd. ......... B,G,L,N ............. 9
Faital Spa ............................... D ...................... 7
Ferrotec Corporation ................ L .....................19
Fluid Metering, Inc. ................. J .....................14
HiVi, Inc. ............................... D ...................CV3
Jantzen Audio Denmark ........... L,O ................... 5
Klippel GmbH ......................... G,N ..................25
Menlo Scientific, Ltd. ................ B ......................21
MISCO/Minneapolis
Speaker Company .................. C,D,L ................ 3
Mundorf EB GmbH ................... C,L ..................11
One Magnet Electronic Co., Ltd. I .....................17
Prism Media Products .............. G ...................CV4
Quality Guru Audit & Inspection Services .............25
SM Audio
Engineering Consulting .......... B .....................18
Solen, Inc. ............................. C,D ..................22
Suzuki Kanshi Co.,Ltd. ............. L .....................14
Tang Band Industries Co. ......... D ................21, 23
Vance Dickason ........................ B ......................16
Wavecor Ltd. .......................... F,H ..................12
CATEGORY KEY
A = ADHESIVES
B = CONSULTANTS & ENGINEERS
C = CROSSOVERS & PASSIVE
COMPONENTS
D = DRIVERS
E = EMPLOYMENT OPPORTUNITIES
F = ENCLOSURES & ENCLOSURE
PARTS
G = ENGINEERING/DESIGN SOFTWARE
H = FINISHED SYSTEMS
I = MAGNETS & EQUIPMENT
J = MANUFACTURING EQUIPMENT
K = MICROPHONES
L = PARTS
M = RECONING
N = TEST EQUIPMENT
O = VOICE COILS − COMPONENTS
& MATERIALS
P = TRANSDUCERS
This product/services index is provided as a value-added service to our readers and advertisers. The publisher will not be held liable for any errors or deletions contained herein.
Products & Services Index
PHOTO 5: Bang & Olufsen’s BeoSound 8.

...integrated
electronic test, acoustic test...
Prism Sound is now a globalsales & support agent for:
������������������� �������� ������������������������������������ ���������������������������������������������������������� ����������������
��������������������� ���������� ������������ ���������������������
������������������� !�����������������������������������������������������"������ ���������� �����#�������������������$�����%dScope Series III
analog and digitalaudio analyzers
������������������� ��������������������������������������������� �!"#�����$ ����
Loudspeaker design and analysis solutions

V O L U M E 2 4 , I S S U E 4 F E B R U A R Y 2 0 1 1
®
IN THIS ISSUEINDUSTRY NEWS AND DEVELOPMENTS
TEST BENCH5
1
Scan-Speak Discovery DriversBy Vance Dickason
SPOTLIGHT11
30 Products & Services Index
Constant-Current Source Impedance Measurements By Charlie Hughes
SPOTLIGHT16Green Audio and Then Some By Nora Wong and Mike Klasco
Industry News and DevelopmentsBy Vance Dickason
AES NewsThe Audio Engineering Society announced that its 130th AES Convention will take place in London, May 13–16, while the 131st Convention is confirmed for New York City, October 20-23. “Extraordinarily positive attendee and exhibitor feedback confirmed the success of our 129th Convention in San Francisco this past November,” according to the association. The call for papers has been posted for the London Convention, and final electronic manuscripts must be submitted by March 10. The 130th AES Convention will be held in the Novotel London West Convention Centre, Friday, May 13, to Monday, May 16. The 131st Convention is confirmed for New York’s Jacob Javits Center, Thursday, October 20, through Sunday, Oct. 23. Also, the AES 41st International Conference, titled “Audio For Games,” will take place February 2-4 in London at the prestigious headquarters of the British Academy of Film and Television Arts (BAFTA). For more, visit www.aes.org.
ALMA Call for PapersA “Call for Papers” has been issued for ALMA International’s 2011 ALMA Europe Symposium, “PA Speakers: Yesterday, Today and Tomorrow.” Building on the success of its events in the US and China, the ALMA Europe Symposium will take place April 9 at the Messe Frankfurt as part of the much larger Prolight & Sound Event. ALMA plans a series of events throughout 2011 marking the 50th anniversary of the founding of ALMA, the only international trade associa-tion dedicated to improving the design and manufacture of loudspeakers. This program will highlight the 50-year legacy of the PA loudspeaker industry by looking back at historical accomplishments and analyzing future technology.
Technical papers are invited and abstracts will be evalu-
ated on the basis of their overall quality and relevance to
the theme of the symposium, relevance and value to the
loudspeaker industry, and practical feasibility and usage of
the topic and information presented. Each paper session is
scheduled to last 30 minutes, and up to four papers will be
selected. Presenters should submit to ALMA:
• A title
• A 250-word or less abstract/summary suitable for
reprinting in pre-symposium promotional literature
ACOUSTIC PATENTS20By James Croft
INDUSTRY WATCH26By Vance Dickason
Are you behind the green
movement? p. 16.
sWho was recently
honored by ALMA? p. 5.
Scan-Speak’s
Discovery Drivers
p. 5.
���������� ��������������������������������� ��!"" !��"#
���!�$����%�&'(%&
����������� �
In Europe:
intertechnik.de
In Asia:
baysidenet.jp
In Canada:
solen.ca
Dayton Audio’s OmniMic is a
must-have for system integrators,
acoustic engineers, and A/V
installers. It was developed
in collaboration with Liberty
Audio, inventors of the Praxis
Measurement System. The
OmniMic provides quick and
accurate measurements that will
reduce installation time, saving
you both labor and money. Test
signals may be initiated from
the host computer, or from any
audio CD player. System includes
calibrated USB microphone,
mic clip, software and test signal
discs, 6 ft. USB cable, and
carrying case. Compatible
with Windows XP, Vista,
and Windows 7.
Measurements:
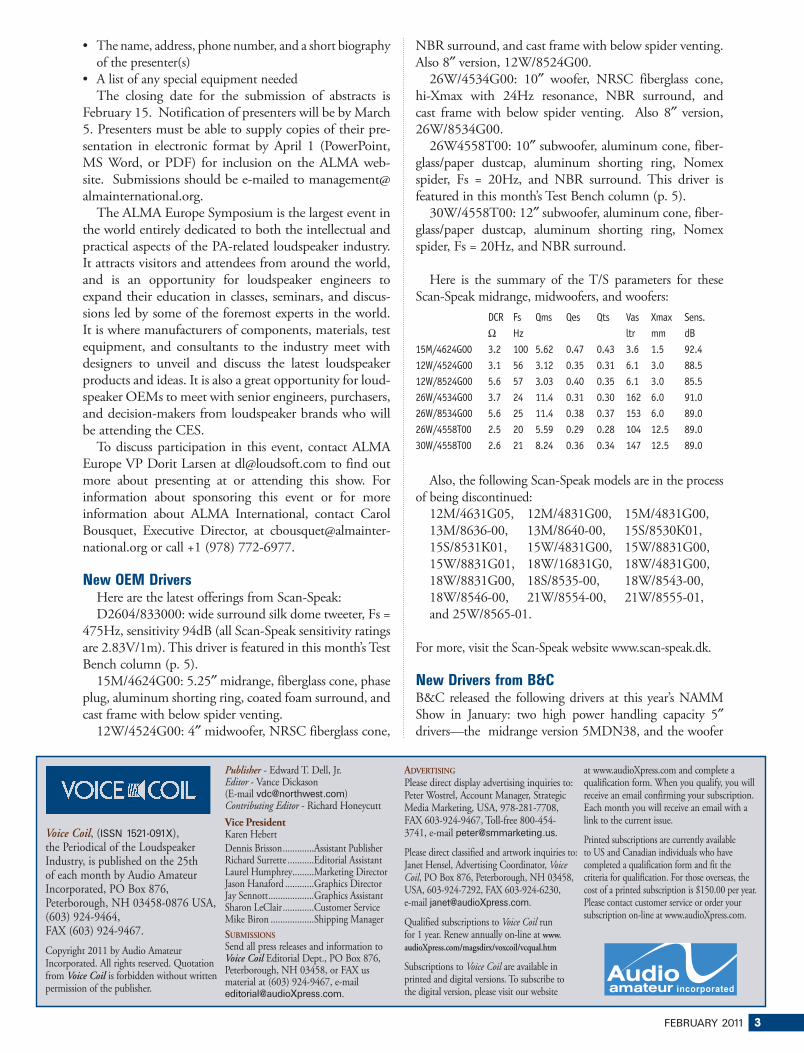
FEBRUARY 2011 3
• The name, address, phone number, and a short biography
of the presenter(s)
• A list of any special equipment needed
The closing date for the submission of abstracts is
February 15. Notification of presenters will be by March
5. Presenters must be able to supply copies of their pre-
sentation in electronic format by April 1 (PowerPoint,
MS Word, or PDF) for inclusion on the ALMA web-
site. Submissions should be e-mailed to management@
almainternational.org.
The ALMA Europe Symposium is the largest event in
the world entirely dedicated to both the intellectual and
practical aspects of the PA-related loudspeaker industry.
It attracts visitors and attendees from around the world,
and is an opportunity for loudspeaker engineers to
expand their education in classes, seminars, and discus-
sions led by some of the foremost experts in the world.
It is where manufacturers of components, materials, test
equipment, and consultants to the industry meet with
designers to unveil and discuss the latest loudspeaker
products and ideas. It is also a great opportunity for loud-
speaker OEMs to meet with senior engineers, purchasers,
and decision-makers from loudspeaker brands who will
be attending the CES.
To discuss participation in this event, contact ALMA
Europe VP Dorit Larsen at [email protected] to find out
more about presenting at or attending this show. For
information about sponsoring this event or for more
information about ALMA International, contact Carol
Bousquet, Executive Director, at cbousquet@almainter-
national.org or call +1 (978) 772-6977.
New OEM DriversHere are the latest offerings from Scan-Speak:
D2604/833000: wide surround silk dome tweeter, Fs =
475Hz, sensitivity 94dB (all Scan-Speak sensitivity ratings
are 2.83V/1m). This driver is featured in this month’s Test
Bench column (p. 5).
15M/4624G00: 5.25″ midrange, fiberglass cone, phase
plug, aluminum shorting ring, coated foam surround, and
cast frame with below spider venting.
12W/4524G00: 4″ midwoofer, NRSC fiberglass cone,
NBR surround, and cast frame with below spider venting.
Also 8″ version, 12W/8524G00.
26W/4534G00: 10″ woofer, NRSC fiberglass cone,
hi-Xmax with 24Hz resonance, NBR surround, and
cast frame with below spider venting. Also 8″ version,
26W/8534G00.
26W4558T00: 10″ subwoofer, aluminum cone, fiber-
glass/paper dustcap, aluminum shorting ring, Nomex
spider, Fs = 20Hz, and NBR surround. This driver is
featured in this month’s Test Bench column (p. 5).
30W/4558T00: 12″ subwoofer, aluminum cone, fiber-
glass/paper dustcap, aluminum shorting ring, Nomex
spider, Fs = 20Hz, and NBR surround.
Here is the summary of the T/S parameters for these
Scan-Speak midrange, midwoofers, and woofers:
DCR Fs Qms Qes Qts Vas Xmax Sens. Ω Hz ltr mm dB15M/4624G00 3.2 100 5.62 0.47 0.43 3.6 1.5 92.412W/4524G00 3.1 56 3.12 0.35 0.31 6.1 3.0 88.512W/8524G00 5.6 57 3.03 0.40 0.35 6.1 3.0 85.526W/4534G00 3.7 24 11.4 0.31 0.30 162 6.0 91.026W/8534G00 5.6 25 11.4 0.38 0.37 153 6.0 89.026W/4558T00 2.5 20 5.59 0.29 0.28 104 12.5 89.030W/4558T00 2.6 21 8.24 0.36 0.34 147 12.5 89.0
Also, the following Scan-Speak models are in the process
of being discontinued:
12M/4631G05, 12M/4831G00, 15M/4831G00,
13M/8636-00, 13M/8640-00, 15S/8530K01,
15S/8531K01, 15W/4831G00, 15W/8831G00,
15W/8831G01, 18W/16831G0, 18W/4831G00,
18W/8831G00, 18S/8535-00, 18W/8543-00,
18W/8546-00, 21W/8554-00, 21W/8555-01,
and 25W/8565-01.
For more, visit the Scan-Speak website www.scan-speak.dk.
New Drivers from B&CB&C released the following drivers at this year’s NAMM Show in January: two high power handling capacity 5″ drivers—the midrange version 5MDN38, and the woofer
Voice Coil, (ISSN 1521-091X), the Periodical of the Loudspeaker Industry, is published on the 25th of each month by Audio Amateur Incorporated, PO Box 876, Peterborough, NH 03458-0876 USA, (603) 924-9464, FAX (603) 924-9467.
Copyright 2011 by Audio Amateur Incorporated. All rights reserved. Quotation from Voice Coil is forbidden without written permission of the publisher.
Publisher - Edward T. Dell, Jr.Editor - Vance Dickason (E-mail [email protected])Contributing Editor - Richard Honeycutt
Vice PresidentKaren Hebert
Dennis Brisson .............Assistant PublisherRichard Surrette ...........Editorial AssistantLaurel Humphrey.........Marketing DirectorJason Hanaford ............Graphics DirectorJay Sennott ...................Graphics AssistantSharon LeClair .............Customer ServiceMike Biron ..................Shipping Manager
SUBMISSIONSSend all press releases and information to Voice Coil Editorial Dept., PO Box 876, Peterborough, NH 03458, or FAX us material at (603) 924-9467, e-mail [email protected].
ADVERTISING
Please direct display advertising inquiries to: Peter Wostrel, Account Manager, Strategic Media Marketing, USA, 978-281-7708, FAX 603-924-9467, Toll-free 800-454-3741, e-mail [email protected].
Please direct classified and artwork inquiries to: Janet Hensel, Advertising Coordinator, Voice Coil, PO Box 876, Peterborough, NH 03458, USA, 603-924-7292, FAX 603-924-6230, e-mail [email protected].
Qualified subscriptions to Voice Coil run for 1 year. Renew annually on-line at www.audioXpress.com/magsdirx/voxcoil/vcqual.htm
Subscriptions to Voice Coil are available in printed and digital versions. To subscribe to the digital version, please visit our website
at www.audioXpress.com and complete a qualification form. When you qualify, you will receive an email confirming your subscription. Each month you will receive an email with a link to the current issue.
Printed subscriptions are currently available to US and Canadian individuals who have completed a qualification form and fit the criteria for qualification. For those overseas, the cost of a printed subscription is $150.00 per year. Please contact customer service or order your subscription on-line at www.audioXpress.com.
4 VOICE COIL
5NDL38. Both have 180W power ratings (90W AES), 1.5″ diameter voice coils, neodymium ring magnets, cop-per cap on the pole, and glass fiber formers. T/S parameters are as follows:
DCR Fs Qms Qes Qts Vas Xmax Sens. Ω Hz ltr mm dB (1W/1m)5MDL38 5.6 162 5.5 0.38 0.35 1.6 1.8 945NDL38 5.5 92 11 0.50 0.48 3.3 3.3 90
The company also released a 6.5″ coaxial driver, the
6HCX51, which uses a single neodymium magnet for both
the woofer and the compression driver. In terms of features,
the compression driver uses a polyester diaphragm, has a
small 70 × 70° horn, a 36mm (1.4″) diameter voice coil,
105dB sensitivity, and a recommended crossover frequency
of 2.2kHz. Features for the woofer include a 51mm (2″)
diameter voice coil, 92dB sensitivity, and a rated power
handling of 300W (150W AES). T/S parameters for the
6.5″ section of this coaxial are:
DCR Fs Qms Qes Qts Vas Xmax Sens. Ω Hz ltr mm dB (1W/1m)6HCX51 woofer 5.2 89 7.5 0.40 0.38 5 5 92
B&C has added two 15″ subwoofers, the 15SW100
and 15SW115 (a review of the 18″ versions of these subs
appeared in the May 2010 issue for the 18SW115 and
in the October 2010 issue for the 18SW100). Common
features include 3000W power handling (1500W AES),
ventilated voice coil cap, double silicone spider, alumi-
num shorting ring, ribbed and coated cone and coated
dust cap, pleated coated cloth triple roll surround, neo-
dymium inside slug magnet system, T-pole, glass fiber
former wound with copper wire, and TWP waterproof-
ing on both sides of the cone. The 15SW100 uses a 4″
diameter voice coil, and the 15SW115 a 4.5″ diameter
voice coil. T/S parameters for these two high-powered
subwoofers are:
DCR Fs Qms Qes Qts Vas Xmax Sens Ω Hz ltr mm dB (1W/1m)15SW100 5.4 35 4.8 0.34 0.31 110 12.5 9515SW115 5.2 35 4.4 0.25 0.24 110 13.5 96
For more on these and other B&C drivers, go to www.
bcspeakers.com.
New Drivers from BeymaBeyma has recently released two compression drivers,
the CD10Fe and the CD10Nd, and a new 12″ neo motor
woofer, the 12SW1300Nd. The CD10Fe and CD10Nd
are both 1″ compression drivers that feature a PM-4
polymer diaphragm, lightweight edgewound aluminum
ribbon voice coil, 140W power handing (70W AES),
recommended 1.2kHz or higher crossover frequency,
and a finned aluminum cover (also acting as a heatsink).
Individually, the CD10Fe uses a ferrite magnet and has
a 109dB at 2.83V/1m sensitivity with a Beyma TD-164
horn, and the CD10Nd uses a neodymium magnet
and has a 111dB at 2.83V/1m sensitivity with the same
Beyma TD-164 horn.
The Beyma 12SW1300Nd is a 12″ addition to Beyma’s
SW1600Nd series of high power handling woofers. Features
include the patented Beyma HELICEX cooling technol-
ogy, 2400W power handing (1200W AES), 4″ diameter
duo double inner/outer voice coil winding, CONEX spi-
der, uncoated ribbed paper cone, and a coated triple roll
cloth surround. T/S parameters for the new woofer (the
12SW1300Nd will be featured in the March 2011 issue of
Voice Coil) are as follows:
DCR Fs Qms Qes Qts Vas Xmax Sens. Ω Hz ltr mm dB (2.83V/1m)12SW1300Nd 4.9 45 12.1 0.27 0.26 45 5.5 96
For more information on these and other Beyma drivers,
visit www.beyma.com.
New Tymphany WebsiteTymphany HK LTD has re-launched its company
website, www.tymphany.com. The complete redesign of
the site reflects the expanded capability the China-based
company brings to the ODM industry and allows simpli-
fied product search for standard components. The site also
reflects Tymphany’s surging growth in electronics and active
systems production balanced by an 80-year heritage in
transducer and passive system design, all manufactured in
Asia under Western management. Tymphany sales represen-
tatives in Asia, Europe, and the Americas can be reached at
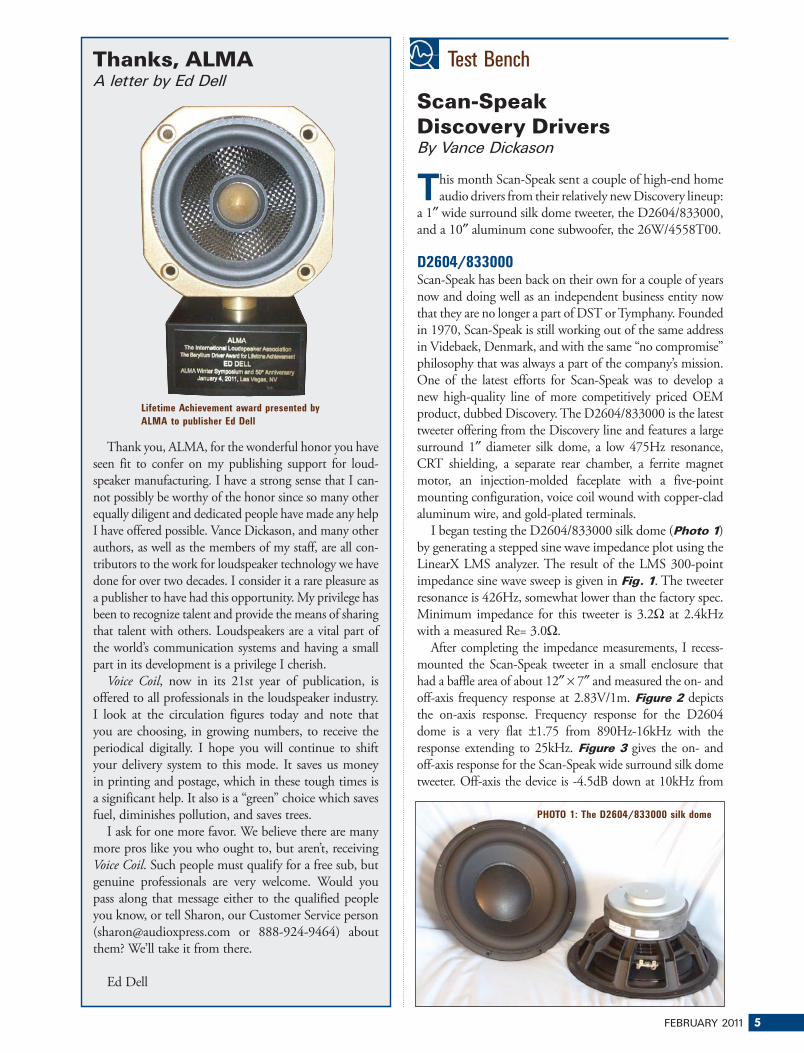
FEBRUARY 2011 5
Test Bench
Scan-Speak Discovery DriversBy Vance Dickason
�his month Scan-Speak sent a couple of high-end home
audio drivers from their relatively new Discovery lineup:
a 1″ wide surround silk dome tweeter, the D2604/833000,
and a 10″ aluminum cone subwoofer, the 26W/4558T00.
D2604/833000Scan-Speak has been back on their own for a couple of years now and doing well as an independent business entity now that they are no longer a part of DST or Tymphany. Founded in 1970, Scan-Speak is still working out of the same address in Videbaek, Denmark, and with the same “no compromise” philosophy that was always a part of the company’s mission. One of the latest efforts for Scan-Speak was to develop a new high-quality line of more competitively priced OEM product, dubbed Discovery. The D2604/833000 is the latest tweeter offering from the Discovery line and features a large surround 1″ diameter silk dome, a low 475Hz resonance, CRT shielding, a separate rear chamber, a ferrite magnet motor, an injection-molded faceplate with a five-point mounting configuration, voice coil wound with copper-clad aluminum wire, and gold-plated terminals.
I began testing the D2604/833000 silk dome (Photo 1)
by generating a stepped sine wave impedance plot using the
LinearX LMS analyzer. The result of the LMS 300-point
impedance sine wave sweep is given in Fig. 1. The tweeter
resonance is 426Hz, somewhat lower than the factory spec.
Minimum impedance for this tweeter is 3.2Ω at 2.4kHz
with a measured Re= 3.0Ω.
After completing the impedance measurements, I recess-
mounted the Scan-Speak tweeter in a small enclosure that
had a baffle area of about 12″ × 7″ and measured the on- and
off-axis frequency response at 2.83V/1m. Figure 2 depicts
the on-axis response. Frequency response for the D2604
dome is a very flat ±1.75 from 890Hz-16kHz with the
response extending to 25kHz. Figure 3 gives the on- and
off-axis response for the Scan-Speak wide surround silk dome
tweeter. Off-axis the device is -4.5dB down at 10kHz from
Thanks, ALMAA letter by Ed Dell
Thank you, ALMA, for the wonderful honor you have
seen fit to confer on my publishing support for loud-
speaker manufacturing. I have a strong sense that I can-
not possibly be worthy of the honor since so many other
equally diligent and dedicated people have made any help
I have offered possible. Vance Dickason, and many other
authors, as well as the members of my staff, are all con-
tributors to the work for loudspeaker technology we have
done for over two decades. I consider it a rare pleasure as
a publisher to have had this opportunity. My privilege has
been to recognize talent and provide the means of sharing
that talent with others. Loudspeakers are a vital part of
the world’s communication systems and having a small
part in its development is a privilege I cherish.
Voice Coil, now in its 21st year of publication, is
offered to all professionals in the loudspeaker industry.
I look at the circulation figures today and note that
you are choosing, in growing numbers, to receive the
periodical digitally. I hope you will continue to shift
your delivery system to this mode. It saves us money
in printing and postage, which in these tough times is
a significant help. It also is a “green” choice which saves
fuel, diminishes pollution, and saves trees.
I ask for one more favor. We believe there are many
more pros like you who ought to, but aren’t, receiving
Voice Coil. Such people must qualify for a free sub, but
genuine professionals are very welcome. Would you
pass along that message either to the qualified people
you know, or tell Sharon, our Customer Service person
([email protected] or 888-924-9464) about
them? We’ll take it from there.
Ed Dell
PHOTO 1: The D2604/833000 silk dome
Lifetime Achievement award presented by
ALMA to publisher Ed Dell

6 VOICE COIL
the on-axis response with respect to the 30° off-axis curve
and -7.2dB at 45° off-axis, again with respect to the on-axis
response. Figure 4 illustrates the normalized version of
Fig. 3. In terms of production consistency, the two-sample
SPL comparison is depicted in Fig. 5, indicating the two
samples were well matched with some minor variation in the
3-7.5kHz region.
Next, I used the Listen Inc. SoundCheck analyzer and
SCM microphone to measure the impulse response with the
tweeter recess-mounted. Importing this data in the Listen
Inc. SoundMap software produced the cumulative spectral
decay plot (waterfall) shown in Fig. 6. While there are no
major resonances indicated in this plot, it is very difficult to
correlate long decay resonances with subjective performance.
Figure 7 gives the Short Time Fourier Transform (STFT)
displayed as a surface plot. Last, I set the 1m SPL to 94dB
(5.8V), and the sweep range to 2kHz-20kHz and measured
the 2nd and 3rd harmonic distortion at 10cm, depicted in
Fig. 8. This shows the relationship between 2nd and 3rd
harmonic distortion; however, correlation to subjective pref-
erence based on THD is not well established.
For those of you who have not used this format tweeter
in a system, it’s a great design and one of my favorites. All of
the various incarnations I have designed into systems have
sounded very good, and given the quality and craftsmanship
always exhibited by Scan-Speak, this is a great addition to
their new Discovery line.
26W/4558T00The new Scan-Speak 26W/4558T00 subwoofer (Photo 2) is built on an eight-spoke proprietary cast aluminum frame, which includes eight 35mm × 20mm “windows” below the spider mounting shelf for cooling. Scan-Speak obviously spent a lot of time designing the cone for this woofer. The material used for this cone is a thick black flat profile anodized alumi-num that has the outside perimeter of the cone turned down to strengthen the edge to prevent flexing. However, even more interesting is that the cone has a 5″ articulation that forms a 1/16″ rib that is in just about the same place that the dust cap attaches on the front side of the cone, which should add considerable stiffness. There are also eight slightly oblong ¼″ × 3/8″ holes intended to vent air out of the area beneath the dust cap. The dust cap is a 5″ diameter convex type made from a black coated fiberglass/paper sandwich.
Providing compliance for this woofer is a fairly wide
(30mm) black NBR surround and a black 6″ diameter flat
300 Hz 500 1K 2K 5K 10K 20K 40K
dBSPL
45
50
55
60
65
70
75
80
85
90
95
100
105SPL vs Freq
10 Hz 20 50 100 200 500 1K 2K 5K 10K 20K 40K
Ohm
1
2
5
10
20
50
100Impedance vs Freq
300 Hz 500 1K 2K 5K 10K 20K 40K
dBSPL
45
50
55
60
65
70
75
80
85
90
95
100
105SPL vs Freq
A
BC
D
300 Hz 500 1K 2K 5K 10K 20K 40K
dBR
-40
-35
-30
-25
-20
-15
-10
-5
0
5
10Ratio vs Freq
A
BC
D
FIGURE 2: Scan-Speak D2604/833000 on-axis response.
FIGURE 3: Scan-Speak D2604/833000 horizontal on- and off-axis fre-
quency response (A = 0°; B = 15°; C = 30°; D = 45°).
FIGURE 1: Scan-Speak D2604/833000 free-air impedance plot.
FIGURE 4: Scan-Speak D2604/833000 normalized on- and off-axis fre-
quency response (A = 0°; B = 15°; C = 30°; D = 45°).PHOTO 2: The Scan-Speak
26W/4558T00 subwoofer

FEBRUARY 2011 7
300 Hz 500 1K 2K 5K 10K 20K 40K
dBSPL
45
50
55
60
65
70
75
80
85
90
95
100
105SPL vs Freq
10 Hz 20 50 100 200 500 1K 2K 5K 10K 20K
Ohm
1
2
5
10
20
50
100Impedance vs Freq
10 Hz 20 50 100 200 500 1K
Sec
0
5m
10m
15m
20m
Time vs Freq
10 Hz 20 50 100 200 500 1K
M
1m
2m
3m
4m
5m
6m
7m
8m
9m
10m
20m
Excursion vs Freq
10 Hz 20 50 100 200 500 1K
dBSPL
70
75
80
85
90
95
100
105
110
115
120
SPL vs Freq
AB
CD
FIGURE 7: Scan-Speak D2604/833000 SoundCheck STFT surface intensity plot.
FIGURE 9: Scan-Speak 26W/4558T00 free-air impedance plot.
FIGURE 6: Scan-Speak D2604/833000 SoundCheck CSD waterfall plot.
FIGURE 5: Scan-Speak D2604/833000 two-sample SPL comparison.
FIGURE 11: Group delay curves for the 2.83V curves in Fig. 10.
FIGURE 12: Cone excursion curves for the 36/40V curves in Fig. 10.
FIGURE 10: Scan-Speak 26W/4558T00 computer box simulations (A = sealed
at 2.83V; B = vented at 2.83V; C = sealed at 36V; D = vented at 40V).
FIGURE 8: Scan-Speak D2604/833000 SoundCheck distortion plots.

8 VOICE COIL
Nomex spider. It also includes flat Litz wire sewn into the
spider and terminates to a pair of gold-plated terminals.
While not connected to a terminal (this is a single voice coil
subwoofer), there is another pair of Litz wires sewn into the
opposite side of the spider.
The motor system for the 26W is composed of a stacked
pair of 147mm diameter and 18mm thick ferrite magnets.
These are sandwiched between an 8mm front plate and a
9mm back plate with a 10mm bump out.
I commenced testing the Scan-Speak 10″ 26W subwoof-
er using the LinearX LMS analyzer and VIBox to produce
both voltage and admittance (current) curves with the driver
clamped to a rigid test fixture in free-air at 1V, 3V, 6V, 10V,
15V, and 20V. The twelve 550-point stepped sine wave
sweeps for each 26W sample were post-processed and the
voltage curves divided by the current curves (admittance) to
produce impedance curves, phase added using LMS calcu-
lation method, and, along with the accompanying voltage
curves, uploaded to the LEAP 5 Enclosure Shop software.
Besides the LEAP 5 LTD model results, I additionally
produced a LEAP 4 TSL model set of parameters using
just the 1V free-air curves. The final data, which includes
the multiple voltage impedance curves for the LTD model
(see Fig. 9 for the 1V free-air impedance curve) and the 1V
impedance curve for the TSL model, were selected and the
parameters created in order to perform the computer box
simulations. Table 1 compares the LEAP 5 LTD and TSL
data and factory parameters for both 26W samples.
LEAP parameter calculation results for the 26W were rea-
sonably close to the factory data, although my data showed
a lower sensitivity. Following my usual protocol, I proceeded
setting up computer enclosure simulations using the LEAP
LTD parameters for Sample 1. I set up two box simulations,
one sealed and one vented. For the closed box simulation I
used a 1.0ft3 enclosure with 50% fiberglass fill material, and
for the vented box, a 1.7ft3 QB3 type vented alignment with
15% fiberglass fill material and tuned to 24Hz.
Figure 10 illustrates the results for the Scan-Speak 26W
subwoofer in the sealed and vented boxes at 2.83V and at
a voltage level high enough to increase cone excursion to
Xmax + 15% (14.4mm for the 26W). This yielded a F3
= 40Hz with a box/driver Qtc of 0.67 for the 1.0ft3 sealed
enclosure and –3dB = 33.5Hz for the 1.7ft3 vented simula-
tion. Increasing the voltage input to the simulations until
the maximum linear cone excursion was reached resulted
in 111.2dB at 40V for the sealed enclosure simulation and
106dB with an 16V input level for the larger vented box
(see Figs. 11 and 12 for the 2.83V group delay curves and
the 36/40V excursion curves).
Klippel analysis for the Scan-Speak 10″ subwoofer pro-
duced the Bl(X), Kms(X) and Bl and Kms symmetry range
plots given in Figs. 13-16. The Bl(X) curve for the 26W
(Fig. 13) is very broad and reasonably symmetrical, typical
of high Xmax drivers. Looking at the Bl Symmetry plot (Fig. 14), this curve shows a coil forward (coil out) offset that
goes from 2.8mm at rest to about 2.3mm of excursion at
the physical Xmax position. Because it stays fairly constant
throughout the operating range, this is likely a physical off-
FIGURE 15: Klippel Analyzer mechanical stiffness of suspension Kms (X)
curve for the Scan-Speak 26W/4558T00.
FIGURE 13: Klippel Analyzer Bl (X) curve for the Scan-Speak
26W/4558T00.
FIGURE 14: Klippel Analyzer Bl symmetry range curve for the Scan-
Speak 26W/4558T00.
��������1����1* �7��8%�##�����1�>,��= �
TSL model LTD model Factory sample 1 sample 2 sample 1 sample 2
FS 22.1Hz 21.9Hz 21.2Hz 21.1Hz 20Hz REVC 2.51 2.51 2.51 2.51 2.5 Sd 0.0340 0.0340 0.0340 0.0340 0.0352QMS 6.17 5.99 5.95 6.13 5.59 QES 0.38 0.38 0.35 0.38 0.29 QTS 0.36 0.36 0.35 0.36 0.28 VAS 83.3 ltr 85.2 ltr 94.7 ltr 92.2 ltr 104 ltr SPL 2.83V 85.7dB 85.6dB 85.3dB 85.4dB 89dB XMAX 12.5mm 12.5mm 12.5mm 12.5m 12.5mm

FEBRUARY 2011 9
set. Figures 15 and 16 give the Kms(X) and Kms symme-
try range curves for the Scan-Speak 26W. The Kms(X) curve
(Fig. 15) is also as moderately symmetrical as the Bl curve,
and likewise has a coil-out offset. In the Kms symmetry range
curve in Fig. 16, the coil-out offset is 4.4mm at rest decreas-
ing to about 3mm at the physical Xmax position. From the
displacement limiting numbers calculated by the Klippel
analyzer for the 26W, the XBl @ 70% is Bl = 12.6mm and
for XC @ 50% Cms the minimum was 13.2mm, which
means that for the 26W woofer, Bl was the limiting factor for
the prescribed 20% distortion limit. This occurs at just about
the physical Xmax of the driver, so not bad.
Figure 17 gives the inductance curves L(X) for the 26W.
The curve illustrates a decreasing inductance as the coil
moves inward, the result of the aluminum shorting sleeve in
this motor system. Voice coil inductance varies only about
0.16mH from Xmax in to Xmax out (0.43mH to 0.59mH),
which is very good given the amount of wire in the voice coil.
Even though the 26W is a subwoofer and could likely
be used with a plate amp limiting its upward extension to
100Hz, this 10″ driver could also find application in three-
way designs. Given that, I mounted the 26W/4558T00
subwoofer in an enclosure which had a 17″ × 8″ baffle and
was filled with damping material (foam) and then measured
the DUT on- and off-axis from 300Hz to 20kHz frequency
response at 2.83V/1m using a 100 point gated sine wave
sweep. Figure 18 gives the 26W’s on-axis response display-
ing a very smooth rising response to about 600Hz, followed
sponsors of “The Loudspeaker University” seminars
Liaison Between Materials,
Suppliers, & Audio Manufacturers
Technical Support for Headset,
Mic, Speaker & Manufacturers
Product Development
Sourcing Guidance
Test & Measurement
Instrumentation
MENLO
S C I E N T I F I C
Engineering Consulting
for the Audio Community
USA tel 510.758.9014
Michael Klasco
www.menloscientific.com
FIGURE 17: Klippel Analyzer L(X) curve for the Scan-Speak 26W/4558T00.
FIGURE 16: Klippel Analyzer Kms symmetry range curve for the Scan-
Speak 26W/4558T00.
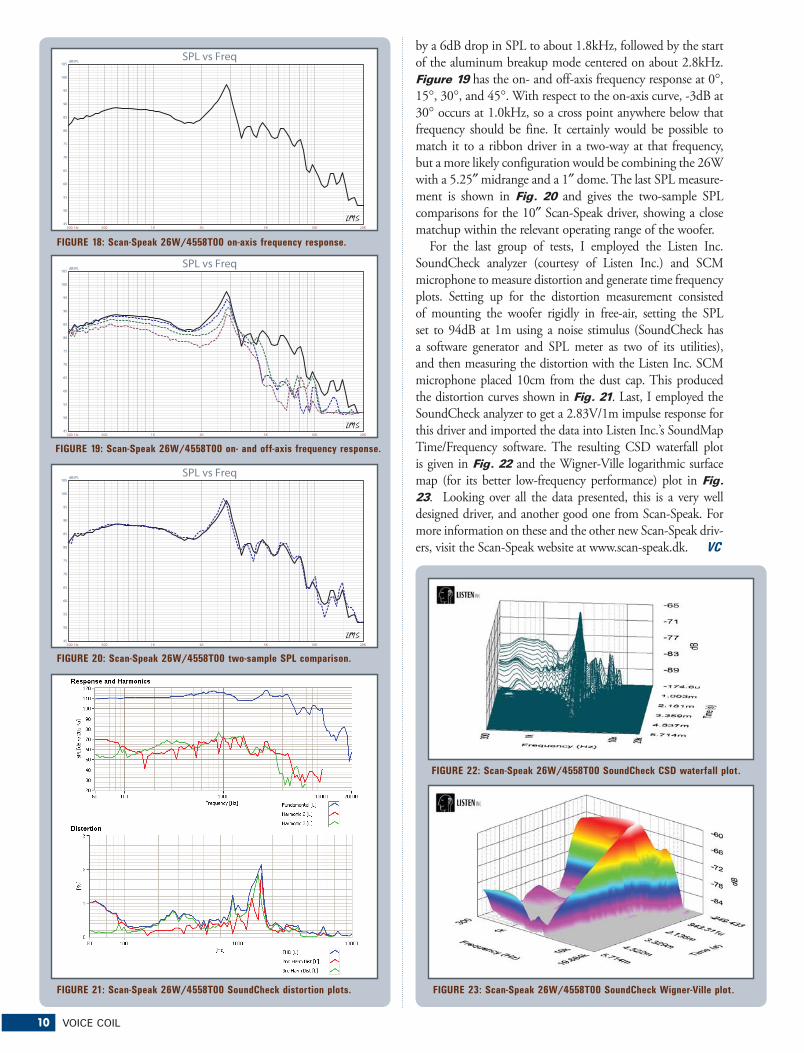
10 VOICE COIL
by a 6dB drop in SPL to about 1.8kHz, followed by the start
of the aluminum breakup mode centered on about 2.8kHz.
Figure 19 has the on- and off-axis frequency response at 0°,
15°, 30°, and 45°. With respect to the on-axis curve, -3dB at
30° occurs at 1.0kHz, so a cross point anywhere below that
frequency should be fine. It certainly would be possible to
match it to a ribbon driver in a two-way at that frequency,
but a more likely configuration would be combining the 26W
with a 5.25″ midrange and a 1″ dome. The last SPL measure-
ment is shown in Fig. 20 and gives the two-sample SPL
comparisons for the 10″ Scan-Speak driver, showing a close
matchup within the relevant operating range of the woofer.
For the last group of tests, I employed the Listen Inc.
SoundCheck analyzer (courtesy of Listen Inc.) and SCM
microphone to measure distortion and generate time frequency
plots. Setting up for the distortion measurement consisted
of mounting the woofer rigidly in free-air, setting the SPL
set to 94dB at 1m using a noise stimulus (SoundCheck has
a software generator and SPL meter as two of its utilities),
and then measuring the distortion with the Listen Inc. SCM
microphone placed 10cm from the dust cap. This produced
the distortion curves shown in Fig. 21. Last, I employed the
SoundCheck analyzer to get a 2.83V/1m impulse response for
this driver and imported the data into Listen Inc.’s SoundMap
Time/Frequency software. The resulting CSD waterfall plot
is given in Fig. 22 and the Wigner-Ville logarithmic surface
map (for its better low-frequency performance) plot in Fig. 23. Looking over all the data presented, this is a very well
designed driver, and another good one from Scan-Speak. For
more information on these and the other new Scan-Speak driv-
ers, visit the Scan-Speak website at www.scan-speak.dk. VC
300 Hz 500 1K 2K 5K 10K 20K
dBSPL
45
50
55
60
65
70
75
80
85
90
95
100
105SPL vs Freq
300 Hz 500 1K 2K 5K 10K 20K
dBSPL
45
50
55
60
65
70
75
80
85
90
95
100
105SPL vs Freq
300 Hz 500 1K 2K 5K 10K 20K
dBSPL
45
50
55
60
65
70
75
80
85
90
95
100
105SPL vs Freq
FIGURE 19: Scan-Speak 26W/4558T00 on- and off-axis frequency response.
FIGURE 22: Scan-Speak 26W/4558T00 SoundCheck CSD waterfall plot.
FIGURE 18: Scan-Speak 26W/4558T00 on-axis frequency response.
FIGURE 21: Scan-Speak 26W/4558T00 SoundCheck distortion plots.
FIGURE 20: Scan-Speak 26W/4558T00 two-sample SPL comparison.
FIGURE 23: Scan-Speak 26W/4558T00 SoundCheck Wigner-Ville plot.
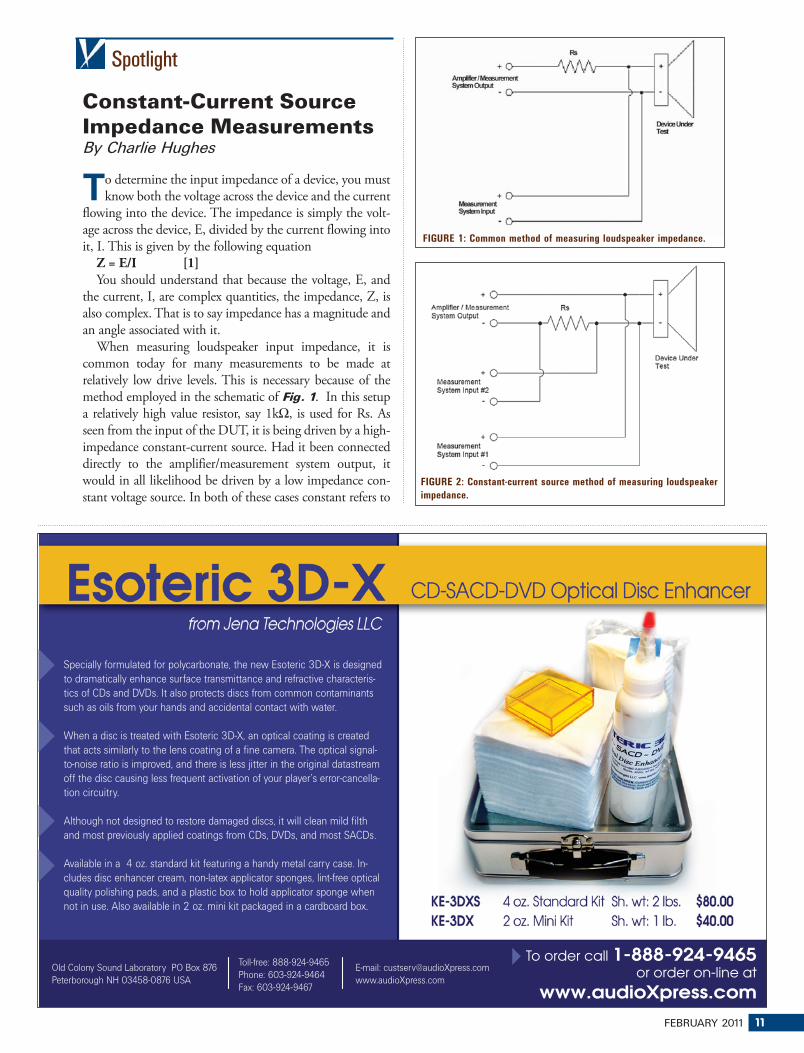
FEBRUARY 2011 11
Spotlight
Constant-Current Source Impedance MeasurementsBy Charlie Hughes
�o determine the input impedance of a device, you must
know both the voltage across the device and the current
flowing into the device. The impedance is simply the volt-
age across the device, E, divided by the current flowing into
it, I. This is given by the following equation
Z = E/I [1]You should understand that because the voltage, E, and
the current, I, are complex quantities, the impedance, Z, is
also complex. That is to say impedance has a magnitude and
an angle associated with it.
When measuring loudspeaker input impedance, it is
common today for many measurements to be made at
relatively low drive levels. This is necessary because of the
method employed in the schematic of Fig. 1. In this setup
a relatively high value resistor, say 1kΩ, is used for Rs. As
seen from the input of the DUT, it is being driven by a high-
impedance constant-current source. Had it been connected
directly to the amplifier/measurement system output, it
would in all likelihood be driven by a low impedance con-
stant voltage source. In both of these cases constant refers to
FIGURE 1: Common method of measuring loudspeaker impedance.
FIGURE 2: Constant-current source method of measuring loudspeaker
impedance.
Specially formulated for polycarbonate, the new Esoteric 3D-X is designed
to dramatically enhance surface transmittance and refractive characteris-
tics of CDs and DVDs. It also protects discs from common contaminants
such as oils from your hands and accidental contact with water.
When a disc is treated with Esoteric 3D-X, an optical coating is created
that acts similarly to the lens coating of a fine camera. The optical signal-
to-noise ratio is improved, and there is less jitter in the original datastream
off the disc causing less frequent activation of your player’s error-cancella-
tion circuitry.
Although not designed to restore damaged discs, it will clean mild filth
and most previously applied coatings from CDs, DVDs, and most SACDs.
Available in a 4 oz. standard kit featuring a handy metal carry case. In-
cludes disc enhancer cream, non-latex applicator sponges, lint-free optical
quality polishing pads, and a plastic box to hold applicator sponge when
not in use. Also available in 2 oz. mini kit packaged in a cardboard box.
Old Colony Sound Laboratory PO Box 876
Peterborough NH 03458-0876 USA
E-mail: [email protected]
www.audioXpress.com
Toll-free: 888-924-9465
Phone: 603-924-9464
Fax: 603-924-9467
To order call 1-888-924-9465 or order on-line at
www.audioXpress.com
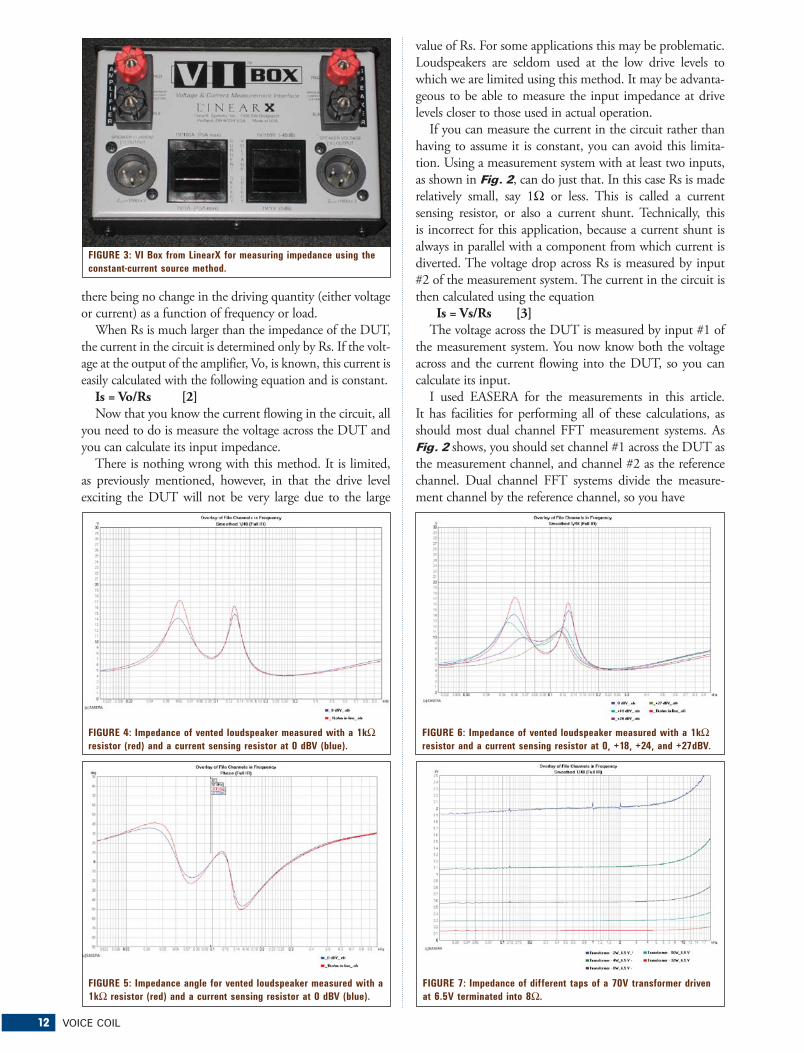
12 VOICE COIL
there being no change in the driving quantity (either voltage
or current) as a function of frequency or load.
When Rs is much larger than the impedance of the DUT,
the current in the circuit is determined only by Rs. If the volt-
age at the output of the amplifier, Vo, is known, this current is
easily calculated with the following equation and is constant.
Is = Vo/Rs [2]Now that you know the current flowing in the circuit, all
you need to do is measure the voltage across the DUT and
you can calculate its input impedance.
There is nothing wrong with this method. It is limited,
as previously mentioned, however, in that the drive level
exciting the DUT will not be very large due to the large
value of Rs. For some applications this may be problematic.
Loudspeakers are seldom used at the low drive levels to
which we are limited using this method. It may be advanta-
geous to be able to measure the input impedance at drive
levels closer to those used in actual operation.
If you can measure the current in the circuit rather than
having to assume it is constant, you can avoid this limita-
tion. Using a measurement system with at least two inputs,
as shown in Fig. 2, can do just that. In this case Rs is made
relatively small, say 1Ω or less. This is called a current
sensing resistor, or also a current shunt. Technically, this
is incorrect for this application, because a current shunt is
always in parallel with a component from which current is
diverted. The voltage drop across Rs is measured by input
#2 of the measurement system. The current in the circuit is
then calculated using the equation
Is = Vs/Rs [3]The voltage across the DUT is measured by input #1 of
the measurement system. You now know both the voltage
across and the current flowing into the DUT, so you can
calculate its input.
I used EASERA for the measurements in this article.
It has facilities for performing all of these calculations, as
should most dual channel FFT measurement systems. As
Fig. 2 shows, you should set channel #1 across the DUT as
the measurement channel, and channel #2 as the reference
channel. Dual channel FFT systems divide the measure-
ment channel by the reference channel, so you have
FIGURE 3: VI Box from LinearX for measuring impedance using the
constant-current source method.
FIGURE 5: Impedance angle for vented loudspeaker measured with a
1kΩ resistor (red) and a current sensing resistor at 0 dBV (blue).
FIGURE 6: Impedance of vented loudspeaker measured with a 1kΩ
resistor and a current sensing resistor at 0, +18, +24, and +27dBV.
FIGURE 7: Impedance of different taps of a 70V transformer driven
at 6.5V terminated into 8Ω.
FIGURE 4: Impedance of vented loudspeaker measured with a 1kΩ
resistor (red) and a current sensing resistor at 0 dBV (blue).

FEBRUARY 2011 13
Result = Channel #1/Channel #2= VDUT/Vs
By substitution from Equation 3:
Result = VDUT/(Is*Rs)
Because Z = VDUT/Is it follows that
Z = Result * Rs or Z = Rs * Channel #1/Channel #2
All you need to do is multiply the dual channel FFT
measurement by the value of Rs used and you get the cor-
rect value for impedance. If you choose Rs to be 1.0Ω, this
becomes really easy.
In EASERA there is not an Ohm display selection.
Selecting a Volt display will yield the correct values for the
displayed curve. For other measurement systems this may
work as well, but it is recommended to check the display
by measuring a known resistor value for proper calibration.
A very useful device for performing impedance measure-
ments using this current sensing resistor method is the VI Box
from LinearX (www.linearx.com). The signal from the ampli-
fier is routed through the VI Box, which contains the current
sensing resistor, and then onto the DUT (Fig. 3). It actually
contains two selectable sensing resistors, 1Ω and 10mΩ (mil-
li-Ohm), which allow for measurements using a greater range
of current supplied to the load (DUT). The voltage across the
selected resistor is present across pins 2 and 3 of one of the XL
connectors. The voltage across the DUT is present across pins
2 and 3 of the other XL connector. These connectors allow for
quick and easy interface with balanced inputs of a computer/
audio interface (sound card). There is also a selectable voltage
divider so the input of the audio interface won’t be overloaded
when testing with very high voltage.
I mentioned previously that measuring input impedance
at low drive levels may present a problem for some applica-
tions. A couple of these that come to mind are vented loud-
speaker enclosures and constant voltage distributed system
transformers. I’m sure the interested reader will find others.
The impedance response of a vented loudspeaker enclo-
sure is shown in Fig. 4. The angle of the impedance for
this device is shown in Fig. 5. The vent tuning resonance
of this loudspeaker is found when the impedance angle is
zero indicating the voltage and current are in phase. This
is denoted by the marker at approximately 98Hz. These
graphs show measurements using both the constant-current
method with a 1kΩ resistor and using a current sensing
resistor. The current sensing resistor measurement used a
0dBV (1.0V) drive level to excite the loudspeaker. There is
some difference between these two measurements.
The impedance measurements in Fig. 6 tell us much
more. In this graph you have additional measurements at
+18, +24, and +27dBV. You can see that at these higher drive
levels the impedance curve changes rather dramatically.
The vent surface area of this loudspeaker is relatively small
compared to the surface area of the driver. When the woofer is
driven harder, it moves much more air. The vents are too small
to allow this same volume of air to be moved through them.
The vents saturate. As more air attempts to move through
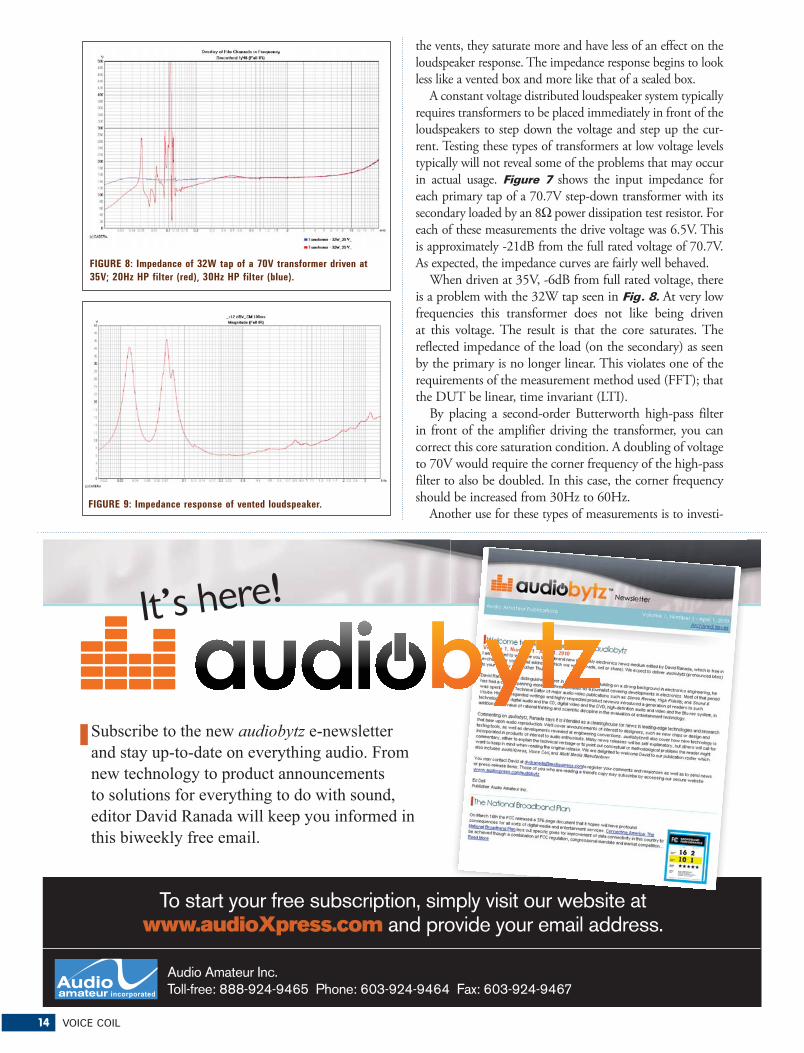
14 VOICE COIL
the vents, they saturate more and have less of an effect on the
loudspeaker response. The impedance response begins to look
less like a vented box and more like that of a sealed box.
A constant voltage distributed loudspeaker system typically
requires transformers to be placed immediately in front of the
loudspeakers to step down the voltage and step up the cur-
rent. Testing these types of transformers at low voltage levels
typically will not reveal some of the problems that may occur
in actual usage. Figure 7 shows the input impedance for
each primary tap of a 70.7V step-down transformer with its
secondary loaded by an 8Ω power dissipation test resistor. For
each of these measurements the drive voltage was 6.5V. This
is approximately -21dB from the full rated voltage of 70.7V.
As expected, the impedance curves are fairly well behaved.
When driven at 35V, -6dB from full rated voltage, there
is a problem with the 32W tap seen in Fig. 8. At very low
frequencies this transformer does not like being driven
at this voltage. The result is that the core saturates. The
reflected impedance of the load (on the secondary) as seen
by the primary is no longer linear. This violates one of the
requirements of the measurement method used (FFT); that
the DUT be linear, time invariant (LTI).
By placing a second-order Butterworth high-pass filter
in front of the amplifier driving the transformer, you can
correct this core saturation condition. A doubling of voltage
to 70V would require the corner frequency of the high-pass
filter to also be doubled. In this case, the corner frequency
should be increased from 30Hz to 60Hz.
Another use for these types of measurements is to investi-
#�$ ���$������%������ ���������!�� �������&� �&'���!��!&���������'�%�(�&�����)����������%���('�����������&������� ���� ������ �*�������'�%�(���������%� ��+��������&����&&&������,����'����*��������%� �$����,�'�*������&���
To start your free subscription, simply visit our website at www.audioXpress.com and provide your email address.
Audio Amateur Inc. Toll-free: 888-924-9465 Phone: 603-924-9464 Fax: 603-924-9467
It’s here!
FIGURE 8: Impedance of 32W tap of a 70V transformer driven at
35V; 20Hz HP filter (red), 30Hz HP filter (blue).
FIGURE 9: Impedance response of vented loudspeaker.
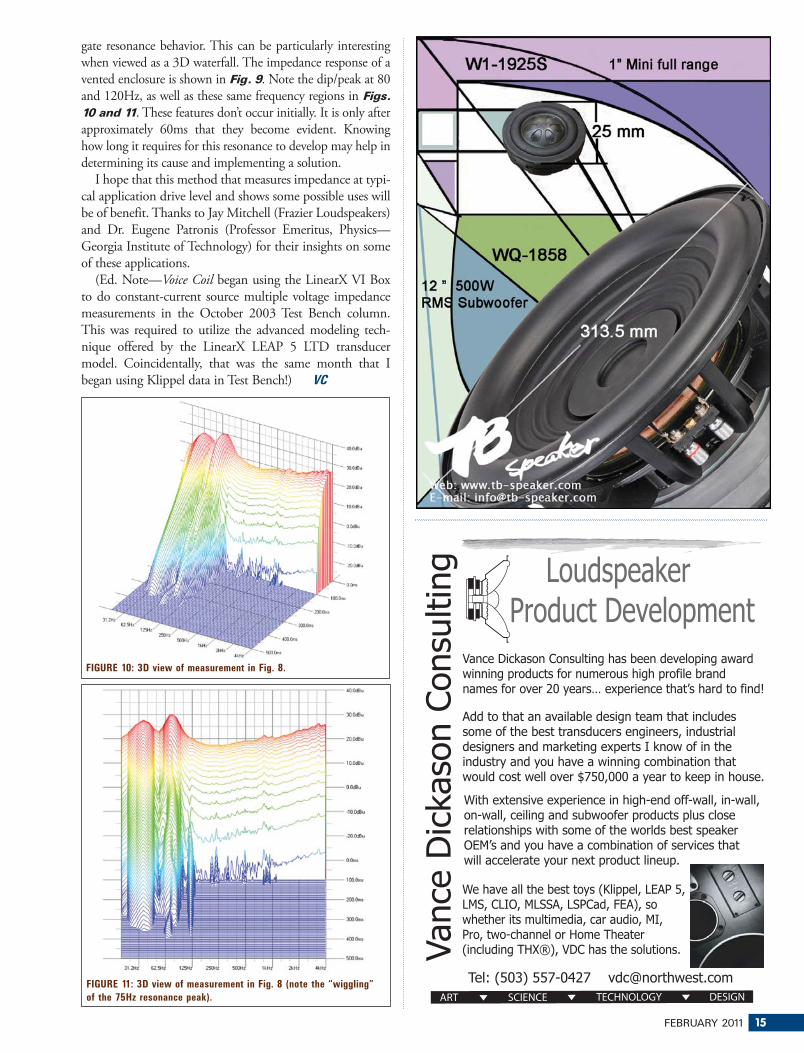
FEBRUARY 2011 15
gate resonance behavior. This can be particularly interesting
when viewed as a 3D waterfall. The impedance response of a
vented enclosure is shown in Fig. 9. Note the dip/peak at 80
and 120Hz, as well as these same frequency regions in Figs. 10 and 11. These features don’t occur initially. It is only after
approximately 60ms that they become evident. Knowing
how long it requires for this resonance to develop may help in
determining its cause and implementing a solution.
I hope that this method that measures impedance at typi-
cal application drive level and shows some possible uses will
be of benefit. Thanks to Jay Mitchell (Frazier Loudspeakers)
and Dr. Eugene Patronis (Professor Emeritus, Physics—
Georgia Institute of Technology) for their insights on some
of these applications.
(Ed. Note—Voice Coil began using the LinearX VI Box
to do constant-current source multiple voltage impedance
measurements in the October 2003 Test Bench column.
This was required to utilize the advanced modeling tech-
nique offered by the LinearX LEAP 5 LTD transducer
model. Coincidentally, that was the same month that I
began using Klippel data in Test Bench!) VC
FIGURE 11: 3D view of measurement in Fig. 8 (note the “wiggling”
of the 75Hz resonance peak).
FIGURE 10: 3D view of measurement in Fig. 8.
��������������������� �������������������������
���������������� !���"�������#������������������������
$ ��
��#
%�!
����
&��
����%
�'
�
�
$ ����#%�! ����&������%�'�� ��)�����������%�'� � ����%��%�'����������(�������������%'�����(%���)� ���� ����(����������*� ��+��,���%������� �-��� ������(%��.�
/%����,����%����,���%�����%���%'� �����(( � ��0�%� � ��0��� � ��0���%�%�'� �����)���(�������������������������� �%����%����%���������(������������)������� !���123-�� ���*���� ��� ����)%� �%����(�����%������ ���%��� ������ ���*������,�����������%�����
/��� ��� �������)������*���4�%����0��25"��0�360�&�710�3�6650��6"& �0�825�0������������%�������%���% 0�� �� ��%�0�370�"��0���� �� ��������9������� �����%�����%�'��9:;�0�$#&�� �����������%����
5�������� �� �� � %� )������%'���� ���� ��%��������������(�����)������ �����������'%�����0�%������% �����%'����� ���� �!��%�'��,������7�!�����(�%������%������*� ���*���� ��� ��%��%�'����)%� �%����� �����������������������<��0� �*� �����!����%��������
16 VOICE COIL
Spotlight
Green Audio and Then SomeBy Nora Wong and Mike Klasco
&et’s start with a confession. In many ways I have
mixed feelings about the “green movement.” Of
course, it makes good sense to conserve resources, not
pollute, and it is good technique to maximize design
efficiency. Yet aspects of “eco-friendly” are actually waste-
ful and counterproductive. For example, recycling glass
made from cheap and plentiful raw materials (limestone,
sand, and salt cake) costs more and uses more energy for
handling and producing than making new glass bottles.
The dirty secret is that after you drag your bottles back to
the supermarket in most localities they just dump them
in the garbage.
I am tired of having my groceries splatter on the street
because the recycled brown paper bags ripped apart due
to poor tear strength caused by the lack of longer fibers.
These days the grocery packers know how inadequate
recycled paper bags are and double- and triple-bag—a
net loss over using just one new quality (unrecycled)
paper bag.
Any good idea can take a wrong turn, resulting in
misguided efforts at productivity, such as the infamous
USSR shoe factory in the 1960s that made only left
shoes because their output would be higher than mak-
ing matching pairs. Great for Russian jokes but some
fool running the show was serious. Perhaps that factory
manager has joined the board of directors of the green
movement.
While I have been pondering all this for years, what
triggered this article (rant) were some comments I heard
at the ALMA China Symposium. I was on a panel focus-
ing on profitability and providing value and heard many
good ideas. But one approach suggested that with the
application of sophisticated design simulations, cheap
materials could be used for achieving good performance
but shortened life. The product would last long enough
����8�+8���<<�.�333�2>?�2?9:��8���8�+8��=<�=+��5����������1@8+ ����
NEW FROM
Toll-free: 888-924-9465 Phone: 603-924-9464 Fax: 603-924-9467
E-mail: [email protected] www.audioXpress.com
D-4 Prototyping PC-Board���������������������
Measures 2¼” × 3¼” and featuring
quality fiberglass construction with
tinned, durable copper traces.
� ���������&��%��+�-&�'�-&��+�%& � �%� � ��� &'�&$�����%�� $�&��� ./%�� $�&�� � � ���'� 0(�����1� &� %����&������&���&��&����'��*�2����!&������3��� ����%�������(�&'����4�&��� �������� ����'+�(����&��&�� �����������&�� �&����&������������(���'5/%���!�� � � ��� �'� 4� �� �%����� *��� �&��� &���� ��!&������3��� �6�� ��������+�7������8�$�&�?������������������������������������������������ A:�**
Old Colony Sound Laboratory PO Box 876 Peterborough NH 03458-0876 USA
PHOTO 1: B&O earphones—a true classic.
FEBRUARY 2011 17
(perhaps a couple of years) that it would be too late for
the customer to return it to the store. Somehow this
approach was considered “green.” I take exception to this,
because planned obsolescence and disposable products
are anything but green, at least from my perspective.
If you are still reading, then you might ask what are
my two cents on criteria for sustainable product design?
These include bioplastics, sustainable, biodegradable, or
end of life recyclable attributes are all aspects of a truly
green product. I think that a conscionable green design
philosophy focuses on the total integration of “good
citizen” eco-friendly materials and processes and long,
useful life.
Let’s look at a product category that is “disposable”; for
example, the typical earphone fails within the first year
of use. Intermittent cables and connectors, worn foam
eartips, and an inadvertent visit to the clothes washer/
dryer are some of the causes of premature failure. Some
popular earphones cannot retain stable operation if you
break into a sweat at the gym, let alone encounter a
downpour.
Contrast this with a headphone or earphone that can
be worn for years, looking and feeling good, and main-
taining its sound quality. This is true high value, and these
qualities are inherently green. One example that comes
to mind was never intended as a “green” product—the
iconic B&O earphone (www.bang-olufsen.com). This
product has a classic “design” (rather than short-term
“fashion”), retains its appearance without discoloration
or fading, has quality cables and connectors that last for
years, and the value provided to the owner is excellent
(Photo 1). While the purchase price is stiff, this earphone
will outlast a half dozen cheap earphones for about the
same cost of ownership. Meanwhile, the sound quality,
comfort, and style are superior.
What about the paper in speaker cones and green
issues? When you consider the millions of people who
toss out the Sunday NY Times every week—each a
couple of pounds of cellulose “newsprint”—this is a real
consideration and does add up. But 10 grams of speaker
cone paper used for 10 years is not a consideration. Let’s
get real.
Yet audio performance can be improved by adding bast
family fibers (such as banana leaf and hemp fiber) and
other renewable organic fibers. Fostex (www.fostex.com)
(Photo 2) and Dai-Ichi (www.daiichielectronics.com) are
known for their use of banana leaf fibers due to the high
tensile strength in their high-quality cones. Banana fiber
is extracted from the bark and leaves of the banana plant.
The appearance of banana fiber is similar to bamboo and
ramie fiber. Characteristics include high strength, small
elongation, and light weight to strength ratio. Paper and
fabrics from banana fibers were first used in the 13th
century in Japan.
Although hemp and other bast family fibers have been
used as a secret sauce in speaker cone formulations from
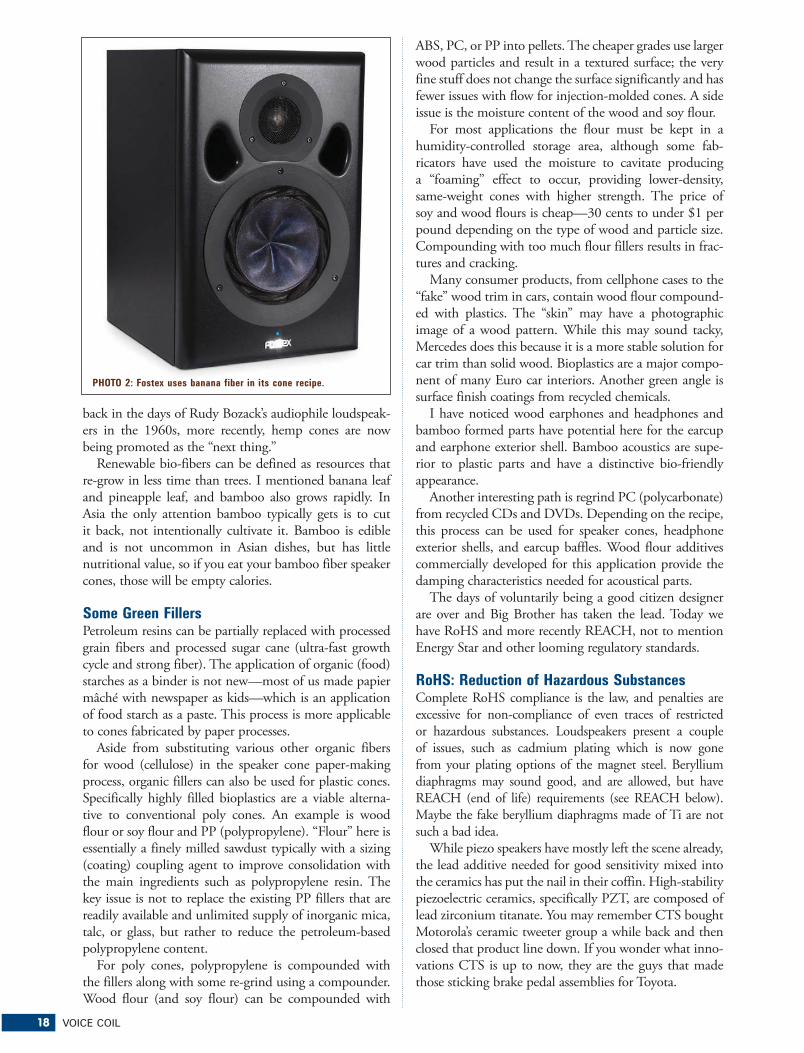
18 VOICE COIL
back in the days of Rudy Bozack’s audiophile loudspeak-
ers in the 1960s, more recently, hemp cones are now
being promoted as the “next thing.”
Renewable bio-fibers can be defined as resources that
re-grow in less time than trees. I mentioned banana leaf
and pineapple leaf, and bamboo also grows rapidly. In
Asia the only attention bamboo typically gets is to cut
it back, not intentionally cultivate it. Bamboo is edible
and is not uncommon in Asian dishes, but has little
nutritional value, so if you eat your bamboo fiber speaker
cones, those will be empty calories.
Some Green FillersPetroleum resins can be partially replaced with processed grain fibers and processed sugar cane (ultra-fast growth cycle and strong fiber). The application of organic (food) starches as a binder is not new—most of us made papier mâché with newspaper as kids—which is an application of food starch as a paste. This process is more applicable to cones fabricated by paper processes.
Aside from substituting various other organic fibers
for wood (cellulose) in the speaker cone paper-making
process, organic fillers can also be used for plastic cones.
Specifically highly filled bioplastics are a viable alterna-
tive to conventional poly cones. An example is wood
flour or soy flour and PP (polypropylene). “Flour” here is
essentially a finely milled sawdust typically with a sizing
(coating) coupling agent to improve consolidation with
the main ingredients such as polypropylene resin. The
key issue is not to replace the existing PP fillers that are
readily available and unlimited supply of inorganic mica,
talc, or glass, but rather to reduce the petroleum-based
polypropylene content.
For poly cones, polypropylene is compounded with
the fillers along with some re-grind using a compounder.
Wood flour (and soy flour) can be compounded with
ABS, PC, or PP into pellets. The cheaper grades use larger
wood particles and result in a textured surface; the very
fine stuff does not change the surface significantly and has
fewer issues with flow for injection-molded cones. A side
issue is the moisture content of the wood and soy flour.
For most applications the flour must be kept in a
humidity-controlled storage area, although some fab-
ricators have used the moisture to cavitate producing
a “foaming” effect to occur, providing lower-density,
same-weight cones with higher strength. The price of
soy and wood flours is cheap—30 cents to under $1 per
pound depending on the type of wood and particle size.
Compounding with too much flour fillers results in frac-
tures and cracking.
Many consumer products, from cellphone cases to the
“fake” wood trim in cars, contain wood flour compound-
ed with plastics. The “skin” may have a photographic
image of a wood pattern. While this may sound tacky,
Mercedes does this because it is a more stable solution for
car trim than solid wood. Bioplastics are a major compo-
nent of many Euro car interiors. Another green angle is
surface finish coatings from recycled chemicals.
I have noticed wood earphones and headphones and
bamboo formed parts have potential here for the earcup
and earphone exterior shell. Bamboo acoustics are supe-
rior to plastic parts and have a distinctive bio-friendly
appearance.
Another interesting path is regrind PC (polycarbonate)
from recycled CDs and DVDs. Depending on the recipe,
this process can be used for speaker cones, headphone
exterior shells, and earcup baffles. Wood flour additives
commercially developed for this application provide the
damping characteristics needed for acoustical parts.
The days of voluntarily being a good citizen designer
are over and Big Brother has taken the lead. Today we
have RoHS and more recently REACH, not to mention
Energy Star and other looming regulatory standards.
RoHS: Reduction of Hazardous SubstancesComplete RoHS compliance is the law, and penalties are excessive for non-compliance of even traces of restricted or hazardous substances. Loudspeakers present a couple of issues, such as cadmium plating which is now gone from your plating options of the magnet steel. Beryllium diaphragms may sound good, and are allowed, but have REACH (end of life) requirements (see REACH below). Maybe the fake beryllium diaphragms made of Ti are not such a bad idea.
While piezo speakers have mostly left the scene already,
the lead additive needed for good sensitivity mixed into
the ceramics has put the nail in their coffin. High-stability
piezoelectric ceramics, specifically PZT, are composed of
lead zirconium titanate. You may remember CTS bought
Motorola’s ceramic tweeter group a while back and then
closed that product line down. If you wonder what inno-
vations CTS is up to now, they are the guys that made
those sticking brake pedal assemblies for Toyota.
PHOTO 2: Fostex uses banana fiber in its cone recipe.
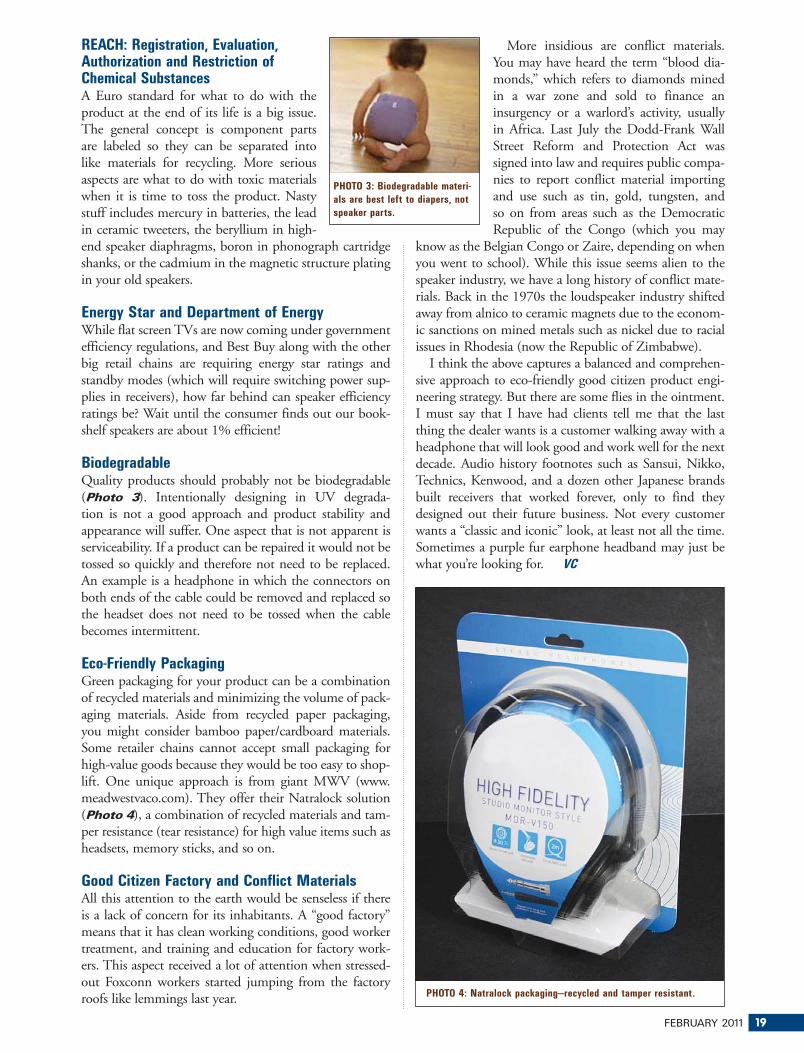
FEBRUARY 2011 19
REACH: Registration, Evaluation, Authorization and Restriction of Chemical SubstancesA Euro standard for what to do with the product at the end of its life is a big issue. The general concept is component parts are labeled so they can be separated into like materials for recycling. More serious aspects are what to do with toxic materials when it is time to toss the product. Nasty stuff includes mercury in batteries, the lead in ceramic tweeters, the beryllium in high-end speaker diaphragms, boron in phonograph cartridge shanks, or the cadmium in the magnetic structure plating in your old speakers.
Energy Star and Department of Energy While flat screen TVs are now coming under government efficiency regulations, and Best Buy along with the other big retail chains are requiring energy star ratings and standby modes (which will require switching power sup-plies in receivers), how far behind can speaker efficiency ratings be? Wait until the consumer finds out our book-shelf speakers are about 1% efficient!
BiodegradableQuality products should probably not be biodegradable (Photo 3). Intentionally designing in UV degrada-tion is not a good approach and product stability and appearance will suffer. One aspect that is not apparent is serviceability. If a product can be repaired it would not be tossed so quickly and therefore not need to be replaced. An example is a headphone in which the connectors on both ends of the cable could be removed and replaced so the headset does not need to be tossed when the cable becomes intermittent.
Eco-Friendly PackagingGreen packaging for your product can be a combination of recycled materials and minimizing the volume of pack-aging materials. Aside from recycled paper packaging, you might consider bamboo paper/cardboard materials. Some retailer chains cannot accept small packaging for high-value goods because they would be too easy to shop-lift. One unique approach is from giant MWV (www.meadwestvaco.com). They offer their Natralock solution (Photo 4), a combination of recycled materials and tam-per resistance (tear resistance) for high value items such as headsets, memory sticks, and so on.
Good Citizen Factory and Conflict MaterialsAll this attention to the earth would be senseless if there is a lack of concern for its inhabitants. A “good factory” means that it has clean working conditions, good worker treatment, and training and education for factory work-ers. This aspect received a lot of attention when stressed-out Foxconn workers started jumping from the factory roofs like lemmings last year.
More insidious are conflict materials.
You may have heard the term “blood dia-
monds,” which refers to diamonds mined
in a war zone and sold to finance an
insurgency or a warlord’s activity, usually
in Africa. Last July the Dodd-Frank Wall
Street Reform and Protection Act was
signed into law and requires public compa-
nies to report conflict material importing
and use such as tin, gold, tungsten, and
so on from areas such as the Democratic
Republic of the Congo (which you may
know as the Belgian Congo or Zaire, depending on when
you went to school). While this issue seems alien to the
speaker industry, we have a long history of conflict mate-
rials. Back in the 1970s the loudspeaker industry shifted
away from alnico to ceramic magnets due to the econom-
ic sanctions on mined metals such as nickel due to racial
issues in Rhodesia (now the Republic of Zimbabwe).
I think the above captures a balanced and comprehen-
sive approach to eco-friendly good citizen product engi-
neering strategy. But there are some flies in the ointment.
I must say that I have had clients tell me that the last
thing the dealer wants is a customer walking away with a
headphone that will look good and work well for the next
decade. Audio history footnotes such as Sansui, Nikko,
Technics, Kenwood, and a dozen other Japanese brands
built receivers that worked forever, only to find they
designed out their future business. Not every customer
wants a “classic and iconic” look, at least not all the time.
Sometimes a purple fur earphone headband may just be
what you’re looking for. VC
PHOTO 3: Biodegradable materi-
als are best left to diapers, not
speaker parts.
PHOTO 4: Natralock packaging—recycled and tamper resistant.

20 VOICE COIL
Acoustic PatentsBy James Croft
�he following loudspeaker-related patents were filed
primarily under the Office of Patent and Trademarks
classification 181 for acoustical devices and 381 for electri-
cal-signal processing systems and HO4R for international
patents. This also includes new patent applications that are
published in the Patent Application Journal.
COMPACT AUDIO REPRODUCTION SYSTEM WITH
LARGE PERCEIVED ACOUSTIC SIZE AND IMAGE
Patent Number: US 7,817,812
Granted: October 19, 2010
Inventors: Matthew S. Polk, Jr. (Gibson Island, Md.),
Bradley M. Starobin (Baltimore, Md.)
Assignee: Polk Audio, Inc. (Baltimore, Md.)
Filed: May 31, 2005
US Class: 381/300, 20 Claims, 5 drawings
ABSTRACT FROM PATENTA compact audio reproduction system (Fig. 1) for two
input signals includes at least four loudspeakers disposed
at the vertices of a quadrilateral not more than 2′ on any
side and such that no two loudspeakers are located at a
distance from one another which is less than one-fourth the
greatest distance between any two loudspeakers. The two
input signals are connected to alternate speakers such that
no two loudspeakers at adjacent vertices of the quadrilateral
produce the same signal such that a listener at an arbitrary
location perceives a sound source larger than the quadrilat-
eral and significant stereo image. The signals received by two
loudspeakers located at adjacent vertices may receive signals
which are equalized separately from the signals received by
the other loudspeakers for the purpose of reducing comb
filtering and improving the tolerance of the device to place-
ment near walls and other obstructions. Two loudspeakers
may be delayed by a time corresponding to a sound distance
FIGURE 1: US Patent Number 7,817,812.

FEBRUARY 2011 21
at least equal to the shortest distance between two loud-
speakers and not greater than the longest distance between
two loudspeakers, for the purpose of reducing comb filter-
ing and improving the perception of large sound source size
and stereo imaging for listeners at arbitrary locations.
INDEPENDENT CLAIMS“1. An audio reproduction system comprising: a first
audio input signal and a second audio input signal; a first,
second, third, and fourth loudspeaker wherein said first,
second, third, and fourth loudspeakers are located at the
first, second, third, and fourth vertices, respectively, of
a quadrilateral, and are oriented to radiate sound away
from the quadrilateral; wherein the maximum distance
between any two of said first, second, third, and fourth
loudspeakers is not more than four times the minimum
distance between any two of said first, second, third, and
fourth loudspeakers; means for transmitting said first input
signal to said first and said third loudspeakers, wherein said
first and third loudspeakers reproduce sound associated
with signals received by said first and third loudspeakers;
and means for transmitting said second input signal to
said second and fourth loudspeakers, wherein said second
and fourth loudspeakers reproduce sound associated with
signals received by said second and fourth loudspeakers,
wherein no two adjacent loudspeakers reproduce the same
input signal; and wherein the sound reproduced by said
first, second, third, and fourth loudspeakers is perceived by
a listener to be a sound source larger than the physical size
of the quadrilateral.
“12. A compact audio reproduction system, compris-
ing: a unitary physical structure encloses a volume and has
sidewalls defining a housing having first, second, third, and
fourth vertices; signal processing circuitry supported within
said unitary physical structure is configured to provide first
and second input signals; a first, second, third, and fourth
loudspeaker wherein said first, second, third, and fourth
loudspeakers are within said unitary physical structure
and located at the first, second, third, and fourth vertices,
respectively, of the housing, and are oriented to radiate
sound away from the quadrilateral; wherein the maximum
distance between any two of said first, second, third, and
fourth loudspeakers is not more than four times the mini-
mum distance between any two of said first, second, third,
and fourth loudspeakers; wherein said signal processing
circuitry is configured to transmit said first input signal
to said first and said third loudspeakers, wherein said first
and third loudspeakers reproduce sound associated with
signals received by said first and third loudspeakers; and
wherein said signal processing circuitry is also configured to
transmit said second input signal to said second and fourth
loudspeakers, wherein said second and fourth loudspeakers
reproduce sound associated with signals received by said
second and fourth loudspeakers; wherein no two adjacent
loudspeakers reproduce the same input signal; and wherein
the sound reproduced by said first, second, third, and fourth
loudspeakers is perceived by a listener to be a sound source
larger than the physical size of the housing.”
- Custom coils available in: Multi-layer wire configurations Multiple lead configurations Round and Flat Wire Custom lead-out attachments
Free standing coils Multiple wire types Bifilar or Edgewound Custom bobbin wound coils
- High temperature adhesive coated Copper and Aluminum wire in round and flat sizes. CCAW wire available in round sizes.
- Adhesive coated custom cut forms and Collars.
- Custom slit rolls of Form and Collar material available coated or uncoated.
8940 North Fork Drive, North Fort Myers, Florida 33903Phone (239) 997-3860 Fax (239) 997-3243
For samples, information, or a quotation, please contact Jon Van Rhee at [email protected]
Visit us on the web at www.precisioneconowind.com
- Highest quality domestic or imported coils.
SPECIALIZING IN high-temperature edge-wound and multiple layer flat-wound coils for the pro
audio, home theater, and automotive aftermarket

22 VOICE COIL
REVIEWER COMMENTS Disclosed is a compact audio system for reproducing at
least a two channel input signal which is optimized to pro-
duce a perceived sound source much larger than its actual
physical size, even when listeners are seated in arbitrary loca-
tions. Besides having the goal to produce the spaciousness
of a large sound field, the system is said to maintain focused
imaging. A third objective is to have the system be tolerant
of placement in a variety of acoustic environments.
To achieve these desired results, at least four loudspeakers
are disposed at the vertices of a rectangle not more than 2′ on any side with an aspect ratio of not more than 4:1, or a
quadrilateral of arbitrary shape, arranged such that no two
loudspeakers are located at a distance from one another which
is less than one-fourth the greatest distance between any two
loudspeakers. The two input signals are connected to alternate
loudspeakers such that no two loudspeakers at adjacent verti-
ces of the rectangle, or quadrilateral, produce the same signal
such that a listener at an arbitrary location perceives a sound
source larger than the rectangle and significant stereo image.
Some embodiments of the invention, two loudspeakers
located at adjacent vertices receive signals which are equalized
separately from the signals received by the other loudspeakers
for the purpose of reducing comb filtering and improving
the tolerance of the device to placement near walls and other
obstructions. Additionally, two speakers are delayed by a time
corresponding to a sound distance at least equal to the short-
est distance between two loudspeakers and not greater than
the longest distance between two loudspeakers, for the pur-
pose of reducing comb filtering and improving the perception
of large sound source size and stereo imaging for listeners at
arbitrary locations.
In one implementation, a band reject filter is centered
approximately between 400Hz and 2000Hz with approxi-
mate bandwidth of between 1 and 3 octaves and gain
approximately between -4dB and -10dB. Another imple-
mentation includes a high frequency rolloff that provides
gain reduction of approximately -6dB at a frequency approx-
imately between 2kHz and 10kHz. Other examples may
include combinations of high-pass and low bass filters, band
emphasis or reject filters, and high or low shelving filters.
These novel approaches are applied to achieve an improve-
ment in comparison to prior art systems that often utilize
crosstalk cancellation systems to produce surround sound type
spaciousness, but at the expense of limited seating position.
One of the devices that utilizes the technology disclosed
in this patent is the Polk Audio I-Sonic ES2, which pro-
vides a good showing for the approach, providing spacious
sound-field that appears to originate at locations well out-
side the box, and you can listen from a fairly diverse range of
seating positions, which does diminish specificity of image
location, but the sense of scale and space is substantially
maintained. While it is unclear as to which aspects of the
patent are actually implemented in the Polk product, the
details of the patented approach are novel and at least one
embodiment appears to work quite well.

FEBRUARY 2011 23
WALL MOUNTED SPEAKER SYSTEM,
APPARATUS AND METHOD
Patent Number: US 7,844,068
Inventor: Robert W. Carver (Snohomish, Wash.)
Assignee: Linear Corporation (Carlsbad, Calif.)
Filed: January 4, 2006
Granted: November 30, 2010
US Class: 381/354, 22 Drawings, 16 Claims
REVIEWER COMMENTS In recent years, there has been a growing trend of high-qual-ity loudspeakers being mounted in-wall. Also, as these in-wall loudspeakers have been advanced, they are exhibiting greater acoustic output power. However, there have been problems in faithfully reproducing the program material because of the presence of unwanted noise resulting from vibrating movement of the wall structure to which the loud-speaker is mounted. The unwanted noise arises because the wall vibrates sympathetically relative to the speaker output. The generation of unwanted noise is especially bothersome with the lower frequency waves that are emitted from a woofer or subwoofer, particularly in the range of approxi-mately 20 to 200Hz.
The problem can be particularly insidious, because cur-
rent in-wall woofers can actually generate as much, or more,
output from the wall surface as produced by the woofers
themselves. The most common solution in the current art
(Fig. 2) is that of using opposing pairs of transducers to
effectively cancel the unwanted
vibrations. While this approach
has been proven to be quite
effective for free-standing woofer
systems, relative to the in-wall
application, the depth of the wall
cavity available tends to be lim-
ited to that of the 2″ × 4″ or 2″
× 6″ studs supporting the wall,
which limits the size of opposing
woofers to be mounted within
the wall structure.
With this new patent, Bob
Carver, an audio innovator
whose novel products have con-
tributed to keeping audio inter-
esting since the early 1970s, has
re-surfaced with an alternative
solution to the in-wall vibration
problem. His approach preferably includes the use of at least
two woofer transducers of generally any desired diameter
mounted onto the wall surface. The inventive aspect is an
inertial vibration suppression motor section including an
inertial mass, which is driven in such a manner as to gen-
erate offsetting inertial forces to diminish or substantially
eliminate the inertial forces of the primary transducer that
would otherwise create a noise producing vibratory motion
of the wall structure to which the woofer is mounted.
FIGURE 2: US Patent
Number 7,844,068.
24 VOICE COIL
��������™ R & D Measurement system
�������������
Features: Multiple displays of min. 16 responses
Cumulative decay spectrum “Waterfall”
THD + 2 – 9th harmonics distortion
1/12 - 1/6 - 1/3 – 1/2 – 1/1 octave
Anechoic FFT - Acoustic auto-delay
50 curves/responses/TS parameters
SPL/Frequency, Imp., phase, export
Soundcards: PCI/USB/Firewire/ASIO
Headsets, USB/Bluetooth
One example of the inertial mass section includes an
inertial member, with the inertial member being moved in
a back and forth arcuate (arc shaped) movement by a small
electric motor. The inertial mass is made in the shape of a flat
metal disk, and the motor is a small electric motor such as
those found in a handheld hairdryer. The inertial cancellation
device is placed between the two woofers to produce sym-
metry around which the vibration contributed by the two
woofers can more effectively be canceled by the inertial mass.
The loudspeakers are driven by an amplified signal that
is also directed to drive the motor of the inertial noise
suppression section, so that the inertial mass is moved syn-
chronously with the movement of the diaphragm section.
This is done in a manner that the optimization of the drive
for the inertial mass is synchronized with the speakers such
that the phase, amplitude inertial mass matches that of the
two speakers. There are a few different architectures dis-
closed in the patent and the specifics are difficult to convey
without seeing all the drawings in the patent, but basically,
one has a separate active dual inertial mass structure that
is optimized to produce an equal and opposite force to
eliminate wall panel vibration. Sunfire produces an in-wall
subwoofer (SubRosa SRS-210W) utilizing this technology,
trademarked as “StillBass.” You can see a production version
of the inertial damper at www.sunfire.com/productdetail.
asp?id=28 and click on the “StillBass Technology” picture.
It will be interesting to see how well this system can work
in practice. It would seem that it would be difficult to opti-
mize and match well enough over a wide band of frequencies
to correlate perfectly to nullify all audible vibration without
coupling some independent outputs of its own to the wall
surface, but it would appear they have applied it successfully.
It’s great to see that Mr. Carver is still innovating.
WIDE FREQUENCY RANGE HORN WITH
MODULAR METHOD FOR REDUCING
DIFFRACTION EFFECTS
Patent Number: 7,845,462
Inventors: Dana A. Moore (Bothell, Wash.)
Assignee: None
Filed: August 7, 2008
Granted: December 7, 2010
Current U.S. Class: 181/192, 20 Claims, 12 drawings
Reviewer Comments Disclosed in the patent (Fig. 3) is a structure to provide
a reduction in horn mouth diffraction—particularly hori-
zontal diffraction when compared to flat baffle mounted
horns of the same cutoff frequency (Fc) and overall mouth
size. In a loudspeaker horn for operation in a middle to high
frequency range, at the termination of the horn mouth,
the invention provides a modular horn mouth with a
smooth large radius termination with a rearward extension,
the extension consisting of at least two outer side baffles
attached to at least two opposite and outer sides of the horn
mouth and adapted to be substantially equal in height to
the horn mouth sides. The large radius forms a smooth
and continuous substantially, quarter roll extension which
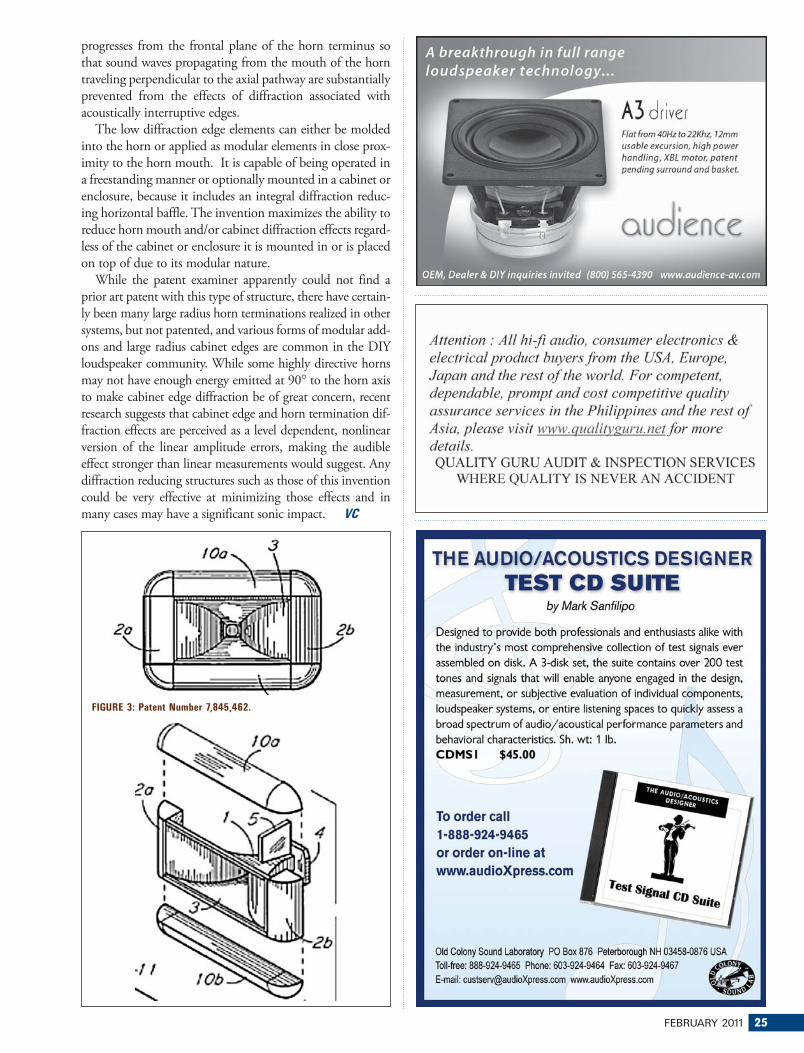
FEBRUARY 2011 25
progresses from the frontal plane of the horn terminus so
that sound waves propagating from the mouth of the horn
traveling perpendicular to the axial pathway are substantially
prevented from the effects of diffraction associated with
acoustically interruptive edges.
The low diffraction edge elements can either be molded
into the horn or applied as modular elements in close prox-
imity to the horn mouth. It is capable of being operated in
a freestanding manner or optionally mounted in a cabinet or
enclosure, because it includes an integral diffraction reduc-
ing horizontal baffle. The invention maximizes the ability to
reduce horn mouth and/or cabinet diffraction effects regard-
less of the cabinet or enclosure it is mounted in or is placed
on top of due to its modular nature.
While the patent examiner apparently could not find a
prior art patent with this type of structure, there have certain-
ly been many large radius horn terminations realized in other
systems, but not patented, and various forms of modular add-
ons and large radius cabinet edges are common in the DIY
loudspeaker community. While some highly directive horns
may not have enough energy emitted at 90° to the horn axis
to make cabinet edge diffraction be of great concern, recent
research suggests that cabinet edge and horn termination dif-
fraction effects are perceived as a level dependent, nonlinear
version of the linear amplitude errors, making the audible
effect stronger than linear measurements would suggest. Any
diffraction reducing structures such as those of this invention
could be very effective at minimizing those effects and in
many cases may have a significant sonic impact. VC
FIGURE 3: Patent Number 7,845,462.

26 VOICE COIL
Industry WatchBy Vance Dickason
(ack in the 70s and 80s, Southern California audio
fans were familiar with RSL Speaker Systems, sold
at Rogersound Labs audio/video stores throughout the
area. During those decades, RSL was one of the best-selling
brands in the region. The RSL Studio Monitors were a
familiar sight in many of LA’s recording studios and radio
stations and were owned by many of LA’s top musicians.
They still have a loyal following. RSL speakers stood for
high quality and great sound at reasonable, factory-direct
prices. “I am amazed by the number of e-mails I receive
from owners who still are happy with their older RSL
Speakers,” says founder Howard Rodgers.
For the past three years, Howard Rodgers and his son
Joseph have been developing a new line of home theater
speakers and studio monitors based upon RSL’s patented
Compression Guide Technology. According to Rodgers,
Compression Guide Technology is a different approach
to speaker tuning, which dramatically increases the clar-
ity of the voices and instruments as well as improving the
soundstage (the company’s slogan is, “Hear Outside the
Box”). It also results in significant bass extension with less
boominess and overhang. RSL Speaker Systems (Photo 1) are offered exclusively through their website www.
rslspeakers.com. All RSL speakers come with a 30-day
satisfaction money-back guarantee. RSL will even pay
shipping both ways so that customers will pay nothing
to try them, if returned.
The initial RSL line includes a compact two-way speaker
designed to complement their new subwoofer, the RSL
Speedwoofer 10, which features wireless remote control of
volume and crossover frequency. It is powered by a 375W
pure analog Class A/B amplifier. Rodgers describes the bass
as impactful with extreme clarity that doesn’t intrude on the
mid-range sound like most subwoofers.
The line includes a new RSL Studio Monitor, which can
also perform as an ideal center-channel when placed hori-
zontally. All models feature RSL’s patented Compression
Guide Technology and high-gloss black piano finished cabi-
nets. Combinations of these models are suitable for home
theater as well as stereo installations. The company will also
be introducing in-wall and in-ceiling models which will
acoustically match the other speakers in the line.
������ ��!!�������"�����
"""#"������#���
�������������� ���������� ����� ������������ ���������������������� � ���������� ������������������������ � ������� ���� �!"��#�$��������������� �����%� ������������& �'!"��(�������"��)*+����,-.������������������������%����
PHOTO 1: RSL System.

FEBRUARY 2011 27
Cobham Technical Services’ Opera 3D electromagnetic
field simulator is playing a vital role in the design of an
innovative hybrid magnet being developed by the USA’s
National High Magnetic Field Laboratory (NHMFL) in
Tallahassee, Fla. The NHMFL—popularly known as the
MagLab—is home to some of the largest and most power-
ful laboratory magnets in the world. Headquartered in a
370,000ft2 complex at Florida State University, the facility
provides scientists and engineers with a unique environ-
ment in which to conduct experiments involving very high-
energy magnetic fields.
Many of the innovative magnets used at the MagLab are
designed and built on-site, by the facility’s Magnet Science
& Technology group. One of the latest additions, currently
early in its construction, is a Series-Connected Hybrid
(SCH) magnet designed to provide unprecedented power
efficiency and field homogeneity. Development of this
resistive-superconducting hybrid magnet is being funded
by an $11.7 million grant from the US National Science Foundation, and the magnet will be used for research
purposes in high field nuclear magnetic resonance (NMR),
condensed matter physics, biology, and chemistry.
The SCH uses a water-cooled Florida-Bitter resistive
magnet—a highly innovative technology developed by
the MS&T group, capable of generating high magnetic
field strengths more efficiently than alternative means—
nested within a superconducting magnet that is cooled
by liquid helium. The two magnets are connected in
series and together produce a very high intensity central
magnetic field of 36 tesla. The SCH is connected to a
650V supply and has an operating current of 20,000A;
this 13MW power consumption is 66% less than what
would be required for an all-resistive magnet providing
the same field and bore. Electromagnetic shielding of
the SCH is provided by a set of eight magnetically soft,
100mm thick iron plates which form an octagonal wall
around the entire magnet system. The magnetic proper-
ties of these shields were characterized by a B-H curve,
obtained by using Opera 3D.
Opera 3D has also been used for a variety of other
performance-related studies on the SCH, including
evaluating the magnetic fields around the magnet’s HTS
(high temperature superconductor) vapor-cooled leads,
and calculating eddy currents in the thermal radiation
shields surrounding the superconducting coil. In the lat-
ter case, these calculations are of critical importance; dur-
ing fast discharge of the magnet—such as in the case of a
quench—eddy currents can exert large mechanical forces
on the shields, and they therefore need to be accurately
simulated for safety.
The SCH promises to set a new standard in powered
magnet performance. Its efficiency means that it will have
a lower operating cost than any other magnet in its class,
and its innovative magnet configuration should provide
an unprecedented level of field homogeneity and stabil-
ity. Such is the design expectation that the MagLab is
already involved in two further variations of the SCH; one
other under construction is destined for the Helmholtz
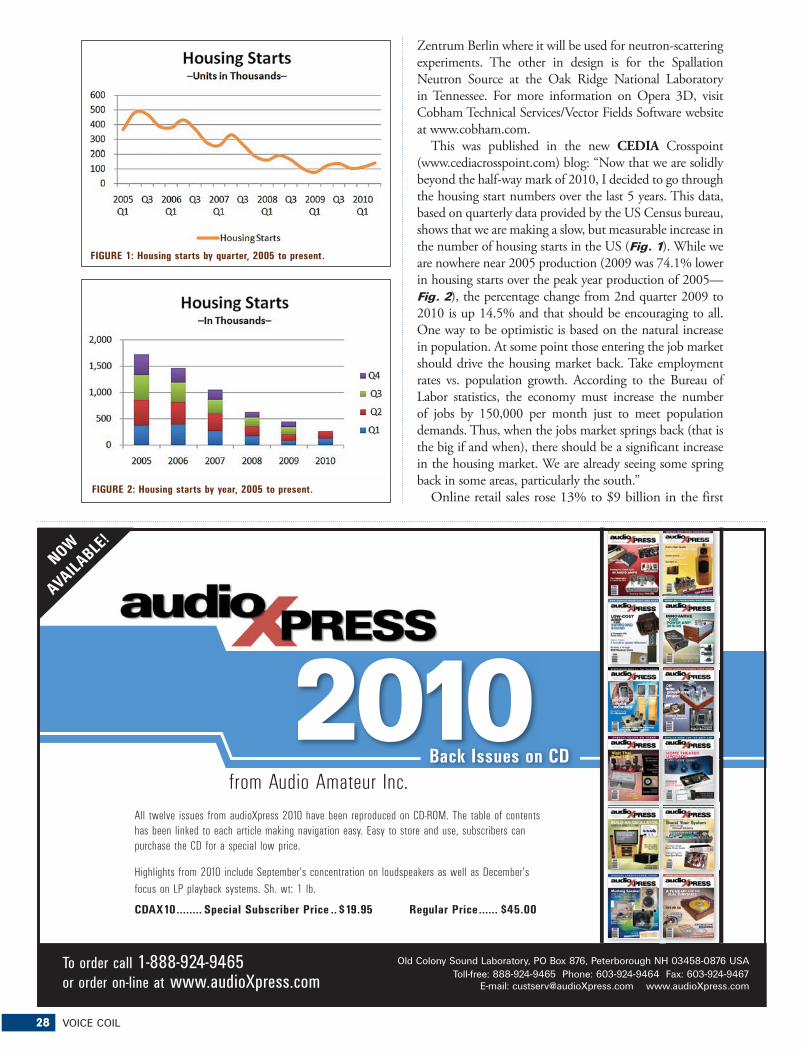
28 VOICE COIL
Zentrum Berlin where it will be used for neutron-scattering
experiments. The other in design is for the Spallation
Neutron Source at the Oak Ridge National Laboratory
in Tennessee. For more information on Opera 3D, visit
Cobham Technical Services/Vector Fields Software website
at www.cobham.com.
This was published in the new CEDIA Crosspoint
(www.cediacrosspoint.com) blog: “Now that we are solidly
beyond the half-way mark of 2010, I decided to go through
the housing start numbers over the last 5 years. This data,
based on quarterly data provided by the US Census bureau,
shows that we are making a slow, but measurable increase in
the number of housing starts in the US (Fig. 1). While we
are nowhere near 2005 production (2009 was 74.1% lower
in housing starts over the peak year production of 2005—
Fig. 2), the percentage change from 2nd quarter 2009 to
2010 is up 14.5% and that should be encouraging to all.
One way to be optimistic is based on the natural increase
in population. At some point those entering the job market
should drive the housing market back. Take employment
rates vs. population growth. According to the Bureau of
Labor statistics, the economy must increase the number
of jobs by 150,000 per month just to meet population
demands. Thus, when the jobs market springs back (that is
the big if and when), there should be a significant increase
in the housing market. We are already seeing some spring
back in some areas, particularly the south.”
Online retail sales rose 13% to $9 billion in the first FIGURE 2: Housing starts by year, 2005 to present.
FIGURE 1: Housing starts by quarter, 2005 to present.
All twelve issues from audioXpress 2010 have been reproduced on CD-ROM. The table of contents
has been linked to each article making navigation easy. Easy to store and use, subscribers can
purchase the CD for a special low price.
Highlights from 2010 include September’s concentration on loudspeakers as well as December’s
focus on LP playback systems. Sh. wt: 1 lb.
CDAX10 ........ Special Subscriber Price ..$19.95 Regular Price ...... $45.00
from Audio Amateur Inc.
Old Colony Sound Laboratory, PO Box 876, Peterborough NH 03458-0876 USAToll-free: 888-924-9465 Phone: 603-924-9464 Fax: 603-924-9467
E-mail: [email protected] www.audioXpress.com
To order call 1-888-924-9465 or order on-line at www.audioXpress.com
Back Issues on CD
NOW
AVAI
LABL
E!

FEBRUARY 2011 29
three weeks of November, according to comScore (www.
comscore.com). The market research firm is also fore-
casting an 11% increase in e-tail sales year over year for
the full holiday season, to $32.4 billion. This year free-
shipping offers have become a key element in holiday
promotions. According to a comScore consumer survey
conducted Nov. 11-15, more than three quarters (77%)
of respondents considered free delivery important, and
one-third said they wouldn’t make a purchase without
it. During the third quarter, 41% of e-tail purchases
included free shipping. The survey also showed that
consumers are split on the intensity of this season’s online
promotions. Forty percent said the number of sales,
discounts, or promotions is about the same compared
to last year, while 36% perceived an increase and 11%
perceived a decrease.
Despite a burst of holiday spending in November,
retail sales may likely wane over the remaining days
before Christmas, a Consumer Reports survey suggests
(www.consumerreports.org). According to the consumer
advocacy organization, increased stress, slipping confi-
dence, and a growing reluctance to spend could put a
crimp in December sales. Planned December purchases
are down slightly following gains in November, the
survey showed, led by fewer planned purchases of per-
sonal electronics year over year. By comparison, planned
purchases of home electronics were up nearly 12% in
November year over year, and planned purchases of
major appliances were up 19%.
Always a good indicator of the health of CE sales, Best Buy (www.bestbuy.com) reported lower revenue and net
earnings in its fiscal third quarter, ended Nov. 27, which
covered part of Thanksgiving weekend, as compared with
last year. Net earnings were $217 million, down $10 mil-
lion year on year. Revenue was $11.89 billion, down from
the prior year’s $12.02 billion. Comp-store sales were down
3.3% compared with last year, but operating income was up
$9 million to $385 million during the quarter.
German Maestro (www.german-maestro.de) is expand-
ing its selection of car audio products with the launch of
its first amplifiers and new speakers, including two three-
way component speakers. The products were displayed at
International CES and started shipping around show time.
The company, which entered the US market two years ago,
is launching eight products in all, including the two three-
way component speakers, three 2Ω speakers designed for
OEM replacement, a subwoofer, and two amps.
Wisdom Audio (www.wisdomaudio.com) exhibited its
highest-end in-room speaker series to date at CES in January.
The Wisdom series consists of two line-source planar-
magnetic tower speakers priced at $30,000 and $40,000
each. Because each model is only 12″ deep, interior designers
can place them behind decorative, acoustically transparent
cloth for a completely hidden installation. The speakers are
designed to work with the company’s $10,000 STS subwoof-
er, said to combine musicality with the high-output extended
bass needed for home theaters in large residential spaces.
Sunfire (www.sunfire.com) launched its lowest-price
powered subwoofers to date to broaden its potential
customer base at this year’s CES. The three models in the
Dynamic series are the brand’s first to incorporate efficient
Class D amplifier technology, and they’re priced at a sug-
gested $350 for an 8″ model, $450 for a 10″ model, and
$550 for a 12″ model, all with passive radiators. They also
feature signal-sensing power on/off, continuously variable
phase, crossover, and volume controls, and an optional
2.4GHz wireless transmitter/receiver pair to eliminate
speaker-cable runs. Up to four receivers at a time are able
to stream bass from a single transmitter. The 8″ model
reproduces 32Hz to 150Hz frequencies with up to 400W
������������ ����� �� ������� ���� ���������������������������������������������������� �����!������������ ���� ���� ���������������"���������#�"������"���������"�������������� ��$�����"����$����%����"&��������"�����������'(�����������$$����������!����������'����'���
)*���&+��������#�������������,��������-��������!���%���"����,����������� ����� "�&�����..���������&��%���"����,������������ ��������&�����$����$����� "����"$��������/��$�������'�$�,������������������!�����������#������������"� ����������"&�������!����&���"� ����0����������������� ����$����"�������'���������"�1����$��������"���'����&�����,���"���&��'����"������234����&������������������$��� "��������!����������&�����&��%�������"����,��������������"������,��%����������'���� �����������'����������������� ��&�����������������$����#������$������&����"&����������"$����������"�����������&����������"����1����������%�������������� ������
����������������������������������� � ��!�"�� ������������������ 5+6+7 ��������������8�/99-9�)-3*:.��;��<�=��
#$��"�%&� �'�
���������� �������������������������������������������������������
����������� ������������������������ ����������������
��� ��!�"!�!"#!##�$�% ��!�"!�&"�#�&'''����(����������)���)*���(����������+)��)���, )�-�.����/
�������
� ��!�"!����
��#��$%&'����$
�������
��#����(!��(�"�)(�* ���"+�,���$-�!��.�������/���0���.����0�1��
&'����2*!(����
������� �"*���3�4�5�.�#�3�"6�
��$-�.�����7$-���!��8��30�
��� �����
������0�����0)�1�)2���0��
����
������
���� ����������������
������
������������� ����
!�"���������#� ���$������ �%��� ���
���&������

30 VOICE COIL
of peak output, while the 10″ model reproduces 30Hz
to 150Hz frequencies with up to 500W peaks. The 12″
model delivers 28Hz to 150Hz frequencies with 600W
peaks. The next step up in Sunfire’s subwoofer selection is
the HRS (High Resolution Series), promoted as offering
audiophile performance in a small package. At the top
of the selection is the limited-production luxury-perfor-
mance XT series, which consists of the SubRosa in-room
and in-wall subwoofer system.
MartinLogan (www.martinlogan.com) launched nine
new in-wall and in-ceiling speakers, all due to ship in sum-
mer 2011. All are the company’s first custom speakers with
what the company calls “virtually no bezel.” Prices start
at $249.95 each for the Motion Architectural Series and
$399.95 each for the ElectroMotion Architectural Series.
Pricing for the flagship Stealth Architectural Series wasn’t
available. The three models in the Motion Architectural
Series are voice-matched with the company’s Motion
Series of in-room speakers with rigid, poly cone woofers
in 6.5- and 8″ sizes and 1 × 1.4″ Folded Motion tweeters.
The ElectroMotion Architectural Series features step-up
performance with low-distortion aluminum-cone woofers.
The flagship Stealth Architectural Series (Photo 2) uses the
company’s larger, low-distortion Folded Motion XT tweet-
ers, along with black-aluminum, high-excursion bass, and
mid-range drivers. They feature a gloss piano-black speaker
baffle and solid one-piece cast aluminum chassis.
Last, you can add Teac (www.teac.com) to January’s
list of new iPod music systems. Teac America added two
new iPod/iPhone-docking audio systems to its selec-
tion with the shipment of the $199 SR-80i and $299
SR-100i. Both are positioned as “high-fidelity systems
with superior design aesthetics at an affordable price.”
They feature radio, and the top model adds a slot-in CD
player; both were displayed at International CES. The
SR-80i features 2 × 15W amplification, AM/FM PLL
synthesized tuner, and the ability to capture the digital
PCM output of docked iPods/iPhones. It also plays MP3
files from a USB stick, and a video output displays stored
videos and photos on a connected TV. It’s equipped with
full-range speakers, bass-reflex port, and DSP-enhanced
bass response. The SR-100i features PLL FM tuner, 2 ×
50W amplification, two-way speaker system with 3.5″
midwoofers, bass-reflex ports, slot-in CD player, and
retractable dock. The CD player supports CD-R/RW,
MP3, and WMA discs. A USB port plays MP3 files on a
USB stick. An aux-in is included. VC
Advertiser Categories PageACO Pacific .................................... K,N ......................29
Audience ....................................... B,C,H ..................25
Audio Amateur Inc.
audiobytz ...............................................................14
Voice Coil Digital Magazine .......................................22
Old Colony Sound Lab
D-4 Prototyping PC-Board ....................................16
Esoteric 3D-X Optical Disc Enhancer ......................11
Testing Loudspeakers ............................................23
Test Signal CD Suite .............................................25
Beston Technology Corporation ....... D ........................26
BMS Speakers GmbH ....................... D ........................27
CMS Magnetics ............................... I .........................13
Faital Spa ...................................... D ........................21
LOUDSoft ...................................... G ........................24
Menlo Scientific, Ltd. ...................... B ...........................9
One Magnet Electronic Co., Ltd. ...... I .........................17
Parts Express ................................. L ...................... CV2
Precision Econowind ....................... O ........................21
Prism Media Products ..................... G ...................... CV4
Quality Guru Audit & Inspection Services ..................... 25
SM Audio Engineering Consulting ..... B ........................29
Solen, Inc. ................................... C,D .....................20
Tang Band Industries Co. ............... D ................... 13, 15
Vance Dickason .............................. B .........................15
Wavecor Ltd. ................................ F,H .....................26
CATEGORY KEYA = ADHESIVES
B = CONSULTANTS & ENGINEERS
C = CROSSOVERS & PASSIVE
COMPONENTS
D = DRIVERS
E = EMPLOYMENT OPPORTUNITIES
F = ENCLOSURES & ENCLOSURE
PARTS
G = ENGINEERING/DESIGN SOFTWARE
H = FINISHED SYSTEMS
I = MAGNETS & EQUIPMENT
J = MANUFACTURING EQUIPMENT
K = MICROPHONES
L = PARTS
M = RECONING
N = TEST EQUIPMENT
O = VOICE COILS − COMPONENTS
& MATERIALS
P = TRANSDUCERS
This product/services index is provided as a value-added service to our readers and advertisers. The publisher will not be held liable for any errors or deletions contained herein.
Products & Services Index
PHOTO 2: MartinLogan flagship ceiling speaker.

��������������Test CDs�*�������"������'�#���9&$
������������������PO Box 876, Dept. AX Peterborough, NH 03458-0876 USAToll-free: 888-924-9465 Phone: 603-924-9464 Fax: 603-924-9467:!�&����� ������� �������������
��������������������
Check out more
test CDs and track
listings for these
products on-line at
www.audioXpress.com
or call today for a
FREE CATALOG
1-888-924-9465!
DCAT3 Audio Test Tone CD Set����������������������;�������%� ���� ����*���8�&���� �(&� ��%��%�� ����'�� �*���*��������&��� ���&���� �� ��$&�&��(�&�&�����<��������� ��(�&���&��&������CDT1 $39.99
CARA Test CD for Room Acoustics � !"�������������������#��$�
/%���;�;�/� ������ �� �(�����%����'����� ���%��&��� ��� ��*�'������ ���(�������/�&�, ��=�>����&�������#���?&���/�� �@8�� ��� �������&�,A��/�&�, �� =������������&����$&�@BCD+����&��A�&���,��� ��@8�� ��� �������&�,A��/%���& ��*������&�, ����%��
� ��������������&���+����&���'+�&��%& ���� ��(�CDCARA $19.95
www.audioXpress.com
Shipping weight of all CDs is 1 lb. each.
EIA-426-B Loudspeaker Power Rating Test CD-from ALMA International���������& �&�����&�������%��������� �&&�+��%��������&� ��%���&��$�&����&��� �� �(&� �*���&����� � ��4�����%�� �&&��&������� ��%���������� �*����&,�(�$� ��� ���*��%��� ,��� ����(��%���������&��( ��*���� ��&,�� �&��%��&����4�� ��%&��������%����;� ������� �&���$����*��� �! �(&����&�, +������(�&����&��%�(%��!*��<���'��������� �&� %&�������$�� � +����&��&����*��%�� �&&���������CDAL2 $99.00
The Audio/Acoustics Designer Test CD Suite%����&����'����
E!� �� ��+��%�� ��������&� ������������ ����� �&� �(&� ��%&��������&$���&'����(&(�����%��� �(+���& ������+���� �$3���������&��&�����*������&��������� +���� ��&,��� ' ��� +������������ ���(� �&�� ����<���,�'�& � �&�$��&� ���������*�&���F&��� ���&�����*���&����&�&����� �&�$�%&����&���%&�&����� ��� �CDMS1 $45.00
Stereophile Test CD Three)�����%����$�� %�� ��*�#������%�����&(&D��+����&� ��8���&�, ��%��%��������� ��&�� ������� �&� �(&� �*����� ��(���� ��&,�� �&����� +������������������ +�&����4�� �&������&'�� �CDSTPH3 $9.95
Auditory Demonstrations Test Disc(��������
8 ���&�, �*�&����(���� ��&��� ��*��&������%&����� +����$��� �&��+��& ,�(+�
�����&���&��%+���(&���%����&�����&��*��<���'� �&�� +��**�����*���%�� +�&������CDAC $37.95
AUDIO-CD®
;��& '�&���G�� �����&'����������%�&��(��� ��&��'H&�����(�'�������&,������������&������������&�������CDDR1 $24.95
CD-CHECK®
:& ��'�� ����'������!��&'��������� ��%������������&(���*��(��&�� �����CDDR2 $24.95

32 VOICE COIL
...integrated
electronic test, acoustic test...
Prism Sound is now a globalsales & support agent for:
������������������� �������� ������������������������������������ ���������������������������������������������������������� ����������������
��������������������� ���������� ������������ ���������������������
������������������� !�����������������������������������������������������"������ ���������� �����#�������������������$�����%dScope Series III
analog and digitalaudio analyzers
������������������� ��������������������������������������������� �!"#�����$ ����
Loudspeaker design and analysis solutions

Show Spotlight
ALMA 2011 Winter Symposium (Part 1)By Steve Tatarunis and Mike Klasco
'LMA International’s Winter Symposium theme,
Loudspeakers: Yesterday, Today and Tomorrow, was a
timely one as 2011 marks ALMA’s 50th year as the loud-
speaker industry’s only trade association.
The last few years have taken a toll on ALMA member-
ship due to the ongoing evaporation of speaker manu-
facturing in the US and unsettled economic conditions
worldwide. Because of this, ALMA president Stu Lumsden
and the symposium committee spent the last year work-
ing with returning ALMA Executive Director, Carol
Bousquet, to reinvigorate ALMA as an organization.
Originally founded in 1961 as the American Loudspeaker
Manufacturers Association (ALMA), in 2001 ALMA
changed its name to ALMA International (Association
for Loudspeaker Manufacturing and Acoustics) to reflect
its growing geographically diverse membership base.
Geographic makeup aside, the name is still ALMA. Today,
ALMA is a genuine international association with con-
tinued growth in international membership and a strong
demand for symposia programming in other parts of the
world such as the successful ALMA European and Asian
symposiums this last year.
This year’s ALMA Symposium, held in Las Vegas at the
Orleans Hotel and Casino on January 4-5, had near-record
attendance and, as in previous years, featured manufactur-
ing exhibits, technical papers, industry awards, round-table
discussions, panels, seminars, and committee meetings.
Here is a list of this year’s exhibitors:
Voice Coil Magazine: Peter Wostrel and Mike Costa
were manning this booth, which featured the Loudspeaker
Industry Sourcebook directory (for most of us it is a desk ref-
erence), and, of course, issues of Voice Coil. They were also
promoting audioXpress and Ed Dell’s new blog, “Ed Dell’s
Decibels.” www.audioXpress.com
Dr. Kurt Mueller GmbH.: This long-time European
member was back exhibiting this year with its superb
quality, advanced technology speaker cones, and tweeter
diaphragms. Watching the attrition of cone companies this
last year has been a bit disconcerting. Strong and commit-
V O L U M E 2 4 , I S S U E 5 M A R C H 2 0 1 1
®
IN THIS ISSUE
INDUSTRY NEWS AND DEVELOPMENTS
TEST BENCH9
7
More from Vifa and Scan-SpeakBy Vance Dickason
SPOTLIGHT
SPOTLIGHT
INDUSTRY WATCH
1
20
24
29 Products & Services IndexALMA 2011Winter Symposium (Part 1) By Steve Tatarunis and Mike Klasco
CEDIA EXPO: Speaker Technology TrendsBy Mike Klasco and Nora Wong
Who walked away
with the beryllium,
platinum, and gold
at this year’s ALMA
awards? p. 6.
Vifa’s flat-cone
full-range driver, p. 9.
By Vance Dickason
ServicesV
fu

��
���������� ���������� ���
�
������� ���� �������������
���
�� ������������
����������� ���������������
�������������������������������
��
����������������������������������
��� ��!""#$��%���
������&��������'�������� ��!$(#)
��%���
�
���� ����
*��� ��+���,������ ���-�������
���� �������� �-��� ���� ������ -�
�����
���,�������� ���+��� ���,������ �
���� �� .������������� ���� ���� ��
,�� �-�
,������� ������� ��� ��������� ����
� �/��.���� ��,��+��� ,��-�������0
� �*����
�������,�������������+���������-����
������������.����������������������������
������
,��-�������� ������,����� �+��� ����
��-�� �-� ���� ���,�����0� 1������ �/�
�������
���������������� ,��,������� ���,���
������ -������������������������ �����
�����
����������0� �� ���,�������+�� ��
�� �-� ������ �-� .��������� ������
�� ����
�������� ���,������ ���,��������
���+���� ��� ������.��� ��������� -��2
�����
���,������ ��������������+����� �����
������� ������������ �� �� ����� ,����
���+��
�.�������������������-������0��
.�����������--�������������������
���������
,��-��������������������,����������
��������-��2������������.�+��$��3
40�
�
!"� �#$� %�&��#%$�
*����,�,���,��������������������-����
�������-�.������������������������-�
���������,������
�-��������-��2�������������������
����������0��*������������,��,�����
���-�.������������
���,���������� ������� ���� ����
���� ���� ���� -���� ��� .�� �,����
�� -��� ����� ,�,���0��
5��������,��������-����������.��
����������������������������-��������
������������������
�/������,�����������+��������������
���������� -��� ��,��+�����������
���� ����+����������
��������������0�����-��������,
�������������������.�������������.
���������������������
���� ��+��0� ��,�������+�� �����
��� �������� ����� ��� �� ����������� �.
�� ���� ,���������
���,������ ���� ������ ���������0�
������ ������ ����� ������ .���+�
��� �-� ���� ������
���,������0�
�
'"����#��% (�%���) (��#&*�����
��#��� �+*�*��) #���
�������� ��� �� ����� ���� ��2�� �
����� ������ ��� ���� ��� �� ��.��� �
-� ����� �����������
���������� ��������� ��������� ����
�,����� ���� ����6������� ,������0�
� �,,���������� -���
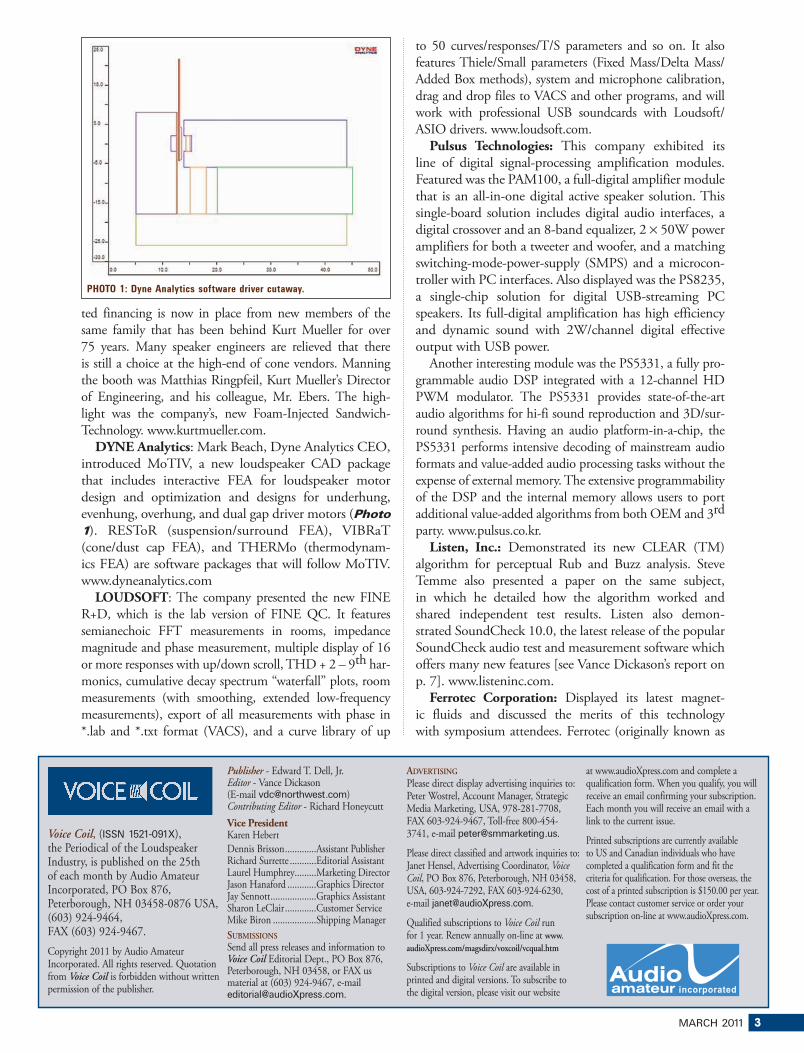
MARCH 2011 3
ted financing is now in place from new members of the
same family that has been behind Kurt Mueller for over
75 years. Many speaker engineers are relieved that there
is still a choice at the high-end of cone vendors. Manning
the booth was Matthias Ringpfeil, Kurt Mueller’s Director
of Engineering, and his colleague, Mr. Ebers. The high-
light was the company’s, new Foam-Injected Sandwich-
Technology. www.kurtmueller.com.
DYNE Analytics: Mark Beach, Dyne Analytics CEO,
introduced MoTIV, a new loudspeaker CAD package
that includes interactive FEA for loudspeaker motor
design and optimization and designs for underhung,
evenhung, overhung, and dual gap driver motors (Photo 1). RESToR (suspension/surround FEA), VIBRaT
(cone/dust cap FEA), and THERMo (thermodynam-
ics FEA) are software packages that will follow MoTIV.
www.dyneanalytics.com
LOUDSOFT: The company presented the new FINE
R+D, which is the lab version of FINE QC. It features
semianechoic FFT measurements in rooms, impedance
magnitude and phase measurement, multiple display of 16
or more responses with up/down scroll, THD + 2 – 9th har-
monics, cumulative decay spectrum “waterfall” plots, room
measurements (with smoothing, extended low-frequency
measurements), export of all measurements with phase in
*.lab and *.txt format (VACS), and a curve library of up
to 50 curves/responses/T/S parameters and so on. It also
features Thiele/Small parameters (Fixed Mass/Delta Mass/
Added Box methods), system and microphone calibration,
drag and drop files to VACS and other programs, and will
work with professional USB soundcards with Loudsoft/
ASIO drivers. www.loudsoft.com.
Pulsus Technologies: This company exhibited its
line of digital signal-processing amplification modules.
Featured was the PAM100, a full-digital amplifier module
that is an all-in-one digital active speaker solution. This
single-board solution includes digital audio interfaces, a
digital crossover and an 8-band equalizer, 2 × 50W power
amplifiers for both a tweeter and woofer, and a matching
switching-mode-power-supply (SMPS) and a microcon-
troller with PC interfaces. Also displayed was the PS8235,
a single-chip solution for digital USB-streaming PC
speakers. Its full-digital amplification has high efficiency
and dynamic sound with 2W/channel digital effective
output with USB power.
Another interesting module was the PS5331, a fully pro-
grammable audio DSP integrated with a 12-channel HD
PWM modulator. The PS5331 provides state-of-the-art
audio algorithms for hi-fi sound reproduction and 3D/sur-
round synthesis. Having an audio platform-in-a-chip, the
PS5331 performs intensive decoding of mainstream audio
formats and value-added audio processing tasks without the
expense of external memory. The extensive programmability
of the DSP and the internal memory allows users to port
additional value-added algorithms from both OEM and 3rd
party. www.pulsus.co.kr.
Listen, Inc.: Demonstrated its new CLEAR (TM)
algorithm for perceptual Rub and Buzz analysis. Steve
Temme also presented a paper on the same subject,
in which he detailed how the algorithm worked and
shared independent test results. Listen also demon-
strated SoundCheck 10.0, the latest release of the popular
SoundCheck audio test and measurement software which
offers many new features [see Vance Dickason’s report on
p. 7]. www.listeninc.com.
Ferrotec Corporation: Displayed its latest magnet-
ic fluids and discussed the merits of this technology
with symposium attendees. Ferrotec (originally known as
PHOTO 1: Dyne Analytics software driver cutaway.
Voice Coil, (ISSN 1521-091X), the Periodical of the Loudspeaker Industry, is published on the 25th of each month by Audio Amateur Incorporated, PO Box 876, Peterborough, NH 03458-0876 USA, (603) 924-9464, FAX (603) 924-9467.
Copyright 2011 by Audio Amateur Incorporated. All rights reserved. Quotation from Voice Coil is forbidden without written permission of the publisher.
Publisher - Edward T. Dell, Jr.Editor - Vance Dickason (E-mail [email protected])Contributing Editor - Richard Honeycutt
Vice PresidentKaren Hebert
Dennis Brisson .............Assistant PublisherRichard Surrette ...........Editorial AssistantLaurel Humphrey.........Marketing DirectorJason Hanaford ............Graphics DirectorJay Sennott ...................Graphics AssistantSharon LeClair .............Customer ServiceMike Biron ..................Shipping Manager
SUBMISSIONSSend all press releases and information to Voice Coil Editorial Dept., PO Box 876, Peterborough, NH 03458, or FAX us material at (603) 924-9467, e-mail [email protected].
ADVERTISING
Please direct display advertising inquiries to: Peter Wostrel, Account Manager, Strategic Media Marketing, USA, 978-281-7708, FAX 603-924-9467, Toll-free 800-454-3741, e-mail [email protected].
Please direct classified and artwork inquiries to: Janet Hensel, Advertising Coordinator, Voice Coil, PO Box 876, Peterborough, NH 03458, USA, 603-924-7292, FAX 603-924-6230, e-mail [email protected].
Qualified subscriptions to Voice Coil run for 1 year. Renew annually on-line at www.audioXpress.com/magsdirx/voxcoil/vcqual.htm
Subscriptions to Voice Coil are available in printed and digital versions. To subscribe to the digital version, please visit our website
at www.audioXpress.com and complete a qualification form. When you qualify, you will receive an email confirming your subscription. Each month you will receive an email with a link to the current issue.
Printed subscriptions are currently available to US and Canadian individuals who have completed a qualification form and fit the criteria for qualification. For those overseas, the cost of a printed subscription is $150.00 per year. Please contact customer service or order your subscription on-line at www.audioXpress.com.
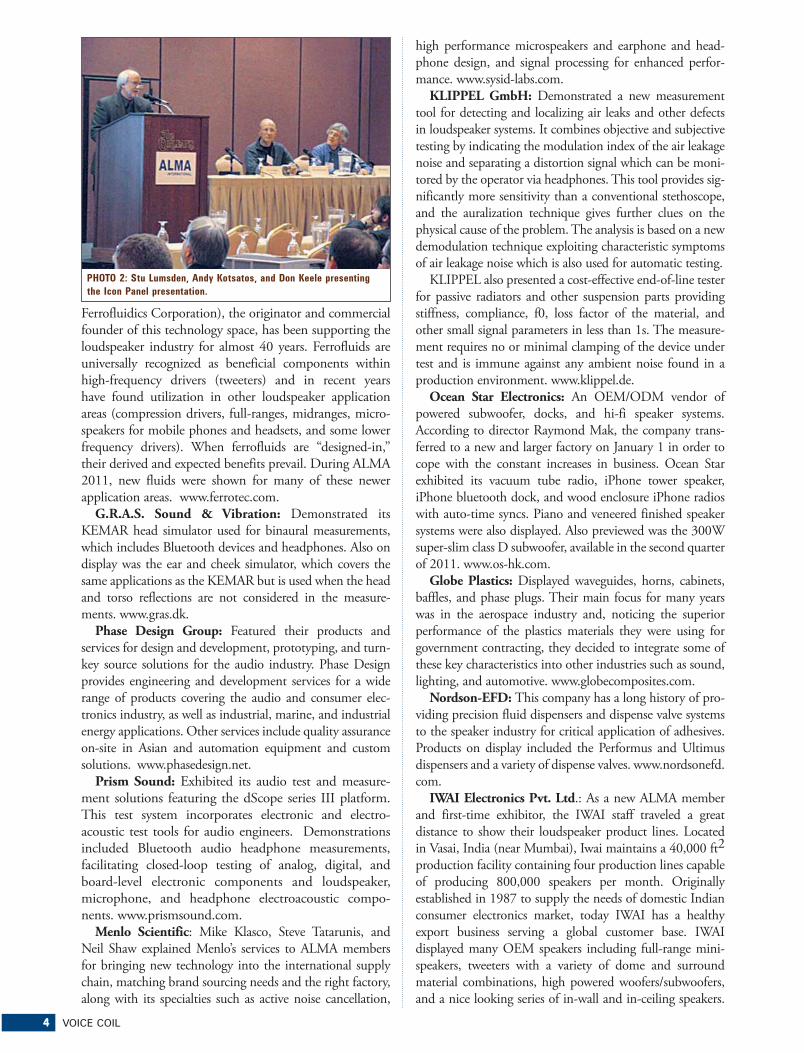
4 VOICE COIL
Ferrofluidics Corporation), the originator and commercial
founder of this technology space, has been supporting the
loudspeaker industry for almost 40 years. Ferrofluids are
universally recognized as beneficial components within
high-frequency drivers (tweeters) and in recent years
have found utilization in other loudspeaker application
areas (compression drivers, full-ranges, midranges, micro-
speakers for mobile phones and headsets, and some lower
frequency drivers). When ferrofluids are “designed-in,”
their derived and expected benefits prevail. During ALMA
2011, new fluids were shown for many of these newer
application areas. www.ferrotec.com.
G.R.A.S. Sound & Vibration: Demonstrated its
KEMAR head simulator used for binaural measurements,
which includes Bluetooth devices and headphones. Also on
display was the ear and cheek simulator, which covers the
same applications as the KEMAR but is used when the head
and torso reflections are not considered in the measure-
ments. www.gras.dk.
Phase Design Group: Featured their products and
services for design and development, prototyping, and turn-
key source solutions for the audio industry. Phase Design
provides engineering and development services for a wide
range of products covering the audio and consumer elec-
tronics industry, as well as industrial, marine, and industrial
energy applications. Other services include quality assurance
on-site in Asian and automation equipment and custom
solutions. www.phasedesign.net.
Prism Sound: Exhibited its audio test and measure-
ment solutions featuring the dScope series III platform.
This test system incorporates electronic and electro-
acoustic test tools for audio engineers. Demonstrations
included Bluetooth audio headphone measurements,
facilitating closed-loop testing of analog, digital, and
board-level electronic components and loudspeaker,
microphone, and headphone electroacoustic compo-
nents. www.prismsound.com.
Menlo Scientific: Mike Klasco, Steve Tatarunis, and
Neil Shaw explained Menlo’s services to ALMA members
for bringing new technology into the international supply
chain, matching brand sourcing needs and the right factory,
along with its specialties such as active noise cancellation,
high performance microspeakers and earphone and head-
phone design, and signal processing for enhanced perfor-
mance. www.sysid-labs.com.
KLIPPEL GmbH: Demonstrated a new measurement
tool for detecting and localizing air leaks and other defects
in loudspeaker systems. It combines objective and subjective
testing by indicating the modulation index of the air leakage
noise and separating a distortion signal which can be moni-
tored by the operator via headphones. This tool provides sig-
nificantly more sensitivity than a conventional stethoscope,
and the auralization technique gives further clues on the
physical cause of the problem. The analysis is based on a new
demodulation technique exploiting characteristic symptoms
of air leakage noise which is also used for automatic testing.
KLIPPEL also presented a cost-effective end-of-line tester
for passive radiators and other suspension parts providing
stiffness, compliance, f0, loss factor of the material, and
other small signal parameters in less than 1s. The measure-
ment requires no or minimal clamping of the device under
test and is immune against any ambient noise found in a
production environment. www.klippel.de.
Ocean Star Electronics: An OEM/ODM vendor of
powered subwoofer, docks, and hi-fi speaker systems.
According to director Raymond Mak, the company trans-
ferred to a new and larger factory on January 1 in order to
cope with the constant increases in business. Ocean Star
exhibited its vacuum tube radio, iPhone tower speaker,
iPhone bluetooth dock, and wood enclosure iPhone radios
with auto-time syncs. Piano and veneered finished speaker
systems were also displayed. Also previewed was the 300W
super-slim class D subwoofer, available in the second quarter
of 2011. www.os-hk.com.
Globe Plastics: Displayed waveguides, horns, cabinets,
baffles, and phase plugs. Their main focus for many years
was in the aerospace industry and, noticing the superior
performance of the plastics materials they were using for
government contracting, they decided to integrate some of
these key characteristics into other industries such as sound,
lighting, and automotive. www.globecomposites.com.
Nordson-EFD: This company has a long history of pro-
viding precision fluid dispensers and dispense valve systems
to the speaker industry for critical application of adhesives.
Products on display included the Performus and Ultimus
dispensers and a variety of dispense valves. www.nordsonefd.
com.
IWAI Electronics Pvt. Ltd.: As a new ALMA member
and first-time exhibitor, the IWAI staff traveled a great
distance to show their loudspeaker product lines. Located
in Vasai, India (near Mumbai), Iwai maintains a 40,000 ft2
production facility containing four production lines capable
of producing 800,000 speakers per month. Originally
established in 1987 to supply the needs of domestic Indian
consumer electronics market, today IWAI has a healthy
export business serving a global customer base. IWAI
displayed many OEM speakers including full-range mini-
speakers, tweeters with a variety of dome and surround
material combinations, high powered woofers/subwoofers,
and a nice looking series of in-wall and in-ceiling speakers.
PHOTO 2: Stu Lumsden, Andy Kotsatos, and Don Keele presenting
the Icon Panel presentation.
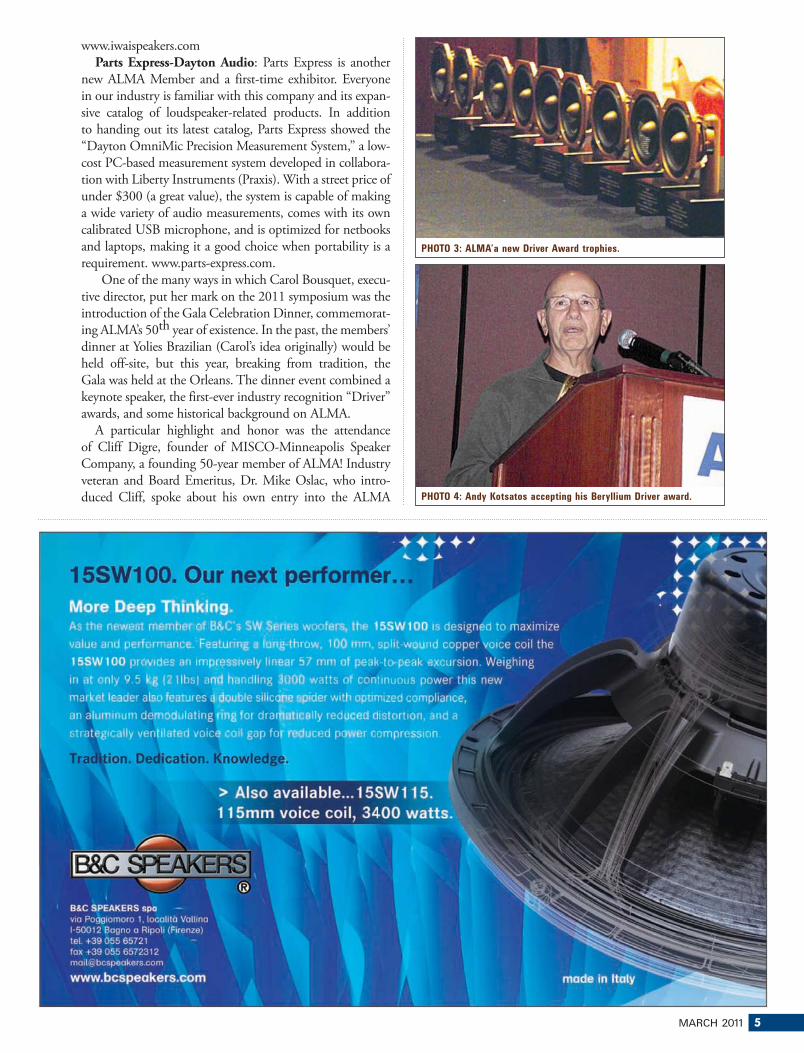
MARCH 2011 5
www.iwaispeakers.com
Parts Express-Dayton Audio: Parts Express is another
new ALMA Member and a first-time exhibitor. Everyone
in our industry is familiar with this company and its expan-
sive catalog of loudspeaker-related products. In addition
to handing out its latest catalog, Parts Express showed the
“Dayton OmniMic Precision Measurement System,” a low-
cost PC-based measurement system developed in collabora-
tion with Liberty Instruments (Praxis). With a street price of
under $300 (a great value), the system is capable of making
a wide variety of audio measurements, comes with its own
calibrated USB microphone, and is optimized for netbooks
and laptops, making it a good choice when portability is a
requirement. www.parts-express.com.
One of the many ways in which Carol Bousquet, execu-
tive director, put her mark on the 2011 symposium was the
introduction of the Gala Celebration Dinner, commemorat-
ing ALMA’s 50th year of existence. In the past, the members’
dinner at Yolies Brazilian (Carol’s idea originally) would be
held off-site, but this year, breaking from tradition, the
Gala was held at the Orleans. The dinner event combined a
keynote speaker, the first-ever industry recognition “Driver”
awards, and some historical background on ALMA.
A particular highlight and honor was the attendance
of Cliff Digre, founder of MISCO-Minneapolis Speaker
Company, a founding 50-year member of ALMA! Industry
veteran and Board Emeritus, Dr. Mike Oslac, who intro-
duced Cliff, spoke about his own entry into the ALMA
PHOTO 3: ALMA’a new Driver Award trophies.
PHOTO 4: Andy Kotsatos accepting his Beryllium Driver award.
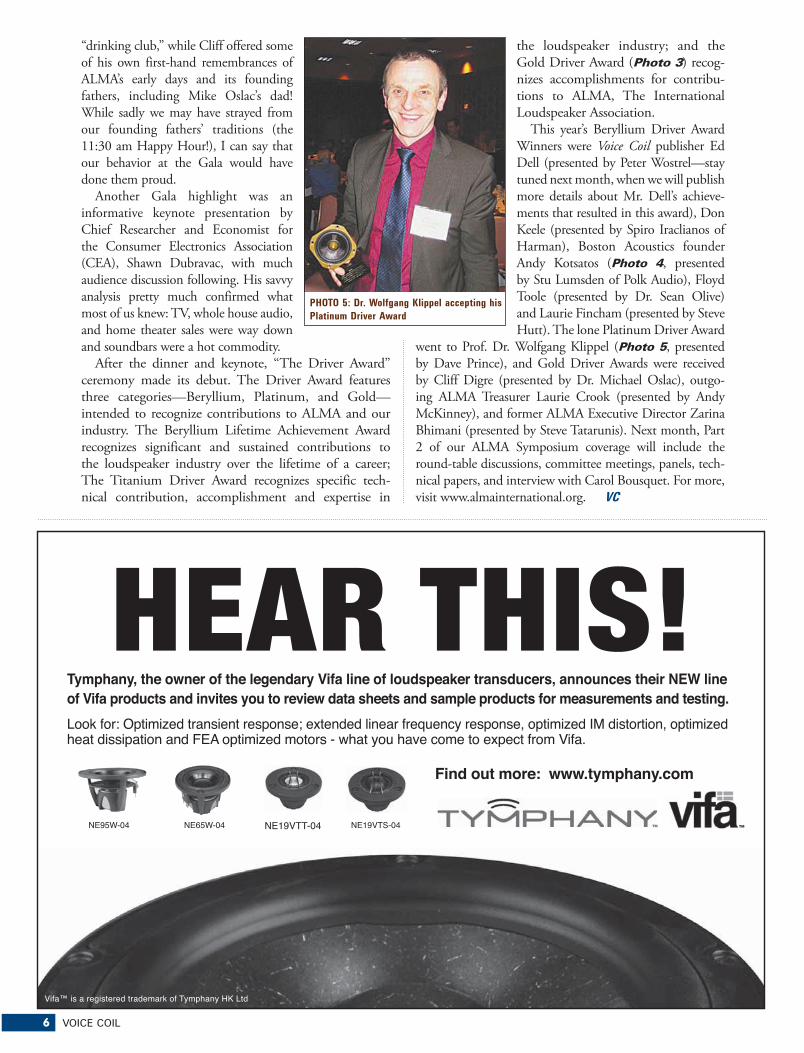
6 VOICE COIL
“drinking club,” while Cliff offered some
of his own first-hand remembrances of
ALMA’s early days and its founding
fathers, including Mike Oslac’s dad!
While sadly we may have strayed from
our founding fathers’ traditions (the
11:30 am Happy Hour!), I can say that
our behavior at the Gala would have
done them proud.
Another Gala highlight was an
informative keynote presentation by
Chief Researcher and Economist for
the Consumer Electronics Association
(CEA), Shawn Dubravac, with much
audience discussion following. His savvy
analysis pretty much confirmed what
most of us knew: TV, whole house audio,
and home theater sales were way down
and soundbars were a hot commodity.
After the dinner and keynote, “The Driver Award”
ceremony made its debut. The Driver Award features
three categories—Beryllium, Platinum, and Gold—
intended to recognize contributions to ALMA and our
industry. The Beryllium Lifetime Achievement Award
recognizes significant and sustained contributions to
the loudspeaker industry over the lifetime of a career;
The Titanium Driver Award recognizes specific tech-
nical contribution, accomplishment and expertise in
the loudspeaker industry; and the
Gold Driver Award (Photo 3) recog-
nizes accomplishments for contribu-
tions to ALMA, The International
Loudspeaker Association.
This year’s Beryllium Driver Award
Winners were Voice Coil publisher Ed
Dell (presented by Peter Wostrel—stay
tuned next month, when we will publish
more details about Mr. Dell’s achieve-
ments that resulted in this award), Don
Keele (presented by Spiro Iraclianos of
Harman), Boston Acoustics founder
Andy Kotsatos (Photo 4, presented
by Stu Lumsden of Polk Audio), Floyd
Toole (presented by Dr. Sean Olive)
and Laurie Fincham (presented by Steve
Hutt). The lone Platinum Driver Award
went to Prof. Dr. Wolfgang Klippel (Photo 5, presented
by Dave Prince), and Gold Driver Awards were received
by Cliff Digre (presented by Dr. Michael Oslac), outgo-
ing ALMA Treasurer Laurie Crook (presented by Andy
McKinney), and former ALMA Executive Director Zarina
Bhimani (presented by Steve Tatarunis). Next month, Part
2 of our ALMA Symposium coverage will include the
round-table discussions, committee meetings, panels, tech-
nical papers, and interview with Carol Bousquet. For more,
visit www.almainternational.org. VC
PHOTO 5: Dr. Wolfgang Klippel accepting his
Platinum Driver Award
����������� ���� ��������������������� �� ����������������������� ����������������� ������� ���������������� �� ��������������������������� ������ ������������������������
������� ��!"#$%$&'(�# )*+$'*#� '+"�*+'��',#'*('(�-$*') �� './'*01� '+"�*+'���"#$%$&'(�23�($+#� #$�*���"#$%$&'(�4')#�($++$")#$�*�)*(�567��"#$%$&'(�%�#� +���84)#�1�/�4)9'�0�%'�#��',"'0#�� �%�:$�)�
���� ��� �� �������������� �
��������
;6�:<<��;6�=�� ;6>�=�� ;6�:<?�� ! !
:$�)@�$+�)� 'A$+#' '(�# )('%) �����<1%"4)*1�BC��#(
MARCH 2011 7
Industry News and DevelopmentsBy Vance Dickason
ALMA International’s Europe SymposiumALMA International’s Europe Symposium, “PA Speakers: Yesterday, Today and Tomorrow,” will take place April 9, at the Messe Frankfurt—and is free to attendees! This marks a series of ALMA events throughout 2011 celebrating the 50th anniversary of the founding of the International Loudspeaker Association. This program will highlight the 50-year legacy of the PA Loudspeaker Industry by looking back at historical accomplishments and analyzing future technology.
Paper presentations include “Ferrofluids for PA
Loudspeakers—the Future,” by Barry D. Moskowitz,
Global GM Fluids Business Unit, Ferrotec Corporation;
“Spider Materials and Their Influence on Speaker
Behavior,” by Matthias Ringpfeil, Chief Engineer of
Dr. Kurt Müeller GmbH; “Loudspeaker Design—
Predictions for Tomorrow,” by Peter Larsen, President,
LOUDSOFT Ltd.; “Class D Amplifiers-Future
Applications,” by Kristian Ougaard, CTO of Bang &
Olufsen ICEpower a/s; “Contributions to the Control
of the Frequency Response of a Pleated Loudspeaker,”
by Pedro Enguidanos, Key Account Manager, Acústica
Beyma; “A High Performance Beryllium Dome
Diaphragm Assembly for Large Format Compression
Drivers,” by Peter Andrews, Electro-Acoustic Engineer,
Brush Wellman-Electrofusion Products; “Same Speaker,
Different Data? Ensuring Consistency in Electroacoustic
Measurements,” by Simon Woollard, Engineer/
Applications, Prism Media Products Ltd., “Detection
of Air Leaks in Loudspeaker Systems,” by Dr. Prof.
Wolfgang Klippel, President, Klippel GmbH.
The ALMA Europe Symposium is the largest event in
the world entirely dedicated to both the intellectual and
practical aspects of the PA-related loudspeaker industry. It
attracts visitors and attendees from around the world, and
is an opportunity for loudspeaker engineers to expand
their education in classes, seminars, and discussions led
by some of the foremost experts in the world. For more
information, visit www.almainternational.org. For on-site
coordination please contact ALMA Europe VP, Dorit
Larsen, at [email protected]
Listen Inc. Releases SoundCheck Version 10SoundCheck® 10.0 (Photo 1), the latest release of Listen Inc.’s popular audio test and measurement soft-ware package, contains a host of new features which offer both additional testing capability and improved user-friendliness. One of the most significant changes is that the memory list (SoundCheck’s database of curves, values, waveforms, and results) has been completely redesigned and is now organized into custom named folders. This is a huge benefit for anyone who needs to analyze and manipulate data, whether in an R&D or a production setting. You can group the information by
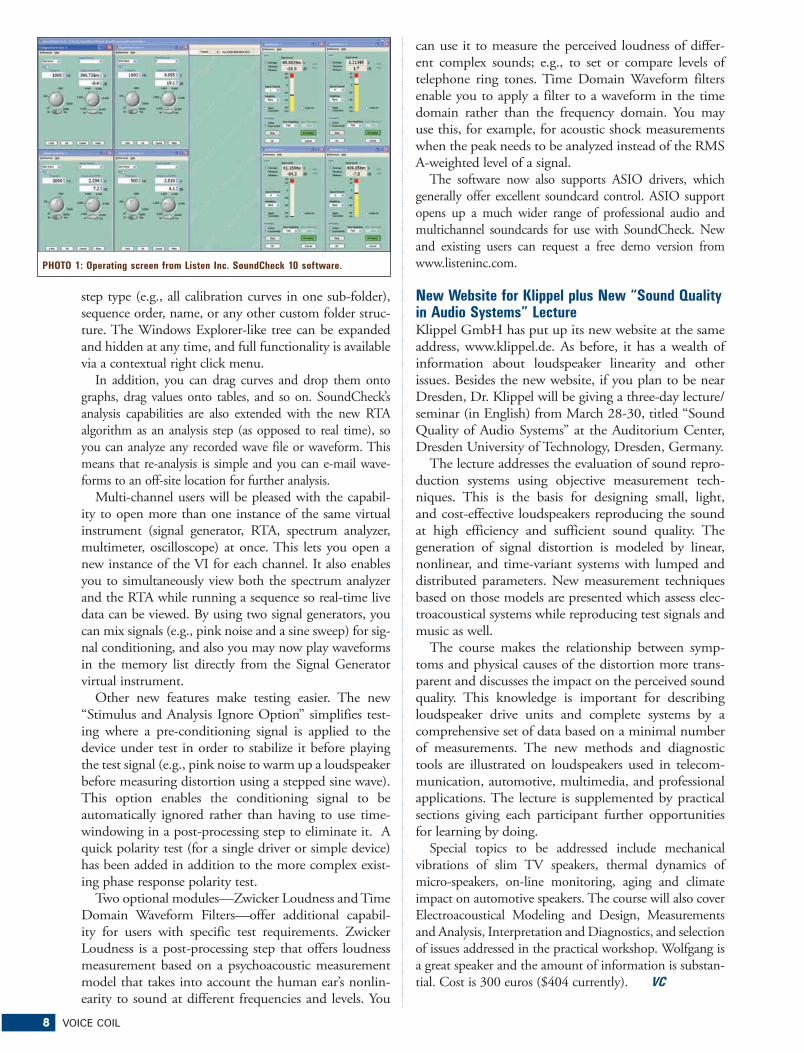
8 VOICE COIL
step type (e.g., all calibration curves in one sub-folder), sequence order, name, or any other custom folder struc-ture. The Windows Explorer-like tree can be expanded and hidden at any time, and full functionality is available via a contextual right click menu.
In addition, you can drag curves and drop them onto
graphs, drag values onto tables, and so on. SoundCheck’s
analysis capabilities are also extended with the new RTA
algorithm as an analysis step (as opposed to real time), so
you can analyze any recorded wave file or waveform. This
means that re-analysis is simple and you can e-mail wave-
forms to an off-site location for further analysis.
Multi-channel users will be pleased with the capabil-
ity to open more than one instance of the same virtual
instrument (signal generator, RTA, spectrum analyzer,
multimeter, oscilloscope) at once. This lets you open a
new instance of the VI for each channel. It also enables
you to simultaneously view both the spectrum analyzer
and the RTA while running a sequence so real-time live
data can be viewed. By using two signal generators, you
can mix signals (e.g., pink noise and a sine sweep) for sig-
nal conditioning, and also you may now play waveforms
in the memory list directly from the Signal Generator
virtual instrument.
Other new features make testing easier. The new
“Stimulus and Analysis Ignore Option” simplifies test-
ing where a pre-conditioning signal is applied to the
device under test in order to stabilize it before playing
the test signal (e.g., pink noise to warm up a loudspeaker
before measuring distortion using a stepped sine wave).
This option enables the conditioning signal to be
automatically ignored rather than having to use time-
windowing in a post-processing step to eliminate it. A
quick polarity test (for a single driver or simple device)
has been added in addition to the more complex exist-
ing phase response polarity test.
Two optional modules—Zwicker Loudness and Time
Domain Waveform Filters—offer additional capabil-
ity for users with specific test requirements. Zwicker
Loudness is a post-processing step that offers loudness
measurement based on a psychoacoustic measurement
model that takes into account the human ear’s nonlin-
earity to sound at different frequencies and levels. You
can use it to measure the perceived loudness of differ-
ent complex sounds; e.g., to set or compare levels of
telephone ring tones. Time Domain Waveform filters
enable you to apply a filter to a waveform in the time
domain rather than the frequency domain. You may
use this, for example, for acoustic shock measurements
when the peak needs to be analyzed instead of the RMS
A-weighted level of a signal.
The software now also supports ASIO drivers, which
generally offer excellent soundcard control. ASIO support
opens up a much wider range of professional audio and
multichannel soundcards for use with SoundCheck. New
and existing users can request a free demo version from
www.listeninc.com.
New Website for Klippel plus New “Sound Quality in Audio Systems” LectureKlippel GmbH has put up its new website at the same address, www.klippel.de. As before, it has a wealth of information about loudspeaker linearity and other issues. Besides the new website, if you plan to be near Dresden, Dr. Klippel will be giving a three-day lecture/seminar (in English) from March 28-30, titled “Sound Quality of Audio Systems” at the Auditorium Center, Dresden University of Technology, Dresden, Germany.
The lecture addresses the evaluation of sound repro-
duction systems using objective measurement tech-
niques. This is the basis for designing small, light,
and cost-effective loudspeakers reproducing the sound
at high efficiency and sufficient sound quality. The
generation of signal distortion is modeled by linear,
nonlinear, and time-variant systems with lumped and
distributed parameters. New measurement techniques
based on those models are presented which assess elec-
troacoustical systems while reproducing test signals and
music as well.
The course makes the relationship between symp-
toms and physical causes of the distortion more trans-
parent and discusses the impact on the perceived sound
quality. This knowledge is important for describing
loudspeaker drive units and complete systems by a
comprehensive set of data based on a minimal number
of measurements. The new methods and diagnostic
tools are illustrated on loudspeakers used in telecom-
munication, automotive, multimedia, and professional
applications. The lecture is supplemented by practical
sections giving each participant further opportunities
for learning by doing.
Special topics to be addressed include mechanical
vibrations of slim TV speakers, thermal dynamics of
micro-speakers, on-line monitoring, aging and climate
impact on automotive speakers. The course will also cover
Electroacoustical Modeling and Design, Measurements
and Analysis, Interpretation and Diagnostics, and selection
of issues addressed in the practical workshop. Wolfgang is
a great speaker and the amount of information is substan-
tial. Cost is 300 euros ($404 currently). VC
PHOTO 1: Operating screen from Listen Inc. SoundCheck 10 software.
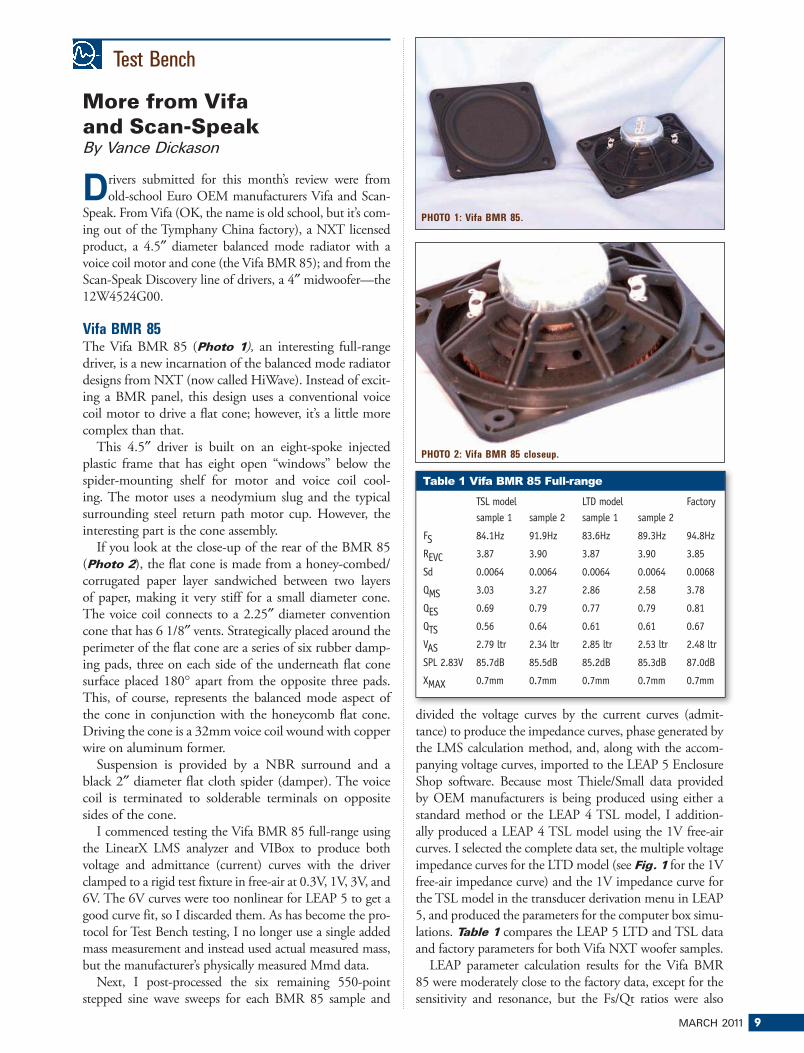
MARCH 2011 9
Test Bench
More from Vifa and Scan-SpeakBy Vance Dickason
�rivers submitted for this month’s review were from
old-school Euro OEM manufacturers Vifa and Scan-
Speak. From Vifa (OK, the name is old school, but it’s com-
ing out of the Tymphany China factory), a NXT licensed
product, a 4.5″ diameter balanced mode radiator with a
voice coil motor and cone (the Vifa BMR 85); and from the
Scan-Speak Discovery line of drivers, a 4″ midwoofer—the
12W4524G00.
Vifa BMR 85The Vifa BMR 85 (Photo 1), an interesting full-range driver, is a new incarnation of the balanced mode radiator designs from NXT (now called HiWave). Instead of excit-ing a BMR panel, this design uses a conventional voice coil motor to drive a flat cone; however, it’s a little more complex than that.
This 4.5″ driver is built on an eight-spoke injected
plastic frame that has eight open “windows” below the
spider-mounting shelf for motor and voice coil cool-
ing. The motor uses a neodymium slug and the typical
surrounding steel return path motor cup. However, the
interesting part is the cone assembly.
If you look at the close-up of the rear of the BMR 85
(Photo 2), the flat cone is made from a honey-combed/
corrugated paper layer sandwiched between two layers
of paper, making it very stiff for a small diameter cone.
The voice coil connects to a 2.25″ diameter convention
cone that has 6 1/8″ vents. Strategically placed around the
perimeter of the flat cone are a series of six rubber damp-
ing pads, three on each side of the underneath flat cone
surface placed 180° apart from the opposite three pads.
This, of course, represents the balanced mode aspect of
the cone in conjunction with the honeycomb flat cone.
Driving the cone is a 32mm voice coil wound with copper
wire on aluminum former.
Suspension is provided by a NBR surround and a
black 2″ diameter flat cloth spider (damper). The voice
coil is terminated to solderable terminals on opposite
sides of the cone.
I commenced testing the Vifa BMR 85 full-range using
the LinearX LMS analyzer and VIBox to produce both
voltage and admittance (current) curves with the driver
clamped to a rigid test fixture in free-air at 0.3V, 1V, 3V, and
6V. The 6V curves were too nonlinear for LEAP 5 to get a
good curve fit, so I discarded them. As has become the pro-
tocol for Test Bench testing, I no longer use a single added
mass measurement and instead used actual measured mass,
but the manufacturer’s physically measured Mmd data.
Next, I post-processed the six remaining 550-point
stepped sine wave sweeps for each BMR 85 sample and
divided the voltage curves by the current curves (admit-
tance) to produce the impedance curves, phase generated by
the LMS calculation method, and, along with the accom-
panying voltage curves, imported to the LEAP 5 Enclosure
Shop software. Because most Thiele/Small data provided
by OEM manufacturers is being produced using either a
standard method or the LEAP 4 TSL model, I addition-
ally produced a LEAP 4 TSL model using the 1V free-air
curves. I selected the complete data set, the multiple voltage
impedance curves for the LTD model (see Fig. 1 for the 1V
free-air impedance curve) and the 1V impedance curve for
the TSL model in the transducer derivation menu in LEAP
5, and produced the parameters for the computer box simu-
lations. Table 1 compares the LEAP 5 LTD and TSL data
and factory parameters for both Vifa NXT woofer samples.
LEAP parameter calculation results for the Vifa BMR
85 were moderately close to the factory data, except for the
sensitivity and resonance, but the Fs/Qt ratios were also
PHOTO 1: Vifa BMR 85.
PHOTO 2: Vifa BMR 85 closeup.
TSL model LTD model Factory sample 1 sample 2 sample 1 sample 2
FS 84.1Hz 91.9Hz 83.6Hz 89.3Hz 94.8Hz
REVC 3.87 3.90 3.87 3.90 3.85
Sd 0.0064 0.0064 0.0064 0.0064 0.0068
QMS 3.03 3.27 2.86 2.58 3.78
QES 0.69 0.79 0.77 0.79 0.81
QTS 0.56 0.64 0.61 0.61 0.67
VAS 2.79 ltr 2.34 ltr 2.85 ltr 2.53 ltr 2.48 ltr
SPL 2.83V 85.7dB 85.5dB 85.2dB 85.3dB 87.0dB
XMAX 0.7mm 0.7mm 0.7mm 0.7mm 0.7mm
��>� ���3(=���&���#����������
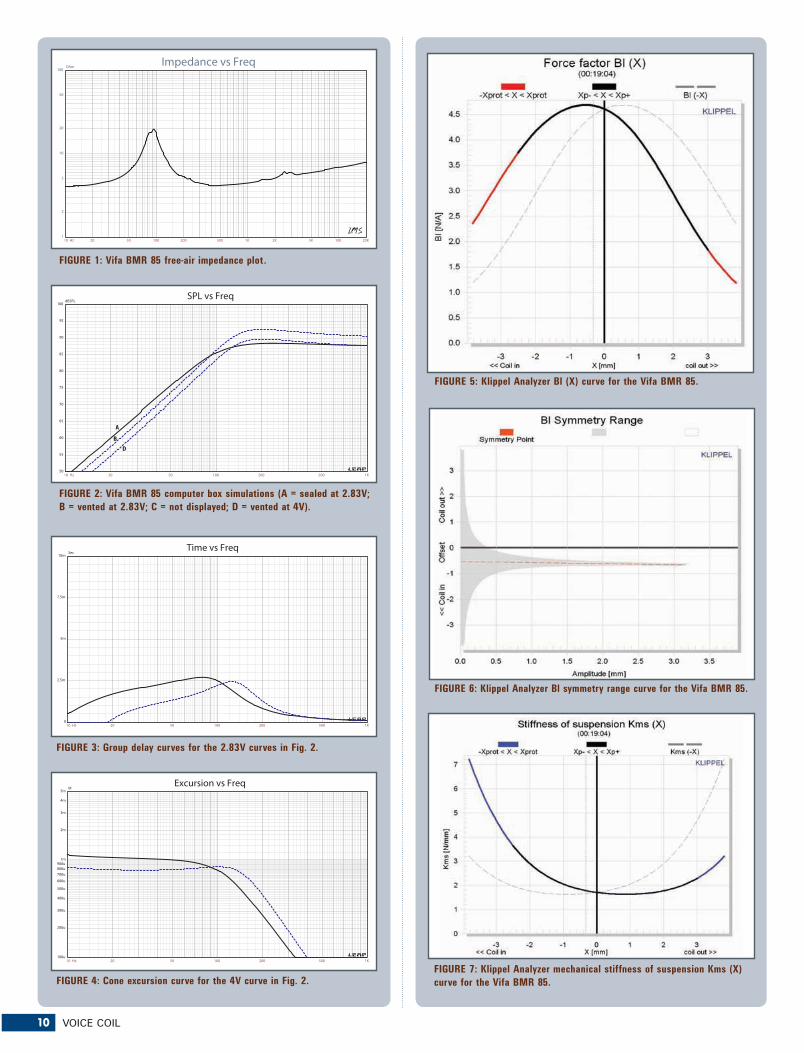
10 VOICE COIL
10 Hz 20 50 100 200 500 1K 2K 5K 10K 20K
Ohm
1
2
5
10
20
50
100Impedance vs Freq
10 Hz 20 50 100 200 500 1K
dBSPL
50
55
60
65
70
75
80
85
90
95
100
SPL vs Freq
B
D
A
FIGURE 1: Vifa BMR 85 free-air impedance plot.
FIGURE 2: Vifa BMR 85 computer box simulations (A = sealed at 2.83V;
B = vented at 2.83V; C = not displayed; D = vented at 4V).
10 Hz 20 50 100 200 500 1K
Sec
0
2.5m
5m
7.5m
10m
Time vs Freq
10 Hz 20 50 100 200 500 1K
M
100u
200u
300u
400u
500u
600u
700u
800u900u
1m
2m
3m
4m
5m
Excursion vs Freq
FIGURE 3: Group delay curves for the 2.83V curves in Fig. 2.
FIGURE 4: Cone excursion curve for the 4V curve in Fig. 2.
FIGURE 5: Klippel Analyzer Bl (X) curve for the Vifa BMR 85.
FIGURE 6: Klippel Analyzer Bl symmetry range curve for the Vifa BMR 85.
FIGURE 7: Klippel Analyzer mechanical stiffness of suspension Kms (X)
curve for the Vifa BMR 85.
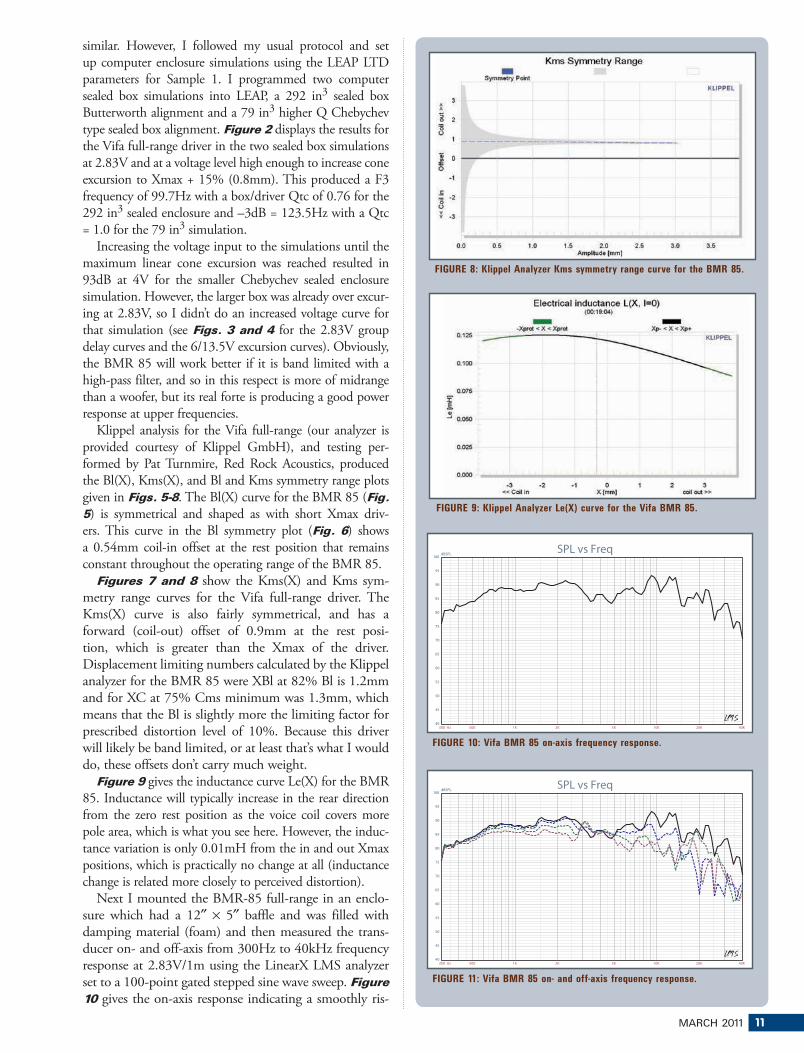
MARCH 2011 11
similar. However, I followed my usual protocol and set
up computer enclosure simulations using the LEAP LTD
parameters for Sample 1. I programmed two computer
sealed box simulations into LEAP, a 292 in3 sealed box
Butterworth alignment and a 79 in3 higher Q Chebychev
type sealed box alignment. Figure 2 displays the results for
the Vifa full-range driver in the two sealed box simulations
at 2.83V and at a voltage level high enough to increase cone
excursion to Xmax + 15% (0.8mm). This produced a F3
frequency of 99.7Hz with a box/driver Qtc of 0.76 for the
292 in3 sealed enclosure and –3dB = 123.5Hz with a Qtc
= 1.0 for the 79 in3 simulation.
Increasing the voltage input to the simulations until the
maximum linear cone excursion was reached resulted in
93dB at 4V for the smaller Chebychev sealed enclosure
simulation. However, the larger box was already over excur-
ing at 2.83V, so I didn’t do an increased voltage curve for
that simulation (see Figs. 3 and 4 for the 2.83V group
delay curves and the 6/13.5V excursion curves). Obviously,
the BMR 85 will work better if it is band limited with a
high-pass filter, and so in this respect is more of midrange
than a woofer, but its real forte is producing a good power
response at upper frequencies.
Klippel analysis for the Vifa full-range (our analyzer is
provided courtesy of Klippel GmbH), and testing per-
formed by Pat Turnmire, Red Rock Acoustics, produced
the Bl(X), Kms(X), and Bl and Kms symmetry range plots
given in Figs. 5-8. The Bl(X) curve for the BMR 85 (Fig. 5) is symmetrical and shaped as with short Xmax driv-
ers. This curve in the Bl symmetry plot (Fig. 6) shows
a 0.54mm coil-in offset at the rest position that remains
constant throughout the operating range of the BMR 85.
Figures 7 and 8 show the Kms(X) and Kms sym-
metry range curves for the Vifa full-range driver. The
Kms(X) curve is also fairly symmetrical, and has a
forward (coil-out) offset of 0.9mm at the rest posi-
tion, which is greater than the Xmax of the driver.
Displacement limiting numbers calculated by the Klippel
analyzer for the BMR 85 were XBl at 82% Bl is 1.2mm
and for XC at 75% Cms minimum was 1.3mm, which
means that the Bl is slightly more the limiting factor for
prescribed distortion level of 10%. Because this driver
will likely be band limited, or at least that’s what I would
do, these offsets don’t carry much weight.
Figure 9 gives the inductance curve Le(X) for the BMR
85. Inductance will typically increase in the rear direction
from the zero rest position as the voice coil covers more
pole area, which is what you see here. However, the induc-
tance variation is only 0.01mH from the in and out Xmax
positions, which is practically no change at all (inductance
change is related more closely to perceived distortion).
Next I mounted the BMR-85 full-range in an enclo-
sure which had a 12″ × 5″ baffle and was filled with
damping material (foam) and then measured the trans-
ducer on- and off-axis from 300Hz to 40kHz frequency
response at 2.83V/1m using the LinearX LMS analyzer
set to a 100-point gated stepped sine wave sweep. Figure 10 gives the on-axis response indicating a smoothly ris-
FIGURE 8: Klippel Analyzer Kms symmetry range curve for the BMR 85.
FIGURE 9: Klippel Analyzer Le(X) curve for the Vifa BMR 85.
300 Hz 500 1K 2K 5K 10K 20K 40K
dBSPL
40
45
50
55
60
65
70
75
80
85
90
95
100SPL vs Freq
300 Hz 500 1K 2K 5K 10K 20K 40K
dBSPL
40
45
50
55
60
65
70
75
80
85
90
95
100SPL vs Freq
FIGURE 11: Vifa BMR 85 on- and off-axis frequency response.
FIGURE 10: Vifa BMR 85 on-axis frequency response.
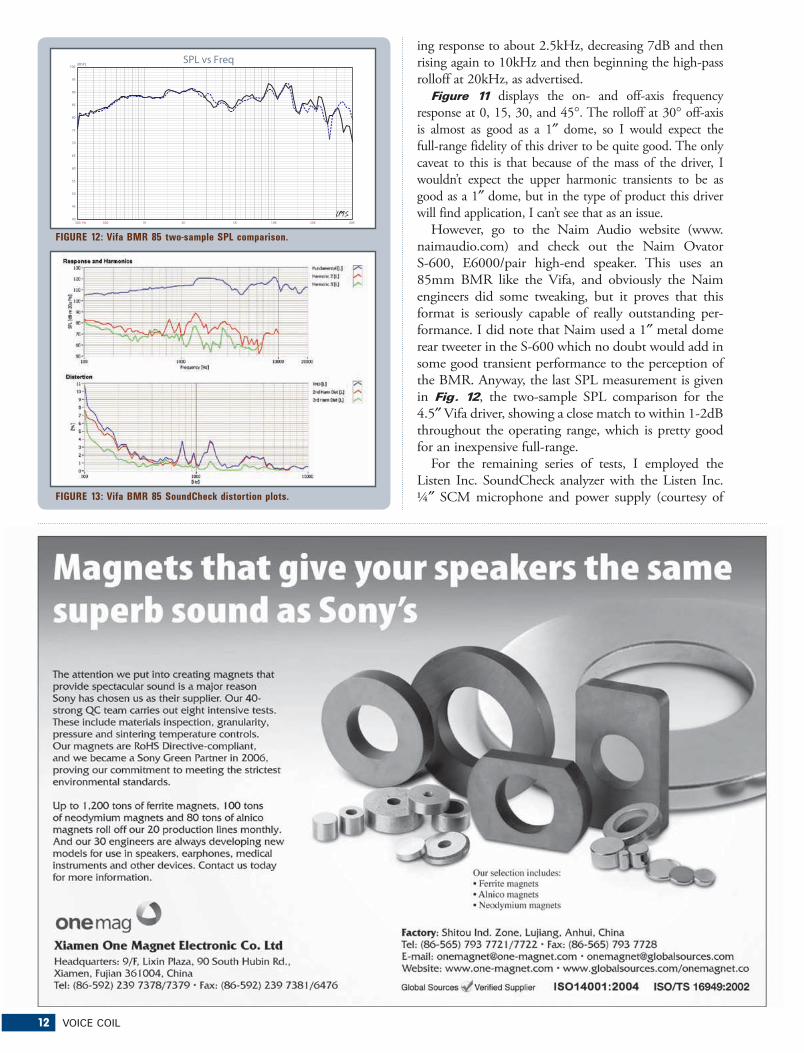
12 VOICE COIL
ing response to about 2.5kHz, decreasing 7dB and then
rising again to 10kHz and then beginning the high-pass
rolloff at 20kHz, as advertised.
Figure 11 displays the on- and off-axis frequency
response at 0, 15, 30, and 45°. The rolloff at 30° off-axis
is almost as good as a 1″ dome, so I would expect the
full-range fidelity of this driver to be quite good. The only
caveat to this is that because of the mass of the driver, I
wouldn’t expect the upper harmonic transients to be as
good as a 1″ dome, but in the type of product this driver
will find application, I can’t see that as an issue.
However, go to the Naim Audio website (www.
naimaudio.com) and check out the Naim Ovator
S-600, E6000/pair high-end speaker. This uses an
85mm BMR like the Vifa, and obviously the Naim
engineers did some tweaking, but it proves that this
format is seriously capable of really outstanding per-
formance. I did note that Naim used a 1″ metal dome
rear tweeter in the S-600 which no doubt would add in
some good transient performance to the perception of
the BMR. Anyway, the last SPL measurement is given
in Fig. 12, the two-sample SPL comparison for the
4.5″ Vifa driver, showing a close match to within 1-2dB
throughout the operating range, which is pretty good
for an inexpensive full-range.
For the remaining series of tests, I employed the
Listen Inc. SoundCheck analyzer with the Listen Inc.
¼″ SCM microphone and power supply (courtesy of
300 Hz 500 1K 2K 5K 10K 20K 40K
dBSPL
40
45
50
55
60
65
70
75
80
85
90
95
100SPL vs Freq
FIGURE 12: Vifa BMR 85 two-sample SPL comparison.
FIGURE 13: Vifa BMR 85 SoundCheck distortion plots.

MARCH 2011 13
ALMA Honors 50 Year Member
MISCO founder, Cliff Digre received special honors at the ALMA 50th Anniversary - Winter Symposium & Industry Driver Awards. Cliff, recognized for his outstanding ALMA contributions over the past 50 years, was overheard saying, “What did we ever do without ALMA for our first 10 years”. MISCO recently celebrated their 60th year in the loudspeaker industry, designing and manufacturing high quality and high-performance loudspeakers for specific applications in a wide variety of industries, including: Medical, Military, Pro-Sound, Gaming, Aerospace, Auto/Motorcycle, Home Audio and more. Appropriately so, MISCO has developed the slogan MISCO ~ for the sound you want.
For more information on MISCO visit: www.miscospeakers.com -or- call: 612-825-1010
e-mail: [email protected]
Celebrating 60 years of manufacturing high-performance loudspeakers
Cliff Digre honored at ALMA
FIGURE 14: Vifa BMR 85 SoundCheck CSD waterfall plot.
FIGURE 15: Vifa BMR 85 SoundCheck Wigner-Ville plot.

14 VOICE COIL
��������������������� �������������������������
���������������� !���"�������#������������������������
$ ��
��#
%�!
����
&��
����%
�'�
�
$ ����#%�! ����&������%�'�� ��)�����������%�'� � ����%��%�'����������(�������������%'�����(%���)� ���� ����(����������*� ��+��,���%������� �-��� ������(%��.�
/%����,����%����,���%�����%���%'� �����(( � ��0�%� � ��0��� � ��0���%�%�'� �����)���(�������������������������� �%����%����%���������(������������)������� !���123-�� ���*���� ��� ����)%� �%����(�����%������ ���%��� ������ ���*������,�����������%�����
/��� ��� �������)������*���4�%����0��25"��0�360�&�710�3�6650��6"& �0�825�0������������%�������%���% 0�� �� ��%�0�370�"��0���� �� ��������9������� �����%�����%�'��9:;�0�$#&�� �����������%����
5�������� �� �� � %� )������%'���� ���� ��%��������������(�����)������ �����������'%�����0�%������% �����%'����� ���� �!��%�'��,������7�!�����(�%������%������*� ���*���� ��� ��%��%�'����)%� �%����� �����������������������<��0� �*� �����!����%��������
Listen Inc.) to measure distortion and generate time
frequency plots. For the distortion measurement, I
mounted the BMR 85 woofer rigidly in free-air, and set
the SPL to 94dB at 1m (6.8V) using a noise stimulus,
and then measured the distortion with the microphone
placed 10cm from the dust cap. This produced the dis-
tortion curves shown in Fig. 13.
I then used SoundCheck to get a 2.83V/1m impulse
response for this driver and imported the data into Listen
Inc.’s SoundMap Time/Frequency software. The resulting
CSD waterfall plot is given in Fig. 14 and the Wigner-Ville
(for its better low-frequency performance) plot in Fig. 15.
While the intended application for this Vifa 4.5″ full-range
driver is multimedia and lifestyle speakers, band limited
with a small subwoofer would also work well. For more on
this interesting new product, visit the Tymphany website
www.tymphany.com.
Scan-Speak 12W/4524G00Next I began collecting data on the Scan-Speak 4″ diam-eter 12W/4524G00 (Photo 3), the new midwoofer addition to the price-sensitive Scan-Speak Discovery line. Small diameter midwoofers used in mini bookshelf speakers have been an important product with Scan-Speak. The 12W is built on a six-spoke cast aluminum frame that has three 25mm × 6mm “windows” for enhanced voice coil cooling. Powering this 4″ device is a conventional 15mm thick 72mm diameter ferrite
PHOTO 3: Scan-Speak 12W/4524G00.
TSL model LTD model Factory
sample 1 sample 2 sample 1 sample 2
FS 51.2Hz 50.9Hz 52.3Hz 51.4Hz 56.0Hz
REVC 3.09 3.02 3.09 3.02 3.1
Sd 0.0059 0.0059 0.0059 0.0059 0.0058
QMS 3.32 3.50 4.18 3.66 3.12
QES 0.35 0.32 0.41 0.37 0.35
QTS 0.35 0.29 0.38 0.33 0.31
VAS 7.6 ltr 7.7 ltr 7.4 ltr 7.6 ltr 6.1 ltr
SPL 2.83V 86.6dB 86.9dB 85.9dB 86.4dB 88.5dB
XMAX 3.0mm 3.0mm 3.0mm 3.0mm 3.0mm
��>� ���1����1* �7���%�#��9���&(0,��= �
�
� � � � � � � � � � � � �
�� ����
� ��� � � � � � � � � �
��������������������������������� ��!�������"
�������� ��� ��� ������� �� � ���� �� ��������� �� ������������� �� ���� ������ �� � �������� ��������� �������������������� �� � ����������� ������������� ������� ��������������� �� ����� �� � � ������ ���������� �������� �� � ������� �� ��������������������������������!�����������"##$��� ����������������%

MARCH 2011 15
����������� ������������������������ ����������������
��� ��!�"!�!"#!##�$�% ��!�"!�&"�#�&'''����(����������)���)*���(����������+)��)���, )�-�.����/
�������
� ��!�"!����
��#��$%&'����$
�������
��#����(!��(�"�)(�* ���"+�,���$-�!��.�������/���0���.����0�1��
&'����2*!(����
������� �"*���3�4�5�.�#�3�"6�
��$-�.�����7$-���!��8��30�
��� �����
������0�����0)�1�)2���0��
����
������
���� ����������������
������
������������� ����
!�"���������#� ���$������ �%��� ���
���&������
10 Hz 20 50 100 200 500 1K 2K 5K 10K 20K
Ohm
1
2
5
10
20
50
100Impedance vs Freq
10 Hz 20 50 100 200 500 1K
dBSPL
60
65
70
75
80
85
90
95
100
105
110
SPL vs Freq
A
B
CD
FIGURE 16: Scan-Speak 12W/4524G00 free-air impedance plot.
FIGURE 17: Scan-Speak 12W/4524G00 computer box simulations (A =
sealed at 2.83V; B = vented at 2.83V; C = sealed at 12V; D = vented at 12V).
magnet sandwiched between the front and rear plates. Features include a fiberglass slightly curvilinear cone, fiberglass 1″ diameter dust cap, NBR rubber surround, 2.5″ diameter black flat cloth spider, 1″ (25mm) diam-eter voice coil (aluminum former wound with round copper wire), and gold-plated terminals.
Testing commenced with the driver clamped to a
rigid test fixture in free-air and voltage and current
sweeps taken at 0.3V, 1V, 3V, and 6V. Because this is
a small diameter driver with only 3mm Xmax, the 6V
data was too nonlinear for LEAP 5 to curve-fit, so I
did not include it. I post-processed the six 550-point
stepped sine wave sweeps for each 12W midwoofer
sample and divided the voltage curves by the current
curves (admittance) to produce impedance curves,
phase added using LMS calculation method, and, along
with the accompanying voltage curves, uploaded to the
LEAP 5 Enclosure Shop software.
In addition to the LEAP 5 LTD model results, I also
produced a LEAP 4 TSL model set of parameters using
just the 1V free-air curves. I selected the final data set,
which includes the multiple voltage impedance curves for
the LTD model (see Fig. 16 for the 1V free-air impedance
curve) and the 1V impedance curve for the TSL model,
and produced the parameters in order to perform the
computer box simulations. Table 2 compares the LEAP 5
LTD and TSL data and factory parameters for both Scan-
Speak 4″ samples.

16 VOICE COIL
LEAP parameter calculation results for the 12W mid-
woofer were close to the factory data, although the LEAP
calculated sensitivity was about 2dB lower. Given this, I
proceeded to set up computer enclosure simulations using
the LEAP LTD parameters for Sample 1. I programmed in
two enclosures, one sealed and the other vented. For the
first closed box Butterworth simulation I used a 120 in3
enclosure with 50% fiberglass fill material, and for the sec-
ond vented box, a larger volume of 251 in3 QB3 with 15%
fiberglass fill material tuned to 55.4Hz.
Figure 17 displays the results for the 12W/4524G00
in the sealed and vented boxes at 2.83V and at a voltage
level high enough to increase cone excursion to Xmax
+ 15% (4.5mm). This resulted in a F3 = 109Hz with a
box/driver Qtc of 0.69 for the 120 in3 closed box design
and a -3dB = 72Hz for the 251 in3 vented simulation.
Increasing the voltage input to the simulations until the
maximum linear cone excursion was reached generated
102dB at 12V for the sealed enclosure simulation and
103.5dB with same 12V input level for the larger ported
enclosure (see Figs. 18 and 19 for the 2.83V group delay
curves and the 12V excursion curves). Very reasonable
performance for a 4″ woofer.
Klippel analysis for the 12W midwoofer produced the
Bl(X), Kms(X), and Bl and Kms symmetry range plots given
in Figs. 20-23. The Bl(X) curve (Fig. 20) is moderately
broad and symmetrical, with a coil-in (rearward) offset. In
the Bl symmetry range curve in Fig. 21, there is a 0.8mm
coil-in (rearward) offset that goes to 0.3mm at the physical
Xmax position (3mm), so not too bad.
Figures 22 and 23 give the Kms(X) and Kms symme-
try range curves for the 4″ midwoofer. The Kms(X) curve
is even more symmetrical. Figure 23, the Kms symmetry
range plot, shows a 0.35mm coil-in offset at the rest position
that increases somewhat to 0.5mm at the physical Xmax of
the driver. Displacement limiting numbers calculated by
the Klippel analyzer for the midrange were XBl at 82% Bl
= 3.4mm and for XC at 75% Cms minimum was 2.4mm,
which means that for this 4″ midwoofer, the suspension
offset is the most limiting factor for prescribed distortion
level of 10%.
Figure 24 gives the inductance curves L(X) for the
12W/4524G00, which shows a typical situation where
the inductance increases and the voice coil travels inward
covering more of the pole piece. Inductance swing from
Xmax forward to Xmax rearward is about 0.21mH
inductance. Having Scan-Speak add a copper cap to the
pole will decrease the inductive swing, plus you could
incorporate the copper cap along with a non-conducting
former and get some reasonable subjective improvement,
but, of course, you just increased the cost of a cost-
effective product!
With the Klippel testing finalized, I mounted the 12W
midwoofer in an enclosure which had a 15″ × 5″ baffle
and filled with foam damping material and proceeded
to measure the driver frequency response both on- and
off-axis from 300Hz to 40kHz at 2.83V/1m using a
100-point gated sine wave sweep. Figure 25 depicts the
10 Hz 20 50 100 200 500 1K
Sec
0
5m
10m
15m
20m
Time vs Freq
10 Hz 20 50 100 200 500 1K
M
1m
2m
3m
4m
5m
6m
7m
8m
9m
10m
Excursion vs Freq
FIGURE 18: Group delay curves for the 2.83V curves in Fig. 17.
FIGURE 19: Cone excursion curves for the 12V curves in Fig. 17.
FIGURE 20: Klippel Analyzer Bl (X) curve for the 12W/4524G00.
FIGURE 21: Klippel Analyzer Bl symmetry range curve.
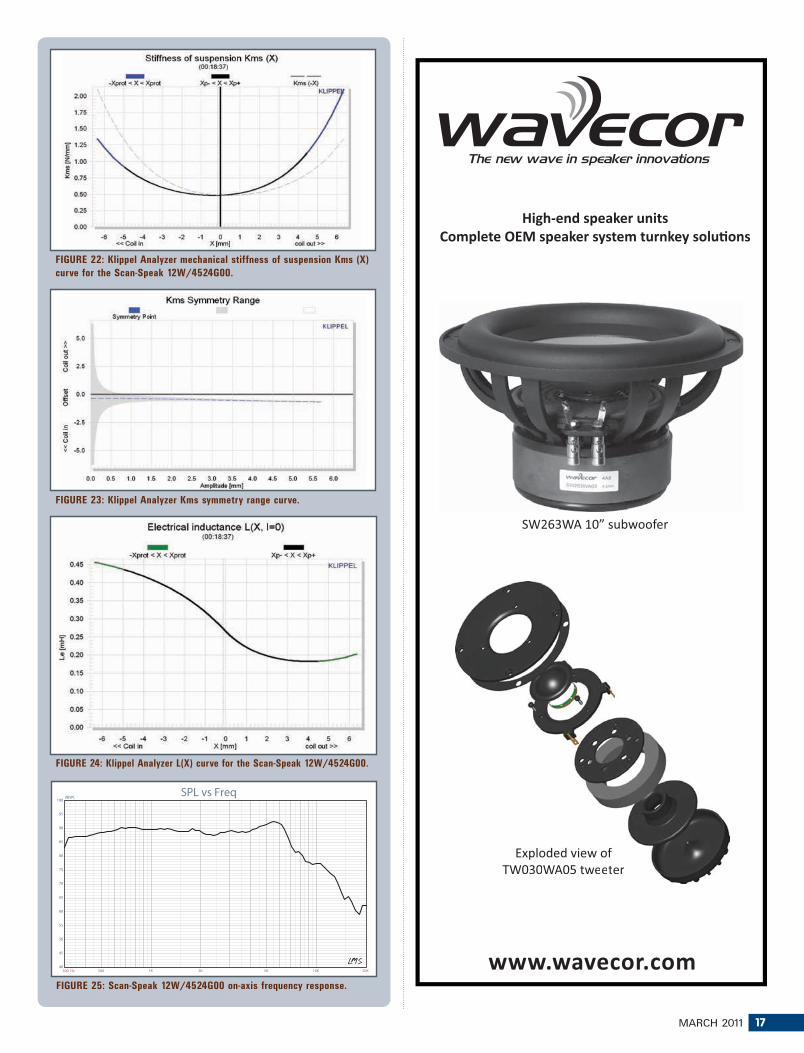
MARCH 2011 17
"""#"������#���
����$�������%��&���� ���'���(�����%���������&��%����'& ���
(/0*1/2�3 4��������
5$%�������������#/ 1 /2 +��������
��5$%������������#// 1 /22 +���������
FIGURE 23: Klippel Analyzer Kms symmetry range curve.
FIGURE 22: Klippel Analyzer mechanical stiffness of suspension Kms (X)
curve for the Scan-Speak 12W/4524G00.
FIGURE 24: Klippel Analyzer L(X) curve for the Scan-Speak 12W/4524G00.
300 Hz 500 1K 2K 5K 10K 20K
dBSPL
40
45
50
55
60
65
70
75
80
85
90
95
100SPL vs Freq
FIGURE 25: Scan-Speak 12W/4524G00 on-axis frequency response.
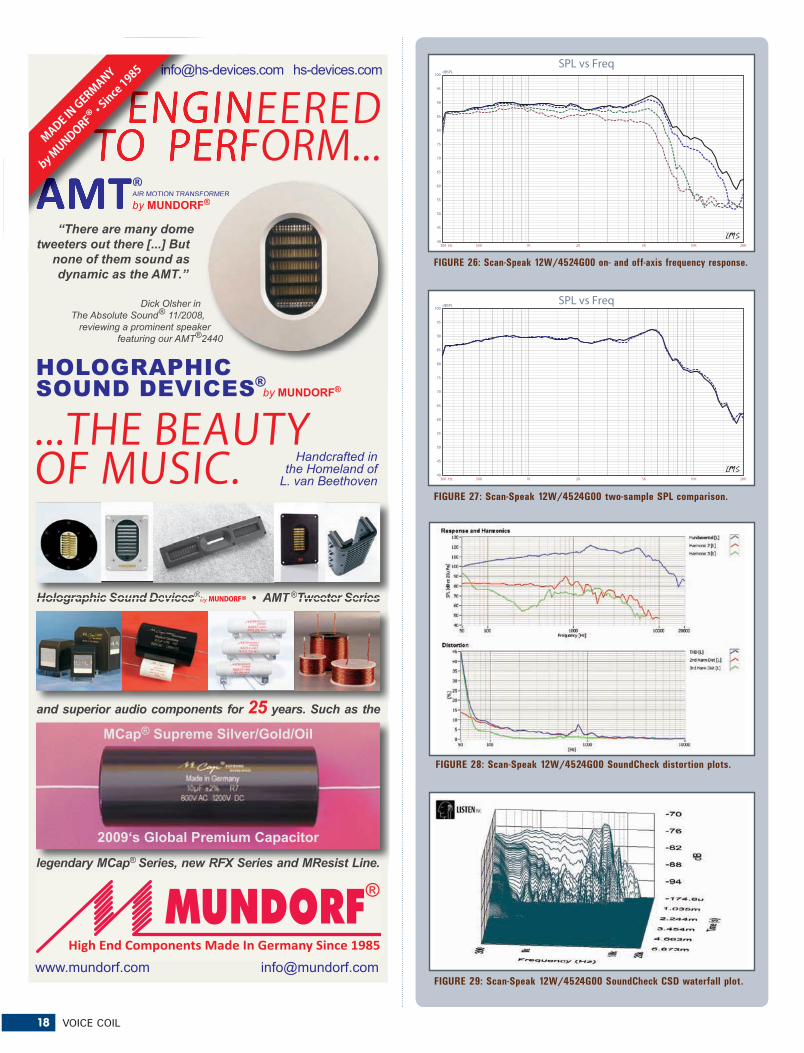
18 VOICE COIL
300 Hz 500 1K 2K 5K 10K 20K
dBSPL
40
45
50
55
60
65
70
75
80
85
90
95
100
SPL vs Freq
300 Hz 500 1K 2K 5K 10K 20K
dBSPL
40
45
50
55
60
65
70
75
80
85
90
95
100SPL vs Freq
FIGURE 26: Scan-Speak 12W/4524G00 on- and off-axis frequency response.
FIGURE 27: Scan-Speak 12W/4524G00 two-sample SPL comparison.
FIGURE 28: Scan-Speak 12W/4524G00 SoundCheck distortion plots.
FIGURE 29: Scan-Speak 12W/4524G00 SoundCheck CSD waterfall plot.
ENGINEERED TO PERFORM...
...THE BEAUTY OF MUSIC.
��&'(�� �)����*�� (�� �)����*��
����������������������� ������������������ ������������������� �� ������� ������������������������
���������� ������ ������� ����������������
� �� ��� �!�"��#�� ����" !� ��$ !����� ������%���&&�
$2�29���$��12:+)�)�3���1;
���;
��������)
��������������� �����!����"#$� ����������"������%��������� ���� ����� ��������� � �����! �� "#"#$$ � ����� � �� ��""� ��� ��� %%����
��� +��� ��������������������
�������������� ��������� �!�"��
+
������ �������������������������������
*��� �&*��� ��&'��� �&*��
& � �������� ���'�(��������MUNDORF® • ������������� ������
��������� ������ �� � ����� ��)*�������� ������������
'!����!$� ������� �'�# !����$�
()��!��* ���� �
��,��-$�-.�$,�.�/-,��,�
& & �� ��������� ���''� �(��������� MUNDORF® • ����������������� � �����
�������������������������&&&&&&&&&&'(�� �)���
���������������������� ������������������ ������������������� �� ������� ����������� �� ��� �����
;
��������� )))��,��-$�-.�$,�.�/---,��,
MADE IN GERMANY
by MUNDORF® • Since 1985
��������)

MARCH 2011 19
on-axis response resulting in a very flat rising response that
is ±1.68dB from 300Hz to 4.5kHz with a small peak just
before the low-pass rolloff. Figure 26 has the on- and off-
axis frequency response at 0, 15, 30, and 45°. -3dB at 30°
with respect to the on-axis curve occurs at 4.5kHz, so a
3-4.5kHz crossover frequency would be appropriate for this
Scan-Speak small woofer. And finally, Fig. 27 gives the two-
sample SPL comparisons for the 4″ 12W driver, showing a
good match within the operating range.
For the last body of testing on the Scan-Speak 4″ mid-
woofer, I again fired up the SoundCheck analyzer and
SCM microphone and power supply to measure distor-
tion and generate time frequency plots. Setting up for the
distortion measurement again consisted of mounting the
woofer rigidly in free-air, and the SPL set to 94dB at 1m
(5.8V) using a noise stimulus (SoundCheck has a soft-
ware generator and SPL meter as two of its utilities), and
then the distortion measured with the SCM microphone
placed 10cm from the dust cap. This produced the distor-
tion curves shown in Fig. 28.
For the last test on the 12W, I used the SoundCheck
analyzer to get a 2.83V/1m impulse response for this driver
and imported the data into Listen Inc.’s SoundMap Time/
Frequency software. The resulting CSD waterfall plot is
given in Fig. 29 and the Wigner-Ville (for its better low-
frequency performance) plot in Fig. 30. For more on this
midrange and all the other great Scan-Speak drivers, visit
www.scan-speak.dk. VC
FIGURE 30: Scan-Speak 12W/4524G00 SoundCheck Wigner-Ville plot.
20 VOICE COIL
Spotlight
CEDIA EXPO: Speaker Technology TrendsBy Mike Klasco and Nora Wong
�EDIA EXPO (www.cedia.net), which has become the
dominant US trade show for home theater, whole house
audio, and video, offers a showcase for new technologies,
training, and networking in the residential electronic systems
industry. The 2010 CEDIA EXPO took place in Atlanta in
late September with almost 21,000 attending—a bit more
than last year. Considering the state of the whole house audio,
home automation, and home theater businesses, attendance
was better than most hoped for. And taking into account the
dismal participation of the industry at the recent regional
EHX shows (www.ehxweb.com), which focus on the same
markets, CEDIA held its own against last year’s performance.
High-end audio electronics brands such as Parasound
(www.parasound.com) did not show this year, while B&K did
not make it period, closing their doors as I write this. On a
brighter note DM (Denon/Marantz, www.d-mpro.com) and
their McIntosh group were back at CEDIA after a gap of a
couple years; so was speaker maker NHT (www.nhthifi.com).
At the CEDIA Expo the first day was reserved for train-
ing classes, with more training and exhibitions the follow-
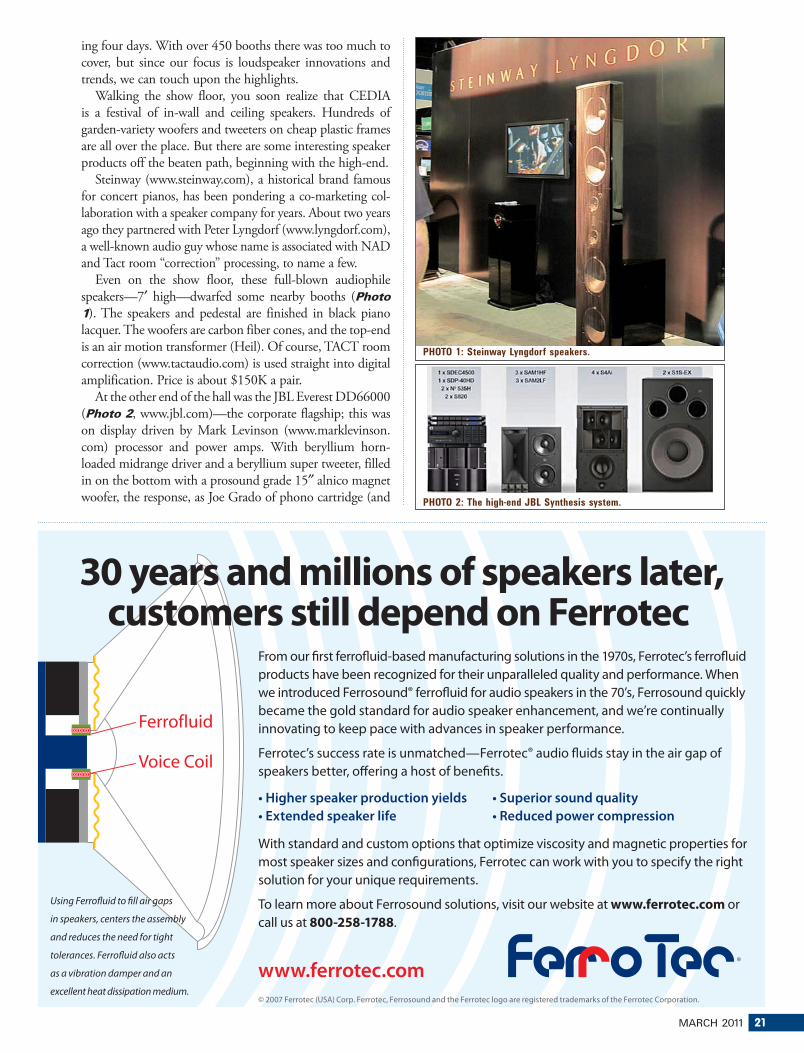
MARCH 2011 21
From our first ferrofluid-based manufacturing solutions in the 1970s, Ferrotec’s ferrofluid products have been recognized for their unparalleled quality and performance. Whenwe introduced Ferrosound® ferrofluid for audio speakers in the 70’s, Ferrosound quickly became the gold standard for audio speaker enhancement, and we’re continually innovating to keep pace with advances in speaker performance.
Ferrotec’s success rate is unmatched—Ferrotec® audio fluids stay in the air gap of speakers better, offering a host of benefits.
© 2007 Ferrotec (USA) Corp. Ferrotec, Ferrosound and the Ferrotec logo are registered trademarks of the Ferrotec Corporation.
With standard and custom options that optimize viscosity and magnetic properties for most speaker sizes and configurations, Ferrotec can work with you to specify the right solution for your unique requirements.
To learn more about Ferrosound solutions, visit our website at www.ferrotec.com or call us at 800-258-1788.
• Higher speaker production yields• Extended speaker life
• Superior sound quality• Reduced power compression
Ferrofluid
Voice Coil
30 years and millions of speakers later,customers still depend on Ferrotec
Using Ferrofluid to fill air gaps
in speakers, centers the assembly
and reduces the need for tight
tolerances. Ferrofluid also acts
as a vibration damper and an
excellent heat dissipation medium.
®
ing four days. With over 450 booths there was too much to
cover, but since our focus is loudspeaker innovations and
trends, we can touch upon the highlights.
Walking the show floor, you soon realize that CEDIA
is a festival of in-wall and ceiling speakers. Hundreds of
garden-variety woofers and tweeters on cheap plastic frames
are all over the place. But there are some interesting speaker
products off the beaten path, beginning with the high-end.
Steinway (www.steinway.com), a historical brand famous
for concert pianos, has been pondering a co-marketing col-
laboration with a speaker company for years. About two years
ago they partnered with Peter Lyngdorf (www.lyngdorf.com),
a well-known audio guy whose name is associated with NAD
and Tact room “correction” processing, to name a few.
Even on the show floor, these full-blown audiophile
speakers—7′ high—dwarfed some nearby booths (Photo 1). The speakers and pedestal are finished in black piano
lacquer. The woofers are carbon fiber cones, and the top-end
is an air motion transformer (Heil). Of course, TACT room
correction (www.tactaudio.com) is used straight into digital
amplification. Price is about $150K a pair.
At the other end of the hall was the JBL Everest DD66000
(Photo 2, www.jbl.com)—the corporate flagship; this was
on display driven by Mark Levinson (www.marklevinson.
com) processor and power amps. With beryllium horn-
loaded midrange driver and a beryllium super tweeter, filled
in on the bottom with a prosound grade 15″ alnico magnet
woofer, the response, as Joe Grado of phono cartridge (and PHOTO 2: The high-end JBL Synthesis system.
PHOTO 1: Steinway Lyngdorf speakers.
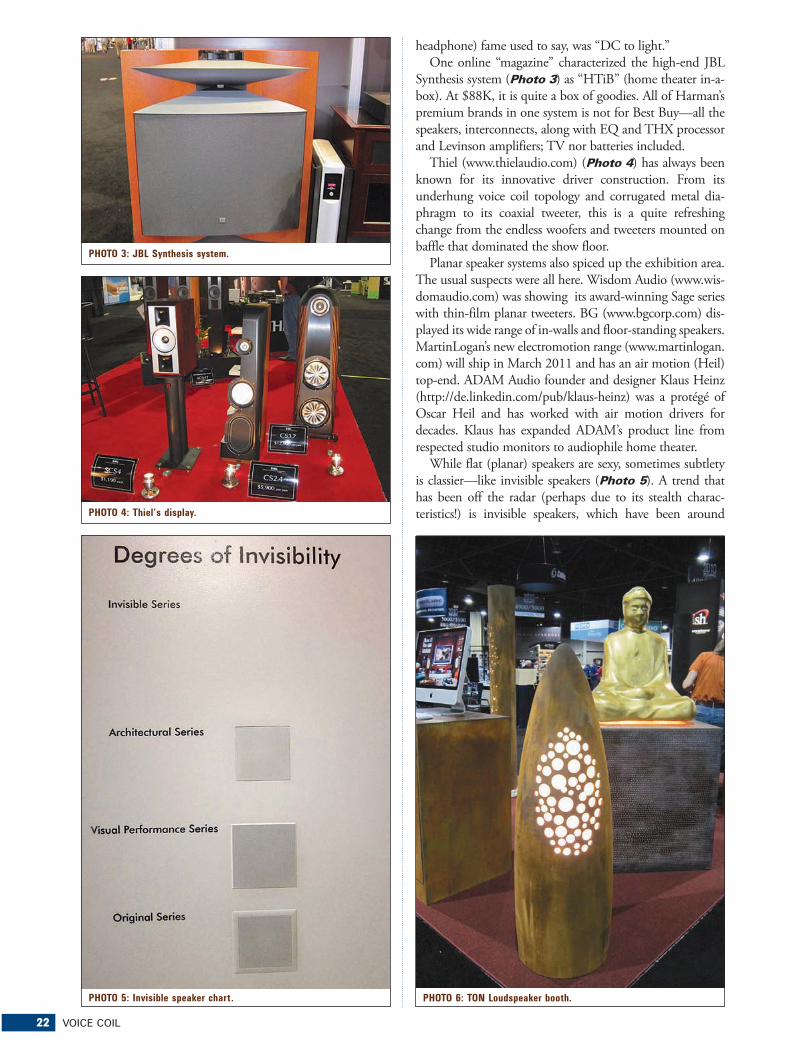
22 VOICE COIL
headphone) fame used to say, was “DC to light.”
One online “magazine” characterized the high-end JBL
Synthesis system (Photo 3) as “HTiB” (home theater in-a-
box). At $88K, it is quite a box of goodies. All of Harman’s
premium brands in one system is not for Best Buy—all the
speakers, interconnects, along with EQ and THX processor
and Levinson amplifiers; TV nor batteries included.
Thiel (www.thielaudio.com) (Photo 4) has always been
known for its innovative driver construction. From its
underhung voice coil topology and corrugated metal dia-
phragm to its coaxial tweeter, this is a quite refreshing
change from the endless woofers and tweeters mounted on
baffle that dominated the show floor.
Planar speaker systems also spiced up the exhibition area.
The usual suspects were all here. Wisdom Audio (www.wis-
domaudio.com) was showing its award-winning Sage series
with thin-film planar tweeters. BG (www.bgcorp.com) dis-
played its wide range of in-walls and floor-standing speakers.
MartinLogan’s new electromotion range (www.martinlogan.
com) will ship in March 2011 and has an air motion (Heil)
top-end. ADAM Audio founder and designer Klaus Heinz
(http://de.linkedin.com/pub/klaus-heinz) was a protégé of
Oscar Heil and has worked with air motion drivers for
decades. Klaus has expanded ADAM’s product line from
respected studio monitors to audiophile home theater.
While flat (planar) speakers are sexy, sometimes subtlety
is classier—like invisible speakers (Photo 5). A trend that
has been off the radar (perhaps due to its stealth charac-
teristics!) is invisible speakers, which have been around
PHOTO 5: Invisible speaker chart. PHOTO 6: TON Loudspeaker booth.
PHOTO 3: JBL Synthesis system.
PHOTO 4: Thiel’s display.

MARCH 2011 23
using various technologies for many years. Bergami’s Sound
Accompany (variously known as BES, BEST, and later
Sound Accompany) used its flat panel technology (co-
licensed to nxt). Sound Accompany applied its techniques
to a wall panel speaker that would later be plastered over.
Today this innovation lives on as Sonance’s SA series,
and Alex Bergami continues to support new refinements.
Sonance (www.sonance.com) offers a range of various levels
of subtlety in installation, including elegant but pricey Trufit
in-walls, ceiling, and electrical box products.
Stealth (www.stealthacoustics.com) showed a full product
line of invisible (wall panel) speakers, which, like some of the
others, use a hybrid approach of a woofer and nxt exciters for
the upper range. Amina uses a full-range nxt solution with
rather beefy nxt exciters. Induction Dynamics (www.induc-
tiondynamics.com) demonstrated its solid drive wall exciters.
Originally using a sonar technology material (Terfenol-D),
the latest development uses a push-pull neo magnetic struc-
ture—and the sound quality is quite decent now.
On the existential speaker side, TON showed Buddha
and egg-shaped speakers with gold finish (Photo 6). The
guts were premium, using Tannoy (www.tannoy.com) coax
speakers, along with pricing that was also out of this world.
IP Speakers NetstreamsAtlantic (www.atlantictechnology.com) and Polk (www.pol-kaudio.com) had IP addressable speakers using StreamNet technologies (Photo 7). While these were not new prod-
ucts, NetStreams (www.netstreams.com) has boosted R&D development since its acquistion last year by ClearOne (www.clearone.com). The SpeakerLinX IP decoder model #SL-2150, which is a dual monoblock amplifier capable of producing 600W RMS at 4Ω, was evidence of this new effort. Also added this year is BlueTooth to all of the IP speaker decoders that enable streaming wirelessly from your iPad/iPhone directly to any of your IP speakers without the need to have the device in a dock.
Overall, it was a strong show considering the condi-
tion of whole house AV, home automation, and home
theater markets. VC
PHOTO 7: StreamNet Technologies Founders Presentation.
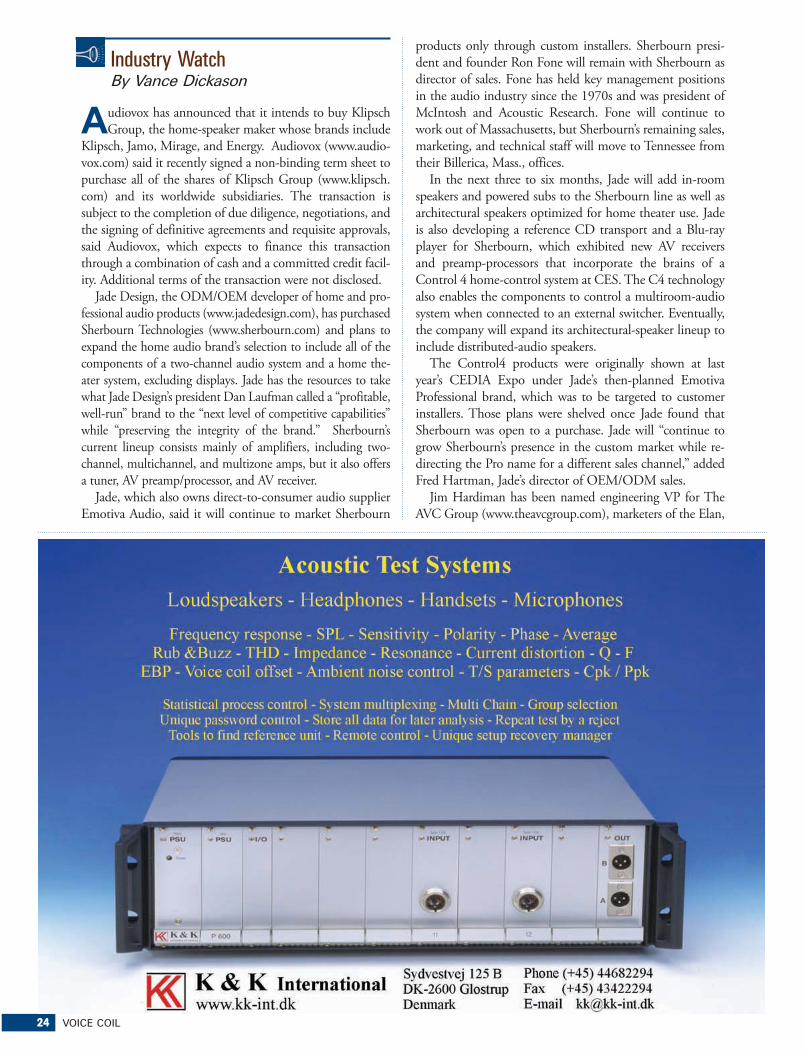
24 VOICE COIL
Industry WatchBy Vance Dickason
'udiovox has announced that it intends to buy Klipsch
Group, the home-speaker maker whose brands include
Klipsch, Jamo, Mirage, and Energy. Audiovox (www.audio-
vox.com) said it recently signed a non-binding term sheet to
purchase all of the shares of Klipsch Group (www.klipsch.
com) and its worldwide subsidiaries. The transaction is
subject to the completion of due diligence, negotiations, and
the signing of definitive agreements and requisite approvals,
said Audiovox, which expects to finance this transaction
through a combination of cash and a committed credit facil-
ity. Additional terms of the transaction were not disclosed.
Jade Design, the ODM/OEM developer of home and pro-
fessional audio products (www.jadedesign.com), has purchased
Sherbourn Technologies (www.sherbourn.com) and plans to
expand the home audio brand’s selection to include all of the
components of a two-channel audio system and a home the-
ater system, excluding displays. Jade has the resources to take
what Jade Design’s president Dan Laufman called a “profitable,
well-run” brand to the “next level of competitive capabilities”
while “preserving the integrity of the brand.” Sherbourn’s
current lineup consists mainly of amplifiers, including two-
channel, multichannel, and multizone amps, but it also offers
a tuner, AV preamp/processor, and AV receiver.
Jade, which also owns direct-to-consumer audio supplier
Emotiva Audio, said it will continue to market Sherbourn
products only through custom installers. Sherbourn presi-
dent and founder Ron Fone will remain with Sherbourn as
director of sales. Fone has held key management positions
in the audio industry since the 1970s and was president of
McIntosh and Acoustic Research. Fone will continue to
work out of Massachusetts, but Sherbourn’s remaining sales,
marketing, and technical staff will move to Tennessee from
their Billerica, Mass., offices.
In the next three to six months, Jade will add in-room
speakers and powered subs to the Sherbourn line as well as
architectural speakers optimized for home theater use. Jade
is also developing a reference CD transport and a Blu-ray
player for Sherbourn, which exhibited new AV receivers
and preamp-processors that incorporate the brains of a
Control 4 home-control system at CES. The C4 technology
also enables the components to control a multiroom-audio
system when connected to an external switcher. Eventually,
the company will expand its architectural-speaker lineup to
include distributed-audio speakers.
The Control4 products were originally shown at last
year’s CEDIA Expo under Jade’s then-planned Emotiva
Professional brand, which was to be targeted to customer
installers. Those plans were shelved once Jade found that
Sherbourn was open to a purchase. Jade will “continue to
grow Sherbourn’s presence in the custom market while re-
directing the Pro name for a different sales channel,” added
Fred Hartman, Jade’s director of OEM/ODM sales.
Jim Hardiman has been named engineering VP for The
AVC Group (www.theavcgroup.com), marketers of the Elan,

MARCH 2011 25
Niles, Xantech, Sunfire, and Aton brands. A 35-year engi-
neering and product development veteran, Hardiman comes
to The AVC Group from Harman International, where he
served as engineering VP from 2005 until 2008 and then
as consumer global engineering VP. Prior to this, from
2000 until 2005, he served as hard-
ware engineering VP at ThinkEngine
Networks, advanced development
director at Media 100, as well as
engineering and product development
posts at Data Translation, Digital
Television Imagery, Integral Data
Systems, and Data General.
An active member of AES, AVB,
China Professionals, and the HDTV
Group, among others, Jim Hardiman
is the recipient of three US patents
in the area of video compression and decompression and a
2000 Emmy for Television Sciences awarded by the National
Academy of Television Arts and Sciences for the pioneering
development of full-motion broadcast-quality PC video
and compression plug-in cards utilized in the manufacture
of nonlinear editing systems or video servers. Bob Farinelli,
who had served as chief technology officer of The AVC
Group and previously as President of ELAN Home Systems,
is retiring, but will remain with the Group as a consultant.
THX Ltd. (www.thx.com) demonstrated at this year’s
CES a horizontal single-enclosure speaker that puts the
stereo sweet spot in every chair in the room. The THX
PHOTO 1: AVC Group’s New
CTO Jim Hardiman.
26 VOICE COIL
Steerable Line Array technology, which the company could
decide to license, uses digital signal processing (DSP) and
other techniques to produce “multiple unique sweet spots
at the same time so everyone can enjoy content at the same
time no matter where they are sitting in the room.” The
technology will be demonstrated in a concept product at the
company’s private suite at the Renaissance Hotel. The con-
cept system that THX demonstrated delivers left and right
channels from 92 tiny drivers in a line array in an enclosure
with only about a cubic foot of internal volume. DSP is
applied to direct multiple beams of sound to any part of the
room, enabling every seat in the room to become “the best
seat in the house,” the company said. The technology is not
dependent on reflecting sound waves off walls, according to
THX senior VP Laurie Fincham.
The concept speaker is 10″ high × 82″ wide × 4″ deep and
features an outboard amplifier/DSP module that, if it were
embedded inside the enclosure, would add only about an
eighth of an inch to the enclosure’s depth. Frequency response
is 30Hz-20kHz with sound pressure levels of well over 100dB.
The concept speaker will steer sound to produce eight sweet
spots in the room, but if higher processing power were used,
the technology could produce more simultaneous sweet spots.
Because of its scalability, the technology can be used to produce
smaller or larger enclosures with as few as 25 drivers or as many
as 100, depending on the desired sound levels and low-frequen-
cy cutoff. This could be as little as one liter of total volume or
equivalent to a 4″ cube. The bottom line is that the enclosure is
small and takes up considerably less space than existing systems.
A Steerable Line Array stereo system can be made so
unobtrusive that it can disappear leaving only the music.
The system’s low-profile analog amplifier delivers “traditional
audiophile quality” with “modern requirements for the high-
est energy efficiency.” The technology could be designed into
two vertically oriented towers in lieu of one horizontal speaker
to deliver the same effects, according to Mr. Fincham. The
technology could also be used in two horizontal speakers,
one for the front of the room and one for the back, to deliver
multichannel surround sound to multiple sweet spots in a
room, he added.
In the THX demo speaker, tweeters are positioned on
the front panel and fire forward. Low-frequency drivers are
mounted inside the enclosure at a 90° angle to the tweeters, fir-
ing into a front-panel slot running up and down the face of the
enclosure. Each driver is powered by its own analog amplifier.
The technology is based on general principles outlined in an
Audio Engineering Society paper published by Fincham and
Peter Brown of THX. “With steering there are two aspects
that technologies need to address,” Fincham added. “One is
the steering of sound to one or more listening locations, and
two is controlling beam width. Our system handles both these
aspects at the same time. We can illuminate many listening
locations, and we can control beam direction.”
In 2008, a UK-based company called Airsound (www.
airsound.com) unveiled technology that promised a room-
wide sweet spot delivered by a single-enclosure speaker.

MARCH 2011 27
Other companies use DSP in speakers to steer the stereo
sweet spot to a particular location to compensate for poor
speaker placement but not to deliver a sweet spot to every
seat in the house. Other companies, such as technology
developer Focus, use DSP to steer a surround-sound sweet
spot to a specific location in a room.
The pace of single-family housing starts presents a mixed
picture for custom integrators. Single-family housing starts
trailed off at the end of 2010, but the year nonetheless turned
out slightly ahead of 2009’s record low, Census Bureau sta-
tistics show. Based on preliminary December statistics, the
number of single-family housing starts for calendar 2010 rose
5.8% to 470,900 following a disastrous 28.4% decline in
2009 to 445,100 units, the statistics show. Despite the year’s
gain, the numbers were at their lowest point in the 51 years
that the Census Bureau began collecting statistics. And they
weren’t much better than the 325,000 pace recorded by the
US Department of Labor in 1945 during World War II.
In December 2010, the seasonally adjusted annualized rate
of housing starts slipped to 417,000 following November’s
458,000 annualized rate. The year started out much stronger,
thanks to federal home-purchase tax credits that expired in
the spring. Annualized rates peaked at 563,000 in April and
fell to a range of 433,000 to 459,000 in the following months
through November.
The National Association of Home Builders (www.nahb.
org) forecasts that in 2011 new single-family construction
will accelerate, experiencing 21.1% growth to 575,000 units,
followed in 2012 by a 49.6% gain to 860,000. The 2012
numbers, nonetheless, will still be well below 2005’s peak of
1,715,800 units as reported by the Census Bureau. If NAHB’s
forecast for 2010 is any measure, however, the association
might be overly optimistic. This time last year, NAHB forecast
a calendar-2010 gain of 34.9% to 600,000, but the actual
numbers turned out to be 470,900, a gain of only 5.8%.
NAHB’s 2009 forecast, however, hit the mark. The associa-
tion forecast a 25.9% drop to 461,000, and the final Census
Bureau statistics put the number at 445,100, down 28.4%.
DTS (www.dts.com) is launching Neo:X post-process-
ing surround-sound technology, promoted as the first
technology to upmix stereo and multi-channel audio
programs to as many as 11.1 channels. DTS Neo:X
adds a pair of front-height speakers and a pair of front-
wide speakers to a traditional 5.1-channel or 7.1-channel
surround-sound speaker system. The first AV receivers
and preamp-processors incorporating the technology could
hit the market as soon as the second quarter of 2011.
The front-height speakers “bring discrete effects to the ver-
tical dimension,” enabling an aircraft to seem as if it’s flying
overhead, DTS said. The front-height speakers also “elevate
ambient sounds,” such as wind, thunder, background
music, public address systems, and the like. The front-wide
speakers, DTS continued, widen the front sound-stage
image while also providing “smooth and seamless tracking
of front-to-side actions,” such as the sound of a car moving
from the front to the left side of the screen. Though the
sponsors of “The Loudspeaker University” seminars
Liaison Between Materials,
Suppliers, & Audio Manufacturers
Technical Support for Headset,
Mic, Speaker & Manufacturers
Product Development
Sourcing Guidance
Test & Measurement
Instrumentation
MENLO
S C I E N T I F I C
Engineering Consulting
for the Audio Community
USA tel 510.758.9014
Michael Klasco
www.menloscientific.com
28 VOICE COIL
Neo:X matrix-upmixing technology will work its magic
on existing 2-, 5.1-, and 7.1-channel soundtracks, DTS
said movie studios could also produce Neo:X-optimized
soundtracks. Studios would be able to produce directional
cues that could be heard only through front-height and
front-wide speaker channels with no audible leakage to
other speakers. The soundtracks would be compatible with
standard 5.1- and 7.1-channel home theater systems.
Although it’s possible for any DTS, Dolby, or PCM
soundtrack to incorporate the additional cues, to get the
best effects out of it, you should use the DTS-HD MA
7.1 [codec]. As a post-processing technology, Neo:X is
promoted as upconverting 2.0-, 5.1-, 6.1-, and 7.1-channel
soundtracks to 9.1 or 11.1 channels. The technology also
features cinema, music, and game modes. Cinema mode
is designed to deliver a clear center channel with dialog
enhancement and ambient cues for immersive effects. Music
mode delivers enhanced immersion in a recorded environ-
ment, and game mode provides strong directionality for an
interactive experience.
DTS’s demo is not the company’s first demo of a post-
processing technology that upmixes two- and multi-chan-
nel soundtracks to 11.1 channels. At 2009’s CES, the com-
pany demonstrated an 11.1-channel technology that it did
not bring to market. That technology, unnamed but part of
the company’s Neo technology family, added front-height
channels to a traditional 5.1- or 7.1-channel system and
could also be used to add an extra pair of surround speakers
to a 7.1 system. A system using all 11.1 channels would
feature six surround speakers, two front-height speakers,
and the traditional front-left, -center, and -right speakers.
For its part, Audyssey Laboratories (www.audyssey.com)
already offers Dynamic Surround Expansion (DSX) post-
processing technology, which adds front-height speakers
and a pair of image-widening front speakers to a traditional
5.1-speaker setup to produce a system with up to 9.1 chan-
nels. The technology has been available in select AV receiv-
ers since 2009.
In its promotional messages to generate future growth,
AudioControl (awww.audiocontrol.com) encourages a grass-
roots movement within the autosound aftermarket to refocus
on audio performance. As a result, the company has devel-
oped the “Make Better Sound” slogan and logo that it is
offering without copyright fees to retailers and suppliers at
CES for use in print, web, and broadcast ads. The intent
is to “invite autosound enthusiasts to rediscover their audio
roots,” said President Tom Walker. The Make Better Sound
campaign encourages mobile electronics specialists to demon-
strate and educate their customers in achieving better audio
performance. According to Walker, part of the problem is
that much of the audio industry’s focus has turned to con-
venience in recent years. “Great sounding car audio systems
leave a lasting impression with their owners,” he continued.
“Ultimately, happy customers show off their systems to their
friends, who in many cases become enthusiasts themselves.”
International CES show attendance was not so bad this
year. More than 140,000 industry professionals attended,
according to the show’s owner and producer, the Consumer
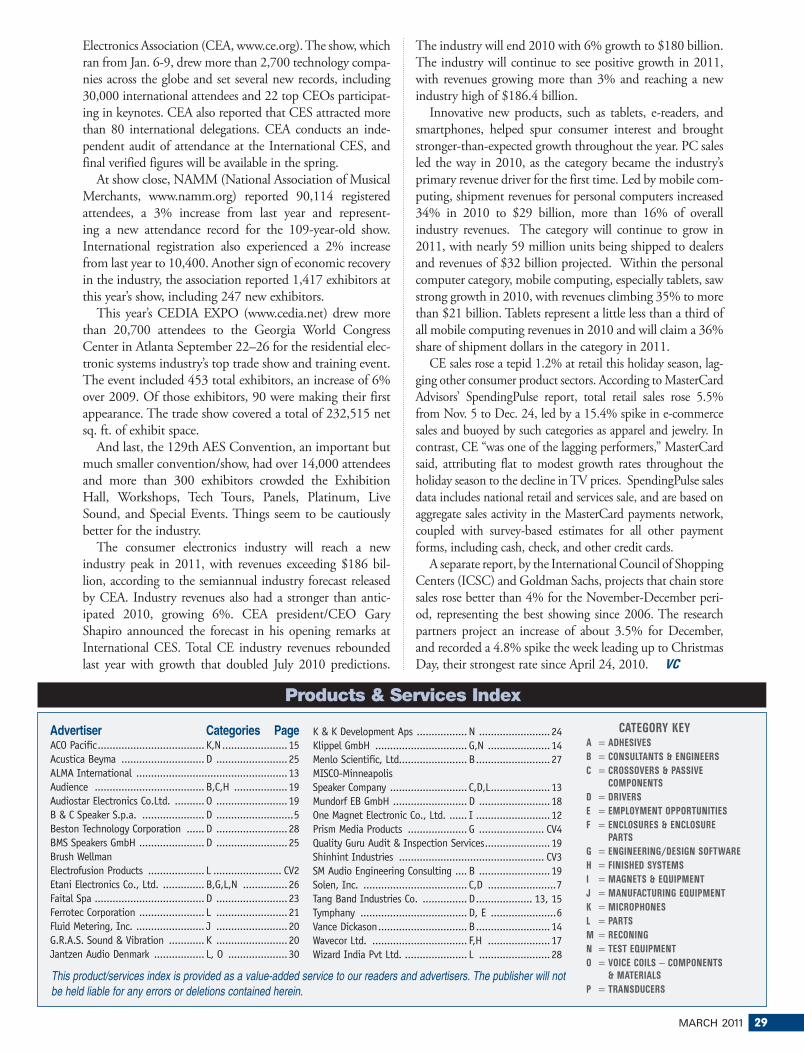
MARCH 2011 29
Electronics Association (CEA, www.ce.org). The show, which
ran from Jan. 6-9, drew more than 2,700 technology compa-
nies across the globe and set several new records, including
30,000 international attendees and 22 top CEOs participat-
ing in keynotes. CEA also reported that CES attracted more
than 80 international delegations. CEA conducts an inde-
pendent audit of attendance at the International CES, and
final verified figures will be available in the spring.
At show close, NAMM (National Association of Musical
Merchants, www.namm.org) reported 90,114 registered
attendees, a 3% increase from last year and represent-
ing a new attendance record for the 109-year-old show.
International registration also experienced a 2% increase
from last year to 10,400. Another sign of economic recovery
in the industry, the association reported 1,417 exhibitors at
this year’s show, including 247 new exhibitors.
This year’s CEDIA EXPO (www.cedia.net) drew more
than 20,700 attendees to the Georgia World Congress
Center in Atlanta September 22–26 for the residential elec-
tronic systems industry’s top trade show and training event.
The event included 453 total exhibitors, an increase of 6%
over 2009. Of those exhibitors, 90 were making their first
appearance. The trade show covered a total of 232,515 net
sq. ft. of exhibit space.
And last, the 129th AES Convention, an important but
much smaller convention/show, had over 14,000 attendees
and more than 300 exhibitors crowded the Exhibition
Hall, Workshops, Tech Tours, Panels, Platinum, Live
Sound, and Special Events. Things seem to be cautiously
better for the industry.
The consumer electronics industry will reach a new
industry peak in 2011, with revenues exceeding $186 bil-
lion, according to the semiannual industry forecast released
by CEA. Industry revenues also had a stronger than antic-
ipated 2010, growing 6%. CEA president/CEO Gary
Shapiro announced the forecast in his opening remarks at
International CES. Total CE industry revenues rebounded
last year with growth that doubled July 2010 predictions.
The industry will end 2010 with 6% growth to $180 billion.
The industry will continue to see positive growth in 2011,
with revenues growing more than 3% and reaching a new
industry high of $186.4 billion.
Innovative new products, such as tablets, e-readers, and
smartphones, helped spur consumer interest and brought
stronger-than-expected growth throughout the year. PC sales
led the way in 2010, as the category became the industry’s
primary revenue driver for the first time. Led by mobile com-
puting, shipment revenues for personal computers increased
34% in 2010 to $29 billion, more than 16% of overall
industry revenues. The category will continue to grow in
2011, with nearly 59 million units being shipped to dealers
and revenues of $32 billion projected. Within the personal
computer category, mobile computing, especially tablets, saw
strong growth in 2010, with revenues climbing 35% to more
than $21 billion. Tablets represent a little less than a third of
all mobile computing revenues in 2010 and will claim a 36%
share of shipment dollars in the category in 2011.
CE sales rose a tepid 1.2% at retail this holiday season, lag-
ging other consumer product sectors. According to MasterCard
Advisors’ SpendingPulse report, total retail sales rose 5.5%
from Nov. 5 to Dec. 24, led by a 15.4% spike in e-commerce
sales and buoyed by such categories as apparel and jewelry. In
contrast, CE “was one of the lagging performers,” MasterCard
said, attributing flat to modest growth rates throughout the
holiday season to the decline in TV prices. SpendingPulse sales
data includes national retail and services sale, and are based on
aggregate sales activity in the MasterCard payments network,
coupled with survey-based estimates for all other payment
forms, including cash, check, and other credit cards.
A separate report, by the International Council of Shopping
Centers (ICSC) and Goldman Sachs, projects that chain store
sales rose better than 4% for the November-December peri-
od, representing the best showing since 2006. The research
partners project an increase of about 3.5% for December,
and recorded a 4.8% spike the week leading up to Christmas
Day, their strongest rate since April 24, 2010. VC
Advertiser Categories PageACO Pacific .................................... K,N ......................15Acustica Beyma ............................ D ........................25ALMA International ...................................................13Audience ..................................... B,C,H ..................19Audiostar Electronics Co.Ltd. .......... O ........................19B & C Speaker S.p.a. ..................... D ..........................5Beston Technology Corporation ...... D ........................28BMS Speakers GmbH ...................... D ........................25Brush Wellman Electrofusion Products ................... L ....................... CV2 Etani Electronics Co., Ltd. .............. B,G,L,N ...............26Faital Spa ..................................... D ........................23Ferrotec Corporation ...................... L ........................21Fluid Metering, Inc. ....................... J ........................20G.R.A.S. Sound & Vibration ............ K ........................20Jantzen Audio Denmark ................. L, O ....................30
K & K Development Aps ................. N ........................24Klippel GmbH ............................... G,N .....................14Menlo Scientific, Ltd. ...................... B .........................27MISCO-Minneapolis Speaker Company .......................... C,D,L ....................13 Mundorf EB GmbH ......................... D ........................18One Magnet Electronic Co., Ltd. ...... I .........................12Prism Media Products .................... G ...................... CV4Quality Guru Audit & Inspection Services ......................19 Shinhint Industries ................................................. CV3SM Audio Engineering Consulting .... B ........................19Solen, Inc. ................................... C,D .......................7Tang Band Industries Co. ............... D ................... 13, 15Tymphany .................................... D, E ......................6Vance Dickason .............................. B .........................14Wavecor Ltd. ................................ F,H .....................17Wizard India Pvt Ltd. ..................... L ........................28
CATEGORY KEYA = ADHESIVES
B = CONSULTANTS & ENGINEERS
C = CROSSOVERS & PASSIVE
COMPONENTS
D = DRIVERS
E = EMPLOYMENT OPPORTUNITIES
F = ENCLOSURES & ENCLOSURE
PARTS
G = ENGINEERING/DESIGN SOFTWARE
H = FINISHED SYSTEMS
I = MAGNETS & EQUIPMENT
J = MANUFACTURING EQUIPMENT
K = MICROPHONES
L = PARTS
M = RECONING
N = TEST EQUIPMENT
O = VOICE COILS − COMPONENTS
& MATERIALS
P = TRANSDUCERS
This product/services index is provided as a value-added service to our readers and advertisers. The publisher will not be held liable for any errors or deletions contained herein.
Products & Services Index
�*+�,,����-�.�-�*/�0��1��2���0123�45��6��789:;7��<���07=8���>?787;�>;��2>�7��<�@3��0�A><BC�7>==<�2>D7��A9D1�19:1�7EE9F97;F<3�GH�22��027�@I�>J�DA77D7��A9D1��@ A>?7:I9�7B
��-�.�-�3��+�4�5��5����K�7>D7���<���07=8���>?787;�E0���>;DL7;�@I�90
�+�6 7 �MN���C���K�M��A9D1I��D0�OB����N�F>�>F9D<BN17�7�0D17��F09=8�:7D�0?7�17>D7�3��<0I�I8D�0��7���>;DL7;�K K09=8B�789:;7��E0���>883�8I�A00E7�8�>;�>2�=9E97�8B
�8699���6 7 19:1 7;��9;�IFD90;�F09=B@�80=ID7=<�D17�F=0878D�D0�D17�9�7>=9;�IFD0��9;�D17�N0�=�B
:*;���6 7 A0I;��0E�F0��7��E09=>;���>�7��9;8I=>D90;BN>J�92��7:;>D7�B�>���>8�>��0FPB7F0;��D0�;0;7B
<=>���<=�����?�@������A0��0;:�7J�7FD7����A>;D7�Q�7A��0I;��A9�7�F09=�2>�7�0E�RB����RB��22��>P7��A9�7B@?>9=>�=7�>8�>9��F0�7��F09=�>;��A9D1�;0; E7��9D7�F0�7B
9/��0���� ?7;�D17�E9;78D;I>;F78�F>;��7�17>��B�17�80I;��;7?7��:7D8�0?7� 7�:7�3�7>==<�8I�7���;>DI�>=;788�A9D1>�8027A1>D���9:1D�D0� 7;�B9�2����� I�7��8200D1�F>��A9D10ID>;<�1>�81�>��9D90;8�D0�D17�80I;�B@�80=ID7=<�;7ID�>=�D0;>=��>=>;F7B@�D�I=<�0ID8D>;�9;:�>I�90��>�DB9�2��B0������ �0�7��780=ID90;320�7�80I;��8D>:7B��0D8�0E��<;>29F8BS>8D��7>FD90;3�=9E7�E77=9;:�>;��;>DI�>=�80I;�B
C 0 ��0 � � - �0 D ��� = E�- �.�- +�/� 0 = A 0��� �5 � �2� � �? � � � � � ���� =�� �5 +�F��5 5 = A 0��� �0 �G� � ��- �.�- �* /� 0 � ��� � � 5
�0?�?�H��G��?�5���/�0�A0��0-�-�5�-��G��:0��I

725 Pleasant Valley Dr.Springboro, OH 45066Tel: 800-338-0531
parts-express.com/vcm
Distributed By:
In Europe:
intertechnik.de
In Asia:
baysidenet.jp
In Canada:
solen.ca
Dayton Audio’s OmniMic is a
must-have for system integrators,
acoustic engineers, and A/V
installers. It was developed
in collaboration with Liberty
Audio, inventors of the Praxis
Measurement System. The
OmniMic provides quick and
accurate measurements that will
reduce installation time, saving
you both labor and money. Test
signals may be initiated from
the host computer, or from any
audio CD player. System includes
calibrated USB microphone,
mic clip, software and test signal
discs, 6 ft. USB cable, and
carrying case. Compatible
with Windows XP, Vista,
and Windows 7.
Measurements:
...integrated
electronic test, acoustic test...
Prism Sound is now a globalsales & support agent for:
������������������� �������� ������������������������������������ ���������������������������������������������������������� ����������������
��������������������� ���������� ������������ ���������������������
������������������� !�����������������������������������������������������"������ ���������� �����#�������������������$�����%dScope Series III
analog and digitalaudio analyzers
������������������� ��������������������������������������������� �!"#�����$ ����
Loudspeaker design and analysis solutions

V O L U M E 2 4 , I S S U E 6 A P R I L 2 0 1 1
®
IN THIS ISSUEINDUSTRY NEWS AND DEVELOPMENTS
1
TEST BENCH11Wavecor and Beyma Home and Pro DriversBy Vance Dickason
ACOUSTIC PATENTS
INDUSTRY WATCH
22
24
29 Products & Services Index
SPOTLIGHT5ALMA 2011 Winter Symposium Pt. 2 By Rob Baum, Spiro Iraclianos, Matt Lyons, Sean Olive, and Mike Klasco
Industry News and DevelopmentsBy Vance Dickason
Publisher Ed Dell Receives ALMA Driver Award
&ast month’s ALMA 2011 Winter Symposium Part 1
announced the winners of the ALMA Driver Awards.
Among the distinguished recipients was Audio Amateur’s
founder and CEO, publisher Ed Dell (Photo 1). Because I was
not certain that all Voice Coil’s readers are aware of Mr. Dell’s
contribution to the loudspeaker industry, I will reprint the intro-
duction I wrote that was read at the Driver Awards presentation:
When I was asked to write an introduction for the pre-
sentation of ALMA’s first Driver Award to Ed Dell, the first
thing that came to mind was to wonder how many audio
professionals realize the impact Ed has had on the loudspeaker
industry over the years. The story began in 1970 when Mr.
Dell founded Audio Amateur Inc. in Swarthmore, Penn.,
and commenced publication of The Audio Amateur, a quar-
terly magazine dedicated to do-it-yourself audio enthusiasts.
While Audio Amateur included articles on all aspects of hi-fi,
it immediately attracted the information-hungry group of
loudspeaker enthusiasts and resulted in a substantial percent-
Cutaway of Beyma’s
SW1300Nd cone
assembly, p. 11.
What was discussed
at ALMA’s roundtable
sessions? See p. 5.
By James Croft
By Vance Dickason

���������� �• �����������������������������������
• �������������������������������������������������
• ���������������������������������������������������
• ������������ !�����������������������������
• "��������#�������������������������$��������������
�
������������%����&�����������������'�(�������������
�'��)� !*���������������������� ��
�������������� ����������������+���������,-./0��'������������������������������1��������!����������$�����'������������������������'�������2����������'���'����������������������������3����������4�#����������������������������������������������������������������/��#��������������������������#���� �
��������������3�������������������������������������������������������������$0��'��)� !������������������������1�������0��������������56��������������������������������������������������������������� �
��������������"��������������'�����������)����������������������������������������������� �
�����������������������������������'���'�������'������������������'����������������(�������������'������(�������� !�����������������������'����������������������0��������������� �
�
"������ ����������� ������)���� ��������7����������� ������)���8���9:;�//�<<�,-<=�
�
�
�
��������� ���������������������������������� ������������������������������������������� !!�

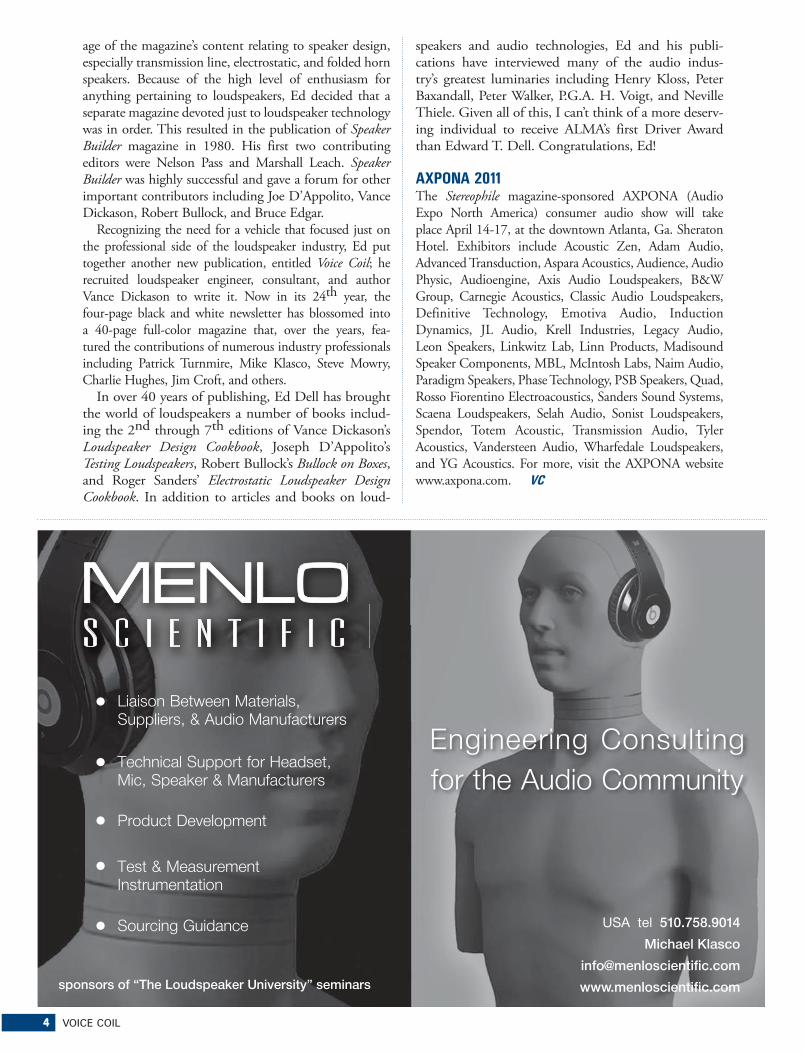
4 VOICE COIL
age of the magazine’s content relating to speaker design,
especially transmission line, electrostatic, and folded horn
speakers. Because of the high level of enthusiasm for
anything pertaining to loudspeakers, Ed decided that a
separate magazine devoted just to loudspeaker technology
was in order. This resulted in the publication of Speaker
Builder magazine in 1980. His first two contributing
editors were Nelson Pass and Marshall Leach. Speaker
Builder was highly successful and gave a forum for other
important contributors including Joe D’Appolito, Vance
Dickason, Robert Bullock, and Bruce Edgar.
Recognizing the need for a vehicle that focused just on
the professional side of the loudspeaker industry, Ed put
together another new publication, entitled Voice Coil; he
recruited loudspeaker engineer, consultant, and author
Vance Dickason to write it. Now in its 24th year, the
four-page black and white newsletter has blossomed into
a 40-page full-color magazine that, over the years, fea-
tured the contributions of numerous industry professionals
including Patrick Turnmire, Mike Klasco, Steve Mowry,
Charlie Hughes, Jim Croft, and others.
In over 40 years of publishing, Ed Dell has brought
the world of loudspeakers a number of books includ-
ing the 2nd through 7th editions of Vance Dickason’s
Loudspeaker Design Cookbook, Joseph D’Appolito’s
Testing Loudspeakers, Robert Bullock’s Bullock on Boxes,
and Roger Sanders’ Electrostatic Loudspeaker Design
Cookbook. In addition to articles and books on loud-
speakers and audio technologies, Ed and his publi-
cations have interviewed many of the audio indus-
try’s greatest luminaries including Henry Kloss, Peter
Baxandall, Peter Walker, P.G.A. H. Voigt, and Neville
Thiele. Given all of this, I can’t think of a more deserv-
ing individual to receive ALMA’s first Driver Award
than Edward T. Dell. Congratulations, Ed!
AXPONA 2011The Stereophile magazine-sponsored AXPONA (Audio Expo North America) consumer audio show will take place April 14-17, at the downtown Atlanta, Ga. Sheraton Hotel. Exhibitors include Acoustic Zen, Adam Audio, Advanced Transduction, Aspara Acoustics, Audience, Audio Physic, Audioengine, Axis Audio Loudspeakers, B&W Group, Carnegie Acoustics, Classic Audio Loudspeakers, Definitive Technology, Emotiva Audio, Induction Dynamics, JL Audio, Krell Industries, Legacy Audio, Leon Speakers, Linkwitz Lab, Linn Products, Madisound Speaker Components, MBL, McIntosh Labs, Naim Audio, Paradigm Speakers, Phase Technology, PSB Speakers, Quad, Rosso Fiorentino Electroacoustics, Sanders Sound Systems, Scaena Loudspeakers, Selah Audio, Sonist Loudspeakers, Spendor, Totem Acoustic, Transmission Audio, Tyler Acoustics, Vandersteen Audio, Wharfedale Loudspeakers, and YG Acoustics. For more, visit the AXPONA website www.axpona.com. VC
sponsors of “The Loudspeaker University” seminars
Liaison Between Materials,
Suppliers, & Audio Manufacturers
Technical Support for Headset,
Mic, Speaker & Manufacturers
Product Development
Sourcing Guidance
Test & Measurement
Instrumentation
MENLO
S C I E N T I F I C
Engineering Consulting
for the Audio Community
USA tel 510.758.9014
Michael Klasco
www.menloscientific.com
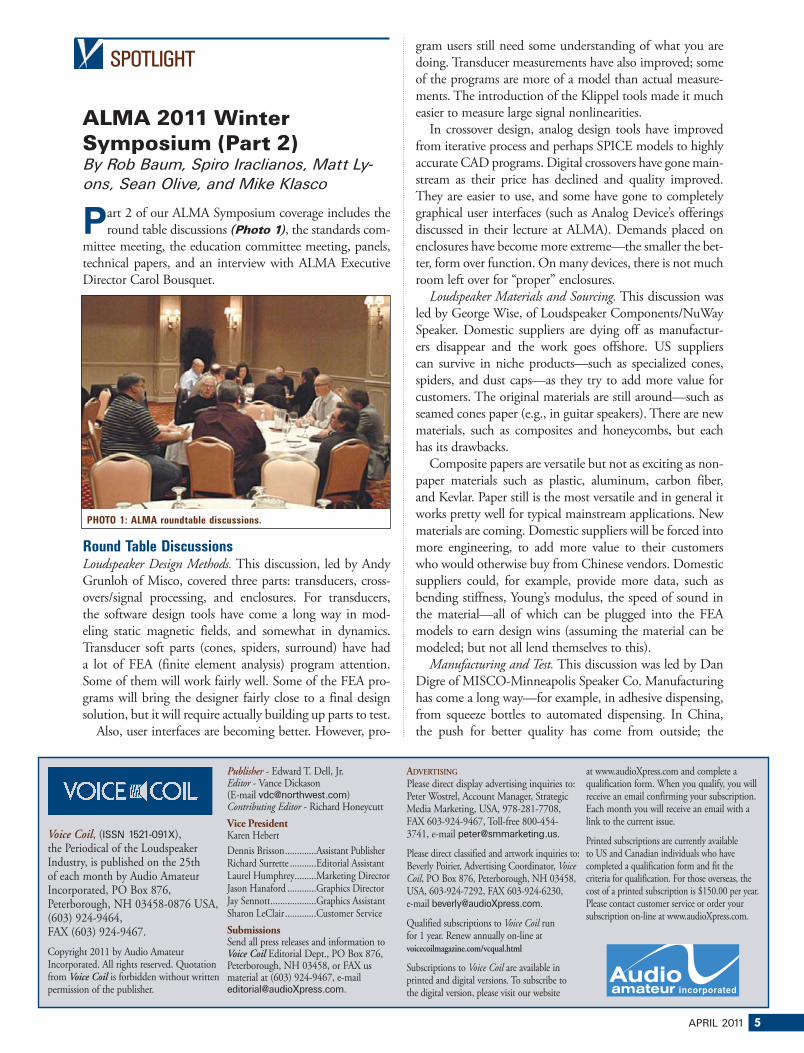
APRIL 2011 5
SPOTLIGHT
ALMA 2011 Winter Symposium (Part 2)By Rob Baum, Spiro Iraclianos, Matt Ly-ons, Sean Olive, and Mike Klasco
art 2 of our ALMA Symposium coverage includes the
round table discussions (Photo 1), the standards com-
mittee meeting, the education committee meeting, panels,
technical papers, and an interview with ALMA Executive
Director Carol Bousquet.
Round Table DiscussionsLoudspeaker Design Methods. This discussion, led by Andy Grunloh of Misco, covered three parts: transducers, cross-overs/signal processing, and enclosures. For transducers, the software design tools have come a long way in mod-eling static magnetic fields, and somewhat in dynamics. Transducer soft parts (cones, spiders, surround) have had a lot of FEA (finite element analysis) program attention. Some of them will work fairly well. Some of the FEA pro-grams will bring the designer fairly close to a final design solution, but it will require actually building up parts to test.
Also, user interfaces are becoming better. However, pro-
gram users still need some understanding of what you are
doing. Transducer measurements have also improved; some
of the programs are more of a model than actual measure-
ments. The introduction of the Klippel tools made it much
easier to measure large signal nonlinearities.
In crossover design, analog design tools have improved
from iterative process and perhaps SPICE models to highly
accurate CAD programs. Digital crossovers have gone main-
stream as their price has declined and quality improved.
They are easier to use, and some have gone to completely
graphical user interfaces (such as Analog Device’s offerings
discussed in their lecture at ALMA). Demands placed on
enclosures have become more extreme—the smaller the bet-
ter, form over function. On many devices, there is not much
room left over for “proper” enclosures.
Loudspeaker Materials and Sourcing. This discussion was
led by George Wise, of Loudspeaker Components/NuWay
Speaker. Domestic suppliers are dying off as manufactur-
ers disappear and the work goes offshore. US suppliers
can survive in niche products—such as specialized cones,
spiders, and dust caps—as they try to add more value for
customers. The original materials are still around—such as
seamed cones paper (e.g., in guitar speakers). There are new
materials, such as composites and honeycombs, but each
has its drawbacks.
Composite papers are versatile but not as exciting as non-
paper materials such as plastic, aluminum, carbon fiber,
and Kevlar. Paper still is the most versatile and in general it
works pretty well for typical mainstream applications. New
materials are coming. Domestic suppliers will be forced into
more engineering, to add more value to their customers
who would otherwise buy from Chinese vendors. Domestic
suppliers could, for example, provide more data, such as
bending stiffness, Young’s modulus, the speed of sound in
the material—all of which can be plugged into the FEA
models to earn design wins (assuming the material can be
modeled; but not all lend themselves to this).
Manufacturing and Test. This discussion was led by Dan
Digre of MISCO-Minneapolis Speaker Co. Manufacturing
has come a long way—for example, in adhesive dispensing,
from squeeze bottles to automated dispensing. In China,
the push for better quality has come from outside; the
Voice Coil, (ISSN 1521-091X), the Periodical of the Loudspeaker Industry, is published on the 25th of each month by Audio Amateur Incorporated, PO Box 876, Peterborough, NH 03458-0876 USA, (603) 924-9464, FAX (603) 924-9467.
Copyright 2011 by Audio Amateur Incorporated. All rights reserved. Quotation from Voice Coil is forbidden without written permission of the publisher.
Publisher - Edward T. Dell, Jr.Editor - Vance Dickason (E-mail [email protected])Contributing Editor - Richard Honeycutt
Vice PresidentKaren Hebert
Dennis Brisson .............Assistant PublisherRichard Surrette ...........Editorial AssistantLaurel Humphrey.........Marketing DirectorJason Hanaford ............Graphics DirectorJay Sennott ...................Graphics AssistantSharon LeClair .............Customer Service
SubmissionsSend all press releases and information to Voice Coil Editorial Dept., PO Box 876, Peterborough, NH 03458, or FAX us material at (603) 924-9467, e-mail [email protected].
ADVERTISING
Please direct display advertising inquiries to: Peter Wostrel, Account Manager, Strategic Media Marketing, USA, 978-281-7708, FAX 603-924-9467, Toll-free 800-454-3741, e-mail [email protected].
Please direct classified and artwork inquiries to: Beverly Poirier, Advertising Coordinator, Voice Coil, PO Box 876, Peterborough, NH 03458, USA, 603-924-7292, FAX 603-924-6230, e-mail [email protected].
Qualified subscriptions to Voice Coil run for 1 year. Renew annually on-line at voicecoilmagazine.com/vcqual.html
Subscriptions to Voice Coil are available in printed and digital versions. To subscribe to the digital version, please visit our website
at www.audioXpress.com and complete a qualification form. When you qualify, you will receive an email confirming your subscription. Each month you will receive an email with a link to the current issue.
Printed subscriptions are currently available to US and Canadian individuals who have completed a qualification form and fit the criteria for qualification. For those overseas, the cost of a printed subscription is $150.00 per year. Please contact customer service or order your subscription on-line at www.audioXpress.com.
PHOTO 1: ALMA roundtable discussions.
6 VOICE COIL
factory usually will not do it themselves. Chinese factories
(in general, there are exceptions) are not so great at finding
solutions on their own. Equipment in the factories needs
to be simple to use. Labor shortages and high turnover in
China also make manufacturing more challenging. The US
workforce is more stable.
In China, it is also true that it is hard to find tight tol-
erance work, due to both the higher skill levels required
and less demand for such work. Quality in China is
clearly improving, but it usually requires a push from
outside. There have been improvements in equipment and
documentation. Automated end-of-line testing has also
improved; to catch defects that otherwise would have gone
through. It is tougher to get good quality out of a factory
you don’t control; customers sourcing from Chinese facto-
ries did not set up the corporate culture.
Aesthetic demands have increased; looks matter at both
the finished product and sub assembly level—for example,
neat glue lines and centering of parts. Specifications are
important, and so is the process by which a product is manu-
factured. Changes upstream may have consequences down-
stream (e.g., change a solvent somewhere, and glue adhesion
may be affected later in the manufacturing process).
Failure Mode and Effects Analysis (FMEA) is a procedure
in product development and operations management for
analysis of potential failure modes within a system, for clas-
sification by the severity and likelihood of failures. There
is improvement in FMEA in China, but it takes time and
paperwork.
Automated testing has also improved, but in China
you need to be sure you are using the real equipment and
software, not counterfeits. End-of-line testing is commonly
done for most products, except for the larger items such
as pro audio speakers in large enclosures. Is automation
an answer to bringing manufacturing back to the US and
Europe? It is useful in Asia, particularly in high volume
manufacturing. JBL’s fancy automated production lines
have disappeared as production went to China. One fact
pushing against the return of manufacturing is that factories
in general should be close to the final customer for competi-
tive advantage. As the Chinese domestic market continues
to expand rapidly, that is all the more reason for factories to
move and stay in China.
Winter 2011 Standards Symposium ReportThe ALMA International Standards Committee held an open committee meeting, which was attended by nine participants from various areas of the Loudspeaker and Consumer Electronics Industries. In an effort to further strengthen the potential collaboration between ALMA and CEA, the Senior Director of Technology and Standards attended to obtain an understanding of ALMA operations and offered ideas for future efforts. Additionally, the com-mittee reviewed progress that was made during the 2010 calendar year.
Standards have been posted on the newly updated ALMA
International website. The Master List was reviewed and
ideas for updating and maintaining the collection were
discussed. You can view the current ALMA Standards at
www.almainternational.org/alma-standards. The commit-
tee has many ideas and potential action items to work on to
improve the value of the standards that ALMA is endorsing.
Additional meetings are being planned for 2011. Please visit
the ALMA International website or ALMA via LinkedIn for
additional upcoming detailed information.
ALMA Loudspeaker Education CommitteeThe ALMA Education Committee, chaired by Matt Lyons, adjunct professor at the Peabody Conservatory of the Johns Hopkins University, welcomed many new members to its meeting and agreed to continue to focus on the develop-ment of the student loudspeaker design competition with outreach to select institutions of higher education and is working to refine competition criteria. Outreach tactics will consist more of a focused, one-to-one approach in 2011. Efforts in 2010 proved to be elusive in reaching students because the committee convened only mid-year; however, much was learned and accomplished by the committee along the way with many new contacts and affiliations made that will serve future objectives. Each committee member will work to mentor at least one school to produce an ALMA student section with the aim of recruiting par-ticipation in the student design competition, and ALMA Education committee members will work one-on-one men-toring students for the contest.
The committee is updating the student design contest
rules and will schedule its first teleconference soon to review
which institutions will be assigned to which education com-
mittee members. The first phase of the student competition
will be a “design on paper.” Then a round of five candidates
will be selected and five designs will be built. The ALMA
education committee is soliciting the greater loudspeaker
industry for support for the construction of the five final-
ists’ pairs of loudspeakers to be judged by industry experts
at the next ALMA Winter Symposium. Final judging will
be chaired by Earl Geddes. One of the main goals of the
ALMA education committee is to work with students to
help shape the future of loudspeaker design and to foster
membership in ALMA.
Contest details will be posted on the ALMA website.
Educators are encouraged to contact Matt Lyons through
the ALMA website for more information.
Technical PapersThere were five excellent technical papers presented at ALMA as follows:
A High Performance Beryllium Dome Diaphragm for Large
Format Compression Drivers—presented by Marshall Buck,
PhD., President, Psychotechnology, Inc., with co-authors
Gordon Simmons, Peter Andrews, and Sam Saye (Materion
Electrofusion, formerly Brush Wellman, Electrofusion
Products). This paper details the development, manu-
facture, and testing of a new large format compression
driver diaphragm using a beryllium dome and new type
of polymer surround that exhibits improved performance.
This design promises to give long life and good reliability
8 VOICE COIL
with little or no change in performance anticipated over
the life of the diaphragm. Design exercises include material
properties comparisons, finite element analysis, and modal
simulations. A comprehensive set of tests of beryllium,
aluminum, and titanium diaphragm compression drivers is
described including frequency response, distortion, wavelet
time domain analysis on a 2″ plane wave tube, and laser
scans of modes. Substantial differences were measured in the
performance categories, particularly in the frequency range
above 4kHz.
Introduction to CBT Loudspeaker Arrays—presented by
Don Keele, who discussed the background and history of
his line arrays based on “Constant Beam-width Transducer”
(CBT) technology, which is a term the US military origi-
nated in a series of three un-classified Naval Research Lab
ASA papers published in the late 70s and early 80s describ-
ing spherical-cap underwater transducers. Don applied the
technology to loudspeakers in a series of six AES papers
between 2000 and 2010.
The CBT loudspeaker arrays provide directional control
and sound-field coverage that borders on revolutionary and
can be simply implemented without any sophisticated DSP
signal processing. The CBT arrays provide a broadband
3D sound field that is extremely uniform and well behaved
with frequency, at all distances from very close to far away.
The CBT line-array concept dictates that multiple identical
loudspeakers be placed evenly around a circular arc and that
frequency-independent shading (simple change in level) be
applied to each speaker.
Practical Implementation of Perceptual Rub & Buzz
Distortion—presented by Steve Temme, President, Listen,
Inc. Researchers previously demonstrated how to use an
auditory perceptual model based on an ITU standard to
detect audible Rub & Buzz defects on loudspeakers using
a single tone stimulus. In this paper, Steve explained how
this principle has been refined to offer an accurate per-
ceptual Rub & Buzz technique for production line use,
with a stepped sine stimulus, easy limit setting, and good
immunity to background noise. He also demonstrated (with
test results) how this method produces a single absolute
measurement of Rub & Buzz loudness that can easily be
correlated to human audibility, and discussed future devel-
opment potential.
Automatic EQ, Crossover and Alignment of Speaker
Systems—presented by Miguel Chavez Salas, Analog
Devices. As digital technology extends into speakers and
becomes more sophisticated, the use of DSP has become
critical in the system design process. Short timelines require
more efficient design techniques than ever before. Analog
Devices has design software for improving such system
design within their DSP line of ICs (i.e., SigmaDSP and
Sharc). The Auto EQ for SigmaStudio reduces speaker
design time allowing designers to focus on other important
system considerations.
Detection of Air Leaks in Loudspeaker Systems—presented
by Prof. Dr. Wolfgang Klippel, President, Klippel, GmBH.
Air leaks in the dust cap and in sealed loudspeaker enclo-
sures generate turbulent noise which highly impairs the per-
ceived sound quality like irregular distortion generated by a
rubbing coil, buzzing component, loose particles, and other
loudspeaker defects. Traditional measurement techniques
fail in the detection of air leaks because the noise has low
energy, and has similar spectral properties such as ambient
noise as found in a production environment. Conventional
averaging can’t be applied to measured signals due to the
random nature of the symptom.
Wolfgang’s paper presented a novel measurement tech-
nique performing an asynchronical demodulation of the
turbulent noise and generating the envelope of the noise
signal which contains the fundamental component and har-
monics of the sinusoidal stimulus. This technique exploits
the total energy of the air leakage noise and becomes more
sensitive than a human ear. Furthermore, this demodulation
technique can be combined with a cross-correlation tech-
nique to localize the source of the air leakage.
Listening Tests in the Audio Industry: Are They Good Enough?
By Sean Olive
This last event of the ALMA show, chaired by Dr.
Sean Olive (Harman International), featured panelists Dr.
Wolfgang Klippel (Klippel GmbH), Don Keele (DBK
Associates and Audio Artistry), and Dr. Mead Killion
(Etymotic Research). Sean Olive gave an overview of how
to conduct controlled listening tests so that the results are
accurate, reliable, and meaningful. He presented experi-
mental evidence showing that both trained and untrained
listeners tend to prefer the most accurate loudspeakers
based on a set of comprehensive anechoic measurements.
In terms of cost and efficiency, trained listeners are pre-
ferred because they give more discriminating and reliable
responses than untrained listeners.
Using samples of Japanese, Chinese, and American
listeners, his research so far indicates that accurate sound
reproduction is preferred regardless of culture or age. Even
Generation Y prefers lossless audio formats over low bit-rate
MP3, and accurate loudspeakers when given the oppor-
tunity to compare them against inferior products. Olive
concluded those audio product categories in greatest need
for better controlled listening tests are automotive audio,
headphones, and professional audio installations.
Don Keele reviewed an article published in Stereophile
magazine in February 1988 concerning a study conducted
by Wharfedale in which identical loudspeakers with dif-
ferent color grilles were evaluated by three groups of 30
students each. The surprising result was that the apparent
timbre of the loudspeaker was influenced by the color of
the grille cloth itself. The red speakers were judged to offer
better bass. The blue speakers were rated as having the great-
est clarity and openness. The yellow speakers were perceived
as being louder and having more treble. The green speakers
were rated as being evenly balanced.
Wolfgang Klippel discussed the relationship between the
subjective and objective measurements of loudspeakers. The
ultimate goal is to predict the results of loudspeaker listen-
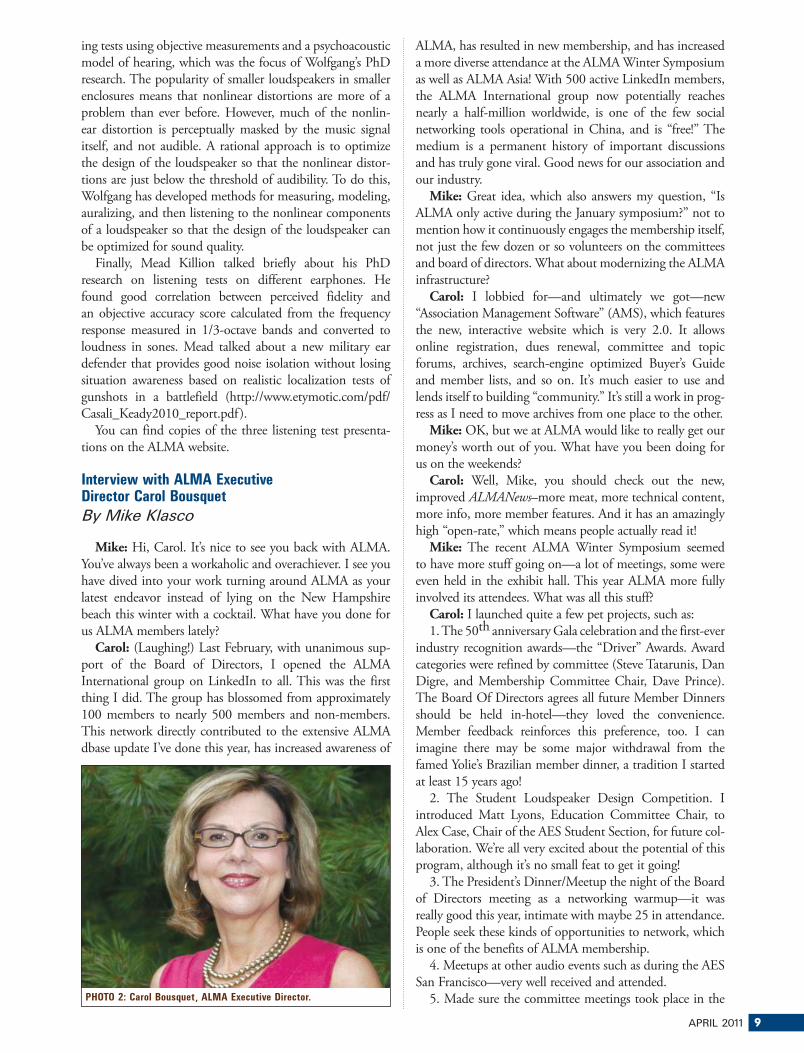
APRIL 2011 9
ing tests using objective measurements and a psychoacoustic
model of hearing, which was the focus of Wolfgang’s PhD
research. The popularity of smaller loudspeakers in smaller
enclosures means that nonlinear distortions are more of a
problem than ever before. However, much of the nonlin-
ear distortion is perceptually masked by the music signal
itself, and not audible. A rational approach is to optimize
the design of the loudspeaker so that the nonlinear distor-
tions are just below the threshold of audibility. To do this,
Wolfgang has developed methods for measuring, modeling,
auralizing, and then listening to the nonlinear components
of a loudspeaker so that the design of the loudspeaker can
be optimized for sound quality.
Finally, Mead Killion talked briefly about his PhD
research on listening tests on different earphones. He
found good correlation between perceived fidelity and
an objective accuracy score calculated from the frequency
response measured in 1/3-octave bands and converted to
loudness in sones. Mead talked about a new military ear
defender that provides good noise isolation without losing
situation awareness based on realistic localization tests of
gunshots in a battlefield (http://www.etymotic.com/pdf/
Casali_Keady2010_report.pdf).
You can find copies of the three listening test presenta-
tions on the ALMA website.
Interview with ALMA Executive Director Carol Bousquet
By Mike Klasco
Mike: Hi, Carol. It’s nice to see you back with ALMA.
You’ve always been a workaholic and overachiever. I see you
have dived into your work turning around ALMA as your
latest endeavor instead of lying on the New Hampshire
beach this winter with a cocktail. What have you done for
us ALMA members lately?
Carol: (Laughing!) Last February, with unanimous sup-
port of the Board of Directors, I opened the ALMA
International group on LinkedIn to all. This was the first
thing I did. The group has blossomed from approximately
100 members to nearly 500 members and non-members.
This network directly contributed to the extensive ALMA
dbase update I’ve done this year, has increased awareness of
ALMA, has resulted in new membership, and has increased
a more diverse attendance at the ALMA Winter Symposium
as well as ALMA Asia! With 500 active LinkedIn members,
the ALMA International group now potentially reaches
nearly a half-million worldwide, is one of the few social
networking tools operational in China, and is “free!” The
medium is a permanent history of important discussions
and has truly gone viral. Good news for our association and
our industry.
Mike: Great idea, which also answers my question, “Is
ALMA only active during the January symposium?” not to
mention how it continuously engages the membership itself,
not just the few dozen or so volunteers on the committees
and board of directors. What about modernizing the ALMA
infrastructure?
Carol: I lobbied for—and ultimately we got—new
“Association Management Software” (AMS), which features
the new, interactive website which is very 2.0. It allows
online registration, dues renewal, committee and topic
forums, archives, search-engine optimized Buyer’s Guide
and member lists, and so on. It’s much easier to use and
lends itself to building “community.” It’s still a work in prog-
ress as I need to move archives from one place to the other.
Mike: OK, but we at ALMA would like to really get our
money’s worth out of you. What have you been doing for
us on the weekends?
Carol: Well, Mike, you should check out the new,
improved ALMANews–more meat, more technical content,
more info, more member features. And it has an amazingly
high “open-rate,” which means people actually read it!
Mike: The recent ALMA Winter Symposium seemed
to have more stuff going on—a lot of meetings, some were
even held in the exhibit hall. This year ALMA more fully
involved its attendees. What was all this stuff?
Carol: I launched quite a few pet projects, such as:
1. The 50th anniversary Gala celebration and the first-ever
industry recognition awards—the “Driver” Awards. Award
categories were refined by committee (Steve Tatarunis, Dan
Digre, and Membership Committee Chair, Dave Prince).
The Board Of Directors agrees all future Member Dinners
should be held in-hotel—they loved the convenience.
Member feedback reinforces this preference, too. I can
imagine there may be some major withdrawal from the
famed Yolie’s Brazilian member dinner, a tradition I started
at least 15 years ago!
2. The Student Loudspeaker Design Competition. I
introduced Matt Lyons, Education Committee Chair, to
Alex Case, Chair of the AES Student Section, for future col-
laboration. We’re all very excited about the potential of this
program, although it’s no small feat to get it going!
3. The President’s Dinner/Meetup the night of the Board
of Directors meeting as a networking warmup—it was
really good this year, intimate with maybe 25 in attendance.
People seek these kinds of opportunities to network, which
is one of the benefits of ALMA membership.
4. Meetups at other audio events such as during the AES
San Francisco—very well received and attended.
5. Made sure the committee meetings took place in the PHOTO 2: Carol Bousquet, ALMA Executive Director.
10 VOICE COIL
exhibit area—committee chairs were ecstatic about atten-
dance and participation versus people having to leave the
excitement of the exhibit area and go to a dark meeting
room halfway to Timbuktu. This really worked!
6. And, as important as any of the above, the new contract
with Job Target to create an online Job Board for the loud-
speaker industry on the ALMA website—debuting this Spring.
Mike: You have reached out to other organizations and
media—and seem to have some results. . .
Carol: The whole graphical corporate image of ALMA
underwent a makeover and redesign this year that has
worked to generate excitement and enthusiasm and has
resulted in new membership and attendance at the sym-
posia. Additionally, thanks to a generous sponsorship by
Voice Coil, I was able to include a full-page two-sided
Winter Symposium insert/invitation in the October AES
edition. We supplemented that distribution during the San
Francisco AES by having them in ALMA-AES member
booths as well as handed them out. We also distributed
custom invitations specifically to the AES-ALMA Meetup.
It’s classical marketing stuff.
Mike: The CEA, the group that owns the CES show, is a
large industry organization and lobby. From the interaction
with CEA representatives at the ALMA Board meeting, my
impression is that we are not big enough to get even the few
crumbs ALMA needs. You were staffing the ALMA booth
on the CES floor thanks to an affiliated association relation-
ship (one of the tidbits CEA offers to us) at the entrance
to the North Hall during CES. You were also hanging out
in the IEEE-CE Division booth—are you dating anyone
there? By the way, I joined the IEEE when I was in gradu-
ate school (in the early 1970s) and it is a great organiza-
tion. They offer everything from student grants to health
insurance programs for its membership. The IEEE audio
group (IEEE transactions on audio and electroacoustics)
faded into the consumer electronics group and AES became
the forum for this stuff. And the IEEE is strong enough to
wrestle space and attention from the CEA.
Carol: As a result of the conversations I had with the
folks there, I’ve been thinking how this is an important
discussion to pursue for sure. I expect it will be part of our
Spring Strategic Planning Meeting—which, by the way, is
open to members, not just the Board of Directors. At the
CES show the IEEE people insisted they’d welcome us not
for the cash (however, they have deep pockets and could
help ALMA along financially and in many other ways, I’m
sure) but for the intelligence sharing. It seems to me, at first
glance, obvious. Everyone I’ve discussed this with lights up
like a lantern and are IEEE members already or have had
a positive experience with them over time and know how
impactful they can be. Think of ALMA loudspeaker stan-
dards and so on. . .
Mike: Finally, I would like to mention that Carol sug-
gested her goal in life is to be nominated for a Driver Award
herself. Having worked with Carol on various ALMA
endeavors, from my heart, I suggest Carol have the honor
of a special award—the ALMA Slave Driver Award! VC

APRIL 2011 11
Test Bench
Wavecor and Beyma Home and Pro DriversBy Vance Dickason
�his month’s Test Bench driver submissions came from
Wavecor and Beyma, representing high-end home
audio drivers and high-power pro audio drivers. From
Wavecor I received a 7″ paper cone midwoofer, the
WF182BD04-1, and from Beyma, a new 12″ neo sub-
woofer, the 12SW1300Nd.
WF182BD04-1As with the previously reviewed Wavecor WF152
(October 2010 Voice Coil), the highlight of this Wavecor
midbass driver design is the Wavecor Balanced Drive sys-
tem, a proprietary distortion reducing motor technology.
Basically, Wavecor’s Balanced Drive Technology takes the
form of a tapered extended pole as seen in the FEA diagram
in Fig. 1, which shows the dual tapered outlets on the pole
vent, used to decrease turbulence in the vent. As with any
extended pole, the result is a more linear Bl curve, as you
will see in the Klippel analysis of this product.
In terms of features, like the WF152BD, the WF182
is built on a six-spoke cast aluminum frame that sports a
completely open area below the spider-mounting shelf for
enhanced cooling. The WF182 cone assembly includes a
very stiff curvilinear black coated semi air-dried cone with a
2″ diameter convex black coated paper dust cap. These are
suspended by a NBR butyl rubber surround that has a nice
shallow angle where it attaches to the cone edge and a 4″
diameter black conex flat spider. Driving the assembly is a
39mm (1.5″) diameter voice coil using round copper wire
wound on a black non-conducting fiberglass voice coil for-
mer that incorporates a series of eight 4mm diameter former
vents just below the neck joint.
The motor uses a single 20mm × 117mm ferrite magnet
sandwiched between a shaped T-yoke and 5mm high front
plate, both with a black emissive coating for enhanced cool-
ing performance. For additional cooling, the T-yoke incor-
porates a dual flare 10mm diameter pole vent. The motor
also incorporates an aluminum Faraday shield/shorting ring
as well as a copper cap on the top of the pole piece for dis-
tortion reduction. Voice coil tinsel lead wires are terminated
to a set of gold-plated terminals.
I began testing the WF182BD04 midbass woofer using
the LinearX LMS analyzer and VIBox to produce both
voltage and admittance (current) curves with the driver
clamped to a rigid test fixture in free-air at 0.3V, 1V, 3V, 6V,
and 10V. As has become the protocol for Test Bench test-
ing, I no longer use a single added mass measurement and
instead used actual measured mass, but the manufacturers
measured Mmd data. Unlike the smaller diameter WF152,
the 10V curves were sufficiently linear to provide a good
curve fit, so I included them in the optimization.
Next, I post-processed the ten 550 point stepped sine
wave sweeps for each WF182 sample and divided the voltage
curves by the current curves (admittance) to derive impedance
curves, phase added by the LMS calculation method, and,
along with the accompanying voltage curves, imported to the
LEAP 5 Enclosure Shop software. Because most Thiele/Small
data provided by OEM manufacturers is being produced
using either a standard method or the LEAP 4 TSL model, I
additionally produced a LEAP 4 TSL model using the 1V free-
air curves. I selected the complete data set, the multiple voltage
impedance curves for the LTD model (see Fig. 2 for the 1V
free-air impedance curve) and the 1V impedance curve for the
TSL model, in the transducer derivation menu in LEAP 5 and
produced the parameters for the computer box simulations.
Table 1 compares the LEAP 5 LTD and TSL data and factory
parameters for both WF182BD04-01 samples.
LEAP parameter Qts calculation results for the WF182
were very close to the factory data, actually even more so than
I usually see. Given that, I proceeded to produce two com-
puter box simulations and programmed them into LEAP
5, one sealed and one vented. This resulted in a 0.24ft3
Butterworth sealed enclosure with 50% fiberglass fill mate-
10 Hz 20 50 100 200 500 1K 2K 5K 10K 20K
Ohm
1
2
5
10
20
50
100
200
300Impedance vs Freq
FIGURE 1: Wavecor Balance Drive FEA diagram.
FIGURE 2: Wavecor WF182BD04-01 midwoofer free-air impedance plot.
PHOTO 1: WF182BD04-01 front. PHOTO 2: WF182BD04-01 back.
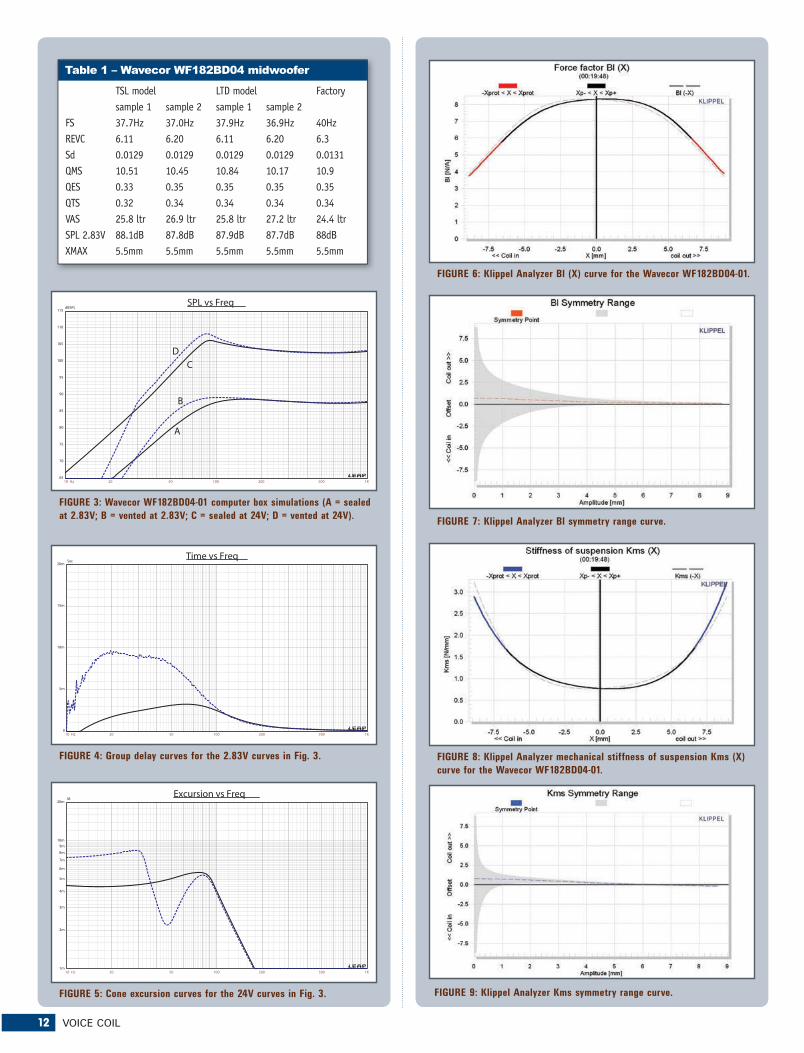
12 VOICE COIL
10 Hz 20 50 100 200 500 1K
dBSPL
65
70
75
80
85
90
95
100
105
110
115
SPL vs Freq
A
B
CD
10 Hz 20 50 100 200 500 1K
Sec
0
5m
10m
15m
20m
Time vs Freq
10 Hz 20 50 100 200 500 1K
M
1m
2m
3m
4m
5m
6m
7m
8m
9m
10m
20m
Excursion vs Freq
FIGURE 3: Wavecor WF182BD04-01 computer box simulations (A = sealed
at 2.83V; B = vented at 2.83V; C = sealed at 24V; D = vented at 24V).
FIGURE 6: Klippel Analyzer Bl (X) curve for the Wavecor WF182BD04-01.
FIGURE 7: Klippel Analyzer Bl symmetry range curve.
FIGURE 8: Klippel Analyzer mechanical stiffness of suspension Kms (X)
curve for the Wavecor WF182BD04-01.
FIGURE 4: Group delay curves for the 2.83V curves in Fig. 3.
FIGURE 5: Cone excursion curves for the 24V curves in Fig. 3.
TSL model LTD model Factory sample 1 sample 2 sample 1 sample 2FS 37.7Hz 37.0Hz 37.9Hz 36.9Hz 40HzREVC 6.11 6.20 6.11 6.20 6.3Sd 0.0129 0.0129 0.0129 0.0129 0.0131QMS 10.51 10.45 10.84 10.17 10.9QES 0.33 0.35 0.35 0.35 0.35QTS 0.32 0.34 0.34 0.34 0.34 VAS 25.8 ltr 26.9 ltr 25.8 ltr 27.2 ltr 24.4 ltrSPL 2.83V 88.1dB 87.8dB 87.9dB 87.7dB 88dB XMAX 5.5mm 5.5mm 5.5mm 5.5mm 5.5mm
��>� ���?��� ���������)���"(0,��= �
FIGURE 9: Klippel Analyzer Kms symmetry range curve.

APRIL 2011 13
rial, and a 0.37ft3 vented QB3 alignment enclosure simula-
tion with 15% fiberglass fill material and tuned to 44Hz.
Figure 3 displays the results for the WF182BD04 in the
sealed and vented boxes at 2.83V and at a voltage level high
enough to increase cone excursion to Xmax + 15% (5.75mm).
This produced a F3 frequency of 77Hz with a box/driver Qtc
of 0.68 for the 0.24ft3 sealed enclosure and –3dB = 44Hz
for the 0.37ft3 vented QB3 simulation. Increasing the volt-
age input to the simulations until the maximum linear cone
excursion was reached resulted in 106dB at 24V for the sealed
enclosure simulation and 108dB with the same 24V input
level for the larger ported enclosure (see Figs. 4 and 5 for
the 2.83V group delay curves and the 24V excursion curves).
Note that excursion begins increasing below 35Hz, so a high-
pass filter below this frequency would greatly increase the
power handling, which is the case for most vented designs.
Klippel analysis for the Wavecor 7″ woofer (our analyzer
is provided courtesy of Klippel GmbH), performed by Pat
Turnmire, Red Rock Acoustics (author of the SpeaD and
RevSpeaD software) produced the Bl(X), Kms(X) and Bl and
Kms symmetry range plots given in Figs. 6-9. The Bl(X) curve
for the WF182 (Fig. 6) is relatively broad and nicely sym-
metrical. The Bl symmetry plot curve (Fig. 7) shows a trivial
0.69mm coil forward offset at the rest position that decreases to
0.2mm at the physical 5.5mm Xmax of the driver, so this driver
looks very well balanced. Figures 8 and 9 show the Kms(X)
and Kms symmetry range curves for the Wavecor midbass woof-
er. The Kms(X) curve is also very symmetrical, and has a very
minor forward (coil-out) offset of 0.76mm at the rest position
that decreases to 0.17mm at the 5.5mm physical Xmax location
on the graph, which is likewise trivial. Displacement limiting
numbers calculated by the Klippel analyzer for the WF182 were
XBl at 82% Bl = 5.5mm, and for XC at 75% Cms minimum
was 3.9mm, which means that the compliance is the most limit-
ing factor for prescribed distortion level of 10%.
Figure 10 displays the inductance curve Le(X) for the
WF182BD04-01. Inductance will typically increase in the
rear direction from the zero rest position as the voice coil covers
more pole area. However, the WF182 inductance shows only
minor inductive variation as the coil moves in both directions
due to the dual shorting ring configuration. The inductance
variation is only a maximum of 0.03mH from the rest position
to the full in and out Xmax positions, which is very good.
Next I mounted the WF182 woofer in an enclosure which
had an 18″ × 8″ baffle and was filled with damping material
(foam) and then measured the DUT on- and off-axis from
300Hz to 40kHz frequency response at 2.83V/1m using
the LinearX LMS analyzer set to a 100-point gated sine
wave sweep. Figure 11 gives the WF182’s on-axis response
indicating a very smoothly rising response to about 5.5kHz,
with no peaking at the high-pass rolloff. Figure 12 displays
the on- and off-axis frequency response at 0, 15, 30, and
45°. -3dB at 30° off-axis with respect to the on-axis curve
occurs at 3.0kHz, so a crossover in the 3kHz region would be
appropriate. And, finally, Fig. 13 gives the two-sample SPL
comparisons for the 7″ Wavecor midbass, showing a close
match to less than 0.5dB throughout the operating range.
For the remaining battery of tests, I employed the Listen

14 VOICE COIL
300 Hz 500 1K 2K 5K 10K 20K
dBSPL
45
50
55
60
65
70
75
80
85
90
95
100
105SPL vs Freq
300 Hz 500 1K 2K 5K 10K 20K
dBSPL
45
50
55
60
65
70
75
80
85
90
95
100
105SPL vs Freq
300 Hz 500 1K 2K 5K 10K 20K
dBSPL
45
50
55
60
65
70
75
80
85
90
95
100
105SPL vs Freq
FIGURE 10: Klippel Analyzer Le(X) curve for the Wavecor WF182BD04-01.
FIGURE 11: Wavecor WF182BD04-01 on-axis frequency response.
FIGURE 14: Wavecor WF182BD04-01 SoundCheck distortion plot.
FIGURE 15: Wavecor WF182BD04-01 SoundCheck CSD waterfall plot.
FIGURE 16: Wavecor WF182BD04-01 SoundCheck Wigner-Ville plot.
FIGURE 13: Wavecor WF182BD04-01 two-sample SPL comparison.
FIGURE 12: Wavecor WF182BD04-01 on- and off-axis frequency response.
FIGURE 17: Beyma SW1300Nd cone assembly cutaway to measure Mmd.
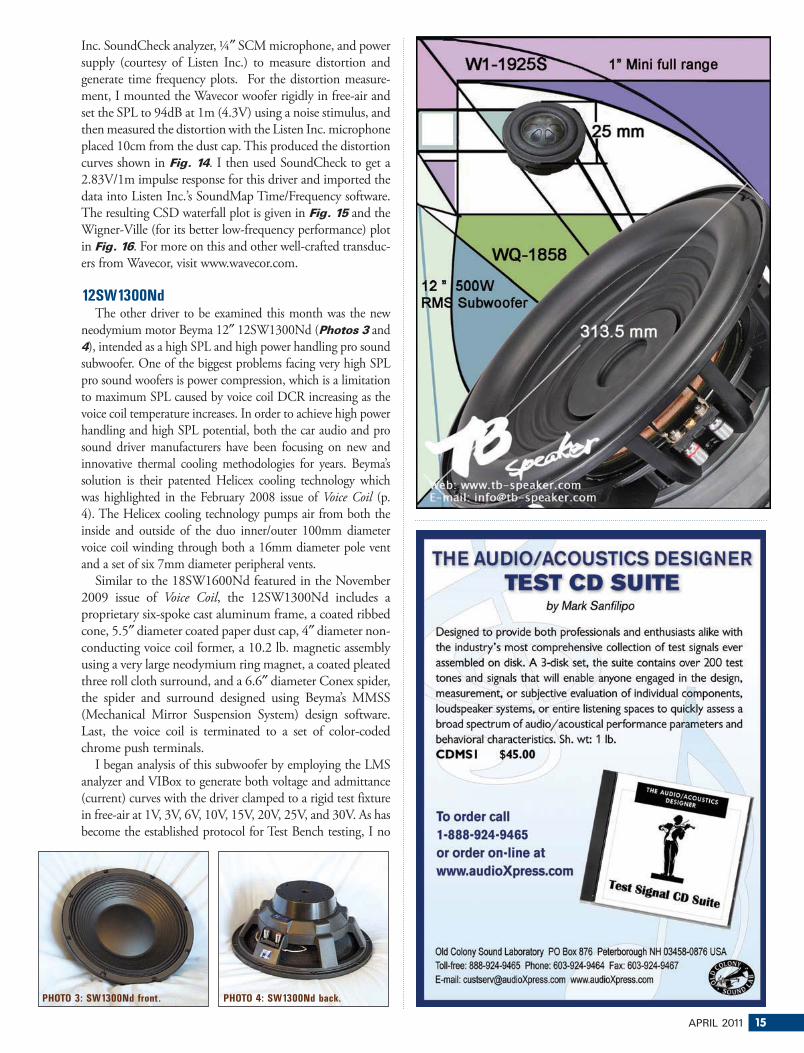
APRIL 2011 15
Inc. SoundCheck analyzer, ¼″ SCM microphone, and power
supply (courtesy of Listen Inc.) to measure distortion and
generate time frequency plots. For the distortion measure-
ment, I mounted the Wavecor woofer rigidly in free-air and
set the SPL to 94dB at 1m (4.3V) using a noise stimulus, and
then measured the distortion with the Listen Inc. microphone
placed 10cm from the dust cap. This produced the distortion
curves shown in Fig. 14. I then used SoundCheck to get a
2.83V/1m impulse response for this driver and imported the
data into Listen Inc.’s SoundMap Time/Frequency software.
The resulting CSD waterfall plot is given in Fig. 15 and the
Wigner-Ville (for its better low-frequency performance) plot
in Fig. 16. For more on this and other well-crafted transduc-
ers from Wavecor, visit www.wavecor.com.
12SW1300NdThe other driver to be examined this month was the new
neodymium motor Beyma 12″ 12SW1300Nd (Photos 3 and
4), intended as a high SPL and high power handling pro sound
subwoofer. One of the biggest problems facing very high SPL
pro sound woofers is power compression, which is a limitation
to maximum SPL caused by voice coil DCR increasing as the
voice coil temperature increases. In order to achieve high power
handling and high SPL potential, both the car audio and pro
sound driver manufacturers have been focusing on new and
innovative thermal cooling methodologies for years. Beyma’s
solution is their patented Helicex cooling technology which
was highlighted in the February 2008 issue of Voice Coil (p.
4). The Helicex cooling technology pumps air from both the
inside and outside of the duo inner/outer 100mm diameter
voice coil winding through both a 16mm diameter pole vent
and a set of six 7mm diameter peripheral vents.
Similar to the 18SW1600Nd featured in the November
2009 issue of Voice Coil, the 12SW1300Nd includes a
proprietary six-spoke cast aluminum frame, a coated ribbed
cone, 5.5″ diameter coated paper dust cap, 4″ diameter non-
conducting voice coil former, a 10.2 lb. magnetic assembly
using a very large neodymium ring magnet, a coated pleated
three roll cloth surround, and a 6.6″ diameter Conex spider,
the spider and surround designed using Beyma’s MMSS
(Mechanical Mirror Suspension System) design software.
Last, the voice coil is terminated to a set of color-coded
chrome push terminals.
I began analysis of this subwoofer by employing the LMS
analyzer and VIBox to generate both voltage and admittance
(current) curves with the driver clamped to a rigid test fixture
in free-air at 1V, 3V, 6V, 10V, 15V, 20V, 25V, and 30V. As has
become the established protocol for Test Bench testing, I no
PHOTO 3: SW1300Nd front. PHOTO 4: SW1300Nd back.

16 VOICE COIL
longer (or at least seldom) use a single added mass measure-
ment and instead used actual measured Mmd. This requires
50% of the surround, spider, and voice coil leads removed
before putting the entire cone assembly including the voice
coil (see Fig. 17 for a picture of the Beyma cone cut up to
produce the correct Mmd measurement) on a digital scale, or
in my case, an Ohaus Triple Beam. You should also note that I
ran the sine wave at the given sweep voltage level at 200Hz for
a given period of time to raise the voice coil temperature to the
3rd time constant for that voltage level to better approximate
actual operating conditions. I further processed the 16 sine
wave sweeps (two at each voltage level for each driver sample)
with the voltage curves divided by the current curves to pro-
duce impedance curves. I generated phase curves using the
LEAP phase calculation routine and then copy/pasted imped-
ance magnitude and phase curves plus the associated voltage
curves into the LEAP 5 software’s Guide Curve library and
used this data to calculate parameters using the LEAP 5 LTD
transducer model. Because virtually all manufacturing data is
being produced using either a standard transducer model or
in many cases the LEAP 4 TSL model, I also generated LEAP
4 TSL model parameters using the 1V free-air curve that can
also be compared with the manufacturer’s data (see Fig. 18 for
the Beyma 12SW1300Nd 1V free-air impedance plot). Table 2 compares the LEAP 5 LTD and LEAP 4 TSL T/S param-
eter sets for the two 12SW1300Nd driver samples submitted
by Beyma with the Beyma factory data.
The measured data in Table 2 had some variance with
����������� ������������������������ ����������������
��� ��!�"!�!"#!##�$�% ��!�"!�&"�#�&'''����(����������)���)*���(����������+)��)���, )�-�.����/
�������
� ��!�"!����
��#��$%&'����$
�������
��#����(!��(�"�)(�* ���"+�,���$-�!��.�������/���0���.����0�1��
&'����2*!(����
������� �"*���3�4�5�.�#�3�"6�
��$-�.�����7$-���!��8��30�
��� �����
������0�����0)�1�)2���0��
����
������
���� ����������������
������
������������� ����
!�"���������#� ���$������ �%��� ���
���&������
10 Hz 20 50 100 200 500 1K 2K 5K 10K 20K
Ohm
1
2
5
10
20
50
100
200
300Impedance vs Freq
10 Hz 20 50 100 200 500 1K
dBSPL
70
75
80
85
90
95
100
105
110
115
120
SPL vs Freq
A
B
FIGURE 18: Beyma SW1300Nd free-air impedance plot.
FIGURE 19: Beyma SW1300Nd computer box simulations (A = vented at
2.83V; B = vented at 30V).
TSL model LTD model Factory sample 1 sample 2 sample 1 sample 2FS 41.4Hz 40.5Hz 42.2Hz 38.0Hz 45HzREVC 5.00 5.06 5.00 5.06 4.9Sd 0.0531 0.0531 0.0531 0.0531 0.0550QMS 6.43 6.31 6.46 6.13 12.07QES 0.27 0.24 0.24 0.21 0.27QTS 0.27 0.23 0.21 0.20 0.26VAS 52.8 ltr 55.2 ltr 53.3 ltr 63.3 ltr 45 ltrSPL 2.83V 93.3dB 93.7dB 93.7dB 94.0dB 96dBXMAX 5.5mm 5.5mm 5.5mm 5.5mm 5.5mm
��>� ���?�� @"����1�<��+0�*���6���0�6�>,��= �
10 Hz 20 50 100 200 500 1K
Sec
0
5m
10m
15m
20m
Time vs Freq
FIGURE 20: Group delay curves for the 2.83V curves in Fig. 19.

APRIL 2011 17
the factory data. The biggest variation was the factory Vas,
which was smaller. I programmed the factory data into
LEAP 5, and it produced an enclosure simulation result
close to my data, so obviously the Fs/Qt ratios were similar.
However, following my normal protocol, I proceeded to use
the LEAP 5 LTD parameters for sample 1. The only caveat
here is that the intended application for this driver is as a
horn coupled woofer including some specific EQ settings,
which LEAP 5 does not simulate. You can check this out
at http://profesional.beyma.com/download/pdf/SB12.pdf.
Because this driver could also possibly be used in a
vented application, I put together a single vented simula-
tion, an EBS (Extended Bass Shelf) alignment in a 0.9ft3
enclosure with 15% fill material (fiberglass) and tuned to
55Hz. Figure 19 gives the results for the 12SW1300Nd in
the single vented enclosures at 2.83V and at a voltage level
high enough to increase cone excursion to Xmax + 15%
(6.3mm for the Beyma neo subwoofer). This resulted in a
F3 of 60Hz (F6 = 54Hz) for the 0.9ft3 box. Increasing the
voltage input to the simulations until the maximum linear
cone excursion reached Xmax +15% resulted in 115dB at
30V (see Figs. 20 and 21 for the 2.83V group delay curve
and the 30V excursion curve). Note that I chose 30Hz as
the low-frequency point for the maximum excursion for
this box simulation, and using a 20-30Hz high-pass would
limit excursion and increase power handling.
Klippel analysis for the Beyma 12″ subwoofer produced the
Bl(X), Kms(X) and Bl and Kms symmetry range plots given
in Figs. 22-25. The Bl(X) curve for the 12SW1300Nd (Fig. 22) is very symmetrical and like most pro sound drivers, not
as broad as a really high Xmax device. The Bl symmetry plot
curve (Fig. 23) shows zero coil forward offset at the rest posi-
tion that increases to a trivial 0.13mm at the physical 5.5mm
Xmax of the driver, so this driver looks very well balanced.
Figures 24 and 25 show the Kms(X) and Kms symmetry
range curves. The Kms(X) curve is also very symmetrical, and
has a small amount of rearward (coil-10) offset of 1.2mm
at the rest position that decreases to 0.99mm at the 5.5mm
physical Xmax location on the graph (not a lot, perhaps just
positioned slightly to the rear in assembly, but within manu-
facturing tolerance). Displacement limiting numbers calculat-
ed by the Klippel analyzer were XBl at 70% Bl = 9.1mm, and
for XC at 50% Cms minimum was 11.4mm, which means
that the Bl is the most limiting factor for prescribed distortion
level of 20%, but as noted by Beyma in the product literature,
was almost 10mm with a 5.5mm physical Xmax.
Figure 26 gives the inductance curve Le(X) for the
12SW1300Nd woofer. While the same criterion for con-
ventional ferrite motor woofers does not apply to some of
the neodymium motor configurations, you can see that the
inductance variance over the operating range (Xmax in to
Xmax out) is only 1.73mH to 2.10mH, which is minimal
variation for this size driver.
With the Klippel testing completed, I mounted the
12SW1300Nd pro sound driver in an enclosure which had
a 17″ × 17″ baffle and was filled with foam damping mate-
Just open the box and start testing in minutes!
Dayton Audio’s OmniMic is a must-have for system
integrators, acoustic engineers, and A/V installers. It
was developed in collaboration with Liberty Audio,
inventors of the Praxis Measurement System. The
OmniMic provides quick and accurate measurements
that will reduce installation time, saving you both labor
and money. Test signals may be initiated from the host
computer, or from any audio CD player. System includes
calibrated USB microphone, mic clip, software and
test signal discs, 6 ft. USB cable, and carrying case.
Compatible with Windows XP, Vista, and Windows 7.
Distributed By:
Tel:800-338-0531725 Pleasant Valley Dr.Springboro, OH 45066
In Europe:
intertechnik.de
In Asia:
baysidenet.jp
In Canada:
solen.caparts-express.com/vcm

18 VOICE COIL
10 Hz 20 50 100 200 500 1K
M
1m
2m
3m
4m
5m
6m
7m
8m
9m
10m
20m
Excursion vs Freq
FIGURE 22: Klippel Analyzer Bl (X) curve for the Beyma SW1300Nd.
FIGURE 24: Klippel Analyzer mechanical stiffness of suspension Kms (X)
curve for the Beyma SW1300Nd.
FIGURE 21: Cone excursion curves for the 30V curves in Fig. 19. FIGURE 23: Klippel Analyzer Bl symmetry range curve for the SW1300Nd.

APRIL 2011 19
300 Hz 500 1K 2K 5K 10K 20K
dBSPL
45
50
55
60
65
70
75
80
85
90
95
100
105SPL vs Freq
FIGURE 26: Klippel Analyzer Le(X) curve for the Beyma SW1300Nd.
FIGURE 25: Klippel Analyzer Kms symmetry range curve for the SW1300Nd. FIGURE 27: Beyma SW1300Nd on-axis frequency response.
300 Hz 500 1K 2K 5K 10K 20K
dBSPL
45
50
55
60
65
70
75
80
85
90
95
100
105SPL vs Freq
FIGURE 28: Beyma SW1300Nd on- and off-axis frequency response.

20 VOICE COIL
"""#"������#���
����$�������%��&���� ���'���(�����%���������&��%����'& ���
(/0*1/2�3 4��������
5$%�������������#/ 1 /2 +��������
��5$%������������#// 1 /22 +������ ���
300 Hz 500 1K 2K 5K 10K 20K
dBSPL
45
50
55
60
65
70
75
80
85
90
95
100
105SPL vs Freq
FIGURE 29: Beyma SW1300Nd two-sample SPL comparison.
FIGURE 31: Beyma SW1300Nd SoundCheck CSD waterfall plot.
FIGURE 32: Beyma SW1300Nd SoundCheck Wigner-Ville plot.
FIGURE 30: Beyma SW1300Nd SoundCheck distortion plots.

APRIL 2011 21
rial and then measured the driver both on- and off-axis from
300Hz to 20kHz frequency response at 2.83V/1m using
a 100-point gated sine wave sweep. Figure 27 depicts the
on-axis response that is a smooth even response up to cone
breakup peak at 1.3kHz followed by the low-pass rolloff.
Figure 28 illustrates the on- and off-axis frequency response
at 0, 15, 30, and 45°. Even though this is a subwoofer, it
would be possible to use it in a two-way or three-way con-
figuration with a vented box. In the suggested Beyma horn
load application, it would just be a subwoofer. And last, Fig. 29 gives the two-sample SPL comparisons for the 12″ Beyma
driver, showing a good match throughout the operating range
of this woofer. Of course, if you are using it as a sub in a short
coupled horn enclosure, this really isn’t important.
For the last body of testing on the Beyma 12″, I again
fired up the Listen Inc. SoundCheck analyzer and SCM
microphone and power supply to measure distortion and
generate time frequency plots. Setting up for the distortion
measurement again consisted of mounting the woofer rigidly
in free-air, and setting the SPL to 104dB at 1m (14.8V)
using a noise stimulus (SoundCheck has a software generator
and SPL meter as two of its utilities). I then measured the
distortion with the SCM microphone placed 10cm from the
dust cap, which produced the distortion curves in Fig. 30.
For the last test on the 12SW1300Nd, I used the
SoundCheck analyzer to get a 2.83V/1m impulse response
for this driver and imported the data into Listen Inc.’s
SoundMap Time/Frequency software. The resulting CSD
waterfall plot is given in Fig. 31 and the Wigner-Ville (for its
better low-frequency performance) plot in Fig. 32. For more
information on this well-executed neo 12″ driver and other
Beyma pro sound products, visit www.beyma.com. VC
Sample Submission for Test BenchTest Bench is an open forum for OEM driver manufacturers in the industry and all OEMs are invited to submit samples to Voice Coil for inclusion in the monthly Test Bench column. Driver samples can be for use in any sector of the loudspeaker market including transducers for home audio, car audio, pro sound, multimedia, or musical instrument applications. While many of the drivers featured in Voice Coil come from OEMs that have a stable catalog of product, this is not a necessary criterion for submission. OEM manufacturers are encouraged to send samples of woofers, midranges, or tweeters they think are representative of their work. However, please contact Voice Coil Editor Vance Dickason prior to submission to discuss which drivers are being submitted. Samples should be sent in pairs and addressed to:
Vance Dickason Consulting333 S. State St., #152Lake Oswego, OR 97034(503-557-0427)[email protected] samples must include any published data on the prod-
uct, patent information, or any special information necessary to explain the functioning of the transducer. This should include details regarding the various materials used to construct the transducer such as cone material, voice coil former material, and voice coil wire type. For woofers and midrange drivers, please include the voice coil height, gap height, RMS power handling, and physically measured Mmd (complete cone assembly including the cone, surround, spider, and voice coil with 50% of the spider, surround, and lead wires removed).
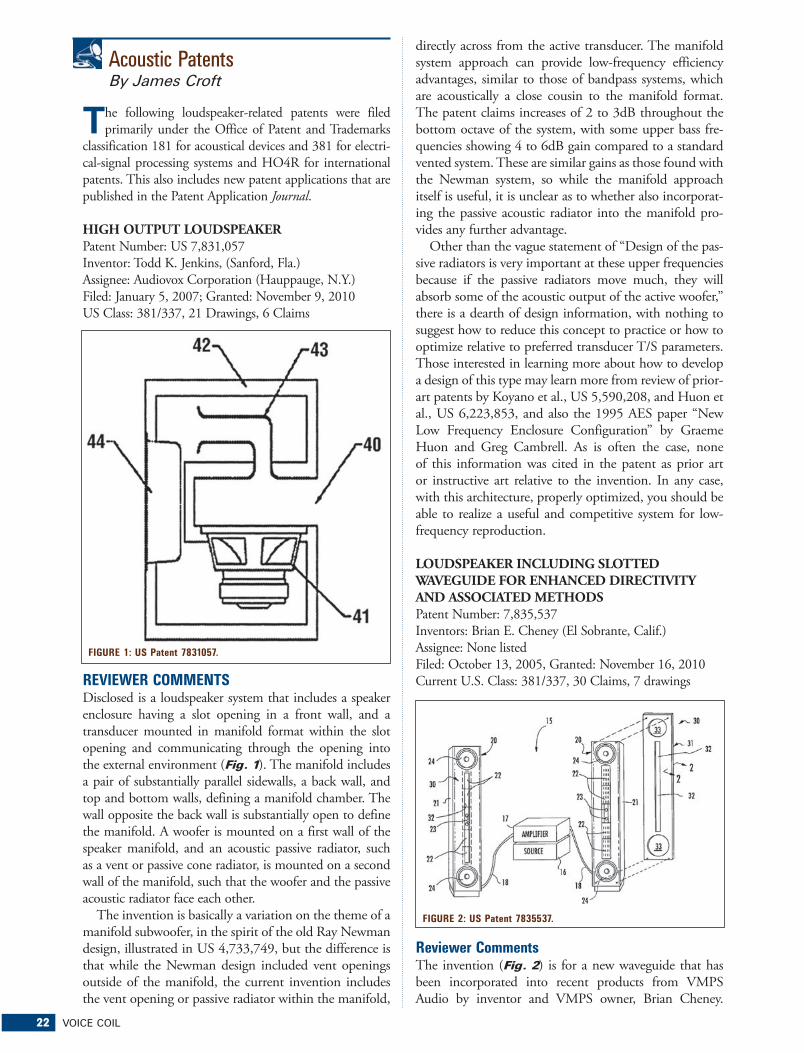
22 VOICE COIL
Acoustic Patents By James Croft
�he following loudspeaker-related patents were filed
primarily under the Office of Patent and Trademarks
classification 181 for acoustical devices and 381 for electri-
cal-signal processing systems and HO4R for international
patents. This also includes new patent applications that are
published in the Patent Application Journal.
HIGH OUTPUT LOUDSPEAKERPatent Number: US 7,831,057
Inventor: Todd K. Jenkins, (Sanford, Fla.)
Assignee: Audiovox Corporation (Hauppauge, N.Y.)
Filed: January 5, 2007; Granted: November 9, 2010
US Class: 381/337, 21 Drawings, 6 Claims
REVIEWER COMMENTS Disclosed is a loudspeaker system that includes a speaker enclosure having a slot opening in a front wall, and a transducer mounted in manifold format within the slot opening and communicating through the opening into the external environment (Fig. 1). The manifold includes a pair of substantially parallel sidewalls, a back wall, and top and bottom walls, defining a manifold chamber. The wall opposite the back wall is substantially open to define the manifold. A woofer is mounted on a first wall of the speaker manifold, and an acoustic passive radiator, such as a vent or passive cone radiator, is mounted on a second wall of the manifold, such that the woofer and the passive acoustic radiator face each other.
The invention is basically a variation on the theme of a
manifold subwoofer, in the spirit of the old Ray Newman
design, illustrated in US 4,733,749, but the difference is
that while the Newman design included vent openings
outside of the manifold, the current invention includes
the vent opening or passive radiator within the manifold,
directly across from the active transducer. The manifold
system approach can provide low-frequency efficiency
advantages, similar to those of bandpass systems, which
are acoustically a close cousin to the manifold format.
The patent claims increases of 2 to 3dB throughout the
bottom octave of the system, with some upper bass fre-
quencies showing 4 to 6dB gain compared to a standard
vented system. These are similar gains as those found with
the Newman system, so while the manifold approach
itself is useful, it is unclear as to whether also incorporat-
ing the passive acoustic radiator into the manifold pro-
vides any further advantage.
Other than the vague statement of “Design of the pas-
sive radiators is very important at these upper frequencies
because if the passive radiators move much, they will
absorb some of the acoustic output of the active woofer,”
there is a dearth of design information, with nothing to
suggest how to reduce this concept to practice or how to
optimize relative to preferred transducer T/S parameters.
Those interested in learning more about how to develop
a design of this type may learn more from review of prior-
art patents by Koyano et al., US 5,590,208, and Huon et
al., US 6,223,853, and also the 1995 AES paper “New
Low Frequency Enclosure Configuration” by Graeme
Huon and Greg Cambrell. As is often the case, none
of this information was cited in the patent as prior art
or instructive art relative to the invention. In any case,
with this architecture, properly optimized, you should be
able to realize a useful and competitive system for low-
frequency reproduction.
LOUDSPEAKER INCLUDING SLOTTED WAVEGUIDE FOR ENHANCED DIRECTIVITY AND ASSOCIATED METHODSPatent Number: 7,835,537
Inventors: Brian E. Cheney (El Sobrante, Calif.)
Assignee: None listed
Filed: October 13, 2005, Granted: November 16, 2010
Current U.S. Class: 381/337, 30 Claims, 7 drawings
Reviewer CommentsThe invention (Fig. 2) is for a new waveguide that has been incorporated into recent products from VMPS Audio by inventor and VMPS owner, Brian Cheney.
FIGURE 1: US Patent 7831057.
FIGURE 2: US Patent 7835537.
APRIL 2011 23
While planar film devices can provide desirable attributes, one of their weaknesses is that of less efficiency, or output, per unit area than conventional cone and dome devices. To offset that limitation, planar magnetic devices are most often made larger in diaphragm surface area than conventional devices covering a similar frequency range. To realize their ability to operate over a very wide band-width also requires that the device be relatively wide to maintain a low enough fundamental resonant frequency, but that limits the dispersion at the highest frequencies. Maximizing the performance of these devices sometimes requires compromise in device width and low-frequency capability.
This patent addresses the problem with an effective
solution. It is expressed in the patent as a loudspeaker
comprising a baffle, a thin film diaphragm, planar trans-
ducer mounted on the baffle, and a slotted waveguide
mounted adjacent to the front surface of the transducer.
The waveguide has a slotted opening, and the planar
transducer has an elongated rectangular shape registered
in a manner centered with the slotted opening. The
planar diaphragm transducer has a width greater than a
width of the slotted opening.
In the preferred embodiment, the opening width of
the waveguide is approximating a wavelength relative to
a predetermined high frequency. For a design frequency
of 20kHz, the slotted opening is to be no greater than
17mm. It is claimed that the loudspeaker would pro-
vide a constant horizontal directivity of -6dB at ±75°up to about 20kHz. The slotted waveguide preferably
includes a sound-absorbing layer adjacent to the surface
of the planar film diaphragm transducer, and a sound-
reflecting layer adjacent to the sound absorbing layer,
both having a slot opening of the specified width. While
the concept is meant to work with any planar diaphragm
transducer including an electrostatic transducer, the
preferred system, and current application, incorporates a
planar magnetic transducer.
These types of slotted directivity devices can be quite
effective at increasing the dispersion of a transducer with
a diaphragm larger than the slot opening. While they cer-
tainly increase dispersion, it is not quite accurate to suggest
that they are “constant directivity” devices as suggested by
the patent, although, if you apply a narrow enough slot, on
a wide enough baffle, you can maintain a fairly constant
half-space directivity, similar to mounting an omnidirec-
tional device boundary coupled to a wall surface.
As is often the case, there are prior-art examples that
appear to anticipate this “invention” but were not disclosed
to, or discovered by, the examiner. One example is that of
US patent number 7,316,290, by Hutt et al. Others, such
as David Graebener, currently of Wisdom Audio, have
experimented with this concept for more than a couple
decades with his extensive work with planar magnetic trans-
ducers. It can be more important to optimize and apply a
technology effectively than to be the first to invent it, and
Mr. Cheney has apparently applied the slotted waveguide
effectively, receiving favorable reviews of his system. VC��������������������� �������������������������
���������������� !���"�������#������������������������
$ ��
��#
%�!
����
&��
����%
�'
�
�
$ ����#%�! ����&������%�'�� ��)�����������%�'� � ����%��%�'����������(�������������%'�����(%���)� ���� ����(����������*� ��+��,���%������� �-��� ������(%��.�
/%����,����%����,���%�����%���%'� �����(( � ��0�%� � ��0��� � ��0���%�%�'� �����)���(�������������������������� �%����%����%���������(������������)������� !���123-�� ���*���� ��� ����)%� �%����(�����%������ ���%��� ������ ���*������,�����������%�����
/��� ��� �������)������*���4�%����0��25"��0�360�&�710�3�6650��6"& �0�825�0������������%�������%���% 0�� �� ��%�0�370�"��0���� �� ��������9������� �����%�����%�'��9:;�0�$#&�� �����������%����
5�������� �� �� � %� )������%'���� ���� ��%��������������(�����)������ �����������'%�����0�%������% �����%'����� ���� �!��%�'��,������7�!�����(�%������%������*� ���*���� ��� ��%��%�'����)%� �%����� �����������������������<��0� �*� �����!����%��������

24 VOICE COIL
Industry WatchBy Vance Dickason
'udiovox (www.audiovox.com) and
Klipsch Group (www.klipsch.com)
entered into a definitive agreement in
which Audiovox will buy Klipsch for
$166 million. Klipsch will become a
wholly owned subsidiary of Audiovox,
will be run as a standalone operation
in Indianapolis, and will continue to
be led by Klipsch’s current management
team. Audiovox expects to finance the
acquisition with a combination of exist-
ing Audiovox cash and a new asset-based
revolving credit facility that will also be
used for operating capital. Once the deal
closes, Audiovox also expects to have money left over under the
credit facility for general corporate purposes. On a pro-forma
basis, for the 12 months ending Nov. 30, 2010, the combined
companies’ revenues were about $742.2 million, compared
with $573.1 million for Audiovox as a standalone company.
Ultimate Acquisition Partners, the parent company of the
46-store A/V and appliance chain (www.ultimateelectron-
ics.com), has filed for Chapter 11 bankruptcy protection in
Delaware. In the filing, CEO Bruce Giesbrecht said the action
was prompted by “a significant downturn in business” at some
Ultimate Electronics locations and the refusal of certain ven-
dors to ship products on open credit. The company, which is
71% held by chairman Mark Wattles’ investment firm, Wattles
Capital Management, and 25% held by Hewlett-Packard, is
seeking to use cash collateral to continue day-to-day operations
and pay its vendors. Many of the chain’s vendors have agreed to
reopen their credit lines once their payables are paid.
Top unsecured creditors include New Age Electronics/
Synnex ($5.5 million), Sony Electronics ($4.8 million),
GE Money Bank ($3 million), and Monster ($2.3 million).
Manufacturers owed between $1 million and $2 million
include, in descending order, Klipsch, Mitsubishi, Toshiba,
Haier, and Whirlpool. The company has accounts receivable
of about $2 million, inventory valued at $98 million, and real
estate holdings valued at $12.8 million. Liabilities are between
$100 million and $500 million, court documents show.
This is the second filing for Ultimate Electronics in six
years. Wattles, the founder of Hollywood Video and a dissi-
dent Circuit City shareholder, bought a controlling interest
in the chain in 2005, filed Chapter 11, and reacquired the
business in a bankruptcy auction later that year. Since then
Wattles built the Colorado-based company from 32 to 46
stores, including some in distant markets in the Northeast,
and added new categories to its core A/V mix, including
major appliances and billiard tables.
Rockford Corp. (www.rockfordcorp.com) appointed its
VP sales and marketing Bill Jackson to the position of
president while Gary Suttle, formerly president and CEO,
remains CEO. The company said Jackson’s appointment
will allow Suttle to focus on Rockford’s strategic direc-
tion as it completes its transformation
from a manufacturing-focused company
to a “designer, marketer and distribu-
tor” of car audio aftermarket and OEM
products. Jackson will assume primary
responsibility for Rockford’s worldwide,
day-to-day operations, the company
said. He will be replaced by Michael
Chass, VP Automotive OEM for D &
M Holdings (the holding company for
Denon, Marantz, Boston Acoustics, and
other companies), who will assume the
title of VP sales. Jackson joined Rockford
in 1995 as a regional sales manager and
held a variety of sales management posi-
tions until he was named VP of sales and
marketing in February 2004. Prior to
joining Rockford, he managed a retail
consumer electronics store for 13 years and operated a manu-
facturer’s sales representative firm for three years.
The Lenbrook Group (www.lenbrook.com) appointed
audio-industry veteran Dean Miller (Photo 1) as president/
CEO of US-based subsidiary Lenbrook America, which mar-
kets NAD electronics and PSB speakers. The Sharon, Mass.-
based subsidiary also distributes Tivoli Audio products. Miller,
who will be responsible for Lenbrook’s US market activities,
was president of specialty cable manufacturer AudioQuest.
Before that, he was president of the US subsidiaries of Bang
& Olufsen and Nakamichi. In the late 1990s, he was presi-
dent of the American subsidiary of Rolls-Royce and Bentley
Motor Cars Inc. Miller has also served on the board of the
Consumer Electronics Association’s Audio Division and
PARA (Professional Audio/Video Retailers Association) and
is known for his forward-looking and creative approach to
building successful business within the specialty A/V world.
A Hawaii state legislative committee has indefinitely
deferred a proposal to ban the installation and ownership
of aftermarket car stereo systems with speakers of more
than 6.5″ in height or depth, with five or more speakers,
and with speakers rated at more than 100W. The House
assembly transportation committee doesn’t expect to hold
any more hearings on the topic, which was introduced to
assuage residents annoyed by loud car audio systems. The
legislature’s current session ended Feb. 18. More than 200
people, including dealers, came out to oppose the measure,
according to the Honolulu Star Advertiser. This controversy
harkens back to the 1980s and 1990s when multiple states
and municipalities considered proposals, which subse-
quently failed, to limit the types of car audio products that
could be installed to reduce noise levels in neighborhoods.
The first such effort occurred in Jersey City, N.J.
Meridian America (www.meridian-audio.com) signifi-
cantly scaled back its dealer base and product selection
beginning in 2009, yet posted a 12% sales gain in 2010.
Meridian grew by focusing more resources on fewer, more
committed dealers and by taking more of a luxury position
in the A/V market. With its greater focus on the luxury
market, Meridian brought in new staff with a luxury-mar-
PHOTO 1: New Lenbrook CEO Dean Miller.
APRIL 2011 25
ket background and opened up its US headquarters here for
use as a dealer showroom to demonstrate Meridian’s high-
end audio and video products to high-level business execu-
tives, athletes, and actors who don’t shop in retail stores.
Meridian also began to support dealers whose high-profile
customers want a demo in their own homes. For these
dealers, Meridian flies out products and staff to set up and
demo a system in the potential customer’s home and let the
homeowner live with it for a day. About 90% of the time,
Meridian staff makes the presentation to the consumer, but
the dealer sets up the appointment and profits from the sale.
All home demos to date have closed a sale.
The reduction in the US dealer base began in late 2009,
and by the end of 2010, the company had reduced its 250
active accounts to 150. By mid February, the company had
pared more dealers, bringing the base to 120. And more
cuts could be coming. To reinforce its luxury position, a
Meridian-branded autosound system will appear globally
this May in the Range Rover Evoque. The Meridian brand
already appears on sound systems in McLaren vehicles.
In paring its selection, the company reduced its SKU
count to 30 from as many as 130 in 2007. The company,
however, is gearing up to add at least one more product, a
six-zone Sooloos audio server that offers more zones and
more output types per zone compared to the company’s other
multizone servers. The MediaCore 600 will be Meridian’s
first multizone server with proprietary SpeakerLink output.
Although many specs haven’t been finalized, the server will
feature one analog output, one coaxial digital output, and
one SpeakerLink output per zone.
SpeakerLink delivers balanced 96kHz/24-bit digital audio
and control signals up to 300′ over CAT-5e RJ-45-terminated
cable to the company’s active DSP speakers, including its
active in-wall DSP speakers. SpeakerLink eliminates signal
losses and coloration induced by analog signals riding on a
cable, and it simplifies cable connections because Meridian
DSP speakers can be daisy-chained to avoid home-running
cable from each speaker to a Meridian component.
Harman International’s consumer division posted world-
wide operating income of $11 million in its fiscal second quar-

26 VOICE COIL
ter (www.harman.com). This was up sequentially from zero
operating income in the first quarter and up 91% from the $6
million posted a year ago. The division’s income gain came on
net sales growth in the second quarter of 10% to $139 million,
up sequentially from a 3% gain in the previous quarter and up
10% from the year-ago quarter. For the half, net sales were up
7% to $226 million. Consumer division gross profit also rose
in the quarter and half, with second-quarter gross profit rising
19% to $42 million, and second-half gross profit hitting $67
million, up 16% from the year-ago $57 million.
On a consolidated basis that includes the automotive
OEM and professional-audio divisions, Harman posted
gains in net sales, operating income, and net income in its
fiscal second quarter and first half, marking the company’s
fifth consecutive quarterly net profit. Growth in sales and
operating income came in the professional-audio segment
in the quarter and half ending December 2010. Operating
income in the automotive OEM segment rose in the quar-
ter and half, but automotive sales dipped 1% in the quarter
while rising in the half by 5%. Consolidated sales in all three
segments were up 3% to $956 million in the quarter and
up 7% in the half to $1.79 billion. Consolidated operating
income was up 82% to $68 million for the quarter and
almost quadrupled for the half to $111 million. Net income
from continuing operations almost tripled to $53 million in
the quarter from a year-ago $13.4 million and shot way up
to $80.4 million for the half from a year-ago $1.82 million.
Consumer confidence in the overall economy reached its
highest level in nearly three years this month, according to the
latest figures released by the Consumer Electronics Association
(CEA). The CEA Indexes also show consumer confidence in
technology reached an all-time high for the month of January.
For the sixth consecutive month, consumer confidence
in the overall direction of the economy improved. The CEA
PHOTO 2: One of Kicker’s new OEM car audio speakers.
PHOTO 3: The Harman-Kardon sound bar.
APRIL 2011 27
��������™ R & D Measurement system
�������������
Features: Multiple displays of min. 16 responses
Cumulative decay spectrum “Waterfall”
THD + 2 – 9th harmonics distortion
1/12 - 1/6 - 1/3 – 1/2 – 1/1 octave
Anechoic FFT - Acoustic auto-delay
50 curves/responses/TS parameters
SPL/Frequency, Imp., phase, export
Soundcards: PCI/USB/Firewire/ASIO
Headsets, USB/Bluetooth
Index of Consumer Expectations (ICE) rose one point in
January to 175.7. That’s the highest the ICE has been since
February 2008. The ICE, which measures consumer expec-
tations about the broader economy, is up more than nine
points from this time last year.
Consumer confidence in technology is the highest it’s ever
been in the month of January, despite dropping from last
month’s record high. The CEA Index of Consumer Technology
Expectations (ICTE) fell 5.6 points to 88.1 this month. The
ICTE, which measures consumer expectations about technol-
ogy spending, still recorded its highest level ever for the month
of January and is up more than four points from this time last
year. The CEA Indexes comprise the ICE and ICTE, both
of which are updated on a monthly basis through consumer
surveys. New data is released on the fourth Tuesday of each
month. CEA has been tracking index data since January 2007.
To find current and past indexes, charts, methodology, and
future release dates, log on to CEAindexes.org.
Stillwater Designs has begun shipping its Kicker-brand
KS series of coaxial and three-way car speakers designed for
drop-in replacement of factory speakers (www.kicker.com).
The updated series of ten models, priced from a suggested
$59.95 to $179.95/pair, features larger magnet/motor struc-
tures than the predecessor series to handle more power, be
more efficient, and thus play louder and with greater accu-
racy, a spokesman said. The models (Photo 2) also feature
proprietary Extended Voice Coil technology to deliver high
excursion and thus deeper bass response. The series starts
with 3.5″ coaxial and tops out with a 6 × 9″ three-way
model with 1″ midrange and 0.75″ tweeter. Sizes include
3.5, 4, 4 × 10, 5.25, 6, 6.5, 6 × 8, and 6 × 9″ models.
Harman Kardon (www.harmankardon.com) launched its
first sound bar system, the $599-suggested SB 16 (Photo 3) with virtual surround processing, wireless subwoofer, and
audio-input switching. Each left and right speaker channel fea-
tures two 3″ midrange drivers and a 0.75″ tweeter. The speaker
complement is driven by a 2 × 25W amplifier rated at 20Hz to
20kHz onto 8Ω with less than 0.07% THD with both chan-
nels driven simultaneously. The sound bar’s jack pack consists
of a stereo analog input for source one. The source two input
features both a coaxial digital input and an optical digital input,
allowing for digital connection of two additional devices, such
as a Blu-ray player, set-top box, or game console, according
to the product manual, but the sound bar doesn’t incorporate
Dolby Digital or DTS 5.1-channel decoders. The sound bar
also features a switchable stereo mode for music playback.
The 4.3″ × 36.25″ × 3.5″ sound bar can be programmed
to respond to a TV remote’s volume, power, and source
commands, and an EQ switch adjusts response for wall
mounting or table mounting. An auto turn-on circuit auto-
matically turns on the subwoofer when an audio signal is
present. The subwoofer’s down-firing bass-reflex enclosure
allows for placement flexibility by loading the sub against
the floor instead of against surrounding walls, the company
said. The sub also comes with level, crossover, and phase
controls. A trim switch lets consumers adjust the sound bar’s
input sensitivity so it will work with a variety of TVs with
different audio-signal output levels. VC

28 VOICE COIL
Product News
Jensen Falcon 10″Jensen® Musical Instrument Speakers’ latest addition to the Jensen® Jet series is the 10″ Falcon. With its 40W of power,
a ceramic magnet, and a seamed green cone made from all
natural materials, the 10″ Falcon is specially designed to
ensure optimum tone for all styles of music.
The Falcon 10″ tone is warm and straightforward with
a pronounced low end. According to the company, its mid
frequencies are slightly enhanced over the Falcon 12″, and
it has a very sweet, yet cutting, high end. When presented
with overdrive distortion it produces some mean fuzz. For
more, go to jensentone.com.
New from B&CB&C’s high-performance “SW Series” subwoofer fam-ily has two new 15″ members. The 15SW100 4″ voice coil subwoofer is a 3,000W neodymium motor driver that incorporates B&C’s split winding voice coil technol-ogy, which dramatically reduces distortion and nonlinear-ity. And peak-to-peak excursion is 57mm. Other features include a ventilated voice coil gap for reduced power compression, and an aluminum demodulation ring that
B&C’s 6HCX51 coaxial.
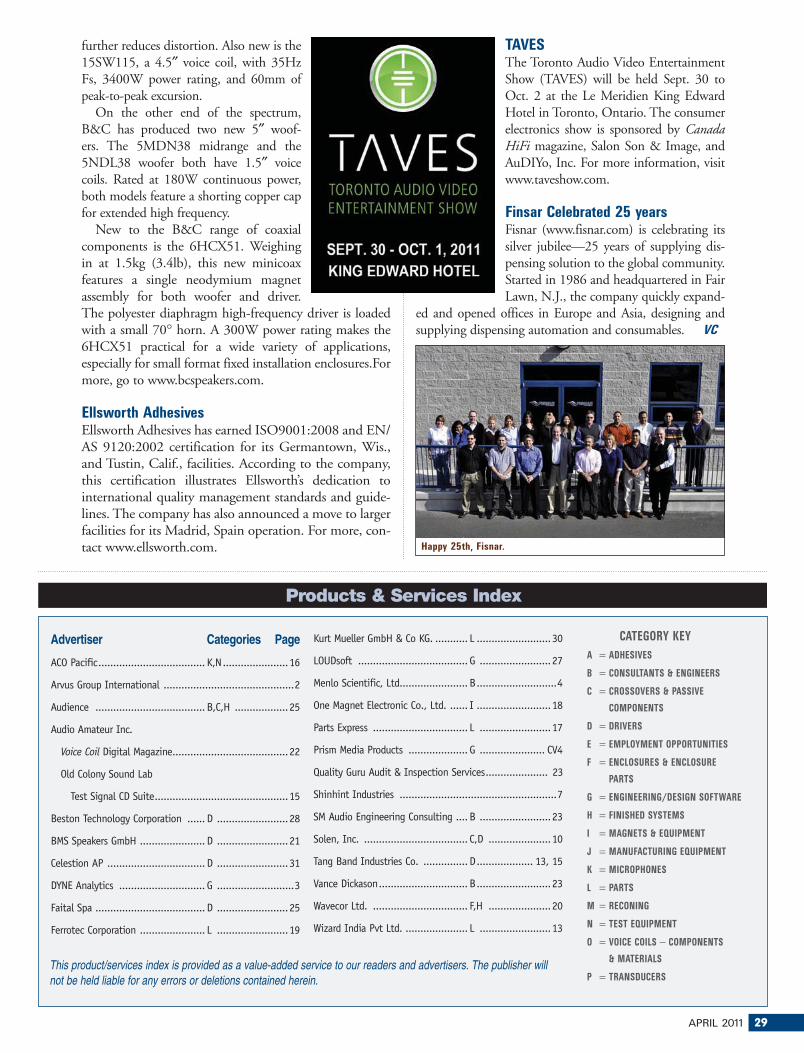
APRIL 2011 29
Advertiser Categories Page
ACO Pacific .................................... K,N ......................16
Arvus Group International ............................................2
Audience ..................................... B,C,H ..................25
Audio Amateur Inc.
Voice Coil Digital Magazine .......................................22
Old Colony Sound Lab
Test Signal CD Suite .............................................15
Beston Technology Corporation ...... D ........................28
BMS Speakers GmbH ...................... D ........................21
Celestion AP ................................. D ........................31
DYNE Analytics ............................. G ..........................3
Faital Spa ..................................... D ........................25
Ferrotec Corporation ...................... L ........................19
Kurt Mueller GmbH & Co KG. ........... L .........................30
LOUDsoft ..................................... G ........................27
Menlo Scientific, Ltd. ...................... B ...........................4
One Magnet Electronic Co., Ltd. ...... I .........................18
Parts Express ................................ L ........................17
Prism Media Products .................... G ...................... CV4
Quality Guru Audit & Inspection Services ..................... 23
Shinhint Industries .....................................................7
SM Audio Engineering Consulting .... B ........................23
Solen, Inc. ................................... C,D .....................10
Tang Band Industries Co. ............... D ................... 13, 15
Vance Dickason .............................. B .........................23
Wavecor Ltd. ................................ F,H .....................20
Wizard India Pvt Ltd. ..................... L ........................13
CATEGORY KEY
A = ADHESIVES
B = CONSULTANTS & ENGINEERS
C = CROSSOVERS & PASSIVE
COMPONENTS
D = DRIVERS
E = EMPLOYMENT OPPORTUNITIES
F = ENCLOSURES & ENCLOSURE
PARTS
G = ENGINEERING/DESIGN SOFTWARE
H = FINISHED SYSTEMS
I = MAGNETS & EQUIPMENT
J = MANUFACTURING EQUIPMENT
K = MICROPHONES
L = PARTS
M = RECONING
N = TEST EQUIPMENT
O = VOICE COILS − COMPONENTS
& MATERIALS
P = TRANSDUCERSThis product/services index is provided as a value-added service to our readers and advertisers. The publisher will not be held liable for any errors or deletions contained herein.
Products & Services Index
further reduces distortion. Also new is the 15SW115, a 4.5″ voice coil, with 35Hz Fs, 3400W power rating, and 60mm of peak-to-peak excursion.
On the other end of the spectrum,
B&C has produced two new 5″ woof-
ers. The 5MDN38 midrange and the
5NDL38 woofer both have 1.5″ voice
coils. Rated at 180W continuous power,
both models feature a shorting copper cap
for extended high frequency.
New to the B&C range of coaxial
components is the 6HCX51. Weighing
in at 1.5kg (3.4lb), this new minicoax
features a single neodymium magnet
assembly for both woofer and driver.
The polyester diaphragm high-frequency driver is loaded
with a small 70° horn. A 300W power rating makes the
6HCX51 practical for a wide variety of applications,
especially for small format fixed installation enclosures.For
more, go to www.bcspeakers.com.
Ellsworth Adhesives Ellsworth Adhesives has earned ISO9001:2008 and EN/AS 9120:2002 certification for its Germantown, Wis., and Tustin, Calif., facilities. According to the company, this certification illustrates Ellsworth’s dedication to international quality management standards and guide-lines. The company has also announced a move to larger facilities for its Madrid, Spain operation. For more, con-tact www.ellsworth.com.
TAVESThe Toronto Audio Video Entertainment Show (TAVES) will be held Sept. 30 to Oct. 2 at the Le Meridien King Edward Hotel in Toronto, Ontario. The consumer electronics show is sponsored by Canada HiFi magazine, Salon Son & Image, and AuDIYo, Inc. For more information, visit www.taveshow.com.
Finsar Celebrated 25 yearsFisnar (www.fisnar.com) is celebrating its silver jubilee—25 years of supplying dis-pensing solution to the global community. Started in 1986 and headquartered in Fair Lawn, N.J., the company quickly expand-
ed and opened offices in Europe and Asia, designing and supplying dispensing automation and consumables. VC
Happy 25th, Fisnar.

3������ �����*� ����(��,���%�����%���������%�'� ���������%�'�������� !����������������������%'���������%=� �%����
>��&����>����������#����>��6�%����>��6��������>��#����& ��
����!��������������
#���4����3?�����@�)9�A�&���4@� �4��(������6�� B��C�� ���DE�4��(���� �@��� �*������F�E��C�C���E � �8 ,��F�E��C�C����E�C� �%�(��!��������������
2�'%
����
%�'�
���
����
����
�
� ����0��� ���8C
������������������ �
��������������������������
������������������������
��������������������
���������������������
����������������������
� ������������������
��������������������!�����
������������������
�������!�����������
"���������#�CDX14-3050
$�%�&���� '()���� ��
$�(���� '*)�������������
$�+���!����������
$������������������
$�,�����������������
����������� ����������
Celestion: Your Global Driver Solutions Partner
Innovative drivers Custom development services Global operations
���������������������������
-�+./0-+ "-12
�����������������������������
For more information on Celestion's comprehensive range of professional audio productsincluding CDX compression drivers, visit the Celestion Professional website:
...integrated
electronic test, acoustic test...
Prism Sound is now a globalsales & support agent for:
������������������� �������� ������������������������������������ ���������������������������������������������������������� ����������������
��������������������� ���������� ������������ ���������������������
������������������� !�����������������������������������������������������"������ ���������� �����#�������������������$�����%dScope Series III
analog and digitalaudio analyzers
������������������� ��������������������������������������������� �!"#�����$ ����
Loudspeaker design and analysis solutions

V O L U M E 2 4 , I S S U E 7 M A Y 2 0 1 1
®
IN THIS ISSUEINDUSTRY NEWS AND DEVELOPMENTS
SPOTLIGHT
SPOTLIGHT
5
21
1
Measurement and Perception of Regular Loudspeaker DistortionBy Wolfgang Klippel and Robert Werner
Acoustic ResistanceSecret Sauce for Speakers By Mike Klasco and Steve Tatarunis
TEST BENCH13
30 Products & Services Index
Wavecor and Faital Home and Pro Drivers By Vance Dickason
Industry News and DevelopmentsBy Vance Dickason
AES 130th AES ConventionThe AES 130th Convention is taking place May 13-16 at the Novetel London West, UK. The theme for this year’s show is “Make the Right Connections.” For more and a peek at this year’s program, visit www.aes.org. Also, the deadline for submitting scholarship applications from students getting a graduate degree in audio engineering or a related field (such as acoustics) is May 15. You can read about this program on the AES Educational Foundation website (accessible from the AES website, www.aes.org).
New Planar-Pivot (Planot) TransducerInvented by John J. Gaudreault and covered by a US Patent #7860265, the Planot transducer design yields a unique single full-range driver. The geometry, apparently never before used in a diaphragm, is three-dimensional triangle shape (3D-Diaphragm), as
opposed to two-dimensional cone or ribbon diaphragms. The inven-tion’s geometry allows for a pivoting motion, as opposed to the pistonic motion of two-dimensional dia-phragms. These two factors and oth-ers set the Planot apart from all other loudspeaker drivers.
Figure 1 shows that the dia-
phragm has at least three equal
sides. Other implementations may
have larger even numbers of sides
(4, 8, or 16, and so on). The edges
of the functional sides are parallel
to the pivotal axis. Each “side” of
its “cross section” could be .75″to 1″ long. The diaphragm length
could be between 1 and 4′ long.
No enclosing structure such as a
box, enclosure, or baffle is required.
Eliminating the box eliminates all
of the negative attributes of a box such as diffraction of
sound off the outside of the box, internal reflection of sound
The Faital
18XL1600, p. 13.
Lake Como, Italy, where
acoustic mesh is king. p. 21.
ACOUSTIC PATENTS26By James Croft
INDUSTRY WATCH28By Vance Dickason
FIGURE 1: Cross-
section diagram of
the Planot transducer
diaphragm.
FIGURE 2: Side view of
the Planot triangular
transducer.

���������� ��������������������������������� ��!"" !��"#
���!�$����%�&'(%&
����������� �
In Europe:
intertechnik.de
In Asia:
baysidenet.jp
In Canada:
solen.ca
Dayton Audio’s OmniMic is a
must-have for system integrators,
acoustic engineers, and A/V
installers. It was developed
in collaboration with Liberty
Audio, inventors of the Praxis
Measurement System. The
OmniMic provides quick and
accurate measurements that will
reduce installation time, saving
you both labor and money. Test
signals may be initiated from
the host computer, or from any
audio CD player. System includes
calibrated USB microphone,
mic clip, software and test signal
discs, 6 ft. USB cable, and
carrying case. Compatible
with Windows XP, Vista,
and Windows 7.
Measurements:
��
���������� ���������� ���
�
������� ���� �������������
���
�� ������������
����������� ���������������
�������������������������������
��
����������������������������������
��� ��!""#$��%���
������&��������'�������� ��!$(#)
��%���
�
���� ����
*��� ��+���,������ ���-�������
���� �������� �-��� ���� ������ -�
�����
���,�������� ���+��� ���,������ �
���� �� .������������� ���� ���� ��
,�� �-�
,������� ������� ��� ��������� ����
� �/��.���� ��,��+��� ,��-�������0
� �*����
�������,�������������+���������-����
������������.����������������������������
������
,��-�������� ������,����� �+��� ����
��-�� �-� ���� ���,�����0� 1������ �/�
�������
���������������� ,��,������� ���,���
������ -������������������������ �����
�����
����������0� �� ���,�������+�� ��
�� �-� ������ �-� .��������� ������
�� ����
�������� ���,������ ���,��������
���+���� ��� ������.��� ��������� -��2
�����
���,������ ��������������+����� �����
������� ������������ �� �� ����� ,����
���+��
�.�������������������-������0��
.�����������--�������������������
���������
,��-��������������������,����������
��������-��2������������.�+��$��3
40�
�
!"� �#$� %�&��#%$�
*����,�,���,��������������������-����
�������-�.������������������������-�
���������,������
�-��������-��2�������������������
����������0��*������������,��,�����
���-�.������������
���,���������� ������� ���� ����
���� ���� ���� -���� ��� .�� �,����
�� -��� ����� ,�,���0��
5��������,��������-����������.��
����������������������������-��������
������������������
�/������,�����������+��������������
����������-��� ��,��+�����������
���� ����+����������
��������������0�����-��������,
�������������������.�������������.
���������������������
���� ��+��0� ��,�������+�� �����
��� �������� ����� ��� �� ����������� �.
�� ���� ,���������
���,������ ���� ������ ���������0�
������ ������ ����� ������ .���+�
��� �-� ���� ������
���,������0�
�
'"����#��% (�%���) (��#&*�����
��#��� �+*�*��) #���
�������� ��� �� ����� ���� ��2�� �
����� ������ ��� ���� ��� �� ��.��� �
-� ����� �����������
���������� ��������� ��������� ����
�,����� ���� ����6������� ,������0�
� �,,���������� -���

4 VOICE COIL
inside the box, sound generated by
box vibration, and the associated
costs of building an enclosure (Fig. 2). The Planot’s diaphragm radi-
ates 360° and thus requires no box.
Because the diaphragm is cen-
tered by fixed bearings, the voice
coil is always perfectly aligned to
the magnets in the motor. The
diaphragm is controlled by an
electric motor that uses a mag-
netic repulsion system for cen-
tering and damping diaphragm
movement in place of the tra-
ditional elastic surround/spider
mechanism (Fig. 3).According to Mr. Gaudreault,
another major advantage of the Planot design is that sound
is projected evenly in the listening area. The typical Planot
diaphragm is long and thin and stands perpendicular
to the floor with a motor in its base. The
geometry allows sound at all frequencies to
be launched into the listening area with equal
energy and consequently with a very flat and
even radiation in frequency and phase. A
single diaphragm may be used, and the dis-
tortions and costs associated with crossover
networks are eliminated. If greater dynamic
range or greater sound levels for pro-sound
applications are needed, then this same dia-
phragm can be implemented in multiway
configurations such as two-way and three-way
designs as you can see in Fig. 4.
The Planot design also allows for the
use of modular construction techniques.
This way of connecting all of the compo-
nents facilitates CNC (computer numerical
control) construction, reducing production
costs. Twin supports, mast, motor, and dia-
phragm may all be easily changed. There
are several advantages to this approach: 1.
ease of manufacture, 2. rapid prototyping,
3. consumer upgrades, 4. consumer custom-
ization, 5. ease of repair, 6. pro sound onsite assembly
and customization. Again, according to the inventor,
the Planot design can be utilized in many applications
including but not limited to headphones, theater and
auditorium systems, public address, high fidelity systems,
portable electronic devices, automobiles, and boats.
Planot, LLC, is currently soliciting interested manufac-
turers to license Gaudreault’s patented driver design. More
information is available to OEM driver and loudspeaker
manufacturers. E-mail Planot, LLC, at info@planotspeaker.
com, or visit www.planotspeaker.com.
AN HONORABLE GUEST AT SCAN-SPEAKOne of our industry’s “grand old men,” 90-year old Mr. Neville Thiele (Photo 1), paid Scan-Speak a visit recent-
ly. Mr. Thiele has worked with acoustics since the early 1950s, influencing loudspeaker professionals ever since. He has uncovered a significant amount of knowledge on acoustics and loudspeakers, including the well-known Thiele/Small parameters, developed in cooperation with Mr. Richard Small. Mr. Thiele also published numerous papers on loudspeaker technology. Scan-Speak thought that Voice Coil readers would like to read a brief selection of Mr. Thiele’s comments after his visit:
“It was a great experience for me to visit the factory at
Videbæk again with my colleague Graeme Huon and find
the company thriving. It is now nearly 140 years since
my grandfather Neils Benzen Rasmussen emigrated from
Jylland to Queensland, but I nevertheless feel a strong
connection to your beautiful country, through my kins-
folk living in Silkeborg, Haderslev, and Sønderborg and
through my admiration for the Danish audio industry
that continues to maintain its reputation for excellence.
“I was particularly interested to see how, while much
of the loudspeaker technology has changed little over the
years, your company has adapted to new
ideas and materials as they have become
available and made significant improve-
ments. In particular, I have admired your
long-throw drivers that go a long way
to making good big bass sound possible
from the smaller diameter drivers that the
market increasingly demands.
“I remember reading in 1936 when I was
first taking an interest in audio that “anyone
who made it possible to produce good bass
from a cabinet the size of an orange box
would deserve the gratitude of humanity.”
Loudspeakers have changed a lot since then,
but I continue to think of it as an object
that we all should—and in your and my
case do—keep striving towards.
“It was most exciting to compare notes
with your engineers on the finer points of
loudspeaker design. There are many who
assure us that it is a “mature technology,”
but electrodynamic loudspeakers still
present problems of considerable com-
plexity to those of us who, like your engineers, realize
that a deeper understanding leads
to a better product.
“May I, on behalf of myself and
Graeme, wish your company and all
your people that we met, who con-
tribute their varied skills to the enter-
prise, continuing success in your
engineering, manufacturing, and
marketing efforts. We very much
appreciated your hospitality during
our visit and look forward to further
discussions in the future.” VC
FIGURE 3 Closeup view of the
Planot transducer motor control
assembly.
PHOTO 1: Neville Thiele.
FIGURE 4: Concept drawing of
a multi-way Planot transducer.

MAY 2011 5
Voice Coil, (ISSN 1521-091X), the Periodical of the Loudspeaker Industry, is published on the 25th of each month by Audio Amateur Incorporated, PO Box 876, Peterborough, NH 03458-0876 USA, (603) 924-9464, FAX (603) 924-9467.
Copyright 2011 by Audio Amateur Incorporated. All rights reserved. Quotation from Voice Coil is forbidden without written permission of the publisher.
Publisher - Edward T. Dell, Jr.Editor - Vance Dickason (E-mail [email protected])Contributing Editor - Richard Honeycutt
Vice PresidentKaren Hebert
Dennis Brisson .............Assistant PublisherRichard Surrette ...........Editorial AssistantLaurel Humphrey.........Marketing DirectorJason Hanaford ............Graphics DirectorJay Sennott ...................Graphics AssistantSharon LeClair .............Customer Service
SubmissionsSend all press releases and information to Voice Coil Editorial Dept., PO Box 876, Peterborough, NH 03458, or FAX us material at (603) 924-9467, e-mail [email protected].
ADVERTISING
Please direct display advertising inquiries to: Peter Wostrel, Account Manager, Strategic Media Marketing, USA, 978-281-7708, FAX 603-924-9467, Toll-free 800-454-3741, e-mail [email protected].
Please direct classified and artwork inquiries to: Beverly Poirier, Advertising Coordinator, Voice Coil, PO Box 876, Peterborough, NH 03458, USA, 603-924-7292, FAX 603-924-6230, e-mail [email protected].
Qualified subscriptions to Voice Coil run for 1 year. Renew annually on-line at voicecoilmagazine.com/vcqual.html
Subscriptions to Voice Coil are available in printed and digital versions. To subscribe to the digital version, please visit our website
at www.audioXpress.com and complete a qualification form. When you qualify, you will receive an email confirming your subscription. Each month you will receive an email with a link to the current issue.
Printed subscriptions are currently available to US and Canadian individuals who have completed a qualification form and fit the criteria for qualification. For those overseas, the cost of a printed subscription is $150.00 per year. Please contact customer service or order your subscription on-line at www.audioXpress.com.
SPOTLIGHT
Measurement and Perception of Regular Loudspeaker DistortionBy Wolfgang Klippel and Robert Werner Klippel GmbH, Dresden, Germany
A major part of the signal distortion generated by loudspeak-
er systems is directly related to the geometry and properties of
the material used in loudspeaker design and found in all good
units passing the assembly line. Those regular distortions are
the result of an optimization process giving the best compromise
between perceived sound quality, maximal output, cost, weight,
and size. This article discusses the physical causes of the regular
distortions, their modeling by using lumped and distributed
parameters, the objective assessment using modern measurement
techniques, and the perception by the human ear.
�he target of an audio reproduction system is to generate
at the listening position an output signal pout(t), which
is similar to the input signal pin(t) at the source point. The
difference between the two time signals may be considered
as a distortion signal pdist(t)=pout(t) - pin(t) generated
somewhere in the audio chain. After introducing digital sig-
nal processing, transmission, and data storage, the weakest
part is the electroacoustical conversion (loudspeaker) and
in the interaction with an acoustical environment (room).
The generation of signal distortion can be modeled by
a flowchart as shown in Fig. 1. It comprises a linear and
a nonlinear model, a black box system describing further
defects and faults in the system and an independent noise
source. The linear and the nonlinear models describe the
target performance of the loudspeaker, which should be
materialized in the golden reference units at the end of
loudspeaker development. The outputs of the linear and
nonlinear models are regarded as regular distortions because
they are accepted within the design process and are the
result of an optimization process giving the best compro-
mise with other constraints (weight, size, cost, and so on).
Irregular distortions are generated by defects caused by the
manufacturing process, aging, and other external impacts
(overload, climate) during the later life cycle of the product.
A rubbing voice coil, buzzing parts, loose particles, and air
leaks are typical loudspeaker defects which produce irregular
distortions which are quite audible and not acceptable. A
related paper12 discusses the physical causes and measure-
ment techniques in greater detail.
This article focuses on the regular distortions gener-
ated by the linear and nonlinear models which are the
theoretical basis of the loudspeaker design process. Linear
modeling based on lumped parameter modeling (Thiele/
Small parameters) has a long history in loudspeaker design.
More complex models using distributed parameters have
been introduced to explain the cone vibration and sound
radiation at higher frequencies. The linear modeling fails in
describing the large signal performance of the loudspeaker
which is directly related to maximal output and cost, size,
and weight of the loudspeaker. Therefore, modeling and
direct measurement of loudspeaker nonlinearities is an
important part of modern loudspeaker design.
Linear DistortionTable 1 gives an overview of dominant causes of linear
distortion caused by transducer and system design and by
the acoustical environment in the final application. The first
FIGURE 1: Signal flow diagram showing the generation of signal distortion in
a loudspeaker system.
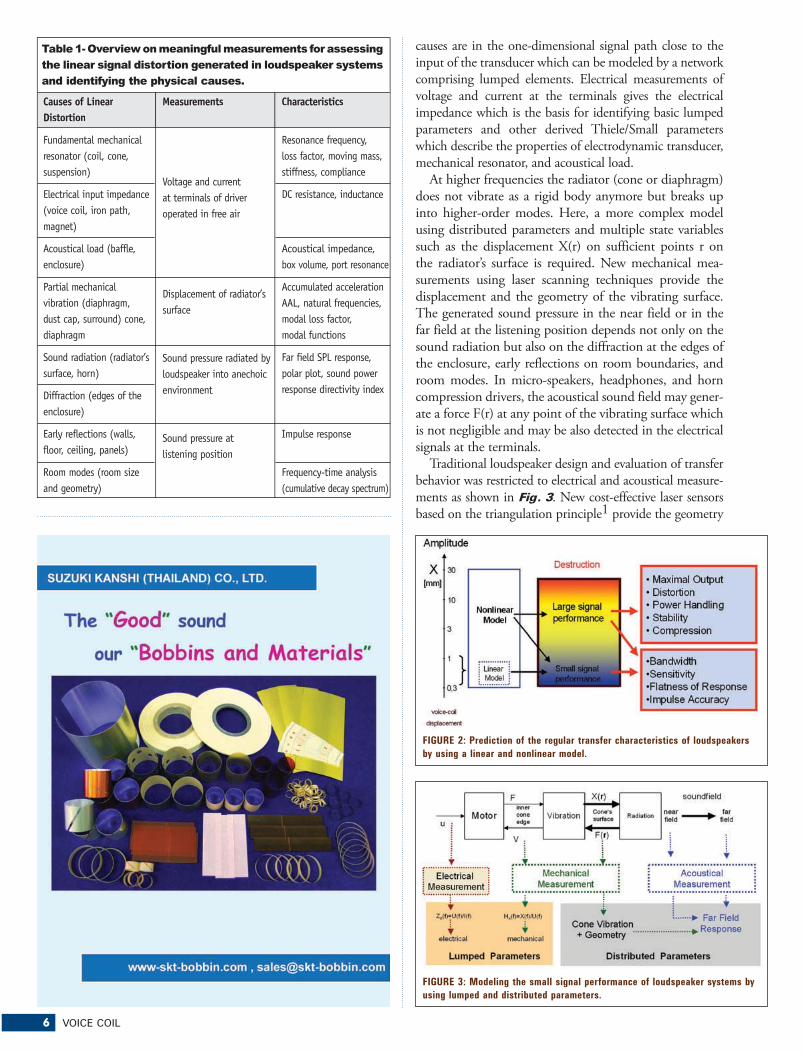
6 VOICE COIL
causes are in the one-dimensional signal path close to the
input of the transducer which can be modeled by a network
comprising lumped elements. Electrical measurements of
voltage and current at the terminals gives the electrical
impedance which is the basis for identifying basic lumped
parameters and other derived Thiele/Small parameters
which describe the properties of electrodynamic transducer,
mechanical resonator, and acoustical load.
At higher frequencies the radiator (cone or diaphragm)
does not vibrate as a rigid body anymore but breaks up
into higher-order modes. Here, a more complex model
using distributed parameters and multiple state variables
such as the displacement X(r) on sufficient points r on
the radiator’s surface is required. New mechanical mea-
surements using laser scanning techniques provide the
displacement and the geometry of the vibrating surface.
The generated sound pressure in the near field or in the
far field at the listening position depends not only on the
sound radiation but also on the diffraction at the edges of
the enclosure, early reflections on room boundaries, and
room modes. In micro-speakers, headphones, and horn
compression drivers, the acoustical sound field may gener-
ate a force F(r) at any point of the vibrating surface which
is not negligible and may be also detected in the electrical
signals at the terminals.
Traditional loudspeaker design and evaluation of transfer
behavior was restricted to electrical and acoustical measure-
ments as shown in Fig. 3. New cost-effective laser sensors
based on the triangulation principle1 provide the geometry
Causes of Linear Distortion
Fundamental mechanical resonator (coil, cone, suspension)
Electrical input impedance (voice coil, iron path, magnet)
Acoustical load (baffle, enclosure)
Partial mechanical vibration (diaphragm, dust cap, surround) cone, diaphragm
Sound radiation (radiator’s surface, horn)
Diffraction (edges of the enclosure)
Early reflections (walls, floor, ceiling, panels)
Room modes (room size and geometry)
Measurements
Voltage and current at terminals of driver operated in free air
Displacement of radiator’s surface
Sound pressure radiated by loudspeaker into anechoic environment
Sound pressure at listening position
Characteristics
Resonance frequency, loss factor, moving mass, stiffness, compliance
DC resistance, inductance
Acoustical impedance, box volume, port resonance
Accumulated acceleration AAL, natural frequencies, modal loss factor, modal functions
Far field SPL response, polar plot, sound power response directivity index
Impulse response
Frequency-time analysis (cumulative decay spectrum)
��>� ����2� ��( ,����" ��(��=���" �6�� " �!6�=����66 66(���! ��(� ���6(�����0(6!��!(���� � ��! 0�(�����06* �7 ��6@6! "6���0�(0 �!(=@(���! �* @6(�������6 6A
Causes of Linear Distortion
Measurements Characteristics
FIGURE 2: Prediction of the regular transfer characteristics of loudspeakers
by using a linear and nonlinear model.
FIGURE 3: Modeling the small signal performance of loudspeaker systems by
using lumped and distributed parameters.

MAY 2011 7
of the radiating surface at high accuracy and the linear
transfer functions between terminal voltage and displace-
ment X(r) at sufficient points r on the surface. Figure 4
shows, for example, the result of such a scanning process
collecting mechanical information at about 1000 measure-
ment points. The mechanical scanning process requires no
anechoic room and may be applied to the drive unit oper-
ated in a vacuum.
Numerical calculation based on the scanned data pro-
vides the sound pressure on-axis or at any point in the far
field giving the polar pattern of the loudspeaker as illustrat-
ed in Fig. 5. A new Sound Pressure Related Decomposition
Method2 shows how each part of the cone contributes to
the sound pressure output in a constructive or destructive
way. This reveals acoustical cancellation effects, critical
rocking modes, and undesired circumferential modes. A
Modal Analysis applied to the mechanical data simplifies
the mechanical analysis and provides the modal loss factor
η and other material parameters which are important input
parameters for a Finite Element Analysis to investigate
the design choices in greater detail. A Boundary Element
Analysis may also consider the particular shape of the enclo-
sure, horn, or room boundaries to predict the sound field
at high accuracy.
Three curves calculated from the mechanical scanning data
give the most condensed but almost comprehensive descrip-
tion of a loudspeaker’s small signal performance: The on-axis
sound pressure response predicted in 1m distance in the far
FIGURE 4: A critical vibration pattern depicted as a sectional view (left
down) and as 3D animation (right) of a soft dome tweeter at 15kHz causing
a peak in the sound pressure on-axis response (upper left).
FIGURE 5: Vibration and radiation analysis using distributed loudspeaker
parameters (geometry and vibration of the radiator’s surface) measured by
laser scanning techniques.
�� � ����� � � � � ���� �� � ��� ���� �� � ������ � � � �2� � � �� � � � � � ������� � � � � ��� ���� � ��� �� �� ��� � � ��� � ��� ���� �� ���� � � � �
��� !" ���������� ����������������������������������������������������� �������!"�����#������!���$�%�&�%��'����������%�!�(���)���"���)���(�����%!������W'���(�����
#����������� � �%�����(�%���%��%������%�)������!� ������%!�%� ��������� ��'�!��!"������������)�%������%������������W������)���������'�%!�
#��2������ *������W�����������������%���������!!����%������������%!�+)���������%���������%���)���%���+�������������%!�%����!��������
#��2���$������� ,�������������%"W�������%!��������-�����(�!�%�W����.�����������%"���(��(����%���%!�%����������%!�
�8 ##��� !" ����'�%!��%!�����%������+)�����������������������������!����%!�������%���������!�
<�%���<�&������'������������-�%���/�����!�0���%��!1������%!�����������W�!���(�2�3�0�2�4�WW�)�5�!������+ ����)��������������!�������%!������%�%'(������������
(�)��� !" ���%!��(��������(�����%!�������%�������%���/��W����%���!�6��!���������5�*���%!����%�%��
���&,,&���������������&*����2��4���W"�78�!9�!����%�!)�� ������:�� ���%��%!�W�!��)��*�+*"��������!������W���!������������((����%��"�;<�WW�!�W��+�!�/��������������$+'�� ����!��
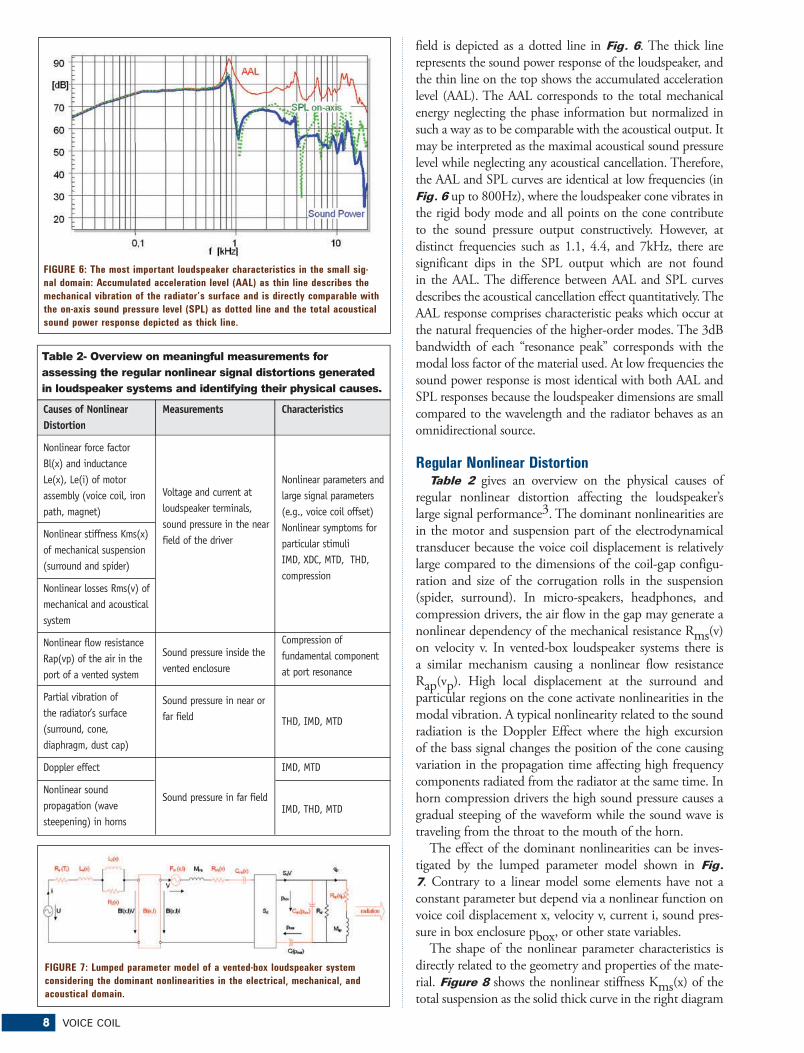
8 VOICE COIL
field is depicted as a dotted line in Fig. 6. The thick line
represents the sound power response of the loudspeaker, and
the thin line on the top shows the accumulated acceleration
level (AAL). The AAL corresponds to the total mechanical
energy neglecting the phase information but normalized in
such a way as to be comparable with the acoustical output. It
may be interpreted as the maximal acoustical sound pressure
level while neglecting any acoustical cancellation. Therefore,
the AAL and SPL curves are identical at low frequencies (in
Fig. 6 up to 800Hz), where the loudspeaker cone vibrates in
the rigid body mode and all points on the cone contribute
to the sound pressure output constructively. However, at
distinct frequencies such as 1.1, 4.4, and 7kHz, there are
significant dips in the SPL output which are not found
in the AAL. The difference between AAL and SPL curves
describes the acoustical cancellation effect quantitatively. The
AAL response comprises characteristic peaks which occur at
the natural frequencies of the higher-order modes. The 3dB
bandwidth of each “resonance peak” corresponds with the
modal loss factor of the material used. At low frequencies the
sound power response is most identical with both AAL and
SPL responses because the loudspeaker dimensions are small
compared to the wavelength and the radiator behaves as an
omnidirectional source.
Regular Nonlinear DistortionTable 2 gives an overview on the physical causes of
regular nonlinear distortion affecting the loudspeaker’s
large signal performance3. The dominant nonlinearities are
in the motor and suspension part of the electrodynamical
transducer because the voice coil displacement is relatively
large compared to the dimensions of the coil-gap configu-
ration and size of the corrugation rolls in the suspension
(spider, surround). In micro-speakers, headphones, and
compression drivers, the air flow in the gap may generate a
nonlinear dependency of the mechanical resistance Rms(v)
on velocity v. In vented-box loudspeaker systems there is
a similar mechanism causing a nonlinear flow resistance
Rap(vp). High local displacement at the surround and
particular regions on the cone activate nonlinearities in the
modal vibration. A typical nonlinearity related to the sound
radiation is the Doppler Effect where the high excursion
of the bass signal changes the position of the cone causing
variation in the propagation time affecting high frequency
components radiated from the radiator at the same time. In
horn compression drivers the high sound pressure causes a
gradual steeping of the waveform while the sound wave is
traveling from the throat to the mouth of the horn.
The effect of the dominant nonlinearities can be inves-
tigated by the lumped parameter model shown in Fig. 7. Contrary to a linear model some elements have not a
constant parameter but depend via a nonlinear function on
voice coil displacement x, velocity v, current i, sound pres-
sure in box enclosure pbox, or other state variables.
The shape of the nonlinear parameter characteristics is
directly related to the geometry and properties of the mate-
rial. Figure 8 shows the nonlinear stiffness Kms(x) of the
total suspension as the solid thick curve in the right diagram
FIGURE 6: The most important loudspeaker characteristics in the small sig-
nal domain: Accumulated acceleration level (AAL) as thin line describes the
mechanical vibration of the radiator’s surface and is directly comparable with
the on-axis sound pressure level (SPL) as dotted line and the total acoustical
sound power response depicted as thick line.
FIGURE 7: Lumped parameter model of a vented-box loudspeaker system
considering the dominant nonlinearities in the electrical, mechanical, and
acoustical domain.
Causes of Nonlinear Distortion
Nonlinear force factor Bl(x) and inductance Le(x), Le(i) of motor assembly (voice coil, iron path, magnet)
Nonlinear stiffness Kms(x) of mechanical suspension (surround and spider)
Nonlinear losses Rms(v) of mechanical and acoustical system
Nonlinear flow resistance Rap(vp) of the air in the port of a vented system
Partial vibration of the radiator’s surface (surround, cone, diaphragm, dust cap)
Doppler effect
Nonlinear sound propagation (wave steepening) in horns
Measurements
Voltage and current at loudspeaker terminals,sound pressure in the near field of the driver Sound pressure inside the vented enclosure
Sound pressure in near or far field
Sound pressure in far field
Characteristics
Nonlinear parameters and large signal parameters (e.g., voice coil offset)Nonlinear symptoms for particular stimuliIMD, XDC, MTD, THD, compression
Compression of fundamental component at port resonance
THD, IMD, MTD
IMD, MTD
IMD, THD, MTD
��>� ����2� ��( ,����" ��(��=���" �6�� " �!6�=����66 66(���! �� ����������(� ���6(�����0(6!��!(��6�� � ��! 0�(�����06* �7 ��6@6! "6���0�(0 �!(=@(���! (��* @6(�������6 6A
Causes of Nonlinear Distortion
Measurements Characteristics
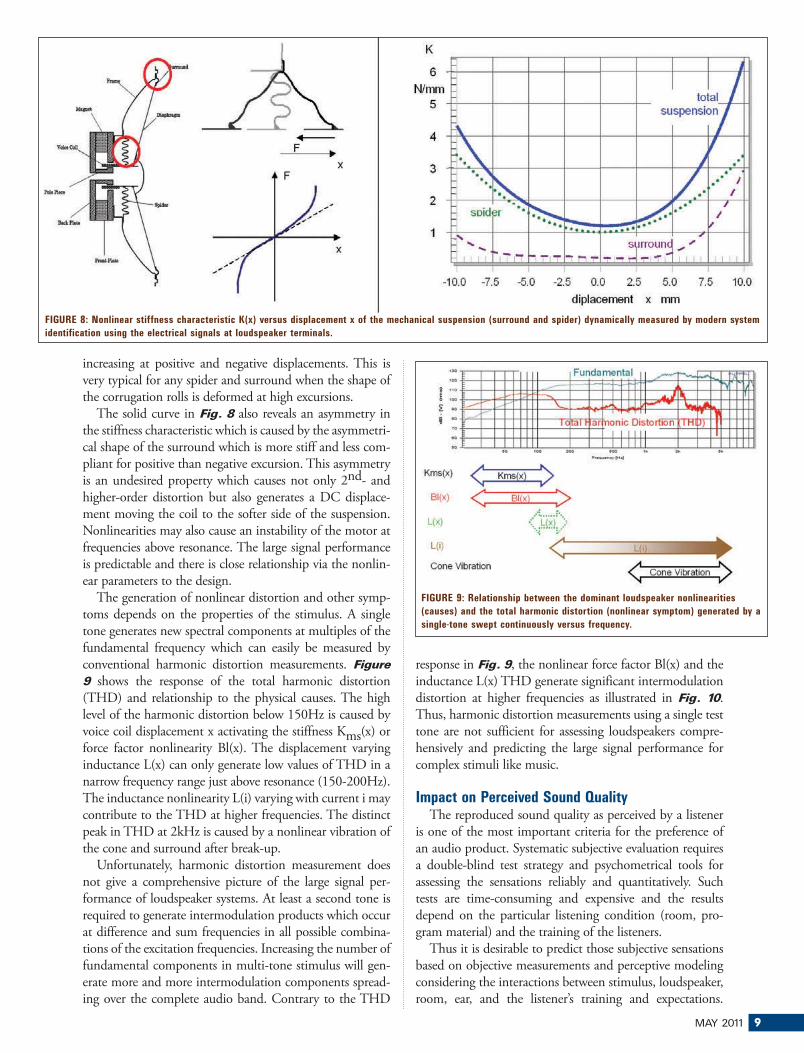
MAY 2011 9
increasing at positive and negative displacements. This is
very typical for any spider and surround when the shape of
the corrugation rolls is deformed at high excursions.
The solid curve in Fig. 8 also reveals an asymmetry in
the stiffness characteristic which is caused by the asymmetri-
cal shape of the surround which is more stiff and less com-
pliant for positive than negative excursion. This asymmetry
is an undesired property which causes not only 2nd- and
higher-order distortion but also generates a DC displace-
ment moving the coil to the softer side of the suspension.
Nonlinearities may also cause an instability of the motor at
frequencies above resonance. The large signal performance
is predictable and there is close relationship via the nonlin-
ear parameters to the design.
The generation of nonlinear distortion and other symp-
toms depends on the properties of the stimulus. A single
tone generates new spectral components at multiples of the
fundamental frequency which can easily be measured by
conventional harmonic distortion measurements. Figure 9 shows the response of the total harmonic distortion
(THD) and relationship to the physical causes. The high
level of the harmonic distortion below 150Hz is caused by
voice coil displacement x activating the stiffness Kms(x) or
force factor nonlinearity Bl(x). The displacement varying
inductance L(x) can only generate low values of THD in a
narrow frequency range just above resonance (150-200Hz).
The inductance nonlinearity L(i) varying with current i may
contribute to the THD at higher frequencies. The distinct
peak in THD at 2kHz is caused by a nonlinear vibration of
the cone and surround after break-up.
Unfortunately, harmonic distortion measurement does
not give a comprehensive picture of the large signal per-
formance of loudspeaker systems. At least a second tone is
required to generate intermodulation products which occur
at difference and sum frequencies in all possible combina-
tions of the excitation frequencies. Increasing the number of
fundamental components in multi-tone stimulus will gen-
erate more and more intermodulation components spread-
ing over the complete audio band. Contrary to the THD
response in Fig. 9, the nonlinear force factor Bl(x) and the
inductance L(x) THD generate significant intermodulation
distortion at higher frequencies as illustrated in Fig. 10.
Thus, harmonic distortion measurements using a single test
tone are not sufficient for assessing loudspeakers compre-
hensively and predicting the large signal performance for
complex stimuli like music.
Impact on Perceived Sound QualityThe reproduced sound quality as perceived by a listener
is one of the most important criteria for the preference of
an audio product. Systematic subjective evaluation requires
a double-blind test strategy and psychometrical tools for
assessing the sensations reliably and quantitatively. Such
tests are time-consuming and expensive and the results
depend on the particular listening condition (room, pro-
gram material) and the training of the listeners.
Thus it is desirable to predict those subjective sensations
based on objective measurements and perceptive modeling
considering the interactions between stimulus, loudspeaker,
room, ear, and the listener’s training and expectations.
FIGURE 8: Nonlinear stiffness characteristic K(x) versus displacement x of the mechanical suspension (surround and spider) dynamically measured by modern system
identification using the electrical signals at loudspeaker terminals.
FIGURE 9: Relationship between the dominant loudspeaker nonlinearities
(causes) and the total harmonic distortion (nonlinear symptom) generated by a
single-tone swept continuously versus frequency.
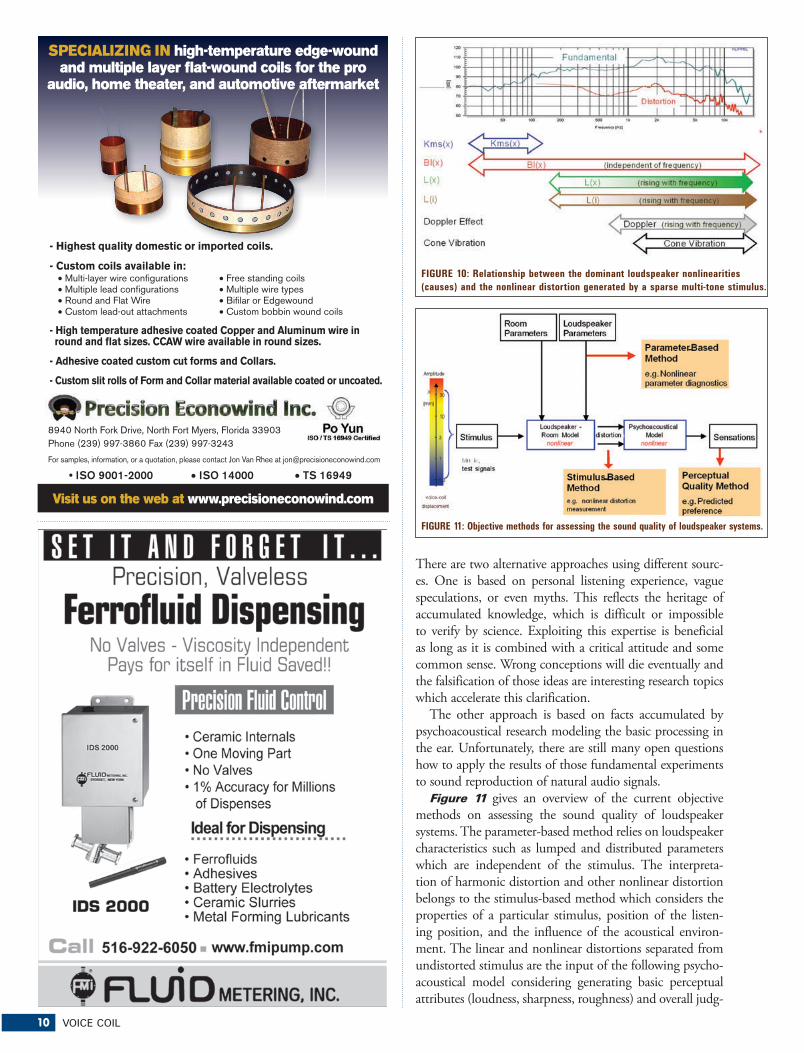
10 VOICE COIL
There are two alternative approaches using different sourc-
es. One is based on personal listening experience, vague
speculations, or even myths. This reflects the heritage of
accumulated knowledge, which is difficult or impossible
to verify by science. Exploiting this expertise is beneficial
as long as it is combined with a critical attitude and some
common sense. Wrong conceptions will die eventually and
the falsification of those ideas are interesting research topics
which accelerate this clarification.
The other approach is based on facts accumulated by
psychoacoustical research modeling the basic processing in
the ear. Unfortunately, there are still many open questions
how to apply the results of those fundamental experiments
to sound reproduction of natural audio signals.
Figure 11 gives an overview of the current objective
methods on assessing the sound quality of loudspeaker
systems. The parameter-based method relies on loudspeaker
characteristics such as lumped and distributed parameters
which are independent of the stimulus. The interpreta-
tion of harmonic distortion and other nonlinear distortion
belongs to the stimulus-based method which considers the
properties of a particular stimulus, position of the listen-
ing position, and the influence of the acoustical environ-
ment. The linear and nonlinear distortions separated from
undistorted stimulus are the input of the following psycho-
acoustical model considering generating basic perceptual
attributes (loudness, sharpness, roughness) and overall judg-
- Custom coils available in: Multi-layer wire configurations Multiple lead configurations Round and Flat Wire Custom lead-out attachments
Free standing coils Multiple wire types Bifilar or Edgewound Custom bobbin wound coils
- High temperature adhesive coated Copper and Aluminum wire in round and flat sizes. CCAW wire available in round sizes.
- Adhesive coated custom cut forms and Collars.
- Custom slit rolls of Form and Collar material available coated or uncoated.
8940 North Fork Drive, North Fort Myers, Florida 33903Phone (239) 997-3860 Fax (239) 997-3243
For samples, information, or a quotation, please contact Jon Van Rhee at [email protected]
Visit us on the web at www.precisioneconowind.com
- Highest quality domestic or imported coils.
SPECIALIZING IN high-temperature edge-wound and multiple layer flat-wound coils for the pro
audio, home theater, and automotive aftermarket
FIGURE 10: Relationship between the dominant loudspeaker nonlinearities
(causes) and the nonlinear distortion generated by a sparse multi-tone stimulus.
FIGURE 11: Objective methods for assessing the sound quality of loudspeaker systems.
MAY 2011 11
ments describing the pleasantness of the sound and prefer-
ence considering the ideal conceptions of the listener10.
The psychoacoustical model performs a binaural nonlin-
ear processing in which a significant part of the distortion
component is masked by other signal components. The fol-
lowing main mechanisms are summarized and consequenc-
es for interpreting objective measurements are discussed:
• Spectral components within third-octave bandwidth
contribute to the same excitation level above 400Hz.
Smoothed amplitude response describes the perception of
stimuli having a dense spectrum (e.g., pink noise). The
shape of a resonance (gain, Q factor) has a minor influence
on audibility as long as the excitation within the critical
band is constant6.
• Spectral components below 100Hz contribute to the
excitation level of one critical band. Sufficient bass sensa-
tion can be generated by higher frequencies (60. . . 100Hz)
when the very low frequency components (20. . . 40Hz) are
attenuated by the cutoff frequency of the loudspeaker.
• A variation larger than 1dB in the excitation level
within a critical band becomes audible.
• Spectral masking excites adjacent bands. Dips in the
frequency response are less audible than peaks. Nonlinear
distortion components are masked by fundamental com-
ponents7.
• Temporal masking. The RMS value (rather than the
peak value) determines the audibility of the regular nonlin-
ear distortion.
• Hearing threshold. Bass components are not audible
if the listening level is too low. A small level difference of
components close to the hearing threshold may cause a
significant difference in perceived bass sensation and in the
detection of nonlinear distortion.
• Monaural processing is not very sensitive for phase shift
of signal components processed in separate critical bands.
Phase distortion corresponding with a group delay variation
of 0.4 . . . 2ms within a critical band changes the timbre and
roughness of the sound.
• Binaural processing4 is sensitive for interaural level
differences (1 . . . 2dB) and time delay (50μs). Latency and
group delay response should be identical in the symmetrical
channels of a multi-way system to avoid lateralization of the
perceived sound image.
• Precedence effect4 maintains the primary image as long
as the lateral reflections are sufficiently low or the time delay
is small. Strong reflections after 80ms are unpleasant and are
perceived as echo.
• Audible lateral reflections may generate a preferred
sensation of spaciousness and a broadening of the primary
image13; the optimal delay and level depend on the prop-
erty’s audio signal (20ms delay for speech or 40ms for music
and reflections having the same level as the direct sound).
Early reflections as found in relatively small rooms improve
sound quality; artificial generation of lateral reflections may
be desired in an anechoic environment or small rooms (cars).
• Adaptation6 to the acoustical environment causes a
variation of the ideal conceptions versus time. The listener
becomes less sensitive to linear distortion caused by room

12 VOICE COIL
and loudspeaker after some time.
• Intermodulation distortion is detected by the ear
not only by exploiting spectral but also temporal clues.
Amplitude modulation is much more audible than frequen-
cy modulation and is perceived as fluctuation (modulating
bass tone f1 < 20Hz) or roughness at higher frequencies
(20Hz < fb < 400Hz) or separated spectral components
(> 400Hz). Low amplitude intermodulation distortion at
1. . . 3% caused by nonlinear force factor Bl(x) and induc-
tance L(x) is detected as an unnatural roughness.
Auralization TechniquesAlthough the perceptive modeling gives valuable insight
into fundamental psychoacoustical mechanisms and basic
sound attributes, it is not very accurate in predicting the
overall assessment of the perceived sound quality and in
the preference of an audio product at the current state. The
ideal conceptions of a listener highly depend on training,
listening habits, fashion, cultural factors, and artistic prop-
erties of the program material. Some linear and nonlinear
distortion is clearly audible but may be acceptable for a par-
ticular application and program material (popular music)
or may even be perceived as an interesting effect (artificial
bass enhancement). The reliable evaluation of those criteria
requires systematic listening tests using modern auralization
techniques8, 9.
Figure 12 shows a digital signal processing system based
on loudspeaker modeling to generate a virtual audio system.
This model has a sandwich structure in which a nonlinear
system modeling the dominant nonlinearities in the elec-
trodynamical transducer is embedded by linear systems.
The first linear system corresponds with the electrical signal
path from the source to the loudspeaker terminals, while the
second linear system models the signal path in the mechani-
cal and acoustical domain where the amplitude is relatively
small and the sound propagation is sufficiently linear. This
technique is a convenient tool for investigating design
choices before a first prototype is made and combines sub-
jective and objective evaluation.
ConclusionsLinear and nonlinear distortion is unavoidable in
current electroacoustical transducers using a moving
coil assembly driving diaphragms, cones, and other
radiators. The regular distortion is deterministic and
can be predicted by using linear and nonlinear models
and identified loudspeaker parameters in an early design
stage. Finding acceptable limits for those regular distor-
tions is an important part in defining the target perfor-
mance at the beginning of loudspeaker development.
Subjective evaluation is required to assess the audibility
and the impact on perceived sound quality. Some distor-
tions which are audible might still be acceptable or even
desirable in some applications. Systematic listening tests,
nonlinear auralization, and objective assessment based
on a perceptual model are useful tools to assess regular
distortion.
References1. Klippel, W.; Schlechter, J.: “Distributed Mechanical
Parameters of Loudspeakers Part 1: Measurement,” J. Audio
Eng. Society 57, No. 9 pp. 696-708 (2009 Sept.).
2. Klippel, W.; Schlechter, J.: “Distributed Mechanical
Parameters of Loudspeakers Part 2: Diagnostics,” J. Audio
Eng. Society 57, No. 9 pp. 696-708 (2009 Sept.).
3. Klippel, W.: Tutorial: “Loudspeaker Nonlinearities -
Causes, Parameters, Symptoms,” J. Audio Eng. Society 54,
No. 10 pp. 907-939 (2006 Oct.).
4. Zwicker, E.; Fastl, H: Psychoacoustics – Facts and
Models. Springer, Berlin, 1999, ISBN 3-540-65063-6.
5. Blauert, J.: “Spatial Hearing,” Hirzel Verlag, MIT,
1997.
6. Toole, F. E.; Sound Reproduction, Focal Press,
Amsterdam, 2008.
7. Gäßler, G; “Die Grenzen der Hörbarkeit nich-
tlinearer Verzerrungen bei der Übertragung von
Instrumentenklängen,” Frequenz, Volume 9 (1955), Nr. 1,
pages 15–25.
8. Klippel, W: “Speaker Auralization – Subjective
Evaluation of Nonlinear Distortion,” presented at the 110th
Convention of the Audio Eng. Soc., Amsterdam, May
12-15, 2001, preprint 5310, J. of Audio Eng. Soc., volume
49, No. 6, 2001 June, p. 526. (abstract).
9. Klippel, W.: “Auralization – Subjective Evaluation
of Speaker Distortion,” Fortschritte der Akustik -
Plenarvorträge und Fachvorträge der 27. Jahrestagung für
Akustik DAGA 01, Hamburg, 2001.
10. Klippel, W: “Multidimensional Relationship between
Subjective Listening Impression and Objective Loudspeaker
Parameters,” Acustica 70, Heft 1, S. 45-54, 1990.
11. Klippel, W.: “Zusammenhang zwischen objek-
tiven Lautsprecherparametern und subjektiver
Qualitätsbeurteilung,” Beitrag in Angewandte Akustik 1, S.
46-101, Verlag Technik Berlin, 1987.
12. Werner, R.; Klippel, W.: “Measurement and
Perception of Irregular Loudspeaker Defects,” (to be pub-
lished in the June 2011 issue of Voice Coil).
13. Ando, Y.: “Subjective Preference in Relation to
Objective Parameters of Music Sound Fields with a Single
Echo,” J. Acoust. Soc. Am. 62, pp. 1436. VC
FIGURE 12: Simulation and auralization of loudspeaker distortion in reproduced
audio signal based on linear and nonlinear modeling and using natural audio
signals (music, speech) or artificial test signals.
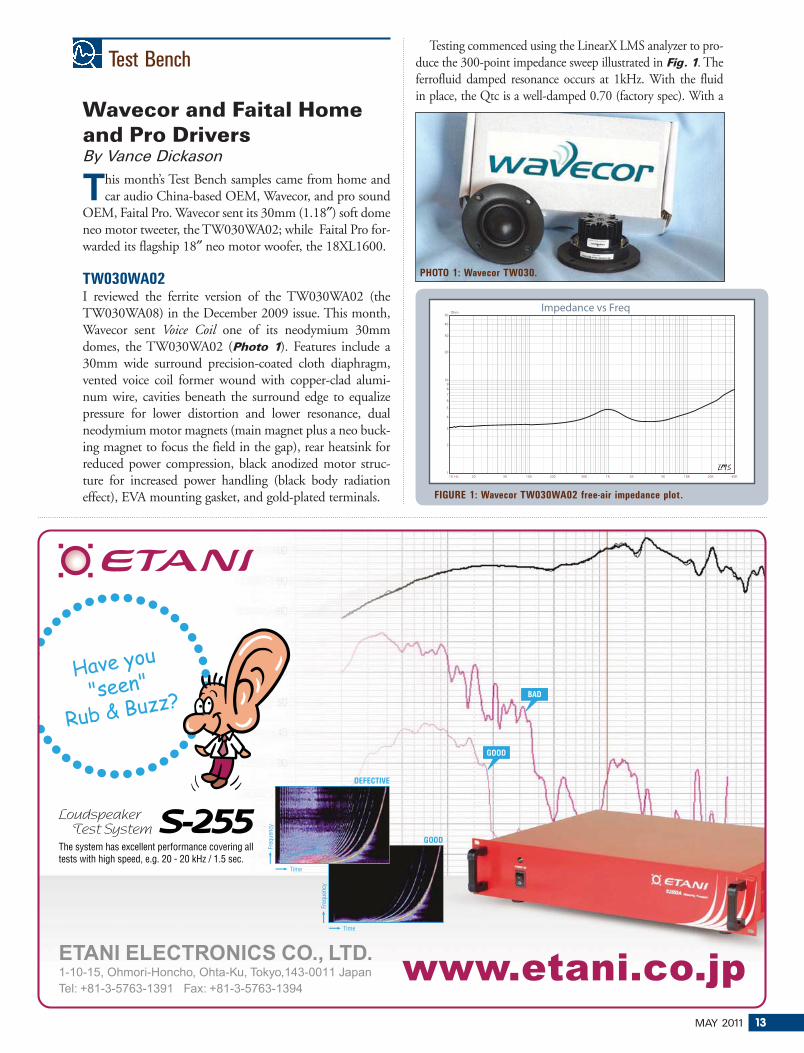
MAY 2011 13
Test Bench
Wavecor and Faital Home and Pro DriversBy Vance Dickason
�his month’s Test Bench samples came from home and
car audio China-based OEM, Wavecor, and pro sound
OEM, Faital Pro. Wavecor sent its 30mm (1.18″) soft dome
neo motor tweeter, the TW030WA02; while Faital Pro for-
warded its flagship 18″ neo motor woofer, the 18XL1600.
TW030WA02I reviewed the ferrite version of the TW030WA02 (the TW030WA08) in the December 2009 issue. This month, Wavecor sent Voice Coil one of its neodymium 30mm domes, the TW030WA02 (Photo 1). Features include a 30mm wide surround precision-coated cloth diaphragm, vented voice coil former wound with copper-clad alumi-num wire, cavities beneath the surround edge to equalize pressure for lower distortion and lower resonance, dual neodymium motor magnets (main magnet plus a neo buck-ing magnet to focus the field in the gap), rear heatsink for reduced power compression, black anodized motor struc-ture for increased power handling (black body radiation effect), EVA mounting gasket, and gold-plated terminals.
Testing commenced using the LinearX LMS analyzer to pro-
duce the 300-point impedance sweep illustrated in Fig. 1. The
ferrofluid damped resonance occurs at 1kHz. With the fluid
in place, the Qtc is a well-damped 0.70 (factory spec). With a
10 Hz 20 50 100 200 500 1K 2K 5K 10K 20K 40K
Ohm
1
2
3
4
5
6
7
89
10
20
30
40
50Impedance vs Freq
FIGURE 1: Wavecor TW030WA02 free-air impedance plot.
PHOTO 1: Wavecor TW030.

14 VOICE COIL
3.2Ω DCR, the minimum impedance for this tweeter is 3.50Ω
at 2.78kHz. This tweeter is also available without ferrofluid.
Why would anyone not use ferrofluid given not only
its almost universal application in tweeters throughout the
industry, but also its ability to significantly reduce warranty
replacement problems? The answer is simple: it sounds bet-
ter. It’s not that ferrofluid sounds bad, but if you are reach-
ing for that last nuance of loudspeaker performance, even
low viscosity fluid in the gap damps transient performance
in a tweeter. However, I will say that my personal belief is
that about the only people who can appreciate this are the
engineers who design loudspeakers for a living, and, OK,
maybe a few obsessive audiophile types.
Next I recess-mounted the Wavecor tweeter in an enclo-
sure that had a baffle area of 12″ × 8″ and measured the
on- and off-axis frequency response with a 100-point gated
sine wave sweep at 2.83V/1m. Figure 2 shows the on-axis
response to be a very flat ±1.8dB from 2kHz-24.4kHz.
Figure 3 depicts the on- and off-axis response of TW030,
with the off-axis curves normalized to the on-axis response
in Fig. 4. I noted that the 30° off-axis is very similar to
the Vifa XT ring dome 30° off-axis curve, a tweeter which
has been criticized for its somewhat substandard power
response, but at the same time also has one of the more
musical timbres in the field of medium-cost 1″ soft domes.
The two-sample SPL comparison is illustrated in Fig. 5,
indicating the two samples were very closely matched,
pretty much what I would expect from a company run by
a couple of former Vifa engineers.
300 Hz 500 1K 2K 5K 10K 20K 40K
dBSPL
40
45
50
55
60
65
70
75
80
85
90
95
100SPL vs Freq
300 Hz 500 1K 2K 5K 10K 20K 40K
dBR
-45
-40
-35
-30
-25
-20
-15
-10
-5
0
5Ratio vs Freq
A
BC
D
300 Hz 500 1K 2K 5K 10K 20K 40K
dBSPL
40
45
50
55
60
65
70
75
80
85
90
95
100SPL vs Freq
A
BC
D
300 Hz 500 1K 2K 5K 10K 20K 40K
dBSPL
40
45
50
55
60
65
70
75
80
85
90
95
100SPL vs Freq
FIGURE 2: Wavecor TW030WA02 on-axis response.
FIGURE 4: Wavecor TW030WA02 normalized on- and off-axis frequency
response (A = 0°; B = 15°; C = 30°; D = 45°).
FIGURE 3: Wavecor TW030WA02 horizontal on- and off-axis frequency
response (A = 0°; B = 15°; C = 30°; D = 45°).
FIGURE 5: Wavecor TW030WA02 two-sample SPL comparison.

MAY 2011 15
The next test procedure was to use the Listen Inc.
SoundCheck analyzer and SCM ¼″ microphone (pro-
vided courtesy of Listen Inc.) to measure the impulse
response with the tweeter recess-mounted on the test baffle.
Importing this data into the Listen Inc. SoundMap software
produced the cumulative spectral decay plot (waterfall)
given in Fig. 6. Figure 7 is a Short Time Fourier Transform
(STFT) displayed as a surface plot. For the final test pro-
cedure, I set the 1m SPL to 94dB (3.32V) using a noise
stimulus, and measured the 2nd and 3rd harmonic distor-
tion at 10cm, depicted in Fig. 8. For more information
on this and other Wavecor drivers, visit www.wavecor.com.
18XL1600The second driver I examined comes from Italian OEM pro sound manufacturer Faital Pro. The 18XL1600 (Photo 2) is the latest 18″ in their line of high-performance pro sound woofers. With a rated nominal power handling of 1600W, this driver definitely falls into the “high performance” category.
As with all the models in Faital’s line of neodymium
motor pro sound woofers, the 18XL is built on a very styl-
ish proprietary cast aluminum frame that is designed to also
perform as a heatsink for the motor system. Using a series of
eight spokes, the frame terminates in a chamber for motor
magnetic return cup, which, like many designs over the last
few years, has the motor assembly loaded from the front
side of the driver rather than being attached to the back of
the frame. Photo 3 shows that part of the frame casting is a
solid 2.5″ high wall that joins all eight spokes and forms the
driver’s primary cooling exhaust at the back of the frame.
This produces a substantial thermal path that exhausts 360°
around the motor back plate that contains the series of 15
1.25″ diameter neodymium slugs mounted around the
periphery of the motor. The eight exhaust “windows,” each
FIGURE 6: Wavecor TW030WA02 SoundCheck CSD waterfall plot.
FIGURE 7: Wavecor TW030WA02 SoundCheck STFT surface intensity plot.
FIGURE 8: Wavecor TW030WA02 SoundCheck distortion plots.
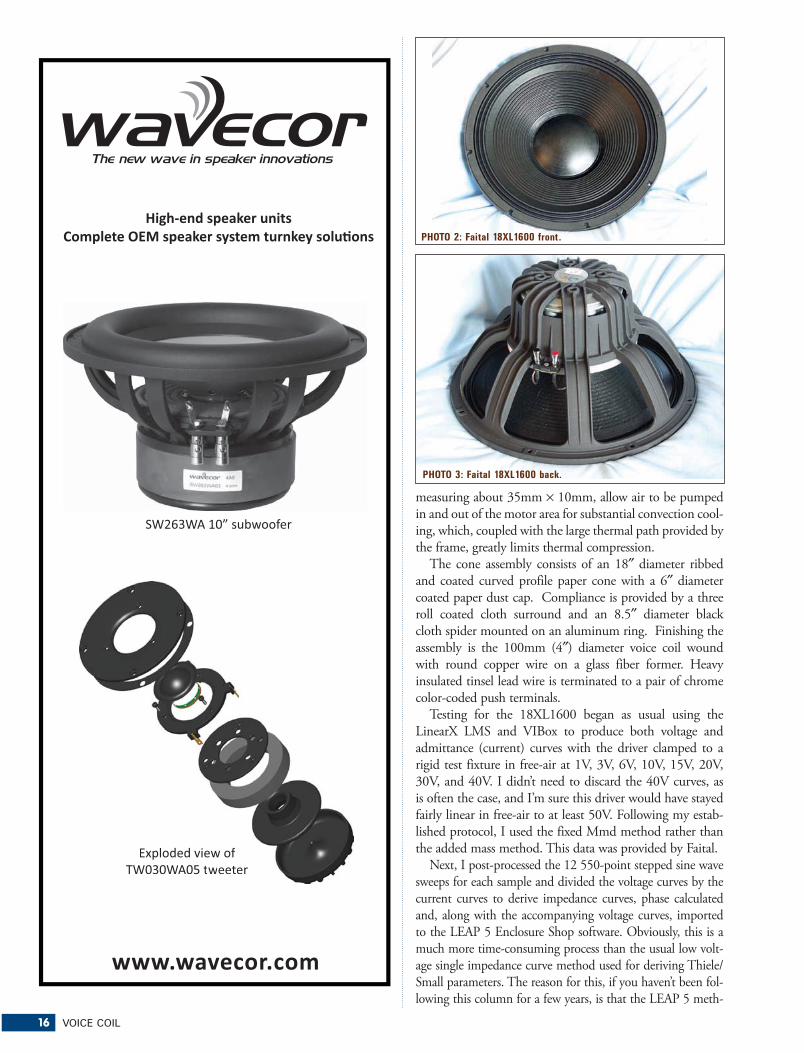
16 VOICE COIL
measuring about 35mm × 10mm, allow air to be pumped
in and out of the motor area for substantial convection cool-
ing, which, coupled with the large thermal path provided by
the frame, greatly limits thermal compression.
The cone assembly consists of an 18″ diameter ribbed
and coated curved profile paper cone with a 6″ diameter
coated paper dust cap. Compliance is provided by a three
roll coated cloth surround and an 8.5″ diameter black
cloth spider mounted on an aluminum ring. Finishing the
assembly is the 100mm (4″) diameter voice coil wound
with round copper wire on a glass fiber former. Heavy
insulated tinsel lead wire is terminated to a pair of chrome
color-coded push terminals.
Testing for the 18XL1600 began as usual using the
LinearX LMS and VIBox to produce both voltage and
admittance (current) curves with the driver clamped to a
rigid test fixture in free-air at 1V, 3V, 6V, 10V, 15V, 20V,
30V, and 40V. I didn’t need to discard the 40V curves, as
is often the case, and I’m sure this driver would have stayed
fairly linear in free-air to at least 50V. Following my estab-
lished protocol, I used the fixed Mmd method rather than
the added mass method. This data was provided by Faital.
Next, I post-processed the 12 550-point stepped sine wave
sweeps for each sample and divided the voltage curves by the
current curves to derive impedance curves, phase calculated
and, along with the accompanying voltage curves, imported
to the LEAP 5 Enclosure Shop software. Obviously, this is a
much more time-consuming process than the usual low volt-
age single impedance curve method used for deriving Thiele/
Small parameters. The reason for this, if you haven’t been fol-
lowing this column for a few years, is that the LEAP 5 meth-
"""#"������#���
����$�������%��&���� ���'���(�����%���������&��%����'& ���
(/0*1/2�3 4��������
5$%�������������#/ 1 /2 +��������
��5$%������������#// 1 /22 +������ ���
PHOTO 3: Faital 18XL1600 back.
PHOTO 2: Faital 18XL1600 front.

MAY 2011 17
odology results in a much more accurate prediction of excur-
sion at high voltage levels, which is one of the real strengths of
the LEAP 5 software and why I use it for Test Bench testing.
Because most T/S data provided by OEM manufacturers is
being produced using either a standard method or the LEAP
4 TSL model, I additionally produced a LEAP 4 TSL model
using the 1V free-air curves. I selected the complete data set,
the multiple voltage impedance curves for the LTD model (see
Fig. 9 for the woofer 1V free-air impedance curve) and the
1V impedance curves for the TSL model, in the Transducer
Derivation menu in LEAP 5 and produced the parameters for
the computer enclosure simulations. Table 1 compares the
LEAP 5 LTD and TSL data and factory parameters for both
18XL1600 samples.
Parameter measurement results for the 18XL1600 showed
close agreement with the factory-published data, with the
10 Hz 20 50 100 200 500 1K 2K 5K 10K 20K
Ohm
1
2
5
10
20
50
100
200Impedance vs Freq
10 Hz 20 50 100 200 500 1K
dBSPL
75
80
85
90
95
100
105
110
115
120
125
SPL vs Freq
A
B
C
D
FIGURE 9: Faital Pro 18XL1600 woofer free-air impedance plot.
FIGURE 10: 18XL1600 computer box simulations (A = vented 1 at 2.83V;
B = vented 2 at 2.83V; C = vented 1 at 43V; D = vented 2 at 47V).
TSL model LTD model Factory sample 1 sample 2 sample 1 sample 2FS 33.8Hz 32.9Hz 32.7Hz 31.7Hz 32Hz REVC 5.41 5.40 5.41 5.40 5.4 Sd 0.121 0.121 0.121 0.121 0.117QMS 8.71 7.85 6.33 5.96 9.30 QES 0.41 0.41 0.37 0.38 0.37 QTS 0.40 0.39 0.35 0.36 0.36VAS 191.5 ltr 203.2 ltr 207.7 ltr 221.2 ltr 182 ltr SPL 2.83V 94.4dB 94.4dB 94.7dB 94.5dB 98dB 1W/1m XMAX 7.9mm 7.9mm 7.9mm 7.9mm 7.9mm
��>� ������(!�����B��8��
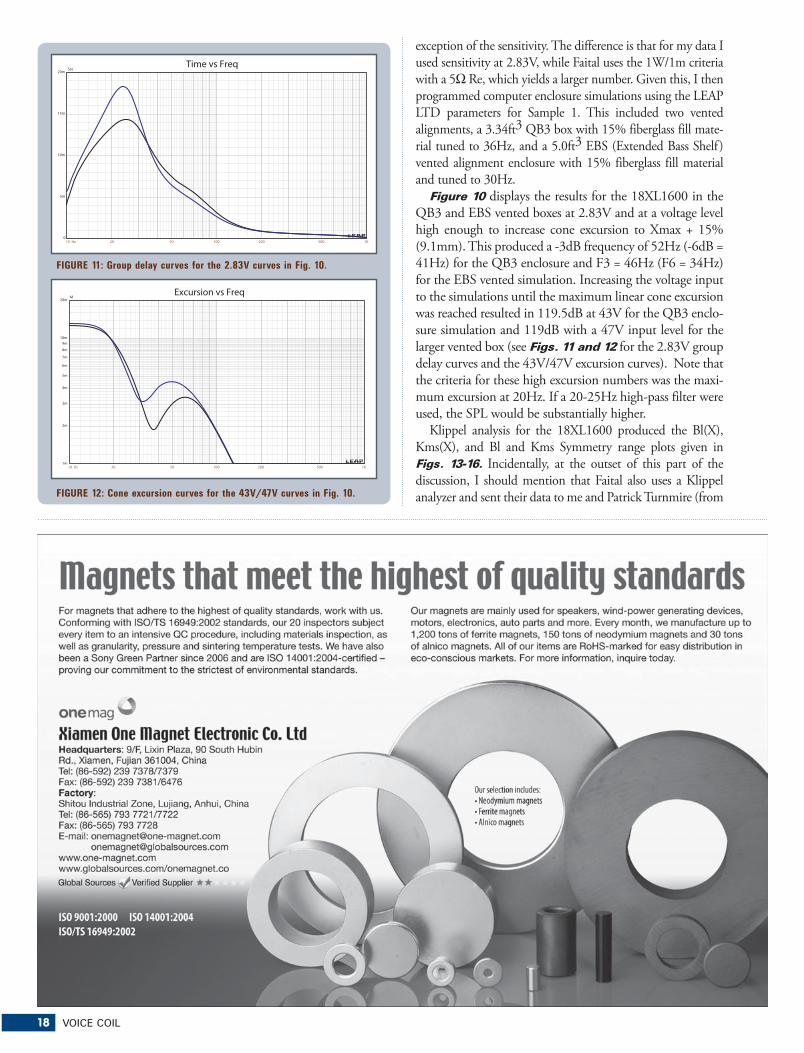
18 VOICE COIL
exception of the sensitivity. The difference is that for my data I
used sensitivity at 2.83V, while Faital uses the 1W/1m criteria
with a 5Ω Re, which yields a larger number. Given this, I then
programmed computer enclosure simulations using the LEAP
LTD parameters for Sample 1. This included two vented
alignments, a 3.34ft3 QB3 box with 15% fiberglass fill mate-
rial tuned to 36Hz, and a 5.0ft3 EBS (Extended Bass Shelf)
vented alignment enclosure with 15% fiberglass fill material
and tuned to 30Hz.
Figure 10 displays the results for the 18XL1600 in the
QB3 and EBS vented boxes at 2.83V and at a voltage level
high enough to increase cone excursion to Xmax + 15%
(9.1mm). This produced a -3dB frequency of 52Hz (-6dB =
41Hz) for the QB3 enclosure and F3 = 46Hz (F6 = 34Hz)
for the EBS vented simulation. Increasing the voltage input
to the simulations until the maximum linear cone excursion
was reached resulted in 119.5dB at 43V for the QB3 enclo-
sure simulation and 119dB with a 47V input level for the
larger vented box (see Figs. 11 and 12 for the 2.83V group
delay curves and the 43V/47V excursion curves). Note that
the criteria for these high excursion numbers was the maxi-
mum excursion at 20Hz. If a 20-25Hz high-pass filter were
used, the SPL would be substantially higher.
Klippel analysis for the 18XL1600 produced the Bl(X),
Kms(X), and Bl and Kms Symmetry range plots given in
Figs. 13-16. Incidentally, at the outset of this part of the
discussion, I should mention that Faital also uses a Klippel
analyzer and sent their data to me and Patrick Turnmire (from
10 Hz 20 50 100 200 500 1K
Sec
0
5m
10m
15m
20m
Time vs Freq
10 Hz 20 50 100 200 500 1K
M
1m
2m
3m
4m
5m
6m
7m
8m
9m
10m
20m
Excursion vs Freq
FIGURE 11: Group delay curves for the 2.83V curves in Fig. 10.
FIGURE 12: Cone excursion curves for the 43V/47V curves in Fig. 10.
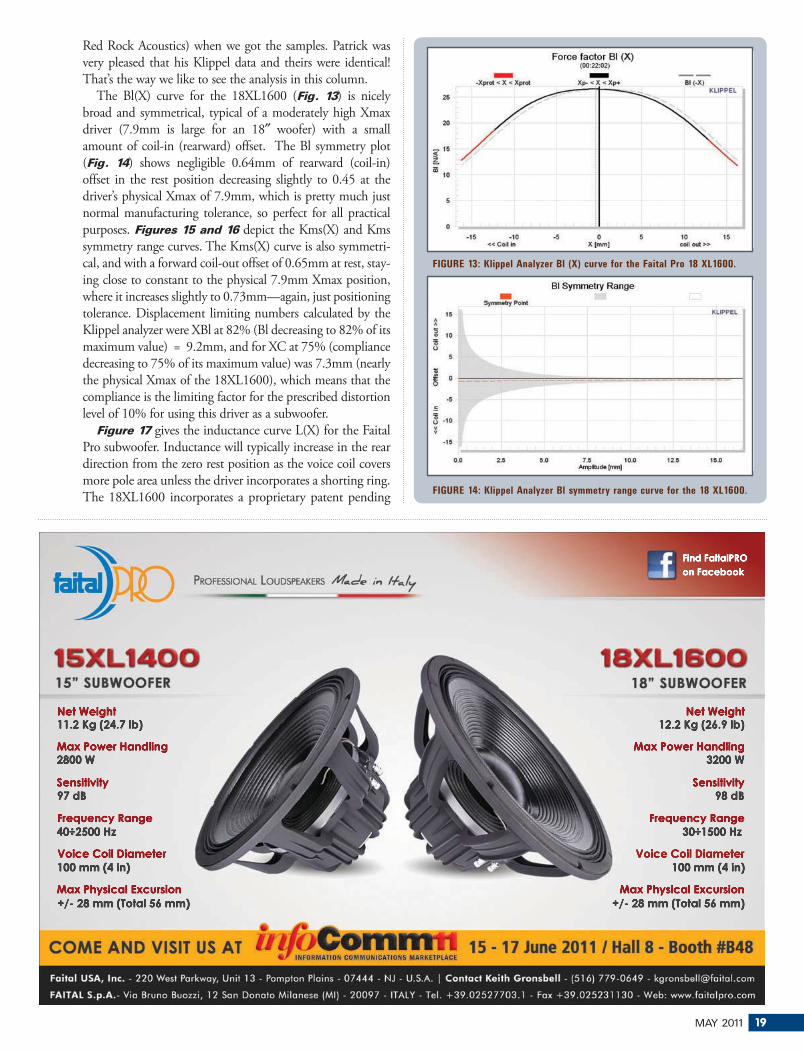
MAY 2011 19
Red Rock Acoustics) when we got the samples. Patrick was
very pleased that his Klippel data and theirs were identical!
That’s the way we like to see the analysis in this column.
The Bl(X) curve for the 18XL1600 (Fig. 13) is nicely
broad and symmetrical, typical of a moderately high Xmax
driver (7.9mm is large for an 18″ woofer) with a small
amount of coil-in (rearward) offset. The Bl symmetry plot
(Fig. 14) shows negligible 0.64mm of rearward (coil-in)
offset in the rest position decreasing slightly to 0.45 at the
driver’s physical Xmax of 7.9mm, which is pretty much just
normal manufacturing tolerance, so perfect for all practical
purposes. Figures 15 and 16 depict the Kms(X) and Kms
symmetry range curves. The Kms(X) curve is also symmetri-
cal, and with a forward coil-out offset of 0.65mm at rest, stay-
ing close to constant to the physical 7.9mm Xmax position,
where it increases slightly to 0.73mm—again, just positioning
tolerance. Displacement limiting numbers calculated by the
Klippel analyzer were XBl at 82% (Bl decreasing to 82% of its
maximum value) = 9.2mm, and for XC at 75% (compliance
decreasing to 75% of its maximum value) was 7.3mm (nearly
the physical Xmax of the 18XL1600), which means that the
compliance is the limiting factor for the prescribed distortion
level of 10% for using this driver as a subwoofer.
Figure 17 gives the inductance curve L(X) for the Faital
Pro subwoofer. Inductance will typically increase in the rear
direction from the zero rest position as the voice coil covers
more pole area unless the driver incorporates a shorting ring.
The 18XL1600 incorporates a proprietary patent pending
FIGURE 13: Klippel Analyzer Bl (X) curve for the Faital Pro 18 XL1600.
FIGURE 14: Klippel Analyzer Bl symmetry range curve for the 18 XL1600.

20 VOICE COIL
aluminum demodulation ring (shorting ring) in the motor
assembly, which is readily apparent in the L(X) curve. As
you can observe, the inductance variation is extremely small,
only 0.12mH from rest to Xmax in either direction. This is
key to a low-distortion accurate-sounding driver.
Because I don’t keep 18″ and 21″ enclosures available
for this kind of testing, I was unable to measure the SPL
of the 18XL1600 firsthand; however, Fig. 18 gives the fac-
tory SPL on-axis as 45° off-axis curves. From the off-axis
response, certainly 500Hz-800Hz would be possible for a
three-way configuration with this driver.
Because I eliminated SPL measurements for the 18XL00
report, I then moved on to the last test which was per-
formed again using the Listen Inc. SoundCheck analyzer
and SC-1 microphone (courtesy of Listen Inc.) to measure
distortion. Because no enclosure was available, I also dis-
pensed with the impulse measurements and used the Listen
Inc. SoundMap software for time frequency presentations.
Setting up for the distortion measurement consisted of
mounting the woofer rigidly in free-air, and setting the
SPL to 104dB at 1m (11.5V) using a noise stimulus
(SoundCheck has a software noise generator and SPL meter
as two of its utilities), and then measuring the distortion
with the Listen Inc. microphone placed 10cm from the dust
cap. This produced the distortion curves shown in Fig. 19.
As you can see from this data, Faital Pro’s High
Performance Series 18″ woofer is just that—a very high per-
formance woofer—with both impressive performance and
impressive design integrity. For more information on this
and other pro sound products from Faital Pro, contact Faital
S.p.A., via B. Buozzi, 12 20097 San Donato Milanese, Italy,
(39) 02 527-7031, fax: (39) 02 523-1130, or in the US,
contact Keith Gronsbell, (516) 779-0649, e-mail kgrons-
[email protected], or visit www.faitalpro.com. VC
FIGURE 15: Klippel Analyzer mechanical stiffness of suspension Kms (X)
curve for the Faital Pro 18 XL1600.
FIGURE 16: Klippel Analyzer Kms symmetry range curve for the 18 XL1600.
FIGURE 18: 18 XL1600 factory on- and off-axis frequency response.
FIGURE 17: Klippel Analyzer L(X) curve for the Faital Pro 18 XL1600.
FIGURE 19: Faital Pro 18XL1600 SoundCheck distortion plots.

MAY 2011 21
SPOTLIGHT
Acoustic ResistanceSecret Sauce for Speakers By Mike Klasco and Steve Tatarunis
�he application of acoustic resistance
as a design element in the optimiza-
tion of transducers and enclosures has
been given short shrift in audio engi-
neering. When mentioned, it is often
referred to as a bandage for poorly
matched speaker parameters and wrong-
sized enclosures. But in these times of
sleek flat-screen TVs and surround chan-
nels, the customer can’t accept a half
dozen super-sized speakers in his/her living room.
Beyond enabling bigger speaker drivers into smaller
enclosures, acoustic resistance meshes also are powerful
tools to optimize transient response. Controlling the acous-
tic resistance of the driver radiation is a quality factor that
is overlooked in most loudspeaker predictive modeling soft-
ware. Settling time of adjustments was a basic consideration
in the original works of Benson, Novick, and Thiele.
Acoustic resistance can be obtained from both woven
and nonwoven filters. Wovens are selected for repeatability
and for uniformity, with maximum deviation of less than
10%. When cost is critical nonwovens are selected. Yet in an
earphone or headphone, the nonwoven material contributes
more variation in production in the bass than even the driv-
er. Nonwovens vary over 30% in acoustic resistance, and
characteristics change with humidity. Open a Sennheiser
headphone—even their lower-end Chinese models—and
you will see mesh, not nonwoven membranes. Yet lower
grade mesh that absorbs moisture can pick up dust and
become clogged, so hydrophobic-treated mesh is a benefi-
cial requirement for stable long-term characteristics.
In the specific case of speakers and speaker systems,
acoustic resistance may take the physical form of a woven
fabric tensioned onto either the windows of the woofer
frame and/or on the bass reflex vent opening. The inter-
action with the performance is different for damping the
driver versus damping the enclosure, with damping the
driver itself being preferred.
This article—including the sidebar profile of Saatitech,
the specialist vendor of acoustic resistance materials—
explores applications of acoustic resistance for audio.
Acoustic resistance is the opposition to the flow of sound
through a surface such as a mesh or nonwoven membrane.
Readers will recognize common examples of acoustic resis-
tance meshes such as mike wind screens, but speaker appli-
cations are more obscure, such as meshes over vented pole
pieces or meshed covers on the frame for venting behind
the spider on woofers and aperiodic bass reflex venting in
enclosures and mesh over vents in headphones. Of course,
most mikes and cellphones have wind screens.
The variovent (Photo 1) consists of two grilles with
some damping material stuck in between. The diameter,
amount of damping material, and the compression of the
material determine the air flow properties, and thus acoustic
resistance.
To start at the beginning, a tightly precision woven
mesh provides “dialed in” uniform acoustical resistance. A
path between the front and back radia-
tion provides an acoustical short circuit.
Placing a mesh over a vent hole results
in a partial short circuit—i.e., there
is some (acoustical) resistance. Using
an electrical circuit filter analogy (such
as Thiele/Small parameters), acoustic
mesh can be modeled as a “resistor”
across an inductor or capacitor or other
tuned circuit. The application of acous-
tic mesh can improve impulse response
settling time (damping).
As you would expect, when the Q factor is damped, then
less than maximally flat response results. Q is a term with
beginnings in radio frequency (RF) design, with the peak-
ing of the inductor characteristic being the Quality figure
of merit. For sound reproduction a very high Q peak is
not necessarily what we are looking for. Acoustic mesh is a
design tool to widen the bandwidth of the Q.
Surface-treated acoustic mesh can provide benefits out-
side of acoustics, such as water penetration resistance in
mobile phones, outdoor mikes, and speakers. Conversely,
mesh that is treated for wetting can absorb binder resins,
such as for spiders, fabric surrounds, woven high perfor-
mance fiber cones, or tweeter domes.
Practical Aspects and Implementation of Acoustic ImpedanceThe tighter the mesh aperture (opening), the higher the acoustic resistance damping and the greater the loss of low-end response. The more open the mesh weave, the more acoustically transparent the mesh. If the electromagnetic control of the driver at resonance is not sufficient for a given enclosure and tuning, then for some misalignments you
PHOTO 1: Variovent cover

22 VOICE COIL
end up with a high-pass response characteristic of a sharp response peak before the output takes a dive. Conditions such as speakers that are crammed into too small bass reflex or lossy enclosures are common offenders. Acoustic resistance damping is far less expensive than overmotoring through electromagnetic damping!
While a sealed acoustic suspension enclosure can provide
tight linear control using an “air spring,” it is at the expense
of sensitivity or bass extension. Ideal bass reflex solutions
are often too large or require pricey magnetic structures to
adequately motor the design. To tweak the bass reflex align-
ments that are too compact and to keep woofer cost within
budget can often benefit from acoustic resistance. Acoustic
resistance used on the back frame of a driver or bass reflex
vent is a gray area between sealed and vented solutions.
Consider the following half-dozen applications in which
acoustic resistance is a valuable design technique.
Bass Driver Cavity VentingFor ventilation cooling, many woofers vent the pole piece and/or the cavity under the spider. QC personnel checking woofers on the production line will recognize the phenom-ena of higher buzz and rub in less than perfect units when the unbaffled woofer is tested dangling in the air (such as holding the woofer in your hands while you test), but when placed on a table the buzz and rub goes away. Various factors account for this—one is the slightly reduced excursion when the vent is blocked (by the table). But mostly the blocked vent produces an “air bearing” which minimizes scrapes.
You can retain venting while maintaining some of this
air bearing effect by selection of the proper “acoustic impe-
dence mesh.” Another related phenomenon is the chuffing
of the vented pole piece—due to the air velocity reaching
turbulence. The mesh across the vented pole piece drops the
volume of air which will reduce the vent noise (of course,
also cutting down on the cooling).
Microspeakers, balanced drive tweeters, and headphone
drivers mostly have similar topology. Specifically, centering
during assembly is on the periphery of the surround, with
a one-point suspension (no spider) being the compliance
corrugation at the edge of the cone. At higher excursions
the voice coil tends to rock and there is little restoring force.
In the case of earphones and headphone enclosures, there
are typically front and rear vents. If there is a headphone
enclosure (earcup) venting positioned in front of the dia-
phragm, the bass will “evaporate” unless you use an acoustic
resistance mesh. The acoustic mesh enables the use of a
larger vent hole without loss of bass.
Selection of the degree of acoustic resistance controls the
trade-off between bass output versus settling time (damp-
ing). Then there is the issue of nonwovens versus monofila-
ment mesh. It is the nature of nonwovens to have very wide
variation—not just roll to roll, but within the roll itself.
Nonwovens are usually hydroscopic and change character-
istics with humidity.
Acoustic meshes can be precision materials with uni-
formity of well over 90%, so when an optimum mesh
damping is determined, the production is repeatable. In
��������������������� �������������������������
���������������� !���"�������#������������������������
$ ��
��#
%�!
����
&��
����%
�'�
�
$ ����#%�! ����&������%�'�� ��)�����������%�'� � ����%��%�'����������(�������������%'�����(%���)� ���� ����(����������*� ��+��,���%������� �-��� ������(%��.�
/%����,����%����,���%�����%���%'� �����(( � ��0�%� � ��0��� � ��0���%�%�'� �����)���(�������������������������� �%����%����%���������(������������)������� !���123-�� ���*���� ��� ����)%� �%����(�����%������ ���%��� ������ ���*������,�����������%�����
/��� ��� �������)������*���4�%����0��25"��0�360�&�710�3�6650��6"& �0�825�0������������%�������%���% 0�� �� ��%�0�370�"��0���� �� ��������9������� �����%�����%�'��9:;�0�$#&�� �����������%����
5�������� �� �� � %� )������%'���� ���� ��%��������������(�����)������ �����������'%�����0�%������% �����%'����� ���� �!��%�'��,������7�!�����(�%������%������*� ���*���� ��� ��%��%�'����)%� �%����� �����������������������<��0� �*� �����!����%��������
�
� � � � � � � � � � � � �
�� ����
� ��� � � � � � � � � �
��������������������������������� ��!�������"
�������� ��� ��� ������� �� � ���� �� ��������� �� ������������� �� ���� ������ �� � �������� ��������� �������������������� �� � ����������� ������������� ������� ��������������� �� ����� �� � � ������ ���������� �������� �� � ������� �� ��������������������������������!�����������"##$��� ����������������%

MAY 2011 23
microspeakers and headsets one of the key variations is the
damping fabric, and just by shifting to precision meshes the
lower octave response variations tighten up dramatically.
Using acoustic resistance can improve settling time in
planar ribbon and electrostatic speakers. With the mesh
behind the planar, a thin evenly distributed air cushion will
reduce the settling time of the tensioned diaphragm. At
resonance, tensioned diaphragms act like a plucked guitar
string and the mesh damps the decay.
Non-Acoustic Applications of MeshTotally unrelated to speaker driver and enclosure charac-teristics is the application of precision meshes for grille cloth. The higher acoustic impedance meshes with smaller openings (tighter weaves) provide damping. You can select open weaves that offer complete acoustic transparency. Compared to conventional fabrics, precision acoustic mesh-es are consistent, so production run batches are essentially identical. These monofilament polyester meshes are not hydroscopic, so there is negligible moisture absorption or change in sound transparency with humidity. For mobile consumer electronics products such as cellphones, hydro-phobic meshes enable venting for sound, pressure equaliza-tion and cooling while blocking water.
Many automotive OEMs require meshes on the rear
of the speakers for dust and debris protection, and when
used in this open back (“free air”) condition there is also an
opportunity for some acoustic resistance benefit. A hint for
designers of in-wall speakers: If the in-wall has a back cover,
then the internal volume tends to be too tight, but left open
the back volume is too large. With acoustic resistance mesh
tensioned over the woofer, you can bring this into balance
without needing the back cover.
Microphone ApplicationsThe most common application of acoustic resistance meshes is for mike wind screens. Other applications for acoustical filters for mikes include handsfree car phones, Onstar talkback, over-the-ear bluetooth, cellphones, and computer headsets with boom mike. In most cases there is a scrim used in front of the mike—or foam, or foam and felt. For full waterproof applications there is composite mesh with a thin film lamination that fully meets IP 47 and 48 with nominal wideband acoustic loss.
Up to three layers of different meshes can be used
on outdoor, stage, movie, and electronic-news-gathering
(ENG) microphones to block wind, rain, or debris. Special
mesh metalizing treatments also block electrical noise (emi)
and electrostatic discharge (esd). In directional mikes,
meshes can be used for “tuning” back chamber baffling to
smooth and widen back of mike sound rejection.
While acoustic mesh has been a common design tech-
nique in European mikes and headphones for decades,
acoustic resistance has only recently become a consideration
of experienced speaker engineers. Aside from the acoustic
contribution, precision meshes are a unique solution to
keep rain off outdoor speakers, wind and spit out of micro-
phones, and debris from the back of car door speakers. VC

24 VOICE COIL
Saatitech – Acoustic Mesh Specialist
Acoustic mesh is an obscure area in audio, and a catalog of this stuff is not likely to be on most speaker engineers’ desks. My initial contact with acoustic resistance mesh was in the early 1960s with my first speaker—a Goodman’s Axiom 80, which was a full-range speaker with cantilever suspension and literally no surround (Photo A). The recommended enclosure used an Acoustic Resistance Unit (“ARU”), which was a tight mesh sandwiched into a supporting frame. Forty years later, acoustic resistance was a hot technique promoted by David Navone and Richard Clark in controlling autosound trunk-mounted subwoofers http://
www.teamaudionutz.com/tutorial/1/AP_Enclosures-The_
Aperiodic_Cookbook
While wandering through the AES in San Francisco five
years ago, I came across Saatitech’s booth. Here was an outfit
that not only offered acoustic mesh in the range that a speaker,
mike, or headphone engineer could use, but they also actually
understood why their products worked for audio.
ApplicationsSaatiTech is a member of the Saati Group, whose main busi-ness is the manufacturing of precision woven fabrics. Founded in Italy in 1935, the Saati Group has perfected the manufac-turing of industrial fabrics to a high degree of precision and
consistency as it relates to pore size openings. In addition to weaving, Saati has also developed proprietary technology in fabric surface treatments, espe-cially with hydrophobic and hydrophilic coat-ings. SaatiTech fabrics are used in a wide range of industries besides acoustics, such as medical and diagnostic, filtration, automotive, milling, and sifting (Photo B).
Many Saati meshes cross over to other
industries, such as the use of mesh behind
OEM autosound speakers installed in car
doors to both control bottom end boominess
as well as protect from debris floating inside
the car door. The application of acoustic mesh in headphones
and earphones was derived first from
its application in hearing aids for vent-
ing to minimize occlusion effects. Most
smartphones use SaatiTech as a wind
screen, an application that was first used
in professional microphones for outdoor
recording of movie soundtracks and
outdoor concert stage mikes.
Beyond audio, Saati fabricates Kevlar
and carbon fiber and other sophisti-
cated materials for military and high-
performance applications. Advanced
capabilities include tri-axial weaves (ideal for speaker cones
������������ ��������������� ����� ������������������ ����� ����� ����� ����� ����������������� ���������������� ������������������� ��������� ������� ������������ �������
����������������� ����� ����������������������� ��������������������� �������������� ��� ������������� ����� !�"#$%"�������� �
��$���������� ��� ������������%�������������� �������&�����'����� ������� ��������� ������������!('��������)����� �����
��������
������ ��
������������������� �� ��������������� ��&�������
"(�*+,- .,/ 0-/,,,1���2��� ��12��� ��@�����3��
4��-/5 6,6 770/1�������� ���1���� ���@�����3��
�&"8�09 /,06/.-..,5%����)��*���� )�%*���� )�@�����3��
� �����
..9 ./. .6. .6: .,6 .5: .9: .7: .-. /5: /9. 69.
(�� ����� �� 2���� �
�� ���������
�������� ���������������� ��� � ��� �������������������������� ����������
PHOTO A: Goodmann’s speak-
er cover, 1960.
PHOTO B: Saati precision
woven material.
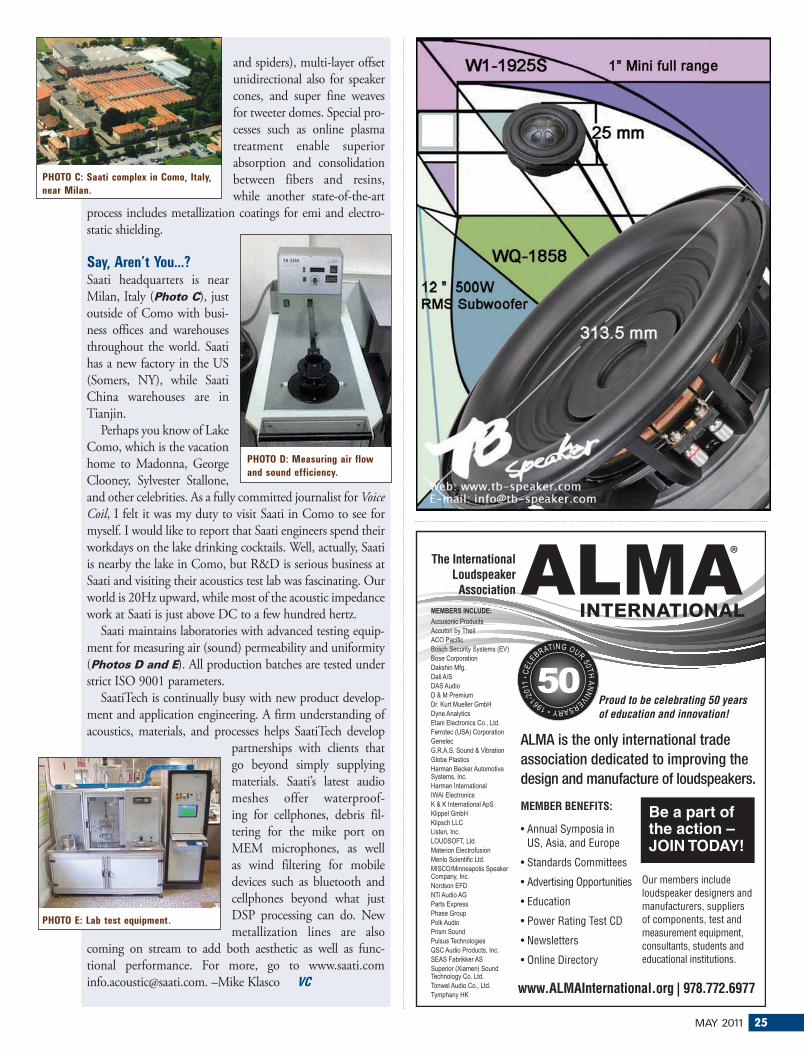
MAY 2011 25
CEL
EBRATING OUR
50THA
NN
IVERSARY•1961-20
11• 50
MEMBERS INCLUDE:Accusonic ProductsAccuton by TheilACO PacificBosch Security Systems (EV)Bose CorporationDakshin Mfg.Dali A/SDAS AudioD & M PremiumDr. Kurt Mueller GmbHDyne AnalyticsEtani Electronics Co., Ltd.Ferrotec (USA) CorporationGenelecG.R.A.S. Sound & VibrationGlobe PlasticsHarman Becker AutomotiveSystems, Inc.Harman InternationalIWAI ElectronicsK & K International ApSKlippel GmbHKlipsch LLCListen, Inc.LOUDSOFT, Ltd.Materion ElectrofusionMenlo Scientific Ltd.MISCO/Minneapolis SpeakerCompany, Inc.Nordson EFDNTi Audio AGParts ExpressPhase GroupPolk AudioPrism SoundPulsus TechnologiesQSC Audio Products, Inc.SEAS Fabrikker ASSuperior (Xiamen) SoundTechnology Co. Ltd.Tonwel Audio Co., Ltd.Tymphany HK
ALMA is the only international tradeassociation dedicated to improving thedesign and manufacture of loudspeakers.
MEMBER BENEFITS:
• Annual Symposia inUS, Asia, and Europe
• Standards Committees
• Advertising Opportunities
• Education
• Power Rating Test CD
• Newsletters
• Online Directory
Our members includeloudspeaker designers andmanufacturers, suppliersof components, test andmeasurement equipment,consultants, students andeducational institutions.
Be a part ofthe action –JOIN TODAY!
Proud to be celebrating 50 yearsof education and innovation!
www.ALMAInternational.org | 978.772.6977
The InternationalLoudspeaker
AssociationALMAINTERNATIONAL
®
and spiders), multi-layer offset
unidirectional also for speaker
cones, and super fine weaves
for tweeter domes. Special pro-
cesses such as online plasma
treatment enable superior
absorption and consolidation
between fibers and resins,
while another state-of-the-art
process includes metallization coatings for emi and electro-
static shielding.
Say, Aren’t You...?Saati headquarters is near Milan, Italy (Photo C), just outside of Como with busi-ness offices and warehouses throughout the world. Saati has a new factory in the US (Somers, NY), while Saati China warehouses are in Tianjin.
Perhaps you know of Lake
Como, which is the vacation
home to Madonna, George
Clooney, Sylvester Stallone,
and other celebrities. As a fully committed journalist for Voice
Coil, I felt it was my duty to visit Saati in Como to see for
myself. I would like to report that Saati engineers spend their
workdays on the lake drinking cocktails. Well, actually, Saati
is nearby the lake in Como, but R&D is serious business at
Saati and visiting their acoustics test lab was fascinating. Our
world is 20Hz upward, while most of the acoustic impedance
work at Saati is just above DC to a few hundred hertz.
Saati maintains laboratories with advanced testing equip-
ment for measuring air (sound) permeability and uniformity
(Photos D and E). All production batches are tested under
strict ISO 9001 parameters.
SaatiTech is continually busy with new product develop-
ment and application engineering. A firm understanding of
acoustics, materials, and processes helps SaatiTech develop
partnerships with clients that
go beyond simply supplying
materials. Saati’s latest audio
meshes offer waterproof-
ing for cellphones, debris fil-
tering for the mike port on
MEM microphones, as well
as wind filtering for mobile
devices such as bluetooth and
cellphones beyond what just
DSP processing can do. New
metallization lines are also
coming on stream to add both aesthetic as well as func-
tional performance. For more, go to www.saati.com
[email protected]. –Mike Klasco VC
PHOTO D: Measuring air flow
and sound efficiency.
PHOTO E: Lab test equipment.
PHOTO C: Saati complex in Como, Italy,
near Milan.
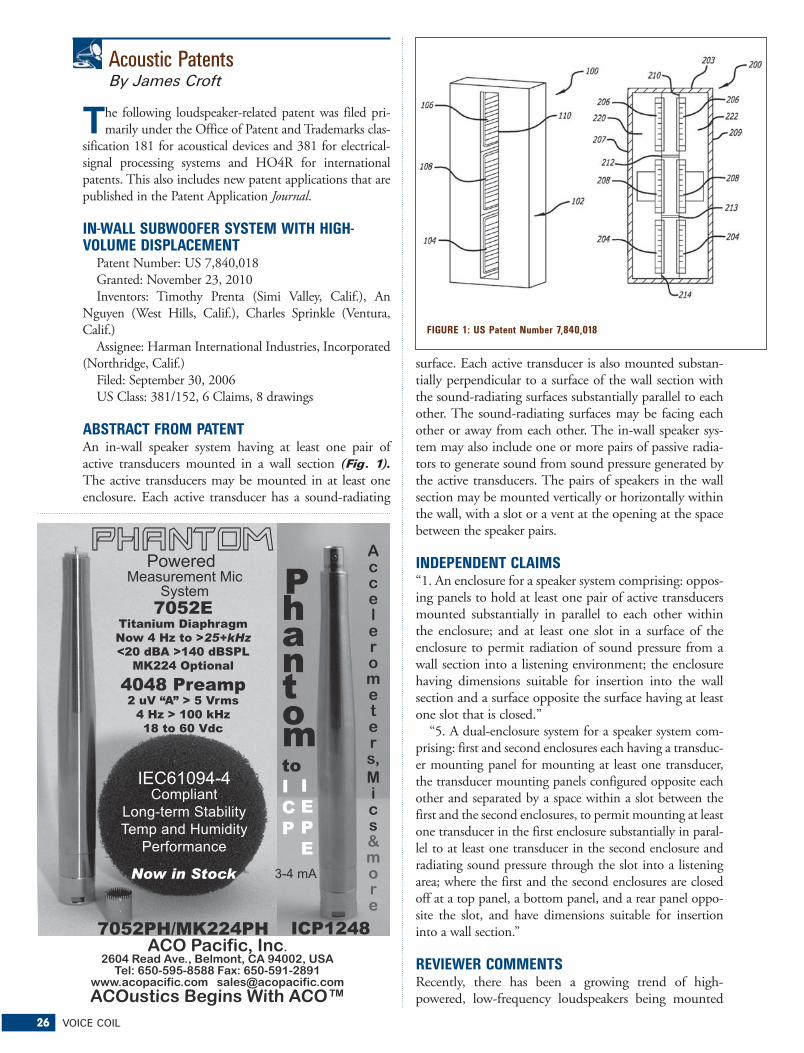
26 VOICE COIL
Acoustic Patents By James Croft
�he following loudspeaker-related patent was filed pri-
marily under the Office of Patent and Trademarks clas-
sification 181 for acoustical devices and 381 for electrical-
signal processing systems and HO4R for international
patents. This also includes new patent applications that are
published in the Patent Application Journal.
IN-WALL SUBWOOFER SYSTEM WITH HIGH-VOLUME DISPLACEMENT
Patent Number: US 7,840,018
Granted: November 23, 2010
Inventors: Timothy Prenta (Simi Valley, Calif.), An
Nguyen (West Hills, Calif.), Charles Sprinkle (Ventura,
Calif.)
Assignee: Harman International Industries, Incorporated
(Northridge, Calif.)
Filed: September 30, 2006
US Class: 381/152, 6 Claims, 8 drawings
ABSTRACT FROM PATENTAn in-wall speaker system having at least one pair of active transducers mounted in a wall section (Fig. 1). The active transducers may be mounted in at least one enclosure. Each active transducer has a sound-radiating
surface. Each active transducer is also mounted substan-tially perpendicular to a surface of the wall section with the sound-radiating surfaces substantially parallel to each other. The sound-radiating surfaces may be facing each other or away from each other. The in-wall speaker sys-tem may also include one or more pairs of passive radia-tors to generate sound from sound pressure generated by the active transducers. The pairs of speakers in the wall section may be mounted vertically or horizontally within the wall, with a slot or a vent at the opening at the space between the speaker pairs.
INDEPENDENT CLAIMS“1. An enclosure for a speaker system comprising: oppos-ing panels to hold at least one pair of active transducers mounted substantially in parallel to each other within the enclosure; and at least one slot in a surface of the enclosure to permit radiation of sound pressure from a wall section into a listening environment; the enclosure having dimensions suitable for insertion into the wall section and a surface opposite the surface having at least one slot that is closed.”
“5. A dual-enclosure system for a speaker system com-
prising: first and second enclosures each having a transduc-
er mounting panel for mounting at least one transducer,
the transducer mounting panels configured opposite each
other and separated by a space within a slot between the
first and the second enclosures, to permit mounting at least
one transducer in the first enclosure substantially in paral-
lel to at least one transducer in the second enclosure and
radiating sound pressure through the slot into a listening
area; where the first and the second enclosures are closed
off at a top panel, a bottom panel, and a rear panel oppo-
site the slot, and have dimensions suitable for insertion
into a wall section.”
REVIEWER COMMENTS Recently, there has been a growing trend of high-powered, low-frequency loudspeakers being mounted
����������� ������������������������ ����������������
��� ��!�"!�!"#!##�$�% ��!�"!�&"�#�&'''����(����������)���)*���(����������+)��)���, )�-�.����/
�������
� ��!�"!����
��#��$%&'����$
�������
��#����(!��(�"�)(�* ���"+�,���$-�!��.�������/���0���.����0�1��
&'����2*!(����
������� �"*���3�4�5�.�#�3�"6�
��$-�.�����7$-���!��8��30�
��� �����
������0�����0)�1�)2���0��
����
������
���� ����������������
������
������������� ����
!�"���������#� ���$������ �%��� ���
���&������
FIGURE 1: US Patent Number 7,840,018

MAY 2011 27
for in-wall use. Many of those operating as subwoofers use high mass diaphragms with significant excursion capability. Unfortunately, most living room walls are not particularly acoustically inert and a high-powered woofer that is flush-mounted in the wall can stimulate the surface into mobility such that the wall as a pas-sive radiator can—in many cases—produce outputs at certain frequencies that are equal, or greater than, the output of the woofer itself.
In loudspeaker enclosures, including subwoofers, this
problem can also exist, but usually to a lesser degree
due to well-built loudspeaker enclosures being more
rigid and well damped than the standard studded wall.
With subwoofers, many have adopted the technique of
using two woofers mounted on opposite sides of a cabi-
net “back-to-back” to effectively cancel low-frequency
vibration, substantially eliminating the problem. The
Harman patent essentially adopts this technique to an
in-wall structure by using at least two woofers mounted
in the wall, parallel to each other and perpendicular to
the surface of the wall, so that they radiate face-to-face
into a common slot that exits out into the room. The
recommended woofers tend to be oblong or racetrack
form factors so that they can achieve the greatest cone
surface area while achieving a better fit within the depth
of the wall studs.
Although it is not claimed, in the specification they
disclose the concept that, along with a pair of active driv-
ers mounted opposed within the in-wall slot, there may
be a pair of passive radiators also mounted opposing each
other within the in-wall slot. This approach is an excellent
solution that has proven to be very effective in cancelling
wall surface vibrations even when used with very power-
ful subwoofers operating to frequencies down to 20Hz or
less. And this fact, of lots of proof of the success of this
technology, may be the downfall of the validity of this
case going forward.
If you look into the history of other applications of
this approach, there are many prior art expressions that
bring the patentability into question; one of which is the
Artison RCC Six Hundred in-wall subwoofer developed
by Cary Christie prior to the September 30, 2006, fil-
ing date of the patent. You can see the Artison device
at http://www.artisonusa.com/subwoofers/rcc-600-sm-
in-wall/ with the literature, with copyrights of 2006
shown at http://www.artisonusa.com/PFRCC600.pdf.
Even earlier disclosures were delivered in show reports in
2003 and 2004 of substantially the same device shown
at THE Show and CES, respectively, by Wisdom Audio.
Harman disclosed neither of these prior-art usages,
nor did the patent examiner find them. So, while this
approach is one that has obvious and proven merit,
you might expect that there will be many manufactur-
ers making this type of system available, even though
Harman has been granted a patent. VC
sponsors of “The Loudspeaker University” seminars
Liaison Between Materials,
Suppliers, & Audio Manufacturers
Technical Support for Headset,
Mic, Speaker & Manufacturers
Product Development
Sourcing Guidance
Test & Measurement
Instrumentation
MENLO
S C I E N T I F I C
Engineering Consulting
for the Audio Community
USA tel 510.758.9014
Michael Klasco
www.menloscientific.com

28 VOICE COIL
Industry WatchBy Vance Dickason
'udiovox (www.audiovox.com) com-
pleted its acquisition of Klipsch Group for $166 million. As a wholly
owned subsidiary of Audiovox, Klipsch
Group (www.klipsch.com) will operate as
a stand-alone entity that will continue to
be run by its current management team in
its established Indianapolis headquarters.
Audiovox expects the addition of Klipsch to
generate about $170 million in additional net sales and $25
million in EBITDA (earnings before interest, taxes, depre-
ciation, and amortization) in fiscal 2012, which started
March 1, 2011. Revenue for the combined companies in
fiscal 2012 will be around $730 million with potential
upside for growth based on market conditions and con-
tinued execution of strategic growth initiatives. Audiovox
intends to continue to support Klipsch’s R&D capabili-
ties and its quality reputation. The purchase was financed
through Audiovox cash and a new $175 million asset-based
revolving credit facility.
Kicker Performance Audio (www.kicker.com) is part-
nering with Subaru of America (www.subaru.com) to
supply OE (original equipment) upgrades in specific
models. The Kicker upgrades are said to be compatible
with all 2008 through 2011 Impreza, Impreza WRX, and
2011 WRX STI sedans and five-door vehicles with naviga-
tion or non-navigation audio systems. The audio system
includes a 10″ powered subwoofer in a molded enclosure
made to fit in the trunk or cargo area of the specific model.
Suggested retail for the upgrade is $499. The subwoofer
is powered by an integrated 100W, high-efficiency digital
amplifier that connects into the existing Subaru audio
system using a plug-and-play wire harness. These audio
upgrade kits are currently available through Subaru dealer-
ships. The upgrade kit may either be installed at the fac-
tory port processing facility or at the dealership prior to
delivery, according to Kicker.
Hernon Manufacturing (hernonmfg.com), the adhesive
and sealing technologies company, has confirmed that it
has signed a joint venture agreement with China-based
ShenZhen Dover Technology Co., Ltd. (www.doverchina.
com). Under the terms of the agreement, Hernon Dover will provide direct order fulfillment, product support, and
repackaging for Hernon’s existing network of Chinese dis-
tributors and direct customers. Initially, the joint venture
will seek to expand the use of Hernon’s high performance
adhesives and sealants in the electronic and speaker manu-
facturing sectors. However, both companies anticipate an
expansion into multiple sectors and industries as Hernon
Dover will have access to the complete Hernon product line
with over 300 products available for sale.
Both parties cite numerous advantages for the new
Hernon Dover label including lower costs for customers
because the product can be packaged and sold locally;
faster and more responsive customer service
because order fulfillment and support will
be handled locally in ShenZhen, China; and
access to new market sectors that source their
chemical needs from China while expand-
ing the offerings that ShenZen Dover has
to offer its customer base. The joint venture
calls for repackaging the Hernon products
under the label Hernon Dover.
Eminence Speaker LLC’s Josh
Martin (Photo 1) has been promoted to
Technology Sales Manager. In this new role,
Martin will be responsible for the market
development and sale of a revolutionary new technology
called D-FEND™, which provides programmable control
over key performance characteristics of passive systems and
loudspeakers. Prior to his promotion, Martin held several
key positions with Eminence (eminence.com).
Klipsch, which has offered desktop PC speakers for
about a decade, is entering the market for embedded
laptop speakers with the planned launch by Alienware
(www.alienware.com) of a series of gaming laptops.
The deal with Dell subsidiary Alienware isn’t Klipsch’s
first OEM speaker deal with a computer maker. In the
past, Klipsch has offered Klipsch-branded speakers that
Hewlett-Packard and Compaq bundled with their desk-
top speakers. The first Alienware laptop with Klipsch
speakers is the M17x, the company’s first 3D-capable
gaming laptop. Klipsch said the speakers would give gam-
ers sound quality superior to anything they’ve ever heard
in built-in laptop speakers. The company said its current
THX-certified ProMedia 2.1 speaker system has been the
de facto speakers in the gaming community.
Home Technology Specialists of America (HTSA,
www.htsa.com), the $400 million buying group for dealers,
installers, and system integrators, has launched a new online
magazine for consumers. Dubbed HDLiving.com, the
technology and entertainment site was designed to provide
PHOTO 1: Josh Martin.
PHOTO 2: Paradigm Reference MilleniaSub with PT-2 Wireless
Transmitter.
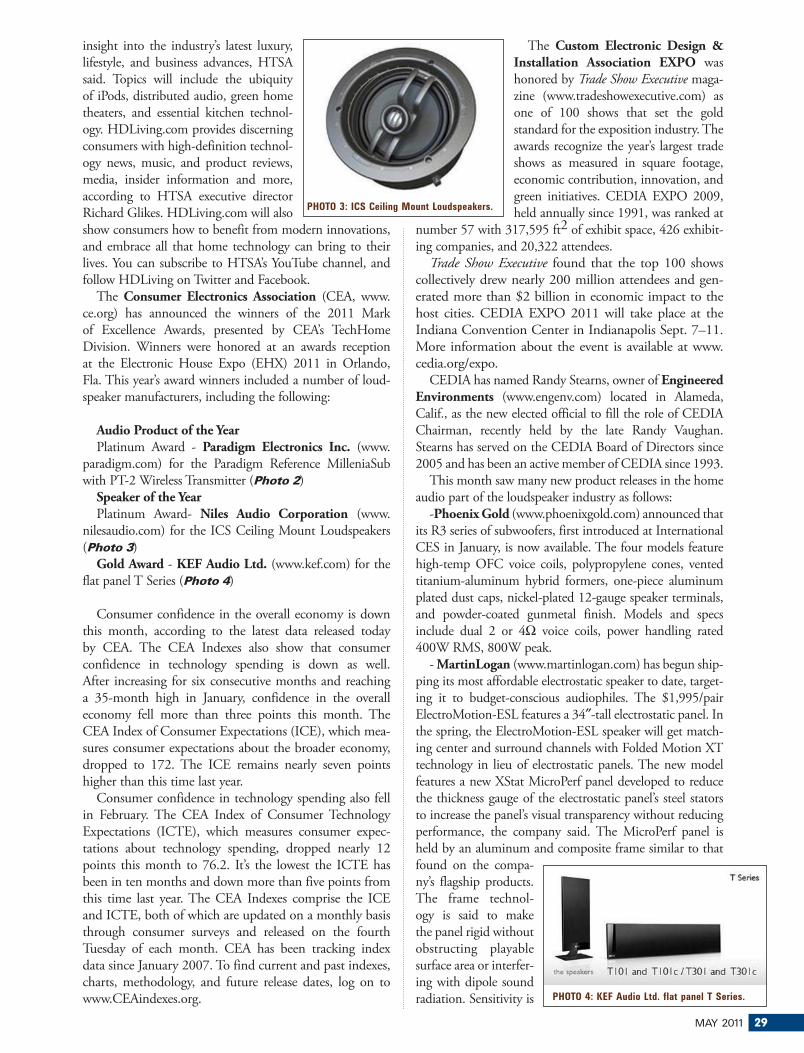
MAY 2011 29
insight into the industry’s latest luxury,
lifestyle, and business advances, HTSA
said. Topics will include the ubiquity
of iPods, distributed audio, green home
theaters, and essential kitchen technol-
ogy. HDLiving.com provides discerning
consumers with high-definition technol-
ogy news, music, and product reviews,
media, insider information and more,
according to HTSA executive director
Richard Glikes. HDLiving.com will also
show consumers how to benefit from modern innovations,
and embrace all that home technology can bring to their
lives. You can subscribe to HTSA’s YouTube channel, and
follow HDLiving on Twitter and Facebook.
The Consumer Electronics Association (CEA, www.
ce.org) has announced the winners of the 2011 Mark
of Excellence Awards, presented by CEA’s TechHome
Division. Winners were honored at an awards reception
at the Electronic House Expo (EHX) 2011 in Orlando,
Fla. This year’s award winners included a number of loud-
speaker manufacturers, including the following:
Audio Product of the YearPlatinum Award - Paradigm Electronics Inc. (www.
paradigm.com) for the Paradigm Reference MilleniaSub
with PT-2 Wireless Transmitter (Photo 2)
Speaker of the YearPlatinum Award- Niles Audio Corporation (www.
nilesaudio.com) for the ICS Ceiling Mount Loudspeakers
(Photo 3)
Gold Award - KEF Audio Ltd. (www.kef.com) for the
flat panel T Series (Photo 4)
Consumer confidence in the overall economy is down
this month, according to the latest data released today
by CEA. The CEA Indexes also show that consumer
confidence in technology spending is down as well.
After increasing for six consecutive months and reaching
a 35-month high in January, confidence in the overall
economy fell more than three points this month. The
CEA Index of Consumer Expectations (ICE), which mea-
sures consumer expectations about the broader economy,
dropped to 172. The ICE remains nearly seven points
higher than this time last year.
Consumer confidence in technology spending also fell
in February. The CEA Index of Consumer Technology
Expectations (ICTE), which measures consumer expec-
tations about technology spending, dropped nearly 12
points this month to 76.2. It’s the lowest the ICTE has
been in ten months and down more than five points from
this time last year. The CEA Indexes comprise the ICE
and ICTE, both of which are updated on a monthly basis
through consumer surveys and released on the fourth
Tuesday of each month. CEA has been tracking index
data since January 2007. To find current and past indexes,
charts, methodology, and future release dates, log on to
www.CEAindexes.org.
The Custom Electronic Design & Installation Association EXPO was
honored by Trade Show Executive maga-
zine (www.tradeshowexecutive.com) as
one of 100 shows that set the gold
standard for the exposition industry. The
awards recognize the year’s largest trade
shows as measured in square footage,
economic contribution, innovation, and
green initiatives. CEDIA EXPO 2009,
held annually since 1991, was ranked at
number 57 with 317,595 ft2 of exhibit space, 426 exhibit-
ing companies, and 20,322 attendees.
Trade Show Executive found that the top 100 shows
collectively drew nearly 200 million attendees and gen-
erated more than $2 billion in economic impact to the
host cities. CEDIA EXPO 2011 will take place at the
Indiana Convention Center in Indianapolis Sept. 7–11.
More information about the event is available at www.
cedia.org/expo.
CEDIA has named Randy Stearns, owner of Engineered Environments (www.engenv.com) located in Alameda,
Calif., as the new elected official to fill the role of CEDIA
Chairman, recently held by the late Randy Vaughan.
Stearns has served on the CEDIA Board of Directors since
2005 and has been an active member of CEDIA since 1993.
This month saw many new product releases in the home
audio part of the loudspeaker industry as follows:
-Phoenix Gold (www.phoenixgold.com) announced that
its R3 series of subwoofers, first introduced at International
CES in January, is now available. The four models feature
high-temp OFC voice coils, polypropylene cones, vented
titanium-aluminum hybrid formers, one-piece aluminum
plated dust caps, nickel-plated 12-gauge speaker terminals,
and powder-coated gunmetal finish. Models and specs
include dual 2 or 4Ω voice coils, power handling rated
400W RMS, 800W peak.
- MartinLogan (www.martinlogan.com) has begun ship-
ping its most affordable electrostatic speaker to date, target-
ing it to budget-conscious audiophiles. The $1,995/pair
ElectroMotion-ESL features a 34″-tall electrostatic panel. In
the spring, the ElectroMotion-ESL speaker will get match-
ing center and surround channels with Folded Motion XT
technology in lieu of electrostatic panels. The new model
features a new XStat MicroPerf panel developed to reduce
the thickness gauge of the electrostatic panel’s steel stators
to increase the panel’s visual transparency without reducing
performance, the company said. The MicroPerf panel is
held by an aluminum and composite frame similar to that
found on the compa-
ny’s flagship products.
The frame technol-
ogy is said to make
the panel rigid without
obstructing playable
surface area or interfer-
ing with dipole sound
radiation. Sensitivity is
PHOTO 3: ICS Ceiling Mount Loudspeakers.
PHOTO 4: KEF Audio Ltd. flat panel T Series.

30 VOICE COIL
91dB into 6Ω. The electrostatic panel is paired with an 8″
rigid, lightweight woofer designed to optimize cone suspen-
sion and the magnetic flux field to produce high levels of
bass output with low distortion, the company said.
- KEF launched two new in-ceiling speaker series—
QR and CR. The former features thin bezels and
the company’s proprietary Uni-Q driver configuration,
which places the tweeter in the acoustic center of the
woofer to deliver wide, even dispersion. The CR series
features an asymmetrical tweeter island to deliver near
Uni-Q performance at a lower price. The three two-
way models are the Ci 200QR with 8″ woofer and 1″
aluminum-dome tweeter ($349), Ci160QR with 6.5″
woofer and 0.75″ aluminum-dome tweeter ($299), and
Ci130QR with 5.25″ woofer and 0.75″ aluminum-dome
tweeter ($249). The CR speakers are the Ci200CR with
8″ woofer and 1″ aluminum-dome tweeter ($274), the
Ci160CR with 6.5″ woofer and 0.75″ aluminum-dome
tweeter ($224), the Ci130CR with 5.25″ woofer and
0.75″ tweeter($179), and Ci160CRds single-speaker-
stereo model with dual 0.75″ aluminum-dome tweeters
and one dual-voice-coil 6.5″ woofer ($274).
- JBL (www.jbl.com) will join a growing number of
home audio companies launching tabletop speaker sys-
tems equipped with Apple’s Air Play wireless streaming
technology. The company plans spring deliveries of its
first iPod/iPhone-docking speaker system with Air Play
at a price that wasn’t disclosed. The On Air Wireless
Speaker System, which incorporates dock and RDS FM
dual-alarm clock radio, streams music via a wireless home
network from a PC or Mac equipped with iTunes 10.1 or
later music-management software. The speaker systems
also stream music from a Wi-Fi-enabled iPad, iPhone,
or iPod Touch equipped with iOS 4.2 or later OS. The
system uses horizontal acoustic level optimization (Halo)
technology and speakers embedded in a halo around
the docked iPod or iPhone to deliver wide dispersion.
The company unveiled a sneak peak of the system on its
Facebook page.
- RSL Speaker Systems has released three new speakers
featuring Compression Guide Technology, which, accord-
ing to the company, increases the clarity of the voices and
instruments as well as improving the soundstage, and also
results in significant bass extension with less boominess and
overhang. The RSL CG4 two-way can be used along with
a subwoofer in a home theater or in an audiophile-quality
stereo system. The RSL Speedwoofer 10 is a subwoofer with
fast transient response and features wireless remote control
of volume and crossover frequency and a class A/B amplifier
conservatively rated at 375V RMS. The RSL CG 24 moni-
tor is a relatively compact speaker designed to be used either
as a studio monitor or as a center channel in a home theater
system. For more, contact www.rslspeakers.com. VC
Advertiser Categories Page
ACO Pacific ............................................K,N...............26
ALMA International ....................................................25
Audience ..............................................B,C,H ..........21
Beston Technology Corporation ..............D ................14
BMS Speakers GmbH ..............................D ................17
Etani Electronics Co., Ltd. ......................B,G,L,N ........13
Faital Spa .............................................D ................19
Fluid Metering, Inc. ...............................J .................10
Jantzen Audio Denmark .........................L, O ...............7
Klippel GmbH .......................................G,N .............22
Materion Electrofusion ............................L ...................3
Menlo Scientific, Ltd. ..............................B .................27
One Magnet Electronic Co., Ltd. ..............I .................18
Parts Express .........................................L ................ CV2
Precision Econowind ..............................O .................10
Prism Media Products ............................G .............. CV4
Quality Guru Audit & Inspection Services ......................23
SaatiTech ..................................................................24
Shinhint Industries ................................................. CV3
SM Audio Engineering Consulting ............B ................23
Solen, Inc. ...........................................C,D ..............11
Suzuki Kanshi Co Ltd ....................................................6
Tang Band Industries Co. .......................D ........... 23, 25
Vance Dickason ......................................B .................22
Wavecor Ltd. ........................................F,H ...............16
Wizard India Pvt Ltd. .............................L .................15
CATEGORY KEY
A = ADHESIVES
B = CONSULTANTS & ENGINEERS
C = CROSSOVERS & PASSIVE
COMPONENTS
D = DRIVERS
E = EMPLOYMENT OPPORTUNITIES
F = ENCLOSURES & ENCLOSURE
PARTS
G = ENGINEERING/DESIGN SOFTWARE
H = FINISHED SYSTEMS
I = MAGNETS & EQUIPMENT
J = MANUFACTURING EQUIPMENT
K = MICROPHONES
L = PARTS
M = RECONING
N = TEST EQUIPMENT
O = VOICE COILS − COMPONENTS
& MATERIALS
P = TRANSDUCERS
This product/services index is provided as a value-added service to our readers and advertisers. The publisher will not be held liable for any errors or deletions contained herein.
Products & Services Index
PHOTO 5: RSL Speaker’s new CG4 speaker line.


...integrated
electronic test, acoustic test...
Prism Sound is now a globalsales & support agent for:
������������������� �������� ������������������������������������ ���������������������������������������������������������� ����������������
��������������������� ���������� ������������ ���������������������
������������������� !�����������������������������������������������������"������ ���������� �����#�������������������$�����%dScope Series III
analog and digitalaudio analyzers
������������������� ��������������������������������������������� �!"#�����$ ����
Loudspeaker design and analysis solutions
V O L U M E 2 4 , I S S U E 8 J U N E 2 0 1 1
®
IN THIS ISSUEINDUSTRY NEWS AND DEVELOPMENTS
SPOTLIGHT
SPOTLIGHT
6
23
1
Measurement and Perception of Irregular Loudspeaker Defects, pt. 2By Wolfgang Klippel and Robert Werner
Twilight of the Rising Sun? By Nora Wong, Maria Markowski, and Chris Clendening
TEST BENCH14
30 Products & Services Index
Pro Sound Drivers from B&C and Faital Pro By Vance Dickason
VC Remembers
Sid Harman, p. 27.ACOUSTIC PATENTS25By James Croft
INDUSTRY WATCH27By Vance Dickason
Is Japan headed
for another “Lost
Decade”? p. 23.Decade ? p. 23.
Industry News and DevelopmentsBy Vance Dickason
Listen Inc. Releases SoundCheck v. 10
SoundCheck continues to be
one of the most widely used QC
and R&D analyzers on the mar-
ket (this includes communica-
tions, audio, broadcast, and vari-
ous other industries that make
use of audio analyzers). Here’s
a closer look at the many new
features of their latest software
release, version 10 (which we first
looked at in the March 2011
issue):
1. Better Data Organization with Memory List Grouping—The memory list, which func-
tions as SoundCheck’s database of curves, values, waveforms
and results, can now be organized into custom named fold-
ers. This enables grouping by step type (e.g., all calibration
curves in one sub-folder), sequence order, name, or any
other custom folder structure. The Windows Explorer-like
tree can be expanded and hidden at any time and full func-
tionality is available via a contextual right click menu. In
addition, curves can be dragged and dropped onto graphs,
values can be dragged onto tables, and so on (Fig. 1).
2. Multiple Virtual Instruments—With v10, many
instances of the same virtual instrument may be opened at once.
This means that for multi-channel applications, a new instance
of the VI can be opened for each channel. It also enables both
the spectrum analyzer and the RTA to simultaneously be
viewed while running a sequence so real time live data can be
viewed. By using two sig-
nal generators, signals can
be mixed (e.g., pink noise
and a sine sweep) for signal
conditioning. Waveforms
in the memory list may
also now be played directly
from the Signal Generator
VI (Fig. 2).
3. ASIO Driver Support—ASIO drivers
FIGURE 1: New
SoundCheck Memory List.
FIGURE 2: Multiple instances of
the same virtual instrument in
SoundCheck 10.
������������������ �
��������������������������
������������������������
��������������������
���������������������
����������������������
� ������������������
��������������������!�����
������������������
�������!�����������
"���������#�CDX14-3050
$�%�&���� '()���� ��
$�(���� '*)�������������
$�+���!����������
$������������������
$�,�����������������
����������� ����������
Celestion: Your Global Driver Solutions Partner
Innovative drivers Custom development services Global operations
���������������������������
-�+./0-+ "-12
�����������������������������
For more information on Celestion's comprehensive range of professional audio productsincluding CDX compression drivers, visit the Celestion Professional website:

��
���������� ���������� ���
�
������� ���� �������������
���
�� ������������
����������� ���������������
�������������������������������
��
����������������������������������
��� ��!""#$��%���
������&��������'�������� ��!$(#)
��%���
�
���� ����
*��� ��+���,������ ���-�������
���� �������� �-��� ���� ������ -�
�����
���,�������� ���+��� ���,������ �
���� �� .������������� ���� ���� ��
,�� �-�
,������� ������� ��� ��������� ����
� �/��.���� ��,��+��� ,��-�������0
� �*����
�������,�������������+���������-����
������������.����������������������������
������
,��-�������� ������,����� �+��� ����
��-�� �-� ���� ���,�����0� 1������ �/�
�������
���������������� ,��,������� ���,���
������ -������������������������ �����
�����
����������0� �� ���,�������+�� ��
�� �-� ������ �-� .��������� ������
�� ����
�������� ���,������ ���,��������
���+���� ��� ������.��� ��������� -��2
�����
���,������ ��������������+����� �����
������� ������������ �� �� ����� ,����
���+��
�.�������������������-������0��
.�����������--�������������������
���������
,��-��������������������,����������
��������-��2������������.�+��$��3
40�
�
!"� �#$� %�&��#%$�
*����,�,���,��������������������-����
�������-�.������������������������-�
���������,������
�-��������-��2�������������������
����������0��*������������,��,�����
���-�.������������
���,���������� ������� ���� ����
���� ���� ���� -���� ��� .�� �,����
�� -��� ����� ,�,���0��
5��������,��������-����������.��
����������������������������-��������
������������������
�/������,�����������+��������������
����������-��� ��,��+�����������
���� ����+����������
��������������0�����-��������,
�������������������.�������������.
���������������������
���� ��+��0� ��,�������+�� �����
��� �������� ����� ��� �� ����������� �.
�� ���� ,���������
���,������ ���� ������ ���������0�
������ ������ ����� ������ .���+�
��� �-� ���� ������
���,������0�
�
'"����#��% (�%���) (��#&*�����
��#��� �+*�*��) #���
�������� ��� �� ����� ���� ��2�� �
����� ������ ��� ���� ��� �� ��.��� �
-� ����� �����������
���������� ��������� ��������� ����
�,����� ���� ����6������� ,������0�
� �,,���������� -���
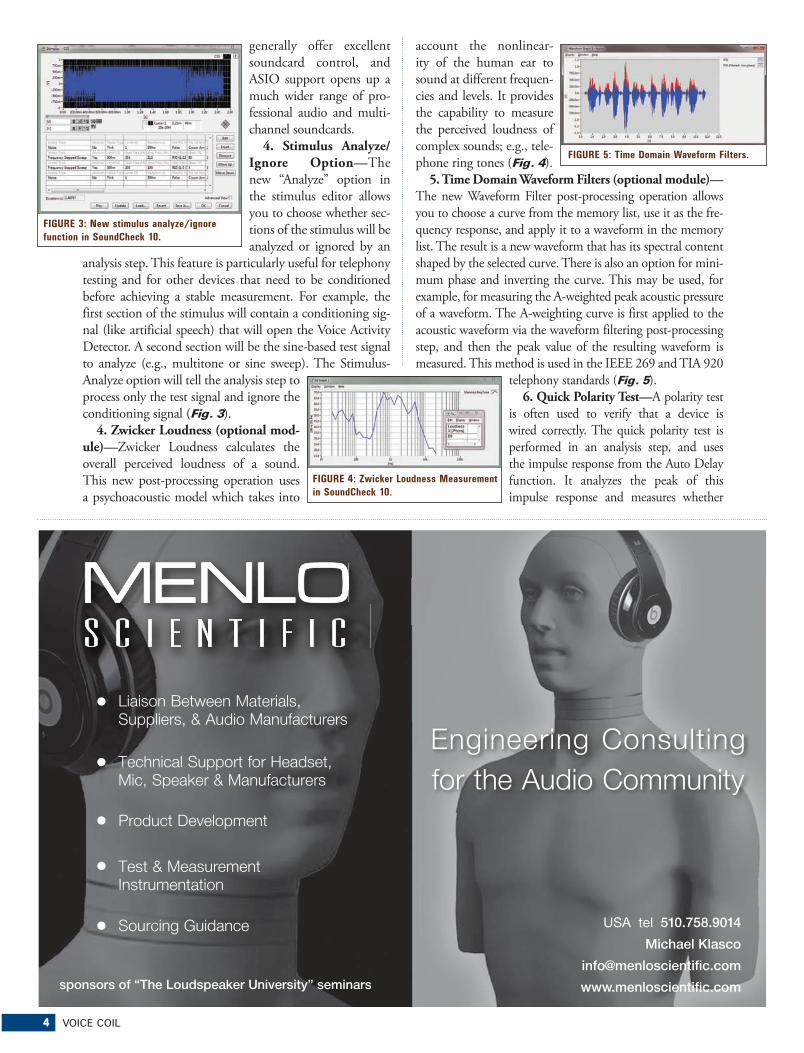
4 VOICE COIL
generally offer excellent
soundcard control, and
ASIO support opens up a
much wider range of pro-
fessional audio and multi-
channel soundcards.
4. Stimulus Analyze/Ignore Option—The
new “Analyze” option in
the stimulus editor allows
you to choose whether sec-
tions of the stimulus will be
analyzed or ignored by an
analysis step. This feature is particularly useful for telephony
testing and for other devices that need to be conditioned
before achieving a stable measurement. For example, the
first section of the stimulus will contain a conditioning sig-
nal (like artificial speech) that will open the Voice Activity
Detector. A second section will be the sine-based test signal
to analyze (e.g., multitone or sine sweep). The Stimulus-
Analyze option will tell the analysis step to
process only the test signal and ignore the
conditioning signal (Fig. 3).
4. Zwicker Loudness (optional mod-ule)—Zwicker Loudness calculates the
overall perceived loudness of a sound.
This new post-processing operation uses
a psychoacoustic model which takes into
account the nonlinear-
ity of the human ear to
sound at different frequen-
cies and levels. It provides
the capability to measure
the perceived loudness of
complex sounds; e.g., tele-
phone ring tones (Fig. 4).
5. Time Domain Waveform Filters (optional module)—The new Waveform Filter post-processing operation allows
you to choose a curve from the memory list, use it as the fre-
quency response, and apply it to a waveform in the memory
list. The result is a new waveform that has its spectral content
shaped by the selected curve. There is also an option for mini-
mum phase and inverting the curve. This may be used, for
example, for measuring the A-weighted peak acoustic pressure
of a waveform. The A-weighting curve is first applied to the
acoustic waveform via the waveform filtering post-processing
step, and then the peak value of the resulting waveform is
measured. This method is used in the IEEE 269 and TIA 920
telephony standards (Fig. 5).
6. Quick Polarity Test—A polarity test
is often used to verify that a device is
wired correctly. The quick polarity test is
performed in an analysis step, and uses
the impulse response from the Auto Delay
function. It analyzes the peak of this
impulse response and measures whether
FIGURE 3: New stimulus analyze/ignore
function in SoundCheck 10.
FIGURE 4: Zwicker Loudness Measurement
in SoundCheck 10.
sponsors of “The Loudspeaker University” seminars
Liaison Between Materials,
Suppliers, & Audio Manufacturers
Technical Support for Headset,
Mic, Speaker & Manufacturers
Product Development
Sourcing Guidance
Test & Measurement
Instrumentation
MENLO
S C I E N T I F I C
Engineering Consulting
for the Audio Community
USA tel 510.758.9014
Michael Klasco
www.menloscientific.com
FIGURE 5: Time Domain Waveform Filters.
JUNE 2011 5
it is negative or positive to determine overall polarity. It is a
simple and easy alternative to phase domain testing for simple
devices or single drivers where the phase does not change more
than 180°. Polarity measurement using phase response is still
available as an alternative method for more complex devices.
For more information about this new software version for
the SoundCheck analyzer and other Listen Inc. products, visit
www.listeninc.com.
Increased Prices for China Rare Earth MaterialsChina’s exports of rare earth metals burst through the
$100,000-per-tonne (metric ton) mark for the first time in
February 2011, up almost nine fold from a year before, while
the volume of trade stayed far below historical averages.
China’s squeeze on rare earths, which are used in a wide
range of hardware including precision-guided weapons,
hybrid car batteries, loudspeakers, and iPads, has forced
prices up dramatically since July last year, when each ton
fetched a mere $14,405 on average. The apparent price rises
have averaged $10,000 per ton per month but accelerated
in February, galloping ahead by $34,000 per ton, according
to calculations based on data from China’s Customs office.
February China exports were valued at $109,036/ton,
including the cost of insurance and freight, almost half as
much again as the average value in January. The explosion
in export values has coincided with a collapse in volumes
coming out of China, the source of almost the entire world’s
rare earth supplies, which has cut export quotas of the
17 rare earth metals and raised tariffs on exports. China’s
actions have infuriated its trading partners but lifted the
shares of the few mining and prospecting companies outside
China that are well-placed to capitalize on the constric-
tion of Chinese supply. They include US miner Molycorp
Inc., Canada’s Rare Element Resources and Neo Material
Technologies, and Australia’s Arafura and Lynas.
But those firms’ share prices have been under pressure
this month because Japan’s earthquake and tsunami are
expected to temporarily slash demand from China’s biggest
customer. In February, 281 tons of Chinese exports went to
Japan, valued at $38.9 million or $138,406 per ton. China
exported a total of 750 tons in February; slightly more than
the 647 tons shipped in January but otherwise the lowest
monthly volume since February 2009, when demand was
hit by the global financial crisis. China’s Customs office
changed its method of presenting rare earths exports in its
headline data this year, boosting the reported volume by
including products made from rare earth metals in the total.
By that method, exports were 2,976 tons in February,
up by 132% from a year before, when the figure did not
include rare earth products.
Southern California Audio ShowIt has been years since Southern California has had a via-
ble high-end audio convention bringing new advancements
and technologies in high-end to a population of over 24 mil-
lion consumers. T.H.E. (The Home Entertainment) Show,
which has a notable reputation for an exclusively high-end
audio, industry-related convention every January (running
concurrent with the giant electronics convention, CES in Las
Vegas), is bringing a whole new concept to Newport Beach,
CA, every spring for consumers and industry-insiders alike.
The Show Newport will be held at the Newport Beach,
CA, Hilton Hotel (Irvine) on June 3rd, 4th, and 5th, 2011.
Expanding on several common “interests” of this high-end
crowd, T.H.E. Show will also include a classic car show, in
conjunction with Crevier BMW Auto Museum; a wine-
tasting area courtesy of Southern Wine and Spirits, and jazz
concerts every evening produced by BluePort Jazz Festival
International. Several other local quality jazz groups will be
featured. Estimates suggest that there will be over 100 sepa-
rate “listening and viewing” exhibit rooms where attendees
can actually “listen and experience” these products in an unin-
terrupted and controlled atmosphere, much like experiencing
these spectacular high-end products in their own home.
T.H.E. Show Newport will also feature seminars on audio
and home theater advancements, from the early days to now,
including iPod and iPad streaming music and more. Saturday
and Sunday will feature hourly seminars covering new tech-
nologies and addressing such topics as “the difference between
a $500 speaker as opposed to a $50,000 set of speakers.”
There will also be a short seminar titled “How to Build Your
Own High-end Speakers,” along with local experts explaining
how to set up a high-end home theater on a budget. For more
information go to: www.theshownewport.com VC
Voice Coil, (ISSN 1521-091X), the Periodical of the Loudspeaker Industry, is published on the 25th of each month by Audio Amateur Incorporated, PO Box 876, Peterborough, NH 03458-0876 USA, (603) 924-9464, FAX (603) 924-9467.
Copyright 2011 by Audio Amateur Incorporated. All rights reserved. Quotation from Voice Coil is forbidden without written permission of the publisher.
Publisher - Edward T. Dell, Jr.Editor - Vance Dickason (E-mail [email protected])Contributing Editor - Richard Honeycutt
Vice PresidentKaren Hebert
Dennis Brisson .............Assistant PublisherRichard Surrette ...........Editorial AssistantLaurel Humphrey.........Marketing DirectorJason Hanaford ............Graphics DirectorJay Sennott ...................Graphics AssistantSharon LeClair .............Customer Service
SubmissionsSend all press releases and information to Voice Coil Editorial Dept., PO Box 876, Peterborough, NH 03458, or FAX us material at (603) 924-9467, e-mail [email protected].
ADVERTISING
Please direct display advertising inquiries to: Peter Wostrel, Account Manager, Strategic Media Marketing, USA, 978-281-7708, FAX 603-924-9467, Toll-free 800-454-3741, e-mail [email protected].
Please direct classified and artwork inquiries to: Jamie Costa, Advertising Coordinator, Voice Coil, PO Box 876, Peterborough, NH 03458, USA, 603-924-7292, FAX 603-924-6230, e-mail [email protected].
Qualified subscriptions to Voice Coil run for 1 year. Renew annually on-line at voicecoilmagazine.com/vcqual.html
Subscriptions to Voice Coil are available in printed and digital versions. To subscribe to the digital version, please visit our website
at www.audioXpress.com and complete a qualification form. When you qualify, you will receive an email confirming your subscription. The current issue of each digital Voice Coil will be posted to www.audioamateurinc.com at the end of the month. To access, use the link in the e-mail notification, or you can simply log in to the website to view your issue along with the archived issues. For questions relating to the digital issue, please go to the help page at www.audioxpress.com/digital_issue_help.htm.
For those overseas, the cost of a printed subscription is $150.00 per year. Please contact customer service or order your subscription on-line at www.audioXpress.com.

6 VOICE COIL
SPOTLIGHT
Measurement and Perception of Irregular Loudspeaker DefectsBy Wolfgang Klippel and Robert Werner Klippel GmbH, Dresden, Germany
&oudspeaker defects caused by manufacturing, aging,
overload, or climate impact generate a special kind
of irregular distortion commonly known as rub & buzz,
which is highly audible and intolerable for the human ear.
Contrary to regular loudspeaker distortions defined in the
design process, the irregular distortions are hardly predict-
able and are generated by an independent process triggered
by the input signal. Traditional distortion measurements
such as THD fail in the reliable detection of those defects.
This article discusses the most important defect classes, new
measurement techniques, audibility, and the impact on
perceived sound quality.
A major part of the linear and nonlinear signal distortions
generated by loudspeaker systems is already determined dur-
ing the design process, as discussed in last month’s Part 11.
Those regular distortions are very systematic, reproducible,
and can be modeled by a linear and a nonlinear subsystem
(Fig. 1). This article addresses the third mechanism, which
is related to loudspeaker defects. Manufacturing errors,
aging, and overload cause parameter drifts or mechanical
defects, which are not found in approved prototypes or
golden reference units.
Some of the defects, such as a short circuit of the voice
coil or a deviation in the moving mass, may be detected by
checking variation of the linear and nonlinear parameters
using permissible limit values. Other defects commonly
called rub and buzz generate a different kind of signal dis-
tortion which has a much higher impact on the perceived
sound quality but cannot be detected by conventional mea-
surement techniques. Those distortions are caused by inde-
pendent sound generation processes being mechanically or
acoustically coupled to moving parts of the loudspeaker and
triggered by the input signal. In many cases those processes
are difficult to model.
The properties of stimulus signal (level, spectrum) and
other measurement condition (orientation of the driver)
have a strong influence on the excitation of those defects,
which are usually not related to size, weight, and cost of the
product and vary with time. Therefore, defects which are
not audible during end-of-line testing may be detected in
the final application (mounted in the car).
The human ear is very sensitive to those irregular distor-
tions, especially in a quiet environment. Therefore, trained
human operators have been used for subjective evaluation of
each unit during end-of-line testing. Shorter cycle times and
the new requirements of 100% automatic testing require
new measurement techniques to detect those defects reliably.
Distortion Generation ProcessTable 1 gives a short overview about typical loudspeaker defects and optimal measurement techniques. Most loud-speaker defects behave as an independent oscillator produc-ing a new mode of vibration which is powered, triggered, or synchronized by the stimulus3. For example, a faulty glue joint between the surround and the membrane is such a nonlinear mass-spring system generating weakly damped vibration (buzzing) above a critical amplitude of the stimulus. The beating of the braid wire on the loud-speaker diaphragm is a similar defect generating impulses at a particular position of the voice coil. The energy of the irregular distortion is usually very small and does not grow significantly if the level of the stimulus is further increased. Air leaks in dust caps or in sealed enclosures emit a small airflow driven by the AC sound pressure inside the box, which generates air turbulences and random noise4. Dust
FIGURE 1: Signal flow diagram showing the generation of signal distortion in a
loudspeaker system (model).
Irregular Loudspeaker Defects
Air leaks in the dust cap or enclosure
Voice coil rubbing
Buzzing parts (loose glue joint)
Parasitic vibration of the baffle or electronic components
Bottoming of the voice coil former at the back plate
Beating of the braid wire
Loose electrical connection due to soldering
Loose particles
Measurements
Sound pressure measurement using single tone stimulus
Sound pressure measurement using single tone or continuous sweep excitation
Characteristics
Modulated Distortion MODrel, MODabs
Deterministic impulsive distortion
Random impulsive distortion
Irregular Loudspeaker Defects
Measurements Characteristics
��>� ���� ����! �(6!(�6���0�" �6�� " �!��=�(�� ���������06* �7 ��0 = �!6�F�� ��( ,GA
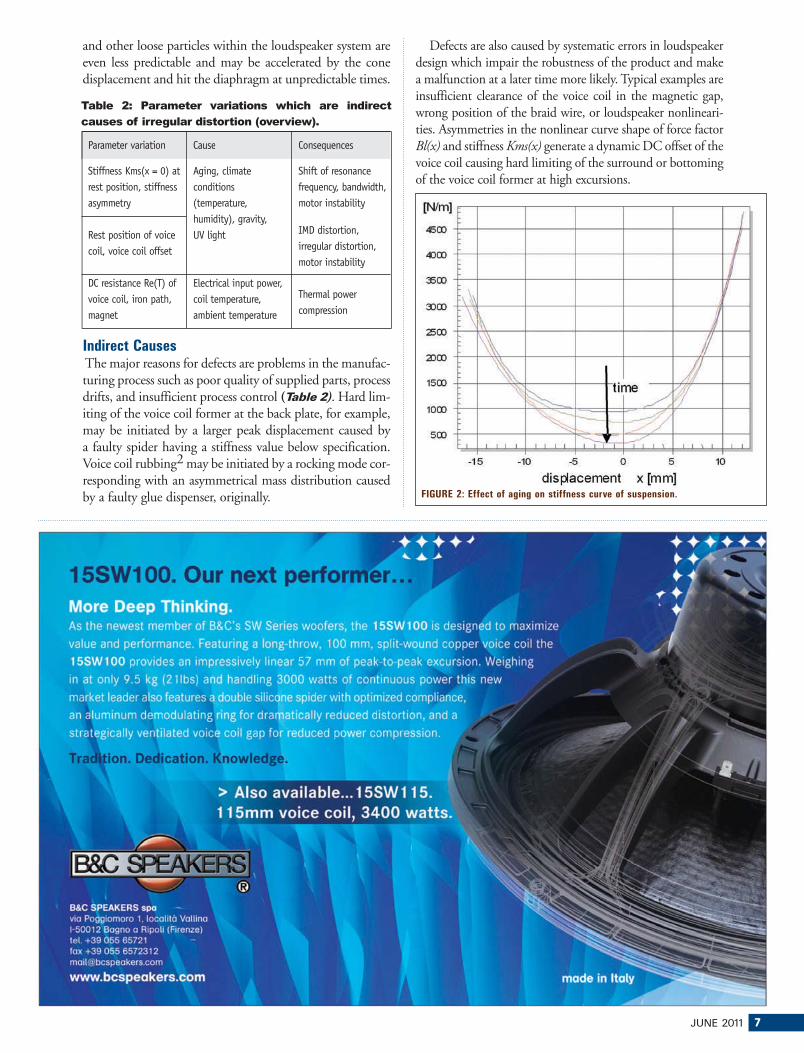
JUNE 2011 7
and other loose particles within the loudspeaker system are even less predictable and may be accelerated by the cone displacement and hit the diaphragm at unpredictable times.
Indirect Causes The major reasons for defects are problems in the manufac-turing process such as poor quality of supplied parts, process drifts, and insufficient process control (Table 2). Hard lim-iting of the voice coil former at the back plate, for example, may be initiated by a larger peak displacement caused by a faulty spider having a stiffness value below specification. Voice coil rubbing2 may be initiated by a rocking mode cor-responding with an asymmetrical mass distribution caused by a faulty glue dispenser, originally.
Defects are also caused by systematic errors in loudspeaker
design which impair the robustness of the product and make
a malfunction at a later time more likely. Typical examples are
insufficient clearance of the voice coil in the magnetic gap,
wrong position of the braid wire, or loudspeaker nonlineari-
ties. Asymmetries in the nonlinear curve shape of force factor
Bl(x) and stiffness Kms(x) generate a dynamic DC offset of the
voice coil causing hard limiting of the surround or bottoming
of the voice coil former at high excursions.
Parameter variation
Stiffness Kms(x = 0) at rest position, stiffness asymmetry
Rest position of voice coil, voice coil offset
DC resistance Re(T) of voice coil, iron path, magnet
Cause
Aging, climate conditions (temperature, humidity), gravity, UV light
Electrical input power, coil temperature, ambient temperature
Consequences
Shift of resonance frequency, bandwidth, motor instability
IMD distortion, irregular distortion, motor instability
Thermal power compression
Parameter variation Cause Consequences
��>� � �� ����" ! �� ���(�!(��6� , (� � �� � (�0(� �!����6 6��=�(�� ������0(6!��!(���F�� ��( ,GA
FIGURE 2: Effect of aging on stiffness curve of suspension.
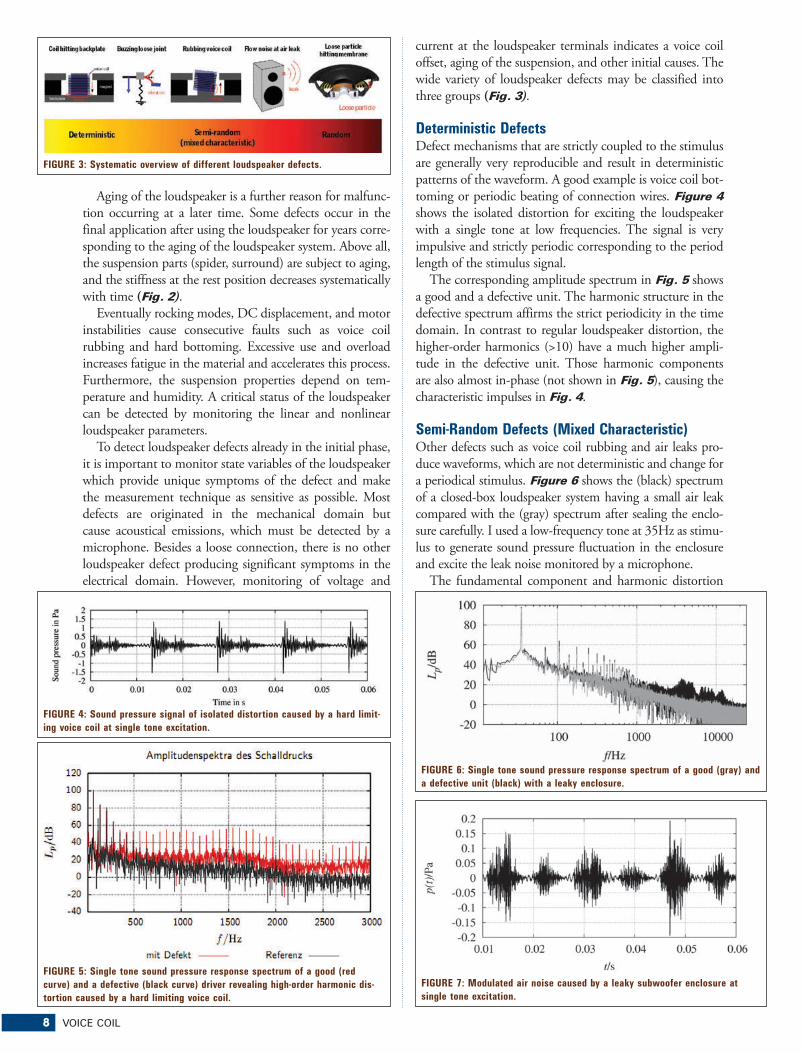
8 VOICE COIL
Aging of the loudspeaker is a further reason for malfunc-
tion occurring at a later time. Some defects occur in the
final application after using the loudspeaker for years corre-
sponding to the aging of the loudspeaker system. Above all,
the suspension parts (spider, surround) are subject to aging,
and the stiffness at the rest position decreases systematically
with time (Fig. 2).Eventually rocking modes, DC displacement, and motor
instabilities cause consecutive faults such as voice coil
rubbing and hard bottoming. Excessive use and overload
increases fatigue in the material and accelerates this process.
Furthermore, the suspension properties depend on tem-
perature and humidity. A critical status of the loudspeaker
can be detected by monitoring the linear and nonlinear
loudspeaker parameters.
To detect loudspeaker defects already in the initial phase,
it is important to monitor state variables of the loudspeaker
which provide unique symptoms of the defect and make
the measurement technique as sensitive as possible. Most
defects are originated in the mechanical domain but
cause acoustical emissions, which must be detected by a
microphone. Besides a loose connection, there is no other
loudspeaker defect producing significant symptoms in the
electrical domain. However, monitoring of voltage and
current at the loudspeaker terminals indicates a voice coil
offset, aging of the suspension, and other initial causes. The
wide variety of loudspeaker defects may be classified into
three groups (Fig. 3).
Deterministic DefectsDefect mechanisms that are strictly coupled to the stimulus are generally very reproducible and result in deterministic patterns of the waveform. A good example is voice coil bot-toming or periodic beating of connection wires. Figure 4 shows the isolated distortion for exciting the loudspeaker with a single tone at low frequencies. The signal is very impulsive and strictly periodic corresponding to the period length of the stimulus signal.
The corresponding amplitude spectrum in Fig. 5 shows
a good and a defective unit. The harmonic structure in the
defective spectrum affirms the strict periodicity in the time
domain. In contrast to regular loudspeaker distortion, the
higher-order harmonics (>10) have a much higher ampli-
tude in the defective unit. Those harmonic components
are also almost in-phase (not shown in Fig. 5), causing the
characteristic impulses in Fig. 4.
Semi-Random Defects (Mixed Characteristic)Other defects such as voice coil rubbing and air leaks pro-duce waveforms, which are not deterministic and change for a periodical stimulus. Figure 6 shows the (black) spectrum of a closed-box loudspeaker system having a small air leak compared with the (gray) spectrum after sealing the enclo-sure carefully. I used a low-frequency tone at 35Hz as stimu-lus to generate sound pressure fluctuation in the enclosure and excite the leak noise monitored by a microphone.
The fundamental component and harmonic distortion
FIGURE 3: Systematic overview of different loudspeaker defects.
FIGURE 4: Sound pressure signal of isolated distortion caused by a hard limit-
ing voice coil at single tone excitation.
FIGURE 5: Single tone sound pressure response spectrum of a good (red
curve) and a defective (black curve) driver revealing high-order harmonic dis-
tortion caused by a hard limiting voice coil.
FIGURE 7: Modulated air noise caused by a leaky subwoofer enclosure at
single tone excitation.
FIGURE 6: Single tone sound pressure response spectrum of a good (gray) and
a defective unit (black) with a leaky enclosure.
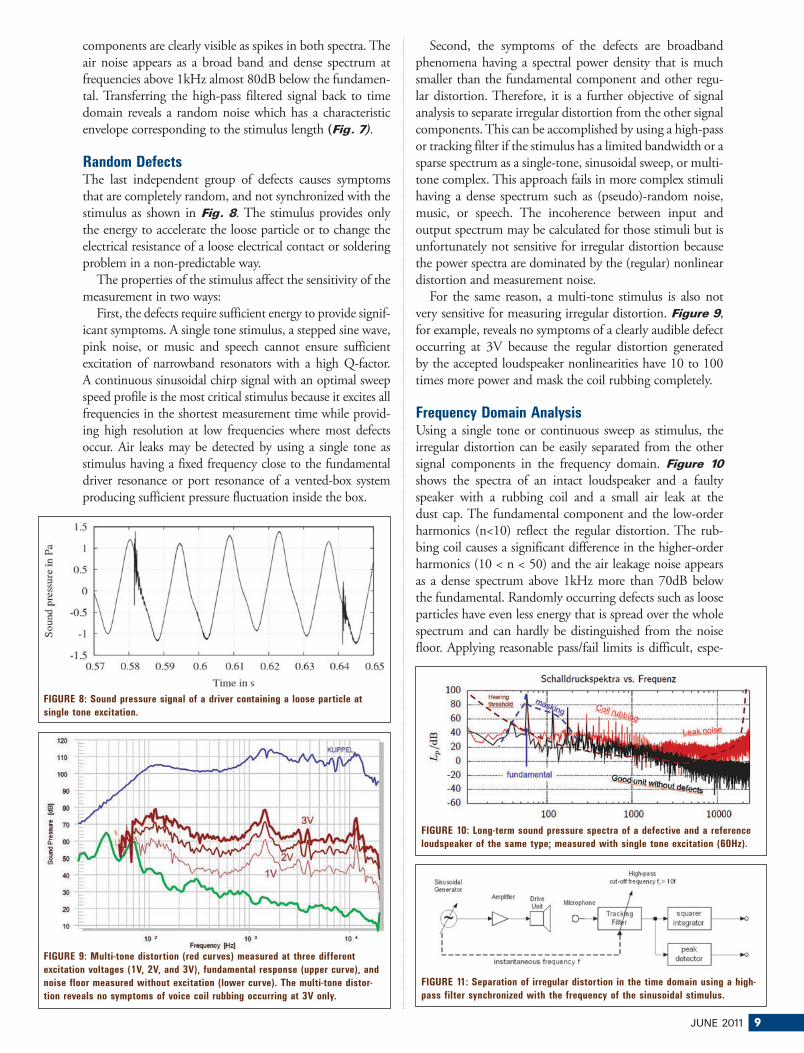
JUNE 2011 9
components are clearly visible as spikes in both spectra. The
air noise appears as a broad band and dense spectrum at
frequencies above 1kHz almost 80dB below the fundamen-
tal. Transferring the high-pass filtered signal back to time
domain reveals a random noise which has a characteristic
envelope corresponding to the stimulus length (Fig. 7).
Random DefectsThe last independent group of defects causes symptoms that are completely random, and not synchronized with the stimulus as shown in Fig. 8. The stimulus provides only the energy to accelerate the loose particle or to change the electrical resistance of a loose electrical contact or soldering problem in a non-predictable way.
The properties of the stimulus affect the sensitivity of the
measurement in two ways:
First, the defects require sufficient energy to provide signif-
icant symptoms. A single tone stimulus, a stepped sine wave,
pink noise, or music and speech cannot ensure sufficient
excitation of narrowband resonators with a high Q-factor.
A continuous sinusoidal chirp signal with an optimal sweep
speed profile is the most critical stimulus because it excites all
frequencies in the shortest measurement time while provid-
ing high resolution at low frequencies where most defects
occur. Air leaks may be detected by using a single tone as
stimulus having a fixed frequency close to the fundamental
driver resonance or port resonance of a vented-box system
producing sufficient pressure fluctuation inside the box.
Second, the symptoms of the defects are broadband
phenomena having a spectral power density that is much
smaller than the fundamental component and other regu-
lar distortion. Therefore, it is a further objective of signal
analysis to separate irregular distortion from the other signal
components. This can be accomplished by using a high-pass
or tracking filter if the stimulus has a limited bandwidth or a
sparse spectrum as a single-tone, sinusoidal sweep, or multi-
tone complex. This approach fails in more complex stimuli
having a dense spectrum such as (pseudo)-random noise,
music, or speech. The incoherence between input and
output spectrum may be calculated for those stimuli but is
unfortunately not sensitive for irregular distortion because
the power spectra are dominated by the (regular) nonlinear
distortion and measurement noise.
For the same reason, a multi-tone stimulus is also not
very sensitive for measuring irregular distortion. Figure 9,
for example, reveals no symptoms of a clearly audible defect
occurring at 3V because the regular distortion generated
by the accepted loudspeaker nonlinearities have 10 to 100
times more power and mask the coil rubbing completely.
Frequency Domain AnalysisUsing a single tone or continuous sweep as stimulus, the irregular distortion can be easily separated from the other signal components in the frequency domain. Figure 10 shows the spectra of an intact loudspeaker and a faulty speaker with a rubbing coil and a small air leak at the dust cap. The fundamental component and the low-order harmonics (n<10) reflect the regular distortion. The rub-bing coil causes a significant difference in the higher-order harmonics (10 < n < 50) and the air leakage noise appears as a dense spectrum above 1kHz more than 70dB below the fundamental. Randomly occurring defects such as loose particles have even less energy that is spread over the whole spectrum and can hardly be distinguished from the noise floor. Applying reasonable pass/fail limits is difficult, espe-
FIGURE 8: Sound pressure signal of a driver containing a loose particle at
single tone excitation.
FIGURE 9: Multi-tone distortion (red curves) measured at three different
excitation voltages (1V, 2V, and 3V), fundamental response (upper curve), and
noise floor measured without excitation (lower curve). The multi-tone distor-
tion reveals no symptoms of voice coil rubbing occurring at 3V only.
FIGURE 10: Long-term sound pressure spectra of a defective and a reference
loudspeaker of the same type; measured with single tone excitation (60Hz).
FIGURE 11: Separation of irregular distortion in the time domain using a high-
pass filter synchronized with the frequency of the sinusoidal stimulus.
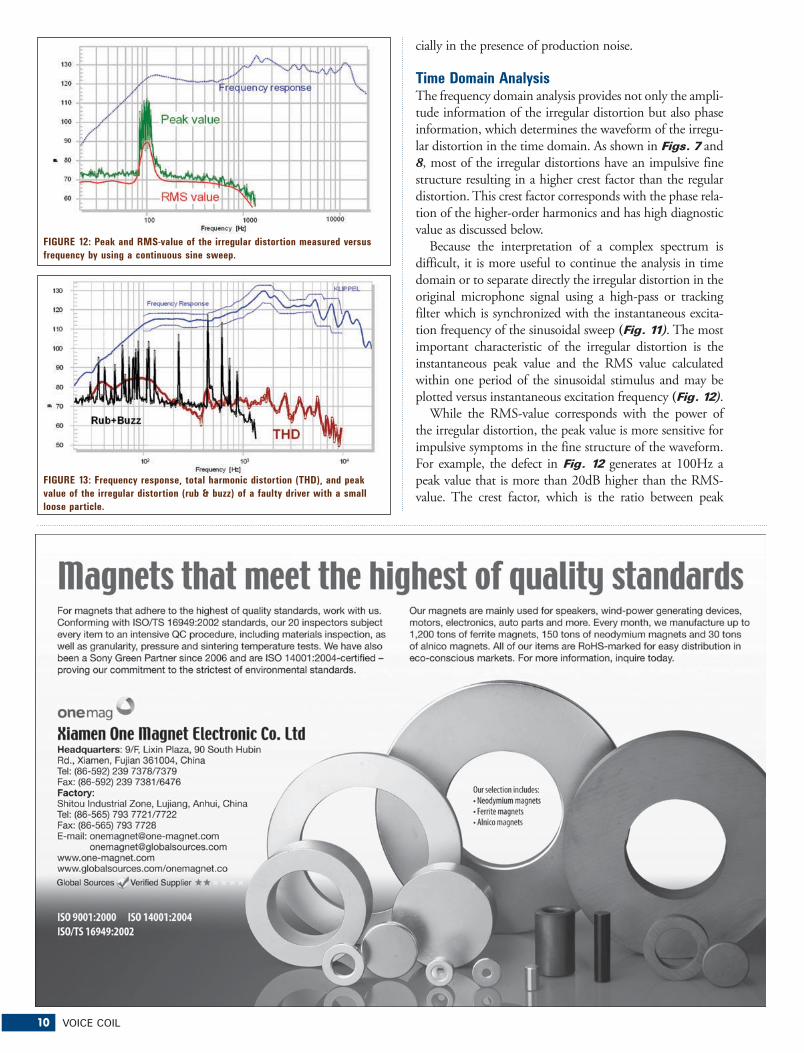
10 VOICE COIL
cially in the presence of production noise.
Time Domain AnalysisThe frequency domain analysis provides not only the ampli-tude information of the irregular distortion but also phase information, which determines the waveform of the irregu-lar distortion in the time domain. As shown in Figs. 7 and 8, most of the irregular distortions have an impulsive fine structure resulting in a higher crest factor than the regular distortion. This crest factor corresponds with the phase rela-tion of the higher-order harmonics and has high diagnostic value as discussed below.
Because the interpretation of a complex spectrum is
difficult, it is more useful to continue the analysis in time
domain or to separate directly the irregular distortion in the
original microphone signal using a high-pass or tracking
filter which is synchronized with the instantaneous excita-
tion frequency of the sinusoidal sweep (Fig. 11). The most
important characteristic of the irregular distortion is the
instantaneous peak value and the RMS value calculated
within one period of the sinusoidal stimulus and may be
plotted versus instantaneous excitation frequency (Fig. 12).While the RMS-value corresponds with the power of
the irregular distortion, the peak value is more sensitive for
impulsive symptoms in the fine structure of the waveform.
For example, the defect in Fig. 12 generates at 100Hz a
peak value that is more than 20dB higher than the RMS-
value. The crest factor, which is the ratio between peak
FIGURE 12: Peak and RMS-value of the irregular distortion measured versus
frequency by using a continuous sine sweep.
FIGURE 13: Frequency response, total harmonic distortion (THD), and peak
value of the irregular distortion (rub & buzz) of a faulty driver with a small
loose particle.
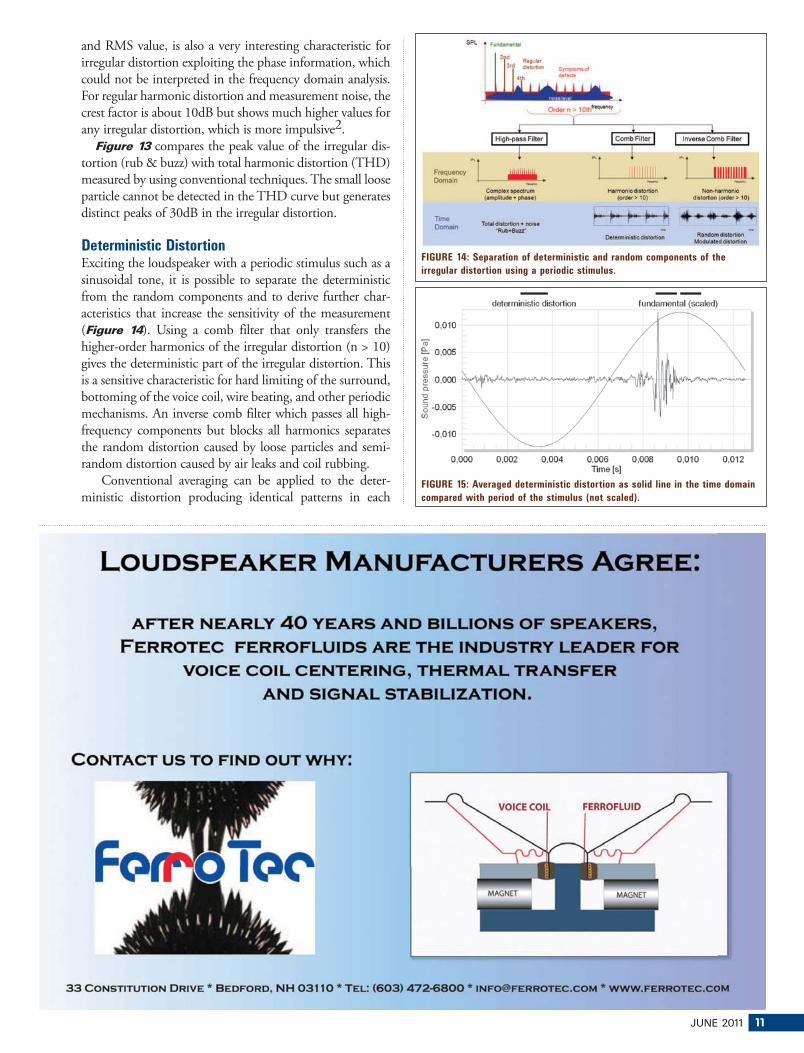
JUNE 2011 11
and RMS value, is also a very interesting characteristic for
irregular distortion exploiting the phase information, which
could not be interpreted in the frequency domain analysis.
For regular harmonic distortion and measurement noise, the
crest factor is about 10dB but shows much higher values for
any irregular distortion, which is more impulsive2.
Figure 13 compares the peak value of the irregular dis-
tortion (rub & buzz) with total harmonic distortion (THD)
measured by using conventional techniques. The small loose
particle cannot be detected in the THD curve but generates
distinct peaks of 30dB in the irregular distortion.
Deterministic DistortionExciting the loudspeaker with a periodic stimulus such as a sinusoidal tone, it is possible to separate the deterministic from the random components and to derive further char-acteristics that increase the sensitivity of the measurement (Figure 14). Using a comb filter that only transfers the higher-order harmonics of the irregular distortion (n > 10) gives the deterministic part of the irregular distortion. This is a sensitive characteristic for hard limiting of the surround, bottoming of the voice coil, wire beating, and other periodic mechanisms. An inverse comb filter which passes all high-frequency components but blocks all harmonics separates the random distortion caused by loose particles and semi-random distortion caused by air leaks and coil rubbing.
Conventional averaging can be applied to the deter-
ministic distortion producing identical patterns in each
FIGURE 14: Separation of deterministic and random components of the
irregular distortion using a periodic stimulus.
FIGURE 15: Averaged deterministic distortion as solid line in the time domain
compared with period of the stimulus (not scaled).

12 VOICE COIL
period of the stimulus. Averaging attenuates other stochastic
components such as ambient and microphone noise and
improves the signal to noise ratio by 3dB for doubling the
averaging time.
Figure 15 shows the deterministic distortion averaged
over 100 periods generated by a beating wire. The peak and
RMS-value may also be derived from the averaged signal.
The high crest factor of 21.4dB indicates a high significant
impulsiveness, which is typical for this defect.
Modulated DistortionAir leaks and other semi-random defects produce a stochas-tic noise-like signal that is modulated in a deterministic way. The envelope directly corresponds with the fundamental frequency supplied via the stimulus to the loudspeaker and low-order harmonics. Conventional averaging of the original time signal would reduce the stochastic symptoms in the same way as ambient noise and other uncorrelated signals are attenuated. Consequently, averaging should only be applied to the deterministic information which is the envelope of the noise signal. This can be accomplished by using a new asynchronous demodulation technique4.
Figure 16 shows the averaged modulation envelope of
irregular distortion emitted by a box leak. The turbulent
noise is emitted twice per period when the sound pressure
inside the box has a positive or negative maximum. Reading
the maximal peak value of the averaged squared envelope
gives the absolute and relative Modulation Level, MODabs
and MODrel, respectively. Values of MODrel close to 0dB
indicate no significant modulation, but higher values above
5dB reveal significant modulations caused by air leaks, voice
coil rubbing, or other semi-random defects.
The last section of this article continues the discussion of
the perceptual assessment of loudspeaker distortion as started
in Part 11 but focuses here on the audibility of the irregular
distortion and the impact on perceived sound quality.
Masking by Fundamental Components The perception of the irregular distortion highly depends on the spectral complexity of the stimulus. A single tone or sinusoidal sweep is the most critical stimulus not only for an objective measurement system but also for the human ear. For this reason, a human operator prefers a simple sine gen-erator for testing loudspeakers at the assembly line. Other test signals such as two-tone signals, multi-tone complexes, and music and speech are less critical and less useful for detecting irregular loudspeaker defects in the shortest time possible and at high reliability.
The main reason for this is the spectral masking effect in
the perceptional processing of the ear. For a single tone used
as stimulus, the irregular distortion is far away from the fun-
damental component and is not masked by the excitation
threshold generated by the stimulus. Filling the stimulus
with further excitation components means each fundamen-
tal will also excite all critical bands close to the fundamentals
and the resulting excitation level masks irregular distortion.
Masking by the Hearing ThresholdIrregular distortion has a low power spectral density which is close to the hearing threshold of the human ear. Some loudspeaker defects such as air leaks are inaudible if the loudspeaker is far away from the listening point but can eas-ily be detected at a closer position. For this reason, a human tester can more reliably detect defects on small loudspeakers at a relatively small listening distance. An automatic mea-surement system using sensitive microphones and a test box for shielding ambient noise may outperform a human tester and can detect defects at an early phase.
The regular nonlinearities as defined by motor and suspen-
sion design as discussed in Part 1 also mask the irregular distor-
tion. This mechanism affects subjective testing on the assembly
line. A trained operator can reliably detect a defect at medium
excitation level but fails if the voltage of stimulus is increased.
The reason is that the regular distortion rises with excita-
tion level but the irregular distortion stays at almost the same
level. However, some defects are only activated if the voice coil
displacement is high. This dilemma can only be solved with a
measurement instrument which compensates actively for the
regular distortion using an adaptive system learning the deter-
ministic properties of good units (meta-hearing technology).
SharpnessThe term of sensory pleasantness combines different aspects to take into account the aesthetics and annoyance of audi-tory events. The influencing factors are loudness, tonality, sharpness, and roughness. Referring to irregular loudspeaker distortion, the last two mentioned factors must be exam-ined in detail.
Irregular distortions are a broadband signal covering the
complete audio band up to ultra-sonic frequencies. Those
components increase the sharpness of the perceived sound,
which is modeled by Zwicker5 using a specific loudness
model and a weighting function rising to higher frequen-
cies, starting at 3kHz. This sensation of sharpness may be
generated by many frequency components that are widely
independent of level and the spectral fine structure, espe-
cially within one critical bandwidth. For a low-frequency
stimulus the sharpness of the perceived sound is mostly
determined by the irregular distortion generated by the
speaker. Especially air leaks increase the sharpness of the
perceived sound significantly and can easily be detected in
subwoofers only reproducing a bass signal. High values of
sharpness are perceived as unpleasant.
The detection of irregular distortion and the impact on
perceived sound quality cannot be explained by considering
the spectral properties only. The temporal fine structure of
FIGURE 16: Averaged squared modulation envelope e(t)2.
JUNE 2011 13
the irregular distortion, especially the periodic variation of
the signal envelope, is highly relevant for human percep-
tion. This is the case for most stimulus-coupled irregular
distortions initiated by air leakage and other semi-random
defects. The human auditory system perceives amplitude
modulation of single tones and broadband noise between
20 and 300Hz as “roughness,” which is inversely propor-
tional to auditory pleasantness, increasing the aggressiveness
and noticeability. Especially in the relevant frequency range,
defects are most likely to be excited.
ConclusionLoudspeaker defects generate irregular distortions that are often impulsive, highly audible, and unpleasant to the human ear due to high perceptual roughness and sharpness. Contrary to regular distortions which are directly related to cost, weight, and size of the loudspeaker, the irregular dis-tortion is usually caused by parameter variation of the soft parts (spider and surround), insufficient process control, aging, and overload. The generation of irregular distortion is difficult to model, depends on particular properties of the stimulus, operation conditions of the driver (orientation), and become worse over time.
It is risky to ship faulty loudspeakers even if the symp-
toms are almost inaudible. Manufacturers use experienced
operators for the subjective testing at the end-of-line which
are more sensitive than an untrained ear to detect defects
already in the initial state. A measurement instrument
which exploits the particular irregular distortion symptoms
can detect defects objectively in a shorter time, more reli-
ably and with more sensitivity than a human ear. It also
provides diagnostic clues about the physical cause of the
defect and can cope with ambient production noise cor-
rupting the measurement.
Irregular distortions that become audible in the final
application are generally not acceptable for the user hav-
ing a significant negative impact on the perceived sound
quality. Rental companies for professional equipment are
interested in anticipating this point to avoid a malfunc-
tion during a concert. Sensitive measurement instruments
may indicate the first symptoms, and regular testing of the
motor and suspension properties indicate fatigue and the
progress of aging processes. VC
References1. Klippel, W.; Werner, R.: “Measurement and Perception of
Regular Loudspeaker Distortion,” Voice Coil, May 2011, p. 5.
2. Klippel, W.; Seidel, U.: “Measurement of Impulsive
Distortion, Rub and Buzz and other Disturbances,” 114th AES
Convention Amsterdam, Mar. 2003.
3. Klippel, W.; Irrgang, S.; Seidel, U.: “Loudspeaker Testing at
the Production Line,” 120th AES Convention Paris, May 2006.
4. Klippel, W.; Werner, R.: “Measurement of Turbulent
Air Noise Distortion in Loudspeaker Systems,” 129th AES
Convention San Francisco, November 2010.
5. Zwicker, E.; Fastl, H: Psychoacoustics – Facts and Models,
Springer, Berlin, 1999, ISBN 3-540-65063-6.

14 VOICE COIL
Test Bench
Pro Sound Drivers from B&C and Faital Pro By Vance Dickason
�his month’s Test Bench samples came from two well-
known Italian OEM Pro Sound OEM manufactur-
ers—B&C and Faital Pro. From B&C, a new 1.4″ neo-
dymium compression driver, the DE620, mated up with
the B&C ME 90; and from Faital Pro, the 15″ neo motor
woofer, the 15XL1400.
B&C DE620B&C has recently released many new compression driv-ers including the 0.5″ DE5, 0.75″ DE7, 1″ DE120, 1.4″
DE620, and 2″ DE850TN. The company’s latest is the DE620 1.4″ throat compression driver along with their new constant directivity 80 × 60° coverage ME 90 horn. Features for the DE620 (Photo 1) include 160W continu-ous power handling capacity, 35mm (2.5″) aluminum wire voice coil, titanium diaphragm, 107dB rated sensitivity, and a neodymium ring magnet assembly with a copper shorting cap. The ME90 is designed to work with the DE620 with a 1.4″ throat. This is an 80 × 60° format constant directivity horn with a cutoff frequency of 900Hz and built from cast aluminum.
Testing commenced using the LinearX LMS analyzer
to produce the 300-point stepped sine wave impedance
plot shown in Fig. 1. Note that the solid curve shows the
impedance of the DE620 mounted on the ME90 horn, and
the dashed curve represents the impedance of the compres-
sion driver without the horn. The minimum impedance of
the DE620/ME90 combination was 6.5Ω at 6.4kHz.
For the next test sequence, I mounted the B&C DE620/
ME90 on top of an enclosure with a 15″ × 14″ baffle and
proceeded to measure both the horizontal and vertical
on- and off-axis at 2.83V/1m using a 100-point gated sine
wave sweep. Figure 2 displays the on-axis of the compres-
sion driver/horn combination and shows the sensitivity to
be somewhat more than the 107dB specified in B&C’s
published data. -3dB at the bottom end of the response is
about 660Hz, with the company recommending a 1.2kHz
minimum crossover frequency.
Figure 3 gives the horizontal on- and off-axis response
out to 60° off-axis, and Fig. 4 displays the vertical response.
I have also included some graphs from B&C, including
10 Hz 20 50 100 200 500 1K 2K 5K 10K 20K 40K
Ohm
1
2
5
10
20
50
100
200Impedance vs Freq
300 Hz 500 1K 2K 5K 10K 20K 40K
dBSPL
60
65
70
75
80
85
90
95
100
105
110
115
120SPL vs Freq
FIGURE 1: B&C DE620/ME90 free air impedance plot. FIGURE 2: B&C DE620/ME90 on-axis response.
300 Hz 500 1K 2K 5K 10K 20K 40K
dBSPL
60
65
70
75
80
85
90
95
100
105
110
115
120SPL vs Freq
FIGURE 3: B&C DE620/ME90 horizontal on- and off-axis frequency
response (A = 0°; B = 15°; C = 30°; D = 45°; E = 60°).
PHOTO 1: B&C DE620.
300 Hz 500 1K 2K 5K 10K 20K 40K
dBSPL
60
65
70
75
80
85
90
95
100
105
110
115
120SPL vs Freq
FIGURE 4: Vertical on- and off-axis frequency response (A = 0°; B = 15°; C = 30°; D = 45°; E = 60°).
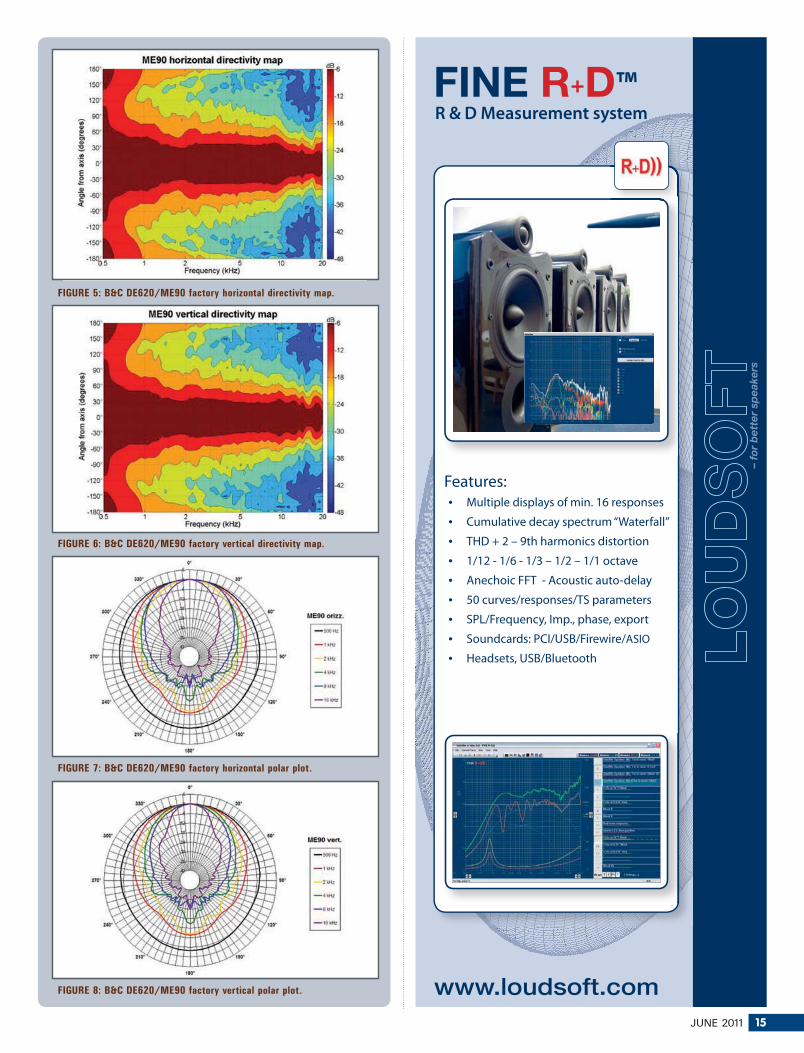
JUNE 2011 15
FIGURE 5: B&C DE620/ME90 factory horizontal directivity map.
FIGURE 6: B&C DE620/ME90 factory vertical directivity map.
FIGURE 7: B&C DE620/ME90 factory horizontal polar plot.
FIGURE 8: B&C DE620/ME90 factory vertical polar plot.
��������™ R & D Measurement system
�������������
Features: Multiple displays of min. 16 responses
Cumulative decay spectrum “Waterfall”
THD + 2 – 9th harmonics distortion
1/12 - 1/6 - 1/3 – 1/2 – 1/1 octave
Anechoic FFT - Acoustic auto-delay
50 curves/responses/TS parameters
SPL/Frequency, Imp., phase, export
Soundcards: PCI/USB/Firewire/ASIO
Headsets, USB/Bluetooth

16 VOICE COIL
300 Hz 500 1K 2K 5K 10K 20K 40K
dBSPL
60
65
70
75
80
85
90
95
100
105
110
115
120SPL vs Freq
FIGURE 9: B&C DE620/ME90 two-sample SPL comparison.
FIGURE 11: B&C DE620/ME90 SoundCheck CSD waterfall plot.
FIGURE 10: B&C DE620/ME90 SoundCheck distortion plots. FIGURE 12: B&C DE620/ME90 SoundCheck STFT plot.
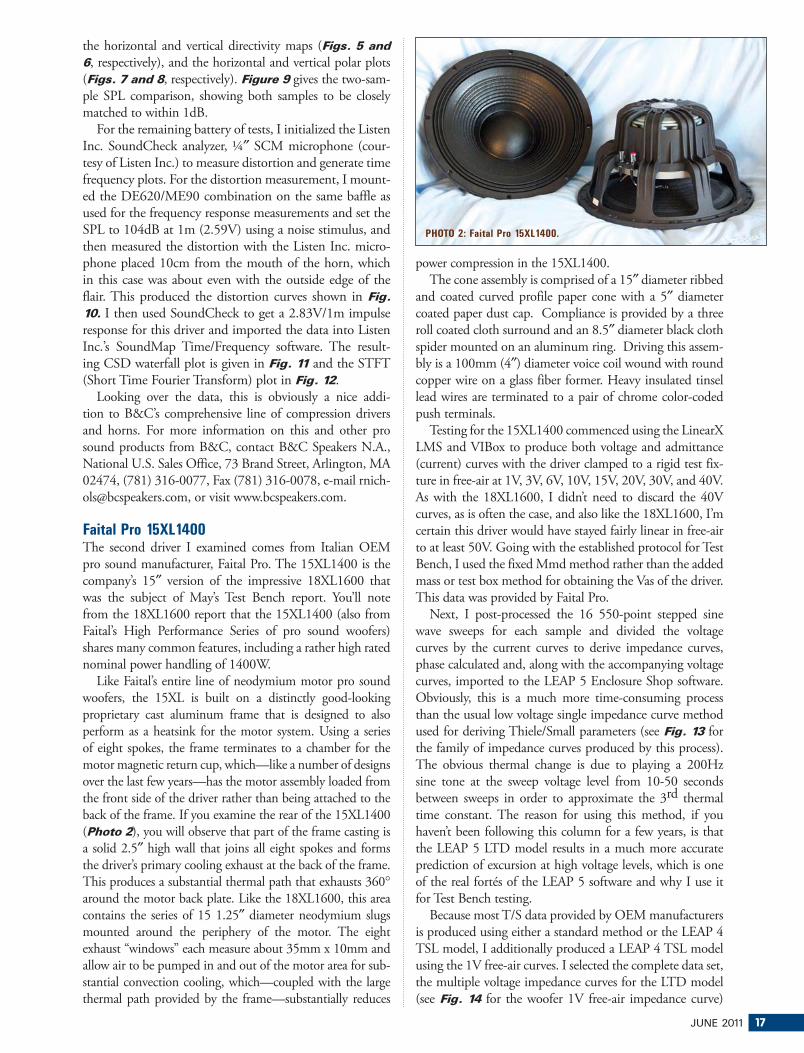
JUNE 2011 17
the horizontal and vertical directivity maps (Figs. 5 and 6, respectively), and the horizontal and vertical polar plots
(Figs. 7 and 8, respectively). Figure 9 gives the two-sam-
ple SPL comparison, showing both samples to be closely
matched to within 1dB.
For the remaining battery of tests, I initialized the Listen
Inc. SoundCheck analyzer, ¼″ SCM microphone (cour-
tesy of Listen Inc.) to measure distortion and generate time
frequency plots. For the distortion measurement, I mount-
ed the DE620/ME90 combination on the same baffle as
used for the frequency response measurements and set the
SPL to 104dB at 1m (2.59V) using a noise stimulus, and
then measured the distortion with the Listen Inc. micro-
phone placed 10cm from the mouth of the horn, which
in this case was about even with the outside edge of the
flair. This produced the distortion curves shown in Fig. 10. I then used SoundCheck to get a 2.83V/1m impulse
response for this driver and imported the data into Listen
Inc.’s SoundMap Time/Frequency software. The result-
ing CSD waterfall plot is given in Fig. 11 and the STFT
(Short Time Fourier Transform) plot in Fig. 12.
Looking over the data, this is obviously a nice addi-
tion to B&C’s comprehensive line of compression drivers
and horns. For more information on this and other pro
sound products from B&C, contact B&C Speakers N.A.,
National U.S. Sales Office, 73 Brand Street, Arlington, MA
02474, (781) 316-0077, Fax (781) 316-0078, e-mail rnich-
[email protected], or visit www.bcspeakers.com.
Faital Pro 15XL1400The second driver I examined comes from Italian OEM pro sound manufacturer, Faital Pro. The 15XL1400 is the company’s 15″ version of the impressive 18XL1600 that was the subject of May’s Test Bench report. You’ll note from the 18XL1600 report that the 15XL1400 (also from Faital’s High Performance Series of pro sound woofers) shares many common features, including a rather high rated nominal power handling of 1400W.
Like Faital’s entire line of neodymium motor pro sound
woofers, the 15XL is built on a distinctly good-looking
proprietary cast aluminum frame that is designed to also
perform as a heatsink for the motor system. Using a series
of eight spokes, the frame terminates to a chamber for the
motor magnetic return cup, which—like a number of designs
over the last few years—has the motor assembly loaded from
the front side of the driver rather than being attached to the
back of the frame. If you examine the rear of the 15XL1400
(Photo 2), you will observe that part of the frame casting is
a solid 2.5″ high wall that joins all eight spokes and forms
the driver’s primary cooling exhaust at the back of the frame.
This produces a substantial thermal path that exhausts 360°
around the motor back plate. Like the 18XL1600, this area
contains the series of 15 1.25″ diameter neodymium slugs
mounted around the periphery of the motor. The eight
exhaust “windows” each measure about 35mm x 10mm and
allow air to be pumped in and out of the motor area for sub-
stantial convection cooling, which—coupled with the large
thermal path provided by the frame—substantially reduces
power compression in the 15XL1400.
The cone assembly is comprised of a 15″ diameter ribbed
and coated curved profile paper cone with a 5″ diameter
coated paper dust cap. Compliance is provided by a three
roll coated cloth surround and an 8.5″ diameter black cloth
spider mounted on an aluminum ring. Driving this assem-
bly is a 100mm (4″) diameter voice coil wound with round
copper wire on a glass fiber former. Heavy insulated tinsel
lead wires are terminated to a pair of chrome color-coded
push terminals.
Testing for the 15XL1400 commenced using the LinearX
LMS and VIBox to produce both voltage and admittance
(current) curves with the driver clamped to a rigid test fix-
ture in free-air at 1V, 3V, 6V, 10V, 15V, 20V, 30V, and 40V.
As with the 18XL1600, I didn’t need to discard the 40V
curves, as is often the case, and also like the 18XL1600, I’m
certain this driver would have stayed fairly linear in free-air
to at least 50V. Going with the established protocol for Test
Bench, I used the fixed Mmd method rather than the added
mass or test box method for obtaining the Vas of the driver.
This data was provided by Faital Pro.
Next, I post-processed the 16 550-point stepped sine
wave sweeps for each sample and divided the voltage
curves by the current curves to derive impedance curves,
phase calculated and, along with the accompanying voltage
curves, imported to the LEAP 5 Enclosure Shop software.
Obviously, this is a much more time-consuming process
than the usual low voltage single impedance curve method
used for deriving Thiele/Small parameters (see Fig. 13 for
the family of impedance curves produced by this process).
The obvious thermal change is due to playing a 200Hz
sine tone at the sweep voltage level from 10-50 seconds
between sweeps in order to approximate the 3rd thermal
time constant. The reason for using this method, if you
haven’t been following this column for a few years, is that
the LEAP 5 LTD model results in a much more accurate
prediction of excursion at high voltage levels, which is one
of the real fortés of the LEAP 5 software and why I use it
for Test Bench testing.
Because most T/S data provided by OEM manufacturers
is produced using either a standard method or the LEAP 4
TSL model, I additionally produced a LEAP 4 TSL model
using the 1V free-air curves. I selected the complete data set,
the multiple voltage impedance curves for the LTD model
(see Fig. 14 for the woofer 1V free-air impedance curve)
PHOTO 2: Faital Pro 15XL1400.
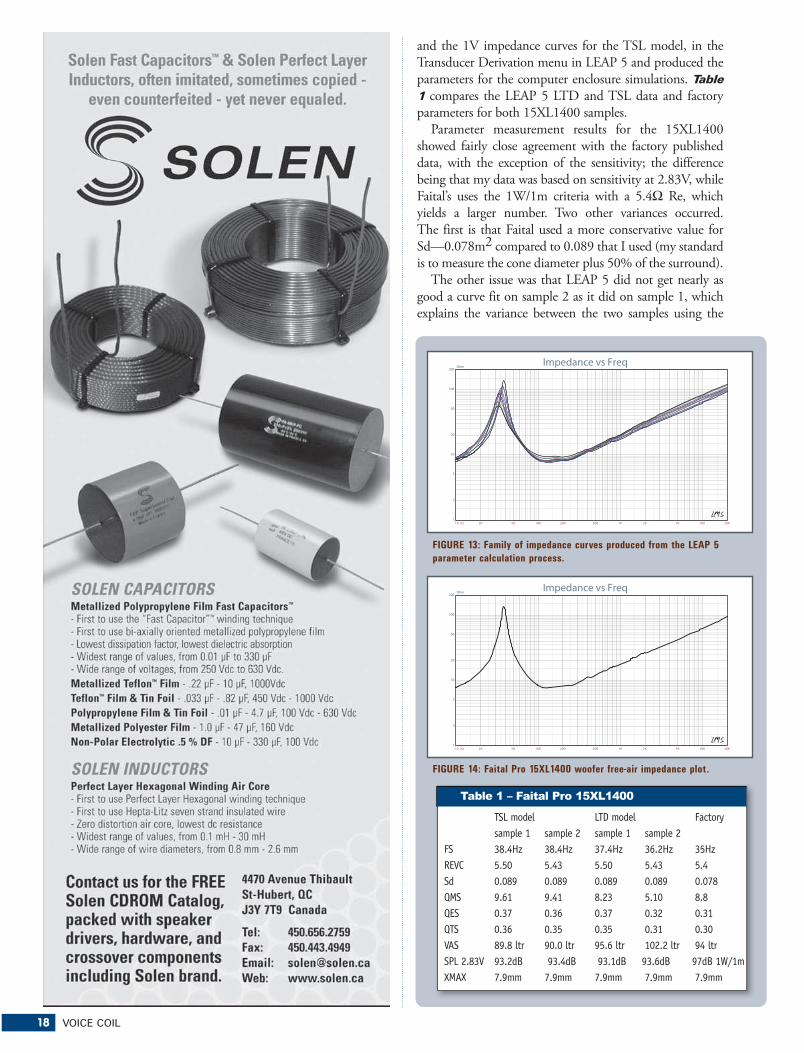
18 VOICE COIL
and the 1V impedance curves for the TSL model, in the
Transducer Derivation menu in LEAP 5 and produced the
parameters for the computer enclosure simulations. Table 1 compares the LEAP 5 LTD and TSL data and factory
parameters for both 15XL1400 samples.
Parameter measurement results for the 15XL1400
showed fairly close agreement with the factory published
data, with the exception of the sensitivity; the difference
being that my data was based on sensitivity at 2.83V, while
Faital’s uses the 1W/1m criteria with a 5.4Ω Re, which
yields a larger number. Two other variances occurred.
The first is that Faital used a more conservative value for
Sd—0.078m2 compared to 0.089 that I used (my standard
is to measure the cone diameter plus 50% of the surround).
The other issue was that LEAP 5 did not get nearly as
good a curve fit on sample 2 as it did on sample 1, which
explains the variance between the two samples using the
10 Hz 20 50 100 200 500 1K 2K 5K 10K 20K
Ohm
1
2
5
10
20
50
100
200Impedance vs Freq
10 Hz 20 50 100 200 500 1K 2K 5K 10K 20K
Ohm
1
2
5
10
20
50
100
200Impedance vs Freq
FIGURE 13: Family of impedance curves produced from the LEAP 5
parameter calculation process.
FIGURE 14: Faital Pro 15XL1400 woofer free-air impedance plot.
TSL model LTD model Factory sample 1 sample 2 sample 1 sample 2FS 38.4Hz 38.4Hz 37.4Hz 36.2Hz 35HzREVC 5.50 5.43 5.50 5.43 5.4Sd 0.089 0.089 0.089 0.089 0.078QMS 9.61 9.41 8.23 5.10 8.8QES 0.37 0.36 0.37 0.32 0.31QTS 0.36 0.35 0.35 0.31 0.30VAS 89.8 ltr 90.0 ltr 95.6 ltr 102.2 ltr 94 ltrSPL 2.83V 93.2dB 93.4dB 93.1dB 93.6dB 97dB 1W/1mXMAX 7.9mm 7.9mm 7.9mm 7.9mm 7.9mm
��>� ���?���(!��������#B�����

JUNE 2011 19
LTD method. Given this, I followed my usual protocol
and programmed computer enclosure simulations using the
LEAP 5 LTD parameters for Sample 1. This included two
vented alignments, a 2.2ft3 QB3 box with 15% fiberglass
fill material tuned to 48Hz, and a 2.7ft3 EBS (Extended
Bass Shelf) vented alignment enclosure with 15% fiberglass
fill material and tuned to 45Hz.
Figure 15 displays the results for the 15XL1400 in
the QB3 and EBS vented boxes at 2.83V and at a voltage
level high enough to increase cone excursion to Xmax +
15% (9.1mm). This produced a -3dB frequency of 49Hz
(-6dB = 42Hz) for the QB3 enclosure and F3 = 45Hz (F6
= 39Hz) for the EBS vented simulation, so not much dif-
ference between these two iterations. Increasing the voltage
input to the simulations until the maximum linear cone
excursion was reached resulted in 116dB at 36V for the
QB3 enclosure simulation and 115.5dB with the same 36V
input level for the larger vented box (see Figs. 16 and 17
for the 2.83V group delay curves and the 36V excursion
curves). Note that the criterion for these high excursion
SPL numbers was the maximum excursion at 20Hz. If
a 20-25Hz high-pass filter were used, the SPL would be
substantially higher.
Klippel analysis for Faital Pro’s 15XL1400 (analyzer
provided courtesy of Klippel GmbH), which as usual
was performed by Patrick Turnmire, Red Rock Acoustics
(author of the SpeaD and RevSpeaD transducer simulation
software) produced the Bl(X), Kms(X) and Bl and Kms
In Europe:
intertechnik.de
In Asia:
baysidenet.jp
In Canada:
solen.ca
Distributed By:
Tel:800-338-0531725 Pleasant Valley Dr.Springboro, OH 45066
parts-express.com/vcm
Dayton Audio’s OmniMic is a must-have for system integrators, acoustic engineers, and A/V installers. It was
developed in collaboration with Liberty Audio, inventors of the Praxis analysis tool. The OmniMic provides quick and accurate measurements that will reduce installation time,
saving you both labor and money.
Just open the box and start testing in minutes!
Dayton Audio’s WT3 just got better—the same great features as before, but now perfect for incoming or end-of-line QC inspections! DIY speaker builders will also fi nd the new
capabilities useful when comparing multiple drivers for line array type systems. The WT3 is manufactured on state-of-the-art equipment and uses precision surface-mount components.
Try a WT3 and build better speaker systems!
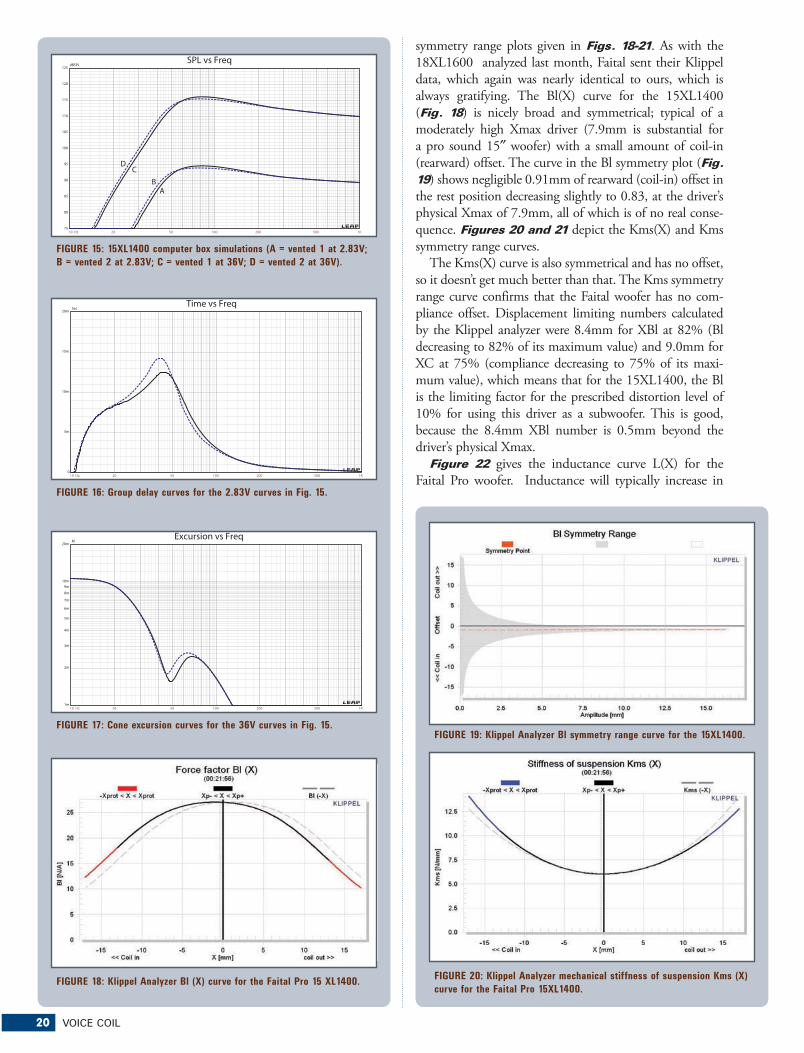
20 VOICE COIL
symmetry range plots given in Figs. 18-21. As with the
18XL1600 analyzed last month, Faital sent their Klippel
data, which again was nearly identical to ours, which is
always gratifying. The Bl(X) curve for the 15XL1400
(Fig. 18) is nicely broad and symmetrical; typical of a
moderately high Xmax driver (7.9mm is substantial for
a pro sound 15″ woofer) with a small amount of coil-in
(rearward) offset. The curve in the Bl symmetry plot (Fig. 19) shows negligible 0.91mm of rearward (coil-in) offset in
the rest position decreasing slightly to 0.83, at the driver’s
physical Xmax of 7.9mm, all of which is of no real conse-
quence. Figures 20 and 21 depict the Kms(X) and Kms
symmetry range curves.
The Kms(X) curve is also symmetrical and has no offset,
so it doesn’t get much better than that. The Kms symmetry
range curve confirms that the Faital woofer has no com-
pliance offset. Displacement limiting numbers calculated
by the Klippel analyzer were 8.4mm for XBl at 82% (Bl
decreasing to 82% of its maximum value) and 9.0mm for
XC at 75% (compliance decreasing to 75% of its maxi-
mum value), which means that for the 15XL1400, the Bl
is the limiting factor for the prescribed distortion level of
10% for using this driver as a subwoofer. This is good,
because the 8.4mm XBl number is 0.5mm beyond the
driver’s physical Xmax.
Figure 22 gives the inductance curve L(X) for the
Faital Pro woofer. Inductance will typically increase in
10 Hz 20 50 100 200 500 1K
dBSPL
75
80
85
90
95
100
105
110
115
120
125
SPL vs Freq
10 Hz 20 50 100 200 500 1K
Sec
0
5m
10m
15m
20m
Time vs Freq
10 Hz 20 50 100 200 500 1K
M
1m
2m
3m
4m
5m
6m
7m
8m
9m
10m
20m
Excursion vs Freq
FIGURE 15: 15XL1400 computer box simulations (A = vented 1 at 2.83V;
B = vented 2 at 2.83V; C = vented 1 at 36V; D = vented 2 at 36V).
FIGURE 16: Group delay curves for the 2.83V curves in Fig. 15.
FIGURE 17: Cone excursion curves for the 36V curves in Fig. 15.FIGURE 19: Klippel Analyzer Bl symmetry range curve for the 15XL1400.
FIGURE 18: Klippel Analyzer Bl (X) curve for the Faital Pro 15 XL1400.FIGURE 20: Klippel Analyzer mechanical stiffness of suspension Kms (X)
curve for the Faital Pro 15XL1400.

JUNE 2011 21
the rear direction from the zero rest position as the voice
coil covers more pole area unless the driver incorporates a
shorting ring. Like the 18XL1600, the 15XL1400 incor-
porates proprietary patent-pending aluminum demodula-
tion ring (shorting ring) in the motor assembly, which
is readily apparent in the L(X) curve. As you can see,
the inductance variation is extremely small—only 0.14-
0.19mH from rest to Xmax in either direction. Minimal
inductance variation is critical to a low distortion and
accurate sounding driver.
Last month, I didn’t perform SPL on- and off-axis
measurements for the Faital 18XL1600 because I don’t
keep 18″ or 21″ test enclosures in my inventory. However,
I do have 15″ test boxes, so I proceeded to measure the
15XL1400 on- and off-axis using the LMS gated sine
wave technique. Figure 23 gives the on-axis response
for this driver, which is ±2.75dB up to the low-pass
rolloff. The on- and off-axis response from 0 to 45° is
displayed in Fig. 24. The -3dB frequency at the 30° off-
axis response with respect to the on-axis response occurs
at about 1.2kHz, probably a good upper crossover point
for this driver. The SPL to 1.2kHz is ±1.5dB. Last, Fig. 25 gives the two-sample SPL comparison showing the
Faital samples to be matched with 1dB within the relevant
operating range.
For the last body of testing on the Faital Pro 15″ woofer,
I again fired up the SoundCheck analyzer and SCM micro-
FIGURE 21: Klippel Analyzer Kms symmetry range curve for the
15XL1400.
FIGURE 22: Klippel Analyzer L(X) curve for the Faital Pro 15XL1400.
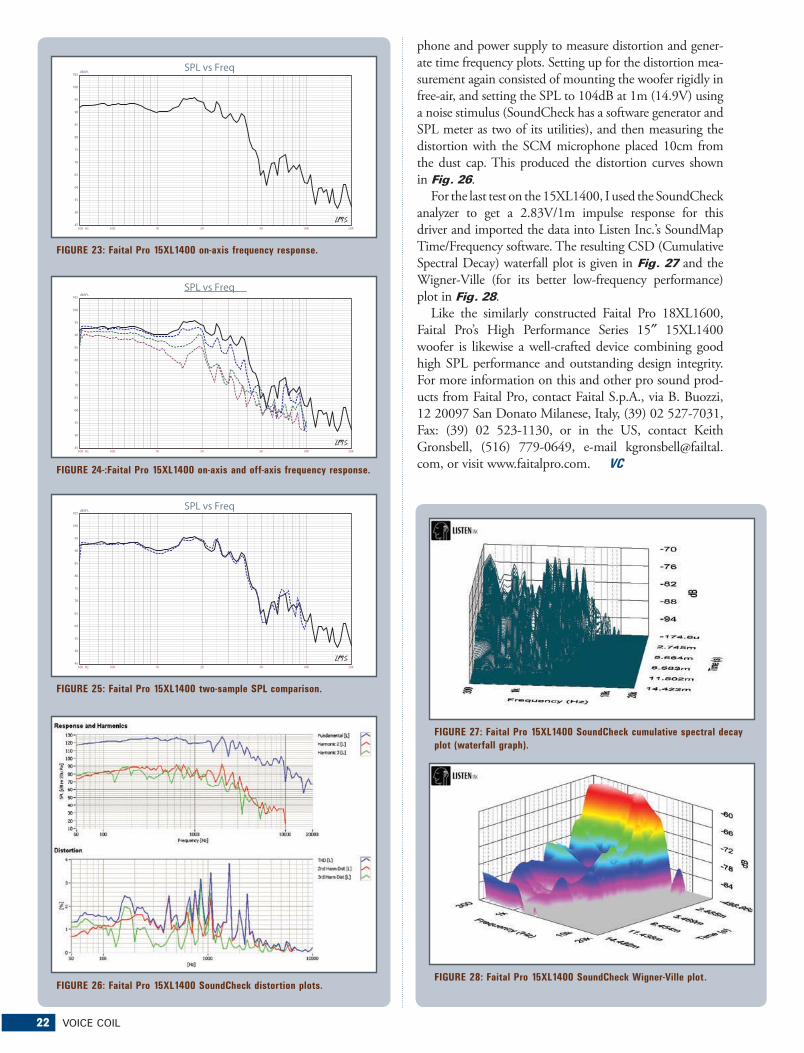
22 VOICE COIL
phone and power supply to measure distortion and gener-
ate time frequency plots. Setting up for the distortion mea-
surement again consisted of mounting the woofer rigidly in
free-air, and setting the SPL to 104dB at 1m (14.9V) using
a noise stimulus (SoundCheck has a software generator and
SPL meter as two of its utilities), and then measuring the
distortion with the SCM microphone placed 10cm from
the dust cap. This produced the distortion curves shown
in Fig. 26.
For the last test on the 15XL1400, I used the SoundCheck
analyzer to get a 2.83V/1m impulse response for this
driver and imported the data into Listen Inc.’s SoundMap
Time/Frequency software. The resulting CSD (Cumulative
Spectral Decay) waterfall plot is given in Fig. 27 and the
Wigner-Ville (for its better low-frequency performance)
plot in Fig. 28.
Like the similarly constructed Faital Pro 18XL1600,
Faital Pro’s High Performance Series 15″ 15XL1400
woofer is likewise a well-crafted device combining good
high SPL performance and outstanding design integrity.
For more information on this and other pro sound prod-
ucts from Faital Pro, contact Faital S.p.A., via B. Buozzi,
12 20097 San Donato Milanese, Italy, (39) 02 527-7031,
Fax: (39) 02 523-1130, or in the US, contact Keith
Gronsbell, (516) 779-0649, e-mail kgronsbell@failtal.
com, or visit www.faitalpro.com. VC
300 Hz 500 1K 2K 5K 10K 20K
dBSPL
45
50
55
60
65
70
75
80
85
90
95
100
105SPL vs Freq
300 Hz 500 1K 2K 5K 10K 20K
dBSPL
45
50
55
60
65
70
75
80
85
90
95
100
105
SPL vs Freq
300 Hz 500 1K 2K 5K 10K 20K
dBSPL
45
50
55
60
65
70
75
80
85
90
95
100
105SPL vs Freq
FIGURE 23: Faital Pro 15XL1400 on-axis frequency response.
FIGURE 24-:Faital Pro 15XL1400 on-axis and off-axis frequency response.
FIGURE 25: Faital Pro 15XL1400 two-sample SPL comparison.
FIGURE 26: Faital Pro 15XL1400 SoundCheck distortion plots.FIGURE 28: Faital Pro 15XL1400 SoundCheck Wigner-Ville plot.
FIGURE 27: Faital Pro 15XL1400 SoundCheck cumulative spectral decay
plot (waterfall graph).
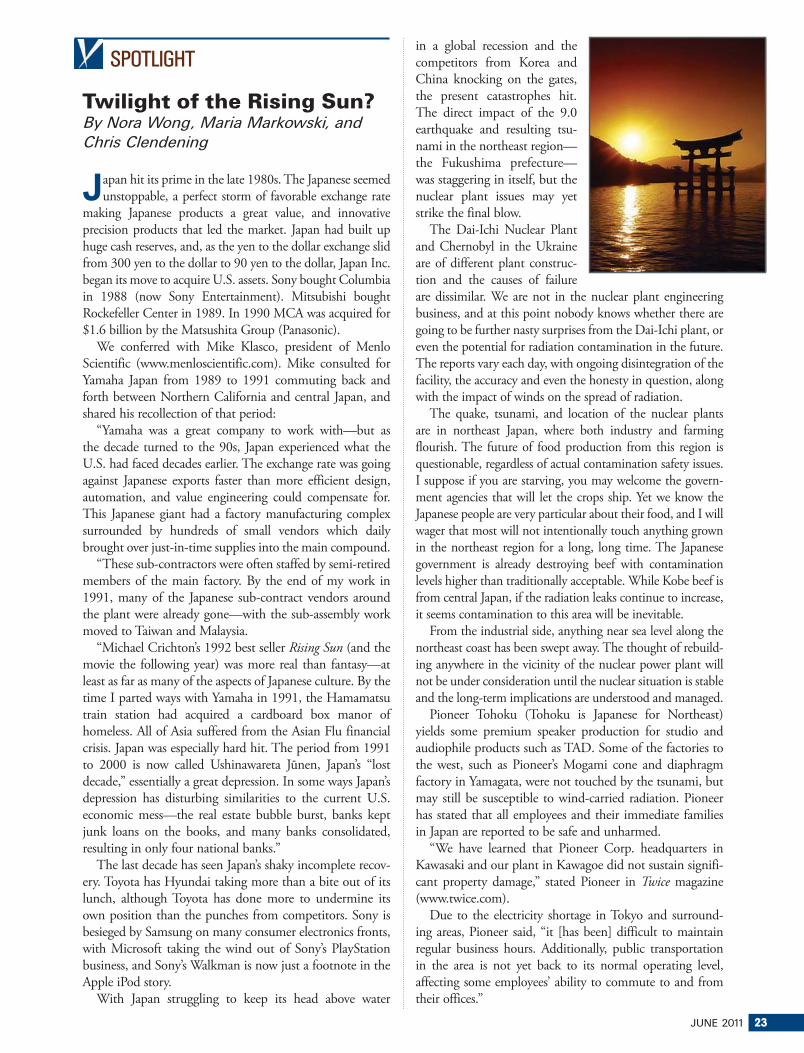
JUNE 2011 23
SPOTLIGHT
Twilight of the Rising Sun?By Nora Wong, Maria Markowski, and Chris Clendening
$apan hit its prime in the late 1980s. The Japanese seemed
unstoppable, a perfect storm of favorable exchange rate
making Japanese products a great value, and innovative
precision products that led the market. Japan had built up
huge cash reserves, and, as the yen to the dollar exchange slid
from 300 yen to the dollar to 90 yen to the dollar, Japan Inc.
began its move to acquire U.S. assets. Sony bought Columbia
in 1988 (now Sony Entertainment). Mitsubishi bought
Rockefeller Center in 1989. In 1990 MCA was acquired for
$1.6 billion by the Matsushita Group (Panasonic).
We conferred with Mike Klasco, president of Menlo
Scientific (www.menloscientific.com). Mike consulted for
Yamaha Japan from 1989 to 1991 commuting back and
forth between Northern California and central Japan, and
shared his recollection of that period:
“Yamaha was a great company to work with —but as
the decade turned to the 90s, Japan experienced what the
U.S. had faced decades earlier. The exchange rate was going
against Japanese exports faster than more efficient design,
automation, and value engineering could compensate for.
This Japanese giant had a factory manufacturing complex
surrounded by hundreds of small vendors which daily
brought over just-in-time supplies into the main compound.
“These sub-contractors were often staffed by semi-retired
members of the main factory. By the end of my work in
1991, many of the Japanese sub-contract vendors around
the plant were already gone—with the sub-assembly work
moved to Taiwan and Malaysia.
“Michael Crichton’s 1992 best seller Rising Sun (and the
movie the following year) was more real than fantasy—at
least as far as many of the aspects of Japanese culture. By the
time I parted ways with Yamaha in 1991, the Hamamatsu
train station had acquired a cardboard box manor of
homeless. All of Asia suffered from the Asian Flu financial
crisis. Japan was especially hard hit. The period from 1991
to 2000 is now called Ushinawareta Jūnen, Japan’s “lost
decade,” essentially a great depression. In some ways Japan’s
depression has disturbing similarities to the current U.S.
economic mess—the real estate bubble burst, banks kept
junk loans on the books, and many banks consolidated,
resulting in only four national banks.”
The last decade has seen Japan’s shaky incomplete recov-
ery. Toyota has Hyundai taking more than a bite out of its
lunch, although Toyota has done more to undermine its
own position than the punches from competitors. Sony is
besieged by Samsung on many consumer electronics fronts,
with Microsoft taking the wind out of Sony’s PlayStation
business, and Sony’s Walkman is now just a footnote in the
Apple iPod story.
With Japan struggling to keep its head above water
in a global recession and the
competitors from Korea and
China knocking on the gates,
the present catastrophes hit.
The direct impact of the 9.0
earthquake and resulting tsu-
nami in the northeast region—
the Fukushima prefecture—
was staggering in itself, but the
nuclear plant issues may yet
strike the final blow.
The Dai-Ichi Nuclear Plant
and Chernobyl in the Ukraine
are of different plant construc-
tion and the causes of failure
are dissimilar. We are not in the nuclear plant engineering
business, and at this point nobody knows whether there are
going to be further nasty surprises from the Dai-Ichi plant, or
even the potential for radiation contamination in the future.
The reports vary each day, with ongoing disintegration of the
facility, the accuracy and even the honesty in question, along
with the impact of winds on the spread of radiation.
The quake, tsunami, and location of the nuclear plants
are in northeast Japan, where both industry and farming
flourish. The future of food production from this region is
questionable, regardless of actual contamination safety issues.
I suppose if you are starving, you may welcome the govern-
ment agencies that will let the crops ship. Yet we know the
Japanese people are very particular about their food, and I will
wager that most will not intentionally touch anything grown
in the northeast region for a long, long time. The Japanese
government is already destroying beef with contamination
levels higher than traditionally acceptable. While Kobe beef is
from central Japan, if the radiation leaks continue to increase,
it seems contamination to this area will be inevitable.
From the industrial side, anything near sea level along the
northeast coast has been swept away. The thought of rebuild-
ing anywhere in the vicinity of the nuclear power plant will
not be under consideration until the nuclear situation is stable
and the long-term implications are understood and managed.
Pioneer Tohoku (Tohoku is Japanese for Northeast)
yields some premium speaker production for studio and
audiophile products such as TAD. Some of the factories to
the west, such as Pioneer’s Mogami cone and diaphragm
factory in Yamagata, were not touched by the tsunami, but
may still be susceptible to wind-carried radiation. Pioneer
has stated that all employees and their immediate families
in Japan are reported to be safe and unharmed.
“We have learned that Pioneer Corp. headquarters in
Kawasaki and our plant in Kawagoe did not sustain signifi-
cant property damage,” stated Pioneer in Twice magazine
(www.twice.com).
Due to the electricity shortage in Tokyo and surround-
ing areas, Pioneer said, “it [has been] difficult to maintain
regular business hours. Additionally, public transportation
in the area is not yet back to its normal operating level,
affecting some employees’ ability to commute to and from
their offices.”

24 VOICE COIL
Mitsubishi Electric said major busi-
ness operations in the Tohoku region
have sustained damage as a result of
the earthquake, but no significant
injuries among employees have been
reported. At the Tohoku branch, locat-
ed in Sendai, Miyagi prefecture, “there
was some damage in the office.” At the
Koriyama factory, located in Koriyama,
Fukushima prefecture, some damage
was reported and “production has tem-
porarily ceased at this factory, which
manufactures CCTVs and communications equipment.
Upon confirming operational safety, Mitsubishi Electric will
consider when to resume operations, while taking into account
the impact of the earthquake on its manufacturing facilities.”
Yamaha president Mitsuru Umemura issued a statement, say-
ing, “We have not received any reports of injuries to Yamaha
Corporation personnel.”
“Yamaha’s sales office in Sendai, and retail shops of sales
companies located in the disaster area sustained some slight
damage, and we have closed some retail stores and music
schools in this area. The Kakegawa factory and Toyooka
factory, both located in Shizuoka prefecture, are continuing
normal operations,” the company said.
Alpine said no injuries have been reported at its Iwaki
City global headquarters in the Fukushima prefecture
or at affiliated companies in Japan. Alpine’s global head-
quarters “suffered some damage due
to the earthquake,” according to the
company, which is evaluating damage
to its administrative offices and manu-
facturing plants there. Once the safety
of the facilities is confirmed, operations
will resume, it added. In the meantime,
the Iwaki headquarters and other local
Alpine companies were closed from
Monday, March 14, through Monday,
March 21. During that time, limited
personnel continued to work toward
restoring manufacturing and operations, the company said.
Semiconductor manufacturing must be vibration–free
and precisely calibrated (Photo 1). These plants that manu-
facture consumer electronics ICs are going to take months to
get back on-line. Expect shortages on mixed signal ICs such
as class D switching amps and switching power supply ICs.
Packaging digital logic, analog audio, and power transistors
into an IC is limited to specialized IC foundries mostly in
Japan.
Sony has paused operations at its Blu-ray disc plant
and one corporate office. Other Sony locations voluntarily
closed to assist in disaster recovery, but no significant inju-
ries of employees have been reported at any of these sites
when the earthquake or tsunami occurred. The plants that
will face the greatest challenges are the ones in the north-
east. These include Sony Energy Devices Corporation,
Koriyama, and Motomiya plants, which produce Lithium
Ion secondary batteries. In addition to these manufactur-
ing sites, Sony Corporation Sendai Technology Center
(Tagajyo, Miyagi) temporarily ceased operations.
According to an article in Twice, many other Japanese
electronics manufacturers, including D&M (Denon and
Marantz) and Toshiba, were also focusing their attention on
the safety and welfare of their employees. The companies
noted that all employees were safe and accounted for, and
that the facilities were being evaluated for damage. So far,
damage seems minimal.
Other issues that will affect most Japanese manufacturing
on an ongoing basis include supply chain interruption caused
by a combination of damaged facilities of key parts suppliers,
damaged roads, and limited rail service. All of Japan is expe-
riencing power shortages. Everyone is expecting supply prob-
lems from Japanese vendors. We are writing this report from
Asia, and the entire supply chain is busy looking to source
workarounds for Japanese components. While this may ease
supply issues from product assembled in the rest of Asia, it
does not provide an encouraging picture for Japan’s recovery.
On the surface, Japan is ready to go back to work, and the
months following the quake have seen little impact on prod-
uct availability. Yet about the time this article appears in print,
the real shortages will begin. Most operations in Japan main-
tain a two-month inventory that is on consignment from the
supplier. In most cases these reserves will be depleted some-
time in May, with erratic supply following for the foreseeable
future. Recovery will not be in terms of months but of years.
Perhaps Japan’s Second Lost Decade has just begun. VC��������������������� �������������������������
���������������� !���"�������#������������������������
$ ��
��#
%�!
����
&��
����%
�'
�
�
$ ����#%�! ����&������%�'�� ��)�����������%�'� � ����%��%�'����������(�������������%'�����(%���)� ���� ����(����������*� ��+��,���%������� �-��� ������(%��.�
/%����,����%����,���%�����%���%'� �����(( � ��0�%� � ��0��� � ��0���%�%�'� �����)���(�������������������������� �%����%����%���������(������������)������� !���123-�� ���*���� ��� ����)%� �%����(�����%������ ���%��� ������ ���*������,�����������%�����
/��� ��� �������)������*���4�%����0��25"��0�360�&�710�3�6650��6"& �0�825�0������������%�������%���% 0�� �� ��%�0�370�"��0���� �� ��������9������� �����%�����%�'��9:;�0�$#&�� �����������%����
5�������� �� �� � %� )������%'���� ���� ��%��������������(�����)������ �����������'%�����0�%������% �����%'����� ���� �!��%�'��,������7�!�����(�%������%������*� ���*���� ��� ��%��%�'����)%� �%����� �����������������������<��0� �*� �����!����%��������
Photo 1: Power shortages, the quake, tsunami,
and tremors are not conducive to quality
semiconductor manufacturing.

JUNE 2011 25
Acoustic Patents By James Croft
�he following loudspeaker-related patents were filed
primarily under the Office of Patent and Trademarks
classification 181 for acoustical devices and 381 for electri-
cal-signal processing systems and HO4R for international
patents. This also includes new patent applications that are
published in the Patent Application Journal.
IN-PLANE SPEAKER Patent Number: US 7,881,488
Granted: February 1, 2011
Inventor: Douglas J. Holmi (Marlborough, Mass.)
Assignee: Bose Corporation (Framingham, Mass.)
Filed: November 1, 2006
US Class: 381/386, 16 Claims, 7 drawings
REVIEWER COMMENTS Disclosed is an electroacoustic transducer oriented such that its transducer axis is parallel to—and in—the plane of a baffle coupled to the electroacoustic transducer for the purpose of reduced baffle vibration. As we have seen in a few of the recent patent reviews, there is a plethora of transducer/baffle configurations arranged for the purpose of reducing enclosure or baffle vibrations. These have been as simple as having back-to-back, or face-to-face transducers, mounted parallel to each
other, on spaced apart paral-lel baffles, and as complex as a separate vibrating mass to cancel baffle vibrations. (The former being better at miti-gating total cabinet move-ment, and the latter better at baffle vibration reduction.) While these approaches have become common in separate subwoofers, the most popular usage of late, and one where the problem is a significant one, is that of in-wall systems, which can set very large radiating wall surfaces into high output, passive acoustic radiators.
The present invention is directed to a structure compris-
ing a baffle, an electroacoustic transducer, and a housing
supporting the electroacoustic transducer at an orientation
such that the transducer axis is parallel to the plane of the
baffle. It is disclosed that the baffle may be incorporated
into room wall, floor or ceiling, a vehicle door panel, a
vehicle rear package shelf, or a vehicle instrument panel.
When an electroacoustic transducer is mounted to the
baffle, oriented with the transducer axis perpendicular to
the baffle plane, a reaction force generated by the movement
of the diaphragm is applied as a perpendicular force on the
baffle causing the baffle to vibrate. The out-of-plane vibra-
tion of the baffle may generate a buzzing or acoustical out-
put that may reach a level of audibility that is high enough
to be heard above the masking of the primary signal.
As shown in Fig. 1, the transducer axis 115 is in the plane
FIGURE 1: US Patent # 7,881,488.
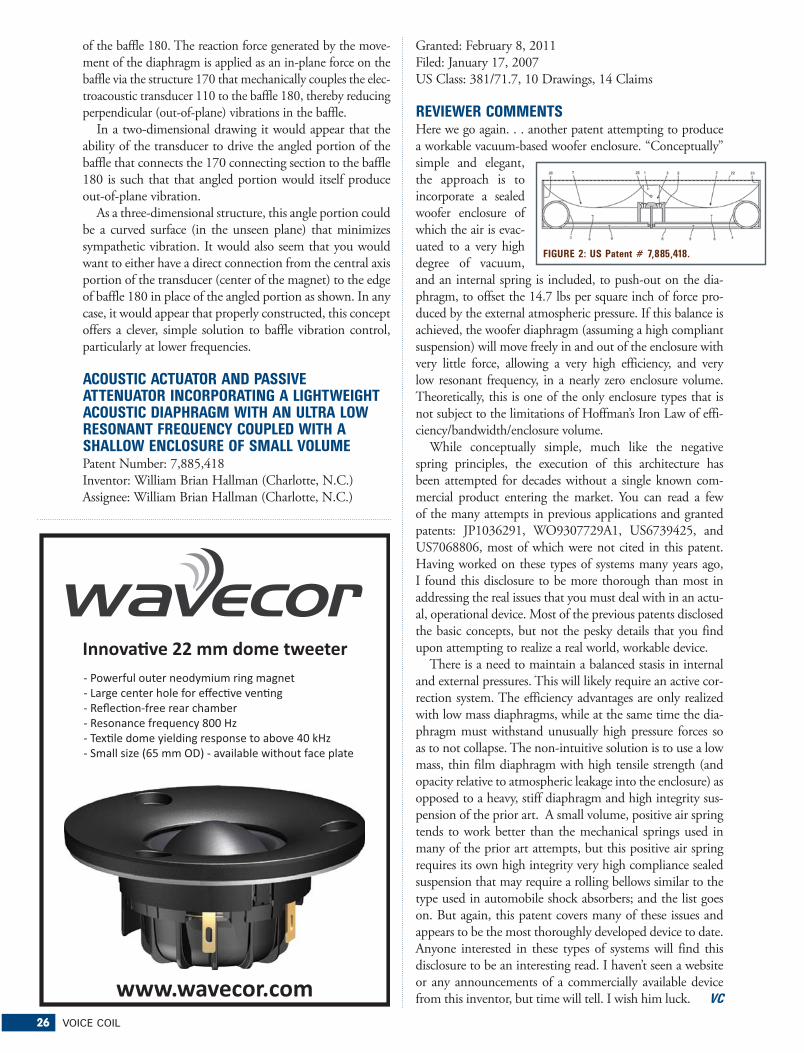
26 VOICE COIL
of the baffle 180. The reaction force generated by the move-
ment of the diaphragm is applied as an in-plane force on the
baffle via the structure 170 that mechanically couples the elec-
troacoustic transducer 110 to the baffle 180, thereby reducing
perpendicular (out-of-plane) vibrations in the baffle.
In a two-dimensional drawing it would appear that the
ability of the transducer to drive the angled portion of the
baffle that connects the 170 connecting section to the baffle
180 is such that that angled portion would itself produce
out-of-plane vibration.
As a three-dimensional structure, this angle portion could
be a curved surface (in the unseen plane) that minimizes
sympathetic vibration. It would also seem that you would
want to either have a direct connection from the central axis
portion of the transducer (center of the magnet) to the edge
of baffle 180 in place of the angled portion as shown. In any
case, it would appear that properly constructed, this concept
offers a clever, simple solution to baffle vibration control,
particularly at lower frequencies.
ACOUSTIC ACTUATOR AND PASSIVE ATTENUATOR INCORPORATING A LIGHTWEIGHT ACOUSTIC DIAPHRAGM WITH AN ULTRA LOW RESONANT FREQUENCY COUPLED WITH A SHALLOW ENCLOSURE OF SMALL VOLUMEPatent Number: 7,885,418
Inventor: William Brian Hallman (Charlotte, N.C.)
Assignee: William Brian Hallman (Charlotte, N.C.)
Granted: February 8, 2011
Filed: January 17, 2007
US Class: 381/71.7, 10 Drawings, 14 Claims
REVIEWER COMMENTS Here we go again. . . another patent attempting to produce a workable vacuum-based woofer enclosure. “Conceptually” simple and elegant, the approach is to incorporate a sealed woofer enclosure of which the air is evac-uated to a very high degree of vacuum, and an internal spring is included, to push-out on the dia-phragm, to offset the 14.7 lbs per square inch of force pro-duced by the external atmospheric pressure. If this balance is achieved, the woofer diaphragm (assuming a high compliant suspension) will move freely in and out of the enclosure with very little force, allowing a very high efficiency, and very low resonant frequency, in a nearly zero enclosure volume. Theoretically, this is one of the only enclosure types that is not subject to the limitations of Hoffman’s Iron Law of effi-ciency/bandwidth/enclosure volume.
While conceptually simple, much like the negative
spring principles, the execution of this architecture has
been attempted for decades without a single known com-
mercial product entering the market. You can read a few
of the many attempts in previous applications and granted
patents: JP1036291, WO9307729A1, US6739425, and
US7068806, most of which were not cited in this patent.
Having worked on these types of systems many years ago,
I found this disclosure to be more thorough than most in
addressing the real issues that you must deal with in an actu-
al, operational device. Most of the previous patents disclosed
the basic concepts, but not the pesky details that you find
upon attempting to realize a real world, workable device.
There is a need to maintain a balanced stasis in internal
and external pressures. This will likely require an active cor-
rection system. The efficiency advantages are only realized
with low mass diaphragms, while at the same time the dia-
phragm must withstand unusually high pressure forces so
as to not collapse. The non-intuitive solution is to use a low
mass, thin film diaphragm with high tensile strength (and
opacity relative to atmospheric leakage into the enclosure) as
opposed to a heavy, stiff diaphragm and high integrity sus-
pension of the prior art. A small volume, positive air spring
tends to work better than the mechanical springs used in
many of the prior art attempts, but this positive air spring
requires its own high integrity very high compliance sealed
suspension that may require a rolling bellows similar to the
type used in automobile shock absorbers; and the list goes
on. But again, this patent covers many of these issues and
appears to be the most thoroughly developed device to date.
Anyone interested in these types of systems will find this
disclosure to be an interesting read. I haven’t seen a website
or any announcements of a commercially available device
from this inventor, but time will tell. I wish him luck. VC
������ ��!!�������"�����
"""#"������#���
�������������� ���������� ����� ������������ ���������������������� � ���������� ������������������������ � ������� ���� �!"��#�$��������������� �����%� ������������& �'!"��(�������"��)*+����,-.������������������������%����
FIGURE 2: US Patent # 7,885,418.
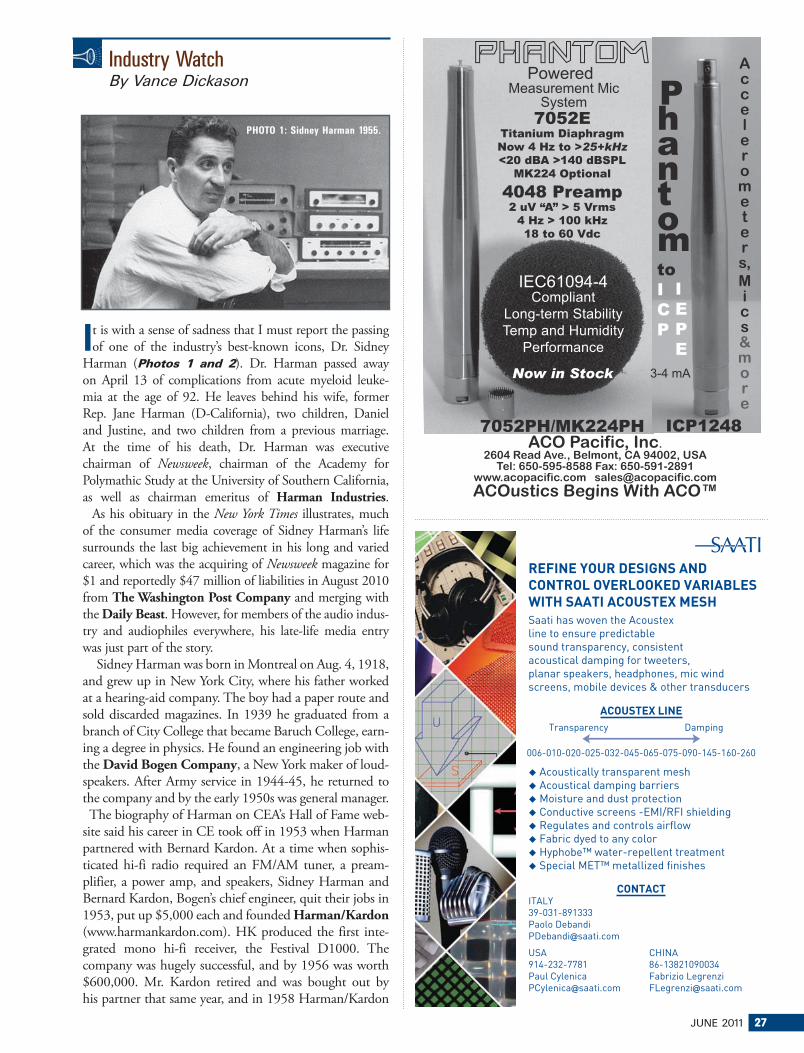
JUNE 2011 27
Industry WatchBy Vance Dickason
#t is with a sense of sadness that I must report the passing
of one of the industry’s best-known icons, Dr. Sidney
Harman (Photos 1 and 2). Dr. Harman passed away
on April 13 of complications from acute myeloid leuke-
mia at the age of 92. He leaves behind his wife, former
Rep. Jane Harman (D-California), two children, Daniel
and Justine, and two children from a previous marriage.
At the time of his death, Dr. Harman was executive
chairman of Newsweek, chairman of the Academy for
Polymathic Study at the University of Southern California,
as well as chairman emeritus of Harman Industries. As his obituary in the New York Times illustrates, much
of the consumer media coverage of Sidney Harman’s life
surrounds the last big achievement in his long and varied
career, which was the acquiring of Newsweek magazine for
$1 and reportedly $47 million of liabilities in August 2010
from The Washington Post Company and merging with
the Daily Beast. However, for members of the audio indus-
try and audiophiles everywhere, his late-life media entry
was just part of the story.
Sidney Harman was born in Montreal on Aug. 4, 1918,
and grew up in New York City, where his father worked
at a hearing-aid company. The boy had a paper route and
sold discarded magazines. In 1939 he graduated from a
branch of City College that became Baruch College, earn-
ing a degree in physics. He found an engineering job with
the David Bogen Company, a New York maker of loud-
speakers. After Army service in 1944-45, he returned to
the company and by the early 1950s was general manager.
The biography of Harman on CEA’s Hall of Fame web-
site said his career in CE took off in 1953 when Harman
partnered with Bernard Kardon. At a time when sophis-
ticated hi-fi radio required an FM/AM tuner, a pream-
plifier, a power amp, and speakers, Sidney Harman and
Bernard Kardon, Bogen’s chief engineer, quit their jobs in
1953, put up $5,000 each and founded Harman/Kardon (www.harmankardon.com). HK produced the first inte-
grated mono hi-fi receiver, the Festival D1000. The
company was hugely successful, and by 1956 was worth
$600,000. Mr. Kardon retired and was bought out by
his partner that same year, and in 1958 Harman/Kardon
������������ ��������������� ����� ������������������ ����� ����� ����� ����� ����������������� ���������������� ������������������� ��������� ������� ��������������������������� �������
����������������� ����� ����������������������� ��������������������� �������������� ��� ������������� �� !�"#$%"�������� ���$���������� ��� ������������%�������������� �������&�����'����� ������� ��������� ������������!('��������)����� �����
�������� ���������������� ��� � ��� �������������������������� ����������
(�� ����� �� 2���� �
�� ���������
..9 ./. .6. .6: .,6 .5: .9: .7: .-. /5: /9. 69.
"(�*+,- .,/ 0-/,,,1���2��� ��12��� ��@�����3��
4��-/5 6,6 770/1�������� ���1���� ���@�����3��
�&"8�09 /,06/.-..,5%����)��*���� )�%*���� )�@�����3��
� �����
PHOTO 1: Sidney Harman 1955.
����������� ������������������������ ����������������
��� ��!�"!�!"#!##�$�% ��!�"!�&"�#�&'''����(����������)���)*���(����������+)��)���, )�-�.����/
�������
� ��!�"!����
��#��$%&'����$
�������
��#����(!��(�"�)(�* ���"+�,���$-�!��.�������/���0���.����0�1��
&'����2*!(����
������� �"*���3�4�5�.�#�3�"6�
��$-�.�����7$-���!��8��30�
��� �����
������0�����0)�1�)2���0��
����
������
���� ����������������
������
������������� ����
!�"���������#� ���$������ �%��� ���
���&������

28 VOICE COIL
produced the first hi-fi stereo receiver,
the Festival TA230. In later years, the
company made speakers, amplifiers, noise-
reduction devices, video and navigation
equipment, voice-activated telephones, cli-
mate controls, and home theater systems.
Dr. Harman expanded Harman/Kardon
and in the early 1970s Harman began
experimenting at his Tennessee factory with
a new management technique. Nicknamed
the Bolivar Project, it involved cooperative
labor-management of the plant in which
workers set their own schedules and goals.
The national publicity from the project
led to Harman’s appointment as Undersecretary of the
Department of Commerce during the Carter administra-
tion. When Harman moved to Washington in 1976, he
sold his company to conglomerate Beatrice Foods, but in
1980, after leaving government service, he pieced together
Harman International Industries by reacquiring a num-
ber of the businesses he had sold to Beatrice including
JBL, Harman/Kardon, Infinity, and Epicure loudspeak-
ers as well as other brands in the professional market.
Harman International expanded into the automotive
market with car speakers. Harman acquired a $5 million
business from the wire division of United Technologies and in five years transformed it into a $100 million business
and became a leading speaker supplier to the automotive
OEM market. Four years ago in April 2007 Harman and
the Harman International board signed an agreement to
sell Harman Industries to Goldman Sachs and Kohlberg Kravis Roberts & Co. for about $8 billion, but the deal fell
through, due to a variety of factors in September of that year.
Dr. Harman retired from Harman Industries in 2008
when he was succeeded by current chairman, president and
CEO Dinesh C. Paliwal, who joined the company in 2007.
Paliwal said in a company statement on Harman’s passing,
“His legacy of leading-edge innovation and premium qual-
ity will continue to live on at Harman and I am grateful to
Dr. Harman for the trust he placed in the company’s man-
agement to carry on his legacy. He will be remembered for
his great charm, his curiosity, his philanthropic and public
service interests, his genuine kindness to employees and
customers alike.”
Other notable accomplishments later in Sidney’s life
included joining the University of Southern California in
2008 as a polymath professor, lecturing on architecture,
medicine, law, economics, and other subjects. He donated
$20 million for the Shakespeare Theater Company’s
Sidney Harman Hall in Washington, and was a trustee
of the Aspen Institute, the California Institute of Technology, Freedom House, the Martin Luther King Center for Social Change, the Los Angeles Philharmonic
and the National Symphony Orchestra. Dr. Harman was
the co-author with Daniel Yankelovich of “Starting With
the People” (1988), an analysis of national policies through
a prism of public values. He also wrote an autobiography,
Mind Your Own Business: A Maverick’s Guide to Business
Leadership and Life (2003). A truly amaz-
ing life. He will be missed.
Loudspeaker Components, LLC has
been named a “2011 Wisconsin Company
to Watch” award winner. Loudspeaker
Components LLC, located in Lancaster,
Wisc., was one of 33 out of 120 appli-
cant companies from throughout the state
of Wisconsin selected for this honor.
Companies to Watch (CTW) is a unique
award program developed by the Edward
Lowe Foundation to honor second-stage
companies that demonstrate high perfor-
mance in the marketplace, exhibit inno-
vative products or processes, or otherwise make those
companies “worth watching.”
Recognizing that many second-stage companies fly
under the radar screen of typical awards programs,
Companies to Watch is specifically designed to seek out
businesses from a wide range of industries representing all
areas of the state, not just in the major metropolitan areas.
In addition to being evaluated on past growth and pro-
jected success, applicants are also judged according to their
special strengths. These special strengths revolve around
a company’s innovative products and business practices,
special use of technology, work within their community,
and more. For more information on companies to watch,
see EdwardLowe.org.
Loudspeaker Components, LLC is the most diversi-
fied US manufacturer of “soft part” speaker components.
Loudspeaker Components, LLC exports to many countries
throughout the world. Depending on the application of the
speaker, components are manufactured with paper, plastic,
foam, cloth, rubber, aluminum, and other materials made
with molds produced in-house.
Owners Neil Kirschbaum of Glen Haven, Wisc., and
Brian Haas of Hazel Green, Wisc., also recently announced
the acquisition of NuWay Speaker (www.nuway-speaker.
com). NuWay Speaker has been in the business of making
speaker components for all segments of the loudspeaker
industry since 1953 in the US and Nogales, Mexico. The
NuWay acquisition increased the capabilities of speaker
component production using the latest technology in the
industry.
A division of Loudspeaker Components, LLC, Stratos Machine is composed of precision lathe turning, milling,
grinding, and wire EDM. Stratos Machine is known for
making difficult parts in small-to-large volume, which
other companies are not willing or able to produce. For
more information about Stratos Machine, visit http://www.
stratosmachine.com or call 608-723-2120. For more infor-
mation about Loudspeaker Components, LLC, contact
their office in Lancaster WI at 608-723-2127, or visit www.
loudspeakercomponents.com.
In a conference call for investors in the month of
April, Nortek, Inc. (www.nortek-inc.com) announced
the financial results for their 2010 fiscal fourth quarter
and for the full year. Saying they were “pleased” with the
PHOTO 2: Sidney Harman.
JUNE 2011 29
company’s financial results in 2010, Chairman, President,
and Chief Executive Officer Richard Bready noted that
overall sales growth of 5% was especially noteworthy
when you consider that “the majority of the markets we
serve remain challenging.”
Nortek is a diversified manufacturer of a broad range of
products such as residential and commercial ventilation,
HVAC, and technology products. The company owns a
large stable of brands in their TECH division including
well-known stalwarts such as Niles, Elan, SpeakerCraft, Proficient Audio Systems, Xantech, Gefen, Linear, OmniMount, and more. Nortek acquired two new
brands during 2010 including Skycam, LLC in July
and Ergotron, Inc. in December. Skycam is an online
dealer of security cameras and digital video recorders
sold under the brand Luxor. Ergotron makes and sells
mounting and mobility products for computer monitors,
notebooks, and flat panel displays under the Ergotron
brand name.
Most of the company’s product offerings are designed
for residential and commercial installations. Even the
company’s TECH division offerings are, for the most
part, custom integration-oriented products designed to be
installed by professional custom installers. At first blush,
the financial results looked pretty good. For the fourth
quarter, the company reported net sales increased 7.9%
from last year’s $429 million to $463 million this year. And
operating income was $12.6 million as compared to a loss
from operations last year of $31.2 million. However, last
year’s operations were impacted by a write-off of $34 mil-
lion for goodwill impairment and $15.1 million in restruc-
turing charges. And for Nortek’s entire 2010 fiscal year, the
company reported sales of $1.9 billion—an increase of 5%
over 2009’s sales of 1.8 billion.
Operating income for the year came in at $70.6 million
as compared with 2009’s operating loss of $204.6 million.
As in the quarter, in fiscal 2009 the company took a charge
of $284 million for goodwill impairment and a reorganiza-
tion charge of $22.5 million. However, the company clearly
continues to struggle with a variety of challenges as it posted
a net loss of $10 million for the fourth quarter and $13.4
million for the year. Goodwill write-downs to correct for
over-valued acquisitions heavily impacted Nortek’s 2009
business, and results were probably saved by their late-year
bankruptcy reorganization which unloaded their financials
of a lot of debt.
In 2010, the company launched a series of cost-cutting
moves in all of their divisions, including a major consolida-
tion in the TECH division to try and adjust cost structures
to new lower sales levels in the difficult economic environ-
ment. Cost-cutting, consolidation, and efficiency continue
to be the company’s watchwords. Nortek’s TECH division
delivered a sales increase of $62.8 million or 15.7% in 2010
as compared to the previous year. However, that increase
was largely due to the addition of one large, unidentified
security customer which single-handedly accounted for
$52.1 million of the $62.8 million increase. The TECH
division’s sales also benefited from “the effects of an acqui-
sition” which added another $4.2 million in sales for the
period. So clearly, the TECH division did not benefit from
a strong growth rate in 2010 as the division added only $6.5
million or an anemic 1% of the division’s $465.6 million in
sales organically.
The True North Project (TNP), a non-profit coali-
tion of 12-volt retailers, distributors, and manufacturers,
announced it has launched a website. The site, www.
truenorthproject.com, was created to provide info to
TNP members and those interested in joining the group
(there is no fee to join). Info includes tips for promoting
a 12-volt specialty retail business, and there is a space
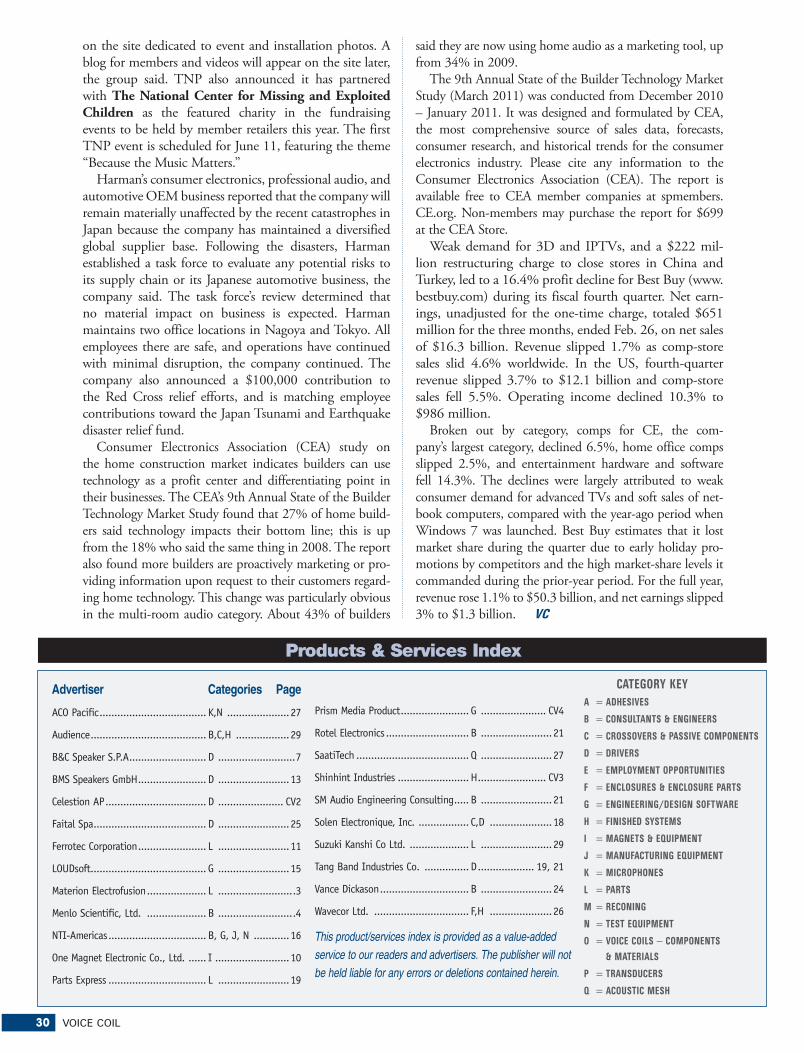
30 VOICE COIL
on the site dedicated to event and installation photos. A
blog for members and videos will appear on the site later,
the group said. TNP also announced it has partnered
with The National Center for Missing and Exploited Children as the featured charity in the fundraising
events to be held by member retailers this year. The first
TNP event is scheduled for June 11, featuring the theme
“Because the Music Matters.”
Harman’s consumer electronics, professional audio, and
automotive OEM business reported that the company will
remain materially unaffected by the recent catastrophes in
Japan because the company has maintained a diversified
global supplier base. Following the disasters, Harman
established a task force to evaluate any potential risks to
its supply chain or its Japanese automotive business, the
company said. The task force’s review determined that
no material impact on business is expected. Harman
maintains two office locations in Nagoya and Tokyo. All
employees there are safe, and operations have continued
with minimal disruption, the company continued. The
company also announced a $100,000 contribution to
the Red Cross relief efforts, and is matching employee
contributions toward the Japan Tsunami and Earthquake
disaster relief fund.
Consumer Electronics Association (CEA) study on
the home construction market indicates builders can use
technology as a profit center and differentiating point in
their businesses. The CEA’s 9th Annual State of the Builder
Technology Market Study found that 27% of home build-
ers said technology impacts their bottom line; this is up
from the 18% who said the same thing in 2008. The report
also found more builders are proactively marketing or pro-
viding information upon request to their customers regard-
ing home technology. This change was particularly obvious
in the multi-room audio category. About 43% of builders
said they are now using home audio as a marketing tool, up
from 34% in 2009.
The 9th Annual State of the Builder Technology Market
Study (March 2011) was conducted from December 2010
– January 2011. It was designed and formulated by CEA,
the most comprehensive source of sales data, forecasts,
consumer research, and historical trends for the consumer
electronics industry. Please cite any information to the
Consumer Electronics Association (CEA). The report is
available free to CEA member companies at spmembers.
CE.org. Non-members may purchase the report for $699
at the CEA Store.
Weak demand for 3D and IPTVs, and a $222 mil-
lion restructuring charge to close stores in China and
Turkey, led to a 16.4% profit decline for Best Buy (www.
bestbuy.com) during its fiscal fourth quarter. Net earn-
ings, unadjusted for the one-time charge, totaled $651
million for the three months, ended Feb. 26, on net sales
of $16.3 billion. Revenue slipped 1.7% as comp-store
sales slid 4.6% worldwide. In the US, fourth-quarter
revenue slipped 3.7% to $12.1 billion and comp-store
sales fell 5.5%. Operating income declined 10.3% to
$986 million.
Broken out by category, comps for CE, the com-
pany’s largest category, declined 6.5%, home office comps
slipped 2.5%, and entertainment hardware and software
fell 14.3%. The declines were largely attributed to weak
consumer demand for advanced TVs and soft sales of net-
book computers, compared with the year-ago period when
Windows 7 was launched. Best Buy estimates that it lost
market share during the quarter due to early holiday pro-
motions by competitors and the high market-share levels it
commanded during the prior-year period. For the full year,
revenue rose 1.1% to $50.3 billion, and net earnings slipped
3% to $1.3 billion. VC
CATEGORY KEY
A = ADHESIVES
B = CONSULTANTS & ENGINEERS
C = CROSSOVERS & PASSIVE COMPONENTS
D = DRIVERS
E = EMPLOYMENT OPPORTUNITIES
F = ENCLOSURES & ENCLOSURE PARTS
G = ENGINEERING/DESIGN SOFTWARE
H = FINISHED SYSTEMS
I = MAGNETS & EQUIPMENT
J = MANUFACTURING EQUIPMENT
K = MICROPHONES
L = PARTS
M = RECONING
N = TEST EQUIPMENT
O = VOICE COILS − COMPONENTS
& MATERIALS
P = TRANSDUCERS
Q = ACOUSTIC MESH
Products & Services Index
Advertiser Categories Page
ACO Pacific .................................... K,N .....................27
Audience ....................................... B,C,H ..................29
B&C Speaker S.P.A .......................... D ..........................7
BMS Speakers GmbH ....................... D ........................13
Celestion AP .................................. D ...................... CV2
Faital Spa ...................................... D ........................25
Ferrotec Corporation ....................... L ........................11
LOUDsoft ....................................... G ........................15
Materion Electrofusion .................... L ..........................3
Menlo Scientific, Ltd. .................... B ..........................4
NTI-Americas ................................. B, G, J, N ............16
One Magnet Electronic Co., Ltd. ...... I .........................10
Parts Express ................................. L ........................19
Prism Media Product ....................... G ...................... CV4
Rotel Electronics ............................ B ........................21
SaatiTech ...................................... Q ........................27
Shinhint Industries ........................ H ....................... CV3
SM Audio Engineering Consulting ..... B ........................21
Solen Electronique, Inc. ................. C,D .....................18
Suzuki Kanshi Co Ltd. .................... L ........................29
Tang Band Industries Co. ............... D ................... 19, 21
Vance Dickason .............................. B ........................24
Wavecor Ltd. ................................ F,H .....................26
This product/services index is provided as a value-added service to our readers and advertisers. The publisher will not be held liable for any errors or deletions contained herein.

JUNE 2011 31JUJUJUJUUJUJUJUJUUUJUUJUUUUUUJUUUJUJUUUUUUUUUUJJJUJUUUUUUUUUUUUUUUUUUJUUUUUJUUUJUUUUUUUUUJUJJJUJUUUUUUJUUUUUUUUUUUUUUUUUUUUUUUUUUUUUUUUUUUUUUUUJUUUUUUUUUUJJJUJUUUUUJJJJJJUJUJUUUUUUUUUUJUJUJJJUUUUUUJUJJJJJUUUUUUJJJJJJUUUUUUJUJJUUUUUUUUNENENENENENENNEENENENENENNNNNEEENEENENENENNNEEEENNNNNNNNNNENNENNNEENEEEEEEENNNNNNENENENNNENNNEEEEENENEEEENENENEENNENNNNNNENENNEENENEEEENEENENENNNNNNNENEEEEEEEENENNNNNNNNENNEENEEEEENEENNNNNNNENEEENENNNNENNNNEEEENENENNNNEEEENENNNNNNENNNNEEEEEEENENNNENENENNEEEEENNNNNNNNNNEEENENNNNNNEENEEEENNNNNNNNNNEEEEENNNNNNNEEEEENNNNNNNNNEEEEEEEEE 2222222222 2 2222222222222222222222222222222222222222222222222222 2222222222222222222222222222222222222222222222222222222222222222222 222220101010101001010101010101001010100100000100110101000100011101000001010000111110000000001001011011010000100000000110110110100000000110111000010000111000001000000000110000010100000000001000100010000001111111111111111111111111111111111111111111111111111111111111111111111111111111 31
32 VOICE COIL
...integrated
electronic test, acoustic test...
Prism Sound is now a globalsales & support agent for:
������������������� �������� ������������������������������������ ���������������������������������������������������������� ����������������
��������������������� ���������� ������������ ���������������������
������������������� !�����������������������������������������������������"������ ���������� �����#�������������������$�����%dScope Series III
analog and digitalaudio analyzers
������������������� ��������������������������������������������� �!"#�����$ ����
Loudspeaker design and analysis solutions

V O L U M E 2 4 , I S S U E 9 J U L Y 2 0 1 1
®
IN THIS ISSUEINDUSTRY NEWS AND DEVELOPMENTS
1
TEST BENCH14B&C Pro Sound Compression Drivers and HornsBy Vance Dickason
SPOTLIGHT8Phase Response and Receive DelayBy Charlie Hughes
SPOTLIGHT20ALMA at Prolight+Sound 2011By Mike Klasco
SPOTLIGHT12eMagine Factory Industrial/Mechanical Design ConsultantsBy Vance Dickason
Industry News and DevelopmentsBy Vance Dickason
New Measurement Microphone from ACO PacificACO Pacific has recently released the 7052PH Type 1.5 phantom-powered measurement microphone sys-tem (Photo 1). Designed to work with from 48 to 18V DC Phantom Power, the 7052PH’s rugged titanium diaphragm provides excellent long-term stability and temperature performance, according to the company. The companion 4048 ACOtron preamp offers both low noise and a wide dynamic range. A WS1 3 windscreen is included.
Specifications for the 7052PH and 4048 ACOtron pre-
amp are as follows:
7052PH 1/2 Electret Free-Field Microphone
Type 1.5—a superior Type 2
Frequency response: <3Hz to >20kHz typical (capsule)
Sensitivity: 22mV/Pa (-33dBV/Pa) typical
Dynamic range (capsule) 1% THD: <20dBA-
150dBSPL (capsule)
Diaphragm material: titanium
TempCo: 0.01dB/C
Mounting Thread:
11.7mm 60UNS2
4048 ACOtron 1/2
Phantom Preamp
Frequency response
at 22pF: 5Hz to 200kHz
(-2dB)
Loss at 22pF: 1.5dB
typical
Noise floor at 22pF:
<1.5 V typical about
16dBA with 7052H
Output performance
48 to 24V Phantom:
1kHz - 14Vp-p (5V
RMS) into a 5000pF load
<1%THD
Power supply sensitivity: <0.1dB
Mike mounting thread: 11.7mm 60UNS2
Power/output connector: XLR 3 pin -male
For more information on the 7025PH and 4048 pre-
amp, visit www.acopacific.com.
30 Products & Services Index
ACOUSTIC PATENTS21By James Croft
INDUSTRY WATCH24By Vance Dickason
PHOTO 1: ACO Pacific 7052Ph.
eMagine this speaker
design, p. 12.g , p
dex
Coming soon from KEF:
the Blade speakers, p. 24.

4 VOICE COIL
New Pedal Steel Guitar Speaker from EminenceEminence Speaker LLC has announced the addition of an ultra-lightweight 15 guitar speaker designed for the steel guitar player: the EPS-15C (Photos 2 and 3). Now avail-able in the Patriot Series of guitar speakers, the EPS-15C is a 4 cast-aluminum frame guitar driver featuring a light-weight neodymium magnet. Weighing in at less than 8 lbs., the EPS-15C (Fig. 1) delivers the highly sought-after classic pedal steel tones at a fraction of the weight of most suitable drivers on the market, according to the company. The addi-tion of an aluminum dust cap lends “chimey,” extended highs that have come to define the classic pedal steel sound. Specifications for this new driver are as follows:
Fs 42Hz
Re 3.57
Qms 14.41
Qes 0.32
Qts 0.31
Vas 188.4 ltr
Mms 79.9 grams
Sd 864.6cm2
Bl 15.3Tm
Xmax 3.3mm
For more on this new driver from Eminence, and to take
a look at Eminence’s new website, go to www.eminence.com.
NTi Audio Launches FLEXUS Audio AnalyzerNTi Audio AG has recently unveiled its new FLEXUS Audio Analyzer (Photos 4 and 5), which features a modu-lar concept with flexible configurations. High-performance
PHOTO 2: Eminence EPS-15C back. PHOTO 3: Eminence EPS-15C front.FIGURE 1: Eminence EPS-15C response graph.
Liaison Between Materials,
Suppliers, & Audio Manufacturers
Technical Support for Headset,
Mic, Speaker & Manufacturers
Product Development
Sourcing Guidance
Test & Measurement
Instrumentation
MENLO
S C I E N T I F I C
Engineering Consulting
for the Audio Community
USA tel
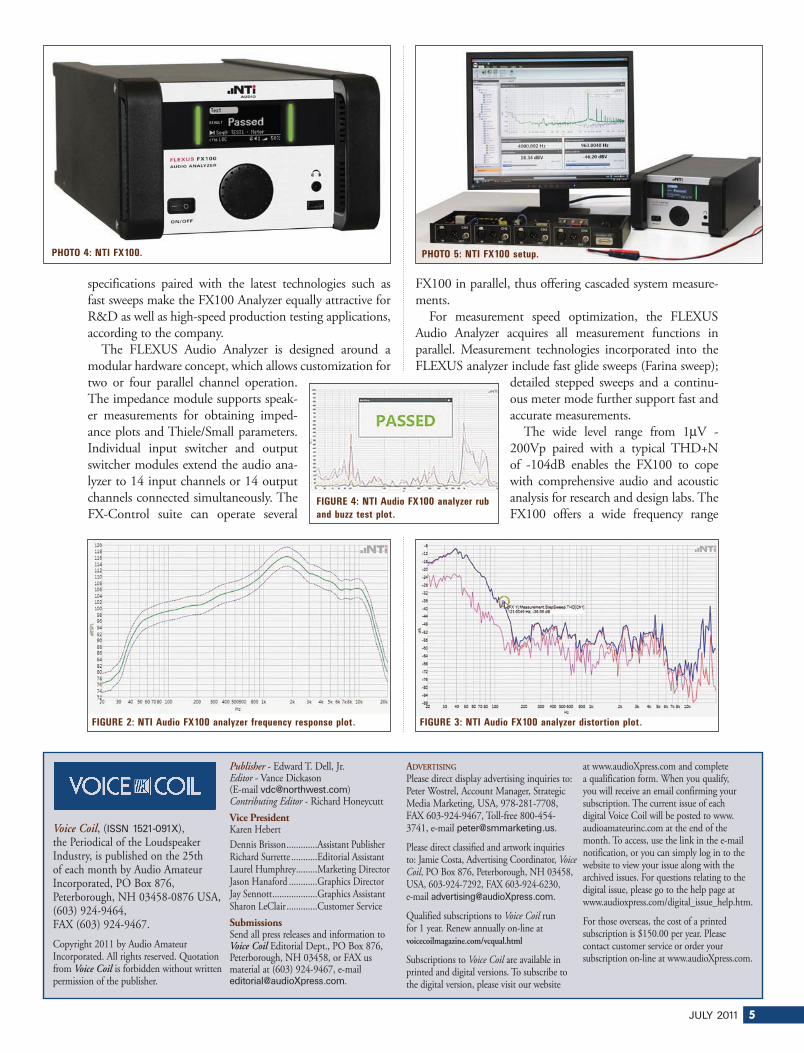
JULY 2011 5
specifications paired with the latest technologies such as fast sweeps make the FX100 Analyzer equally attractive for R&D as well as high-speed production testing applications, according to the company.
The FLEXUS Audio Analyzer is designed around a
modular hardware concept, which allows customization for
two or four parallel channel operation.
The impedance module supports speak-
er measurements for obtaining imped-
ance plots and Thiele/Small parameters.
Individual input switcher and output
switcher modules extend the audio ana-
lyzer to 14 input channels or 14 output
channels connected simultaneously. The
FX-Control suite can operate several
FX100 in parallel, thus offering cascaded system measure-
ments.
For measurement speed optimization, the FLEXUS
Audio Analyzer acquires all measurement functions in
parallel. Measurement technologies incorporated into the
FLEXUS analyzer include fast glide sweeps (Farina sweep);
detailed stepped sweeps and a continu-
ous meter mode further support fast and
accurate measurements.
The wide level range from 1 V -
200Vp paired with a typical THD+N
of -104dB enables the FX100 to cope
with comprehensive audio and acoustic
analysis for research and design labs. The
FX100 offers a wide frequency range
Voice Coil, (ISSN 1521-091X), the Periodical of the Loudspeaker Industry, is published on the 25th of each month by Audio Amateur Incorporated, PO Box 876, Peterborough, NH 03458-0876 USA, (603) 924-9464, FAX (603) 924-9467.
Copyright 2011 by Audio Amateur Incorporated. All rights reserved. Quotation from Voice Coil is forbidden without written permission of the publisher.
Publisher - Edward T. Dell, Jr.Editor - Vance Dickason (E-mail [email protected])Contributing Editor - Richard Honeycutt
Vice PresidentKaren Hebert
Dennis Brisson .............Assistant PublisherRichard Surrette ...........Editorial AssistantLaurel Humphrey.........Marketing DirectorJason Hanaford ............Graphics DirectorJay Sennott ...................Graphics AssistantSharon LeClair .............Customer Service
SubmissionsSend all press releases and information to Voice Coil Editorial Dept., PO Box 876, Peterborough, NH 03458, or FAX us material at (603) 924-9467, e-mail [email protected].
ADVERTISING
Please direct display advertising inquiries to: Peter Wostrel, Account Manager, Strategic Media Marketing, USA, 978-281-7708, FAX 603-924-9467, Toll-free 800-454-3741, e-mail [email protected].
Please direct classified and artwork inquiries to: Jamie Costa, Advertising Coordinator, Voice Coil, PO Box 876, Peterborough, NH 03458, USA, 603-924-7292, FAX 603-924-6230, e-mail [email protected].
Qualified subscriptions to Voice Coil run for 1 year. Renew annually on-line at voicecoilmagazine.com/vcqual.html
Subscriptions to Voice Coil are available in printed and digital versions. To subscribe to the digital version, please visit our website
at www.audioXpress.com and complete a qualification form. When you qualify, you will receive an email confirming your subscription. The current issue of each digital Voice Coil will be posted to www.audioamateurinc.com at the end of the month. To access, use the link in the e-mail notification, or you can simply log in to the website to view your issue along with the archived issues. For questions relating to the digital issue, please go to the help page at www.audioxpress.com/digital_issue_help.htm.
For those overseas, the cost of a printed subscription is $150.00 per year. Please contact customer service or order your subscription on-line at www.audioXpress.com.
FIGURE 4: NTI Audio FX100 analyzer rub
and buzz test plot.
PHOTO 4: NTI FX100. PHOTO 5: NTI FX100 setup.
FIGURE 2: NTI Audio FX100 analyzer frequency response plot. FIGURE 3: NTI Audio FX100 analyzer distortion plot.

6 VOICE COIL
from 5Hz up to 80kHz and simultaneous measurement
of the DC voltage. This, of course, includes frequency
response graphs (Fig. 2), distortion graphs (Fig. 3), and
rub and buzz measurements (Fig. 4).
The high-resolution FFT with 192kHz sampling rate
presents a detailed analysis of the audio frequency spectrum.
FFT graph panels may be customized showing one or more
traces in the same panel simultaneously. Detailed R&D
measurements are supported with Frequency, Amplitude,
Time, and Table Sweeps, which may trigger with internal
or external signals.
The FX100 includes the FX-Control Suite software,
which provides straightforward access to all audio ana-
lyzer features. The flexible architecture supports the intui-
tive setup of single, parallel, or sequential measurement.
Individual configuration and result panels may be displayed
on various worksheets. Individual measurements may be
combined with test sequences, including tolerance han-
dling and Pass/Fail result, producing an easy operator test
flow. The software utilizes the advantages of state-of-the-art
ribbon architecture for today’s and future measurement
applications.
The FX-Control Suite software supports all .NET pro-
gramming languages, such as C#.NET and Visual Basic.
NET. This implies fast and easy integration into custom-
ized production solutions. Furthermore, FX-Control can be
configured to illustrate the external hardware wiring. This
ensures fast setup by sending the project configuration to
remote production lines.
Specifications for the FLEXUS analyzer are as follows:
Analog GeneratorTest Signals Sine, StepSweep, GlideSweep, White NoiseLevel Range 10 V to 12.45V (-100dBV to 21.9dBV)Level Accuracy 0.05dBLevel Flatness < 0.01dB (10Hz to 20kHz) Frequency Range 5Hz to 80kHz -104dB at 1kHz, 0 dBV (typical)THD+N -101dB + 1.3 V (20Hz to 20kHz fundamental, Lowpass 22kHz)
Analog AnalyzerMeasurement Level (selective and wideband)Functions Frequency FFT Gain THD THD+N Harmonics k2-k35 Crosstalk Polarity Phase DC-Level DC-Impedance optional: PureSound™ Rub&Buzz Sweeps Frequency Sweep, Time Sweep, Level Sweep, Table SweepSpeed Frequency response down to 200ms from 20Hz to 20kHz (GlideSweep)
Level Range <1.0 V to 141V (maximum 200 Vp), channel independent auto rangingLevel Accuracy 0.1dB at 1kHzLevel Flatness < 0.02dB (20Hz to 20kHz)Frequency Range DC, 5Hz to 80kHzTHD+N -104dB + 1.5 V (20Hz to 20kHz fundamental, LP 22kHz) -104dB at 1kHz, 0 dBV (typical)Residual Noise 1.5 V (20Hz to 20kHz bandwidth)Filters A-Weighting, C-Weighting, AES17 Brickwall Highpass 22Hz, Highpass 400Hz, Lowpass 22kHzCrosstalk –120dB + 1 V to 20kHzInput Bias Supply 2V DC, 48V DC Phantom Power, ICP®Input Coupling AC or DC
GeneralChannels two or four Parallel Independent Inputs/Outputs Analog XLR and BNC connectors
Extension Slots three empty slots at Base Unit FX100 for modular extensionsInterfaces USB 2.0 Communication to PC Headphone connector for audio out, 1/4 Jack Stereo LAN (prepared for later firmware extension)Pass/Fail Result Built in DIO-Interface controls external peripherals Dual color display with green/red indicationFX-Control Suite PC Software with full access to all audio analyzer features Parallel measurements with internal/external triggering Calculation panels for mathematical processing of measurement data Result reporting: txt-files, csv-files, or xlsx- files Full tolerance handling and hardware wiring diagramProgramming Supports .NET Assembly (e.g. C#.NET, Visual Basic.NET)Design Desktop use or ½ size 19 rack mountingMains Power 100 - 230V AC/50 - 60HzCalibration interval 1 year recommendedDimensions 215 132 420mm (8.5 W 5.2 H 16.5 D), three rack units highWeight Base unit 5.4 kg, 11.4 lbsOperating Temp. +5 C to +45 C (+40 F to +110 F)Relative Humidity < 90% non condensingFor more, visit the NTI Audio website www.nti-audio.com.
2011-2012 AES CandidatesIn accordance with the AES bylaws, the Nominations Committee hereby notifies all voting members of the Audio Engineering Society that the following slate of candidates has been nominated by the Committee:
-President-Elect
Andres Mayo
Frank Wells
-Vice President Central Region, US & Canada
Michael Fleming
Jason Corey
-Vice President Central Region, Europe
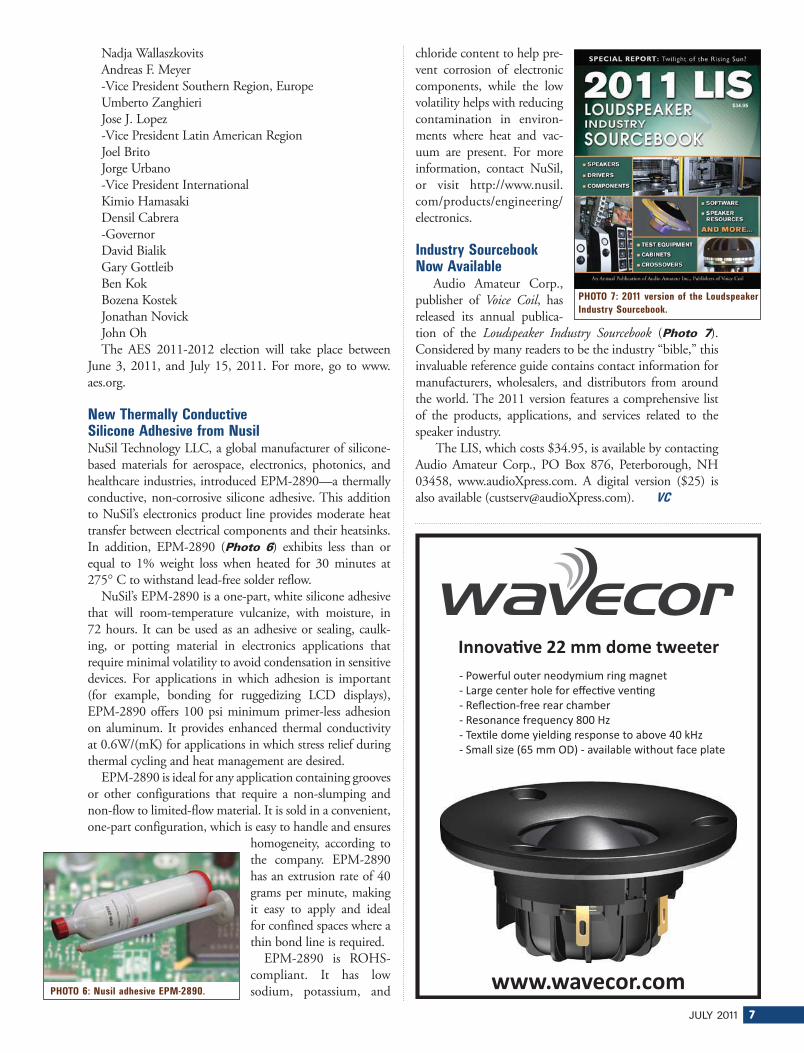
JULY 2011 7
Nadja Wallaszkovits
Andreas F. Meyer
-Vice President Southern Region, Europe
Umberto Zanghieri
Jose J. Lopez
-Vice President Latin American Region
Joel Brito
Jorge Urbano
-Vice President International
Kimio Hamasaki
Densil Cabrera
-Governor
David Bialik
Gary Gottleib
Ben Kok
Bozena Kostek
Jonathan Novick
John Oh
The AES 2011-2012 election will take place between
June 3, 2011, and July 15, 2011. For more, go to www.
aes.org.
New Thermally Conductive Silicone Adhesive from NusilNuSil Technology LLC, a global manufacturer of silicone-based materials for aerospace, electronics, photonics, and healthcare industries, introduced EPM-2890—a thermally conductive, non-corrosive silicone adhesive. This addition to NuSil’s electronics product line provides moderate heat transfer between electrical components and their heatsinks. In addition, EPM-2890 (Photo 6) exhibits less than or equal to 1% weight loss when heated for 30 minutes at 275 C to withstand lead-free solder reflow.
NuSil’s EPM-2890 is a one-part, white silicone adhesive
that will room-temperature vulcanize, with moisture, in
72 hours. It can be used as an adhesive or sealing, caulk-
ing, or potting material in electronics applications that
require minimal volatility to avoid condensation in sensitive
devices. For applications in which adhesion is important
(for example, bonding for ruggedizing LCD displays),
EPM-2890 offers 100 psi minimum primer-less adhesion
on aluminum. It provides enhanced thermal conductivity
at 0.6W/(mK) for applications in which stress relief during
thermal cycling and heat management are desired.
EPM-2890 is ideal for any application containing grooves
or other configurations that require a non-slumping and
non-flow to limited-flow material. It is sold in a convenient,
one-part configuration, which is easy to handle and ensures
homogeneity, according to
the company. EPM-2890
has an extrusion rate of 40
grams per minute, making
it easy to apply and ideal
for confined spaces where a
thin bond line is required.
EPM-2890 is ROHS-
compliant. It has low
sodium, potassium, and
chloride content to help pre-
vent corrosion of electronic
components, while the low
volatility helps with reducing
contamination in environ-
ments where heat and vac-
uum are present. For more
information, contact NuSil,
or visit http://www.nusil.
com/products/engineering/
electronics.
Industry Sourcebook Now Available Audio Amateur Corp., publisher of Voice Coil, has released its annual publica-tion of the Loudspeaker Industry Sourcebook (Photo 7). Considered by many readers to be the industry “bible,” this invaluable reference guide contains contact information for manufacturers, wholesalers, and distributors from around the world. The 2011 version features a comprehensive list of the products, applications, and services related to the speaker industry.
The LIS, which costs $34.95, is available by contacting
Audio Amateur Corp., PO Box 876, Peterborough, NH
03458, www.audioXpress.com. A digital version ($25) is
also available ([email protected]). VC
PHOTO 6: Nusil adhesive EPM-2890.
PHOTO 7: 2011 version of the Loudspeaker
Industry Sourcebook.
������ ��!!�������"�����
"""#"������#���
�������������� ���������� ����� ������������ ���������������������� � ���������� ������������������������ � ������� ���� �!"��#�$��������������� �����%� ������������& �'!"��(�������"��)*+����,-.������������������������%����
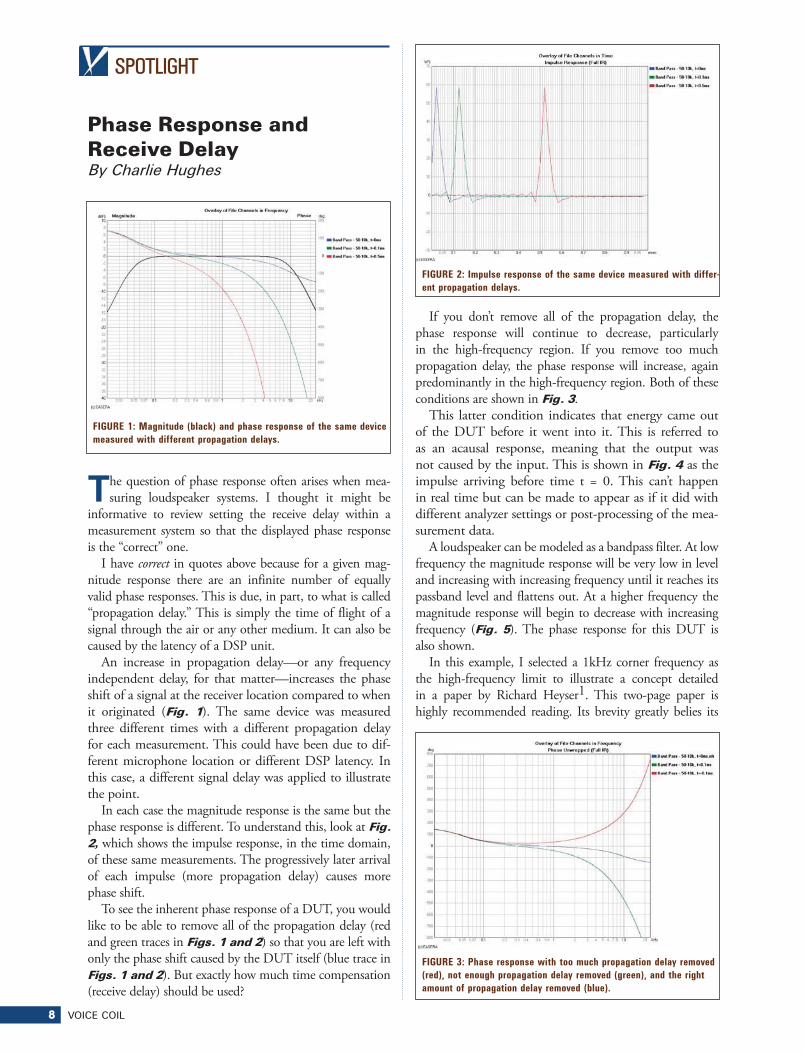
8 VOICE COIL
SPOTLIGHT
Phase Response and Receive DelayBy Charlie Hughes
�he question of phase response often arises when mea-
suring loudspeaker systems. I thought it might be
informative to review setting the receive delay within a
measurement system so that the displayed phase response
is the “correct” one.
I have correct in quotes above because for a given mag-
nitude response there are an infinite number of equally
valid phase responses. This is due, in part, to what is called
“propagation delay.” This is simply the time of flight of a
signal through the air or any other medium. It can also be
caused by the latency of a DSP unit.
An increase in propagation delay—or any frequency
independent delay, for that matter—increases the phase
shift of a signal at the receiver location compared to when
it originated (Fig. 1). The same device was measured
three different times with a different propagation delay
for each measurement. This could have been due to dif-
ferent microphone location or different DSP latency. In
this case, a different signal delay was applied to illustrate
the point.
In each case the magnitude response is the same but the
phase response is different. To understand this, look at Fig. 2, which shows the impulse response, in the time domain,
of these same measurements. The progressively later arrival
of each impulse (more propagation delay) causes more
phase shift.
To see the inherent phase response of a DUT, you would
like to be able to remove all of the propagation delay (red
and green traces in Figs. 1 and 2) so that you are left with
only the phase shift caused by the DUT itself (blue trace in
Figs. 1 and 2). But exactly how much time compensation
(receive delay) should be used?
If you don’t remove all of the propagation delay, the
phase response will continue to decrease, particularly
in the high-frequency region. If you remove too much
propagation delay, the phase response will increase, again
predominantly in the high-frequency region. Both of these
conditions are shown in Fig. 3.
This latter condition indicates that energy came out
of the DUT before it went into it. This is referred to
as an acausal response, meaning that the output was
not caused by the input. This is shown in Fig. 4 as the
impulse arriving before time t = 0. This can’t happen
in real time but can be made to appear as if it did with
different analyzer settings or post-processing of the mea-
surement data.
A loudspeaker can be modeled as a bandpass filter. At low
frequency the magnitude response will be very low in level
and increasing with increasing frequency until it reaches its
passband level and flattens out. At a higher frequency the
magnitude response will begin to decrease with increasing
frequency (Fig. 5). The phase response for this DUT is
also shown.
In this example, I selected a 1kHz corner frequency as
the high-frequency limit to illustrate a concept detailed
in a paper by Richard Heyser1. This two-page paper is
highly recommended reading. Its brevity greatly belies its
FIGURE 1: Magnitude (black) and phase response of the same device
measured with different propagation delays.
FIGURE 2: Impulse response of the same device measured with differ-
ent propagation delays.
FIGURE 3: Phase response with too much propagation delay removed
(red), not enough propagation delay removed (green), and the right
amount of propagation delay removed (blue).
JULY 2011 9
substance.
Heyser stated that “If the value of time delay in the
measuring medium is to be subtracted in the measure-
ment process, as can be done for impulse, cross spectrum
and TDS measurements, then the proper value of time
delay has been subtracted, and the true acoustic position
for the phase measurement has been obtained, when the
plot of phase angle versus frequency approaches a flat
horizontal line for frequencies well outside the pass band
of the DUT.” In other words, you have removed the cor-
rect propagation delay when the phase response in the
frequency region well above the cutoff frequency of the
DUT approaches a horizontal line. This is exactly what is
beginning to occur in Fig. 5 at approximately 8kHz and
higher. The phase response is asymptotically approaching
a horizontal line.
Notice also that in the higher-frequency region of the
passband and just beyond (500 – 2,000Hz) the phase
response is not flat. It is erroneous—albeit possible—to set
a receive delay to yield a nearly horizontal phase response in
this frequency region. This is a very common error and one
that I formerly perpetrated with some regularity.
Now that you know what to look for in the phase
response, how do you achieve it? You can look at Figs.
2 or 4 and conclude that the correct receive delay to
apply is some time between the initial perturbation of
the impulse response from a magnitude of 0 (or out
of the noise floor) and its maximum value. You could
iteratively try each incremental data point (sample) of
the IR and look at the phase to see whether you had it
right. This may become quite time consuming, however.
Alternatively, you can use group delay to help deter-
mine the correct receive delay. Group delay is defined
as the negative rate of change of phase with respect to
frequency.
g = -d /d
In this equation the Greek letter omega ( ) denotes angular frequency which is simply 2 times frequency. The Greek letters tau ( ) and phi ( ) denote group delay and phase, respectively. This is just a mathematical way of saying that the negative slope of the phase response gives the group delay response. This means that if the slope of the phase response is constant—i.e., a straight line—over a range of frequencies, then the group delay has a constant value over that same range of frequencies.
In real time the phase response always slopes down
with increasing frequency. This means the slope is
negative. If this actual slope is used as the group delay,
it implies that group delay is negative; that is, the signal
arrives at the mike/listener at some negative time (prior to
FIGURE 4: Impulse response with too much propagation delay
removed (red), not enough propagation delay removed (green), and the
right amount of propagation delay removed (blue).
FIGURE 5: Magnitude and phase response of a loudspeaker with
100Hz – 1kHz passband.

10 VOICE COIL
when it left the loudspeaker). Because this can’t happen in
real time, you negate the slope (multiply it by -1) of the
phase response to get group delay. A negative slope times
-1 will always yield a positive group delay (the signal
arrives at the mike/listener at some time after it left the
loudspeaker).
To see the constant slope of the phase response you
must view it on a linear frequency scale. When viewed
on the more common logarithmic frequency scale, the
phase response appears to curve down more in the high-
frequency region. This is simply a result of viewing phase
on a log frequency scale. The phase response curves of
Fig. 1 are shown on a linear frequency scale in Fig. 6.Here you see that progressively greater propagation delay
results in a straight line (in the high-frequency region)
with progressively greater downward slope (compare Fig. 6 with Fig. 2).
The group delay for these phase responses is shown in
Fig. 7. The group delay in the very high-frequency region
of each of these curves approaches the actual propagation
delay for each measurement.
The example in Fig. 5 has a much lower cutoff fre-
quency (high-frequency limit) than the example in Fig. 1. Because it has less high-frequency output and more
phase shift as seen in the frequency domain, the impulse
FIGURE 6: Magnitude (black) and phase response of the same device measured
with different propagation delays (from Fig. 1) shown on a linear frequency scale.
FIGURE 7: Group delay for the phase response graphs in Figs. 1 and 6.
FIGURE 8: Impulse response of device from Fig. 5 with added propa-
gation delay.
FIGURE 9: Group delay of device from Fig. 5 with added propagation delay.
Pedal Steel Players,Chime in.
www.eminence.com
Now available in the Patriot™ Series of guitar speakers, the 15” cast-aluminum frame EPS-15C
delivers the highly sought after classic pedal steel tones at a fraction of the weight of most suitable
drivers on the market. Learn more at www.eminence.com

JULY 2011 11
response (or the ETC) in the time domain will have a
longer rise time. This makes it more difficult to deter-
mine its true propagation delay from these time domain
graphs. The cursor in Fig. 8 shows the peak arrival at
13.9ms. However, the cursor at 8kHz on the group delay
response shown in Fig. 9 indicates the propagation delay
to be 13.71ms. This is the true propagation delay for this
measurement.
If you had used 13.9ms as the receive delay, you would
have removed 190 s (microseconds) more than the actual
propagation time. This would have resulted in the phase
response turning up and increasing with increasing frequen-
cy. This is shown in Fig. 10 along with the phase response
using a 13.71ms receive delay. Comparing this to Fig. 5
should be convincing.
You have seen that the proper receive delay to be used
for removing propagation delay is not the time cor-
responding to the maximum value (peak) of the IR (or
ETC) but typically a bit earlier. You have also seen that
this time can be located fairly accurately by looking at
the group delay. Using these techniques you have also
seen that the phase response of a system with a bandpass
response, typically of loudspeakers, does not have flat
phase response in the high-frequency region of its pass-
band. It is only at higher frequencies, well above its pass-
band, that the inherent phase response of a device begins
to approach a flat, horizontal line. I hope this information
will be useful to those of you making measurements
to determine the correct acoustical position and phase
response of loudspeaker system. VC
REFERENCE1. “Determining the Acoustic Position for Proper
Phase Response of Transducers,” JAES, vol. 32, no.
1/2, pp. 23-25 (Jan/Feb 1984); also in Time Delay
Spectrometry – An Anthology of the Works of Richard C.
Heyser, pp. 182-183.
FIGURE 10: Phase response of the IR in Fig. 8 with 13.9ms (blue)
and 13.71ms (green) receive delay.

12 VOICE COIL
SPOTLIGHT
eMagine FactoryIndustrial/Mechanical Design ConsultantsBy Vance Dickason
eMagineFactory, LLC and its president, Doug Wright,
have been providing award-winning industrial design and
advanced, innovative mechanical engineering services to
the loudspeaker industry for over 20 years. Industry awards
for loudspeaker products that eMagineFactory was all or
partially responsible for include:
Niles Audio, Inc.—OS Series of outdoor loudspeakers
(Photo 1).
1997 Audio Video Intl.’s Hi-Fi Grand Prix Product of
the Year – OS10.
1999 Audio Video Intl.’s Hi-Fi Grand Prix Award –
OS20.
2001 Audio Video Intl.’s Hi-Fi Grand Prix Award –
OS20.
Niles Audio, Inc.—AT series of in-wall loudspeakers.
1998 CES Innovations Design & Engineering Award –
AT8700.
1999 Audio Video International’s Hi-Fi Grand Prix
Award – AT8500.
Niles Audio, Inc.—DS series of in-ceiling loudspeakers.
2002 CES Innovations Design & Engineering Award –
DS6500AT.
2003 Electronic House Magazine Product of the Year –
DS6500AT.
coNEXTion Systems, Inc.—zc series of in-ceiling loud-
speakers.
2005 CES Innovations Design & Engineering Showcase
Award – z600c.
2005 Custom Retailer EXCITE! Award Winner – z600c.
2005 EHX Multi-Room Audio/Video Award Finalist –
z600c.
2005 Tech-Home Mark of Excellence Award Finalist –
z600c.
coNEXTion Systems, Inc.—sonoma series indoor/out-
door loudspeakers.
2004 CEDIA Resi-Award Finalist – sonoma 10.
2006 CES Innovations Design & Engineering Showcase
Award – sonoma 10.
eMagineFactory has also been the recipient of over ten
patents relating to loudspeaker mechanical, acoustic, and
industrial design. Here are some of the more important
patents you are probably familiar with:
Niles Audio Corp.—AT series of in-wall loudspeakers.
Patent #6,026,927: For rotating/angling driver sub-baffle
assembly.
Patent #6,070,694: For low-diffraction eyeball tweeter
assembly.
Niles Audio Corp.—DS series of in-ceiling loudspeakers.
Patent #6,683,963: For spring retained Eyeball Tweeter
and for rotating woofer systems.
coNEXTion Systems, Inc.—zc series of in-ceiling loud-
speakers.
Patent #7,334,767: For tool-less frame fastening system.
Patent #7,121,756 B2 & #7,483,544 B2: For extend-
ing tweeter center post system and for 50 angling tweeter
system.
Patent #7,587,059 B2: For baffle-to-frame attachment
system.
Patent #7,570,778 B2: For angling woofer system.
coNEXTion Systems, Inc.—sonoma series indoor/out-
door loudspeakers.
Patent #D512,047 S. (Design Patent)
eMagineFactory, LLC
Patent #7,784,957 B2: For a combination solid-state
light and loudspeaker system.
In addition to the patents listed above, eMagineFactory
PHOTO 1: OS series outdoor speaker.
PHOTO 2: Wright speaker design for coNEXTion Systems.
JULY 2011 13
also has an impressive portfolio of additional patented or
patent-pending mechanical designs and methods, relating
to the design and installation of in-wall, in-ceiling, and
outdoor loudspeaker products, that are available for licens-
ing and/or outright acquisition. These innovations enable
substantial differentiation and/or revolutionary advance-
ment to a product’s features and capabilities.
eMagineFactory can also provide a wide variety of prod-
uct development consulting services, including:
Product definition assistance/guidance.
Full parametric solid modeling.
High quality photo-realistic rendering.
Design, process, and manufacturing troubleshooting.
eMagineFactory brings to an industry that has largely
capitulated to “been there, done that,” a level of creativ-
ity and experience that is unparalleled. A quick check of
eMagineFactory’s contributions over the past 20 years
loudly testifies that, in contrast, there remain substantial
opportunities to produce offerings that go far beyond the
present generation’s staid, generic, and boring product.
Business is tough. Finding and developing a real, tangible
product edge may mean the difference between surviving
and not surviving.
For more, visit the eMagineFactory’s website www.eMag-
ineFactory.com, or contact Mr. Wright directly at doug@
eMagineFactory.com, 805-583-0505. VC
NTi Audio AG Liechtenstein+423 239 [email protected]
NTI Americas Inc. Portland, Oregon, USA+1 503 684 [email protected]
NTI ChinaSuzhou, Beijing, Shenzhen+86 512 6802 0075 [email protected]
NTI JapanTokyo, Japan +81 3 3634 [email protected]
www.nti-audio.com
FX100 Audio Analyzer offers proven
PureSound™speaker testing technology
Proven PureSound™ technology For the most reliable detection of different defect types. Supports defects testing across all installed analyzer channels.
Modular Analyzer architecture Customize your speaker test system by choosing the number of analysis channels, built-in impedance and DC-resistance measurements, switchers etc.
Cost efficiency System costs are controlled with modular configurations matched to specific applications.
Maximum test speed Very fast glide sweep technology measures all quality para-meters from a single stimulus within a fraction of a second.
FX-Control software Powerful and complete system control suite supports flexible GUI designs, built-in limits handling and sequenced measurements.
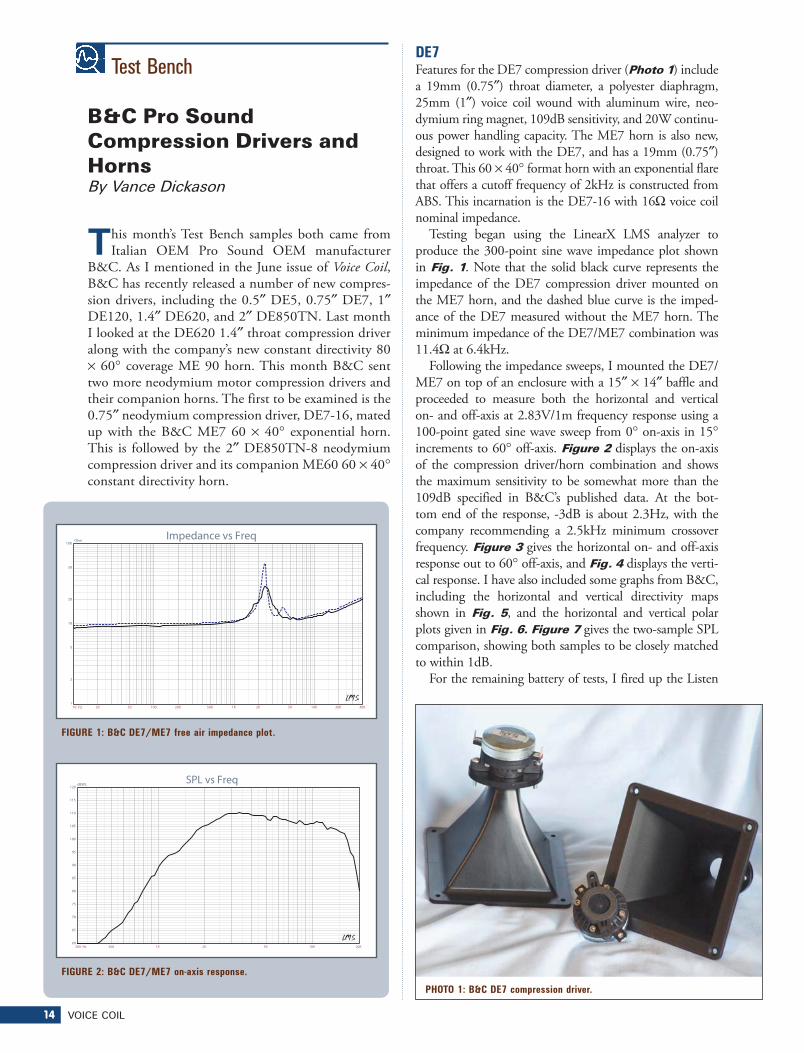
14 VOICE COIL
Test Bench
B&C Pro Sound Compression Drivers and Horns By Vance Dickason
�his month’s Test Bench samples both came from
Italian OEM Pro Sound OEM manufacturer
B&C. As I mentioned in the June issue of Voice Coil,
B&C has recently released a number of new compres-
sion drivers, including the 0.5 DE5, 0.75 DE7, 1
DE120, 1.4 DE620, and 2 DE850TN. Last month
I looked at the DE620 1.4 throat compression driver
along with the company’s new constant directivity 80
60 coverage ME 90 horn. This month B&C sent
two more neodymium motor compression drivers and
their companion horns. The first to be examined is the
0.75 neodymium compression driver, DE7-16, mated
up with the B&C ME7 60 40 exponential horn.
This is followed by the 2 DE850TN-8 neodymium
compression driver and its companion ME60 60 40
constant directivity horn.
DE7Features for the DE7 compression driver (Photo 1) include a 19mm (0.75 ) throat diameter, a polyester diaphragm, 25mm (1 ) voice coil wound with aluminum wire, neo-dymium ring magnet, 109dB sensitivity, and 20W continu-ous power handling capacity. The ME7 horn is also new, designed to work with the DE7, and has a 19mm (0.75 ) throat. This 60 40 format horn with an exponential flare that offers a cutoff frequency of 2kHz is constructed from ABS. This incarnation is the DE7-16 with 16 voice coil nominal impedance.
Testing began using the LinearX LMS analyzer to
produce the 300-point sine wave impedance plot shown
in Fig. 1. Note that the solid black curve represents the
impedance of the DE7 compression driver mounted on
the ME7 horn, and the dashed blue curve is the imped-
ance of the DE7 measured without the ME7 horn. The
minimum impedance of the DE7/ME7 combination was
11.4 at 6.4kHz.
Following the impedance sweeps, I mounted the DE7/
ME7 on top of an enclosure with a 15 14 baffle and
proceeded to measure both the horizontal and vertical
on- and off-axis at 2.83V/1m frequency response using a
100-point gated sine wave sweep from 0 on-axis in 15
increments to 60 off-axis. Figure 2 displays the on-axis
of the compression driver/horn combination and shows
the maximum sensitivity to be somewhat more than the
109dB specified in B&C’s published data. At the bot-
tom end of the response, -3dB is about 2.3Hz, with the
company recommending a 2.5kHz minimum crossover
frequency. Figure 3 gives the horizontal on- and off-axis
response out to 60 off-axis, and Fig. 4 displays the verti-
cal response. I have also included some graphs from B&C,
including the horizontal and vertical directivity maps
shown in Fig. 5, and the horizontal and vertical polar
plots given in Fig. 6. Figure 7 gives the two-sample SPL
comparison, showing both samples to be closely matched
to within 1dB.
For the remaining battery of tests, I fired up the Listen
10 Hz 20 50 100 200 500 1K 2K 5K 10K 20K 40K
Ohm
1
2
5
10
20
50
100Impedance vs Freq
300 Hz 500 1K 2K 5K 10K 20K
dBSPL
60
65
70
75
80
85
90
95
100
105
110
115
120SPL vs Freq
FIGURE 1: B&C DE7/ME7 free air impedance plot.
FIGURE 2: B&C DE7/ME7 on-axis response.
PHOTO 1: B&C DE7 compression driver.

JULY 2011 15
300 Hz 500 1K 2K 5K 10K 20K
dBSPL
60
65
70
75
80
85
90
95
100
105
110
115
120SPL vs Freq
300 Hz 500 1K 2K 5K 10K 20K
dBSPL
60
65
70
75
80
85
90
95
100
105
110
115
120
SPL vs Freq
300 Hz 500 1K 2K 5K 10K 20K
dBSPL
60
65
70
75
80
85
90
95
100
105
110
115
120SPL vs Freq
FIGURE 3: B&C DE7/ME7 horizontal on- and off-axis frequency response
(A = 0 ; B = 15 ; C = 30 ; D = 45 ; E = 60 ).
FIGURE 4: B&C DE7/ME7 vertical on- and off-axis frequency response
(A = 0 ; B = 15 ; C = 30 ; D = 45 ; E = 60 ).
FIGURE 7: B&C DE7/ME7 two-sample SPL comparison.
FIGURE 5: B&C DE7/ME7 factory hor-
izontal and vertical directivity maps.
FIGURE 6: B&C DE7/ME7 factory
horizontal and vertical polar plots.
16 VOICE COIL
FIGURE 8: B&C DE7/ME7 SoundCheck distortion plots.
FIGURE 9: B&C DE7/ME7 SoundCheck CSD waterfall plot.
FIGURE 10: B&C DE7/ME7 SoundCheck STFT plot.
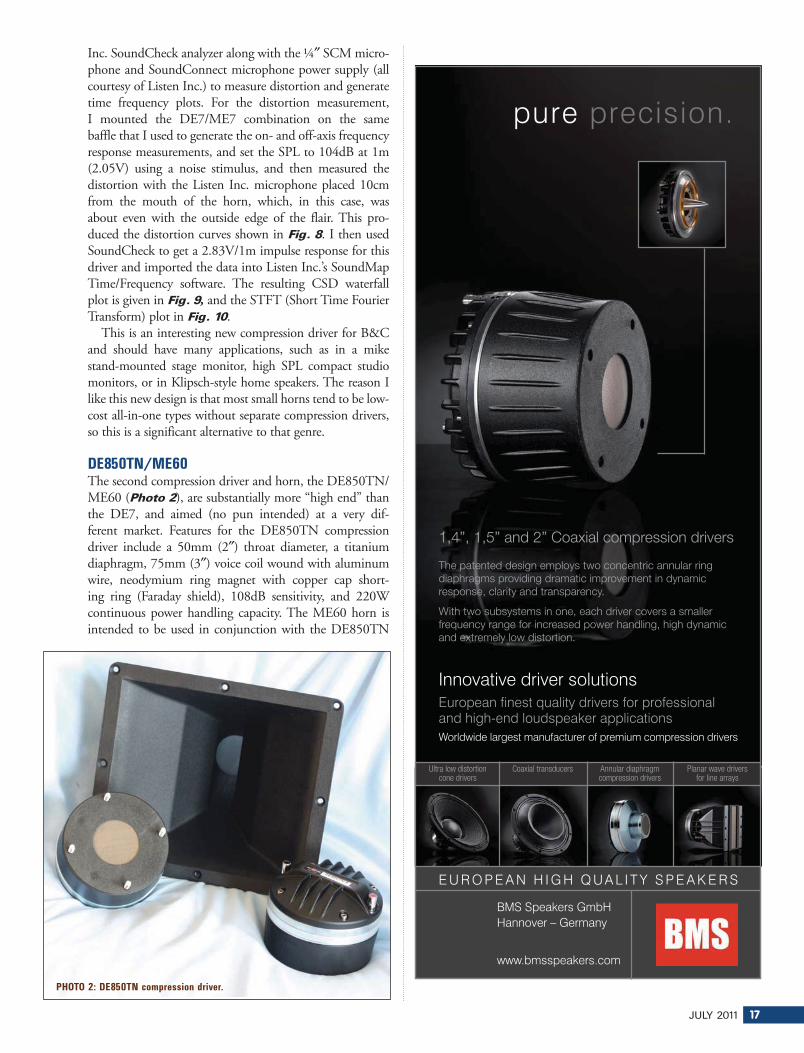
JULY 2011 17
Inc. SoundCheck analyzer along with the ¼ SCM micro-
phone and SoundConnect microphone power supply (all
courtesy of Listen Inc.) to measure distortion and generate
time frequency plots. For the distortion measurement,
I mounted the DE7/ME7 combination on the same
baffle that I used to generate the on- and off-axis frequency
response measurements, and set the SPL to 104dB at 1m
(2.05V) using a noise stimulus, and then measured the
distortion with the Listen Inc. microphone placed 10cm
from the mouth of the horn, which, in this case, was
about even with the outside edge of the flair. This pro-
duced the distortion curves shown in Fig. 8. I then used
SoundCheck to get a 2.83V/1m impulse response for this
driver and imported the data into Listen Inc.’s SoundMap
Time/Frequency software. The resulting CSD waterfall
plot is given in Fig. 9, and the STFT (Short Time Fourier
Transform) plot in Fig. 10.
This is an interesting new compression driver for B&C
and should have many applications, such as in a mike
stand-mounted stage monitor, high SPL compact studio
monitors, or in Klipsch-style home speakers. The reason I
like this new design is that most small horns tend to be low-
cost all-in-one types without separate compression drivers,
so this is a significant alternative to that genre.
DE850TN/ME60The second compression driver and horn, the DE850TN/ME60 (Photo 2), are substantially more “high end” than the DE7, and aimed (no pun intended) at a very dif-ferent market. Features for the DE850TN compression driver include a 50mm (2 ) throat diameter, a titanium diaphragm, 75mm (3 ) voice coil wound with aluminum wire, neodymium ring magnet with copper cap short-ing ring (Faraday shield), 108dB sensitivity, and 220W continuous power handling capacity. The ME60 horn is intended to be used in conjunction with the DE850TN
PHOTO 2: DE850TN compression driver.
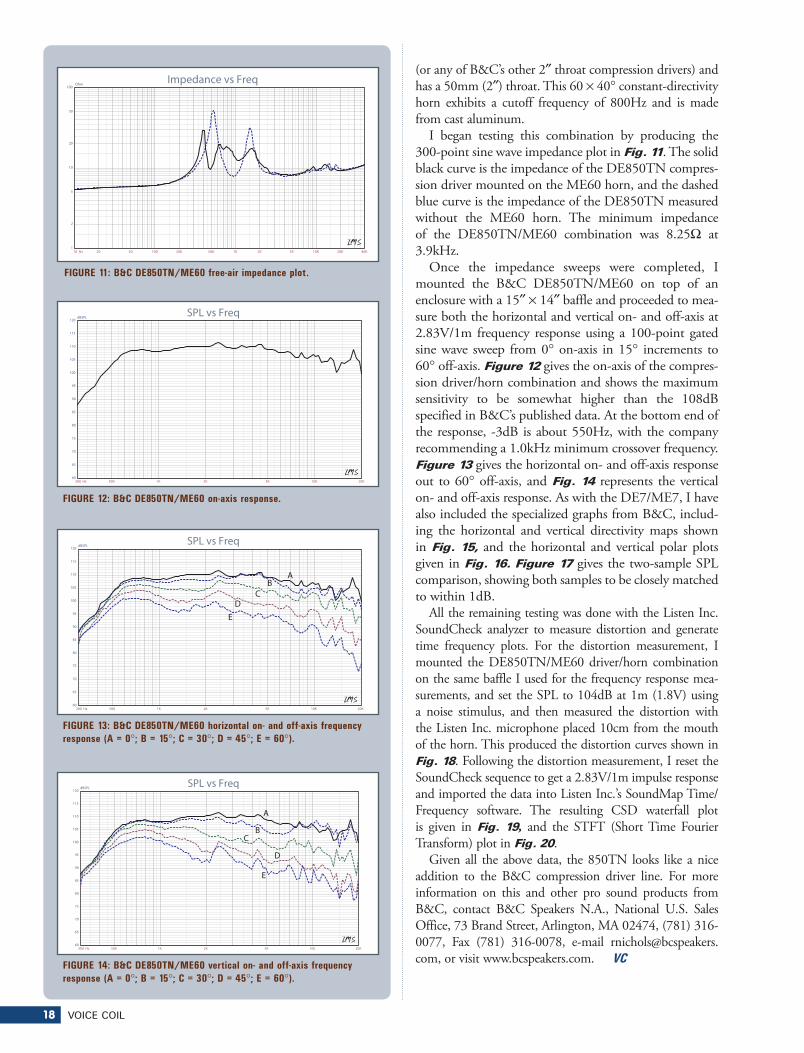
18 VOICE COIL
(or any of B&C’s other 2 throat compression drivers) and has a 50mm (2 ) throat. This 60 40 constant-directivity horn exhibits a cutoff frequency of 800Hz and is made from cast aluminum.
I began testing this combination by producing the
300-point sine wave impedance plot in Fig. 11. The solid
black curve is the impedance of the DE850TN compres-
sion driver mounted on the ME60 horn, and the dashed
blue curve is the impedance of the DE850TN measured
without the ME60 horn. The minimum impedance
of the DE850TN/ME60 combination was 8.25 at
3.9kHz.
Once the impedance sweeps were completed, I
mounted the B&C DE850TN/ME60 on top of an
enclosure with a 15 14 baffle and proceeded to mea-
sure both the horizontal and vertical on- and off-axis at
2.83V/1m frequency response using a 100-point gated
sine wave sweep from 0 on-axis in 15 increments to
60 off-axis. Figure 12 gives the on-axis of the compres-
sion driver/horn combination and shows the maximum
sensitivity to be somewhat higher than the 108dB
specified in B&C’s published data. At the bottom end of
the response, -3dB is about 550Hz, with the company
recommending a 1.0kHz minimum crossover frequency.
Figure 13 gives the horizontal on- and off-axis response
out to 60 off-axis, and Fig. 14 represents the vertical
on- and off-axis response. As with the DE7/ME7, I have
also included the specialized graphs from B&C, includ-
ing the horizontal and vertical directivity maps shown
in Fig. 15, and the horizontal and vertical polar plots
given in Fig. 16. Figure 17 gives the two-sample SPL
comparison, showing both samples to be closely matched
to within 1dB.
All the remaining testing was done with the Listen Inc.
SoundCheck analyzer to measure distortion and generate
time frequency plots. For the distortion measurement, I
mounted the DE850TN/ME60 driver/horn combination
on the same baffle I used for the frequency response mea-
surements, and set the SPL to 104dB at 1m (1.8V) using
a noise stimulus, and then measured the distortion with
the Listen Inc. microphone placed 10cm from the mouth
of the horn. This produced the distortion curves shown in
Fig. 18. Following the distortion measurement, I reset the
SoundCheck sequence to get a 2.83V/1m impulse response
and imported the data into Listen Inc.’s SoundMap Time/
Frequency software. The resulting CSD waterfall plot
is given in Fig. 19, and the STFT (Short Time Fourier
Transform) plot in Fig. 20.
Given all the above data, the 850TN looks like a nice
addition to the B&C compression driver line. For more
information on this and other pro sound products from
B&C, contact B&C Speakers N.A., National U.S. Sales
Office, 73 Brand Street, Arlington, MA 02474, (781) 316-
0077, Fax (781) 316-0078, e-mail rnichols@bcspeakers.
com, or visit www.bcspeakers.com. VC
300 Hz 500 1K 2K 5K 10K 20K
dBSPL
60
65
70
75
80
85
90
95
100
105
110
115
120SPL vs Freq
300 Hz 500 1K 2K 5K 10K 20K
dBSPL
60
65
70
75
80
85
90
95
100
105
110
115
120SPL vs Freq
300 Hz 500 1K 2K 5K 10K 20K
dBSPL
60
65
70
75
80
85
90
95
100
105
110
115
120SPL vs Freq
FIGURE 12: B&C DE850TN/ME60 on-axis response.
FIGURE 13: B&C DE850TN/ME60 horizontal on- and off-axis frequency
response (A = 0 ; B = 15 ; C = 30 ; D = 45 ; E = 60 ).
FIGURE 14: B&C DE850TN/ME60 vertical on- and off-axis frequency
response (A = 0 ; B = 15 ; C = 30 ; D = 45 ; E = 60 ).
10 Hz 20 50 100 200 500 1K 2K 5K 10K 20K 40K
Ohm
1
2
5
10
20
50
100Impedance vs Freq
FIGURE 11: B&C DE850TN/ME60 free-air impedance plot.

JULY 2011 19
300 Hz 500 1K 2K 5K 10K 20K
dBSPL
60
65
70
75
80
85
90
95
100
105
110
115
120SPL vs Freq
FIGURE 17: B&C DE850TN/ME60 two-sample SPL comparison.
FIGURE 18: B&C DE850TN/ME60 SoundCheck distortion plots.
FIGURE 19: B&C DE850TN/ME60 SoundCheck CSD waterfall plot.
FIGURE 20: B&C DE850TN/ME60 SoundCheck STFT plot.
FIGURE 15: DE850TN/ME60 factory
horizontal and vertical directivity maps.
FIGURE 16: DE850TN/ME60 factory
horizontal and vertical polar plots.
Sample Submission for Test BenchTest Bench is an open forum for OEM driver manufacturers in the industry and all OEMs are invited to submit samples to Voice Coil for inclusion in the monthly Test Bench column. Driver samples can be for use in any sector of the loudspeaker market including transducers for home audio, car audio, pro sound, multimedia, or musical instrument applications. While many of the drivers featured in Voice Coil come from OEMs that have a stable catalog of product, this is not a necessary criterion for submission. OEM manufacturers are encouraged to send samples of woofers, midranges, or tweeters they think are representative of their work. However, please contact Voice Coil Editor Vance Dickason prior to submission to discuss which drivers are being submitted. Samples should be sent in pairs and addressed to:
Vance Dickason Consulting333 S. State St., #152Lake Oswego, OR 97034(503-557-0427)[email protected] samples must include any published data on the prod-
uct, patent information, or any special information necessary to explain the functioning of the transducer. This should include details regarding the various materials used to construct the transducer such as cone material, voice coil former material, and voice coil wire type. For woofers and midrange drivers, please include the voice coil height, gap height, RMS power handling, and physically measured Mmd (complete cone assembly including the cone, surround, spider, and voice coil with 50% of the spider, surround, and lead wires removed).

20 VOICE COIL
SPOTLIGHT
ALMA at ProLight+Sound 2011By Mike Klasco
�he Music Messe/Prolight+Sound shows are like
NAMM on steroids. Held in Frankfurt, Germany, in
April, the show includes a half dozen halls with endless
exhibitors. Music Messe is the musical instrument side, and
ProLight+Sound is for sound reinforcement, pro-sumer,
and commercial sound gear. The main show had endless
mike, speaker, amplifier, and related hardware/software for
signal processing, signal transport and control, and every-
thing else. As is the fashion these days for pro-sound, the
main hall was a festival of line arrays.
This is more of an international business trade show
than NAMM. While NAMM proudly focuses on its
retailer members, ProLight+Sound is more about interna-
tional trade with many more Asian manufacturers exhibit-
ing and looking for international agents. In the not-so-
distant past, the Chinese prosound speaker manufacturers
could make the hardware (frames, magnetic structures)
but had to fake it on the cones and spiders. The woof-
ers looked real, but cone paper, adhesives, and so on just
were not up to the task. Today Chinese prosound speaker
factories are buying and using premium cones, and getting
the rest right, although there is still a ways to go on their
compression drivers.
The last ALMA Europe event I attended was buried off
to the side of the ProLight+Sound show, and the display
area was open only during the symposium and was only
just a long table with the exhibits side by side. This year’s
dramatic improvement featured an ALMA Pavilion on
the main floor itself open throughout the show (Photo 1). ALMA exhibitors were Kurt Mueller, Klippel, LCC,
Prism, Loudsoft, and Ferrotec. Frankly, if you are a
speaker engineer, this was the most interesting space at
the show. During the ALMA presentations the long table
exhibit area of the past remains, but now it serves to
facilitate face-to-face meetings between the exhibitors and
attendees as well as networking.
At the show I talked with the Kurt Mueller and
Brush Wellman guys, all of whom seemed very happy
with the new ALMA show arrangements. The actual
ALMA presentations, which were well attended, were
truly international in favor. They included Japanese/US
Ferrotec from Barry Moskowitz, Matthias Ringpfeil’s talk
on spiders from Kurt Mueller of Germany, Dr. John Oh
of Korea Pulsus on DSP amplifiers, to British Prism on
round-robin testing of drivers and getting different data,
and so on.
In the recent past the main discussion at ALMA had
been its impending demise—but this topic appears quite
dead as ALMA is apparently thriving. Kudos to ringlead-
ers Carol Bousquet and Dorit Larsen. The ALMA board
has taken the long-term approach to grow the Euro
symposium by applying the exhibitor fees toward provid-
ing free open attendance as well as lunch to all attendees
(who says there is no free lunch?). I thought that I was
back in my hometown (NYC) calling the hot dogs their
rightful name—frankfurters. My next stop was the Hong
Kong shows—but that is another article from the Flying
Dutchman of Audio. VCPHOTO 1: ALMA Pavilion at ProLight+Sound
PHOTO 2: At the Dr. Kurt Müller booth in Frankfurt: (from left)
Steve Phillips, Matthias Ringpfeil, and Daniel and Helmut Ebers.
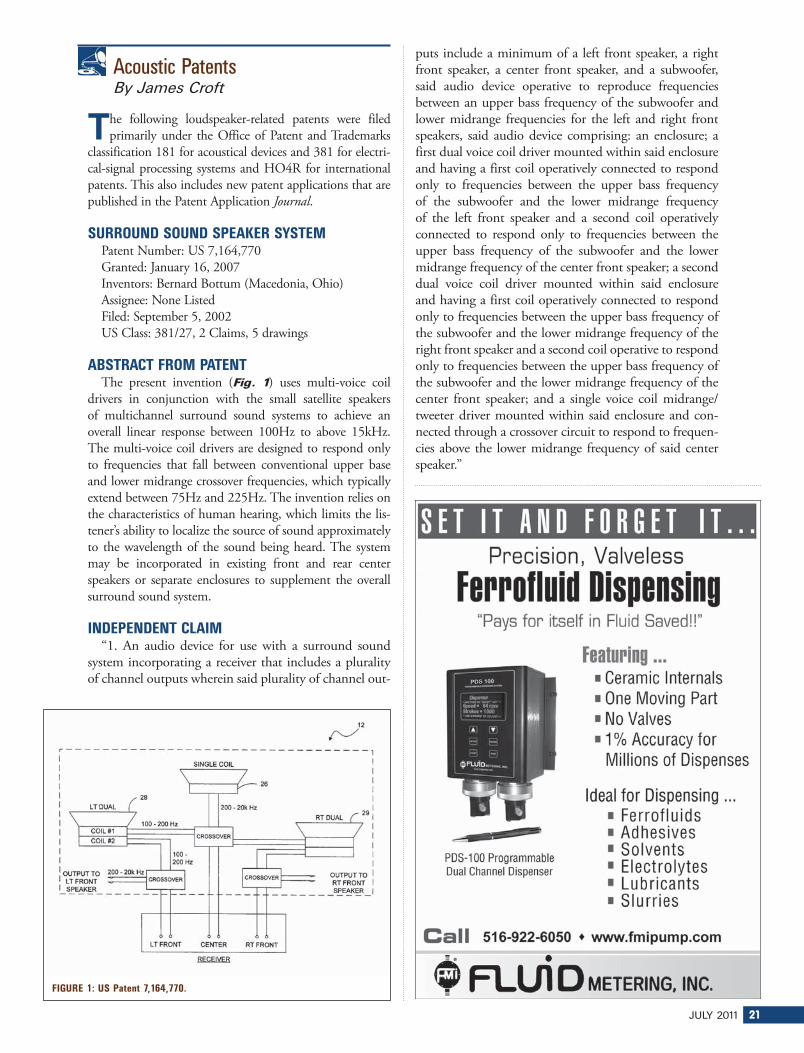
JULY 2011 21
Acoustic Patents By James Croft
�he following loudspeaker-related patents were filed
primarily under the Office of Patent and Trademarks
classification 181 for acoustical devices and 381 for electri-
cal-signal processing systems and HO4R for international
patents. This also includes new patent applications that are
published in the Patent Application Journal.
SURROUND SOUND SPEAKER SYSTEMPatent Number: US 7,164,770
Granted: January 16, 2007
Inventors: Bernard Bottum (Macedonia, Ohio)
Assignee: None Listed
Filed: September 5, 2002
US Class: 381/27, 2 Claims, 5 drawings
ABSTRACT FROM PATENTThe present invention (Fig. 1) uses multi-voice coil
drivers in conjunction with the small satellite speakers
of multichannel surround sound systems to achieve an
overall linear response between 100Hz to above 15kHz.
The multi-voice coil drivers are designed to respond only
to frequencies that fall between conventional upper base
and lower midrange crossover frequencies, which typically
extend between 75Hz and 225Hz. The invention relies on
the characteristics of human hearing, which limits the lis-
tener’s ability to localize the source of sound approximately
to the wavelength of the sound being heard. The system
may be incorporated in existing front and rear center
speakers or separate enclosures to supplement the overall
surround sound system.
INDEPENDENT CLAIM“1. An audio device for use with a surround sound
system incorporating a receiver that includes a plurality
of channel outputs wherein said plurality of channel out-
puts include a minimum of a left front speaker, a right
front speaker, a center front speaker, and a subwoofer,
said audio device operative to reproduce frequencies
between an upper bass frequency of the subwoofer and
lower midrange frequencies for the left and right front
speakers, said audio device comprising: an enclosure; a
first dual voice coil driver mounted within said enclosure
and having a first coil operatively connected to respond
only to frequencies between the upper bass frequency
of the subwoofer and the lower midrange frequency
of the left front speaker and a second coil operatively
connected to respond only to frequencies between the
upper bass frequency of the subwoofer and the lower
midrange frequency of the center front speaker; a second
dual voice coil driver mounted within said enclosure
and having a first coil operatively connected to respond
only to frequencies between the upper bass frequency of
the subwoofer and the lower midrange frequency of the
right front speaker and a second coil operative to respond
only to frequencies between the upper bass frequency of
the subwoofer and the lower midrange frequency of the
center front speaker; and a single voice coil midrange/
tweeter driver mounted within said enclosure and con-
nected through a crossover circuit to respond to frequen-
cies above the lower midrange frequency of said center
speaker.”
FIGURE 1: US Patent 7,164,770.
22 VOICE COIL
REVIEWER COMMENTS It is common for surround sound systems these days
to use very small satellite enclosures and transducers. The
satellite woofer or full-range driver is most often of the 2
to 3 variety and may be mounted in an enclosure that is
much less than 100 in3, with some less than half that size
and having a face print that is usually less than 4 4
square. As with most home theater systems, these miniatur-
ized satellite systems are used with subwoofers, but in their
case—due to the reduced size—they tend to be compro-
mised in terms of low-frequency output capability. The
reduced low-frequency output is due to having both a high
resonant frequency and minimal baffle support, causing a
droop in the response.
With most subwoofers crossing over at the standard
frequencies of 80 to 150Hz, there is usually a gap in the
response, at and above the crossover frequency, causing
the system to sound somewhat thin. One solution has
been to use a multi-tuned, steep slope bandpass subwoofer
design, such as those found in US 5,092,424 by Schreiber
or US 6,389,146 and US 7,103,193 by Croft, wherein the
crossover frequency of the woofer can be as high as approxi-
mately 250Hz while maintaining a lack of aural localization
of the subwoofer. This patent addresses the issue by incor-
porating a pair of dual voice coil woofers into the center
channel cabinet, placed left and right of the center channel
transducer, which is the same utilized in the satellite enclo-
sures. Each of the dual voice coil “mid-woofers” receives
a signal to one of the voice coils from the center-channel
output, and to the other voice coil from either the right or
left channel output.
The two dual voice coil woofers operate as mid-bass
couplers, and are bandpassed from 80Hz to 250Hz, to
reinforce the lower midrange and upper bass for the micro
satellites. With the less directional mid-bass anchored to
the center-channel enclosure, the soundstage remains stable
while the system achieves a substantially flatter, more uni-
fied frequency response, without the hole in the mid-bass
with sound quality as balanced and powerful as a 5 to 6
woofer-based satellite system.
By comparison, sending the same 80 – 250Hz
frequency range to a standard subwoofer would com-
promise imaging. Even with the specialized band-
pass subwoofers, with higher crossover frequencies, the
results are less consistent than with this new solution.
Ultimately, by enlarging the center-channel enclosure to
incorporate the mid-bass couplers, you can maintain the
miniaturization of the four (or more) remaining satellite
channels while providing the sound quality of a larger
scale system.
This patent has apparently been licensed to HSU
Research (www.hsuresearch.com), which markets a
system called the Ventriloquist VT-12, incorporating
the architecture disclosed in the patent. The system is
quite impressive considering the modest components
employed, with much richer, more robust sound quality
than other micro-satellite systems. A very useful inven-
tion, effectively deployed.
WAVEGUIDE ELECTROACOUSTICAL TRANSDUCING
Patent Application Number: US 2009/0214066
Published: August 27, 2009
Inventors: Robert Preston Parker (Westborough,
Mass.); Eric J. Freeman (Sutton, Mass.); Jeffrey J. Hoefler
(Westwood, Mass.)
Assignee: BOSE CORPORATION
Filed: February 21, 2008
US Class: 381/339, 33 Claims, 22 drawings
REVIEWER COMMENTSBose (www.bose.com) has been refining the high effi-
ciency, lossless, quarter-wave resonant pipe approach to
low-frequency reproduction since their first tuned pipe
patent (US 4,628,528) and products (Acoustic Wave Music
System and The Bose Cannon) in 1984. The original device
had a waveguide attached to the backside of the woofer/
transducer and a second, shorter waveguide attached to the
front of the woofer.
More recent expressions of the Bose waveguide archi-
tectures have incorporated a singular waveguide loading
just one side of the woofer diaphragm, with the other
side of the woofer diaphragm radiating directly into the
listening environment. With this approach there remains
a problem that is the scourge of all quarter-wave pipe and
�������
� ��!�"!����
��#��$%&'����$
�������
��#����(!��(�"�)(�* ���"+�,���$-�!��. �/���0���.����0�1��
&'����2*!(����
������� �"*���3�4�5�.�#�3�"6�
��$-�.�����7$-���!��8��30�
����
������
���� ����������������
������
������������� ����
!�"���������#� ���$������ �%��� ���
���&������
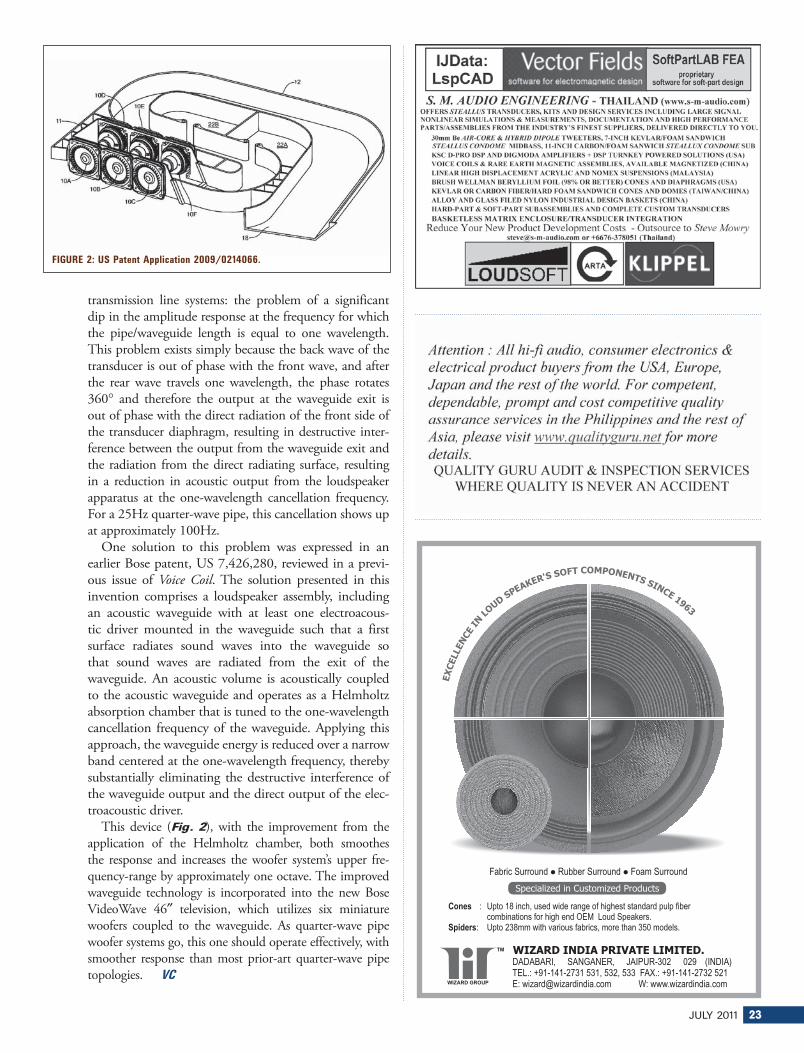
JULY 2011 23
transmission line systems: the problem of a significant
dip in the amplitude response at the frequency for which
the pipe/waveguide length is equal to one wavelength.
This problem exists simply because the back wave of the
transducer is out of phase with the front wave, and after
the rear wave travels one wavelength, the phase rotates
360 and therefore the output at the waveguide exit is
out of phase with the direct radiation of the front side of
the transducer diaphragm, resulting in destructive inter-
ference between the output from the waveguide exit and
the radiation from the direct radiating surface, resulting
in a reduction in acoustic output from the loudspeaker
apparatus at the one-wavelength cancellation frequency.
For a 25Hz quarter-wave pipe, this cancellation shows up
at approximately 100Hz.
One solution to this problem was expressed in an
earlier Bose patent, US 7,426,280, reviewed in a previ-
ous issue of Voice Coil. The solution presented in this
invention comprises a loudspeaker assembly, including
an acoustic waveguide with at least one electroacous-
tic driver mounted in the waveguide such that a first
surface radiates sound waves into the waveguide so
that sound waves are radiated from the exit of the
waveguide. An acoustic volume is acoustically coupled
to the acoustic waveguide and operates as a Helmholtz
absorption chamber that is tuned to the one-wavelength
cancellation frequency of the waveguide. Applying this
approach, the waveguide energy is reduced over a narrow
band centered at the one-wavelength frequency, thereby
substantially eliminating the destructive interference of
the waveguide output and the direct output of the elec-
troacoustic driver.
This device (Fig. 2), with the improvement from the
application of the Helmholtz chamber, both smoothes
the response and increases the woofer system’s upper fre-
quency-range by approximately one octave. The improved
waveguide technology is incorporated into the new Bose
VideoWave 46 television, which utilizes six miniature
woofers coupled to the waveguide. As quarter-wave pipe
woofer systems go, this one should operate effectively, with
smoother response than most prior-art quarter-wave pipe
topologies. VC
FIGURE 2: US Patent Application 2009/0214066.

24 VOICE COIL
Industry WatchBy Vance Dickason
�harlesbank Capital Partners (www.charlesbank.
com), a middle-market private equity investment
firm, has reached a definitive agreement to acquire
DEI Holdings (www.deiholdings.com), parent of mul-
tiple car electronics brands and home-speaker mak-
ers Polk Audio (www.polkaudio.com) and Definitive
Technologies (www.definitivetech.com). The cash
transaction is valued at around $285 million, includ-
ing the assumption of debt. The transaction will be
financed through a combination of equity and debt.
The agreement permits DEI Holdings to solicit, receive,
and enter into negotiations for a purchase by other com-
panies for a 35-day “go-shop” period from the date of the
merger agreement. Charlesbank, however, gets the right to
match any competing proposal. If a better offer isn’t made,
the transaction is expected to close in late June 2011. If
the transaction is completed, DEI Holdings will remain
headquartered in Vista, Calif., and maintain its offices in
Maryland and Canada. The company will continue to
be led by its existing management team, including presi-
dent/CEO James Minarik and executive VP/CFO Kevin
Duffy. Under the terms of the agreement, holders of the
outstanding DEI common shares will get around $3.79-
$3.81 per share in cash, reflecting a premium of about
142% of DEI’s closing share price on May 12.
MSE Audio (www.mseaudio.com) has added
Rockustics (www.rockustics.com) to its stable of audio
brands, which include Induction Dynamics (www.induc-
tiondynamics.com) and Phase Technology (www.pha-
setech.com) for the residential market and SoundTube
Entertainment (www.soundtube.com) for the commer-
cial market. Rockustics, founded in 1987, designs and
manufactures weatherproof speakers for residential and
commercial markets. Rockustics products are designed
to blend in with outdoor landscapes and include rock
speakers, omnidirectional speakers, subwoofers, speak-
ers built into garden planters, and speakers designed for
placement in landscaping walls. The Rockustics products
complement MSE’s current lines and offer almost no
duplication of existing products. Rockustics residential-
market sales will be handled by the Induction Dynamics
and Phase Technology sales staffs and the SoundTube
Entertainment sales staff will drive sales into the com-
mercial market. MSE’s other brand is SolidDrive (www.
soliddrive.com).
Nortek (www.nortek-inc.com) increased its first-quarter
net sales by 13% to $489 million, but operating earnings
declined and net losses increased from the year-ago quarter.
The sales gain of $58 million was largely due to last year’s
acquisition of companies, whose sales contributed $51.1
million in the quarter’s sales increase, the company said.
The parent of multiple residential- and commercial-system

JULY 2011 25
suppliers posted operating earnings of $1.9 million, down
from a year-ago $4.2 million. Rising interest expenses of
$29.3 million compared to year-ago interest expenses $23.6
million yielded a net loss of $21.1 million, up from a year-
ago net loss of $13.4 million.
To cut future interest payments, Nortek recently refi-
nanced $753 million of 11% senior secured notes to reduce
interest payments by about $22 million per year. Because
of the results, Nortek continues to focus on cost reduction
and working capital improvement to maintain and improve
margins and cash flow. Though the financial picture wasn’t
pretty, the company performed well given challenging mar-
ket conditions and rising commodity prices, which have put
pressure on both net sales and operating earnings during the
historically weakest quarter. Residential HVAC sales were
adversely affected by a surge of orders in the fourth quarter
of last year.
In the first quarter of 2011, US housing starts decreased
by 10% compared to the prior year, new home sales
decreased by 18%, existing home sales fell 2%, and spend-
ing on residential improvements fell almost 10%. The
commercial construction market declined by 12.5% in
the first quarter. Nortek’s residential brands include Niles
Audio, Xantech, Elan, Gefen, Omnimount, Panamax,
SpeakerCraft, and others.
Furniture maker Bassett (www.bassettfurniture.com)
has teamed up with Boston Acoustics (www.bostonacous-
tics.com) to embed the audio supplier’s soundbar technol-
ogy into a series of Nvelop credenzas for flat-panel TVs
(Photo 1). Four wood credenzas priced from a suggested
$1,499 to $1,999 are currently available through Bassett
distribution channels. The credenzas incorporate a Boston
Acoustics powered soundbar to improve the sound qual-
ity of TV programs and TV-connected video sources as
well as deliver virtual 5.1-channel surround sound. The
credenzas also include a wired subwoofer and wire man-
agement system.
The products mark the first time that Boston Acoustics
has teamed up directly with a furniture company and
the first time that Bassett has teamed up with an audio
company. The credenzas are positioned as delivering “big
sound” with “no clutter” to give consumers a no-hassle
way to improve the low-quality audio performance of
ever-thinner flat-panel TVs, Boston Acoustics said. With
that simplicity in mind, the soundbar learns the remote
commands of a consumer’s existing TV or cable remote,
enabling the remote to control soundbar functions.
The soundbar combines a 5.1-channel Dolby Digital
decoder with proprietary Digitally Optimized Virtual
Surround (DOVS) surround processing to deliver virtual
center and surround speakers. DOVS also digitally derives
5.1 channels from 2.0-channel sources. The soundbar con-
nects to the TV set’s optical digital outputs and features
auxiliary RCA stereo and 3.5mm inputs.
Ultimate Electronics (www.ultimateelectronics.com) is
looking to convert its Chapter 11 bankruptcy to Chapter
7 liquidation. The company, which liquidated its stores
recently and will auction off its trademark, website,
and other intellectual assets, filed the motion in a US
Bankruptcy Court in Delaware. The move was prompted
by GE Capital Corp. (GECC); a secured lender owed
$65 million, which is blocking Ultimate’s access to cash.
The chain is now requesting a trustee to oversee its final
dissolution.
The retailer, founded in 1968 by Bill and Barbara Pearse
and controlled by investor Mark Wattles since 2005, filed
for Chapter 11 bankruptcy protection in January for the
PHOTO 1: Boston Acoustics and Bassett Furniture together.

26 VOICE COIL
second time in six years after business soured, bills went
unpaid, and vendors severed their credit lines. The compa-
ny opted to sell off its inventory in a six-week fire sale after
it was unable to secure financing or access its cash collateral
to fund operations.
Klipsch (www.klipsch.com) rolled out a new speaker
series exclusive to Best Buy (www.bestbuy.com). The
Klipsch Icon series of five SKUs priced up to $899/pair are
available for purchase in Best Buy Stores nationwide. The
Icon series isn’t Klipsch’s first exclusive speaker line for the
chain. In 2008, Best Buy launched Klipsch’s Icon V series
on an exclusive basis.
The new five-SKU series consists of two floor-standing
speaker pairs at $699 to $899, a $249 bookshelf pair, a
$249 center channel, and a $279 surround pair. They will
join matching Klipsch subwoofers already in the store at
$350 and $450. Upgrades to the series include a new
finish, new logos, and new feet, the company said. The
speakers also feature IMG woofers that use light, sturdy
diaphragms and a massive motor structure to deliver
highly defined, accurate bass response. The surround
speakers feature Klipsch’s Wide Dispersion Surround
Technology (WDST) to deliver both maximum sur-
round coverage and improved placement flexibility, the
company noted.
Harman International (www.harman.com) plans to
offer scholarships in memory of founder Sidney Harman
and a series of limited-edition products to commemo-
rate his legacy. However, the company did not disclose
details of the planned products. Dr. Sidney Harman died
April 12 at age 92. In 1953, he teamed up with Bernard
Kardon to form Harman/Kardon, whose first products
were a mono FM tuner and mono amplifiers for the
nascent high-fidelity market. The company eventually
grew into Harman International, from which he retired
in 2008.
Harman International’s consumer division posted a $1
million operating loss in its fiscal third quarter on a 17%
sales gain to $95 million, but the group nonetheless posted
year-to-date operating income of $10 million, up 74%. The
2011LIS2011LIS2011Only $25.00 for one full year of
access to the fully linked Sourcebook will keep the information ready to use
on your computer.
Audio Amateur Inc. • Phone: 603-924-9464 • Fax: 603-924-9467 • [email protected]
NEW! THE 2011 LOUDSPEAKER INDUSTRY SOURCEBOOK
is available on-line by subscription!
It’s easy, just find the company who sources the products you
want and click to visit their website or email a question.
To subscribe to the 2011 Sourcebook Digital call 1-888-924-9465 or visit www.audioxpress.com to start your subscription today!

JULY 2011 27
group’s year-to-date sales rose 10% to
$320 million.
The quarter’s operating loss, which
included $2 million in restructuring-
related charges, matched the year-ago
loss and followed second-quarter oper-
ating income of $11 million and zero
operating income in the first quarter.
Harman International’s consolidated
sales, consisting of OEM automotive
infotainment, professional audio, and
consumer audio, grew 13% in the
third quarter to $948 million and
by 9% for the nine-month period
to $2.74 billion. Consolidated net
income rose 145% to $37 million in
the third quarter, marking the com-
pany’s sixth consecutive quarterly net
profit. For the nine-month period, net
income rose to $117 million from the
year-ago $17 million. Consolidated
operating income doubled to $54
million for the third quarter and rose
by 174% to $164 million for the nine-month period.
Automotive OEM accounted for 75% of consolidated
sales in the third quarter and 73% for the nine-month
period.
Audiovox (www.audiovox.com) posted its fiscal year
financials reporting lower sales but higher net income in
its fiscal fourth quarter ended February 28. Net income for
the quarter was $17.4 million as compared to net income
of $6.6 million year-on-year. Net income for the 2011 fiscal
fourth quarter was positively impacted by a net tax benefit
of $12.3 million compared to a net tax benefit of $1 mil-
lion in the comparable fiscal fourth quarter. Net sales for the
quarter were $138.9 million, a decrease of 7.6% compared
to net sales of $150.3 million reported in the comparable
three-month period.
Electronics sales, which includes both mobile and
consumer electronics products, were $102.8 million in
the quarter as compared to $107.3 million for the prior
year’s final quarter, a decrease of 4.2%. Electronics sales
were positively impacted by the acquisition of Invision
(www.invisionautomotive.com), as well as higher sales
of mobile electronics products in most categories. The
increases in mobile electronics were partially offset by
declines in mobile audio, lower margin consumer elec-
tronics business, and sales of FLO TV products (www.
flotv.com), which were included in fiscal 2010 compari-
sons. Accessory sales were $36.1 million in the quarter as
compared to $43.1 million for the prior year, a decrease
of 16.1%. The Accessories group was impacted by the
continued slowdown in consumer electronics sales at
retail, particularly video-related products which correlate
to the company’s accessories offering. In the fiscal year net
sales were $561.7 million, an increase of 2% compared
to net sales of $550.7 million reported in the comparable
year ago period.
Operating income for the fiscal year
was $9 million compared to operating
income of $3.8 million in the com-
parable year ago period. Net income
for the fiscal year 2011 period was
$23 million compared to net income
of $22.5 million in the prior year.
Net income for fiscal year 2011 was
positively impacted by a $10.5 mil-
lion tax benefit compared to an $11.3
million tax benefit in the comparable
fiscal year.
The Audiovox acquisition of Klipsch
Group for $167.6 million was com-
pleted on March 1, and its perfor-
mance will be included in fiscal year
2012 results. In its year-end report
Audiovox did say on a pro forma basis,
had the Klipsch acquisition taken place
on March 1, 2009, the company would
have reported net sales of $728.3 mil-
lion for the fiscal year-ended February
28, 2011, as compared to net sales of
$706.7 million for the fiscal year-ended February 28, 2010.
Net income for the year ended Feb. 28, 2011, would have
been $31.4 million compared to the prior year’s net income
of $38.9 million.
The Consumer Electronics Association (CEA), pro-
ducer of the International CES, reported that the audited
attendance for the 2011 event reported an overall increase
and international attendance gains compared with 2010.
Overall audited attendance was 149,529 during its January
6-9, 2011, run, up from last year’s 126,641 audited atten-
dance. International attendance was 31,677, up 30% from
last year.
Technology innovation spanned more than 1.6 million
net square feet of exhibit space, as an estimated 20,000
new products were launched by more than 2,700 exhibit-
ing companies at the 2011 CES. International attendees
represented 140 countries. Aside from the US, the top
10 countries represented in terms of attendees were
Canada, South Korea, Japan, China, United Kingdom,
Mexico, Taiwan, France, Germany, and Brazil. For full
audit results, please visit www.CESweb.org/exhibitors.
The 2012 International CES is scheduled for January
10-13 in Las Vegas.
The Custom Electronic Design and Installation
Association (CEDIA, www.cedia.net) Technology
Advisory Group recently released the first video in a
series on emerging trends. The new video series will
aim to help CEDIA members and members of the elec-
tronic systems industry stay informed of opportunities
and threats within the industry. The video is available
for anyone to view on CEDIA Crosspoint. CEDIA’s
Technology Advisory Group will produce emerging
trends videos on a quarterly basis; the next video will be
released in the beginning of July. This quarter’s emerging
trends video covers multiple topics; including connected
PHOTO 2: The KEF Blade speaker.
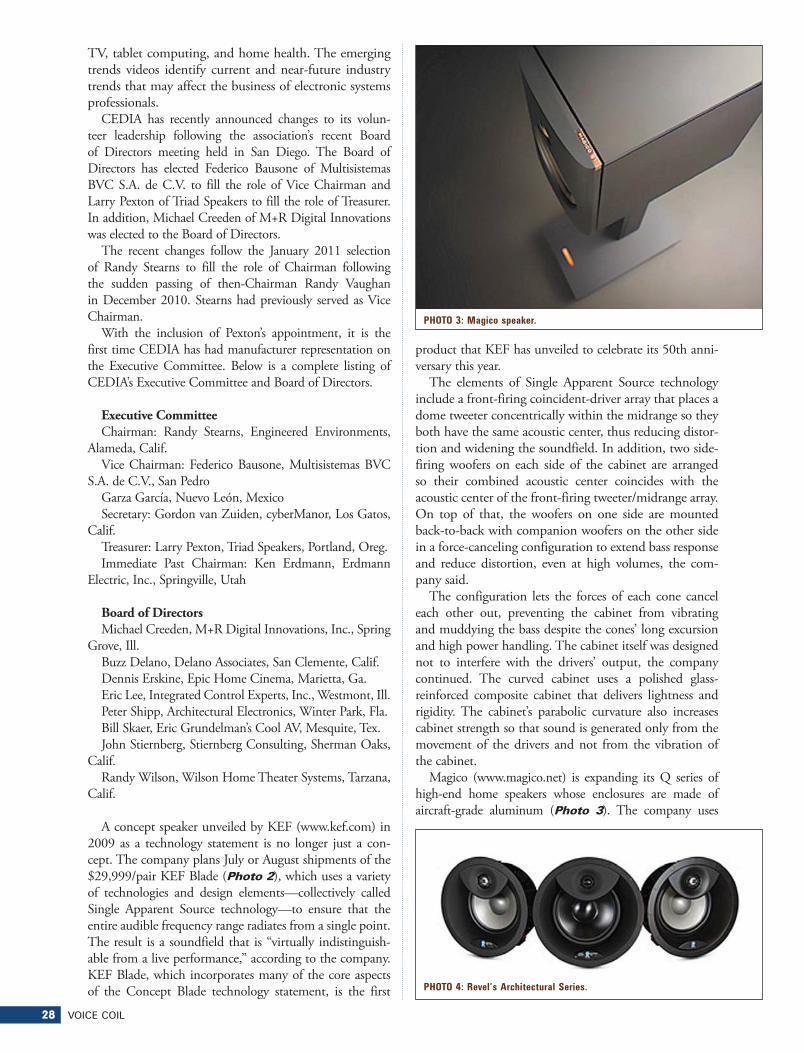
28 VOICE COIL
TV, tablet computing, and home health. The emerging
trends videos identify current and near-future industry
trends that may affect the business of electronic systems
professionals.
CEDIA has recently announced changes to its volun-
teer leadership following the association’s recent Board
of Directors meeting held in San Diego. The Board of
Directors has elected Federico Bausone of Multisistemas
BVC S.A. de C.V. to fill the role of Vice Chairman and
Larry Pexton of Triad Speakers to fill the role of Treasurer.
In addition, Michael Creeden of M+R Digital Innovations
was elected to the Board of Directors.
The recent changes follow the January 2011 selection
of Randy Stearns to fill the role of Chairman following
the sudden passing of then-Chairman Randy Vaughan
in December 2010. Stearns had previously served as Vice
Chairman.
With the inclusion of Pexton’s appointment, it is the
first time CEDIA has had manufacturer representation on
the Executive Committee. Below is a complete listing of
CEDIA’s Executive Committee and Board of Directors.
Executive Committee Chairman: Randy Stearns, Engineered Environments,
Alameda, Calif.
Vice Chairman: Federico Bausone, Multisistemas BVC
S.A. de C.V., San Pedro
Garza García, Nuevo León, Mexico
Secretary: Gordon van Zuiden, cyberManor, Los Gatos,
Calif.
Treasurer: Larry Pexton, Triad Speakers, Portland, Oreg.
Immediate Past Chairman: Ken Erdmann, Erdmann
Electric, Inc., Springville, Utah
Board of DirectorsMichael Creeden, M+R Digital Innovations, Inc., Spring
Grove, Ill.
Buzz Delano, Delano Associates, San Clemente, Calif.
Dennis Erskine, Epic Home Cinema, Marietta, Ga.
Eric Lee, Integrated Control Experts, Inc., Westmont, Ill.
Peter Shipp, Architectural Electronics, Winter Park, Fla.
Bill Skaer, Eric Grundelman’s Cool AV, Mesquite, Tex.
John Stiernberg, Stiernberg Consulting, Sherman Oaks,
Calif.
Randy Wilson, Wilson Home Theater Systems, Tarzana,
Calif.
A concept speaker unveiled by KEF (www.kef.com) in
2009 as a technology statement is no longer just a con-
cept. The company plans July or August shipments of the
$29,999/pair KEF Blade (Photo 2), which uses a variety
of technologies and design elements—collectively called
Single Apparent Source technology—to ensure that the
entire audible frequency range radiates from a single point.
The result is a soundfield that is “virtually indistinguish-
able from a live performance,” according to the company.
KEF Blade, which incorporates many of the core aspects
of the Concept Blade technology statement, is the first
product that KEF has unveiled to celebrate its 50th anni-
versary this year.
The elements of Single Apparent Source technology
include a front-firing coincident-driver array that places a
dome tweeter concentrically within the midrange so they
both have the same acoustic center, thus reducing distor-
tion and widening the soundfield. In addition, two side-
firing woofers on each side of the cabinet are arranged
so their combined acoustic center coincides with the
acoustic center of the front-firing tweeter/midrange array.
On top of that, the woofers on one side are mounted
back-to-back with companion woofers on the other side
in a force-canceling configuration to extend bass response
and reduce distortion, even at high volumes, the com-
pany said.
The configuration lets the forces of each cone cancel
each other out, preventing the cabinet from vibrating
and muddying the bass despite the cones’ long excursion
and high power handling. The cabinet itself was designed
not to interfere with the drivers’ output, the company
continued. The curved cabinet uses a polished glass-
reinforced composite cabinet that delivers lightness and
rigidity. The cabinet’s parabolic curvature also increases
cabinet strength so that sound is generated only from the
movement of the drivers and not from the vibration of
the cabinet.
Magico (www.magico.net) is expanding its Q series of
high-end home speakers whose enclosures are made of
aircraft-grade aluminum (Photo 3). The company uses
PHOTO 3: Magico speaker.
PHOTO 4: Revel’s Architectural Series.
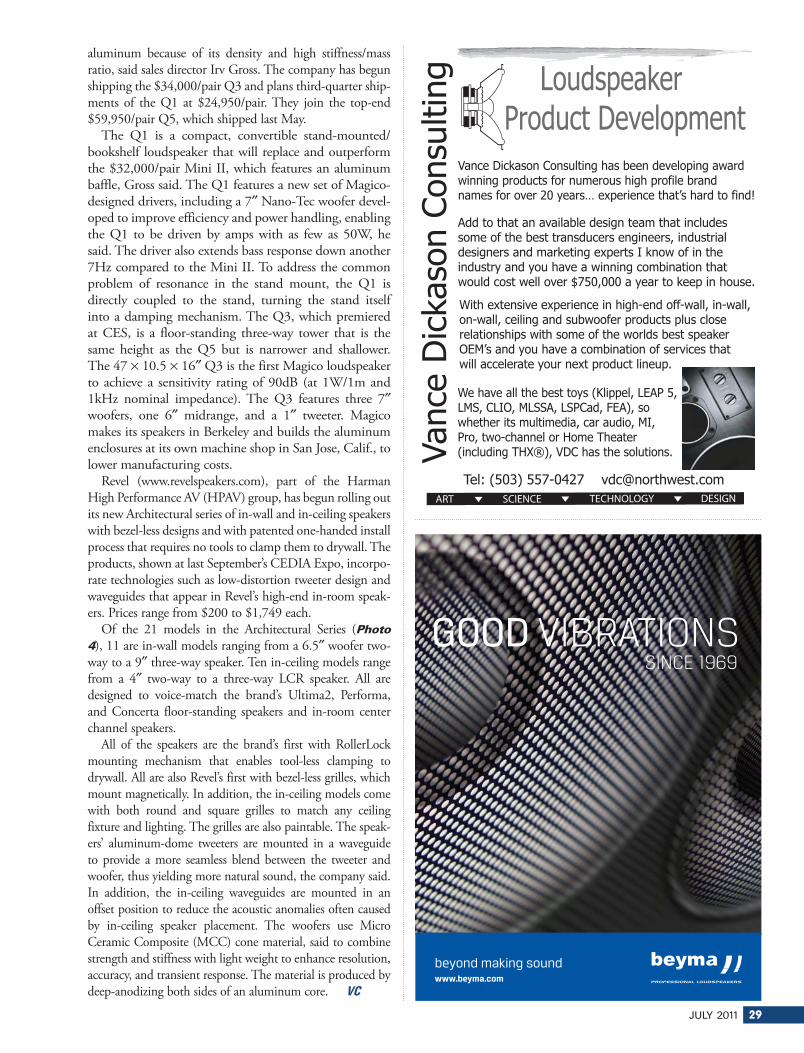
JULY 2011 29
aluminum because of its density and high stiffness/mass
ratio, said sales director Irv Gross. The company has begun
shipping the $34,000/pair Q3 and plans third-quarter ship-
ments of the Q1 at $24,950/pair. They join the top-end
$59,950/pair Q5, which shipped last May.
The Q1 is a compact, convertible stand-mounted/
bookshelf loudspeaker that will replace and outperform
the $32,000/pair Mini II, which features an aluminum
baffle, Gross said. The Q1 features a new set of Magico-
designed drivers, including a 7 Nano-Tec woofer devel-
oped to improve efficiency and power handling, enabling
the Q1 to be driven by amps with as few as 50W, he
said. The driver also extends bass response down another
7Hz compared to the Mini II. To address the common
problem of resonance in the stand mount, the Q1 is
directly coupled to the stand, turning the stand itself
into a damping mechanism. The Q3, which premiered
at CES, is a floor-standing three-way tower that is the
same height as the Q5 but is narrower and shallower.
The 47 10.5 16 Q3 is the first Magico loudspeaker
to achieve a sensitivity rating of 90dB (at 1W/1m and
1kHz nominal impedance). The Q3 features three 7
woofers, one 6 midrange, and a 1 tweeter. Magico
makes its speakers in Berkeley and builds the aluminum
enclosures at its own machine shop in San Jose, Calif., to
lower manufacturing costs.
Revel (www.revelspeakers.com), part of the Harman
High Performance AV (HPAV) group, has begun rolling out
its new Architectural series of in-wall and in-ceiling speakers
with bezel-less designs and with patented one-handed install
process that requires no tools to clamp them to drywall. The
products, shown at last September’s CEDIA Expo, incorpo-
rate technologies such as low-distortion tweeter design and
waveguides that appear in Revel’s high-end in-room speak-
ers. Prices range from $200 to $1,749 each.
Of the 21 models in the Architectural Series (Photo 4), 11 are in-wall models ranging from a 6.5 woofer two-
way to a 9 three-way speaker. Ten in-ceiling models range
from a 4 two-way to a three-way LCR speaker. All are
designed to voice-match the brand’s Ultima2, Performa,
and Concerta floor-standing speakers and in-room center
channel speakers.
All of the speakers are the brand’s first with RollerLock
mounting mechanism that enables tool-less clamping to
drywall. All are also Revel’s first with bezel-less grilles, which
mount magnetically. In addition, the in-ceiling models come
with both round and square grilles to match any ceiling
fixture and lighting. The grilles are also paintable. The speak-
ers’ aluminum-dome tweeters are mounted in a waveguide
to provide a more seamless blend between the tweeter and
woofer, thus yielding more natural sound, the company said.
In addition, the in-ceiling waveguides are mounted in an
offset position to reduce the acoustic anomalies often caused
by in-ceiling speaker placement. The woofers use Micro
Ceramic Composite (MCC) cone material, said to combine
strength and stiffness with light weight to enhance resolution,
accuracy, and transient response. The material is produced by
deep-anodizing both sides of an aluminum core. VC
��������������������� �������������������������
���������������� !���"�������#������������������������
$ ��
��#
%�!
����
&��
����%
�'
�
�
$ ����#%�! ����&������%�'�� ��)�����������%�'� � ����%��%�'����������(�������������%'�����(%���)� ���� ����(����������*� ��+��,���%������� �-��� ������(%��.�
/%����,����%����,���%�����%���%'� �����(( � ��0�%� � ��0��� � ��0���%�%�'� �����)���(�������������������������� �%����%����%���������(������������)������� !���123-�� ���*���� ��� ����)%� �%����(�����%������ ���%��� ������ ���*������,�����������%�����
/��� ��� �������)������*���4�%����0��25"��0�360�&�710�3�6650��6"& �0�825�0������������%�������%���% 0�� �� ��%�0�370�"��0���� �� ��������9������� �����%�����%�'��9:;�0�$#&�� �����������%����
5�������� �� �� � %� )������%'���� ���� ��%��������������(�����)������ �����������'%�����0�%������% �����%'����� ���� �!��%�'��,������7�!�����(�%������%������*� ���*���� ��� ��%��%�'����)%� �%����� �����������������������<��0� �*� �����!����%��������

30 VOICE COIL
CATEGORY KEY
A ADHESIVES
B CONSULTANTS & ENGINEERS
C CROSSOVERS & PASSIVE COMPONENTS
D DRIVERS
E EMPLOYMENT OPPORTUNITIES
F ENCLOSURES & ENCLOSURE PARTS
G ENGINEERING/DESIGN SOFTWARE
H FINISHED SYSTEMS
I MAGNETS & EQUIPMENT
J MANUFACTURING EQUIPMENT
K MICROPHONES
L PARTS
M RECONING
N TEST EQUIPMENT
O VOICE COILS COMPONENTS
& MATERIALS
P TRANSDUCERS
Q ACOUSTIC MESH
Products & Services Index
Advertiser Categories Page
ACO Pacific .................................... K,N ......................22
Acustica Beyma ............................. D .........................29
Audience ....................................... B,C,H ...................26
BMS Speakers GmbH ....................... D .........................17
Eminence ..................................................................10
Faital Spa ...................................... D .........................15
Fluid Metering ............................... J .........................21
Menlo Scientific, Ltd. .................... B ...........................4
NTI-Americas ................................. B, G, J, N .............13
One Magnet Electronic Co., Ltd. ...... I ..........................11
Prism Media Products ..................... G .........................32
Rotel Electronics ............................ B .........................23
Shinhint Industries ........................ H ...........................3
SM Audio Engineering Consulting ..... B .........................23
Solen Electronique, Inc. ................. C,D ......................16
SpeakerPower, Inc .......................................................9
Tang Band Industries Co. ............... D ................... 13, 15
Vance Dickason .............................. B .........................29
Wavecor Ltd. ................................ F,H.........................7
Wizard India Pvt Ltd ...................................................23
This product/services index is provided as a value-added service to our readers and advertisers. The publisher will not be held liable for any errors or deletions contained herein.
���JK�L������K�"���#����
M��N�"O���J�����&����(���"������(�������*� ��J"��� ���� ���"��*
��NJ������(���������������/*��
����!O��(�� �"��� ������*
�O�����(�� �"��� �������)������� ��/���#X��$����������������*
��""�JK���������Y���� ��)������������"�*�
����!���J������(�� �"��� ����������&� �������� �*�
��� �-)�� ������(� �����������"�� �������(�����"��(�� �"��� ������*
'�!O������������������*�
�������� �$"" ��#������� � ����Z�����"������������*�
�P�"�� �� ����(�������*
.�)�"����#�����*
.�[����"�*
���#��(����������Z����(����"������� �*
���)�������"�*
�����������(��X�&��� )�����(�����#������(��(�� ������\����������"���� ,!*
JULY 2011 31
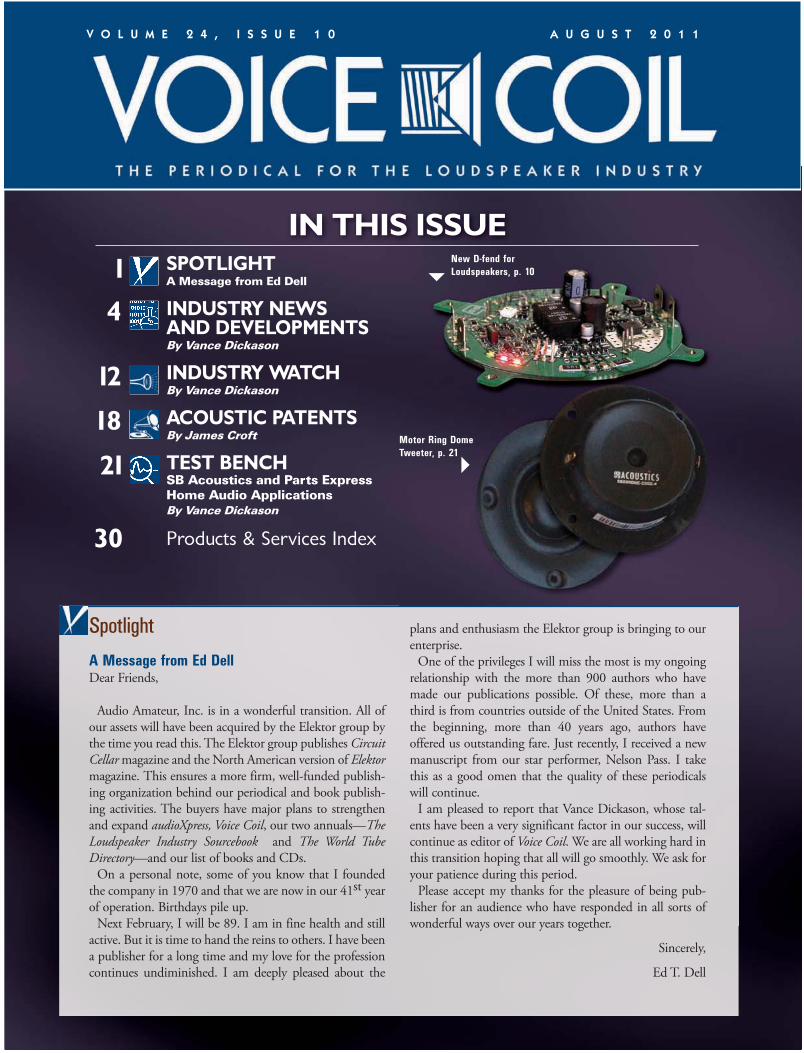
®
IN THIS ISSUE1
18
4
12
21
Spotlight
A Message from Ed Dell Dear Friends,
Audio Amateur, Inc. is in a wonderful transition. All of
our assets will have been acquired by the Elektor group by
the time you read this. The Elektor group publishes Circuit
Cellar magazine and the North American version of Elektor
magazine. This ensures a more firm, well-funded publish-
ing organization behind our periodical and book publish-
ing activities. The buyers have major plans to strengthen
and expand audioXpress, Voice Coil, our two annuals—The
Loudspeaker Industry Sourcebook and The World Tube
Directory—and our list of books and CDs.
On a personal note, some of you know that I founded
the company in 1970 and that we are now in our 41st year
of operation. Birthdays pile up.
Next February, I will be 89. I am in fine health and still
active. But it is time to hand the reins to others. I have been
a publisher for a long time and my love for the profession
continues undiminished. I am deeply pleased about the
plans and enthusiasm the Elektor group is bringing to our
enterprise.
One of the privileges I will miss the most is my ongoing
relationship with the more than 900 authors who have
made our publications possible. Of these, more than a
third is from countries outside of the United States. From
the beginning, more than 40 years ago, authors have
offered us outstanding fare. Just recently, I received a new
manuscript from our star performer, Nelson Pass. I take
this as a good omen that the quality of these periodicals
will continue.
I am pleased to report that Vance Dickason, whose tal-
ents have been a very significant factor in our success, will
continue as editor of Voice Coil. We are all working hard in
this transition hoping that all will go smoothly. We ask for
your patience during this period.
Please accept my thanks for the pleasure of being pub-
lisher for an audience who have responded in all sorts of
wonderful ways over our years together.
Sincerely,
Ed T. Dell
30
New D-fend for
Loudspeakers, p. 10
V O L U M E 2 4 , I S S U E 1 0 A U G U S T 2 0 1 1
SPOTLIGHTA Message from Ed Dell
INDUSTRY NEWS AND DEVELOPMENTSBy Vance Dickason
INDUSTRY WATCH By Vance Dickason
ACOUSTIC PATENTS By James Croft TEST BENCHSB Acoustics and Parts Express Home Audio ApplicationsBy Vance Dickason
Products & Services Index
Motor Ring Dome
Tweeter, p. 21

��
���������� ���������� ���
�
������� ���� �������������
���
�� ������������
����������� ���������������
�������������������������������
��
����������������������������������
��� ��!""#$��%���
������&��������'�������� ��!$(#)
��%���
�
���� ����
*��� ��+���,������ ���-�������
���� �������� �-��� ���� ������ -�
�����
���,�������� ���+��� ���,������ �
���� �� .������������� ���� ���� ��
,�� �-�
,������� ������� ��� ��������� ����
� �/��.���� ��,��+��� ,��-�������0
� �*����
�������,�������������+���������-����
������������.����������������������������
������
,��-�������� ������,����� �+��� ����
��-�� �-� ���� ���,�����0� 1������ �/�
�������
���������������� ,��,������� ���,���
������ -������������������������ �����
�����
����������0� �� ���,�������+�� ��
�� �-� ������ �-� .��������� ������
�� ����
�������� ���,������ ���,��������
���+���� ��� ������.��� ��������� -��2
�����
���,������ ��������������+����� �����
������� ������������ �� �� ����� ,����
���+��
�.�������������������-������0��
.�����������--�������������������
���������
,��-��������������������,����������
��������-��2������������.�+��$��3
40�
�
!"� �#$� %�&��#%$�
*����,�,���,��������������������-����
�������-�.������������������������-�
���������,������
�-��������-��2�������������������
����������0��*������������,��,�����
���-�.������������
���,���������� ������� ���� ����
���� ���� ���� -���� ��� .�� �,����
�� -��� ����� ,�,���0��
5��������,��������-����������.��
����������������������������-��������
������������������
�/������,�����������+��������������
����������-��� ��,��+�����������
���� ����+����������
��������������0�����-��������,
�������������������.�������������.
���������������������
���� ��+��0� ��,�������+�� �����
��� �������� ����� ��� �� ����������� �.
�� ���� ,���������
���,������ ���� ������ ���������0�
������ ������ ����� ������ .���+�
��� �-� ���� ������
���,������0�
�
'"����#��% (�%���) (��#&*�����
��#��� �+*�*��) #���
�������� ��� �� ����� ���� ��2�� �
����� ������ ��� ���� ��� �� ��.��� �
-� ����� �����������
���������� ��������� ��������� ����
�,����� ���� ����6������� ,������0�
� �,,���������� -���
4 VOICE COIL
Industry News and DevelopmentsBy Vance Dickason
Neodymium Prices “Skyrocket” Voice Coil magazine has featured news about the continu-ally rising price of China-sourced Neodymium for several years. The consequences of this are obvious; however, the news is now showing up in other industry market-oriented publications such as CE Pro. Here is an excerpt from the July 13 article in CE Pro, written by James Knott titled, “Why Loudspeaker Prices Will Skyrocket”:
“Neodymium magnets used in low-profile loudspeakers
are set to increase in price by 40% on July 1. The cost for
the rare earth metal has risen by 1,400% since 2008. In
addition to skyrocketing prices for petroleum and copper
that have affected the cost of cabling, there is another loom-
ing crisis for the custom electronics industry: the increasing
price of neodymium, a rare-earth metal.
The magnets are instrumental in the manufacturing of
some low-profile loudspeakers from Definitive Technology,
Earthquake, Wisdom Audio, Totem Acoustic, BG Radia,
and Martin Logan. Not all manufacturers use neodymium
drivers, some use magnets made of ferrite, which has the
same properties as neodymium but requires a larger magnet.
Due to the rising prices of neodymium, Shin-Etsu
Chemical Co. Ltd., a neodymium supplier, raised its price
sponsors of “The Loudspeaker University” seminars
Liaison Between Materials,
Suppliers, & Audio Manufacturers
Technical Support for Headset,
Mic, Speaker & Manufacturers
Product Development
Sourcing Guidance
Test & Measurement
Instrumentation
MENLO
S C I E N T I F I C
Engineering Consulting
for the Audio Community
USA tel 510.758.9014
Michael Klasco
www.menloscientific.com
by 40%, effective July 1. According to Business China, it
is only a matter of time before the move trickles down to
U.S. manufacturers. Business China says the price for both
neodymium and dysprosium ‘continues to rise steeply due
to mining restrictions and the cutting of export quotas for
rare-earth minerals by China.’”
China exports more than 90% of the world’s rare-earth
metals and houses more than one third of the world’s
reserves, according to Business China. The market is con-
trolled by the Chinese government, which in recent years
has limited export quotas.
Neodymium Price Up 1,400%The price of neodymium has risen to RMB 1.4 million
per ton from RMB 100,000 per ton since the end of 2008,
when China issued a series of tightening measures for the
country’s rare-earth industry, according to a survey by the
21st
Century Business Herald. On June 3, 2010, Japan
enacted a series of emergency measures to prevent the
country’s consumer electronics manufacturing companies
from being held hostage by the price increase by China. The
Japanese government used 8.7 billion yen to buy rare-earth
metals in 2010.”
While Mr. Knott’s article focused on home audio loud-
speaker manufacturers, even harder hit will be pro sound
manufacturers which have been incorporating Neodymium
into large pro sound woofers and compression drivers for

AUGUST 2011 5AAUAAUAUAUAAAAAUAUAAUAUUUUAUAAAUAAAAAAUAAUAUAAAAAAAUAAUAAAAAAAAUAAAAUUUUUUAUAAAAAAAAAUAAUUUUAUUAUAAAAAAAAAUUAUAAAUAAAAAAAAUUUUUUAUUAAAAUUUUUUUUAUAAAAAAAAAUUAUAUAUAUUUUUUUAAAAAAAAAUAUUAUUUUAAAAAAUUUAAAAUAAAAAUUUUAAAAAUAAAAAUAAAAAAUAAAAA GUGGUGUGGUGUGUGUGUGUGUGUUGUGUGUGUGUGUGUUGUGUGUGUGUGUGGGGUGUGUGUUUGUGUGUGUUGUUGUUGGUGUGUGUUUUUUUUUUGUGUGGGGGGGUUUUUUGUGUGUUUUUGUGGUGGGGGGUGUUGUGGGGGUUUGUGUGGGGGGGUUUGUGGGGGUGUUUUUGUGGGGUUUUGUGGGGGUGUUUUUGGUGGGGGGGUUUUUGUGGGUUUUGGUGGUGGUUGUUGGGGGGUUUUGGGGUUGUUUUGUGUUGGGUUUGGGG STSTSTSSTSTSTSTSSTSSTSTSTSTSTSTSTSTSTTSTSTSSTSTSSTSSTSTSTSTSTSSTTSTTTTSTSTTTSSSSTSSTSTSTSSSTSTSTSTSTTTSTSSSSSSSSTSSSSTTTTTTSTTTTSSSTSSSTSTSSTSSTTSTTSTTTTTTSTSSSTSTSTSTSSTTTTSTSTTTSSTSSSSSSTTTTTTTSSSSSSTSTTSTTSTTTSSTSSTSTTSTTTTSTSTSSTSTTTTSTSSSSSTTTTTTTTTSSSSTTTSTSTTSTSSSSSSSTTTTSTSTSSSTSTSSSTTSTTSTTTSTSSTTTTSSSSTTSTSTTSSTSTSTTSTSTT 222 222222222222222 22 22222222222222222222222222222 222222 2 22222222222222222222222222222222 222222 222222 2 222222222 2222222 22222222222 2222222222222222222222010101010000010001011010101000001010010110000100000001011000000000100001110101000010100100010100001001111011000001001110001100001000010010000000001110100000101000101001000100010111000000001100100100011010001000111000001111111111111111111111111111111111111111111111111111111111 5
6 VOICE COIL
years. Brands like Eminence, B&C, Faital Pro, Eighteen
Sound, Beyma, and others will be forced into very high
price increases or need to return to huge and extremely
heavy ferrite magnets. This is the most serious supply prob-
lem facing the loudspeaker industry since DuPont decided
to stop selling Kapton for loudspeakers a few years ago.
Permanent Magnets 2010–2020Permanent Magnets 2010–2020 is a book designed to be a
resource for every sector of the Global Permanent Magnet
Industry including producers, users, fabricators and distrib-
utors, and industry suppliers. It is an important resource for
anyone seeking to understand today’s dynamics and plan-
ning for success in the ever-expanding Global Permanent
Magnet Industry. The authors have a combined experience
in the Permanent Magnet Industry totaling nearly
100 years, bringing a unique skill set and extensive
experience in their individual area of expertise.
This yields a first of its kind, comprehensive refer-
ence and resource. Permanent Magnets 2010–2020
includes 400 pages of useful data and information
that will be essential for anyone involved in the
Global Permanent Magnet Industry.
Here is the Table of Contents for Permanent Magnets 2010–2020:
The price of this strategic report is $5,000, so valuable,
but expensive.
The authors of this industry document are Walter Benecki,
Terry Clagett, and Stanley Trout. Here is a brief bio of each
contributor.
Walter T. Benecki—Walt graduated from Penn State
University in 1962 with B.S. and M.S. degrees in Ceramic
Engineering. He began his career with RCA as a devel-
opment engineer prior to earning an M.B.A. from the
University of Pittsburgh in 1965. For the next 24 years,
Walt held a variety of strategic planning, marketing, new
product development, and general management respon-
sibilities with Carborundum Abrasives Products, General
Electric, and Copperweld. In 1989, Walt was named
president of Arnold Engineering (now Arnold Magnetic
Technologies). By 2000, Arnold grew to become a
profitable worldwide enterprise with sales of $140
million. Arnold was one of the first companies in the
magnetics industry to establish Chinese alliances and
commit to manufacturing in mainland China. Walt
was president of the MMPA from 1994–1997. Since
2001, Walt has headed a consulting practice serving
the worldwide magnetics industry. He is currently a
member of the board of directors of SMMA, EMERF, and
Bunting Magnetics Company. Over the past 20 years,
Walt has been a principle or strategic advisor for 15 suc-
cessful acquisitions, dispositions or joint ventures within
the magnetics industry.
Terry K. Clagett —Terry is currently president and CEO
of WebMagnetics, Inc. Terry has more than 30 years of
experience in sales, sales management, market develop-
ment, marketing, and general management. He has served
the permanent magnet and sealant and adhesive equipment
industries at Colt Industries, the Allen-Bradley Company,
Crucible Steel, and Accumetric. Terry has experience estab-
lishing sales organizations serving the European, Canadian,
Chinese, Asian, and South and Central American markets,
including distribution networks. Terry’s permanent mag-
net expertise includes alnico, sintered and bonded ferrite,
samarium cobalt, and sintered and bonded neodymium
iron boron. He has executive management experience with off-
the-shelf and custom-designed equipment for dispensing
Voice Coil ISSN 1521-091X
Voice Coil
Publisher Editor
Contributing Editor
C. J. Abate ...................Editorial CoordinatorShannon Becker ...........Editorial AssistantShannon Barraclough ...Marketing DirectorJoyce Scheer .................GraphicsDebbie Lavoie ..............Customer Service
Submissions
Voice Coil, Segment, LLC
ADVERTISING
Voice Coil
Voice Coil
voicecoilmagazine.com/vcqual.html
Subscriptions to Voice Coil are available in printed and digital versions. To subscribe to the digital version, please visit our website
at www.audioXpress.com and complete a qualification form. When you qualify, you will receive an e-mail confirming your subscription. The current issue of each digital Voice Coil will be posted to www.gotomyvoicecoil.com at the end of the month. To access, use the link in the e-mail notification, or you can simply log in to the website to view your issue along with the archived issues. For questions relating to the digital issue, please go to the help page at www.audioxpress.com/digital_issue_help.htm.
For those overseas, the cost of a printed subscription is $150.00 per year. Please contact customer service or order your subscription online at www.audioXpress.com.
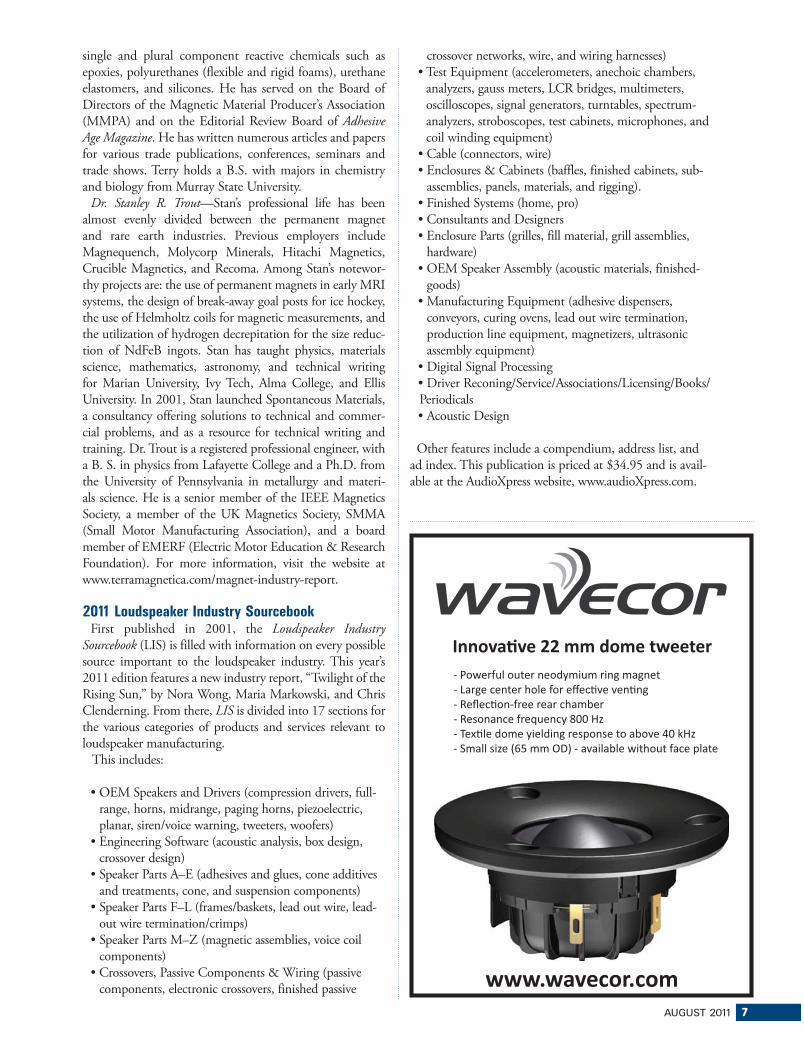
AUGUST 2011 7
single and plural component reactive chemicals such as
epoxies, polyurethanes (flexible and rigid foams), urethane
elastomers, and silicones. He has served on the Board of
Directors of the Magnetic Material Producer’s Association
(MMPA) and on the Editorial Review Board of Adhesive
Age Magazine. He has written numerous articles and papers
for various trade publications, conferences, seminars and
trade shows. Terry holds a B.S. with majors in chemistry
and biology from Murray State University.
Dr. Stanley R. Trout—Stan’s professional life has been
almost evenly divided between the permanent magnet
and rare earth industries. Previous employers include
Magnequench, Molycorp Minerals, Hitachi Magnetics,
Crucible Magnetics, and Recoma. Among Stan’s notewor-
thy projects are: the use of permanent magnets in early MRI
systems, the design of break-away goal posts for ice hockey,
the use of Helmholtz coils for magnetic measurements, and
the utilization of hydrogen decrepitation for the size reduc-
tion of NdFeB ingots. Stan has taught physics, materials
science, mathematics, astronomy, and technical writing
for Marian University, Ivy Tech, Alma College, and Ellis
University. In 2001, Stan launched Spontaneous Materials,
a consultancy offering solutions to technical and commer-
cial problems, and as a resource for technical writing and
training. Dr. Trout is a registered professional engineer, with
a B. S. in physics from Lafayette College and a Ph.D. from
the University of Pennsylvania in metallurgy and materi-
als science. He is a senior member of the IEEE Magnetics
Society, a member of the UK Magnetics Society, SMMA
(Small Motor Manufacturing Association), and a board
member of EMERF (Electric Motor Education & Research
Foundation). For more information, visit the website at
www.terramagnetica.com/magnet-industry-report.
2011 Loudspeaker Industry SourcebookFirst published in 2001, the Loudspeaker Industry
Sourcebook (LIS) is filled with information on every possible
source important to the loudspeaker industry. This year’s
2011 edition features a new industry report, “Twilight of the
Rising Sun,” by Nora Wong, Maria Markowski, and Chris
Clenderning. From there, LIS is divided into 17 sections for
the various categories of products and services relevant to
loudspeaker manufacturing.
This includes:
-
range, horns, midrange, paging horns, piezoelectric,
planar, siren/voice warning, tweeters, woofers)
crossover design)
and treatments, cone, and suspension components)
-
out wire termination/crimps)
components)
components, electronic crossovers, finished passive
crossover networks, wire, and wiring harnesses)
analyzers, gauss meters, LCR bridges, multimeters,
oscilloscopes, signal generators, turntables, spectrum-
analyzers, stroboscopes, test cabinets, microphones, and
coil winding equipment)
assemblies, panels, materials, and rigging).
hardware)
-
goods)
conveyors, curing ovens, lead out wire termination,
production line equipment, magnetizers, ultrasonic
assembly equipment)
Periodicals
ad index. This publication is priced at $34.95 and is avail-
able at the AudioXpress website, www.audioXpress.com.
������ ��!!�������"�����
"""#"������#���
�������������� ���������� ����� ������������ ���������������������� � ���������� ������������������������ � ������� ���� �!"��#�$��������������� �����%� ������������& �'!"��(�������"��)*+����,-.������������������������%����

8 VOICE COIL
LinearX LX500 Analyzer UpdateWhile no official release date has been announced by
LinearX, the company’s new LX500 LMS replacement ana-
lyzer is nearing completion. It’s probably unfair to call this a
replacement for LMS, as the LX500 is a substantially more
advanced analyzer than the highly successful LMS analyzer,
now nearly 20 years in use throughout the industry. Features
and capabilities of the new LX500 will include the following:
versions
Performance, measurements, 10
lengths
architecture
detectors, both for accurate
noise and signal measurements
Noise Immunity and 360°
continuous phase
limited noise generation th
th
multiplecurves
and hardware/software features
control of relays, servos, etc.
with traceable calibration
Noise immunity is an important focus for the LX500.
-
rate measurements in either low noise or high noise systems.
�����
��������������������������������
����������������� �������������������������������
�����������������������������������
[email protected] www.speakerpower.net
Fig. 1 - Latest block diagram for the LinearX LX500.
AUGUST 2011 9
Instrumentation designed for measurements where noise
is assumed to be small often perform poorly in high-noise
situations. Electroacoustic measurements often involve high
background noise and/or distortion which can create spe-
cific problems for many types of instrumentation.
For example, common measurements on most electri-
cal audio equipment easily achieve 100dB signal-to-noise
ratios (SNR). However, acoustic measurements are often
performed where the signal level is perhaps 90dBspl and the
background noise level is 60dBspl. This is an SNR of only
30dB, and presents vastly different problems for instrumen-
tation than measuring a system with 100dB SNR.
The architecture of the LX500 (see Figs. 1-4) was, accord-
ing to LinearX, specifically created for accurate signal mea-
surement in high noise systems where background noise is
substantially large and SNR is low. For example, the Phase
detector in the LX500 was designed based on SNR values
of merely 10dB, yet producing only 0.4° phase error. The
background noise is effectively averaged out. Conversely,
many other phase meters produce wildly erratic and
grossly inaccurate results when signals contain even modest
amounts of noise.
The LX500 features narrow band highly selective fil-
tering in order to measure harmonic distortion. Large
amounts of background noise are therefore eliminated.
The advanced programmable filters in the LX500 utilize 8
pole 1/12 octave Bandpass filters to isolate each harmonic,
producing 113dB of attenuation in one octave, enabling
individual harmonic distortion measurements down to
www.aes.org
CONFERENCE
October 20-232011EXHIBITS
October 21-232011
Jacob K. Javits Convention Center New York, NY
Fig. 4 - Internal view of the new LinearX LX500 Analyzer.
Fig. 2 - Front view of the new LinearX LX500 Analyzer.
Fig. 3 - Rear view of the new LinearX LX500 Analyzer.

10 VOICE COIL
0.0003% residual. For more information, visit the LinearX
website at www.linearx.com.
Eminence Releases New Loudspeaker Protection Device for Pro Audio and MI Markets
Eminence Speaker has announced an exclusive license
agreement with Evenstar, a wholly owned subsidiary of SLS
Audio, to use and sublicense their new D-fend technology
within the Professional Audio and Musical Instrument mar-
kets. D-fend is the industry’s first all-digital, programmable
loudspeaker protection and attenuation circuit designed
to solve the age-old problems associated with protecting
loudspeakers from excessive power conditions. D-fend has
eliminated the headaches for speaker engineers, so there is
no more hassling with polyswitches, blown lamp filaments,
lossy resistors, or slow relays.
Incorporating such features as digital signal processing
with on-board digital filtering, customizable microprocessor
and MOSFET construction, the D-fend protection circuit
enables a designer to use this technology prior to passive
filtration and allows different sensitivity settings in specific
frequency bands, such as woofer over-excursion bands or
high frequency peak damage regions.
Basically, the D-fend circuit acts as a high power, speak-
er-level compressor/limiter that will enable a loudspeaker
designer to guarantee levels of protection for multiple
components in unpowered loudspeakers. By incorporating
D-fend in their products, system designers, brand owners,
and facilities will have a new level of protection for pas-
sive loudspeaker systems. The graphs given in Figs. 1–3
illustrate how D-fend can be programmed to match a loud-
speaker’s power handling characteristics, including both
response time and required attenuation levels and compares
this to the standard “light bulb” technique. For additional
information on this new passive speaker protection device,
visit the Eminence website at www.eminence.com.
�
w w w . k l i p p e l . d e
SMALLa n d
L O U Ds p e a k e r s �
Increase Output – Shrink Size – Improve Performance!
�������� ��� ��� ������� �� � ���� �� ��������� �� ������������� �� ���� ������ �� � �������� ��������� �������������������� �� � ����������� ������������� ������� ��������������� �� ����� �� � � ������ ���������� �������� �� � ������� �� ��������������������������������!�����������"##$��� ����������������%
RE
QU
IRE
D A
TT
EN
UA
TIO
N (d
B)
INPUT POWER
TIM
E (sec)
DR
IVE
R R
MS
RA
TIN
G
Typical Loudspeaker Power Handling Performance
Fig. 1 - Loudspeaker power handing
graph.
RE
QU
IRE
D A
TT
EN
UA
TIO
N (d
B)
TIM
E (sec)
INPUT POWER
Typical Loudspeaker Power Handling PerformanceOverlaid with a lamp
RM
S R
AT
ING
LAMP
D-fend™
DR
IVE
R R
MS
RA
TIN
G
RE
QU
IRE
D A
TT
EN
UA
TIO
N (d
B)
TIM
E (sec)
INPUT POWER
Typical Loudspeaker Power Handling PerformanceOverlaid with D-fend™
Fig. 2 - Loudspeaker power handing
graph overlaid with lamp attenuation
performance.
Fig. 3 - Loudspeaker power handing
graph overlaid with Eminence D-fend
attenuation.
AUGUST 2011 11
CJS Labs Fundamentals of Electroacoustic Measurements Seminar
CJS Labs will be presenting a one-day seminar, enti-
tled “Fundamentals of Electroacoustic Measurements” on
Monday, October 24, 2011 in New York, immediately
following the AES 131st Convention. This course focuses
on measurements of electroacoustic transducers. The fun-
damentals of acoustics and electroacoustic measurements
are presented, including instrumentation, data interpreta-
tion, and information on how to perform appropriate tests.
Techniques for diagnosing problems in design and QC are
shown. Practical demonstrations are provided throughout
the course. This course is intended for technical persons
who are responsible for the electroacoustical performance
of loudspeakers, microphones, headphones, telephones,
hearing aids, or transducer-equipped media devices. R&D,
Q.C/Q.A., and Production-related topics are covered. The
level and content are appropriate for both novices and per-
sons with test and measurement experience. This training
will enable participants to perform accurate measurements
and provide them with the necessary tools to understand
and correctly interpret the results.
Topics covered in the CJS Seminar include:
Frequency Distortion Tests
The seminar will take place at the AMA Conference th Floor,
New York, NY 10019. CJS has been presenting this mate-
rial for some time, and has been highly successful, making
this a worthwhile course for engineers who need to come up
to speed on acoustic measurement technology. The tuition
is $399 for this seminar. Space is limited to 15 persons, so
contact CJS Labs to reserve your place. For more, visit the
CJS Labs website at www.cjs-labs.com. VC
Acoustic
Measurement
Technology.
12 VOICE COIL
ers and uncovers emerging talent in Architecture, Interior,
Product, Graphic, and Fashion design. At only 4.5" deep,
Leon’s Aaros A10-UT can be converted to a forward-firing
or down-firing position and placed in any room. With a
solid aluminum baffle and a highly specialized driver, it
also offers more tonal balance than traditional large subs,
according to the company. To demonstrate the possibilities
for customization, a subwoofer featured on the IDA web-
site includes a black leather-wrapped baffle in a cabinet
constructed out of solid African Wenge hardwood. Other
custom options include a zebra wood cabinet and a brushed
aluminum baffle.
To date, designers from more than 76 countries (on six
continents) have submitted their work for IDA consid-
eration. The 2011 panel of jurors included: Josh Rubin
(founder, Cool Hunting), Hans Fonk (editor-in-chief,
OBJEKT International), Lise Coirier (editor-in-chief, TL),
Aaron Kenedi (editor-in-chief, Print), William Menking
(editor-in-chief, The Architect’s Newspaper), and Alice
Blackwood (editor-in-chief, Design Quarterly). For a com-
plete list of 2011 IDA winners in the Product Design
category, visit the IDA website at www.idesignawards.com.
Alcons Audio Enters U.S. Market Dutch loudspeaker manufacturer, Alcons Audio, has
announced the formation of Alcons Audio USA, which sees
the company take its first significant steps toward penetrat-
ing the U.S. market. The move is set to bring the advantages
of Alcons Audio’s range of Pro-Ribbon solutions—from
point-source through line-source to line array—to a new
geographical market. Alcons Audio USA will be headed
by David Rahn, who most recently served as national sales
manager at Renkus Heinz, and Pauline Ortiz y Pino, a busi-
ness development specialist. The company will be based in
Dana Point, CA.
Klipsch Renovates WebsiteKlipsch has unveiled a new website renovation that will
benefit both the overall brand and consumer experience.
Now more user-friendly, informational, and easy to navi-
gate, the company’s website better mirrors the Klipsch
persona, providing updated content and features for deal-
ers and consumers. Upgraded design and new technol-
ogy play a major role in the new website. As part of the
upgrade, Klipsch has partnered with a retail-integrated
e-commerce solution provider for branded manufacturers,
distributors, and multi-channel retailers. Consumers will
benefit from a more convenient and efficient shopping
experience. The enhanced site architecture undoubtedly
makes it easier for consumers to find the products they
seek, and offers assistance in understanding how to best
utilize Klipsch Speakers. Photos, videos, and text on the
website have also been updated to reflect the most up-to-
date and detailed features and benefits available.
A new education center has also been created as an
overall hub of knowledge, working to expand consumers’
understanding of all things audio. It will include a variety
of tips regarding home theater installation and set up,
Howard Steps DownR. Brent Howard, president and founder of TruAudio,
officially announced that he will be stepping down as presi-
dent of Soundvision Technologies, which houses the brands
TruAudio, Forge Racks, and FatCat, for personal reasons.
Over the last six months, Howard had been more involved
in the design, manufacturing, and logistics of products
rather than day-to-day operations, so the actual internal
change should be minimal. Despite the current state of the
economy, Soundvision’s brands are in great shape, according
to Howard, and the company will continue to manufacture
products for the CI industry. Howard clarified that the
projects he is working on are still within the industry but
may not be directly connected to TruAudio, Forge Racks,
or FatCat. W. Bryan Garner, formerly the national sales
manager for TruAudio, has been named president.
Harary to Start GEM CEIndustry veteran Eli Harary, senior vice president of
global brand management at Boston Acoustics, is leaving
the company to start GEM CE, a consulting company
focused on the audio and CE businesses. No successor has
been named. Harary, who has worked in the Consumer
Electronics industry for 40 years, was with Boston Acoustics
for five years, previously held management positions at
Infinity and JBL, and owned and operated Paris Audio
stores in Los Angeles.
His new company, which opens for business August 1,
offers retail and manufacturer consulting, initially focused
on home audio but may include some pro audio. At the
supplier level, he will work with ODM manufacturers and
brands to aid with brand identity, product design, sourc-
ing, marketing, merchandising, and communications ser-
vices, he said. Retail consulting will include store design.
Harary said he’s leaving Boston Acoustics “in good
shape” and is “excited about moving on to my next great
adventure.” Harary started his CE career as owner of
Paris Audio, which he ran for 19 years and, at one point,
had three stores. In the early 1990s, Harary left retail to
join Harman, launching JBL’s Synthesis high-end audio
systems, and became JBL’s global VP of marketing. He
later became global brand manager of Harman’s Infinity
brand, before his promotion to Infinity sales and market-
ing senior VP. He went to Boston Acoustics in early 2006
as senior VP/GM. Harary’s last day at Boston Acoustics
was June 17.
Speakers Awarded IDA Leon Speakers has been awarded an International Design
Award (IDA) for the Aaros 10" Ultra-Thin Subwoofer. The
subwoofer took the Silver Award for Product Design in
the TV, Video, and Audio Equipment category. The IDA
recognizes and promotes the world’s most visionary design-
Industry WatchBy Vance Dickason

AUGUST 2011 13
along with many other features and educational mate-
rials. Updated Klipsch dealer locator information will
ultimately assist consumers in finding the nearest loca-
tions so they can see and hear the revolutionary products
first-hand in the store. To explore the new website and all
its features, visit http://www.klipsch.com.
Klipsch Group executives Fred Klipsch and Paul Jacobs
are changing duties at the company, but plan to stay
as part of a promise by Audiovox, the company’s new
owner. Audiovox agreed to retain Klipsch management
and the company’s culture and philosophy, according
to Audiovox president/CEO Pat Lavelle. Paul Jacobs,
Klipsch Group president/COO has been promoted to
president/CEO, and Fred Klipsch has relinquished his
CEO title, but will remain Klipsch Group chairman. He
will stand for election to the Audiovox Board of Directors
at the company’s annual meeting on July 21. The COO
position will not be filled. Klipsch Group is a wholly-
owned subsidiary of Audiovox, which purchased the
company in March 2011. Audiovox markets home audio
speakers and audio electronics under the Klipsch, Jamo,
Mirage, and Energy brands.
Fred Klipsch has led the organization since 1989, when
he and wife Judy purchased the company from cousin
and Klipsch founder Paul W. Klipsch. Paul Klipsch
started the company in 1946 and died in 2002, at age 98.
Jacobs joined the company in 1991 as a sales representa-
tive, promoted to regional manager and then to EVP of
In Europe:
intertechnik.de
In Asia:
baysidenet.jp
In Canada:
solen.ca
Distributed By:
Tel:800-338-0531725 Pleasant Valley Dr.Springboro, OH 45066
parts-express.com/vcm
Dayton Audio’s OmniMic is a must-have for system integrators, acoustic engineers, and A/V installers. It was
developed in collaboration with Liberty Audio, inventors of the Praxis analysis tool. The OmniMic provides quick and accurate measurements that will reduce installation time,
saving you both labor and money.
Just open the box and start testing in minutes!
Dayton Audio’s WT3 just got better—the same great features as before, but now perfect for incoming or end-of-line QC inspections! DIY speaker builders will also fi nd the new
capabilities useful when comparing multiple drivers for line array type systems. The WT3 is manufactured on state-of-the-art equipment and uses precision surface-mount components.
Try a WT3 and build better speaker systems!

14 VOICE COIL
be the most-owned CE device. Forty percent of televi-
sions in U.S. households are HDTVs, with LCD TVs the
preferred choice. Internet-connected TVs and 3-D TVs,
both included in the study for the first time this year, are
two new products driving video growth. In particular,
broadband-enabled TVs are expected to have a quick
uptake, with 10% of consumers planning to purchase an
Internet-connected TV in the next year. Household pen-
etration for LCD TVs grew the most of any CE device,
growing 12% year-over-year. Wireless CE products also
gained momentum among U.S. households. Ownership
of e-readers doubled to 13% over the past 12 months.
Additionally, more than one-third of households now
own a smartphone and almost one in 10 households
own a tablet computer. These products are expected to
see increased penetration in the marketplace this year as
they were among the top devices consumers intend to
purchase.
Subscriptions to movie rental services experienced a
40% growth year-over-year. With more than 28 mil-
lion subscribers, content providers have enabled access
to services directly through displays, game consoles, and
other set-top boxes connected to the Internet. Greater
broadband access will continue to increase streaming
video subscriptions, the study concluded. The study,
Trends in MRVA Usage, was conducted between January
27–31. It was designed and formulated by CEA Market
Research and is available free to CEA member companies
at members.CE.org.
Non-members may purchase the study for $999 at the
CEA Store.
Car Tech Week Raises Tech Awareness The Consumer Electronics Association (CEA) held its
first-ever Car Tech Week at retailers nationwide ending
Friday, May 27. CEA has worked with manufacturers,
retailers, and installers to raise consumer awareness about
in-vehicle and 12-V technologies and demonstrate to
consumers the many benefits of these products. For a
complete list of companies and retailers participating in
Car Tech Week, go to www.digitaltips.org.
Retailers hosted special events, promotions, and dem-
onstrations with knowledgeable staff, including installers
certified by the Mobile Electronics Certified Professional
(MECP) designation from CEA, to show consumers how
innovative technologies can be easily used in their cars to
keep them safe, entertained, and informed.
The MECP program is the only nationally recognized
program that certifies mobile electronics installation
technicians and salespeople on the installation techniques
and capabilities of automotive information technology,
entertainment, navigation and safety/security systems.
Sales of in-vehicle technology will reach a projected $9.3
billion in 2011—more than 2% higher than 2010 and
more than 12% higher than 2009. Additionally, CEA
expects a record line-up of automotive electronics exhibi-
tors at the 2012 International CES, January 10–13, 2012,
in Las Vegas. Audi, Ford, GM Onstar, Kia, and Toyota will
sales and marketing. As COO, he was responsible for all
national and international company operations, includ-
ing the strategic direction of the Klipsch, Jamo, Mirage,
and Energy brands. Jacobs becomes CEO following the
company’s most profitable year to date in 2010, said Fred
Klipsch, “and the momentum continues to build with
the introduction of over 30 new products this year.” The
group’s international sales have grown from 5 to 40% of
volume in the past five years, with the Klipsch, Jamo, and
Energy brands sold in China, other Asia/Pacific coun-
tries, Australia, Russia, South America, and throughout
Europe, the Middle East, and Africa.
Velodyne Expands DistributionPowered-subwoofer supplier Velodyne has expanded
distribution of its Chrysalis Acoustics brand of pow-
ered subwoofers to multiple regional distributors in
the U.S. and Canada to better reach custom installers,
the company announced. The brand, launched in May
2008, was originally developed by Velodyne to target
national catalog distributors, who remain the core of
the business. The products include in-room and in-wall
subwoofers. The new distributors are Allnet Distributing
(Illinois, Wisconsin, Indiana, and Kentucky), Big Dog
Distributing (Atlanta, Ga. and Nashville, Tenn.), Bursma
Electronic Distributing (Michigan, Ohio and Western
Pennsylvania), Cardinal Sales (New York City) and
Pacific Cabling Solutions (British Columbia, Canada).
The distributors sell Chrysalis products to dealers pre-
approved by Velodyne. Chrysalis offers four series: the
Install Advantage series of in-wall subs; the Photon series
of small, Class-D-powered in-room subs; the Bass Matrix
series of DSP-equipped subs with remote controls; and
the Starfire series of subs promoted as affordable and styl-
ish. Velodyne-brands subs are sold through reps as well
as through regional distributors, whose dealers must be
preapproved to get the products.
U.S. Consumer Spending DropsThe average U.S. household spent $1,179 on consumer
electronics (CE) products in the past 12 months, down
$201 from last year’s findings, according to a new study
released by the Consumer Electronics Association (CEA).
CEA’s 13th annual Household CE Ownership and
Market Potential Study found that the average adult
spent $652 on CE products in the past 12 months, down
from $794 the 12 months prior. Women spent, on aver-
age, $520 on CE, down $111 from last year’s study. Men
reported personally spending $793, down $176 from 12
months ago. The average household reports owning 24
discrete CE products, down slightly from 25 devices last
year. Consumer ownership of most devices has increased
despite consumers spending less on CE in the past year.
Several factors have led to a decrease in spending, includ-
ing changes in consumer purchase patterns, product
consolidation, decreasing price points, and the high
unemployment rate.
The study also found that video products continue to

AUGUST 2011 15
be coming back to the show in 2012, and Mercedes returns
to the show for the first time since 2001. With a record six
automotive companies onsite, in-vehicle technology exhibits
at the 2012 International CES will span more than 80,000
net square feet of exhibit space.
Harman Offers Training ProgramsHarman JBL Synthesis is offering training and certifica-
tion programs for its ARCOS Adaptive Room Correction
and Optimization System. To receive ARCOS certifica-
tion, installers, distributors, or acoustical/theater design
consultants must complete a training program given
by JBL Synthesis. Certification is given at two levels,
Master and Standard. Completing the Standard-level
course will qualify the attendee to calibrate JBL Synthesis
systems using ARCOS. Completing the Master-level
course will give a person Standard-level training, and
additional training that makes them factory authorized to
qualify a JBL Synthesis/Harman High Performance AV
(HPAV) installation as a Factory-Certified JBL Synthesis
Calibrated Theater.
To complete the Standard level course, an attendee
must be an employee of an authorized JBL Synthesis U.S.
dealer or international distributor, and must complete
the ARCOS factory calibration training course with JBL
Synthesis Field Application Engineer. For completion of
the Master level course, a participant must currently oper-
ate or be an employee of an acoustical consulting or the-
ater design firm, purchase an ARCOS calibration kit, and
pay an annual usage license. In addition, a Master-level
company cannot be an installer or integrator of home the-
ater products. Upon completing the Master-level course,
attendees will receive a Certificate of Completion, an offi-
cial listing on all HPAV websites (JBL Synthesis, Lexicon,
Mark Levinson and Revel), and access to software updates
and technical support.
The first Harman ARCOS Calibrator Training Master-
Level Course was held March 15–16, 2011 at the Harman
Northridge, CA facility. The following consultants attend-
ed: Keith Yates (KYDG), Anthony Grimani (PMI), Adam
Pelz and Jim Harber (Quest Acoustical Interiors).
Best Buy’s Sales DropIncreased promotions, higher transportation costs, and
disrupted digital imaging shipments contributed to soft
sales and falling profits during Best Buy’s first fiscal quarter.
Net earnings declined 12.3% to $136 million for the three
months, ended May 28, on net revenue of $10.9 billion, a
1.4% gain. Comp-store sales slipped 1.7% company-wide.
In the U.S., revenue was essentially flat at $7.9 billion while
comp-store sales fell 2.4%. Operating income declined 21%
to $234 million, compared with a 10% decline company-
wide to $282 million.
U.S. gross profit declined 3% to $2 billion, compared
with a 6% increase overseas to $798 million, as the domestic
gross profit rate declined by 60 basis points. Best Buy attrib-
uted the drop to increased promotions to drive improved
revenue; industry-wide supply interruptions of digital imag-
16 VOICE COIL
ing products due to the earthquake and tsunami in Japan;
higher transportation costs; and a large, annual vendor
rebate in the first quarter of 2010 that impacted year-over-
year comparisons. Partially offsetting the declines was a 28%
spike in cell phone sales, a 12% increase in online revenue,
and a 20% increase in subscriptions and other “connection”
sales in the U.S. The company also pointed to strength in
mobile computing and tablets, as well as e-readers, appli-
ances and warranty, and repair and installation services,
but reported weakness in TV, digital imaging, and physical
media.
Broken out by category, domestic store sales for the newly
combined computing and mobile phone categories rose
4.7%, to 40% of the mix; major appliance sales rose 2.9%,
to 6% of the mix; CE products, including TV and digital
imaging, declined 6.8%, to 35% of the mix; entertainment,
including music and movies, fell 13.1%, to 12% of the mix;
and services remained flat at 6% of the mix.
New Engineering Briefs for AES ConventionsWhile the usual Call for Papers was issued for the upcom-
ing Audio Engineering Society (AES) 131st Convention—
taking place this year in New York City, October 20–23—
something new has been added, Engineering Briefs.
According to the AES, AES convention attendees have
expressed a desire for more application-oriented papers. The
current Convention Papers and Posters are often research-
oriented, but the AES has a lot of engineers and practitio-
ners who would appreciate presentations of a more practical
nature. At the London AES Convention, the AES instituted
a new presentation format, called Engineering Briefs, which
are now available on the AES website.
These are intended to be short verbal talks or poster pre-
sentations that will be of interest to AES members. For the
New York convention, posters or short 15-minute verbal
presentations will be allowed. Contributors to the 131st
Convention had to supply a short synopsis by July 15, 2011,
to indicate their desire to present an Engineering Brief, fol-
lowed later by an electronic manuscript. These manuscripts
will be freely available for download for any AES member
during and after the Convention, but there will be no paper
copies.
Topics for the Engineering Briefs can be wide-ranging,
such as studio experience, equipment construction, new
loudspeaker concepts, room acoustic measurements, analysis
of audio equipment, and project studio startups, to name just
a few. Relaxed reviewing of submissions will consider mainly
whether they are of interest to AES convention attendees
and are not overly commercial. Double-column electronic
manuscripts following the prescribed template will be
restricted to four pages in length, and are due by August 30,
2011. For more information on the new Engineering Brief
format, visit the AES website at www.aes.org.
ALMA Winter Symposium 2012 Program and Call for Papers
ALMA, the International Loudspeaker Association, is
pleased to announce new dates and a new location for the
AUGUST 2011 17
2012 Winter Symposium. ALMA will meet starting on the
last day of CES, Friday, January 13, and Saturday, January
14, and will meet in a new location, the Riviera Hotel, in
Las Vegas. The theme of the Winter Symposium program
is “Loudspeakers: The Next 50 Years.”
The ALMA Winter Symposium will overlap and parallel
The International Conference on Consumer Electronics
(ICCE), presented by the IEEE Consumer Electronics
Society, which will take place January 13–16, in the North
Hall of the Las Vegas Convention Center, an easy commute
to The Riviera.
ALMA’s board of directors, in consideration of the pro-
gram theme relating to the future of loudspeakers, agreed
to facilitate opportunities for knowledge-sharing by paral-
leling the two programs and moving to this new location.
The ICCE is where key technologies, products, services,
and architectures for consumer entertainment and informa-
tion delivery are first presented (see www.icce.org for more
information).
Winter Symposium exhibitor and attendee information
will be posted soon on ALMA’s website. Hotel rooms
are blocked at The Riviera under the CES from January
6–15 and under ALMA, the International Loudspeaker
Association, from January 13–16.
A Call for Papers has been issued for ALMA
International’s 2012 Winter Symposium. Technical
papers are invited and abstracts will be evaluated on the
basis of their overall quality and relevance to the theme of
the symposium, relevance, and value to the loudspeaker
industry, and practical feasibility and usage of topic and
information presented. Each paper session is scheduled
to last 30 minutes, and up to four papers will be selected.
Presenters should submit to ALMA:
reprinting in pre-symposium promotional literature
-
phy of the presenter(s)
The closing date for the submission of abstracts is
September 15, 2011. Notification of Presenters will be by
October 15, 2010. Presenters must be able to supply cop-
ies of thier presentation in electronic format (PowerPoint,
MS Word or PDF) by December 15, 2011. Submissions
should be e-mailed to management@almainternational.
org. For more information, visit the ALMA website, at
www.almainternational.org. VC
Renew your subscription to Voice Coil.
Renew annually on-line at
voicecoilmagazine.com/vcqual.html
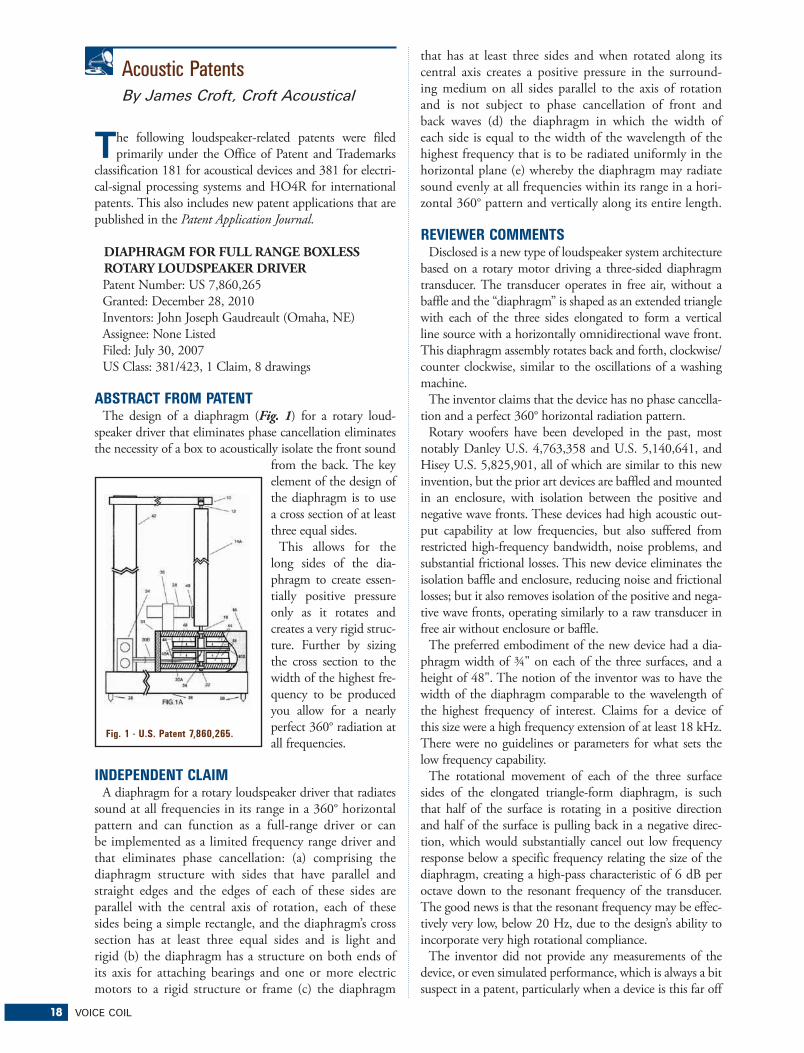
18 VOICE COIL
The following loudspeaker-related patents were filed
primarily under the Office of Patent and Trademarks
classification 181 for acoustical devices and 381 for electri-
cal-signal processing systems and HO4R for international
patents. This also includes new patent applications that are
published in the Patent Application Journal.
DIAPHRAGM FOR FULL RANGE BOXLESS ROTARY LOUDSPEAKER DRIVERPatent Number: US 7,860,265
Granted: December 28, 2010
Inventors: John Joseph Gaudreault (Omaha, NE)
Assignee: None Listed
Filed: July 30, 2007
US Class: 381/423, 1 Claim, 8 drawings
ABSTRACT FROM PATENTThe design of a diaphragm (Fig. 1) for a rotary loud-
speaker driver that eliminates phase cancellation eliminates
the necessity of a box to acoustically isolate the front sound
from the back. The key
element of the design of
the diaphragm is to use
a cross section of at least
three equal sides.
This allows for the
long sides of the dia-
phragm to create essen-
tially positive pressure
only as it rotates and
creates a very rigid struc-
ture. Further by sizing
the cross section to the
width of the highest fre-
quency to be produced
you allow for a nearly
perfect 360° radiation at
all frequencies.
INDEPENDENT CLAIMA diaphragm for a rotary loudspeaker driver that radiates
sound at all frequencies in its range in a 360° horizontal
pattern and can function as a full-range driver or can
be implemented as a limited frequency range driver and
that eliminates phase cancellation: (a) comprising the
diaphragm structure with sides that have parallel and
straight edges and the edges of each of these sides are
parallel with the central axis of rotation, each of these
sides being a simple rectangle, and the diaphragm’s cross
section has at least three equal sides and is light and
rigid (b) the diaphragm has a structure on both ends of
its axis for attaching bearings and one or more electric
motors to a rigid structure or frame (c) the diaphragm
that has at least three sides and when rotated along its
central axis creates a positive pressure in the surround-
ing medium on all sides parallel to the axis of rotation
and is not subject to phase cancellation of front and
back waves (d) the diaphragm in which the width of
each side is equal to the width of the wavelength of the
highest frequency that is to be radiated uniformly in the
horizontal plane (e) whereby the diaphragm may radiate
sound evenly at all frequencies within its range in a hori-
zontal 360° pattern and vertically along its entire length.
REVIEWER COMMENTSDisclosed is a new type of loudspeaker system architecture
based on a rotary motor driving a three-sided diaphragm
transducer. The transducer operates in free air, without a
baffle and the “diaphragm” is shaped as an extended triangle
with each of the three sides elongated to form a vertical
line source with a horizontally omnidirectional wave front.
This diaphragm assembly rotates back and forth, clockwise/
counter clockwise, similar to the oscillations of a washing
machine.
The inventor claims that the device has no phase cancella-
tion and a perfect 360° horizontal radiation pattern.
Rotary woofers have been developed in the past, most
notably Danley U.S. 4,763,358 and U.S. 5,140,641, and
Hisey U.S. 5,825,901, all of which are similar to this new
invention, but the prior art devices are baffled and mounted
in an enclosure, with isolation between the positive and
negative wave fronts. These devices had high acoustic out-
put capability at low frequencies, but also suffered from
restricted high-frequency bandwidth, noise problems, and
substantial frictional losses. This new device eliminates the
isolation baffle and enclosure, reducing noise and frictional
losses; but it also removes isolation of the positive and nega-
tive wave fronts, operating similarly to a raw transducer in
free air without enclosure or baffle.
The preferred embodiment of the new device had a dia-
phragm width of ¾" on each of the three surfaces, and a
height of 48". The notion of the inventor was to have the
width of the diaphragm comparable to the wavelength of
the highest frequency of interest. Claims for a device of
this size were a high frequency extension of at least 18 kHz.
There were no guidelines or parameters for what sets the
low frequency capability.
The rotational movement of each of the three surface
sides of the elongated triangle-form diaphragm, is such
that half of the surface is rotating in a positive direction
and half of the surface is pulling back in a negative direc-
tion, which would substantially cancel out low frequency
response below a specific frequency relating the size of the
diaphragm, creating a high-pass characteristic of 6 dB per
octave down to the resonant frequency of the transducer.
The good news is that the resonant frequency may be effec-
tively very low, below 20 Hz, due to the design’s ability to
incorporate very high rotational compliance.
The inventor did not provide any measurements of the
device, or even simulated performance, which is always a bit
suspect in a patent, particularly when a device is this far off
Fig. 1 - U.S. Patent 7,860,265.
Acoustic PatentsBy James Croft, Croft Acoustical

AUGUST 2011 19
the beaten path and includes questionable attributes.
There are two aspects of this design that raise concern.
First, the low frequency capability would appear to be self-
cancelling, with the apparent opposite phases being radiated
off of each diaphragm surface. Again, the fall-off rate is only
a slow 6 dB/octave below the cutoff frequency, but that cut-
off frequency may be well above 1 kHz for the given design
example that is claimed to be a “full range” device.
A second issue is the phase variations off the diaphragm
surfaces and what artificial spatial effects the device might
exhibit. If one reviews the comments on the PlanotSpeaker.
com website, both by the inventor and users of the system,
they suggest that one can use a single device and still achieve
a spacious sound field even in mono, with sound sources
appearing far removed from the location of the device.
Some listeners even suggested being able to hear sounds
coming from behind them. This would indicate that a
rather severe phase anomaly is being generated by the sys-
tem, which is consistent with an analysis of the wave launch
characteristics of the rotational, open baffle diaphragm. A
phase coherent line source should, when fed a mono signal,
maintain a well-anchored and focused image.
There are some attributes that should be positive, such as
the fact the diaphragm surfaces can be so small, it should be
possible to have the diaphragm breakup modes be very well
behaved. It should also be possible to make effective moving
mass and moment of inertia quite small. The inherent abil-
ity for the system to be expressed as a seamless line source
should have a good result. It is clearly an interesting, innova-
tive concept, but it remains to be seen as to whether it can
be a practical device in terms of delivering lower frequency
acoustic output and also whether it can project an accurate
sonic image.
I look forward to seeing some test results and hearing a
demo.
WAVEGUIDE ELECTROACOUSTICAL TRANSDUCING
Patent Application Number: US 2009/0214066
Published: August 27, 2009
Inventors: Robert Preston Parker (Westborough,
MA); Eric J Freeman (Sutton, MA); Jeffrey J Hoefler
(Westwood, MA)
Assignee: Bose Corporation
Filed: February 21, 2008
US Class: 381/339, 33 Claims, 22 drawings
REVIEWER COMMENTSBose has been refining the high efficiency, lossless, quarter-
wave resonant pipe approach to low frequency reproduc-
tion since their first tuned pipe patent (U.S. 4,628,528)
and products (Acoustic Wave Music System and the Bose
Cannon) in 1984. The original device had a waveguide
attached to the backside of the woofer/transducer and a sec-
ond, shorter waveguide attached to the front of the woofer.
More recent expressions of the Bose waveguide architec-
tures have incorporated a singular waveguide loading just
one side of the woofer diaphragm, with the other side of
the woofer diaphragm radiating directly into the listening
environment.
With this approach there remains a problem that is the
scourge of all quarter wave pipe and transmission line
systems; the problem of a significant dip in the amplitude
response at the frequency for which the pipe/waveguide
length is equal to one-wavelength. This problem exists
simply because the back wave of the transducer is out of
phase with the front wave. So, after the rear wave travels one
wavelength, the phase rotates 360°. Therefore the output at
the waveguide exit is out of phase with the direct radiation
of the front side of the transducer diaphragm, resulting
in destructive interference between the output from the
waveguide exit and the radiation from the direct radiating
surface, causing a reduction in acoustic output from the
loudspeaker apparatus at the one-wavelength cancellation
frequency. For a 25-Hz quarter-wave pipe, this cancellation
shows up at approximately 100 Hz.
One solution to this problem was expressed in an earlier
Bose patent, U.S. 7,426,280, reviewed in a previous issue
of Voice Coil. The solution presented in this invention
comprises a loudspeaker assembly, including an acoustic
waveguide with at least one electroacoustic driver mounted
in the waveguide such that a first surface radiates sound
waves into the waveguide so that sound waves are radi-
ated from the exit of the waveguide. An acoustic volume is
acoustically coupled to the acoustic waveguide. The acoustic
volume operates as a Helmholtz absorption chamber that
is tuned to the 1-wavelength cancellation frequency of the
waveguide. Applying this approach, the waveguide energy
is reduced over a narrow band centered at the 1-wavelength
frequency, thereby substantially eliminating the destructive
interference of the waveguide output and the direct output
of the electroacoustic driver.
This device, (Fig. 2) with the improvement from the
application of the Helmholtz chamber, both smoothes
the response and increases the woofer system’s upper fre-
quency-range by approximately one octave. The improved
waveguide technology is incorporated into the new Bose
VideoWave 46" television, which utilizes six miniature
woofers coupled to the waveguide. As quarter-wave pipe
woofer systems go, this one should operate effectively; with
smoother response than most prior art quarter wave pipe
topologies.
HIGH OUTPUT SUB-WOOFERPatent Number: U.S. 7,953,239
Granted: May 31, 2011
Fig. 2 - U.S. Patent 2009/0214066.

20 VOICE COIL
Inventors: William Andrew
Decanio (Castaic, CA)
Assignee: Harman International Industries,
Incorporated (Northridge, CA)
Filed: February 16, 2007
U.S. Class: 381/349, 15 Claims, 2 drawings
ABSTRACT FROM PATENTFor a speaker system (Fig. 3) that contains an enclosure
having at least six sides, at least two active transducers are
mounted inside the enclosure. Each active transducer is ori-
ented to project from one of the sides. At least four passive
radiators are mounted inside the enclosure. Each passive
radiator is oriented to project from one of the sides. The
number of active transducers and passive radiators equals
the number of sides on the enclosure.
INDEPENDENT CLAIMA speaker system comprising: an enclosure having at least
six sides; at least two active transducer assemblies, each
active transducer assembly including at least one active
transducer, mounted on the enclosure, each active trans-
ducer assembly oriented to project from opposite sides of
the enclosure; and at least four passive radiator assemblies,
each passive radiator assembly including at least one passive
radiator, mounted on the enclosure, each passive radiator
assembly oriented to project from opposite sides of the
enclosure, where the number of active transducer assem-
blies plus passive radiator assemblies equals the number of
sides on the enclosure.
A system comprising: an external amplifier connected
to a plurality of speakers, the amplifier operable to couple
audio signals to the speakers; at least one of the plurality of
speakers including a subwoofer, the subwoofer having: an
enclosure with at least six sides; at least two active trans-
ducer assemblies mounted on the enclosure, each active
transducer assembly is oriented to project from opposite
sides; and at least four passive radiator assemblies mounted
on the enclosure, each passive radiator assembly is oriented
to project from one of the sides, where the number of active
transducer assemblies plus passive radiator assemblies equals
the number of sides on the enclosure.
REVIEWER COMMENTSFor the last two decades high-out-
put, deep-bass capability in compact
subwoofers has been a significant mar-
ket demand and engineering chal-
lenge. One challenge faced by speaker
designers is making subwoofers more
compact without losing cubic volume
displacement capability. This is in
respect to both excursion and dia-
phragm surface area. While there has
been significant and successful devel-
opment achieving very high X-max
drivers, the smaller and smaller enclo-
sure dimensions have restricted the
maximum diameter and surface area of the transducer
diaphragm.
To minimize excursion in the active driver(s) it is standard
to implement the enclosure system as a Helmholtz resona-
tor, with a passive acoustic radiator such as a vent or passive
diaphragm radiator. Due to high acoustic masses required
in small bass reflex enclosures, the vent size tends to be too
large to be practical, so high mass passive diaphragm radia-
tors are the common choice. It is generally understood that
the passive radiator cubic volume displacement requirement
is at least twice that of the active driver.
An additional issue in these small low-frequency enclo-
sures is that of vibration and, in some cases, enclosure
“hopping” due to very high forces causing the small,
relatively lightweight enclosure to move about. This has
been substantially cured by applying active drivers to
opposite sides of the woofer enclosure, which minimizes
the vibrations by way of opposing cancellation. Reduced
size while maintaining extended low-frequency bandwidth
has been successfully realized from a number of different
approaches, but large-signal, low-distortion capability at
the lowest frequencies continues to be a challenge in the
miniaturized devices.
In an attempt to address the above issues, the invention
provides a speaker system that includes a standard enclo-
sure with six sides. Two active transducers are mounted on
opposite facing enclosure sides, and four passive radiators
are mounted on the remaining four sides of the enclosure.
Each passive radiator is mounted on opposite enclosure
sides to enable acoustic summation and address mechanical
force cancellation.
In summation, the number of active transducers and pas-
sive radiators used in the system equals the number of sides
on the enclosure to maximize the total diaphragm area for a
given enclosure surface area. There is no discussion of how
this system would be mounted on the floor. It is assumed
that one surface of the enclosure could face downward, with
standoffs creating a slot-loaded exit for the diaphragm on
that particular surface, be it active or passive.
One mounting approach to this type of system that has
been used in the past is to mount the enclosure on a point
that is the intersection of three sides providing a "sus-
pended" appearance that enables all diaphragms to radiate
freely, with equivalent loading, and
provides an interesting appearance.
In the prior art, there have been
enclosures with an active driver
and passive radiators on all remain-
ing sides, active drivers on all sides,
and enclosures with multiple active
transducers and multiple passive
radiators, but, it is possible that
there has not been a commercial
device that fully duplicates the
exact architecture of the device
disclosed in this patent. Properly
implemented, it should be a very
effective subwoofer system. VCFig. 3 - U.S. Patent 7,953,239.
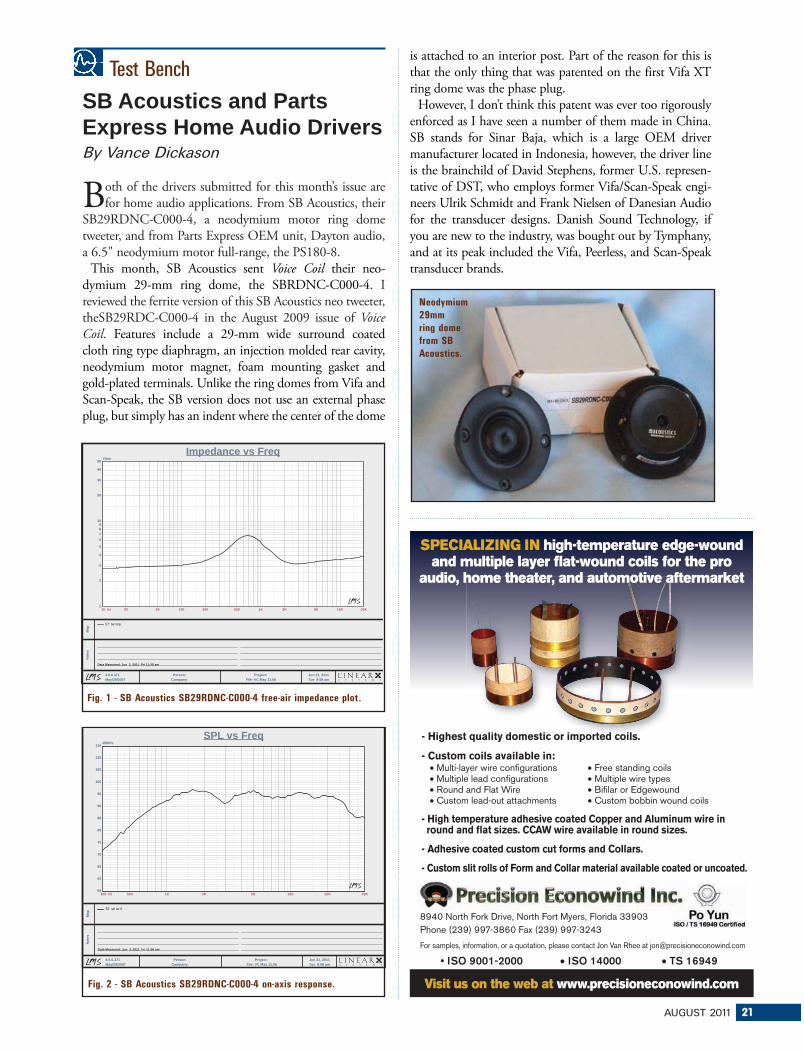
AUGUST 2011 21
is attached to an interior post. Part of the reason for this is
that the only thing that was patented on the first Vifa XT
ring dome was the phase plug.
However, I don’t think this patent was ever too rigorously
enforced as I have seen a number of them made in China.
SB stands for Sinar Baja, which is a large OEM driver
manufacturer located in Indonesia, however, the driver line
is the brainchild of David Stephens, former U.S. represen-
tative of DST, who employs former Vifa/Scan-Speak engi-
neers Ulrik Schmidt and Frank Nielsen of Danesian Audio
for the transducer designs. Danish Sound Technology, if
you are new to the industry, was bought out by Tymphany,
and at its peak included the Vifa, Peerless, and Scan-Speak
transducer brands.
- Custom coils available in: Multi-layer wire configurations Multiple lead configurations Round and Flat Wire Custom lead-out attachments
Free standing coils Multiple wire types Bifilar or Edgewound Custom bobbin wound coils
- High temperature adhesive coated Copper and Aluminum wire in round and flat sizes. CCAW wire available in round sizes.
- Adhesive coated custom cut forms and Collars.
- Custom slit rolls of Form and Collar material available coated or uncoated.
8940 North Fork Drive, North Fort Myers, Florida 33903Phone (239) 997-3860 Fax (239) 997-3243
For samples, information, or a quotation, please contact Jon Van Rhee at [email protected]
Visit us on the web at www.precisioneconowind.com
- Highest quality domestic or imported coils.
SPECIALIZING IN high-temperature edge-wound and multiple layer flat-wound coils for the pro
audio, home theater, and automotive aftermarket
SB Acoustics and Parts Express Home Audio DriversBy Vance Dickason
Both of the drivers submitted for this month’s issue are
for home audio applications. From SB Acoustics, their
SB29RDNC-C000-4, a neodymium motor ring dome
tweeter, and from Parts Express OEM unit, Dayton audio,
a 6.5" neodymium motor full-range, the PS180-8.
This month, SB Acoustics sent Voice Coil their neo-
dymium 29-mm ring dome, the SBRDNC-C000-4. I
reviewed the ferrite version of this SB Acoustics neo tweeter,
theSB29RDC-C000-4 in the August 2009 issue of Voice
Coil. Features include a 29-mm wide surround coated
cloth ring type diaphragm, an injection molded rear cavity,
neodymium motor magnet, foam mounting gasket and
gold-plated terminals. Unlike the ring domes from Vifa and
Scan-Speak, the SB version does not use an external phase
plug, but simply has an indent where the center of the dome
Data Measured: Jun 3, 2011 Fri 11:06 am
Person:
Company:
Project:
File: VC May 11.lib
Jun 21, 2011
Tue 9:08 am
4.6.0.371
May/29/2007
No
tes
Map
52: sb tw 0
300 Hz 500 1K 2K 5K 10K 20K 40K
dBSPL
55
60
65
70
75
80
85
90
95
100
105
110
115
SPL vs Freq
Fig. 2 - SB Acoustics SB29RDNC-C000-4 on-axis response.
Data Measured: Jun 3, 2011 Fri 11:25 am
Person:
Company:
Project:
File: VC May 11.lib
Jun 21, 2011
Tue 8:58 am
4.6.0.371
May/29/2007
No
tes
Map
57: tw imp
10 Hz 20 50 100 200 500 1K 2K 5K 10K 20K
Ohm
1
2
3
4
5
6
7
8
910
20
30
40
50
Impedance vs Freq
Fig. 1 - SB Acoustics SB29RDNC-C000-4 free-air impedance plot.
Test Bench
Neodymium
29mm
ring dome
from SB
Acoustics.
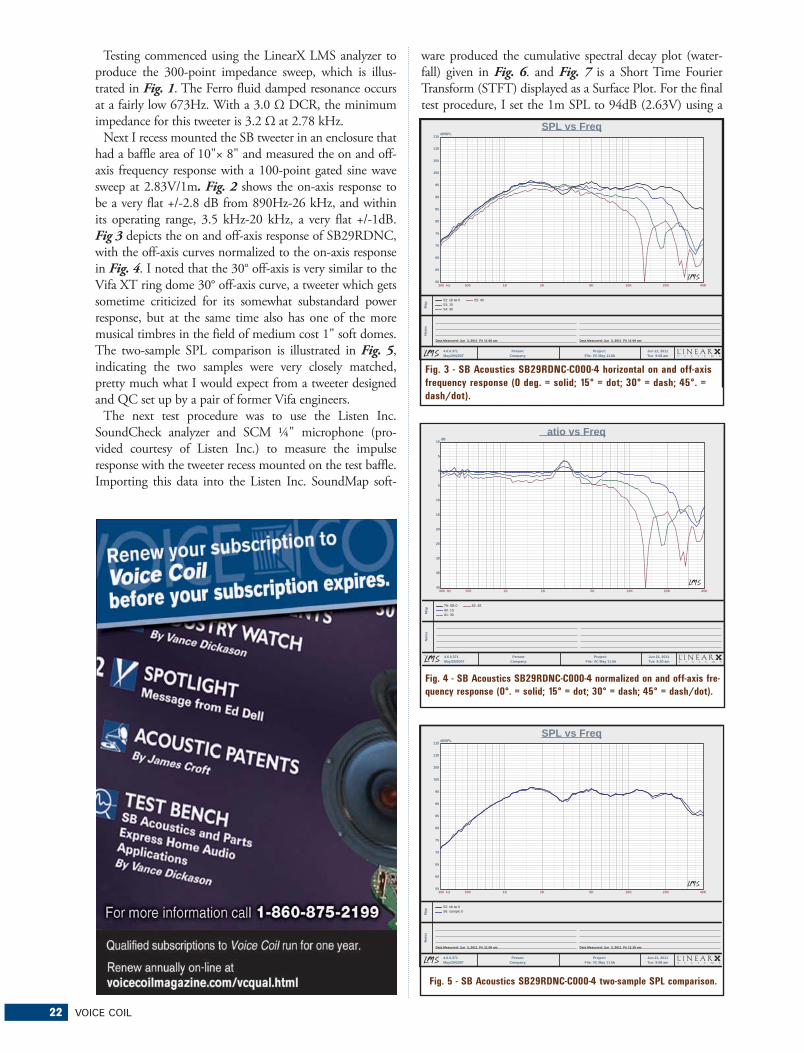
22 VOICE COIL
Testing commenced using the LinearX LMS analyzer to
produce the 300-point impedance sweep, which is illus-
trated in Fig. 1. The Ferro fluid damped resonance occurs
at a fairly low 673Hz. With a 3.0 Ω DCR, the minimum
impedance for this tweeter is 3.2 Ω at 2.78 kHz.
Next I recess mounted the SB tweeter in an enclosure that
had a baffle area of 10"× 8" and measured the on and off-
axis frequency response with a 100-point gated sine wave
sweep at 2.83V/1m. Fig. 2 shows the on-axis response to
be a very flat +/-2.8 dB from 890Hz-26 kHz, and within
its operating range, 3.5 kHz-20 kHz, a very flat +/-1dB.
Fig 3 depicts the on and off-axis response of SB29RDNC,
with the off-axis curves normalized to the on-axis response
in Fig. 4. I noted that the 30° off-axis is very similar to the
Vifa XT ring dome 30° off-axis curve, a tweeter which gets
sometime criticized for its somewhat substandard power
response, but at the same time also has one of the more
musical timbres in the field of medium cost 1" soft domes.
The two-sample SPL comparison is illustrated in Fig. 5,
indicating the two samples were very closely matched,
pretty much what I would expect from a tweeter designed
and QC set up by a pair of former Vifa engineers.
The next test procedure was to use the Listen Inc.
SoundCheck analyzer and SCM ¼" microphone (pro-
vided courtesy of Listen Inc.) to measure the impulse
response with the tweeter recess mounted on the test baffle.
Importing this data into the Listen Inc. SoundMap soft-
ware produced the cumulative spectral decay plot (water-
fall) given in Fig. 6. and Fig. 7 is a Short Time Fourier
Transform (STFT) displayed as a Surface Plot. For the final
test procedure, I set the 1m SPL to 94dB (2.63V) using a
Data Measured: Jun 3, 2011 Fri 11:06 am Data Measured: Jun 3, 2011 Fri 11:09 am
Person:
Company:
Project:
File: VC May 11.lib
Jun 21, 2011
Tue 9:08 am
4.6.0.371
May/29/2007
No
tes
Map
52: sb tw 0
53: 15
54: 30
55: 45
300 Hz 500 1K 2K 5K 10K 20K 40K
dBSPL
55
60
65
70
75
80
85
90
95
100
105
110
115
SPL vs Freq
Fig. 3 - SB Acoustics SB29RDNC-C000-4 horizontal on and off-axis
frequency response (0 deg. = solid; 15° = dot; 30° = dash; 45°. =
dash/dot).
Person:
Company:
Project:
File: VC May 11.lib
Jun 21, 2011
Tue 9:30 am
4.6.0.371
May/29/2007
No
tes
Ma
p
79: SB 0
80: 15
81: 30
82: 45
300 Hz 500 1K 2K 5K 10K 20K 40K
dB
40
35
30
25
20
15
10
5
0
5
10
atio vs Freq
Fig. 4 - SB Acoustics SB29RDNC-C000-4 normalized on and off-axis fre-
quency response (0°. = solid; 15° = dot; 30° = dash; 45° = dash/dot).
Data Measured: Jun 3, 2011 Fri 11:06 am Data Measured: Jun 3, 2011 Fri 11:16 am
Person:
Company:
Project:
File: VC May 11.lib
Jun 21, 2011
Tue 9:08 am
4.6.0.371
May/29/2007
No
tes
Map
52: sb tw 0
56: sample b
300 Hz 500 1K 2K 5K 10K 20K 40K
dBSPL
55
60
65
70
75
80
85
90
95
100
105
110
115
SPL vs Freq
Fig. 5 - SB Acoustics SB29RDNC-C000-4 two-sample SPL comparison.

AUGUST 2011 23
noise stimulus, and measured the 2nd and 3rd harmonic
distortion at 10cm, depicted in Fig. 8. For more informa-
tion on this and other SB Acoustics drivers, visit the SB
Acoustics website at www.sbacoustics.com.
The second driver to be tested this month is a new one
from Parts Express Dayton OEM division, the full-range
6.5" PS180-8. Large diameter (5.25"-8") full-range driv-
ers have a rather cult following in the world of audiophile
home speakers, both manufactured and DIY built. Fostex
was probably one the early providers of transducers for this
type of driver and is still popular today. Other driver manu-
facturers such as Lowther and Mark Audio have also figured
prominently in this type of format. When I was a judge at
Saati has woven the Acoustex line to ensure predictablesound transparency, consistent acoustical damping for tweeters,planar speakers, headphones, mic wind screens, mobile devices & other transducers
� Acoustically transparent mesh� Acoustical damping barriers� Moisture and dust protection� Conductive screens -EMI/RFI shielding� Regulates and controls airflow� Fabric dyed to any color� Hyphobe™ water-repellent treatment� Special MET™ metallized finishes
REFINE YOUR DESIGNS AND CONTROL OVERLOOKED VARIABLES WITH SAATI ACOUSTEX MESH
Transparency Damping
ACOUSTEX LINE
006-010-020-025-032-045-065-075-090-145-160-260
ITALY39-031-891333Paolo [email protected]
USA914-232-7781Paul [email protected]
CHINA86-13821090034Fabrizio [email protected]
CONTACT
Fig. 7 - SB Acoustics SB29RDNC-C000-4 SoundCheck STFT Surface
intensity plot.
Fig. 6 - SB Acoustics SB29RDNC-C000-4 SoundCheck CSD
Waterfall plot.
Fig. 8 - SB Acoustics SB29RDNC-C000-4 SoundCheck Distortion plots.

24 VOICE COIL
heat sink for the neodymium motor. The cone assembly is
comprised of a light-weight paper cone and paper whizzer
cone to extend the upper frequency response. Compliance
is provided by an “M” shaped pleated cloth surround,
making the format a lot like a pro sound driver, using the
same techniques to achieve high efficiency. This was done
so as to make the driver easier to drive with low Watt class
A amplifiers such as single triode tube designs. Remaining
compliance comes from a 3.5" diameter flat cloth spider.
The motor design on the Dayton PS180 is rather sophis-
ticated (due in part to the transducer consulting work
performed by Patrick Turnmire of Red Rock Acoustics) and
includes and undercut T-pole with a copper cap as well as
a copper plated articulated phase plug/shorting gap glued
to the top of the pole (this will be obvious when you see
the shallow reactive upper rise in the drivers 1V impedance
curve).
The neodymium ring magnet motor is FEA designed
using a 1" diameter voice coil with copper wire wound on
a non-conducting Kapton former. Motor parts, the T-yoke
and front plate are coated with a black heat emissive coat-
ing for improved cooling (no other vents such as pole or
peripheral back plate vents are used). Last the voice coil is
terminated to a pair of chrome color coated push terminals.
Cosmetically speaking, this is very good looking driver.
I began analysis of the PS180 using the LinearX LMS ana-
lyzer and Vibox to create both voltage and admittance (cur-
rent) curves with the driver clamped to a rigid test fixture
one of Parts Express's sponsored DIY speaker contests a few
years back, certainly large diameter (6.5" and 8") full-range
drivers were well represented. The feeling among the group
of practitioners in this narrow spectrum of loudspeaker
design formats is that a well executed full-range 6.5" is
capable of providing the most “realistic” audio experience of
any other format. Enter the new Dayton PS180 full-range
6.5" neodymium motor transducer.
Starting with the frame, PE utilized cast aluminum frame
incorporating six 5mm diameter vent holes in the area below
the spider mounting shelf, plus the frame well as providing a
Seems simple enough.Since 1994, the B&C DE75 two inch high frequency driver has been an industry leader. Since 1994, every DE75 has sounded identical.
We understand that consistency is critical. Getting a sample to sound great seems simple enough. Getting the next 25,000 to sound the same? Not so simple. Tradition. Dedication. Knowledge.
B&C SPEAKERS spa
via Poggiomoro 1, località VallinaI-50012 Bagno a Ripoli (Firenze) tel. +39 055 65721fax +39 055 6572312 [email protected]
www.bcspeakers.com made in Italy
DE75. DE75. DE75. DE75. DE75. DE75. DE75. DE75. DE75. DE75.
Person:
Company:
Project:
File: VC May 11.lib
Jun 21, 2011
Tue 11:59 am
4.6.0.371
May/29/2007
No
tes
Map
59: 1V
10 Hz 20 50 100 200 500 1K 2K 5K 10K 20K
Ohm
1
2
5
10
20
50
100
Impedance vs Freq
Fig. 9 - Dayton PS180 full-range free-air impedance plot.

AUGUST 2011 25
in free-air at 0.3V, 1V, 3V, 6V and 10V. As with almost all
6.5" drivers, the 10V curves were too nonlinear for LEAP to
get a reasonable curve fit and were discarded. As has become
the protocol for Test Bench testing, I no longer use a single
added mass measurement and instead used actual measured
mass, but the manufacturers measured Mmd data (6.28
grams). Next, the remaining eight 550-point stepped sine
wave sweeps for each PS180 sample were post-processed
and the voltage curves divided by the current curves (admit-
tance) to derive impedance curves, phase added by the LMS
calculation method, and along with the accompanying
voltage curves, imported to the LEAP 5 Enclosure Shop
software.
Since the most Thiele-Small data provided by the major-
ity of OEM manufacturers is generated using either the
standard model or the LEAP 4 TSL model, I additionally
created a LEAP 4 TSL parameter set using the 1V free-air
curves. The complete data set, the multiple voltage imped-
ance curves for the LTD model (see Fig. 9 for the 1V free-
air impedance curve) and the 1V impedance curve for the
TSL model were selected in the transducer derivation menu
in LEAP 5 and the parameters created for the computer
box simulations. Table 1 compares the LEAP 5 LTD and
TSL data and factory parameters for both of Parts Express
PS180-8 samples.
LEAP parameter Qts calculation results for the PS180 ACO Pacific, Inc. 2604 Read Ave., Belmont, CA 94002, USA
Tel: 650-595-8588 Fax: 650-591-2891www.acopacific.com [email protected] Begins With ACO™
ICP1248
PhantomtoICP
7052PH/MK224PH
Phantom
7052ETitanium DiaphragmNow 4 Hz to >25+kHz<20 dBA >140 dBSPL
MK224 Optional
4048 Preamp2 uV “A” > 5 Vrms
4 Hz > 100 kHz18 to 60 Vdc
Now in Stock
Accelerometers,Mics&mo r e
IEPE
3-4 mA
PoweredMeasurement Mic
System
IEC61094-4Compliant
Long-term StabilityTemp and Humidity
Performance
Table 1 – Dayton PS180-8 Full-range
TSL model LTD mode Factory sample 1 sample 2 sample 1 sample 2 FS 55.9Hz 51.7Hz 54.2Hz 50.1Hz 48.2Hz REVC 6.38 6.18 6.38 6.18 6.32 Sd 0.0137 0.0137 0.0137 0.0137 NAQMS 4.16 5.91 4.09 6.13 3.86 QES 0.31 0.27 0.34 0.30 0.24 QTS 0.29 0.27 0.31 0.29 0.23 VAS 29.9 ltr 35.0 ltr 2.1 ltr 37.6 ltr 40.5 ltr SPL 2.83V 94.2dB 94.3dB 93.6dB 93.8dB 94.7dB XMAX 4.6mm 4.6mm 4.6mm 4.6mm 4.6mm
Person:Company:
Project:File: VC Jan 11.led
Jun 21, 2011Tue 12:01 pm
nclosurehop5.2.0.363 May/14/2007
No
tes
Ma
p
171: P 1 0 vt1 2. 3V F3 9Hz
173: P 1 0 vt1 7.5V 102.7d
175: P 1 0 vt2 2. 3V F3 60Hz
177: P 1 0 vt1 7.5V 101d
10 Hz 20 50 100 200 500 1K
d P
60
65
70
75
0
5
90
95
100
105
110
P vs Freq
Fig. 10 - Dayton PS180 computer box simulations (black solid =
vented 1 @ 2.83V; Blue dash = vented 2@ 2.83V; black solid =
vented 1@ 7.5V; blue dash = vented 2 @ 7.5V).

26 VOICE COIL
were somewhat higher compared to the factory data.
Although the preliminary factory data showed some varia-
tion, I followed my usual protocol and proceeded setting
up computer enclosure simulations using the LEAP LTD
parameters for Sample 1. Two computer vented box simu-
lations were programmed into LEAP 5, one QB3 with a
0.34ft3 volume tuned to 67Hz and an Extended Bass
Shelf (EBS) vented enclosure with a 0.73ft3 volume tuned
to 60Hz, both enclosures simulated with 15% fiberglass
damping material.
Fig. 10 displays the results for the Dayton PS180-8 in
the two vented boxes at 2.83V and at a voltage level suf-
ficiently high enough to increase cone excursion to Xmax
+ 15% (5.3mm for the PS180). This produced a F3 fre-
quency of 89Hz (F6 = 75Hz) for the QB3 enclosure and
–3dB = 60Hz (F6 = 53Hz) for the EBS vented simulation.
Increasing the voltage input to the simulations until the
maximum linear cone excursion was reached resulted in
102.7dB at 7.5V for the QB3 enclosure simulation and
101dB for the same 7.5V input level for the larger vented
box (see Figs. 11 and 12 for the 2.83V group delay curves
and the 7.5V excursion curves). Note that because both
drivers reach maximum excursion at about 20Hz, a steep
Person:Company:
Project:File: VC Jan 11.led
Jun 21, 2011Tue 12:01 pm
nclosurehop5.2.0.363 May/14/2007
No
tes
Ma
p
172: 2. 3V roup elay
176: 2. 3V roup elay
10 Hz 20 50 100 200 500 1K
ec
0
5m
10m
15m
20m
Time vs Freq
Fig. 11 - Group Delay curves for the 2.83V curves in Fig.10.
Person:Company:
Project:File: VC Jan 11.led
Jun 21, 2011Tue 12:03 pm
nclosurehop5.2.0.363 May/14/2007
No
tes
Ma
p
174: 7.5V cursion
17 : cursion p r
10 Hz 20 50 100 200 500 1K
M
100u
200u
500u
1m
2m
5m
10m
cursion vs Freq
Fig. 12 - Cone excursion curves for the 7.5V curves in Fig. 10.
Fig. 15 - Klippel Analyzer Mechanical Stiffness of Suspension Kms
(X) curve for the Dayton PS180.
Fig. 13 - Klippel Analyzer Bl (X) curve for the Dayton PS180.
Fig. 14 - Klippel Analyzer Bl Symmetry Range curve for the Dayton
PS180.
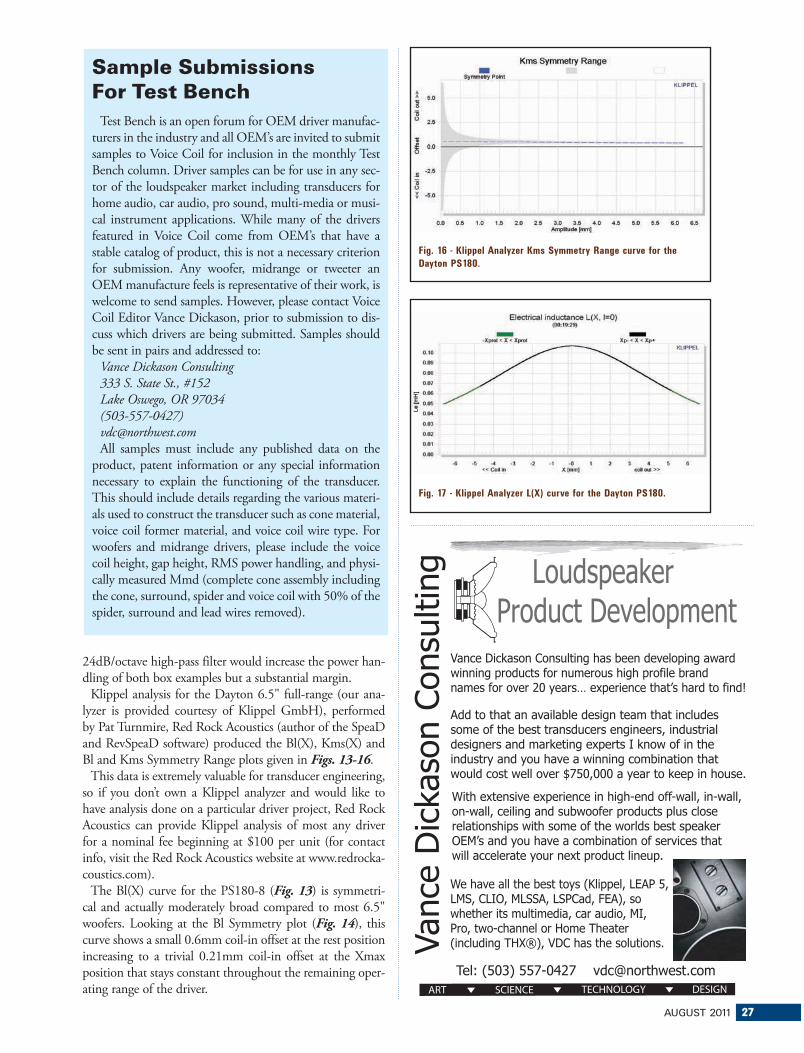
AUGUST 2011 27
24dB/octave high-pass filter would increase the power han-
dling of both box examples but a substantial margin.
Klippel analysis for the Dayton 6.5" full-range (our ana-
lyzer is provided courtesy of Klippel GmbH), performed
by Pat Turnmire, Red Rock Acoustics (author of the SpeaD
and RevSpeaD software) produced the Bl(X), Kms(X) and
Bl and Kms Symmetry Range plots given in Figs. 13-16.
This data is extremely valuable for transducer engineering,
so if you don’t own a Klippel analyzer and would like to
have analysis done on a particular driver project, Red Rock
Acoustics can provide Klippel analysis of most any driver
for a nominal fee beginning at $100 per unit (for contact
info, visit the Red Rock Acoustics website at www.redrocka-
coustics.com).
The Bl(X) curve for the PS180-8 (Fig. 13) is symmetri-
cal and actually moderately broad compared to most 6.5"
woofers. Looking at the Bl Symmetry plot (Fig. 14), this
curve shows a small 0.6mm coil-in offset at the rest position
increasing to a trivial 0.21mm coil-in offset at the Xmax
position that stays constant throughout the remaining oper-
ating range of the driver.
Sample Submissions For Test Bench
Test Bench is an open forum for OEM driver manufac-
turers in the industry and all OEM’s are invited to submit
samples to Voice Coil for inclusion in the monthly Test
Bench column. Driver samples can be for use in any sec-
tor of the loudspeaker market including transducers for
home audio, car audio, pro sound, multi-media or musi-
cal instrument applications. While many of the drivers
featured in Voice Coil come from OEM’s that have a
stable catalog of product, this is not a necessary criterion
for submission. Any woofer, midrange or tweeter an
OEM manufacture feels is representative of their work, is
welcome to send samples. However, please contact Voice
Coil Editor Vance Dickason, prior to submission to dis-
cuss which drivers are being submitted. Samples should
be sent in pairs and addressed to:
Vance Dickason Consulting
333 S. State St., #152
Lake Oswego, OR 97034
(503-557-0427)
All samples must include any published data on the
product, patent information or any special information
necessary to explain the functioning of the transducer.
This should include details regarding the various materi-
als used to construct the transducer such as cone material,
voice coil former material, and voice coil wire type. For
woofers and midrange drivers, please include the voice
coil height, gap height, RMS power handling, and physi-
cally measured Mmd (complete cone assembly including
the cone, surround, spider and voice coil with 50% of the
spider, surround and lead wires removed).
Fig. 16 - Klippel Analyzer Kms Symmetry Range curve for the
Dayton PS180.
Fig. 17 - Klippel Analyzer L(X) curve for the Dayton PS180.
Tel: (503) 557-0427 [email protected]
Loudspeaker Product Development
Vanc
e D
icka
son
Con
sulti
ng
Vance Dickason Consulting has been developing award winning products for numerous high profile brand names for over 20 years… experience that’s hard to find!
With extensive experience in high-end off-wall, in-wall, on-wall, ceiling and subwoofer products plus close relationships with some of the worlds best speaker OEM’s and you have a combination of services that will accelerate your next product lineup.
We have all the best toys (Klippel, LEAP 5,LMS, CLIO, MLSSA, LSPCad, FEA), so whether its multimedia, car audio, MI, Pro, two-channel or Home Theater (including THX®), VDC has the solutions.
Add to that an available design team that includes some of the best transducers engineers, industrial designers and marketing experts I know of in the industry and you have a winning combination that would cost well over $750,000 a year to keep in house.
28 VOICE COIL
Figs. 15 and 16 show the Kms(X) and Kms Symmetry
Range curves for the PS180. The Kms(X) curve is likewise
very symmetrical in both directions, but with a small for-
ward (coil-out) offset of about 0.5mm at the rest position
decreasing to 0.47mm coil-out offset at the physical Xmax
position, which means it stays mostly constant suggesting
ata Measured: Jun 3, 2011 Fri 10:50 am ata Measured: Jun 3, 2011 Fri 10:51 am
Person:
Company:
Project:
File: VC May 11.lib
Jun 21, 2011
Tue 12:36 pm
4.6.0.371
May/29/2007
No
tes
Map
: 1
: 15
9:
5 : 5
300 Hz 500 1K 2K 5K 10K 20K 40K
d P
55
60
65
70
75
0
5
90
95
100
105
110
115
P vs Freq
Fig. 19 - Dayton PS180 horizontal on and off-axis frequency
response (0° = solid; 15° = dot; 30° =dash; 45° = dash/dot).
ata Measured: Jun 3, 2011 Fri 10:50 am ata Measured: Jun 3, 2011 Fri 10:5 am
Person:
Company:
Project:
File: VC May 11.lib
Jun 21, 2011
Tue 12:36 pm
4.6.0.371
May/29/2007
No
tes
Map
: 1
51:
300 Hz 500 1K 2K 5K 10K 20K 40K
d P
55
60
65
70
75
0
5
90
95
100
105
110
115
P vs Freq
Fig. 20 - Dayton PS180 two-sample SPL comparison.
ata Measured: Jun 3, 2011 Fri 10:50 am
Person:
Company:
Project:
File: VC May 11.lib
Jun 21, 2011
Tue 12:36 pm
4.6.0.371
May/29/2007
No
tes
Map
: 1
300 Hz 500 1K 2K 5K 10K 20K 40K
d P
55
60
65
70
75
0
5
90
95
100
105
110
115
P vs Freq
Fig. 18 - Dayton PS180 on-axis and off-axis frequency response.
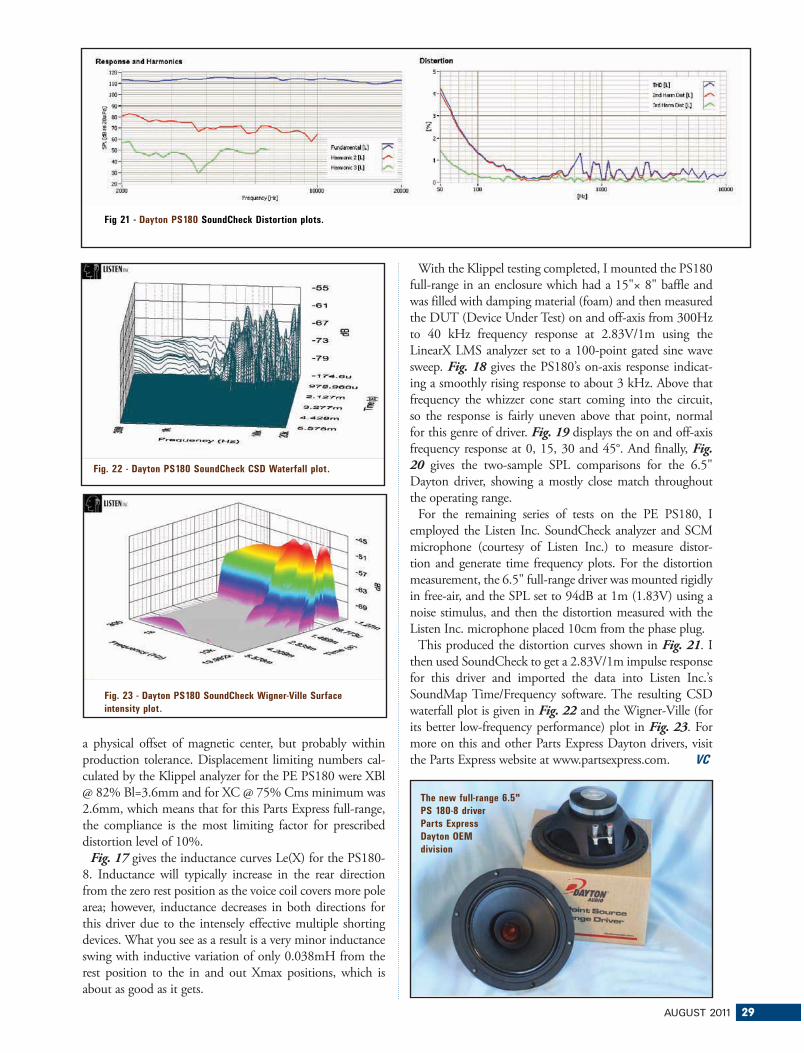
AUGUST 2011 29
a physical offset of magnetic center, but probably within
production tolerance. Displacement limiting numbers cal-
culated by the Klippel analyzer for the PE PS180 were XBl
@ 82% Bl=3.6mm and for XC @ 75% Cms minimum was
2.6mm, which means that for this Parts Express full-range,
the compliance is the most limiting factor for prescribed
distortion level of 10%.
Fig. 17 gives the inductance curves Le(X) for the PS180-
8. Inductance will typically increase in the rear direction
from the zero rest position as the voice coil covers more pole
area; however, inductance decreases in both directions for
this driver due to the intensely effective multiple shorting
devices. What you see as a result is a very minor inductance
swing with inductive variation of only 0.038mH from the
rest position to the in and out Xmax positions, which is
about as good as it gets.
Fig. 23 - Dayton PS180 SoundCheck Wigner-Ville Surface
intensity plot.
Fig. 22 - Dayton PS180 SoundCheck CSD Waterfall plot.
With the Klippel testing completed, I mounted the PS180
full-range in an enclosure which had a 15"× 8" baffle and
was filled with damping material (foam) and then measured
the DUT (Device Under Test) on and off-axis from 300Hz
to 40 kHz frequency response at 2.83V/1m using the
LinearX LMS analyzer set to a 100-point gated sine wave
sweep. Fig. 18 gives the PS180’s on-axis response indicat-
ing a smoothly rising response to about 3 kHz. Above that
frequency the whizzer cone start coming into the circuit,
so the response is fairly uneven above that point, normal
for this genre of driver. Fig. 19 displays the on and off-axis
frequency response at 0, 15, 30 and 45°. And finally, Fig. 20 gives the two-sample SPL comparisons for the 6.5"
Dayton driver, showing a mostly close match throughout
the operating range.
For the remaining series of tests on the PE PS180, I
employed the Listen Inc. SoundCheck analyzer and SCM
microphone (courtesy of Listen Inc.) to measure distor-
tion and generate time frequency plots. For the distortion
measurement, the 6.5" full-range driver was mounted rigidly
in free-air, and the SPL set to 94dB at 1m (1.83V) using a
noise stimulus, and then the distortion measured with the
Listen Inc. microphone placed 10cm from the phase plug.
This produced the distortion curves shown in Fig. 21. I
then used SoundCheck to get a 2.83V/1m impulse response
for this driver and imported the data into Listen Inc.’s
SoundMap Time/Frequency software. The resulting CSD
waterfall plot is given in Fig. 22 and the Wigner-Ville (for
its better low-frequency performance) plot in Fig. 23. For
more on this and other Parts Express Dayton drivers, visit
the Parts Express website at www.partsexpress.com. VC
Fig 21 - Dayton PS180 SoundCheck Distortion plots.
The new full-range 6.5"
PS 180-8 driver
Parts Express
Dayton OEM
division

30 VOICE COIL
CATEGORY KEY
A = ADHESIVES
B = CONSULTANTS & ENGINEERS
C = CROSSOVERS & PASSIVE COMPONENTS
D = DRIVERS
E = EMPLOYMENT OPPORTUNITIES
F = ENCLOSURES & ENCLOSURE PARTS
G = ENGINEERING/DESIGN SOFTWARE
H = FINISHED SYSTEMS
I = MAGNETS & EQUIPMENT
J = MANUFACTURING EQUIPMENT
K = MICROPHONES
L = PARTS
M = RECONING
N = TEST EQUIPMENT
O = VOICE COILS − COMPONENTS
& MATERIALS
P = TRANSDUCERS
Q = ACOUSTIC MESH
Products & Services Index
Advertiser Categories Page
ACO Pacific .................................... K,N ......................25
Audience ....................................... B,C,H ...................26
Audio Engineering Society.............................................9
B & C Speaker ................................ D .........................24
BMS Speakers GmbH ....................... D .........................17
HIVI, Inc. ..................................... D .........................31
Klippel GmbH ................................ G, N .....................10
Materion Electrofusion .................... B, L, O ...................3
Menlo Scientific, Ltd. .................... B ...........................4
One Magnet Electronic Co., Ltd. ...... I ..........................11
Parts Express ................................. L .........................13
Precision Econowind ...................... O .........................21
Prism Media Products ..................... G .........................32
Pulsus Technologies ....................... G ...........................2
Rotel Electronics ........................... B .........................23
Saati Tech ..................................... Q .........................23
Shinhint Industries ........................ H ...........................5
SM Audio Engineering Consulting ..... B .........................25
Solen Electronique, Inc. ................. C,D ......................16
SpeakerPower, Inc. ......................................................8
Suzuki Kanshi, Co. . ....................... L .........................15
Tang Band Industries Co. ................ D .................... 13,15
Vance Dickason .............................. B .........................27
Wavecor Ltd. ................................ F,H.........................7
Using Your Digital Issue
Preview all pages.View a list of archived issues.Flip to the cover. Flip to the previous page.Flip to mthe next page. Flip to the back cover. Search.Print.Download entire pdf. Toggle full screen. Help guide.Close.
Navigationbuttons.
Next page.
���#��(����������Z���the page manually.
Previouspage.
Be sure to check for rollover / hotspot buttons which allow you to jump to a page or URL.
This product/services index is provided as a value-added service to our readers and advertisers. The publisher will not be held liable for any errors or deletions contained herein.
Preview all pages.View a list of archived issues.Flip to the cover. Flip to the previous page.Flip to mthe next page. Flip to the back cover. Search.Print.Download entire pdf. Toggle full screen. Help guide.Close.
AUGUST 2011 31
...integrated
electronic test, acoustic test...
Prism Sound is now a globalsales & support agent for:
������������������� �������� ������������������������������������ ���������������������������������������������������������� ����������������
��������������������� ���������� ������������ ���������������������
������������������� !�����������������������������������������������������"������ ���������� �����#�������������������$�����%dScope Series III
analog and digitalaudio analyzers
������������������� ��������������������������������������������� �!"#�����$ ����
Loudspeaker design and analysis solutions

®
IN THIS ISSUE
1
16
8
20
28
CEDIA Expo Floor Show, p. 5
V O L U M E 2 4 , I S S U E 1 1 S E P T E M B E R 2 0 1 1
INDUSTRY NEWS AND DEVELOPMENTSBy Vance Dickason
SPOTLIGHTAutomated Perceptual Rub & Buzz DistortionBy Steve Temme
ACOUSTIC PATENTS By James Croft
TEST BENCHSB Acoustics and SEAS Drivers for Home Audio ApplicationsBy Vance Dickason
INDUSTRY WATCH By Vance Dickason
Products & Services Index
SEAS of Norway's New
Midbass Woofer, p. 21
Industry News and Developments By Vance Dickason
CEDIA Expo 2011 This year’s CEDIA (Custom Electronic Design & Installa-tion Association) Expo event is being held back at the Indiana Convention Center on September 7–10 in Indianapolis, IN. This will be the first Indianapolis CEDIA event since the re-modeling of the Indiana Convention Center several years ago. Indianapolis also happens to be CEDIA’s headquarters.
As usual, CEDIA University is providing a wide selection of
workshops, classes, and seminars related to the various aspects
of the AV install industry. Courses of interest to loudspeaker
industry persons include:
Fundamentals of Home Theater Design—Instructor: Jeff
Gardner—This course is the starting point for all other train-
ing in home theater system design. At the conclusion of this
course, participants should be able to:
video display options
considerations
Home Theater Room Design—Instructor: Sam Cavitt—The
room itself plays a huge role in how a home theater system
performs. A good design starts with room location, size and
shape, and also takes into consideration lighting, sight lines,
a good room designer can make you a better theater designer.
At the conclusion of this course, participants should be able to:
bass response
aesthetics
Home Theater and Acoustics Part I—Instructor: Dr. Floyd
Toole—This is Part I of a comprehensive three-part series that
covers how loudspeakers perform inside rooms. This course
30

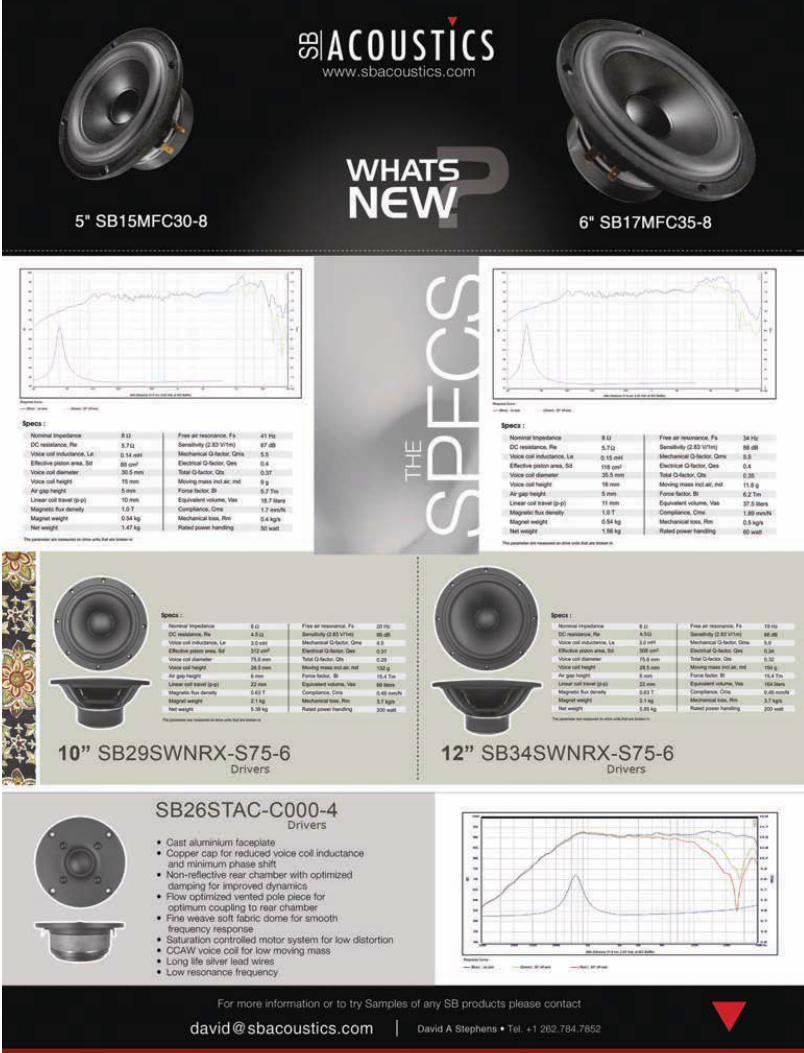
SB AcousticsFull Page

4 VOICE COIL
enables you to deliver the best possible results with your sur-
round sound system designs. At the conclusion of this course,
participants should be able to:
Home Theater and Acoustics Part II
sound reproduction in rooms. Build on the knowledge from
-
At the conclusion of this course, participants should be able to:
goals
specification
Home Theater and Acoustics Part III
Toole—This is the final installment in a comprehensive three-
part series on audio and acoustics in home theaters. Apply the
knowledge gained in the first two sessions to properly design
theater surround systems that meet the performance bench-
marks as well as the client’s budget and other constraints. At
the conclusion of this course, participants should be able to:
for smooth bass response
Advanced Home Theater Design Lab—
Grimani, Rich Green, and Jeff Gardner—This session pro-
the top designers in the industry facilitate the hands-on design
-
try standards in their work, including:
on client needs
with the rest of the home
Home Theater Design All-Star Panel
Theo Kalomirakis—Join a panel of industry icons and learn
how they have overcome real-world challenges to successfully
problems in the future.
Acoustical Treatments

SEPTEMBER 2011 5
Voice Coil, (ISSN 1521-091X), the Periodical of the Loudspeaker Industry, is published monthly by Segment, LLC, 4 Park St., Vernon, CT 06066 USA, (860) 875-2199, FAX (860) 871-0411.
Copyright 2011 by Segment, LLC. All rights reserved. Quotation from Voice Coil is forbidden without written permission of the publisher.
Publisher - Hugo Van haecke Editor - Vance Dickason (E-mail [email protected])
C. J. Abate.................Editorial CoordinatorShannon Becker ..............Editorial AssistantShannon Barraclough ....Marketing DirectorKC Prescott ...................................GraphicsJeff Yanco ....................................ControllerDebbie Lavoie ..................Customer ServiceValerie Luster.....Administrative Coordinator
SubmissionsSend all press releases and information to Voice Coil, Segment, LLC Editorial Dept., 4 Park St., Vernon, CT 06066, or FAX us material at (860) 871-0411, or e-mail [email protected].
ADVERTISING
Please direct display advertising inquiries to: Peter Wostrel, Account Manager, Strategic Media Marketing, USA, (978) 281-7708, or FAX 603-924-9467, Toll-free (800) 454-3741, e-mail [email protected].
Please direct classified and artwork inquiries to: Erica Fienman, Voice Coil, Segment, LLC, 4 Park St., Vernon, CT 06066, or FAX us material at (860) 871-0411, or e-mail [email protected].
Qualified subscriptions to Voice Coil run for one year. Renew annually on-line at voicecoilmagazine.com/vcqual.html
Subscriptions to Voice Coil are available in printed and digital versions. To subscribe to
the digital version, please visit our website at www.audioXpress.com and complete a qualification form. When you qualify, you will receive an e-mail confirming your subscription. The current issue of each digital Voice Coil will be posted to www.gotomyvoicecoil.com at the end of the month. To access, use the link in the e-mail notification, or you can simply log in to the website to view your issue along with the archived issues. For questions relating to the digital issue, please go to the help page at www.audioxpress.com/digital_issue_help.htm.
For those overseas, the cost of a printed subscription is $150.00 per year. Please contact customer service or order your subscription online at www.audioXpress.com.
Despite all the attention given to loudspeakers, most of the
sound heard in a theater is reflected, rather than direct. Clearly,
the room surfaces must be treated as a system component. Get
the inside scoop on acoustical treatments of all types from one
of Expo’s favorite presenters!
Audio Technologies for Technicians—Instructor: Dennis
Erskine—Learn about the fundamentals of the science of
audio and acoustics, including technologies and formats.
Apply the knowledge gained from this course regarding audio
reproduction and room acoustics to provide a better listening
experience for customers. At the conclusion of this course,
participants should be able to:
application of different types
Audio Set-Up and Calibration—Instructor: Gerry Lemay—
Explore the complex science of audio calibration within a
home theater setting. Participants receive the knowledge
required to effectively listen, properly utilize calibration
equipment, and efficiently perform an advanced home theater
audio calibration. At the conclusion of this course, partici-
pants should be able to:
CEDIA Expo has no doubt become the most important
show for home theater and distributed audio loudspeaker
manufacturers, so much so, that more than a few com-
panies have ceased exhibiting at CES in favor of CEDIA.
This year, one of the largest booths at the show, Runco,
is back. With some improvement in the overall CEDIA
target market, this year’s show will have a lot to offer
in terms of both education and exhibitors. The list of
loudspeaker manufacturers and other loudspeaker related
exhibitors at the 2011 CEDIA Expo includes: Adam Audio
B&K Components, B&W Group, Bay Audio, BG Radia
Corps., Boston Acoustics, B&W Group, Canton, California
Audio Technology, Cambridge Audio, Control 4, Crestron
Electronics, Current Audio, Definitive Technology, DesignQ,
Earthquake Sound, Elan Home Systems, Epson America,
Focal JMLab, Genelec, Harman International, Induction
Dynamics, James Loudspeaker, KEF America, Klipsch Group,
Krell Industries, Leon Speakers, Linear LLC, Martin Logan,
MB Quart, MK Sound, Monitor Audio, Monster, Mordaunt-
Short, Niles Audio, NuVo Technologies, Paradigm, Parts
Express, Phase Technology, Pioneer Electronics, Polk Audio,
Pro Audio Technology, Procella Audio, Proficient Audio, PSB
Speakers, RBH Sound, Rives Audio, Rockustics, Russound,
Snap AV, Sonance, SpeakerCraft, Stealth Acoustics, Steinway
Lyngdorf, Sunfire, Tannoy, Terra Speakers, The AVC Group,
THX Ltd., Tivoli Audio, Totem Acoustic, Triad Speakers,
Photo 1: CEDIA Expo floor show Photo 2: CEDIA Expo registration area

6 VOICE COIL
Wharfedale Loudspeakers, Wisdom Audio, Xantech, and
Yamaha Electronics Corporation. For more information on
this year’s CEDIA Expo, check out the CEDIA website at
www.cedia.net.
ALMA Winter Symposium 2012 “Loudspeakers: The Next 50 Years”
A “Call for Papers” has been issued for ALMA International’s
2012 Winter Symposium, “Loudspeakers: The Next 50
Years.” Technical papers are invited and abstracts will be evalu-
ated on the basis of their overall quality and relevance to the
theme of the symposium, relevance, and value to the loud-
speaker industry, and practical feasibility and usage of topic
and information presented. Each paper session is scheduled
to last 30 minutes, and up to four papers will be selected.
Presenters should submit to ALMA:
reprinting in pre-symposium promotional literature
biography of the presenter(s)
The closing date for the submission of abstracts is October 15,
2011. Notification of Presenters will be by October 31, 2011.
Presenters must be able to supply copies of their presentations
in electronic format by December 15, 2011 (PowerPoint, MS
Word, or PDF). Submissions should be e-mailed to manage-
This year’s ALMA Symposium starts on the last day of
CES and will be held January 13–14, at a new location, The
Riviera Hotel. Because of the new dates, ALMA’s Winter
Symposium will overlap The International Conference
on Consumer Electronics (ICCE), presented by the IEEE
Consumer Electronics Society, which takes place January
13–16, in the North Hall of the Las Vegas Convention
Center, an easy commute to The Riviera.
The ALMA Board of Directors, in consideration of the
loudspeakers theme, plans to facilitate opportunities for
knowledge-sharing by paralleling the two programs and mov-
ing to the new location. The ICCE is where key technologies,
products, services, and architectures for consumer entertain-
ment and information delivery are first presented (see www.
icce.org for more information).
Winter Symposium exhibitor and attendee information will
be posted on www.almainternational.org. Hotel rooms are
blocked at The Riviera under the CES from January 6–15 and
under ALMA, the International Loudspeaker Association,
from January 13–16.
New Drivers from TB-SpeakersTangBand Speakers has released their first new drivers
of 2011, the 25-1983 titanium dome tweeter and the
The 25-1983 features a reverse coated titanium dome with
foam rubber surround, Ferrofluid cooling, neodymium motor

SEPTEMBER 2011 7
who are responsible for the electroacoustical performance of
loudspeakers, microphones, headphones, telephones, hear-
ing aids, or transducer-equipped media devices. R&D,
Q.C/Q.A., and Production-related topics are covered. The
level and content are appropriate for both novices and persons
with test and measurement experience.
Topics in the CJS Seminar include:
Tests
8th (enter on 48th
worthwhile course for engineer’s needing to come up to speed
-
VC
Speakers website at www.tb-speaker.com.
CJS Labs Fundamentals of Electroacoustic Measurements Seminar
-
-st Convention. This course focuses on
measurements of electroacoustic transducers. The fundamen-
tals of acoustics and electroacoustic measurements are present-
ed, including instrumentation,
data interpretation, and infor-
mation on how to perform
appropriate tests. Techniques
for diagnosing problems in
design and QC are shown.
Practical demonstrations are
provided and this course is
intended for technical persons Acoustic Measurement
Technology
The TangBand woofer
w3-1876s
The TangBand 25-1983 tita-
nium dome tweeter
The TangBand 25-1983 titanium dome tweeter
The TangBand woofer w3-1876s
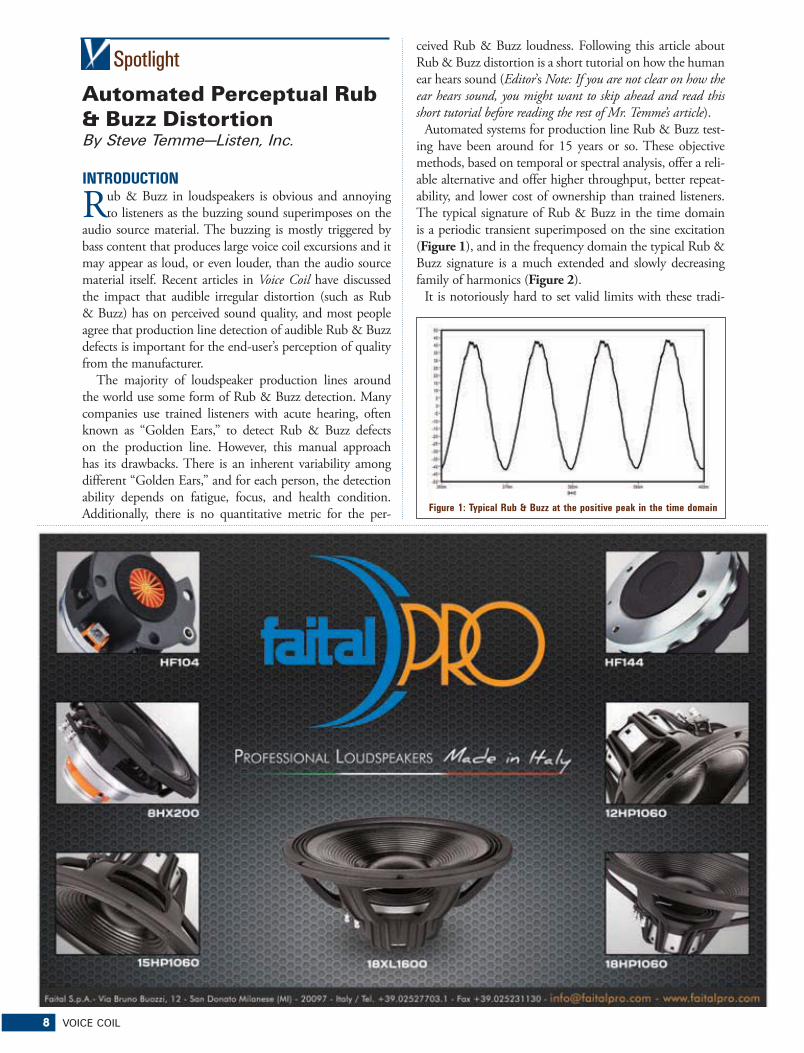
8 VOICE COIL
Automated Perceptual Rub & Buzz DistortionBy Steve Temme—Listen, Inc.
INTRODUCTION
Rub & Buzz in loudspeakers is obvious and annoying
to listeners as the buzzing sound superimposes on the
audio source material. The buzzing is mostly triggered by
bass content that produces large voice coil excursions and it
may appear as loud, or even louder, than the audio source
material itself. Recent articles in Voice Coil have discussed
the impact that audible irregular distortion (such as Rub
& Buzz) has on perceived sound quality, and most people
agree that production line detection of audible Rub & Buzz
defects is important for the end-user’s perception of quality
from the manufacturer.
The majority of loudspeaker production lines around
the world use some form of Rub & Buzz detection. Many
companies use trained listeners with acute hearing, often
known as “Golden Ears,” to detect Rub & Buzz defects
on the production line. However, this manual approach
has its drawbacks. There is an inherent variability among
different “Golden Ears,” and for each person, the detection
ability depends on fatigue, focus, and health condition.
Additionally, there is no quantitative metric for the per-
ceived Rub & Buzz loudness. Following this article about
Rub & Buzz distortion is a short tutorial on how the human
ear hears sound (Editor’s Note: If you are not clear on how the
ear hears sound, you might want to skip ahead and read this
short tutorial before reading the rest of Mr. Temme’s article).
Automated systems for production line Rub & Buzz test-
ing have been around for 15 years or so. These objective
methods, based on temporal or spectral analysis, offer a reli-
able alternative and offer higher throughput, better repeat-
ability, and lower cost of ownership than trained listeners.
The typical signature of Rub & Buzz in the time domain
is a periodic transient superimposed on the sine excitation
(Figure 1), and in the frequency domain the typical Rub &
Buzz signature is a much extended and slowly decreasing
family of harmonics (Figure 2).
It is notoriously hard to set valid limits with these tradi-
Figure 1: Typical Rub & Buzz at the positive peak in the time domain
Spotlight

SEPTEMBER 2011 9
tional automated Rub & Buzz measurement methods, and
operator expertise is required. Automated systems using
these methods will detect all instances of Rub & Buzz
regardless of whether they are audible or not. For many
manufacturers this is desirable, as Rub & Buzz, even in the
inaudible range, may be a good indicator of production line
issues that need to be rectified (e.g., poorly glued parts, lead
wires hitting the cone or spider, etc.), or may lead to speaker
failure later in life.
However, the increasing quest for higher yields, particu-
larly for small inexpensive speakers such as those in laptops
and cell phones, is leading many manufacturers to choose a
model that rejects only audible defects. This has driven the
demand for automated perceptual Rub & Buzz measure-
ment. This article explains a newly developed method for
automated perceptual Rub & Buzz detection, discusses the
theory behind it, and shows test results in comparison to
other Rub & Buzz detection methods.
THE FOUNDATION: THE ITU PEAQ STANDARDIn the early 90s, speech and music codecs were prolif-
erating, but there was no standard way to qualify them
because their non-linear and non-stationary nature means
that traditional measurement methods (e.g., frequency
response, THDN, etc.) did not provide good results. In
1994, the International Telecommunication Union (ITU)
asked several institutions to work on competitive solutions
to measure the audio performance of codecs. The different
methods that came out of that joint effort were then com-
piled in one single method called Perceptual Evaluation of
Audio Quality (PEAQ). It was published in 1998 as ITU-R
Recommendation BS.1387 “Method for objective mea-
surements of perceived audio quality.”[2] Although aimed
primarily at codecs, the hearing model outlined in this
document could be applied to any device, a sentiment that
was made clear in the recommendation on the front page
of the ITU publication. Figure 3 shows a general block diagram
of PEAQ. It is worth noting that
the model produces a single met-
ric: ODG (Objective Difference
Grade). That simple index rates
the perceived audio quality of the
signal under test compared to the
reference signal.
There are two variants of the
PEAQ algorithm, a basic FFT-
based version, and a more
advanced version using a combi-
nation of FFT and a filter bank.
The basic version is intended for
real-time implementation where-
as the more complex advanced
one is aimed at in-depth analysis.
Both algorithms transform suc-
cessive time frames of the signals
into “internal representations,”
where the loudness of the sound
is distributed along a pitch scale.
In other words, the model trans-
forms a time-frequency distribu-
tion of sound pressure into a
time-pitch distribution of loud-
ness. During the process of going
from physics to physiology, the
Figure 2: Rub & Buzz in the frequency domain
Figure 3: Block diagram of PEAQ
Figure 4: Basic flow
chart of the CLEAR
Algorithm

Check your label to find the expira�on date.
For more informa�on call 860.875.2199 x206
Qualified subscrip�ons to Voice Coil run for one year.
Renew annually online at www.voiceccoilmagazine.com/vcqual.html
Renew your subscription to Voice Coil before your
subscription expires!
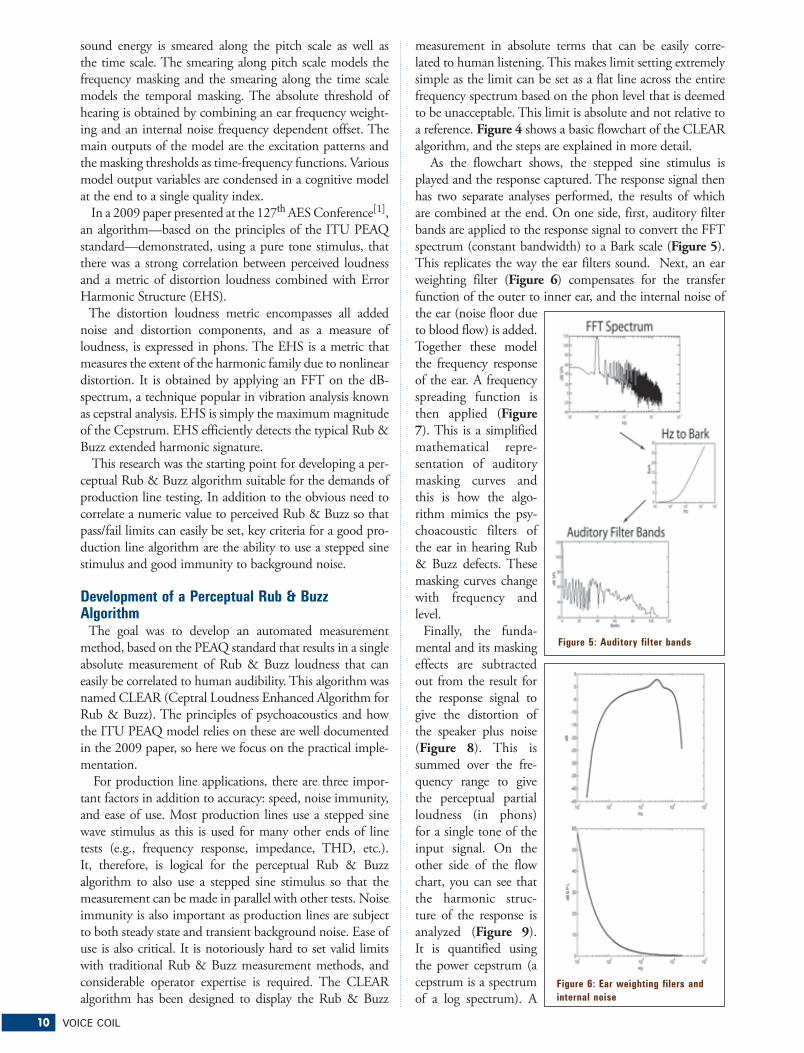
10 VOICE COIL
measurement in absolute terms that can be easily corre-
lated to human listening. This makes limit setting extremely
simple as the limit can be set as a flat line across the entire
frequency spectrum based on the phon level that is deemed
to be unacceptable. This limit is absolute and not relative to
a reference. Figure 4 shows a basic flowchart of the CLEAR
algorithm, and the steps are explained in more detail.
As the flowchart shows, the stepped sine stimulus is
played and the response captured. The response signal then
has two separate analyses performed, the results of which
are combined at the end. On one side, first, auditory filter
bands are applied to the response signal to convert the FFT
spectrum (constant bandwidth) to a Bark scale (Figure 5).
This replicates the way the ear filters sound. Next, an ear
weighting filter (Figure 6) compensates for the transfer
function of the outer to inner ear, and the internal noise of
the ear (noise floor due
to blood flow) is added.
Together these model
the frequency response
of the ear. A frequency
spreading function is
then applied (Figure 7). This is a simplified
mathematical repre-
sentation of auditory
masking curves and
this is how the algo-
rithm mimics the psy-
choacoustic filters of
the ear in hearing Rub
& Buzz defects. These
masking curves change
with frequency and
level.
Finally, the funda-
mental and its masking
effects are subtracted
out from the result for
the response signal to
give the distortion of
the speaker plus noise
(Figure 8). This is
summed over the fre-
quency range to give
the perceptual partial
loudness (in phons)
for a single tone of the
input signal. On the
other side of the flow
chart, you can see that
the harmonic struc-
ture of the response is
analyzed (Figure 9).
It is quantified using
the power cepstrum (a
cepstrum is a spectrum
of a log spectrum). A
sound energy is smeared along the pitch scale as well as
the time scale. The smearing along pitch scale models the
frequency masking and the smearing along the time scale
models the temporal masking. The absolute threshold of
hearing is obtained by combining an ear frequency weight-
ing and an internal noise frequency dependent offset. The
main outputs of the model are the excitation patterns and
the masking thresholds as time-frequency functions. Various
model output variables are condensed in a cognitive model
at the end to a single quality index.
In a 2009 paper presented at the 127th AES Conference[1],
an algorithm—based on the principles of the ITU PEAQ
standard—demonstrated, using a pure tone stimulus, that
there was a strong correlation between perceived loudness
and a metric of distortion loudness combined with Error
Harmonic Structure (EHS).
The distortion loudness metric encompasses all added
noise and distortion components, and as a measure of
loudness, is expressed in phons. The EHS is a metric that
measures the extent of the harmonic family due to nonlinear
distortion. It is obtained by applying an FFT on the dB-
spectrum, a technique popular in vibration analysis known
as cepstral analysis. EHS is simply the maximum magnitude
of the Cepstrum. EHS efficiently detects the typical Rub &
Buzz extended harmonic signature.
This research was the starting point for developing a per-
ceptual Rub & Buzz algorithm suitable for the demands of
production line testing. In addition to the obvious need to
correlate a numeric value to perceived Rub & Buzz so that
pass/fail limits can easily be set, key criteria for a good pro-
duction line algorithm are the ability to use a stepped sine
stimulus and good immunity to background noise.
Development of a Perceptual Rub & Buzz Algorithm
The goal was to develop an automated measurement
method, based on the PEAQ standard that results in a single
absolute measurement of Rub & Buzz loudness that can
easily be correlated to human audibility. This algorithm was
named CLEAR (Ceptral Loudness Enhanced Algorithm for
Rub & Buzz). The principles of psychoacoustics and how
the ITU PEAQ model relies on these are well documented
in the 2009 paper, so here we focus on the practical imple-
mentation.
For production line applications, there are three impor-
tant factors in addition to accuracy: speed, noise immunity,
and ease of use. Most production lines use a stepped sine
wave stimulus as this is used for many other ends of line
tests (e.g., frequency response, impedance, THD, etc.).
It, therefore, is logical for the perceptual Rub & Buzz
algorithm to also use a stepped sine stimulus so that the
measurement can be made in parallel with other tests. Noise
immunity is also important as production lines are subject
to both steady state and transient background noise. Ease of
use is also critical. It is notoriously hard to set valid limits
with traditional Rub & Buzz measurement methods, and
considerable operator expertise is required. The CLEAR
algorithm has been designed to display the Rub & Buzz
Figure 5: Auditory filter bands
Figure 6: Ear weighting filers and
internal noise
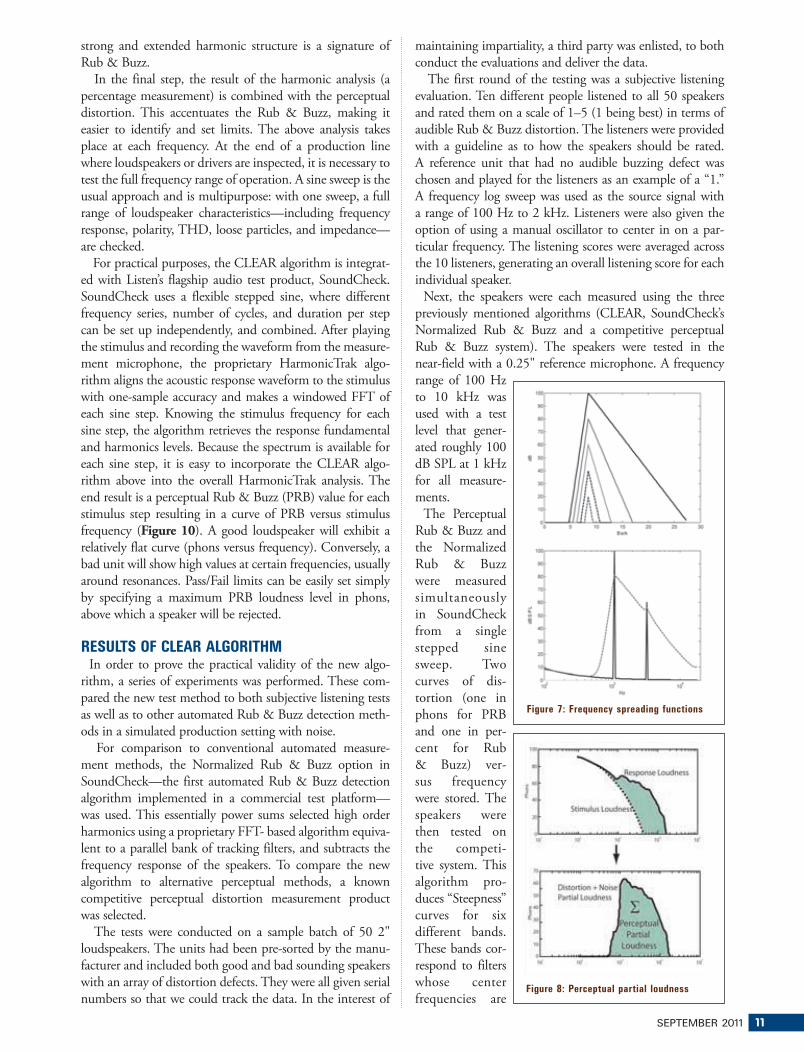
SEPTEMBER 2011 11
strong and extended harmonic structure is a signature of
Rub & Buzz.
In the final step, the result of the harmonic analysis (a
percentage measurement) is combined with the perceptual
distortion. This accentuates the Rub & Buzz, making it
easier to identify and set limits. The above analysis takes
place at each frequency. At the end of a production line
where loudspeakers or drivers are inspected, it is necessary to
test the full frequency range of operation. A sine sweep is the
usual approach and is multipurpose: with one sweep, a full
range of loudspeaker characteristics—including frequency
response, polarity, THD, loose particles, and impedance—
are checked.
For practical purposes, the CLEAR algorithm is integrat-
ed with Listen’s flagship audio test product, SoundCheck.
SoundCheck uses a flexible stepped sine, where different
frequency series, number of cycles, and duration per step
can be set up independently, and combined. After playing
the stimulus and recording the waveform from the measure-
ment microphone, the proprietary HarmonicTrak algo-
rithm aligns the acoustic response waveform to the stimulus
with one-sample accuracy and makes a windowed FFT of
each sine step. Knowing the stimulus frequency for each
sine step, the algorithm retrieves the response fundamental
and harmonics levels. Because the spectrum is available for
each sine step, it is easy to incorporate the CLEAR algo-
rithm above into the overall HarmonicTrak analysis. The
end result is a perceptual Rub & Buzz (PRB) value for each
stimulus step resulting in a curve of PRB versus stimulus
frequency (Figure 10). A good loudspeaker will exhibit a
relatively flat curve (phons versus frequency). Conversely, a
bad unit will show high values at certain frequencies, usually
around resonances. Pass/Fail limits can be easily set simply
by specifying a maximum PRB loudness level in phons,
above which a speaker will be rejected.
RESULTS OF CLEAR ALGORITHMIn order to prove the practical validity of the new algo-
rithm, a series of experiments was performed. These com-
pared the new test method to both subjective listening tests
as well as to other automated Rub & Buzz detection meth-
ods in a simulated production setting with noise.
For comparison to conventional automated measure-
ment methods, the Normalized Rub & Buzz option in
SoundCheck—the first automated Rub & Buzz detection
algorithm implemented in a commercial test platform—
was used. This essentially power sums selected high order
harmonics using a proprietary FFT- based algorithm equiva-
lent to a parallel bank of tracking filters, and subtracts the
frequency response of the speakers. To compare the new
algorithm to alternative perceptual methods, a known
competitive perceptual distortion measurement product
was selected.
The tests were conducted on a sample batch of 50 2"
loudspeakers. The units had been pre-sorted by the manu-
facturer and included both good and bad sounding speakers
with an array of distortion defects. They were all given serial
numbers so that we could track the data. In the interest of
maintaining impartiality, a third party was enlisted, to both
conduct the evaluations and deliver the data.
The first round of the testing was a subjective listening
evaluation. Ten different people listened to all 50 speakers
and rated them on a scale of 1–5 (1 being best) in terms of
audible Rub & Buzz distortion. The listeners were provided
with a guideline as to how the speakers should be rated.
A reference unit that had no audible buzzing defect was
chosen and played for the listeners as an example of a “1.”
A frequency log sweep was used as the source signal with
a range of 100 Hz to 2 kHz. Listeners were also given the
option of using a manual oscillator to center in on a par-
ticular frequency. The listening scores were averaged across
the 10 listeners, generating an overall listening score for each
individual speaker.
Next, the speakers were each measured using the three
previously mentioned algorithms (CLEAR, SoundCheck’s
Normalized Rub & Buzz and a competitive perceptual
Rub & Buzz system). The speakers were tested in the
near-field with a 0.25" reference microphone. A frequency
range of 100 Hz
to 10 kHz was
used with a test
level that gener-
ated roughly 100
dB SPL at 1 kHz
for all measure-
ments.
The Perceptual
Rub & Buzz and
the Normalized
Rub & Buzz
were measured
simultaneously
in SoundCheck
from a single
stepped sine
sweep. Two
curves of dis-
tortion (one in
phons for PRB
and one in per-
cent for Rub
& Buzz) ver-
sus frequency
were stored. The
speakers were
then tested on
the competi-
tive system. This
algorithm pro-
duces “Steepness”
curves for six
different bands.
These bands cor-
respond to filters
whose center
frequencies are
Figure 7: Frequency spreading functions
Figure 8: Perceptual partial loudness
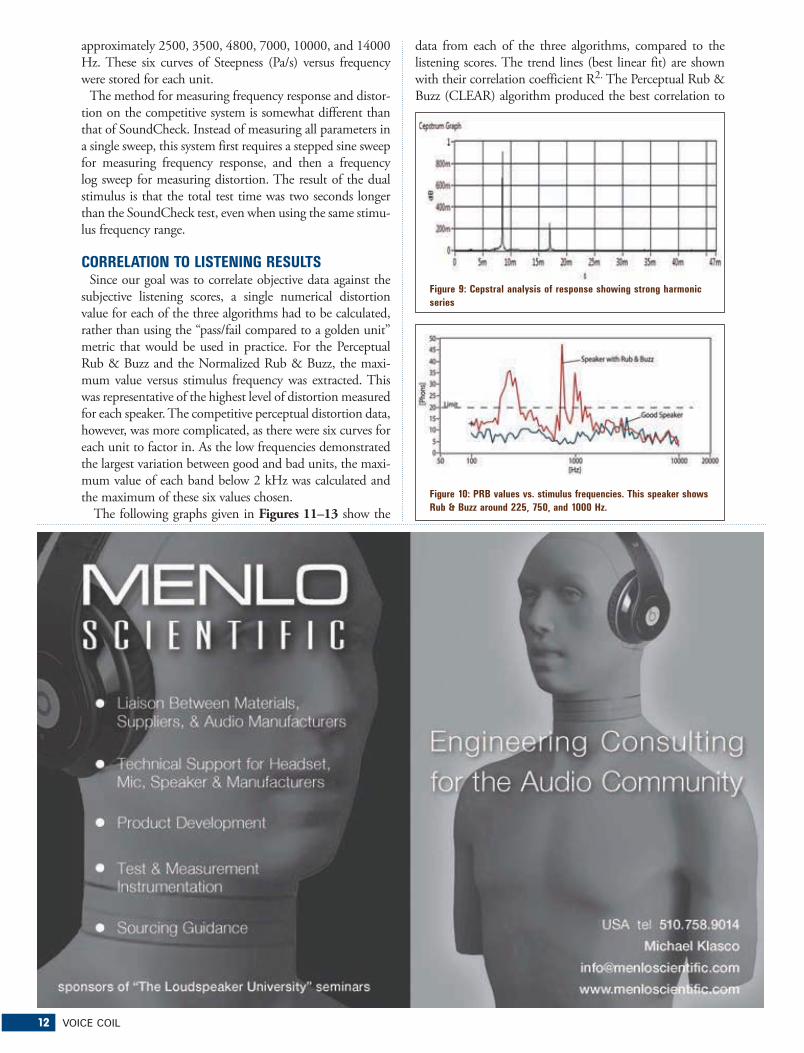
12 VOICE COIL
approximately 2500, 3500, 4800, 7000, 10000, and 14000
Hz. These six curves of Steepness (Pa/s) versus frequency
were stored for each unit.
The method for measuring frequency response and distor-
tion on the competitive system is somewhat different than
that of SoundCheck. Instead of measuring all parameters in
a single sweep, this system first requires a stepped sine sweep
for measuring frequency response, and then a frequency
log sweep for measuring distortion. The result of the dual
stimulus is that the total test time was two seconds longer
than the SoundCheck test, even when using the same stimu-
lus frequency range.
CORRELATION TO LISTENING RESULTSSince our goal was to correlate objective data against the
subjective listening scores, a single numerical distortion
value for each of the three algorithms had to be calculated,
rather than using the “pass/fail compared to a golden unit”
metric that would be used in practice. For the Perceptual
Rub & Buzz and the Normalized Rub & Buzz, the maxi-
mum value versus stimulus frequency was extracted. This
was representative of the highest level of distortion measured
for each speaker. The competitive perceptual distortion data,
however, was more complicated, as there were six curves for
each unit to factor in. As the low frequencies demonstrated
the largest variation between good and bad units, the maxi-
mum value of each band below 2 kHz was calculated and
the maximum of these six values chosen.
The following graphs given in Figures 11–13 show the
data from each of the three algorithms, compared to the
listening scores. The trend lines (best linear fit) are shown
with their correlation coefficient R2. The Perceptual Rub &
Buzz (CLEAR) algorithm produced the best correlation to
Figure 9: Cepstral analysis of response showing strong harmonic
series
Figure 10: PRB values vs. stimulus frequencies. This speaker shows
Rub & Buzz around 225, 750, and 1000 Hz.
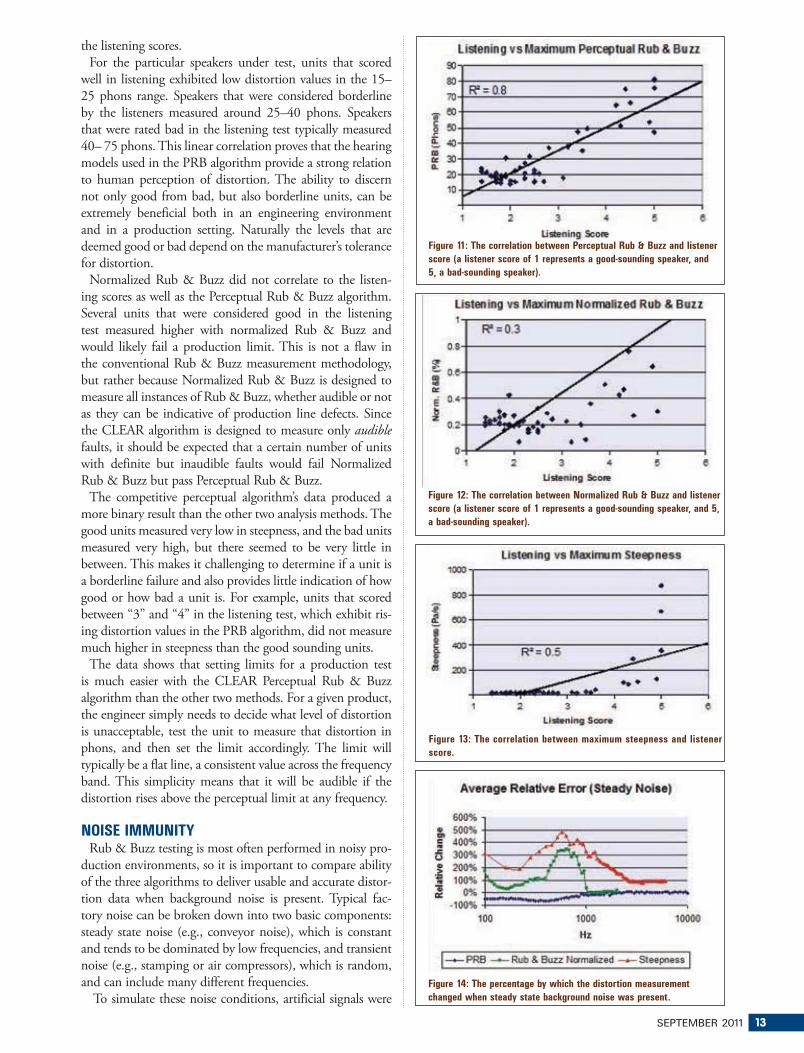
SEPTEMBER 2011 13
the listening scores.
For the particular speakers under test, units that scored
well in listening exhibited low distortion values in the 15–
25 phons range. Speakers that were considered borderline
by the listeners measured around 25–40 phons. Speakers
that were rated bad in the listening test typically measured
40– 75 phons. This linear correlation proves that the hearing
models used in the PRB algorithm provide a strong relation
to human perception of distortion. The ability to discern
not only good from bad, but also borderline units, can be
extremely beneficial both in an engineering environment
and in a production setting. Naturally the levels that are
deemed good or bad depend on the manufacturer’s tolerance
for distortion.
Normalized Rub & Buzz did not correlate to the listen-
ing scores as well as the Perceptual Rub & Buzz algorithm.
Several units that were considered good in the listening
test measured higher with normalized Rub & Buzz and
would likely fail a production limit. This is not a flaw in
the conventional Rub & Buzz measurement methodology,
but rather because Normalized Rub & Buzz is designed to
measure all instances of Rub & Buzz, whether audible or not
as they can be indicative of production line defects. Since
the CLEAR algorithm is designed to measure only audible
faults, it should be expected that a certain number of units
with definite but inaudible faults would fail Normalized
Rub & Buzz but pass Perceptual Rub & Buzz.
The competitive perceptual algorithm’s data produced a
more binary result than the other two analysis methods. The
good units measured very low in steepness, and the bad units
measured very high, but there seemed to be very little in
between. This makes it challenging to determine if a unit is
a borderline failure and also provides little indication of how
good or how bad a unit is. For example, units that scored
between “3” and “4” in the listening test, which exhibit ris-
ing distortion values in the PRB algorithm, did not measure
much higher in steepness than the good sounding units.
The data shows that setting limits for a production test
is much easier with the CLEAR Perceptual Rub & Buzz
algorithm than the other two methods. For a given product,
the engineer simply needs to decide what level of distortion
is unacceptable, test the unit to measure that distortion in
phons, and then set the limit accordingly. The limit will
typically be a flat line, a consistent value across the frequency
band. This simplicity means that it will be audible if the
distortion rises above the perceptual limit at any frequency.
NOISE IMMUNITYRub & Buzz testing is most often performed in noisy pro-
duction environments, so it is important to compare ability
of the three algorithms to deliver usable and accurate distor-
tion data when background noise is present. Typical fac-
tory noise can be broken down into two basic components:
steady state noise (e.g., conveyor noise), which is constant
and tends to be dominated by low frequencies, and transient
noise (e.g., stamping or air compressors), which is random,
and can include many different frequencies.
To simulate these noise conditions, artificial signals were
Figure 11: The correlation between Perceptual Rub & Buzz and listener
score (a listener score of 1 represents a good-sounding speaker, and
5, a bad-sounding speaker).
Figure 12: The correlation between Normalized Rub & Buzz and listener
score (a listener score of 1 represents a good-sounding speaker, and 5,
a bad-sounding speaker).
Figure 13: The correlation between maximum steepness and listener
score.
Figure 14: The percentage by which the distortion measurement
changed when steady state background noise was present.
14 VOICE COIL
played through a separate reference (low distortion) speaker
while performing the same measurements described earlier.
For steady state noise, a pink noise stimulus with an equal-
ization applied to heavily weight the low frequencies was
used.
For the transient noise, a series of tightly band-limited
noise bursts, centered on varying frequencies was generated.
These bursts were spaced in time to occur randomly during
the test. The noise signals were each calibrated to produce
72 dBSPL at the measurement microphone. This level
represents a particularly noisy, but not uncommon, factory
environment and simulates a test condition where acoustic
isolation has not been implemented.
Each speaker was tested three times, initially with no
noise present to serve as a baseline, then with steady state
noise playing during the test, and finally with transient
noise. Measurements were made with both Perceptual and
Normalized Rub & Buzz on SoundCheck, and also on the
competitive system.
In order to quantify the relative change in measured dis-
tortion when environmental noise was present, the results
were compared to the baseline results, and the amount by
which the distortion changed was calculated on a percentage
basis for each frequency point in the distortion curve. The
data for all 50 speakers was averaged to produce two curves
for each algorithm: percentage error (steady state noise) ver-
sus frequency and percentage error (transient noise) versus
frequency (Figures 14 and 15). For the competitive system,
the data was averaged across the six distortion bands.
SoundCheck’s CLEAR algorithm showed the greatest
immunity to both steady state and transient noise. The
measured low frequency distortion does decrease slightly
in the presence of steady state noise due to noise masking
some of the offending harmonics and thus making it harder
to distinguish noise from distortion. The algorithm shows
remarkable immunity to transient noise, which is often a
big problem for traditional Rub & Buzz test methods.
The Perceptual algorithm performed better than the
Traditional Rub & Buzz algorithm with both steady state
and transient noise because the presence of additional noise
in the measurement causes the level of upper order harmon-
ics to appear artificially higher, and thus raises the measured
distortion. Transients tend to present a more significant
problem if they consist of higher frequencies and occur
during the low frequency part of the sweep.
The competitive perceptual algorithm performed the
worst in the noise immunity comparison, particularly with
transient noise. The distortion data varied widely when
background noise was introduced, making it extremely dif-
ficult to discern good units from bad. The steepness, which
is the derivative of the acoustic pressure, is by nature a noise
sensitive quantity. While all of the measurement methods
would benefit from noise isolation in this simulation, the
Perceptual Rub & Buzz algorithm requires the least, and
thus would provide the most accurate data and the greatest
degree of flexibility in terms of placement on a factory floor.
CONCLUSIONSThe experimental results prove that the CLEAR Perceptual
Rub & Buzz algorithm correlates better to a human listener
than both simple high-order harmonic based Rub & Buzz
measurements and a competitive perceptual distortion
technique.
This strong correlation means that users are able to easily
set limits for the PRB algorithm with confidence that it will
reject units with audible Rub & Buzz defects.
The data also demonstrates that under noisy conditions
the perceptual Rub & Buzz algorithm correlates better to
results obtained under ideal conditions, making it an ideal
choice for demanding production environments.
These encouraging results show that the perceptual
approach is valid. This approach could be extended in the
Figure 15: The percentage by which the distortion measurement
changed when transient background noise was present.
SEPTEMBER 2011 15
future to other kinds of test signals and distortion types,
for example the use of a two-tone test signal to perceptually
measure intermodulation distortion for the detection of Rub
& Buzz in tweeters and horns, the use of narrow-band noise
as a test signal to measure Rub & Buzz distortion in tele-
phony and other signal processing-intensive applications.,
and the use of a continuous Log Sweep test signal (e.g.,
Farina sweep) for faster tests. VC
REFERENCES[1] S. Temme, P. Brunet, and D. B. (Don) Keele, “Practical
Measurement of Loudspeaker Distortion Using a Simplified
Auditory Perceptual Model,” AES 127th Convention
October 2009. (preprint 7905)
[2] Recommendation ITU-R BS.1387-1, “Method for
Objective Measurements of Perceived Audio Quality,”
1998-2001.
[3] S. Temme, P. Brunet, and B. Fallon, “Practical
Implementation of Perceptual Rub & Buzz Distortion and
Experimental Results,” AES 129th Convention, November 2010.
Psychoacoustic Theory: How Does the Ear "Hear" Sound?By Steve Temme, Listen, Inc.
As sound enters the human ear, the sound is attenuated
from the outer to the inner ear by a band-pass filter
transfer characteristic (Figure 1 is the graph of this transfer
function). As the sound progresses inside the ear, noise
(greatest at low frequency) caused by blood flow is added
(Figure 2 is the graph of the ear’s internal noise spectrum.)
The combination of the transfer function and the inner
noise plus some other minor effects gives the absolute
threshold of hearing (Figure 3 is the graph of the thresh-
old of hearing, which you should recognize as resembling
the bottom curve in the set of Fletcher Munson curves.)
The cochlea is covered with hair cell receptors that are
divided into groups, each specialized in a frequency band.
These non-overlapping frequency bands constitute the
Bark scale. The position along the scale corresponds to
Figure 1: Outer and middle ear frequency characteristic
Figure 4: Frequency spreading applied to two
tones. The resulting excitation pattern is the wide
curve superimposed on the two discrete tones.
Figure 3: Absolute threshold of hearing
the pitch. Each hair cell acts as a triangular-shaped, non-
linear band-pass filter. A pure tone excites a range of hair
cells; the louder the sound the wider the range. Multiple
sound excitations add up in a non-linear way, smearing
the frequency content along the pitch scale. This raises
the threshold of hearing for frequencies close to a tone,
so a weaker adjacent tone may be inaudible if it is too
close. In this example (see Figure 4), the tone at 3 kHz is
inaudible due to the stronger tone at 1 kHz. The masking
threshold is a fuzzy transition that corresponds to a 50%
chance of detection by an average person.
Overall the total loudness is non-linear function of
the sound pressure level and its spectral distribution.
The loudness level in phons is the level in dB SPL of an
equally loud 1000-Hz tone. These physiological effects of
the human ear create the representation of the sound that
is given to the brain. Beyond that we enter the cognitive
level, where the brain interprets the data and psychology
intervenes. VC
Figure 2: Internal noise spectrum

16 VOICE COIL
audio signal, a correlation reducing means for reducing the
correlation of the high-frequency components and the low-
frequency components of the input audio signal and a delay
means for delaying the low-frequency components and sup-
plying them to a subwoofer by way of a predetermined low
frequency range amplifier.
INDEPENDENT CLAIM1. An audio signal-processing apparatus comprising:
high-frequency components extraction means for extracting
high-frequency components higher than a predetermined
cutoff frequency from the input audio signal and supply-
ing them to satellite speakers by way of a predetermined
high frequency range amplifier; low-frequency components
extraction means for extracting low-frequency components
lower than a predetermined cutoff frequency from the
input audio signal; correlation reducing means for reducing
the correlation of the high-frequency components and the
low-frequency components of the input audio signal; and
delay means for delaying the low-frequency components
and supplying them to a subwoofer by way of a predeter-
mined low frequency range amplifier.
2. An audio signal-processing method comprising: a
high-frequency components extraction step of extracting
high-frequency components higher than a predetermined
cutoff frequency from the input audio signal and supplying
them to satellite speakers by way of a predetermined high-
frequency range amplifier; a low-frequency components
extraction step of extracting low-frequency components
lower than a predetermined cutoff frequency from the
input audio signal; a correlation reducing step of reducing
the correlation of the high-frequency components and the
low-frequency components of the input audio signal; and a
delay step of delaying the low-frequency components and
supplying them to a subwoofer by way of a predetermined
low-frequency range amplifier.
3. A recording medium storing an audio signal-processing
program for causing the computer of an audio signal pro-
cessing apparatus to execute: a high-frequency components
extraction step of extracting high-frequency components
higher than a predetermined cutoff frequency from the
input audio signal and supplying them to satellite speakers
Acoustic PatentsBy James Croft, Croft Acoustical
The following loudspeaker-related patents were filed
primarily under the Office of Patent and Trademarks
classification 181 for acoustical devices and 381 for electri-
cal-signal processing systems and HO4R for international
patents. This also includes new patent applications that are
published in the Patent Application Journal.
AUDIO SIGNAL-PROCESSING APPARATUS AND AUDIO SIGNAL-PROCESSING METHODPatent Application Publication Number: U.S. 2007/0288110
Inventors: Shinichi INOUE (Saitama, JP); Kazunobu
KUBOTA(Saitama, JP)
Assignee: Sony Corporation (Tokyo, Japan)
Filed: April 3, 2007
Published: December 13, 2007
U.S. Class: 700/94, 10 Claims, 20 drawings
ABSTRACT FROM PATENTAn audio signal-processing apparatus includes a high-
frequency components extraction means for extracting
high-frequency components higher than a predetermined
cutoff frequency from the input audio signal and supplying
them to satellite speakers by way of a predetermined high
frequency range amplifier, a low-frequency components
extraction means for extracting low-frequency components
lower than a predetermined cutoff frequency from the input
U.S. Patent 2007/0288110

SEPTEMBER 2011 17
by way of a predetermined high-frequency range amplifier;
a low-frequency components extraction step of extracting
low-frequency components lower than a predetermined
cutoff frequency from the input audio signal; a correlation
reducing step of reducing the correlation of the high-fre-
quency components and the low-frequency components of
the input audio signal; and a delay step of delaying the low-
frequency components and supplying them to a subwoofer
by way of a predetermined low frequency.
REVIEWER COMMENTS Miniaturization in loudspeaker systems, while maintain-
ing sound quality, has been an ongoing quest, particularly
in multi-satellite 5.1 or 7.1 home theater systems. As a refer-
ence point, Bose has realized the smallest satellites for more
than two decades by way of deploying specialized subwoof-
ers with steep slope, low-pass acoustical post filtering, which
supports crossing over at higher than conventional subwoof-
er crossover frequencies, such as approximately 250 Hz as
compared to the more standard 80 Hz or 120 Hz crossover
points. The smallest Bose satellites consist of dual transducer
devices that are about 4.5" H × 2.25" W × 3.25" D.
This patent application relates to a signal-processing sys-
tem for the purpose of allowing higher a higher crossover
point and smaller satellites in a home theater sound system.
Directional cues from a single subwoofer in a multi-channel
system usually require that, independent of the crossover fre-
quency, the output of the subwoofer is down at least 18 dB
at 300 Hz. Sony has developed a system that minimizes
the ability to aurally locate the subwoofer, while raising the
crossover frequency all the way up to approximately 650 Hz.
The way they achieve this has a number of subtleties, but
relative to this patent, has to do with applying two signal-
processing steps. The first is to delay the subwoofer, so that
the precedence effect tells the ear-brain sensors that the first
arrivals for a set of harmonics of a bass note are arriving
from the earlier signal, which comes from the satellites. This
effect is also applied passively in the Bose devices by way of
the group delay of the woofer’s steep low pass filter.
The novel addition of the Sony system is that they apply
a decorrelation filter in series with the woofer that essen-
tially causes a number of steep phase rotations through the
crossover region. An example would be that of multiple
phase-flips of plus and minus approximately 170° with
six narrow-band rotations between 100 Hz and 1 kHz.
The decorrelation filter is said to consist of multiple delay
circuits and/or band-pass filters fed into a summing mixer
to create the desired phase rotations. Alternatively, the
decorrelation filters may be applied to the satellite channels
instead of the woofer channel to achieve a similar low cor-
relation relationship between the high-passed satellites and
the low-passed subwoofer.
This approach is realized in a Sony system, model DAV-
IS10, which consists of a subwoofer, crossed at about
100 Hz to a midwoofer/lower-midrange driver, facing
upward in the top of the subwoofer cabinet. The mid-
woofer is crossed over to the satellites at approximately 650
Hz with the midwoofer channel including the decorrelation
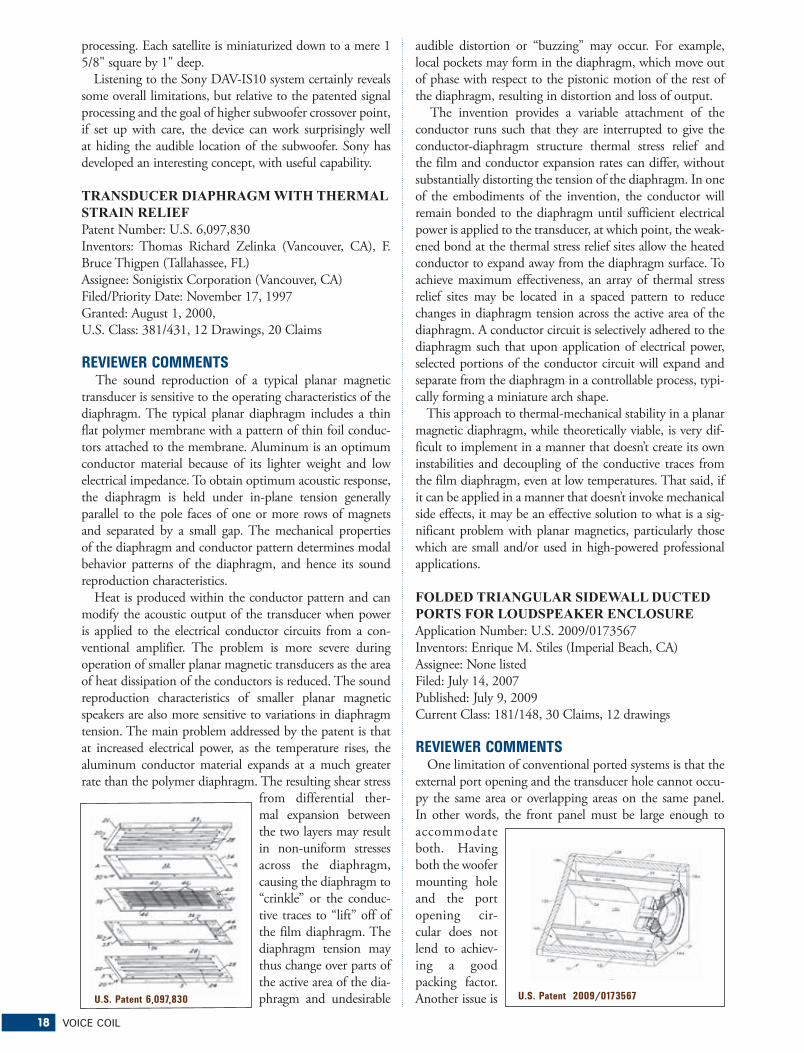
18 VOICE COIL
processing. Each satellite is miniaturized down to a mere 1
5/8" square by 1" deep.
Listening to the Sony DAV-IS10 system certainly reveals
some overall limitations, but relative to the patented signal
processing and the goal of higher subwoofer crossover point,
if set up with care, the device can work surprisingly well
at hiding the audible location of the subwoofer. Sony has
developed an interesting concept, with useful capability.
TRANSDUCER DIAPHRAGM WITH THERMAL STRAIN RELIEFPatent Number: U.S. 6,097,830
Inventors: Thomas Richard Zelinka (Vancouver, CA), F.
Bruce Thigpen (Tallahassee, FL)
Assignee: Sonigistix Corporation (Vancouver, CA)
Filed/Priority Date: November 17, 1997
Granted: August 1, 2000,
U.S. Class: 381/431, 12 Drawings, 20 Claims
REVIEWER COMMENTS The sound reproduction of a typical planar magnetic
transducer is sensitive to the operating characteristics of the
diaphragm. The typical planar diaphragm includes a thin
flat polymer membrane with a pattern of thin foil conduc-
tors attached to the membrane. Aluminum is an optimum
conductor material because of its lighter weight and low
electrical impedance. To obtain optimum acoustic response,
the diaphragm is held under in-plane tension generally
parallel to the pole faces of one or more rows of magnets
and separated by a small gap. The mechanical properties
of the diaphragm and conductor pattern determines modal
behavior patterns of the diaphragm, and hence its sound
reproduction characteristics.
Heat is produced within the conductor pattern and can
modify the acoustic output of the transducer when power
is applied to the electrical conductor circuits from a con-
ventional amplifier. The problem is more severe during
operation of smaller planar magnetic transducers as the area
of heat dissipation of the conductors is reduced. The sound
reproduction characteristics of smaller planar magnetic
speakers are also more sensitive to variations in diaphragm
tension. The main problem addressed by the patent is that
at increased electrical power, as the temperature rises, the
aluminum conductor material expands at a much greater
rate than the polymer diaphragm. The resulting shear stress
from differential ther-
mal expansion between
the two layers may result
in non-uniform stresses
across the diaphragm,
causing the diaphragm to
“crinkle” or the conduc-
tive traces to “lift” off of
the film diaphragm. The
diaphragm tension may
thus change over parts of
the active area of the dia-
phragm and undesirable
audible distortion or “buzzing” may occur. For example,
local pockets may form in the diaphragm, which move out
of phase with respect to the pistonic motion of the rest of
the diaphragm, resulting in distortion and loss of output.
The invention provides a variable attachment of the
conductor runs such that they are interrupted to give the
conductor-diaphragm structure thermal stress relief and
the film and conductor expansion rates can differ, without
substantially distorting the tension of the diaphragm. In one
of the embodiments of the invention, the conductor will
remain bonded to the diaphragm until sufficient electrical
power is applied to the transducer, at which point, the weak-
ened bond at the thermal stress relief sites allow the heated
conductor to expand away from the diaphragm surface. To
achieve maximum effectiveness, an array of thermal stress
relief sites may be located in a spaced pattern to reduce
changes in diaphragm tension across the active area of the
diaphragm. A conductor circuit is selectively adhered to the
diaphragm such that upon application of electrical power,
selected portions of the conductor circuit will expand and
separate from the diaphragm in a controllable process, typi-
cally forming a miniature arch shape.
This approach to thermal-mechanical stability in a planar
magnetic diaphragm, while theoretically viable, is very dif-
ficult to implement in a manner that doesn’t create its own
instabilities and decoupling of the conductive traces from
the film diaphragm, even at low temperatures. That said, if
it can be applied in a manner that doesn’t invoke mechanical
side effects, it may be an effective solution to what is a sig-
nificant problem with planar magnetics, particularly those
which are small and/or used in high-powered professional
applications.
FOLDED TRIANGULAR SIDEWALL DUCTED PORTS FOR LOUDSPEAKER ENCLOSUREApplication Number: U.S. 2009/0173567
Inventors: Enrique M. Stiles (Imperial Beach, CA)
Assignee: None listed
Filed: July 14, 2007
Published: July 9, 2009
Current Class: 181/148, 30 Claims, 12 drawings
REVIEWER COMMENTS One limitation of conventional ported systems is that the
external port opening and the transducer hole cannot occu-
py the same area or overlapping areas on the same panel.
In other words, the front panel must be large enough to
accommodate
both. Having
both the woofer
mounting hole
and the port
opening cir-
cular does not
lend to achiev-
ing a good
packing factor.
Another issue is U.S. Patent 6,097,830 U.S. Patent 2009/0173567

SEPTEMBER 2011 19
that the duct and the transducer cannot occupy the same
space within the enclosure. In many applications, it is desir-
able to make the front panel as small as possible, such that
its size is limited only by the dimensions of the transducer.
With a circular transducer and a square front panel, this
leaves only four very small, generally triangular areas of the
front panel through which a port could be cut. In many
cases, these areas are simply too small for a circular duct
to provide the minimum required port cross-sectional area
needed to avoid port wind noise during high SPL opera-
tion. Some enclosures have included more than one port,
but it is problematic to achieve the same results with plural
ducts that can otherwise be achieved with a single duct, in
part because the interior duct wall surface area to duct cross-
sectional area ratio is higher with plural ducts than with a
single, larger cross-sectional area duct.
The patent application discloses a loudspeaker enclosure
having a folded port formed by an adjoining pair of the
enclosure’s panels and a pair of diagonally mounted, inter-
nal panels. At a lower left corner of the enclosure, a trian-
gular first section of the folded duct extends inward from a
triangular opening in the front panel toward the back panel
and is formed by the left panel, the bottom panel, and a first
internal duct panel.
A trapezoidal second section of the folded port extends in
the opposite direction and is formed by the left panel, the
bottom panel, the first internal port panel, and a second
internal duct panel. The first internal duct panel is coupled
to the front panel but ends short of the back panel to form
the fold connecting the first and second portions of the
folded duct. The second internal duct panel is coupled to
the back panel and ends short of the front panel to con-
nect the folded duct with the enclosed air volume of the
enclosure. Other than the unique port configuration, the
loudspeaker enclosure operates as a conventional vented
enclosure.
One concern may be how one might incorporate a flared
opening to minimize port turbulence, but otherwise, the
approach appears to be a useful way to minimizing the
front panel dimensions for a given woofer diameter, while
maximizing port cross sectional area. VC

20 VOICE COIL
Test Bench
Figure 1: SB Acoustics SB26STCN-C000-4 free-air impedance plot
SB Acoustics and SEAS Drivers for Home Audio ApplicationsBy Vance Dickason
Both of the drivers submitted for this month’s issue are
for home audio applications: from SB Acoustics, the
cost-effective SB26STCN-C000-4, a neodymium motor
1" dome tweeter, and from SEAS, their relatively new Curv
Cone 6.5", the U18RNX/P.
This month, SB Acoustics sent Voice Coil their neo-
dymium 26-mm softdome, the SB26STCN-C000-4. (Last
month’s issue featured the SB ring dome SB29RDNC.) SB
is an acronym for Sinar Baja, which is a large OEM driver
manufacturer located in Indonesia; however, the driver
300 Hz 500 1K 2K 5K 10K 20K 40K
dBSPL
45
50
55
60
65
70
75
80
85
90
95
100
105
SPL vs Freq
300 Hz 500 1K 2K 5K 10K 20K 40K
dBSPL
45
50
55
60
65
70
75
80
85
90
95
100
105
SPL vs Freq
line was conceptualized by David Stephens, a former U.S.
representative of DST. And, the transducer design of all SB
drivers is done by former Vifa/Scan-Speak engineers Ulrik
Schmidt and Frank Nielsen, the principles of Danesian
Audio. Danish Sound Technology, if you are new to the
industry, was purchased by Tymphany, and at its peak,
included the Vifa, Peerless, and Scan-Speak transducer
brands.)
Features for the SB26STCN include a 1" coated cloth
dome and surround, plastic face plate, plastic rear cavity,
neodymium motor and color coded terminals (Photo 1).
Testing began using the LinearX LMS analyzer to produce
the 300-point impedance sweep illustrated in Figure 1. The
ferro fluid damped resonance occurs at a nominal 940 Hz,
pretty typical for a 1" neo dome. With a 3.1 Ω DCR, the
minimum impedance for this tweeter is 3.24 Ω at 2.9 kHz.
Following the impedance measurements, I recess mounted
the SB tweeter in an enclosure that had a baffle area of 10"
× 8" and measured the on- and off-axis frequency response
with a 100-point gated sine wave sweep at 2.83 V/1 m.
Figure 2 shows the on-axis response to be ±2.8 dB from 930
Hz–24 kHz, and within its operating range, 3.5 kHz–20
kHz, a very flat ±2 dB. Figure 3 depicts the on- and off-axis
response of SB29RDNC, typical of a 1" soft dome, with the
off-axis curves normalized to the on-axis response in Figure 4. The two-sample SPL comparison is illustrated in Figure 5, indicating the two samples were very closely matched
except for a minor area at 3 kHz, but otherwise exactly what
I would expect from a tweeter designed and quality control
set up by a pair of former Vifa engineers.
The next test in the Test Bench protocol was to utilize
the Listen, Inc. SoundCheck analyzer and SCM 0.25"
microphone (provided courtesy of Listen, Inc.) to measure
the impulse response with the tweeter recess mounted on
the test baffle. Importing this data into the Listen, Inc.
SoundMap software produced the cumulative spectral
decay plot (waterfall) given in Figure 6. Figure 7 is a Short
Time Fourier Transform (STFT) displayed as a Surface Plot.
For the final test procedure, I set the 1 m SPL to 94 dB
(3.74 V) using a noise stimulus, and measured the 2nd and
3rd harmonic distortion at 10 cm, depicted in Figure 8. For
more information on this and other SB Acoustics drivers,
Figure 2: SB Acoustics SB26STCN-C000-4 on-axis response
Figure 3: SB Acoustics SB26STCN-C000-4 horizontal on- and off-axis
frequency response (0° = solid; 15° = dot; 30° = dash; 45° dash/dot).
Photo 1: The cost-effective SB26STCN-C000-4, a neodymium
motor 1" dome tweeter, from SB Acoustics
10 Hz 20 50 100 200 500 1K 2K 5K 10K 20K
Ohm
1
2
3
4
5
6789
10
20
30
40
50
Impedance vs Freq
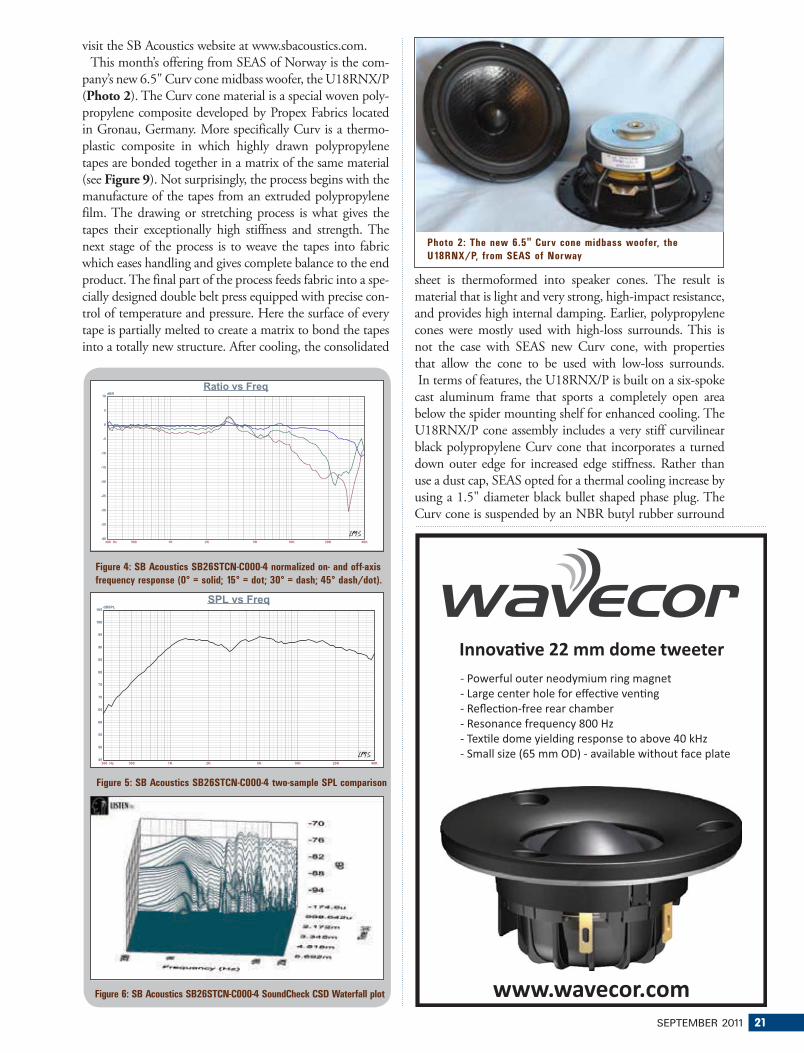
SEPTEMBER 2011 21
300 Hz 500 1K 2K 5K 10K 20K 40K
dBSPL
45
50
55
60
65
70
75
80
85
90
95
100
105
SPL vs Freq
visit the SB Acoustics website at www.sbacoustics.com.
This month’s offering from SEAS of Norway is the com-pany’s new 6.5" Curv cone midbass woofer, the U18RNX/P (Photo 2). The Curv cone material is a special woven poly-propylene composite developed by Propex Fabrics located in Gronau, Germany. More specifically Curv is a thermo-
plastic composite in which highly drawn polypropylene
tapes are bonded together in a matrix of the same material
(see Figure 9). Not surprisingly, the process begins with the
manufacture of the tapes from an extruded polypropylene
film. The drawing or stretching process is what gives the
tapes their exceptionally high stiffness and strength. The
next stage of the process is to weave the tapes into fabric
which eases handling and gives complete balance to the end
product. The final part of the process feeds fabric into a spe-
cially designed double belt press equipped with precise con-
trol of temperature and pressure. Here the surface of every
tape is partially melted to create a matrix to bond the tapes
into a totally new structure. After cooling, the consolidated
300 Hz 500 1K 2K 5K 10K 20K 40K
dBR
-40
-35
-30
-25
-20
-15
-10
-5
0
5
10
Ratio vs Freq
Figure 5: SB Acoustics SB26STCN-C000-4 two-sample SPL comparison
sheet is thermoformed into speaker cones. The result is
material that is light and very strong, high-impact resistance,
and provides high internal damping. Earlier, polypropylene
cones were mostly used with high-loss surrounds. This is
not the case with SEAS new Curv cone, with properties
that allow the cone to be used with low-loss surrounds.
In terms of features, the U18RNX/P is built on a six-spoke
cast aluminum frame that sports a completely open area
below the spider mounting shelf for enhanced cooling. The
U18RNX/P cone assembly includes a very stiff curvilinear
black polypropylene Curv cone that incorporates a turned
down outer edge for increased edge stiffness. Rather than
use a dust cap, SEAS opted for a thermal cooling increase by
using a 1.5" diameter black bullet shaped phase plug. The
Curv cone is suspended by an NBR butyl rubber surround
������ ��!!�������"�����
"""#"������#���
�������������� ���������� ����� ������������ ���������������������� � ���������� ������������������������ � ������� ���� �!"��#�$��������������� �����%� ������������& �'!"��(�������"��)*+����,-.������������������������%����
Figure 4: SB Acoustics SB26STCN-C000-4 normalized on- and off-axis
frequency response (0° = solid; 15° = dot; 30° = dash; 45° dash/dot).
Figure 6: SB Acoustics SB26STCN-C000-4 SoundCheck CSD Waterfall plot
Photo 2: The new 6.5" Curv cone midbass woofer, the
U18RNX/P, from SEAS of Norway
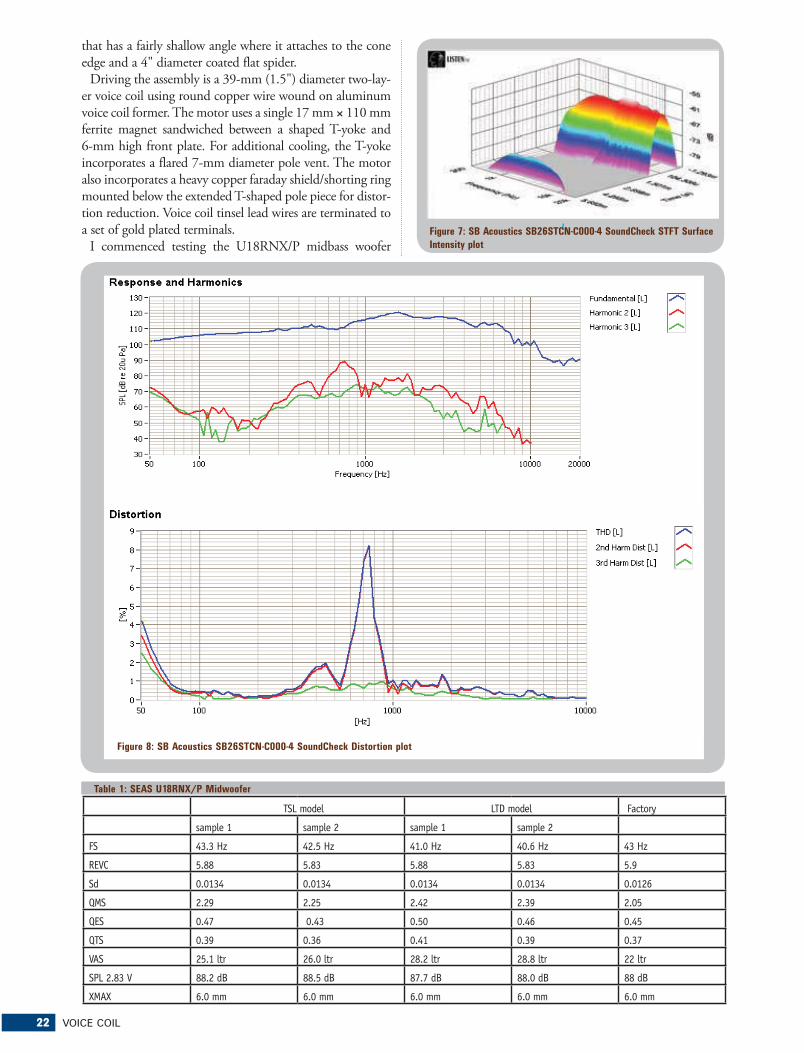
22 VOICE COIL
that has a fairly shallow angle where it attaches to the cone
edge and a 4" diameter coated flat spider.
Driving the assembly is a 39-mm (1.5") diameter two-lay-
er voice coil using round copper wire wound on aluminum
voice coil former. The motor uses a single 17 mm × 110 mm
ferrite magnet sandwiched between a shaped T-yoke and
6-mm high front plate. For additional cooling, the T-yoke
incorporates a flared 7-mm diameter pole vent. The motor
also incorporates a heavy copper faraday shield/shorting ring
mounted below the extended T-shaped pole piece for distor-
tion reduction. Voice coil tinsel lead wires are terminated to
a set of gold plated terminals.
I commenced testing the U18RNX/P midbass woofer
TSL model LTD model Factory
sample 1 sample 2 sample 1 sample 2
FS 43.3 Hz 42.5 Hz 41.0 Hz 40.6 Hz 43 Hz
REVC 5.88 5.83 5.88 5.83 5.9
Sd 0.0134 0.0134 0.0134 0.0134 0.0126
QMS 2.29 2.25 2.42 2.39 2.05
QES 0.47 0.43 0.50 0.46 0.45
QTS 0.39 0.36 0.41 0.39 0.37
VAS 25.1 ltr 26.0 ltr 28.2 ltr 28.8 ltr 22 ltr
SPL 2.83 V 88.2 dB 88.5 dB 87.7 dB 88.0 dB 88 dB
XMAX 6.0 mm 6.0 mm 6.0 mm 6.0 mm 6.0 mm
Table 1: SEAS U18RNX/P Midwoofer
Figure 8: SB Acoustics SB26STCN-C000-4 SoundCheck Distortion plot
Figure 7: SB Acoustics SB26STCN-C000-4 SoundCheck STFT Surface
Intensity plot
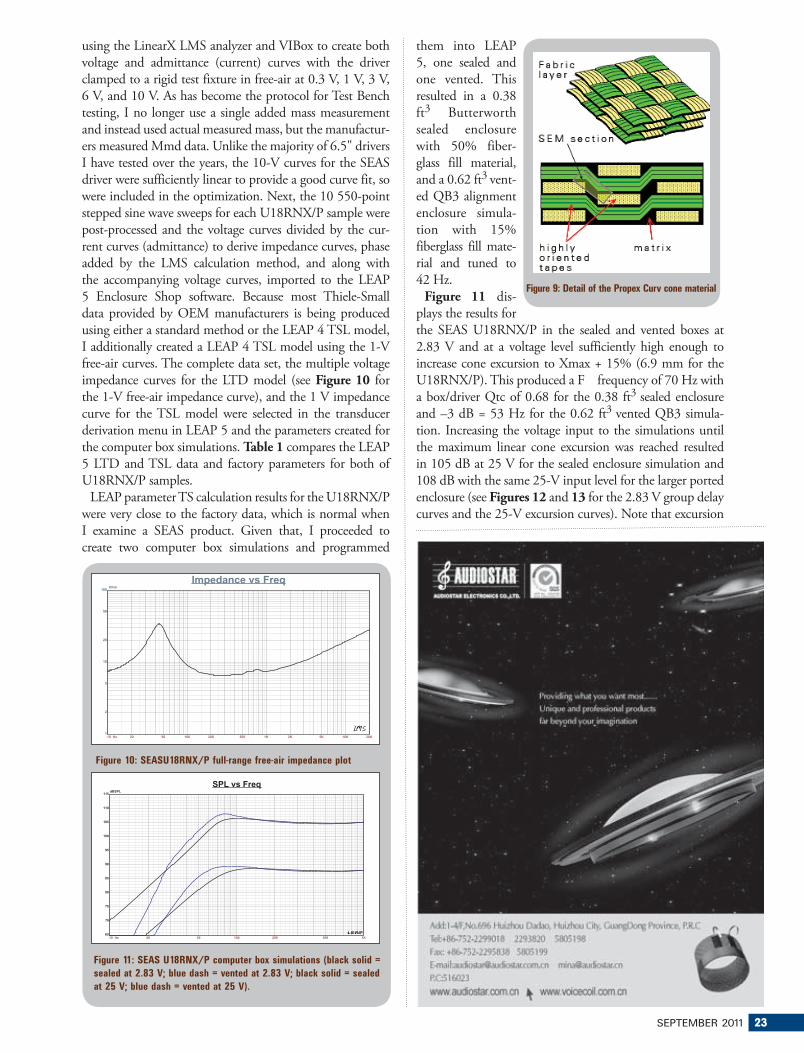
SEPTEMBER 2011 23
them into LEAP
5, one sealed and
one vented. This
resulted in a 0.38
ft3 Butterworth
sealed enclosure
with 50% fiber-
glass fill material,
and a 0.62 ft3 vent-
ed QB3 alignment
enclosure simula-
tion with 15%
fiberglass fill mate-
rial and tuned to
42 Hz.
Figure 11 dis-
plays the results for
the SEAS U18RNX/P in the sealed and vented boxes at
2.83 V and at a voltage level sufficiently high enough to
increase cone excursion to Xmax + 15% (6.9 mm for the
U18RNX/P). This produced a F frequency of 70 Hz with
a box/driver Qtc of 0.68 for the 0.38 ft3 sealed enclosure
and –3 dB = 53 Hz for the 0.62 ft3 vented QB3 simula-
tion. Increasing the voltage input to the simulations until
the maximum linear cone excursion was reached resulted
in 105 dB at 25 V for the sealed enclosure simulation and
108 dB with the same 25-V input level for the larger ported
enclosure (see Figures 12 and 13 for the 2.83 V group delay
curves and the 25-V excursion curves). Note that excursion
using the LinearX LMS analyzer and VIBox to create both
voltage and admittance (current) curves with the driver
clamped to a rigid test fixture in free-air at 0.3 V, 1 V, 3 V,
6 V, and 10 V. As has become the protocol for Test Bench
testing, I no longer use a single added mass measurement
and instead used actual measured mass, but the manufactur-
ers measured Mmd data. Unlike the majority of 6.5" drivers
I have tested over the years, the 10-V curves for the SEAS
driver were sufficiently linear to provide a good curve fit, so
were included in the optimization. Next, the 10 550-point
stepped sine wave sweeps for each U18RNX/P sample were
post-processed and the voltage curves divided by the cur-
rent curves (admittance) to derive impedance curves, phase
added by the LMS calculation method, and along with
the accompanying voltage curves, imported to the LEAP
5 Enclosure Shop software. Because most Thiele-Small
data provided by OEM manufacturers is being produced
using either a standard method or the LEAP 4 TSL model,
I additionally created a LEAP 4 TSL model using the 1-V
free-air curves. The complete data set, the multiple voltage
impedance curves for the LTD model (see Figure 10 for
the 1-V free-air impedance curve), and the 1 V impedance
curve for the TSL model were selected in the transducer
derivation menu in LEAP 5 and the parameters created for
the computer box simulations. Table 1 compares the LEAP
5 LTD and TSL data and factory parameters for both of
U18RNX/P samples.
LEAP parameter TS calculation results for the U18RNX/P
were very close to the factory data, which is normal when
I examine a SEAS product. Given that, I proceeded to
create two computer box simulations and programmed
10 Hz 20 50 100 200 500 1K 2K 5K 10K 20K
Ohm
1
2
5
10
20
50
100
Impedance vs Freq
Figure 10: SEASU18RNX/P full-range free-air impedance plot
Figure 9: Detail of the Propex Curv cone material
10 Hz 20 50 100 200 500 1K
dBSPL
65
70
75
80
85
90
95
100
105
110
115
SPL vs Freq
Figure 11: SEAS U18RNX/P computer box simulations (black solid =
sealed at 2.83 V; blue dash = vented at 2.83 V; black solid = sealed
at 25 V; blue dash = vented at 25 V).

24 VOICE COIL
in the distortion curve in Figure 18, which breaks the distor-
tion down into component causes, Bl, inductance, and the
suspension. As can be seen, the suspension is the produces
the highest distortion levels. You can also see the asymmetry
in the compliance in the Peak and Bottom curve given in
Figure 19. This Klippel curve shows the displacement in
both directions for a given voltage input. The displacement
10 Hz 20 50 100 200 500 1K
Sec
0
5m
10m
15m
20m
Time vs Freq
10 Hz 20 50 100 200 500 1K
M
100u
200u
500u
1m
2m
5m
10m
20m
Excursion vs Freq
Figure 12: Group Delay curves for the 2.83 V curves in Figure 11.
Figure 13: Cone excursion curves for the 25 V curves in Figure 11
Figure 14: Klippel Analyzer B1 (X) curve for the SEAS U18RNX/P
Figure 15: Klippel Analyzer B1 (X) Symmetry Range curve for the
SEAS U18RNX/P
begins increasing beyond Xmax + 15% below 35 Hz, so a
high-pass filter below this frequency would greatly increase
the power handling, which is the case for most vented
designs.
Klippel analysis for the SEAS U18RNX/P 6.5" woofer
(our analyzer is provided courtesy of Klippel GmbH),
performed by Pat Turnmire, Red Rock Acoustics (author of
the SpeaD and RevSpeaD software), produced the Bl(X),
Kms(X) and Bl and Kms Symmetry Range plots given in
Figures 14–17. The Bl(X) curve for the U18RNX/P
(see Figure 14) is relatively broad and nicely symmetri-
cal. Looking at the Bl Symmetry plot (see Figure 15),
this curve shows a 1.8-mm coil forward (coil-out)
offset at the rest position that decreases to 0.1 mm at
the physical 6 mm Xmax of the driver. Figures 16
and 17 show the Kms(X) and Kms Symmetry Range curves
for the SEAS midbass woofer. The Kms(X) curve is also very
symmetrical in one direction (coil-out), but shows a limita-
tion if the other direction (coil-in), and has a forward (coil-
out) offset of 0.95 mm at the rest position that increases to
2.5 mm at the 6-mm physical Xmax location on the graph,
which is an important issue to address, but this should be
an easy fix requiring a change in the spider. Displacement
limiting numbers calculated by the Klippel analyzer for the
U18RNX/P were XBl at 82% Bl = 6.6 mm and for XC at
75% Cms minimum was 4.2 mm, which means that for
this SEAS woofer, the compliance is the most limiting factor
for prescribed distortion level of 10%. This can also be seen

SEPTEMBER 2011 25
Figure 16: Klippel Analyzer Mechanical Stiffness for Suspension Kms
(X) curve for the SEAS U18RNX/P
Figure 17: Klippel Analyzer Kms Symmetry curve for the SEAS
U18RNX/P
Figure 18: Klippel Analyzer Distortion Analysis curve for the SEAS
U18RNX/P
Figure 19: Klippel Analyzer Peak and Bottom Waveform Value curve
SEAS U18RNX/P
300 Hz 500 1K 2K 5K 10K 20K
dBSPL
40
45
50
55
60
65
70
75
80
85
90
95
100
SPL vs Freq
Figure 22: SEAS U18RNX/P horizontal on- and off-axis frequency
response (0° = solid; 15° = dot; 30° = dash; 45° = dash/dot).
Figure 23: SEAS U18RNX/P two-sample SPL comparison
300 Hz 500 1K 2K 5K 10K 20K
dBSPL
40
45
50
55
60
65
70
75
80
85
90
95
100
SPL vs FreqFigure 21: SEAS U18RNX/P on-axis and off-axis frequency response
Figure 20: Klippel Analyzer L (X) curve for the SEAS U18RNX/P
300 Hz 500 1K 2K 5K 10K 20K
dBSPL
40
45
50
55
60
65
70
75
80
85
90
95
100
SPL vs Freq
is fairly even up to about 1 V, but by 6.2 V the coil-in
displacement is about 4.8 mm and coil-out is 6.4 mm,
showing that the suspension is limited in the coil-in
direction. Again, this is an easy fix by changing the spider
configuration.
Figure 20 displays the inductance curve Le(X) for the
U18RNX/P. Inductance will typically increase in the rear
direction from the zero rest position as the voice coil cov-
ers more pole area; however, the U18RNX/P inductance
exhibits only minor inductive variation as the coil moves in
both directions due to the copper shorting ring configura-
tion. The inductance variation is only of 0.11 mH from the
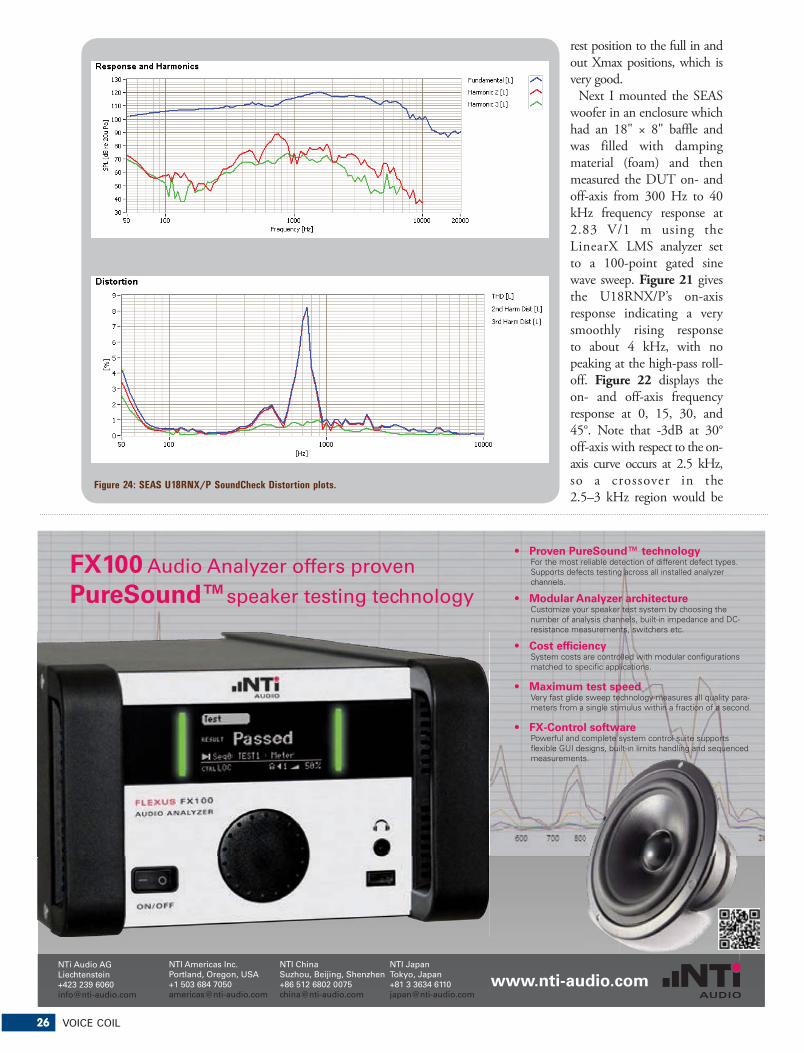
26 VOICE COIL
NTi Audio AG Liechtenstein+423 239 [email protected]
NTI Americas Inc. Portland, Oregon, USA+1 503 684 [email protected]
NTI ChinaSuzhou, Beijing, Shenzhen+86 512 6802 0075 [email protected]
NTI JapanTokyo, Japan +81 3 3634 [email protected]
www.nti-audio.com
FX100 Audio Analyzer offers proven
PureSound™speaker testing technology
Proven PureSound™ technology For the most reliable detection of different defect types. Supports defects testing across all installed analyzer channels.
Modular Analyzer architecture Customize your speaker test system by choosing the number of analysis channels, built-in impedance and DC-resistance measurements, switchers etc.
Cost efficiency System costs are controlled with modular configurations matched to specific applications.
Maximum test speed Very fast glide sweep technology measures all quality para-meters from a single stimulus within a fraction of a second.
FX-Control software Powerful and complete system control suite supports flexible GUI designs, built-in limits handling and sequenced measurements.
Figure 24: SEAS U18RNX/P SoundCheck Distortion plots.
rest position to the full in and
out Xmax positions, which is
very good.
Next I mounted the SEAS
woofer in an enclosure which
had an 18" × 8" baffle and
was filled with damping
material (foam) and then
measured the DUT on- and
off-axis from 300 Hz to 40
kHz frequency response at
2.83 V/1 m using the
LinearX LMS analyzer set
to a 100-point gated sine
wave sweep. Figure 21 gives
the U18RNX/P’s on-axis
response indicating a very
smoothly rising response
to about 4 kHz, with no
peaking at the high-pass roll-
off. Figure 22 displays the
on- and off-axis frequency
response at 0, 15, 30, and
45°. Note that -3dB at 30°
off-axis with respect to the on-
axis curve occurs at 2.5 kHz,
so a crossover in the
2.5–3 kHz region would be
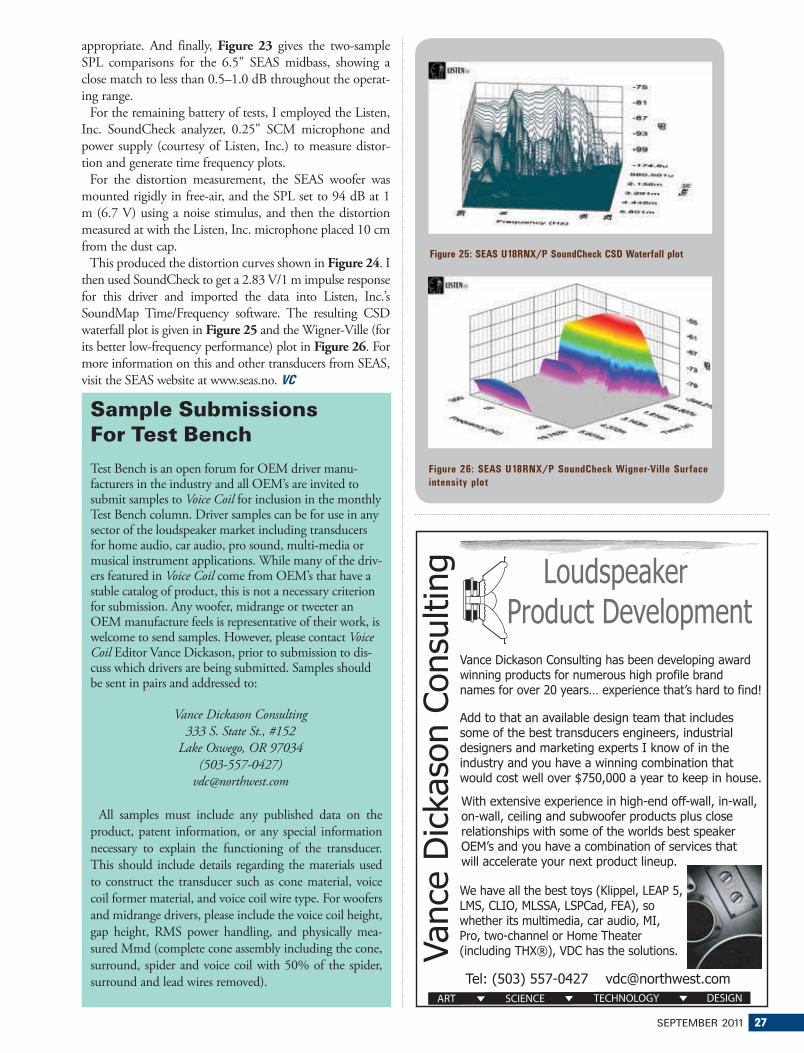
SEPTEMBER 2011 27
Tel: (503) 557-0427 [email protected]
Loudspeaker Product Development
Vanc
e D
icka
son
Con
sulti
ng
Vance Dickason Consulting has been developing award winning products for numerous high profile brand names for over 20 years… experience that’s hard to find!
With extensive experience in high-end off-wall, in-wall, on-wall, ceiling and subwoofer products plus close relationships with some of the worlds best speaker OEM’s and you have a combination of services that will accelerate your next product lineup.
We have all the best toys (Klippel, LEAP 5,LMS, CLIO, MLSSA, LSPCad, FEA), so whether its multimedia, car audio, MI, Pro, two-channel or Home Theater (including THX®), VDC has the solutions.
Add to that an available design team that includes some of the best transducers engineers, industrial designers and marketing experts I know of in the industry and you have a winning combination that would cost well over $750,000 a year to keep in house.
Figure 25: SEAS U18RNX/P SoundCheck CSD Waterfall plot
Figure 26: SEAS U18RNX/P SoundCheck Wigner-Ville Surface
intensity plot
Sample Submissions For Test Bench
Test Bench is an open forum for OEM driver manu-facturers in the industry and all OEM’s are invited to submit samples to Voice Coil for inclusion in the monthly Test Bench column. Driver samples can be for use in any sector of the loudspeaker market including transducers for home audio, car audio, pro sound, multi-media or musical instrument applications. While many of the driv-ers featured in Voice Coil come from OEM’s that have a stable catalog of product, this is not a necessary criterion for submission. Any woofer, midrange or tweeter an OEM manufacture feels is representative of their work, is welcome to send samples. However, please contact Voice Coil Editor Vance Dickason, prior to submission to dis-cuss which drivers are being submitted. Samples should be sent in pairs and addressed to:
Vance Dickason Consulting
333 S. State St., #152
Lake Oswego, OR 97034
(503-557-0427)
All samples must include any published data on the
product, patent information, or any special information
necessary to explain the functioning of the transducer.
This should include details regarding the materials used
to construct the transducer such as cone material, voice
coil former material, and voice coil wire type. For woofers
and midrange drivers, please include the voice coil height,
gap height, RMS power handling, and physically mea-
sured Mmd (complete cone assembly including the cone,
surround, spider and voice coil with 50% of the spider,
surround and lead wires removed).
appropriate. And finally, Figure 23 gives the two-sample
SPL comparisons for the 6.5" SEAS midbass, showing a
close match to less than 0.5–1.0 dB throughout the operat-
ing range.
For the remaining battery of tests, I employed the Listen,
Inc. SoundCheck analyzer, 0.25" SCM microphone and
power supply (courtesy of Listen, Inc.) to measure distor-
tion and generate time frequency plots.
For the distortion measurement, the SEAS woofer was
mounted rigidly in free-air, and the SPL set to 94 dB at 1
m (6.7 V) using a noise stimulus, and then the distortion
measured at with the Listen, Inc. microphone placed 10 cm
from the dust cap.
This produced the distortion curves shown in Figure 24. I
then used SoundCheck to get a 2.83 V/1 m impulse response
for this driver and imported the data into Listen, Inc.’s
SoundMap Time/Frequency software. The resulting CSD
waterfall plot is given in Figure 25 and the Wigner-Ville (for
its better low-frequency performance) plot in Figure 26. For
more information on this and other transducers from SEAS,
visit the SEAS website at www.seas.no. VC
28 VOICE COIL
Industry WatchBy Vance Dickason
Nollman To Lead Boston Acoustics D&M Holdings has named Mitch
Nollman as VP/GM of Boston Acoustics.
Nollman, who begins with Boston Acoustics July 5, 2011.
He replaces Steve Chilinski, who the company said in a
statement is leaving to pursue other career interests. Tim
Bailey, president, consumer group, D&M Holdings, said
in the statement that Nollman will “help Boston Acoustics
build on the success of our recent landmark loudspeaker
introductions, including our acclaimed sound bar home
entertainment audio solutions.” He joins Boston Acoustics
following 16 years at Bose, where he served in a variety
of executive positions, including product marketing. His
career with Bose spanned several product categories, includ-
ing component loudspeakers, home audio marketing, and
professional systems.
Fine Sounds SpA Acquires Sumiko Fine Sounds SpA, owner of Sonus Faber, Audio Research
Corporation and Wadia Digital, announced today that it
has acquired high-end audio distributor Sumiko, based
here (the cost of the transaction was not revealed). Current
Sumiko owners Donald Brody and John Hunter will take
seats on the board of Fine Sounds SpA. Sumiko will remain
the exclusive North America distributor for all its existing
lines: Sonus Faber (loudspeakers), REL (sub-bass systems),
Pro-Ject Audio Systems (turntables and electronics), SME
(turntables and tonearms), Sumiko Phono Cartridges and
Okki Nokki (record cleaning machines). The REL and
Wolf Cinema brands are still owned by Donald Brody
and John Hunter. While REL enters into an agreement to
be distributed by Fine Sounds globally, Wolf Cinema will
remain independent. Fine Sounds views both the U.S. and
China as top priority markets. Direct distribution in China
is currently managed through Sonus Faber Asia, and with
the Sumiko acquisition, now realizes direct distribution in
North America.
Sunfire Patents Anti-Shake TechnologySunfire reports it has been awarded a U.S. patent for the
StillBass Anti-Shake technology featured in the company’s
Sunfire SubRosa Subwoofer. Sunfire received U.S. Patent
#7,844,068 by the U. S. Patent Office for the StillBass
Anti-Shake technology that was featured first in 2008 in
the Sunfire SubRosa subwoofer. A product the company
claimed is the world’s first flat-panel subwoofer. By control-
ling the subwoofer’s “shake,” StillBass technology allows
the woofer to be placed in a wide variety of locations
rarely considered for high quality bass. The SubRosa can be
mounted on a wall, located below a big screen TV, behind
a couch, under a bed and even inside the wall. This newly-
patented technology is only available from Sunfire, and at
the moment, only in the SubRosa subwoofer.
New Product Offers Wireless Light and SoundArtison, a high-end audio technology firm, and Osram
Sylvania, a lighting company, debuted MusicLites today, an
electronics product that combines a wireless, high-fidelity
Furness Resigns as AES Executive DirectorRoger Furness, Audio Engineering Society (AES) execu-
tive director since 1994, will step down from his position
at the end of 2011. An AES member since 1975, Furness
has served as section chair, vice president AES Europe and
as AES president.
To ensure continuity in all aspects of the AES organiza-
tion, the Executive Committee has asked him to remain as
executive director emeritus throughout 2012.
“My 17 years as AES executive director have been an
exhilarating and deeply gratifying experience,” Furness said.
“I have thoroughly enjoyed collaborating with conven-
tion committees on nearly 40 major events in the United
States and throughout Europe. I have also been privileged
to work with AES members
around the world on hun-
dreds of conferences, work-
shops, and internal events.
I take great pride in these
accomplishments and in hav-
ing guided the AES through
the particularly difficult times
experienced by the entire pro-
fessional audio industry over
the past decade. I look forward to continuing to contribute
my time and energy to this indispensable organization in
future years.”
Jim Kaiser, president of AES, reports that an Executive
Director Search Committee will be formed, and that a Call
For Application announcement will be forthcoming.
“Roger Furness has performed an important and extreme-
ly difficult job for the AES for the past 17 years,” Kaiser
said. “We greatly appreciate his decision to continue work-
ing with us after a qualified replacement has been found, to
ensure a smooth transition.”
Smith Named Interim CEO of Nortek Richard L. Bready, chairman, president and CEO of
Nortek, has retired, and the company has named J. David
Smith as interim CEO. Nortek’s board also announced that
it is retaining an executive search firm to identify and secure
a permanent replacement.
Prior to assuming the Interim CEO title, Smith served for
about two years as an outside director on Nortek’s board
as well as on its compensation committee. Smith has more
than 36 years experience in the building products industry,
including 12 years as the chairman, president and CEO of
Euramax International—a producer of aluminum, steel,
vinyl, copper and fiberglass products for OEM, distributors,
contractors, and home centers worldwide.
Bready is retiring after 36 years of service to Nortek and
its predecessor companies. Brand names acquired during
Bready’s tenure include Niles, Speakercraft, Elan, Xantech,
Sunfire, and Linear.
Roger Furness
SEPTEMBER 2011 29
speaker with a state-of-the-art LED light. MusicLites, which
can be powered by plugging into any standard light socket,
is now available to consumers and businesses across the
U.S. MusicLites allows consumers and businesses to create
a high-end audio and lighting experience without wires
almost anywhere they have light sockets. The light socket
powers both the speaker and the light. The speakers and
audio source communicate through a proprietary wire-
less transmitter and receiver system, the companies said.
Each MusicLites’ unit features a 10-W LED light that
puts out the equivalent of a 65-W reflector bulb. It also
has a 70-mm full-range high-fidelity loudspeaker and a
wireless audio receiver. A 2.4-GHZ wireless transmitter can
be connected to just about any audio source—including
stereos, televisions, computers, iPods, iPads, and smart-
phones—to transmit a signal to the MusicLites speakers.
MusicLites fit into 4-, 5- or 6" recessed lighting cans. Each
MusicLites kit contains two 3.8 × 5.3" modules and a
remote that can dim the lights and raise or lower the audio.
As many as five zones with up to 12 MusicLites in each
zone can be tied together in a single network, creating a scal-
able lighting and audio system. MusicLites also are water-
resistant. For more information, visit www.musiclites.com.
Electronic Systems Contractors Offer Diversified Services
Electronic systems contractors (ESCs) who are CEDIA
members enjoyed 13% revenue growth and rising profit
margins in 2010 despite the depressed market for new
home construction, CEDIA’s annual benchmarking survey
found. The responding companies also expect their rev-
enues to grow in 2011. Average revenues for a responding
company hit $1.32 million in 2010, up 13%, with install-
ers expecting 2011 gross revenues to increase on average by
15% to $1.52 million.
In 2010, most of the ESC’s revenues again came from
retrofit and remodeling installs, both of which accounted
for an average of 63% of gross revenue in 2010. Average
net profit margin rose to 4.1 % in 2010 from 3.5 % in
2009, though the average margin is still below 2007’s 6.8%.
For 2011, the respondents expect the number of jobs they
do to increase from 2010, when the median number of
projects for ESC companies was 41, and they expect that
number to grow to a median 51 in 2011. The average
2010 project size was $32,000. A stepped-up marketing
effort was the reason cited most often by installers for their
expectations of rising sales and profits in 2011. After the
end of the first quarter of 2011, 93% of respondents indi-
cated that they expect to be profitable at the end of 2011.
Among project types, home theater/media room installs
accounted for a smaller share of respondents’ gross revenues,
falling to 17% in 2010 from the previous year’s 24%, pre-
sumably because installers have been diversifying into light-
ing, security, energy management, and systems integration.
In fact, respondents called “systems integration/control”
their most profitable product category in 2010. In addition,
installers see themselves offering a variety of products and
services (see table) during the next two years. Seventy-two
percent expect to be offering energy-management products,
24% expect to offer smart appliances, 33 % expect to offer
home health equipment, 49% expect to be offering LED
lighting, and 18 % expect to offer alternative energy sources.
For the 2011 survey, 112 companies completed valid survey
responses for a response rate of about 8%. The companies
employ a total of 932 employees. Results are representative
of CEDIA members and reported at a 95% confidence
level, CEDIA said. The survey was conducted by research
firm Brand Ubiquity. Results are free to respondents and
available for purchase through the CEDIA Marketplace for
$1,495 for CEDIA members and $2,995 for non-members.
A discount of 35% is available on reports pre-ordered before
September 11. VC
Employment Opportunities

30 VOICE COIL
CATEGORY KEY
A = ADHESIVES
B = CONSULTANTS & ENGINEERS
C = CROSSOVERS & PASSIVE COMPONENTS
D = DRIVERS
E = EMPLOYMENT OPPORTUNITIES
F = ENCLOSURES & ENCLOSURE PARTS
G = ENGINEERING/DESIGN SOFTWARE
H = FINISHED SYSTEMS
I = MAGNETS & EQUIPMENT
J = MANUFACTURING EQUIPMENT
K = MICROPHONES
L = PARTS
M = RECONING
N = TEST EQUIPMENT
O = VOICE COILS − COMPONENTS
& MATERIALS
P = TRANSDUCERS
Q = ACOUSTIC MESH
Products & Services Index
Advertiser Categories Page
ACO Pacific .................................... K,N ......................14
Acustica Beyma ............................. D .........................24
Audience ....................................... B,C,H ...................16
Audiostar Electronics Co., Ltd .......... O .........................23
audioXpress .................................................................2
BMS Speakers GmbH ....................... D ...........................6
Etani Electronics Co., Ltd ................ B,G,L,N ..................4
Faital Spa ...................................... D ...........................8
Listen, Inc .................................... C,G,N ...................31
Menlo Scientific, Ltd. .................... B .........................12
NTI-Americas ................................. B,G,J,N ................26
One Magnet Electronic Co., Ltd. ...... I ..........................17
PowerBass USA, Inc. ....................... E .........................29
Prism Media Products ..................... G .........................32
Rotel Electronics ........................... B .........................16
SB Acoustics .................................. L ...........................3
SM Audio Engineering Consulting ..... B .........................19
Solen Electronique, Inc. ................. C,D ......................19
Speaker Design Consultants ............. E .........................29
Tang Band Industries Co. ................ D ........................7,9
Vance Dickason .............................. B .........................27
Wavecor Ltd. ................................ F,H.......................21
Using Your Digital Issue
Preview all pages.View a list of archived issues.Flip to the cover. Flip to the previous page.Flip to mthe next page. Flip to the back cover. Search. Print.Download entire pdf. Toggle full screen. Help guide.Close.
Navigationbuttons.
Next page.
���#��(����������Z���the page manually.
Previous page.
Be sure to check for rollover / hotspot buttons which allow you to jump to a page or URL.
This product/services index is provided as a value-added service to our readers and advertisers. The publisher will not be held liable for any errors or deletions contained herein.
Preview all pages.View a list of archived issues.Flip to the cover. Flip to the previous page.Flip to mthe next page. Flip to the back cover. Search. Print.Download entire pdf. Toggle full screen. Help guide.Close.

Low cost
True Perceptual Rub & Buzz detection
Insensitive to background noise
Excellent correlation to the human ear
When it comes to increasing yield, you only want to reject speakersthat sound bad. Listen’s new CLEAR Perceptual Rub & Buzz algorithm is your fully automated, 100% reliable golden ear. Used on the production line, it accurately replicates the response of a human listener to give you fully automated pass/fail measurements with intelligence.
+ =SoundCheck’s
TMCLEARPerceptualRub & Buzz
TM
Visit www.Listeninc.com/clearVC for a FREE demo and 20% discount*
Tel: +1 617 556 4104 Email: [email protected]: www.Listeninc.com
dCh k’
NEW
®
* Discount applies to CLEAR module (part number 2030) only. See web site for full terms and conditions.
See us at
AES

...integrated
electronic test, acoustic test...
Prism Sound is now a globalsales & support agent for:
������������������� �������� ������������������������������������ ���������������������������������������������������������� ����������������
��������������������� ���������� ������������ ���������������������
������������������� !�����������������������������������������������������"������ ���������� �����#�������������������$�����%dScope Series III
analog and digitalaudio analyzers
������������������� ��������������������������������������������� �!"#�����$ ����
Loudspeaker design and analysis solutions

®
Dr. William Marshall Leach
Remembered, p. 39
V O L U M E 2 4 , I S S U E 1 2 O C T O B E R 2 0 1 1
IN THIS ISSUE
33
18
39
46
INDUSTRY NEWS AND DEVELOPMENTSBy Vance Dickason
TEST BENCHA Full-Range 8" from Dayton Audio and a New 10" Woofer from Scan-Speak By Vance Dickason
ACOUSTIC PATENTS By James Croft
INDUSTRY WATCH By Vance Dickason
Products & Services Index
Industry News and DevelopmentsBy Vance Dickason
131st AES Convention NYCThis year’s AES Convention will be held, as it is
every other year, at the Jacob K. Javits Convention
Center in New York City, New York. Dates for this
year’s Convention/Trade Show are October 20–23,
2011. As with all AES conventions, this one prom-
ises to have a lot of information for the loudspeaker
industry. Between workshops, master classes, live
sound sessions, and paper presentations, there will be
an enormous amount of information available to the
loudspeaker engineering community. Paper presen-
tations of particular interest to the industry at this
year’s convention include the following. (Please note
that some paper presentation descriptions were not
available when Voice Coil went to print.)
The following Live Sound Seminars will take place:
DSP Algorithms—Chairman: Rich Frembes,
Fulcrum Acoustics: It’s not talked about often, but
almost no two brands of digital loudspeaker proces-
sors use the same filter definitions. As a result, there
is no such thing as a cross-platform, DSP agnostic,
optimal crossover setting. This panel looks at how
to create a precise set of crossover and equalization
filters for the best loudspeaker performance despite
so much variability in DSP filter shapes. DSP engi-
neers and loudspeaker experts talk filter definitions,
1
New FINE Hardware USB
FFT Analyzer, p. 14
Drivers on the Test Bench, p. 18
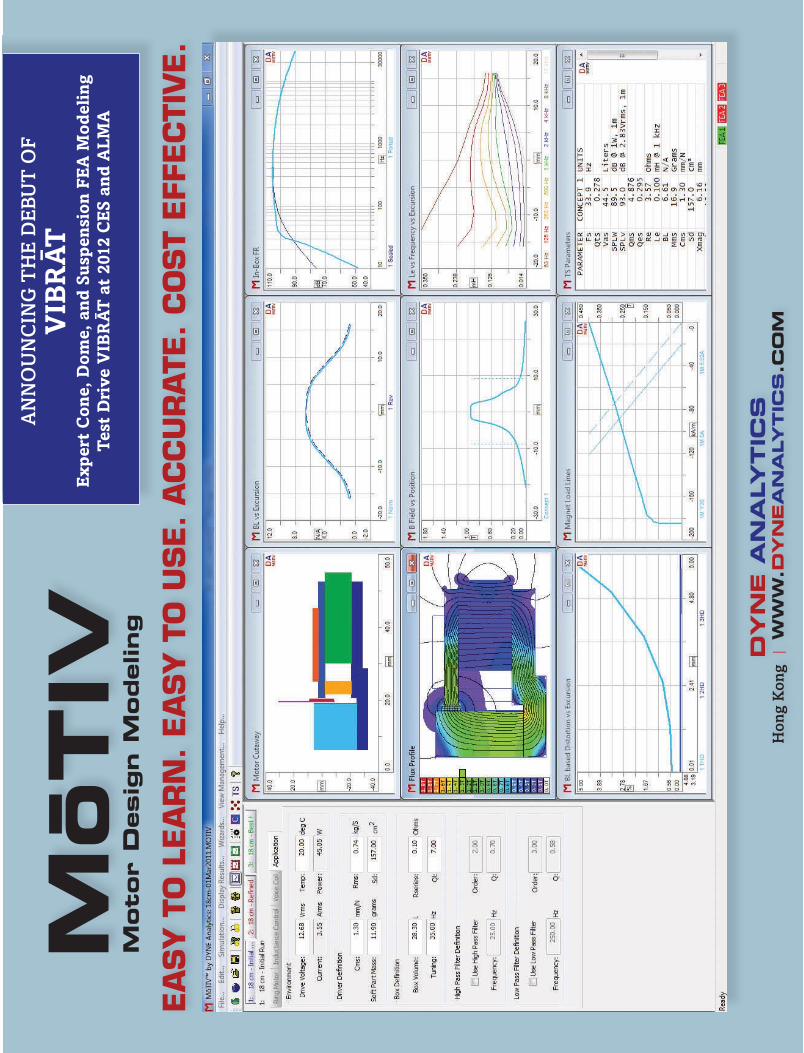
DY
NE A
NA
LYTIC
SH
ong
Kon
g |
WW
W.D
YN
EA
NA
LYTIC
S.C
OM
EA
SY T
O L
EA
RN
. EA
SY T
O U
SE. A
CC
UR
ATE
. C
OST
EFF
EC
TIVE.
MoTIV
Moto
r D
esig
n M
odeling
AN
NO
UN
CIN
G T
HE
DE
BU
T O
F
VIB
RA
TE
xper
t C
one,
Dom
e, a
nd
Su
spen
sion
FE
A M
odel
ing
Tes
t D
rive
VIB
RA
T a
t 20
12 C
ES
and
ALM
A
��
���������� ���������� ���
�
������� ���� �������������
���
�� ������������
����������� ���������������
�������������������������������
��
����������������������������������
��� ��!""#$��%���
������&��������'�������� ��!$(#)
��%���
�
���� ����
*��� ��+���,������ ���-�������
���� �������� �-��� ���� ������ -�
�����
���,�������� ���+��� ���,������ �
���� �� .������������� ���� ���� ��
,�� �-�
,������� ������� ��� ��������� ����
� �/��.���� ��,��+��� ,��-�������0
� �*����
�������,�������������+���������-����
������������.����������������������������
������
,��-�������� ������,����� �+��� ����
��-�� �-� ���� ���,�����0� 1������ �/�
�������
���������������� ,��,������� ���,���
������ -������������������������ �����
�����
����������0� �� ���,�������+�� ��
�� �-� ������ �-� .��������� ������
�� ����
�������� ���,������ ���,��������
���+���� ��� ������.��� ��������� -��2
�����
���,������ ��������������+����� �����
������� ������������ �� �� ����� ,����
���+��
�.�������������������-������0��
.�����������--�������������������
���������
,��-��������������������,����������
��������-��2������������.�+��$��3
40�
�
!"� �#$� %�&��#%$�
*����,�,���,��������������������-����
�������-�.������������������������-�
���������,������
�-��������-��2�������������������
����������0��*������������,��,�����
���-�.������������
���,���������� ������� ���� ����
���� ���� ���� -���� ��� .�� �,����
�� -��� ����� ,�,���0��
5��������,��������-����������.��
����������������������������-��������
������������������
�/������,�����������+��������������
����������-��� ��,��+�����������
���� ����+����������
��������������0�����-��������,
�������������������.�������������.
���������������������
���� ��+��0� ��,�������+�� �����
��� �������� ����� ��� �� ����������� �.
�� ���� ,���������
���,������ ���� ������ ���������0�
������ ������ ����� ������ .���+�
��� �-� ���� ������
���,������0�
�
'"����#��% (�%���) (��#&*�����
��#��� �+*�*��) #���
�������� ��� �� ����� ���� ��2�� �
����� ������ ��� ���� ��� �� ��.��� �
-� ����� �����������
���������� ��������� ��������� ����
�,����� ���� ����6������� ,������0�
� �,,���������� -���

4 VOICE COIL
Voice Coil, (ISSN 1521-091X), the Periodical of the Loudspeaker Industry, is published monthly by Segment, LLC, 4 Park St., Vernon, CT 06066 USA, (860) 875-2199, FAX (860) 871-0411. Periodical rates paid at Vernon, CT and additional offices.
Copyright 2011 by Segment, LLC. All rights reserved. Quotation from Voice Coil is forbidden without written permission of the publisher.
Publisher - Hugo Van haecke Editor - Vance Dickason (E-mail [email protected])
C. J. Abate.................Editorial CoordinatorShannon Becker ..............Editorial AssistantShannon Barraclough ....Marketing DirectorKC Prescott ...................................GraphicsJeff Yanco ....................................ControllerDebbie Lavoie ..................Customer ServiceValerie Luster.....Administrative Coordinator
SubmissionsSend all press releases and information to Voice Coil, Segment, LLC Editorial Dept., 4 Park St., Vernon, CT 06066, or FAX us material at (860) 871-0411, or e-mail [email protected].
ADVERTISING
For advertising reservations contact: Strategic Media Marketing, Inc., 2 Main St., Gloucester, MA 01930 USA, Phone: (978) 281-7708, or Fax: 603-924-9467, Toll-free (800) 454-3741, e-mail [email protected].
E-mail Erica Fienman with artwork inquiries at: [email protected].
Qualified subscriptions to Voice Coil run for one year. Renew annually on-line at voicecoilmagazine.com/vcqual.html
Subscriptions to Voice Coil are available in printed and digital versions. To subscribe to the digital version, please visit our website at www.audioXpress.com and complete a qualification form. When you qualify,
you will receive an e-mail confirming your subscription. The current issue of each digital Voice Coil will be posted to www.gotomyvoicecoil.com at the end of the month. To access, use the link in the e-mail notification, or you can simply log in to the website to view your issue along with the archived issues. For questions relating to the digital issue, please go to the help page at www.audioxpress.com/digital_issue_help.htm.
For those overseas, the cost of a printed subscription is $150.00 per year. Please contact customer service or order your subscription online at www.audioXpress.com.
tips on DSP settings conversion, and the need for a
loudspeaker filter definition standard.
Subwoofer Arrays and Beam Steering: Nothing seems
more topical than the control of low-frequency energy
via array design. The problem of excess low-frequency
energy will be addressed with subwoofer and array
design, placement, and DSP control. The methods of
achieving good coverage for the audience and elimi-
nating bass build up on stage or other areas will be
discussed.
Production Wireless Systems Practical Applications
and Practices—Chairman: James Stoffo: One of the
prime RF coordinators in the industry, James Stoffo
will moderate a panel of leading manufacturers in a
discussion of RF techniques and best practices. Topics
will include proper radio spectrum band planning,
antenna specification and techniques, proper audio
gain staging, scanners and analyzers, wireless accesso-
ries, squelch threshold, RF war gaming, and tips and
tricks for maximum success.
The following Master Class is scheduled:
Human Hearing 101—How it Works (The Short
Version)—Presenter: Jim Johnston, DTS, Inc.: In this
class, a variety of subjects will be discussed at a con-
ceptual level, from head-related transfer functions to
the actual filters implemented in the human cochlea.
Along the way, loudness vs. intensity, the law of the
first wave front, localization, auditory masking, and
the effects of attention and inter-sensory interaction
will be discussed. For each subject, an example will be
given. For one or two of the subjects, a demonstration
may be provided. When you are done with this class,
you will have an understanding of how the ear does
frequency analysis, and the way that affects everything
else that relates to the human auditory system, from
localization, through masking, to the absolute thresh-
old of hearing. In addition to the above, issues of
envelopment, direct vs. diffuse sensation, and spatial
perception will be discussed as time allows.
The following Paper Presentations will take place:
Accurate Acoustic Modeling of Small Rooms—Holger
Schmalle, AFMG Ahnert Feistel Media Group - Berlin,
Germany; Dirk Noy, WSDG Walters-Storyk Design
Group - Basal, Switzerland; Stefan Feistel, AFMG
Ahnert Feistel Media Group - Berlin, Germany;
Gabriel Hauser, WSDG Walters-Storyk Design
Group - Basal, Switzerland; Wolfgang Ahnert, AFMG
Ahnert Feistel Media Group - Berlin, Germany; John
Storyk, WSDG Walters-Storyk Design Group - Basal,
Switzerland: Modeling of sound reinforcement sys-
tems and room acoustics in large- and medium-size
venues has become a standard in the audio industry.
However, acoustic modeling of small rooms has not
yet evolved into a widely accepted concept, mainly
because of the unavailable tool set. This work intro-
duces a practical and accurate software-based approach
for simulating the acoustic properties of studio rooms
based on FEM. A detailed case study is presented and
modeling results are compared with measurements. It
is shown that results match within given uncertainties.
Also, it is indicated how the simulation software can be
enhanced to optimize loudspeaker locations and place
absorbers and diffusers in order to improve the acoustic
quality of the space and thus the listening experience.
MTF-Based Loudspeaker Optimization Objective
Functions—Andrew Christian
An Approach to Small Size Direct Radiation
Transducers with High SPL—Jose Martinez, Acústica
Beyma, S.L. - Valencia, Spain; Enrique Segovia, Obras
Públicas e Infraestructura Urbana - Alicante, Spain;
Jaime Ramis, Ingeniería de Sistemas y Teoria de la
Señal - San Vicent del Raspeig, Spain; Alejandro Espí,
Acústica Beyma, S.L. - Valencia, Spain; Jesús Carbajo,
Ingeniería de Sistemas y Teoria de la Señal - San
Vicent del Raspeig, Spain: This work analyzes some
of the issues related to small size, direct-radiation
loudspeakers design and aims to achieve high SPL
using this kind of loudspeaker. In order to reach it,
large diaphragm displacements are needed. Structural

For The Sound You Want
Get the sound you want when you want it supersizedMisco applies 60 years of engineering development and experience for your sound reinforcement. Get the exact frequency response and power requirement you want.
Get the sound you want in all kinds of weatherMisco has a sterling reputation for waterproof speakers and enclosures. We’ll help you get great sound outdoors, rain or shine.
Get the sound you want in complete packagesMisco offers speakers for clear, intelligible sound, and we can put those speakers in line matching transformers, grills and vandal-proof enclosures to complete your speaker package.
Get the sound you want in a vintage or modern toneMusical instrument amp builders are passionate about building electronics that deliver exceptional performances. We’re just as passionate about building speakers that deliver the exact tone you want, from fat lows to smooth highs.
Get the sound you want with your custom designMisco’s ability to engineer and build speakers for any pro-commercial or musical instrument application. Your loudspeaker - Your specifi cations. We deliver the sound you want!
For Professional Audio, your sound begins with Misco.
Misco helps engineers meet the special needs of pro-audio, commercial sound and musical instruments. We’ll work with you to create speakers that deliver both intelligible speech and full-range music in spaces with challenging requirements.
Toll Free: 1-800-276-995E-mail: [email protected] www.miscospeakers.com

6 VOICE COIL
dynamic behavior of the moving assembly must be
emphasized. With the aid of a numerical model imple-
mented with finite elements, it is possible to quantify
the influence of changing the number of folds in the
suspension (spider), the distance between spiders, and
the effect of unbalanced forces inherent to the loud-
speaker construction. Numerical model predictions
are compared with experimental results having as ref-
erence a six-inch loudspeaker development.
Delay Compensation in Multi-Way Speaker Designs—
Is the Ruler Measurement Enough?—Bogic Petrovic
A Novel Sharp Beam-Forming Flat-Panel Loudspeaker
Using Digitally Driven Speaker System—Mitsuhiro
Iwaide, Akira Yasuda, Daigo Kuniyoshi, Kazuyuki
Yokota, Moriyasu, Yugo, Kenji Sakuta, Fumiaki
Nakashima, Masayuki, Yashiro, Michitaka Yoshino,
Hosei University - Koganei, Tokyo, Japan: In this
paper, the presenters propose a beam-forming speaker
based on a digitally-direct driven speaker system
(digital-SP); the proposed speaker employs multi-bit
delta-sigma modulation in addition to a line speaker
array with flat-panel loudspeakers (FPLS), and a delay
circuit. The proposed speaker can be realized only
by D flip-flops and digital-SP. The sound direction
can easily be controlled digitally. All processes can be
performed digitally without the use of analog com-
ponents such as power amplifiers, and a small, light,
thin, high-quality, beam-forming speaker system can
be realized. The prototype is constructed using an
FPGA, CMOS drivers, and a line FPLS array. The
20-dB attenuation for 20° direction is measured.
The Influence of the Directional Radiation Performance
of the Individual Speaker Module, and Overall Array,
on the Tonal Balance, Quality and Consistency of
Sound Reinforcement Systems—Akira Mochimaru,
Paul Fidlin, Soichiro Hayashi, Kevin Manzolini,
Bose Corporation - Framingham, MA, USA: Room
acoustic characteristics, such as reflections and rever-
beration, often change the performance of speaker
systems in a room. It has always been challenging to
maintain the tonal balance of a single speaker mod-
ule when multiple modules are used to form speaker
arrays.
Both phenomena are unique to sound reinforcement
speakers and are mainly determined by a combina-
tion of the radiation characteristics of an individual
speaker module and the interactions between mod-
ules, known as arrayability. First, this study reviews
the performance of conventional speaker systems.
Next, the acoustic characteristics of speaker modules
desired for forming an ideal speaker array are dis-
cussed.
A new category of speaker system, the Progressive
Directivity Array, is introduced to realize the theory
as a practical solution.

8 VOICE COIL
Subwoofers in Rooms: Equalization of Multi-Subwoofer
Systems
A Systematic Approach to Measurement Limit
Definitions in Loudspeaker Production
Inverse Distance Weighting for Extrapolating Balloon-
Directivity-Plots
Mechanical Fatigue and Load-Induced Aging of
Loudspeaker Suspension—Wolfgang Klippel
A Parametric Study of Magnet System Topologies for
Miniature Loudspeakers
A Computational Model of Vented Band-Pass Enclosure
Using Transmission Line Enclosure Modeling
Non-Linear Viscoelastic Models
Practical applications of a Closed Feedback Loop
Transducer System Equipped with Differential Pressure
Control
Dual Diaphragm Compression Drivers—Alex
OCTOBER 2011 9
Voishvillo, JBL Professional - Northridge, CA: A new
type of compression driver consists of two motors,
two diaphragm assemblies, and two phasing plugs
connected to the same acoustical load (horn or wave-
guide). The annular flexural diaphragms are made of
light and strong polymer film providing low-moving
mass. Unique configuration of the phasing plugs
provides summation of both acoustical signals and
direction of the resulting signal into a mutual acous-
tical load. Principles of operation of the dual driver
are explained using a combination of matrix analysis,
finite elements analysis, and data obtained from a
scanning vibrometer. A comparison of performance
for this driver and a conventional driver, based on
a titanium-dome diaphragm, is performed. A new
transducer provides increase of power handling, lower
thermal compression, smoother frequency response,
and decrease of nonlinear distortion and sub-har-
monics.
ize and Shape of Listening Area Reproduced by Three-
Dimensional Multichannel Sound System with Various
Numbers of Loudspeakers
Tokyo, Japan: A wide listening area is necessary
so that several people can listen to a multichannel
sound program together. It is considered that the
size of the listening area depends on the number of
loudspeakers. To examine the relationship between
the number of loudspeakers and the size of listening
area that maintains spatial impression at the center of
a 3-D, multichannel sound, two subjective evaluation
experiments were carried out. The first experiment
showed that the size of the listening area increases by
increasing the number of loudspeakers. The second
experiment showed that the shape of the listening area
is dependent on the locations of loudspeakers. On the
basis of the experimental results, a new parameter for
estimating the shape of a listening area is proposed.
Numerically Optimized Touring Loudspeaker Arrays—
Practical Applications—Ambrose Thompson, Jason
Baird, Bill Webb, Martin Audio - High Wycombe,
UK: The implementation of a user-guided auto-
mated process that improves the quality and consis-
tency of loudspeaker array deployment is described.
After determining basic venue geometry a few easily
understood goals for regions surrounding the array
are specified. The relative importance of the goals is
then communicated to the optimization algorithm in
are presented, initially optimized with default cover-
age goals. Extra requirements ar imposed, such as
changing the coverage at the last moment, avoiding
noise-sensitive regions, and demanding a particularly
+�� ����� � � � � ���� �� � ��� ���� �� � ������ � � � �2� � � �� � � � � � ������� � � � � ��� ���� � ��� �� �� ��� � � ��� � ��� ���� �� ���� � � � �
��� !" ���������� ����������������������������������������������������� �������!"�����#������!���$�%�&�%��'����������%�!�(���)���"���)���(�����%!������W'���(�����
#����������� � �%�����(�%���%��%������%�)������!� ������%!�%� ��������� ��'�!��!"������������)�%������%������������W������)���������'�%!�
#��2������ *������W�����������������%���������!!����%������������%!�+)���������%���������%���)���%���+�������������%!�%����!��������
#��2���$������� ,�������������%"W�������%!��������-�����(�!�%�W����.�����������%"���(��(����%���%!�%����������%!�
�8 ##��� !" ����'�%!��%!�����%������+)�����������������������������!����%!�������%���������!�
<�%���<�&������'������������-�%���/�����!�0���%��!1������%!�����������W�!���(�2�3�0�2�4�WW�)�5�!������+ ����)��������������!�������%!������%�%'(������������
(�)��� !" ���%!��(��������(�����%!�������%�������%���/��W����%���!�6��!���������5�*���%!����%�%��
���&,,&���������������&*����2��4���W"�78�!9�!����%�!)�� ������:�� ���%��%!�W�!��)��*�+*"��������!������W���!������������((����%��"�;<�WW�!�W��+�!�/��������������$+'�� ����!��

OCTOBER 2011 11
quiet stage.
Vertical Loudspeaker Arrangement for Reproducing
Uniformly Diffuse Sound—Satoshi Oode, Ikuko
Sawaya, Akio Ando, Kimio Hamasaki, Japan
Broadcasting Corporation - Setagaya, Tokyo, Japan;
Kenji Ozawa, University of Yamanashi - Kofu,
Yamanashi, Japan: It was recently recognized that
the loudspeaker arrangement of multichannel sound
systems can be vertically expanded to improve the
spatial impression. This paper discusses the relation-
ship between the vertical interval between loudspeak-
ers placed in a semicircle above ear height and the
impression of spatially uniform sound, as part of a
study of 3-D, multichannel sound systems. In total,
24 listeners evaluated the spatial uniformity of white
noise reproduced by loudspeakers arranged in vertical
semicircles at equal intervals of 15°, 30°, 45°, 60°, 90°,
or 180°, and with azimuthal angles of 0°, 45°, or 90°.
Loudspeakers arranged with vertical intervals that were
less than 45° were found to reproduce spatially uniform
sound for all of the azimuthal angles tested.
Design of Free-Standing Constant Beamwidth
Transducer (CBT) Loudspeaker Line Arrays for Sound
Reinforcement—D. Keele, Jr., DBK Associates and
Labs - Bloomington, IN, Audio Artistry, Raleigh,
NC: This paper presents design guidelines for choos-
ing the parameters of a free-standing CBT line array,
including its physical height and circular arc angle, its
location, and downward pitch angle to appropriately
cover a single 2-D, straight-line audience sound-rein-
forcement listening line. These parameters are par-
ticularly easy to determine in advance for a CBT line
array because of the extreme uniformity of its sound
field with both frequency and distance, and its inher-
ent constant-directivity characteristics. This paper
presents a design scenario that allows the designer
to choose these system parameters and optimize the
direct-field coverage in the prescribed seating region
without requiring the use of sound-system design and
prediction software. The design technique forces the
SPL at the front and rear of the listening region to be
equal by aiming the array at the rear of the listening
region and then choosing its beamwidth (and its asso-
ciated off-axis roll-off ) to provide this front-rear SPL
equality. The SPL and frequency response at interme-
diate points of the covered region are then defined by
the off-axis roll-off behavior of the CBT array.
Comparison of Subjective Assessments Obtained from
Listening Tests through Headphones and Loudspeaker
Setups—Vincent Koehl, Mathieu Paquier, University
of Brest (UEB) - Plouzané, France; Symeon Delikaris-
Manias, National Engineering School of Brest (UEB)
- Plouzané, France: Sound reproduction over head-
DE920TN. Smooth player.
Improving on a Standard.The DE900 series high frequency drivers from B&C have been an industry standard for more than a decade. The DE920TN improves on this standard. This compact, neodymium motor driver features a modified titanium diaphragm that incorporates a special resonance damper that significantly improves high frequency performance, while reducing distortion. The titanium diaphragm ensures long-term reliability with a natural response from 500-18,000 Hz, making the DE920TN an excellent 1.4” exit solution for two way point source enclosures, or for use on a wave guide horn for multi-driver line array systems. Also available is the DE950TN, 2” exit version. Tradition. Dedication. Knowledge.
B&C SPEAKERS spa
via Poggiomoro 1, località VallinaI-50012 Bagno a Ripoli (Firenze) tel. +39 055 65721fax +39 055 6572312 [email protected]
www.bcspeakers.com made in Italy
Seems like all of a sudden,compact arrays are big
business. So talk toCelestion about our range
of high performance,small-format drivers.
It’s anotherinnovation in sound
from Celestion.
Find us on Facebook
www.celestion.com
We’re thinking small
AN2075 50mm/2" AN2775 70mm/2.75" AN3510 88mm/3.5"

OCTOBER 2011 13
phones is, because of its convenience, indifferently
used to reproduce and assess a large variety of audio
contents. Nevertheless, it is not yet proven that
differences between sound sequences are equally
perceived when played back through headphones as
using dedicated loudspeaker systems. This study aims
at evaluating whether differences and preferences
between excerpts are equally perceived using these
two reproduction methods. Various types of audio
contents, issued by two different recording systems,
were then to be compared on both headphones and
loudspeaker setups. The results indicate that the two
reproduction methods provided consistent similar-
ity and preference judgments. This suggests that
the features involved in similarity and preference
assessments were preserved when reproducing these
excerpts over headphones.
The following Product Design Session is being
offered:
Hot and Nonlinear—Loudspeakers at High
Amplitudes—Chairman: Wolfgang Klippel, Klippel
GmbH - Dresden, Germany: Nonlinearities inherent
in electro-dynamical transducer and the heating of
the voice coil and magnetic system limit the acousti-
cal output, generate distortion and other symptoms
at high amplitudes. The large signal performance is
the result of a deterministic process and predictable
by lumped parameter models comprising nonlinear
and thermal elements. The tutorial gives an intro-
duction into the fundamentals, shows alternative
measurement techniques and discusses the relation-
ship between the physical causes and symptoms
depending on the properties of the particular stimulus
(test signal, music). Selection of meaningful measure-
ments, the interpretation of the results and practical
loudspeaker diagnostic is the main objective of the
tutorial which is important for designing small and
light transducers producing the desired output at high
efficiency and reasonable cost.
The following Workshop is scheduled:
Listen Professionally or Train Your Ear!—Chairman:
Sungyoung Kim, Yamaha Corp. Panelists: Jason Corey,
University of Michigan, Ann Arbor, MI; Kazuhiko
Kawahara, University of Kyusyu-Atsushi Marui, Tokyo
National Institute of Fine Art and Music, Tokyo,
Japan; Sean Olive, Harman International: Abstract:
It has been generally accepted that critical listening
ability is essential for audio engineers. Compared to
traditional training methods, recent training pro-
grams provide multiple trainees with fast acquisition
of such listening ability through a systematic curricu-
lum optimized for the required task. Moreover, due to

14 VOICE COIL
UA-25.
FINE R&D features include:
-
Figure 1
Figure 2
Figure 3
Figure 4 -
Figure 5. FINE
-
-
st
The New Chinese Version of the Loudspeaker Design Cookbook
-
-
Loudspeaker Design
Cookbook
New Analyzer from LOUDSoft: FINE R&D
Photo 1-
nd
Photo 1: New FINE Hardware USB FFT Analyzer
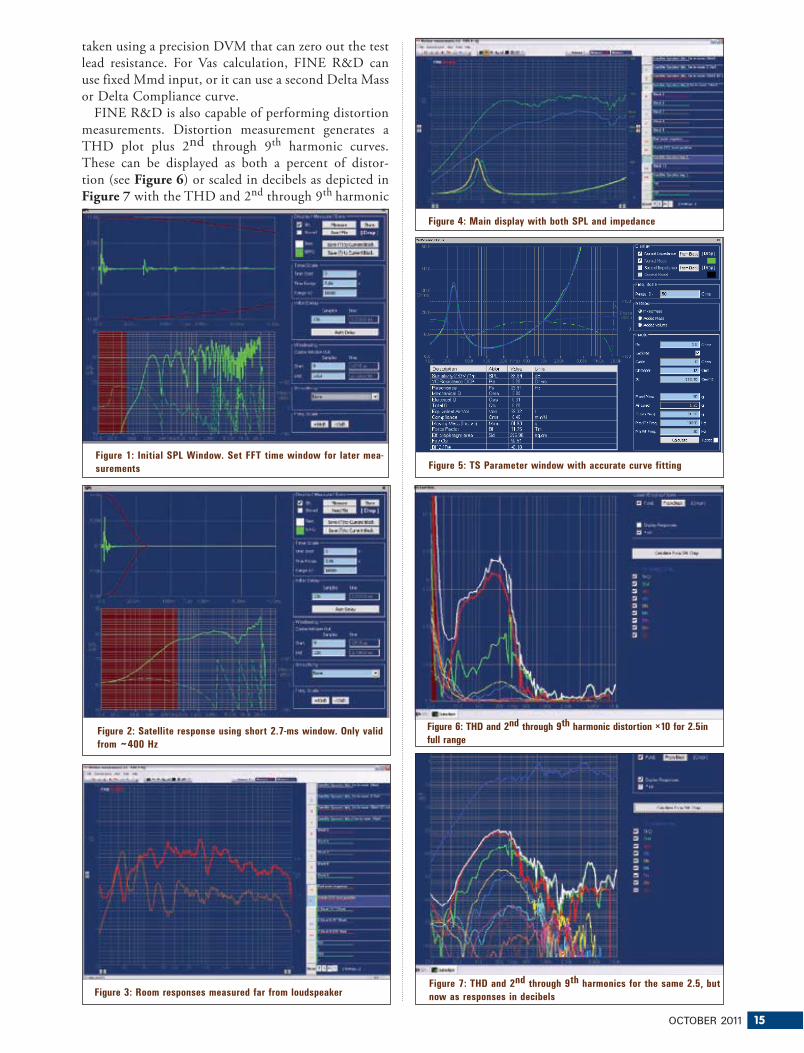
OCTOBER 2011 15
taken using a precision DVM that can zero out the test
lead resistance. For Vas calculation, FINE R&D can
use fixed Mmd input, or it can use a second Delta Mass
or Delta Compliance curve.
FINE R&D is also capable of performing distortion
measurements. Distortion measurement generates a
THD plot plus 2nd through 9th harmonic curves.
These can be displayed as both a percent of distor-
tion (see Figure 6) or scaled in decibels as depicted in
Figure 7 with the THD and 2nd through 9th harmonic
Figure 1: Initial SPL Window. Set FFT time window for later mea-
surements
Figure 3: Room responses measured far from loudspeaker
Figure 2: Satellite response using short 2.7-ms window. Only valid
from ~400 Hz
Figure 4: Main display with both SPL and impedance
Figure 5: TS Parameter window with accurate curve fitting
Figure 6: THD and 2nd through 9th harmonic distortion ×10 for 2.5in
full range
Figure 7: THD and 2nd through 9th harmonics for the same 2.5, but
now as responses in decibels

16 VOICE COIL
curves displayed along with the SPL magnitude.
The price for FINE R&D, including the FINE
Hardware platform, is $4,300. It’s and $6,000 includ-
ing FINEQC. For more information, visit LOUDSoft
at www.loudsoft.com.
New Drivers from BeymaBeyma has just released six new products for the
OEM Pro Sound market. This includes two new neo-
dymium coax models, the 12" 12CXA400Nd and the
15" 15CXA400Nd, two
new neodymium com-
pression drivers, the
CD1014Nd and the
CP855Nd, plus new
high power handling 5"
and 8" ferrite magnet
woofers, the 5CX200Fe
and the 8CX300Fe.
The 12CXA400Nd
and 15CXA400Nd
coaxial drivers are
designed to offer the
features that will cover
the needs of various
high-performance, pro-
audio application. The
low-frequency units uti-
lize a stiff low weight waterproof (both sides) cone and
a 4" (100 mm) aluminium wound voice coil that results
in power handling rated at 800-W program and with
98-dB sensitivity. The parameters have been optimized
for compact vented cabinets, making these drivers an
ideal choice for stage monitors where the size is a critical
aspect in the design of the system. The high-frequency
unit features a 2.8" (72.2 mm) diameter voice coil with
a Titanium diaphragm
with polyester surround
composite edge coupled to
a 60° horn. The common
magnetic circuit for both
units reduces in a signifi-
cant way the depth and
weight of the component.
Demodulating (shorting)
rings are incorporated into
both the low and the high
frequency units help to
minimize the distortion in
the whole working band.
The new CD1014Nd
is a driver based on the
Beyma existing CD10Nd,
but featuring a 1.4" (36
mm) throat diameter. The
moving assembly is com-
The 12” 12CXA400Nd
The 15” 15CXA400Nd
The new CD1014Nd driver
The CP855Nd compressed
driver
NTi Audio AG Liechtenstein+423 239 [email protected]
NTI Americas Inc. Portland, Oregon, USA+1 503 684 [email protected]
NTI ChinaSuzhou, Beijing, Shenzhen+86 512 6802 0075 [email protected]
NTI JapanTokyo, Japan +81 3 3634 [email protected]
www.nti-audio.com
FX100 Audio Analyzer offers proven
PureSound™speaker testing technology
Proven PureSound™ technology For the most reliable detection of different defect types. Supports defects testing across all installed analyzer channels.
Modular Analyzer architecture Customize your speaker test system by choosing the number of analysis channels, built-in impedance and DC-resistance measurements, switchers etc.
Cost efficiency System costs are controlled with modular configurations matched to specific applications.
Maximum test speed Very fast glide sweep technology measures all quality para-meters from a single stimulus within a fraction of a second.
FX-Control software Powerful and complete system control suite supports flexible GUI designs, built-in limits handling and sequenced measurements.
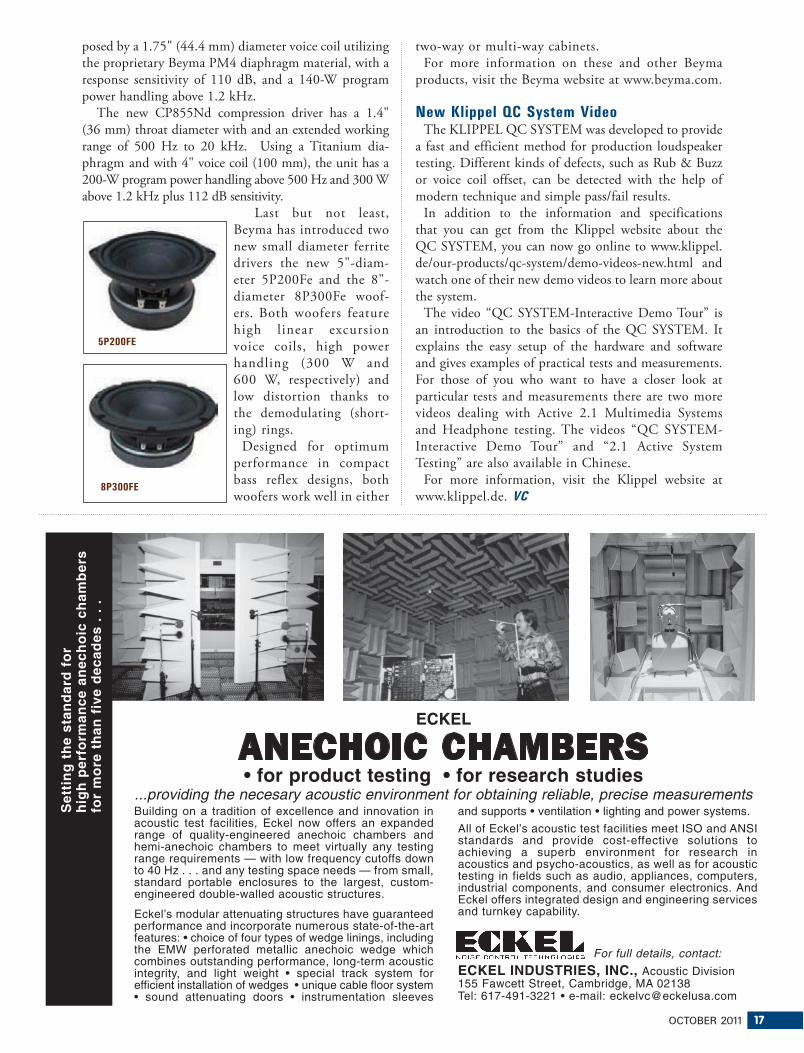
OCTOBER 2011 17
posed by a 1.75" (44.4 mm) diameter voice coil utilizing
the proprietary Beyma PM4 diaphragm material, with a
response sensitivity of 110 dB, and a 140-W program
power handling above 1.2 kHz.
The new CP855Nd compression driver has a 1.4"
(36 mm) throat diameter with and an extended working
range of 500 Hz to 20 kHz. Using a Titanium dia-
phragm and with 4" voice coil (100 mm), the unit has a
200-W program power handling above 500 Hz and 300 W
above 1.2 kHz plus 112 dB sensitivity.
Last but not least,
Beyma has introduced two
new small diameter ferrite
drivers the new 5"-diam-
eter 5P200Fe and the 8"-
diameter 8P300Fe woof-
ers. Both woofers feature
h igh l inear excursion
voice coils, high power
handling (300 W and
600 W, respectively) and
low distortion thanks to
the demodulating (short-
ing) rings.
Designed for optimum
performance in compact
bass reflex designs, both
woofers work well in either
two-way or multi-way cabinets.
For more information on these and other Beyma
products, visit the Beyma website at www.beyma.com.
New Klippel QC System VideoThe KLIPPEL QC SYSTEM was developed to provide
a fast and efficient method for production loudspeaker
testing. Different kinds of defects, such as Rub & Buzz
or voice coil offset, can be detected with the help of
modern technique and simple pass/fail results.
In addition to the information and specifications
that you can get from the Klippel website about the
QC SYSTEM, you can now go online to www.klippel.
de/our-products/qc-system/demo-videos-new.html and
watch one of their new demo videos to learn more about
the system.
The video “QC SYSTEM-Interactive Demo Tour” is
an introduction to the basics of the QC SYSTEM. It
explains the easy setup of the hardware and software
and gives examples of practical tests and measurements.
For those of you who want to have a closer look at
particular tests and measurements there are two more
videos dealing with Active 2.1 Multimedia Systems
and Headphone testing. The videos “QC SYSTEM-
Interactive Demo Tour” and “2.1 Active System
Testing” are also available in Chinese.
For more information, visit the Klippel website at
www.klippel.de. VC8P300FE
5P200FE
ECKEL
ANECHOIC CHAMBERS• for product testing • for research studies
...providing the necesary acoustic environment for obtaining reliable, precise measurementsBuilding on a tradition of excellence and innovation inacoustic test facilities, Eckel now offers an expandedrange of quality-engineered anechoic chambers andhemi-anechoic chambers to meet virtually any testingrange requirements — with low frequency cutoffs downto 40 Hz . . . and any testing space needs — from small,standard portable enclosures to the largest, custom-engineered double-walled acoustic structures.
Eckel’s modular attenuating structures have guaranteedperformance and incorporate numerous state-of-the-artfeatures: • choice of four types of wedge linings, includingthe EMW perforated metallic anechoic wedge whichcombines outstanding performance, long-term acousticintegrity, and light weight • special track system forefficient installation of wedges • unique cable floor system• sound attenuating doors • instrumentation sleeves
and supports • ventilation • lighting and power systems.
All of Eckel’s acoustic test facilities meet ISO and ANSIstandards and provide cost-effective solutions toachieving a superb environment for research inacoustics and psycho-acoustics, as well as for acoustictesting in fields such as audio, appliances, computers,industrial components, and consumer electronics. AndEckel offers integrated design and engineering servicesand turnkey capability.
For full details, contact:
ECKEL INDUSTRIES, INC., Acoustic Division155 Fawcett Street, Cambridge, MA 02138Tel: 617-491-3221 • e-mail: [email protected]
Set
tin
g t
he
stan
dar
d f
or
hig
h p
erfo
rman
ce a
nec
ho
ic c
ham
ber
sfo
r m
ore
th
an f
ive
dec
ades
. .
.
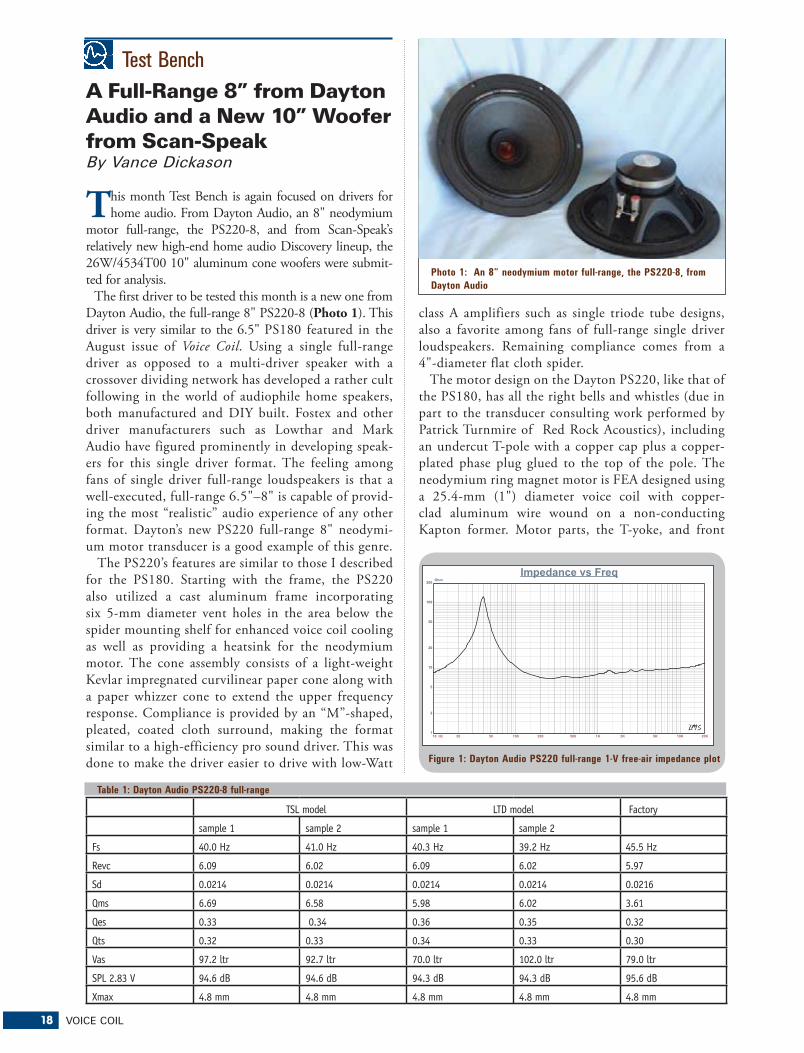
18 VOICE COIL
Test Bench
Photo 1: An 8” neodymium motor full-range, the PS220-8, from
Dayton Audio
Figure 1: Dayton Audio PS220 full-range 1-V free-air impedance plot
10 Hz 20 50 100 200 500 1K 2K 5K 10K 20K
Ohm
1
2
5
10
20
50
100
200
Impedance vs Freq
A Full-Range 8” from Dayton Audio and a New 10” Woofer from Scan-SpeakBy Vance Dickason
This month Test Bench is again focused on drivers for
home audio. From Dayton Audio, an 8" neodymium
motor full-range, the PS220-8, and from Scan-Speak’s
relatively new high-end home audio Discovery lineup, the
26W/4534T00 10" aluminum cone woofers were submit-
ted for analysis.
The first driver to be tested this month is a new one from
Dayton Audio, the full-range 8" PS220-8 (Photo 1). This
driver is very similar to the 6.5" PS180 featured in the
August issue of Voice Coil. Using a single full-range
driver as opposed to a multi-driver speaker with a
crossover dividing network has developed a rather cult
following in the world of audiophile home speakers,
both manufactured and DIY built. Fostex and other
driver manufacturers such as Lowthar and Mark
Audio have figured prominently in developing speak-
ers for this single driver format. The feeling among
fans of single driver full-range loudspeakers is that a
well-executed, full-range 6.5"–8" is capable of provid-
ing the most “realistic” audio experience of any other
format. Dayton’s new PS220 full-range 8" neodymi-
um motor transducer is a good example of this genre.
The PS220’s features are similar to those I described
for the PS180. Starting with the frame, the PS220
also utilized a cast aluminum frame incorporating
six 5-mm diameter vent holes in the area below the
spider mounting shelf for enhanced voice coil cooling
as well as providing a heatsink for the neodymium
motor. The cone assembly consists of a light-weight
Kevlar impregnated curvilinear paper cone along with
a paper whizzer cone to extend the upper frequency
response. Compliance is provided by an “M”-shaped,
pleated, coated cloth surround, making the format
similar to a high-efficiency pro sound driver. This was
done to make the driver easier to drive with low-Watt
class A amplifiers such as single triode tube designs,
also a favorite among fans of full-range single driver
loudspeakers. Remaining compliance comes from a
4"-diameter flat cloth spider.
The motor design on the Dayton PS220, like that of
the PS180, has all the right bells and whistles (due in
part to the transducer consulting work performed by
Patrick Turnmire of Red Rock Acoustics), including
an undercut T-pole with a copper cap plus a copper-
plated phase plug glued to the top of the pole. The
neodymium ring magnet motor is FEA designed using
a 25.4-mm (1") diameter voice coil with copper-
clad aluminum wire wound on a non-conducting
Kapton former. Motor parts, the T-yoke, and front
TSL model LTD model Factory
sample 1 sample 2 sample 1 sample 2
Fs 40.0 Hz 41.0 Hz 40.3 Hz 39.2 Hz 45.5 Hz
Revc 6.09 6.02 6.09 6.02 5.97
Sd 0.0214 0.0214 0.0214 0.0214 0.0216
Qms 6.69 6.58 5.98 6.02 3.61
Qes 0.33 0.34 0.36 0.35 0.32
Qts 0.32 0.33 0.34 0.33 0.30
Vas 97.2 ltr 92.7 ltr 70.0 ltr 102.0 ltr 79.0 ltr
SPL 2.83 V 94.6 dB 94.6 dB 94.3 dB 94.3 dB 95.6 dB
Xmax 4.8 mm 4.8 mm 4.8 mm 4.8 mm 4.8 mm
Table 1: Dayton Audio PS220-8 full-range
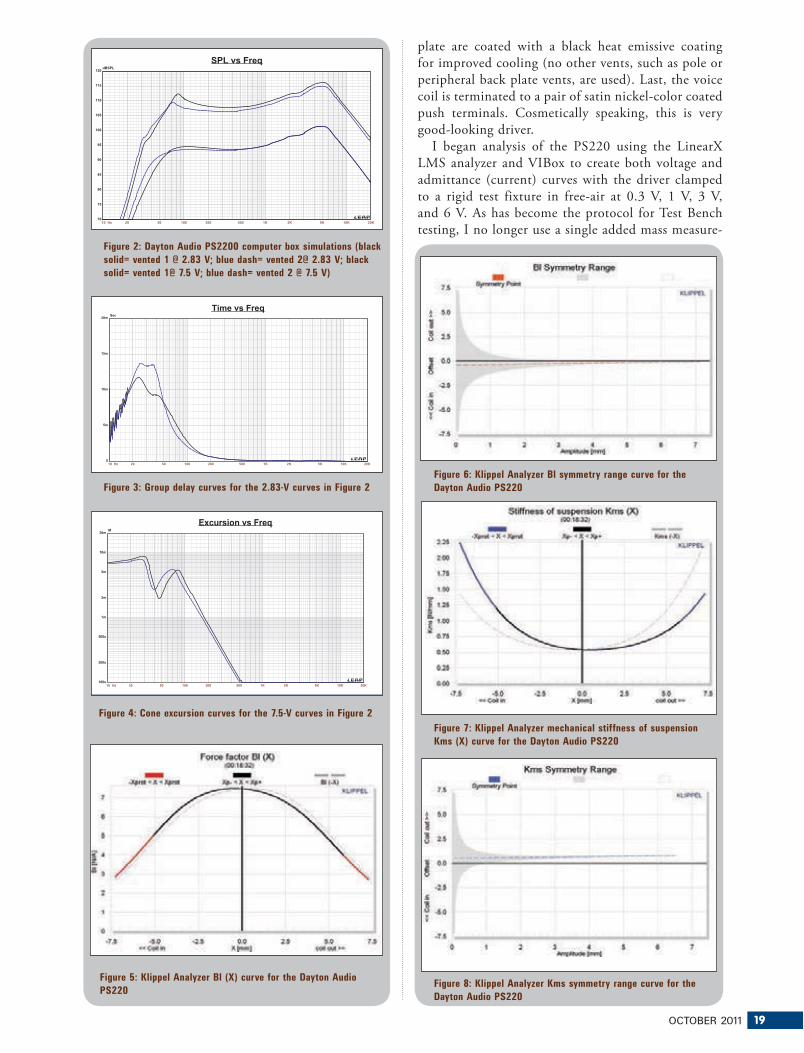
OCTOBER 2011 19
10 Hz 20 50 100 200 500 1K 2K 5K 10K 20K
M
100u
200u
500u
1m
2m
5m
10m
20m
Excursion vs Freq
Figure 5: Klippel Analyzer Bl (X) curve for the Dayton Audio
PS220
Figure 4: Cone excursion curves for the 7.5-V curves in Figure 2
Figure 6: Klippel Analyzer Bl symmetry range curve for the
Dayton Audio PS220
plate are coated with a black heat emissive coating
for improved cooling (no other vents, such as pole or
peripheral back plate vents, are used). Last, the voice
coil is terminated to a pair of satin nickel-color coated
push terminals. Cosmetically speaking, this is very
good-looking driver.
I began analysis of the PS220 using the LinearX
LMS analyzer and VIBox to create both voltage and
admittance (current) curves with the driver clamped
to a rigid test fixture in free-air at 0.3 V, 1 V, 3 V,
and 6 V. As has become the protocol for Test Bench
testing, I no longer use a single added mass measure-10 Hz 20 50 100 200 500 1K 2K 5K 10K 20K
dBSPL
70
75
80
85
90
95
100
105
110
115
120
SPL vs Freq
10 Hz 20 50 100 200 500 1K 2K 5K 10K 20K
Sec
0
5m
10m
15m
20m
Time vs Freq
Figure 2: Dayton Audio PS2200 computer box simulations (black
solid= vented 1 @ 2.83 V; blue dash= vented 2@ 2.83 V; black
solid= vented 1@ 7.5 V; blue dash= vented 2 @ 7.5 V)
Figure 3: Group delay curves for the 2.83-V curves in Figure 2
Figure 7: Klippel Analyzer mechanical stiffness of suspension
Kms (X) curve for the Dayton Audio PS220
Figure 8: Klippel Analyzer Kms symmetry range curve for the
Dayton Audio PS220
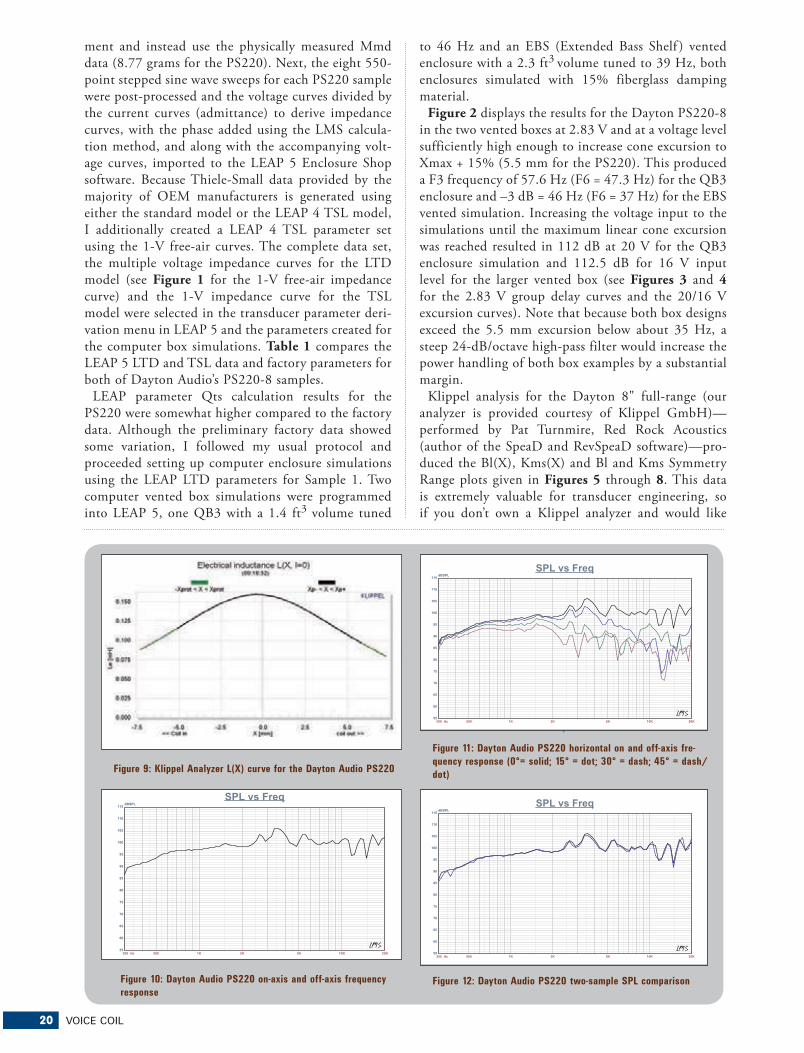
20 VOICE COIL
Figure 9: Klippel Analyzer L(X) curve for the Dayton Audio PS220
300 Hz 500 1K 2K 5K 10K 20K
dBSPL
55
60
65
70
75
80
85
90
95
100
105
110
115
SPL vs Freq
Figure 10: Dayton Audio PS220 on-axis and off-axis frequency
response
300 Hz 500 1K 2K 5K 10K 20K
dBSPL
55
60
65
70
75
80
85
90
95
100
105
110
115
SPL vs Freq
Figure 11: Dayton Audio PS220 horizontal on and off-axis fre-
quency response (0°= solid; 15° = dot; 30° = dash; 45° = dash/
dot)
300 Hz 500 1K 2K 5K 10K 20K
dBSPL
55
60
65
70
75
80
85
90
95
100
105
110
115
SPL vs Freq
Figure 12: Dayton Audio PS220 two-sample SPL comparison
ment and instead use the physically measured Mmd
data (8.77 grams for the PS220). Next, the eight 550-
point stepped sine wave sweeps for each PS220 sample
were post-processed and the voltage curves divided by
the current curves (admittance) to derive impedance
curves, with the phase added using the LMS calcula-
tion method, and along with the accompanying volt-
age curves, imported to the LEAP 5 Enclosure Shop
software. Because Thiele-Small data provided by the
majority of OEM manufacturers is generated using
either the standard model or the LEAP 4 TSL model,
I additionally created a LEAP 4 TSL parameter set
using the 1-V free-air curves. The complete data set,
the multiple voltage impedance curves for the LTD
model (see Figure 1 for the 1-V free-air impedance
curve) and the 1-V impedance curve for the TSL
model were selected in the transducer parameter deri-
vation menu in LEAP 5 and the parameters created for
the computer box simulations. Table 1 compares the
LEAP 5 LTD and TSL data and factory parameters for
both of Dayton Audio’s PS220-8 samples.
LEAP parameter Qts calculation results for the
PS220 were somewhat higher compared to the factory
data. Although the preliminary factory data showed
some variation, I followed my usual protocol and
proceeded setting up computer enclosure simulations
using the LEAP LTD parameters for Sample 1. Two
computer vented box simulations were programmed
into LEAP 5, one QB3 with a 1.4 ft3 volume tuned
to 46 Hz and an EBS (Extended Bass Shelf ) vented
enclosure with a 2.3 ft3 volume tuned to 39 Hz, both
enclosures simulated with 15% fiberglass damping
material.
Figure 2 displays the results for the Dayton PS220-8
in the two vented boxes at 2.83 V and at a voltage level
sufficiently high enough to increase cone excursion to
Xmax + 15% (5.5 mm for the PS220). This produced
a F3 frequency of 57.6 Hz (F6 = 47.3 Hz) for the QB3
enclosure and –3 dB = 46 Hz (F6 = 37 Hz) for the EBS
vented simulation. Increasing the voltage input to the
simulations until the maximum linear cone excursion
was reached resulted in 112 dB at 20 V for the QB3
enclosure simulation and 112.5 dB for 16 V input
level for the larger vented box (see Figures 3 and 4
for the 2.83 V group delay curves and the 20/16 V
excursion curves). Note that because both box designs
exceed the 5.5 mm excursion below about 35 Hz, a
steep 24-dB/octave high-pass filter would increase the
power handling of both box examples by a substantial
margin.
Klippel analysis for the Dayton 8" full-range (our
analyzer is provided courtesy of Klippel GmbH)—
performed by Pat Turnmire, Red Rock Acoustics
(author of the SpeaD and RevSpeaD software)—pro-
duced the Bl(X), Kms(X) and Bl and Kms Symmetry
Range plots given in Figures 5 through 8. This data
is extremely valuable for transducer engineering, so
if you don’t own a Klippel analyzer and would like

22 VOICE COIL
Figure 13: Dayton Audio PS220 SoundCheck Distortion plots
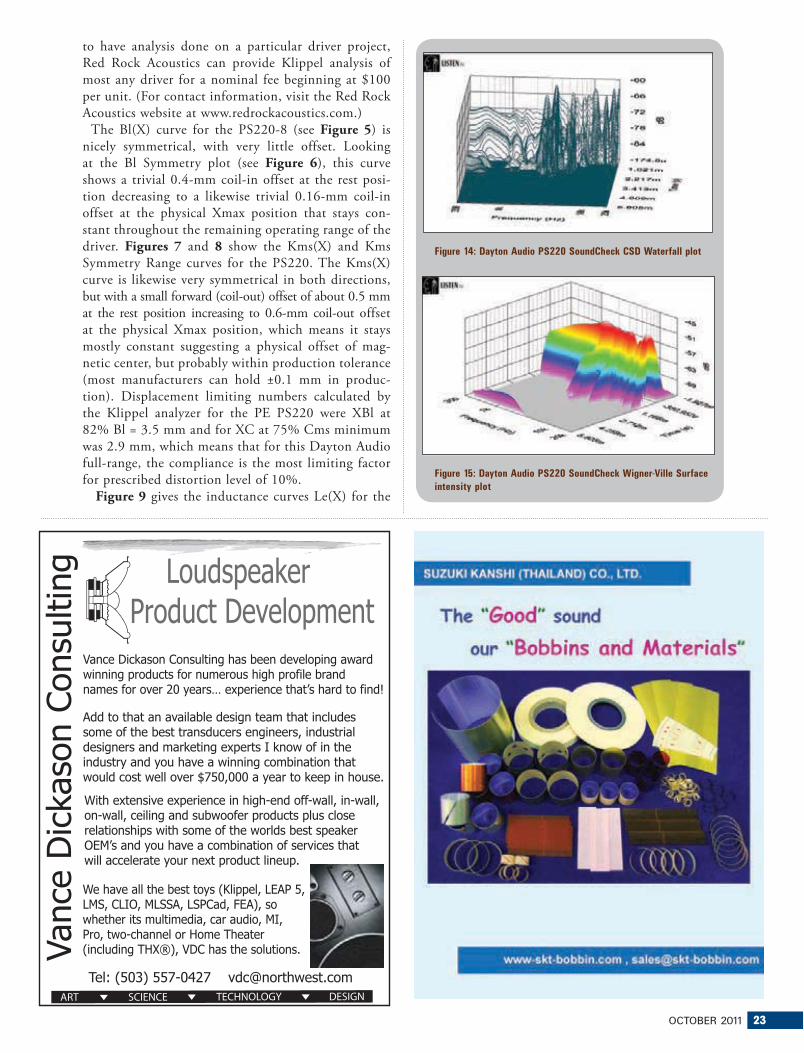
OCTOBER 2011 23
Figure 14: Dayton Audio PS220 SoundCheck CSD Waterfall plot
Figure 15: Dayton Audio PS220 SoundCheck Wigner-Ville Surface
intensity plot
to have analysis done on a particular driver project,
Red Rock Acoustics can provide Klippel analysis of
most any driver for a nominal fee beginning at $100
per unit. (For contact information, visit the Red Rock
Acoustics website at www.redrockacoustics.com.)
The Bl(X) curve for the PS220-8 (see Figure 5) is
nicely symmetrical, with very little offset. Looking
at the Bl Symmetry plot (see Figure 6), this curve
shows a trivial 0.4-mm coil-in offset at the rest posi-
tion decreasing to a likewise trivial 0.16-mm coil-in
offset at the physical Xmax position that stays con-
stant throughout the remaining operating range of the
driver. Figures 7 and 8 show the Kms(X) and Kms
Symmetry Range curves for the PS220. The Kms(X)
curve is likewise very symmetrical in both directions,
but with a small forward (coil-out) offset of about 0.5 mm
at the rest position increasing to 0.6-mm coil-out offset
at the physical Xmax position, which means it stays
mostly constant suggesting a physical offset of mag-
netic center, but probably within production tolerance
(most manufacturers can hold ±0.1 mm in produc-
tion). Displacement limiting numbers calculated by
the Klippel analyzer for the PE PS220 were XBl at
82% Bl = 3.5 mm and for XC at 75% Cms minimum
was 2.9 mm, which means that for this Dayton Audio
full-range, the compliance is the most limiting factor
for prescribed distortion level of 10%.
Figure 9 gives the inductance curves Le(X) for the
Tel: (503) 557-0427 [email protected]
Loudspeaker Product Development
Vanc
e D
icka
son
Con
sulti
ng
Vance Dickason Consulting has been developing award winning products for numerous high profile brand names for over 20 years… experience that’s hard to find!
With extensive experience in high-end off-wall, in-wall, on-wall, ceiling and subwoofer products plus close relationships with some of the worlds best speaker OEM’s and you have a combination of services that will accelerate your next product lineup.
We have all the best toys (Klippel, LEAP 5,LMS, CLIO, MLSSA, LSPCad, FEA), so whether its multimedia, car audio, MI, Pro, two-channel or Home Theater (including THX®), VDC has the solutions.
Add to that an available design team that includes some of the best transducers engineers, industrial designers and marketing experts I know of in the industry and you have a winning combination that would cost well over $750,000 a year to keep in house.


OCTOBER 2011 25
For the remaining series of tests on the PE PS220,
I employed the Listen, Inc. SoundCheck analyzer and
SCM microphone (courtesy of Listen, Inc.) to mea-
sure distortion and generate time frequency plots. For
the distortion measurement, the 8" full-range driver
was mounted rigidly in free-air, the SPL was set to
94 dB at 1 m (1.79 V) using a noise stimulus, and
then the distortion was measured with the Listen, Inc.
microphone placed 10 cm from the phase plug. This
produced the distortion curves shown in Figure 13. I
then used SoundCheck to get a 2.83 V/1 m impulse
response for this driver and imported the data into
Listen, Inc.’s SoundMap Time/Frequency software. The
resulting CSD waterfall plot is given in Figure 14 and
PS220-8. Inductance will typically increase in the rear
direction from the zero rest position as the voice coil
covers more pole area; however, inductance decreases
in both directions for this driver due to the very
effective multiple shorting devices. What you see as
a result is a very minor inductance swing with induc-
tive variation of only 0.04 mH from the rest position
to the in and out Xmax positions, which is excellent
performance.
With the Klippel testing completed, I mounted the
PS220 full-range in an enclosure that had a 15" × 8"
baffle and was filled with damping material (foam) and
then measured the DUT (Device Under Test) on and
off-axis from 300 Hz to 40 kHz frequency response at
2.83 V/1 m using the LinearX LMS analyzer set to a
100-point gated sine wave sweep. Figure 10 gives the
PS220’s on-axis response indicating a smoothly rising
response to about 2.5 kHz. Above that frequency, the
whizzer cone starts coming into the circuit, so the
response is fairly uneven above that point, normal
for this genre of driver. Figure 11 displays the on
and off-axis frequency response at 0, 15, 30, and 45°,
typical for an 8" woofer. Over the years, I’ve found
this an interesting phenomenon. Full-range drivers go
from line sources of 2" woofers up to 8" woofers. And
finally, Figure 12 displays the two-sample SPL com-
parisons for the 8" Dayton driver, showing a mostly
close match throughout the operating range.
Photo 2: The new Scan-Speak 26W/4534G00 woofer
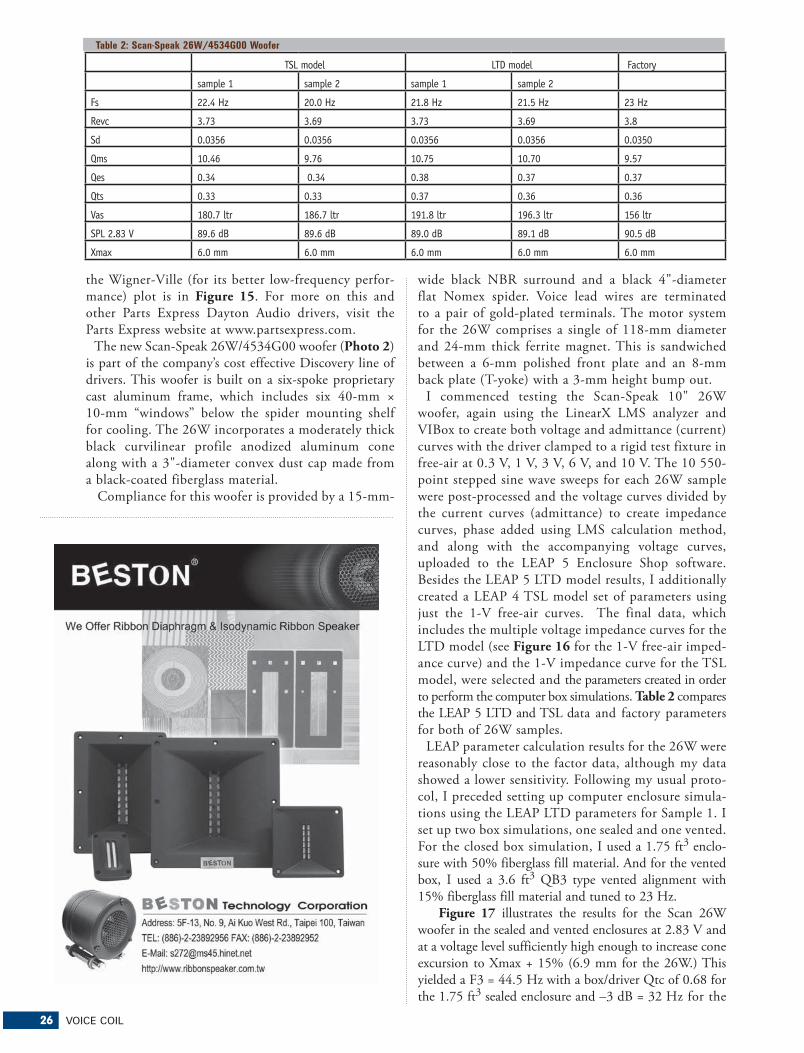
26 VOICE COIL
TSL model LTD model Factory
sample 1 sample 2 sample 1 sample 2
Fs 22.4 Hz 20.0 Hz 21.8 Hz 21.5 Hz 23 Hz
Revc 3.73 3.69 3.73 3.69 3.8
Sd 0.0356 0.0356 0.0356 0.0356 0.0350
Qms 10.46 9.76 10.75 10.70 9.57
Qes 0.34 0.34 0.38 0.37 0.37
Qts 0.33 0.33 0.37 0.36 0.36
Vas 180.7 ltr 186.7 ltr 191.8 ltr 196.3 ltr 156 ltr
SPL 2.83 V 89.6 dB 89.6 dB 89.0 dB 89.1 dB 90.5 dB
Xmax 6.0 mm 6.0 mm 6.0 mm 6.0 mm 6.0 mm
Table 2: Scan-Speak 26W/4534G00 Woofer
wide black NBR surround and a black 4"-diameter
flat Nomex spider. Voice lead wires are terminated
to a pair of gold-plated terminals. The motor system
for the 26W comprises a single of 118-mm diameter
and 24-mm thick ferrite magnet. This is sandwiched
between a 6-mm polished front plate and an 8-mm
back plate (T-yoke) with a 3-mm height bump out.
I commenced testing the Scan-Speak 10" 26W
woofer, again using the LinearX LMS analyzer and
VIBox to create both voltage and admittance (current)
curves with the driver clamped to a rigid test fixture in
free-air at 0.3 V, 1 V, 3 V, 6 V, and 10 V. The 10 550-
point stepped sine wave sweeps for each 26W sample
were post-processed and the voltage curves divided by
the current curves (admittance) to create impedance
curves, phase added using LMS calculation method,
and along with the accompanying voltage curves,
uploaded to the LEAP 5 Enclosure Shop software.
Besides the LEAP 5 LTD model results, I additionally
created a LEAP 4 TSL model set of parameters using
just the 1-V free-air curves. The final data, which
includes the multiple voltage impedance curves for the
LTD model (see Figure 16 for the 1-V free-air imped-
ance curve) and the 1-V impedance curve for the TSL
model, were selected and the parameters created in order
to perform the computer box simulations. Table 2 compares
the LEAP 5 LTD and TSL data and factory parameters
for both of 26W samples.
LEAP parameter calculation results for the 26W were
reasonably close to the factor data, although my data
showed a lower sensitivity. Following my usual proto-
col, I preceded setting up computer enclosure simula-
tions using the LEAP LTD parameters for Sample 1. I
set up two box simulations, one sealed and one vented.
For the closed box simulation, I used a 1.75 ft3 enclo-
sure with 50% fiberglass fill material. And for the vented
box, I used a 3.6 ft3 QB3 type vented alignment with
15% fiberglass fill material and tuned to 23 Hz.
Figure 17 illustrates the results for the Scan 26W
woofer in the sealed and vented enclosures at 2.83 V and
at a voltage level sufficiently high enough to increase cone
excursion to Xmax + 15% (6.9 mm for the 26W.) This
yielded a F3 = 44.5 Hz with a box/driver Qtc of 0.68 for
the 1.75 ft3 sealed enclosure and –3 dB = 32 Hz for the
the Wigner-Ville (for its better low-frequency perfor-
mance) plot is in Figure 15. For more on this and
other Parts Express Dayton Audio drivers, visit the
Parts Express website at www.partsexpress.com.
The new Scan-Speak 26W/4534G00 woofer (Photo 2)
is part of the company’s cost effective Discovery line of
drivers. This woofer is built on a six-spoke proprietary
cast aluminum frame, which includes six 40-mm ×
10-mm “windows” below the spider mounting shelf
for cooling. The 26W incorporates a moderately thick
black curvilinear profile anodized aluminum cone
along with a 3"-diameter convex dust cap made from
a black-coated fiberglass material.
Compliance for this woofer is provided by a 15-mm-
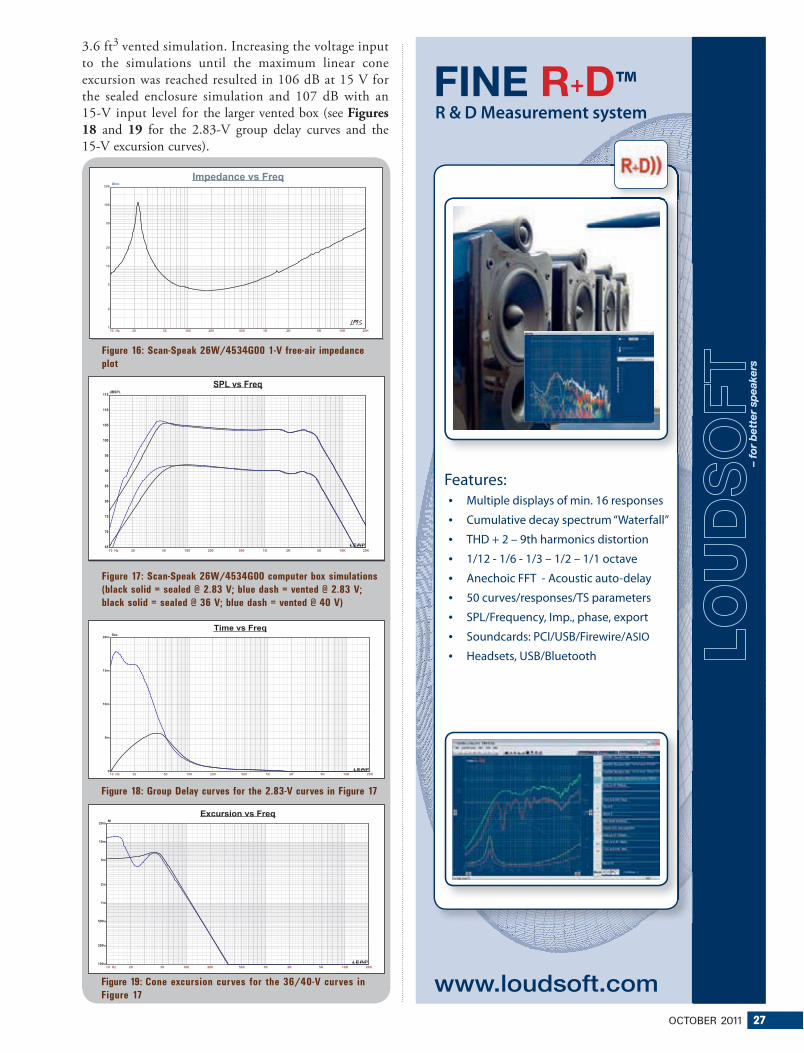
OCTOBER 2011 27
3.6 ft3 vented simulation. Increasing the voltage input
to the simulations until the maximum linear cone
excursion was reached resulted in 106 dB at 15 V for
the sealed enclosure simulation and 107 dB with an
15-V input level for the larger vented box (see Figures 18 and 19 for the 2.83-V group delay curves and the
15-V excursion curves).
10 Hz 20 50 100 200 500 1K 2K 5K 10K 20K
Ohm
1
2
5
10
20
50
100
200
Impedance vs Freq
10 Hz 20 50 100 200 500 1K 2K 5K 10K 20K
Sec
0
5m
10m
15m
20m
Time vs Freq
Figure 16: Scan-Speak 26W/4534G00 1-V free-air impedance
plot
10 Hz 20 50 100 200 500 1K 2K 5K 10K 20K
dBSPL
65
70
75
80
85
90
95
100
105
110
115
SPL vs Freq
Figure 17: Scan-Speak 26W/4534G00 computer box simulations
(black solid = sealed @ 2.83 V; blue dash = vented @ 2.83 V;
black solid = sealed @ 36 V; blue dash = vented @ 40 V)
Figure 18: Group Delay curves for the 2.83-V curves in Figure 17
10 Hz 20 50 100 200 500 1K 2K 5K 10K 20K
M
100u
200u
500u
1m
2m
5m
10m
20m
Excursion vs Freq
Figure 19: Cone excursion curves for the 36/40-V curves in
Figure 17
������+�™ R & D Measurement system
www.loudsoft.com
Features: Multiple displays of min. 16 responses
Cumulative decay spectrum “Waterfall”
THD + 2 – 9th harmonics distortion
1/12 - 1/6 - 1/3 – 1/2 – 1/1 octave
Anechoic FFT - Acoustic auto-delay
50 curves/responses/TS parameters
SPL/Frequency, Imp., phase, export
Soundcards: PCI/USB/Firewire/ASIO
Headsets, USB/Bluetooth
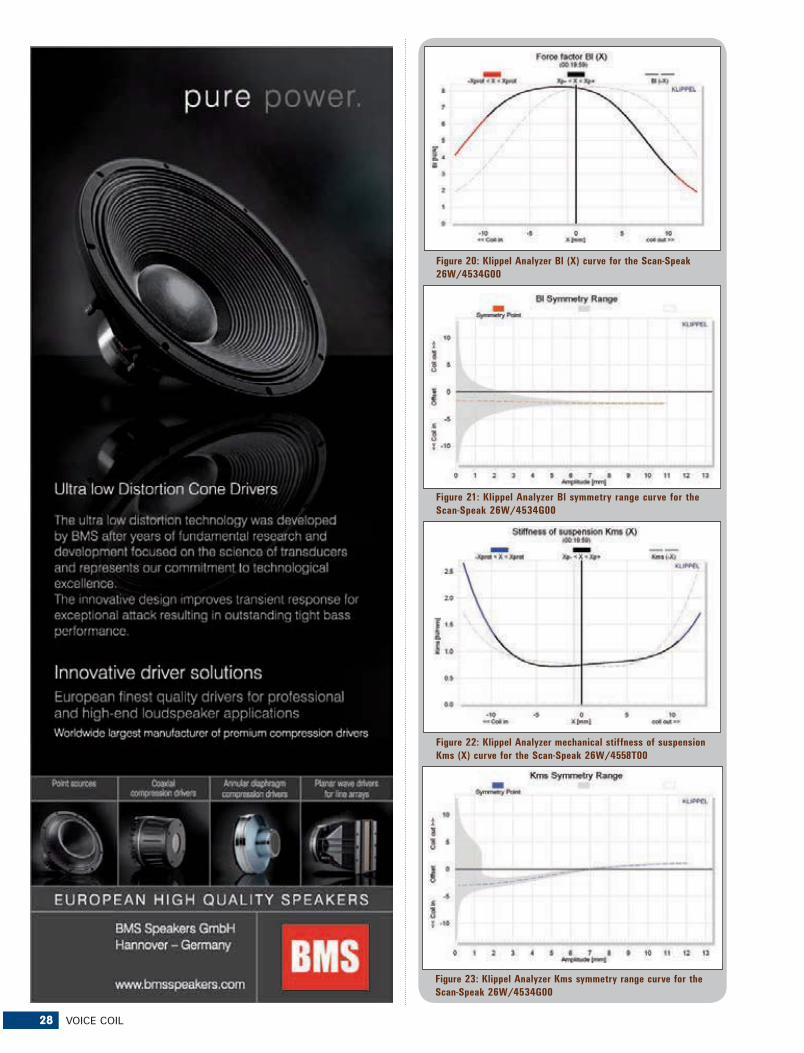
28 VOICE COIL
Figure 22: Klippel Analyzer mechanical stiffness of suspension
Kms (X) curve for the Scan-Speak 26W/4558T00
Figure 23: Klippel Analyzer Kms symmetry range curve for the
Scan-Speak 26W/4534G00
Figure 21: Klippel Analyzer Bl symmetry range curve for the
Scan-Speak 26W/4534G00
Figure 20: Klippel Analyzer Bl (X) curve for the Scan-Speak
26W/4534G00
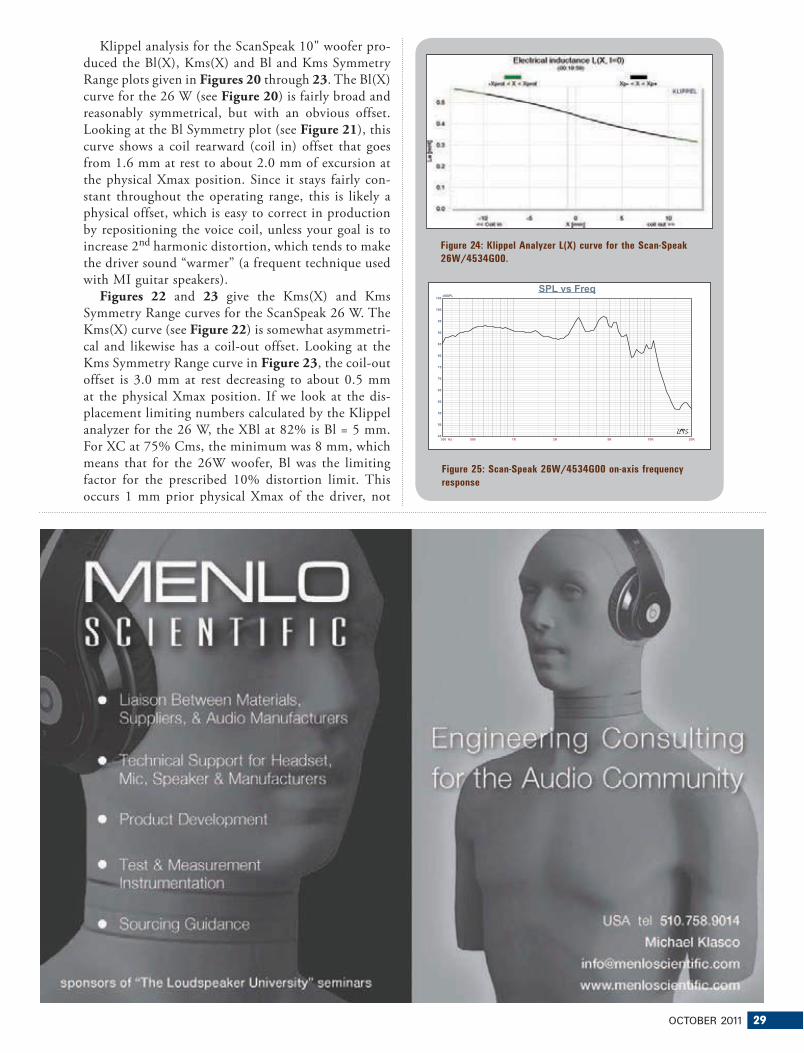
OCTOBER 2011 29
Figure 24: Klippel Analyzer L(X) curve for the Scan-Speak
26W/4534G00.
300 Hz 500 1K 2K 5K 10K 20K
dBSPL
45
50
55
60
65
70
75
80
85
90
95
100
105
SPL vs Freq
Figure 25: Scan-Speak 26W/4534G00 on-axis frequency
response
Klippel analysis for the ScanSpeak 10" woofer pro-
duced the Bl(X), Kms(X) and Bl and Kms Symmetry
Range plots given in Figures 20 through 23. The Bl(X)
curve for the 26 W (see Figure 20) is fairly broad and
reasonably symmetrical, but with an obvious offset.
Looking at the Bl Symmetry plot (see Figure 21), this
curve shows a coil rearward (coil in) offset that goes
from 1.6 mm at rest to about 2.0 mm of excursion at
the physical Xmax position. Since it stays fairly con-
stant throughout the operating range, this is likely a
physical offset, which is easy to correct in production
by repositioning the voice coil, unless your goal is to
increase 2nd harmonic distortion, which tends to make
the driver sound “warmer” (a frequent technique used
with MI guitar speakers).
Figures 22 and 23 give the Kms(X) and Kms
Symmetry Range curves for the ScanSpeak 26 W. The
Kms(X) curve (see Figure 22) is somewhat asymmetri-
cal and likewise has a coil-out offset. Looking at the
Kms Symmetry Range curve in Figure 23, the coil-out
offset is 3.0 mm at rest decreasing to about 0.5 mm
at the physical Xmax position. If we look at the dis-
placement limiting numbers calculated by the Klippel
analyzer for the 26 W, the XBl at 82% is Bl = 5 mm.
For XC at 75% Cms, the minimum was 8 mm, which
means that for the 26W woofer, Bl was the limiting
factor for the prescribed 10% distortion limit. This
occurs 1 mm prior physical Xmax of the driver, not
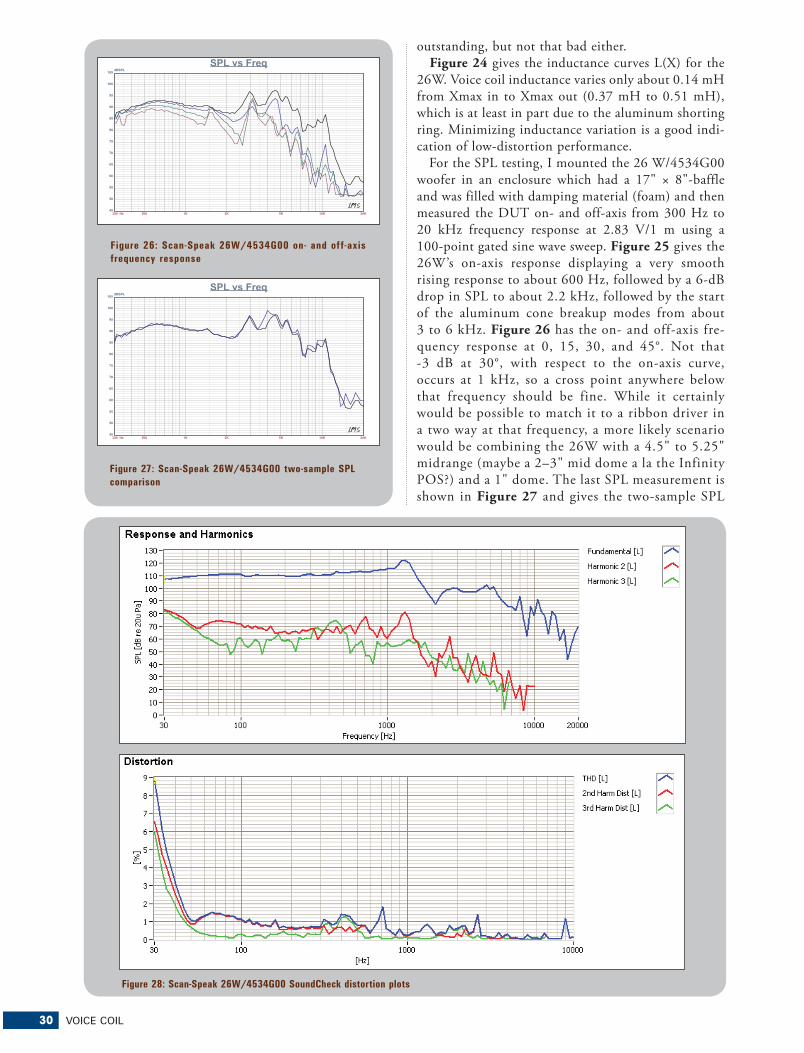
30 VOICE COIL
300 Hz 500 1K 2K 5K 10K 20K
dBSPL
45
50
55
60
65
70
75
80
85
90
95
100
105
SPL vs Freq
300 Hz 500 1K 2K 5K 10K 20K
dBSPL
45
50
55
60
65
70
75
80
85
90
95
100
105
SPL vs Freq
Figure 26: Scan-Speak 26W/4534G00 on- and off-axis
frequency response
Figure 27: Scan-Speak 26W/4534G00 two-sample SPL
comparison
Figure 28: Scan-Speak 26W/4534G00 SoundCheck distortion plots
outstanding, but not that bad either.
Figure 24 gives the inductance curves L(X) for the
26W. Voice coil inductance varies only about 0.14 mH
from Xmax in to Xmax out (0.37 mH to 0.51 mH),
which is at least in part due to the aluminum shorting
ring. Minimizing inductance variation is a good indi-
cation of low-distortion performance.
For the SPL testing, I mounted the 26 W/4534G00
woofer in an enclosure which had a 17" × 8"-baffle
and was filled with damping material (foam) and then
measured the DUT on- and off-axis from 300 Hz to
20 kHz frequency response at 2.83 V/1 m using a
100-point gated sine wave sweep. Figure 25 gives the
26W’s on-axis response displaying a very smooth
rising response to about 600 Hz, followed by a 6-dB
drop in SPL to about 2.2 kHz, followed by the start
of the aluminum cone breakup modes from about
3 to 6 kHz. Figure 26 has the on- and off-axis fre-
quency response at 0, 15, 30, and 45°. Not that
-3 dB at 30°, with respect to the on-axis curve,
occurs at 1 kHz, so a cross point anywhere below
that frequency should be fine. While it certainly
would be possible to match it to a ribbon driver in
a two way at that frequency, a more likely scenario
would be combining the 26W with a 4.5" to 5.25"
midrange (maybe a 2–3" mid dome a la the Infinity
POS?) and a 1" dome. The last SPL measurement is
shown in Figure 27 and gives the two-sample SPL

OCTOBER 2011 31
comparisons for the 10" ScanSpeak driver, show-
ing a close match up within the relevant operating
range of the woofer.
For the last group of tests, I employed the Listen,
Inc. SoundCheck analyzer (courtesy of Listen, Inc.)
and SCM microphone to measure distortion and
generate time frequency plots. Setting up for the
distortion measurement consisted of mounting the
woofer rigidly in free-air, and the SPL set to 94 dB
(4.43 V) at 1m using a noise stimulus (SoundCheck
has a software generator and SPL meter as two of
its utilities), and then the distortion measured with
the Listen, Inc. SCM microphone placed 10 cm
from the dust cap. This produced the distortion
curves shown in Figure 28. Last, I employed the
SoundCheck analyzer to get a 2.83 V/1 m impulse
response for this driver and imported the data into
Listen, Inc.’s SoundMap Time/Frequency software.
The resulting CSD waterfall plot is given in Figure 29 and the Wigner-Ville logarithmic surface map
(for its better low-frequency performance) plot in
Figure 30. Looking over all the data presented,
this is a well designed driver with some minor
issues. Given this is a cost effective driver from
Scan-Speak, cost vs. performance is good. For more
information on this and the other new ScanSpeak
Discovery drivers, visit the ScanSpeak website at
www.scan-speak.dk. VC
Figure 29: Scan-Speak 26W/4534G00 SoundCheck CSD
waterfall plot
Figure 30: Scan-Speak 26W/4534G00 SoundCheck Wigner-
Ville plot
Saati has woven the Acoustex line to ensure predictablesound transparency, consistent acoustical damping for tweeters,planar speakers, headphones, mic wind screens, mobile devices & other transducers
� Acoustically transparent mesh� Acoustical damping barriers� Moisture and dust protection� Conductive screens -EMI/RFI shielding� Regulates and controls airflow� Fabric dyed to any color� Hyphobe™ water-repellent treatment� Special MET™ metallized finishes
REFINE YOUR DESIGNS AND CONTROL OVERLOOKED VARIABLES WITH SAATI ACOUSTEX MESH
Transparency Damping
ACOUSTEX LINE
006-010-020-025-032-045-065-075-090-145-160-260
ITALY39-031-891333Paolo [email protected]
USA914-232-7781Paul [email protected]
CHINA86-13821090034Fabrizio [email protected]
CONTACT

32 VOICE COIL
Test Bench is an open forum for OEM driver man-
ufacturers in the industry and all OEM’s are invited
to submit samples to Voice Coil for inclusion in the
monthly Test Bench column. Driver samples can
be for use in any sector of the loudspeaker market
including transducers for home audio, car audio,
pro sound, multi-media or musical instrument
applications. While many of the drivers featured
in Voice Coil come from OEM’s that have a stable
catalog of product, this is not a necessary criterion
for submission. Any woofer, midrange or tweeter
an OEM manufacture feels is representative of their
work, is welcome to send samples. However, please
contact Voice Coil Editor Vance Dickason, prior
to submission to discuss which drivers are being
submitted. Samples should be sent in pairs and
addressed to:
Vance Dickason Consulting
333 S. State St., #152
Lake Oswego, OR 97034
(503-557-0427)
All samples must include any published data on
the product, patent information, or any special
information necessary to explain the functioning of
the transducer. This should include details regarding
the materials used to construct the transducer such
as cone material, voice coil former material, and
voice coil wire type. For woofers and midrange driv-
ers, please include the voice coil height, gap height,
RMS power handling, and physically measured
Mmd (complete cone assembly including the cone,
surround, spider and voice coil with 50% of the
spider, surround and leadwires removed).
Manufacturers Asked to Submit Samples for Test Bench

OCTOBER 2011 33
Acoustic PatentsBy James Croft, Croft Acoustical
U.S. Patent 2011/0188699
The following loudspeaker-related patents were
filed primarily under the Office of Patent and
Trademarks classification 181 for acoustical devices and
381 for electrical-signal processing systems and HO4R
for international patents. This also includes new patent
applications that are published in the Patent Application
Journal.
WOVEN OR KNITTED FABRIC, DIAPHRAGM FOR SPEAKER, AND SPEAKERPatent Application Publication Number: U.S.
2011/0188699
Inventors: Hiroshi SHIBAOKA (Hikone-shi, JP);
Sunao TAKAHIRA; (Takarazuka-shi, JP) ; Tatsuhiko
NINOMIYA (Kashiba-shi, JP); Emiko SHIBATA
(Osaka-shi, JP)
Assignee: Sony Corporation (Tokyo, Japan)
Filed: March 2, 2011
US Class: 381/428
Published: August 4, 2011, 17 Claims, 14 drawings
ABSTRACT FROM PATENTA speaker having a diaphragm made of a woven/
knitted fabric containing a conductive fiber and a non-
conductive fiber, where the fabric has a woven structure
or a knitted structure of the non-conductive fiber, and a
continuous wiring forming a coil of the conductive fiber.
INDEPENDENT CLAIMA speaker comprising a diaphragm, wherein the dia-
phragm comprises a woven/knitted fabric comprising a
conductive fiber and a non-conductive fiber, the woven/
knitted fabric having a woven structure or a knitted
structure of said non-conductive fiber and continuous
wiring forming a coil of the conductive fiber.
REVIEWER COMMENTSDisclosed is a planar magnetic-type transducer with
the novelty being a diaphragm comprised of non-con-
ductive interlaced fibers, such as woven cloth.
Conventional planar magnetic transducers most often
use thin film diaphragms, with polyester, polyimide,
polyethylene naphthalate, and similar compositions
being the preferred film types. While these have been
generally effective, the practitioners of planar mag-
netic devices are always seeking improvements. Main
issues tend to be the thermal limits of the film and the
adhesives used to attach the conductive traces to the

Low cost
True Perceptual Rub & Buzz detection
Insensitive to background noise
Excellent correlation to the human ear
When it comes to increasing yield, you only want to reject speakersthat sound bad. Listen’s new CLEAR Perceptual Rub & Buzz algorithm is your fully automated, 100% reliable golden ear. Used on the production line, it accurately replicates the response of a human listener to give you fully automated pass/fail measurements with intelligence.
+ =SoundCheck’s
TMCLEARPerceptualRub & Buzz
TM
Visit www.Listeninc.com/clearVC for a FREE demo and 20% discount*
Tel: +1 617 556 4104 Email: [email protected]: www.Listeninc.com
dCh k’
NEW
®
* Discount applies to CLEAR module (part number 2030) only. See web site for full terms and conditions.
See us at
AES
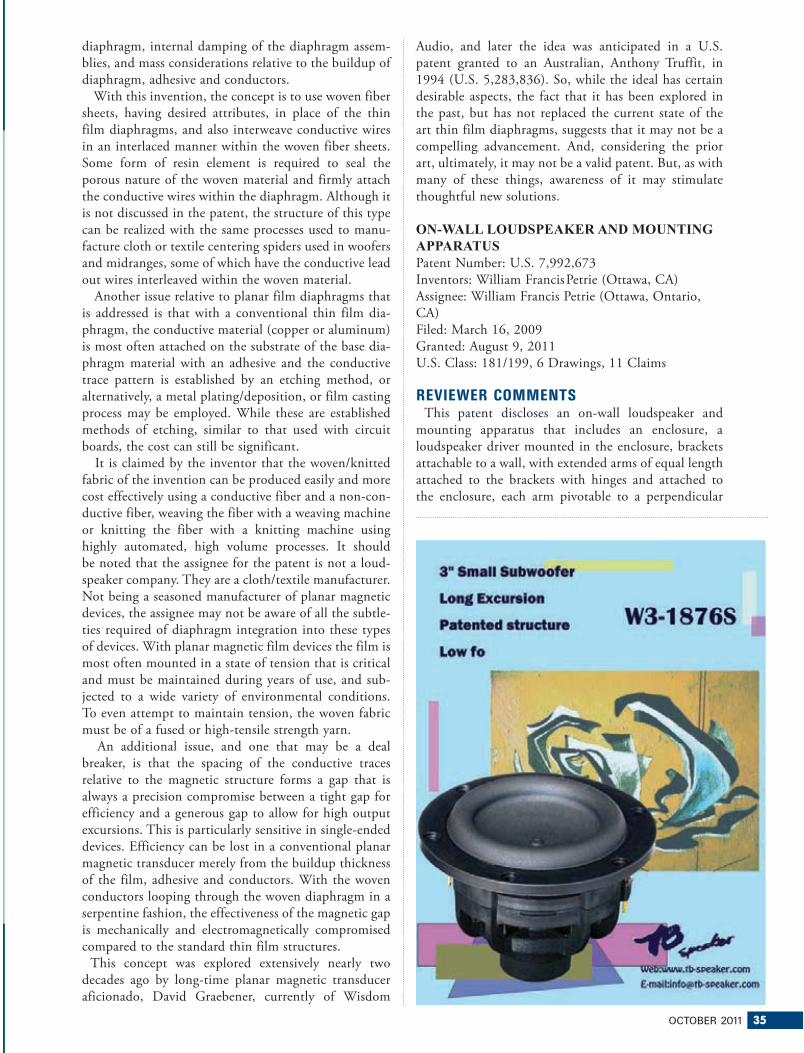
OCTOBER 2011 35
Audio, and later the idea was anticipated in a U.S.
patent granted to an Australian, Anthony Truffit, in
1994 (U.S. 5,283,836). So, while the ideal has certain
desirable aspects, the fact that it has been explored in
the past, but has not replaced the current state of the
art thin film diaphragms, suggests that it may not be a
compelling advancement. And, considering the prior
art, ultimately, it may not be a valid patent. But, as with
many of these things, awareness of it may stimulate
thoughtful new solutions.
ON-WALL LOUDSPEAKER AND MOUNTING APPARATUSPatent Number: U.S. 7,992,673
Inventors: William Francis Petrie (Ottawa, CA)
Assignee: William Francis Petrie (Ottawa, Ontario,
CA)
Filed: March 16, 2009
Granted: August 9, 2011
U.S. Class: 181/199, 6 Drawings, 11 Claims
REVIEWER COMMENTS This patent discloses an on-wall loudspeaker and
mounting apparatus that includes an enclosure, a
loudspeaker driver mounted in the enclosure, brackets
attachable to a wall, with extended arms of equal length
attached to the brackets with hinges and attached to
the enclosure, each arm pivotable to a perpendicular
diaphragm, internal damping of the diaphragm assem-
blies, and mass considerations relative to the buildup of
diaphragm, adhesive and conductors.
With this invention, the concept is to use woven fiber
sheets, having desired attributes, in place of the thin
film diaphragms, and also interweave conductive wires
in an interlaced manner within the woven fiber sheets.
Some form of resin element is required to seal the
porous nature of the woven material and firmly attach
the conductive wires within the diaphragm. Although it
is not discussed in the patent, the structure of this type
can be realized with the same processes used to manu-
facture cloth or textile centering spiders used in woofers
and midranges, some of which have the conductive lead
out wires interleaved within the woven material.
Another issue relative to planar film diaphragms that
is addressed is that with a conventional thin film dia-
phragm, the conductive material (copper or aluminum)
is most often attached on the substrate of the base dia-
phragm material with an adhesive and the conductive
trace pattern is established by an etching method, or
alternatively, a metal plating/deposition, or film casting
process may be employed. While these are established
methods of etching, similar to that used with circuit
boards, the cost can still be significant.
It is claimed by the inventor that the woven/knitted
fabric of the invention can be produced easily and more
cost effectively using a conductive fiber and a non-con-
ductive fiber, weaving the fiber with a weaving machine
or knitting the fiber with a knitting machine using
highly automated, high volume processes. It should
be noted that the assignee for the patent is not a loud-
speaker company. They are a cloth/textile manufacturer.
Not being a seasoned manufacturer of planar magnetic
devices, the assignee may not be aware of all the subtle-
ties required of diaphragm integration into these types
of devices. With planar magnetic film devices the film is
most often mounted in a state of tension that is critical
and must be maintained during years of use, and sub-
jected to a wide variety of environmental conditions.
To even attempt to maintain tension, the woven fabric
must be of a fused or high-tensile strength yarn.
An additional issue, and one that may be a deal
breaker, is that the spacing of the conductive traces
relative to the magnetic structure forms a gap that is
always a precision compromise between a tight gap for
efficiency and a generous gap to allow for high output
excursions. This is particularly sensitive in single-ended
devices. Efficiency can be lost in a conventional planar
magnetic transducer merely from the buildup thickness
of the film, adhesive and conductors. With the woven
conductors looping through the woven diaphragm in a
serpentine fashion, the effectiveness of the magnetic gap
is mechanically and electromagnetically compromised
compared to the standard thin film structures.
This concept was explored extensively nearly two
decades ago by long-time planar magnetic transducer
aficionado, David Graebener, currently of Wisdom

36 VOICE COIL
relationship to the wall. It is claimed that the
invention not only mitigates vibrations trans-
mitted to walls and other building structures,
but also provides improved means for repro-
ducing low frequencies below a range of
conventional loudspeakers.
The concept is that the enclosure is sus-
pended on “pivotal hooks” at the end of
each of the four extended mounting arms,
such that the loudspeaker can “rock” back
and forth at low frequencies, as sympathetic
vibration of the cabinet in reaction to the
diaphragm displacements of the woofer. So,
as most loudspeaker developers are attempt-
ing to minimize cabinet vibration with push-
pull woofers and other means, this inventor
is attempting to stimulate cabinet movement,
in an attempt to use the large surface areas of
the front and back panels of the enclosure to
enhance the woofers output of low frequency
energy.
The length of each rotating arm that captures the
loudspeaker is chosen to provide a predetermined
resonant frequency of the loudspeaker enclosure, based
on the mass of the enclosure and the compliance of
the rotatable arm or hook. The resonant frequency of
the loudspeaker is set to be less than a lower cutoff
frequency of the transducer in the enclosure. Positions
of attachment of the bottom ends of the arms to the
enclosure and a center of gravity of the loudspeaker
are arranged to be substantially coplanar. The length of
each bracket is chosen to be substantially greater than
the distance from the distal end of the bracket to a rear
surface of the enclosure plus the length of the arms.
The loudspeaker is spaced from the wall by a distance
U.S. Patent 7,992,673
������������� ����������.��� �������.������������� �.��!"�#�$$�%���%&��&�.�'�(#�$$�%���%&�$��.��%)� *#���*�+��������.������������
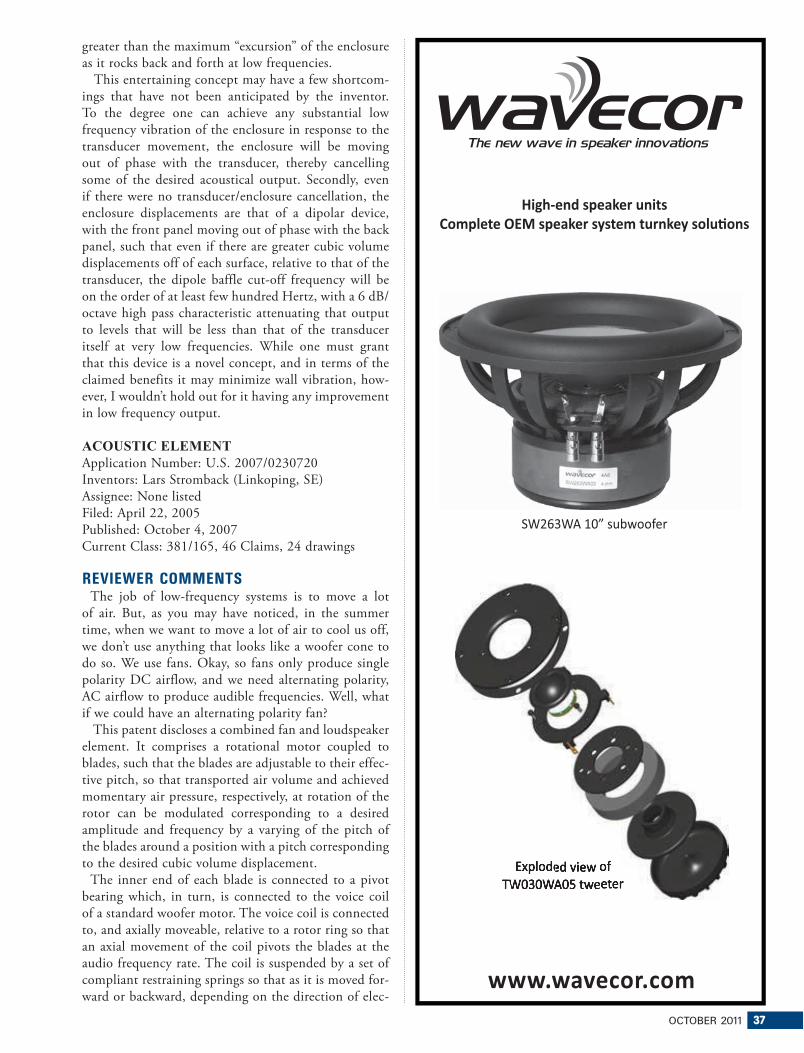
OCTOBER 2011 37
greater than the maximum “excursion” of the enclosure
as it rocks back and forth at low frequencies.
This entertaining concept may have a few shortcom-
ings that have not been anticipated by the inventor.
To the degree one can achieve any substantial low
frequency vibration of the enclosure in response to the
transducer movement, the enclosure will be moving
out of phase with the transducer, thereby cancelling
some of the desired acoustical output. Secondly, even
if there were no transducer/enclosure cancellation, the
enclosure displacements are that of a dipolar device,
with the front panel moving out of phase with the back
panel, such that even if there are greater cubic volume
displacements off of each surface, relative to that of the
transducer, the dipole baffle cut-off frequency will be
on the order of at least few hundred Hertz, with a 6 dB/
octave high pass characteristic attenuating that output
to levels that will be less than that of the transducer
itself at very low frequencies. While one must grant
that this device is a novel concept, and in terms of the
claimed benefits it may minimize wall vibration, how-
ever, I wouldn’t hold out for it having any improvement
in low frequency output.
ACOUSTIC ELEMENTApplication Number: U.S. 2007/0230720
Inventors: Lars Stromback (Linkoping, SE)
Assignee: None listed
Filed: April 22, 2005
Published: October 4, 2007
Current Class: 381/165, 46 Claims, 24 drawings
REVIEWER COMMENTS The job of low-frequency systems is to move a lot
of air. But, as you may have noticed, in the summer
time, when we want to move a lot of air to cool us off,
we don’t use anything that looks like a woofer cone to
do so. We use fans. Okay, so fans only produce single
polarity DC airflow, and we need alternating polarity,
AC airflow to produce audible frequencies. Well, what
if we could have an alternating polarity fan?
This patent discloses a combined fan and loudspeaker
element. It comprises a rotational motor coupled to
blades, such that the blades are adjustable to their effec-
tive pitch, so that transported air volume and achieved
momentary air pressure, respectively, at rotation of the
rotor can be modulated corresponding to a desired
amplitude and frequency by a varying of the pitch of
the blades around a position with a pitch corresponding
to the desired cubic volume displacement.
The inner end of each blade is connected to a pivot
bearing which, in turn, is connected to the voice coil
of a standard woofer motor. The voice coil is connected
to, and axially moveable, relative to a rotor ring so that
an axial movement of the coil pivots the blades at the
audio frequency rate. The coil is suspended by a set of
compliant restraining springs so that as it is moved for-
ward or backward, depending on the direction of elec-www.wavecor.com
High-end speaker unitsComplete OEM speaker system turnkey solu ons
SW263WA 10” subwoofer
Exploded view of TW030WA05 tweeter
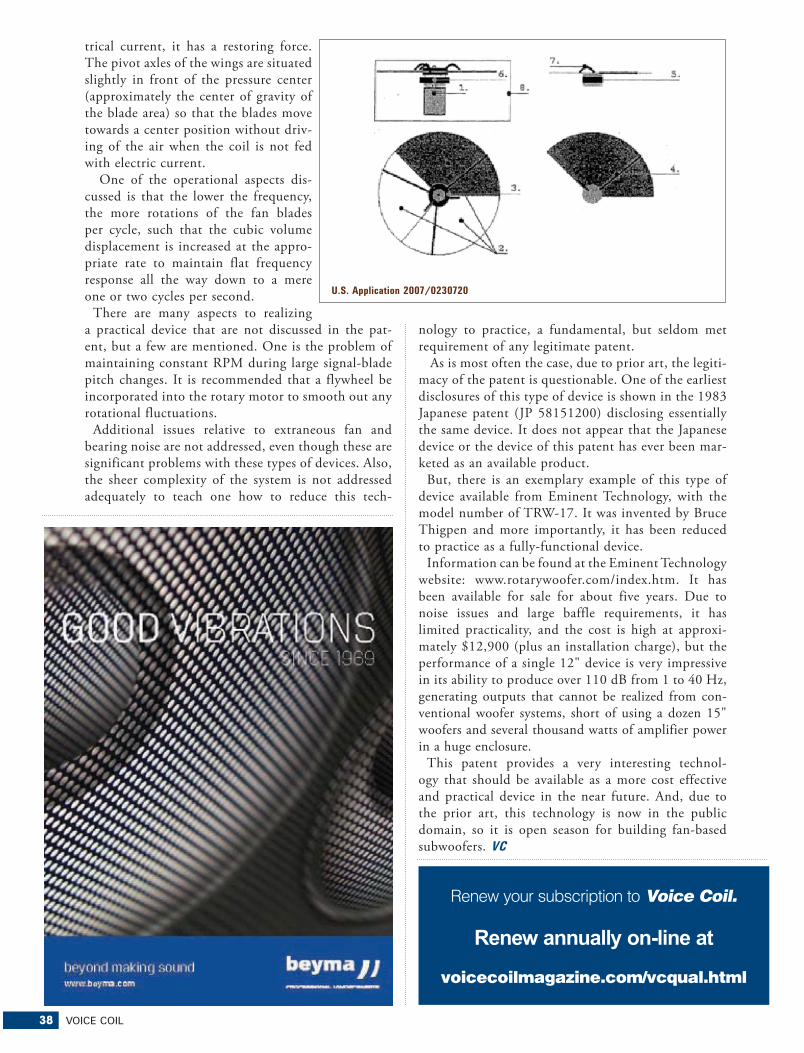
38 VOICE COIL
trical current, it has a restoring force.
The pivot axles of the wings are situated
slightly in front of the pressure center
(approximately the center of gravity of
the blade area) so that the blades move
towards a center position without driv-
ing of the air when the coil is not fed
with electric current.
One of the operational aspects dis-
cussed is that the lower the frequency,
the more rotations of the fan blades
per cycle, such that the cubic volume
displacement is increased at the appro-
priate rate to maintain flat frequency
response all the way down to a mere
one or two cycles per second.
There are many aspects to realizing
a practical device that are not discussed in the pat-
ent, but a few are mentioned. One is the problem of
maintaining constant RPM during large signal-blade
pitch changes. It is recommended that a flywheel be
incorporated into the rotary motor to smooth out any
rotational fluctuations.
Additional issues relative to extraneous fan and
bearing noise are not addressed, even though these are
significant problems with these types of devices. Also,
the sheer complexity of the system is not addressed
adequately to teach one how to reduce this tech-
U.S. Application 2007/0230720
nology to practice, a fundamental, but seldom met
requirement of any legitimate patent.
As is most often the case, due to prior art, the legiti-
macy of the patent is questionable. One of the earliest
disclosures of this type of device is shown in the 1983
Japanese patent (JP 58151200) disclosing essentially
the same device. It does not appear that the Japanese
device or the device of this patent has ever been mar-
keted as an available product.
But, there is an exemplary example of this type of
device available from Eminent Technology, with the
model number of TRW-17. It was invented by Bruce
Thigpen and more importantly, it has been reduced
to practice as a fully-functional device.
Information can be found at the Eminent Technology
website: www.rotarywoofer.com/index.htm. It has
been available for sale for about five years. Due to
noise issues and large baffle requirements, it has
limited practicality, and the cost is high at approxi-
mately $12,900 (plus an installation charge), but the
performance of a single 12" device is very impressive
in its ability to produce over 110 dB from 1 to 40 Hz,
generating outputs that cannot be realized from con-
ventional woofer systems, short of using a dozen 15"
woofers and several thousand watts of amplifier power
in a huge enclosure.
This patent provides a very interesting technol-
ogy that should be available as a more cost effective
and practical device in the near future. And, due to
the prior art, this technology is now in the public
domain, so it is open season for building fan-based
subwoofers. VC
Renew your subscription to Voice Coil.
Renew annually on-line at
voicecoilmagazine.com/vcqual.html
OCTOBER 2011 39
Dr. William Marshall LeachIt is with great regret that Voice Coil announces the
passing of Georgia Tech professor William Marshall
Leach, Jr., on November 20, 2010, a day after suffer-
ing a heart attack at the age of 70. I apologize to the
family that this announcement was not made sooner,
but, unfortunately, I only learned about his passing
just before going to press this month.
Dr. Leach joined the School of Electrical and
Computer Engineering faculty after receiving his doc-
torate in electrical engineering from the Institute in
1972. He taught courses in audio engineering, elec-
troacoustics, ana-
log electronics and
e lec t romagnet ic s .
During his 38-year
career at Tech, Dr.
Leach was chosen
by senior ECE stu-
dents four times
to receive the
ECE Richard M.
Bass/Eta Kappa
Nu Outstanding
Industry WatchBy Vance Dickason
Dr. William Marshall Leach
Teacher Award.
Born and raised in Abbeville, S.C., Dr. Leach received
bachelor’s and master’s degrees in electrical engineer-
ing from the University of South Carolina. He was
commissioned a second lieutenant in the Air Force
upon graduation. Following a six-month stint work-
ing at NASA’s Langley Research Center, he entered
the Air Force, serving three years at McClellan Air
Force Base in California as an electronics research and
development officer. In addition to teaching at Tech,
Dr. Leach also was a longtime adviser for the student
chapter of the Institute of Electrical and Electronics
Engineers, a technical adviser for WREK FM and
a member of the Institute Radio Communication
Board. In his faculty bio, Dr. Leach listed among his
hobbies “unraveling the riddles of loudspeakers and
audio amplifiers, writing, and growing grass” as a
landscaping enthusiast. He will be missed.
Speaker Manufacturers Naim, Focal MergeSpeaker maker Focal and audio electronics maker
Naim are merging their businesses to bolster their
R&D capabilities and build market share. The merged
company, called Focal & Co., will own and manage
Focal and Naim as independent brands to retain their
product philosophies, with each brand continuing to
be run independently by their respective management
teams, the company said in a written statement. Both
40 VOICE COIL
brands focus on music reproduction through high-
end components.
Mahul, long-time Focal investor CM-CIC Capital
Finance, and the Focal and Naim management
teams will own the merged entity, which will con-
tinue to employ 325 people at the Focal facilities
in Saint-Etienee and Naim’s facilities in Salisbury,
U.K. Their combined sales exceed $79.2 mil-
lion, (€55 million) with Focal contributing $50.4
million and Naim contributing $28.8 million.
Focal markets high-end home and aftermarket car
speakers, pro audio speakers, and automotive OEM
speakers, Naim markets amplifiers, CD players, home
speakers, a HDD music-storage device, and other
home audio electronics. Both brands are sold in
Europe, Asia, and the U.S., and the company said it
would capitalize on new opportunities to bring the
brands to new geographic markets.
Nortek Post Q2 Net Loss on Rising SalesNortek increased its net sales in the second quarter
and first half but posted lower operating earnings
in both periods and net losses for both periods. The
supplier of residential and commercial ventilation,
HVAC, and technology products is parent of multiple
residential brands, including Niles Audio, Xantech,
Elan, Omnimount, Panamax, and SpeakerCraft.
Company-wide sales rose 11% in the second quar-
ter to $564.9 million and by 12% in the first half
to $1.05 billion, thanks to recent acquisitions. The
quarter’s sales were up entirely as a result of recent
acquisitions, and all but $3.5 million of the $114
million first-half sales gain was due to acquisitions.
Operating earnings declined 23% to $20.8 million
in the quarter and by 27.5% in the half to $22.7
million. The first-quarter net loss hit $31.9 million
compared with a year-ago net profit of $300,000.
The first-half net loss widened to $53 million from
the year-ago $13.1 million.
In the company’s tech segment, consisting mainly of
residential products but including products for select
commercial applications, dollar volume and operat-
ing earnings were up in the quarter and half. For the
quarter, tech sales rose 56% to $180.6 million, and
operating earnings rose 38.7% to $19 million. For the
half, tech sales rose 61% to $337.9 million, and the
segment posted operating earnings of $20.7 million
compared to a year-ago operating loss of $3.5 million.
Harman Reorganizes, Post FY, Q4 ResultsHarman has reorganized its automotive and con-
sumer divisions to create two new divisions, lifestyle
and infotainment, and released its fourth quar-
ter and fiscal year financial results. The company
decided to reorganize its automotive and consumer
divisions into lifestyle and infotainment divisions
�
w w w . k l i p p e l . d e
SMALLa n d
L O U Ds p e a k e r s �
Increase Output – Shrink Size – Improve Performance!
�������� ��� ��� ������� �� � ���� �� ��������� �� ������������� �� ���� ������ �� � �������� ��������� �������������������� �� � ����������� ������������� ������� ��������������� �� ����� �� � � ������ ���������� �������� �� � ������� �� ��������������������������������!�����������"##$��� ����������������%
OCTOBER 2011 41
The “Must Have” reference for loudspeaker engineering professionals.
Home, Car, or Home Theater!Back and better than ever, this 7th edition
provides everything you need to become a
better speaker designer. If you still have a
3rd, 4th, 5th or even the 6th edition of the
Loudspeaker Design Cookbook, you are
missing out on a tremendous amount of
new and important information!
Now including: Klippel analysis of drivers,
a chapter on loudspeaker voicing, advice
on testing and crossover changes, and so
much more! Ships complete with bonus CD
containing over 100 additional figures and
a full set of loudspeaker design tools.
A $99 value!
Yours today for just $39.95.
Shop for this book, and manyother Audio Amateur products,at www.cc-webshop.com.

42 VOICE COIL
because, according to Dinesh Paliwal, chairman, presi-
dent, and CEO, “Consumers want simplicity, seamless
portability and sound integration that fits their lifestyle.
There is a clear convergence happening among consumer
devices in the home, office, car, and everywhere in between.
Consumers no longer view these locations and personal
mobile devices as separate domains, but as one, continuous
ecosystem where the delivery of information and enter-
tainment should flow seamlessly between them, anytime,
anywhere, anyplace.”
On the financial side net sales for the fiscal year were $3.8
billion, an increase of 12% compared to the prior year. Net
income for the year was $135.9 million, down from the
prior year’s $164.1 million. Net sales for the fiscal fourth
quarter, ended June 30, was $1.03 billion, up from $850.7
million in the prior year. Net income for the quarter from
continuing operations was $18.9 million compared with
$18.4 million in the prior year.
In the consumer division net sales in fiscal 2011 were
$420 million, an increase of 13%. Operating income was
$7 million, a $4 million increase over the prior year. Net
sales in the fourth quarter were $100 million, an increase
of 24%. Operating loss in the fourth quarter was $5 mil-
lion compared with an operating loss of $7 million in the
prior year.
Velodyne Drops Independent RepsVelodyne Acoustics has become the second audio
specialty supplier in recent months to drop inde-
pendent representatives and go factory-direct. The
company has begun selling its Velodyne-branded
powered subwoofers directly through its in-house
salespeople and through its website to retailers and
distributors. Like before, dealers who buy through
distributors must be pre-approved by Velodyne.
In another distribution change, Velodyne stepped
up consumer-direct sales of Velodyne-branded prod-
ucts through its website. Previously, the company
sold lower priced close-out products through its
website to consumers, but now it is selling all mod-
els in its current lineup through its web site to con-
sumers at MAP prices, a spokesperson said.
The company is also trying to put a stop to unau-
thorized web sales that violate its current MAP
policies and wrestle back control of all web sales
of its products worldwide. The company dropped
its independent reps as of July 28, 2011, and it
has already launched sales of all Velodyne products
through its website to consumers, the spokesman
said. Velodyne-brand products continue to be avail-
able on-line through such authorized on-line stores
as Crutchfield.
With the ranks of specialty A/V dealers dwindling
over the years, Lenbrook dropped independent
reps for an inside sales force to reach specialty A/V
dealers more cost effectively, and suppliers such as
Bowers & Wilkins have had to expand beyond inde-
pendent specialists to build sales. Other audio sup-
pliers have expanded distribution to on-line stores.
Rockford Posts Q2, First-Half GainsRockford increased its sales, net profit, and gross
margins in its fiscal second quarter and first half.
Net sales rose 14.2% in the quarter ending June 30
to $17 million and rose 18.9% in the first half to
$33.6 million. Net income rose in the quarter to
$1.8 million from a year-ago $1.1 million and in the
first half to $3.1 million compared with a year-ago
$1.8 million. Gross margin as a percent of net sales
rose to 38.3% in the quarter from a year-ago 36.7%.
Gross margins in the first half rose to 39%, from a
year ago, 37%. Sales growth in both periods came in
all of the car electronics company’s sales channels:
aftermarket, international, and OEM. Gross mar-
gins grew in both periods primarily because of lower
returns and discounts as a percentage of sales, higher
overall sales, and increased OEM royalty revenue.
The company also said its OEM business is rebound-
ing because of an improving new-car market and
that Japan-based automakers are returning to normal
production schedules. OEM royalty revenues for the
half hit $1.4 million, up from a year ago $1.1 million.
Klipsch Group Acquisition Puts Audiovox in the Black
Audiovox posted higher net income and reversed
- Custom coils available in: Multi-layer wire configurations Multiple lead configurations Round and Flat Wire Custom lead-out attachments
Free standing coils Multiple wire types Bifilar or Edgewound Custom bobbin wound coils
- High temperature adhesive coated Copper and Aluminum wire in round and flat sizes. CCAW wire available in round sizes.
- Adhesive coated custom cut forms and Collars.
- Custom slit rolls of Form and Collar material available coated or uncoated.
8940 North Fork Drive, North Fort Myers, Florida 33903Phone (239) 997-3860 Fax (239) 997-3243
For samples, information, or a quotation, please contact Jon Van Rhee at [email protected]
Visit us on the web at www.precisioneconowind.com
- Highest quality domestic or imported coils.
SPECIALIZING IN high-temperature edge-wound and multiple layer flat-wound coils for the pro
audio, home theater, and automotive aftermarket

OCTOBER 2011 43
operating losses in its fiscal first quarter on a 26.9%
sales gain due solely to its acquisition of the Klipsch
Group. Net income for the quarter, ended May 31,
hit $2.49 million compared with a year ago net
income of $1.12 million. Operating earnings hit
$3.98 million compared with a year-ago operat-
ing loss of $1.49 million. Net sales rose by $35
million, or 26.9%, to $165.3 million, but would
have been essentially flat without the addition of
$35.1 million in sales from the Klipsch Group,
whose acquisition was recently concluded. Sales
were in line with projections, and the bottom line
exceeded forecasts, said President/CEO Pat Lavelle.
Gross margins raised 500 basis points to 26.4%,
driven by the addition of Klipsch’s high-end audio
sales, gains in automotive OEM, and a shift away
from lower-margin consumer electronics and fulfill-
ment programs toward higher-margin accessories and
mobile electronics, the company said. The company
expects future gross margins to hit 25%. Operating
expenses increased $11.2 million, primarily because
of the Klipsch acquisition. Overall electronics sales,
including Klipsch, were up $37.8 million, or 40%,
to $132.3 million. Klipsch sales accounted for all
but $2.7 million of the increase. Accessory sales
were down $2.8 million, or 7.8%, to $33 million.
Electronics sales rose because of the Klipsch acqui-
sition, audio and video sales increases, and mobile
OEM gains, partially offset by lower sales of con-
sumer goods and satellite-radio products, the com-
pany said. Accessory sales fell because of continued
slowness in U.S. retail sales, partially offset by inter-
national sales gains. In the company’s fiscal fourth
quarter, net income rose as sales fell year on year,
with both sales of electronics and accessories down.
The main integration of Klipsch and Audiovox
are complete, according to Audiovox President/
CEO Pat Lavelle. Lavelle added that Klipsch met its
plan in the first full quarter as an Audiovox-owned
company. In a conference call with investors, Lavelle
again stressed that Audiovox is running Klipsch as a
stand-alone operation, given the different markets
they serve. Likewise, the company has no plans of
combining efforts on the part of Klipsch and the
other Audiovox brands, except perhaps for Klipsch-
branded OEM mobile audio products. Other oppor-
tunities for Klipsch include expanded commercial-
market sales and international sales.
Klipsch has begun selling the entire Klipsch-brand
audio lineup through its website, but the company
teamed up with Shopatron so that authorized deal-
ers fulfill consumers’ orders and make a margin
on the sale, Klipsch said. Klipsch is the latest CE
supplier to team with Shopatron to develop such a
program. Dealers who fulfill orders placed through
Klipsch’s website make their standard margin, minus
a small fee that they pay to Shopatron for the lead,
explained Klipsch Group Marketing Director Jill
Escol. Consumers can have the product shipped to
them by the dealer or choose to pick up the prod-
uct at the dealer’s location, she said. The company
previously sold only its headphones, iPod docks,
and computer speakers through its site. Shopatron,
which calls itself a retail-integrated eCommerce
solution provider, said its program eliminates chan-
nel conflict, builds retailer relationships, grows dis-
tribution, and increases overall sales for the brand.
Through the Klipsch site, consumers get full access
to information on all Klipsch products, including
specifications, user manuals, and product images,
Klipsch said. The site also includes how-tos on get-
ting the most out of a speaker system, a live chat for
product questions, product reviews by consumers
and professionals, links to product videos, and inte-
gration with Klipsch’s social-media sites.
Solus to Bring H-PAS Bass Technology to Custom Speakers
Solus/Clements Loudspeakers plans to unveil the
industry’s first in-wall and in-ceiling speakers incor-
porating its H-PAS bass-extension technology, pro-
moted as delivering targeted bass performance with
50% smaller cabinets, smaller drivers and lower
costs. The company will also expand its selection
of in-room speakers with the technology, which was
developed by Solus/Clements and also appears in-
�����
��������������������������������
����������������� �������������������������������
�����������������������������������
[email protected] www.speakerpower.net

44 VOICE COIL
room speakers made by Atlantic Technology. Atlantic
is licensing the technology to other companies, and
several licensing deals have already been conclud-
ed, said Solus/Clements President Phil Clements.
Hybrid Pressure Acceleration System (H-PAS) com-
bines elements of bass-reflex, inverse-horn, and
transmission-line speaker technologies to pressurize
and accelerate low frequencies. H-PAS is promoted
as breaking what the companies have called “the
iron law of loudspeaker design.” The law states that
among three key goals of speaker design—deep bass,
compact enclosures, and good efficiency—two must
be selected at the expense of the third.
Licensees of H-PAS technology are developing
their own custom speakers with the technology, but
Solus/Clements is the first out of the gate and will
be the only company with H-PAS custom speakers
at the show, Clements said. The company’s models
ship in mid December at prices that haven’t been
finalized.
The custom speakers consist of the SX-4.0 in-wall/
on-wall speaker, the SX-4.0 IC in-ceiling speaker,
the SX-4.0 CC center channel, and the three-
channel SX-4.0 in-wall/on-wall LCR, all with back
boxes and ability to deliver bass down to 40 Hz
or 42 Hz with a 3 dB down point, depending on
the model. All models are two-way models featur-
ing one or more 4" woofers. The SX-4.0 in-wall/
on-wall features 1" silk soft-dome tweeter and 4"
woofer in an enclosure measuring 23.8" × 8.5" by
4". It’s designed for use with flat-panel TVs with
screen sizes of 46" and larger. The SX-4.0 CC center
channel is 8.5" × 48" × 4" and features a 1" silk soft-
dome tweeter flanked on each side by a 4" woofer,
each in its own enclosure. The in-ceiling speaker
and the three-channel SX-4.0 LCRs are the same
size as the center channel. The LCR’s left and right
channels are each in their own enclosures like the
SX center channel. The in-ceiling speaker features
1" tweeter and 4" woofer, and the three-channel
LCR features a two-way driver complement for the
left and right channels and two three-inch full-range
drivers for the center channel. H-PAS technol-
ogy is used only on the LCR›s left-right channels.
Electronic Systems Contractors Offer Diversified Services
Electronic systems contractors (ESCs) who are
CEDIA members enjoyed 13% revenue growth and
rising profit margins in 2010 despite the depressed
market for new home construction, CEDIA’s annual
benchmarking survey found. The responding com-
panies also expect their revenues to grow in 2011.
Average revenues for a responding company hit
$1.32 million in 2010, up 13%, with installers
expecting 2011 gross revenues to increase on average
by 15% to $1.52 million.
In 2010, most of the ESC’s revenues again came
from retrofit and remodeling installs, both of
which accounted for an average of 63% of gross
revenue in 2010. Average net profit margin rose
to 4.1% in 2010 from 3.5% in 2009, though
the average margin is still below 2007’s 6.8%.
For 2011, the respondents expect the number of
jobs they do to increase from 2010, when the medi-
an number of projects for ESC companies was 41,
and they expect that number to grow to a median 51
in 2011. The average 2010 project size was $32,000.
A stepped-up marketing effort was the reason cited
Employment Opportunity
OCTOBER 2011 45
most often by installers for their expectations of ris-
ing sales and profits in 2011. After the end of the
first quarter of 2011, 93% of respondents indicated
that they expect to be profitable at the end of 2011
Among project types, home theater/media room
installs accounted for a smaller share of respondents’
gross revenues, falling to 17% in 2010 from the
previous year’s 24%, presumably because installers
have been diversifying into lighting, security, energy
management, and systems integration. In fact,
respondents called “systems integration/control”
their most profitable product category in 2010.
In addition, installers see themselves offering a
variety of products and services during the next two
years. Seventy-two percent expect to be offering
energy-management products, 24% expect to offer
smart appliances, 33% expect to offer home health
equipment, 49% expect to be offering LED lighting,
and 18% expect to offer alternative energy sources
For the 2011 survey, 112 companies completed
valid survey responses for a response rate of about
8%. The companies employ a total of 932 employ-
ees. Results are representative of CEDIA members
and reported at a 95% confidence level, CEDIA
said. The survey was conducted by research firm
Brand Ubiquity.
Results are free to respondents and available for
purchase through the CEDIA Marketplace for
$1,495 for CEDIA members and $2,995 for non-
members.
Consumer Electronics Industry Experiences Growth
The consumer electronics industry will have
stronger than anticipated growth in 2011, with
tablet PCs, smartphones, and e-readers driving
sales, according to the semiannual industry fore-
cast recently released by the Consumer Electronics
Association (CEA).
The industry is estimated to surpass $190 billion
in overall shipment revenues this year, a growth rate
of 5.6%, which is higher than the previous projec-
tion from January. “The U.S. Consumer Electronics
Sales and Forecast” (July 2011) also projects indus-
try shipments will grow in 2012, reaching an all-
time high of $197 billion. The forecast estimates
2011 shipment revenues of 5.6%, up from a fore-
cast of 3.5% in January, and assumes a U.S. GDP
growth rate of 2.4%. Industry shipment revenues
will surpass $190 billion this year, about $4 billion
more than anticipated in January. Growth is pro-
jected to continue into 2012, reaching $197 billion
in shipment revenues, an all-time high. CEA expects
the surging sales of mobile-connected devices to
be significant enough to push the overall industry
higher than previously projected. VC
www.assistanceaudio.com
Assistance AudioThe North American Distributor
High Quality European Speaker Components
All components are designed and built for the demanding needs of proaudio, with the high fidelity quality associated with studio or audiophile use.
IF YOU WANT THE BEST, GO WITH
HIGH AND MID-HIGHCOMPRESSION DRIVERS:1. High sensitivity, lightweight2. Low distortion3. Fast transient response
BMS DIAPHRAGMS:1. Lightweight polyester for low distortion & fast transient response.2. Ring radiator design for more control, less curvature & more coherent phase response.
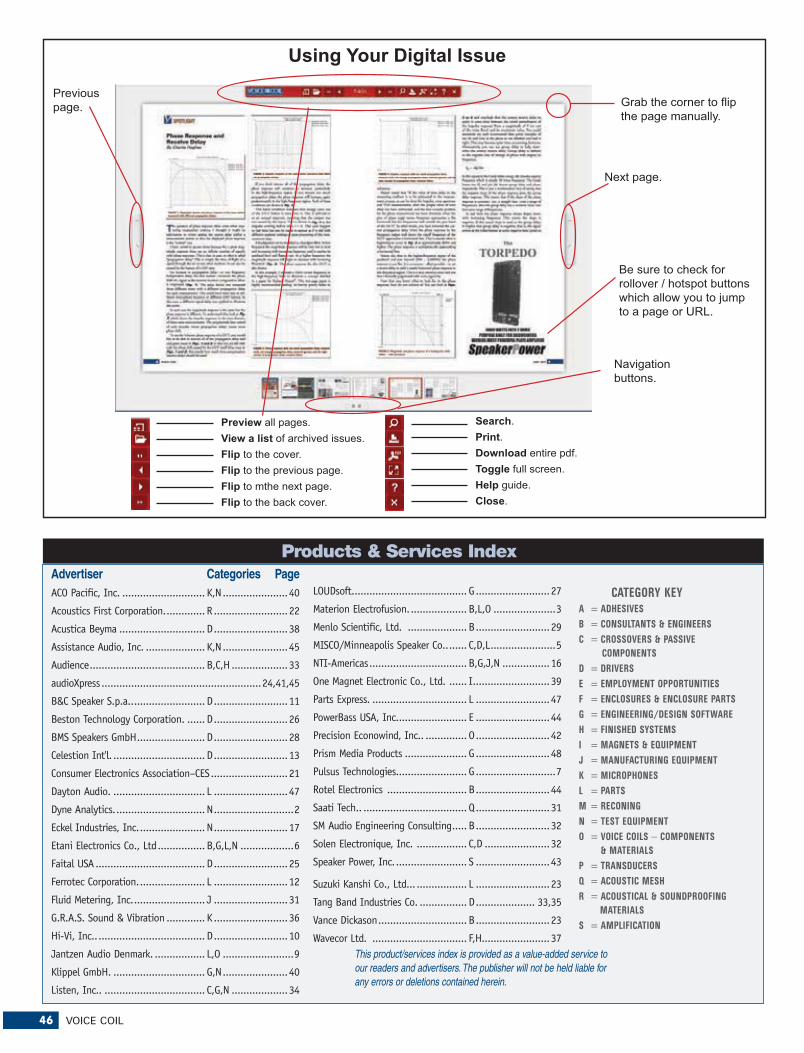
46 VOICE COIL
CATEGORY KEY
A = ADHESIVES
B = CONSULTANTS & ENGINEERS
C = CROSSOVERS & PASSIVE
COMPONENTS
D = DRIVERS
E = EMPLOYMENT OPPORTUNITIES
F = ENCLOSURES & ENCLOSURE PARTS
G = ENGINEERING/DESIGN SOFTWARE
H = FINISHED SYSTEMS
I = MAGNETS & EQUIPMENT
J = MANUFACTURING EQUIPMENT
K = MICROPHONES
L = PARTS
M = RECONING
N = TEST EQUIPMENT
O = VOICE COILS − COMPONENTS
& MATERIALS
P = TRANSDUCERS
Q = ACOUSTIC MESH
R = ACOUSTICAL & SOUNDPROOFING
MATERIALS
S = AMPLIFICATION
Products & Services IndexAdvertiser Categories PageACO Pacific, Inc. ............................ K,N ......................40
Acoustics First Corporation. ............. R .........................22
Acustica Beyma ............................. D .........................38
Assistance Audio, Inc. .................... K,N ......................45
Audience ....................................... B,C,H ...................33
audioXpress ......................................................24,41,45
B&C Speaker S.p.a.. ........................ D .........................11
Beston Technology Corporation. ...... D .........................26
BMS Speakers GmbH ....................... D .........................28
Celestion Int'l. ............................... D .........................13
Consumer Electronics Association–CES ..........................21
Dayton Audio. ............................... L .........................47
Dyne Analytics. .............................. N ...........................2
Eckel Industries, Inc. ...................... N .........................17
Etani Electronics Co., Ltd ................ B,G,L,N ..................6
Faital USA ..................................... D .........................25
Ferrotec Corporation. ...................... L .........................12
Fluid Metering, Inc. ........................ J .........................31
G.R.A.S. Sound & Vibration ............. K .........................36
Hi-Vi, Inc.. .................................... D .........................10
Jantzen Audio Denmark. ................. L,O ........................9
Klippel GmbH. ............................... G,N ......................40
Listen, Inc.. .................................. C,G,N ...................34
LOUDsoft. ...................................... G .........................27
Materion Electrofusion. ................... B,L,O .....................3
Menlo Scientific, Ltd. .................... B .........................29
MISCO/Minneapolis Speaker Co.. ...... C,D,L ......................5
NTI-Americas ................................. B,G,J,N ................16
One Magnet Electronic Co., Ltd. ...... I ..........................39
Parts Express. ................................ L .........................47
PowerBass USA, Inc. ....................... E .........................44
Precision Econowind, Inc.. .............. O .........................42
Prism Media Products ..................... G .........................48
Pulsus Technologies.. ...................... G ...........................7
Rotel Electronics ........................... B .........................44
Saati Tech.. ................................... Q .........................31
SM Audio Engineering Consulting ..... B .........................32
Solen Electronique, Inc. ................. C,D ......................32
Speaker Power, Inc. ........................ S .........................43
Suzuki Kanshi Co., Ltd... ................. L .........................23
Tang Band Industries Co. ................ D .................... 33,35
Vance Dickason .............................. B .........................23
Wavecor Ltd. ................................ F,H.......................37
Using Your Digital Issue
Preview all pages.View a list of archived issues.Flip to the cover. Flip to the previous page.Flip to mthe next page. Flip to the back cover.
Search.Print.Download entire pdf. Toggle full screen. Help guide.Close.
Navigationbuttons.
Next page.
the page manually.
Previouspage.
Be sure to check for rollover / hotspot buttons which allow you to jump to a page or URL.
This product/services index is provided as a value-added service to our readers and advertisers. The publisher will not be held liable for any errors or deletions contained herein.
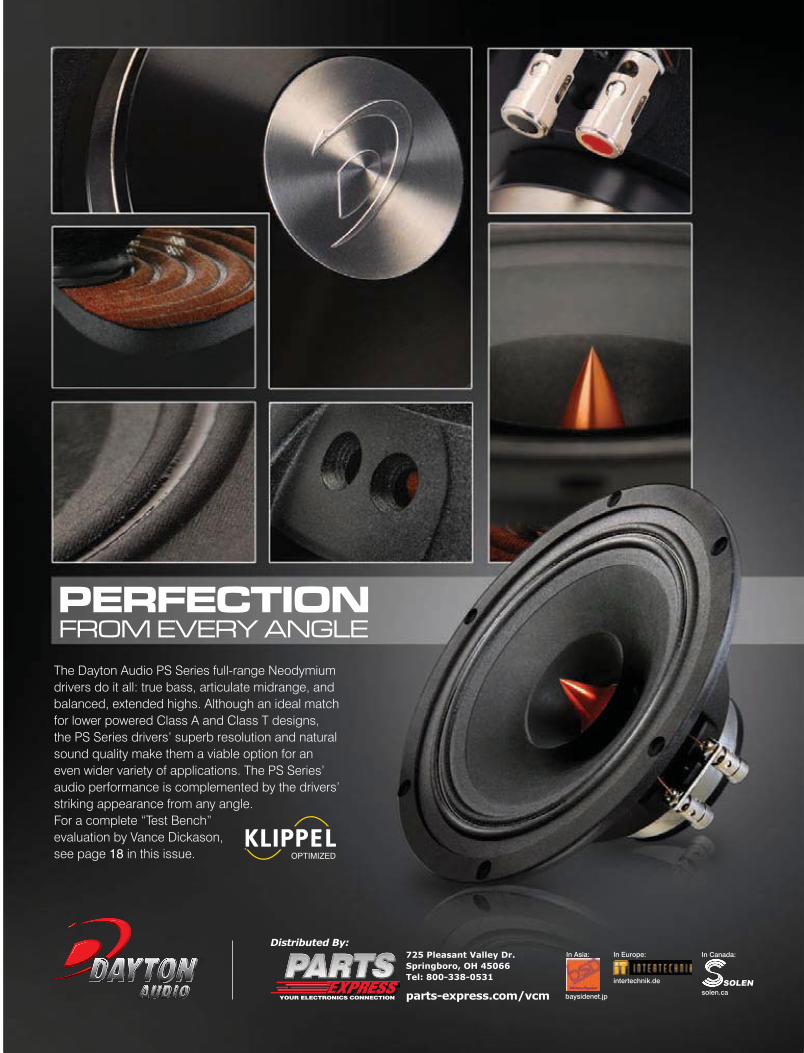
725 Pleasant Valley Dr.Springboro, OH 45066Tel: 800-338-0531
parts-express.com/vcm
Distributed By:In Europe:
intertechnik.de
In Asia:
baysidenet.jp
In Canada:
solen.ca
PERFECTIONFROM EVERY ANGLE
The Dayton Audio PS Series full-range Neodymium drivers do it all: true bass, articulate midrange, and balanced, extended highs. Although an ideal match for lower powered Class A and Class T designs, the PS Series drivers’ superb resolution and natural sound quality make them a viable option for an even wider variety of applications. The PS Series’ audio performance is complemented by the drivers’ striking appearance from any angle. For a complete “Test Bench” evaluation by Vance Dickason, see page in this issue.
In Asia:

...integrated
electronic test, acoustic test...
Prism Sound is now a globalsales & support agent for:
������������������� �������� ������������������������������������ ���������������������������������������������������������� ����������������
��������������������� ���������� ������������ ���������������������
������������������� !�����������������������������������������������������"������ ���������� �����#�������������������$�����%dScope Series III
analog and digitalaudio analyzers
������������������� ��������������������������������������������� �!"#�����$ ����
Loudspeaker design and analysis solutions
IN THIS ISSUE
Happy 25th Anniversary Voice Coil: A Quarter Century of Loudspeaker Technology!
November 2011 marks the beginning of Voice Coil’s 25th
year as an information resource for the loudspeaker industry.
Voice Coil magazine started with a conversation between Ed
Dell and me following the Audio Amateur, Inc. publication of
the 3rd edition of the Loudspeaker Design Cookbook. Ed related
to me a concept of creating a publication that would become
an information “super highway” for the loudspeaker industry.
Needless to say, I considered it not only an outstanding con-
cept for a new publication, but something I felt the industry
badly needed and would happily support. Obviously, after 25
years, we were both correct in moving forward with the pub-
lication. Mr. Dell came up with the name, Voice Coil, and as
they say, the rest is history.
From the first issue in November 1987 until June of 1995,
Voice Coil was a monthly subscription-based, black-and-white,
four-page newsletter that was written entirely by me, with no
other contributors and no advertising. However, the June 1995
issue jumped to 20 pages (we are currently about 32 to 48
pages each month!) of four-color printing on gloss paper and
became advertiser-driven with no subscription fee. As we head
into the era of digital delivery, Voice Coil just this year became
available as an Internet-delivered subscription.
Besides the change in printing, distribution, and digital
delivery, Voice Coil began to include other contributors such as
Wolfgang Klippel, Steve Temme, Jim Croft, Mike Klasco, Pat
Turnmire, Charlie Hughes, Steve Mowry, and many others
over the years. Support has come not only from some of the
industries finest engineers, but by the generosity of analyzer/
software manufacturers Klippel GmbH, LinearX, and Listen,
Inc., who have supplied Voice Coil with some of the best test
equipment available.
As this loudspeaker industry magazine has grown and
matured, Voice Coil continues to be what its originator and
former publisher Ed Dell conceived it to be, a world-class
clearing-house of information for loudspeaker engineers,
manufacturers, marketing specialists, and OEM suppliers.
Evidenced by the participation of writers, advertisers, and
Industry News and DevelopmentsBy Vance Dickason
16
9
29
31
INDUSTRY NEWS AND DEVELOPMENTSBy Vance Dickason
SPOTLIGHTSubwoofer Alignment with Full-Range System By Charlie Hughes
ACOUSTIC PATENTS By James Croft
TEST BENCHA New Tweeter and a New Woofer from SB Acoustics
INDUSTRY WATCH By Vance Dickason
Products & Services Index
1
20
Soft Dome Tweeter on the Test Bench, p. 20
5YEARS
CELEBRATING
New Linear X Amplifier Filter & Attenuator, p. 8
V O L U M E 2 5 , I S S U E 1 N O V E M B E R 2 0 1 1
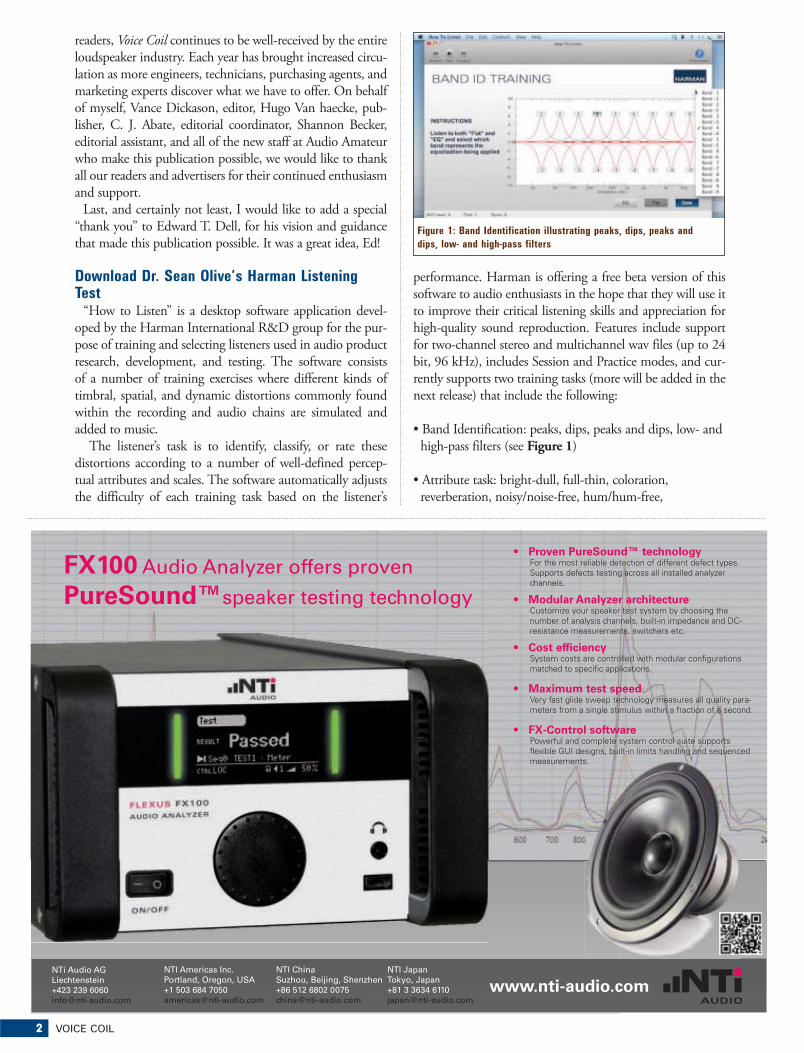
2 VOICE COIL
NTi Audio AG Liechtenstein+423 239 [email protected]
NTI Americas Inc. Portland, Oregon, USA+1 503 684 [email protected]
NTI ChinaSuzhou, Beijing, Shenzhen+86 512 6802 0075 [email protected]
NTI JapanTokyo, Japan +81 3 3634 [email protected]
www.nti-audio.com
FX100 Audio Analyzer offers proven
PureSound™speaker testing technology
Proven PureSound™ technology For the most reliable detection of different defect types. Supports defects testing across all installed analyzer channels.
Modular Analyzer architecture Customize your speaker test system by choosing the number of analysis channels, built-in impedance and DC-resistance measurements, switchers etc.
Cost efficiency System costs are controlled with modular configurations matched to specific applications.
Maximum test speed Very fast glide sweep technology measures all quality para-meters from a single stimulus within a fraction of a second.
FX-Control software Powerful and complete system control suite supports flexible GUI designs, built-in limits handling and sequenced measurements.
readers, Voice Coil continues to be well-received by the entire
loudspeaker industry. Each year has brought increased circu-
lation as more engineers, technicians, purchasing agents, and
marketing experts discover what we have to offer. On behalf
of myself, Vance Dickason, editor, Hugo Van haecke, pub-
lisher, C. J. Abate, editorial coordinator, Shannon Becker,
editorial assistant, and all of the new staff at Audio Amateur
who make this publication possible, we would like to thank
all our readers and advertisers for their continued enthusiasm
and support.
Last, and certainly not least, I would like to add a special
“thank you” to Edward T. Dell, for his vision and guidance
that made this publication possible. It was a great idea, Ed!
Download Dr. Sean Olive’s Harman Listening Test
“How to Listen” is a desktop software application devel-
oped by the Harman International R&D group for the pur-
pose of training and selecting listeners used in audio product
research, development, and testing. The software consists
of a number of training exercises where different kinds of
timbral, spatial, and dynamic distortions commonly found
within the recording and audio chains are simulated and
added to music.
The listener’s task is to identify, classify, or rate these
distortions according to a number of well-defined percep-
tual attributes and scales. The software automatically adjusts
the difficulty of each training task based on the listener’s
performance. Harman is offering a free beta version of this
software to audio enthusiasts in the hope that they will use it
to improve their critical listening skills and appreciation for
high-quality sound reproduction. Features include support
for two-channel stereo and multichannel wav files (up to 24
bit, 96 kHz), includes Session and Practice modes, and cur-
rently supports two training tasks (more will be added in the
next release) that include the following:
high-pass filters (see Figure 1)
reverberation, noisy/noise-free, hum/hum-free,
Figure 1: Band Identification illustrating peaks, dips, peaks and
dips, low- and high-pass filters

4 VOICE COIL
Voice Coil, (ISSN 1521-091X), the Periodical of the Loudspeaker Industry, is published monthly by Segment, LLC, 4 Park St., Vernon, CT 06066 USA, (860) 875-2199, FAX (860) 871-0411. Periodical rates paid at Vernon, CT and additional offices.
Copyright 2011 by Segment, LLC. All rights reserved. Quotation from Voice Coil is forbidden without written permission of the publisher.
Publisher - Hugo Van haecke Editor - Vance Dickason (E-mail [email protected])
C. J. Abate.................Editorial CoordinatorShannon Becker ..............Editorial AssistantShannon Barraclough ....Marketing DirectorKC Prescott ...................................GraphicsJeff Yanco ....................................ControllerDebbie Lavoie ..................Customer ServiceValerie Luster.....Administrative Coordinator
SubmissionsSend all press releases and information to Voice Coil, Segment, LLC Editorial Dept., 4 Park St., Vernon, CT 06066, or FAX us material at (860) 871-0411, or e-mail [email protected].
ADVERTISING
For advertising reservations contact: Strategic Media Marketing, Inc., 2 Main St., Gloucester, MA 01930 USA, Phone: (978) 281-7708, or Fax: 603-924-9467, Toll-free (800) 454-3741, e-mail [email protected].
E-mail Erica Fienman with artwork inquiries at: [email protected].
Qualified subscriptions to Voice Coil run for one year. Renew annually on-line at voicecoilmagazine.com/vcqual.html
Subscriptions to Voice Coil are available in printed and digital versions. To subscribe to the digital version, please visit our website at www.audioXpress.com and complete a qualification form. When you qualify,
you will receive an e-mail confirming your subscription. The current issue of each digital Voice Coil will be posted to www.gotomyvoicecoil.com at the end of the month. To access, use the link in the e-mail notification, or you can simply log in to the website to view your issue along with the archived issues. For questions relating to the digital issue, please go to the help page at www.audioxpress.com/digital_issue_help.htm.
For those overseas, the cost of a printed subscription is $150.00 per year. Please contact customer service or order your subscription online at www.audioXpress.com.
left/right balance (stereo mode), front/rear balance
(surround mode)
To download a free copy of “How to Listen” software and
user manual, visit the website at www.harmanhowtolisten.
blogspot.com.
Call for Applications: AES Executive Director The Audio Engineering Society, Inc. (AES) is seeking appli-
cations for the position of executive director; employment will
begin on January 1, 2012. The AES is the only professional
society devoted exclusively to audio technology. Founded in the
United States in 1948, the AES has grown to become an inter-
national organization with the purpose of: uniting persons per-
forming professional services in the audio engineering field and
its allied arts; collecting, collating, and disseminating scientific
knowledge in the field of audio engineering and its allied arts:
advancing such science in both theoretical and practical appli-
cations; and preparing, publishing, and distributing literature
and periodicals relative to the foregoing purposes and policies.
Currently, over 14,000 members are affiliated with more
than 75 AES professional sections and more than 95 AES stu-
dent sections around the world. The AES also serves the edu-
cational needs of its members and the audio industry at-large
through international technical meetings, equipment exhibi-
tions, and a wide range of publications. Conventions, which
include scientific presentations, student activities, workshops,
and exhibitions, are held annually both in the United States
and Europe. Additional conferences and regional summits are
held periodically throughout Latin America, Asia, Europe, and
North America.
Capsule Job Description of the Executive Director: The executive director (ED) facilitates the operational activi-
ties of the AES and serves as the Society’s chief operating officer.
The ED is responsible to the AES Board of Governors and its
Executive Committee, which provide overall policy guidance
and operational oversight. The ED provides leadership and
performs such duties as required for AES to refine and suc-
cessfully meet its strategic objectives, and successfully conduct
operations in accordance with its educational and scientific
purpose.
The headquarters office of the AES is in New York City, N.Y.
and the ED is required to conduct the business of the Society
at this office. The ED shall devote best efforts, attention, and
energies to the business of the Society, and during the term of
employment, may not engage in any other business or occupa-
tion which conflicts with this obligation without prior specific
written consent of the Board of Governors.
Qualifications for Executive Director Applicants:
diverse and decentralized global not-for-profit associations
the ability to operate in a constantly changing environment
including professional association experience
issues and relationships, including leadership styles that
successfully meet diverse situations
the ability to recommend and initiate productive
actions to meet those needs, including organizational change
institution, preferably in engineering or a related field
technical base; further, possessing a high level of comfort
with both existing and emerging audio-related technology
as well as the ability to work with volunteers and staff to
meet the technological needs of AES’s membership
engineering community, (i.e., with other professional
technical societies, the National Academy of Engineering,
the National Science Foundation, the Acoustical Society of
America, the Institute of Electrical and the Electronic
Engineers, etc., and their international counterparts)
volunteer professional society that continues to take pride in
operating as a volunteer-staff patnership
productively with the volunteers to meet the goals and
objectives of AES
listen, to act, and to stand behind decisions
increasing global and multicultural responsibilities while

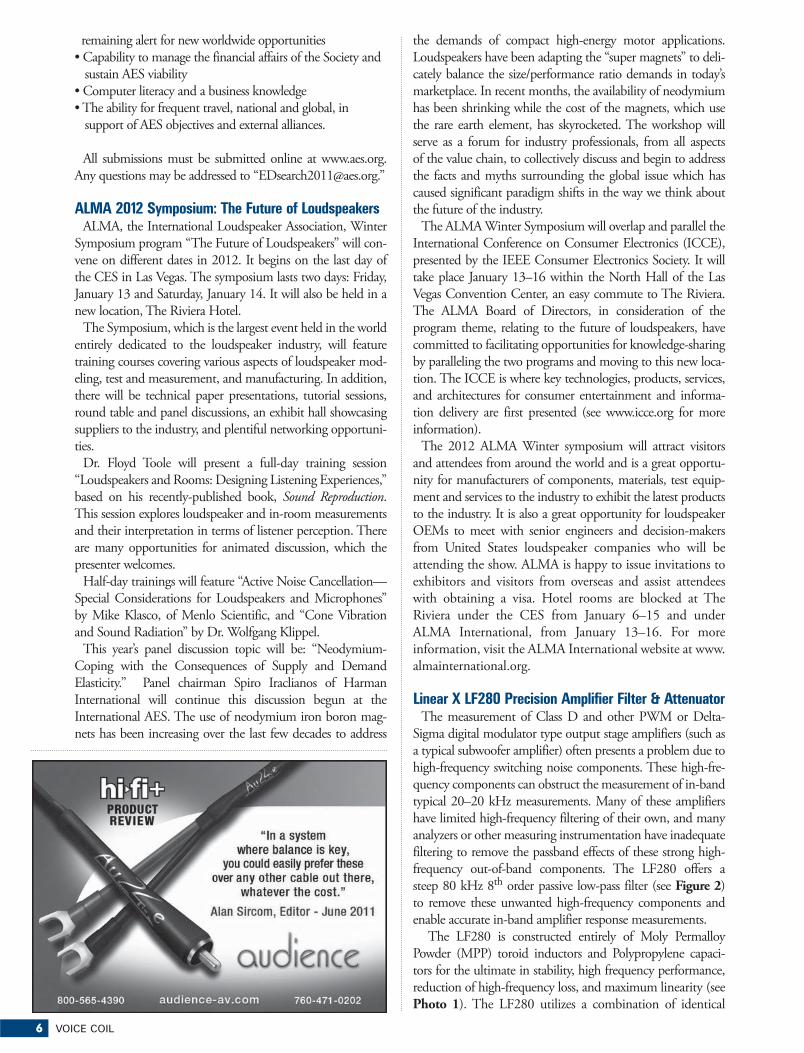
6 VOICE COIL
remaining alert for new worldwide opportunities
ALMA 2012 Symposium: The Future of Loudspeakers
-
-
-
Sound Reproduction
-
-
-
-
-
-
Linear X LF280 Precision Amplifier Filter & Attenuator
-
Figure 2
-
Photo 1

Where the next big thing meets the light of day.Somewhere a back room conversation has caused a burst of inspiration. And it will be unveiled here. Come see a bright idea light the way to tomorrow.
Tuesday, January 10 – Friday, January 13, 2012Las Vegas, Nevada | CESweb.org REGISTER NOW

8 VOICE COIL
components to reduce component sensitivity and produce
a highly stable response with maximum passband flatness.
A common problem with any passive filter is loading by the
external cable capacitance or analyzer/meter input circuitry
which can alter the response. The LF280 provides a precision
R2R ladder attenuator, which largely removes the effects of
external device loading, and provides a constant low output
impedance regardless of the attenuation selected. For attenua-
tion levels of –6 dB, –12 dB, or lower, the effects of any exter-
nal device loading are effectively eliminated. An additional
advantage of the precision attenuator is to reduce signal levels
fed to other measuring devices which may not be capable of
handling the very large signals produced from high-power
amplifiers. Features include:
th order 80-kHz, low-pass filters
differential mode
For more information, visit www.linearx.com. VC
Figure 2: LinearX LF280 80-kHz 8th order passive low-pass
filter graph
Photo 1: The Linear X LF280 Precision Amplifier Filter &
Attenuator

NOVEMBER 2011 9
Spotlight
Subwoofer Alignment with Full-Range SystemBy Charlie Hughes
I have heard the following question asked many times:
“How do I align a subwoofer with a full-range loud-
speaker system?” I thought it might be interesting to delve
into this to see if I could come up with an answer. The task
of adding a subwoofer to a loudspeaker system to increase
the low-frequency bandwidth should typically entail three
primary items:
full-range system (crossover)
full-range system (gain)
woofer and the full-range system (delay)
It is this last item that is perhaps the most challenging. This
is the one that we will primarily investigate. We will also look
at the first item briefly. With these taken care of the second
item should not be too much of a problem.
Loudspeakers, by their nature, are band-pass devices. To
simplify the measurements and make it easier to see what’s
going on with the graphs, I will use high-pass and low-pass
filters instead of actual loudspeakers. The results will be the
same with one exception: microphone location. Since our
examples don’t use a microphone (only electrical measure-
ments), it can’t be moved to a different location. This can
be much more critical for measurements at higher frequen-
cies because the directivity response of a loudspeaker will
lead to differences in the measured response of a device at
different locations. For devices that are, for the most part,
omni-directional in the lower-frequency region, this will
not be an issue.
There is another issue, of which one should be aware,
concerning microphone placement that could lead to mea-
sured differences. That is the potential change in path length
from the two devices under test (lower-frequency device and
higher-frequency device) to the measurement microphone
(or the listener’s ear.) At one mic position there may be
very good summation. At another location, where the path
length difference has changed by one-half wavelength of
frequencies in the crossover region, there will be a notch
(cancellation) in the summed response. When making field
measurements, it is advisable to place the microphone(s) in
position(s) that are typical of magnitude and arrival time
differences to which most of the intended coverage area will
be subjected.
Let’s imagine a hypothetical system that has a full-range
cluster that reproduces 60 Hz to 14 kHz adequately. We will
Figure 1: Magnitude response of individual simulated loudspeakers
Figure 2: Magnitude response of cluster without HP filter (blue), target
Linkwitz-Riley response (green), and cluster with HP filter (red)
10 VOICE COIL
add a subwoofer that is physically displaced from the full-
range cluster. The subwoofer reproduces adequately down
to 30 Hz. These response curves are shown in Figure 1. We
want a crossover at 100 Hz with a 4th order Linkwitz-Riley
alignment.
We can simply apply a 4th Linkwitz-Riley low-pass filter
at 100 Hz to the subwoofer since its response is relatively
flat, well above the intended crossover region. This is not the
case for the cluster, however. Its output is already beginning
to decrease, with decreasing frequency through the intended
crossover region. We will need to apply an electrical filter
that, when combined with the natural response of the clus-
ter, will yield an acoustical output that matches a 4th order
Linkwitz-Riley filter with an Fc of 100 Hz. Figure 2 shows
Figure 3: Magnitude response of individual passbands and the
summed response
Figure 4: ETC of individual passbands

NOVEMBER 2011 11
the natural output of the cluster and the target Linkwitz-
Riley response along with the cluster’s output after it has
been high-pass filtered. A 3rd order Butterworth high pass
at 115 Hz was used to get this response. A lower Fc and a
parametric EQ filter might be used to achieve a more exact
match. The response shown will be close enough for our
purposes.
When the outputs of the two devices are combined, we get
the responses shown in Figure 3. The summed magnitude
response is not at all what we want. It is clear that some-
thing is causing cancellation. We know that the acoustic
Linkwitz-Riley response of each device should sum to a flat
response. Since it doesn’t, this would seem to indicate the
problem is a misalignment of the two devices in the time
domain. Looking at the Envelope Time Curve (ETC) of the
passbands (see Figure 4) confirms that they are not synchro-
nized. We need to delay the cluster, but by how much?
If we choose to align the cluster’s peak arrival with the
peak arrival from the subwoofer, we need to delay the cluster
14.7 ms. Alternatively we might choose to try to place the
arrival of the cluster more towards the leading edge of the
subwoofer’s ETC. This will require approximate 10 ms of
delay for the cluster. The frequency and time domain of
both these scenarios are shown in Figure 5 and Figure 6.
Neither of the frequency domain curves looks like what one
would consider good summation (reasonably flat response).
The time domain would seem to indicate that the shorter
delay is closer to the ideal response than the longer delay. We
could go on guessing at different delay times in an attempt
to optimize the response in both domains. Hopefully, there
is a better way.
The underlying problem is that we have only low-fre-
quency information output from the subwoofer. From the
equation:
where Δt is time resolution and Δf is frequency resolution,
we can see that high-frequency resolution (small value of Δf)
will yield low-time resolution (large values of Δt). We need
higher-frequency output from the subwoofer (correspond-
ing to higher Δf, lower-frequency resolution) to increase the
time resolution in order for us to know when to position
the cluster. If possible, we can bypass the low-pass filter on
the subwoofer to get more high-frequency content in the
output signal. This may help in more precisely determining
the arrival time of energy from the subwoofer. Let’s assume
that we can’t do this or if we can that it still doesn’t give us
sufficient time resolution.
What we need is a way to get precise time information
without high-frequency content. This is a seemingly impos-
sible task, but only so in the time domain. In the frequency
domain, there is a metric available that yields quite precise
relative timing information. This is the group delay. The
group delay is defined mathematically as the negative rate
of change of the phase response with respect to frequency.
Figure 5: Magnitude response summed response with the cluster
delayed 10 ms (red) and 14.7 ms (blue)
Figure 6: ETC of the summed response with the cluster delayed
10 ms (red) and 14.7 ms (blue)
ΔΔ
t = 1f
τ φω
g dd
= −
12 VOICE COIL
Figure 3 and Figure 4 show different views (domains)
of the same measurement for the individual passbands. If
we look at the group delay of this same data, we can derive
some valuable information. The high-frequency limit (pla-
teau) of each curve indicates the arrival time of the signal
from that device. From this we see that the cluster arrival
time is approximately 3.3 ms. This correlates very well with
the ETC in Figure 4.
Don’t let the appearance of the subwoofer curve in the
high-frequency region be bothersome. This is due to the
low signal-to-noise ratio of the measurement above 400 Hz.
Referring to Figure 3, the output of the subwoofer is less
than –24 dB at 200 Hz. Our use of a 4th order filter would
indicate a level of less than –48 dB at 400 Hz and decreasing
rapidly. It’s no wonder there is an SNR problem at higher
frequencies.
We can look at the subwoofer curve around 300 Hz to
get an indication of the high-frequency limit of its group
delay. This turns out to be approximately 11.0 ms. The
group delay of the cluster at this frequency is approximately
3.9 ms. This is a bit different than the 3.3 ms at higher fre-
quencies. This is caused by the phase shift of the high-pass
filter and the natural high-pass response of the device. The
low-pass filter being used on the subwoofer will have similar
phase shift, and consequently, similar group delay differ-
ences in the high-frequency region if our measurement SNR
was good enough to see it.
Taking the difference in 11.0 ms and 3.9 ms we now
have a value of 7.1 ms to use as our delay setting for the
Figure 8: Magnitude response of individual passbands and the
summed response with the cluster delayed 7.1 ms
Figure 7: Group delay of the cluster (red) and subwoofer (blue) with
crossover filters in place


14 VOICE COIL
cluster. This yields the summation, along with the individual
passbands, shown in Figure 8 and Figure 9. This is almost the
exact response we desire. There is less than 0.5 dB error in the
vicinity of 150 Hz. This error is due to the output of the cluster
and high-pass filter not exactly matching the Linkwitz-Riley
target (see Figure 2).
There is one more item that I think might be of interest in
helping to see how a low-pass filter response affects apparent
arrival time. I say apparent because it only appears that the
arrival time is changing. Figure 10 and Figure 11 show the
ETC and IR, respectively, of a 4th order Butterworth low-pass
filter. The only difference in these curves is the corner fre-
quency (–3 dB point) of the filter. The true arrival time for all
of these filter curves is 5 ms. A complementary high-pass filter
with an arrival time of 5 ms will combine properly with its low-
pass counterpart in the graph. If the high pass is delayed so as
to place the arrival so that it occurs later than 5 ms, there will
be errors in the summation of the filters just as was illustrated
in Figure 5 and Figure 6.
We have seen how the response of an electrical filter can
combine with the response of a loudspeaker to yield the desired
response (alignment) from the combined output. We have
seen how the low-pass behavior of a device may make it appear
that its arrival time is later than it actually is. We also demon-
strated how to use group delay to determine the correct delay
setting with relatively high precision when the high-frequency
output of a device is limited due to its low pass behavior. I hope
that some will find use for these techniques. VC
Figure 9: ETC of individual passbands and the summed response
with the cluster delayed 7.1 ms
Figure 10: ETC of low-pass filter with different corner frequencies
Figure 11: IR of low-pass filter with different corner frequencies
- Custom coils available in: Multi-layer wire configurations Multiple lead configurations Round and Flat Wire Custom lead-out attachments
Free standing coils Multiple wire types Bifilar or Edgewound Custom bobbin wound coils
- High temperature adhesive coated Copper and Aluminum wire in round and flat sizes. CCAW wire available in round sizes.
- Adhesive coated custom cut forms and Collars.
- Custom slit rolls of Form and Collar material available coated or uncoated.
8940 North Fork Drive, North Fort Myers, Florida 33903Phone (239) 997-3860 Fax (239) 997-3243
For samples, information, or a quotation, please contact Jon Van Rhee at [email protected]
Visit us on the web at www.precisioneconowind.com
- Highest quality domestic or imported coils.
SPECIALIZING IN high-temperature edge-wound and multiple layer flat-wound coils for the pro
audio, home theater, and automotive aftermarket
Seems like all of a sudden,compact arrays are big
business. So talk toCelestion about our range
of high performance,small-format drivers.
It’s anotherinnovation in sound
from Celestion.
Find us on Facebook
www.celestion.com
We’re thinking small
AN2075 50mm/2" AN2775 70mm/2.75" AN3510 88mm/3.5"
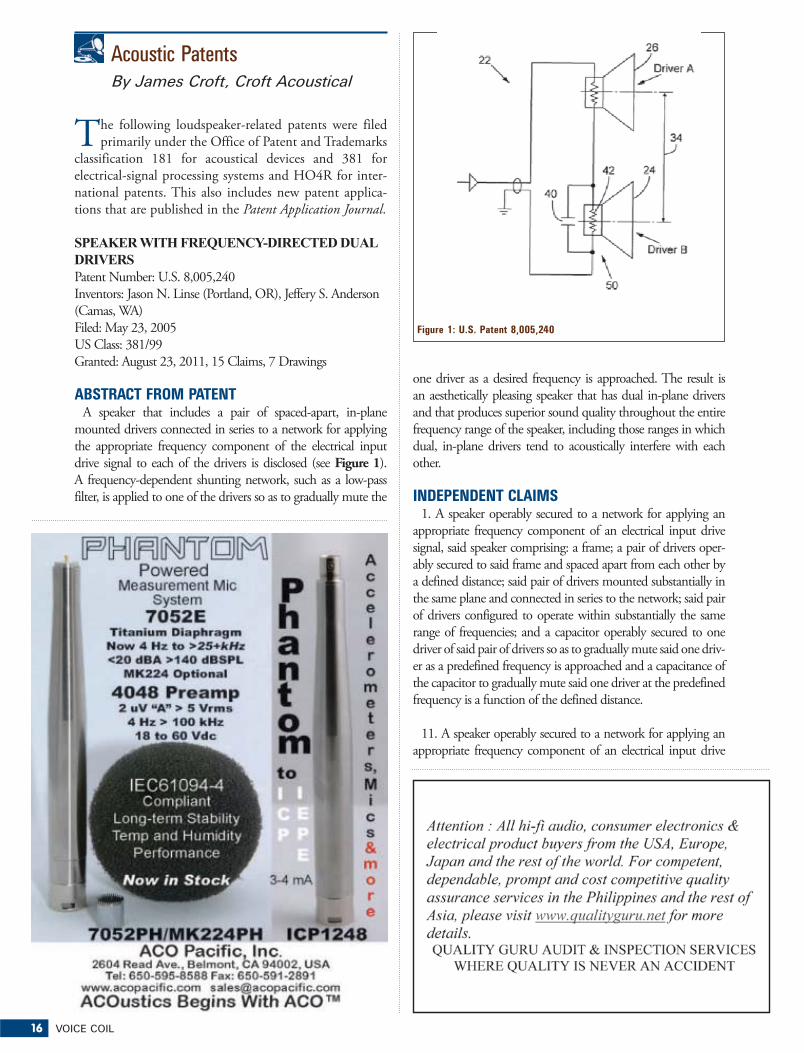
16 VOICE COIL
Acoustic PatentsBy James Croft, Croft Acoustical
Figure 1: U.S. Patent 8,005,240
The following loudspeaker-related patents were filed
primarily under the Office of Patent and Trademarks
classification 181 for acoustical devices and 381 for
electrical-signal processing systems and HO4R for inter-
national patents. This also includes new patent applica-
tions that are published in the Patent Application Journal.
SPEAKER WITH FREQUENCY-DIRECTED DUAL DRIVERSPatent Number: U.S. 8,005,240
Inventors: Jason N. Linse (Portland, OR), Jeffery S. Anderson
(Camas, WA)
Filed: May 23, 2005
US Class: 381/99
Granted: August 23, 2011, 15 Claims, 7 Drawings
ABSTRACT FROM PATENTA speaker that includes a pair of spaced-apart, in-plane
mounted drivers connected in series to a network for applying
the appropriate frequency component of the electrical input
drive signal to each of the drivers is disclosed (see Figure 1).
A frequency-dependent shunting network, such as a low-pass
filter, is applied to one of the drivers so as to gradually mute the
one driver as a desired frequency is approached. The result is
an aesthetically pleasing speaker that has dual in-plane drivers
and that produces superior sound quality throughout the entire
frequency range of the speaker, including those ranges in which
dual, in-plane drivers tend to acoustically interfere with each
other.
INDEPENDENT CLAIMS1. A speaker operably secured to a network for applying an
appropriate frequency component of an electrical input drive
signal, said speaker comprising: a frame; a pair of drivers oper-
ably secured to said frame and spaced apart from each other by
a defined distance; said pair of drivers mounted substantially in
the same plane and connected in series to the network; said pair
of drivers configured to operate within substantially the same
range of frequencies; and a capacitor operably secured to one
driver of said pair of drivers so as to gradually mute said one driv-
er as a predefined frequency is approached and a capacitance of
the capacitor to gradually mute said one driver at the predefined
frequency is a function of the defined distance.
11. A speaker operably secured to a network for applying an
appropriate frequency component of an electrical input drive
NOVEMBER 2011 17
signal, said speaker comprising: a frame; a pair of drivers oper-
ably secured to said frame and spaced apart from each other
by a defined distance; said pair of drivers configured to operate
within substantially the same range of frequencies, and con-
nected to the network; a capacitor operably secured to one driver
of said pair of drivers so as to gradually mute said one driver
as a predefined frequency is approached by the network and a
capacitance of the capacitor to gradually mute said one driver at
the predefined frequency is a function of the defined distance.
REVIEWER COMMENTS This is an excellent example of a patent that lays claim to an
old, useful concept, but it is granted due to a special combina-
tion of circumstances. This usually happens by way of one or
more of three things: (1) the patent examiner viewing only past
patents, but being unaware of audio development disclosed
in the literature (AES, JASA, etc.); (2) being assigned a patent
examiner who is unaware of standard loudspeaker system design
practice; and (3) to have a skillful patent attorney who can
effectively argue your case with the examiner and write claims
that appear to differentiate, but in actuality, provide a very broad
coverage.
A study of this simple case can be a good learning tool for
those interested in how effective claims can be crafted and
argued, and also, how naïve the patent office can be relative to
the field of loudspeaker prior art. Disclosed is a pair of transduc-
ers mounted adjacent to each other and wired in series. As the
frequency of operation is increased, and the wavelength of the
drive frequency is a half wavelength or greater than the center-
to-center separation of the two transducers, a bypass capacitor is
connected in parallel with one of the transducers, so as to act as
a low-pass filter for that transducer.
This type of series driver arrangement with a parallel bypass
capacitor can be very effective and elegantly economical in what
it accomplishes, in that with a single component, it not only
creates a low-pass filter for the one of the transducers, it also
level shifts the remaining transducer upward in output, so as to
maintain the same system output above and below the crossover
frequency for a given input voltage. For the levels between the
two transducers to remain equal in their passband, and the
transition to work as perfectly as described, requires that the
two transducers are identical, or that they at least have identi-
cal impedance curves and sensitivities at and near the crossover
frequency. When the crossover frequency is near the resonance
frequency of the drivers, with the usual associated impedance
peak, there will be an amplitude imbalance between the two
drivers. If used near the resonant frequency, it works best with
impedance smoothing networks, or with transducers with
substantially resistive impedance characteristics, such as some
planar magnetics. But, if used well removed from the resonant
frequency, this simple technique can be quite effective and eco-
nomical compared to the equivalent transfer function applied to
two transducers in parallel.
As a side note, not mentioned in the patent, this technique
can also be a very low-cost and effective way to passively
transition line source arrays of multiple drivers to maintain a

18 VOICE COIL
substantially constant ratio of wavelength vs. source size over
a wide range of frequencies. As one can see, even with its high
value simplicity, this approach is not as common as the alterna-
tives because its usability is at the effect of the problems of series
connected drivers and associated impedance liabilities. But, if
the conditions are suitable, it is a most efficient way to crossover,
and level shift, multiple similar drivers in an effective manner.
ELASTOMER LOUDSPEAKER BOX SYSTEMPublication Number: U.S. 2011/0216933
Inventors: Quiling Lan (Guangki, CN)
Assignee: None disclosed
Filed: November 28, 2008
Published: September 8, 2011
U.S. Class: 381/386, 25 Drawings, 10 Claims
REVIEWER COMMENTS Now this is a curious speaker enclosure concept. Whether it
actually has utility or not, is yet to be determined. The device
has two basic forms (see Figure 2a and Figure 2b). The novel
portion is that of a cylindrical tube that is formed from a type
of multi-pleated bellows, with a circular plate mounted at one
end that both seals off the tube, and also has the characteristic
of acoustic mass. In the Figure 2a example, the tube is itself the
total volume of the enclosure in which the driver is mounted. In
the Figure 2b example, the bellows-based tube is attached to an
enclosure volume as an additional element.
The inventor’s view of his invention is that it is a sealed box,
������ ��!!�������"�����
"""#"������#���
�������������� ���������� ����� ������������ ���������������������� � ���������� ������������������������ � ������� ���� �!"��#�$��������������� �����%� ������������& �'!"��(�������"��)*+����,-.������������������������%����
Figure 2a: The tube is itself the total volume of the enclosure in
which the driver is mounted. b: The bellows based tube is attached
to an enclosure volume as an additional element
acoustic suspension-type system that includes an enclosure wall
that is flexible. Nowhere is it stated that the system operates a
bass reflex, Helmholtz resonator, or that the flexible bellows and
mass are effectively a form of a passive radiator. On the other
hand, the illustrations show, and the specification describes,
small holes that are to be placed in the walls of the corrugated
bellows and are said to be there for the purpose of changing the
compliance of the side-walls of the bellows.
In general, the discussion of the technology appears to mirror
some of the old loudspeakers of decades ago that introduced
flexing walls to “release more energy” or reduce the acoustic stiff-
ness of the air volume of the “sealed” enclosure. One wonders
if a more in-depth analysis, modeling, and optimization of the
architecture would possibly reveal any particular advantages
over conventional systems. In general, flexing walls will create
a loss, reducing the “Q” of the Helmholtz resonant output.
It is possible that some variation on this form could provide a
smaller passive radiator with a great excursion capability, but it
would seem that this would be plagued with possible extraneous
mechanical noise generation during large excursions, and also
the required mass for low-frequency tuning would most likely
cause the device to sag with the bellows loosing its ability to fully
support the weight required for the system to be tuned to a low
frequency. From the reading of the patent, I don’t expect any
breakthroughs in performance, but it is always possible that a
review of this type of inventor’s effort just might stimulate new
thoughts, allowing the creation of new useful ideas by others.
ULTRA LOW-FREQUENCY TRANSDUCER AND LOUD SPEAKER COMPRISING SAMEPatent Number: U.S. 8,023,688
Inventors: Steven M. Irby (Stillwater, OK), William O. Doerring
a)
b)

NOVEMBER 2011 19
(Stillwater, OK)
Assignee: Stillwater Designs and Audio, Inc. (Stillwater, OK)
Filed: January 29, 2008
Granted: September 20, 2011
Current Class: 381/398, 11 Claims, 4 Drawings
Reviewer Comments Disclosed is a loudspeaker system including a transducer with
the transducer assembly supported inside an enclosure. In this
loudspeaker, the enclosure has a square opening to mount the
transducer. The transducer diaphragm suspension and frame
have a square periphery shaped to conform to the opening in
the enclosure for the purpose of maximizing the diaphragm
surface area for a given square face of the enclosure.
The low-frequency transducer is optimized to be utilized as
a subwoofer for automotive speaker systems operating over an
approximate range of 20 Hz to 80 Hz. The substantially square,
and concave diaphragm includes a convex surround around the
periphery of the diaphragm with pleated corners to minimize
binding of the suspension corners during large excursions. For
increased durability under high-force conditions, trusses are
formed in the diaphragm.
The invention is basically a claim that the specific combina-
tion of attributes of the well-designed, rugged, high-output sub-
woofers for use in automobiles, as one can find in the Stillwater
Kicker series models going back to 1999, and including the
current SoloX and Solo-Baric L7, all of which have stood the
test of time as competitive devices. VC
Figure 3a: The enclosure has a square opening to mount the
transducer. b: The transducer diaphragm suspension and frame
have a square periphery
a)
b)
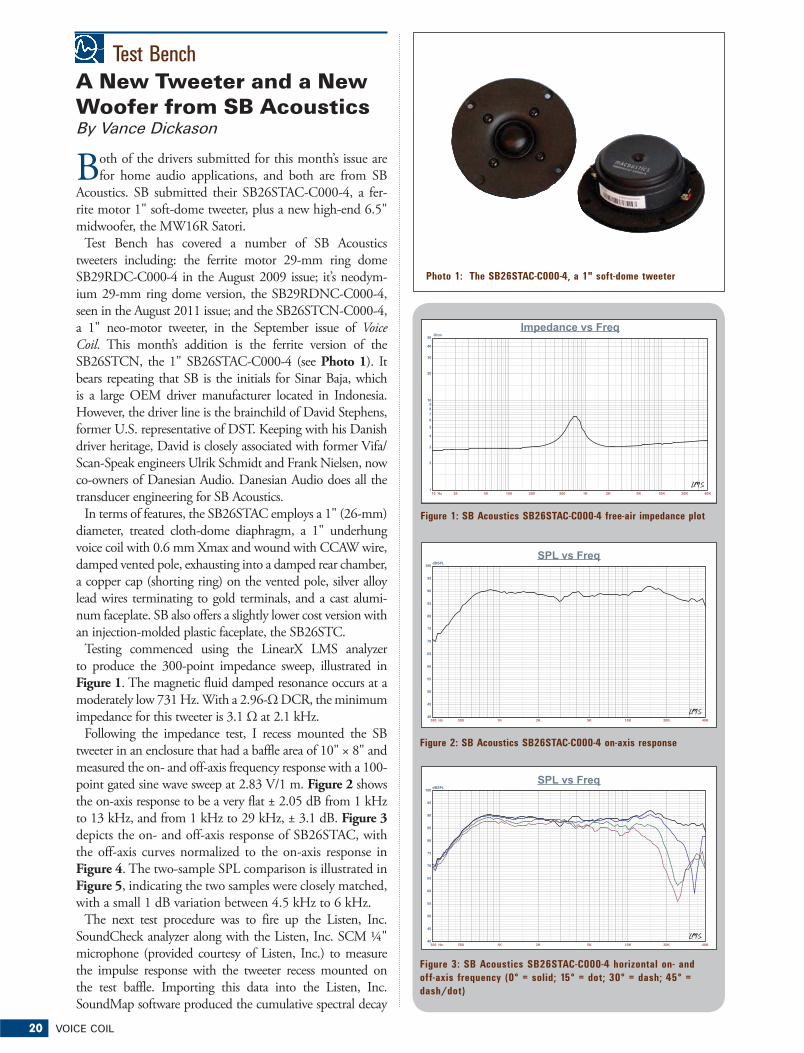
20 VOICE COIL
Test Bench
Photo 1: The SB26STAC-C000-4, a 1" soft-dome tweeter
Figure 1: SB Acoustics SB26STAC-C000-4 free-air impedance plot
10 Hz 20 50 100 200 500 1K 2K 5K 10K 20K 40K
Ohm
1
2
3
4
5
6789
10
20
30
40
50
Impedance vs Freq
A New Tweeter and a New Woofer from SB AcousticsBy Vance Dickason
Both of the drivers submitted for this month’s issue are
for home audio applications, and both are from SB
Acoustics. SB submitted their SB26STAC-C000-4, a fer-
rite motor 1" soft-dome tweeter, plus a new high-end 6.5"
midwoofer, the MW16R Satori.
Test Bench has covered a number of SB Acoustics
tweeters including: the ferrite motor 29-mm ring dome
SB29RDC-C000-4 in the August 2009 issue; it’s neodym-
ium 29-mm ring dome version, the SB29RDNC-C000-4,
seen in the August 2011 issue; and the SB26STCN-C000-4,
a 1" neo-motor tweeter, in the September issue of Voice
Coil. This month’s addition is the ferrite version of the
SB26STCN, the 1" SB26STAC-C000-4 (see Photo 1). It
bears repeating that SB is the initials for Sinar Baja, which
is a large OEM driver manufacturer located in Indonesia.
However, the driver line is the brainchild of David Stephens,
former U.S. representative of DST. Keeping with his Danish
driver heritage, David is closely associated with former Vifa/
Scan-Speak engineers Ulrik Schmidt and Frank Nielsen, now
co-owners of Danesian Audio. Danesian Audio does all the
transducer engineering for SB Acoustics.
In terms of features, the SB26STAC employs a 1" (26-mm)
diameter, treated cloth-dome diaphragm, a 1" underhung
voice coil with 0.6 mm Xmax and wound with CCAW wire,
damped vented pole, exhausting into a damped rear chamber,
a copper cap (shorting ring) on the vented pole, silver alloy
lead wires terminating to gold terminals, and a cast alumi-
num faceplate. SB also offers a slightly lower cost version with
an injection-molded plastic faceplate, the SB26STC.
Testing commenced using the LinearX LMS analyzer
to produce the 300-point impedance sweep, illustrated in
Figure 1. The magnetic fluid damped resonance occurs at a
moderately low 731 Hz. With a 2.96-Ω DCR, the minimum
impedance for this tweeter is 3.1 Ω at 2.1 kHz.
Following the impedance test, I recess mounted the SB
tweeter in an enclosure that had a baffle area of 10" × 8" and
measured the on- and off-axis frequency response with a 100-
point gated sine wave sweep at 2.83 V/1 m. Figure 2 shows
the on-axis response to be a very flat ± 2.05 dB from 1 kHz
to 13 kHz, and from 1 kHz to 29 kHz, ± 3.1 dB. Figure 3
depicts the on- and off-axis response of SB26STAC, with
the off-axis curves normalized to the on-axis response in
Figure 4. The two-sample SPL comparison is illustrated in
Figure 5, indicating the two samples were closely matched,
with a small 1 dB variation between 4.5 kHz to 6 kHz.
The next test procedure was to fire up the Listen, Inc.
SoundCheck analyzer along with the Listen, Inc. SCM ¼"
microphone (provided courtesy of Listen, Inc.) to measure
the impulse response with the tweeter recess mounted on
the test baffle. Importing this data into the Listen, Inc.
SoundMap software produced the cumulative spectral decay
300 Hz 500 1K 2K 5K 10K 20K 40K
dBSPL
40
45
50
55
60
65
70
75
80
85
90
95
100
SPL vs Freq
Figure 2: SB Acoustics SB26STAC-C000-4 on-axis response
300 Hz 500 1K 2K 5K 10K 20K 40K
dBSPL
40
45
50
55
60
65
70
75
80
85
90
95
100
SPL vs Freq
Figure 3: SB Acoustics SB26STAC-C000-4 horizontal on- and
off-axis frequency (0° = solid; 15° = dot; 30° = dash; 45° =
dash/dot)

NOVEMBER 2011 21
300 Hz 500 1K 2K 5K 10K 20K 40K
dBSPL
40
45
50
55
60
65
70
75
80
85
90
95
100
SPL vs Freq
Figure 5: SB Acoustics SB26STAC-C000-4 two-sample SPL
comparison
300 Hz 500 1K 2K 5K 10K 20K 40K
dBR
-40
-35
-30
-25
-20
-15
-10
-5
0
5
10
Ratio vs Freq
Figure 4: SB Acoustics SB26STAC-C000-4 normalized on- and
off-axis frequency response (0° = solid; 15° = dot; 30° = dash;
45° = dash/dot)
Figure 6: SB Acoustics SB26STAC-C000-4 Soundcheck CSD
waterfall plot
Figure 7: SB Acoustics SB26STAC-C000-4 Sound Check STFT
surface intensity plot
Figure 8: SB Acoustics SB26STAC-C000-4 SoundCheck distortion plots

22 VOICE COIL
plot (usually referred to as a “waterfall” plot) given in
Figure 6. Figure 7 is a Short Time Fourier Transform
(STFT) displayed as a surface plot. For the final test pro-
cedure, I set the 1 m SPL to 94 dB (4.2 V) using a noise
stimulus, and measured the 2nd and 3rd harmonic distor-
tion at 10 cm, depicted in Figure 8.
The next SB Acoustics driver is part of what I assume will
be a complete new series of ultra high-end transducers for SB,
the Satori line. So far, there are only two drivers in this line,
the Satori TW29R (similar to the SB29RDC-C000-4 ring
dome) and the subject of this report, the Satori MW16R (see
Photo 2a and 2b). In the Zen Buddhist tradition, satori refers
to a flash of sudden awareness, or individual enlightenment,
and is considered a “first step” or embarkation toward nir-
vana. So, to sport such an ambitious moniker, I would expect
the driver to be something special, so let’s get to it.
In terms of features, the MW16P is built on a very cosmeti-
cally attractive six-spoke frame, somewhat resembling two
other fairly recent entries into the high-end driver market, the
Scan-Speak Illuminator product line and the Vifa NE series.
This frame has its own unique features, but like the Scan and
Vifa woofers, the frame has a minimal reflective footprint
behind the cone to cause reflections and a completely open
area beneath the spider mounting shelf. Both are highly desir-
able attributes. The spider mounting shelf itself is pinned
to the frame to limit vibration transfer from the frame to
this part of the suspension system. The neodymium motor
cup attaches to the bottom of the frame and has a separate
cosmetic/heatsink part that looks like the continuation of the
frame attached to the peripheral of the motor.
The motor is comprised of neodymium ring magnet and
the cup that completes the field and forms the gap area. In
addition (see the FEA motor cutaway in Figure 9), there is
an overhung copper sleeve shorting ring to reduce distortion.
The device uses a 1.4" (36 mm) diameter voice coil with a
Kapton former wound with round copper wire, and termi-
nated to a pair of gold-plated terminals.
The cone and dust cap material are also very unique and
composed of 60% pure Egyptian papyrus parchment fibers,
a very expensive, but light and stiff material. This incidentally
is available in the black cone seen in the accompanying photo,
as well as a natural off-white color if you are going for that
Yamaha NS-10 look. Suspension is provided by a NBR sur-
round that uses a special vertical and horizontal attachment
process, along with a Dr. Kurt Muller Bimax spider. Bimax is
purported to have less twisting tendencies compared to other
cloth spider materials and is warm shaped with a durometer
resin.
I commenced analysis of the MW16R using the LinearX
LMS analyzer (soon to be replaced by a more advanced
outboard chassis with USB interface analzyer called the
LX500) and VIBox to create both voltage and admittance
(current) curves with the driver clamped to a rigid test fixture
in free-air at 0.3 V, 1 V, 3 V, 6 V, and 10 V. As has become
the protocol for Test Bench testing, I no longer use a single
added mass measurement and instead used actual measured
mass, but the manufacturer’s measured Mmd data. At this
point, the 10-V curves were discarded as being too nonlinear Figure 9: SB Acoustics MW16R motor cutaway drawing
Photo 2a): The Satori MW16R top view. b): The Satori MW16R bot-
tom view
a)
b)
for the curve-fitting algorithm to resolve. Next, the remaining
eight 550-point stepped sine wave sweeps for each MW16R
sample were post-processed and the voltage curves divided
by the current curves (admittance curves) to derive imped-
ance curves, phase added by the LMS calculation method,
and along with the accompanying voltage curves, imported
to the LEAP 5 Enclosure Shop software. Since most Thiele-
Small data provided by the majority of OEM manufacturers
is generated using either the standard model or the LEAP 4
TSL model, I additionally created a LEAP 4 TSL parameter
set using the 1-V free-air curves. The complete data set, the
multiple voltage impedance curves for the LTD model (see
Figure 10 for the 1-V free-air impedance curve) and the 1-V
The “Must Have” reference for loudspeaker engineering professionals.
Home, Car, or Home Theater!Back and better than ever, this 7th edition
provides everything you need to become a
better speaker designer. If you still have a
3rd, 4th, 5th or even the 6th edition of the
Loudspeaker Design Cookbook, you are
missing out on a tremendous amount of
new and important information!
Now including: Klippel analysis of drivers,
a chapter on loudspeaker voicing, advice
on testing and crossover changes, and so
much more! Ships complete with bonus CD
containing over 100 additional figures and
a full set of loudspeaker design tools.
A $99 value!
Yours today for just $39.95.
Shop for this book, and manyother Audio Amateur products,at www.cc-webshop.com.

24 VOICE COIL
tion and 103 dB with a 13.5-V input level for the larger vented
box (see Figure 12 and 13 for the 2.83 V group delay curves
and the 14/13.5 V excursion curves).
Klippel analysis for the SB Acoustics 6.5" woofer (our ana-
lyzer is provided courtesy of Klippel GmbH), performed by
Pat Turnmire, Red Rock Acoustics (author of the SpeaD and
RevSpeaD software) produced the Bl(X), Kms(X) and Bl and
Kms symmetry range plots given in Figures 14 to 17. This data
is extremely valuable for transducer engineering, so if you don’t
own a Klippel analyzer and would like to have analysis done
on a particular driver project, Red Rock Acoustics can provide
Klippel analysis of almost any driver for a nominal fee of $100
per unit (for contact information, visit the Red Rock Acoustics
website at www.redrockacoustics.com).
The Bl(X) curve for the MW16R (see Figure 14) is fairly
broad and but obviously with a component of asymmetry, with
a forward (coil-out) offset. Looking at the Bl Symmetry plot
(see Figure 15), this curve shows a 3.4-mm coil forward offset
at the rest position that decreases to 1 mm at the 7 mm, just
beyond the physical Xmax for this driver. One of the things I
have not talked about very often is the grey area on the graph.
This represents the area of uncertainty for the analyzer. Since Bl
curves are typically flat until you reach the knee where Bl begins
to decrease, it is difficult to resolve exactly what is happening to
the motor system. Figure 16 and 17 show the Kms(X) and
impedance curve for the TSL model were selected in the
transducer derivation menu in LEAP 5 and the parameters
created for the computer box simulations. Table 1 compares
the LEAP 5 LTD and TSL data and factory parameters for
both of Satori MW16R samples.
LEAP TS parameter calculation results for the MW16R
were reasonably close to the factory data, however my
data definitely showed a lower Vas compared to the factory
data. Although the preliminary factory data showed some
variation, I followed my usual protocol and proceeded setting
up computer enclosure simulations using the LEAP LTD
parameters for Sample 1. Two computer box simulations
were programmed into LEAP, one sealed and one vented.
This resulted in a 0.5 ft3 sealed enclosure with 50% fiberglass
fill material, and a 1.0 ft3 QB3 vented enclosure with 15%
fiberglass fill material and tuned to 30 Hz.
Figure 11 displays the results for the SB Acoustics Satori
woofer in the sealed and vented boxes at 2.83 V and at a volt-
age level sufficiently high enough to increase cone excursion
to Xmax + 15% (6.9 mm for the MW16R). This produced
a F3 frequency of 58 Hz with a box/driver Qtc of 0.69 for
the 0.5 ft3 sealed enclosure and –3 dB = 40 Hz for the 1.0 ft3
vented simulation. Increasing the voltage input to the simula-
tions until the maximum linear cone excursion was reached
resulted in 101.5 dB at 14 V for the sealed enclosure simula-
Test Bench is an open forum for OEM driver manufac-
turers in the industry and all OEM’s are invited to submit
samples to Voice Coil for inclusion in the monthly Test
Bench column.
Driver samples can be for use in any sector of the loud-
speaker market including transducers for home audio,
car audio, pro sound, multi-media or musical instrument
applications.
While many of the drivers featured in Voice Coil come
from OEM’s that have a stable catalog of product, this
is not a necessary criterion for submission. Any woofer,
midrange or tweeter an OEM manufacture feels is repre-
sentative of their work, is welcome to send samples. Please
contact Voice Coil Editor Vance Dickason, prior to submis-
sion to discuss which drivers are being submitted. Samples
should be sent in pairs and addressed to:
Sample Submissions for Test BenchVance Dickason Consulting
333 S. State St., #152
Lake Oswego, OR 97034
(503-557-0427)
All samples must include any published data on the prod-
uct, patent information, or any special information necessary
to explain the functioning of the transducer. This should
include details regarding the materials used to construct the
transducer such as cone material, voice coil former material,
and voice coil wire type. For woofers and midrange drivers,
please include the voice coil height, gap height, RMS power
handling, and physically measured Mmd (complete cone
assembly including the cone, surround, spider and voice coil
with 50% of the spider, surround and leadwires removed).
TSL model LTD model Factory
sample 1 sample 2 sample 1 sample 2
Fs 27.6 Hz 27.6 Hz 27.0 Hz 27.0 Hz 29.0 Hz
Revc 5.99 6.01 5.99 6.01 6.20
Sd 0.0123 0.0123 0.0123 0.0123 0.0119
Qms 5.60 5.33 5.35 5.75 4.50
Qes 0.34 0.37 0.38 0.42 0.35
Qts 0.32 0.35 0.35 0.39 0.34
Vas 57.2 ltr 57.1 ltr 60.2 ltr 60.0 ltr 48 ltr
SPL 2.83 V 87.4 dB 87.0 dB 86.8 dB 86.4 dB 87.5 dB
Xmax 6.0 mm 6.0 mm 6.0 mm 6.0 mm 6.0 mm
Table 1: SB Acoustics Satori MW16R midwoofer

NOVEMBER 2011 25
Kms Symmetry Range curves for the SB Acoustics MW16R.
The Kms(X) curve is very symmetrical in both directions, but
also with a small rearward (coil-in) offset of about 0.1 mm
at the rest position and transitioning to 0.1 mm coil-out
offset at the physical Xmax position. Looking at both sets
of data, Bl and compliance, the conclusion is likely that the
coil is about 1 mm offset from magnetic center. I say this
because that is the offset at a place of strong certainty in the
measurement at 7 mm.
Displacement limiting numbers calculated by the Klippel
analyzer for the MW16R were XBl @ 82% Bl = 4.9 mm and
for XC @ 75% Cms minimum was 4.6 mm, which means
that for this Vifa woofer, the compliance is the most limiting
factor for prescribed distortion level of 10%.
Figure 18 gives the inductance curves Le(X) for the Satori
6.5". Inductance will typically increase in the rear direction
from the zero rest position as the voice coil covers more pole
area, which is what you see in the MW16R Le(X) curve,
however, the variation is only 0.20 mH to 0.15 mH from the
in and out Xmax positions, which is very good.
Next, I mounted the MW16R woofer in an enclosure
which had a 13" × 6" baffle and was filled with damping
material (foam) and then measured the DUT on- and
off-axis from 300-Hz to 20-kHz frequency response
at 2.83 V/1 m using the LinearX LMS analyzer set to
a 100-point gated sine wave sweep. Figure 19 gives the
Satori woofer’s on-axis response indicating a smoothly rising
response to about 1 kHz then flattening out up to 3 kHz
10 Hz 20 50 100 200 500 1K 2K 5K 10K 20K
Ohm
1
2
5
10
20
50
100
200
Impedance vs Freq
Figure 10: SB Acoustics MW16R woofer free-air impedance plot
10 Hz 20 50 100 200 500 1K 2K 5K 10K 20K
dBSPL
60
65
70
75
80
85
90
95
100
105
110
SPL vs Freq
Figure 11: SB Acoustics MW16R computer box simulations (black
solid = sealed @ 2.83 V; blue dash = vented @ 2.83 V; black solid =
sealed @ 14 V; blue dash = vented @ 13.5 V
10 Hz 20 50 100 200 500 1K 2K 5K 10K 20K
Sec
0
5m
10m
15m
20m
Time vs Freq
Figure 12: Group delay curves for the 2.83-V curves in Figure 11
10 Hz 20 50 100 200 500 1K 2K 5K 10K 20K
M
1m
2m
3m
4m
5m
6m
7m
8m9m
10m
20m
Excursion vs Freq
Figure 13: Cone excursion curves for the 14/13.5-V curves in Figure 11 Tel: (503) 557-0427 [email protected]
Loudspeaker Product Development
Vanc
e D
icka
son
Con
sulti
ng
Vance Dickason Consulting has been developing award winning products for numerous high profile brand names for over 20 years… experience that’s hard to find!
With extensive experience in high-end off-wall, in-wall, on-wall, ceiling and subwoofer products plus close relationships with some of the worlds best speaker OEM’s and you have a combination of services that will accelerate your next product lineup.
We have all the best toys (Klippel, LEAP 5,LMS, CLIO, MLSSA, LSPCad, FEA), so whether its multimedia, car audio, MI, Pro, two-channel or Home Theater (including THX®), VDC has the solutions.
Add to that an available design team that includes some of the best transducers engineers, industrial designers and marketing experts I know of in the industry and you have a winning combination that would cost well over $750,000 a year to keep in house.

With the information contained in these tools you can build the speaker of
your dreams, revamp your amps, fi nd reliable manufacturers, and so much more.
Save big by buying annual magazine collections in bulk. Elevate
your audio know-how with these incredible resource tools today!
off20% Shop now at
www.CC-Webshop.comCoupon Code: AUDIO112011
Offer Expires November 30, 2011
November’s Audio Blowout
Saleon all Audio Amateur books, back issues, archive CDs, and sourcebooks!
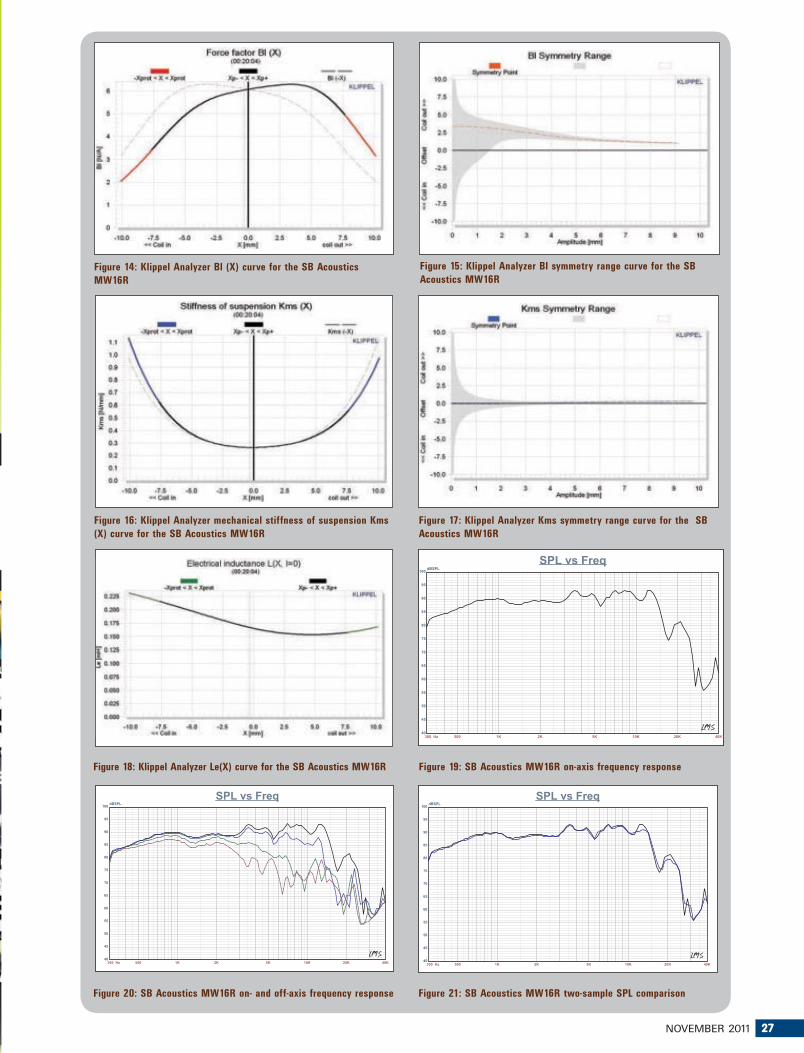
NOVEMBER 2011 27
Figure 14: Klippel Analyzer Bl (X) curve for the SB Acoustics
MW16R
Figure 15: Klippel Analyzer Bl symmetry range curve for the SB
Acoustics MW16R
Figure 16: Klippel Analyzer mechanical stiffness of suspension Kms
(X) curve for the SB Acoustics MW16R
Figure 17: Klippel Analyzer Kms symmetry range curve for the SB
Acoustics MW16R
Figure 18: Klippel Analyzer Le(X) curve for the SB Acoustics MW16R
300 Hz 500 1K 2K 5K 10K 20K 40K
dBSPL
40
45
50
55
60
65
70
75
80
85
90
95
100
SPL vs Freq
Figure 19: SB Acoustics MW16R on-axis frequency response
300 Hz 500 1K 2K 5K 10K 20K 40K
dBSPL
40
45
50
55
60
65
70
75
80
85
90
95
100
SPL vs Freq
Figure 20: SB Acoustics MW16R on- and off-axis frequency response
300 Hz 500 1K 2K 5K 10K 20K 40K
dBSPL
40
45
50
55
60
65
70
75
80
85
90
95
100
SPL vs Freq
Figure 21: SB Acoustics MW16R two-sample SPL comparison
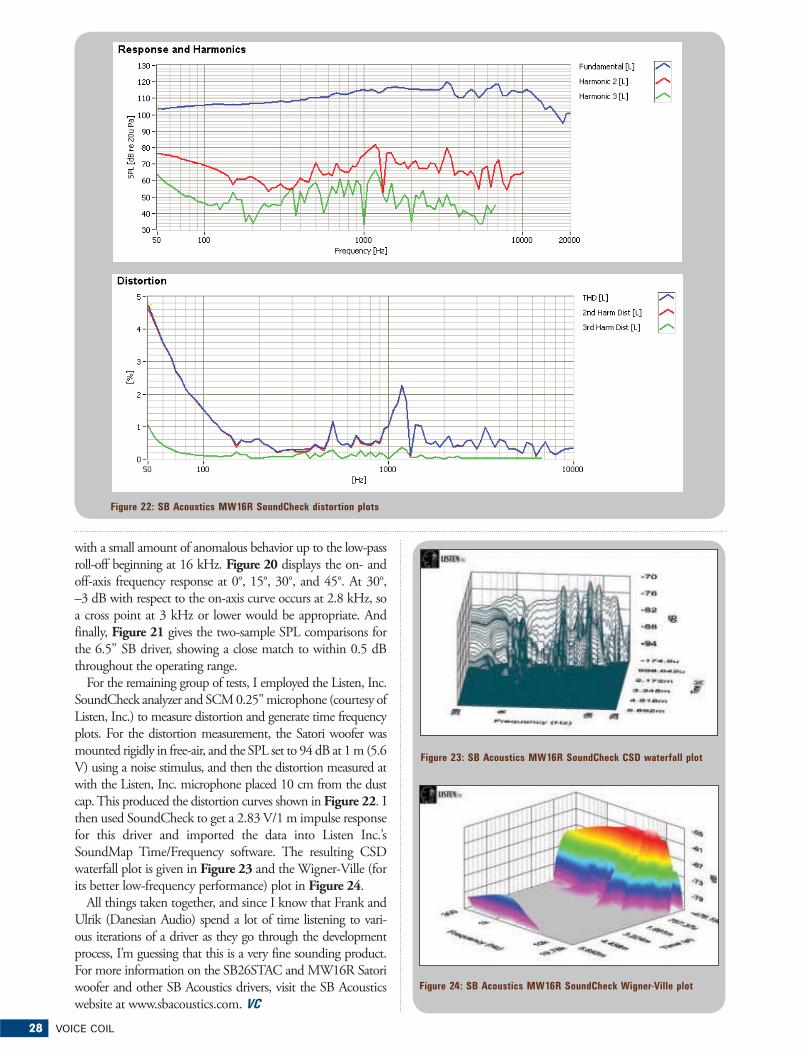
28 VOICE COIL
with a small amount of anomalous behavior up to the low-pass
roll-off beginning at 16 kHz. Figure 20 displays the on- and
off-axis frequency response at 0°, 15°, 30°, and 45°. At 30°,
–3 dB with respect to the on-axis curve occurs at 2.8 kHz, so
a cross point at 3 kHz or lower would be appropriate. And
finally, Figure 21 gives the two-sample SPL comparisons for
the 6.5" SB driver, showing a close match to within 0.5 dB
throughout the operating range.
For the remaining group of tests, I employed the Listen, Inc.
SoundCheck analyzer and SCM 0.25" microphone (courtesy of
Listen, Inc.) to measure distortion and generate time frequency
plots. For the distortion measurement, the Satori woofer was
mounted rigidly in free-air, and the SPL set to 94 dB at 1 m (5.6
V) using a noise stimulus, and then the distortion measured at
with the Listen, Inc. microphone placed 10 cm from the dust
cap. This produced the distortion curves shown in Figure 22. I
then used SoundCheck to get a 2.83 V/1 m impulse response
for this driver and imported the data into Listen Inc.’s
SoundMap Time/Frequency software. The resulting CSD
waterfall plot is given in Figure 23 and the Wigner-Ville (for
its better low-frequency performance) plot in Figure 24.
All things taken together, and since I know that Frank and
Ulrik (Danesian Audio) spend a lot of time listening to vari-
ous iterations of a driver as they go through the development
process, I’m guessing that this is a very fine sounding product.
For more information on the SB26STAC and MW16R Satori
woofer and other SB Acoustics drivers, visit the SB Acoustics
website at www.sbacoustics.com. VC
Figure 22: SB Acoustics MW16R SoundCheck distortion plots
Figure 23: SB Acoustics MW16R SoundCheck CSD waterfall plot
Figure 24: SB Acoustics MW16R SoundCheck Wigner-Ville plot
10 VOICE COIL

Check your label to find the expira�on date.
For more informa�on call 860.875.2199 x206
Qualified subscrip�ons to Voice Coil run for one year.
Renew annually online at www.voiceccoilmagazine.com/vcqual.html
Renew your subscription to Voice Coil before your
subscription expires!
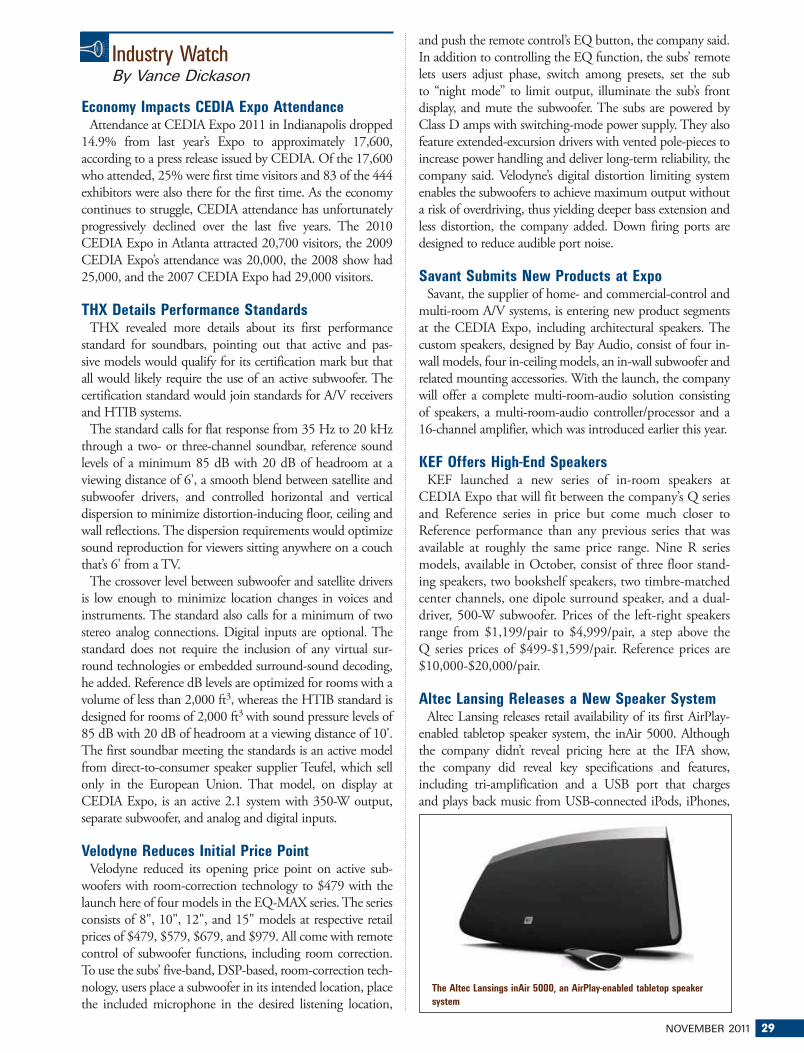
NOVEMBER 2011 29
Industry WatchBy Vance Dickason
Economy Impacts CEDIA Expo AttendanceAttendance at CEDIA Expo 2011 in Indianapolis dropped
14.9% from last year’s Expo to approximately 17,600,
according to a press release issued by CEDIA. Of the 17,600
who attended, 25% were first time visitors and 83 of the 444
exhibitors were also there for the first time. As the economy
continues to struggle, CEDIA attendance has unfortunately
progressively declined over the last five years. The 2010
CEDIA Expo in Atlanta attracted 20,700 visitors, the 2009
CEDIA Expo’s attendance was 20,000, the 2008 show had
25,000, and the 2007 CEDIA Expo had 29,000 visitors.
THX Details Performance StandardsTHX revealed more details about its first performance
standard for soundbars, pointing out that active and pas-
sive models would qualify for its certification mark but that
all would likely require the use of an active subwoofer. The
certification standard would join standards for A/V receivers
and HTIB systems.
The standard calls for flat response from 35 Hz to 20 kHz
through a two- or three-channel soundbar, reference sound
levels of a minimum 85 dB with 20 dB of headroom at a
viewing distance of 6', a smooth blend between satellite and
subwoofer drivers, and controlled horizontal and vertical
dispersion to minimize distortion-inducing floor, ceiling and
wall reflections. The dispersion requirements would optimize
sound reproduction for viewers sitting anywhere on a couch
that’s 6' from a TV.
The crossover level between subwoofer and satellite drivers
is low enough to minimize location changes in voices and
instruments. The standard also calls for a minimum of two
stereo analog connections. Digital inputs are optional. The
standard does not require the inclusion of any virtual sur-
round technologies or embedded surround-sound decoding,
he added. Reference dB levels are optimized for rooms with a
volume of less than 2,000 ft3, whereas the HTIB standard is
designed for rooms of 2,000 ft3 with sound pressure levels of
85 dB with 20 dB of headroom at a viewing distance of 10'.
The first soundbar meeting the standards is an active model
from direct-to-consumer speaker supplier Teufel, which sell
only in the European Union. That model, on display at
CEDIA Expo, is an active 2.1 system with 350-W output,
separate subwoofer, and analog and digital inputs.
Velodyne Reduces Initial Price PointVelodyne reduced its opening price point on active sub-
woofers with room-correction technology to $479 with the
launch here of four models in the EQ-MAX series. The series
consists of 8", 10", 12", and 15" models at respective retail
prices of $479, $579, $679, and $979. All come with remote
control of subwoofer functions, including room correction.
To use the subs’ five-band, DSP-based, room-correction tech-
nology, users place a subwoofer in its intended location, place
the included microphone in the desired listening location,
and push the remote control’s EQ button, the company said.
In addition to controlling the EQ function, the subs’ remote
lets users adjust phase, switch among presets, set the sub
to “night mode” to limit output, illuminate the sub’s front
display, and mute the subwoofer. The subs are powered by
Class D amps with switching-mode power supply. They also
feature extended-excursion drivers with vented pole-pieces to
increase power handling and deliver long-term reliability, the
company said. Velodyne’s digital distortion limiting system
enables the subwoofers to achieve maximum output without
a risk of overdriving, thus yielding deeper bass extension and
less distortion, the company added. Down firing ports are
designed to reduce audible port noise.
Savant Submits New Products at ExpoSavant, the supplier of home- and commercial-control and
multi-room A/V systems, is entering new product segments
at the CEDIA Expo, including architectural speakers. The
custom speakers, designed by Bay Audio, consist of four in-
wall models, four in-ceiling models, an in-wall subwoofer and
related mounting accessories. With the launch, the company
will offer a complete multi-room-audio solution consisting
of speakers, a multi-room-audio controller/processor and a
16-channel amplifier, which was introduced earlier this year.
KEF Offers High-End SpeakersKEF launched a new series of in-room speakers at
CEDIA Expo that will fit between the company’s Q series
and Reference series in price but come much closer to
Reference performance than any previous series that was
available at roughly the same price range. Nine R series
models, available in October, consist of three floor stand-
ing speakers, two bookshelf speakers, two timbre-matched
center channels, one dipole surround speaker, and a dual-
driver, 500-W subwoofer. Prices of the left-right speakers
range from $1,199/pair to $4,999/pair, a step above the
Q series prices of $499-$1,599/pair. Reference prices are
$10,000-$20,000/pair.
Altec Lansing Releases a New Speaker SystemAltec Lansing releases retail availability of its first AirPlay-
enabled tabletop speaker system, the inAir 5000. Although
the company didn’t reveal pricing here at the IFA show,
the company did reveal key specifications and features,
including tri-amplification and a USB port that charges
and plays back music from USB-connected iPods, iPhones,
The Altec Lansings inAir 5000, an AirPlay-enabled tabletop speaker
system

30 VOICE COIL
and iPads. With AirPlay, however, consumers don’t have
to physically connect their portable Apple devices to play
back stored music. The inAir 5000 uses AirPlay to wirelessly
stream music via Wi-Fi 802.11b/g from an iPhone, iPad, or
iPod touch. AirPlay also enables the device to stream music
wirelessly from a networked computer’s iTunes application.
The device boasts 110 W of amplification, DSP, two soft-
dome 1" neodymium-magnet tweeters, two 3" Kevlar cone
tweeters, one 4" woofer, and one passive bass radiator. Its
curved chassis measures 7.5" × 19" × 6.75", and its non-
parallel walls prevent internal standing waves that generate
distortion. Frequency response is 50 Hz to 20 kHz (–10 dB).
Other features include analog aux input, headphone output,
and IR remote that controls system volume as well as such
iTunes and portable-device functions as play, pause, and skip
forward/back.
Klipsch Offers New AirPlay SystemKlipsch plans fall availability in the U.S. of its first AirPlay-
enabled tabletop speaker system and an expanded headphone
selection, which includes the brand’s first headphone series
targeted exclusively to A/V specialty stores. The products will
be displayed for the first time at the IFA show in Berlin. In
releasing more details about its long-awaited AirPlay speaker,
the company priced the Klipsch Gallery G-17 Air at a sug-
gested $549. Klipsch also revealed that the thin speaker system
is not only Apple AirPlay compatible but also streams music
via Wi-Fi network from handheld Android devices equipped
with third-party DLNA-capable music-player apps. As an
AirPlay-compatible speaker, the G-17 Air streams music
from a home’s Wi-Fi network, from handheld Apple iOS 4.2
devices and from a PC’s iTunes application. When streaming
music from iTunes, consumers can control song selection
by using their Apple handheld device as a Wi-Fi remote.
The 6" × 6.9" × 3.5" speaker, which is also wall-mountable, is
a biamplified two-way stereo speaker system with two ported
2.5" woofers and two 0.75" tweeters, which are loaded in
square Tractrix Horns. Total amplification of 60 W deliv-
ers output of 102 dB in a typical room, the company said.
Frequency response is rated at 57 Hz to 23 kHz ±3 dB, but
usable bass is said to go down to 47 Hz. The speaker comes
in high-gloss piano-black enclosure with a front that curves
on both sides and dark-tint tempered-glass base. The speaker
also features a USB port to charge handheld USB-connected
Apple devices and play their music. A 3.5-mm analog input
connects to other portable devices to play back their music.
The Klipsch Gallery G-17 Air streams music via Wi-Fi network
MK Sound Exhibits Several New ProductsMK Sound exhibited a number of new products at the
September CEDIA Expo with its first floor-standing speaker,
first flat on-wall speaker intended for use with flat-panel
TVs, and an addition to its in-wall speaker series. The com-
pany also displayed three new powered subwoofers. In its
Architectural series of speakers, the company added its first
in-ceiling model to its current selection of three in-wall speak-
ers without bezels. The new IW5 features 4" midbass driver
and 1" neodymium dome tweeter with choice of square or
round magnet-mounted grilles, which are white and paint-
able. It also features spring-loaded terminals with polarity
markings, steel front baffle, and acoustic signature designed
to match the MK Sound M series of in-room satellites. It
will join two-way models with 5.25" and 6.5" woofers, all
of which feature the company’s proprietary Phase-Focused
crossover design to ensure a strong imaging throughout a
room regardless of speaker placement, the company said.
The brand’s first floor-standing speaker, the 950F, is a floor-
standing version of the 950 monitor, which launched last year
to fit between the 750 THX Select speaker and the 150 THX
Ultra speaker. The sealed-enclosure 950F is 48" tall but nar-
row to provide a minimal footprint. It is said to deliver a wide
sweet spot. Designed for use with any MK Sound subwoofer,
the 950F features dual 5.25" polypropylene woofers, MK’s
Sound Pro tweeter and the company’s Phase Focused crossover,
which optimizes response in both the vertical and horizontal
planes. The open-back tweeter is said to be fast and accurate
while eliminating high-frequency smearing and phase/combing
anomalies. It sports a metal mesh-curved grille that is acousti-
cally inert and held in place with magnets to eliminate the
buzzing and rattling.
For its MP7 on-wall speaker, the company developed a reduced-
depth version of its in-room M7 but retained the M7’s internal
volume to retain the audio quality of a full-size compact speaker,
the company said. It’s designed for use with flat-screen TVs.
In powered subs, the company unveiled the X8, X10, and
X12 subwoofers, which feature two 8", two 10", and two
12" drivers, respectively. In each sub, the drivers are arrayed
in a push-pull configuration with front-mounted woofer
and identical bottom-mounted “back-out” woofer to deliver
high SPLs and accurate extended low frequencies, thanks to
reduced mechanical distortion, which is usually generated by
the woofer suspensions, and reduced electrical distortion, which
is usually generated by a moving voice coil, the company said.
In other planned launches, the company updated its 150 THX
Ultra2-certified speaker and S-150T THX Ultra2-certified
Mk 2 Tripole surround speaker. Both add proprietary Pro
high-frequency tweeter with coated silk dome, lightweight
copper-clad aluminum wire, and waveguide to step up high-
frequency clarity and resolution. The revised S-150T THX
Ultra2 Tripole is a monopole/dipole speaker suited for left-right
and back-surround channels with 3.25" polypropylene cone
driver on each side, which generates the dipolar sound field,
and a direct-radiating woofer/tweeter combo on the front. The
driver complement generates solid imaging while also delivering
diffuse ambience as needed. As a result, consumers don’t have
to make a choice between monopole and dipole speakers. VC

NOVEMBER 2011 31
CATEGORY KEYA = ADHESIVES
B = CONSULTANTS & ENGINEERS
C = CROSSOVERS & PASSIVE
COMPONENTS
D = DRIVERS
E = EMPLOYMENT OPPORTUNITIES
F = ENCLOSURES & ENCLOSURE PARTS
G = ENGINEERING/DESIGN SOFTWARE
H = FINISHED SYSTEMS
I = MAGNETS & EQUIPMENT
J = MANUFACTURING EQUIPMENT
K = MICROPHONES
L = PARTS
M = RECONING
N = TEST EQUIPMENT
O = VOICE COILS − COMPONENTS
& MATERIALS
P = TRANSDUCERS
Q = ACOUSTIC MESH
R = ACOUSTICAL & SOUNDPROOFING
MATERIALS
S = AMPLIFICATION
Products & Services Index
Advertiser Categories PageACO Pacific, Inc. ............................ K,N ......................16
Audience ....................................... B,C,H .....................6
audioXpress .......................................................... 23,26
Beston Technology Corporation. ...... D .........................19
BMS Speakers GmbH ....................... D ...........................8
Celestion Int'l. ............................... D .........................15
Consumer Electronics Association–CES ............................7
Faital USA ..................................... D .........................19
Materion Electrofusion. ................... B,L,O .....................3
Menlo Scientific, Ltd. .................... B .........................13
Ningbo Yinzhou Huada Sound.......... F,L .......................12
NTI-Americas ................................. B,G,J,N ..................2
One Magnet Electronic Co., Ltd. ...... I ..........................17
Precision Econowind, Inc.. .............. O .........................14
Prism Media Products ..................... G .........................32
Pulsus Technologies.. ...................... G ...........................5
Rotel Electronics ........................... B .........................16
Solen Electronique, Inc. ................. C,D ......................10
Speaker Design Consultants ............. E .........................10
Tang Band Industries Co. ................ D ...................... 9,11
Vance Dickason .............................. B .........................25
Voice Coil ..................................................................14
Wavecor Ltd. ................................ F,H.......................18
This product/services index is provided as a value-added service to our readers and advertisers. The publisher will not be held liable for any errors or deletions contained herein.
Using Your Digital Issue
Preview all pages.View a list of archived issues.Flip to the cover. Flip to the previous page.Flip to mthe next page. Flip to the back cover. Search.Print.Download entire pdf. Toggle full screen. Help guide.Close.
Navigationbuttons.
Next page.
���#��(����������Z���the page manually.
Previouspage.
Be sure to check for rollover / hotspot buttons which allow you to jump to a page or URL.
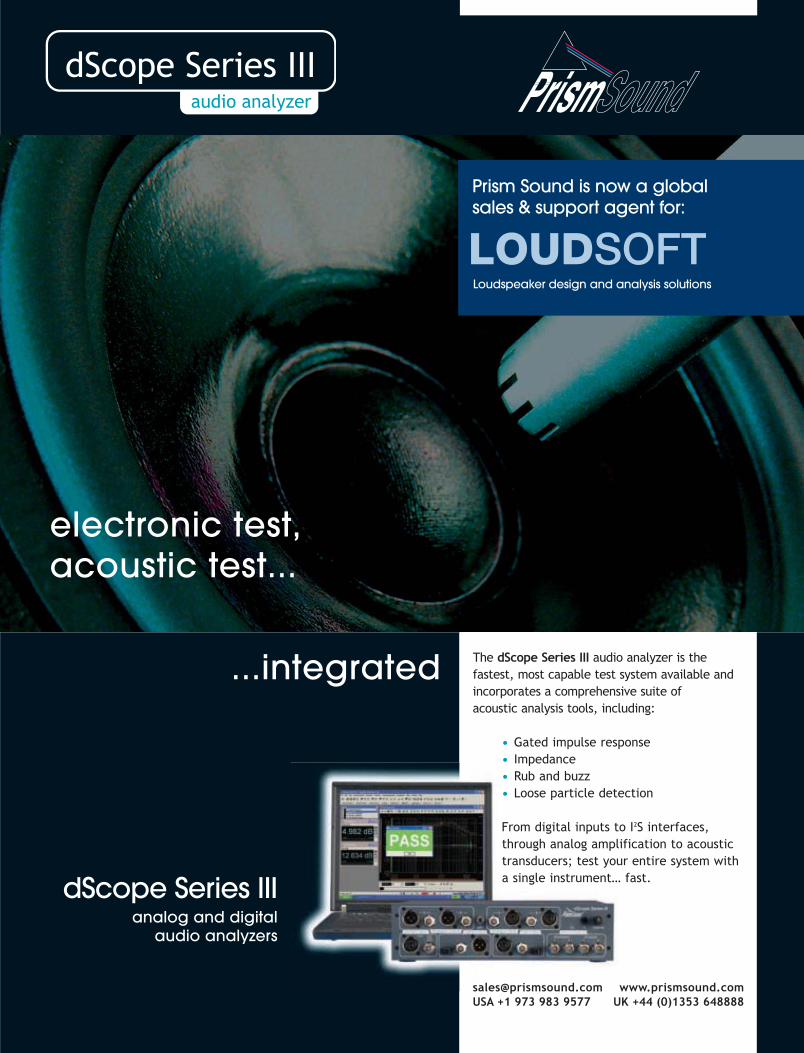
...integrated
electronic test, acoustic test...
Prism Sound is now a globalsales & support agent for:
������������������� �������� ������������������������������������ ���������������������������������������������������������� ����������������
��������������������� ���������� ������������ ���������������������
������������������� !�����������������������������������������������������"������ ���������� �����#�������������������$�����%dScope Series III
analog and digitalaudio analyzers
������������������� ��������������������������������������������� �!"#�����$ ����
Loudspeaker design and analysis solutions

IN THIS ISSUE
Industry News and DevelopmentsBy Vance Dickason
19
11
38
46
INDUSTRY NEWS AND DEVELOPMENTSBy Vance Dickason
SPOTLIGHTHeadphone Testing (Part 1)The Basics By Steve Temme
TEST BENCH New Ribbon from FPS and Two 4" Drivers from SB AcousticsBy Vance Dickason
SPOTLIGHTMoTIV Loudspeaker Magnetics ModelerBy Rob Baum
INDUSTRY WATCH By Vance Dickason
Products & Services Index
1
35
Testing a 4" woofer, p. 23
A head-and-torso simulator, p. 15
V O L U M E 2 5 , I S S U E 2 D E C E M B E R 2 0 1 1
CES 2012The 2012 International Consumer Electronics Show
(Number 44—the first one launched in June 1967 in
New York City with 200 exhibitors and 17,500 attendees)
will be held this year from January 10–13, 2012 in Las
Vegas, Nevada. This year’s International CES will feature
product debuts from more than 2,700 exhibitors, cover-
ing more than 30 product areas, including the latest in
content, wireless, digital imaging, mobile electronics, home
theater, and audio, including a focus on electric vehicles
and in-vehicle technology (see Photo 1). With a focus on
green technology, it’s interesting to note that the Consumer
Electronics Association (CEA) announced that the 2009
International CES was named North America’s Greenest
Show by Trade Show Executive (TSE) magazine. CEA was
awarded the highly coveted “Leader in Green Initiatives”
Gold Grand Award for outstanding green presence in pro-
ducing the world’s largest consumer technology tradeshow,
the International CES. Topping that off, CEA recently
announced that the 2010 International CES was named
both the largest tradeshow and the tradeshow with the high-
est economic impact by TSE magazine. CEA was awarded
the highly coveted number one spot in TSE’s Gold 100
Rankings of 2010. CES has earned top honors as the largest
annual tradeshow in each of the four years of the Gold 100
Photo 1: A view of last year's International CES

L i s t e n
Inc.
Full Page
Low cost
True Perceptual Rub & Buzz detection
Insensitive to background noise
Excellent correlation to the human ear
When it comes to increasing yield, you only want to reject speakersthat sound bad. Listen’s new CLEAR Perceptual Rub & Buzz algorithm is your fully automated, 100% reliable golden ear. Used on the production line, it accurately replicates the response of a human listener to give you fully automated pass/fail measurements with intelligence.
+ =SoundCheck’s
TMCLEARPerceptualRub & Buzz
TM
Visit www.Listeninc.com/clearVC for a FREE demo and 20% discount*
Tel: +1 617 556 4104 Email: [email protected]: www.Listeninc.com
NEW
®
* Discount applies to CLEAR module (part number 2030) only. See web site for full terms and conditions.
Scan for more info
®
Tuning Forks: Let Your Ears Do Th e Math!
Peter J. Andrews, Sr. Electro-Acoustics Engineer
While many audiophiles and engineers are aware that beryllium is the lightest and stiff est metal for electro-acoustic transducers, it is
perhaps not easy to grasp the vast performance advantages it has over other common ‘lightweight’ metals from a theoretical discussion
like our white paper 1. For an easily audible demonstration, we machined three tuning forks to the exact same dimensions; one made of
aluminum, one of titanium, and one of beryllium. We hope you had a chance to ‘ping’ these at a recent trade show demonstration.
Th e fi rst thing you might notice when picking up the three forks is the diff erence in weight, with the titanium feeling much heavier in
your hands compared to the other two. Titanium, of course, has a relatively high density, at 4.50g/cm3. Th e aluminum fork is defi nitely
lighter, at 2.70g/cm3, and the beryllium fork even lighter than that, only 1.85g/cm3. Th e actual masses of our example tuning forks are:
Aluminum Fork = 55.7 g (2.0 oz.)
Titanium Fork = 93.7 g (3.3 oz.)
Beryllium Fork = 38.5 g (1.4 oz.)
Th e next thing you might notice is that the aluminum and titanium forks ring at nearly the same pitch (roughly C5) when struck on a
hard surface, but the beryllium rings at a much higher pitch (roughly E6). Even though titanium is ~1.6x stiff er than aluminum, it is
also ~1.7x heavier, giving essentially the same resonant frequency in both materials.
MATERION CORPORATION
www.materion.com/truextent
ELECTROFUSION
44036 South Grimmer Boulevard
Fremont, CA 94538-6346
+1 510.661.9755
TRUEXTENT TECH BRIEF
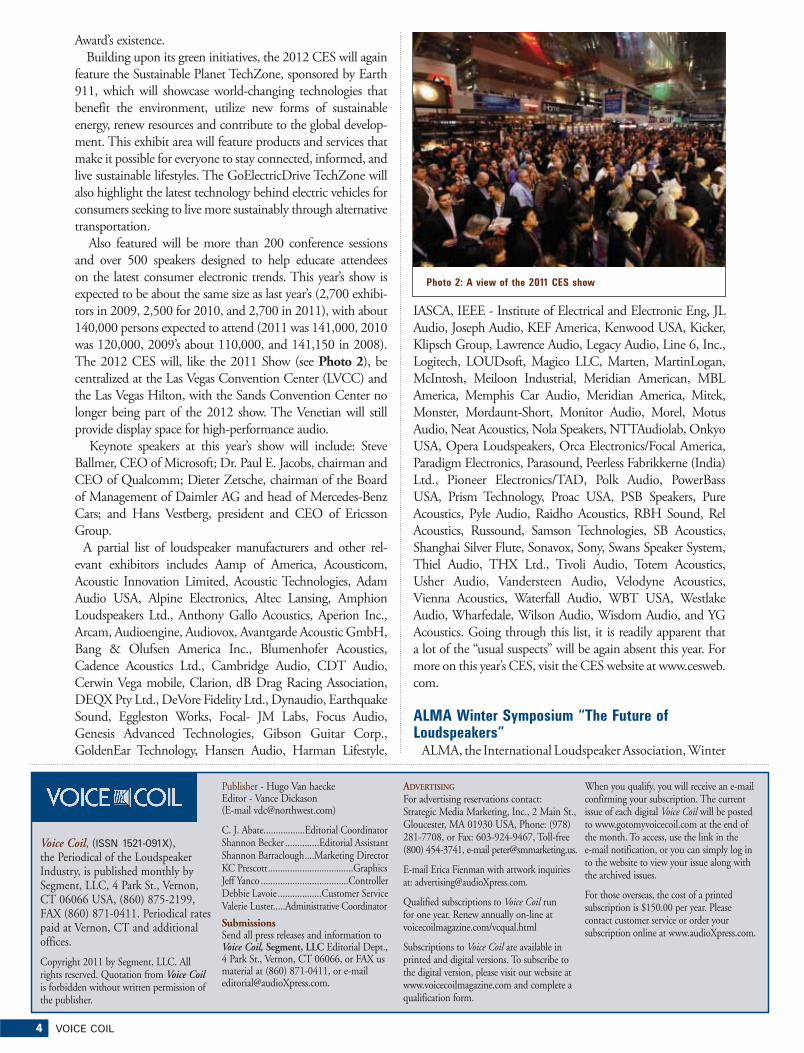
4 VOICE COIL
Voice Coil, (ISSN 1521-091X), the Periodical of the Loudspeaker Industry, is published monthly by Segment, LLC, 4 Park St., Vernon, CT 06066 USA, (860) 875-2199, FAX (860) 871-0411. Periodical rates paid at Vernon, CT and additional offices.
Copyright 2011 by Segment, LLC. All rights reserved. Quotation from Voice Coil is forbidden without written permission of the publisher.
Publisher - Hugo Van haecke Editor - Vance Dickason (E-mail [email protected])
C. J. Abate.................Editorial CoordinatorShannon Becker ..............Editorial AssistantShannon Barraclough ....Marketing DirectorKC Prescott ...................................GraphicsJeff Yanco ....................................ControllerDebbie Lavoie ..................Customer ServiceValerie Luster.....Administrative Coordinator
SubmissionsSend all press releases and information to Voice Coil, Segment, LLC Editorial Dept., 4 Park St., Vernon, CT 06066, or FAX us material at (860) 871-0411, or e-mail [email protected].
ADVERTISING
For advertising reservations contact: Strategic Media Marketing, Inc., 2 Main St., Gloucester, MA 01930 USA, Phone: (978) 281-7708, or Fax: 603-924-9467, Toll-free (800) 454-3741, e-mail [email protected].
E-mail Erica Fienman with artwork inquiries at: [email protected].
Qualified subscriptions to Voice Coil run for one year. Renew annually on-line at voicecoilmagazine.com/vcqual.html
Subscriptions to Voice Coil are available in printed and digital versions. To subscribe to the digital version, please visit our website at www.voicecoilmagazine.com and complete a qualification form.
When you qualify, you will receive an e-mail confirming your subscription. The current issue of each digital Voice Coil will be posted to www.gotomyvoicecoil.com at the end of the month. To access, use the link in the e-mail notification, or you can simply log in to the website to view your issue along with the archived issues.
For those overseas, the cost of a printed subscription is $150.00 per year. Please contact customer service or order your subscription online at www.audioXpress.com.
Award’s existence.
Building upon its green initiatives, the 2012 CES will again
feature the Sustainable Planet TechZone, sponsored by Earth
911, which will showcase world-changing technologies that
benefit the environment, utilize new forms of sustainable
energy, renew resources and contribute to the global develop-
ment. This exhibit area will feature products and services that
make it possible for everyone to stay connected, informed, and
live sustainable lifestyles. The GoElectricDrive TechZone will
also highlight the latest technology behind electric vehicles for
consumers seeking to live more sustainably through alternative
transportation.
Also featured will be more than 200 conference sessions
and over 500 speakers designed to help educate attendees
on the latest consumer electronic trends. This year’s show is
expected to be about the same size as last year’s (2,700 exhibi-
tors in 2009, 2,500 for 2010, and 2,700 in 2011), with about
140,000 persons expected to attend (2011 was 141,000, 2010
was 120,000, 2009’s about 110,000, and 141,150 in 2008).
The 2012 CES will, like the 2011 Show (see Photo 2), be
centralized at the Las Vegas Convention Center (LVCC) and
the Las Vegas Hilton, with the Sands Convention Center no
longer being part of the 2012 show. The Venetian will still
provide display space for high-performance audio.
Keynote speakers at this year’s show will include: Steve
Ballmer, CEO of Microsoft; Dr. Paul E. Jacobs, chairman and
CEO of Qualcomm; Dieter Zetsche, chairman of the Board
of Management of Daimler AG and head of Mercedes-Benz
Cars; and Hans Vestberg, president and CEO of Ericsson
Group.
A partial list of loudspeaker manufacturers and other rel-
evant exhibitors includes Aamp of America, Acousticom,
Acoustic Innovation Limited, Acoustic Technologies, Adam
Audio USA, Alpine Electronics, Altec Lansing, Amphion
Loudspeakers Ltd., Anthony Gallo Acoustics, Aperion Inc.,
Arcam, Audioengine, Audiovox, Avantgarde Acoustic GmbH,
Bang & Olufsen America Inc., Blumenhofer Acoustics,
Cadence Acoustics Ltd., Cambridge Audio, CDT Audio,
Cerwin Vega mobile, Clarion, dB Drag Racing Association,
DEQX Pty Ltd., DeVore Fidelity Ltd., Dynaudio, Earthquake
Sound, Eggleston Works, Focal- JM Labs, Focus Audio,
Genesis Advanced Technologies, Gibson Guitar Corp.,
GoldenEar Technology, Hansen Audio, Harman Lifestyle,
IASCA, IEEE - Institute of Electrical and Electronic Eng, JL
Audio, Joseph Audio, KEF America, Kenwood USA, Kicker,
Klipsch Group, Lawrence Audio, Legacy Audio, Line 6, Inc.,
Logitech, LOUDsoft, Magico LLC, Marten, MartinLogan,
McIntosh, Meiloon Industrial, Meridian American, MBL
America, Memphis Car Audio, Meridian America, Mitek,
Monster, Mordaunt-Short, Monitor Audio, Morel, Motus
Audio, Neat Acoustics, Nola Speakers, NTTAudiolab, Onkyo
USA, Opera Loudspeakers, Orca Electronics/Focal America,
Paradigm Electronics, Parasound, Peerless Fabrikkerne (India)
Ltd., Pioneer Electronics/TAD, Polk Audio, PowerBass
USA, Prism Technology, Proac USA, PSB Speakers, Pure
Acoustics, Pyle Audio, Raidho Acoustics, RBH Sound, Rel
Acoustics, Russound, Samson Technologies, SB Acoustics,
Shanghai Silver Flute, Sonavox, Sony, Swans Speaker System,
Thiel Audio, THX Ltd., Tivoli Audio, Totem Acoustics,
Usher Audio, Vandersteen Audio, Velodyne Acoustics,
Vienna Acoustics, Waterfall Audio, WBT USA, Westlake
Audio, Wharfedale, Wilson Audio, Wisdom Audio, and YG
Acoustics. Going through this list, it is readily apparent that
a lot of the “usual suspects” will be again absent this year. For
more on this year’s CES, visit the CES website at www.cesweb.
com.
ALMA Winter Symposium “The Future of Loudspeakers”
ALMA, the International Loudspeaker Association, Winter
Photo 2: A view of the 2011 CES show
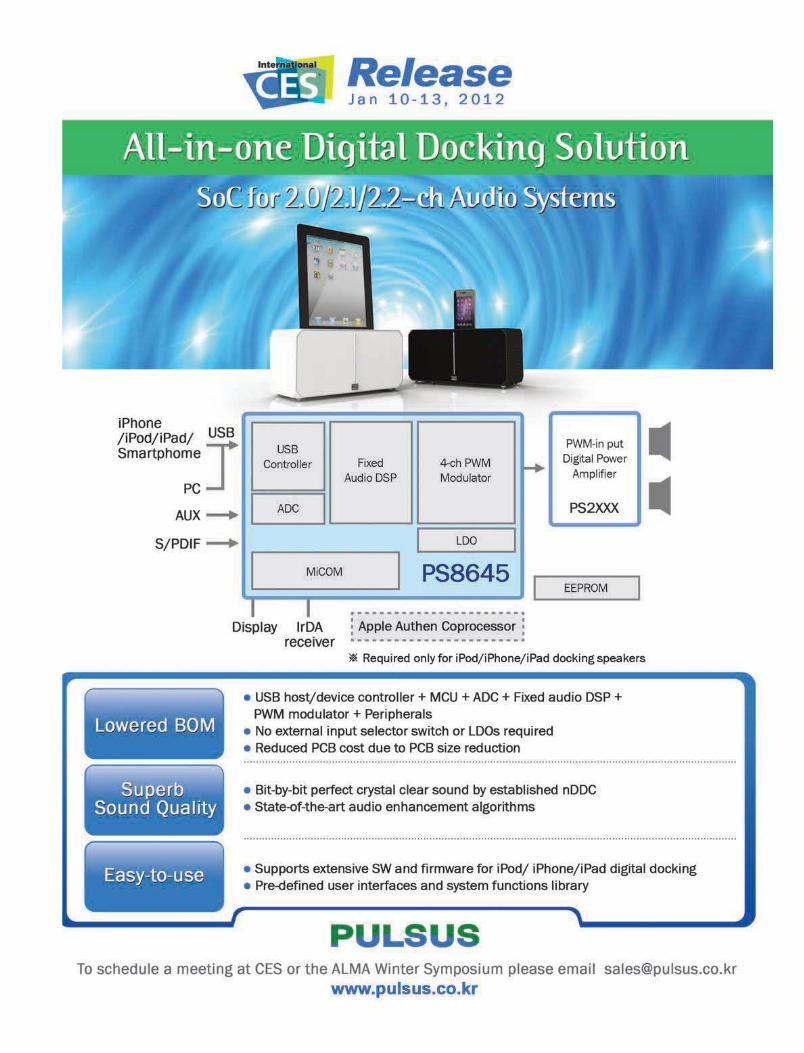
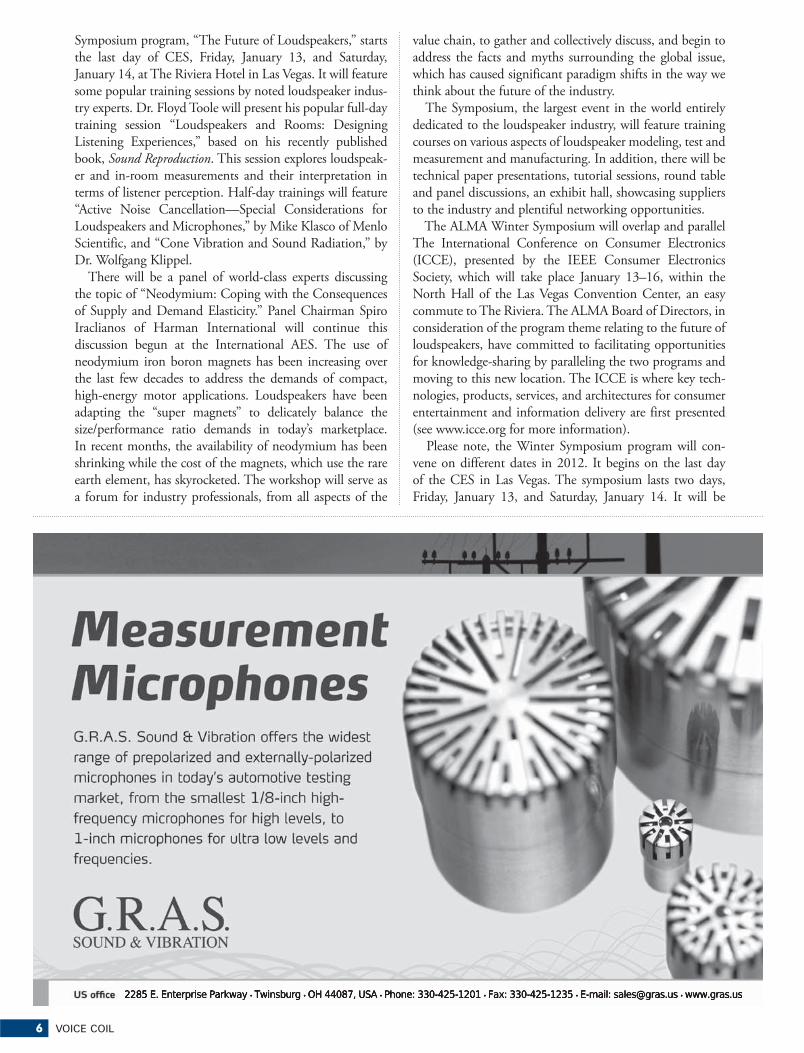
6 VOICE COIL
Symposium program, “The Future of Loudspeakers,” starts
the last day of CES, Friday, January 13, and Saturday,
January 14, at The Riviera Hotel in Las Vegas. It will feature
some popular training sessions by noted loudspeaker indus-
try experts. Dr. Floyd Toole will present his popular full-day
training session “Loudspeakers and Rooms: Designing
Listening Experiences,” based on his recently published
book, Sound Reproduction. This session explores loudspeak-
er and in-room measurements and their interpretation in
terms of listener perception. Half-day trainings will feature
“Active Noise Cancellation—Special Considerations for
Loudspeakers and Microphones,” by Mike Klasco of Menlo
Scientific, and “Cone Vibration and Sound Radiation,” by
Dr. Wolfgang Klippel.
There will be a panel of world-class experts discussing
the topic of “Neodymium: Coping with the Consequences
of Supply and Demand Elasticity.” Panel Chairman Spiro
Iraclianos of Harman International will continue this
discussion begun at the International AES. The use of
neodymium iron boron magnets has been increasing over
the last few decades to address the demands of compact,
high-energy motor applications. Loudspeakers have been
adapting the “super magnets” to delicately balance the
size/performance ratio demands in today’s marketplace.
In recent months, the availability of neodymium has been
shrinking while the cost of the magnets, which use the rare
earth element, has skyrocketed. The workshop will serve as
a forum for industry professionals, from all aspects of the
value chain, to gather and collectively discuss, and begin to
address the facts and myths surrounding the global issue,
which has caused significant paradigm shifts in the way we
think about the future of the industry.
The Symposium, the largest event in the world entirely
dedicated to the loudspeaker industry, will feature training
courses on various aspects of loudspeaker modeling, test and
measurement and manufacturing. In addition, there will be
technical paper presentations, tutorial sessions, round table
and panel discussions, an exhibit hall, showcasing suppliers
to the industry and plentiful networking opportunities.
The ALMA Winter Symposium will overlap and parallel
The International Conference on Consumer Electronics
(ICCE), presented by the IEEE Consumer Electronics
Society, which will take place January 13–16, within the
North Hall of the Las Vegas Convention Center, an easy
commute to The Riviera. The ALMA Board of Directors, in
consideration of the program theme relating to the future of
loudspeakers, have committed to facilitating opportunities
for knowledge-sharing by paralleling the two programs and
moving to this new location. The ICCE is where key tech-
nologies, products, services, and architectures for consumer
entertainment and information delivery are first presented
(see www.icce.org for more information).
Please note, the Winter Symposium program will con-
vene on different dates in 2012. It begins on the last day
of the CES in Las Vegas. The symposium lasts two days,
Friday, January 13, and Saturday, January 14. It will be
������������� ����������.��� �������.������������� �.��!"�#�$$�%���%&��&�.�'�(#�$$�%���%&�$��.��%)� *#���*�+��������.������������
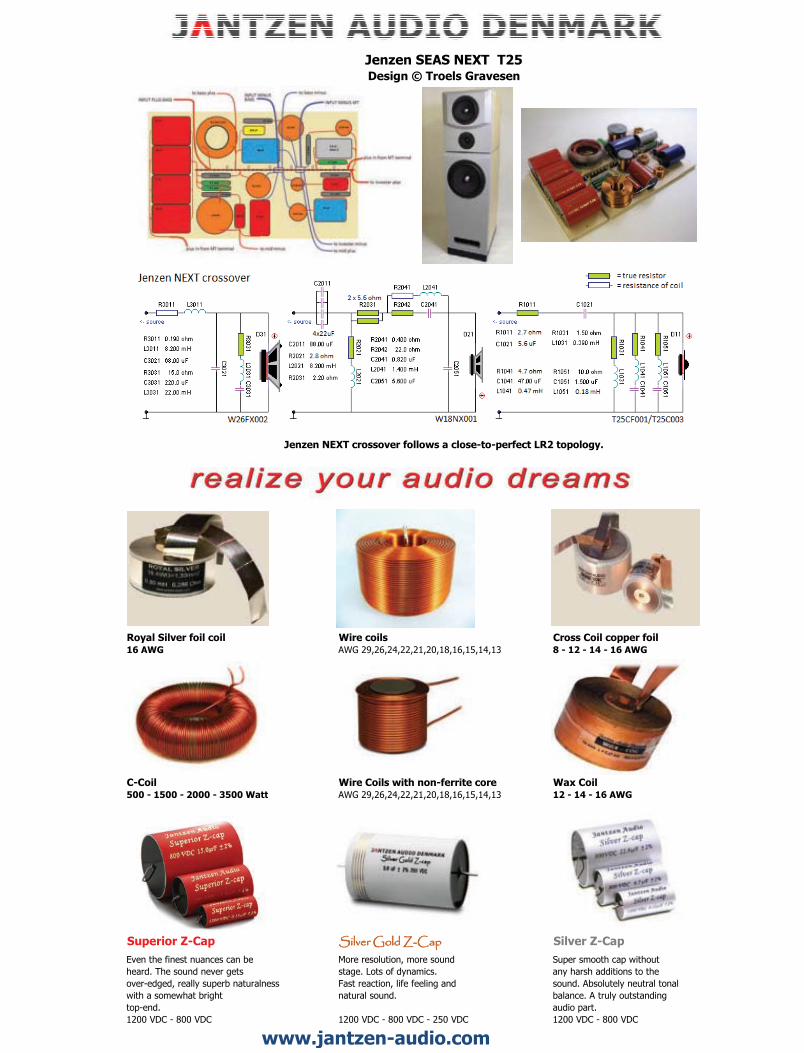
����������������� �������������������������
������������������������������������������������ ! ��������"#
!�"������������������� $��������� %�����%���������������&'�$� ��������������������� ���������� (���& ���&)���&'�$�
%�%��� $����%��������*����������������� $�+�%�����,,���&�,,��� ,,,���-�,,�$��� ��������������������� ���������� & ���&)���&'�$�
�.�������/�%�� ����������� �������������� �������������� �������������� ��� �������/�%�������������������������������� ��������� �������!��������" #�$����!�������$�%����������"&�'�������"�������(��� ���(�&�)�������"*��!���& ��*��������""�����������������+�"(�"����� *���$���������� ���� ,�������������� ������� ��(���" ����"&����� ��� *������� ����� %��������!�%�������(�� ������ �����"& �� ����&������ *��������"��(��$+��"& ��"���$���&�����-./�+� ���-./ �����-./�+� ���-./�+�����-./ �����-./�+� ���-./
���#0��������.1��#��2���#0������ �.1��#��2
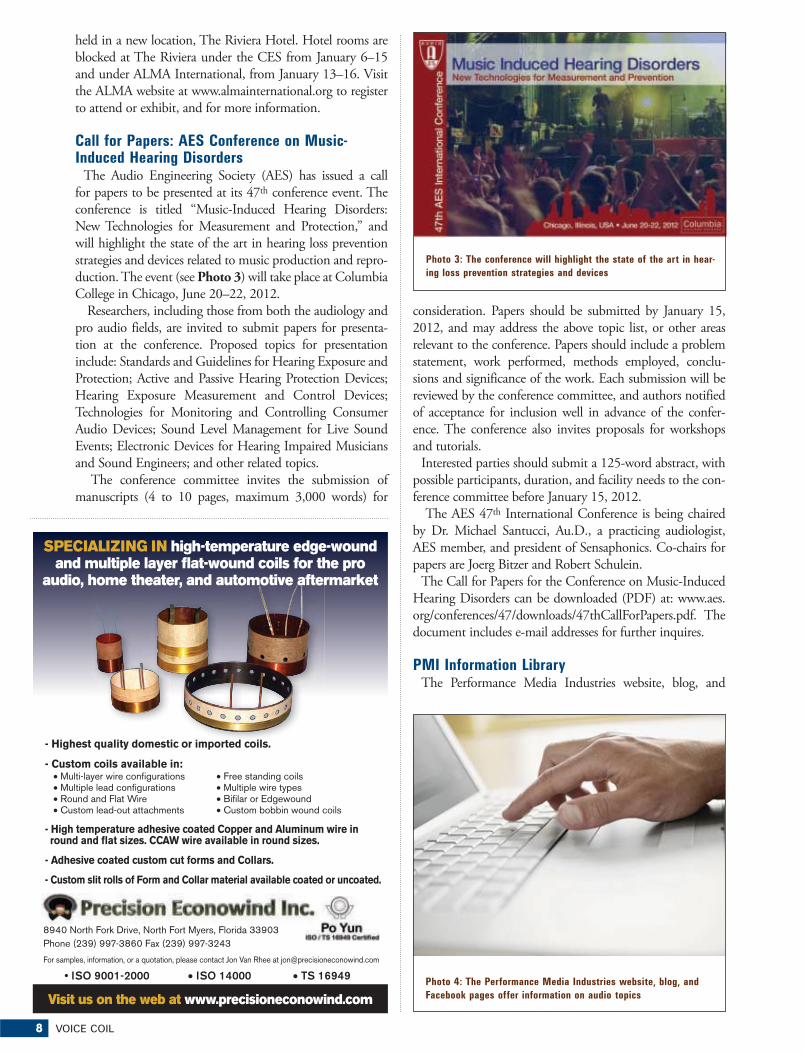
8 VOICE COIL
held in a new location, The Riviera Hotel. Hotel rooms are
blocked at The Riviera under the CES from January 6–15
and under ALMA International, from January 13–16. Visit
the ALMA website at www.almainternational.org to register
to attend or exhibit, and for more information.
Call for Papers: AES Conference on Music-Induced Hearing Disorders
The Audio Engineering Society (AES) has issued a call
for papers to be presented at its 47th conference event. The
conference is titled “Music-Induced Hearing Disorders:
New Technologies for Measurement and Protection,” and
will highlight the state of the art in hearing loss prevention
strategies and devices related to music production and repro-
duction. The event (see Photo 3) will take place at Columbia
College in Chicago, June 20–22, 2012.
Researchers, including those from both the audiology and
pro audio fields, are invited to submit papers for presenta-
tion at the conference. Proposed topics for presentation
include: Standards and Guidelines for Hearing Exposure and
Protection; Active and Passive Hearing Protection Devices;
Hearing Exposure Measurement and Control Devices;
Technologies for Monitoring and Controlling Consumer
Audio Devices; Sound Level Management for Live Sound
Events; Electronic Devices for Hearing Impaired Musicians
and Sound Engineers; and other related topics.
The conference committee invites the submission of
manuscripts (4 to 10 pages, maximum 3,000 words) for
consideration. Papers should be submitted by January 15,
2012, and may address the above topic list, or other areas
relevant to the conference. Papers should include a problem
statement, work performed, methods employed, conclu-
sions and significance of the work. Each submission will be
reviewed by the conference committee, and authors notified
of acceptance for inclusion well in advance of the confer-
ence. The conference also invites proposals for workshops
and tutorials.
Interested parties should submit a 125-word abstract, with
possible participants, duration, and facility needs to the con-
ference committee before January 15, 2012.
The AES 47th International Conference is being chaired
by Dr. Michael Santucci, Au.D., a practicing audiologist,
AES member, and president of Sensaphonics. Co-chairs for
papers are Joerg Bitzer and Robert Schulein.
The Call for Papers for the Conference on Music-Induced
Hearing Disorders can be downloaded (PDF) at: www.aes.
org/conferences/47/downloads/47thCallForPapers.pdf. The
document includes e-mail addresses for further inquires.
PMI Information LibraryThe Performance Media Industries website, blog, and
Photo 3: The conference will highlight the state of the art in hear-
ing loss prevention strategies and devices
Photo 4: The Performance Media Industries website, blog, and
Facebook pages offer information on audio topics
- Custom coils available in: Multi-layer wire configurations Multiple lead configurations Round and Flat Wire Custom lead-out attachments
Free standing coils Multiple wire types Bifilar or Edgewound Custom bobbin wound coils
- High temperature adhesive coated Copper and Aluminum wire in round and flat sizes. CCAW wire available in round sizes.
- Adhesive coated custom cut forms and Collars.
- Custom slit rolls of Form and Collar material available coated or uncoated.
8940 North Fork Drive, North Fort Myers, Florida 33903Phone (239) 997-3860 Fax (239) 997-3243
For samples, information, or a quotation, please contact Jon Van Rhee at [email protected]
Visit us on the web at www.precisioneconowind.com
- Highest quality domestic or imported coils.
SPECIALIZING IN high-temperature edge-wound and multiple layer flat-wound coils for the pro
audio, home theater, and automotive aftermarket
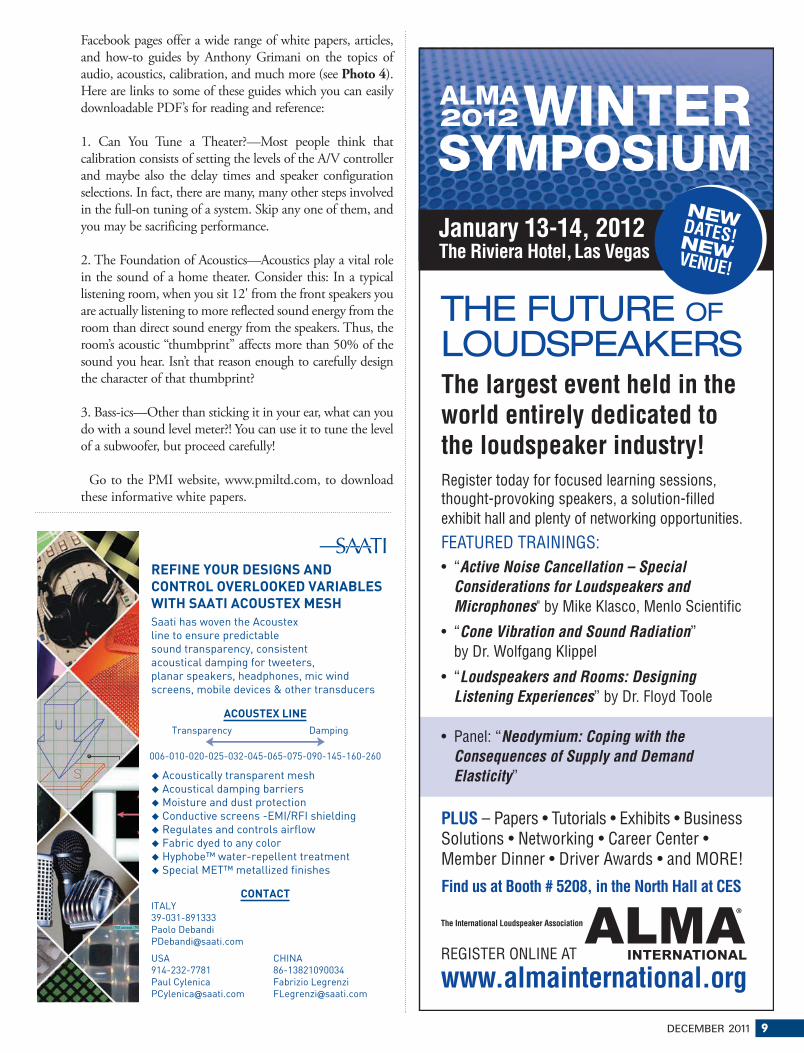
DECEMBER 2011 9
Facebook pages offer a wide range of white papers, articles,
and how-to guides by Anthony Grimani on the topics of
audio, acoustics, calibration, and much more (see Photo 4).
Here are links to some of these guides which you can easily
downloadable PDF’s for reading and reference:
1. Can You Tune a Theater?—Most people think that
calibration consists of setting the levels of the A/V controller
and maybe also the delay times and speaker configuration
selections. In fact, there are many, many other steps involved
in the full-on tuning of a system. Skip any one of them, and
you may be sacrificing performance.
2. The Foundation of Acoustics—Acoustics play a vital role
in the sound of a home theater. Consider this: In a typical
listening room, when you sit 12' from the front speakers you
are actually listening to more reflected sound energy from the
room than direct sound energy from the speakers. Thus, the
room’s acoustic “thumbprint” affects more than 50% of the
sound you hear. Isn’t that reason enough to carefully design
the character of that thumbprint?
3. Bass-ics—Other than sticking it in your ear, what can you
do with a sound level meter?! You can use it to tune the level
of a subwoofer, but proceed carefully!
Go to the PMI website, www.pmiltd.com, to download
these informative white papers.
The International Loudspeaker AssociationALMAINTERNATIONAL
®
The largest event held in theworld entirely dedicated tothe loudspeaker industry!Register today for focused learning sessions,thought-provoking speakers, a solution-filledexhibit hall and plenty of networking opportunities.
FEATURED TRAININGS:• “Active Noise Cancellation – Special
Considerations for Loudspeakers andMicrophones" by Mike Klasco, Menlo Scientific
• “Cone Vibration and Sound Radiation”by Dr. Wolfgang Klippel
• “Loudspeakers and Rooms: DesigningListening Experiences” by Dr. Floyd Toole
• Panel: “Neodymium: Coping with theConsequences of Supply and DemandElasticity”
ALMA2012WINTERSYMPOSIUM
THE FUTURE OFLOUDSPEAKERS
January 13-14, 2012The Riviera Hotel,Las Vegas
REGISTER ONLINE AT
www.almainternational.org
NEWDATES!NEWVENUE!
PLUS – Papers • Tutorials • Exhibits • BusinessSolutions • Networking • Career Center •Member Dinner • Driver Awards • and MORE!
Find us at Booth # 5208, in the North Hall at CES
Saati has woven the Acoustex line to ensure predictablesound transparency, consistent acoustical damping for tweeters,planar speakers, headphones, mic wind screens, mobile devices & other transducers
� Acoustically transparent mesh� Acoustical damping barriers� Moisture and dust protection� Conductive screens -EMI/RFI shielding� Regulates and controls airflow� Fabric dyed to any color� Hyphobe™ water-repellent treatment� Special MET™ metallized finishes
REFINE YOUR DESIGNS AND CONTROL OVERLOOKED VARIABLES WITH SAATI ACOUSTEX MESH
Transparency Damping
ACOUSTEX LINE
006-010-020-025-032-045-065-075-090-145-160-260
ITALY39-031-891333Paolo [email protected]
USA914-232-7781Paul [email protected]
CHINA86-13821090034Fabrizio [email protected]
CONTACT
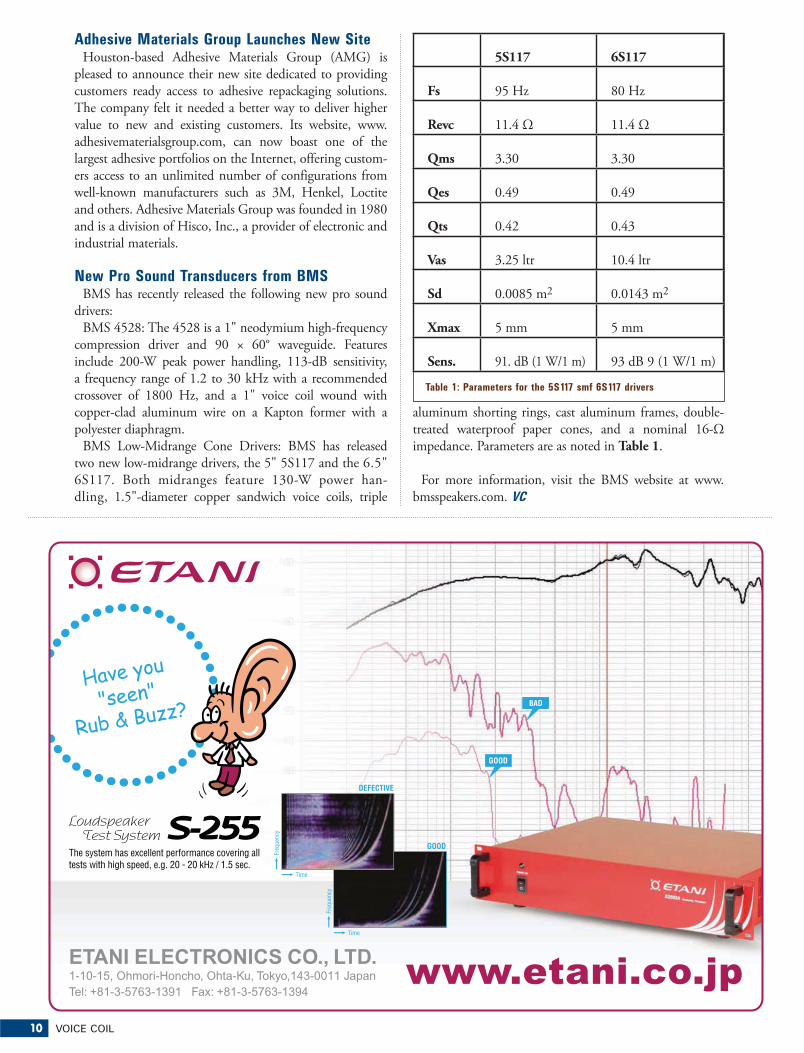
10 VOICE COIL
Adhesive Materials Group Launches New Site Houston-based Adhesive Materials Group (AMG) is
pleased to announce their new site dedicated to providing
customers ready access to adhesive repackaging solutions.
The company felt it needed a better way to deliver higher
value to new and existing customers. Its website, www.
adhesivematerialsgroup.com, can now boast one of the
largest adhesive portfolios on the Internet, offering custom-
ers access to an unlimited number of configurations from
well-known manufacturers such as 3M, Henkel, Loctite
and others. Adhesive Materials Group was founded in 1980
and is a division of Hisco, Inc., a provider of electronic and
industrial materials.
New Pro Sound Transducers from BMSBMS has recently released the following new pro sound
drivers:
BMS 4528: The 4528 is a 1" neodymium high-frequency
compression driver and 90 × 60° waveguide. Features
include 200-W peak power handling, 113-dB sensitivity,
a frequency range of 1.2 to 30 kHz with a recommended
crossover of 1800 Hz, and a 1" voice coil wound with
copper-clad aluminum wire on a Kapton former with a
polyester diaphragm.
BMS Low-Midrange Cone Drivers: BMS has released
two new low-midrange drivers, the 5" 5S117 and the 6.5"
6S117. Both midranges feature 130-W power han-
dling, 1.5"-diameter copper sandwich voice coils, triple
aluminum shorting rings, cast aluminum frames, double-
treated waterproof paper cones, and a nominal 16-Ω
impedance. Parameters are as noted in Table 1.
For more information, visit the BMS website at www.
bmsspeakers.com. VC
Table 1: Parameters for the 5S117 smf 6S117 drivers
5S117 6S117
Fs 95 Hz 80 Hz
Revc 11.4 Ω 11.4 Ω
Qms 3.30 3.30
Qes 0.49 0.49
Qts 0.42 0.43
Vas 3.25 ltr 10.4 ltr
Sd 0.0085 m2 0.0143 m2
Xmax 5 mm 5 mm
Sens. 91. dB (1 W/1 m) 93 dB 9 (1 W/1 m)

DECEMBER 2011 11
Spotlight
Figure 1a and b: Comparison between an ideal loudspeaker free-
field measurement and the same measurement in the ear of a
head-torso simulation devise
Headphone Testing (Part 1) The BasicsBy Steve Temme, Listen, Inc.
IntroductionAs more and more loudspeaker engineers find themselves
employed in the fast-growing headphone market, either through
company diversification or changing jobs, it is important that
the unique challenges of testing headphone packages are fully
understood. Many of the characteristics that make for a good in-
room listening experience with a loudspeaker—good frequency
response, low distortion, no Rub & Buzz or loose particles,
etc.—also apply to headphones, and many of the principles of
loudspeaker test apply. However, there are some major differences
and additional issues that need to be taken into account. These
include couplers and associated correction curves, acoustic seal,
fixturing, and additional tests such as L/R tracking. In this article,
we discuss the issues that are common to testing all types of
headphones. In Part 2 (a future article) we will address the specific
needs of special cases of headphones such as Bluetooth and USB
headphone testing, noise-cancelling headphones, and Max SPL
measurements to prevent hearing loss.
Similarities and DifferencesFirst, let us look at the similarities in testing loudspeakers and
headphones. The set-up essentially consists of an electroacoustic
measurement system, some kind of ear simulator containing a
reference microphone, and the device under test. A test signal is
sent to the transducer (headphone), which in turn is measured by
a reference microphone in a coupler.
The basic measurements made on headphones are very similar
to those made on loudspeakers. These include frequency response,
phase (polarity), distortion (THD and Rub & Buzz), and imped-
ance. In both cases, the test signal is usually a swept sine wave,
and the level can vary. Some set the drive level to achieve a certain
sound pressure level at a given frequency; others choose the level
that equates to 1 mW of power. Certain products may necessitate
testing the frequency response at one level and performing a sec-
ond, higher level test for distortion.
Now, let us look at the differences. The primary difference in
the test set up between a loudspeaker and a headphone mea-
surement is in the way in which the transducer interacts with
the microphone. Whereas loudspeakers are tested in open air, a
headphone or earphone must be presented with an acoustic load
that simulates the human ear. It is common to compare the left
and right-channel frequency response. Large differences at certain
frequencies can be very audible in a stereo device, even though
the individual responses may be within specification. Sometimes,
electrical characteristics such as crosstalk may also be measured.
ConsiderationsBefore beginning to test headphones, there are two major con-
siderations that need to be taken into account—correction curves,
and the acoustic seal. These both have an effect of the frequency
response. The latter also affects the repeatability of measurements.
Coupler Correction CurvesLoudspeaker engineers are familiar with the ideal frequency
response for a loudspeaker measured in the free field being a
flat line (see Figure 1a). For headphones, however, this is not
the case. Headphone measurements are taken at what is known
as the Drum Reference Point (DRP)—a point representing the
human eardrum. Figure 2 shows where this is on a Head &
Torso Simulator (HATS). If you were to measure the same loud-
speaker that produced the flat free-field response curve in Figure
1a at the Drum Reference Point, the frequency response would
look like Figure 1b. In other words, for a headphone to sound
like a loudspeaker with a flat frequency response, it must produce
a frequency response curve like Figure 1b.
This frequency response curve is a correction curve, or transfer
function that represents the effects of the head, torso, pinna, ear
canal and ear simulator. To further complicate matters, different
correction curves are applied according to whether your mea-
surements are made in the free field (anechoic room) or diffuse
field (reverberation room) (see Figure 3). For the most part, like
loudspeaker measurements, the free field is used. Typically, when
making measurements, the subtraction of the correction curve
from the actual measurement can be carried out in your test
software, so that your output frequency response is shown as the
familiar straight line.
Headphone/Ear SealAnother issue that needs to be addressed when testing head-
phone is the acoustic seal, or leakage. Realistic headphone mea-
surements (using a HATS or similar) have a certain degree of
leakage as the headphone does not fit tightly to the pinna. This
has an effect on the frequency response, with a demonstrable loss
a)
b)
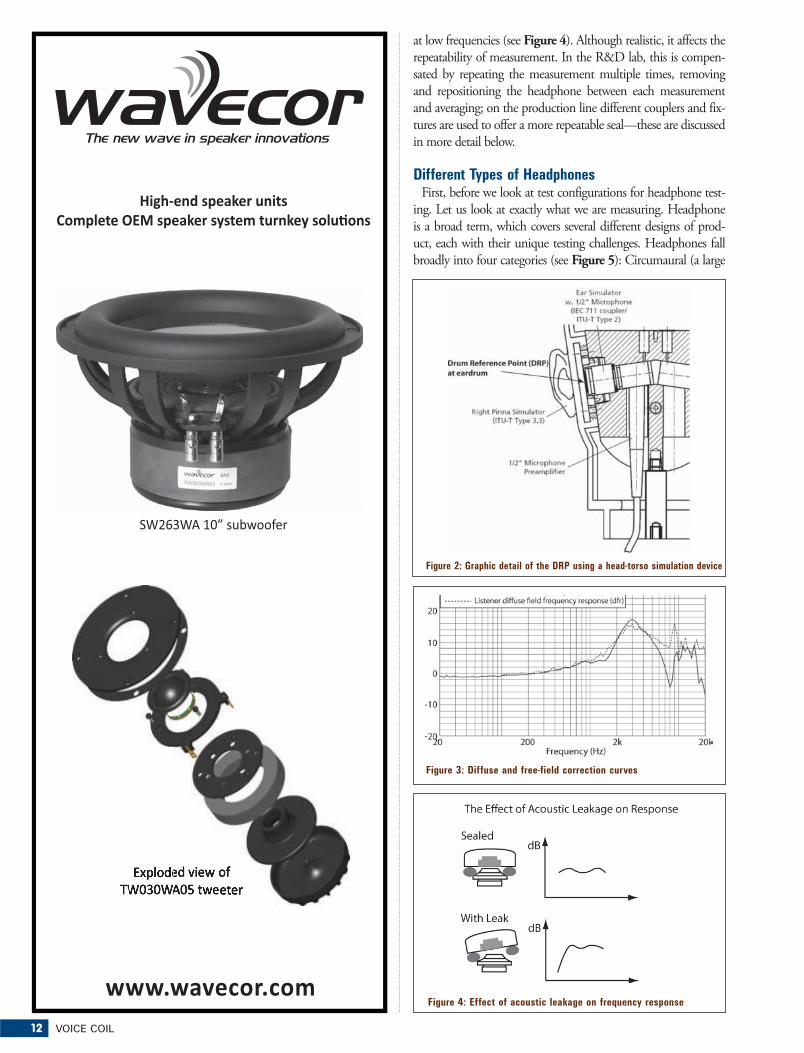
12 VOICE COIL
Figure 2: Graphic detail of the DRP using a head-torso simulation device
at low frequencies (see Figure 4). Although realistic, it affects the
repeatability of measurement. In the R&D lab, this is compen-
sated by repeating the measurement multiple times, removing
and repositioning the headphone between each measurement
and averaging; on the production line different couplers and fix-
tures are used to offer a more repeatable seal—these are discussed
in more detail below.
Different Types of HeadphonesFirst, before we look at test configurations for headphone test-
ing. Let us look at exactly what we are measuring. Headphone
is a broad term, which covers several different designs of prod-
uct, each with their unique testing challenges. Headphones fall
broadly into four categories (see Figure 5): Circumaural (a large
Figure 3: Diffuse and free-field correction curves
Figure 4: Effect of acoustic leakage on frequency responsewww.wavecor.com
High-end speaker unitsComplete OEM speaker system turnkey solu ons
SW263WA 10” subwoofer
Exploded view of TW030WA05 tweeter

14 VOICE COIL
cup that completely surrounds the ear and pinna), Supra-aural
(an earpad that sits on the pinna), Earbuds (also known as Supra-
Concha), where the transducer rests at the entrance to the ear
canal, and In-ear where the sound port sits inside the ear canal.
Although the measurements that need to be made are the same
for each of these, the fixturing—a critical part of the test set-up—
is different for each type.
A Basic Headphone Test SetupFigure 6 shows a headphone test set-up (suitable for all types
of headphones) using a PC and soundcard-based measurement
system. Although hardware-based systems may, of course, also
be used, a soundcard offers more than sufficient accuracy for
testing headphones, and such a system is usually less expensive.
As you can see, the only part of this setup that will be unfamiliar
to those accustomed to loudspeaker measurements is the “black
Figure 5: Comparison of different headphone types

DECEMBER 2011 15
box” that represents a device that simulates the ear (and replaces
the microphone in a loudspeaker setup).
What’s in the Black Box?The equipment in the black box can be a multitude of things,
depending on whether you are testing in the R&D lab or on the
production line, your budget, and the type of headphone you are
testing. Essentially it will be the microphone-containing device
you have selected which simulates the human ear with some
degree of accuracy, and appropriate fixturing to ensure repeatable
results with the particular headphones you are testing. This is
perhaps the most complex part of this setup, and the one which
poses the most challenges to engineers.
In order to select the most appropriate ear simulation device,
the first question that must be asked is whether the test should
be a realistic simulation of actual use (commonly performed in
development) or a highly repeatable test capable of differentiating
defective units from good ones (production).
When developing a product, it is desirable to have a means of
measuring under conditions that the end user will experience.
A head-and-torso simulator provides this level of simulation,
as it is equipped with artificial ears, which mimic the acoustic
characteristics of the human ear, as well as artificial pinnae, which
mimic the way a headphone would fit on a real person. The fit
of headphones and earphones can vary from person to person
and even from one use to another, and can drastically change the
user’s listening experience. Testing on a head-and-torso simulator
(see Photo 1) can reveal this variability between fit and acoustic
Figure 6: Analyzer setup for measuring headphone response
����������������� ��� ���������� ������������� ������������������������������������������������������������������ ���������������� �� ��������!���" ���#$%&'�(��)�*+*,�-�*�(,�(.�*��/*�0,��+����1%%�2'3�$�&%�#4�'%�5'��/���1%%�2'3�$�&%�#4�$'�46��
+�����"�( �����������7�68��6�69&8:�-��������;����������:����!"��� <��-�" ��������7�� ������ ��� �:�)�����������*���"������-�" ���7�� ������ ��� �:�!���"������"��������:�������� ��-�" ����������7�-�������-����� ��� �:�!���":�/ ��"<����:�=�>��"�����:����!"����� �����( �����7�) < �,�� � ����:�) < �!���"�)���� �<:����
����������� ����������������������������
��������������������������������
+?'%&�' !*6#';'
&'�('))*+��,-�.'-/0('1&�-1
.'-/0('1&�-1�0�&-1�0�&+-,)(�'��1�0�&'-/)(1��.�1
Photo 1: Testing on a head-and-torso simulator
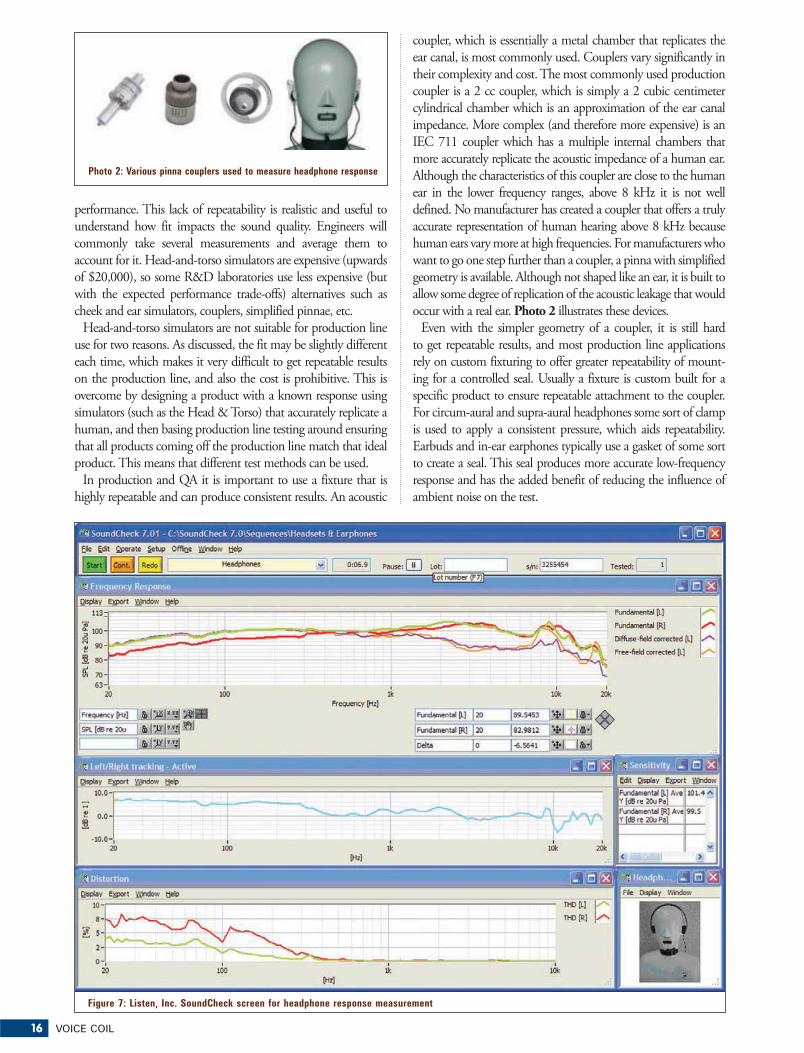
16 VOICE COIL
coupler, which is essentially a metal chamber that replicates the
ear canal, is most commonly used. Couplers vary significantly in
their complexity and cost. The most commonly used production
coupler is a 2 cc coupler, which is simply a 2 cubic centimeter
cylindrical chamber which is an approximation of the ear canal
impedance. More complex (and therefore more expensive) is an
IEC 711 coupler which has a multiple internal chambers that
more accurately replicate the acoustic impedance of a human ear.
Although the characteristics of this coupler are close to the human
ear in the lower frequency ranges, above 8 kHz it is not well
defined. No manufacturer has created a coupler that offers a truly
accurate representation of human hearing above 8 kHz because
human ears vary more at high frequencies. For manufacturers who
want to go one step further than a coupler, a pinna with simplified
geometry is available. Although not shaped like an ear, it is built to
allow some degree of replication of the acoustic leakage that would
occur with a real ear. Photo 2 illustrates these devices.
Even with the simpler geometry of a coupler, it is still hard
to get repeatable results, and most production line applications
rely on custom fixturing to offer greater repeatability of mount-
ing for a controlled seal. Usually a fixture is custom built for a
specific product to ensure repeatable attachment to the coupler.
For circum-aural and supra-aural headphones some sort of clamp
is used to apply a consistent pressure, which aids repeatability.
Earbuds and in-ear earphones typically use a gasket of some sort
to create a seal. This seal produces more accurate low-frequency
response and has the added benefit of reducing the influence of
ambient noise on the test.
Photo 2: Various pinna couplers used to measure headphone response
Figure 7: Listen, Inc. SoundCheck screen for headphone response measurement
performance. This lack of repeatability is realistic and useful to
understand how fit impacts the sound quality. Engineers will
commonly take several measurements and average them to
account for it. Head-and-torso simulators are expensive (upwards
of $20,000), so some R&D laboratories use less expensive (but
with the expected performance trade-offs) alternatives such as
cheek and ear simulators, couplers, simplified pinnae, etc.
Head-and-torso simulators are not suitable for production line
use for two reasons. As discussed, the fit may be slightly different
each time, which makes it very difficult to get repeatable results
on the production line, and also the cost is prohibitive. This is
overcome by designing a product with a known response using
simulators (such as the Head & Torso) that accurately replicate a
human, and then basing production line testing around ensuring
that all products coming off the production line match that ideal
product. This means that different test methods can be used.
In production and QA it is important to use a fixture that is
highly repeatable and can produce consistent results. An acoustic

DECEMBER 2011 17
Headphone TestsNow that we understand the test set-up, lets talk about what
we typically measure with a headphone. If you are buying a new
test system for testing headphones, you should consider what and
how you want to test before purchasing, as it has a bearing on the
number of inputs and outputs you will need on your soundcard
or test system. If you are testing a stereo pair simultaneously, you
will need a two-channel soundcard just for the acoustic tests. If
you want to also simultaneously measure electrical characteristics
such as impedance, you will need four channels. If you already
have a two-channel system, you can measure impedance sequen-
tially rather than simultaneously, although it will be a little slower.
A typical basic R&D test using a head and torso simulator
for a stereo headphone pair would consist of playing a 1/12
octave stepped sine sweep from 20 to 20 kHz and measuring
the harmonic distortion and fundamental frequency response.
Correction curves would compensate for the free-field response
from 0° incidence to the nose to the eardrum. Post-processing can
then be used to compare the left and right earphone responses
and show the difference curve, both for magnitude and phase.
With a four-channel analyzer, this test may be expanded with
the addition of a couple of reference resistors to measure imped-
ance of the headphones at the same time. Other options for more
detailed testing would include measuring intermodulation and
difference frequency distortion, or measuring maximum SPL
using the distortion level to set the upper limit. Naturally, each
company wants to test their products slightly differently, and
most test and measurement systems offer the ability to custom-
ize tests. A typical production line test would be similar, but a
custom compensation curve, based on the coupler and fixturing
would need to be applied. On the line, impedance, if measured,
would be done simultaneously for speed reasons. Figure 7 shows
an example test report for a R&D headphone test carried out in
SoundCheck, a soundcard based test system that is used in the
R&D lab and on the production line for measuring headphones.
StandardsIEC 60268-7: Sound System Equipment—Part 7: Headphones
and Earphones is probably the most comprehensive standard on
headphone testing. It talks about how to classify earphone types
(e.g., supra-aural versus supra-concha) describes various couplers
and acoustic ear simulators, defines free-field versus diffuse field
conditions, and describes how to test headphones. It specifies the
standard test level to be 94 dBSPL at 500 Hz or 1 mW at the
earphone’s rated impedance and defines how to measure the rated
impedance. A copy of this standard costs approximately $200,
and may be purchased from the IEC website (http://webstore.iec.
ch/webstore/webstore.nsf/Artnum_PK/43714).
ConclusionThis article covered the basics of headphone testing, focusing
on those issues applicable to all types of headphones. In Part 2,
a follow-up to this feature, we will discuss special cases of head-
phone testing, specifically Bluetooth and USB headphone test-
ing, noise-cancelling headphones, and Max SPL measurements.
These are complex subjects requiring the use of different test
signals and compensation for time delays, dropouts, and other
characteristics inherent to these special types of headphone.VC


DECEMBER 2011 19
Test Bench
Photo 1: The FPS1030M3F1R, a large format multi-cell ribbon,
from Flat Panel Speakers (FPS)
Figure 1: Graphic layout of the FPS MMCA ribbon configuration
New Ribbon from FPS and Two 4" Drivers from SB AcousticsBy Vance Dickason
The samples received for this month’s installment of Test
Bench included a large format multi-cell ribbon from
FPS, the FPS1030M3F1R, plus two 4" ferrite motor driv-
ers from SB Acoustics, the SB12NRX25-4 woofer and the
SB12MNRX25-4 midrange.
FPS, which stands for Flat Panel Speakers, is a Japanese com-
pany founded in 1999 to produce ribbon-based technology.
The company manufactures a variety of ribbon transducers
from tweeters to large format units intended for use as PA
speakers in public venues to pro sound line source stage speak-
ers. Most of their technology is based on a patented (Patent
# U.S. 6,963,654 Diaphragm, Flat-Type Acoustic Transducer,
and Flat-Type Diaphragm) multiple ribbon cell format titled
MMCA for Multi Cell Microtransducer Array (see Photo 1).
Figure 1 gives the basic layout of their ribbon transducers
with the total ribbon area formed by an array of voice coils
with alternating magnetic polarity. You can see how this is
specifically applied in the photos of the review subject, the
FPS1030M3F1R. Figure 2 illustrates the diaphragm voice coil
layout, and Figure 3 depicts the frame and neo magnet layout.
Note that the frame photo is for only one side, with another set
of magnets located on the opposite side of the frame.
In terms of features, the FPS1030 is a large-format ribbon
suitable for full-range PA applications or as a mid-range in a
multi-way system, or as a wide range in a line source. The rib-
bon radiating area is about 30.5 × 10.5 cm, or about 320 cm2.
Power handling is rated at 75-W nominal, sensitivity at 82 dB
with a frequency range of 90 Hz to 10 kHz, and is a nominal
8 Ω.
Testing commenced using the LinearX LMS analyzer to
measure the impedance as seen in Figure 4. As with most
ribbons, the impedance is very flat 7.2 Ω across most of the
operating range with a minor resonance at 163 Hz. Next, I
mounted the transducer in a small enclosure filled with damp-
ing material about the same size as the ribbon frame, so very
little baffle reinforcement. Figure 5 gives the on-axis response
down to 300 Hz using a 100-point stepped sine wave sweep.
The response is quite smooth out to about 10 kHz, with a
6-dB shelf between 600 Hz and 1 kHz. With a larger baffle
or mounted in half-space like an in-wall speaker, the ribbon
would perform to a substantially lower frequency. Figure 6
displays the on- and off-axis response in the horizontal plane
out to 45° off-axis, while Figure 7 gives the same data in the
vertical plane. Given the directivity in the horizontal plane,
using the FPS1030 as a midrange in a multi-way system,
crossover points of 800 Hz to 5 kHz with a narrow baffle would
likely work well, and a lower cross point in half-space or with
a larger baffle. Figure 8 shows the nearfield response with a
low-frequency roll-off of about –3 dB at 91 Hz, as specified in
the product data. And for the last SPL measurement, Figure 9
gives the two-sample SPL comparison showing these drivers to
Figure 2: Photograph of the voice coil layout in the FPS1030M3F1R
Figure 3: Photograph of the frame and magnet layout of the
FPS1030M3F1R
be well matched throughout the operating range.
The final test procedure was to setup the Listen, Inc.
SoundCheck analyzer along with the Listen, Inc. SCM ¼"
microphone (provided courtesy of Listen, Inc.) to measure the
impulse response with the FPS ribbon recess mounted on the
test baffle. Importing this data into the Listen Inc. SoundMap
software produced the cumulative spectral decay plot (usually
referred to as a “waterfall” plot) given in Figure 10. Figure 11 is
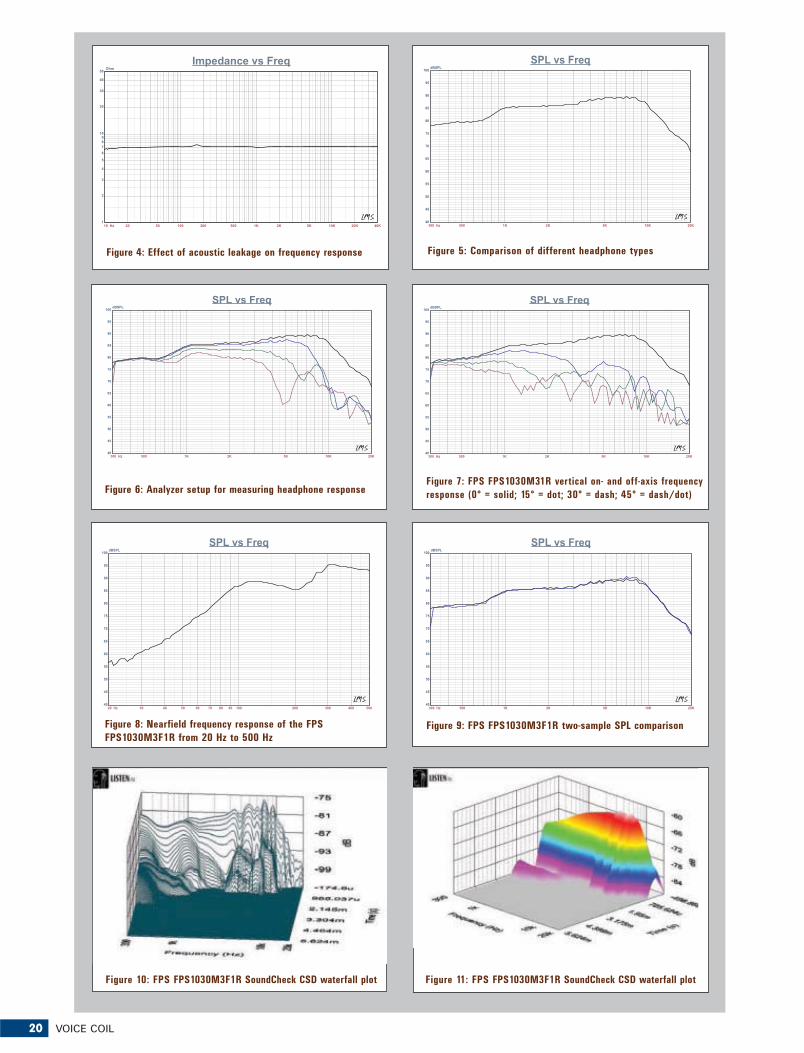
20 VOICE COIL
300 Hz 500 1K 2K 5K 10K 20K
dBSPL
40
45
50
55
60
65
70
75
80
85
90
95
100
SPL vs Freq
Figure 5: Comparison of different headphone types
10 Hz 20 50 100 200 500 1K 2K 5K 10K 20K 40K
Ohm
1
2
3
4
5
6789
10
20
30
40
50
Impedance vs Freq
Figure 4: Effect of acoustic leakage on frequency response
300 Hz 500 1K 2K 5K 10K 20K
dBSPL
40
45
50
55
60
65
70
75
80
85
90
95
100
SPL vs Freq
300 Hz 500 1K 2K 5K 10K 20K
dBSPL
40
45
50
55
60
65
70
75
80
85
90
95
100
SPL vs Freq
Figure 6: Analyzer setup for measuring headphone responseFigure 7: FPS FPS1030M31R vertical on- and off-axis frequency
response (0° = solid; 15° = dot; 30° = dash; 45° = dash/dot)
Figure 8: Nearfield frequency response of the FPS
FPS1030M3F1R from 20 Hz to 500 Hz
20 Hz 30 40 50 60 70 80 90 100 200 300 400 500
dBSPL
40
45
50
55
60
65
70
75
80
85
90
95
100
SPL vs Freq
Figure 9: FPS FPS1030M3F1R two-sample SPL comparison
300 Hz 500 1K 2K 5K 10K 20K
dBSPL
40
45
50
55
60
65
70
75
80
85
90
95
100
SPL vs Freq
Figure 10: FPS FPS1030M3F1R SoundCheck CSD waterfall plot Figure 11: FPS FPS1030M3F1R SoundCheck CSD waterfall plot
Seems like all of a sudden,compact arrays are big
business. So talk toCelestion about our range
of high performance,small-format drivers.
It’s anotherinnovation in sound
from Celestion.
Find us on Facebook
www.celestion.com
We’re thinking small
AN2075 50mm/2" AN2775 70mm/2.75" AN3510 88mm/3.5"
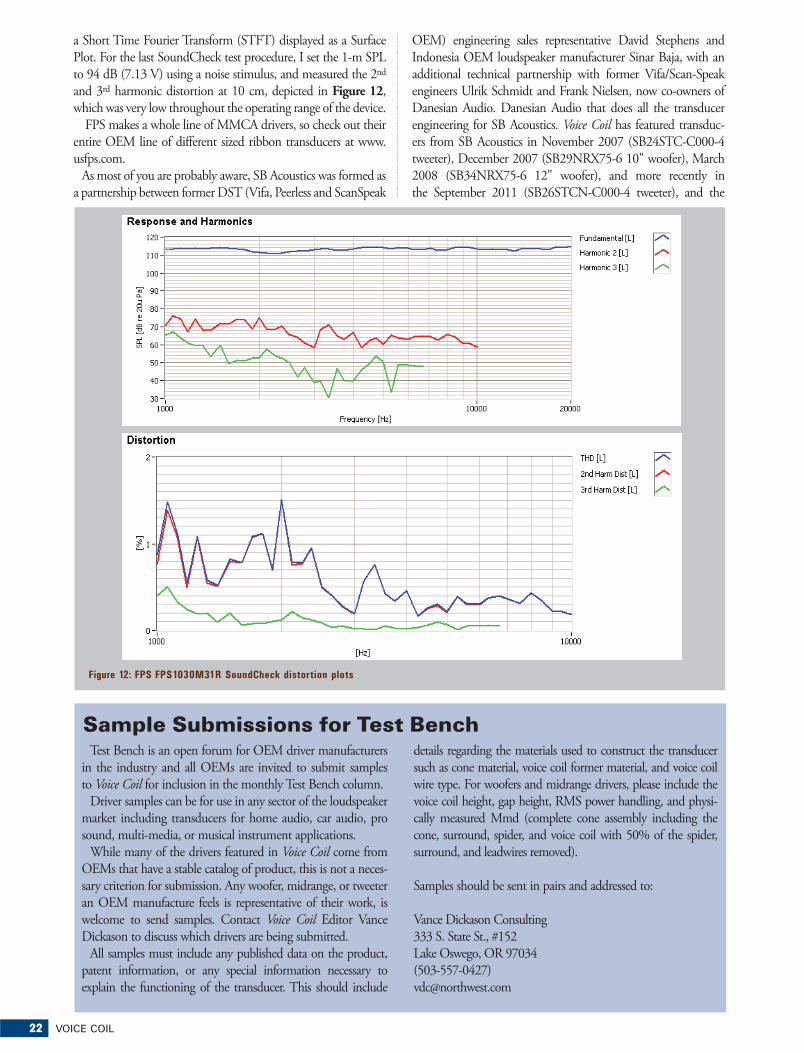
22 VOICE COIL
Test Bench is an open forum for OEM driver manufacturers
in the industry and all OEMs are invited to submit samples
to Voice Coil for inclusion in the monthly Test Bench column.
Driver samples can be for use in any sector of the loudspeaker
market including transducers for home audio, car audio, pro
sound, multi-media, or musical instrument applications.
While many of the drivers featured in Voice Coil come from
OEMs that have a stable catalog of product, this is not a neces-
sary criterion for submission. Any woofer, midrange, or tweeter
an OEM manufacture feels is representative of their work, is
welcome to send samples. Contact Voice Coil Editor Vance
Dickason to discuss which drivers are being submitted.
All samples must include any published data on the product,
patent information, or any special information necessary to
explain the functioning of the transducer. This should include
Sample Submissions for Test Benchdetails regarding the materials used to construct the transducer
such as cone material, voice coil former material, and voice coil
wire type. For woofers and midrange drivers, please include the
voice coil height, gap height, RMS power handling, and physi-
cally measured Mmd (complete cone assembly including the
cone, surround, spider, and voice coil with 50% of the spider,
surround, and leadwires removed).
Samples should be sent in pairs and addressed to:
Vance Dickason Consulting
333 S. State St., #152
Lake Oswego, OR 97034
(503-557-0427)
a Short Time Fourier Transform (STFT) displayed as a Surface
Plot. For the last SoundCheck test procedure, I set the 1-m SPL
to 94 dB (7.13 V) using a noise stimulus, and measured the 2nd
and 3rd harmonic distortion at 10 cm, depicted in Figure 12,
which was very low throughout the operating range of the device.
FPS makes a whole line of MMCA drivers, so check out their
entire OEM line of different sized ribbon transducers at www.
usfps.com.
As most of you are probably aware, SB Acoustics was formed as
a partnership between former DST (Vifa, Peerless and ScanSpeak
OEM) engineering sales representative David Stephens and
Indonesia OEM loudspeaker manufacturer Sinar Baja, with an
additional technical partnership with former Vifa/Scan-Speak
engineers Ulrik Schmidt and Frank Nielsen, now co-owners of
Danesian Audio. Danesian Audio that does all the transducer
engineering for SB Acoustics. Voice Coil has featured transduc-
ers from SB Acoustics in November 2007 (SB24STC-C000-4
tweeter), December 2007 (SB29NRX75-6 10" woofer), March
2008 (SB34NRX75-6 12" woofer), and more recently in
the September 2011 (SB26STCN-C000-4 tweeter), and the
Figure 12: FPS FPS1030M31R SoundCheck distortion plots
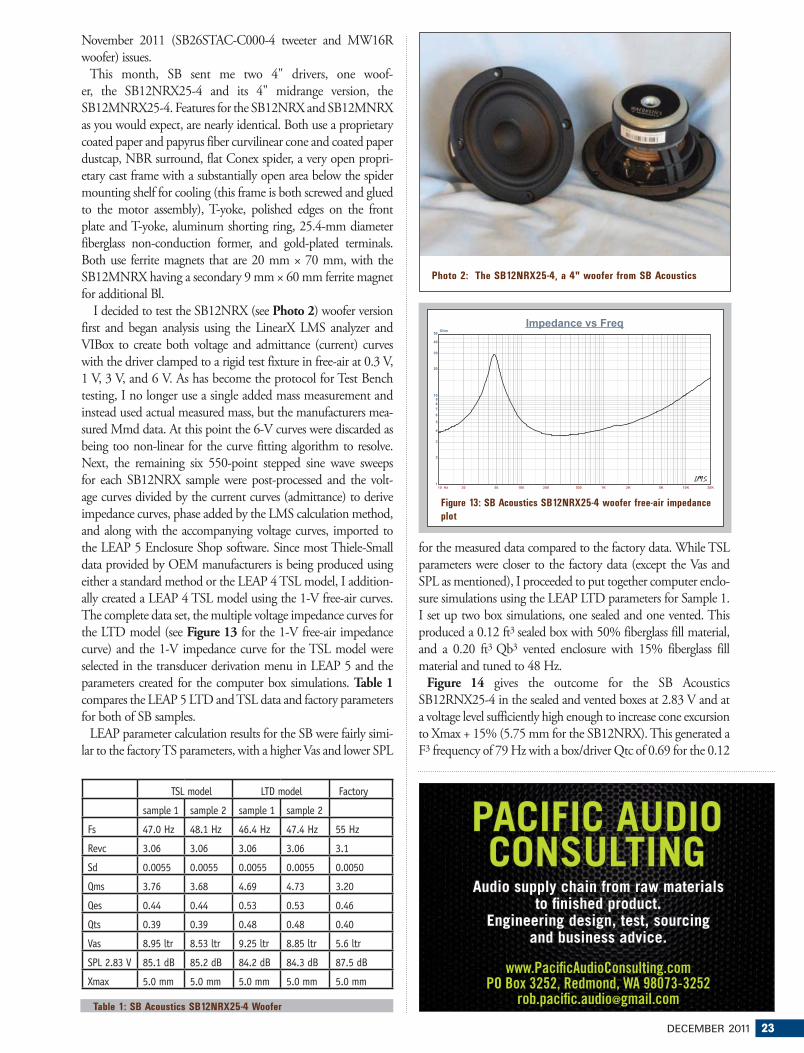
DECEMBER 2011 23
for the measured data compared to the factory data. While TSL
parameters were closer to the factory data (except the Vas and
SPL as mentioned), I proceeded to put together computer enclo-
sure simulations using the LEAP LTD parameters for Sample 1.
I set up two box simulations, one sealed and one vented. This
produced a 0.12 ft3 sealed box with 50% fiberglass fill material,
and a 0.20 ft3 Qb3 vented enclosure with 15% fiberglass fill
material and tuned to 48 Hz.
Figure 14 gives the outcome for the SB Acoustics
SB12RNX25-4 in the sealed and vented boxes at 2.83 V and at
a voltage level sufficiently high enough to increase cone excursion
to Xmax + 15% (5.75 mm for the SB12NRX). This generated a
F3 frequency of 79 Hz with a box/driver Qtc of 0.69 for the 0.12
November 2011 (SB26STAC-C000-4 tweeter and MW16R
woofer) issues.
This month, SB sent me two 4" drivers, one woof-
er, the SB12NRX25-4 and its 4" midrange version, the
SB12MNRX25-4. Features for the SB12NRX and SB12MNRX
as you would expect, are nearly identical. Both use a proprietary
coated paper and papyrus fiber curvilinear cone and coated paper
dustcap, NBR surround, flat Conex spider, a very open propri-
etary cast frame with a substantially open area below the spider
mounting shelf for cooling (this frame is both screwed and glued
to the motor assembly), T-yoke, polished edges on the front
plate and T-yoke, aluminum shorting ring, 25.4-mm diameter
fiberglass non-conduction former, and gold-plated terminals.
Both use ferrite magnets that are 20 mm × 70 mm, with the
SB12MNRX having a secondary 9 mm × 60 mm ferrite magnet
for additional Bl.
I decided to test the SB12NRX (see Photo 2) woofer version
first and began analysis using the LinearX LMS analyzer and
VIBox to create both voltage and admittance (current) curves
with the driver clamped to a rigid test fixture in free-air at 0.3 V,
1 V, 3 V, and 6 V. As has become the protocol for Test Bench
testing, I no longer use a single added mass measurement and
instead used actual measured mass, but the manufacturers mea-
sured Mmd data. At this point the 6-V curves were discarded as
being too non-linear for the curve fitting algorithm to resolve.
Next, the remaining six 550-point stepped sine wave sweeps
for each SB12NRX sample were post-processed and the volt-
age curves divided by the current curves (admittance) to derive
impedance curves, phase added by the LMS calculation method,
and along with the accompanying voltage curves, imported to
the LEAP 5 Enclosure Shop software. Since most Thiele-Small
data provided by OEM manufacturers is being produced using
either a standard method or the LEAP 4 TSL model, I addition-
ally created a LEAP 4 TSL model using the 1-V free-air curves.
The complete data set, the multiple voltage impedance curves for
the LTD model (see Figure 13 for the 1-V free-air impedance
curve) and the 1-V impedance curve for the TSL model were
selected in the transducer derivation menu in LEAP 5 and the
parameters created for the computer box simulations. Table 1
compares the LEAP 5 LTD and TSL data and factory parameters
for both of SB samples.
LEAP parameter calculation results for the SB were fairly simi-
lar to the factory TS parameters, with a higher Vas and lower SPL
TSL model LTD model Factory
sample 1 sample 2 sample 1 sample 2
Fs 47.0 Hz 48.1 Hz 46.4 Hz 47.4 Hz 55 Hz
Revc 3.06 3.06 3.06 3.06 3.1
Sd 0.0055 0.0055 0.0055 0.0055 0.0050
Qms 3.76 3.68 4.69 4.73 3.20
Qes 0.44 0.44 0.53 0.53 0.46
Qts 0.39 0.39 0.48 0.48 0.40
Vas 8.95 ltr 8.53 ltr 9.25 ltr 8.85 ltr 5.6 ltr
SPL 2.83 V 85.1 dB 85.2 dB 84.2 dB 84.3 dB 87.5 dB
Xmax 5.0 mm 5.0 mm 5.0 mm 5.0 mm 5.0 mm
Table 1: SB Acoustics SB12NRX25-4 Woofer
Photo 2: The SB12NRX25-4, a 4" woofer from SB Acoustics
10 Hz 20 50 100 200 500 1K 2K 5K 10K 20K
Ohm
1
2
3
4
5
6789
10
20
30
40
50
Impedance vs Freq
Figure 13: SB Acoustics SB12NRX25-4 woofer free-air impedance
plot
PACIFIC AUDIO CONSULTING
Audio supply chain from raw materialsto finished product.
Engineering design, test, sourcing and business advice.
www.PacificAudioConsulting.com PO Box 3252, Redmond, WA 98073-3252
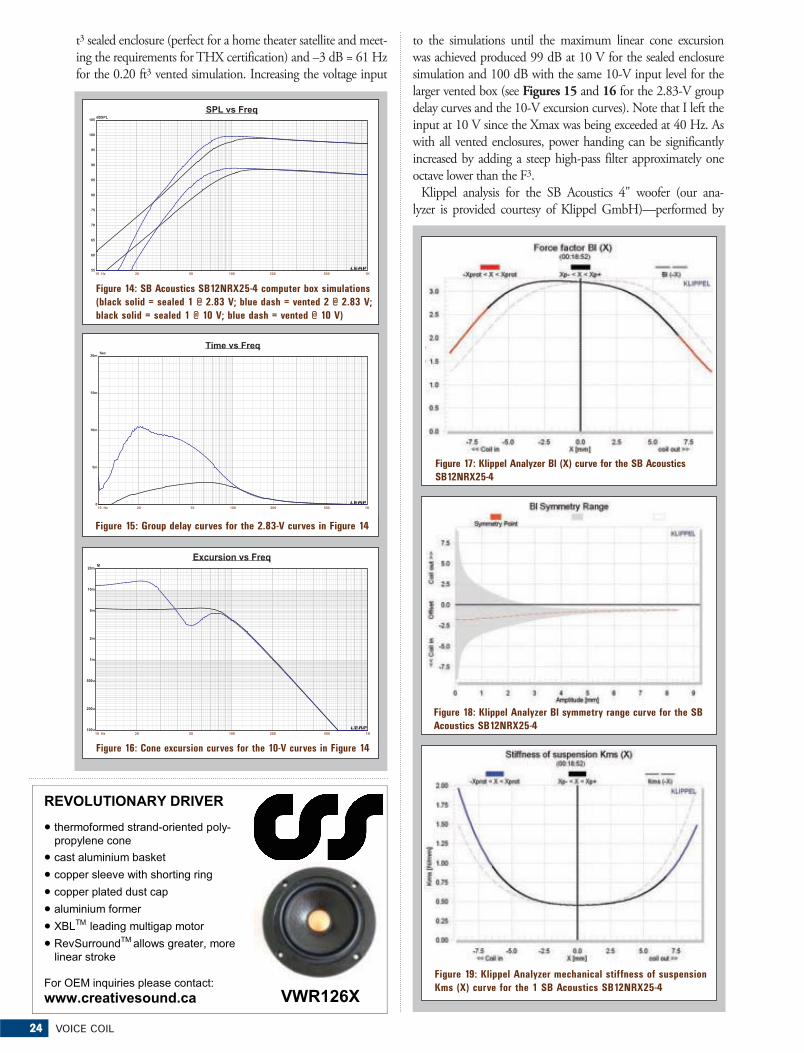
24 VOICE COIL
t3 sealed enclosure (perfect for a home theater satellite and meet-
ing the requirements for THX certification) and –3 dB = 61 Hz
for the 0.20 ft3 vented simulation. Increasing the voltage input
10 Hz 20 50 100 200 500 1K
dBSPL
55
60
65
70
75
80
85
90
95
100
105
SPL vs Freq
Figure 14: SB Acoustics SB12NRX25-4 computer box simulations
(black solid = sealed 1 @ 2.83 V; blue dash = vented 2 @ 2.83 V;
black solid = sealed 1 @ 10 V; blue dash = vented @ 10 V)
10 Hz 20 50 100 200 500 1K
Sec
0
5m
10m
15m
20m
Time vs Freq
Figure 15: Group delay curves for the 2.83-V curves in Figure 14
10 Hz 20 50 100 200 500 1K
M
100u
200u
500u
1m
2m
5m
10m
20m
Excursion vs Freq
Figure 16: Cone excursion curves for the 10-V curves in Figure 14
Figure 17: Klippel Analyzer Bl (X) curve for the SB Acoustics
SB12NRX25-4
Figure 18: Klippel Analyzer Bl symmetry range curve for the SB
Acoustics SB12NRX25-4
Figure 19: Klippel Analyzer mechanical stiffness of suspension
Kms (X) curve for the 1 SB Acoustics SB12NRX25-4
to the simulations until the maximum linear cone excursion
was achieved produced 99 dB at 10 V for the sealed enclosure
simulation and 100 dB with the same 10-V input level for the
larger vented box (see Figures 15 and 16 for the 2.83-V group
delay curves and the 10-V excursion curves). Note that I left the
input at 10 V since the Xmax was being exceeded at 40 Hz. As
with all vented enclosures, power handing can be significantly
increased by adding a steep high-pass filter approximately one
octave lower than the F3.
Klippel analysis for the SB Acoustics 4" woofer (our ana-
lyzer is provided courtesy of Klippel GmbH)—performed by
REVOLUTIONARY DRIVER
� thermoformed strand-oriented poly-propylene cone
� cast aluminium basket � copper sleeve with shorting ring � copper plated dust cap � aluminium former � XBLTM leading multigap motor� RevSurroundTM allows greater, more
linear stroke
For OEM inquiries please contact: www.creativesound.ca VWR126X
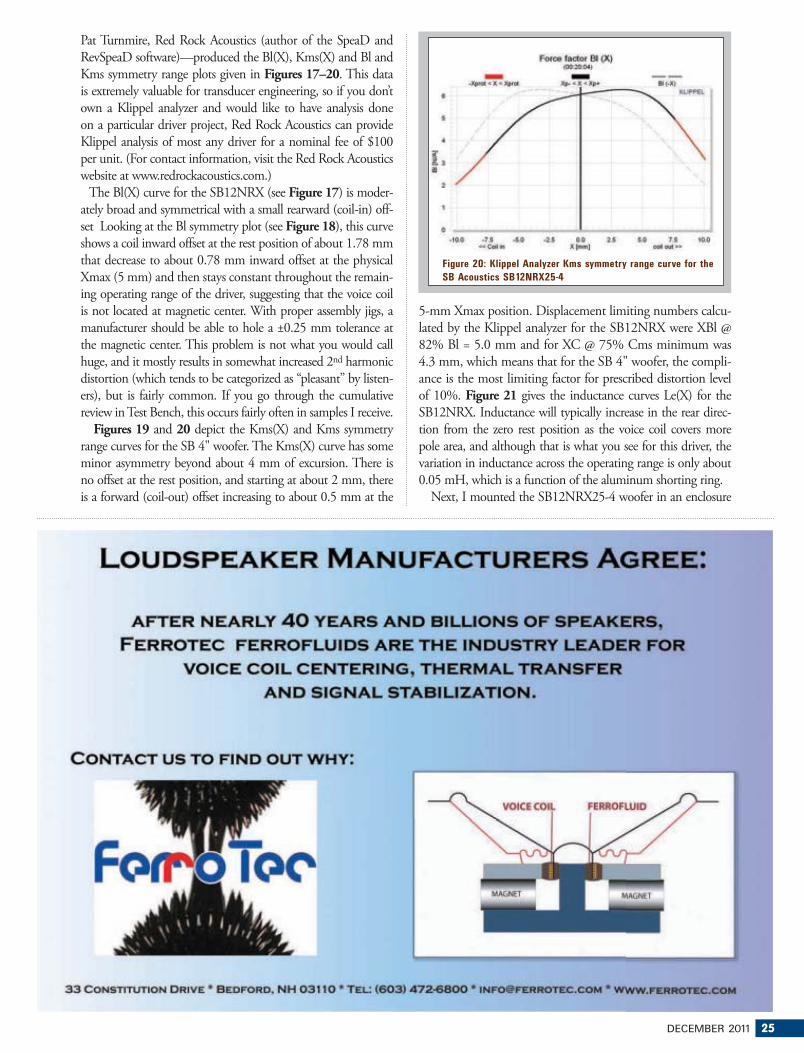
DECEMBER 2011 25
Pat Turnmire, Red Rock Acoustics (author of the SpeaD and
RevSpeaD software)—produced the Bl(X), Kms(X) and Bl and
Kms symmetry range plots given in Figures 17–20. This data
is extremely valuable for transducer engineering, so if you don’t
own a Klippel analyzer and would like to have analysis done
on a particular driver project, Red Rock Acoustics can provide
Klippel analysis of most any driver for a nominal fee of $100
per unit. (For contact information, visit the Red Rock Acoustics
website at www.redrockacoustics.com.)
The Bl(X) curve for the SB12NRX (see Figure 17) is moder-
ately broad and symmetrical with a small rearward (coil-in) off-
set Looking at the Bl symmetry plot (see Figure 18), this curve
shows a coil inward offset at the rest position of about 1.78 mm
that decrease to about 0.78 mm inward offset at the physical
Xmax (5 mm) and then stays constant throughout the remain-
ing operating range of the driver, suggesting that the voice coil
is not located at magnetic center. With proper assembly jigs, a
manufacturer should be able to hole a ±0.25 mm tolerance at
the magnetic center. This problem is not what you would call
huge, and it mostly results in somewhat increased 2nd harmonic
distortion (which tends to be categorized as “pleasant” by listen-
ers), but is fairly common. If you go through the cumulative
review in Test Bench, this occurs fairly often in samples I receive.
Figures 19 and 20 depict the Kms(X) and Kms symmetry
range curves for the SB 4" woofer. The Kms(X) curve has some
minor asymmetry beyond about 4 mm of excursion. There is
no offset at the rest position, and starting at about 2 mm, there
is a forward (coil-out) offset increasing to about 0.5 mm at the
5-mm Xmax position. Displacement limiting numbers calcu-
lated by the Klippel analyzer for the SB12NRX were XBl @
82% Bl = 5.0 mm and for XC @ 75% Cms minimum was
4.3 mm, which means that for the SB 4" woofer, the compli-
ance is the most limiting factor for prescribed distortion level
of 10%. Figure 21 gives the inductance curves Le(X) for the
SB12NRX. Inductance will typically increase in the rear direc-
tion from the zero rest position as the voice coil covers more
pole area, and although that is what you see for this driver, the
variation in inductance across the operating range is only about
0.05 mH, which is a function of the aluminum shorting ring.
Next, I mounted the SB12NRX25-4 woofer in an enclosure
Figure 20: Klippel Analyzer Kms symmetry range curve for the
SB Acoustics SB12NRX25-4
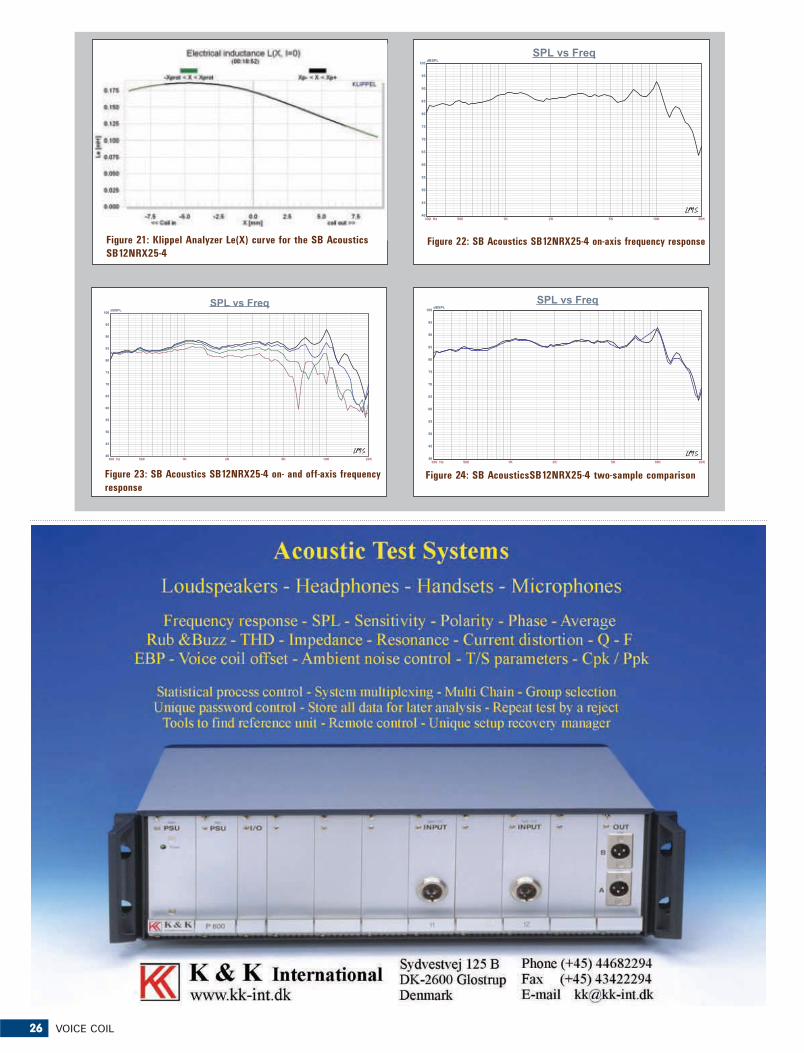
26 VOICE COIL
Figure 21: Klippel Analyzer Le(X) curve for the SB Acoustics
SB12NRX25-4
300 Hz 500 1K 2K 5K 10K 20K
dBSPL
40
45
50
55
60
65
70
75
80
85
90
95
100
SPL vs Freq
Figure 22: SB Acoustics SB12NRX25-4 on-axis frequency response
300 Hz 500 1K 2K 5K 10K 20K
dBSPL
40
45
50
55
60
65
70
75
80
85
90
95
100
SPL vs Freq
Figure 23: SB Acoustics SB12NRX25-4 on- and off-axis frequency
response
Figure 24: SB AcousticsSB12NRX25-4 two-sample comparison
300 Hz 500 1K 2K 5K 10K 20K
dBSPL
40
45
50
55
60
65
70
75
80
85
90
95
100
SPL vs Freq
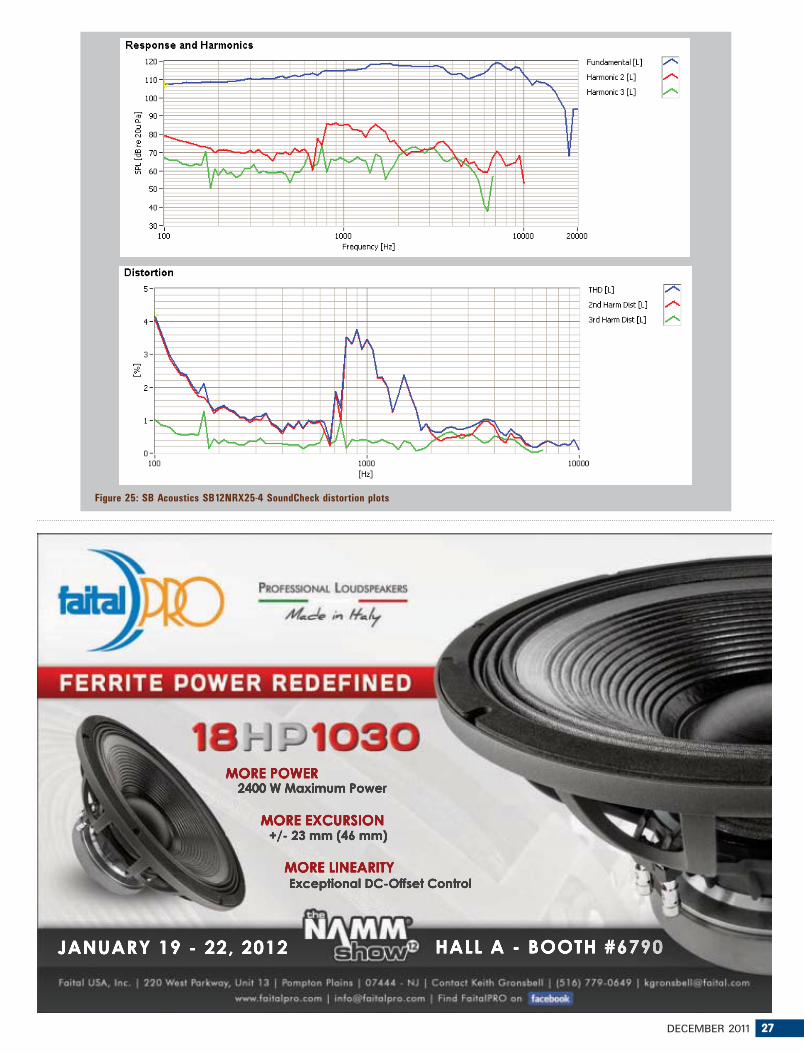
DECEMBER 2011 27
Figure 25: SB Acoustics SB12NRX25-4 SoundCheck distortion plots
28 VOICE COIL
Tel: (503) 557-0427 [email protected]
Loudspeaker Product Development
Vanc
e D
icka
son
Con
sulti
ng
Vance Dickason Consulting has been developing award winning products for numerous high profile brand names for over 20 years… experience that’s hard to find!
With extensive experience in high-end off-wall, in-wall, on-wall, ceiling and subwoofer products plus close relationships with some of the worlds best speaker OEM’s and you have a combination of services that will accelerate your next product lineup.
We have all the best toys (Klippel, LEAP 5,LMS, CLIO, MLSSA, LSPCad, FEA), so whether its multimedia, car audio, MI, Pro, two-channel or Home Theater (including THX®), VDC has the solutions.
Add to that an available design team that includes some of the best transducers engineers, industrial designers and marketing experts I know of in the industry and you have a winning combination that would cost well over $750,000 a year to keep in house.
which had a 13" × 6" baffle (filled with foam damping material)
and then measured the driver on- and off-axis from 300 Hz
to 20-kHz frequency response at 2.83 V/1 m using the
LinearX LMS analyzer set to a 100-point gated sine wave
sweep. Figure 22 depicts the SB12NRX’s on-axis response
indicating a smoothly rising response to about 5 kHz, with
the typical 3 to 4 dB peaking centered on 1.2 kHz, and a
couple of breakup modes centered on 7 kHz and 10 kHz.
Figure 23 displays the on- and off-axis frequency response at
0°, 15°, 30°, and 45°. –3 dB at 30° with respect to the on-axis
curve occurs at 4.5 kHz, so a cross point in that vicinity or lower
should be optimal. And finally, Figure 24 gives the two-sample
SPL comparisons for the 4" SB Acoustics driver, showing a very
close match throughout the operating range.
For the remaining group of test, I used the Listen, Inc.
SoundCheck analyzer (courtesy of Listen, Inc.) to measure
distortion and generate time frequency plots. For the distortion
measurement, the woofer was mounted rigidly in free-air, and
the SPL set to 94 dB (6.85 V) at 1 m using a noise stimulus,
and then the distortion measured at with the Listen, Inc. micro-
phone placed 10 cm from the dust cap. This produced the dis-
tortion curves shown in Figure 25. I then used SoundCheck to
get a 2.83 V/1-m impulse response for this driver and imported
the data into Listen, Inc.’s SoundMap Time/Frequency software.
The resulting CSD waterfall plot is given in Figure 26 and the
Wigner-Ville (for its better low-frequency performance) plot in
Figure 27.
With analysis on the first SB woofer accomplished, I per-Figure 26: SB Acoustics SB12NRX25-4 SoundCheck CSD waterfall
plot
Figure 27: SB Acoustics SB12NRX25-4 SoundCheck Wigner-Ville
plot
formed an identical group of tests on the SB Acoustics 7"
SB12MNRX (see Photo 3). As before, the LinearX LMS
analyzer and VIBox were employed to create both voltage and
admittance (current) curves. This test is accomplished with the
driver clamped to a rigid test fixture in free-air with sweeps
taken at 0.3 V, 1 V, 3 V, and 6 V. Like the SB12NRX, the 6-V
curve was too nonlinear and was discarded, which is interest-
ing considering the SB12MNRX has on 2.25 mm Xmax
compared to the 5-mm Xmax of the woofer version. The
remaining six 550-point stepped sine wave sweeps for each
SB12MNRX sample were post-processed and the voltage curves
divided by the current curves (admittance) to create impedance
curves, phase added using LMS calculation method, and along
with the accompanying voltage curves, saved to the LEAP 5
Enclosure Shop software. In addition to the LEAP 5 LTD model
The “Must Have” reference for loudspeaker engineering professionals.
Home, Car, or Home Theater!Back and better than ever, this 7th edition
provides everything you need to become a
better speaker designer. If you still have a
3rd, 4th, 5th or even the 6th edition of the
Loudspeaker Design Cookbook, you are
missing out on a tremendous amount of
new and important information!
Now including: Klippel analysis of drivers,
a chapter on loudspeaker voicing, advice
on testing and crossover changes, and so
much more! Ships complete with bonus CD
containing over 100 additional figures and
a full set of loudspeaker design tools.
A $99 value!
Yours today for just $39.95.
Shop for this book, and manyother Audio Amateur products,at www.cc-webshop.com.

30 VOICE COIL
results, I also created a LEAP 4 TSL model set of parameters
using just the 1-V free-air curves. The final data set, which
includes the multiple voltage impedance curves for the LTD
model (see Figure 28 for the 1-V free-air impedance curve) and
the 1-V impedance curve for the TSL model, were selected and
the parameters created in order to perform the computer box
simulations. Table 2 compares the LEAP 5 LTD and TSL data
and factory parameters for both of SB Acoustics 4" midrange
samples.
LEAP parameter calculation results for the SB12MNRX
midrange, like the woofer version, only moderately close to the
SB factory data, again with the measured data yielding a closer
match with the TSL data except for the higher Vas and lower
SPL. I proceeded however, to set up computer enclosure simula-
tions using the LEAP LTD parameters for Sample 2. I set up
two box simulations, one sealed and one vented. For the closed
box simulation I used a 0.16 ft3 enclosure with 50% fiberglass fill
material, and for the vented box, a 0.15 ft3 Qb3 vented enclosure
with 15% fiberglass fill material and tuned to 61 Hz.
Figure 29 displays the results for the SB12MNRX in the
sealed and vented boxes at 2.83 V and at a voltage level suf-
ficiently high enough to increase cone excursion to Xmax +
15% (2.6 mm for the SB12 midrange). This resulted in a F3
= 106 Hz with a box/driver Qtc of 0.69 for the 0.16 ft3 sealed
enclosure and a –3 dB = 76 Hz for the 0.15 ft3 vented simula-
tion. Increasing the voltage input to the simulations until the
maximum linear cone excursion was reached generated 97 dB
at 6 V for the sealed enclosure simulation and 97.3 dB with the
same 6-V input level for the larger vented box (see Figures 30
and 31 for the 2.83-V group delay curves and the 6-V excursion
curves). As with any midrange transducer, the box size is usually
only a method to locate the resonance as low in frequency as pos-
sible to facilitate a passive high-pass section of a band-pass filter.
Power handling with such a filter is substantially increased from
the non-filter simulation above.
Klippel analysis for the SB Acoustics 4" midrange produced
the Bl(X), Kms(X) and Bl and Kms Symmetry Range plots given
in Figures 32 to 35. The Bl(X) curve for the SB12MNRX (see
Figure 32) is fairly narrow, but very symmetrical, about what
you expect from a small Xmax midrange. For all practical pur-
poses, there is zero offset indication, so about as good as it ever
gets. Figures 34 and 35 give the Kms(X) and Kms symmetry
Range curves for the SB Acoustics 4" mid. The Kms(X) curve,
Photo 3: The SB12MNRX, a 7" driver from SB Acoustics
10 Hz 20 50 100 200 500 1K 2K 5K 10K 20K
Ohm
1
2
3
4
5
6789
10
20
30
40
50
Impedance vs Freq
Figure 28: SB Acoustics SB12MNRX25-4 free-air impedance plot
TSL model LTD model Factory
sample 1 sample 2 sample 1 sample 2
Fs 57.3 Hz 59.5 Hz 55.2 Hz 57.4 Hz 58 Hz
Revc 3.18 3.14 3.18 3.14 3.2
Sd 0.0055 0.0055 0.0055 0.0055 0.0050
Qms 3.79 4.25 4.25 4.05 3.6
Qes 0.44 0.43 0.53 0.47 0.42
Qts 0.39 0.39 0.47 0.42 0.37
Vas 6.88 ltr 6.37 ltr 7.46 ltr 6.90 ltr 5.5 ltr
SPL 2.83 V 86.5 dB 86.8 dB 85.6 dB 86.3 dB 88.5 dB
Xmax 2.25 mm 2.25 mm 2.25 mm 2.25 mm 2.25 mm
Table 2: SB Acoustics SB12MNRX25-4 midrange
10 Hz 20 50 100 200 500 1K
dBSPL
55
60
65
70
75
80
85
90
95
100
105
SPL vs Freq
Figure 29: SB Acoustics SB12MNRX25-4 computer box simula-
tions (black solid = vented @ 2.83V; blue dash = vented @ 2.83 V;
black solid = vented @6 V; blud dash = vented @ 6 V)
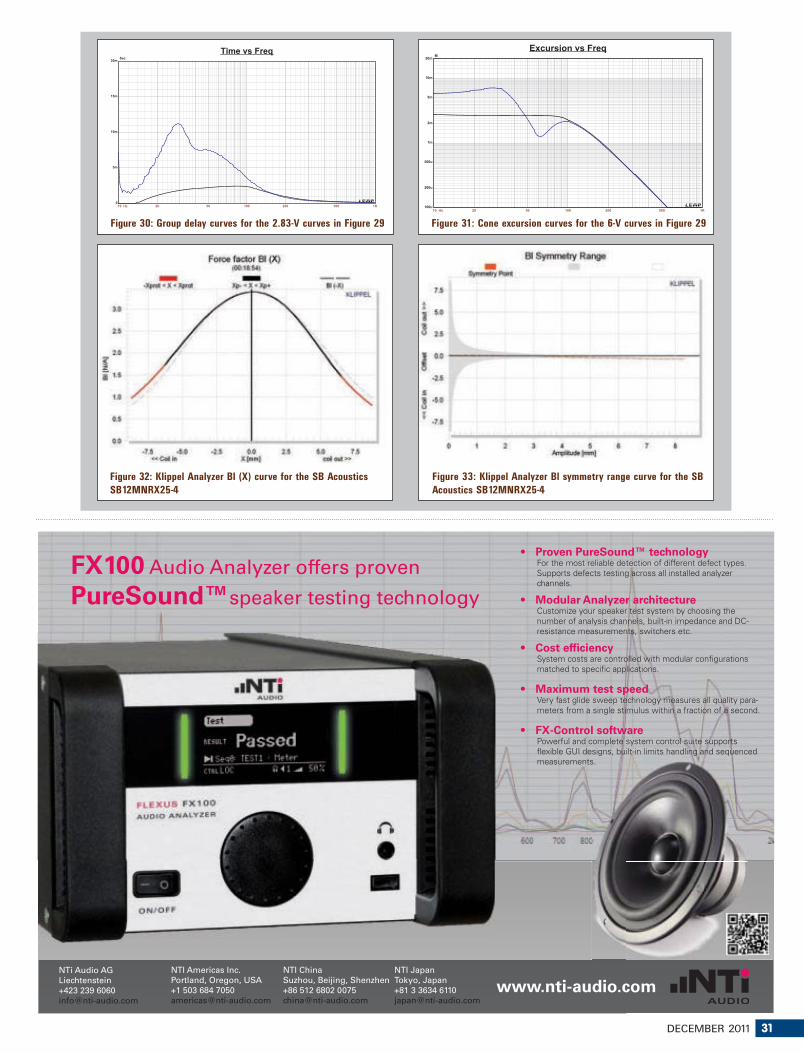
DECEMBER 2011 31
10 Hz 20 50 100 200 500 1K
Sec
0
5m
10m
15m
20m
Time vs Freq
Figure 30: Group delay curves for the 2.83-V curves in Figure 29
10 Hz 20 50 100 200 500 1K
M
100u
200u
500u
1m
2m
5m
10m
20m
Excursion vs Freq
Figure 31: Cone excursion curves for the 6-V curves in Figure 29
Figure 32: Klippel Analyzer Bl (X) curve for the SB Acoustics
SB12MNRX25-4
Figure 33: Klippel Analyzer Bl symmetry range curve for the SB
Acoustics SB12MNRX25-4
NTi Audio AG Liechtenstein+423 239 [email protected]
NTI Americas Inc. Portland, Oregon, USA+1 503 684 [email protected]
NTI ChinaSuzhou, Beijing, Shenzhen+86 512 6802 0075 [email protected]
NTI JapanTokyo, Japan +81 3 3634 [email protected]
www.nti-audio.com
FX100 Audio Analyzer offers proven
PureSound™speaker testing technology
Proven PureSound™ technology For the most reliable detection of different defect types. Supports defects testing across all installed analyzer channels.
Modular Analyzer architecture Customize your speaker test system by choosing the number of analysis channels, built-in impedance and DC-resistance measurements, switchers etc.
Cost efficiency System costs are controlled with modular configurations matched to specific applications.
Maximum test speed Very fast glide sweep technology measures all quality para-meters from a single stimulus within a fraction of a second.
FX-Control software Powerful and complete system control suite supports flexible GUI designs, built-in limits handling and sequenced measurements.
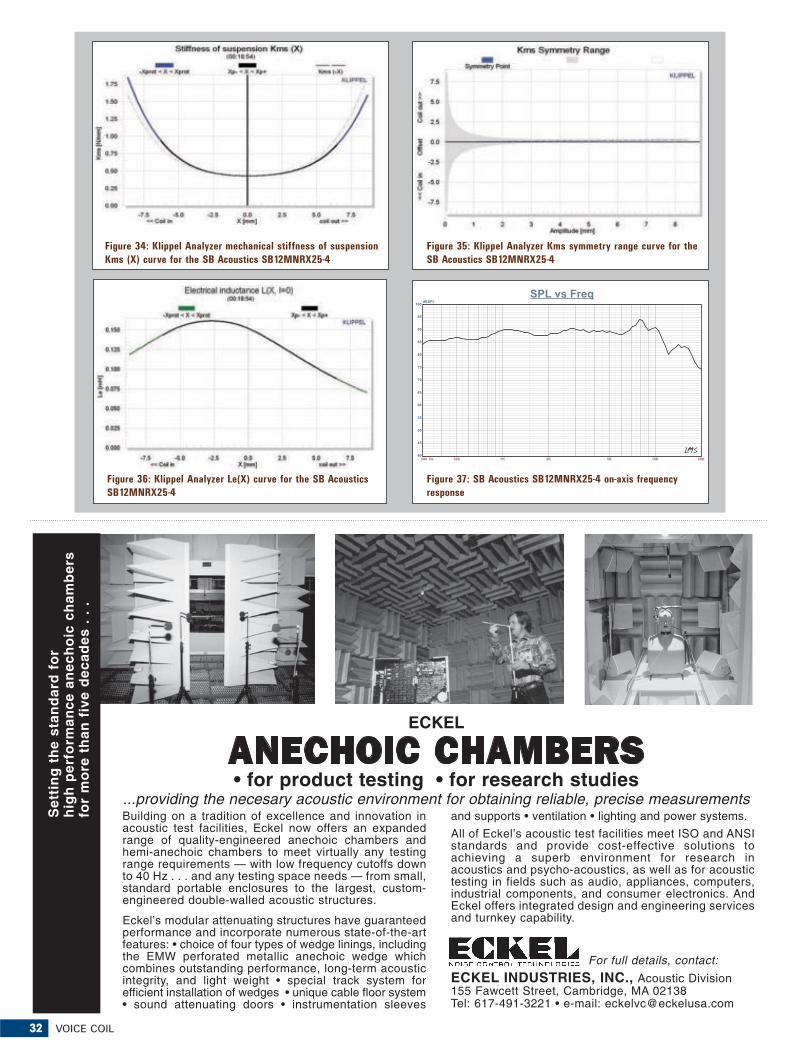
32 VOICE COIL
Figure 34: Klippel Analyzer mechanical stiffness of suspension
Kms (X) curve for the SB Acoustics SB12MNRX25-4
Figure 35: Klippel Analyzer Kms symmetry range curve for the
SB Acoustics SB12MNRX25-4
Figure 36: Klippel Analyzer Le(X) curve for the SB Acoustics
SB12MNRX25-4
300 Hz 500 1K 2K 5K 10K 20K
dBSPL
40
45
50
55
60
65
70
75
80
85
90
95
100
SPL vs Freq
Figure 37: SB Acoustics SB12MNRX25-4 on-axis frequency
response
ECKEL
ANECHOIC CHAMBERS• for product testing • for research studies
...providing the necesary acoustic environment for obtaining reliable, precise measurementsBuilding on a tradition of excellence and innovation inacoustic test facilities, Eckel now offers an expandedrange of quality-engineered anechoic chambers andhemi-anechoic chambers to meet virtually any testingrange requirements — with low frequency cutoffs downto 40 Hz . . . and any testing space needs — from small,standard portable enclosures to the largest, custom-engineered double-walled acoustic structures.
Eckel’s modular attenuating structures have guaranteedperformance and incorporate numerous state-of-the-artfeatures: • choice of four types of wedge linings, includingthe EMW perforated metallic anechoic wedge whichcombines outstanding performance, long-term acousticintegrity, and light weight • special track system forefficient installation of wedges • unique cable floor system• sound attenuating doors • instrumentation sleeves
and supports • ventilation • lighting and power systems.
All of Eckel’s acoustic test facilities meet ISO and ANSIstandards and provide cost-effective solutions toachieving a superb environment for research inacoustics and psycho-acoustics, as well as for acoustictesting in fields such as audio, appliances, computers,industrial components, and consumer electronics. AndEckel offers integrated design and engineering servicesand turnkey capability.
For full details, contact:
ECKEL INDUSTRIES, INC., Acoustic Division155 Fawcett Street, Cambridge, MA 02138Tel: 617-491-3221 • e-mail: [email protected]
Set
tin
g t
he
stan
dar
d f
or
hig
h p
erfo
rman
ce a
nec
ho
ic c
ham
ber
sfo
r m
ore
th
an f
ive
dec
ades
. .
.
DECEMBER 2011 33
like the Bl curve, is very symmetrical with practically no offset,
indicating a lot of design integrity. Displacement limiting num-
bers calculated by the Klippel analyzer for the SB12MNRX were
XBl @ 82% Bl = 3.3 mm (1.05 mm greater than the physical
Xmax!) and for XC @ 75% Cms minimum was 4.0 mm, which
means that for the SB12MNRX woofer, the Bl is the most limit-
ing factor for prescribed distortion level of 10%. Figure 36 gives
the inductance curves Le(X) for the SB12MNRX. This also very
similar to the SB12NRX, with a very small inductance change
across the operating range of 0.03 mH, indicating that the alu-
minum shorting ring does a good job of controlling inductance.
With the Klippel testing accomplished, I mounted the
SB12MNXR25-4 midrange driver in an enclosure which had a
13" × 6" baffle and was filled with foam damping material and
then measured the driver both on and off-axis from 300 Hz to
20 kHz frequency response at 2.83 V/1 m using a 100-point
gated sine wave sweep. Figure 37 depicts the SB12MNRX’s on-
axis response displaying a very smooth rising response to about
6 kHz, with a 2 dB peak centered on 1.2 kHz and breakup
mode centered on 8 kHz, and as you would expect, very similar
to the SB12NRX. Figure 38 has the on and off-axis frequency
response at 0°, 15°, 30°, and 45°. –3 dB at 30° with respect to the
on-axis curve occurs at 4.5 kHz, so a 4.5 kHz to 5 kHz crossover
frequency would be appropriate for this SB driver. And finally,
Figure 39 gives the two-sample SPL comparisons for the 4" SB
midrange driver, showing a less than 0.5 dB match up to 4 kHz.
For the last body of testing on the SB 4" mid, I again fired up
the Listen, Inc. SoundCheck analyzer (courtesy of Listen, Inc.)
300 Hz 500 1K 2K 5K 10K 20K
dBSPL
40
45
50
55
60
65
70
75
80
85
90
95
100
SPL vs Freq
Figure 38: SB Acoustics SB12MNRX25-4 on- and off-axis frequency
response
300 Hz 500 1K 2K 5K 10K 20K
dBSPL
40
45
50
55
60
65
70
75
80
85
90
95
100
SPL vs Freq
Figure 39: SB Acoustics SB12MNRX25-4 two-sample SPL com-
parison

34 VOICE COIL
Figure 40: SB Acoustics SB12MNRX25-4 SoundCheck distortion plots
Figure 41: SB Acoustics SB12MNRX25-4 SoundCheck CSD
waterfall plot
Figure 42: SB Acoustics SB12MNRX25-4 SoundCheck Wigner-
Ville plot
and SCM microphone and power supply to measure distortion
and generate time frequency plots. Setting up for the distortion
measurement again consisted of mounting the woofer rigidly in
free-air, and the SPL set to 94 dB (5.27 V) at 1 m using a noise
stimulus (SoundCheck has a software generator and SPL meter
as two of its utilities), and then the distortion measured with
the SCM microphone placed 10 cm from the dust cap. This
produced the distortion curves shown in Figure 40. Finally, I
employed the SoundCheck analyzer to get a 2.83 V/1 m impulse
response for this driver and imported the data into Listen, Inc.’s
SoundMap Time/Frequency software. The resulting CSD water-
fall plot is given in Figure 41 and the Wigner-Ville (for its better
low-frequency performance) plot in Figure 42. For more infor-
mation, visit the SB website at www.sbacoustics.com. VC
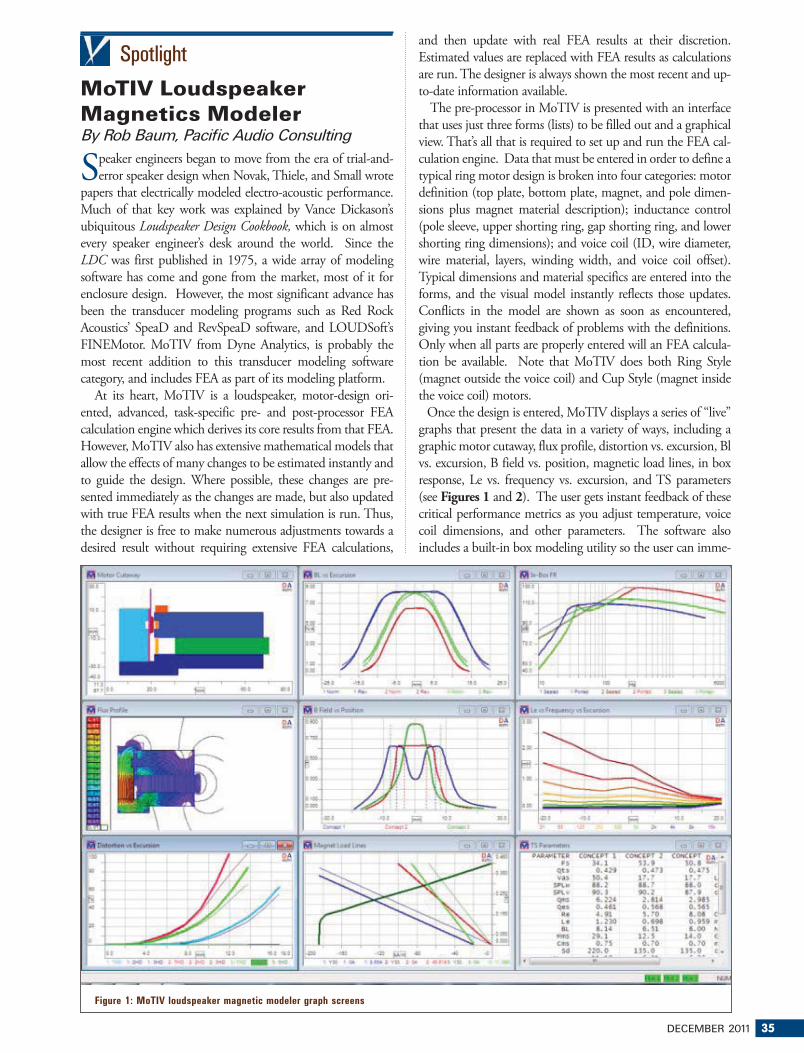
DECEMBER 2011 35
Spotlight
Figure 1: MoTIV loudspeaker magnetic modeler graph screens
b)
MoTIV Loudspeaker Magnetics Modeler By Rob Baum, Pacific Audio Consulting
Speaker engineers began to move from the era of trial-and-
error speaker design when Novak, Thiele, and Small wrote
papers that electrically modeled electro-acoustic performance.
Much of that key work was explained by Vance Dickason’s
ubiquitous Loudspeaker Design Cookbook, which is on almost
every speaker engineer’s desk around the world. Since the
LDC was first published in 1975, a wide array of modeling
software has come and gone from the market, most of it for
enclosure design. However, the most significant advance has
been the transducer modeling programs such as Red Rock
Acoustics’ SpeaD and RevSpeaD software, and LOUDSoft’s
FINEMotor. MoTIV from Dyne Analytics, is probably the
most recent addition to this transducer modeling software
category, and includes FEA as part of its modeling platform.
At its heart, MoTIV is a loudspeaker, motor-design ori-
ented, advanced, task-specific pre- and post-processor FEA
calculation engine which derives its core results from that FEA.
However, MoTIV also has extensive mathematical models that
allow the effects of many changes to be estimated instantly and
to guide the design. Where possible, these changes are pre-
sented immediately as the changes are made, but also updated
with true FEA results when the next simulation is run. Thus,
the designer is free to make numerous adjustments towards a
desired result without requiring extensive FEA calculations,
and then update with real FEA results at their discretion.
Estimated values are replaced with FEA results as calculations
are run. The designer is always shown the most recent and up-
to-date information available.
The pre-processor in MoTIV is presented with an interface
that uses just three forms (lists) to be filled out and a graphical
view. That’s all that is required to set up and run the FEA cal-
culation engine. Data that must be entered in order to define a
typical ring motor design is broken into four categories: motor
definition (top plate, bottom plate, magnet, and pole dimen-
sions plus magnet material description); inductance control
(pole sleeve, upper shorting ring, gap shorting ring, and lower
shorting ring dimensions); and voice coil (ID, wire diameter,
wire material, layers, winding width, and voice coil offset).
Typical dimensions and material specifics are entered into the
forms, and the visual model instantly reflects those updates.
Conflicts in the model are shown as soon as encountered,
giving you instant feedback of problems with the definitions.
Only when all parts are properly entered will an FEA calcula-
tion be available. Note that MoTIV does both Ring Style
(magnet outside the voice coil) and Cup Style (magnet inside
the voice coil) motors.
Once the design is entered, MoTIV displays a series of “live”
graphs that present the data in a variety of ways, including a
graphic motor cutaway, flux profile, distortion vs. excursion, Bl
vs. excursion, B field vs. position, magnetic load lines, in box
response, Le vs. frequency vs. excursion, and TS parameters
(see Figures 1 and 2). The user gets instant feedback of these
critical performance metrics as you adjust temperature, voice
coil dimensions, and other parameters. The software also
includes a built-in box modeling utility so the user can imme-
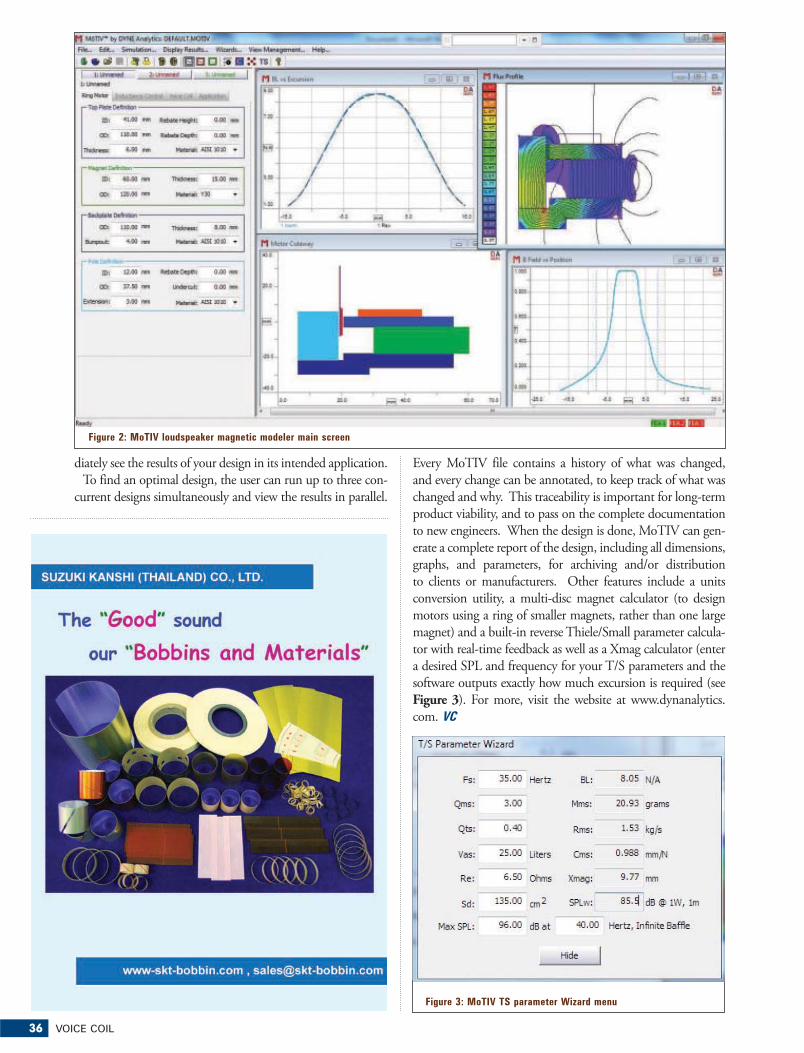
36 VOICE COIL
diately see the results of your design in its intended application.
To find an optimal design, the user can run up to three con-
current designs simultaneously and view the results in parallel.
Figure 2: MoTIV loudspeaker magnetic modeler main screen
Figure 3: MoTIV TS parameter Wizard menu
Every MoTIV file contains a history of what was changed,
and every change can be annotated, to keep track of what was
changed and why. This traceability is important for long-term
product viability, and to pass on the complete documentation
to new engineers. When the design is done, MoTIV can gen-
erate a complete report of the design, including all dimensions,
graphs, and parameters, for archiving and/or distribution
to clients or manufacturers. Other features include a units
conversion utility, a multi-disc magnet calculator (to design
motors using a ring of smaller magnets, rather than one large
magnet) and a built-in reverse Thiele/Small parameter calcula-
tor with real-time feedback as well as a Xmag calculator (enter
a desired SPL and frequency for your T/S parameters and the
software outputs exactly how much excursion is required (see
Figure 3). For more, visit the website at www.dynanalytics.
com. VC

DY
NE A
NA
LY
TIC
SH
ong
Kon
g |
WW
W.D
YN
EA
NA
LY
TIC
S.C
OM
EA
SY T
O L
EA
RN
. EA
SY T
O U
SE. A
CC
UR
ATE
. C
OST
EFF
EC
TIVE.
MoTIV
Moto
r D
esig
n M
odeling
AN
NO
UN
CIN
G T
HE
DE
BU
T O
F
VIB
RA
TE
xp
ert
Con
e, D
ome,
an
d S
usp
ensi
on F
EA
Mod
elin
gT
est
Dri
ve V
IBR
AT
at
2012
CE
S an
d A
LM
A

38 VOICE COIL
had immigrated from
Russia. His father was
editor of a Russian-
language newspaper,
his mother a biologist.
It was his service in
World War II that
sparked Mr. Villchur’s
fascination with
sound and electron-
ics. He had graduated
from City College in
1938, and then earned a master’s degree in education there two
years later. But within a year he was drafted into the Army Air
Forces and was trained as an electronics technician. For most
of the next five years, while rising to captain, he was responsible
for his squadron’s radio operations in the Pacific. After the
war Mr. Villchur opened a radio shop in Greenwich Village,
making repairs and building custom hi-fi sets. He also taught a
course in sound reproduction at New York University.
Mr. Villchur married Rosemary Shafer in 1945. Besides his
wife and daughter, he is survived by a son, Mark, of Boston.
The Villchurs moved to Woodstock in 1952. In his basement,
Mr. Villchur began testing his notion of a sealed-cabinet loud-
speaker. One day in spring 1954, speaking to his acoustics class
at N.Y.U, he hinted at his idea. One student, Henry Kloss,
stayed after class, eager to learn more. Soon, student and teach-
er were in Mr. Villchur’s 1938 Buick, headed to Woodstock.
Audio Pioneer Dies at Age 94It is with regret that Voice
Coil must report the passing
of one of the loudspeaker
industry’s true pioneers.
Edgar M. Villchur—whose
invention of a small loud-
speaker that could produce
deep, rich bass opened the
high-fidelity music market
in the 1950s to millions of
everyday listeners—died on October 17, 2011 at his home in
Woodstock, N.Y. He was 94. In the Hi-Fi News 50th anniver-
sary issue in 2006, the magazine ranked him No. 1 among the
50 most important audio pioneers. Many others, such as John
Atkinson, the editor of Stereophile magazine, also credits him
with bringing hi-fi into the home.
Such is the general public’s knowledge of Mr. Villchur, but
those of us actively involved in designing loudspeakers realize
the tremendous impact of his work in developing sealed-box
loudspeakers. The following was published in the October 17,
2011 edition of the New York Times:
“Edgar Marion Villchur was born in Manhattan on May
28, 1917, the only child of Mark and Mariam Villchur, who
Industry WatchBy Vance Dickason
Edgar M. Villchur (1917-2011)
Edgar M. Villchur

DECEMBER 2011 39
a short presentation Mr. Villchur made in February 2001. He
will be missed.
Steve Jobs RememberedIt would be impossible for Voice Coil not to also acknowledge
the passing of Steve Jobs. While Steve’s contributions were not
specific to loudspeakers, his effect upon the consumer elec-
tronics industry was unparalleled. For our industry, you only
have to look at the recent proliferation of iPod dock desktop
loudspeakers to see the tremendous impact that he had. Sadly,
Steve’s life was cut short at 56, so we will never know what
electronic marvels he would have helped usher into the world.
Like Edgar, he will be missed.
KEF Celebrates 50 YearsBritish audio brand KEF celebrated its 50th anniversary with
parties worldwide, including a party at the British consul-gener-
al’s official residence. About 100 KEF dealers, reps, employees,
and customers attended the event, hosted by consul-general
Danny Lopez, who lauded KEF for exemplifying innovation.
In speaking to guests, KEF America President Alec Chanin
noted that in the home audio industry, not a lot of compa-
nies have had this long a run. Besides doing its own design
and engineering, he said, KEF still invests in pure research.
To continue the celebration, in February KEF will launch its
second 50th anniversary product following the launch earlier
this year of the $29,999/pair KEF Blade, which was played at
the event and was the first product launched by the company
In Mr. Villchur’s basement workshop, they listened to the copi-
ous low-frequency tones on an LP recorded by the renowned
organist E. Power Biggs. Mr. Kloss had a loft in Cambridge,
Mass., where he was already building mail-order cabinets for
Baruch-Lang speakers. It became the first headquarters for
Acoustic Research. Mr. Kloss, who died in 2002, is credited
with designing the production process for the AR-1 speaker
and its successors, the AR-2 and the AR-3, which combined
Mr. Villchur’s woofer and tweeter models.
Among Mr. Villchur’s duties was promoting the products.
In the early 1960s, he sponsored “live vs. recorded” con-
certs around the country, including one in a recital room at
Carnegie Hall and another at Grand Central Terminal. At the
concerts, a string quartet would play a piece of music, then
mime it as parts of a recording by the same quartet played
through a pair of AR-3 speakers. The listeners were rarely able
to detect the switchovers.
Mr. Villchur was president of Acoustic Research until 1967.
After being bought by a series of manufacturers, the company
went out of business in 2004. Its brand name was bought
by the Audiovox Corporation. Soon after leaving Acoustic
Research, Mr. Villchur started the Foundation for Hearing
Aid Research in Woodstock, where he developed a prototype
of the multichannel compression hearing aid that has become
an industry standard.”
If you have never seen Edgar talk about his favorite subject,
transducers, go to the Audio Engineering Society’s website
oral history section (www.aes.org/historical/oral/?ID=39) for
�
w w w . k l i p p e l . d e
SMALLa n d
L O U Ds p e a k e r s �
Increase Output – Shrink Size – Improve Performance!
�������� ��� ��� ������� �� � ���� �� ��������� �� ������������� �� ���� ������ �� � �������� ��������� �������������������� �� � ����������� ������������� ������� ��������������� �� ����� �� � � ������ ���������� �������� �� � ������� �� ��������������������������������!�����������"##$��� ����������������%

40 VOICE COIL
to celebrate its anniversary.
KEF is promoting its 50th
anniversary message in print
and online ads that focus on
its heritage and feature a series
of famous past products, said
KEF America Marketing
Manager Stephanie Scola.
On September 29, the com-
pany will launch a website, www.kef.com/thefifty, to highlight
the top 50 products from its 50 years in business. A commem-
orative hardcover book outlining KEF’s history has also been
published and became available on Amazon in mid-October at
$89.99. Happy Birthday KEF!
HTSA Experiences ResurgenceThe Home Technology Specialists of America (HTSA) is
enjoying a resurgence of its high-end audio, automation and
home-networking businesses, the buying group’s senior execu-
tives reported. Executive committee members Jon Robbins,
principal of HiFi House, and Brian Hudkins, owner of
Gramophone, maintain that many of HTSA’s 56 member inte-
grators, A/V dealers and custom installers have seen a significant
“bump” in those categories, as customers elect to invest in their
current homes rather than purchase new ones. The group, now
in its 16th year, gathered for its annual fall “Pump Up” meeting,
the first without former executive director Richard Glikes, who
resigned unexpectedly in August. HTSA began interviewing
KEF celebrates its 50th anniversary
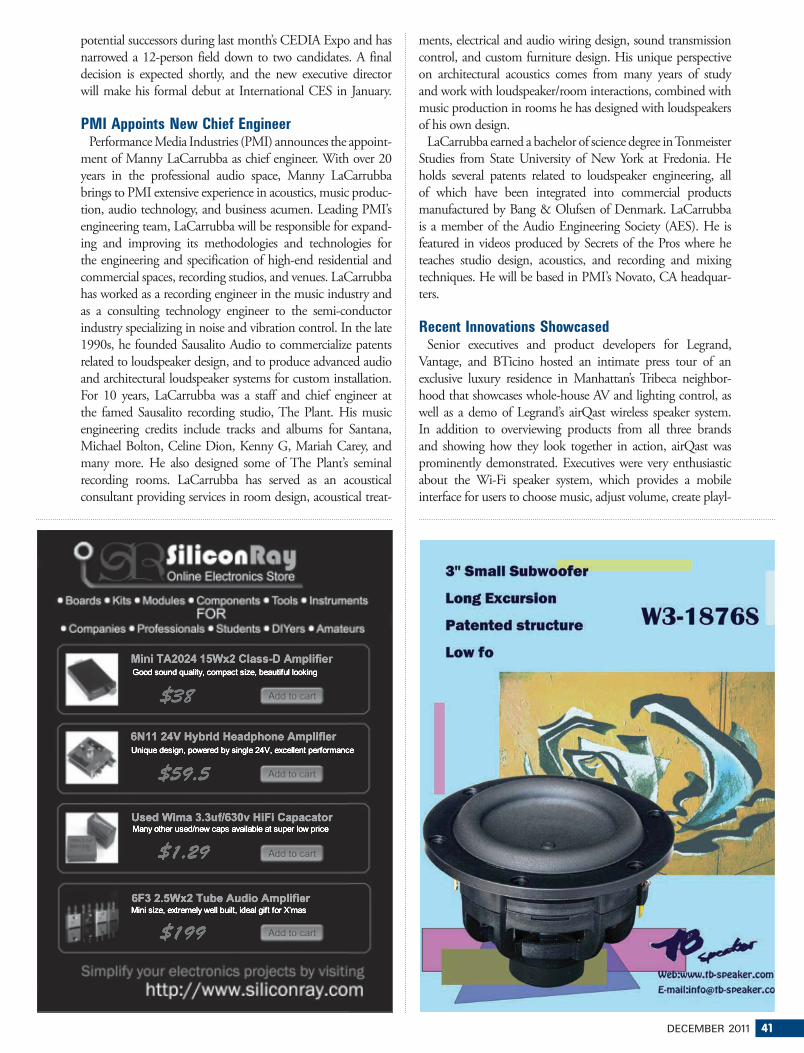
DECEMBER 2011 41
potential successors during last month’s CEDIA Expo and has
narrowed a 12-person field down to two candidates. A final
decision is expected shortly, and the new executive director
will make his formal debut at International CES in January.
PMI Appoints New Chief EngineerPerformance Media Industries (PMI) announces the appoint-
ment of Manny LaCarrubba as chief engineer. With over 20
years in the professional audio space, Manny LaCarrubba
brings to PMI extensive experience in acoustics, music produc-
tion, audio technology, and business acumen. Leading PMI’s
engineering team, LaCarrubba will be responsible for expand-
ing and improving its methodologies and technologies for
the engineering and specification of high-end residential and
commercial spaces, recording studios, and venues. LaCarrubba
has worked as a recording engineer in the music industry and
as a consulting technology engineer to the semi-conductor
industry specializing in noise and vibration control. In the late
1990s, he founded Sausalito Audio to commercialize patents
related to loudspeaker design, and to produce advanced audio
and architectural loudspeaker systems for custom installation.
For 10 years, LaCarrubba was a staff and chief engineer at
the famed Sausalito recording studio, The Plant. His music
engineering credits include tracks and albums for Santana,
Michael Bolton, Celine Dion, Kenny G, Mariah Carey, and
many more. He also designed some of The Plant’s seminal
recording rooms. LaCarrubba has served as an acoustical
consultant providing services in room design, acoustical treat-
ments, electrical and audio wiring design, sound transmission
control, and custom furniture design. His unique perspective
on architectural acoustics comes from many years of study
and work with loudspeaker/room interactions, combined with
music production in rooms he has designed with loudspeakers
of his own design.
LaCarrubba earned a bachelor of science degree in Tonmeister
Studies from State University of New York at Fredonia. He
holds several patents related to loudspeaker engineering, all
of which have been integrated into commercial products
manufactured by Bang & Olufsen of Denmark. LaCarrubba
is a member of the Audio Engineering Society (AES). He is
featured in videos produced by Secrets of the Pros where he
teaches studio design, acoustics, and recording and mixing
techniques. He will be based in PMI’s Novato, CA headquar-
ters.
Recent Innovations ShowcasedSenior executives and product developers for Legrand,
Vantage, and BTicino hosted an intimate press tour of an
exclusive luxury residence in Manhattan’s Tribeca neighbor-
hood that showcases whole-house AV and lighting control, as
well as a demo of Legrand’s airQast wireless speaker system.
In addition to overviewing products from all three brands
and showing how they look together in action, airQast was
prominently demonstrated. Executives were very enthusiastic
about the Wi-Fi speaker system, which provides a mobile
interface for users to choose music, adjust volume, create playl-
Monster®, the world’s leader in high-end consumer electronics accessories, is growing and expanding rapidly.
We want to talk to technically savvy product development A Players to join our Team!
The Coolest Nerds Work at Monster! !
Product EngineersMonster is looking for experienced Product Engineers with a successful track record of designing and deploying innovative consumer electronics accessories. The successful candidate will demonstrate a thorough understanding of a structured product lifecycle management process utilizing US design resources and collaborative supply chain analytics to bring high quality consumer electronics products to market on time and at the right price.
Product Area Managers (PAM)Monster is looking for product category experts who are innovators, who can be market gurus, partner with sales, project managers and business leaders. You are the subject matter expert on big-box retail channels, specialized channels, independent retailers, distributors, sales and marketing strategies. You’re in charge of leading product development by getting the right product at the right price to market on-time, with the proper sell-in and sell-through support, with responsibility for worldwide profitability.
For more information, please visit www.monstercable.com/company_info/careers.asp
DECEMBER 2011 43
ists, and stream IP radio from their smartphones and tablets.
The CEDIA channel had an initial glimpse of airQast recently
at EXPO in Indianapolis, but the demo was much more
impactful without the tradeshow buzz soaking up the sound.
Consisting of two speakers with 40 W per channel, the sound
quality exhibited a strong range in volume and came across
without any noticeable distortion on the high end. The speak-
ers are set up for use with a subwoofer that is sold separately.
CEA Standardizes TermsThe Consumer Electronics Association (CEA) have
announced the publication of CEA-2042.1, Wireless Power
Glossary of Terms. The standard, defined by CEA’s Wireless
Power Subcommittee, addresses system components in order
to facilitate widespread deployment of interoperable wire-
less power systems. It is the first of several planned standards
designed to advance wireless charging technology, changing
how consumers charge their devices. Wireless power technol-
ogy streamlines the process of charging portable consumer elec-
tronics devices by eliminating the need to physically connect
the device and the charger.
CEA-2042.1 is available for purchase from IHS at www.ihs.
com. CEA’s Wireless Power Subcommittee is also working on
standards for highly resonant (also known as “loosely coupled”)
wireless power transfer, tightly coupled wireless power systems,
and energy-efficiency measurements for wireless power sys-
tems. Companies interested in participating in this CEA work
can visit standards.CE.org and join the R6.3 Wireless Power
Subcommittee and its working groups. For more information,
contact Dave Wilson at [email protected], or 703-907-7421.
Harman's Sales RiseHarman International Industries reported higher net
sales and higher net profits in its fiscal first quarter, ended
September 30. Net sales for the first quarter were $1.051
million, an increase of 26% compared with the same period
last year. Excluding foreign currency translation, net sales
increased by 19%. Net income was $48 million, up from
the prior year’s $27 million. Operating income was $74 mil-
lion, compared with $43 million in the same period last year.
During this quarter, all three of the company’s divisions report-
ed higher sales. In the infotainment division, net sales were
$603 million, up from the prior year’s $446 million. Operating
income was $47 million, up from $8 million. Harman attrib-
uted higher sales to pent-up demand from the Japan tsunami
and earthquake and continued growth in BRIC countries. In
its lifestyle division, sales were up 19% to $300 million com-
pared with last year due to the same factors in the infotainment
division, but operating income was down $3 million to $26
million. Profits were down due to higher costs of neodymium
magnets. In the professional division, net sales were $148 mil-
lion, up $8 million, while operating profit was down $6 million
from the prior year’s quarter to $19 million.
Japan's Earthquake Impacts Overseas PartnersRockford Corporation boosted net income and gross margins in
its fiscal third-quarter and year-to-date periods on a 0.7% decline
in third-quarter sales and a 12.3% rise in year-to-date sales. Sales
44 VOICE COIL
nami that reduced their operations in the second quarter.
Audiovox Experiences GrowthAudiovox reported higher net sales and net income for its fis-
cal second quarter, ended August 31. Net income for the quar-
ter was $3.4 million, compared with net income of $600,000
in the prior year’s second quarter. Net sales for the second quar-
ter were $158.3 million, an increase of 22.5%, compared with
net sales of $129.3 million reported in the comparable year-ago
period. For the fiscal first half net sales were $323.7 million, an
increase of 24.7% as compared with net sales of $259.6 mil-
lion for the prior year’s first half. First-half net income was $5.9
million, compared with a net income of $1.8 million last year.
For the three- and six-month periods, ended August 31,
electronics sales were $126.7 million and $259.0 million, an
increase of 33.1% and 36.5%, respectively, over the compa-
rable prior-year periods. Accessories sales were $31.6 million
and $64.7 million, a decrease of 7.2% and 7.5%, respectively.
For both periods, the electronics group was favorably impacted
by the addition of Klipsch, improvements in the automotive
OEM channel, both domestically and abroad, and increases in
international operations of Audiovox. Offsetting these increases
were lower sales of consumer electronics products and select
groups in the audio category, as well as lower sales of acces-
sory products attached to TV sales in the United States. As
a percentage of net sales, electronics represented 80% of the
net sales for the three and six months, ended August 31, and
accessories represented the remaining 20% for these periods.
fell in the third quarter primarily because of declining revenue
from Japanese automakers whose supply chains were interrupted
by the Japan earthquake earlier this year, the company said.
Net sales for the three months, ended September 30, were down
0.7% to $14.2 million compared with the year-ago $14.3 mil-
lion. Net sales for the first nine months of the fiscal year rose
12.3% to $47.8 million compared with a year-ago $42.6 mil-
lion. Net income for the third quarter rose 71% to $1.2 million
from a year-ago $700,000, and for the nine-month period,
net income rose 68% to $4.2 million from a year-ago $2.5
million. As percent of net sales, gross margins increased during
both periods, rising in the quarter to 37.4% from a year-ago
36.9%. For the nine-month period, gross margin increased to
38.5% from the year ago 37%. Operating expenses for the
three months fell to $4.1 million from a year-ago $4.5 million
but were up for the nine-month period to $14.1 million from
a year-ago $13.1 million. The increase in operating expenses
for the nine-month period was due primarily to higher vari-
able expenses, such as outbound freight and commissions,
resulting from higher sales and increased sales and promotional
expenditures.
OEM revenues were down for the quarter as well as for
the nine-month period, with nine-month OEM revenues
falling to $2 million compared with a year-ago $2.2 mil-
lion, because of interrupted production by Japanese auto-
maker customers. Nonetheless the company’s OEM busi-
ness remains stable, and their Japanese-based partners have
returned to normal production after the earthquake and tsu-
DECEMBER 2011 45
Operating income was $7.7 million, compared with operat-
ing income of $2 million in the comparable year-ago period.
For the fiscal first half, operating income was $11.6 million,
compared with an operating loss of $1.3 million in the prior
year.
Consumer Confidence Hits New LowConsumer sentiment in the overall economy is at its low-
est point in the history of the CEA Indexes, the Consumer
Electronics Association (CEA) announced. Consumer confi-
dence in technology spending also fell in September.
For the fifth consecutive month, consumer confidence in
the overall economy has dropped, now to its lowest level in
the history of the CEA Indexes, which began tracking in
January 2007. In September, the CEA Index of Consumer
Expectations (ICE) fell to 156.8, down two points from last
month and six-and-a-half points lower than this time last year.
Consumer confidence in technology also fell in September.
After strong gains, the CEA Index of Consumer Technology
Expectations (ICTE), which measures consumer expectations
about technology spending, dropped two-and-a-half points
to 81.9. The ICTE is at its lowest level since May 2011, but
remains up a point from this time last year.
The CEA Indexes comprise the ICE and ICTE, which are
updated on a monthly basis through consumer surveys. New
data is released on the fourth Tuesday of each month. CEA
has been tracking index data since January 2007. For more
information, log on to CEAindexes.org. VC
������+�™ R & D Measurement system
www.loudsoft.com
Features: Multiple displays of min. 16 responses
Waterfall Decay with Time curtain
THD + 2 – 9th harmonics distortion
1/12 - 1/6 - 1/3 – 1/2 – 1/1 octave
Anechoic FFT - Acoustic auto-delay
50 curves/responses/TS parameters
SPL/Frequency, Imp., phase, export
Soundcards: PCI/USB/Firewire/ASIO
Headsets, USB/Bluetooth
19” hardware USB+25W Amp/48V
Perfect replacement for MLSSA and
LMS

46 VOICE COIL
Products & Services Index
Advertiser Categories PageAAC–Applications Acoustiques de Composites. D,L ..............15, 43
ACO Pacific, Inc. .................................. K,N ................... 44
Acoustics First Corporation. ................... R ...................... 33
ALMA International. ............................. T ........................9
Audience ............................................. B,C,H ................ 34
Audiostar Electronics Co., Ltd. ............... O ...................... 44
audioXpress .................................................................. 29
Beston Technology Corporation.............. D ...................... 40
BMS Speakers GmbH ............................. D ...................... 17
Celestion Int'l. ..................................... D ...................... 21
Creative Sound Solutions ...................... D..... ................. 24
Dyne Analytics ..................................... N ...................... 37
Eckel Industries. .................................. N ...................... 32
Etani Electronics Co., Ltd. ..................... B,G,L,N ............. 10
EzPCB ................................................. C,N,O ................ 41
Faital USA ........................................... D ...................... 27
Ferrotec Corporation ............................. L ...................... 25
Fluid Metering, Inc ............................... J ...................... 45
G.R.A.S Sound & Vibration. ................... K ........................6
HiVi, Inc ............................................. D ...................... 13
Jantzen Audio Denmark ........................ L,O .....................7
K & K Development. ............................. N ...................... 26
Klippel GmbH. ..................................... G,N ................... 39
Listen, Inc. ......................................... C,G,N ..................2
LOUDsoft ............................................. G ...................... 45
Materion Electrofusion. ......................... B,L,O ..................3
Menlo Scientific, Ltd. .......................... B ...................... 18
Monster Cable. ..................................... E ...................... 42
Morel. ................................................. D ...................... 47
Ningbo Yinzhou Huada Sound................ F,L .................... 40
NTI-Americas ....................................... B,G,J,N ............. 31
One Magnet Electronic Co., Ltd. ............ I....................... 38
Pacific Audio Consulting ....................... B ...................... 23
Parts Express ....................................... L ...................... 46
Precision Econowind, Inc.. .................... O ........................8
Prism Media Products ........................... G ...................... 48
Pulsus Technologies.. ............................ G ........................5
Rotel Electronics ................................. B ...................... 28
Saati Tech ........................................... Q ........................9
Solen Electronique, Inc. ........................ C,D ................... 14
Suzuki Kanshi (Thailand) Co.,Ltd. ......... L ...................... 36
Tang Band Industries Co. ...................... D ..................39,41
Vance Dickason .................................... B ...................... 28
Wavecor Ltd. ...................................... F,H ................... 12
This product/services index is provided as a value-added service to our readers and advertisers. The publisher will not be held liable for any errors or deletions contained herein.
CATEGORY KEYA = ADHESIVES
B = CONSULTANTS & ENGINEERS
C = CROSSOVERS & PASSIVE
COMPONENTS
D = DRIVERS
E = EMPLOYMENT OPPORTUNITIES
F = ENCLOSURES & ENCLOSURE PARTS
G = ENGINEERING/DESIGN SOFTWARE
H = FINISHED SYSTEMS
I = MAGNETS & EQUIPMENT
J = MANUFACTURING EQUIPMENT
K = MICROPHONES
L = PARTS
M = RECONING
N = TEST EQUIPMENT
O = VOICE COILS − COMPONENTS
& MATERIALS
P = TRANSDUCERS
Q = ACOUSTIC MESH
R = ACOUSTICAL & SOUNDPROOFING
MATERIALS
S = AMPLIFICATION
T = TRADE SHOW
In Europe:
intertechnik.de
In Asia:
baysidenet.jp
In Canada:
solen.ca
Distributed By:
Tel:800-338-0531725 Pleasant Valley Dr.Springboro, OH 45066
parts-express.com/vcm
Dayton Audio’s OmniMic is a must-have for system integrators, acoustic engineers, and A/V installers. It was
developed in collaboration with Liberty Audio, inventors of the Praxis analysis tool. The OmniMic provides quick and accurate measurements that will reduce installation time,
saving you both labor and money.
Just open the box and start testing in minutes!
Dayton Audio’s WT3 just got better—the same great features as before, but now perfect for incoming or end-of-line QC inspections! DIY speaker builders will also fi nd the new
capabilities useful when comparing multiple drivers for line array type systems. The WT3 is manufactured on state-of-the-art equipment and uses precision surface-mount components.
Try a WT3 and build better speaker systems!
Driving your loudspeaker toa higher end.Extensive R&D was devoted into our wide range of high-performance drive units, offering innovative technology, hand-made craftsmanship and outstanding acoustic performance. Made in Israel, all of our products are manufactured in the most stringent conditions to ensure consistency and high product quality.
We understand the importance of having a stable supply of high quality drive units, R&D support, affordable prices and superb customer service.
We invite you to discover morel’s extensive line of raw drivers.
Come visit us at 2012 International CES, January 10-13, 2012.Mobile audio: Venetian Suite 29-309 Home audio: Venetian Suite 30-308
17 Hamazmera St. Ness Ziona 70400, Israel, Tel.: +972-8-930-1161 Email: [email protected] www.morelhifi.com

...integrated
electronic test, acoustic test...
Prism Sound is now a globalsales & support agent for:
������������������� �������� ������������������������������������ ���������������������������������������������������������� ����������������
��������������������� ���������� ������������ ���������������������
������������������� !�����������������������������������������������������"������ ���������� �����#�������������������$�����%dScope Series III
analog and digitalaudio analyzers
������������������� ��������������������������������������������� �!"#�����$ ����
Loudspeaker design and analysis solutions