Role of Adiposity-Driven Inflammation in Depressive Morbidity
J. Clin. Endocrinol. Metab. 2011 96:1560-1567 originally published online Mar 2, 2011; , doi: 10.1210/jc.2010-2388
Kumaravel Rajakumar, Javier de las Heras, Tai C. Chen, SoJung Lee, Michael F. Holick and Silva A. Arslanian
ChildrenVitamin D Status, Adiposity, and Lipids in Black American and Caucasian
Society please go to: http://jcem.endojournals.org//subscriptions/ or any of the other journals published by The EndocrineJournal of Clinical Endocrinology & MetabolismTo subscribe to
Copyright © The Endocrine Society. All rights reserved. Print ISSN: 0021-972X. Online

Vitamin D Status, Adiposity, and Lipids in BlackAmerican and Caucasian Children
Kumaravel Rajakumar, Javier de las Heras, Tai C. Chen, SoJung Lee,Michael F. Holick, and Silva A. Arslanian
Department of Pediatrics (K.R.), Division of General Academic Pediatrics, University of Pittsburgh Schoolof Medicine, Pittsburgh, Pennsylvania 15224; Department of Pediatrics (J.d.l.H., S.L., S.A.A.), Division ofWeight Management and Wellness, Children’s Hospital of Pittsburgh, Pittsburgh, Pennsylvania 15224;Division of Pediatric Endocrinology, Metabolism, and Diabetes Mellitus (S.A.A.), University of PittsburghSchool of Medicine, Pittsburgh, Pennsylvania 15224; Department of Pediatrics and Endocrinology andDiabetes Research Group (J.d.l.H.), Cruces Hospital, 48903 Barakaldo, Vizcaya, Spain; and Departmentof Medicine (T.C.C., M.F.H.), Boston University School of Medicine, Boston, Massachusetts 02118
Objective: The aim of the study was to examine the relationship between vitamin D status, totaland abdominal adiposity, and lipids in black and white children.
Methods: Plasma 25-hydroxyvitamin D [25(OH)D], adiposity [body mass index (BMI), percentage oftotal body fat, visceral adipose tissue (VAT), sc adipose tissue (SAT)], and fasting lipids were assessedin healthy obese and nonobese 8- to 18-yr-old black and white children.
Results: We studied 237 children (mean � SD age, 12.7 � 2.2 yr; 47% black, 47% obese, and 43%male). Mean 25(OH)D concentration for the entire cohort was 19.4 � 7.4 ng/ml. The majority of thechildren were vitamin D deficient [25(OH)D � 20 ng/ml; 73% blacks, 40% whites]. Plasma 25(OH)Dwas associated inversely with BMI, BMI percentile, percentage of total body fat, VAT, and SAT andpositively with HDL cholesterol in the entire cohort. VAT was higher in vitamin D-deficient whites,and SAT was higher in vitamin D-deficient blacks compared with their respective vitamin D-non-deficient counterparts. Race, season, pubertal status, and VAT were independent significant pre-dictors of 25(OH)D status.
Conclusions: In black and white youth examined together, lower levels of 25(OH)D are associatedwith higher adiposity measures and lower HDL. Furthermore, vitamin D deficiency is associatedwith higher VAT in whites and greater SAT in blacks. Besides therapeutic interventions to correctthe high rates of vitamin D deficiency in youth, benefits of vitamin D optimization on adipositymeasures and lipid profile need to be explored. (J Clin Endocrinol Metab 96: 1560–1567, 2011)
Studies in adults and children have shown a link be-tween obesity and vitamin D status (1–6). Serum 25-
hydroxyvitamin D [25(OH)D], the recognized biomarkerof vitamin D status, is inversely associated with clinicaland laboratory measures of adiposity such as body massindex (BMI), waist circumference, and percentage of totalbody fat in adults and adolescents (1, 2, 4, 7–10). Seques-tration of vitamin D in body fat stores and its consequentreduced bioavailability offer a plausible explanation for
this association (5, 11). Racial and ethnic differences in thedegree of adiposity and distribution of body fat are wellrecognized (12–16). For a given BMI, African-Americanchildren have lower levels of adiposity than Caucasianchildren (12). Furthermore, distribution of abdominal ad-ipose tissue varies by race—compared with Caucasianchildren, African-American children have lower visceraladipose tissue (VAT) and higher sc adipose tissue (SAT)(13). Racial differences in abdominal fat topography may
ISSN Print 0021-972X ISSN Online 1945-7197Printed in U.S.A.Copyright © 2011 by The Endocrine Societydoi: 10.1210/jc.2010-2388 Received October 12, 2010. Accepted February 14, 2011.First Published Online March 2, 2011
Abbreviations: %BF, Percentage body fat; BMI, body mass index; DXA, dual-energy x-rayabsorptiometry; HDL, high-density lipoprotein; LDL, low-density lipoprotein; NS, nonsig-nificant; 25(OH)D, 25-hydroxyvitamin D; OR, odds ratio; SAT, sc adipose tissue; VAT,visceral adipose tissue; VLDL, very low-density lipoprotein.
O R I G I N A L A R T I C L E
E n d o c r i n e R e s e a r c h
1560 jcem.endojournals.org J Clin Endocrinol Metab, May 2011, 96(5):1560–1567

explain the racial variations in the metabolic risks of ab-dominal adiposity, such as higher diabetogenic risk andbetter lipid profile in African-Americans compared withCaucasians (13, 17).
Data characterizing the racial differences in the rela-tionship between vitamin D status and adiposity, partic-ularly abdominal adipose tissue distribution, are limited.Because adiposity is a risk factor for hypovitaminosis Dand dyslipidemia and abdominal fat topography (distri-bution of SAT and VAT) influences the metabolic risks ofadiposity, we examined the racial differences in the rela-tionship between vitamin D status, BMI, total body adi-posity, intraabdominal SAT and VAT, and lipid levels inhealthy obese and nonobese 8- to 18-yr-old black andwhite children.
Subjects and Methods
ParticipantsSubjects were 237 normal-weight and overweight 8- to 18-
yr-old black and white otherwise healthy children residing at alatitude of 40.4° N in Pittsburgh, Pennsylvania, of whom 28 hada diagnosis of polycystic ovary syndrome without any treatment.Subjects were participants in an ongoing National Institutes ofHealth-funded RO1 grant “Childhood Metabolic Markers ofAdult Morbidity in Blacks” and a K24 grant “Childhood InsulinResistance.” Subjects were enrolled between November 1995and April 2009. Data from some of these participants have beenreported previously (18–20). The studies were approved by theUniversity of Pittsburgh Institutional Review Board. Signedparental informed consent and participant assent were ob-tained before enrollment. Healthy research volunteers wererecruited through newspaper advertisements, fliers posted onbus routes, youth recreational locations, and the university cam-pus. Children with diabetes or on medications that influenceglucose or lipid metabolism or blood pressure were excluded.Medical history and physical examination, with assessment ofpubertal development using Tanner staging, and routine hema-tological and biochemical tests were performed in all partici-pants to ensure that subjects who entered into the protocol werehealthy. Race was determined by self-identity of the parents asbeing black or white for at least three generations.
Study designAll study procedures were completed at the Pediatric Clinical
and Translational Research Center at the Children’s Hospital ofPittsburgh. Weight and height were measured to the nearest 0.1kg and 0.1 cm, respectively, using a weighing balance and awall-mounted stadiometer. Body composition [total body fatand percentage body fat (%BF)] was assessed by dual-energyx-ray absorptiometry (DXA) as before (13). Abdominal SAT andVAT were measured in 216 subjects by a 10-mm single axialcomputed tomography scan at L4–5 intervertebral space as pre-viously reported (13, 21) and in 11 subjects with magnetic res-onance imaging (22). Data are not available in 10 subjects, ineight the weight exceeded the limit for computed tomographyscan or magnetic resonance imaging, and in two electronic data
were lost. Blood samples were obtained after a 10- to 12-h over-night fast for determination of plasma 25(OH)D and fasting lipidlevels.
Biochemical measurementsPlasma lipid levels [total, low-density lipoprotein (LDL),
high-density lipoprotein (HDL), and very low-density lipopro-tein (VLDL) cholesterol, and triglycerides] were measured usingthe standards recommended by the Centers for Disease Controland Prevention (23, 24). Plasma 25(OH)D was measured withcompetitive protein binding assay using vitamin D-binding pro-tein as described by Chen et al. (25). The competitive proteinbinding assay identifies 25(OH)D2 and 25(OH)D3 equally welland has been validated by liquid chromatography tandem massspectrophotometry assay, which measures the contributions ofserum 25(OH)D2 and 25(OH)D3 (26). The intraassay and in-terassay coefficients of variation were 8 and 10%, respectively.The lower limit of detection was 4 ng/ml.
Statistical analysisDifferences in the means for the various adiposity measures
(BMI, BMI percentile, VAT, SAT, %BF) and lipid parameters(total, LDL, HDL, and VLDL cholesterol, and triglycerides) werecompared between vitamin D-deficient [25(OH)D �20 ng/ml]and nondeficient [25(OH)D �20 ng/ml] groups in the entirecohort and the racially stratified subgroups (blacks and whites)using Student t test or Mann-Whitney U test, depending on datadistribution. Differences in the mean of 25(OH)D between blackand white children and demographic characteristics [obese (BMI�95th percentile for age and sex) vs. nonobese (BMI �95thpercentile), and pubertal vs. prepubertal] were also assessed byt tests or Mann-Whitney U tests. Racial differences in the rates ofvitamin D deficiency [defined as plasma 25(OH)D less than 20ng/ml] and insufficiency (from 20 to less than 30 ng/ml) wereassessed using �2. The association between plasma 25(OH)Dand the different study variables was examined by bivariate Pear-son or Spearman correlations depending on data distribution.Multiple linear regression analysis models were performed todetermine the independent effects of race, season, pubertal sta-tus, and each of the adiposity measures (BMI, %BF, VAT, andSAT) separately on plasma 25(OH)D after adjusting for age andsex. Logistic regression was done to determine the influence ofthese variables on vitamin D deficiency [plasma 25(OH)D �20ng/ml—as a categorical outcome]. A two-way ANOVA analysiswas conducted to examine the independent relationship of obe-sity [obese (BMI � 95th percentile) vs. nonobese (BMI �95thpercentile)], race, and the interaction term of obesity�race with25(OH)D concentration.
All statistical assumptions were met. Data are presented asmean � SEM unless otherwise indicated. Statistical significancewas set at P � 0.05. The statistical analysis was done using PASWStatistics (version 18; SPSS Inc., Chicago, IL).
Results
A total of 237 healthy 8- to 18-yr-old obese [112 (47%)]and nonobese [125 (53%)] black [112 (47%)] and white[125 (53%)] children were studied during either winter/spring [110 (46%)] or summer/fall [127 (54%)]. The
J Clin Endocrinol Metab, May 2011, 96(5):1560–1567 jcem.endojournals.org 1561

study population had a mean age (�SD) of 12.7 � 2.2 yr,43% were males, and 18% were Tanner I, prepubertal.
Vitamin D statusMean (�SD) plasma 25(OH)D for the entire cohort was
19.4 � 7.4 ng/ml. Mean plasma 25(OH)D levels werelower in black vs. white children (16.4 � 5.8 vs. 22.0 � 7.7ng/ml; P � 0.001), or obese vs. nonobese (17.6 � 7.1 vs.20.9 � 7.4 ng/ml; P � 0.001), or pubertal vs. prepubertal(18.5 � 6.9 vs. 23.3 � 8.4 ng/ml; P � 0.001). There weresignificant differences (P � 0.001) between the two racialgroups in the proportion of children classified as vita-min D deficient [25(OH)D, �20 ng/ml], insufficient[25(OH)D, 20 to �30 ng/ml], or sufficient [25(OH)D,�30 ng/ml] (Fig. 1). The racial disparities in the circulatinglevels of 25(OH)D persisted throughout the year irrespec-tive of season (Fig. 2). Within each racial group there wassignificant seasonal variation in vitamin D status. Themean plasma 25(OH)D levels during summer/fall werehigher than during winter/spring (whites, 23.8 � 8.2 vs.20.7 � 7.0 ng/ml, P � 0.031; blacks, 17.5 � 5.9 vs. 14.2 �5.0 ng/ml, P � 0.003).
25(OH)D, adiposity, and fasting lipid relationshipsDifferences in adiposity and lipid measures between
vitamin D deficient [25(OH)D �20 ng/ml] and nondefi-cient [25(OH)D �20 ng/ml] groups in the entire cohort
and the racially stratified subgroups are depicted in Table1. In the entire cohort, vitamin D-deficient subjects hadhigher BMI, BMI percentile, %BF, VAT, SAT, and pro-portion of obesity than nondeficient subjects. Results weresimilar in whites when analyzed separately, except thatthere was no difference in SAT between vitamin D-defi-cient and nondeficient subjects. In blacks, however, exceptfor SAT, there were no differences in BMI, BMI percentile,%BF, VAT, and rates of obesity between vitamin D-defi-cient and nondeficient subjects. Because of a black outlierwith high plasma 25(OH)D concentration, differences inadiposity indices between vitamin D-deficient and nonde-ficient blacks were examined after excluding this outlier.The results were similar, except for the difference in BMI,which became significant (27.7 � 1.0 vs. 24.0 � 1.5 kg/m2; P � 0.037) (Table 1, see footnote). There were nodifferences in lipid parameters (total, LDL, HDL, andVLDL cholesterol, and triglycerides) between the vitaminD-deficient and nondeficient groups in the entire cohortand in whites and blacks. Examination of the data sepa-rately for boys and girls in each racial group revealed sig-nificant differences in adiposity indices in vitamin D-de-ficient vs. nondeficient white females, but not white males,black males, or black females (data not shown). However,our numbers for such an analysis remain relatively limited.The ANOVA statistics of the independent relationship ofobesity, race, and the interaction term of obesity�race with25(OH)D concentration showed that obesity (P � 0.001)and race (P � 0.001) have an independent relationshipto circulating 25(OH)D, but not the interaction term(P � 0.366).
Correlates of plasma 25(OH)DFor the entire cohort, plasma 25(OH)D was associated
inversely with BMI (r � �0.209; P � 0.001), BMI per-centile (r � �0.187; P � 0.004), %BF (r � �0.172; P �
0.010), VAT (r � �0.149; P � 0.024), and SAT (r �
�0.174; P � 0.009); and positively with HDL cholesterol(r � 0.214; P � 0.001). Plasma 25(OH)D was inverselyassociated with BMI, VAT, SAT, and %BF only in whitechildren, and positively with HDL cholesterol in bothblack (r � 0.382; P � 0.001) and white children (r �
0.217; P � 0.016) (Fig. 3). In blacks, the relationshipsshown in Fig. 3 change when the analyses are performedexcluding the outlier with the highest plasma 25(OH)D.Without the outlier, plasma 25(OH)D becomes inverselyassociated with BMI (r � �0.212; P � 0.026), VAT (r �
�0.194; P � 0.045), SAT (r � �0.208; P � 0.032) and%BF (r � �0.192; P � 0.047) with no association withHDL (r � 0.130; P � 0.179).
icip
ants
50607080
WhiteBlack
% o
f par
ti
010203040
25(OH)D (ng/mL)
<20 20-30 ≥30
FIG. 1. Vitamin D status (deficient, insufficient, and sufficient) by race.
g/m
L)
20
25
30
White
p= 0.031
25(O
H)D
(ng
5
10
15
20Black
p= 0.003
0Winter Spring Summer Fall
FIG. 2. Seasonal variation in plasma 25(OH)D by race. Mann-WhitneyU test for 25(OH)D values in winter/spring vs. summer/fall in whitesand blacks.
1562 Rajakumar et al. Vitamin D in Black and White Children J Clin Endocrinol Metab, May 2011, 96(5):1560–1567
Predictors of plasma 25(OH)D levels and vitamin Ddeficiency
Multiple linear regression analysis models assessing theindependent effects of race, season, pubertal status, andeach of the adiposity measures (BMI, %BF, VAT, andSAT) separately on plasma 25(OH)D levels after control-ling for age and sex are shown in Table 2. Race, season,pubertal status, and VAT were significant independentpredictors of plasma 25(OH)D, explaining 28.3% of vari-ance in plasma 25(OH)D concentrations, the majority ofwhich was attributable to the strong influence of race,pubertal status, and season. In a logistic regression modeladjusted for age, the odds of vitamin D deficiency werehighest in blacks compared with whites [odds ratio (OR),95% confidence interval (CI): 6.00, 3.14 to 11.47; P �0.001], higher in females compared with males (OR, 2.01;95% CI, 1.10 to 3.66; P � 0.023), pubertal compared withprepubertal children (OR, 2.88; 95% CI, 1.27 to 6.57; P �0.012), and winter/spring season compared with summer/fall (OR, 2.29; 95% CI, 1.22 to 4.29; P � 0.010). Fur-thermore, for each 10-cm2 increase in VAT, the odds ofvitamin D deficiency multiplied by 1.087 (95% CI, 1.002to 1.180; P � 0.042).
Discussion
We found in healthy obese and nonobese 8- to 18-yr-oldblack and white youth, when examined together, an inverse
gradient in the relationship between plasma 25(OH)D levelsandclinical and laboratorymeasuresofadiposity.BMI,BMIpercentile, %BF, and abdominal adiposity (SAT and VAT)were significantly higher in vitamin D-deficient than nonde-ficient children. Vitamin D deficiency was associated withhigher levels of BMI, %BF, and VAT in whites but not inblacks, and higher levels of SAT in blacks but not in whites.Removal of an outlier with high plasma 25(OH)D in blacksaltered the observed racial dimorphism in the correlationsbetween vitamin D status and adiposity (Fig. 3).
Our findings compare and contrast with previouslypublished research on vitamin D and adiposity relation-ships in children and adolescents (27–29). Dong et al. (27)observed inverse correlations between serum 25(OH)Dand BMI, waist circumference, and total and regionalmeasures of adiposity in 14- to 18-yr-old black and whiteadolescents (n � 559) residing in Atlanta, Georgia (33°N). Lenders et al. (2) noted an independent inverse asso-ciation between serum 25(OH)D and total body fat (fatmass assessed by DXA) in a cross-sectional cohort of 58obese adolescents enrolled from five geographic areas in theUnited States. Foo et al. (28) found no association betweenplasma 25(OH)D and total body adiposity assessed by DXAin 15-yr-old adolescent girls (n � 323) residing in Beijing,China (40° N). In a cross-sectional study of 6- to 21-yr-oldchildren (n � 384; 4% obese) residing in Philadelphia, Penn-sylvania (40° N), significant bivariate associations betweenlow serum 25(OH)D status (�30 ng/ml) and BMI, BMI z-
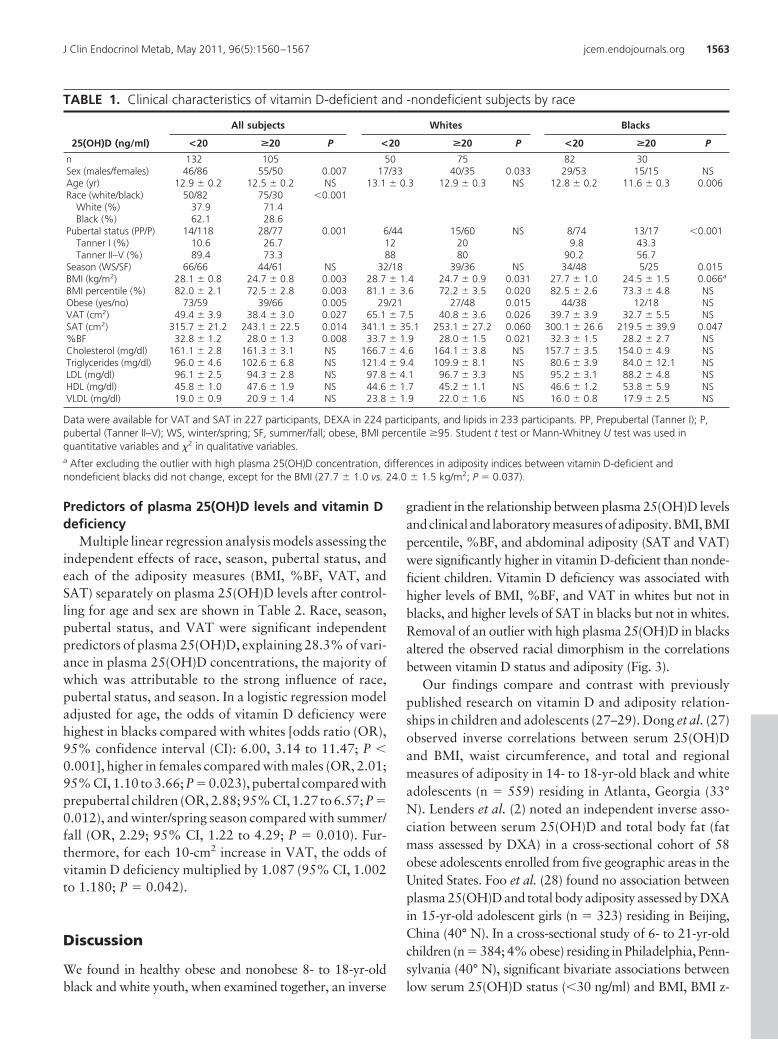
TABLE 1. Clinical characteristics of vitamin D-deficient and -nondeficient subjects by race
25(OH)D (ng/ml)
All subjects Whites Blacks
<20 >20 P <20 >20 P <20 >20 P
n 132 105 50 75 82 30Sex (males/females) 46/86 55/50 0.007 17/33 40/35 0.033 29/53 15/15 NSAge (yr) 12.9 � 0.2 12.5 � 0.2 NS 13.1 � 0.3 12.9 � 0.3 NS 12.8 � 0.2 11.6 � 0.3 0.006Race (white/black) 50/82 75/30 �0.001
White (%) 37.9 71.4Black (%) 62.1 28.6
Pubertal status (PP/P) 14/118 28/77 0.001 6/44 15/60 NS 8/74 13/17 �0.001Tanner I (%) 10.6 26.7 12 20 9.8 43.3Tanner II–V (%) 89.4 73.3 88 80 90.2 56.7
Season (WS/SF) 66/66 44/61 NS 32/18 39/36 NS 34/48 5/25 0.015BMI (kg/m2) 28.1 � 0.8 24.7 � 0.8 0.003 28.7 � 1.4 24.7 � 0.9 0.031 27.7 � 1.0 24.5 � 1.5 0.066a
BMI percentile (%) 82.0 � 2.1 72.5 � 2.8 0.003 81.1 � 3.6 72.2 � 3.5 0.020 82.5 � 2.6 73.3 � 4.8 NSObese (yes/no) 73/59 39/66 0.005 29/21 27/48 0.015 44/38 12/18 NSVAT (cm2) 49.4 � 3.9 38.4 � 3.0 0.027 65.1 � 7.5 40.8 � 3.6 0.026 39.7 � 3.9 32.7 � 5.5 NSSAT (cm2) 315.7 � 21.2 243.1 � 22.5 0.014 341.1 � 35.1 253.1 � 27.2 0.060 300.1 � 26.6 219.5 � 39.9 0.047%BF 32.8 � 1.2 28.0 � 1.3 0.008 33.7 � 1.9 28.0 � 1.5 0.021 32.3 � 1.5 28.2 � 2.7 NSCholesterol (mg/dl) 161.1 � 2.8 161.3 � 3.1 NS 166.7 � 4.6 164.1 � 3.8 NS 157.7 � 3.5 154.0 � 4.9 NSTriglycerides (mg/dl) 96.0 � 4.6 102.6 � 6.8 NS 121.4 � 9.4 109.9 � 8.1 NS 80.6 � 3.9 84.0 � 12.1 NSLDL (mg/dl) 96.1 � 2.5 94.3 � 2.8 NS 97.8 � 4.1 96.7 � 3.3 NS 95.2 � 3.1 88.2 � 4.8 NSHDL (mg/dl) 45.8 � 1.0 47.6 � 1.9 NS 44.6 � 1.7 45.2 � 1.1 NS 46.6 � 1.2 53.8 � 5.9 NSVLDL (mg/dl) 19.0 � 0.9 20.9 � 1.4 NS 23.8 � 1.9 22.0 � 1.6 NS 16.0 � 0.8 17.9 � 2.5 NS
Data were available for VAT and SAT in 227 participants, DEXA in 224 participants, and lipids in 233 participants. PP, Prepubertal (Tanner I); P,pubertal (Tanner II–V); WS, winter/spring; SF, summer/fall; obese, BMI percentile �95. Student t test or Mann-Whitney U test was used inquantitative variables and �2 in qualitative variables.a After excluding the outlier with high plasma 25(OH)D concentration, differences in adiposity indices between vitamin D-deficient andnondeficient blacks did not change, except for the BMI (27.7 � 1.0 vs. 24.0 � 1.5 kg/m2; P � 0.037).
J Clin Endocrinol Metab, May 2011, 96(5):1560–1567 jcem.endojournals.org 1563

score, and fat mass assessed by DXA were not significant inmultivariable regression analysis (29). Lack of similarity ofbody composition, growth, and pubertal status among thevarious study cohorts may explain the differences in the25(OH)D-adiposity relationships in these studies.
An inverse relationship between 25(OH)D status andregional adiposity was found in adults (7, 30), youngwomen (31), and older adolescents (27), and our dataconfirm this relationship in 8- to 18-yr-old black andwhite children. We found VAT to be an independent pre-dictor of plasma 25(OH)D levels and vitamin D deficiency
in children. Similar to our findings,the inverse relationship between25(OH)D and the individual indicesof regional fat was much stronger forVAT than SAT in Caucasian adultsexamined as part of the third genera-tion offspring cohort of the Framing-ham Heart Study (7).
Racial differences in the relationshipbetween vitamin D status and adiposityhave been observed in 12�-yr-old black(n � 2475) and white (n � 3567) adoles-cent and adult females examined in theNationalHealthandExaminationNutri-tionSurvey(NHANES)III (1988–94)co-hort (32). Inverse association betweenbody fat (assessed by bioelectrical imped-ance) and serum 25(OH)D varied by raceand was stronger in whites comparedwith blacks. Our results extend thosefindings to children younger than 12 yr,inwhomtheinverseassociationsbetween25(OH)D and adiposity measures weredetected only in whites. Although thesedifferences could stem from racial varia-tion in the degree of sequestration of vi-tamin D in body fat, they are more likelyto be due to the confounding effects ofracial variations in skin color (32). In ourcohort,blackshadsignificantly lower lev-els of 25(OH)D than whites throughoutthe year. Race-related differences in vis-ceral adiposity could also play a role inthe differing relationships of adipositywith vitamin D between the two racialgroups(13,33).However,our findingsoflack of a significant association between25(OH)D concentrations and adiposityin blacks should be interpreted withcaution because this relationship wasstrongly influenced by one outlier withhigh plasma 25(OH)D, and the P values
changed when analyzed without the outlier. Furthermore,we found no significant interaction terms between adiposityand race on their effects on circulating 25(OH)D, suggestingno racial differences in the relationship between adiposityand25(OH)D.Therefore,additionaldataareneededregard-ing the relationship between 25(OH)D and adiposity in dif-ferent racial groups.
Lipid profile parameters did not differ between vitaminD-deficient and nondeficient groups of children in the en-tire cohort or in the racial subgroups. However, there were
FIG. 3. Correlations between plasma 25(OH)D levels and BMI, %BF, VAT, SAT, and HDLcholesterol in white (A–E) and black (F–J) youth. In blacks, the “r” and “P” values for thecorrelation analyses with and without an outlier with high plasma 25(OH)D (arrow) areshown.
1564 Rajakumar et al. Vitamin D in Black and White Children J Clin Endocrinol Metab, May 2011, 96(5):1560–1567

positive correlations between plasma 25(OH)D and HDLcholesterol in black and white children (r � 0.214; P �0.001), and this association was stronger in blacks (r �0.382; P � 0.001) compared with whites (r � 0.217;P � 0.016); the relationship in blacks was strongly influ-enced by an outlier with high plasma 25(OH)D and be-came nonsignificant when examined without the outlier[r � 0.130; P � nonsignificant (NS)]. Similar to our find-ings, Johnson et al. (34) noted a positive association be-tween 25(OH)D and HDL cholesterol (r � 0.41; P �
0.001) and lower levels of HDL cholesterol in childrenwith hypovitaminosis D in a retrospective record review of2- to 18-yr-old children (70% Caucasian) seen at a pedi-atric specialty clinic at Rochester, Minnesota (44° N).These data lend support to the fact that vitamin D mayplay a role in HDL cholesterol levels in children.
We have documented excessive prevalence of vitamin Ddeficiency and insufficiency in a sample of healthy blackand white children who volunteered to participate in re-search. Our combined prevalence rates of vitamin D de-ficiency and insufficiency in black children (98%) andwhite children (90%) are comparable to published rates ofvitamin D deficiency and insufficiency in children exam-ined in the 2001–2004 NHANES cohort (35). In the2001–2004 NHANES cohort, 62% of white girls, 66% ofwhite boys, 98% of black girls, and 96% of black boyswho were 13–21 yr old; and 64% of white girls, 53% ofwhite boys, 96% of black girls, and 93% of black boys
who were 7–12 yr old were vitamin D deficient [serum25(OH)D �15 ng/ml] or vitamin D insufficient (15–30ng/ml). Our data confirm the relevance of season, race(surrogate indicator of skin color), pubertal status, BMI,and adiposity in the determination of vitamin D status ofchildren residing in the Northeast (4, 35–40). Althoughplasma 25(OH)D concentrations were higher during sum-mer/fall than during winter/spring in blacks and whites,the disparities in the vitamin D status between black andwhite children persisted throughout the year, and this canbe explained by the racial differences in skin pigmentation.We found race, season, pubertal status, and visceral fat tobe significant predictors of plasma 25(OH)D. These vari-ables explained 28.3% of the variance in plasma25(OH)D levels of our cohort. Black race, female gen-der, adolescence, winter/spring season, and excessiveVAT were associated with higher odds of being vitaminD deficient.
Our data have few limitations for a better character-ization of the racial differences in vitamin D levels of ourcohort and assessment of the differences in adiposity mea-sures between vitamin D-deficient and nondeficientblacks. Information regarding recognized confounders ofvitamin D status such as dietary vitamin D, duration of sunexposure, usage of sunscreen, and quantification of UVradiation assessed by dosimeters and objective assessmentof skin melanization with skin spectrophotometer wouldhave helped. Lack of significant difference in BMI andadiposity measures (%BF and VAT) between vitamin D-deficient and nondeficient black children may be related tothe small number of vitamin D-nondeficient children inthis group and the associated limited variability in BMIcategories in this small sample. Strengths of our study areaccurate characterization of total body and abdominaladiposity in an appreciable number of obese and nonobeseblack and white healthy volunteer children.
ConclusionsWe conclude that vitamin D deficiency and insuffi-
ciency are highly prevalent in 8- to 18-yr-old preadoles-cent and adolescent black and white children residing inthe Northeast. Race, female gender, season, pubertal sta-tus, and visceral adiposity are independent predictors ofplasma 25(OH)D status. Our data show that the relation-ship between vitamin D status and adiposity in children iscomplex and needs further exploration. Our observedracial differences in the relationship between plasma25(OH)D concentrations and adiposity measures andHDL cholesterol should be interpreted with caution be-cause the P values for our findings differ when analyzedwith and without an outlier with high plasma 25(OH)Dconcentration. Lack of significant differences in %BF and
TABLE 2. Multiple linear regression analysis for plasma25(OH)D (ng/ml) adjusted for age and sex
Estimate 95% CI P R2
Model 1Race �6.31 �8.01 to �4.61 <0.001 0.275Pubertal status �4.44 �7.24 to �1.63 0.002Season �3.34 �5.02 to �1.65 <0.001BMI �0.08 �0.19 to 0.03 0.168
Model 2Race �6.62 �8.34 to �4.89 <0.001 0.279Pubertal status �4.69 �7.64 to �1.73 0.002Season �3.45 �5.19 to �1.72 <0.001%BF �0.03 �0.10 to 0.04 0.420
Model 3Race �6.48 �8.20 to �4.76 <0.001 0.283Pubertal status �4.45 �7.28 to �1.62 0.002Season �3.51 �5.22 to �1.81 <0.001VAT (by every
10 cm2)�0.25 �0.48 to �0.01 0.037
Model 4Race �6.22 �7.94 to �4.50 <0.001 0.268Pubertal status �4.66 �7.51 to �1.80 <0.001Season �3.56 �5.28 to �1.84 <0.001SAT (by every
10 cm2)�0.02 �0.06 to 0.02 0.275
P � 0.05 is indicated in bold. Race: 0 � white, 1 � black; pubertalstatus: 0 � prepubertal, 1 � pubertal; season: 0 � summer/fall, 1 �winter/spring.
J Clin Endocrinol Metab, May 2011, 96(5):1560–1567 jcem.endojournals.org 1565

VAT between vitamin D-deficient and nondeficient blackchildren, even after excluding the outlier, could be due tothe small sample size of vitamin D-nondeficient childrenand the limited variability in their BMI. Furthermore,there was no significant interaction between adiposity andrace on their effects on circulating 25(OH)D, suggestingno differences in the influence of adiposity on 25(OH)D inwhites and blacks. Therefore, additional studies are war-ranted to explore the relationship between 25(OH)D andadiposity in children of different ethnic groups. Plasma25(OH)D is inversely associated with adiposity and pos-itively associated with HDL cholesterol. Besides therapeu-tic interventions to correct the high rates of vitamin Ddeficiency in high-risk youth, studies are warranted to testthe effects of vitamin D optimization on adiposity mea-sures and lipid profile in children.
Acknowledgments
These studies would not have been possible without the devotionof nursing staff of the Pediatric Clinical and Translational Re-search Center and the research team, and most importantly, thecommitment of the study participants and their parents.
Address all correspondence and requests for reprints to: SilvaArslanian, M.D., Children’s Hospital of Pittsburgh, 4401 PennAvenue, Pittsburgh, Pennsylvania 15224. E-mail: [email protected].
This work was supported by U.S. Public Health Service GrantRO1 HD27503 (to S.A.A.), K24 HD01357 (to S.A.A.), the Rich-ard L. Day Endowed Chair (to S.A.A.), K23 HD052550 (toK.R.), Río Hortega contract from the Instituto de Salud CarlosIII of the Spanish Ministry of Health (CM07/00211) (to J.d.l.H.),and National Institutes of Health Grants 1UL1RR025771 CTSIand UL1 RR024153 CTSA (previously MO1 RR00084 GCRC).
Disclosure Summary: The authors have no financial relation-ships relevant to this article to disclose.
References
1. Alemzadeh R, Kichler J, Babar G, Calhoun M 2008 Hypovitamin-osis D in obese children and adolescents: relationship with adiposity,insulin sensitivity, ethnicity, and season. Metabolism 57:183–191
2. Lenders CM, Feldman HA, Von Scheven E, Merewood A, SweeneyC, Wilson DM, Lee PD, Abrams SH, Gitelman SE, Wertz MS, KlishWJ, Taylor GA, Chen TC, Holick MF 2009 Relation of body fatindexes to vitamin D status and deficiency among obese adolescents.Am J Clin Nutr 90:459–467
3. Liel Y, Ulmer E, Shary J, Hollis BW, Bell NH 1988 Low circulatingvitamin D in obesity. Calcif Tissue Int 43:199–201
4. Reis JP, von Muhlen D, Miller 3rd ER, Michos ED, Appel LJ 2009Vitamin D status and cardiometabolic risk factors in the UnitedStates adolescent population. Pediatrics 124:e371–e379
5. Wortsman J, Matsuoka LY, Chen TC, Lu Z, Holick MF 2000 De-creased bioavailability of vitamin D in obesity. Am J Clin Nutr 72:690–693
6. Yanoff LB, Parikh SJ, Spitalnik A, Denkinger B, Sebring NG,
Slaughter P, McHugh T, Remaley AT, Yanovski JA 2006 The prev-alence of hypovitaminosis D and secondary hyperparathyroidism inobese black Americans. Clin Endocrinol (Oxf) 64:523–529
7. Cheng S, Massaro JM, Fox CS, Larson MG, Keyes MJ, McCabe EL,Robins SJ, O’Donnell CJ, Hoffmann U, Jacques PF, Booth SL, VasanRS, Wolf M, Wang TJ 2010 Adiposity, cardiometabolic risk, andvitamin D status: the Framingham Heart Study. Diabetes 59:242–248
8. McKinney K, Breitkopf CR, Berenson AB 2008 Association of race,body fat and season with vitamin D status among young women: across-sectional study. Clin Endocrinol (Oxf) 69:535–541
9. Rodríguez-Rodríguez E, Navia-Lomban B, Lopez-Sobaler AM, Or-tega RM 2010 Associations between abdominal fat and body massindex on vitamin D status in a group of Spanish schoolchildren. EurJ Clin Nutr 64:461–467
10. Vilarrasa N, Maravall J, Estepa A, Sanchez R, Masdevall C, NavarroMA, Alía P, Soler J, Gomez JM 2007 Low 25-hydroxyvitamin Dconcentrations in obese women: their clinical significance and rela-tionship with anthropometric and body composition variables. JEndocrinol Invest 30:653–658
11. Blum M, Dolnikowski G, Seyoum E, Harris SS, Booth SL, PetersonJ, Saltzman E, Dawson-Hughes B 2008 Vitamin D(3) in fat tissue.Endocrine 33:90–94
12. Freedman DS, Wang J, Thornton JC, Mei Z, Pierson Jr RN, DietzWH, Horlick M 2008 Racial/ethnic differences in body fatnessamong children and adolescents. Obesity (Silver Spring) 16:1105–1111
13. Lee S, Kuk JL, Hannon TS, Arslanian SA 2008 Race and genderdifferences in the relationships between anthropometrics and ab-dominal fat in youth. Obesity (Silver Spring) 16:1066–1071
14. Rush EC, Scragg R, Schaaf D, Juranovich G, Plank LD 2009 Indicesof fatness and relationships with age, ethnicity and lipids in NewZealand European, Maori and Pacific children. Eur J Clin Nutr63:627–633
15. Sisson SB, Katzmarzyk PT, Srinivasan SR, Chen W, Freedman DS,Bouchard C, Berenson GS 2009 Ethnic differences in subcutaneousadiposity and waist girth in children and adolescents. Obesity (SilverSpring) 17:2075–2081
16. Tybor DJ, Lichtenstein AH, Dallal GE, Daniels SR, Must A 2010Racial differences in central adiposity in a longitudinal cohort ofblack and white adolescent females. BMC Pediatr 10:2
17. Goran MI, Gower BA 1999 Relation between visceral fat and dis-ease risk in children and adolescents. Am J Clin Nutr 70:149S–156S
18. Arslanian SA, Saad R, Lewy V, Danadian K, Janosky J 2002 Hy-perinsulinemia in African-American children: decreased insulinclearance and increased insulin secretion and its relationship to in-sulin sensitivity. Diabetes 51:3014–3019
19. Burns SF, Arslanian SA 2009 Waist circumference, atherogenic li-poproteins, and vascular smooth muscle biomarkers in children.J Clin Endocrinol Metab 94:4914–4922
20. Lee S, Gungor N, Bacha F, Arslanian S 2007 Insulin resistance: linkto the components of the metabolic syndrome and biomarkers ofendothelial dysfunction in youth. Diabetes Care 30:2091–2097
21. Danadian K, Balasekaran G, Lewy V, Meza MP, Robertson R, Ar-slanian SA 1999 Insulin sensitivity in African-American childrenwith and without family history of type 2 diabetes. Diabetes Care22:1325–1329
22. Lee S, Guerra N, Arslanian S 2010 Skeletal muscle lipid content andinsulin sensitivity in black versus white obese adolescents: is there arace differential? J Clin Endocrinol Metab 95:2426–2432
23. Lee S, Bacha F, Arslanian SA 2006 Waist circumference, blood pres-sure, and lipid components of the metabolic syndrome. J Pediatr149:809–816
24. Matthews KA, Kuller LH, Wing RR, Meilahn EN, Plantinga P 1996Prior to use of estrogen replacement therapy, are users healthier thannonusers? Am J Epidemiol 143:971–978
25. Chen TC, Turner AK, Holick MF 1990 Methods for the determi-
1566 Rajakumar et al. Vitamin D in Black and White Children J Clin Endocrinol Metab, May 2011, 96(5):1560–1567

nation of the circulating concentration of 25-hydroxyvitamin D. JNutr Biochem 1:315–319
26. Holick MF, Siris ES, Binkley N, Beard MK, Khan A, Katzer JT,Petruschke RA, Chen E, de Papp AE 2005 Prevalence of vitamin Dinadequacy among postmenopausal North American women re-ceiving osteoporosis therapy. J Clin Endocrinol Metab 90:3215–3224
27. Dong Y, Pollock N, Stallmann-Jorgensen IS, Gutin B, Lan L, ChenTC, Keeton D, Petty K, Holick MF, Zhu H 2010 Low 25-hydroxyvi-tamin D levels in adolescents: race, season, adiposity, physical ac-tivity, and fitness. Pediatrics 125:1104–1111
28. Foo LH, Zhang Q, Zhu K, Ma G, Trube A, Greenfield H, Fraser DR2009 Relationship between vitamin D status, body composition andphysical exercise of adolescent girls in Beijing. Osteoporos Int 20:417–425
29. Weng FL, Shults J, Leonard MB, Stallings VA, Zemel BS 2007 Riskfactors for low serum 25-hydroxyvitamin D concentrations in oth-erwise healthy children and adolescents. Am J Clin Nutr 86:150–158
30. Young KA, Engelman CD, Langefeld CD, Hairston KG, HaffnerSM, Bryer-Ash M, Norris JM 2009 Association of plasma vitaminD levels with adiposity in Hispanic and African Americans. J ClinEndocrinol Metab 94:3306–3313
31. Kremer R, Campbell PP, Reinhardt T, Gilsanz V 2009 Vitamin Dstatus and its relationship to body fat, final height, and peak bonemass in young women. J Clin Endocrinol Metab 94:67–73
32. Looker AC 2005 Body fat and vitamin D status in black versus whitewomen. J Clin Endocrinol Metab 90:635–640
33. Bacha F, Saad R, Gungor N, Janosky J, Arslanian SA 2003 Obesity,regional fat distribution, and syndrome X in obese black versuswhite adolescents: race differential in diabetogenic and atherogenicrisk factors. J Clin Endocrinol Metab 88:2534–2540
34. Johnson MD, Nader NS, Weaver AL, Singh R, Kumar S 2010 Re-lationships between 25-hydroxyvitamin D levels and plasma glucoseand lipid levels in pediatric outpatients. J Pediatr 156:444–449
35. Kumar J, Muntner P, Kaskel FJ, Hailpern SM, Melamed ML 2009Prevalence and associations of 25-hydroxyvitamin D deficiency inUS children: NHANES 2001–2004. Pediatrics 124:e362–e370
36. Clemens TL, Adams JS, Henderson SL, Holick MF 1982 Increasedskin pigment reduces the capacity of skin to synthesise vitamin D3.Lancet 1:74–76
37. Harris SS, Dawson-Hughes B 1998 Seasonal changes in plasma 25-hydroxyvitamin D concentrations of young American black andwhite women. Am J Clin Nutr 67:1232–1236
38. Saintonge S, Bang H, Gerber LM 2009 Implications of a new def-inition of vitamin D deficiency in a multiracial US adolescent pop-ulation: the National Health and Nutrition Examination Survey III.Pediatrics 123:797–803
39. Norman AW 1998 Sunlight, season, skin pigmentation, vitamin D,and 25-hydroxyvitamin D: integral components of the vitamin Dendocrine system. Am J Clin Nutr 67:1108–1110
40. Webb AR 2006 Who, what, where and when—influences on cuta-neous vitamin D synthesis. Prog Biophys Mol Biol 92:17–25
Members receive an email digest of endocrinology-related news
selected from thousands of sources.
J Clin Endocrinol Metab, May 2011, 96(5):1560–1567 jcem.endojournals.org 1567
Copyright © 2022 FDOKUMEN