Home-based digital leisure: Doing the same leisure activities, but digital
Upload
khangminh22Category
view
0download
0
271STUDIES IN SPORT, PHYSICAL EDUCATION AND HEALTH
Leisure-time Physical Activity Habits and Abdominal Adiposity in
Young Adulthood
Twin Cohort and Co-Twin Control Studies
Mirva Rottensteiner

STUDIES IN SPORT, PHYSICAL EDUCATION AND HEALTH 271
Mirva Rottensteiner
Esitetään Jyväskylän yliopiston liikuntatieteellisen tiedekunnan suostumuksellajulkisesti tarkastettavaksi yliopiston vanhassa juhlasalissa S212
kesäkuun 29. päivänä 2018 kello 12.
Academic dissertation to be publicly discussed, by permission ofthe Faculty of Sport and Health Sciences of the University of Jyväskylä,
in building Seminarium, auditorium S212, on June 29, 2018 at 12 o’clock noon.
UNIVERSITY OF JYVÄSKYLÄ
JYVÄSKYLÄ 2018
Leisure-time Physical Activity Habits and Abdominal Adiposity in Young Adulthood
Twin Cohort and Co-Twin Control Studies

Leisure-time Physical Activity Habits and Abdominal Adiposity in Young Adulthood
Twin Cohort and Co-Twin Control Studies

STUDIES IN SPORT, PHYSICAL EDUCATION AND HEALTH 271
Mirva Rottensteiner
Leisure-time Physical Activity Habits and Abdominal Adiposity in Young Adulthood
Twin Cohort and Co-Twin Control Studies
UNIVERSITY OF JYVÄSKYLÄ
JYVÄSKYLÄ 2018

EditorsIna TarkkaFaculty of Sport and Health Sciences, University of JyväskyläPäivi Vuorio, Sini TuikkaPublishing Unit, University Library of Jyväskylä
Permanent link to this publication: http://urn.fi/URN:ISBN:978-951-39-7472-5URN:ISBN:978-951-39-7472-5ISBN 978-951-39-7472-5 (PDF)
ISBN 978-951-39-7471-8 (nid.)ISSN 0356-1070
Copyright © 2018, by University of Jyväskylä
Jyväskylä University Printing House, Jyväskylä 2018

ABSTRACT
Rottensteiner, Mirva Leisure-time Physical Activity Habits and Abdominal Adiposity in Young Adulthood - Twin Cohort and Co-Twin Control Studies Jyväskylä: University of Jyväskylä, 2018, 113 p. (Studies in Sport, Physical Education and Health ISSN 0356-1070; 271) ISBN 978-951-39-7471-8 (print) ISBN 978-951-39-7472-5 (pdf) Finnish summary Diss.
Twin study designs were utilized to investigate how and what types of leisure-time physical activity (LTPA) are associated with abdominal adiposity in young adulthood taking into consideration diet and other selected health factors. The data of two studies were used: the longitudinal FinnTwin16 cohort and the clinical FITFATWIN study. In FinnTwin16, questionnaire data together with self-measured waist circumference (WC) of 3 383 (1 578 men) cohort members at mean ages 24.5 y and 34 y were used to study LTPA level and waist gain. Cross-sectional data of 4 027 (1 874 men) cohort members at mean age 34 y was used to study LTPA modes and WC. In FITFATTWIN study, ten monozygotic (MZ) male twin pairs discordant for LTPA (mean age 34 y) participated in series of comprehensive health measurements including MRI of abdomen. In the longitudinal study, an increase in LTPA or staying active during the follow-up decade was associated with less waist gain, but any decrease in activity level, regardless of baseline activity, led to a waist gain resembling that of persistently inactive subjects. The difference in waist gain between the MZ twins whose activity decreased and their co-twins whose activity increased was significant. In the cross-sectional study, the number of sport disciplines engaged in was inversely associated with WC. This result persisted after adjustment for LTPA volume and diet quality. In men, all three activity types (aerobic, power and mixed) were individually associated with smaller WC, while in women this association was found only for mixed and power activities. The FITFATTWIN study revealed that in the absence of an overall difference in BMI (~3%), the less active male co-twins tended to have more body fat (~21%), and had an average 31 % more intra-abdominal adipose tissue (IAAT), and 41% more intraperitoneal adipose tissue than their genetically identical but more active brothers. IAAT was associated with the markers of glucose homeostasis. Diet did not differ between co-twins. The findings of this dissertation underline the importance of adopting and maintaining an adequate level of LTPA from young adulthood onward, independently of genes, in seeking to minimize abdominal fat accumulation and the possible development of related metabolic complications.
Keywords: physical activity, waist circumference, abdominal obesity, diet, twins

Author’s address Mirva Rottensteiner, MSc Faculty of Sport and Health Sciences University of Jyväskylä P.O. Box 35 FI-40014 University of Jyväskylä Jyväskylä, Finland [email protected]
Supervisors Professor Urho Kujala, MD, PhD Faculty of Sport and Health Sciences University of Jyväskylä Jyväskylä, Finland
Professor Jaakko Kaprio, MD, PhD Department of Public Health Institute for Molecular Medicine FIMM University of Helsinki Helsinki, Finland
Reviewers Professor Jean-Pierre Després, PhDDepartment of Kinesiology Faculty of Medicine & Québec Heart and Lung Institute Université Laval Québec, Canada
Professor Eco de Geus, PhD Department of Biological Psychology Faculty of Behavioural and Movement Sciences Vrije Universiteit Amsterdam, The Netherlands
Opponent Professor Raija Korpelainen, PhD Department of Sports and Exercise Medicine Oulu Deaconess Institute & Center for Life Course Health Research University of Oulu Oulu, Finland

ACKNOWLEDGEMENTS
My PhD studies were conducted in the Faculty of Sport and Health Sciences at the University of Jyväskylä, and my dissertation is based on data from the FinnTwin16 cohort and FITFATTWIN studies, which are collaborative studies between the Universities of Jyväskylä and Helsinki. I sincerely thank all the twins who participated in these two studies, as well as all the personnel and students for their valuable efforts in collecting the data. The data collections were financially supported by the Finnish Ministry of Education and Culture, the EU FP7 META-PREDICT project, the National Institute of Alcohol Abuse and Alcoholism, and the Academy of Finland, all of which are gratefully acknowledged. I am also grateful to the Juho Vainio Foundation, the Finnish Cultural Foundation and the Faculty of Sport and Health Science at the University of Jyväskylä for financial support for my PhD work.
First and foremost, I would like to warmly thank my principal supervisor, Professor Urho Kujala, for introducing me the world of scientific research, giving me great opportunities to learn, trusting me, and always having an open door. Discussions with you have always been great learning experiences. It has been an immense honor to work in your research group. I would like to express my sincere gratitude to my second supervisor, Professor Jaakko Kaprio, for enabling me to undertake this dissertation in the area of highly esteemed twin studies. I greatly appreciate your careful editing and constructive comments throughout this PhD process. Thank you for sharing your expertise.
I feel honored to have Professor Jean-Pierre Després and Professor Eco de Geus as the official reviewers of this dissertation. I am grateful for their valuable comments and encouraging words. I also want to thank Docent Ina Tarkka for her help in editing this dissertation. And thank you, Professor Raija Korpelainen for graciously agreeing to be my opponent in the public examination.
I would like to cordially thank all the co-authors of the original papers; Sari Aaltonen, PhD, Leonie H. Bogl, PhD, Kauko Heikkilä, PhLic, Elina Järvelä-Reijonen, MSc, Professor Heikki Kainulainen, Vuokko Kovanen, PhD, Tuija Leskinen, PhD, Sara Mäkelä, MD, Sara Mutikainen, PhD, Eini Niskanen, PhD, Professor Kirsi H. Pietiläinen, Ina M. Tarkka, PhD, Timo Törmäkangas, PhD, Karoliina Väisänen, MSc, and Jan Wikgren, PhD. Your valuable work greatly contributed to the articles as well as to my learning process as a researcher. I also want to thank Markku Kauppinen, MSc, for the statistical advices, and Michael Freeman, for language revision of this dissertation.
I am grateful to the Faculty of Sport and Health Sciences for providing excellent working facilities. I want to warmly thank all the staff members and students I have been privileged to work with during these years. Especially, Tuija, you guided me in the beginning of my studies, thank you for your support on various occasions. Special thanks to your kind guidance in experimental research and your extensive input in MRI analyses. Tiina, I am grateful that we shared office and congress travels, and became friends also outside of the work, let´s

continue running together. Katja, thank you for always being ready to help and discuss various matters.
The support outside of the office has also been crucial for accomplishing this project. I am grateful to all my close friends. In addition to the office, I have spent hours and hours in the playground during the last few years, and the joy of meeting other families has been important for the overall balance of my life. Dear Kirsi and Piia, I imagine that you, too, have learnt much about research during these years. I am deeply grateful to our long conversations about everything in life thank you both for always being there for me. My in-laws in Austria, thank you for always being so warm-hearted. I am especially grateful to you, Christa and Philipp, my parents-in-law, for your unfailing support. My sister Riina, whether you are near or on the other side of world, I feel immense warmth. I am grateful for my brother’s family for bringing joy to our family-life. I want to devote my warmest thanks to my parents, Leila and Jaakko. Your encouragement and support, especially your help with childcare during these years, has been indispensable. And thank you, dad, for over and over again waxing my skis, and sharing the same interests in sports and exercise.
Finally, Christoph, heartfelt thank you for all the love, laughs, encouragement, understanding and sport hours during these years, years that have also included our most important life-events. There are no words to express how happy I am that you moved to Finland, and made this all possible. I want to dedicate this dissertation to our precious sons. Elias, Aaron, and Tobias you are the sunshine of our lives!
Jyväskylä, May 2018
Mirva

FIGURES
FIGURE 1 Participants and data utilized in the present dissertation. ................. 36FIGURE 2 Flow chart of the participants in the FITFATTWIN study. ................ 39FIGURE 3 Illustration showing where to measure waist circumference. ........... 42FIGURE 4 An illustrative example of a MRI slice of the abdomen
at the level of L2-L3. .................................................................................. 47FIGURE 5 Persistence and change in LTPA and waist gain (cm, mean and
95%CI) during follow-up. ........................................................................ 56FIGURE 6 Differences in waist gain (cm, mean and 95%CI) during
follow-up ..................................................................................................... 57FIGURE 7 Illustrative example of intra-abdominal fat accumulation in a
young adult male MZ twin pair discordant for LTPA over the past 3 years. ................................................................................ 69
FIGURE 8 Individual paired data (1 to 10 twin pairs discordant for LTPA) and means for difference in intra-abdominal adipose tissue mass, 12 month and 3-year LTPA habits, and energy intake. ....................... 70
TABLES
TABLE 1 Timetable of the two-day laboratory measurements in the FITFATTWIN study. ................................................................................ 44
TABLE 2 Characteristics of the participants at baseline and at follow-up by gender and LTPA categoriesa .......................................... 52
TABLE 3 Characteristics of the participants by gender and number of sport disciplines participated in. ............................................................. 54
TABLE 4 Pairwise differences in waist gain during follow-up between twin pairs discordant for LTPA .............................................................. 59
TABLE 5 The most popular sport disciplines and waist circumference among young adult twins in Finland. ................................................... 61
TABLE 6 Number of sport disciplines participated in and waist circumference. ........................................................................................... 62
TABLE 7 Waist circumference, body mass index, dietary quality, and LTPA volume among co-twins discordanta for the number of sport disciplines participated in. ...................................................................... 63
TABLE 8 Participation in different types of activities and waist circumference ............................................................................................ 64
TABLE 9 Linear model of types of activity significantly predicting waist circumference (men N=1 874, women N=2 153). ................................. 65
TABLE 10 Characteristics of the male MZ twin pairs discordant for LTPA ..................................................................................................... 67

TABLE 11 Differences in abdominal adipose tissue masses between male MZ twin pairs discordant for LTPA ...................................................... 68
TABLE 12 Differences in nutrient intake between male MZ twin pairs discordant for LTPA. ................................................................................ 71

LIST OF ORIGINAL PUBLICATIONS
This dissertation is based on the following four original publications, which are referred to in the text by their Roman numerals.
I Rottensteiner, M., Pietiläinen, K.H., Kaprio, J. & Kujala, U.M. Persistence or change in leisure-time physical activity habits and waist gain during early adulthood: a twin-study. Obesity 2014; 22 (9), 2061-2070; doi: 10.1002/oby.20788.
II Rottensteiner, M., Mäkelä, S., Bogl, L.H., Törmäkangas, T., Kaprio J. & Kujala U.M. Sport disciplines, types of sports, and waist circumference in young adulthood - a population-based twin study. European Journal of Sport Science 2017; 17 (9), 1184-1193. doi:10.1080/17461391.2017.1356874.
III Rottensteiner M., Leskinen T., Niskanen E., Aaltonen S., Mutikainen S., Wikgren J., Heikkilä K., Kovanen V., Kainulainen H., Kaprio J., Tarkka I.M. & Kujala U.M. Physical activity, fitness, glucose homeostasis, and brain morphology in twins. Medicine & Science in Sports & Exercise 2015; 47(3): 509-518; doi:10.1249/MSS.0000000000000437.
IV Rottensteiner, M., Leskinen, T., Järvelä-Reijonen, E., Väisänen, K., Aaltonen, S., Kaprio, J. & Kujala U.M. Leisure-time physical activity and intra-abdominal fat in young adulthood: a monozygotic co-twin control study. Obesity 2016; 24 (5): 1185-1191; doi:10.1002/oby.21465

ABBREVIATIONS
ASAT abdominal subcutaneous adipose tissue BMI body mass index CI confidence interval CVD cardiovascular diseases DEXA dual-energy X-ray absorptiometry DZ dizygotic E% percentage of energy HIIT high intensity interval training HR heart rate HRR heart rate reserve IAAT intra-abdominal adipose tissue IL-6 interleukin-6 kcal kilocalorie LTPA leisure-time physical activity LPL lipoprotein lipase MET metabolic equivalent MRI magnetic resonance imaging MZ monozygotic PAI-1 plasminogen activator inhibitor-1 RCT randomized controlled trial RPE rating of perceived exertion TE echotime TR repetition time TDEE total daily energy expenditure TNF- tumor necrosis factor alpha VAT visceral adipose tissue WC waist circumference VO2R aerobic capacity reserve WHO World Health Organization VO2max maximum aerobic capacity 1RM one-repetition maximum

CONTENTS
ABSTRACT ACKNOWLEDGEMENTS FIGURES AND TABLES LIST OF ORIGINAL PUBLICATIONS ABBREVIATIONS CONTENTS
1 INTRODUCTION .............................................................................................. 13
2 REVIEW OF THE LITERATURE ..................................................................... 162.1 Body fat distribution and health ............................................................. 16
2.1.1 Health consequences of abdominal obesity .............................. 182.1.2 Assessment of abdominal adiposity ........................................... 19
2.2 Defining and quantifying physical activity .......................................... 212.3 Physical activity and abdominal adiposity ........................................... 25
2.3.1 Longitudinal physical activity habits ......................................... 252.3.2 Physical activity mode .................................................................. 27
2.4 Diet in relation to physical activity and abdominal adiposity ........... 292.5 Twin study design .................................................................................... 31
3 AIMS OF THE STUDY ...................................................................................... 34
4 PARTICIPANTS AND METHODS ................................................................. 354.1 Participants of the FinnTwin16 cohort study (Studies I and II) ......... 364.2 Participants of the FITFATTWIN clinical study (Studies III and
IV) ................................................................................................................ 374.3 Measurements in FinnTwin16 cohort study ......................................... 40
4.3.1 Leisure-time physical activity ..................................................... 404.3.2 Waist circumference ..................................................................... 424.3.3 Dietary quality score ..................................................................... 434.3.4 Other confounding factors ........................................................... 43
4.4 Measurements in FITFATTWIN clinical study ..................................... 444.4.1 Leisure-time physical activity. .................................................... 454.4.2 Physical fitness .............................................................................. 464.4.3 Anthropometrics and body composition. ................................. 464.4.4 Magnetic resonance imaging of the abdomen .......................... 464.4.5 Blood samples ................................................................................ 474.4.6 Nutrient intake .............................................................................. 48
4.5 Ethics of the study .................................................................................... 484.6 Statistical methods .................................................................................... 48

5 RESULTS ............................................................................................................. 50
5.1 FinnTwin16 cohort study ........................................................................ 505.1.1 Participants characteristics .......................................................... 505.1.2 Persistence or change in physical activity and waist gain ...... 555.1.3 Sport disciplines, types of activity, and waist circumference . 60
5.2 FITFATTWIN clinical study of activity-discordant twins .................. 665.2.1 Physical activity level, fitness, body composition, and
glucose homeostasis ...................................................................... 665.2.2 Abdominal adipose tissue compartments ................................. 675.2.3 Nutrient intake .............................................................................. 71
6 DISCUSSION ...................................................................................................... 726.1 Persistence or change in physical activity and waist gain .................. 736.2 Sport disciplines, types of activity, and waist circumference ............ 746.3 Physical activity level, abdominal fat compartments, and other
selected health indicators ........................................................................ 766.4 Diet, physical activity and abdominal adiposity ................................. 776.5 Methodological considerations ............................................................... 786.6 Implications and future directions ......................................................... 82
7 MAIN FINDINGS AND CONCLUSIONS ..................................................... 84
YHTEENVETO (FINNISH SUMMARY) .................................................................. 86
APPENDIX 1 ................................................................................................................ 89
APPENDIX 2 ................................................................................................................ 90
APPENDIX 3 ................................................................................................................ 92
REFERENCES ............................................................................................................... 93
ORIGINAL PUBLICATIONS

1 INTRODUCTION
Worldwide trends in overweight and obesity are a cause of concern (NCD Risk Factor Collaboration 2017). The prevalence of obesity has nearly tripled over last four decades, with over 1.9 billion adults (39%) estimated to be overweight and 650 million obese (13%) in 2016 (WHO 2017a). In Finland, an increasing long-term trend has been also observed, and with an estimated 60 % of men and 43 % of women overweight in 2014 (Helldán & Helakorpi, 2014). In general, in the rather complex interaction between environment and genes (Dixon 2010), body weight increases when energy intake exceeds energy consumption over a given period, and in general 60 % to 80 % of the increased body mass is composed of fat (Hill, Wyatt & Peters 2012). During the last few decades, rapid urbanization, industrialization, motorized transport, reduction in occupational physical activity, along with increased availability of food have challenged individuals’ ability to maintain energy balance (Hallal et al. 2012, Hill, Wyatt & Peters 2012). Obesity is no longer only a problem in the high-income countries, but has also been on the rise in low- and middle-income countries (NCD Risk Factor Collaboration 2017). The prevalence of obesity and overweight are high, but promising signs of a leveling off have been observed (Flegal et al. 2010, Rokholm, Baker & Sorensen 2010, Lao et al. 2015). However, in some countries, waist circumference (WC), a surrogate marker of abdominal obesity, has continued to rise (Ford, Maynard & Li 2014, Lao et al. 2015, Koponen et al. 2018). The growth in waist circumference or prevalence of abdominal obesity has increased, in particular, among younger adults (Lahti-Koski et al. 2012, Ladabaum et al. 2014, Albrecht et al. 2015, Jacobsen & Aars 2016).
While the health consequences of obesity are indisputable (WHO 2000), the location of body fat seems to have a more important influence, especially on cardio-metabolic health, than general obesity (Kissebah et al. 1982, Després 2012). Abdominal obesity is an independent risk factor for type 2 diabetes and cardiovascular diseases (Janssen, Katzmarzyk & Ross 2004, Yusuf et al. 2005, Balkau et al. 2007), which are the major global health concerns (Roth et al. 2015, NCD Risk Factor Collaboration 2016). Intra-abdominal adipose tissue (IAAT), located within the abdomen cavity close to the inner organs, is a metabolically

14 active fat depot (Ibrahim 2010), and has been shown to be more strongly associated with obesity-related metabolic disturbances than subcutaneous abdominal adipose tissue (Fox et al. 2007, Smith et al. 2012). As abdominal obesity has become increasingly common among younger people, early stages prevention strategies to minimize the development of related health problems are important. Moreover, preventing excessive fat accumulation should be a priority as it seems to be easier to accomplish than reducing obesity (Hill, Wyatt & Peters 2012).
There is a convincing body of evidence to show that regular physical activity has important health benefits (Physical Activity Guidelines Advisory Committee 2008), although many questions concerning the optimal dose of exercise for different health outcomes remain unanswered. Importantly, in most adults, the benefits outweigh the risks (Garber et al. 2011). Based on the current scientific knowledge, engaging in moderate-intensity physical activity for at least 150 min a week or vigorous-intensity physical activity for at least 75 min a week is recommended, along with resistance exercises for the major muscle groups at least twice a week (WHO 2010, Garber et al. 2011). Globally, despite all the acknowledged benefits of physical activity, the proportion of inactive people remains substantial (Hallal et al. 2012, WHO 2017b), and inactivity has been identified as one of the leading risk factors for non-communicable diseases and mortality (WHO 2009).
Physical activity is the most modifiable component of total daily energy expenditure (McArdle et al. 2015), and has, therefore, good potential to prevent and reduce abdominal obesity. With the decrease in routine daily activity in modern society, the emphasis in modifying total daily energy expenditure nowadays is on the role of leisure-time time physical activity (LTPA), which has shown a positive trend over recent decades (Borodulin et al. 2008, Hallal et al. 2012). Longitudinal studies have shown that regular physical activity is related to favorable WC (Waller, Kaprio & Kujala 2008, Hankinson et al. 2010). Nevertheless, despite constant physical activity WC seems to continue to grow (Hankinson et al. 2010, May et al. 2010). Intervention studies have demonstrated that aerobic training can reduce IAAT among people with overweight and obesity, even without caloric restriction or weight loss (Vissers et al. 2013, Verheggen et al. 2016). Observational studies on changes in physical activity habits along with prolonged activity have highlighted the need of an increase in activity level to attenuate age-related waist gain (Aadahl et al. 2009, Shibata et al. 2016). However, less is known about this phenomenon among younger adults, who are at an age when waist gain already seem to escalate (Lahti-Koski et al. 2012, Ladabaum et al. 2014) and many other major changes in life that affect physical activity habits occur (i.e. work- and family- related commitments) (Engberg et al. 2012), making this a critical life phase from the obesity epidemic viewpoint. Recently, whereas the health benefits of specific sport disciplines have been discussed (Oja et al. 2015, Oja et al. 2016), the evidence on body fat distribution remains scarce. The range of popular sport disciplines is much broader than the activity modes typically used in intervention trials or reported

15
in observational studies. From a health promotion perspective, study of the health benefits of a wide range of popular physical activities could be beneficial.
Furthermore, the studies that have investigated the relationship between physical activity and health outcomes have largely been performed in genetically unrelated individuals. As genetics plays a role in obesity (Locke et al. 2015, Shungin et al. 2015, Turcot et al. 2018) and exercise participation (de Geus et al. 2014), purely observational studies may be biased by genetic selection favoring high physical activity levels and a suitable body composition in certain individuals. Very long exercise trials are difficult to accomplish, and other study designs reflecting causality, such as Mendelian Randomization or genetic risk score studies, are difficult to apply in exercise research because the genetic background of physical activity is multifactorial and strong genetic markers needed for such analyses are lacking (Lightfoot et al. 2018). Discordant twin study designs offer a means to tackle the challenges presented by genetic factors in the field of exercise research. By studying twin pairs discordant for an exposure, such as physical activity, childhood family environment and genetic background can be fully (monozygotic (MZ) pairs) or partially (dizygotic (DZ) pairs) controlled for.
For this dissertation, twin study designs were utilized to investigate how and what types of LTPA are associated with abdominal fat accumulation in young adulthood. Changes in LTPA habits during young adulthood and the role of different activity modes along with diet quality were investigated in the observational studies. In the clinical study, MZ male twin pairs discordant for LTPA level were studied to determine the differences in abdominal adipose tissue compartments and other health—related factors, such as diet, fitness, body mass index (BMI), body fat, and glucose homeostasis, independently of genetics or shared environmental factors. In the clinical study, young adult males were studied to see whether differences arising from differing physical activity levels are observable prior to the onset of overt chronic diseases or to the presence of widespread abnormal values for other cardio-metabolic risk factors.

2 REVIEW OF THE LITERATURE
2.1 Body fat distribution and health
The health consequences of obesity, the phenotype of increased adipose tissue mass, are indisputable, and include among others increased risk for overall mortality, cardiovascular diseases, type 2 diabetes, insulin resistance, hypertension, dyslipidemia, nonalcoholic liver fat disease, obstructive sleep apnea, osteoarthritis, and several cancers (WHO 2000, Haslam & James 2005, Kumanyika et al. 2008). Obesity is universally defined based on body mass index (BMI, kg/m2). Thus, normal weight is classified as BMI between 18.5-24.9, overweight as BMI between 25-29.9, and obesity as BMI 30 or over (WHO 2000). However, the location of body fat seems to have a more important influence, especially on cardio-metabolic health, than general obesity (Kissebah et al. 1982, Després 2012). Obesity is a very heterogeneous and complex condition where equally overweight or obese persons may show individual variation in regional fat distribution, and, further, markedly different risk factor profiles (Britton & Fox 2011, Després 2012).
Adipose tissue comprises about 20% and 28% of men´s and women´s body weight, respectively, but can show a considerable increase in the state of obesity (Thompson et al. 2012). Adipose tissue is loose connective tissue that has a role as a body insulator and cushion (Shen et al. 2003). It consists mainly of adipocytes, but also of other non-fat cells (e.g., inflammatory cells), and of vascular, connective, and neural tissues (Ibrahim 2010). The main chemical component of adipose tissue is fat (~80%), and remaining part (~20%) comprises water, protein, and minerals (Shen et al. 2003). Adipose tissue is specialized in the storage and mobilization of lipids, but its central role as an endocrine organ has received increasing attention (Després & Lemieux 2006, Hajer, van Haeften & Visseren 2008). As such, it releases many hormones and cytokines (such as adiponectin, TNF- , IL-6, PAI-1, LPL, leptin among others) involved in glucose and lipid metabolism, inflammation, coagulation, blood pressure, and feeding behavior. Therefore, the metabolism and function of many other organs and tissues are

17
influenced by adipose tissue. In the state of obesity, the number of macrophages infiltrated in adipose tissue is increased and the produce of these biological mediators is often changed (Hajer, van Haeften & Visseren 2008). However, adipose tissue cannot be considered as a single uniform tissue, as there seems to be differences in its biological function according to its location (Shen et al. 2003, Ibrahim 2010). Adipose tissue can expand by adipocyte hyperplasia or hypertrophy. With regards to adipose tissue function, adipocyte size is the determining factor, and there seem to be regional differences in the preference for storing fat through hyperplasia or hypertrophy (Tchernof & Després 2013).
Adipose tissue is distributed throughout the body as subcutaneous adipose tissue and internal adipose tissue (Shen et al. 2003). Most of the body fat, approximately 80%, is located in subcutaneous adipose tissue, mainly in gluteal-tight regions, and in the back and anterior abdominal wall (Ibrahim 2010). A thin fascial plane separates subcutaneous adipose tissue further into superficial and deep portions. Internal adipose tissue, in turn, consists of intra-abdominal adipose tissue (IAAT) (i.e., visceral adipose tissue (VAT)) and non-abdominal internal adipose tissue. The latter consist mainly of intra-, perimuscular- and cardiac adipose tissues (Shen et al. 2003, Thomas et al. 2013).
The muscle wall of the abdomen separates the two main abdominal adipose tissue depots of ASAT and IAAT/VAT. The terms VAT and IAAT are mostly reported interchangeably. IAAT is typically defined as adipose tissue in the body cavity within the abdomen, or as the sum of adipose tissue in the two anatomically connected body cavities within the abdomen and pelvis. IAAT can anatomically be further divided into intraperitoneal (omental and mesenteric) and retroperitoneal regions (Shen et al. 2003). These two depots have venous drainage differences, as intraperitoneal adipose tissue drains directly through the portal vein to the liver, and retroperitoneal adipose tissue is drained systemically (Shen et al. 2003, Item & Konrad 2012). In addition to adipose tissue found surrounding some important organs, fat can also be accumulated within organs and tissue such as the liver, pancreas, and heart, or muscle, where it is known as an ectopic fat (Thomas et al. 2013).
If energy intake exceeds energy expenditure over the longer term, the body´s limited capacity to store glycogen is exceeded, and the excess energy will be stored at most as fat in adipocytes in adipose tissue (Hill, Wyatt & Peters 2012, Thompson et al. 2012). Physical activity and diet play a pivotal role in energy balance and further in body fat accumulation. However, various other factors such as genotype, sex, age, race/ethnicity, hormonal profile, total adiposity, stress, smoking, and sleeping habits, among others, seem to influence the pattern of body fat distribution. (Cornier et al. 2011, Tchernof & Després 2013). Physical activity, diet, and genetics are discussed in Chapters 2.3, 2.4, and 2.5. Body fat percent is generally higher in women, and they are more likely to accumulate fat subcutaneously in the gluteal-femoral region, while men tend to deposit fat in the abdominal region (Power & Schulkin 2008). Fat deposition in IAAT relative to subcutaneous tissue seems to increase with age. Among women, owing to changes in the sex hormonal profile, the greatest change is seen from pre- to

18 postmenopause. With respect to race and ethnicity, different populations show differences in the susceptibility to accumulate adipose tissue in the subcutaneous and intra-abdominal depots. Despite lower total adiposity values, Asian and Indian Asians have a tendency to accumulate IAAT. Caucasian also have a propensity to accumulate IAAT when compared to African-Americans at the same total adiposity level (Tchernof & Després 2013). Cigarette smokers may have a smaller BMI than non-smokers, but they seem to accumulate more fat in central body (Barrett-Connor & Khaw 1989, Canoy et al. 2005). Maladaptive response to stress is considered to play a role in the preferential accumulation of intra-abdominal fat relative to overall obesity (Björntorp 2001, Drapeau et al. 2003). Recently, short sleep duration has received attention as a risk factor for preferential increases in central adiposity (Chaput, Després et al. 2011, Chaput, Bouchard & Tremblay 2014).
2.1.1 Health consequences of abdominal obesity
It is well established that excess abdominal adiposity is associated with a constellation of metabolic abnormalities, and furthermore an important risk factor for cardio-metabolic diseases (Björntorp 1993, Després & Lemieux 2006, Després 2012). In the late 1940s, the French physician Jean Vague demonstrated for the first time that obesity—related health problems were associated with the central distribution of body fat. He introduced the term android (male-type, upper body) obesity, which was found to be more frequently related to diabetes and cardiovascular diseases than gynoid (female-type, lower body) obesity (Vague 1947, Vague 1956). Since then, the body of evidence has accumulated and the health hazards of abdominal obesity have been demonstrated to be independent of overall obesity. Excess abdominal fat accumulation is closely related to many cardio-metabolic risk factors such as insulin resistance, glucose intolerance, atherogenic dyslipidemia, elevated blood pressure, and inflammatory markers (Kissebah et al. 1982, Janssen, Katzmarzyk & Ross 2004, Karter et al. 2005, Panagiotakos et al. 2005, Wannamethee et al. 2005), and, further, to increased risk for type 2 diabetes and cardiovascular diseases (Rexrode et al. 1998, Lakka et al. 2002, Wang et al. 2005, Yusuf et al. 2005, Balkau et al. 2007, Winter et al. 2008), and mortality (Pischon et al. 2008, Jacobs et al. 2010, Leitzmann et al. 2011). The associations between abdominal adiposity and cardio-metabolic risks are found in both sexes and across age and ethnicity. The International Diabetes Federation has nominated abdominal obesity alongside insulin resistance as a major determinant of metabolic syndrome (International Diabetes Federation 2006). It is almost three decades since it was demonstrated for the first time that of the two abdominal fat compartments, IAAT is more strongly related to metabolic disturbances and disease risk than SAAT (Fujioka et al. 1987, Després et al. 1990). Subsequently, many studies have confirmed the detrimental role of excess IAAT in associations with metabolic health and increased risk for cardio-metabolic diseases (Fox et al. 2007, Liu et al. 2010, Neeland et al. 2012, Smith et al. 2012, Yano et al. 2016).

19
The underlying mechanisms linking intra-abdominal adiposity and disease risks are, however, complex and not fully understood. The unique anatomical position and metabolic peculiarities of IAAT may explain its specific role (Abate & Garg 1995). Hypertrophied adipocytes in IAAT are lipolytically very active and, according to the “portal theory”, the liver is directly exposed to the overflow of free fatty acids and cytokines from portally drained intra-abdominal fat deposits, which in turn leads to impairments in hepatic metabolism (Bjorntorp 1990, Després & Lemieux 2006, Item & Konrad 2012). If IAAT is separated into its two sub-compartments, the intra- and retroperitoneal depots, the intraperitoneal depot, which drains into portal circulation, has a potentially different metabolic effect from that of the retroperitoneal depot, which is drained systemically (Abate & Garg 1995). Further, the “endocrine” function of IAAT, that is, the excessive release of the different adipokines involved in the inflammation process and lipid and glucose metabolism, among others, has been proposed to play a central role in metabolic disturbances related to intra-abdominal adiposity (Després & Lemieux 2006, Després et al. 2008). Excess of IAAT may also be a marker of dysfunctional adipose tissue. In that case, it rather reflects the inability of subcutaneous adipose tissue to store caloric excess and thus to act as the “protective metabolic sink”, leading to the accumulation of fat, generally termed ectopic fat deposit, at undesired sites such as the liver, heart, pancreas, and skeletal muscles (Després et al. 2008, Britton & Fox 2011). Metabolic derangements may therefore be due to the accumulation of adipose tissue in organs that are essential to glucose, insulin and lipid metabolism (Britton & Fox 2011). This may explain the protective role of peripheral subcutaneous adipose tissue found in some studies (Snijder et al. 2004).
Although the existence of a causal relation between excess IAAT and the constellation of metabolic abnormalities remains unclear, consistent strong associations between these indicate that excessive accumulation of intra-abdominal fat could be considered as a good marker of metabolic derangements, and hence of increased risk for cardiometabolic diseases (Després & Lemieux 2006, Després 2012).
2.1.2 Assessment of abdominal adiposity
Various methods of assessing the quantity of abdominal adiposity have been developed. These methods include surrogate measures using anthropometrics such as waist circumference (WC), waist-to-hip ratio, waist-to-height ratio and abdominal sagittal diameter; indirect estimates such as bioelectrical impedance, dual-energy X-ray absorptiometry (DEXA) and ultrasonography; and imaging methods such as computed tomography and magnetic resonance imaging (MRI). Imaging methods are regarded as the gold standard for directly quantifying different fat depots (Cornier et al. 2011, Thomas et al. 2013). WC and MRI were the methods employed in this dissertation research.
Anthropometric measures are a simple and inexpensive way of deriving an estimate of body fat distribution in clinical practice and larger study populations. The selection of an anthropometric indicator of body fat distribution is usually

20 based on its ability to correlate with other risk factors, morbidity, and mortality, or to predict the amount of intra-abdominal fat (Molarius & Seidell 1998). BMI is generally used to assess body fatness, but it does not reveal information about body fat distribution (Cornier et al. 2011). WC correlates with BMI at the population level, but for any given BMI value substantial differences will be found in both WC and visceral adiposity (Després 2011, Nazare et al. 2015). Although the measurement of WC does not allow IAAT to be distinguished from less harmful SAAT, it seems to reflect intra-abdominal fat accumulation better than waist-to-hip ratio (Pouliot et al. 1994, Rankinen et al. 1999), and its ability to predict IAAT is not improved when adjusted for BMI (Berentzen et al. 2012). Therefore, WC seems to be a good anthropometric predictor of intra-abdominal adiposity. Moreover, if change in abdominal adiposity over a given period is of interest, use of the waist-to-hip ratio may not detect the true change in abdominal fat if both gluteal-tight and abdominal adiposity have increased or decreased (Tchernof & Després 2013).
WC is rather easy to measure, and the results are simple to interpret in the public health context (Molarius & Seidell 1998). Only a tape measure and simple training in the appropriate technique are required (Cornier et al. 2011). However, no universally accepted protocol for measuring WC exist, and considerable variability in the precise location of the tape measure has been reported, but the advantage of using one measurement site over others has not been clearly demonstrated (Klein et al. 2007). It is evident that the cut-off thresholds for increased risk of metabolic complications are gender-specific. Recently, the recommendation to use ethnic specific thresholds has been highlighted, as different ethnic populations seem to manifest considerable differences in body fat distribution and risk for further obesity-related disease (WHO 2008). Typically used cut-offs for increased cardio-metabolic risk are > 102 cm and > 88 cm for men and women, respectively (Jensen et al. 2014). However, the cut-offs for the diagnoses of metabolic syndrome are lower; for Europeans, for instance, the cut-offs are 94 cm and 80 cm for men and women, whereas for South Asians and Chinese the corresponding cut-offs are 90 and 80 for men and women, respectively (International Diabetes Federation 2006).
As anthropometric measures can provide only a rough indication of abdominal fat accumulation, the measurement of different abdominal adipose tissue compartments requires imaging methods such as computed tomography or MRI. These two methods are considered the gold standard because of their specificity and accuracy in quantifying IAAT and SAAT (Seidell, Bakker & van der Kooy 1990, Abate et al. 1994, Cornier et al. 2011, Thomas et al. 2013,). However, the availability of sophisticated equipment along with costs, time, and the technical skills required limits the use of these methods for routine purposes (Cornier et al. 2011). One of the main advantages of MRI is the absence of exposure to a radiation, which makes it preferable, for instance in follow-up studies and with children (Thomas et al. 2013). A sophisticated MRI scanner generates and controls magnetic fields that interact with the protons in different human tissues. The construction of the sliced images is based on the rate at which

21
protons from different tissues return to the equilibrium state after exposure to a magnetic field (Cornier et al. 2011). As fat differs from the other tissue constituents in proton relaxation time, adipose tissue is easy to identify in the image slice as, in contrast with other tissues, it shows as a bright area (Abate et al. 1994). A single cross-sectional slice shows only one area of adipose tissue, whereas volumetric analysis requires multiple slice scans. Scanning of the entire abdomen, typically covering from the head of the femoral bone to the top of the liver (Thomas et al. 2013), produces the most accurate results on IAAT and SAAT volumes. However, to compromise between cost, including scanning and analysis time, and accuracy, a single cross-sectional image is often used to represent the adipose tissue compartments (Shen et al. 2003, Thomas et al. 2013), or utilized to estimate total volumes of different abdominal fat depots (Abate et al. 1997). The selection of the intervertebral space level of a single cross-sectional slice is based on its ability to predict disease risk and IAAT volume. There is no generally accepted protocol, but the intervertebral space at level L(lumbar)4-L5 has frequently been used (Verheggen et al. 2016). However, accumulating evidence indicates that a level somewhat above that (e.g. L2-3, L3-L4, L4-L5+4-10 cm) could better detect IAAT volume and cardiometabolic risk (Abate et al. 1997, Shen et al. 2004, Shen et al. 2007, Demerath et al. 2008, Irlbeck et al. 2010). Cross-sectional IAAT cut-off values indicating optimal health or increased health risk have recently been under discussion, but more research with standardized localization of abdominal scans is needed (Tchernof & Després 2013).
2.2 Defining and quantifying physical activity
Definitions of terms Physical activity, exercise, sports, and physical fitness are closely related terms that are commonly used in the field of sport and exercise science. Physical activity is defined as “any bodily movement produced by skeletal muscles that results in energy expenditure” (Caspersen, Powell & Christenson 1985). Typically physical activity accounts for 15 % to 30% of total daily energy expenditure (TDEE), while other components are resting metabolic rate (about 60-75%), and the thermic effect of feeding (about 10%). Physical activity is themost modifiable component of TDEE (McArdle, 2015). Exercise is “a subset ofphysical activity that is planned, structured, and repetitive, and has a final or anintermediate objective, the improvement or maintenance of physical fitness”(Caspersen, Powell & Christenson 1985). Physical fitness is “the ability to carry outdaily tasks with vigor and alertness, without undue fatigue and with ampleenergy to enjoy leisure-time pursuits and to meet unforeseen emergencies”.Operationalized measurable health-related components of physical fitness arecardiorespiratory fitness, muscular strength and endurance, body composition,flexibility and neuromotor fitness (Caspersen, Powell & Christenson 1985).Furthermore, the term sports can be defined as a subset of exercise, that has adefined goal, and participants who individually or as a part of team adhere to acommon set of rules or expectations (Khan et al. 2012).

22
Physical activity is also categorized into domains according to the context in which activity is performed, such as occupational, transportation or commuting, household, and leisure-time or recreational activities. Leisure-time physical activity (LTPA) includes exercise conditioning or training, sports participation, and unstructured recreational activities that are performed at the individual´s discretion. Activities essential for daily living (e.g. household) are not included in LTPA (Physical Activity Guidelines Advisory Committee 2008). Routine daily activity has decreased in modern society, and therefore the role of LTPA in particular in modifying TDEE is emphasized (Borodulin et al. 2008, Hallal et al. 2012). Given that different domains of physical activity, such as LTPA and occupational physical activity, are associated differentially with health outcomes (Holtermann et al. 2018), it is important to provide data of activity domains.
LTPA covers a range of different activity modes. These may denote specific activities (termed “sport disciplines” in this dissertation), such as walking, cycling, dance, or football, or the physiological and biomechanical demands/types of the activity such as aerobic, strength training, or balance training (Strath et al. 2013). Endurance (aerobic) training is rhythmic, involves dynamic contractions of larger muscle groups for a prolonged period, and mainly utilizes an aerobic energy-producing system. This type of training enhances cardiorespiratory fitness. Typical aerobic activities include walking, jogging, swimming, and cross-country skiing. However, if performed with sufficient duration and intensity, many sport disciplines, for instance, racquet and ball games, have elements of aerobic training and can thus enhance cardiorespiratory fitness. Resistance (strength) training typically involves short bursts of muscular contractions with different loads, and enhances muscular fitness, that is, skeletal muscle strength, power, endurance, and mass (ACSM 2006, Physical Activity Guidelines Advisory Committee 2008, Garber et al. 2011).
Quantity of physical activity The amount (dose) of physical activity, and hence of energy expenditure is dependent on the frequency, duration, and intensity of the activity performed. Intensity describes the magnitude of the effort or rate of energy expenditure needed to perform the activity. Intensity can be expressed as an absolute value, without considering individual factors, or as a relative value that takes the individual’s exercise capacity into account (Physical Activity Guidelines Advisory Committee 2008). Absolute intensity can be expressed for instance as caloric expenditure (kcal/min), metabolic equivalents (METs), absolute oxygen uptake (mL/kg), and the speed of the activity (e.g. jogging at 6 miles per hour) (Physical Activity Guidelines Advisory Committee 2008, Garber et al. 2011). Most observational studies have used the absolute level of intensity when describing physical activity, whereas relative intensity is usually utilized in intervention studies (Haskell 2012). Commonly used methods, which take the individual’s exercise capacity into account, are a percentage of the individual’s maximum aerobic capacity (%VO2max) or aerobic capacity reserve (%VO2R), percentage of the maximum heart rate (%HRmax) or heart rate reserve (%HRR), percentage of maximum MET (%METmax), and the rating of perceived

23
exertion (RPE)(Borg scale 6-20), which expresses the individual´s perception of how hard she/he is exercising. Relative resistance training intensity is often represented as a percentage of the one-repetition maximum (%1RM) (Garber et al. 2011). Examples of definitions of the intensity of aerobic physical activity are given below (Strath et al. 2013, modified from U.S. Department of Health and Human Services 1996):
Relative intensity Absolute intensity
Intensity VO2max or Heart Rate Reserve
Maximal Heart Rate RPE Intensity METs
Very light <25% <30% <9 Sedentary 1-1.5Light 25-44% 30-49% 9-10 Light 1.6-2.9Moderate 45-59% 50-69% 11-12 Moderate 3-0-5.9Hard 60-84% 70-89% 13-16 Vigorous 6.0 Very hard 85% 90% >16Maximal 100% 100% 20
Notes: VO2max, maximal aerobic capacity, RPE, rating of perceived exertion, MET, metabolic equivalents.
MET indicates the metabolic cost of physical activities as the ratio of the task metabolic rate to a standard resting metabolic rate. One MET refers to the resting metabolic rate or the energy cost of person sitting at rest, and is considered approximately 3.5 mL oxygen consumption per kg of body weight per minute, or 1.0 kcal per kg of body weight per hour (Ainsworth et al. 2011). The Compendium of Physical Activities (Ainsworth et al. 2011) is a widely accepted resource for estimating and classifying the energy cost of adults’ physical activities based on MET values. It provides MET intensity values for different types of physical activities, ranging from 0.9 (sleeping) to 23 METs (fast running). The Compendium resource enables better comparability of study results using self-reported physical activity, because of the consistency it offers in assigning intensity levels to physical activities. MET-scores, which are independent of body weight, can be calculated by multiplying the activity MET value by the duration of the activity in hours or minutes, and summing the values obtained for different activities (Ainsworth et al. 2011). In epidemiological studies, the total volume of physical activity over a given period (typically a day or a week) is often expressed in MET-hours or MET-minutes. Other commonly used measures of the volume of physical activity over a given period are kcal, kcal per kg of body weight, and hours or minutes spent in specific intensity threshold range (Garber et al. 2011, Strath et al. 2013).
Assessment methods As physical activity is a very multidimensional behavior, its accurate assessment is challenging and no single gold standard method exist that can capture all the subcomponents and domains of physical activity (Lagerros & Lagiou 2007, Warren et al. 2010). The nature of the research question determines the choice of method, which is typically a compromise between accuracy and feasibility (Warren et al. 2010). For instance, the desired components of the activity, the number of individuals to be assessed, the financial resources available, personnel requirements, and how quickly the results are

24 needed all affect selection of the most appropriate method, which should also be feasible, practical and capable of detecting changes. Assessment methods divide into subjective and objective measurements. At the population level, subjective methods are typically used, in which case the individual records the activities performed (records, logs) or recall previous activities (self-report or interview-based questionnaires) (Strath et al. 2013). Subjective methods are practical, cost-effective, and impose only a low burden on the participant, and recalls, in particular, have low interference with usual habits (Lagerros & Lagiou 2007). Self-reports typically suffer from recall and response bias (e.g. socially desirable response, inaccurate memory) (Warren et al. 2010), leading to both under- and overestimation of true physical activity (Prince et al. 2008). However, questionnaires can provide data on activity domains, potentially valid estimates of physical activity volume and intensity on the group level (Warren et al. 2010), and rank individuals by their activity level (Strath et al. 2013). Perception of intensity is highly dependent on fitness, age, and gender, and therefore intensity captured by a questionnaire with response options (e.g. low, moderate, high and vigorous), might only be comparable for a homogenous sample (Lagerros & Lagiou 2007). Although many questionnaires have been developed, no one questionnaire can be recommended for use on all occasions (van Poppel et al. 2010), and self-reports are always culturally dependent (Warren et al. 2010).
Objective methods measure components that indicate physical activity or energy expenditure in real time (Strath et al. 2013), and can be used to increase accuracy and precision of the physical activity data, as well as to validate self-report methods (Warren et al. 2010). Common objective methods include motion sensors (e.g. accelerometers, pedometers), heart rate monitors, indirect and direct calorimetry, and doubly labeled water as the gold standard in estimating total energy expenditure. While latter two are more demanding and expensive laboratory methods, that typically are hard to apply with larger groups, they are rather useful for the validation of other methods (Lagerros & Lagiou 2007). With advances in technology, use of accelerometers in monitoring the frequency, duration, and intensity of physical activity pattern throughout the day have rapidly increased. Although accelerometers have enabled a more precise assessment of physical activity in larger study samples, they are, however, limited by their inability to provide information on activity type or to capture certain activities such as swimming, cycling, stair use, or activities that require lifting a load (Strath et al. 2013). It is worth noting that when interpreting accelerometer data based on absolute-intensity, low-fit and high-fit individuals reach the target volume of physical activity differentially, and that when using relative-intensity, where the individual´s fitness level is taken into account, there is more similarity across participants in reaching the target volume (Kujala et al. 2017). As objective and subjective methods are not always able to measure the same aspects of activity, using both methods in combination could be advantageous (Haskell 2012). Although interest in using objective measures of physical activity in public health-oriented research has grown rapidly and they have yielded valuable information, Haskell (Haskell 2012) emphasized the

25
importance of bearing in mind that current physical activity guidelines are mainly based on self-reported physical activity data; the generally held view that these guidelines are reasonably reliable testifies to the usefulness of self-report data in physical activity research (Haskell 2012).
2.3 Physical activity and abdominal adiposity
2.3.1 Longitudinal physical activity habits
Constant physical activity level Longitudinal cohort studies have shown that habitual physical activity is related to smaller WC and lower waist gain. Hankinson et al. (Hankinson et al. 2010) followed 3 554 young adults (age 18–30 y at baseline) for 20 years (CARDIA study), and demonstrated that maintaining high levels of physical activity in the transition towards middle-age was associated with a smaller gain in WC (mean gain of 3.1 cm less in men, and 3.8 cm less in women) compared to maintaining only low levels of activity. Notably, almost 2 000 individuals who were not in the constant activity groups changed their physical activity pattern during the follow-up. In the Whitehall II cohort study, 4 880 adults (mean age 49.3 y at baseline) were followed over 10 years in the three phases (Hamer et al. 2013). Participants were divided into three groups: those who did not adhere to the physical activity guidelines, and those who adhered, either mostly through moderate activity, or mostly through vigorous activity. Meeting the guidelines at baseline was cross-sectionally associated with smaller WC, but baseline activity level did not predict waist change during the follow-up. Those who met the physical activity guidelines in every phase, i.e., who showed habitual activity, had a smaller WC at follow-up and a lower risk of central obesity, than those who met the criterion only once or not at all. Regarding the possible bi-directional nature of the associations, no association between weight gain and change in activity in the succeeding phase was observed. Longitudinal twin studies have also reported that habitual physical activity is related to favorable levels of WC and IAAT. Waller et al. (Waller, Kaprio & Kujala 2008) found that among 42 twin pairs with 30-year discordance in their LTPA habits (age 18-48 y at baseline), WC was an average 8.4 cm smaller in the active twins than in the inactive co-twins. In the study by Leskinen et al. (Leskinen, Sipilä et al. 2009), a clear difference in IAAT area (50% greater for the inactive co-twin) was seen between 16 twin pairs with over 30-year discordance in physical activity habits. A twin study by Pietiläinen et al. (Pietiläinen et al. 2008) underlined the importance of physical activity in the prevention of abdominal obesity during the transition from adolescence to young adulthood. A low activity level at ages 16 to 18 y was a significant predictor of abdominal obesity at age 24.
Change in physical activity level However, constant physical activity may be insufficient to prevent age-related waist gain, as WC seems to grow with time despite regular physical activity (Hankinson et al. 2010, May et al. 2010), even

26 among vigorous runners (Williams & Wood 2006). Studies that have taken change in physical activity habits into consideration have highlighted the role of increased activity in the attenuation of waist gain (Koh-Banerjee et al. 2003, Sternfeld et al. 2004, Aadahl et al. 2009, Davidson, Tucker & Peterson 2010, May et al. 2010, Choi et al. 2012, Shibata et al. 2016). In general, changes in physical activity habits may explain the weak ability of baseline physical activity to predict the changes in WC at follow-up (Berentzen et al. 2008, May et al. 2010, Hamer et al. 2013), although in a very large prospective cohort study (EPIC study) among 288 498 adults from European countries (age 25-79 y at baseline) a high baseline level of physical activity predicted smaller WC during the 5 year follow-up independent of body weight (Ekelund et al. 2011).
A recent study among 3 261 Australian adults (age 25-74 y at baseline) found that an increase in weekly physical activity (1 h of moderate-to-vigorous activity) from baseline to 5 year follow-up was associated with smaller waist gain from baseline to 12 year follow-up. On the other hand, a decrease in moderate-to-vigorous activity was a significant predictor of waist gain (Shibata et al. 2016). The results of the Doetinchem Cohort Study (May et al. 2010) conducted among 4 944 adults (age 26-66 y at baseline) showed that an increase in daily physical activity (equal to 30 min aerobic exercise) from baseline to 5 year follow-up was inversely related to waist change, but only in men, and that similar inverse trend was seen in the succeeding 5-year period, providing evidence that physical activity was a true determinant of WC. Another large-scale study among 16 587 adult US men (age 40-75 y at baseline) revealed that over a 9-year follow-up an increase of 25 MET-h per week in vigorous physical activity was associated with a concurrent decrease in WC. The men who increased their weight training by 30 min or more per week showed a decrease in WC. Interestingly, whereas walking volume was not associated with WC, the men who increased their walking pace by 1.6 km/h showed a reduction in WC (Koh-Banerjee et al. 2003). Aadahl et al. (Aadahl et al. 2009) who followed 4 039 Danish adults (age 30–60 y at baseline) over five years highlighted the importance of increasing physical activity, or of maintaining a moderate or high level of activity. When compared to those whose physical activity level increased or consistently followed public health recommendations, those whose activity decreased showed larger increases in WC. A few shorter (2 to 3 y) follow-up studies have also shown the benefits of increasing physical activity level in seeking to attenuate waist gain among middle-aged women (Sternfeld et al. 2004, Davidson, Tucker & Peterson 2010, Choi et al. 2012).
While prior studies on changes in physical activity habits have included adults ranging widely in age, they have seldom focused on early adulthood, a period when escalation in age-related waist gain already seems to start (Lahti-Koski et al. 2012, Ladabaum et al. 2014, Albrecht et al. 2015, Jacobsen & Aars 2016). A study among 5 706 young Finnish adults found that a decline in physical activity level in the period from adolescence (at age 14 y) into adulthood (at age 31 y) predicted severe abdominal obesity (WC 88cm) at age 31 among women (Tammelin, Laitinen & Näyhä 2004).

27
2.3.2 Physical activity mode
Aerobic and resistance training trials Several reviews and meta-analyses on exercise training and abdominal adiposity from different perspectives have been published. These show that intervention studies have typically focused on traditional aerobic and strength training, and that imaging methods have been dominant in assessing abdominal adiposity. Participants have mostly been overweight or obese. In 2006, Kay and Fiatarone Singh (Kay & Fiatarone Singh 2006) reviewed the accumulated evidence of the effect of different exercises on abdominal adipose tissue. The limited evidence of 19 randomized controlled trials (RCT) and 8 non-RCTs showed that moderate- to-high-intensity aerobic exercise ( 60% of HRmax) was beneficial in reducing abdominal fat among middle-age and older overweight and obese subjects, especially when imaging methods were used to evaluate abdominal adiposity. When both imaging and anthropometric methods were used in the same study, WC did not consistently reflect the changes found in IAAT by imaging methods. In 2007, Ohkawara et al. (Ohkawara et al. 2007) reviewed studies to find out whether the reduction in IAAT by aerobic exercise has a dose-response relationship. Unlike earlier reviews, they converted the amount of aerobic exercise into MET hours per week. The nine RCTs and 7 non-RCTs included in the review showed that in obese subjects, when the individuals with metabolic-related disorders were excluded, aerobic exercise and IAAT reduction had a dose-response relationship. Aerobic exercise generating at least 10 MET hours per week was required for IAAT reduction, which may occur even without significant weight loss. In 2012, Ismail et al. (Ismail et al. 2012) reviewed the literature of independent and synergistic effects of aerobic exercise and progressive resistance training on IAAT modulation. The review included 35 RCTs and showed that among overweight and obese individuals, the aerobic component of exercise was central for IAAT reduction. An amount of activity equal to the physical activity recommendations ( 150 min/week of moderate intensity) was sufficient for IAAT modification, although this amount is below the guidelines for the treatment of overweight and obesity. In 2013, Vissers et al. (Vissers et al. 2013) reviewed 9 RCTs and 6 non-RCTs and found with that, without caloric restriction, moderate (60-70% of HRmax) or high intensity ( 70% of HRmax) aerobic training was needed to reduce IAAT, whereas combining aerobic training with strength training did not result in a higher reduction in IAAT among overweight and obese adults. The need for gender-specific studies were highlighted, as according to the limited evidence, men tended to benefit more from exercise than women.
Overall, intervention studies have focused on individuals with overweight or obesity as well as on middle-aged or older people. Among non-obese and/or younger adults, the results have been more inconclusive. Thomas et al. (Thomas et al. 2000) found in their non-controlled trial among non-obese healthy sedentary premenopausal women (age range 25-45 y), that moderate aerobic exercise (3 times a week for 6 months) resulted in a decrease in IAAT without significant change in weight. In contrast, Poehlman et al. (Poehlman et al. 2000)

28 observed no reduction in IAAT after an endurance or strength training program (3 times a week for 6 months) compared to controls in non-obese sedentary young adult women (age range 18-35 y). In the RCT reported by Donelly et al. (Donnelly et al. 2003), sedentary overweight or moderately obese young adult men and women (age range 17-35 y) completed a moderate intensity exercise program (5 times a week for 16 months). In men, the reduction in IAAT was significant during the training period, but not significantly different from controls. In women, the mean area of IAAT seemed to increase in controls, while remaining stable in the exercise group; the difference, however, was non-significant.
High intensity interval training trials Over the last decade, growing research interest has been shown in the health benefits of high-intensity interval training (HIIT) consisting of short, intermittent bouts of vigorous activity followed by recovery at low intensity activity or rest. A review by Boutcher in 2011 (Boutcher 2011) concluded that the effect of HIIT is promising for abdominal adipose tissue reduction, and that the lower training volume required could make HIIT a time-efficient strategy to accrue adaptations and possible health benefits. A recent meta-analysis of 13 intervention studies compared the effect of HIIT training and moderate-intensity continuous training on changes in body composition among younger (age range 18-45 y) overweight and obese adults (Wewege et al. 2017). While HIIT ( 85% of HRmax) and traditional aerobic training (60-75% of HRmax), conducted for 5-16 weeks, had a similar effect on WC (~3 cm reduction), HIIT required an average 40% less time commitment. To date, a few studies have directly compared the effect of HIIT and traditional aerobic training on IAAT using imaging methods. In the study by Zhang et al. (Zhang et al. 2017) young (age range 18-22 y) overweight women completed a 12-week HIIT (90% of VO2max) or a moderate-intensity (60% of VO2max) continuous training program (3-4 times a week). Similar reductions in IAAT were observed while control values remained unchanged. Heydari et al. (Heydari, Freund & Boutcher 2012) found a significant reduction in IAAT after 12-week HIIT (80-90% of HRmax) program (20 min, 3 times a week) among young overweight adult men compared to controls. In the study by Sasaki et al. (Sasaki et al. 2014) neither short-term (4 weeks, 3 times a week) HIIT (at 85% of VO2max) or low-intensity aerobic training (22 min, at 45%of VO2max) was sufficient to induce changes in IAAT in sedentary normal-weight men. Overall, HIIT seems to be an effective exercise mode and, if not consistently superior to continuous aerobic exercise, time-effective alternative. Interestingly, in the trial reported by Karstoft et al. (Karstoft et al. 2013), free-living interval walking (3 min repetitions at low and high intensity) and continuous walking (moderate intensity) were performed over a four-month period (1-h, 5 times a week) among type 2 diabetic patients, a reduction of IAAT occurred only in the interval-walking group.
Specific activities (i.e. sport disciplines) Several questions on the optimal exercise prescription for preventing and treating abdominal fat accumulation remain open. Although intervention trials have shown the benefits of aerobic exercise to be superior to those of strength training (Ismail et al. 2012), this has

29
not been wholly corroborated by real-life studies. A large study among 10 500 US men showed a stronger inverse dose-response association of waist change with weight training than with moderate-to-vigorous aerobic activity (Mekary et al. 2015). However, the most optimal way to attenuate age-associated waist gain seemed to be a combination of weight training and moderate-to-vigorous aerobic activity. The study by Koh-Banerjee et al. (Koh-Banerjee et al. 2003) also demonstrated the benefits of increasing strength training, as an increase in weight training of 30 min or more in a week was associated with a decrease in WC among men. A study among overweight women aged 21 to 46 years showed that training adherence (40min, 2 times a week), whether to aerobic or resistance exercise, one year after a weight loss intervention prevented regain of IAAT (Hunter et al. 2010).
In sum, exercise trials have mainly focused on traditional aerobic exercise and strength training (Ismail et al. 2012), and on HIIT in the form of stationary cycling or running (Wewege et al. 2017). Observational studies, in turn, have usually focused on general levels of PA (Hankinson et al. 2010, Hamer et al. 2013) rather than specific activity modes. Recently, the health benefits of different sport disciplines have been taken up (Oja et al. 2015, Oja et al. 2016). The studies reported have mainly focused on specific activities, one at a time, and have found the strongest, if limited, evidence of benefit to body adiposity for football (Bangsbo et al. 2015, Oja et al. 2015), running (Oja et al. 2015) and structured dancing (Fong Yan et al. 2018). Indicators of body fat distribution have seldom been reported. Knoepfli-Lenzin et al. (Knoepfli-Lenzin et al. 2010) investigated the effects of football training (consisting, naturally, of HIIT) and continuous running on the health profile in men aged 25–45 years. After a 12-week training period (1-h, 2.4 times a week), WC decreased only in the football group, whereas in the running and control groups it remained almost unchanged. With respect to the number of activities participated in, a retrospective study by de Silva Garcez et al. (de Silva Garcez et al. 2015) found that women (age range 18–53 y) who participated in five or more different physical activities in adolescence were less likely to be abdominal obese in adulthood when compared to women who participated at most in one activity. The range of popular sport disciplines is much wider than that of the activities typically used in intervention trials or reported in observational studies. Evidence on the health benefit of different activity modes could be beneficial and bring additional insights of practical value in health promotion.
2.4 Diet in relation to physical activity and abdominal adiposity
Recently, Verheggen et al. (Verheggen et al. 2016) conducted a meta-analysis of the effects of hypocaloric diet and exercise on IAAT reduction in overweight and obese individuals. Based on 117 studies, both caloric restriction and aerobic exercise training were able to induce IAAT loss. However, IAAT responded differently to these two methods. In the absence of weight loss, energy-restriction

30 resulted in virtually no change in IAAT, whereas exercise training induced a loss 6.1% in IAAT. When body weight was reduced by 5% by the hypocaloric diet, the reduction in IAAT was 13.3%. However, when a similar amount of weight reduction was achieved by exercise training, IAAT showed a reduction of 21.3%.
Compelling evidence from on dietary determinants of abdominal obesity is lacking, but certain factors may have a role in abdominal adipose tissue modulation. A large cohort study showed no association of waist change with total energy intake or with energy intake from carbohydrates or fats; instead, protein intake protected from waist gain (Halkjaer et al. 2006). Other large follow-up studies found greater waist gain among those who had higher energy density (Du et al. 2009, Romaguera et al. 2010) and higher glycemic index diets (Romaguera et al. 2010). It is suggested that fructose may induce the selective accumulation of fat in the intra-abdominal depot. Stanhope at al. (Stanhope et al. 2009) demonstrated in their trial that consuming fructose-sweetened beverages increased intra-abdominal fat significantly more than did glucose-sweetened beverages, although the weight gain in both groups was similar. The intake of dietary fiber has shown a promising protective association with abdominal fat accumulation (Koh-Banerjee et al. 2003, Du et al. 2010, Romaguera et al. 2010, Kaartinen et al. 2016). With respect to food consumption, it seems that a high intake of fruits and dairy products may have protective role against WC growth (Halkjaer et al. 2009, Romaguera et al. 2011). In the study by Halkjaer et al (Halkjaer et al. 2006), carbohydrates from fruit and vegetables were inversely associated with waist change, while carbohydrates from refined grains, potatoes, sugary foods were all associated with larger waist gain in women. A similar non-significant trend was seen in men. The consumption of white or refined bread has been associated with waist gain in both sexes (Romaguera et al. 2011), and only in women (Halkjaer et al. 2004). A higher intake of soft drinks, snack foods, and processed meat has also shown a positive association with WC in the larger follow-up studies (Halkjaer et al. 2009, Romaguera et al. 2011). Higher alcohol consumption has predicted a larger WC in women (Halkjaer et al. 2004, Romaguera et al. 2010) and men (Schröder et al. 2007).
It has been suggested, that overall dietary pattern may have a more important effect on health than specific nutrients or food items (Hu 2002). The Mediterranean diet has been demonstrated to have a beneficial effect on abdominal obesity in observational and clinical studies (Kastorini et al. 2011). With regards to the Baltic Sea diet consumed in the Nordic countries, Kanerva et al. (Kanerva et al. 2013), found that subjects who reported a high adherence to that diet were less likely to be abdominally obese. The role of Nordic cereals (rye, oats and barley) along with moderate alcohol consumption emerged as most important components in the association with WC. Overall, although the results remain limited or inconclusive, it seems that above and beyond proportion of macronutrients, foods and diet pattern may have a more important role in abdominal obesity prevention (Fogelholm et al. 2012).
Some earlier studies have suggested that physical activity and healthy eating pattern may be correlated behaviors. For example, earlier studies have

31
found that physical activity is associated with a greater consumption of vegetables and fruits (Loprinzi 2015, Gillman et al. 2001) and an overall healthier diet (Charreire et al. 2011, Loprinzi, Smit & Mahoney 2014). Hill et al. (Hill, Wyatt & Peters 2012) have demonstrated the theory that the body´s energy balance may be better regulated when energy throughput is high due to physical activity, whereas in today’s obesogenic environment sedentary individuals are prone to have a positive energy balance. A recent review by Donnelly et al. (Donnelly et al. 2014) concluded that increased energy expenditure due to exercise is not necessarily compensated for by increased energy intake. An earlier twin study showed that while physically active twin siblings did not have a necessarily healthier diet than their inactive co-twins, but it seemed to be easier for the active co-twins to eat according to need and reach and maintain a healthier body composition (Rintala et al. 2011).
2.5 Twin study design
From the public health perspective, it is important to identify modifiable causes of adverse health outcomes to be able to put effort into the right prevention and treatment strategies. Purely observational studies, even in a longitudinal set-up, can only produce associations between studied outcomes, while establishing cause-and-effect relationships is highly problematic. Another problem arising in purely observational studies is selection bias due to genetics. If, because of her or his genetic predisposition, a person becomes ill, gains weight, or has naturally low aerobic fitness, the outcome may be inactivity (Kujala 2011). The best-known study design for determining cause-and-effect is the RCT. However, in exercise science, very long-term trials are challenging to implement, and on the other hand, many health-related phenomenon are not testable in intervention studies. Genetic designs using e.g., Mendelian randomization (Latvala & Ollikainen 2016) and genetic risk scores, if the specific genetic variants of a specific phenotype are well known, offer an alternative approach for testing causality. However, designs of this type are hard to apply in the exercise sciences, as physical activity has a multifactorial genetic background and as of yet very few robust genetic markers exist for physical activity (Lightfoot et al. 2018). No common high impact genetic variants are available that could be tested for causality between physical activity and adiposity, even though many markers exist for adiposity (Turcot et al. 2018). The discordant twin study design, however, offers an alternative that, under conditions in which potential confounding factors of genetics and shared childhood environment can be controlled for, renders visible the potential causal relation between physical activity and different health outcomes.
Several twin study designs are available. The best known, the classical twin design is used to derive estimates of genetic and environmental impacts on complex trait variation (van Dongen et al. 2012). Heritability refers to the degree of variation in the trait that arise between individuals in a given population at a certain time due to heritable differences (van Dongen et al. 2012). Many twin

32 studies of the heritabilities of multiple traits have been published (Polderman et al. 2015). Another design is based on the fact that almost every human condition is affected by genetic variation. Thus, discordant MZ twins (differing in a specific phenotype) offer a valuable opportunity to study whether associations reflect causality or rather are due to confounding genetic and environmental factors. MZ twins derive from a single fertilized egg cell and share therefore identical genetic material. DZ twins, in turn, derive from two distinct fertilized egg cells, and thus on average, as siblings (Philipps 1993), they share half of their segregating genes (van Dongen et al. 2012). MZ and DZ twin pairs are usually reared together, and thus they also typically share their family environment to the same degree. In addition to prenatal environment (Phillips 1993), parenting style, parental attitudes, family functioning, neighborhood characteristics or family financial status are examples of shared environmental factors (de Geus et al. 2014). Therefore, a discordant MZ twin pair study design naturally controls for several genetic and environmental confounding factors that are shared by the co-twins (Vitaro, Brendgen & Arseneault 2009). Same-sex DZ pairs are informative when comparing the pattern of results associated with non-shared environmental experience with that of MZ pairs. If the MZ twin pairs show greater similarity than the same-sex DZ pairs concerning the predicted outcome, a genetic contribution is likely to be present (Phillips 1993, Vitaro, Brendgen & Arseneault 2009). However, estimations of the importance of genetic effects may be biased if MZ twins are treated more similarly in childhood than DZ pairs. An important further assumption in twin studies is that twins are representative of the general population, and therefore it is important to evaluate if the outcomes of interest are to a significant degree different those in the general population (Kyvik 2000). Pregnancy and birth outcomes may be less favorable for twins than singletons (Kyvik 2000); however, it seems that disease risks are often similar to those in the general population, indicating the good generalizability of data drawn from twin studies (Kyvik 2000, Andrew et al. 2001).
Various studies have shown that physical fitness and the ability to achieve high levels of physical activity have genetic components (Bouchard et al. 1992, Stubbe et al. 2006, Lightfoot et al. 2018). Recent estimates of the genetic variation in leisure-time exercise range overall from 27% to 84%, and in the younger population, from age 16 to 35, between 31% and 42% (de Geus et al. 2014). Inherited biological characteristics may make it easier for individuals to exercise and therefore may favor them with lower morbidity and mortality owing to the interaction between these (Kujala 2011). It is also evident that genetics influence body fat distribution (Shungin et al. 2015). Twin and family studies have estimated heritability for WC to range from 48% to 71% (Schousboe et al. 2004, Mustelin et al. 2009, Mustelin et al. 2011), and for IAAT from 36% to 56% ( Pérusse et al. 1996, Hong et al. 1998, Fox et al. 2007). Responsiveness to exercise-induced abdominal fat reduction may also vary due to genetics (Bouchard et al. 1994). Interestingly, the effect of genetic factors related to obesity can be positively modified by physical activity, as influence of the genetic effect on adiposity have been demonstrated to be reduced by physical activity (Mustelin et al. 2009,

33
Kilpeläinen et al. 2011, Reddon et al. 2016). The traits influenced by genetic variants are often complex, and genetic pleiotropy, where the same genetic variants may influence several traits (e.g. body composition, fitness, physical activity, disease risk), has received more attention (Lee et al. 2015, Visscher et al. 2017). The present dissertation utilized twin study designs to tackle the typical bias arising from the influence of genetics.

3 AIMS OF THE STUDY
The purpose of this dissertation was to investigate how and what type of leisure-time physical activity is associated with abdominal adiposity in young adulthood taking into consideration diet and other selected health factors. The unique twin study designs utilized in this dissertation permitted childhood family environment and genetic effects to be taken into account. The research questions were:
1. Is persistence or change in physical activity habits from early adulthood (24 y) towards adulthood (34 y) associated with waist gain? (Study I)
2. Is the number of sport disciplines and types of activity participated in associated with waist circumference in early adulthood (34 y), and is diet quality linked to these associations? (Study II)
3. What specific differences are there in the abdominal fat compartments
of monozygotic co-twins discordant for physical activity in their mid-30s? Are diet, body mass index, body fat, cardiorespiratory fitness, and glucose homeostasis linked to these differences? (Studies III and IV)

4 PARTICIPANTS AND METHODS
This dissertation includes data gathered for two different studies: the population-based FinnTwin16 cohort study and the clinical FITFATTWIN study. The FinnTwin16 twin cohort study (Kaprio 2006) investigates the role of genetic and environmental factors as determinants of different health behaviors, disease risk factors and chronic diseases. For FinnTwin16, virtually all twins born in 1975–1979 were identified from the Finnish population register. The follow-up cohort contains about 5 500 individuals and almost 2 700 twin pairs. The data collection for this follow-up study started in 1991, and participants were sent the first questionnaire, including questions related to health, body composition and physical activity, within two months of their 16th birthday. Later, questionnaires were mailed when participants were 17 and 18.5 years old. The wave 4 questionnaire was administered during 2000–2002, when the participants were on average 24.5 years old. The wave 5 questionnaire was administered during 2010–2012, when the participants were an average 34 years old.
The clinical FITFATTWIN study investigated the relationships between LTPA levels and different cardiometabolic risk factors and neuropsychological function in younger adulthood. The FITFATTWIN study participants were initially selected from the FinnTwin16 cohort based on their physical activity habits. The final study sample comprised ten young-adult male MZ twin pairs (mean age 34 y) who had been discordant for physical activity for the previous three years. The FITFATTWIN clinical study consisted of a series of comprehensive health measurements and physical activity interviews over two consecutive days during 2011-2012.

36
FIGURE 1 Participants and data utilized in the present dissertation.
4.1 Participants of the FinnTwin16 cohort study (Studies I and II)
Study I The 4th and 5th data collections waves of the FinnTwin16 cohort study were used in Study I. The wave 4 data (so-called baseline) implemented at the mean age of 24.5 years (range 22-27) were collected using a postal paper questionnaire. The wave 5 follow-up data were collected at the mean age of 34 years (range 32-37) using a web-based questionnaire. To be able to access the questionnaire, the study participants were mailed an invitation letter containing the access code to the Internet survey. The overall cohort response rates were 84.5% and 71.9% for waves 4 and 5, respectively, with 77.9% of those replying at wave 4 also replying at wave 5.
Altogether 3 866 twin individuals (men 1 578, 46.6%) from five consecutive birth cohorts (1975–1979) answered both questionnaires (wave 4/baseline and wave 5/follow-up). The study included all participants who on both occasions answered the questions related to LTPA, weight and height, and measured their WC. All the women who had responded in the affirmative to the question asking if they were pregnant were excluded from this study (n=263). After all exclusions, the final study group contained 3 383 twin individuals (1 578 men and 1 805 women), including 1 109 twin pairs in which both co-twins were participants (393
FinnTwin16 cohort study
Finnish twins born 1975-1979 Wave 1: Questionnaire survey at age 16Wave 2: Questionnaire survey at age 17Wave 3: Questionnaire survey at age 18.5
Wave 5: Web-based questionnaire survey at mean age of 34 y (32-37)4406 twins responded, response rate 71.9%
Wave 4: Questionnaire survey at mean age of 24.5 y (22-27)5065 twins responded, response rate 84.5%
FITFATTWIN clinical study
Study III and IV: Final study groupN=10 MZ male twin pairs discordant for physical activity.LTPA level, cardiorespiratory fitness, body composition, MRI of abdomen, glucose homeostasis
Respondedin both waves 4 and 5N=4023
Study I: Final study group N=3383 (men=1578, women=1805)Change or persistence in LTPA habitsWaist change
Study II: Final study group N=4027 (men=1874, women=2153)Sport disciplines, types of activityWaist circumferencesee
FIGURE 2Flow chart

37
MZ, 679 DZ, and 37 with unknown zygosity). Determination of zygosity was based on accurate and validated questionnaire method (Sarna et al. 1978).
Study II A total of 4 406 twin individuals (men 1 962, 44.5%) responded to the wave 5 questionnaire at age 32-37 (mean 34.0), yielding a response rate of 71.9% of all the cohort members alive and resident in Finland (Kaprio 2013). All the participants who answered the questions related to LTPA, weight and height, and measured their WC were included in the study. Women who reported being pregnant at the time of data collection (n=197) were excluded. The final study group comprised 4 027 twin individuals (1 874 men and 2 153 women), including 1 443 twin pairs (492 MZ, 894 DZ, and 57 with unknown zygosity) in which both co-twins were participants.
4.2 Participants of the FITFATTWIN clinical study (Studies III and IV)
Seventeen young adult male MZ twin pairs potentially discordant for physical activity were recruited for the FITFATTWIN study. Among these, 10 pairs were determined to be discordant for LTPA during the past 3 years. The selection procedure is described in detail below.
The participants for the FITFATTWIN study were initially selected from the most recent data collection of the FinnTwin16 cohort study (wave 5) when the twins were aged 32–37 (mean 34.0) (see details above). A total of 4 183 twin individuals (1 880 men) had responded to the latest web-based questionnaire at the time of initial selection. The responders included 202 male MZ pairs with data on physical activity from both co-twins. The selection of the twin pairs for the FITFATTWIN study was based on data gathered by a telephone interview, face-to-face interview, and a medical examination at the laboratory, in addition to the web-based questionnaire.
Initially, all the MZ male twin pairs were selected from the FinnTwin16 cohort (wave 5) and their physical activity level was estimated based on answers to questions about LTPA. Potential participants for the FITFATTWIN study were then identified by screening and including the pairs with the highest discordance in LTPA (Figure 2). Specifically, the difference in physical activity between the co-twins of a twin pair was assessed based on frequency of LTPA as follows: the so-called active co-twin of the twin pair was physically active 2 times per week, whereas the so-called inactive co-twin of the same pair was physically active 2 times per month (inclusion criterion 1 in Figure 2). If this criterion was not met, the physically active co-twin needed to participate in LTPA 2 times per week at an intensity equivalent to easy or brisk running while the LTPA of the inactive co-twin needed to be less intense and less frequent or of shorter duration, and neither frequency nor duration could be more than that of his active co-twin (inclusion criterion 2 in Figure 2). Because chronic diseases can restrict the ability to be physically active, twins with specific chronic diseases were excluded.

38 Furthermore, twins reporting heavy use of alcohol or use of medication for a chronic disease were excluded.
Of the 202 MZ male pairs from the FinnTwin16 Cohort, 26 pairs fulfilled inclusion criterion 1, and 13 pairs fulfilled inclusion criterion 2. All of these pairs (n = 39) were interviewed by telephone. The interview included questions on current health and physical activity habits during the past 3 years similar to those asked in previous studies (Kujala et al. 1998). Of these 39 pairs, 19 pairs were excluded from the FITFATTWIN study for the following reasons: unwillingness to take part in the study, having specific acute diseases that affected the ability to be physically active, failure to attend the telephone interview, or recent major changes in physical activity levels (Figure 2). Finally, 17 MZ male pairs (10 pairs meeting inclusion criterion 1 and 7 pairs meeting inclusion criterion 2) accepted the invitation to participate in the study and underwent comprehensive clinical study measurements and detailed physical activity interviews.
Final criteria for selection of physical activity discordant twin pairs. After the FITFATTWIN physical activity interviews (see details below), 10 of these 17 pairs were classified as discordant for LTPA (Figure 2). These 10 pairs met the following five criteria set for maximal LTPA discordance.
1) Inclusion based on criterion 1 or 2, above. 2) A pairwise difference of 1.5 MET-h/d between the active and inactive
co-twin in LTPA (including commuting activity), determined from the 12-month physical activity interview (12-mo-LTMET index; see below) (Lakka & Salonen 1997, Waller, Kaprio & Kujala 2008).
3) 12-mo-LTMET index of <5 MET-h/d for the inactive co-twin. 4) 1 MET-h/d pairwise difference between the active and inactive co-
twins in LTPA (including commuting activity) for the past 3 years, determined from the shorter physical activity interview (3-y-LTMET index; see below) (Kujala et al. 1998, Waller, Kaprio & Kujala 2008, Leskinen, Waller et al. 2009).
5) A higher Baecke sport index for the active versus inactive co-twin (Baecke, Burema & Frijters 1982).

39
FIGURE 2 Flow chart of the participants in the FITFATTWIN study. Notes: For selection criteria 1 and 2 and the five final criteria for the activity-discordant pairs, see Methods-section.
MZ male twin pairs (N=202 pairs)
Twin pairs not chosen for telephone interview due to:- specific chronic diseases affecting the ability to be physically active- alcohol and/or drug abuse(n=13 pairs)
Discordant for physical activity – Survey questionnaire criterion 1(n=39 pairs)
Discordant for physical activity – Survey questionnaire criterion 2(n=22 pairs)
Twin pairs not chosen for telephone interview due to:- specific chronic diseases affecting the ability to be physically active- alcohol and/or drug abuse(n=9 pairs)
Chosen for telephone interview(n=26 pairs)
Chosen for telephone interview(n=13 pairs)
Twin pairs not invited due to: - unwillingness to take part in thestudy- specific acute diseases affecting the ability to be physically active- failure to attend telephoneinterview- recent major change in physicalactivity levels(n=13 pairs)
Twin pairs not invited due to: - unwillingness to take part in thestudy- specific acute diseases affecting the ability to be physically active- failure to attend telephone interview- recent major change in physicalactivity levels(n=6 pairs)
Invited to the study(n=7 pairs)
Invited to the study(n=13 pairs)
Participated in the study(n=7 pairs)
Participated in the study(n=10 pairs)
Twin pairs not able to take part in the study because of work commitments or for personal reasons(n=3 pairs)
Classified as physical activity discordant pairs (fulfilled 5 final discordance criteria)(n=10 pairs)
Classified as other pairs(n=7 pairs)
7 pairs 3 pairs3 pairs 4 pairs

40 4.3 Measurements in FinnTwin16 cohort study
The FinnTwin16 survey included a wide range of questions related to health, body composition and LTPA.
4.3.1 Leisure-time physical activity
The assessment of LTPA was based on a series of questions covering LTPA and commuting activity. These questions were identical at waves 4 and 5. The questionnaire included following three structured questions on LTPA and one structured question on commuting activity.
How often do you exercise/engage in physical activity during your leisure time?
1) not at all (coded as 0 times per month; coding not included in the questionnaire) 2) less than once a month (0.5) 3) 1-2 times a month (1.5) 4) once a week (4) 5) 2-3 times a week (10) 6) 4-5 times a week (18) 7) about every day (26)
Is your physical activity during leisure time about as tiring on average as
1) walking (coded as 4METs/h) 2) alternatively walking and jogging (6METs/h) 3) jogging (light run) (10METs/h) 4) running (13METs/h)
How long does one session of physical activity last on average?
1) less than 30 min (coded as 15 min) 2) from 30 min to less than one hour (45 min) 3) from one hour to under two hours (90 min) 4) two hours or more (150 min)
How much of your daily journey to work/study is spent walking, cycling, running, cross-country skiing and/or rollerblading?
1) less than 15 min (coded as 7 min) 2) from 15 min to less than half an hour (22 min) 3) from half an hour to less than one hour (45 min) 4) one hour or more (75 min)
LTPA volume was quantified to form a leisure-time MET index. Leisure-time physical activities were calculated as average frequency (per month) × duration (min) × intensity (MET), and commuting activity as frequency (five times per week) × duration (min) × intensity of 4 METs (corresponding to walking). Total LTPA volume was expressed as the sum score of MET hours per day (MET index), as described earlier (Kujala et al. 1998), with modifications to account for the slightly different response alternatives corresponding questions in the present questionnaires. This shorter MET index has shown a high intra-class correlation

41
with a MET index based on detailed 12-month physical activity recall (0.68, P<0.001 for LTPA, and 0.93, P<0.001 for commuting activity) (Waller, Kaprio & Kujala 2008).
Persistence or change in LTPA (Study I) habits was evaluated by dividing participants into sex-specific thirds, using tertiles computed from the LTPA MET index at baseline and follow-up. The participants in the first tertile were categorized as inactive, in the second as moderately active, and in the third as active. Persistence or change in LTPA habits was based on whether the participant remained in the same category throughout the follow-up or changed to another category (nine groups in total).
To further confirm the role of decreased or increased LTPA in waist gain, all same-sex (MZ and DZ) twin pairs and MZ twin pairs in which one co-twin was more active than the co-twin were identified as follows: 1) decreased activity (any change from a higher to a lower tertile) vs. increased activity (any change from a lower to a higher tertile); 2) persistently inactive vs. changed from inactive to moderately active or active; and 3) the persistently active vs. changed from active to moderately active or inactive. The same re-categorizing was also done at the individual level.
The twin individuals also answered a multiple-choice question about what kind of leisure-time physical activities/exercises/sports disciplines they participated in (Study II). The original formulation of this question in Finnish covers both competitive and recreational sports and exercises, and thus, in the present study the term sport discipline refers to both kinds. Twenty-six common sport disciplines and an open field option were given as response alternatives; multiple alternatives could be reported. Each sport discipline was coded separately for the analysis (total of 76 including open-field responses). We then calculated the number of sport disciplines participated in, and classified the twin individuals into four groups: 1) none; 2) 1-2; 3) 3-4; and 4) 5 or more sport disciplines. To further confirm the within-in pair associations among the discordant twin pairs, we identified all the same-sex twin pairs (MZ and DZ) in which one twin reported five or more sport disciplines and his/her co-twin at most 2 disciplines.
Which of the following of leisure-time physical activities/exercises/sports disciplines do you participate in? (you can choose more than one)
1 Walking/Nordic walking 11 Floorball 21 Golf 2 Jogging/running 12 Football 22 Downhill skiing/snowboarding 3 Bicycling 13 Ice-hockey 23 Horse riding 4 Cross-country skiing 14 Rinkball 24 Orienteering 5 Swimming/water running 15 Volleyball 25 Rowing/canoeing 6 Skating/rollerblading 16 Basketball 26 Martial art 7 Gym training 17 Finnish baseball 27 Other?, if so, what? 8 Aerobics 18 Badminton ___________________ 9 Gymnastics 19 Squash ___________________ 10 Dance 20 Tennis ___________________

42 Next, the sport disciplines were divided into four groups based on what fitness parameters are principally enhanced by participation in that activity (modified from Sarna et al. 1993 and Aarnio et al. 2002). The “aerobic” -group comprised sport disciplines that mainly improve aerobic fitness, the “power” -group those that mainly improve muscle strength, the “mixed” -group those that improve both aerobic fitness and muscle strength, and the group “other” those that mainly improve something else, e.g., skills/techniques with a low or unclear cardio-respiratory or muscular loading intensity. The twin individuals were then re-classified into eight groups, covering all the possible combinations of participation in aerobic, power, and mixed activities, or no participation in any sport disciplines in the aerobic, power or mixed groups (see Table 8).
4.3.2 Waist circumference
Self-measurement of WC was done using a tape measure supplied for the purpose at both data collections; in wave 5, it was included in the mailed invitation letter that contained the access code to the Internet survey. The instructions, including an illustration, for measuring WC were included in the questionnaire (Figure 3).
WC was measured while standing, at either the narrowest part of the waist, or if that was not found, at the midpoint between the lowest part of the ribs and the top of the hip bone. Self-reported and measured WC showed a high intra-class correlation in FinnTwin16 participants at wave 4 (r=0.75, mean difference 2.48 cm 95% CI 0.96 to 3.00, n=566) (Mustelin et al. 2009), and in older twins (r=0.97, P<0.001, n=24) (Waller, Kaprio & Kujala 2008). A change in WC (Study I) was calculated as the difference between follow-up (wave 5) and baseline (wave 4) values.
FIGURE 3 Illustration showing where to measure waist circumference.

43
4.3.3 Dietary quality score
A dietary quality score based on nutrition recommendations was constructed from responses to 11 food-frequency questions and two questions on bread consumption (Study II). Selecting from five response options ranging from “not at all” to “many times a day”, participants estimated how often daily, over the past 12 months, they had usually eaten the following food items: 1) fruit and berries, 2) vegetables, 3) fish, 4) whole grains (with examples), 5) fast food (with examples), 6) fat-free or reduced-fat milk, sour milk, or yoghurt, 7) sugar-sweetened soft drinks or juices, 8) energy drinks, 9) butter, 10) margarine, and 11) vegetable oil. Margarine and vegetable oil were combined into one category. In addition, participants were asked how many slices of dark and white bread they usually consume per day; examples of both types of bread were given. For each of the 12 food categories, one point was given if the dietary recommendation was met, resulting in a score that ranged from 0 to 12, with a higher score indicating better dietary quality and an overall healthier diet. The cut-offs for each of the 12 dietary guidelines were derived from the most recent Nordic (Nordic Council of Ministers 2014) and Finnish nutrition recommendations (National Nutrition Council 2014). In testing for validity, a positive correlation between the dietary quality score and nutrients assessed by 4-day food diaries was found for 20 male twin individuals, including fibre (r=0.46, P=0.04) and minerals (e.g. r=0.65 for energy-adjusted magnesium, P=0.002).
4.3.4 Other confounding factors
Multiple potential confounders were addressed in the self-reported survey data. BMI was calculated from self-reported height and weight (waves 4 and 5) (Mustelin et al. 2009). Age and the number of children (wave 5) were used as continuous variables. Occupational physical activity (wave 5) was assessed with a question about how strenuous work or studies are physically (see classification in Table 2). The question was slightly modified from Kujala et al. (Kujala, Kaprio & Koskenvuo 2002). Educational level was defined as the highest level reached (wave 5). This question about completed education was re-categorized as follows: 1) primary and compulsory education (nine years), 2) secondary vocational andacademic (up to 12 years), 3) tertiary education (>12 years, i.e. university andpolytechnic) (Latvala et al. 2011) . Chronic diseases were reported as having/nothaving a chronic disease or handicap interfering with one´s daily activities(Aarnio, Kujala & Kaprio 1997). Alcohol use at follow-up was assessed by askingthe participant to state the frequency of drinking any alcohol (Aarnio, Kujala &Kaprio 1997); responses were grouped into five categories (see Table 2). Smokingstatus was defined as 1) current smoker, 2) occasional smoker, 3) quitter, 4) neversmoked, according to a structured question on current smoking habits (Aarnio,Kujala & Kaprio 1997).

44
4.4 Measurements in FITFATTWIN clinical study
In the FITFATTWIN study, a series of comprehensive clinical measurements were conducted over two consecutive days (Table 1). All of the main body composition outcome measurements (MRI, DEXA) were carried out blind to physical activity status. Because aim was to investigate long-term adaptations to exercise, all participants were requested not to exercise vigorously (except for walking and performing other daily chores) during the 2 days before the measurements. The measurements are described in more detail below.
TABLE 1 Timetable of the two-day laboratory measurements in the FITFATTWIN study.
Before Structured instructions for the study measurements Four-day food diary, food-frequency questionnaire, questionnaire on eating habits Three-day heart rate monitoring
Day 1
12:oo pm Standardized interview to assess smoking habits, use of alcohol and dietary habits Questionnaires on physical activity habits, exercise motivation, work-related stress, and sleeping habits
1:00 pm Resting electrocardiography and blood pressure 1:20 pm Standardized clinical medical examination including current medications 2:00 pm Maximal bicycle ergometer exercise test with direct gas analysis
(spiroergometry) 7:00 pm MRI of brain, abdomen, and thigh 10:00 pm Beginning of overnight fast Day 2
7:00 am Anthropometric measurement (height, weight, waist and hip circumference) and assessment of body composition using bioelectrical impedance and DEXA
7:30 am Basal metabolic rate monitoring and blood pressure 8:00 am Fasting serum, plasma, and whole blood samples 8:00-10:00 am Oral glucose tolerance test
Standardized physical activity history interview 10:50 am Vertical jump, maximal isometric left knee extensor strength, and left and right
hand grip strength measurements 13:15 pm Neuropsychological tests to study cognitive functions, depression and
dexterity Electroencephalography

45
4.4.1 Leisure-time physical activity.
Two structured physical activity interviews were used to assess the volume of participants´ LTPA, including commuting activity.
The first, a shorter retrospective physical activity interview (Kujala et al. 1998, Waller, Kaprio & Kujala 2008, Leskinen, Waller et al. 2009), was used to assess LTPA volume at one-year intervals over the past 6 years. Structured questions, similar to those used in the FinnTwin16 survey, on average monthly frequency of activity, average intensity of activity, and duration of one session of activity were asked (see questions in Chapter 4.3.1.). Commuting activity was assessed with a structured question on the average time spent during one day on commuting. LTPA volume was then calculated as average frequency (per month) x duration (min) x intensity (MET), and commuting activity volume as frequency (five times per week) x duration (min) x intensity (4 METs). Total LTPA volume was expressed as the sum -score of MET hours per day (MET index). A mean leisure-time MET index during the past 3 years (3-y-LTMET index as MET-h/d) was calculated and used as one of the criterion variables for pairwise comparison of LTPA discordance (see above, discordance criterion 4).
The second, a more detailed, structured interview, used to determine the volume of leisure-time activities, daily (non-exercise) activities, and work journey activity over the previous 12 months, employed a modified version of the Kuopio Ischemic Heart Disease Risk Factor Study Questionnaire (Lakka & Salonen 1997, Waller, Kaprio & Kujala 2008). Here, ‘modified version’ refers to the updated list of activities included in the questionnaire. This questionnaire contained a 20-item list of different types of physical activities, including leisure-time (e.g., running, skiing, and swimming), daily (e.g., gardening, berry-picking, do-it-yourself activities), and commuting activity (walking or cycling) along with “other” physical activities specified by the responder. Each twin brother reported the monthly frequency of each physical activity session over the previous 12 months. Each twin brother also reported the average intensity of his activity sessions on a scale from 1 to 4: 1 = recreational, outdoor activities that do not cause breathlessness or sweating; 2 = conditioning exercise that induces breathlessness but not sweating; 3 = brisk conditioning exercise that induces breathlessness and sometimes sweating; and 4 = competitive, strenuous exercise that induces breathlessness and extensive sweating. Each self-rated physical activity intensity was converted into MET values (Ainsworth et al. 2000, Lakka & Salonen 1997, Ainsworth et al. 2011). To calculate the overall dose of activity (MET × average duration × frequency, MET-h/d), the average duration per exercise session was also reported for each activity. The overall dose of LTPA during the past 12 months (12-mo-LTMET index as MET-h/d) was calculated by summing the values for leisure-time and commuting activity, excluding daily activities, and used in the identification of discordant pairs (see above, criteria 2 and 3). The most common types of LTPA reported were jogging and walking.
The 16-item Baecke Questionnaire was also used to assess recent vigorous physical activity (Baecke, Burema & Frijters 1982). The three indexes (work, sport,

46 and leisure-time excluding sports) were summed as proposed in the original paper, and the sport index was used as the measure of vigorous physical activity (Mustelin et al. 2012).
4.4.2 Physical fitness
Cardiorespiratory fitness was measured by a maximal exercise test with gas exchange analysis (spiroergometry), using an electrically braked bicycle ergometer. Gas exchange, including oxygen uptake, was measured breath-by-breath with a Vmax spiroergometer (Sensormedics, Yorba Linda, CA, USA). The work load started at 25 W and was increased stepwise by 25 W every 2 min until exhaustion, or until maximal exercise capacity was reached, using a rate of perceived exertion of 19-20/20 on the Borg Scale, or a gas exchange ratio (VCO2/VO2) of over 1.1 as the criterion. Maximal oxygen uptake was determined as the mean value of the two highest consecutive VO2 values recorded during periods of 30 s. Electrocardiogram recordings were performed with the participant at rest and monitored during exercise and recovery. Blood pressure was measured at rest and during exercise and recovery at 2-min intervals.
Maximal isometric left knee extensor force was measured in a sitting position using an adjustable dynamometer chair (Good Strength, Metitur, Palokka, Finland) (Sipilä et al. 1996). Briefly, the left knee was set at an angle of 60° from full extension. Overall, four maximal efforts separated by a 30-s pause were performed. The best performance with the highest value was accepted as the participant’s score. In our laboratory, the coefficients of variation between two consecutive measurements have been 6%.
4.4.3 Anthropometrics and body composition.
Weight and height were measured, with the participant in bare feet and light clothing, to the nearest 100 g and 0.5 cm, respectively. WC was measured when the participant was standing arms at the side and clear of the abdominal region. A stretch-resistant tape measure was placed around the body parallel to the floor and located midway between the spina iliaca superior and the margin of the lower rib. The measurement was taken at end of a normal expiration (WHO 2008). Hip circumference was measured at the level of the greater trochanters. Both circumferences were measured to the nearest 0.5 cm, and the mean of the three measurements was calculated. Whole body composition was determined after an overnight fast using dual-energy X-ray absorptiometry (DEXA Prodigy; GE Lunar Corp., Madison, WI USA).
4.4.4 Magnetic resonance imaging of the abdomen
T1-weighted MRI axial scans were acquired using a Siemens 1.5 T whole body MR scanner (Siemens Symphony, Siemens Medical Systems, Erlangen, Germany). The parameters were as follows: matrix size 512×384, field of view 1418×680, repetition time (TR) 80 ms, and echotime (TE) 2.20 ms. The protocol involved

47
axial images with a 10-mm slice thickness at 13-mm intervals covering the whole abdominal area with the subject in a supine position.
Areas of SAAT and IAAT were segmented from a single transaxial slice at the level of the L2-L3 intervertebral disc using Slice-o-matic software (http://www.tomovision.com/products/sliceomatic.html). Segmentation was performed blind to physical activity status. IAAT was subdivided into intraperitoneal and retroperitoneal fat areas using anatomical landmarks, such as the ascending and descending colon, aorta and inferior vena cava, and kidneys (Baumgartner et al. 1988, Abate et al. 1994). A separating line was manually drawn from the aorta to the ascending and descending colon; fat in front of this line was intraperitoneal fat and the fat compartment behind the line retroperitoneal fat (Figure 4). The masses of the different abdominal adipose tissue compartments were predicted from the measured adipose tissue areas at the L2-L3 level using formulae adapted from Abate et al. (Abate et al. 1997).
FIGURE 4 An illustrative example of a MRI slice of the abdomen at the level of L2-L3. Notes: IAAT, intra-abdominal adipose tissue; SAAT, subcutaneous abdominal adipose tissue
4.4.5 Blood samples
Ten-hour fasting blood samples were collected by venipuncture after 10 min of supine rest. Plasma glucose was determined using a Konelab 20 XT (Thermo Fisher Scientific, Vantaa, Finland) and serum insulin with an IMMULITE® 1000 Analyzer (Siemens Medical Solution Diagnostics, Los Angeles, CA, USA). A homeostatic model assessment (HOMA) index was calculated using the following formula: (Fasting plasma glucose × Fasting plasma insulin)/22.5 (Muniyappa et al. 2008). After drawing the fasting blood samples, an oral glucose tolerance test (OGTT) was performed with a glucose load of 75 g (GlucosePro,

48 Comed LLC, Tampere, Finland) and blood samples taken at 30 min, 1 h, and 2 h. Plasma glucose and insulin were determined from the samples, as described above. The Matsuda index (Matsuda & DeFronzo 1999) (insulin sensitivity index) was calculated according to the web-based calculator at http://mmatsuda.diabetes-smc.jp/MIndex.html.
4.4.6 Nutrient intake
Food intake was assessed with a 4-day food diary over three consecutive week days and one weekend day. The food diary and detailed instructions, including an example of how to record food consumption, were mailed to the study participants before the clinical examinations. Participants were asked to record in detail all the foods and drinks they consumed using ordinary household measures, and to include the time and place of the meal, cooking method, and type and brands of foods and drinks. The completed food diary was personally returned during attendance at the clinical examination, and checked by a researcher and corrections and additions made as needed.
Nutrient intake was calculated from the food diary data using AivoDiet 2.0.1.2 -software (Aivo Ltd., Turku, Finland). The consumed amounts of foods and drinks were coded into the software by a nutritionist. The nutritional calculations in the software are based on the Fineli® Finnish Food Composition Database (National Institute for Health and Welfare, Nutrition Unit, Helsinki, Finland). Nutrient intake was calculated as the mean intake of the 4 days as grams per day and percentage of energy (E%) and adjusted by energy (g/MJ). Use of vitamin or mineral supplements was not included in the calculations.
4.5 Ethics of the study
The studies were conducted according to the guidelines laid down in the Declaration of Helsinki. The ethics committee of the Central Finland Health Care District approved the FinnTwin16 study plan April 24, 2010 (Dnro 5e/2010), and the FITFATTWIN study protocol was approved March 22, 2011 (Dnro 4U/2011). The FinnTwin16 study participants gave their informed consent when responding to the survey, and the FITFATTWIN participants gave their written informed consent prior to the clinical study measurements.
4.6 Statistical methods
Data were analyzed using Stata 12.0 (Stata Corp., College Station, TX, USA) and SPSS Statistics 19.0, 20.0, and 22.0 (IBM Corp., Armonk, NY, USA). In all analyses, the level of significance was set at P < 0.05. Individual–based analyses were performed separately for men and women. The clustering of observations in twin

49
pairs was accounted for in all analyses. Descriptive analyses were based on twin study design-corrected chi-squared test statistics (Rao & Scott, 1984) for categorical variables, and design-corrected mean comparisons from linear models (Korn & Graubard, 1999) for continuous variables. The mean values or regression coefficients, and their ninety-five percent confidence intervals (95% CIs) were calculated for the main outcomes. The main analyses were carried out first independently and then adjusted for single or multiple potential confounders. In the discordant co-twin analysis, the Shapiro-Wilk test was used to test the normality of the variables. Two-sided paired sample t test was used for normally distributed data to study differences between the physical activity discordant co-twins, and the Wilcoxon matched-pair signed-rank test was used for non-normally distributed data. Ninety-five percent confidence intervals (95% CIs) were calculated for the absolute mean differences between the discordant co-twins.
Study I The differences in participant characteristics between the LTPA categories (inactive, moderately active, active) were analyzed as described above. The F-test (analysis of variance) was used to compare differences between nine different LTPA groups (persistently inactive vs. other groups) in the mean values of waist gain during follow-up among. Also in these analyses, the design corrected mean comparisons were used. In addition, pairwise analyses comparing the co-twins discordant for persistence or change in physical activity habits were carried out.
Study II The differences in participant characteristics between the categories of the number of sport disciplines participated in (none, 1-2, 3-4, over 5 sport disciplines) were analyzed as described above. In addition, multiple testing was controlled for by using False Discovery Rate correction on the raw p-values. The mean values or/and regression coefficients, and their 95% confidence intervals for WC in each sport discipline, by number of sport disciplines and type of activity participated in were estimated by design corrected linear regression model. Further, the pairwise comparisons between the co-twins discordant for the number of sport disciplines participated in were performed.
Studies III and IV The main analysis were carried out by pairwise comparisons between the inactive and active co-twins in each twin pair. Additionally, in Study III, Generalized Estimating Equations analysis was used to see whether, in addition to physical activity, dietary habits have an independent effect on IAAT. Individual-based correlations between intra-abdominal fat and the markers of glucose homeostasis were estimated with Pearson´s correlation coefficient, and the significance of the association was tested using a linear regression model in which the within-pair dependency of twin individuals was taken into account (Williams 2000).
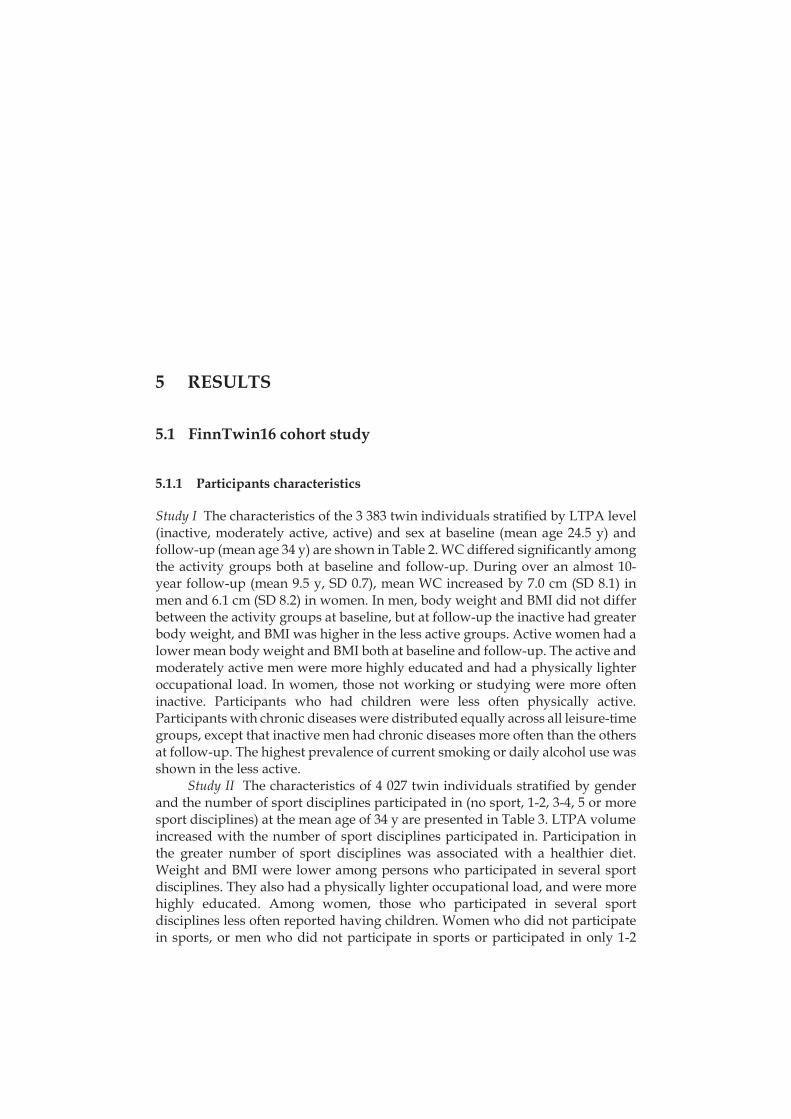
5 RESULTS
5.1 FinnTwin16 cohort study
5.1.1 Participants characteristics
Study I The characteristics of the 3 383 twin individuals stratified by LTPA level (inactive, moderately active, active) and sex at baseline (mean age 24.5 y) and follow-up (mean age 34 y) are shown in Table 2. WC differed significantly among the activity groups both at baseline and follow-up. During over an almost 10- year follow-up (mean 9.5 y, SD 0.7), mean WC increased by 7.0 cm (SD 8.1) in men and 6.1 cm (SD 8.2) in women. In men, body weight and BMI did not differ between the activity groups at baseline, but at follow-up the inactive had greater body weight, and BMI was higher in the less active groups. Active women had a lower mean body weight and BMI both at baseline and follow-up. The active and moderately active men were more highly educated and had a physically lighter occupational load. In women, those not working or studying were more often inactive. Participants who had children were less often physically active. Participants with chronic diseases were distributed equally across all leisure-time groups, except that inactive men had chronic diseases more often than the others at follow-up. The highest prevalence of current smoking or daily alcohol use was shown in the less active.
Study II The characteristics of 4 027 twin individuals stratified by gender and the number of sport disciplines participated in (no sport, 1-2, 3-4, 5 or more sport disciplines) at the mean age of 34 y are presented in Table 3. LTPA volume increased with the number of sport disciplines participated in. Participation in the greater number of sport disciplines was associated with a healthier diet. Weight and BMI were lower among persons who participated in several sport disciplines. They also had a physically lighter occupational load, and were more highly educated. Among women, those who participated in several sport disciplines less often reported having children. Women who did not participate in sports, or men who did not participate in sports or participated in only 1-2

51
sport disciplines slightly more often reported having a chronic disease. Current smoking showed the highest prevalence in those who did not participate in any sports.

TABL
E 2
Cha
ract
eris
tics
of th
e pa
rtic
ipan
ts a
t bas
elin
e an
d at
follo
w-u
p by
gen
der a
nd L
TPA
cat
egor
iesa
Ba
selin
e
Fo
llow
-up
Inac
tive
Mod
erat
ely
ac
tive
A
ctiv
e
Inac
tive
Mod
erat
ely
activ
e A
ctiv
e
M
en, N
=157
8 n=
488
n=52
1 n=
569
n=52
5 n=
527
n=52
6
LTP
A-v
olum
e (M
ET-h
/d)
MET
< 2
.3
2.3
MET
< 6
.8
MET
6
.8
Pb
M
ET <
2.2
2.
2 M
ET <
5.4
M
ET
5.4
Pb
A
ge (y
) 24
.4 ±
0.9
24
.4 ±
0.9
24
.4 ±
1.0
-
34
.0 ±
1.2
33
.8 ±
1.1
33
.8 ±
1.2
A
B
Wei
ght (
kg)
77.7
± 1
3.7
76.1
± 1
1.8
77.1
± 1
0.2
-
85.1
± 1
4.8
82.6
± 1
3.9
81.8
± 1
1.6
AB
Hei
ght (
cm)
179.
3 ±
6.6
179.
3 ±
6.3
179.
9 ±
6.7
-
179.
5 ±
6.6
179.
2 ±
6.3
179.
9 ±
6.9
- B
MI (
kg/m
2 ) 24
.1 ±
3.7
23
.6 ±
3.1
23
.8 ±
2.6
-
26
.4 ±
4.1
25
.7 ±
3.8
25
.2 ±
3.1
A
BC
Wai
st c
ircu
mfe
renc
e (c
m)
87.3
± 1
1.1
85.2
± 9
.1
83.7
± 7
.1
ABC
95.2
± 1
2.0
92.1
± 1
0.3
89.7
± 9
.0
ABC
Occ
upat
iona
l phy
sica
l act
ivity
, (n)
P fo
r tre
nd
P fo
r tre
nd
Sede
ntar
y 3
8.1%
(185
) 49
.0%
(254
) 27
3 (4
8.1%
) <0
.001
39.7
% (2
08)
50.7
% (2
67)
49.0
% (2
58)
0.00
5 St
andi
ng o
r wal
king
at w
ork
14.8
% (7
2)
19.3
% (1
00)
117
(20.
7%)
19.1
% (1
00)
17.5
% (9
2)
20.9
% (1
10)
Li
ght m
anua
l wor
k 23
.5%
(114
) 18
.1%
(94)
10
2 (1
8.0%
)
21
.9%
(115
) 17
.6%
(93)
18
.1%
(95)
Hea
vy m
anua
l wor
k 15
.0%
(73)
8.
5% (4
4)
59 (1
0.4%
)
14
.1%
(74)
10
.8%
(57)
8.
6% (4
5)
N
ot w
orki
ng o
r stu
dyin
g 8.
6% (4
2)
5.0%
(26)
15
(2.7
%)
5.2%
(27)
3.
4% (1
8)
3.4%
(18)
Educ
atio
nal l
evel
, (N
)
Prim
ary
4.0%
(21)
3.
6% (1
9)
2.1%
( 11)
<0
.001
Se
cond
ary
57
.8%
(303
) 42
.5%
(224
) 46
.6%
(245
)
Tert
iary
38.2
% (2
00)
53.9
% (2
84)
51.3
% (2
70)
C
hild
ren,
(n)
Ye
s 15
.2%
(74)
9.
0% (4
7)
6.7%
(38)
<0
.001
60.2
% (3
15)
56.0
% (2
95)
51.7
% (2
72)
0.02
C
hron
ic d
isea
ses,
(n)
Ye
s 12
.2%
(62)
10
.1%
(52)
11
.4%
(64)
0.
39
18
.7%
(98)
13
.9%
) 12
.8%
(67)
0.
02
Smok
ing
stat
us, (
n)
C
urre
nt (d
aily
) sm
oker
44
.9%
(219
) 28
.0%
(146
) 16
.7%
(95)
<0
.001
29.1
% (1
53)
16.3
% (8
6)
14.3
% (7
5)
<0.0
01
Occ
asio
nal s
mok
er
13.1
% (6
4)
15.9
% (8
3)
17.9
% (1
02)
13.3
% (7
0)
14.1
% (7
4)
9.5%
(50)
Qui
tters
11
.3%
(55)
15
.7%
(82)
15
.6%
(89)
23
.0%
(121
) 22
.8%
(120
) 21
.9%
(115
)
Nev
er sm
oked
30
.7%
(159
) 40
.3%
(210
) 49
.7%
(283
)
34
.5%
(181
) 46
.8%
(246
) 54
.4%
(286
)
Alc
ohol
use
, (n)
Dai
ly
4.3%
(21)
1.
9% (1
0)
1.4%
(8)
0.03
8.4%
(44)
4.
6% (2
4)
3.2%
(17)
0.
003
1–2
times
/wee
k 57
.7%
(281
) 59
.8%
(311
) 56
.2%
(319
)
60
.7%
(318
) 60
.0%
(316
) 55
.9%
(294
)
1–2
times
/mon
th
24.6
% (1
20)
23.7
% (1
23)
29.5
% (1
68)
95 (1
8.1%
) 22
.2%
(117
) 24
.0%
(126
)
Less
than
onc
e a
mon
th
8.6%
(42)
7.
5% (3
9)
7.4%
(42)
41
(7.8
%)
7.8%
(41)
10
.1%
(53)
Nev
er
4.7%
(23)
7.
1% (3
7)
5.4%
(31)
26
(5.0
%)
5.5%
(29)
6.
8% (3
6)
(con
tinue
s)

TA
BLE
2 (c
ontin
ues)
Wom
en, N
=180
5 n=
562
n=63
5 n=
608
n=59
1 n=
611
n=60
3
LTP
A-v
olum
e (M
ET-h
/d)
MET
< 2
.5
2.5
MET
< 5
.5
MET
5
.5
Pb
M
ET <
2.0
2.
0 M
ET <
5.0
M
ET
5.0
Pb
A
ge (y
) 24
.3 ±
0.9
24
.3 ±
0.9
24
.3 ±
0.9
-
33
.9 ±
1.3
33
.9 ±
1.2
33
.9 ±
1.2
-
Wei
ght (
kg)
61.8
± 1
2.0
61.5
± 1
0.0
59.9
± 7
.9
BC
67
.4 ±
14.
8 66
.2 ±
13.
2 63
.9 ±
10.
3 BC
Hei
ght (
cm)
165.
4 ±
5.8
165.
8 ±
5.4
166.
6 ±
5.9
BC
16
5.6
± 5.
8 16
5.8
± 5.
8 16
6.4
± 5.
6 B
BM
I (kg
/m2 )
22.5
± 4
.0
22.3
± 3
.3
21.6
± 2
.5
BC
24
.6 ±
5.2
24
.1 ±
4.6
23
.0 ±
3.4
BC
Wai
st c
ircu
mfe
renc
e (c
m)
76.1
± 1
0.2
74.9
± 8
.6
72.4
± 7
.0
ABC
83.0
± 1
3.2
80.7
± 1
1.1
77.9
± 9
.5
ABC
Occ
upat
iona
l phy
sica
l act
ivity
, (n)
P fo
r tre
nd
P fo
r tre
nd
Sede
ntar
y 39
.6%
(222
) 46
.3%
(294
) 47
.5%
(289
) <0
.001
40.3
% (2
38)
37.3
% (2
28)
43.4
% (2
61)
<0.0
01
Stan
ding
or w
alki
ng a
t wor
k 14
.8%
(83)
20
.2%
(128
) 21
.5%
(131
)
14
.2%
(84)
23
.4%
(143
) 21
.8%
(131
)
Ligh
t man
ual w
ork
20.4
% (1
14)
19.9
% (1
26)
20.9
% (1
27)
22.2
% (1
31)
23.4
(143
) 23
.3%
(140
)
Hea
vy m
anua
l wor
k 4.
1% (2
3)
2.4%
(15)
3.
1% (1
8)
2.2%
(13)
1.
1% (7
) 2.
7% (1
6)
N
ot w
orki
ng o
r stu
dyin
g 21
.1%
(118
) 11
.2%
(71)
7.
1% (4
3)
21.0
% (1
24)
14.7
% (9
0)
9.0%
(54)
Educ
atio
nal l
evel
, (n)
Prim
ary
3.4%
(20)
0.
8% (5
) 2.
3% (1
4)
0.00
2 Se
cond
ary
40
.9%
(242
) 43
.0%
(263
) 35
.3%
(213
)
Tert
iary
55.7
% (3
29)
56.1
% (3
43)
62.4
.% (3
76)
C
hild
ren,
(n)
Ye
s 21
.5%
(121
) 13
.2%
(84)
6.
7% (4
1)
<0.0
01
72
.9%
(431
) 61
.0%
(372
) 54
.1%
(326
) <0
.001
C
hron
ic d
isea
ses,
(n)
Ye
s 13
.3%
(74)
11
.0%
(69)
10
.2%
(62)
0.
25
17
.6%
(104
) 17
.5%
(107
) 15
.3%
(92)
0.
46
Smok
ing
stat
us, (
n)
C
urre
nt (d
aily
) sm
oker
30
.8%
(173
) 22
.7%
(144
) 16
.4%
(100
) <0
.001
18.4
% (1
09)
17.2
% (1
05)
11.6
% (7
0)
0.05
O
ccas
iona
l sm
oker
16
.0%
(90)
12
.3%
(78)
16
.0%
(97)
8.
8% (5
2)
7.7%
(47)
9.
8% (5
9)
Q
uitte
rs
14.2
% (8
0)
15.3
% (9
7)
11.3
% (6
9)
20.3
% (1
20)
20.7
% (1
26)
20.7
% (1
25)
N
ever
smok
ed
39.0
% (2
19)
49.8
% (3
16)
56.2
% (3
42)
52.5
% (3
10)
54.4
% (3
32)
57.9
% (3
49)
A
lcoh
ol u
se, (
n)
D
aily
0.
5% (3
) 0.
2% (1
) 0.
5% (3
) 0.
92
2.
4% (1
4)
0.5%
(3)
0.3%
(2)
0.00
7 1–
2 tim
es/w
eek
42.3
% (2
38)
40.7
% (2
59)
41.8
% (2
54)
37.2
% (2
20)
42.4
% (2
59)
41.1
% (2
48)
1–
2 tim
es/m
onth
35
.8%
(201
) 38
.1%
(242
) 36
.4%
(221
)
29
.5%
(175
) 31
.4%
(192
) 29
.5%
(178
)
Less
than
onc
e a
mon
th
16.2
% (9
1)
15.1
% (9
6)
16.6
% (1
01)
24.5
% (1
45)
19.0
% (1
16)
22.4
% (1
35)
N
ever
5.
2% (2
9)
5.8%
(37)
4.
6% (2
8)
6.4%
(38)
6.
7% (4
1)
6.6%
(40)
Not
es: D
ata
are
mea
n ±
SD
LTPA
, lei
sure
-tim
e ph
ysic
al a
ctiv
ity; M
ET, m
etab
olic
equ
ival
ent;
BMI,
body
mas
s in
dex;
SD
, sta
ndar
d de
viat
ion.
a Ph
ysic
al a
ctiv
ity c
ateg
ory
by L
TPA
MET
-h/d
: low
est t
ertil
e: in
activ
e; m
iddl
e te
rtile
: mod
erat
ely
activ
e; h
ighe
st te
rtile
: act
ive.
b S
igni
fican
t diff
eren
ces (
P<0.
05) b
etw
een
activ
ity g
roup
s are
cod
ed: A
inac
tive
vs. m
oder
atel
y ac
tive,
B in
activ
e vs
. act
ive,
C m
oder
atel
y ac
tive
vs. a
ctiv
e.

54
TABLE 3 Characteristics of the participants by gender and number of sport disciplines participated in.
Number of sport disciplines
A) None B) 1-2 C) 3-4 D) 5 or more
Men, N=1874 n=105 n=733 n=595 n=441 LTPA-volume (MET-h/d) 1.1 ± 1.4 B,C,D 3.5 ± 3.3 A,C,D 5.2 ± 4.2 A,B,D 6.7 ± 4.6 A,B,C Age (y) 34.2 ± 1.4 33.9 ± 1.2 34.0 ± 1.3 34.0 ± 1.3 Weight (kg) 86.1 ± 16.7 D 83.7 ± 14.7 D 83.3 ± 13.2 D 81.1 ± 10.9 A,B,C Height (cm) 178.4 ± 6.8 179.0 ± 6.7 D 179.6 ± 6.6 180.2 ± 6.6 B BMI (kg/m2) 27.0 ± 4.8 C,D 26.0 ± 3.9 D 25.8 ± 3.6 A,D 24.9 ± 2.8 A,B,C Dietary qualitya (SD) 6.1 ± 1.8 B,C,D 6.8 ± 2.1 A,C,D 7.5 ± 2.2 A,B,D 8.1 ± 1.9 A,B,C Occupational physical activity, % (n)
P for trend
Sedentary 26 % (27) 39.4% (288) 49.6% (295) 57.1% (252) <0.001 Standing or walking at work
15.4% (16) 18.9% (138) 23.0% (137) 17.5% (77)
Light manual work 29.8% (31) 22.4% (164) 14.8% (88) 16.6% (73) Heavy manual work 21.2% (22) 13.8% (101) 8.7% (52) 6.6% (29) Not working or studying
7.7% (8) 5.5% (40) 3.9% (23) 2.3% (10)
Educational level, % (n) Primary 6.7% (7) 4.5% (33) 2.5% (15) 1.6% (7) <0.001 Secondary 71.4% (75) 58.5% (428) 44.9% (267) 39.2% (173) Tertiary 21.9% (23) 37% (271) 52.6% (313) 59.2% (261)
Children, % (n) Yes 61.0% (64) 55.1% (403) 54.4% (323) 54.8% (241) 0.672
Chronic diseases, % (n) Yes 22.9% (24) 18.2% (133) 15.0% (89) 10.3% (45) <0.001
Smoking status, % (n) Current (daily) smoker 44.8% (47) 26.7% (196) 17.3% (103) 10.0% (44) <0.001 Occasional smoker 7.6% (8) 12.1% (89) 13.3% (79) 11.6% (51) Quitters 19.0% (20) 23.6% (173) 24.4% (145) 21.1% (93) Never smoked 28.6% (30) 37.5% (275) 44.9% (267) 57.4% (253)
Alcohol use, % (n) Daily 10.5% (11) 6.6% (48) 4.2% (25) 2.9% (13) 0.122 1–2 times a week 54.3% (57) 57.2% (419) 59.0% (351) 62.1% (274) 1–2 times a month 20.0% (21) 20.5% (150) 22.7% (135) 20.4% (90) Less than once a month 8.6% (9) 10.0% (73) 8.2% (49) 9.5% (49) Never 6.7% (7) 5.7% (42) 5.9% (35) 5.0% (22)
Women, N=2153 n=84 n=771 n=805 n=493 LTPA-volume (MET-h/d) 1.0 ± 1.2 B,C,D 3.0 ± 3.2 A,C,D 4.4 ± 3.8 A,B,D 7.1 ± 5.0 A,B,C Age (y) 33.9 ± 1.3 34.0 ± 1.3 34.0 ± 1.3 33.9 ± 1.2 Weight (kg) 70.7 ± 17.4 D 67.0 ± 14.2 D 65.9 ± 12.7 D 63.9 ± 9.7 A,B,C Height (cm) 166.0 ± 5.8 165.6 ± 6.0 165.8 ± 5.7 166.4 ± 5.6 BMI (kg/m2) 25.7 ± 6.0 C,D 24.4 ± 5.0 D 24.0 ± 4.4 A,D 23.1 ± 3.3 A,B,C Dietary qualitya 6.8 ± 2.0 B,C,D 7.8 ± 2.0 A,C,D 8.4 ± 2.1 A,B,D 9.0 ± 1.8 A,B,C
(continues)

55
TABLE 3 (continues) (Occupational physical activity PA, % (n)
P for trend
Sedentary 35.7% (30) 32.2% (248) 40.3% (324) 47.6% (234) <0.001 Standing or walking at work
16.7% (14) 19.1% (147) 20.3% (163) 25.8% (127)
Light manual work 25.0% (21) 25.9% (200) 23.0% (185) 18.5% (91) Heavy manual work 1.2% (1) 3.1% (24) 2.2% (18) 0.8% (4) Not working or studying
21.4% (18) 19.7% (152) 14.1% (113) 7.3% (36)
Educational level, % (n) Primary 8.3% (7) 3.2% (25) 1.9% (15) 1.0% (5) <0.001 Secondary 50.0% (42) 48.1% (371) 39.9% (321) 30.6% (151) Tertiary 41.7% (35) 48.6% (375) 58.3% (469) 68.4% (337)
Children, % (n) Yes 67.9% (57) 68.4% (527) 62.4% (502) 56.6% (279) <0.001
Chronic diseases, % (n) Yes 27.4% (23) 16.1% (124) 16.8% (135) 14.8% (73) 0.041
Smoking status, % (n) Current (daily) smoker 32.1% (27) 21.4% (165) 14.9% (120) 7.7% (38) <0.001 Occasional smoker 8.3% (7) 8.6% (66) 8.1% (65) 10.1% (50) Quitters 19.0% (16) 21.7% (167) 20.8% (168) 20.3% (100) Never smoked 40.5% (34) 48.4% (373) 56.1% (451) 61.9% (305)
Alcohol use, % (n) Daily 4.8% (4) 1.4% (11) 1.2% (10) 0.6% (3) <0.001 1–2 times a week 34.5% (29) 36.6% (282) 43.0% (346) 41.8% (206) 1–2 times a month 27.4% (23) 29.6% (228) 28.4% (229) 33.9% (167) Less than once a month 23.8% (20) 26.0% (200) 22.0% (177) 15.0% (74) Never 9.5% (8) 6.4% (49) 5.3% (43) 8.7% (43)
Notes: Data are mean ± SD LTPA, leisure-time physical activity; MET, metabolic equivalent; BMI, body mass index; SD, standard deviation. Superscripts A,B,C,D indicate statistically significant differences (P-value <0.05) between groups differing by the number of sport disciplines participated in. a Dietary quality score 0-12 points
5.1.2 Persistence or change in physical activity and waist gain
Study I During the almost 10-year follow-up period, WC increased in both sexes in all the LTPA groups (persistence or change) (mean waist gain from 3.7 to 9.7 cm by group). When comparing the waist gain of the persistently inactive group to all the other groups (Figure 5, Appendix 1), the persistently active men or men whose activity increased during the follow-up showed less waist gain than the persistently inactive men (P<0.05). Men, whose activity decreased or who remained only moderately active showed waist gain resemble that associated with being persistently inactive. Among women, those who remained at least moderately active or whose activity increased during the follow-up, showed less waist gain than those who were persistently inactive (P<0.01). Women, whose activity level decreased during the follow-up showed similar waist gain to those who remained persistently inactive. Further, the highest mean waist gain in both men and women occurred in those who changed from active to inactive during the follow-up. Adjusting for potential confounders, such as age, baseline WC and

56 BMI, occupational physical activity, educational level, number of children, chronic diseases, smoking status and alcohol use, did not change the results substantially (Appendix 1).
FIGURE 5 Persistence and change in LTPA and waist gain (cm, mean and 95%CI) during follow-up. Notes: Significant differences are coded (persistently inactive as reference group): * P<0.05, † P<0.01, ‡ P<0.001.
In the second individual-based analysis (Figure 6a), the participants whose LTPA decreased during the follow-up showed significantly greater waist gain (mean increase: men 8.4 cm; 95% CI 7.6 to 9.2, women 7.5 cm; 95% CI 6.7 to 8.2) than those whose activity increased (men 4.8 cm; 95% CI 3.9 to 5.6, women 4.3 cm; 95% CI 3.6 to 5.0). The persistently inactive participants showed more waist gain (men 8.1 cm; 95% CI 6.9 to 9.2, women 8.4 cm; 95% CI 7.1 to 9.6) than those, who were inactive at baseline but whose activity increased during the follow-up (men 5.2 cm; 95% CI 4.0 to 6.4, women 4.7 cm; 95% CI 3.7 to 5.6). The persistently active respondents showed less waist gain (men 6.3 cm; 95% CI 5.6 to 7.1, women 4.7 cm; 95%CI 3.9 to 5.5) than those who were active at baseline but whose activity decreased during the follow-up (men 8.5 cm; 95% CI 7.6 to 9.4, women 7.7 cm; 95% CI 6.7 to 8.7).

57
FIGURE 6 Differences in waist gain (cm, mean and 95%CI) during follow-up A. Sex-specific differences among individuals taking into account clustered observation of twin pairs. B. Pairwise difference among same-sex twin pairs discordant for LTPA. C. Pairwise differences among MZ twin pairs discordant for LTPA. Notes: decreased activity: changed from a higher tertile to a lower one; increased activity: changed from a lower tertile to a higher one.

58 Among all the same-sex discordant twin pairs, the twins whose physical activity decreased during the follow-up gained an average 2.8 cm more WC than their co-twins whose physical activity increased (P=0.009); among MZ twin pairs, the difference was 4.2 cm (P=0.008) (illustrated in Figure 6b and 6c, numeric values in Table 4). These pairwise differences remained statistically significant when each waist measure was divided by the corresponding BMI value (P=0.027 for all pairs, 0.027 for MZ pairs).
When comparing the persistently inactive twins to their co-twins who were inactive at baseline but whose activity increased during follow-up, the persistently inactive gained an average 4.7 cm and 4.0 cm more waist among all same-sex pairs (P=0.007) and MZ pairs (P=0.10), respectively. The difference in waist gain between those who were persistently active and those who were active at baseline but whose activity decreased during the follow-up was significant only among all same-sex twin pairs (2.9 cm, P=0.02), but not among only MZ twin pairs.

TABL
E 4
Pair
wis
e di
ffere
nces
in w
aist
gai
n du
ring
follo
w-u
p be
twee
n tw
in p
airs
dis
cord
ant f
or L
TPA
All
sam
e-se
x tw
in p
airs
M
onoz
ygot
ic tw
in p
airs
W
aist
gai
n (c
m)
Wai
st g
ain
(cm
) Pa
irs,
n Tw
in 1
Tw
in 2
M
ean
diffe
renc
e (9
5 %
CI)
P
Pair
s, n
Twin
1
Twin
2
Mea
n di
ffere
nce
(95
%C
I) P
Dec
reas
ed a
ctiv
ity (
twin
1)
vs. i
ncre
ased
act
ivity
(tw
in 2
) 85
(3
1 m
ale)
7.7
± 9.
5 5.
0 ±
7.5
2.8
(0.4
to 5
.1)
0.00
9 43
(1
6 m
ale)
8.
3 ±
10.3
4.
2 ±
7.3
4.2
(1.2
to 7
.2)
0.00
8
Pers
iste
ntly
inac
tive
(twin
1)
vs.
incr
ease
d ac
tivity
fro
m
inac
tive
(twin
2)
41
(16
mal
e)
9.7
± 8.
8 5.
1 ±
7.6
4.7
(1.3
to 8
.0)
0.00
7 22
(9
mal
e)
10.2
± 1
0.1
6.2
± 8.
8 4.
0 (-0
.8 to
8.8
) 0.
10
Dec
reas
ed
activ
ity
from
ac
tive
(twin
1)
vs
. pe
rsis
tent
ly a
ctiv
e (tw
in 2
)
63
(30
mal
e)
8.3
± 9.
8 5.
4 ±
4.5
2.9
(0.5
to 5
.3)
0.02
34
(1
5 m
ale)
6.
6 ±
9.5
5.4
± 4.
4 1.
2 (-1
.9 to
4.4
) 0.
44
Not
es: D
ata
are
mea
n ±
SD.
LTPA
, lei
sure
-tim
e ph
ysic
al a
ctiv
ity; S
D, s
tand
ard
devi
atio
n; C
I, co
nfid
ence
inte
rval
.

60
5.1.3 Sport disciplines, types of activity, and waist circumference
Study II Among the Finnish twin individuals of both sexes at the mean age of 34 years, walking, cycling and jogging were the most popular aerobic activities, while among men floorball and among women aerobics were the most popular mixed sports (Table 5). Table 5 also shows the mean WC values by sport discipline. Those not participating in any sport discipline had the largest WC means, while the individual sport disciplines showed a large degree of variation in mean WC values.

TABL
E 5
The
mos
t pop
ular
spo
rt d
isci
plin
es a
nd w
aist
cir
cum
fere
nce
amon
g yo
ung
adul
t tw
ins
in F
inla
nd.
Men
N=1
874
W
omen
N=2
153
Spor
t dis
cipl
ine
Spor
t typ
ea
n W
aist
cir
cum
fere
nce
(cm
), m
ean
(95%
CI)
Sp
ort d
isci
plin
e Sp
ort t
ypea
n
Wai
st c
ircu
mfe
renc
e (c
m),
m
ean
(95%
CI)
N
o sp
ort
105
96.8
(93.
9 to
99.
7)
No
spor
t 84
84
.6 (8
1.3
to 8
7.9)
W
alki
ng /N
ordi
c w
alki
ng
Aer
obic
79
1 93
.7 (9
2.9
to 9
4.6)
W
alki
ng /N
ordi
c w
alki
ng
Aer
obic
16
18
81.2
(80.
5 to
81.
8)
Cyc
ling
Aer
obic
69
6 91
.3 (9
0.5
to 9
2.2)
Bi
cycl
ing
Aer
obic
82
6 80
.1 (7
9.3
to 8
0.8)
Jo
ggin
g/ru
nnin
g A
erob
ic
693
89.6
(88.
8 to
90.
3)
Jogg
ing/
runn
ing
Aer
obic
72
1 76
.9 (7
6.3
to 7
7.5)
G
ym tr
aini
ng
Pow
er
690
91.0
(90.
2 to
91.
7)
Gym
trai
ning
Po
wer
61
1 78
.4 (7
7.6
to 7
9.3)
C
ross
-cou
ntry
ski
ing
Aer
obic
44
6 90
.4 (8
9.5
to 9
1.3)
Sw
imm
ing
Aer
obic
58
0 82
.3 (8
1.2
to 8
3.4)
Sw
imm
ing
Aer
obic
35
9 93
.2 (9
1.9
to 9
4.4)
C
ross
-cou
ntry
ski
ing
Aer
obic
44
5 77
.9 (7
7.0
to 7
8.8)
Fl
oorb
all
Mix
ed
333
91.4
(90.
4 to
92.
5)
Aer
obic
s M
ixed
39
8 78
.7 (7
7.7
to 7
9.7)
Ba
dmin
ton
Mix
ed
223
90.7
(89.
4 to
92.
0)
Dan
ce
Aer
obic
30
8 79
.0 (7
7.8
to 8
0.2)
Fo
otba
ll M
ixed
20
4 90
.5 (8
9.2
to 9
1.9)
G
ymna
stic
s
Oth
er
200
79.6
(78.
1 to
81.
1)
Dow
nhill
ski
ing
/ sn
owbo
ardi
ng
Mix
ed
204
90.5
(89.
2 to
91.
9)
Dow
nhill
ski
ing
/ sn
owbo
ardi
ng
Mix
ed
197
78.4
(76.
9 to
79.
9)
Skat
ing/
rolle
rbla
ding
A
erob
ic
189
90.9
(89.
5 to
92.
2)
Skat
ing/
rolle
r-sk
atin
g A
erob
ic
171
76.7
(75.
4 to
78.
1)
Ice-
hock
ey
Mix
ed
136
91.6
(90.
1 to
93.
2)
Hor
se ri
ding
O
ther
13
8 77
.5 (7
5.9
to 7
9.1)
G
olf
Aer
obic
12
2 89
.9 (8
8.3
to 9
1.5)
Yo
ga
Oth
er
75
76.0
(74.
3 to
77.
7)
Tenn
is
Mix
ed
104
91.1
(89.
3 to
92.
9)
Floo
rbal
l M
ixed
67
79
.5 (7
7.5
to 8
1.5)
M
artia
l art
(e
.g. J
udo,
Kar
ate)
M
ixed
93
90
.5 (8
8.4
to 9
2.6)
Ba
dmin
ton
Mix
ed
66
80.7
(78.
0 to
83.
5)
Vol
leyb
all
Mix
ed
85
92.7
(90.
5 to
94.
9)
Gol
f A
erob
ic
59
76.3
(74.
6 to
78.
0)
Rin
kbal
l M
ixed
54
90
.0 (8
7.9
to 9
2.1)
Te
nnis
M
ixed
50
77
.4 (7
4.5
to 8
0.4)
O
rien
teer
ing
Aer
obic
54
87
.6 (8
4.9
to 9
0.3)
M
artia
l art
(e
.g. J
udo,
Kar
ate)
M
ixed
47
80
.1 (7
7.5
to 8
2.7)
Row
ing
/ can
oein
g A
erob
ic
50
90.2
(87.
2 to
93.
3)
Pila
tes
Oth
er
47
78.4
(75.
2 to
81.
6)
Gym
nast
ics
O
ther
38
87
.5 (8
4.6
to 9
0.3)
V
olle
ybal
l M
ixed
42
82
.5 (7
9.1
to 8
6.0)
Ba
sket
ball
Mix
ed
34
89.2
(85.
8 to
92.
6)
Row
ing
/ can
oein
g A
erob
ic
37
79.1
(76.
0 to
82.
1)
Squa
sh
Mix
ed
34
90.7
(88.
3 to
93.
1)
Foot
ball
Mix
ed
33
79.8
(76.
9 to
82.
8)
Dan
ce
Aer
obic
32
91
.2 (8
7.3
to 9
5.0)
O
rien
teer
ing
Aer
obic
32
77
.8 (7
4.2
to 8
1.4)
In
door
cyc
ling
/spi
nnin
g A
erob
ic
32
80.0
(75.
8 to
84.
3)
Not
es: C
I, co
nfid
ence
inte
rval
Sp
ort d
isci
plin
es w
ith N
low
er th
an 3
0 ar
e no
t pre
sent
ed in
the
tabl
e.
a A
erob
ic: s
port
dis
cipl
ines
mai
nly
impr
ovin
g ae
robi
c fit
ness
, Pow
er: s
port
dis
cipl
ines
mai
nly
impr
ovin
g m
uscl
e st
reng
th, M
ixed
: spo
rt d
isci
plin
es m
ainl
y im
prov
ing
both
aer
obic
fitn
ess a
nd m
uscl
e st
reng
th, O
ther
type
of s
port
: spo
rt d
isci
plin
es m
ainl
y im
prov
ing
som
ethi
ng e
lse
(e.g
. ski
ll/te
chni
que)
.

62
TABLE 6 Number of sport disciplines participated in and waist circumference.
Number of sport disciplinesa
Men, N=1874 Women, N=2153 n (%) WC (cm),
mean (95% CI) n (%) WC (cm),
mean (95% CI) 1) 0 105 (5.6) 96.8 (93.9 to 99.7) 84 (3.9) 84.6 (81.3 to 87.9) 2) 1-2 733 (39.1) 93.6 (92.7 to 94.4) 771 (35.8) 82.4 (81.5 to 83.4) 3) 3-4 595 (31.8) 92.0 (91.1 to 92.9) 805 (37.4) 80.5 (79.6 to 81.3) 4) 5 or more 441 (23.5) 89.6 (88.7 to 90.4) 493 (22.9) 77.5 (76.7 to 78.3)
Notes: WC, waist circumference; CI, confidence interval. a Includes all sport disciplines (also seasonal sports) that the person reported participating in. Participation in a higher number of sport disciplines was associated with a smaller WC in both sexes (Table 6). The linear decrease per each additional sport discipline was 1.38 cm (95% CI 1.10 to 1.65). The results did not materially change when adjusted for LTPA volume (linear decrease 1.04 cm, 95% CI 0.75 to 1.33), diet quality (0.95cm, 95% CI 0.68 to 1.23), or multiple potential confounders (1.10 cm, 95%CI 0.83 to 1.38).
Among all the discordant twin pairs, the men and women who participated in five or more sport disciplines had WC 3.3 cm (95% CI 0.3 to 6.3) and 5.2 cm (95% CI 1.6 to 8.9), respectively, smaller than that of their co-twins who participated in only 1-2 or no sport disciplines (Table 7). Among the DZ pairs, the difference was greater: 4.8 cm (95% CI 0.4 to 9.1) in men, and 11.2 cm (95% CI 4.4 to 18.0) in women. Significant within-pair differences were also seen in BMI and diet quality in women, but not in men. No differences were detected in WC, BMI or diet quality among the 43 discordant MZ pairs.

TABL
E 7
Wai
st c
ircu
mfe
renc
e, b
ody
mas
s in
dex,
die
tary
qua
lity,
and
LTP
A v
olum
e am
ong
co-tw
ins
disc
orda
nta f
or th
e nu
mbe
r of
spo
rt
disc
iplin
es p
artic
ipat
ed in
.
Men
W
omen
Pa
irs,
n
Twin
1
Twin
2
Mea
n in
trap
air
diff
eren
ce (9
5%C
I)
P Pa
irs,
n
Twin
1
Twin
2
Mea
n in
trap
air
diff
eren
ce
(95%
CI)
P
All
sam
e-se
x pa
irs
55
44W
aist
cir
cum
fere
nce
(cm
) 93
.0 ±
11.
6 89
.7 ±
8.3
-3
.3 (-
6.3
to -0
.3)
0.03
4 82
.8 ±
12.
9 77
.6 ±
9.8
-5
.2 (-
8.9
to -1
.6)
0.01
1 Bo
dy m
ass
inde
x (k
g/m
2 ) 25
.9 ±
4.0
25
.1 ±
3.0
-0
.8 (-
1.8
to 0
.2)
0.11
9 24
.8 ±
5.4
23
.4 ±
4.3
-1
.4 (-
2.6
to -0
.2)
0.04
1 D
ieta
ry q
ualit
yb
6.8
± 1.
9 7.
5 ±
1.6
0.7
(0.0
3 to
1.4)
0.
064
8.1
± 2.
0 9.
2 ±
1.8
1.0
(0.3
to 1
.8)
0.01
0 LT
PA-v
olum
e (M
ET-h
/d)
2.6
± 2.
6 5.
7 ±
4.5
3.0
(1.7
to 4
.4)
<0.0
01
3.1
± 3.
2 6.
7 ±
5.5
3.6
(1.8
to 5
.4)
<0.0
01
Diz
ygot
ic p
airs
36
20
Wai
st c
ircu
mfe
renc
e (c
m)
94.8
± 1
2.6
90.1
± 7
.2
-4.8
(-9.
1 to
-0.4
) 0.
033
87.2
± 1
3.1
76.0
± 9
.0
-11.
2 (-1
8.0
to -4
.4)
0.00
3 Bo
dy m
ass
inde
x (k
g/m
2 ) 26
.5 ±
4.3
25
.1 ±
2.8
-1
.3 (-
2.8
to 0
.1)
0.06
5 25
.4 ±
5.4
22
.7 ±
3.8
-2
.8 (-
5.2
to -0
.4)
0.02
5 D
ieta
ry q
ualit
yb
7.1
± 1.
9 7.
6 ±
1.7
0.5
(-0.3
to 1
.3)
0.22
3 7.
8 ±
2.0
9.3
± 1.
8 1.
5 (0
.01
to 3
.0)
0.02
4 LT
PA-v
olum
e (M
ET-h
/d)
3.0
± 2.
8 5.
8 ±
4.6
2.8
(1.0
to 4
.6)
0.00
3 2.
0 ±
1.7
6.1
± 4.
3 4.
1 (1
.7 to
6.5
) 0.
002
Mon
ozyg
otic
pai
rs
19
24W
aist
cir
cum
fere
nce
(cm
) 89
.5 ±
8.4
89
.1 ±
10.
2 -0
.4 (-
3.4
to 2
.5)
0.76
8 79
.1 ±
11.
7 78
.9 ±
10.
4 -0
.2 (-
2.7
to 2
.3)
0.86
5 Bo
dy m
ass
inde
x (k
g/m
2 ) 24
.7 ±
2.9
25
.0 ±
3.3
0.
2 (-0
.8 to
1.3
) 0.
629
24.3
± 5
.5
24.0
± 4
.7
-0.3
(-1.
2 to
0.6
) 0.
525
Die
tary
qua
lityb
6.
2 ±
2.0
7.4
± 1.
5 1.
2 (-0
.2 to
2.5
) 0.
098
8.5
± 2.
0 9.
1 ±
2.0
0.6
(-0.1
to 1
.4)
0.10
5 LT
PA-v
olum
e (M
ET-h
/d)
1.8
± 1.
9 5.
3 ±
4.4
3.5
(1.5
to 5
.5)
0.00
2 4.
0 ±
3.8
7.2
± 6.
4 3.
1 (0
.3 to
5.9
) 0.
030
Not
es: D
ata
are
mea
n ±
SD
LTPA
, lei
sure
-tim
e ph
ysic
al a
ctiv
ity; C
I, co
nfid
ence
inte
rval
; MET
, met
abol
ic e
quiv
alen
t; SD
, sta
ndar
d de
viat
ion.
a Tw
in 1
= pa
rtic
ipat
ed in
0 to
2 d
iffer
ent s
port
dis
cipl
ines
, Tw
in 2
= pa
rtic
ipat
ed in
5 o
r mor
e di
ffere
nt s
port
dis
cipl
ines
. b
Die
tary
qua
lity
scor
e 0-
12 p
oint
s.

64 After re-classifying the twins into eight groups for possible combinations of participation (or no participation) in aerobic, power, and mixed activities (Table 8), in men, all three types of activities were individually associated with smaller WC in comparison to those who did not participated in these activity types (Table 9). In women, participation in power and/or mixed activities, regardless of participation in aerobic activities, was related to smaller WC. Adjusting for LTPA volume, diet quality, and multiple potential confounders did not substantially alter the results (Table 9).
TABLE 8 Participation in different types of activities and waist circumference
Men, N=1874 Women, N=2153 Sport type WC (cm),
mean (95% CI) WC (cm),
mean (95% CI) Aerobic Power Mixed n (%) n (%) - - - 116 (6.2) 96.5 (93.7 to 99.2) 113 (5.2) 83.0 (80.2 to 85.8) + - - 508 (27.1) 94.1 (93.0 to 95.3) 976 (45.3) 82.1 (81.3 to 82.9) - + - 46 (2.5) 93.4 (90.9 to 95.9) 18 (0.8) 77.9 (73.2 to 82.5) - - + 112 (6.0) 92.8 (91.0 to 94.5) 29 (1.3) 78.5 (75.5 to 81.5) + + - 282 (15.0) 91.2 (89.9 to 92.4) 290 (13.5) 79.0 (77.7 to 80.2) + - + 441 (23.5) 91.1 (90.1 to 92.1 ) 412 (19.1) 80.0 (79.0 to 81.0) - + + 36 (1.9) 92.6 (89.8 to 95.4) 11 (0.5) 81.5 (75.3 to 87.8) + + + 333 (17.8) 90.4 (89.4 to 91.4) 304 (14.1) 77.8 (76.7 to 78.9)
Notes: WC, waist circumference; CI, confidence interval. Aerobic: sport disciplines mainly improving aerobic fitness; Power: sport disciplines mainly improving muscle strength; Mixed: sport disciplines mainly improving both aerobic fitness and muscle strength. - No participation in a sport discipline classified in that group + Participation in at least one sport discipline classified in that group

65
TABLE 9 Linear model of types of activity significantly predicting waist circumference (men N=1 874, women N=2 153).
Waist circumference(cm),
(95%CI) P
Model 1 Men
Aerobic -2.07 (-3.49 to -0.66) 0.004 Power -2.98 (-4.51 to -1.45) <0.001 Mixed -3.16 (-4.53 to -1.79) <0.001 Power × Mixed 2.36 (0.38 to 4.34) 0.020
Women Power -2.72 (-3.76 to -1.67) <0.001 Mixed -1.84 (-2.82 to -0.87) <0.001
Model 2 Men
Aerobic -1.71 (-3.11 to -0.32) 0.016 Power -1.81 (-3.34 to -0.28) 0.021 Mixed -2.32 (-3.69 to -0.95) 0.001 Power × Mixed 2.16 (0.19 to 4.13) 0.031
Women Power -1.48 (-2.59 to -0.37) 0.009 Mixed -0.95 (-1.93 to -0.33) 0.060
Model 3 Men
Aerobic -1.63 (-3.04 to -0.22) 0.023 Power -2.42 (-3.91 to -0.92) 0.002 Mixed -2.97 (-4.32 to -1.61) <0.001 Power × Mixed 2.19 (0.24 to 4.14) 0.027
Women Power -2.39 (-3.43 to -1.35) <0.001 Mixed -1.63 (-2.60 to -0.66) 0.001
Model 4 Men
Aerobic -1.43 (-2.86 to 0.01) 0.051 Power -2.64 (-4.20 to -1.09) 0.001 Mixed -2.81 (-4.19 to -1.44) <0.001 Power × Mixed 2.27 (0.29 to 4.25) 0.025
Women Power -2.50 (-3.55 to -1.45) <0.001 Mixed -1.37 (-2.34 to -0.40) 0.006
Notes: CI, confidence interval Aerobic: sport disciplines mainly improving aerobic fitness; Power: sport disciplines mainly improving muscle strength; Mixed: sport disciplines mainly improving both aerobic fitness and muscle strength. Model 1: No covariates in the model. Model 2: Adjusted for leisure-time physical activity volume. Model 3: Adjusted for dietary quality. Model 4: Multiple adjustment for age, occupational physical activity, educational level, number of children, chronic diseases, alcohol use, smoking status.

66 5.2 FITFATTWIN clinical study of activity-discordant twins
5.2.1 Physical activity level, fitness, body composition, and glucose homeostasis
The tree indexes characterizing LTPA level, i.e., the past 3-y-LTMET index, the 12-mo-LTMET index, and Baecke sport index, differed between the male MZ co-twins discordant for physical activity (Table 10). Neither occupational physical loading nor daily activity differed between the more and less active co-twins. According to retrospective interviews on physical activity over the 1-6 years prior to the outcome measurements, there was a pairwise difference in LTPA during past three years (3-y-LTMET index) but no difference was seen 4-6 years prior to the examinations (see Appendix 2). Among these activity-discordant pairs, no pairwise difference was found in LTPA according to the questionnaire data collected on the cohort at the mean age of 24.5 years, nor based on questionnaire data from ages 16 to 18.5 years during their late adolescence (Appendix 2). Consequently, the present study investigated the effects of physical activity differences during the 3-year period before the outcome measurements.
As expected, the active brother had higher cardiorespiratory fitness (P < 0.01) than his inactive co-twin. Leg extension force did not differ between the co-twins (Table 10).
While the co-twins did not have difference in body weight (P = 0.38) or BMI (P = 0.28), the inactive twin brothers had a higher percentage of body fat (P = 0.029) and tended to have higher (~21%, P= 0.059) body fat mass than their active co-twins. The pairwise differences in WC (P = 0.099), and body lean mass (P = 0.094) did not reach statistical significance. A small intrapair difference was found in waist-to-hip ratio (P = 0.027).
With respect to the markers of glucose homeostasis, the Matsuda index was higher (P = 0.021) and the HOMA index lower (P = 0.031) among the active than inactive co-twins, indicating better insulin sensitivity/lower insulin resistance among the more active individuals.

67
TABLE 10 Characteristics of the male monozygotic twin pairs discordant for LTPA.
Characteristic Inactive (N = 10)
Active (N = 10)
Mean intrapair difference (95% CI)
P
Age (y) 34 (range 32–36) Leisure-time physical activity
3-y-LTMET index (MET-h/d) 1.7 ± 1.3 5.0 ± 2.7 3.3 (1.9 to 4.8) 0.001 12-mo-LTMET index (MET-h/d) 1.2 ± 0.9 3.9 ± 1.2 2.8 (2.0 to 3.5) <0.001 Baecke sport index 2.2 ± 0.4 3.1 ± 0.4 0.9 (0.4 to 1.3) 0.005
Physical fitness VO2max (ml/kg/min)b 37.3 ± 3.5 43.6 ± 4.2 6.3 (4.1 to 8.5) <0.001 VO2max (ml/kg of lean mass/min) b
52.4 ± 5.3 58.1 ± 4.9 5.7 (2.8 to 8.6) 0.001
VO2max (L/min) b 2.9 ± 0.4 3.3 ± 0.3 0.4 (0.2 to 0.5) 0.002 Leg extension force (N) 591 ± 146 619 ± 114 28 (-43 to 98) 0.65
Body composition Body height (cm) 179.1 ± 5.2 179.8 ± 5.4 0.7 (-0.5 to 1.8) 0.21 Body weight (kg) 77.8 ± 12.7 75.8 ± 8.5 -2.0 (-6.9 to 2.9) 0.38 Body mass index (kg/m2) 24.2 ± 3.3 23.4 ± 1.7 -0.8 (-2.3 to 0.8) 0.28 Waist circumference (cm) 88.6 ± 8.2 85.3 ± 6.2 -3.3 (-7.4 to 0.8) 0.099 Waist-to-hip ratio 0.91 ± 0.05 0.89 ± 0.04 -0.02 (-0.004 to -0.003) 0.027Fat percent (%)c 24.0 ± 4.6 20.7 ± 4.0 -3.3 (-6.2 to -0.4) 0.029 Fat mass (kg)c 19.2 ± 6.6 16.0 ± 4.5 -3.3 (-6.7 to 0.2) 0.059 Lean mass (kg)c 55.5 ± 6.1 56.9 ± 4.8 1.4 (-0.3 to 3.0) 0.094
Glucose homeostasisFasting plasma glucose (mmol/L)
5.3 ± 0.4 5.2 ± 0.3 -0.01 (-0.2 to 0.2) 0.92
Fasting plasma insulin (μU) 4.5 ± 1.7 3.2 ± 2.6 -1.3 (-2.6 to -0.1) 0.042 Matsuda index 8.6 ± 2.2 21.7 ± 18.1 13.1 (-0.6 to 26.9) 0.021 HOMA index 1.1 ± 0.5 0.8 ± 0.7 -0.3 (-0.6 to -0.03) 0.031
Notes: Data are mean ± SD. LTPA, leisure-time physical activity; CI, confidence interval; LTMET, leisure-time metabolic equivalent; SD, standard deviation; HOMA, homeostatic model assessment. a Physical activity during leisure-time and commuting activity. b n=9 pairs; one active twin did not participate, and for one inactive twin maximal oxygen uptake was extrapolated based on his sub-maximal test. c Dual-energy X-ray absorptiometry (DEXA Prodigy; GE Lunar Corp., Madison, WI, USA).
5.2.2 Abdominal adipose tissue compartments
According to the MRI-based prediction of abdominal adipose tissue masses, the inactive co-twins had an average 31% (mean difference 0.52 kg, 95% CI 0.12 to 0.91, P=0.016) more IAAT than their active twin brothers (Table 11), whereas the intrapair difference in SAAT was 13% (P=0.21). Further analysis indicated that intraperitoneal adipose tissue mass was an average 41% (mean difference 0.41 kg, 95% CI 0.11 to 0.70, P=0.012) higher among the inactive co-twins than their

68 active twin brothers, whereas the intrapair difference for retroperitoneal adipose tissue was 16% (P=0.10).
TABLE 11 Differences in abdominal adipose tissue masses between male MZ twin pairs discordant for LTPA.
Abdominal adipose tissuea Inactive (N=10)
Active (N=10)
Mean intrapair difference (95% CI)
P
SAAT mass (kg) 2.65 ± 0.70 2.35 ± 0.68 -0.30 (-0.81 to 0.21) 0.21 IAAT mass (kg) 2.21 ± 0.74 1.69 ± 0.64 -0.52 (-0.91 to -0.12) 0.016 Intraperitoneal adipose tissue mass (kg)
1.41 ± 0.52 1.00 ± 0.43 -0.41 (-0.70 to -0.11) 0.012
Retroperitoneal adipose tissue mass (kg)
0.80 ± 0.23 0.69 ± 0.23 -0.11 (-0.25 to 0.03) 0.10
Notes: Data are mean ± SD. LTPA, leisure-time physical activity; CI, confidence interval; SAAT, subcutaneous abdominal adipose tissue; IAAT, intra-abdominal adipose tissue. a Predicted from single transaxial MRI slice at the L2-L3 level according to Abate et al. (Abate et al. 1997) In individual-based correlations, IAAT was inversely associated with cardiorespiratory fitness expressed as VO2max ml/kg/min (r=-0.494, P=0.03). IAAT also strongly correlated with markers of glucose homeostasis: fasting glucose (r=0.675, P=0.001), fasting insulin (r=0.516, P=0.02) and the HOMA index (r=0.579, P=0.008).
Figure 7 presents an illustrative example of a MRI slice at the level L2-L3 for one activity-discordant twin pair. Further, Figure 8 illustrates the individual paired data and means for IAAT, LTPA level and energy intake of the 10 activity-discordant twin pairs.

69
FIGURE 7 Illustrative example of intra-abdominal fat accumulation in a young adult male MZ twin pair discordant for LTPA over the past 3 years. Notes: The active co-twin was physically active daily in leisure-time at an intensity level of brisk walking or jogging, whereas his inactive co-twin was physically active a few times a week with low intensity walking. The co-twins were in the same occupation. In this illustrative example, the less active twin had 72% more IAAT and 132% more intraperitoneal fat (above the drawn separation line) than his more active co-twin. The difference in retroperitoneal fat was 14% (behind the drawn separation line), and in SAAT 12%.

70
FIGURE 8 Individual paired data (1 to 10 twin pairs discordant for LTPA) and means for difference in intra-abdominal adipose tissue mass, 12 month and 3-year LTPA habits, and energy intake.

71
5.2.3 Nutrient intake
Differences in nutrient intake between co-twins are presented in Table 12. According to the 4-day food diaries, nutrient intake did not differ between the inactive and active co-twins. The mean energy intake for the inactive was 9.4 MJ/d (2254 kcal/d) and for the active co-twins 10.1 MJ/d (2401 kcal/d) (P=0.32). In general, the co-twins’ diet seemed to be rather high in protein (inactive 19.7 E% vs. active 20.6 E%) and fat (inactive 34.7 E% vs. active 34.1 E%), low in carbohydrate (inactive 41.2 E% vs. active 43.2 E%), and especially low in dietary fiber (inactive 14.6 g/d vs. active 17.7 g/d) based on current Nordic nutrition recommendations (Nordic Council of Ministers 2014).
Additionally, Generalized Estimating Equations analysis revealed that energy intake, based on 4-day food diaries, did not have an independent effect ( =0.000, SE 0.0002, P=0.19) on the difference in the amount of IAAT between physical activity discordant pairs. For the other common nutrients, the results seemed to be similar.
TABLE 12 Differences in nutrient intake between male MZ twin pairs discordant for LTPA.
Nutrient Inactive Active Mean intrapairdifference (95% CI)
P (N=10) (N=10)
Energy MJ/d 9.4 ± 1.7 10.1 ± 1.7 0.6 (-0.7 to 1.9) 0.32
kcal/d 2 254 ± 407 2 401 ± 404 146 (-165 to 458) Energy per body weight kJ/kg 123 ± 27 133 ± 22 9.9 (-8.6 to 28.5)
0.26 kcal/kg 29.5 ± 6.4 31.9 ± 5.3 2.4 (-2.1 to 6.8)
Protein g/d 108 ± 22 122 ± 26 13 (-4 to 31) 0.12 E% 19.7 ± 3.4 20.6 ± 2.8 0.9 (-2.0 to 3.8) 0.52
Fat g/d 85.9 ± 17.7 91.8 ± 27.4 5.9 (-14.6 to 26.3) 0.53 E% 34.7 ± 4.7 34.1 ± 5.2 -0.7 (-6.4 to 5.0) 0.79
Saturated fat g/d 33.7 ± 6.7 34.6 ± 13.5 0.9 (-8.6 to 10.5 ) 0.83 E% 13.7 ± 2.0 12.8 ± 3.6 -0.8 (-4.2 to 2.5) 0.59
Monounsaturated fat g/d 29.6 ± 6.0 31.3 ± 9.1 1.7 (-5.5 to 9.0) 0.60 E% 12.0 ± 1.7 11.6 ± 1.6 -0.4 (-2.2 to 1.5 ) 0.67
Polyunsaturated fat g/d 13.6 ± 3.8 13.7 ± 4.9 0.1 (-4.0 to 4.2) 0.94 E% 5.5 ± 1.1 5.2 ± 1.3 -0.3 (-1.3 to 0.6) 0.45
Carbohydrate g/d 228 ± 42 252 ± 29 23 (-19 to 66) 0.24 E% 41.2 ± 4.4 43.2 ± 6.1 2.0 (-2.5 to 6.6) 0.34
Sucrose g/d 51.7 ± 29.2 59.3 ± 23.1 7.6 (-14.7 to 30.0) 0.46 E% 9.5 ± 5.2 10.7 ± 5.7 1.2 (-2.4 to 4.8) 0.48
Alcohol g/d 13.1 ± 21.5 3.9 ± 5.9 -9.2 (-26.0 to 7.6) 0.25 E% 3.6 ± 5.7 1.1 ± 1.6 -2.5 (-6.9 to 2.0) 0.24
Dietary fiber g/d 14.6 ± 3.5 17.7 ± 5.2 3.1 (-0.8 to 6.9) 0.10 g/MJ 1.6 ± 0.4 1.8 ± 0.5 0.2 (-0.1 to 0.5) 0.18
Notes: Data are mean ± SD. LTPA, leisure-time physical activity; CI, confidence interval; E%, percentage of energy, SD, standard deviation.

6 DISCUSSION
This dissertation utilized twin study designs to investigate whether persistence or change in LTPA level, and participation in different modes of physical activity, are associated with WC in young adulthood. A further aim was to investigate specific differences in abdominal fat compartments between physical activity-discordant male MZ twin pairs in their mid-30s, and whether other selected health-related factors are associated with this when childhood environment and genes are controlled for.
Among the young adult cohort members, an increase in LTPA level (shift from a lower to a higher tertile) or remaining active was associated with lower waist gain over the almost 10-year follow-up period. Any decrease in LTPA during the follow-up, regardless of the starting category, led to waist gain resembling that of the persistently inactive participants. The cross-sectional results showed that in the mid-30s, the number of sport disciplines participated in was inversely associated with WC, also after adjustment for LTPA volume and diet quality. A similar association was also seen in the twin pair analysis among all twin pairs discordant for the number of sport disciplines engaged in, but not among the MZ-only twin pairs. Additionally, each of the three types of activities, aerobic, power, and mixed, was individually associated with smaller WC in men, while, only mixed and power activities were associated with smaller WC in women. In the clinical co-twin control study, the MZ twin brothers with a clear difference in their LTPA habits over the past three years, showed a significant difference in cardiorespiratory fitness. Nutrient intake did not differ between the co-twins. In the absence of an overall difference (~3%) in BMI, the less active co-twins tended to have more body fat (~21%), and had an average 31% more IAAT, and 41% more intraperitoneal adipose tissue compared to their genetically identical but more active brothers. Pairwise differences in the markers of insulin sensitivity and insulin resistance were also seen.

73
6.1 Persistence or change in physical activity and waist gain
WC increased in both sexes, including in the most active groups, during the almost 10-year follow-up. Earlier studies have reported rather similar age-related mean WC growth during follow-up among young adults (Hankinson et al. 2010) as well as among middle-aged and older populations (Koh-Banerjee et al. 2003, May et al. 2010), and even among vigorous runners (Williams & Wood 2006). Age-related waist and weight gain, even among the highly physically active, may be linked to known decrease in basal metabolic rate during the aging process (St-Onge & Gallagher 2010) in combination with living in a modern sedentary obesogenic environment that may promote overconsumption of food and thereby challenge energy balance (Chaput, Klingenberg et al. 2011). In particular, the results of this dissertation stress the associations between changes in physical activity habits and waist gain. This is in accordance with previously observed associations (Koh-Banerjee et al. 2003, Aadahl et al. 2009, May et al. 2010, Shibata et al. 2016), highlighting on the one hand the importance of increasing the activity level to attenuate age-related waist gain and on the other hand, the risk of for greater waist gain if the activity level is decreased. However, prior studies have not focused on early adulthood, a period when waist gain seem to be already increasingly common (Lahti-Koski et al. 2012, Ladabaum et al. 2014, Albrecht et al. 2015, Jacobsen & Aars 2016) and many life-events influencing physical activity habits occur (Engberg et al. 2012), making young adulthood an important period from the obesity epidemic viewpoint. The present findings showed, importantly, that decreasing physical activity irrespective of the baseline activity level was related to increased waist gain. This may have implications for the results of studies which have only looked at the predictive value of baseline physical activity on follow-up waist or obesity. In the present study, 52% of men and 57% of women changed their LTPA habits. This may explain why baseline physical activity may not always reflect the changes in WC at follow-up (Berentzen et al. 2008, May et al. 2010, Hamer et al. 2013).
The results of the present study did not substantially change after adjusting the relation of physical activity change to waist gain for potential confounders such as baseline WC and BMI, occupational physical activity, educational level, number of children, chronic diseases, smoking status or alcohol use. However, dietary habits, which could potentially attenuate the associations found, were not controlled for in this study. In addition, other confounders may potentially affect both traits. For instance, shortened sleep duration has been shown to be related both decreased physical activity level (Schmid et al. 2009) and increased abdominal obesity (Chaput, Bouchard & Tremblay 2014).
Pairwise analysis among all the same-sex and MZ twin pairs confirmed the importance of increasing LTPA and the risk of decreasing activity for waist gain also when taking genetic background and childhood environment into account. It should be remembered that in typical epidemiological studies the causality between physical activity and adiposity is not testable, and that the possibility of

74 reverse causation exists (Bauman et al. 2012). For instance, as weight increases, physical activity may become more difficult and less pleasurable, resulting in lower levels of activity. In the present study, the analysis among activity-discordant MZ twins may reflect causality as the co-twins did not have difference in their BMI or WC at baseline, factors that could potentially lead to inactivity. An earlier study by Pietiläinen et al. (Pietiläinen et al. 2008) with three follow-up points found, in support of this, that among young co-twins discordant for BMI at the mean age of 24 years, the difference in physical activity preceded the difference in BMI. On the other hand, their study also showed, that physical activity remained very low once obesity was established, suggesting a vicious circle between physical inactivity and obesity.
6.2 Sport disciplines, types of activity, and waist circumference
Intervention studies have reported that aerobic exercise of at least moderate intensity is superior to strength training in reducing abdominal adiposity (Ismail et al. 2012). In the present observational study, participation in aerobic activities alone showed weaker associations with WC than exercise behaviors that included engagement in power and/or mixed activities (e.g. ball games). A recent cohort study showed stronger benefits from strength training than from aerobic exercise on WC growth (Mekary et al. 2015), as well another study reported that training adherence, whether to aerobic or resistance exercise, one year after a weight loss intervention prevented regain of IAAT (Hunter et al. 2010). The inconsistency in the findings between habitual self-selected PA and intervention trials may be explained by the limited ability of individuals with excess weight to achieve a sufficient intensity and volume of aerobic exercise outside of the trial (Westerterp 1999, Catenacci & Wyatt 2007). With respect to the activity-type categories of the present study, 38% and 44% of the men and women participating only in aerobic activities reported that in general the average intensity level of their PA was as strenuous as walking (i.e. the lowest intensity level). Therefore, aerobic exercises performed at a low level of intensity may explain why participation in aerobic activities alone was not as beneficial in the present free-living population as might be assumed based on the results of intervention trials. In addition to the fact that higher training intensity indicates higher energy expenditure, it may cause higher post-exercise energy expenditure and fat oxidation (Warren et al. 2009), effects that have also been suggested for strength training (Kirk et al. 2009), although the energy expenditure during strength training may remain relatively low. Interestingly, in the free-living trial by Karstoft et al. (Karstoft et al. 2013), interval walking was found to be effective for intra-abdominal fat reduction whereas the decrease did not occur in the continuous walking group. Of note, Drenowatz et al. (Drenowatz, Grieve & DeMello 2015) demonstrated in their study that compensatory reduction in non-exercise physical activity (i.e. activities of daily living) may occur in response to aerobic exercise, whereas resistance exercise appeared to increase these activities.

75
This may also, to some extent, explain the findings with regards resistance training and WC.
Previous studies of sport disciplines and health have mainly focused on specific sport disciplines one at a time, and it seems that the evidence of health benefits have mostly accumulated for football (Bangsbo et al. 2015, Oja et al. 2015), running (Oja et al. 2015), and dancing (Fong Yan et al. 2017). In the present study, the smallest mean WC was found in the men who participated in gymnastics, orienteering, basketball, and jogging/running, and the women who participated in yoga, golf, skating/rollerblading, and jogging/running. The men and women who did not participate in any sport discipline had the largest WC, followed by those who participated in walking, swimming, and volleyball. Overall, mean WC values varied widely within the individual sport disciplines, rendering inter-comparisons of individual sport discipline challenging. It should be noted, when interpreting the results, that some of the sport disciplines included in this study are highly seasonable (e.g. cross-country skiing), and that the frequency or duration of the participation in each sport discipline were not recorded. It should also be remembered that the associations found in this study may be bi-directional: participation in certain sport disciplines and activity types may impact on body composition, or it may be that a certain body composition facilitates participation in specific activities. It can be assumed, for example, that so-called low-threshold exercises, such as walking, which are easy to perform without specific equipment or skills, travel to a specific sport venue, or participation fees, may be favored by occasionally active persons. Similarly, walking, cycling and swimming are among the easier exercises most likely to be adopted by persons with excess weight or low physical fitness. There might also be specific activities that are typically characterized by high commitment, and thus indicate a longer activity history.
The number of sports disciplines participated in was inversely associated with WC. Although the number of sport disciplines correlated with the volume of physical activity (Table 3), the association between WC and the number of sport disciplines persisted after adjusting for the overall volume of physical activity. In addition, adjusting for diet quality, and multiple potential confounders such as for age, occupational physical activity, educational level, number of children, chronic diseases, alcohol use, and smoking status did not materially change the results. The analysis of all the activity-discordant twin pairs confirmed the inverse relationship between the number of sport disciplines participated in and WC, and, as twins are usually reared together, enabled the results to be controlled for various confounding childhood experiences. In line with the present findings, Garcez et al. (de Silva Garcez et al. 2015) showed that women who had participated in five or more different physical activities in adolescence were less likely to be abdominally obese in adulthood. The benefits of diverse physical activity participation may be manifold. From the exercise adherence perspective, Borodulin et al. (Borodulin et al. 2012) found that participation in many types of physical activities in young adulthood was associated with lesser inactivity in adulthood. Another study among adolescents

76 showed that participation in several different sports and exercises may protect from harmful effects of single-risk sport, such as musculoskeletal problems (Auvinen et al. 2008).
6.3 Physical activity level, abdominal fat compartments, and other selected health indicators
As expected, LTPA was associated with increased cardiorespiratory fitness in the present clinical co-twin control study, indicating causality between physical activity level and fitness. Similar associations were not found for maximum muscular strength or power, possibly because the participants usually reported participation in aerobic exercises. The finding of increased cardiorespiratory fitness among physically active individuals over the long term is significant as low cardiorespiratory fitness is a strong predictor of different cardiometabolic risks and mortality (Kodama et al. 2009, Grundy et al. 2012).
For body composition, the results of the present co-twin control study accord with those of the previous research on older twin pairs highly discordant for physical activity over a long period of time. Leskinen et al. (Leskinen, Sipilä et al. 2009) found that the inactive co-twins had only slightly higher body weight but markedly higher body fat percent than their twin siblings. The present results demonstrated a similar pattern in abdominal fat distribution, as Leskinen et al. (Leskinen, Sipilä et al. 2009) reported earlier among highly discordant older twins; the inactive had clearly more IAAT than the active co-twin, although the difference in body weight was only minor. In addition, the within-pair difference in WC did not reach statistical significance, although IAAT assessed with an imaging method showed a clear difference. As found in the earlier exercise trials, WC did not consistently reflect the changes IAAT when both measures were present (Kay & Fiatarone Singh 2006).
Earlier intervention studies have indicated a beneficial role of aerobic exercise training in reducing IAAT, even in the absence of weight loss or without caloric restriction (Ross et al. 2000, Vissers et al. 2013, Verheggen et al. 2016). Studies have usually focused on obese or overweight individuals and middle-aged or older people. However, the results among non-obese or younger adults are more inconclusive (Poehlman et al. 2000, Thomas et al. 2000, Donnelly et al. 2003, Heydari, Freund & Boutcher 2012, Sasaki et al. 2014, Zhang et al. 2017). These inconclusive findings suggest that exercise may be more likely to be protective against increases in IAAT. Moreover, if the baseline level of non-obese subjects’ IAAT is already low, it may be difficult to achieve reductions. The results of this dissertation research encourage the use of habitual physical activity as a potential method of preventing intra-abdominal fat accumulation from early adulthood onwards.
Interestingly, the healthy young MZ co-twins discordant for physical activity already showed differences in their insulin resistance/sensitivity as

77
measured by both a steady-state (HOMA) index and dynamic (Matsuda) index. This result supports earlier findings of the beneficial role of physical activity in glucose homeostasis (Lin et al. 2015), and possibly also in reducing the risk for type 2 diabetes in later life. An earlier twin study showed a lower risk for type 2 diabetes among older physically active members of MZ twin pairs compared to their inactive co-twins (Waller et al. 2010). Diabetes prevention is currently of central importance given the rapid global rise in the prevalence of the disease. In 2014, 422 million people were estimated to have type 2 diabetes (NCD Risk Factor Collaboration 2016).
Although both IAAT and SAAT correlate with metabolic risk factors, IAAT seems to be more strongly associated with cardio-metabolic disturbances (Fox et al. 2007, Liu et al. 2010). In the present study, IAAT correlated strongly with markers of glucose homeostasis, i.e., fasting glucose, fasting insulin, and HOMA index, which is consistent with the generally accepted view of a harmful relationship between IAAT and health. According to anatomical landmarks, IAAT can be subdivided into intraperitoneal and retroperitoneal fat depots (Baumgartner et al. 1988, Abate et al. 1994) (Figure 4). Intraperitoneal adipose tissue, which drains into the portal circulation, is postulated to be metabolically different from retroperitoneal adipose tissue (Abate et al. 1994, Shen et al. 2003). It is noteworthy that in the present study, when we subdivided IAAT into intraperitoneal and retroperitoneal fat depots, the difference between the active and inactive co-twins was observed for intraperitoneal adipose tissue but not retroperitoneal adipose tissue.
6.4 Diet, physical activity and abdominal adiposity
In the present cross-sectional cohort study, eating habits were evaluated by constructing a dietary quality score. As demonstrated in the recent large cohort studies (Fung et al. 2015, Fung et al. 2016) assessment of overall food-based diet quality may better discriminate health outcomes. The results of present dissertation showed that the more physically active individuals had healthier diet according to dietary quality score. This is the line with earlier suggestions that physically active individuals may have healthier diet habits (Charreire et al. 2011, Loprinzi, Smit & Mahoney 2014). However, the results on the associations between the number of sport disciplines and types of activity engaged in and WC did not alter substantially after adjustment for dietary quality, indicating that the associations found were due to physical activity rather than diet.
To assess dietary intake in the clinical study, the twins were asked to keep a 4-day food diary. Nutrient intake was calculated as the mean intake over the 4 days; however, with the software used it was not possible to calculate food consumptions. The results showed that their energy intake was rather resembled that of the 25- to 44-year-old Finnish men in the national FINDIET 2012 survey (Helldán et al. 2013). Interestingly, the intake of common nutrients did not differ between the inactive and active co-twins, indicating, as proposed earlier, that

78 genes may influence the food habits of young adults (Keskitalo et al. 2008). This observation emphasizes the possible independent role of physical activity in the prevention of intra-abdominal fat accumulation. This assumption was confirmed by the Generalized Estimating Equations analysis, which showed no independent effect of energy intake on the difference in IAAT between the activity-discordant co-twins. As energy intake was at similar level for both, the less and more active twin brothers of the present study, it can be assumed that the active co-twin had a more optimal energy- balance due to physical activity. This accords with an earlier twin study showing that MZ co-twins had a similar level of energy intake despite being discordant in body weight (Doornweerd et al. 2016). A previous study among older twin pairs discordant for physical activity showed that the active co-twins did not necessarily have a healthier diet than inactive, but the active co-twins seemed to find it easier to eat according to need (Rintala et al. 2011). The pairwise results on nutrient intake in the present clinical study must, however, be interpreted with caution as the statistical power for detecting significant differences remained rather low owing to the small sample size. No pairwise difference was found in smoking or alcohol use, assessed using structured questions, between the studied twin pairs. One smoker was present in the inactive co-twin group and one in the active twin group.
6.5 Methodological considerations
This dissertation focused on young adults at an age (22 to 37 y in this dissertation) when many major life events occur that may have significant effects on physical activity habits. The transition to higher education, beginning work, pregnancy, having a child, getting married, divorce/separation, changes in working conditions are examples of life changes that may have a negative impact on the physical activity levels of young adults (Engberg et al. 2012). Furthermore, although overall obesity has shown promising signs of leveling off (Flegal et al. 2010, Rokholm, Baker & Sorensen 2010), increases in WC and the prevalence of abdominal obesity seem to be continuing among some population segments, especially younger adults (Lahti-Koski et al. 2012, Ladabaum et al. 2014, Albrecht et al. 2015, Jacobsen & Aars 2016). Therefore, young adulthood a critical life phase from the obesity epidemic viewpoint.
In many diseases, such as coronary heart disease and type 2 diabetes, a long pre-symptomatic phase is thought to precede clinical onset. Hence, studies assessing a low level of physical activity as a potential risk factor for such diseases among middle-aged or older people require long follow-up times to avoid influence on the investigated risk factors from preclinical pathogenic processes or changes in physical activity levels arising from the prodromal phase of a disease. In the present clinical study young healthy adult males were studied to see whether differences arising from differing physical activity levels would be observable under conditions in which chronic diseases are uncommon, and medications or possible prodromal phases thus do not interfere with the

79
interpretation of the findings. Thus, focusing on young healthy adult males in the clinical study helped to avoid bias arising from effects of sex differences, chronic diseases, degenerative changes, or medications.
WC used in the present cohort studies, is considered a valid marker of abdominal adiposity (Pouliot et al. 1994, Rankinen et al. 1999). It is also affordable and easy to use in large population studies. Although BMI and WC correlate at the population level, substantial differences in WC are seen for any given BMI value (Després 2011, Nazare et al. 2015). When WC was divided by the corresponding BMI value in the present longitudinal study, the change in this ratio differed significantly between the twins whose physical activity decreased compared to their co-twins whose physical activity increased, supporting the importance of WC as an indicator of the effect of physical activity. However, it should be kept in mind that WC is only a surrogate marker of abdominal adiposity and cannot separate more hazardous intra-abdominal fat from subcutaneous abdominal fat. A limitation of the present cohort studies is the use of self-reported WC, which, while it enables low-cost large data collection, can also include measurement errors and lead to reporting bias. However, a high intra-class correlation has been found for measured and self-reported WC among both young adults (r=0.75, n=566) (Mustelin et al. 2009) and older twins (r=0.97, n=24) (Waller, Kaprio & Kujala 2008). In the present clinical study, a single transaxial MRI slice at the level of the L2-L3 intervertebral disc was used to determine the masses of the different abdominal adipose tissue compartments. According to Abate et al. (Abate et al. 1997), this method has acceptable reliability and accuracy for predicting SAAT and IAAT (both intraperitoneal and retroperitoneal) mass in men, in addition to being simple to implement and less costly. The anatomical level of L2-L3 exhibited the most consistent and strongest predictive ability for the different abdominal adipose tissue mass compartments compared to the other anatomical levels (Abate et al. 1997). Although IAAT measured at the L4-L5 intervertebral disc level is frequently used (Verheggen et al. 2016), it may not be the optimal level for detecting the total volume of IAAT and disease risk (Demerath et al. 2008, Irlbeck et al. 2010).
LTPA was of special interest in this dissertation, as routine daily physical activity (e.g. occupational and household) has decreased in today’s society, hence emphasizing the role of LTPA in modifying TDEE (Borodulin et al. 2008, Hallal et al. 2012). Commuting activity was included in LTPA, as it is rather common form of physical activity in Finland (Borodulin et al. 2015), and shown to be associated with reduced level of cardiovascular risk factors (Barengo et al. 2006, Vaara et al. 2014). Separating LTPA and occupational physical activity was considered important as they associate differently with health outcomes (Holtermann et al. 2018). Notably, in the present co-twin control study, neither occupational physical loading nor daily activities differed between the more active and less active co-twins.
The physical activity data used in dissertation research were collected with questionnaires and interviews. It is well known that self-report methods often include reporting bias, and that subjective methods both under- and

80 overestimates a person’s true activity habits (Prince et al. 2008). However, the use of objective methods in a large study sample presents its own challenges, e.g. issues of costs and logistics. In addition, retrospective data collection among potential activity-discordant co-twins would not be possible with objective assessment methods. In the cohort study, the MET index used, which is based on short physical activity questions, has shown a high correlation with the MET index based on 12-month retrospective physical activity interview (0.68, P<0.001 for LTPA, and 0.93, P<0.001 for commuting activity) (Waller, Kaprio & Kujala 2008). In the present clinical study, various validated reporting methods were used to assess the long-term physical activity habits of twin brothers (Baecke, Burema & Frijters 1982, Lakka & Salonen 1997, Kujala et al. 1998, Waller, Kaprio & Kujala 2008, Leskinen, Waller et al. 2009). The intrapair differences in physical activity habits were clear in each of the physical activity questionnaires and interviews. It should be noted that a variety of physical activity assessment methods was used at different time points to identify enough discordant pairs with a true intrapair difference in LTPA habits. The question was not one of applying different equivalent physical activity assessment methods, but rather of simply finding enough discordant pairs to study the relationship between physical activity and health independently of genetic background. Individual paired differences in LTPA MET-h/day are shown in Figure 8. Moreover, the difference in cardiorespiratory fitness at the end of the follow-up provides additional support for a true intrapair difference in physical activity habits. Self-reported dietary habits may also include reporting bias, such as underreporting (Hirvonen et al. 1997). In the clinical study, it was sought to minimize this drawback by issuing detailed written instructions on how to keep the food diary, checking food diary when the study participant personally returned it, and performing analyses with energy-adjusted outcomes.
As genetics plays a role in exercise participation (de Geus et al. 2014, Lightfoot et al. 2018) and the development of obesity (Shungin et al. 2015, Turcot et al. 2018) it may be easier for some individuals to achieve high levels of physical activity and an appropriate body composition. In observational studies of nonrelated individuals this may lead to selection bias, and make it difficult to assess the true extent of the causal relation between physical activity and health outcomes. A MZ co-twin control study is thus more incisive in exposing causal relations between physical activity and health outcomes than observational follow-up studies of unrelated individuals. A major strength of this dissertation was the pairwise analysis conducted among physical activity-discordant twin pairs, as it permits taking into account genetic effects, either fully (monozygotic, MZ twin pairs) or partially (dizygotic, DZ twin pairs), and childhood environment, including differences, for instance, in social class and education, family structure and parenting practices, as twins usually share the same childhood environment at home and school.
On the other hand, a major limitation of the present study is the low number of MZ twin pairs discordant for physical activity, regardless of our nationwide search of five consecutive birth cohorts. As participation in physical activity has

81
rather high heritability (de Geus et al. 2014), and MZ twin pairs often have fairly similar health habits as a consequence of being raised together at home, in addition to genetic liability, finding physical activity discordant MZ twin pairs is challenging. Differences mostly arise after they have moved out of the parental home to study or take up a job. Among the physical activity-discordant twin pairs in the present clinical study, the most commonly reported reason given by the inactive co-twins for being physically inactive were work- or family-related commitments. In the cross-sectional study, the results on the number of sport disciplines engaged in and WC, could not be replicated in activity-discordant MZ twin pair analysis. This may be due to the sharing of the genetic background seen in twin studies of physical activity and abdominal obesity. Another possible explanation is that a small number of discordant MZ pairs reduces the power to detect possible differences. However, the present clinical co-twin control study showed that a substantial difference in physical activity volume over longer periods leads to differences in IAAT, including among MZ twins. The statistical power for detecting significant (P<0.05) differences between co-twins was 0.75 for IAAT and 0.80 for intraperitoneal adipose tissue. The pairwise results on the nutrient intake of the co-twins must be interpreted with caution, as the statistical power for detecting significant differences remained rather low. The main analyses in the cohort studies were also adjusted for other lifestyle factors that could potentially influence abdominal fat accumulation in addition to physical activity. The results did not change substantially after adjustment, indicating the important role of physical activity in the association with abdominal adiposity.
Owing to the cross-sectional design of the study on sport disciplines, causal inferences cannot be drawn. Moreover, as discussed earlier, the association can be bi-directional. In the longitudinal study, only two follow-up points were used, and therefore it is not possible to determine when the changes in LTPA occurred or interpret causality. However, various pairwise analyses among the MZ physical activity-discordant twin pairs support the argument for a causal association between physical activity and risk factor of interest.
The generalizability of the cohort study results is reasonable good, as the BMI values of the twins were only slightly lower than those of the general Finnish population (Peltonen et al. 2008). Furthermore, with respect to the comparability of the clinical study sample with the general population, the participants of the clinical study were compared to the other men from FinnTwin16 cohort who participated in the web-based questionnaire survey at the mean age of 34 (see Appendix 3). The clinical study participants had a somewhat lower BMI and mean physical activity level, but otherwise rather similar subject characteristics compared to the other men in the FinnTwin16 cohort. The generalizability of the clinical control study results for women needs further research. Although women and men tend to accumulate fat differentially (Power & Schulkin 2008), in the present cohort studies, the associations were rather similar for both sexes, if in general slightly stronger in men.

82 6.6 Implications and future directions
A study design with an appreciably larger number of MZ twin pairs discordant for the exposure of interest, would be an advantage in future studies. Unfortunately, such a sample is highly unlikely to be gathered, since, as a consequence of being raised together at home, in addition to genetic liability, MZ twins often have fairly similar health habits. Data from the FITFATTWIN clinical study, employed in this dissertation, have demonstrated additional interesting findings that were not the focus of this dissertation. Although MZ twin pairs usually show a high degree of similarity in brain structure/volumes, the more active co-twins had a larger gray matter volumes in the striatum and frontal cortex in the non-dominant hemisphere compared to their less active co-twin brother. Thus, physical activity-discordant MZ twin pair analysis offers a unique study design to avoid bias arising from genetic effects, and reflect causality between physical activity and different health outcomes.
Future prospective studies would be advised to place more emphasis on change in PA habits, as it seems that many individuals change their PA habits with time. First, this may have an influence on the results of studies which only look at the predictive value of baseline physical activity on follow-up WC or obesity, and secondly, valuable data is lost if individuals who change their activity level during the follow-up are not included in the analyses. More research is also needed to determine how to prevent waist gain among those whose physical activity for various reasons decreases. As prevention of excessive fat accumulation seems to be easier to accomplish than reducing obesity (Hill, Wyatt & Peters 2012), it is crucial to find ways to protect individuals who have already adopted a physically active lifestyle from dropping out. For other, young adulthood would be an important age to finally embark on a physically active lifestyle, as, although the chronic diseases are yet uncommon, harmful, but invisible, changes in the body may already be occurring, as was seen in the present clinical study.
In abdominal obesity prevention, the present results suggest that it may be less important to focus on single sport disciplines and more important to encourage participation in a diversity of activities. Popular sport disciplines could be diversely incorporated into future study designs, especially in intervention studies that test feasible ways to prevent abdominal obesity and enhance health. The present results for different sport disciplines are cross-sectional, and, as stated earlier, the associations may be bi-directional, and therefore should be viewed as preliminary only and in need of replication with more rigorous prospective or intervention studies. With regard to specific sport disciplines, intervention studies have demonstrated that, for example, in small-side recreational football, while exercise intensity can be high, typically highly intermittent, including multiple turns, jumps and sprints, the perceived exertion has, however, been found to be lower than in other activities such as jogging, interval running or fitness training. Further, the participant often found the game

83
enjoyable and interest in it was often maintained after the intervention (Bangsbo et al. 2015). Theoretically, many ball and racquet games could be modified to incorporate similar content and impact, and hence cardio-metabolic benefits, as football-interventions have shown. Recently, a large observational study demonstrated that instead frequency and duration, activity modes were associated with mental health, highlighting the role of the social and play features of activities (Sciamanna et al. 2017). Another recent review demonstrated that in addition to the health benefits of structured dancing, the enjoyment and pleasure experienced by participants engaging in dancing may promote the long-term maintenance of that activity, and its accompanying long-term health benefits (Fong Yan et al. 2018). In exercise counseling, individuals’ exercise preferences are central, as intrinsic motivation is crucial for long-term exercise maintenance (Teixeira et al. 2012). Because the range of popular sport disciplines is much broader than the activity modes typically used in intervention trials or reported in observational studies, investigation of the health benefits of a wide range of popular physical activities could bring additional insights to bear in the domain of exercise promotion.
Physical activity seems to be beneficial for weight reduction, but the effect has been reported to be only modest, unless the levels of exercise are very high (Janiszewski & Ross 2007, Swift et al. 2014). An appropriate volume of physical activity for weight loss, which is approximately double that currently recommended for maintaining and improving health (Donnelly et al. 2009), may be difficult for overweight and obese individuals to achieve, especially in the modern sedentary environment. Because physical activity has numerous health benefits even without weight loss (Physical Activity Guidelines Advisory Committee 2008), it is important to encourage individuals with excess weight to start or to continue exercising despite of their possible inability to lose weight (Janiszewski & Ross 2007, Swift et al. 2014). Exercise training can induce loss of IAAT even with minimal or no weight loss (Verheggan et al. 2016); this, in turn, may have significant benefits for metabolic health (Fox et al. 2007). In the present clinical study, the activity-discordant MZ male co-twins did not materially differ in weight but clearly differed in IAAT, which in turn was already associated among these healthy young adults with the markers of glucose homeostasis. Thus, in exercise science, abdominal adiposity is important as an indicator of the influence of physical activity on body composition. Overall, the results of this dissertation underline the importance from young adulthood onwards of promoting LTPA, and possibly also engagement in a diversity of activities, in seeking to minimize age-related waist gain and intra-abdominal fat accumulation, and the possible development of related metabolic complications.

7 MAIN FINDINGS AND CONCLUSIONS
The main findings and conclusions of the present dissertation are:
1. Increasing leisure-time physical activity (LTPA) or staying active
attenuated age-related waist gain in both sexes during young adulthood. Despite the starting level, any decrease in LTPA led to waist gain resembling that associated with being persistently inactive. Pairwise analyses among MZ physical activity-discordant twin pairs (comparing co-twins whose activity decreased with that of their twin siblings whose activity increased), confirmed the associations when genetics were controlled for. Thus, changes in easily measured waist circumference (WC), which correlates well with many cardio-metabolic risk factors, are associated with changes in LTPA habits already in early adulthood.
2. Among young adults in their mid-30s, the number of sport disciplines participated in was inversely associated with WC, also after adjusting for overall LTPA volume. The result did not materially alter after adjusting for diet quality, although the more active individuals had a healthier diet. The association was also seen in the twin pairs discordant for the number of activities. In men, all three types of activities (aerobic, power, and mixed) were individually associated with a smaller WC, while in women, only mixed and power activities showed this association. Promoting participation in a diversity of LTPAs rather than specific activities may be beneficial in preventing abdominal obesity among young adults.
3. Among the physical activity discordant MZ male twin pairs, in the absence of any overall BMI difference (~3 %), the inactive co-twins tended to have more body fat (~21%), and had an average 31 % more intra-abdominal adipose tissue (IAAT), and 41% more intraperitoneal adipose tissue compared to their genetically identical but more active twin brothers. IAAT was associated with the markers of glucose homeostasis.

85
Diet did not differ between the discordant co-twins. The results emphasize the role of LTPA independent of genes and childhood environment in the prevention of intra-abdominal fat accumulation from early adulthood onward, avoiding the possible development of related metabolic complications.

86
YHTEENVETO (FINNISH SUMMARY)
Vapaa-ajan liikunta-aktiivisuus ja keskivartalon rasvoittuminen nuorilla ai-kuisilla – Seuranta- ja tapausverrokkitutkimuksia kaksosilla
Liikunnalla on monia terveysvaikutuksia, mutta merkittävä osa väestöstä liikkuu terveytensä kannalta riittämättömästi. Ylipaino, lihavuus sekä niiden liitännäis-sairaudet ovat jo pitkään olleet maailmanlaajuisia terveyshaasteita, joiden lisään-tymiseen liian vähäinen fyysinen aktiivisuus nähdään yhtenä tärkeänä tekijänä. Terveyden kannalta on merkitystä mihin rasva kehossa kertyy. Vatsaonteloon lähelle sisäelimiä kertynyt rasvakudos on aineenvaihdunnallisesti aktiivista ja sen on osoitettu olevan ihonalaisrasvakudosta vahvemmin yhteydessä sairauk-sien riskitekijöihin kuten glukoosi- ja rasva-aineenvaihdunnan häiriöihin, korke-aan verenpaineeseen, ja matala-asteiseen tulehdukseen. Siksi erityisesti vyötä-rölihavuus, jossa vatsaonteloon kertynyt rasvakudos laajentaa vyötäröä, lisää ris-kiä moniin kansantauteihin kuten sydän- ja verisuonitauteihin ja tyypin 2 diabe-tekseen. Vyötärölihavuus on myös yksi metabolisen oireyhtymän kriteereistä. Vaikka lihavuuden kasvu on osoittanut merkkejä tasoittumisesta joissakin maissa, vyötärölihavuus on ollut edelleen kasvussa monissa maissa, ja on yleis-tynyt terveyshuoli yhä nuoremmilla. Suomessa lähes puolet aikuisista täyttää vyötärölihavuuden kriteerit (naiset >90 cm ja miehet > 100 cm).
Kehon rasvakudoksen määrä on pääasiallisesti riippuvainen energiansaan-nin ja -kulutuksen tasapainosta pidemmällä aikavälillä. Yhteiskunnan moderni-saation ja teknologian kehityksen myötä vähentynyt työn ja arjen fyysinen aktii-visuus, istuvan elämäntavan lisääntyminen ja toisaalta helposti saatavilla oleva runsasenerginen ravinto haastavat energiatasapainoa jatkuvasti. Näiden muu-tosten johdosta vapaa-ajan liikunnan merkitys on nykypäivänä korostunut ener-giankulutuksen säätelijänä ja muutoinkin terveyttä edistävän liikunnan lähteenä. Seurantatutkimukset ovat osoittaneet, että liikunnan lisääminen tai korkea lii-kunta-aktiivisuus on yhteydessä pienempään vyötärönympärykseen, ja inter-ventiotutkimusten mukaan liikuntaharjoittelulla on mahdollista vähentää vatsa-ontelonsisäistä rasvaa ylipainoisilla ja lihavilla aikuisilla, jopa ilman energian-saannin rajoittamista tai painon putoamista. Perintötekijöiden tiedetään kuiten-kin vaikuttavan sekä kehon rasvoittumiseen, että liikuntatottumuksiin. Aikai-semmissa liikuntatutkimuksissa on harvemmin pystytty huomioimaan sekä pe-rintötekijöiden vaikutus tuloksiin, että keskitytty nuoriin aikuisiin, jotka ovat tär-keä kohderyhmä vyötärölihavuuden sekä siihen liittyvien metabolisten häiriöi-den ehkäisyn kannalta.
Tämän väitöskirjatutkimuksen tarkoituksena oli selvittää miten ja minkä tyyppinen vapaa-ajan liikunta on yhteydessä keskivartalon rasvoittumiseen kol-mekymppisillä aikuisilla. Tutkimuksessa tarkasteltiin myös ravitsemuksen sekä muiden terveyteen liittyvien tekijöiden kuten painoindeksin, koko kehon rasvan määrän, kestävyyskunnon, ja glukoositasapainon yhteyksiä tähän ilmiöön. Tut-
87
kimuksissa käytetyt ainutlaatuiset kaksostutkimusasetelmat mahdollistivat tu-losten vakioinnin yhteisten perintötekijöiden sekä lapsuusajan ympäristötekijöi-den osalta.
Väitöskirjatutkimus perustuu kahteen eri tutkimusaineistoon, Nuorten Kaksosten Terveystutkimuksen (englanniksi FinnTwin16) –kohorttiin sekä klii-niseen FITFATTWIN –tutkimukseen. Väitöskirjan seurantatutkimuksessa Nuor-ten Kaksosten Terveystutkimuksen kaksoset (1805 naista ja 1578 miestä) vastasi-vat seurantatutkimuksen neljänteen kyselyyn keskimäärin 24.5 vuoden iässä (vaihteluväli 22-27 vuotta) ja viidenteen kyselyyn 34 vuoden iässä (vaihteluväli 32-37 vuotta) ja mittasivat itse vyötärönympäryksensä kyselyn mukana tulleellamittanauhalla. Vapaa-ajan liikunnan (sisältäen työmatkaliikunnan) kokonais-määrä arvioitiin liikuntakysymysten perusteella molemmissa aikapisteissä, ja lii-kunta-aktiivisuuden muutoksen/pysyvyyden yhteyksiä vyötärönympäryksenmuutokseen tarkasteltiin seuranta-aikana. Väitöskirjan poikkileikkaustutkimuk-sessa tarkasteltiin Nuorten Kaksosten Terveystutkimuksen 2153 naiskaksosen ja1874 mieskaksosen keskimäärin 34 (32-37) vuoden iässä harrastettujen liikunta-lajien määrän ja liikunnan kuormitustyypin (aerobinen, lihasvoima, ja sekalajit(esim. pallopelit)) yhteyksiä vyötärönympärykseen. Kliiniseen FITFATTWIN -tutkimukseen osallistui kymmenen liikunta-aktiivisuuden suhteen eroavaa ge-neettisesti identtistä mieskaksosparia, iältään 32–36 -vuotiaita. Kaksosparin toi-nen kaksonen oli harrastanut vapaa-ajanliikuntaa aktiivisesti viimeisen kolmenvuoden aikana, kun taas hänen kaksosveljensä oli harrastanut liikuntaa vain vä-hän (ns. inaktiivinen kaksosveli) (ero ~3 MET tuntia/pvä). Kaksosten välinen lii-kunta-aktiivisuusero määritettiin useilla liikuntakyselyillä ja –haastatteluilla.Kaksosparit osallistuivat kahden peräkkäisen päivän ajan laajoihin terveyteenliittyviin tutkimusmittauksiin, joissa vatsan rasvakudoksen määrää ja jakautu-mista määritettiin magneettitutkimuksella
Väitöskirjan seurantatutkimus osoitti, että liikunta-aktiivisuuden lisäys tai pysyminen liikunnallisesti aktiivisena nuorella aikuisiällä oli yhteydessä pie-nempään vyötärönympäryksen lisäykseen. Toisaalta liikunta-aktiivisuuden vä-hentäminen, lähtötilanteen aktiivisuustasosta riippumatta, johti samanlaiseen vyötärönympäryksen muutokseen kuin vain vähän liikkuvina pysyneillä. Lisä-analyysit identtisillä kaksospareilla, joista toinen kaksosparin jäsen oli lisännyt ja toinen vähentänyt liikunta-aktiivisuutta seuranta-aikana, osoitti liikunnan muu-toksen näkyvän vyötärönympäryksen muutoksessa myös silloin kuin perintöte-kijöiden vaikutus oli vakioitu. Poikkileikkaustutkimuksessa harrastettujen lii-kuntalajien määrä oli käänteisesti yhteydessä vyötärönympärykseen, myös sil-loin kun tulos vakioitiin liikunnan kokonaismäärällä tai ruokavalion laadulla. Kaikki kolme liikunnan tyyppiä (aerobinen, lihasvoima ja sekalajit) olivat mie-hillä kukin erikseen yhteydessä pienempään vyötärönympärykseen, kun taas naisilla yhteys havaittiin lihasvoima- ja sekalajien harrastamisen suhteen.
Väitöskirjan kliinisessä tutkimuksessa liikunta-aktiivisuuden suhteen eroa-vat identtiset kaksosveljet erosivat toisistaan myös polkupyöräergometrilla mi-tatun maksimaalisen kestävyyskunnon osalta, mikä antoi vahvistusta kaksosvel-jien todelliselle erolle liikunta-aktiivisuudessa. Näiden perimältään identtisten

88
kaksosten välillä ei ollut eroa painoindeksissä (~3%), mutta kehonkoostumus (DEXA) - mittauksen perusteella inaktiivisilla kaksosilla näytti olevan kehossa enemmän rasvaa (~21%), ja heillä oli magneettikuvauksen perusteella keskimää-rin 31% enemmän vatsaontelonsisäistä rasvakudosta, ja 41% enemmän vatsakal-vonsisäistä rasvakudosta kuin liikunnallisesti aktiivisilla identtisillä kaksosveljil-lään. Yksilötason korrelaatioissa vatsaontelonsisäisen rasvakudoksen määrä oli yhteydessä glukoositasapainon markkereihin; paastosokeriin, paastoinsuliiniin ja näistä laskettavaan insuliiniresistenssia kuvaavaan HOMA-indeksiin. Neljän päivän ruokapäiväkirjan perusteella kaksosveljien välillä ei ollut eroa ravinnon-saannissa.
Väitöskirjatutkimuksen tulosten mukaan liikunta-aktiivisuuden muutokset näkyvät nuorilla aikuisilla vyötärönympäryksessä. Tulokset antavat myös viit-teitä siitä, että monipuolinen liikunnan harrastaminen yksittäisen lajin suosimi-sen sijaan on yhteydessä pienempään vyötärönympärykseen. Vähäinen liikun-nan harrastaminen näyttäisi olevan perintötekijöistä riippumatta yhteydessä suurempaan vatsaontelonsisäisen rasvan kertymiseen terveillä miehillä jo kol-mekymppisenä, ja muutokset eivät välttämättä näy painoindeksissä. Väitöskir-jan tulokset korostavat vapaa-ajan liikunnan lisäämisen ja ylläpitämisen merki-tystä, perintötekijöistä riippumatta, keksivartalon liiallisen rasvoittumisen eh-käisyssä nuorella aikuisiällä, ja näin myös mahdollisten myöhempien metabolis-ten liitännäisongelmien kehittymisen ehkäisyssä.

APP
END
IX 1
Diff
eren
ces
in w
aist
gai
n du
ring
follo
w-u
p by
sex
and
adj
uste
d fo
r po
tent
ial c
ofou
nder
s. M
odel
with
eac
h po
tent
ial c
onfo
unde
r ad
ded
indi
vidu
ally
to a
mod
el w
ith w
aist
gai
n as
the
depe
nden
t var
iabl
e an
d ph
ysic
al a
ctiv
ity a
s th
e in
depe
nden
t var
iabl
e.
Pers
iste
nce
or c
hang
e in
LTP
A
Wai
st g
ain
(cm
)a
N
o co
vari
ates
in
the
mod
el
Wai
st g
ain
adju
sted
for:
Age
(y)c
Base
line
WC
(cm
)c Ba
selin
e BM
I (k
g m
-2)c
Occ
upa-
tiona
l ph
ysic
al
activ
ityd
Educ
a-
tiona
l le
veld
Chi
ldre
nc
Chr
onic
di
seas
esd
Smok
ing
stat
usd
Alc
ohol
us
ed
n (%
) M
ean
(95%
CI)
Pb
M
en
1. P
ersi
sten
tly in
activ
e 26
4 (1
6.7)
8.
1 (6
.9 to
9.2
) Re
fere
nce
grou
p 2.
Fro
m m
oder
atel
y ac
tive
to in
activ
e 16
2 (1
0.3)
8.
2 (6
.9 to
9.6
) 0.
85
0.87
0.
91
0.84
0.
92
0.70
0.
70
0.83
0.
82
0.85
3.
Fro
m a
ctiv
e to
inac
tive
99 (6
.3)
9.7
(8.0
to 1
1.3)
0.
11
0.12
0.
14
0.11
0.
11
0.09
0.
23
0.14
0.
14
0.14
4.
Fro
m a
ctiv
e to
mod
erat
ely
activ
e 18
0 (1
1.4)
7.
9 (6
.8 to
9.0
) 0.
82
0.78
0.
49
0.83
0.
72
0.88
0.
69
0.85
0.
92
0.97
5.
Per
sist
ently
mod
erat
e ac
tive
204
(12.
9)
7.9
(6.9
to 8
.9)
0.84
0.
79
0.62
0.
85
0.73
0.
82
0.55
0.
85
0.86
0.
93
6. F
rom
inac
tive
to m
oder
atel
y ac
tive
143
(9.1
) 6.
0 (4
.7 to
7.4
) 0.
03
0.02
0.
02
0.03
0.
02
0.04
0.
04
0.03
0.
02
0.04
7.
Fro
m in
activ
e to
act
ive
81 (5
.1)
3.7
(1.5
to 5
.8)
<0.0
01
<0.0
01
<0.0
01
<0.0
01
<0.0
01
<0.0
01
0.01
<0
.001
<0
.001
<0
.001
8.
Fro
m m
oder
atel
y ac
tive
to a
ctiv
e 15
5 (9
.8)
4.2
(3.1
to 5
.3)
<0.0
01
<0.0
01
<0.0
01
<0.0
01
<0.0
01
<0.0
01
<0.0
01
<0.0
01
<0.0
01
<0.0
01
9. P
ersi
sten
tly a
ctiv
e 29
0 (1
8.4)
6.
3 (5
.6 to
7.1
) 0.
01
0.01
0.
003
0.01
0.
01
0.04
0.
02
0.02
0.
02
0.03
W
omen
1. P
ersi
sten
tly in
activ
e 26
0 (1
4.4)
8.
4 (7
.1 to
9.6
) Re
fere
nce
grou
p 2.
Fro
m m
oder
atel
y ac
tive
to in
activ
e 20
5 (1
1.4)
7.
2 (6
.1 to
8.3
) 0.
16
0.15
0.
14
0.16
0.
15
0.23
0.
74
0.17
0.
19
0.16
3.
Fro
m a
ctiv
e to
inac
tive
126
(7.0
) 8.
5 (6
.8 to
10.
3)
0.88
0.
90
0.94
0.
86
0.86
0.
73
0.91
0.
79
0.82
0.
73
4. F
rom
act
ive
to m
oder
atel
y ac
tive
171
(9.5
) 7.
0 (5
.9 to
8.2
) 0.
11
0.11
0.
06
0.12
0.
12
0.19
0.
65
0.14
0.
14
0.15
5.
Per
sist
ently
mod
erat
e ac
tive
242
(13.
4)
6.0
(5.1
to 6
.8)
0.00
2 0.
002
0.00
1 0.
002
0.00
2 0.
003
0.17
0.
002
0.00
2 0.
003
6. F
rom
inac
tive
to m
oder
atel
y ac
tive
198
(11.
0)
4.8
(3.7
to 6
.0)
<0.0
01
<0.0
01
<0.0
01
<0.0
01
<0.0
01
<0.0
01
0.01
<0
.001
<0
.001
<0
.001
7.
Fro
m in
activ
e to
act
ive
104
(5.8
) 4.
3 (2
.7 to
5.9
) <0
.001
<0
.001
<0
.001
<0
.001
<0
.001
<0
.001
0.
02
<0.0
01
<0.0
01
<0.0
01
8. F
rom
mod
erat
ely
activ
e to
act
ive
188
(10.
4)
3.8
(2.8
to 4
.8)
<0.0
01
<0.0
01
<0.0
01
<0.0
01
<0.0
01
<0.0
01
<0.0
01
<0.0
01
<0.0
01
<0.0
01
9. P
ersi
sten
tly a
ctiv
e 31
1 (1
7.2)
4.
7 (3
.9 to
5.5
) <0
.001
<0
.001
<0
.001
<0
.001
<0
.001
<0
.001
0.
009
<0.0
01
<0.0
01
<0.0
01
Not
es: L
TPA
, lei
sure
-tim
e ph
ysic
al a
ctiv
ity; W
C, w
aist
cir
cum
fere
nce;
BM
I, bo
dy m
ass
inde
x; C
I, co
nfid
ence
inte
rval
a O
vera
ll ob
serv
ed c
hang
e in
WC
bet
wee
n ba
selin
e an
d fo
llow
-up
b P
valu
e fo
r diff
eren
ce in
wai
st g
ain
duri
ng fo
llow
-up
com
pare
d to
per
sist
ently
inac
tive
c use
d as
con
tinuo
us v
aria
ble
d use
d as
cat
egor
ical
var
iabl
e

90 APPENDIX 2
Long-term intrapair differences in LTPA among the FITFATTWIN study participants
LTPA Inactive
Active
Mean difference (95% CI)
P
LTPA MET-h/day a,b N=10 N=10 12-mo-LTMET index at mean age 34 y 1.2 ± 0.9 3.9 ± 1.2 2.8 (2.0 to 3.5) <0.001 3-yr-LTMET index (mean; 1 to 3 y prior to the FITFATTWIN study)
1.7 ± 1.3 5.0 ± 2.7 3.3 (1.9 to 4.8) 0.001
LTPA MET index 1 to 6 y prior to the FITFATTWIN study
1 y 1.4 ± 1.5 5.6 ± 4.4 4.3 (1.8 to 6.7) 0.005 2 y 1.1 ± 0.7 5.6 ± 3.0 4.4 (2.4 to 6.4) 0.001 3 y 2.6 ± 2.4 3.9 ± 2.5 1.3 (-0.3 to 2.9) 0.096 4 y 3.4 ± 3.7 3.4 ± 2.5 -0.1 (-3.1 to 2.9) 0.58 5 y 3.7 ± 3.2 2.8 ± 2.6 -0.9 (-3.8 to 1.9) 0.96 6 y 3.3 ± 3.6 4.1 ± 3.7 0.9 (-2.6 to 4.4) 0.58
LTPA MET index at mean age of 24.5 y 5.0 ± 2.6 4.5 ± 3.5 -0.5 (-1.6 to 0.5) 0.28 LTPA frequency c n n Pd LTPA frequency at mean age of 34 y (N=20) 0.063
Not at all 0 0 Less than once a month 3 0 1-2 times a month 4 0 About once a week 2 0 2-3 times a week 1 8 4-5 times a week 0 0 About every day 0 2
LTPA frequency at mean age of 24.5 y, (N=20) 1.0 Not at all 0 1 Less than once a month 0 1 1-2 times a month 1 1 About once a week 3 1 2-3 times a week 5 4 4-5 times a week 1 1 About every day 0 1
LTPA frequency at age 18.5 y, (N=18) 1.0 Not at all 0 0 Less than once a month 0 0 1-2 times a month 0 1 About once a week 2 3 2-3 times a week 3 1 4-5 times a week 3 3 About every day 1 1
LTPA frequency at age 17 y, (N=20) 1.0 Not at all 0 0 Less than once a month 0 0 1-2 times a month 0 1 About once a week 2 1 2-3 times a week 3 2 4-5 times a week 3 3 About every day 2 3
LTPA frequency at age 16 y, (N=10) 1.0 Not at all 0 1

91
Less than once a month 0 0 1-2 times a month 0 1 About once a week 1 2 2-3 times a week 4 1 4-5 times a week 3 2 About every day 2 3
Notes: Data are mean ± SD. LTPA, leisure-time physical activity; CI, confidence interval; MET, metabolic equivalent; SD, standard deviation. a Leisure-time physical activity and commuting activity. b According to the physical activity interviews in the FITFATTWIN study examinations. c According to the questionnaire survey (FinnTwin16 Cohort Study). d P-value according to symmetry test (Stata 12.0).

92 APPENDIX 3
Characteristics of FITFATTWIN participants in comparison to all the other men in the FinnTwin16 cohort study.
FITFATTWIN (N= 20 men)
FinnTwin16 cohort (N=1558 men)
Pa
Pb LTPA MET hours per dayc 3.2 ± 2.5 4.7 ± 4.2 <0.001 Age (y) 33.7 ± 1.2 33.9 ± 1.2 0.62 Weight (kg) 76.1 ± 10.4 83.3 ± 13.6 0.022 Height (cm) 179.2 ± 5.1 179.5 ± 6.6 0.85 Body mass index (kg/m2) 23.6 ± 2.3 25.8 ± 3.7 <0.001 Waist circumference (cm) 87.3 ± 8.1 92.4 ± 10.8 0.031
%
%
Pd
Occupational physical activity Sedentary 65.0 46.2 0.63 Standing or walking at work 15.0 19.2 Light manual work 10.0 19.3 Heavy manual work 10.0 11.2 Not working or studying 0 4.0
Educational level Primary 0 3.3 0.17 Secondary 25.0 49.3 Tertiary 75.0 47.5
Children Yes 45.0 56.1 0.40
Chronic diseases Yes 0 15.3 0.17
Smoking status Current (daily) smoker 10.0 20.0 0.59 Occasional smoker 15.0 12.3 Quitters 20.0 22.6 Never smoked 55.0 45.1
Alcohol use Daily 0 5.5 0.24 1–2 times/week 85.0 58.5 1–2 times/month 15.0 21.5 Less than once a month 0 8.7 Never 0 5.8
Notes: Data are mean ± SD. LTPA, leisure-time physical activity; MET, metabolic equivalent; SD, standard deviation. a P-value for difference between FITFATTWIN participants (10 physical activity-discordant MZ male pairs) and all the other men from FinnTwin16 cohort. b Analyzed with the adjusted Wald test (Stata 12.0) taking into account clustered observations of twins within pairs. c LTPA and commuting activity according to structured physical activity questions. d Analyzed with the Pearson’s 2 test (Stata 12.0) taking into account clustered observations of twins within pairs.

93 REFERENCES
Aadahl, M., von Huth Smith, L., Pisinger, C., Toft, U. N., Glumer, C., Borch-Johnsen, K. & Jorgensen, T. 2009. Five-year change in physical activity is associated with changes in cardiovascular disease risk factors: the Inter99 study. Preventive Medicine 48 (4), 326-331.
Aarnio, M., Kujala, U. M. & Kaprio, J. 1997. Associations of health-related behaviors, school type and health status to physical activity patterns in 16 year old boys and girls. Scandinavian Journal of Social Medicine 25 (3), 156-167.
Aarnio, M., Winter, T., Peltonen, J., Kujala, U. M. & Kaprio, J. 2002. Stability of leisure-time physical activity during adolescence--a longitudinal study among 16-, 17- and 18-year-old Finnish youth. Scandinavian Journal of Medicine & Science in Sports 12 (3), 179-185.
Abate, N., Burns, D., Peshock, R. M., Garg, A. & Grundy, S. M. 1994. Estimation of adipose tissue mass by magnetic resonance imaging: validation against dissection in human cadavers. Journal of Lipid Research 35 (8), 1490-1496.
Abate, N. & Garg, A. 1995. Heterogeneity in adipose tissue metabolism: causes, implications and management of regional adiposity. Progress in Lipid Research 34 (1), 53-70.
Abate, N., Garg, A., Coleman, R., Grundy, S. M. & Peshock, R. M. 1997. Prediction of total subcutaneous abdominal, intraperitoneal, and retroperitoneal adipose tissue masses in men by a single axial magnetic resonance imaging slice. American Journal of Clinical Nutrition 65 (2), 403-408.
Ainsworth, B. E., Haskell, W. L., Herrmann, S. D., Meckes, N., Bassett, D. R.,Jr, Tudor-Locke, C., Greer, J. L., Vezina, J., Whitt-Glover, M. C. & Leon, A. S. 2011. 2011 Compendium of Physical Activities: a second update of codes and MET values. Medicine and Science in Sports and Exercise 43 (8), 1575-1581.
Ainsworth, B. E., Haskell, W. L., Whitt, M. C., Irwin, M. L., Swartz, A. M., Strath, S. J. et al. 2000. Compendium of physical activities: an update of activity codes and MET intensities. Medicine and Science in Sports and Exercise 32 (9 Suppl), S498-504.
Albrecht, S. S., Gordon-Larsen, P., Stern, D. & Popkin, B. M. 2015. Is waist circumference per body mass index rising differentially across the United States, England, China and Mexico? European Journal of Clinical Nutrition 69 (12), 1306-1312.
American College of Sports Medicine 2006. ACSM´s Guidelines for exercise testing and prescribtion. 7th edition. Baltimore: Lippincott Williams & Wilkins.
Andrew, T., Hart, D. J., Snieder, H., de Lange, M., Spector, T. D. & MacGregor, A. J. 2001. Are twins and singletons comparable? A study of disease-related and lifestyle characteristics in adult women. Twin Research 4 (6), 464-477.
Auvinen, J. P., Tammelin, T. H., Taimela, S. P., Zitting, P. J., Mutanen, P. O. & Karppinen, J. I. 2008. Musculoskeletal pains in relation to different sport and

94
exercise activities in youth. Medicine and Science in Sports and Exercise 40 (11), 1890-1900.
Baecke, J. A., Burema, J. & Frijters, J. E. 1982. A short questionnaire for the measurement of habitual physical activity in epidemiological studies. American Journal of Clinical Nutrition 36 (5), 936-942.
Balkau, B., Deanfield, J. E., Després, J. P., Bassand, J. P., Fox, K. A., Smith, S. C.,Jr, Barter, P., Tan, C. E., Van Gaal, L., Wittchen, H. U., Massien, C. & Haffner, S. M. 2007. International Day for the Evaluation of Abdominal Obesity (IDEA): a study of waist circumference, cardiovascular disease, and diabetes mellitus in 168,000 primary care patients in 63 countries. Circulation 116 (17), 1942-1951.
Bangsbo, J., Hansen, P. R., Dvorak, J. & Krustrup, P. 2015. Recreational football for disease prevention and treatment in untrained men: a narrative review examining cardiovascular health, lipid profile, body composition, muscle strength and functional capacity. British Journal of Sports Medicine 49 (9), 568-576.
Barengo, N. C., Kastarinen, M., Lakka, T., Nissinen, A. & Tuomilehto, J. 2006. Different forms of physical activity and cardiovascular risk factors among 24-64-year-old men and women in Finland. European Journal of Cardiovascular Prevention and Rehabilitation 13 (1), 51-59.
Barrett-Connor, E. & Khaw, K. T. 1989. Cigarette smoking and increased central adiposity. Annals of Internal Medicine 111 (10), 783-787.
Bauman, A. E., Reis, R. S., Sallis, J. F., Wells, J. C., Loos, R. J., Martin, B. W. & Lancet Physical Activity Series Working Group 2012. Correlates of physical activity: why are some people physically active and others not? Lancet 380 (9838), 258-271.
Baumgartner, R. N., Heymsfield, S. B., Roche, A. F. & Bernardino, M. 1988. Abdominal composition quantified by computed tomography. American Journal of Clinical Nutrition 48 (4), 936-945.
Berentzen, T., Petersen, L., Schnohr, P. & Sorensen, T. I. 2008. Physical activity in leisure-time is not associated with 10-year changes in waist circumference. Scandinavian Journal of Medicine & Science in Sports 18 (6), 719-727.
Berentzen, T. L., Ängquist, L., Kotronen, A., Borra, R., Yki-Järvinen, H., Iozzo, P. et al. 2012. Waist circumference adjusted for body mass index and intra-abdominal fat mass. PloS One 7 (2), e32213, doi:10.1371/journal.pone.0032213.
Björntorp, P. 2001. Do stress reactions cause abdominal obesity and comorbidities? Obesity Reviews 2 (2), 73-86.
Björntorp, P. 1993. Visceral obesity: a "civilization syndrome". Obesity Research 1 (3), 206-222.
Björntorp, P. 1990. "Portal" adipose tissue as a generator of risk factors for cardiovascular disease and diabetes. Arteriosclerosis 10 (4), 493-496.
Borodulin, K., Harald, K., Jousilahti, P., Laatikainen, T., Männistö, S. & Vartiainen, E. 2015. Time trends in physical activity from 1982 to 2012 in Finland. Scandinavian Journal of Medicine & Science in Sports 26 (1), 93-100.

95
Borodulin, K., Laatikainen, T., Juolevi, A. & Jousilahti, P. 2008. Thirty-year trends of physical activity in relation to age, calendar time and birth cohort in Finnish adults. European Journal of Public Health 18 (3), 339-344.
Borodulin, K., Mäkinen, T. E., Leino-Arjas, P., Tammelin, T. H., Heliövaara, M., Martelin, T., Kestilä, L. & Prättälä, R. 2012. Leisure time physical activity in a 22-year follow-up among Finnish adults. International Journal of Behavioral Nutrition and Physical Activity 9, 121, doi:10.1186/1479-5868-9-121.
Bouchard, C., Dionne, F. T., Simoneau, J. A. & Boulay, M. R. 1992. Genetics of aerobic and anaerobic performances. Exercise and Sport Sciences Reviews 20, 27-58.
Bouchard, C., Tremblay, A., Després, J. P., Theriault, G., Nadeau, A., Lupien, P. J., Moorjani, S., Prudhomme, D. & Fournier, G. 1994. The response to exercise with constant energy intake in identical twins. Obesity Research 2 (5), 400-410.
Boutcher, S. H. 2011. High-intensity intermittent exercise and fat loss. Journal of Obesity 868305, doi:10.1155/2011/868305.
Britton, K. A. & Fox, C. S. 2011. Ectopic fat depots and cardiovascular disease. Circulation 124 (24), e837-41, doi: 10.1161/CIRCULATIONAHA.111.077602.
Canoy, D., Wareham, N., Luben, R., Welch, A., Bingham, S., Day, N. & Khaw, K. T. 2005. Cigarette smoking and fat distribution in 21,828 British men andwomen: a population-based study. Obesity Research 13 (8), 1466-1475.
Caspersen, C. J., Powell, K. E. & Christenson, G. M. 1985. Physical activity, exercise, and physical fitness: definitions and distinctions for health-related research. Public Health Reports 100 (2), 126-131.
Catenacci, V. A. & Wyatt, H. R. 2007. The role of physical activity in producing and maintaining weight loss. Nature Clinical Practice Endocrinology & Metabolism 3 (7), 518-529.
Chaput, J. P., Bouchard, C. & Tremblay, A. 2014. Change in sleep duration and visceral fat accumulation over 6 years in adults. Obesity 22 (5), e9-12,doi:10.1002/oby.20701.
Chaput, J. P., Després, J. P., Bouchard, C. & Tremblay, A. 2011. Short sleep duration preferentially increases abdominal adiposity in adults: preliminary evidence. Clinical Obesity 1 (4-6), 141-146.
Chaput, J. P., Klingenberg, L., Astrup, A. & Sjodin, A. M. 2011. Modern sedentary activities promote overconsumption of food in our current obesogenic environment. Obesity Reviews 12 (5), e12-20, doi: 10.1111/j.1467-789X.2010.00772.x
Charreire, H., Kesse-Guyot, E., Bertrais, S., Simon, C., Chaix, B., Weber, C., Touvier, M., Galan, P., Hercberg, S. & Oppert, J. M. 2011. Associations between dietary patterns, physical activity (leisure-time and occupational) and television viewing in middle-aged French adults. British Journal of Nutrition 105 (6), 902-910.

96 Choi, J., Guiterrez, Y., Gilliss, C. & Lee, K. A. 2012. Physical activity, weight, and
waist circumference in midlife women. Health Care for Women International 33 (12), 1086-1095.
Cornier, M. A., Després, J. P., Davis, N., Grossniklaus, D. A., Klein, S., Lamarche, B., Lopez-Jimenez, F., Rao, G., St-Onge, M. P., Towfighi, A., Poirier, P., American Heart Association Obesity Committee of the Council on Nutrition, Physical Activity and Metabolism, Council on Arteriosclerosis, Thrombosis and Vascular Biology, Council on Cardiovascular Disease in the Young, Council on Cardiovascular Radiology and Intervention, Council on Cardiovascular Nursing, Council on Epidemiology and Prevention & Council on the Kidney in Cardiovascular Disease, and Stroke Council 2011. Assessing adiposity: a scientific statement from the American Heart Association. Circulation 124 (18), 1996-2019.
Davidson, L. E., Tucker, L. & Peterson, T. 2010. Physical activity changes predict abdominal fat change in midlife women. Journal of Physical Activity & Health 7 (3), 316-322.
de Geus, E. J., Bartels, M., Kaprio, J., Lightfoot, J. T. & Thomis, M. 2014. Genetics of regular exercise and sedentary behaviors. Twin Research and Human Genetics 17 (4), 262-271.
de Silva Garcez, A., Olinto, M. T., Canuto, R., Olinto, B. A., Pattussi, M. P. & Paniz, V. M. 2015. Physical activity in adolescence and abdominal obesity in adulthood: a case-control study among women shift workers. Women & Health 55 (4), 419-431.
Demerath, E. W., Reed, D., Rogers, N., Sun, S. S., Lee, M., Choh, A. C., Couch, W., Czerwinski, S. A., Chumlea, W. C., Siervogel, R. M. & Towne, B. 2008. Visceral adiposity and its anatomical distribution as predictors of the metabolic syndrome and cardiometabolic risk factor levels. American Journal of Clinical Nutrition 88 (5), 1263-1271.
Després, J. P. 2012. Body fat distribution and risk of cardiovascular disease: an update. Circulation 126 (10), 1301-1313.
Després, J. P. 2011. Excess visceral adipose tissue/ectopic fat the missing link in the obesity paradox?. Journal of the American College of Cardiology 57 (19), 1887-1889.
Després, J. P. & Lemieux, I. 2006. Abdominal obesity and metabolic syndrome. Nature 444 (7121), 881-887.
Després, J. P., Lemieux, I., Bergeron, J., Pibarot, P., Mathieu, P., Larose, E., Rodes-Cabau, J., Bertrand, O. F. & Poirier, P. 2008. Abdominal obesity and the metabolic syndrome: contribution to global cardiometabolic risk. Arteriosclerosis, Thrombosis and Vascular Biology 28 (6), 1039-1049.
Després, J. P., Moorjani, S., Lupien, P. J., Tremblay, A., Nadeau, A. & Bouchard, C. 1990. Regional distribution of body fat, plasma lipoproteins, and cardiovascular disease. Arteriosclerosis 10 (4), 497-511.
Dixon, J. B. 2010. The effect of obesity on health outcomes. Molecular & Cellular Endocrinology 316 (2), 104-108.

97
Donnelly, J. E., Blair, S. N., Jakicic, J. M., Manore, M. M., Rankin, J. W., Smith, B. K. & American College of Sports Medicine 2009. American College of SportsMedicine Position Stand. Appropriate physical activity interventionstrategies for weight loss and prevention of weight regain for adults.Medicine and Science in Sports and Exercise 41 (2), 459-471.
Donnelly, J. E., Herrmann, S. D., Lambourne, K., Szabo, A. N., Honas, J. J. & Washburn, R. A. 2014. Does increased exercise or physical activity alter ad-libitum daily energy intake or macronutrient composition in healthy adults? A systematic review. PloS One 9 (1), e83498, doi:10.1371/journal.pone.0083498.
Donnelly, J. E., Hill, J. O., Jacobsen, D. J., Potteiger, J., Sullivan, D. K., Johnson, S. L. et al. 2003. Effects of a 16-month randomized controlled exercise trial onbody weight and composition in young, overweight men and women: theMidwest Exercise Trial. Archives of Internal Medicine 163 (11), 1343-1350.
Doornweerd, S., IJzerman, R. G., van der Eijk, L., Neter, J. E., van Dongen, J., van der Ploeg, H. P. & de Geus, E. J. 2016. Physical activity and dietary intake in BMI discordant identical twins. Obesity 24 (6), 1349-1355.
Drapeau, V., Therrien, F., Richard, D. & Tremblay, A. 2003. Is visceral obesity a physiological adaptation to stress? Panminerva Medica 45 (3), 189-195.
Drenowatz, C., Grieve, G. L. & DeMello, M. M. 2015. Change in energy expenditure and physical activity in response to aerobic and resistance exercise programs. Springerplus 4, 798, eCollection 2015, doi:10.1186/s40064-015-1594-2.
Du, H., van der, A. D. L., Boshuizen, H. C., Forouhi, N. G., Wareham, N. J., Halkjaer, J. et al. 2010. Dietary fiber and subsequent changes in body weight and waist circumference in European men and women. American Journal of Clinical Nutrition 91 (2), 329-336.
Du, H., van der, A. D. L., Ginder, V., Jebb, S. A., Forouhi, N. G., Wareham, N. J., et al. 2009. Dietary energy density in relation to subsequent changes of weight and waist circumference in European men and women. PloS One 4 (4), e5339, doi: 10.1371/journal.pone.0005339.
Ekelund, U., Besson, H., Luan, J., May, A. M., Sharp, S. J., Brage, S. et al. 2011. Physical activity and gain in abdominal adiposity and body weight: prospective cohort study in 288,498 men and women. American Journal of Clinical Nutrition 93 (4), 826-835.
Engberg, E., Alen, M., Kukkonen-Harjula, K., Peltonen, J. E., Tikkanen, H. O. & Pekkarinen, H. 2012. Life events and change in leisure time physical activity: a systematic review. Sports Medicine 42 (5), 433-447.
Flegal, K. M., Carroll, M. D., Ogden, C. L. & Curtin, L. R. 2010. Prevalence and trends in obesity among US adults, 1999-2008. JAMA 303 (3), 235-241.rok
Fogelholm, M., Anderssen, S., Gunnarsdottir, I. & Lahti-Koski, M. 2012. Dietary macronutrients and food consumption as determinants of long-term weight change in adult populations: a systematic literature review. Food & nutrition research 56, doi: 10.3402/fnr.v56i0.19103.

98 Fong Yan, A., Cobley, S., Chan, C., Pappas, E., Nicholson, L. L., Ward, R. E.,
Murdoch, R. E., Gu, Y., Trevor, B. L., Vassallo, A. J., Wewege, M. A. & Hiller, C. E. 2018. The effectiveness of dance interventions on physical health outcomes compared to other forms of physical activity: a systematic review and meta-analysis. Sports Medicine 48 (4), 933-951.
Ford, E. S., Maynard, L. M. & Li, C. 2014. Trends in mean waist circumference and abdominal obesity among US adults, 1999-2012. JAMA 312 (11), 1151-1153.
Fox, C. S., Massaro, J. M., Hoffmann, U., Pou, K. M., Maurovich-Horvat, P., Liu, C. Y. et al. 2007. Abdominal visceral and subcutaneous adipose tissue compartments: association with metabolic risk factors in the Framingham Heart Study. Circulation 116 (1), 39-48.
Fujioka, S., Matsuzawa, Y., Tokunaga, K. & Tarui, S. 1987. Contribution of intra-abdominal fat accumulation to the impairment of glucose and lipid metabolism in human obesity. Metabolism 36 (1), 54-59.
Fung T.T., Pan A., Hou T., Mozaffarian D., Rexrode KM., Willett W.C. & Hu FB. 2016. Food quality score and the risk of coronary artery disease: a prospective analysis in 3 cohorts. American Journal of Clinical Nutrition 104 (1), 65-72.
Fung T.T., Pan A., Hou T., Chiuve S.E., Tobias D.K., Mozaffarian D., Willett W.C. & Hu F.B. 2015. Long-term change in diet quality is associated with body weight change in men and women. Journal of Nutrition 145 (8), 1850-1856.
Garber, C. E., Blissmer, B., Deschenes, M. R., Franklin, B. A., Lamonte, M. J., Lee, I. M., Nieman, D. C., Swain, D. P. & American College of Sports Medicine 2011. American College of Sports Medicine position stand. Quantity and quality of exercise for developing and maintaining cardiorespiratory, musculoskeletal, and neuromotor fitness in apparently healthy adults: guidance for prescribing exercise. Medicine and Science in Sports and Exercise 43 (7), 1334-1359.
Gillman, M. W., Pinto, B. M., Tennstedt, S., Glanz, K., Marcus, B. & Friedman, R. H. 2001. Relationships of physical activity with dietary behaviors among adults. Preventive Medicine 32 (3), 295-301.
Grundy, S. M., Barlow, C. E., Farrell, S. W., Vega, G. L. & Haskell, W. L. 2012. Cardiorespiratory fitness and metabolic risk. American Journal of Cardiology 109 (7), 988-993.
Hajer, G. R., van Haeften, T. W. & Visseren, F. L. 2008. Adipose tissue dysfunction in obesity, diabetes, and vascular diseases. European Heart Journal 29 (24), 2959-2971.
Halkjaer, J., Sorensen, T. I., Tjonneland, A., Togo, P., Holst, C. & Heitmann, B. L. 2004. Food and drinking patterns as predictors of 6-year BMI-adjusted changes in waist circumference. British Journal of Nutrition 92 (4), 735-748.
Halkjaer, J., Tjonneland, A., Overvad, K. & Sorensen, T. I. 2009. Dietary predictors of 5-year changes in waist circumference. Journal of the American Dietetic Association 109 (8), 1356-1366.

99
Halkjaer, J., Tjonneland, A., Thomsen, B. L., Overvad, K. & Sorensen, T. I. 2006. Intake of macronutrients as predictors of 5-y changes in waist circumference. American Journal of Clinical Nutrition 84 (4), 789-797.
Hallal, P. C., Andersen, L. B., Bull, F. C., Guthold, R., Haskell, W., Ekelund, U. & Lancet Physical Activity Series Working Group 2012. Global physical activity levels: surveillance progress, pitfalls, and prospects. Lancet 380 (9838), 247-257.
Hamer, M., Brunner, E. J., Bell, J., Batty, G. D., Shipley, M., Akbaraly, T., Singh-Manoux, A. & Kivimaki, M. 2013. Physical activity patterns over 10 years in relation to body mass index and waist circumference: the Whitehall II cohort study. Obesity 21 (12), E755-61, doi:10.1002/oby.20446.
Hankinson, A. L., Daviglus, M. L., Bouchard, C., Carnethon, M., Lewis, C. E., Schreiner, P. J., Liu, K. & Sidney, S. 2010. Maintaining a high physical activity level over 20 years and weight gain. JAMA 304 (23), 2603-2610.
Haskell, W. L. 2012. Physical activity by self-report: a brief history and future issues. Journal of Physical Activity & Health 9 (Suppl 1), S5-10.
Haslam, D. W. & James, W. P. 2005. Obesity. Lancet 366 (9492), 1197-1209. Helldán, A. & Helakorpi, S. 2015. Suomalaisen aikuisväestön
terveyskäyttäytyminen ja terveys, kevät 2014 - Health Behaviour and Health among the Finnish adult population, Spring 2014. [Access date October 20, 2017] Available online at: https://www.julkari.fi/handle/10024/126023
Helldán, A., Raulio, S., Kosola, M., Tapanainen, H., Ovaskainen, M. & Virtanen, S. 2013. The National FINDIET survey. Report no.:16/2013. Helsinki:National Institute for Health and Welfare.
Heydari, M., Freund, J. & Boutcher, S. H. 2012. The effect of high-intensity intermittent exercise on body composition of overweight young males. Journal of Obesity, 480467, doi: 10.1155/2012/480467.
Hill, J. O., Wyatt, H. R. & Peters, J. C. 2012. Energy balance and obesity. Circulation 126 (1), 126-132.
Hirvonen, T., Männistö, S., Roos, E. & Pietinen, P. 1997. Increasing prevalence of underreporting does not necessarily distort dietary surveys. European Journal of Clinical Nutrition 51 (5), 297-301.
Holtermann, A., Krause, N., van der Beek, A. J. & Straker, L. 2018. The physical activity paradox: six reasons why occupational physical activity (OPA) does not confer the cardiovascular health benefits that leisure time physical activity does. British Journal of Sports Medicine 52 (3), 149-150.
Hong, Y., Rice, T., Gagnon, J., Després, J. P., Nadeau, A., Perusse, L., Bouchard, C., Leon, A. S., Skinner, J. S., Wilmore, J. H. & Rao, D. C. 1998. Familial clustering of insulin and abdominal visceral fat: the HERITAGE Family Study. Journal of Clinical Endocrinology and Metabolism 83 (12), 4239-4245.
Hu, F. B. 2002. Dietary pattern analysis: a new direction in nutritional epidemiology. Current Opinion in Lipidology 13 (1), 3-9.

100 Hunter, G. R., Brock, D. W., Byrne, N. M., Chandler-Laney, P. C., Del Corral, P.
& Gower, B. A. 2010. Exercise training prevents regain of visceral fat for 1 year following weight loss. Obesity 18 (4), 690-695.
Ibrahim, M. M. 2010. Subcutaneous and visceral adipose tissue: structural and functional differences. Obesity Reviews 11 (1), 11-18.
International Diabetes Federation 2006. IDF Consensus Worldwide Definition of the Metabolic Syndrome. Brussels: 2006. [Access date October 30, 2017] Available online at https://www.idf.org/e-library/consensus-statements/60-idfconsensus-worldwide-definitionof-the-metabolic-syndrome.
Irlbeck, T., Massaro, J. M., Bamberg, F., O'Donnell, C. J., Hoffmann, U. & Fox, C. S. 2010. Association between single-slice measurements of visceral and abdominal subcutaneous adipose tissue with volumetric measurements: the Framingham Heart Study. International Journal of Obesity 34 (4), 781-787.
Ismail, I., Keating, S. E., Baker, M. K. & Johnson, N. A. 2012. A systematic review and meta-analysis of the effect of aerobic vs. resistance exercise training on visceral fat. Obesity Reviews 13 (1), 68-91.
Item, F. & Konrad, D. 2012. Visceral fat and metabolic inflammation: the portal theory revisited. Obesity Reviews 13 (Suppl 2), 30-39.
Jacobs, E. J., Newton, C. C., Wang, Y., Patel, A. V., McCullough, M. L., Campbell, P. T., Thun, M. J. & Gapstur, S. M. 2010. Waist circumference and all-cause mortality in a large US cohort. Archives of Internal Medicine 170 (15), 1293-1301.
Jacobsen, B. K. & Aars, N. A. 2016. Changes in waist circumference and the prevalence of abdominal obesity during 1994-2008 - cross-sectional and longitudinal results from two surveys: the Tromso Study. BMC Obesity 3, (41), eCollection2016, doi: 10.1186/s40608-016-0121-5.
Janiszewski, P. M. & Ross, R. 2007. Physical activity in the treatment of obesity: beyond body weight reduction. Applied Physiology, Nutrition, and Metabolism 32 (3), 512-522.
Janssen, I., Katzmarzyk, P. T. & Ross, R. 2004. Waist circumference and not body mass index explains obesity-related health risk. American Journal of Clinical Nutrition 79 (3), 379-384.
Jensen, M. D., Ryan, D. H., Apovian, C. M., Ard, J. D., Comuzzie, A. G., Donato, K. A. et al. American College of Cardiology/American Heart Association Task Force on Practice Guidelines & Obesity Society 2014. 2013 AHA/ACC/TOS guideline for the management of overweight and obesity in adults: a report of the American College of Cardiology/American Heart Association Task Force on Practice Guidelines and The Obesity Society. Journal of the American College of Cardiology 63 (25), 2985-3023.
Kaartinen, N. E., Knekt, P., Kanerva, N., Valsta, L. M., Eriksson, J. G., Rissanen, H., Jääskelainen, T. & Männistö, S. 2016. Dietary carbohydrate quantity and quality in relation to obesity: A pooled analysis of three Finnish population-based studies. Scandinavian Journal of Public Health 44 (4), 385-393.

101 Kanerva, N., Kaartinen, N. E., Schwab, U., Lahti-Koski, M. & Männistö, S. 2013.
Adherence to the Baltic Sea diet consumed in the Nordic countries is associated with lower abdominal obesity. British Journal of Nutrition 109 (3), 520-528.
Kaprio, J. 2013. The Finnish Twin Cohort Study: an update. Twin Research and Human Genetics 16 (1), 157-162.
Kaprio, J. 2006. Twin studies in Finland 2006. Twin Research and Human Genetics 9 (6), 772-777.
Karstoft, K., Winding, K., Knudsen, S. H., Nielsen, J. S., Thomsen, C., Pedersen, B. K. & Solomon, T. P. 2013. The effects of free-living interval-walking training on glycemic control, body composition, and physical fitness in type 2 diabetic patients: a randomized, controlled trial. Diabetes Care 36 (2), 228-236.
Karter, A. J., D'Agostino, R. B.,Jr, Mayer-Davis, E. J., Wagenknecht, L. E., Hanley, A. J., Hamman, R. F., Bergman, R., Saad, M. F., Haffner, S. M. & IRAS investigators 2005. Abdominal obesity predicts declining insulin sensitivity in non-obese normoglycaemics: the Insulin Resistance Atherosclerosis Study (IRAS). Diabetes, Obesity & Metabolism 7 (3), 230-238.
Kastorini, C. M., Milionis, H. J., Esposito, K., Giugliano, D., Goudevenos, J. A. & Panagiotakos, D. B. 2011. The effect of Mediterranean diet on metabolic syndrome and its components: a meta-analysis of 50 studies and 534,906 individuals. Journal of the American College of Cardiology 57 (11), 1299-1313.
Kay, S. J. & Fiatarone Singh, M. A. 2006. The influence of physical activity on abdominal fat: a systematic review of the literature. Obesity Reviews 7 (2), 183-200.
Keskitalo, K., Silventoinen, K., Tuorila, H., Perola, M., Pietiläinen, K. H., Rissanen, A. & Kaprio, J. 2008. Genetic and environmental contributions to food use patterns of young adult twins. Physiology & Behavior 93 (1-2), 235-242.
Khan, K. M., Thompson, A. M., Blair, S. N., Sallis, J. F., Powell, K. E., Bull, F. C. & Bauman, A. E. 2012. Sport and exercise as contributors to the health of nations. Lancet 380 (9836), 59-64.
Kilpeläinen, T. O., Qi, L., Brage, S., Sharp, S. J., Sonestedt, E., Demerath, E. et al. 2011. Physical activity attenuates the influence of FTO variants on obesity risk: a meta-analysis of 218,166 adults and 19,268 children. PLoS Medicine 8 (11), e1001116, doi: 10.1371/journal.pmed.1001116.
Kirk, E. P., Donnelly, J. E., Smith, B. K., Honas, J., Lecheminant, J. D., Bailey, B. W., Jacobsen, D. J. & Washburn, R. A. 2009. Minimal resistance training improves daily energy expenditure and fat oxidation. Medicine and Science in Sports and Exercise 41 (5), 1122-1129.
Kissebah, A. H., Vydelingum, N., Murray, R., Evans, D. J., Hartz, A. J., Kalkhoff, R. K. & Adams, P. W. 1982. Relation of body fat distribution to metabolic complications of obesity. Journal of Clinical Endocrinology and Metabolism 54 (2), 254-260.

102 Klein, S., Allison, D. B., Heymsfield, S. B., Kelley, D. E., Leibel, R. L., Nonas, C.,
Kahn, R., Association for Weight Management and Obesity Prevention, NAASO, Obesity Society, American Society for Nutrition & American Diabetes Association 2007. Waist circumference and cardiometabolic risk: a consensus statement from shaping America's health: Association for Weight Management and Obesity Prevention; NAASO, the Obesity Society; the American Society for Nutrition; and the American Diabetes Association. Diabetes Care 30 (6), 1647-1652.
Knoepfli-Lenzin, C., Sennhauser, C., Toigo, M., Boutellier, U., Bangsbo, J., Krustrup, P., Junge, A. & Dvorak, J. 2010. Effects of a 12-week intervention period with football and running for habitually active men with mild hypertension. Scandinavian Journal of Medicine & Science in Sports 20 (Suppl 1), 72-79.
Kodama, S., Saito, K., Tanaka, S., Maki, M., Yachi, Y., Asumi, M., Sugawara, A., Totsuka, K., Shimano, H., Ohashi, Y., Yamada, N. & Sone, H. 2009. Cardiorespiratory fitness as a quantitative predictor of all-cause mortality and cardiovascular events in healthy men and women: a meta-analysis. JAMA 301 (19), 2024-2035.
Koh-Banerjee, P., Chu, N. F., Spiegelman, D., Rosner, B., Colditz, G., Willett, W. & Rimm, E. 2003. Prospective study of the association of changes in dietary intake, physical activity, alcohol consumption, and smoking with 9-y gain in waist circumference among 16 587 US men. American Journal of Clinical Nutrition 78 (4), 719-727.
Koponen, P., Borodulin, K., Lundqvist, A., Sääksjärvi, K. & Koskinen S. eds. 2018. Health, functional capacity and welfare in Finland – FinHealth 2017 study. Report no.:4/2018. Helsinki: National Institute for Health and Welfare.
Korn EL & Graubard BI 1999. Analysis of Health Surveys. New York: Wiley. Kujala, U. M. 2011. Physical activity, genes, and lifetime predisposition to chronic
disease. European Review of Aging and Physical Activity 8 (1), 31-36. Kujala, U. M., Kaprio, J. & Koskenvuo, M. 2002. Modifiable risk factors as
predictors of all-cause mortality: the roles of genetics and childhood environment. American Journal of Epidemiology 156 (11), 985-993.
Kujala, U. M., Kaprio, J., Sarna, S. & Koskenvuo, M. 1998. Relationship of leisure-time physical activity and mortality: the Finnish twin cohort. JAMA 279 (6), 440-444.
Kujala, U. M., Pietilä, J., Myllymäki, T., Mutikainen, S., Föhr, T., Korhonen, I. & Helander, E. 2017. Physical activity: absolute intensity versus relative-to-fitness-level volumes. Medicine and Science in Sports and Exercise 49 (3), 474-481.
Kumanyika, S. K., Obarzanek, E., Stettler, N., Bell, R., Field, A. E., Fortmann, S. P., Franklin, B. A., Gillman, M. W., Lewis, C. E., Poston, W. C.,2nd, Stevens, J., Hong, Y. & American Heart Association Council on Epidemiology and Prevention, Interdisciplinary Committee for Prevention 2008. Population-based prevention of obesity: the need for comprehensive promotion of healthful eating, physical activity, and energy balance: a scientific statement

103
from American Heart Association Council on Epidemiology and Prevention, Interdisciplinary Committee for Prevention (formerly the expert panel on population and prevention science). Circulation 118 (4), 428-464.
Kyvik, K. O. 2000. Generalisability and assumptions of twin studies. In Spector, T.D., Snieder, H. & MacGregor, A.J. (Eds.), Advances in twin and sib-pairanalysis. London: Greenwich Medical Media, 67-77.
Ladabaum, U., Mannalithara, A., Myer, P. A. & Singh, G. 2014. Obesity, abdominal obesity, physical activity, and caloric intake in US adults: 1988 to 2010. American Journal of Medicine 127 (8), 717-727.
Lagerros, Y. T. & Lagiou, P. 2007. Assessment of physical activity and energy expenditure in epidemiological research of chronic diseases. European Journal of Epidemiology 22 (6), 353-362.
Lahti-Koski, M., Harald, K., Saarni, S. E., Peltonen, M. & Männistö, S. 2012. Changes in body mass index and measures of abdominal obesity in Finnish adults between 1992 and 2007, the National FINRISK Study. Clinical Obesity 2 (1-2), 57-63.
Lakka, T. & Salonen, J. 1997. The physical activity questionnaires of the Kuopio Ischemic Heart Disease Study (KIHD). A collection of physical activity questionnaires for health-related reseach. Medicine and Science in Sports and Exercise 29, S46-S58.
Lakka, H. M., Lakka, T. A., Tuomilehto, J. & Salonen, J. T. 2002. Abdominal obesity is associated with increased risk of acute coronary events in men. European Heart Journal 23 (9), 706-713.
Lao, X. Q., Ma, W. J., Sobko, T., Zhang, Y. H., Xu, Y. J., Xu, X. J., Yu, D. M., Nie, S. P., Cai, Q. M., Xia, L., Thomas, G. N. & Griffiths, S. M. 2015. Overall obesity is leveling-off while abdominal obesity continues to rise in a Chinese population experiencing rapid economic development: analysis of serial cross-sectional health survey data 2002-2010. International Journal of Obesity 39 (2), 288-294.
Latvala, A., Dick, D. M., Tuulio-Henriksson, A., Suvisaari, J., Viken, R. J., Rose, R. J. & Kaprio, J. 2011. Genetic correlation and gene-environment interactionbetween alcohol problems and educational level in young adulthood.Journal of Studies on Alcohol and Drugs 72 (2), 210-220.
Latvala, A. & Ollikainen, M. 2016. Mendelian randomization in (epi)genetic epidemiology: an effective tool to be handled with care. Genome Biology 17 (1), 156, doi:10.1186/s13059-016-1018-9.
Lee, H., Ash, G. I., Angelopoulos, T. J., Gordon, P. M., Moyna, N. M., Visich, P. et al. 2015. Obesity-related genetic variants and their associations with physical activity. Sports Medicine Open 1 (1), 34, doi:10.1186/s40798-015-0036-6.
Leitzmann, M. F., Moore, S. C., Koster, A., Harris, T. B., Park, Y., Hollenbeck, A. & Schatzkin, A. 2011. Waist circumference as compared with body-mass index in predicting mortality from specific causes. PloS One 6 (4), e18582, doi:10.1371/journal.pone.0018582.

104 Leskinen, T., Sipilä, S., Alen, M., Cheng, S., Pietiläinen, K. H., Usenius, J. P.,
Suominen, H., Kovanen, V., Kainulainen, H., Kaprio, J. & Kujala, U. M. 2009. Leisure-time physical activity and high-risk fat: a longitudinal population-based twin study. International Journal of Obesity 33 (11), 1211-1218.
Leskinen, T., Waller, K., Mutikainen, S., Aaltonen, S., Ronkainen, P. H., Alen, M. et al. 2009. Effects of 32-year leisure time physical activity discordance in twin pairs on health (TWINACTIVE study): aims, design and results for physical fitness. Twin Research and Human Genetics 12 (1), 108-117.
Lightfoot, J. T., De Geus, E. J. C., Booth, F. W., Bray, M. S., den Hoed, M., Kaprio, J., Kelly, S. A., Pomp, D., Saul, M. C., Thomis, M. A., Garland, T.,Jr & Bouchard, C. 2018. Biological/genetic regulation of physical activity level: consensus from GenBioPAC. Medicine and Science in Sports and Exercise 50 (4), 863-873.
Lin, X., Zhang, X., Guo, J., Roberts, C. K., McKenzie, S., Wu, W. C., Liu, S. & Song, Y. 2015. Effects of exercise training on cardiorespiratory fitness and biomarkers of cardiometabolic health: a systematic review and meta-analysis of randomized controlled trials. Journal of the American Heart Association 4 (7), e002014, doi:10.1161/JAHA.115.002014.
Liu, J., Fox, C. S., Hickson, D. A., May, W. D., Hairston, K. G., Carr, J. J. & Taylor, H. A. 2010. Impact of abdominal visceral and subcutaneous adipose tissue on cardiometabolic risk factors: the Jackson Heart Study. Journal of Clinical Endocrinology and Metabolism 95 (12), 5419-5426.
Locke, A. E., Kahali, B., Berndt, S. I., Justice, A. E., Pers, T. H., Day, F. R. et al. 2015. Genetic studies of body mass index yield new insights for obesity biology. Nature 518 (7538), 197-206.
Loprinzi, P. D. 2015. Association between accelerometer-determined physical activity and flavonoid-rich fruit and vegetable consumption among a national sample of U.S. adults. Preventive Medicine Reports 3, 58-61.
Loprinzi, P. D., Smit, E. & Mahoney, S. 2014. Physical activity and dietary behavior in US adults and their combined influence on health. Mayo Clinic Proceedings 89 (2), 190-198.
Matsuda, M. & DeFronzo, R. A. 1999. Insulin sensitivity indices obtained from oral glucose tolerance testing: comparison with the euglycemic insulin clamp. Diabetes Care 22 (9), 1462-1470.
May, A. M., Bueno-de-Mesquita, H. B., Boshuizen, H., Spijkerman, A. M., Peeters, P. H. & Verschuren, W. M. 2010. Effect of change in physical activity on body fatness over a 10-y period in the Doetinchem Cohort Study. American Journal of Clinical Nutrition 92 (3), 491-499.
McArdle, W. D., Katch, F. I. & Katch, V. L. 2015. Exercise physiology – nutrition,energy, and human performance. 8th edition. Baltimore: Lippincott Williams & Wilkins.
Mekary, R. A., Grontved, A., Després, J. P., De Moura, L. P., Asgarzadeh, M., Willett, W. C., Rimm, E. B., Giovannucci, E. & Hu, F. B. 2015. Weight training, aerobic physical activities, and long-term waist circumference change in men. Obesity 23 (2), 461-467.

105
Molarius, A. & Seidell, J. C. 1998. Selection of anthropometric indicators for classification of abdominal fatness--a critical review. International Journal of Obesity 22 (8), 719-727.
Muniyappa, R., Lee, S., Chen, H. & Quon, M. J. 2008. Current approaches for assessing insulin sensitivity and resistance in vivo: advantages, limitations, and appropriate usage. American journal of physiology. Endocrinology and Metabolism 294 (1), E15-26.
Mustelin, L., Joutsi, J., Latvala, A., Pietiläinen, K. H., Rissanen, A. & Kaprio, J. 2012. Genetic influences on physical activity in young adults: a twin study. Medicine and Science in Sports and Exercise 44 (7), 1293-1301.
Mustelin, L., Latvala, A., Pietiläinen, K. H., Piirilä, P., Sovijärvi, A. R., Kujala, U. M., Rissanen, A. & Kaprio, J. 2011. Associations between sports participation, cardiorespiratory fitness, and adiposity in young adult twins. Journal of Applied Physiology 110 (3), 681-686.
Mustelin, L., Silventoinen, K., Pietilainen, K., Rissanen, A. & Kaprio, J. 2009. Physical activity reduces the influence of genetic effects on BMI and waist circumference: a study in young adult twins. International Journal of Obesity (2005) 33 (1), 29-36.
Nazare, J. A., Smith, J., Borel, A. L., Aschner, P., Barter, P., Van Gaal, L. et al. 2015. Usefulness of measuring both body mass index and waist circumference for the estimation of visceral adiposity and related cardiometabolic risk profile (from the INSPIRE ME IAA study). American Journal of Cardiology 115 (3), 307-315.
National Nutrition Council 2014. Ministry of Agriculture and Forestry. Finnishnutrition recommendations. Helsinki. [Access date December 28, 2017] Available online at: https://www.evira.fi/globalassets/vrn/pdf/ravitsemussuositukset_2014_fi_web.3_es-1.pdf
Nordic Council of Ministers 2014. Nordic Nutrition Recommendations 2012 -Integrating nutrition and physical activity. (5th ed.). Copenhagen. [Access date December 28, 2017] Available online at: http://www.norden.org/en/theme/former-themes/themes-2016/nordic-nutrition-recommendation/nordic-nutrition-recommendations-2012
NCD Risk Factor Collaboration 2017. Worldwide trends in body-mass index, underweight, overweight, and obesity from 1975 to 2016: a pooled analysis of 2416 population-based measurement studies in 128.9 million children, adolescents, and adults. Lancet 390 (10113), 2627-2642.
NCD Risk Factor Collaboration 2016. Worldwide trends in diabetes since 1980: a pooled analysis of 751 population-based studies with 4.4 million participants. Lancet 387 (10027), 1513-1530.
Neeland, I. J., Turer, A. T., Ayers, C. R., Powell-Wiley, T. M., Vega, G. L., Farzaneh-Far, R., Grundy, S. M., Khera, A., McGuire, D. K. & de Lemos, J. A. 2012. Dysfunctional adiposity and the risk of prediabetes and type 2diabetes in obese adults. JAMA 308 (11), 1150-1159.

106 Ohkawara, K., Tanaka, S., Miyachi, M., Ishikawa-Takata, K. & Tabata, I. 2007. A
dose-response relation between aerobic exercise and visceral fat reduction: systematic review of clinical trials. International Journal of Obesity 31 (12), 1786-1797.
Oja, P., Kelly, P., Pedisic, Z., Titze, S., Bauman, A., Foster, C., Hamer, M., Hillsdon, M. & Stamatakis, E. 2016. Associations of specific types of sports and exercise with all-cause and cardiovascular-disease mortality: a cohort study of 80 306 British adults. British Journal of Sports Medicine 51 (19), 812-817.
Oja, P., Titze, S., Kokko, S., Kujala, U. M., Heinonen, A., Kelly, P., Koski, P. & Foster, C. 2015. Health benefits of different sport disciplines for adults: systematic review of observational and intervention studies with meta-analysis. British Journal of Sports Medicine 49 (7), 434-440.
Panagiotakos, D. B., Pitsavos, C., Yannakoulia, M., Chrysohoou, C. & Stefanadis, C. 2005. The implication of obesity and central fat on markers of chronic inflammation: The ATTICA study. Atherosclerosis 183 (2), 308-315.
Peltonen, N., Harald, K., Männistö, S., Saarikoski, L., Peltomäki, P., Lund, L. et al. 2008. The National FINRISK 2007 Study. Publications of the National Public Health Institute B34/2008. Helsinki.
Pérusse, L., Després, J. P., Lemieux, S., Rice, T., Rao, D. C. & Bouchard, C. 1996. Familial aggregation of abdominal visceral fat level: results from the Quebec family study. Metabolism 45 (3), 378-382.
Phillips D.I. 1993. Twin studies in medical research: Can they tell us whether diseases are genetically determined? Lancet, 341 (8851), 1008-1009. Physical Activity Guidelines Advisory Committee 2008. Physical Activity Guidelines Advisory Committee Report, 2008. Washington DC, United State of America: Department of Health and Human Services. [Access date December 15, 2017] Available online at: https://health.gov/paguidelines/report/pdf/CommitteeReport.pdf
Pietiläinen, K. H., Kaprio, J., Borg, P., Plasqui, G., Yki-Järvinen, H., Kujala, U. M., Rose, R. J., Westerterp, K. R. & Rissanen, A. 2008. Physical inactivity and obesity: a vicious circle. Obesity 16 (2), 409-414.
Pischon, T., Boeing, H., Hoffmann, K., Bergmann, M., Schulze, M. B., Overvad, K. et al. 2008. General and abdominal adiposity and risk of death in Europe. New England Journal of Medicine 359 (20), 2105-2120.
Poehlman, E. T., Dvorak, R. V., DeNino, W. F., Brochu, M. & Ades, P. A. 2000. Effects of resistance training and endurance training on insulin sensitivity in nonobese, young women: a controlled randomized trial. Journal of Clinical Endocrinology and Metabolism 85 (7), 2463-2468.
Polderman, T. J., Benyamin, B., de Leeuw, C. A., Sullivan, P. F., van Bochoven, A., Visscher, P. M. & Posthuma, D. 2015. Meta-analysis of the heritability of human traits based on fifty years of twin studies. Nature Genetics 47 (7), 702-709.
Pouliot, M. C., Després, J. P., Lemieux, S., Moorjani, S., Bouchard, C., Tremblay, A., Nadeau, A. & Lupien, P. J. 1994. Waist circumference and abdominal sagittal diameter: best simple anthropometric indexes of abdominal visceral

107
adipose tissue accumulation and related cardiovascular risk in men and women. American Journal of Cardiology 73 (7), 460-468.
Power, M. L. & Schulkin, J. 2008. Sex differences in fat storage, fat metabolism, and the health risks from obesity: possible evolutionary origins. British journal of nutrition 99 (5), 931-940.
Prince, S. A., Adamo, K. B., Hamel, M. E., Hardt, J., Connor Gorber, S. & Tremblay, M. 2008. A comparison of direct versus self-report measures for assessing physical activity in adults: a systematic review. International Journal of Behavioral Nutrition and Physical Activity 5, 56, doi: 10.1186/1479-5868-5-56.
Rankinen, T., Kim, S. Y., Perusse, L., Després, J. P. & Bouchard, C. 1999. The prediction of abdominal visceral fat level from body composition and anthropometry: ROC analysis. International Journal of Obesity 23 (8), 801-809.
Rao J.N.K. & Scott A.J. 1984. On chi-squared tests for multiway contingency tables with cell proportions estimated from survey data. Annals of Statistics 12, 46-60.
Reddon, H., Gerstein, H. C., Engert, J. C., Mohan, V., Bosch, J., Desai, D., Bailey, S. D., Diaz, R., Yusuf, S., Anand, S. S. & Meyre, D. 2016. Physical activity and genetic predisposition to obesity in a multiethnic longitudinal study. Scientific Reports 6, 18672, doi: 10.1038/srep18672.
Rexrode, K. M., Carey, V. J., Hennekens, C. H., Walters, E. E., Colditz, G. A., Stampfer, M. J., Willett, W. C. & Manson, J. E. 1998. Abdominal adiposity and coronary heart disease in women. JAMA 280 (21), 1843-1848.
Rintala, M., Lyytikainen, A., Leskinen, T., Alen, M., Pietilainen, K. H., Kaprio, J. & Kujala, U. M. 2011. Leisure-time physical activity and nutrition: a twin study. Public Health Nutrition 14 (5), 846-852.
Rokholm, B., Baker, J. L. & Sorensen, T. I. 2010. The levelling off of the obesity epidemic since the year 1999--a review of evidence and perspectives. Obesity Reviews 11 (12), 835-846.
Romaguera, D., Ängquist, L., Du, H., Jakobsen, M. U., Forouhi, N. G., Halkjaer, J. et al. 2011. Food composition of the diet in relation to changes in waist circumference adjusted for body mass index. PloS One 6 (8), e23384, doi:10.1371/journal.pone.0023384.
Romaguera, D., Ängquist, L., Du, H., Jakobsen, M. U., Forouhi, N. G., Halkjaer, J. et al. 2010. Dietary determinants of changes in waist circumference adjusted for body mass index - a proxy measure of visceral adiposity. PloS One 5 (7), e11588, doi: 10.1371/journal.pone.0011588.
Romaguera, D., Ängquist, L., Du H., Jakobsen, M.U., Forouhi, N.G., Halkjaer J. et al. 2011 Food composition of the diet in relation to changes in waist circumference adjusted for body mass index. PLoS One. 6(8):e23384. doi:10.1371/journal.pone.0023384.
Ross, R., Dagnone, D., Jones, P.J., Smith, H., Paddags, A., Hudson, R. & Janssen, I. 2000. Reduction in obesity and related comorbid conditions after diet-

108
induced weight loss or exercise-induced weight loss in men. A randomized, controlled trial. Annals of Internal Medicine 133 (2), 92-103.
Roth, G. A., Huffman, M. D., Moran, A. E., Feigin, V., Mensah, G. A., Naghavi, M. & Murray, C. J. 2015. Global and regional patterns in cardiovascular mortality from 1990 to 2013. Circulation 132 (17), 1667-1678.
Sarna, S., Kaprio, J., Sistonen, P. & Koskenvuo, M. 1978. Diagnosis of twin zygosity by mailed questionnaire. Human Heredity 28 (4), 241-254.
Sarna, S., Sahi, T., Koskenvuo, M. & Kaprio, J. 1993. Increased life expectancy of world class male athletes. Medicine and Science in Sports and Exercise 25 (2), 237-244.
Sasaki, H., Morishima, T., Hasegawa, Y., Mori, A., Ijichi, T., Kurihara, T. & Goto, K. 2014. 4 weeks of high-intensity interval training does not alter the exercise-induced growth hormone response in sedentary men. SpringerPlus 3, 336, doi: 10.1186/2193-1801-3-336.
Schmid, S. M., Hallschmid, M., Jauch-Chara, K., Wilms, B., Benedict, C., Lehnert, H., Born, J. & Schultes, B. 2009. Short-term sleep loss decreases physical activity under free-living conditions but does not increase food intake under time-deprived laboratory conditions in healthy men. The American Journal of Clinical Nutrition 90 (6), 1476-1482.
Schousboe, K., Visscher, P. M., Erbas, B., Kyvik, K. O., Hopper, J. L., Henriksen, J. E., Heitmann, B. L. & Sorensen, T. I. 2004. Twin study of genetic and environmental influences on adult body size, shape, and composition. International Journal of Obesity 28 (1), 39-48.
Schröder, H., Morales-Molina, J. A., Bermejo, S., Barral, D., Mandoli, E. S., Grau, M., Guxens, M., de Jaime Gil, E., Alvarez, M. D. & Marrugat, J. 2007. Relationship of abdominal obesity with alcohol consumption at population scale. European journal of nutrition 46 (7), 369-376.
Sciamanna, C. N., Smyth, J. M., Doerksen, S. E., Richard, B. R., Kraschnewski, J. L., Mowen, A. J., Hickerson, B. D., Rovniak, L. S., Lehman, E. B. & Yang, C. 2017. Physical activity mode and mental distress in adulthood. American Journal of Preventive Medicine 52 (1), 85-93.
Seidell, J. C., Bakker, C. J. & van der Kooy, K. 1990. Imaging techniques for measuring adipose-tissue distribution--a comparison between computed tomography and 1.5-T magnetic resonance. American Journal of Clinical Nutrition 51 (6), 953-957.
Shen, W., Punyanitya, M., Chen, J., Gallagher, D., Albu, J., Pi-Sunyer, X., Lewis, C. E., Grunfeld, C., Heymsfield, S. B. & Heshka, S. 2007. Visceral adipose tissue: relationships between single slice areas at different locations and obesity-related health risks. International Journal of Obesity 31 (5), 763-769.
Shen, W., Punyanitya, M., Wang, Z., Gallagher, D., St-Onge, M. P., Albu, J., Heymsfield, S. B. & Heshka, S. 2004. Visceral adipose tissue: relations between single-slice areas and total volume. American Journal of Clinical Nutrition 80 (2), 271-278.

109 Shen, W., Wang, Z., Punyanita, M., Lei, J., Sinav, A., Kral, J. G., Imielinska, C.,
Ross, R. & Heymsfield, S. B. 2003. Adipose tissue quantification by imaging methods: a proposed classification. Obesity Research 11 (1), 5-16.
Shibata, A. I., Oka, K., Sugiyama, T., Salmon, J. O., Dunstan, D. W. & Owen, N. 2016. Physical Activity, television viewing time, and 12-Year changes in waist circumference. Medicine and Science in Sports and Exercise 48 (4), 633-640.
Shungin, D., Winkler, T. W., Croteau-Chonka, D. C., Ferreira, T., Locke, A. E., Magi, R. et al. 2015. New genetic loci link adipose and insulin biology to body fat distribution. Nature 518 (7538), 187-196.
Sipilä, S., Multanen, J., Kallinen, M., Era, P. & Suominen, H. 1996. Effects of strength and endurance training on isometric muscle strength and walking speed in elderly women. Acta Physiologica Scandinavica 156 (4), 457-464.
Smith, J. D., Borel, A. L., Nazare, J. A., Haffner, S. M., Balkau, B., Ross, R., Massien, C., Almeras, N. & Després, J. P. 2012. Visceral adipose tissue indicates the severity of cardiometabolic risk in patients with and without type 2 diabetes: results from the INSPIRE ME IAA study. Journal of Clinical Endocrinology and Metabolism 97 (5), 1517-1525.
Snijder, M. B., Zimmet, P. Z., Visser, M., Dekker, J. M., Seidell, J. C. & Shaw, J. E. 2004. Independent and opposite associations of waist and hip circumferences with diabetes, hypertension and dyslipidemia: the AusDiab Study. International Journal of Obesity and Related Metabolic Disorders 28 (3), 402-409.
Stanhope, K. L., Schwarz, J. M., Keim, N. L., Griffen, S. C., Bremer, A. A., Graham, J. L. et al. 2009. Consuming fructose-sweetened, not glucose-sweetened, beverages increases visceral adiposity and lipids and decreases insulin sensitivity in overweight/obese humans. Journal of Clinical Investigation 119 (5), 1322-1334.
Sternfeld, B., Wang, H., Quesenberry, C. P.,Jr, Abrams, B., Everson-Rose, S. A., Greendale, G. A., Matthews, K. A., Torrens, J. I. & Sowers, M. 2004. Physical activity and changes in weight and waist circumference in midlife women: findings from the Study of Women's Health Across the Nation. American Journal of Epidemiology 160 (9), 912-922.
St-Onge, M. P. & Gallagher, D. 2010. Body composition changes with aging: the cause or the result of alterations in metabolic rate and macronutrient oxidation? Nutrition 26 (2), 152-155.
Strath, S. J., Kaminsky, L. A., Ainsworth, B. E., Ekelund, U., Freedson, P. S., Gary, R. A., Richardson, C. R., Smith, D. T., Swartz, A. M. & American Heart Association Physical Activity Committee of the Council on Lifestyle and Cardiometabolic Health and Cardiovascular, Exercise, Cardiac Rehabilitation and Prevention Committee of the Council on Clinical Cardiology, and Council 2013. Guide to the assessment of physical activity: Clinical and research applications: a scientific statement from the American Heart Association. Circulation 128 (20), 2259-2279.

110 Stubbe, J. H., Boomsma, D. I., Vink, J. M., Cornes, B. K., Martin, N. G., Skytthe, A.
et al. 2006. Genetic influences on exercise participation in 37,051 twin pairs from seven countries. PloS One 1 (1), e22, doi:10.1371/journal.pone.0000022
Swift, D. L., Johannsen, N. M., Lavie, C. J., Earnest, C. P. & Church, T. S. 2014. The role of exercise and physical activity in weight loss and maintenance. Progress in Cardiovascular Diseases 56 (4), 441-447.
Tammelin, T., Laitinen, J. & Näyhä, S. 2004. Change in the level of physical activity from adolescence into adulthood and obesity at the age of 31 years. International journal of obesity 28 (6), 775-782.
Tchernof, A. & Després, J. P. 2013. Pathophysiology of human visceral obesity: an update. Physiological Reviews 93 (1), 359-404.
Teixeira, P. J., Carraca, E. V., Markland, D., Silva, M. N. & Ryan, R. M. 2012. Exercise, physical activity, and self-determination theory: a systematic review. The International Journal of Behavioral Nutrition and Physical Activity 9, 78, doi: 10.1186/1479-5868-9-78.
Thomas, E. L., Brynes, A. E., McCarthy, J., Goldstone, A. P., Hajnal, J. V., Saeed, N., Frost, G. & Bell, J. D. 2000. Preferential loss of visceral fat following aerobic exercise, measured by magnetic resonance imaging. Lipids 35 (7), 769-776.
Thomas, E. L., Fitzpatrick, J. A., Malik, S. J., Taylor-Robinson, S. D. & Bell, J. D. 2013. Whole body fat: content and distribution. Progress in Nuclear Magnetic Resonance Spectroscopy 73, 56-80.
Thompson, D., Karpe, F., Lafontan, M. & Frayn, K. 2012. Physical activity and exercise in the regulation of human adipose tissue physiology. Physiological Reviews 92 (1), 157-191.
Turcot, V., Lu, Y., Highland, H. M., Schurmann, C., Justice, A. E., Fine, R. S., Bradfield, J. P. et al. 2018. Protein-altering variants associated with body mass index implicate pathways that control energy intake and expenditure in obesity. Nature Genetics 50 (1), 26-41.
U.S. Department of Health and Human Services 1996. Physical Activity and Health: A Report of the Surgeon General. Atlanta, GA: U.S. Department of Health and Human Services, Centers for Disease Control and Prevention, National Center for Chronic Disease Prevention and Health Promotion, 1996.
Vaara, J. P., Kyröläinen, H., Fogelholm, M., Santtila, M., Häkkinen, A., Häkkinen, K. & Vasankari, T. 2014. Associations of leisure time, commuting, and occupational physical activity with physical fitness and cardiovascular risk factors in young men. Journal of Physical Activity & Health 11 (8), 1482-1491.
Vague, J. 1947. Sexual differentiation, a factor affecting the forms of obesity. La Presse Médicale 30, 339-340.
Vague, J. 1956. The degree of masculine differentiation of obesities: a factor determining predisposition to diabetes, atherosclerosis, gout, and uric calculous disease. American Journal of Clinical Nutrition 4 (1), 20-34.

111 van Dongen, J., Slagboom, P. E., Draisma, H. H., Martin, N. G. & Boomsma, D. I.
2012. The continuing value of twin studies in the omics era. Nature Reviews Genetics 13 (9), 640-653.
van Poppel, M. N., Chinapaw, M. J., Mokkink, L. B., van Mechelen, W. & Terwee, C. B. 2010. Physical activity questionnaires for adults: a systematic review of measurement properties. Sports Medicine 40 (7), 565-600.
Verheggen, R. J., Maessen, M. F., Green, D. J., Hermus, A. R., Hopman, M. T. & Thijssen, D. H. 2016. A systematic review and meta-analysis on the effects of exercise training versus hypocaloric diet: distinct effects on body weight and visceral adipose tissue. Obesity Reviews 17 (8), 664-690.
Visscher, P. M., Wray, N. R., Zhang, Q., Sklar, P., McCarthy, M. I., Brown, M. A. & Yang, J. 2017. 10 Years of GWAS discovery: biology, function, and translation. American Journal of Human Genetics 101 (1), 5-22.
Vissers, D., Hens, W., Taeymans, J., Baeyens, J. P., Poortmans, J. & Van Gaal, L. 2013. The effect of exercise on visceral adipose tissue in overweight adults: a systematic review and meta-analysis. PloS One 8 (2), e56415, doi:10.1371/journal.pone.0056415
Vitaro, F., Brendgen, M. & Arseneault, L. 2009. The discordant MZ-twin method: One step closer to the holy grail of causality. International Journal of Behavioral Development 33 (4), 376-382.
Waller, K., Kaprio, J. & Kujala, U. M. 2008. Associations between long-term physical activity, waist circumference and weight gain: a 30-year longitudinal twin study. International Journal of Obesity 32 (2), 353-361.
Waller, K., Kaprio, J., Lehtovirta, M., Silventoinen, K., Koskenvuo, M. & Kujala, U. M. 2010. Leisure-time physical activity and type 2 diabetes during a 28 year follow-up in twins. Diabetologia 53 (12), 2531-2537.
Wang, Y., Rimm, E. B., Stampfer, M. J., Willett, W. C. & Hu, F. B. 2005. Comparison of abdominal adiposity and overall obesity in predicting risk of type 2 diabetes among men. American Journal of Clinical Nutrition 81 (3), 555-563.
Wannamethee, S. G., Shaper, A. G., Morris, R. W. & Whincup, P. H. 2005. Measures of adiposity in the identification of metabolic abnormalities in elderly men. American Journal of Clinical Nutrition 81 (6), 1313-1321.
Warren, A., Howden, E. J., Williams, A. D., Fell, J. W. & Johnson, N. A. 2009. Postexercise fat oxidation: effect of exercise duration, intensity, and modality. International Journal of Sport Nutrition and Exercise Metabolism 19 (6), 607-623.
Warren, J. M., Ekelund, U., Besson, H., Mezzani, A., Geladas, N., Vanhees, L. & Experts Panel 2010. Assessment of physical activity - a review of methodologies with reference to epidemiological research: a report of the exercise physiology section of the European Association of Cardiovascular Prevention and Rehabilitation. European Journal of Cardiovascular Prevention and Rehabilitation 17 (2), 127-139.
Westerterp, K. R. 1999. Obesity and physical activity. International Journal of Obesity 23 (Suppl 1), 59-64.

112 Wewege, M., van den Berg, R., Ward, R. E. & Keech, A. 2017. The effects of high-
intensity interval training vs. moderate-intensity continuous training on body composition in overweight and obese adults: a systematic review and meta-analysis. Obesity Reviews 18 (6), 635-646.
Williams, P. T. & Wood, P. D. 2006. The effects of changing exercise levels on weight and age-related weight gain. International Journal of Obesity (2005) 30 (3), 543-551.
Williams, R. L. 2000. A note on robust variance estimation for cluster-correlated data. Biometrics 56 (2), 645-646.
Winter, Y., Rohrmann, S., Linseisen, J., Lanczik, O., Ringleb, P. A., Hebebrand, J. & Back, T. 2008. Contribution of obesity and abdominal fat mass to risk of stroke and transient ischemic attacks. Stroke 39 (12), 3145-3151.
World Health Organization 2000. Obesity: preventing and managing the global epidemic. Geneva: report of a WHO consultation. WHO Technical Report Series 894.
World Health Organization 2008. Waist circumference and waist-hip ratio: report of the WHO expert consultation. Geneva: 2008. [Access date December 16, 2017] Available online at: http://apps.who.int/iris/bitstream/10665/44583/1/9789241501491_eng.pdf?ua=1
World Health Organization. 2009. Global health risks: mortality and burden ofdisease attributable to selected major risks. Geneva: WHO. [Access date December 27, 2017] Available online at: http://www.who.int/healthinfo/global_burden_disease/GlobalHealthRisks_report_full.pdf
World Health Organization 2010. Global recommendations on physical activity for health. [Access date December 27, 2017] Available online at: http://apps.who.int/iris/bitstream/10665/44399/1/9789241599979_eng.pdf World Health Organization 2017a. Obesity and overweight, Fact sheet February 2018. [Access date February 16, 2018] Available online at: http://www.who.int/mediacentre/factsheets/fs311/en/
World Health Organization 2017b. Physical activity, Fact sheet February 2018. [Access date February 15, 2018] Available online at: http://www.who.int/mediacentre/factsheets/fs385/en/
Yano, Y., Vongpatanasin, W., Ayers, C., Turer, A., Chandra, A., Carnethon, M. R., Greenland, P., de Lemos, J. A. & Neeland, I. J. 2016. Regional fat distribution and blood pressure level and variability: The Dallas Heart Study. Hypertension 68 (3), 576-583.
Yusuf, S., Hawken, S., Ôunpuu, S., Bautista, L., Franzosi, M. G., Commerford, P. & INTERHEART Study Investigators 2005. Obesity and the risk of myocardial infarction in 27,000 participants from 52 countries: a case-control study. Lancet 366 (9497), 1640-1649.
Zhang, H., Tong, T. K., Qiu, W., Zhang, X., Zhou, S., Liu, Y. & He, Y. 2017. Comparable effects of high-intensity interval training and prolonged continuous exercise training

113
on abdominal visceral fat reduction in obese young women. Journal of Diabetes Research 5071740, doi: 10.1155/2017/5071740.

ORIGINAL PUBLICATIONS
I
PERSISTENCE OR CHANGE IN LEISURE-TIME PHYSICAL ACTIVITY HABITS AND WAIST GAIN DURING EARLY
ADULTHOOD: A TWIN-STUDY
by
Rottensteiner, M., Pietiläinen, K.H., Kaprio, J. & Kujala, U.M. 2014
Obesity vol 22, 2061-2070
Available at: https://rdcu.be/WRMn
Reproduced with kind permission by Wiley.

II
SPORT DISCIPLINES, TYPES OF SPORTS, AND WAIST CIRCUMFERENCE IN YOUNG ADULTHOOD
- A POPULATION-BASED TWIN STUDY
by
Rottensteiner, M., Mäkelä, S., Bogl, L.H., Törmäkangas, T., Kaprio J. & Kujala U.M. 2017
European Journal of Sport Science vol 17, 1184-1193
Reproduced with kind permission by Taylor and Francis.

1
Sport disciplines, types of sports, and waist circumference in young
adulthood - a population-based twin study
Mirva Rottensteiner (Corresponding author), Health Sciences, Faculty of Sport and
Health Sciences, University of Jyväskylä. Postal address: P.O. Box 35, 40014 University of
Jyväskylä, Finland. Email: [email protected]
Sara Mäkelä, Department of Public Health, University of Helsinki, Finland.
Email: [email protected]
Leonie H. Bogl, Department of Public Health, University of Helsinki, and Institute for
Molecular Medicine FIMM, University of Helsinki, Finland.
Email: [email protected]
Timo Törmäkangas, Health Sciences, Faculty of Sport and Health Sciences, University of
Jyväskylä, Finland. Email: [email protected]
Jaakko Kaprio, Department of Public Health, University of Helsinki, and Institute for
Molecular Medicine FIMM, University of Helsinki, Finland.
Email: [email protected]
Urho M. Kujala, Health Sciences, Faculty of Sport and Health Sciences, University of
Jyväskylä, Finland. Email: [email protected]

2
Acknowledgements
Data collection in FinnTwin16 has been made possible by the Academy of Finland (grants
100499, 205585, 118555, and 141054 to JK), the National Institute of Alcohol Abuse and
Alcoholism (grants AA-12502, AA-00145, and AA-09203 to Richard J Rose), and the
Finnish Ministry of Education and Culture (UK). Analyses and manuscript preparation have
been supported by the Juho Vainio Foundation (MR), the Finnish Cultural Foundation (MR),
the Finnish Ministry of Education and Culture (UK), META-PREDICT (within the European
Union Seventh Framework Programme, HEALTH-F2-2012-277936 to UK), and the
Academy of Finland (grants 265240, and 263278 to JK, grant 286536 to TT).
Conflicts of interest: The authors declare no conflicts of interest.
Word count: 3194

3
Abstract
Purpose: The benefits of physical activity in preventing abdominal obesity are well
recognized, but the role of different sport disciplines remains open. We aimed, therefore, to
investigate how participation in different sport disciplines, and the number and types of sports
engaged in are associated with waist circumference (WC) in young adulthood. Methods: This
population-based cohort study comprised 4027 Finnish twin individuals (1874 men), with a
mean age of 34 y (32-37), who answered a survey, including self-measured WC. We
extracted the number and identified the types (aerobic, power, mixed) of the different sports
disciplines respondents reported participating in. Results: The number of sport disciplines
participated in was inversely associated with waist circumference, the linear decrease
averaging 1.38 cm (95% CI 1.10 to 1.65) per each additional sport discipline. The result
persisted after adjustment for the main covariates, such as volume of physical activity and
diet quality. Among dizygotic twin pairs discordant for sports participation (0-2 vs. 5 or more
disciplines), the mean within-pair difference in WC was 4.8 cm (95% CI 0.4 to 9.1) for men
and 11.2 cm (95% CI 4.4 to 18.0) for women; among discordant monozygotic pairs no
differences were observed. In men, all three types of sports were individually associated with
smaller WC, while in women, only mixed and power sports showed this association.
Conclusions: Participation in several sport disciplines and sport types was associated with
smaller WC among young adults in their mid-30s. Shared genetic background may explain
some of the associations.
Keywords: Physical activity, sport disciplines, abdominal obesity, waist circumference, twin
study

4
Introduction
The location of body fat seems to have a more important influence on cardio-metabolic health
than general obesity (Despres, 2012). Abdominal obesity is independently related to type 2
diabetes, cardiovascular diseases, and their risk factors (Balkau et al., 2007; Janssen,
Katzmarzyk, & Ross, 2004; Yusuf et al., 2005), and mortality (Pischon et al., 2008). Waist
circumference (WC) is considered a valid marker of abdominal obesity (Klein et al., 2007;
Rankinen, Kim, Perusse, Despres, & Bouchard, 1999), and is both easy to measure and
affordable in clinical practice and large population studies. Abdominal obesity has become
increasingly common among younger people (Ladabaum, Mannalithara, Myer, & Singh,
2014; Lahti-Koski, Harald, Saarni, Peltonen, & Männistö, 2012), and therefore, to minimize
the development of related health problems, early stages prevention strategies are important.
Physical activity (PA) has good potential to prevent and reduce abdominal obesity.
Longitudinal studies have shown that regular PA is related to favourable levels of WC
(Hamer et al., 2013; Hankinson et al., 2010; Rottensteiner, Pietilainen, Kaprio, & Kujala,
2014), and randomized controlled trials have confirmed the beneficial independent role of
aerobic exercise in reducing abdominal fat among people with overweight and obesity
(Ismail, Keating, Baker, & Johnson, 2012; Vissers et al., 2013). However, several questions
on the optimal exercise modality to prevent and treat abdominal fat accumulation remain
open. Exercise trials have mainly focused on the effects of aerobic exercise and strength
training (Ismail et al., 2012), and observational studies on general levels of PA rather than
specific exercise modes (Hamer et al., 2013; Hankinson et al., 2010). Recently, the health
benefits of different sport disciplines have been under discussion (Oja et al., 2015; Oja et al.,
2016), but the evidence on the effect of individual sports on body composition is scarce.

5
The purpose of our study was to investigate how participation in different sport disciplines,
and the number of sport disciplines and types of sport engaged in are associated with WC in
young adulthood. This knowledge gained from a real-life setting could be valuable in clinical
health promotion and when planning interventions aimed at finding optimal way to prevent
and reduce abdominal obesity. Both exercise participation (de Geus, Bartels, Kaprio,
Lightfoot, & Thomis, 2014) and abdominal obesity (Shungin et al., 2015) have genetic
components. Shared genetic effects may influence both sports participation and abdominal
obesity. Our co-twin control study design permits taking into account both childhood family
environment and genetic effects either fully (monozygotic, MZ twin pairs) or partially
(dizygotic, DZ twin pairs).
Materials and methods
Data collection
This study forms part of the population-based FinnTwin16 cohort study (Kaprio, 2006)
investigating the role of genetic and environmental factors as determinants of different health
behaviours, disease risk factors and chronic disease. Virtually all twins born between October
1974 and December 1979 were identified from the Finnish population register, and data
collection started when the twins were aged 16. In the present study, we used the fifth wave
of data collection, which was conducted in 2010–2012. Data was collected using a web-based
questionnaire, containing questions related to health, body composition and leisure-time
physical activity (LTPA). Twins were mailed an invitation letter including the access code to
the Internet survey (Rottensteiner et al., 2014).

6
This study was conducted according the guidelines laid down in the Declaration of Helsinki.
The ethics committee of the Central Finland Hospital district approved the study protocol,
and participants gave their informed consent.
Participants
Altogether, 4406 twin individuals (men 1962, 44.5%) responded to the questionnaire at 32-37
(mean 34.0) years of age, yielding a response rate of 71.9% of all the cohort members alive
and resident in Finland (Kaprio, 2013). All the participants who responded the questions
related to LTPA, weight and height, and measured their WC were included in the study.
Women pregnant at the time of data collection (n=197) were excluded. The final study group
comprised 4027 twin individuals (1874 men and 2153 women), including 1443 twin pairs
with both twins participating (492 MZ, 894 DZ, and 57 with unknown zygosity).
Measurement of waist circumference
WC was self-measured with a tape measure that was included in the mailed invitation letter
(Rottensteiner et al., 2014). The web-based questionnaire included illustrated instructions for
measuring WC. Measurement was performed while standing, at either the narrowest part of
the waist, or if not located, the midpoint between the lowest part of the rib and top of the hip
bone. Self-measured and healthcare professional-measured WC (n=24) have shown a high
intra-class correlation (r=0.97, P<0.001) (Waller, Kaprio, & Kujala, 2008).
Assessment of physical activity
The twins answered to a multiple-choice question about what kind of leisure-time physical
activities/sports disciplines/exercises they participated in (see Supplement Material 1). The
original formulation of this question in Finnish covers both competitive and recreational

7
sports and exercises, and thus, in the present study the term sport disciplines refers to both
kinds. Twenty-six common sport disciplines and an open field option were given as response
alternatives; multiple alternatives could be reported. Each sport discipline was coded
separately for the analysis (total of 76 including open-field responses). We then calculated the
number of sport disciplines participated in, and classified the twin individuals into four
groups: 1) no sport; 2) 1-2; 3) 3-4; and 4) 5 or more sport disciplines. To further confirm the
within-in pair associations among the discordant twin pairs, we identified all the same-sex
twin pairs (MZ and DZ) in which one twin reported five or more sport disciplines and his/her
co-twin at most 2 disciplines.
Next, the sport disciplines were divided into four groups based on what fitness parameters
participation in that sport principally enhances (modified from Aarnio, Winter, Peltonen,
Kujala, and Kaprio (2002) and Sarna, Sahi, Koskenvuo, and Kaprio (1993)). The “aerobic”-
group comprised the sport disciplines that mainly improve aerobic fitness, the “power”-
group those that mainly improve muscle strength, the “mixed”-group those that improve both
aerobic fitness and muscle strength, and the group “other” those that mainly improve
something else, e.g., skills/techniques with a low or unclear cardio-respiratory or muscular
loading intensity. We then re-classified the twin individuals into eight groups, covering all
the possible combinations of participating in aerobic, power, and mixed sports, or no
participation in any sport disciplines in the aerobic, power or mixed groups (see Supplement
Table II).
We also assessed total LTPA volume based on structured questions on the average frequency,
intensity, and duration of activity, and the mean commuting time per day. LTPA volume was
calculated as average frequency (per month) x duration (min) x intensity (MET), and

8
commuting activity volume as frequency (five times per week) x duration (min) x intensity (4
METs), and the total LTPA volume was expressed as the sum-score of MET hours per day
(Rottensteiner et al., 2014). Detailed validity information is available elsewhere (Waller et
al., 2008).
Assessment of confounding factors
A dietary quality score based on nutrition recommendations was constructed from 11 food-
frequency questions and two questions on bread consumption. Selecting from five response
options ranging from "not at all" to "many times a day", participants estimated how often
daily, over the past 12 months, they had usually eaten the following food items: 1) fruit and
berries, 2) vegetables, 3) fish, 4) whole grains (with examples), 5) fast food (with examples),
6) fat-free or reduced-fat milk, sour milk, or yoghurt, 7) sugar-sweetened soft drinks or
juices, 8) energy drinks, 9) butter, 10) margarine, and 11) vegetable oil. Margarine and
vegetable oil were combined into one category. In addition, participants were asked how
many slices of dark and white bread they usually consume per day, and examples of both
types of bread given. For each of the 12 food categories, one point was given if the dietary
recommendation was met, resulting in a score that ranged from 0 to 12, with a higher score
indicating better dietary quality and an overall healthier diet. The cut-offs for each of the 12
dietary guidelines were derived from the most recent Nordic (Nordic Council of Ministers,
2014) and Finnish nutrition recommendations (National Nutrition Council, 2014). As a test of
validity, a positive correlation between the dietary quality score and nutrients assessed by 4-
day food diaries was found for 20 male twin individuals, including fibre (r=0.46, P=0.04) and
minerals (e.g. r=0.65 for energy-adjusted magnesium, P=0.002).

9
A separate multiple adjustment included several potential confounders. Age and number of
children were used as continuous variables. Work-related PA (a question about how
physically strenuous work or studies are), educational level (1. primary and compulsory
education (9 years); 2. secondary vocational and academic education (up to 12 years); 3.
tertiary education (over 12 years)), chronic diseases (reported chronic disease or handicap
interfering with daily activities; yes/no), alcohol use (frequency of drinking alcohol) and
smoking status were used as categorical variables (Rottensteiner et al., 2014).
Statistical analysis
In the individual-based analyses, data were analyzed using Stata 12.0 (Stata Corp., College
Station, TX, USA). The mean values or regression coefficients, and their 95% confidence
intervals were estimated by linear regression using the survey analysis estimation
methodology, where linearized standard errors account for a sampling design based on twin
pair clusters (Korn EL & Graubard BI, 1999). False Discovery Rate -corrected pairwise
comparisons were used to identify mean differences between groups differing in the number
of sport disciplines participated in. Chi-square tests were adjusted for the sampling design by
using the design-based test statistic of Rao and Scott (1984). Pairwise comparisons between
discordant co-twins were performed with SPSS Statistics 22.0 (IBM Corp., Armonk, NY,
USA). The normality of variables was assessed with the Shapiro-Wilk test. Normally
distributed data were analysed with two-sided paired-sample t-tests and non-normally
distributed data with the Wilcoxon signed-rank test. The level of significance was set at P <
0.05.

10
Results
Participant characteristics
Participant characteristics stratified by gender and the number of sport disciplines
participated in (no sport, 1-2, 3-4, 5 or more) are presented in Table I. LTPA volume and diet
quality increased with the number of sport disciplines participated in. Weight and BMI were
lower among persons who participated in several sport disciplines. They also had a physically
lighter work-load, and were more highly educated. Among women, those who participated in
several sport disciplines less often reported having children. Women who did not participate
in sports, or men who did not participate in sports or participated in only 1-2 sport disciplines
slightly more often reported having a chronic disease. Current smoking showed the highest
prevalence in those who did not participate in any sports.
Sport disciplines
Walking, bicycling and jogging were the most popular aerobic sports, while floorball among
men and aerobics among women were the most popular mixed sports (Table II). Table II also
shows the mean WC values by sport. Those not participating in any sport had the largest WC
means, while the individual sports showed a large degree of variation in mean WC values.
Participation in a higher number of sport disciplines was associated with a smaller WC
among both genders (Supplement Table I). The linear decrease per each additional sport
discipline was 1.38 cm (95% CI 1.10 to 1.65). The results did not materially alter when
adjusted for LTPA volume (linear decrease 1.04 cm, 95% CI 0.75 to 1.33), diet quality
(0.95cm, 95% CI 0.68 to 1.23), or multiple potential confounders (1.10 cm, 95%CI 0.83 to
1.38).

11
Among all the discordant twin pairs, the men and women who participated in five or more
sport disciplines had WC 3.3 cm (95% CI 0.3 to 6.3) and 5.2 cm (95% CI 1.6 to 8.9),
respectively, smaller than that of their co-twins who participated in only 1-2 or no sport
disciplines (Table III). Among the DZ pairs, the difference was greater: 4.8 cm (95% CI 0.4
to 9.1) in men, and 11.2 cm (95% CI 4.4 to 18.0) in women. Significant within-pair
differences were also seen in BMI and diet quality in women, but not in men. No differences
were detected in WC, BMI or diet quality among the 43 discordant MZ pairs.
Types of sports
After re-classifying the twins into eight groups for possible combinations of participation (or
no participation) in aerobic, power, and mixed sports, all three types of sports were
individually associated with smaller WC among men (Table IV and Supplement Table II). In
women, participation in power and/or mixed sports, regardless of participation in aerobic
sports, was related to smaller WC. Adjusting for LTPA volume, diet quality, and multiple
potential confounders did not substantially alter the results (Table IV).
Discussion
Among young adults in their mid-30s, the number of sport disciplines participated in was
inversely associated with WC. This was also seen in the discordant twin pair analysis.
However, the discordant MZ twin pairs had no difference in WC. Additionally, each of the
three types of sports was individually associated with smaller WC in men, while, only mixed
and power sports were associated with smaller WC in women.
Intervention studies have reported that aerobic exercise is more effective in reducing
abdominal fat than strength training (Ismail et al., 2012). In the present observational study,

12
participation in aerobic sports alone showed lower associations with WC than exercise
behaviours that included participation in power and/or mixed sports. A recent cohort study
showed stronger benefits of strength training than aerobic exercise on WC growth (Mekary et
al., 2015), as well another study reported that training adherence, whichever to aerobic or
resistance exercise, one year after a weight loss intervention prevented regain of visceral fat
(Hunter et al., 2010). The inconsistency in the findings between habitual self-selected PA and
intervention trials may be explained by the limited ability of individuals with excess weight
to achieve sufficient intensity and volume of aerobic exercise outside of the trial (Ohkawara,
Tanaka, Miyachi, Ishikawa-Takata, & Tabata, 2007; Westerterp, 1999). With respect to our
sport type categories, 38% and 44% of the men and women participating only in aerobic
sports, reported that in general the average intensity level of their PA was as strenuous as
walking (i.e. the lowest intensity level). Therefore, aerobic exercises performed at low
intensity level may explain why participation in aerobic sports alone was not as beneficial in
this free-living population as might be assumed based on intervention trials.
Previous studies of sport disciplines and health have mainly focused one at a time on specific
sport disciplines, and have found the strongest, if limited, evidence of benefit for football and
running (Oja et al., 2015). In the present study, the smallest mean WC was found in the men
who participated in gymnastics, orienteering, basketball, and jogging/running, and the women
who participated in yoga, golf, skating/roller-skating, and jogging/running. The men and
women who did not participate in any sports had the largest WC, followed by those who
participated in walking, swimming, and volleyball. Overall, mean WC values varied widely
within the individual sport disciplines, and comparison of individual sport to each other is
challenging. However, the number of sports disciplines participated in was inversely
associated with WC. Although the number of sport disciplines participated in correlated with

13
the volume of physical activity, the association between WC and the number of sport
disciplines participated in persisted after adjusting for the overall volume of physical activity.
In line with our findings, da Silva Garcez et al. (2015) showed that women who had
participated in five or more different physical activities in adolescence were less likely to be
abdominal obese in adulthood. The benefits of diverse sport participation may be manifold.
From the exercise adherence perspective, Borodulin et al. (2012) found that participation in
many types of sports in young adulthood was associated with lesser inactivity in adulthood.
Another study among young men showed that participation in several different sports may
protect from harmful effects of single-risk sport, such as musculoskeletal problems (Auvinen
et al., 2008).
In abdominal obesity prevention, it seems less important to focus on single sports and more
important to encourage participation in a diversity of sports. In exercise counselling,
individuals’ exercise preferences are in the centre, as intrinsic motivation is crucial for long-
term exercise maintenance (Teixeira, Carraca, Markland, Silva, & Ryan, 2012). Popular sport
disciplines should be diversely incorporated into future study designs, especially in
intervention studies that test feasible ways to prevent abdominal obesity. It should be
remembered that the associations found in this study may be bi-directional: participation in
certain sport disciplines and sport types may impact on body composition, or it may be that a
certain body composition facilitates participation in specific sports. It can be assumed, for
example, that so-called low-threshold sports, such as walking, which are easy to perform
without specific equipment or skills, travel to a specific sport venue, or participation fees,
may be favoured by occasionally active persons. Similarly, walking, bicycling, and
swimming are among the easier exercises most likely to be adopted by persons with excess

14
weight or low physical fitness. Thus, the possibility of reverse causation (Bauman et al.,
2012) also exists between body composition and sports.
Our analysis of all the discordant twin pairs confirmed the inverse relationship between the
number of sport disciplines participated in and WC, and enabled the results to be controlled
for various confounding childhood experiences as twins are usually reared together. We were
unable to replicate the results for the discordant MZ twin pairs. This may be due to the
sharing of the genetic background seen in twin studies of sports activity and abdominal
obesity (de Geus et al., 2014). To date, however, only a few studies have identified some
genetic variants associated with body composition and physical activity (Reddon et al.,
2016). A possible explanation is that the small number of discordant MZ pairs reduced the
power to detect possible differences. According to the earlier studies, a substantial difference
in physical activity volume over longer periods leads to the differences in intra-abdominal fat
among MZ twins as well (Leskinen et al., 2009; Rottensteiner et al., 2016). A strength of the
present study was the possibility to adjust the results for diet quality, although this did not
materially change the results. One of the limitations of the study is the use of self-reported
data, which can lead to reporting bias; however, this method enabled the large observational
data collection, including self-measured WC. Owing to the cross-sectional study design we
are unable to draw causal inferences. It should be noted, when interpreting the results, that
some of the sport disciplines included in this study are highly seasonable (e.g. cross-country
skiing). The generalizability of the results is fairly good, as the BMI values of our sample of
twins resemble or are slightly lower than those of the general Finnish population (Peltonen et
al., 2008).

15
Conclusion
Among young adults in their mid-30s, the number of sport disciplines participated in was
inversely associated with WC, also after adjusting for overall LTPA volume. The association
was also seen in twin pairs discordant for the number of sports disciplines. In men, all three
types of sports (aerobic, power, and mixed) were individually associated with a smaller WC,
while in women, only mixed and power sports showed this association. With respect to
exercise counselling, promoting participation in a diversity of sports rather than specific
sports may be beneficial in terms of preventing abdominal obesity among adults in everyday
life.

16
Table I. Characteristics of the study participants by gender and number of sport disciplines participated in.
A) B) C) D)
Men, N=1874
No sport n=105
1-2 sport disciplines n=733
3-4 sport disciplines n=595
5 or more sport disciplines n=441
Age, mean (SD) (y) 34.2 (1.4) 33.9 (1.2) 34.0 (1.3) 34.0 (1.3) Weight, mean (SD) (kg) 86.1 (16.7)D 83.7 (14.7)D 83.3 (13.2)D 81.1 (10.9)A,B,C Height, mean (SD) (cm) 178.4 (6.8) 179.0 (6.7)D 179.6 (6.6) 180.2 (6.6)B BMI, mean (SD) (kg/m2) 27.0 (4.8)C,D 26.0 (3.9)D 25.8 (3.6)A,D 24.9 (2.8)A,B,C LTPA-volumea, mean (SD) (MET-h/d) 1.1 (1.4)B,C,D 3.5 (3.3)A,C,D 5.2 (4.2)A,B,D 6.7 (4.6)A,B,C Dietary qualityb, mean (SD) 6.1 (1.8)B,C,D 6.8 (2.1)A,C,D 7.5 (2.2)A,B,D 8.1 (1.9)A,B,C P for trend Work-related PA, % (n) <0.001
Sedentary 26 % (27) 39.4% (288) 49.6% (295) 57.1% (252) Standing or walking at work 15.4% (16) 18.9% (138) 23.0% (137) 17.5% (77) Light manual work 29.8% (31) 22.4% (164) 14.8% (88) 16.6% (73) Heavy manual work 21.2% (22) 13.8% (101) 8.7% (52) 6.6% (29) Not working or studying 7.7% (8) 5.5% (40) 3.9% (23) 2.3% (10)
Educational level, % (n) <0.001 Primary 6.7% (7) 4.5% (33) 2.5% (15) 1.6% (7) Secondary 71.4% (75) 58.5% (428) 44.9% (267) 39.2% (173) Tertiary 21.9% (23) 37% (271) 52.6% (313) 59.2% (261)
Children, % (n) 0.672 Yes 61.0% (64) 55.1% (403) 54.4% (323) 54.8% (241)
Chronic diseases, % (n) <0.001 Yes 22.9% (24) 18.2% (133) 15.0% (89) 10.3% (45)
Smoking status, % (n) <0.001 Current (daily) smoker 44.8% (47) 26.7% (196) 17.3% (103) 10.0% (44) Occasional smoker 7.6% (8) 12.1% (89) 13.3% (79) 11.6% (51) Quitters 19.0% (20) 23.6% (173) 24.4% (145) 21.1% (93) Never smoked 28.6% (30) 37.5% (275) 44.9% (267) 57.4% (253)
Alcohol use, % (n) 0.122 Daily 10.5% (11) 6.6% (48) 4.2% (25) 2.9% (13)
1–2 times a week 54.3% (57) 57.2% (419) 59.0% (351) 62.1% (274) 1–2 times a month 20.0% (21) 20.5% (150) 22.7% (135) 20.4% (90) Less than once a month 8.6% (9) 10.0% (73) 8.2% (49) 9.5% (49) Never 6.7% (7) 5.7% (42) 5.9% (35) 5.0% (22)
A) B) C) D) Women, N=2153
No sport n=84
1-2 sport disciplines n=771
3-4 sport disciplines n=805
5 or more sport disciplines n=493
Age, mean (SD) (y) 33.9 (1.3) 34.0 (1.3) 34.0 (1.3) 33.9 (1.2) Weight, mean (SD) (kg) 70.7 (17.4)D 67.0 (14.2)D 65.9 (12.7)D 63.9 (9.7)A,B,C Height, mean (SD) (cm) 166.0 (5.8) 165.6 (6.0) 165.8 (5.7) 166.4 (5.6) BMI, mean (SD) (kg/m2) 25.7 (6.0)C,D 24.4 (5.0)D 24.0 (4.4)A,D 23.1 (3.3)A,B,C LTPA-volumea, mean (SD) (MET-h/d) 1.0 (1.2)B,C,D 3.0 (3.2)A,C,D 4.4 (3.8)A,B,D 7.1 (5.0)A,B,C Dietary qualityb, mean (SD) 6.8 (2.0)B,C,D 7.8 (2.0)A,C,D 8.4 (2.1)A,B,D 9.0 (1.8)A,B,C P for trend
Work-related PA, % (n) <0.001

17
Sedentary 35.7% (30) 32.2% (248) 40.3% (324) 47.6% (234) Standing or walking at work 16.7% (14) 19.1% (147) 20.3% (163) 25.8% (127) Light manual work 25.0% (21) 25.9% (200) 23.0% (185) 18.5% (91) Heavy manual work 1.2% (1) 3.1% (24) 2.2% (18) 0.8% (4) Not working or studying 21.4% (18) 19.7% (152) 14.1% (113) 7.3% (36)
Educational level, % (n) <0.001 Primary 8.3% (7) 3.2% (25) 1.9% (15) 1.0% (5) Secondary 50.0% (42) 48.1% (371) 39.9% (321) 30.6% (151) Tertiary 41.7% (35) 48.6% (375) 58.3% (469) 68.4% (337)
Children, % (n) <0.001 Yes 67.9% (57) 68.4% (527) 62.4% (502) 56.6% (279)
Chronic diseases, % (n) 0.041 Yes 27.4% (23) 16.1% (124) 16.8% (135) 14.8% (73)
Smoking status, % (n) <0.001 Current (daily) smoker 32.1% (27) 21.4% (165) 14.9% (120) 7.7% (38) Occasional smoker 8.3% (7) 8.6% (66) 8.1% (65) 10.1% (50) Quitters 19.0% (16) 21.7% (167) 20.8% (168) 20.3% (100) Never smoked 40.5% (34) 48.4% (373) 56.1% (451) 61.9% (305)
Alcohol use, % (n) Daily 4.8% (4) 1.4% (11) 1.2% (10) 0.6% (3) <0.001 1–2 times a week 34.5% (29) 36.6% (282) 43.0% (346) 41.8% (206) 1–2 times a month 27.4% (23) 29.6% (228) 28.4% (229) 33.9% (167) Less than once a month 23.8% (20) 26.0% (200) 22.0% (177) 15.0% (74) Never 9.5% (8) 6.4% (49) 5.3% (43) 8.7% (43)
Notes: SD, standard deviation; BMI, body mass index, LTPA, leisure-time physical activity; PA, physical activity. Superscripts A,B,C,D indicate statistically significant differences (P-value <0.05) between groups differing for the number of sport disciplines participated in. a LTPA and commuting activity expressed as MET-h/day b Dietary quality score 0-12 points

18
Table II. The most popular sport disciplines and waist circumference among young adult twins in Finland. Men N=1874 Women N=2153 Sport discipline Sport typea n WC (cm)
mean (95% CI) Sport discipline Sport typea n WC (cm)
mean (95% CI) No sport 105 96.8 (93.9 to 99.7) No sport 84 84.6 (81.3 to 87.9) Walking /Nordic walking Aerobic 791 93.7 (92.9 to 94.6) Walking /Nordic walking Aerobic 1618 81.2 (80.5 to 81.8) Bicycling Aerobic 696 91.3 (90.5 to 92.2) Bicycling Aerobic 826 80.1 (79.3 to 80.8) Jogging/running Aerobic 693 89.6 (88.8 to 90.3) Jogging/running Aerobic 721 76.9 (76.3 to 77.5) Gym training Power 690 91.0 (90.2 to 91.7) Gym training Power 611 78.4 (77.6 to 79.3) Cross-country skiing Aerobic 446 90.4 (89.5 to 91.3) Swimming Aerobic 580 82.3 (81.2 to 83.4) Swimming Aerobic 359 93.2 (91.9 to 94.4) Cross-country skiing Aerobic 445 77.9 (77.0 to 78.8) Floorball Mixed 333 91.4 (90.4 to 92.5) Aerobics Mixed 398 78.7 (77.7 to 79.7) Badminton Mixed 223 90.7 (89.4 to 92.0) Dance Aerobic 308 79.0 (77.8 to 80.2) Football Mixed 204 90.5 (89.2 to 91.9) Gymnastics Other 200 79.6 (78.1 to 81.1) Downhill skiing / snowboarding
Mixed 204 90.5 (89.2 to 91.9) Downhill skiing / snowboarding
Mixed 197 78.4 (76.9 to 79.9)
Skating/roller-skating Aerobic 189 90.9 (89.5 to 92.2) Skating/roller-skating Aerobic 171 76.7 (75.4 to 78.1) Ice-hockey Mixed 136 91.6 (90.1 to 93.2) Horse riding Other 138 77.5 (75.9 to 79.1) Golf Aerobic 122 89.9 (88.3 to 91.5) Yoga Other 75 76.0 (74.3 to 77.7) Tennis Mixed 104 91.1 (89.3 to 92.9) Floorball Mixed 67 79.5 (77.5 to 81.5) Martial art (e.g. Judo, Karate)
Mixed 93 90.5 (88.4 to 92.6) Badminton Mixed 66 80.7 (78.0 to 83.5)
Volleyball Mixed 85 92.7 (90.5 to 94.9) Golf Aerobic 59 76.3 (74.6 to 78.0) Rinkball Mixed 54 90.0 (87.9 to 92.1) Tennis Mixed 50 77.4 (74.5 to 80.4) Orienteering Aerobic 54 87.6 (84.9 to 90.3) Martial art
(e.g. Judo, Karate) Mixed 47 80.1 (77.5 to 82.7)
Rowing / canoeing Aerobic 50 90.2 (87.2 to 93.3) Pilates Other 47 78.4 (75.2 to 81.6) Gymnastics Other 38 87.5 (84.6 to 90.3) Volleyball Mixed 42 82.5 (79.1 to 86.0) Basketball Mixed 34 89.2 (85.8 to 92.6) Rowing / canoeing Aerobic 37 79.1 (76.0 to 82.1) Squash Mixed 34 90.7 (88.3 to 93.1) Football Mixed 33 79.8 (76.9 to 82.8) Dance Aerobic 32 91.2 (87.3 to 95.0) Orienteering Aerobic 32 77.8 (74.2 to 81.4) Indoor cycling /spinning Aerobic 32 80.0 (75.8 to 84.3)
Notes: WC, waist circumference; CI, confidence interval. Sport disciplines with N lower than 30 are not presented in the table. a Aerobic: sport disciplines mainly improving aerobic fitness, Power: sport disciplines mainly improving muscle strength, Mixed: sport disciplines mainly improving both aerobic fitness and muscle strength, Other type of sport: sport disciplines mainly improving something else (e.g. skill/technique).

19
Table III. Waist circumference, body mass index, dietary quality, and LTPA volume among co-twins discordanta for the number of sport disciplines participated in.
Men Women Twin 1 Twin 2 Twin 1 Twin 2 Pairs,
N Mean (SD) Mean (SD) Mean intrapair
difference (95%CI)
P-value Pairs, N
Mean (SD) Mean (SD) Mean intrapair difference (95%CI)
P-value
All same sex pairs 55 44 WC (cm) 93.0 (11.6) 89.7 (8.3) -3.3 (-6.3 to -0.3) 0.034 82.8 (12.9) 77.6 (9.8) -5.2 (-8.9 to -1.6) 0.011 BMI (kg/m2) 25.9 (4.0) 25.1 (3.0) -0.8 (-1.8 to 0.2) 0.119 24.8 (5.4) 23.4 (4.3) -1.4 (-2.6 to -0.2) 0.041 Dietary qualityb 6.8 (1.9) 7.5 (1.6) 0.7 (0.03 to1.4) 0.064 8.1 (2.0) 9.2 (1.8) 1.0 (0.3 to 1.8) 0.010 LTPA-volumec 2.6 (2.6) 5.7 (4.5) 3.0 (1.7 to 4.4) <0.001 3.1 (3.2) 6.7 (5.5) 3.6 (1.8 to 5.4) <0.001
Dizygotic pairs 36 20 WC (cm) 94.8 (12.6) 90.1 (7.2) -4.8 (-9.1 to -0.4) 0.033 87.2 (13.1) 76.0 (9.0) -11.2 (-18.0 to -4.4) 0.003 BMI (kg/m2) 26.5 (4.3) 25.1 (2.8) -1.3 (-2.8 to 0.1) 0.065 25.4 (5.4) 22.7 (3.8) -2.8 (-5.2 to -0.4) 0.025 Dietary qualityb 7.1 (1.9) 7.6 (1.7) 0.5 (-0.3 to 1.3) 0.223 7.8 (2.0) 9.3 (1.8) 1.5 (0.01 to 3.0) 0.024 LTPA-volumec 3.0 (2.8) 5.8 (4.6) 2.8 (1.0 to 4.6) 0.003 2.0 (1.7) 6.1 (4.3) 4.1 (1.7 to 6.5) 0.002
Monozygotic pairs 19 24 WC (cm) 89.5 (8.4) 89.1 (10.2) -0.4 (-3.4 to 2.5) 0.768 79.1 (11.7) 78.9 (10.4) -0.2 (-2.7 to 2.3) 0.865 BMI (kg/m2) 24.7 (2.9) 25.0 (3.3) 0.2 (-0.8 to 1.3) 0.629 24.3 (5.5) 24.0 (4.7) -0.3 (-1.2 to 0.6) 0.525 Dietary qualityb 6.2 (2.0) 7.4 (1.5) 1.2 (-0.2 to 2.5) 0.098 8.5 (2.0) 9.1 (2.0) 0.6 (-0.1 to 1.4) 0.105 LTPA-volumec 1.8 (1.9) 5.3 (4.4) 3.5 (1.5 to 5.5) 0.002 4.0 (3.8) 7.2 (6.4) 3.1 (0.3 to 5.9) 0.030
Notes: LTPA, leisure-time physical activity; SD, standard deviation; CI, confidence interval; WC, waist circumference; BMI, body mass index. a Twin 1= participated in 0 to 2 different sport disciplines, Twin 2= participated in 5 or more different sport disciplines. b Dietary quality score 0-12 points. c LTPA and commuting activity expressed as MET-h/day.

20
Table IV. Linear model of types of sport significantly predicting waist circumference. WC (cm),
β (95%CI)
P-value Model 1 Men
Aerobic -2.07 (-3.49 to -0.66) 0.004 Power -2.98 (-4.51 to -1.45) <0.001 Mixed -3.16 (-4.53 to -1.79) <0.001 Power × Mixed 2.36 (0.38 to 4.34) 0.020
Women Power -2.72 (-3.76 to -1.67) <0.001 Mixed -1.84 (-2.82 to -0.87) <0.001
Model 2 Men
Aerobic -1.71 (-3.11 to -0.32) 0.016 Power -1.81 (-3.34 to -0.28) 0.021 Mixed -2.32 (-3.69 to -0.95) 0.001 Power × Mixed 2.16 (0.19 to 4.13) 0.031
Women Power -1.48 (-2.59 to -0.37) 0.009 Mixed -0.95 (-1.93 to -0.33) 0.060
Model 3 Men
Aerobic -1.63 (-3.04 to -0.22) 0.023 Power -2.42 (-3.91 to -0.92) 0.002 Mixed -2.97 (-4.32 to -1.61) <0.001 Power × Mixed 2.19 (0.24 to 4.14) 0.027
Women Power -2.39 (-3.43 to -1.35) <0.001 Mixed -1.63 (-2.60 to -0.66) 0.001
Model 4 Men
Aerobic -1.43 (-2.86 to 0.01) 0.051 Power -2.64 (-4.20 to -1.09) 0.001 Mixed -2.81 (-4.19 to -1.44) <0.001 Power × Mixed 2.27 (0.29 to 4.25) 0.025
Women Power -2.50 (-3.55 to -1.45) <0.001 Mixed -1.37 (-2.34 to -0.40) 0.006
Notes: WC, waist circumference; CI, confidence interval. Model 1: No covariates in the model, Model 2: Adjusted for leisure-time physical activity volume, Model 3: Adjusted for dietary quality, Model 4: Multiple adjustment for age, work-related physical activity, educational level, number of children, chronic diseases, alcohol use, smoking status.

21
References
Aarnio, M., Winter, T., Peltonen, J., Kujala, U. M., & Kaprio, J. (2002). Stability of leisure-
time physical activity during adolescence--a longitudinal study among 16-, 17- and 18-
year-old Finnish youth. Scandinavian Journal of Medicine & Science in Sports, 12, 179-
185. doi:10.1034/j.1600-0838.2002.00250.x
Auvinen, J. P., Tammelin, T. H., Taimela, S. P., Zitting, P. J., Mutanen, P. O., & Karppinen,
J. I. (2008). Musculoskeletal pains in relation to different sport and exercise activities in
youth. Medicine and Science in Sports and Exercise, 40, 1890-1900.
doi:10.1249/MSS.0b013e31818047a2
Balkau, B., Deanfield, J. E., Despres, J. P., Bassand, J. P., Fox, K. A., Smith, S. C.,Jr, . . .
Haffner, S. M. (2007). International day for the evaluation of abdominal obesity (IDEA):
A study of waist circumference, cardiovascular disease, and diabetes mellitus in 168,000
primary care patients in 63 countries. Circulation, 116, 1942-1951.
doi:10.1161/CIRCULATIONAHA.106.676379
Bauman, A. E., Reis, R. S., Sallis, J. F., Wells, J. C., Loos, R. J., Martin, B. W., & Lancet
Physical Activity Series Working Group. (2012). Correlates of physical activity: Why
are some people physically active and others not? Lancet, 380, 258-271.
doi:10.1016/S0140-6736(12)60735-1
Borodulin, K., Makinen, T. E., Leino-Arjas, P., Tammelin, T. H., Heliovaara, M., Martelin,
T., . . . Prattala, R. (2012). Leisure time physical activity in a 22-year follow-up among
Finnish adults. The International Journal of Behavioral Nutrition and Physical Activity,
9, 121. doi:10.1186/1479-5868-9-121

22
da Silva Garcez, A., Olinto, M. T., Canuto, R., Olinto, B. A., Pattussi, M. P., & Paniz, V. M.
(2015). Physical activity in adolescence and abdominal obesity in adulthood: A case-
control study among women shift workers. Women & Health, 55, 419-431.
doi:10.1080/03630242.2015.1022686
de Geus, E. J., Bartels, M., Kaprio, J., Lightfoot, J. T., & Thomis, M. (2014). Genetics of
regular exercise and sedentary behaviors. Twin Research and Human Genetics, 17, 262-
271. doi:10.1017/thg.2014.42
Despres, J. P. (2012). Body fat distribution and risk of cardiovascular disease: An update.
Circulation, 126, 1301-1313. doi:10.1161/CIRCULATIONAHA.111.067264
Hamer, M., Brunner, E. J., Bell, J., Batty, G. D., Shipley, M., Akbaraly, T., . . . Kivimaki, M.
(2013). Physical activity patterns over 10 years in relation to body mass index and waist
circumference: The Whitehall II Cohort Study. Obesity, 21, E755-61.
doi:10.1002/oby.20446
Hankinson, A. L., Daviglus, M. L., Bouchard, C., Carnethon, M., Lewis, C. E., Schreiner, P.
J., . . . Sidney, S. (2010). Maintaining a high physical activity level over 20 years and
weight gain. The Journal of the American Medical Association, 304, 2603-2610.
doi:10.1001/jama.2010.1843
Hunter, G. R., Brock, D. W., Byrne, N. M., Chandler-Laney, P. C., Del Corral, P., & Gower,
B. A. (2010). Exercise training prevents regain of visceral fat for 1 year following
weight loss. Obesity, 18, 690-695. doi:10.1038/oby.2009.316

23
Ismail, I., Keating, S. E., Baker, M. K., & Johnson, N. A. (2012). A systematic review and
meta-analysis of the effect of aerobic vs. resistance exercise training on visceral fat.
Obesity Reviews, 13, 68-91. doi:10.1111/j.1467-789X.2011.00931.x
Janssen, I., Katzmarzyk, P. T., & Ross, R. (2004). Waist circumference and not body mass
index explains obesity-related health risk. The American Journal of Clinical Nutrition,
79, 379-384.
Kaprio, J. (2006). Twin studies in Finland 2006. Twin Research and Human Genetics, 9, 772-
777. doi:10.1375/183242706779462778
Kaprio, J. (2013). The Finnish Twin Cohort Study: An update. Twin Research and Human
Genetics, 16, 157-162. doi:10.1017/thg.2012.142
Klein, S., Allison, D. B., Heymsfield, S. B., Kelley, D. E., Leibel, R. L., Nonas, C., Kahn, R.
(2007). Waist circumference and cardiometabolic risk: A consensus statement from
Shaping America's Health: Association for weight management and obesity prevention;
NAASO, the Obesity Society; the American Society for Nutrition; and the American
Diabetes Association. Diabetes Care, 30, 1647-1652. doi:10.2337/dc07-9921
Korn EL, & Graubard BI. (1999). Analysis of health surveys. New York: Wiley.
Ladabaum, U., Mannalithara, A., Myer, P. A., & Singh, G. (2014). Obesity, abdominal
obesity, physical activity, and caloric intake in US adults: 1988 to 2010. The American
Journal of Medicine, 127, 717-727. doi:10.1016/j.amjmed.2014.02.026
Lahti-Koski, M., Harald, K., Saarni, S. E., Peltonen, M., & Männistö, S. (2012). Changes in
body mass index and measures of abdominal obesity in Finnish adults between 1992 and

24
2007, the National FINRISK Study. Clinical Obesity, 2, 57-63. doi:10.1111/j.1758-
8111.2012.00035.x
Leskinen, T., Sipila, S., Alen, M., Cheng, S., Pietilainen, K. H., Usenius, J. P., . . . Kujala, U.
M. (2009). Leisure-time physical activity and high-risk fat: A longitudinal population-
based twin study. International Journal of Obesity, 33, 1211-1218.
doi:10.1038/ijo.2009.170
Mekary, R. A., Grontved, A., Despres, J. P., De Moura, L. P., Asgarzadeh, M., Willett, W.
C., . . . Hu, F. B. (2015). Weight training, aerobic physical activities, and long-term waist
circumference change in men. Obesity, 23, 461-467. doi:10.1002/oby.20949
National Nutrition Council. Finnish Nutrition Recommendations 2014. Helsinki, 2014
Nordic Council of Ministers. Nordic Nutrition Recommendations 2012. Integrating Nutrition
and Physical Activity. 5th ed. Copenhagen, 2014.
Ohkawara, K., Tanaka, S., Miyachi, M., Ishikawa-Takata, K., & Tabata, I. (2007). A dose-
response relation between aerobic exercise and visceral fat reduction: Systematic review
of clinical trials. International Journal of Obesity, 31, 1786-1797.
doi:10.1038/sj.ijo.0803683
Oja, P., Kelly, P., Pedisic, Z., Titze, S., Bauman, A., Foster, C., . . . Stamatakis, E. (2016).
Associations of specific types of sports and exercise with all-cause and cardiovascular-
disease mortality: A cohort study of 80 306 British adults. British Journal of Sports
Medicine, 51, 812-817. doi:10.1136/bjsports-2016-096822
Oja, P., Titze, S., Kokko, S., Kujala, U. M., Heinonen, A., Kelly, P., . . . Foster, C. (2015).
Health benefits of different sport disciplines for adults: Systematic review of

25
observational and intervention studies with meta-analysis. British Journal of Sports
Medicine, 49, 434-440. doi:bjsports-2014-093885
Peltonen, N., Harald, K., Männistö, S., Saarikoski, L., Peltomäki, P., Lund, L., . . .
Vartiainen, E. (2008). The National FINRISK 2007 Study. Helsinki: Publications of the
National Public Health Institute, B34/2008
Pischon, T., Boeing, H., Hoffmann, K., Bergmann, M., Schulze, M. B., Overvad, K., . . .
Riboli, E. (2008). General and abdominal adiposity and risk of death in Europe. The New
England Journal of Medicine, 359, 2105-2120. doi:10.1056/NEJMoa0801891
Rankinen, T., Kim, S. Y., Perusse, L., Despres, J. P., & Bouchard, C. (1999). The prediction
of abdominal visceral fat level from body composition and anthropometry: ROC
analysis. International Journal of Obesity and Related Metabolic Disorders, 23, 801-
809. doi:10.1038/sj.ijo.0800929
Rao J. N. K., & Scott A. J. (1984). On chi-squared tests for multiway contingency tables with
cell proportions estimated from survey data. Annals of Statistics, 12, 46-60.
doi:10.1214/aos/1176346391
Reddon, H., Gerstein, H. C., Engert, J. C., Mohan, V., Bosch, J., Desai, D., . . . Meyre, D.
(2016). Physical activity and genetic predisposition to obesity in a multiethnic
longitudinal study. Scientific Reports, 6, 18672. doi:10.1038/srep18672
Rottensteiner, M., Leskinen, T., Järvelä-Reijonen, E., Väisänen, K., Aaltonen, S., Kaprio, J.,
& Kujala, U. M. (2016). Leisure-time physical activity and intra-abdominal fat in young
adulthood: A monozygotic co-twin control study. Obesity, 24, 1185-1191.
doi:10.1002/oby.21465

26
Rottensteiner, M., Pietilainen, K. H., Kaprio, J., & Kujala, U. M. (2014). Persistence or
change in leisure-time physical activity habits and waist gain during early adulthood: A
twin-study. Obesity, 22, 2061-2070. doi:10.1002/oby.20788
Sarna, S., Sahi, T., Koskenvuo, M., & Kaprio, J. (1993). Increased life expectancy of world
class male athletes. Medicine and Science in Sports and Exercise, 25, 237-244.
doi:10.1249/00005768-199302000-00013
Shungin, D., Winkler, T. W., Croteau-Chonka, D. C., Ferreira, T., Locke, A. E., Magi, R., . . .
Mohlke, K. L. (2015). New genetic loci link adipose and insulin biology to body fat
distribution. Nature, 518, 187-196. doi:10.1038/nature14132
Teixeira, P. J., Carraca, E. V., Markland, D., Silva, M. N., & Ryan, R. M. (2012). Exercise,
physical activity, and self-determination theory: A systematic review. The International
Journal of Behavioral Nutrition and Physical Activity, 9, 78. doi:10.1186/1479-5868-9-
78
Vissers, D., Hens, W., Taeymans, J., Baeyens, J. P., Poortmans, J., & Van Gaal, L. (2013).
The effect of exercise on visceral adipose tissue in overweight adults: A systematic
review and meta-analysis. PloS One, 8, e56415. doi:10.1371/journal.pone.0056415
Waller, K., Kaprio, J., & Kujala, U. M. (2008). Associations between long-term physical
activity, waist circumference and weight gain: A 30-year longitudinal twin study.
International Journal of Obesity, 32, 353-361. doi:10.1038/sj.ijo.0803692
Westerterp, K. R. (1999). Obesity and physical activity. International Journal of Obesity, 23
Suppl 1, s59-s64.

27
Yusuf, S., Hawken, S., Ounpuu, S., Bautista, L., Franzosi, M. G., Commerford, P., . . .
INTERHEART Study Investigators. (2005). Obesity and the risk of myocardial
infarction in 27,000 participants from 52 countries: A case-control study. Lancet, 366,
1640-1649. doi:S0140-6736(05)67663-5

28
Sport disciplines, types of sports, and waist circumference in young adulthood - a
population-based twin study
Online Supplemental Material Supplement material 1 What kind of leisure-time physical activities/sports disciplines/exercises do you participate in? (you can choose several sports) 1 Walking/Nordic walking 11 Floorball 21 Golf 2 Jogging/running 12 Football 22 Downhill skiing/snowboarding 3 Bicycling 13 Ice-hockey 23 Horse riding 4 Cross-country skiing 14 Rinkball 24 Orienteering 5 Swimming/water running 15 Volleyball 25 Rowing/canoeing 6 Skating/roller-skating 16 Basketball 26 Martial art 7 Gym training 17 Finnish baseball 27 Other, what?_____ 8 Aerobics 18 Badminton ___________________ 9 Gymnastics 19 Squash ___________________ 10 Dance 20 Tennis ___________________ Note: The original Finnish formulation of this question covers both competitive and recreational sports and exercises. Supplement Table I. Number of sport disciplines participated in and waist circumference among young adult men and women.
Number of sport disciplinesa
Men, N=1874 Women, N=2153 WC (cm),
mean (95% CI) WC (cm),
mean (95% CI) n (%) n (%) 1) 0 105 (5.6) 96.8 (93.9 to 99.7) 84 (3.9) 84.6 (81.3 to 87.9) 2) 1-2 733 (39.1) 93.6 (92.7 to 94.4) 771 (35.8) 82.4 (81.5 to 83.4) 3) 3-4 595 (31.8) 92.0 (91.1 to 92.9) 805 (37.4) 80.5 (79.6 to 81.3) 4) 5 or more 441 (23.5) 89.6 (88.7 to 90.4) 493 (22.9) 77.5 (76.7 to 78.3)
WC, waist circumference; CI, confidence interval a Includes all sport disciplines (also seasonal sports) that the person reported participating in

29
Supplement Table II. Participation in different types of sports and waist circumference among young adult men and women.
Men, N=1874 Women, N=2153 Sport type WC (cm),
mean (95% CI) WC (cm),
mean (95% CI) Aerobic Power Mixed n (%) n (%) - - - 116 (6.2) 96.5 (93.7 to 99.2) 113 (5.2) 83.0 (80.2 to 85.8) + - - 508 (27.1) 94.1 (93.0 to 95.3) 976 (45.3) 82.1 (81.3 to 82.9) - + - 46 (2.5) 93.4 (90.9 to 95.9) 18 (0.8) 77.9 (73.2 to 82.5) - - + 112 (6.0) 92.8 (91.0 to 94.5) 29 (1.3) 78.5 (75.5 to 81.5) + + - 282 (15.0) 91.2 (89.9 to 92.4) 290 (13.5) 79.0 (77.7 to 80.2) + - + 441 (23.5) 91.1 (90.1 to 92.1 ) 412 (19.1) 80.0 (79.0 to 81.0) - + + 36 (1.9) 92.6 (89.8 to 95.4) 11 (0.5) 81.5 (75.3 to 87.8) + + + 333 (17.8) 90.4 (89.4 to 91.4) 304 (14.1) 77.8 (76.7 to 78.9)
Notes: WC, waist circumference; CI, confidence interval. Aerobic: sport disciplines mainly improving aerobic fitness, Power: sport disciplines mainly improving muscle strength, Mixed: sport disciplines mainly improving both aerobic fitness and muscle strength. - No participation in a sport discipline classified in that group. + Participation in at least one sport discipline classified in that group.

III
PHYSICAL ACTIVITY, FITNESS, GLUCOSE HOMEOSTASIS, AND BRAIN MORPHOLOGY IN TWINS
by
Rottensteiner M., Leskinen T., Niskanen E., Aaltonen S., Mutikainen S., Wikgren J., Heikkilä K., Kovanen V., Kainulainen H., Kaprio J., Tarkka I.M.
& Kujala U.M. 2015
Medicine & Science in Sports & Exercise vol 47, 509-518
Reproduced with kind permission by Wolters Kluwer.

1
Physical activity, fitness, glucose homeostasis, and brain morphology in twins
MIRVA ROTTENSTEINER1,*, TUIJA LESKINEN1,*, EINI NISKANEN2, SARI
AALTONEN1, SARA MUTIKAINEN1, JAN WIKGREN3, KAUKO HEIKKILÄ4,
VUOKKO KOVANEN1, HEIKKI KAINULAINEN5, JAAKKO KAPRIO4,6,7, INA M.
TARKKA1, and URHO M. KUJALA1,*
1Department of Health Sciences, University of Jyväskylä, Jyväskylä; 2Department of Applied
Physics, University of Eastern Finland, Kuopio; 3Department of Psychology, University of
Jyväskylä, Jyväskylä; 4Department of Public Health, Hjelt Institute, University of Helsinki,
Helsinki; 5Department of Biology of Physical Activity, University of Jyväskylä, Jyväskylä;
6Department of Mental Health and Substance Abuse Services, National Institute for Health
and Welfare, Helsinki; 7Institute for Molecular Medicine (FIMM), University of Helsinki,
Helsinki, all in FINLAND
*Contributed equally to this paper.
Address for correspondence: Urho M. Kujala, MD, PhD, Department of Health Sciences,
Sports and Health Laboratory, Rautpohjankatu 8, University of Jyväskylä, P.O. Box 35 (LL),
FI-40014 University of Jyväskylä, Finland.
E-mail: [email protected]
Running title: Physical activity, metabolism, and brain
Disclosure of funding: The FITFATTWIN study was supported by the Finnish Ministry of
Education and Culture (UMK), META-PREDICT (within the European Union Seventh

2
Framework Programme, HEALTH-F2-2012-277936 to UMK), Juho Vainio Foundation
(MR), and Finnish Cultural Foundation (MR). The data collection of the FT16 study was
supported by the National Institute of Alcohol Abuse and Alcoholism (grants AA-12502, AA-
00145, and AA-09203 to RJ Rose) and the Academy of Finland (grants 100499, 205585,
118555, 141054, and 264146 to JK).
Conflicts of interest: There are no conflicts of interest.

3
ABSTRACT
ROTTENSTEINER, M., T. LESKINEN, E. NISKANEN, S. AALTONEN, S.
MUTIKAINEN, J. WIKGREN, K. HEIKKILÄ, V. KOVANEN, H. KAINULAINEN, J.
KAPRIO, I. M. TARKKA, and U. M. KUJALA. Physical activity, fitness, glucose
homeostasis, and brain morphology in twins. Med. Sci. Sports. Exerc. Vol. xx, No. xx, pp.
xxxx-xxxx, xxxx. Purpose: The main aim of the present study (FITFATTWIN) was to
investigate how physical activity level is associated with body composition, glucose
homeostasis, and brain morphology in young adult male monozygotic (MZ) twin pairs
discordant for physical activity. Methods: From a population-based twin cohort, we
systematically selected 10 young adult male MZ twin pairs (age range 32–36 y) discordant for
leisure-time physical activity during the past 3 years. Based on interviews, we calculated a
mean sum index for leisure-time and commuting activity during the past 3 years (3-y LTMET
index expressed as MET-h/d). We conducted extensive measurements on body composition
(including fat% measured by dual-energy X-ray absorptiometry), glucose homeostasis
including HOMA index and insulin sensitivity index (Matsuda index, calculated from glucose
and insulin values from an oral glucose tolerance test), and whole brain magnetic resonance
imaging for regional volumetric analyses. Results: According to pairwise analysis, the active
twins had lower body fat% (P = 0.029) and HOMA index (P = 0.031), and higher Matsuda
index (P = 0.021) compared to their inactive co-twins. Striatal and prefrontal cortex (sub-
gyral and inferior frontal gyrus) brain gray matter volumes were larger in the non-dominant
hemisphere in active twins compared to inactive co-twins with a statistical threshold of P <
0.001. Conclusions: Among healthy adult male twins in their mid-thirties, a greater level of
physical activity is associated with improved glucose homeostasis and modulation of striatum
and prefrontal cortex gray matter volume independent of genetic background. The findings
may contribute to later reduced risk of type 2 diabetes and mobility limitations.

4
Key Words: EXERCISE, FITNESS, BODY COMPOSITION, GRAY MATTER VOLUME,
GLUCOSE

5
INTRODUCTION
Paragraph Number 1 High levels of leisure-time physical activity and physical fitness are
associated with reduced levels of total and visceral fat, lowered cardiometabolic risk factors,
better cognitive function, reduced mortality, and reduced prevalence of metabolic syndrome,
type 2 diabetes, and coronary heart disease (5,16,29,30). In many diseases, such as coronary
heart disease, type 2 diabetes, and Alzheimer’s disease, a long pre-symptomatic phase is
thought to precede clinical onset. Hence, studies assessing a low level of physical activity as a
potential risk factor for such diseases among middle-aged or older people require long follow-
up times to avoid influence on the investigated risk factors from preclinical pathogenic
processes or changes in physical activity levels arising from the prodromal phase of a disease.
Paragraph Number 2 In exercise science, very long-term intervention studies are
challenging to accomplish for both funding and logistical reasons. Purely observational
follow-up studies, even in a longitudinal setup, also present problems in establishing cause-
and-effect relationships. If, because of genetic susceptibility, a person becomes ill, gains
weight, or has naturally low aerobic fitness, the result can be inactivity with the consequence
of selection bias in observational studies (13). Various studies have shown that physical
fitness and the ability to achieve high levels of physical activity also have genetic components
(6,36). Inherited biological characteristics may make it easier for individuals to exercise and
therefore may favor them with lower morbidity and mortality because of this interaction (13).
Childhood environment also plays a role in adult exercise behavior. A monozygotic (MZ)
twin-pair study design controls for somatic genetic predisposition (MZ pairs are genetically
identical at the sequence level) and largely controls for childhood home environment because
the pairs almost always share the same childhood environment.

6
Paragraph Number 3 According to individual-based observational studies, healthy
elderly adults who have a high aerobic fitness level maintain larger specific brain volumes,
especially in the hippocampus, compared to their less physically active age-matched controls
(9). A larger right hippocampus is also implicated in younger exercising adults compared to
those not exercising (11). However, theoretically, the observed difference reported by
Killgore et al. (11) may be explained by other associated unstudied factors among unrelated
individuals whereas MZ twin pairs usually show similar regional brain volumes (37).
Paragraph Number 4 The main aim of the present co-twin control study (the
FITFATTWIN study) was to investigate how physical activity level is associated with body
composition, glucose homeostasis, and brain morphology in young adult male MZ twin pairs
discordant for physical activity. We studied young adult males to see whether differences
arising from differing physical activity levels are observable under conditions in which
chronic diseases are uncommon, and medications or possible prodromal phases thus do not
interfere with interpretation of findings.
METHODS
Participants
Paragraph Number 5 We recruited 17 young adult male MZ twin pairs for the
FITFATTWIN study among whom 10 pairs were determined to be discordant for leisure-time
physical activity during the past 3 years. The selection process is described in detail below.
Paragraph Number 6 The participants for this study were initially identified from the
FinnTwin16 Cohort, which is a population-based, longitudinal study of Finnish twins born
between October 1974 and December 1979 (10). All twins had been sent by mail a paper
questionnaire at ages 16, 17, 18.5, and 22–27 (mean of the last range, 24.5). The latest data
collection (wave 5), using a web-based questionnaire, was conducted when the twins were

7
ages 32–37 (mean 34.0). All questionnaires included questions related to health, body
composition, and physical activity. A total of 4183 twin individuals (1880 males) responded
to the latest web-based questionnaire, and the response rate for the overall cohort was 71.9%.
The responders included 202 male MZ pairs with data on physical activity from both co-
twins. The zygosity of the twins was determined by means of a validated questionnaire (33).
Paragraph Number 7 The selection of the twin pairs for the FITFATTWIN study was
done based on data gathered with a telephone interview, face-to-face interview, and medical
examination at the laboratory, in addition to the web-based questionnaire.
Paragraph Number 8 Initially, we selected all of the MZ male twin pairs from the
FinnTwin16 Cohort (wave 5) and estimated their physical activity level based on answers to
questions about leisure-time physical activity. We identified potential participants for the
FITFATTWIN study by screening and including the pairs with the highest discordance in
their leisure-time physical activity (Figure 1). Specifically, the difference in physical activity
between the co-twins of a twin pair was assessed based on frequency of leisure-time physical
activity as follows: The so-called active co-twin of the twin pair was physically active ≥2
times per week, and the so-called inactive co-twin of the same pair ≤2 times per month
(inclusion criterion 1 in Figure 1). If this criterion was not met, the physically active co-twin
needed to participate in leisure-time physical activity ≥2 times/week at an intensity equivalent
to easy or brisk running while the leisure-time physical activity of the inactive co-twin needed
to be less intense and less frequent or of shorter duration, and neither frequency nor duration
could be more than that of his active co-twin (inclusion criterion 2 in Figure 1). Because
chronic diseases can restrict the ability to be physically active, twins with specific chronic
diseases were excluded. Furthermore, twins reporting heavy use of alcohol or use of
medication for a chronic disease were excluded.

8
Paragraph Number 9 Among the 202 MZ male pairs of the FinnTwin16 Cohort, 26
pairs fulfilled inclusion criterion 1, and 13 pairs fulfilled inclusion criterion 2. All of these
pairs (n = 39) were interviewed by telephone. The interview included questions on current
health and physical activity habits during the past 3 years similar to those asked in our
previous studies (15). Of these 39 pairs, 19 pairs were excluded from the FITFATTWIN study
for the following reasons: declining to take part in the study; having specific acute diseases
that affected the ability to be physically active; failure to attend the telephone interview; or
recent major changes in physical activity levels (Figure 1). Finally, 17 MZ male pairs (10
pairs meeting inclusion criterion 1 and 7 pairs meeting inclusion criterion 2) accepted the
invitation to participate in the study and went through our comprehensive clinical study
measurements and detailed physical activity interviews (Figure 1).
Paragraph Number 10 Final criteria of physical activity discordant twin pairs.
After the FITFATTWIN physical activity interviews (see details below), 10 of these 17 pairs
were classified as discordant for leisure-time physical activity (Figure 1). These 10 pairs met
the following five criteria set for maximal leisure-time physical activity discordance.
1. Inclusion based on criterion 1 or 2, above.
2. A pairwise difference ≥1.5 MET-h/d (MET, metabolic equivalent) between active and
inactive co-twins in leisure-time physical activity (including work journey activity),
according to the 12-month physical activity interview (12-mo-LTMET index; see
below) (17,38).
3. 12-mo-LTMET index <5 MET-h/d for the inactive co-twin.
4. ≥1 MET-h/d pairwise difference between active and inactive co-twins in leisure-time
physical activity (including work journey activity) for the past 3 years, according to
the shorter physical activity interview (3-y-LTMET index; see below) (15,19,38).
5. A higher Baecke sport index for the active versus the inactive co-twin (4).

9
Measurements
Paragraph Number 11 We conducted a series of comprehensive clinical
measurements over two consecutive days (see table in Supplemental Digital Content 1, which
shows the list of measurements with a timetable). All of the main outcome measurements
were carried out blind to physical activity status. All participants were advised not to exercise
vigorously (except for walking and other daily chores) during the 2 days before the
measurements because our aim was to investigate long-term adaptations to exercise. The
measurements reported in this paper are described in more detail below.
Paragraph Number 12 Leisure-time physical activity. The two different structured
physical activity interviews were used to assess the volume of participant leisure-time
physical activity, including work journey activity. First, a shorter retrospective physical
activity interview (15,19,38) was used to assess leisure-time physical activity volume at one-
year intervals over the past 6 years. Leisure-time physical activity volume was quantified as a
leisure-time MET index. Leisure-time physical activities were calculated as frequency (per
month) × duration (min) × intensity (MET) and work journey activity as frequency (five times
per week) × duration (min) × intensity of 4 METs. The results were expressed as a sum score
of MET-h/d (MET index). The mean leisure-time MET index during the past 3 years (3-y-
LTMET index as MET-h/d) was calculated and used as one of the criterion variables for
pairwise comparison of leisure-time physical activity discordance (see above, discordance
criterion 4).
Paragraph Number 13 The second, more detailed, structured interview that was used
to determine the volume of leisure-time activities, daily (non-exercise) activities, and work
journey activity over the previous 12 months employed a modified version of the Kuopio
Ischemic Heart Disease Risk Factor Study Questionnaire (17,38). Here, ‘modified version’

10
refers to the updated list of activities included in the questionnaire. This questionnaire
contained a 20-item list of different types of physical activity, including leisure-time (e.g.,
running, skiing, and swimming), daily (e.g., gardening, berry-picking, do-it-yourself
activities), and commuting activity (walking or cycling) along with “other” physical activities
specified by the responder. Both twin brothers reported the monthly frequency of each
physical activity session over the previous 12 months. They also reported the average
intensity of their activity sessions on a scale from 1 to 4: 1 = recreational, outdoor activities
that do not cause breathlessness or sweating; 2 = conditioning exercise that induces
breathlessness but not sweating; 3 = brisk conditioning exercise that induces breathlessness
and sometimes sweating; and 4 = competitive, strenuous exercise that induces breathlessness
and extensive sweating. Each self-rated physical activity intensity was converted into MET
values (2,3,17). For each activity, the average duration per exercise session was also reported
to calculate the overall dose of activity (MET × average duration × frequency, MET-h/d). The
overall dose of leisure-time physical activity during the past 12 months (12-mo-LTMET index
as MET-h/d) was calculated by summing the values for leisure-time and work journey
activity, excluding daily activities, and used in the identification of discordant pairs (see
above, criteria 2 and 3). The most common types of leisure-time physical activity reported
were jogging and walking.
Paragraph Number 14 We also used the 16-item Baecke Questionnaire to assess
recent vigorous physical activity (4). We then summed the three indexes (work, sport, and
leisure-time excluding sports) as proposed in the original paper (4). The sport index was used
as a measure of the vigorous physical activity.
Paragraph Number 15 Psychological factors. To evaluate participant motives for
leisure-time physical activity, the Finnish version (for details, see Aaltonen [1]) of the original
73-item version of the Recreational Exercise Motivation Measure (REMM), developed by

11
Rogers and Morris (31), was used. The 73 REMM items comprise eight sub-dimensions for
exercise motivation (each with 8 to 13 items). The sub-dimension ‘enjoyment’ (i.e., ‘to have a
good time/I enjoy exercising’), representing intrinsic motivation, was included in this initial
analysis to study its associations with the other characteristics related to physical activity.
Paragraph Number 16 Physical fitness. Cardiorespiratory fitness was measured by a
maximal exercise test with gas exchange analysis (spiroergometry), using an electrically
braked bicycle ergometer. Gas exchange, including oxygen uptake, was measured breath-by-
breath with a Vmax spiroergometer (Sensormedics, Yorba Linda, CA, USA). The work load
started at 25 W and was increased stepwise by 25 W every 2 min until exhaustion, or until
maximal exercise capacity was reached, using a rate of perceived exertion of 19-20/20 on the
Borg Scale, or a gas exchange ratio (VCO2/VO2) of over 1.1 as the criterion. Maximal oxygen
uptake was determined as the mean value of the two highest consecutive VO2 values recorded
during periods of 30 s. Electrocardiogram recordings were performed with the participant at
rest and monitored during exercise and recovery. Blood pressure was measured at rest and
during exercise and recovery at 2-min intervals.
Paragraph Number 17 Maximal isometric left knee extensor force was measured in a
sitting position using an adjustable dynamometer chair (Good Strength, Metitur, Palokka,
Finland) (35). Briefly, the left knee was set at an angle of 60° from full extension. Overall,
four maximal efforts separated by a 30-s pause were performed. The best performance with
the highest value was accepted as the participant’s score. In our laboratory, the coefficients of
variation between two consecutive measurements have been 6%.
Paragraph Number 18 Anthropometrics and body composition. Weight and height
were measured, with the participant in bare feet and light clothing, to the nearest 100 g and
0.5 cm, respectively. Waist circumference was measured midway between the spina iliaca
superior and the lower rib margin, and hip circumference at the level of the greater

12
trochanters, both to the nearest half centimeter (21). Whole body composition was determined
after an overnight fast using dual-energy X-ray absorptiometry (DEXA Prodigy; GE Lunar
Corp., Madison, WI USA).
Paragraph Number 19 Blood samples. Ten-hour fasting blood samples were collected
by venipuncture after 10 min of supine rest. Plasma glucose was determined using a Konelab
20 XT (Thermo Fisher Scientific, Vantaa, Finland) and serum insulin with an IMMULITE®
1000 Analyzer (Siemens Medical Solution Diagnostics, Los Angeles, CA, USA). The
homeostatic model assessment (HOMA) index was calculated using the following formula:
(Fasting plasma glucose × Fasting plasma insulin)/22.5 (23). After drawing the fasting blood
samples, an oral glucose tolerance test (OGTT) was performed with a glucose load of 75 g
(GlucosePro, Comed LLC, Tampere, Finland) and blood samples taken at 30 min, 1 h, and 2
h. Plasma glucose and insulin were determined from the samples, as described above. The
Matsuda index (22) (insulin sensitivity index) was calculated according to the web-based
calculator at http://mmatsuda.diabetes-smc.jp/MIndex.html.
Paragraph Number 21 Brain magnetic resonance imaging and voxel-based
morphometry (VBM) preprocessing. Participant brain scans were acquired using a 1.5 T
whole body magnetic resonance (MR) scanner (Siemens Symphony, Siemens Medical
Systems, Erlangen, Germany). The 3D T1-weighted MPRAGE images of whole brain were
taken with the following parameters: TR = 2180 ms, TE = 3.45 ms, TI = 1100 ms, flip angle =
15˚, slice thickness = 1.0 mm, in-plane resolution 1.0 mm × 1.0 mm, and matrix size = 256 ×
256. Nine pairs had complete MR images (one pair was excluded for excessive artefacts from
dental work). Three participants were left-handed, and their MR images were axially flipped
to create a database in which all participants had their dominant hemisphere on the left.
Therefore, the VBM results reported here reflect differences in gray matter (GM) volume on
either the dominant or non-dominant hemisphere, not on the right or left hemisphere. VBM

13
analyses were performed with VBM8 toolbox (http://dbm.neuro.uni-jena.de/vbm/) for SPM8
(Wellcome Trust Center for Neuroimaging, UCL, UK) running under Matlab R2010a (The
Mathworks Inc., Natick, MA, USA). First, the MR images were segmented into GM, white
matter (WM), and cerebrospinal fluid (CSF). Images were then normalized to the Montreal
Neurological Institute brain template using a high-dimensional DARTEL algorithm.
Nonlinearly modulated GM images were created to preserve relative differences in regional
GM volume. Finally, the GM volumes were spatially smoothed with 12 mm full width at half
maximum Gaussian kernel. Total intracranial volume was calculated for each individual from
the segmentation maps to be used as a covariate in statistical analysis.
Ethical Approval
Paragraph Number 22 This study was conducted according to good clinical and
scientific practice/guidelines and the Declaration of Helsinki. The Ethics Committee of the
Central Finland Health Care District approved the study plan on 9/29/2011, and all
participants gave their written informed consent.
Statistical Analysis
Paragraph Number 23 Data analyses were carried out as pairwise analyses comparing
inactive vs. active members of twin pairs discordant for physical activity. The normality of
the variables was assessed by the Shapiro–Wilk test. In the pairwise comparison, student’s
paired t-test was used for normally distributed variables and the Wilcoxon matched-pair
signed-rank test for non-normally distributed variables. Effect sizes for the motives for
leisure-time physical activity were calculated as Cohen’s d, which illustrates the strength of
the phenomenon (means divided by the standard deviations). The 95% confidence intervals
(95% CIs) were calculated for the absolute mean differences between the inactive vs. active

14
co-twins. The level of significance was set at P < 0.05. Data were analyzed using IBM SPSS
Statistics 19 and StataIC 12 software.
Paragraph Number 24 Brain VBM analysis. The GM volume of the active twin was
compared to that of the inactive co-twin using a paired t-test with total intracranial volume
included in the model as a covariate. A statistical threshold of P < 0.001 (uncorrected) with a
minimum cluster size of 15 voxels was used in the analysis.
RESULTS
Paragraph Number 25 The characteristics of our twin participants are shown in Table
1 and the intrapair differences in Table 2. By definition, the past 3-y-LTMET index, the 12-
mo-LTMET index, and Baecke sport index, all three of which characterize leisure-time
physical activity level, differed between the members of the twin pairs discordant for physical
activity (Table 2). According to our retrospective interviews covering year by year the time 1-
6 years prior the outcome measurements there was a pairwise difference in leisure time
physical activity during past three years but no difference was seen 4-6 years prior to the
examinations. Among these pairs there was no pairwise difference in leisure-time physical
activity according to the questionnaire data collected on the cohort at the mean age of 24.5 y,
nor during their late adolescence based on questionnaire data from ages 16 to 18.5 yrs (see
table in Supplemental Digital Content 2). This means that we investigate the effects of
physical activity differences during the 3-year period before outcome measurements.
Paragraph Number 26 As expected, active twins had higher cardiorespiratory fitness
(P < 0.001) compared to their inactive co-twins. Active twins tended to have higher exercise
enjoyment (P < 0.06) with a moderate effect size (Cohen’s d = 0.75) compared to their
inactive co-twins (Table 2). To establish more personal reasons for engaging or not engaging
in leisure-time physical activity, the co-twins were asked to describe in their own words their

15
reasons for their physical activity behaviors. Six of the inactive co-twins reported that work
and/or family commitments were the primary reasons for physical inactivity.
Paragraph Number 27 The active twins had a lower body fat percent (P = 0.029)
compared to inactive co-twins, but there was no pairwise difference in the lean mass (Table
2). The Matsuda index was higher (P = 0.021) and the HOMA index lower (P = 0.031) among
active twins compared to their inactive co-twins, indicating better insulin sensitivity/lower
insulin resistance among the more active individuals (Table 2).
Paragraph Number 28 Segmentation of brain MR images revealed that total GM,
WM, and CSF volumes were similar between co-twins (P > 0.60 for all comparisons).
However, the VBM analysis indicated regional GM volume differences in the non-dominant
striatum and prefrontal cortex between active and inactive members of the pairs. Specifically,
the putamen (peak voxel coordinates 18, 6, -6; peak T = 8.8; 395 voxels in cluster) in the non-
dominant hemisphere showed larger GM volume in the active twins compared to their
inactive co-twins (Figure 2). In addition, non-dominant prefrontal cortex (sub-gyral and
inferior frontal gyrus (IFG), peak voxel coordinates 34.5, 33, 18; peak T = 6.6; 99 voxels in
cluster) showed larger GM volume in active members than in inactive members of the pair
(Figures 2 and 3).
DISCUSSION
Paragraph Number 29 Our results show that physical fitness and glucose homeostasis
differed between the members of the MZ twin pairs discordant for physical activity,
supporting the argument for a causal association between physical activity and risk factor
profile in healthy young adult men. Interestingly, in MZ twins with a high degree of similarity
in brain structure (38), we observed specific modulation in GM in the striatum and frontal
cortex on the non-dominant hemisphere associated with physical activity. The active member

16
of the twin pair had a larger striatal GM volume; furthermore, the non-dominant prefrontal
cortex in the sub-gyral and IFG had a larger GM volume. Because in this age group, total
cortical GM and WM volumes are typically stable, our finding provides evidence for the
structural effects of long-term physical activity on the healthy adult brain.
Paragraph Number 30 Identifying MZ co-twins who have long-term discordance in
their physical activity habits is challenging because participation in physical activity has a
rather high heritability (14,24). In our comprehensive screening of five consecutive age
cohorts of twins in Finland, we identified 10 male twin pairs who fulfilled our criteria for
discordance in physical activity, which included differential participation in physical activity
between the co-twins during the past 3 years. Members of MZ twin pairs usually have rather
similar health habits because they are reared together at home, and differences mostly arise
after they have moved out of the parental home for study or work. Among the physical
activity–discordant twin pairs, the most commonly reported reason for being physically
inactive given by the inactive members were work- or family-related commitments.
Paragraph Number 31 As expected, physical activity was associated with increased
cardiorespiratory fitness in our pairwise analysis, indicating causality between physical
exercise and fitness. Similar associations were not found for maximum muscular strength or
power, possibly because our participants usually reported participation in aerobic sports. Over
the long term, the finding of increased aerobic fitness among physically active individuals has
clinical significance because low cardiorespiratory fitness is a quantitative predictor of all-
cause mortality (12).
Paragraph Number 32 For body composition, our results accord with those of our
previous studies (19) on older twin pairs highly discordant for physical activity over a long
period of time, where the inactive twins had only slightly higher body weight but markedly
higher body fat% and body fat mass than their active co-twins. This result also is in line with

17
the results of intervention studies showing that aerobic exercise leads to visceral fat reduction
in a dose-response manner (26).
Paragraph Number 33 Interestingly, the young co-twins discordant for physical
activity already had differences in their insulin resistance/sensitivity as measured by both a
steady-state (fasting/HOMA) index and dynamic (Matsuda) index. This finding is evidence
for a reduced risk for type 2 diabetes in later life. In addition, it is in line with results of a
randomized controlled trial showing that exercise can prevent the occurrence of type 2
diabetes among people with impaired glucose tolerance (28) and with our previous twin study
showing a lower risk for type 2 diabetes among physically active members of MZ twin pairs
compared to their inactive co-twins (39).
Paragraph Number 34 A novel aim of the present study was to analyze brain
morphology in young adult twin pairs discordant for physical activity. The voxel-wise whole
brain analysis revealed a surprisingly extensive difference in the volume of GM between the
members of the pairs in the striatum in the non-dominant hemisphere and a somewhat smaller
area in the IFG, also in the non-dominant hemisphere, in favor of those with physically active
life style. Reduced basal ganglia volume was associated with metabolic syndrome in a recent
study by Onyewuenyi et al. (27), who analyzed GM region-of-interest volumes of basal
ganglia in participants of an age similar to our group. A reduced basal ganglia volume
(specifically pallidal) was associated with greater odds having metabolic syndrome (27). Also
a large study of elderly persons showed that their walking speed decreased progressively with
the decreasing volume of the basal ganglia (8). Various parts of the basal ganglia are heavily
involved with motor control networks as well as with networks involved in frontal and
prefrontal association areas and limbic networks (25). As for the healthy elderly general
population, 6 months of aerobic exercise intervention increased GM volume in the anterior
cingulate and supplementary motor area (SMA) as well as in the right IFG (7). Increased GM

18
volume in the SMA and other frontal cortex regions as well as in the hippocampus has been
associated with various aerobic sport activities when compared to sedentary persons or
nonaerobic athletes (9,34). Our present analysis also implicated non-dominant IFG as a
potential brain region to benefit from long-term physical activity. IFG is heavily connected
with SMA, an important region for planning and initiating motor actions, thus being an
important node in the cognitive-motor network. Recent extensive analysis of IFG functions
revealed four functional clusters, three in the dominant hemisphere involved with language,
memory and emotion, and one in the non-dominant hemisphere involved with fine movement
control. This area is known to have broad anatomical connections to visual and limbic areas
establishing its role in the cognitive-motor network (20). Effects of increased use of motor
planning and execution were observed in the present GM volumes. Our young healthy twins
did not show GM differences in areas connected to memory performance, such as
hippocampi. It is noteworthy, that the association between aerobic fitness and larger
hippocampal volumes has been shown in elderly adults with diverse backgrounds (9) and it is
possible that our twins’ hippocampus-mediated memory functions were at a general healthy
level with absence of detectable pathology. Thus we could not detect changes affected by
exercise or the pairwise differences were so small that they did not reach high enough
statistical power to be detected in our analyses. Increased GM volumes presumably reflect the
capability of the structures in question to modulate their function, e.g., to enhance local
dendritic complexity. It is assumed that neuroplasticity, well known in animal and human
pathological studies, is the mechanism behind the increased GM volumes. The overall
interpretation is that the capacity of the brain to coordinate motor activities and the necessary
associative and cognitive functions in the frontal cortex is improved.
Paragraph Number 35 The limitations of our study include the low number of twin
pairs discordant for physical activity despite our nationwide search. Because of this low

19
number, we had to use a relatively low statistical threshold in the VBM analysis (uncorrected
P < 0.001). On the other hand, focusing on young healthy adult males helped us to avoid bias
arising from effects of sex differences, chronic diseases, degenerative changes, or
medications. There was no pairwise difference in the occupational physical loading or in the
daily activities among the studied pairs. There was one smoker in the inactive and the active
co-twin groups, respectively, and the active compared to the inactive members of the twin
pairs did not have statistically significant differences in their diet according to a food
frequency questionnaire (results on diet will be reported in more detail elsewhere). Therefore,
it is unlikely that smoking or dietary differences explain our findings. With respect to the
comparability of our sample with the general population (generalizability), we compared the
participants of this study to the other men from FinnTwin16 Cohort, who participated in the
web-based questionnaire survey at the mean age of 34 (32) (see table in Supplemental Digital
Content 3, which shows the subject characteristics comparisons). Participants of the current
study had somewhat lower BMI and mean physical activity level but otherwise rather similar
subject characteristics compared to the other men in the cohort. The generalizability of the
results to women needs further research. Our future analyses on metabolomics and properties
of skeletal muscle and fat tissues will increase our understanding of the complicated
underlying mechanisms, some of which have already been investigated among older twins
(16,18). Our FITFATTWIN study also includes physical activity–concordant twin pairs (not
included in this report), allowing us to study different associations using a larger population.
Conclusions
Paragraph Number 36 In healthy adult male twins, the level of leisure-time physical
activity is at a young age already associated with factors known to be related to reduced
cardiometabolic risk. A significantly larger striatal GM volume in active twins indicates

20
structural modulation of the brain GM as a result of long-term physical activity. When
studying the effects of physical activity on health, the multi-dimensional influences should be
considered in addition to specific, single variables.
Competing interests
The authors declare that they have no competing interests.
Acknowledgements
The authors apologize that because of constraints on space, it was not possible to cite all the
outstanding work in this area.
We thank Professor James A. Timmons for his comments on the manuscript.
The FITFATTWIN study was supported by the Finnish Ministry of Education and Culture
(UMK), META-PREDICT (within the European Union Seventh Framework Programme,
HEALTH-F2-2012-277936 to UMK), Juho Vainio Foundation (MR), and Finnish Cultural
Foundation (MR). The data collection of the FT16 study was supported by the National
Institute of Alcohol Abuse and Alcoholism (grants AA-12502, AA-00145, and AA-09203 to
RJ Rose) and the Academy of Finland (grants 100499, 205585, 118555, 141054, and 264146
to JK).
The results of the present study do not constitute endorsement by the American
College of Sports Medicine.

21
References
1. Aaltonen S. Leisure-time physical activity in a Finnish twin study. Genetic and
environmental influences as determinants and motives as correlates. Thesis,
University of Jyväskylä, 2013; http://urn.fi/URN:ISBN:978-951-39-5326-3 .
2. Ainsworth BE, Haskell WL, Herrmann SD, et al. Compendium of physical activities:
a second update of codes and MET values. Med Sci Sports Exerc. 2011;43:1575-1581.
3. Ainsworth BE, Haskell WL, Whitt MC, et al. Compendium of physical activities: an
update of activity codes and MET intensities. Med Sci Sports Exerc. 2000;32 (suppl
9):S498-S504.
4. Baecke JA, Burema J, Frijters JE. A short questionnaire for the measurement of
habitual physical activity in epidemiological studies. Am J Clin Nutr. 1982;36:936-
942.
5. Booth FW, Roberts CK, Laye MJ. Lack of exercise is a major cause of chronic
diseases. Compr Physiol. 2012;2:1143-1211.
6. Bouchard C, Dionne FT, Simoneau JA, Boulay MR. Genetics of aerobic and
anaerobic performances. Exerc Sport Sci Rev. 1992;20:27–58.
7. Colcombe SJ, Erickson KI, Scalf PE, et al. Aerobic exercise training increases brain
volume in aging humans. J Gerontol A Biol Sci Med Sci. 2006;61:1166-1170.
8. Dumurgier J, Crivello F, Mazoyer B, et al. MRI atrophy of the caudate nucleus and
slower walking speed in the elderly. Neuroimage. 2012;60:871-878.
9. Eriksson KI, Prakash RS, Vos MW, et al. Aerobic fitness is associated with
hippocampal volume in elderly humans. Hippocampus. 2009;19:1030-1039.
10. Kaprio J, Pulkkinen L, Rose RJ. Genetic and environmental factors in health-related
behaviors: Studies on Finnish twins and twin families. Twin Research. 2002;5:366–
371.

22
11. Killgore WD, Olson EA, Weber M. Physical exercise habits correlate with gray matter
volume of the hippocampus in healthy adult humans. Sci Rep. 2013;3:3457.
12. Kodama S, Saito K, Tanaka S, et al. Cardiorespiratory fitness as a quantitative
predictor of all-cause mortality and cardiovascular events in healthy men and women:
a meta-analysis. JAMA. 2009;301:2024-2035.
13. Kujala U. Physical activity, genes, and lifetime predisposition to chronic disease. Eur
Rev Aging Phys Act. 2011;8:31-36.
14. Kujala UM, Kaprio J, Koskenvuo M. Modifiable risk factors as predictors of all-cause
mortality: The roles of genetics and childhood environment. Am J Epidemiol.
2002;156:985-993.
15. Kujala UM, Kaprio J, Sarna S, Koskenvuo M. Relationship of leisure-time physical
activity and mortality: the Finnish twin cohort. JAMA. 1998;279:440-444.
16. Kujala UM, Mäkinen V-P, Heinonen I, et al. Long-term leisure-time physical activity
and serum metabolome. Circulation. 2013;127:340-348.
17. Lakka TA, Salonen JT. The physical activity questionnaores of the Kuopio Ischemic
Heart Disease Study (KIHD). A collection of physical activity questionnaires for
health-related reseach. Med Sci Sports Exerc. 1997;29:S46-S58.
18. Leskinen T, Rinnankoski-Tuikka R, Rintala M, et al. Differences in muscle and
adipose tissue gene expression and cardio-metabolic risk factors in the members of
physical activity discordant twin pairs. PLoS One. 2010;5:e12609.
doi:10.1371/journal.pone.0012609.
19. Leskinen T, Sipilä S, Alen M, et al. Leisure time physical activity and high-risk fat: A
longitudinal population-based twin study. Int J Obesity. 2009;33:1211-1218.
20. Liakakis G, Nickel J, Seitz RJ. Diversity of the inferior frontal gyrus - a meta-analysis
of neuroimaging studies. Behav Brain Res. 2011;225:341-347.

23
21. Marti B, Tuomilehto J, Salomaa V, Kartovaara L, Korhonen HJ, Pietinen P. Body fat
distribution in the Finnish population: Environmental determinants and predictive
power for cardiovascular risk factor levels. J Epidemiol Community Health.
1991;45:131-137.
22. Matsuda M, DeFronzo RA: Insulin sensitivity indices obtained from oral glucose
tolerance testing: comparison with the euglycemic insulin clamp. Diabetes Care.
1999;22:1462-1470.
23. Muniyappa R, Lee S, Chen H, Quon MJ. Current approaches for assessing insulin
sensitivity and resistance in vivo: advantages, limitations, and appropriate usage. Am J
Physiol Endocrinol Metab. 2008;294:E15-26.
24. Mustelin L, Joutsi J, Latvala A, Pietiläinen KH, Rissanen A, Kaprio J. Genetic
influences on physical activity in young adults: a twin study. Med Sci Sports Exerc.
2012;44:1293-1301.
25. Noback CR, Strominger NL, Demarest RJ, Ruggiero DA. The Human Nervous
System. Structure and Function. 6th ed. Totova (NJ): Humana Press; 2005. 477 p.
26. Ohkawara K, Tanaka S, Miyachi M, Ishikawa-Takata K, Tabata I. A dose-response
relation between aerobic exercise and visceral fat reduction: systematic review of
clinical trials. Int J Obesity. 2007;31:1786-1797.
27. Onyewuenyi IC, Muldoon FM, Christie IC, Erickson KI, Gianaros PJ. Basal ganglia
morphology links the metabolic syndrome and depressive symptoms. Physiol Behav.
2014;123:214-222.
28. Pan XR, Li GW, Hu YH, et al. Effects of diet and exercise in preventing NIDDM in
people with impaired glucose tolerance. The Da Qing IGT and Diabetes Study.
Diabetes Care. 1997;20:537-544, 1997.

24
29. Physical Activity Guidelines Advisory Committee. Physical Activity Guidelines
Advisory Committee Report, 2008. Washington, DC: U.S. Department of Health and
Human Services, 2008.
30. Reiner M, Niermann C, Jekauc D, Woll A. Long-term health benefits of physical
activity – a systematic review of longitudinal studies. BMC Public Health.
2013;13:813.
31. Rogers H, Morris T. An overview of the development and validation of the
Recreational Exercise Motivation Measure (REMM). XI the European Congress of
Sport Psychology–proceedings. 2003;144.
32. Rottensteiner M, Pietiläinen KH, Kaprio J, Kujala UM. Persistence or change in leisure-
time physical activity habits and waist gain during early adulthood: A twin-study.
Obesity. 2014;in press. doi: 10.1002/oby.20788. [Epub ahead of print]
33. Sarna S, Kaprio J, Sistonen P, Koskenvuo M. Diagnosis of twin zygosity by mailed
questionnaire. Hum Hered. 1978;28:241-254.
34. Schlaffke L, Lissek S, Lenz M, et al. Sports and brain morphology – A voxel-based
morphometry study with endurance athletes and martial artists. Neuroscience.
2014;259:35-42.
35. Sipilä S, Multanen J, Kallinen M, Era P, Suominen H. Effects of strength and
endurance training on isometric muscle strength and walking speed in elderly women.
Acta Physiol Scand. 1996;156:457-464.
36. Stubbe JH, Boomsma DI, Vink JM, et al. Genetic influences on exercise participation
in 37.051 twin pairs from seven countries. PLoS ONE. 2006;1(1): e22.
doi:10.1371/journal.pone.0000022.

25
37. Tramo MJ, Loftus WC, Stukel TA, Green RL, Weaver JB, Gazzaniga MS. Brain size,
head size, and intelligence quotient in monozygotic twins. Neurology. 1998;50:1246-
1252.
38. Waller K, Kaprio J, Kujala UM. Associations between long-term physical activity,
waist circumference and weight gain: a 30-year longitudinal twin study. Int J Obesity.
2008;32:353-361.
39. Waller K, Kaprio J, Lehtovirta M, Silventoinen K, Koskenvuo M, Kujala UM.
Leisure-time physical activity and type 2 diabetes during a 28-year follow-up in twins.
Diabetologia. 2010;53:2531-2537.

26
FIGURE 1 - Flow chart of the participants in the FITFATTWIN study.
For selection criteria 1 and 2 and the five final criteria for discordant pairs, see methods.

27
Table 1 Characteristics of the male monozygotic twin pairs discordant for physical activity (10 male
monozygotic twin pairs, 20 individuals).
Mean ± SD Min Max
Age (y) 33.9 ± 1.3 32 36
3-y-LTMET index (MET-h/d) 3.4 ± 2.7 0.2 10.4
12-mo-LTMET index (MET-h/d)a 2.6 ± 1.8 0.1 6.7
Baecke total index 7.8 ± 1.2 5.6 9.8
Baecke sport index 2.7 ± 0.6 1.8 4.0
Exercise enjoyment (5-point Likert scale) 4.1 ± 0.5 3.1 4.9
VO2-max (ml/kg/min)b 40.3 ± 4.9 31.6 49.1
Leg extension strength (Newton) 605 ± 128 430 865
Height (cm) 179.4 ± 5.2 173.0 188.0
Weight (kg) 76.8 ± 10.5 59.2 95.9
Body mass index (kg/m2) 23.8 ± 2.6 19.8 30.1
Waist circumference (cm) 87.0 ± 7.3 74.5 102.0
Waist-to-hip ratio 0.90 ± 0.05 0.82 0.99
Fat percent (%) 22.4 ± 4.5 14.1 32.0
Fat mass (kg) 17.6 ± 5.8 10.3 30.8
Lean mass (kg) 56.2 ± 5.4 46.1 63.6
Systolic blood pressure (mmHg) 115 ± 10 102 140
Diastolic blood pressure (mmHg) 68 ± 9 50 80
Fasting glucose (mmol/L) 5.3 ± 0.4 4.7 5.9
Fasting insulin (µU) 3.8 ± 2.2 0.2 8.5
Matsuda index (n = 44) 15.1 ± 14.2 3.7 51.5
HOMA index 0.9 ± 0.6 0.1 2.2
aExcludes daily activities
bOne active twin did not participate, and for one inactive twin, maximal oxygen uptake was extrapolated based
on his sub-maximal test.

28
Table 2 Intrapair differences in male monozygotic twin pairs discordant for physical activity.
Characteristics Inactive
(N = 10)
Active
(N = 10)
Mean difference
(95% CI)
P value
Age (y) 34 (range 32–36)
Physical activity
3-y-LTMET index (MET-h/d) 1.7 ± 1.3 5.0 ± 2.7 3.3 (1.9 to 4.8) 0.001
12-mo-LTMET index (MET-h/d)a 1.2 ± 0.9 3.9 ± 1.2 2.8 (2.0 to 3.5) <0.001
Baecke total index 7.2 ± 1.2 8.4 ± 0.9 1.2 (0.6 to 1.9) 0.002
Baecke sport index 2.2 ± 0.4 3.1 ± 0.4 0.9 (0.4 to 1.3) 0.005
Exercise enjoyment (5-point Likert scale) 3.9 ± 0.4 4.2 ± 0.6 0.3 (-0.02 to 0.6) 0.060
Physical fitness
VO2-max (ml/kg/min) (n = 9 pairs)b 37.3 ± 3.5 43.6 ± 4.2 6.3 (4.1 to 8.5) <0.001
Leg extension force (N) 591 ± 146 619 ± 114 28 (-43 to 98) 0.65
Body composition
Body height (cm) 179.1 ± 5.2 179.8 ± 5.4 0.7 (-0.5 to 1.8) 0.21
Body weight (kg) 77.8 ± 12.7 75.8 ± 8.5 -2.0 (-6.9 to 2.9) 0.38
Body mass index (kg/m2) 24.2 ± 3.3 23.4 ± 1.7 -0.8 (-2.3 to 0.8) 0.28
Waist circumference (cm) 88.6 ± 8.2 85.3 ± 6.2 -3.3 (-7.4 to 0.8) 0.099
Waist-to-hip ratio 0.91 ± 0.05 0.89 ± 0.04 -0.02 (-0.04 to -0.003) 0.027
Fat percent (%) 24.0 ± 4.6 20.7 ± 4.0 -3.3 (-6.2 to -0.4) 0.029
Fat mass (kg) 19.2 ± 6.6 16.0 ± 4.5 -3.3 (-6.7 to 0.2) 0.059
Lean mass (kg) 55.5 ± 6.1 56.9 ± 4.8 1.4 (-0.3 to 3.0) 0.094
Glucose homeostasis
Fasting plasma glucose (mmol/L) 5.3 ± 0.4 5.2 ± 0.3 -0.01 (-0.2 to 0.2) 0.92
Fasting plasma insulin (µU) 4.5 ± 1.7 3.2 ± 2.6 -1.3 (-2.6 to -0.1) 0.042
Matsuda index 8.6 ± 2.2 21.7 ± 18.1 13.1 (-0.6 to 26.9) 0.021
HOMA index 1.1 ± 0.5 0.8 ± 0.7 -0.3 (-0.6 to -0.03) 0.031
CI, confidence interval; MET, metabolic equivalent
aExcludes daily activities bOne active twin did not participate, and for one inactive twin, maximal oxygen uptake was extrapolated based
on his sub-maximal test.

29
FIGURE 2 - Axial MRI slices extending from inferior tip of putamen (-10) to superior tip of
caudate nucleus (+18) illustrating increased gray matter volume in yellow and red in the non-
dominant hemisphere of active vs. inactive members of twin pairs (9 pairs). D = dominant
hemisphere; ND = non-dominant hemisphere.

30
FIGURE 3 - Coronal MRI slices demonstrating the extent of significantly differing gray
matter volumes in the striatum in the non-dominant hemisphere (+4) and in the sub-gyral,
prefrontal region in the non-dominant hemisphere (+32). The same regions are shown in axial
slices in Figure 2. D = dominant hemisphere; ND = non-dominant hemisphere.

31
Supplemental Digital Content
Supplemental Digital Content 1. Timetable of examinations related to the laboratory visits in FITFATTWIN study.
VISIT I
Before Structured instructions for the study measurements Four-day food diary, food-frequency questionnaire, questionnaire on eating habits Three-day heart rate monitoring
Day 1
12:00 pm
Standardized interview to assess smoking habits, use of alcohol and dietary habits Questionnaires on work-related stress, sleeping habits, exercise habits, and exercise motivation
1:00 pm
Resting electrocardiography and blood pressure
1:20 pm
Standardized clinical medical examination with assessment of medications
2:00 pm
Maximal bicycle ergometer exercise test with direct gas analysis (spiroergometry)
7:00 pm
MR imaging of brain (for volumetry), abdomen (for visceral and liver fat), and thigh (for fat and muscle composition)
10:00 pm
Beginning of overnight fast
Day 2 7:00 am
Anthropometric measurement (height, weight, waist and hip circumference) and assessment of body composition using bioelectrical impedance and DEXA
8:30 am
Basal metabolic rate monitoring and blood pressure
8:00 am
Fasting serum, plasma, and whole blood (DNA, RNA) samples
8:00–10:00 am
Oral glucose tolerance test Standardized physical activity history interview
10:50 am
Vertical jump, maximal isometric left knee extensor strength, and left and right hand grip strength measurements
13:15 pm
Neuropsychological tests to study cognitive functions, depression, dexterity, and depression EEG
VISIT II
Before Structured instruction of exercise before/after biopsy Overnight fast
Day 3 8–10 am
Muscle and subcutaneous adipose tissue biopsies for histological, biochemical, and gene expression studies

32
Supplemental Digital Content 2. Intrapair differences in leisure-time physical activity among FITFATTWIN study participants LTPA Inactive
(N=10) Active (N=10)
Mean difference (95% CI)
P value
LTPA MET-h/day a,b 12-mo-LTMET index at mean age 34 y 1.2 ± 0.9 3.9 ± 1.2 2.8 (2.0 to 3.5) <0.001 3-yr-LTMET index (mean; 1 to 3 years prior to the FITFATTWIN study)
1.7 ± 1.3 5.0 ± 2.7 3.3 (1.9 to 4.8) 0.001
LTPA MET index 1 to 6 years (y) prior to the FITFATTWIN study
1 y 1.4 ± 1.5 5.6 ± 4.4 4.3 (1.8 to 6.7) 0.005 2 y 1.1 ± 0.7 5.6 ± 3.0 4.4 (2.4 to 6.4) 0.001 3 y 2.6 ± 2.4 3.9 ± 2.5 1.3 (-0.3 to 2.9) 0.096 4 y 3.4 ± 3.7 3.4 ± 2.5 -0.1 (-3.1 to 2.9) 0.58 5 y 3.7 ± 3.2 2.8 ± 2.6 -0.9 (-3.8 to 1.9) 0.96 6 y 3.3 ± 3.6 4.1 ± 3.7 0.9 (-2.6 to 4.4) 0.58
LTPA MET index at mean age of 24.5 years 5.0 ± 2.6 4.5 ± 3.5 -0.5 (-1.6 to 0.5) 0.28 LTPA frequency c n n P valuee LTPA frequency at mean age of 34 years 0.063
Not at all 0 0 Less than once a month 3 0 1-2 times a month 4 0 About once a week 2 0 2-3 times a week 1 8 4-5 times a week 0 0 About every day 0 2
LTPA frequency at mean age of 24.5 years 1.0 Not at all 0 1 Less than once a month 0 1 1-2 times a month 1 1 About once a week 3 1 2-3 times a week 5 4 4-5 times a week 1 1 About every day 0 1
LTPA frequency at age 18.5 years (N=18) 1.0 Not at all 0 0 Less than once a month 0 0

33
1-2 times a month 0 1 About once a week 2 3 2-3 times a week 3 1 4-5 times a week 3 3 About every day 1 1
LTPA frequency at age 17 years 1.0 Not at all 0 0 Less than once a month 0 0 1-2 times a month 0 1 About once a week 2 1 2-3 times a week 3 2 4-5 times a week 3 3 About every day 2 3
LTPA frequency at age 16 years 1.0 Not at all 0 1 Less than once a month 0 0 1-2 times a month 0 1 About once a week 1 2 2-3 times a week 4 1 4-5 times a week 3 2 About every day 2 3
LTPA, leisure-time physical activity; CI, confidence interval; MET, metabolic equivalent aPhysical activity during leisure-time and journeys to and from work. bAccording to the physical activity interviews in the FITFATTWIN study examinations. cAccording to the questionnaire surveys to FinnTwin16 Cohort. dStata symmetry test.

34
Supplemental Digital Content 3. Characteristics of FITFATTWIN participants and all other men from FinnTwin16 cohorta
FITFATTWIN (N= 20 men)
FinnTwin16 cohort
(N=1558 men)
P valueb
Mean (SD)
P c
LTPA MET hours per day d 3.2 ± 2.5 4.7 ± 4.2 <0.001 Age (y) 33.7 ± 1.2 33.9 ± 1.2 0.62 Weight (kg) 76.1 ± 10.4 83.3 ± 13.6 0.022 Height (cm) 179.2 ± 5.1 179.5 ± 6.6 0.85 Body mass index, mean (kg/m2) 23.6 ± 2.3 25.8 ± 3.7 <0.001 Waist circumference (cm) 87.3 ± 8.1 92.4 ± 10.8 0.031
%
P e
Work-related physical activity 0.63 Sedentary 65.0 46.2 Standing or walking at work 15.0 19.2 Light manual work 10.0 19.3 Heavy manual work 10.0 11.2 Not working or studying 0 4.0
Educational level 0.17 Primary 0 3.3 Secondary 25.0 49.3 Tertiary 75.0 47.5
Children 0.40 Yes 45.0 56.1 No 55.0 43.9
Chronic diseases 0.17 Yes 0 15.3 No 100.0 84.7
Smoking status 0.59 Current (daily) smoker 10.0 20.0 Occasional smoker 15.0 12.3 Quitters 20.0 22.6 Never smoked 55.0 45.1
Alcohol use 0.24 Daily 0 5.5 1–2 times/week 85.0 58.5 1–2 times/month 15.0 21.5 Less than once a month 0 8.7 Never 0 5.8
LTPA, leisure-time physical activity; MET, metabolic equivalent; BMI, body mass index aFITFATTWIN participants are selected from FinnTwin16 Cohort members. For more detailed classification of characteristics, see Rottensteiner et al. 2014. bP-value for difference between FITFATTWIN participants (10 physical activity discordant MZ men pairs) and all other men from FinnTwin16 cohort. cAnalyzed with the adjusted Wald test (Stata 12.0) by taking into account clustered observations of twins within pairs. dLeisure-time physical activity and physical activity during journeys to and from work according to physical activity questions (Rottensteiner et al. 2014)

35
eAnalyzed with the Pearson’s χ2 test (Stata 12.0) by taking into account clustered observations of twins within pairs. Reference: Rottensteiner M, Pietiläinen KH, Kaprio J, Kujala UM. Persistence or change in leisure-time physical activity habits and waist gain during early adulthood: A twin-study. Obesity. 2014; doi: 10.1002/oby.20788. [Epub ahead of print]
IV
LEISURE-TIME PHYSICAL ACTIVITY AND INTRA-ABDOMINAL FAT IN YOUNG ADULTHOOD: A MONOZYGOTIC CO-TWIN
CONTROL STUDY
by
Rottensteiner, M., Leskinen, T., Järvelä-Reijonen, E., Väisänen, K., Aaltonen, S., Kaprio, J. & Kujala U.M. 2016
Obesity vol 24, 1185-1191
Available at: https://rdcu.be/OeO6
Reproduced with kind permission by Wiley.
Copyright © 2022 FDOKUMEN