Lutetium-177 radiopharmaceuticals, Manila, Philippines, 2009
Upload
khangminh22Category
view
5download
0
Vital andHealth StatisticsImpairments dueto Injuries:United States, 1985-87
Series 10:Data FromNo, 177
the National Health Survey
Estimates of the number of selected impairments due to Hufles by O@ ofimpairment, are presented by age, cross-tabukded by sex race, geographicregion, place of residence, family income, education of responsible adultfamily member, living arrangement, marital status, respondent-assessed healthstatus, and employment status. Selected impairments due to injuries are alsoshown by class and place of accident, resulting limitation of activity, anddisability days,
U.S. DEPARTMENT OF HEALTH AND HUMAN SERVICESPublic Heaith ServiceCenters for Disease ControlNational Center for Health Statistics
Hyaftsville, MarylandAugust 1991DHHS Publication No, [PHS] 91-1505
Copyright Information
All material appearing In th!s report IS m the publlc domam and may bereproduced or cop!ed without permlsslon: ctatton as to source, however, ISappreciated
Suggested citation
Collins JG Impairments due to in]unes Unrted States, 1985-87 NatlanalCenter for Health Statwtlcs Vltai Health Stat 10(t 77) 1991
Libraty of Congress Cataloging-in-Publication Data
Impairments due to injuries Un!ted States, 1985-87p cm. – (Vital and health statistics Series 10, Data from the Nat[onal
Health Interview Survey ; no 177) (DHHS pubhcatlon : no (PHS) 9t 15051Prepared by John Gary ColhnsIncludes b!bhographcai referencesSupt. of Dots. no.: HE 206209 10/177ISBN 0-8406 -0445-91 Wounds and mjur!es - United States Stahstlcs
2, Physically handicapped – Umted States Statlstm 3 Healthsurveys – Umted States – Statlstlcs 4 United States – Statmtlcs, Med!cal INattonal Center for Health Statistics (U S ) II Series Ill Ser!es’ Vital and healthstatistics Series 10, Data from the National Health Survey’ no 117
[DNLM’ 1 Acctdents– Umted States – stat! stlcs 2 Actiwtles for DallyLiving – United States – statistics. 3. Handicapped – Umted States - statwtlcs 4.Health Surveys– Umted States. 5. Wounds and Irrjunes– UmtedStates – statistics.W2 A N148vj no. 177]RA407.3 A346 no, 177[RD93.8]362.1 ‘0973’021 S –dc20[61 7.1 ‘00973’021 ]DNLM/DLCfor Library of Congress 91 13672
CIP
National Center for Health Statistics
Manning Feinleib, M.D., Dr. P.H., Director
Jacob J. Feldman, Ph. D., Associate Director for Analysisand Epidemiolo~
Gail F. Fisher, Ph. D., Associate Director for Harming andExtramural Programs
Peter L. Hurley, Associate Director for J4tal and HealthStatistics Systems
Robert A. Israel, Acting Associate Director forInternational Statktics
Stephen E. Nieberding, Associate Director forManagement
Charles J. Rothwell, Associate Director for DataProcessing and Services
Monroe G. Sirken, Ph. D., Associate Director for Researchand Methodology
David L. Larson, Assistant Directo~ Atlanta
Division of Health Interview Statistics
Owen T. Thornberry, Jr., Ph. D., Director
Deborah M. Winn, Ph. D., Deputy Director
Gerry E. Hendershot, Ph. D., Chiej Illness and Disabili~Statistics Branch
Nelma B, Keen, Chiej Systems and Programming Branch
Stewart C. Rice, Jr., Chiej Survey Planning andDevelopment Branch
Robert A. Wright, Chie$ Utilization and ExpenditureStatistics Branch
Cooperation of the Cl.S. Bureau of Ihe Census
Under the legislatiori establishing the National Health Survey, the PublicHealth Service is authorized to use, insofar as possible, the services or facilitiesof other Federal, State, or private agencies.
In accordance with specifications established by the National Center forHealth Statistics, the U.S. Bureau of the Census, under a contractualarrangement, participated in planning the suwey and collecting the data.
Introduction . . . . . . . . . . . . . . . . . . . . . . . . . . . . . . . . . . . . . . . . . . . . . . . . . . . . . . . . . . . . . . . . . . . . . . . . . . . . . . . . . . . . . . . . . . 1
Highlights . . . . . . . . . . . . . . . . . . . . . . . . . . . . . . . . . . . . . . . . . . . . . . . . . . . . . . . . . . . . . . . . . . . . . . . . . . . . . . . . . . . . . . . . . . . .
Sources and limitations ofdata. . . . . . . . . . . . . . . . . . . . . . . . . . ...1 . . . . . . . . . . . . . . . . . . . . . . . . . . . . . . . . . . . . . . . . . . .
Background information . . . . . . . . . . . . . . . . . . . . . . . . . . . . . . . . . . . . . . . . . . . . . . . . . . . . . . . . . . . . . . . . . . . . . . . . . . . . . . .
Comparisonwith data for 1980-81. . . . . . . . . . . . . . . . . . . . . . . . . . . . . . . . . . . . . . . . . . . . . . . . . . . . . . . . . . . . . . . . . . . . . . .
Impairments due to injuries . . . . . . . . . . . . . . . . . . . . . . . . . . . . . . . . . . . . . . . . . . . . . . . . . . . . . . . . . . . . . . . . . . . . . . . . . . . .Visual impairments . . . . . . . . . . . . . . . . . . . . . . . . . . . . . . . . . . . . . . . . . . . . . . . . . . . . . . . . . . . . . . . . . . . . . . . . . . . . . . . . .Hearing impairments . . . . . . . . . . . . . . . . . . . . . . . . . . . . . . . . . . . . . . . . . . . . . . . . . . . . . . . . . . . . . . . . . . . . . . . . . . . . . . . .Absence of extremities or parts ofextremities . . . . . . . . . . . . . ,. . . . . . . . . . . . . . . . . . . . . . . . . . . . . . . . . . . . . . . . . . #.Deformities or orthopedic impairments . . . . . . . . . . . . . . . . . . . . . . . . . . . . . . . . . . . . . . . . . . . . . . . . . . . . . . . . . . . . . . . .Other impairments . . . . . . . . . . . . . . . . . . . . . . . . . . . . . . . . . . . . . . . . . . . . . . . . . . . . . . . . . . . . . . . . . . . . . . . . . . . . . . . . . .Class of accident . . . . . . . . . . . . . . . . . . . . . . . . . . . . . . . . . . . . . . . . . . . . . . . . . . . . . . . . . . . . . . . . . . . . . . . . . . . . . . . . . . . .Place ofaccident . . . . . . . . . . . . . . . . . . . . . . . . . . . . . . . . . . . . . . . . . . . . . . . . . . . . . . . . . . . . . . . . . . . . . . . . . . . . . . . . . . .Limitation of activity . . . . . . . . . . . . . . . . . . . . . . . . . . . . . . . . . . . . . . . . . . . . . . . . . . . . . . . . . . . . . . . . . . . . . . . . . . . . . . . .Restricted-activi~ days . . . . . . . . . . . . . . . . . . . . . . . . . . . . . . . . . . . . . . . . . . . . . . . . . . . . . . . . . . . . . . . . . . . . . . . . . . . . . .Bed-disability days . . . . . . . . . . . . . . . . . . . . . . . . . . . . . . . . . . . . . . . . . . . . . . . . . . . . . . . . . . . . . . . . . . . . . . . . . . . . . . . . . .
References . . . . . . . . . . . . . . . . . . . . . . . . . . . . . . . . . . . . . . . . . . . . . . . . . . . . . . . . . . . . . . . . . . . . . . . . . . . . . . . . . . . . , . . . . . .
List of detailed tables . . . . . . . . . . . . . . . . . . . . . . . . . . . . . . . . . . . . . . . . . . . . . . . . . . . . . . . . . . . . . . . . . . . . . . . . . . . . . . . . . .
Appendixes
1. Technical notes on methods . . . . . . . . . . . . . . . . . . . . . . . . . . . . . . . . . . . . . . . . . . . . . . . . . . . . . . . . . . . . . . . . . . . . . . .II. Definitions of certain terms used in this report . . . . . . . . . . . . . . . . . . . . . . . . . . . . . . . . . . . . . . . . . . . . . . . . . . . . . . .111. Questionnaire items and flashcards . . . . . . . . . . . . . . . . . . . . . . . . . . . . . . . . . . . . . . . . . . . . . . . . . . . . . . . . . . . . . . . . .
List of text figures
1. Percent distribution of selected impairments due to injuries by type of impairment: United States, 1985-87..2. Average annual number of selected impairments due to injuries per 1,000 population, by type ofimpairrnent:
United States, 1985-87 . . . . . . . . . . . . . . . . . . . . . . . . . . . . . . . . . . . . . . . . . . . . . . . . . . . . . . . . . . . . . . . . . . . . . . . . . . . .
List of text tables
A. Number ofselected impairments due to injuries perl,OOO population, bytype of impairment: United States,1980-81 and 1985-87 . . . . . . . . . . . . . . . . . . . . . . . . . . . . . . . . . . . . . . . .
B.. . . . . . . . . . . . . . . . . . . . . . . . . . . . . . . . . . . . .
Percent ofselected impairments due to injuries occurring at5 main places of accident, bytype ofimpairment:United States, 1980-81 and 1985-87 . . . . . . . . . . . . . . . . . . . . . . . . . . . . . . . . . . . . . . . . . . . . . . . . . . . . . . . . . . . . . . . .
c. Percentofselected impairments due to injuries resulting in limitation ofactivi~, bytype ofimpairment: UnitedStates, 1980-81 and 1985-87 . . . . . . . . . . . . . . . . . . . . . . . . . . . . . . . . . . . . . . . . . . . . . . . . . . . . . . . . . . . . . . . . . . . . . . .
D. Average annual prevalence ofselected impairments, prevalence ofselected impairments due toinjuries, andpercent of impairments that are due to injuries, by type of impairment: United States, 1985-87 . . . . . . . . . . . . .
2
3
5
6
8899
10101111111112
13
14
333945
8
9
6
7
7
8
...Ill
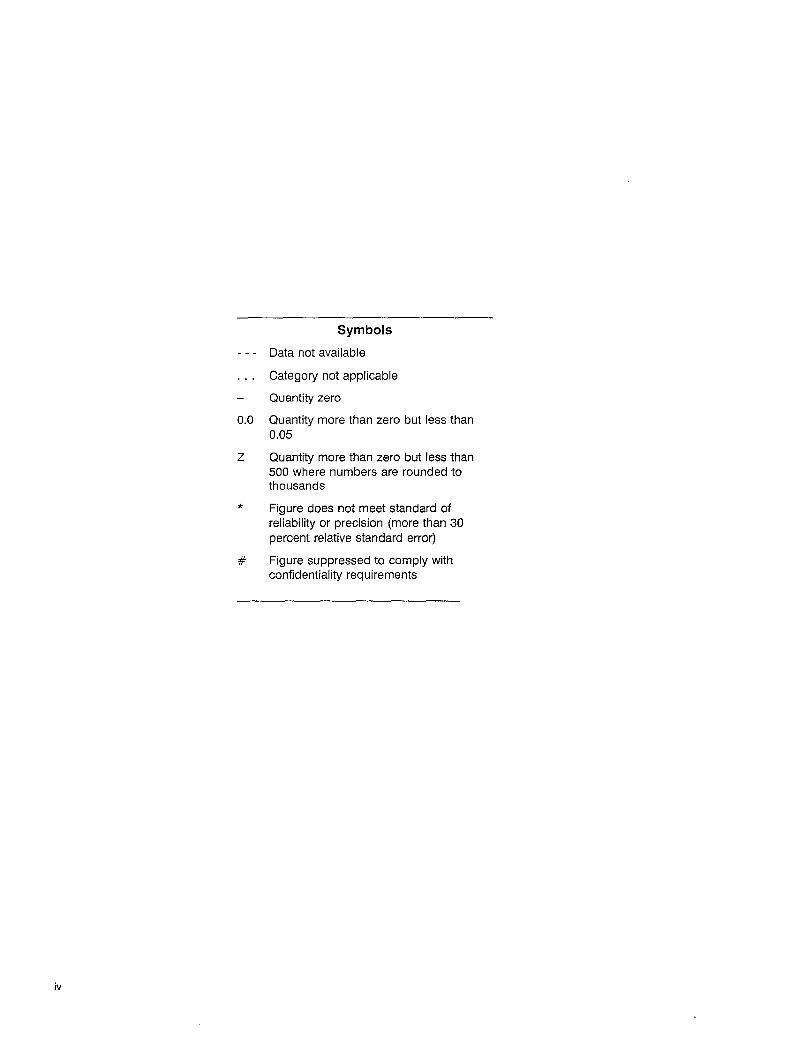
Symbols
. . . Data not available
,.. Category not applicable
— Quantity zero
0.0 Quantity more than zero but less than0.05
z Quantity more than zero but less than500 where numbers are rounded tothousands
* Figure does not meet standard ofreliability or precision (more than 30percent relative standard error)
# Figure suppressed to comply withconfidentiality requirements
Impairments due toInjuries: United States,1985–87by John Gary Collins, M.B.A.,Division of Health Interview Statistics
IntroductionNational estimates of the average annual prevalence
of selected impairments due to injuries in the civiliannoninstitutionalized population of the United States arepresented in this report. These estimates are based ondata collected by the National Center for Health Statistics(NCHS) by means of the National Health InterviewSurvey (NHIS) in 1985, 1986, and 1987.
Data on the prevalence of selected impairments dueto injuries are presented by age and selected impairments,cross-tabulated by sex, race, geographic region, place ofresidence, family income, education of responsible adultfamily member, living arrangement, marital status, heaIthstatus, and current employment status. Data on selected
impairments due to injuries are also shown by class ofaccident, place of accident, degree of limitation of activity,days of restricted activity, and days of bed disability.
The most recent NCHS reports of data from NHISthat focused on impairments due to injuries were for 1971,Series 10, No. 87 (l), and 1980-81, Series 10, No. 159 (2).
Information on the number of episodes of personsinjured and on the prevalence of all impairments is avail-able through the annual series of NCHS reports “Currentestimates from the National Health Interview Survey.”The most recent “Current estimates” report – Series 10,No. 176 (3) –is for 1989.
1
Highlights
Highlights of the data contained in this report for the3-year period 1985–87 are summarized in the followingstatements:
Impairments due to injuries accounted for26.3 percent of all impairments and 96.1 percent ofabsence of entire finger(s) and/or thumb(s).The estimated prevalence of selected impairmentsdue to injuries was 18.9 million, of which 13.6 mil-lion, or almost 72 percent, were deformities ororthopedic impairments.Almost 2.2 million selected impairments due toinjuries had occurred in the 12 months prior tointerview.The prevalence rates for all types of selectedimpairments due to injuries, except for deformitiesand orthopedic impairments of the back, were higheramong men than women.More than one of every four selected impairmentsdue to injuries occurred in accidents on streets andhighways, and more than one of every five occurredin accidents at home.Forty-five percent of visual impairments due toinjuries occurred in accidents at home.
Almost two of every five accidents causing paralysisof extremities or parts of extremities occurred on thestreet and highway.Seven of every 10 accidents resulting in loss of entirefinger(s) and/or thumb(s) occurred in industrialplaces or at home.A total of 46.5 percent of all selected impairmentsdue to injuries and 87.3 percent of paralysis ofextremities or parts of extremities resulted inlimitation of activity,Selected impairments due to injuries caused almost275 million days of restricted activity and 88 milliondays of bed disability.Selected impairments due to injuries were re-sponsible for substantially more days of restrictedactivity among males. However, a higher number ofbed-disability days were reported for females,The rates of both restricted-activity days and bed-disability days were higher among persons 45–64 years of age than for the population as a whole.
Sources and limitationsof data
The information from the National Health InterviewSurvey (NHIS) presented in this report is based on datacollected in a continuing nationwide survey by householdinterview. Each week, a probability sample of the civiliannoninstitutionalized population of the United States isinterviewed by personnel of the U.S. Bureau of theCensus. Information is obtained about the health andother characteristics of each member of the household.
One of the strengths of NHIS is the ability to combinedata over multiple years. This is possible because of thesampling design of NHIS and its use of standard questionsover several years. It is particularly desirable when makingestimates for variables with relatively small samplesizes —in this case, for impairments, which are chronicconditions, estimates for which are derived from a one-sixth sample in a given year. The stabili~ of the estimatesis increased because increasing the sample size leads tosmaller sampling errors. Therefore, for this report, dataare based on information obtained by the National Centerfor Health Statistics (NCHS) in the 1985, 1986, and 1987NHIS, and annual averages for these three years arepresented.
The NHIS sample for 1985–87 was composed of about106,000 eligible households, containing approximately276,000 persons living at the time of interwiew. The totalnonintewiew rate for NHIS was about 4.3 percent;2.7 percent was due to respondent refusal, and theremainder was primarily due to failure to locate an eligiblerespondent at home after repeated calls.
In 1985, several new sample design features wereadopted for NHIS although, conceptually, the samplingplan remained the same as the previous design. The majorchanges included (a) reducing the number of primarylocations from 376 to 198 for sampling efficiency, (b)oversampling the black population to improve the preci-sion of the statistics, (c) subdividing the NHIS sample intofour separate representative panels to facilitate linkage to “other NCHS surveys, and (d) using an all-area frame notbased on the decennial census to facilitate NCHS surveylinkage and to conduct NHIS followback surveys. Descrip-tions of the survey design, the methods used in estimation,and general qualifications of the data obtained from thesurvey are presented in appendix I.
Because the estimates presented in this report arebased on a sample of the population, they are subject tosampling errors. Therefore, readers should pay particular
attention to the section of appendix I entitled “Reliabilityof the estimates,” which presents formulas for calculatingstandard errors and instructions for their use. Samplingerrors for most of the estimates are relatively low. How-ever, when an estimated number or the numerator ordenominator of a rate or percent is small, the samplingerror may be large. The relatively small size of the samplefor the chronic condition lists (one-sixth of the totalsample per year) limits the number of variables with whichthe impairment data can be effectively analyzed.
All information collected in the survey results fromreports by responsible family members residing in thehousehold. When possible, all adult family members par-ticipate in the interview. However, proxy responses areaccepted for family members who are not at home and arerequired for all children and for family members who arephysically or mentally incapable of responding for them-selves. Although a considerable effort is made to ensureaccurate reporting, the information from both proxy andself-respondents may be inaccurate because the respond-ent is unaware of relevant information, has forgotten it,does not wish to reveal it to an interviewer, or does notunderstand the intended meaning of a question. Errorsmay also be introduced by interviewers, coders, and othersduring the processing and analysis of the data.
Certain terms used in this report are defined inappendix II and have specialized meanings for the pur-pose of the survey. It is suggested that the reader becomefamiliar with these definitions. For example, the impair-ments due to injuries discussed in this report are definedas chronic conditions, regardless of date of onset, andhave been classified by means of a special supplementarycode according to type of functional impairment andetiology. The impairment classification is shown in theNCHS Medical Coding Manual (4).
Appendix III contains the probe questions and therecording forms used to obtain information on the preva-lence of selected impairments due to injuries and theresulting limitation of activity and disability days. Thequestions for 1985, 1986, and 1987 are presented in theirentirety in the “Current estimates” reports for these years,Series 10, Nos. 160, 164, and 166, respectively (5-7). Theportions of the questionnaire shown in appendix III for1987 are the same for 1985 and 1986.
Information about the prevalence of impairments dueto injuries was obtained from responses to the checklist of
3
impairments in section H on Condition List 2, question 2a,which is phrased as follows: “Does anyone in the family(read names) now have ‘?” Estimates of days ofdisability caused by impairments due to injuries are basedon the number of disabili~ days reported for these condi-tions for the 2-week reference period. Questions on dis-ability days for impairments due to injuries are located onthe condition portion of the questionnaire in section K,and questions on limitation of activity are located insection B.
The survey includes data only on persons living in thehousehold at the time of interview. Thus, the injuryexperience of persons who died during the 2 weeks priorto the time of interview is excluded from the data. AISOexcluded is the injury experience of persons who wereinstitutionalized or who were members of the ArmedForces at the time of the household interview.
In this report, terms such as “similar” and “the same”mean that no statistically significant difference existsbetween the statistics being compared. Terms relating todifference (for example, “greater” or “less”) indicate that
differences are statistically significant. The t-test, with acritical value of t 1,96 (0.05 level of significance), wasused to test all comparisons discussed. Lack of commentregarding the difference between any two statistics doesnot mean that the difference was tested and found to benot significant.
An asterisk is placed beside certain figures to indicatea relative standard error of 30 percent or more. Figuresmarked with an asterisk are given primarily to allow thereader to combine them with related estimates andthereby, possibly, to produce a more reliable overall esti-mate for a broader category.
When a comparison is made in the analysis, if it is notfor dichotomous variables (for example, male and female),the comparison is between the specified variable and thetotal persons in that variable grouping.
The Division of Health Interview Statistics of NCHSshould be contacted for information about coding andediting procedures used to produce the final data file fromwhich the estimates shown in this report are derived,
Backgroundinformation
Although the National Center for Health Statisticssponsors several programs that provide data on accidentsand injuries as well as on chronic conditions, the NationalHealth Interview Survey (NHIS) is the only source of dataon impairments due to injuries – a combination of the twotypes of data sets, As a result, NHIS is a unique source ofinformation on disabling conditions in the United States.
Reports on impairments due to injuries using NHISdata have been published infrequently in the past 40 years.Only three have been published previously: Series 10, No.6 (8), No. 87 (l), and No. 159 (2). The first report coversthe period July 1959–June 1961, the second covers cal-endar year 1971, and the third is for 1980–81.
The annual average prevalence estimates for impair-ments due to injuries are based on data from the chroniccondition checklist for selected impairments, which isadministered to a one-sixth subsample of NHIS. In pre-vious NHIS reports on impairments due to injucies, theannual average prevalence of selected impairments due toinjuries was reported as 60.5 per 1,000 population for July1959-June 1961 (8), 62.0 per 1,000 population for 1971(l), and 66.7 per 1,000 population for 1980-81 (2). For1985-87, the average prevalence was reported as 79.9 per1,000 population. The categorical groupings for July1959–June 1961 and for 1971 vary somewhat from those inboth the 1980-81 report and the current report, and thedata presented in those earlier reports are based on aprevious edition of the International Classification ofDiseases. Therefore, trend comparisons will be shownonly for the latter two time periods.
Five types of impairment categories, some with sub-groups, plus a residual category for other selected impair-ments are presented in this report. A list of categorieswith corresponding supplementary code numbers from theNCHS Medical Coding Manual (4) is as follows:
All selected impairments (XOO-X99)Visual impairments (XOO-X03)Hearing impairments (X05-X09)Absence of extremities or parts of extremities (exclud-ing tips of fingers or toes only) (X20-X29)
Absence of entire finger(s) and/or thumb(s) only(x22, x25)Absence of other extremities or parts of extremi-ties (X20, X21, X23, X24, X26-X29)
Paralysis, complete or partial, of extremities or partsof extremities(X40-X59)Deformities or orthopedic impairments(X70-X89)
Deformities or orthopedic impairments of back(X70, X71, X80)Deformities or orthopedic impairments of upperextremities or parts of upper extremities (X73,X74, X84)Deformities or orthopedic impairments of lowerextremities or parts of lower extremities(X75-X78, X85, X86)Deformities or orthopedic impairments –other(X79, X89)
Other selected impairments (X1O-X12, X14, X19,X30-X35, X60-X64, X90-X99)
Comparison with datafor 1980-81
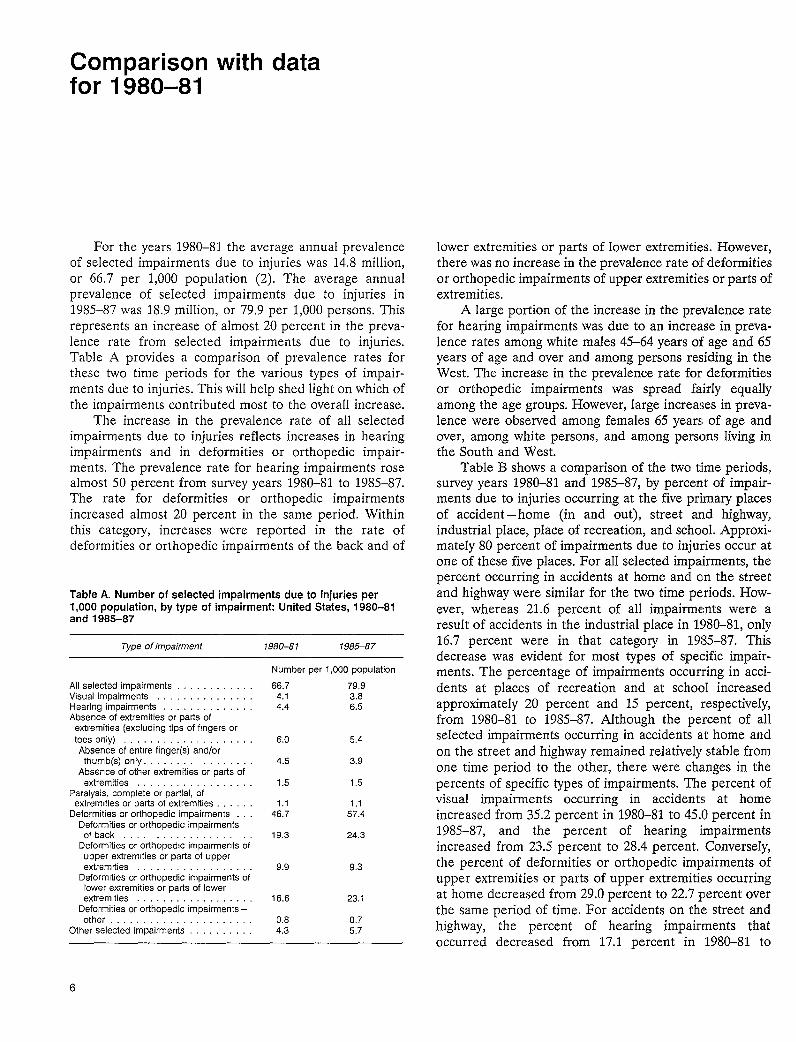
For the years 1980–81 the average annual prevalenceof selected impairments due to injuries was 14.8 million,or 66.7 per 1,000 population (2). The average annualprevalence of selected impairments due to injuries in1985-87 was 18.9 million, or 79.9 per 1,000 persons. Thisrepresents an increase of almost 20 percent in the preva-lence rate from selected impairments due to injuries.Table A provides a comparison of prevalence rates forthese two time periods for the various types of impair-ments due to injuries. This will help shed light on which ofthe impairments contributed most to the overall increase.
The increase in the prevalence rate of all selectedimpairments due to injuries reflects increases in hearingimpairments and in deformities or orthopedic impair-ments, The prevalence rate for hearing impairments rosealmost 50 percent from survey years 1980–81 to 1985–87.The rate for deformities or orthopedic impairmentsincreased almost 20 percent in the same period. Withinthis category, increases were reported in the rate ofdeformities or orthopedic impairments of the back and of
Table A. Number of selected impairments due to injuries per1,000 population, by type of impairment: United States, 1980-81and 1985-87
Type of impairment 1980–8 1 1985-87
Number per 1,000 population
All selected impairments . . . 66.7 79.9Wsual impairments . . . . . . . . . . . . 4.1 3$8Hearing impairments . . . . . . . . . 4.4 6.5Absence of extremities or parts of
extremities (excluding tips of fingers ortoes only) .,, . . . . . . . . . . . . . ,,. . 6.0 5.4Absence of entire finger(s) and/or
thumb(s) only . . . . . . . . . . . . . 4.5 3.9Absence of other extremities or parts of
extremities . . . . . . . . . . . . . . . . . . 1.5 1.5Paralysis, complete or partial, of
extremities or parts of extremities 1.1 1.1Deformities or orthopedic impairments . . 46.7 57.4
Deformities or orthopedic impairmentsof back.... . . . . . . . . ., 19,3 24.3
Deformities or orthopedic impairments ofupper extremities or parts of upperextremities . . . . . . . . . . . . . . . . . 9.9 9.3
Deformities or orthopedic impairments oflower extremities or parts of lowerextremities . . . . . . . . . . . . . 16.6 23.1
Deformities or orthopedic impairments–other . . . . . . . . . . . . . . . . . . . . 0.6 0,7
Other selected impairments . . 4.3 5,7
lower extremities or parts of lower extremities. However,there was no increase in the prevalence rate of deformitiesor orthopedic impairments of upper extremities or parts ofextremities.
A large portion of the increase in the prevalence ratefor hearing impairments was due to an increase in preva-lence rates among white males 45-64 years o]fage and 65years of age and over and among persons residing in theWest. The increase in the prevalence rate for deformitiesor orthopedic impairments was spread fairly equallyamong the age groups. However, large increases in preva-lence were observed among females 65 years of age andover, among white persons, and among persons living inthe South and West.
Table B shows a comparison of the two time periods,survey years 1980–81 and 1985-87, by percent of impair-ments due to injuries occurring at the five primary placesof accident – home (in and out), street and highway,industrial place, place of recreation, and school, Approxi-mately 80 percent of impairments due to injuries occur atone of these five places. For all selected impairments, thepercent occurring in accidents at home and cm the streetand highway were similar for the two time periods. How-ever, whereas 21.6 percent of all impairments were aresult of accidents in the industrial place in 1980–81, only16.7 percent were in that category in 1985-87. Thisdecrease was evident for most types of specific impair-ments. The percentage of impairments occurring in acci-dents at places of recreation and at schocd increasedapproximately 20 percent and 15 percent, respectively,from 1980-81 to 1985–87. Although the percent of allseIected impairments occurring in accidents at home andon the street and highway remained relatively stable fromone time period to the other, there were changes in thepercents of specific types of impairments. The percent ofvisual impairments occurring in accidents at homeincreased from 35.2 percent in 1980-81 to 45.0 percent in1985–87, and the percent of hearing impairmentsincreased from 23.5 percent to 28.4 percent. Conversely,the percent of deformities or orthopedic impairments ofupper extremities or parts of upper extremities occurringat home decreased from 29.0 percent to 22.7 percent overthe same period of time. For accidents on the street andhighway, the percent of hearing impairments thatoccurred decreased from 17.1 percent in 1980–81 to
6
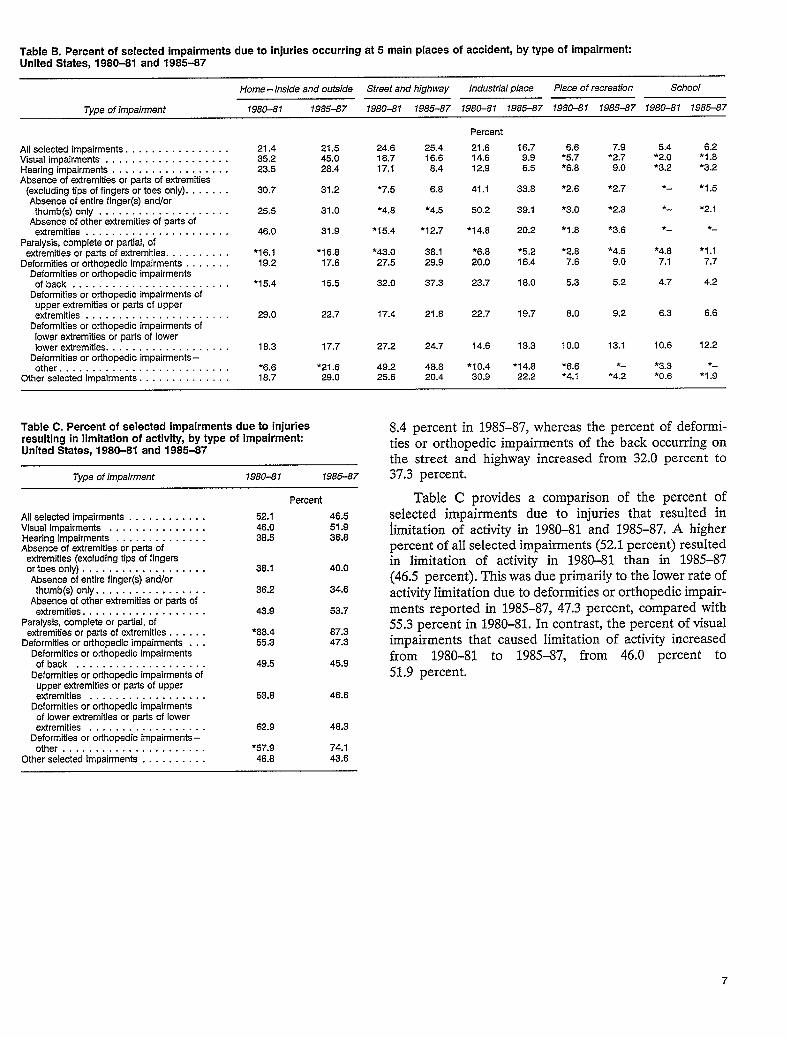
Table B. Percent of selected impairments due to injuries occurring at 5 main places of accident, by type of impairmentUnited States, 1980-81 and 1985-87
Home–inside andoutside Street andhighway Industrial place Place of recreation School
Type of impairment 1980-81 1985-87 1980-61 1985-67 1980-81 1985-87 1980-81 1985-87 1980-81 1985-87
Percent
21.6 16.714.6 9.912.9 6.5
41.1 33.8
50.2 39.1
●14.8 20.2
*6.8 *5.220.0 16.4
23.7 18.0
22.7 19.7
14.6 13.3
*1 0.4 *I 4.830.9 22.2
All selected impairments. . . . . . . . . . . . . . .Visual impairments . . . . . . . . . . . . . . . . . .Hearing impairments . . . . . . . . . . . . . . . . .Absence of extremities or parts of extremities
(excluding tips of fingers or toes only). . . . . .Absence of entire finger(s) and/or
thumb(s) only . . . . . . . . . . . . . . . . . . .Absence of other extremities of parts of
extremities . . . . . . . . . . . . . . . . . . . . .Paralysis, complete or partial, of
extremities or parts ofextremities. . . . . . . .Deformities ororthopedic impakments . . . . . .
Deformities or orthopedic impairmentsofback . . . . . . . . . . . . . . . . . . . . . . .
Deformities or orthopedic impairments ofupper extremities or parts of upperextremities . . . . . . . . . . . . . . . . . . . . .
Deformities or orthopedic impairments oflower extremities or parts of lowerIowerextremities . . . . . . . . . . . . . . . . . .
Deformities or orthopedic impairments –other . . . . . . . . . . . . . . . . . . . . . . . . .
Other selected impairments. . . . . . . . . .
21.435.223.5
30.7
25.5
46.0
*16.119.2
*1 5.4
21.5 24.645,0 18.728.4 17.1
31.2 *7.5
31.0 *4.8
31.9 *15.4
*1 6.8 *43.O17.6 27.5
15.5 32.0
25.416.6
8.4
6.8
*4.5
*1 2.7
38.129.9
37.3
21.8
24.7
48.820.4
6.6*5.7*6.8
7.9*2.79.0
5.4*2.O*3.2
6.2*1 .8*3.2
●2.6 *2.7 *- *I .5
●3.O *2.3 *- *2. 1
*1.8 *3.6 *— *-
*2.87.6
*4.59.0
*4.87.1
*I .17.7
4.25.3 5.2 4.7
29.0 22.7 17.4 6.0 9.2 6.3 6.6
10.0 13.1 10.6 12.218.3
*6.618.7
17.7 27.2
*21 .6 49.229.0 25.6
*3.3*O.6
*6.6*4. 1
*-*4.2
*—*1.9
8.4 percentin 1985–87, whereas the percentof deformi-ties or orthopedic impairments of the back occurringonthe street and highway increased from 32.0 percent to37.3 percent.
Table C provides a comparison of the percent ofselected impairments due to injuries that resulted in}imitationof activi~in 1980-81 and 1985-87. A higherpercent of aII selected impairments (52.1 percent) resultedin limitation of activity in 1980-81 than in 1985-87(46.5 percent) .Thiswas dueprimariIy tothe Iower rateofactivity limitation due to deformities or orthopedic impair-ments reported in 1985–87, 47.3 percent, compared with55.3 percent in 1980-81. Incontrast, thepercent of visualimpairments that caused limitation of activity increasedfrom 1980-81 to 1985–87, from 46.0 percent to51.9 percent.
Table C. Percent of selected Impairments due to injuriesresulting in limitation of activity, by type of impairment:United States, 1980-8i and 1985-87
Type of impairment 1980-81 1985-87
Percent
46.551.936.6
40.0
34.6
53.7
87.347.3
45.9
46.6
48.3
74.143.6
All selected impairments . . . . . . . . . . . .Vkual impairments . . . . . . . . . . . . . . .Hearing Impairments . . . . . . . . . . . . . .Absence of extremities or parts of
extremities (excluding tips of fingeraortoesonly) . . . . . . . . . . . . . . . . . . .Absence of entire finger(s) and/or
thumb(s) only . . . . . . . . . . . . . . . . .Absence of other extremities or parts of
extremities . . . . . . . . . . . . . . . . . . .Paralysis, complete or partial, of
extremities orparta of extremities . . . . . .Deformities ororthopedic impairments . . .
Deformities or orthopedic Impairmentsof back . . . . . . . . . . . . . . . . . . . .
Deformities or orthopedic impairments ofupper extremities or parts of upperextremities . . . . . . . . . . . . . . . . . .
Deformities or orthopedic impairmentsof lower extremities or parta of lowerextremities . . . . . . . . . . . . . . . . . .
Deformities or orthopedic impairments-other . . . . . . . . . . . . . . . . . . . . . .
Other selected impairments . . . . . . . . . .
52.146.036.5
36.1
36.2
43.9
*88.455.3
49.5
53.8
62.9
*57.946.8
7
Impairments due toinjuries
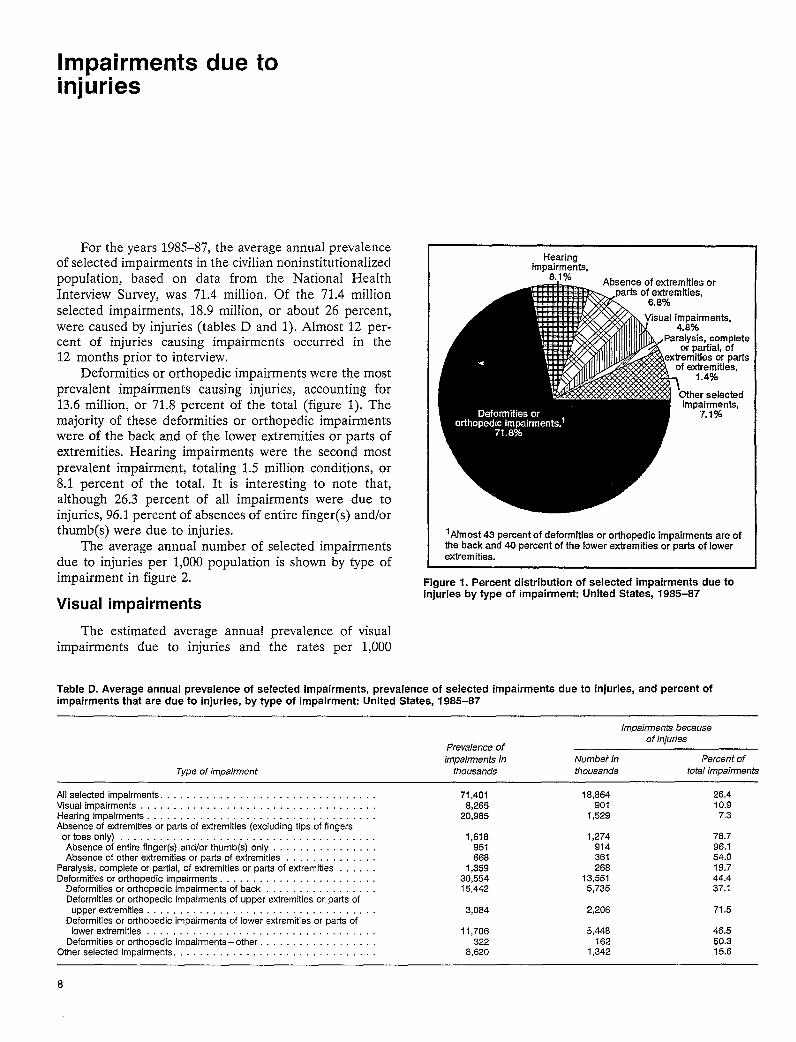
For the years 1985–87, the average annual prevalenceof selected impairments in the civilian noninstitutionalizedpopulation, based on data from the National HealthInterview Survey, was 71.4 million. Of the 71.4 millionselected impairments, 18.9 million, or about 26 percent,were caused by injuries (tables D and 1), Almost 12 per-cent of injuries causing impairments occurred in the12 months prior to interview.
Deformities or orthopedic impairments were the mostprevalent impairments causing injuries, accounting for13.6 million, or 71.8 percent of the total (figure 1). Themajority of these deformities or orthopedic impairmentswere of the back and of the lower extremities or parts ofextremities. Hearing impairments were the second mostprevalent impairment, totaling 1.5 million conditions, or8.1 percent of the total. It is interesting to note that,although 26.3 percent of all impairments were due toinjuries, 96.1 percent of absences of entire finger(s) and/orthumb(s) were due to injuries.
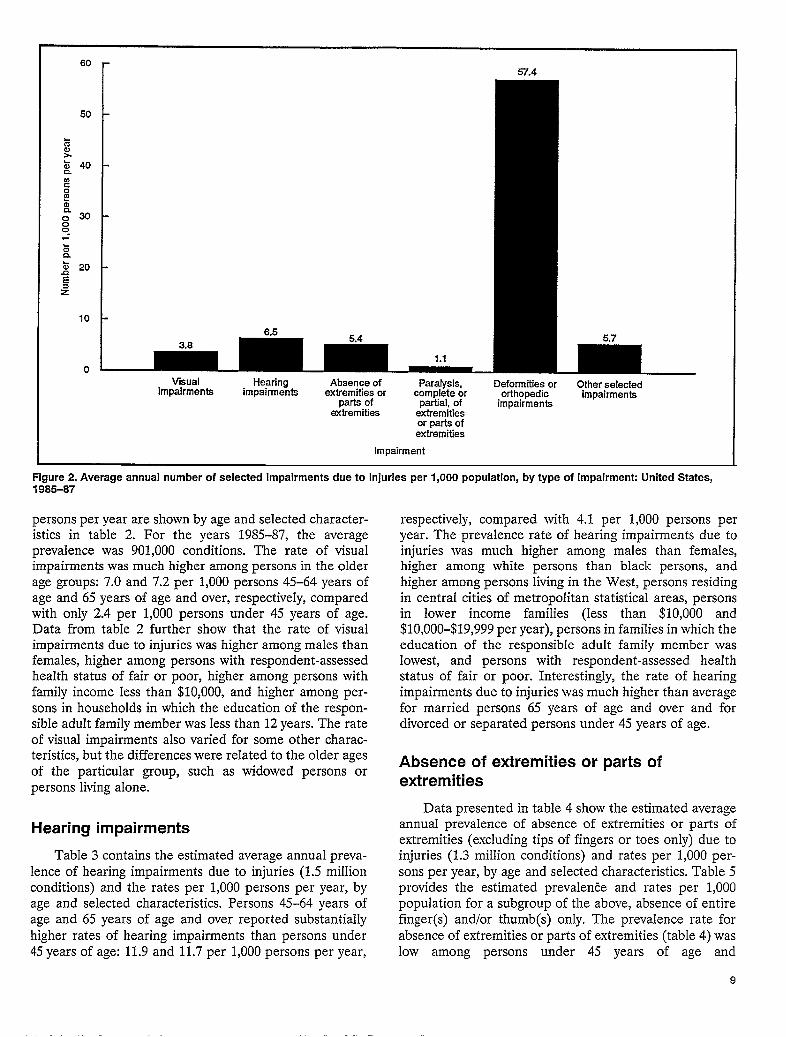
The average annual number of selected impairmentsdue to injuries per 1,000 population is shown by type ofimpairment in figure 2.
Visual impairments
The estimated average annual prevalence of visualimpairments due to injuries and the rates per 1,000
Hearingimpairments,
8.1 “kAbsence of extremities or
EI!?w -partsof extremities,
imF4.E
~airments,)%
IIKIIL ,Paralysis, completeor oartial. of
1,4%
Other selectedinnpalrments,
7.1%
lAlmost 43 percentof deformities or orthopedic impairments are of
the back and 40 percent of the lower extremities or parfs of lowerextremities.
Figure 1. Percent distribution of selected impairments due toinjuries by type of impairment: United States, 1985-87
Table D. Average annual prevalence of selected impairments, prevalence of seiected impairments due to injuries, and percent ofimpairments that are due to injuries, by type of impairment: United States, 1985-87
Impairments becauae
Prevalence ofof injuries
impairments in Numbet in Percent of
Type of impairment thousands thousands total impairments
All selected impairments . . . . . . . . . . . . . . . . . . . . . . . . . . . . . 71,401 18,864 26.4Visual impairments . . . . . . . . . . . . . . . . . . . . . . . . . . . . . . . . 8,265 901 10.9Hearing impairments . . . . . . . . . . . . . . . . . . . . . . . . . . . . . . . . . . . 20,985 1,529 7,3Absence of extremities or parts of extremities (excluding tips of fingers
ortoes only) . . . . . . . . . . . . . . . . . . . . . . . . . . . . . . . . . . . . . 1,618 1,274 78.7Absence of entire finger(s) and/or thumb(s) only . . . . . . 951 914 96.1Absence of other extremities or parts of extremities . . . . . 668 361 54.0
Paralysis, complete or partial, of extremities or parts of extremities . . . . . 1,359 268 19.7Deformities or orthopedic impairments . . . . . . . . . . . . . . 30,554 13,551 44.4
Deformities or orthopedic impairments of back . . . . . . . 15,442 5,735 37.1Deformities or orthopedic impairments of upper extremities or parts of
upper extremities . . . . . . . . . . . . . . . . . . . . . . . . . . . ,,, . 3,084 2,206 71.5Deformities or orthopedic impairments of lower extremities or parts of
Iower extremities . . . . . . . . . . . . . . . . . . . . . . . . . . . 11,706 5,44a 46.5Deformities or orthopedic impairments–other . . . 322 162 50.3
Other selected impairments .,.... . . . . . . . . . . . . . . . . . 8,620 1,342 15.6
8
60
50
10
1.10
57.4
57
Visual Hearing Absence of Paralysis, Deformities or Other selectedimpairments impairments extremities or complete or orthopedic impairments
parts of partial, of impairmentsextremities extremities
or parts ofextremities
Impairment
Figure 2. Average annual number of selected impairments due to injuries per 1,000 population, by type of impairment United States,1985-87
persons per year are shown by age and selected character-istics in table 2. For the years 1985–87, the averageprevalence was 901,000 conditions. The rate of visualimpairments was much higher among persons in the olderage groups: 7.0 and 7.2 per 1,000 persons 45-64 years ofage and 65 years of age and over, respectively, comparedwith only 2.4 per 1,000 persons under 45 years of age.Data from tabIe 2 further show that the rate of visualimpairments due to injuries was higher among males thanfemales, higher among persons with respondent-assessedhealth status of fair or poor, higher among persons withfamily income less than $10,000, and higher among per-sons in households in which the education of the respon-sible adr.dt family member was Iess than 12 years. The rateof visual impairments also varied for some other charac-teristics, but the differences were reIated to the older agesof the particular group, such as widowed persons orpersons living aIone.
Hearing impairments
Table 3 contains the estimated average annual preva-lence of hearing impairments due to injuries (1.5 millionconditions) and the rates per 1,000 persons per year, byage and seIected characteristics. Persons 45–64 years ofage and 65 years of age and over reported substantiallyhigher rates of hearing impairments than persons under45 years of age: 11.9 and 11.7 per 1,000 persons per year,
respectively, compared with 4.1 per 1,000 persons peryear. The prevalence rate of hearing impairments due toinjuries was much higher among males than females,higher among white persons than black persons, andhigher among persons living in the West, persons residingin central cities of metropolitan statistical areas, personsin lower income famiIies (Iess than $10,000 and$10,000-$19,999 per year), persons in families in which theeducation of the responsible adult family member wasIowest, and persons with respondent-assessed heaIthstatus of fair or poor. Interestingly, the rate of hearingimpairments due to injuries was much higher than averagefor married persons 65 years of age and over and fordivorced or separated persons under 45 years of age.
Absence of extremities or parts ofextremities
Data presented in table 4 show the estimated averageannual prevalence of absence of extremities or parts ofextremities (excluding tips of fingers or toes only) due toinjuries (1.3 miIlion conditions) and rates per 1,000 per-sons per year, by age and seIected characteristics. Table 5provides the estimated prevalence and rates per 1,000population for a subgroup of the above, absence of entirefinger(s) and/or thumb(s) ordy. The prevalence rate forabsence of extremities or parts of extremities (table 4) waslow among persons under 45 years of age and
9
progressively higher in the older age groups, 45–64 yearsof age and 65 years of age and over – 2.6, 10.2, and 14,3per 1,000 persons per year, respectively. The prevalencerate of absence of extremities or parts of extremities wasmore than four times higher for males than females,higher among white persons than black persons, andhigher for persons living in nonmetropolitan statisticalareas, persons in families in which the education of theresponsible adult family member was less than 12 years,and persons with respondent-assessed health status of fairor poor. Conversely, the prevalence rate for absence ofextremities or parts of extremities due to injuries was lowamong persons living in metropolitan statistical areas, infamilies with an income of $35,000 or more, and infamilies in which the education of the responsible adultfamily member was 16 years or more.
The estimated average annual prevalence of absenceof entire finger(s) and/or thumb(s) only due to injuriesand the accompanying rates per 1,000 persons per year areshown in table 5 by age and selected characteristics. The914,000 conditions estimated represent a subgroup of theabsence of extremities catego~, the prevalence patternsreported were very similar to those for absence of extrem-ities by age and selected characteristics.
Deformities or orthopedicimpairments
Table 6 contains the estimated annual average preva-lence of all deformities or orthopedic impairments due toinjuries and the rates per 1,000 persons per year, by ageand selected characteristics. Tables 7–9 provide the esti-mated average annual prevalence and rates for threesubgroups of the above —deformities or orthopedicimpairments of the back, deformities or orthopedicimpairments of upper extremities or parts of extremities,and deformities or orthopedic impairments of lowerextremities or parts of extremities – by age and selectedcharacteristics. Deformities or orthopedic impairmentsdue to injuries were estimated at 13.6 million, or 57.4 per1,000 persons per year, for the years 1985–87. The preva-lence rate for all deformities or orthopedic impairmentswas lower than average for persons under 45 years of age,47.2 per 1,000 persons, and virtually identical for the twoolder age groups, 80.2 per 1,000 among persons 45–64 years of age and 80.7 per 1,000 among persons 65 yearsof age and over. Data presented in table 6 further indicatea higher prevalence rate among males than females in theage groups under 45 years and 45–64 years of age, a higherrate among white persons than black persons, and higherrates among persons in the West, persons in families withless than $10,000 family income, persons with respondent-assessed health status of fair or poor, divorced or sepa-rated persons, and persons living alone or withnonrelative.
Deformities or orthopedic impairments of the backdue to injuries had a reported prevalence of 5.7 millionconditions, or 24.3 per 1,000 persons per year (table 7).
10
The prevalence rate for these conditions was highestamong persons 45–64 years of age and lowest amongpersons under 45 years of age, 34.6 and 20.4 per 1,000persons per year, respectively. Prevalence rates for deform-ities or orthopedic impairments of the back were higherthan average for persons living in the West, persons inhouseholds in which the family income was less than$10,000, persons with respondent-assessed health status offair or poor, and persons who were divorced or separated.
Data presented in table 8 show the estimated averageannual prevalence of deformities or orthopedic impair-ments of upper extremities or parts of upper extremitiesdue to injuries to be 2.2 million conditions, or 9.3 per1,000 persons per year. The pattern of prevalence rateswas similar to that of all deformities and orthopedicimpairments: Higher among persons in age groups45 years of age and over, higher among males thanfemales in the two younger age groups, higher amongwhite persons than black persons, and higher amongpersons living in the West, persons in families with incomeless than $10,000, persons with fair or poor respondent-assessed health status, divorced or separated persons, andpersons living alone or with nonrelatives. In addition, theprevalence rate for deformities or orthopedic impairmentsof upper extremities was high for persons living outsidemetropolitan statistical areas,
Table 9 contains the estimated average annual preva-lence of deformities or orthopedic impairments of lowerextremities or parts of lower extremities due to injuries,which was 5.4 million for 1985–87, or 23,1 conditions per1,000 persons per year, The rate of these impairments waslowest among persons under 45 years of age and highestamong persons 65 years of age and over, 18.6 and 36.9 per1,000 persons per year, respectively. The prevalence ratefor deformities or orthopedic impairments of lowerextremities or parts of lower extremities was also highestamong males, higher among persons in the two older agegroups for those in families with less than $10,000 income,higher among persons living alone or with nonrelatives,higher among widowed and divorced or separated persons,and higher among persons with respondent-assessedhealth status of fair or poor.
Other impairments
Information presented in table 10 contains the esti-mated average annual prevalence of absence of otherextremities or parts of extremities and paralysis, com-plete or partial, of extremities or parts of extremities dueto injuries and the accompanying rates per 1,000 persons,by selected characteristics. Table 11 contains the esti-mated average annual prevalence and rates per 1,000persons for other selected impairments due to injuries, byage and selected characteristics, The average prevalenceof absence of other extremities or parts of extremitiesand paralysis, complete or partial, of extremities or partsof extremities were 361,000 and 268,000, respectively(table 10). Because of the relatively low prevalence,

further analysis is of little utility. Data in table 11 incIudeother selected impairments (1.3 million), such as speechimpairments; impairment of sensation; absence of lung,kidney, breast, bone, joint, or muscle of extremity or tipsof fingers or toes; disfigurement; cleft palate; dentofacialhandicap; deformity of slcdl, artificial orifice, or valve; andspecial impairments (ill defined). Even though this cate-gory is a mixture of a number of types of impairments, theprevalence profile is similar to that for many of thespecific types of impairments due to injuries: That is, theprevalence rate per 1,000 persons is lowest among personsunder 45 years of age and highest among persons 65 yearsof age and over, higher among males than females, higheramong white persons than black persons, and higheramong persons in families in which the education of theresponsible family member was less than 12 years, personsliving alone or with nonrelative, and persons withrespondent-assessed health status of fair or poor.
Class of accident
For purposes of the National Health Interview Survey,accidents are grouped into four general cIasses: (a)moving motor-vehicle accidents (with traffic accidents as asubclass), (b) accidents occurring while at work, (c) acci-dents occurring in the home, and (d) other accidents. Theterm “accidents” is used broadly to include many kinds ofmishaps, such as effects of exposure, poisonings, compli-cations of medical or surgical procedures, or nonacci-dental violence (for instance, attempted suicide). Theclasses of accidents are not mutualIy exclusive; forexample, an injury may occur in a moving motor-vehicleaccident while at work, or an injury may occur while atwork in the home.
Table 12 contains the estimated average annuld prev-alence of selected impairments due to injuries and thenumber per 1,000 persons per year for each class ofaccident, by type of impairment. When injuries occurringin the “other” class of accident category are excluded, theremaining impairments due to injuries are distributedfairly evenly over the other three classes of accident:4.5 million at work, 4.3 million in moving motor vehicles,and 4.1 miIlion at home. Of these three classes of acci-dent, accidents at home are highest in prevalence forvisual impairments and hearing impairments, accidents atwork are highest in prevalence for absence of extremitiesor parts of extremities, and accidents in moving motorvehicles are highest in prevalence for deformities or ortho-pedic impairments.
Place of accident
In addition to questions on class of accident, personswere asked where the accident occurred. Primaryresponses were home (inside and outside), street andhighway, industrial place, school, place of recreation,farm, and other and unknown.
The estimated average annual prevalence of selectedimpairments due to injuries is shown in table 13 by placeof accident and type of impairment and in tabIe 14 as apercent distribution by pIace of accident, according to typeof impairment. Of the 18.9 million total selected impair-ments, 4.8 million took place in accidents on streets andhighways, 4.1 million in accidents at home, and 3.1 miIIionin accidents at industrial pIaces (table 13). These threeplaces of accident accounted for about 64 percent of aIlselected impairments due to injuries (table 14). Whereasonly 21.5 percent of all seIected impairments resultedfrom accidents at home, 45.0 percent of visual impair-ments, 31.2 percent of absence of extremities or parts ofextremities, and 28.4 percent of hearing impairmentsresulted from accidents at home. Accidents on streets andhighways accounted for 25.4 percent of all impairmentsbut for 38.1 percent of all paralysis, complete or partial, ofextremities or parts of extremities and for almost 30percent of deformities or orthopedic impairments. Acci-dents in the industrial place were responsible for 16.7percent of aII selected impairments due to injuries but for33.8 percent of absence of extremities or parts ofextremities.
Limitation of activity
Table 15 presents the average annual prevalence ofselected impairments due to injuries, by degree of activitylimitation and type of impairment, and table 16 contains apercent distribution of prevalence of selected impairmentsby degree of activity limitation, according to type ofimpairment. Of the 18.9 million selected impairments, 8.8million caused activity Imitation; of these, 6.1 milIioncaused limitation in a person’s major activity (table 15),2.8 miIIion being unable to carry on their major activityand 3.3 million being limited in the amount or kind ofmajor activi~. These 8.8 million impairments causingactivity limitation represented 46.5 percent of all selectedimpairments due to injuries (table 16). The most limitingtype of impairment was paralysis, complete or partial, ofextremities or parts of extremities, of which 87.3 percentcaused limitation of activity, 80.3 percent in the person’smajor activity.
Restricted-activity days
The average annual number of restricted-activity daysfrom seIected impairments due to injuries and the numberper 100 persons per year are shown by sex and type ofimpairment in table 17. For the years 1985–87, the averageannual number of restricted-activity days from selectedimpairments due to injuries was 275.0 million. Of these,157.7 million were among men and 117.3 million wereamong women. Among both men and women, almost90 percent of the restricted-activity days from selectedimpairments were caused by deformities or orthopedicimpairments.
11
The average annual number of days of restrictedactivity from selected impairments due to injuries and thenumber per 100 persons per year are shown by age andtype of impairment in table 18. Although about half of thetotal restricted-activity days, 137.1 million, were for per-sons under 45 years of age, the rate per 100 persons was byfar the highest among persons 45–64 years of age – 226.5per 100 persons, compared with 83.6 and 132.6 per 100persons for those under 45 years of age and 65 years of ageand over, respectively. The pattern of high rates ofrestricted-activity days for persons 45–64 years of age wasfairly consistent for most types of impairments.
Bed-disability days
Table 19 contains the average annual number of daysof bed disability from selected impairments due to injuriesand the number per 100 persons per year by sex and typeof impairment. For the years 1985–87, the average annualnumber of bed-disability days from selected impairmentsdue to injuries was 87.8 million. Of these, 35.4 million
were reported for males, whereas 52.4 million werereported for females. This is in contrast to the distributionof restricted-activity days by sex cited previously. The rateof bed-disability days for deformities or orthopedicimpairments was almost twice as high among females asmales, 36.1 as opposed to 19.1 per 100 persons per year.
The average annual number of days of bed disabilityfrom selected impairments due to injuries and number per100 persons per year are shown in table 20 by age and typeof impairment. The rate of bed-disability days fromselected impairments was highest for persons 45–64 yearsof age, 72.9 days per 100 persons per year. In ealch of theage groups, the majority of bed-disability days were attrib-uted to deformities or orthopedic impairments. Thelargest proportion of bed-disability days from deformitiesor orthopedic impairments were due to deformities ororthopedic impairments of the back for persons under45 years and 45–64 years of age.
The population figures used in computing rates shownin this report are found in table 21.
12
References
1. Wilder CS, Pearson AN. Impairments due to injury, UnitedStates, 1971. National Center for Health Statistics. VitalHealth Stat 10(87). 1973.
2. Collins JG. Types of injuries and impairments due to inju-ries, United States. National Center for Health Statistics.Vital Health Stat 10(159). 1986.
3. Adams PF, Benson V. Current estimates from the NationalHealth Interview Survey, 1989. National Center for HealthStatistics. Vital Health Stat 10(176). 1990.
4. National Center for Health Statistics. National HealthInterview Survey medical coding manual and short index.Hyattsville, Maryland. 1980.
5. Moss AJ, Parsons VL. Current estimates from the NationalHealth Interview Survey, United States, 1985. NationalCenter for Health Statistics. Vital Health Stat 10(160). 1986.
6. Dawson DA, Adams PF. Current estimates from theNational Health Interview Survey, United States, 1986.National Center for Health Statistics. Vital Health Stat10(164). 1987.
7. Schoenborn CA, Marano M. Current estimates from theNational Health Interview Survey, United States, 1987.National Center for Health Statistics. Vital Health Stat10(166). 19S8.
8. Gleeson GA. Impairments due to injury by class and type ofaccident, United States, July 1959–June 1961. NationalCenter for Health Statistics. Vital Health Stat 10(6). 1964.
9. Moore TF. Redesign of the National Health InterviewSurvey. U.S. Bureau of the Census Statistical MethodsDivision methodological memorandum series; report noCB/SMDiMM/85/02; unpublished technical paper. 1985.
10. National Center for Health Statistics. The National HealthInterview Survey design, 1973-84, and procedures, 1975-S3.National Center for Health Statistics. Vital Health Stat1(1S). 1985.
11. Koons DA. Quality control and measurement of nonsam-pling error in the Health Interview Survey. National Centerfor Health Statistics. Vital Health Stat 2(54). 1973.
12. Balamuth E, Shapiro S. Health interview responses com-pared with medical records. National Center for HealthStatistics. Vital Health Stat 2(7). 1965.
13. National Center for Health Statistics. Comparison of hospi-talization reporting in three survey procedures. NationalCenter for Health Statistics. Vital Health Stat 2(8). 1965.
14. Madow WG. Interview data on chronic conditions com-pared with information derived from medical records.National Center for Health Statistics. Vital Health Stat2(23). 1967.
15. Canne]l CF, Fowler, FJ Jr., Marquis KH. The influence ofinterviewer and respondent psychological and behavioralvariables on the reporting in household interviews. NationalCenter for Health Statistics. Vital Health Stat 2(26). 1968.
16. National Center for Health Statistics. Reporting of hospital-ization in the Health Interview Survey. National Center forHealth Statistics. Vital Health Stat 2(6). 1965.
17. World Health organization. Manual of the InternationalStatistical Classification of Diseases, Injuries, and Causes ofDeath, based on the recommendations of the Ninth Revi-sion Conference, 1975. Geneva: World Health Organiza-tion. 1977.
13
List of detailed tables
1.
2.
3.
4.
5.
Average annual prevalence of selected impairments,prevalence of impairments due to injuries and numberper 1,000 population, percent of impairments due toinjuries, and percent of impairments due to injuriesoccurring in the past year, by type of impairment:United States, 1985-87 . . . . . . . . . . . . . . . . . . . . . . . .
Average annuaI prevalence of visual impairments dueto injuries and number per 1,000 population, by ageand selected characteristics: United States, 1985–87. .
Average annual prevalence of hearing impairmentsdue to injuries and number per 1,000 population, byage and selected characteristics: United States,1985-87 . . . . . . . . . . . . . . . . . . . . . . . . . . . . . . . . . . . .
Average annual prevalence of absence of extremitiesor parts of extremities (excluding tips of fingers or toesonly) due to injuries and number per 1,000 population,by age and selected characteristics: United States,1985-87 . . . . . . . . . . . . . . . . . . . . . . . . . . . . . . . . . . . .
Average annual prevalence of absence of entire fin-ger(s) and/or thumb(s) only due to injuries andnumber per 1,000 population, by age and selectedcharacteristics: United States, 1985-87 . . . . . . . . . . . .
6. Average annual prevalence of all deformities or ortho-
7.
8.
9.
10.
14
pedic impairments due to injuries and number per1,000 population, by age and selected characteristics:United States, 1985-87 . . . . . . . . . . . . . . . . . . . . . . . .
Average annual prevalence of deformities or ortho-pedic impairments of the back due to injuries andnumber per 1,000 population, by age and selectedcharacteristics: United States, 1985–87 . . . . . . . . . . . .
Average annual prevalence of deformities or ortho-pedic impairments of upper extremities or parts ofupper extremities due to injuries and number per1,000 population, by age and selected characteristics:United States, 1985-87 . . . . . . . . . . . . . . . . . . . . . . . .
Average annual prevalence of deformities or ortho-pedic impairments of lower extremities or parts oflower extremities due to injuries and number per 1,000population, by age and selected characteristics: UnitedStates, 1985-87 . . . . . . . . . . . . . . . . . . . . . . . . . . . . . .
Average annual prevalence of absence of otherextremities or parts of other extremities and paralysis,complete or partial, of extremities or parts of extrem-ities due to injuries and number per 1,000 population,by selected characteristics: United States, 1985-87 . . .
15
16
17
18
19
20
21
22
23
24
11.
12.
13.
14.
15.
16.
17.
18.
19.
20.
21.
Average annual prevalence of other selected impair-ments due to injuries and number per 1,000 popula-tion, by age and selected characteristics: UnitedStates, 1985-87, . . . . . . . . . . . . . . . . . . . . . . . . . . . . .
Average annual prevalence of selected impairmentsdue to injuries and ~umber per 1,000 population, byclass of accident and type of impairment: UnitedStates, 1985-87 . . . . . . . . . . . . . . . . . . . . . . . . . . . . . .
Average annual prevalence of selected impairmentsdue to injuries, by place of accident and type ofimpairment: United States, 1985-87 . . . . . . . . . . . . . .
Percent distribution ofprevalenceof selected impair-ments due to injuries by place of accident, accordingto type ofimpairment: United States, 1985-87 ..,..,
Average annual prevalence of selected impairmentsdue to injuries, by degree of resulting limitation ofactivity and type of impairment: United States,1985-87 . . . . . . . . . . . . . . . . . . . . . . . . . . . . . . . . . . .
Percent distribution of prevalence of selected impair-ments due to injuries by degree of resulting limitationof activity, according to type of impairment: UnitedStates, 1985-87 . . . . . . . . . . . . . . . . . . . . . . . . . . . . . .
Average annual number of days of restricted activityfrom selected impairments due to injuries and numberper 100 persons per year, by sex and type of impair-ment:United States, 1985-87 . . . . . . . . . . . . . . . . . . .
Average annual number of days of restricted activityfrom selected impairments due to injuries and numberper 100 persons per year, by age and type of impair-ment:United States, 1985-87 . . . . . . . . . . . . . . . . . . .
Average annual number of days of bed disability fromselected impairments due to injuries and number per100 persons per year, bysexand typeof impairment:United States, 1985-87 . . . . . . . . . . . . . . . . . . . . . . . .
Average annual number of days of bed disability fromselected impairments due to injuries and number per100 persons per year, by age and type ofimpairment:United States, 1985-87 . . . . . . . . . . . . . . . . . . . . . . . .
Population used in obtaining rates shown in this pub-lication, by age and selected characteristics: UnitedStates, 1985-87 . . . . . . . . . . . . . . . . . . . . . . . . . . . . . .
25
26
26
27
27
28
28
29
29
30
30
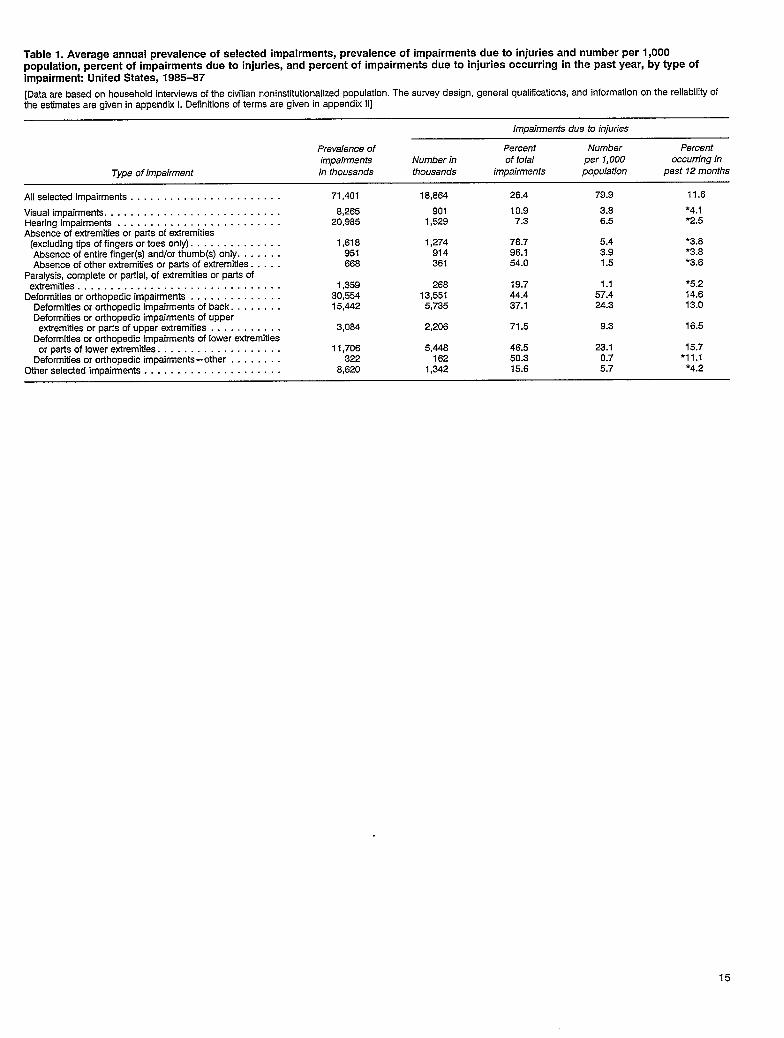
Table 1. Average annual prevalence of selected impairments, prevalence of impairments due to injuries and number per 1,000population, percent of impairments due to injuries, and percent of impairments due to injuries occurring in the past year, by type ofimpairment United States, 1985-87
[Data are based on household interviews of the civilian noninstitutionalized population. The survey design, general qualifications, and information on the reliability ofthe estimates are given in appendix L Definitions of terms are given in appendix 11]
Impairments due to injuries
Prevalence of Percent Number Percentimpairments Number in of total per 1,000 occurring in
Type of impairment in thousands thousands impairments population past 12 months
All selected impairments . . . . . . . . . . . . . . . . . . . . . . . 71,401 18,864 26.4 79.9 11.6
Visual impairments . . . . . . . . . . . . . . . . . . . . . . . . . . . 8,265 901 10.9 3.8 *4.1Hearing impairments . . . . . . . . . . . . . . . . . . . . . . . . . 20,985 1,529 7.3 6.5 *2.5Absence of extremities or parts of extremities
(excluding tips of fingers or toes only). . . . . . . . . . . . . . 1,618 1,274 78.7 5.4 *3.8Absence of entire finger(s) and/or thumb(s) only. . . . . . . 951 914 96.1 3.9 *3.8Absence of other extremities or parts of extremities. . . . . 668 361 54.0 1.5 *3.6
Paralysis, complete or partial, of extremities or parts ofextremities . . . . . . . . . . . . . . . . . . . . . . . . . . . . . . . 1,359 268 19.7 1.1 *5.2
Deformities oroRhopadic impairmente . . . . . . . . . . . . . . 30,554 13,551 44.4 57.4 14.6Deformities ororthopedlc impairmente of back. . . . . . . . 15,442 5,735 37.1 24.3 13.0Deformities or orthopedic impairments of upper
extremities orparts ofuppar extremities . . . . . . . . . 3,084 2,206 71.5 9.3 16.5Deformities or orthopedic impairments of lower extremities
orparts of lower extremities . . . . . . . . . . . . . . . . . . . 11,706 5,448 46.5 23.1 15.7Deformities ororthopedic impairments-other . . . . . . . 322 162 50.3 0.7 ●11.1
Other selected impairmenta . . . . . . . . . . . . . . . . . . . . . 8,620 1,342 15.6 5.7 *4.2
15
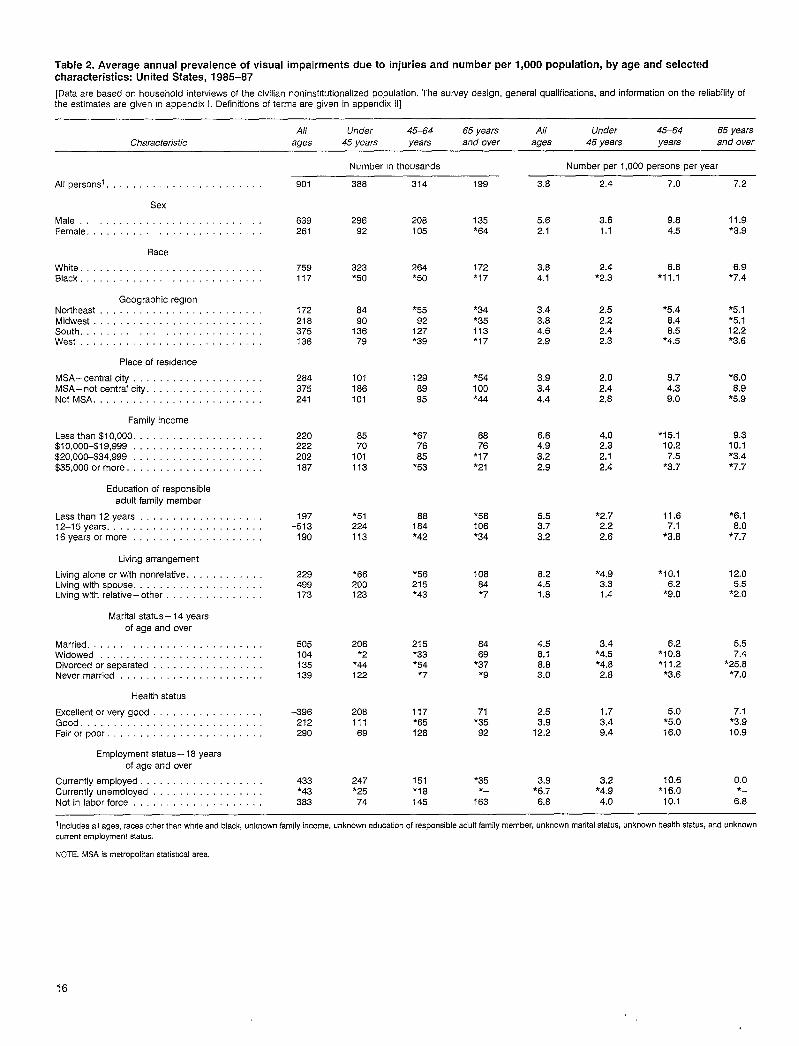
Table 2. Average annual prevalence of visual impairments due to injuries andnumber perl,OOO population, byageandselectt!dcharacteristics: United States, 1985-87
[Data are based on household interviews of the civilian noninstltutionalized population. The survey design, genersl qualifications, and information on the reliability ofthe estimates are given m appendix 1. Definitions of terms are given in appendix 11]
All Under 45–64 65 years All Under 45–64 65 yearsCharacteristic ages 45 years years and over ages 45 years years and over
Number m thousands Number per 1,000 persons per year
All personsi . . . . . . . . . . . . . . . . . .
Sex
MaleFemale..::::::::”::::: ::::::::.::
Race
White . . . . . . . . . . . . . . . . . . . .Black . . . . . . . . . . . . . . . . . . . .
Geographic regionNortheast . . . . . . . . . . . . . . . .Midweek ...,........,,,. . . . . . . . . .South. ,..,... . . . . . . . . . . .West, . . . . . . . . . . . . . . . . . . . . . . . .
Place of residence
MSA–central city . . . . . . . . . . . . . . . .MSA–notcentral city . . . . . . . . . . . . . . . . . .Not MSA. . . . . . . . . . . . . . . . . . . . . .
Family income
Lessthan $10,000 . . . . . . . . . . . . . . . . . . . .$10!000-$19,999 . . . . . . . . . . . . . . . . . .$20,000-$34,999 . .,, . . . . . . . . . . . . . . . .$35,0000rmore. .,, ,, .,..... . . . . . . . .
Education of responsibleadult family member
Lessthan 12years . . . . . . . . . . . . . . . . . . .12–15years . . . . . . . . . . . . . . . . . . . . . . .16years ormore ., ..,,,... . . . . . . . . . .
Living arrangement
Living alone orwith nonrelative. .Living with spouse . . . . . . . . . . . . . . . . . . . .!-ivingwit hrelative-other. .
Marital status – 14 yearsof age and over
Married . . . . . . . . . . . . . . . . . . . . . . . .Widowed . . . . . . . . . . . . . . . . . . . . . .Divorced orseparated . . . . . . . . . . . .Nevermarried . . . . . . . . . . . . . . . . . . . . . .
Health status
Excellentorverygood ...,.... . . . . . . .Good . . . . . . . . . . . . . . . . . . . . . . .Fairer poor . . . . . . . . . . . . . . . . . . .
Employment status –18years
of age and over
Currentlyemployed . . . . . . . . . . . . . . . . . . .CurrentIyunemployed . . . . . . . . . . . . . . . . .Not in laborforce . . . . . . . . . . . . . . . . . .
901
639261
759117
172218375136
284375241
220222202187
197-513
190
229499173
505104135139
-396212290
433*43383
386
29692
323*5O
8490
13679
101186101
8570
101113
*51224113
*66200123
206*2
*44122
20811169
247*2574
314
208105
264’50
*5592
127*39
1298995
*677665
*53
88184*42
*56215’43
215*33*54
*7
117*65128
151*I8145
199
135*64
172*I7
*34*35113*17
*54100*44
6876
*17*21
*58106*34
10884*7
8469
*37*9
71*3592
*35*—
163
3.8
5.62.1
3.84.1
3.43.84.62.9
3.93.44.4
6.64.93.22.9
5.53.73.2
8.24.51,8
4.58.18.83.0
2.63.9
12.2
3,9*6.76.8
2.4
3.61.1
2.4*2.3
2,52,22.42,3
2.02.42,8
4.02.32.12.4
*2.72.22.6
*4.93.31.4
3.4*4.5*4.82.8
1.73.49.4
3.2*4.94.0
7.0
9.84.5
6.8*11.1
*5.48.48.5
*4.5
9.74.39,0
*I 5.110.27.5
*3.7
11.67.1
*3.8
*10.16.2
‘9.0
6.2*1 0.8*1 1.2
*3.6
5.0*5.O16.0
10.6*16.O
10.1
7.2
11.9*3.9
6.9*7.4
*5.1*5.112,2*3.6
*6.O8.9
*5.9
9.310.1*3.4*7.7
*6.18.0
*7.7
12.05.5
*2,0
5.57.4
*25.8*7.O
7.1*3.910.9
0.0*-
6.8
1Includes all ages, races other than white and black, unknown family income, unknown education of responsible adult family member, unknown marital status, unknown health status, and unknown
current employment status.
NOTE. MSA is metropolitan atatisbcalarea,
16
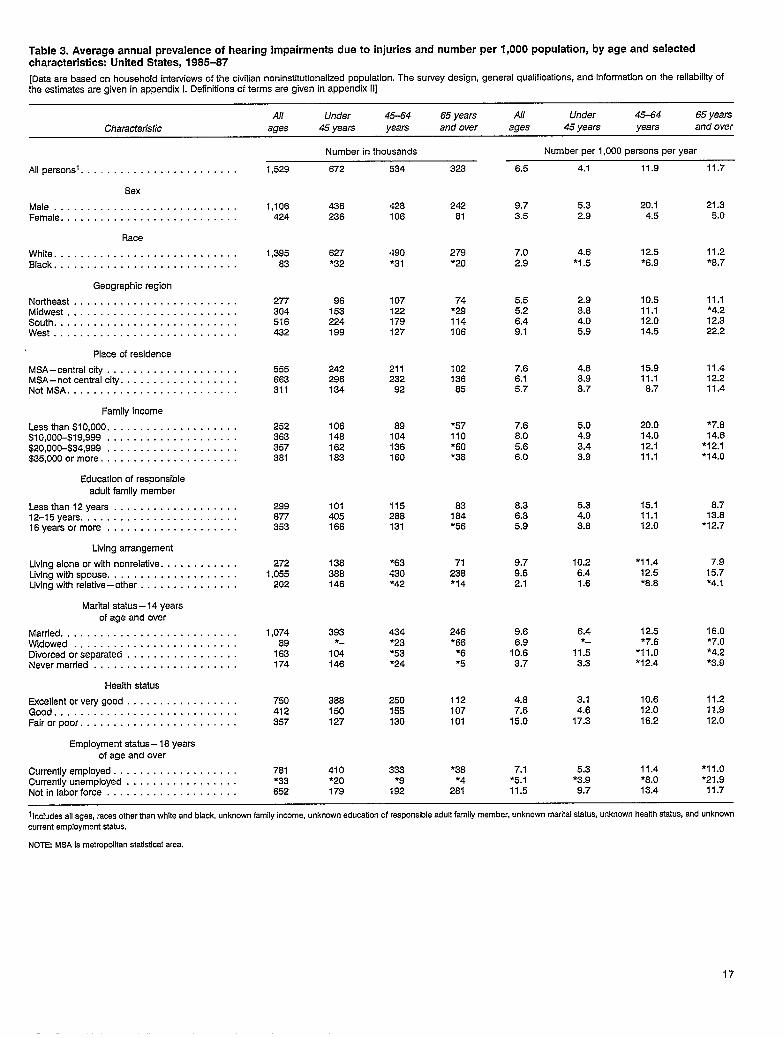
Table 3. Average annual prevalence of hearing impairments due to injuries and number per 1,000 population, by age and selectedcharacteristics: United States, 1985-87
[Data are based on household interviews of the civilian noninstiiutionalized population. The survey design, general qualifications, and information on the reliability ofthe estimates are given in appendix 1. Definitions of terms are given in appendix II]
All Under 45-64 65 years All Under 45-64 65 yearsCharacteristic ages 45 years years and over ages 45 years years and over
Number in thousands
Allpersonsl . . . . . . . . . . . . . . . . . . . . . . . .
Sex
Male . . . . . . . . . . . . . . . . . . . . . . . . . . . .Female . . . . . . . . . . . . . . . . . . . . . . . . . . .
Race
White . . . . . . . . . . . . . . . . . . . . . . . . . . . .Black . . . . . . . . . . . . . . . . . . . . . . . . . . . .
Geographic region
Northeast . . . . . . . . . . . . . . . . . . . . . . . . .Midwest, . . . . . . . . . . . . . . . . . . . . . . . . .South. . . . . . . . . . . . . . . . . . . . . . . . . . . .West . . . . . . . . . . . . . . . . . . . . . . . . . . . .
Place of residence
MSA-central city . . . . . . . . . . . . . . . . . . . .MSA-notcentral city . . . . . . . . . . . . . . . . . .NotMSA . . . . . . . . . . . . . . . . . . . . . . . . . .
Family income
Lessthan$lO,OOO . . . . . . . . . . . . . . . . . . . .$10,000-$19,999 . . . . . . . . . . . . . . . . . . . .$20,000-$34,939 . . . . . . . . . . . . . . . . . . . .$35,0000rmore . . . . . . . . . . . . . . . . . . . . .
Education of responsibleadult family member
Lessthan 12years . . . . . . . . . . . . . . . . . . .12-15years . . . . . . . . . . . . . . . . . . . . . . . .16yearaormore . . . . . . . . . . . . . . . . . . . .
Living arrangement
Living alone orwithnonrelatlve. . . . . . . . . . . .Livlngwith epouse. ..,...... . . . . . . . . . .LMingwithr elative-other. . . . . . . . . . . . . .
Marital status – 14 yearsof age and over
Married . . . . . . . . . . . . . . . . . . . . . . . . . . .Widowed . . . . . . . . . . . . . . . . . . . . . . . . .Divorced orseparated . . . . . . . . . . . . . . . . .Nevermarried . . . . . . . . . . . . . . . . . . . . . .
Health status
Excellentorverygood . . . . . . . . . . . . . . . . .Good . . . . . . . . . . . . . . . . . . . . . . . . . . . .Fairorpoor . . . . . . . . . . . . . . . . . . . . . . . .
Employment status -18 yearsof age and over
Currentlyemployed . . . . . . . . . . . . . . . . . . .Currentlyunemployed . . . . . . . . . . . . . . . . .Notin laborforce . . . . . . . . . . . . . . . . . . . .
1,529
1,106424
1,39563
277304516432
555663311
252363357381
299877353
2721,055
202
i ,07489
163174
750412357
781*33652
672
436236
627*32
96153224199
242296134
106148162183
101405166
138388146
393*-
104146
388150127
410●2O179
534
428106
490*3I
107122179127
211232
92
89104136160
115288131
*63430*42
434*23*53*24
250155130
333*9
192
323
24281
279*2O
74● 29114106
10213685
*57110*6O’38
83184*56
71238*14
246*86
*6*5
112107101
●38*4
261
Number per 1,000 pereons per year
6.5 4.1
9.73.5
7.02.9
5.55.26.49.1
7.66.15.7
7.68.05.66.0
8.36.35.9
9.79.62.1
9.66.9
10.63.7
4.87.6
15.0
7.1*5.111.5
5.32.9
4.6*1.5
2.93.84.05.9
4.83.93.7
5.04.93.43.9
5.34.03.8
10.26.41.6
6.4
1I:i3.3
3.14.6
17.3
5.3*3.99.7
11.9
20.14.5
12.5*6.9
10.511.112.014.5
15.911.18.7
20.014.012.111.1
15.111.112.0
*11.412,5*8.8
12.5*7.6
*11.O*1 2.4
10.612.016.2
11.4*8.O13.4
11.7
21.35.0
11.2*8.7
11.1*4.212.322.2
11.412.211.4
*7.814.6
*12.1*1 4.0
8.713.8
*12.7
7.915.7*4.1
16.0*7.O*4.2*3.9
11.211.912.0
*1 1.0*2 I .9
11.7
1lnc!ude$ ~11ages, ~ac$5 ~th$r than ~~te and black, unknown family income, unknown education of responsible adult family member, unknown marital status, unknown health status. and unknown
current employment ststus.
NOTE MSA la metropolitan statistical erea.
17
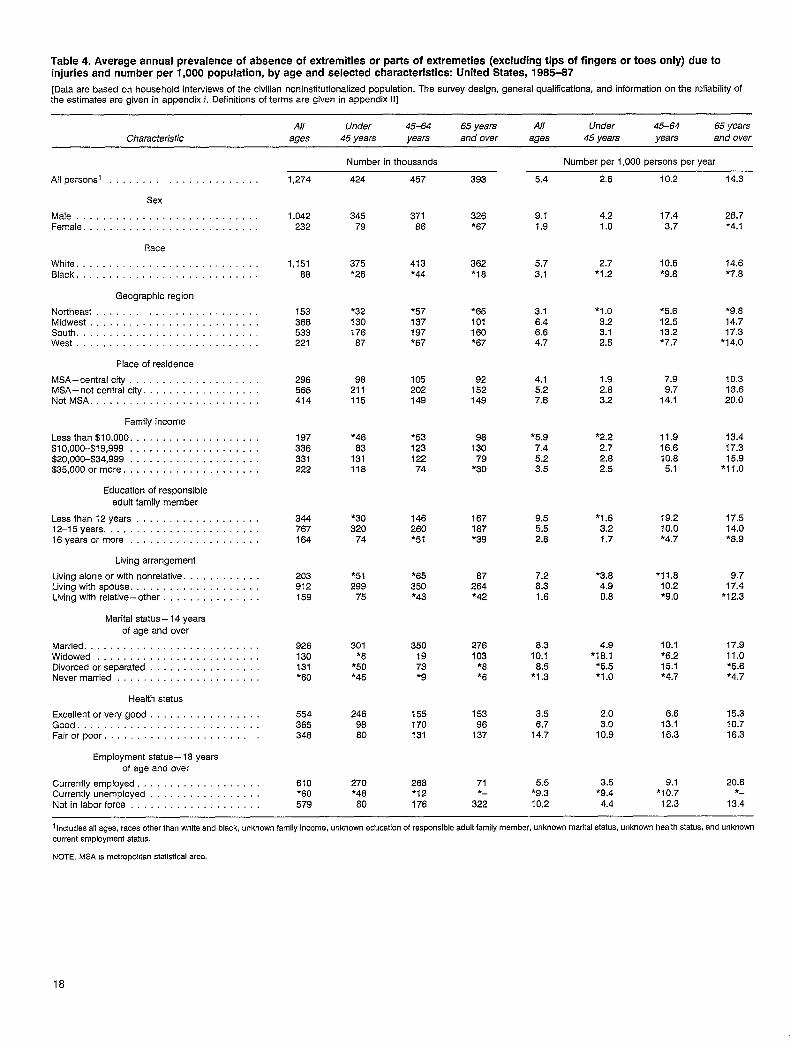
Table 4. Average annual prevalence of absence of extremities or parts of extremities (excluding tips of fingers or toes only) due toinjuries and number per 1,000 population, by age and selected characteristics: United States, 1985-87
[Data are based on household interviews of the civilian noninstitutionalized population. The survey dasign, general qualifications, and information on the reliability ofthe estimates are given in appendix 1, Definitions of terms are given in appendix 11]
All Under 45-64 65 years All Under 45-64Characteristic
65 yearsa.aes 45 years vears and over ages 45 years Vears and over
Number in thousands Number per 1,000 persons per year
Allperaonsl ...,.... . . . . . . . . . . . . . .
Sex
Male . . . . . . . . . . . . . . . . . . . . . . . . . . .Female . . . . . . . . . . . . . . . . . . . . . . . . . .
Race
White . . . . . . . . . . . . . . . . . . . . . . ,,, ,..Black . . . . . . . . . . . . . . . . . . . .,,,,,...
Geographic region
Northeast, . . . . . . . . . . . . . . . . . . . . . . . .Midwest .,.........,,,,. . . . . . . . . . .South. . . . . . . . . . . . . . . . . . . . . . . . . .West, . . . . . . . . . . . . . . . . . . . . . . . . . . .
Place of residence
MSA–centralcity . . . . . . . . . . . . . . . .MSA–notcentral cry . . . . . . . . . . . . .NotMSA . . . . . . . . . . . . . . . . . . . . . .
Famiiyincome
Lessthan $10,000 . . . . . . . . . . . . . . . . . . . .$10!000-$19,999 . . . . . . . . . . . . . . . . . . . .$20,000-$34,999 . . . . . . . . . . . . . . . . . . . .$35,0000rmore . . . . . . . . . . . . . . . . . . . . .
Education of responsibleadult family member
Lessthan 12years, . . . . . . . . . . . . . . . . . .12-15years. . . . . . . . . . . . . . . . . . . . . . . .16years ormore, . . . . . . . . . . . . . . . . . . .
Living arrangement
Living alone or with nonrelative. . . .Livingwithspouse, . . . . . . . . . . . . . . . . . . .Living with relative-other. . . . . . . . . .
Marital status -14 yearsof age and over
Married . . . . . . . . . . . . . . . . . . . . . . . . . .widowed . . . . . . . . . . . . . . . . . . . . . . . . .Divorced orseparated . . . . . . . . . . . . . . . . .Nevermarried . . . . . . . . . . . . . . . . . . . . . .
Health status
Excellentorverygood . . . . . . . . . . . . . . . . .Good . . . . . . . . . . . . . . . . . . . . . . . . . . . .Fairorpoor . . . . . . . . . . . . . . . . . . . .
Employment statua - 18 yearsof age and over
Currently employed . . . . . . . . . . . . . . . . . . .Currently unemployed . . . . . . . . . . . . . . . . .Notin laborforce . . . . . . . . . . . . . . . . . . . .
1,274
1,042232
1,15186
153366533221
296565414
197336331222
344767164
203912159
926130131*6O
554365346
610*6O579
424
34579
375*26
*3213017687
98211115
’4663
131118
*3O320
74
*51299
75
301*8
*5O*45
2469880
270*4880
457
371
86
413
*44
*57
137
197
*67
105202149
’5312312274
146260*51
*65350*43
3501973*9
155170131
268*12176
393
326*67
362*I6
*65101160*67
92152149
9813079
*3O
167187*39
67264*42
276103
*8*6
15396
137
71
3;;
5.4
9.11.9
5.73.1
3.16.46.64.7
4.15.27.6
*5.97.45.23.5
9.55.52.8
7.28.31.6
8.310.1
8.5*1 .3
3.56.7
14.7
5.5*9.310.2
2,6
4.21.0
2.7*1.2
*1.O3.23.12.6
1.92.83.2
*2.22.72.62.5
*1.63.21.7
*3.84.90.6
4.9*18.~
*5.5*1.0
2,03.0
10.9
3.5*9.44.4
10.2
17.43,7
10.6*9.8
*5.612.513.2*7.7
7.99.7
14.1
11.916.610.85.1
19.210.0*4.7
*1 1.810.2*9,0
10.1*6.215.1*4.7
6.613.116.3
9.1*1O.7
12.3
14.3
26.7*4.1
14.6*7.8
*9.814.717.3
*1 4.0
10.313.620.0
13.417.315.9
*1 1.0
17.514.0*8.9
9.71?.4
*1 2.3
17.911.0*5.6*4.7
15.310.716.3
20.6*_
13.4
1Includes all ages, races other than white and black, unknown family Incoma, unknown education of responsible adult family mamber, unknown marital status, unknown health status, and unknown
current employment status.
NOTE: MSAtsmetrODoltan statistical area.
18
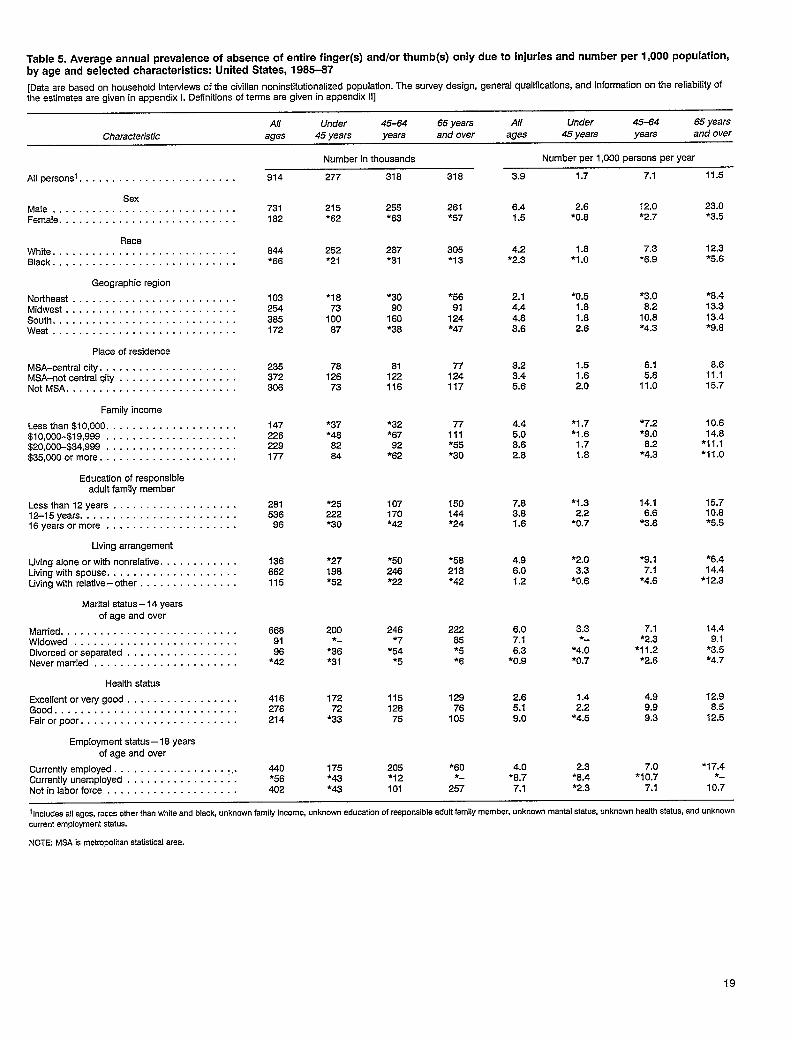
Table 5. Average annual prevalence of absence of entire finger(s) and/or thumb(s) only duetoinjuries andnumber perl,OOO population,by age and selected characteristics: United States, 1985-87
[Data are based on household interviews of the civilian noninstitutionalized population. The survey design, general qualifications, and information on the reliability ofthe estimates are given in appendix 1. Definitions of terms are given in appendix 11]
All Under 45-64 65 yeara All Under 45-64 65 yearsCharacteristic ages 45 years years and over ages 45 years years and over
Number per 1,000 pereons per yearNumber in thousands
3.9 11.5
23.0*3.5
12.3*5.6
*8.413.313.4*9.8
8.611.115.7
10.614.a
●11.1*11.O
15.710.8*5.5
*6.414.4
*12.3
14.49.1*3.5*4.7
12.98.512.5
*17.4*-
10.7
All personsi . . . . . . . . . . . . . . . . . . . . . . . .
SexMale . . . . . . . . . . . . . . . . . . . . . . . . . . . .Female . . . . . . . . . . . . . . . . . . . . . . . . . . .
RaceWhite . . . . . . . . . . . . . . . . . . . . . . . . . . . .Black . . . . . . . . . . . . . . . . . . . . . . . . . . . .
Geographic region
Northeast . . . . . . . . . . . . . . . . . . . . . . . . .Midwest . . . . . . . . . . . . . . . . . . . . . . . . . .South . . . . . . . . . . . . . . . . . . . . . . . . . . . .West . . . . . . . . . . . . . . . . . . . . . . . . . . . .
Place of residence
MSA-centralcity . . . . . . . . . . . . . . . . . . . . .MSA-notcentral~ity . . . . . . . . . . . . . . . . . .Not MSA . . . . . . . . . . . . . . . . . . . . . . . . . .
Family income
Lessthan $10,000 . . . . . . . . . . . . . . . . . . . .$10,000-$19,999 . . . . . . . . . . . . . . . . . . . .$20,00C-$34,999 . . . . . . . . . . . . . . . . . . . .$35,0000rmore . . . . . . . . . . . . . . . . . . . . .
Education of responsibleadult family member
Lessthan 12years . . . . . . . . . . . . . . . . . . .12-15years . . . . . . . . . . . . . . . . . . . . . . . .16yearsormore . . . . . . . . . . . . . . . . . . . .
Living arrangement
Living alone orwith nonrelative. . . . . . . . . . . .Livingwith spouse . . . . . . . . . . . . . . . . . . . .Livingwith relative-other . . . . . . . . . . . . . . .
Marital status – 14 yearsofage and over
Married . . . . . . . . . . . . . . . . . . . . . . . . . . .Widowed . . . . . . . . . . . . . . . . . . . . . . . . .Divorced orseparated . . . . . . . . . . . . . . . . .Nevermarried . . . . . . . . . . . . . . . . . . . . . .
Health status
Excellentorverygood . . . . . . . . . . . . . . . . .Good . . . . . . . . . . . . . . . . . . . . . . . . . . . .Fairorpoor . . . . . . . . . . . . . . . . . . . . . . . .
Employment status –18yearsof age and over
Currently employed . . . . . . . . . . . . . . . . . . ..Currently unemployed . . . . . . . . . . . . . . . . .Notin laborforce . . . . . . . . . . . . . . . . . . . .
914
731162
644●66
103254385172
235372306
147226229177
26153696
136662115
6689196
●42
416276214
440*56402
277
215
318 318
261*57
305*I3
*5691
124*47
77124117
77111*55*3O
150144●24
●58218*42
22285*5*6
12976
105
*6O
2:;
1.7 7.1
2.6*0.8
12.0*2.7
255 6.41.5*82 *63
252 287●31
4.2*2.3
1.s*1.0
7.3*6.9*2I
*187310067
78
*0.51.81.82.6
*3.O8.210.8*4.3
*3O 2.14.44.83.6
90160*38
81122116
1.51.62.0
6.15.811.0
3.23.45.6
12673
*37 4.45.03.62.8
*I.7*1.61.71.8
*7.2*9.O
6.2*4.3
*32*48 *67
926264 *62
*1.32.2
‘0.7
14.16.6*3.8
*25 107170
7.83.61.6
222*3O *42
*9.17.1*4.6
*27198*52
200*-
*5O248*22
246*7
*54*5
115
4.96.01.2
*2.O3.3*0.6
6.07.16.3
*0.9
3.3*-
*4.O*0.7
7.1*2.3
*11.2*2.6
*36*31
17272
●33
175*43*43
2.65.19.0
1.42.2*4.5
4.99.99.3
12675
205*I2101
4.0*8.77.1
2.3*8.4*2.3
7.0*1O.77.1
1lnclude5 all ~ge~, ,aceS other than ~hjte and black, unknown family Income, unknown education of responsible adult femi!y member, unknown Marltel status, unknown beam Status, and unknown
current employment status.
NOTE MSA is metropolitan statistical area.
19
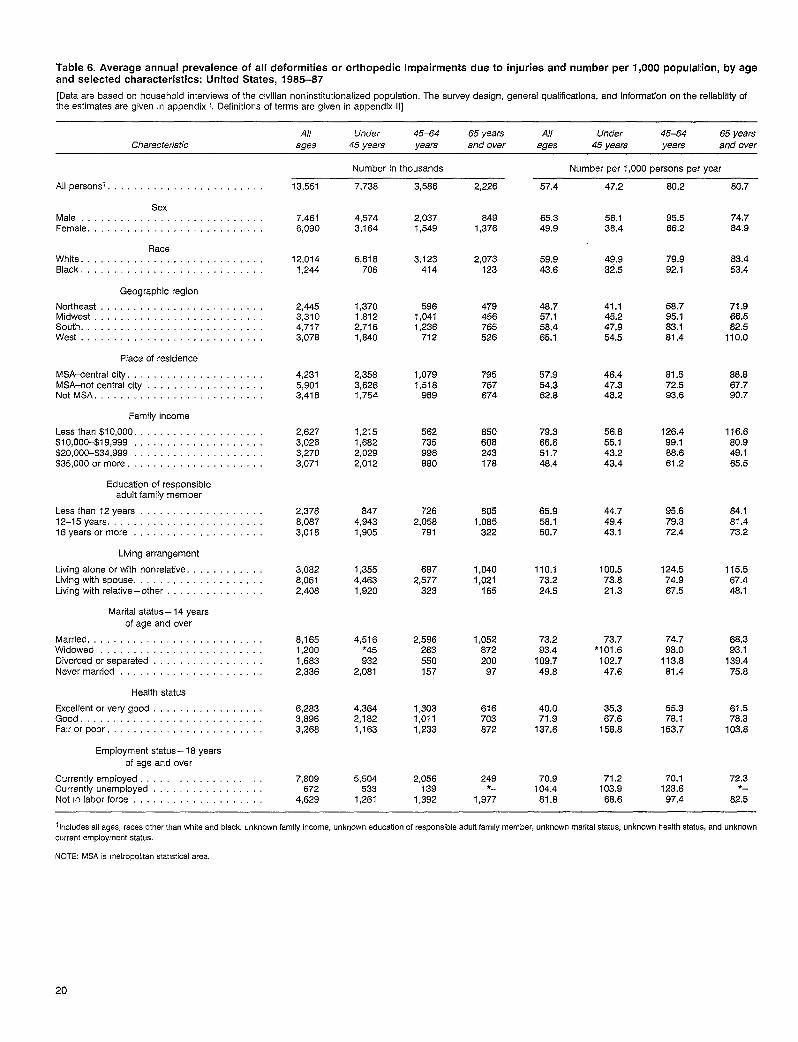
Table 6. Average annual prevalence of all deformities or orthopedic impairments due to injuries and number per 1,000 population, by ageand aelected characteristics: United States, 1985-67
[Data are based on household interviews of the civilian noninstitutionalized population. The survey design, general qualifications, and information on the reliability oftheestimates aregiven inappendixl, Definitions ofterms aregiven inappendixll]
All Under 45-64 65 years All Under 45–64Characteristic
65 yearsages 45 years years and over ages 45 years years and over
Number in thousands Number per 1,000 persons per year
Allpersonsl . . . . . . . . . . . . . . . . . . . . . .
SexMale . . . . . . . . . . . . . . . . . . . . . . .Female . . . . . . . . . . . . . . . . . . . . . .
RaceWhite. . . . . . . . . . . . . . . . . . . . . . . .Black. ,,, . . . . . . . . . . . . . . . . . . . . . .
Geographic region
Northeast . . . . . . . . . . . . . . . . . . . . . . . . .Midwest . . . . . . . . . . . . . . . . . . . . .South . . . . . . . . . . . . . . . . . . . . . . . . . . . .West . . . . . . . . . . . . . . . . . . . . . . . . .
Place of residence
MSA-central city . . . . . . . . . . . . . . . . . . . . .MSA–notcentral city ...,,,... . . . . . . . . .Not MSA . . . . . . . . . . . . . . . . . . . . . . . . . .
Family income
Lessthan $10,000, . . . . . . . . . . .,, ,,,...$10,000-$19,999 . . . . . . . . . . . . . . . . . . .$20,00C-$34,999 .,...,.,,,,,. . . . . . . .$35,0000rmore . . . . . . . . . . . . . . . . . . . . .
Education of responsibleadult family member
Lessthan 12years, . . . . . . . . . . . . . . .12–15years, . . . . . . . . . . . . . . . . . . .16years ormore . . . . . . . . . . . . . . . .
Living arrangement
Living alone or with nonrelative. . . . . .Livingwith spouse. ,., ,,,... . . . . . . . . . .Livingwith relative-other, . . . . . . . . .
Marital status – 14 years
of age and over
Married. ,, . . . . . . . . . . . . . . . . . . . . . . . .widowed, . . . . . . . . . . . . . . . . . . . . . . . .Oivorced orseparated ...,.... . . . . . . . . .Nevermarried . . . . . . . . . . . . . . . . . . . . . .
Health status
Excellentorverygood ..,..... . . . . . . . . .Good . . . . . . . . . . . . . . . . . . . . . . . . . . .Fairorpoor, . . . . . . . . . . . . . . . . . . . .
Employment status – 18 years
of age and over
Currently employed,,,.. . . . . . . . . .,Currently unemployed . . . . . . . . . . . .Not m laborforce, . . . . . . . . . . . . . . . .
13,551 7,738
4,5743,164
6,618706
1,3701,8122,7161,840
2,3583,6261,754
1,2151,6822,0292,012
8474,9431,905
1,3554,4631,920
4,516*45932
2,081
4,3642,1821,163
5,504533
1,261
3,586 2,226
6491,376
2,073123
479456765526
795757674
850608243178
8051,065
322
1,0401,021
165
1,052672200
97
616703872
249*-
1,977
57.4 47,2 80.2
95.566.2
79.992.1
80.7
74.784,9
83.453.4
71.966.582.5
110.0
88.867.790.7
116.680.949.165,5
84.181.473.2
115.567.448.1
68.393.1
139.475.8
61.578.3
103.8
72.3*-
82.5
7,4616,090
2,0371,549
65.349.9
56.138.4
3,123414
59.943.6
12,0141,244
49.932.5
2,4453,3104,7173,078
596 48.757.158.465.1
41.145.247,954.5
58.795.183.181.4
1,0411,236
712
4,2315,9013.418
1,0791.518
57.954.362.8
46.447.348.2
81.572.593.6“989
2,6273,026
562735998
79.366.651.748,4
56.855.143.243.4
126.499.188.661.2
3,2703,071 860
2,3768,0873,018
7262,058
791
65.958.150.7
44.749,443,1
95.679.372.4
3,0828,0612,408
6872,577
323
110.173.224.5
100.573.821.3
124.574.967.5
8,1651,2001,6832,336
2,596263550157
73.293.4
109.749.8
73.7*1OI.6
102.747.6
74.793.0
113<881.4
6,2833,8983,266
1,3031,0111,233
40.071.9
137.6
35.367.6
158.8
55.378.1
153.7
7,609672
4,629
2,056139
1,392
70.9104.4
81.8
71.2103.9
66.6
70.1123.6
97.4
1Includes all ages, races other than white and black, unknown family income, unkoown education of responsible adult family member, unknown marital status, unknown health status, and unknown
current employment status.
NOTE: MSAismetropoltan stattatical area,
20
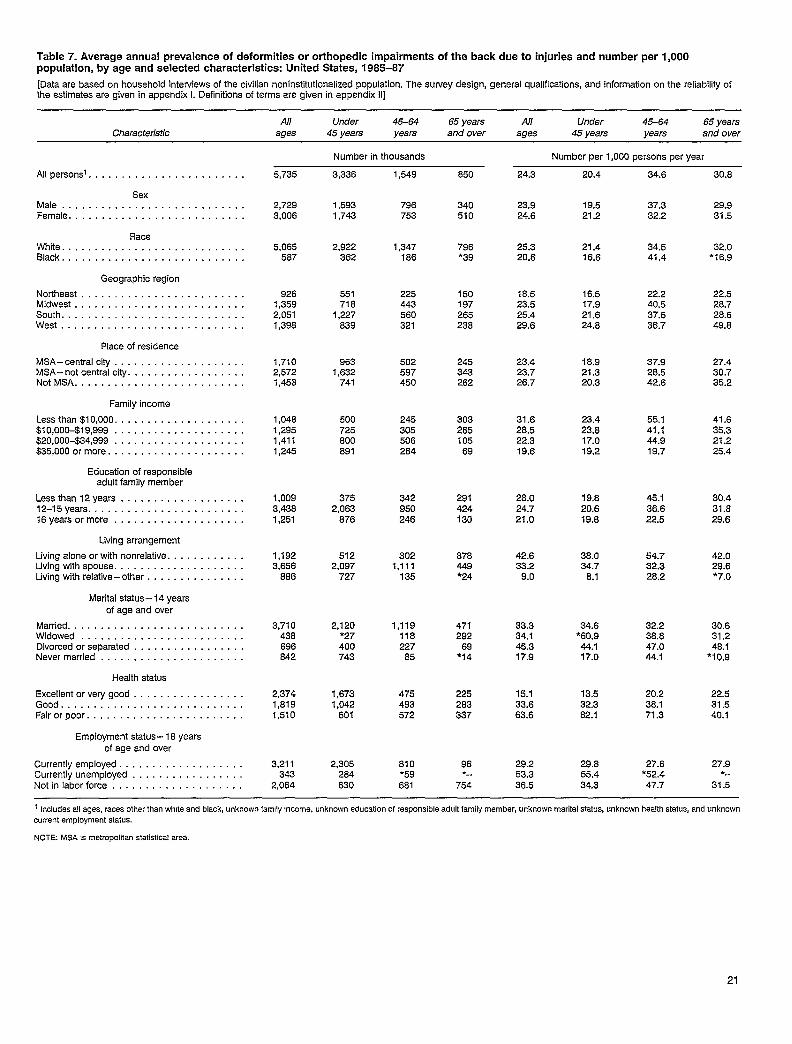
Table 7. Average annual prevalence of deformities or orthopedic impairments of the back due to injuries and number per 1,000population, by age and selected characteristics: United States, 1985-87
[Data are based on household interviews of the civilian noninstitutionalized population. The survey design, general qualifications, and information on the reliability ofthe estimates are given in appendix 1. Definitions of terms are given in appendix 11]
All Under 45-64 65 years Ail UnderCharacteristic
45-64 65 yearsages 45 years years and over ages 45 years years and over
Number in thousands Number per 1,000 persons per year
Allpersonsl . . . . . . . . . . . . . . . . . . . . . . . .
SexMale . . . . . . . . . . . . . . . . . . . . . . . . . . . .Female . . . . . . . . . . . . . . . . . . . . . . . . . . .
RaceWhite . . . . . . . . . . . . . . . . . . . . . . . . . . . .black . . . . . . . . . . . . . . . . . . . . . . . . . . . .
Geographic region
Northeast . . . . . . . . . . . . . . . . . . . . . . . . .Midwest . . . . . . . . . . . . . . . . . . . . . . . . . .South . . . . . . . . . . . . . . . . . . . . . . . . . . . .West . . . . . . . . . . . . . . . . . . . . . . . . . . . .
Place of residence
MSA–centrai city . . . . . . . . . . . . . . . . . . . .MSA-notcentralcity . . . . . . . . . . . . . . . . . .NotMSA . . . . . . . . . . . . . . . . . . . . . . . . . .
Family income
Lessthan $10,000 . . . . . . . . . . . . . . . . . . . .$10,000-$19,999 . . . . . . . . . . . . . . . . . . . .$20,00C-$34,999 . . . . . . . . . . . . . . . . . . . .$35,0000rmore . . . . . . . . . . . . . . . . . . . . .
Education of responsibleadult family member
Lessthan 12years . . . . . . . . . . . . . . . . . . .12–15years . . . . . . . . . . . . . . . . . . . . . . . .16yearsormore . . . . . . . . . . . . . . . . . . . .
Liiing arrangement
Living alone orwith nonrelative. . . . . . . . . . . .Living withspouse . . . . . . . . . . . . . . . . . . . .Livingwith relative-other . . . . . . . . . . . . . . .
Marital status– 14 yearsof age and over
Married. . . . . . . . . . . . . . . . . . . . . . . . . . .Widowed . . . . . . . . . . . . . . . . . . . . . . . . .Divorced orseparated . . . . . . . . . . . . . . . . .Nevermarried . . . . . . . . . . . . . . . . . . . . . .
Health status
Excellantorverygood . . . . . . . . . . . . . . . . .Good . . . . . . . . . . . . . . . . . . . . . . . . . . . .Fairorpoor . . . . . . . . . . . . . . . . . . . . . . . .
Employment status -18yearsof age and over
Currentlyemployed . . . . . . . . . . . . . . . . . . .Currentlyunemployed . . . . . . . . . . . . . . . . .Notin laborforce . . . . . . . . . . . . . . . . . . . .
5,735
2,7293,006
5,065587
3,336
1,5931,743
2,922362
551718
1,227839
1,549
796753
1,347166
650
340510
796*39
150197285230
245343262
303265105
69
291424130
376449*24
471292
69*I4
225283337
96*-
754
24.3
23.924.6
25.320.6
16.523.525.429.6
23.423.726.7
31.628.522.319.6
20.4 34.6 30.8
19.521.2
37.332.2
29.931.5
21.416.6
34.541.4
32.0*1 6.9
926 225 16.517.921.624.8
22.240.537.636.7
22.528.728.649.8
1,3592,0511,398
1,7102,5721,453
1,0481,2951,4111,245
1,0093,4381,251
1,1923,656
888
3.710
443560321
502597450
245305506284
342950246
3021,111
135
1,119118227
85
475493572
810*59681
963 18.921.320.3
37.928.542.6
27.430.735.2
1,632741
500725800891
3752,063
876
5122,097
727
2,120*27400743
1,6731,042
601
2,305284630
23.423.817.019.2
55.141.144.919.7
41.635.321.225.4
45.136.622.5
30.431.829.6
28,0 19.820.619.8
24.721,0
42.633.2
9.0
33.334.145.317.9
15.133.663.6
29.253.336.5
38.034.7
8.1
54.732.328.2
42.029.6*7.O
32.238.847.044.1
30.631.248.1
●10,9
34.6‘60.944.117.0
“438896842
2,3741,8191,510
3,211343
2,064
13.532.382.1
20.238.171.3
22.531.540.1
29.855.434.3
27.6*52.447.7
27.9●-
31.5
1 includes allages, races olherthan whlteand black, unknown famtly!ncome, unknown education ofresponsible adult fami~member, unknown matitaI status, unknown health sktus, and unknown
current employment status.
NOTE. MSA IS metropolitan statistical area.
21
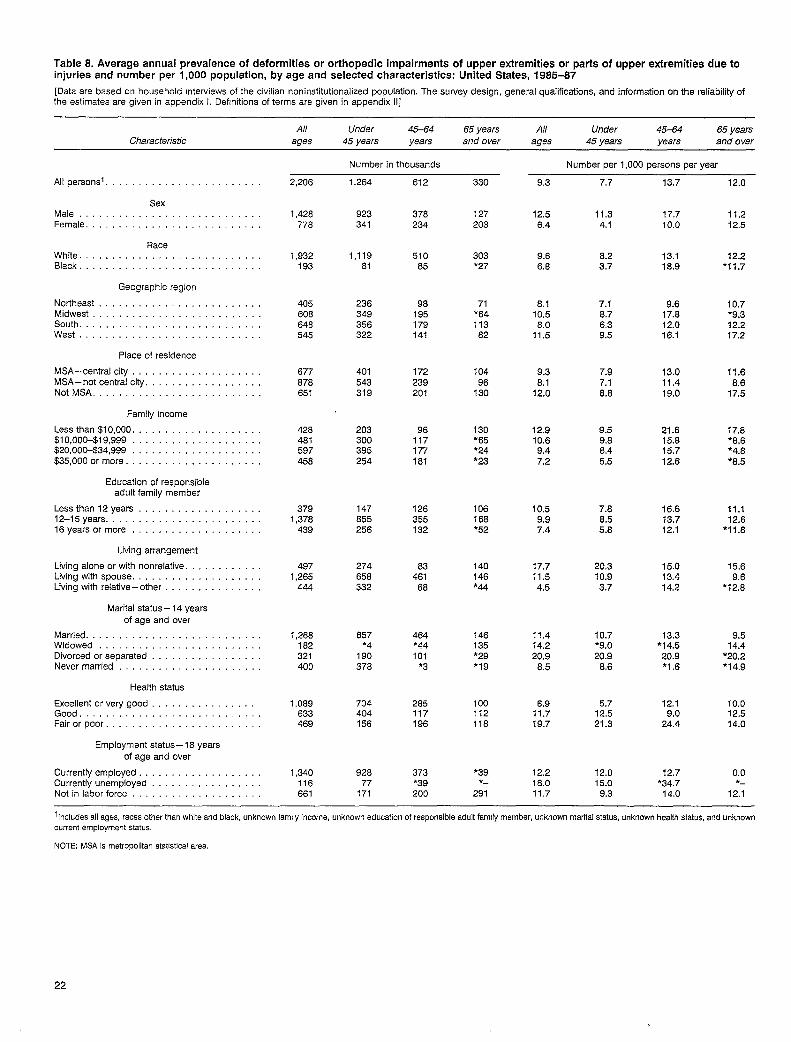
Table 8. Average annual prevalence of deformities or orthopedic impairments of upper extremities or parts of upper extremities due toinjuries and number per 1,000 population, by age and selected characteristics: United States, 1985-87
[Data are based on household interviews of the civilian noninstitutionalized population. The survey design, general qualifications, and information on the reliability ofthe estimates are given in appendix 1, Definitions of terms are given in appendix 11]
All Under 45-64 65 yeara All Under 45-64 65 yearsCharacteristic ages 45 years years and over ages 45 yeara years and ovar
Number in thousands
All personsi .,, ,,, ,. . . . . . . . . . . . .
SexMale, , .,, . . . . . . . . . . . . . . . .Female . . . . . . . . . . . . . . . . . . ... ..,,,,
RaceWhite . . . . . . . . . . . . . . . . . . . . . . . ,., ,.Black . . . . . . . . . . . . . . . . . . ., ..,,,,..
Geographic region
Northeast .,, . . . . . . . . . . . . . . . . . . . . . .Midwest . . . . . . . . . . . . . . . . . . . . . . .South. ..,,.....,...,,,. . . . . . . . . .West .,,...........,,,. . . . . . . . . .
Place of residence
MSA-central city ., .,,,.... . . . . . .MSA-notcentral city, ,, . . . . . . . . . . . .NotMSA . . . . . . . . . . . . . . . . . . . . . .
Family income
Lessthan$lO,OOO . . . . . . . . . . . . . . . . . . .$10,000-$19,999 . . . . . . . . . . . . . . . . . . . .$20,00&$34,999 . . . . . . . . . . . . . . . . . . . .$35,0000rmore . . . . . . . . . . . . . . . . . . . . .
Education of responsibleadult family member
Lessthan 12years, . . . . . . . . . . . . . . .12–15years. ,,, . . . . . . . . . . . . . . . . . . . .16yearsormore . . . . . . . . . . . . . . . . .
Living arrangement
Living alone orwith nonrelative, , .Livingwith spouse . . . . . . . . . . . . . . . . . . . .Living with relative-other. . . . . . .
Marital status – 14 yaarsof age and over
Married . . . . . . . . . . . . . . . . . . . . . . .Widowed . . . . . . . . . . . . . . . . . . . . . .Divorced orseparated . . . . . . . . . . . . . . . . .Nevermarried ...,,,...,,, . . . . . . . . . .
Haalth status
Excellentorverygood, ,,,... . . . . . . . .Good, . . . . . . . . . . . . . . . . . . . . . . .Fairer poor . . . . . . . . . . . . . . . . . . . .
Employmentstatus– 18yearsofage and over
Currentlyemployed . . . . . . . . . . . . . . . . . .Currentlyunemployed . . . . . . . . . . . . . .Notin laborforce . . . . . . . . . . . . . . . . . . . .
2,206
1,428776
1,932193
40560884I3545
677876651
428481597458
3791,376
439
4971,265
444
1,268182321400
1,089633469
1,340118861
1,264
923341
1,11981
236349356322
401543319
203300395254
147855256
274658332
657*4
190378
704404156
92877
171
612
378234
51065
98195179141
172239201
96117177181
126355132
83461
68
464*44101
*3
285117196
373*39200
330
127203
303*27
71’6411382
10496
130
130*65*24*23
106168*52
140146*44
146135*29*I9
100112118
*39*_
291
Number per 1,000 persons per year
9.3 7.7
12,56,4
9.68.8
8.110.5
1U
9.36.1
12.0
12.910,6
9.47.2
10.59.97.4
17.711.54.5
11.414.220.9
8.5
8.911.719.7
12.218.011,7
11.34.1
6.23.7
7.18.76,39.5
7.97.18.6
9.59.88.45.5
7.68.55.8
20,310.93.7
10.7*9.O20.9
8.6
5.712.521.3
12.015.09.3
13.7
17.710.0
13.118.9
9.617.812.016.1
13.011.419.0
21.615.815.712.6
16.613.712.1
15.013.414.2
13.3*1 4.520.9*1 .6
12.19.0
24.4
12.7*34.7
14.0
12.0
11.212,5
12.2*11.7
10.7*9.312.217.2
11.68.6
17.5
17.8*6.6*4.8*8.5
11.112.8
*11.8
15.69.6
*1 2.8
9.514.4
*20.2*1 4,9
10.012.514.0
0.0*_
12.1
l[n~ludesallage~, races other than WMteand black, unknown family income, unknown education ofresponaible adult fmllymember, unknown marital tietus, unknown health status, and unknoWncurrent employment status.
NOTE: MSAismetropolitan statisticelaraa.
22
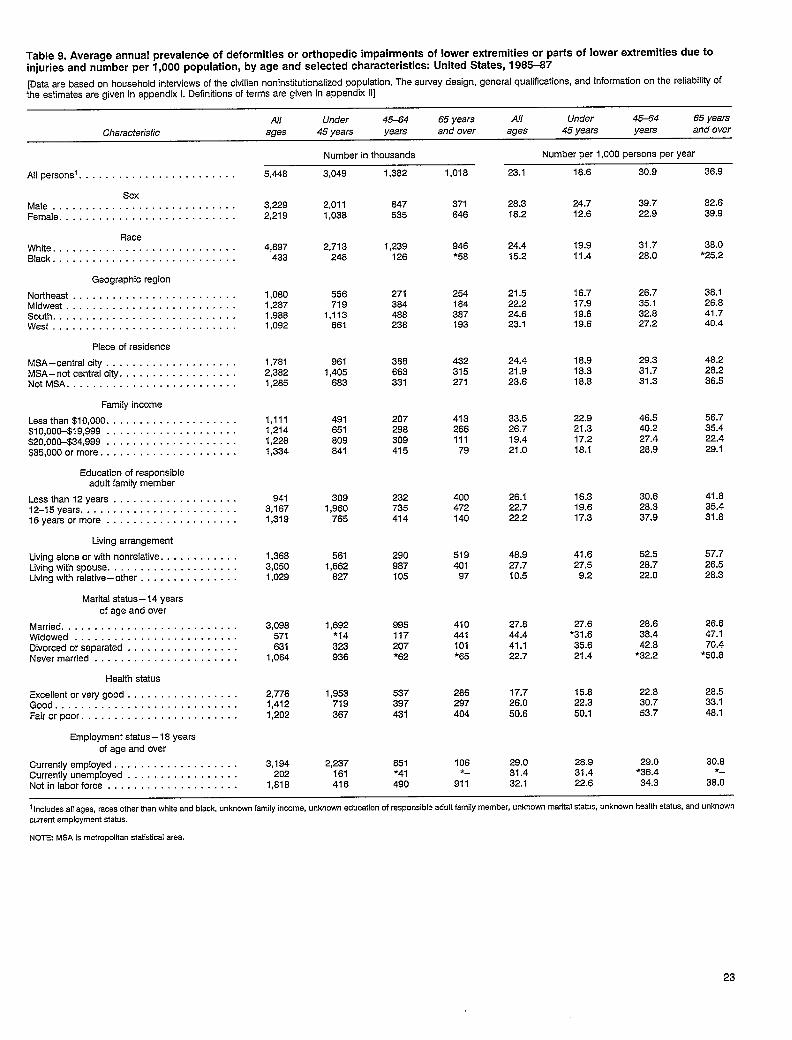
Table 9. Average annual prevalence of deformities or orthopedic impairments of lower extremities or parts of lower extremities due toinjuries and number per 1,000 population, by age and selected characteristics: United States, 1985-87
[Data are based on household interviews of the civilian noninstitutionalized population. The survey design, general qualifications, and information on the reliability ofthe estimates are given in appendix 1. Definitions of terms are given in appendix 11]
All Under 45-64 65 years All Under 45-64 65 yearsCharscterktic ages 45 yeara years and over ages 45 years years and over
Number Der 1.000 Dersons ~er yearNumber in thousands ,.1,382 1,018 23.1 18.6
24.712.6
19.911.4
16.717.919.619.6
18.91&316.8
22.921.317.218.1
16.319.617.3
41,827,5
9.2
27.8*3 I .635.621.4
15.822.350.1
28.931.422.6
30.9 38.9All personsi . . . . . . . . . . . . . . . . . . . . . . . .
SexMale, . . . . . . . . . . . . . . . . . . . . . . . . . . .Female . . . . . . . . . . . . . . . . . . . . . . . . . . .
RaceWhite . . . . . . . . . . . . . . . . . . . . . . . . . . . .Black . . . . . . . . . . . . . . . . . . . . . . . . . . . .
Geographic region
Northeast . . . . . . . . . . . . . . . . . . . . . . . . .Midwest . . . . . . . . . . . . . . . . . . . . . . . . . .South . . . . . . . . . . . . . . . . . . . . . . . . . . . .West . . . . . . . . . . . . . . . . . . . . . . . . . . . .
Place of residence
MSA–central city . . . . . . . . . . . . . . . . . . . .MSA–notcentral city . . . . . . . . . . . . . . . . . .NotMSA . . . . . . . . . . . . . . . . . . . . . . . . . .
Family income
Lessthan$lO,OOO . . . . . . . . . . . . . . . . . . . .$10,000-$19,999 . . . . . . . . . . . . . . . . . . . .$20,000-$34,999 . . . . . . . . . . . . . . . . . . . .$35,0000rmore . . . . . . . . . . . . . . . . . . . . .
Education of responsibleadult family member
Lessthan 12years . . . . . . . . . . . . . . . . . . .12-15years . . . . . . . . . . . . . . . . . . . . . . . .18yearsormore . . . . . . . . . . . . . . . . . . . .
Living arrangement
Living alone orwith nonrelative. . . . . . . . . . . .Livingwith spouse . . . . . . . . . . . . . . . . . . . .Living with relative-other . . . . . . . . . . . . . . .
Marital status– 14 yearsof age and over
Married . . . . . . . . . . . . . . . . . . . . . . . . . . .Widowed . . . . . . . . . . . . . . . . . . . . . . . . .Divorced orseparated . . . . . . . . . . . . . . . . .Nevermarried . . . . . . . . . . . . . . . . . . . . . .
Health status
Excellentorverygood . . . . . . . . . . . . . . . . .Good . . . . . . . . . . . . . . . . . . . . . . . . . . . .Fairorpoor . . . . . . . . . . . . . . . . . . . . . . . .
Employment status -18 yearsof age and over
Currently employed . . . . . . . . . . . . . . . . . . .Currentlyunemployed . . . . . . . . . . . . . . . . .Notin laborforce . . . . . . . . . . . . . . . . . . . .
5,448
3,2292,219
4,897433
i ,0801,2871,9881,092
1,7812,3821,285
1,1111,2141,2281,334
9413,1671,319
1,3683,0501,029
3,098571631
1,064
2,7761,4121,202
3,194202
1,818
3,049
847535
1,239126
271384488238
388663331
207296309415
232735414
290987105
995117207*62
537397431
851*4I490
371648
946*58
254184387193
432315271
413266111
79
400472140
519401
97
410441101*65
286297404
106*—
911
28.318.2
39.722.9
32.639.9
2,0111,036
31.728.0
38.0*25.2
2,713248
24.415.2
21.522.224.623.1
26.735.132.827,2
36.126.841.740.4
556719
1,113661
29.331.731.3
48.228.236.5
9611,405
683
24.421.923.6
33.526.719.421.0
46.540.227.426.9
56.735.422.429.1
491651809841
3091,960
765
26.122.722.2
30.628.337.9
41.835.431.8
52.528.722.0
57.726.528.3
5611,662
827
48.927.710.5
26.647.170.4
*50.8
1,692*14323936
27.844.441.122.7
28.638.442.8
*32.2
22.630.753.7
28.533.148.1
1,953719367
17.726.050.6
2,237161416
29.031.432.1
29.0*38.434.3
30.6*—
38.0
1Includes all ages, races other than white and black, unknown family income, unknown education of responsible adult family member, unknown marital status, unknown health status, and unknown
current employment status.
NOTE MSAismetropolitan statistical area.
23
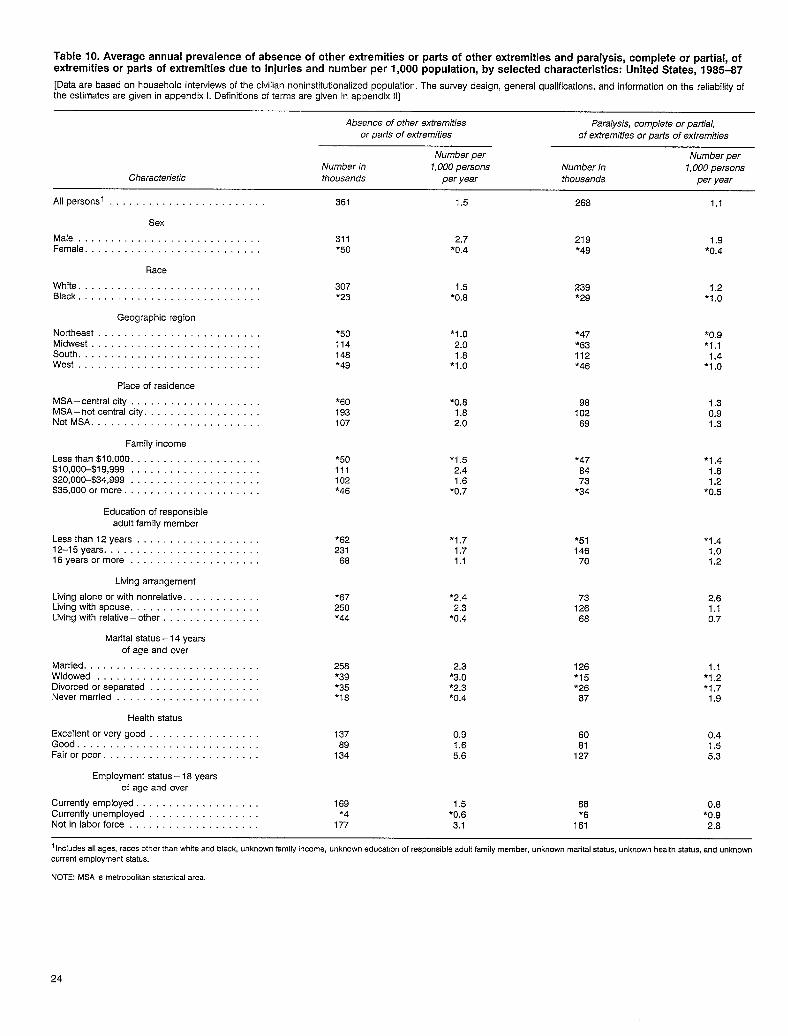
Table 10. Average annual prevalence of absence of other extremities or parts of other extremities and paralysis, complete or partial, ofextremities or parts of extremities due to injuries and number per 1,000 population, by selected characteristics: United States, 1985-87
[Data are based on household interviews of the civilian noninstitutionalized population, The survey design, general qualifications, and information on the reliability ofthe estimates are given in appendix 1. Definitions of terms are given in appendix 11]
Absence of other extremities Para/ysis, comp/ete or pwtja/,or patis of extremities of extremities or parts of extremities
Number per Number perNumber in 1,000 persons Number jn 1,000 persons
Characteristic thousands per year thousands per year
Allpersonsl . . . . . . . . . . . . . . . . . 361 1,5 268 1.1
Sex
Male, . . . . . . . . . . . . . . . . . . . . . . . . 311 2.7 219Female . . . . . . . . . . . . . . . . . . . . . . . . . *5O
1.9*0.4 *49 *0.4
Race
White . . . . . . . . . . . . . . . . . . . . . . . . 307Black . . . . . . . . . . . . . . . . . . . . . . . . *23
1.5*0.8
239*29
1.2*1.O
Geographic region
Northeast . . . . . . . . . . . . . . . . . . . . . . . “50 *1.O *47Midwest . . . . . . . . . . . . . . . . . . . . . . .
*0.9114 2.0 *63
South, . . . . . . . . . . . . . . . . . . . . . . . .*1.1
148 1.8 112West . . . . . . . . . . . . . . . . . . . *49
1.4*1.O *46 *1 .0
Place of residence
MSA–centralcity, . . . . . . . . . . . . . . . . *6O *0.8 98 1.3MSA–notcentral city . . . . . . . . . . . . . . . 193 1.6 102 0.9Not MSA. . . . . . . . . . . . . . . . . . . . . . . . 107 2,0 69 1.3
Family income
Lesethan $10,000 . . . . . . . . . . . . . . . . . . . *5O ‘1,5 ’47$10,000-$19,999 . . . . . . . . . . . . . .
*1.4111 2,4 84
$20,00C-$34,999 . . . . . . . . . . . . . . . . . . . . 1021.8
1.6 73$35,0000rmore . . . . . . . . . . . . . . . . . . . . . *46
1.2‘0.7 *34 *0.5
Education of responsibleadult family member
Lessthan 12years . . . . . . . . . . *62 *1 .7 *5I12–15years . . . . . . . . . . . . . . . . . . . . . .
*1.4231 1.7 146
18yearsormore . . . . . . . . . . . . . . . . . . .1.0
68 1.1 70 1.2
Living arrangement
Living alone or with nonrelative. . . ●67 *2.4 73Livingwith spouse. . . . . . . . . . . . . . . . . . 250
2.62.3 126
Living with relative-other. . . .1.1
*44 *0.4 68 0.7
Marital status – 14 years
of age and over
Married . . . . . . . . . . . . . . . . . . . . . . . . . 258 2.3 126Widowed . . . . . . . . . . . . . . . . . . . . . . .
1.1*39 *3.O *15
Divorced orseparated . . . . . . . . . . . . .*1.2
*35 *2.3 *26Never married .,, . . . . . . . . .
*1.7*18 ‘0.4 87 1.9
Health status
Excellentorverygood . . . . . . . 137 0.9 60Good . . . . . . . . . . . . . . . . . . . . . . . . . . .
0.469 1,6 81
Fairorpoor, . . . . . . . . . . . . . . . . . . . . .1.5
134 5.6 127 5.3
Employment status- 18 yearsof age and over
Currentlyemployed . . . . . . . . . . . . . . . . . . . 169 1.5 68Currentlyunemployed . . . . . . . .
0.6*4 *0.6 *6
Not in laborforce . . . . . . . . . . . . . . . . . . .*0.9
177 3.1 161 2.8
‘Includes all ages, races other than wMteand b[ack, unknown family income, unknown education ofresponsible adult family member, unknown matihlstatus, unknown health atatus, and unknown
current employment status.
NOTE: MSA IS metropolitan statistical area.
24
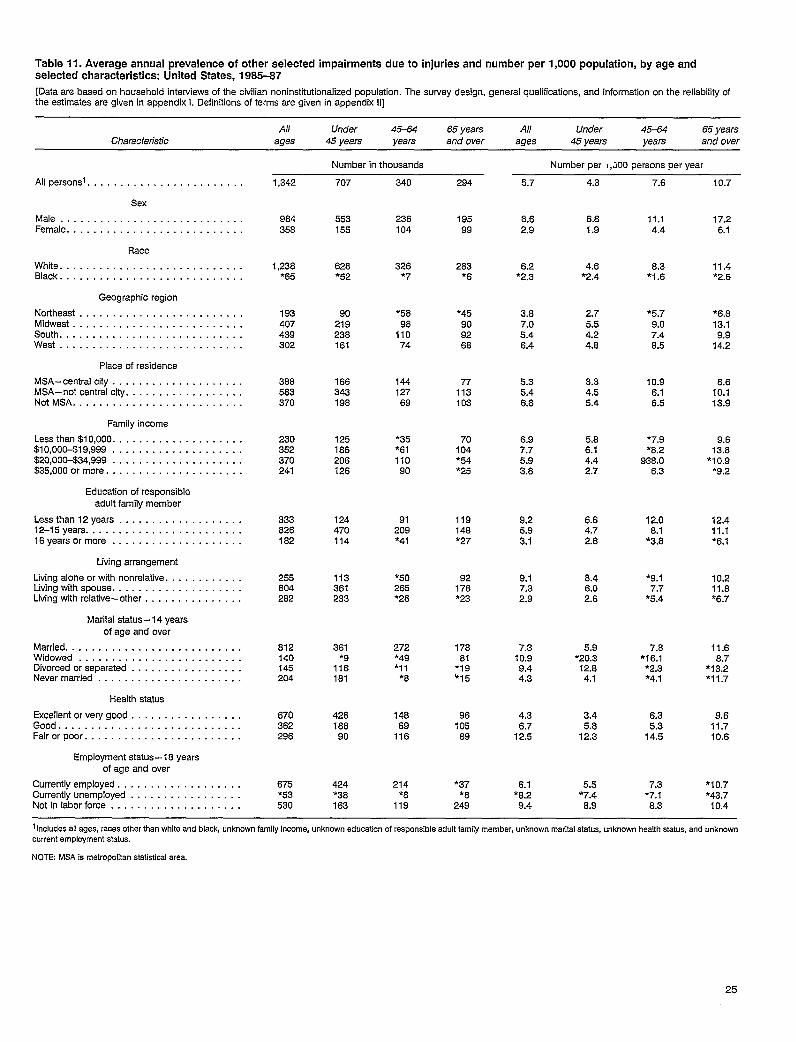
Table 11. Average annual prevalence of other selected impairments due to injuries and number per 1,000 population, by age andselected characteristics: United States, 1985-87
[Data are based on household intewiews of the civilian noninstitutionalized population. The survey design, general qualifications, and information on the reliability ofthe estimates are given in appendix 1. Definitions of terms are given in appendix 11]
All Under 45=64 65 years All Under 45-64 65 yearsCharacteristic ages 45 years years and over ages 45 years years and over
Number in thousands
Allpersonsl . . . . . . . . . . . . . . . . . . . . . . . .
Sex
Male . . . . . . . . . . . . . . . . . . . . . . . . . . . .Female . . . . . . . . . . . . . . . . . . . . . . . . . . .
Race
White . . . . . . . . . . . . . . . . . . . . . . . . . . . .Black . . . . . . . . . . . . . . . . . . . . . . . . . . . .
Geographic region
Northeast . . . . . . . . . . . . . . . . . . . . . . . . .Midwest . . . . . . . . . . . . . . . . . . . . . . . . . .South . . . . . . . . . . . . . . . . . . . . . . . . . . . .West . . . . . . . . . . . . . . . . . . . . . . . . . . . .
Place of residence
MSA-centralcity . . . . . . . . . . . . . . . . . . . .MSA-notcentral city . . . . . . . . . . . . . . . . . .Not MSA . . . . . . . . . . . . . . . . . . . . . . . . . .
Family income
Lessthan $101000 . . . . . . . . . . . . . . . . . . . .$10,00C-$19,999 . . . . . . . . . . . . . . . . . . . .$20,000-$34,999 . . . . . . . . . . . . . . . . . . . .$35,0000rmore . . . . . . . . . . . . . . . . . . . . .
Education of responsibleadult family member
Lessthan 12years . . . . . . . . . . . . . . . . . . .12–15years . . . . . . . . . . . . . . . . . . . . . . . .16years ormore . . . . . . . . . . . . . . . . . . . .
Living arrangement
Living alone orwith nonrelative. . . . . . . . . . .Livingwithspouse . . . . . . . . . . . . . . . . . . . .Livingwith relative-other . . . . . . . . . . . . . .
Maritalstatus-14 years
of age and over
Married . . . . . . . . . . . . . . . . . . . . . . . . . . .Widowed . . . . . . . . . . . . . . . . . . . . . . . . .Divorced orseparated . . . . . . . . . . . . . . . . .Nevermarried . . . . . . . . . . . . . . . . . . . . . .
Health status
Excellentorverygood, . . . . . . . . . . . . . . . .Good . . . . . . . . . . . . . . . . . . . . . . . . . . . .Fairorpoor . . . . . . . . . . . . . . . . . . . . . . . .
Employment status -18yearsof age and over
Currentlyemployed . . . . . . . . . . . . . . . . . . .Currentlyunemployed . . . . . . . . . . . . . . . . .Notin laborforce . . . . . . . . . . . . . . . . . . . .
1,342
984356
1,238*65
193407439302
388583370
230352370241
333826182
255804282
812140145204
670362296
675*53530
707
553155
628“52
2:238161
166343198
125186206126
124470114
113361233
361
1%181
42616690
424*38163
340
236104
326●7
*5898
11074
14412769
*35*6I110
90
91209*41
*5O265*26
272*49*11
*8
14669
116
214*8
119
294
19599
283*6
*45909268
77113103
70104*54*25
119148*27
92178*23
17881
*I9*I5
96105
89
*37*8
249
Number per l, JOOpersons peryear
5.7
8.62.9
6.2●2 .3
3.87.05.46.4
5.35.46.8
6.97.75.93.8
9.25.93.1
9.17.32.9
7.310.99.44.3
4.36.7
12.5
6.1*8.29.4
4.3
6.81.9
4.6*2.4
2.75.54.24.8
3.34.55.4
5.86.14.42.7
6.64.72.6
8.46.02.6
5.9*20.3
12.84.1
3.45.8
12.3
5.5*7.4
8.9
7.6
11.14.4
8.3*1 .6
*5.79.07.48.5
10.96.16.5
*7.9*8.2
938.06.3
12.08.1
*3.8
*9.17.7
*5.4
7.6*1 6.1
*2.3*4.1
6.35.3
14.5
7.3*7.1
8.3
10.7
17.26.1
11.4*2.6
*6.813.19.9
14.2
8.610.113.9
9.613.6
*10.9*9.2
12.411.1*6.1
10.211.6*6.7
11.68.7
*13.2*11.7
9.611.710.6
*I 0.7*43.7
10.4
1Includes all ages, races other than white and black, unknown family income, unknown education of responsible adult family member, unknown maritalstatus, unknown health status, and unknowncurrent employment status.
NOTE MSA is matropolltan statistical area.
25
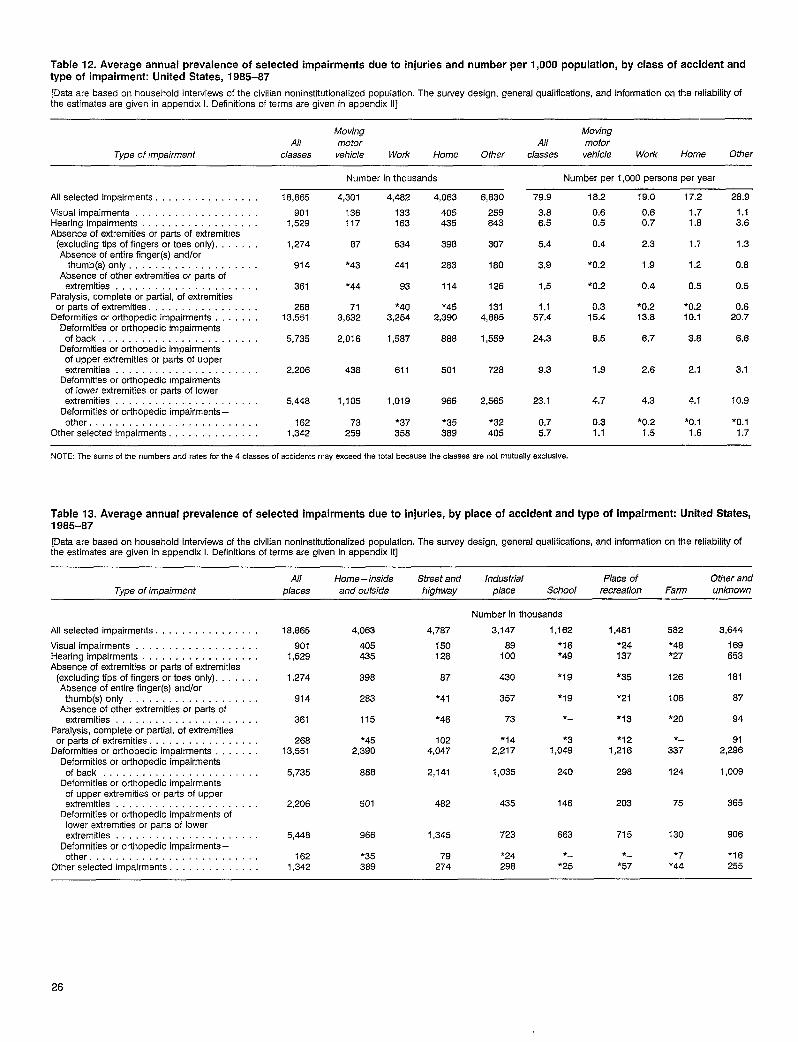
Table 12. Average annual prevalence of selected impairments due to injuries and number per 1,000 population, by class of accident andtype of impairment: United States, 1985-87
[Data are based on household interviews of the civilian noninstiiutionalized population, The survey design, general qualifications, and information on the reliability ofthe estimates are given in appendix 1. Definitions of terms are given in appendix 11]
MovingAll
Movingmotor All motor
Type of impairment classes vehicle Work Home Other classes veh;cle Work Home Other
Number in thousands Number per 1,000 persons per year
All selected impairments . . .
Visual impairments .,, ,, . . . . . . . . . . .Hearing impairments . . . . . . . . . . . . . . .Absence of extremities or parta of extremities
(excluding tips of fingers or toes only).Absence of entire finger(s) and/or
thumb(s) only,.....,....,., . . . . . .Absence of other exlremifies or parts of
extremities . . . . . . . . . . . . . . . . . . . . . .Paralysis, complete or partial, of extremities
orparts ofextremfties . . . . . . . . . . . . . . . . .Deformities or orthopedic impairments . . .
Deformities or orthopedic impairmentsof back . . . . . . . . . . . . . . . . . . . . . . . .
Deformities or orthopedic impairmentsof upper extremities or parts of upperextremities . . . . . . . . . . . . . . . . . . .
Deformities or orthopedic Impairmentsof lower extremities or parts of lowerexkemities ...,......,.. . . . .
Deformities or orthopedic impairments –other . . . . . . . . . . . . . . . . . . . . . .
Other selected impairments. . . . . . . . .
18,865
9011,529
1,274
4,301
136117
67
4,462
133163
534
4,063
405435
398
283
114
*452,390
888
501
966
*35369
6,830
259843
307
180
126
1314,885
1,559
79.9 18.2 19.0 17.2 28.9
3.6 0.6 0.6 1.7 1.16.5 0.5 0.7 1.E1 3,6
5,4 0.4 2.3 1.7 1.3
3.9 *0.2 1.9 1.2 0.8914 *43 441
361 *44 93 1.5 *0.2 0.4 0.5 0.5
26813,551
713,632
*403,254
1.1 0.3 *0.2 *0.2 0.657.4 15.4 13.8 10.1 20.7
5,735 2,016 1,567 24.3 8.5 6.7 3.8 6.6
9.3 1.9 2.6 2.1 3.12,206 438 611 728
23,1 4.7 4.3 4.1 10.95,448 1,105 1,019 2,565
*32405
1621,342
73259
*37358
0.7 0.3 *0.2 *0.I *0.15.7 1.1 1.5 1.6 1.7
NOTE The sums of the numbers and rates for ihe 4 classes of accidents may exceed the total because the classes are not mutually exclusive.
Table 13. Average annual prevalence ofselected impairments duetoinjuries, bypIace ofaccidentand~peof impairment: United States,1985-87
[Data are based on household interviews of the civilian noninstitutionalized population. The survey design, general qualifications, and information on the reliability ofthe estimates are given in appendix 1. Definitions of terms are given in appendix 11]
All Home–insjde Street and Industrial Place of Other andType of impairment places and outside highway place School recreation Farm unknown
Number in thousands
3,147 1,162 1,481 582 3,644All selected impairments. . . . . . . . . . . . .
Visual impairments . . . . . . . . . . . . . . . . . . .Hearing impairments . . . . . . . . . . . . . . . . . .Absence of extremities or parts of extremities
(excluding tips of fingers or toes only). . . . . .Absence ofentire finger(s) and/or
thumb(s) only, . . . . . . . . . . . . . . . . .Absence of other extremities or patts of
extremities . . . . . . . . . . . . . . . . . . . . . .Paralysis, complete or partial, of extremities
orparts of extremities . . . . . . . . . . . . . .Deformities or orthopedic impairments .
Deformities or orthopedic impairmentsofback . . . . . . . . . . . . . . . . . . . . . .
Deformities or orthopedic impairmentsof upper extremities orparts of upperextremities . . . . . . . . . . . . . . . . . . . . .
Deformities or orthopedic Impairments oflower extremities or parts of lowerextremities . . . . . . . . . . . . . . . . . .
Deformities or orthopedic impairments–other . . . . . . . . . . . . . . . . . . . . . . . . . .
Otherselected impairments. . .
18,865
9011,529
4,063
405435
4,787
150128
89100
430
357
73
*142,217
1,035
435
723
*24298
*16*49
*24137
*35
*21
*I3
*121,216
298
*48*27
169653
181
87
94
912,296
1,009
1,274 398 87 *19 126
914
361
283
115
*4I
*46
*I9 106
*2O
*_
337
124
*-
*326813,551
*452,390
1024,047 ,049
5,735 888 2,141 240
2,208 501 462 146 203 75 365
663 715
*-
*57
130
*7*44
906
*16255
5,448 966 1,345
1621,342
*35389
79274
*_*25
26
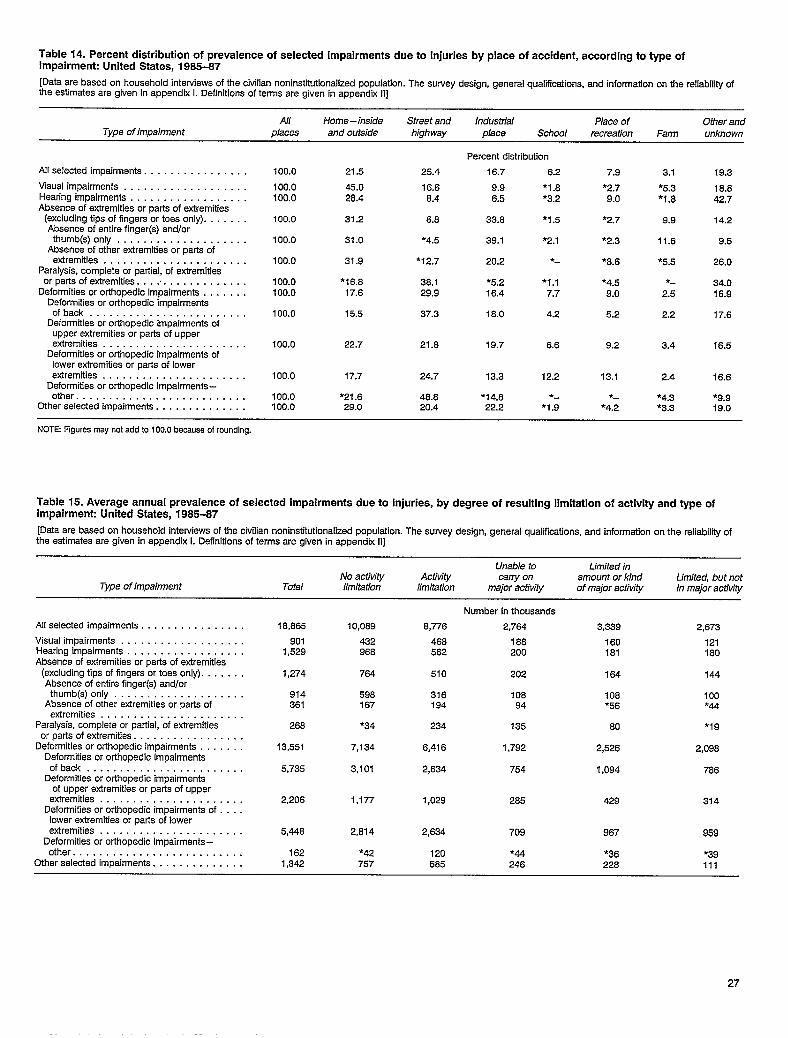
Table 14. Percent distribution of prevalence of selected impairments due to injuries by place of accident, according to type ofimpairment: United States, 1985-87
[Data are based on househoid intetviawa of the civilian noninstitutionaiized population. The survey design, generai qualifications, and information on the reliability ofthe estimates are given in appendix 1. Definitions of terms are given in appendix 11]
All Home–inside Street and Industrial Place of Other andType of impakment places and outside highway place School recreation Farm unknown
Percent distribution
Allselected impairments. . . . . . . . . . . . . . . . 100.0 21.5 25.4 16.7 6.2 7.9 3.1 19.3
Visual impairments . ...,..... . . . . . . . . . 100.0 45.0 16.6 9.9 ●1.8 *2.7 *5.3 18.8Hearing impairmente . . . . . . . . . . . . . . . . . . 100.0 28.4 6.4 6.5 *3.2 9.0 *1.6 42.7Absence of extremities or parts of extremities
(exciuding tips of fingers or toes only). . . . . . . 100.0 31.2 6.8 33.8 *1.5Absence of entire finger(s) and/or
*2.7 9.9 14.2
thumb(s) only . . . . . . . . . . . . . . . . . . . . 100.0 31.0 *4.5 39.1 ●2.1 *2.3 11.6 9.5Absence of other extremities or parts of
extremities . . . . . . . . . . . . . . . . . . . . . . 100.0 31.9 *12.7 20.2 *— *3.6 *5.5 26.0Paraiysis, complete or partial, of extremities
Orpartsofextremities . . . .. . . . . . . . . . . . . 100.0 *1 6.8 38.1 *5.2 ●1.1 *4.5 *_
Deformities or orthopedic impairments . . . . . . . 100.0 17.634.0
29.9 16.4 7.7 9.0 2.5 16.9Deformities or orthopedic impairments
ofback . . . . . . . . . . . . . . . . . . . . . . . . 100.0 15.5 37.3 18.0 4.2Deformities or orthopedic impairments of
5.2 2.2 17.6
upper extremities or parta of upperextremities . . . . . . . . . . . . . . . . . . . . . . 100.0 22.7 21.8 19.7 6.6
Deformities or orthopedic impairments of9.2 3.4 16.5
Iowerextremifies orpartsoflowerextremities, . . . . . . . . . . . . . . . . . . . . . 100.0 17.7 24.7 13.3 12.2 13.1 2.4 16.6
Deformities or orthopedic impairments –other . . . . . . . . . . . . . . . . . . . . . . . . . . 100.0 *21 .6 48.8 *1 4.6 *-
Otheraelected impairments. . . . . . . . . . . . . .
*- ●4.3 *9.9100.0 29.0 20.4 22.2 *1 .9 *4.2 *3.3 19.0
NOTE Figures may not add to 100.0 because of rounding.
Tabie 15. Average annuai prevalence of seiected impairments due to injuries, by degree of resuiting imitation of activity and type ofimpairment United States, 1985-87
[Data are based on household interviews of the civiiien noninetitutionalized popuiafion. The suwey design, generai qualifications, and information on the reliability ofthe estimates are given in appendix i. Definitions of terms are given in appendix II]
Unable to Limited inNo activity Activity carry on
Type of impairment Totalamount or kind Limited, but not
limitation limitation major activity of major activity in major actiw”ty
Number in thousands
Allselected impairments . . . . . . . . . . . . . . . . 18,865 10,089 6,776 2,764 3,339 2,673
Visual impairments . . . . . . . . . . . . . . . . . . . 901 432 468 186Hearing impairments . . . . . . . . . . . . . . . . . .
160 1211,529 968 562 200
Absence of extremities or parts of extremities161 180
(exciuding tips of fingers or toes only). . . . . . . 1,274 764 510 202Absence of entire finger(s) and/or
164 144
thumb(s) only . . . . . . . . . . . . . . . . . . . . 914 596 316 108Absence of other extremities or parts of
108361 167
100194 94 ●56
extremities . . . . . . . . . . . . . . . . . . . . . .*44
Paralysis, complete or partial, of extremities 266 *34 234 135 80 *19orparts ofextremities . . . . . . . . . . . . . . . . .
Deformities ororthopedic impairments . . . . . . . 13,551 7,134 6,416 1,792Deformities or orthopedic impairments
2,526 2,098
ofback . . . . . . . . . . . . . . . . . . . . . . . . 5,735 3,101 2,634 754Deformities or orthopedic impairments
1,094 786
of upper extremities or parts of upperextremities . . . . . . . . . . . . . . . . . . . . . . 2,206 1,177 1,029 285
Deformities ororthopedic impairments of . . . .429 314
lower extremities or patts of lowerextremities . ., ..,,,.... . . . . . . . . . . 5,448 2,614 2,634 709
Deformities or orthopedic lmpairments–967 959
other. . . . . . . . . . . . . . . . . . . . . . . . . . 162 *42 120 *44Otherselected impairments . . . . . . . . . . . .
*36 *391,342 757 585 246 228 111
27
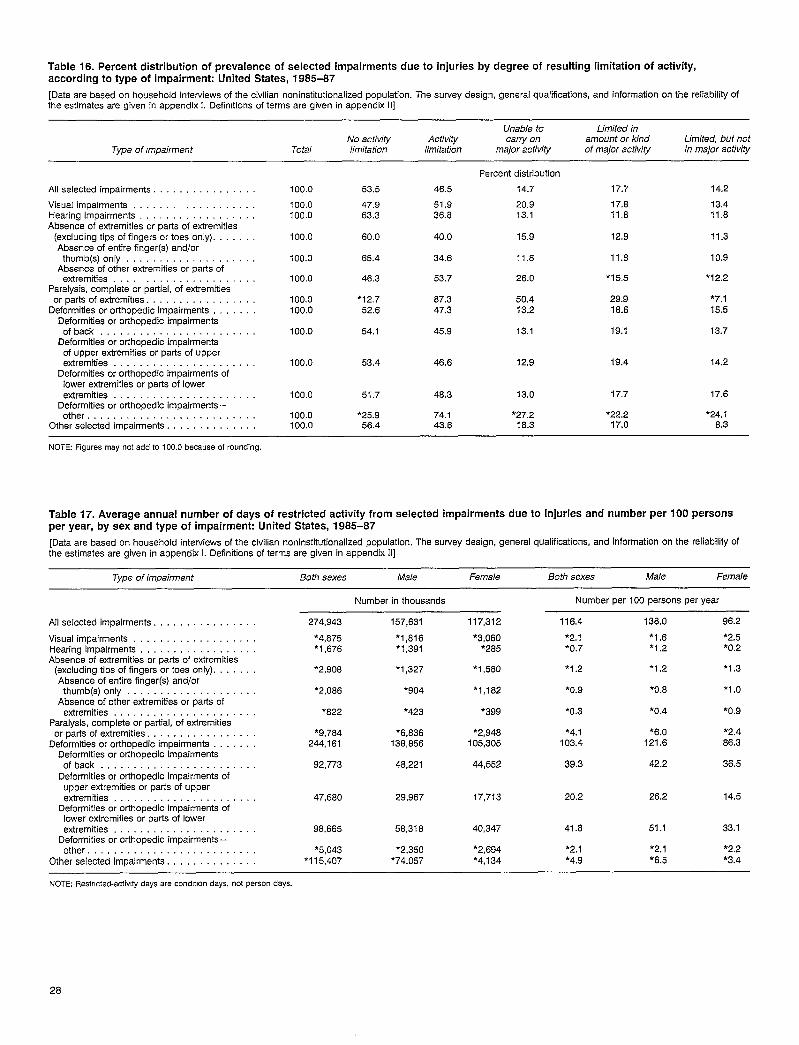
Table 16. Percent distribution of prevalence of selected impairments due to injuries by degree of resulting limitation of activity,according to type of impairment United States, 1985-87
[Data are based on household interviews of the civilian noninstitutionalized population. The survey design, general qualifications, and information on the reliability ofthe estimates are given in appendix 1, Definitions of terms are given in appendix 11]
Unable to Limited inNo activiiy Activity carry on amount or kind
Type of impairmentLimited, but not
Total /imitation /imitation major acfMty of major activity in major activiiy
Percent distribution
14.7
20.913.1
All selected impairments . 100.0
Visual impairments, . . . . . . . . . . . . . . . . 100.0Hearing impairments . . . . . . . . . . . 100.0Absence of extremities or parts of extremities
(excluding tips of fingers or toes only). . . . . . 100.0Absence of entire finger(s) and/or
thumb(s) only . . . . . . . . . . . . . . . . . 100.0Absence of other extremities or parts of
extremities . . . . . . . . . . . 100.0Paralysis, complete or partial, of extremities
orparts ofextremitles. . . . . . . . . . . . . . . 100.0Deformities ororthopedic impairments . . 100.0
Deformities or orthopedic impairmentsofback . . . . . . . . . . . . . . . . . . . . . 100.0
Deformities or orthopedic impairmentsof upper extremities or parts of upperextremities . . . . . . . . . . . . . . . . . . . . . . 100.0
Deformities or orthopedic impairments oflower extremities or parts of lowerextremities . . . . . . . . . . . . . . . . . . . . 100.0
Deformities or orthopedic impairments –other . . . . . . . . . . . . . . . . . . . . . . . . . . 100.0
Otherselected impairments. . . . . . 100.0
53.5
47,9
63,3
60.0
46.5
51.9
36.8
17.7
17.8
11.8
14.2
13,4
11,8
40,0 15,9 12.9 11.3
65.4 34.6 11.8 11.8 10.9
*1 2.246.3 53.7 26.0 *1 5,5
*12.752.6
87.347.3
45.9
50.413.2
13.1
29.918.8
19.1
*7.115.5
13.754,1
19.4 14.253.4 46.6 12,9
51.7 48.3 13.0
*27.216.3
i 7.7 17.6
*25.956.4
74.143.6
*22.217.0
*24.16.3
NOTE: Figures may not add to 100.0 bscause of rounding.
Tabie17. Average annual numberof days of restricted activity from selected impairments due to injuries and number perlOO personsper year, bysex and type of impairment: United States, 1985-87
[Data are based on household interviews of the civilian noninstitutionalized population. The survey design, general qualifications, and information on the reliability ofthe estimates are given in appendix 1. Definitions of terms are given in appendix H]
Type of impairment Both sexes Male Female Both sexes Male Female
Number in thousands Number per 100 persons per year
All selected impairments. . . . . . . . . . 274,943 157,631 117,312 116.4 138.0 96.2
Visual impairments . . . . . . . . . . . . . . . . . *4,875 *1,816 ‘3,060 *2.1 *1.6 *2.5Hearing impairmente ..,...... . . . . . . . . . *1 ,676 *1 ,391 *285 *0.7 *1 .2 *0.2Absence of extremities or parts of extremities
(excluding tips of fingers ortoes only). . . . ‘2,906 *1 ,327 *1 ,560 *1 .2 *1 .2 *1 ,3Absence of entire finger(s) and/or
thumb(s) only . . . . . . . . . . . . . . . . . . . ‘2,086 ’904 *1,182 *0.9 *0.6 *1.OAbsence of other extremities or parts of
extremities . . . . . . . . . . . . . . . . . . . . . *622 ’423 *399 *0.3 *0.4 *0.9Paralysis, complete orpartfal, of extremities
orparts ofextremitfes. . . . . . . . . . . . . . . *9,784 *6,836 *2,948 *4. 1 *6.O *2.4Deformities ororthopedic impairments . . . 244,161 138,856 105,305 103.4 121.6 86.3
Deformities or orthopedic impairmentsofback . . . . . . . . . . . . . . . . . . . . . . . . 92,773 48,221 44,552 39.3 42.2 36.5
Deformities or orthopedic impairments ofupper eflremities or parts of upperextremities . . . . . . . . . . . . . . . . . . . . . . 47,680 29,967 17,713 20.2 26.2 14.5
Deformities or orthopedic impairments oflower extremities or park of lowerextremities, . . . . . . . . . . . . . . . . . . . . 98,665 58,318 40,347 41.8 51.1 33.1
Deformities or orthopedic impairments–other . . . . . . . . . . . . . . . . . . . . . . . . *5,043 *2,350 *2,694 *2.1 *2.1 *2.2
Other selected impairments. . . . . . . . . . . *11 5,407 *74,057 *4,134 *4.9 *6.5 *3.4
NOTE: Restncted-activlty days arecondfllon days, notpsrson days.
28
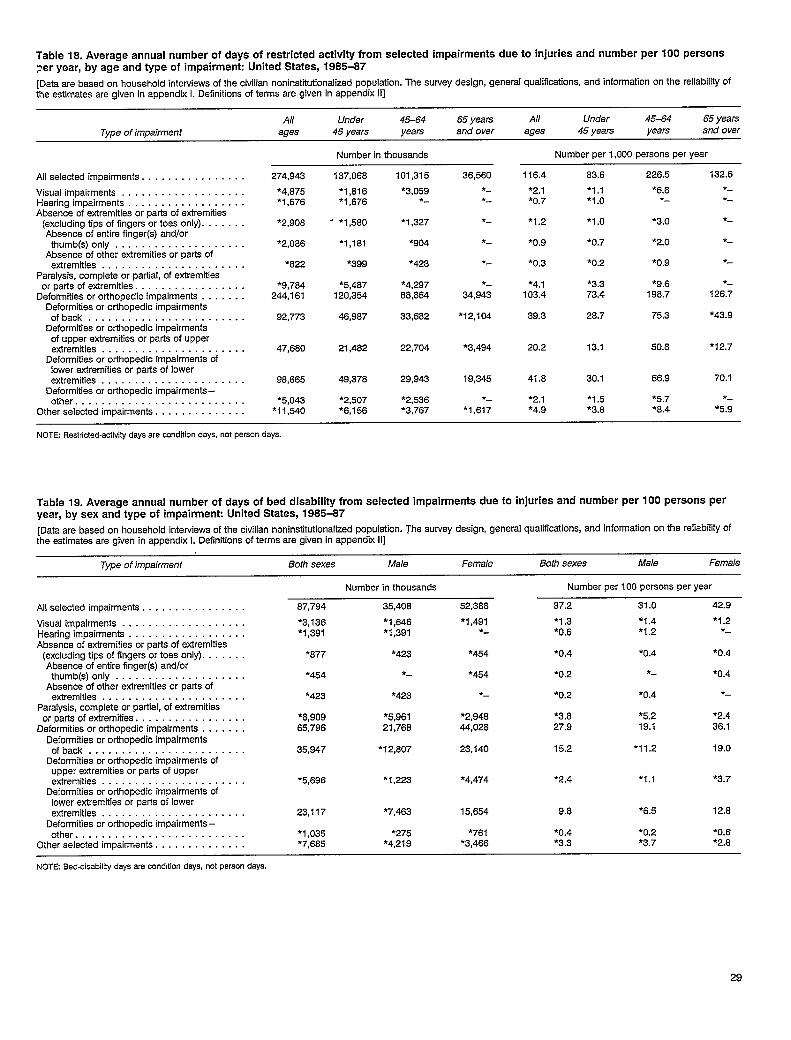
Table 18. Average annual number of days of restricted activity from selected impairments due to injuries and number per 100 personsper year, by age and type of impairment United States, 1985-87
[Data are based on household interviews of the civilian noninstitutionalized population. The survey design, general qualifications, and information on the reliability ofthe estimates are given in appendix 1. Definitions of terms are givan in appendix 11]
All Under 45-64 65 years All Under 45-64 65 yearsType of impairment ages 45 years years and over ages 45 years years and over
Number in thousands Number per 1,000 parsons per year
All selected impairments . . . . . . . . . . . . . . . . 274,943 137,068 101,315 36,560 116,4 83.6 226.5 132.6
Visual impairments . . . . . . . . . . . . . . . . . . . *4,875 *1 ,816 ‘3,059 *- *2. 1 *1 .1 *6.8 *-Hearing impairments . . . . . . . . . . . . . . . . . . *1 ,676 *1 ,676 *- ●- *O.7 *1.0 *- *-Absence of extremities or parts of extremities
(excluding tips of fingers or toes only). . . . . . . *2,908 “ ●1 ,580 *1 ,327 ●- *I .2 *1.0 *3.O *-Absence of entire finger(s) and/or
thumb(s) only . . . ‘2,086 *1,181 ’904 *_
Absence of other extre~t~es ~; p~&”of” “ “ “ “*0.9 ●0.7 *2.O *—
extremities . . . . . . . . . . . . . . . . . . . . . . *822 *399 *423 ●- *O.3 *0.2 *0.9 *-Paralysis, complete or partial, of extremities
orparts of extremities . . . . . . . . . . . . . . . . . *9,784 ●5,467 *4,297 *— *4. 1 *3.3 *9.6 *—Deformities or orthopedic impairments . . . . . . . 244,161 120,354 88,864 34,943 103.4 73.4 198.7 126.7
Deformities or orthopedic impairmentsof back . . . . . . . . . . . . . . . . . . . . . . . . 92,773 46,987 33,682 *I2,104 39.3 28.7 75.3 *43.9
Deformities or orthopedic impairmentsof upper extremities or parts of upperetiremities . . . . . . . . . . . . . . . . . . . . . . 47,680 21,482 22,704 *3,494 20.2 13.1 50.8 *1 2.7
Deformities or orthopedic impairments oflower extremities or parts of lowerextremities . . . . . . . . . . . . . . . . . . . . . . 98,665 49,378 29,943 19,345 41.8 30.1 66.9 70.1
Deformities or orthopedic impairments-other . . . . . . . . . . . . . . . . . . . . . . . . . . ‘5,043 *2,507 *2,536 *— *2. 1 *1.5 *5.7 *-
Otherselected impairments. . . . . . . . . . . . . . *11 ,540 *6,156 *3,767 *1,617 *4.9 *3.8 *8.4 *5.9
NOTE Restricted-activity days are condition days, not persondays
Table 19. Average annual number of days of bed disability from selected impairments due to injuries and number per 100 persons peryear, by sex and type of impairment United States, 1985-87
[Date are based on household Interviews of the civilian noninstiiutionalized population. The survey design, generaI qualifications, and information on the reliability ofthe estimates are given in appendix 1. Definitions of terms are given in appendix 11]
Type of impairment Both sexes Male Female Both sexes Male Female
Allselected impairmante. . . . . . . . . . . . . . . .
Visual impairments . . . . . . . . . . . . . . . . . . .Hearing Impairments . . . . . . . . . . . . . . . . . .Absence of extremities or parts of extremities
(axcluding tips of fingers or toes only). . . . . . .Absence of entire finger(s) and/or
thumb(s) only . . . . . . . . . . . . . . . . . . . .Absence of other extremities or parts of
extremities . . . . . . . . . . . . . . . . . . . . . .Paralysis, complete or partial, of extremities
orparts of extremities . . . . . . . . . . . . . . . . .Deformities ororthopedic impakmenta . . . . . . .
Deformities or orthopedic impairmentsof back . . . . . . . . . . . . . . . . . . . . . . . .
Deformities or orthopedic impairments ofupper extremities or parts of upperextremitie s . . . . . . . . . . . . . . . . . . . . .
Deformities or orthopedic impairments oflower extremities or parts of lowerextremities . . . . . . . . . . . . . . . . . . . . . .
Deformities or orthopedic impairments –other . . . . . . . . . . . . . . . . . . . . . . . . . .
Otherselected impairments. . . . . . . . . . . . . .
Number in thousands
67,794 35,408 52,388
*3, 138 *1 ,646 *1 ,491*1 ,391 *1 ,391 *-
*877 *423 *454
●454 *- *454
*423 *423 *-
*8,909 ●5,961 *2,94865,796 21,768 44,028
35,947 ●12,807 23,140
*5,696 *1 ,223 *4,474
23,117 *7,463 15,654
*1 ,035 *275 *761*7,685 *4,21 9 *3,466
Number per 100 persons per year
37.2
*1 .3*0.6
*0.4
*0.2
‘0.2
*3.827.9
15.2
31.0
*1.4*1.2
*0.4
*—
*0.4
*5.219.1
*1 1.2
42.9
*1.2*_
*0.4
*0.4
*—
*2.438.1
19.0
*2.4 *1.1 *3.7
9.8 *6.5 12.8
*0.4 *0.2 *0.6*3.3 *3.7 *2.8
NOTE Bed-disability days are condtlon days, not person days.
29
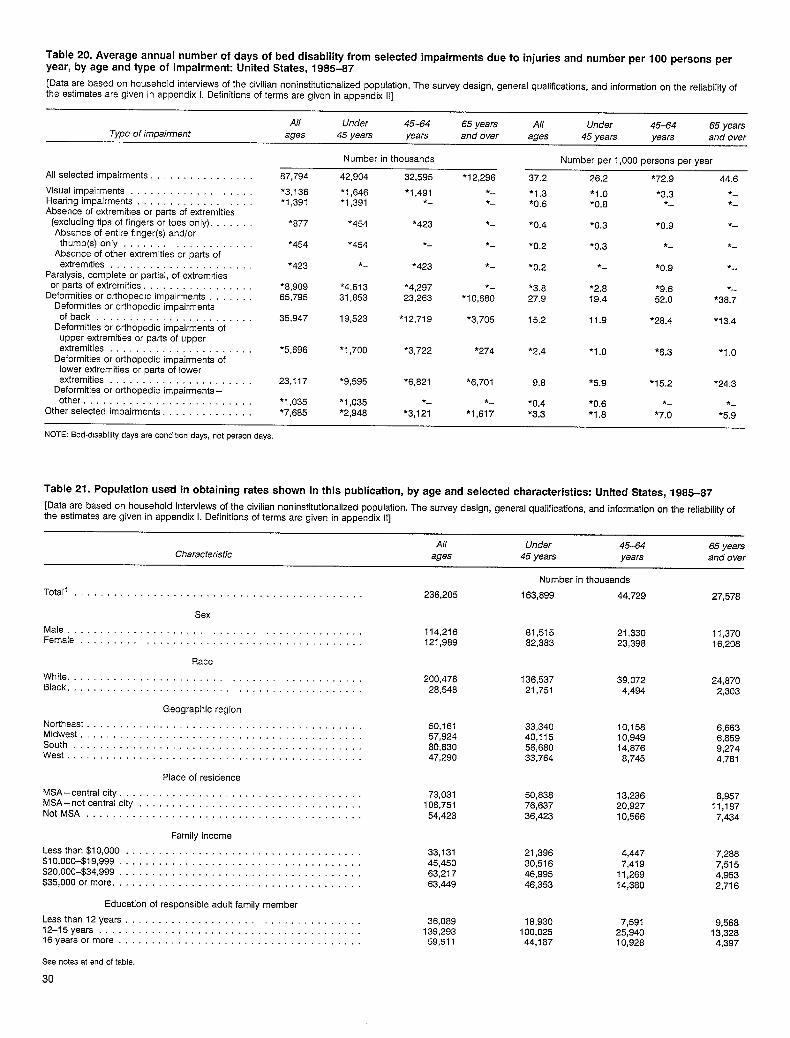
Table 20. Average annual number of days of bed disability from selected impairments due to injuries and number per 100 persons peryear, by age and type of impairment: United States, 1985-87
[Data are based on household interviews of the civilian noninstitutionalized population, The suwey design, general qualifications, and information on the reliability ofthe estimates are given in appendix 1. Definitions of terms are given in appendix Ii]
All Under 45–64 65 yeara All UnderType of impairment
45-64 65 yearsages 45 years years and over ages 45 yeats years and over
Number in thousands Number per 1,000 persons per year
All selected impairments 87,794 42,904 32,595 *1 2,296 37.2 26.2 *72.9 44.6
Visual impairments.....,,,, . . . . . . . . . . *3,136 ‘1 ,646 *1,491 *_
Hearing impairments*1 .3 *1. O *3.3 *—
“1 ,391 *1 ,391 *_
Absence of extremities or parts of extremities’*— *0,6 ‘0.8 *_ *-
(excluding tips of fingers or toes only). ., *877 ’454 *423 *- *0.4Absence of entire finger(s) and/or
*0.3 *0.9 *_
thumb(s) only..,,,., . .,....,,,,, *454 *454 *_ *_
Absence of other extremities or parts of*0.2 ‘0.3 *- *_
extremitie s . . . . . . . . . . . . . . . *423 *_ *423 *_
Paralysis, complete or partial, of extremities‘0.2 *_ *0.9 *-
orparts of extremities...,.. .,, ,,, ,. .,, ‘8,909 *4,613 ‘4,297 *_
Deformities or orthopedic impairments*3.8 *2.8 *9.6 *-
65,795 31,853 23,263 ‘1 O,68ODeformities or orthopedic impairments
27.9 19.4 52.0 *38.7
of back, ,, . . . . . . . . . . . . . . . . . . 35,947 19,523 ‘12,719 *3,705Deformities or orthopedic impairments of
15,2 11.9 *28.4 *1 3,4
upper efiremities or parts of upperextremities . . . . . . . . . . . . . . . . . . . . . . *5,696 *1 ,700 *3,722 *274
Deformities or orthopedic impairments of*2,4 *1.O *8.3 *1,0
lower extremities or parts of lowerextremities . . . . . . . . . . . . . . . . . . . . . . 23,117 *9,595 ‘6,821 ‘6,701
Deformities or orthopedic impairmente–9.8 *5.9 *I 5.2 *24,3
other, . . . . . . . . . . . . . . . . . . . . . . . . . *1 ,035 *1 ,035 *_ *-Other selected impairmenta, . . . . . . . . .
*0.4 *0.6 *— *—
*7,685 *2,948 *3,121 *1,617 *3.3 *7.8 *7.O *5.9
NOTE: Bed-disability days are condlt!on days, not person days,
Table 21. Population usdinobtaining rates shown inthlspublicatlon, byageand seletied characteristics: United States, 1985-.87
[Data are based on household interviews of the civilian noninstitutionalized population. The survey design, general qualifications, and information on the reliability ofthe estimates are given in appendix 1. Definitions of terms are given in appendix 11]
All Under 45-64 65 yearsCharacteristic aaes 45 vears years and over
Total . . . . . . . . . . . .
Male, . . . . . . . . . . . . .Female ...,,,... .,
White. . .,, . . . . . . . . .Black, .,,,......,.,
Northeast . . . . . . . . . . .Midwest . . . . . . . . . . . .South, . . . . . . . . . . . .West, . . . . . . . . . . . . .
MSA–centralcity,MSA–not central city .NotMSA . . . . . . . . . . .
Lessthan$lO,OOO . . .$10,000-$ 19,999 . . . . . .$20,000-$34,999 . . . . .$35,0000rmore. .
. ..,,, . . . . . . . . . . ..,,, ,,,,.
Sex
. . . ,..,, ,,,,, ,,,,,. . . ,,,,. . . . . . . . ,,,,, ,,,,,
Race
.,.,, ..,,, .,.., ,,,, ,,,,, .,,,,
..,,. . . . . ,,,.. .,,,,
Geographic region
. . . . . . . . . ,,,,. . . . . . ,,,,,. . . . . . . ...,, .,,,,,. . . . . . . ...,, ,,,... . .,,,,,. . . . . . . . .,.,, ,,,,,
Place of residence
..,,, . . . . . ,.,,, ,,,,,. . . . . ,.,,. . . . . . ,,,,, ,,,,, ,. . . . . . ,,..,. . . . . . . ...,,
Family income
..,,, . . . . . ,,,,, . . . . . . . . . .. . . . . . . . . . . . . . . . . . . . . . . . .
. . . . . . . . . ...,, . . . . . . . . . .,,... . . . . . . ,,,.. . . ..,,,
114,216121,989
200,47828,548
50,16157,92480,83047,290
73,031108,75154,423
33,13145,45063,21763,449
Number in thousands
163,899 44,729
81,515 21,33082,383 23,398
136,537 39,07221,751 4,494
33,340 10,15640,115 10,94956,680 14,67633,764 8,745
50,838 13,23676,637 20,92736,423 10,568
21,396 4,44730,516 7,41946,995 11,26946,353 14,380
27,578
11,37016,208
24,8702.303
6,6636,8599,2744,761
8,95711,1877,434
7,2687,5154,9532,716
Education of responsible adult family member
Lessthan 12years, ,, . . . . . . . . . . . . . . . . . . . . . . . . . . . . 36,089 16,93012–15years . . . . . . . . . . . . . . . . . . . . . . . . . . . . . . . . . ,,,,.,.
7,591 9,568139,293 100,025
16yearsormore .,,..... . . . . . . . . . . . . . . . . . . . . . . .25,940
59,51113,328
44,187 10,928 4,397
See notes at end of table,
30
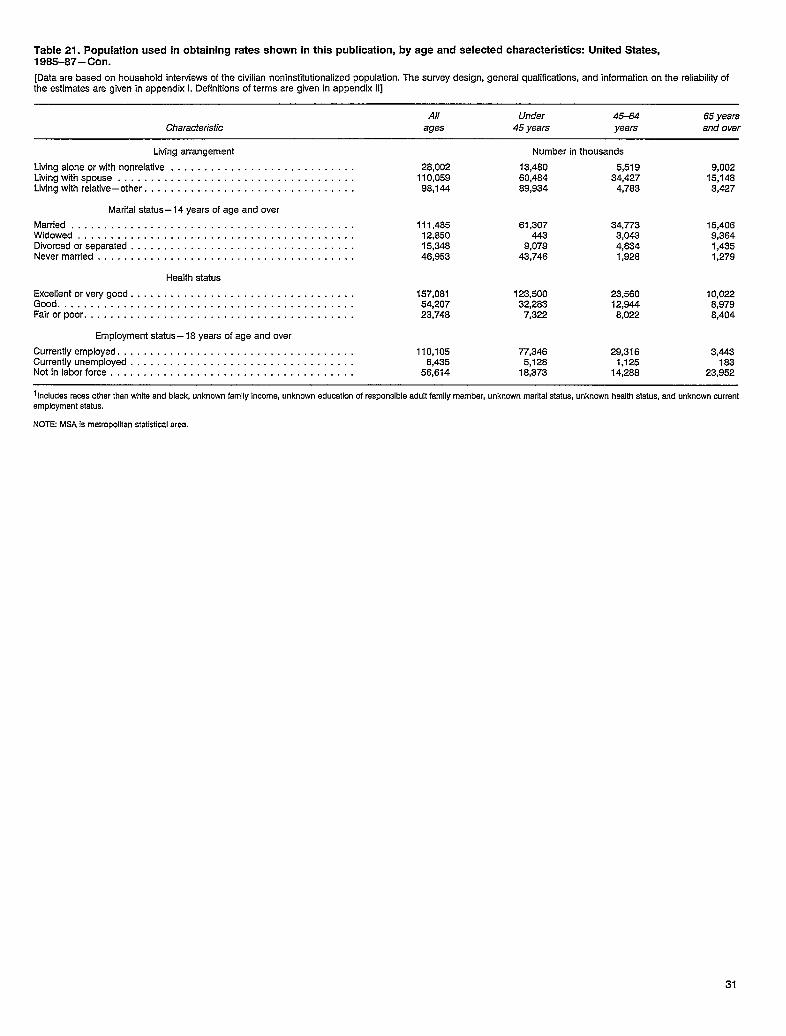
Table 21. Population used in obtaining rates shown in this publication, by age and selected characteristics: United States,1985-87-Con.
[Data are based on household interviews of the civilian noninstitutionalized population. The survey design, general qualifications, and information on the reliability ofthe estimates are given in appendix 1. Definitions of terms are given in appendix 11]
All Under 45-64 65 yearsCharacteristic ages 45 years years and over
Living arrangement Number in thousands
Living alone orwith nonrelative . . . . . . . . . . . . . . . . . . . . . . . . . . . . 28,002 13,480 5)51 9Livingwithspouse . . . . . . . . . . . . . . . . . . . . . . . . . . . . . . . . . . . .
9,002110,059 60,484 34,427
Livingwith relative–other . . . . . . . . . . . . . . . . . . . . . . . . . . . . . . . .15,148
98,144 89,934 4,783 3,427
Mariial status– 14 years of age and over
Married . . . . . . . . . . . . . . . . . . . . . . . . . . . . . . . . . . . . . . . . . . . 111,485Widowed . . . . . . . . . . . . . . . . . . . . . . . . . . . . . . . . . . . . . . . . . .
61,307 34,773 15,40612,850 443 3,043
Divorced orseparated . . . . . . . . . . . . . . . . . . . . . . . . . . . . . . . . . .9,364
15,348 9,079 4,834Nevermarried . . . . . . . . . . . . . . . . . . . . . . . . . . . . . . . . . . . . . . .
1,43546,953 43,746 1,928 1,279
Heaith status
Excellentorverygood . . . . . . . . . . . . . . . . . . . . . . . . . . . . . . . . . . 157,081 123,500 23,560Good . . . . . . . . . . . . . . . . . . . . . . . . . . . . . . . . . . . . . . . . . . . . .
10,02254,207 32,283 12,944
Fairorpoor . . . . . . . . . . . . . . . . . . . . . . . . . . . . . . . . . . . . . . . . .8,979
23,748 7,322 8,022 8,404
Employment status -18 years of age and over
Currentlyemployed . . . . . . . . . . . . . . . . . . . . . . . . . . . . . . . . . . . . 110,105 77,346 29,316Currentlyunemployed . . . . . . . . . . . . . . . . . . . . . . . . . . . . . . . . . .
3,4436,435 5,128 1,125
Notin laborforce, .,,...... . . . . . . . . . . . . . . . . . . . . . . . . . . . 56,614183
18,373 14,288 23,952
1lncluds~ ~acss~thsr than ~~te and black, unknown family income, unknown education of responsible adult family member, unknown marital StatUa,unknown health @atuS,and unknowr current
employment ststus.
NOTE MSA is matro~olitan statistical area.
31
Appendixes
I.
II.
Technical notes on methods . . . . . . . . . . . . . . . . . . . . . . . . . . . . . . . . . . . . . . . . . . . . . . . . . . . . . . . . . . . . . . . . . . . . . . . .Background . . . . . . . . . . . . . . . . . . . . . . . . . . . . . . . . . . . . . . . . . . . . . . . . . . . . . . . . . . . . . . . . . . . . . . . . . . . . . . . . . . . . .Statistical design ofNHIS . . . . . . . . . . . . . . . . . . . . . . . . . . . . . . . . . . . . . . . . . . . . . . . . . . . . . . . . . . . . . . . . . . . . . . . . .Collection and processing ofdata . . . . . . . . . . . . . . . . . . . . . . . . . . . . . . . . . . . . . . . . . . . . . . . . . . . . . . . . . . . . . . . . . .Estimation procedures . . . . . . . . . . . . . . . . . . . . . . . . . . . . . . . . . . . . .’. . . . . . . . . . . . . . . . . . . . . . . . . . . . . . . . . . . . . . .Types of estimates. . . . . . . . . . . . . . . . . . . . . . . . . . . . . . . . . . . . . . . . . . . . . . . . . . . . . . . . . . . . . . . . . . . . . . . . . . . . . . . .Reliability of the estimates . . . . . . . . . . . . . . . . . . . . . . . . . . . . . . . . . . . . . . . . . . . . . . . . . . . . . . . . . . . . . . . . . . . . . . . .
Definitions of certain terms used in this reuort . . . . . . . . . . . . . . . . . . . . . . . . . . . . . . . . . . . . . . . . . . . . . . . . . . . . . . . .Terms relating to injuries . . . . . . . . . . . . . . . . . . . . . . . . . . . . . . . . . . . . . . . . . . . . . . . . . . . . . . . . . . . . . . . . . . . . . . . . .Terms relating to conditions. . . . . . . . . . . . . . . . . . . . . . . . . . . . . . . . . . . . . . . . . . . . . . . . . . . . . . . . . . . . . . . . . . . . . . .Terms relating to class of accident. . . . . . . . . . . . . . . . . . . . . . . . . . . . . . . . . . . . . . . . . . . . . . . . . . . . . . . . . . . . . . . . . .Terms relating to place ofaccident . . . . . . . . . . . . . . . . . . . . . . . . . . . . . . . . . . . . . . . . . . . . . . . . . . . . . . . . . . . . . . . . .Terms relating to disability . . . . . . . . . . . . . . . . . . . . . . . . . . . . . . . . . . . . . . . . . . . . . . . . . . . . . . . . . . . . . . . . . . . . . . . .Demographic terms . . . . . . . . . . . . . . . . . . . . . . . . . . . . . . . . . . . . . . . . . . . . . . . . . . . . . . . . . . . . . . . . . . . . . . . . . . . . . . .
111. Questionnaire items and flashcards . . . . . . . . . . . . . . . . . . . . . . . . . . . . . . . . . . . . . . . . . . . . . . . . . . . . . . . . . . . . . . . . . .Household composition page.. . . . . . . . . . . . . . . . . . . . . . . . . . . . . . . . . . . . . . . . . . . . . . . . . . . . . . . . . . . . . . . . . . . . .Activity-limitation pages . . . . . . . . . . . . . . . . . . . . . . . . . . . . . . . . . . . . . . . . . . . . . . . . . . . . . . . . . . . . . . . . . . . . . . . . . . .Restricted-activity page . . . . . . . . . . . . . . . . . . . . . . . . . . . . . . . . . . . . . . . . . . . . . . . . . . . . . . . .,, . . . . . . . . . . . . . . . . .Health indicator question . . . . . . . . . . . . . . . . . . . . . . . . . . . . . . . . . . . . . . . . . . . . . . . . . . . . . . . . . . . . . . . . . . . . . . . . .Condition pages . . . . . . . . . . . . . . . . . . . . . . . . . . . . . . . . . . . . . . . . . . . . . . . . . . . . . . . . . . . . . . . . . . . . . . . . . . . . . . . . . .Demographic background page. . . . . . . . . . . . . . . . . . . . . . . . . . . . . . . . . . . . . . . . . . . . . . . . . . . . . . . . . . . . . . . . . . . .Flashcards . . . . . . . . . . . . . . . . . . . . . . . . . . . . . . . . . . . . . . . . . . . . . . . . . . . . . . . . . . . . . . . . . . . . . . . . . . . . . . . . . . . . . . .
Appendix tables
1. The 60 poststratification age-sex-race cells in the National Health Interview Survey . . . . . . . . . . . . . . . . . . . . . .II. Estimated standard error parameters for the National Health Interview Survey (NHIS): 1985-87 . . . . . . . . . . .
333333
;;3536393939404141424545464949505355
3537
Appendix ITechnical notes onmethods
Background
This report is one of a series of statistical reportspublished by the staff of the National Center for HealthStatistics (NCHS). It is based on information collected ina continuing nationwide sample of households included inthe National Health Interview Survey (NHIS). Data areobtained on the personal, sociodemographic, and healthcharacteristics of the family members and unrelated indi-viduals living in these households.
Field operations for the survey are conducted by theU.S. Bureau of the Census under specifications estab-lished by NCHS. The U.S. Bureau of the Census partici-pates in the survey planning, selects the sample, andconducts the interviews. The data are then transmitted toNCHS for preparation, processing, and analysis.
Summary reports and reports on special topics foreach year’s data are prepared by the staff of the Divisionof Health Interview Statistics for publication in Series 10reports of NCHS. Data are also tabulated for otherreports published by NCHS staff and for use by otherorganizations and by researchers within and outside theGovernment. Since 1969, public use tapes have beenprepared for each year of data collection.
It should be noted that the health characteristicsdescribed by NHIS estimates pertain only to the resident,civilian noninstitutionalized population of the UnitedStates living at the time of the interview. The sample doesnot include persons residing in nursing homes, membersof the Armed Forces, institutionalized persons, or U.S.nationals living abroad.
Statistical design of NHIS
General design
Data from NHIS have been collected continuouslysince 1957. The sample design of the survey has under-gone changes following each decennial census. This peri-odic redesign of the NI-HS sample allows theincorporation of the latest population information andstatistical methodology into the survey design. The datapresented in this report are from an NHIS sample designfirst used in 1985. It is anticipated that this design will beused until 1995.
The sample design plan of NHIS follows a multistageprobability design that permits a continuous sampIing of
the civilian noninstitutionalized population residing in theUnited States. The survey is designed in such a way thatthe sample scheduled for each week is representative ofthe target population, and the weekly samples are additiveover time. This design permits estimates for high-frequency measures or for large population groups to beproduced from a short period of data collection. Estimatesfor low-frequency measures or for smaller populationsubgroups can be obtained from a longer period of datacollection. The annual sample is designed so that tabula-tions can be provided for each of the four major geo-graphic regions. Because interviewing is done throughoutthe year, there is no seasonal bias for annual estimates.
The continuous data collection also has administrativeand operational advantages because fieldwork can behandled on a continuing basis with an experienced, stablestaff.
Sample selection
The target population for NH(S is the civilian nonin-stitutionalized population residing in the United States.For the first stage of the sample design, the United Statesis considered to be a universe composed of approximately1,900 geographically defined primary sampling units(PSU’S). A PSU consists of a county, a small group ofcontiguous counties, or a metropolitan statistical area.The PSU’S collectively cover the 50 States and the Districtof Columbia. The 52 largest PSU’S are selected into thesample with certainty and are referred to as self-representing PSU’S. The other PSU’S in the universe arereferred to as non-self-representing PSU’S. These PSU’Sare clustered into 73 strata, and 2 sample PSU’S arechosen from each stratum with probability proportional topopulation size. This gives a total of 198 PSU’S selected inthe first stage.
Within a PSU, two types of second-stage units areused: Area segments and permit area segments. Areasegments are defined geographically and contain anexpected eight households. Permit area segments covergeographical areas containing housing units built after the1980 census. The permit area segments are defined usingupdated lists of building permits issued in the PSU since1980 and contain an expected four households.
Within each segment all occupied households aretargeted for interview. On occasion, a sample segmentmay contain a large number of households. In this
33
situation the households are subsampled to provide amanageable interviewer workload.
The sample was designed so that a typical NHISsample for the data collection years 1985 to 1995 willconsist of approximately 7,500 segments containing about59,000 assigned households. Of these households, anexpected 10,000 will be vacant, demolished, or occupied bypersons not in the target population of the survey. Theexpected sample of 49,000 occupied households will yielda probability sample of about 127,000 persons.
Features of the NHIS sample redesign
Starting in 1985, the NHIS design incorporated sev-eral new design features. The major changes include thefollowing:
1.
2.
3,
34
The use of an all-area j%ame. The NHIS sample is nowdesigned so that it can serve as a sample frame forother NCHS population-based surveys. In previousNHIS designs about two-thirds of the sample wasobtained from lists of addresses compiled at the timeof the decennial census; that is, a list frame, Becauseof U.S. Bureau of the Census confidentiality restric-tions, these sample addresses could be used for onlythose surveys being conducted by the U.S. Bureau ofthe Census. The methodology used to obtainaddresses in the 1985 NHIS area frame does not usethe census address lists. The sample addresses thusobtained can be used as a sampling frame for otherNCHS surveys.I’?HIS as four panels. Four national subdesigns, orpanels, constitute the full NHIS. Each panel containsa representative sample of the U.S. civilian noninsti-tutionalized population, Each of the four panels hasthe same sampling properties, and any combination ofpanels defines a national design. Panels were con-structed to facilitate the linkage of NHIS to othersurveys and also to efficiently make large reductionsin the size of the sample by eliminating panels fromthe survey.
During 1985-87 the sample consisted of 17,946segments ~ontaining 134,760 assigned households. Ofthe 110,567 households eligible for interview, 105,922were actually interviewed, resulting in a sample of276,442 persons.l%e oversampling of black persons. One of the goalsin designing the current NHIS was to improve theprecision of estimates for black persons. This wasaccomplished by the use of differential sampling ratesin PSU’S with about 5–50 percent black population.Sampling rates for selection of segments wereincreased in areas known to have the highest concen-trations of black persons. Segment sampling rateswere decreased in other areas within the PSU toensure that the total sample in each PSU was thesame size as it would have been without oversamplingblack persons.
4.
5,
Z7zereduction of the number of sampled PSUS. Inter-viewer travel to sample PSU’s constitutes a largecomponent of the total field costs for NHIS. Theprevious NHIS design included 376 PSU’S. FLesearchshowed that reducing the number of sample PSU’Swhile increasing the sample size within PSU’S wouldreduce traveI costs and also maintain the reliability ofhealth estimates (9). The design now contains 198Psu’s.The selection of two PSU’S per non-self representingstratum. In the previous design, one PSU was selectedfrom each non-self-representing stratum. This featurenecessitated the use of less efficient variance estima-tion procedures; the selection of two PSU’S rdlowsmore efficient variance, estimation methodology (9).
Collection and processing of data
The NHIS questionnaire contains two major parts.The first consists of topics that remain relatively the samefrom year to year. Among these topics are the incidence ofacute conditions, the prevalence of chronic conditions,persons limited in activity due to chronic conditions,restriction in activity due to impairment or health prob-lems, and utilization of health care services involvingphysician care and short-stay hospitalization. The secondpart consists of special topics added as supplements toeach year’s questionnaire.
Careful procedures are followed to assure the qualityof data collected in the interview. Most households in thesample are contacted by mail before the interviewersarrive. Potential respondents are informed of the. impor-tance of the survey and assured that all informationobtained in the interview will be held in strict confidence,Interviewers make repeated trips to a household! when arespondent is not immediately found. The success of theseprocedures is indicated by the response rate for thesurvey, which has been 95–98 percent over the years.
When contact is made, the interviewer attempts tohave all family members of the household 19 years of ageand over present during the interview, When this is notpossible, proxy responses for absent adult family membersare accepted. In most situations, proxy respondents areused for persons under 19 years of age. Persons 17 and18 years of age may respond for themselves, however.
Interviewers undergo extensive training andretraining, The quality of their work is checked by meansof periodic observation and by reinterview. Their work isalso evaluated by statistical studies of the data they obtainin their interviews. A field edit is performed on allcompleted interviews so that if there are any problemswith the information on the questionnaire, respondentsmay be recontacted to solve the problem.
Completed questionnaires are sent from the U.S.Bureau of the Census field offices to NCHS for codingand editing. To ensure the accuracy of coding, a 5-percentsample of all questionnaires is recoded and keyed by other
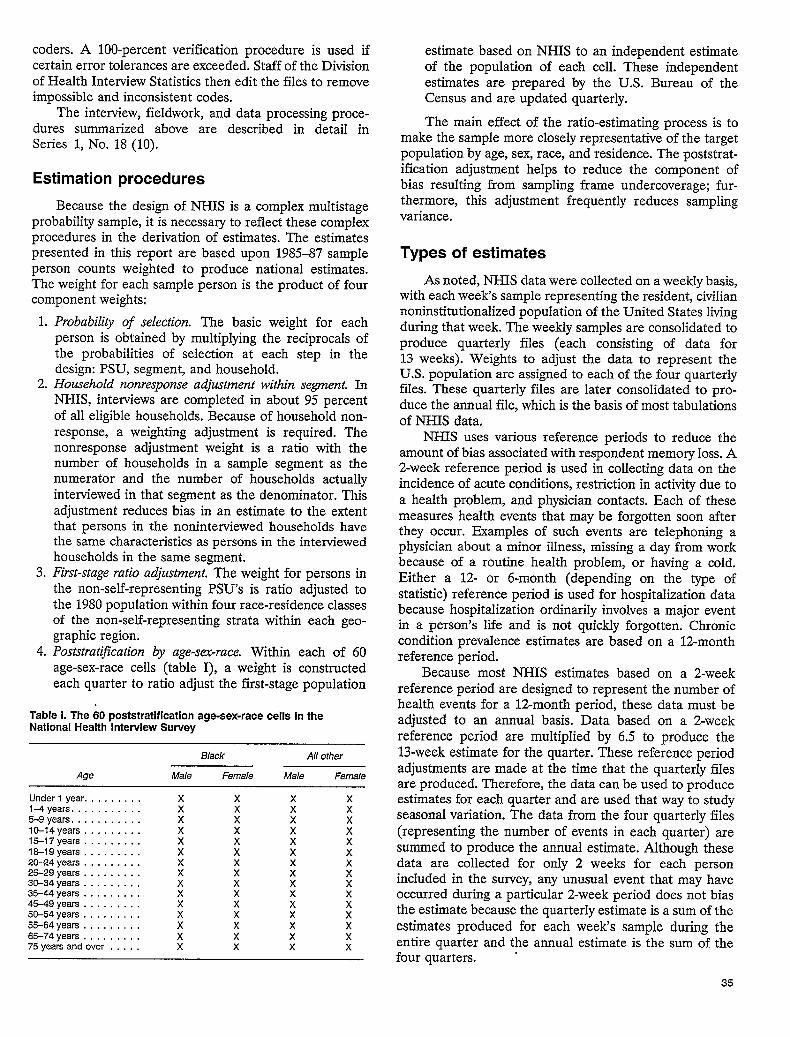
, , .,. . ... ..Coaers. A luu-percent Vermcatlon procedure 1s used IIcertain error tolerances are exceeded. Staff of the Divisionof Health Interview Statistics then edit the files to removeimpossible and inconsistent codes.
The interview, fieldwork, and data processing proce-dures summarized above are described in detail inSeries 1, No. 18 (10).
Estimation procedures
Because the design of NHIS is a complex multistageprobability sample, it is necessa~ to reflect these complexprocedures in the derivation of estimates. The estimatespresented in this report are based upon 1985–87 sampleperson counts weighted to produce national estimates.The weight for each sample person is the product of fourcomponent weights:
10
2.
3.
4.
Probability of selection. The basic weight for eachperson is obtained by multiplying the reciprocals ofthe probabilities of selection at each step in thedesign: PSU, segment, and household.Household nonresponse adjustment within segment. InNHIS, interviews are completed in about 95 percentof all eligible households. Because of household non-response, a weighting adjustment is required. Thenonresponse adjustment weight is a ratio with thenumber of households in a sample segment as thenumerator and the number of households actuallyinterviewed in that segment as the denominator. Thisadjustment reduces bias in an estimate to the extentthat persons in the nonintemiewed households havethe same characteristics as persons in the interviewedhouseholds in the same segment.First-stage ratio adjustment. The weight for persons inthe non-self-representing PSU’S is ratio adjusted tothe 1980 population within four race-residence classesof the non-self-representing strata within each geo-graphic region.Poststratij’ication by age-sex-race. Within each of 60age-sex-race cells (table I), a weight is constructedeach quarter to ratio adjust the first-stage population
Table L The 60 poststratificatlon age-sex-race cells In theNational Health Interview Survey
Black All other
Age Male Female Male Female
Under l year . . . . . . . . . xl-4years . . . . . . . . . . . x5-9years. . . . . . . . . . .10-14 years . . . . . . . . . 115-17 years . . . . . . . . . xlS-19years . . . . . . . . . x20-24 years . . . . . . . . . x25-29 years . . . . . . . . . x30-34 years . . . . . . . . . x35-44 years . . . . . . . . . x45-49 years . . . . . . . . . x50-54 years . . . . . . . . .55-64 years,,....,.. ;65–74years . . . . . . . . . x75 years and over . . . . . x
xxxxxxxxxxxxxxx
xxxxxxxxxxxxxxx
xxxxxxxxxxx
1xx
estimate based on NHIS to an independent estimateof the population of each cell. These independentestimates are prepared by the U.S. Bureau of theCensus and are updated quarterly.
The main effect of the ratio-estimating process is tomake the sample more closely representative of the targetpopulation by age, sex, race, and residence. The poststrat-ification adjustment helps to reduce the component ofbias resulting from sampling frame undercoverage; fur-thermore, this adjustment frequently reduces samplingvariance.
Types of estimates
As noted, NHIS data were collected on a weeldy basis,with each week’s sample representing the resident, civiliannoninstitutionalized population of the United States livingduring that week. The weekly samples are consolidated toproduce quarterly files (each consisting of data for13 weeks). Weights to adjust the data to represent theU.S. population are assigned to each of the four quarterlyfiles. These quarterly files are later consolidated to pro-duce the annual file, which is the basis of most tabulationsof NHIS data.
NHIS uses various reference periods to reduce theamount of bias associated with respondent memory loss. A2-week reference period is used in collecting data on theincidence of acute conditions, restriction in activity due toa health problem, and physician contacts. Each of thesemeasures health events that may be forgotten soon afterthey occur. Examples of such events are telephoning aphysician about a minor illness, missing a day from workbecause of a routine health problem, or having a cold,Either a 12- or 6-month (depending on the type ofstatistic) reference period is used for hospitalization databecause hospitalization ordinarily involves a major eventin a person’s life and is not quickly forgotten. Chroniccondition prevalence estimates are based on a 12-monthreference period.
Because most NHIS estimates based on a 2-weekreference period are designed to represent the number ofhealth events for a 12-month period, these data must beadjusted to an annual basis. Data based on a 2-weekreference period are multiplied by 6.5 to produce the13-week estimate for the quarter. These reference periodadjustments are made at the time that the quarterly filesare produced. Therefore, the data can be used to produceestimates for each quarter and are used that way to studyseasonal variation. The data from the four quarterly files(representing the number of events in each quarter) aresummed to produce the amual estimate. Although thesedata are collected for only 2 weeks for each personincluded in the survey, any unusual event that may haveoccurred during a particular 2-week period does not biasthe estimate because the quarterly estimate is a sum of theestimates produced for each week’s sample during theentire quarter and the annual estimate is the sum of thefour quarters. .
35
For prevalence statistics, such as the number of per-sons limited in activity due to chronic conditions, theannual estimate results from summing the weighted quar-terly files and dividing by 4. This division is necessarybecause, as noted above, each quarterly file has beenweighted to produce an estimate of the number of personsin the U.S. population with a given characteristic. Sum-ming the four quarters and dividing by 4 in effect averagesthese quarterly results for the year. Thus, the type ofprevalence estimate ordinarily derived from NHIS data isan annual average prevalence estimate.
For data related to short-stay hospital discharges thatare based on a 6-month reference period, cases identifiedduring any quarter of data collection are multiplied by 2 toproduce a quarterly estimate of the annual number ofcharacteristics associated with short-stay hospital dis-charges, The NHIS average annual estimate of hospitaldischarges is derived by summing the four quarterly esti-mates and dividing by 4, just as the prevalence estimatesare.
Reliability of the estimates
Because NHIS estimates are based on a sample, theymay differ somewhat from the figures that would havebeen obtained if a complete census had been taken usingthe same survey and processing procedures. There are twotypes of errors possible in an estimate based on a samplesurvey: Sampling and nonsampIing errors. To the extentpossible, these types of errors are kept to a minimum bymethods built into the survey procedures described earlier(11). Although it is very difficult to measure the extent ofbias in NHIS, several studies have been conducted toexamine this problem. The results have been published inseveral reports (12–15).
Nonsampling errors
Interviewing process. Information such as the numberof days of restricted activity caused by the condition canbe obtained more accurately from household membersthan from any other source because only the personsconcerned are in a position to report this information.However, there are limitations to the accuracy of diag-nostic and other information collected in household inter-views. For example, for diagnostic information, thehousehold respondent can usually pass on to the inter-viewer only the information the physician has given to thefamily. For conditions not medically attended, diagnosticinformation is often no more than a description of symp-toms, Further, respondents may not answer a question inthe intended manner because they have not properlyunderstood the question, have forgotten the event, do notknow, or do not wish to divulge the answer. Regardless ofthe type of measure, all NHIS data are estimates of knownreported morbidity, disability, and so forth.
Reference period bias. NHIS estimates do not repre-sent a complete measure of any given topic during the
specified calendar period because data are not collected inthe interview for persons who died or became institution-alized during the reference period. For many types ofstatistics collected in the survey, the reference period isthe 2 weeks prior to the interview week. For such a shortperiod, the contribution by decedents to a total inventoryof conditions or services should be very small. However,the contribution by decedents during a long referenceperiod (such as 1 year) might be significant, especially forolder persons.
Underreporting associated with a long referenceperiod is most germane to data on hospitalization. Anal-ysis has shown that there is an increase in underreportingof hospitalizations with an increase in the time intervalbetween the discharge and the interview. Exclusive of thehospital experience of decedents, the net underreportingusing a 12-month recall period is in the neighborhood of10 percent (16). The underreporting of discharges within6 months of the week of interview is estimated to beabout 5 percent (16). For this reason, hospital dischargedata are based on hospital discharges reported to haveoccurred within 6 months of the week of interview.
Because hospitalization is common in the periodimmediately preceding death or institutionalization andolder persons are much more likely to die than youngerones, the data should not be used to estimate the volumeof hospitalization of the elderly, although the data can beused to measure characteristics of elderly people.
It should further be noted that, although the reportedfrequencies and rates related to hospital episodes arepresented by the year in which the data were collected, theestimates are, in most cases, based on hospitalizations thatoccurred during the year of data collection and the prioryear. Overall, approximately one-half of the reportedhospitalizations for the 12-month reference periodoccurred in the year prior to the year of data collection.
Population estimates. Some of the published tablesinclude population figures for specified categories. Exceptfor overall totals for the 60 age, sex, and race groups,which are adjusted to independent estimates, these figuresare based on the sample of households in NI-HS. They aregiven primarily to provide denominators for rate compu-tation, and for this purpose they are more appropriate foruse with the accompanying measures of health character-istics than other population data that may be available.With the exception of the overall totals by age, sex, andrace mentioned above, the population figures may differfrom figures (which are derived from different sources)published in reports of the U.S. Bureau of the Census.Official population estimates are presented in U.S.Bureau of the Census reports in Series P-20, P-25, andP-60.
Rounding of numbers. In published tables, the figuresare rounded to the nearest thousand, although they arenot necessarily accurate to that detail. Derived statistics,such as rates and percent distributions, are computedafter the estimates on which these are based have beenrounded to the nearest thousand.
36
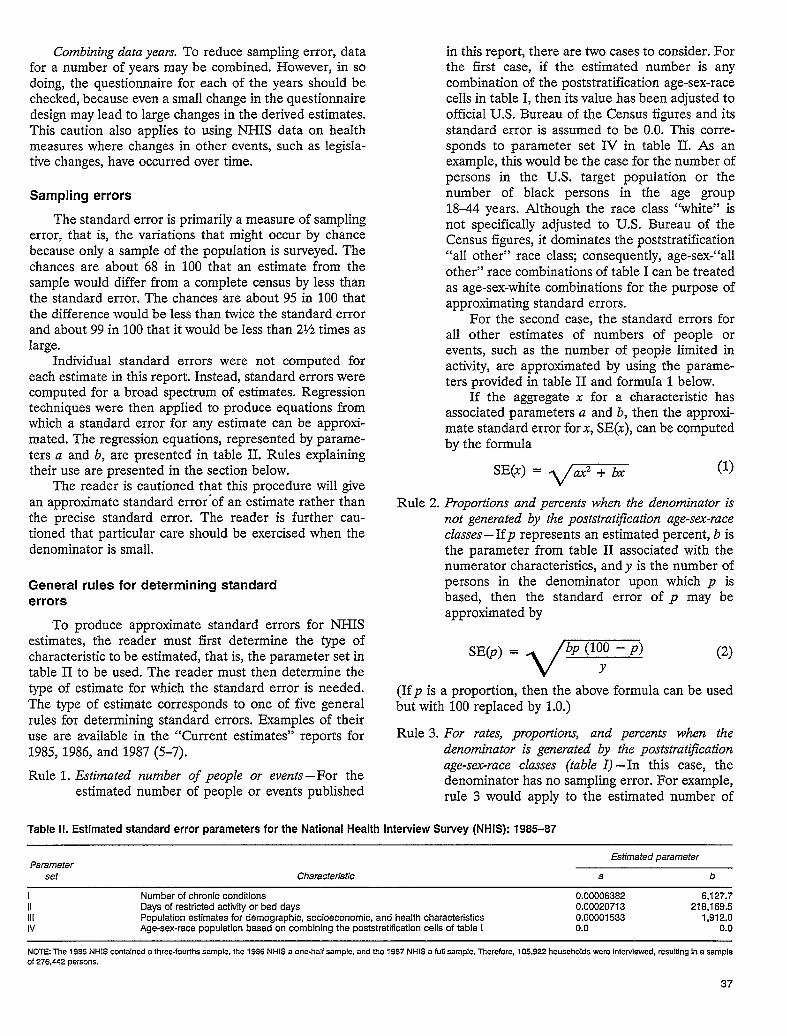
Combining data years. To reduce sampling error, datafor a number of years may be combined. However, in sodoing, the questionnaire for each of the years should bechecked, because even a small change in the questionnairedesign may lead to large changes in the derived estimates.This caution also applies to using NHIS data on healthmeasures where changes in other events, such as legisla-tive changes, have occurred over time.
Sampling errors
The standard error is primarily a measure of samplingerror, that is, the variations that might occur by chancebecause only a sample of the population is surveyed. Thechances are about 68 in 100 that an estimate from thesample would differ from a complete census by less thanthe standard error. The chances are about 95 in 100 thatthe difference would be less than twice the standard errorand about 99 in 100 that it would be less than 21/2 times aslarge.
Individual standard errors were not computed foreach estimate in this report. Instead, standard errors werecomputed for a broad spectrum of estimates. Regressiontechniques were then applied to produce equations fromwhich a standard error for any estimate can be approxi-mated. The regression equations, represented by parame-ters a and b, are presented in table II. Rules explainingtheir use are presented in the section below.
The reader is cautioned that this procedure will givean approximate standard error ‘of an estimate rather thanthe precise standard error. The reader is further cau-tioned that particular care should be exercised when thedenominator is small.
General rules for determining standarderrors
To produce approximate standard errors for NHISestimates, the reader must first determine the type ofcharacteristic to be estimated, that is, the parameter set intable II to be used. The reader must then determine thetype of estimate for which the standard error is needed.The type of estimate corresponds to one of five generalrules for determining standard errors. Examples of theiruse are available in the “Current estimates” reports for1985, 1986, and 1987 (5-7).
Rule 1. Estimated number of people or events – For theestimated number of people or events published
in this report, there are two cases to consider. Forthe first case, if the estimated number is anycombination of the poststratification age-sex-racecells in table I, then its value has been adjusted toofficial U.S. Bureau of the Census figures and itsstandard error is assumed to be 0.0. This corre-sponds to parameter set IV in table II. As anexample, this would be the case for the number ofpersons in the U.S. target population or thenumber of black persons in the age group18-44 years. Although the race class “white” isnot specifically adjusted to U.S. Bureau of theCensus figures, it dominates the poststratification“all other” race class; consequently, age-sex-’’allother” race combinations of table I can be treatedas age-sex-white combinations for the purpose ofapproximating standard errors.
For the second case, the standard errors forall other estimates of numbers of people orevents, such as the number of people limited inactivity, are approximated by using the parame-ters provided in table H and forrmda 1 below.
If the aggregate x for a characteristic hasassociated parameters a and b, then the approxi-mate standard error for x, SE(x), can be computedby the forrmda
SE(x) =v
(1)
Rule 2. Propotiion.s and percents when the denominator isnot generated by the poststratij?cation age-sex-raceclasses —If p represents an estimated percent, b isthe parameter from table II associated with thenumerator characteristics, and y is the number ofpersons in the denominator upon which p isbased, then the standard error of p may beapproximated by
‘E’)=C (2)
(Ifp is a proportion, then the above formula can be usedbut with 100 replaced by 1.0.)
Rule 3. For rates, propotiions, and percents when thedenominator is generated by the poststratificationage-sex-race classes (table I) —In this case, thedenominator has no samphng error. For example,rule 3 would apply to the estimated number of
Table Il. Estimated standard error parametersfor the National Health Interview Survey (NHLS): 1985-87
ParameterEstimated parameter
set Characteristic a b
I Number of chronic conditions 0.00006382II
6,127.7Days of restricted activity or bed days 0.00020713 218,169.5
[11 Population estimates for demographic, socioeconomic, and health characteristics 0.00001533Iv
1,912.0Age-sex-race population based on combining the poststratification cells of table I 0.0 0.0
NOTE The 1985 NHIS contained a three-fourths sample, the 1986 NHIS a one-half sample, and the 1987 NHIS a full sample. Therefore, 105,922 households were interviewed, resulting in a sample
of 276,442 persons.
37
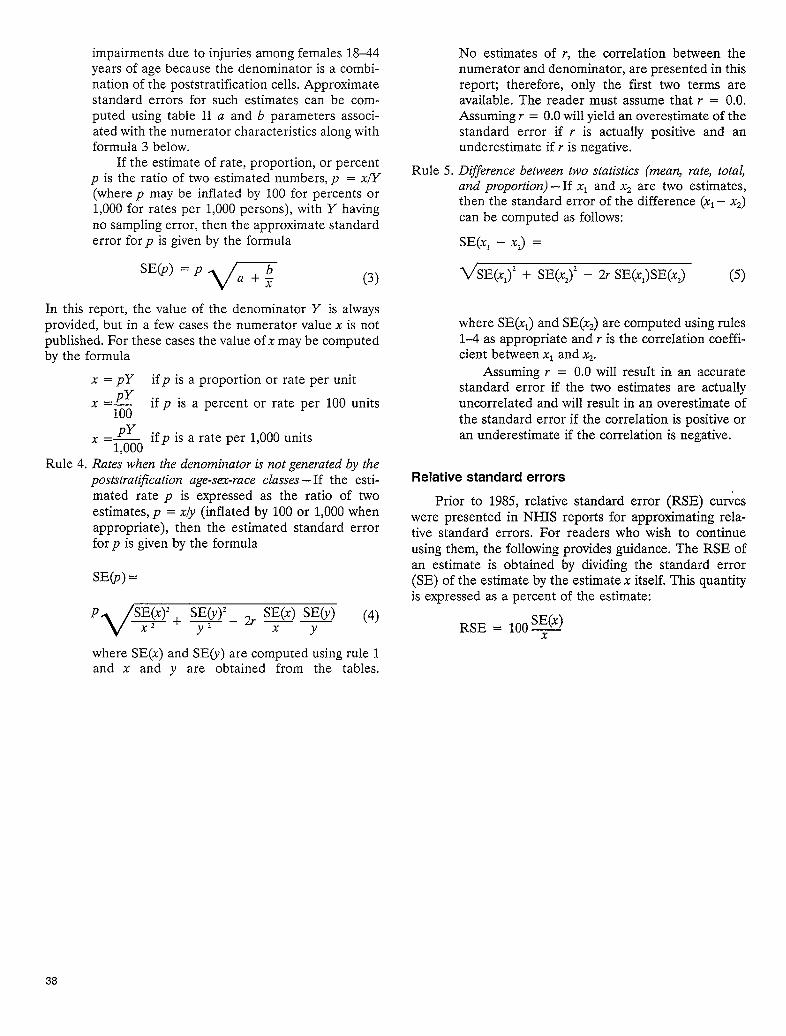
impairments due to injuries among females 18–44years of age because the denominator is a combi-nation of the poststratification cells. Approximatestandard errors for such estimates can be com-puted using table II a and b parameters associ-ated with the numerator characteristics along withformula 3 below.
If the estimate of rate, proportion, or percentp is the ratio of two estimated numbers, p = x/Y(where p may be inflated by 100 for percents or1,000 for rates per 1,000 persons), with Y havingno sampling error, then the approximate standarderror for p is given by the formula
‘E’)‘pm (3)
In this report, the value of the denominator Y is alwaysprovided, but in a few cases the numerator value x is notpublished. For these cases the value ofx maybe computedby the formula
x=pY if p is a proportion or rate per unit
x SLY if100
p is a percent or rate per 100 units
~ ifp is a rate px ‘1,000 er 1,000 units
Rule 4. Rates when the denominator is not generated by thepoststratification age-sex-race classes – If the esti-mated rate p is expressed as the ratio of twoestimates, p = xly (inflated by 100 or 1,000 whenappropriate), then the estimated standard errorfor p is given by the formula
SE(j) =
P SE(X)2+ SE(’y)2_ ~r ~) ~)— — (4)X2 y?. x
Rule 5.
No estimates of r, the correlation between thenumerator and denominator, are presented in thisreport; therefore, only the first two terms areavailable. The reader must assume that ;P = 0.0.Assuming r = 0.0 will yield an overestimate of thestandard error if r is actually positive and anunderestimate if r is negative.
Difference between two statistics (mean, rate, total,and proportion) —If xl and X2 are two estimates,then the standard error of the difference (xl – X2)can be computed as follows:
SE(X1 – X2) =
VSE(XI)2 + ‘E(x2)2 - Zr ‘EKE (5)
where SE(XJ and SE(X2)are computed using rtdes1-4 as appropriate and r is the correlation coeffi-cient between xl and X2.
Assuming r = 0.0 wiH result in an accuratestandard error if the two estimates are actuallyuncorrelated and will result in an overestimate ofthe standard error if the correlation is positive oran underestimate if the correlation is negative.
Relative standard errors
Prior to 1985, relative standard error (RSE) curveswere presented in NHIS reports for approximating rela-tive standard errors. For readers who wish to continueusing them, the following provides guidance. The RSE ofan estimate is obtained by dividing the standard error(SE) of the estimate by the estimate x itself. This quantityis expressed as a percent of the estimate:
RSE = 100~)
where SE(x) and SE(Y) are computed using rule 1and x and y are obtained from the tables.
38
Appendix IIDefinitions of certainterms used in thisreport
Terms relating to injuries
Injwy condition –An injury condition, or simply aninjury, is a condition of the type that is classified accordingto the nature of injury code numbers (800-999) in theInternational Classification of Diseases (17). In additionto fractures, lacerations, contusions, bums, and so forth,which are commonly thought of as injuries, this group ofcodes includes effects of exposure, such as sunburn;adverse reactions to immunization and other medicalprocedures; and poisonings. Unless otherwise specified,the term “inju~” is used to cover all of these.
Because a person may sustain more than one injury ina single accident (for example, a broken leg and lacerationof the scalp), the number of injury conditions may exceedthe number of persons injured.
Statistics of acute injury conditions include only thoseinjuries that involved at least one-half day of restrictedactivity or medical attendance.
Episodes of persons injured– Each time a person isinvolved in an accident or nonaccidental violence causinginjury that results in medical attention or at least a halfday of restricted activity, it is counted as a separateepisode of a person injured. Therefore, one person mayaccount for more than one episode of a person injured.
The number of episodes of persons injured is notequivalent to the number of accidents for several reasons:(a) the term “accident” as commonly used may not involveinjury at all; (b) more than one injured person may beinvolved in a single accident, so the number of accidentsresulting in injury would be less than the number ofpersons injured in accidents; and (c) the term “accident”ordinarily implies an accidental origin, whereas “personsinjured” as used in the National Health Interview Survey(NHIS) includes persons whose injuries resulted fromcertain nonaccidental violence.
The number of episodes of persons injured in aspecified time interval is equal to or less than the inci-dence of injury conditions because a person may incurmore than one injury in a single accident.
Terms relating to conditions
Condition – Condition is a general term that includesany specific illness, injury, or impairment. Condition dataare derived from the survey in two ways. First,
respondents are asked to identi~ any conditions thatcaused certain types of impact associated with health, suchas a visit to a doctor or a day spent in bed. Second,respondents are read lists of selected chronic conditionsand asked whether they or any family members have anyof these conditions.
At a later point in the survey, a series of questions isasked about each of the conditions identified in either ofthe two ways just described. The information obtainedabout each condition helps to clarify the nature of thecondition and whether medical services have beeninvolved in its diagnosis or treatment. It also aids in thecoding of the condition. All conditions except impairmentsare coded according to the Ninth Revision of the Interna-tional Classification of Diseases (17), with certain modifi-cations adopted to make the codes more suitable forinformation derived from a household survey. A specialset of codes devised by NHIS is used to code impairments.
Chronic condition –A condition is considered chronicif (a) the respondent indicates it was first noticed morethan 3 months before the reference date of the interviewor (b) it is a type of condition that ordinarily has aduration of more than 3 months. Examples of conditionsthat are considered chronic regardless of their time ofonset are diabetes, heart conditions, emphysema, andarthritis. A complete list of these conditions may beobtained by contacting the Division of Health InterviewStatistics, National Center for Health Statistics.
Irnpaimzent –An impairment is a chronic or perma-nent defect, usually static in nature, that results fromdisease, injury, or congenital malformation. It represents adecrease in or loss of ability to perform various functions,particularly those of the musculoskeletal system and thesense organs. Impairments are grouped according to typeof functional impairment and etiology in the special NHISimpairment codes. The impairment classification is shownin the NCHS Medical Coding Manual (4).
It should be noted that the statistics on impairmentsshown in this report are for the number of impairments,not the number of persons with impairments. Because aperson may have more than one impairment, the numberof impairments exceeds the number of persons withimpairments. Thus, for instance, the total number ofimpairments due to injury reported in table 1–18,864,000–is greater than the number of persons withimpairments due to injury.
39
Impairment groups – In this report, impairments due toinjuries are grouped for presentation with their X–codenumbers as follows:
Total selected impairments (XOO-X99)Visual impairments (XOO-X03)Hearing impairments (X05-X09)Absence of extremities or parts of extremities (exclud-ing tips of fingers or toes only) (X20–X29)
Absence of entire finger(s) and/or thumb(s) only(X22, X25)Other extremities or parts of extremities absent(X20, X21, X23, X24, X26-X29)
Paralysis, complete or partial, of extremities or partsof extremities (X40–X59)Deformities or orthopedic impairments (X70-X89)
Deformities or orthopedic impairments of back(X70, X71, X80)Deformities or orthopedic impairments of upperextremities or parts of upper extremities (X73,X74, X84)Deformities or orthopedic impairments of lowerextremities or parts of lower extremities(X75-X78, X85, X86)Deformities or orthopedic impairments – other(X79, X89)
Other selected impairments (X1 O-X12, X14, X19,X30-X35, X60-X64, X90-X99)
Irzjzoyas an etiology of impaiment – The etiology of animpairment is its cause in terms of what the respondentconsiders as the cause. Injury as an etiology (coded 9 inthe fourth digit of the X–code) is defined as a conditionsustained in an accident or in nonaccidental violence that,at time of occurrence, would have been codable to Inter-national Classification of Diseases codes 800–999.
Prevalence of conditions – In general, the prevalence ofconditions is the estimated number of conditions of aspecified type existing at a specified time or the averagenumber existing during a specified interval of time. Theprevalence of chronic conditions is defined as the numberof chronic cases reported to be present or assumed to bepresent at the time of the interview. Those assumed to bepresent at the time of the interview are cases specified bythe respondent as present on the selected chronic condi-tion list or described by the respondent in terms of one ofthe diseases on the list of conditions always consideredchronic (see definition of chronic condition above) andreported to have been present at some time during the12-month period prior to the interview,
Onset of condition – A condition is considered to havehad its onset when it was first noticed. This could be thetime the person first felt sick or became injured, or itcould be the time when the person or his or her family wasfirst told by a physician that the person had a condition ofwhich he or she was previously unaware.
Incidence of conditions – The incidence of conditions isthe estimated number of conditions having their onset in aspecified time period. As previously mentioned, minor
acute conditions involving neither restricted activity normedical attention are excluded from the statistics.
Terms relating to class of accident
Class of accident– Injuries, injured persons, resultingdays of disability, and impairments due to injuries maybegrouped according to class of accident, This is a broadclassification of the types of events that resulted in per-sonal injuries. Most of these events are accidents in theusual sense of the word, but some are other kinds ofmishaps, such as overexposure to the sun or adversereactions to medical procedures, and others are nonacci-dental violence, such as attempted suicide. The classes ofaccident are (a) moving motor-vehicle accidents, (b)accidents occurring while at work, (c) accidents occurringat home, and (d) other accidents. These categories are notmutually exclusive. For example, a person may be injuredin a moving motor-vehicle accident that occurred whilethe person was at home or at work. The accident class“moving motor vehicle” includes “home —moving motorvehicle” and “while at work—moving motor vehicle.”Similarly, the classes “while at work” and “home” includeduplicated counts; for example, “moving motorvehicle —while at work” is included under “while atwork.”
Motor vehicle –A motor vehicle is any mechanically orelectrically powered device not operated on rails on whichor by which a person or property can be transported ordrawn upon a land highway. Any object (such as a trailer,coaster, sled, or wagon) being towed by a motor vehicle isconsidered a part of the motor vehicle, Devices used solelyfor moving persons or materials within the confines of abuilding and its premises are not counted as motorvehicles.
Moving motor-vehicle accident – The accident is classi-fied as “moving motor vehicle” if at least one of the motorvehicles involved in the accident was moving at the time ofthe accident.
Accident while at work –The class of accident is “whileat work” if the injured person was 18 years of age or overand was at work at a job or a business at the time theaccident occurred,
Accident while at home –The class of accident is“while at home” if the injury occurred either inside oroutside the house. “Outside the house” refers to the yard,building, and sidewalks on the property. “Home” includesnot only the person’s own home but also any other homein which the person may have been injured.
Other accident– The class of accident is “other” if theoccurrence of injury cannot be classified in one or more ofthe first three class-of-accident categories. This categoryincludes persons injured in public places (for example,tripping and falling in a store or on a public sidewalk) andalso nonaccidental injuries, such as homicidal and suicidalattempts. The survey does not cover the military popula-tion, but current disability of various types resulting fromprior injury in the Armed Forces is covered and is
40
included in this class. The class also includes mishaps forwhich the class of accident could not be ascertained.
Terms relating to place of accident
Place of accident –Persons injured are classifiedaccording to the type of place where the injury occurred.The places of accidents are (a) home, (b) street orhighway, (c) industrial place, (d) school, (e) place ofrecreation, (f) farm, and (g) other.
Home–The place of accident is considered as“home” if the injury occurred either inside or outside thehome but within the property boundaries. “Home”includes not only the person’s own home but also anyother home (vacant or occupied) in which he or she mayhave been at the time of the injury. “Home” includes anystructure that has the primary function of a dwelling unitand includes the structure and premises of such places asapartment houses and house trailers.
. hide the house –This subcategory includes anyroom, attic, cellar, porch, or steps leading to anentrance of the house. However, inside the garage isnot considered as inside the house.
. Outside the house –This subcategory includes theyard, driveway, garage, patio, gardens, or walks. Ona farm, only the premises adjacent to the house areconsidered as part of the home. Injuries due toaccidents occurring on cultivated land, in barns, orin other similar farm buildings would not beconsidered home injuries.
Street or highway –This category means the entire areabetween property lines of which any part is open for theuse of the public as a matter of right or custom. It includesthe roadway, shoulder, curb, or public sidewalk; excludedare private driveways, lanes, or sidewalks.
Industrial place – This term is applied to accidentsoccurring in an industrial place or on the premises.Included are such places as factories, railway yards, ware-houses, workshops, logging camps, shipping piers, oilfields, shipyards, sand and gravel pits, canneries, and autorepair garages. Construction projects such as houses,buildings, bridges, and new roads are included in thiscategory. Buildings undergoing remodeling, with theexception of private homes, are classified as industrialplaces or premises.
School– “School” as a place of accident includes allaccidents occurring in school buildings or on the premises.This classification includes elementary schools, highschools, colleges, and trade and business schools.
Place of recreation – “Place of recreation” is used todescribe accidents occurring in places organized for sportsand recreation other than recreational areas located at aplace already defined as “home,” “industrial place,” or“school.” Bowling alley, amusement park, football sta-dium, and dance hall are examples of “place ofrecreation.” In “place of accident” classification of inju-ries, the place is significant rather than the activity in
which the person was engaged at the time of accident.Hence, an injury sustained by a person at a dance hallwhile he or she was at work is classified as a “place-of-recreation” injury. Likewise, an injury occurring while aperson was engaged in a sport in an industrial place isclassified as an “industrial-place” injury.
Farm – “Farm” as a place of accident refers to acci-dents occurring in farm buildings or on cultivated land butdoes not include accidents occurring in the farm home orpremises. A ranch is considered a farm.
Other–Accidents that cannot be classified in any ofthe above groups or for which the place is unknown areclassified as “other.” Included in this classification aresuch places as restaurants, churches, business and profes-sional offices, and open or wooded country.
Terms relating to disability
Disabili@–Disability is a general term that refers toany long- or short-term reduction of a person’s activity asa result of an acute or chronic condition. Limitation ofactivity refers to a long-term reduction in a person’scapaci~ to perform the average kind or amount of activi-ties associated with his or her age group. Restriction ofactivity refers to particular kinds of behavior usuallyassociated with a reduction in activity due to either long-or short-term conditions. Thus, limitation of activity refersto what a person is generally capable of doing, butrestriction of activi~ ordinarily refers to a relatively short-term reduction in a person’s activity below his or hernormal capacity.
Limitation of activi~ because of chronic con-ditions– Persons are classified in terms of the majoractivity usually associated with their particular age group.The major activities for the age groups are ordinary playfor children under 5 years of age, attending school forthose 5–17 years of age, working or keeping house forpersons 18-69 years of age, and capacity for independentliving (the abili~ to bathe, shop, dress, eat, and so forthwithout needing the help of another person) for those70 years of age and over. People 18–69 years of age whoare classified as keeping house are also classified by theirabili~ to work at a job or business. (In this report, themajor activity of persons 65–69 years of age is assumed tobe working or keeping house; however, questions werealso asked about the capacity for independent living in thisage group, which would permit an alternative definition oflimitation.)
In regard to these activities, each person is classifiedinto one of four categories: (a) unable to perform themajor activity, (b) able to perform the major activity butlimited in the kind or amount of this activity, (c) notlimited in the major activity but limited in the kind oramount of other activities, and (d) not limited in anyway.In regard to these four categories, NHIS publicationsoften classify persons onIy by whether they are Iimited(groups a-c) or not limited (group d). Persons are notclassified as limited in activity urdess one or more chronic
41
conditions are reported as the cause of the activitylimitation. If more than one condition is reported, therespondent is asked to identify the condition that is themajor cause of the limitation.
Restriction of activi~ – Four types of restricted activityare measured in NHIS: Bed days, work-loss days forcurrently employed persons 18 years of age and over,school-loss days for children 5–17 years of age, and cut-down days.
A bed-disability day is one during which a personstayed in bed more than half a day because of illness orinjury. All hospital days for inpatients are considered beddays even if the patient was not in bed more than half aday.
A work-loss day is one on which a currently employedperson 18 years of age and over missed more than half aday from a job or business.
A school-loss day is one on which a student 5–17 yearsof age missed more than half a day from the school inwhich he or she was currently enrolled.
A cut-down day is a day on which a person cuts downfor more than half a day on the things he or she usuallydoes.
Work-loss, school-loss, and cut-down days refer to theshort-term effects of illness or injury. However, bed daysare a measure of both long- and short-term disability,because a chronically ill bedridden person and a personwith a cold could both report having spent more than halfa day in bed because of an illness.
The number of restricted-activity days is the numberof days a person experienced at least one of the four typesof activity restriction just described. It is the most inclusivemeasure of disability days and the least descriptive; 4 daysof restricted activity may mean 4 bed days associated withserious illness or 4 days during which a person merely cutdown on his or her usual activities due to a mild illness.
A single restricted-activity day may involve both a bedday and a work-loss or school-loss day. However, a cut-down day cannot overlap with any of these three types ofdisability days. In calculating the sum of restricted-activitydays, each day is counted only once even if more than onetype of activity restriction was involved.
Restricted-activity days may be associated with eitherpersons or conditions. Person days are days during which aperson restricted his or her activity. Condition days aredays during which a condition caused a person to restricthis or her activity. A person day of restricted activity canbe caused by more than one condition. In such a case,each condition causing restriction is associated with thatday of restricted activity. Therefore, the number of condi-tion days of restricted activity may exceed the number ofperson days of restricted activity. This relationship holdsfor each type of restricted-activity day.
When two or more conditions cause a day of restrictedactivity, the conditions may be (a) both (all) acute, (b) one(some) acute and the other (some) chronic, or (c) both(ail) chronic. The number of restricted-activity days asso-ciated with acute conditions includes groups (a) and (b);
the number of such days associated with chronicconditions includes groups (b) and (c), The phrase “asso-ciated with” rather than “caused by” is used to indicatethat some days associated with acute or chronic conditionsare not necessarily caused solely by that type of condition.
Assessed health status –The categories related to thisconcept result from asking the respondent, “Would yousay ‘s health is excellent, very good, good, fair,or poor?” As such, it is based on a respondent’s opinionand not directly on any clinical evidence.
Demographic terms
Age –The age recorded for each person is the age atlast birthday. Age is recorded in single years and groupedin a variety of distributions depending on the purpose ofthe table.
Geographic region - For the purpose of classifying thepopulation by geographic area, the States are grouped intofour regions. These regions, which correspond to thoseused by the U.S. Bureau of the Census, are as follows:
Region States included
Northeast Maine, Vermont, New Hampshire,Massachusetts, Connecticut, RhodeIsland, New York, New Jersqy, andPennsylvania.
Midwest Ohio, Illinois, Indiana, Michigan,Wisconsin, Minnesota, Iowa, Mis-souri, North Dakota, South Dakota,Kansas, and Nebraska.
South Delaware, Maryland, District ofColumbia, West Virginia, Virginia,Kentucky, Tennessee, North Carolina,South Carolina, Georgia, Florida,Alabama, Mississippi, Louisiana,Oklahoma, Arkansas, and Texas.
West Washington, Oregon, California,Nevada, New Mexico, Arizona, Idaho,Utah, Colorado, Montana, Wyoming,Alaska, and Hawaii.
Place of residence –The place of residence of amember of the civilian noninstitutionalized population isclassified as inside a metropolitan statistical area (MSA)or outside an MSA. Place of residence inside an MSA isfurther classified as either central city or not central city.
Metropolitan statistical area –The definition and titlesof MSA’S are established by the U.S. Office of ,Manage-ment and Budget with the advice of the Federal Com-mittee on Metropolitan Statistical Areas. Generallyspeaking, an MSA consists of a county or group ofcounties containing at least one city (or twin cities) havinga population of 50,000 or more plus adjacent counties thatare metropolitan in character and are economically andsocially integrated with the central city. In New England,towns and cities rather than counties are the units used indefining MSA’S. There is no limit to the number of
42
adjacent counties included in the MSA as long as they areintegrated with the central city, nor is an MSA limited to asingle State; boundaries may cross State lines. The metro-politan population in this report is based on MSA’S asdefined in the 1980 census and does not include anysubsequent additions or changes.
Central city of an MSA –The largest city in an MSA isalways a central city. One or two additional cities may besecondary central cities in the MSA on the basis of eitherof the following criteria:
1. The additional city or cities must have a populationone-third or more of that of the largest city and aminimum population of 25,000.
2. The additional city or cities must have at least 250,000inhabitants.
Not central ci~ of an MSA –This includes all of theMSA that is not part of the central city itself.
Not in MSA –This includes all other places in thecountry.
Race –The population is divided into three racialgroups – “white, “ “black,” and “all other.” “AN other”includes Aleut, Eskimo or American Indian, Asian orPacific Islander, and any other races. Race characteriza-tion is based on the respondent’s description of his or herracial background.
Income of family or of unrelated individuals – Eachmember of a family is classified according to the totalincome of the family of which he or she is a member.Within the household, all persons related to each other byblood, marriage, or adoption constitute a family. Unre-lated individuals are classified according to their ownincomes.
The income recorded is the total of all incomereceived by members of the family (or by an unrelatedindividual) in the 12-month period preceding the week ofinterview. Income from all sources —for example, wages,salaries, rents from properiy, pensions, government pay-ments, and help from relatives —is included.
Highest education of responsible adult family mem-ber– Each member of a family is classified according tothe highest education level of a responsible adult memberof the family of which he or she is a member. Within thehousehold all persons related to each other by blood,marriage, or adoption constitute a family. Unrelated indi-viduals are classified according to their own education.The highest education level is classified in terms of highestgrade of school completed. Only grades completed inregular schools, where persons are given a formal educa-tion, are included. A “regular” school is one that advancesa person toward an elementary or high school diploma, ora college, university, or professional school degree. Thus,education in vocational, trade, or business schools outsidethe regular school system is not counted in determiningthe highest grade of school completed.
Living arrangement-The three categories of livingarrangements shown in this report are as follows:
● Living alone or with nonrelative –Living alone isdefined as living in a one-member household; living
with nonrelative is defined as living withnonrelatives in a household of two or moremembers.
● Living with spouse –This category includes marriedpersons who are living together in a household.Marital status is recorded only for persons 14 yearsof age and over. Persons with common-law marriagesare considered to be married. Persons other than thehusband and wife in the household are included inthe next category.
. Living with other relatives-This category includes allpersons living with relatives except husband and wifeliving together.
Marital status– Marital status is classified by the fol-lowing four categories:
● Cun-ently mam”ed includes all persons not separatedfrom their spouses for reasons of marital discord.Persons living apart because of circumstances oftheir employment are considered married. Personsliving together as husband and wife are consideredmarried, regardless of legal status.
. Separated and divorced includes persons who arelegally separated or divorced or who are living apartfor reasons of marital discord.
. Widowed includes persons who have lost their spouseas a result of death.
. Never mam”ed includes persons who were nevermarried and persons whose only marriage wasannulled.
Employment status –Employment status is classifiedby the following three categories:
● Curent~ employed–Persons 18 years of age andover who reported that, at any time during the 2-week period covered by the interview, they eitherworked at or had a job or business are defined ascurrently employed. Current employment includespaid work as an employee of someone else; self-employment in business, farming, or professionalpractice; and unpaid work in a family business orfarm. Persons who were temporarily absent from ajob or business because of a temporary illness,vacation, strike, or bad weather are consideredcurrently employed if they expected to work as soonas the particular event causing the absence no longerexisted.
Freelance workers are considered currentlyemployed if they had a definite arrangement with oneemployer or more to work for pay according to aweekly or monthly schedule, either full time or parttime.
Excluded from the currently employed populationare persons who had no definite employment schedulebut worked only when their services were needed.Also excluded from the currently employed popula-tion are (a) persons who received revenue froman enterprise but did not participate in its
43
operation, (b) persons who did housework or charitywork for which they received no pay, (c) seasonalworkers during the portion of the year they were notworking, and (d) persons who were not working,even though having a job or business, but were onlayoff or were on layoff and looking for work.
The number of currently employed persons esti-mated from NHIS will differ from the estimates pre-pared from the Current Population Survey (CPS) ofthe U.S. Bureau of the Census for several reasons. Inaddition to sampling variability, the estimates includethree primary conceptual differences, namely:
● NHIS estimates are for persons 18 years of ageand over; CPS estimates are for persons 16 yearsof age and over.
● NHIS uses a 2-week reference period; CPS usesa l-week reference period.
● NHIS is a continuing survey with separatesamples taken weekly; CPS is a monthly sampletaken for the survey week that includes the 12thof the month,
● Currently unemployed – Persons 18 years of age andover who, during the 2-week period prior tointerview, did not work or had no job or businessbut were looking for work, and those who had a jobbut were on layoff or were on layoff and looking forwork, are considered currently unemployed.
● Not in labor force – Persons not in the labor forceinclude those under 18 years of age and those whodid not, at any time during the 2-week periodcovered by the interview, have a job or business,were not looking for work, and were not on layofffrom a job. In general, persons excluded from thelabor force are children under the age of 18, retiredpersons, physically handicapped persons unable towork, and housewives or charity workers who receiveno pay.
44
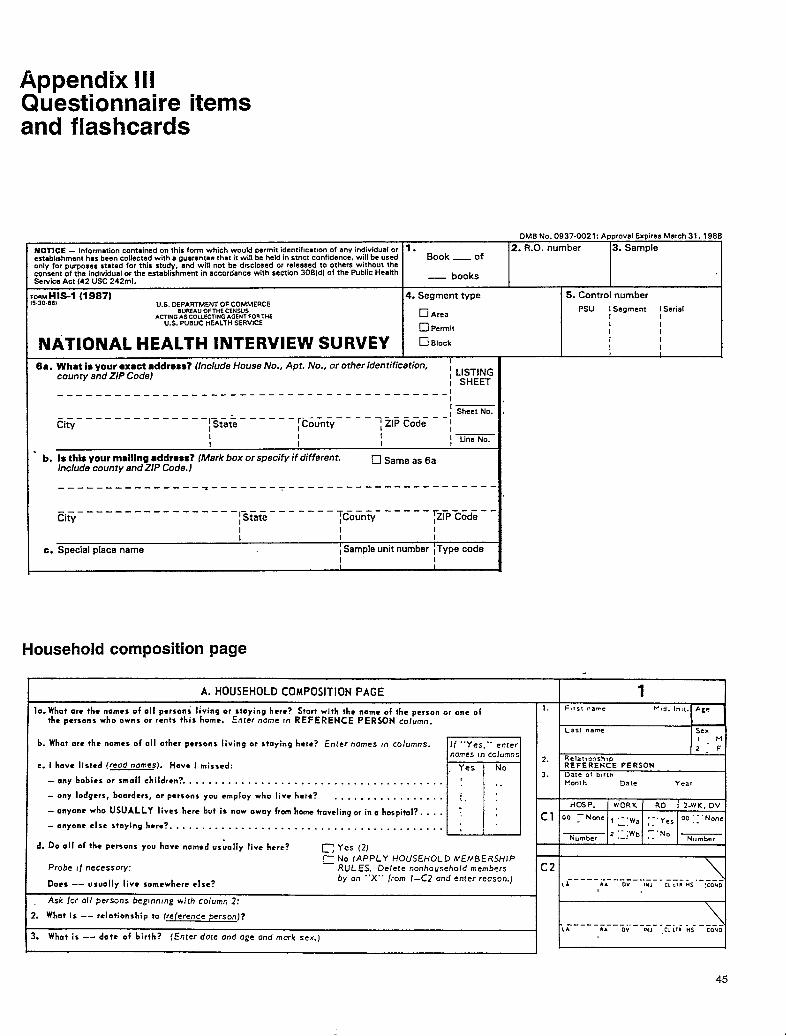
Appendix HIQuestionnaire itemsand flashcards
OMB No. 0937-0021: Approval Expires March 31, 1988
NOTICE - Information contained on this form which would permit identifmattion of any individual or 1. 2. R.O. number 3. Sampleestablmhment has been collected with a guarantee that it will be held in strict confidence, will be used Book — ofonly for purposes stated for this study’, and will not be dmclosed or released to others without theconsent of the indwidual or the establishment in accordance with section 3081d) of the Pubfic HealthService Act (42 USC 242ml.
— books
@llS-1 (1 987)U.S. DEPARTMENT OF COMMERCE
BUREAUOFTHECENSUSACTINGASCOLLECTINGAGENTFORTHE
u.S. PUBLICHEALTH SERVICE
4. Segment type
❑ Area
Cl Permit
NATIONAL HEALTH INTERVIEW SURVEY I ❑ BIOCII
6a. What is your ●xact address? (Include House No,, Apt. No., or other identification, ‘county and ZIP Code) : LISTING
I SHEETI---- —--- -— -- —— -- ---- -—- --- --— -—- -- --—— -—-!
L-—— ———/ Sheet No,
Eifi–------ –-––– --@atep.;n~y – - - –-l~@&~;--:
i,—1 I ! Line No.
‘ b. Is this your mailing ●ddress? (Mark box or specify if differenr.Include county and ZIP Code.)
❑ Same as 6a
---- ---- ---- ---= ---- -.-= -- ---— ---- ---- -————---
“------------- ‘ ----@at; ------ ‘~C;<n?y------ ~ZTP Code--— -.
CityI I II I I
c. Special placa name j Sample unit number jType codeI I
I 5. Control number
Psu I Segment I Serial
;II
I II
Household composition page
A. HOUSEHOLD COMPOSITION PAGE
10. What ors the names of all person; living or staying hew? Start with the name of the person or one ofth~ persons who owns or rents this hem*. Enfer name In REFERENCE PERSON co fwmn.
b. What are the names of all other prrsont living or staying here? Enter names ,n columns.
c. I hove listed [reed names). liav~ I missed:
-any babies orsmoll children?. . . . . . . . . . . . . . . . . . . . . . . . . . . . . . . . . . . . . . . .
any lodgers, boordrrs, or persons you employ who live here? . . . . . . . . . . . . . . . . .
- anyone who USUALLY lives hert but is now owoy from home traveling ~, in a hospitnl? . . . .
-onyone clsestayinghrre?. . . . . . . . . . . . . . . . . . . . . . . . . . . . . . . . . . . . . . . . . .
d. Do all of the persons you have nam~d us&lly live here? ~. Yes (2J
f ““Yes.”” enrerIorres tn column:
=-r-=:1!.
iL-,,,Probe If necessary:
~ No (APPLY HOUSEHOLD MEMBERSHIPRULES. Delete nonhousehold members
Does -- usuolly live somewhere ●lse?by on “’X”” from I-C? and enter reason.)
Ask for all persons beg, nnlng with column 2:
I. What is -- relationship to (reference person)?
. What if -- date of birth? (Enter dote ond oge and mark sex. )
T
2.
3.
cl
—
C2
1
,Last name 1 Sex
II M2’F
Rela!, onsh, pREFERENCE PERSONDale of brotht’lcmt h Date Year
,A 1-------
----- ~.--”, cih-”,cih us COP(D(m,
45
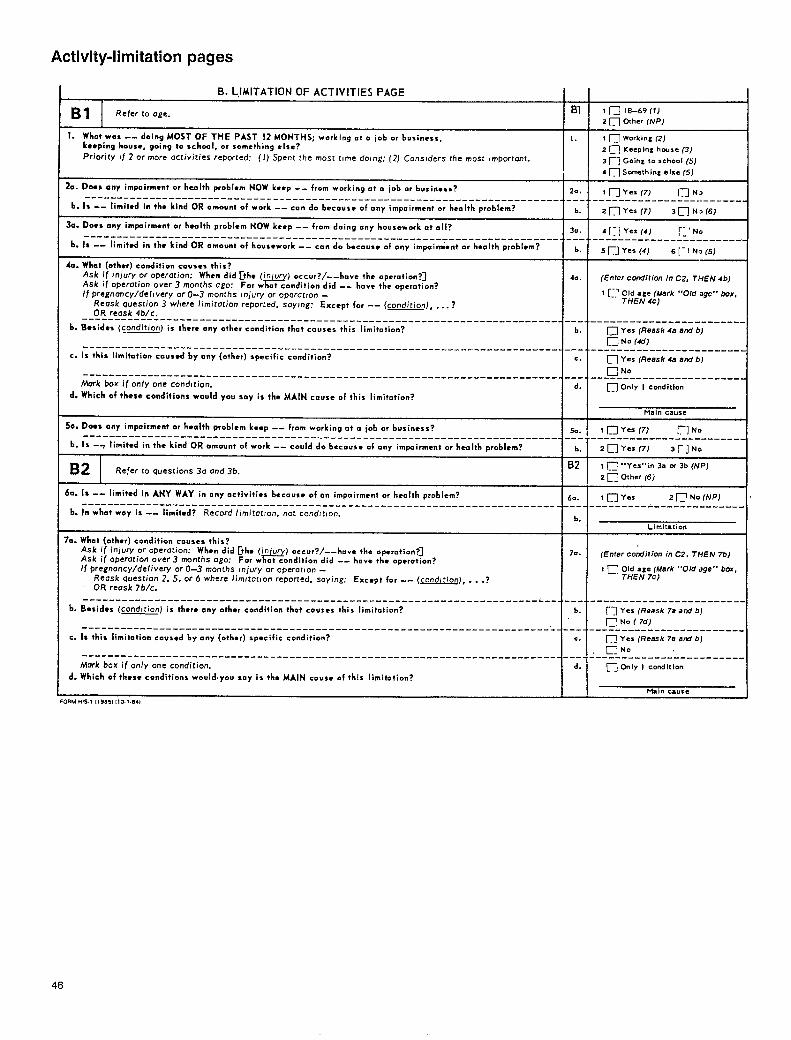
Activity -1imitation pages
B. LIMITATION OF ACTIVITIES PAGE II
BI Refer to age.B1 1 m 18–69 (7)
z ~ other (NP)
1. What wos -- doing MOST OF THE PAST 12 MONTHS; working at o iob or business,keeping housr, going to school, or something ●[se?
1. 1 ~ Workint (2)
Priority If 2 or more activities reported: (1) Spent the most tome do flng: (2) Considers the most #mporcant.2 ~ K==slnz hw= (3)3 n Goint to .Chool (5)
4 ~ Somethin; else (5)
!o. D-s any impairment or henlth problcm NOW keep -- from working at o iob or busin. tz?
--------------------------------------------------------------------------,____ __’_u_y_=:::)- ____~_f-: ______
20.
b. Is -- Iimit*d in th. kind OR amount of ~ork -- can do becoute of ony impairment or hralth problem? b. 2 ~ Yes (7) 3m No(6)
10. DO*S any impairrn.nf or health problem NOW kc.p -- from doing any housework at all? 30. 4(~1 Yes(4) r- , No_______________________________________ ____________________________ .___, ______________ ‘---
b. Is -- Iimit.d in th. kind OR amount of hou~ework -- can do because of any impairnicnt or health problem? b. 5 ~J Yes (4) 6 (-I No(5)
(o. What (othrr) condition c-us-s this?Ask if Injury or operation: When did [the (m) c.ccur?/--have the operation?]Ask if operation over 3 months ago: For what condition did -- have +he ~Perofion?
4.. (Enter condition in C2, TFlEt44b)
If pregnoncy/def #very or o-.3 months tnjury or operatfon - 1 [~.’ Old age (Mark ‘“O/d age”” box,
Reosk question 3 where limitation reported, soylng: Except for -- (condition), . ..?THEN 4c)
OR reosk 4b/c.-------------------------------------------------------------------------- —---- -----------------------
b. Bcsid*~ (condition) is there any other condition that couses this limitation? b. D Yes (Reask 4a aod b)
~No(4d)____________________________________________ ___________________ _____ ____________
C. Is this Iimitcstion causrd by ony (other) specific condition? c. ~ Yes (Re8sk 43 and b)
❑ No- _ --- —_________ _______________________________ ______ ---- _____ ----------- ------
Murk box if only one co”dltiO”.
d. Which of thrse condifionz would you soy is the MAIN cause of this Iimitotion?
d. ~ Only I condition
Main cause
k. Do.s any impairment or hmlth problem ke. p --_________________________________________________________________ _- _____ _~_~ y“ (7) _~l_Nj--_-_-from working ot a iob or business? %.
b. Is -~ limited in the kind OR amount of work -- cwdd do because O{ any impairment or health problem? b. 2 I-J Yes (7) 3r]No
B2 Refer to questions 3a ond 3b.B2 I ~ “-Yes”in 3a w 3b (NP)
2 m Other (6)
60. Is -- Iimit*d in ANY WAY in any octivitics becaus< of on impairment or health problem?______________________________________________________ ------------ -,6:: 1 ~ Yes 2P No (NP)
b. In what way is --- limited? Record fimitotton, “ot condftlo”.
--------- A -------------
b.Limitation
70. What (other) condition couset this?Ask if injury or operation: When did [the (in’ur ) occur? /--have the ewration?]
P ~~Ask if operation over 3 months ogcI: For w at =Ondltlon did -_ haY= +hc ~P=ra*ion?70. (Enter condition in C2, THEN 7b)
/f pregnancy/delivery or O-3 months Injury or operation - t ~ Old ●ge (Mark “OL5 age’” bax,
Reask question 2, 5, or 6 where Iimltot#on reported. soying: Except for -- (Condition), . . .? THEN 7c)
OR rettsk 7b/c.
---------------------- —-- _____________________________________________ L--- ----- -----------------------
b. Basid*x (condition) is there rJnY oth.r condition that causes this limitation? b. r~ Ye% (Reask 7a and b)
~ No ( 7d)------------------------------------------------------------------------ L- ---- _______________________
c. Is this limitation cau>.d by ony (other) specific condition? c. ~ Yes (Reask 7. end b)
DNo-------------------------------------------------------------------------- ---- : ______________________
Mork box if only one condition. d. n Only I Corditlon
d. Which of these conditions would. you soy is the MAIN cuuse of this limitation?
Main cause
)RMHtS.1 1198S11101.841
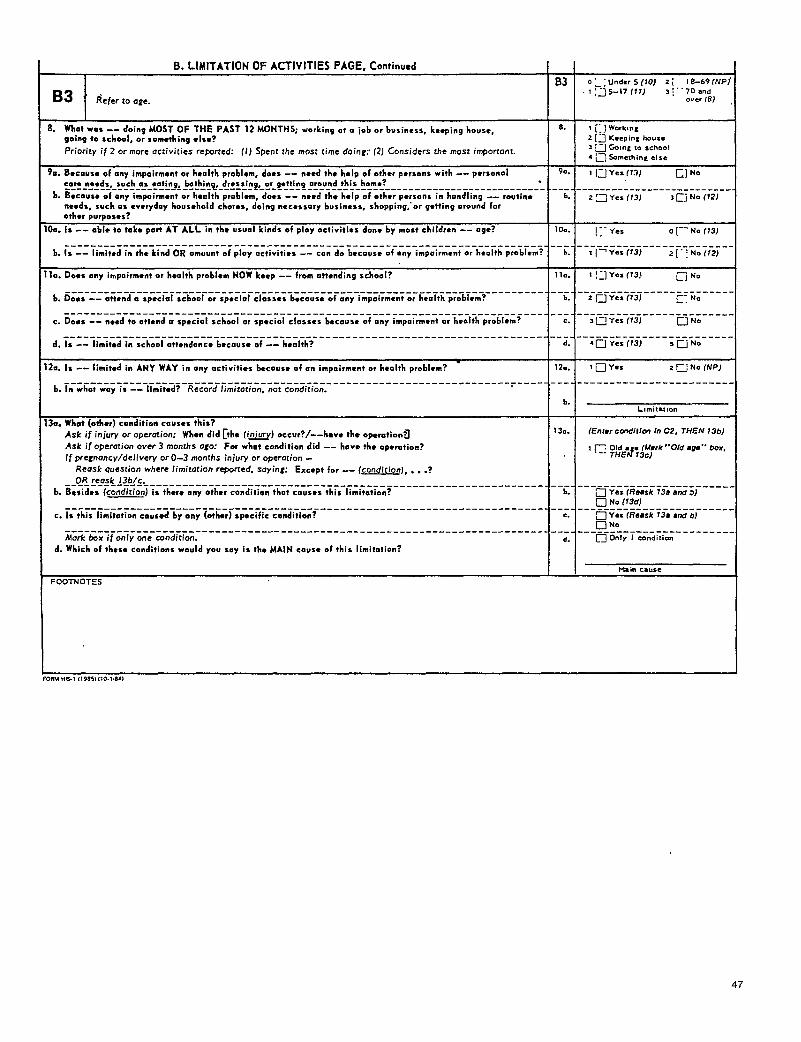
—.—-- .-—.B. LIMITATION OF ACTIVITIES PAGE, Continued
I
1
8. What WOS -- doing MOST OF THE PAST 12 MONTHS; working at a lob or busimess, kesping house,going *O school, or somrthin9 ●Is*?
Priority if 2 or more activities reported: (1) Spent the most time doing: (2] Considers the most important.
91S.E.cou$. of any impairment w h.alth problem, dors -- -nerd the help of other pcrss. nswith -- pcrsenalcar- needs, such as catin9, bathing, drossirq, or getting ❑round this hem*? .------------------------- ------ ----------------------------------------------- .
b. Because of any impoirm.nt or hsalth problcm, dots -- -need tho help of othsr parsons in handlin9 -- routinenecdx, such ❑ s cvtryday hous~hold cher.s, doing ncc.ssary bvsin. ss, shopping,”or 9tttin9 around forothtr purposas?
b. Is -- ablr to tak~ part AT ALL in tho usual kinds of play activities done by most children -- a9e?
------------------------------- ------------------------------------------b. Is -- limit-d in the kind OR amount of pfoy activities -- can do btcavse of ●ny impoirmrnt or htalth problem?
10. Does any impairnw.t or hcolth problcm NOW keep -- from attmding school?
-------------------------------------------------------------------------c. DO*S -- need to ottend a sptcial school or spociol closses because of ony impairment or health problem?
------------------------------------------------ -------------------------d. IS -- Iimitsd in school ❑ttondanco btcausc of -- hmsfth?
Za. fs -- limited in ANY WAY in any activities brcausc of an impairment or health problcm?
-------- ~----_-.-__-_---- ~-:-= -------------------------------- -------- ~----b. In whoi way IS -- Iim,ted? Record Ilmttotron, not conditton.
3a. What (other) condition causes this?
Ask if injury or operation: When did [the (i-) occur?/--hsvc th~ opsrationd
Ask if operation over 3 months ago: For what condition did -- hovr the op~ration?
If preznoncy/delivery or O-3 months injury or operation -
Reosk question where Iimitotion reported, saying: Except for -- (condition), . . .?
OR reask f3b/c--------- ~:-------------------------------------------------------- -------b. Bcsidos (condttton) is there any other condition that couscs thix limitation?
------------------------------------------- _________________ -------------C. Is this limitation caused by any (other) specific condition?
------ ~---------- ~r _________________________________________ _____________
Mark hx !f only one condttton.
d. Which of thcsa conditions would you say i% th. MAIN cause of this Iimitntion?
B3
7-
K
---b.
K
--b.
c
--b.
--c.
---d.
12..
--
b.
.
I30.
---b.
--e.
--d.
.
0 ~. j Under 5 (f@) z i ‘-1 8-69 (NP
1 ,J5-17(flJ 3; ’’70 andover 18)
! [~] Worktnt
2 [~ Ceeping house3 ~ Gorng to school
4 L~ Something else
1 ~ Ye$ (13) c] No
------ -------------------
2 g Yes (13] J Cj No (72)
[~” Ye. o [--’ NO (73)
-----------------------i [= Yes (13) 2[”:No (72)
1 1‘] Yes (73),_ m No
---------------- =------2 r~ Yes (73) CNO
------------------ ------3 ~ Yes (73) u No
----------- _______ -----4 u Yes (73) SUNO
! ❑ Yes 2 ~ No (NPJ
-----------------------
Ltmita; ton
(Entw cmditlm in C2, THEN 13bJ
I ~ Old ● e fM8rk “’0/6 ●ge’” b~r,TffEff 13c)
-------------------- ---~ Yes (Reask 73a and 3)
~ No (13d)-----------------------
~ Yes (Reask 138 ●nd b)❑ No
-----------------------n Only I condition
M2in cause
>RMHIS.! [19851110.1.84)
47
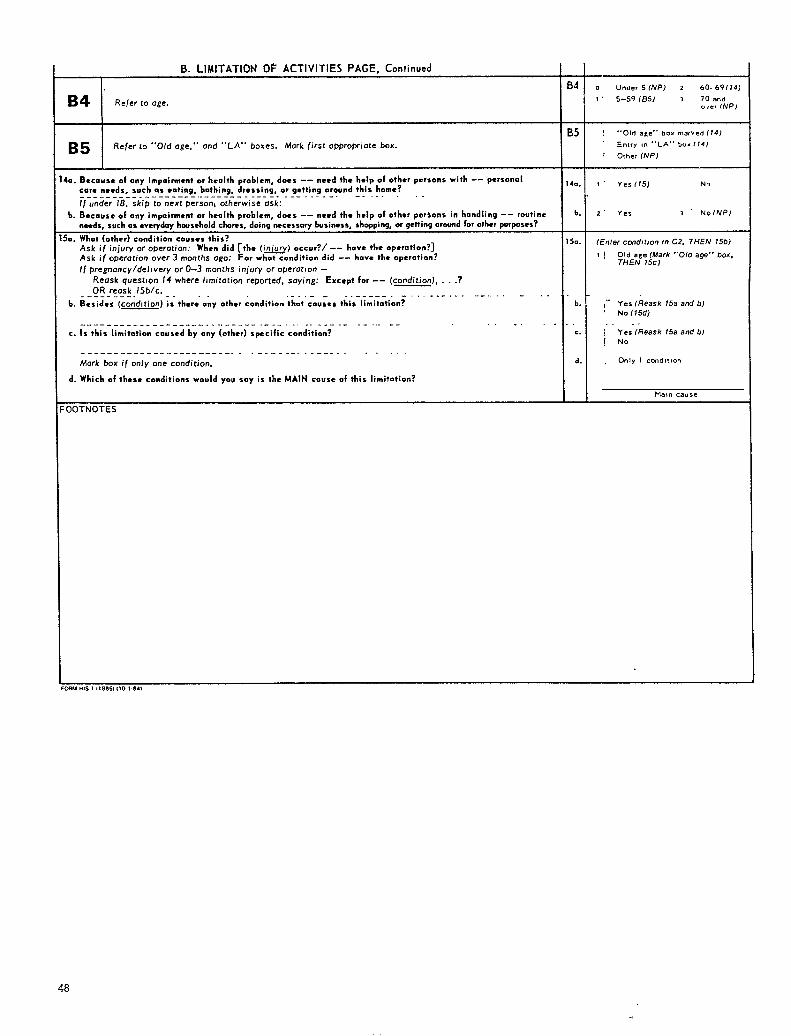
B. LIMITATION OF ACTIVITIES PAGE. Continued II04 0 uncle, 5 (lVP) 2 60-69{ 14)
B4 Refer to OE,.1, 5-59 (B5) 3 70 and
o.,, INPI
B5 ! ‘. Old age”’ bov ma, ked(14)
B5 Refer to “Old age,”’ and ‘“LA”’ boxes. Mark first oppro~ iate bat. Entry ,. ‘“LA”’ box (14J
! Other (NPI
10. BccauI. of any impaimcnt m h.rolth problem, does -- need the hdp of other perzons with -- personalcore nreds, such as eoting, bathing, dressing, e.r getting around this home?
14a. 1’ Yes fY5) No
--------- --------- --------- ------ . . . . . . ---- . . . . .-If under 18, skip to next person; otherwise osk:
b. Because of any impairment or health problcm, does -- need the help of other per$ons in handling -- routine b. 2’ Yes 3“ No /NP)
n-ds, such rm weq&y household chores, doing necessary business, *hopping, or g=tting or-d for oth*r PUrPOSeS?
k. Whet (other) condition causet this?Ask if injury or operation: When did [the (w) occur?/ -- have the opsrotion?]
15.. (Enter cond,fton (n C2, THEN 15b)
Ask if operation over 3 months ego: For what candition did -- hovo the operation?,[ Old a:e (Mark “’Old age” bor,
If pregncmcyldellvery or O-3 months injury or operotlon -THEN 75cJ
Reosk question 14 where limitation reported, soying: Excrpt for -- (condition), . . .?
OR remk 15b/c.----- . .. . . ------ ------- . . . . . . . .. . . . . . . .b. Beside< (concfltion) ;S there any other condition that causes this limitation? b. ,’- Yes (Reask 15a and b)
No f15d)
------------------------- . . ------- .-,. -. . . . . . . ---- . .. . . .,. , ,. . .
c. Is this limitation cou~ed by any (other) specific condition?
. . . .. . I Yes (Reask f5a and bJ
[ No------------- ---------- -.. . ---- . . . ----- . .,
Mark bx if only one condition. d. Only I cond, t,on
d. Which of thes~ conditions would you say is the MAIN couse of this Iimitotion?
Ma$n cause
oo-mo-rEs
1 (1985,,10 1.841
48
.
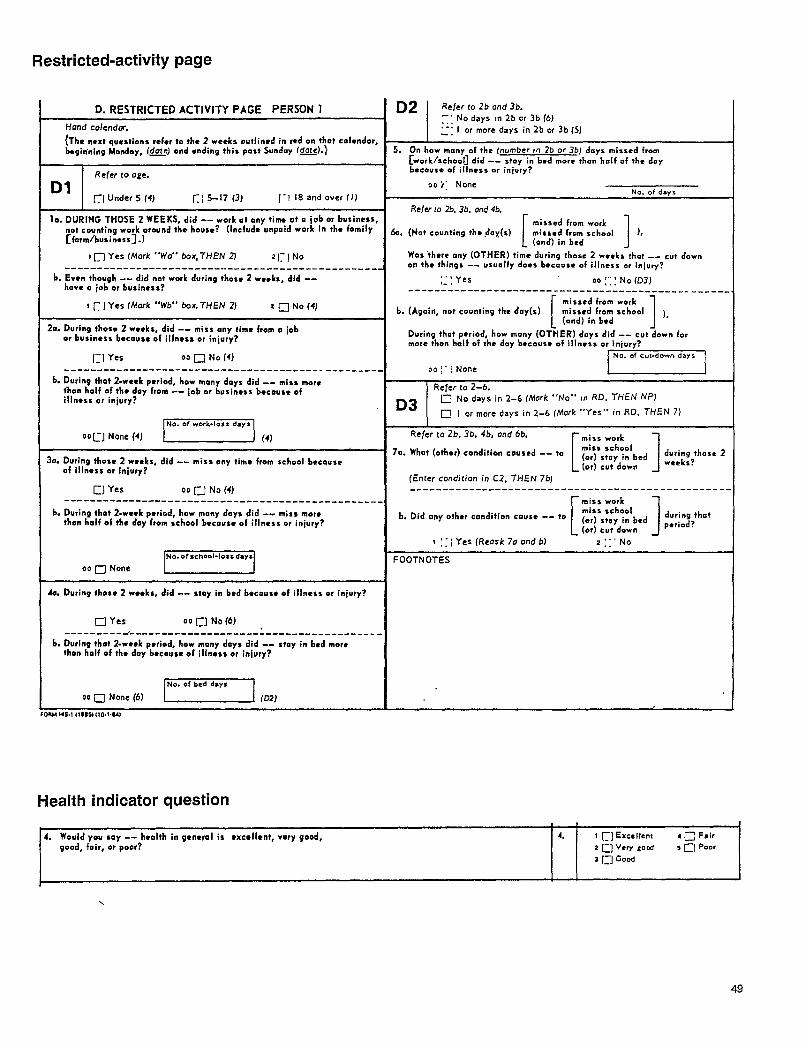
Restricted-activity page
D. RESTRICTED ACTIVITY PAGE PERSON 1
ffcmd calendof.
{The next qusstions refer to the 2 weeks outlined in rrd on that colendor,baginning Monday, (c&e) and ending thi. PESt Sunday f4Q@-}
I Refer to am.
D1 -~1 Under 5 (4) ~; 5-17 (3) [-1 18 and over (1)
la. DURING THOSE 2 WEEKS, did -- “O, k at any fi~ at a job or business,
not counting work oround the hous~? (Include unpaid work in the fomilycfarm/busintss].)
I ~ Yes (Mark ““Wa”” box, THEN 2) 2[:]N0---------------- -------- ----------------------- --
b. Evrn though -- did not work during thosr 2 wrcks, did ---hove a job or business?
I ~ I Yes (Mark “’Wb” 60X, THEN 2) z ❑ No (4)
2s. During thosr 2 wteks, did -- miss any time from o jobor busintss because of illnrss or injury?
[:] Yes 00 ❑ No (4)
--------- -------------------------- -------------
b. During that 2.wr*k prriod, how many cloys did -- miss morethan half Of th* day from -- job or busin*ss because ofillnczs or iniury?
00 ~] None (4) m (4)
30. During those 2 weeks, did -- miss any time from school becauseof illness or injufy?
Cj Yes DO [:] No (4)--------- ----- ----.----- ----- ------ ---------.- .-
b. During thot 2.wmek pwied, how many cloys did -- miss morethan half of the day from school because of illness or injury?
00 ~ None m
&. During those 2 weeks, did -- stay in bed btcauso of illne$s or injury?
❑ Yes OD [:] NO (6) .------ --_-,- --.-- ---------- ----- ------- --------- -
b. During that Z.week prriad, how mony deys did -- stay in bcd morethen half of the day bocausc of illnots or injury?
00 ❑ None (6) m (D2)
‘?MHIS.1 {19 S5) (10.144)
D2 Refer to 2b ond 3b.:: No days m 2b or 3b {6)
:: I or more days in 2b or 3b(51
5. On how many of the (number rn 2b or 3b) day~ mizsed from
[werk/z.hoo~ did -- stay in btd more than half of the daybacauss of illness or injury?
00 ): Nonef4m of days
Sa.
Refer to 2b, 3b, ond 4b.
[
missed from work
(Nof counting the .&w(s) mis-cd from school 1 ),L (and) in bed J
Was }here any (OTHER) time during those 2 weeks that -- cut downon tht thingx -- usually does because of illness or iniury?
;: ; Yes 00:’:: No (D3J------- ------------ --------------- -------- -------
[
missed from workb. (Again, not counting the day(s) 1missed from zchool )
(and) in brd
During that period, how mony (OTHER) days did -- cut down formore thsm half of the day becousr of illness or iniwy?
No. of Cut-down days I
D3Refer to 2-6.
G No days in 2-6 (Mark ..No,” in RD. THEN NP)
@ I or more days in 2-6 (Mork “’yes’” in RD. THEN 7J
Refer to 2b, 3b, 4b, and 6b. rmiss work 1
70. Whet (other) condition coused -- to
1
miss school(or) stoy in bed
J
during those 2
(or) cut down wreks?
(Enter condition ;n C2. THEN 7bJ------------ ---------------------- ---------------
rmis. wo,k ~
b. Did any othw condition cause -- to
1
mi$s school(or) stay in brd
J
during that
(or) cut downperiod?
I ::; Yts (Reosk 70 and b) 2 ::” No
FOOTNOTES
Health indicator question1 J
4, Would YOU SOY -- health in gcncrol is cxcellcnt, very good, 4, t ~) Excel tent 4C Fair
good, fair, or poor? 2 ~] Very zood 5 c1 Poor
3 [~] Gocd
\
49
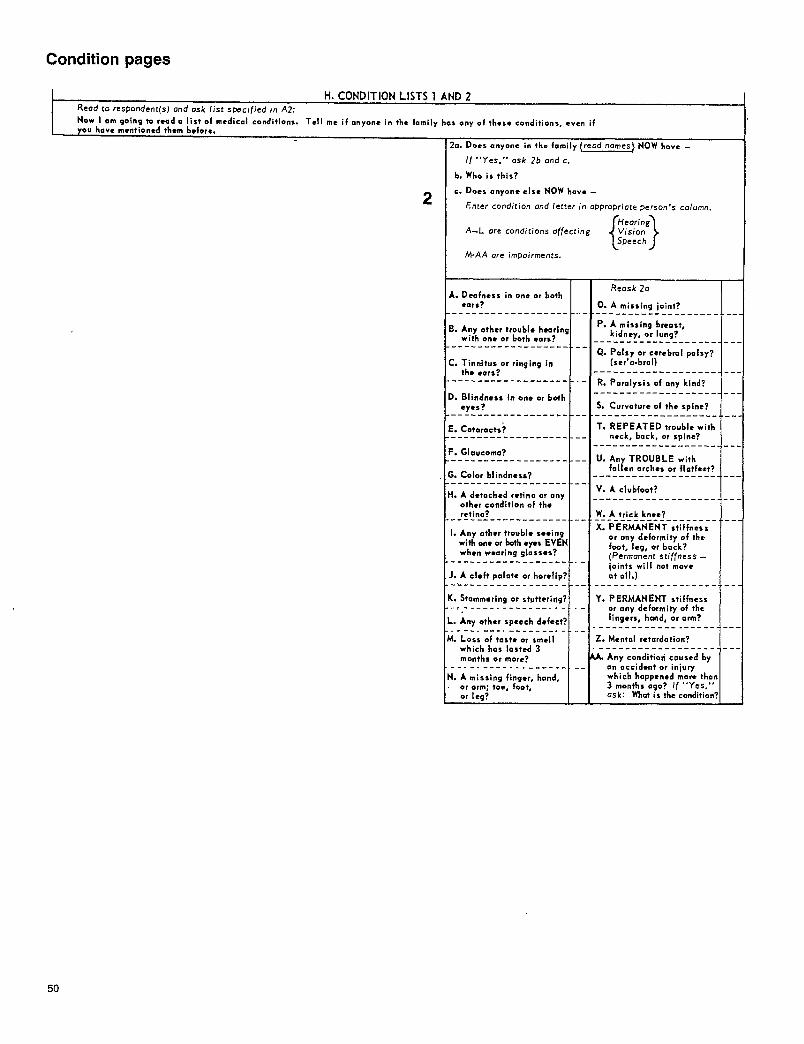
Condition pages
H. CONDITION LISTS 1 AND 2Read to respondent(s) and ask fist sxcified In A2:
Now I om going to read o list of medical conditions. Tell me if cmyone in th- family ha$ ony of the$e conditions, even ifyou hovr mcntiencd them before.
2a. Does anyone in ihe family (reed names} NOW hove -
2
If “’yes, ” ask 2b arid c.
b. Who is this?
c. Does anyone else NOW have -
Enter condition and letter in opproDriote >erson’s columrl.
A-L ore conditions effecting M::’)
h%AA are impairments.
TA. Oeafness in one or both
●ars?------------------- ..
B. Any other trouble hcariogwith on- or both ●ors?
----------------- ----
C. Tinnitus or ringing intho ●ars?
----------- ------ ----
D. Blindness in one or both
CyQs?----------------- .- .-.
E. Cataracts?------------------- ---
F. Gloucoma?------------------- .-.
G. Color blindntss?------------------- ---
H. A drtachcd retina or anyothar condition of theretina?------------------ ---
1. Any oth-r trouble seeingwith on- or both ●ye~ EVENwhen wearing glasses?
---------------- -- . .
J. A cleft palate or harelip?-------------- ----.- ---
K. Stammering or stuttering?... ----- ------ ------ .-
L. Any othar speech defect?. . . . . . . ..- -------- . . . .,-
M. Loss of taste or smrllwhich has lasted 3months or more?
--------- . -------- -.
N. A mis~ing fingar, hand,or arm; toe, foot,or leg?
Reosk 20
0. A mizsing ioint?----------------- .,-
P. A missing bren~t,kidney, or lung?
-------------------
Q. Palsy or ccrebml pafsy?
(ser’a.bral)-------------------
R. Pamlysis of ony kind?’-------------------
S. Curvature of the spine?-------------------
T. REPEATED trouble withneck, back, or xpine?
-------------------
U. Any TROUBLE withfallan arch-s or flatfwct?
-------------------
V. A clubfoot?------------------
W. A trick knee?-------------------X. PERMANENT stiffness
or ony deformity of the.foot, leg, or bock?(Permanent stiffness -
ioints will not moveat 011.)
------ -------- ., ----
Y. PERMANENT xtiffnessor any deformity of thefingers, hand, or arm?
--------- ---------
Z. Mental rctordation?---------------- --
A. Any conditiori caused byan accident or iniu~which happened mere thorn3 months 090? If ‘“Yes, ”ask: What is the condition!
.
-.
--
--
--
-.
--
--
--
--
--
--
--
50
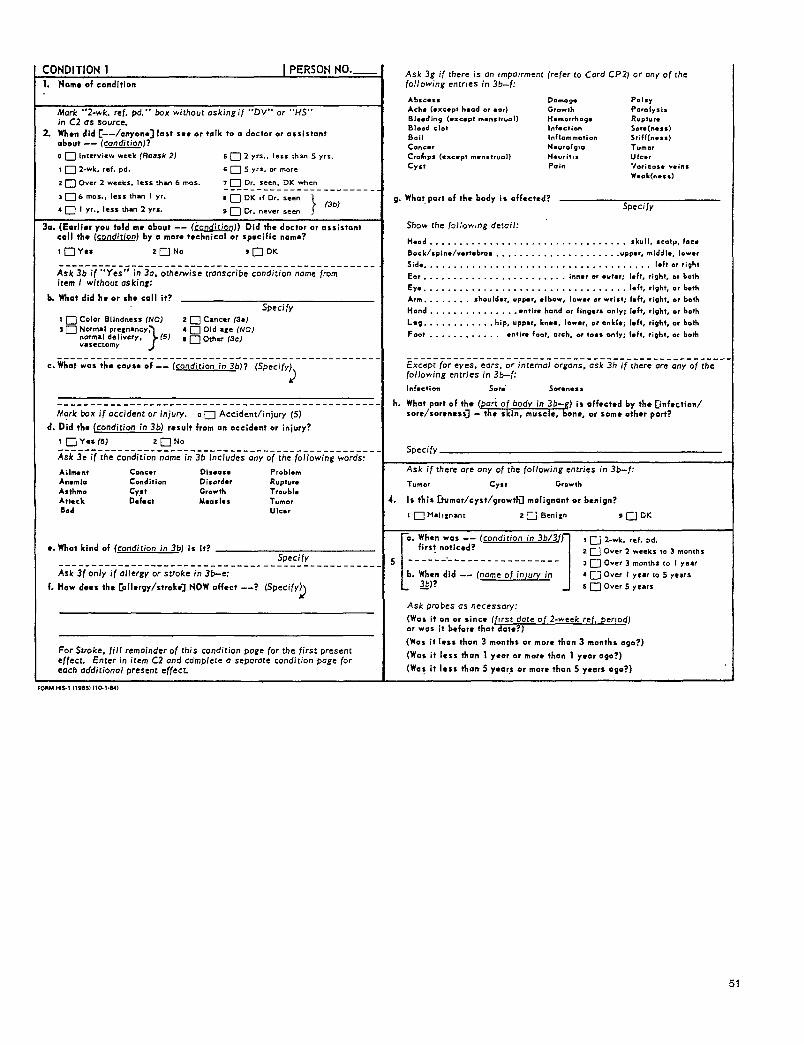
CONDITION 1 I PERSONNO._1. Nomc of condition
Mark “’2-wfc. ref. pd.”’ box without askingif “DV’” or ‘“ffS’”in C2 as source.
2. When did [--/anyone] last s-e or tolk to o doctor or assistantabout -- {condition)?
0 ❑ Interview week (Rea~k 2) s ❑ 2 yrs., less than 5 yrs.
I n 2-wk. ref. pd. 6 ❑ 5 yrs. or more
2 m Over 2 weeks. less than 6 mos. 7 n Dr. seen, DK when-----------------------
306 mo$., less than I yr. 8 ❑ DK if Dr. seen
s n I yr,, less than 2 yrs. }(3bJ
9 ❑ Dr. never seen
3a, (Earlier you told mc about -- (&mUQO)) Did the doctOr Or assistantcall tho (Condition) by a mar- technical or specific namt?
------------------------------------------------Ask 3b if ‘“Yes” in 3a, othemise transcribe condition nome fromitem I without asking:
b. what did he or sht call it?Specify
1 ❑ Color Blindnexs (NC) 2 ❑ Cancer (30)
}
s ❑ Nmmal Pre;nancy, 4 ❑ Old ate (NC)normal delivery, (5) o ❑ Other (3c)vasectomy
--------------------------- ---------------------c. What was tho COUS* of -- (condition in 3b)? (Specify)
2
------------------------------------------------Mark ~X if occident or injury. o D Accident/i ”jurY [5)
d. Did the fcondition in 3b) result from an accident or iniury?
1 ❑ Y*S (S) ZDNO------------------------------------------------Ask 3e if the coridition name in 3b includes any of the following words:
Ailrmnt Cane.r Dis*asa Prc.bl*m
An.mia Condition Disordor RuptureAsthma Cy,s? Grewth TroublmAwack Dafect M*a51ms TumorMad UIC*<
c. What kind of (condition in 3bJ is it?SWrifv
Ask 3f only if allergy or stroke in 3b-e:
f. How decs the [allergy/strokr] NOW offrct --? (Specify)J
For Stroke, fill remainder of this condition poge for the first present
●ffect. Enter in item C2 and ctimplete a seporate condit;on poge foreoch addjcionol present effect.
9.
h.
Ask 3g if there is an imputrmen! (refer to Cord CP2J or any of the
following entries in 3b-f:
Absc*ss Dtwn.age P.1’y
Ach. (except h-ad G, ●O,) Growth Po,e{ysis
B1..di. g (.xcep~ m.nst,.al) H.merrhrq. RupwreBlood clot l. f..tion Sora(rmss)Boil I. fllmune?;o” Stifr(”.ss}
Cone.r N.. rolgw TumorC,!+* (.xc.pr m.”, t,”ol) N.uri!, s ule*rcyst Pain .to,ic as. v.i. s
Waqk(mmzs)
What, part of the body is affected?Specify
Show the fol:owmg detail:
Head . . . . . . . . . . . . . . . . . . . . . . . . . . . . . . . ..skull. scolp. foco
80. k/spin.l..rt*br.. . . . . . . . . . . . . . . . . . . . . .upp. r, middl*, low*r
Sid*. . . . . . . . . . . . . . . . . . . . . . . . . . . . . . . . . . . . . . loft or right
Ear . . . . . . . . . . . . . . . . . . . . . . . . innar or eutar; l*ft, right, c.. both
Eye . . . . . . . . . . . . . . . . . . . . . . . . . . . . . . . . ..l*ft. right. or bo$h
Arm . . . . . . . . sho.ld. r, .p~r, .Ibow, Iew.r or wrisl; I.ft, right, or bovh
Hand . . . . . . . . . . . . . . . ●ntire hand er fing.rc SOIY; I.ft, right, or bath
L-g . . . . . . . . . . . . hip, .ppar, knee, Iowar, ar .nklc; 1A, right, or both
Feet . . . . . . . . . . . . .ntir. foot, circh, S, 9c..s only; I.ft, ,i*ht, er borh
------------------------------------------------Except foreycs, ears, orinternol organs, ask3h iftherersre any of thefollowing entries in 3b-f:
Inf.cfion Seri S.r.n. ss
Whotpart of the{par~ of body in3b- ) i$affcctcd bythe[infcction/sOr*/sOr*n*s$] - the skin, muscle, one, or some other port?
Ask ifthereareany of the following entries in3b-f:
Tumor cyst Growth
4. lsthis[tumor/cYst/growtm malignant or benign?
1 CMal!snant z~ Benizn sUDK
[
a, When was -- (condition in 3b/3f)-firs? noticed?
5 ------ ,------- ----------
b. When did -- (name of inlury in3b)?
1 D 2-wk. ref. pd.
2 U OV=r 2 weeks 10 3 InOnth$3 ~ Over 3 months to I yew
c ~ Over I year to 5 years
5 I_J Over 5 years
Ask probes as necessary:
(was it on or since ({, rst date of 2.week ref. fjerlOd)or wos it btferc that date?
(Was it Irss then 3 months or more than 3 months ago?)
(Was it less than 1 yeor or more than 1 ytor 090?)
(WaS it Icss than 5 year? or more than 5 years 090?)
51
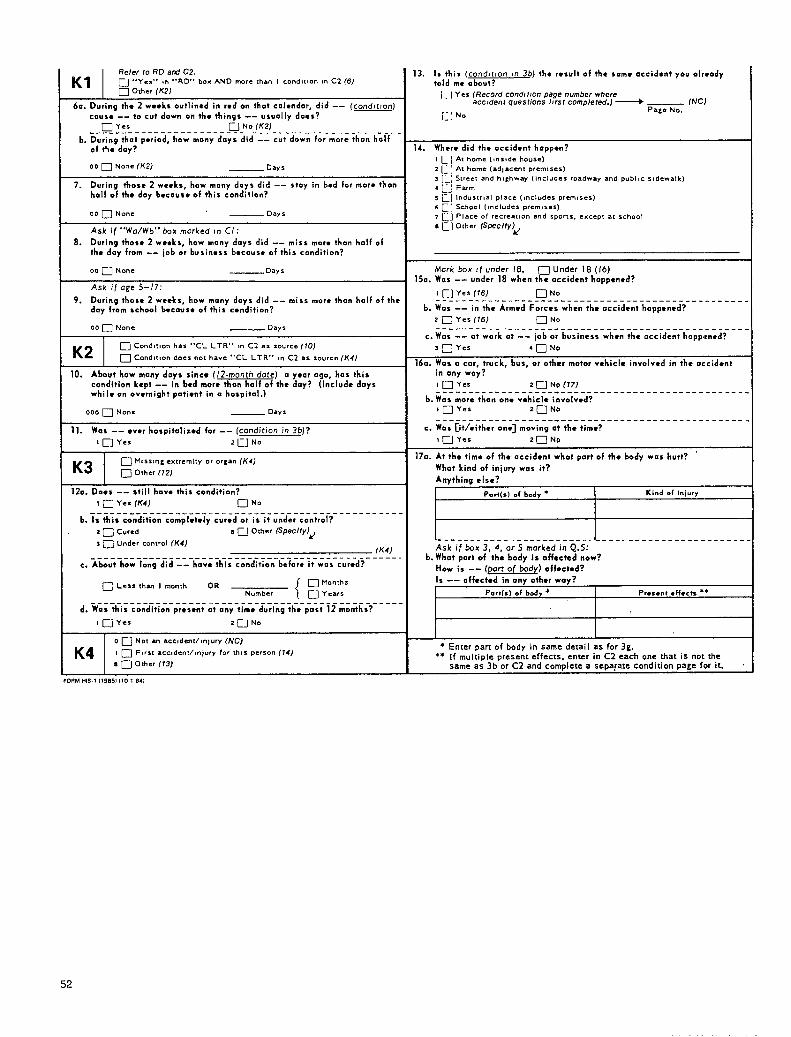
I Refer to RD ard C2.
‘1 I F!Olher (W)
‘+Yes,. ,n .. RO. - box AND more than t cond, t,.an ,. Cl (6)
I -.,–’
6a. During the 2 wcoks outlined in rrd on that colrndor, did -- (condltton)cousa -- to cut down on the thinas -- UJUOIIY do-s?
D Yes ~ No(f(z) ‘------------------- —--- _ —---------- ____________
b. During that period, hew many day. did -- cut down for more then halfof tie day?
00 ❑ None (K2) Days
7. During thosr 2 wcrks, how many days did -- stay in bed for more thanhalf of the doy bccousc of this condition?
00 ❑ None Day S
Ask if ‘“Wo/Wb’” box morked !n Cl:
8. During those 2 weeks, how many cloys did -- miss more than half ofthe day from -- 10b or buziness becauss of this condition?
00 u None _Days
Ask if age 5-/7:
9. During those 2 weeks, how many days did -- miss more than half of th{day from school b-cause of this csndition?
00 ❑ None _ Days
❑ Cond,tion has “’CL LTR”” m C2 as source (10)
K2 ❑ C.and,tm” does mt hzve ‘CL LTR. IrI Cl as source(K4)
10. About how m.wry days sinco (12-month dote) a year ago, has thiscondition kept -- in bcd more then half of the day? (Include doyzwhile cm ovcmight patient in a hospital.)
000 ❑ None Days
11. Wos -- ●wr hospitalized for -- (condition in 3b)?
1 n Yes 2 ~] No
K3❑ M8sstn~ =xtremity or or;an (K4)
❑ Other (12)
I
120. Does -- still hove thi$ condition?
I ❑ ye$ fK4) D No
---------------------------------------------- -
b. Is this condition completely cured or is it under control?
2 G Cured s U Other I’Specify)J
3 n Under c.antrol (K4)
-___ -__-- ______ -________ ----------- _;-------f::'-c. About how long did -- have this condition before it was cured?
❑ Less thm I month OR
{
u Months
Number u Years-----------------------------------------------
d. Was this condition pre~wzt at any tim~ during the post 12 months?
I H Yes 2UN0
0 u Not ●n accddentl, njury (NC)
K4 : ~ ::=:;;;dent/!nj.ry for th,s pe,s.m (14)
13. It this (cond, t!on In 3bJ the result of the same acciden! you alreadytold rnt about?
i . I y eS (Record Condf l]on page number whereacc!denf questions Irrs t completed.) ~ _ (NC)
Page No.[:! No
14. Where did the occident hoppen?
I ~ ~ At home (,ns, d= house)
21:1 AI home(adlacent prem, ses)
3 [=} %e.1 and hlKh W.Y (includes roadway and publ, c s!dcwa!k)4 u Farm
5 L] Ind.%tr,al place (,ncludes prem, ses)
6 C I school (Includes premises)
7 ~] place of ,ecreat, on and sporrs. e.c,pt at S. IIOQI
o L ] Other (.SP.?c/fy)d
Mark box tf under 18. a Under 18 (16)150. Was -- under 18 when thr accident happmod?
1 ~] Yes (16) ❑ No------------------ -----------------------------
b. Was -- in the Armed Forces when the occident happtned?
2 ❑ Yes (76) ❑ No--------- --------------------------------- -----
C. WCIS -- at work at -- 10b or bu-iness when tht occident happen ad?
3 ❑ Yes 4DN0
160. Was a car, truck, bus, or oth~r motor vchiclc involved in the occid~ntin any way?
1 ❑ Yes 2 u Ne (77)------------------ -----------------------------
b. Wa~ more than on= vahiclc involved?1 u Yes 2uN0
------------------ -----------------------------
c. Was fit/either one] moving at thr time?
1 u Yes 20N0
170. At the time of the accident what port of the body was hurt?
What kind of iniur~ was it?.,Anything ●lse?
I Par*(s) O( body * Kind .1 ini. ry
+
I---------------------- .,. L -----------------------
Ask if box 3, 4, or 5 marked in Q.5:b. Whet Dart of the body is affected now?
How ;s -- (Part of ~dy) affrctcd?
1, -- affected in any otlmr woy?
IPm,!(s) of body * I Pr. s.nl .Ff. ctx **
\
1 I* Enter par! of body in same detail as for 3g.
U* ,f ~ultiple ~resent effects, enter in C2 each one hat is not he
same as 3b or C2 and complete a sepaptte condition page for it.
FORM HIS.? 119B51I1O 1 84)
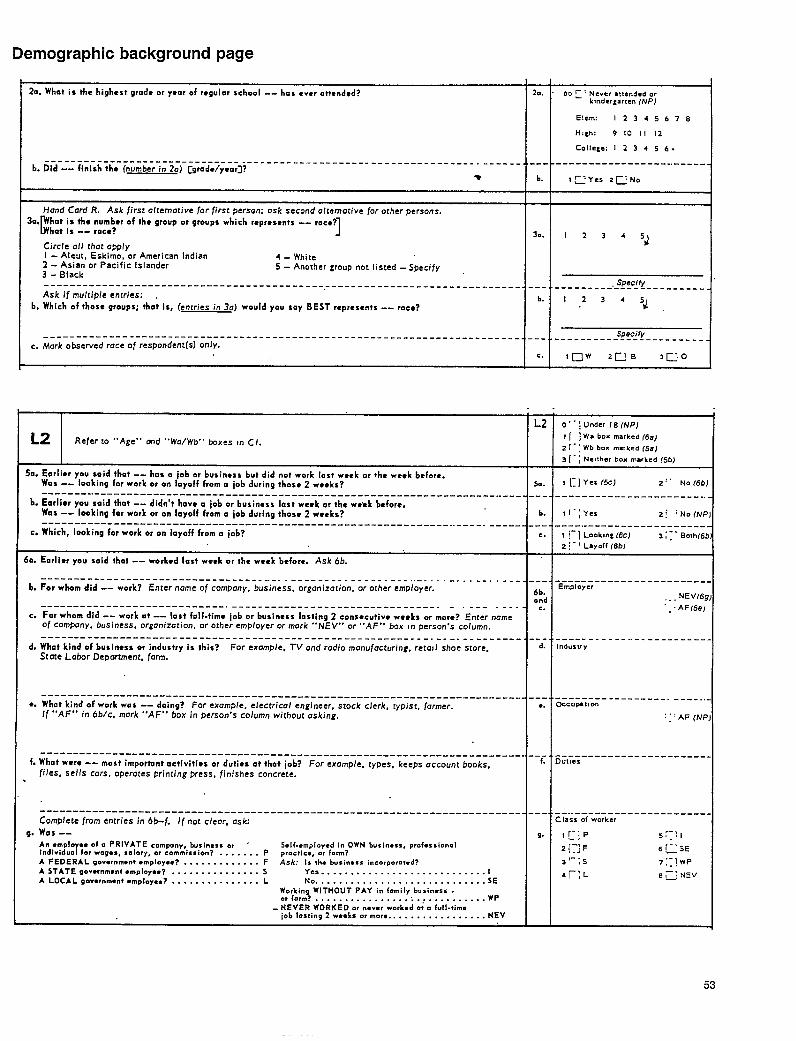
Demographic background page,, ,
20. What is the highest gradr or yror of rqulor school -- hos cv.r Cttcnd.d? 2.7. 00 ~ : Never mrended orkmder~.rten (NP)
Etem: 12345678
H,th: 9 10 II 12
Colle;e: 1 2 3 4 5 6+
b. ~fi----”-:---------------------- ‘----------- -------- ---” ------------ ---------- ftnt$htho (number in 2a) [grade/y aar]? ---- ------------------” -----* b. l~Yes 2~N0
Hand Card R, Ask firscafcemotive for first person: ask second aftemative for other persons.
II3a. hatisthc numbcrof thcgroup or groups which r*pr*smts--rac*?
hat [S -- ,sc.? 1 3m. 12.34
:ircle all that apply‘i
-Aleut, Eskimo, or American Indian
2- Asian or Pacific Islander4 -White5_ Another group notlisted-SpeCifY
3- Black
------------------------------------------- ------------------------ . ------- . ---- .--------_.-------------- Specify
Ask ifmultipfeenrries: .
b, Which ofthose groups; thot is, (~ntriesin3cr) would you SOY BEST represcnts--rnc*?
b. [2345t!
----------------------------------------------------- ----------------------- . ---- .-----_----------------_ Specify
c. Mark observed race of respondent(s) only.c. law 2G1B 3G0
. .
L2 o ‘ “ ; Under la (NP)
L2 Refer m ‘“Age”” and ““Wcr/Wb.’ fmxes m Cl.7 [ ; Wa box marked (6a)
2:”: Wb box rrmfked (5a)
3 [ - ~ Netther box marked (5b)
50. Earlitr you soid that -- has o iob or businrss but did not work lost wrek or the week before.was-- looking for work or on layoff from ❑ iob during those 2 weeks?
--------, ------------------------------------------- ------------------- _:::;::-::... -_--_::y:,:y:,
sm.
b. Earlier you said that -- didn’t have o job or businass last wsrk or the week before,Was-- looking for work or on layoff from a iob during those 2 weeks? b. 11-; Ye5 . ; NO (NP2!
------------------------------- -------------------------------- ------ ------- ---- ----, ------------------- .
c. Which, looking for work or on layoff from a job? e. 1 ~“”}Lookmt(6c) .;’ Both(6b3,
2 ;-’ Layoff (6bJ
60. Earlier yousoid that-- worked Ia$t week o, the week before. Ask 6b.
-------------------- -------------- ---.------ ------- ------ ,, ----- --, ,-- ..-_- --- _______________ ---
b. For whom did ..- work? Enter name of compony, business, organization, or other employer. Employer6b. ,., NEVf6go nd
---------------------------- -------------------------------- .-, --- . . . . . ~.
c. For whom djd -- work at -- last full-time iob or businrss lasting 2 consecutive weeks or more? Enter name
“ - .AF(6e)
of compony, business, organization, or other employer or mark “.NEV’. or ‘.AF” box In persons column.
--------------------------------------------------------- ------- ---.----- . ---. ------- -------- --------- ,
d. What kind of business or industry is this? For example, TV and rodio manufacturing, retarl shoe store, d.
Stote Lobor Deportment, form.
Industry
-------------------------------------------------------------------- -------- ----- ----------------- ----- .,.
●. What kind of work wos -- doing? For example, electrical engineer, stock clerk, typist, farmer. . . Occ”mt, on
If ‘“AF” in 6b/c. mark “AF’” box in person”s column without asking. ~: ‘ AF (NP,
_________________________ ______________ _____________________ -, ----- ________________ .
f. What wore -- most important activities or dutits at that iob? For exompfe, types, keeps account books,f. Out,es
files, sells cars, operoles printing press, finishes concrete.
-------------------------------------------------------------------------- ----- ------------------------- .
Complete from entries in 6b-f. If not clear. dsk:C lass Or worker
go W12S -- 9. fr-]P 5
An ●np!e ●. of o PRIVATE company, busln. ss m .r
::!1
S.lf.ernplayed i“ OWN busin. s., pr.afrssi.nolIndiv idun for wng. s, salory, e, commission? . . . . . . . P pmctic., or form?
z [~j F 6 ~~ SE
A FEDERAL goverrw(wnt .mploya*? . . . . . . . . . . . . . F Ask: IS th. busi.. ss in.orper.t.d? 3 r- ,s,.-,
A STATE go.mnm.nt .mploy..? . . . . . . . . ..-. . . . S
,.:WP
Yes . . . . . . . . . . . . . . . . . . . . . . . . . ...1
A LOCAL gov.mnwn~ .mplc.y..? . . . . . . . . . . . . . . . L No. . . . . . . . . . . . . . . . . . . . . . . . . . . ..SE4r; L e T: NEV
Working WITHOUT PAY in fomily business ..rfonn? . . . . . . . . . . . . . . . . .. . .. . . . . . . . . . .WP
- NEVER WORKED o, rmv.r work. d et c Iul[. timeloblosting 2wc*ksormorc. . . . . . . . . . . . . . . ..NEV
53
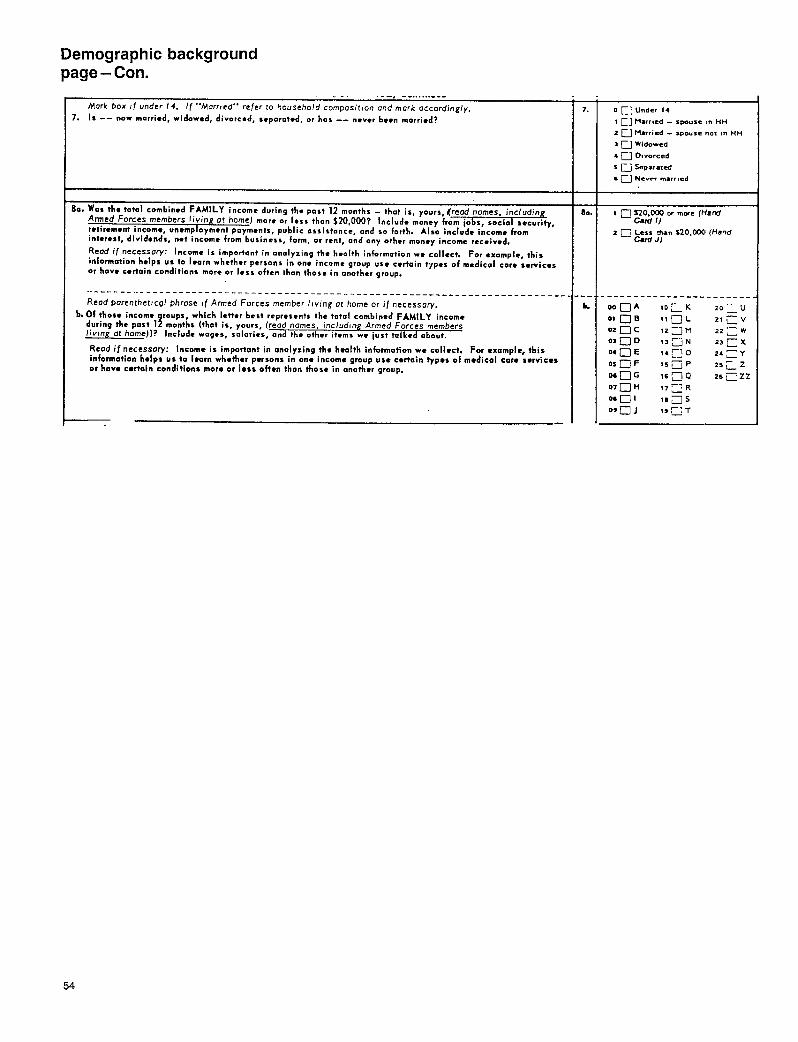
Demographic backgroundpage - Con.
. . .- —,-+........-Mark box (f under 14. If ““Morr(ed’” refer to household composition and mark occordin~/Y.
7. IS -- now rnarricd, widewcd, divorcad, s.porotcd, or has -- n.ver been mor,icd7
!a. Was the total combined FAMILY income during the post 12 months - that is, yours, ~reod names. includin
~Armed Forces members living ot home) more or I*SS than $20,000? Include money fm= socIa secur!ty,
rmtircment income, urwmploymsnt poymrnts, public assistance, and so forth. Also include income frominterest, dividends, not income from busine$s, farm, or rent, and any othrr monq income received.
Read if necessary: Income is important in analyzing the hrolth infornmtion we collect. For example, thisinformation hdps us to Icarn whrthtr pertons in on- income group U*E crrtain tyypes of medical cur- servicssor have certain conditions more or less often than thoss in another group.
.------- ___________________________________________________________________Read parenthettcgl phrose rf Armed Forces member l)ving a home or if necessary.
b. Of those inconm ,ovps, which Iettcr best repr~srnts the total combin~d FAMILY income1during the past 1 months (that is, yours, (read names, includfng Armed Forces members
Iivlng at home))? Include woges, solari. s, and the other it.ms wc iust tolkcd about.
Reed if necesso~: lncomc is importont in onalyzing the hcolth information we collect. For ●xample, thisinformation helps us toIoarn whothar pcrsens in one income group US* cwtoin types of medical care servicesor have certain conditions more or loss oftrn then thosa in anoth.r greup.
—7.
8.3.
--
L
o~:Ur.der 14
1 ~j M=rr,ed - spouse ,r, HH
2 U Married - spouse not (n HH
3 U Widowed
● E Davorc=d
5 D Sep.raced
s U t4=v- m*rr, =d
I ❑ S20,000 w more (HandCard 1)
=’ n ~=ss dun S20.000 (l+a”~Card J)
54
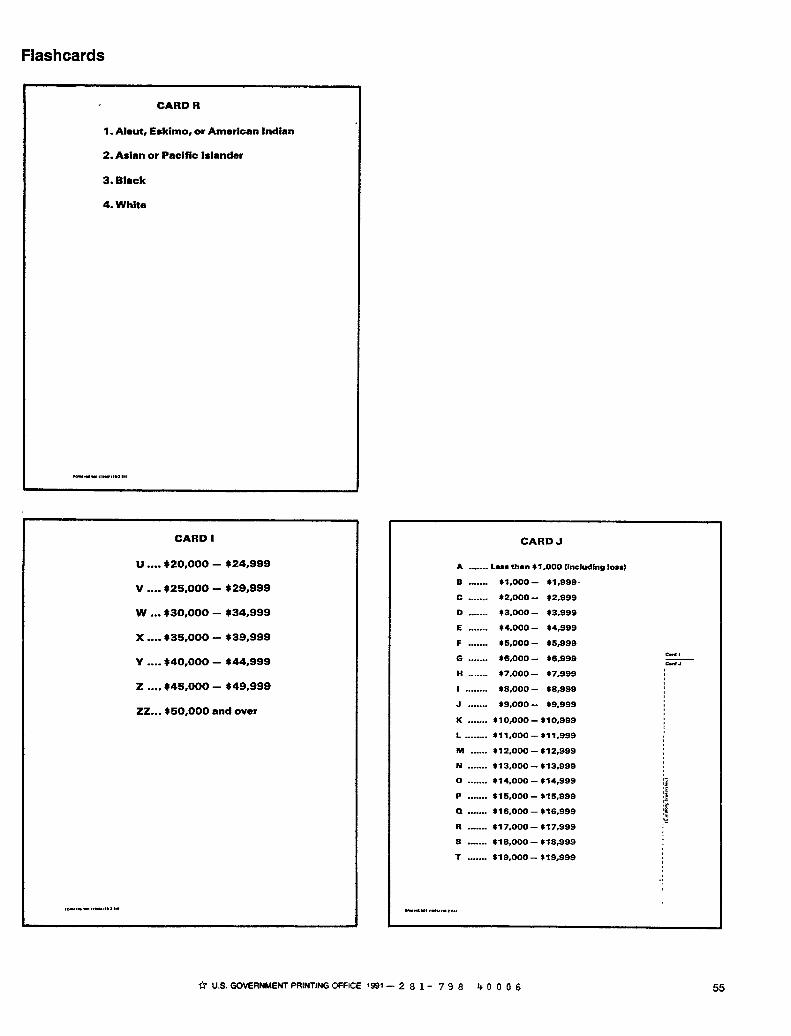
CARD R
1. Alwt, Eskimo, or American Indian
2. Asian or Pacific Islander
3. Black
4. White
,x- W,,, D,#l,,.,*,
CARD I
u ....*20,000 – $24,999
v ....$25.000-$29.999
w ...*30,000 – *34,999
x ....$35.000– $39,999
Y ....*40,000 – *44,999
z ..,.*45,000 – $49,999
ZZ...$50,000 and over
,-!. s”, ,,””, !., ,.!
CARD J
A ....... km than $1,000 (including loss)
B ....... $1,000 – *1 ,999.
c ....... $2,000- ;2,S99
D ....... $3,000 – $3,999
E ....... $4,000- *4,999
F ....... $5,000 – *5,999
G ....... $S,000 - $6,999w,M.
H .. ..... $7,000 – * 7,999
1 ........ $S,000 – $8,999
J ....... *9,000 - $9,999
K ....... $10,000 – *1 0,999
L ........ $11,000– $11,999
m ...... $12,000 – $12,999
N ....... *1 3,000 – *1 3,999
0 *1 4,000 – $14,999 :7....... ,.
P;f
....... $15,000 – $15,999 ,3;:
a . . . . . . . $16,000 – $16,999 ;$,~
R *1 7,000 – M 7.999,-
.......
s ... .... *1 S,ooo – $1s,999
T ....... *1 9,000 – $19,999
.:
-.E “1I!.M,,,.,”,
I& U.S. GOVERNMENT PRINTING OFFICE IS91 – 281- 798 !+ 0006 55
Vital and Health Statisticsseries descriptions
SERIES 1.
SERIES 2.
SERIES 3.
SERIES 4.
SERIES 5.
SERIES 6.
SERIES 10.
SERIES 11.
SERIES 12.
SERIES 13.
SERIES 14.
Programs and Collection Procedures – Reports
describing the general programs of the National Center for
Health Statistics and its offices and divisions and the data
collection methods used. They also include definitions and
other material necessa~ for understanding the data.
Dsta Evaluation and Methods Research – Studies of new
statistical methodology including experimental tests of new
survey methods, studies of vital statistics collection
methods, new analytical techniques, objective evaluations
of reliability of collected data, and contributions to statistical
theory. Studies also include comparison of U.S.
methodology with those of other countries.
Analytical and Epidemiological Studies – Reports
presenting analytical or interpretive studies based on vital
and health statistics, carrying the analysw further than the
expository types of reports in the other series.
Documents and Committee Reports – Final reperk of
major committees concerned with vital and health statistics
and documents such as recommended model vital
registration laws and revised birth and death certificates.
Comparative International Vital and Health Statistics
Reports – Analytical and descriptive reports comparing
U.S. vital and health statistics with those of other countries.
Cognition and Survey Measurement – Reports from the
National i-eborato~ for Collaborate Research in Cognition
and Survey Measurement using methods of cogmtive
science to design, evaluate, and test survey instruments.
Data From the National Health Interview Survey –
Statistics on illness, accidental injuries, disability, use of
hospital, medical, dental, and other services, and other
health-related topics, all based on data collected in the
continuing national household interview survey.
Data From the National Health Examination Survey and
the National Health and Nutrition Examination Survey–
Data from direct examination, testing, and measurement of
national samples of the civilian noninstitutionahzed
population provide the basis for (1) estimates of the
medically defined prevalence of specific diseases m the
United States and the distributions of the population with
respect to physical, physiological, and psychological
characteristics and (2) analysis of relationships among the
various measurements without reference to an expilclt fmte
universe of persons.
Data From the Institutionalized Population Surveys –
Discontinued in 1975. Reports from these surveys are
included in Series 13.
Data on Health Resources Utilization – Statlstlcs on the
utilization of health manpower and faciht[es providing long-
term care, ambulatory care, hospital care, and family
planning services.
Data on Health Resources: Manpower and Facilities –
Statistics on the numbers, geographic distribution, and
characteristics of health resources including physicians,
dentists, nurses, other health occupations, hospitals,
nursing homes, and outpatient facihties.
SERIES
SERIES
SERIES
SERIES
SERIES
SERIES
15.
16.
20.
21.
22.
23.
24.
Data From Special Surveys – Statistics on health and
health-related topics collected in special surveys that are
not a part of the continuing data systems of the National
Center for Health Statistics.
Compilations of Advance Data From Vital and Health
Statistics – These reports provide early release of data
from the National Center for Health Statistics’ health and
demographic surveys. Many of these releases are followed
by detatled reports in the Vital and Health Statistics Series.
Data on Mortality – Various statistics on mortality other
than as included in regular annual or monthly reports.
Special analyses by cause of death, age, and other
demographic variables; geographic and time series
analyses; and statistics on characteristics of deaths not
available from the vital records based on sample surveys of
those records.
Data on Natality, Marriage, and Divorce –Various
statistics on natali~, marriage, and divorce other than
those included in regular annual or monthly reports.
Special analyses by demographic variables; geographic
and time series analyses; studies of fertili~ and statistics
on characteristics of births not available from the vital
records based on sample surveys of those records.
Data From the National Mortality and Natality Surveys–
Discontinued in 1975. Reports from these sample surveys
based on vital records are included in Series 20 and 21,
respectively.
Data From the National Survey of Family Growth –
Statistics on fertility, family formation and dissolution, family
planning, and related maternal and infant health topics
derived from a periodic survey of a nationwide probability
sample of women 15=14 years of age.
Compilations of Data on NataHty, Mortality, Marriage,
Divorce, and Induced Terminations of Pregnancy–
Advance reports of births, deaths, marriages, and divorces
are based on final data from the National Vital Statistics
System and are published annually as supplements to the
Monthly Vital Statistics Report (MVSR). These reports are
followed by the publication of detailed data in Vital
Statistics of the United States annual volumes. Other
reports including induced terminations of pregnancy issued
penod]cally as supplements to the MVSR provide selected
findings based on data from the National Vital Statistics
System and may be followed by detailed reporta in the Vital
and Health Statistics Series.
For answers to questions about this report or for a list of titles of reports
published in these series, contact:
Scientific and Technical Information Branch
National Center for Health Statistics
Centers for Disease Control
Public Health Service
6525 Belcrest Road, Room 1064
Hyattsvi[le, fvtd. 20782
301-436-8500
DEPARTMENT OFHEALTH & HUMAN SERVICES
Publlc Health ServiceCenters for Drsease ControlNational Center for Health Statistics6525 Belcrest RoadHyattswlie, Maryland 20782
OFFICIAL BUSINESSPENALTY FOR PRIVATE USE, $300
BULK RATEPOSTAGE & FEES PAID
PHS/NCHSPERMIT NO. G-281
DHHS Publication No. (PHS) 91-1505, Series 10, No. 177
Copyright © 2022 FDOKUMEN