Vital and Health Statistics, Series 13, No 124 - CDC
78
Series 13 No. 124 Trends in Hospital Utilization: United States, 1988–92 June 1996 Vital and Health Statistics From the CENTERS FOR DISEASE CONTROL AND PREVENTION / National Center for Health Statistics U.S. DEPARTMENT OF HEALTH AND HUMAN SERVICES Public Health Service Centers for Disease Control and Prevention National Center for Health Statistics
-
Upload
khangminh22 -
Category
Documents
-
view
0 -
download
0
Transcript of Vital and Health Statistics, Series 13, No 124 - CDC

Series 13No. 124
Trends in Hospital Utilization:United States, 1988–92
June 1996
Vital andHealth StatisticsFrom the CENTERS FOR DISEASE CONTROL AND PREVENTION /National Center for Health Statistics
U.S. DEPARTMENT OF HEALTH AND HUMAN SERVICESPublic Health Service
Centers for Disease Control and PreventionNational Center for Health Statistics

Copyright information
All material appearing in this report is in the public domain and may bereproduced or copied without permission; citation as to source, however, isappreciated.
Suggested Citation
Gillum BS, Graves EJ, Kozak LJ. Trends in hospital utilization: United States1988–92. National Center for Health Statistics. Vital Health Stat 13(124). 1996.
Library of Congress Catalog Card Number
Gillum, Brenda.Trends in hospital utilization : United States, 1988–92 / [B.S. Gillum, E.J.
Graves, L.J. Kozak].p. cm. — (Vital and health statistics. Series 13, Data from the national
health survey ; no. 124) (DHHS publication ; no. (PHS) 96-1785)ISBN 0-8406-0516-11. Hospital utilization—United States—Statistics. I. Graves, Edmund. II.
Kozak, Lola Jean. III. National Center for Health Statistics (U.S.) IV. Title. V.Series. VI. Series: DHHS publication ; no. (PHS) 96-1785.RA981.A2G486 1996362.1'30973021—dc20 96-8988
CIP
For sale by the U.S. Government Printing OfficeSuperintendent of DocumentsMail Stop: SSOPWashington, DC 20402-9328

Trends in Hospital Utilization:United States, 1988–92
Series 13:Data From the National HealthSurveyNo. 124This report presents statistics on the utilization of non-Federal short-stayhospitals based on data collected through the National Hospital DischargeSurvey for the years 1988 through 1992. The survey is a national sample ofhospital records of discharged patients. Estimates are provided by thedemographic characteristics of patients discharged, by geographic regionof hospitals, and by selected conditions diagnosed and proceduresperformed. Measurements of hospital use include frequency, rate, percent,and average length of stay.
Hyattsville, MarylandJune 1996DHHS Publication No. (PHS) 96-1785
Vital andHealth Statistics
U.S. DEPARTMENT OF HEALTH AND HUMAN SERVICESPublic Health ServiceCenters for Disease Control and PreventionNational Center for Health Statistics

National Center for Health StatisticsEdward J. Sondik, Ph.D.Director
Jack R. Anderson,Deputy Director
Jacob J. Feldman, Ph.D.,Associate Director for Analysis,Epidemiology, and Health Promotion
Gail F. Fisher, Ph.D.,Associate Director for Planning andExtramural Programs
Jack R. Anderson,Acting Associate Director forInternational Statistics
Stephen E. Nieberding,Associate Director forManagement
Charles J. Rothwell,Associate Director for DataProcessing and Services
Monroe G. Sirken, Ph.D.,Associate Director for Researchand Methodology
Division of Health Care Statistics
W. Edward Bacon, Ph.D.,Director
Thomas McLemore,Deputy Director
Robert Pokras,Chief, Hospital Care Statistics Branch
Manoochehr K. Nozary,Chief, Technical Services Branch
Cooperation of the U.S. Bureau of the Census
Under the legislation establishing the National Health Survey, the Public HealthService is authorized to use, insofar as possible, the services or facilities of otherFederal, State, or private agencies.
In accordance with specifications established by the National Center for HealthStatistics, the U.S. Bureau of the Census, under a contractual arrangement, participatedin planning the survey and collecting the data.

Contents
Introduction. . . . . . . . . . . . . . . . . . . . . . . . . . . . . . . . . . . . . . . . . . . . . . . . . . . . . . . . . . . . . . . . . . . . . . . . . . . . . . . . . . . . . . . . . . . . .1
Highlights . . . . . . . . . . . . . . . . . . . . . . . . . . . . . . . . . . . . . . . . . . . . . . . . . . . . . . . . . . . . . . . . . . . . . . . . . . . . . . . . . . . . . . . . . . . . . .2
Methods. . . . . . . . . . . . . . . . . . . . . . . . . . . . . . . . . . . . . . . . . . . . . . . . . . . . . . . . . . . . . . . . . . . . . . . . . . . . . . . . . . . . . . . . . . . . . . . .3
Hospital utilization. . . . . . . . . . . . . . . . . . . . . . . . . . . . . . . . . . . . . . . . . . . . . . . . . . . . . . . . . . . . . . . . . . . . . . . . . . . . . . . . . . . . . . .6
Utilization by sex. . . . . . . . . . . . . . . . . . . . . . . . . . . . . . . . . . . . . . . . . . . . . . . . . . . . . . . . . . . . . . . . . . . . . . . . . . . . . . . . . . . . . . . .8
Utilization by region. . . . . . . . . . . . . . . . . . . . . . . . . . . . . . . . . . . . . . . . . . . . . . . . . . . . . . . . . . . . . . . . . . . . . . . . . . . . . . . . . . . . . .9
Utilization by diagnosis and sex. . . . . . . . . . . . . . . . . . . . . . . . . . . . . . . . . . . . . . . . . . . . . . . . . . . . . . . . . . . . . . . . . . . . . . . . . . .10
Utilization of procedures by sex. . . . . . . . . . . . . . . . . . . . . . . . . . . . . . . . . . . . . . . . . . . . . . . . . . . . . . . . . . . . . . . . . . . . . . . . . . .13
Utilization of selected sex-specific procedures. . . . . . . . . . . . . . . . . . . . . . . . . . . . . . . . . . . . . . . . . . . . . . . . . . . . . . . . . . . . . . . .14
Utilization of selected heart-related procedures by sex. . . . . . . . . . . . . . . . . . . . . . . . . . . . . . . . . . . . . . . . . . . . . . . . . . . . . . . . .16
Summary. . . . . . . . . . . . . . . . . . . . . . . . . . . . . . . . . . . . . . . . . . . . . . . . . . . . . . . . . . . . . . . . . . . . . . . . . . . . . . . . . . . . . . . . . . . . . .18
References. . . . . . . . . . . . . . . . . . . . . . . . . . . . . . . . . . . . . . . . . . . . . . . . . . . . . . . . . . . . . . . . . . . . . . . . . . . . . . . . . . . . . . . . . . . . .19
List of detailed tables. . . . . . . . . . . . . . . . . . . . . . . . . . . . . . . . . . . . . . . . . . . . . . . . . . . . . . . . . . . . . . . . . . . . . . . . . . . . . . . . . . . .21
Appendixes
I. Technical notes on methods. . . . . . . . . . . . . . . . . . . . . . . . . . . . . . . . . . . . . . . . . . . . . . . . . . . . . . . . . . . . . . . . . . . . . . . . . .55II. Definitions of terms. . . . . . . . . . . . . . . . . . . . . . . . . . . . . . . . . . . . . . . . . . . . . . . . . . . . . . . . . . . . . . . . . . . . . . . . . . . . . . . .67III. Recent publications from the National Hospital Discharge Survey. . . . . . . . . . . . . . . . . . . . . . . . . . . . . . . . . . . . . . . . . . .70
Text tables
A. Crude and age-adjusted rates of discharges from short-stay hospitals by first-listed diagnosis of malignant neoplasmor pneumonia and sex: United States, 1988–92. . . . . . . . . . . . . . . . . . . . . . . . . . . . . .. . . . . . . . . . . . . . . . . . . . . . . . . . . . . . 4
B. Crude and age-adjusted rates of cardiac catheterizations and diagnostic ultrasounds for discharges from short-stayhospitals by sex: United States, 1988–92. . . . . . . . . . . . . . . . . . . . . . . . . . . . . . . .. . . . . . . . . . . . . . . . . . . . . . . . . . . . . . . .4
C. Median age of discharges from short-stay hospitals and the U.S. civilian population: United States, 1980, 1985, and1988–92. . . . . . . . . . . . . . . . . . . . . . . . . . . . . . . . . . . . . . . . . . . . .. . . . . . . . . . . . . . . . . . . . . . . . . . . . . . . . . . . . . . . . . . . . .6
D. Number and percent distribution of newborn infants discharged from short-stay hospitals by length of stay andaverage length of stay by health status: United States, 1980, 1985, and 1988–92. . . . . . . . . . . . . . . .. . . . . . . . . . . . . . . . 7
E. Number of discharges from short-stay hospitals, days of care, and average length of stay, by selected first-listeddiagnoses: United States, 1988 and 1992. . . . . . . . . . . . . . . . . . . . . . . . . . . . . . . .. . . . . . . . . . . . . . . . . . . . . . . . . . . . . . . .10
F. Number and rate of male discharges from short-stay hospitals by selected first-listed diagnoses: United States, 1988and 1992. . . . . . . . . . . . . . . . . . . . . . . . . . . . . . . . . . . . . . . . . . . . .. . . . . . . . . . . . . . . . . . . . . . . . . . . . . . . . . . . . . . . . . . . . .11
G. Number and rate of female discharges from short-stay hospitals by selected first-listed diagnoses: United States,1988 and 1992. . . . . . . . . . . . . . . . . . . . . . . . . . . . . . . . . . . . . . . . . .. . . . . . . . . . . . . . . . . . . . . . . . . . . . . . . . . . . . . . . . . .11
List of text figures
1. Crude and age-adjusted rates of discharges with a first-listed diagnosis of malignant neoplasm or pneumonia: UnitedStates, 1988–92. . . . . . . . . . . . . . . . . . . . . . . . . . . . . . . . . . . . . . . . . .. . . . . . . . . . . . . . . . . . . . . . . . . . . . . . . . . . . . . . . . . .5
2. Crude and age-adjusted rates of diagnostic ultrasounds and cardiac catheterizations: United States, 1988–92. . . . .. . . . . 5
iii

3. Rate of discharges by sex: United States, 1988–92. . . . . . . . . . . . . . . . . . . . . . . . . . . .. . . . . . . . . . . . . . . . . . . . . . . . . . . . 84. Rate of days of care by sex: United States, 1988–92. . . . . . . . . . . . . . . . . . . . . . . . . . .. . . . . . . . . . . . . . . . . . . . . . . . . . . 85. Average length of stay by sex: United States, 1988–92. . . . . . . . . . . . . . . . . . . . . . . . . . .. . . . . . . . . . . . . . . . . . . . . . . . . . . 86. Rate of discharges by region: United States, 1988–92. . . . . . . . . . . . . . . . . . . . . . . . . . .. . . . . . . . . . . . . . . . . . . . . . . . . . . 97. Average length of stay by region: United States, 1988–92. . . . . . . . . . . . . . . . . . . . . . . . .. . . . . . . . . . . . . . . . . . . . . . . . . 98. Rate of hysterectomies for females by age: United States, 1988–92. . . . . . . . . . . . . . . . . . . . .. . . . . . . . . . . . . . . . . . . . . 149. Rate of cesarean sections for females by age: United States, 1988–92. . . . . . . . . . . . . . . . . . . .. . . . . . . . . . . . . . . . . . . . 1410. Rate of prostatectomies for males aged 65–74 years and 75 years and over: United States, 1988–92. . . . . . . . . . . . . . 1511. Percent of male newborn infants circumcised by region: United States, 1988–92. . . . . . . . . . . . . . .. . . . . . . . . . . . . . . 1512. Rate of open heart surgery by sex: United States, 1988–92. . . . . . . . . . . . . . . . . . . . . . . .. . . . . . . . . . . . . . . . . . . . . . . . 1613. Rate of removal of coronary artery obstructions by sex: United States, 1982–92. . . . . . . . . . . . . . . .. . . . . . . . . . . . . . . . 1614. Rate of discharges with one or more coronary artery bypass grafts by sex: United States, 1988–92. . . . . . . .. . . . . . . . 1615. Rate of cardiac catheterizations by sex: United States, 1988–92. . . . . . . . . . . . . . . . . . . . . .. . . . . . . . . . . . . . . . . . . . . . 17
iv

asstanauseanhav, a65Th98icses.hisusis–8ngthd b
inyeanduserebe
reh asofC),udiedonavejec-
s,andis-the
th-ssesthesex,hownf the
ital
fore and
-d
Trends in HospitalUtilization: United States,1988–92
by Brenda S. Gillum, Edmund J. Graves, and Lola JeanKozak, Division of Health Care Statistics
Introduction
The National Hospital Discharge Survey (NHDS) hbeen conducted annually since 1965. Hospital utilizationtistics from the NHDS are routinely published by the NatioCenter for Health Statistics for individual years. Becaalmost 30 years of data are available, there is much demfor NHDS data on trends in hospital use. Some trend databeen included in previous NHDS reports. In additiondetailed description of trends in hospital utilization from 19through 1986 was presented in a previous report (1).purpose of this report is to present general statistics from 1through 1992 on hospital utilization by patient characteristgeographic region, and selected diagnoses and procedur
The period beginning with 1988 was chosen for treport because that was the first year a new design wasfor the NHDS (seemethods section). Estimates based on thnew design could differ from those based on the 1965design due to changes in the survey rather than actual chain hospital utilization. Because 1988–92 data are all fromsame survey design, trends for this period are not affectedesign effects.
However, many users of NHDS data are interestedlonger perspective on hospital use than can be seen in 5of data. For historical information, estimates for 1980 a1985 are included in most of the tables in this report. Becahospital use trends during the first half of the 1980’s wdiscussed in depth in an earlier report (1), they will notdiscussed again here.
trical
latedl ofand
ACKNOWLEDGMENTS: This report was prepared in the Division of Health Care
Statistics. Lester Curtin and Iris Shimizu, Office of Research and Methodology, provide
methodological advice. Maria Owings, Hospital Care Statistics Branch, provided specifi
standard errors used in statistical tests. Virginia Freid and Deborah Ingram, Office o
Analysis, Epidemiology, and Health Promotion, were the peer reviewers. The report wa
edited by Klaudia Cox and typeset by Annette F. Holman, Division of Data Services.
-l
de
e8,
ed
7esey
ars
e
Data from the National Hospital Discharge Survey aused to examine a wide array of health issues. Topics sucmorbidity from cerebrovascular disease, the frequencyvaginal births after previous cesarean section delivery (VBAand hospital use for cardiovascular disease have been stusing NHDS data (2–5). Trend analyses of NHDS dataHIV, hysterectomy, diabetes, and obstetrical procedures hbeen published (6–10). NHDS data are used to track obtives related to the 22 priority areas targeted inHealthy People2000 (11), including objectives on unintentional injurieenvironmental health, maternal and infant health, diabeteschronically disabling conditions, and sexually transmitted deases. Data for several of these topics are shown innumbered tables.
This report is organized into several sections. The meods section briefly describes the survey design and discuissues related to the production of the statistics shown intables A–Gand1–32andfigures 1–15. The methods section ifollowed by sections that present selected findings by sregion, diagnoses, and procedures. Detailed tables are safter the text. The appendixes describe technical aspects osurvey (appendix I), definitions of terms (appendix II), andrecent NCHS publications of data from the National HospDischarge Survey (appendix III).
The 32 numbered tables show hospital utilization data1980, 1985, and 1988–92. Trend data are presented by agsex (tables 1–3), by age and region (tables 4–6), by hospitaldeaths (table 7), by selected diagnoses by sex (tables 8–16), bydischarges with procedures (table 17), and by selected procedures by sex (tables 18–23). Trends in the use of selectesex-specific procedures are shown intables 24–28. Theseinclude hysterectomy, cesarean section and other obsteprocedures, prostatectomy, and circumcision.Tables 29–32present trend data by age and sex for selected heart-reprocedures. This includes open heart surgery, removacoronary artery obstruction, coronary artery bypass graft,cardiac catheterizations.
d
c
f
s
1

eeed
th
erte88
hyterd,h
-hee
nale
o-uc-cin
Highlights
+ The rate of discharges did not change significantly betw1988 and 1992, but the rate of days of care declin10 percent.
+ The average length of stay declined 6 percent for bomales and females from 1988 to 1992.
+ Deliveries, heart disease, and malignant neoplasms wcommon reasons for hospitalization and represenapproximately 30 percent of first-listed diagnoses in 19and 1992.
+ Each year from 1988 to 1992, episiotomy, arteriograpand angiocardiography using contrast material, compuized axial tomography (CAT scan), diagnostic ultrasounand fetal EKG and other fetal monitoring were eacperformed over 1 million times on hospital inpatients.
2
n
ed
-
+ In 1992, 61 percent of male newborn infants were circumcised before they were discharged from the hospital; tproportion circumcised ranged from 38 percent in thWest to 78 percent in the Midwest.
+ The rate for removal of coronary artery obstructioincreased 57 percent for males and 96 percent for femdischarges from 1988 to 1992.
+ Males accounted for 67 percent of four heart-related prcedures (open heart surgeries, removal of coronary obstrtion, coronary artery bypass graft, and cardiacatheterizations) performed in 1988, and 65 percent1992.

S)a
speingizef
65taryallhewathmpitan
th
asitabhe8,orendrdenersreital
ingn,
thghn-g,’’iag1
hees
ce-
irths,he
e-cificwasn
ges.geofs ofare
estes
-pec-ofon,. Toerears,eseiond.tod toca-
bepareu-her
thstalof
Methods
Data for the National Hospital Discharge Survey (NHDcome from a sample of inpatient records obtained fromnational sample of non-Federal general and short-staycialty hospitals in the United States. Information concernthe universe from which the sample is drawn, sample sresponse rate, and number of medical abstracts collectedeach data year shown in this report, is inappendix I.
NHDS data have been collected continuously since 19The original sample was selected from a frame of short-shospitals listed in the 1963 National Master Facility Inventoof Hospitals. The frame and sample were updated periodicto include newly opened hospitals. Beginning in 1988, tNHDS was redesigned and a new sample of hospitalsselected. Differences between NHDS statistics based on1965–87 sample and statistics based on the new samplebe due to sample design rather than to real changes in hosuse patterns. A brief description of the sample designsurvey methods is inappendix I. Detailed reports on theoriginal design of the NHDS and on a comparison betweentwo designs have been published (12,13).
The frame of hospitals for the redesigned survey wbased on hospitals contained in the April 1987 SMG HospMarket Database (14). Only hospitals accepting inpatientsAugust 1987 were included. The definition of hospitals in tNHDS was modified slightly in the redesign. Prior to 198hospitals with an average length of stay of 30 days or mwere excluded. Beginning in 1988, general medical asurgical and children’s general hospitals were included regaless of the overall average length of stay of the inpatipopulation. However, the term ‘‘short-stay’’ continues to bused because 98 percent of hospitals in the NHDS univefall into this category. In 1991, the frame and sample weupdated to include hospitals from the 1991 SMG HospDatabase (15).
Medical data for hospitalized patients are coded accordto the International Classification of Diseases, 9th RevisioClinical Modification, or ICD–9–CM (16). A maximum ofseven diagnoses and four procedures are coded frommedical record for each discharge in the sample. Althoudiagnoses included in the ICD–9–CM section, ‘‘Supplemetary classification of external causes of injury and poisonin(coded E800–E999) are collected in the NHDS, these dnoses are excluded from the report. Beginning October1986, annual addenda to the ICD–9–CM have been publisThey add, delete, or change diagnostic and procedure cod
-
,or
.y
y
seayald
e
ly
-t
e
e
-,d.or
their titles. Changes in codes that affect diagnostic or produre categories in this report are discussed inappendix I.
Data for newborn infants are shown intables Dand28.Because these data are based on a sample of hospital bthey may not agree with data on births published in tMonthly Vital Statistics Reportand Vital Statistics of theUnited States, which report all births.
Tables 1–6contain numbers, age-specific rates, and agadjusted rates for discharges and days of care, and age-speand age-adjusted average lengths of stay. Age-adjustmentcomputed using the direct method (17) with the 1980 civiliapopulation, as described inappendix II. Age-adjusted averagestays shown intables 3and6 were computed by dividing theadjusted days of care by the adjusted number of discharBecause the age distribution of the population did not chansubstantially in the 5-year period 1988–92 that is the focusthis report, crude (unadjusted) rates and average lengthstay were used in the weighted regression analysis andshown intables 7–32andfigures 1–15.
Researchers wanting to eliminate the effects of differencin the age structure of the population when comparing racan age-adjust rates using a standard population.Tables AandB and figures 1 and 2 show examples of crude and ageadjusted rates for two diagnoses and two procedures, restively. In these tables, the crude rate is the numberdischarges or procedures divided by the midyear populatiexpressed as a rate per 10,000 or per 100,000 populationage-adjust, rates for specific diagnoses or procedures wcomputed for four age groups (under 15 years, 15–44 ye45–64 years, and 65 years and over) of both sexes. Thage-specific rates were multiplied by the standard populat(seeappendix II) for the corresponding age group and summeThe sum was divided by the total standard populationproduce an age-adjusted rate. Age-specific data needecompute age-adjusted rates are available in NHDS publitions (seeappendix III) or from the NHDS. Crude rates, whichreflect the actual frequency of hospital use, should notcompared with age-adjusted rates. However, one can comage-adjusted rates to control for differences in age distribtions by year, region, race, sex, or other variables. Furtdiscussion of age-adjustment is available inHealthy People2000 Statistical Notes(18).
Table 7shows the estimated numbers of hospital deaand hospital fatality rates for selected conditions. A hospifatality rate is the number of stated deaths for a category
3

is-iteehsgththed
esi
-y,’’
edei-89Mith
his
Table A. Crude and age-adjusted rates of discharges from short-stay hospitals by first-listed diagnosis of malignant neoplasm orpneumonia and sex: United States, 1988–92[Discharges of inpatients from non-Federal hospitals. Excludes newborn infants. Diagnostic categories and code numbers are based on the International Classificationof Diseases, 9th Revision, Clinical Modification (ICD–9–CM)]
Diagnosis and ICD–9–CM code
Crude rates Age-adjusted rates1
Total Male Female Total Male Female
Malignant neoplasm, 140–208,230–234 Rate per 10,000 population
1988 . . . . . . . . . . . . . . . . . . . . . . . . . . . . . . . . 68.8 65.7 71.7 67.0 70.7 66.01989 . . . . . . . . . . . . . . . . . . . . . . . . . . . . . . . . 65.6 64.8 66.3 63.4 69.6 60.11990 . . . . . . . . . . . . . . . . . . . . . . . . . . . . . . . . 63.4 60.8 65.9 61.4 64.9 60.31991 . . . . . . . . . . . . . . . . . . . . . . . . . . . . . . . . 63.6 64.3 63.0 61.2 68.5 56.71992 . . . . . . . . . . . . . . . . . . . . . . . . . . . . . . . . 62.2 62.2 62.3 59.4 65.5 56.0
Pneumonia, 480–486
1988 . . . . . . . . . . . . . . . . . . . . . . . . . . . . . . . . 38.1 40.2 36.1 37.0 42.5 33.01989 . . . . . . . . . . . . . . . . . . . . . . . . . . . . . . . . 42.2 45.8 38.7 40.8 48.1 35.31990 . . . . . . . . . . . . . . . . . . . . . . . . . . . . . . . . 42.5 44.1 40.9 40.9 46.1 37.01991 . . . . . . . . . . . . . . . . . . . . . . . . . . . . . . . . 43.4 44.8 42.1 41.6 46.8 37.91992 . . . . . . . . . . . . . . . . . . . . . . . . . . . . . . . . 41.8 43.5 40.1 39.9 45.0 35.9
1See appendix II for method of computation.
Table B. Crude and age-adjusted rates of cardiac catheterizations and diagnostic ultrasounds for discharges from short-stay hospitals,by sex: United States, 1988–92[Discharges of inpatients from non-Federal hospitals. Excludes newborn infants. Groupings of procedures and code numbers are based on the InternationalClassification of Diseases, 9th Revision, Clinical Modification (ICD–9–CM)]
Procedure category and ICD–9–CM code
Crude rates Age-adjusted rates1
Total Male Female Total Male Female
Cardiac catheterizations, 37.21–37.23 Rate per 100,000 population
1988 . . . . . . . . . . . . . . . . . . . . . . . . . . . . . . . . 382.9 508.4 265.2 379.1 542.3 243.31989 . . . . . . . . . . . . . . . . . . . . . . . . . . . . . . . . 390.7 506.1 282.3 384.6 538.1 256.51990 . . . . . . . . . . . . . . . . . . . . . . . . . . . . . . . . 401.8 515.8 294.5 395.4 548.0 268.71991 . . . . . . . . . . . . . . . . . . . . . . . . . . . . . . . . 399.2 496.0 307.9 391.2 526.3 277.51992 . . . . . . . . . . . . . . . . . . . . . . . . . . . . . . . . 405.6 517.1 300.4 391.4 541.9 265.7
Diagnostic ultrasound, 88.7
1988 . . . . . . . . . . . . . . . . . . . . . . . . . . . . . . . . 643.2 509.3 768.9 626.8 538.4 715.61989 . . . . . . . . . . . . . . . . . . . . . . . . . . . . . . . . 635.7 528.8 736.1 618.8 557.1 685.01990 . . . . . . . . . . . . . . . . . . . . . . . . . . . . . . . . 649.2 555.3 737.6 627.6 584.9 677.11991 . . . . . . . . . . . . . . . . . . . . . . . . . . . . . . . . 635.2 536.2 728.5 612.6 564.0 668.71992 . . . . . . . . . . . . . . . . . . . . . . . . . . . . . . . . 575.2 477.2 667.6 552.0 497.9 607.6
1See appendix II for method of computation.
first-listed diagnoses, divided by the total number of dcharges for that category, and multiplied by 100. This rateconservative because the formula is based on the assumpthat all patients whose discharge status was not stated wdischarged alive. The hospital fatality rate differs from thmortality rate, which reflects complete reporting of deatregardless of where the death occurred. In addition to bein100 percent enumeration of deaths, mortality data are forunderlying cause of death, which may not be identical tofirst-listed diagnosis. Mortality rates are regularly publishby NCHS in theMonthly Vital Statistics Reportand in theVital Statistics of the United States.
The conditions diagnosed and procedures performappearing intables 8–16and 18–23are the same categorieshown in the 1990–93 NHDS annual summaries published
4
sionre
aee
d
n
Advance Data From Vital and Health Statisticsand series 13of Vital and Health Statistics. Data for a more detailed list ofICD–9–CM codes are in the annual report, ‘‘Detailed Diagnoses and Procedures, National Hospital Discharge Survealso published in series 13 ofVital and Health Statistics.
The number of discharges with procedures intable 17andthe total number of procedures per year intables 18–23wereaffected by changes in NHDS coding practices. As describin appendix II, not all procedures were coded when thICD–9–CM was first used for the 1979 NHDS data. Addtional procedures began to be coded in the 1983 and 19NHDS, and beginning with the 1991 data, all the ICD–9–Ccodes were used. In addition, the number of discharges wsurgical procedures intable 17was affected by a revision inthe classification of procedures as surgical or nonsurgical. T

lsruo
fores
ce-eseadnca-y
ee-of
nts
tesehatedhe
ort
forzedm-
i-rted
-thr-inns.
1988 1989 1990 1991 19920
303540455055606570758085
Rat
e pe
r 10
,000
pop
ulat
ion
Malignant neoplasm
Pneumonia
Crude rates Age-adjusted rates
Figure 1. Crude and age-adjusted rates of discharges with afirst-listed diagnosis of malignant neoplasm or pneumonia:United States, 1988–92
1988 1989 1990 1991 19920
300350400450500550600650700750800850
Rat
e pe
r 10
0,00
0 po
pula
tion
Cardiac catheterizations
Diagnostic ultrasounds
Crude rates Age-adjusted rates
Figure 2. Crude and age-adjusted rates of diagnostic ultrasoundsand cardiac catheterizations: United States, 1988–92
became effective with 1989 NHDS data. This revision is adiscussed inappendix II. Tables 18–23present estimates foall-listed procedures. That is, all occurrences of a procedare counted, regardless of the order, up to a maximum of fprocedures per discharge.
Table 25contains trend data on obstetrical proceduresfemales with deliveries. Rates for some obstetric procedu
o
reur
r
are shown per 100 deliveries. Rates for other obstetric produres are shown per 100 vaginal deliveries because thprocedures are not expected to be done for women who hcesarean delivery. In addition to NHDS data, information odeliveries (e.g., obstetric procedures and pregnancy complitions) is obtained from birth certificates and published bNCHS in theMonthly Vital Statistics Report, andVital Statis-tics of the United States.
The estimates intable 31are for discharges with at leastone coronary artery bypass graft (CABG)(ICD–9–CM cod36.1). A surgeon may perform more than one CABG procdure during a single operation. For example, in 1992, a total468,000 CABG procedures (table 18) were performed on309,000 discharges (table 31). Thus, the number of CABGprocedures should not be equated with the number of patiehaving the procedure.
The rates presented in this report are based on estimaof the civilian population as revised by the U.S. Bureau of thCensus after the 1990 census. These rates differ somewfrom rates in previous NCHS publications, which were bason earlier population estimates from the U.S. Bureau of tCensus. However, as shown inappendix I, the differencesbetween previously published rates and the rates in this repare small.
Weighted linear regression was used to analyze trendsselected variables. Specific standard errors for rates analyin the regression were produced using the SUDAAN progra(19). Seeappendix I for a detailed explanation of the techniques used for weighted regression.
Familiarity with the definitions used in the NHDS isimportant for interpreting the data and for making comparsons with data on hospital utilization available from othesources. Definitions of terms used in this report are presenin appendix II.
Information on short-stay hospital utilization also is collected in another program of NCHS, the National HealInterview Survey (NHIS). Estimates from this survey geneally differ from those of the NHDS because of differencescollection procedures, the population sampled, and definitioData from the NHIS are published in series 10 ofVital andHealth Statistics.
5

tois-aretive.s-s ofjorlthusentzedday.eentnewklyth
ee.inteaxintesnertenldiersrylth
ngital
88,is-50.7beert of
upare
-nser
,orofdrnr-
Table C. Median age of discharges from short-stay hospitals andthe U.S. civilian population: United States, 1980, 1985, and1988–92
YearHospital
discharges1U.S. civilianpopulation2
Median age in years
1980 . . . . . . . . . . . . . . . 43.9 30.11985 . . . . . . . . . . . . . . . 46.6 31.51988 . . . . . . . . . . . . . . . 48.5 32.31989 . . . . . . . . . . . . . . . 48.4 32.61990 . . . . . . . . . . . . . . . 48.9 32.91991 . . . . . . . . . . . . . . . 49.0 33.21992 . . . . . . . . . . . . . . . 50.7 33.5
1Discharges of inpatients from non-Federal hospitals excluding newborn infants.2Based on population estimates consistent with Series P-25, Current Population Reports,U.S. Bureau of the Census.
Hospital utilization
The focus of the report is hospital utilization from 19881992 as measured by data from the National Hospital Dcharge Survey. Estimates of hospital use in 1980 and 1985included in the tables to provide a broader historical perspec
A previous report on trends in hospital utilization dicussed the dramatic rise of hospital discharges and daycare in the 1970’s and their decline in the 1980’s due to mainfluences from technology, an aging population, and heacare policy (1). One of the strongest influences on hospitalin the late 1980’s and 1990’s was the growth of outpatiesurgery. Patients who previously would have been hospitaliwere undergoing surgery and returning home the sameAccording to the American Hospital Association (AHA), thrise in outpatient surgery was facilitated by the developmof new technologies, such as endoscopic techniques, andanesthetic drugs that allow patients to wake up more quicafter surgery, as well as changes in reimbursement policypromote outpatient surgery (20).
Outpatient or ambulatory surgeries are performed in frstanding or hospital-based ambulatory surgery centers1988, 1.7 million surgical procedures were performedapproximately 980 free-standing ambulatory surgical cen(FASC’s) in the United States (21). In 1993, this number hgrown to 3.2 million surgical procedures performed in appromately 1,860 FASC’s. However, the majority of outpatiesurgeries occur in hospitals. Ambulatory surgeries in thhospitals increased from 10.6 million in 1988 to 12.8 millioin 1992 for AHA-registered hospitals (21). Outpatient surgies done in either hospitals or free-standing surgical cenare not included in the NHDS nor in this report because ohospital inpatients are within the scope of the survey. Adtional information about the use of ambulatory surgery centis being gathered in the National Survey of AmbulatoSurgery begun in 1994 by the National Center for HeaStatistics.
In addition to the growth of ambulatory surgery, the agiof the U.S. population continues to influence inpatient hospuse. As shown intable C, the median age of the civilianpopulation was 30.1 years of age in 1980, 32.3 years in 19and 33.5 years in 1992. The median age for hospital dcharges was 43.9 years in 1980, 48.5 years in 1988, andyears in 1992. The aging of the hospital population also canseen intables 1and 2. In 1980, persons 45 years and ovaccounted for 49 percent of total discharges and 64 percen
6
at
-In
rsd-
e
-rsy-
the days of care. In 1992, persons 45 years and over made56 percent of the discharges and 68 percent of the days of c(tables 1and2).
Changing health care policies also affect hospital utilization. A recent example is the efforts by managed-care plaand other insurers to shorten hospital stays for women aftdelivery and for their newborn infants (22–24).Table Dshowsthe trends in lengths of stay for newborn infants. In 198031 percent of newborn infants stayed in the hospital 2 daysless, and 63 percent stayed 3 to 7 days. In 1988, 55 percentnewborn infants had hospital stays of 2 days or less, an41 percent stayed 3–7 days. By 1992, 66 percent of newboinfants were hospitalized for 2 days or less and only 29 pecent had stays of 3–7 days.
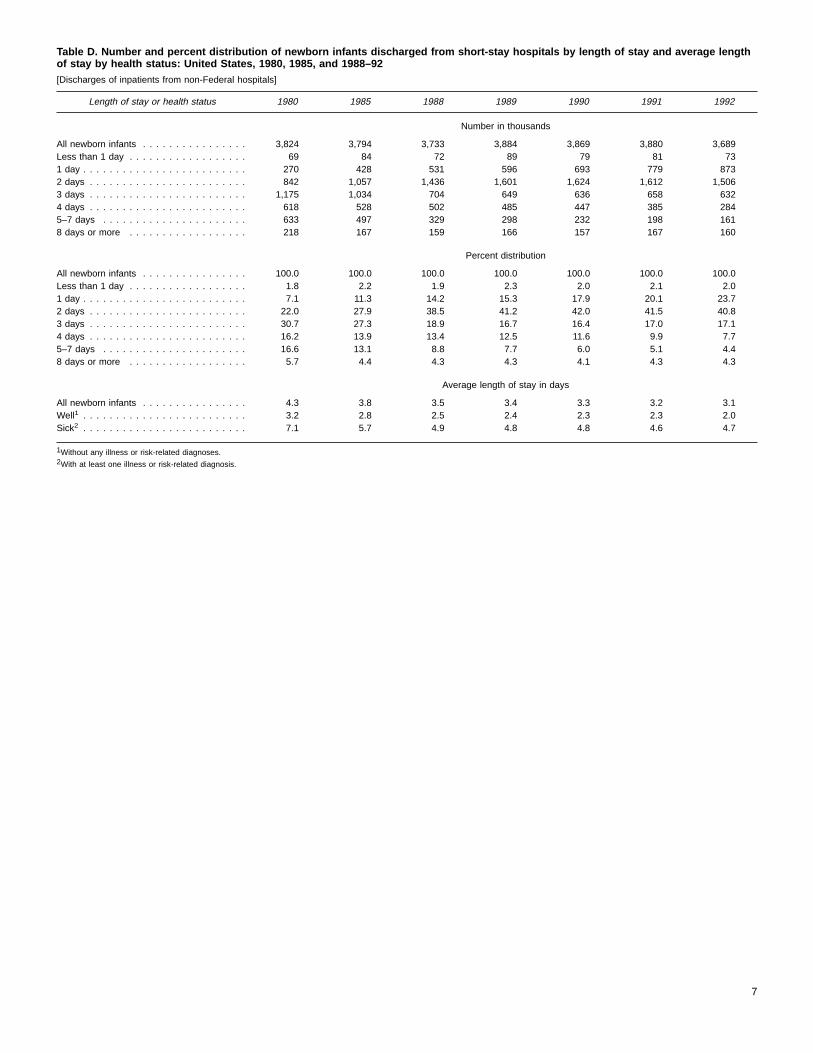
Table D. Number and percent distribution of newborn infants discharged from short-stay hospitals by length of stay and average lengthof stay by health status: United States, 1980, 1985, and 1988–92[Discharges of inpatients from non-Federal hospitals]
Length of stay or health status 1980 1985 1988 1989 1990 1991 1992
Number in thousands
All newborn infants . . . . . . . . . . . . . . . . 3,824 3,794 3,733 3,884 3,869 3,880 3,689Less than 1 day . . . . . . . . . . . . . . . . . . 69 84 72 89 79 81 731 day . . . . . . . . . . . . . . . . . . . . . . . . . 270 428 531 596 693 779 8732 days . . . . . . . . . . . . . . . . . . . . . . . . 842 1,057 1,436 1,601 1,624 1,612 1,5063 days . . . . . . . . . . . . . . . . . . . . . . . . 1,175 1,034 704 649 636 658 6324 days . . . . . . . . . . . . . . . . . . . . . . . . 618 528 502 485 447 385 2845–7 days . . . . . . . . . . . . . . . . . . . . . . 633 497 329 298 232 198 1618 days or more . . . . . . . . . . . . . . . . . . 218 167 159 166 157 167 160
Percent distribution
All newborn infants . . . . . . . . . . . . . . . . 100.0 100.0 100.0 100.0 100.0 100.0 100.0Less than 1 day . . . . . . . . . . . . . . . . . . 1.8 2.2 1.9 2.3 2.0 2.1 2.01 day . . . . . . . . . . . . . . . . . . . . . . . . . 7.1 11.3 14.2 15.3 17.9 20.1 23.72 days . . . . . . . . . . . . . . . . . . . . . . . . 22.0 27.9 38.5 41.2 42.0 41.5 40.83 days . . . . . . . . . . . . . . . . . . . . . . . . 30.7 27.3 18.9 16.7 16.4 17.0 17.14 days . . . . . . . . . . . . . . . . . . . . . . . . 16.2 13.9 13.4 12.5 11.6 9.9 7.75–7 days . . . . . . . . . . . . . . . . . . . . . . 16.6 13.1 8.8 7.7 6.0 5.1 4.48 days or more . . . . . . . . . . . . . . . . . . 5.7 4.4 4.3 4.3 4.1 4.3 4.3
Average length of stay in days
All newborn infants . . . . . . . . . . . . . . . . 4.3 3.8 3.5 3.4 3.3 3.2 3.1Well1 . . . . . . . . . . . . . . . . . . . . . . . . . 3.2 2.8 2.5 2.4 2.3 2.3 2.0Sick2 . . . . . . . . . . . . . . . . . . . . . . . . . 7.1 5.7 4.9 4.8 4.8 4.6 4.7
1Without any illness or risk-related diagnoses.2With at least one illness or risk-related diagnosis.
7

Utilization by sex
watedra8n88,00 i9dhs
ng
007
1havefo
ne92om
s a92.t ofare.7.1agein
The number of discharges from short-stay hospitalsapproximately 31 million in both 1988 and 1992. Weighlinear regression was used to analyze trends in dischargerates of days of care, and average length of stay from 1981992. The rate of discharges per 1,000 population didchange significantly during this period; it was 128.3 in 19and 122.1 in 1992. However, the rate of days of care per 1population declined 10 percent, from 838.8 in 1988 to 751.1992. The average length of stay declined 5 percent from 1(6.5 days) to 1992 (6.2 days).Tables 1–3present numbers anrates of discharges and days of care, and average lengtstay, by age and sex.
+ Discharge rates for males and females did not chasignificantly from 1988 to 1992 (figure 3). Males had107.5 discharges per 1,000 population in 1988 and 1in 1992. For females, the discharge rates were 147.1988 and 142.2 in 1992.
+ Males accounted for approximately 40 percent (12 tomillion) of total discharges in 1988 and 1992. Femalesabout 19 million discharges in both these years. O10 percent of all discharges in 1988 and 1992 werefemales with deliveries (see section onutilization bydiagnosis and sex).
+ Rates of days of care per 1,000 population declisignificantly for males and females from 1988 to 19(figure 4). For males, the rate declined 11 percent fr
1988 1989 1990 1991 19920
100
110
120
130
140
150
160
Rat
e pe
r 1,
000
popu
latio
n Female
Male
Figure 3. Rate of discharges by sex: United States, 1988–92
8
s
tes,toot
00n88
of
e
.8in
3drr
d
760.7 in 1988 to 679.7 in 1992. For females, there wa10 percent decrease, from 912.1 in 1988 to 818.3 in 19
+ In both 1988 and 1992, males accounted for 44 percendays of care and females used 56 percent of days of c
+ The average stay for males declined 6 percent fromdays in 1988 to 6.7 days in 1992. For females, the averlength of stay also declined 6 percent from 6.2 days1988 to 5.8 days in 1992 (figure 5).
1988 1989 1990 1991 19920
700
750
800
850
900
950
1,000
Rat
e pe
r 1,
000
popu
latio
n
Male
Female
650
Figure 4. Rate of days of care by sex: United States, 1988–92
1988 1989 1990 1991 19920
6.0
6.5
7.0
7.5
Ave
rage
leng
th o
f sta
y in
day
s
Male
Female
5.5
Figure 5. Average length of stay by sex: United States, 1988–92

isn
ur
isy
meto
mnd2.stin
th,entsh,st,
sedt,re
Utilization by region
Weighted linear regression analysis of the rates of dcharges and days of care showed that these rates didchange significantly from 1988 to 1992 for any of the fogeographic regions of the country.Tables 4–6present hospitalutilization data by age and region. Regional trends in dcharge rates are shown infigure 6, and average lengths of staby region are displayed infigure 7.
1988 1989 1990 1991 19920
100
105
110
115
120
125
130
135
140
145
150
Rat
e pe
r 1,
000
popu
latio
n
Midwest
South
Northeast
West
95
Figure 6. Rate of discharges by region: United States, 1988–92
1988 1989 1990 1991 19920
5.5
6.0
6.5
7.0
7.5
8.0
8.5
Ave
rage
leng
th o
f sta
y in
day
s
Northeast
Midwest
South
West5.0
Figure 7. Average length of stay by region: United States,1988–92
-ot
-
+ In 1988, discharge rates per 1,000 population ranged fro107.4 per 1,000 population in the West to 140.3 in thNortheast. In 1992 the range was from 99.5 in the West139.9 in the Northeast.
+ Rates of days of care per 1,000 population ranged fro624.3 in the West to 1,081.0 in the Northeast in 1988 afrom 513.9 in the West to 1,005.1 in the Northeast in 199
+ Average lengths of stay varied from 5.8 days in the Weto 7.7 days in the Northeast in 1988 and from 5.2 daysthe West to 7.2 days in the Northeast in 1992.
+ In 1988, 35 percent of discharges were in the Sou25 percent were in the Midwest, 23 percent were in thNortheast, and 17 percent were in the West. The percefor 1992 were 36 percent of discharges in the Sout23 percent in the Midwest, 23 percent in the Northeaand 18 percent in the West.
+ In 1988 and 1992, persons 45 years of age and over utwo-thirds or more of days of care in the NortheasMidwest, and South, but 55–62 percent of the days of cain the West.
9

elf2euthile
n9
thyup
r-deysnt
essehad
Utilization by diagnosis andsex
Hospital use measures for selected first-listed diagnosare shown intable E. The categories shown accounted for haor more of all discharges and days of care in 1988 and 199Table F lists the diagnostic categories with 200,000 or mormale discharges in 1988 or 1992. These categories madenearly half of male discharges. Diagnostic categories wi200,000 or more female discharges in 1988 or 1992 aretable G, and these categories include more than half of femadischarges. Diagnostic data intables E–Gand table 7 arehighlighted below. Additional diagnostic data are intables8–16.
+ Heart disease was the first-listed diagnosis for 12 perce(3.6 million) of discharges in 1988 and 13 percent (3.
Table E. Number of discharges from short-stay hospitals, days of care, andUnited States, 1988 and 1992[Discharges of inpatients from non-Federal hospitals. Excludes newborn infants. Diagnof Diseases, 9th Revision, Clinical Modification (ICD–9–CM)]
Diagnosis and ICD–9–CM codes
Dis
1988
All conditions1 . . . . . . . . . . . . . . . . . . . . . . . . . . . . . . . . . . . . 31,146
Heart disease . . . . . . 391–392.0,393–398,402,404,410–416,420–429 3,641Acute myocardial infarction . . . . . . . . . . . . . . . . . . . . . . . . 410 716Coronary atherosclerosis . . . . . . . . . . . . . . . . . . . . . . . . 414.0 411Other ischemic heart disease . . . . . . . . . . . 411–413,414.1–414.9 921Cardiac dysrhythmias . . . . . . . . . . . . . . . . . . . . . . . . . . . 427 491Congestive heart failure . . . . . . . . . . . . . . . . . . . . . . . . . 428.0 634
Females with deliveries . . . . . . . . . . . . . . . . . . . . . . . . . . . V27 3,781Malignant neoplasms . . . . . . . . . . . . . . . . . . . . 140–208,230–234 1,670Pneumonia . . . . . . . . . . . . . . . . . . . . . . . . . . . . . . . . 480–486 924Fractures . . . . . . . . . . . . . . . . . . . . . . . . . . . . . . . . . 800–829 1,014Psychosis . . . . . . . . . . . . . . . . . . . . . . . . . . . . . . . . . 290–299 781Cerebrovascular disease . . . . . . . . . . . . . . . . . . . . . . . 430–438 784Arthropathies and related disorders . . . . . . . . . . . . . . . . . 710–719 459Cholelithiasis . . . . . . . . . . . . . . . . . . . . . . . . . . . . . . . . . . 574 484Diabetes mellitus . . . . . . . . . . . . . . . . . . . . . . . . . . . . . . . 250 454Asthma . . . . . . . . . . . . . . . . . . . . . . . . . . . . . . . . . . . . . 493 479Benign neoplasms and neoplasms of uncertain behavior andunspecified nature . . . . . . . . . . . . . . . . . . . . . 210–229,235–239 428Intervertebral disc disorders . . . . . . . . . . . . . . . . . . . . . . . . . 722 417Acute respiratory infection . . . . . . . . . . . . . . . . . . . . . . . 460–466 445
1Includes data for diagnostic conditions not shown in table.
NOTE: This table includes diagnostic categories that accounted for 400,000 or more discharges in 1
10
s
.
p
n
t
million) in 1992. These discharges had an average lengof stay of 7.1 days in 1988 and 6.7 days in 1992. Theused 13–14 percent of total days of care, and made23 percent of hospital deaths.
+ Females hospitalized for deliveries accounted for 12 pecent (3.8 million) of first-listed diagnoses in 1988 an13 percent (3.9 million) in 1992. Because their averaglengths of stay were short—2.9 days in 1988 and 2.6 dain 1992—females with deliveries made up only 5 perceof the total days of care.
+ Malignant neoplasms (cancers) were first-listed diagnosfor 5 percent of discharges in 1988 and 1992. Thedischarges used 7–8 percent of total days of care and
average length of stay, by selected first-listed diagnoses:
ostic categories and code numbers are based on the International Classification
charges Days of careAverage length
of stay
1992 1988 1992 1988 1992
Number in thousands Days
30,951 203,678 190,386 6.5 6.2
3,935 25,883 26,256 7.1 6.7747 6,432 6,058 9.0 8.1416 2,502 2,342 6.1 5.6971 4,871 4,831 5.3 5.0542 2,758 2,835 5.6 5.2822 5,560 6,506 8.8 7.9
3,910 11,029 10,040 2.9 2.61,577 15,676 13,433 9.4 8.51,059 7,801 8,793 8.4 8.31,016 8,558 7,842 8.4 7.7908 11,812 11,746 15.1 12.9829 7,611 7,302 9.7 8.8554 3,416 4,027 7.4 7.3512 3,162 2,236 6.5 4.4476 3,734 3,274 8.2 6.9463 2,279 2,008 4.8 4.3
422 2,117 1,947 4.9 4.6407 2,466 1,786 5.9 4.4376 2,282 1,495 5.1 4.0
988 or 1992.

Table F. Number and rate of male discharges from short-stay hospitals by selected first-listed diagnoses: United States, 1988 and 1992[Discharges of inpatients from non-Federal hospitals. Excludes newborn infants. Diagnostic categories and code numbers are based on the International Classificationof Diseases, 9th Revision, Clinical Modification (ICD–9–CM)]
Diagnosis and ICD–9–CM codes 1988 1992 1988 1992
Number inthousands
Rate per10,000 population
All conditions1 . . . . . . . . . . . . . . . . . . . . . . . . . . . . . . . . . . . . . . . . . . . . . . . . . . . . . . . . . 12,642 12,406 1,075.3 1,008.0
Heart disease . . . . . . . . . . . . . . . . . . . . . . . . . . . 391–392.0,393–398,402,404,410–416,420–429 1,955 2,083 166.3 169.3Acute myocardial infarction . . . . . . . . . . . . . . . . . . . . . . . . . . . . . . . . . . . . . . . . . . . . . . 410 451 458 38.4 37.2Coronary atherosclerosis . . . . . . . . . . . . . . . . . . . . . . . . . . . . . . . . . . . . . . . . . . . . . 414.0 278 285 23.6 23.2Other ischemic heart disease . . . . . . . . . . . . . . . . . . . . . . . . . . . . . . . . 411–413,414.1–414.9 491 505 41.7 41.0Cardiac dysrhythmias . . . . . . . . . . . . . . . . . . . . . . . . . . . . . . . . . . . . . . . . . . . . . . . . . 427 228 256 19.4 20.8Congestive heart failure . . . . . . . . . . . . . . . . . . . . . . . . . . . . . . . . . . . . . . . . . . . . . . 428.0 277 373 23.6 30.3
Malignant neoplasms . . . . . . . . . . . . . . . . . . . . . . . . . . . . . . . . . . . . . . . . . . 140–208,230–234 772 765 65.7 62.2Pneumonia . . . . . . . . . . . . . . . . . . . . . . . . . . . . . . . . . . . . . . . . . . . . . . . . . . . . . 480–486 472 535 40.2 43.5Fractures . . . . . . . . . . . . . . . . . . . . . . . . . . . . . . . . . . . . . . . . . . . . . . . . . . . . . . 800–829 506 465 43.0 37.8Psychosis . . . . . . . . . . . . . . . . . . . . . . . . . . . . . . . . . . . . . . . . . . . . . . . . . . . . . . 290–299 341 408 29.0 33.2Cerebrovascular disease . . . . . . . . . . . . . . . . . . . . . . . . . . . . . . . . . . . . . . . . . . . . 430–438 336 375 28.5 30.5Intervertebral disc disorders . . . . . . . . . . . . . . . . . . . . . . . . . . . . . . . . . . . . . . . . . . . . . . . 722 247 222 21.0 18.0Hyperplasia of prostate . . . . . . . . . . . . . . . . . . . . . . . . . . . . . . . . . . . . . . . . . . . . . . . . . 600 247 221 21.0 18.0Arthropathies and related disorders . . . . . . . . . . . . . . . . . . . . . . . . . . . . . . . . . . . . . . 710–719 191 212 16.3 17.2Diabetes mellitus . . . . . . . . . . . . . . . . . . . . . . . . . . . . . . . . . . . . . . . . . . . . . . . . . . . . . 250 209 207 17.7 16.8Asthma . . . . . . . . . . . . . . . . . . . . . . . . . . . . . . . . . . . . . . . . . . . . . . . . . . . . . . . . . . . 493 210 201 17.8 16.3Acute respiratory infection . . . . . . . . . . . . . . . . . . . . . . . . . . . . . . . . . . . . . . . . . . . . 460–466 224 187 19.1 15.2Inguinal hernia . . . . . . . . . . . . . . . . . . . . . . . . . . . . . . . . . . . . . . . . . . . . . . . . . . . . . . . 550 232 98 19.7 7.9
1Includes data for diagnostic conditions not shown in table.
NOTE: This table includes diagnostic categories that accounted for 200,000 or more male discharges in 1988 or 1992.
Table G. Number and rate of female discharges from short-stay hospitals by selected first-listed diagnoses: United States, 1988 and1992[Discharges of inpatients from non-Federal hospitals. Excludes newborn infants. Diagnostic categories and code numbers are based on the International Classificationof Diseases, 9th Revision, Clinical Modification (ICD–9–CM)]
Diagnosis and ICD–9–CM codes 1988 1992 1988 1992
Number inthousands
Rate per10,000 population
All conditions1 . . . . . . . . . . . . . . . . . . . . . . . . . . . . . . . . . . . . . . . . . . . . . . . . . . . . . . . . . 18,504 18,545 1,477.4 1,422.0
Females with deliveries . . . . . . . . . . . . . . . . . . . . . . . . . . . . . . . . . . . . . . . . . . . . . . . . V27 3,781 3,910 301.9 299.8Heart disease . . . . . . . . . . . . . . . . . . . . . . . . . . . 391–392.0,393–398,402,404,410–416,420–429 1,686 1,852 134.6 142.0Acute myocardial infarction . . . . . . . . . . . . . . . . . . . . . . . . . . . . . . . . . . . . . . . . . . . . . . 410 265 289 21.2 22.1Coronary atherosclerosis and other ischemic heart disease . . . . . . . . . . . . . . . . . . . . . . . 411–414 565 597 45.1 45.8Cardiac dysrhythmias . . . . . . . . . . . . . . . . . . . . . . . . . . . . . . . . . . . . . . . . . . . . . . . . . 427 263 286 21.0 21.9Congestive heart failure . . . . . . . . . . . . . . . . . . . . . . . . . . . . . . . . . . . . . . . . . . . . . . 428.0 357 449 28.5 34.4
Malignant neoplasms . . . . . . . . . . . . . . . . . . . . . . . . . . . . . . . . . . . . . . . . . . 140–208,230–234 898 812 71.7 62.3Fractures . . . . . . . . . . . . . . . . . . . . . . . . . . . . . . . . . . . . . . . . . . . . . . . . . . . . . . 800–829 508 552 40.6 42.3Fracture of neck of femur . . . . . . . . . . . . . . . . . . . . . . . . . . . . . . . . . . . . . . . . . . . . . . . 820 186 205 14.9 15.7
Pneumonia . . . . . . . . . . . . . . . . . . . . . . . . . . . . . . . . . . . . . . . . . . . . . . . . . . . . . 480–486 452 524 36.1 40.1Psychosis . . . . . . . . . . . . . . . . . . . . . . . . . . . . . . . . . . . . . . . . . . . . . . . . . . . . . . 290–299 440 500 35.1 38.3Cerebrovascular disease . . . . . . . . . . . . . . . . . . . . . . . . . . . . . . . . . . . . . . . . . . . . 430–438 448 454 35.8 34.8Cholelithiasis . . . . . . . . . . . . . . . . . . . . . . . . . . . . . . . . . . . . . . . . . . . . . . . . . . . . . . . . 574 352 358 28.1 27.5Benign neoplasms and neoplasms of uncertain behavior and unspecified nature . . . . . 210–229,235–239 350 342 27.9 26.3Arthropathies and related disorders . . . . . . . . . . . . . . . . . . . . . . . . . . . . . . . . . . . . . . 710–719 267 342 21.3 26.3Diabetes mellitus . . . . . . . . . . . . . . . . . . . . . . . . . . . . . . . . . . . . . . . . . . . . . . . . . . . . . 250 245 269 19.6 20.6Asthma . . . . . . . . . . . . . . . . . . . . . . . . . . . . . . . . . . . . . . . . . . . . . . . . . . . . . . . . . . . 493 270 263 21.5 20.1Noninfectious enteritis and colitis . . . . . . . . . . . . . . . . . . . . . . . . . . . . . . . . . . . . . . . 555–558 230 220 18.4 16.8Acute respiratory infection . . . . . . . . . . . . . . . . . . . . . . . . . . . . . . . . . . . . . . . . . . . . 460–466 221 189 17.7 14.5Abortions and ectopic and molar pregnancies . . . . . . . . . . . . . . . . . . . . . . . . . . . . . . . . 630–639 266 179 21.2 13.7
1Includes data for diagnostic conditions not shown in table.
NOTE: This table includes diagnostic categories that accounted for 200,000 or more female discharges in 1988 or 1992.
11

hea
r desou98
t
fer.7.9
ofinh and
er-foroth
forer-us
17–18 percent of hospital deaths in 1988 and 1992. Taverage length of stay was 9.4 days in 1988 and 8.5 din 1992.
+ Pneumonia, fractures, psychoses, and cerebrovasculaease each accounted for more than 700,000 discharg1988 and 1992. Discharges with each of these fdiagnoses used more than 7 million days of care in 1and 1992.
+ Females hospitalized for deliveries made up 20 percenfemale discharges in 1988 and 21 percent in 1992.
+ For males, heart disease was the first-listed diagnosis15 percent (2.0 million) of discharges in 1988 and 17 pcent (2.1 million) in 1992. For females, 9 percent (1million) of hospitalizations in 1988 and 10 percent (1million) in 1992 were for heart disease.
12
irys
is-inr8
of
or-
+ For males, malignant neoplasms made up 6 percentfirst-listed diagnoses—772,000 in 1988 and 765,0001992. Females had 898,000 discharges (5 percent) witfirst-listed diagnosis of malignant neoplasms in 1988 a812,000 (4 percent) in 1992.
+ Only males had more than 200,000 discharges for intvertebral disc disorders in 1988 and 1992. Dischargeshyperplasia of prostate also exceeded 200,000 in byears.
+ Only females had more than 200,000 dischargescholelithiasis, benign neoplasms and neoplasms of unctain behavior and unspecified nature, and noninfectioenteritis and colitis in 1988 and 1992.

theomns aassodioin
cere.ndec
rt-urepro.0–.4
m
reg-m-icnere
d
.8
rete-a-
ndr-
Utilization of procedures bysex
Neither the number of discharges with procedures nornumber with surgical procedures changed significantly fr1988 to 1992 (table 17), using weighted linear regressioanalysis. However, the estimates are not comparable acrosyears because of coding changes and a revision in the clfication of procedures as surgical or nonsurgical. These mfications are discussed inappendix II.The coding changes alsaffected the total number of all-listed procedures showntables 18–23.
+ In 1988, 19.9 million discharges (64 percent) had a produre during hospitalization. In 1992, procedures weperformed on 20.4 million, or 66 percent of discharges
+ Discharges with surgical procedures made up 49 a47 percent of all discharges in 1988 and 1992, resptively.
+ At least two-thirds of all procedures performed in shostay hospitals in 1988 and 1992 were in four procedcategories: miscellaneous diagnostic and therapeuticcedures (10.9–13.9 million), obstetrical procedures (66.7 million), operations on the digestive system (5.3–5
lli--
-
-
-
million), and operations on the cardiovascular syste(3.6–4.4 million).
+ In 1988 and 1992, procedures performed a million or motimes on hospital inpatients included episiotomy, arterioraphy and angiocardiography using contrast material, coputerized axial tomography (CAT scan), diagnostultrasound, and fetal EKG and other fetal monitoring. I1992, respiratory therapy and cardiac catheterization walso done more than a million times.
+ Males had 15.7 million procedures in 1988, comparewith 23.5 million for females. Likewise, in 1992, maleshad 16.8 million procedures, but females underwent 25million procedures.
+ Frequent procedures for males in 1988 and 1992 wearteriography and angiocardiography using contrast marial, cardiac catheterization, computerized axial tomogrphy, and diagnostic ultrasound.
+ Procedures commonly performed on females in 1988 a1992 were episiotomy, fetal EKG and other fetal monitoing, cesarean section, and diagnostic ultrasound.
13

er
inag acifi92hermy
00s-o
an
age
aereal
peion
n
reor
taonofnoale
int ofseies
.-hetoin
Utilization of selectedsex-specific procedures
Female-specific procedures
Trend data for selected procedures that are only pformed on females are shown intables 24–26.The data forobstetrical procedures intables 25and26 are for females withdeliveries. Rates are per 100 deliveries, or per 100 vagdeliveries when the procedure would not be done durincesarean section delivery. The rates for most female-speprocedures did not change significantly from 1988 to 19using weighted linear regression analysis. For example, twere no significant changes in the rates for hysterectoepisiotomy, or cesarean section.
+ Women had 578,000 hysterectomies in 1988 and 580,in 1992. In both years, approximately two-thirds of hyterectomies were performed on women 30–49 yearsage, a fourth on those aged 50 years and over,8–9 percent on women 15–29 years of age.Figure 8illustrates trends in hysterectomy rates for thesegroups.
+ In 1988, 1.7 million episiotomies were performed, forrate of 59.0 per 100 vaginal deliveries. In 1992, there w1.6 million episiotomies, for a rate of 53.8 per 100 vagindeliveries.
+ In 1988, cesarean sections were performed 24.7 times100 deliveries. In 1992, there were 23.6 cesarean sect
1988 1989 1990 1991 19920
100200
300400500600
700800900
1,0001,1001,200
Rat
e pe
r 10
0,00
0 fe
mal
e po
pula
tion
30 49 years
50 years and over
15 29 years
Figure 8. Rate of hysterectomies for females by age: UnitedStates, 1988–92
14
-
l
c,e,
0
fd
rs
per 100 deliveries.Figure 9shows the trends in cesareasection rates by age.
Male-specific procedures
Two frequent procedures performed only on males aprostatectomy and circumcision of the penis. Trends fprostatectomy are shown by age intable 27, and table 28shows circumcision trends by region. The circumcision daonly reflect circumcisions performed in short-stay hospitalsnewborn infants and thus underestimate the total numbercircumcisions performed. From 1988 to 1992, there weresignificant changes in the rates of prostatectomy or mcircumcision, using weighted linear regression analysis.
+ Men had 358,000 prostatectomies in 1988 and 353,0001992. Men 65–74 years of age accounted for 41 percenprostatectomies in 1988 and 42 percent in 1992. Thoaged 75 years and over had 40 percent of prostatectomin 1988 and 37 percent in 1992.Figure 10 shows thetrends in prostatectomy rates for these two age groups
+ The proportion of male newborn infants who were circumcised was 58 percent in 1988 and 61 percent in 1992. Tpercent circumcised ranged from 45 percent in the West73 percent in the Midwest in 1988, and from 38 percentthe West to 78 percent in the Midwest in 1992 (figure 11).
1988 1989 1990 1991 19920
20
25
30
35
Rat
e pe
r 10
0 de
liver
ies
Under 20 years
20 24 years
25 29 years
30 34 years
35 years and over
15
Figure 9. Rate of cesarean sections for females by age: UnitedStates, 1988–92

1988 1989 1990 1991 1992
1,500
2,000
2,500
3,000
3,500
4,000R
ate
per
100,
000
mal
e po
pula
tion
75 years and over
65 74 years
0
Figure 10. Rate of prostatectomies for males aged 65–74 yearsand 75 years and over: United States, 1988–92
1988 1989 1990 1991 19920
4045505560657075808590
Per
cent
of m
ale
new
born
s
Midwest
Northeast
South
West35
Figure 11. Percent of male newborn infants circumcised byregion: United States, 1988–92
15

uc-ion2.0neass aery-fo
on
e-an
ere. In0 o
ryin6.1les
000
passup) inrges000are
Utilization of selectedheart-related procedures bysex
Open-heart surgery, removal of coronary artery obstrtion, coronary artery bypass graft, and cardiac catheterizattogether accounted for 1.6 million procedures in 1988 andmillion in 1992. Among these four procedures, only osignificant change in rates during the 1988–92 period wfound using weighted linear regression analysis. This wa68 percent increase in the rate of removal of coronary artobstruction.Tables 29–32show trend data for the four procedures by age and sex. It should be noted that the dataopen-heart surgery, shown intable 29, do not include coronaryartery bypass graft. Estimates for discharges with at leastcoronary artery bypass graft are shown intable 31. Thenumber of all-listed bypass procedures are shown intables 18,20, and22.
+ Two-thirds (67 percent) of the four heart-related procdures listed above were performed on males in 1988,males had 65 percent of these procedures in 1992.
+ In 1988, a total of 92,000 open-heart procedures wperformed—53,000 on males and 39,000 on females1992, there were 104,000 open-heart surgeries—57,00males and 48,000 on females.Figure 12shows trends inrates of open-heart surgery by sex.
+ The rate per 100,000 population for removal of coronaartery obstruction increased from 93.3 in 1988 to 157.21992. The rate for males increased 57 percent (from 13to 213.3 per 100,000 population) and the rate for fema
1988 1989 1990 1991 19920
30
35
40
45
50
Rat
e pe
r 10
0,00
0 po
pula
tion
Male
Female
Figure 12. Rate of open-heart surgery by sex: United States,1988–92
16
s
r
e
d
nincreased 96 percent (from 53.1 to 104.3 per 100,population) from 1988 to 1992 (figure 13).
+ There were 253,000 discharges with coronary artery bygrafts in 1988 and 309,000 in 1992. Males made75 percent of discharges with bypass surgery (189,0001988 and 72 percent (221,000) in 1992. Female dischawith bypass surgery numbered 63,000 in 1988 and 88,in 1992. Rates of discharges with bypass surgeryshown by sex infigure 14.
1988 1989 1990 1991 1992
50
75
100
125
150
175
200
225
250
Rat
e pe
r 10
0,00
0 po
pula
tion
Male
Female
025
Figure 13. Rate of removal of coronary artery obstructions bysex: United States, 1982–92
1988 1989 1990 1991 19920
25
50
75
100
125
150
175
200
Rat
e pe
r 10
0,00
0 po
pula
tion
Male
Female
Figure 14. Rate of discharges with one or more coronary arterybypass grafts by sex: United States, 1988–92

per92.alessti-an
ex.
+ An estimated 930,000 cardiac catheterizations wereformed in 1988 and 1,028,000 were performed in 19Males underwent 598,000 catheterizations and femhad 332,000 catheterizations in 1988. In 1992, the emates were 636,000 cardiac catheterizations for males392,000 catheterizations for females.Figure 15displaystrends in rates of cardiac catheterizations by s
-
d
1988 1989 1990 1991 1992
200
250
300
350
400
450
500
550
600
Rat
e pe
r 10
0,00
0 po
pula
tion
Male
Female
0
Figure 15. Rate of cardiac catheterizations by sex: United States,1988–92
17
ptstaatemenifi-.ndsmedands oula
edas
r-onec-o-ntof
ry,ssex.88ofh
Summary
After a large increase in the 1970’s and an abrudecrease in the 1980’s, the discharge rates for short-hospitals leveled off in the 1988–92 period. However, the rof days of care continued to decline, falling 10 percent fro1988 to 1992. Average length of stay also declined 5 percfrom 1988 to 1992. Discharge rates did not change signcantly in any of the four geographic regions of the country
The major reasons for hospitalization in both 1988 a1992 were delivery, heart disease, and malignant neoplaThroughout this period, the majority of procedures performwere in one of four categories—miscellaneous diagnostictherapeutic procedures, obstetrical procedures, operationthe digestive system, and operations on the cardiovascsystem.
Particular attention was given to commonly performsex-specific procedures. Obstetrical procedures, such
18
y
t
.
nr
episiotomy, fetal EKG and other fetal monitoring, and cesaean section, were among the leading procedures performedfemales. Other female-specific procedures, such as hystertomy, were also commonly done. Frequent male-specific prcedures were prostatectomy and circumcision. No significachanges in rates occurred in the 1988–92 period for anythese sex-specific procedures.
The four heart-related procedures—open-heart surgeremoval of coronary artery obstruction, coronary artery bypagraft, and cardiac catheterization—were also examined by sMales accounted for 67 percent of these procedures in 19and 64 percent in 1992. The rate for one procedure, removalcoronary artery obstruction, increased significantly for botmales and females during the 1988–92 period.

References
1. Pokras R, Kozak LJ, McCarthy E, Graves EJ. Trends in hospitalutilization: United States, 1965–86. National Center for HealthStatistics. Vital Health Stat 13(101). 1989.
2. Howard G, Cravern TE, Sanders L, Evans GW. Relationship ofhospitalized stroke rate and in-hospital mortality to the declinein U.S. stroke mortality. Neuroepidemiology 10(5–6):251–9.1991.
3. Taffel SM, Placek PJ, Moien M, Kosary CL. 1989 U.S. cesareansection rate steadies - VBAC rate rises to nearly one in five.Birth 18(2):73–77. 1991.
4. Gillum, RF. Peripheral arterial occlusive disease of the extremi-ties in the United States: hospitalization and mortality. AmHeart J 120(6 Pt 1):1414–18. 1990.
5. Feinleib M, Havlik RJ, Gillum RF, et al. Coronary heart diseaseand related procedures: National Hospital Discharge Surveydata. Circulation 79(6 Suppl I):13–18. 1989.
6. Rosenblum LS, Castro KG, Dooley S, Morgan M. Effect of HIVinfection and tuberculosis on hospitalizations and cost of carefor young adults in the United States, 1985 to 1990. Ann InternMed 121(10): 786–92. 1994.
7. Wilcox LS, Koonin LM, Pokras R, et al. Hysterectomy in theUnited States, 1988–1990. Obstet-Gynecol 83(4):549–55. 1994.
8. Geiss LS, Herman WH, Goldschmid MG, et al. Surveillance fordiabetes mellitus - United States, 1980–89. MMWR CDCSurveill Summ 42(2):1–20. 1993.
9. Zahniser SC, Kendrick JS, Franks AL, Saftlas AF. Trends inobstetric operative procedures, 1980 to 1987. Am J PublicHealth 82(10):1340–44. 1992.
10. Kozak LJ. Surgical and nonsurgical procedures associated withhospital delivery in the United States: 1980–87. Birth 16(4):209–13. 1989.
11. National Center for Health Statistics. Healthy People 2000Review, 1993. Hyattsville, Md: Public Health Service. 1994.
12. Simmons WR, Schnack GA. Development of the design of theNCHS Hospital Discharge Survey. National Center for HealthStatistics. Vital Health Stat 2(39). 1977.
13. Haupt BJ, Kozak LJ. Estimates from two survey designs:National Hospital Discharge Survey. National Center for HealthStatistics. Vital Health Stat 13(111). 1992.
14. SMG Marketing Group, Inc. Hospital Market Database. Chi-cago, Illinois: Healthcare Information Specialists. April 1987.
15. SMG Marketing Group, Inc. Hospital Market Database. Chi-cago, Illinois: Healthcare Information Specialists. April 1991.
16. Public Health Service and Health Care Financing Administra-tion. International Classification of Diseases, 9th Revision,Clinical Modification, 4th ed. Washington: Public Health Ser-vice. 1991.
17. Dawson-Saunders B, Trapp RG. Basic and clinical biostatistics.Norwalk, Connecticut: Appleton and Lange. 1990.
18. Curtin LR and Klein RJ. Direct standardization (age-adjusteddeath rates). National Center for Health Statistics. HealthyPeople 2000 Statistical Notes, No 6, March 1995.
19. Shah, BV, Barnwell BG, Hunt PN, LaVange LM. SUDAANuser’s manual, release 5.50. Research Triangle Park, NorthCarolina: Research Triangle Institute. 1991.
20. American Hospital Association. Ambulatory Care Trendlines:Outpatient Surgery Trends, 1980–90. 1(2). 1992.
21. Rogers CM, ed. Socio-economic factbook for surgery, 1995.Chicago, Illinois: American College of Surgeons. 1995.
22. Rovner J. USA divides over early discharge of mothers. TheLancet 346(8968):171–72. 1995.
23. Britton JR, Britton HL, Beebe SA. Early discharge of the termnewborn: a continued dilemma. Pediatrics 94(3):291–95. 1994.
24. Centers for Disease Control. Trends in length of stay forhospital deliveries-United States, 1970–92. MMWR 44(17):335–37. 1995.
25. Massey JT, Moore TF, Parsons VL, Tadros W. Design andestimation for the National Health Interview Survey, 1985–94.National Center for Health Statistics. Vital Health Stat 2(110).1989.
26. National Archives and Records Administration. Federal Regis-ter 50(147). Washington: National Archives and Records Admin-istration. 31038–40. 1985.
27. Graves EJ. Detailed diagnoses and procedures, National Hospi-tal Discharge Survey, 1992. National Center for Health Statis-tics. Vital Health Stat 13(118). 1994.
28. Graves EJ. Utilization of short-stay hospitals, United States,1985, annual summary. National Center for Health Statistics.Vital Health Stat 13(91). 1987.
29. Graves EJ. National Hospital Discharge Survey: annual sum-mary, 1988. National Center for Health Statistics. Vital HealthStat 13(106). 1991.
30. Graves EJ, Kozak LJ. National Hospital Discharge Survey:annual summary, 1989. National Center for Health Statistics.Vital Health Stat 13(109). 1992.
31. Graves EJ. National Hospital Discharge Survey: annual sum-mary, 1990. National Center for Health Statistics. Vital HealthStat 13(112). 1992.
32. Haupt BJ. Utilization of short-stay hospitals: annual summaryfor the United States, 1980. National Center for Health Statis-tics. Vital Health Stat 13(64). 1982.
33. Pokras R, Kozak LJ. Adjustment of hospital utilization rates,United States, 1965–80. National Center for Health Statistics.Vital Health Stat 13(81). 1984.
34. Graves EJ. National Hospital Discharge Survey: annual sum-mary, 1991. National Center for Health Statistics. Vital HealthStat 13(114). 1993.
19

35. Graves EJ. National Hospital Discharge Survey: annual sum-mary, 1992. National Center for Health Statistics. Vital HealthStat 13(119). 1994.
36. Sirken MG. Utilization of short-stay hospitals, summary ofnonmedical statistics, United States, 1965. National Center forHealth Statistics. Vital Health Stat 13(2). 1967.
37. Witkin MJ. Utilization of short-stay hospitals by characteristicsof discharged patients, United States, 1965. National Center forHealth Statistics. Vital Health Stat 13(3). 1967.
38. SMG Marketing Group, Inc. Hospital Market Database. Chi-cago, Illinois: Healthcare Information Specialists. April 1989.
39. SMG Marketing Group, Inc. Hospital Market Database. Chi-cago, Illinois: Healthcare Information Specialists. April 1990.
40. SMG Marketing Group, Inc. Hospital Market Database. Chi-cago, Illinois: Healthcare Information Specialists. April 1992.
41. SMG Marketing Group, Inc. Hospital Market Database. Chi-cago, Illinois: Healthcare Information Specialists. April 1993.
42. Shah BV. SESUDAAN: Standard errors program for computingof standardized rates from sample survey data. Research Tri-angle Park, North Carolina: Research Triangle Institute. 1981.
43. Hansen MH, Hurwitz WN, Madow WG. Sample survey meth-ods and theory, vol 1. New York: John Wiley & Sons. 1953.
44. Cochran WG. Sampling techniques, 3rd ed. New York: JohnWiley & Sons. 1977.
45. Gardocki GJ, Pokras R. Utilization of short-stay hospitals bypersons with heart disease and malignant neoplasms: NationalHospital Discharge Survey, United States, 1977. National Cen-ter for Health Statistics. Vital Health Stat 13(52). 1981.
46. Sirken MG, Shimizu BI, French DK, Brock, DB. Manual onstandards and procedures for reviewing statistical reports. Rock-ville, Maryland: National Center for Health Statistics. 1974.
47. National Committee on Vital and Health Statistics, TechnicalConsultant Panel. UHDDS classes of procedures, ICD–9–CM.Ann Arbor, Michigan: Commission on Professional and Hospi-tal Activities. 1978.
20

List of detailed tables
1. Number and rate of discharges from short-stay hospitalsby sex and age, and age-adjusted rate by sex: UnitedStates, 1980, 1985, and 1988–92. . . . . . . . . . . . . . . . . . 22
2. Number and rate of days of care for discharges fromshort-stay hospitals by sex and age, and age-adjusted rateby sex: United States, 1980, 1985, and 1988–92. . . . . . . 23
3. Average length of stay for discharges from short-stayhospitals by sex and age, and age-adjusted average stay bysex: United States, 1980, 1985, and 1988–92. . . . . . . . . 24
4. Number and rate of discharges from short-stay hospitalsby region and age, and age-adjusted rate by region: UnitedStates, 1980, 1985, and 1988–92. . . . . . . . . . . . . . . . . . 25
5. Number and rate of days of care for discharges fromshort-stay hospitals by region and age, and age-adjustedrate by region: United States, 1980, 1985, and1988–92. . . . . . . . . . . . . . . . . . . . . . . . . . . . . . . . . . . . 26
6. Average length of stay for discharges from short-stayhospitals by region and age, and age-adjusted average stayby region: United States, 1980, 1985, and 1988–92. . . . . 27
7. Number of deaths and fatality rate for discharges fromshort-stay hospitals by selected categories of first-listeddiagnosis: United States, 1980, 1985, and 1988–92. . . . . 28
8. Number of discharges from short-stay hospitals by first-listed diagnosis: United States, 1980, 1985, and1988–92. . . . . . . . . . . . . . . . . . . . . . . . . . . . . . . . . . . . 29
9. Rate of discharges from short-stay hospitals by first-listeddiagnosis: United States, 1980, 1985, and 1988–92. . . . . 30
10. Number of days of care for discharges from short-stayhospitals by first-listed diagnosis: United States, 1980,1985, and 1988–92. . . . . . . . . . . . . . . . . . . . . . . . . . . . 31
11. Rate of days of care for discharges from short-stay hospi-tals by first-listed diagnosis: United States, 1980, 1985,and 1988–92. . . . . . . . . . . . . . . . . . . . . . . . . . . . . . . . . 32
12. Average length of stay for discharges from short-stayhospitals by first-listed diagnosis: United States, 1980,1985, and 1988–92. . . . . . . . . . . . . . . . . . . . . . . . . . . . 33
13. Number of male discharges from short-stay hospitals byfirst-listed diagnosis: United States, 1980, 1985, and 1988–92. . . . . . . . . . . . . . . . . . . . . . . . . . . . . . . . . . . . . . . . . 34
14. Rate of male discharges from short-stay hospitals byfirst-listed diagnosis: United States, 1980, 1985, and 1988–92. . . . . . . . . . . . . . . . . . . . . . . . . . . . . . . . . . . . . . . . . 35
15. Number of female discharges from short-stay hospitals byfirst-listed diagnosis: United States, 1980, 1985, and 1988–92. . . . . . . . . . . . . . . . . . . . . . . . . . . . . . . . . . . . . . . . . 36
16. Rate of female discharges from short-stay hospitals byfirst-listed diagnosis: United States, 1980, 1985, and 1988–92. . . . . . . . . . . . . . . . . . . . . . . . . . . . . . . . . . . . . . . . . 37
17. Number of discharges from short-stay hospitals with andwithout procedures and percent with procedures: UnitedStates, 1980, 1985, and 1988–92. . . . . . . . . . . . . . . . . . 38
18. Number of all-listed procedures for discharges from short-stay hospitals by procedure category: United States, 1980,1985, and 1988–92. . . . . . . . . . . . . . . . . . . . . . . . . . . . 39
19. Rate of all-listed procedures for discharges from short-stayhospitals by procedure category: United States, 1980,1985, and 1988–92. . . . . . . . . . . . . . . . . . . . . . . . . . . . 40
20. Number of all-listed procedures for male discharges fromshort-stay hospitals by procedure category: United States,1980, 1985, and 1988–92. . . . . . . . . . . . . . . . . . . . . . . . 41
21. Rate of all-listed procedures for male discharges fromshort-stay hospitals by procedure category: United States,1980, 1985, and 1988–92. . . . . . . . . . . . . . . . . . . . . . . . 42
22. Number of all-listed procedures for female dischargesfrom short-stay hospitals by procedure category: UnitedStates, 1980, 1985, and 1988–92. . . . . . . . . . . . . . . . . . 43
23. Rate of all-listed procedures for female discharges fromshort-stay hospitals by procedure category: United States,1980, 1985, and 1988–92. . . . . . . . . . . . . . . . . . . . . . . . 44
24. Number and rate of hysterectomies for female dischargesfrom short-stay hospitals by age: United States, 1980,1985, and 1988–92. . . . . . . . . . . . . . . . . . . . . . . . . . . . 45
25. Number and rate of selected obstetrical procedures forfemales with deliveries discharged from short-stay hospi-tals by type of procedure: United States, 1980, 1985, and1988–92. . . . . . . . . . . . . . . . . . . . . . . . . . . . . . . . . . . . 46
26. Number and rate of cesarean sections for females withdeliveries discharged from short-stay hospitals by age:United States, 1980, 1985, and 1988–92. . . . . . . . . . . . . 47
27. Number and rate of prostatectomies for male dischargesfrom short-stay hospitals by age: United States, 1980,1985, and 1988–92. . . . . . . . . . . . . . . . . . . . . . . . . . . . 48
28. Number of male newborn infants and number and percentcircumcised in short-stay hospitals by region: UnitedStates, 1980, 1985, and 1988–92. . . . . . . . . . . . . . . . . . 49
29. Number and rate of open-heart surgeries for dischargesfrom short-stay hospitals, by sex and age: United States,1980, 1985, and 1988–92. . . . . . . . . . . . . . . . . . . . . . . . 50
30. Number and rate of removal of coronary artery obstruc-tions for discharges from short-stay hospitals by sex andage: United States, 1980, 1985, and 1988–92. . . . . . . . . 51
31. Number and rate of discharges from short-stay hospitalswith one or more coronary artery bypass grafts by sex andage: United States, 1980, 1985, and 1988–92. . . . . . . . . 52
32. Number and rate of cardiac catheterizations for dischargesfrom short-stay hospitals by sex and age: United States,1980, 1985, and 1988–92. . . . . . . . . . . . . . . . . . . . . . . . 53
21

Table 1. Number and rate of discharges from short-stay hospitals by sex and age, and age-adjusted rate by sex: United States, 1980,1985, and 1988–92[Discharges of inpatients from non-Federal hospitals. Excludes newborn infants]
Sex and year All agesUnder15 years
15–44years
45–64years
65 yearsand over
Age-adjusted rate1
Both sexes Number of discharges in thousands
1980 . . . . . . . . . . . . . . . . . . . . . . . . . . . . . . . . 37,832 3,672 15,635 8,660 9,864 . . .1985 . . . . . . . . . . . . . . . . . . . . . . . . . . . . . . . . 35,056 2,972 13,966 7,610 10,508 . . .1988 . . . . . . . . . . . . . . . . . . . . . . . . . . . . . . . . 31,146 2,610 11,934 6,456 10,146 . . .1989 . . . . . . . . . . . . . . . . . . . . . . . . . . . . . . . . 30,947 2,597 11,848 6,271 10,230 . . .1990 . . . . . . . . . . . . . . . . . . . . . . . . . . . . . . . . 30,788 2,412 11,799 6,244 10,333 . . .1991 . . . . . . . . . . . . . . . . . . . . . . . . . . . . . . . . 31,098 2,498 11,620 6,173 10,806 . . .1992 . . . . . . . . . . . . . . . . . . . . . . . . . . . . . . . . 30,951 2,531 11,227 6,329 10,864 . . .
Male
1980 . . . . . . . . . . . . . . . . . . . . . . . . . . . . . . . . 15,145 2,063 4,687 4,127 4,268 . . .1985 . . . . . . . . . . . . . . . . . . . . . . . . . . . . . . . . 14,160 1,698 4,153 3,776 4,533 . . .1988 . . . . . . . . . . . . . . . . . . . . . . . . . . . . . . . . 12,642 1,486 3,485 3,221 4,450 . . .1989 . . . . . . . . . . . . . . . . . . . . . . . . . . . . . . . . 12,583 1,521 3,405 3,179 4,478 . . .1990 . . . . . . . . . . . . . . . . . . . . . . . . . . . . . . . . 12,280 1,362 3,330 3,115 4,472 . . .1991 . . . . . . . . . . . . . . . . . . . . . . . . . . . . . . . . 12,478 1,435 3,248 3,088 4,708 . . .1992 . . . . . . . . . . . . . . . . . . . . . . . . . . . . . . . . 12,406 1,416 3,162 3,135 4,692 . . .
Female
1980 . . . . . . . . . . . . . . . . . . . . . . . . . . . . . . . . 22,686 1,609 10,949 4,533 5,596 . . .1985 . . . . . . . . . . . . . . . . . . . . . . . . . . . . . . . . 20,896 1,274 9,813 3,834 5,975 . . .1988 . . . . . . . . . . . . . . . . . . . . . . . . . . . . . . . . 18,504 1,125 8,448 3,235 5,696 . . .1989 . . . . . . . . . . . . . . . . . . . . . . . . . . . . . . . . 18,364 1,077 8,443 3,092 5,752 . . .1990 . . . . . . . . . . . . . . . . . . . . . . . . . . . . . . . . 18,508 1,049 8,469 3,129 5,861 . . .1991 . . . . . . . . . . . . . . . . . . . . . . . . . . . . . . . . 18,620 1,064 8,372 3,085 6,098 . . .1992 . . . . . . . . . . . . . . . . . . . . . . . . . . . . . . . . 18,545 1,115 8,064 3,194 6,172 . . .
Both sexes Rate of discharges per 1,000 population
1980 . . . . . . . . . . . . . . . . . . . . . . . . . . . . . . . . 167.7 71.6 150.1 194.8 383.7 167.71985 . . . . . . . . . . . . . . . . . . . . . . . . . . . . . . . . 148.4 57.7 125.0 170.8 369.8 146.61988 . . . . . . . . . . . . . . . . . . . . . . . . . . . . . . . . 128.3 49.8 103.9 142.1 336.8 125.71989 . . . . . . . . . . . . . . . . . . . . . . . . . . . . . . . . 126.2 48.8 102.7 136.8 333.4 123.51990 . . . . . . . . . . . . . . . . . . . . . . . . . . . . . . . . 124.3 44.6 101.6 135.0 330.9 121.31991 . . . . . . . . . . . . . . . . . . . . . . . . . . . . . . . . 124.1 45.3 99.3 132.2 340.3 121.01992 . . . . . . . . . . . . . . . . . . . . . . . . . . . . . . . . 122.1 45.2 96.0 131.0 336.5 118.8
Male
1980 . . . . . . . . . . . . . . . . . . . . . . . . . . . . . . . . 139.0 78.7 91.5 195.3 411.8 145.61985 . . . . . . . . . . . . . . . . . . . . . . . . . . . . . . . . 124.0 64.4 75.3 177.6 397.9 129.71988 . . . . . . . . . . . . . . . . . . . . . . . . . . . . . . . . 107.5 55.3 61.3 148.0 367.8 112.01989 . . . . . . . . . . . . . . . . . . . . . . . . . . . . . . . . 106.0 55.8 59.5 144.6 363.1 110.01990 . . . . . . . . . . . . . . . . . . . . . . . . . . . . . . . . 102.2 49.2 57.8 140.2 356.1 106.11991 . . . . . . . . . . . . . . . . . . . . . . . . . . . . . . . . 102.7 50.8 55.9 137.5 368.1 106.41992 . . . . . . . . . . . . . . . . . . . . . . . . . . . . . . . . 100.8 49.4 54.4 134.7 359.7 103.9
Female
1980 . . . . . . . . . . . . . . . . . . . . . . . . . . . . . . . . 194.4 64.2 206.8 194.3 364.7 189.91985 . . . . . . . . . . . . . . . . . . . . . . . . . . . . . . . . 171.2 50.6 173.5 164.6 351.0 164.01988 . . . . . . . . . . . . . . . . . . . . . . . . . . . . . . . . 147.7 43.9 145.8 136.7 316.0 140.21989 . . . . . . . . . . . . . . . . . . . . . . . . . . . . . . . . 145.3 41.5 145.1 129.7 313.5 137.71990 . . . . . . . . . . . . . . . . . . . . . . . . . . . . . . . . 145.0 39.7 144.7 130.2 314.0 137.31991 . . . . . . . . . . . . . . . . . . . . . . . . . . . . . . . . 144.3 39.5 142.1 127.2 321.6 136.31992 . . . . . . . . . . . . . . . . . . . . . . . . . . . . . . . . 142.2 40.8 137.1 127.6 320.8 134.3
. . . Category not applicable.1See appendix II for method of computation.
22

Table 2. Number and rate of days of care for discharges from short-stay hospitals by sex and age, and age-adjusted rate by sex:United States, 1980, 1985, and 1988–92[Discharges of inpatients from non-Federal hospitals. Excludes newborn infants]
Sex and year All agesUnder 15years
15–44years
45–64years
65 yearsand over
Age-adjustedrate1
Both sexes Number of days of care in thousands
1980 . . . . . . . . . . . . . . . . . . . . . . . . . . . . . . . . 274,508 16,191 81,951 71,008 105,358 . . .1985 . . . . . . . . . . . . . . . . . . . . . . . . . . . . . . . . 226,217 13,554 67,397 53,541 91,726 . . .1988 . . . . . . . . . . . . . . . . . . . . . . . . . . . . . . . . 203,678 13,028 56,558 43,901 90,191 . . .1989 . . . . . . . . . . . . . . . . . . . . . . . . . . . . . . . . 200,827 12,632 55,420 41,979 90,795 . . .1990 . . . . . . . . . . . . . . . . . . . . . . . . . . . . . . . . 197,422 11,655 54,062 42,153 89,552 . . .1991 . . . . . . . . . . . . . . . . . . . . . . . . . . . . . . . . 199,099 12,037 54,020 40,100 92,942 . . .1992 . . . . . . . . . . . . . . . . . . . . . . . . . . . . . . . . 190,386 12,289 48,660 39,952 89,484 . . .
Male
1980 . . . . . . . . . . . . . . . . . . . . . . . . . . . . . . . . 116,267 8,950 29,748 33,589 43,981 . . .1985 . . . . . . . . . . . . . . . . . . . . . . . . . . . . . . . . 97,269 7,647 25,268 26,135 38,219 . . .1988 . . . . . . . . . . . . . . . . . . . . . . . . . . . . . . . . 89,435 7,493 21,996 21,855 38,091 . . .1989 . . . . . . . . . . . . . . . . . . . . . . . . . . . . . . . . 88,493 7,408 21,155 21,429 38,501 . . .1990 . . . . . . . . . . . . . . . . . . . . . . . . . . . . . . . . 85,067 6,484 20,388 20,961 37,234 . . .1991 . . . . . . . . . . . . . . . . . . . . . . . . . . . . . . . . 86,930 6,981 20,698 20,157 39,095 . . .1992 . . . . . . . . . . . . . . . . . . . . . . . . . . . . . . . . 83,664 6,946 19,108 20,082 37,527 . . .
Female
1980 . . . . . . . . . . . . . . . . . . . . . . . . . . . . . . . . 158,241 7,241 52,204 37,420 61,377 . . .1985 . . . . . . . . . . . . . . . . . . . . . . . . . . . . . . . . 128,948 5,907 42,128 27,405 53,507 . . .1988 . . . . . . . . . . . . . . . . . . . . . . . . . . . . . . . . 114,242 5,536 34,562 22,045 52,100 . . .1989 . . . . . . . . . . . . . . . . . . . . . . . . . . . . . . . . 112,334 5,225 34,265 20,551 52,294 . . .1990 . . . . . . . . . . . . . . . . . . . . . . . . . . . . . . . . 112,355 5,171 33,674 21,191 52,318 . . .1991 . . . . . . . . . . . . . . . . . . . . . . . . . . . . . . . . 112,168 5,056 33,322 19,944 53,846 . . .1992 . . . . . . . . . . . . . . . . . . . . . . . . . . . . . . . . 106,722 5,342 29,552 19,870 51,957 . . .
Both sexes Rate of days of care per 1,000 population
1980 . . . . . . . . . . . . . . . . . . . . . . . . . . . . . . . . 1,216.7 315.7 786.8 1,596.9 4,098.4 1,216.71985 . . . . . . . . . . . . . . . . . . . . . . . . . . . . . . . . 957.7 263.0 603.3 1,201.6 3,228.0 942.91988 . . . . . . . . . . . . . . . . . . . . . . . . . . . . . . . . 838.8 248.4 492.6 966.5 2,994.1 815.51989 . . . . . . . . . . . . . . . . . . . . . . . . . . . . . . . . 819.3 237.4 480.3 915.9 2,959.2 793.41990 . . . . . . . . . . . . . . . . . . . . . . . . . . . . . . . . 796.9 215.4 465.3 911.5 2,867.7 770.21991 . . . . . . . . . . . . . . . . . . . . . . . . . . . . . . . . 794.6 218.3 461.8 858.5 2,927.0 765.51992 . . . . . . . . . . . . . . . . . . . . . . . . . . . . . . . . 751.0 219.6 416.1 827.1 2,771.7 720.8
Male
1980 . . . . . . . . . . . . . . . . . . . . . . . . . . . . . . . . 1,067.4 341.3 580.9 1,589.5 4,243.6 1,142.51985 . . . . . . . . . . . . . . . . . . . . . . . . . . . . . . . . 851.9 289.9 458.2 1,229.0 3,354.9 901.91988 . . . . . . . . . . . . . . . . . . . . . . . . . . . . . . . . 760.7 279.0 386.8 1,004.5 3,148.5 798.71989 . . . . . . . . . . . . . . . . . . . . . . . . . . . . . . . . 745.1 271.9 369.9 974.6 3,121.8 780.31990 . . . . . . . . . . . . . . . . . . . . . . . . . . . . . . . . 708.2 234.1 353.6 943.6 2,964.7 740.21991 . . . . . . . . . . . . . . . . . . . . . . . . . . . . . . . . 715.2 247.3 356.5 897.4 3,056.5 745.91992 . . . . . . . . . . . . . . . . . . . . . . . . . . . . . . . . 679.7 242.4 328.8 862.9 2,876.7 704.7
Female
1980 . . . . . . . . . . . . . . . . . . . . . . . . . . . . . . . . 1,356.0 288.8 985.9 1,603.7 4,000.3 1,292.71985 . . . . . . . . . . . . . . . . . . . . . . . . . . . . . . . . 1,056.6 234.8 744.8 1,176.5 3,143.0 987.21988 . . . . . . . . . . . . . . . . . . . . . . . . . . . . . . . . 912.1 216.2 596.4 931.5 2,890.3 837.41989 . . . . . . . . . . . . . . . . . . . . . . . . . . . . . . . . 888.9 201.1 588.8 861.7 2,849.9 812.11990 . . . . . . . . . . . . . . . . . . . . . . . . . . . . . . . . 880.3 195.8 575.4 881.9 2,802.6 803.31991 . . . . . . . . . . . . . . . . . . . . . . . . . . . . . . . . 869.3 187.9 565.6 822.4 2,839.6 789.41992 . . . . . . . . . . . . . . . . . . . . . . . . . . . . . . . . 818.3 195.6 502.3 793.8 2,700.5 740.5
. . . Category not applicable.1See appendix II for method of computation.
23

Table 3. Average length of stay for discharges from short-stay hospitals by sex and age, and age-adjusted average stay by sex: UnitedStates, 1980, 1985, and 1988–92[Discharges of inpatients from non-Federal hospitals. Excludes newborn infants]
Sex and year All agesUnder
15 years15–44years
45–64years
65 yearsand over
Ageadjusted1
Both sexes Average length of stay in days
1980 . . . . . . . . . . . . . . . . . . . . . . . . . . . . . . . . 7.3 4.4 5.2 8.2 10.7 7.31985 . . . . . . . . . . . . . . . . . . . . . . . . . . . . . . . . 6.5 4.6 4.8 7.0 8.7 6.41988 . . . . . . . . . . . . . . . . . . . . . . . . . . . . . . . . 6.5 5.0 4.7 6.8 8.9 6.51989 . . . . . . . . . . . . . . . . . . . . . . . . . . . . . . . . 6.5 4.9 4.7 6.7 8.9 6.41990 . . . . . . . . . . . . . . . . . . . . . . . . . . . . . . . . 6.4 4.8 4.6 6.8 8.7 6.31991 . . . . . . . . . . . . . . . . . . . . . . . . . . . . . . . . 6.4 4.8 4.6 6.5 8.6 6.31992 . . . . . . . . . . . . . . . . . . . . . . . . . . . . . . . . 6.2 4.9 4.3 6.3 8.2 6.1
Male
1980 . . . . . . . . . . . . . . . . . . . . . . . . . . . . . . . . 7.7 4.3 6.3 8.1 10.3 7.81985 . . . . . . . . . . . . . . . . . . . . . . . . . . . . . . . . 6.9 4.5 6.1 6.9 8.4 7.01988 . . . . . . . . . . . . . . . . . . . . . . . . . . . . . . . . 7.1 5.0 6.3 6.8 8.6 7.11989 . . . . . . . . . . . . . . . . . . . . . . . . . . . . . . . . 7.0 4.9 6.2 6.7 8.6 7.11990 . . . . . . . . . . . . . . . . . . . . . . . . . . . . . . . . 6.9 4.8 6.1 6.7 8.3 7.01991 . . . . . . . . . . . . . . . . . . . . . . . . . . . . . . . . 7.0 4.9 6.4 6.5 8.3 7.01992 . . . . . . . . . . . . . . . . . . . . . . . . . . . . . . . . 6.7 4.9 6.0 6.4 8.0 6.8
Female
1980 . . . . . . . . . . . . . . . . . . . . . . . . . . . . . . . . 7.0 4.5 4.8 8.3 11.0 6.81985 . . . . . . . . . . . . . . . . . . . . . . . . . . . . . . . . 6.2 4.6 4.3 7.1 9.0 6.01988 . . . . . . . . . . . . . . . . . . . . . . . . . . . . . . . . 6.2 4.9 4.1 6.8 9.1 6.01989 . . . . . . . . . . . . . . . . . . . . . . . . . . . . . . . . 6.1 4.9 4.1 6.6 9.1 5.91990 . . . . . . . . . . . . . . . . . . . . . . . . . . . . . . . . 6.1 4.9 4.0 6.8 8.9 5.91991 . . . . . . . . . . . . . . . . . . . . . . . . . . . . . . . . 6.0 4.8 4.0 6.5 8.8 5.81992 . . . . . . . . . . . . . . . . . . . . . . . . . . . . . . . . 5.8 4.8 3.7 6.2 8.4 5.5
1See appendix II for method of computation.
24

Table 4. Number and rate of discharges from short-stay hospitals by region and age, and age-adjusted rate by region: United States,1980, 1985, and 1988–92[Discharges of inpatients from non-Federal hospitals. Excludes newborn infants]
Region and year All agesUnder15 years
15–44years
45–64years
65 yearsand over
Allages
Under15 years
15–44years
45–64years
65 yearsand over
Age-adjustedrate1
Number in thousands Rate per 1,000 populatuion
United States
1980 . . . . . . . . . . . . . . . . . . . . . . . . . . . . . . . . 37,832 3,672 15,635 8,660 9,864 167.7 71.6 150.1 194.8 383.7 167.71985 . . . . . . . . . . . . . . . . . . . . . . . . . . . . . . . . 35,056 2,972 13,966 7,610 10,508 148.4 57.7 125.0 170.8 369.8 146.61988 . . . . . . . . . . . . . . . . . . . . . . . . . . . . . . . . 31,146 2,610 11,934 6,456 10,146 128.3 49.8 103.9 142.1 336.8 125.71989 . . . . . . . . . . . . . . . . . . . . . . . . . . . . . . . . 30,947 2,597 11,848 6,271 10,230 126.2 48.8 102.7 136.8 333.4 123.51990 . . . . . . . . . . . . . . . . . . . . . . . . . . . . . . . . 30,788 2,412 11,799 6,244 10,333 124.3 44.6 101.6 135.0 330.9 121.31991 . . . . . . . . . . . . . . . . . . . . . . . . . . . . . . . . 31,098 2,498 11,620 6,173 10,806 124.1 45.3 99.3 132.2 340.3 121.01992 . . . . . . . . . . . . . . . . . . . . . . . . . . . . . . . . 30,951 2,531 11,227 6,329 10,864 122.1 45.2 96.0 131.0 336.5 118.8
Northeast
1980 . . . . . . . . . . . . . . . . . . . . . . . . . . . . . . . . 7,868 700 3,107 1,886 2,176 160.3 67.7 140.3 179.6 356.7 156.21985 . . . . . . . . . . . . . . . . . . . . . . . . . . . . . . . . 7,168 529 2,673 1,614 2,353 144.1 54.2 114.1 161.1 358.2 137.61988 . . . . . . . . . . . . . . . . . . . . . . . . . . . . . . . . 7,078 634 2,503 1,514 2,428 140.3 64.4 105.0 151.7 356.0 133.61989 . . . . . . . . . . . . . . . . . . . . . . . . . . . . . . . . 7,044 621 2,579 1,455 2,389 139.1 62.3 108.3 146.0 346.4 132.41990 . . . . . . . . . . . . . . . . . . . . . . . . . . . . . . . . 6,895 550 2,566 1,425 2,354 135.9 54.5 108.1 143.5 337.7 129.11991 . . . . . . . . . . . . . . . . . . . . . . . . . . . . . . . . 7,153 662 2,522 1,455 2,515 140.6 64.5 106.7 146.4 357.0 133.51992 . . . . . . . . . . . . . . . . . . . . . . . . . . . . . . . . 7,141 570 2,494 1,553 2,524 139.9 55.0 106.8 152.3 354.2 132.2
Midwest
1980 . . . . . . . . . . . . . . . . . . . . . . . . . . . . . . . . 10,878 1,105 4,465 2,488 2,820 185.1 81.3 165.5 217.3 419.1 185.41985 . . . . . . . . . . . . . . . . . . . . . . . . . . . . . . . . 9,111 754 3,538 1,996 2,823 155.3 57.6 129.5 181.3 389.4 153.01988 . . . . . . . . . . . . . . . . . . . . . . . . . . . . . . . . 7,832 654 2,868 1,607 2,703 132.5 50.4 104.2 145.1 357.8 129.01989 . . . . . . . . . . . . . . . . . . . . . . . . . . . . . . . . 7,676 646 2,792 1,553 2,685 129.4 49.3 101.7 139.9 350.7 125.71990 . . . . . . . . . . . . . . . . . . . . . . . . . . . . . . . . 7,620 575 2,760 1,583 2,703 127.8 43.5 100.3 142.0 348.5 123.91991 . . . . . . . . . . . . . . . . . . . . . . . . . . . . . . . . 7,315 570 2,602 1,441 2,702 121.7 42.7 94.0 128.6 343.9 117.61992 . . . . . . . . . . . . . . . . . . . . . . . . . . . . . . . . 7,121 659 2,394 1,386 2,683 117.5 49.1 86.6 119.8 336.9 113.2
South
1980 . . . . . . . . . . . . . . . . . . . . . . . . . . . . . . . . 12,983 1,387 5,416 2,883 3,297 173.4 79.3 157.4 199.4 385.8 174.01985 . . . . . . . . . . . . . . . . . . . . . . . . . . . . . . . . 12,274 1,274 5,006 2,650 3,344 152.4 71.0 132.2 175.0 349.2 151.51988 . . . . . . . . . . . . . . . . . . . . . . . . . . . . . . . . 10,845 704 4,340 2,293 3,508 130.6 38.6 111.3 147.4 341.8 128.21989 . . . . . . . . . . . . . . . . . . . . . . . . . . . . . . . . 10,960 796 4,350 2,269 3,545 130.7 43.3 110.9 144.1 337.6 127.91990 . . . . . . . . . . . . . . . . . . . . . . . . . . . . . . . . 11,173 770 4,342 2,318 3,743 131.6 41.3 109.8 145.2 348.9 128.41991 . . . . . . . . . . . . . . . . . . . . . . . . . . . . . . . . 11,290 803 4,216 2,293 3,978 131.2 42.3 105.4 141.7 363.5 127.61992 . . . . . . . . . . . . . . . . . . . . . . . . . . . . . . . . 11,256 819 4,066 2,396 3,975 128.9 42.5 101.4 142.7 356.4 125.2
West
1980 . . . . . . . . . . . . . . . . . . . . . . . . . . . . . . . . 6,103 480 2,647 1,403 1,572 142.2 48.6 128.3 174.2 362.5 145.91985 . . . . . . . . . . . . . . . . . . . . . . . . . . . . . . . . 6,502 415 2,749 1,350 1,988 137.6 38.6 118.9 161.0 396.0 140.51988 . . . . . . . . . . . . . . . . . . . . . . . . . . . . . . . . 5,391 618 2,224 1,042 1,507 107.4 54.1 90.8 118.3 274.7 108.81989 . . . . . . . . . . . . . . . . . . . . . . . . . . . . . . . . 5,268 535 2,128 994 1,611 102.6 45.4 85.4 110.2 286.1 104.11990 . . . . . . . . . . . . . . . . . . . . . . . . . . . . . . . . 5,100 516 2,131 919 1,533 97.1 42.5 84.0 99.8 265.6 98.41991 . . . . . . . . . . . . . . . . . . . . . . . . . . . . . . . . 5,340 464 2,281 983 1,612 99.7 37.0 88.8 104.8 272.6 101.11992 . . . . . . . . . . . . . . . . . . . . . . . . . . . . . . . . 5,433 484 2,273 994 1,683 99.5 37.4 87.9 101.8 278.4 100.9
1See appendix II for method of computation.
25

Table 5. Number and rate of days of care for discharges from short-stay hospitals by region and age, and age-adjusted rate by region:United States, 1980, 1985, and 1988–92[Discharges of inpatients from non-Federal hospitals. Excludes newborn infants]
Region and yearAllages
Under15 years
15–44years
45–64years
65 yearsand over
Allages
Under15 years
15–44years
45–64years
65 yearsand over
Age-adjustedrate1
United States Number of days of care in thousands Rate of days of care per 1,000 population
1980 . . . . . . . . . . . . . . . . . . . . . . . . . . . . . . . . 274,508 16,191 81,951 71,008 105,358 1,216.7 315.7 786.8 1,596.9 4,098.4 1,216.71985 . . . . . . . . . . . . . . . . . . . . . . . . . . . . . . . . 226,217 13,554 67,397 53,541 91,726 957.7 263.0 603.3 1,201.6 3,228.0 942.91988 . . . . . . . . . . . . . . . . . . . . . . . . . . . . . . . . 203,678 13,028 56,558 43,901 90,191 838.8 248.4 492.6 966.5 2,994.1 815.51989 . . . . . . . . . . . . . . . . . . . . . . . . . . . . . . . . 200,827 12,632 55,420 41,979 90,795 819.3 237.4 480.3 915.9 2,959.2 793.41990 . . . . . . . . . . . . . . . . . . . . . . . . . . . . . . . . 197,422 11,655 54,062 42,153 89,552 796.9 215.4 465.3 911.5 2,867.7 770.21991 . . . . . . . . . . . . . . . . . . . . . . . . . . . . . . . . 199,099 12,037 54,020 40,100 92,942 794.6 218.3 461.8 858.5 2,927.0 765.51992 . . . . . . . . . . . . . . . . . . . . . . . . . . . . . . . . 190,386 12,289 48,660 39,952 89,482 751.0 219.6 416.1 827.1 2,771.7 720.8
Northeast
1980 . . . . . . . . . . . . . . . . . . . . . . . . . . . . . . . . 67,238 3,196 17,592 17,784 28,666 1,370.1 309.2 794.7 1,693.7 4,699.3 1,306.41985 . . . . . . . . . . . . . . . . . . . . . . . . . . . . . . . . 55,513 2,391 13,956 13,240 25,925 1,115.6 245.1 595.9 1,321.8 3,947.1 1,041.11988 . . . . . . . . . . . . . . . . . . . . . . . . . . . . . . . . 54,554 3,193 13,126 11,809 26,426 1,081.0 324.5 550.9 1,183.3 3,875.4 1,002.81989 . . . . . . . . . . . . . . . . . . . . . . . . . . . . . . . . 54,182 3,273 13,953 11,116 25,840 1,069.9 328.1 586.2 1,115.6 3,747.6 992.01990 . . . . . . . . . . . . . . . . . . . . . . . . . . . . . . . . 52,823 2,669 13,931 11,177 25,045 1,041.4 264.3 587.1 1,125.7 3,592.8 962.31991 . . . . . . . . . . . . . . . . . . . . . . . . . . . . . . . . 52,518 3,334 13,227 10,465 25,491 1,032.4 324.9 559.9 1,052.9 3,619.4 952.21992 . . . . . . . . . . . . . . . . . . . . . . . . . . . . . . . . 51,288 2,681 12,507 10,984 25,116 1,005.1 258.7 535.8 1,077.1 3,525.1 920.1
Midwest
1980 . . . . . . . . . . . . . . . . . . . . . . . . . . . . . . . . 82,000 5,014 25,142 21,286 30,559 1,395.7 369.0 931.7 1,859.0 4,542.0 1,397.91985 . . . . . . . . . . . . . . . . . . . . . . . . . . . . . . . . 61,514 3,932 18,987 14,376 24,219 1,048.5 300.6 694.9 1,305.7 3,340.0 1,027.01988 . . . . . . . . . . . . . . . . . . . . . . . . . . . . . . . . 50,118 2,887 13,526 10,706 22,999 847.8 222.5 491.7 966.5 3,044.6 815.01989 . . . . . . . . . . . . . . . . . . . . . . . . . . . . . . . . 49,046 3,026 13,328 10,180 22,513 826.7 230.7 485.4 916.8 2,940.9 792.31990 . . . . . . . . . . . . . . . . . . . . . . . . . . . . . . . . 48,698 2,674 12,971 10,613 22,441 816.4 202.2 471.3 952.3 2,893.7 780.91991 . . . . . . . . . . . . . . . . . . . . . . . . . . . . . . . . 47,448 2,746 12,625 9,298 22,780 789.6 205.7 456.2 829.8 2,899.3 751.31992 . . . . . . . . . . . . . . . . . . . . . . . . . . . . . . . . 43,903 3,087 10,914 8,519 21,384 724.6 230.0 394.8 736.9 2,685.7 685.8
South
1980 . . . . . . . . . . . . . . . . . . . . . . . . . . . . . . . . 88,216 6,072 27,154 22,325 32,665 1,178.0 347.4 789.3 1,544.1 3,822.7 1,183.21985 . . . . . . . . . . . . . . . . . . . . . . . . . . . . . . . . 73,817 5,479 23,212 17,862 27,265 916.7 305.3 613.2 1,179.1 2,846.9 909.21988 . . . . . . . . . . . . . . . . . . . . . . . . . . . . . . . . 67,658 3,139 19,690 15,139 29,690 814.9 172.3 505.0 972.9 2,892.7 793.71989 . . . . . . . . . . . . . . . . . . . . . . . . . . . . . . . . 68,983 3,458 19,851 14,951 30,723 822.9 188.3 506.2 949.2 2,926.0 797.01990 . . . . . . . . . . . . . . . . . . . . . . . . . . . . . . . . 67,810 3,438 18,642 14,962 30,769 799.0 184.6 471.3 937.3 2,868.1 771.01991 . . . . . . . . . . . . . . . . . . . . . . . . . . . . . . . . 70,331 3,646 19,054 14,658 32,973 817.2 192.3 476.5 905.7 3,013.4 785.51992 . . . . . . . . . . . . . . . . . . . . . . . . . . . . . . . . 67,141 3,962 17,227 15,147 30,804 769.1 205.8 429.5 902.3 2,761.5 737.6
West
1980 . . . . . . . . . . . . . . . . . . . . . . . . . . . . . . . . 37,054 1,909 12,065 9,613 13,469 863.6 193.1 584.7 1,193.4 3,106.9 903.01985 . . . . . . . . . . . . . . . . . . . . . . . . . . . . . . . . 35,373 1,751 11,242 8,062 14,318 748.4 162.9 486.4 961.8 2,852.1 776.11988 . . . . . . . . . . . . . . . . . . . . . . . . . . . . . . . . 31,347 3,810 10,216 6,246 11,075 624.3 333.5 417.1 709.3 2,018.4 638.11989 . . . . . . . . . . . . . . . . . . . . . . . . . . . . . . . . 28,615 2,875 8,288 5,733 11,719 557.5 244.4 332.6 635.8 2,080.9 571.51990 . . . . . . . . . . . . . . . . . . . . . . . . . . . . . . . . 28,091 2,874 8,519 5,401 11,297 535.0 236.5 335.8 586.5 1,956.5 547.31991 . . . . . . . . . . . . . . . . . . . . . . . . . . . . . . . . 28,802 2,311 9,114 5,679 11,698 538.0 184.0 354.8 605.5 1,979.1 550.51992 . . . . . . . . . . . . . . . . . . . . . . . . . . . . . . . . 28,053 2,559 8,012 5,302 12,180 513.9 198.0 309.9 543.4 2,015.6 524.8
1See appendix II for method of computation.
26

Table 6. Average length of stay for discharges from short-stay hospitals by region and age, and age-adjusted average stay by region:United States, 1980, 1985, and 1988–92[Discharges of inpatients from non-Federal hospitals. Excludes newborn infants]
Region and yearAllages
Under15 years
15–44years
45–64years
65 yearsand over
Ageadjusted1
United States Average length of stay in days
1980 . . . . . . . . . . . . . . . . . . . . . . . . . . . . . . . . 7.3 4.4 5.2 8.2 10.7 7.31985 . . . . . . . . . . . . . . . . . . . . . . . . . . . . . . . . 6.5 4.6 4.8 7.0 8.7 6.41988 . . . . . . . . . . . . . . . . . . . . . . . . . . . . . . . . 6.5 5.0 4.7 6.8 8.9 6.51989 . . . . . . . . . . . . . . . . . . . . . . . . . . . . . . . . 6.5 4.9 4.7 6.7 8.9 6.41990 . . . . . . . . . . . . . . . . . . . . . . . . . . . . . . . . 6.4 4.8 4.6 6.8 8.7 6.31991 . . . . . . . . . . . . . . . . . . . . . . . . . . . . . . . . 6.4 4.8 4.6 6.5 8.6 6.31992 . . . . . . . . . . . . . . . . . . . . . . . . . . . . . . . . 6.2 4.9 4.3 6.3 8.2 6.1
Northeast
1980 . . . . . . . . . . . . . . . . . . . . . . . . . . . . . . . . 8.5 4.6 5.7 9.4 13.2 8.41985 . . . . . . . . . . . . . . . . . . . . . . . . . . . . . . . . 7.7 4.5 5.2 8.2 11.0 7.61988 . . . . . . . . . . . . . . . . . . . . . . . . . . . . . . . . 7.7 5.0 5.2 7.8 10.9 7.51989 . . . . . . . . . . . . . . . . . . . . . . . . . . . . . . . . 7.7 5.3 5.4 7.6 10.8 7.51990 . . . . . . . . . . . . . . . . . . . . . . . . . . . . . . . . 7.7 4.8 5.4 7.8 10.6 7.51991 . . . . . . . . . . . . . . . . . . . . . . . . . . . . . . . . 7.3 5.0 5.2 7.2 10.1 7.11992 . . . . . . . . . . . . . . . . . . . . . . . . . . . . . . . . 7.2 4.7 5.0 7.1 10.0 7.0
Midwest
1980 . . . . . . . . . . . . . . . . . . . . . . . . . . . . . . . . 7.5 4.5 5.6 8.6 10.8 7.51985 . . . . . . . . . . . . . . . . . . . . . . . . . . . . . . . . 6.8 5.2 5.4 7.2 8.6 6.71988 . . . . . . . . . . . . . . . . . . . . . . . . . . . . . . . . 6.4 4.4 4.7 6.7 8.5 6.31989 . . . . . . . . . . . . . . . . . . . . . . . . . . . . . . . . 6.4 4.7 4.8 6.6 8.4 6.31990 . . . . . . . . . . . . . . . . . . . . . . . . . . . . . . . . 6.4 4.6 4.7 6.7 8.3 6.31991 . . . . . . . . . . . . . . . . . . . . . . . . . . . . . . . . 6.5 4.8 4.9 6.5 8.4 6.41992 . . . . . . . . . . . . . . . . . . . . . . . . . . . . . . . . 6.2 4.7 4.6 6.1 8.0 6.1
South
1980 . . . . . . . . . . . . . . . . . . . . . . . . . . . . . . . . 6.8 4.4 5.0 7.7 9.9 6.81985 . . . . . . . . . . . . . . . . . . . . . . . . . . . . . . . . 6.0 4.3 4.6 6.7 8.2 6.01988 . . . . . . . . . . . . . . . . . . . . . . . . . . . . . . . . 6.2 4.5 4.5 6.6 8.5 6.21989 . . . . . . . . . . . . . . . . . . . . . . . . . . . . . . . . 6.3 4.3 4.6 6.6 8.7 6.21990 . . . . . . . . . . . . . . . . . . . . . . . . . . . . . . . . 6.1 4.5 4.3 6.5 8.2 6.01991 . . . . . . . . . . . . . . . . . . . . . . . . . . . . . . . . 6.2 4.5 4.5 6.4 8.3 6.21992 . . . . . . . . . . . . . . . . . . . . . . . . . . . . . . . . 6.0 4.8 4.2 6.3 7.7 5.9
West
1980 . . . . . . . . . . . . . . . . . . . . . . . . . . . . . . . . 6.1 4.0 4.6 6.8 8.6 6.21985 . . . . . . . . . . . . . . . . . . . . . . . . . . . . . . . . 5.4 4.2 4.1 6.0 7.2 5.51988 . . . . . . . . . . . . . . . . . . . . . . . . . . . . . . . . 5.8 6.2 4.6 6.0 7.3 5.91989 . . . . . . . . . . . . . . . . . . . . . . . . . . . . . . . . 5.4 5.4 3.9 5.8 7.3 5.51990 . . . . . . . . . . . . . . . . . . . . . . . . . . . . . . . . 5.5 5.6 4.0 5.9 7.4 5.61991 . . . . . . . . . . . . . . . . . . . . . . . . . . . . . . . . 5.4 5.0 4.0 5.8 7.3 5.41992 . . . . . . . . . . . . . . . . . . . . . . . . . . . . . . . . 5.2 5.3 3.5 5.3 7.2 5.2
1See appendix II for method of computation.
27

Table 7. Number of deaths and fatality rate for discharges from short-stay hospitals by selected categories of first-listed diagnosis:United States, 1980, 1985, and 1988–92[Discharges of inpatients from non-Federal hospitals. Excludes newborn infants. Diagnostic groupings and code numbers are based on the International Classification ofDiseases, 9th Revision, Clinical Modification (ICD–9–CM)]
First-listed diagnosis and ICD–9–CM code 1980 1985 1988 1989 1990 1991 1992
Number of deaths in thousands
All deaths1 . . . . . . . . . . . . . . . . . . . . . . . . . . . . . . . . . . . . . . 964 944 947 883 877 918 821Heart disease . . . . . . 391–392.0,393–398,402,404,410–416,420–429 269 246 222 187 190 207 189Acute myocardial infarction . . . . . . . . . . . . . . . . . . . . . . . . 410 80 117 99 84 84 86 81Congestive heart failure . . . . . . . . . . . . . . . . . . . . . . . . . 428.0 40 45 54 44 53 60 57
Malignant neoplasms . . . . . . . . . . . . . . . . . . . . 140–208,230–234 242 190 167 161 150 151 140Pneumonia . . . . . . . . . . . . . . . . . . . . . . . . . . . . . . . . 480–486 45 65 77 77 82 82 72Cerebrovascular disease . . . . . . . . . . . . . . . . . . . . . . . 430–438 99 80 77 65 67 69 61Septicemia . . . . . . . . . . . . . . . . . . . . . . . . . . . . . . . . . . . 038 14 29 36 32 37 40 42Injury and poisoning . . . . . . . . . . . . . . . . . . . . . . . . . . 800–999 39 43 45 47 43 41 39
Fatality rate per 100 discharges
All deaths1 . . . . . . . . . . . . . . . . . . . . . . . . . . . . . . . . . . . . . . 2.5 2.7 3.0 2.9 2.8 3.0 2.7Heart disease . . . . . . 391–392.0,393–398,402,404,410–416,420–429 8.4 6.9 6.1 5.3 5.3 5.6 4.8Acute myocardial infarction . . . . . . . . . . . . . . . . . . . . . . . . 410 18.4 15.5 13.8 12.1 12.5 12.3 10.8Congestive heart failure . . . . . . . . . . . . . . . . . . . . . . . . . 428.0 9.9 8.1 8.5 6.8 7.5 7.9 6.9
Malignant neoplasms . . . . . . . . . . . . . . . . . . . . 140–208,230–234 12.9 9.9 10.0 10.0 9.6 9.5 8.9Pneumonia . . . . . . . . . . . . . . . . . . . . . . . . . . . . . . . . 480–486 5.7 7.6 8.3 7.5 7.8 7.6 6.8Cerebrovascular disease . . . . . . . . . . . . . . . . . . . . . . . 430–438 12.4 8.7 9.8 8.2 8.2 8.3 7.3Septicemia . . . . . . . . . . . . . . . . . . . . . . . . . . . . . . . . . . . 038 23.7 19.5 18.4 16.5 17.2 16.7 15.0Injury and poisoning . . . . . . . . . . . . . . . . . . . . . . . . . . 800–999 1.1 1.3 1.6 1.7 1.6 1.5 1.5
1Incudes deaths for diagnoses not shown in table.
28

Table 8. Number of discharges from short-stay hospitals by first-listed diagnosis: United States, 1980, 1985, and 1988–92[Discharges of inpatients from non-Federal hospitals. Excludes newborn infants. Diagnostic groupings and code numbers are based on the International Classification ofDiseases, 9th Revision, Clinical Modification (ICD–9–CM)]
First-listed diagnosis and ICD–9–CM code 1980 1985 1988 1989 1990 1991 1992
Number of discharges in thousands
All conditions . . . . . . . . . . . . . . . . . . . . . . . . . . . . . . . . . . . . . . . . . . . . . . 37,832 35,056 31,146 30,947 30,788 31,098 30,951
Infectious and parasitic diseases . . . . . . . . . . . . . . . . . . . . . . . . . . . . 001–139 649 669 693 726 737 759 808Septicemia . . . . . . . . . . . . . . . . . . . . . . . . . . . . . . . . . . . . . . . . . . . . 038 59 149 193 196 216 240 279
Neoplasms . . . . . . . . . . . . . . . . . . . . . . . . . . . . . . . . . . . . . . . . . 140–239 2,476 2,411 2,098 2,001 1,965 2,001 1,999Malignant neoplasms . . . . . . . . . . . . . . . . . . . . . . . . . . . . 140–208,230–234 1,873 1,911 1,670 1,608 1,571 1,594 1,577Malignant neoplasm of large intestine and rectum . . . . . . . . . . . 153–154,197.5 200 197 165 167 175 168 161Malignant neoplasm of trachea, bronchus, and lung . . . . . . . . . 162,197.0,197.3 277 315 236 239 231 236 215Malignant neoplasm of breast . . . . . . . . . . . . . . . . . . . . . . . 174–175,198.81 213 208 177 163 164 158 170
Benign neoplasms and neoplasms of uncertain behavior and unspecifiednature . . . . . . . . . . . . . . . . . . . . . . . . . . . . . . . . . . . . . 210–229,235–239 604 500 428 392 393 407 422
Endocrine, nutritional and metabolic diseases, and immunity disorders . . . . 240–279 1,145 1,068 1,038 1,097 1,089 1,143 1,178Diabetes mellitus . . . . . . . . . . . . . . . . . . . . . . . . . . . . . . . . . . . . . . . . 250 645 480 454 438 420 429 476Volume depletion . . . . . . . . . . . . . . . . . . . . . . . . . . . . . . . . . . . . . . 276.5 100 239 266 285 319 329 308
Diseases of the blood and blood-forming organs . . . . . . . . . . . . . . . . . . 280–289 336 342 295 318 324 348 322Mental disorders . . . . . . . . . . . . . . . . . . . . . . . . . . . . . . . . . . . . . . 290–319 1,692 1,700 1,559 1,514 1,538 1,657 1,711Psychoses . . . . . . . . . . . . . . . . . . . . . . . . . . . . . . . . . . . . . . . . 290–299 507 701 781 773 812 902 908Alcohol dependence syndrome . . . . . . . . . . . . . . . . . . . . . . . . . . . . . . . 303 439 388 237 218 239 228 258
Diseases of the nervous system and sense organs . . . . . . . . . . . . . . . . 320–389 1,762 1,211 922 819 770 755 708Diseases of the central nervous system . . . . . . . . . . . . . . . . . 320–336,340–349 408 425 348 341 342 331 314Diseases of the ear and mastoid process . . . . . . . . . . . . . . . . . . . . . 380–389 405 259 200 177 157 144 145
Diseases of the circulatory system . . . . . . . . . . . . . . . . . . . . . . . . . . 390–459 5,140 5,470 5,296 5,197 5,161 5,338 5,597Heart disease . . . . . . . . . . . . . . 391–392.0,393–398,402,404,410–416,420–429 3,201 3,584 3,641 3,534 3,556 3,704 3,935Acute myocardial infarction . . . . . . . . . . . . . . . . . . . . . . . . . . . . . . . . 410 431 755 716 695 675 697 747Coronary atherosclerosis . . . . . . . . . . . . . . . . . . . . . . . . . . . . . . . . 414.0 562 304 411 407 410 384 416Other ischemic heart disease . . . . . . . . . . . . . . . . . . . 411–413,414.1–414.9 793 992 921 893 870 876 971Cardiac dysrhythmias . . . . . . . . . . . . . . . . . . . . . . . . . . . . . . . . . . . . 427 389 511 491 487 483 536 542Congestive heart failure . . . . . . . . . . . . . . . . . . . . . . . . . . . . . . . . 428.0 401 557 634 643 701 764 822
Cerebrovascular disease . . . . . . . . . . . . . . . . . . . . . . . . . . . . . . . 430–438 796 916 784 795 812 835 829Diseases of the respiratory system . . . . . . . . . . . . . . . . . . . . . . . . . . 460–519 3,445 3,238 2,937 2,996 2,966 3,052 2,923Acute respiratory infections . . . . . . . . . . . . . . . . . . . . . . . . . . . . . . 460–466 523 464 445 475 487 518 376Chronic disease of tonsils and adenoids . . . . . . . . . . . . . . . . . . . . . . . . . . 474 457 288 197 134 102 76 73Pneumonia . . . . . . . . . . . . . . . . . . . . . . . . . . . . . . . . . . . . . . . . 480–486 782 854 924 1,033 1,052 1,088 1,059Asthma . . . . . . . . . . . . . . . . . . . . . . . . . . . . . . . . . . . . . . . . . . . . . . 493 408 462 479 475 476 490 463
Diseases of the digestive system . . . . . . . . . . . . . . . . . . . . . . . . . . . 520–579 4,650 3,873 3,268 3,295 3,239 3,256 3,187Ulcers of the stomach and small intestine . . . . . . . . . . . . . . . . . . . . . 531–534 363 292 256 256 244 237 232Appendicitis . . . . . . . . . . . . . . . . . . . . . . . . . . . . . . . . . . . . . . . 540–543 266 250 242 227 238 232 227Inguinal hernia . . . . . . . . . . . . . . . . . . . . . . . . . . . . . . . . . . . . . . . . . 550 509 384 257 213 168 135 112Noninfectious enteritis and colitis . . . . . . . . . . . . . . . . . . . . . . . . . . 555–558 621 474 362 378 373 351 354Cholelithiasis . . . . . . . . . . . . . . . . . . . . . . . . . . . . . . . . . . . . . . . . . . 574 458 474 484 482 506 552 512
Diseases of the genitourinary system . . . . . . . . . . . . . . . . . . . . . . . . . 580–629 3,599 2,805 2,204 2,191 2,175 2,071 2,018Calculus of kidney and ureter . . . . . . . . . . . . . . . . . . . . . . . . . . . . . . . . 592 310 325 287 278 272 241 218Hyperplasia of prostate . . . . . . . . . . . . . . . . . . . . . . . . . . . . . . . . . . . . 600 276 246 247 249 259 229 221
Complications of pregnancy, childbirth, and the puerperium1 . . . . . . . . . . . 630–676 1,010 968 837 756 734 723 662Abortions and ectopic and molar pregnancies . . . . . . . . . . . . . . . . . . 630–639 531 382 266 229 208 180 179
Diseases of the skin and subcutaneous tissue . . . . . . . . . . . . . . . . . . . 680–709 597 542 460 480 462 462 462Cellulitis and abscess . . . . . . . . . . . . . . . . . . . . . . . . . . . . . . . . . 681–682 201 257 280 303 288 297 307
Diseases of the musculoskeletal system and connective tissue . . . . . . . . . 710–739 2,245 2,170 1,647 1,569 1,592 1,600 1,610Arthropathies and related disorders . . . . . . . . . . . . . . . . . . . . . . . . . 710–719 543 465 459 431 479 526 554Intervertebral disc disorders . . . . . . . . . . . . . . . . . . . . . . . . . . . . . . . . . 722 385 508 417 396 425 391 407
Congenital anomalies . . . . . . . . . . . . . . . . . . . . . . . . . . . . . . . . . . . 740–759 343 269 227 207 182 192 191Certain conditions originating in the perinatal period . . . . . . . . . . . . . . . . 760–779 91 159 158 152 163 147 141Symptoms, signs, and ill-defined conditions . . . . . . . . . . . . . . . . . . . . . 780–799 637 534 398 381 410 386 350Injury and poisoning . . . . . . . . . . . . . . . . . . . . . . . . . . . . . . . . . . . 800–999 3,593 3,303 2,817 2,806 2,774 2,768 2,701Fractures, all sites . . . . . . . . . . . . . . . . . . . . . . . . . . . . . . . . . . . 800–829 1,163 1,129 1,014 1,021 1,017 1,034 1,016Fracture of neck of femur . . . . . . . . . . . . . . . . . . . . . . . . . . . . . . . . . 820 210 258 254 265 281 300 278
Intracranial injuries (excluding those with skull fracture) . . . . . . . . . . . . 850–854 295 268 201 186 184 180 152Lacerations and open wounds . . . . . . . . . . . . . . . . . . . . . . . . . . . . 870–904 334 277 232 224 240 193 180
Supplementary classifications . . . . . . . . . . . . . . . . . . . . . . . . . . . . . . V01–V82 4,421 4,324 4,295 4,444 4,507 4,438 4,383Females with deliveries . . . . . . . . . . . . . . . . . . . . . . . . . . . . . . . . . . . V27 3,762 3,854 3,781 3,937 4,025 3,973 3,910
1The first-listed diagnosis for females with deliveries is coded V27, shown under ‘‘Supplementary classifications.’’
NOTE: See ‘‘Medical Coding and Edit,’’ appendix I, for information about changes in coding system and coding modifications for the National Hospital Discharge Survey.
29

Table 9. Rate of discharges from short-stay hospitals by first-listed diagnosis: United States, 1980, 1985, and 1988–92[Discharges of inpatients from non-Federal hospitals. Excludes newborn infants. Diagnostic groupings and code numbers are based on the International Classification ofDiseases, 9th Revision, Clinical Modification (ICD–9–CM)]
First-listed diagnosis and ICD–9–CM code 1980 1985 1988 1989 1990 1991 1992
Rate of discharges per 10,000 population
All conditions . . . . . . . . . . . . . . . . . . . . . . . . . . . . . . . . . . . . . . . . . . . . . . 1,676.8 1,484.1 1,282.7 1,262.5 1,242.7 1,241.1 1,221.0
Infectious and parasitic diseases . . . . . . . . . . . . . . . . . . . . . . . . . . . . 001–139 28.8 28.3 28.5 29.6 29.7 30.3 31.9Septicemia . . . . . . . . . . . . . . . . . . . . . . . . . . . . . . . . . . . . . . . . . . . . 038 2.6 6.3 8.0 8.0 8.7 9.6 11.0
Neoplasms . . . . . . . . . . . . . . . . . . . . . . . . . . . . . . . . . . . . . . . . . 140–239 109.8 102.1 86.4 81.6 79.3 79.9 78.9Malignant neoplasms . . . . . . . . . . . . . . . . . . . . . . . . . . . . 140–208,230–234 83.0 80.9 68.8 65.6 63.4 63.6 62.2Malignant neoplasm of large intestine and rectum . . . . . . . . . . . 153–154,197.5 8.9 8.3 6.8 6.8 7.1 6.7 6.3Malignant neoplasm of trachea, bronchus, and lung . . . . . . . . . 162,197.0,197.3 12.3 13.3 9.7 9.8 9.3 9.4 8.5Malignant neoplasm of breast . . . . . . . . . . . . . . . . . . . . . . . 174–175,198.81 9.4 8.8 7.3 6.7 6.6 6.3 6.7
Benign neoplasms and neoplasms of uncertain behavior and unspecifiednature . . . . . . . . . . . . . . . . . . . . . . . . . . . . . . . . . . . . . 210–229,235–239 26.8 21.2 17.6 16.0 15.9 16.2 16.6
Endocrine, nutritional and metabolic diseases, and immunity disorders . . . . 240–279 50.8 45.2 42.7 44.7 44.0 45.6 46.5Diabetes mellitus . . . . . . . . . . . . . . . . . . . . . . . . . . . . . . . . . . . . . . . . 250 28.6 20.3 18.7 17.9 17.0 17.1 18.8Volume depletion . . . . . . . . . . . . . . . . . . . . . . . . . . . . . . . . . . . . . . 276.5 4.4 10.1 10.9 11.6 12.9 13.1 12.2
Diseases of the blood and blood-forming organs . . . . . . . . . . . . . . . . . . 280–289 14.9 14.5 12.1 13.0 13.1 13.9 12.7Mental disorders . . . . . . . . . . . . . . . . . . . . . . . . . . . . . . . . . . . . . . 290–319 75.0 72.0 64.2 61.8 62.1 66.1 67.5Psychoses . . . . . . . . . . . . . . . . . . . . . . . . . . . . . . . . . . . . . . . . 290–299 22.5 29.7 32.2 31.5 32.8 36.0 35.8Alcohol dependence syndrome . . . . . . . . . . . . . . . . . . . . . . . . . . . . . . . 303 19.5 16.4 9.8 8.9 9.6 9.1 10.2
Diseases of the nervous system and sense organs . . . . . . . . . . . . . . . . 320–389 78.1 51.3 38.0 33.4 31.1 30.1 27.9Diseases of the central nervous system . . . . . . . . . . . . . . . . . 320–336,340–349 18.1 18.0 14.3 13.9 13.8 13.2 12.4Diseases of the ear and mastoid process . . . . . . . . . . . . . . . . . . . . . 380–389 18.0 11.0 8.3 7.2 6.4 5.8 5.7
Diseases of the circulatory system . . . . . . . . . . . . . . . . . . . . . . . . . . 390–459 227.8 231.6 218.1 212.0 208.3 213.1 220.8Heart disease . . . . . . . . . . . . . . 391–392.0,393–398,402,404,410–416,420–429 141.9 151.7 150.0 144.1 143.5 147.8 155.2Acute myocardial infarction . . . . . . . . . . . . . . . . . . . . . . . . . . . . . . . . 410 19.1 31.9 29.5 28.3 27.2 27.8 29.5Coronary atherosclerosis . . . . . . . . . . . . . . . . . . . . . . . . . . . . . . . . 414.0 24.9 12.9 16.9 16.6 16.5 15.3 16.4Other ischemic heart disease . . . . . . . . . . . . . . . . . . . 411–413,414.1–414.9 35.1 42.0 37.9 36.4 35.1 35.0 38.3Cardiac dysrhythmias . . . . . . . . . . . . . . . . . . . . . . . . . . . . . . . . . . . . 427 17.2 21.6 20.2 19.9 19.5 21.4 21.4Congestive heart failure . . . . . . . . . . . . . . . . . . . . . . . . . . . . . . . . 428.0 17.8 23.6 26.1 26.2 28.3 30.5 32.4
Cerebrovascular disease . . . . . . . . . . . . . . . . . . . . . . . . . . . . . . . 430–438 35.3 38.8 32.3 32.4 32.8 33.3 32.7Diseases of the respiratory system . . . . . . . . . . . . . . . . . . . . . . . . . . 460–519 152.7 137.1 120.9 122.2 119.7 121.8 115.3Acute respiratory infections . . . . . . . . . . . . . . . . . . . . . . . . . . . . . . 460–466 23.2 19.7 18.3 19.4 19.7 20.7 14.8Chronic disease of tonsils and adenoids . . . . . . . . . . . . . . . . . . . . . . . . . . 474 20.3 12.2 8.1 5.5 4.1 3.0 2.9Pneumonia . . . . . . . . . . . . . . . . . . . . . . . . . . . . . . . . . . . . . . . . 480–486 34.7 36.2 38.1 42.2 42.5 43.4 41.8Asthma . . . . . . . . . . . . . . . . . . . . . . . . . . . . . . . . . . . . . . . . . . . . . . 493 18.1 19.5 19.7 19.4 19.2 19.6 18.3
Diseases of the digestive system . . . . . . . . . . . . . . . . . . . . . . . . . . . 520–579 206.1 164.0 134.6 134.4 130.7 129.9 125.7Ulcers of the stomach and small intestine . . . . . . . . . . . . . . . . . . . . . 531–534 16.1 12.4 10.5 10.4 9.8 9.5 9.1Appendicitis . . . . . . . . . . . . . . . . . . . . . . . . . . . . . . . . . . . . . . . 540–543 11.8 10.6 10.0 9.3 9.6 9.2 9.0Inguinal hernia . . . . . . . . . . . . . . . . . . . . . . . . . . . . . . . . . . . . . . . . . 550 22.6 16.3 10.6 8.7 6.8 5.4 4.4Noninfectious enteritis and colitis . . . . . . . . . . . . . . . . . . . . . . . . . . 555–558 27.5 20.1 14.9 15.4 15.1 14.0 13.9Cholelithiasis . . . . . . . . . . . . . . . . . . . . . . . . . . . . . . . . . . . . . . . . . . 574 20.3 20.0 19.9 19.7 20.4 22.0 20.2
Diseases of the genitourinary system . . . . . . . . . . . . . . . . . . . . . . . . . 580–629 159.5 118.8 90.8 89.4 87.8 82.7 79.6Calculus of kidney and ureter . . . . . . . . . . . . . . . . . . . . . . . . . . . . . . . . 592 13.7 13.8 11.8 11.3 11.0 9.6 8.6Hyperplasia of prostate . . . . . . . . . . . . . . . . . . . . . . . . . . . . . . . . . . . . 600 12.2 10.4 10.2 10.1 10.5 9.2 8.7
Complications of pregnancy, childbirth, and the puerperium1 . . . . . . . . . . . 630–676 44.8 41.0 34.5 30.8 29.6 28.8 26.1Abortions and ectopic and molar pregnancies . . . . . . . . . . . . . . . . . . 630–639 23.5 16.2 10.9 9.4 8.4 7.2 7.0
Diseases of the skin and subcutaneous tissue . . . . . . . . . . . . . . . . . . . 680–709 26.5 22.9 18.9 19.6 18.6 18.4 18.2Cellulitis and abscess . . . . . . . . . . . . . . . . . . . . . . . . . . . . . . . . . 681–682 8.9 10.9 11.5 12.3 11.6 11.9 12.1
Diseases of the musculoskeletal system and connective tissue . . . . . . . . . 710–739 99.5 91.9 67.8 64.0 64.3 63.9 63.5Arthropathies and related disorders . . . . . . . . . . . . . . . . . . . . . . . . . 710–719 24.1 19.7 18.9 17.6 19.4 21.0 21.9Intervertebral disc disorders . . . . . . . . . . . . . . . . . . . . . . . . . . . . . . . . . 722 17.1 21.5 17.2 16.2 17.1 15.6 16.0
Congenital anomalies . . . . . . . . . . . . . . . . . . . . . . . . . . . . . . . . . . . 740–759 15.2 11.4 9.3 8.4 7.4 7.7 7.6Certain conditions originating in the perinatal period . . . . . . . . . . . . . . . . 760–779 4.0 6.7 6.5 6.2 6.6 5.9 5.6Symptoms, signs, and ill-defined conditions . . . . . . . . . . . . . . . . . . . . . 780–799 28.2 22.6 16.4 15.5 16.6 15.4 13.8Injury and poisoning . . . . . . . . . . . . . . . . . . . . . . . . . . . . . . . . . . . 800–999 159.2 139.8 116.0 114.5 112.0 110.5 106.6Fractures, all sites . . . . . . . . . . . . . . . . . . . . . . . . . . . . . . . . . . . 800–829 51.5 47.8 41.8 41.7 41.0 41.3 40.1Fracture of neck of femur . . . . . . . . . . . . . . . . . . . . . . . . . . . . . . . . . 820 9.3 10.9 10.5 10.8 11.3 12.0 11.0
Intracranial injuries (excluding those with skull fracture) . . . . . . . . . . . . 850–854 13.1 11.4 8.3 7.6 7.4 7.2 6.0Lacerations and open wounds . . . . . . . . . . . . . . . . . . . . . . . . . . . . 870–904 14.8 11.7 9.6 9.2 9.7 7.7 7.1
Supplementary classifications . . . . . . . . . . . . . . . . . . . . . . . . . . . . . . V01–V82 195.9 183.1 176.9 181.3 181.9 177.1 172.9Females with deliveries . . . . . . . . . . . . . . . . . . . . . . . . . . . . . . . . . . . V27 166.8 163.2 155.7 160.6 162.5 158.6 154.2
1The first-listed diagnoses for females with deliveries is coded V27, shown under ‘‘Supplementary classifications.’’
NOTE: See ‘‘Medical Coding and Edit,’’ appendix I, for information about changes in coding system and coding modifications for the National Hospital Discharge Survey.
30

Table 10. Number of days of care for discharges from short-stay hospitals by first-listed diagnosis: United States, 1980, 1985, and1988–92[Discharges of inpatients from non-Federal hospitals. Excludes newborn infants. Diagnostic groupings and code numbers are based on the International Classification ofDiseases, 9th Revision, Clinical Modifications (ICD–9–CM)]
First-listed diagnosis and ICD–9–CM code 1980 1985 1988 1989 1990 1991 1992
Number of days of care in thousands
All conditions . . . . . . . . . . . . . . . . . . . . . . . . . . . . . . . . . . . . . . . . . . . . . . 274,508 226,217 203,678 200,827 197,422 199,099 190,386
Infectious and parasitic diseases . . . . . . . . . . . . . . . . . . . . . . . . . . . . 001–139 4,509 4,664 5,603 5,560 6,725 6,432 6,401Septicemia . . . . . . . . . . . . . . . . . . . . . . . . . . . . . . . . . . . . . . . . . . . . 038 849 1,770 2,484 2,173 2,858 2,790 3,014
Neoplasms . . . . . . . . . . . . . . . . . . . . . . . . . . . . . . . . . . . . . . . . . 140–239 26,004 19,740 17,792 16,692 16,771 16,414 15,379Malignant neoplasms . . . . . . . . . . . . . . . . . . . . . . . . . . . . 140–208,230–234 22,273 17,001 15,676 14,843 14,693 14,602 13,433Malignant neoplasms of large intestine and rectum . . . . . . . . . . . 153–154,197.5 3,143 2,430 2,150 2,337 2,402 2,448 1,848Malignant neoplasm of trachea, bronchus, and lung . . . . . . . . . 162,197.0,197.3 3,561 2,884 2,233 2,068 1,961 2,034 1,783Malignant neoplasm of breast . . . . . . . . . . . . . . . . . . . . . . . 174–175,198.81 2,330 1,489 990 882 751 695 695
Benign neoplasms and neoplasms of uncertain behavior and unspecifiednature . . . . . . . . . . . . . . . . . . . . . . . . . . . . . . . . . . . . . 210–229,235–239 3,731 2,740 2,117 1,849 2,078 1,812 1,947
Endocrine, nutritional and metabolic diseases, and immunity disorders . . . . 240–279 10,972 7,845 7,784 7,514 7,610 8,092 7,488Diabetes mellitus . . . . . . . . . . . . . . . . . . . . . . . . . . . . . . . . . . . . . . . . 250 6,754 3,901 3,734 3,308 3,295 3,043 3,274Volume depletion . . . . . . . . . . . . . . . . . . . . . . . . . . . . . . . . . . . . . . 276.5 895 1,481 1,879 1,931 2,085 2,479 1,985
Diseases of the blood and blood-forming organs . . . . . . . . . . . . . . . . . . 280–289 2,420 2,050 1,826 1,907 1,877 2,163 1,950Mental disorders . . . . . . . . . . . . . . . . . . . . . . . . . . . . . . . . . . . . . . 290–319 19,578 20,956 20,339 19,254 18,824 18,966 18,581Psychoses . . . . . . . . . . . . . . . . . . . . . . . . . . . . . . . . . . . . . . . . 290–299 7,480 10,435 11,812 11,194 11,861 12,153 11,746Alcohol dependence syndrome . . . . . . . . . . . . . . . . . . . . . . . . . . . . . . . 303 4,424 4,169 2,643 2,312 2,366 2,167 2,438
Diseases of the nervous system and sense organs . . . . . . . . . . . . . . . . 320–389 9,597 6,595 4,988 4,527 4,268 4,271 3,907Diseases of the central nervous system . . . . . . . . . . . . . . . . . 320–336,340–349 4,372 4,092 3,276 2,937 2,955 2,924 2,772Diseases of the ear and mastoid process . . . . . . . . . . . . . . . . . . . . . 380–389 1,277 729 499 461 437 409 381
Diseases of the circulatory system . . . . . . . . . . . . . . . . . . . . . . . . . . 390–459 51,431 43,144 39,927 39,291 37,899 38,965 39,379Heart disease . . . . . . . . . . . . . . 391–392.0,393–398,402,404,410–416,420–429 30,500 26,082 25,883 24,706 24,557 25,279 26,256Acute myocardial infarction . . . . . . . . . . . . . . . . . . . . . . . . . . . . . . . . 410 5,432 7,152 6,432 5,947 5,674 5,666 6,058Coronary atherosclerosis . . . . . . . . . . . . . . . . . . . . . . . . . . . . . . . . 414.0 5,625 2,016 2,502 2,521 2,393 2,735 2,342Other ischemic heart disease . . . . . . . . . . . . . . . . . . . 411–413,414.1–414.9 6,078 5,379 4,871 4,661 4,503 4,423 4,831Cardiac dysrhythmias . . . . . . . . . . . . . . . . . . . . . . . . . . . . . . . . . . . . 427 2,963 3,148 2,758 2,805 2,795 2,825 2,835Congestive heart failure . . . . . . . . . . . . . . . . . . . . . . . . . . . . . . . . 428.0 4,154 4,459 5,560 5,387 5,604 6,070 6,506Cerebrovascular disease . . . . . . . . . . . . . . . . . . . . . . . . . . . . . . 430–438 10,114 9,600 7,611 8,130 7,727 7,805 7,302
Diseases of the respiratory system . . . . . . . . . . . . . . . . . . . . . . . . . . 460–519 21,649 19,583 19,435 20,133 20,433 20,651 19,753Acute respiratory infections . . . . . . . . . . . . . . . . . . . . . . . . . . . . . . 460–466 2,439 2,073 2,282 2,341 2,494 2,467 1,495Chronic disease of tonsils and adenoids . . . . . . . . . . . . . . . . . . . . . . . . . . 474 870 437 241 160 128 91 95Pneumonia . . . . . . . . . . . . . . . . . . . . . . . . . . . . . . . . . . . . . . . . 480–486 6,497 6,788 7,801 8,343 8,744 8,954 8,793Asthma . . . . . . . . . . . . . . . . . . . . . . . . . . . . . . . . . . . . . . . . . . . . . . 493 2,435 2,275 2,279 2,130 2,222 2,224 2,008
Diseases of the digestive system . . . . . . . . . . . . . . . . . . . . . . . . . . . 520–579 32,342 23,950 20,179 20,727 19,197 19,347 18,404Ulcers of the stomach and small intestine . . . . . . . . . . . . . . . . . . . . . 531–534 3,101 2,088 1,850 1,882 1,593 1,643 1,607Appendicitis . . . . . . . . . . . . . . . . . . . . . . . . . . . . . . . . . . . . . . . 540–543 1,457 1,248 1,254 1,113 1,044 982 1,009Inguinal hernia . . . . . . . . . . . . . . . . . . . . . . . . . . . . . . . . . . . . . . . . . 550 2,404 1,231 636 547 383 324 280Noninfectious enteritis and colitis . . . . . . . . . . . . . . . . . . . . . . . . . . 555–558 3,459 2,372 2,031 2,069 1,814 1,948 1,732Cholelithiasis . . . . . . . . . . . . . . . . . . . . . . . . . . . . . . . . . . . . . . . . . . 574 4,254 3,558 3,162 3,055 2,925 2,745 2,236
Diseases of the genitourinary system . . . . . . . . . . . . . . . . . . . . . . . . . 580–629 20,068 14,531 11,600 11,451 10,989 10,011 9,448Calculus of kidney and ureter . . . . . . . . . . . . . . . . . . . . . . . . . . . . . . . . 592 1,542 1,217 884 847 838 663 678Hyperplasia of prostate . . . . . . . . . . . . . . . . . . . . . . . . . . . . . . . . . . . . 600 2,459 1,572 1,550 1,299 1,283 1,215 971
Complications of pregnancy, childbirth, and the puerperium1 . . . . . . . . . . . 630–676 2,531 2,461 2,286 2,119 1,913 2,105 1,703Abortions and ectopic and molar pregnancies . . . . . . . . . . . . . . . . . . 630–639 1,129 821 609 531 438 432 352
Diseases of the skin and subcutaneous tissue . . . . . . . . . . . . . . . . . . . 680–709 4,803 4,292 3,710 3,857 3,670 3,889 3,583Cellulitis and abscess . . . . . . . . . . . . . . . . . . . . . . . . . . . . . . . . . 681–682 1,618 1,968 1,963 2,208 2,059 2,121 2,070
Diseases of the musculoskeletal system and connective tissue . . . . . . . . . 710–739 18,679 14,609 10,403 10,231 10,222 10,224 10,017Arthropathies and related disorders . . . . . . . . . . . . . . . . . . . . . . . . . 710–719 5,090 3,584 3,416 3,321 3,752 3,891 4,027Intervertebral disc disorders . . . . . . . . . . . . . . . . . . . . . . . . . . . . . . . . . 722 3,791 3,693 2,466 2,149 2,167 1,955 1,786
Congenital anomalies . . . . . . . . . . . . . . . . . . . . . . . . . . . . . . . . . . . 740–759 2,265 1,506 1,349 1,211 1,099 1,187 1,212Certain conditions originating in the perinatal period . . . . . . . . . . . . . . . . 760–779 787 2,062 1,968 1,720 1,657 1,572 1,743Symptoms, signs, and ill-defined conditions . . . . . . . . . . . . . . . . . . . . . 780–799 2,897 2,023 1,319 1,243 1,163 1,168 1,038Injury and poisoning . . . . . . . . . . . . . . . . . . . . . . . . . . . . . . . . . . . 800–999 27,640 21,917 19,147 19,086 18,891 19,138 16,856Fractures, all sites . . . . . . . . . . . . . . . . . . . . . . . . . . . . . . . . . . . 800–829 12,583 9,864 8,558 8,691 8,435 8,733 7,842Fracture of neck of femur . . . . . . . . . . . . . . . . . . . . . . . . . . . . . . . . . 820 4,333 3,784 3,405 3,492 3,610 3,692 3,250
Intracranial injuries (excluding those with skull fracture) . . . . . . . . . . . . 850–854 1,665 1,497 1,108 1,302 1,016 1,041 839Lacerations and open wounds . . . . . . . . . . . . . . . . . . . . . . . . . . . . 870–904 1,720 1,196 957 838 1,031 940 684
Supplementary classifications . . . . . . . . . . . . . . . . . . . . . . . . . . . . . . V01–V82 16,337 14,288 14,023 14,303 14,212 14,504 13,542Females with deliveries . . . . . . . . . . . . . . . . . . . . . . . . . . . . . . . . . . . V27 14,158 12,640 11,029 11,468 11,225 11,028 10,040
1The first-listed diagnoses for females with deliveries is coded V27, shown under ‘‘Supplementary classifications.’’
NOTE: See ‘‘Medical Coding and Edit,’’ appendix I, for information about changes in coding system and coding modifications for the National Hospital Discharge Survey.
31

Table 11. Rate of days of care for discharges from short-stay hospitals by first-listed diagnosis: United States, 1980, 1985, and 1988–92[Discharges of inpatients from non-Federal hospitals. Excludes newborn infants. Diagnostic groupings and code numbers are based on the International Classification ofDiseases, 9th Revision, Clinical Modification (ICD–9–CM)]
First-listed diagnosis and ICD–9–CM code 1980 1985 1988 1989 1990 1991 1992
Rate of days of care per 10,000 population
All conditions . . . . . . . . . . . . . . . . . . . . . . . . . . . . . . . . . . . . . . . . . . . . . . 12,166.8 9,576.6 8,388.1 8,192.6 7,968.6 7,946.0 7,510.4
Infectious and parasitic diseases . . . . . . . . . . . . . . . . . . . . . . . . . . . . 001–139 199.9 197.5 230.8 226.8 271.4 256.7 252.5Septicemia . . . . . . . . . . . . . . . . . . . . . . . . . . . . . . . . . . . . . . . . . . . . 038 37.6 75.0 102.3 88.6 115.4 111.3 118.9
Neoplasms . . . . . . . . . . . . . . . . . . . . . . . . . . . . . . . . . . . . . . . . . 140–239 1,152.6 835.7 732.7 680.9 676.9 655.1 606.7Malignant neoplasms . . . . . . . . . . . . . . . . . . . . . . . . . . . . 140–208,230–234 987.2 719.7 645.6 605.5 593.0 582.8 529.9Malignant neoplasm of large intestine and rectum . . . . . . . . . . . 153–154,197.5 139.3 102.9 88.6 95.3 96.9 97.7 72.9Malignant neoplasm of trachea, bronchus, and lung . . . . . . . . . 162,197.0,197.3 157.8 122.1 92.0 84.4 79.2 81.2 70.3Malignant neoplasm of breast . . . . . . . . . . . . . . . . . . . . . . . 174–175,198.81 103.3 63.1 40.8 36.0 30.3 27.8 27.4
Benign neoplasms and neoplasms of uncertain behavior and unspecifiednature . . . . . . . . . . . . . . . . . . . . . . . . . . . . . . . . . . . . 210–229,235–239 165.4 116.0 87.2 75.4 83.9 72.3 76.8
Endocrine, nutritional and metabolic diseases, and immunity disorders . . . . 240–279 486.3 332.1 320.6 306.5 307.2 322.9 295.4Diabetes mellitus . . . . . . . . . . . . . . . . . . . . . . . . . . . . . . . . . . . . . . . . 250 299.4 165.1 153.8 134.9 133.0 121.4 129.2Volume depletion . . . . . . . . . . . . . . . . . . . . . . . . . . . . . . . . . . . . . . 276.5 39.7 62.7 77.4 78.8 84.1 98.9 78.3
Diseases of the blood and blood-forming organs . . . . . . . . . . . . . . . . . . 280–289 107.3 86.8 75.2 77.8 75.8 86.3 76.9Mental disorders . . . . . . . . . . . . . . . . . . . . . . . . . . . . . . . . . . . . . . 290–319 867.8 887.1 837.6 785.4 759.8 756.9 733.0Psychoses . . . . . . . . . . . . . . . . . . . . . . . . . . . . . . . . . . . . . . . . 290–299 331.5 441.7 486.5 456.6 478.7 485.0 463.3Alcohol dependence syndrome . . . . . . . . . . . . . . . . . . . . . . . . . . . . . . . 303 196.1 176.5 108.9 94.3 95.5 86.5 96.2
Diseases of the nervous system and sense organs . . . . . . . . . . . . . . . . 320–389 425.4 279.2 205.4 184.7 172.3 170.4 154.1Diseases of the central nervous system . . . . . . . . . . . . . . . . . 320–336,340–349 193.8 173.2 134.9 119.8 119.3 116.7 109.3Diseases of the ear and mastoid process . . . . . . . . . . . . . . . . . . . . . 380–389 56.6 30.8 20.6 18.8 17.6 16.3 15.0
Diseases of the circulatory system . . . . . . . . . . . . . . . . . . . . . . . . . . 390–459 2,279.5 1,826.4 1,644.3 1,602.9 1,529.7 1,555.1 1,553.4Heart disease . . . . . . . . . . . . . . 391–392.0,393–398,402,404,410–416,420–429 1,351.8 1,104.2 1,065.9 1,007.9 991.2 1,008.9 1,035.7Acute myocardial infarction . . . . . . . . . . . . . . . . . . . . . . . . . . . . . . . . 410 240.7 302.8 264.9 242.6 229.0 226.1 239.0Coronary atherosclerosis . . . . . . . . . . . . . . . . . . . . . . . . . . . . . . . . 414.0 249.3 85.3 103.0 102.8 96.6 109.1 92.4Other ischemic heart disease . . . . . . . . . . . . . . . . . . . 411–413,414.1–414.9 269.4 227.7 200.6 190.1 181.8 176.5 190.6Cardiac dysrhythmias . . . . . . . . . . . . . . . . . . . . . . . . . . . . . . . . . . . . 427 131.3 133.3 113.6 114.4 112.8 112.7 111.8Congestive heart failure . . . . . . . . . . . . . . . . . . . . . . . . . . . . . . . . 428.0 184.1 188.8 229.0 219.8 226.2 242.2 256.7
Cerebrovascular disease . . . . . . . . . . . . . . . . . . . . . . . . . . . . . . . 430–438 448.3 406.4 313.5 331.7 311.9 311.5 288.0Diseases of the respiratory system . . . . . . . . . . . . . . . . . . . . . . . . . . 460–519 959.5 829.0 800.4 821.3 824.8 824.2 779.2Acute respiratory infections . . . . . . . . . . . . . . . . . . . . . . . . . . . . . . 460–466 108.1 87.8 94.0 95.5 100.6 98.5 59.0Chronic disease of tonsils and adenoids . . . . . . . . . . . . . . . . . . . . . . . . . . 474 38.6 18.5 9.9 6.5 5.2 3.6 3.8Pneumonia . . . . . . . . . . . . . . . . . . . . . . . . . . . . . . . . . . . . . . . . 480–486 288.0 287.3 321.3 340.4 352.9 357.4 346.8Asthma . . . . . . . . . . . . . . . . . . . . . . . . . . . . . . . . . . . . . . . . . . . . . . 493 107.9 96.3 93.9 86.9 89.7 88.8 79.2
Diseases of the digestive system . . . . . . . . . . . . . . . . . . . . . . . . . . . 520–579 1,433.5 1,013.9 831.1 845.6 774.9 772.1 726.0Ulcers of the stomach and small intestine . . . . . . . . . . . . . . . . . . . . . 531–534 137.4 88.4 76.2 76.8 64.3 65.6 63.4Appendicitis . . . . . . . . . . . . . . . . . . . . . . . . . . . . . . . . . . . . . . . 540–543 64.6 52.9 51.6 45.4 42.2 39.2 39.8Inguinal hernia . . . . . . . . . . . . . . . . . . . . . . . . . . . . . . . . . . . . . . . . . 550 106.5 52.1 26.2 22.3 15.5 12.9 11.0Noninfectious enteritis and colitis . . . . . . . . . . . . . . . . . . . . . . . . . . 555–558 153.3 100.4 83.6 84.4 73.2 77.7 68.3Cholelithiasis . . . . . . . . . . . . . . . . . . . . . . . . . . . . . . . . . . . . . . . . . . 574 188.5 150.6 130.2 124.6 118.1 109.6 88.2
Diseases of the genitourinary system . . . . . . . . . . . . . . . . . . . . . . . . . 580–629 889.4 615.1 477.7 467.1 443.5 399.5 372.7Calculus of kidney and ureter . . . . . . . . . . . . . . . . . . . . . . . . . . . . . . . . 592 68.3 51.5 36.4 34.5 33.8 26.5 26.7Hyperplasia of prostate . . . . . . . . . . . . . . . . . . . . . . . . . . . . . . . . . . . . 600 109.0 66.6 63.8 53.0 51.8 48.5 38.3
Complications of pregnancy, childbirth, and the puerperium1 . . . . . . . . . . . 630–676 112.2 104.2 94.1 86.5 77.2 84.0 67.2Abortions and ectopic and molar pregnancies . . . . . . . . . . . . . . . . . . 630–639 50.0 34.8 25.1 21.7 17.7 17.2 13.9
Diseases of the skin and subcutaneous tissue . . . . . . . . . . . . . . . . . . . 680–709 212.9 181.7 152.8 157.4 148.1 155.2 141.3Cellulitis and abscess . . . . . . . . . . . . . . . . . . . . . . . . . . . . . . . . . 681–682 71.7 83.3 80.8 90.1 83.1 84.6 81.6
Diseases of the musculoskeletal system and connective tissue . . . . . . . . . 710–739 827.9 618.5 428.4 417.4 412.6 408.0 395.2Arthropathies and related disorders . . . . . . . . . . . . . . . . . . . . . . . . . 710–719 225.6 151.7 140.7 135.5 151.4 155.3 158.9Intervertebral disc disorders . . . . . . . . . . . . . . . . . . . . . . . . . . . . . . . . . 722 168.0 156.4 101.6 87.7 87.4 78.0 70.5
Congenital anomalies . . . . . . . . . . . . . . . . . . . . . . . . . . . . . . . . . . . 740–759 100.4 63.7 55.6 49.4 44.4 47.4 47.8Certain conditions originating in the perinatal period . . . . . . . . . . . . . . . . 760–779 34.9 87.3 81.0 70.2 66.9 62.8 68.7Symptoms, signs, and ill-defined conditions . . . . . . . . . . . . . . . . . . . . . 780–799 128.4 85.7 54.3 50.7 47.0 46.6 40.9Injury and poisoning . . . . . . . . . . . . . . . . . . . . . . . . . . . . . . . . . . . 800–999 1,225.0 927.8 788.5 778.6 762.5 763.8 664.9Fractures, all sites . . . . . . . . . . . . . . . . . . . . . . . . . . . . . . . . . . . 800–829 557.7 417.6 352.4 354.5 340.5 348.5 309.3Fracture of neck of femur . . . . . . . . . . . . . . . . . . . . . . . . . . . . . . . . . 820 192.1 160.2 140.2 142.5 145.7 147.3 128.2
Intracranial injuries (excluding those with skull fracture) . . . . . . . . . . . . 850–854 73.8 63.4 45.6 53.1 41.0 41.6 33.1Lacerations and open wounds . . . . . . . . . . . . . . . . . . . . . . . . . . . . 870–904 76.2 50.6 39.4 34.2 41.6 37.5 27.0
Supplementary classifications . . . . . . . . . . . . . . . . . . . . . . . . . . . . . . V01-V82 724.1 604.8 577.5 583.5 573.6 578.9 534.2Females with deliveries . . . . . . . . . . . . . . . . . . . . . . . . . . . . . . . . . . . V27 627.5 535.1 454.2 467.8 453.1 440.1 396.1
1The first-listed diagnoses for females with deliveries is coded V27, shown under ‘‘Supplementary classifications.’’
NOTE: See ‘‘Medical Coding and Edit,’’ appendix I, for information about changes in coding system and coding modifications for the National Hospital Discharge Survey.
32

Table 12. Average length of stay for discharges from short-stay hospitals by first-listed diagnosis: United States, 1980, 1985, and1988–92[Discharges of inpatients from non-Federal hospitals. Excludes newborn infants. Diagnostic groupings and code numbers are based on the International Classification ofDiseases, 9th Revision, Clinical Modification (ICD–9–CM)]
First-listed diagnosis and ICD–9–CM code 1980 1985 1988 1989 1990 1991 1992
Average length of stay in days
All conditions . . . . . . . . . . . . . . . . . . . . . . . . . . . . . . . . . . . . . . . . . . . . . . 7.3 6.5 6.5 6.5 6.4 6.4 6.2
Infectious and parasitic diseases . . . . . . . . . . . . . . . . . . . . . . . . . . . . 001–139 6.9 7.0 8.1 7.7 9.1 8.5 7.9Septicemia . . . . . . . . . . . . . . . . . . . . . . . . . . . . . . . . . . . . . . . . . . . . 038 14.3 11.9 12.8 11.1 13.3 11.6 10.8
Neoplasms . . . . . . . . . . . . . . . . . . . . . . . . . . . . . . . . . . . . . . . . . 140–239 10.5 8.2 8.5 8.3 8.5 8.2 7.7Malignant neoplasms . . . . . . . . . . . . . . . . . . . . . . . . . . . . 140–208,230–234 11.9 8.9 9.4 9.2 9.4 9.2 8.5Malignant neoplasm of large intestine and rectum . . . . . . . . . . . 153–154,197.5 15.7 12.3 13.1 14.0 13.7 14.6 11.5Malignant neoplasm of trachea, bronchus, and lung . . . . . . . . . 162,197.0,197.3 12.8 9.2 9.5 8.6 8.5 8.6 8.3Malignant neoplasm of breast . . . . . . . . . . . . . . . . . . . . . . . 174–175,198.81 10.9 7.2 5.6 5.4 4.6 4.4 4.1
Benign neoplasms and neoplasms of uncertain behavior and unspecifiednature . . . . . . . . . . . . . . . . . . . . . . . . . . . . . . . . . . . . 210–229,235–239 6.2 5.5 4.9 4.7 5.3 4.5 4.6
Endocrine, nutritional and metabolic diseases, and immunity disorders . . . . 240–279 9.6 7.3 7.5 6.8 7.0 7.1 6.4Diabetes mellitus . . . . . . . . . . . . . . . . . . . . . . . . . . . . . . . . . . . . . . . . 250 10.5 8.1 8.2 7.6 7.8 7.1 6.9Volume depletion . . . . . . . . . . . . . . . . . . . . . . . . . . . . . . . . . . . . . . 276.5 8.9 6.2 7.1 6.8 6.5 7.5 6.4
Diseases of the blood and blood-forming organs . . . . . . . . . . . . . . . . . . 280–289 7.2 6.0 6.2 6.0 5.8 6.2 6.0Mental disorders . . . . . . . . . . . . . . . . . . . . . . . . . . . . . . . . . . . . . . 290–319 11.6 12.3 13.0 12.7 12.2 11.4 10.9Psychoses . . . . . . . . . . . . . . . . . . . . . . . . . . . . . . . . . . . . . . . . 290–299 14.8 14.9 15.1 14.5 14.6 13.5 12.9Alcohol dependence syndrome . . . . . . . . . . . . . . . . . . . . . . . . . . . . . . . 303 10.1 10.7 11.2 10.6 9.9 9.5 9.4
Diseases of the nervous system and sense organs . . . . . . . . . . . . . . . . 320–389 5.4 5.4 5.4 5.5 5.5 5.7 5.5Diseases of the central nervous system . . . . . . . . . . . . . . . . . 320–336,340–349 10.7 9.6 9.4 8.6 8.6 8.8 8.8Diseases of the ear and mastoid process . . . . . . . . . . . . . . . . . . . . . 380–389 3.1 2.8 2.5 2.6 2.8 2.8 2.6
Diseases of the circulatory system . . . . . . . . . . . . . . . . . . . . . . . . . . 390–459 10.0 7.9 7.5 7.6 7.3 7.3 7.0Heart disease . . . . . . . . . . . . . . 391–392.0,393–398,402,404,410–416,420–429 9.5 7.3 7.1 7.0 6.9 6.8 6.7Acute myocardial infarction . . . . . . . . . . . . . . . . . . . . . . . . . . . . . . . . 410 12.6 9.5 9.0 8.6 8.4 8.1 8.1Coronary atherosclerosis . . . . . . . . . . . . . . . . . . . . . . . . . . . . . . . . 414.0 10.0 6.6 6.1 6.2 5.8 7.1 5.6Other ischemic heart disease . . . . . . . . . . . . . . . . . . . 411–413,414.1–414.9 7.7 5.4 5.3 5.2 5.2 5.0 5.0Cardiac dysrhythmias . . . . . . . . . . . . . . . . . . . . . . . . . . . . . . . . . . . . 427 7.6 6.2 5.6 5.8 5.8 5.3 5.2Congestive heart failure . . . . . . . . . . . . . . . . . . . . . . . . . . . . . . . . 428.0 10.4 8.0 8.8 8.4 8.0 7.9 7.9
Cerebrovascular disease . . . . . . . . . . . . . . . . . . . . . . . . . . . . . . . 430–438 12.7 10.5 9.7 10.2 9.5 9.3 8.8Diseases of the respiratory system . . . . . . . . . . . . . . . . . . . . . . . . . . 460–519 6.3 6.0 6.6 6.7 6.9 6.8 6.8Acute respiratory infections . . . . . . . . . . . . . . . . . . . . . . . . . . . . . . 460–466 4.7 4.5 5.1 4.9 5.1 4.8 4.0Chronic disease of tonsils and adenoids . . . . . . . . . . . . . . . . . . . . . . . . . . 474 1.9 1.5 1.2 1.2 1.3 1.2 1.3Pneumonia . . . . . . . . . . . . . . . . . . . . . . . . . . . . . . . . . . . . . . . . 480–486 8.3 7.9 8.4 8.1 8.3 8.2 8.3Asthma . . . . . . . . . . . . . . . . . . . . . . . . . . . . . . . . . . . . . . . . . . . . . . 493 6.0 4.9 4.8 4.5 4.7 4.5 4.3
Diseases of the digestive system . . . . . . . . . . . . . . . . . . . . . . . . . . . 520–579 7.0 6.2 6.2 6.3 5.9 5.9 5.8Ulcers of the stomach and small intestine . . . . . . . . . . . . . . . . . . . . . 531–534 8.6 7.1 7.2 7.3 6.5 6.9 6.9Appendicitis . . . . . . . . . . . . . . . . . . . . . . . . . . . . . . . . . . . . . . . 540–543 5.5 5.0 5.2 4.9 4.4 4.2 4.4Inguinal hernia . . . . . . . . . . . . . . . . . . . . . . . . . . . . . . . . . . . . . . . . . 550 4.7 3.2 2.5 2.6 2.3 2.4 2.5Noninfectious enteritis and colitis . . . . . . . . . . . . . . . . . . . . . . . . . . 555–558 5.6 5.0 5.6 5.5 4.9 5.6 4.9Cholelithiasis . . . . . . . . . . . . . . . . . . . . . . . . . . . . . . . . . . . . . . . . . . 574 9.3 7.5 6.5 6.3 5.8 5.0 4.4
Diseases of the genitourinary system . . . . . . . . . . . . . . . . . . . . . . . . . 580–629 5.6 5.2 5.3 5.2 5.1 4.8 4.7Calculus of kidney and ureter . . . . . . . . . . . . . . . . . . . . . . . . . . . . . . . . 592 5.0 3.7 3.1 3.0 3.1 2.7 3.1Hyperplasia of prostate . . . . . . . . . . . . . . . . . . . . . . . . . . . . . . . . . . . . 600 8.9 6.4 6.3 5.2 4.9 5.3 4.4
Complications of pregnancy, childbirth, and the puerperium1 . . . . . . . . . . . 630–676 2.5 2.5 2.7 2.8 2.6 2.9 2.6Abortions and ectopic and molar pregnancies . . . . . . . . . . . . . . . . . . 630–639 2.1 2.1 2.3 2.3 2.1 2.4 2.0
Diseases of the skin and subcutaneous tissue . . . . . . . . . . . . . . . . . . . 680–709 8.0 7.9 8.1 8.0 7.9 8.4 7.8Cellulitis and abscess . . . . . . . . . . . . . . . . . . . . . . . . . . . . . . . . . 681–682 8.0 7.7 7.0 7.3 7.2 7.1 6.7
Diseases of the musculoskeletal system and connective tissue . . . . . . . . . 710–739 8.3 6.7 6.3 6.5 6.4 6.4 6.2Arthropathies and related disorders . . . . . . . . . . . . . . . . . . . . . . . . . 710–719 9.4 7.7 7.4 7.7 7.8 7.4 7.3Intervertebral disc disorders . . . . . . . . . . . . . . . . . . . . . . . . . . . . . . . . . 722 9.9 7.3 5.9 5.4 5.1 5.0 4.4
Congenital anomalies . . . . . . . . . . . . . . . . . . . . . . . . . . . . . . . . . . . 740–759 6.6 5.6 5.9 5.9 6.0 6.2 6.3Certain conditions originating in the perinatal period . . . . . . . . . . . . . . . . 760–779 8.7 13.0 12.4 11.3 10.2 10.7 12.4Symptoms, signs, and ill-defined conditions . . . . . . . . . . . . . . . . . . . . . 780–799 4.5 3.8 3.3 3.3 2.8 3.0 3.0Injury and poisoning . . . . . . . . . . . . . . . . . . . . . . . . . . . . . . . . . . . 800–999 7.7 6.6 6.8 6.8 6.8 6.9 6.2Fractures, all sites . . . . . . . . . . . . . . . . . . . . . . . . . . . . . . . . . . . 800–829 10.8 8.7 8.4 8.5 8.3 8.4 7.7Fracture of neck of femur . . . . . . . . . . . . . . . . . . . . . . . . . . . . . . . . . 820 20.6 14.7 13.4 13.2 12.8 12.3 11.7
Intracranial injuries (excluding those with skull fracture) . . . . . . . . . . . . 850–854 5.6 5.6 5.5 7.0 5.5 5.8 5.5Lacerations and open wounds . . . . . . . . . . . . . . . . . . . . . . . . . . . . 870–904 5.1 4.3 4.1 3.7 4.3 4.9 3.8
Supplementary classifications . . . . . . . . . . . . . . . . . . . . . . . . . . . . . . V01–V82 3.7 3.3 3.3 3.2 3.2 3.3 3.1Females with deliveries . . . . . . . . . . . . . . . . . . . . . . . . . . . . . . . . . . . V27 3.8 3.3 2.9 2.9 2.8 2.8 2.6
1The first-listed diagnoses for females with deliveries is coded V27, shown under ‘‘Supplementary classifications.’’
NOTE: See ‘‘Medical Coding and Edit,’’ appendix I, for information about changes in coding system and coding modifications for the National Hospital Discharge Survey.
33

Table 13. Number of male discharges from short-stay hospitals by first-listed diagnosis: United States, 1980, 1985, and 1988–92[Discharges of inpatients from non-Federal hospitals. Excludes newborn infants. Diagnostic groupings and code numbers are based on the International Classification ofDiseases, 9th Revision, Clinical Modifications (ICD–9–CM)]
First-listed diagnosis and ICD–9–CM code 1980 1985 1988 1989 1990 1991 1992
Number of male discharges in thousands
All conditions . . . . . . . . . . . . . . . . . . . . . . . . . . . . . . . . . . . . . . . . . . . . . . 15,145 14,160 12,642 12,583 12,280 12,478 12,406
Infectious and parasitic diseases . . . . . . . . . . . . . . . . . . . . . . . . . . . . 001–139 309 308 333 362 356 363 403Septicemia . . . . . . . . . . . . . . . . . . . . . . . . . . . . . . . . . . . . . . . . . . . . 038 28 64 86 96 99 103 131
Neoplasms . . . . . . . . . . . . . . . . . . . . . . . . . . . . . . . . . . . . . . . . . 140–239 1,028 1,008 851 842 804 860 845Malignant neoplasms . . . . . . . . . . . . . . . . . . . . . . . . . . . . 140–208,230–234 878 892 772 770 730 781 765Malignant neoplasm of large intestine and rectum . . . . . . . . . . . 153–154,197.5 91 93 77 84 85 86 78Malignant neoplasm of trachea, bronchus, and lung . . . . . . . . . 162,197.0,197.3 193 206 136 147 141 147 124Malignant neoplasm of breast . . . . . . . . . . . . . . . . . . . . . . . 174–175,198.81 * * * * * * *
Benign neoplasms and neoplasms of uncertain behavior and unspecifiednature . . . . . . . . . . . . . . . . . . . . . . . . . . . . . . . . . . . . 210–229,235–239 150 116 78 72 74 78 79
Endocrine, nutritional and metabolic diseases, and immunity disorders . . . . 240–279 396 409 414 453 436 437 487Diabetes mellitus . . . . . . . . . . . . . . . . . . . . . . . . . . . . . . . . . . . . . . . . 250 245 194 209 197 190 185 207Volume depletion . . . . . . . . . . . . . . . . . . . . . . . . . . . . . . . . . . . . . . 276.5 35 93 102 126 127 121 122
Diseases of the blood and blood-forming organs . . . . . . . . . . . . . . . . . . 280–289 145 149 140 154 158 167 137Mental disorders . . . . . . . . . . . . . . . . . . . . . . . . . . . . . . . . . . . . . . 290–319 885 918 765 778 777 840 868Psychoses . . . . . . . . . . . . . . . . . . . . . . . . . . . . . . . . . . . . . . . . 290–299 248 325 341 351 360 416 408Alcohol dependence syndrome . . . . . . . . . . . . . . . . . . . . . . . . . . . . . . . 303 342 312 179 165 184 172 196
Diseases of the nervous system and sense organs . . . . . . . . . . . . . . . . 320–389 794 537 430 364 356 352 330Diseases of the central nervous system . . . . . . . . . . . . . . . . . 320–336,340–349 194 196 169 158 155 160 147Diseases of the ear and mastoid process . . . . . . . . . . . . . . . . . . . . . 380–389 205 117 99 87 77 72 72
Diseases of the circulatory system . . . . . . . . . . . . . . . . . . . . . . . . . . 390–459 2,590 2,783 2,722 2,670 2,668 2,728 2,866Heart disease . . . . . . . . . . . . . . 391–392.0,393–398,402,404,410–416,420–429 1,688 1,910 1,955 1,892 1,913 1,977 2,083Acute myocardial infarction . . . . . . . . . . . . . . . . . . . . . . . . . . . . . . . . 410 272 466 451 421 413 422 458Coronary atherosclerosis . . . . . . . . . . . . . . . . . . . . . . . . . . . . . . . . 414.0 303 190 278 282 277 263 285Other ischemic heart disease . . . . . . . . . . . . . . . . . . . 411–413,414.1–414.9 474 549 491 471 465 461 505Cardiac dysrhythmias . . . . . . . . . . . . . . . . . . . . . . . . . . . . . . . . . . . . 427 185 244 228 220 244 249 256Congestive heart failure . . . . . . . . . . . . . . . . . . . . . . . . . . . . . . . . 428.0 176 247 277 304 315 360 373
Cerebrovascular disease . . . . . . . . . . . . . . . . . . . . . . . . . . . . . . . 430–438 371 416 336 344 359 370 375Diseases of the respiratory system . . . . . . . . . . . . . . . . . . . . . . . . . . 460–519 1,755 1,591 1,464 1,507 1,430 1,508 1,436Acute respiratory infections . . . . . . . . . . . . . . . . . . . . . . . . . . . . . . 460–466 251 236 224 244 235 258 187Chronic disease of tonsils and adenoids . . . . . . . . . . . . . . . . . . . . . . . . . . 474 192 124 87 58 41 32 32Pneumonia . . . . . . . . . . . . . . . . . . . . . . . . . . . . . . . . . . . . . . . . 480–486 414 433 472 544 530 545 535Asthma . . . . . . . . . . . . . . . . . . . . . . . . . . . . . . . . . . . . . . . . . . . . . . 493 180 195 210 204 191 221 201
Diseases of the digestive system . . . . . . . . . . . . . . . . . . . . . . . . . . . 520–579 2,171 1,839 1,515 1,501 1,449 1,455 1,392Ulcers of the stomach and small intestine . . . . . . . . . . . . . . . . . . . . . 531–534 191 156 137 134 131 125 115Appendicitis . . . . . . . . . . . . . . . . . . . . . . . . . . . . . . . . . . . . . . . 540–543 145 143 141 135 138 129 135Inguinal hernia . . . . . . . . . . . . . . . . . . . . . . . . . . . . . . . . . . . . . . . . . 550 458 343 232 193 149 120 98Noninfectious enteritis and colitis . . . . . . . . . . . . . . . . . . . . . . . . . . 555–558 255 197 132 150 151 142 134Cholelithiasis . . . . . . . . . . . . . . . . . . . . . . . . . . . . . . . . . . . . . . . . . . 574 115 140 132 132 132 159 154
Diseases of the genitourinary system . . . . . . . . . . . . . . . . . . . . . . . . . 580–629 1,100 958 828 851 803 781 730Calculus of kidney and ureter . . . . . . . . . . . . . . . . . . . . . . . . . . . . . . . . 592 210 215 183 180 177 160 143Hyperplasia of prostate . . . . . . . . . . . . . . . . . . . . . . . . . . . . . . . . . . . . 600 276 246 247 249 259 229 221
Diseases of the skin and subcutaneous tissue . . . . . . . . . . . . . . . . . . . 680–709 288 268 234 238 234 245 230Cellulitis and abscess . . . . . . . . . . . . . . . . . . . . . . . . . . . . . . . . . 681–682 110 141 145 149 151 165 158
Diseases of the musculoskeletal system and connective tissue . . . . . . . . . 710–739 971 939 774 745 735 738 714Arthropathies and related disorders . . . . . . . . . . . . . . . . . . . . . . . . . 710–719 215 188 191 193 197 228 212Intervertebral disc disorders . . . . . . . . . . . . . . . . . . . . . . . . . . . . . . . . . 722 212 281 247 219 241 225 222
Congenital anomalies . . . . . . . . . . . . . . . . . . . . . . . . . . . . . . . . . . . 740–759 167 156 128 112 105 101 102Certain conditions originating in the perinatal period . . . . . . . . . . . . . . . . 760–779 52 82 92 88 93 79 81Symptoms, signs, and ill-defined conditions . . . . . . . . . . . . . . . . . . . . . 780–799 291 260 200 191 201 202 173Injury and poisoning . . . . . . . . . . . . . . . . . . . . . . . . . . . . . . . . . . . 800–999 2,025 1,800 1,535 1,514 1,476 1,437 1,405Fractures, all sites . . . . . . . . . . . . . . . . . . . . . . . . . . . . . . . . . . . 800–829 582 550 506 480 466 481 465Fracture of neck of femur . . . . . . . . . . . . . . . . . . . . . . . . . . . . . . . . . 820 52 62 68 61 72 80 73
Intracranial injuries (excluding those with skull fracture) . . . . . . . . . . . . 850–854 179 162 124 114 112 106 97Lacerations and open wounds . . . . . . . . . . . . . . . . . . . . . . . . . . . . 870–904 255 203 176 171 179 137 130
Supplementary classifications . . . . . . . . . . . . . . . . . . . . . . . . . . . . . . V01–V82 178 156 217 214 198 188 207
* Figure does not meet standard of reliability or precision.
NOTE: See ‘‘Medical Coding and Edit,’’ appendix I, for information about changes in coding system and coding modifications for the National Hospital Discharge Survey.
34

Table 14. Rate of male discharges from short-stay hospitals by first-listed diagnosis: United States, 1980, 1985, and 1988–92[Discharges of inpatients from non-Federal hospitals. Excludes newborn infants. Diagnostic groupings and code numbers are based on the International Classification ofDiseases, 9th Revision, Clinical Modifications (ICD–9–CM)]
First-listed diagnosis and ICD–9–CM code 1980 1985 1988 1989 1990 1991 1992
Rate of male discharges per 10,000 population
All conditions . . . . . . . . . . . . . . . . . . . . . . . . . . . . . . . . . . . . . . . . . . . . . . 1,390.4 1,240.2 1,075.3 1,059.5 1,022.2 1,026.7 1,008.0
Infectious and parasitic diseases . . . . . . . . . . . . . . . . . . . . . . . . . . . . 001–139 28.4 27.0 28.3 30.5 29.7 29.8 32.8Septicemia . . . . . . . . . . . . . . . . . . . . . . . . . . . . . . . . . . . . . . . . . . . . 038 2.5 5.6 7.3 8.1 8.3 8.5 10.6
Neoplasms . . . . . . . . . . . . . . . . . . . . . . . . . . . . . . . . . . . . . . . . . 140–239 94.4 88.2 72.4 70.9 66.9 70.7 68.6Malignant neoplasms . . . . . . . . . . . . . . . . . . . . . . . . . . . . 140–208,230–234 80.6 78.1 65.7 64.8 60.8 64.3 62.2Malignant neoplasm of large intestine and rectum . . . . . . . . . . . 153–154,197.5 8.4 8.2 6.6 7.1 7.0 7.0 6.3Malignant neoplasm of trachea, bronchus, and lung . . . . . . . . . 162,197.0,197.3 17.7 18.0 11.5 12.4 11.8 12.1 10.1Malignant neoplasm of breast . . . . . . . . . . . . . . . . . . . . . . . 174–175,198.81 * * * * * * *
Benign neoplasms and neoplasms of uncertain behavior and unspecifiednature . . . . . . . . . . . . . . . . . . . . . . . . . . . . . . . . . . . . . 210–229,235–239 13.7 10.2 6.7 6.1 6.2 6.4 6.4
Endocrine, nutritional and metabolic diseases, and immunity disorders . . . . 240–279 36.3 35.8 35.2 38.1 36.3 35.9 39.5Diabetes mellitus . . . . . . . . . . . . . . . . . . . . . . . . . . . . . . . . . . . . . . . . 250 22.5 17.0 17.7 16.6 15.8 15.2 16.8Volume depletion . . . . . . . . . . . . . . . . . . . . . . . . . . . . . . . . . . . . . . 276.5 3.2 8.1 8.7 10.6 10.6 10.0 9.9
Diseases of the blood and blood-forming organs . . . . . . . . . . . . . . . . . . 280–289 13.3 13.0 11.9 12.9 13.2 13.7 11.2Mental disorders . . . . . . . . . . . . . . . . . . . . . . . . . . . . . . . . . . . . . . 290–319 81.3 80.4 65.1 65.5 64.7 69.1 70.5Psychoses . . . . . . . . . . . . . . . . . . . . . . . . . . . . . . . . . . . . . . . . 290–299 22.7 28.5 29.0 29.5 30.0 34.2 33.2Alcohol dependence syndrome . . . . . . . . . . . . . . . . . . . . . . . . . . . . . . . 303 31.4 27.4 15.2 13.9 15.3 14.2 15.9
Diseases of the nervous system and sense organs . . . . . . . . . . . . . . . . 320–389 72.9 47.0 36.6 30.6 29.6 28.9 26.8Diseases of the central nervous system . . . . . . . . . . . . . . . . . 320–336,340–349 17.8 17.2 14.4 13.3 12.9 13.1 11.9Diseases of the ear and mastoid process . . . . . . . . . . . . . . . . . . . . . 380–389 18.8 10.3 8.4 7.3 6.4 6.0 5.8
Diseases of the circulatory system . . . . . . . . . . . . . . . . . . . . . . . . . . 390–459 237.8 243.8 231.5 224.8 222.1 224.4 232.9Heart disease . . . . . . . . . . . . . . 391–392.0,393–398,402,404,410–416,420–429 155.0 167.3 166.3 159.3 159.3 162.6 169.3Acute myocardial infarction . . . . . . . . . . . . . . . . . . . . . . . . . . . . . . . . 410 25.0 40.8 38.4 35.4 34.4 34.7 37.2Coronary atherosclerosis . . . . . . . . . . . . . . . . . . . . . . . . . . . . . . . . 414.0 27.8 16.7 23.6 23.7 23.0 21.7 23.2Other ischemic heart disease . . . . . . . . . . . . . . . . . . . 411–413,414.1–414.9 43.5 48.1 41.7 39.7 38.7 37.9 41.0Cardiac dysrhythmias . . . . . . . . . . . . . . . . . . . . . . . . . . . . . . . . . . . . 427 17.0 21.4 19.4 18.5 20.3 20.5 20.8Congestive heart failure . . . . . . . . . . . . . . . . . . . . . . . . . . . . . . . . 428.0 16.2 21.6 23.6 25.6 26.2 29.6 30.3
Cerebrovascular disease . . . . . . . . . . . . . . . . . . . . . . . . . . . . . . . 430–438 34.0 36.4 28.5 29.0 29.9 30.4 30.5Diseases of the respiratory system . . . . . . . . . . . . . . . . . . . . . . . . . . 460–519 161.1 139.3 124.5 126.9 119.0 124.1 116.7Acute respiratory infections . . . . . . . . . . . . . . . . . . . . . . . . . . . . . . 460–466 23.0 20.6 19.1 20.6 19.6 21.2 15.2Chronic disease of tonsils and adenoids . . . . . . . . . . . . . . . . . . . . . . . . . . 474 17.7 10.8 7.4 4.9 3.4 2.6 2.6Pneumonia . . . . . . . . . . . . . . . . . . . . . . . . . . . . . . . . . . . . . . . . 480–486 38.1 37.9 40.2 45.8 44.1 44.8 43.5Asthma . . . . . . . . . . . . . . . . . . . . . . . . . . . . . . . . . . . . . . . . . . . . . . 493 16.6 17.1 17.8 17.2 15.9 18.2 16.3
Diseases of the digestive system . . . . . . . . . . . . . . . . . . . . . . . . . . . 520–579 199.3 161.0 128.8 126.4 120.7 119.7 113.1Ulcers of the stomach and small intestine . . . . . . . . . . . . . . . . . . . . . 531–534 17.5 13.6 11.7 11.3 10.9 10.3 9.3Appendicitis . . . . . . . . . . . . . . . . . . . . . . . . . . . . . . . . . . . . . . . 540–543 13.3 12.5 12.0 11.4 11.5 10.6 11.0Inguinal hernia . . . . . . . . . . . . . . . . . . . . . . . . . . . . . . . . . . . . . . . . . 550 42.0 30.0 19.7 16.2 12.4 9.9 7.9Noninfectious enteritis and colitis . . . . . . . . . . . . . . . . . . . . . . . . . . 555–558 23.4 17.3 11.2 12.6 12.5 11.7 10.9Cholelithiasis . . . . . . . . . . . . . . . . . . . . . . . . . . . . . . . . . . . . . . . . . . 574 10.6 12.3 11.2 11.1 11.0 13.1 12.5
Diseases of the genitourinary system . . . . . . . . . . . . . . . . . . . . . . . . . 580–629 101.0 83.9 70.4 71.7 66.8 64.2 59.3Calculus of kidney and ureter . . . . . . . . . . . . . . . . . . . . . . . . . . . . . . . . 592 19.3 18.8 15.6 15.2 14.7 13.2 11.6Hyperplasia of prostate . . . . . . . . . . . . . . . . . . . . . . . . . . . . . . . . . . . . 600 25.3 21.5 21.0 20.9 21.6 18.9 18.0
Diseases of the skin and subcutaneous tissue . . . . . . . . . . . . . . . . . . . 680–709 26.5 23.5 19.9 20.0 19.5 20.1 18.7Cellulitis and abscess . . . . . . . . . . . . . . . . . . . . . . . . . . . . . . . . . 681–682 10.1 12.4 12.3 12.5 12.6 13.6 12.9
Diseases of the musculoskeletal system and connective tissue . . . . . . . . . 710–739 89.2 82.3 65.9 62.7 61.2 60.7 58.0Arthropathies and related disorders . . . . . . . . . . . . . . . . . . . . . . . . . 710–719 19.8 16.5 16.3 16.3 16.4 18.7 17.2Intervertebral disc disorders . . . . . . . . . . . . . . . . . . . . . . . . . . . . . . . . . 722 19.5 24.6 21.0 18.5 20.1 18.5 18.0
Congenital anomalies . . . . . . . . . . . . . . . . . . . . . . . . . . . . . . . . . . . 740–759 15.3 13.7 10.9 9.4 8.8 8.3 8.3Certain conditions originating in the perinatal period . . . . . . . . . . . . . . . . 760–779 4.8 7.2 7.8 7.4 7.7 6.5 6.6Symptoms, signs, and ill-defined conditions . . . . . . . . . . . . . . . . . . . . . 780–799 26.8 22.7 17.0 16.0 16.7 16.6 14.0Injury and poisoning . . . . . . . . . . . . . . . . . . . . . . . . . . . . . . . . . . . 800–999 185.9 157.6 130.6 127.5 122.9 118.2 114.1Fractures, all sites . . . . . . . . . . . . . . . . . . . . . . . . . . . . . . . . . . . 800–829 53.5 48.2 43.0 40.5 38.8 39.6 37.8Fracture of neck of femur . . . . . . . . . . . . . . . . . . . . . . . . . . . . . . . . . 820 4.7 5.5 5.8 5.2 6.0 6.6 5.9
Intracranial injuries (excluding those with skull fracture) . . . . . . . . . . . . 850–854 16.5 14.2 10.5 9.6 9.3 8.7 7.9Lacerations and open wounds . . . . . . . . . . . . . . . . . . . . . . . . . . . . 870–904 23.4 17.8 15.0 14.4 14.9 11.3 10.5
Supplementary classifications . . . . . . . . . . . . . . . . . . . . . . . . . . . . . . V01–V82 16.4 13.6 18.4 18.0 16.5 15.5 16.8
*Figure does not meet standard of reliability or precision.
NOTE: See ‘‘Medical Coding and Edit,’’ appendix I, for information about changes in coding system and coding modifications for the National Hospital Discharge Survey.
35

Table 15. Number of female discharges from short-stay hospitals by first-listed diagnosis: United States, 1980, 1985, and 1988–92[Discharges of inpatients from non-Federal hospitals. Excludes newborn infants. Diagnostic groupings and code numbers are based on the International Classification ofDiseases, 9th Revision, Clinical Modifications (ICD–9–CM)]
First-listed diagnosis and ICD–9–CM code 1980 1985 1988 1989 1990 1991 1992
Number of female discharges in thousands
All conditions . . . . . . . . . . . . . . . . . . . . . . . . . . . . . . . . . . . . . . . . . . . . . . 22,686 20,896 18,504 18,364 18,508 18,620 18,545
Infectious and parasitic diseases . . . . . . . . . . . . . . . . . . . . . . . . . . . . 001–139 340 361 359 363 380 396 404Septicemia . . . . . . . . . . . . . . . . . . . . . . . . . . . . . . . . . . . . . . . . . . . . 038 32 85 108 100 116 137 148
Neoplasms . . . . . . . . . . . . . . . . . . . . . . . . . . . . . . . . . . . . . . . . . 140–239 1,448 1,403 1,247 1,159 1,161 1,141 1,154Malignant neoplasms . . . . . . . . . . . . . . . . . . . . . . . . . . . . 140–208,230–234 994 1,019 898 838 841 812 812Malignant neoplasm of large intestine and rectum . . . . . . . . . . . 153–154,197.5 109 104 87 83 90 82 83Malignant neoplasm of trachea, bronchus, and lung . . . . . . . . . 162,197.0,197.3 84 110 100 92 90 89 91Malignant neoplasm of breast . . . . . . . . . . . . . . . . . . . . . . . 174–175,198.81 212 207 176 162 163 156 169
Benign neoplasms and neoplasms of uncertain behavior and unspecifiednature . . . . . . . . . . . . . . . . . . . . . . . . . . . . . . . . . . . . . 210–229,235–239 454 384 350 320 319 329 342
Endocrine, nutritional and metabolic diseases, and immunity disorders . . . . 240–279 750 659 623 644 653 706 691Diabetes mellitus . . . . . . . . . . . . . . . . . . . . . . . . . . . . . . . . . . . . . . . . 250 400 286 245 241 230 245 269Volume depletion . . . . . . . . . . . . . . . . . . . . . . . . . . . . . . . . . . . . . . 276.5 65 147 163 159 192 208 186
Diseases of the blood and blood-forming organs . . . . . . . . . . . . . . . . . . 280–289 191 193 155 164 166 181 185Mental disorders . . . . . . . . . . . . . . . . . . . . . . . . . . . . . . . . . . . . . . 290–319 807 782 793 736 761 817 843Psychoses . . . . . . . . . . . . . . . . . . . . . . . . . . . . . . . . . . . . . . . . 290–299 259 376 440 422 452 486 500Alcohol dependence syndrome . . . . . . . . . . . . . . . . . . . . . . . . . . . . . . . 303 97 76 58 53 55 56 63
Diseases of the nervous system and sense organs . . . . . . . . . . . . . . . . 320–389 968 674 492 455 414 404 378Diseases of the central nervous system . . . . . . . . . . . . . . . . . 320–336,340–349 214 229 179 183 187 171 167Diseases of the ear and mastoid process . . . . . . . . . . . . . . . . . . . . . 380–389 200 142 102 90 81 72 73
Diseases of the circulatory system . . . . . . . . . . . . . . . . . . . . . . . . . . 390–459 2,549 2,686 2,574 2,527 2,493 2,611 2,730Heart disease . . . . . . . . . . . . . . 391–392.0,393–398,402,404,410–416,420–429 1,513 1,674 1,686 1,642 1,643 1,727 1,852Acute myocardial infarction . . . . . . . . . . . . . . . . . . . . . . . . . . . . . . . . 410 159 289 265 274 261 275 289Coronary atherosclerosis . . . . . . . . . . . . . . . . . . . . . . . . . . . . . . . . 414.0 259 114 134 125 133 121 130Other ischemic heart disease . . . . . . . . . . . . . . . . . . . 411–413,414.1–414.9 319 443 431 422 406 415 467Cardiac dysrhythmias . . . . . . . . . . . . . . . . . . . . . . . . . . . . . . . . . . . . 427 204 267 263 267 239 287 286Congestive heart failure . . . . . . . . . . . . . . . . . . . . . . . . . . . . . . . . 428.0 224 310 357 339 386 405 449
Cerebrovascular disease . . . . . . . . . . . . . . . . . . . . . . . . . . . . . . . 430–438 425 500 448 451 452 466 454Diseases of the respiratory system . . . . . . . . . . . . . . . . . . . . . . . . . . 460–519 1,691 1,647 1,473 1,489 1,536 1,544 1,486Acute respiratory infections . . . . . . . . . . . . . . . . . . . . . . . . . . . . . . 460–466 272 229 221 230 252 261 189Chronic disease of tonsils and adenoids . . . . . . . . . . . . . . . . . . . . . . . . . . 474 265 164 110 76 61 44 41Pneumonia . . . . . . . . . . . . . . . . . . . . . . . . . . . . . . . . . . . . . . . . 480–486 368 421 452 489 522 543 524Asthma . . . . . . . . . . . . . . . . . . . . . . . . . . . . . . . . . . . . . . . . . . . . . . 493 228 266 270 271 285 269 263
Diseases of the digestive system . . . . . . . . . . . . . . . . . . . . . . . . . . . 520–579 2,479 2,034 1,753 1,794 1,790 1,801 1,795Ulcers of the stomach and small intestine . . . . . . . . . . . . . . . . . . . . . 531–534 172 137 118 122 113 112 117Appendicitis . . . . . . . . . . . . . . . . . . . . . . . . . . . . . . . . . . . . . . . 540–543 122 107 101 92 101 103 92Inguinal hernia . . . . . . . . . . . . . . . . . . . . . . . . . . . . . . . . . . . . . . . . . 550 51 42 25 20 18 14 14Noninfectious enteritis and colitis . . . . . . . . . . . . . . . . . . . . . . . . . . 555–558 366 277 230 228 223 209 220Cholelithiasis . . . . . . . . . . . . . . . . . . . . . . . . . . . . . . . . . . . . . . . . . . 574 342 333 352 351 374 393 358
Diseases of the genitourinary system . . . . . . . . . . . . . . . . . . . . . . . . . 580–629 2,500 1,848 1,376 1,340 1,373 1,291 1,289Calculus of kidney and ureter . . . . . . . . . . . . . . . . . . . . . . . . . . . . . . . . 592 99 110 104 98 95 81 75
Complications of pregnancy, childbirth, and the puerperium1 . . . . . . . . . . . 630–676 1,010 968 837 756 734 723 662Abortions and ectopic and molar pregnancies . . . . . . . . . . . . . . . . . . 630–639 531 382 266 229 208 180 179
Diseases of the skin and subcutaneous tissue . . . . . . . . . . . . . . . . . . . 680–709 309 273 226 242 228 217 232Cellulitis and abscess . . . . . . . . . . . . . . . . . . . . . . . . . . . . . . . . . 681–682 92 115 135 154 137 132 148
Diseases of the musculoskeletal system and connective tissue . . . . . . . . . 710–739 1,273 1,231 872 825 857 862 896Arthropathies and related disorders . . . . . . . . . . . . . . . . . . . . . . . . . 710–719 328 276 267 237 283 298 342Intervertebral disc disorders . . . . . . . . . . . . . . . . . . . . . . . . . . . . . . . . . 722 172 227 170 177 183 166 185
Congenital anomalies . . . . . . . . . . . . . . . . . . . . . . . . . . . . . . . . . . . 740–759 177 113 98 95 77 91 89Certain conditions originating in the perinatal period . . . . . . . . . . . . . . . . 760–779 39 77 66 63 70 68 60Symptoms, signs, and ill-defined conditions . . . . . . . . . . . . . . . . . . . . . 780–799 346 275 198 190 209 184 177Injury and poisoning . . . . . . . . . . . . . . . . . . . . . . . . . . . . . . . . . . . 800–999 1,568 1,503 1,281 1,292 1,298 1,331 1,296Fractures, all sites . . . . . . . . . . . . . . . . . . . . . . . . . . . . . . . . . . . 800–829 580 579 508 541 551 553 552Fracture of neck of femur . . . . . . . . . . . . . . . . . . . . . . . . . . . . . . . . . 820 158 196 186 204 209 219 205
Intracranial injuries (excluding those with skull fracture) . . . . . . . . . . . . 850–854 116 107 78 73 72 74 56Lacerations and open wounds . . . . . . . . . . . . . . . . . . . . . . . . . . . . 870–904 79 74 56 53 61 56 50
Supplementary classifications . . . . . . . . . . . . . . . . . . . . . . . . . . . . . . V01–V82 4,243 4,168 4,078 4,230 4,309 4,250 4,176Females with deliveries . . . . . . . . . . . . . . . . . . . . . . . . . . . . . . . . . . . V27 3,762 3,854 3,781 3,937 4,025 3,973 3,910
1The first-listed diagnoses for females with deliveries is coded V27, shown under ‘‘Supplementary classifications.’’
NOTE: See ‘‘Medical Coding and Edit,’’ appendix I, for information about changes in coding system and coding modifications for the National Hospital Discharge Survey.
36

Table 16. Rate of female discharges from short-stay hospitals by first-listed diagnosis: United States, 1980, 1985, and 1988–92[Discharges of inpatients from non-Federal hospitals. Excludes newborn infants. Diagnostic grouping and code numbers are based on the International Classification ofDiseases, 9th Revision, Clinical Modifications (ICD–9–CM)]
First-listed diagnosis and ICD–9–CM code 1980 1985 1988 1989 1990 1991 1992
Rate of female discharges per 10,000 population
All conditions . . . . . . . . . . . . . . . . . . . . . . . . . . . . . . . . . . . . . . . . . . . . . . 1,944.0 1,712.2 1,477.4 1,453.2 1,450.2 1,443.3 1,422.0
Infectious and parasitic diseases . . . . . . . . . . . . . . . . . . . . . . . . . . . . 001–139 29.1 29.6 28.7 28.8 29.8 30.7 31.0Septicemia . . . . . . . . . . . . . . . . . . . . . . . . . . . . . . . . . . . . . . . . . . . . 038 2.7 6.9 8.6 7.9 9.1 10.6 11.4
Neoplasms . . . . . . . . . . . . . . . . . . . . . . . . . . . . . . . . . . . . . . . . . 140–239 124.1 115.0 99.6 91.7 90.9 88.4 88.5Malignant neoplasms . . . . . . . . . . . . . . . . . . . . . . . . . . . . 140–208,230–234 85.2 83.5 71.7 66.3 65.9 63.0 62.3Malignant neoplasm of large intestine and rectum . . . . . . . . . . . 153–154,197.5 9.3 8.5 7.0 6.6 7.1 6.4 6.4Malignant neoplasm of trachea, bronchus, and lung . . . . . . . . . 162,197.0,197.3 7.2 9.0 8.0 7.3 7.1 6.9 7.0Malignant neoplasm of breast . . . . . . . . . . . . . . . . . . . . . . . 174–175,198.81 18.2 16.9 14.1 12.8 12.8 12.1 13.0
Benign neoplasms and neoplasms of uncertain behavior and unspecifiednature . . . . . . . . . . . . . . . . . . . . . . . . . . . . . . . . . . . . 210–229,235–239 38.9 31.5 27.9 25.3 25.0 25.5 26.3
Endocrine, nutritional and metabolic diseases, and immunity disorders . . . . 240–279 64.2 54.0 49.8 50.9 51.2 54.7 53.0Diabetes mellitus . . . . . . . . . . . . . . . . . . . . . . . . . . . . . . . . . . . . . . . . 250 34.3 23.4 19.6 19.0 18.0 19.0 20.6Volume depletion . . . . . . . . . . . . . . . . . . . . . . . . . . . . . . . . . . . . . . 276.5 5.6 12.0 13.0 12.6 15.0 16.1 14.2
Diseases of the blood and blood-forming organs . . . . . . . . . . . . . . . . . . 280–289 16.3 15.8 12.4 13.0 13.0 14.1 14.2Mental disorders . . . . . . . . . . . . . . . . . . . . . . . . . . . . . . . . . . . . . . 290–319 69.2 64.1 63.3 58.2 59.6 63.4 64.7Psychoses . . . . . . . . . . . . . . . . . . . . . . . . . . . . . . . . . . . . . . . . 290–299 22.2 30.8 35.1 33.4 35.4 37.7 38.3Alcohol dependence syndrome . . . . . . . . . . . . . . . . . . . . . . . . . . . . . . . 303 8.3 6.2 4.6 4.2 4.3 4.3 4.8
Diseases of the nervous system and sense organs . . . . . . . . . . . . . . . . 320–389 83.0 55.2 39.3 36.0 32.5 31.3 29.0Diseases of the central nervous system . . . . . . . . . . . . . . . . . 320–336,340–349 18.3 18.7 14.3 14.4 14.6 13.3 12.8Diseases of the ear and mastoid process . . . . . . . . . . . . . . . . . . . . . 380–389 17.2 11.6 8.1 7.1 6.3 5.6 5.6
Diseases of the circulatory system . . . . . . . . . . . . . . . . . . . . . . . . . . 390–459 218.5 220.1 205.5 199.9 195.3 202.3 209.4Heart disease . . . . . . . . . . . . . . 391–392.0,393–398,402,404,410–416,420–429 129.6 137.1 134.6 129.9 128.7 133.9 142.0Acute myocardial infarction . . . . . . . . . . . . . . . . . . . . . . . . . . . . . . . . 410 13.6 23.7 21.2 21.7 20.5 21.3 22.1Coronary atherosclerosis . . . . . . . . . . . . . . . . . . . . . . . . . . . . . . . . 414.0 22.2 9.3 10.7 9.9 10.4 9.3 10.0Other ischemic heart disease . . . . . . . . . . . . . . . . . . . 411–413,414.1–414.9 27.3 36.3 34.4 33.4 31.8 32.1 35.8Cardiac dysrhythmias . . . . . . . . . . . . . . . . . . . . . . . . . . . . . . . . . . . . 427 17.5 21.8 21.0 21.1 18.7 22.3 21.9Congestive heart failure . . . . . . . . . . . . . . . . . . . . . . . . . . . . . . . . 428.0 19.2 25.4 28.5 26.8 30.2 31.4 34.4
Cerebrovascular disease . . . . . . . . . . . . . . . . . . . . . . . . . . . . . . . 430–438 36.5 41.0 35.8 35.7 35.5 36.1 34.8Diseases of the respiratory system . . . . . . . . . . . . . . . . . . . . . . . . . . 460–519 144.9 134.9 117.6 117.9 120.3 119.7 114.0Acute respiratory infections . . . . . . . . . . . . . . . . . . . . . . . . . . . . . . 460–466 23.3 18.7 17.7 18.2 19.8 20.2 14.5Chronic disease of tonsils and adenoids . . . . . . . . . . . . . . . . . . . . . . . . . . 474 22.7 13.4 8.7 6.0 4.8 3.4 3.2Pneumonia . . . . . . . . . . . . . . . . . . . . . . . . . . . . . . . . . . . . . . . . 480–486 31.5 34.5 36.1 38.7 40.9 42.1 40.1Asthma . . . . . . . . . . . . . . . . . . . . . . . . . . . . . . . . . . . . . . . . . . . . . . 493 19.5 21.8 21.5 21.5 22.3 20.9 20.1
Diseases of the digestive system . . . . . . . . . . . . . . . . . . . . . . . . . . . 520–579 212.4 166.7 140.0 141.9 140.2 139.6 137.7Ulcers of the stomach and small intestine . . . . . . . . . . . . . . . . . . . . . 531–534 14.7 11.2 9.5 9.7 8.9 8.7 8.9Appendicitis . . . . . . . . . . . . . . . . . . . . . . . . . . . . . . . . . . . . . . . 540–543 10.4 8.8 8.1 7.3 7.9 8.0 7.1Inguinal hernia . . . . . . . . . . . . . . . . . . . . . . . . . . . . . . . . . . . . . . . . . 550 4.4 3.4 2.0 1.6 1.4 1.1 1.1Noninfectious enteritis and colitis . . . . . . . . . . . . . . . . . . . . . . . . . . 555–558 31.4 22.7 18.4 18.0 17.4 16.2 16.8Cholelithiasis . . . . . . . . . . . . . . . . . . . . . . . . . . . . . . . . . . . . . . . . . . 574 29.3 27.3 28.1 27.7 29.3 30.4 27.5
Diseases of the genitourinary system . . . . . . . . . . . . . . . . . . . . . . . . . 580–629 214.2 151.4 109.9 106.0 107.6 100.0 98.8Calculus of kidney and ureter . . . . . . . . . . . . . . . . . . . . . . . . . . . . . . . . 592 8.5 9.0 8.3 7.7 7.5 6.3 5.8
Complications of pregnancy, childbirth, and the puerperium1 . . . . . . . . . . . 630–676 86.5 79.3 66.8 59.8 57.5 56.0 50.8Abortions and ectopic and molar pregnancies . . . . . . . . . . . . . . . . . . 630–639 45.5 31.3 21.2 18.1 16.3 13.9 13.7
Diseases of the skin and subcutaneous tissue . . . . . . . . . . . . . . . . . . . 680–709 26.5 22.4 18.0 19.2 17.8 16.8 17.8Cellulitis and abscess . . . . . . . . . . . . . . . . . . . . . . . . . . . . . . . . . 681–682 7.9 9.4 10.8 12.2 10.7 10.2 11.4
Diseases of the musculoskeletal system and connective tissue . . . . . . . . . 710–739 109.1 100.9 69.6 65.3 67.1 66.8 68.7Arthropathies and related disorders . . . . . . . . . . . . . . . . . . . . . . . . . 710–719 28.1 22.6 21.3 18.8 22.2 23.1 26.3Intervertebral disc disorders . . . . . . . . . . . . . . . . . . . . . . . . . . . . . . . . . 722 14.8 18.6 13.6 14.0 14.4 12.9 14.2
Congenital anomalies . . . . . . . . . . . . . . . . . . . . . . . . . . . . . . . . . . . 740–759 15.1 9.3 7.9 7.5 6.0 7.1 6.8Certain conditions originating in the perinatal period . . . . . . . . . . . . . . . . 760–779 3.3 6.3 5.3 5.0 5.5 5.3 4.6Symptoms, signs, and ill-defined conditions . . . . . . . . . . . . . . . . . . . . . 780–799 29.6 22.5 15.8 15.0 16.4 14.3 13.6Injury and poisoning . . . . . . . . . . . . . . . . . . . . . . . . . . . . . . . . . . . 800–999 134.4 123.2 102.3 102.3 101.7 103.2 99.4Fractures, all sites . . . . . . . . . . . . . . . . . . . . . . . . . . . . . . . . . . . 800–829 49.7 47.4 40.6 42.8 43.2 42.9 42.3Fracture of neck of femur . . . . . . . . . . . . . . . . . . . . . . . . . . . . . . . . . 820 13.6 16.1 14.9 16.1 16.4 17.0 15.7
Intracranial injuries (excluding those with skull fracture) . . . . . . . . . . . . 850–854 9.9 8.7 6.2 5.7 5.6 5.7 4.3Lacerations and open wounds . . . . . . . . . . . . . . . . . . . . . . . . . . . . 870–904 6.8 6.1 4.5 4.2 4.8 4.4 3.8
Supplementary classifications . . . . . . . . . . . . . . . . . . . . . . . . . . . . . . V01–V82 363.5 341.6 325.6 334.7 337.6 329.4 320.2Females with deliveries . . . . . . . . . . . . . . . . . . . . . . . . . . . . . . . . . . . V27 322.4 315.8 301.9 311.5 315.4 307.9 299.8
1The first-listed diagnoses for females with deliveries is coded V27, shown under ‘‘Supplementary classifications.’’
NOTE: See ‘‘Medical Coding and Edit,’’ appendix I, for information about changes in coding system and coding modifications for the National Hospital Discharge Survey.
37

Table 17. Number of discharges from short-stay hospitals with and without procedures and percent with procedures: United States,1980, 1985, and 1988–92[Discharges of inpatients from non-Federal hospitals. Excludes newborn infants]
YearAll
discharges
Dischargeswithout
procedures
Discharges with procedures1
TotalWith surgicalprocedures Total
With surgicalprocedures
Number in thousands Percent
1980 . . . . . . . . . . . . . . . . . . . . . . . . . . . . . . . . 37,832 18,065 19,766 17,005 52.2 44.919852 . . . . . . . . . . . . . . . . . . . . . . . . . . . . . . . 35,056 14,406 20,651 16,097 58.9 45.91988 . . . . . . . . . . . . . . . . . . . . . . . . . . . . . . . . 31,146 11,216 19,930 15,269 64.0 49.019892 . . . . . . . . . . . . . . . . . . . . . . . . . . . . . . . 30,947 10,840 20,106 14,690 65.0 47.51990 . . . . . . . . . . . . . . . . . . . . . . . . . . . . . . . . 30,788 10,562 20,226 14,563 65.7 47.319912 . . . . . . . . . . . . . . . . . . . . . . . . . . . . . . . 31,098 10,121 20,977 14,628 67.5 47.01992 . . . . . . . . . . . . . . . . . . . . . . . . . . . . . . . . 30,951 10,525 20,426 14,483 66.0 46.8
1Procedures are classified for the National Hospital Discharge Survey as surgical or nonsurgical. This classification was revised in 1989. See appendix II for further information.2Includes procedures not coded in previous years. See appendix II.
38

Table 18. Number of all-listed procedures for discharges from short-stay hospitals by procedure category: United States, 1980, 1985, and1988–92[Discharges of inpatients from non-Federal hospitals. Excludes newborn infants. Groupings of procedures and code numbers are based on the InternationalClassification of Diseases, 9th Revision, Clinical Modification (ICD–9–CM)]
Procedure category and ICD–9–CM code 1980 1985 1988 1989 1990 1991 1992
Number of all-listed procedures in thousands
All procedures . . . . . . . . . . . . . . . . . . . . . . . . . . . . . . . . . . . . . . . . . . . . . . . . . . 31,412 36,760 39,192 40,043 40,506 43,922 42,627
Operations on the nervous system . . . . . . . . . . . . . . . . . . . . . . . . . . . . . . . . . 01–05 728 898 896 909 952 970 921Spinal tap . . . . . . . . . . . . . . . . . . . . . . . . . . . . . . . . . . . . . . . . . . . . . . . 03.31 216 305 353 377 396 380 339
Operations on the endocrine system . . . . . . . . . . . . . . . . . . . . . . . . . . . . . . . . 06–07 117 95 111 113 96 103 102Operations on the eye . . . . . . . . . . . . . . . . . . . . . . . . . . . . . . . . . . . . . . . . . 08–16 1,050 718 547 448 350 399 332Operations on the ear . . . . . . . . . . . . . . . . . . . . . . . . . . . . . . . . . . . . . . . . . 18–20 415 256 198 168 137 129 121Operations on the nose, mouth, and pharynx . . . . . . . . . . . . . . . . . . . . . . . . . . . 21–29 1,603 1,173 820 734 585 541 533Tonsillectomy with or without adenoidectomy . . . . . . . . . . . . . . . . . . . . . . . 28.2–28.3 464 317 213 155 117 86 80
Operations on the respiratory system . . . . . . . . . . . . . . . . . . . . . . . . . . . . . . . . 30–34 868 981 991 1,051 975 956 1,031Bronchoscopy with or without biopsy1 . . . . . . . . . . . . . . . . . . . . . . 33.21–33.24,33.27 269 292 313 318 298 309 315
Operations on the cardiovascular system . . . . . . . . . . . . . . . . . . . . . . . . . . . . . 35–39 1,352 2,414 3,626 3,722 3,881 4,123 4,424Removal of coronary artery obstruction . . . . . . . . . . . . . . . . . . . . . . . . . . . . . . 36.0 *6 82 227 259 285 331 399Coronary artery bypass graft2 . . . . . . . . . . . . . . . . . . . . . . . . . . . . . . . . . . . . 36.1 137 230 353 368 392 407 468Cardiac catheterization . . . . . . . . . . . . . . . . . . . . . . . . . . . . . . . . . . . 37.21–37.23 348 681 930 958 995 1,000 1,028Insertion, replacement, removal, and revision of pacemaker leads or device . . . . 37.7–37.8 187 223 291 275 259 300 274Shunt or vascular bypass . . . . . . . . . . . . . . . . . . . . . . . . . . . . . . . . . . . 39.0–39.2 98 140 140 167 162 168 178Hemodialysis . . . . . . . . . . . . . . . . . . . . . . . . . . . . . . . . . . . . . . . . . . . . . 39.95 38 125 188 192 216 261 322
Operations on the hemic and lymphatic system . . . . . . . . . . . . . . . . . . . . . . . . . 40–41 321 397 392 385 361 392 398Operations on the digestive system . . . . . . . . . . . . . . . . . . . . . . . . . . . . . . . . . 42–54 5,320 5,740 5,257 5,360 5,271 5,559 5,358Endoscopy of small intestine with or without biopsy . . . . . . . . . . . . . . 45.11–45.14,45.16 282 537 595 752 785 804 864Endoscopy of large intestine with or without biopsy . . . . . . . . . . . . . . . . . . 45.21–45.25 535 614 537 545 548 574 573Partial excision of large intestine . . . . . . . . . . . . . . . . . . . . . . . . . . . . . . . . . . 45.7 139 182 202 197 204 220 217Appendectomy, excluding incidental . . . . . . . . . . . . . . . . . . . . . . . . . . . . . . . . 47.0 291 283 273 253 274 255 261Cholecystectomy . . . . . . . . . . . . . . . . . . . . . . . . . . . . . . . . . . . . . . . . . . . . 51.2 458 475 497 504 522 571 525Repair of inguinal hernia . . . . . . . . . . . . . . . . . . . . . . . . . . . . . . . . . . . 53.0–53.1 537 416 290 243 205 172 139Lysis of peritoneal adhesions . . . . . . . . . . . . . . . . . . . . . . . . . . . . . . . . . . . . 54.5 228 309 296 329 323 339 344
Operations on the urinary system . . . . . . . . . . . . . . . . . . . . . . . . . . . . . . . . . . 55–59 1,921 1,729 1,706 1,594 1,664 1,558 1,413Cystoscopy with or without biopsy . . . . . . . . . . . . . . . . . . . . . . . . . . . . 57.31–57.33 875 666 581 525 527 458 414
Operations on the male genital organs . . . . . . . . . . . . . . . . . . . . . . . . . . . . . . . 60–64 799 744 633 648 594 584 539Prostatectomy . . . . . . . . . . . . . . . . . . . . . . . . . . . . . . . . . . . . . . . . . . 60.2–60.6 335 367 358 376 364 363 353
Operations on the female genital organs . . . . . . . . . . . . . . . . . . . . . . . . . . . . . . 65–71 4,274 3,318 2,501 2,385 2,440 2,308 2,302Oophorectomy and salpingo-oophorectomy . . . . . . . . . . . . . . . . . . . . . . . . 65.3–65.6 483 525 451 421 476 458 464Bilateral destruction or occlusion of fallopian tubes . . . . . . . . . . . . . . . . . . . 66.2–66.3 641 466 406 389 419 401 380Hysterectomy . . . . . . . . . . . . . . . . . . . . . . . . . . . . . . . . . . . . . . . . . . 68.3–68.7 649 670 578 541 591 546 580Dilation and curettage of uterus . . . . . . . . . . . . . . . . . . . . . . . . . . . . . . . . . . . 69.0 1,251 597 279 265 220 196 173Repair of cystocele and rectocele . . . . . . . . . . . . . . . . . . . . . . . . . . . . . . . . . . 70.5 162 165 136 135 137 139 141
Obstetrical procedures . . . . . . . . . . . . . . . . . . . . . . . . . . . . . . . . . . . . . . . . . 72–75 3,603 4,304 6,042 6,383 6,792 6,867 6,664Episiotomy with or without forceps or vacuum extraction . . . . . .72.1,72.21,72.31,72.71,73.6 2,014 1,820 1,680 1,704 1,717 1,684 1,611Artificial rupture of membranes . . . . . . . . . . . . . . . . . . . . . . . . . . . . . . . . . . . 73.0 120 316 586 654 691 775 729Cesarean section . . . . . . . . . . . . . . . . . . . . . . . . . . . . . . . . . 74.0–74.2,74.4,74.99 619 877 933 938 945 933 921Fetal EKG (scalp) and fetal monitoring, not otherwise specified . . . . . . . . . . 75.32,75.34 124 275 1,143 1,206 1,377 1,327 1,241Repair of current obstetric laceration . . . . . . . . . . . . . . . . . . . . . . . . . . . . 75.5–75.6 355 548 690 762 795 795 790
Operations on the musculoskeletal system . . . . . . . . . . . . . . . . . . . . . . . . . . . . 76–84 3,215 3,523 3,143 3,171 3,132 3,323 3,266Partial excision of bone . . . . . . . . . . . . . . . . . . . . . . . . . . . . . . 76.2–76.3,77.6–77.8 205 225 190 215 193 216 222Open reduction of fracture with internal fixation . . . . . . . . . . . . . . . . . . . . . . . . . 79.3 301 393 394 409 391 418 417Excision or destruction of intervertebral disc . . . . . . . . . . . . . . . . . . . . . . . . . . . 80.5 142 228 250 262 305 306 319Total hip replacement3 . . . . . . . . . . . . . . . . . . . . . . . . . . . . . . . . . . . . . . . . 81.51 58 111 129 - - - 119 117 127Total knee replacement . . . . . . . . . . . . . . . . . . . . . . . . . . . . . . . . . . . . 81.41,81.54 45 73 105 94 129 160 167
Operations on the integumentary system . . . . . . . . . . . . . . . . . . . . . . . . . . . . . . 85–86 1,896 1,653 1,475 1,428 1,387 1,324 1,371Mastectomy . . . . . . . . . . . . . . . . . . . . . . . . . . . . . . . . . . . . . . . . . . . . . . . 85.4 109 116 124 120 122 118 117Debridement of wound, infection, or burn . . . . . . . . . . . . . . . . . . . . . . . . 86.22,86.28 196 265 322 351 332 326 308Skin graft . . . . . . . . . . . . . . . . . . . . . . . . . . . . . . . . . . . . . . . . . . . . . 86.6–86.7 183 157 148 124 110 99 108
Miscellaneous diagnostic and therapeutic procedures . . . . . . . . . . . . . . . . . . . . . . 87–99 3,930 8,819 10,854 11,544 11,890 14,785 13,854Computerized axial tomography . . . . . . . . . . . . . . . . . . . 87.03,87.41,87.71,88.01,88.38 306 1,378 1,613 1,519 1,506 1,459 1,266Pyelogram . . . . . . . . . . . . . . . . . . . . . . . . . . . . . . . . . . . . . . . . . . . 87.73–87.75 466 443 325 288 291 245 203Arteriography and angiocardiography using contrast material . . . . . . . . . . . . . 88.4–88.5 569 1,117 1,624 1,620 1,735 1,718 1,771Diagnostic ultrasound . . . . . . . . . . . . . . . . . . . . . . . . . . . . . . . . . . . . . . . . . 88.7 318 1,234 1,562 1,558 1,608 1,592 1,458Circulatory monitoring . . . . . . . . . . . . . . . . . . . . . . . . . . . . . . . . . . . . . . . . . 89.6 76 635 846 779 724 703 596Radioisotope scan . . . . . . . . . . . . . . . . . . . . . . . . . . . . . . . . . . . . . . . 92.0–92.1 525 838 704 635 603 539 464Respiratory therapy . . . . . . . . . . . . . . . . . . . . . . . . . . . . . . . . . . . . . . . 93.9,96.7 *7 62 272 927 1,164 1,214 1,195
- - - Data not available.
*Figure does not meet standard of reliability or precision.1ICD–9–CM code 33.27 was not included in the category before 1987.2Number of coronary artery bypass graft procedures. See table 31 for number of discharges with coronary artery bypass grafts.3Total hip replacement was not available in 1989 due to a change in codes. Before 1989, the ICD–9–CM code was 81.5.
NOTE: See ‘‘Medical Coding and Edit,’’ appendix I, for additional information about changes in coding system and coding modifications for the National Hospital Discharge Survey. 39

Table 19. Rate of all-listed procedures for discharges from short-stay hospitals by procedure category: United States, 1980, 1985, and1988–92[Discharges of inpatients from non-Federal hospitals. Excludes newborn infants. Groupings of procedures and code numbers are based on the InternationalClassification of Diseases, 9th Revision, Clinical Modification (ICD–9–CM)]
Procedure category and ICD–9–CM code 1980 1985 1988 1989 1990 1991 1992
Rate of all-listed procedures per 100,000 population
All procedures . . . . . . . . . . . . . . . . . . . . . . . . . . . . . . . . . . . . . . . . . . . . . . . . . . 13,922.3 15,561.8 16,140.4 16,335.2 16,349.3 17,529.3 16,815.7
Operations on the nervous system . . . . . . . . . . . . . . . . . . . . . . . . . . . . . . . . . 01–05 322.6 380.1 369.0 370.9 384.1 387.3 363.2Spinal tap . . . . . . . . . . . . . . . . . . . . . . . . . . . . . . . . . . . . . . . . . . . . . . . 03.31 95.9 129.1 145.6 154.0 159.8 151.6 133.7
Operations on the endocrine system . . . . . . . . . . . . . . . . . . . . . . . . . . . . . . . . 06–07 51.9 40.2 45.6 46.2 38.6 41.0 40.0Operations on the eye . . . . . . . . . . . . . . . . . . . . . . . . . . . . . . . . . . . . . . . . . 08–16 465.3 304.1 225.2 182.7 141.1 159.2 130.9Operations on the ear . . . . . . . . . . . . . . . . . . . . . . . . . . . . . . . . . . . . . . . . . 18–20 183.9 108.5 81.3 68.6 55.1 51.6 47.7Operations on the nose, mouth, and pharynx . . . . . . . . . . . . . . . . . . . . . . . . . . . 21–29 710.5 496.6 337.9 299.5 236.2 216.1 210.1Tonsillectomy with or without adenoidectomy . . . . . . . . . . . . . . . . . . . . . . . 28.2–28.3 205.6 134.4 87.8 63.2 47.4 34.1 31.4
Operations on the respiratory system . . . . . . . . . . . . . . . . . . . . . . . . . . . . . . . . 30–34 384.5 415.1 408.2 428.7 393.6 381.7 406.7Bronchoscopy with or without biopsy1 . . . . . . . . . . . . . . . . . . . . . . 33.21–33.24,33.27 119.2 123.6 128.7 129.9 120.3 123.4 124.4
Operations on the cardiovascular system . . . . . . . . . . . . . . . . . . . . . . . . . . . . . 35–39 599.4 1,021.8 1,493.2 1,518.2 1,566.4 1,645.5 1,745.1Removal of coronary artery obstruction . . . . . . . . . . . . . . . . . . . . . . . . . . . . . . 36.0 *2.6 34.7 93.3 105.6 115.2 131.9 157.2Coronary artery bypass graft2 . . . . . . . . . . . . . . . . . . . . . . . . . . . . . . . . . . . . 36.1 60.8 97.5 145.4 150.2 158.3 162.6 184.8Cardiac catheterization . . . . . . . . . . . . . . . . . . . . . . . . . . . . . . . . . . . 37.21–37.23 154.4 288.1 382.9 390.7 401.8 399.1 405.6Insertion, replacement, removal, and revision of pacemaker leads or device . . . 37.7–37.8 83.0 94.6 119.8 112.1 104.5 119.6 108.1Shunt or vascular bypass . . . . . . . . . . . . . . . . . . . . . . . . . . . . . . . . . . . 39.0–39.2 43.6 59.1 57.7 68.3 65.2 67.2 70.3Hemodialysis . . . . . . . . . . . . . . . . . . . . . . . . . . . . . . . . . . . . . . . . . . . . . 39.95 17.0 52.8 77.4 78.4 87.3 104.0 127.2
Operations on the hemic and lymphatic system . . . . . . . . . . . . . . . . . . . . . . . . . 40–41 142.5 168.0 161.6 157.0 145.7 156.3 156.8Operations on the digestive system . . . . . . . . . . . . . . . . . . . . . . . . . . . . . . . . . 42–54 2,357.9 2,430.1 2,165.1 2,186.6 2,127.5 2,218.8 2,113.6Endoscopy of small intestine with or without biopsy . . . . . . . . . . . . . . 45.11–45.14,45.16 124.8 227.4 244.9 306.6 316.8 320.9 341.0Endoscopy of large intestine with or without biopsy . . . . . . . . . . . . . . . . . . 45.21–45.25 237.2 260.1 221.1 222.2 221.2 229.0 226.0Partial excision of large intestine . . . . . . . . . . . . . . . . . . . . . . . . . . . . . . . . . . 45.7 61.5 77.0 83.2 80.2 82.5 87.7 85.6Appendectomy, excluding incidental . . . . . . . . . . . . . . . . . . . . . . . . . . . . . . . . 47.0 128.8 119.9 112.4 103.1 110.5 101.8 102.9Cholecystectomy . . . . . . . . . . . . . . . . . . . . . . . . . . . . . . . . . . . . . . . . . . . . 51.2 203.0 201.0 204.7 205.4 210.7 227.8 207.1Repair of inguinal hernia . . . . . . . . . . . . . . . . . . . . . . . . . . . . . . . . . . . 53.0–53.1 238.1 176.0 119.3 99.2 82.7 68.8 54.9Lysis of peritoneal adhesions . . . . . . . . . . . . . . . . . . . . . . . . . . . . . . . . . . . . 54.5 101.2 130.7 121.8 134.2 130.5 135.4 135.5
Operations on the urinary system . . . . . . . . . . . . . . . . . . . . . . . . . . . . . . . . . . 55–59 851.5 731.7 702.5 650.4 671.7 621.8 557.4Cystoscopy with or without biopsy . . . . . . . . . . . . . . . . . . . . . . . . . . . . 57.31–57.33 387.9 282.0 239.5 214.1 212.8 182.6 163.5
Operations on the male genital organs . . . . . . . . . . . . . . . . . . . . . . . . . . . . . . . 60–64 354.0 314.8 260.6 264.3 239.8 233.2 212.5Prostatectomy . . . . . . . . . . . . . . . . . . . . . . . . . . . . . . . . . . . . . . . . . . 60.2–60.6 148.5 155.3 147.2 153.5 146.8 145.1 139.1
Operations on the female genital organs . . . . . . . . . . . . . . . . . . . . . . . . . . . . . . 65–71 1,894.3 1,404.4 1,030.1 973.1 984.8 921.3 908.2Oophorectomy and salpingo-oophorectomy . . . . . . . . . . . . . . . . . . . . . . . . 65.3–65.6 214.1 222.1 185.7 171.6 192.1 182.7 183.1Bilateral destruction or occlusion of fallopian tubes . . . . . . . . . . . . . . . . . . . 66.2–66.3 284.0 197.5 167.2 158.5 169.0 160.1 149.8Hysterectomy . . . . . . . . . . . . . . . . . . . . . . . . . . . . . . . . . . . . . . . . . . 68.3–68.7 287.8 283.8 238.2 220.6 238.6 218.0 228.8Dilation and curettage of uterus . . . . . . . . . . . . . . . . . . . . . . . . . . . . . . . . . . . 69.0 554.5 252.9 115.0 107.9 88.9 78.0 68.3Repair of cystocele and rectocele . . . . . . . . . . . . . . . . . . . . . . . . . . . . . . . . . . 70.5 71.7 69.7 56.0 55.1 55.2 55.3 55.7
Obstetrical procedures . . . . . . . . . . . . . . . . . . . . . . . . . . . . . . . . . . . . . . . . . 72–75 1,597.0 1,821.9 2,488.2 2,603.8 2,741.6 2,740.4 2,628.9Episiotomy with or without forceps or vacuum extraction . . . . . 72.1,72.21,72.31,72.71,73.6 892.5 770.6 692.1 695.0 693.1 672.2 635.4Artificial rupture of membranes . . . . . . . . . . . . . . . . . . . . . . . . . . . . . . . . . . . 73.0 53.2 133.8 241.4 266.7 278.9 309.2 287.5Cesarean section . . . . . . . . . . . . . . . . . . . . . . . . . . . . . . . . . 74.0–74.2,74.4,74.99 274.6 371.2 384.4 382.6 381.6 372.5 363.3Fetal EKG (scalp) and fetal monitoring, not otherwise specified . . . . . . . . . . 75.32,75.34 55.1 116.2 470.7 492.0 555.7 529.5 489.6Repair of current obstetric laceration . . . . . . . . . . . . . . . . . . . . . . . . . . . . 75.5–75.6 157.2 231.8 284.3 310.9 320.8 317.3 311.8
Operations on the musculoskeletal system . . . . . . . . . . . . . . . . . . . . . . . . . . . . 76–84 1,425.0 1,491.4 1,294.5 1,293.5 1,264.3 1,326.4 1,288.3Partial excision of bone . . . . . . . . . . . . . . . . . . . . . . . . . . . . . . 76.2–76.3,77.6–77.8 91.1 95.1 78.1 87.8 77.9 86.2 87.6Open reduction of fracture with internal fixation . . . . . . . . . . . . . . . . . . . . . . . . . 79.3 133.6 166.4 162.2 166.9 157.8 166.7 164.4Excision or destruction of intervertebral disc . . . . . . . . . . . . . . . . . . . . . . . . . . . 80.5 63.2 96.4 103.0 107.1 123.0 122.2 125.9Total hip replacement3 . . . . . . . . . . . . . . . . . . . . . . . . . . . . . . . . . . . . . . . . 81.51 25.7 46.8 53.1 - - - 48.0 46.6 50.1Total knee replacement . . . . . . . . . . . . . . . . . . . . . . . . . . . . . . . . . . . 81.41,81.54 20.2 30.9 43.4 38.3 52.1 64.0 66.1
Operations on the integumentary system . . . . . . . . . . . . . . . . . . . . . . . . . . . . . . 85–86 840.2 699.6 607.3 582.4 559.8 528.5 540.9Mastectomy . . . . . . . . . . . . . . . . . . . . . . . . . . . . . . . . . . . . . . . . . . . . . . . 85.4 48.2 49.1 51.0 49.1 49.2 47.2 46.0Debridement of wound, infection, or burn . . . . . . . . . . . . . . . . . . . . . . . . 86.22,86.28 86.9 112.1 132.7 143.0 134.1 130.0 121.4Skin graft . . . . . . . . . . . . . . . . . . . . . . . . . . . . . . . . . . . . . . . . . . . . . 86.6–86.7 81.1 66.3 60.8 50.7 44.4 39.5 42.5
Miscellaneous diagnostic and therapeutic procedures . . . . . . . . . . . . . . . . . . . . . . 87–99 1,741.8 3,733.4 4,470.2 4,709.3 4,799.1 5,900.5 5,465.1Computerized axial tomography . . . . . . . . . . . . . . . . . . . 87.03,87.41,87.71,88.01,88.38 135.6 583.2 664.1 619.5 607.8 582.4 499.4Pyelogram . . . . . . . . . . . . . . . . . . . . . . . . . . . . . . . . . . . . . . . . . . . 87.73–87.75 206.7 187.3 133.9 117.3 117.5 97.8 79.9Arteriography and angiocardiography using contrast material . . . . . . . . . . . . . 88.4–88.5 252.3 472.9 668.7 661.0 700.4 685.8 698.7Diagnostic ultrasound . . . . . . . . . . . . . . . . . . . . . . . . . . . . . . . . . . . . . . . . . 88.7 141.2 522.3 643.2 635.7 649.2 635.2 575.2Circulatory monitoring . . . . . . . . . . . . . . . . . . . . . . . . . . . . . . . . . . . . . . . . . 89.6 33.7 268.8 348.2 318.0 292.4 280.5 234.9Radioisotope scan . . . . . . . . . . . . . . . . . . . . . . . . . . . . . . . . . . . . . . . 92.0–92.1 232.6 354.8 290.0 259.0 243.4 215.0 183.1Respiratory therapy . . . . . . . . . . . . . . . . . . . . . . . . . . . . . . . . . . . . . . . 93.9,96.7 *3.3 26.1 112.0 378.2 469.8 484.5 471.4
- - - Data not available. *Figure does not meet standard of reliability or precision.1ICD–9–CM code 33.27 was not included in the category before 1987.2Rate of coronary artery bypass graft procedures. See table 31 for rate of discharges with coronary artery bypass grafts.3Total hip replacement was not available in 1989 due to a change in codes. Before 1989, the ICD–9–CM code was 81.5.
NOTE: See ‘‘Medical Coding and Edit,’’ appendix I, for additional information about changes in coding system and coding modifications for the National Hospital Discharge Survey.
40

Table 20. Number of all-listed procedures for male discharges from short-stay hospitals by procedure category: United States, 1980,1985, and 1988–92[Discharges of inpatients from non-Federal hospitals. Excludes newborn infants. Groupings of procedures and code numbers are based on the InternationalClassification of Diseases, 9th Revision, Clinical Modification (ICD–9–CM)]
Procedure category and ICD–9–CM code 1980 1985 1988 1989 1990 1991 1992
Number of all-listed procedures for males in thousands
All procedures . . . . . . . . . . . . . . . . . . . . . . . . . . . . . . . . . . . . . . . . . . . . . . . . . . 11,891 14,694 15,735 16,088 15,916 17,264 16,791
Operations on the nervous system . . . . . . . . . . . . . . . . . . . . . . . . . . . . . . . . . 01–05 362 451 467 475 479 500 442Spinal tap . . . . . . . . . . . . . . . . . . . . . . . . . . . . . . . . . . . . . . . . . . . . . . . 03.31 107 159 183 203 204 208 184
Operations on the endocrine system . . . . . . . . . . . . . . . . . . . . . . . . . . . . . . . . 06–07 32 24 31 31 26 28 29Operations on the eye . . . . . . . . . . . . . . . . . . . . . . . . . . . . . . . . . . . . . . . . . 08–16 451 309 243 198 174 189 162Operations on the ear . . . . . . . . . . . . . . . . . . . . . . . . . . . . . . . . . . . . . . . . . 18–20 218 130 109 93 73 75 68Operations on the nose, mouth, and pharynx . . . . . . . . . . . . . . . . . . . . . . . . . . . 21–29 779 589 436 386 327 288 280Tonsillectomy with or without adenoidectomy . . . . . . . . . . . . . . . . . . . . . . . 28.2–28.3 195 135 94 69 49 40 33
Operations on the respiratory system . . . . . . . . . . . . . . . . . . . . . . . . . . . . . . . . 30–34 538 582 561 608 555 561 575Bronchoscopy with or without biopsy1 . . . . . . . . . . . . . . . . . . . . . . 33.21–33.24,33.27 167 181 182 192 175 186 178
Operations on the cardiovascular system . . . . . . . . . . . . . . . . . . . . . . . . . . . . . 35–39 821 1,425 2,220 2,236 2,317 2,383 2,630Removal of coronary artery obstruction . . . . . . . . . . . . . . . . . . . . . . . . . . . . . . 36.0 *5 58 160 177 200 223 262Coronary artery bypass graft2 . . . . . . . . . . . . . . . . . . . . . . . . . . . . . . . . . . . . 36.1 108 172 270 271 286 296 347Cardiac catheterization . . . . . . . . . . . . . . . . . . . . . . . . . . . . . . . . . . . 37.21–37.23 228 439 598 601 620 603 636Insertion, replacement, removal, and revision of pacemaker leads or device . . . 37.7–37.8 102 118 165 142 138 145 140Shunt or vascular bypass . . . . . . . . . . . . . . . . . . . . . . . . . . . . . . . . . . . 39.0–39.2 60 79 85 97 95 92 99Hemodialysis . . . . . . . . . . . . . . . . . . . . . . . . . . . . . . . . . . . . . . . . . . . . . 39.95 20 62 99 105 105 129 156
Operations on the hemic and lymphatic system . . . . . . . . . . . . . . . . . . . . . . . . . 40–41 156 190 192 190 187 212 202Operations on the digestive system . . . . . . . . . . . . . . . . . . . . . . . . . . . . . . . . . 42–54 2,334 2,530 2,277 2,309 2,194 2,319 2,258Endoscopy of small intestine with or without biopsy . . . . . . . . . . . . . . 45.11–45.14,45.16 117 250 274 348 357 391 405Endoscopy of large intestine with or without biopsy . . . . . . . . . . . . . . . . . . 45.21–45.25 228 269 230 218 212 234 238Partial excision of large intestine . . . . . . . . . . . . . . . . . . . . . . . . . . . . . . . . . . 45.7 58 80 86 88 89 94 91Appendectomy, excluding incidental . . . . . . . . . . . . . . . . . . . . . . . . . . . . . . . . 47.0 146 150 147 141 147 135 143Cholecystectomy . . . . . . . . . . . . . . . . . . . . . . . . . . . . . . . . . . . . . . . . . . . . 51.2 122 147 132 144 147 166 165Repair of inguinal hernia . . . . . . . . . . . . . . . . . . . . . . . . . . . . . . . . . . . 53.0–53.1 483 370 261 220 181 155 121Lysis of peritoneal adhesions . . . . . . . . . . . . . . . . . . . . . . . . . . . . . . . . . . . . 54.5 32 44 51 59 62 60 67
Operations on the urinary system . . . . . . . . . . . . . . . . . . . . . . . . . . . . . . . . . . 55–59 1,087 1,049 1,018 962 946 884 776Cystoscopy with or without biopsy . . . . . . . . . . . . . . . . . . . . . . . . . . . . 57.31–57.33 548 472 424 379 377 333 291
Operations on the male genital organs . . . . . . . . . . . . . . . . . . . . . . . . . . . . . . . 60–64 799 744 633 648 594 584 539Prostatectomy . . . . . . . . . . . . . . . . . . . . . . . . . . . . . . . . . . . . . . . . . . 60.2–60.6 335 367 358 376 364 363 353
Operations on the musculoskeletal system . . . . . . . . . . . . . . . . . . . . . . . . . . . . 76–84 1,666 1,734 1,648 1,676 1,624 1,710 1,652Partial excision of bone . . . . . . . . . . . . . . . . . . . . . . . . . . . . . . 76.2–76.3,77.6–77.8 91 112 102 120 112 119 115Open reduction of fracture with internal fixation . . . . . . . . . . . . . . . . . . . . . . . . . 79.3 153 178 193 186 177 193 187Excision or destruction of intervertebral disc . . . . . . . . . . . . . . . . . . . . . . . . . . . 80.5 85 136 158 157 175 181 175Total hip replacement3 . . . . . . . . . . . . . . . . . . . . . . . . . . . . . . . . . . . . . . . . 81.51 21 41 47 - - - 48 50 49Total knee replacement . . . . . . . . . . . . . . . . . . . . . . . . . . . . . . . . . . . . 81.41,81.54 13 28 34 30 46 60 53
Operations on the integumentary system . . . . . . . . . . . . . . . . . . . . . . . . . . . . . . 85–86 754 658 639 633 580 552 563Mastectomy . . . . . . . . . . . . . . . . . . . . . . . . . . . . . . . . . . . . . . . . . . . . . . . 85.4 *6 * * * * * *Debridement of wound, infection, or burn . . . . . . . . . . . . . . . . . . . . . . . . 86.22,86.28 130 152 196 218 184 181 178Skin graft . . . . . . . . . . . . . . . . . . . . . . . . . . . . . . . . . . . . . . . . . . . . . 86.6–86.7 106 96 91 75 66 60 59
Miscellaneous diagnostic and therapeutic procedures . . . . . . . . . . . . . . . . . . . . . . 87–99 1,894 4,279 5,262 5,644 5,842 6,981 6,615Computerized axial tomography . . . . . . . . . . . . . . . . . . . 87.03,87.41,87.71,88.01,88.38 152 671 775 721 736 702 608Pyelogram . . . . . . . . . . . . . . . . . . . . . . . . . . . . . . . . . . . . . . . . . . . 87.73–87.75 241 243 192 161 149 133 105Arteriography and angiocardiography using contrast material . . . . . . . . . . . . . 88.4–88.5 355 693 995 1,000 1,051 989 1,060Diagnostic ultrasound . . . . . . . . . . . . . . . . . . . . . . . . . . . . . . . . . . . . . . . . . 88.7 114 478 599 628 667 652 587Circulatory monitoring . . . . . . . . . . . . . . . . . . . . . . . . . . . . . . . . . . . . . . . . . 89.6 39 332 430 388 344 339 287Radioisotope scan . . . . . . . . . . . . . . . . . . . . . . . . . . . . . . . . . . . . . . . 92.0–92.1 236 375 315 287 268 228 203Respiratory therapy . . . . . . . . . . . . . . . . . . . . . . . . . . . . . . . . . . . . . . . 93.9,96.7 * 34 148 472 586 596 579
* Figure does not meet standard of reliability or precision.
- - - Data not available.1ICD–9–CM code 33.27 was not included in the category before 1987.2Number of coronary artery bypass graft procedures. See table 31 for number of discharges with coronary artery bypass grafts.3Total hip replacement was not available in 1989 due to a change in codes. Before 1989, the ICD–9–CM code was 81.5.
NOTE: See ‘‘Medical Coding and Edit,’’ appendix I, for additional information about changes in coding system and coding modifications for the National Hospital Discharge Survey.
41

Table 21. Rate of all-listed procedures for male discharges from short-stay hospitals by procedure category: United States, 1980, 1985,and 1988–92[Discharges of inpatients from non-Federal hospitals. Excludes newborn infants. Groupings of procedures and code numbers are based on the InternationalClassification of Diseases, 9th Revision, Clinical Modification (ICD–9–CM)]
Procedure category and ICD–9–CM code 1980 1985 1988 1989 1990 1991 1992
Rate of all-listed procedures per 100,000 male population
All procedures . . . . . . . . . . . . . . . . . . . . . . . . . . . . . . . . . . . . . . . . . . . . . . . . . . 10,916.7 12,868.6 13,383.1 13,546.6 13,249.7 14,204.6 13,642.3
Operations on the nervous system . . . . . . . . . . . . . . . . . . . . . . . . . . . . . . . . . 01–05 332.4 395.0 397.6 399.7 399.1 411.5 359.1Spinal tap . . . . . . . . . . . . . . . . . . . . . . . . . . . . . . . . . . . . . . . . . . . . . . . 03.31 98.2 139.0 155.4 171.3 170.0 171.1 149.4
Operations on the endocrine system . . . . . . . . . . . . . . . . . . . . . . . . . . . . . . . . 06–07 29.0 20.7 26.7 25.8 21.4 22.9 23.6Operations on the eye . . . . . . . . . . . . . . . . . . . . . . . . . . . . . . . . . . . . . . . . . 08–16 414.1 270.5 206.5 166.6 144.6 155.7 131.9Operations on the ear . . . . . . . . . . . . . . . . . . . . . . . . . . . . . . . . . . . . . . . . . 18–20 200.6 114.3 92.8 78.5 60.5 61.7 54.9Operations on the nose, mouth, and pharynx . . . . . . . . . . . . . . . . . . . . . . . . . . . 21–29 715.2 515.5 370.4 325.3 272.1 236.7 227.7Tonsillectomy with or without adenoidectomy . . . . . . . . . . . . . . . . . . . . . . . 28.2–28.3 179.3 117.9 79.7 57.9 41.1 32.5 26.9
Operations on the respiratory system . . . . . . . . . . . . . . . . . . . . . . . . . . . . . . . . 30–34 493.8 510.0 477.2 512.3 461.8 461.2 467.0Bronchoscopy with or without biopsy1 . . . . . . . . . . . . . . . . . . . . . . 33.21–33.24,33.27 153.0 158.8 154.7 161.4 145.8 153.4 144.4
Operations on the cardiovascular system . . . . . . . . . . . . . . . . . . . . . . . . . . . . . 35–39 753.7 1,248.1 1,888.2 1,882.7 1,928.5 1,960.3 2,136.9Removal of coronary artery obstruction . . . . . . . . . . . . . . . . . . . . . . . . . . . . . . 36.0 *4.6 50.4 136.1 149.1 166.8 183.5 213.3Coronary artery bypass graft2 . . . . . . . . . . . . . . . . . . . . . . . . . . . . . . . . . . . . 36.1 99.1 151.1 229.3 228.1 238.3 243.5 281.8Cardiac catheterization . . . . . . . . . . . . . . . . . . . . . . . . . . . . . . . . . . . 37.21–37.23 209.6 384.6 508.4 506.1 515.8 496.0 517.1Insertion, replacement, removal, and revision of pacemaker leads or device . . . 37.7–37.8 94.1 103.4 140.7 119.7 114.8 119.3 113.5Shunt or vascular bypass . . . . . . . . . . . . . . . . . . . . . . . . . . . . . . . . . . . 39.0–39.2 54.9 69.3 72.6 81.5 78.9 75.7 80.8Hemodialysis . . . . . . . . . . . . . . . . . . . . . . . . . . . . . . . . . . . . . . . . . . . . . 39.95 18.0 54.0 83.9 88.6 87.6 106.0 126.5
Operations on the hemic and lymphatic system . . . . . . . . . . . . . . . . . . . . . . . . . 40–41 143.3 166.1 163.6 160.2 155.3 174.3 164.4Operations on the digestive system . . . . . . . . . . . . . . . . . . . . . . . . . . . . . . . . . 42–54 2,142.8 2,215.6 1,936.3 1,944.0 1,826.5 1,908.0 1,834.4Endoscopy of small intestine with or without biopsy . . . . . . . . . . . . . . 45.11–45.14,45.16 107.7 218.7 232.9 293.0 297.2 321.9 329.1Endoscopy of large intestine with or without biopsy . . . . . . . . . . . . . . . . . . 45.21–45.25 209.6 236.0 195.7 183.7 176.4 192.6 193.5Partial excision of large intestine . . . . . . . . . . . . . . . . . . . . . . . . . . . . . . . . . . 45.7 53.3 69.7 73.5 74.3 73.9 77.7 74.0Appendectomy, excluding incidental . . . . . . . . . . . . . . . . . . . . . . . . . . . . . . . . 47.0 134.1 131.4 124.7 118.5 122.5 111.4 116.1Cholecystectomy . . . . . . . . . . . . . . . . . . . . . . . . . . . . . . . . . . . . . . . . . . . . 51.2 112.4 129.1 112.0 121.5 122.7 136.9 133.9Repair of inguinal hernia . . . . . . . . . . . . . . . . . . . . . . . . . . . . . . . . . . . 53.0–53.1 443.8 323.8 221.7 184.9 150.6 127.4 98.2Lysis of peritoneal adhesions . . . . . . . . . . . . . . . . . . . . . . . . . . . . . . . . . . . . 54.5 29.3 38.6 43.3 49.9 51.5 49.4 54.4
Operations on the urinary system . . . . . . . . . . . . . . . . . . . . . . . . . . . . . . . . . . 55–59 998.1 918.9 865.8 809.6 787.5 727.4 630.5Cystoscopy with or without biopsy . . . . . . . . . . . . . . . . . . . . . . . . . . . . 57.31–57.33 503.4 413.0 360.4 319.2 314.0 273.9 236.5
Operations on the male genital organs . . . . . . . . . . . . . . . . . . . . . . . . . . . . . . . 60–64 733.4 651.2 538.1 545.6 494.5 480.8 437.8Prostatectomy . . . . . . . . . . . . . . . . . . . . . . . . . . . . . . . . . . . . . . . . . . 60.2–60.6 307.5 321.2 304.1 316.9 302.8 299.1 286.6
Operations on the musculoskeletal system . . . . . . . . . . . . . . . . . . . . . . . . . . . . 76–84 1,529.7 1,518.2 1,401.5 1,411.3 1,351.8 1,406.7 1,342.3Partial excision of bone . . . . . . . . . . . . . . . . . . . . . . . . . . . . . . 76.2–76.3,77.6–77.8 84.0 98.3 86.7 101.3 93.3 97.6 93.7Open reduction of fracture with internal fixation . . . . . . . . . . . . . . . . . . . . . . . . . 79.3 140.2 156.1 164.2 156.7 147.0 158.4 151.9Excision or destruction of intervertebral disc . . . . . . . . . . . . . . . . . . . . . . . . . . . 80.5 78.2 119.3 134.4 131.9 145.7 149.3 142.4Total hip replacement3 . . . . . . . . . . . . . . . . . . . . . . . . . . . . . . . . . . . . . . . . 81.51 19.6 36.2 40.0 - - - 40.1 41.1 39.4Total knee replacement . . . . . . . . . . . . . . . . . . . . . . . . . . . . . . . . . . . 81.41,81.54 12.1 24.2 29.1 25.5 37.9 49.4 42.9
Operations on the integumentary system . . . . . . . . . . . . . . . . . . . . . . . . . . . . . . 85–86 691.8 576.6 543.2 533.1 482.5 453.8 457.7Mastectomy . . . . . . . . . . . . . . . . . . . . . . . . . . . . . . . . . . . . . . . . . . . . . . . 85.4 *5.4 * * * * * *Debridement of wound, infection, or burn . . . . . . . . . . . . . . . . . . . . . . . . 86.22,86.28 119.0 133.5 166.7 183.9 153.0 149.0 145.0Skin graft . . . . . . . . . . . . . . . . . . . . . . . . . . . . . . . . . . . . . . . . . . . . . 86.6–86.7 97.1 84.4 77.7 63.1 54.9 49.0 48.1
Miscellaneous diagnostic and therapeutic procedures . . . . . . . . . . . . . . . . . . . . . . 87–99 1,738.8 3,747.9 4,475.3 4,751.9 4,863.5 5,743.6 5,374.2Computerized axial tomography . . . . . . . . . . . . . . . . . . . 87.03,87.41,87.71,88.01,88.38 139.1 587.5 659.2 607.2 612.3 577.4 493.9Pyelogram . . . . . . . . . . . . . . . . . . . . . . . . . . . . . . . . . . . . . . . . . . . 87.73–87.75 221.6 212.5 163.1 135.1 123.9 109.3 85.0Arteriography and angiocardiography using contrast material . . . . . . . . . . . . . 88.4–88.5 325.6 606.5 846.2 841.9 874.6 813.8 861.3Diagnostic ultrasound . . . . . . . . . . . . . . . . . . . . . . . . . . . . . . . . . . . . . . . . . 88.7 104.8 418.4 509.3 528.8 555.3 536.2 477.2Circulatory monitoring . . . . . . . . . . . . . . . . . . . . . . . . . . . . . . . . . . . . . . . . . 89.6 35.6 290.8 365.9 327.0 286.7 278.9 232.9Radioisotope scan . . . . . . . . . . . . . . . . . . . . . . . . . . . . . . . . . . . . . . . 92.0–92.1 216.5 328.1 267.6 242.0 223.1 187.5 165.3Respiratory therapy . . . . . . . . . . . . . . . . . . . . . . . . . . . . . . . . . . . . . . . 93.9,96.7 * 30.1 126.0 397.2 487.6 490.1 470.3
- - - Data not available.
* Figure does not meet standard of reliability or precision.1ICD–9–CM code 33.27 was not included in the category before 1987.2Rate of coronary artery bypass graft procedures. See table 31 for rate of discharges with coronary artery bypass grafts.3Total hip replacement was not available in 1989 due to a change in codes. Before 1989, the ICD–9–CM code was 81.5.
NOTE: See ‘‘Medical Coding and Edit,’’ appendix I, for additional information about changes in coding system and coding modifications for the National Hospital Discharge Survey.
42

Table 22. Number of all-listed procedures for female discharges from short-stay hospitals by procedure category: United States, 1980,1985, and 1988–92[Discharges of inpatients from non-Federal hospitals. Excludes newborn infants. Groupings of procedures and code numbers are based on the InternationalClassification of Diseases, 9th Revision, Clinical Modification (ICD–9–CM)]
Procedure category and ICD–9–CM code 1980 1985 1988 1989 1990 1991 1992
Number of all-listed procedures for females in thousands
All procedures . . . . . . . . . . . . . . . . . . . . . . . . . . . . . . . . . . . . . . . . . . . . . . . . . . 19,521 22,066 23,457 23,954 24,590 26,658 25,836
Operations on the nervous system . . . . . . . . . . . . . . . . . . . . . . . . . . . . . . . . . 01–05 366 447 429 435 472 470 479Spinal tap . . . . . . . . . . . . . . . . . . . . . . . . . . . . . . . . . . . . . . . . . . . . . . . 03.31 110 146 171 174 192 172 155
Operations on the endocrine system . . . . . . . . . . . . . . . . . . . . . . . . . . . . . . . . 06–07 85 71 79 83 70 75 72Operations on the eye . . . . . . . . . . . . . . . . . . . . . . . . . . . . . . . . . . . . . . . . . 08–16 599 409 304 250 176 210 169Operations on the ear . . . . . . . . . . . . . . . . . . . . . . . . . . . . . . . . . . . . . . . . . 18–20 197 126 88 75 64 54 53Operations on the nose, mouth, and pharynx . . . . . . . . . . . . . . . . . . . . . . . . . . . 21–29 824 584 385 348 258 254 252Tonsillectomy with or without adenoidectomy . . . . . . . . . . . . . . . . . . . . . . . 28.2–28.3 269 183 119 86 68 46 46
Operations on the respiratory system . . . . . . . . . . . . . . . . . . . . . . . . . . . . . . . . 30–34 330 398 430 442 420 396 456Bronchoscopy with or without biopsy1 . . . . . . . . . . . . . . . . . . . . . . 33.21–33.24,33.27 102 111 131 127 123 123 138
Operations on the cardiovascular system . . . . . . . . . . . . . . . . . . . . . . . . . . . . . 35–39 531 989 1,406 1,486 1,564 1,740 1,794Removal of coronary artery obstruction . . . . . . . . . . . . . . . . . . . . . . . . . . . . . . 36.0 * 24 67 82 85 107 136Coronary artery bypass graft2 . . . . . . . . . . . . . . . . . . . . . . . . . . . . . . . . . . . . 36.1 29 58 83 97 106 111 122Cardiac catheterization . . . . . . . . . . . . . . . . . . . . . . . . . . . . . . . . . . . 37.21–37.23 120 241 332 357 376 397 392Insertion, replacement, removal, and revision of pacemaker leads or device . . . 37.7–37.8 85 105 125 133 121 155 134Shunt or vascular bypass . . . . . . . . . . . . . . . . . . . . . . . . . . . . . . . . . . . 39.0–39.2 39 61 55 71 67 76 79Hemodialysis . . . . . . . . . . . . . . . . . . . . . . . . . . . . . . . . . . . . . . . . . . . . . 39.95 19 63 89 87 111 132 167
Operations on the hemic and lymphatic system . . . . . . . . . . . . . . . . . . . . . . . . . 40–41 165 207 200 195 174 180 195Operations on the digestive system . . . . . . . . . . . . . . . . . . . . . . . . . . . . . . . . . 42–54 2,986 3,210 2,981 3,051 3,077 3,241 3,100Endoscopy of small intestine with or without biopsy . . . . . . . . . . . . . . 45.11–45.14,45.16 164 287 321 404 428 413 459Endoscopy of large intestine with or without biopsy . . . . . . . . . . . . . . . . . . 45.21–45.25 307 345 307 326 336 340 335Partial excision of large intestine . . . . . . . . . . . . . . . . . . . . . . . . . . . . . . . . . . 45.7 81 102 116 108 116 125 126Appendectomy, excluding incidental . . . . . . . . . . . . . . . . . . . . . . . . . . . . . . . . 47.0 145 133 126 112 127 120 118Cholecystectomy . . . . . . . . . . . . . . . . . . . . . . . . . . . . . . . . . . . . . . . . . . . . 51.2 336 327 365 359 375 404 360Repair of inguinal hernia . . . . . . . . . . . . . . . . . . . . . . . . . . . . . . . . . . . 53.0–53.1 54 46 29 24 24 17 18Lysis of peritoneal adhesions . . . . . . . . . . . . . . . . . . . . . . . . . . . . . . . . . . . . 54.5 197 265 245 270 261 279 277
Operations on the urinary system . . . . . . . . . . . . . . . . . . . . . . . . . . . . . . . . . . 55–59 834 679 688 633 718 674 637Cystoscopy with or without biopsy . . . . . . . . . . . . . . . . . . . . . . . . . . . . 57.31–57.33 327 195 158 146 150 125 123
Operations on the female genital organs . . . . . . . . . . . . . . . . . . . . . . . . . . . . . . 65–71 4,274 3,318 2,501 2,385 2,440 2,308 2,302Oophorectomy and salpingo-oophorectomy . . . . . . . . . . . . . . . . . . . . . . . . 65.3–65.6 483 525 451 421 476 458 464Bilateral destruction or occlusion of fallopian tubes . . . . . . . . . . . . . . . . . . . 66.2–66.3 641 466 406 389 419 401 380Hysterectomy . . . . . . . . . . . . . . . . . . . . . . . . . . . . . . . . . . . . . . . . . . 68.3–68.7 649 670 578 541 591 546 580Dilation and curettage of uterus . . . . . . . . . . . . . . . . . . . . . . . . . . . . . . . . . . . 69.0 1,251 597 279 265 220 196 173Repair of cystocele and rectocele . . . . . . . . . . . . . . . . . . . . . . . . . . . . . . . . . . 70.5 162 165 136 135 137 139 141
Obstetrical procedures . . . . . . . . . . . . . . . . . . . . . . . . . . . . . . . . . . . . . . . . . 72–75 3,603 4,304 6,042 6,383 6,792 6,867 6,664Episiotomy with or without forceps or vacuum extraction . . . . . 72.1,72.21,72.31,72.71,73.6 2,014 1,820 1,680 1,704 1,717 1,684 1,611Artificial rupture of membranes . . . . . . . . . . . . . . . . . . . . . . . . . . . . . . . . . . . 73.0 120 316 586 654 691 775 729Cesarean section . . . . . . . . . . . . . . . . . . . . . . . . . . . . . . . . . 74.0–74.2,74.4,74.99 619 877 933 938 945 933 921Fetal EKG (scalp) and fetal monitoring, not otherwise specified . . . . . . . . . . 75.32,75.34 124 275 1,143 1,206 1,377 1,327 1,241Repair of current obstetric laceration . . . . . . . . . . . . . . . . . . . . . . . . . . . . 75.5–75.6 355 548 690 762 795 795 790
Operations on the musculoskeletal system . . . . . . . . . . . . . . . . . . . . . . . . . . . . 76–84 1,549 1,789 1,496 1,495 1,508 1,614 1,614Partial excision of bone . . . . . . . . . . . . . . . . . . . . . . . . . . . . . . 76.2–76.3,77.6–77.8 114 112 88 95 81 97 107Open reduction of fracture with internal fixation . . . . . . . . . . . . . . . . . . . . . . . . . 79.3 149 215 201 223 214 225 230Excision or destruction of intervertebral disc . . . . . . . . . . . . . . . . . . . . . . . . . . . 80.5 57 92 92 106 130 125 144Total hip replacement3 . . . . . . . . . . . . . . . . . . . . . . . . . . . . . . . . . . . . . . . . 81.51 37 69 82 - - - 71 67 79Total knee replacement . . . . . . . . . . . . . . . . . . . . . . . . . . . . . . . . . . . 81.41,81.54 32 45 71 64 83 100 115
Operations on the integumentary system . . . . . . . . . . . . . . . . . . . . . . . . . . . . . . 85–86 1,142 994 836 795 807 773 808Mastectomy . . . . . . . . . . . . . . . . . . . . . . . . . . . . . . . . . . . . . . . . . . . . . . . 85.4 103 114 123 118 121 117 116Debridement of wound, infection, or burn . . . . . . . . . . . . . . . . . . . . . . . . 86.22,86.28 67 112 126 132 148 145 129Skin graft . . . . . . . . . . . . . . . . . . . . . . . . . . . . . . . . . . . . . . . . . . . . . 86.6–86.7 77 60 56 49 44 39 48
Miscellaneous diagnostic and therapeutic procedures . . . . . . . . . . . . . . . . . . . . . . 87–99 2,036 4,540 5,593 5,900 6,048 7,804 7,239Computerized axial tomography . . . . . . . . . . . . . . . . . . . 87.03,87.41,87.71,88.01,88.38 154 707 838 798 770 757 658Pyelogram . . . . . . . . . . . . . . . . . . . . . . . . . . . . . . . . . . . . . . . . . . . 87.73–87.75 225 200 133 127 142 112 98Arteriography and angiocardiography using contrast material . . . . . . . . . . . . . 88.4–88.5 215 425 629 620 685 729 711Diagnostic ultrasound . . . . . . . . . . . . . . . . . . . . . . . . . . . . . . . . . . . . . . . . . 88.7 204 756 963 930 941 940 871Circulatory monitoring . . . . . . . . . . . . . . . . . . . . . . . . . . . . . . . . . . . . . . . . . 89.6 37 303 415 391 380 364 309Radioisotope scan . . . . . . . . . . . . . . . . . . . . . . . . . . . . . . . . . . . . . . . 92.0–92.1 289 463 390 347 335 311 261Respiratory therapy . . . . . . . . . . . . . . . . . . . . . . . . . . . . . . . . . . . . . . . 93.9,96.7 * 27 124 455 578 618 616
* Figure does not meet standard of reliability or precision.
- - - Data not available.1ICD–9–CM code 33.27 was not included in the category before 1987.2Number of coronary artery bypass graft procedures. See table 31 for number of discharges with coronary artery bypass grafts.3Total hip replacement was not available in 1989 due to a change in codes. Before 1989, the ICD–9–CM code was 81.5.
NOTE: See ‘‘Medical Coding and Edit,’’ appendix I, for additional information about changes in coding system and coding modifications for the National Hospital Discharge Survey.
43

Table 23. Rate of all-listed procedures for female discharges from short-stay hospitals by procedure category: United States, 1980, 1985,and 1988–92[Discharges of inpatients from non-Federal hospitals. Excludes newborn infants. Groupings of procedures and code numbers are based on the InternationalClassification of Diseases, 9th Revision, Clinical Modification (ICD–9–CM)]
Procedure category and ICD–9–CM code 1980 1985 1988 1989 1990 1991 1992
Rate of all-listed procedures per 100,000 female population
All procedures . . . . . . . . . . . . . . . . . . . . . . . . . . . . . . . . . . . . . . . . . . . . . . . . 16,727.7 18,081.6 18,728.8 18,956.0 19,266.8 20,661.0 19,810.6
Operations on the nervous system . . . . . . . . . . . . . . . . . . . . . . . . . . . . . . 01–05 313.4 366.2 342.2 343.9 370.0 364.5 367.1Spinal tap . . . . . . . . . . . . . . . . . . . . . . . . . . . . . . . . . . . . . . . . . . . . . 03.31 93.8 119.9 136.3 137.7 150.2 133.2 118.8
Operations on the endocrine system . . . . . . . . . . . . . . . . . . . . . . . . . . . . . 06–07 73.2 58.5 63.3 65.4 54.8 58.1 55.6Operations on the eye . . . . . . . . . . . . . . . . . . . . . . . . . . . . . . . . . . . . . . 08–16 513.0 335.5 242.7 197.8 137.8 162.4 129.9Operations on the ear . . . . . . . . . . . . . . . . . . . . . . . . . . . . . . . . . . . . . . 18–20 168.4 103.0 70.6 59.2 50.0 42.0 41.0Operations on the nose, mouth, and pharynx . . . . . . . . . . . . . . . . . . . . . . . . 21–29 706.1 478.9 307.3 275.3 202.5 196.7 193.6Tonsillectomy with or without adenoidectomy . . . . . . . . . . . . . . . . . . . . . 28.2–28.3 230.1 149.8 95.3 68.3 53.2 35.7 35.6
Operations on the respiratory system . . . . . . . . . . . . . . . . . . . . . . . . . . . . . 30–34 282.5 326.3 343.4 350.1 329.4 306.6 349.8Bronchoscopy with or without biopsy1 . . . . . . . . . . . . . . . . . . . . 33.21–33.24,33.27 87.6 90.7 104.4 100.3 96.2 95.2 105.5
Operations on the cardiovascular system . . . . . . . . . . . . . . . . . . . . . . . . . . 35–39 455.4 810.1 1,122.5 1,175.6 1,225.7 1,348.9 1,375.4Removal of coronary artery obstruction . . . . . . . . . . . . . . . . . . . . . . . . . . . . 36.0 * 19.9 53.1 64.7 66.6 83.3 104.3Coronary artery bypass graft2 . . . . . . . . . . . . . . . . . . . . . . . . . . . . . . . . . . 36.1 25.1 47.4 66.5 77.0 83.0 86.4 93.2Cardiac catheterization . . . . . . . . . . . . . . . . . . . . . . . . . . . . . . . . 37.21–37.23 102.9 197.8 265.2 282.3 294.5 307.9 300.4Insertion, replacement, removal, and revision of pacemaker leads or device . 37.7–37.8 72.7 86.3 100.2 105.1 94.8 119.9 102.9Shunt or vascular bypass . . . . . . . . . . . . . . . . . . . . . . . . . . . . . . . . . 39.0–39.2 33.1 49.6 43.8 55.9 52.3 59.1 60.4Hemodialysis . . . . . . . . . . . . . . . . . . . . . . . . . . . . . . . . . . . . . . . . . . . 39.95 16.0 51.7 71.3 68.8 87.1 102.2 127.8
Operations on the hemic and lymphatic system . . . . . . . . . . . . . . . . . . . . . . 40–41 141.7 169.8 159.6 154.0 136.7 139.4 149.7Operations on the digestive system . . . . . . . . . . . . . . . . . . . . . . . . . . . . . . 42–54 2,558.7 2,630.7 2,379.9 2,414.5 2,410.7 2,511.9 2,377.0Endoscopy of small intestine with or without biopsy . . . . . . . . . . . . 45.11–45.14,45.16 140.7 235.5 256.1 319.4 335.2 320.0 352.1Endoscopy of large intestine with or without biopsy . . . . . . . . . . . . . . . 45.21–45.25 263.0 282.6 245.0 258.3 263.3 263.4 256.7Partial excision of large intestine . . . . . . . . . . . . . . . . . . . . . . . . . . . . . . . . 45.7 69.1 83.8 92.4 85.8 90.6 97.1 96.6Appendectomy, excluding incidental . . . . . . . . . . . . . . . . . . . . . . . . . . . . . . 47.0 123.8 109.1 100.9 88.6 99.2 92.7 90.4Cholecystectomy . . . . . . . . . . . . . . . . . . . . . . . . . . . . . . . . . . . . . . . . . . 51.2 287.6 268.3 291.7 284.3 293.5 313.4 276.1Repair of inguinal hernia . . . . . . . . . . . . . . . . . . . . . . . . . . . . . . . . . 53.0–53.1 46.1 37.7 23.3 18.6 18.8 13.6 14.1Lysis of peritoneal adhesions . . . . . . . . . . . . . . . . . . . . . . . . . . . . . . . . . . 54.5 168.4 217.0 195.5 213.3 204.7 216.5 212.1
Operations on the urinary system . . . . . . . . . . . . . . . . . . . . . . . . . . . . . . . 55–59 714.6 556.7 549.2 500.8 562.7 522.3 488.5Cystoscopy with or without biopsy . . . . . . . . . . . . . . . . . . . . . . . . . 57.31–57.33 280.1 159.5 126.0 115.3 117.6 96.7 94.6
Operations on the female genital organs . . . . . . . . . . . . . . . . . . . . . . . . . . . 65–71 3,662.5 2,718.5 1,997.1 1,887.7 1,911.6 1,789.0 1,765.4Oophorectomy and salpingo-oophorectomy . . . . . . . . . . . . . . . . . . . . . . 65.3–65.6 413.9 429.8 359.9 332.8 373.0 354.8 355.9Bilateral destruction or occlusion of fallopian tubes . . . . . . . . . . . . . . . . . 66.2–66.3 549.1 382.3 324.2 307.5 328.1 310.9 291.1Hysterectomy . . . . . . . . . . . . . . . . . . . . . . . . . . . . . . . . . . . . . . . . 68.3–68.7 556.5 549.3 461.8 427.8 463.1 423.4 444.7Dilation and curettage of uterus . . . . . . . . . . . . . . . . . . . . . . . . . . . . . . . . . 69.0 1,072.1 489.5 223.0 209.4 172.6 151.6 132.8Repair of cystocele and rectocele . . . . . . . . . . . . . . . . . . . . . . . . . . . . . . . . 70.5 138.6 134.8 108.5 106.9 107.2 107.4 108.2
Obstetrical procedures . . . . . . . . . . . . . . . . . . . . . . . . . . . . . . . . . . . . . . 72–75 3,087.6 3,526.6 4,823.9 5,050.9 5,322.1 5,321.8 5,109.9Episiotomy with or without forceps or vacuum extraction . . . 72.1,72.21,72.31,72.71,73.6 1,725.5 1,491.5 1,341.7 1,348.1 1,345.5 1,305.5 1,235.1Artificial rupture of membranes . . . . . . . . . . . . . . . . . . . . . . . . . . . . . . . . . 73.0 102.8 258.9 468.0 517.3 541.4 600.4 558.9Cesarean section . . . . . . . . . . . . . . . . . . . . . . . . . . . . . . . 74.0–74.2,74.4,74.99 530.9 718.4 745.3 742.2 740.7 723.4 706.1Fetal EKG (scalp) and fetal monitoring, not otherwise specified . . . . . . . . 75.32,75.34 106.4 224.9 912.6 954.5 1,078.7 1,028.1 951.6Repair of current obstetric laceration . . . . . . . . . . . . . . . . . . . . . . . . . . 75.5–75.6 304.0 448.7 551.2 603.1 622.6 616.1 606.1
Operations on the musculoskeletal system . . . . . . . . . . . . . . . . . . . . . . . . . 76–84 1,327.3 1,466.2 1,194.2 1,182.8 1,181.9 1,250.6 1,237.4Partial excision of bone . . . . . . . . . . . . . . . . . . . . . . . . . . . 76.2–76.3,77.6–77.8 97.7 92.1 70.0 75.1 63.3 75.5 81.7Open reduction of fracture with internal fixation . . . . . . . . . . . . . . . . . . . . . . . 79.3 127.5 176.1 160.3 176.5 167.9 174.6 176.3Excision or destruction of intervertebral disc . . . . . . . . . . . . . . . . . . . . . . . . . 80.5 49.1 75.1 73.5 83.7 101.6 96.6 110.4Total hip replacement3 . . . . . . . . . . . . . . . . . . . . . . . . . . . . . . . . . . . . . . 81.51 31.3 56.8 65.3 - - - 55.4 51.8 60.2Total knee replacement . . . . . . . . . . . . . . . . . . . . . . . . . . . . . . . . . 81.41,81.54 27.7 37.2 56.8 50.3 65.4 77.8 87.9
Operations on the integumentary system . . . . . . . . . . . . . . . . . . . . . . . . . . . 85–86 978.6 814.6 667.6 628.8 632.5 598.8 619.4Mastectomy . . . . . . . . . . . . . . . . . . . . . . . . . . . . . . . . . . . . . . . . . . . . . 85.4 88.2 93.7 97.8 93.2 94.7 90.9 88.8Debridement of wound, infection, or burn . . . . . . . . . . . . . . . . . . . . . . 86.22,86.28 57.1 92.2 100.9 104.6 116.2 112.1 99.1Skin graft . . . . . . . . . . . . . . . . . . . . . . . . . . . . . . . . . . . . . . . . . . . 86.6–86.7 66.2 49.4 45.0 39.2 34.5 30.6 37.1
Miscellaneous diagnostic and therapeutic procedures . . . . . . . . . . . . . . . . . . . 87–99 1,744.7 3,720.0 4,465.4 4,669.2 4,738.5 6,048.2 5,551.0Computerized axial tomography . . . . . . . . . . . . . . . . 87.03,87.41,87.71,88.01,88.38 132.3 579.2 668.8 631.2 603.5 587.0 504.7Pyelogram . . . . . . . . . . . . . . . . . . . . . . . . . . . . . . . . . . . . . . . . 87.73–87.75 192.7 163.8 106.4 100.5 111.5 86.9 75.1Arteriography and angiocardiography using contrast material . . . . . . . . . . . 88.4–88.5 183.8 347.9 502.3 490.9 536.4 565.3 545.2Diagnostic ultrasound . . . . . . . . . . . . . . . . . . . . . . . . . . . . . . . . . . . . . . . 88.7 175.1 619.6 768.9 736.1 737.6 728.5 667.6Circulatory monitoring . . . . . . . . . . . . . . . . . . . . . . . . . . . . . . . . . . . . . . . 89.6 31.9 248.3 331.6 309.5 297.7 282.0 236.9Radioisotope scan . . . . . . . . . . . . . . . . . . . . . . . . . . . . . . . . . . . . . 92.0–92.1 247.6 379.8 311.0 274.9 262.5 240.7 199.9Respiratory therapy . . . . . . . . . . . . . . . . . . . . . . . . . . . . . . . . . . . . 93.9,96.7 * 22.4 98.9 360.4 453.1 479.1 472.6
* Figure does not meet standard of reliability or precision.
- - - Data not available.1ICD–9–CM code 33.27 was not included in the category before 1987.2Rate of coronary artery bypass graft procedures. See table 31 for rate of discharges with coronary artery bypass grafts.3Total hip replacement was not available in 1989 due to a change in codes. Before 1989, the ICD–9–CM code was 81.5.
NOTE: See ‘‘Medical Coding and Edit,’’ appendix I, for additional information about changes in coding system and coding modifications for the National Hospital Discharge Survey.
44

Table 24. Number and rate of hysterectomies for female discharges from short-stay hospitals by age: United States, 1980, 1985, and1988–92[Discharges of inpatients from non-Federal hospitals. Excludes newborn infants. Data are for International Classification of Diseases, 9th Revision, Clinical Modificationcodes 68.3–68.7]
YearAll
ages115–29years
30–49years
50 yearsand over
Allages1
15–29years
30–49years
50 yearsand over
Number in thousands Rate per 100,000 female population
1980 . . . . . . . . . . . . . . . . . . . . . . . . . . . . . . 649 84 409 157 556.5 272.4 1,471.2 474.81985 . . . . . . . . . . . . . . . . . . . . . . . . . . . . . . 670 74 440 156 549.3 242.7 1,372.6 453.61988 . . . . . . . . . . . . . . . . . . . . . . . . . . . . . . 578 52 390 137 461.8 175.1 1,110.5 389.71989 . . . . . . . . . . . . . . . . . . . . . . . . . . . . . . 541 48 355 138 427.8 165.9 982.6 389.11990 . . . . . . . . . . . . . . . . . . . . . . . . . . . . . . 591 51 396 144 463.1 177.6 1,068.2 404.81991 . . . . . . . . . . . . . . . . . . . . . . . . . . . . . . 546 37 375 135 423.4 131.3 983.1 374.81992 . . . . . . . . . . . . . . . . . . . . . . . . . . . . . . 580 44 387 149 444.7 159.1 990.1 409.5
1Includes age groups not shown in table.
45

Table 25. Number and rate of selected obstetrical procedures for females with deliveries discharged from short-stay hospitals by type ofprocedure: United States, 1980, 1985, and 1988–92[Discharges of inpatients from non-Federal hospitals. Procedure groupings and code numbers are based on the International Classification of Diseases, 9th Revision,Clinical Modification (ICD–9–CM). Data are for selected procedures performed on discharges with code V27, females with deliveries]
Procedure category and ICD–9–CM code 1980 1985 1988 1989 1990 1991 1992
Number of all-listed procedures in thousands
Episiotomy . . . . . . . . . . . . . . . . . . . . 72.1,72.21,72.31,72.71,73.6 2,012 1,820 1,679 1,703 1,714 1,683 1,609Fetal EKG and fetal monitoring, not otherwise specified . . 75.32,75.34 106 250 1,094 1,147 1,306 1,259 1,180Cesarean section . . . . . . . . . . . . . . . . . . . . 74.0–74.2,74.4,74.99 619 877 933 937 945 933 921Manually assisted delivery . . . . . . . . . . . . . . . . . . . . . . . . . . 73.5 70 193 628 638 750 792 806Repair of current obstetric laceration . . . . . . . . . . . . . . . 75.5–75.6 350 543 684 759 789 790 785Artificial rupture of membranes . . . . . . . . . . . . . . . . . . . . . . . 73.0 120 315 585 652 691 774 727Medical induction of labor . . . . . . . . . . . . . . . . . . . . . . . . . . 73.4 42 66 152 196 225 258 276Vacuum extraction1 . . . . . . . . . . . . . . . . . . . . . . . . . . . . . . 72.7 22 66 114 156 190 223 238Forceps delivery1 . . . . . . . . . . . . . 72.0–72.4,72.51,72.53,72.6,73.3 555 376 294 294 269 230 220
Rate per 100 deliveries2
Fetal EKG and fetal monitoring, not otherwise specified . . 75.32,75.34 2.8 6.5 28.9 29.1 32.4 31.7 30.2Cesarean section . . . . . . . . . . . . . . . . . . . . 74.0–74.2,74.4,74.99 16.5 22.7 24.7 23.8 23.5 23.5 23.6Artificial rupture of membrane . . . . . . . . . . . . . . . . . . . . . . . 73.0 3.2 8.2 15.5 16.6 17.2 19.5 18.6Medical induction of labor . . . . . . . . . . . . . . . . . . . . . . . . . . 73.4 1.1 1.7 4.0 5.0 5.6 6.5 7.1
Rate per 100 vaginal deliveries3
Episiotomy . . . . . . . . . . . . . . . . . . . . 72.1,72.21,72.31,72.71,73.6 64.0 61.1 59.0 56.8 55.7 55.4 53.8Manually assisted delivery . . . . . . . . . . . . . . . . . . . . . . . . . . 73.5 2.2 6.5 22.1 21.3 24.3 26.0 27.0Repair of current obstetric laceration . . . . . . . . . . . . . . . 75.5–75.6 11.1 18.2 24.0 25.3 25.6 26.0 26.3Vacuum extraction1 . . . . . . . . . . . . . . . . . . . . . . . . . . . . . . 72.7 0.7 2.2 4.0 5.2 6.2 7.3 8.0Forceps delivery1 . . . . . . . . . . . . . 72.0–72.4,72.51,72.53,72.6,73.3 17.7 12.6 10.3 9.8 8.7 7.6 7.4
1Vacuum extraction and forceps delivery with episiotomy are also included in the episiotomy category.2Per 100 discharges with ICD–9–CM code V27, females with deliveries.3Per 100 discharges with ICD–9–CM code V27, excluding those with a cesarean section.
46

Table 26. Number and rate of cesarean sections for females with deliveries discharged from short-stay hospitals by age: United States,1980, 1985, and 1988–92[Discharges of inpatients from non-Federal hospitals. Data are coded based on the International Classification of Diseases, 9th Revision, Clinical Modification. Includesfemale discharges with diagnostic code V27 and procedure codes 74.0–74.2, 74.4, and 74.99]
YearAllages
Under20 years
20–24years
25–29years
30–34years
35 yearsand over
Number in thousands
1980 . . . . . . . . . . . . . . . . . . . . . . . . . . . . . . . . . . . . . . . 619 85 194 199 107 351985 . . . . . . . . . . . . . . . . . . . . . . . . . . . . . . . . . . . . . . . 877 77 243 288 192 761988 . . . . . . . . . . . . . . . . . . . . . . . . . . . . . . . . . . . . . . . 933 94 206 322 217 941989 . . . . . . . . . . . . . . . . . . . . . . . . . . . . . . . . . . . . . . . 937 89 224 312 210 1031990 . . . . . . . . . . . . . . . . . . . . . . . . . . . . . . . . . . . . . . . 945 89 219 287 238 1131991 . . . . . . . . . . . . . . . . . . . . . . . . . . . . . . . . . . . . . . . 933 98 218 283 227 1071992 . . . . . . . . . . . . . . . . . . . . . . . . . . . . . . . . . . . . . . . 921 86 220 264 230 120
Rate per 100 deliveries
1980 . . . . . . . . . . . . . . . . . . . . . . . . . . . . . . . . . . . . . . . 16.5 14.5 15.8 16.7 18.0 20.61985 . . . . . . . . . . . . . . . . . . . . . . . . . . . . . . . . . . . . . . . 22.7 16.1 21.2 22.9 26.6 30.71988 . . . . . . . . . . . . . . . . . . . . . . . . . . . . . . . . . . . . . . . 24.7 19.5 20.1 26.7 28.0 32.11989 . . . . . . . . . . . . . . . . . . . . . . . . . . . . . . . . . . . . . . . 23.8 18.1 21.1 24.8 26.6 30.31990 . . . . . . . . . . . . . . . . . . . . . . . . . . . . . . . . . . . . . . . 23.5 16.6 21.0 23.3 27.8 31.41991 . . . . . . . . . . . . . . . . . . . . . . . . . . . . . . . . . . . . . . . 23.5 18.2 21.0 24.3 26.6 28.41992 . . . . . . . . . . . . . . . . . . . . . . . . . . . . . . . . . . . . . . . 23.6 17.5 21.4 23.2 27.1 30.1
47

Table 27. Number and rate of prostatectomies for male discharges from short-stay hospitals by age: United States, 1980, 1985, and1988–92[Discharges of inpatients from non-Federal hospitals. Data are for International Classification of Diseases, 9th Revision, Clinical Modification codes 60.2–60.6]
YearAll
ages145–64years
65 years and over
Total65–74years
75 yearsand over
Number in thousands
1980 . . . . . . . . . . . . . . . . . . . . . . . . . . . . . . 335 83 251 139 1121985 . . . . . . . . . . . . . . . . . . . . . . . . . . . . . . 367 81 284 150 1341988 . . . . . . . . . . . . . . . . . . . . . . . . . . . . . . 358 67 290 146 1441989 . . . . . . . . . . . . . . . . . . . . . . . . . . . . . . 376 71 304 162 1431990 . . . . . . . . . . . . . . . . . . . . . . . . . . . . . . 364 80 284 159 1251991 . . . . . . . . . . . . . . . . . . . . . . . . . . . . . . 363 68 295 158 1381992 . . . . . . . . . . . . . . . . . . . . . . . . . . . . . . 353 74 278 148 131
Rate per 100,000 male population
1980 . . . . . . . . . . . . . . . . . . . . . . . . . . . . . . 307.5 392.1 2,423.0 2,051.2 3,128.51985 . . . . . . . . . . . . . . . . . . . . . . . . . . . . . . 321.2 382.0 2,495.9 2,041.6 3,318.41988 . . . . . . . . . . . . . . . . . . . . . . . . . . . . . . 304.1 309.9 2,394.2 1,892.4 3,276.01989 . . . . . . . . . . . . . . . . . . . . . . . . . . . . . . 316.9 322.5 2,468.9 2,064.9 3,170.01990 . . . . . . . . . . . . . . . . . . . . . . . . . . . . . . 302.8 357.9 2,261.5 2,003.6 2,703.41991 . . . . . . . . . . . . . . . . . . . . . . . . . . . . . . 299.1 302.7 2,308.8 1,965.1 2,887.01992 . . . . . . . . . . . . . . . . . . . . . . . . . . . . . . 286.6 318.3 2,131.5 1,815.5 2,653.4
1Includes age groups not shown in table.
48

Table 28. Number of male newborn infants and number and percent circumcised in short-stay hospitals by region: United States, 1980,1985, and 1988–92[Infants born in non-Federal hospitals. Circumcision data are for International Classification of Diseases, 9th Revision, Clinical Modification code 64.0]
YearUnitedStates Northeast Midwest South West
Number of male newborn infants in thousands
1980 . . . . . . . . . . . . . . . . . . . . . . . . . . . . . . 1,950 376 531 676 3661985 . . . . . . . . . . . . . . . . . . . . . . . . . . . . . . 1,953 339 469 701 4451988 . . . . . . . . . . . . . . . . . . . . . . . . . . . . . . 1,882 373 443 614 4521989 . . . . . . . . . . . . . . . . . . . . . . . . . . . . . . 1,989 392 481 643 4721990 . . . . . . . . . . . . . . . . . . . . . . . . . . . . . . 1,982 379 449 693 4611991 . . . . . . . . . . . . . . . . . . . . . . . . . . . . . . 2,003 366 465 685 4871992 . . . . . . . . . . . . . . . . . . . . . . . . . . . . . . 1,926 365 424 656 482
Number circumcised in thousands
1980 . . . . . . . . . . . . . . . . . . . . . . . . . . . . . . 1,261 253 403 379 2261985 . . . . . . . . . . . . . . . . . . . . . . . . . . . . . . 1,163 221 331 393 2181988 . . . . . . . . . . . . . . . . . . . . . . . . . . . . . . 1,092 235 322 330 2041989 . . . . . . . . . . . . . . . . . . . . . . . . . . . . . . 1,170 248 356 372 1941990 . . . . . . . . . . . . . . . . . . . . . . . . . . . . . . 1,169 238 341 396 1951991 . . . . . . . . . . . . . . . . . . . . . . . . . . . . . . 1,224 228 363 436 1971992 . . . . . . . . . . . . . . . . . . . . . . . . . . . . . . 1,170 247 331 411 181
Percent circumcised
1980 . . . . . . . . . . . . . . . . . . . . . . . . . . . . . . 64.7 67.4 75.9 56.0 61.81985 . . . . . . . . . . . . . . . . . . . . . . . . . . . . . . 59.5 65.2 70.6 56.0 49.01988 . . . . . . . . . . . . . . . . . . . . . . . . . . . . . . 58.0 63.2 72.7 53.8 45.21989 . . . . . . . . . . . . . . . . . . . . . . . . . . . . . . 58.8 63.2 74.0 57.9 41.01990 . . . . . . . . . . . . . . . . . . . . . . . . . . . . . . 59.0 62.6 76.0 57.1 42.41991 . . . . . . . . . . . . . . . . . . . . . . . . . . . . . . 61.1 62.4 78.2 63.6 40.41992 . . . . . . . . . . . . . . . . . . . . . . . . . . . . . . 60.7 67.6 78.2 62.7 37.5
49

Table 29. Number and rate of open-heart surgeries for discharges from short-stay hospitals, by sex and age: United States, 1980, 1985,and 1988–92[Discharges of inpatients from non-Federal hospitals. Excludes newborn infants. Data are for International Classification of Diseases, 9th Revision, Clinical Modificationcodes 35.1–35.51, 35.53–35.95, 35.98–35.99, 36.2, 36.9, 37.10–37.11, 37.32–37.33, and 37.4–37.5]
Sex and yearAllages
Under 45years
45–64years
65 yearsand over
Allages
Under45 years
45–64years
65 yearsand over
Both sexes Number in thousands Rate per 100,000 population
1980 . . . . . . . . . . . . . . . . . . . . . . . . . . . . . . 54 20 18 16 23.8 12.7 41.6 60.41985 . . . . . . . . . . . . . . . . . . . . . . . . . . . . . . 67 22 20 25 28.6 13.4 45.1 89.61988 . . . . . . . . . . . . . . . . . . . . . . . . . . . . . . 92 30 28 34 37.8 18.0 61.0 112.61989 . . . . . . . . . . . . . . . . . . . . . . . . . . . . . . 91 33 19 39 37.3 19.7 42.0 126.51990 . . . . . . . . . . . . . . . . . . . . . . . . . . . . . . 103 33 23 47 41.8 19.6 49.4 151.21991 . . . . . . . . . . . . . . . . . . . . . . . . . . . . . . 97 32 24 41 38.9 18.6 52.2 129.01992 . . . . . . . . . . . . . . . . . . . . . . . . . . . . . . 104 33 25 46 41.2 19.3 51.1 143.7
Male
1980 . . . . . . . . . . . . . . . . . . . . . . . . . . . . . . 26 10 9 *7 24.0 12.4 43.9 69.31985 . . . . . . . . . . . . . . . . . . . . . . . . . . . . . . 35 12 10 13 30.4 14.6 47.9 111.21988 . . . . . . . . . . . . . . . . . . . . . . . . . . . . . . 53 18 14 21 45.0 21.2 65.9 171.81989 . . . . . . . . . . . . . . . . . . . . . . . . . . . . . . 46 18 11 17 38.4 20.9 51.5 134.81990 . . . . . . . . . . . . . . . . . . . . . . . . . . . . . . 55 18 14 23 45.7 21.5 63.3 179.61991 . . . . . . . . . . . . . . . . . . . . . . . . . . . . . . 48 18 12 19 39.8 20.6 51.4 148.81992 . . . . . . . . . . . . . . . . . . . . . . . . . . . . . . 57 19 13 24 46.0 21.8 57.8 186.0
Female
1980 . . . . . . . . . . . . . . . . . . . . . . . . . . . . . . 28 10 9 *8 23.7 13.0 39.4 54.51985 . . . . . . . . . . . . . . . . . . . . . . . . . . . . . . 33 10 10 13 26.8 12.3 42.4 75.21988 . . . . . . . . . . . . . . . . . . . . . . . . . . . . . . 39 12 13 13 31.0 14.8 56.4 73.01989 . . . . . . . . . . . . . . . . . . . . . . . . . . . . . . 46 16 *8 22 36.2 18.5 33.3 121.01990 . . . . . . . . . . . . . . . . . . . . . . . . . . . . . . 49 15 *9 25 38.0 17.8 36.5 132.11991 . . . . . . . . . . . . . . . . . . . . . . . . . . . . . . 49 14 13 22 38.1 16.7 53.0 115.71992 . . . . . . . . . . . . . . . . . . . . . . . . . . . . . . 48 14 11 22 36.6 16.7 44.8 115.0
*Figure does not meet standard of reliability or precision.
50

Table 30. Number and rate of removal of coronary artery obstructions for discharges from short-stay hospitals by sex and age: UnitedStates, 1980, 1985, and 1988–92[Discharges of inpatients from non-Federal hospitals. Excludes newborn infants. Data are for International Classification of Diseases, 9th Revision, Clinical Modificationcode 36.0]
Sex and yearAll
ages145–64years
65 years and over
Allages1
45–64years
65 years and over
Total65–74years
75 yearsand over Total
65–74years
75 yearsand over
Both sexes Number in thousands Rate per 100,000 population
1980 . . . . . . . . . . . . . . . . . . . . . . . . . . . . . . *6 * * * – *2.6 * * * –1985 . . . . . . . . . . . . . . . . . . . . . . . . . . . . . . 82 47 23 20 * 34.7 105.4 82.5 118.4 *1988 . . . . . . . . . . . . . . . . . . . . . . . . . . . . . . 227 117 92 71 21 93.3 257.9 304.5 401.7 167.31989 . . . . . . . . . . . . . . . . . . . . . . . . . . . . . . 259 133 107 74 33 105.6 289.8 348.9 412.0 261.01990 . . . . . . . . . . . . . . . . . . . . . . . . . . . . . . 285 148 115 89 26 115.2 320.4 368.3 490.3 200.01991 . . . . . . . . . . . . . . . . . . . . . . . . . . . . . . 331 163 143 98 45 131.9 350.0 449.1 536.5 330.51992 . . . . . . . . . . . . . . . . . . . . . . . . . . . . . . 399 177 192 129 63 157.2 366.2 594.4 699.9 453.6
Male
1980 . . . . . . . . . . . . . . . . . . . . . . . . . . . . . . *5 * * * – *4.6 * * * –1985 . . . . . . . . . . . . . . . . . . . . . . . . . . . . . . 58 34 13 11 * 50.4 162.1 115.2 153.2 *1988 . . . . . . . . . . . . . . . . . . . . . . . . . . . . . . 160 88 58 46 12 136.1 403.5 475.6 594.6 266.61989 . . . . . . . . . . . . . . . . . . . . . . . . . . . . . . 177 100 61 42 19 149.1 453.5 497.1 539.4 423.71990 . . . . . . . . . . . . . . . . . . . . . . . . . . . . . . 200 111 72 58 15 166.8 498.3 575.7 725.4 319.01991 . . . . . . . . . . . . . . . . . . . . . . . . . . . . . . 223 119 84 60 24 183.5 530.3 654.8 746.6 500.21992 . . . . . . . . . . . . . . . . . . . . . . . . . . . . . . 262 127 110 79 31 213.3 546.5 842.4 976.0 621.7
Female
1980 . . . . . . . . . . . . . . . . . . . . . . . . . . . . . . * – * * – * – * * –1985 . . . . . . . . . . . . . . . . . . . . . . . . . . . . . . 24 12 10 *9 * 19.9 53.7 60.5 *91.5 *1988 . . . . . . . . . . . . . . . . . . . . . . . . . . . . . . 67 29 34 25 9 53.1 124.2 189.6 251.8 113.51989 . . . . . . . . . . . . . . . . . . . . . . . . . . . . . . 82 33 46 31 14 64.7 138.8 249.3 312.7 172.71990 . . . . . . . . . . . . . . . . . . . . . . . . . . . . . . 85 37 43 31 12 66.6 155.9 228.7 306.8 135.31991 . . . . . . . . . . . . . . . . . . . . . . . . . . . . . . 107 44 59 38 21 83.3 183.0 310.4 372.1 237.51992 . . . . . . . . . . . . . . . . . . . . . . . . . . . . . . 136 50 82 50 32 104.3 198.6 426.3 482.9 360.6
1Includes age groups not shown in table.
* Figure does not meet standard of reliability or precision.
- Quantity zero.
51

Table 31. Number and rate of discharges from short-stay hospitals with one or more coronary artery bypass grafts by sex and age:United States, 1980, 1985, and 1988–92[Discharges of inpatients from non-Federal hospitals. Excludes newborn infants. Data are for discharges with International Classification of Diseases, 9th Revision,Clinical Modification code 36.1]
Sex and yearAll
ages145–64years
65 years and over
Allages1
45–64years
65 years and over
Total65–74years
75 yearsand over Total
65–74years
75 yearsand over
Both sexes Number in thousands Rate per 100,000 population
1980 . . . . . . . . . . . . . . . . . . . . . . . . . . . . . . 136 87 38 33 *5 60.2 195.6 149.1 212.5 *50.41985 . . . . . . . . . . . . . . . . . . . . . . . . . . . . . . 201 109 79 61 18 85.2 245.1 278.7 361.6 157.61988 . . . . . . . . . . . . . . . . . . . . . . . . . . . . . . 253 111 130 101 29 104.0 244.9 430.3 572.8 229.31989 . . . . . . . . . . . . . . . . . . . . . . . . . . . . . . 260 113 138 102 36 105.9 246.1 449.0 569.0 281.81990 . . . . . . . . . . . . . . . . . . . . . . . . . . . . . . 262 108 143 93 50 105.9 233.6 457.6 516.0 377.11991 . . . . . . . . . . . . . . . . . . . . . . . . . . . . . . 265 111 140 97 44 105.8 237.2 442.3 530.4 322.81992 . . . . . . . . . . . . . . . . . . . . . . . . . . . . . . 309 125 174 118 56 121.9 259.7 539.4 641.3 403.4
Male
1980 . . . . . . . . . . . . . . . . . . . . . . . . . . . . . . 106 71 27 23 * 97.7 334.9 256.7 345.9 *1985 . . . . . . . . . . . . . . . . . . . . . . . . . . . . . . 150 88 51 41 11 131.5 412.9 450.2 552.9 264.31988 . . . . . . . . . . . . . . . . . . . . . . . . . . . . . . 189 88 91 75 16 160.9 402.7 755.2 976.2 367.01989 . . . . . . . . . . . . . . . . . . . . . . . . . . . . . . 186 88 90 67 23 156.6 402.3 729.4 861.9 499.41990 . . . . . . . . . . . . . . . . . . . . . . . . . . . . . . 188 83 95 66 30 156.6 375.2 757.2 826.2 638.71991 . . . . . . . . . . . . . . . . . . . . . . . . . . . . . . 187 83 93 67 27 153.8 371.5 730.0 831.8 558.81992 . . . . . . . . . . . . . . . . . . . . . . . . . . . . . . 221 100 113 79 34 179.8 429.1 864.5 971.6 687.7
Female
1980 . . . . . . . . . . . . . . . . . . . . . . . . . . . . . . 29 16 12 10 * 25.1 69.4 76.3 110.3 *1985 . . . . . . . . . . . . . . . . . . . . . . . . . . . . . . 51 21 28 20 *8 41.8 92.0 163.9 214.2 *100.01988 . . . . . . . . . . . . . . . . . . . . . . . . . . . . . . 63 24 38 26 13 50.7 99.9 212.2 259.1 154.91989 . . . . . . . . . . . . . . . . . . . . . . . . . . . . . . 74 24 48 34 14 58.3 102.0 260.6 340.8 163.71990 . . . . . . . . . . . . . . . . . . . . . . . . . . . . . . 74 25 48 28 20 58.2 102.7 256.1 273.9 234.71991 . . . . . . . . . . . . . . . . . . . . . . . . . . . . . . 78 27 47 30 17 60.5 112.9 248.3 294.6 193.61992 . . . . . . . . . . . . . . . . . . . . . . . . . . . . . . 88 26 61 39 22 67.2 102.1 319.0 381.5 246.3
*Figure does not meet standard of reliability or precision.1Includes age groups not shown in table.
NOTE: Patients that had more than one coronary artery bypass graft during a single operation were counted once in this table. For number and rate of coronary artery bypass procedures, seetables 18–23. See appendix II.
52

Table 32. Number and rate of cardiac catheterizations for discharges from short-stay hospitals by sex and age: United States, 1980,1985, and 1988–92[Discharges of inpatients from non-Federal hospitals. Excludes newborn infants. Data are for International Classification of Diseases 9th Revision, Clinical Modificationcodes 37.21–37.23]
Sex and yearAll
ages115–44years
45–64years
65 years and over
Allages1
15–44years
45–64years
65 years and over
Total65–74years
75 yearsand over Total
65–74years
75 yearsand over
Both sexes Number in thousands Rate per 100,000 population
1980 . . . . . . . . . . . . . . . . . . . . . . . . . . . . . . 348 51 187 84 71 13 154.4 49.4 420.3 326.5 454.3 127.71985 . . . . . . . . . . . . . . . . . . . . . . . . . . . . . . 681 79 350 227 178 50 288.1 71.1 785.0 800.3 1,055.1 428.71988 . . . . . . . . . . . . . . . . . . . . . . . . . . . . . . 930 93 432 385 286 99 382.9 81.4 951.4 1,276.6 1,620.0 792.31989 . . . . . . . . . . . . . . . . . . . . . . . . . . . . . . 958 95 425 414 306 108 390.7 82.7 927.9 1,350.5 1,714.4 843.41990 . . . . . . . . . . . . . . . . . . . . . . . . . . . . . . 995 100 457 421 296 125 401.8 86.0 988.5 1,348.4 1,637.0 950.81991 . . . . . . . . . . . . . . . . . . . . . . . . . . . . . . 1,000 89 447 446 296 150 399.1 75.9 956.3 1,404.8 1,620.7 1,111.81992 . . . . . . . . . . . . . . . . . . . . . . . . . . . . . . 1,028 95 432 486 330 156 405.6 81.3 893.8 1,506.3 1,787.5 1,130.8
Male
1980 . . . . . . . . . . . . . . . . . . . . . . . . . . . . . . 228 35 129 52 46 *6 209.6 68.0 611.2 501.3 673.9 173.91985 . . . . . . . . . . . . . . . . . . . . . . . . . . . . . . 439 58 241 126 102 24 384.6 104.8 1,135.4 1,106.5 1,390.5 592.11988 . . . . . . . . . . . . . . . . . . . . . . . . . . . . . . 598 67 296 222 172 49 508.4 118.4 1,361.2 1,831.0 2,232.4 1,125.61989 . . . . . . . . . . . . . . . . . . . . . . . . . . . . . . 601 70 291 230 175 55 506.1 122.3 1,321.5 1,861.6 2,234.8 1,213.81990 . . . . . . . . . . . . . . . . . . . . . . . . . . . . . . 620 68 306 236 170 66 515.8 118.1 1,379.3 1,879.8 2,143.7 1,426.81991 . . . . . . . . . . . . . . . . . . . . . . . . . . . . . . 603 61 296 235 169 66 496.0 105.7 1,317.4 1,835.5 2,106.5 1,379.51992 . . . . . . . . . . . . . . . . . . . . . . . . . . . . . . 636 71 291 266 194 72 517.1 122.1 1,251.2 2,040.7 2,387.1 1,468.7
Female
1980 . . . . . . . . . . . . . . . . . . . . . . . . . . . . . . 120 17 58 32 25 *7 102.9 31.3 247.4 208.4 286.1 102.11985 . . . . . . . . . . . . . . . . . . . . . . . . . . . . . . 241 22 108 101 76 26 197.8 38.3 465.2 595.5 796.6 340.41988 . . . . . . . . . . . . . . . . . . . . . . . . . . . . . . 332 26 136 163 113 50 265.2 45.1 574.7 904.4 1,143.8 611.91989 . . . . . . . . . . . . . . . . . . . . . . . . . . . . . . 357 26 135 185 131 53 282.3 43.9 565.0 1,007.1 1,308.9 642.51990 . . . . . . . . . . . . . . . . . . . . . . . . . . . . . . 376 32 151 185 126 59 294.5 54.4 627.1 991.0 1,241.3 691.71991 . . . . . . . . . . . . . . . . . . . . . . . . . . . . . . 397 27 151 211 127 84 307.9 46.5 621.9 1,114.2 1,240.7 965.11992 . . . . . . . . . . . . . . . . . . . . . . . . . . . . . . 392 24 141 220 136 84 300.4 41.0 561.4 1,144.0 1,316.1 944.1
*Figure does not meet standard of reliability or precision.1Includes age groups not shown in table.
53

Appendixes
Contents
I. Technical notes on methods. . . . . . . . . . . . . . . . . . . . . . . . . . . . . . . . . . . . . . . . . . . . . . . . . . . . . . . . . . . . . . . . . . . . . . . . . .55Statistical design of the National Hospital Discharge Survey. . . . . . . . . . . . . . . . . . . . . . . . . . . . . . . . . . . . . . . . . . . . .55Data collection and processing. . . . . . . . . . . . . . . . . . . . . . . . . . . . . . . . . . . . . . . . . . . . . . . . . . . . . . . . . . . . . . . . . . . . .56Presentation of estimates. . . . . . . . . . . . . . . . . . . . . . . . . . . . . . . . . . . . . . . . . . . . . . . . . . . . . . . . . . . . . . . . . . . . . . . . . .59Estimation procedures. . . . . . . . . . . . . . . . . . . . . . . . . . . . . . . . . . . . . . . . . . . . . . . . . . . . . . . . . . . . . . . . . . . . . . . . . . . .61Reliability of estimates. . . . . . . . . . . . . . . . . . . . . . . . . . . . . . . . . . . . . . . . . . . . . . . . . . . . . . . . . . . . . . . . . . . . . . . . . . .62Weighted least squares as a test for trend. . . . . . . . . . . . . . . . . . . . . . . . . . . . . . . . . . . . . . . . . . . . . . . . . . . . . . . . . . . .64Tests of significance. . . . . . . . . . . . . . . . . . . . . . . . . . . . . . . . . . . . . . . . . . . . . . . . . . . . . . . . . . . . . . . . . . . . . . . . . . . . .66
II. Definitions of terms. . . . . . . . . . . . . . . . . . . . . . . . . . . . . . . . . . . . . . . . . . . . . . . . . . . . . . . . . . . . . . . . . . . . . . . . . . . . . . . .67Terms relating to hospitalization. . . . . . . . . . . . . . . . . . . . . . . . . . . . . . . . . . . . . . . . . . . . . . . . . . . . . . . . . . . . . . . . . . . .67Terms relating to diagnoses. . . . . . . . . . . . . . . . . . . . . . . . . . . . . . . . . . . . . . . . . . . . . . . . . . . . . . . . . . . . . . . . . . . . . . .67Terms relating to procedures. . . . . . . . . . . . . . . . . . . . . . . . . . . . . . . . . . . . . . . . . . . . . . . . . . . . . . . . . . . . . . . . . . . . . . .67Demographic terms. . . . . . . . . . . . . . . . . . . . . . . . . . . . . . . . . . . . . . . . . . . . . . . . . . . . . . . . . . . . . . . . . . . . . . . . . . . . . .68
III. Recent publications from the National Hospital Discharge Survey. . . . . . . . . . . . . . . . . . . . . . . . . . . . . . . . . . . . . . . . . .70
Appendix figure
I. Medical abstract for the National Hospital Discharge Survey, 1992. . . . . . . . . . . . . . . . . . . . . . . . . . . . . . . . . . . . . . . . . .57
Appendix tables
I. Number of hospitals in the National Hospital Discharge Survey universe and sample, number of in-scope andresponding sample hospitals, response rates, and number of abstracts collected: 1980, 1985, and 1988–92. . . . . . . . . . 56
II. Conversion table of changes in diagnosis codes that affect diagnostic categories in this report. . . . . . . . . . . . . . . . . . . . 58III. Conversion table of changes in procedure codes that affect procedure categories in this report. . . . . . . . . . . . . . . . . . . . 59IV. Civilian population by age, sex, and geographic region: United States, 1980, 1985, and 1988–92. . . . . . . . . . . . . . . . . . 60V. Rate of discharges from short-stay hospitals reported in annual summary and revised using population based on 1990
census by sex and age: United States, 1985 and 1988–90. . . . . . . . . . . . . . . . . . . . . . . . . . . . . . . . . . . . . . . . . . . . . . . . .61VI. Approximate relative standard errors of estimated number of discharges or first-listed diagnoses by size of estimate:
1980 and 1985. . . . . . . . . . . . . . . . . . . . . . . . . . . . . . . . . . . . . . . . . . . . . . . . . . . . . . . . . . . . . . . . . . . . . . . . . . . . . . . . . . . . .63VII. Approximate relative standard errors of estimated number of days of care by size of estimate: 1980 and 1985. . . . . . . 63VIII. Approximate relative standard errors of estimated number of procedures by size of estimate: 1980 and 1985. . . . . . . . 63IX. Estimated parameters for approximate relative standard error equations for number of discharges or first-listed
diagnoses by selected characteristics: 1988–92. . . . . . . . . . . . . . . . . . . . . . . . . . . . . . . . . . . . . . . . . . . . . . . . . . . . . . . . . . .64X. Estimated parameters for approximate relative standard error equations for number of days of care by selected
characteristics: 1988–92. . . . . . . . . . . . . . . . . . . . . . . . . . . . . . . . . . . . . . . . . . . . . . . . . . . . . . . . . . . . . . . . . . . . . . . . . . . . .64XI. Estimated parameters for approximate relative standard error equations for number of procedures by selected
characteristics: 1988–92. . . . . . . . . . . . . . . . . . . . . . . . . . . . . . . . . . . . . . . . . . . . . . . . . . . . . . . . . . . . . . . . . . . . . . . . . . . . .65XII. Worksheet for weighted least squares regression of discharge rate on year: United States, 1988–92. . . . . . . . . . . . . . . . 66XIII. Code numbers for class 4 procedures and year first used to code data from the National Hospital Discharge Survey. . 68XIV. Code numbers for procedures considered nonsurgical in the National Hospital Discharge Survey, by chapter and
year . . . . . . . . . . . . . . . . . . . . . . . . . . . . . . . . . . . . . . . . . . . . . . . . . . . . . . . . . . . . . . . . . . . . . . . . . . . . . . . . . . . . . . . . . . . . .69XV. Standard million age distribution used to adjust rates to the U.S. civilian population on July 1, 1980. . . . . . . . . . . . . . . 69
54

rsratedalsthamedl) ota
asnatayatlyrobinl, ad.na
inerecolpurfromp
erghthear
t isn thmpitnd
from
ere4)TheomSoringsign.itssedhentswn-plela-26medseonsoruterISeathe, thehethe
ctedpledataerethepitaltherviced oftry,ion,ther
Appendix ITechnical notes on methods
Statistical design of the National HospitalDischarge Survey
Scope of the survey
The National Hospital Discharge Survey (NHDS) covedischarges from noninstitutional hospitals, except Fedemilitary, and Department of Veterans Affairs hospitals, locain the 50 States and the District of Columbia. Only hospitwith at least six beds and an average length of stay of less30 days for all patients were included in the survey fro1965–87. Beginning in 1988, the universe also includhospitals whose specialty was general (medical or surgicachildren’s general, even if the hospital’s average length of swas 30 days or more.
NHDS history
The National Center for Health Statistics (NCHS) hconducted the NHDS continuously since 1965. The origisample was selected in 1964 from a frame of short-shospitals listed in the National Master Facility Inventory. Thsample was updated periodically with samples of newopened hospitals. Sample hospitals were selected with pabilities ranging from certainty for the largest hospitals to 140 for the smallest hospitals. Within each sample hospitasystematic random sample of discharges was selectedescription of the development and design of the origiNHDS has been published (12).
Until 1985, all data were collected by a manual systemwhich sample selection and transcription of information wdone manually. Starting in 1985, some data were alsolected by using an automated system whereby NCHSchased data tapes containing discharge medical abstractscommercial abstracting services and State data systems. Sawere selected from these tapes.
In 1988, NCHS redesigned the NHDS to link it with othsurveys conducted by NCHS and to improve efficiency throuuse of information and technologies not available whensurvey was designed in 1964. Details of the new designoutlined below.
The changes in the survey may affect trend data. Thasome of the differences between NHDS estimates based o1965–87 design and estimates based on the new designbe due to survey redesign rather than to changes in hosutilization. A report describing the two survey designs a
l,
n
ry
l
-
Al
--mles
e
,eayal
discussing the effects of the design changes on estimatesthe survey has been published (13).
New sampling design
The 1988 sampling frame consisted of hospitals that wlisted in the April 1987 SMG Hospital Market Database (1and that began to accept inpatients by August 1987.sampling frame was updated in 1991 to include hospitals frthe 1991 SMG Hospital Market Database (15). The NHDsample includes with certainty all hospitals with 1,000 bedsmore or 40,000 discharges or more annually. The remainsample of hospitals is based on a stratified three-stage de
The first stage consists of 112 primary sampling un(PSU’s) that comprise a probability subsample of PSU’s uin the 1985–94 National Health Interview Survey (NHIS). TPSU’s are counties, groups of counties, county equivale(such as parishes or independent cities), or towns and toships (for some PSU’s in New England). The NHDS samincludes with certainty the 26 PSU’s with the largest poputions. In addition, the sample includes half of the nextlargest PSU’s and one PSU from each of 73 PSU strata forfrom the remaining PSU’s for the NHIS sample design. Tho73 PSU strata were defined within four geographical regiand were assigned metropolitan statistical area (MSA)non-MSA status by using 1980 census data and a compprogram that minimized the between-PSU variances for NHstratification variables. (MSA is a metropolitan statistical ardefined by the U.S. Office of Management and Budget onbasis of the 1980 Census.) From the 73 strata thus formedPSU’s were selected with probability proportional to tprojected 1985 population. A more detailed analysis ofNHIS PSU sample design is presented in a series 2,Vital andHealth Statisticsreport (25).
The second stage consists of noncertainty hospitals selefrom the sample PSU’s. To ensure distribution of the samacross PSU’s and to maximize the potential for automatedcollection, the noncertainty hospitals in those PSU’s wstratified. The strata were defined by region, PSU, and in12 largest PSU’s by abstracting status (whether the hossubscribed to a commercial abstracting service). Withinstrata, the hospitals were ordered by PSU, abstracting sestatus, and hospital specialty-size groups. Group 1 consistehospitals with 6–999 beds that specialized in psychiatuberculosis and other respiratory diseases, rehabilitatchronic disease, mental retardation, alcoholism and o
55

2iahu
yp
a
hre
tl
1Hpethn
eleag
s
bsp
aah
ers,andge.ly
heto-ndtedceptis-theis-ta.ngforcts.–92
y.atatedinguto-itals
heoteden
orerk
chemical dependencies, or children’s psychiatry. Groupsincluded general medical and surgical hospitals and spechospitals other than those in group 1. Group 2 hospitals6–174 beds, group 3 hospitals had 175–349 beds, and grohospitals had 350–999 beds.
Within each specialty-size group, hospitals were arraby their annual numbers of discharges recorded in the A1987 SMG Hospital Market Database. Hospitals were thselected from each stratum’s ordered array by systemrandom sampling with probability proportional to their SMGrecorded 1987 annual numbers of discharges. At least thospitals were selected from every PSU containing theligible hospitals or more. In PSU’s with fewer than thrhospitals, all hospitals in the PSU were selected.
For 1992, the sample consisted of 528 hospitals. Of528 hospitals, 14 were found to be out of scope (ineligibbecause prior to 1992 they went out of business or otherwfailed to meet the criteria for the NHDS universe. Of the 5in-scope (eligible) hospitals, 494 hospitals responded (NCcollected data for at least half of the number of samdischarges expected in half or more of the months thhospitals were in scope). The number of hospitals inuniverse, the sample, and the responding sample are show1980, 1985, and 1988–92 intable I.
At the third stage, a sample of discharges from eahospital was selected by a systematic random sampling tnique. For hospitals using the manual system of data coltion, the discharges were selected at the hospital from dlisting sheets, computer files, or other lists in which discharwere listed in some chronological order. For most of thehospitals, the sample discharges were selected on the bathe terminal digit(s) of the patient’s medical record. In somcases, an admission number, billing number, or other numwas used. If no patient numbers useful for sampling purpowere available in a hospital’s list of discharges, the samwas selected by starting with a randomly selected dischaand taking everykth discharge thereafter.
For hospitals whose data were collected via the automsystem, the discharges were selected by NCHS from dischmedical abstract files after sorting by the first two digits of t
Table I. Number of hospitals in the National Hospital Discharge Survey unhospitals, response rates, and number of abstracts collected: 1980, 1985,
Year UniverseTotalsample
N
1980 . . . . . . . . . . . . . . . . . . . . . . . . . . . . . . 38,017 5441985 . . . . . . . . . . . . . . . . . . . . . . . . . . . . . . 6,007 5581988 . . . . . . . . . . . . . . . . . . . . . . . . . . . . . . 6,400 5421989 . . . . . . . . . . . . . . . . . . . . . . . . . . . . . . 6,400 5421990 . . . . . . . . . . . . . . . . . . . . . . . . . . . . . . 6,400 5421991 . . . . . . . . . . . . . . . . . . . . . . . . . . . . . . 6,250 5281992 . . . . . . . . . . . . . . . . . . . . . . . . . . . . . . 6,250 528
1Excludes hospitals that were out of business for the whole year or that failed to meet the definitiohospital in 1988–92.2In 1980 and 1985, all hospitals participating in the survey; in 1988–92, hospitals for which data wdischarges expected in half or more of the months the hospitals were in scope.3All hospitals added to universe from 1965–79, including those that had gone out of business, wh
56
–4ltyadp 4
edrilentic-reeeee
hee)ise4Sleseefor
chch-c-ilyesseis ofeereslerge
tedrgee
ICD–9–CM code of the first-listed diagnosis, the patient’s agat time of admission (under 1 year, 1–14 years, 15–44 yea45–64 years, 65–74 years, 75–84 years, 85 years and over,age unknown), the patient’s sex, and the date of discharThese samples were selected by starting with a randomselected discharge and taking everykth discharge thereafter.
The third-stage sampling rate was determined by thospital’s sampling stratum and the system (manual or aumated) used to collect data from the hospital. One percent a5 percent of discharges in the certainty hospitals were selecunder the manual and automated systems, respectively. Exfor certainty hospitals, the target sample size was 250 dcharges each from all manual system hospitals and fromautomated system hospitals that had fewer than 4,000 dcharges annually according to the 1987 sampling frame daSamples of 2,000 were targeted for each of the remaininoncertainty automated system hospitals. The final sample1992 included 274,000 discharge medical record abstraThe number of abstracts collected for 1980, 1985, and 1988are shown intable I.
Data collection and processing
Data collection
Two data collection procedures were used for the surveOne was a manual system of sample selection and dabstraction. The other, first used in 1985, was an automasystem involving the purchase of data tapes from abstractservice organizations and selected State systems. The amated system was used by 17 percent of respondent hospin 1985 and by 33–37 percent in 1988–92.
In the manual system, the sample selection and ttranscription of information from the hospital records tabstract forms were performed at the hospitals. The compleforms, along with sample selection control sheets, were thforwarded to NCHS for coding, editing, and weighting. A fewof these hospitals submitted their data via computer printouttape. In 1980, 1985, and 1988–92, half to two-thirds of thhospitals participating in the manual system had the wo
iverse and sample, number of in-scope and responding sampleand 1988–92
Samplein-scope1 Respondents2
Responserate
Abstractscollected
umber of hospitals Percent Number
492 420 85 224,000496 414 83 195,000531 422 79 250,000526 408 78 233,000519 474 91 266,000521 484 93 274,000514 494 96 274,000
n of a short-stay hospital in 1980 and 1985, or of a general, children’s general, or short-stay
ere collected by the National Center for Health Statistics for at least half the number of sample
ich were excluded from totals in 1985 and 1988–92.

Figure I. Medical abstract for the National Hospital Discharge Survey, 1992
57

ing.S.orningmple
nalate,ortivetatus,icalandgery.s-e,are
entbyreical, aned.andh
Sisinnu-s,atesDSt ofthfuis-aee
ca
mdnoush
ar’’
ry,
o-talgeddto
seasfor
alryerngry
Table II. Conversion table of changes in diagnosis codes thataffect diagnostic categories in this report[Codes are based on the International Classification of Diseases, 9th Revision,Clinical Modification (ICD–9–CM)]
Current code(s)assignment
EffectiveOctober 1
Previous code(s)assignment
042.0–042.9 . . . . . . . . . . . . . . . . . . 1986 279.19043.0–043.9 . . . . . . . . . . . . . . . . . . 1986 279.19044.0–044.9 . . . . . . . . . . . . . . . . . . 1986 279.19
203.01 . . . . . . . . . . . . . . . . . . . . . . 1991 V10.79203.11 . . . . . . . . . . . . . . . . . . . . . . 1991 V10.79203.81 . . . . . . . . . . . . . . . . . . . . . . 1991 V10.79
204.01 . . . . . . . . . . . . . . . . . . . . . . 1991 V10.61204.11 . . . . . . . . . . . . . . . . . . . . . . 1991 V10.61204.21 . . . . . . . . . . . . . . . . . . . . . . 1991 V10.61204.81 . . . . . . . . . . . . . . . . . . . . . . 1991 V10.61204.91 . . . . . . . . . . . . . . . . . . . . . . 1991 V10.61
205.01 . . . . . . . . . . . . . . . . . . . . . . 1991 V10.62205.11 . . . . . . . . . . . . . . . . . . . . . . 1991 V10.62205.21 . . . . . . . . . . . . . . . . . . . . . . 1991 V10.62205.31 . . . . . . . . . . . . . . . . . . . . . . 1991 V10.62205.81 . . . . . . . . . . . . . . . . . . . . . . 1991 V10.62205.91 . . . . . . . . . . . . . . . . . . . . . . 1991 V10.62
206.01 . . . . . . . . . . . . . . . . . . . . . . 1991 V10.63206.11 . . . . . . . . . . . . . . . . . . . . . . 1991 V10.63206.21 . . . . . . . . . . . . . . . . . . . . . . 1991 V10.63206.81 . . . . . . . . . . . . . . . . . . . . . . 1991 V10.63206.91 . . . . . . . . . . . . . . . . . . . . . . 1991 V10.63
207.01 . . . . . . . . . . . . . . . . . . . . . . 1991 V10.69207.11 . . . . . . . . . . . . . . . . . . . . . . 1991 V10.69207.21 . . . . . . . . . . . . . . . . . . . . . . 1991 V10.69207.81 . . . . . . . . . . . . . . . . . . . . . . 1991 V10.69
208.01 . . . . . . . . . . . . . . . . . . . . . . 1991 V10.60208.11 . . . . . . . . . . . . . . . . . . . . . . 1991 V10.60208.21 . . . . . . . . . . . . . . . . . . . . . . 1991 V10.60208.81 . . . . . . . . . . . . . . . . . . . . . . 1991 V10.60208.91 . . . . . . . . . . . . . . . . . . . . . . 1991 V10.60
411.81 . . . . . . . . . . . . . . . . . . . . . . 1989 410.9
429.71 . . . . . . . . . . . . . . . . . . . . . . 1989 410.0–410.9429.79 . . . . . . . . . . . . . . . . . . . . . . 1989 410.0–410.9
518.81 . . . . . . . . . . . . . . . . . . . . . . 1987 799.1
569.84 . . . . . . . . . . . . . . . . . . . . . . 1990 557.1
performed by their own medical records staff. In the remainhospitals using the manual system, personnel of the UBureau of the Census did this work on behalf of NCHS. Fthe automated system, NCHS purchased tapes contaimachine-readable medical record data and selected sadischarges from these tapes.
The medical abstract form (figure I) and the abstractservice data tapes contain items relating to the persocharacteristics of the patient. These items include birth dsex, race, ethnicity, marital status, ZIP Code (but not nameaddress), and expected sources of payment. Administradata such as admission and discharge dates, discharge sand medical record number are also included. The medinformation about patients includes diagnoses, surgicalnonsurgical operations and procedures, and dates of surThese data items conform with the Uniform Hospital Dicharge Data Set (UHDDS)(26). The PSU, hospital nammedical record number, date of birth, and patient ZIP Codeconfidential information not available to the public.
Medical coding and edit
The medical information recorded on the sample patiabstracts, collected by the manual system, was codedNCHS staff. A maximum of seven diagnostic codes weassigned for each sample abstract. In addition, if the medinformation included surgical or nonsurgical proceduresmaximum of four codes for these procedures were assigThe system currently used for coding the diagnosesprocedures is theInternational Classification of Diseases, 9tRevision, Clinical Modification, or ICD–9–CM (16).
Although the ICD–9–CM has been used for coding NHDdata since 1979, it should be noted that this coding systemnot static, but undergoes periodic updating. Beginning1986, addenda to the ICD–9–CM have been published anally and go into effect on October 1. They include additiondeletions, and changes in codes or titles. The actual dwhen these coding changes went into effect in the NHvaried over time and by source of data. For 1988–91, parthe data for certain hospitals were coded according toyear’s addenda, but the addenda changes were notimplemented until the following year. To improve the constency of the coding, beginning with the 1992 data, no use wmade of the addenda until the beginning of the calender yfollowing their effective date. Thus, the 1992 data were codusing the 1986–91 addenda, and the 1992 addenda wereused until 1993 data were coded.
Changes in codes affecting diagnostic or procedureegories in this report are shown intables II and III. Theseconversion tables show the new ICD–9–CM codes fro1986–91 addenda, the date the codes were introduced, ancode to which the diagnosis or procedure had been assigprior to the development of the new code. Information aball coding changes in the 1986–91 addenda has been publi(27).
Among the changes affecting categories in this report wthe 1987 revision of ICD–9–CM code 33.27 from ‘‘othebiopsy of lung,’’ to ‘‘closed endoscopic biopsy of lung.
58
atlly
sardnot
t-
theedted
s
Before 1987, code 33.27 was not included in the catego‘‘bronchoscopy with or without biopsy,’’ but after the revisionit was included.
The codes for joint replacement, revision, and arthrplasty were substantially revised in the 1989 addenda. ‘‘Toknee replacement,’’ which had been coded 81.41, was chanto 81.54. ‘‘Total hip replacement,’’ which had been code81.51 and 81.59 became 81.51 only; 81.59 was redefined‘‘revision of joint replacement not otherwise classified.’’ Becauthere were two definitions for code 81.59 during 1989, it wnot possible to make an estimate of total hip replacementthat year.
In the 1991 addenda, code 93.92, ‘‘other mechanicassistance to respiration,’’ was deleted from the respiratotherapy category and new codes 96.70–96.72 for ‘‘othcontinuous mechanical ventilation’’ were added to the codisystem. These new codes were included in the ‘‘respiratotherapy’’ category in this report.

cerdvicisiauteryth
henearcierdsgeding
acteutethed
l
nd17ngticries
hedsare
antlyifi-re
in
oereithmeS,eented.
re,ereith
reanfhed inb-
hatSresede
e
Table III. Conversion table of changes in procedure codes thataffect procedure categories in this report[Codes are based on the International Classification of Diseases, 9th Revision,Clinical Modification (ICD–9–CM)]
Current code(s)assignment
EffectiveOctober 1
Previous code(s)assignment
29.31 . . . . . . . . . . . . . 1991 83.02
33.27 . . . . . . . . . . . . . 1987 33.22+33.2733.28 . . . . . . . . . . . . . 1987 33.27
35.96 . . . . . . . . . . . . . 1986 35.03
36.04 . . . . . . . . . . . . . 1986 39.97
37.79 . . . . . . . . . . . . . 1987 86.09
44.44 . . . . . . . . . . . . . 1989 38.86
45.16 . . . . . . . . . . . . . 1988 45.14 (45.15 before 1987)
45.75 (Hartmannresection added) . . . . 1988 48.66 (code deleted)
56.35 . . . . . . . . . . . . . 1987 45.12
77.56 . . . . . . . . . . . . . 1989 77.89,78.49,81.1877.57 . . . . . . . . . . . . . 1989 77.89,80.48,81.18,83.85
81.51 . . . . . . . . . . . . . 1989 81.51,81.5981.53 . . . . . . . . . . . . . 1989 81.51,81.59,81.61,81.62,
81.63,81.6481.54–81.55 . . . . . . . . 1989 81.41
86.27 . . . . . . . . . . . . . 1986 86.22–86.2386.28 . . . . . . . . . . . . . 1988 86.22
96.70 . . . . . . . . . . . . . 1991 93.92 (code deleted)96.71 . . . . . . . . . . . . . 1991 93.92 (code deleted)96.72 . . . . . . . . . . . . . 1991 93.92 (code deleted)
97.05 . . . . . . . . . . . . . 1989 51.97
98.51–98.52 . . . . . . . . 1989 59.96 (code deleted)98.59 . . . . . . . . . . . . . 1989 59.96 (code deleted)
With two exceptions, the order of diagnoses and produres for sampled discharges is preserved to reflect the oon the medical record face sheet or in the abstracting serfile. One exception is for women admitted for delivery. In thcase, a code of V27 from the supplemental classificationassigned as the first-listed code in order to provide an estimof all deliveries. In the other exception, whenever an acmyocardial infarction is encountered with other circulatodiagnoses and is other than the first entry, it is reordered tofirst position.
An ongoing quality control program is undertaken on tcoding and entering of data from abstracts to machireadable form. Approximately 5 percent of the abstractsindependently recoded by an NHDS coder, with discrepanresolved by the chief coder. Overall error rates for recomanually coded by NCHS for the 1988–92 data years ranfrom 1.6 to 3.5 percent for medical (ICD–9–CM) coding anentering and from 0.4 to 0.8 percent for demographic codand entering.
Following conversion of the data on the medical abstrto computer tape and combining the data with the automadata tapes, a final medical edit was performed by compinspection and by a manual review of rejected abstracts. Ifsex or age of the patient was incompatible with the record
-ere
ste
e
-es
d
tdre
medical information, priority was given to the medicainformation.
Presentation of estimates
Grouping of diagnoses and procedures
In this report, the broadest groupings of diseases ainjuries shown correspond to the ICD–9–CM chapters 1–and the supplementary classification of factors influencihealth status and contact with health services. Diagnoscategories, the most detailed groupings of diseases and injushown, are subsets of the major groups or chapters.
The procedure groupings used in this report are tgroups numbered 1–16 in the ICD–9–CM section entitle‘‘Procedure Classification.’’ Specific categories of operationor procedures, the most detailed of these groups shown,subsets of the major groups.
In developing tables of diagnoses and of procedures,effort was made to present data for the most frequenoccurring conditions or procedures, as well as those of signcant public health interest. The diagnostic and proceducategories intables 8–16and 18–23are the same categoriesshown in the 1990–93 NHDS annual summaries publishedAdvance Data From Vital and Health Statisticsand series 13of Vital and Health Statistics.
Patient characteristics not stated
Age or sex of the patient was not stated for 0.5 t2 percent of sample discharges for 1988–92. These data wimputed by assigning the patient an age or sex consistent wthe age or sex of other sampled patients with the sadiagnostic code. In addition to the edits performed by NCHdata obtained through the automated system may have bedited by an abstract service and may have had data impuThe extent of this imputation, if any, is unknown.
Rounded numbers
Estimates in this report have been rounded. Therefodetailed figures may not add to totals. Rates and percents wcalculated using unrounded figures and may not agree wcomputations made from the rounded data.
Population estimates
The population estimates used in computing rates afrom published and unpublished estimates for the U.S. civilipopulation, including institutionalized persons, on July 1 othe data year provided by the U.S. Bureau of the Census. Testimates by age, sex, and geographic region are presentetable IV and are consistent with population estimates pulished inCurrent Population Reports, Series P-25.
The population estimates intable IV are based on the1990 census as enumerated. They are generally somewsmaller than the population estimates used in the NHDannual summaries for 1985 and 1988–90 (28–31), which webased on the 1980 census. As a result, the population-barates in this report are generally slightly higher than thpreviously reported rates for 1985 and 1988–90 (table V),although the differences are not statistically significant. Th
59

Table IV. Civilian population by age, sex, and geographic region: United States, 1980, 1985, and 1988–92[Population estimates consistent with Series P-25, Current Population Reports, U.S. Bureau of the Census]
Age, sex, and geographic region 1980 1985 1988 1989 1990 1991 1992
All ages Population in thousands
Total . . . . . . . . . . . . . . . . . . . . . . . . . . . . . . 225,621 236,219 242,817 245,131 247,751 250,566 253,497
Sex:Male . . . . . . . . . . . . . . . . . . . . . . . . . . . . . 108,924 114,182 117,571 118,763 120,124 121,539 123,081Female . . . . . . . . . . . . . . . . . . . . . . . . . . . 116,697 122,037 125,246 126,368 127,627 129,027 130,416
Region:Northeast . . . . . . . . . . . . . . . . . . . . . . . . . . 49,075 49,759 50,467 50,642 50,725 50,871 51,026Midwest . . . . . . . . . . . . . . . . . . . . . . . . . . . 58,752 58,667 59,115 59,327 59,647 60,090 60,586South . . . . . . . . . . . . . . . . . . . . . . . . . . . . 74,886 80,526 83,026 83,830 84,872 86,067 87,299West . . . . . . . . . . . . . . . . . . . . . . . . . . . . 42,908 47,267 50,209 51,332 52,507 53,537 54,586
Under 15 years
Total . . . . . . . . . . . . . . . . . . . . . . . . . . . . . . 51,290 51,534 52,451 53,222 54,103 55,130 55,962
Sex:Male . . . . . . . . . . . . . . . . . . . . . . . . . . . . . 26,219 26,374 26,851 27,245 27,698 28,225 28,653Female . . . . . . . . . . . . . . . . . . . . . . . . . . . 25,071 25,160 25,600 25,977 26,405 26,906 27,309
Region:Northeast . . . . . . . . . . . . . . . . . . . . . . . . . . 10,337 9,756 9,841 9,978 10,097 10,263 10,361Midwest . . . . . . . . . . . . . . . . . . . . . . . . . . . 13,589 13,080 12,974 13,113 13,226 13,350 13,422South . . . . . . . . . . . . . . . . . . . . . . . . . . . . 17,480 17,945 18,213 18,367 18,625 18,957 19,251West . . . . . . . . . . . . . . . . . . . . . . . . . . . . 9,884 10,753 11,423 11,764 12,154 12,561 12,929
15–44 years
Total . . . . . . . . . . . . . . . . . . . . . . . . . . . . . . 104,158 111,711 114,819 115,393 116,178 116,973 116,946
Sex:Male . . . . . . . . . . . . . . . . . . . . . . . . . . . . . 51,209 55,151 56,866 57,198 57,653 58,063 58,110Female . . . . . . . . . . . . . . . . . . . . . . . . . . . 52,949 56,560 57,953 58,195 58,525 58,910 58,836
Region:Northeast . . . . . . . . . . . . . . . . . . . . . . . . . . 22,137 23,419 23,827 23,805 23,729 23,625 23,342Midwest . . . . . . . . . . . . . . . . . . . . . . . . . . . 26,985 27,325 27,510 27,455 27,522 27,676 27,641South . . . . . . . . . . . . . . . . . . . . . . . . . . . . 34,402 37,856 38,988 39,213 39,557 39,984 40,106West . . . . . . . . . . . . . . . . . . . . . . . . . . . . 20,634 23,112 24,494 24,921 25,371 25,687 25,856
45–64 years
Total . . . . . . . . . . . . . . . . . . . . . . . . . . . . . . 44,465 44,558 45,423 45,835 46,243 46,710 48,304
Sex:Male . . . . . . . . . . . . . . . . . . . . . . . . . . . . . 21,132 21,265 21,757 21,987 22,214 22,461 23,274Female . . . . . . . . . . . . . . . . . . . . . . . . . . . 23,333 23,293 23,667 23,848 24,029 24,249 25,031
Region:Northeast . . . . . . . . . . . . . . . . . . . . . . . . . . 10,500 10,017 9,980 9,964 9,929 9,939 10,198Midwest . . . . . . . . . . . . . . . . . . . . . . . . . . . 11,450 11,010 11,077 11,104 11,144 11,206 11,561South . . . . . . . . . . . . . . . . . . . . . . . . . . . . 14,459 15,148 15,561 15,751 15,962 16,185 16,787West . . . . . . . . . . . . . . . . . . . . . . . . . . . . 8,055 8,383 8,806 9,016 9,208 9,379 9,758
65 years and over
Total . . . . . . . . . . . . . . . . . . . . . . . . . . . . . . 25,707 28,416 30,123 30,682 31,228 31,753 32,28565–74 years . . . . . . . . . . . . . . . . . . . . . . . . 15,651 16,859 17,626 17,864 18,098 18,280 18,46175 years and over . . . . . . . . . . . . . . . . . . . . 10,057 11,557 12,497 12,818 13,129 13,474 13,824
Male . . . . . . . . . . . . . . . . . . . . . . . . . . . . . . 10,364 11,392 12,098 12,333 12,559 12,791 13,04565–74 years . . . . . . . . . . . . . . . . . . . . . . . . 6,787 7,339 7,710 7,824 7,934 8,022 8,12575 years and over . . . . . . . . . . . . . . . . . . . . 3,577 4,053 4,388 4,509 4,626 4,769 4,920
Female . . . . . . . . . . . . . . . . . . . . . . . . . . . . 15,343 17,024 18,026 18,349 18,668 18,963 19,24065–74 years . . . . . . . . . . . . . . . . . . . . . . . . 8,863 9,520 9,916 10,040 10,165 10,258 10,33675 years and over . . . . . . . . . . . . . . . . . . . . 6,480 7,504 8,109 8,308 8,504 8,705 8,904
Region:Northeast . . . . . . . . . . . . . . . . . . . . . . . . . . 6,100 6,568 6,819 6,895 6,971 7,043 7,125Midwest . . . . . . . . . . . . . . . . . . . . . . . . . . . 6,728 7,251 7,554 7,655 7,755 7,857 7,962South . . . . . . . . . . . . . . . . . . . . . . . . . . . . 8,545 9,577 10,264 10,500 10,728 10,942 11,155West . . . . . . . . . . . . . . . . . . . . . . . . . . . . 4,335 5,020 5,487 5,632 5,774 5,911 6,043
60

thetherthaan99
s-.Sti-ryDralral
umgmtlythibu
Seried oaben
eonalrt offore
in
reeili-andnde—tayn
a)fheshe-alltis
ofan
or
Table V. Rate of discharges from short-stay hospitals reported in annual summary and revised using population based on 1990 censusby sex and age: United States, 1985 and 1988–90[Discharges of inpatients from non-Federal hospitals. Excludes newborn infants]
Sex and age
1985 1988 1989 1990
Annualsummary Revised
Annualsummary Revised
Annualsummary Revised
Annualsummary Revised
Rate of discharges per 1,000 population
Both sexes . . . . . . . . . . . . . . . . . . . . . 147.9 148.4 127.6 128.3 125.5 126.2 123.5 124.3Under 15 years . . . . . . . . . . . . . . . . . 57.2 57.7 49.2 49.8 48.2 48.8 43.9 44.615–44 years . . . . . . . . . . . . . . . . . . . 125.1 125.0 104.0 103.9 102.8 102.7 101.7 101.645–64 years . . . . . . . . . . . . . . . . . . . 169.5 170.8 140.5 142.1 135.0 136.8 133.1 135.065 years and over . . . . . . . . . . . . . . . 368.3 369.8 334.1 336.8 330.2 333.4 327.1 330.9
Male . . . . . . . . . . . . . . . . . . . . . . . . . 123.5 124.0 106.9 107.5 105.3 106.0 101.5 102.2Under 15 years . . . . . . . . . . . . . . . . . 63.8 64.4 54.6 55.3 55.1 55.8 48.5 49.215–44 years . . . . . . . . . . . . . . . . . . . 75.4 75.3 61.5 61.3 59.8 59.5 58.0 57.845–64 years . . . . . . . . . . . . . . . . . . . 176.2 177.6 146.4 148.0 142.8 144.6 138.3 140.265 years and over . . . . . . . . . . . . . . . 393.2 397.9 360.3 367.8 354.4 363.1 346.2 356.1
Female . . . . . . . . . . . . . . . . . . . . . . . 170.7 171.2 147.0 147.7 144.5 145.3 144.1 145.0Under 15 years . . . . . . . . . . . . . . . . . 50.2 50.6 43.4 43.9 40.9 41.5 39.2 39.715–44 years . . . . . . . . . . . . . . . . . . . 173.4 173.5 145.6 145.8 144.9 145.1 144.5 144.745–64 years . . . . . . . . . . . . . . . . . . . 163.4 164.6 135.1 136.7 127.9 129.7 128.2 130.265 years and over . . . . . . . . . . . . . . . 351.4 351.0 316.2 316.0 313.5 313.5 313.8 314.0
estimate of the 1980 population changed very little when1990 census was taken into account. However, the rates in1980 annual summary (32) differ from rates presented hbecause institutionalized persons were not included inpopulation used to compute rates in the 1980 annual summ(33). The populations used to compute rates in the 19911992 annual summaries (34,35) were based on the 1census.
Rates using civilian population estimates will be overetimated to the extent that military personnel and non-Ucitizens use NHDS-eligible hospitals and will be underesmates to the extent that civilians (for example, militadependents or retirees) use hospitals that are not in the NHuniverse, that is, hospitals that are institutional, Fedemilitary, veteran, or long-stay hospitals that are not genematernal, or children’s general hospitals.
Published and flagged estimates
Estimates are not presented unless a reasonable asstion regarding the probability of distribution of the samplinerror is possible on the basis of the Central Limit TheoreThe Central Limit Theorem states that, given a sufficienlarge sample size, the sample estimate approximatespopulation estimate, and upon repeated sampling, its distrtion would be approximately normal.
Because of the complex sample design of the NHDestimates of less than 5,000 are not presented; only an ast(*) appears in the tables. These estimates generally havrelative standard error of more than 30 percent or are basea sample of less than 30 cases. Estimates of 5,000–9,000presented with an asterisk (*) to indicate that they may notreliable. These estimates are generally based on less thacases.
eeeryd0
.
S,,
p-
.
e-
,skanre
60
Estimation procedures
Statistics from the NHDS are derived by a multistagestimation procedure that produces essentially unbiased natiestimates. The estimation procedure was changed as pathe 1988 redesign of the survey. The procedure used be1988 is described in detail inappendix Iof two publications(36,37), and is compared with the new estimation procedurea recent report (13).
The estimation procedure used for 1988–92 data has thbasic components: (a) inflation by reciprocals of the probabties of sample selection, (b) adjustment for nonresponse,(c) population weighting ratio adjustments. The second athird components were made separately by admission typthat is, for discharges of newborn infants (whose hospital sbegan with their births) and for discharges of other thanewborn infants.
Inflation by reciprocals of probabilities of selection
There is one probability for each stage of sampling: (the probability of selecting the PSU, (b) the probability oselecting the hospital, and (c) the probability of selecting tdischarge within the hospital. The last probability variemonthly and is calculated to be the sample size from thospital for the month divided by the total number of discharges occurring at the hospital that month. The overprobability of selection is the product of the probabilities aeach stage. The inverse of the overall selection probabilitythe basic inflation weight.
Adjustment for nonresponse
NHDS data were adjusted to account for two typesnonresponse. The first type of nonresponse occurred whenin-scope (NHDS-eligible) sample hospital did not respond f
61

ushtenteitan,amththnsishasad thaenisG
HStheis-gnonthto) oporgeosfoouhaofsuchirgon
tyizisFoisoftaltomornceure8–
ple.
ngrs,ess-beofbenedave
ythecksg,m-s.’’
d oneamethe-
m-pleardhenot
thethencein
isheive
erein ars
s-
nreredtics
more than half the months during which it was in scope, thmaking it a nonrespondent hospital. In this case, the weigof discharges from hospitals similar to the nonrespondhospitals were inflated to account for discharges represenby the nonrespondent hospitals. For this purpose, hospwere judged to be similar if they were in the same regiohospital specialty-size group, and if possible, the same spling stratum (that is, the same abstracting status group ifnonrespondent hospital was in the 12 largest PSU’s and insame PSU, otherwise). The adjustments for this nonrespowere made separately for admission types—that is, for dcharges of newborn infants and for all other discharges. Tadjustment consisted of a ratio for which the numerator wthe weighted number of discharges of the admission type insimilar sample hospitals (regardless of response status) andenominator was the weighted total of discharges of tadmission type from the hospitals similar to the nonrespondhospitals. Data on the number of discharges for each admsion type came from either the hospitals or the 1989–93 SMHospital Market Databases (15,38–41).
The second type of nonresponse occurred when NCfailed to collect all the discharge abstracts expected (number expected is the product of the hospital’s total dcharges each month and the discharge sampling rate assito the hospital). In each month when the hospital was respdent (at least half the expected abstracts were collected),weights of abstracts collected for the month were inflatedaccount for the missing abstracts. For a hospital’s month(snonresponse, the weights of discharges in the hospital’s resdent months were inflated by ratios that varied with dischagroups defined by the ICD–9–CM diagnostic classes of thdischarges’ first-listed diagnoses. The adjustment ratioeach partially respondent hospital and each discharge grwas calculated using only data from sample hospitals twere both NHDS eligible and respondent for all 12 monthsthe data year. The ratio had as its numerator the weightedof discharges in that discharge group for all months in whithe partially respondent hospital was in scope and had asdenominator the weighted sum of discharges in that dischagroup that occurred in the months when the partially respdent hospital did not respond to the NHDS.
Population weighting ratio adjustment
Adjustments were made within each of 16 noncertainhospital groups defined by region and hospital specialty-sclasses to adjust for oversampling or undersampling of dcharges reported in the sampling frame for the data year.discharges other than newborn infants, the adjustmentmultiplicative factor that had as its numerator the numberadmissions reported for the year at sampling frame hospiwithin each region-specialty-size group and as its denominathe estimated number of those admissions for that sahospital group. The adjustment for discharges of newbinfants was similar, but numbers of births were used in plaof admissions. The ratio numerators were based on the figobtained from the SMG Hospital Market Databases (15,3
62
stdls
-eee-e
llhett-
ed-e
fn-
erpt
m
tse-
e-ra
sre
s
41) and the ratio denominators were obtained through a siminflation of the SMG figures for the NHDS sample hospitals
Reliability of estimates
Nonsampling errors
As from any survey, results are subject to nonsamplierrors, which include errors due to sampling frame errohospital nonresponse, missing abstracts, and recording procing errors. The magnitude of the nonsampling errors cannotdetermined. However, errors resulting from the exclusionin-scope hospitals from the sampling frame are believed tosmall because the hospitals excluded are ones that opeafter the frame was constructed, and hence, they tend to hfew discharges relative to hospitals that are in the frame.
Other nonsampling errors are kept to a minimum bmethods built into the survey procedures, such as trainingdata collectors in sampling and data abstraction, quality cheof sampling and abstracting, manual and computer editinand verification of keypunching and coding. Some nonsapling errors are discussed under ‘‘Presentation of estimate
Sampling errors
Because the statistics presented in this report are basea sample, they may differ from the figures that would bobtained if a complete census had been taken using the sforms, definitions, instructions, and procedures. However,probability design of NHDS permits the calculation of sampling errors.
The standard error (SE) is primarily a measure of sapling variability that occurs by chance because only a samrather than the entire population is surveyed. The standerror, as calculated for the NHDS, also reflects part of tvariation that arises in the measurement process, but doesinclude any systematic bias.
The chances are about 68 in 100 that an estimate fromsample would differ from a complete census by less thanstandard error. The chances are 95 in 100 that the differewould be less than twice the standard error, and about 99100 that it would be less than 2.5 times as large.
The relative standard error (RSE) of an estimateobtained by dividing the standard error by the estimate. Tresulting value can be multiplied by 100 to express the relatstandard error as a percent of the estimate.
Relative standard errors for aggregate estimates
Estimates of standard errors for 1980 and 1985 data wcalculated using a customized computer routine describedprevious publication (12). Approximate relative standard errowere calculated from these estimates and are shown intablesVI–VIII. The approximate relative standard errors for dicharges or first-listed diagnoses are intable VI, those for daysof care are intable VII, and those for procedures are itable VIII. For the 1985 estimates and the 1980 proceduestimates, the standard errors of regional estimates diffefrom the standard errors of estimates for other characteris

tivethrgedarthil
tiveaithorshestia
d
euted
allatet
rdiveless
byor
Table VI. Approximate relative standard errors of estimatednumber of discharges or first-listed diagnoses by size ofestimate: 1980 and 1985
Size of estimate 19801
1985
RegionAll other
characteristics2
5,000 . . . . . . . . . . . . . . . . . . 18.0 22.4 13.210,000 . . . . . . . . . . . . . . . . . 14.9 18.3 10.625,000 . . . . . . . . . . . . . . . . . 11.9 14.3 8.150,000 . . . . . . . . . . . . . . . . . 10.1 12.0 6.7100,000 . . . . . . . . . . . . . . . . 8.8 10.3 5.7250,000 . . . . . . . . . . . . . . . . 7.4 8.5 4.6500,000 . . . . . . . . . . . . . . . . 6.5 7.5 4.01,000,000 . . . . . . . . . . . . . . . 5.8 6.6 3.53,000,000 . . . . . . . . . . . . . . . 5.0 5.6 2.95,000,000 . . . . . . . . . . . . . . . 4.7 5.2 2.710,000,000 . . . . . . . . . . . . . . 4.3 4.8 2.420,000,000 . . . . . . . . . . . . . . 4.0 4.4 2.230,000,000 . . . . . . . . . . . . . . 3.8 4.2 2.140,000,000 . . . . . . . . . . . . . . 3.7 4.1 2.1
1Applicable to all 1980 estimates of discharges or first-listed diagnoses shown in this report.2Applicable to all 1985 estimates of discharges or first-listed diagnoses shown in this reportexcept regional estimates.
Table VII. Approximate relative standard errors of estimatednumber of days of care by size of estimate: 1980 and 1985
Size of estimate 19801
1985
RegionAll other
characteristics2
10,000 . . . . . . . . . . . . . . . . . . . . . . . . 24.7 35.4 16.930,000 . . . . . . . . . . . . . . . . . . . . . . . . 18.9 26.4 13.050,000 . . . . . . . . . . . . . . . . . . . . . . . . 16.8 23.2 11.6100,000 . . . . . . . . . . . . . . . . . . . . . . . 14.3 19.4 9.9300,000 . . . . . . . . . . . . . . . . . . . . . . . 11.2 14.9 7.8500,000 . . . . . . . . . . . . . . . . . . . . . . . 10.1 13.2 7.11,000,000 . . . . . . . . . . . . . . . . . . . . . . 8.8 11.2 6.23,000,000 . . . . . . . . . . . . . . . . . . . . . . 7.1 8.8 5.05,000,000 . . . . . . . . . . . . . . . . . . . . . . 6.5 7.9 4.610,000,000 . . . . . . . . . . . . . . . . . . . . . 5.7 6.9 4.150,000,000 . . . . . . . . . . . . . . . . . . . . . 4.4 5.1 3.2100,000,000 . . . . . . . . . . . . . . . . . . . . 4.0 4.5 2.9250,000,000 . . . . . . . . . . . . . . . . . . . . 3.5 3.9 2.6
1Applicable to all 1980 estimates of days of care shown in this report.2Applicable to all 1985 estimates of days of care shown in this report except regionalestimates.
Table VIII. Approximate relative standard errors of estimatednumber of procedures by size of estimate: 1980 and 1985
Size of estimate
1980 1985
RegionAll other
characteristics1 RegionAll other
characteristics2
5,000 . . . . . . . . . . . 29.8 17.3 31.3 18.210,000 . . . . . . . . . . 24.3 14.7 26.4 15.125,000 . . . . . . . . . . 19.1 12.1 21.4 12.050,000 . . . . . . . . . . 16.1 10.6 18.6 10.3100,000 . . . . . . . . . 13.8 9.4 16.3 8.9250,000 . . . . . . . . . 11.4 8.1 13.9 7.5500,000 . . . . . . . . . 10.0 7.3 12.5 6.71,000,000 . . . . . . . . 8.9 6.7 11.3 6.03,000,000 . . . . . . . . 7.5 5.9 9.9 5.15,000,000 . . . . . . . . 7.0 5.6 9.3 4.810,000,000 . . . . . . . 6.4 5.2 8.7 4.420,000,000 . . . . . . . 5.9 4.9 8.1 4.130,000,000 . . . . . . . 5.7 4.7 7.8 4.0
1Applicable to all 1980 estimates of procedures shown in this report except regionalestimates.2Applicable to all 1985 estimates of procedures shown in this report except regionalestimates.
shown in this report. Thus, one set of approximate relastandard errors was derived for regional estimates and anoset for the other estimates. For 1980 estimates of dischaand days of care, only one set of approximate relative stanerrors was required for the characteristics in this report asstandard errors computed for these characteristics were simto each other.
The estimated parameters for the approximate relastandard error equations for 1988–92 aggregate statisticsderived from standard error estimates calculated wSESUDAAN software. SESUDAAN computes standard errby using a first-order Taylor series approximation of tdeviation of estimates from their expected values (42). Emated parameters for discharges or first-listed diagnoses
ersdear
re
-re
shown intable IX, those for days of care intable X, and thosefor procedures intable XI. The approximate relative standarerror (RSE) of an estimateX, expressed as a percent ofX, maybe calculated using the formula:
RSE(X) = 100√a+b/Xwherea, andb are as defined in tables IX–XI.
Relative standard errors for estimates of percents
The approximate relative standard error for a percentp,expressed as a percent ofp, in which the numerator (N) andthe denominator (D) are estimates from the NHDS and thnumerator is a subclass of the denominator, can be compusing the formula:
RSE(p = N/D) = 100 √(SEN2/N2)–(SED
2 /D2).
This formula can be used for percents based on data fromyears of the NHDS. For the 1988–92 data, the approximrelative standard error for a percentp, expressed as a percenof p, also can be calculated directly using the formula:
RSE(p) = 100√b(1–p) /(pX)where 100p is the percent of interest,X is the denominator ofthe percent, andb is the parameterb in the formula forapproximating the RSE(X). The values forb are given intables IX–XI.
These approximations are valid if the relative standaerror of the denominator is less than 5 percent or the relatstandard errors of the numerator and denominator are boththan 10 percent (43,44).
Relative standard errors where the numerator is nota subclass of the denominator
If the denominator of the rate is an estimate producedthe U.S. Bureau of the Census for the total U.S. population
63

helento
ive
hearha
usedveys inerends.oft-ofhein
ts(for
Table IX. Estimated parameters for approximate relative standard error equations for number of discharges or first-listed diagnoses byselected characteristics: 1988–92
Selected characteristic
1988 1989 1990 1991 1992
a b a b a b a b a b
Total . . . . . . . . . . . . . . . . . . 0.00358 173.173 0.00360 171.428 0.00213 228.834 0.00101 546.321 0.00097 449.059
Sex
Male . . . . . . . . . . . . . . . . . . 0.00273 263.937 0.00271 348.880 0.00152 313.079 0.00447 213.042 0.00377 355.244Female . . . . . . . . . . . . . . . . 0.00214 355.406 0.00235 338.538 0.00125 311.632 0.00099 442.186 0.00089 404.530
Age
Under 15 years . . . . . . . . . . . 0.01984 109.886 0.02168 107.150 0.01597 47.116 0.01786 65.842 0.06075 81.77515–44 years . . . . . . . . . . . . . 0.00312 158.564 0.00341 165.558 0.00142 299.762 0.00956 111.147 0.01291 44.50545–64 years . . . . . . . . . . . . . 0.00361 139.812 0.00295 252.955 0.00157 234.543 0.01292 44.094 0.00656 147.70665 years and over . . . . . . . . . . 0.00262 248.331 0.00281 202.073 0.00161 263.223 0.01149 25.788 0.00175 464.831
Region
Northeast . . . . . . . . . . . . . . . 0.00432 154.474 0.00380 132.181 0.00274 56.268 0.00293 243.156 0.00275 277.031Midwest . . . . . . . . . . . . . . . . 0.01049 215.711 0.01126 252.898 0.00487 183.531 0.00603 331.780 0.00358 296.767South . . . . . . . . . . . . . . . . . 0.00637 194.720 0.00588 175.845 0.00375 343.892 0.00247 547.686 0.00375 464.132West . . . . . . . . . . . . . . . . . . 0.00858 221.258 0.01397 245.475 0.00564 318.914 0.00513 403.340 0.00006 1,168.044
NOTE: The approximate relative standard error (RSE) for an estimate (X) can be determined from the equation RSE(X) = 100 √a + b/x.
Table X. Estimated parameters for approximate relative standard error equations for number of days of care by selected characteristics:1988–92
Selected characteristic
1988 1989 1990 1991 1992
a b a b a b a b a b
Total . . . . . . . . . . . . . . . . . . 0.00446 1,222.400 0.00404 1,438.643 0.00358 452.582 0.00173 2,343.213 0.00150 2,671.104
SexMale . . . . . . . . . . . . . . . . . . 0.00331 1,554.308 0.00311 1,853.369 0.00293 292.127 0.00518 5,120.963 0.00823 995.275Female . . . . . . . . . . . . . . . . 0.00241 1,602.350 0.00253 1,907.568 0.00213 701.564 0.00194 1,634.957 0.00149 1,914.510
Age
Under 15 years . . . . . . . . . . . 0.01604 708.124 0.01976 1,248.390 0.00224 140.764 0.07618 737.582 0.12836 71.17115–44 years . . . . . . . . . . . . . 0.00289 1,097.768 0.00298 1,225.181 0.00301 460.089 0.02384 475.352 0.02014 222.39645–64 years . . . . . . . . . . . . . 0.00366 1,102.740 0.00278 1,551.060 0.00920 432.971 0.02949 92.219 0.01746 151.92065 years and over . . . . . . . . . . 0.00312 2,314.965 0.00295 2,110.341 0.00251 762.854 0.01849 25.558 0.01680 456.313
Region
Northeast . . . . . . . . . . . . . . . 0.00421 1,003.567 0.00432 972.782 0.00368 146.195 0.00451 1,967.234 0.00489 2,079.029Midwest . . . . . . . . . . . . . . . . 0.01152 1,086.414 0.01289 1,493.015 0.00605 970.001 0.01037 608.558 0.00557 1,297.946South . . . . . . . . . . . . . . . . . 0.00733 1,722.863 0.00436 1,408.247 0.00540 929.232 0.00400 1,435.185 0.00457 1,148.825West . . . . . . . . . . . . . . . . . . 0.01053 1,188.078 0.01456 1,361.642 0.01036 830.740 0.00891 871.769 0.02108 1,902.219
NOTE: The approximate relative standard error (RSE) for an estimate (X) can be determined from the equation RSE(X) = 100 √a + b/x.
one or more of the age and sex groups of the population, tthe approximate relative standard error of the rate is equivato the approximate relative standard error of the numerathat can be obtained fromtables VI–XI.
If the numeratorX and the denominatorY are bothestimated from the NHDS, then the approximate relatstandard error of the ratioX/Y, expressed as a percent ofX/Y,is calculated using the formula:
RSE(X/Y) = 100√[RSE(X)]2+ [RSE(Y)]2
This approximation is valid if the relative standard error of tdenominator is less than 5 percent or the relative standerrors of the numerator and denominator are both less t10 percent (43,44).
64
ntr
dn
Weighted least squares as a test for trend
Aweighted least squares regression method has beento analyze data from the National Hospital Discharge Sur(45). This method was adapted to analyze selected trendrates for the years 1988–92. Exact standard errors wobtained for use in the weighted least squares test for treThese standard errors were computed using SUDAAN sware, which uses a first-order Taylor series approximationthe deviation of estimates from their expected values. TSUDAAN software and the approach it uses is describedthe user’s manual (19).
If it is hypothesized that a linear relationship exisbetween an independent variable and a dependent variable

ththopo
e
gu
naua
litS
s
thfr
d
rva-
ical
Table XI. Estimated parameters for approximate relative standard error equations for number of procedures by selected characteristics:1988–92
Selected characteristic
1988 1989 1990 1991 1992
a b a b a b a b a b
Total . . . . . . . . . . . . . . . . . . 0.00415 464.814 0.00440 477.756 0.00547 92.597 0.00153 427.265 0.00143 377.158
Sex
Male . . . . . . . . . . . . . . . . . . 0.00376 428.402 0.00388 444.732 0.00410 89.724 0.00568 139.827 0.00465 336.276Female . . . . . . . . . . . . . . . . 0.00332 467.482 0.00373 457.376 0.00337 83.021 0.00164 342.466 0.00124 416.841
Age
Under 15 years . . . . . . . . . . . 0.02228 428.541 0.02644 386.539 0.03171 44.124 0.03313 53.065 0.10248 74.71515–44 years . . . . . . . . . . . . . 0.00362 443.165 0.00376 445.183 0.00302 139.070 0.00986 87.726 0.00903 153.67545–64 years . . . . . . . . . . . . . 0.00374 463.928 0.00376 483.766 0.00491 68.024 0.01182 125.847 0.00494 295.56465 years and over . . . . . . . . . . 0.00351 442.050 0.00383 468.438 0.00436 47.886 0.01629 12.837 0.00986 288.155
Region
Northeast . . . . . . . . . . . . . . . 0.00493 285.834 0.00456 331.430 0.00588 108.765 0.00746 181.945 0.00556 166.484Midwest . . . . . . . . . . . . . . . . 0.01138 464.393 0.01426 491.416 0.00886 107.681 0.00781 333.914 0.00587 240.949South . . . . . . . . . . . . . . . . . 0.00833 449.500 0.00854 452.325 0.00781 50.919 0.00298 468.737 0.00298 430.632West . . . . . . . . . . . . . . . . . . 0.01193 571.693 0.01387 541.125 0.01235 144.582 0.00753 251.058 0.00831 735.033
NOTE: The approximate relative standard error (RSE) for an estimate (X) can be determined from the equation RSE(X) = 100 = a + b/x.
example, year and discharge rate), then a useful test forrelationship is to fit a regression line to the data, determineslope of the line, and then determine whether or not this slis significantly different from zero. That is, a regression linethe form
Yi = a + bXi
is fitted to the data, where, for this example,Yi = predicteddischarge rate,Xi = year, a = the estimatedY–intercept, that isthe estimated discharge rate if year equals zero, andb = theestimated slope ofY onX, that is, the estimated rate of changin the discharge rate per unit change in year.
The data available from the National Hospital DischarSurvey present certain basic problems that discourage theof classical regression procedures. Among these problemsviolation of the assumptions of independence of the origiobservations, violation of homoscedasticity, that is, eqvariances of the dependent variable within each categorythe independent variable, perhaps violation of the normaassumption, and so forth. Dr. Paul Levy, formerly of NCHhas devised a modified regression model that makesassumptions about the original observations and that makestronger assumptions about the sample estimates thanmade in testing whether two means are equal whenestimated means and their standard errors are obtainedcomplex surveys (45,46).
The proposed model is as follows:
1. LetYi be the estimate of interest andSyi be the estimatedstandard error for theith group.
2. LetXi be the independent variable for the group.
3. AssumeSyi is based on a large enough number ofobservations that it can be assumed to be equal
iseef
esearellofy,nonoareeom
to
syi and thus without sampling error.
4. Further assume that
E ( Yi ) = α + βXi
V ( Yi )= Syi2 for i = 1, 2, . . . ,K
whereα is the trueY–intercept,β is the true slope, andK is thenumber of groups.
5. Finally, assume that theYi are normally distributed anare statistically independent of each other.
The weighting procedure proposed weights all obsetions by the reciprocal of the variance. That is,wi = 1/Syi
2 andthe meanX = Σ wi Xi /Σ wi and the meanY = Σ wi Yi /Σ wi .
The slope is computed in a manner similar to the classleast squares regression, by using the following formula:
b =Σwi (Xi –X )Yi
Σwi (Xi – X )2
This is easily computed by using
b =ΣwiXiYi – (Σwi) (X) (Y)
Σwi Xi2 – (Σwi) X
2
The variance of the slope is
sb2 =
Σwi (Xi – X)2σy
2
[Σwi (Xi –X)2]2
Becausewi= 1/σyi2 , this formula can be simplified to
σb2 =
Σwi (X i –X)2
[Σwi (Xi –X)2]2
=1
Σwi (Xi–X)2
and computationally
65

is isntlyoes
byhe
is-
tee
ate
d
er-
se
tst onthat
Table XII. Worksheet for weighted least squares regression ofdischarge rate on year: United States, 1988–92
Year (Xi )
Discharge rateper 1,000
population (Yi )
Standard errorof dischargerate (Syi ) wi = 1/Syi
2
1988 . . . . . . . . . . . . . 128.3 4.093 0.0601989 . . . . . . . . . . . . . 126.2 4.329 0.0531990 . . . . . . . . . . . . . 124.3 3.170 0.1001991 . . . . . . . . . . . . . 124.1 3.426 0.0851992 . . . . . . . . . . . . . 122.1 3.301 0.092
Sb=Π1
Σwi Xi2– (Σwi) X
2
For the weighted least squares test, the null hypothesthat the slope of the regression line does not significadiffer from zero, and the alternate hypothesis is that it ddiffer from zero (i.e.,H0:β=0, andHA:β≠0). An approximatenormal deviate test of the null hypothesis can be performedcomputingz= b/Sb and comparing the absolute value of tresult to the appropriate critical value.
For example, the discharge rate (Y) by year (X)recorded as shown intable XII. Exact standard errors, computed using SUDAAN software are shown intable XII. Thesemay not agree with approximate standard errors calculafrom tables IX–XI. By applying the method described to thdata shown, we have:
Swi X i Yi = 96,721.547
Swi = 0.390
Swi X i = 776.196
SwiYi = 48.598
Swi X i2 = 1,544,821.826
X = 1,990.246
Y= 124.611
b = –1.429
Sb = 1.177
z= –1.215
66
d
Because thez value is less than the critical value(z1.215z<1.96), no association between the discharge rand year is demonstrated.
Tests of significance
In this report, the statistical significance of the weighteleast squares test for trends is based on the two-sidedz-testwith a critical value of 1.96 (0.05 level of significance). Thdetermination of statistical inference for the testing of diffeences between rates intable Vis based on the two-sidedt-testwith a critical value of 1.96 (0.05 level of significance). Termsuch as ‘‘higher’’ and ‘‘less’’ that relate to differences arstatistically significant. Terms such as ‘‘similar’’ or ‘‘no differ-ence’’ mean that no statistically significant difference exisbetween the estimates being compared. A lack of commenthe difference between any two estimates does not meanthe difference was tested and found not significant.

failgalsix
ret’’
.l;thois-
lth
aantntaygo
ft
b
s
slfntyth
ofi-ge
ur-eir
-al
ord-e-re-ndeetil4ded
ear
a.
ndereswnryassll9.
Appendix IIDefinitions of terms
Terms relating to hospitalization
Hospitals—Hospitals with an average length of stay oless than 30 days for all patients. For 1988–92, hospitwhose specialty was general (medical or surgical) or chdren’s general were also included, even if the average lenof stay for all patients was 30 days or more. Federal hospithospital units of institutions, and hospitals with less thanbeds staffed for patients’ use are not included.
Inpatient—A person who is formally admitted to theinpatient service of a short-stay hospital for observation, cadiagnosis, or treatment. The terms ‘‘inpatient’’ and ‘‘patienare used synonymously.
Newborn infant—Apatient admitted by birth to a hospitalDischarge—The formal release of a patient by a hospita
that is, the termination of a period of hospitalization by deaor by disposition to place of residence, nursing home,another hospital. The terms ‘‘discharges’’ and ‘‘patients dcharged’’ are used synonymously.
Discharge rate—The ratio of the number of hospitadischarges during a year to the number of persons incivilian population on July 1 of that year.
Days of care—The number of patient days accumulatedthe time of discharge by a patient. A stay of less than 1 d(patient admission and discharge on the same day) is couas 1 day in the summation of total days of care. For patieadmitted and discharged on different days, the number of dof care is computed by counting all days from (and includinthe date of admission to (but not including) the datedischarge.
Rate of days of care—The ratio of the number of days ocare accumulated during a year to the number of persons incivilian population on July 1 of that year.
Average length of stay—The number of days of careaccumulated by patients discharged during the year dividedthe number of these discharges.
Fatality rate—The ratio of the number of hospital deathto the number of discharges, multiplied by 100.
Terms relating to diagnoses
Diagnosis—A disease or injury (or factor that influencehealth status and contact with health services that is not itsecurrent illness or injury) listed on the medical record of a patie
Principal diagnosis—The condition established after studto be chiefly responsible for occasioning the admission ofpatient to the hospital for care.
ls-ths,
,
r
e
tyedss)f
he
y
a.
e
First-listed diagnosis—The diagnosis specified as theprincipal diagnosis on the face sheet or discharge summarythe medical record, or if the principal diagnosis is not specfied, the diagnosis listed first on the face sheet or discharsummary of the medical record (see the ‘‘Medical coding andedit’’ section of appendix I). The number of first-listed diag-noses is equivalent to the number of discharges.
Terms relating to procedures
Discharges with procedures—The estimated number ofpatients discharged from non-Federal short-stay hospitals ding the year who underwent at least one procedure during thhospitalization.
Procedure—A surgical or nonsurgical operation, diagnostic procedure, or special treatment reported on the medicrecord of a patient. (See the ‘‘Medical coding and edit’’ sectionof appendix I for further details.)
Procedures have been categorized into four classes accing to UHDDS guidelines (47). Classes 1–3 consist of procdures that carry an operative or anesthetic risk or requihighly trained personnel, special facilities, or special equipment. Class 4 procedures do not meet these criteria, areporting class 4 procedures was optional in 1979. Only thrclass 4 procedures were coded for the NHDS from 1979 un1983. The decision was made to code additional classprocedures in 1983, and the number coded was further expanin 1989. Beginning with the 1991 data, all ICD–9–CMprocedure codes have been used for the NHDS.Table XIIIshows the code numbers for class 4 procedures and the yeach code was first used in the NHDS.
All-listed procedures—All occurrences of a procedure onmedical record, regardless of the order. In the NHDSmaximum of four procedures are coded for each discharge
Surgical procedures—All procedures except those shownin table XIV are considered surgical procedures.
Nonsurgical procedures—Procedures generally notregarded as surgical, including diagnostic endoscopy aradiotherapy, physical medicine and rehabilitation, and othdiagnostic and therapeutic procedures. The ICD–9–CM codclassified as nonsurgical procedures for the NHDS are shoin table XIV. The classification of procedures as surgical ononsurgical was revised beginning with the 1989 data. Manof the procedures added to the nonsurgical category were cl4 procedures that had not been coded until 1983 or 1989. Aobstetrical procedures were classified as surgical until 198
67

-iao
-
e
d,oatfeoUe
sb
t
Table XIII. Code numbers for class 4 procedures and year first used to code data from the National Hospital Discharge Survey[Code numbers are from the International Classification of Diseases, 9th Revision, Clinical Modification (ICD–9–CM)]
Procedurecode
Firstused
Procedurecode
Firstused
Procedurecode
Firstused
Procedurecode
Firstused
01.18–01.19 . . . . . . 1983 38.29. . . . . . . . . . . . . 1983 71.19. . . . . . . . . . . . . 1983 89.66. . . . . . . . . . . . . 198903.39 . . . . . . . . . . . 1983 40.19. . . . . . . . . . . . . 1983 73.6 . . . . . . . . . . . . . 1979 89.7 . . . . . . . . . . . . . 199104.19 . . . . . . . . . . . 1983 41.38–41.39 . . . . . . . . 1989 73.91–73.92 . . . . . . . . 1989 90.01–91.99 . . . . . . . . 199105.19 . . . . . . . . . . . 1983 42.29. . . . . . . . . . . . . 1989 75.35. . . . . . . . . . . . . 1989 93.01–93.25 . . . . . . . . 199106.19 . . . . . . . . . . . 1983 44.91. . . . . . . . . . . . . 1989 76.19. . . . . . . . . . . . . 1983 93.27–93.28 . . . . . . . . 199107.19 . . . . . . . . . . . 1983 45.19. . . . . . . . . . . . . 1989 78.80–78.89 . . . . . . . . 1983 93.31–93.39 . . . . . . . . 199108.19 . . . . . . . . . . . 1989 45.28–45.29 . . . . . . . . 1989 81.98. . . . . . . . . . . . . 1983 93.42–93.44 . . . . . . . . 198908.91–08.93 . . . . . . 1983 48.23. . . . . . . . . . . . . 1989 83.29. . . . . . . . . . . . . 1983 93.61–93.89 . . . . . . . . 199109.19 . . . . . . . . . . . 1983 48.29. . . . . . . . . . . . . 1989 85.19. . . . . . . . . . . . . 1989 93.91. . . . . . . . . . . . . 199109.41–09.49 . . . . . . 1983 49.21. . . . . . . . . . . . . 1989 86.19. . . . . . . . . . . . . 1989 93.94. . . . . . . . . . . . . 198910.29 . . . . . . . . . . . 1983 49.29. . . . . . . . . . . . . 1989 86.92. . . . . . . . . . . . . 1989 93.96. . . . . . . . . . . . . 198911.29 . . . . . . . . . . . 1983 49.41. . . . . . . . . . . . . 1989 87.09–87.12 . . . . . . . . 1991 93.99. . . . . . . . . . . . . 198912.29 . . . . . . . . . . . 1983 50.19. . . . . . . . . . . . . 1983 87.16–87.17 . . . . . . . . 1991 94.01–94.23 . . . . . . . . 199114.19 . . . . . . . . . . . 1983 51.19. . . . . . . . . . . . . 1983 87.22–87.29 . . . . . . . . 1991 94.25. . . . . . . . . . . . . 199115.09 . . . . . . . . . . . 1983 52.19. . . . . . . . . . . . . 1983 87.36–87.37 . . . . . . . . 1989 94.29–94.59 . . . . . . . . 199116.21 . . . . . . . . . . . 1989 54.29. . . . . . . . . . . . . 1983 87.39. . . . . . . . . . . . . 1991 95.01–95.03 . . . . . . . . 199116.29 . . . . . . . . . . . 1983 55.29. . . . . . . . . . . . . 1983 87.43–87.49 . . . . . . . . 1991 95.05–95.11 . . . . . . . . 199118.01 . . . . . . . . . . . 1989 56.39. . . . . . . . . . . . . 1983 87.69. . . . . . . . . . . . . 1989 95.14–95.15 . . . . . . . . 199118.11 . . . . . . . . . . . 1989 57.39. . . . . . . . . . . . . 1983 87.79. . . . . . . . . . . . . 1989 95.31–95.48 . . . . . . . . 199118.19 . . . . . . . . . . . 1989 58.29. . . . . . . . . . . . . 1989 87.85–87.89 . . . . . . . . 1991 95.49. . . . . . . . . . . . . 198920.39 . . . . . . . . . . . 1983 59.29. . . . . . . . . . . . . 1983 87.92. . . . . . . . . . . . . 1991 96.09. . . . . . . . . . . . . 198921.21 . . . . . . . . . . . 1989 60.18. . . . . . . . . . . . . 1983 87.95–87.99 . . . . . . . . 1991 96.11–96.19 . . . . . . . . 199121.29 . . . . . . . . . . . 1989 61.19. . . . . . . . . . . . . 1989 88.09. . . . . . . . . . . . . 1991 96.26–96.28 . . . . . . . . 199122.19 . . . . . . . . . . . 1989 62.19. . . . . . . . . . . . . 1983 88.16–88.31 . . . . . . . . 1991 96.34–96.59 . . . . . . . . 199124.19 . . . . . . . . . . . 1989 63.09. . . . . . . . . . . . . 1983 88.33. . . . . . . . . . . . . 1991 97.01–97.04 . . . . . . . . 199125.09 . . . . . . . . . . . 1989 64.0 . . . . . . . . . . . . . 1979 88.35. . . . . . . . . . . . . 1991 97.14–97.69 . . . . . . . . 199125.91 . . . . . . . . . . . 1989 64.19. . . . . . . . . . . . . 1989 88.37. . . . . . . . . . . . . 1991 97.71. . . . . . . . . . . . . 197926.19 . . . . . . . . . . . 1989 64.91. . . . . . . . . . . . . 1989 88.39. . . . . . . . . . . . . 1991 97.72–97.89 . . . . . . . . 199127.29 . . . . . . . . . . . 1989 64.94. . . . . . . . . . . . . 1989 89.01–89.09 . . . . . . . . 1991 99.02–99.14 . . . . . . . . 199127.91 . . . . . . . . . . . 1989 65.19. . . . . . . . . . . . . 1983 89.11–89.13 . . . . . . . . 1991 99.16–99.24 . . . . . . . . 199128.19 . . . . . . . . . . . 1983 66.19. . . . . . . . . . . . . 1983 89.15–89.16 . . . . . . . . 1991 99.26–99.59 . . . . . . . . 199129.19 . . . . . . . . . . . 1989 67.19. . . . . . . . . . . . . 1983 89.26–89.31 . . . . . . . . 1991 99.71–99.79 . . . . . . . . 198931.48–31.49 . . . . . . 1989 68.19. . . . . . . . . . . . . 1983 89.33–89.39 . . . . . . . . 1991 99.82–99.84 . . . . . . . . 199033.28–33.29 . . . . . . 1983 69.92. . . . . . . . . . . . . 1989 89.45–89.49 . . . . . . . . 1989 99.91–99.99 . . . . . . . . 199034.28–34.29 . . . . . . 1983 70.21. . . . . . . . . . . . . 1989 89.51–89.53 . . . . . . . . 198937.29 . . . . . . . . . . . 1989 70.29. . . . . . . . . . . . . 1983 89.55–89.59 . . . . . . . . 1989
Rate of procedures—The ratio of the number of procedures during a year to the number of persons in the civilpopulation on July 1 of that year determines the rateprocedures.
Demographic terms
Population—The U.S. resident population excluding members of the Armed Forces.
Age—Patient’s age at birthday prior to admission to thhospital.
Age adjustment—Age adjustment, using the direct methois the application of the age-specific rates in a populationinterest to a standardized age distribution in order to eliminthe differences in observed rates that result from age difences in population composition. In this report, ratesdischarges and days of care are age adjusted to thestandard million population (relative age distribution of th1980 civilian population totaling 1,000,000) (table XV). Adjust-ment is based on four age groups. Adjusted average lengthstay were computed by dividing adjusted days of careadjusted discharges.
68
nf
fer-f.S.
ofy
Geographic region—Hospitals are classified by locationin one of the four geographic regions of the United States thacorrespond to those used by the U.S. Bureau of the Census.
Region States included
Northeast Maine, New Hampshire, Vermont,Massachusetts, Rhode Island,Connecticut, New York, New Jersey,and Pennsylvania
Midwest Michigan, Ohio, Illinois, Indiana,Wisconsin, Minnesota, Iowa,Missouri, North Dakota, SouthDakota, Nebraska, and Kansas
South Delaware, Maryland, District ofColumbia, Virginia, West Virginia,North Carolina, South Carolina,Georgia, Florida, Kentucky,Tennessee, Alabama, Mississippi,Arkansas, Louisiana, Oklahoma, andTexas
West Montana, Idaho, Wyoming, Colorado,New Mexico, Arizona, Utah, Nevada,Washington, Oregon, California,Hawaii, and Alaska

Table XIV. Code numbers for procedures considered nonsurgical in the National Hospital Discharge Survey by chapter and year[Code numbers and chapters are based on the International Classification of Diseases, 9th Revision, Clinical Modification (ICD–9–CM)]
Procedure chapter and ICD–9–CM code 1979–88 1989–92
Nonsurgical codes
Operations on the nervous system . . . . . . . . . . . . . . . . . . . . . . . . . . . . . . . . . 01–05 03.31 01.18–01.19,03.31,03.39,04.19,05.19
Operations on the endocrine system . . . . . . . . . . . . . . . . . . . . . . . . . . . . . . . . 06–07 06.19, 07.19
Operations on the eye . . . . . . . . . . . . . . . . . . . . . . . . . . . . . . . . . . . . . . . . . 08–16 11.21,12.21,14.11,16.22 08.19,09.19,09.41–09.49,10.29,11.29,12.29,14.19,15.09,16.21,16.29
Operations on the ear . . . . . . . . . . . . . . . . . . . . . . . . . . . . . . . . . . . . . . . . . 18–20 20.31 18.01,18.11,18.19,20.31,20.39
Operations on the nose, mouth, and pharynx . . . . . . . . . . . . . . . . . . . . . . . . . . . 21–29 29.11 21.00–21.02,21.21,21.29,22.19,24.19,25.09,26.19,27.29,28.19,29.11,29.19
Operations on the respiratory system . . . . . . . . . . . . . . . . . . . . . . . . . . . . . . . . 30–34 31.41–31.42,33.21–33.23 31.41–31.42,31.48–31.49,34.21–34.22 33.21–33.23,33.29,
34.21–34.22,34.28–34.29
Operations on the cardiovascular system . . . . . . . . . . . . . . . . . . . . . . . . . . . . . 35–39 39.95 37.26–37.27,37.29,38.29,39.95
Operations on the hemic and lymphatic system . . . . . . . . . . . . . . . . . . . . . . . . . 40–41 40.19,41.38–41.39
Operations on the digestive system . . . . . . . . . . . . . . . . . . . . . . . . . . . . . . . . . 42–54 42.21–42.23,44.11–44.13, 42.22–42.23,42.29,45.11–45.13,45.21–45.24, 44.11–44.13,44.19,48.21–48.22,51.11,54.21 45.11–45.13,45.19,
45.21–45.24,45.28–45.29,48.21–48.23,48.29,49.21,49.29,50.19,51.10–51.11,51.19,52.19,54.21,54.29
Operations on the urinary system . . . . . . . . . . . . . . . . . . . . . . . . . . . . . . . . . . 55–59 55.21–55.22,56.31, 55.21–55.22,55.29,56.31,57.31–57.32,58.21–58.22 56.35,56.39,57.31–57.32,
57.39,57.94–57.95,58.21–58.22,58.29,59.29
Operations on the male genital organs . . . . . . . . . . . . . . . . . . . . . . . . . . . . . . . 60–64 60.19 60.18–60.19,61.19,62.19,63.09,64.19,64.94
Operations on the female genital organs . . . . . . . . . . . . . . . . . . . . . . . . . . . . . . 65–71 68.11–68.12,70.22 65.19,66.19,67.19,68.11,68.19,69.92,70.21–70.22,70.29,71.19
Obstetrical procedures . . . . . . . . . . . . . . . . . . . . . . . . . . . . . . . . . . . . . . . . . 72–75 73.4,73.51–73.59,73.91–73.92,75.31–75.32,75.34–75.35,75.94
Operations on the musculoskeletal system . . . . . . . . . . . . . . . . . . . . . . . . . . . . 76–84 80.20–80.29 76.19,78.80–78.89,80.20–80.29,81.98,83.29,84.41–84.43,84.45–84.47
Operations on the integumentary system . . . . . . . . . . . . . . . . . . . . . . . . . . . . . . 85–86 85.19,86.19,86.92
Miscellaneous diagnostic and therapeutic procedures . . . . . . . . . . . . . . . . . . . . . . 87–99 87.01–99.99 87.01–99.99
Table XV. Standard million age distribution used to adjust ratesto the U.S. civilian population on July 1, 1980[Based on population estimates consistent with Series P-25, Current PopulationReports, U.S. Bureau of the Census]
AgeStandardmillion
All ages . . . . . . . . . . . . . . . . . . . . . . . . . . . . 1,000,000Under 15 years . . . . . . . . . . . . . . . . . . . . . . . 227,32815–44 years . . . . . . . . . . . . . . . . . . . . . . . . . 461,65345–64 years . . . . . . . . . . . . . . . . . . . . . . . . . 197,07865 years and over . . . . . . . . . . . . . . . . . . . . . . 113,941
69

rnleS
aln,
Appendix IIIRecent publications from theNational Hospital DischargeSurvey
Data from the National Hospital Discharge Survey apresented each year in a variety of publications of the NatioCenter for Health Statistics (NCHS). The following tabshows recent NCHS publications. For a list of NCH
Year(s)of data Title
1965–86 Trends in hospital utilization, United St
1987 1987 summary: National Hospital Disch
National Hospital Discharge Survey: ansummary, 1987
Detailed diagnoses and procedures, NaHospital Discharge Survey, 1987
1983–87 Hospital inpatient surgery: United State
1988 1988 summary: National Hospital Disch
National Hospital Discharge Survey: ansummary, 1988
Detailed diagnoses and procedures, NaHospital Discharge Survey, 1988
Estimates from two survey designs: NaDischarge Survey
1989 1989 summary: National Hospital Disch
Detailed diagnoses and procedures, NaHospital Discharge Survey, 1989
National Hospital Discharge Survey: ansummary, 1989
1990 1990 summary: National Hospital Disch
National Hospital Discharge Survey: ansummary, 1990
Detailed diagnoses and procedures, NaHospital Discharge Survey, 1990
Expected principal source of payment fdischarges: United States, 1990
70
ealpublications that contain 1965–86 data from the NationHospital Discharge Survey, see Trends in hospital utilizatioUnited States, 1965–86.
Series
ates, 1965–86 Vital and Health StatisticsSeries 13, No. 101
arge Survey Advance Data From Vital andHealth Statistics, No. 159(rev)
nual Vital and Health StatisticsSeries 13, No. 99
tional Vital and Health StatisticsSeries 13, No. 100
s,1983–87 Advance Data From Vital andHealth Statistics, No. 169
arge Survey Advance Data From Vital andHealth Statistics, No. 185
nual Vital and Health StatisticsSeries 13, No. 106
tional Vital and Health StatisticsSeries 13, No. 107
tional Hospital Vital and Health StatisticsSeries 13, No. 111
arge Survey Advance Data From Vital andHealth Statistics, No. 199
tional Vital and Health StatisticsSeries 13, No. 108
nual Vital and Health StatisticsSeries 13, No. 109
arge Survey Advance Data From Vital andHealth Statistics, No. 210
nual Vital and Health StatisticsSeries 13, No. 112
tional Vital and Health StatisticsSeries 13, No. 113
or hospital Advance Data From Vital andHealth Statistics, No. 220

Year(s)of data Title Series
1980–90 Long-stay patients in short-stay hospitals Advance Data From Vital andHealth Statistics, No. 229
1991 1991 summary: National Hospital Discharge Survey Advance Data From Vital andHealth Statistics, No. 227
National Hospital Discharge Survey: annualsummary, 1991
Vital and Health StatisticsSeries 13, No. 114
Detailed diagnoses and procedures, NationalHospital Discharge Survey, 1991
Vital and Health StatisticsSeries 13, No. 115
Hospitalizations for injury and poisoning in the United States,1991
Advance Data From Vital andHealth Statistics, No. 252
1992 1992 summary: National Hospital Discharge Survey Advance Data From Vital andHealth Statistics, No. 249
Detailed diagnoses and procedures, NationalHospital Discharge Survey, 1992
Vital and Health StatisticsSeries 13, No. 118
National Hospital Discharge Survey: annualsummary, 1992
Vital and Health StatisticsSeries 13, No. 119
1990–92 Underreporting of race in the National HospitalDischarge Survey
Advance Data From Vital andHealth Statistics, No. 265
71

DEPARTMENT OFHEALTH & HUMAN SERVICES
Public Health ServiceCenters for Disease Control and PreventionNational Center for Health Statistics6525 Belcrest RoadHyattsville, Maryland 20782
OFFICIAL BUSINESSPENALTY FOR PRIVATE USE, $300
DHHS Publication No. (PHS) 96-1782, Series 13, No. 1246-0308 (6/96)
BULK RATEPOSTAGE & FEES PAID
PHS/NCHSPERMIT NO. G-281
FOLD FOLDSPINE
COVER 4PRINTER: ADJUST SPINE TO FIT
PRINTER:
POSITIVE ART FOR BACK COVER (cover 4): PRINT SOLID PMS
NEGATIVE ART FOR FRONT COVER (cover 1): PRINT SOLID PMS