Visual access to city websites: A challenge for PDA's GUI
18
This article was originally published in a journal published by Elsevier, and the attached copy is provided by Elsevier for the author’s benefit and for the benefit of the author’s institution, for non-commercial research and educational use including without limitation use in instruction at your institution, sending it to specific colleagues that you know, and providing a copy to your institution’s administrator. All other uses, reproduction and distribution, including without limitation commercial reprints, selling or licensing copies or access, or posting on open internet sites, your personal or institution’s website or repository, are prohibited. For exceptions, permission may be sought for such use through Elsevier’s permissions site at: http://www.elsevier.com/locate/permissionusematerial
Transcript of Visual access to city websites: A challenge for PDA's GUI

This article was originally published in a journal published byElsevier, and the attached copy is provided by Elsevier for the
author’s benefit and for the benefit of the author’s institution, fornon-commercial research and educational use including without
limitation use in instruction at your institution, sending it to specificcolleagues that you know, and providing a copy to your institution’s
administrator.
All other uses, reproduction and distribution, including withoutlimitation commercial reprints, selling or licensing copies or access,
or posting on open internet sites, your personal or institution’swebsite or repository, are prohibited. For exceptions, permission
may be sought for such use through Elsevier’s permissions site at:
http://www.elsevier.com/locate/permissionusematerial

Autho
r's
pers
onal
co
py
Journal ofVisual Languages & ComputingJournal of Visual Languages and Computing
18 (2007) 339–355
Visual access to city websites: A challengefor PDA’s GUI
Robert Laurini�, Sylvie Servigne
LIRIS—INSA-Lyon, F-69621 Villeurbanne, France
Abstract
At the inception of the Internet, the websites were only textual. Now, with the graphic possibilities,
more and more websites integrate visual aspects, essentially to access and to visualize information.
The goal of this paper is to examine the use of some visual techniques in city websites. More
particularly, we will examine the metaphor of virtual cities, hypermaps and geography-based
accesses, news magazines, etc.
In the last part of this paper, we will examine the implications of using those metaphors for small
screens, and overall for Graphic User Interfaces (GUI) of Personal Digital Assistant (PDA). We will
essentially argue that as the syntactic transformations, i.e., the syntactic adaptations are one face of
the problem, the semantic adaptation, i.e., the transformation or the adaptation of the metaphors, is
a very challenging issue.
r 2007 Published by Elsevier Ltd.
Keywords: Visual access; Websites; Cities; Metaphors; PDA; GUI
1. Introduction
Nowadays, all cities have a website. The objective of this paper is not to make a detailedstudy about their contents, but to examine their organization from a visual point of view.By visual, we mean examining the quality of graphics, the metaphors used and theirefficiency.
ARTICLE IN PRESS
www.elsevier.com/locate/jvlc
1045-926X/$ - see front matter r 2007 Published by Elsevier Ltd.
doi:10.1016/j.jvlc.2007.02.002
�Corresponding author.
E-mail addresses: [email protected] (R. Laurini), [email protected] (S. Servigne).

Autho
r's
pers
onal
co
py
First, let us give the following definitions:
� a home page is the first page of a website, usually the Uniform Resource Locator,(URL) which represents the pointer by which documents or data are addressed in theWorld Wide Web;� a sitemap is the entry structure to access all pages lying into a website; in other words, it
can be seen as a table of contents;� and a portal allows the accessing to only few pages, which highlights the more
important items for the administrators and the site owners.
Usually, the portal is located in the home page. However, in multiple language websites,or in user-profile-oriented sites, the home page often acts as a profile selector so as to giveaccess to different sub-websites.With respect to the use of metaphors for website design [1], let us first of all mention
that the two words, portal and sitemap, evoke metaphors: portal meaning the entrancegate and sitemap the cartography of the website. We can summarize the situation asfollows:
Portals Sitemaps
Existence Always Not alwaysContents Salient items Exhaustive or quasi exhaustive table of contentsUse of metaphors Possible Possible
ARTICLE IN PRESS
Fig. 1. Different models of websites’ entry modes: (a) simple website and (b) website with portal and sitemap.
R. Laurini, S. Servigne / Journal of Visual Languages and Computing 18 (2007) 339–355340

Autho
r's
pers
onal
co
pyTaking into account the previous analysis, we can distinguish four models of websites
from a portal point of view. In this model, we will distinguish portals, sitemaps, languageselectors and profile selectors as entry possibilities (the symbol) representing the URL);we will then model the remaining website, as a network (see Figs. 1 and 2). The first onemodels (Fig. 1a) the simpler structure in which usually the home page also acts as both aportal and a sitemap allowing the access to all items; the second model pictures the case inwhich a portal and a sitemap co-exist.
For cases in which selectors must be used, either for languages and user’s profiles, theirmodels are given respectively in Figs. 2a and b. In multilingual websites, usually parallelsub-websites exist, perhaps having only pictures in common. The more complex structurescorrespond to different user’s profiles, generally allowing different trajectories into thesame set of pages; in this case, the metro-line metaphor (see Section 4.2) allowing to accesspages in different orders, offers an interesting theoretical concept.
In this paper, all Internet examples were taken in March 2007. For the less recentexamples, the reader can refer to the URL http://www.archive.org/ in which a very largequantity of Internet pages are stored together with their dates.
On the other hand, more and more location-based services (LBS) are proposed toPersonal Digital Assistants (PDAs). However, due to the limited size of their screens,adaptation of web pages must be done. Therefore, a new technological barrier is emerging,i.e., how are semantically adapt Graphic User Interface (GUI) to PDAs?
In this paper, we will examine the various types of visual accesses in city websites, andalso the way the city metaphor is used in other domains. And in the last part, we willexamine the consequences when using PDA screens.
But beforehand, we will very rapidly study text-only websites.
ARTICLE IN PRESS
Fig. 2. Other more complex different models of websites’ entry modes: (a) multiple language websites and
(b) multiple profile websites.
R. Laurini, S. Servigne / Journal of Visual Languages and Computing 18 (2007) 339–355 341
Autho
r's
pers
onal
co
py
2. Main metaphors for cities
The first aspect to mention is that some sites use neither metaphor nor visual tools: thepresentation is only made with words. In this category, we can distinguish text-only portalsand textual portals with some light pictorial decorations.
2.1. Text-only portals or with light pictorial decorations
Text-only portals presently are very rare, although there were a majority in the 90s. Takefor instance the site of the city of South Milwaukee http://www.ci.south-milwaukee.wi.us/.Several years ago, the portal was practical text-only, with a unique icon for the letterbox.Few years after, the style is quite similar and only a picture of the city entry sign wasadded, emphasizing the idea of a portal as illustrated in Fig. 3.Anyhow, even if those portals were common in the past, they were very functional and
were a sort of preliminary step to reach present portals.Even though the French Minitel experience (for instance, http://en.wikipedia.org/wiki/
Minitel) was little known in the US, let us remind that this system was built on thetelephone system and was very useful to inform people. Minitel is still in use in France andin some other countries; for instance, in France, contacts with the French administration(information, forms to fill, etc.) are still made through Minitel, as for example in university
ARTICLE IN PRESS
Fig. 3. Example of a text-only website and its evolution, http://www.ci.south-milwaukee.wi.us/.
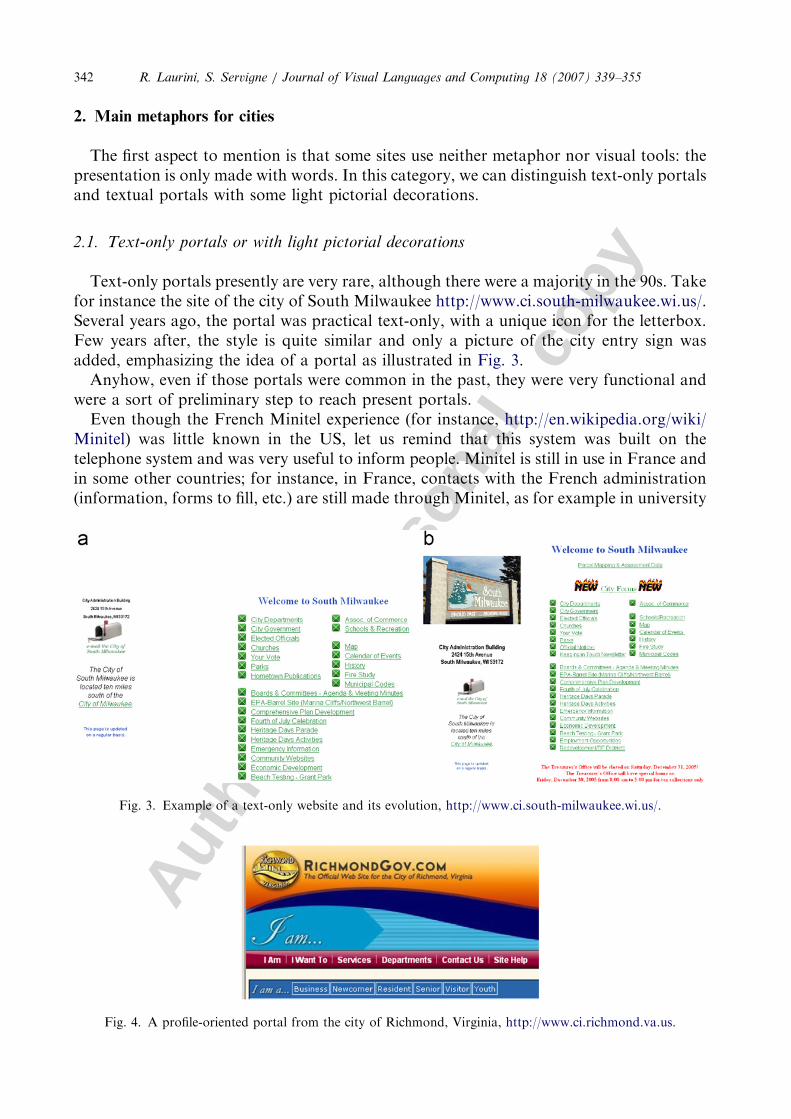
Fig. 4. A profile-oriented portal from the city of Richmond, Virginia, http://www.ci.richmond.va.us.
R. Laurini, S. Servigne / Journal of Visual Languages and Computing 18 (2007) 339–355342

Autho
r's
pers
onal
co
py
registration, or results in the exams. Text-only websites can be seen as outcomes of theMinitel experience.
Another aspect is the diversity of users. In order to target more precise information todeliver, some cities have organized their websites by user profiles. An example is takenfrom the city of Richmond, Virginia (Fig. 4), offering different information according tothe following six text-only profiles, businessmen, newcomer, resident, senior, visitor andyoung people in a text-only list. The Italian city of Salerno offers a dozen of profiles(http://www.comune.salerno.it); for instance profiles such as handicapped, immigrant,sportive and student are added.
2.2. Visual menu
Verbal menus are more and more replaced by visual menus. Fig. 5 gives the example of ahome page including several icons for Edinburgh, Scotland as it was in 2002. Now theportal is replaced by a new one.
ARTICLE IN PRESS
Fig. 5. A visual portal, extract of the Edinburgh visual portal in 2002, http://www.edinburgh.gov.uk.
Fig. 6. Examples of virtual cities: (a) Trenton, New Jersey, http://www.ci.trenton.nj.us/ and (b) Bologna home
page http://www.comune.bologna.it as it was in 2002.
R. Laurini, S. Servigne / Journal of Visual Languages and Computing 18 (2007) 339–355 343

Autho
r's
pers
onal
co
py
2.3. Virtual city
In another direction, there exist portals based on a sort of virtual city. An example isTrenton, New Jersey as illustrated in Fig. 6a. The more famous example is the home pageof Bologna, Italy (See Fig. 6b as it was several years ago). As pictograms such as trains ortheaters are meaningful, the interpretation of some buildings can be misleading. To correctthis drawback, some words are added such as ‘‘ristorante’’, ‘‘shop’’ or ‘‘lex’’; it isinteresting to note that in order to be understandable for anyone, some internationalwords were selected: one of them is in Italian (ristorante), a second in English (shop) andthe last in Latin (lex). However, we were intrigued by the spherical building right in themiddle: it is the entry point for religious information; Indeed, a church pictogram shouldlead to Christian information not valid for other religions. Thus, the search for a verygeneric icon promotes the creation of pictograms the meaning of which is not clear. Toconclude this paragraph, let us say that this approach is very interesting from a visual pointof view, but presents some difficulties for interpretation, especially for people who are notaccustomed with images. Another difficulty is updating such an image.But this metaphor is not only used for cities, but it can be used for any kind of
organization. In the fourth paragraph, we will examine some other examples of the metaphor.
2.4. Hypermaps and geography-based access
A very interesting way of organizing geographic information is to use hypermaps [2],also called clickable maps. Fig. 7a is a good example from the city of Antwerpen, Belgium.Another example is given in Fig. 7b for a gridded map for Oxford (UK).
ARTICLE IN PRESS
Fig. 7. Example of hypermap-based city portals: (a) Antwerp, Belgium, http://www.antwerpen.be/MIDA/ and
(b) Oxford, UK, http://www.oxfordcity.co.uk/maps/ox.html.
R. Laurini, S. Servigne / Journal of Visual Languages and Computing 18 (2007) 339–355344

Autho
r's
pers
onal
co
py
In Venice, Italy, an original entry system is provided through aerial photos (Fig. 8),named ‘‘Fotopiano’’, i.e., photomap. This system is interesting for people knowing Venicea little bit. Two ameliorations can be suggested:
1. at some scales (when zooming), it could be interesting to change the system bypresenting fac-ades, for instance, along the Canale Grande, but in this case, themodification of the access system can trouble some users.
ARTICLE IN PRESS
Fig. 8. Portal based on geographic locations, portal of Venice, Italy based on aerial photos, http://
www.comune.venezia.it.
Fig. 9. Some portals based on geographic locations, excerpt of ‘‘shopping streets’’ from the Visiocity systems,
http://www.mappyvisiocity.com/ for the French Yellow Pages.
R. Laurini, S. Servigne / Journal of Visual Languages and Computing 18 (2007) 339–355 345

Autho
r's
pers
onal
co
py2. it could be also interesting to pinpoint the names of certain important buildings, which
can help the user to position himself in the city.
Some accesses through streetmaps and photos are also a possibility. See Fig. 9 foranother example available from the French Yellow Pages. This system is comparable to theshopping street systems as existing in other cities. In this case, the metaphor evokes apedestrian walking along a street, seeing fac-ades and looking for some shops. For anyshop, opening hours, telephone numbers and URLs website if any are given.Fig. 10 depicts another interesting visual access system for cities, namely from a list of
main streets in Paris. It is interesting to note that only important streets are mentioned,and that they are positioned approximately in a sort of squared grid along the Seine River.
2.5. News magazines
Some cities organize their website as a news magazine: the home page is looking as acover giving a nice picture of the city (Fig. 11). It is overall interesting to know that there isnow a sort of convergence between the presentation of those two media, namely newsmagazine cover and website portal, applying same corporate design, same graphicsemiology and similar content.
ARTICLE IN PRESS
Fig. 10. Another interesting example to access to Paris information from streets (http://www.umsl.edu/
�moosproj/carte.html) that are approximately positioned along the Seine River (blue background).
R. Laurini, S. Servigne / Journal of Visual Languages and Computing 18 (2007) 339–355346

Autho
r's
pers
onal
co
py
2.6. Visual portals for visual portals
In some places, there are portals of portals. By this expression, we mean that, instead ofgiving a textual list, or a set of icons, an interesting idea is directly to include a thumbnail
ARTICLE IN PRESS
Fig. 12. Examples of portals for portals made of thumbnails: (a) Nice, France, http://www.nice.fr/
mairie_nice_1489.html and (b) Piemonte Region, Italy, http://www.regione.piemonte.it/sez_tem/cult_spett/
cult_spett.htm.
Fig. 11. Examples of home pages looking like news magazine covers in March 2007: (a) Lynchburg, VA, http://
www.ci.lynchburg.va.us and (b) Miami, FL http://www.ci.miami.fl.us.
R. Laurini, S. Servigne / Journal of Visual Languages and Computing 18 (2007) 339–355 347

Autho
r's
pers
onal
co
py
of the portal the user desires to go. See two examples in Fig. 12: the first from the Frenchcity of Nice, the second of Region Piemonte in Italy. Usually, those thumbnails are notgenerated in real time; i.e., they are not updated each time a modification occurs, butmoreover a screenshot is taken regularly or once in a while. Another well-known exampleis the Exalead search engine http://www.exalead.com/.
3. Cartography for citizens
Internet mapping for the residents is now something common. Numerous cities allow thecity dwellers some mapping capabilities; indeed, some small geographic informationsystem (GIS) is provided. In this section, we will examine only two aspects: risk mappingand planning consultation.
3.1. Risk mapping
For instance relative to risks, let us examine two examples. In the Italian city of Genua(Fig. 13a), the inhabitants must first give the zone, and then, they will get detailedinformation: in other words, location-type of risks. Whereas in Charlotte (Fig. 13b), NC,this is the contrary; the inhabitants must give first the type of risk, and then they will get amap, i.e., Type of risk-location. Differently said, this kind of visual interface is onlyinformative.
ARTICLE IN PRESS
Fig. 13. Examples of risk mapping through Internet: (a) Genua, Italy, http://cartogis.provincia.genova.it/
cartogis/ppc/rischincbos.htm and (b) Charlotte, NC, USA, http://maps.co.mecklenburg.nc.us/website/floodzone/
map.
R. Laurini, S. Servigne / Journal of Visual Languages and Computing 18 (2007) 339–355348

Autho
r's
pers
onal
co
py3.2. Planning consultation
Another interesting aspect is the participation of citizens for urban planning. Regardingmaster plans, land use plans or development plans, in all countries, there is some phase ofpublic participation. In other words, the planning officers, together with elected politicians,ask the city dwellers their opinions regarding the future of their city. For that, usually someplanning maps are proposed through Internet. But the main problem is how to organizethe participation? Several trials [3] were made under the name of PPGIS (PublicParticipation GIS). One of the important aspects is to allow people giving their opinionabout the projects. For that a solution could be using argumaps. Proposed by Rinner [4],those argument maps are made to help the users to position arguments on a map. Fig. 14gives examples, for instance, by using markers such as pins, flags or smileys. Typically,three types of markers are interested to position pro-opinions, against-opinions and officialarguments. Imagine that a city council wants to construct a new bridge over a river, thenofficial arguments will explain the necessity of building such a bridge and the citizensagreeing this project can give or explain a positive opinion (pro-opinion), whereas theopponents can detail a negative opinion (against-opinion). At the end of the consultation,
ARTICLE IN PRESS
Fig. 14. Cartography of arguments, examples of graphic semiology (pins, flags, smileys) and an application in a
Danish city, http://www.detaktiveaalborgkort.dk in 2006. The argumaps based on pins and flags are issued from
Rinner [4], the third one (based on smileys) is issued from Laurini [5].
R. Laurini, S. Servigne / Journal of Visual Languages and Computing 18 (2007) 339–355 349
Autho
r's
pers
onal
co
py
hotspots can be easily detected, and a synthesis can be made in all places of the debate.Fig. 14c gives such an example in Denmark in 2006.
4. Virtual city as a metaphor for website design
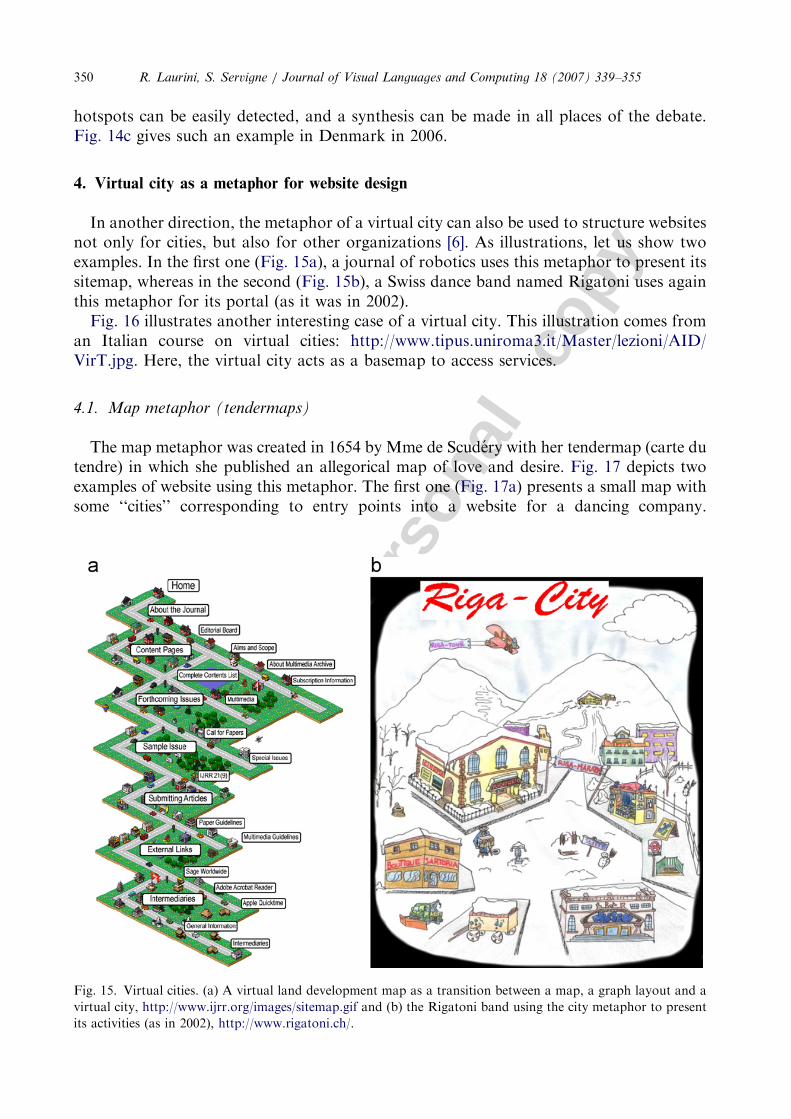
In another direction, the metaphor of a virtual city can also be used to structure websitesnot only for cities, but also for other organizations [6]. As illustrations, let us show twoexamples. In the first one (Fig. 15a), a journal of robotics uses this metaphor to present itssitemap, whereas in the second (Fig. 15b), a Swiss dance band named Rigatoni uses againthis metaphor for its portal (as it was in 2002).Fig. 16 illustrates another interesting case of a virtual city. This illustration comes from
an Italian course on virtual cities: http://www.tipus.uniroma3.it/Master/lezioni/AID/VirT.jpg. Here, the virtual city acts as a basemap to access services.
4.1. Map metaphor (tendermaps)
The map metaphor was created in 1654 by Mme de Scudery with her tendermap (carte dutendre) in which she published an allegorical map of love and desire. Fig. 17 depicts twoexamples of website using this metaphor. The first one (Fig. 17a) presents a small map withsome ‘‘cities’’ corresponding to entry points into a website for a dancing company.
ARTICLE IN PRESS
Fig. 15. Virtual cities. (a) A virtual land development map as a transition between a map, a graph layout and a
virtual city, http://www.ijrr.org/images/sitemap.gif and (b) the Rigatoni band using the city metaphor to present
its activities (as in 2002), http://www.rigatoni.ch/.
R. Laurini, S. Servigne / Journal of Visual Languages and Computing 18 (2007) 339–355350

Autho
r's
pers
onal
co
py
The second (Fig. 17b) reuses an existing map, in which some ‘‘locations’’ are superimposed.Let us call the first one as a real tendermap and the second a fake tendermap.
4.2. Metro-line metaphor
Another interesting metaphor is the metro-line metaphor that was created by Sandvadet al. [7] and modified by Hong et al. [8,9]. Starting from the maps for metros, they use thismetaphor for representing several paths for visiting websites (as metro stops).
Indeed, in some cases, instead of proposing the access to isolate pages, it looks moreimportant to propose structured routes to access information: the metro map metaphorcan be a good metaphor in the context where pages are organized along paths. In this case,
ARTICLE IN PRESS
Fig. 17. Some tendermaps, that is maps in which locations depict accesses to information or services: (a) A
dancing company, http://www.silkroaddance.com/ and (b) a fake tendermap, reusing a real existing map, http://
www.netcentriccommunity.com/iAppliance/WebMap.jpg.
Fig. 16. A city map acting as a virtual town to organize services, http://www.tipus.uniroma3.it/Master/lezioni/
AID/VirT.jpg.
R. Laurini, S. Servigne / Journal of Visual Languages and Computing 18 (2007) 339–355 351

Autho
r's
pers
onal
co
py
the site administrators propose several walk-through tours in lieu of sitemap. Fig. 18 givestwo examples of sitemaps designed with the metro-line map metaphor.Starting from a list of pages, the main difficulty is to select stops and lines. For instance,
one line can correspond to a special class of users. The main interest is the definition stopscorresponding to connections between lines.
5. Adaptation to PDA’s GUI
More and more portable devices such as PDAs or camera phones are used by people forLBS. Among those services, geo-services need portals, especially in cities, for instance, fortourist applications (see [10,11]).Adaptation of services to small PDAs small screens (typically 2–3 in by 3–4 in size)
presents two levels:
� at lower level, one means the transformation of the layout of the interface withoutmodifying the contents, for instance, splitting one long page into several smaller pages[12]; let us call it syntactic adaptation;� at upper level, one means the transformation of the used metaphor; let us call it
metaphor adaptation, or semantic adaptation.
Differently said, screen images are reduced until a factor of 10, and when theyencompass textual information, these texts must not be reduced accordingly, and the sizeof the characters must not be below 8 or 10. So, taking size into account, we can set up themajor specifications as follows:
� only few items can be displayed,� small images and icons can be used,� visual menus can be deployed, provided they are readable.
ARTICLE IN PRESS
Fig. 18. Sitemaps designed with the metro-line metaphor: (a) http://www.multimap.com/images/ps/misc/
sitemap.gif and (b) http://www.germinus.com/mapa.htm.
R. Laurini, S. Servigne / Journal of Visual Languages and Computing 18 (2007) 339–355352

Autho
r's
pers
onal
co
py
Let us take an example: A person equipped with a PDA wants to select a vacant parkinglot not far from a Greek restaurant and a movie theater. For this kind of LBS, a specialinterface must be defined. If the hypermap structure has been used, understandability mustbe the key issue for structuring the visual entry system. The scale of the map, the size ofused characters and of icons must be taken into consideration.
Let us now examine the studied visual systems and their consequences at semantic level.
(a) Text-only entry systems (nothing visual): Two cases depend on the length of the menu.If it is short, no problem, otherwise, it must be split into some hierarchical textualmenus, or even into a rolling list.
(b) Textual menus with thumbnail portals: It can be seen as a variant of the previous one,but with thumbnail images toward the pointed portals. If those thumbnail imageswhen reduced are still understandable, they can still be used; otherwise, thosethumbnail images must be discarded.
(c) Hypermaps, tendermaps, aerial photos, streetmaps, fac-ades: Hypermaps can be stillused, provided the map is still readable, essentially depending on the scale. In somecases, the map can be split into several sub-maps. It can be done similar to tendermaps,aerial photos, streetmaps and fac-ades.
(d) Virtual cities: This case is the more difficult, essentially depending on the size of theimage representing the virtual city. Back to the Bologna example (Fig. 6b), my opinionis that another background drawing must be designed to fulfil the requirements of thePDAs.
(e) Metro-lines: This metaphor can still be used, provided the attached texts are readable.However, when there is a very dense metro-line system, simplification must be done.Otherwise, the metaphor must be totally transformed, and another visual entry systemmust be designed.
(f) News magazines: Here again, this is a question of readability. When the menu is toodense, it must be split into several sub-menus. But in this case, the interest of themetaphor diminishes.
As a conclusion to this very rapid analysis, it is easy to see that the adaptations of themetaphors are not so easy. When the visual system is not very dense in a ‘‘normal’’computer screen (typically 13–19 inch diagonal), the transformation is easy, provided thetext characters are changed to be readable enough. However, when there is very densevisual information, the used metaphor must be either transformed into several newer steps,or totally changed to fulfil PDA’s GUI requirements.
6. Conclusions
Designing visual access to website has become a research domain per se in which somemetaphors seem to structure the websites. In this paper, the structuring and the visualaccessing to local authorities’ websites have unveiled several tendencies.
The Bologna-type virtual city, experience of a total visual access has shown thedifficulty of understanding some icons in an alphabet-based culture. Now, it appearsthat a mixture of icons and letters seems to be a nice compromise. The use of photosinstead of icons also appears as an interesting research direction. Apparently, thedominant metaphor in cities seems to be the news magazine metaphor. It is also interesting
ARTICLE IN PRESSR. Laurini, S. Servigne / Journal of Visual Languages and Computing 18 (2007) 339–355 353
Autho
r's
pers
onal
co
py
to see that now in some news magazines the website metaphor is also in use; in otherwords, those metaphors influence each other, and some cross-fertilizations will certainlyappear.Geography-based metaphors are also a source of inspiration for designing portals and
sitemaps. The tendermaps are one of them, but the big difficulty is to update themregularly, i.e., adding or removing automatically some elements into the map, still keepinghigh esthetic quality levels.The metro-line map metaphor is interesting essentially when different paths can be
defining into the website. The selection of ‘‘lines’’ and ‘‘stops’’ is still difficult, and amethodology must be defined based on decision rules, for instance, in user-oriented portalswith the metro-line metaphor, each line can correspond to a user type. Back in cities, a linecan be defined for residents, a line for businessmen, a line for home-seekers, a line forhandicapped people and so on.In local authorities, some other visual accesses can be defined. Examples in informative
cartography, for instance, for risks are good illustrations. For interactive cartography,visual techniques such as Rinner’s argumaps are an interesting way for structuring publicparticipation in urban planning.However, applying those metaphors to PDA’s GUI is still a challenge. As there are
solutions for light visual entry systems, the problem is more complex for heavy visual entrysystems. In practice, the majority of visual entry systems must be totally designed to fulfillegibility requirements.To conclude this paper, let us say that in the near future some innovation will still
continue to appear in designing visual access to websites, essentially because of thenecessity to attract more people. Local authorities seem an interesting domain to study,not only because they are numerous, but also because each of them tries to emphasize itsown characteristics and culture; differently said, each of them shows or tries to show itsown personality.
References
[1] D.K. Van Duyne, J.A. Landay, J.I. Hong, The Design of Sites, Addison Wesley, Reading, MA, 2003
761p.
[2] R. Laurini, F. Milleret-Raffort, Principles of Geomatic Hypermaps, in: K. Brassel (Ed.), Proceedings of the
Fouth International Symposium on Spatial Data Handling, Zurich, 23–27 Juillet 90, 1990, pp. 642–651.
[3] W.J. Craig, T.M. Harris, D. Weiner (Eds.), Community participation and Geographic Information Systems,
Taylor and Francis, London, 2002.
[4] C. Rinner, Argumaps for spatial planning, In: R. Laurini (Ed.), Proceedings of the First Int’l Workshop on
TeleGeoProcessing, Lyon, May 6–7, 1999, pp. 95–102.
[5] R. Laurini, Information Systems for Urban Planning: A Hypermedia Co-operative Approach, Taylor and
Francis, London, 2001 (308p. February 2001). Website: /http://lisi.insa-lyon.fr/�laurini/isupS.
[6] A. Dieberger, A.U. Frank, A city metaphor for supporting navigation in complex information spaces,
Journal of Visual Languages and Computing (9) (1998) 597–622.
[7] E. S. Sandvad, K. Grønbæk, L. Sloth, J. Lindskov Knudsen, A metro map metaphor for guided tours on the
Web: the Webvise guided tour system. In: Proceedings of the 10th International Conference on World Wide
Web Table of Contents, Hong Kong, Hong Kong, 2001, pp. 326–333.
[8] S.-H. Hong, D. Merrick, H.A.D. do Nascimento, The Metro Map Layout Problem, Graph Drawing, 2004,
pp. 482–491.
[9] S.-H. Hong, D. Merrick, H.A.D. do Nascimento, Automatic visualisation of metro maps, Journal of Visual
Languages and Computing 17 (3) (2006) 203–224.
ARTICLE IN PRESSR. Laurini, S. Servigne / Journal of Visual Languages and Computing 18 (2007) 339–355354

Autho
r's
pers
onal
co
py
[10] S. Burigat, L. Chittaro, L. De Marco, Bringing dynamic queries to mobile devices: a visual preference-based
search tool for tourist decision support, in: Proceedings of the IFIP Conference on Human–Computer
Interaction (INTERACT 2005), LNCS 3585, Springer, Berlin, 2005, pp. 213–226.
[11] S. Burigat, L. Chittaro, Interactive Visual Analysis of Geographic Data on Mobile Devices Based on
Dynamic Queries, Journal of Visual Languages and Computing, 2007, to be published.
[12] T. Chaari, D. Ejigu, F. Laforest, V.-M. Scuturici, Modeling and using context in adapting applications to
pervasive environments, IEEE International Conference on Pervasive Services, Lyon, France, June 2006.
ARTICLE IN PRESSR. Laurini, S. Servigne / Journal of Visual Languages and Computing 18 (2007) 339–355 355