Virology 2012 paper
12
Transcriptome analysis of primary monocytes shows global down-regulation of genetic networks in HIV viremic patients versus long-term non-progressors Jing Qin Wu a , Tara Ruth Sasse ´ b , Georg Wolkenstein b , Viviane Conceicao b , Monica Miranda Saksena c , Maly Soedjono b , Suneth S. Perera b , Bin Wang b , Dominic E. Dwyer b , Nitin K. Saksena b,n a School of Biomedical Sciences and Pharmacy, Faculty of Health, The University of Newcastle, University Drive, Callaghan, NSW 2308, Australia b Retroviral Genetics Division, Center for Virus Research, Westmead Millennium Institute & Westmead Hospital, University of Sydney, Westmead, NSW 2145, Australia c Herpes Virus Pathogenesis Lab, Center for Virus Research, Westmead Millennium Institute, University of Sydney, Westmead, NSW 2145, Australia article info Article history: Received 4 June 2012 Returned to author for revisions 23 September 2012 Accepted 16 October 2012 Available online 13 November 2012 Keywords: HIV Monocyte Transcriptome Microarray Long-term non-progressors Toll-like receptor abstract Despite significant contributions of monocytes to HIV persistence, the genomic basis of HIV-infection of monocytes and its association with plasma viremia remain elusive. To understand HIV interactions with monocytes during disease progression, monocytic transcriptomes from long-term non-progres- sors (LTNP), HIV þ patients with viral load o1000, with viral load 41000, and seronegative controls were analyzed using Illumina microarray. Differentially expressed genes were identified (fold change 42; adjusted p o0.05) and GSEA between HIV þ groups demonstrated that the down-regulation of the pathways including Toll-like receptor (TLR) signaling, cytokine–cytokine receptor interaction, cell cycle and apoptosis was significantly associated with the viremic groups, whereas their up-regulation with the LTNP group. The down-regulation of TLR pathway in the viremic patients was exemplified by the decreased expression of TLR with the subsequent tuning down of MAPK, NF-kB, JAK-STAT, and IRF cascades. These data provide the first transcriptomic distinction between HIV þ progressors and LTNPs based on primary monocytes. Crown Copyright & 2012 Published by Elsevier Inc. All rights reserved. Introduction The phenotypic pliability and the differentiation ability of monocytes empower this cell type to play a crucial role in HIV pathogenesis through cellular differentiation, phagocytosis, and antigen presentation. Compared to T cells and macrophages, monocytes are much less permissive to HIV infection (Lewin et al., 1998; McElrath et al., 1989) although all these cells express HIV receptor CD4 and co-receptors CCR5 and/or CXCR4. In spite of less than 1% of circulating monocytes directly infected in vivo, infectious virus can be isolated from circulating monocytes in untreated patients and HAART responders (Crowe and Sonza, 2000; McElrath et al., 1989), which could become a dominant source of plasma virus in HAART responders in whom HIV replication in activated T cells is blocked (Zhu, 2002). In addition, monocytes represent an important cellular reservoir by harboring and trafficking HIV into various tissue compartments through differentiating into tissue macrophages or dendritic cells, which enable productive HIV replication (Fulcher et al., 2004; Zhu, 2002). Furthermore, undifferentiated monocytic precursor cells, such as CD34 þ progenitor cells, may be infected with HIV and pass on the virus to progeny monocytes and keep on renewing the viral pool in peripheral blood monocytes (Alexaki et al., 2008; Alexaki and Wigdahl, 2008). Despite the significant contributions of monocytes to HIV persistence, the genetic basis of underlying pathogenic mechan- isms remains elusive. To better understand HIV pathogenesis at the genomic level, genome-wide transcriptomic studies of mono- cytes and monocyte-derived macrophages (MDM) infected by HIV in vitro were carried out, which identified several key areas of monocyte dysfunction including induced proinflammatory gene expression (Giri et al., 2006), up-regulation of IFN/NF-kB-respon- sive chemokines and cytokines (Izmailova et al., 2003), impaired Toll-like receptor recognition of HIV replication (Brown et al., 2008), up-regulation of cytoskeletal genes (Cicala et al., 2002), and modulation of the cell cycle (Coberley et al., 2004). Although Contents lists available at SciVerse ScienceDirect journal homepage: www.elsevier.com/locate/yviro Virology 0042-6822/$ - see front matter Crown Copyright & 2012 Published by Elsevier Inc. All rights reserved. http://dx.doi.org/10.1016/j.virol.2012.10.026 n Corresponding author. Fax: þ612 8824 3098. E-mail addresses: [email protected] (J.Q. Wu), [email protected] (T. Ruth Sasse ´), [email protected] (G. Wolkenstein), [email protected] (V. Conceicao), [email protected] (M. Miranda Saksena), [email protected] (M. Soedjono), [email protected] (S.S. Perera), [email protected] (B. Wang), [email protected] (D.E. Dwyer), [email protected] (N.K. Saksena). Virology 435 (2013) 308–319
-
Upload
independent -
Category
Documents
-
view
0 -
download
0
Transcript of Virology 2012 paper
Virology 435 (2013) 308–319
Contents lists available at SciVerse ScienceDirect
Virology
0042-68
http://d
n Corr
E-m
tsas930
georg.w
viviane.
monica
m.soedj
sper548
dominic
nitin.sa
journal homepage: www.elsevier.com/locate/yviro
Transcriptome analysis of primary monocytes shows globaldown-regulation of genetic networks in HIV viremic patients versuslong-term non-progressors
Jing Qin Wu a, Tara Ruth Sasse b, Georg Wolkenstein b, Viviane Conceicao b, Monica Miranda Saksena c,Maly Soedjono b, Suneth S. Perera b, Bin Wang b, Dominic E. Dwyer b, Nitin K. Saksena b,n
a School of Biomedical Sciences and Pharmacy, Faculty of Health, The University of Newcastle, University Drive, Callaghan, NSW 2308, Australiab Retroviral Genetics Division, Center for Virus Research, Westmead Millennium Institute & Westmead Hospital, University of Sydney, Westmead, NSW 2145, Australiac Herpes Virus Pathogenesis Lab, Center for Virus Research, Westmead Millennium Institute, University of Sydney, Westmead, NSW 2145, Australia
a r t i c l e i n f o
Article history:
Received 4 June 2012
Returned to author for revisions
23 September 2012
Accepted 16 October 2012Available online 13 November 2012
Keywords:
HIV
Monocyte
Transcriptome
Microarray
Long-term non-progressors
Toll-like receptor
22/$ - see front matter Crown Copyright & 2
x.doi.org/10.1016/j.virol.2012.10.026
esponding author. Fax: þ612 8824 3098.
ail addresses: [email protected] (J
[email protected] (T. Ruth Sasse),
[email protected] (G. Wolkenstein),
[email protected] (V. Conceicao),
[email protected] (M. Miranda Saksena
[email protected] (M. Soedjono),
[email protected] (S.S. Perera), bin.wang@
[email protected] (D.E. Dwyer),
[email protected] (N.K. Saksena).
a b s t r a c t
Despite significant contributions of monocytes to HIV persistence, the genomic basis of HIV-infection of
monocytes and its association with plasma viremia remain elusive. To understand HIV interactions
with monocytes during disease progression, monocytic transcriptomes from long-term non-progres-
sors (LTNP), HIVþ patients with viral load o1000, with viral load41000, and seronegative controls
were analyzed using Illumina microarray. Differentially expressed genes were identified (fold change
42; adjusted po0.05) and GSEA between HIVþ groups demonstrated that the down-regulation of the
pathways including Toll-like receptor (TLR) signaling, cytokine–cytokine receptor interaction, cell cycle
and apoptosis was significantly associated with the viremic groups, whereas their up-regulation with
the LTNP group. The down-regulation of TLR pathway in the viremic patients was exemplified by the
decreased expression of TLR with the subsequent tuning down of MAPK, NF-kB, JAK-STAT, and IRF
cascades. These data provide the first transcriptomic distinction between HIVþ progressors and LTNPs
based on primary monocytes.
Crown Copyright & 2012 Published by Elsevier Inc. All rights reserved.
Introduction
The phenotypic pliability and the differentiation ability ofmonocytes empower this cell type to play a crucial role in HIVpathogenesis through cellular differentiation, phagocytosis, andantigen presentation. Compared to T cells and macrophages,monocytes are much less permissive to HIV infection (Lewinet al., 1998; McElrath et al., 1989) although all these cells expressHIV receptor CD4 and co-receptors CCR5 and/or CXCR4. In spite ofless than 1% of circulating monocytes directly infected in vivo,infectious virus can be isolated from circulating monocytes inuntreated patients and HAART responders (Crowe and Sonza,2000; McElrath et al., 1989), which could become a dominant
012 Published by Elsevier Inc. All
.Q. Wu),
),
sydney.edu.au (B. Wang),
source of plasma virus in HAART responders in whom HIVreplication in activated T cells is blocked (Zhu, 2002). In addition,monocytes represent an important cellular reservoir by harboringand trafficking HIV into various tissue compartments throughdifferentiating into tissue macrophages or dendritic cells, whichenable productive HIV replication (Fulcher et al., 2004; Zhu,2002). Furthermore, undifferentiated monocytic precursor cells,such as CD34þ progenitor cells, may be infected with HIV andpass on the virus to progeny monocytes and keep on renewing theviral pool in peripheral blood monocytes (Alexaki et al., 2008;Alexaki and Wigdahl, 2008).
Despite the significant contributions of monocytes to HIVpersistence, the genetic basis of underlying pathogenic mechan-isms remains elusive. To better understand HIV pathogenesis atthe genomic level, genome-wide transcriptomic studies of mono-cytes and monocyte-derived macrophages (MDM) infected by HIVin vitro were carried out, which identified several key areas ofmonocyte dysfunction including induced proinflammatory geneexpression (Giri et al., 2006), up-regulation of IFN/NF-kB-respon-sive chemokines and cytokines (Izmailova et al., 2003), impairedToll-like receptor recognition of HIV replication (Brown et al.,2008), up-regulation of cytoskeletal genes (Cicala et al., 2002),and modulation of the cell cycle (Coberley et al., 2004). Although
rights reserved.
J.Q. Wu et al. / Virology 435 (2013) 308–319 309
these findings have provided important insights into HIV-monocyte interactions, these data in vitro may only partiallyreflect the picture in vivo.
To date, the transcriptomic studies of ex vivo derived mono-cytes are limited and they majorly focused on particular aspectsof monocyte dysfunction. For example, in the aspect of cellapoptosis, the anti-apoptosis gene signature in circulating mono-cytes from viremic subjects has been identified (Giri et al., 2009).Regarding the immune activation, a mixed phenotype of bothincreased and decreased proinflammatory features of monocytesfrom viremic patients has been shown (Pulliam et al., 2004; Tiltonet al., 2006). As to metabolic disorder, a novel candidate geneNAMPT has been highlighted in a recent transcriptome analysisbased on the results from gene ontology enrichment whichconfirmed a range of previously described dysregulated processesin monocytes (Van den Bergh et al., 2010). Yet none of thesestudies have looked into the global dysregulations of the biologi-cal pathways in monocytes in different disease statuses as wepreviously did for T cell subsets from viremic patients and long-term non-progressors (LTNPs) (Wu et al., 2008a, 2008b, 2011).
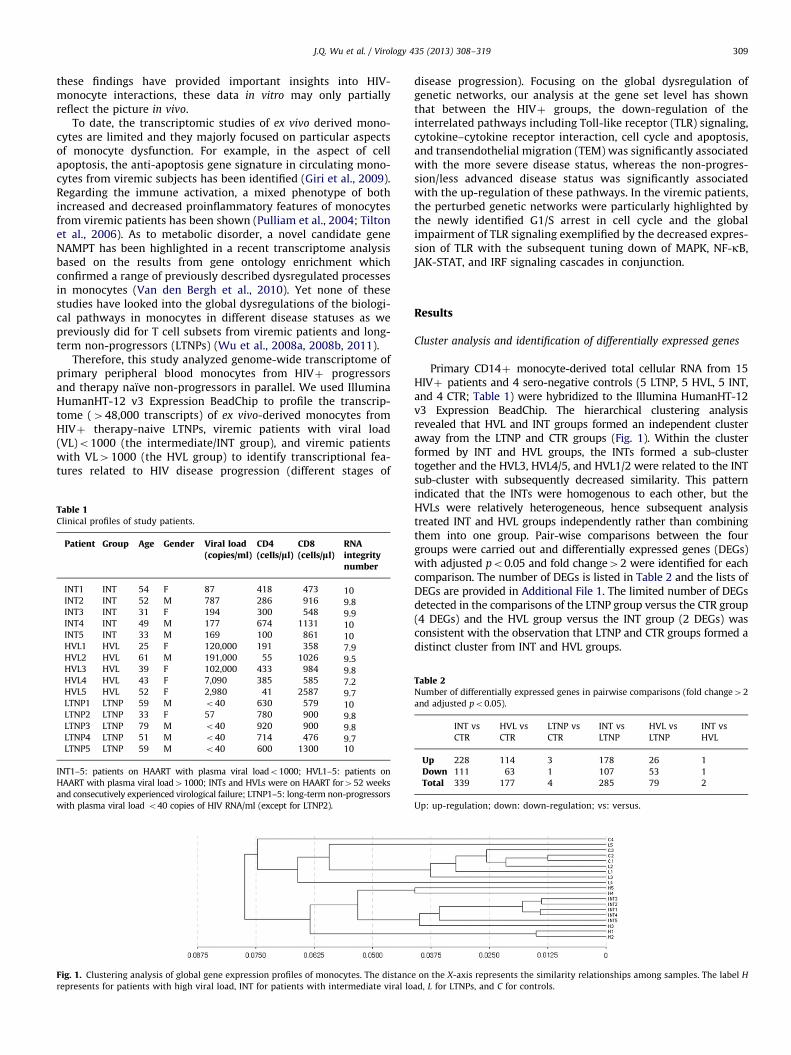
Therefore, this study analyzed genome-wide transcriptome ofprimary peripheral blood monocytes from HIVþ progressorsand therapy naıve non-progressors in parallel. We used IlluminaHumanHT-12 v3 Expression BeadChip to profile the transcrip-tome (448,000 transcripts) of ex vivo-derived monocytes fromHIVþ therapy-naive LTNPs, viremic patients with viral load(VL)o1000 (the intermediate/INT group), and viremic patientswith VL41000 (the HVL group) to identify transcriptional fea-tures related to HIV disease progression (different stages of
Table 1Clinical profiles of study patients.
Patient Group Age Gender Viral load(copies/ml)
CD4(cells/ll)
CD8(cells/ll)
RNAintegritynumber
INT1 INT 54 F 87 418 473 10INT2 INT 52 M 787 286 916 9.8INT3 INT 31 F 194 300 548 9.9INT4 INT 49 M 177 674 1131 10INT5 INT 33 M 169 100 861 10HVL1 HVL 25 F 120,000 191 358 7.9HVL2 HVL 61 M 191,000 55 1026 9.5HVL3 HVL 39 F 102,000 433 984 9.8HVL4 HVL 43 F 7,090 385 585 7.2HVL5 HVL 52 F 2,980 41 2587 9.7LTNP1 LTNP 59 M o40 630 579 10LTNP2 LTNP 33 F 57 780 900 9.8LTNP3 LTNP 79 M o40 920 900 9.8LTNP4 LTNP 51 M o40 714 476 9.7LTNP5 LTNP 59 M o40 600 1300 10
INT1–5: patients on HAART with plasma viral loado1000; HVL1–5: patients on
HAART with plasma viral load41000; INTs and HVLs were on HAART for452 weeks
and consecutively experienced virological failure; LTNP1–5: long-term non-progressors
with plasma viral load o40 copies of HIV RNA/ml (except for LTNP2).
Fig. 1. Clustering analysis of global gene expression profiles of monocytes. The distanc
represents for patients with high viral load, INT for patients with intermediate viral lo
disease progression). Focusing on the global dysregulation ofgenetic networks, our analysis at the gene set level has shownthat between the HIVþ groups, the down-regulation of theinterrelated pathways including Toll-like receptor (TLR) signaling,cytokine–cytokine receptor interaction, cell cycle and apoptosis,and transendothelial migration (TEM) was significantly associatedwith the more severe disease status, whereas the non-progres-sion/less advanced disease status was significantly associatedwith the up-regulation of these pathways. In the viremic patients,the perturbed genetic networks were particularly highlighted bythe newly identified G1/S arrest in cell cycle and the globalimpairment of TLR signaling exemplified by the decreased expres-sion of TLR with the subsequent tuning down of MAPK, NF-kB,JAK-STAT, and IRF signaling cascades in conjunction.
Results
Cluster analysis and identification of differentially expressed genes
Primary CD14þ monocyte-derived total cellular RNA from 15HIVþ patients and 4 sero-negative controls (5 LTNP, 5 HVL, 5 INT,and 4 CTR; Table 1) were hybridized to the Illumina HumanHT-12v3 Expression BeadChip. The hierarchical clustering analysisrevealed that HVL and INT groups formed an independent clusteraway from the LTNP and CTR groups (Fig. 1). Within the clusterformed by INT and HVL groups, the INTs formed a sub-clustertogether and the HVL3, HVL4/5, and HVL1/2 were related to the INTsub-cluster with subsequently decreased similarity. This patternindicated that the INTs were homogenous to each other, but theHVLs were relatively heterogeneous, hence subsequent analysistreated INT and HVL groups independently rather than combiningthem into one group. Pair-wise comparisons between the fourgroups were carried out and differentially expressed genes (DEGs)with adjusted po0.05 and fold change42 were identified for eachcomparison. The number of DEGs is listed in Table 2 and the lists ofDEGs are provided in Additional File 1. The limited number of DEGsdetected in the comparisons of the LTNP group versus the CTR group(4 DEGs) and the HVL group versus the INT group (2 DEGs) wasconsistent with the observation that LTNP and CTR groups formed adistinct cluster from INT and HVL groups.
e on the X-axis represents the similarity relationships among samples. The label H
ad, L for LTNPs, and C for controls.
Table 2Number of differentially expressed genes in pairwise comparisons (fold change42
and adjusted po0.05).
INT vs
CTR
HVL vs
CTR
LTNP vs
CTR
INT vs
LTNP
HVL vs
LTNP
INT vs
HVL
Up 228 114 3 178 26 1
Down 111 63 1 107 53 1
Total 339 177 4 285 79 2
Up: up-regulation; down: down-regulation; vs: versus.
J.Q. Wu et al. / Virology 435 (2013) 308–319310
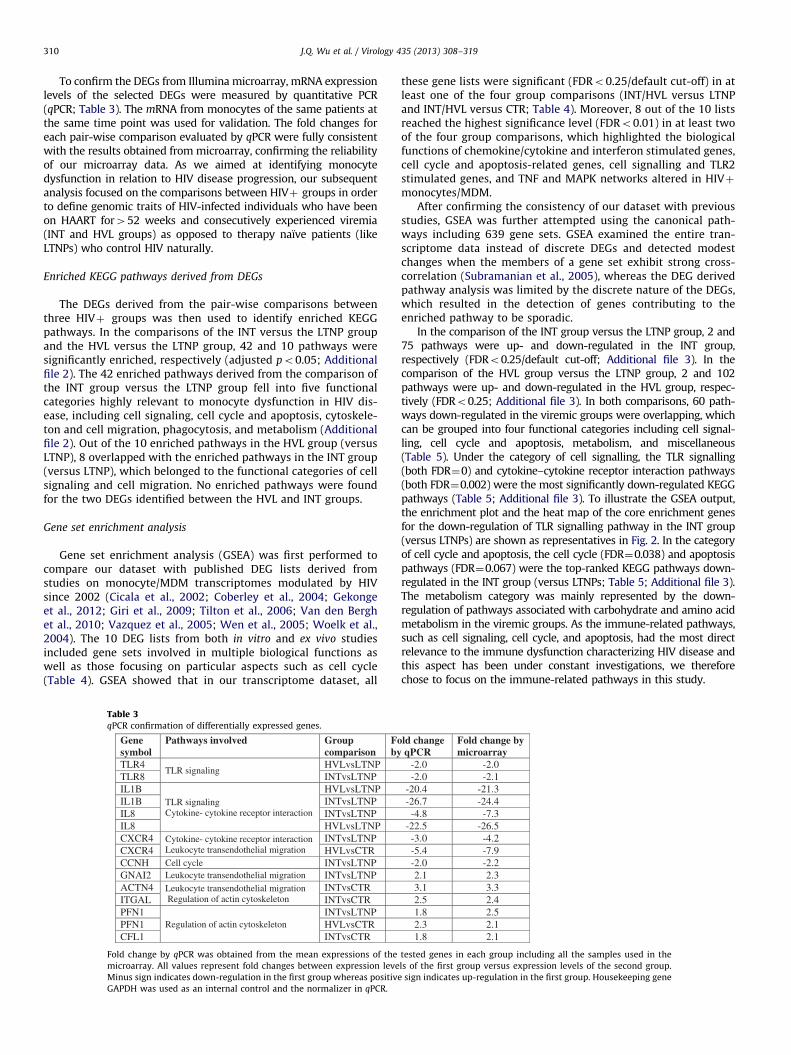
To confirm the DEGs from Illumina microarray, mRNA expressionlevels of the selected DEGs were measured by quantitative PCR(qPCR; Table 3). The mRNA from monocytes of the same patients atthe same time point was used for validation. The fold changes foreach pair-wise comparison evaluated by qPCR were fully consistentwith the results obtained from microarray, confirming the reliabilityof our microarray data. As we aimed at identifying monocytedysfunction in relation to HIV disease progression, our subsequentanalysis focused on the comparisons between HIVþ groups in orderto define genomic traits of HIV-infected individuals who have beenon HAART for452 weeks and consecutively experienced viremia(INT and HVL groups) as opposed to therapy naıve patients (likeLTNPs) who control HIV naturally.
Enriched KEGG pathways derived from DEGs
The DEGs derived from the pair-wise comparisons betweenthree HIVþ groups was then used to identify enriched KEGGpathways. In the comparisons of the INT versus the LTNP groupand the HVL versus the LTNP group, 42 and 10 pathways weresignificantly enriched, respectively (adjusted po0.05; Additionalfile 2). The 42 enriched pathways derived from the comparison ofthe INT group versus the LTNP group fell into five functionalcategories highly relevant to monocyte dysfunction in HIV dis-ease, including cell signaling, cell cycle and apoptosis, cytoskele-ton and cell migration, phagocytosis, and metabolism (Additionalfile 2). Out of the 10 enriched pathways in the HVL group (versusLTNP), 8 overlapped with the enriched pathways in the INT group(versus LTNP), which belonged to the functional categories of cellsignaling and cell migration. No enriched pathways were foundfor the two DEGs identified between the HVL and INT groups.
Gene set enrichment analysis
Gene set enrichment analysis (GSEA) was first performed tocompare our dataset with published DEG lists derived fromstudies on monocyte/MDM transcriptomes modulated by HIVsince 2002 (Cicala et al., 2002; Coberley et al., 2004; Gekongeet al., 2012; Giri et al., 2009; Tilton et al., 2006; Van den Berghet al., 2010; Vazquez et al., 2005; Wen et al., 2005; Woelk et al.,2004). The 10 DEG lists from both in vitro and ex vivo studiesincluded gene sets involved in multiple biological functions aswell as those focusing on particular aspects such as cell cycle(Table 4). GSEA showed that in our transcriptome dataset, all
Table 3qPCR confirmation of differentially expressed genes.
Genesymbol
Pathways involved Groupcomparison
Foby
TLR4TLR signaling
HVLvsLTNPPNTLsvTNI8RLT
IL1BTLR signaling Cytokine- cytokine receptor interaction
HVLvsLTNPPNTLsvTNIB1LIPNTLsvTNI8LIPNTLsvLVH8LI
CXCR4 Cytokine- cytokine receptor interaction Leukocyte transendothelial migration
INTvsLTNP RTCsvLVH4RCXC
CCNH Cell cycle INTvsLTNP GNAI2 Leukocyte transendothelial migration INTvsLTNP ACTN4 Leukocyte transendothelial migration
Regulation of actin cytoskeleton INTvsCTR
RTCsvTNILAGTIPFN1
Regulation of actin cytoskeleton INTvsLTNP
RTCsvLVH1NFPRTCsvTNI1LFC
Fold change by qPCR was obtained from the mean expressions of the
microarray. All values represent fold changes between expression leve
Minus sign indicates down-regulation in the first group whereas positive
GAPDH was used as an internal control and the normalizer in qPCR.
these gene lists were significant (FDRo0.25/default cut-off) in atleast one of the four group comparisons (INT/HVL versus LTNPand INT/HVL versus CTR; Table 4). Moreover, 8 out of the 10 listsreached the highest significance level (FDRo0.01) in at least twoof the four group comparisons, which highlighted the biologicalfunctions of chemokine/cytokine and interferon stimulated genes,cell cycle and apoptosis-related genes, cell signalling and TLR2stimulated genes, and TNF and MAPK networks altered in HIVþmonocytes/MDM.
After confirming the consistency of our dataset with previousstudies, GSEA was further attempted using the canonical path-ways including 639 gene sets. GSEA examined the entire tran-scriptome data instead of discrete DEGs and detected modestchanges when the members of a gene set exhibit strong cross-correlation (Subramanian et al., 2005), whereas the DEG derivedpathway analysis was limited by the discrete nature of the DEGs,which resulted in the detection of genes contributing to theenriched pathway to be sporadic.
In the comparison of the INT group versus the LTNP group, 2 and75 pathways were up- and down-regulated in the INT group,respectively (FDRo0.25/default cut-off; Additional file 3). In thecomparison of the HVL group versus the LTNP group, 2 and 102pathways were up- and down-regulated in the HVL group, respec-tively (FDRo0.25; Additional file 3). In both comparisons, 60 path-ways down-regulated in the viremic groups were overlapping, whichcan be grouped into four functional categories including cell signal-ling, cell cycle and apoptosis, metabolism, and miscellaneous(Table 5). Under the category of cell signalling, the TLR signalling(both FDR¼0) and cytokine–cytokine receptor interaction pathways(both FDR¼0.002) were the most significantly down-regulated KEGGpathways (Table 5; Additional file 3). To illustrate the GSEA output,the enrichment plot and the heat map of the core enrichment genesfor the down-regulation of TLR signalling pathway in the INT group(versus LTNPs) are shown as representatives in Fig. 2. In the categoryof cell cycle and apoptosis, the cell cycle (FDR¼0.038) and apoptosispathways (FDR¼0.067) were the top-ranked KEGG pathways down-regulated in the INT group (versus LTNPs; Table 5; Additional file 3).The metabolism category was mainly represented by the down-regulation of pathways associated with carbohydrate and amino acidmetabolism in the viremic groups. As the immune-related pathways,such as cell signaling, cell cycle, and apoptosis, had the most directrelevance to the immune dysfunction characterizing HIV disease andthis aspect has been under constant investigations, we thereforechose to focus on the immune-related pathways in this study.
ld change qPCR
Fold change by microarray
-2.0 -2.0 1.2-0.2-
-20.4 -21.3 4.42-7.62-3.7-8.4-5.62-5.22-
-3.0 -4.29.7-4.5-
-2.0 -2.22.1 2.33.1 3.3
4.25.21.8 2.5
1.23.21.28.1
tested genes in each group including all the samples used in the
ls of the first group versus expression levels of the second group.
sign indicates up-regulation in the first group. Housekeeping gene

Table 4GSEA of our dataset compared with published gene lists derived from monocyte/MDM transcriptomes modulated by HIV.
Gene set name Pathways/biological functionsDEGs involved in HIV infection/disease progression
Study description Reference Genesetsize
INTvsLTNPFDR
HVLvsLTNPFDR
INTvsCTRFDR
HVLvsCTRFDR
Cicala_cytokine _chemokine Chemokine and cytokine In vitro gp120-treated vs
mock-treated MDM
(Cicala
et al.,
2002)
34 0.000nnn 0.000nnn 0.000nnn 0.075n
Coberley_HIV_induced_repressed Cell cycle regulators, translation,
cell signaling, TNF, MAPK
In vitro HIV-infected vs
mock-treated MDM
(Coberley
et al.,
2004)
38 0.858 0.391 0.286 0.122n
Woelk_inteferon-stimuated Interferon stimulated genes, host
defense genes
In vitro HIV-infected vs
mock-treated MDM
(Woelk
et al.,
2004)
12 0.881 0.000nnn 0.000nnn 0.001nnn
Vazquez_HIV-induced _MDM Signal transduction, transcription,
cell cycle and apoptosis, adhesion
molecules and receptors,
chemokines and cytokines,
proteases and protease inhibitors,
metabolism
In vitro HIV-infected vs
mock-treated MDM
(Vazquez
et al.,
2005)
124 0.005nnn 0.000nnn 0.030nn 0.023nn
Wen_HIVvsMock_U937 Signaling components,
transcription factors, cytokines,
apoptotic and anti-apoptotic
factors, growth factors, anti-HIV
infection genes
In vitro HIV-infected vs
mock-infected U937 human
promonocytes
(Wen
et al.,
2005)
33 0.000nnn 0.005nnn 0.040nn 0.151n
TILTON_cytokineLevel _correlation Type I interferon responses, NF-
kB, mitogen-activated protein
kinase, Jun signaling pathways,
general immune activation,
immune down-regulation, protein
degradation, protein secretion,
and apoptosis
Ex vivo correlations between
changes in gene expression
values and changes in
monocyte cytokine levels in
HIVþ patients on and off
therapy
(Tilton
et al.,
2006)
1295 0.040nn 0.107n 0.067n 0.068n
Giri_apoptosis_stable-differential Apoptosis-related gene signatures,
TNF-a signaling, CD40L/CD40
signaling, MAPK signaling, p53
modulation
Ex vivo HIVþ patients vs
healthy controls
(Giri et al.,
2009)
36 0.003nnn 0.005nnn 0.301 0.270
Van_HIV_serostatus_associated _
validated
Apoptosis, cell cycle,
transcriptional regulation,
immune response, protein
trafficking, lipid metabolism
Ex vivo HIVþ patients vs
healthy controls
(Van den
Bergh
et al.,
2010)
24 0.000nnn 0.000nnn 0.023nn 0.071n
Gekonge_overlap_control_stimulatedvs_
control_HIVvsControl
TLR2-agonist stimulated gene
signature TNF (NFkB), p53 and
MAPK networks
Ex vivo and in vitro HIVþ
patients vs healthy controls
stimulated vs non-
stimulated controls
(Gekonge
et al.,
2012)
62 0.000nnn 0.000nnn 0.032nn 0.048nn
Gekonge_HIVvscontrol ERK/MAPK, TNF/IL6 (NFkB) and
p53 gene networks, apoptosis-
related gene signatures
Ex vivo HIVþ patients vs
healthy controls
(Gekonge
et al.,
2012)
281 0.005nnn 0.001nnn 0.121n 0.155n
DEGs: differentially expressed genes; gene set size: number of genes in a particular gene set; FDR: false discovery rate; INT: the intermediate viral load (VLo1000) group;
HVL: the high viral load group (VL41000); CTR: the healthy control group; LTNP: long-term non-progressors; MDM: monocyte-derived macrophages; vs: versus.n FDRo0.25 (default cut-off).nn FDRo0.05(more stringent).nnn FDRo0.01(most stringent).
J.Q. Wu et al. / Virology 435 (2013) 308–319 311
For the comparison of the HVL group versus the INT group, 30and 74 pathways were up- and down-regulated in the HVL group,respectively (FDRo0.25; Additional file 3). While most of thesedifferential pathways belonged to the same functional categories asdescribed above, the unique down-regulation of leukocyte trans-endothelial migration pathway (FDRo0.24) stood out with a panelof pathways closely related to cytoskeleton and cell migration suchas CXCR4 pathway (FDR¼0.161), integrin mediated cell adhesionpathway (FDR¼0.171), and HSA04810 regulation of actin cytoske-leton pathway (FDR¼0.236), which together confirmed themigration-related dysfunction during HIV disease progression.
Down-regulation of TLR signaling pathway in both viremic groups
versus LTNPs
The highly significant down-regulation of TLR signaling path-way in the INT/HVL group versus LTNPs (Table 5; Additional file 3)was exemplified by the decreased TLR expression with subse-quent tuning down of MAPK, NF-kB, JAK-STAT, and IRF signalingcascades in conjunction. For a detailed inspection of this pathway,
the results from the comparison of the INT group versus the LTNPgroup were used as a representative (Fig. 3). Along the MAPKbranch in TLR pathway, the core enrichment genes (Table 6)included three levels of kinase (MAP3K8/Tpl2, MAP2K3/MKK3,and MAPK3/ERK), the MAPK induced transcription factor JUNfrom AP-1 family, and the inflammatory genes TNF-a, IL6, and IL-1b induced by JUN/AP-1 proteins. Along the JAK-STAT arm of TLRpathway, the core enrichment genes included the type I IFN-b,transcription factor STAT1, chemokines CXCL10/IP-10 and CXCL9/MIG, both induced by STAT1. The other two arms in the TLRpathway involved the activities of NF-kB/Rel proteins and inter-feron regulator factors (IRFs). As shown in Fig. 3, both armsactivated multiple inflammatory genes and IRF7 in particulardrove type I interferon production.
Down-regulation of cytokine network in both viremic groups
versus LTNPs
Cytokine–cytokine receptor interaction (HSA04060) was one ofthe most significantly down-regulated pathways in both INT and

Table 5Top five enriched pathways in each functional category derived from GSEA between INT/HVL and LTNP groups.
Pathways down-regulated in the comparisons of both INT versus LTNP and HVL versus LTNP
Gene set name Gene set size INTvsLTNP NOM p-val INTvsLTNP FDR HVLvsLTNP NOM p-val HVLvsLTNP FDR
Cell signalingHSA04620_TOLL_LIKE_RECEPTOR_SIGNALING_PATHWAY 102 0.000 0.000 0.000 0.000
HSA04060_CYTOKINE_CYTOKINE_RECEPTOR_INTERACTION 253 0.000 0.002 0.000 0.002
CYTOKINEPATHWAY 20 0.000 0.003 0.000 0.006
ERYTHPATHWAY 15 0.000 0.003 0.000 0.002
IL1RPATHWAY 32 0.002 0.011 0.000 0.000
Cell cycle and apoptosisHSA04110_CELL_CYCLE 113 0.000 0.038 0.042 0.222
G1_TO_S_CELL_CYCLE_REACTOME 66 0.006 0.065 0.016 0.112
HSA04210_APOPTOSIS 83 0.002 0.067 0.005 0.114
VIPPATHWAY 27 0.004 0.058 0.002 0.007
APOPTOSIS 66 0.006 0.068 0.063 0.205
MetabolismBETA_ALANINE_METABOLISM 26 0.002 0.059 0.006 0.049
PROPANOATE_METABOLISM 30 0.011 0.067 0.009 0.047
HSA00640_PROPANOATE_METABOLISM 34 0.021 0.069 0.021 0.115
HSA00252_ALANINE_AND_ASPARTATE_METABOLISM 33 0.013 0.101 0.043 0.147
PROSTAGLANDIN_SYNTHESIS_REGULATION 28 0.025 0.106 0.042 0.147
MiscHYPERTROPHY_MODEL 16 0 0.003 0.000 0.008
BREAST_CANCER_ESTROGEN_SIGNALING 93 0 0.026 0.000 0.002
SMOOTH_MUSCLE_CONTRACTION 139 0 0.028 0.000 0.006
HSA05222_SMALL_CELL_LUNG_CANCER 87 0.002 0.037 0.002 0.068
HSA04640_HEMATOPOIETIC_CELL_LINEAGE 87 0.002 0.099 0.000 0.000
Up-regulated pathways in the viremic groups versus LTNPsCOMPPATHWAY 16 NA NA 0.002 0.051
HSA04950_MATURITY_ONSET_DIABETES_OF_THE_YOUNG 21 NA NA 0.000 0.078
HSA03010_RIBOSOME 85 0 0.019 NA NA
HSA00010_GLYCOLYSIS_AND_GLUCONEOGENESIS 64 0 0.154 NA NA
Gene set size: number of genes in a particular gene set; NOM p-val: nominal p-value; FDR: false discovery rate Up: up-regulated; Dn: down-regulated;NA: not applicable.
Fig. 2. Enrichment plot and heat map for the gene set of Toll-like receptor signaling pathway by GSEA. A. Enrichment plot for monocytes from the INT group (INT versus
LTNP). Bottom, plot of the ranked list of all genes. Y-axis, value of the ranking metric; X-axis, the rank for all genes. Genes whose expression levels are most closely
associated with the INT or LTNP group get the highest metric scores with positive or negative sign, and are located at the left or right edge of the list. Middle, the location of
genes from the Toll-like receptor pathway within the ranked list. Top, the running enrichment score for the gene set as the analysis walks along the ranked list. The score at
the peak of the plot is the enrichment score (ES) for this gene set and those genes appear before or at the peak are defined as core enrichment genes for this gene set. B.
Heat map of the core enrichment genes corresponding to A. The genes that contribute most to the ES, i.e., genes that appear in the ranked list before or at the peak point of
ES, are defined as core enrichment genes and highlighted by the red rectangle. Rows, genes; columns, samples. Range of colors (red to blue) shows the range of expression
values (high to low).
J.Q. Wu et al. / Virology 435 (2013) 308–319312
HVL groups when they were compared to the LTNPs (bothFDR¼0.002; Table 5 and Additional file 3). Taking the comparisonbetween the INT group and the LTNP group as the representative
(Fig. 4), the inspection of the core enrichment genes of this pathwayrevealed a wide range of down-regulation of genes encodingcytokine receptors and their ligands (Table 6), which can be

Fig. 3. Coordinately down-regulated genes of Toll-like receptor signaling pathway in monocytes from the INT group (INT versus LTNP). The pathway figure is adapted from
Kyoto Encyclopedia of Genes and Genomes (KEGG; http://www.genome.jp/kegg/). The proteins encoded by the coordinately down-regulated genes in the INT group are
highlighted in red. (For interpretation of the references to color in this figure legend, the reader is referred to the web version of this article.)
Table 6Core enrichment genes contributing to the enrichment of the pathways highly relevant to monocyte dysfunction during HIV disease progression.
Pathway name Figure Comparison FDR Core enrichment genes contributing to the pathway enrichment
HSA04620_TOLL_LIKE_RECEPTOR_SIGNALING_PATHWAY Fig. 3 INTvsLTNP 0.000 CCL4, CHUK, CXCL9, NFKBIA, TLR6, PIK3R1, PIK3CB, TICAM2, MAPK3,
TLR5, PIK3CD, TLR2, PIK3R2, IRF5, STAT1, NFKB1, MAP2K3, IRF7,
IKBKG, IFNB1, IKBKB, TLR7, TLR8, TICAM1, TLR4, JUN, TNF, IL8, CXCL10,
IL6, MAP3K8, CCL5, CCL3, IL1B
HSA04060_CYTOKINE_CYTOKINE_RECEPTOR_INTERACTION Fig. 4 INTvsLTNP 0.002 CXCL6, CXCL9, TNFRSF10B, LTA, CCL7, ACVR1, CCL23, IFNGR2,
TNFRSF14, IL2RB, CCR1, CX3CR1, CSF1R, TNFSF14, IL15, TNFSF10, LTB,
IFNGR1, CXCL1, IFNB1, CCL2, IL7R, IL12RB1, CCL8, IL23A, TNFRSF21,
IL11RA, VEGFA, CXCL16, TNF, IL8, CXCL10, IL6, IL1A, CXCR4, CCL20,
CCL5, OSM, CCL3, CXCL2, IL1B
HSA04110_CELL_CYCLE Fig. 5 INTvsLTNP 0.038 RBX1, SKP2, MCM4, CDK2, YWHAH, ORC5L, PTTG2, ANAPC7, HDAC2,
GADD45G, CREBBP, E2F2, CDC2, HDAC1, MCM3, CDC26, CDC14A,
CHEK2, PCNA, CUL1, PTTG1, ORC2L, TFDP1, YWHAB, CDKN1B, SMAD3,
ATM, CDC23, PRKDC, GADD45A, RB1, SMAD4, ANAPC10, MCM7,
ANAPC4, MCM6, YWHAG, RBL2, CDC16, BUB3, CCND2, GADD45B,
CCNH, CDKN1A
HSA04210_APOPTOSIS Additional
file 4
INTvsLTNP 0.067 CHUK, CYCS, NFKBIA, TNFRSF10B, CASP7, CFLAR, PIK3R1, PIK3CB,
AIFM1, ATM, PIK3CD, PIK3R2, PRKAR1A, TNFSF10, NFKB1, IRAK3,
APAF1, BIRC2, IKBKG, IKBKB, IRAK2, TNF, IL1A, IL1B
HSA04670_LEUKOCYTE_TRANSENDOTHELIAL_MIGRATION Additional
file 5
HVLvsINT 0.240 VASP, CLDN14, PECAM1, PIK3CB, PRKCA, CYBA, RASSF5, ITGA4, PXN,
ITGAL, RAC2, GNAI2, ITGAM, CD99, MAPK14, NCF4, PIK3CG, ACTN4,
NCF1, CXCR4, MMP9
J.Q. Wu et al. / Virology 435 (2013) 308–319 313
classified into following five groups based on the three-dimensionalstructure of the receptors and the signal transduction cascades.
Group 1 was associated with G protein-coupled receptors,which included eight genes from CXC subfamily encoding CXCL1,CXCL2, CXCL6, IL8, CXCL9, CXCL10, CXCL16, and HIV co-receptorCXCR4, CX3CR1 from CX3C subfamily, and eight genes from CCsubfamily encoding CCL20, CCL2 (monocyte chemotactic protein-1; MCP-1), CCL3 (macrophage inflammatory protein-1a; MIP-1a),CCL7, CCL5, CCR1, CCL23, and CCL8 (Fig. 4).
Group 2 was related to cytokine receptors connected to Januskinase (JAK) family of tyrosine kinases. Based on the conservedmotifs in their extracellular amino acid domain, they can befurther divided into five subgroups: (1) gp130 subunit shared(IL11RA, IL6, and oncostatin M); (2) IL2 receptor g chain shared(IL2RB, IL7R, and IL15); (3) IL12 receptor subunit beta-1 shared(IL12RB1 and IL23A); (4) platelet-derived growth factor (PDGF)
family CSF1R and VEGFA; and (5) interferon family IFNB1,IFNGR1, and IFNGR2 (Fig. 4).
Group 3 involved TNF receptors including genes encoding recep-tors TNFRSF10B, TNFRSF21, and TNFRSF14 and genes encodingcytokines TNFSF10, TNF, LTA, LTB, and TNFSF14 (Fig. 4). Group4 comprised of IL1 family genes which included IL1A and IL1B. Ingroup 5, the genes belonged to TGF-b family, which was repre-sented by ACVR1 receptor.
Down-regulation of cell cycle and apoptosis pathways in both viremic
groups versus LTNPs
In addition to cell signaling dysfunction, the cell cycle pathway(HSA04110) was also significantly down-regulated in the viremicgroups (FDR¼0.038 for INT versus LTNP; FDR¼0.222 for HVLversus LTNP; Table 5 and Additional file 3). As the results from the
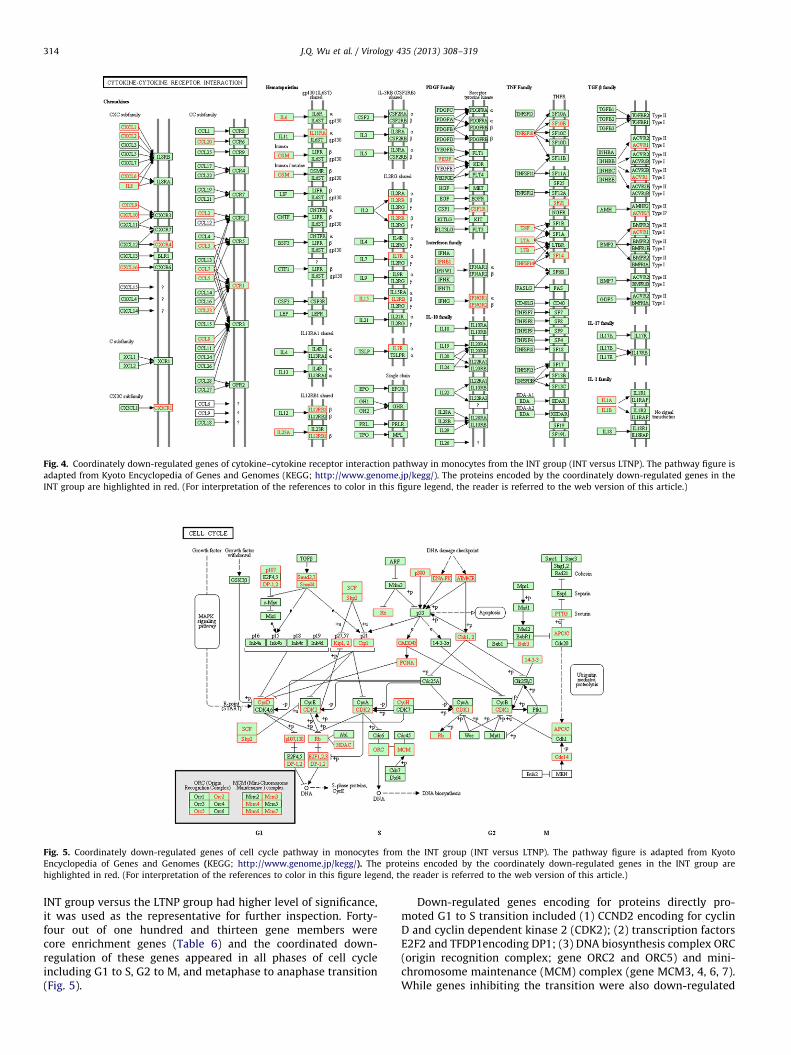
Fig. 4. Coordinately down-regulated genes of cytokine–cytokine receptor interaction pathway in monocytes from the INT group (INT versus LTNP). The pathway figure is
adapted from Kyoto Encyclopedia of Genes and Genomes (KEGG; http://www.genome.jp/kegg/). The proteins encoded by the coordinately down-regulated genes in the
INT group are highlighted in red. (For interpretation of the references to color in this figure legend, the reader is referred to the web version of this article.)
Fig. 5. Coordinately down-regulated genes of cell cycle pathway in monocytes from the INT group (INT versus LTNP). The pathway figure is adapted from Kyoto
Encyclopedia of Genes and Genomes (KEGG; http://www.genome.jp/kegg/). The proteins encoded by the coordinately down-regulated genes in the INT group are
highlighted in red. (For interpretation of the references to color in this figure legend, the reader is referred to the web version of this article.)
J.Q. Wu et al. / Virology 435 (2013) 308–319314
INT group versus the LTNP group had higher level of significance,it was used as the representative for further inspection. Forty-four out of one hundred and thirteen gene members werecore enrichment genes (Table 6) and the coordinated down-regulation of these genes appeared in all phases of cell cycleincluding G1 to S, G2 to M, and metaphase to anaphase transition(Fig. 5).
Down-regulated genes encoding for proteins directly pro-moted G1 to S transition included (1) CCND2 encoding for cyclinD and cyclin dependent kinase 2 (CDK2); (2) transcription factorsE2F2 and TFDP1encoding DP1; (3) DNA biosynthesis complex ORC(origin recognition complex; gene ORC2 and ORC5) and mini-chromosome maintenance (MCM) complex (gene MCM3, 4, 6, 7).While genes inhibiting the transition were also down-regulated

J.Q. Wu et al. / Virology 435 (2013) 308–319 315
such as RBX1 encoding protein SCF, S-phase kinase-associatedprotein 2 (SKP2), CDKN1B encoding KIP1, and CDKN1A encodingCIP1, they most likely represent the coordinated change as thedown-regulation of the core enrichment genes directly involvedin the transition promotion clearly implicated G1/S arrest.
In the G2 to M transition, the down-regulation of CDC2/CDK1was observed, which form complexes with cyclin A and B, leadingto cell cycle progression. Genes encoding proteins that promotethe activity of CDK1 complexes including CDC25A, B, and C,were not significantly altered, which together with CDC2 down-regulation may implicate G2/M arrest. Additionally, genesinvolved in DNA damage checkpoint were coordinately down-regulated in the INT group such as DNA-PK (gene PRKDC) andATM. Three genes ANAPC4, ANAPC7, and ANAPC10 encoding foranaphase promoting complex (APC), which triggers the meta-phase to anaphase transition, were also significantly down-regulated in the INT group. Closely associated with the cell cyclewas the apoptosis pathway (HSA04210), which was significantlydown-regulated in the viremic groups (FDR¼0.067 for INT versusLTNP; FDR¼0.114 for HVL versus LTNP; Additional file 3). Furtherinspection of the apoptosis pathway in INT versus LTNP compar-ison revealed that 24/83 genes were core enrichment genes(Table 6; Additional file 4).
Down-regulation of transendothelial migration pathway in the HVL
group versus the INT group
In the list of differentially regulated pathways between the HVLand INT groups, the leukocyte transendothelial migration pathway(HSA04670) was uniquely down-regulated in the HVL group(FDR¼0.24; Additional files 3 and 5). Inspection of the migrationpathway revealed that 21/113 genes were core enrichment genes(Table 6), which included genes encoding for the following proteins:(1) chemokine receptor CXCR4 coupled to G protein GI/GNAI2,which activates through PI3K (PIK3CB and PIK3CG) and RAC2,eventually impacts cell motility; (2) integrins involved in cellularadhesion (ITGA4, ITGAL, and ITGAM) and RAPL/RASSF5 involved inenhanced adhesion of integrin complexes to ICAM1; (3) microfila-ment protein a-actinin (ACTN4) and vasodilator-stimulated phos-phoprotein (VASP) involved in actin-based mobility; and (4) celladhesion molecule PECAM1, a component of tight junction strandsclaudin 14 (CLDN14/CAMs), cell surface glycoprotein CD99, andmatrix metallopeptidase 9 (MMP9) involved in extracellular matrixdegradation. Along the passage of ICAM1-mediated signals was thecoordinated down-regulation of PKC encoded by PRKCA required forICAM1 dependent leukocyte migration and paxillin encoded by PXNinvolved in actin-membrane attachment at sites of focal adhesion.Along the VCAM1-mediated signal passage was the coordinateddown-regulation of PI3K encoded by PIK3CB and PIK3CG, 3 subunitsof NADPH oxidase (p22phox, p47phox, and p40phox encoded byCYBA, NCF1, and NCF4, respectively), MMPs encoded by MMP9, andP38 encoded by MAPK14.
Discussion
Our study provides the first comprehensive and panoramic snap-shot into the monocytic transcriptome by investigating the globaldysregulations of the biological pathways in circulating primarymonocyte transcriptomes derived from HIV� healthy donors, HIVþprogressors, and long-term non-progressors (Table 1). The mainobjective of the study was to identify genomic signatures associatedwith both progressive and non-progressive HIV disease. The compar-ison between our dataset and previous microarray studies on mono-cyte/MDM transcriptomes (Cicala et al., 2002; Coberley et al., 2004;Gekonge et al., 2012; Giri et al., 2009; Tilton et al., 2006; Van denBergh et al., 2010; Vazquez et al., 2005; Wen et al., 2005; Woelk et al.,
2004) using GSEA revealed that the extracted 10 gene lists were allsignificant (FDRo0.25) in at least one of the four group comparisons(INT/HVL versus LTNP and INT/HVL versus CTR; Table 4) and eightlists were highly significant (FDRo0.01) in at least two groupcomparisons, which unambiguously confirmed the reliability of ourdata. While in accordance with published gene lists in the context ofmonocyte-HIV interactions, our data provided a better genome-widecoverage of monocyte transcriptome (448,000 gene transcripts)than the previous studies. As expected, the enriched pathwaysderived from the DEGs were broadly consistent with the enrichedpathways detected by GSEA using canonical pathways (Additionalfiles 2 and 3). In addition, GSEA enabled a more comprehensivedetection of genes contributing to the enrichment of the pathwayscorrelated with disease progression, as it considered all of the genesin the experiment, not only those above the cut-off of fold change orsignificance (Subramanian et al., 2005). Therefore, the subsequentdiscussion focused on the pathways significantly associated withprogressive phase of HIV disease revealed by GSEA. Since theimmune-related pathways had the most direct relevance to theimmune dysfunction characterizing HIV disease and this aspect hasbeen under constant investigations, our discussion centered on theimmune-related pathways top-ranked by GSEA, which includedpathways of TLR signaling, cytokine–cytokine receptor interaction,cell cycle and apoptosis, and endothelial migration.
At the transcriptomic level, the overall down-regulation of theTLR signaling pathway in the viremic groups (versus LTNP; Fig. 3;Table 6) manifested by the decreased TLR expression with sub-sequent tuning down of the expression of the genes encoding forMAPK, NF-kB, JAK-STAT, IRF signaling cascades, and the reducedexpression of cytokine genes reflected the deficiencies of innateimmune response in monocytes from viremic patients. To ourknowledge, this study is the first to report the simultaneoustuning down of the genes encoding for all the four signalingcascades integrated within the TLR pathway during HIV diseaseprogression, though previous studies have implicated the dys-function of the individual signaling arm discretely. TLRs representan important category of pathogen recognition receptors, whichare crucial in the first-line defense against foreign microbes andare also important for modulating the adaptive immune response.The possible link between HIV infection and TLR expression wassuggested by the finding that the TLR2 expression on monocytesfrom HIV patients was modulated when compared to the healthycontrols (Heggelund et al., 2004b). Moreover, it has been sug-gested that the altered TLR expression and a deficient TLR2/4signaling through ERK may cause the decreased production ofTNF-a in alveolar macrophages, which was associated with HIVdisease progression (Nicol et al., 2008). In our study the detectionof the down-regulation of the enrichment genes along the MAPKbranch not only fully supported the previous observations onaltered expressions of TLR2/4, ERK/MAPK3, and TNF-a, but alsoextended the previous postulation to a clear view of the perturbedMAPK signaling cascade integrated within the TLR pathwayduring disease progression, which revealed the comprehensivelink underlying the observed discrete changes in gene expression.Similarly, the attenuation of the expression of genes along theNF-kB branch detected in our study ex vivo confirmed andextended the previous study reporting the diminished IkBadegradation and NF-kB RelA nuclear translocation through TLR4in MDM infected by HIV in vitro (Noursadeghi et al., 2009).Additionally, the reduced expression of the genes along theJAK-STAT arm associated with the HIV disease progressionaccorded well with the previous finding of loss of IFNa/b respon-siveness in monocytes manifested by the decreased IFNa/bRexpression, IFNa-induced STAT1 phosphorylation, and IFNainduced gene expression, which correlated significantly withHIV disease progression markers (Hardy et al., 2009).
J.Q. Wu et al. / Virology 435 (2013) 308–319316
The down-regulation of the genes encoding for IRF5/7 arm ofthe TLR pathway is of particular interest as it incorporates twoendosomal receptors TLR7/8, which recognize single stranded viralRNA such as HIV. In line with this finding, a previous study hasreported that the expression of TLR7/8 and TNF-a secretionwas significantly decreased in monocytes from chronic and AIDSsubjects compared to LTNPs (Nian et al., 2012). Furthermore, TNF-asecretion was decreased significantly at each subsequent HIVinfection stage via TLR7/8 triggering. While both studies high-lighted the down-regulation of TLR7/8 and inflammatory cytokinegenes during disease progression (Fig. 3), ours also pinned downthe potential link between the reduced expression of TLRs and thecytokine genes to the MyD88-dependent passage (TLR-MyD88-IRAK-TRAF6-MAPK/NFkB) in the TLR pathway. Since previousfindings of the persistent TNF production in T cells and PBMCsfrom HIVþ patients implicated the increased HIV-related inflam-mation effects such as cell apoptosis (Aukrust et al., 1999; Ledruet al., 2000), the down-regulation of TLR7/8 and inflammatorycytokine genes in monocytes observed here may thus suggest thetuning down of inflammation status during disease progression,which could contribute to monocyte survival as a viral reservoir.Given the fact that only a very low frequency of monocytes aredirectly infected by HIV, the global down-regulation of the TLRpathway is likely to arise from the secondary effects of the overallprocess of immunopathogenesis in vivo such as perturbed cytokinenetwork, or the activity of the virus components, which do notrequire direct infection such as HIV envelope glycoprotein gp120.
The decreased expression of cytokine genes observed in theTLR signaling pathway was further manifested by the down-regulation of the cytokine–cytokine receptor interaction pathwayin the viremic groups (versus LTNP; Fig. 4). One of the mostpronounced changes in this pathway was the significant andsystematic down-regulation of genes encoding proinflammatorycytokines including IL-1b, IL-6, IL-8, TNF-a and the receptorCSF1R in the viremic groups (Table 6). On the other hand, theanti-inflammatory cytokine genes such as TGF-b, IL-4, L-10, andIL-13 did not show any significant changes between the INT/HVLand the LTNP groups. This selective reduction in the expressionof proinflammatory cytokine genes during disease progressionwas consistent with the previous report that the frequencies ofmonocytes producing proinflammatory cytokines (IL1b, IL-6, andTNFa) was diminished in patients with viremia during the timeoff therapy compared to the time on therapy with effectivecontrol of viral replication (Tilton et al., 2006). The reduction inthe expression of proinflammatory cytokine genes throughthe TLR pathway could again implicate the tuning down of theinflammatory effects of monocytes as the increased levels of bchemokines were suggested to drive the inflammatory loopleading to cell apoptosis in PBMC from the HIVþ patients(Heggelund et al., 2004a). On the other hand, another studyshowed an invasive phenotype of primary monocyte character-ized by significant increase in expressing CD16, CCR5, and MCP-1associated with disease severity (Pulliam et al., 2004). Thisincrease was mixed with unchanged expression of proinflamma-tory cytokine genes IL-1, IL-6, and TNF-a, whereas our datashowed concordantly reduced expression of both chemotaxisand proinflammatory genes. The contradiction may come fromthe different definitions of high plasma VL, as the previous studydefined VL410,000 (Pulliam et al., 2004) and our study usedVL41000 as the threshold.
Despite the aforementioned contradiction, our observation ofthe decreased expression of chemokine genes in the viremicgroups was fully supported by the recent monocytic transcrip-tome analysis which identified 6 significantly down-regulatedgenes involved in chemotaxis in the viremic patients (Van denBergh et al., 2010). Coincidently, 4 out of these 6 genes (CCL23,
CX3CR1, CXCL2, and IL8) overlapped with our core enrichmentgenes in the cytokine pathway. Among the 7 CC chemokine geneswe identified to be down-regulated, RANTES/CCL5 and MIP-1a/CCL3 were well known to suppress HIV replication in both CD8þT cells and PBMCs from infected individuals (Cocchi et al., 1995;Vicenzi et al., 2000). Thus, the down-regulation of these twochemokine genes may indicate the impaired immune responsesof monocytes during the disease progression. The impairedimmune responses of monocytes in the viremic groups werefurther demonstrated by the decreased expression of the recep-tors for type I cytokine genes involved in the stimulation of cell-mediated immunity (IFNGR1, IFNGR2, and IL2RB). Interestingly,the core enrichment gene IL-15, which shared many activitieswith IL-2 and was down-regulated in viremic patients here, wasalso found to be expressed at significantly higher levels in themonocytes of LTNPs than in those of HIV progressors (Tarkowskiet al., 2011).
The overall down-regulation of the expression of the genesencoding for cell cycle pathway suggested both G1/S and G2/Marrest in monocytes from viremic patients (versus LTNP; Fig. 5;Table 6). While the G2/M arrest was consistent with the findingin MDM treated with HIV strains (Coberley et al., 2004), the G1/Stransitioning was not so well replicated in the study by Coberleyet al. as only four genes were detected to be uniquely expressedin virus-treated cultures. In contrast, our dataset indicated G1/Sarrest evidenced by the down-regulation of genes encodingcyclin D and CDK2 pivotal for S-phase entry, and reducedexpression of transcription factors (E2F2 and TFDP1), DNAbiosynthesis complexes ORC, and MCM complex. This contra-diction may arise from the differences between cell culturesin vitro in other studies and monocytes isolated ex vivo in ourstudy. Closely associated with the dysregulation of the cell cyclewas the down-regulation of the expression of the genes encod-ing for cell apoptosis pathway (Table 6; Additional file 4), whichcontributed to monocytes survival as a viral reservoir. This areaof dysfunction has been investigated both ex vivo and in vitro byprevious studies, which identified the anti-apoptosis gene sig-nature in monocytes from HIVþ subjects and detected thereduced sensitivity of infected monocytic cell lines comparedwith their uninfected counterpart, respectively (Giri et al., 2009;Pinti et al., 2003).
In the comparison of the HVL group versus the INT group, thegenes encoding for leukocyte TEM pathway was uniquely down-regulated in the HVL group (Table 6; Additional file 5), whichimplicated the altered immunosurveillance capacity in mono-cytes during HIV disease progression. Consistently, the previousstudy showed that monocyte TEM was diminished in the stage B/C patients, but unimpaired in stage A patients (Trial et al., 1995).The TEM dysfunction was also detected in MDM infected by HIVin vitro, which caused a defect in reverse TEM without affectingforward TEM (Westhorpe et al., 2009).
It should be noted here that this study uses a cross-sectionaldesign, which cannot provide dynamic findings from a longitudinalperspective such as the evaluations of the normalization of TLRexpression upon treatment by the repeated measures of the sameindividuals upon therapy intervention and the identification of theassociations between altered gene expression and viral replication/immunosuppression by the consecutive viremia data. The lack ofthe prospective transcriptome data also limits further assessmentof the stability of the gene signatures associated with diseaseprogression. Future studies could further confirm the gene signa-tures identified here from both retrospective and prospectiveviews. In addition, this is a transcriptomic study which provideschanges only at mRNA level and functional studies at the proteinlevel in future would help to confirm the changes reported hereand transform them into a mechanistic overview.
J.Q. Wu et al. / Virology 435 (2013) 308–319 317
Materials and methods
Patient profiles and collection protocol
Five HIV-infected LTNPs, five HIVþ patients on HAART withVLo1000 (INT) and five with VL41000 (HVL) along with fourhealthy HIV seronegative controls (CTR) were studied. The infec-tion time for LTNP1, LTNP3, LTNP4, and LTNP5 are 420 years, andL2414 years. These treatment-naıve LTNPs have maintained highCD4þ T cell counts (4500 cells/ml) and below detectable plasmaviremia (o40 HIV RNA copies/ml plasma; Table 1) except LTNP2with very low plasma viremia (57 HIV RNA copies/ml plasma).Patients in the INT and HVL groups were on HAART for452weeks and consecutively experienced virological failure. The INTand HVL groups had VL less and more than 1000, respectively andthey all had CD4þ T cell counts o500 cells/ml except for INT4.These patients received two NRTIs (zidovudine, lamivudine,stavudine, emtricitabine, tenofovir) in association with one ortwo protease inhibitors (darunavir, ritonavir, indinavir, saquina-vir, atazanavir). Twelve patients came from the HIV clinic atWestmead Hospital and three patients plus the four healthycontrols came from the Australian Red Cross Blood Service inSydney. This study was approved by the Sydney West Area HealthServices Research Ethics Committee, and all blood samples werecollected after individual informed written consent.
Purification of CD14þ monocytes and RNA isolation
A single blood sample (10–20 ml in EDTA) was obtained fromeach patient. After separation of plasma, primary PBMC wereisolated immediately after obtaining blood samples by Ficoll-gradient centrifugation and purified. This aspect was strictlyfollowed in our experiments because of previously described lowerRNA yields and possible changes in gene expression profiles uponstorage of blood (Lyons et al., 2007). CD14þ monocytes were thenobtained by positive isolation with antibody-conjugated magneticbeads according to the manufacturer’s instructions (MiltenyiBiotech, Germany) with a purity498.6% as verified by flowcytometry. Binding of antibody to CD14 does not trigger signaltransduction and a previous study has clearly demonstrated thatCD14 positive selection does not alter cellular transcriptome bycomparing gene expression profiles in parallel using either positiveor negative selection (Lyons et al., 2007). Total RNA was isolatedfrom purified cells using RNeasy Mini kit (Qiagen Pty Ltd., CliftonHill, Victoria, Australia) with an integrated step of on-columnDNase treatment.
cRNA preparation, microarray hybridization and scanning
RNA quality was checked by Agilent Bioanalyzer and RNAIntegrity Scores are higher than 7 for all the samples. cRNAamplification and labeling with biotin were performed usingIllumina TotalPrep RNA amplification kit (Ambion, Inc., Austin,USA) with 250 ng total RNA as input material. cRNA yields werequantified with Agilent Bioanalyzer and 750 ng cRNAs werehybridized to the Sentrix HumanHT-12 v3 Expression BeadChips(Illumina, Inc., San Diego, USA). Each chip contains 12 arrays andeach array contains 448,000 gene transcripts, of which, 46,000derived from human genes in the National Center for Biotechnol-ogy Information (NCBI) Reference Sequence (RefSeq) and UniGenedatabases. All reagents and equipment used for hybridizationwere purchased from Illumina, Inc. According to the manufac-turer’s protocol, cRNA was hybridized to arrays for 16 h at 58 1Cbefore being washed and stained with streptavidin-Cy3. Then thebeadchips were centrifuged to dry and scanned on the IlluminaBeadArray Reader confocal scanner. To minimize the batch effect,
the microarray chips were all processed at the single site usingthe same platform with the identical setting of the parameters bythe same experimenter.
Analysis of differentially expressed genes
The quality of the entire data set was assessed by box plot anddensity plot of bead intensities, density plot of coefficient ofvariance, pairwise MAplot, pairwise plot with microarray correla-tion, cluster dendrogram, and non-metric multidimensional scal-ing using R/Bioconductor and the lumi package (Du et al., 2008).Based on the quality assessment, all 19 samples were deemedsuitable for further analysis. Data normalization was performedusing a variance-stabilising transform (VST) and a robust splinenormalization (RSN) implemented in the lumi package forR/Bioconductor (Du et al., 2008; Lin et al., 2008). Cluster analysisfor the whole genome expression of 48,803 transcripts wasperformed based on the Pearson correlation metric implementedin GenomeStudio v2011.1. To reduce false positives, unexpressedgenes (based on a detection p-value cut-off 0.01) were removedfrom the dataset. A linear model fit in conjunction with anempirical Bayes statistics were used to identify candidate DEGs(Smyth, 2004). P-values were corrected for multiple testing usingFDR adjustment implemented in lumi package. Pair-wise com-parisons for the four study groups were carried out and candidateDEGs with fold change 42 and adjusted p o0.05 were identifiedfor each of the comparisons.
For the identified DEGs, KEGG pathway enrichment analysisfrom WebGestalt (Web-based Gene SeT AnaLysis Toolkit) wasused to identify the significantly enriched pathways (Zhang et al.,2005). The hypergeometric test was used to calculate the statisticfor each pathway with human genome as the reference gene setand the p-value was adjusted by Benjamini–Hochberg (BH)correction. KEGG pathways with adjusted po0.05 and minimumnumber of four DEGs being the members of the pathway for thecomparison of INT versus LTNP and minimum number of twoDEGs for the comparison of HVL versus LTNP were identified assignificantly enriched ones.
Gene set enrichment analysis
GSEA was used for both the comparison of our dataset withpublished DEG lists from previous studies (in vivo and ex vivo
since 2002) (Cicala et al., 2002; Coberley et al., 2004; Gekongeet al., 2012; Giri et al., 2009; Tilton et al., 2006; Van den Berghet al., 2010; Vazquez et al., 2005; Wen et al., 2005; Woelk et al.,2004) and the investigation of global dysregulations of thebiological pathways. For the comparison, 10 DEG lists were usedfrom studies on monocyte/MDM transcriptomes modulated byHIV (Table 4). For the pathway investigation, the gene sets arefrom MsigDB (Subramanian et al., 2005), catalog C2 functionalsets, subcatalog canonical pathways, which include 639 genesets from pathway databases (version 2.5). These gene sets arecanonical representations of a biological process compiled bydomain experts such as BioCarta, GenMAPP, and KEGG.
Instead of focusing on discrete DEGs, GSEA analyzed the entiretranscriptome data to identify genes coordinately regulated in pre-defined gene sets from various biological pathways (Subramanianet al., 2005). For each group comparison, GSEA was performed usingthe normalized data of entire 48,803 transcripts (GSEA version 2.07,Broad Institute http://www.broad.mit.edu/gsea). First, a ranked listwas obtained by ranking all genes according to the correlationbetween their expression and the group distinction using the metricsignal to noise ratio. Then the association between a given gene setand the group was measured by the non-parametric running sumstatistic termed the enrichment score (ES), which was calculated by

J.Q. Wu et al. / Virology 435 (2013) 308–319318
walking down the ranked list, increasing when encountering a genein the given gene set and decreasing when encountering a gene not inthe gene set. To estimate the statistical significance of the ES, anominal p value was calculated by permuting the genes 1000 times.To adjust for multiple hypothesis testing, the maximum ES wasnormalized to account for the gene set size (NES) and the falsediscovery rate (FDR) corresponding to each NES was calculated. Alongwith the pathway enrichment results, the gene set details report foreach significant pathway was simultaneously generated, which listedthe details of each gene member with a column indicating whetherthis gene was ‘‘core enrichment’’ or not. The core enrichment genesaccount for the enrichment signal of the pathway and the inspectionof these genes can reveal a biologically important subset within thepathway (Subramanian et al., 2005).
Real-time quantitative PCR
Eleven genes and 15 pairs of group comparison were selectedfor validation based on the coverage of different levels of foldchange and/or biological significance. Purified total cellular RNAwas reverse transcribed using oligo d(T) and Superscript IIIfollowed by RNase H treatment (Invitrogen Life Technologies).The cDNA was subjected to qPCR in a 96-well format in triplicatereactions with defined primers and SYBR Green (Invitrogen LifeTechnologies). The qPCR reactions were carried out usingMx3005PTM QPCR System (Stratagene). The mean expressions ofthe tested genes in each group including all the samples used inthe microarray were obtained and the housekeeping gene GAPDHwas used as an internal control and the normalizer for all data.The fold change was calculated by the relative quantitationmethod 2�(ddCt). Primer sequences for each transcript are avail-able from the authors upon request.
Conclusions
This study provides the first transcriptomic distinctions inmonocytes between HIV viremic patients and long-term non-progressors, which particularly focuses on the dysregulations ofbiological pathways associated with the progression and non-progression of HIV disease. Between HIVþ groups, the significantdown-regulation of the interrelated pathways including TLRsignalling, cytokine–cytokine receptor interaction, cell cycle andapoptosis, and transendothelial migration is significantly asso-ciated with the more severe disease status, whereas the non-progression/less advanced disease status is significantly asso-ciated with the up-regulation of these pathways. In the viremicpatients, the global impairment of TLR pathway is exemplified bythe decreased expression of TLR with the subsequent tuningdown of MAPK, NF-kB, JAK-STAT, and IRF signalling cascades inconjunction. In the cell cycle pathway, the G1/S arrest is newlyidentified along with previously reported G2/M arrest. Focusingon the global dysregulation of biological pathways, these dataoffer new comparative insights into perturbed genetic networksof ex vivo-derived monocytes subverted by HIV during diseaseprogression. Further in-depth functional studies on the regulationof these pathways and the corresponding core enrichment genesmay provide detailed molecular mechanisms underlying HIV-monocyte interactions during disease progression, which mayaid future therapeutic interventions. Building up a database ofthe pathway interactions identified in monocytes, CD4þ/CD8þT cells, B cells, and NK cells will definitely aid the understandingof the interconnections between various pathways and diverseblood leukocytes during HIV infection, which will ultimatelyenable the integration of various molecular mechanisms into asystem level.
Competing interests
The authors declare that they have no competing interests.
Author’s contributions
JQW and TRS conducted the experiments and analyzed thedata; JQW wrote the manuscript; MMS supervised the validationexperiments; MS and GW performed the sample collection andseparated CD14þ monocytes; VC, SSP and GW performed qPCRand analyzed the dataset; BW provided the assistance of experi-ments, trouble shooting and interpretations; DED enrolled HIVpatients, provided clinical input and interpretation to the studyand NKS conceived the idea, supervised the work and assistedwith writing the manuscript.
Acknowledgments
This work was funded by the grant from the Australian Societyfor HIV and Hepatitis Research to NKS. JQW received an NHMRCpostdoctoral training fellowship. The funders had no role instudy design, data collection and analysis, decision to publish,or preparation of the manuscript.
Appendix A. Supplementary materials
Supplementary data associated with this article can be found inthe online version at http://dx.doi.org/http://dx.doi.org/10.1016/j.virol.2012.10.026.
References
Alexaki, A., Liu, Y., Wigdahl, B., 2008. Cellular reservoirs of HIV-1 and their role inviral persistence. Curr. HIV Res. 6 (5), 388–400.
Alexaki, A., Wigdahl, B., 2008. HIV-1 infection of bone marrow hematopoieticprogenitor cells and their role in trafficking and viral dissemination. PLoSPathog. 4 (12), e1000215.
Aukrust, P., Muller, F., Lien, E., Nordoy, I., Liabakk, N.B., Kvale, D., Espevik, T.,Froland, S.S., 1999. Tumor necrosis factor (TNF) system levels in humanimmunodeficiency virus-infected patients during highly active antiretroviraltherapy: persistent TNF activation is associated with virologic and immuno-logic treatment failure. J. Infect. Dis. 179 (1), 74–82.
Brown, J.N., Kohler, J.J., Coberley, C.R., Sleasman, J.W., Goodenow, M.M., 2008. HIV-1 activates macrophages independent of Toll-like receptors. PLoS ONE 3 (12),e3664.
Cicala, C., Arthos, J., Selig, S.M., Dennis Jr., G., Hosack, D.A., Van Ryk, D., Spangler,M.L., Steenbeke, T.D., Khazanie, P., Gupta, N., Yang, J., Daucher, M., Lempicki,R.A., Fauci, A.S., 2002. HIV envelope induces a cascade of cell signals in non-proliferating target cells that favor virus replication. Proc. Natl. Acad. Sci. U.S.A99 (14), 9380–9385.
Coberley, C.R., Kohler, J.J., Brown, J.N., Oshier, J.T., Baker, H.V., Popp, M.P., Sleasman,J.W., Goodenow, M.M., 2004. Impact on genetic networks in human macro-phages by a CCR5 strain of human immunodeficiency virus type 1. J. Virol. 78(21), 11477–11486.
Cocchi, F., DeVico, A.L., Garzino-Demo, A., Arya, S.K., Gallo, R.C., Lusso, P., 1995.Identification of RANTES, MIP-1 alpha, and MIP-1 beta as the major HIV-suppressive factors produced by CD8þ T cells. Science 270 (5243),1811–1815.
Crowe, S.M., Sonza, S., 2000. HIV-1 can be recovered from a variety of cellsincluding peripheral blood monocytes of patients receiving highly activeantiretroviral therapy: a further obstacle to eradication. J. Leukoc. Biol. 68(3), 345–350.
Du, P., Kibbe, W.A., Lin, S.M., 2008. Lumi: a pipeline for processing Illuminamicroarray. Bioinformatics 24 (13), 1547–1548.
Fulcher, J.A., Hwangbo, Y., Zioni, R., Nickle, D., Lin, X., Heath, L., Mullins, J.I., Corey,L., Zhu, T., 2004. Compartmentalization of human immunodeficiency virustype 1 between blood monocytes and CD4þ T cells during infection. J. Virol.78 (15), 7883–7893.
Gekonge, B., Giri, M.S., Kossenkov, A.V., Nebozyhn, M., Yousef, M., Mounzer, K.,Showe, L., Montaner, L.J., 2012. Constitutive gene expression in monocytesfrom chronic HIV-1 infection overlaps with acute Toll-like receptor inducedmonocyte activation profiles. PLoS ONE 7 (7), e41153.

J.Q. Wu et al. / Virology 435 (2013) 308–319 319
Giri, M.S., Nebozhyn, M., Showe, L., Montaner, L.J., 2006. Microarray data on genemodulation by HIV-1 in immune cells: 2000–2006. J. Leukoc. Biol. 80 (5),1031–1043.
Giri, M.S., Nebozyhn, M., Raymond, A., Gekonge, B., Hancock, A., Creer, S., Nicols, C.,Yousef, M., Foulkes, A.S., Mounzer, K., Shull, J., Silvestri, G., Kostman, J.,Collman, R.G., Showe, L., Montaner, L.J., 2009. Circulating monocytes in HIV-1-infected viremic subjects exhibit an antiapoptosis gene signature and virus-and host-mediated apoptosis resistance. J. Immunol. 182 (7), 4459–4470.
Hardy, G.A., Sieg, S.F., Rodriguez, B., Jiang, W., Asaad, R., Lederman, M.M., Harding,C.V., 2009. Desensitization to type I interferon in HIV-1 infection correlateswith markers of immune activation and disease progression. Blood 113 (22),5497–5505.
Heggelund, L., Damas, J.K., Yndestad, A., Holm, A.M., Muller, F., Lien, E., Espevik, T.,Aukrust, P., Froland, S.S., 2004a. Stimulation of toll-like receptor 2 in mono-nuclear cells from HIV-infected patients induces chemokine responses: pos-sible pathogenic consequences. Clin. Exp. Immunol. 138 (1), 116–121.
Heggelund, L., Muller, F., Lien, E., Yndestad, A., Ueland, T., Kristiansen, K.I., Espevik,T., Aukrust, P., Froland, S.S., 2004b. Increased expression of toll-like receptor2 on monocytes in HIV infection: possible roles in inflammation and viralreplication. Clin. Infect. Dis. 39 (2), 264–269.
Izmailova, E., Bertley, F.M., Huang, Q., Makori, N., Miller, C.J., Young, R.A., Aldovini,A., 2003. HIV-1 Tat reprograms immature dendritic cells to express chemoat-tractants for activated T cells and macrophages. Nat. Med. 9 (2), 191–197.
Ledru, E., Christeff, N., Patey, O., de Truchis, P., Melchior, J.C., Gougeon, M.L., 2000.Alteration of tumor necrosis factor-alpha T-cell homeostasis following potentantiretroviral therapy: contribution to the development of human immuno-deficiency virus-associated lipodystrophy syndrome. Blood 95 (10),3191–3198.
Lewin, S.R., Kirihara, J., Sonza, S., Irving, L., Mills, J., Crowe, S.M., 1998. HIV-1 DNAand mRNA concentrations are similar in peripheral blood monocytes andalveolar macrophages in HIV-1-infected individuals. AIDS 12 (7), 719–727.
Lin, S.M., Du, P., Huber, W., Kibbe, W.A., 2008. Model-based variance-stabilizingtransformation for Illumina microarray data. Nucl. Acids Res. 36 (2), e11.
Lyons, P.A., Koukoulaki, M., Hatton, A., Doggett, K., Woffendin, H.B., Chaudhry, A.N.,Smith, K.G., 2007. Microarray analysis of human leucocyte subsets: theadvantages of positive selection and rapid purification. BMC Genomics 8, 64.
McElrath, M.J., Pruett, J.E., Cohn, Z.A., 1989. Mononuclear phagocytes of blood andbone marrow: comparative roles as viral reservoirs in human immunodefi-ciency virus type 1 infections. Proc. Natl. Acad. Sci. U S A 86 (2), 675–679.
Nian, H., Geng, W.Q., Cui, H.L., Bao, M.J., Zhang, Z.N., Zhang, M., Pan, Y., Hu, Q.H.,Shang, H., 2012. R-848 triggers the expression of TLR7/8 and suppresses HIVreplication in monocytes. BMC Infect. Dis. 12, 5.
Nicol, M.Q., Mathys, J.M., Pereira, A., Ollington, K., Ieong, M.H., Skolnik, P.R., 2008.Human immunodeficiency virus infection alters tumor necrosis factor alphaproduction via Toll-like receptor-dependent pathways in alveolar macro-phages and U1 cells. J. Virol. 82 (16), 7790–7798.
Noursadeghi, M., Tsang, J., Miller, R.F., Straschewski, S., Kellam, P., Chain, B.M.,Katz, D.R., 2009. Genome-wide innate immune responses in HIV-1-infectedmacrophages are preserved despite attenuation of the NF-kappa B activationpathway. J. Immunol. 182 (1), 319–328.
Pinti, M., Biswas, P., Troiano, L., Nasi, M., Ferraresi, R., Mussini, C., Vecchiet, J.,Esposito, R., Paganelli, R., Cossarizza, A., 2003. Different sensitivity to apoptosisin cells of monocytic or lymphocytic origin chronically infected with humanimmunodeficiency virus type-1. Exp. Biol. Med. (Maywood) 228 (11),1346–1354.
Pulliam, L., Sun, B., Rempel, H., 2004. Invasive chronic inflammatory monocytephenotype in subjects with high HIV-1 viral load. J. Neuroimmunol. 157 (1–2),93–98.
Smyth, G.K., 2004. Linear models and empirical bayes methods for assessingdifferential expression in microarray experiments. Stat. Appl. Genet. Mol. Biol.,3, Article3.
Subramanian, A., Tamayo, P., Mootha, V.K., Mukherjee, S., Ebert, B.L., Gillette, M.A.,Paulovich, A., Pomeroy, S.L., Golub, T.R., Lander, E.S., Mesirov, J.P., 2005. Gene
set enrichment analysis: a knowledge-based approach for interpretinggenome-wide expression profiles. Proc. Natl. Acad. Sci. U S A 102 (43),15545–15550.
Tarkowski, M., Ferraris, L., Martone, S., de Castillia, F.S., Misciagna, D., Mazzuc-chelli, R.I., Lattuada, E., Paraninfo, G., Galli, M., 2011. Riva For The Elvis StudyGroup, A., 2011. Expression of interleukin-15 and interleukin-15Ralpha inmonocytes of HIV type 1-infected patients with different courses of diseaseprogression. AIDS Res. Hum. Retroviruses.
Tilton, J.C., Johnson, A.J., Luskin, M.R., Manion, M.M., Yang, J., Adelsberger, J.W.,Lempicki, R.A., Hallahan, C.W., McLaughlin, M., Mican, J.M., Metcalf, J.A.,Iyasere, C., Connors, M., 2006. Diminished production of monocyte proin-flammatory cytokines during human immunodeficiency virus viremia ismediated by type I interferons. J. Virol. 80 (23), 11486–11497.
Trial, J., Birdsall, H.H., Hallum, J.A., Crane, M.L., Rodriguez-Barradas, M.C., de Jong,A.L., Krishnan, B., Lacke, C.E., Figdor, C.G., Rossen, R.D., 1995. Phenotypic andfunctional changes in peripheral blood monocytes during progression ofhuman immunodeficiency virus infection. Effects of soluble immune com-plexes, cytokines, subcellular particulates from apoptotic cells, and HIV-1-encoded proteins on monocytes phagocytic function, oxidative burst, trans-endothelial migration, and cell surface phenotype. J. Clin. Invest. 95 (4),1690–1701.
Van den Bergh, R., Florence, E., Vlieghe, E., Boonefaes, T., Grooten, J., Houthuys, E.,Tran, H.T., Gali, Y., De Baetselier, P., Vanham, G., Raes, G., 2010. Transcriptomeanalysis of monocyte-HIV interactions. Retrovirology 7, 53.
Vazquez, N., Greenwell-Wild, T., Marinos, N.J., Swaim, W.D., Nares, S., Ott, D.E.,Schubert, U., Henklein, P., Orenstein, J.M., Sporn, M.B., Wahl, S.M., 2005.Human immunodeficiency virus type 1-induced macrophage gene expressionincludes the p21 gene, a target for viral regulation. J. Virol. 79 (7), 4479–4491.
Vicenzi, E., Alfano, M., Ghezzi, S., Gatti, A., Veglia, F., Lazzarin, A., Sozzani, S.,Mantovani, A., Poli, G., 2000. Divergent regulation of HIV-1 replication inPBMC of infected individuals by CC chemokines: suppression by RANTES, MIP-1alpha, and MCP-3, and enhancement by MCP-1. J. Leukoc. Biol. 68 (3),405–412.
Wen, W., Chen, S., Cao, Y., Zhu, Y., Yamamoto, Y., 2005. HIV-1 infection initiateschanges in the expression of a wide array of genes in U937 promonocytes andHUT78 T cells. Virus Res. 113 (1), 26–35.
Westhorpe, C.L., Zhou, J., Webster, N.L., Kalionis, B., Lewin, S.R., Jaworowski, A.,Muller, W.A., Crowe, S.M., 2009. Effects of HIV-1 infection in vitro ontransendothelial migration by monocytes and monocyte-derived macro-phages. J. Leukoc. Biol. 85 (6), 1027–1035.
Woelk, C.H., Ottones, F., Plotkin, C.R., Du, P., Royer, C.D., Rought, S.E., Lozach, J.,Sasik, R., Kornbluth, R.S., Richman, D.D., Corbeil, J., 2004. Interferon geneexpression following HIV type 1 infection of monocyte-derived macrophages.AIDS Res. Hum. Retroviruses 20 (11), 1210–1222.
Wu, J.Q., Dwyer, D.E., Dyer, W.B., Yang, Y.H., Wang, B., Saksena, N.K., 2008a.Transcriptional profiles in CD8þ T cells from HIVþ progressors on HAART arecharacterized by coordinated up-regulation of oxidative phosphorylationenzymes and interferon responses. Virology 380 (1), 124–135.
Wu, J.Q., Dwyer, D.E., Dyer, W.B., Yang, Y.H., Wang, B., Saksena, N.K., 2011.Genome-wide analysis of primary CD4þ and CD8þ T cell transcriptomesshows evidence for a network of enriched pathways associated with HIVdisease. Retrovirology 8, 18.
Wu, J.Q., Wang, B., Saksena, N.K., 2008b. Transitory viremic surges in a humanimmunodeficiency virus-positive elite controller can shift the cellular tran-scriptome profile: a word of caution for microarray studies. J. Virol. 82 (20),10326–10327.
Zhang, B., Kirov, S., Snoddy, J., 2005. WebGestalt: an integrated system forexploring gene sets in various biological contexts. Nucl. Acids Res. 33,W741–748. (Web Server issue).
Zhu, T., 2002. HIV-1 in peripheral blood monocytes: an underrated viral source.J. Antimicrob. Chemother. 50 (3), 309–311.