Sampe paper Danning 2012
15
Page 1 ON THE VOID CONSOLIDATION MECHANISMS OF CONTINOUS FIBER REINFORCED THERMOPLASTIC COMPOSITES Danning Zhang, Arthur Levy, John W. Gillespie, Jr Department of Materials Science and Engineering Center for Composite Materials University of Delaware Newark DE 19716 ABSTRACT Void consolidation mechanisms of oven vacuum bag consolidation of unidirectional carbon fiber thermoplastic matrix composites were investigated. The statistical distribution of void content (size, spatial location and number density) of AS4 carbon/PEEK prepreg was quantified using optical microscopy and image analysis. The kinetics of void content reduction were studied through a series of oven vacuum bag consolidation experiments for unidirectional and cross-ply laminates processed for 2, 4 and 5 hours at 380C° . Results show a monotonic reduction in average void content achieving essentially void free laminates after 5 hours of consolidation at this process temperature. Data reduction provides details on the evolution of statistical distributions of void content, void size and spatial location of voids versus process time. Mechanisms of void content are discussed and results are correlated to model estimates. 1. INTRODUCTION Continuous fiber reinforced thermoplastic composites have been increasingly used as engineering materials in aerospace and automotive industries [1-2]. Studies have shown that the voids can severely degrade the mechanical properties of thermoplastic composite parts. [2-5] Therefore, it is important to keep the void content low in the final part. Aerospace industry requires less than 1% void content of the composite parts.[3, 6]. For thermosetting composites, studies showed that entrapped air and volatiles generated during curing are the major source of the voids, and the voids can be eliminated with resin flow introduced by high pressure, and vacuum in various processing methods [7-9]. Thermoplastic prepregs also have inherent voids in the tapes (Figure 1) that have to be eliminated; due to the high viscosity, there is significantly less resin flow compared to thermosetting composites. It has been shown that high pressure and vacuum in an autoclave can significantly reduce the void content of thermoplastic parts [10-11]. Non-autoclave processing method such as in situ filament winding and automated tow placement have been studied and voids are difficult to eliminate in these short duration processes. In many cases, post processing with an autoclave is required to achieve a high quality part with low void content [2, 12-14]. There is a strong demand on finding low cost alternative to autoclave
-
Upload
independent -
Category
Documents
-
view
0 -
download
0
Transcript of Sampe paper Danning 2012
Page 1
ON THE VOID CONSOLIDATION MECHANISMS OF
CONTINOUS FIBER REINFORCED THERMOPLASTIC
COMPOSITES
Danning Zhang, Arthur Levy, John W. Gillespie, Jr
Department of Materials Science and Engineering
Center for Composite Materials
University of Delaware
Newark DE 19716
ABSTRACT
Void consolidation mechanisms of oven vacuum bag consolidation of unidirectional carbon fiber
thermoplastic matrix composites were investigated. The statistical distribution of void content
(size, spatial location and number density) of AS4 carbon/PEEK prepreg was quantified using
optical microscopy and image analysis. The kinetics of void content reduction were studied
through a series of oven vacuum bag consolidation experiments for unidirectional and cross-ply
laminates processed for 2, 4 and 5 hours at 380C°. Results show a monotonic reduction in
average void content achieving essentially void free laminates after 5 hours of consolidation at
this process temperature. Data reduction provides details on the evolution of statistical
distributions of void content, void size and spatial location of voids versus process time.
Mechanisms of void content are discussed and results are correlated to model estimates.
1. INTRODUCTION
Continuous fiber reinforced thermoplastic composites have been increasingly used as
engineering materials in aerospace and automotive industries [1-2]. Studies have shown that the
voids can severely degrade the mechanical properties of thermoplastic composite parts. [2-5]
Therefore, it is important to keep the void content low in the final part. Aerospace industry
requires less than 1% void content of the composite parts.[3, 6]. For thermosetting composites,
studies showed that entrapped air and volatiles generated during curing are the major source of
the voids, and the voids can be eliminated with resin flow introduced by high pressure, and
vacuum in various processing methods [7-9]. Thermoplastic prepregs also have inherent voids in
the tapes (Figure 1) that have to be eliminated; due to the high viscosity, there is significantly
less resin flow compared to thermosetting composites. It has been shown that high pressure and
vacuum in an autoclave can significantly reduce the void content of thermoplastic parts [10-11].
Non-autoclave processing method such as in situ filament winding and automated tow placement
have been studied and voids are difficult to eliminate in these short duration processes. In many
cases, post processing with an autoclave is required to achieve a high quality part with low void
content [2, 12-14]. There is a strong demand on finding low cost alternative to autoclave
Page 2
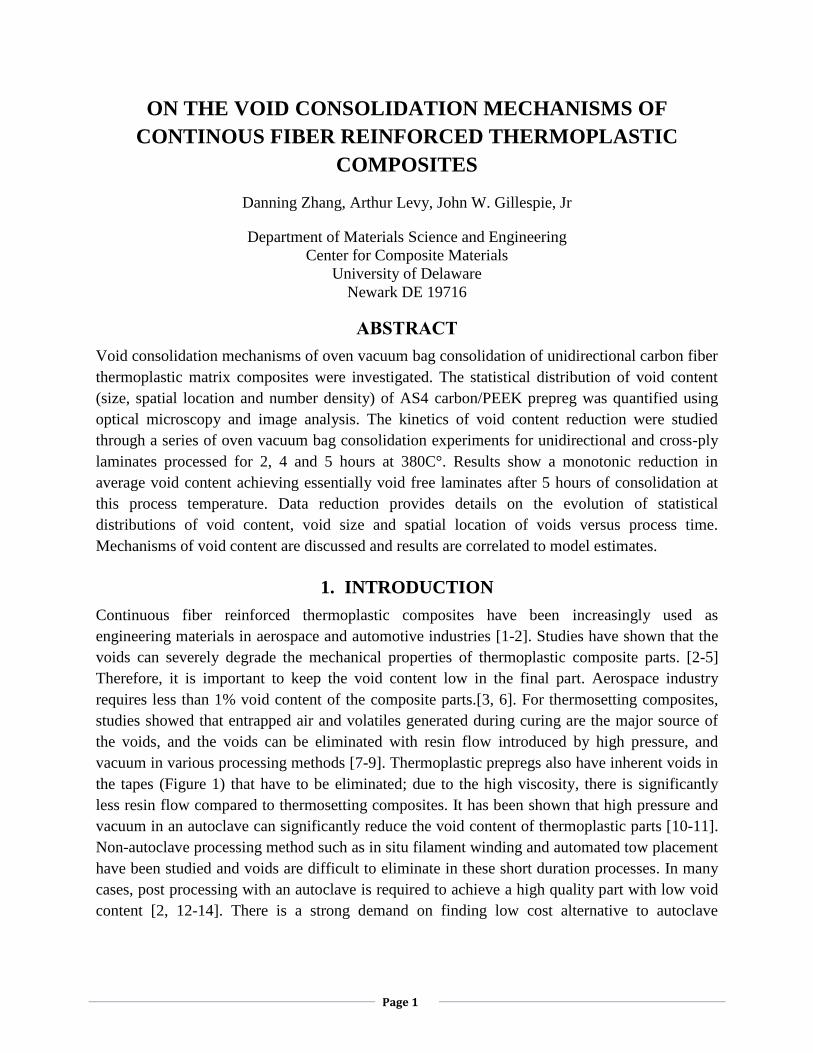
processing for thermoplastic composites, especially in the aerospace industry. In this study, we
consider a vacuum bag oven consolidation process of thermoplastic composites
Figure 1 Voids in the composite tape (voids are the black area), Cytec AS4/APC2 prepreg
A fundamental understanding of void dynamics and consolidation mechanisms is needed to
optimize process temperature and dwell times. Given that only vacuum is used for consolidation,
it is expected that the kinetic aspects of these mechanisms will be important and that much
longer dwell times will be required compared to autoclave process where high positive pressure
is applied. Void consolidation and void dynamics were modeled and applied on the automated
tape placement process. [15-18]. This model considered void size reduction due to the
compression by the high roller pressure of the placement head applied to the tapes. In this model,
the internal void pressure is an important factor that governs the kinetics of void evolution. This
model also shows the importance of void size and spatial distribution of voids within the prepreg
tape. This mechanism clearly shows the benefit of high positive pressure on reducing the time to
achieve a given final void content.
Some recent investigations on curing of thermosetting composite with vacuum bag only process
showed the possibility of voids reduction [9, 19-20]. In this process, gaseous species diffusion
was considered. A study on voids formation and elimination during the stamping process of
PP/glass fiber composite with a labscale experiment indicated that the gas spreads out from the
voids as individual molecules and dissolves into the polymer network [21]. Nucleation and
diffusion in thermoplastic composites were found to play an important role on voids formation,
growth and void dynamics for some composites [22]. Void reduction mechanism was also
studied by considering the solubility, local diffusion, dissolution, and void growth and escape by
means of buoyancy [23]. With these proposed mechanisms, one missing part in these studies is
the experimental confirmation proving which void reduction mechanisms were active during the
consolidation process.
In this paper, optical microscopy and image analysis is used to obtain statistical distribution of
void size, spatial location and number density. The voids behavior is investigated with the
laminates prepared through a series of oven vacuum bag consolidation experiments.

Page 3
The paper first introduces the experimental details of oven vacuum bag consolidation process in
this study, the method to obtain the microscopic images, the image analysis, and the statistical
approach to obtain the experimental data of the voids. After that, the results of the statistical
analysis are presented. Based on the results, the void consolidation mechanisms are then
discussed.
2. EXPERIMENTAL DETAILS
2.1 Laminate Preparation
The thermoplastic prepreg tape used throughout this study is Cytec AS4 carbon/PEEK prepreg.
Each laminate consists of 2 plies and is 300mm by 300mm. The laminates were consolidated
with vacuum bag in an oven. The vacuum bag assembly is shown in Figure 2. There are three
sets of consolidation cycles with 2, 4, and 5 hours dwell at 380°C. For each set of consolidation
cycle, both unidirectional (UD) and cross-ply laminates (CP) were manufactured. The heating
and cooling rate is 2.5°C/min. Figure 3 shows the consolidation program for 2hrs dwell at 380°C.
Figure 2 Schematic of vacuum bag assembly
Figure 3 Consolidation program for the set of 2hrs dwell at 380 °C
After consolidation, samples were cut from the center of the laminates for microscopy. The peel
plies on the top surfaces of the laminates were not always removed, preventing damage from
handling. The size of the samples is approximately 6.35×12.7 and about 0.28 mm thick. To
obtain a relatively large observation area, 4 samples were cut from unidirectional laminates, and
Base Plate
2-layer Laminate on Release Coating
Peel PlyBreather
Vacuum Bag
Vacuum Source
Sealant Tape
0
60
120
180
240
300
360
420
0 100 200 300 400
Tem
pera
ture
( C
)
Time (min)
Vacuum: 1atm

Page 4
8 samples from cross-ply laminates. Void content was quantified in both upper and lower layers
for CP laminates. Besides the laminates, 8 samples of the original as-received prepreg tape from
the same lot were also prepared as our control group. All the samples were embedded in epoxy
resin and polished down to 3m for high quality microscopic observation.
2.2 Optical Microscopy
Sample cross-sections were observed under an optical microscope. The images acquired using a
mono color camera at 20×magnification along the sample cross-sections. At this magnification,
the length of cross-section framed in each image is 0.64mm. Consequently, there were around 20
images obtained from each sample. Example images of original tape, unidirectional laminates
and cross-ply (CP) used for void analysis is shown in Figure 4. Then, the images were analyzed
with Image J software for voids.
Figure 4 Examples of optical micrograph of the cross-sections of original tape and laminates
2.3 Statistical Image Analysis
Through image analysis, information about voids including void content, spatial position, size
and number density can be obtained from each image. Several steps have to be followed to get
useful quantitative information (shown in Figure 5). A micrograph was first rotated to align the
cross section along the horizontal reference line. Then a rectangular area was selected to trim off
the rough surface while covering as much composite area as possible, forming a preprocessed
image. In Image J, the histogram of 256 grey levels (0=black, 255=white) of a preprocessed
image can be plotted, from which an appropriate range of image threshold is set to distinguish
the voids from the polymer and fibers. After setting the threshold, a binary image consisting of
black voids area and white composite area is created.
The number of pixels of the black region can be counted and gives the void fraction. The
through-thickness distribution of voids was quantified using void content at each pixel position
along the thickness direction. The resolution is 2 pixels perm. An example of void through
thickness distribution can be seen in Figure 6. In the binary images, one continuous region is
considered as a void. The areas of continuous black regions were also recorded and converted
into actual area. The voids were approximated as circles in the 2D images, and then the
corresponding diameters were calculated.
(c) CP laminate(b) UD laminate(a) Original tape

Page 5
Figure 5 Basic procedures for image processing
Figure 6 Example of generating voids through thickness distribution
There are a total of 4 sets of consolidation conditions: unconsolidated, 2hrs, 4hrs and 5hrs at
380°C dwell temperatures. The total number of data sets is 7: original tape, 2hrs UD and CP
laminates 4hrs UD and CP laminates, and 5hrs UD and CP laminates. The numerous images in
each study group can provide average void content, overall void spatial distribution, and the
number density, reflecting the actual evolution of voids under different consolidation conditions.
The void content of prepreg tape and UD laminates are the average of the void content values
from all the images in each group. The void content of the CP laminates are the average of the
void fractions of upper and lower layers. The overall void through thickness distributions were
obtained by averaging the void content at each through thickness positions of 10 images which
have void content close to the average void content of this group. The voids examined from
these10 images in this group were gathered and counted for the number density and size
distribution.
Rotating
Trimming
Setting
threshold
Converting into
binary image
0 255
0Through ThicknessPositions
100
0
2
4
6
8
10
12
14
16
0 20 40 60 80 100
Vo
id C
on
ten
t (%
)
Through Thickness Positions ( m)
Page 6
3. RESULTS OF VOID ANALYSIS
3.1 Average Void Content of Prepreg Tape and Laminates
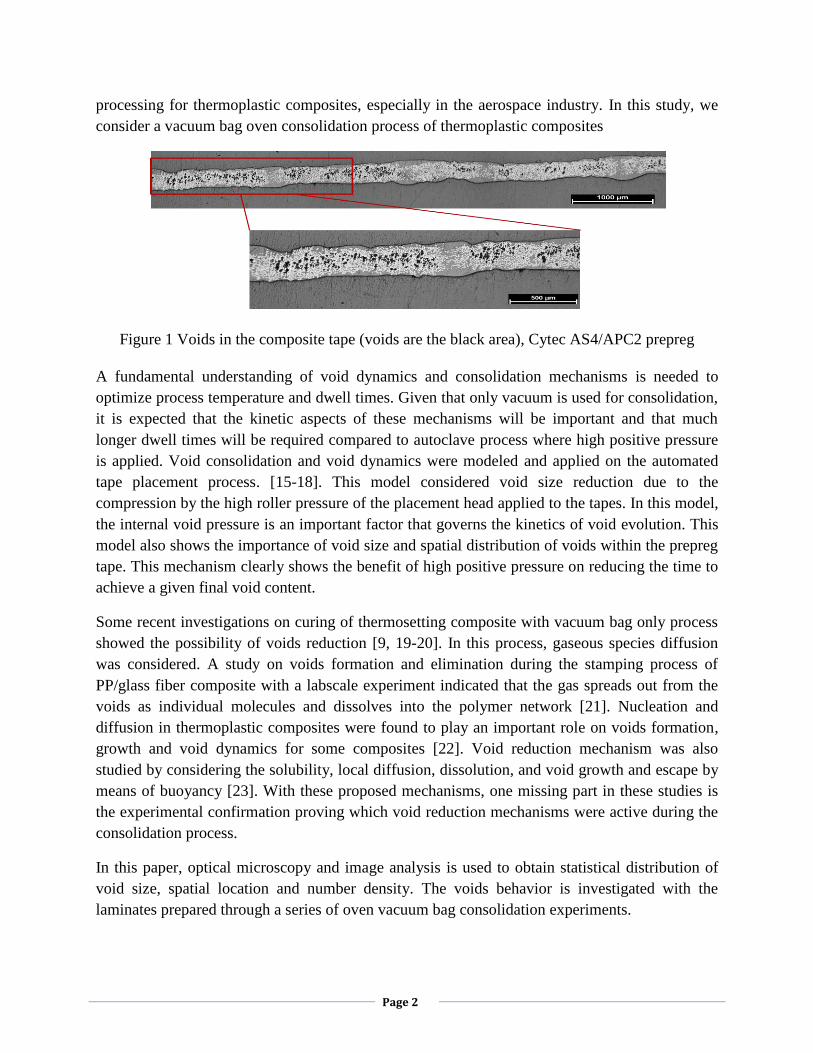
Since a specific size of composite cross-section area was framed in the microscope, the void
content values acquired from the images form distributions. The frequency distributions of void
fraction of the prepreg tape and UD laminates from the microscopy images are shown in Figure 7.
The void content range reduces as the consolidation time increases, indicating the void content of
the laminates decreased. The distribution of void content in prepreg tape tends to be a normal
distribution. As more voids disappear with longer consolidation time, the distribution tends to
concentrate in the low void content range of 0~0.5%.
Figure 7 Distribution of void fraction values of prepreg tape and UD
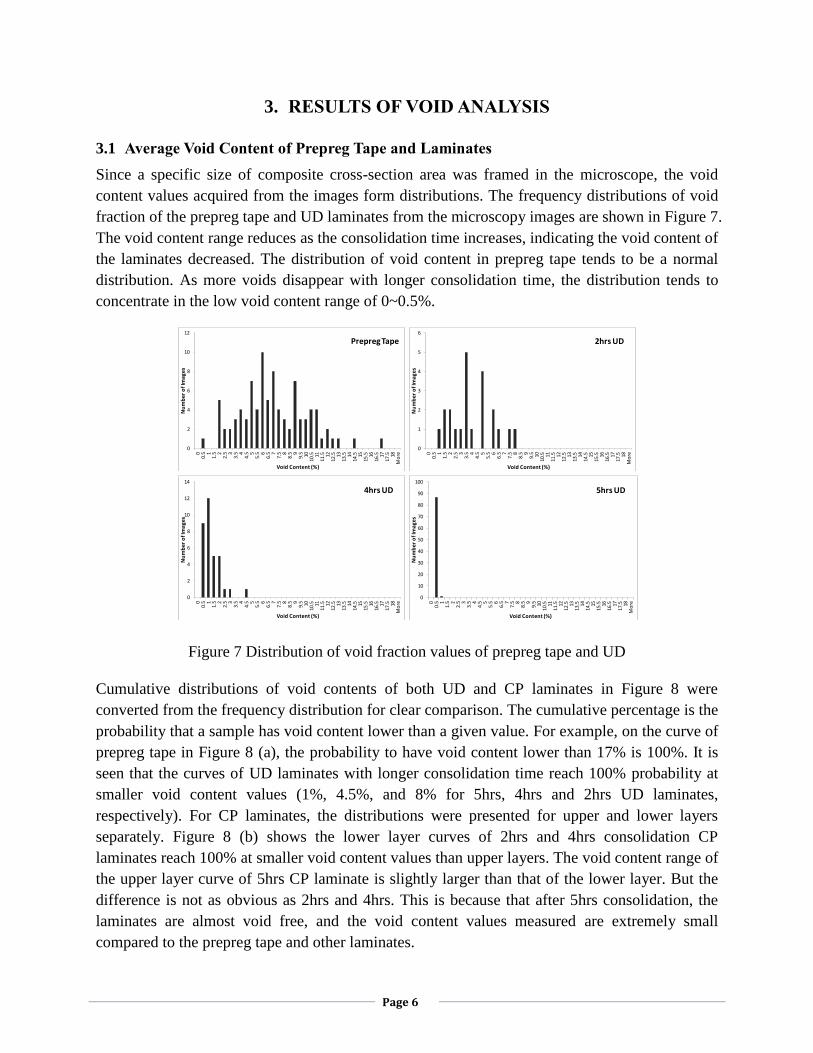
Cumulative distributions of void contents of both UD and CP laminates in Figure 8 were
converted from the frequency distribution for clear comparison. The cumulative percentage is the
probability that a sample has void content lower than a given value. For example, on the curve of
prepreg tape in Figure 8 (a), the probability to have void content lower than 17% is 100%. It is
seen that the curves of UD laminates with longer consolidation time reach 100% probability at
smaller void content values (1%, 4.5%, and 8% for 5hrs, 4hrs and 2hrs UD laminates,
respectively). For CP laminates, the distributions were presented for upper and lower layers
separately. Figure 8 (b) shows the lower layer curves of 2hrs and 4hrs consolidation CP
laminates reach 100% at smaller void content values than upper layers. The void content range of
the upper layer curve of 5hrs CP laminate is slightly larger than that of the lower layer. But the
difference is not as obvious as 2hrs and 4hrs. This is because that after 5hrs consolidation, the
laminates are almost void free, and the void content values measured are extremely small
compared to the prepreg tape and other laminates.
0
2
4
6
8
10
12
00.
5 11.
5 22.
5 33.
5 44.
5 55.
5 66.
5 77.
5 88.
5 99.
5 1010
.5 1111
.5 1212
.5 1313
.5 1414
.5 1515
.5 1616
.5 1717
.5 18M
ore
Nu
mb
er
of
Ima
ge
s
Void Content (%)
Prepreg Tape
0
1
2
3
4
5
6
00.
5 11.
5 22.
5 33.
5 44.
5 55.
5 66.
5 77.
5 88.
5 99.
5 1010
.5 1111
.5 1212
.5 1313
.5 1414
.5 1515
.5 1616
.5 1717
.5 18M
ore
Nu
mb
er o
f Im
ages
Void Content (%)
2hrs UD
0
2
4
6
8
10
12
14
00.
5 11.
5 22.
5 33.
5 44.
5 55.
5 66.
5 77.
5 88.
5 99.
5 1010
.5 1111
.5 1212
.5 1313
.5 1414
.5 1515
.5 1616
.5 1717
.5 18M
ore
Nu
mb
er o
f Im
ages
Void Content (%)
4hrs UD
0
10
20
30
40
50
60
70
80
90
100
00.
5 11.
5 22.
5 33.
5 44.
5 55.
5 66.
5 77.
5 88.
5 99.
5 1010
.5 1111
.5 1212
.5 1313
.5 1414
.5 1515
.5 1616
.5 1717
.5 18M
ore
Nu
mb
er
of
Ima
ge
s
Void Content (%)
5hrs UD
Page 7
Figure 8 Cumulative distributions of void content (a) UD laminates, (b) CP laminates
Figure 9 Average void content (a) UD laminates, (b) CP laminates
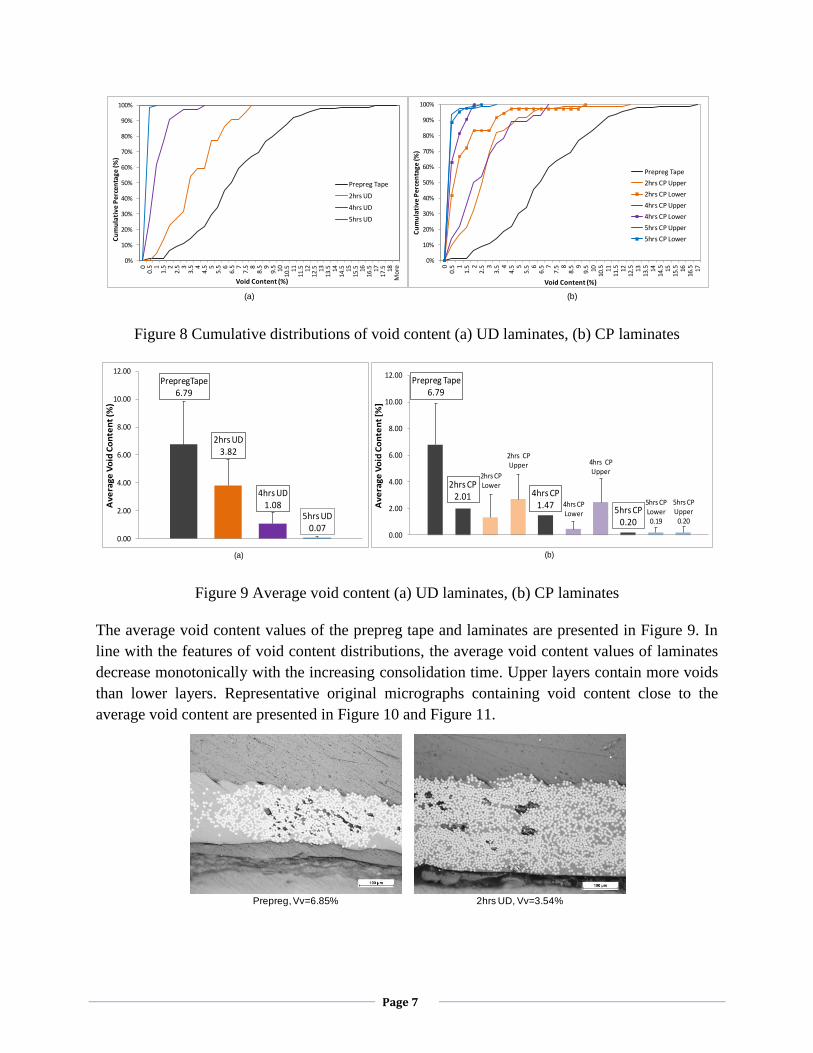
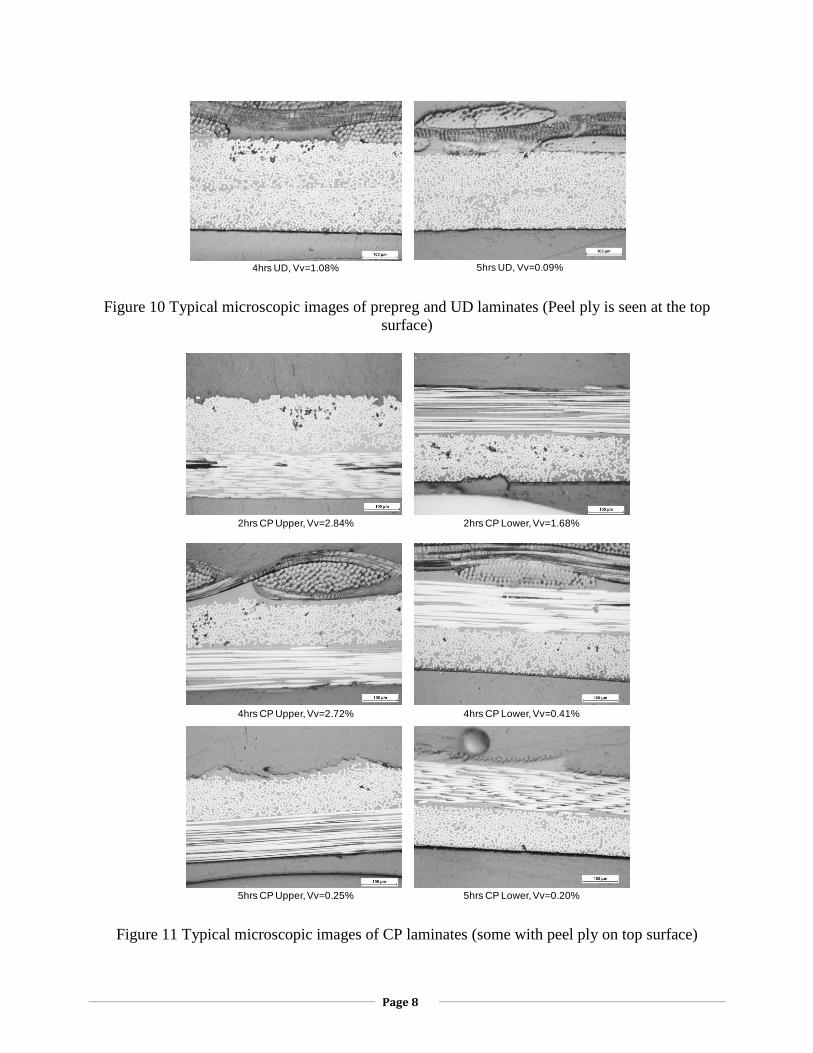
The average void content values of the prepreg tape and laminates are presented in Figure 9. In
line with the features of void content distributions, the average void content values of laminates
decrease monotonically with the increasing consolidation time. Upper layers contain more voids
than lower layers. Representative original micrographs containing void content close to the
average void content are presented in Figure 10 and Figure 11.
0%
10%
20%
30%
40%
50%
60%
70%
80%
90%
100%
00.
5 11.
5 22.
5 33.
5 44.
5 55.
5 66.
5 77.
5 88.
5 99.
5 1010
.5 1111
.5 1212
.5 1313
.5 1414
.5 1515
.5 1616
.5 1717
.5 18M
ore
Cu
mu
lati
ve
Pe
rce
nta
ge
(%
)
Void Content (%)
Prepreg Tape
2hrs UD
4hrs UD
5hrs UD
(a) (b)
0%
10%
20%
30%
40%
50%
60%
70%
80%
90%
100%
00.
5 11.
5 22.
5 33.
5 44.
5 55.
5 66.
5 77.
5 88.
5 99.
5 1010
.5 1111
.5 1212
.5 1313
.5 1414
.5 1515
.5 1616
.5 17
Cu
mu
lati
ve
Pe
rce
nta
ge
(%
)
Void Content (%)
Prepreg Tape
2hrs CP Upper
2hrs CP Lower
4hrs CP Upper
4hrs CP Lower
5hrs CP Upper
5hrs CP Lower
PrepregTape6.79
2hrs UD3.82
4hrs UD1.08
5hrs UD0.07
0.00
2.00
4.00
6.00
8.00
10.00
12.00
Av
era
ge
Vo
id C
on
ten
t (%
)
Prepreg Tape6.79
2hrs CP2.01
2hrs CP Lower
2hrs CP Upper
4hrs CP1.47 4hrs CP
Lower
4hrs CP Upper
5hrs CP0.20
5hrs CP Lower0.19
5hrs CP Upper
0.20
0.00
2.00
4.00
6.00
8.00
10.00
12.00A
ve
rag
e V
oid
Co
nte
nt
[%]
(a) (b)
Prepreg, Vv=6.85% 2hrs UD, Vv=3.54%
5hrs UD, Vv=0.09%4hrs UD, Vv=1.08%
Page 8
Figure 10 Typical microscopic images of prepreg and UD laminates (Peel ply is seen at the top
surface)
Figure 11 Typical microscopic images of CP laminates (some with peel ply on top surface)
Prepreg, Vv=6.85% 2hrs UD, Vv=3.54%
5hrs UD, Vv=0.09%4hrs UD, Vv=1.08%
2hrs CP Upper, Vv=2.84% 2hrs CP Lower, Vv=1.68%
4hrs CP Upper, Vv=2.72% 4hrs CP Lower, Vv=0.41%
5hrs CP Upper, Vv=0.25% 5hrs CP Lower, Vv=0.20%
Page 9
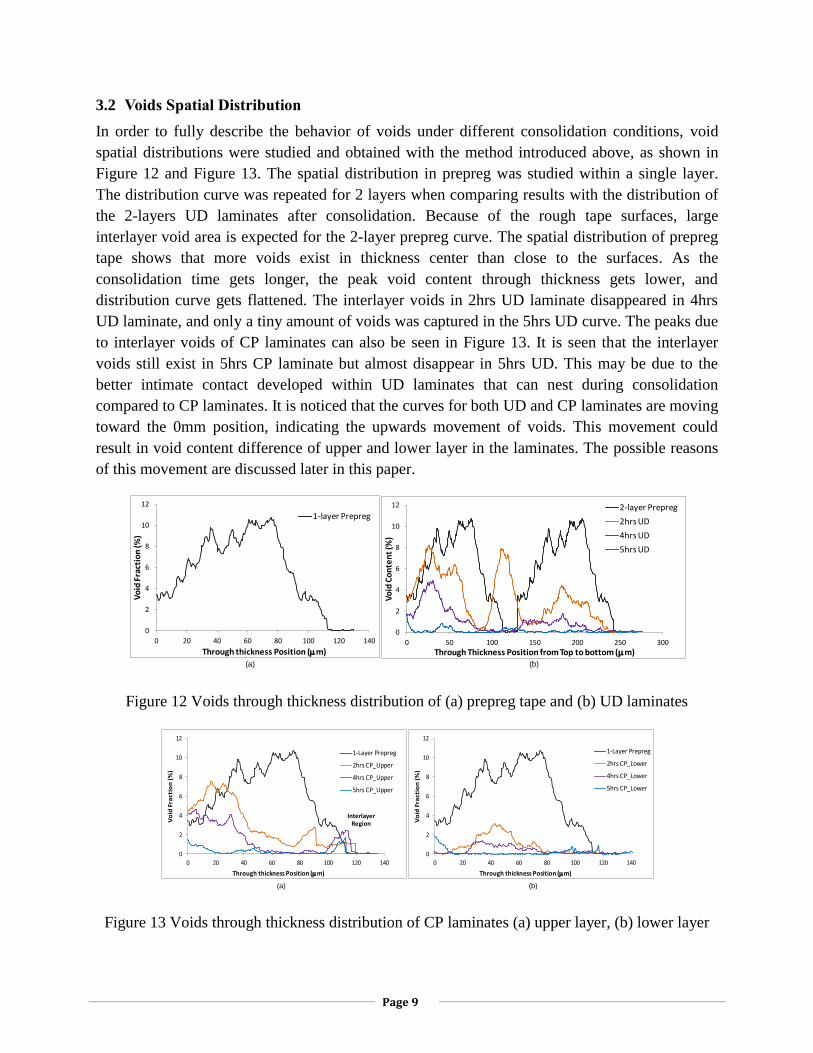
3.2 Voids Spatial Distribution
In order to fully describe the behavior of voids under different consolidation conditions, void
spatial distributions were studied and obtained with the method introduced above, as shown in
Figure 12 and Figure 13. The spatial distribution in prepreg was studied within a single layer.
The distribution curve was repeated for 2 layers when comparing results with the distribution of
the 2-layers UD laminates after consolidation. Because of the rough tape surfaces, large
interlayer void area is expected for the 2-layer prepreg curve. The spatial distribution of prepreg
tape shows that more voids exist in thickness center than close to the surfaces. As the
consolidation time gets longer, the peak void content through thickness gets lower, and
distribution curve gets flattened. The interlayer voids in 2hrs UD laminate disappeared in 4hrs
UD laminate, and only a tiny amount of voids was captured in the 5hrs UD curve. The peaks due
to interlayer voids of CP laminates can also be seen in Figure 13. It is seen that the interlayer
voids still exist in 5hrs CP laminate but almost disappear in 5hrs UD. This may be due to the
better intimate contact developed within UD laminates that can nest during consolidation
compared to CP laminates. It is noticed that the curves for both UD and CP laminates are moving
toward the 0mm position, indicating the upwards movement of voids. This movement could
result in void content difference of upper and lower layer in the laminates. The possible reasons
of this movement are discussed later in this paper.
Figure 12 Voids through thickness distribution of (a) prepreg tape and (b) UD laminates
Figure 13 Voids through thickness distribution of CP laminates (a) upper layer, (b) lower layer
(a)
0
2
4
6
8
10
12
0 20 40 60 80 100 120 140
Vo
id F
ract
ion
(%)
Through thickness Position (m)
1-layer PrepregInterlayer Region
(b)
0
2
4
6
8
10
12
0 50 100 150 200 250 300
Vo
id C
on
ten
t (%
)
Through Thickness Position from Top to bottom (m)
2-layer Prepreg
2hrs UD
4hrs UD
5hrs UD
0
2
4
6
8
10
12
0 20 40 60 80 100 120 140
Vo
id F
ract
ion
(%
)
Through thickness Position (m)
1-Layer Prepreg
2hrs CP_Upper
4hrs CP_Upper
5hrs CP_Upper
Interlayer Region
(a) (b)
0
2
4
6
8
10
12
0 20 40 60 80 100 120 140
Vo
id F
ract
ion
(%
)
Through thickness Position (m)
1-Layer Prepreg
2hrs CP_Lower
4hrs CP_Lower
5hrs CP_Lower

Page 10
From the through thickness distribution of voids, it is also seen that more voids exist in upper
layers than bottom layers of both UD and CP laminates. This is in line with the values of average
void content presented the previous section.
3.3 Void Sizes and Number Density
The equivalent void diameters and the corresponding number of voids in 10 images of each
study group are shown in Figure 14. Micro voids with equivalent diameter smaller than 3.5 m
are not shown in the figures. It is seen that most voids have equivalent diameter of 3.5m to
21m which is 0.5 to 3 times the carbon fiber diameter. Generally, the number of voids at the
same diameter range is largely reduced after consolidation, and keeps decreasing with increasing
consolidation time. Although it shows more voids within 3.5~7m range in 4hrs UD laminate
than 2hrs UD laminate, there are more large voids in the 2hrs UD laminates. Large voids
disappeared in the 5hrs laminates. The voids diameter and number density decreasing with
consolidation time also agree with the trend of average void content results.
Figure 14 Void Size Distribution (a) UD laminates, (b) CP laminates
4. DISCUSSION OF VOID CONSOLIDATION MECHANISMS
The above results show that low void content can be achieved by oven consolidation with
vacuum bag only. The high pressure in autoclave is not necessary although the process times are
increased an order of magnitude. The final void content in the laminates depends on
consolidation time under the same conditions of temperature and vacuum level. This indicates
the voids reducing mechanisms are time dependent. Some existing model and mechanisms are
introduced hereafter and compared to the trend in the experimental results obtained.
The model of microscopic void consolidation used for thermoplastic tow placement process
considers a void in a resin shell (Figure 15). The rate of void size change is governed by the
voids internal pressure and the total stress outside of the void. Since the prepreg tape was kept in
ambient condition, the initial internal pressure of voids can be assumed atmosphere pressure.
(a)
0
100
200
300
400
500
600
700
800
7 10.5 14 17.5 21 24.5 28 31.5 35 More
Nu
mb
er o
f Vo
ids
Equivalent Void Diameter (m)
2-Layer Prepreg
2hrs UD
4hrs UD
5hrs UD
3.5
(b)
0
100
200
300
400
500
600
700
800
7 10.5 14 17.5 21 24.5 28 31.5 35 More
Nu
mb
er o
f Vo
ids
Equivalent Void Diameter (m)
2-Layer Prepreg
2hrs CP
4hrs CP
5hrs CP
3.5

Page 11
Based on the ideal gas low, the internal pressure of a void increases significantly when heated
from room temperature to 380 °C. Due to the relative large surface tension and high viscosity of
PEEK resin, as well as the applied pressure from vacuum, the larger voids could be only
compressed to a limited extent. And the voids stop reducing in size when the pressure within the
void is in equilibrium with the total stress from resin pressure and surface tension. Therefore, this
model cannot be the only mechanism of void reduction as achieving near zero void content
cannot be achieved even with infinite time under vacuum consolidation conditions.
Figure 15 Microscopic Void Consolidation Model [16]
Since the internal pressure of the voids is not at vacuum conditions, there are gas molecules
within the voids. The concentration of the gas molecules at the interface between the void and
surrounding resin follows Henry’s law. If one assumes the concentration of dissolved gas in the
surrounding polymer shell is lower than the gas within the void, a concentration gradient exists
and is a driving force for the gas in the voids to diffuse out into the resin. Together with the
dissolving of the gas molecules, the pressure within the void drops and the voids are compressed
by the surrounding composites as in the microscopic void model. Roychowdhury et al.
developed a model of a void in a polymer shell and considering the stress equilibrium and the
molecule diffusion through the boundary [22]. The momentum equation for the void
compression, the diffusion equation for the gas molecules, and the conservation of mass are the
coupled governing equations in this problem. The equilibrium is controlled by both the
concentration gradient and the stress. In the meantime, the top surface of the composite is
exposed to vacuum, and the gas molecules keep diffusing out from the layers during the
consolidation, which can be modeled with 1-D form of Fick’s second Law, as in [24]. The
concentration of the gas molecules in the resin that surrounds the voids is reducing, leading to
the gas in the voids diffusing out continuously with time. When the composite is void free, all
the gas molecules are already dissolved in the composite and then diffuse out of the composite
based on the concentration equilibrium. Since the diffusion kinetics is slow, the time needed for
the dissolved gas to escape is long. A simplified estimation of the time required at dwell
temperature is:
𝑡 =𝑥2
𝐷 [1]
g
Page 12
Where x is the mean free path of the diffusion, D is the diffusion coefficient of the gas in PEEK
resin. Although the specific diffusion coefficient is unknown, a value of 10-7
cm2/s corresponding
to the diffusion coefficient of water for a range of uncured epoxy resins can be used [9, 25], as a
rough order of magnitude estimate. If x is 0.3mm (about the thickness of the two layers), t is
2.5hrs. This simple relationship indicates the time to achieve void free laminates is very
dependent size and distribution of the voids. This implies that each individual void of a different
size and location within the laminate thickness will take different amounts of time for void
reduction based on this mechanism. Overall, this model would predict that the overall void
content, void size and number density is reducing. Due to these complex interactions, the time
required to get void free part can be longer than 2.5hrs, and 5hrs dwell at processing temperature
to obtain void free part is reasonable. The mechanism of void compression coupled with
dissolving and diffusion could, therefore, be an important mechanism for void consolidation.
Based on the above mechanisms, gas solubility in the amorphous phase of PEEK resin could be
another important factor that affects the void reducing. At the high consolidation temperature,
the activity of the gas molecules increases significantly. As the gas molecules diffuse into the
polymers, the polymer is getting saturated. The dissolving process stops when the local gas
concentration reaches the solubility of the gas in the resin. An important question to answer is
whether the kinetics of gas solubility is faster or slower than the diffusion of gas in the polymer
to the surface. As laminate thickness increases, one would conclude that diffusion would become
the rate limiting mechanism. At this point, further study is needed to quantify the effect of
thickness on the kinetics of void reduction.
From the void analysis, the initial average void content in the prepreg is 6.79%. Assuming air is
in the voids with the density of 1.18Kg/m3, PEEK content is 45% by volume, and PEEK density
is 1320Kg/m3, the weight concentration of air in unit volume of resin is 1.4×10
-4Kg/Kg.
Assuming the solubility of air in PEEK is similar to that in oils, the solubility is on the order of
10-4
Kg/Kg [23]. Therefore, a large amount of air can be dissolved in the resin. However, the gas
species and the solubility and associated kinetics at the consolidation temperature are not well
understood. The consolidation time would still depend on the diffusion of dissolved gas to the
laminate surface.
A model of void filling by resin flow was recently developed at the University of Delaware [26].
This model considers that the distributed voids with different sizes are filled by resin flow
through the fiber bed. If the voids are gathered very close, relatively large amount of local resin
and long time are needed for voids reduction. This is in agreement with the results of void
through thickness distribution which shows that the voids in the thickness center need long time
to be reduced. However, similarly as in the microscopic void model, the driving force for voids
filling in this model is the difference between the applied pressure in the resin and void internal
pressure, and it cannot predict void free laminates manufactured with oven vacuum bag
consolidation. As discussed before, gas dissolving and diffusion can occur. Then void internal

Page 13
pressure drops, and the voids can be further filled with resin. Therefore, voids filling by resin
flow coupled with gas dissolving and diffusion could be another possible mechanism.
According to Muric –Nesic et al [23], buoyancy effect could also help the voids escape. Since
the upward movement of voids was observed from the spatial distribution and different average
void content values of layers in void analysis results, buoyancy effect might be one reason to
drive the voids moving upwards. There are two forces acting on a void: buoyancy force acting
upward, and drag force acting downwards. The buoyancy force has to equal to the drag force to
make the voids float up. Based on Archimedes principle, Stokes law and Newton’s law, the
velocity of the rising void relative to the resin can be expressed as
9
2 2
Bgrv l
[2]
Where l is the density of PEEK resin, rB is the voids radius, equal to 370 Pa.s [27], is the
viscosity of PEEK resin at processing temperature. The significance of this effect largely
depends on the voids size and resin viscosity. For a 40m diameter void in the middle of the
thickness (0.15mm to the surface), the time for it to float up to the surface is 13.4hrs. During 5hrs
consolidation, the void can move 60m. In reality, the velocity of the void migration will be
further impeded by the presence of fibers, further increasing the time for this mechanism to
contribute to void reduction. Furthermore, smaller voids have even lower migration velocity.
From the void spatial distribution results, the apparent waves of the void migration curves move
towards the top surface, and the curves get flatter with local voids reducing in size is seen.
Therefore, the effect of buoyancy does not explain the experimental observations or the time
scales measured for void reduction.
5. CONCLUSIONS
Void consolidation was studied with a series of oven vacuum bag consolidation of UD carbon
fiber thermoplastic prepreg. Through the microscopy images of the cross-sections of the
manufactured laminates and the statistical approach, the detailed information of the average void
content, voids through thickness distribution, and the void sizes and the number distribution were
obtained. As the consolidation time increases at 380°C, the average void content of the laminates
decreases monotonically. More voids distribute in the thickness center of the prepreg tape than
close to the surfaces. After consolidation, the profile of the through thickness void content
distribution move towards the top surface. The upper layer contains more voids than the lower
layer. Most voids have equivalent diameter of 3.5 to 21m. The voids diameter and the number
of voids reduce with consolidation time. Voids free laminates can be eventually achieved
through oven vacuum bag consolidation within 5hrs and the high pressure in autoclave is not
necessary. After relating the results with some relevant mechanisms, voids compression coupled
with gas molecules dissolving and diffusion through the laminate thickness is identified as an

Page 14
important mechanism for the voids elimination during the oven vacuum bag consolidation. The
solubility of the gas molecules in the polymer and the state of gas in the void are important factor
requiring additional study. Voids filling by resin flow coupled with gas dissolving and diffusion
is also possible. The buoyancy effect may affect the voids movement but is not a dominating
mechanism.
The detailed information of voids helped understand the kinetics of the voids evolution with
consolidation time. The voids information of prepreg tape can also be used as future model input,
and the results after consolidation can be used to validate model predictions and ultimately to
optimize the vacuum consolidation process. However, more work is needed to characterize
important material properties and to develop and validate submodels focused on specific
mechanisms.
6. REFERENCE
[1] F. N. Cogswell, Thermoplastic aromatic polymer composites : a study of the structure, processing, and properties of carbon fibre reinforced polyetheretherketone and related materials. Oxford [England]; Boston: Butterworth-Heinemann, 1992.
[2] U. K. Vaidya and K. K. Chawla, "Processing of fibre reinforced thermoplastic composites," International Materials Reviews, vol. 53, pp. 185-218, Jul 2008.
[3] A. R. Chambers, et al., "The effect of voids on the flexural fatigue performance of unidirectional carbon fibre composites developed for wind turbine applications," International Journal of Fatigue, vol. 28, pp. 1389-1398, Oct 2006.
[4] L. Ye, et al., "De-consolidation and re-consolidation in CF/PPS thermoplastic matrix composites," Composites Part a-Applied Science and Manufacturing, vol. 36, pp. 915-922, 2005.
[5] M. A. Lamontia, B.D.Olson, J.W. Gillespie, T.A. Bogetti, "The Effects and Non-Destructive Evaluation of Defects in Thermoplastic Compression-Loaded Composite Cylinders," Journal of Thermoplastic Composite Materials, vol. 8, p. 27, 1995.
[6] L. Liu, et al., "Effects of cure cycles on void content and mechanical properties of composite laminates," Composite Structures, vol. 73, pp. 303-309, Jun 2006.
[7] Y. Z. Gu, et al., "Void Formation Model and Measuring Method of Void Formation Condition During Hot Pressing Process," Polymer Composites, vol. 31, pp. 1562-1571, Sep 2010.
[8] F. Y. C. Boey and S. W. Lye, "Void Reduction in Autoclave Processing of Thermoset Compsites .1. High-Pressure Effects on Void Reduction," Composites, vol. 23, pp. 261-265, Jul 1992.
[9] L. K. Grunenfelder and S. R. Nutt, "Void formation in composite prepregs - Effect of dissolved moisture," Composites Science and Technology, vol. 70, pp. 2304-2309, Dec 2010.
[10] I. Fernandez, et al., "Autoclave forming of thermoplastic composite parts," Journal of Materials Processing Technology, vol. 143, pp. 266-269, Dec 2003.
[11] A. Lystrup and T. L. Andersen, "Autoclave consolidation of fibre composites with a high temperature thermoplastic matrix," Journal of Materials Processing Technology, vol. 77, pp. 80-85, May 1998.
[12] M. A. Lamontia, et al., "Manufacturing flat and cylindrical laminates and built up structure using automated thermoplastic tape laying, fiber placement, and filament winding," Sampe Journal, vol. 39, pp. 30-38, Mar-Apr 2003.

Page 15
[13] R. Gennaro, et al., "On-line Consolidation of Commingled Polypropylene/Glass Roving During Filament Winding," Journal of Thermoplastic Composite Materials, vol. 24, pp. 789-804, Nov 2011.
[14] M. A. Lamontia and M. B. Gruber, "REMAINING DEVELOPMENTS REQUIRED FOR COMMERCIALIZING IN SITU THERMOPLASTIC ATP," SAMPE 2007 - Baltimore, MD, p. 15, 2007.
[15] R. Pitchumani, et al., "Analysis of transport phenomena governing interfacial bonding and void dynamics during thermoplastic tow-placement," International Journal of Heat and Mass Transfer, vol. 39, pp. 1883-1897, Jun 1996.
[16] J. Tierney and J. W. Gillespie, "Modeling of heat transfer and void dynamics for the thermoplastic composite tow-placement process," Journal of Composite Materials, vol. 37, pp. 1745-1768, 2003.
[17] S. Ranganathan, et al., "A Nonisothermal Process Model for Consolidation and Void Reduction During In-Situ Tow Placement of Thermoplastic Composites," Journal of Composite Materials, vol. 29, pp. 1040-1062, 1995.
[18] R. Pitchumani, et al., "Design and optimization of a thermoplastic tow-placement process with in-situ consolidation," Journal of Composite Materials, vol. 31, pp. 244-275, 1997.
[19] L. R. J. Boyd, "Vacuum-Bag-Only-Curable Prepregs That Produce Void-Free Parts," SAMPE 2002 - Long Beach, CA, p. 13, 2002.
[20] T. D. Juska, et al., "Oven Vacuum Bag (OVB) Prepreg Fabrication Infusion Processing," Sampe Journal, vol. 45, pp. 22-36, Jul-Aug 2009.
[21] Y. Leterrier and C. Gsell, "Formation and Elimination of Void During the Prcessing of Thermoplastic Matrix Composites," Polymer Composites, vol. 15, pp. 101-105, Apr 1994.
[22] S. Roychowdhury, et al., "Volatile-induced void formation in amorphous thermoplastic polymeric materials: I. Modeling and parametric studies," Journal of Composite Materials, vol. 35, pp. 340-366, 2001.
[23] J. Muric-Nesic, et al., "On the void reduction mechanisms in vibration assisted consolidation of fibre reinforced polymer composites," Composites Part a-Applied Science and Manufacturing, vol. 42, pp. 320-327, Mar 2011.
[24] J. L. Kardos, et al., "Void Growth and Resin Transport During Prcessing of Thermosetting Matrix Composites," Advances in Polymer Science, vol. 80, pp. 102-123, 1986.
[25] Y. Kobayashi, et al., "Evaluation of Polymer Free-Volume by Positron-annihilation and Gas Diffusivity Measurements," Polymer, vol. 35, pp. 925-928, 1994.
[26] M.B. Gruber, et al.," Thermoplastic In-situ Placement Requires Better Impregnated Tapes and Tows," Sample-Baltimore, 2012
[27] D. D. L. Chung, "Carbon fiber composites." 1994
D. D. L. Chung, "Carbon fiber composites." 1994