Vietnam Plastic Industry TABLE OF CONTENTS LIST OF TABLES
41
Vietnam Plastic Industry Page 1 of 41 VIETNAM PLASTIC INDUSTRY Prepared by Consulting and Research Company for Technology Transfer and Investment August 2013
Transcript of Vietnam Plastic Industry TABLE OF CONTENTS LIST OF TABLES
Vietnam Plastic Industry Page 1 of 41
VIETNAM
PLASTIC INDUSTRY
Prepared by
Consulting and Research Company for Technology Transfer and Investment
August 2013

Vietnam Plastic Industry Page 2 of 41
TABLE OF CONTENTS
LIST OF TABLES ............................................................................................................................ 4
1. INTRODUCTION..................................................................................................................... 5
2. CURRENT SITUATION OF VIETNAM PLASTIC INDUSTRY.......................................... 7
2.1. Arrangement and distribution of Vietnamese plastic enterprises....................................... 7
2.2. Output ................................................................................................................................. 9
2.3. Market and Export capacity.............................................................................................. 10
2.4. Material sources................................................................................................................ 12
2.5. Machinery and technology ............................................................................................... 15
2.5.1. Machinery.................................................................................................................. 15
2.5.2. Technology................................................................................................................ 17
2.6. Labor................................................................................................................................. 18
2.7. Development orientation and policy for plastic industry to 2020 .................................... 20
2.7.1. Development orientation ........................................................................................... 20
2.7.2. Gross output targets of plastic industry..................................................................... 20
2.7.3. Value added targets of plastic industry ..................................................................... 21
2.7.4. Production targets of plastic products ....................................................................... 21
2.7.5. Plastic industry products proportions targets ............................................................ 21
2.7.6. Plastic industry products export targets .................................................................... 21
2.7.7. Development master plan to 2020............................................................................. 22
2.7.8. PP import tax............................................................................................................. 22
3. SURVEY ABOUT PLASTIC PROCESSING TECHNOLOGIES IN VIETNAM ............... 24
3.1. Introduction ...................................................................................................................... 24
3.1.1. Survey objectives ...................................................................................................... 24
3.1.2. Survey objects ........................................................................................................... 24
3.1.3. Survey tools............................................................................................................... 24
3.1.4. Survey process........................................................................................................... 25
3.2. The survey’s main results ................................................................................................. 25
3.2.1. Type of ownership..................................................................................................... 26
3.2.2. Activity area .............................................................................................................. 26
3.2.3. Type of business........................................................................................................ 27
3.2.4. Activity scope............................................................................................................ 27
3.2.5. Staff ........................................................................................................................... 28
3.2.6. Turnover .................................................................................................................... 29
Vietnam Plastic Industry Page 3 of 41
3.2.7. Export Capacity......................................................................................................... 30
3.2.8. Current situation of processing technologies............................................................ 31
3.2.9. Plans for purchasing machine, equipment in next two years .................................... 33
4. CONCLUSION ....................................................................................................................... 35

Vietnam Plastic Industry Page 4 of 41
LIST OF TABLES Table 1. Distribution of companies by geographical area...............................................................7 Table 2. Distribution of companies by product category................................................................8 Table 3. Plastic output and consumption index...............................................................................9 Table 4. Output of plastic products by main categories..................................................................9 Table 5. Export turnover during the period 2006 – 2012..............................................................10 Table 6. Export turnover by region 2008-2012 (thousand USD)..................................................11 Table 7. Export turnover by country 2008-2012 (thousand USD)................................................12 Table 8. Quantity and turnover of imported material in 2008-2012 .............................................13 Table 9. Production capacities of some big domestic companies .................................................13 Table 10. Plastic materials imported into Vietnam..................................................................14 Table 11. Plastic machinery market size.......................................................................................15 Table 12. Rubber and plastic machinery (HS 8477). World exports to Vietnam .........................16 Table 13. Imported machines for plastic manufacturing...............................................................18 Table 14. Labor of plastic industry ...............................................................................................19 Table 15. Gross output targets of plastic industry.........................................................................20 Table 16. Added value targets of plastic industry.........................................................................21 Table 17. Production targets of plastic products ...........................................................................21 Table 18. Plastic industry products proportions targets (unit: %).................................................21 Table 19. Plastic industry products export targets ........................................................................21 Table 20. Development master plan in 2011 -2015 period ...........................................................22 Table 21. Development master plan in 2016 -2020 period ...........................................................22 Table 22. PP import tax................................................................................................................22 Table 23. Distribution of surveyed enterprises by type of ownership ..........................................26 Table 24. Distribution of surveyed enterprises by region .............................................................26 Table 25. Surveyed companies by form of ownership..................................................................27 Table 26. Survey companies by type of plastic products manufactured.......................................28 Table 27. Surveyed companies by employees categories and form of ownership........................29 Table 28. Survey companies by turnover in the last three years (2010, 2011, 2012) ...................30 Table 29. The ratio of exported product on total year production ................................................30 Table 30. Ratio of plastic technologies being used in surveyed companies .................................31 Table 31. Surveyed companies by machine exporters ..................................................................31 Table 32. Surveyed companies by turnover category and new machines purchased ...................32 Table 33. Surveyed companies by form of ownership and new machines purchased ..................33 Table 34. Plans for purchasing machine, equipment in the next two years ..................................33

Vietnam Plastic Industry Page 5 of 41
1. INTRODUCTION
The plastic industry commenced almost half a century ago in Vietnam; however, the production remained limited in compared to that of other countries in the region like Malaysia, Singapore, Thailand and China.
In the 1990’s the output was on average equal to 380,000 tons and consumption hovered around 3.8 kg/person. With the economic reforms of the mid-90’s, plastic production boomed growing 20-25% each year while diversifying in quality and range. One of main reasons attributed to the plastic industry growth is a still low starting point, an average consumption per capita lower than of the region and the world. This is expressed by an average growth of over 20% in value and over 18.75% in production from 2006 until now. Plastic industry size is accounting for 4.48% of local whole industry and playing a role of an essential supplementary industry that needs development in state economy plans. Vietnam plastic industry is one of ten industries that are favored by the government for development priority due to its excellent and stable growth as above-mentioned, performing quite strong in exports activities and having good competitiveness over other regional countries.
Vietnam’s production output of plastics per capita kept on growing strongly, from 23.2 kg of plastic per person in 2005 to 42 kg per capita in 2012. At present, most of household plastics sold in supermarkets are local products and account for around 20% of the industry's total output. Another product category that has achieved strong growth and made up the largest production ratio (around 40%) is plastic packaging, nearly all of which is also locally made. Meanwhile, state owned enterprises typically produce also technical and construction items. In basic sectors such as daily-use household plastic products, domestic enterprises, especially small and medium sized ones (SMEs), are the major producers.
Competition in the Vietnamese market is currently quite vigorous. Many companies are in the hands of Chinese-Vietnamese who procure supplies from family contacts living around the world. The Vietnamese government is encouraging their merger to cope with the increased competition after WTO entry.
Vietnamese plastic products have been sold in 151 countries all over the world such as Japan, USA, The Netherlands, Germany, Cambodia, UK, Indonesia, and Malaysia, and so on. Last year, Vietnam’s plastic export revenue reached nearly USD 2 billion, making an increase of 25% year on year.
In addition to those already mentioned, some shortcomings of and challenges for the Vietnamese plastics industry can be identified as follows.
The industry must import 80% of its materials and currently produces few high-technology products. Because raw materials, chemicals and additives represent between 60-70% of the production cost, the reliance on imports leaves the industry with only a marginal added value. The major plastic exporters to Vietnam are countries in the region, including Taiwan, Japan, China, South Korea and some Europe countries (Germany, Belguim, Italy and Austria). In 2006, the total imported of plastic materials was 1,747 thousand tons, worth nearly USD 3 billion and rising to USD 4 billion in 2012.

Vietnam Plastic Industry Page 6 of 41
Furthermore, the plastic industry is facing difficulty, especially firms using PP as raw material for the production. Because plastics enterprises will bear import duty for plastic material Polypropylene (PP) from 2014, when the import tariff shall be increased from the current level of 0% to 1% in 2014, up to 2% in 2015 and 3% from 2016 onwards1.
Other challenges include the high ratio of unskilled workers, at 70-80% of the workforce and of SMEs which account for 80% of the total and lack capital to improve production.
1 Circular No.107/2013/TT-BTC of August 12, 2013, amending preferential import tax rates applicable to some commodities of headings 2707, 2902 and 3902 in the preferential import tariff

Vietnam Plastic Industry Page 7 of 41
2. CURRENT SITUATION OF VIETNAM PLASTIC INDUSTRY
2.1. Arrangement and distribution of Vietnamese plastic enterprises
The number of plastic corporations in Vietnam reduced sharply from 2,700 in 2006 to 1,400 in 2012. There are some main reasons led to this situation:
- The development of the plastic industry led to strong investment in large enterprises. Small businesses do not have enough capacity so have to cooperate/merge together to be strong enough to compete with big business.
- Due to economic crisis during last time also led to the situation that small businesses face with difficulties in accessing capital for development investment
- The cost of production (including factors: price of input materials - technology, production costs) rise is also another cause of the reducing of the number of plastic firms.
Due to the above reasons, in plastic industry there existed a conflict between a large numbers of companies with real capacity. Among plastic firms, only 6% are state-owned, but they represent about 25% of the total capital invested in the industry. State-owned companies tend to be larger, employing more workers and having greater total investments than their small or medium sized private competitors. The rest are foreign invested enterprises, which account for about 15% total number of plastic firms but having 40% of overall investments. As for private enterprise, some business having right investment for technology and the skills of the workforce have a noticeable development, but the number of these firms is very limited. In fact, private firms account for over 70% total number of plastic firms but having only 35% of overall investments.
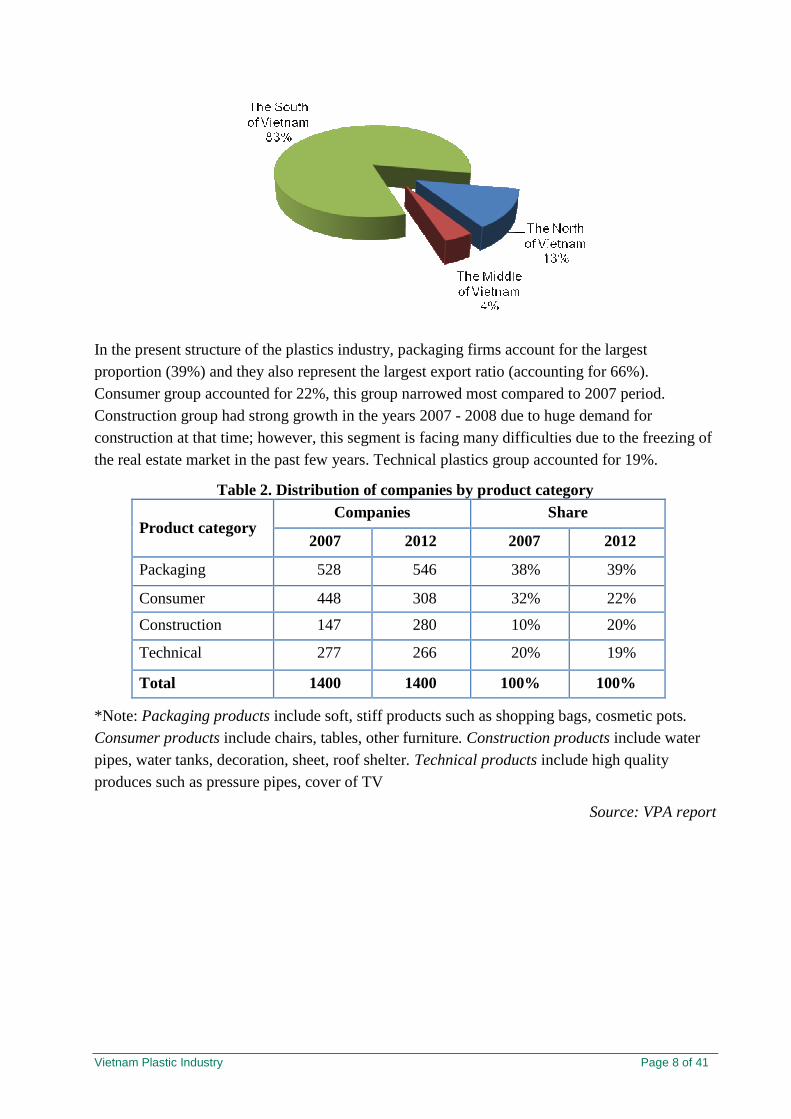
According to VPA report 2012 and Statistical Yearbook of Vietnam 2012, there are 1,400 firms operating in plastic industry. Most enterprises are located in the South of Vietnam. HCMC and the southern provinces contribute 83% to the total plastics production. Hanoi and the northern provinces account for 13% and the central region covers the remaining 4%.
Table 1. Distribution of companies by geographical area
Region Companies Share
The North of Vietnam 182 13%
The Middle of Vietnam 56 4%
The South of Vietnam 1,162 83%
Total 1,400 100%
Source: VPA, GSO
Vietnam Plastic Industry Page 8 of 41
In the present structure of the plastics industry, packaging firms account for the largest proportion (39%) and they also represent the largest export ratio (accounting for 66%). Consumer group accounted for 22%, this group narrowed most compared to 2007 period. Construction group had strong growth in the years 2007 - 2008 due to huge demand for construction at that time; however, this segment is facing many difficulties due to the freezing of the real estate market in the past few years. Technical plastics group accounted for 19%.
Table 2. Distribution of companies by product category Companies Share
Product category 2007 2012 2007 2012
Packaging 528 546 38% 39%
Consumer 448 308 32% 22%
Construction 147 280 10% 20%
Technical 277 266 20% 19%
Total 1400 1400 100% 100%
*Note: Packaging products include soft, stiff products such as shopping bags, cosmetic pots. Consumer products include chairs, tables, other furniture. Construction products include water pipes, water tanks, decoration, sheet, roof shelter. Technical products include high quality produces such as pressure pipes, cover of TV
Source: VPA report

Vietnam Plastic Industry Page 9 of 41
528 546
448
308
147
280 277 266
Packaging Consumer Construction Technical
Product category
Number of companies by product category
2007 2013
2.2. Output
During period 2008-2012, Vietnamese plastic industry has grown at an average rate of 20% a year. The output raised from 1,880 million tons in 2007 to 4,500 million tons in 2012, consumption has grown steadily over the years, from 23,2 kilograms per person in 2006 to 42 kilograms per person in 2012.
Table 3. Plastic output and consumption index Year 2007 2008 2009 2010 2011 2012 (*)
Output (thousand tons) 1,880 2,294 3,200 3,800 4,120 4,500
Output growth rate (%) - 22 39 18 8 9
Consumption index (kg/person/year)
24.6 27.8 31.4 35.6 40.2 42
Note: * Estimated
Source: Ministry of Industry and Trade
In recent years, the output of Vietnam plastic industry has continued to grow, although at a slower pace, given the difficulties brought about by rising prices of petrol and materials.
Table 4. Output of plastic products by main categories
Year 2007 2008 2009 2010 2011 2012 (*)
Kind of products
Volume (tons)
Rate (%)
Volume (tons)
Rate (%)
Volume (tons)
Rate (%)
Volume (tons)
Rate (%)
Volume (tons)
Rate (%)
Volume (tons)
Rate (%)
Packaging 714,400 38% 917,600 40% 1,328,000 41,5% 1,482,000 39% 1,627,400 39,5% 1,800,000 40%
Consumer 488,800 26% 619,380 27% 896,000 28% 1,140,000 30,% 1,277,200 31% 1,440,000 32%

Vietnam Plastic Industry Page 10 of 41
Construction 413,600 22% 481,740 21% 576,000 18% 646,000 17% 618,000 15% 652,500 14.5%
Technical 150,400 8% 160,580 7% 272,000 8,5% 342,000 9% 370,800 9% 382,500 8.5%
Others 112,800 6% 114,700 5% 128,000 4% 190,000 5% 226,600 5,5% 225,000 5%
Total 1,880,000 100% 2,294,000 100% 3,200,000 100% 3,800,000 100% 4.120,000 100% 4,500,000 100%
Note: * Estimated
Source: Ministry of Industry and Trade and GSO
Of the total plastic output in 2012, plastic packaging accounts for 40% while plastic consumer, construction materials, and technical account for 32%, 15% and 9% respectively.
2.3. Market and Export capacity
Vietnam plastic exports has enjoyed a noticable growth since 2007. 2010 was a milestone of Vietnam plastic exports with the turnover of over USD 1.2 billion for the first time. Since then,
export revenue kept on strongly growing to nearly USD 2 billion in 2012. This is considerable growth by Vietnam plastic industry, showing a strong recovery of plastic industry after the 2008 financial crisis, a positive sign of development for Vietnam plastic industry.
Table 5. Export turnover during the period 2006 – 2012
Year 2006 2007 2008 2009 2010 2011 2012
Export turnover (million USD) 478 750 922 968 1,268 1,599 1,995
The growth rate (%) - 56% 23% 4.90% 31% 26% 25%
Source: Ministry of Industry and Trade, Vietnam Custom

Vietnam Plastic Industry Page 11 of 41
Vietnamese plastic products have been sold in 151 countries all over the world such as Japan, USA, The Netherlands, Germany, Cambodia, UK, Indonesia, and Malaysia, and so on. During last five years, Pacific Asia has still been the biggest market of Vietnam (nearly 60% in 2012). Europe market kept a stable ratio (around 28%).
Table 6. Export turnover by region 2008-2012 (thousand USD)
2008 2009 2010 2011 2012 Markets
Export value
Ratio (%)
Export value
Ratio (%)
Export value
Ratio (%)
Export value
Ratio (%)
Export value
Ratio (%)
Pacific Asia 478,307.8 51.9 516,521.0 53.3 729,316.1 57.5 927,343.9 58.0 1,167,234.1 58.5
Europe 260,811.4 28.3 271,088.8 28.0 352,608.5 27.8 450,881.0 28.2 568,652.5 28.5
America 172,338.3 18.7 167,978.2 17.4 171,230.7 13.5 199,858.6 12.5 235,442.1 11.8
Africa 10,137.5 1.1 12,586.3 1.3 15,220.5 1.2 20,785.3 1.3 23,943.3 1.2
Source: Ministry of Industry and Trade
Vietnam plastic export turnover to Italy is quite stable (around 20-30 million USD). The export turnover to China has reduced significantly (from 247 million USD in 2008 to 26 million USD in

Vietnam Plastic Industry Page 12 of 41
2012). Japan is still top-three importer for Vietnam plastic products. However, the export turnover has decreased sharply from 321 million USD to 143 million USD. This situation is the same with Thailand. The total turnover of Vietnam plastic products to Thailand declined from 137 million USD to 27 million USD.
Table 7. Export turnover by country 2008-2012 (thousand USD)
Countries 2008 2009 2010 2011 2012
United States of America 161,734 136,356 114,605 137,777
150,357
Japan
321,429
250,397
194,194
143,535
143,688
Netherlands
98,942
86,463
66,591
47,200
63,838
Germany
140,073
105,769
71,588
55,970
35,682
France
70,002
42,536
32,941
30,248
32,610
Thailand
137,903
79,457
46,139
30,061
27,156
Italy
22,693
28,618
23,728
32,751
27,079
China
247,608
97,514
55,584
34,670
26,010
Malaysia
58,536
48,139
34,144
23,997
24,719
Indonesia
140,836
84,710
44,525
19,259
13,191
United Kingdom
73,000
85,914
53,990
41,993
6,417
Source: Ministry of Industry and Trade
2.4. Material sources
Scarcity of locally produced raw materials poses itself as one of the main barriers to the stable development of the Vietnamese plastic industry in the long term, causing a heavy dependency on imports. As reported, domestic supply of raw materials can meet only 15-20% of the country’s demand (see more data at table 8). Therefore to feed this fast-growing sector, Vietnam has to import a huge quantity of raw materials and auxiliary chemicals. In 2012, import value of plastic materials reached USD 4 billion, twice as much as its export turnover. Because local petro-chemical capacities could not meet fully domestic enterprises demand, domestic raw materials can meet only 15-20% percent of the country’s demand and in fact 80% - 85% of raw materials should be imported from abroad.

Vietnam Plastic Industry Page 13 of 41
Table 8. Quantity and turnover of imported material in 2008-2012 Year 2008 2009 2010 2011 2012
The quantity of imported material in VN (tons)
1,747,845 2,195,645 2,390,162 2,555,997 2,233,999
Import value (thousand USD)
2,952,671 2,814,182 3,784,117 4,763,144 4,000,701
Source: Ministry of Industry and Trade
Table 9. Production capacities of some big domestic companies Item Raw materials Producers Capacities Remarks
1 PVC Phu My Chemicals & Plastics Co. Ltd. TPC Vina Chemicals & Plastics Co. Ltd.
Total capacities of the two companies: 300.000 tons/ year
20% for export 80% for local suply
2 PP Vietnam Petro Chemicals Group
150.000 tons/ year
3 PET Formosa Taiwan - Hung Nghiep Co., Ltd.
150.000 tons/ year 30% for export
4 EPS Việt Nam Polystyrene Co., Ltd
30.000 tons/ year
5 DOP LG VINA Chemicals JV Co.
30.000 tons/ year
6 BOPP film Youl Chon Vina Plastic JS Co.
12.000 tons/ year
Formosa Taiwan - Hung Nghiep Co., Ltd.
40.000 tons/ year
Source: VPA
At present, Vietnam has imported over 30 categories of plastic materials served for production, in which PE and PP are the most imported ones. In 2012, PE was imported from 25 countries in

Vietnam Plastic Industry Page 14 of 41
the world with total imported quantity 544 thousand tons, worth 775 million USD. In which, Saudi Arabia is the biggest PE exporter to Vietnam, counted 33% of total PE imported. PP is the second largest imported material in plastic industry with 472 thousand tons, worth 701 million USD. Saudi Arabia still kept the position of top PE exporter to Vietnam, counted 22% of total PE imported.
Table 10. Plastic materials imported into Vietnam Year 2008 2009 2010 2011 2012
Product label
Imported quantity (Tons)
Value
(Thousand USD)
Imported quantity (Tons)
Value
(Thousand USD)
Imported quantity (Tons)
Value
(Thousand USD)
Imported quantity (Tons)
Value
(Thousand USD)
Imported quantity (Tons)
Value
(ThousandUSD)
PE 547,555 856,113 692,251 795,528 750,775 1,016,752 819,182 1,218,962 544,936 775,030
PP 495,494 731,504 628,457 670,299 607,493 817,569 629,057 1,021,762 472,011 701,170
Polyester 68,300 112,810 67,357 96,786 72,476 123,834 65,155 129,338 202,324 361,704
PET 61,225 85,691 133,893 144,915 187,149 244,073 212,361 353,105 146,706 212,321
PVC 98,988 127,563 139,636 131,736 131,597 152,849 134,847 181,639 133,327 155,871
PS 80,710 146,470 77,040 103,688 90,948 150,810 102,526 202,060 108,027 195,987
ABS 48,178 96,997 63,527 100,415 69,154 144,359 78,358 186,994 87,041 189,670
EVA 45,495 90,909 48,746 73,576 56,703 112,489 57,097 140,889 66,338 131,816
Acrylic 32,732 59,483 40,369 71,343 55,673 113,730 53,263 128,792 60,260 138,397
Polyether 32,028 74,180 42,998 86,312 52,068 126,506 61,332 193,912 58,580 174,342
PC 18,282 51,914 19,875 44,364 30,050 84,833 35,440 111,249 40,088 111,493
PA 10,947 34,927 15,930 40,661 20,603 69,544 42,796 161,783 39,789 130,691
PU 37,381 112,414 38,748 108,608 49,233 147,146 47,694 159,441 34,275 116,066
Alkyd 25,951 45,627 30,294 45,376 32,643 52,448 32,277 61,166 33,918 66,614
EPS 28,011 44,007 36,467 44,256 46,863 69,838 40,656 67,698 30,516 48,064
Lactic-acid PP
5,040 10,505 10,337 14,308 10,854 19,277 8,845 22,014 27,441 46,872
Amino 5,453 9,115 5,630 9,597 5,585 9,962 8,061 18,782 13,953 30,430
Silicone 6,457 30,013 5,567 27,128 8,255 42,454 9,545 50,984 13,653 75,768
Epoxide 12,679 32,248 11,677 25,163 13,395 37,753 14,873 52,873 12,727 48,980
Xenlulo & DX
9,183 29,448 9,957 31,404 12,292 40,469 11,753 52,990 12,437 49,302
Styrene-acrylonitrile
(SAN) copolymers
6,915 12,430 6,746 8,768 7,318 14,163 7,966 17,490 11,888 22,586
PVAC 3,899 8,710 3,807 8,498 5,457 11,957 5,881 13,589 11,736 25,087
PVA 7,027 17,999 6,772 15,812 7,856 19,697 7,058 20,551 9,196 22,138
Melamine 6,536 10,314 6,998 9,881 12,362 15,862 13,526 17,096 8,199 10,953
Phenolic 5,481 10,494 7,164 12,186 7,454 15,116 8,027 17,696 8,008 17,966
Urea 11,107 12,452 9,532 10,420 5,205 6,503 3,602 5,879 7,121 8,549

Vietnam Plastic Industry Page 15 of 41
Cumaron – indene
4,205 7,009 5,009 6,678 5,414 8,143 5,770 11,063 6,110 12,300
VCM 1,128 3,425 2,117 6,997 3,580 12,551 3,358 13,539 4,436 13,605
PMMA 6,945 16,369 7,601 16,801 5,671 15,827 6,505 19,879 3,821 10,973
Natural Polymer
1,452 5,708 1,702 7,216 1,395 10,176 1,893 9,865 1,614 9,060
Ion-exchange
resin 1,296 3,645 1,402 2,492 1,330 3,764 1,010 3,426 1,190 3,899
PTFE 479 5,055 2,271 4,552 304 4,459 670 14,760 853 17,929
Fluoro-polymers
nes 1,065 15,616 731 10,765 1,425 22,869 1,215 23,624 523 15,549
Other 20,221 41,507 15,037 27,653 21,582 46,335 24,398 58,254 20,957 49,519
Source: Ministry of Industry and Trade/ Vietnam Customs
2.5. Machinery and technology
2.5.1. Machinery
Most of the capital equipment in the plastic industry is imported (from about 60 countries in the world). The majority of imported machinery is from Asia countries (including Taiwan, Japan, China, South Korea) and Europe countries (Germany, Belgium, Italy and Austria). However, more than half of imported machine are out-of-date equipment. The total market for plastic machinery in 2012 was approximately US$ 450 million, increasing from US$ 148 million in 2005 (3 times).
Table 11. Plastic machinery market size
Year 2005 2007 2008 2009 2010 2011 2012
Imported plastic machinery (USD)
148,625,490 325,177,069 370,994,588 244,130,860 372,223,167 433,687,546 450,452,630
Growth rate (%) - 119% 14% -34% 52% 16.50% 3.90%
Source: Ministry of Industry and Trade

Vietnam Plastic Industry Page 16 of 41
During the period 2007-2012, China has kept this 1st position in rubber and plastic machinery exporters to Vietnam (nearly 30% of total imported value). Top-five exporters to Vietnam in 2012 are China, Japan, Taiwan, Korean (Republic) and Italy (from rank 7th in 2007 to 5th in 2012). Total exported value of this five countries to Vietnam in 2012 counted nearly 90% total imported value of Vietnam. Notingly, Slovakia (Slovak Rep.) imported rubber and plastic machinery to Vietnam boosted from rank 45th (588 USD) to top-ten exporter to Vietnam (3 million USD).
Table 12. Rubber and plastic machinery (HS 8477). World exports to Vietnam
Unit: Thousand USD
Country 2007 2008 2009 2010 2011 2012
China 83,021.707 89,055.302 67,579.331 108,201.416 117,423.193 132,021.447
Japan 54,538.341 83,258.400 29,508.559 74,903.936 97,959.538 122,889.416
Taiwan 72,616.531 103,885.157 57,232.124 83,881.680 99,744.614 80,680.305
Korea (Republic) 71,063.725 24,229.344 18,796.870 37,723.784 38,982.265 57,500.157
Italy 5,349.275 16,754.280 2,604.884 12,030.714 23,615.516 11,002.750
Malaysia 5,030.842 6,736.048 4,184.939 2,095.831 10,204.797 10,904.165
Austria 1,879.746 1,249.930 8,609.250 3,176.779 3,907.120 7,291.144
Germany 13,628.807 21,898.348 30,570.240 12,247.070 10,492.372 6,408.460
Canada 2,916.139 1,951.390 2,641.266 8,527.574 1,457.170 3,342.216
Slovakia (Slovak Rep.) 588 - - - 1,308.550 3,245.320
United States of America 2,627.702 3,201.204 1,220.601 5,128.233 1,123.759 3,026.853
Thailand 5,849.430 4,499.194 1,043.339 1,850.304 3,741.649 2,497.148
India 1,185.465 1,572.948 286.950 352.724 1,581.979 1,831.478
Singapore 1,275.536 646.742 606.044 501.918 559.183 1,550.667
Switzerland 208.713 127.340 5,357.701 1,012.818 705.220 1,121.297
Mexico 1,076.477

Vietnam Plastic Industry Page 17 of 41
Others 3,397.110 11,928.960 13,888.761 20,588.386 20,880.621 4,063.329
Total 325,177.069 370,994.587 244,130.859 372,223.167 433,687.546 450,452.629
Source: Ministry of Industry and Trade, Vietnam Customs
2.5.2. Technology
In the period 2007 – 2012, along with the fast growth of the plastic industry, plastic firms have invested much to upgrade technology and machinery. However, the percentage of modern technology is still simple and concentrated in the major enterprises only. Since 2005, many plastic processors in Vietnam have invested considerable money in upgrading their manufacturing equipment and machinery to improve their products in terms of quality and design, thus being able to compete successfully in domestic and international markets. For instance, a few large firms are manufacturing high-quality and hi-tech plastic products by using advanced equipment and machines imported from Germany, Italy and Japan.
In average (during the period 2007-2012), Vietnam imported 100 injection machines, over 500 injection blow molding machines and 200 extrusion machines per year. Around 30% of imported machines are new machines and the rest (70%) are second-hand ones.
Up to now, according to data from Ministry of Industry and Trade, there are about 10,000 injection machines, extrusion machines and injection blow molding machines, including nearly 6,000 injection molding machines, more than 3,000 blow molding machines and nearly 1,000 extrusion machines.
Injection technology
This technology is used to make plastic components and parts for the electronics, electrical power, motorbike and automobile industries. Among 6,000 injection molding machines, 75% of them are the second hand used out-of-date technology (made from 2005). Around 1,000 injection molding machines of them are of new generation. The total imported value of injection molding machines of Vietnam increased from 50 million USD in 2007 to 76 million USD in 2012.
Some main brands are currently present in the Vietnam market:
Europe: Engel (Austria); Demag – Battenfeld – Boy- Krauss maffei, Arburg (Germany)
America: Husky (Canada)
Asia
Mitsubishi, Niigata, Toshiba, Kawaguchi, Sumitomo, Nissei, Kurabe (Japan)
Chen De, Chuan Tian, Hai Tian, Yue Hong, Jwell, Keewa, Dakelianshun (China)
LG, Dongshin, Woo Jin, Jinhwa (Korea)
Chuan Lihfa, Fu chu sin, Lien yu, Yanghing, Jonwai, Han Chang (Taiwan)
Injection blow molding technology
A large number of plastic product manufacturers in Vietnam are using injection blow molding machines to produce plastic packaging products, including PET bottles and kegs. The total

Vietnam Plastic Industry Page 18 of 41
imported value of blowing machines decreased from 26 million USD in 2007 to 14 million USD in 2012.
The main brands identified in Vietnam market include: Europe: Sipa (Italy); Sidel (France)
America: Husky (Canada)
Asia: Nissei - Placo (Japan), Kaimei - Parker (Taiwan), Sinco (Thailand); Hongzhen (China)
Extrusion Technology
In Vietnam, this technology is used for making such products as water drainage PVC pipes, water supply PE pipes, aluminum-plastic pipes, optic cables, PVC doors, frames, roofing, and wall coverings. This is a pellicle-blowing technology to make plastic packaging materials from pellicles. This technology is used for blowing polyethylene (PE), polypropylene (PP) bags and PVC pellicles.
The total imported value of extruders increased slightly from 40 million USD in 2007 to 46 million USD in 2012.
The main brands include: Europe: Amut SP (Italy); Battenfelf – Kraussmaffei (Germany); Cincinati (Austria)
America: PTI – Plastic technical International GmbH, SMS Plastic Technology, Tecnomatic (US)
Asia: Shin Kwang Engineering Co., (SK), Yarn Bang Electrical Machinery Co., ltd., SM Platek (Korea); Ka lien, Wuhan, Sen fa Machine Co., ltd (Taiwan); Koei Industrial Co., Ltd, Nissei, Sumittomo, Mitsubishi (Japan), Zhangjiagang (China).
Table 13. Imported machines for plastic manufacturing
Unit: Thousand USD
Imported machines 2007 2008 2009 2010 2011 2012
Injection-molding machines 50,036 55,384 40,203 66,250 68,155 76,060
Extruders 40,769 54,977 26,457 34,325 51,708 46,794
Blowing machines 26,016 10,197 12,983 15,360 16,474 14,091
Vacuum molding machines and other thermoforming machines
55,751 36,507 7,843 28,378 23,822 40,501
Others machines for rubber and plastic manufacturing
127,042 193,673 143,272 194,047 240,702 239,578
Source: Ministry of Industry and Trade, Vietnam Customs
2.6. Labor
In 2012, there are 1,400 plastic firms with around 130,000 labor, working in plastic industry, counted 1.8% of total labor working in manufacturing, 0.25% of total labor in Vietnam. Labor in private plastic firms counted 55.5%. Labor in foreign direct investment companies counted 42%. Labor in state owned enterprises counted 2.5%.
During last time, although the plastic industry is considered having high growth, the plastic

Vietnam Plastic Industry Page 19 of 41
firms are facing with a scarcity in labor supply, especially skilled labor that are able to using new generation equipments. In 2012, there are about 130,000 labors working in plastic industry but that 70% of plastic industry workers were unskilled, low professional skill, unable to operate modern equipments. This percentage is somewhat higher than the combined average of unskilled workers in other industrial sectors such as textiles, footwear… Workers and engineers working in the plastic industry in Vietnam are trained from different mechanical engineering branches of universities and vocational school, there are no training institutions for this sector2.
Table 14. Labor of plastic industry
Labor 2010 2011 2012
Total 107,032 118,925 130,000
Skilled 22% 24.8% 27.17%
Unskilled 78% 74.2% 72.83%
SOEs 3.50% 3% 2.50%
Skilled 27% 31% 33%
Unskilled 73% 69% 77%
Private 56.50% 55% 55.50%
Skilled 17% 19% 21%
Unskilled 83% 81% 79%
FDIs 40% 42% 42%
Skilled 29% 32.00% 35%
Unskilled 71% 58% 65% Source: Ministry of Industry and Trade
According to Human resource development planning of Hochiminh city (HCMC), there are four major economic sectors for the period 2013-2015, orientation for the period 2020 – 2025: electronics, information technology, food processing, chemicals – rubber – plastic and mechanics. HCMC needs 45,900 jobs. In which chemicals – rubber – plastic sector needs 10,800 employees.
According to Ministry of Trade and Industry, the development orientation in the future for labor of plastic industry:
� Along with the focus training in the professional schools, plastic firms need to spend rational cost for retraining staff and technical employees, abroad if necessary. It is essential to effectively use advanced equipment, technology for high product quality and low production costs.
� Develop comprehensive strategic programs and plans in training managers and skilled employees. The training must be conducted in a wide scope to meet the immediate requirements, but also has plans to train for higher-skilled workers for the development in the future
2 In fact, recently, there are some training centers, colleges provide training courses relating: plastic – chemical – petrochemical but it is very few, and their number of students/trainees are small.

Vietnam Plastic Industry Page 20 of 41
� Capacity building for universities, colleges and vocational training to train good managers and skilled workers, meeting the growing needs for labor force in plastic industry.
� Develop training centers, vocational training for plastic industry. These centers operate with the support of enterprises and organizations at home and abroad. These centers are responsible for coordinating with professional units to formulate long term, short term, and thematic training programs to update knowledge and disseminate the latest domestic and international information for trainees.
2.7. Development orientation and policy for plastic industry to 2020
Production and consumption of plastic enterprises in the industry next time will be affected significantly from tightening monetary policy, decreasing public investment spending, as well as the grim situation of the construction industry and real estate. Under this curriculum, on 17 June 2011, the Ministry of Industry and Trade issued Decision no 2992/QD-BCT approving the planning on development of Vietnam's plastic branch until 2020, with orientation to 2025. According to this plan, Plastics’ export revenue is expected to reach US $2.15 billion and US $4.3 billion by 2015 and 2020, respectively; the growth rate is expected approximately 17.56% per year in the period 2011-2015, and, gradually reducing plastic packaging products and plastic consumer, increasing proportion of construction and technical plastics.
2.7.1. Development orientation
� Development of plastic industry shall be oriented to modernization, intensifying automation, gradually eliminating old equipment and technologies to substitute with world state-of-the-art equipment, new materials usage to ensure quality, safety, hygiene norms, meeting environmental criteria requested by Vietnam and the world.
� Plastic industry investment should go straight into modern technologies to create high quality products with low costs that could compete on domestic and world markets, ensuring ecological environment
� To mobilize all resources at home and abroad to focus on investment in plants producing materials, semi-finished products, chemicals, additives for plastic industry. Besides, to encourage investment in mold manufacturing, parts and equipment for the plastic industry; to encourage the development of waste and scrap plastic processing industry.
2.7.2. Gross output targets of plastic industry
Table 15. Gross output targets of plastic industry
2015 2020 2025
Gross output of plastic industry at constant 1994 prices
78,500 billion dong
3.74 billion USD
181,577 billion dong
8.65 billion USD
390,000 billion dong
18.67 billion USD
2011 - 2015 2016 - 2020 2021 - 2025

Vietnam Plastic Industry Page 21 of 41
Growth rate 17.56% 18.26% 16.52%
2.7.3. Value added targets of plastic industry
Table 16. Added value targets of plastic industry
2015 2020 2025
Added value of plastic industry at constant 1994 prices
10,908 billion dong
0.52 billion USD
19,319 billion dong
0.92 billion USD
32,274 billion dong
1.54 billion USD
2011 - 2015 2016 - 2020 2021 - 2025
Growth rate 12.75% 12.11% 10.81%
2.7.4. Production targets of plastic products
Table 17. Production targets of plastic products
2015 2020 2025
Production of plastic products
7.5 million tons 12.5 million tons
Ratio of plastic in structure of the whole industry
5.0% 5.5% 6.0%
2.7.5. Plastic industry products proportions targets
Table 18. Plastic industry products proportions targets (unit: %)
2015 2020 2025
Total in plastic industry 100 100 100
Plastic packaging 36 34 31
Construction plastics 23 25 27
Household plastics 20 18 17
Technical plastics 21 23 25
2.7.6. Plastic industry products export targets
Table 19. Plastic industry products export targets
2015 2020
Export turnover (billion USD) 2.15 4.3
Growth rate (%/year) 15.43 14.87

Vietnam Plastic Industry Page 22 of 41
2.7.7. Development master plan to 2020
Table 20. Development master plan in 2011 -2015 period
Targeted production capacity Total investment capital
Plastic packaging 1,218 thousand tons 13,885 billion dong 0.66 billion USD
Construction plastics 927 thousand tons 7,898 billion dong 0.38 billion USD
Household plastics 702 thousand tons 6,571 billion dong 0.31 billion USD
Technical plastics 853 thousand tons 15,354 billion dong 0.73 billion USD
Table 21. Development master plan in 2016 -2020 period
Targeted production capacity Total investment capital
Plastic packaging 1,550 thousand tons 15,810 billion dong 0.75 billion USD
Construction plastics 1,400 thousand tons 10,752 billion dong 0.51 billion USD
Household plastics 750 thousand tons 6,480 billion dong 0.31 billion USD
Technical plastics 1,300 thousand tons 20,280 billion dong 0.97 billion USD
2.7.8. PP import tax Table 22. PP import tax
2014 2015 2016 onwards
Import tax 1% 2% 3%
Based on this plan, Ministry of Industry and Trade also offer appropriate solutions for each stage of development of the industry. And, the solutions for capital are the most important. Besides equity capital, joint-venture capital, plastics companies will be given priority to borrow loans from Government credit sources. The total investment for plastic industry in the period 2011-2020 is estimated VND 241,066 billion. These funds focus for investment and expansion manufacturing, technological innovation and human resources. This is an opportunity for plastic firms to capacity building, increasing competitiveness.
In order to remove difficulties for materials issues in plastic sector, the Government encourages foreign investors to participate in the production of plastic materials in Vietnam on the basis of domestic oil resource, creating favorable conditions for the cooperation for investors in petrochemical, chemical, plastics industry. The Government also creates favorable conditions for domestic enterprises to participate in the materials project for the plastic industry. Besides, the Government provides credit priority policies for the project in plastic pattern (borrowing 85% of the capital of the Bank for Investment and Development, providing guarantees to each specific project while borrowing foreign capital…). To encourage plastic

Vietnam Plastic Industry Page 23 of 41
enterprises to develop, the State will provide tax priority policies, creating favorable conditions for the import plastic materials, innovation and science and technology transfer, human resource training, market expansion... According to the plan, in order to achieve the above objectives, capital accumulation from enterprises is expected about 28-30% of capital requirements for the industry development, credit loans counts 12-14% and FDI counts 30-32%.

Vietnam Plastic Industry Page 24 of 41
3. SURVEY ABOUT PLASTIC PROCESSING TECHNOLOGIES IN VIE TNAM
3.1. Introduction
3.1.1. Survey objectives
The same to the research in 2007, the 2013 survey aims at the following purposes:
� To define the reality of equipment and technology application in Vietnam plastic industry nowadays.
� To determine demand of equipment use of plastic enterprises in Vietnam in the coming future.
� To update records of 200 plastic enterprises in Vietnam for the purpose of market survey and analysis, sales and marketing strategy.
3.1.2. Survey objects
Survey subjects are 200 plastic enterprises of all economic sectors in Vietnam, including state-owned, private and foreign-invested enterprises.
Based on the experiences from the previous survey and current situation, the survey team sorted out the list of interviewed subjects according to the following requirements:
� Prefer enterprises ever participated in 2007 survey
� Enterprise established by Enterprise Law of Vietnam
� Having factory/plants meeting national standard
� Applying the following technologies: injection molding, blow molding, extrusion
� Belonging to one of the 4 main sub-sectors applying the above-mentioned technologies, i.e. packaging materials, consumer, technical and construction plastic production.
3.1.3. Survey tools
� Desk study
This method helps collect and analyse current situation of plastic industry in Vietnam, general information of plastic enterprises from secondary data/information, existing researches, surveys or articles.
� Telephone interview
The telephone interviews are intended to check the existing/validity of plastic enterprises and collect some general information.
The plastic enterprise list was provided by ICE (from the 2007 research). On that basis, the first, the survey teams checked address of SMEs through directly telephone or email. About 50% of these 200 plastic enterprises in the list has changed address or dissolved or do not want to attend the interview. The interviewers had to search for exact address or alternative enterprises.

Vietnam Plastic Industry Page 25 of 41
� Survey and directly interview based on questionnaire
A questionnaire is built to collect information on plastic enterprises in Vietnam with specific eyes on their (i) general information of enterprises (Name, address, telephone, establishment year, number of staff, enterprise type, turnover, plastic consuming rate, output capacity, etc...); (ii) Plastic production technology of plastic enterprises; (iii) their equipment/machinery (see attached sample). This questionnaire is the same to questionnaire in 2007 survey. Sample questionnaire is provided in Annex - Questionnaire.
3.1.4. Survey process
Interviewers were divided into survey teams in 3 corresponding regions. Each team was trained to clearly understand the survey content. The questionnaire was collected and checked the validity twice. Providing that there was any missing, unclear, illogical information in the questionnaire, interviewers were requested to re-interview. Total 200 plastic firms were interviewed. Collected data was entry by Excel and processed using statistical software – SPSS.
3.2. The survey’s main results
With the preferred list of about 300 enterprises, the interview team has directly interviewed
Survey teams
Desk study
Survey preparation
Provide training for interviewers
Check enterprise list
Literature findings
Logistic for the survey
Adjusted list
Conduct field survey in HCMC, Binh Duong, Long An, Dong Nai, Soc Trang,
Tay Ninh, Ba Ria, Vung Tau, Hai Phong, Hanoi, Bac Ninh, Quang Nam
200 questionnaires collected
Data entry and analysis
Report
Vietnam Plastic Industry Page 26 of 41
200 ones. The majority outcome performed in this part has been based on the data taken from these 200 questionnaires.
3.2.1. Type of ownership
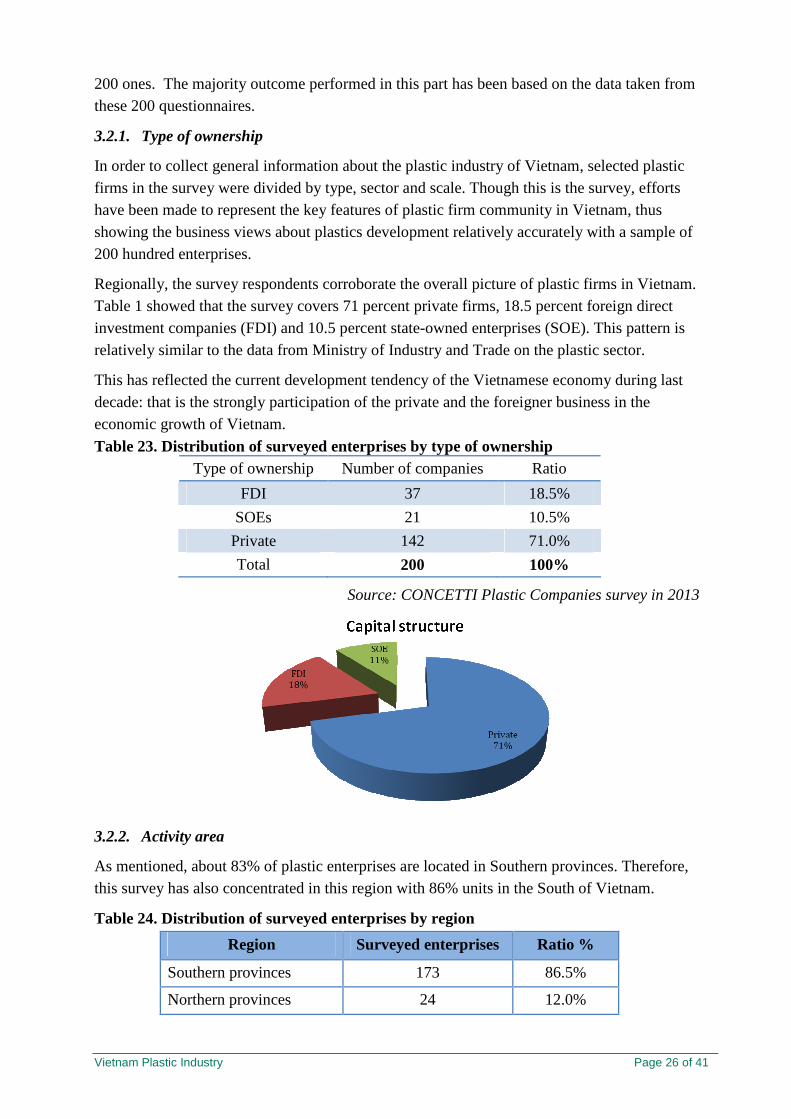
In order to collect general information about the plastic industry of Vietnam, selected plastic firms in the survey were divided by type, sector and scale. Though this is the survey, efforts have been made to represent the key features of plastic firm community in Vietnam, thus showing the business views about plastics development relatively accurately with a sample of 200 hundred enterprises.
Regionally, the survey respondents corroborate the overall picture of plastic firms in Vietnam. Table 1 showed that the survey covers 71 percent private firms, 18.5 percent foreign direct investment companies (FDI) and 10.5 percent state-owned enterprises (SOE). This pattern is relatively similar to the data from Ministry of Industry and Trade on the plastic sector.
This has reflected the current development tendency of the Vietnamese economy during last decade: that is the strongly participation of the private and the foreigner business in the economic growth of Vietnam.
Table 23. Distribution of surveyed enterprises by type of ownership Type of ownership Number of companies Ratio
FDI 37 18.5%
SOEs 21 10.5%
Private 142 71.0%
Total 200 100%
Source: CONCETTI Plastic Companies survey in 2013
3.2.2. Activity area
As mentioned, about 83% of plastic enterprises are located in Southern provinces. Therefore, this survey has also concentrated in this region with 86% units in the South of Vietnam.
Table 24. Distribution of surveyed enterprises by region
Region Surveyed enterprises Ratio %
Southern provinces 173 86.5%
Northern provinces 24 12.0%

Vietnam Plastic Industry Page 27 of 41
Central provinces 3 1.5%
Total 200 100%
Source: CONCETTI Plastic Companies survey in 2013
3.2.3. Type of business
The survey data also revealed that 73 percent in the sample firms are limited liability companies. Joint stock companies have occupied the portion of 25 percent, while private companies only achieved a ratio of 2 percent.
Table 25. Surveyed companies by form of ownership
Type of business Number of companies Ratio %
Limited liability 146 73%
Joint stock 50 25%
Private 4 2%
Total 200 100%
Source: CONCETTI Plastic Companies survey in 2013
3.2.4. Activity scope
More than 47 percent of the survey respondents are engaged in the plastic packaging sub-sector, key product of Vietnamese plastic industry (nearly 40 percent of total plastic firms in Vietnam

Vietnam Plastic Industry Page 28 of 41
operate in this packaging). More than 23 percent are involved in consumer/household plastic, while 16.5 percent of 200 firms operate in industrial plastic, and 12.5 percent in pipe.
Table 26. Survey companies by type of plastic products manufactured
Types of plastic products Number of companies Ratio %
Packaging 95 47.5%
Consumer 47 23.5%
Industrial 33 16.5%
Pipe 25 12.5%
Total 200 100.0%
Source: CONCETTI Plastic Companies survey in 2013
3.2.5. Staff
The surveyed plastic enterprises are concentrated in the labor force categories of medium (from 200-300 staff) and small (under 200 staff) sizes3. The survey data also revealed that nearly half of responding enterprises can be considered small enterprises with less than 200 employees (43.5%). 24 percent of firms can be considered medium enterprises with 200 to 300 employees. 32.5% firms are large firm more than 300 employees.
Meanwhile, the labor rate of the 37 foreign direct investment (FDI) enterprises belong mostly to the groups of 200-300 staff, 300-500 staff, and 500-1,000 staff equivalent with the ratio of 35.1%, 16.2% and 18.9%.
The same to FDI, the state owned enterprises (SOEs) enterprises are concentrated in the group “200-300 staff” with 35.1%. Firms with 500 to 1000 employees counted 24%. Firms with 300 to 500 employees and over 1,000 employees equally distributed with 19 percent of the sample.
Private companies are slightly more concentrated medium labor force scale category (under 200 employees) which accounts for 53.5% of the total of 142 private companies surveyed enterprises. Surprisingly, 3.5% of private companies have over 1,000 staff.
3 Decree No. 56/2009/ND-CP of June 30, 2009, on assistance to the development of small and medium-sized enterprises

Vietnam Plastic Industry Page 29 of 41
Table 27. Surveyed companies by employees categories and form of ownership
Number of employees Type of company
Under 100
staffs
100 -200 staffs
200-300 staffs
300-500 Staffs
500-1000 staffs
over 1000 staffs
Total
Private company
25.4% 28.2% 19.7% 12.0% 11.3% 3.5% 100.0%
FDI 10.8% 16.2% 35.1% 16.2% 18.9% 2.7% 100.0%
SOE 0.0% 4.8% 33.3% 19.0% 23.8% 19.0% 100.0%
Source: CONCETTI Plastic Companies survey in 2013
3.2.6. Turnover
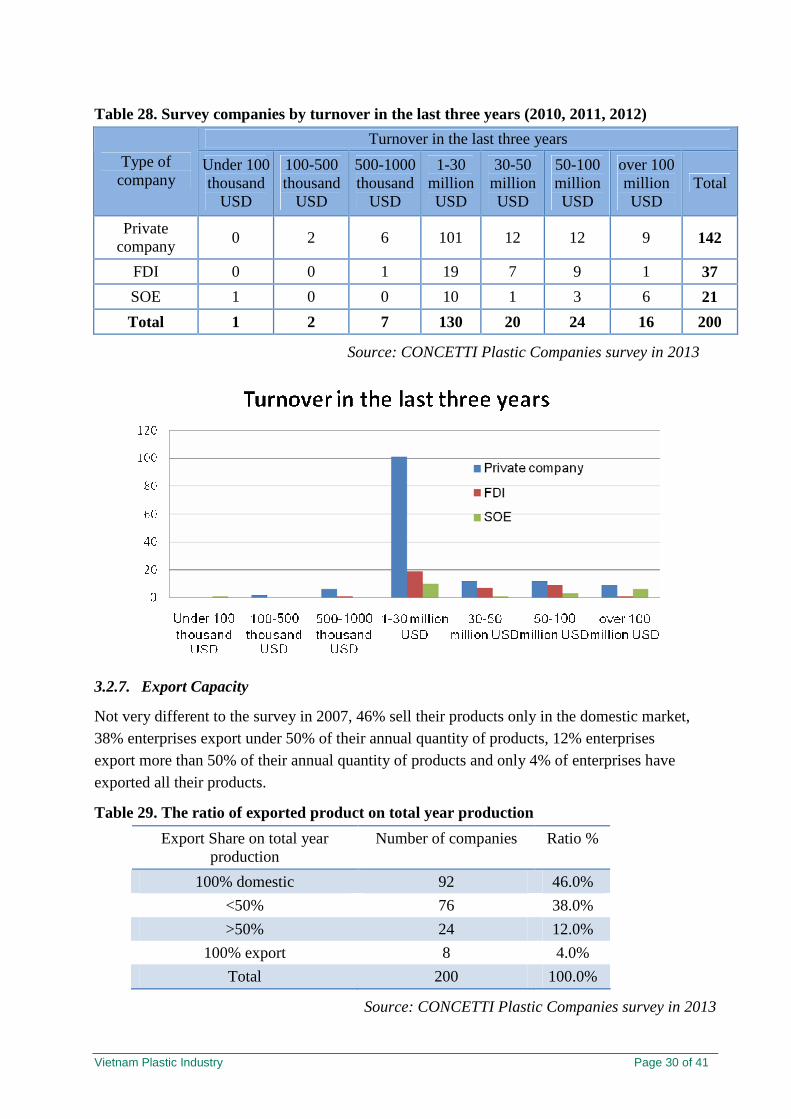
Table 27 shows turnover in the last three years (2010-2012) of a firm in the survey. An average firm has around 36 million USD of turnover for the period 2010-2012.
As mentioned in the first part of this report, only 6% of plastic firms in Vietnam are state-owned, but they represent about 25% of the total capital invested in the industry. Nearly 95% of surveyed SOEs have three years turn over more than 1 million USD, and 30% have three years turn over more than 100 million USD.
More than half of surveyed FDI firms have three years turn over from 1-30 million USD, 43% of them have three years turn over from 30 to 100 million USD. More than 70% private companies have three years turn over from 1 to 30 million USD. Surprisingly, 6.3% of surveyed private companies SOEs have three years turn over more than 100 million USD.
Vietnam Plastic Industry Page 30 of 41
Table 28. Survey companies by turnover in the last three years (2010, 2011, 2012)
Turnover in the last three years
Type of company
Under 100 thousand
USD
100-500 thousand
USD
500-1000 thousand
USD
1-30 million USD
30-50 million USD
50-100 million USD
over 100 million USD
Total
Private company
0 2 6 101 12 12 9 142
FDI 0 0 1 19 7 9 1 37
SOE 1 0 0 10 1 3 6 21
Total 1 2 7 130 20 24 16 200
Source: CONCETTI Plastic Companies survey in 2013
3.2.7. Export Capacity
Not very different to the survey in 2007, 46% sell their products only in the domestic market, 38% enterprises export under 50% of their annual quantity of products, 12% enterprises export more than 50% of their annual quantity of products and only 4% of enterprises have exported all their products.
Table 29. The ratio of exported product on total year production
Export Share on total year production
Number of companies Ratio %
100% domestic 92 46.0%
<50% 76 38.0%
>50% 24 12.0%
100% export 8 4.0%
Total 200 100.0%
Source: CONCETTI Plastic Companies survey in 2013

Vietnam Plastic Industry Page 31 of 41
3.2.8. Current situation of processing technologies
More than half of 200 surveyed plastic firms used multi-technologies (56.5%). They applied injection molding, blow molding, extrusion at the same time. 23% of surveyed firms used only extrusion technology. This figure is 15% with injection molding and 5.5% with blow molding.
Table 30. Ratio of plastic technologies being used in surveyed companies
Technologies Number of companies Ratio %
Blow Molding 11 5.5%
Extrusion 46 23.0%
Injection molding 30 15.0%
Other (use both Injection molding and/or Blow Molding and/or Extrusion…)
113 56.5%
Total 200 100.0%
Source: CONCETTI Plastic Companies survey in 2013
Currently, most of companies used machines from various countries. The main foreign suppliers of the plastic processing machinery to the surveyed firms are from the regional countries such as Taiwan (160/200 companies are using machines from Taiwan), China (106/200), Japan (65/200). There are 20 companies among 200 surveyed companies used machines from Italy and 9/200 companies used machines from Vietnam.
Table 31. Surveyed companies by machine exporters
Countries Number of companies
Taiwan 160
China 106
Japan 65
South Korea 43
Italia 20

Vietnam Plastic Industry Page 32 of 41
Germany 20
Vietnam 9
Others (America , Austria, Australia, Canada, Denmark, France, Hongkong, India, Malaysia,
Swiss, Thailand)
36
Source: CONCETTI Plastic Companies survey in 2013
There is a relationship between the company turnover with the percentage of new machines purchased. Nearly 70% of firms have over 100 million USD of three years turnover have 100% new machines. This figure decreased gradually with each group: 63% of the group having “50-100 million USD of turn over”, 50% - “30-50 million USD”, 32%- “1-30 million USD”. Only group having turnover “under 1 million USD” have 100% second-hand machines with 10% of surveyed companies.
Table 32. Surveyed companies by turnover category and new machines purchased
New machines purchases Turnover in the last three years 100% new
machines > 50% new machines
<50% new machines
100% second-hand
machines
Total
Under 1 million USD
4 5 0 1 10
1-30 million USD 41 80 8 1 130
30-50 million USD 10 10 0 0 20
50-100 million USD
15 9 0 0 24
Over 100 million USD
11 4 1 0 16
Total 81 108 9 2 200 Source: CONCETTI Plastic Companies survey in 2013

Vietnam Plastic Industry Page 33 of 41
Disaggregating by type of ownership shows a wide discrepancy. 86.9% of surveyed FDIs have 100% new machines purchased. Interestingly, more than 90% of private companies have more than 50% new technology new machines purchased, of which 30% of private companies have 100% new machines purchased. None of surveyed SOEs have 100% second-hand machines.
Table 33. Surveyed companies by form of ownership and new machines purchased
New machines purchases Type of company
100% new machines
> 50% new machines
<50% new machines
100% second-hand
machines
Total
Private company 30.3% 62.7% 6.3% 0.7% 100.0%
FDI 86.5% 10.8% 0.0% 2.7% 100.0%
SOE 28.6% 71.4% 0.0% 0.0% 100.0%
Source: CONCETTI Plastic Companies survey in 2013
3.2.9. Plans for purchasing machine, equipment in next two years
One of the top issues for this survey is plan for purchasing machine, equipment in 2013-2014, whether they intend to undertake any activities to renovate and develop technology/equipment. As Table 32 displays, firms appeared to have different plans to different activities. One third of respondents (32%) planned to buy machine/equipment in the next two years. Not surprisingly, two thirds of respondents (68%) did not plan to purchase machine/equipment in the next two years. It is reasonable in the context of difficulties currently. Of which, 43% of surveyed SOEs intended to buy machines/equipment, follow by “private company” with 35% of them planned to buy machine/equipment. Few FDIs planned for purchasing equipments with 16.2%.
Table 34. Plans for purchasing machine, equipment in the next two years
Type of companies Having plans on buying equipments
Not having plans on buying equipments
Total

Vietnam Plastic Industry Page 34 of 41
Private company 49 93 142
FDI 6 31 37
SOE 9 12 21
Total 64 136 200 Source: CONCETTI Plastic Companies survey in 2013

Vietnam Plastic Industry Page 35 of 41
4. CONCLUSION
Plastic industry is recognized as an active and prospective branch of economy in Vietnam, also thanks to the following reasons:
� Increase in industry demand and market requirement
� Plans to increase quality, manufacturer, etc as detailed in the Government’s Strategy to 2020, with orientation to 2025
� Priority policies for foreign investment in Vietnam
� Stable growth of country’s economy
� Political stability
� The labor force has solid educational background, is hardworking and is potentially capable of advancing their skills
� Ability to remain agile and deal with smaller orders
We can come to the following conclusions.
� Vietnam is one of the countries that have highest growth rate of plastics production with average growth of over 20% in value and over 18.75% in production from 2006 until now. In contrast with the slow down of global plastics industry during the economic crisis, the growth of Vietnam plastics industry is thank to domestic demand remains high. Currently, domestic demand reaches 42 kg per capita. The average demand is likely to climb further and contribute greatly to production output and export turnover of the country’s plastic industry.
� Plastics industry is one of the State’s top priority sectors due to high and stable growth, strong exports, and competitiveness compared with other countries in the region.
� Export turnover hit 1 billion USD for the first time in 2010 and Vietnam plastics brand is gradually strengthened in hard-to- pleased export markets. Plastic products from Vietnam are exported to the hard-to-pleased markets that require certain product quality like Japan, America and Germany. This proved that Vietnam’s plastics products has a stable quality level.
� In general, Vietnam plastics industry is developing spontaneously and not concentrated. there are approximately more than 1,400 plastics firms today. Competition is more aggressive in the South with 83% of the businesses in this region, followed by the North with 13%. Packaging is the largest segment in the plastics industry: There are about 546 firms that are producing plastic packaging (39%) nationwide.
� The plastics industry has been among the fastest growing industries in Vietnam during the recent years. The industry’s growth is more extensive rather than intensive with out-of-date technology and little value added. Depending up to 80% on imported raw materials, Vietnam plastics industry is not stable and initiative, and need large working capital.

Vietnam Plastic Industry Page 36 of 41
� Recycled plastics products are finally noticed: The recycled plastics segment is becoming more popular in Vietnam as firms have the advantages of latest technology. Global supply can still not meet demand for this line of products, especially PET products. This is a good chance for Vietnamese firms that can produce these products.
� The potential growth of Vietnam’s plastic industry is a good opportunity for foreign investors and suppliers of raw materials, technology, and machinery. Indeed, the survey indeed shows that 32% of responding firms have an intention to purchase new machinery in the next two years’ time.
� Italian machines are present in the market, although with a rather modest market share. Competitors from regional countries are taking the lion’s share. This result is probably underpinned by a strong price competitiveness but also by a geographical and cultural proximity which makes after-sales service and marketing easier. Both issues should have a strong priority among those which need to be dealt with by local and Italian enterprises and/or their associations and promotion institutions as Ice.

Vietnam Plastic Industry Page 37 of 41
ATTACHMENT – SURVEY QUESTIONNAIRE
BCH SỐ: ...................................
QUESTIONAIRE NO
PVV
Interviewer
Giám sát
Supervisor
Đọc kiểm
Test
Phúc tra
Check
Mã hóa/Nhập liệu
Data enter
Tên: ………… Name
Ngày: ...……… Date
Tên: …………. Name
Ngày: ………... Date
Tên: ……….. Name
Ngày: ……… Date
Tên: ………... Name
Ngày: ……… Date
Tên: ………... Name
Ngày: ……….. Date
Nhằm chuẩn bị cho các dự án xúc tiến thương mại, đầu tư giữa các doanh nghiệp Ý và doanh nghiệp Việt Nam, THƯƠNG VỤ Ý (ITALIAN TRADE COMMISSION) trân trọng giới thiệu đến Quý công ty “Chương Trình Cập Nhật Thông Tin Doanh Nghiệp Ngành Nhựa Việt Nam năm 2013”. Tất cả các thông tin từ Quý công ty sẽ là nhịp cầu nối giữa Quý công ty với các doanh nghiệp Ý trong tương lai.
Chúng tôi kính mong Quý công ty dành chút thời gian quý báu để trả lời những câu hỏi dưới đây. Chúng tôi tin rằng đây cũng là một trong những cách thức tự quảng bá hiệu quả của Quý công ty với các nhà đâu tư Ý. Chúng tôi chân thành cảm ơn sự hợp tác của Quý công ty.
I. THÔNG TIN ĐÁP VIÊN/ I NTERVIEWEE’S INFORMATION
Tên đáp viên:.............................................Điện thoại di động:...............................................
Interviewee Mobile phone
Ngày phỏng vấn: ....................................... ............................................................
Date of interview
II. THÔNG TIN CÔNG TY/ COMPANY INFORMATION
1. Tên công ty: ........................................................................................................................
Company name
2. Địa chỉ:..............................................................................................................................
Address
3. Điện thoại/Tel:…………………………………Fax:…………………………………………
E-mail: ……………………………………………. Website: ……………………………..
4. Ngày thành lập: ...................................................................................................................
Date of establishment
5. Số nhân viên:..................................................................................................................
Number of employees
6. Loại công ty/ Type of company Tư nhân/ Private 1

Vietnam Plastic Industry Page 38 of 41
Công ty có vốn đầu tư nước ngoài/ FDI company 2 Nhà nước/SOE 3
7. Chủ sở hữu/Form of ownership Trách nhiệm hữu hạn/ Limited 1 Cổ phần/Joint -stock 2 Tư nhân/ Private 3
8.
9. Phần trăm sản phẩm xuất khẩu so với tổng sản phẩm trong năm: ..................
Export Share on total year production
10. Mức tiêu thụ nhựa hàng tháng/ Monthly Plastics Consumption
10a. Tính theo tấn : (in ton)
Mức tiêu thụ nhựa hàng tháng
Monthly plastics consumption
Dưới 20 tấn /tháng
Under 20 tons/month 1
20 – 40 tấn /tháng
20 – 40 tons/month 2
40 – 60 tấn/tháng
40 – 60 tons/month 3
60 – 80 tấn/tháng
60 -80 tons/month 4
80 – 100 tấn/tháng
80 – 100 tons/month 5
Trên 100 tấn/tháng
Over 100 tons/month 6
10b. Tính theo loại nhựa chính/By main resins (đơn vị: tấn; unit: ton)
Nguyên liệu chính Main resins
Mức tiêu thụ nhựa hàng tháng Monthly plastics consumption
Nguyên liệu chính Main resins
Mức tiêu thụ nhựa hàng tháng Monthly plastics consumption
Hạt PP 1 Hạt PMMA 9
Hạt LDPE 2 Hạt PVC 10
Hạt HDPE 3 Hạt PS 11
Hạt PE 4 Màng BOPP 12
Hạt HIPS 5 Màng PET 13

Vietnam Plastic Industry Page 39 of 41
Hạt GPPS 6 Màng PA 14
Hạt ABS 7
Hạt SAN 8
Loại khác (nêu rõ): Others
X
11. Loại (các loại) sản phẩm nhựa được sản xuất : ...................................................................
Types of plastic products manufactured
Nhóm ngành
Type of plastic
Tên các sản phẩm chính
Types of plastic products
Nhựa dân dụng
Household ware 1
Bao bì
Packaging 2
Ống nhựa
Pipe 3
Nhựa composite
Composite Plastic 4
Nhựa công nghiệp kỹ thuật cao
Hightech industry plastic 5
Khác (nêu rõ)
Others X
12. Công suất sản xuất hàng tháng cho từng loại sản phẩm :................................................
Monthly capacityof products
.....................................................................................................................................................
.....................................................................................................................................................
.....................................................................................................................................................
.....................................................................................................................................................
.....................................................................................................................................................
.....................................................................................................................................................
13. Các thông tin cần thiết/ Các nhận xét khác về công ty:
Other useful information/ remarks on the company
.....................................................................................................................................................
.....................................................................................................................................................
.....................................................................................................................................................
.....................................................................................................................................................
.....................................................................................................................................................
.....................................................................................................................................................

Vietnam Plastic Industry Page 40 of 41
.....................................................................................................................................................
.....................................................................................................................................................
III. CÔNG NGH Ệ SẢN XUẤT NHỰA/ PLASTICS PROCESSING TECHNOLOGY
1. Công nghệ sản xuất công ty sử dụng
Processing technologies used by the company
Ép phun
Injection Moulding
1
Thổi
Blow moulding 2
Đùn
Extrusion 3
Công nghệ khác: (nêu rõ)/ Others (please specify) ……………………………. ……………………………. ……………………………. …………………………….
4
2. Kế hoạch trang bị thêm máy móc (dự kiến)
Plans on equipment acquisition (if any)
...........................................................................................................................................................
...........................................................................................................................................................
...........................................................................................................................................................
...........................................................................................................................................................
...........................................................................................................................................................
...........................................................................................................................................................
...........................................................................................................................................................
...........................................................................................................................................................
...........................................................................................................................................................
...........................................................................................................................................................
...........................................................................................................................................................
...........................................................................................................................................................
...........................................................................................................................................................
...........................................................................................................................................................
...........................................................................................................................................................
...........................................................................................................................................................

41
IV. MÁY MÓC TRANG THI ẾT BỊ CỦA CÔNG TY
MACHINES INSTALLED IN THE COMPANY
Tình trạng máy ban đầu (cái)
(5) The stiuation of bought machine pcs
Số lượng máy móc sử dụng theo thời gian (cái) Including at age, pcs. (6)
Loại thiết bị
(1) Type of equipment
Loại sản phẩm được sản xuất ra
(2) Type of article
Nước sản xuất
(3) Producing
country
Sốlượng (cái)
(4) Pcs
Mới
New
Đã qua sử dụng
Second hand
Dưới 5 năm
Up to 5 years
Từ 5- 10 năm
From 5 - 10 years
Từ 10 - 20 năm
From 10 - 20 years
Trên 20 năm
Above 20 years
Phần thông tin đến đây là kết thúc. Chân thành cảm ơn sự hợp tác của Quý công ty!