Vessel Extraction in Medical Images by 3D Wave Propagation and Traceback
8
Vessel Extraction in Medical Images by 3D Wave Propagation and Traceback Cemil Kirbas and Francis K.H. Quek Vision Interfaces and Systems Laboratory (VISLab) Department of Computer Science and Engineering Wright State University, Dayton, Ohio email: [email protected] Abstract This paper presents an approach for the extraction of vasculature from a volume of Magnetic Resonance Angiog- raphy (MRA) images by using a 3D wave propagation and traceback mechanism. We discuss both the theory and the implementation of the approach. Using a dual-sigmoidal filter, we label each voxel in the MRA volume with the like- lihood that it is within a vessel. Representing the reciprocal of this likelihood image as an array of refractive indices, we propagate a digital wave through the volume from the base of the vascular tree. This wave ‘washes’ over the vas- culature and extracts the vascular tree, ignoring local noise perturbations. While the approach is inherently SIMD, we present an efficient sequential algorithm for the wave prop- agation, and discuss the traceback algorithm. We demon- strate the effectiveness of our integer image neighborhood- based algorithm and its robustness to image noise. Keywords: Wave propagation, traceback, vascular extrac- tion, Magnetic Resonance Angiography (MRA) 1 Introduction A variety of medical imaging techniques such as Computed Tomography (CT), Magnetic Resonance Imaging (MRI), and Magnetic Resonance Angiography (MRA) are capa- ble of obtaining 3D data on vasculature. This paper de- scribes a 3D wave propagation-based approach to the ex- traction of this vasculature from the image data to obtain its connection morphology and the structure of each ves- sel. As with the processing of most medical images, signal noise, drift in image intensity and lack of image contrast pose significant challenges to the extraction of blood ves- sels. Hence, one cannot extract these vessels directly us- ing the image intensities or gradients alone. Researchers have taken different approaches to this problem. We shall briefly review these under the following headings: pattern recognition techniques, tracking-based approaches, model- based approaches, artificial intelligence approaches, neural network-based approaches, miscellaneous tube-like object detection approaches, and front propagation methods. Representative of traditional pattern recognition ap- proaches are Ritchings and Colchester [1] who apply a syn- tactic pattern recognition scheme, and Thackray and Nelson [2] who use morphological and adaptive thresholding. The former processes X-ray angiograms by applying an edge de- tector. The ‘ribbon segments’, formed by pairing opposing edges, are grouped to obtain extended vessel tracts. The system does not attempt to determine the structure of the vessel segments. The goal was to label for the diagnosis of vascular abnormality. Thackray and Nelson [2] describe an approach which extracts vascular segments using a set of 8 morphological operators, each of which represents an oriented vessel segment (in 8 orientations). The second set of approaches apply explicit vascular tracking. Liu and Sun [3] present an approach that extracts extended tracts of vasculature in X-ray angiograms by an adaptive tracking algorithm. Given an initial point within a vessel, they apply an ‘extrapolation update’ scheme [4] that involves the estimation of local vessel trajectories. Once a segment has been tracked, it is deleted in the angiogram im- age. This procedure is performed recursively to extract the vascular tree. This algorithm requires the user to specify vessel starting points, and does not appear extensible to 3D extraction. Aylward et al [5] describe an approach by which the medial axes of tubular objects such as vessels in an an- giogram are approximated as directed ‘intensity ridges’. As with [3], these ridges are tracked by estimating the local vessel directions. The authors show results of a vascular tree extracted from a MR angiogram. This required a fair amount of user intervention (105 mouse clicks in all). The third class of approaches are model-based in that they apply explicit vessel models to extract the vascula- ture. Klein, Lee, and Amini [6] describe an approach to extract vessels from X-ray angiograms using deformable Proceedings of the Third IEEE Symposium on BioInformatics and BioEngineering (BIBE’03) 0-7695-1907-5/03 $17.00 © 2003 IEEE
Transcript of Vessel Extraction in Medical Images by 3D Wave Propagation and Traceback
Vessel Extraction in Medical Images by 3D Wave Propagation and Traceback
Cemil Kirbas and Francis K.H. QuekVision Interfaces and Systems Laboratory (VISLab)Department of Computer Science and Engineering
Wright State University, Dayton, Ohio
email: [email protected]
Abstract
This paper presents an approach for the extraction ofvasculature from a volume of Magnetic Resonance Angiog-raphy (MRA) images by using a 3D wave propagation andtraceback mechanism. We discuss both the theory and theimplementation of the approach. Using a dual-sigmoidalfilter, we label each voxel in the MRA volume with the like-lihood that it is within a vessel. Representing the reciprocalof this likelihood image as an array of refractive indices,we propagate a digital wave through the volume from thebase of the vascular tree. This wave ‘washes’ over the vas-culature and extracts the vascular tree, ignoring local noiseperturbations. While the approach is inherently SIMD, wepresent an efficient sequential algorithm for the wave prop-agation, and discuss the traceback algorithm. We demon-strate the effectiveness of our integer image neighborhood-based algorithm and its robustness to image noise.
Keywords: Wave propagation, traceback, vascular extrac-tion, Magnetic Resonance Angiography (MRA)
1 Introduction
A variety of medical imaging techniques such as ComputedTomography (CT), Magnetic Resonance Imaging (MRI),and Magnetic Resonance Angiography (MRA) are capa-ble of obtaining 3D data on vasculature. This paper de-scribes a 3D wave propagation-based approach to the ex-traction of this vasculature from the image data to obtainits connection morphology and the structure of each ves-sel. As with the processing of most medical images, signalnoise, drift in image intensity and lack of image contrastpose significant challenges to the extraction of blood ves-sels. Hence, one cannot extract these vessels directly us-ing the image intensities or gradients alone. Researchershave taken different approaches to this problem. We shallbriefly review these under the following headings: pattern
recognition techniques, tracking-based approaches, model-based approaches, artificial intelligence approaches, neuralnetwork-based approaches, miscellaneous tube-like objectdetection approaches, and front propagation methods.Representative of traditional pattern recognition ap-
proaches are Ritchings and Colchester [1] who apply a syn-tactic pattern recognition scheme, and Thackray and Nelson[2] who use morphological and adaptive thresholding. Theformer processes X-ray angiograms by applying an edge de-tector. The ‘ribbon segments’, formed by pairing opposingedges, are grouped to obtain extended vessel tracts. Thesystem does not attempt to determine the structure of thevessel segments. The goal was to label for the diagnosisof vascular abnormality. Thackray and Nelson [2] describean approach which extracts vascular segments using a setof 8 morphological operators, each of which represents anoriented vessel segment (in 8 orientations).The second set of approaches apply explicit vascular
tracking. Liu and Sun [3] present an approach that extractsextended tracts of vasculature in X-ray angiograms by anadaptive tracking algorithm. Given an initial point within avessel, they apply an ‘extrapolation update’ scheme [4] thatinvolves the estimation of local vessel trajectories. Once asegment has been tracked, it is deleted in the angiogram im-age. This procedure is performed recursively to extract thevascular tree. This algorithm requires the user to specifyvessel starting points, and does not appear extensible to 3Dextraction. Aylward et al [5] describe an approach by whichthe medial axes of tubular objects such as vessels in an an-giogram are approximated as directed ‘intensity ridges’. Aswith [3], these ridges are tracked by estimating the localvessel directions. The authors show results of a vasculartree extracted from a MR angiogram. This required a fairamount of user intervention (105 mouse clicks in all).The third class of approaches are model-based in that
they apply explicit vessel models to extract the vascula-ture. Klein, Lee, and Amini [6] describe an approach toextract vessels from X-ray angiograms using deformable
Proceedings of the Third IEEE Symposium on BioInformatics and BioEngineering (BIBE’03) 0-7695-1907-5/03 $17.00 © 2003 IEEE
Webmaster
Text Box
Kirbas, C., and Quek, F., "Vessel Extraction in Medical Images by 3D Wave Propagation and Traceback," IEEE Conference Bio-Informatics and Bio-Engineering (BIBE), 2003, pp. 174-181, Also as VISLab Report: VISLab-02-26
spline models or snakes. In their approach, the user pro-vides an initial estimate of the location of the vascular en-tity, and the system refines the estimate by deforming snaketo minimize some energy function. They use a B-splinemodel in their snake implementation. The energy functiondefines such constraints as the smoothness or coherence ofthe contour, the closeness the contour is to image edge pix-els, and the compactness of the boundary. They use a Ga-bor filter to determine the image (or edge) energy term toattract the snake. The approach is most suitable for the ac-curate extraction of vascular segments. The amount of userinteraction and computation required makes it impracticalfor extracting entire vascular structures.
The fourth class of approaches may be described as ar-tificial intelligence-based. Stansfield [7] describes a rule-based expert system to segment coronary vessels from dig-ital subtracted angiograms. Her system extracts vessel seg-ments as trapezoidal units using an OPS-5 production sys-tem. The rule set is used to determine which edge segmentsmay participate the formation of these trapezoidal strips andwhich segments arise from image noise. The system doesnot combine these units to form an extended vascular struc-ture. Smets et al [8] present a knowledge-based system forthe delineation of blood vessels on subtracted angiograms.The system encodes general knowledge about appearanceof blood vessels in these images in the form of 11 rules (e.g.that vessels have high intensity center lines, comprise highintensity regions bordered by parallel edges etc.). Theserules facilitate the formulation of a 4-level hierarchy (pix-els, center lines, bars, segments) each of which is derivedfrom the preceding level by a subset of the 11 rules. Theresults of their system indicate that the system is success-ful where the image contains high contrast between vesseland the background, and that the system has considerableproblems at vessel bifurcations and self-occlusions.
The fifth class of approaches in the research literatureemploy neural networks in image segmentation and ves-sel detection. Nekovei and Sun [9] describe their back-propagation network for the detection of blood vessels inX-ray angiography. This system applies the neural networkdirectly to the angiogram pixels without prior feature detec-tion. Since angiograms are typically very large, the networkis applied to a small subwindow which slides across the an-giogram. The pixels of this subwindow are directly fed asinput to the network. Pre-labeled angiograms are used asthe training set to set the network’s weights. A modifiedversion of the common delta-rule is used to obtain theseweights. This system does not extract the vascular structure.Its purpose is to label the pixels as vessel or non-vessel.
The sixth class of research approaches deal with the ex-traction of tubular structures from images. This is actuallya ‘miscellaneous’ class of approaches that may be applica-ble to vascular extraction in that vessels are tubular entities,
but these approaches were not designed for vessel extrac-tion per se. Huang and Stockman [10] describe a systemthat uses generalized cylinders to extract tubular structuresin 2D intensity images. These cylinders are defined by across-sectional element that is swept along the axis of thetube using some sweep rule. [10] shows results of this algo-rithm applied to the extraction of tree-roots. Grimson et al[11] observe that cylindrical objects in 3D range images ap-pear as conic profiles along the scan lines. They use a conicdetector to detect such profiles and extract tubular objectsfrom such range images.The last class is front propagation approaches. Caselles
et al [12] and Malladi et al [13] use propagating inter-faces under a curvature dependent speed function to modelanatomical shapes. They used the Level Set Method ap-proach developed by Osher and Sethian [14] and adaptedit to shape recognition process. The main idea behind theLevel Set Method is to represent propagating curves as thezero level set of a higher dimensional function which isgiven in the Eulerian co-ordinate system. Hence, a movingfront is captured implicitly by the level set function. Thisapproach has some advantages that make it attractive. First,it can handle complex interfaces which develop sharp cor-ners and change its topology during the development. Sec-ond, intrinsic properties of the propagating front such as thecurvature of and normal to the curve can be easily extractedfrom the level set function. Third, since the level set func-tion is given in the Eulerian co-ordinate system, discretegrids can be used together with finite differences methods toobtain a numerical approximation to the solution. Finally,it is easily extendable to higher dimensions. Sethian de-veloped another method, called the Fast Marching Method[15], which uses a wave propagation approach for special-ized front problems. Fast Marching Methods are used inthe problems where the front advances monotonically witha speed that does not change its sign. The Fast MarchingMethod’s advantage over the Level Set Methods is that it ismore computationally efficient.
2 The Problem Reframed
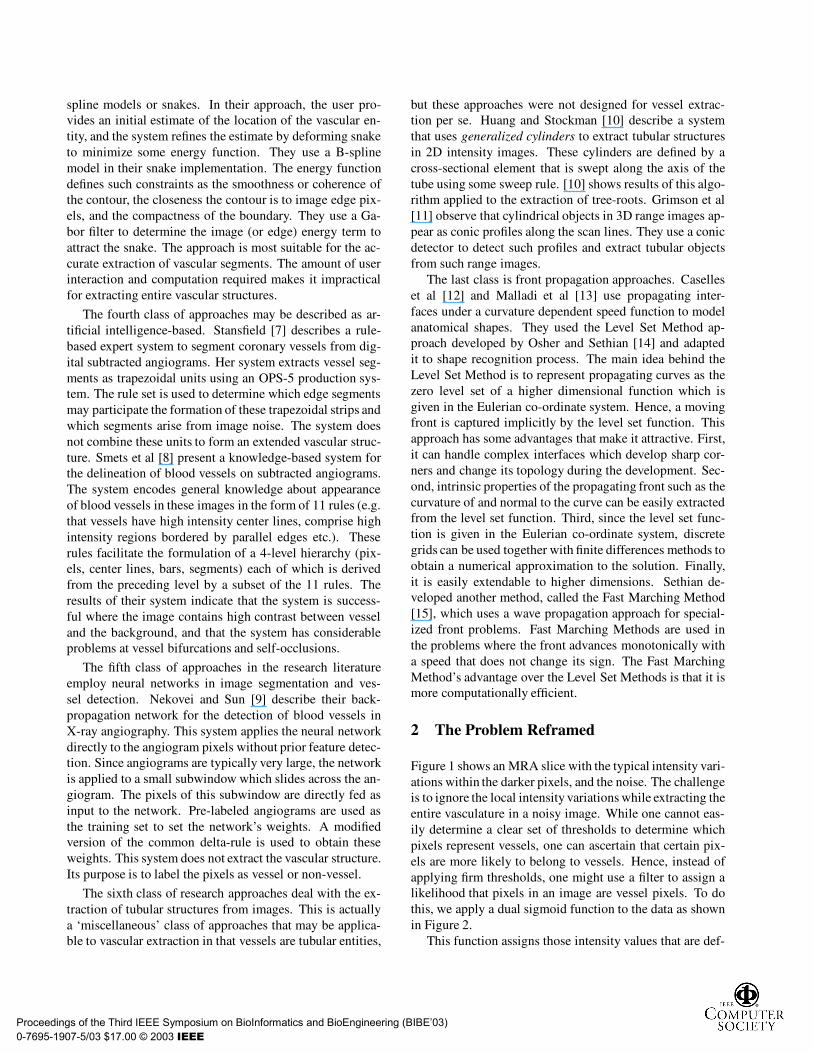
Figure 1 shows an MRA slice with the typical intensity vari-ations within the darker pixels, and the noise. The challengeis to ignore the local intensity variationswhile extracting theentire vasculature in a noisy image. While one cannot eas-ily determine a clear set of thresholds to determine whichpixels represent vessels, one can ascertain that certain pix-els are more likely to belong to vessels. Hence, instead ofapplying firm thresholds, one might use a filter to assign alikelihood that pixels in an image are vessel pixels. To dothis, we apply a dual sigmoid function to the data as shownin Figure 2.This function assigns those intensity values that are def-
Proceedings of the Third IEEE Symposium on BioInformatics and BioEngineering (BIBE’03) 0-7695-1907-5/03 $17.00 © 2003 IEEE
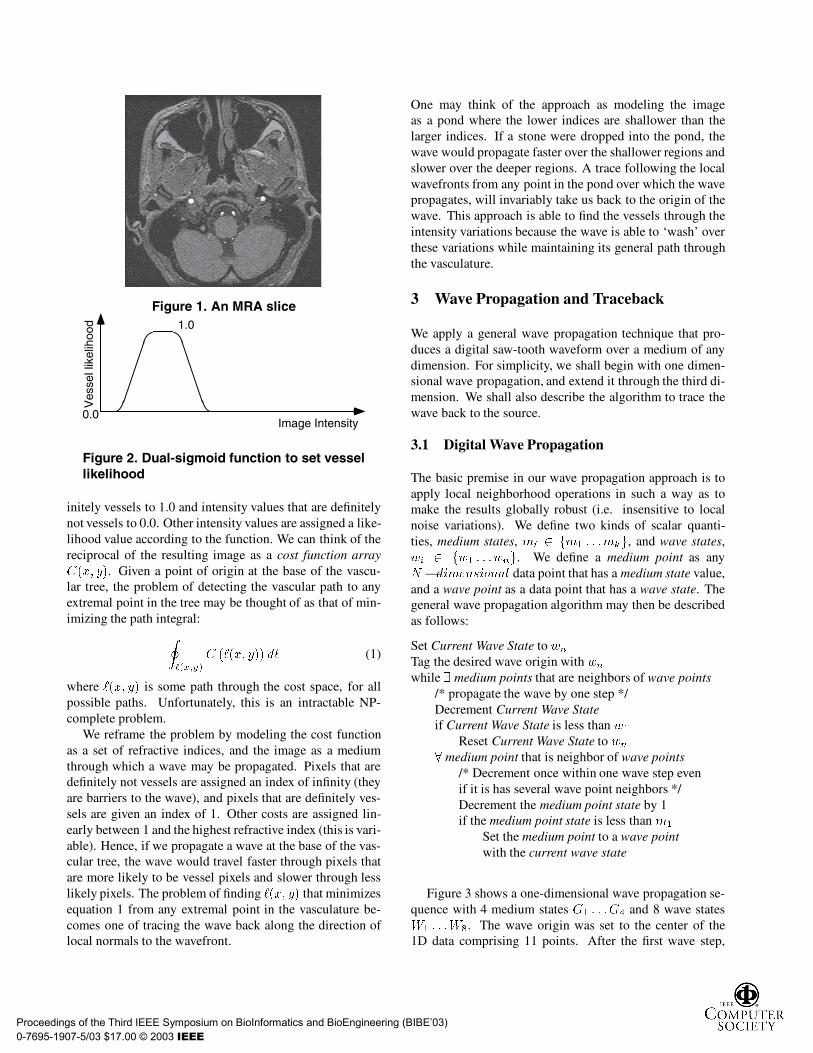
Figure 1. An MRA slice
Ves
sel l
ikel
ihoo
d
Image Intensity
1.0
0.0
Figure 2. Dual-sigmoid function to set vessellikelihood
initely vessels to 1.0 and intensity values that are definitelynot vessels to 0.0. Other intensity values are assigned a like-lihood value according to the function. We can think of thereciprocal of the resulting image as a cost function arrayC(x; y). Given a point of origin at the base of the vascu-lar tree, the problem of detecting the vascular path to anyextremal point in the tree may be thought of as that of min-imizing the path integral:
I`(x;y)
C (`(x; y)) d` (1)
where `(x; y) is some path through the cost space, for allpossible paths. Unfortunately, this is an intractable NP-complete problem.We reframe the problem by modeling the cost function
as a set of refractive indices, and the image as a mediumthrough which a wave may be propagated. Pixels that aredefinitely not vessels are assigned an index of infinity (theyare barriers to the wave), and pixels that are definitely ves-sels are given an index of 1. Other costs are assigned lin-early between 1 and the highest refractive index (this is vari-able). Hence, if we propagate a wave at the base of the vas-cular tree, the wave would travel faster through pixels thatare more likely to be vessel pixels and slower through lesslikely pixels. The problem of finding `(x; y) that minimizesequation 1 from any extremal point in the vasculature be-comes one of tracing the wave back along the direction oflocal normals to the wavefront.
One may think of the approach as modeling the imageas a pond where the lower indices are shallower than thelarger indices. If a stone were dropped into the pond, thewave would propagate faster over the shallower regions andslower over the deeper regions. A trace following the localwavefronts from any point in the pond over which the wavepropagates, will invariably take us back to the origin of thewave. This approach is able to find the vessels through theintensity variations because the wave is able to ‘wash’ overthese variations while maintaining its general path throughthe vasculature.
3 Wave Propagation and Traceback
We apply a general wave propagation technique that pro-duces a digital saw-tooth waveform over a medium of anydimension. For simplicity, we shall begin with one dimen-sional wave propagation, and extend it through the third di-mension. We shall also describe the algorithm to trace thewave back to the source.
3.1 Digital Wave Propagation
The basic premise in our wave propagation approach is toapply local neighborhood operations in such a way as tomake the results globally robust (i.e. insensitive to localnoise variations). We define two kinds of scalar quanti-ties, medium states, mi 2 fm1 : : :mkg, and wave states,wi 2 fw1 : : :wng. We define a medium point as anyN �dimensional data point that has a medium state value,and a wave point as a data point that has a wave state. Thegeneral wave propagation algorithm may then be describedas follows:
Set Current Wave State to wn
Tag the desired wave origin with wn
while 9 medium points that are neighbors of wave points/* propagate the wave by one step */Decrement Current Wave Stateif Current Wave State is less than w1
Reset Current Wave State to wn
8 medium point that is neighbor of wave points/* Decrement once within one wave step evenif it is has several wave point neighbors */Decrement the medium point state by 1if the medium point state is less thanm1
Set the medium point to a wave pointwith the current wave state
Figure 3 shows a one-dimensional wave propagation se-quence with 4 medium states G1 : : :G4 and 8 wave statesW1 : : :W8. The wave origin was set to the center of the1D data comprising 11 points. After the first wave step,
Proceedings of the Third IEEE Symposium on BioInformatics and BioEngineering (BIBE’03) 0-7695-1907-5/03 $17.00 © 2003 IEEE
G2 G3 G1 G3 W8 G2 G2 G1 G3W7
G0
G2 G3 G1 G3 G1 W8 G1 G2 G2 G1 G3
G2 G3 G1 G2 W7 W8 W7 G1 G2 G1 G3
G2 G3 G1 G1 W7 W8 W7 G2 G1 G3W5
G0
G2 G3 G1 W7 W8 W7 W5 G1 G1 G3W4
G0
G2 G3 W7 W8 W7 W5 G1 G3W4 W3
G0W3
G0
G2 G2 W7 W8 W7 W5 G3W4 W3W3 W2
G0
G2 G1 W7 W8 W7 W5 G2W4 W3W3 W2
G2 W7 W8 W7 W5 G1W4 W3W3 W2W8
G0
G1 W7 W8 W7 W5W4 W3W3 W2W8
W7 W8 W7 W5W4 W3W3 W2W8
W7
G0
W7
G0
W6
G0 W7
Current Wave State = 8
Current Wave State = 7
Current Wave State = 6
Current Wave State = 5
Current Wave State = 4
Current Wave State = 3
Current Wave State = 2
Current Wave State = 1
Current Wave State = 8
Current Wave State = 7
Current Wave State = 6
Current Wave Count = 1
Current Wave Count = 1
Current Wave Count = 1
Current Wave Count = 1
Current Wave Count = 1
Current Wave Count = 1
Current Wave Count = 1
Current Wave Count = 1
Current Wave Count = 2
Current Wave Count = 2
Current Wave Count = 2
W8
W1Propagated WavePropagated Wave
Figure 3. 1D wave propagation with 4 mediumstates and 8 wave states
the first neighbors were set to G0 which is less than G1.Hence the data points are replaced with the current wavestate which was W7. This process repeated for 11 wavesteps until the wave had propagated over the entire medium.Figure 3 shows the result of this propagation as a step wave-form. Notice the repetitive saw-tooth form of the wave.
3.2 Two-Dimensional Wave Propagation
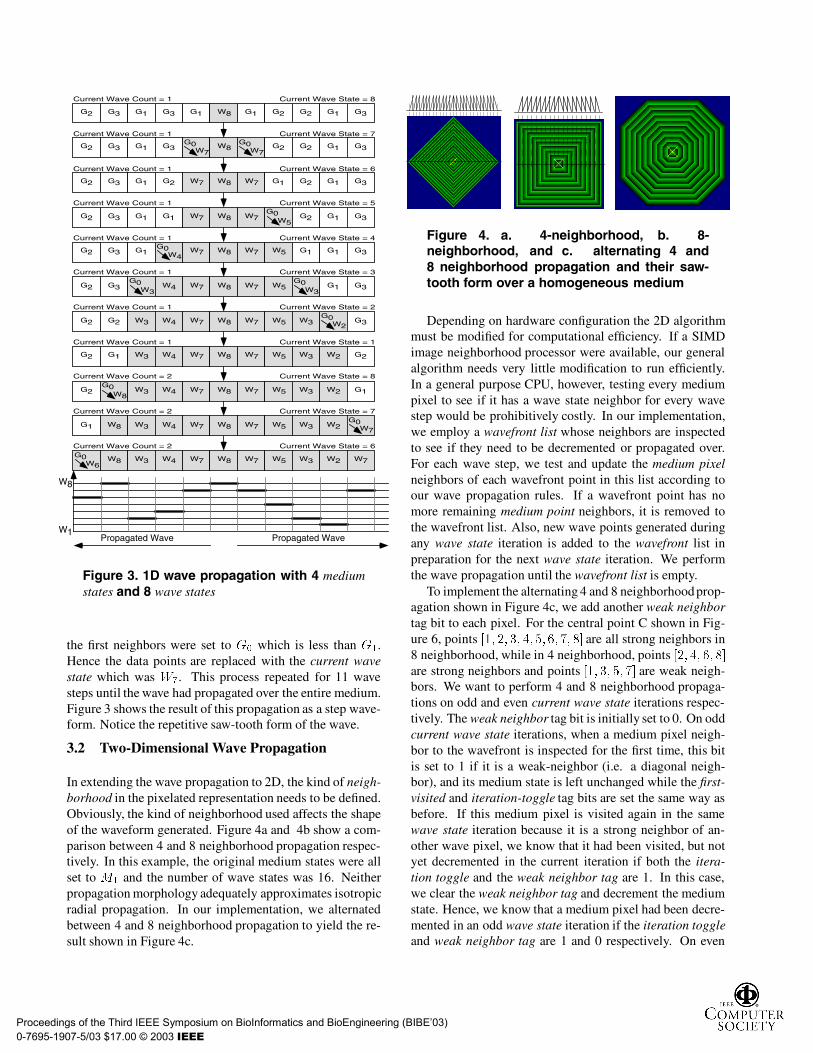
In extending the wave propagation to 2D, the kind of neigh-borhood in the pixelated representation needs to be defined.Obviously, the kind of neighborhood used affects the shapeof the waveform generated. Figure 4a and 4b show a com-parison between 4 and 8 neighborhood propagation respec-tively. In this example, the original medium states were allset to M1 and the number of wave states was 16. Neitherpropagationmorphology adequately approximates isotropicradial propagation. In our implementation, we alternatedbetween 4 and 8 neighborhood propagation to yield the re-sult shown in Figure 4c.
Figure 4. a. 4-neighborhood, b. 8-neighborhood, and c. alternating 4 and8 neighborhood propagation and their saw-tooth form over a homogeneous medium
Depending on hardware configuration the 2D algorithmmust be modified for computational efficiency. If a SIMDimage neighborhood processor were available, our generalalgorithm needs very little modification to run efficiently.In a general purpose CPU, however, testing every mediumpixel to see if it has a wave state neighbor for every wavestep would be prohibitively costly. In our implementation,we employ a wavefront list whose neighbors are inspectedto see if they need to be decremented or propagated over.For each wave step, we test and update the medium pixelneighbors of each wavefront point in this list according toour wave propagation rules. If a wavefront point has nomore remaining medium point neighbors, it is removed tothe wavefront list. Also, new wave points generated duringany wave state iteration is added to the wavefront list inpreparation for the next wave state iteration. We performthe wave propagation until the wavefront list is empty.To implement the alternating 4 and 8 neighborhoodprop-
agation shown in Figure 4c, we add another weak neighbortag bit to each pixel. For the central point C shown in Fig-ure 6, points [1; 2; 3; 4;5;6; 7; 8] are all strong neighbors in8 neighborhood, while in 4 neighborhood, points [2; 4; 6; 8]are strong neighbors and points [1; 3; 5; 7] are weak neigh-bors. We want to perform 4 and 8 neighborhood propaga-tions on odd and even current wave state iterations respec-tively. The weak neighbor tag bit is initially set to 0. On oddcurrent wave state iterations, when a medium pixel neigh-bor to the wavefront is inspected for the first time, this bitis set to 1 if it is a weak-neighbor (i.e. a diagonal neigh-bor), and its medium state is left unchanged while the first-visited and iteration-toggle tag bits are set the same way asbefore. If this medium pixel is visited again in the samewave state iteration because it is a strong neighbor of an-other wave pixel, we know that it had been visited, but notyet decremented in the current iteration if both the itera-tion toggle and the weak neighbor tag are 1. In this case,we clear the weak neighbor tag and decrement the mediumstate. Hence, we know that a medium pixel had been decre-mented in an odd wave state iteration if the iteration toggleand weak neighbor tag are 1 and 0 respectively. On even
Proceedings of the Third IEEE Symposium on BioInformatics and BioEngineering (BIBE’03) 0-7695-1907-5/03 $17.00 © 2003 IEEE
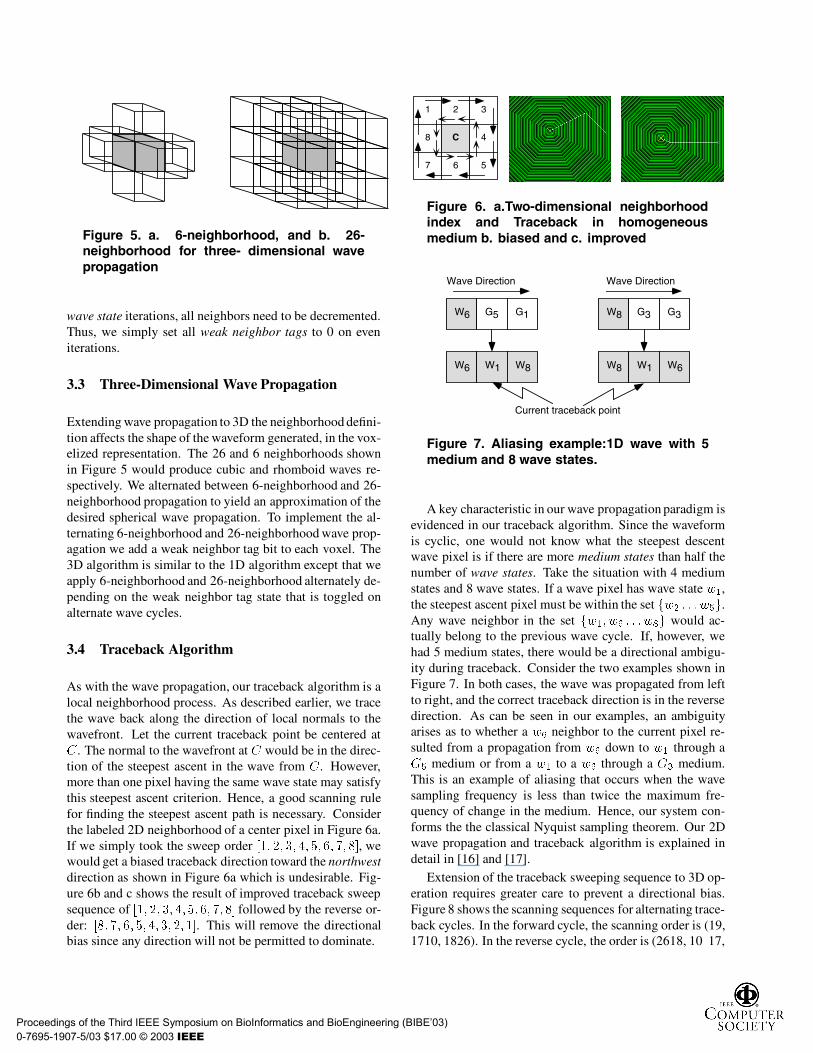
Figure 5. a. 6-neighborhood, and b. 26-neighborhood for three- dimensional wavepropagation
wave state iterations, all neighbors need to be decremented.Thus, we simply set all weak neighbor tags to 0 on eveniterations.
3.3 Three-Dimensional Wave Propagation
Extendingwave propagation to 3D the neighborhood defini-tion affects the shape of the waveform generated, in the vox-elized representation. The 26 and 6 neighborhoods shownin Figure 5 would produce cubic and rhomboid waves re-spectively. We alternated between 6-neighborhood and 26-neighborhood propagation to yield an approximation of thedesired spherical wave propagation. To implement the al-ternating 6-neighborhood and 26-neighborhoodwave prop-agation we add a weak neighbor tag bit to each voxel. The3D algorithm is similar to the 1D algorithm except that weapply 6-neighborhood and 26-neighborhood alternately de-pending on the weak neighbor tag state that is toggled onalternate wave cycles.
3.4 Traceback Algorithm
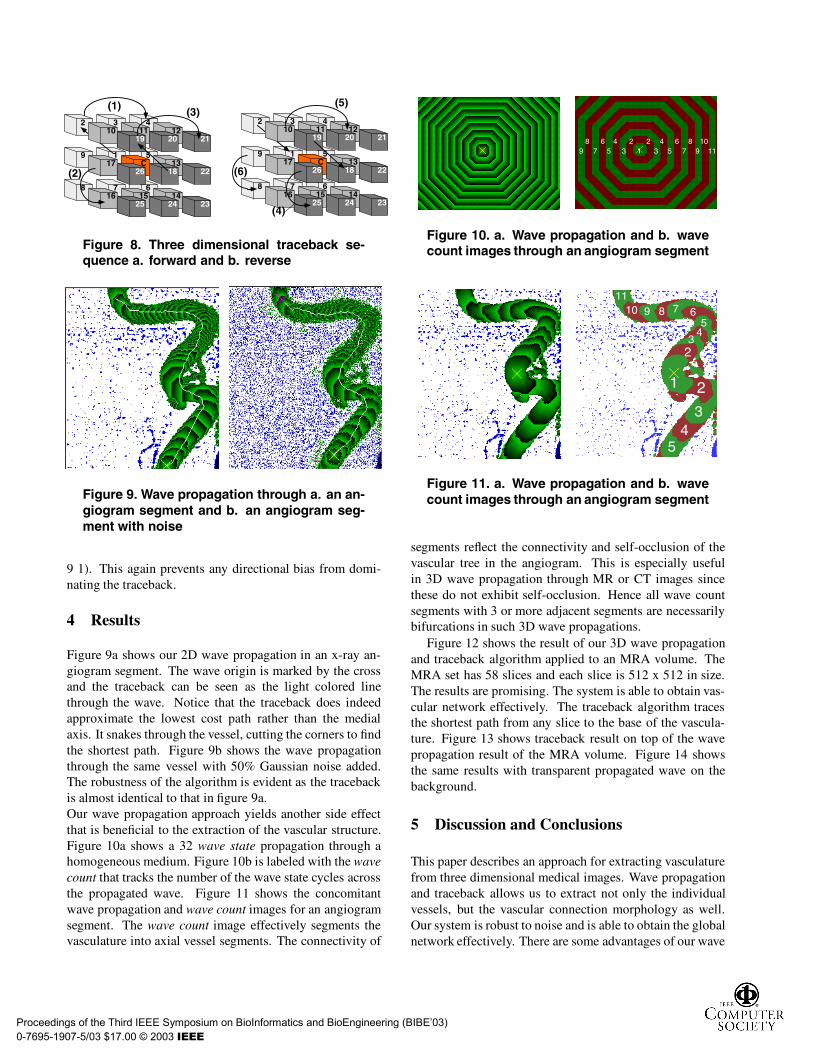
As with the wave propagation, our traceback algorithm is alocal neighborhood process. As described earlier, we tracethe wave back along the direction of local normals to thewavefront. Let the current traceback point be centered atC. The normal to the wavefront at C would be in the direc-tion of the steepest ascent in the wave from C. However,more than one pixel having the same wave state may satisfythis steepest ascent criterion. Hence, a good scanning rulefor finding the steepest ascent path is necessary. Considerthe labeled 2D neighborhood of a center pixel in Figure 6a.If we simply took the sweep order [1; 2; 3; 4;5;6; 7; 8], wewould get a biased traceback direction toward the northwestdirection as shown in Figure 6a which is undesirable. Fig-ure 6b and c shows the result of improved traceback sweepsequence of [1; 2; 3; 4;5;6; 7; 8] followed by the reverse or-der: [8; 7; 6; 5;4;3; 2; 1]. This will remove the directionalbias since any direction will not be permitted to dominate.
1 2 3
8 4
567
C
Figure 6. a.Two-dimensional neighborhoodindex and Traceback in homogeneousmedium b. biased and c. improved
W6 W1 W8 W8 W1 W6
W8 G3 G3W6 G5 G1
Current traceback point
Wave Direction Wave Direction
Figure 7. Aliasing example:1D wave with 5medium and 8 wave states.
A key characteristic in our wave propagation paradigm isevidenced in our traceback algorithm. Since the waveformis cyclic, one would not know what the steepest descentwave pixel is if there are more medium states than half thenumber of wave states. Take the situation with 4 mediumstates and 8 wave states. If a wave pixel has wave state w1,the steepest ascent pixel must be within the set fw2 : : :w5g.Any wave neighbor in the set fw1; w6 : : :w8g would ac-tually belong to the previous wave cycle. If, however, wehad 5 medium states, there would be a directional ambigu-ity during traceback. Consider the two examples shown inFigure 7. In both cases, the wave was propagated from leftto right, and the correct traceback direction is in the reversedirection. As can be seen in our examples, an ambiguityarises as to whether a w6 neighbor to the current pixel re-sulted from a propagation from w6 down to w1 through aG5 medium or from a w1 to a w6 through a G3 medium.This is an example of aliasing that occurs when the wavesampling frequency is less than twice the maximum fre-quency of change in the medium. Hence, our system con-forms the the classical Nyquist sampling theorem. Our 2Dwave propagation and traceback algorithm is explained indetail in [16] and [17].
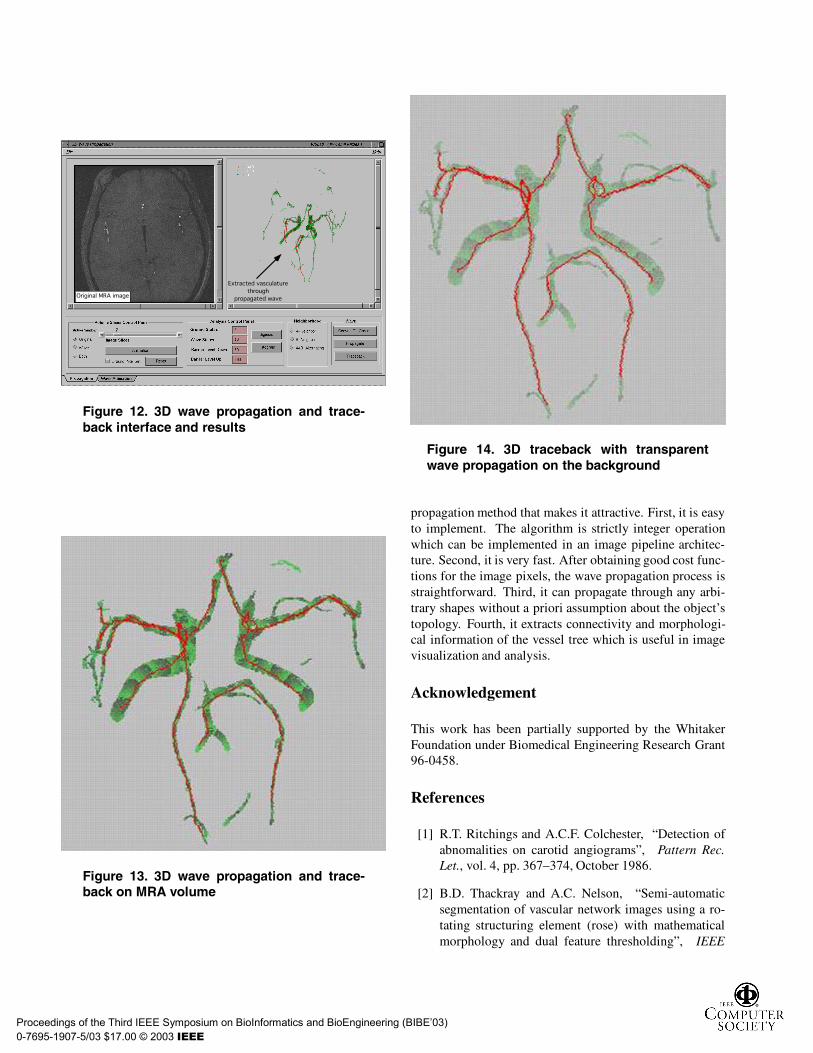
Extension of the traceback sweeping sequence to 3D op-eration requires greater care to prevent a directional bias.Figure 8 shows the scanning sequences for alternating trace-back cycles. In the forward cycle, the scanning order is (19,1710, 1826). In the reverse cycle, the order is (2618, 10 17,
Proceedings of the Third IEEE Symposium on BioInformatics and BioEngineering (BIBE’03) 0-7695-1907-5/03 $17.00 © 2003 IEEE
26 18 22
25 24 23
2 3 4
9 1 5
8 7 6
17 C 13
16 15 14
10 11 1219 20 21
(1)
(2)
(3)
26 18 22
25 24 23
2 3 4
9 1 5
8 7 6
17 C 13
16 15 14
10 11 1219 20 21
(4)
(6)
(5)
Figure 8. Three dimensional traceback se-quence a. forward and b. reverse
Figure 9. Wave propagation through a. an an-giogram segment and b. an angiogram seg-ment with noise
9 1). This again prevents any directional bias from domi-nating the traceback.
4 Results
Figure 9a shows our 2D wave propagation in an x-ray an-giogram segment. The wave origin is marked by the crossand the traceback can be seen as the light colored linethrough the wave. Notice that the traceback does indeedapproximate the lowest cost path rather than the medialaxis. It snakes through the vessel, cutting the corners to findthe shortest path. Figure 9b shows the wave propagationthrough the same vessel with 50% Gaussian noise added.The robustness of the algorithm is evident as the tracebackis almost identical to that in figure 9a.Our wave propagation approach yields another side effectthat is beneficial to the extraction of the vascular structure.Figure 10a shows a 32 wave state propagation through ahomogeneous medium. Figure 10b is labeled with the wavecount that tracks the number of the wave state cycles acrossthe propagated wave. Figure 11 shows the concomitantwave propagation and wave count images for an angiogramsegment. The wave count image effectively segments thevasculature into axial vessel segments. The connectivity of
23579 3 5 7 91
468 2 4 6 8 1011
Figure 10. a. Wave propagation and b. wavecount images through an angiogram segment
1 2
23
3
4
4
5
5
67891011
Figure 11. a. Wave propagation and b. wavecount images through an angiogram segment
segments reflect the connectivity and self-occlusion of thevascular tree in the angiogram. This is especially usefulin 3D wave propagation through MR or CT images sincethese do not exhibit self-occlusion. Hence all wave countsegments with 3 or more adjacent segments are necessarilybifurcations in such 3D wave propagations.Figure 12 shows the result of our 3D wave propagation
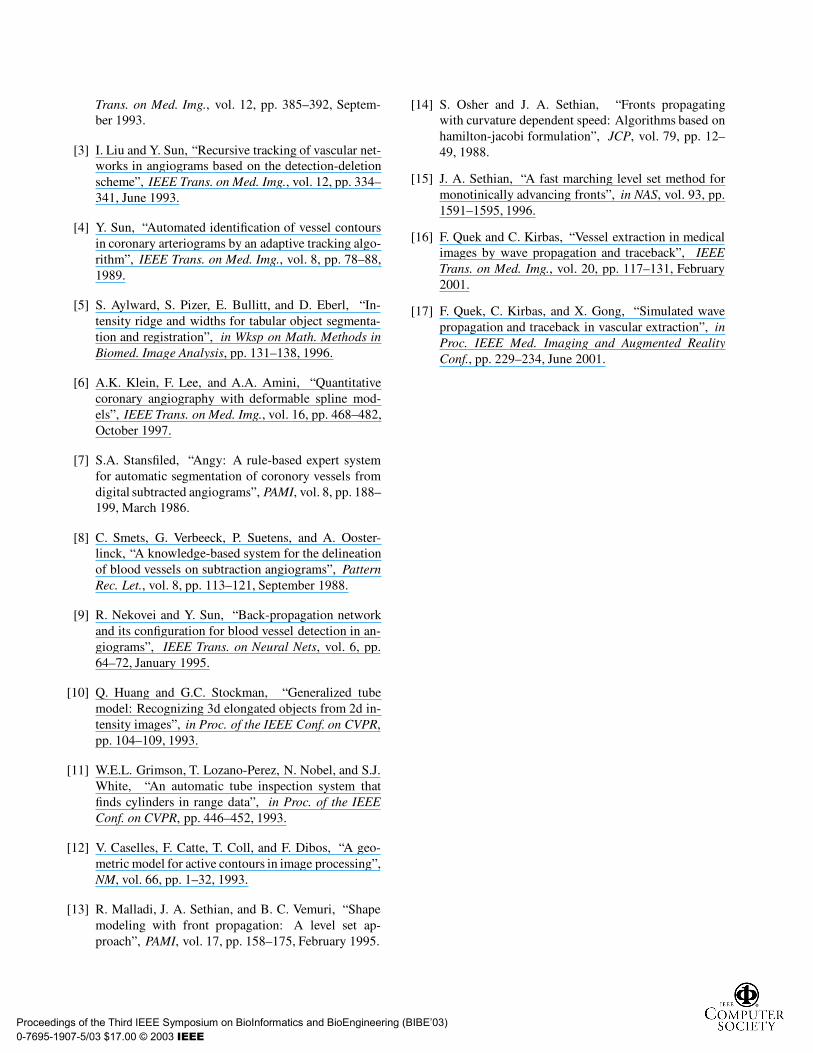
and traceback algorithm applied to an MRA volume. TheMRA set has 58 slices and each slice is 512 x 512 in size.The results are promising. The system is able to obtain vas-cular network effectively. The traceback algorithm tracesthe shortest path from any slice to the base of the vascula-ture. Figure 13 shows traceback result on top of the wavepropagation result of the MRA volume. Figure 14 showsthe same results with transparent propagated wave on thebackground.
5 Discussion and Conclusions
This paper describes an approach for extracting vasculaturefrom three dimensional medical images. Wave propagationand traceback allows us to extract not only the individualvessels, but the vascular connection morphology as well.Our system is robust to noise and is able to obtain the globalnetwork effectively. There are some advantages of our wave
Proceedings of the Third IEEE Symposium on BioInformatics and BioEngineering (BIBE’03) 0-7695-1907-5/03 $17.00 © 2003 IEEE
���������������
������� ������������
�������
�������� �����
Figure 12. 3D wave propagation and trace-back interface and results
Figure 13. 3D wave propagation and trace-back on MRA volume
Figure 14. 3D traceback with transparentwave propagation on the background
propagation method that makes it attractive. First, it is easyto implement. The algorithm is strictly integer operationwhich can be implemented in an image pipeline architec-ture. Second, it is very fast. After obtaining good cost func-tions for the image pixels, the wave propagation process isstraightforward. Third, it can propagate through any arbi-trary shapes without a priori assumption about the object’stopology. Fourth, it extracts connectivity and morphologi-cal information of the vessel tree which is useful in imagevisualization and analysis.
Acknowledgement
This work has been partially supported by the WhitakerFoundation under Biomedical Engineering Research Grant96-0458.
References
[1] R.T. Ritchings and A.C.F. Colchester, “Detection ofabnomalities on carotid angiograms”, Pattern Rec.Let., vol. 4, pp. 367–374, October 1986.
[2] B.D. Thackray and A.C. Nelson, “Semi-automaticsegmentation of vascular network images using a ro-tating structuring element (rose) with mathematicalmorphology and dual feature thresholding”, IEEE
Proceedings of the Third IEEE Symposium on BioInformatics and BioEngineering (BIBE’03) 0-7695-1907-5/03 $17.00 © 2003 IEEE
Trans. on Med. Img., vol. 12, pp. 385–392, Septem-ber 1993.
[3] I. Liu and Y. Sun, “Recursive tracking of vascular net-works in angiograms based on the detection-deletionscheme”, IEEE Trans. on Med. Img., vol. 12, pp. 334–341, June 1993.
[4] Y. Sun, “Automated identification of vessel contoursin coronary arteriograms by an adaptive tracking algo-rithm”, IEEE Trans. on Med. Img., vol. 8, pp. 78–88,1989.
[5] S. Aylward, S. Pizer, E. Bullitt, and D. Eberl, “In-tensity ridge and widths for tabular object segmenta-tion and registration”, in Wksp on Math. Methods inBiomed. Image Analysis, pp. 131–138, 1996.
[6] A.K. Klein, F. Lee, and A.A. Amini, “Quantitativecoronary angiography with deformable spline mod-els”, IEEE Trans. on Med. Img., vol. 16, pp. 468–482,October 1997.
[7] S.A. Stansfiled, “Angy: A rule-based expert systemfor automatic segmentation of coronory vessels fromdigital subtracted angiograms”, PAMI, vol. 8, pp. 188–199, March 1986.
[8] C. Smets, G. Verbeeck, P. Suetens, and A. Ooster-linck, “A knowledge-based system for the delineationof blood vessels on subtraction angiograms”, PatternRec. Let., vol. 8, pp. 113–121, September 1988.
[9] R. Nekovei and Y. Sun, “Back-propagation networkand its configuration for blood vessel detection in an-giograms”, IEEE Trans. on Neural Nets, vol. 6, pp.64–72, January 1995.
[10] Q. Huang and G.C. Stockman, “Generalized tubemodel: Recognizing 3d elongated objects from 2d in-tensity images”, in Proc. of the IEEE Conf. on CVPR,pp. 104–109, 1993.
[11] W.E.L. Grimson, T. Lozano-Perez, N. Nobel, and S.J.White, “An automatic tube inspection system thatfinds cylinders in range data”, in Proc. of the IEEEConf. on CVPR, pp. 446–452, 1993.
[12] V. Caselles, F. Catte, T. Coll, and F. Dibos, “A geo-metric model for active contours in image processing”,NM, vol. 66, pp. 1–32, 1993.
[13] R. Malladi, J. A. Sethian, and B. C. Vemuri, “Shapemodeling with front propagation: A level set ap-proach”, PAMI, vol. 17, pp. 158–175, February 1995.
[14] S. Osher and J. A. Sethian, “Fronts propagatingwith curvature dependent speed: Algorithms based onhamilton-jacobi formulation”, JCP, vol. 79, pp. 12–49, 1988.
[15] J. A. Sethian, “A fast marching level set method formonotinically advancing fronts”, in NAS, vol. 93, pp.1591–1595, 1996.
[16] F. Quek and C. Kirbas, “Vessel extraction in medicalimages by wave propagation and traceback”, IEEETrans. on Med. Img., vol. 20, pp. 117–131, February2001.
[17] F. Quek, C. Kirbas, and X. Gong, “Simulated wavepropagation and traceback in vascular extraction”, inProc. IEEE Med. Imaging and Augmented RealityConf., pp. 229–234, June 2001.
Proceedings of the Third IEEE Symposium on BioInformatics and BioEngineering (BIBE’03) 0-7695-1907-5/03 $17.00 © 2003 IEEE