Delay and Capacity Trade-Offs in Mobile Ad Hoc Networks: A Global Perspective
Electronic copy available at: http://ssrn.com/abstract=1475380
1
Vertical divestitures through equity carve-outs and spin-offs: A product markets
perspective
Bharat A. Jaina, Omesh Kinib, *, Jaideep Shenoyc
a College of Business and Economics, Towson University, Towson, MD 21252 b Robinson College of Business, Georgia State University, Atlanta, GA 30302
c A.B. Freeman School of Business, Tulane University, New Orleans, LA 70118
_____________________________________________________________________________________
ABSTRACT
Using a product markets perspective to investigate the decision to vertically disintegrate, we find that vertical divestitures are more likely in response to positive industry demand shocks, favorable industry financing conditions, and lower parent firm relative productivity and are less likely when the potential for contracting problems is high. Conditional on vertical divestitures, equity carve-outs are more likely in environments in which relationship-specific investments are more prevalent and when the need for external funds is high, while spin-offs are more likely in larger industries and in industries that experience positive demand shocks. Our examinations of announcement-period wealth effects and changes in operating performance indicate that vertical divestitures are motivated by efficiency considerations. JEL classification: G34, L22, L25, D57 Keywords: Vertical divestitures, Equity carve-outs, Spin-offs, Product markets _____________________________________________________________________________________
☆We wish to thank Jayant R. Kale, Isabel Tkatch, Harold Mulherin, Vikram Nanda, Chip Ryan, Paul Spindt, and Sheri Tice for helpful comments. We are particularly thankful to Gordon Phillips (the referee) whose comments helped us significantly improve the paper. We thank Husayn Shahrur for providing us with a cleaned version of the Compustat data on the identity of key suppliers and customers and Ryan Williams for excellent research assistance. The usual disclaimer applies.
*Corresponding author. Robinson College of Business, Georgia State University, Atlanta, GA 30302,
USA. Tel. + 1-404-413-7343; Fax: + 1-404-413-7312. E-mail addresses: [email protected] (Bharat A. Jain), [email protected] (Omesh Kini), [email protected] (Jaideep Shenoy).

Electronic copy available at: http://ssrn.com/abstract=1475380
2
1. Introduction
Since the seminal work of Coase (1937), the extant literature on the structure of vertical
organizations has developed several theories to explain the determinants of the vertical boundaries of a
firm.1 On the one hand, this stream of literature has argued that common ownership over successive
stages of the production or distribution process can create value for the integrating firm through product
market considerations such as reduced transaction costs of negotiating with suppliers or customers and
improved incentives to make relationship-specific investments and facilitation of anti-competitive
strategies such as foreclosure, in which vertical integration is used to raise rival costs, or collusion, in
which vertical integration improves coordination between the integrated firm and its nonintegrated
rivals.2 On the other hand, researchers have suggested that higher organizational complexity and its
resultant negative impact on firm productivity as well as a greater need for external funds may cause
integrated firms to consider shrinking their boundaries.3
Given the trade-offs, value-maximizing managers contract the firm’s vertical boundary when the
potential benefits from product market considerations are dominated by the costs arising from higher
organizational complexity or a greater need for financing. Further, even when a firm decides to contract
its vertical boundary, the nature of the benefits and costs determines whether it chooses to partially or
fully disintegrate. While the causes and consequences of vertical integration are well studied, a paucity of
empirical evidence exists on vertical disintegration. In this paper, we examine whether product market
and financing considerations impact the probability of occurrence of vertical divestitures; the choice of
method of vertical divestitures, i.e., equity carve-outs versus spin-offs, conditional on vertical
1 See, for example, Stigler (1951), Perry (1989), Chen (2005), Joskow (2005), Sappington (2006), Lafontaine and Slade (2007), Eckbo and Thorburn (2008), Acemoglu, Johnson, and Mitton (2009), and Shenoy (2008) for extensive discussions on the economic forces behind vertical integration and disintegration. 2 Extensive research argues that vertical integration can lead to anti-competitive strategies such as foreclosure (e.g., Salinger, 1988; Hart and Tirole, 1990; and Ordover, Saloner, and Salop; 1990) or collusion (e.g., Chen, 2001; and Nocke and White, 2007). 3 Eckbo and Thorburn (2008), Rajan, Servaes, and Zingales (2000), and Burch and Nanda (2003) argue that higher organizational complexity can result in value destruction due to neglect of the firm’s core business, inefficient cross-subsidization, power plays of divisional managers, and poorly structured incentive compensation for divisional managers. Çolak and Whited (2007) and Lang, Poulsen, and Stulz (1995) indicate that financing considerations such as the need for capital influence divestiture decisions. Maksimovic and Phillips (2001, 2002) argue that industry demand shocks and low relative firm productivity cause industry players to reevaluate ownership of assets.
3
divestitures; the announcement-period wealth effects of vertical divestitures on the parent firm, parent and
subsidiary rival firms, supplier firms, and customer firms; and the changes in operating performance
around vertical divestitures.
Our analysis of the determinants of vertical divestitures reveals the following findings. First, the
probability of vertical divestitures increases with positive subsidiary industry demand shocks as well as
low parent firm relative productivity. These results are generally consistent with the neoclassical model of
firm organization proposed by Maksimovic and Phillips (2002). In addition, the probability of vertical
divestitures is lower if parent firms have more significant intra-firm vertical relations or if they belong to
industries containing a higher proportion of vertically integrated firms. Because high vertical relatedness
is indicative of contracting problems and the potential for holdup, our results suggest that vertical
divestitures are less likely in environments requiring investments in relationship specific assets to be
competitive. Finally, favorable industry financing conditions, particularly in subsidiary industries, instead
of parent firm internal financing constraints, are more likely to influence the vertical divestiture decision.
Conditional on vertical divestitures, our analysis of the choice of the method of vertical
divestitures provides insights on factors that explain partial vertical disintegrations via equity carve-outs
or complete vertical disintegrations via spin-offs. We find that partial divestitures through equity
carve-outs are more likely when relationship-specific investments in the subsidiary industry as measured
by its research and development (R&D) intensity are higher and in the presence of explicit product market
contractual agreements between the parent firm and the divested subsidiary after the divestiture. Because
R&D-intensive environments and the presence of product market agreements are likely to indicate
potential contracting problems, parents seem to foresee such problems and maintain an ownership stake in
the subsidiary through a carve-out. These results are consistent with Fee, Hadlock, and Thomas (2006),
who find that equity ownership in supplier firms by customer firms is beneficial when expropriation and
holdup problems are prevalent. In addition, we find that the probability of a vertical divestiture through a
carve-out is larger when the parent firm’s need for external funds is higher. Further, we find that complete
divestitures through spin-offs are more likely in larger industries and in industries that experience positive
4
demand shocks. These findings support Stigler (1951), who suggests that firms in larger industries and in
growing industries strive to capture benefits of specialization, which are maximized under complete
vertical separation. Finally, anti-competitive rationales such as collusion and foreclosure have no bearing
on the choice between equity carve-outs and spin-offs.
The undoing of the vertically integrated structure also enables us to evaluate the announcement-
period wealth effects of the parent firms, as well as related product market participants such as parent and
subsidiary rival firms, supplier firms, and customer firms. On the one hand, the wealth effects to parent
firms are likely to be positive because divestitures can enhance efficiency by decreasing organizational
complexity. On the other hand, negative parent firm wealth effects can occur because divestitures can
reduce efficiency by exacerbating the holdup problem and reducing the incentives to make relationship-
specific investments. The wealth effects to parent firms can also be negative due to a decreased ability to
either foreclose rival firms from critical inputs or collude with them after the divestiture. Further, the
effects to the parent firms are likely to spill over to all related product market participants [e.g., Eckbo
(1983) and Shenoy (2008) in the context of vertical takeovers].
For the full sample of vertical divestitures as well as for both the equity carve-out and spin-off
samples, we find significantly positive announcement-period abnormal returns to parent firms, parent
rival firms, and supplier firms and weakly positive abnormal returns to subsidiary rival firms and
customer firms. Taken together, the positive wealth effects to the parent firms, parent and subsidiary rival
firms, and supplier and customer firms are inconsistent with the foreclosure or collusion rationales. The
picture that emerges from our univariate wealth effects analysis is that vertical divestitures result in
efficiency gains to parent firms due to enhanced focus or specialization benefits and convey information
to parent and subsidiary rival firms that they too, can take advantage of these gains by changing their own
organizational structures. Furthermore, some of the resulting benefits accrue to supplier and customer
firms.
A potential problem with the above interpretation of our univariate results is that our hypotheses
are not mutually exclusive. We, therefore, design cross-sectional tests that enhance our ability to isolate

5
the impact of each potential economic determinant on wealth effects and on the changes in operating
performance around vertical divestitures. We find that the announcement-period wealth effects for parent
firms are higher when the pre-divestiture investments in relationship specific assets are lower. This result
indicates that the abnormal returns for parent firms are higher when the potential for ex post contractual
inefficiencies arising from the undoing of the integrated form is lower. Further, we show that the
announcement-period wealth effects for parent firms are larger if parent firms are less focused prior to the
divestiture. This result indicates that the abnormal returns for parent firms are larger if the potential for a
decrease in organizational complexity is higher. Our examination of changes in operating performance
around vertical divestiture events lends further support to efficiency considerations. Finally, the
determinants of the wealth effects to the rival firms, supplier firms, and customer firms yield further
corroborating evidence consistent with the efficiency-enhancing view and inconsistent with market
power-based rationales.
Our study makes the following contributions. First, it is the only study that we are aware of that
applies a product markets perspective to evaluate the decision to vertically disintegrate and the choice
between equity carve-outs versus spin-offs to conduct a vertical divestiture. Our analysis on determinants
of the vertical divestiture decision enables us to shed light on the extant theoretical and empirical
literature, which suggests that divestitures are optimal responses to industry demand shocks that results in
the transfer of ownership of assets to where they can be most productively deployed leading to efficiency
gains (e.g., Stigler, 1951; Maksimovic and Phillips, 2001, 2002; Chen, 2005; and Sappington, 2006).
Further, the modeling of the choice between carve-outs and spin-offs as alternative mechanisms in
vertical divestitures enables us to test if ownership through carve-outs is a choice made by firms to
mitigate contractual frictions or financial constraints. As such, our work also builds upon recent studies
showing that partial equity stakes in a vertical context are used to ease contracting and financing frictions
(e.g., Fee, Hadlock, and Thomas, 2006). Second, our study is also the first to examine the wealth effects
of vertical divestitures not only for parent firms, but also for parent and subsidiary rival firms, supplier
firms, and customer firms, thereby providing additional insights into the overall economic impact of

6
firms’ decisions to contract their vertical boundaries. Finally, our study complements the extant literature
on vertical integration by demonstrating that firms also shrink their boundaries for efficiency reasons and
that the original vertical integrated structure was not motivated by anti-competitive rationales such as
foreclosure or collusion (e.g., Eckbo, 1983; and Shenoy, 2008).
The remainder of the paper proceeds as follows. Section 2 provides a discussion of the factors
that can affect the vertical divestiture decision and the choice of method of vertical divestiture. In Section
3, we describe our data sources, sample selection criteria, and salient characteristics of our sample. We
present our univariate analysis followed by two-stage Heckman probit regressions in Section 4. In Section
5, we present our univariate and cross-sectional predictions and results regarding both
announcement-period wealth effects of vertical divestitures and changes in operating performance around
vertical divestitures. Finally, we summarize our results and conclude the paper in Section 6.
2. Vertical divestiture decisions: theoretical considerations and variable descriptions
Our analysis of the economics of vertical divestitures is conducted via a two-stage process
whereby in the first stage we examine factors influencing the vertical divestiture decision itself
(Subsection 2.1) and in the second stage, conditional on vertical divestitures; we evaluate the
determinants of the choice of method of vertical divestitures (Subsection 2.2). In these subsections, we
provide theoretical justifications for the selection of variables that are hypothesized to influence either the
vertical divestiture decision or the method of divestiture. A summary of our hypotheses, variable names,
and predictions is provided in Table 1, and detailed variable descriptions and measurements are presented
in the Appendix.
[Insert Table 1 near here]
2.1. Factors influencing the vertical divestiture decision
In the discussion that follows, we provide the theoretical foundations for why industry demand
shocks, relative productivity of the parent, contracting considerations, and financing considerations can
impact the decision by firms to vertically divest.
2.1.1. Industry demand shocks and the decision to divest

7
Maksimovic and Phillips (2001, 2002) present a neoclassical model of firm organization that
provides predictions on factors that drive the sale of corporate assets. Assuming differential productivity
among industry firms, they argue that positive demand shocks to industries alter the value of the assets
causing less efficient producers to transfer assets if they are relatively more valuable to other more
efficient producers in the industry. As such, their model predicts that firms sell assets in their less
productive divisions in response to positive demand shocks to these divisions. In the context of vertical
divestitures, an alternative stream of literature has suggested that industry demand shocks reduce the
benefits of integration relative to separation and provide the impetus for vertically integrated firms to
divest either their upstream or downstream business to preserve the most efficient organizational form
(e.g., Stigler, 1951; Chen, 2005; and Sappington, 2006). The common thread in the literature is that
positive industry demand shocks trigger a change in organizational form.
Drawing on the above arguments, we hypothesize that parent (subsidiary) industry demand
shocks alter the extent of efficiency of the integrated structure and, therefore, influence the vertical
divestiture decision. Consistent with Maksimovic and Phillips (2002), we measure industry demand
shocks as the detrended value of the natural logarithm of parent (subsidiary) industry real sales,
PAR_IND_DETRN_SHP (SUB_IND_DETRN_SHP). We expect a positive relation between the measures
of demand shocks and the probability of a vertical divestiture.
2.1.2. Relative productivity of parent and the decision to divest
Firms are likely to be motivated to seek efficiency gains through a change in organizational form
when the current structure is not achieving competitive levels of productivity. As such, low or declining
firm productivity in an integrated structure is indicative of opportunities for efficiency improvement
under alternative organizational forms. Furthermore, Maksimovic and Phillips (2001) argue that firms sell
assets when they are less productive in comparison with their industry benchmarks when faced with
positive demand shocks. We posit that vertically integrated firms with productivity below benchmark
levels are likely to seek efficiency gains through divestitures. Consistent with Maksimovic and Phillips
(2001), we measure relative firm productivity as the total factor productivity of the parent firm, TFP,
8
computed on the basis of the methodology in Faleye, Mehrotra, and Morck (2006). We expect a negative
relation between total factor productivity and the probability of a vertical divestiture.
2.1.3. Contracting considerations and the decision to divest
It has been argued that vertical integration provides a solution to the holdup problem and allows
firms to undertake relationship specific investments (Coase, 1937; Klein, Crawford, and Alchian, 1978;
Williamson, 1971, 1979; Grossman and Hart, 1986; and Hart and Moore, 1990). Therefore, the vertical
divestiture decision is likely to be based on the economic trade-off between the potential efficiency gains
achieved through vertical separation and the likely increase in contractual inefficiencies when related
parties separate. We posit that in industries in which the need for and extent of investment in
relationship-specific assets is high, the potential for lower contracting costs in an integrated structure is
likely to dominate, thereby resulting in a lower probability of vertical divestiture. Furthermore, in such
industries, we would expect the extent of vertical relatedness among firms to be relatively high.
We consider two measures that capture the extent of vertical relatedness, one at the parent
industry level and the other at the parent firm level. The first measure is the proportion of vertically
integrated firms in the parent industry, PROP_VI_FIRMS. A higher proportion of vertically integrated
firms in the parent’s industry is indicative of an industry structure in which firms rely on investments in
relationship specific assets to secure a competitive advantage. As such, we would expect a negative
relation between the probability of vertical divestitures and the proportion of vertically integrated firms in
the parent industry. At the firm level, we measure the need for investments in relationship-specific assets
by assessing the extent of intra-firm relations through vertical segment sales, VERT_SEG_SALE. We
measure the extent of intra-firm relation by the proportion of the firm’s total sales accounted for by the
average vertically related secondary segment of the parent. A higher value of VERT_SEG_SALE implies
greater loss of contractual efficiencies in the event of a separation and, therefore, a lower likelihood of a
vertical divestiture.
2.1.4. Financing considerations and the decision to divest

9
The main premise behind the financing hypothesis is that firms divest assets when doing so
provides them with the cheapest source of funds (John and Ofek, 1995; and Lang, Poulsen, and Stulz,
1995). A vertically integrated firm could undertake a divestiture if it is capital-constrained and needs to
obtain financing to continue its operations or, alternatively, it could undertake a divestiture simply to take
advantage of favorable industry financing conditions. We use three variables to evaluate the impact of
financing considerations on the probability of vertical divestitures. Our first variable,
NEED_FOR_FUNDS, attempts to capture the extent of internal financing constraints faced by the
integrated firm. Our measure of need for funds is similar in spirit to Gomes and Phillips (2008) and
Maksimovic and Phillips (2008) and is measured as the difference between the firm's capital expenditures
and the sum of its operating income before depreciation and change in working capital. We expect a
positive relation between parent firm need for funds and the probability of a vertical divestiture.
The second variable is the extent of parent (subsidiary) industry capital flows,
PAR_IND_CAPFLOW (SUB_IND_CAPFLOW), and attempts to measure industry financing conditions. It
is measured as the ratio of the total debt and equity issuance in the parent (subsidiary) industry to industry
market capitalization. Our third financing variable measures the attractiveness of industry financing
conditions by assessing the attractiveness of industry valuations or the extent of industry growth
opportunities or both. Higher parent (subsidiary) industry valuations or growth prospects are likely to
increase the demand for capital from industry firms as well as the supply of external financing at
attractive terms. We measure parent (subsidiary) industry valuation or growth opportunities by the
industry Tobin’s q, PAR_IND_TOBQ (SUB_IND_TOBQ). We expect that the probability of a vertical
divestiture to be positively related to parent (subsidiary) industry capital flows and parent (subsidiary)
industry Tobin’s q.
2.2. Factors influencing the choice of method of divestitures conditional on vertical divestitures
Contingent on firms vertically divesting, we develop hypotheses that link product market and
holdup considerations, financial considerations, economies of scale benefits, and anti-competitive
10
rationales like foreclosure and collusion to the choice of method of vertical divestitures, i.e., spin-offs
versus equity carve-outs.
2.2.1. Product market and holdup considerations and the method of vertical divestitures
In the absence of complete vertical integration, extant research has argued that partial equity
ownership in vertically related businesses is a potential solution to the underinvestment problem in
relationship-specific assets (e.g., Aghion and Tirole, 1994; Dasgupta and Tao, 2000; and Harbaugh,
2001). Fee, Hadlock, and Thomas (2006) conclude that equity ownership by customers in suppliers is
beneficial when firms are concerned with expropriation and holdup problems arising from relationship-
specific investments.4
We argue that the presence of explicit long-term product market relations between the parent and
subsidiary after vertical divestitures is likely to indicate the potential for expropriation and holdup
problems. Therefore, the choice of divestiture method is likely to favor carve-outs rather than spin-offs.
We follow Allen and Phillips (2000) and treat buyer-supplier agreements, technology sharing and R&D
agreements, marketing and distribution agreements, and specialty services agreements between the parent
and subsidiary firms after the divestiture as explicit product market relations. Thus, the variable
PRDT_MKT takes on a value of one if explicit product market relations between parent and subsidiary
firm are maintained post-divestiture and is zero otherwise. We expect a negative relation between
PRDT_MKT and the probability of vertical divestitures through spin-offs.
As such, when vertical business relationships are characterized by the need for
investments in relationship-specific assets, equity carve-outs could be more advantageous relative to spin-
offs.
Recent research suggests that the need for investments in relationship-specific assets as well as
the potential for expropriation and holdup is greater in R&D-intensive environments (e.g., Allen and
Philips, 2000; and Fee, Hadlock, and Thomas, 2006). We, therefore, argue that vertical divestitures
through equity carve-outs are more likely when either the parent firm or its subsidiaries operate in high
4 Similarly, several studies show that equity ownership is beneficial when coupled with product market relations (e.g., Allen and Phillips, 2000; Gompers and Lerner, 2000; and Boone, 2003).
11
R&D-intensive industries. The parent (subsidiary) industry R&D intensity is measured by the variable
PAR_IND_RDI (SUB_IND_RDI). Thus, we expect a negative relation between parent (subsidiary)
industry R&D intensity and the probability of a vertical divestiture through a spin-off.
2.2.2. Financing considerations and method of vertical divestitures
We also examine how financing constraints of the parent influence the choice of method of
vertical divestiture. Fee, Hadlock, and Thomas (2006) find that the incidence of equity stakes is more
likely between buyer and supplier firms when financing constraints faced by the supplier firms are higher.
Other researchers argue that firms select carve-outs over spin-offs when they are motivated by a desire to
raise capital (e.g., Allen and McConnell, 1998; and Powers, 2001). We use two proxies to test the
financing hypothesis. First, we create a dichotomous variable FIN_AGR, which takes on the value of one
if the parent and subsidiary firms maintain financing agreements post-divestiture and equals zero
otherwise. If the presence of a financing agreement is indicative of financing constraints for the divested
firm, we expect a negative relation between the presence of financing agreements and the probability of
divestiture through spin-offs. Second, we include the parent firm’s need for external capital
(NEED_FOR_FUNDS). Because a higher value of NEED_FOR_FUNDS suggests that the needs of the
parent to raise external capital are greater, we expect a negative relation between NEED_FOR_FUNDS
and the probability of divestiture via spin-off.
2.2.3. Economies of scale benefits and method of vertical divestitures
Stigler (1951) argues that firms tend to vertically integrate their production if they operate in
industries that are either small or declining. In large or growing industries, however, upstream divisions of
some firms are disintegrated to take advantage of specialization and economies of scale and become
suppliers for the downstream industry. Thus, vertical integration is more likely in either nascent or
declining industries, while vertical disintegration is likely in either large or growing industries.
Subsequently, researchers have built on Stigler’s argument and developed theoretical models to show that
vertical divestitures result in efficiency gains (e.g., Chen, 2005; and Sappington, 2006).
12
Drawing on these studies, we hypothesize that industry shocks that signal a transition in the
industry growth phase influence the decision to conduct the vertical divestiture via spin-off or carve-out.
In particular, we argue that industry size and industry demand shocks signal the transition to a growth
phase. The stronger the magnitude of these shocks, the greater are the likely efficiency gains arising from
separation and consequently weaker the economic rationale for units to remain vertically integrated.
Further, because spin-offs represent a complete separation of vertically related businesses compared with
equity carve-outs in which the separation is partial, the opportunity to capture efficiency gains arising
from specialization are higher in the case of spin-offs.
Our measure of parent (subsidiary) industry demand shocks is PAR_IND_DETRN_SHP
(SUB_IND_DETRN_SHP). We compute parent (subsidiary) industry size as the natural logarithm of the
parent (subsidiary) industry real sales, LOG_PAR_IND_SALE (LOG_SUB_IND_SALE). We expect a
positive relation between the parent (subsidiary) industry size and industry demand shocks and the
probability of a vertical divestiture via spin-off.
2.2.4. Foreclosure and method of vertical divestitures
The foreclosure hypothesis suggests that vertical integration provides an opportunity for
integrated firms to raise the costs of their unintegrated rivals by denying or limiting access to inputs or
distribution outlets to their rivals (e.g., Salinger, 1988; Hart and Tirole, 1990; Ordover, Saloner, and
Salop, 1990; and Rey and Tirole, 2006). The potential for foreclosure benefits in a vertically integrated
structure, however, raises the question of whether vertical divestitures result in the erosion of these
benefits. If foreclosure benefits are high, then the integrated firms are more likely to seek vertical
divestitures through equity carve-outs, where they can continue to exert influence on the divested entity in
raising rival input prices in an attempt to preserve these benefits. Consistent with Shenoy (2008), who
argues that higher market shares of bidder and target firms in vertical takeovers increase the market power
of the integrated firm to foreclose on nonintegrated rivals, we include parent and subsidiary firm market
shares, PAR_MKT_SHR and SUB_MKT_SHR, respectively, as proxies for foreclosure benefits. We
13
expect a negative relation between parent (subsidiary) market share and the probability of a vertical
divestiture through a spin-off.
2.2.5. Collusion and method of vertical divestitures
The basic premise behind the collusion hypothesis is that the subsidiary of the integrated vertical
firm serves as a mechanism that facilitates the flow of information between the integrated firm and its
unintegrated rivals (e.g., Chen, 2001; and Nocke and White, 2007). This flow of information enables
better coordination between the integrated firm and its unintegrated rivals. Thus, vertical divestitures
reduce the ability of rival firms to collude because the divestiture of the input or distribution outlet
eliminates the coordination mechanism for collusion. Consequently, in environments in which
opportunities for collusion between integrated firms and their unintegrated rivals are high, we expect
partial divestures in the form of equity carve-outs instead of complete separation via spin-offs as
integrated firms attempt to retain control of their subsidiaries in an effort to continue to capture the
highest possible benefits from collusion. Because opportunities for collusion among rival firms are
typically higher in concentrated industries, we expect a negative relation between parent industry
concentration and the probability of a vertical divestiture through a spin-off. We follow the two-step
methodology outlined in Hoberg and Phillips (2009) to impute a Census-based Herfindahl index for the
parent industry, PAR_IND_HERFINDX_CENSUS.
2.2.6. Control factors influencing the method of vertical divestitures
In our multivariate tests, we include variables that potentially influence the choice of restructuring
through equity carve-outs versus spin-offs for all types of divestitures, and not just vertical divestitures, as
control variables. We, therefore, control for parent firm financing constraints (PAR_LEVER_PRE),
market conditions favoring equity issuances (SUB_FF_IND_RET and NUM_IPOSEO), and size of
subsidiary relative to parent (REL_SIZE) because the extant literature suggests that the economic forces
represented by these variables influence divestiture decisions (e.g., Allen, Lummer, McConnell, and
Reed, 1995; Hite and Owers, 1983; and Powers, 2001).
3. Data sources, sample selection, and salient characteristics of the sample
14
In this section, we describe the data sources and sample selection criteria used to identify our
sample of vertical divestitures and the control sample of vertically integrated firms. We also provide the
salient characteristics of our final sample of vertical divestitures.
3.1. Construction of initial sample of spin-offs and equity carve-outs
Our sample of divestitures includes both spin-offs and equity carve-outs over the period 1986 –
2005. Our initial sample of spin-offs is obtained from the Securities Data Company (SDC) Platinum
Mergers and Acquisitions database, and our equity carve-out sample is initially identified from SDC
Platinum’s New Issues database and from issues of Mergers and Acquisitions magazine. For each spin-off
and equity carve-out firm in our initial sample, we search for detailed transaction information on Factiva
and LexisNexis. We exclude spin-offs and carve-outs that are characterized by the following: (1) parent
firms are private firms, limited partnerships, financial firms, Real Estate Investment Trusts (REITs),
foreign firms, or joint ventures, (2) information on both the parent and subsidiary firm is unavailable on
Center for Research in Securities Prices (CRSP) immediately after the divestiture, (3) contemporaneous
announcements are made such as quarterly earnings; issues of equity, preferred stock, or warrants;
mergers and acquisitions; other asset sales; termination of technical agreements; share repurchases;
private placements; dividends; executive turnover; and work-force reduction, (4) parents firms
simultaneously announce an intent to divest multiple subsidiaries or split into multiple firms in the case of
spin-offs and to divest remaining ownership via a subsequent spin-off in the case of carve-outs, and (5)
proxy statements are unavailable. Finally, in the case of spin-offs, we retain only transactions that
represent pure spin-offs, which are defined as a tax-free distribution of 100% shares of the subsidiary and
which was 100% owned by the parent prior to the divestiture. As a result of all these restrictions, our final
sample consists of 161 spin-offs and 234 equity carve-out firms. For the identified spin-offs and equity
carve-outs, we hand-collect data on product market agreements and financial agreements from proxy
statements.
3.2. Sample of vertical divestitures through equity carve-outs and spin-offs
15
Prior research finds that firms change their industry classifications over time and recommend
using the historical Standard Industrial Classification (SIC) code instead of the current SIC code to
identify the primary industry classification of a firm (e.g., Kahle and Walkling, 1996). For each spin-off
and equity carve-out in our sample, we find the four-digit historical SIC code (Compustat data item 324)
of the parent and subsidiary for the calendar year following the announcement year of divestiture.
Because Compustat provides the historical SIC code only beginning 1987, for divestitures prior to 1987,
we use the four-digit SIC code of the segment with the highest sales during the announcement year using
Compustat segment data.
To identify vertical relations between the parent and subsidiary, we utilize the Use Table of the
benchmark input-output (IO) accounts for the US economy published by the Bureau of Economic
Analysis. We map the SIC codes of the parent and subsidiary to their respective IO codes by using the
SIC-IO concordance table developed by Fan and Lang (2000). Further, the 1997 benchmark input-output
accounts are based on the North American Industry Classification System (NAICS) instead of the SIC
system of industry classification. To tackle this issue, we first map the SIC codes to their respective
NAICS codes using the Bridge Tables provided by the Bureau of Census. We then find their respective
IO industries using the NAICS-IO concordance table provided under the 1997 benchmark input-output
accounts. Finally, because input-output relations between industries change over time, we use the 1987,
1992, and 1997 Use Tables for divestitures taking place during the periods 1986 – 1990, 1991 – 1997, and
1998 – 2005, respectively.
We then compute the vertical relatedness coefficient (VRC) between pairs of parent-subsidiary
industries. For every divestiture, we compute the dollar flow V1,PS (V1,SP) from the parent (subsidiary)
industry to the subsidiary (parent) industry for every dollar of the parent industry total output, and the
dollar flow V2,PS (V2,SP) from the parent (subsidiary) industry to the subsidiary (parent) industry for every
dollar of the subsidiary industry total output. Then, VRC is calculated as the maximum of the four
coefficients. We retain divestitures with a VRC of 1% or greater. Divestitures in which the parent and
16
subsidiary have the same four-digit SIC code are classified as horizontal divestitures and are not included
in our analysis. Our final sample consists of 46 vertical spin-offs and 65 vertical carve-outs.
Table 2 presents the pairs of parent and subsidiary industries in spin-offs (Panel A) and equity
carve-outs (Panel B) in decreasing order of VRC. For purposes of brevity, we report only pairs of
industries in which the VRC is at least 5%. In both our spin-off and equity carve-out samples, the crude
petroleum and natural gas industry and the petroleum refining industry have the highest vertical linkages.
The VRC is different in the two samples for the same pair of industries only because the divestiture years
are not the same. Table 3 indicates that the yearly distribution of vertical divestitures appears to be similar
for equity carve-outs and spin-offs over our sample period 1986 – 2005.
[Insert Tables 2 and 3 near here]
3.3. Identification of rival, supplier, and customer firms in vertical divestitures
We identify parent (subsidiary) rivals as all firms on Compustat that have the same four-digit
primary SIC code as the parent (subsidiary) during the announcement year. We identify the customer
(supplier) firms for each vertical divestiture as follows. First, we identify the downstream and upstream
industry in the divestiture. Specifically, the downstream industry is the parent (subsidiary) industry if the
parent and subsidiary shared a backward (forward) vertical relation. The upstream industry is the
subsidiary (parent) industry if the parent and subsidiary shared a backward (forward) vertical relation.
The customer industry is the IO industry that purchases the highest proportion of its inputs from the
downstream industry provided it is greater than 1%. The supplier industry is the IO industry that is most
dependent on the upstream industry to sell its outputs provided it is greater than 1%. Finally, we identify
all firms on Compustat in the customer (supplier) IO industry during the divestiture announcement year.
3.4. Construction of control samples of vertically integrated firms
To model the decision to vertically divest, we identify four control samples of vertically
integrated firms. For this purpose, we use the Compustat segment tapes to first identify segment related
information reported by all US-based firms during our sample period 1986 – 2005. We exclude segments
that do not contain complete information on sales or SIC codes. We also eliminate firm-years with
17
missing firm assets or sales, in which the sum of segment sales is not within 5% of the total firm sales, the
sum of segment sales is less than $20 million, and any segment has a one-digit SIC code of six (financial
industry). Finally, because by definition vertically integrated firms involve at least two segments, we
retain only multi-segment firms.
We rely on extant literature to measure the extent of vertical relatedness in a multi-segment firm
(e.g., Fan and Lang, 2000; Acemoglu, Johnson, and Mitton, 2009; and Shenoy, 2009). Following Fan and
Lang (2000), we compute the extent of backward (forward) vertical relatedness between the primary
segment and all secondary segments of the firm. Similarly, following Acemoglu, Johnson, and Mitton
(2009), we compute the extent of backward (forward) vertical relatedness across all segments of the firm.
Then, a firm-year is treated as being vertically integrated when any of the above measures is greater than
1%. These sample selection criteria yield an initial sample of 10,874 vertically integrated firm-years.
Subsequently, we identify four different control samples of vertically integrated firms.
We construct Control Sample 1 by using our universe of all equity carve-outs and spin-offs to
delete firm-years that had any divestiture (vertical, horizontal, or conglomerate) during the observation
year. We also delete firm-years in which the number of reported segments increased (decreased) from the
previous year to the current year. This approach yields 6,038 firm-year observations. This is the most
general control sample to which we add further criteria to obtain the following three additional control
samples. Specifically, to create Control Sample 2, we retain a firm-year observation only if the firm
remains vertically integrated over a three-year period including the observation year (i.e., t, t-1, and t-2)
and the number of segments remains constant over this period. To construct Control Sample 3, we retain a
firm-year observation if the firm remains vertically integrated over a one-year window around each
observation year (i.e., t-1, t, and t+1) and the number of segments remains constant over this window.
Finally, to create Control Sample 4, we retain a firm-year observation only if the firm remains vertically
integrated over seven consecutive years and the number of segments remains constant over the seven-year
period. Control Sample 4 uses sample selection criteria similar to those in Çolak and Whited (2007).
4. Empirical analysis of vertical divestiture decisions
18
In this section, we empirically analyze vertical divestiture decisions to understand a firm’s
decision to dynamically set its boundaries over time.
4.1. Univariate analysis of the decision to vertically divest and the choice of method of divestiture
In Table 4, we present the results of our univariate analysis of the variables identified before as
factors that influence either the vertical divestiture decision (Panel A) or the choice of method of vertical
divestiture (Panel B). All variables are winsorized at their 1% and 99% values in our analysis. The
discussion below focuses on variables that are significantly different for either the divestiture decision or
method of divestiture decision. Comparing all vertical divestiture firms with control firms (Control
Sample 1), we find that the divestiture firms experience higher demand shocks to the subsidiary industry
(SUB_IND_DETRN_SHP), have lower total factor productivity (TFP), have lower intra-firm vertical
relatedness (VERT_SEG_ SALE), and belong to industries that have a smaller proportion of vertically
integrated firms (PROP_VI_FIRMS) and industries with attractive valuations or growth opportunities
(PAR_IND_TOBQ, SUB_IND_TOBQ). The above findings are invariant to the choice of control sample.
Comparing equity carve-out with spin-off firms, we find that carve-out firms have a higher incidence of
product market agreements (PRDT_MKT) and tighter financing constraints (NEED_FOR_FUNDS,
FIN_AGR). The above comparisons are statistically significant in the hypothesized direction.5
[Insert Table 4 near here]
4.2. Two-stage probit selection model estimation results
We use a Heckman two-stage probit self-selection model (Heckprob command in STATA) to
estimate the determinants of the divestiture decision in the first stage and the choice between spin-offs
versus equity carve-outs in the second stage. The inverse Mills ratio (INVMILLS) from the first-stage
estimation is included as a control variable in the second stage to assess the prevalence of self-selection.
The dependent variable in the first stage (VDIVEST) is binary and takes on the value one if the firm
5 In results not reported in Table 4, we also attempt to ascertain whether funds raised in our 65 equity carve-out events are intended for use by the parent firm, subsidiary firm, or both. We find that in 19 (34.5%), 17 (31%), and 19 (34.5%) of the carve-out events, the capital raised at the divestiture is used solely by the parent firm, exclusively by the subsidiary firm, and by both the parent and subsidiary firms, respectively.
19
belongs to the vertical divestiture group and zero if it belongs to the control group of integrated firms.
Similarly, the dependent variable in the second stage (SPODUMMY) is a binary variable that takes on the
value one if the vertical divestiture is in the form of a spin-off and zero if it is through an equity carve-out.
We report results for the Heckman two-stage estimation for all four control samples in Table 5 to
demonstrate the robustness of our results. Because our results are qualitatively similar for all four models,
for purposes of brevity, the discussion of the results is based on the fourth model in Table 5, which was
estimated using the most restrictive control sample. We assess the economic significance of each variable
by computing the change in marginal probability as the value of each independent variable is varied from
its 25th to its 75th percentile value, keeping all other variables at their mean levels. For dummy
explanatory variables, we change their values from zero to one to assess their economic significance.
[Insert Table 5 near here]
We initially focus our discussion on the first-stage probit model to identify factors that influence
the vertical divestiture decision. As can be seen from Model 4 in Table 5, the marginal effect of
SUB_IND_DETRN_SHP is positive and significant, indicating that positive subsidiary industry demand
shocks increase the probability of vertical divestitures. In addition, we find that the marginal effect of
TFP is negative and significant, indicating a higher probability of vertical divestitures when parent firm
relative productivity is lower. Further, we find that the marginal effects of both PROP_VI_FIRMS and
VERT_SEG_SALE are negative and significant. Therefore, vertical divestitures are less likely in industries
with a high proportion of vertically integrated firms and when the parent has more significant intra-firm
vertical relatedness. These results support the argument that when the need for relationship-specific
investments is high, the probability of vertical divestitures is low as firms seek to preserve contractual
efficiency gains through the integrated structure. The results in Table 5 indicate that financing
considerations also influence the vertical divestiture decision. The marginal effects of
PAR_IND_CAPFLOW, SUB_IND_CAPFLOW, and SUB_IND_TOBQ are positive and significant.
However, the marginal effect of NEED_FOR_FUNDS, while positive, is not significant. Our results,
20
therefore, suggest that attractive industry financing conditions, particularly in subsidiary firm industries,
instead of parent firm internal financing constraints influence the vertical divestiture decision.
In addition, we find that when the subsidiary industry demand shock (SUB_IND_DETRN_SHP)
increases from its 25th to 75th percentile value, the probability of vertical divestiture goes up by 6.9%.
Similarly, as the parent firm total factor productivity (TFP) increases from its 25th to 75th percentile
value, the probability of a vertical divestiture declines by 3.8%. Further, as the proportion of vertically
integrated firms in the parent industry (PROP_VI_FIRMS) is varied from its 25th to 75th percentile value,
the probability of a vertical divestiture declines by 7.8%. Among financing considerations, the subsidiary
industry’s financing conditions (SUB_IND_TOBQ) is the most influential variable, causing the
probability of a vertical divestiture to increase by 6.4% when the subsidiary industry Tobin's q increases
from its 25th to 75th percentile value.
To identify the determinants of the choice of method of divestiture conditional on the vertical
divestiture decision, we analyze the results of the second stage of our probit analysis as reported in Table
5. We find that the marginal effects of PRDT_MKT and SUB_IND_RDI are negative and significant,
indicating that vertically integrated firms are likely to partially, not completely, separate to preserve
contractual efficiencies in environments in which the need for relationship-specific investments is greater.
In terms of economic significance, the results suggest that the probability of vertical divestitures via spin-
offs relative to carve-outs declines by 18.3% in the presence of product market contractual agreements
(PRDT_MKT). Similarly, the probability of a vertical divestiture via spin-offs relative to carve-outs
declines by 12.1% when the subsidiary industry R&D intensity (SUB_IND_RDI) is changed from its 25th
to 75th percentile value.
Further, as hypothesized, we find that the marginal effect of NEED_FOR_FUNDS is negative and
significant, indicating that the method of vertical divestiture is likely to be a carve-out instead of a
spin-off in the face of tighter financial constraints. The probability of a vertical divestiture via spin-offs
relative to carve-outs declines by 7.3% when the parent’s internal funding deficit (NEED_FOR_FUNDS)
is varied from its 25th to 75th percentile value. In addition, from our first- and second-stage analysis of
21
NEED_FOR_FUNDS, we can infer that while parent firm internal financing constraints do not influence
the vertical divestiture decision, they do affect the choice of method of divestiture. The marginal effect of
FIN_AGR is negative in all four models, but it is insignificant at conventional levels (p-values range from
0.11 to 0.12). The probability of vertical divestitures via spin-offs relative to carve-outs declines by 9.5%
in the presence of financial agreements (FIN_AGR).
We further find that the marginal effects of SUB_IND_DETRN_SHP and LOG_SUB_IND_SALE
are both positive and significant. The probability of vertical divestitures via spin-offs relative to
carve-outs increases by 9.9% (19.5%) when SUB_IND_DETRN_SHP (LOG_SUB_IND_SALE) increases
from its 25th to 75th percentile value. These results indicate that the higher the subsidiary industry sales
and demand shocks prior to the divestiture, the more likely that vertical divestitures occur through
spin-offs instead of carve-outs as firms strive to capture the benefits of specialization and economies of
scope, which are maximized under a complete vertical separation. While the marginal effect of
LOG_PAR_IND_SALE is negative and significant, the marginal effect of PAR_IND_DETRN_SHP is
insignificant. As such, we are unable to provide consistent evidence to indicate whether parent industry
demand conditions influence vertical divestitures of their subsidiary firms. We find the marginal effect of
PAR_IND_HERFINDX_CENSUS to be negative but insignificant, which is inconsistent with the
collusion hypothesis. Similarly, while the marginal effect of PAR_MKT_SHR and SUB_MKT_SHR are
both positive, only SUB_MKT_SHR is significant. These results do not support the foreclosure
hypothesis.
Several of the control variables are significantly related to the conditional choice of method of
vertical divestiture. The marginal effect of PAR_LEVER_PRE is negative and significant, further
indicating that parents with higher internal financing constraints prior to the divestiture are more likely to
vertically divest through a carve-out instead of a spin-off. Further, the marginal effect of REL_SIZE is
negative and significant, indicating that the larger the size of the subsidiary relative to the parent, the
more likely the vertical divestiture occurs through a carve-out. The marginal effects of
22
SUB_FF_IND_RET and NUM_IPOSEO are both negative as expected but insignificantly different from
zero.
5. Wealth effects and changes in operating performance
In this section, we examine the announcement-period wealth effects of vertical divestitures and
changes in operating performance around vertical divestitures in both univariate and cross-sectional
contexts. We design our cross-sectional tests in a manner that enhances our ability to discriminate
between non-mutually exclusive hypotheses.
5.1. Announcement-period wealth effects of vertical divestitures
In this subsection, we examine the announcement-period wealth effects of vertical divestitures on
parent firms, parent rivals firms, subsidiary rival firms, supplier firms, and customer firms.
5.1.1. Measurement of announcement-period wealth effects
Following Mulherin and Boone (2000), we use market-adjusted returns around the announcement
date to measure the wealth effects from the divestiture. Specifically, we calculate the cumulative
abnormal returns (CARs) over the event windows (0, +1), (-1, +1), (-2, +2), and (-5, +5) trading days
around the announcement date of each divestiture. For every vertical divestiture, we combine the parent
rivals, subsidiary rivals, supplier firms, and customer firms into separate equally weighted portfolios to
compute their portfolio returns. The equally weighted approach is used to account for the
contemporaneous cross-correlation in returns (Eckbo, 1983; Fee and Thomas, 2004; and Shahrur, 2005).
We calculate the market-adjusted returns to the parent rival, subsidiary rival, supplier, and customer
portfolios for the same event windows as for the parent firm.
5.1.2. Univariate results for the wealth effects of parent firms, rivals, suppliers, and customers
A summary of our predictions with brief explanations regarding the wealth effects of vertical
divestitures under the efficiency, collusion, and foreclosure hypotheses for parent firms, parent rival
firms, subsidiary rival firms, supplier firms, and customer firms is provided in Table 6. In Table 7, we
report the announcement-period wealth effects for all the above parties. The abnormal returns for parent
firms are reported in Panel A. For the full sample of vertical divestitures, we find that the mean abnormal

23
returns to parent firms are positive and significant for all four event windows examined. In addition, we
find that the mean wealth effects to parent firms are positive and significant in spin-offs for all windows,
and they are positive and significant in three of the four windows for equity carve-outs. For example, the
mean CAR is 2.68%, 1.63%, and 4.15% over the (0, +1) window for the parent firm in the full sample of
vertical divestitures, the subsample of vertical divestitures through equity carve-outs, and the subsample
of vertical divestitures through spin-offs, respectively.
[Insert Tables 6 and 7 near here]
Thus, it appears that the market assesses vertical divestitures to be value-creating events for
parent firms. The positive stock price reaction for parent firms is consistent with value creation due to
enhanced corporate focus or economies of specialization [see, e.g., Desai and Jain (1999) for spin-offs
and Vijh (2002) for carve-outs]. In a vertical divestiture there is likely to be underinvestment in
relationship-specific assets after the divestiture due to the higher potential for holdup, a lower probability
of collusion between the parent firm and its industry rivals, and a reduced ability to foreclose parent and
subsidiary rivals from inputs and outlets. All these effects would impact the stock price of the parent firm
negatively. The positive stock price reaction to parent firms is inconsistent with these explanations.
We report the abnormal returns to parent rival firms in Panel B. For the full sample of vertical
divestitures, we find that the mean abnormal returns for the parent rival firms are positive and significant
for all the event windows examined. In addition, we find that the mean wealth effects for parent rival
firms are also positive and significant in spin-offs for all the windows, and they are significantly positive
in equity carve-outs for three out of the four event windows. The positive parent rival abnormal returns
are consistent with the view that the divestiture announcement conveys better information to industry
participants about potential efficiency gains from restructuring (Eckbo, 1983, 1990; Rosengren and
Meehan, 1994; and Shenoy, 2008). They are inconsistent with the argument that a vertical divestiture
reduces the probability of collusion in the parent firm’s industry. These results, in conjunction with the
positive abnormal returns to the parent firm, are also inconsistent with the foreclosure argument.
24
The wealth effects for subsidiary rival firms are reported in Panel C. While the mean wealth
effects are positive, they tend to be insignificant. The abnormal returns are positive and significant for the
full sample of vertical divestitures and the sample of equity carve-outs only for the (-5, +5) window. The
positive, albeit generally insignificant, abnormal returns to subsidiary rival firms when viewed in
conjunction with the positive abnormal returns to parent rival firms are inconsistent with the collusion
hypothesis and when viewed in conjunction with the positive abnormal returns to the parent firm, they are
inconsistent with the foreclosure hypothesis.
Panel D contains the abnormal returns to customer firms, and Panel E contains the abnormal
returns to supplier firms. The mean abnormal returns to customers tend to be positive. They are, however,
insignificant in all the windows for the sample of equity carve-outs but significantly positive in the (0, +1)
and (-5, +5) windows for the full sample of vertical divestitures and the sample of spin-offs. The mean
abnormal returns to suppliers, however, are positive and statistically significant for all four event
windows in the overall sample. In addition, we observe a positive and significant wealth effect to supplier
firms in three of the four event windows in both subsamples of equity carve-outs and spin-offs. Again,
when viewed in conjunction with the positive wealth effects for parent firms and rival firms, the positive
wealth effects to the supplier and customer firms are consistent only with the efficiency hypothesis.6
5.1.3. Determinants of wealth effects for parent firms
However, because our hypotheses are not mutually exclusive, we design cross-sectional tests that allow us
to more cleanly disentangle all the economic forces at play.
We propose the cross-sectional regression model given by Equation (1) to examine the
determinants of the wealth effects to the parent firms in vertical divestitures. 6 The data on the customers (suppliers) are coarse because they are identified as all firms in the industry that is downstream (upstream) to the downstream (upstream) industry in the divestiture. As a robustness check, we identify actual key customers (suppliers) of the parent and subsidiary based on Financial Accounting Standards Board (FASB) No. 14 requirement for firms to report customers that account for at least 10% of sales (e.g., Fee and Thomas, 2004). We identify key customers (suppliers) for 23 (29) of the vertical divestitures in our sample. We find that key customers experience insignificant wealth effects and suppliers experience positive and statistically significant wealth effects. These results generally mirror our findings based on the industry level data. A bias of the 10% cutoff is that the data identify large customer firms. For example, we find that the median customer firm is about 14 times the size of the parent firm. The insignificant wealth effects to customers can at least partially be explained by this size differential.

25
)1(**__*_*8__*__*___*___*
___*__*__*_
111097
654
3210
εββββββββ
ββββ
++++++++
++++=
SPODUMMYMERGERPRELEVERPARSIZERELSHRMKTSUBSHRMKTPARCENSUSHERFINDXINDPARSHPDETRNINDSUB
SHPDETRNINDPARPREHERFINDXPARPRERDIPARCARPAR
In the model, the dependent variable PAR_CAR is the cumulative abnormal return to the parent
firm over the (-1, +1) day event window around the divestiture announcement date. The efficiency
hypothesis indicates that efficiency gains can come from enhanced corporate focus or economies of
specialization. We posit that the less focused the pre-divestiture parent firm, the greater the organizational
complexity and, hence, the higher the potential for gains from a divestiture. As a measure for
pre-divestiture corporate focus, we use the parent firm Herfindahl index, PAR_HERFINDX_PRE, and
expect it to be negatively related to PAR_CAR. Further, a source of efficiency gains from vertical
integration is the increase in relationship-specific investments due to the reduction in the severity of the
holdup problem. We use the pre-divestiture R&D intensity of the parent firm, PAR_RDI_PRE, as a proxy
for the extent of relationship-specific investments in the integrated structure (e.g., Levy, 1985; Armour
and Teece, 1980; and Boerner and Macher, 2001). We posit that if the pre-divestiture relationship-specific
investments are higher, the potential for ex post contracting problems after the divestiture is greater.
Therefore, we predict a negative relation between PAR_CAR and PAR_RDI_PRE. In addition, under the
efficiency umbrella, we include measures of parent and subsidiary industry demand shocks
(PAR_IND_DETRN_SHP and SUB_IND_DETRN_SHP). Maksimovic and Phillips (2001) argue that
positive industry demand shocks can lead to efficiency gains as firms are motivated to transfer ownership
of their less productive assets to industry players who can deploy them more productively. As such, we
expect parent and subsidiary industry demand shocks to be positively associated with wealth effects.
Under the collusion hypothesis, a vertical divestiture in a more concentrated industry results in
the parent firm potentially giving up a higher amount of the gains coming from colluding with its rivals.
Thus, we expect a negative relation between parent industry concentration,
PAR_IND_HERFINDX_CENSUS, and parent firm wealth effects. Under the foreclosure hypothesis, the
higher the market share of the parent and the subsidiary firms, the greater is the potential losses arising

26
from their inability to foreclose their rival firms after the vertical divestiture. We, therefore, expect a
negative relation between parent firm wealth effects with both the industry market share of the parent firm
(PAR_MKT_SHR) and industry market share of the subsidiary firm (SUB_MKT_SHR).
The remaining variables REL_SIZE, PAR_LEVER_PRE, MERGER, and SPODUMMY serve as
control variables in our regressions. Relative size of subsidiary to parent (REL_SIZE) is included in
accordance with Mulherin and Boone (2000), who find that the wealth effects for parent firms are
positively related to the relative size of the subsidiary to the parent. When PAR_LEVER_PRE is larger,
the market could be negatively surprised by the extent of the financial constraints faced by the parent and
react more negatively to the announcement. We include MERGER, which is an indicator variable that
equals one if either the parent or subsidiary became the target in an acquisition during the three years
subsequent to the announcement year, as an explanatory variable. If the divestiture wealth effects reflect
the expectation of the future acquisition premium paid by the acquirer, then we would find MERGER to
be positive.7
The cross-sectional results for the determinants of parent firm wealth effects in vertical
divestitures are reported in Table 8. Because the method of vertical divestiture (spin-off versus equity
carve-out) is a choice made by parent firm managers, we control for this choice by using a Heckman
treatment effect model. The first stage in the Heckman analysis is our model of choice of method of
vertical divestiture reported in Table 5. Thus, we report only the results from the second-stage parent
wealth effects regressions in Table 8.
To the extent that the parent wealth effects in a spin-off tend to be greater than those in
equity carve-outs, we also include the dummy variable SPODUMMY to capture any differential effect that
is not accounted for by all the other independent variables in the regression.
8
7 The results we report in Tables 8 and 9 are insensitive to the exclusion of MERGER from the regression specifications.
The p-values associated with all the reported coefficients are based
on heteroskedasticity robust standard errors and are clustered by parent firm.
8 Some variables in the first stage probit regression do not appear in the wealth effect regressions. To investigate if the excluded variables from the first stage make valid instruments, i.e., highly correlated with the choice of method of divestiture but uncorrelated with excess returns, we estimate a two-stage least squares (2SLS) model instead of a
27
[Insert Table 8 here]
In Model 1, we focus on the efficiency arguments by including PAR_RDI_PRE,
PAR_HERFINDX_PRE, PAR_IND_DETRN_SHP, and SUB_IND_DETRN_SHP as explanatory variables.
In Model 2, we focus on the anti-competitive hypotheses by including PAR_IND_HERFINDX_CENSUS,
PAR_MKT_SHR, and SUB_MKT_SHR as explanatory variables. Model 3 is the full specification and
includes all the independent variables. In both Models 1 and 3, we find that the relation between
PAR_CAR and PAR_RDI_PRE is significantly negative. This result indicates that the wealth effects on
announcement of vertical divestitures tend to be lower if the potential for ex post contractual
inefficiencies is higher. In addition, we find a significantly negative relation between PAR_CAR and
PAR_HERFINDX_PRE in both these models. This suggests that the wealth effects are higher when the
potential for an increase in focus as a result of the vertical divestiture is greater. Further, although the
coefficients of PAR_IND_DETRN_SHP and SUB_IND_DETRN_SHP are positively associated with
PAR_CAR, the results are not significant. In Models 2 and 3, we show a negative relation between the
wealth effects for parent firms and the industry concentration of the parent firm,
PAR_IND_HERFINDX_CENSUS. While the result is consistent with the collusion hypothesis, our earlier
analysis of determinants of choice of method of vertical divestitures revealed no evidence of collusion as
a factor.9 As such, we do not find consistent evidence in line with the collusion effect. The negative
coefficient of PAR_IND_HERFINDX_CENSUS is, however, indicative of vertical divestitures being more
beneficial in competitive industries as it allows the divested entities to more nimbly compete in their
industries.10
Heckman treatment model. We conduct relevance and validity tests on these instruments and find that they meet the exclusion restrictions. The results from the 2SLS model are similar to what we report here.
Finally, in the two models in Table 8 involving parent and subsidiary firm market shares, we
find that while the coefficient on the former is significantly positive, the coefficient on the latter is
unrelated to parent firm wealth effects. These results do not support the foreclosure hypothesis.
9 Also, in our analysis of the wealth effects of rival, supplier, and customer firms, we find no evidence to support the collusion hypothesis. 10 We thank the referee for this interpretation.

28
While the coefficient on PAR_LEVER_PRE is significantly negative in all three estimated
models, none of the remaining control variables is significant. The insignificant coefficient on the
SPODUMMY indicates that once we control for the determinants of parent wealth gains and self selection,
the method of divestiture has no impact on value creation in a vertical divestiture.
5.1.4. Determinants of wealth effects of parent and subsidiary firm rivals, suppliers, and customers
For completeness, we also examine the cross-sectional determinants of the announcement-period
wealth effects for the parent rivals, subsidiary rivals, suppliers, and customers.11
In the second set of specifications, we find a significantly negative relation between the wealth
gains to parent rival firms, subsidiary rival firms, and supplier firms and the pre-divestiture focus of the
parent firm. These results indicate that the announcement of the vertical divestiture provides information
to rival and supplier firms that they can also benefit from focus increasing restructuring activities.
Furthermore, we document that parent industry concentration has a significant negative relation with the
wealth effects for both subsidiary rival firms and supplier firms. It is, however, unrelated to the wealth
We estimate two
Heckman treatment effect regression specifications for each of these parties. In the first specification, we
include the abnormal returns to the parent firm in lieu of the efficiency variables. In the second regression
specification, we include the efficiency variables instead of the abnormal returns to the parent firm. In
both specifications, we include variables related to the foreclosure and collusion hypotheses. In the first
set of specifications, we find a significantly positive relation between the wealth effects to subsidiary rival
firms, supplier firms, and customer firms with the wealth effects to the parent firm. The relation between
the wealth effects to parent rival firms with the parent wealth effects is positive but statistically
insignificant. These results indicate that if more wealth is expected to be created for the parent firm from
the divestiture, then all the other parties along the supply chain are generally also better off. This evidence
can be consistent only with an efficiency-based explanation, where rival firms can restructure similarly,
and the resultant gains are passed along to suppliers and customers.
11 We do not report details of this analysis for purposes of brevity. The detailed results are available upon request.
29
effects for the parent rival firms and customer firms. These results are inconsistent with the collusion
hypothesis.
Finally, we find that the wealth effects to parent (subsidiary) rival firms are unrelated to the
market share of the subsidiary (parent) firm. We show a similar insignificant relation between parent
market share and both the customer firm and supplier firm wealth effects. These results are inconsistent
with the foreclosure hypothesis. We find a significantly positive relation between supplier firm wealth
effects and subsidiary market share and a significantly negative relation between customer firm wealth
effects and subsidiary market share. While the former result is consistent with the foreclosure hypothesis,
the latter result is inconsistent with this hypothesis. Hence, when we view the relation between the wealth
effects for all parties along the supply chain with parent and subsidiary market shares through one large
lens, the collective evidence does not support the foreclosure hypothesis. Overall, the cross-sectional
determinants of the wealth effects to the parent and subsidiary rivals, supplier firms, and customer firms
provide additional corroborating evidence in favor of the efficiency hypothesis.
5.2. Determinants of changes in operating performance around vertical divestitures
In this subsection, we examine the determinants of changes in operating performance for our
sample of vertical divestiture firms. Our objective is to assess whether the potential for efficiency gains
from vertical divestitures arising as a result of improvement in focus, positive industry demand shocks,
and product market considerations are reflected in improvements in operating performance. We adopt the
widely used metric of operating cash flows deflated by total assets (Compustat data item 13 divided by
Compustat data item 6), also called operating return on assets, as our measure of operating performance
(e.g., Barber and Lyon, 1996; Daley, Mehrotra, and Sivakumar, 1997; and Jain and Kini, 1994). In
addition, we construct industry-adjusted operating performance measures by adjusting the pre- and post-
divestiture operating performance of sample firms by the median operating performance of all firms
(excluding the parent) that belong in the same two-digit SIC industry as the parent in the year under
consideration.

30
Because the divestitures can result in improvements in operating performance for either the
parent firm or subsidiary firm, or both, researchers have typically adopted a portfolio approach in which
the change in operating performance measure is constructed as the benchmark-adjusted post-divestiture
operating performance of the parent and subsidiary firms minus the benchmark-adjusted performance of
the parent firm in the pre-divestiture period (Daley, Mehrotra, and Sivakumar, 1997; and Desai and Jain,
1999).12
Our univariate analysis generally indicates an improvement in operating performance for the
combined parent and subsidiary firms. Specifically, the median change in industry-adjusted cash flows
from year t-1 to year t+2 (t+3) is 0.833% (1.404%), 1.549% (3.458%), and 0.204% (1.326%) for the
overall sample, spin-off subsample, and carve-out subsample, respectively. A consistent picture does not
emerge if we focus on changes in operating performance for subsidiary firms. The median change in the
industry-adjusted cash flows from year t-1 to year t+2 (t+3) is 0.163% (-0.312%), -2.03% (0.84%), and
0.826% (-1.388%) for the overall sample, spin-off subsample, and carve-out subsample, respectively.
Therefore, as a measure of pre-divestiture performance, we use the industry-adjusted operating
performance of the parent for year t-1, where year t is the divestiture year. For post-divestiture
performance we use the asset-weighted industry-adjusted operating performance of the parent and
divested subsidiary for years t+2 and t+3. We examine changes in operating performance over the (t-1,
t+2) and (t-1, t+3) windows. In addition, we investigate operating performance changes around vertical
divestitures pertaining solely to the divested subsidiary firms. We use Thompson One Banker database
and obtain the first annual report published by the subsidiary firms after the divestiture transaction. We
then use these annual reports to collect financial information on the divested entity for the calendar year
prior to the divestiture transaction (t-1).
In our cross-sectional regression analysis, we follow the extant literature and adopt two
alternative forms of expectation models to detect the change in operating performance around vertical
divestitures. The first model constructs the dependent variable as the change in benchmark-adjusted
12 For instance, as pointed out by Daley, Mehrotra, and Sivakumar (1997), comparing the parent firm alone with the pre-divestiture entity can indicate performance improvements in situations in which a poorly performing subsidiary is divested and there is no change in the productivity of parent share of pre-spin-off assets.
31
operating performance. The second change model, often referred to as the regression-based model,
regresses the post-event benchmark-adjusted operating performance against the pre-event
benchmark-adjusted operating performance (e.g., Healy, Palepu, and Ruback, 1992; Ghosh, 2001; and
Powell and Stark, 2005). We report results using both the change and regression-based approaches.
In our regression-based approach, the dependent variable for the combined parent and subsidiary
firms is COMBCFPOST1 (COMBCFPOST2) and is computed as the industry-adjusted operating return
on assets of the parent and subsidiary for year t+2 (t+3). The corresponding dependent variable only for
subsidiary firms is SUBCFPOST1 (SUBCFPOST2) and is defined as the industry-adjusted operating
return on assets of the subsidiary for year t+2 (t+3). Further, the variables are regressed on the variable
PRECF (SUB_PRECF), which is defined as the pre-divesture industry-adjusted operating return on assets
for the combined firm (subsidiary firm). In the change approach, the dependent variable for the combined
parent and subsidiary firms is CHG_COMBCF1 (CHG_COMBCF2), which is defined as the change in
industry-adjusted performance of the parent plus subsidiary firms over the window (t-1, t+2) [(t-1, t+3)],
while the corresponding dependent variable only for subsidiary firms is CHG_SUBCF1 (CHG_SUBCF2)
and is measured as the change in industry-adjusted performance of the subsidiary over the window (t-1,
t+2) [(t-1, t+3)].
Table 9 presents results for the determinants of operating performance in vertical divestitures
based on the Heckman treatment effect model. In the first stage, we model the choice to conduct a vertical
divestiture through either a spin-off or carve-out. In the second stage, we investigate the determinants of
operating performance using median regressions because operating performance metrics tend to be highly
skewed. While Models 1 – 2 (5 – 6) report results using the regression-based approach, Models 3 – 4 (7 –
8) report results using the change model for combined parent and subsidiary firms (subsidiary firms).
[Insert Table 9 near here]
Focusing on combined parent and subsidiary firms in Models 1 – 4 of Table 9, the independent
variables included are identical to those adopted in the wealth effects regressions in Table 8. The results
in Models 1 – 4 indicate that the coefficient of PAR_RDI_PRE is consistently negative but statistically
32
significant in three of the four specifications, thereby suggesting that the greater the potential for ex post
contractual inefficiencies after the divestiture, the smaller is the change in operating performance around
the divestiture. The coefficient of PAR_HERFINDX_PRE is, however, not significant. Consistent with the
wealth effects analysis, the coefficient of PAR_IND_HERFINDX_CENSUS tends to be significantly
negative, thus providing further support for the argument that the firm after the divestiture can meet the
competition and compete more effectively in competitive industries.
To assess the determinants of the change in operating performance for subsidiary firms alone, we
modify our choice of independent variables to include measures that are more appropriate for subsidiary
firms alone as indicated in Models 5 – 8 in Table 9. In particular, instead of PAR_RDI_PRE, we include
SUB_ RDI_PRE, which is defined as the R&D intensity of the subsidiary firm for year t-1. The results in
Model 5 – 8 indicate that the coefficient of SUB_ RDI_PRE is consistently negative but statistically
significant in three of the four specifications. Thus, the results for subsidiary firms alone also point to a
smaller change in operating performance when the potential for ex post contractual inefficiencies is
larger. Further, we find that the coefficients of PAR_HERFINDX_PRE are consistently negative but
statistically significant in only one of the four models. As such, we find weak evidence for the argument
that the change in operating performance of subsidiary firms is greater when the potential gain in
efficiency from improved focus after the divestiture is higher.
Overall, our cross-sectional analysis of announcement-period wealth effects and changes in
operating performance yield generally consistent findings. Specifically, a greater potential for holdup as a
result of vertical divestitures negatively influences both wealth effects and the change in industry-adjusted
operating performance. Further, while announcement-period wealth effects capture the potential for
efficiency gains arising as a result of a decline in organizational complexity, the evidence is weaker on
whether these benefits are reflected in operating performance changes around the divestiture. Finally,
both these analyses suggest that vertical divestitures in competitive industries are more beneficial as they
allow the divested entities to compete with greater agility during the post-divestiture phase.
6. Summary and concluding remarks

33
In this paper, we examine whether product market considerations such as transactions costs and
property rights, market power, economies of scale or scope, and financing considerations impact the
vertical divestiture decision; the choice between equity carve-outs and spin-offs to vertically disintegrate;
the wealth effects of vertical divestitures on the parent firm, rival firms, supplier firms, and customer
firms; and the changes in operating performance around vertical divestitures.
Consistent with the broader divestiture literature, we find that efficiency and financing
considerations influence the vertical divestiture decision. Our results suggest that parent firms are more
likely to vertically divest subsidiaries whose industries have experienced positive demand shocks.
Further, our results suggest that vertical divestitures are undertaken by relatively less productive parent
firms. However, we find the likelihood of vertical divestitures to be lower in environments in which the
need for relationship-specific investments is important. In addition, we find that attractive industry
financing conditions, particularly in subsidiary industries, instead of internal financing constraints
influence integrated firms to consider vertical divestitures.
Conditional on the vertical divestiture decision, our analysis of the choice of method of vertical
divestiture reveals that ownership stakes mitigate contractual and financing frictions. Specifically, we find
that partial vertical divestitures through equity carve-outs are more likely in environments in which
relationship-specific investments are more prevalent and when the parent firm is more financially
constrained. We also find that complete divestitures through spin-offs are more likely in larger industries
or in industries that experience positive demand shocks, thereby indicating that they are motivated to
maximize the benefits from specialization at upstream and downstream levels. Further, anti-competitive
rationales such as collusion and foreclosure do not impact the choice of the method to vertically
disintegrate.
Our examination of the wealth effects of vertical divestitures indicates that parent firms experience
wealth gains on announcement and that these gains extend to rival firms, supplier firms, and customer
firms. Further, the wealth effects to parent firms in vertical divestitures are related to efficiency motives
coming from enhanced corporate focus and holdup considerations. In addition, our investigation of

34
changes in operating performance around vertical divestitures provides support for efficiency motives.
Finally, our examination of the wealth effects to parent rivals, subsidiary rivals, suppliers, and customers
provides corroborating evidence of an efficiency motivation for vertical divestitures and does not reveal
evidence to indicate that anti-competitive forces such as foreclosure or collusion existed in the vertically
integrated structure.
35
Appendix
This appendix provides details on the construction of variables used in the first and second stages of the Heckman two-stage probit estimation.
A.1. Variables influencing the decision to conduct a vertical divestiture
PAR_IND_DETRN_SHP (SUB_IND_DETRN_SHP): lagged parent (subsidiary) industry detrended shipments.
We use the Compustat database to find the sales of the primary four-digit SIC industry of the parent (subsidiary). We deflate these nominal sales into real sales by a consumer price index deflator with a base year of 1986. We detrend the natural logarithm of real sales by including a yearly time trend. Then, we use the difference between the actual and predicted values as a measure of the industry shock. This approach is consistent with Maksimovic and Phillips (2002). For the control firms, PAR_IND_DETRN_SHP is measured for the primary four-digit SIC, and SUB_IND_DETRN_SHP is measured as the average across all vertically related secondary four-digit SICs in the firm.
NEED_FOR_FUNDS: lagged internal funding deficit for the parent (control firm).
Consistent with Gomes and Phillips (2008), we use the capital expenditure minus operating income before depreciation plus the change in working capital as a measure of the need for financing of the parent (control firm). The variable is calculated based on Compustat data items as follows: Data128 - Data13 + (Data274 - Data302 - Data303 - Data304 - Data305 - Data307 -Data312 - Data301).
PROP_VI_FIRMS: lagged proportion of vertically integrated firms in the parent industry.
To calculate this variable, we find the number of vertically integrated firms in the primary four-digit SIC industry of the parent (control firm) if its vertical relatedness coefficient is 1% or more. For the vertical relatedness coefficient, we use the Fan and Lang (2000) measure or the Acemoglu, Johnson, and Mitton (2009) measure. To find PROP_VI_FIRMS, we divide this by the number of firms in the primary four-digit SIC industry of the parent (control firm).
PAR_IND_TOBQ (SUB_IND_TOBQ): lagged parent (subsidiary) industry Tobin’s q.
PAR_IND_TOBQ (SUB_IND_TOBQ) is calculated as the market value of assets divided by the book value of assets for the primary four-digit SIC industry of the parent (subsidiary). Market value of assets is calculated based on Compustat data items as follows: Data6 + Data25 * Data199 - Data60. Book value of assets is simply Data6. For the control firms, PAR_IND_TOBQ is measured for the primary four-digit SIC, and SUB_IND_TOBQ is measured as the average across all vertically related secondary four-digit SICs in the firm.
TFP: lagged total factor productivity of the parent (control firm).
To calculate total factor productivity, we follow the methodology in Faleye, Mehrotra, and Morck (2006). In particular, for each four-digit SIC industry group, we regress the natural logarithm of firm sales (Compustat data item Data12) on the natural logarithm of number of employees (Compustat data item Data29) and the natural logarithm of net property, plant, and equipment (Compustat data item Data8). TFP is measured as the residual from this regression for the primary four-digit SIC industry group of the parent (control firm).
36
PAR_IND_CAPFLOW (SUB_IND_CAPFLOW): lagged normalized parent (subsidiary) industry capital flows.
We use the SDC Platinum New Issues Database to obtain the total proceeds from debt and equity issuance for each four-digit SIC industry and each calendar year during 1984 to 2006. We also find the market capitalization of each four-digit SIC industry group during 1984 to 2006. PAR_IND_CAPFLOW (SUB_IND_CAPFLOW) is the ratio of total debt and equity issuances to market capitalization of the primary four-digit SIC industry of the parent (subsidiary). For the control firms, PAR_IND_CAPFLOW is measured for the primary four-digit SIC, and SUB_IND_CAPFLOW is measured as the average across all vertically related secondary four-digit SICs in the firm.
VERT_SEG_SALE: lagged sales accounted by vertically related secondary segments of the parent (control firm).
This measure captures the significance of intra-firm vertical relations. It is measured as the average sales accounted for by vertically related secondary segments in the firm divided the total sales of the parent (control firm).
A.2. Variables influencing the method of a vertical divestiture, i.e., spin-off versus equity carve-out
PRDT_MKT: indicator variable to capture the presence of product market contractual agreements between the parent and subsidiary.
We hand-collect data from proxy statements on buyer-supplier agreements, technology sharing and R&Ds agreements, marketing and distribution agreements, and specialty services agreements between the parent and subsidiary firms after the divestiture. Consistent with Allen and Phillips (2000), all these agreements come under the umbrella of product market agreements. PRDT_MKT is an indicator variable that equals one when product market agreements exist and zero otherwise. FIN_AGR: indicator variable to capture financial agreements between the parent and subsidiary.
We collect data on financial agreements between the parent and subsidiary firms post-divestiture. FIN_AGR is an indicator variable that equals one when financing agreements exist and zero otherwise.
PAR_IND_RDI (SUB_IND_RDI): lagged parent (subsidiary) industry R&D intensity.
Parent (subsidiary) four-digit SIC industry R&D expenditure (Compustat data item Data46) divided by industry sales (Compustat data item Data12).
LOG_PAR_IND_SALE (LOG_SUB_IND_SALE): lagged logarithm of parent (subsidiary) industry real sales in which sales are measured in millions of dollars.
PAR_IND_DETRN_SHP (SUB_IND_DETRN_SHP): lagged parent (subsidiary) industry detrended shipments as defined above.
PAR_IND_HERFINDX_CENSUS: lagged imputed Herfindahl index for the primary four-digit SIC of parent (control firm).
To measure industry concentration, we use Census-based Herfindahl indices instead of Compustat-based Herfindahl indices (e.g., Ali, Klasa, and Yeung, 2009). The US Economic Census reports every five years the Herfindahl (HHI) indices for four-digit SIC industries in the manufacturing establishment. These data take into consideration sales made by both public and
37
private firms. We collect data on the Census-based Herfindahl indices for the 1987, 1992, 1997, and 2002 Census. However, these data are not directly usable because they are unavailable for non-manufacturing industries. To complement the Census data, we use segment tapes to also compute the Compustat sales-based HHI. We find the breakup of the total sales of a firm into the different four-digit SIC industries it operates in for calculating the HHIs.
We adopt the two-step methodology outlined in Hoberg and Phillips (2009) and calculate an imputed Herfindahl index for each four-digit SIC industry. In the first step, for the manufacturing industries, we regress the Census Herfindahl index on the Compustat sales-based Herfindahl index, the average number of employees per firm in the industry based on Compustat data, and the number of employees per firm in the industry using the Census data. To calculate the Compustat-based number of employees per firm, we allocate the total number of employees at the firm level into its different segments based on the percentage of firm sales accounted for by the segment. To find the Census-based number of employees per firm, we use the data on the number of employees and the number of establishments for each four-digit SIC industry published by the County Business Patterns. In the second step, we use the estimates obtained in the above regression to compute imputed Herfindahl indices for all four-digit SIC industries (manufacturing and non-manufacturing).
PAR_MKT_SHR (SUB_MKT_SHR): lagged market share of parent (subsidiary).
The market share of the parent (subsidiary) in its primary four-digit SIC industry. For subsidiary firms, we obtain the pre-divestiture sales from the first annual report of the subsidiary as obtained from Thompson One Banker database.
NEED_FOR_FUNDS: lagged internal funding deficit for the parent as defined above.
PAR_LEVER_PRE: lagged book value of leverage for parent (control firm). The sum of the parent long-term debt and debt in current liabilities (Compustat data item
Data9 + Compustat data item Data34) divided by total assets (Compustat data item Data6) for the calendar year prior to the year of announcement.
REL_SIZE: relative size of subsidiary to parent.
The ratio of the equity value of the subsidiary to that of the parent measured on the first day of trading of the subsidiary.
SUB_FF_IND_RET: subsidiary Fama and French industry returns for the calendar year prior to the announcement year.
NUM_IPOSEO: number of initial public offerings and seasoned equity offerings in the three-month period prior to the month of divestiture announcement.
38
References Acemoglu, D., Johnson, S., Mitton, T., 2009. Determinants of vertical integration: financial development
and contracting costs. Journal of Finance 64, 1251 – 1290. Aghion, P., Tirole, J., 1994. The management of innovation. Quarterly Journal of Economics 109, 1185 –
1209. Ali, A., Klasa, S., Yeung, E., 2009. The limitations of industry concentration measures constructed with
Compustat data: implications for finance research. Review of Financial Studies 22, 3839 – 3871. Allen, J. W., Lummer, S. L., McConnell, J. J., Reed, D. K., 1995. Can takeover losses explain spin-off
gains? Journal of Financial and Quantitative Analysis 30, 465 – 485. Allen, J. W., McConnell, J. J., 1998. Equity carve-outs and managerial discretion. Journal of Finance 53,
163 – 186.. Allen, J. W., Phillips, G., 2000. Corporate equity ownership, strategic alliances, and product market
relationships. Journal of Finance 55, 2791 – 2815.. Armour, H. O., Teece, D. J., 1980. Vertical integration and technological innovation. Review of
Economics and Statistics 62, 470 – 474. Barber, B. M., Lyon J. D., 1996. Detecting abnormal operating performance: the empirical power and
application of test statistics. Journal of Financial Economics 41, 359 – 399. Boerner, C. S., Macher, J. T., 2001. Transaction cost economics: an assessment of empirical research in
the social sciences. Unpublished working paper. University of California and Georgetown University, Berkeley, CA and Washington, DC.
Boone, A., 2003. The interaction of ownership, governance, and product markets: evidence from equity
carve-outs. Unpublished working paper. University of Kansas, Lawrence, KS. Burch, T. R., Nanda, V., 2003. Divisional diversity and the conglomerate discount: evidence from spin-
offs. Journal of Financial Economics 70, 69 – 98. Chen, Y., 2001. On vertical mergers and their competitive effects. RAND Journal of Economics 32, 667-
– 685. Chen, Y., 2005. Vertical disintegration. Journal of Economics and Management Strategy 14, 209 – 229. Coase, R. H., 1937. The nature of the firm. Economica 4, 386 – 405. Çolak, G., Whited, T. M., 2007. Spin-offs, divestitures, and conglomerate investment. Review of
Financial Studies 20, 557 – 557. Daley, L., Mehrotra, V., Sivakumar, R., 1997. Corporate focus and value creation: evidence from
spinoffs. Journal of Financial Economics 45, 257 – 281. Dasgupta, S., Tao, Z., 2000. Bargaining, bonding, and partial ownership. International Economic Review
39
41, 609 – 635. Desai, H., Jain, P. C., 1999. Firm performance and focus: long-run stock market performance following
spinoffs. Journal of Financial Economics 54, 75 – 101. Eckbo, B. E., 1983. Horizontal mergers, collusion, and stockholder wealth. Journal of Financial
Economics 11, 241 – 273. Eckbo, B. E., 1990. Competition and wealth effects of horizontal mergers. In: Mathewson, F., Trebilcock,
M., and Walker, M. (Eds.), The Law and Economics of Competition Policy. Fraser Institute, Vancouver, Canada, pp. 297 – 332.
Eckbo, B. E., Thorburn, K. S., 2008. Corporate restructuring: breakups and LBOs. In: Eckbo, B. E. (Ed.)
,Handbook of Corporate Finance: Empirical Corporate Finance. Elsevier, North Holland, Amsterdam, pp. 431 – 496.
Faleye, O., Mehrotra, V., Morck, R., 2006. When labor has a voice in corporate governance. Journal of
Financial and Quantitative Analysis 41, 489 – 510. Fan, J. P. H., Lang, L. H. P., 2000. The measurement of relatedness: an application to corporate
diversification. Journal of Business 73, 629 – 660. Fee, C. E., Hadlock, C. J., Thomas, S., 2006. Corporate equity ownership and the governance of product
market relationships. Journal of Finance 61, 1217 – 1251. Fee, C. E., Thomas, S., 2004. Sources of gains in horizontal mergers: evidence from customer, supplier,
and rival firms. Journal of Financial Economics 74, 423 – 460. Ghosh, A., 2001. Does operating performance really improve following corporate acquisitions? Journal of
Corporate Finance 7, 151 – 178. Gomes, A., Phillips, G., 2008. Private and public security issuance by public firms: the role of
asymmetric information. Unpublished working paper. University of Maryland, College Park, MD.
Gompers, P., Lerner, J., 2000. Money chasing deals? the impact of fund inflows on private equity
valuation. Journal of Financial Economics 55, 281 – 325. Grossman, S. J., Hart, O. D., 1986. The costs and benefits of ownership: a theory of vertical and lateral
integration. Journal of Political Economy 94, 691 – 719. Harbaugh, R., 2001. Equity stakes and hold-up problems. Unpublished working paper. Claremont
McKenna College, Claremont, CA. Hart, O., Moore, J., 1990. Property rights and the nature of the firm. Journal of Political Economy 98,
1119 – 1158. Hart, O., Tirole, J., 1990. Vertical integration and market foreclosure. Brookings Papers on Economic
Activity. Microeconomics 1990, 205 – 276.

40
Healy, P. M., Palepu, K. G., Ruback, R. S., 1992. Does corporate performance improve after mergers? Journal of Financial Economics 31, 135 – 175.
Hite, G. L., Owers, J. E., 1983. Security price reactions around corporate spin-off announcements. Journal
of Financial Economics 12, 409 – 436. Hoberg, G., Phillips, G., 2009. Real and financial industry booms and busts. Journal of Finance 65, 45 –
86. Jain, B. A., Kini, O., 1994. The post-issue operating performance of IPO firms. Journal of Finance 49,
1699 – 1726. John, K., Ofek, E., 1995. Asset sales and increase in focus. Journal of Financial Economics 37, 105 – 126. Joskow, P., 2005. Vertical integration. In: Menard, C., Shirley, M. M. (Eds.), Handbook of New
Institutional Economics. Springer, Netherlands, pp. 319 – 348. Kahle, K. M., Walkling, R. A., 1996. The impact of industry classifications on financial research. Journal
of Financial and Quantitative Analysis 31, 309 – 335. Klein, B., Crawford, R. G., Alchian, A. A., 1978. Vertical integration, appropriable rents, and the
competitive contracting process. Journal of Law and Economics 21, 297 – 326. Lafontaine, F., Slade, M., 2007. Vertical integration and firm boundaries: the evidence. Journal of
Economic Literature 45, 629 – 685. Lang, L., Poulsen, A., Stulz, R., 1995. Asset sales, firm performance, and the agency costs of managerial
discretion. Journal of Financial Economics 37, 3 – 37. Levy, D. T., 1985, The transactions cost approach to vertical integration: an empirical examination.
Review of Economics and Statistics 67, 438 – 445. Maksimovic, V., Phillips, G., 2001. The market for corporate assets: who engages in mergers and asset
sales and are there efficiency gains? Journal of Finance 56, 2019 – 2065. Maksimovic, V., Phillips, G., 2002. Do conglomerate firms allocate resources inefficiently across
industries? Theory and evidence. Journal of Finance 57, 721 – 767. Maksimovic, V., Phillips, G., 2008. The industry life cycle, acquisitions, and investment: does firm
organization matter? Journal of Finance 63, 673 – 708. Mulherin, J. H., Boone, A. L., 2000. Comparing acquisitions and divestitures. Journal of Corporate
Finance 6, 117 – 139. Nocke, V., White, L., 2007. Do vertical mergers facilitate upstream collusion? American Economic
Review 97, 1321 – 1339. Ordover, J. A., Saloner, G., Salop, S. C., 1990. Equilibrium vertical foreclosure. American Economic
Review 80, 127 – 142.
41
Perry, M. K., 1989. Vertical integration: determinants and effects. In: Schmalensee, R., Willig, R. (Eds.), Handbook of Industrial Organization. Elsevier, North Holland, Amsterdam, pp. 183 – 255.
Powell, R. G., Stark, A. W., 2005. Does operating performance increase post-takeover for UK takeovers?
A comparison of performance measures and benchmarks. Journal of Corporate Finance 11, 293 – 317.
Powers, E., 2001. Spin-offs, sell-offs, and equity carve-outs: an analysis of divestiture method choice.
Unpublished working paper. University of South Carolina, Columbia, SC. Rajan, R., Servaes, H., Zingales, L., 2000. The cost of diversity: the diversification discount and
inefficient investment. Journal of Finance 55, 35 – 80. Rey, P., Tirole, J., 2006. A primer on foreclosure. In: Armstrong, M., Porter, R. (Eds.), Handbook of
Industrial Organization. Elsevier, North Holland, Amsterdam, pp. 183 – 255. Rosengren, E. S., Meehan, J. W., Jr., 1994. Empirical evidence on vertical foreclosure. Economic Inquiry
32, 303 – 317. Salinger, M. A., 1988. Vertical mergers and market foreclosure. Quarterly Journal of Economics 103, 345
– 356. Sappington, D., 2006. On the merits of vertical divestiture. Review of Industrial Organization 29, 171 –
191. Shahrur, H., 2005. Industry structure and horizontal takeovers: analysis of wealth effects on rivals,
suppliers, and corporate customers. Journal of Financial Economics 76, 61 – 98. Shenoy, J., 2008. An examination of the efficiency, foreclosure, and collusion rationales for vertical
takeovers. http://papers.ssrn.com/sol3/papers.cfm?abstract_id=1089043 Shenoy, J., 2009. Determinants of firm vertical boundaries, internal capital markets, and firm
performance. Unpublished working paper. Tulane University, New Orleans, LA. Stigler, G. J., 1951. The division of labor is limited by the extent of the market. Journal of Political
Economy 59, 185 – 193. Vijh, A. M., 2002. The positive announcement-period returns of equity carve-outs: asymmetric
information or divestiture gains? Journal of Business 75, 153 – 190. Williamson, O. E., 1971. The vertical integration of production: market failure considerations. American
Economic Review 61, 112 – 123. Williamson, O. E., 1979. Transaction-cost economics: the governance of contractual relations. Journal of
Law and Economics 22, 233 – 261.
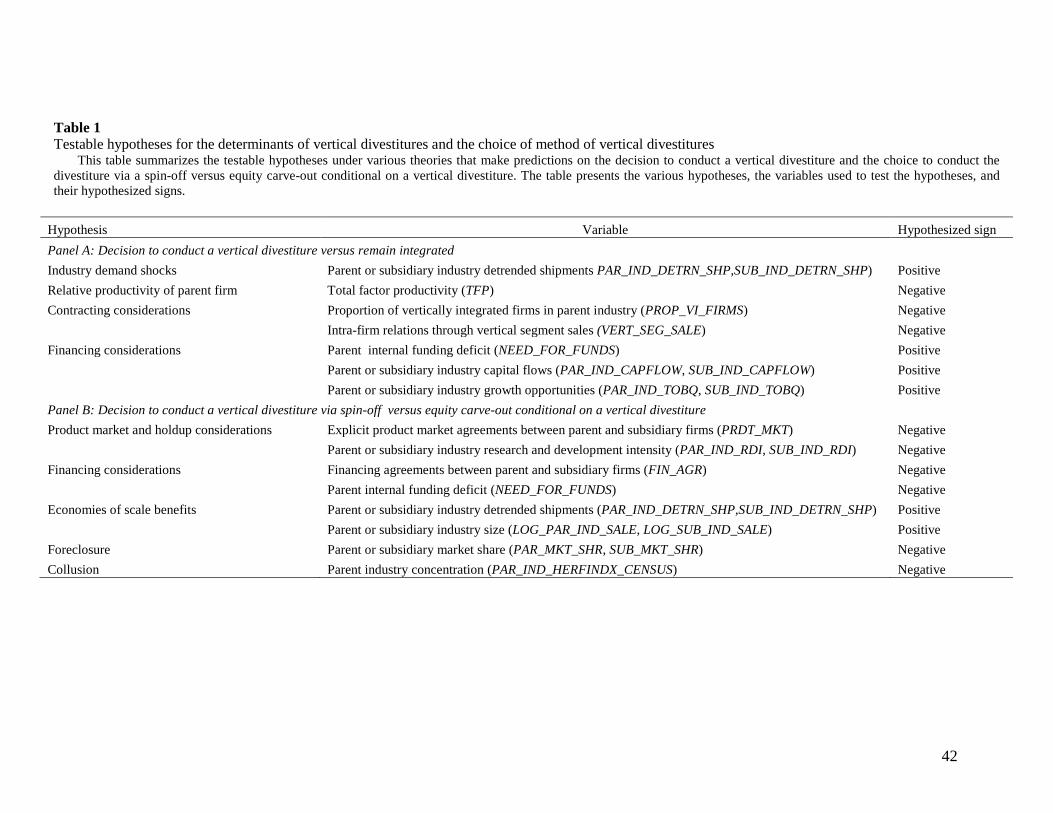
42
Table 1 Testable hypotheses for the determinants of vertical divestitures and the choice of method of vertical divestitures
This table summarizes the testable hypotheses under various theories that make predictions on the decision to conduct a vertical divestiture and the choice to conduct the divestiture via a spin-off versus equity carve-out conditional on a vertical divestiture. The table presents the various hypotheses, the variables used to test the hypotheses, and their hypothesized signs.
Hypothesis Variable Hypothesized sign Panel A: Decision to conduct a vertical divestiture versus remain integrated Industry demand shocks Parent or subsidiary industry detrended shipments PAR_IND_DETRN_SHP,SUB_IND_DETRN_SHP) Positive Relative productivity of parent firm Total factor productivity (TFP) Negative Contracting considerations Proportion of vertically integrated firms in parent industry (PROP_VI_FIRMS) Negative
Intra-firm relations through vertical segment sales (VERT_SEG_SALE) Negative
Financing considerations Parent internal funding deficit (NEED_FOR_FUNDS) Positive
Parent or subsidiary industry capital flows (PAR_IND_CAPFLOW, SUB_IND_CAPFLOW) Positive
Parent or subsidiary industry growth opportunities (PAR_IND_TOBQ, SUB_IND_TOBQ) Positive
Panel B: Decision to conduct a vertical divestiture via spin-off versus equity carve-out conditional on a vertical divestiture Product market and holdup considerations Explicit product market agreements between parent and subsidiary firms (PRDT_MKT) Negative
Parent or subsidiary industry research and development intensity (PAR_IND_RDI, SUB_IND_RDI) Negative
Financing considerations Financing agreements between parent and subsidiary firms (FIN_AGR) Negative
Parent internal funding deficit (NEED_FOR_FUNDS) Negative
Economies of scale benefits Parent or subsidiary industry detrended shipments (PAR_IND_DETRN_SHP,SUB_IND_DETRN_SHP) Positive
Parent or subsidiary industry size (LOG_PAR_IND_SALE, LOG_SUB_IND_SALE) Positive
Foreclosure Parent or subsidiary market share (PAR_MKT_SHR, SUB_MKT_SHR) Negative Collusion Parent industry concentration (PAR_IND_HERFINDX_CENSUS) Negative
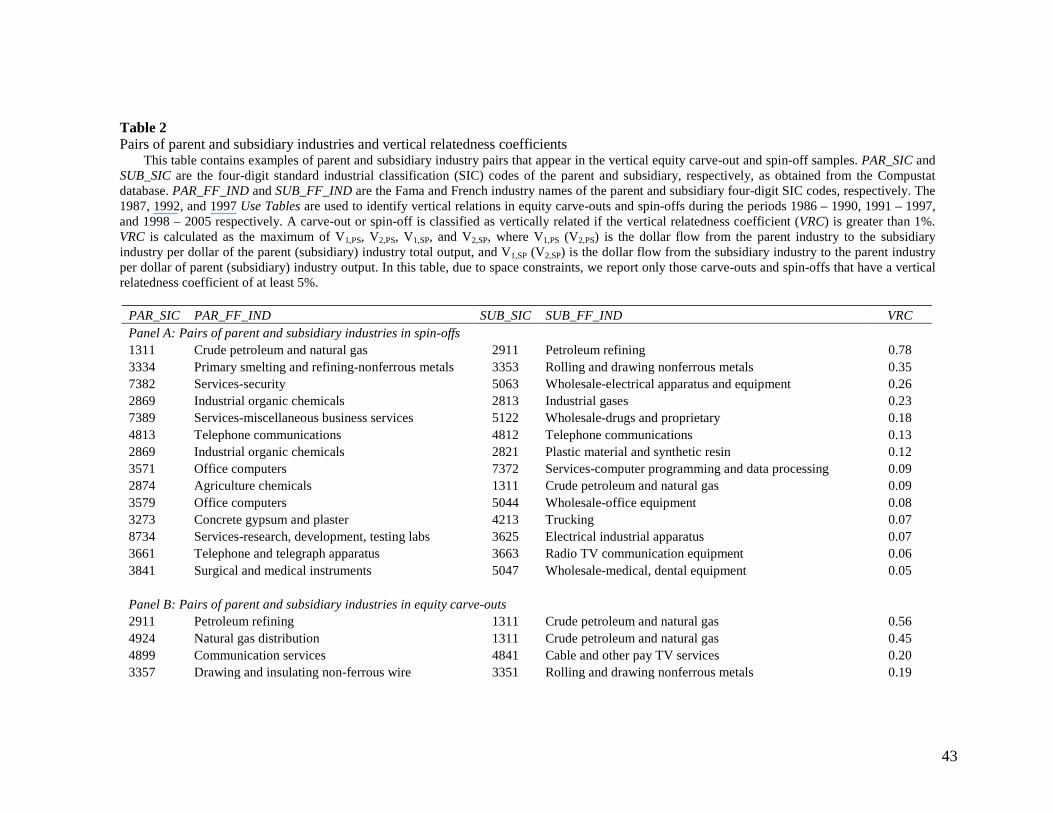
43
Table 2 Pairs of parent and subsidiary industries and vertical relatedness coefficients
This table contains examples of parent and subsidiary industry pairs that appear in the vertical equity carve-out and spin-off samples. PAR_SIC and SUB_SIC are the four-digit standard industrial classification (SIC) codes of the parent and subsidiary, respectively, as obtained from the Compustat database. PAR_FF_IND and SUB_FF_IND are the Fama and French industry names of the parent and subsidiary four-digit SIC codes, respectively. The 1987, 1992, and 1997 Use Tables are used to identify vertical relations in equity carve-outs and spin-offs during the periods 1986 – 1990, 1991 – 1997, and 1998 – 2005 respectively. A carve-out or spin-off is classified as vertically related if the vertical relatedness coefficient (VRC) is greater than 1%. VRC is calculated as the maximum of V1,PS, V2,PS, V1,SP, and V2,SP, where V1,PS (V2,PS) is the dollar flow from the parent industry to the subsidiary industry per dollar of the parent (subsidiary) industry total output, and V1,SP (V2,SP) is the dollar flow from the subsidiary industry to the parent industry per dollar of parent (subsidiary) industry output. In this table, due to space constraints, we report only those carve-outs and spin-offs that have a vertical relatedness coefficient of at least 5%.
PAR_SIC PAR_FF_IND SUB_SIC SUB_FF_IND VRC Panel A: Pairs of parent and subsidiary industries in spin-offs 1311 Crude petroleum and natural gas 2911 Petroleum refining 0.78 3334 Primary smelting and refining-nonferrous metals 3353 Rolling and drawing nonferrous metals 0.35 7382 Services-security 5063 Wholesale-electrical apparatus and equipment 0.26 2869 Industrial organic chemicals 2813 Industrial gases 0.23 7389 Services-miscellaneous business services 5122 Wholesale-drugs and proprietary 0.18 4813 Telephone communications 4812 Telephone communications 0.13 2869 Industrial organic chemicals 2821 Plastic material and synthetic resin 0.12 3571 Office computers 7372 Services-computer programming and data processing 0.09 2874 Agriculture chemicals 1311 Crude petroleum and natural gas 0.09 3579 Office computers 5044 Wholesale-office equipment 0.08 3273 Concrete gypsum and plaster 4213 Trucking 0.07 8734 Services-research, development, testing labs 3625 Electrical industrial apparatus 0.07 3661 Telephone and telegraph apparatus 3663 Radio TV communication equipment 0.06 3841 Surgical and medical instruments 5047 Wholesale-medical, dental equipment 0.05 Panel B: Pairs of parent and subsidiary industries in equity carve-outs 2911 Petroleum refining 1311 Crude petroleum and natural gas 0.56 4924 Natural gas distribution 1311 Crude petroleum and natural gas 0.45 4899 Communication services 4841 Cable and other pay TV services 0.20 3357 Drawing and insulating non-ferrous wire 3351 Rolling and drawing nonferrous metals 0.19
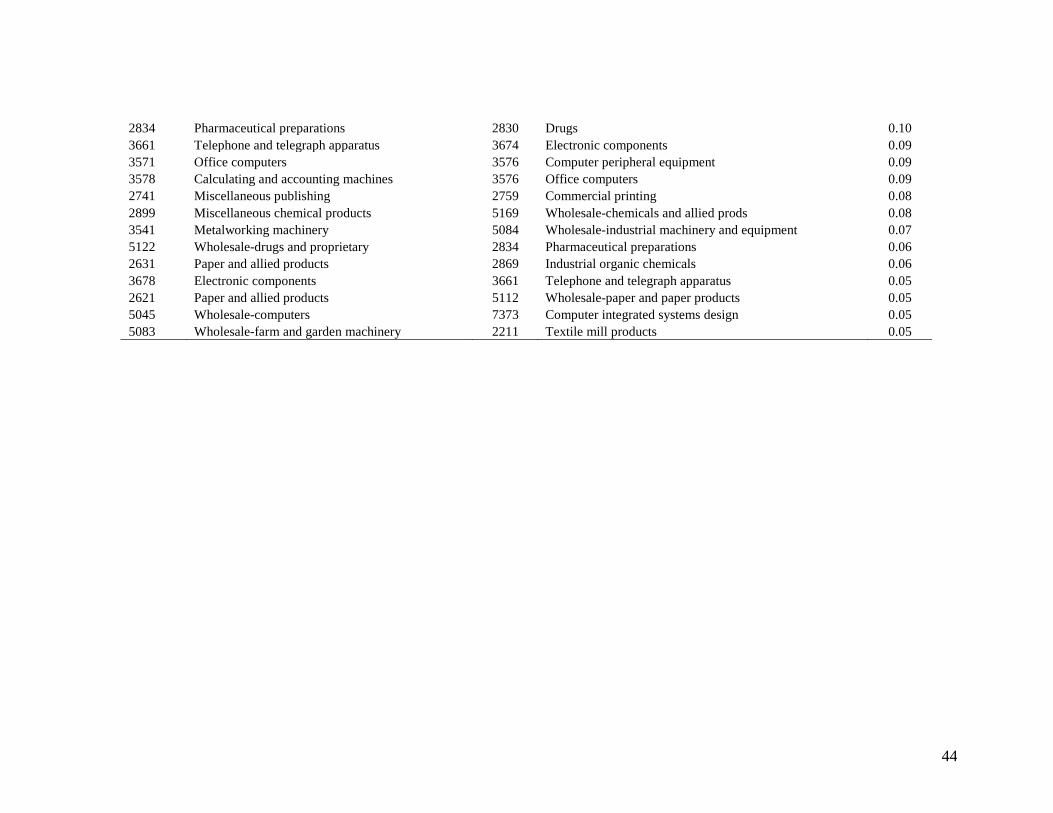
44
2834 Pharmaceutical preparations 2830 Drugs 0.10 3661 Telephone and telegraph apparatus 3674 Electronic components 0.09 3571 Office computers 3576 Computer peripheral equipment 0.09 3578 Calculating and accounting machines 3576 Office computers 0.09 2741 Miscellaneous publishing 2759 Commercial printing 0.08 2899 Miscellaneous chemical products 5169 Wholesale-chemicals and allied prods 0.08 3541 Metalworking machinery 5084 Wholesale-industrial machinery and equipment 0.07 5122 Wholesale-drugs and proprietary 2834 Pharmaceutical preparations 0.06 2631 Paper and allied products 2869 Industrial organic chemicals 0.06 3678 Electronic components 3661 Telephone and telegraph apparatus 0.05 2621 Paper and allied products 5112 Wholesale-paper and paper products 0.05 5045 Wholesale-computers 7373 Computer integrated systems design 0.05 5083 Wholesale-farm and garden machinery 2211 Textile mill products 0.05
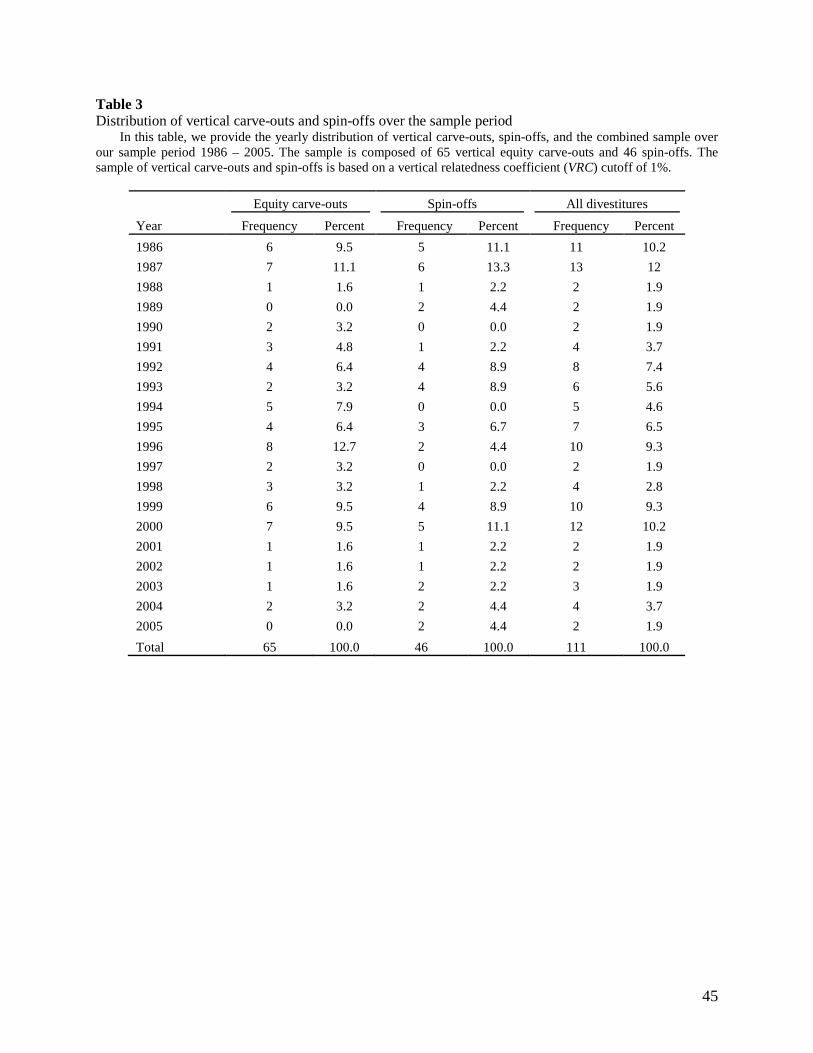
45
Table 3 Distribution of vertical carve-outs and spin-offs over the sample period
In this table, we provide the yearly distribution of vertical carve-outs, spin-offs, and the combined sample over our sample period 1986 – 2005. The sample is composed of 65 vertical equity carve-outs and 46 spin-offs. The sample of vertical carve-outs and spin-offs is based on a vertical relatedness coefficient (VRC) cutoff of 1%.
Equity carve-outs Spin-offs All divestitures
Year Frequency Percent Frequency Percent Frequency Percent 1986 6 9.5 5 11.1 11 10.2 1987 7 11.1 6 13.3 13 12 1988 1 1.6 1 2.2 2 1.9 1989 0 0.0 2 4.4 2 1.9 1990 2 3.2 0 0.0 2 1.9 1991 3 4.8 1 2.2 4 3.7 1992 4 6.4 4 8.9 8 7.4 1993 2 3.2 4 8.9 6 5.6 1994 5 7.9 0 0.0 5 4.6 1995 4 6.4 3 6.7 7 6.5 1996 8 12.7 2 4.4 10 9.3 1997 2 3.2 0 0.0 2 1.9 1998 3 3.2 1 2.2 4 2.8 1999 6 9.5 4 8.9 10 9.3 2000 7 9.5 5 11.1 12 10.2 2001 1 1.6 1 2.2 2 1.9 2002 1 1.6 1 2.2 2 1.9 2003 1 1.6 2 2.2 3 1.9 2004 2 3.2 2 4.4 4 3.7 2005 0 0.0 2 4.4 2 1.9 Total 65 100.0 46 100.0 111 100.0
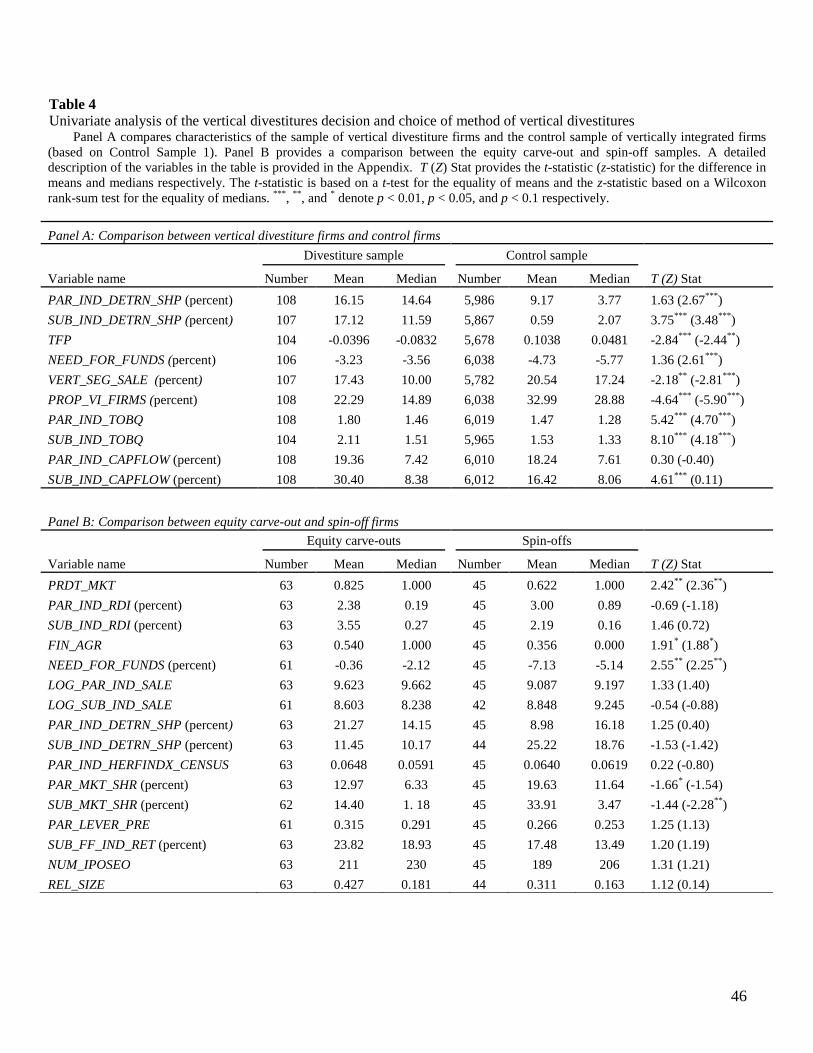
46
Table 4 Univariate analysis of the vertical divestitures decision and choice of method of vertical divestitures
Panel A compares characteristics of the sample of vertical divestiture firms and the control sample of vertically integrated firms (based on Control Sample 1). Panel B provides a comparison between the equity carve-out and spin-off samples. A detailed description of the variables in the table is provided in the Appendix. T (Z) Stat provides the t-statistic (z-statistic) for the difference in means and medians respectively. The t-statistic is based on a t-test for the equality of means and the z-statistic based on a Wilcoxon rank-sum test for the equality of medians. ***, **, and * denote p < 0.01, p < 0.05, and p < 0.1 respectively.
Panel A: Comparison between vertical divestiture firms and control firms
Divestiture sample Control sample
Variable name Number Mean Median Number Mean Median T (Z) Stat PAR_IND_DETRN_SHP (percent) 108 16.15 14.64 5,986 9.17 3.77 1.63 (2.67***) SUB_IND_DETRN_SHP (percent) 107 17.12 11.59 5,867 0.59 2.07 3.75*** (3.48***) TFP 104 -0.0396 -0.0832 5,678 0.1038 0.0481 -2.84*** (-2.44**) NEED_FOR_FUNDS (percent) 106 -3.23 -3.56 6,038 -4.73 -5.77 1.36 (2.61***) VERT_SEG_SALE (percent) 107 17.43 10.00 5,782 20.54 17.24 -2.18** (-2.81***) PROP_VI_FIRMS (percent) 108 22.29 14.89 6,038 32.99 28.88 -4.64*** (-5.90***) PAR_IND_TOBQ 108 1.80 1.46 6,019 1.47 1.28 5.42*** (4.70***) SUB_IND_TOBQ 104 2.11 1.51 5,965 1.53 1.33 8.10*** (4.18***) PAR_IND_CAPFLOW (percent) 108 19.36 7.42 6,010 18.24 7.61 0.30 (-0.40) SUB_IND_CAPFLOW (percent) 108 30.40 8.38 6,012 16.42 8.06 4.61*** (0.11)
Panel B: Comparison between equity carve-out and spin-off firms
Equity carve-outs Spin-offs
Variable name Number Mean Median Number Mean Median T (Z) Stat PRDT_MKT 63 0.825 1.000 45 0.622 1.000 2.42** (2.36**) PAR_IND_RDI (percent) 63 2.38 0.19 45 3.00 0.89 -0.69 (-1.18) SUB_IND_RDI (percent) 63 3.55 0.27 45 2.19 0.16 1.46 (0.72) FIN_AGR 63 0.540 1.000 45 0.356 0.000 1.91* (1.88*) NEED_FOR_FUNDS (percent) 61 -0.36 -2.12 45 -7.13 -5.14 2.55** (2.25**) LOG_PAR_IND_SALE 63 9.623 9.662 45 9.087 9.197 1.33 (1.40) LOG_SUB_IND_SALE 61 8.603 8.238 42 8.848 9.245 -0.54 (-0.88) PAR_IND_DETRN_SHP (percent) 63 21.27 14.15 45 8.98 16.18 1.25 (0.40) SUB_IND_DETRN_SHP (percent) 63 11.45 10.17 44 25.22 18.76 -1.53 (-1.42) PAR_IND_HERFINDX_CENSUS 63 0.0648 0.0591 45 0.0640 0.0619 0.22 (-0.80) PAR_MKT_SHR (percent) 63 12.97 6.33 45 19.63 11.64 -1.66* (-1.54) SUB_MKT_SHR (percent) 62 14.40 1. 18 45 33.91 3.47 -1.44 (-2.28**) PAR_LEVER_PRE 61 0.315 0.291 45 0.266 0.253 1.25 (1.13) SUB_FF_IND_RET (percent) 63 23.82 18.93 45 17.48 13.49 1.20 (1.19) NUM_IPOSEO 63 211 230 45 189 206 1.31 (1.21) REL_SIZE 63 0.427 0.181 44 0.311 0.163 1.12 (0.14)
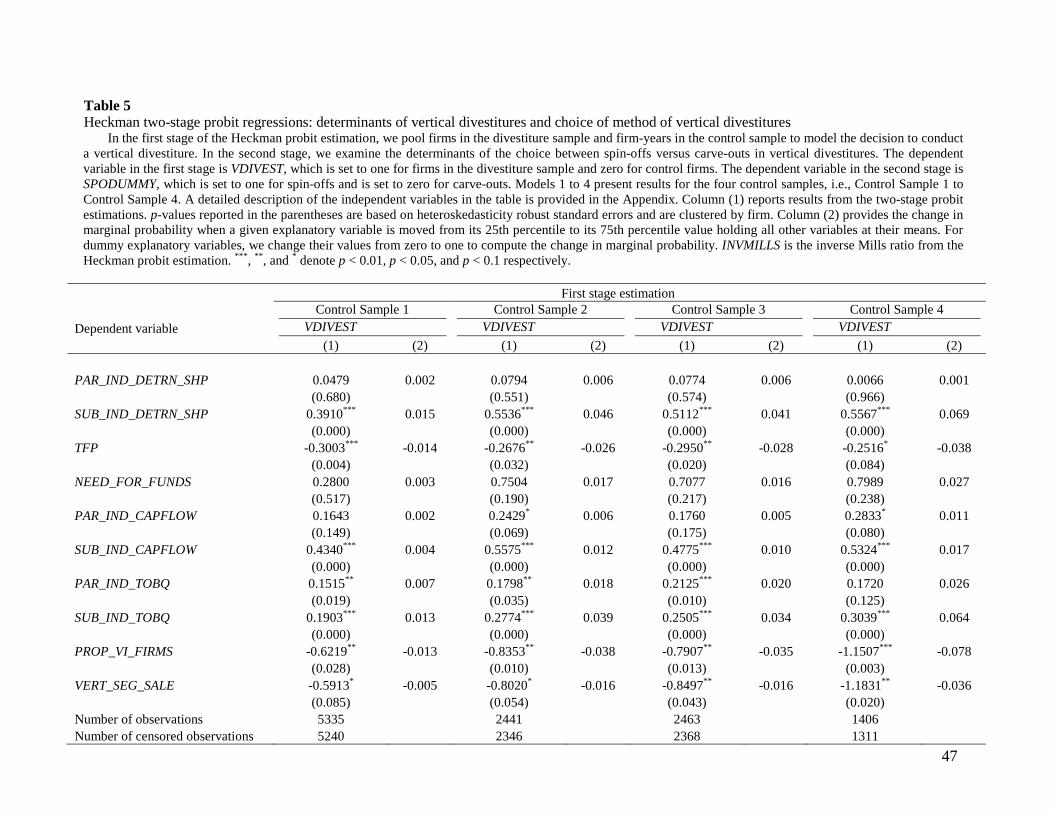
47
Table 5 Heckman two-stage probit regressions: determinants of vertical divestitures and choice of method of vertical divestitures
In the first stage of the Heckman probit estimation, we pool firms in the divestiture sample and firm-years in the control sample to model the decision to conduct a vertical divestiture. In the second stage, we examine the determinants of the choice between spin-offs versus carve-outs in vertical divestitures. The dependent variable in the first stage is VDIVEST, which is set to one for firms in the divestiture sample and zero for control firms. The dependent variable in the second stage is SPODUMMY, which is set to one for spin-offs and is set to zero for carve-outs. Models 1 to 4 present results for the four control samples, i.e., Control Sample 1 to Control Sample 4. A detailed description of the independent variables in the table is provided in the Appendix. Column (1) reports results from the two-stage probit estimations. p-values reported in the parentheses are based on heteroskedasticity robust standard errors and are clustered by firm. Column (2) provides the change in marginal probability when a given explanatory variable is moved from its 25th percentile to its 75th percentile value holding all other variables at their means. For dummy explanatory variables, we change their values from zero to one to compute the change in marginal probability. INVMILLS is the inverse Mills ratio from the Heckman probit estimation. ***, **, and * denote p < 0.01, p < 0.05, and p < 0.1 respectively.
First stage estimation
Control Sample 1 Control Sample 2 Control Sample 3 Control Sample 4
Dependent variable VDIVEST VDIVEST VDIVEST VDIVEST
(1) (2) (1) (2) (1) (2) (1) (2)
PAR_IND_DETRN_SHP 0.0479 0.002 0.0794 0.006 0.0774 0.006 0.0066 0.001
(0.680)
(0.551)
(0.574)
(0.966)
SUB_IND_DETRN_SHP 0.3910*** 0.015 0.5536*** 0.046 0.5112*** 0.041 0.5567*** 0.069
(0.000)
(0.000)
(0.000)
(0.000)
TFP -0.3003*** -0.014 -0.2676** -0.026 -0.2950** -0.028 -0.2516* -0.038
(0.004)
(0.032)
(0.020)
(0.084)
NEED_FOR_FUNDS 0.2800 0.003 0.7504 0.017 0.7077 0.016 0.7989 0.027
(0.517)
(0.190)
(0.217)
(0.238)
PAR_IND_CAPFLOW 0.1643 0.002 0.2429* 0.006 0.1760 0.005 0.2833* 0.011
(0.149)
(0.069)
(0.175)
(0.080)
SUB_IND_CAPFLOW 0.4340*** 0.004 0.5575*** 0.012 0.4775*** 0.010 0.5324*** 0.017
(0.000)
(0.000)
(0.000)
(0.000)
PAR_IND_TOBQ 0.1515** 0.007 0.1798** 0.018 0.2125*** 0.020 0.1720 0.026
(0.019)
(0.035)
(0.010)
(0.125)
SUB_IND_TOBQ 0.1903*** 0.013 0.2774*** 0.039 0.2505*** 0.034 0.3039*** 0.064
(0.000)
(0.000)
(0.000)
(0.000)
PROP_VI_FIRMS -0.6219** -0.013 -0.8353** -0.038 -0.7907** -0.035 -1.1507*** -0.078
(0.028)
(0.010)
(0.013)
(0.003)
VERT_SEG_SALE -0.5913* -0.005 -0.8020* -0.016 -0.8497** -0.016 -1.1831** -0.036
(0.085)
(0.054)
(0.043)
(0.020)
Number of observations 5335
2441
2463
1406 Number of censored observations 5240
2346
2368
1311

48
Second stage estimation
Dependent Variable
Control Sample 1 Control Sample 2 Control Sample 3 Control Sample 4 SPODUMMY SPODUMMY SPODUMMY SPODUMMY
(1) (2) (1) (2) (1) (2) (1) (2)
PRDT_MKT -0.6817** -0.103 -0.7306** -0.178 -0.7188** -0.151 -0.7253** -0.183
(0.047)
(0.037)
(0.033)
(0.035)
PAR_IND_RDI 4.9589 0.018 5.1964 0.032 5.3391 0.028 5.1549 0.034
(0.133)
(0.126)
(0.105)
(0.129)
SUB_IND_RDI -11.1377* -0.067 -11.9907** -0.122 -11.3990* -0.098 -11.4694* -0.121
(0.067)
(0.042)
(0.056)
(0.057)
FIN_AGR -0.4315 -0.050 -0.4492 -0.090 -0.4414 -0.074 -0.4523 -0.095
(0.111)
(0.121)
(0.112)
(0.111)
NEED_FOR_FUNDS -2.5623** -0.041 -2.5955** -0.073 -2.4652** -0.058 -2.4846** -0.073
(0.036)
(0.036)
(0.048)
(0.046)
LOG_PAR_IND_SALE -0.1698** -0.049 -0.1802** -0.089 -0.1763** -0.073 -0.1829** -0.095
(0.047)
(0.043)
(0.039)
(0.035)
PAR_IND_DETRN_SHP -0.0530 -0.003 -0.0527 -0.005 -0.0329 -0.003 -0.0488 -0.005
(0.845)
(0.859)
(0.909)
(0.870)
LOG_SUB_IND_SALE 0.2853** 0.112 0.3018** 0.196 0.2886** 0.159 0.2900** 0.195
(0.021)
(0.017)
(0.023)
(0.020)
SUB_IND_DETRN_SHP 0.8099** 0.049 0.8928** 0.093 0.8857** 0.077 0.9054** 0.099
(0.035)
(0.030)
(0.025)
(0.027)
PAR_MKT_SHR 0.9058 0.021 0.9242 0.038 0.9052 0.031 0.8872 0.038
(0.205)
(0.226)
(0.214)
(0.208)
SUB_MKT_SHR 4.1400*** 0.017 4.2817*** 0.035 4.1356*** 0.028 4.1087*** 0.037
(0.003)
(0.003)
(0.004)
(0.004)
PAR_IND_HERFINDX_CENSUS -0.8045 -0.002 -1.1003 -0.004 -0.7815 -0.002 -1.0100 -0.004
(0.896)
(0.869)
(0.902)
(0.881)
PAR_LEVER_PRE -3.2830*** -0.127 -3.4871*** -0.219 -3.4149*** -0.184 -3.4166*** -0.223
(0.003)
(0.001)
(0.001)
(0.001)
REL_SIZE -0.6592** -0.034 -0.6979*** -0.062 -0.6686*** -0.050 -0.6695*** -0.062
(0.014)
(0.007)
(0.008)
(0.005)
SUB_FF_IND_RET -0.3474 -0.013 -0.3609 -0.024 -0.3045 -0.017 -0.2806 -0.019
(0.577)
(0.584)
(0.625)
(0.661)
NUM_IPOSEO -0.0008 -0.012 -0.0009 -0.025 -0.0009 -0.020 -0.0010 -0.029
(0.608)
(0.580)
(0.589)
(0.540)
Number of observations 95
95
95
95 Chi squared 29.87**
39.89***
35.74***
39.45***
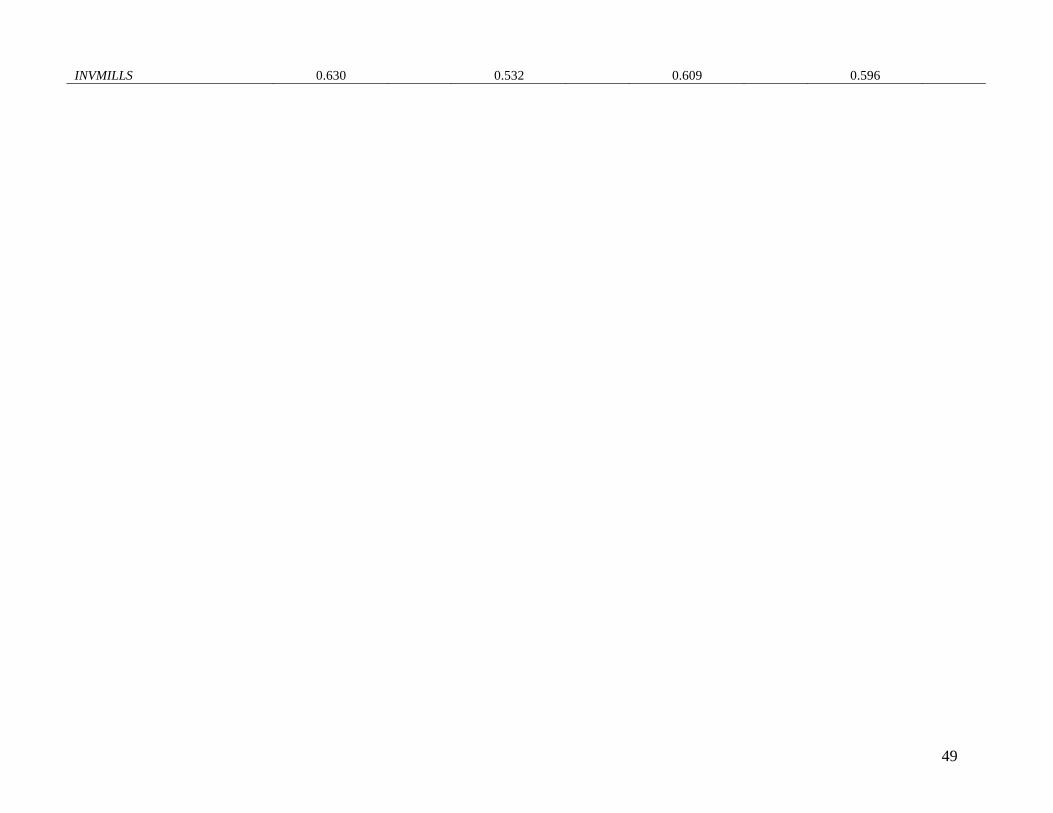
49
INVMILLS 0.630 0.532 0.609 0.596
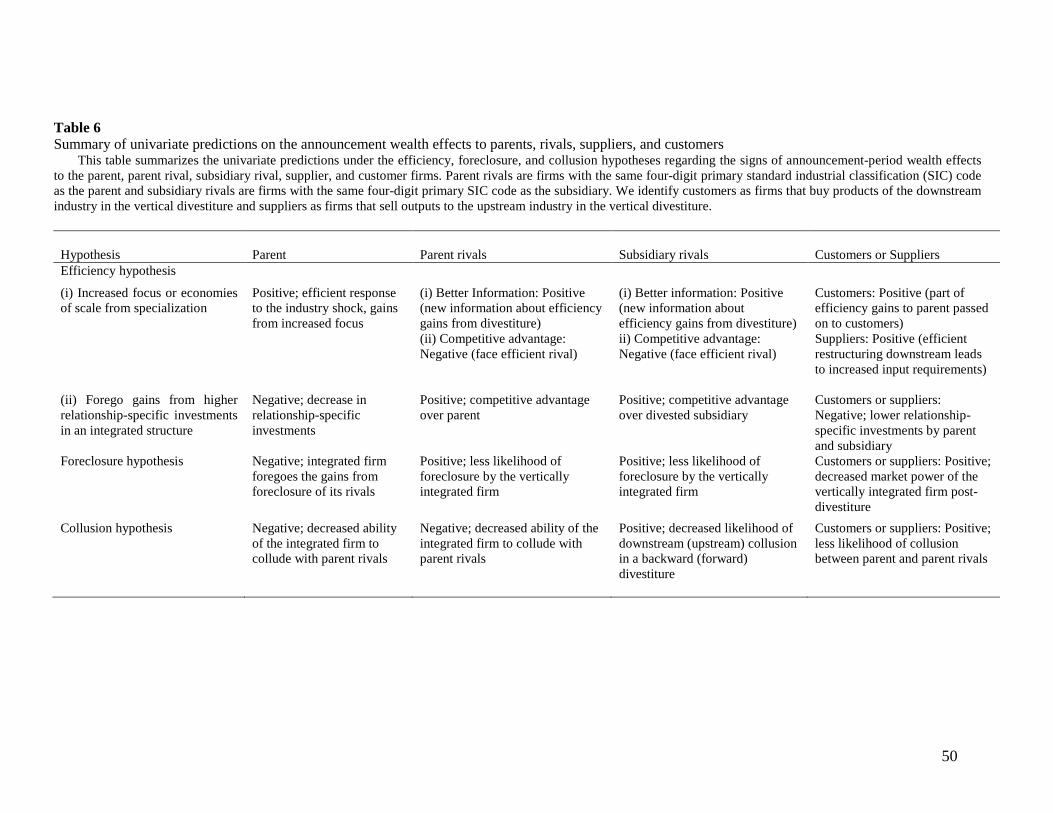
50
Table 6 Summary of univariate predictions on the announcement wealth effects to parents, rivals, suppliers, and customers
This table summarizes the univariate predictions under the efficiency, foreclosure, and collusion hypotheses regarding the signs of announcement-period wealth effects to the parent, parent rival, subsidiary rival, supplier, and customer firms. Parent rivals are firms with the same four-digit primary standard industrial classification (SIC) code as the parent and subsidiary rivals are firms with the same four-digit primary SIC code as the subsidiary. We identify customers as firms that buy products of the downstream industry in the vertical divestiture and suppliers as firms that sell outputs to the upstream industry in the vertical divestiture.
Hypothesis Parent Parent rivals Subsidiary rivals Customers or Suppliers Efficiency hypothesis
(i) Increased focus or economies of scale from specialization
Positive; efficient response to the industry shock, gains from increased focus
(i) Better Information: Positive (new information about efficiency gains from divestiture) (ii) Competitive advantage: Negative (face efficient rival)
(i) Better information: Positive (new information about efficiency gains from divestiture) ii) Competitive advantage: Negative (face efficient rival)
Customers: Positive (part of efficiency gains to parent passed on to customers) Suppliers: Positive (efficient restructuring downstream leads to increased input requirements)
(ii) Forego gains from higher relationship-specific investments in an integrated structure
Negative; decrease in relationship-specific investments
Positive; competitive advantage over parent
Positive; competitive advantage over divested subsidiary
Customers or suppliers: Negative; lower relationship-specific investments by parent and subsidiary
Foreclosure hypothesis
Negative; integrated firm foregoes the gains from foreclosure of its rivals
Positive; less likelihood of foreclosure by the vertically integrated firm
Positive; less likelihood of foreclosure by the vertically integrated firm
Customers or suppliers: Positive; decreased market power of the vertically integrated firm post-divestiture
Collusion hypothesis
Negative; decreased ability of the integrated firm to collude with parent rivals
Negative; decreased ability of the integrated firm to collude with parent rivals
Positive; decreased likelihood of downstream (upstream) collusion in a backward (forward) divestiture
Customers or suppliers: Positive; less likelihood of collusion between parent and parent rivals

51
Table 7 Announcement wealth effects to the parents, rivals, customers, and suppliers
This table provides the abnormal returns (percent) to the parents, parent rivals, subsidiary rivals, suppliers, and customers in the sample of vertical equity carve-outs and spin-offs based on a vertical relatedness coefficient cutoff of 1% during the period 1986 -- 2005. The abnormal returns to the parent are measured as the market-adjusted returns around the (0, +1), (-1, +1), (-2, +2), and (-5, +5) day windows around the announcement date of the carve-out or spin-off. Parent (subsidiary) rival portfolios are based on all Compustat firms in the same four-digit standard industrial classification (SIC) industry as the parent (subsidiary) during the year of announcement. The customer industry is the industry that purchases the highest proportion of its inputs from the downstream industry in the vertical divestiture to produce its total output provided it is greater than 1%. The supplier industry is the industry that sells the highest proportion of its output to the upstream industry in the vertical divestiture provided it is greater than 1%. Customer (supplier) portfolios are based on all firms in Compustat belonging to the customer (supplier) industry during the announcement year. For each divestiture, the portfolio returns to the rivals, customers, and suppliers are calculated as equally weighted market-adjusted returns over the (0, +1), (-1, +1), (-2, +2), and (-5, +5) day windows around the announcement date. t- statistics are used to test if the mean cumulative abnormal returns are statistically different from zero and are provided in the parentheses. %Positive represents the proportion of portfolios that have positive returns. A generalized sign test is performed to test their statistical significance. Num is the number of observations. Difference in means is the difference in mean abnormal returns between the equity carve-out and spin-off samples. ***, ** and * indicate significance at 1%, 5%, and 10%, respectively.
Event windows
Overall Sample Equity Carve-outs Spin-offs
Num
Mean (percent)
%Positive
Num
Mean (percent)
%Positive
Num
Mean (percent)
%Positive
Difference in means
Parent firms (0,+1) 111 2.68*** 62.9*** 65 1.63** 61.5** 46 4.15*** 71.7***
-2.52**
(4.18) (3.85) (2.12) (2.26) (3.85) (3.33) (-2.13) (-1,+1) 111 2.96*** 63.1*** 65 1.62** 56.9 46 4.86*** 80.4*** -3.24**
(4.54) (4.06) (2.18) (1.52) (4.32) (4.51) (-2.52) (-2,+2) 111 3.02*** 61.2*** 65 2.25** 52.3 46 4.12*** 73.9*** -1.87 (3.70) (2.92) (2.25) (0.77) (2.98) (3.63) (-1.11) (-5,+5) 111 3.31*** 64.9*** 65 2.08 56.9 46 5.05*** 76.1*** -2.97
(3.21) (3.68) (1.59) (1.52) (3.04) (3.92) (-1.23)
Parent rivals (0,+1) 108 0.54*** 62.0* 64 0.32** 59.4 44 0.84** 56.8*
-0.52
(2.70) (1.67) (1.65) (0.79) (2.14) (1.66) (-1.19) (-1,+1) 108 0.55** 61.1 64 0.32 57.8 44 0.89* 56.8* -0.57 (2.30) (1.47) (1.42) (0.54) (1.81) (1.66) (-1.11) (-2,+2) 108 0.81*** 59.3 64 0.76*** 60.9 44 0.88* 56.8 -0.12 (3.05) (1.09) (2.44) (1.04) (1.85) (0.45) (-0.23) (-5,+5) 108 1.12** 57.4 64 0.90* 56.3 44 1.44* 59.1 -0.54 (2.43) (0.70) (1.75) (0.29) (1.70) (0.75) (-0.64)

52
Subsidiary rivals (0,+1) 110 0.25 53.6 64 0.15 57.8 46 0.40 47.8
-0.25 (1.11) (0.18) (0.65) (0.31) (0.89) (0.65) (-0.74) (-1,+1) 110 0.39 54.5 64 0.42 56.3 46 0.35 52.2 -0.07 (1.48) (0.01) (1.37) (0.06) (0.73) (-0.06) (-0.06) (-2,+2) 110 0.34 46.4* 64 0.36 45.3* 46 0.31 47.8 0.05 (1.14) (-1.71) (0.79) (-1.70) (0.62) (-0.65) (-0.17) (-5,+5) 110 0.88** 56.4 64 1.21** 60.9 46 0.42 50.0 0.79 (2.03) (0.39) (2.20) (0.82) (0.60) (-0.35) (0.63) Customer firms (0,+1) 90 0.38* 51.1 53 0.30 50.9 37 0.49* 51.4
-0.19
(1.86) (0.62) (1.03) (0.56) (1.82) (0.29) (-0.34) (-1,+1) 90 0.29 51.1 53 0.21 52.8 37 0.39 48.6 -0.18 (1.34) (0.62) (0.71) (0.29) (1.55) (-0.62) (-0.29) (-2,+2) 90 0.29 55.6 53 0.15 58.5 37 0.49 51.4 -0.34 (1.04) (0.23) (0.41) (0.54) (1.16) (0.293) (-0.64) (-5,+5) 90 0.73* 52.2 53 0.42 50.9 37 1.17* 54.1 -0.75
(1.82) (0.41) (0.85) (0.56) (1.76) (0.04) (-1.04) Supplier firms (0,+1) 88 0.54** 61.3* 50 0.39* 60.0 38 0.74* 63.2
-0.35
(2.53) (1.78) (1.73) (1.24) (1.87) (1.30) (-1.00) (-1,+1) 88 0.71** 54.5 50 0.45 56.0 38 1.05* 52.6 -0.60 (2.44) (0.50) (1.63) (0.67) (1.84) (0.01) (-1.49) (-2,+2) 88 1.08** 51.1 50 0.69* 50.0 38 1.59* 52.6 -0.90* (2.37) (-0.13) (1.66) (-0.18) (1.70) (0.01) (-1.70) (-5,+5) 88 1.20*** 61.3* 50 1.54*** 66.0** 38 0.75 55.2 0.79
(2.62) (1.78) (2.63) (2.08) (0.97) (0.33) (1.54)

53
Table 8 Determinants of the parent wealth effects in vertical divestitures
This table provides results for determinants of the wealth effects to parents in vertical divestitures based on the Heckman treatment effect model. In the first stage, we model the choice to conduct a vertical divestiture through either a spin-off or carve-out. In the second stage, we investigate the determinants of the parent wealth effects. The dependent variable (PAR_CAR) is the market-adjusted return to the parent over the (-1, +1) day window around the announcement date of the divestiture. PAR_RDI_PRE is the research and development intensity of the parent for year t-1, where t is the year of divestiture announcement. PAR_HERFINDX_PRE is the segment sales based firm Herfindahl index of the parent for year t-1. MERGER is an indicator variable that equals one if the parent or subsidiary becomes the target in an acquisition within three years of the divestiture announcement year. SPODUMMY is a dummy that equals one when the divestiture is a spin-off and zero if it is a carve-out. A detailed description of the remaining independent variables in the table is provided in the Appendix. INVMILLS is the inverse Mills ratio from the Heckman estimation. p-values reported in the parentheses are based on heteroskedasticity robust standard errors and are clustered by firm. ***, **, and * denote p < 0.01, p < 0.05, and p < 0.1 respectively.
Independent variables Model 1 Model 2 Model 3 PAR_RDI_PRE -0.078***
-0.074***
(0.003)
(0.006)
PAR_HERFINDX_PRE -0.050***
-0.055***
(0.004)
(0.001)
PAR_IND_DETRN_SHP 0.012
0.009
(0.434)
(0.541)
SUB_IND_DETRN_SHP 0.019
0.021
(0.210)
(0.148)
PAR_IND_HERFINDX_CENSUS
-0.535* -0.685**
(0.058) (0.013)
PAR_MKT_SHR
0.059** 0.059**
(0.040) (0.021)
SUB_MKT_SHR
0.025 0.014
(0.141) (0.401)
PAR_LEVER_PRE -0.117*** -0.104*** -0.122***
(0.002) (0.005) (0.001)
REL_SIZE 0.018 0.014 0.017
(0.221) (0.380) (0.226)
MERGER -0.005 -0.012 -0.011
(0.742) (0.384) (0.455)
SPODUMMY -0.031 -0.040 -0.038
(0.329) (0.245) (0.122)
Constant 0.096*** 0.090** 0.137***
(0.002) (0.022) (0.000)
Number of observations 99 99 99 Chi squared 34.69*** 16.30** 42.28*** INVMILLS 0.0513*** 0.0562*** 0.0518***
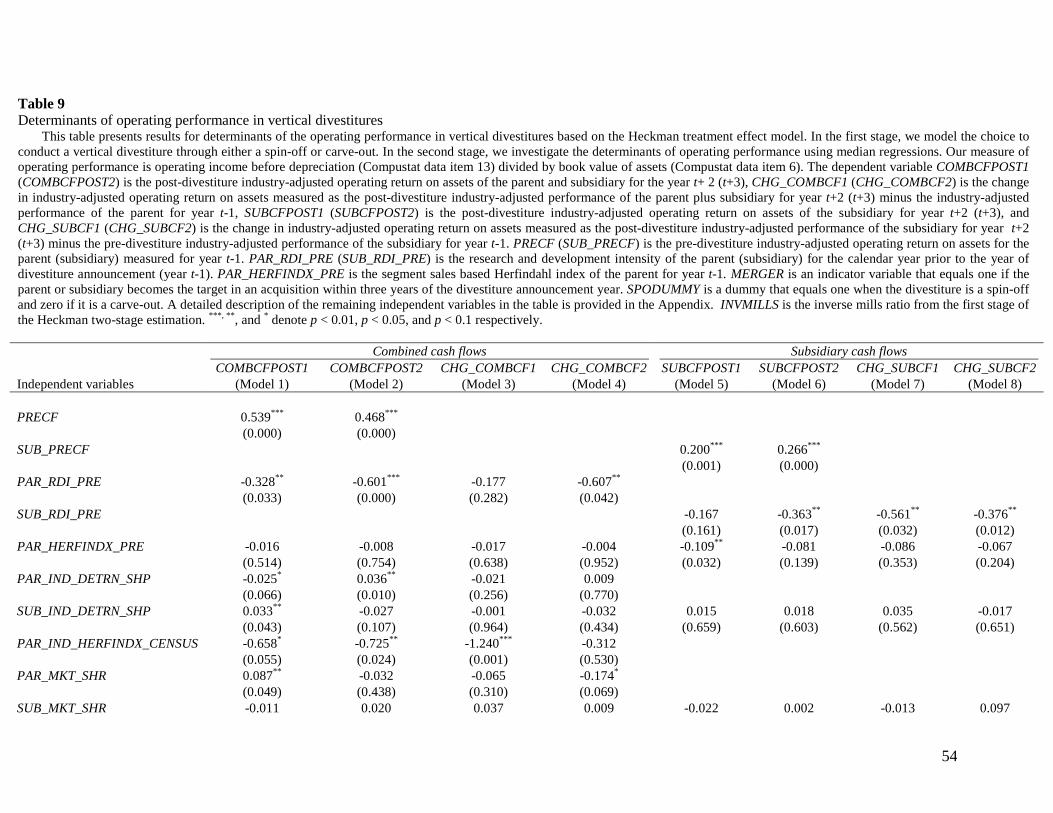
54
Table 9 Determinants of operating performance in vertical divestitures
This table presents results for determinants of the operating performance in vertical divestitures based on the Heckman treatment effect model. In the first stage, we model the choice to conduct a vertical divestiture through either a spin-off or carve-out. In the second stage, we investigate the determinants of operating performance using median regressions. Our measure of operating performance is operating income before depreciation (Compustat data item 13) divided by book value of assets (Compustat data item 6). The dependent variable COMBCFPOST1 (COMBCFPOST2) is the post-divestiture industry-adjusted operating return on assets of the parent and subsidiary for the year t+ 2 (t+3), CHG_COMBCF1 (CHG_COMBCF2) is the change in industry-adjusted operating return on assets measured as the post-divestiture industry-adjusted performance of the parent plus subsidiary for year t+2 (t+3) minus the industry-adjusted performance of the parent for year t-1, SUBCFPOST1 (SUBCFPOST2) is the post-divestiture industry-adjusted operating return on assets of the subsidiary for year t+2 (t+3), and CHG_SUBCF1 (CHG_SUBCF2) is the change in industry-adjusted operating return on assets measured as the post-divestiture industry-adjusted performance of the subsidiary for year t+2 (t+3) minus the pre-divestiture industry-adjusted performance of the subsidiary for year t-1. PRECF (SUB_PRECF) is the pre-divestiture industry-adjusted operating return on assets for the parent (subsidiary) measured for year t-1. PAR_RDI_PRE (SUB_RDI_PRE) is the research and development intensity of the parent (subsidiary) for the calendar year prior to the year of divestiture announcement (year t-1). PAR_HERFINDX_PRE is the segment sales based Herfindahl index of the parent for year t-1. MERGER is an indicator variable that equals one if the parent or subsidiary becomes the target in an acquisition within three years of the divestiture announcement year. SPODUMMY is a dummy that equals one when the divestiture is a spin-off and zero if it is a carve-out. A detailed description of the remaining independent variables in the table is provided in the Appendix. INVMILLS is the inverse mills ratio from the first stage of the Heckman two-stage estimation. ***, **, and * denote p < 0.01, p < 0.05, and p < 0.1 respectively.
Independent variables
Combined cash flows Subsidiary cash flows COMBCFPOST1 COMBCFPOST2 CHG_COMBCF1 CHG_COMBCF2 SUBCFPOST1 SUBCFPOST2 CHG_SUBCF1 CHG_SUBCF2
(Model 1) (Model 2) (Model 3) (Model 4) (Model 5) (Model 6) (Model 7) (Model 8)
PRECF 0.539*** 0.468***
(0.000) (0.000) SUB_PRECF
0.200*** 0.266***
(0.001) (0.000) PAR_RDI_PRE -0.328** -0.601*** -0.177 -0.607**
(0.033) (0.000) (0.282) (0.042) SUB_RDI_PRE
-0.167 -0.363** -0.561** -0.376**
(0.161) (0.017) (0.032) (0.012)
PAR_HERFINDX_PRE -0.016 -0.008 -0.017 -0.004 -0.109** -0.081 -0.086 -0.067
(0.514) (0.754) (0.638) (0.952) (0.032) (0.139) (0.353) (0.204)
PAR_IND_DETRN_SHP -0.025* 0.036** -0.021 0.009
(0.066) (0.010) (0.256) (0.770)
SUB_IND_DETRN_SHP 0.033** -0.027 -0.001 -0.032 0.015 0.018 0.035 -0.017
(0.043) (0.107) (0.964) (0.434) (0.659) (0.603) (0.562) (0.651)
PAR_IND_HERFINDX_CENSUS -0.658* -0.725** -1.240*** -0.312
(0.055) (0.024) (0.001) (0.530)
PAR_MKT_SHR 0.087** -0.032 -0.065 -0.174*
(0.049) (0.438) (0.310) (0.069) SUB_MKT_SHR -0.011 0.020 0.037 0.009 -0.022 0.002 -0.013 0.097
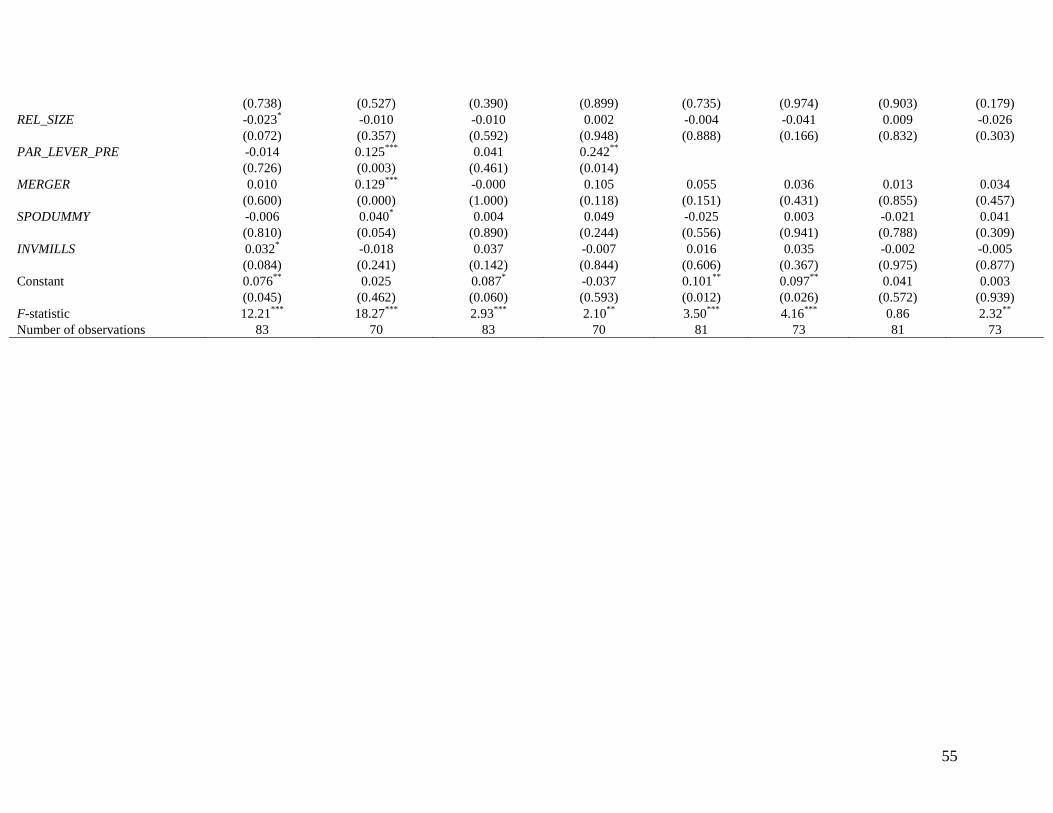
55
(0.738) (0.527) (0.390) (0.899) (0.735) (0.974) (0.903) (0.179)
REL_SIZE -0.023* -0.010 -0.010 0.002 -0.004 -0.041 0.009 -0.026
(0.072) (0.357) (0.592) (0.948) (0.888) (0.166) (0.832) (0.303)
PAR_LEVER_PRE -0.014 0.125*** 0.041 0.242**
(0.726) (0.003) (0.461) (0.014) MERGER 0.010 0.129*** -0.000 0.105 0.055 0.036 0.013 0.034
(0.600) (0.000) (1.000) (0.118) (0.151) (0.431) (0.855) (0.457)
SPODUMMY -0.006 0.040* 0.004 0.049 -0.025 0.003 -0.021 0.041
(0.810) (0.054) (0.890) (0.244) (0.556) (0.941) (0.788) (0.309)
INVMILLS 0.032* -0.018 0.037 -0.007 0.016 0.035 -0.002 -0.005
(0.084) (0.241) (0.142) (0.844) (0.606) (0.367) (0.975) (0.877)
Constant 0.076** 0.025 0.087* -0.037 0.101** 0.097** 0.041 0.003
(0.045) (0.462) (0.060) (0.593) (0.012) (0.026) (0.572) (0.939)
F-statistic 12.21*** 18.27*** 2.93*** 2.10** 3.50*** 4.16*** 0.86 2.32**
Number of observations 83 70 83 70 81 73 81 73
Copyright © 2022 FDOKUMEN