Trade-offs among forest value components in community forests of southwestern Amazonia
11
Copyright © 2014 by the author(s). Published here under license by the Resilience Alliance. Baraloto, C., P. Alverga, S. Baéz Quispe, G. Barnes, N. Bejar Chura, I. Brasil da Silva, W. Castro, H. Da Souza, I. De Souza Moll, J. Del Alcazar Chilo, H. Duenas Linares, J. Garate Quispe, D. Kenji, H. Medeiros, C. A. Rockwell, A. Shenkin, M. Silveira, J. Southworth, G. Vasquez, and S. Perz. 2014. Trade-offs among forest value components in community forests of southwestern Amazonia. Ecology and Society 19(4): 56. http://dx.doi.org/10.5751/ES-06911-190456 Research Trade-offs among forest value components in community forests of southwestern Amazonia Christopher Baraloto 1,2 , Paula Alverga 3 , Sufer Baéz Quispe 4 , Grenville Barnes 5 , Nino Bejar Chura 4 , Izaias Brasil da Silva 3 , Wendeson Castro 3 , Harrison da Souza 6 , Iracema de Souza Moll 3 , Jim del Alcazar Chilo 4 , Hugo Duenas Linares 4 , Jorge Garate Quispe 4 , Dean Kenji 6 , Herison Medeiros 3 , Skya Murphy 2 , Cara A. Rockwell 5 , Alexander Shenkin 2,5 , Marcos Silveira 3 , Jane Southworth 7 , Guido Vasquez 6 and Stephen Perz 8 ABSTRACT. Contemporary conservation interventions must balance potential trade-offs between multiple ecosystem services. In tropical forests, much attention has focused on the extent to which carbon-based conservation provided by REDD+ policies can also mitigate biodiversity conservation. In the nearly one-third of tropical forests that are community owned or managed, conservation strategies must also balance the multiple uses of forest products that support local livelihoods. Although much discussion has focused on policy options, little empirical evidence exists to evaluate the potential for trade-offs among different tropical forest value components. We assessed multiple components of forest value, including tree diversity, carbon stocks, and both timber and nontimber forest product resources, in forest communities across the trinational frontier of Brazil, Peru, and Bolivia. We installed 69 0.5-ha vegetation plots in local communities, and we characterized 15 components of forest value for each plot. Principal components analyses revealed two major axes of forest value, the first of which defined a trade-off between diversity of woody plant communities (taxonomic and functional) versus aboveground biomass and standing timber volume. The second axis described abundance of commercial species, with strong positive loadings for density of timber and nontimber forest products, including Brazil nut (Bertholletia excelsa) and copaiba oil (Copaifera spp.). The observed trade-off between different components of forest value suggests a potential for management conflicts prioritizing biodiversity conservation versus carbon stocks in the region. We discuss the potential for integrative indices of forest value for tropical forest conservation. Key Words: açai; biodiversity conservation; Brazil nut; carbon stocks; livelihood; NTFP; REDD; rubber; timber; tropical rainforest INTRODUCTION Contemporary conservation interventions strive to meet multiple goals, including the maintenance of biodiversity and ecosystem services such as biogeochemical cycles, as well as the alleviation of poverty (Sunderlin et al. 2005, Hirsch et al. 2011). Since the 1992 United Nations Conference on Environment and Development in Rio de Janeiro, Brazil, international policy efforts have sought to reconcile these environmental and socioeconomic priorities (Balmford et al. 2002). For example, protected areas designed for biodiversity conservation often aim to provide other public services such as local sustainable use of natural resources (Schwartzman et al. 2000), stability of regional climates (Soares- Filho et al. 2006), reduced air pollution levels, and watershed maintenance (Parviainen and Frank 2003, Chisholm 2010). Similarly, the development of Reduced Emissions from Deforestation and Forest Degradation (REDD+) initiatives, which protect areas of high carbon stocks via regulatory enforcement and incentive-based mechanisms such as payments for ecosystem services (Angelsen and Brockhaus 2009, Sunderlin and Sills 2012, Duchelle et al. 2014), calls for “cobenefits,” including biodiversity conservation and the enhancement of rural livelihoods (UNFCC 2011, Phelps et al. 2012a, Strassburg et al. 2012). Still, policy options seeking to minimize environmental and economic trade-offs among conservation goals are currently confronted with insufficient empirical data to evaluate potential trade-offs among different components of forest value (Paoli et al. 2010, Hirsch et al. 2011, Phelps et al. 2012b). Global analyses of ecosystem services have revealed geographic overlaps among areas with both high carbon stocks and high biodiversity (Venter et al. 2009, Strassburg et al. 2010). These analyses point to the potential for cobenefits of REDD+ policies to mitigate species extinctions (Phelps et al. 2012b, Strassburg et al. 2012). Nevertheless, at the regional scale, the correspondence of carbon stocks and biodiversity may not be as strong (Paoli et al. 2010, Thomas et al. 2013). If other ecosystem services do not exhibit a strong spatial correspondence with biodiversity, implementation of policies focusing on a specific ecosystem service such as REDD+ and carbon stocks runs significant risks of the displacement of resource exploitation into areas with low carbon stocks but high biodiversity (Paoli et al. 2010, Gardner et al. 2012, Phelps et al. 2012b, Siikamäki and Newbold 2012, Thomas et al. 2013). Tropical forests represent priority areas where REDD+ interventions may have significant cobenefits for biodiversity conservation, because they harbor more than half of the world’s threatened species (Le Saout et al. 2013) and represent a major source of global greenhouse gas emissions (van der Werf et al. 2009). In the nearly one-third of tropical forests that are community owned or managed (Sunderlin et al. 2008), conservation strategies must also balance the multiple uses of forest products that support local livelihoods (Duchelle et al. 2012). Recognition of the economic as well as ecological value of standing forest is of course not new. Indeed, initial approaches to 1 INRA, UMR Ecologie des Forêts de Guyane, French Guiana, 2 Department of Biology, University of Florida, USA, 3 Universidade Federal do Acre, Brazil, 4 Herbario Alwyn Gentry, Universidad Nacional Amazónica de Madre de Dios, Peru, 5 School of Forest Resources and Conservation, University of Florida, USA, 6 Universidad Amazónica de Pando, Bolivia, 7 Department of Geography and Land Use and Environmental Change Institute, University of Florida, USA, 8 Department of Sociology and Criminology & Law, University of Florida, USA
Transcript of Trade-offs among forest value components in community forests of southwestern Amazonia
Copyright © 2014 by the author(s). Published here under license by the Resilience Alliance.Baraloto, C., P. Alverga, S. Baéz Quispe, G. Barnes, N. Bejar Chura, I. Brasil da Silva, W. Castro, H. Da Souza, I. De Souza Moll, J.Del Alcazar Chilo, H. Duenas Linares, J. Garate Quispe, D. Kenji, H. Medeiros, C. A. Rockwell, A. Shenkin, M. Silveira, J.Southworth, G. Vasquez, and S. Perz. 2014. Trade-offs among forest value components in community forests of southwesternAmazonia. Ecology and Society 19(4): 56. http://dx.doi.org/10.5751/ES-06911-190456
Research
Trade-offs among forest value components in community forests ofsouthwestern AmazoniaChristopher Baraloto 1,2, Paula Alverga 3, Sufer Baéz Quispe 4, Grenville Barnes 5, Nino Bejar Chura 4, Izaias Brasil da Silva 3, WendesonCastro 3, Harrison da Souza 6, Iracema de Souza Moll 3, Jim del Alcazar Chilo 4, Hugo Duenas Linares 4, Jorge Garate Quispe 4, DeanKenji 6, Herison Medeiros 3, Skya Murphy 2, Cara A. Rockwell 5, Alexander Shenkin 2,5, Marcos Silveira 3, Jane Southworth 7, GuidoVasquez 6 and Stephen Perz 8
ABSTRACT. Contemporary conservation interventions must balance potential trade-offs between multiple ecosystem services. Intropical forests, much attention has focused on the extent to which carbon-based conservation provided by REDD+ policies can alsomitigate biodiversity conservation. In the nearly one-third of tropical forests that are community owned or managed, conservationstrategies must also balance the multiple uses of forest products that support local livelihoods. Although much discussion has focusedon policy options, little empirical evidence exists to evaluate the potential for trade-offs among different tropical forest value components.We assessed multiple components of forest value, including tree diversity, carbon stocks, and both timber and nontimber forest productresources, in forest communities across the trinational frontier of Brazil, Peru, and Bolivia. We installed 69 0.5-ha vegetation plots inlocal communities, and we characterized 15 components of forest value for each plot. Principal components analyses revealed twomajor axes of forest value, the first of which defined a trade-off between diversity of woody plant communities (taxonomic andfunctional) versus aboveground biomass and standing timber volume. The second axis described abundance of commercial species,with strong positive loadings for density of timber and nontimber forest products, including Brazil nut (Bertholletia excelsa) and copaibaoil (Copaifera spp.). The observed trade-off between different components of forest value suggests a potential for management conflictsprioritizing biodiversity conservation versus carbon stocks in the region. We discuss the potential for integrative indices of forest valuefor tropical forest conservation.
Key Words: açai; biodiversity conservation; Brazil nut; carbon stocks; livelihood; NTFP; REDD; rubber; timber; tropical rainforest
INTRODUCTIONContemporary conservation interventions strive to meet multiplegoals, including the maintenance of biodiversity and ecosystemservices such as biogeochemical cycles, as well as the alleviationof poverty (Sunderlin et al. 2005, Hirsch et al. 2011). Since the1992 United Nations Conference on Environment andDevelopment in Rio de Janeiro, Brazil, international policy effortshave sought to reconcile these environmental and socioeconomicpriorities (Balmford et al. 2002). For example, protected areasdesigned for biodiversity conservation often aim to provide otherpublic services such as local sustainable use of natural resources(Schwartzman et al. 2000), stability of regional climates (Soares-Filho et al. 2006), reduced air pollution levels, and watershedmaintenance (Parviainen and Frank 2003, Chisholm 2010).Similarly, the development of Reduced Emissions fromDeforestation and Forest Degradation (REDD+) initiatives,which protect areas of high carbon stocks via regulatoryenforcement and incentive-based mechanisms such as paymentsfor ecosystem services (Angelsen and Brockhaus 2009, Sunderlinand Sills 2012, Duchelle et al. 2014), calls for “cobenefits,”including biodiversity conservation and the enhancement of rurallivelihoods (UNFCC 2011, Phelps et al. 2012a, Strassburg et al.2012). Still, policy options seeking to minimize environmentaland economic trade-offs among conservation goals are currentlyconfronted with insufficient empirical data to evaluate potentialtrade-offs among different components of forest value (Paoli etal. 2010, Hirsch et al. 2011, Phelps et al. 2012b).
Global analyses of ecosystem services have revealed geographicoverlaps among areas with both high carbon stocks and highbiodiversity (Venter et al. 2009, Strassburg et al. 2010). Theseanalyses point to the potential for cobenefits of REDD+ policiesto mitigate species extinctions (Phelps et al. 2012b, Strassburg etal. 2012). Nevertheless, at the regional scale, the correspondenceof carbon stocks and biodiversity may not be as strong (Paoli etal. 2010, Thomas et al. 2013). If other ecosystem services do notexhibit a strong spatial correspondence with biodiversity,implementation of policies focusing on a specific ecosystemservice such as REDD+ and carbon stocks runs significant risksof the displacement of resource exploitation into areas with lowcarbon stocks but high biodiversity (Paoli et al. 2010, Gardner etal. 2012, Phelps et al. 2012b, Siikamäki and Newbold 2012,Thomas et al. 2013).
Tropical forests represent priority areas where REDD+interventions may have significant cobenefits for biodiversityconservation, because they harbor more than half of the world’sthreatened species (Le Saout et al. 2013) and represent a majorsource of global greenhouse gas emissions (van der Werf et al.2009). In the nearly one-third of tropical forests that arecommunity owned or managed (Sunderlin et al. 2008),conservation strategies must also balance the multiple uses offorest products that support local livelihoods (Duchelle et al.2012). Recognition of the economic as well as ecological value ofstanding forest is of course not new. Indeed, initial approaches to
1INRA, UMR Ecologie des Forêts de Guyane, French Guiana, 2Department of Biology, University of Florida, USA, 3Universidade Federal doAcre, Brazil, 4Herbario Alwyn Gentry, Universidad Nacional Amazónica de Madre de Dios, Peru, 5School of Forest Resources and Conservation,University of Florida, USA, 6Universidad Amazónica de Pando, Bolivia, 7Department of Geography and Land Use and Environmental ChangeInstitute, University of Florida, USA, 8Department of Sociology and Criminology & Law, University of Florida, USA
Ecology and Society 19(4): 56http://www.ecologyandsociety.org/vol19/iss4/art56/
forest valuation emerged before the development of carbonmarkets, arguing that standing forests had significant economicvalue in support of local livelihoods before accounting for carbonstocks or other ecosystem services (Peters et al. 1989, Godoy et al.2000). The extent to which geographic targeting for carbonemission reductions may limit the development of resourceextraction for timber and nontimber forest products (NTFPs) musttherefore be considered (UNFCC 2011, Phelps et al. 2012a).Furthermore, if timber stocks overlap geographically with areasrich in NTFPs, then conflicts of use may ensue if policies prioritizeone over the other. The same applies to policies targeting carbonemissions or biodiversity conservation (Guariguata et al. 2010,Shanley et al. 2012, Herrero-Jáuregui et al. 2013).
The mitigation of conservation trade-offs is further complicatedby the choice of appropriate metrics representing biodiversity, inat least three ways. First, different focal species groups such asplants, insects, and mammals may have different biogeographicdistributions and may respond differently to disturbances (Gardneret al. 2008). Second, biodiversity priorities may include not onlytotal site diversity, but also the presence of threatened or endemicspecies (Strassburg et al. 2010, LeSaout et al. 2013). Third, differentdiversity metrics target different levels of biological organizationand may provide contrasting results. Recent analyses have shownthat traditional metrics of taxonomic diversity are not alwayscongruent with either phylogenetic diversity, which may capturethe potential for adaptation (Tucker and Cadotte 2013), orfunctional diversity, which may help predict the resilience ofcommunities to global change (Lavorel 2013). In particular,functional diversity has been directly linked to important ecologicalprocesses tied to economically important ecosystem services (deBello et al. 2010, Mouillot et al. 2011, Lavorel 2013) and has beenshown to respond differently to disturbance than taxonomicdiversity (Baraloto et al. 2012a).
Given the numerous and diverse stakeholders in tropical forestregions, there exists an urgent need for comprehensive metrics oftropical forest value. Such metrics must encompass not only carbonstocks and other ecosystem services, but also multiple aspects ofbiodiversity, as well as timber and NTFPs essential to rurallivelihoods (UNFCC 2011, Phelps et al. 2012a, Ninan and Inoue2013).
Recent approaches have been developed to estimate somecomponents of forest value using pre-existing data sources that relyon information about forest structure. Such efforts typicallyhighlight estimation of timber stocks and aboveground biomass asderived from remote sensing techniques (Asner et al. 2010) or coarseresolution forestry inventory data (Ahmed and Ewers 2012).However, even for these relatively straightforward components offorest value related to forest structure, substantial uncertaintyremains about different forest types with varying degrees ofdegradation (Sasaki and Putz 2009). As a result, empiricalapproaches using targeted field data via forest inventories are stillneeded to assess these and other components of forest value, andto serve as eventual calibration data as remote sensing techniquesare developed (Hosonuma et al. 2012).
The southwestern Amazon represents a compelling example formore inclusive studies of forest value. The region is recognized forhigh biodiversity and particularly the presence of endemic species(ter Steege et al. 2013). Communities in the region practice multipleuse forest management, which includes harvesting of both timber,
particularly cumaru (Dipteryx spp.), cumaru cetim (Apuleialeiocarpa), ipe (Tabebuia spp.), and cedro (Cedrela spp.), as well ascollection of numerous NTFPs, including Brazil nuts (Bertholletiaexcelsa), rubber (Hevea brasiliensis), sap resins and oils (Copaiferaspp., Myroxylon balsamum, Hymenaea courbaril), and palm fruitsfor food (Euterpe precatoria), in addition to subsistence huntingand materials consumption (Vadjunec and Rocheleau 2009, Gomeset al. 2012, Duchelle et al. 2012). At the same time, there areincipient programs in place for environmental service paymentsrelated to forest carbon in the region, such as Acre’s System ofIncentives for Environmental Services, which was passed into statelaw in 2010 (Duchelle et al. 2014), along with multiple pilot REDD+projects in Madre de Dios (Hajek et al. 2011). Despite thesenumerous sources of forest value, the region is also threatened byagricultural expansion and forest degradation accompanying therecent paving of the Inter-Oceanic Highway (Southworth et al.2011, Perz et al. 2013), and by the acceleration of illegal gold mining(Asner et al. 2013).
We derive empirical estimates of forest value from a network ofvegetation plots across the trinational frontier in the southwesternAmazon where Bolivia, Brazil, and Peru meet. We consider a suiteof metrics of forest value including carbon in forest biomass,taxonomic as well as functional plant diversity, and availability ofboth timber and NTFPs. We then ask how these differentcomponents of forest value are correlated to test for potentialconservation trade-offs in policies that focus on one or anothercomponent of forest value. In particular, we examine (i) thefrequency of trade-offs in geographic targeting between carbonemissions reductions versus different aspects of biodiversityconservation, and (ii) the potential for use of trade-offs resultingfrom overlap in priority sites for carbon stocks or biodiversityconservation versus exploitable resources supporting locallivelihoods. We discuss our results in light of the pressingconservation issues of this dynamic and understudied region.
METHODS
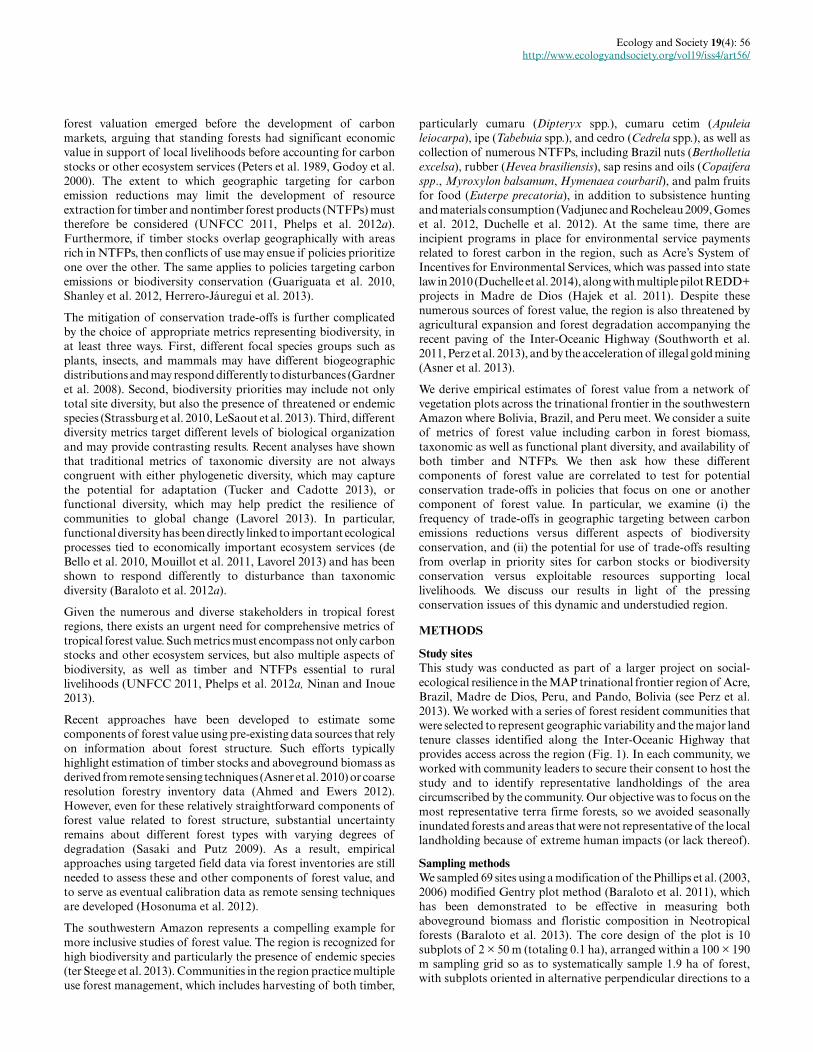
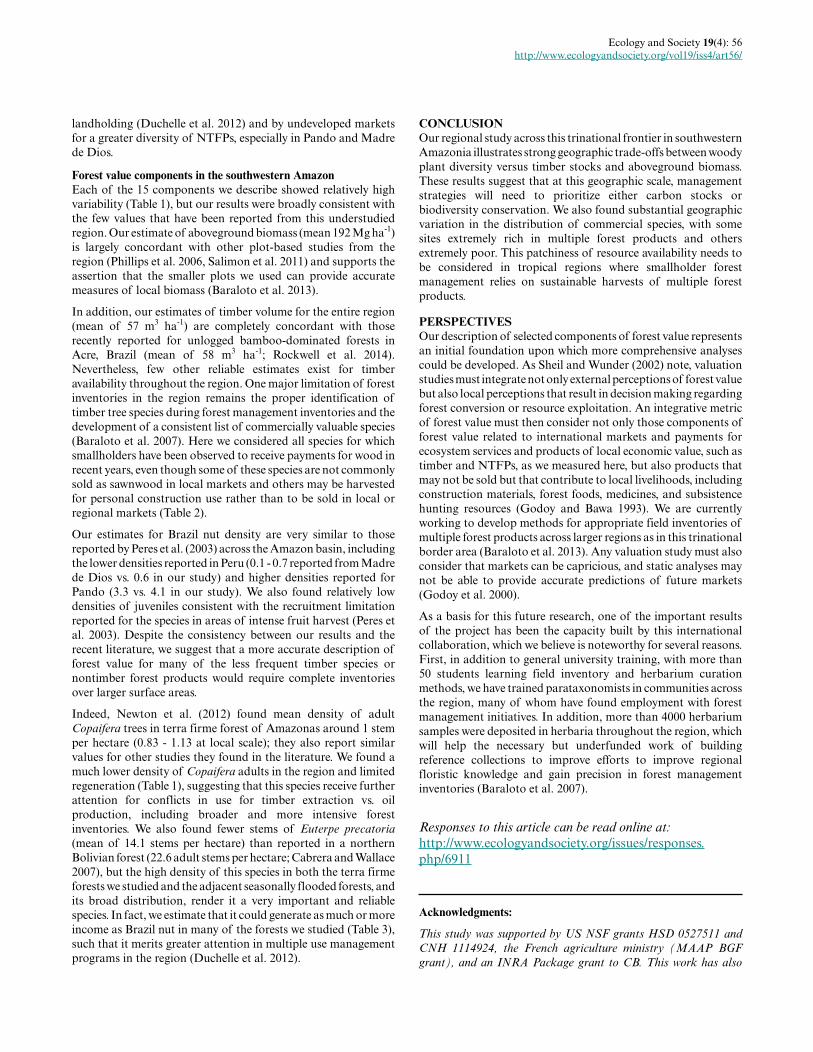
Study sitesThis study was conducted as part of a larger project on social-ecological resilience in the MAP trinational frontier region of Acre,Brazil, Madre de Dios, Peru, and Pando, Bolivia (see Perz et al.2013). We worked with a series of forest resident communities thatwere selected to represent geographic variability and the major landtenure classes identified along the Inter-Oceanic Highway thatprovides access across the region (Fig. 1). In each community, weworked with community leaders to secure their consent to host thestudy and to identify representative landholdings of the areacircumscribed by the community. Our objective was to focus on themost representative terra firme forests, so we avoided seasonallyinundated forests and areas that were not representative of the locallandholding because of extreme human impacts (or lack thereof).
Sampling methodsWe sampled 69 sites using a modification of the Phillips et al. (2003,2006) modified Gentry plot method (Baraloto et al. 2011), whichhas been demonstrated to be effective in measuring bothaboveground biomass and floristic composition in Neotropicalforests (Baraloto et al. 2013). The core design of the plot is 10subplots of 2 × 50 m (totaling 0.1 ha), arranged within a 100 × 190m sampling grid so as to systematically sample 1.9 ha of forest,with subplots oriented in alternative perpendicular directions to a
Ecology and Society 19(4): 56http://www.ecologyandsociety.org/vol19/iss4/art56/
Table 1. Forest value components defined in this study, including a code to abbreviations used in figures, their units, range, and description. Attribute Abbrev units Mean (Range) Description
Tree genus diversity TreeDiv 0.95(0.83 0.98)
Simpson index, i.e., probability of drawing a pair of individuals fromtwo different genera
Tree functionaldiversity
FunDiv 0.92(0.75 0.99)
Rao’s quadratic entropy (Pavoine and Bonsall 2011), integratingdifferences among genera in leaf and wood functional trait values withrelative abundances of genera in each site
Abovegroundbiomass
AGB10 Mg ha-1 191(40 584)
Biomass of stems with diameter greater than 10 cm, calculated usingthe allometry of Chave et al. (2005)
Small stem biomass AGBsm Mg ha-1 7.4(2.7 10.7)
Biomass of stems with diameter less than 10 cm (and greater than 2.5cm), calculated using the allometry of Hughes et al. (1999)
Timber volume Timber m3 ha-1 57(0 386)
Total commercial volume of 28 genera, calculated using the allometryof Nogueira et al. (2008)
Future crop trees TimFCT stems ha-1 63(8 270)
Total density of future timber crop trees, defined as having DBHbetween 20 and 45 cm, of 28 commercial timber genera
Timber regeneration Tim.r stems ha-1 182(10 430)
Total density of regenerating juveniles, defined as having DBH between2.5 and 20 cm, of 28 commercial timber genera
Brazil nut trees Berth stems ha-1 2.4(0 20)
Density of adult (DBH > 50cm) Brazil nut (Bertholletia excelsa) trees(Kainer et al. 2007)
Brazil nutregeneration
Berth.r stems ha-1 5.2(0 80)
Density of regenerating juvenile (DBH between 2.5 and 50 cm) Brazilnut trees
Rubber trees Hevea stems ha-1 2.1(0 50)
Density of adult (DBH > 30cm) rubber (Hevea brasiliensis) trees
Rubber regeneration Hevea.r stems ha-1 7.5(0 40)
Density of regenerating juvenile (DBH between 2.5 and 30cm) rubbertrees
Copaiba trees Copaiba stems ha-1 0.1(0 4)
Density of adult (DBH > 25cm) copaiba (Copaiba spp.) trees (Newtonet al. 2012)
Copaibaregeneration
Copaiba.r stems ha-1 0.3(0 10)
Density of regenerating juvenile (DBH between 2.5 and 25cm) copaibatrees
Açai trees Acai stems ha-1 14.5(0 100)
Density of adult (DBH > 10cm) açai (Euterpe precatoria) trees (Bernalet al. 2011)
Açai regeneration Acai.r stems ha-1 21.5(0 110)
Density of regenerating juvenile (DBH between 2.5 and 10cm) açaitrees
Fig. 1. A map illustrating the study area in southwesternAmazonia, including major highways (in red), the 69 sampleplots (green crosses), and major urban centers (stars).
randomly chosen baseline. Each woody plant rooted within thetransect area and with a diameter at breast height (DBH at 1.3m) of ≥ 2.5 cm was included and measured for both DBH andheight. Where a plant had multiple stems, we recorded it as one
individual, but took separate diameter and height measures for eachstem to be used for calculations of aboveground biomass. Wemodified the original Gentry plot protocol to provide moreaccurate measures of forest biomass and timber and nontimberresources (Baraloto et al. 2013). Each 2 x 50 m subplot was extendedto a 10 x 50 m subplot in which all woody stems with diameter atbreast height of ≥ 20 cm were sampled (Baraloto et al. 2011).
We collected voucher specimens for each species and whenever therewas any uncertainty as to identity. Sampling was conducted from2007 - 2010 as part of training courses for university students atthe three local collaborating universities, and a full duplicate set ofcollections from each country is deposited in each of their threelocal herbaria (the National Amazonian University of Madre deDios [UNAMAD] in Puerto Maldonado, Peru; the Center forResearch on Amazon Protection of the Amazonian University ofPando [CIPA-UAP] in Cobija, Bolivia; and the Zoobotanical Parkof the Federal University of Acre [PZ-UFAC] Rio Branco, Brazil).Samples have been cross-referenced among countries by the leadauthor, but because reference collections at these herbaria are underconstruction, we could identify many of our sterile specimens onlyto the genus level with confidence (Pitman et al. 2008). Overall,93.5% of stems were assigned genus level identifications withconfidence, and 99.5% were assigned to family level.
Forest value componentsWe estimated 15 variables describing forest value (forest valuecomponents; Table 1) in this region. First, we calculated indicesdescribing woody plant diversity in each plot. We used the Simpson
Ecology and Society 19(4): 56http://www.ecologyandsociety.org/vol19/iss4/art56/
index to describe genus-level diversity, and the complementaryRao quadratic entropy to describe functional diversity (Pavoineand Bonsall 2011). The Rao index is analogous to the Simpsonindex but integrates pairwise differences among species in theirfunctional traits. We applied a functional trait database describingleaf and wood tissue characteristics of more than 1200 speciesacross the Amazon region (Baraloto et al. 2010, Fortunel et al.2012). Trait values were applied to each individual in the sampleby taxonomic correspondence. For species or genera in the plotdata that were not present in the functional trait database, wesubstituted the mean values for all individuals pertaining to thenext higher taxonomic level because these traits show weak butsignificant phylogenetic signal (Baraloto et al. 2012b). Of the 397genera present in the dataset, 177 were assigned genus-level traitsand 166 were assigned mean family level trait values.
Second, we estimated aboveground live biomass using allometricequations for different size classes as described in Baraloto et al.(2011). In particular, we estimated the aboveground biomass ofsmaller trees with DBH between 2.5 and 10 cm, including palms,from a single equation modified from the model reported byChave et al. (2004). Also, we estimated the aboveground biomass(AGB) in trees with DBH > 10 cm, including palms, usingallometric formulas that integrate the species trait data on woodspecific gravity (Chave et al. 2005). We also calculated AGB usingallometries developed for the southern Amazon region byNogueira et al. (2008). The two approaches gave very similarresults across our plots (r = 0.98). To facilitate comparisons withother sites in the literature, we chose to report the allometries ofChave et al. (2004, 2005).
We also estimated three other indices that relate forest value tolocal livelihoods, including timber volume of commercial speciesharvested in the region and the abundance of principal NTFPs.We compiled a list of 28 commercially important genera/speciescomplexes in the region (Table 2) based on interviews withcommunity members (Perz et al. 2013). We calculated standingtimber volume for stems of all commercial species with DBH >45 cm in each plot using the Nogueira et al. (2008) allometry forthe southern Amazon region. We also calculated future crop treedensity of timber species (FCT; Rockwell et al. 2007) as thedensity of all trees of the same species group with DBH between20 and 45 cm, and the regeneration density as all stems with DBHbetween 2.5 and 20 cm.
We identified four commercially important species as nontimberforest products in the region (Table 3) based on interviews withcommunity members (Perz et al. 2013), including Brazil nut(Bertholletia excelsa, Lecythidaceae; Kainer et al. 2007), rubber(Hevea brasiliensis; Euphorbiaceae, Duchelle et al. 2012), açai(Euterpe precatoria, Arecaceae; Bernal et al. 2011) and copaibaoil (Copaifera spp., Fabaceae; Newton et al. 2012). For each ofthese taxa, we estimated the density of productive adults, definedhere for each species as the size at which the product (fruit, latex,oil) is harvested; and we estimated the density of regeneration asall stems between 2.5 cm DBH and the productive adult minimumsize (Table 1). Although we do not consider this to be anexhaustive list of NTFP species, these four species are particularlyimportant. Several other species that are common in the regionhave been noted for potential commercialization (e.g., seeds ofCarapa spp., Meliaceae, Klimas et al. 2012), viable markets forthese products do not currently exist, so we opted not to consider
Table 2. Major commercial timber genera, common names, andexamples of 2012 market values from Acre, Brazil. Genera wereincluded when cited as among those that could be soldconsistently outside local communities. Shown are values paid tosmallholders per cubic meter of standing roundwood beforeharvest, with sawnwood values in capital city sawmills indicatedin parentheses. Despite its high quality timber and traditional use,market restrictions limit trade for Bertholletia excelsa. Genus Family Common Names Value
($R) †
Amburana Fabaceae Cerejeira 40 (850)Andira Fabaceae Angelim 40 (750)Apuleia Fabaceae Cumaru cetim 40 (1250)Aspidosperma Apocynaceae Amarelão,
carapanauba40 (850)
Astronium Anacardiaceae Muiracatiara 40 (750)Brosimum Moraceae Inharé, mururé 40 (700)Carapa Meliaceae Andiroba 40
(no market)Cedrela Meliaceae Cedro 40 (1300)Ceiba Malvaceae Samauma 40 (750)Clarisia Moraceae Guariuba 40 (750)Copaifera Fabaceae Copaiba 40 (850)Couratari Lecythidaceae Tauari 40 (750)Diplotropis Fabaceae Sucupira 40 (850)Dipteryx Fabaceae Cumaru ferro 40 (1350)Enterolobium Fabaceae Fava orelinha 40 (850)Hymenaea Fabaceae Jatoba, jutai 40 (950)Hymenolobium Fabaceae Angelim 40 (750)Jacaranda Bignoniaceae Marupa 40 (750)Manilkara Sapotaceae Maçaranduba 40 (850)Mezilaurus Lauraceae Itauba 40 (850)Myroxylon Fabaceae Balsamo 40 (850)Parkia Fabaceae Angico 40 (750)Peltogyne Fabaceae Roxinho 40 (850)Swietenia Meliaceae Mogno Rare, price
negotiatedTabebuia Bignoniaceae Ipe, pau d’arco 40 (850)Terminalia Combretaceae Imbirindiba 40 (750)Tetragastris Burseraceae Breu vermelho 40 (850)Vochysia Vochysiaceae Catuaba 40 (750)†1 Brazilian real = US$0.49Note: Integrating these values with those presented in the manuscript, wecan estimate that the standing roundwood value of forests can reach amaximum of US$7700 in the region.
them here. Thus, we consider our NTFP index to be a reasonableindicator of value as perceived by local community members.
We analyzed relationships among the forest value componentsusing pairwise correlations and principal components analysis,with log transformations where necessary. All analyses wereperformed in the R statistical platform (R Development CoreTeam 2012).
RESULTSAcross the 69 plots, we sampled 15,314 stems representing 87families, 397 genera, and at least 1009 species. The most abundantgenera we sampled for understory trees (DBH between 2.5 and10 cm) were Rinorea (Violaceae, 4.9% of stems), Siparuna (Siparunaceae, 4.2%), Pausandra (Euphorbiaceae, 3.5% ofstems), Tetragastris (Burseraceae, 3.4% of stems), and Inga (Fabaceae, 3.3% of stems); for mid-size trees (DBH between 10and 30 cm), the most abundant genera were Tetragastris (5.4% of
Ecology and Society 19(4): 56http://www.ecologyandsociety.org/vol19/iss4/art56/
Table 3. Nontimber forest product species, common names, and examples of 2012 market values from Acre, Brazil. Genus Family Common Names Part used Value
($R) †
Bertholletia Lecythidaceae Castanha Seed (and timber) 15 - 20/ lata‡
Hevea Euphorbiaceae Seringa Latex 7.8/kgCopaifera Fabaceae Copaiba Sap (and timber) 40/literEuterpe Arecaceae asai Fruit (and stem heart) 10 - 18/ lata†1 Brazilian real = US$0.49‡1 lata ~ 11.5 kg Note: Integrating these values with those presented in the manuscript for densities of these species (Table 1), and productionestimates from the literature, we can estimate that the annual income from harvest of these four products can reach a maximum of US$880.
stems), Pseudolmedia (Moraceae, 4.7% of stems), Euterpe (Arecaceae, 3.9%), Iriartea (Arecaceae, 2.9% of stems), and Inga (2.6% of stems); and for large trees (with DBH greater than 30cm), the most abundant genera were Tetragastris (10.3% of stems),Pseudolmedia (4.1% of stems), Brosimum (Moraceae, 3.8%),Cecropia (Cecropiaceae, 3.5% of stems), Bertholletia (2.9% ofstems), and Pouteria (Sapotaceae, 2.9% of stems).
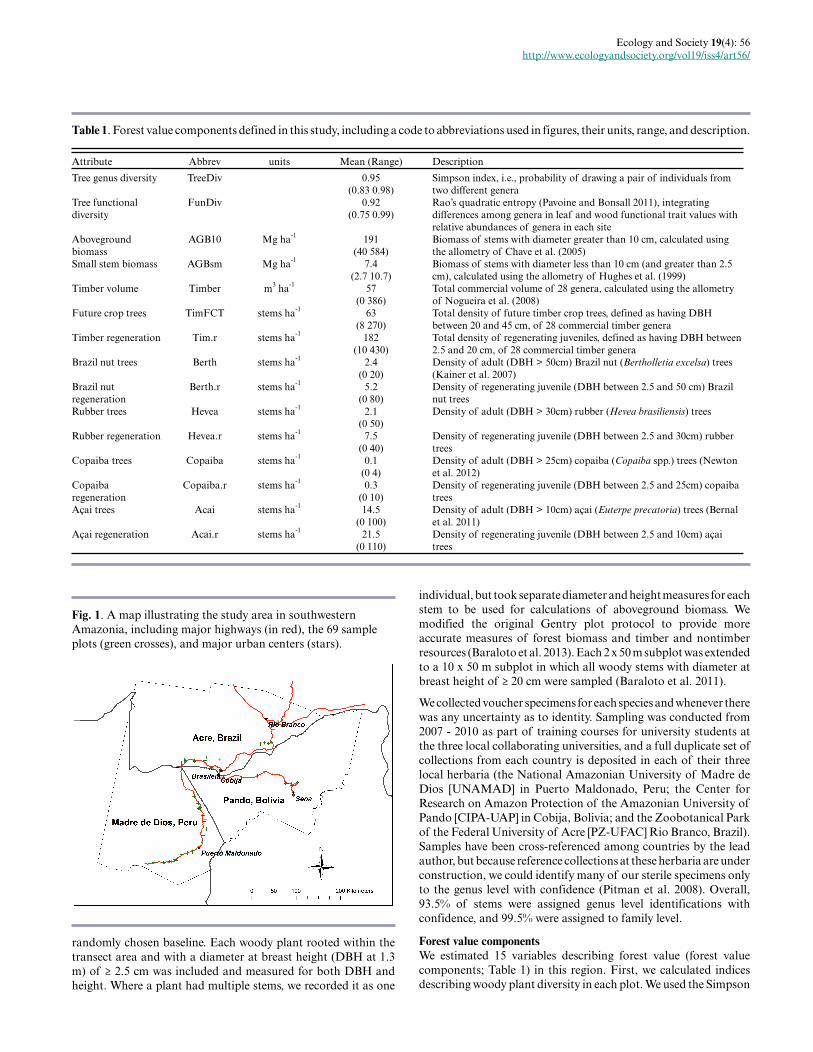
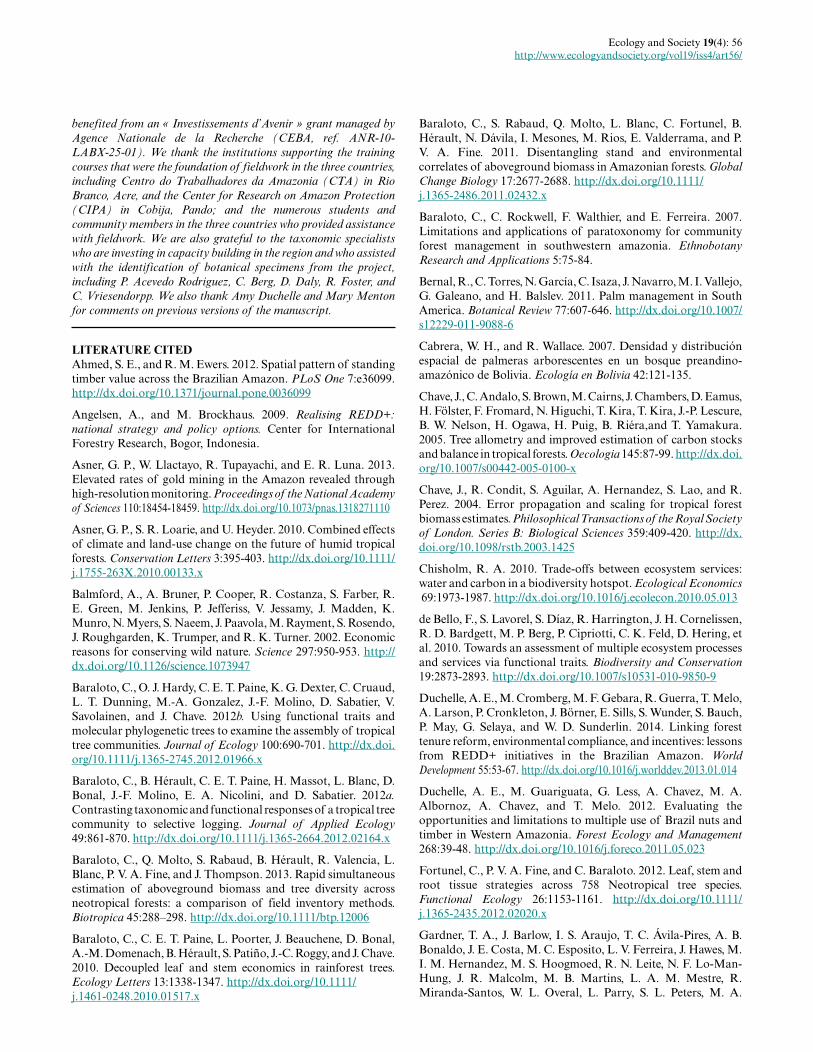
Principal components analysis revealed two primary axes whichtogether explained more than a third of the variation among the15 forest value components (Fig. 2). The first axis described atrade-off between plots with high tree diversity vs. highaboveground biomass (Fig. 2), with strong positive loadings forboth taxonomic and functional diversity as well as strong negativeloadings for variables describing forest structure, includingaboveground biomass and timber stocks (Table 4). The secondaxis synthesized the abundance of many commercial species, sinceit was driven by the abundance of adults and regeneration oftimber and many NTFP species (Fig. 2) and also included strongloadings for aboveground biomass (Table 4).
Fig. 2. Biplot of principal components analysis illustratingcorrelations among forest value components, which areindicated along arrows using abbreviations from Table 1.Ordinations of the 69 forest sample plots are illustrated as greycircles. See Table 4 for complete results of correlation analysesand principal components analysis (PCA) loadings of forestvalue components.
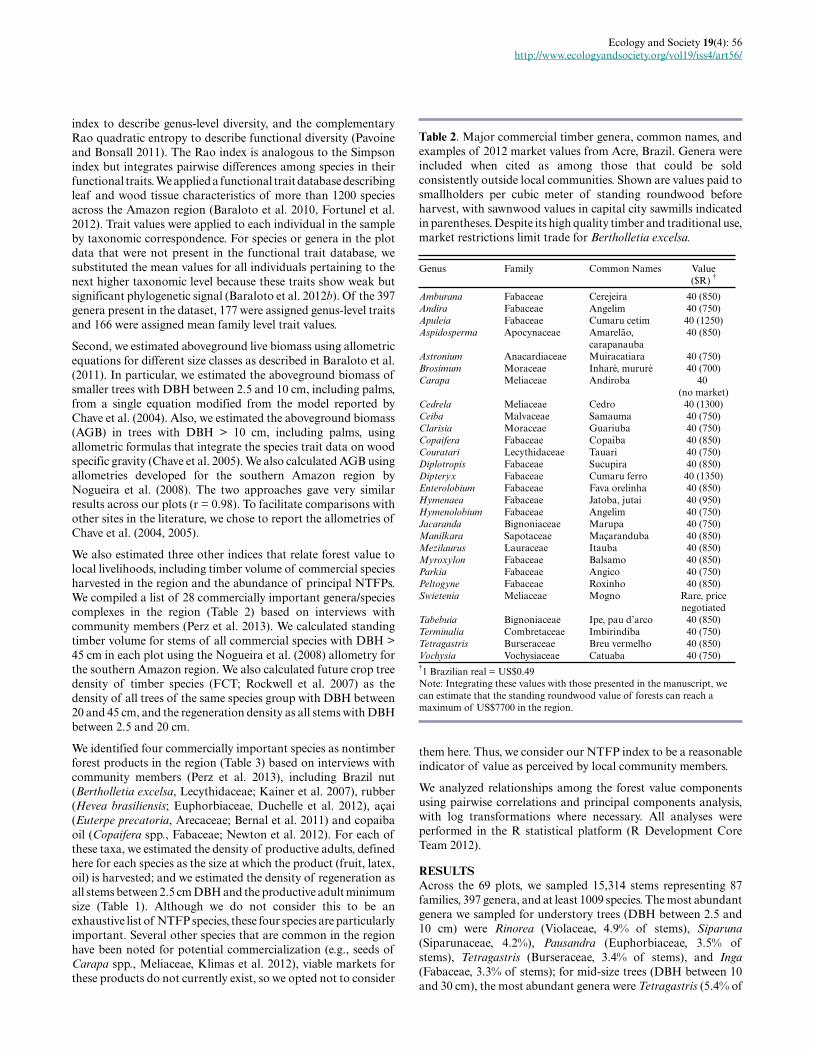
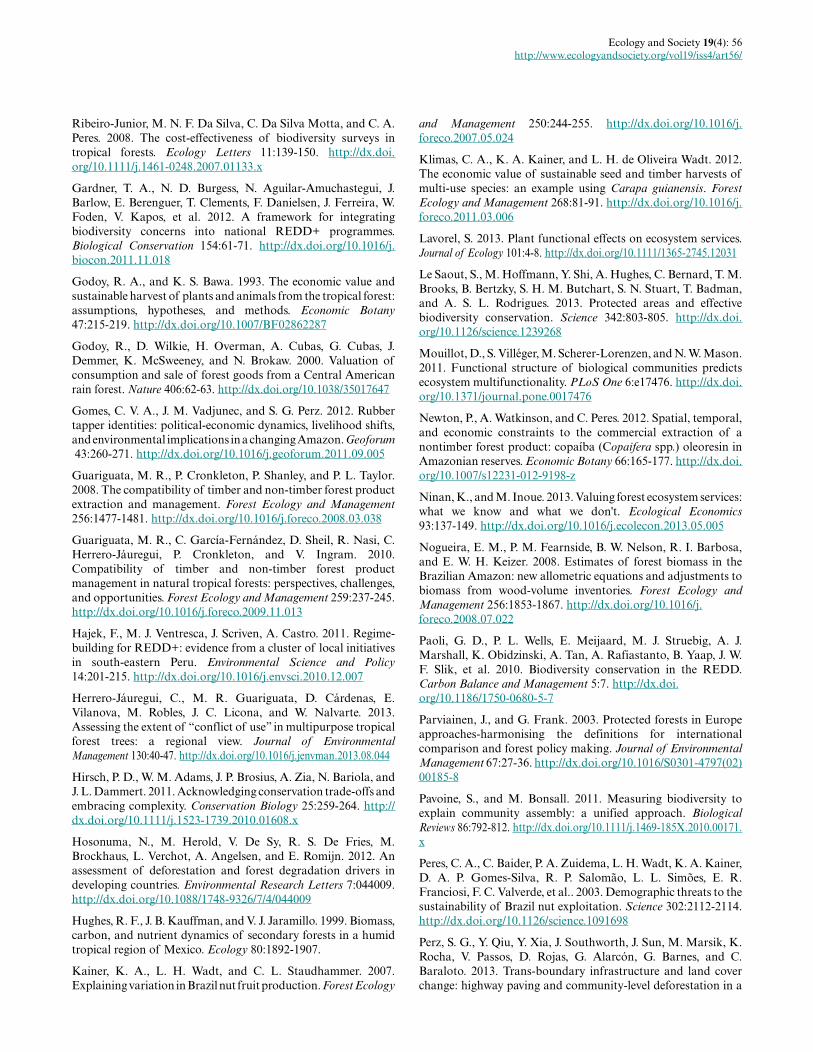
Figure 3 illustrates the pairwise relationships underpinning themultivariate findings. Even the stronger correlations in ourdataset are characterized by some variation. For example, siteswith the lowest tree diversity maintained median values offunctional diversity in the region (Fig. 3a). This suggests that eventhough these metrics are highly positively correlated, they maystill be providing complementary information for management.Biplots also show that the sites with higher tree diversity tend tohave lower timber volume and aboveground biomass, but that lowtree diversity occurs in situations across a range of values of forestbiomass and timber volume (Fig. 3 b-c).
Fig. 3. Biplots of forest value components defining major axesof variation across the 69 sampled plots in southwesternAmazonia. Functional Diversity (Rao’s Q) vs (a) TaxonomicDiversity (Simpson), (b) aboveground biomass, and (c)harvestable volume of commercial timber species.
Ecology and Society 19(4): 56http://www.ecologyandsociety.org/vol19/iss4/art56/
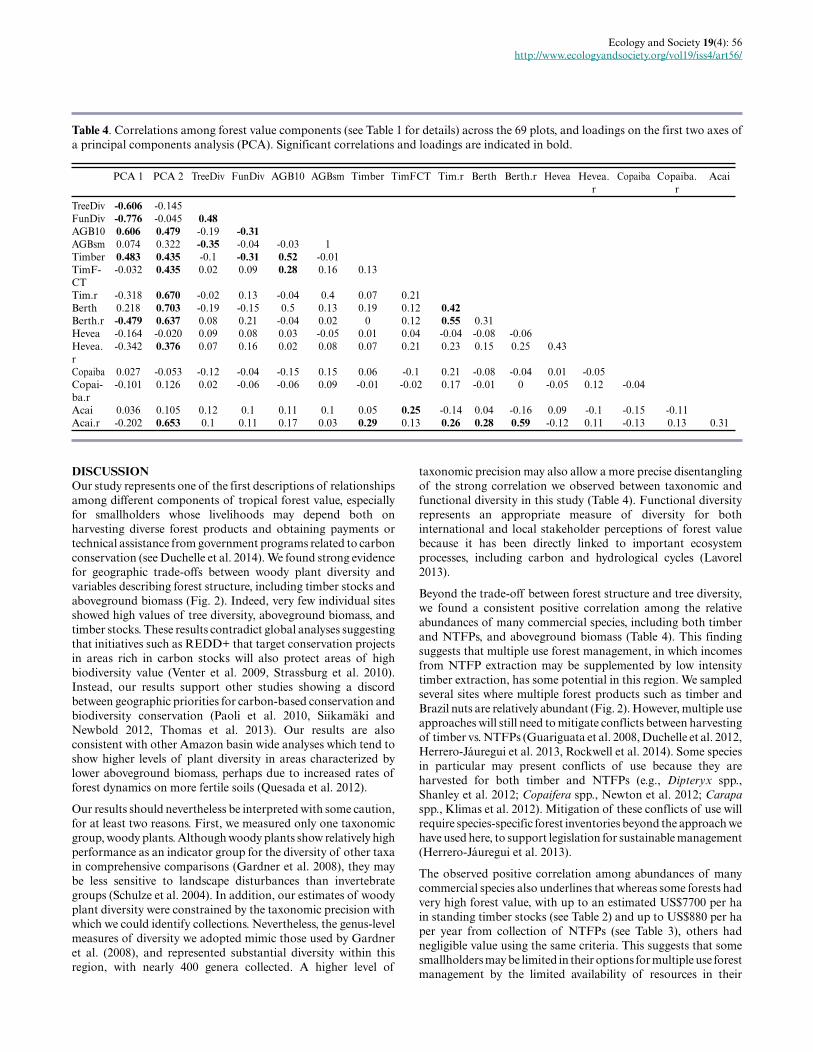
Table 4. Correlations among forest value components (see Table 1 for details) across the 69 plots, and loadings on the first two axes ofa principal components analysis (PCA). Significant correlations and loadings are indicated in bold.
PCA 1 PCA 2 TreeDiv FunDiv AGB10 AGBsm Timber TimFCT Tim.r Berth Berth.r Hevea Hevea.r
Copaiba Copaiba.r
Acai
TreeDiv -0.606 -0.145FunDiv -0.776 -0.045 0.48AGB10 0.606 0.479 -0.19 -0.31AGBsm 0.074 0.322 -0.35 -0.04 -0.03 1Timber 0.483 0.435 -0.1 -0.31 0.52 -0.01TimFCT
-0.032 0.435 0.02 0.09 0.28 0.16 0.13
Tim.r -0.318 0.670 -0.02 0.13 -0.04 0.4 0.07 0.21Berth 0.218 0.703 -0.19 -0.15 0.5 0.13 0.19 0.12 0.42Berth.r -0.479 0.637 0.08 0.21 -0.04 0.02 0 0.12 0.55 0.31Hevea -0.164 -0.020 0.09 0.08 0.03 -0.05 0.01 0.04 -0.04 -0.08 -0.06Hevea.r
-0.342 0.376 0.07 0.16 0.02 0.08 0.07 0.21 0.23 0.15 0.25 0.43
Copaiba 0.027 -0.053 -0.12 -0.04 -0.15 0.15 0.06 -0.1 0.21 -0.08 -0.04 0.01 -0.05Copaiba.r
-0.101 0.126 0.02 -0.06 -0.06 0.09 -0.01 -0.02 0.17 -0.01 0 -0.05 0.12 -0.04
Acai 0.036 0.105 0.12 0.1 0.11 0.1 0.05 0.25 -0.14 0.04 -0.16 0.09 -0.1 -0.15 -0.11Acai.r -0.202 0.653 0.1 0.11 0.17 0.03 0.29 0.13 0.26 0.28 0.59 -0.12 0.11 -0.13 0.13 0.31
DISCUSSIONOur study represents one of the first descriptions of relationshipsamong different components of tropical forest value, especiallyfor smallholders whose livelihoods may depend both onharvesting diverse forest products and obtaining payments ortechnical assistance from government programs related to carbonconservation (see Duchelle et al. 2014). We found strong evidencefor geographic trade-offs between woody plant diversity andvariables describing forest structure, including timber stocks andaboveground biomass (Fig. 2). Indeed, very few individual sitesshowed high values of tree diversity, aboveground biomass, andtimber stocks. These results contradict global analyses suggestingthat initiatives such as REDD+ that target conservation projectsin areas rich in carbon stocks will also protect areas of highbiodiversity value (Venter et al. 2009, Strassburg et al. 2010).Instead, our results support other studies showing a discordbetween geographic priorities for carbon-based conservation andbiodiversity conservation (Paoli et al. 2010, Siikamäki andNewbold 2012, Thomas et al. 2013). Our results are alsoconsistent with other Amazon basin wide analyses which tend toshow higher levels of plant diversity in areas characterized bylower aboveground biomass, perhaps due to increased rates offorest dynamics on more fertile soils (Quesada et al. 2012).
Our results should nevertheless be interpreted with some caution,for at least two reasons. First, we measured only one taxonomicgroup, woody plants. Although woody plants show relatively highperformance as an indicator group for the diversity of other taxain comprehensive comparisons (Gardner et al. 2008), they maybe less sensitive to landscape disturbances than invertebrategroups (Schulze et al. 2004). In addition, our estimates of woodyplant diversity were constrained by the taxonomic precision withwhich we could identify collections. Nevertheless, the genus-levelmeasures of diversity we adopted mimic those used by Gardneret al. (2008), and represented substantial diversity within thisregion, with nearly 400 genera collected. A higher level of
taxonomic precision may also allow a more precise disentanglingof the strong correlation we observed between taxonomic andfunctional diversity in this study (Table 4). Functional diversityrepresents an appropriate measure of diversity for bothinternational and local stakeholder perceptions of forest valuebecause it has been directly linked to important ecosystemprocesses, including carbon and hydrological cycles (Lavorel2013).
Beyond the trade-off between forest structure and tree diversity,we found a consistent positive correlation among the relativeabundances of many commercial species, including both timberand NTFPs, and aboveground biomass (Table 4). This findingsuggests that multiple use forest management, in which incomesfrom NTFP extraction may be supplemented by low intensitytimber extraction, has some potential in this region. We sampledseveral sites where multiple forest products such as timber andBrazil nuts are relatively abundant (Fig. 2). However, multiple useapproaches will still need to mitigate conflicts between harvestingof timber vs. NTFPs (Guariguata et al. 2008, Duchelle et al. 2012,Herrero-Jáuregui et al. 2013, Rockwell et al. 2014). Some speciesin particular may present conflicts of use because they areharvested for both timber and NTFPs (e.g., Dipteryx spp.,Shanley et al. 2012; Copaifera spp., Newton et al. 2012; Carapa spp., Klimas et al. 2012). Mitigation of these conflicts of use willrequire species-specific forest inventories beyond the approach wehave used here, to support legislation for sustainable management(Herrero-Jáuregui et al. 2013).
The observed positive correlation among abundances of manycommercial species also underlines that whereas some forests hadvery high forest value, with up to an estimated US$7700 per hain standing timber stocks (see Table 2) and up to US$880 per haper year from collection of NTFPs (see Table 3), others hadnegligible value using the same criteria. This suggests that somesmallholders may be limited in their options for multiple use forestmanagement by the limited availability of resources in their
Ecology and Society 19(4): 56http://www.ecologyandsociety.org/vol19/iss4/art56/
landholding (Duchelle et al. 2012) and by undeveloped marketsfor a greater diversity of NTFPs, especially in Pando and Madrede Dios.
Forest value components in the southwestern AmazonEach of the 15 components we describe showed relatively highvariability (Table 1), but our results were broadly consistent withthe few values that have been reported from this understudiedregion. Our estimate of aboveground biomass (mean 192 Mg ha-1)is largely concordant with other plot-based studies from theregion (Phillips et al. 2006, Salimon et al. 2011) and supports theassertion that the smaller plots we used can provide accuratemeasures of local biomass (Baraloto et al. 2013).
In addition, our estimates of timber volume for the entire region(mean of 57 m3 ha-1) are completely concordant with thoserecently reported for unlogged bamboo-dominated forests inAcre, Brazil (mean of 58 m3 ha-1; Rockwell et al. 2014).Nevertheless, few other reliable estimates exist for timberavailability throughout the region. One major limitation of forestinventories in the region remains the proper identification oftimber tree species during forest management inventories and thedevelopment of a consistent list of commercially valuable species(Baraloto et al. 2007). Here we considered all species for whichsmallholders have been observed to receive payments for wood inrecent years, even though some of these species are not commonlysold as sawnwood in local markets and others may be harvestedfor personal construction use rather than to be sold in local orregional markets (Table 2).
Our estimates for Brazil nut density are very similar to thosereported by Peres et al. (2003) across the Amazon basin, includingthe lower densities reported in Peru (0.1 - 0.7 reported from Madrede Dios vs. 0.6 in our study) and higher densities reported forPando (3.3 vs. 4.1 in our study). We also found relatively lowdensities of juveniles consistent with the recruitment limitationreported for the species in areas of intense fruit harvest (Peres etal. 2003). Despite the consistency between our results and therecent literature, we suggest that a more accurate description offorest value for many of the less frequent timber species ornontimber forest products would require complete inventoriesover larger surface areas.
Indeed, Newton et al. (2012) found mean density of adultCopaifera trees in terra firme forest of Amazonas around 1 stemper hectare (0.83 - 1.13 at local scale); they also report similarvalues for other studies they found in the literature. We found amuch lower density of Copaifera adults in the region and limitedregeneration (Table 1), suggesting that this species receive furtherattention for conflicts in use for timber extraction vs. oilproduction, including broader and more intensive forestinventories. We also found fewer stems of Euterpe precatoria (mean of 14.1 stems per hectare) than reported in a northernBolivian forest (22.6 adult stems per hectare; Cabrera and Wallace2007), but the high density of this species in both the terra firmeforests we studied and the adjacent seasonally flooded forests, andits broad distribution, render it a very important and reliablespecies. In fact, we estimate that it could generate as much or moreincome as Brazil nut in many of the forests we studied (Table 3),such that it merits greater attention in multiple use managementprograms in the region (Duchelle et al. 2012).
CONCLUSIONOur regional study across this trinational frontier in southwesternAmazonia illustrates strong geographic trade-offs between woodyplant diversity versus timber stocks and aboveground biomass.These results suggest that at this geographic scale, managementstrategies will need to prioritize either carbon stocks orbiodiversity conservation. We also found substantial geographicvariation in the distribution of commercial species, with somesites extremely rich in multiple forest products and othersextremely poor. This patchiness of resource availability needs tobe considered in tropical regions where smallholder forestmanagement relies on sustainable harvests of multiple forestproducts.
PERSPECTIVESOur description of selected components of forest value representsan initial foundation upon which more comprehensive analysescould be developed. As Sheil and Wunder (2002) note, valuationstudies must integrate not only external perceptions of forest valuebut also local perceptions that result in decision making regardingforest conversion or resource exploitation. An integrative metricof forest value must then consider not only those components offorest value related to international markets and payments forecosystem services and products of local economic value, such astimber and NTFPs, as we measured here, but also products thatmay not be sold but that contribute to local livelihoods, includingconstruction materials, forest foods, medicines, and subsistencehunting resources (Godoy and Bawa 1993). We are currentlyworking to develop methods for appropriate field inventories ofmultiple forest products across larger regions as in this trinationalborder area (Baraloto et al. 2013). Any valuation study must alsoconsider that markets can be capricious, and static analyses maynot be able to provide accurate predictions of future markets(Godoy et al. 2000).
As a basis for this future research, one of the important resultsof the project has been the capacity built by this internationalcollaboration, which we believe is noteworthy for several reasons.First, in addition to general university training, with more than50 students learning field inventory and herbarium curationmethods, we have trained parataxonomists in communities acrossthe region, many of whom have found employment with forestmanagement initiatives. In addition, more than 4000 herbariumsamples were deposited in herbaria throughout the region, whichwill help the necessary but underfunded work of buildingreference collections to improve efforts to improve regionalfloristic knowledge and gain precision in forest managementinventories (Baraloto et al. 2007).
Responses to this article can be read online at: http://www.ecologyandsociety.org/issues/responses.php/6911
Acknowledgments:
This study was supported by US NSF grants HSD 0527511 andCNH 1114924, the French agriculture ministry (MAAP BGFgrant), and an INRA Package grant to CB. This work has also
Ecology and Society 19(4): 56http://www.ecologyandsociety.org/vol19/iss4/art56/
benefited from an « Investissements d’Avenir » grant managed byAgence Nationale de la Recherche (CEBA, ref. ANR-10-LABX-25-01). We thank the institutions supporting the trainingcourses that were the foundation of fieldwork in the three countries,including Centro do Trabalhadores da Amazonia (CTA) in RioBranco, Acre, and the Center for Research on Amazon Protection(CIPA) in Cobija, Pando; and the numerous students andcommunity members in the three countries who provided assistancewith fieldwork. We are also grateful to the taxonomic specialistswho are investing in capacity building in the region and who assistedwith the identification of botanical specimens from the project,including P. Acevedo Rodriguez, C. Berg, D. Daly, R. Foster, andC. Vriesendorpp. We also thank Amy Duchelle and Mary Mentonfor comments on previous versions of the manuscript.
LITERATURE CITEDAhmed, S. E., and R. M. Ewers. 2012. Spatial pattern of standingtimber value across the Brazilian Amazon. PLoS One 7:e36099.http://dx.doi.org/10.1371/journal.pone.0036099
Angelsen, A., and M. Brockhaus. 2009. Realising REDD+:national strategy and policy options. Center for InternationalForestry Research, Bogor, Indonesia.
Asner, G. P., W. Llactayo, R. Tupayachi, and E. R. Luna. 2013.Elevated rates of gold mining in the Amazon revealed throughhigh-resolution monitoring. Proceedings of the National Academyof Sciences 110:18454-18459. http://dx.doi.org/10.1073/pnas.1318271110
Asner, G. P., S. R. Loarie, and U. Heyder. 2010. Combined effectsof climate and land-use change on the future of humid tropicalforests. Conservation Letters 3:395-403. http://dx.doi.org/10.1111/j.1755-263X.2010.00133.x
Balmford, A., A. Bruner, P. Cooper, R. Costanza, S. Farber, R.E. Green, M. Jenkins, P. Jefferiss, V. Jessamy, J. Madden, K.Munro, N. Myers, S. Naeem, J. Paavola, M. Rayment, S. Rosendo,J. Roughgarden, K. Trumper, and R. K. Turner. 2002. Economicreasons for conserving wild nature. Science 297:950-953. http://dx.doi.org/10.1126/science.1073947
Baraloto, C., O. J. Hardy, C. E. T. Paine, K. G. Dexter, C. Cruaud,L. T. Dunning, M.-A. Gonzalez, J.-F. Molino, D. Sabatier, V.Savolainen, and J. Chave. 2012b. Using functional traits andmolecular phylogenetic trees to examine the assembly of tropicaltree communities. Journal of Ecology 100:690-701. http://dx.doi.org/10.1111/j.1365-2745.2012.01966.x
Baraloto, C., B. Hérault, C. E. T. Paine, H. Massot, L. Blanc, D.Bonal, J.-F. Molino, E. A. Nicolini, and D. Sabatier. 2012a. Contrasting taxonomic and functional responses of a tropical treecommunity to selective logging. Journal of Applied Ecology 49:861-870. http://dx.doi.org/10.1111/j.1365-2664.2012.02164.x
Baraloto, C., Q. Molto, S. Rabaud, B. Hérault, R. Valencia, L.Blanc, P. V. A. Fine, and J. Thompson. 2013. Rapid simultaneousestimation of aboveground biomass and tree diversity acrossneotropical forests: a comparison of field inventory methods.Biotropica 45:288–298. http://dx.doi.org/10.1111/btp.12006
Baraloto, C., C. E. T. Paine, L. Poorter, J. Beauchene, D. Bonal,A.-M. Domenach, B. Hérault, S. Patiño, J.-C. Roggy, and J. Chave.2010. Decoupled leaf and stem economics in rainforest trees.Ecology Letters 13:1338-1347. http://dx.doi.org/10.1111/j.1461-0248.2010.01517.x
Baraloto, C., S. Rabaud, Q. Molto, L. Blanc, C. Fortunel, B.Hérault, N. Dávila, I. Mesones, M. Rios, E. Valderrama, and P.V. A. Fine. 2011. Disentangling stand and environmentalcorrelates of aboveground biomass in Amazonian forests. GlobalChange Biology 17:2677-2688. http://dx.doi.org/10.1111/j.1365-2486.2011.02432.x
Baraloto, C., C. Rockwell, F. Walthier, and E. Ferreira. 2007.Limitations and applications of paratoxonomy for communityforest management in southwestern amazonia. EthnobotanyResearch and Applications 5:75-84.
Bernal, R., C. Torres, N. García, C. Isaza, J. Navarro, M. I. Vallejo,G. Galeano, and H. Balslev. 2011. Palm management in SouthAmerica. Botanical Review 77:607-646. http://dx.doi.org/10.1007/s12229-011-9088-6
Cabrera, W. H., and R. Wallace. 2007. Densidad y distribuciónespacial de palmeras arborescentes en un bosque preandino-amazónico de Bolivia. Ecología en Bolivia 42:121-135.
Chave, J., C. Andalo, S. Brown, M. Cairns, J. Chambers, D. Eamus,H. Fölster, F. Fromard, N. Higuchi, T. Kira, T. Kira, J.-P. Lescure,B. W. Nelson, H. Ogawa, H. Puig, B. Riéra,and T. Yamakura.2005. Tree allometry and improved estimation of carbon stocksand balance in tropical forests. Oecologia 145:87-99. http://dx.doi.org/10.1007/s00442-005-0100-x
Chave, J., R. Condit, S. Aguilar, A. Hernandez, S. Lao, and R.Perez. 2004. Error propagation and scaling for tropical forestbiomass estimates. Philosophical Transactions of the Royal Societyof London. Series B: Biological Sciences 359:409-420. http://dx.doi.org/10.1098/rstb.2003.1425
Chisholm, R. A. 2010. Trade-offs between ecosystem services:water and carbon in a biodiversity hotspot. Ecological Economics 69:1973-1987. http://dx.doi.org/10.1016/j.ecolecon.2010.05.013
de Bello, F., S. Lavorel, S. Díaz, R. Harrington, J. H. Cornelissen,R. D. Bardgett, M. P. Berg, P. Cipriotti, C. K. Feld, D. Hering, etal. 2010. Towards an assessment of multiple ecosystem processesand services via functional traits. Biodiversity and Conservation 19:2873-2893. http://dx.doi.org/10.1007/s10531-010-9850-9
Duchelle, A. E., M. Cromberg, M. F. Gebara, R. Guerra, T. Melo,A. Larson, P. Cronkleton, J. Börner, E. Sills, S. Wunder, S. Bauch,P. May, G. Selaya, and W. D. Sunderlin. 2014. Linking foresttenure reform, environmental compliance, and incentives: lessonsfrom REDD+ initiatives in the Brazilian Amazon. WorldDevelopment 55:53-67. http://dx.doi.org/10.1016/j.worlddev.2013.01.014
Duchelle, A. E., M. Guariguata, G. Less, A. Chavez, M. A.Albornoz, A. Chavez, and T. Melo. 2012. Evaluating theopportunities and limitations to multiple use of Brazil nuts andtimber in Western Amazonia. Forest Ecology and Management 268:39-48. http://dx.doi.org/10.1016/j.foreco.2011.05.023
Fortunel, C., P. V. A. Fine, and C. Baraloto. 2012. Leaf, stem androot tissue strategies across 758 Neotropical tree species.Functional Ecology 26:1153-1161. http://dx.doi.org/10.1111/j.1365-2435.2012.02020.x
Gardner, T. A., J. Barlow, I. S. Araujo, T. C. Ávila-Pires, A. B.Bonaldo, J. E. Costa, M. C. Esposito, L. V. Ferreira, J. Hawes, M.I. M. Hernandez, M. S. Hoogmoed, R. N. Leite, N. F. Lo-Man-Hung, J. R. Malcolm, M. B. Martins, L. A. M. Mestre, R.Miranda-Santos, W. L. Overal, L. Parry, S. L. Peters, M. A.
Ecology and Society 19(4): 56http://www.ecologyandsociety.org/vol19/iss4/art56/
Ribeiro-Junior, M. N. F. Da Silva, C. Da Silva Motta, and C. A.Peres. 2008. The cost-effectiveness of biodiversity surveys intropical forests. Ecology Letters 11:139-150. http://dx.doi.org/10.1111/j.1461-0248.2007.01133.x
Gardner, T. A., N. D. Burgess, N. Aguilar-Amuchastegui, J.Barlow, E. Berenguer, T. Clements, F. Danielsen, J. Ferreira, W.Foden, V. Kapos, et al. 2012. A framework for integratingbiodiversity concerns into national REDD+ programmes.Biological Conservation 154:61-71. http://dx.doi.org/10.1016/j.biocon.2011.11.018
Godoy, R. A., and K. S. Bawa. 1993. The economic value andsustainable harvest of plants and animals from the tropical forest:assumptions, hypotheses, and methods. Economic Botany 47:215-219. http://dx.doi.org/10.1007/BF02862287
Godoy, R., D. Wilkie, H. Overman, A. Cubas, G. Cubas, J.Demmer, K. McSweeney, and N. Brokaw. 2000. Valuation ofconsumption and sale of forest goods from a Central Americanrain forest. Nature 406:62-63. http://dx.doi.org/10.1038/35017647
Gomes, C. V. A., J. M. Vadjunec, and S. G. Perz. 2012. Rubbertapper identities: political-economic dynamics, livelihood shifts,and environmental implications in a changing Amazon. Geoforum 43:260-271. http://dx.doi.org/10.1016/j.geoforum.2011.09.005
Guariguata, M. R., P. Cronkleton, P. Shanley, and P. L. Taylor.2008. The compatibility of timber and non-timber forest productextraction and management. Forest Ecology and Management 256:1477-1481. http://dx.doi.org/10.1016/j.foreco.2008.03.038
Guariguata, M. R., C. García-Fernández, D. Sheil, R. Nasi, C.Herrero-Jáuregui, P. Cronkleton, and V. Ingram. 2010.Compatibility of timber and non-timber forest productmanagement in natural tropical forests: perspectives, challenges,and opportunities. Forest Ecology and Management 259:237-245.http://dx.doi.org/10.1016/j.foreco.2009.11.013
Hajek, F., M. J. Ventresca, J. Scriven, A. Castro. 2011. Regime-building for REDD+: evidence from a cluster of local initiativesin south-eastern Peru. Environmental Science and Policy 14:201-215. http://dx.doi.org/10.1016/j.envsci.2010.12.007
Herrero-Jáuregui, C., M. R. Guariguata, D. Cárdenas, E.Vilanova, M. Robles, J. C. Licona, and W. Nalvarte. 2013.Assessing the extent of “conflict of use” in multipurpose tropicalforest trees: a regional view. Journal of EnvironmentalManagement 130:40-47. http://dx.doi.org/10.1016/j.jenvman.2013.08.044
Hirsch, P. D., W. M. Adams, J. P. Brosius, A. Zia, N. Bariola, andJ. L. Dammert. 2011. Acknowledging conservation trade-offs andembracing complexity. Conservation Biology 25:259-264. http://dx.doi.org/10.1111/j.1523-1739.2010.01608.x
Hosonuma, N., M. Herold, V. De Sy, R. S. De Fries, M.Brockhaus, L. Verchot, A. Angelsen, and E. Romijn. 2012. Anassessment of deforestation and forest degradation drivers indeveloping countries. Environmental Research Letters 7:044009.http://dx.doi.org/10.1088/1748-9326/7/4/044009
Hughes, R. F., J. B. Kauffman, and V. J. Jaramillo. 1999. Biomass,carbon, and nutrient dynamics of secondary forests in a humidtropical region of Mexico. Ecology 80:1892-1907.
Kainer, K. A., L. H. Wadt, and C. L. Staudhammer. 2007.Explaining variation in Brazil nut fruit production. Forest Ecology
and Management 250:244-255. http://dx.doi.org/10.1016/j.foreco.2007.05.024
Klimas, C. A., K. A. Kainer, and L. H. de Oliveira Wadt. 2012.The economic value of sustainable seed and timber harvests ofmulti-use species: an example using Carapa guianensis. ForestEcology and Management 268:81-91. http://dx.doi.org/10.1016/j.foreco.2011.03.006
Lavorel, S. 2013. Plant functional effects on ecosystem services.Journal of Ecology 101:4-8. http://dx.doi.org/10.1111/1365-2745.12031
Le Saout, S., M. Hoffmann, Y. Shi, A. Hughes, C. Bernard, T. M.Brooks, B. Bertzky, S. H. M. Butchart, S. N. Stuart, T. Badman,and A. S. L. Rodrigues. 2013. Protected areas and effectivebiodiversity conservation. Science 342:803-805. http://dx.doi.org/10.1126/science.1239268
Mouillot, D., S. Villéger, M. Scherer-Lorenzen, and N. W. Mason.2011. Functional structure of biological communities predictsecosystem multifunctionality. PLoS One 6:e17476. http://dx.doi.org/10.1371/journal.pone.0017476
Newton, P., A. Watkinson, and C. Peres. 2012. Spatial, temporal,and economic constraints to the commercial extraction of anontimber forest product: copaíba (Copaifera spp.) oleoresin inAmazonian reserves. Economic Botany 66:165-177. http://dx.doi.org/10.1007/s12231-012-9198-z
Ninan, K., and M. Inoue. 2013. Valuing forest ecosystem services:what we know and what we don't. Ecological Economics 93:137-149. http://dx.doi.org/10.1016/j.ecolecon.2013.05.005
Nogueira, E. M., P. M. Fearnside, B. W. Nelson, R. I. Barbosa,and E. W. H. Keizer. 2008. Estimates of forest biomass in theBrazilian Amazon: new allometric equations and adjustments tobiomass from wood-volume inventories. Forest Ecology andManagement 256:1853-1867. http://dx.doi.org/10.1016/j.foreco.2008.07.022
Paoli, G. D., P. L. Wells, E. Meijaard, M. J. Struebig, A. J.Marshall, K. Obidzinski, A. Tan, A. Rafiastanto, B. Yaap, J. W.F. Slik, et al. 2010. Biodiversity conservation in the REDD.Carbon Balance and Management 5:7. http://dx.doi.org/10.1186/1750-0680-5-7
Parviainen, J., and G. Frank. 2003. Protected forests in Europeapproaches-harmonising the definitions for internationalcomparison and forest policy making. Journal of EnvironmentalManagement 67:27-36. http://dx.doi.org/10.1016/S0301-4797(02)00185-8
Pavoine, S., and M. Bonsall. 2011. Measuring biodiversity toexplain community assembly: a unified approach. BiologicalReviews 86:792-812. http://dx.doi.org/10.1111/j.1469-185X.2010.00171.x
Peres, C. A., C. Baider, P. A. Zuidema, L. H. Wadt, K. A. Kainer,D. A. P. Gomes-Silva, R. P. Salomão, L. L. Simões, E. R.Franciosi, F. C. Valverde, et al.. 2003. Demographic threats to thesustainability of Brazil nut exploitation. Science 302:2112-2114.http://dx.doi.org/10.1126/science.1091698
Perz, S. G., Y. Qiu, Y. Xia, J. Southworth, J. Sun, M. Marsik, K.Rocha, V. Passos, D. Rojas, G. Alarcón, G. Barnes, and C.Baraloto. 2013. Trans-boundary infrastructure and land coverchange: highway paving and community-level deforestation in a
Ecology and Society 19(4): 56http://www.ecologyandsociety.org/vol19/iss4/art56/
tri-national frontier in the Amazon. Land Use Policy 34:27-41.http://dx.doi.org/10.1016/j.landusepol.2013.01.009
Peters, C. M., A. H. Gentry, and R. O. Mendelsohn. 1989.Valuation of an Amazonian rainforest. Nature 339:655-656.http://dx.doi.org/10.1038/339655a0
Phelps, J., D. A. Friess, and E. L. Webb. 2012a. Win-win REDD+approaches belie carbon-biodiversity trade-offs. BiologicalConservation 154:53-60. http://dx.doi.org/10.1016/j.biocon.2011.12.031
Phelps, J., E. L. Webb, and W. M. Adams. 2012b. Biodiversity co-benefits of policies to reduce forest-carbon emissions. NatureClimate Change 2:497-503.
Phillips, O. L., R. V. Martínez, P. N. Vargas, A. L. Monteagudo,M.-E. C. Zans, W. G. Sánchez, A. P. Cruz, M. Timaná, M. Yli-Halla, and S. Rose. 2003. Efficient plot-based floristic assessmentof tropical forests. Journal of Tropical Ecology 19:629-645. http://dx.doi.org/10.1017/S0266467403006035
Phillips, O. L., S. Rose, A. L. Monteagudo, and P. N. Vargas. 2006.Resilience of southwestern Amazon forests to anthropogenicedge effects. Conservation Biology 20:1698-1710. http://dx.doi.org/10.1111/j.1523-1739.2006.00523.x
Pitman, N. C., H. Mogollón, N. Dávila, M. Ríos, R. García‐Villacorta, J. Guevara, T. R. Baker, A. Monteagudo, O. L. Phillips,R. Vásquez‐Martínez, et al. 2008. Tree community change across700 km of lowland Amazonian forest from the Andean foothillsto Brazil. Biotropica 40:525-535. http://dx.doi.org/10.1111/j.1744-7429.2008.00424.x
Quesada, C., O. Phillips, M. Schwarz, C. Czimczik, T. Baker, S.Patiño, N. Fyllas, M. Hodnett, R. Herrera, S. Almeida, et al. 2012.Basin-wide variations in Amazon forest structure and functionare mediated by both soils and climate. Biogeosciences 9:2203-2246. http://dx.doi.org/10.5194/bg-9-2203-2012
Rockwell, C., K. Kainer, C. Staudhammer, and C. Baraloto. 2007.Future crop tree damage in a certified community forest insouthwestern amazonia. Forest Ecology and Management 242:108-118. http://dx.doi.org/10.1016/j.foreco.2006.12.028
Rockwell, C., K. Kainer, M. V. N. d’Oliveira, C. Staudhammer,and C. Baraloto. 2014. Logging in bamboo-dominated forests insouthwestern Amazonia: caveats and opportunities forsmallholder forest management. Forest Ecology and Management 315:202-210. http://dx.doi.org/10.1016/j.foreco.2013.12.022
Salimon, C. I., F. E. Putz, L. Menezes-Filho, A. Anderson, M.Silveira, I. F. Brown, and L. Oliveira. 2011. Estimating state-widebiomass carbon stocks for a REDD plan in Acre, Brazil. ForestEcology and Management 262:555-560. http://dx.doi.org/10.1016/j.foreco.2011.04.025
Sasaki, N., and F. E. Putz. 2009. Critical need for new definitionsof “forest” and “forest degradation” in global climate changeagreements. Conservation Letters 2:226-232. http://dx.doi.org/10.1111/j.1755-263X.2009.00067.x
Schulze, C. H., M. Waltert, P. J. A. Kessler, R. Pitopang, D.Veddeler, M. Mühlenberg, S. R. Gradstein, C. Leuschner, I.Steffan-Dewenter, and T. Tscharntke. 2004. Biodiversity indicatorgroups of tropical land-use systems: comparing plants, birds, andinsects. Ecological Applications 14:1321-1333. http://dx.doi.org/10.1890/02-5409
Schwartzman, S., D. Nepstad, and A. Moreira. 2000. Arguingtropical forest conservation: people versus parks. ConservationBiology 14:1370-1374. http://dx.doi.org/10.1046/j.1523-1739.2000.00227.x
Shanley, P., M. da Serra Silva, T. Melo, R. Carmenta, and R. Nasi.2012. From conflict of use to multiple use: forest managementinnovations by small holders in Amazonian logging frontiers.Forest Ecology and Management 268:70-80. http://dx.doi.org/10.1016/j.foreco.2011.05.041
Sheil, D., and S. Wunder. 2002. The value of tropical forest tolocal communities: complications, caveats, and cautions.Conservation Ecology 6:9.
Siikamäki, J., and S. C. Newbold. 2012. Potential biodiversitybenefits from international programs to reduce carbon emissionsfrom deforestation. Ambio 41:78-89. http://dx.doi.org/10.1007/s13280-011-0243-4
Soares-Filho, B. S., D. C. Nepstad, L. M. Curran, G. C. Cerqueira,R. A. Garcia, C. A. Ramos, E. Voll, A. McDonald, P. Lefebvre,and P. Schlesinger. 2006. Modelling conservation in the Amazonbasin. Nature 440:520-523. http://dx.doi.org/10.1038/nature04389
Southworth, J., M. Marsik, Y. Qiu, S. Perz, G. Cumming, F.Stevens, K. Rocha, A. Duchelle, and G. Barnes. 2011. Roads asdrivers of change: trajectories across the tri-national frontier inMAP, the southwestern Amazon. Remote Sensing 3:1047-1066.http://dx.doi.org/10.3390/rs3051047
Strassburg, B. B. N., A. Kelly, A. Balmford, R. G. Davies, H. K.Gibbs, A. Lovett, L. Miles, C. D. L. Orme, J. Price, R. K. Turner,and A. S. L. Rodrigues. 2010. Global congruence of carbonstorage and biodiversity in terrestrial ecosystems. ConservationLetters 3:98-105. http://dx.doi.org/10.1111/j.1755-263X.2009.00092.x
Strassburg, B. B., A. S. Rodrigues, M. Gusti, A. Balmford, S. Fritz,M. Obersteiner, R. K. Turner, and T. M. Brooks. 2012. Impactsof incentives to reduce emissions from deforestation on globalspecies extinctions. Nature Climate Change 2:350-355. http://dx.doi.org/10.1038/nclimate1375
Sunderlin, W. D., A. Angelsen, B. Belcher, P. Burgers, R. Nasi, L.Santoso, and S. Wunder. 2005. Livelihoods, forests, andconservation in developing countries: an overview. WorldDevelopment 33:1383-1402. http://dx.doi.org/10.1016/j.worlddev.2004.10.004
Sunderlin, W. D., J. Hatcher, and M. Liddle. 2008. From exclusionto ownership? Challenges and opportunities in advancing foresttenure reform. Rights and Resources Initiative, Washington, D.C., USA.
Sunderlin, W. D., and E. O. Sills. 2012. REDD+ projects as ahybrid of old and new forest conservation approaches. Pages177-191 in A. Angelsen, M. Brockhaus, W. D. Sunderlin, and L.Verchot, editors. Analysing REDD+: challenges and choices. Center for International Forestry Research, Bogor, Indonesia.
ter Steege, H., N. C. Pitman, D. Sabatier, C. Baraloto, R. P.Salomão, J. E. Guevara, O. L. Phillips, C. V. Castilho, W. E.Magnusson, J.-F. Molino, et al. 2013. Hyperdominance in theAmazonian tree flora. Science 342(6156). http://dx.doi.org/10.1126/science.1243092

Ecology and Society 19(4): 56http://www.ecologyandsociety.org/vol19/iss4/art56/
Thomas, C. D., B. J. Anderson, A. Moilanen, F. Eigenbrod, A.Heinemeyer, T. Quaife, D. B. Roy, S. Gillings, P. R. Armsworth,and K. J. Gaston. 2013. Reconciling biodiversity and carbonconservation. Ecology Letters 16:39-47. http://dx.doi.org/10.1111/ele.12054
Tucker, C. M., and M. W. Cadotte. 2013. Unifying measures ofbiodiversity: understanding when richness and phylogeneticdiversity should be congruent. Diversity and Distributions 19:845-854. http://dx.doi.org/10.1111/ddi.12087
United Nations Framework Convention on Climate Change(UNFCCC). 2011. Outcome of the work of the ad hoc workinggroup on long-term cooperative action under the convention (DraftDecision [-/CP.17]). UNFCCC, Bonn, Germany.
Vadjunec, J. M., and D. Rocheleau. 2009. Beyond forest cover:land use and biodiversity in rubber trail forests of the ChicoMendes Extractive Reserve. Ecology and Society 14(2): 29.[online] URL: http://www.ecologyandsociety.org/vol14/iss2/art29/
van der Werf, G. R., D. C. Morton, R. S. DeFries , J. G. J. Olivier,P. S. Kasibhatla, R. B. Jackson, G. J. Collatz, and J. T. Randerson.2009. CO2 emissions from forest loss. Nature Geoscience 2:737-738. http://dx.doi.org/10.1038/ngeo671
Venter, O., W. F. Laurance, T. Iwamura, K. A. Wilson, R. A.Fuller, H. P. Possingham. 2009. Harnessing carbon payments toprotect biodiversity. Science 326:1368. http://dx.doi.org/10.1126/science.1180289