Process of keeping creative expression and artistic freedom ...
Upload
khangminh22Category
view
3download
0
RESEARCH ARTICLE
Entropy trade-offs in artistic design: A case study of Tamilkolam
N.-Han Tran1* , Timothy Waring2 , Silke Atmaca1 and Bret A. Beheim1
1Department of Human Behavior, Ecology and Culture, Max Planck Institute for Evolutionary Anthropology, Leipzig,Germany and 2School of Economics, University of Maine, Orono, USA*Corresponding author. E-mail: [email protected]
AbstractFrom an evolutionary perspective, art presents many puzzles. Humans invest substantial effort in gener-ating apparently useless displays that include artworks. These vary greatly from ordinary to intricate. Fromthe perspective of signalling theory, these investments in highly complex artistic designs can reflect infor-mation about individuals and their social standing. Using a large corpus of kolam art from South India(N = 3139 kolam from 192 women), we test a number of hypotheses about the ways in which social strati-fication and individual differences affect the complexity of artistic designs. Consistent with evolutionarysignalling theories of constrained optimisation, we find that kolam art tends to occupy a ‘sweet spot’ atwhich artistic complexity, as measured by Shannon information entropy, remains relatively constantfrom small to large drawings. This stability is maintained through an observable, apparently unconscioustrade-off between two standard information-theoretic measures: richness and evenness. Although thesedrawings arise in a highly stratified, caste-based society, we do not find strong evidence that artistic com-plexity is influenced by the caste boundaries of Indian society. Rather, the trade-off is likely due to indi-vidual-level aesthetic preferences and differences in skill, dedication and time, as well as the fundamentalconstraints of human cognition and memory.
Keywords: Art; signalling; entropy; skill; material culture; Bayesian inference
Social media summary: South Indian Tamil kolam drawings indicate the successful artistic traditionshit a complexity ‘sweet spot’.
Introduction
From the perspective of human evolution, art is mysterious. People in all known populations investsubstantial time, energy and effort in generating abstract patterns and performances (Brown, 1991),to no obvious benefit. In biology, the study of seemingly non-functional traits in social communicationrelies on the evolutionary theory of signalling, a framework for understanding how reproductive trade-offs produce phenomena such as warning displays, mating calls and specialised adaptations such asbright, colourful plumage (Zahavi, 1975). It is currently unclear whether human art is comparablewith signalling behaviours, what features they have in common with each other, or if art is even some-thing that can be usefully understood using an evolutionary approach.
In recent years, the availability of large art datasets has enabled large-scale quantitative analysis (Liuet al., 2018; Müller & Winters, 2018; Sigaki et al., 2018), which is the cornerstone of the ‘populationthinking’ approach characteristic of evolutionary thinking in modern biology (Mayr, 1994). Here we
© The Author(s), 2021. Published by Cambridge University Press on behalf of Evolutionary Human Sciences. This is an Open Access article,distributed under the terms of the Creative Commons Attribution-NonCommercial-ShareAlike licence (http://creativecommons.org/licenses/by-nc-sa/4.0/), which permits non-commercial re-use, distribution, and reproduction in any medium, provided the same Creative Commonslicence is included and the original work is properly cited. The written permission of Cambridge University Press must be obtained for com-mercial re-use.
Evolutionary Human Sciences (2021), 3, e23, page 1 of 14doi:10.1017/ehs.2021.14
present such an analysis of a large corpus of material art from South India: the kolam drawings createdby the women of Tamil Nadu in South India. Because this long-standing artistic tradition follows sys-tematic rules amenable to quantification, statistical models allow us to characterise the strategies pur-sued by individual artists, detect the existence of a theoretically derived entropy trade-off betweenrichness and evenness and weigh the importance of particular constraints on the flow of informationwithin an artistic community.
Theoretical background
In evolutionary theory, signals can successfully coordinate behaviour between organisms by reliablyindicating skill (Hawkes & Bird, 2002), commitment (Bulbulia & Sosis, 2011; Soler, 2012), social status(Smith et al., 2003), strength (Sosis et al., 2007) and cooperativeness (Gintis et al., 2001; Granito et al.,2019). Courtship behaviours, such as the ornate nest structures built by bowerbirds, often have nopractical use, but their great cost itself is a signal of underlying phenotypic quality and potentialmate value (Madden, 2003; Schaedelin & Taborsky, 2009; Zahavi, 1975). Some human behaviours,such as inefficient and unnecessarily difficult spearfishing in Meriam communities (Bliege Bird &Douglas, 2002), have been nominated as having a similar purpose, to enhance a signaller’s social statusand thus mating success (Bird et al., 2001). More generally, costly public signals can lead to improvedstatus and reputational standing (Power, 2017), reproductive success (Smith et al., 2003) or increasedsocial support (Bird et al., 2012). Beyond latent properties of the individuals, signals can evolve to indi-cate persistent group memberships which become the basis for cooperative assortments. Especially inmultiethnic populations, ethnic marker theory has become substantial to understand how individualscoordinate their norms and behaviors with others using identity or group membership signals (Boyd& Richerson, 1987). These signals, referred to as ethnic markers, have evolved to prevent individualsfrom interacting with others with different norms in coordination games (Granito et al., 2019;McElreath et al., 2011; Moffett, 2013).
As a medium of communication, human art might reflect fitness-relevant qualities and capacities(e.g. preferences, skills or personality traits such as patience, creativity, commitment) as well as pro-mote social standing and mating qualities (e.g. health and fertility; Davies, 2012; Grasseni, 2018). Thesignal is manifested as the aesthetic appeal or value of the artwork and as such, it makes sense to seeartists compete with each other in producing the most appealing and aesthetically pleasing artwork(Grasseni, 2018; Gustafsson, 2018; Varella & Fernández, 2015) that reflects their qualities and socialstatus. Information on an artist’s capacities, their social standing or mating qualities is judged bythe apparent costs of the artistic production, reflected in its complexity (Grasseni, 2018; Varella &Fernández, 2015).
A number of quantitative approaches have been used to measure cultural diversity of some distri-bution of traits. In economics and anthropology, a popular distributional measure is the Gini index ofinequality (Ravallion, 2014; Zoli, 1999). A Gini index value of 0 represents a state of total equality,while a value of 1 represents total inequality. In ecology, three common methods of biological diversityare the richness (the number of unique variants present), evenness (the relative abundance of variants)and Shannon information entropy, which weights richness by relative abundance. For a low-entropy,low-diversity state, the representation of alternative variants is highly unequal, and in the limiting casein which only one variant is present, entropy is 0. At the other extreme, all n variants are representedequally, maximising evenness, and so the entropy is also maximised to the value of log(n) (Jost, 2006,2009). Entropy has also been used in several recent papers quantifying artistic diversity, where an art-work can be represented by an empirical probability distribution of variants (Müller & Winters, 2018;Pavlek et al., 2019; Winters & Morin, 2019).
Although the Gini index in economics and diversity in ecology quantify the relative abundance invery similar ways, to our knowledge no systematic relationship has been described between the Giniindex and Shannon information entropy, richness or evenness. If we define evenness as v = 1− g, for agiven Gini index g, numerical simulations show that the relationship between Shannon information
2 N.‐Han Tran et al.
entropy, richness and evenness is quite strict, so that the maximum entropy H is given by evenness vand richness n as
exp (H) ≈ n− (n− 1)v1+2
2+a+ aa+n (1)
where a = exp(0.51390628) (see Supplementary Material for more details). This approximation allowsus to detect entropy trade-offs between evenness and richness, which we use as an analogue to fitnesstrade-offs and can be applied to the study of any well-defined artistic system.
Kolam art of South India
Kolam drawings are geometric art practised by women in the Kodaikanal region of Tamil Nadu,southern India (Layard, 1937). A kolam consists of one or more loops drawn around a grid of dots(in Tamil called pulli). On a typical morning, a Tamil woman will prepare a grid of dots on the thresh-old of her home, and then draw a kolam with rice powder or chalk. During the day the drawing weath-ers away, and a new kolam is created the next day. Kolam drawings are historically traditions ofmatrilines, but more recently are also a topic of cultural education in Tamil schools. Girls in TamilNadu begin practising kolam-making from an early age, and competency in this art is considerednecessary for the transition into womanhood (Nagarajan, 2018). Although the primary medium isthe threshold of the home, women practice kolam-making in notebooks, and it is common for artiststo share, copy and embellish each other’s kolam designs. Such unrestrained artistic exchange is fosteredby the fact that kolam designs are not considered to belong to any one person, but rather to be a typeof community knowledge (Nagarajan, 2018). However, the ability to successfully draw aestheticallypleasing (i.e. diverse, complex, large) kolam drawings is said to reflect certain qualities of a woman(e.g. her degree of traditionalness or patience), and as such her capacity to run a household andbecome a good wife and mother (Laine, 2013; Nagarajan, 2018).
Kolam drawings further broadcast meaningful information about a household to neighbours andvisitors. Nagarajan (2018) argues that the presence or absence of kolam drawings helps mark import-ant events and the emotional or physical state of the artist and its household. Auspicious events, suchas weddings or community festivals, warrant unusually large and complex kolam drawings, whileinauspicious events such as death or illness are marked by the absence of kolam drawings, andmight communicate the inability to receive or host visitors or the need for social support (Laine,2013; Nagarajan, 2018).
Overall, kolam-making plays an integral role in Tamil community and is deeply embedded in theTamil culture with playful or even large-scale competitions among women (Nagarajan, 2018, pp. 179–203). Women often come together to carefully examine and critique each others kolam drawings interms of aesthetic qualities (e.g. geometric complexity or density; Nagarajan, 2018, p. 189) or consulteach other on designs to optimally showcase their skills (Nagarajan, 2018, p. 182). Contemporaryinterpretations of the kolam in Tamil movies even use ‘the motif of the heroine’s beautiful kolamin attracting the male gaze of the hero. The romance is either initiated by a strikingly beautifulkolam or sustained during the nocturnal hours when a kolam is being made by the heroine’(Nagarajan, 2018, pp. 179–267).
Current study
Kolam drawings are highly diverse, and contain multiple distinct artistic families. Here we study thener pulli nelevu or sikku kolam family because of its unique form. Because sikku kolam drawingsrepresent an unusually strict system of artistic expression, kolam drawings can be mapped onto asmall identifiable set of gestures and are therefore well suited to systematic, quantitative analyses asa naturalistic model system of cultural evolution. A given kolam’s gesture sequence can be charac-terised by a number of informative summary statistics which capture aspects of kolam itself: the
Evolutionary Human Sciences 3
sequence length (i.e. the total number of gestures), the discrete canvas size (measured by the grid ofdots, or pulli), the gesture density per unit canvas area and gesture diversity as measured by evenness(here, the Gini index), richness and Shannon information entropy.
With the ability to calculate standard measures and properties to describe artworks derived frominformation theory, we can explore the possible functions of signalling in kolam drawing.Specifically, we wish to understand better the social and strategic landscape within which artistswork. Moreover, we seek to understand how realised kolam drawings result from the conflicting pres-sures of the need to communicate social signals, and various constraints on artistic production, amongthem the skill and experience of the artist, and the social system she lives within.
Since these trade-offs are properties of the design space of the art itself, a substantial amount ofvariation may be explained simply by understanding strategic decisions, conscious or unconscious,made by the artist. Thus, two major research questions arise: first, can a trade-off model explainthe pattern of variation among kolam drawings, as is commonly done in behavioural ecology? Andsecond, can we relate structural and information-theoretic properties of kolam designs to underlyingsocial and cognitive constraints operating on individual artists?
Methods
Kolam dataset
We (TMW) interviewed 312 artists in the Kodaikanal region in Tamil Nadu in 2009, collecting a totalof 6393 kolam drawings from the ner pulli nelevu or sikku kolam family, along with details of eachwoman’s education, kolam-making experience, place of origin and household demographic back-ground, including caste.
Using the lexicon of 29 kolam gestures developed in Waring (2012b), each kolam was digitally tran-scribed into a sequence of gestures, and transferred into a database using the kolam R package (seehttp://github.com/nhtran93/kolam for more details).
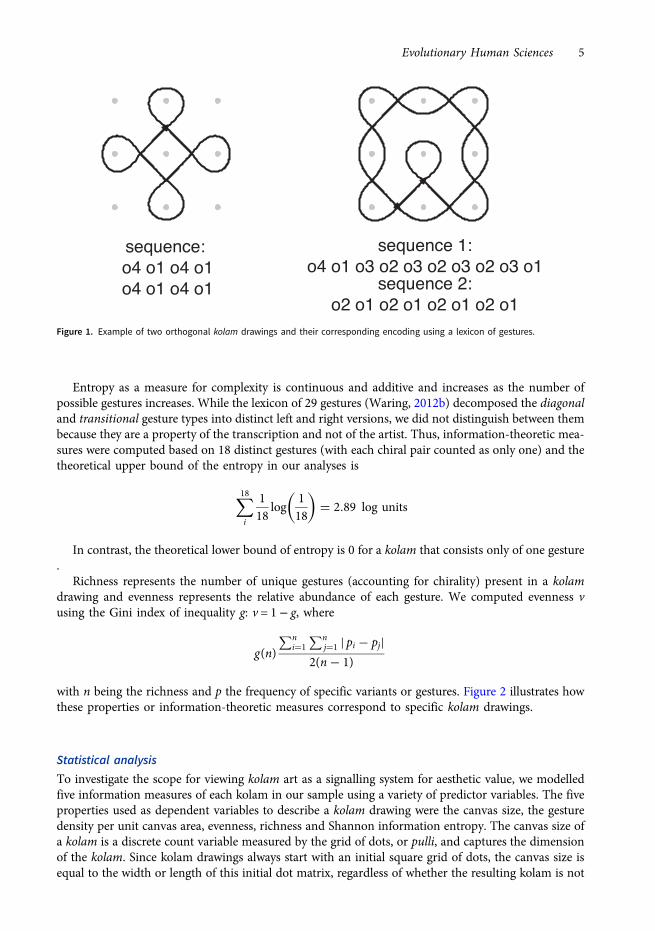
An example of transcribed kolam drawings can be seen in Figure 1. The geometry of the kolam canbe divided into three geometric spaces (orthogonal, diagonal, transitional) with their specific corre-sponding gestures. Each set of gestures is represented by a letter (O, D, T, respectively), while specialvariations of these moves are given special letters (C, H, P). Topologically, diagonal and transitionalgestures are chiral with distinct left and right versions because rotations of these gestures in space can-not yield their exact mirror image (Waring, 2012b). The detailed lexicon of gestures can be consultedin the Supplementary Material.
We excluded 674 kolam drawings that could not be matched to an artist, 695 kolam drawingsbecause they included non-lexical gestures and another 17 kolam drawings owing to transcriptionerrors. We further excluded 120 women because their survey data was incomplete with substantialmissing data in key variables: age, GPS, duration of practice or caste membership. In total, 3139kolam drawings (on average 16 kolam per woman) from 192 artists were included in the analysis(mean age 31.83 years, SD 9.93 years, range 15–50; 75% married). The artists were from 19 differentcastes, spanning from low and middle to high castes. Of the 3139 kolam drawings, 1801 came fromartists of a low caste, 593 from artists of a middle caste and 745 from artists of a high caste.
Information-theoretic measures
We use Shannon information entropy, H( p)j, as a measure of artistic complexity or diversity for eachkolam drawing j and probabilities pi for each possible, discrete gesture i, computed as the averagelog-probability:
H(p)j = −∑ni
pi log ( pi)
4 N.‐Han Tran et al.
Entropy as a measure for complexity is continuous and additive and increases as the number ofpossible gestures increases. While the lexicon of 29 gestures (Waring, 2012b) decomposed the diagonaland transitional gesture types into distinct left and right versions, we did not distinguish between thembecause they are a property of the transcription and not of the artist. Thus, information-theoretic mea-sures were computed based on 18 distinct gestures (with each chiral pair counted as only one) and thetheoretical upper bound of the entropy in our analyses is
∑18i
118
log118
( )= 2.89 log units
In contrast, the theoretical lower bound of entropy is 0 for a kolam that consists only of one gesture.
Richness represents the number of unique gestures (accounting for chirality) present in a kolamdrawing and evenness represents the relative abundance of each gesture. We computed evenness vusing the Gini index of inequality g: v = 1− g, where
g(n)
∑ni=1
∑nj=1 | pi − pj|
2(n− 1)
with n being the richness and p the frequency of specific variants or gestures. Figure 2 illustrates howthese properties or information-theoretic measures correspond to specific kolam drawings.
Statistical analysis
To investigate the scope for viewing kolam art as a signalling system for aesthetic value, we modelledfive information measures of each kolam in our sample using a variety of predictor variables. The fiveproperties used as dependent variables to describe a kolam drawing were the canvas size, the gesturedensity per unit canvas area, evenness, richness and Shannon information entropy. The canvas size ofa kolam is a discrete count variable measured by the grid of dots, or pulli, and captures the dimensionof the kolam. Since kolam drawings always start with an initial square grid of dots, the canvas size isequal to the width or length of this initial dot matrix, regardless of whether the resulting kolam is not
Figure 1. Example of two orthogonal kolam drawings and their corresponding encoding using a lexicon of gestures.
Evolutionary Human Sciences 5

maximally spanning both the width and length of this grid. The gesture density reflects the number ofgestures by canvas area:
density = sequence lengthcanvas size2
Figure 2. Structural and information-theoretic properties of kolam drawings. The figure shows four kolam examples and theirrespective information-theoretic measures and structural properties.
6 N.‐Han Tran et al.
Age, duration of practice and caste were used as predictor variables to explain individual variation.Age and duration of practice were standardised to be centred on 0 with a standard deviation of 1.
Since our data contains repeated observations for artists and castes (i.e. multiple kolam drawingfrom an artist or from any given caste), we partially pooled information across these two unitsusing hierarchical modelling in order to account for imbalances in sampling and to yield more reliableand precise estimates (Efron & Morris, 1977). While information was pooled across artists to avoidover-dispersed parameter estimates, we estimated a random intercept (i.e. offset) for each artist.Caste comprised 19 different categories and was modelled as a varying effect to estimate individualoffsets for each caste category.
Evenness and richness are related to entropy by a mathematical identity (shown in the derivation inthe Supplementary Material) and subject to an optimisation process. This theoretical guide motivatesthe specific choice of predictor variables in our statistical models, which is why we would not include,e.g. canvas size as predicted by richness. Including these predictors would not address our larger ques-tion of modelling information entropy or mapping its potential trade-offs, nor would such an analysisadd an adequate potential alternative explanation of the invariance in entropy and the richness/even-ness trade-offs because the system does not prevent artists from drawing kolams with minimal or max-imum entropy.
The statistical models were implemented in the probabilistic programming language Stan (v2.18)(Carpenter et al., 2017), using 6000 samples in four independent chains. We applied an iterative pro-cess of model building, inference, model checking and evaluation, and model expansion to ensure aprincipled and robust Bayesian workflow (Gabry et al., 2019; Talts et al., 2018). Prior predictive simu-lations and fitted models to simulated data were used to determine reasonable and regularising priorsfor the parameters that respects the parameter type’s bounds. We present a complete description of thestatistical models and the priors in the Supplementary Material. Analyses were performed in R (R CoreTeam, 2019). Data and analyses can be found here: http://github.com/nhtran93/kolam_signalling. AllR values were less than 1.01, and visual inspection of trace plots, rank histograms and pairs plots indi-cated the convergence of all models. Visual MCMC diagnostics can be found in the SupplementaryMaterial.
Results
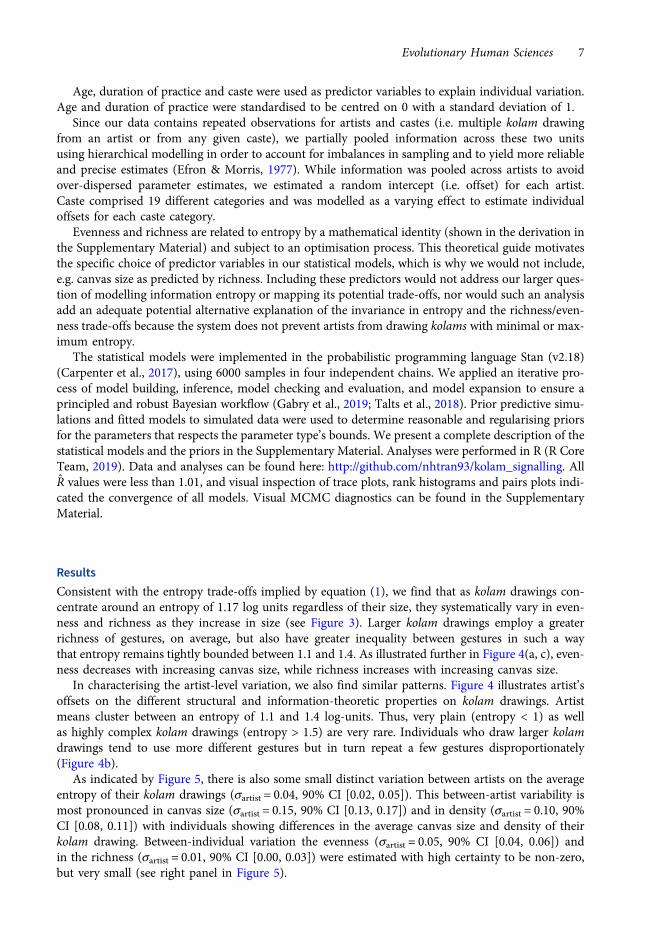
Consistent with the entropy trade-offs implied by equation (1), we find that as kolam drawings con-centrate around an entropy of 1.17 log units regardless of their size, they systematically vary in even-ness and richness as they increase in size (see Figure 3). Larger kolam drawings employ a greaterrichness of gestures, on average, but also have greater inequality between gestures in such a waythat entropy remains tightly bounded between 1.1 and 1.4. As illustrated further in Figure 4(a, c), even-ness decreases with increasing canvas size, while richness increases with increasing canvas size.
In characterising the artist-level variation, we also find similar patterns. Figure 4 illustrates artist’soffsets on the different structural and information-theoretic properties on kolam drawings. Artistmeans cluster between an entropy of 1.1 and 1.4 log-units. Thus, very plain (entropy < 1) as wellas highly complex kolam drawings (entropy > 1.5) are very rare. Individuals who draw larger kolamdrawings tend to use more different gestures but in turn repeat a few gestures disproportionately(Figure 4b).
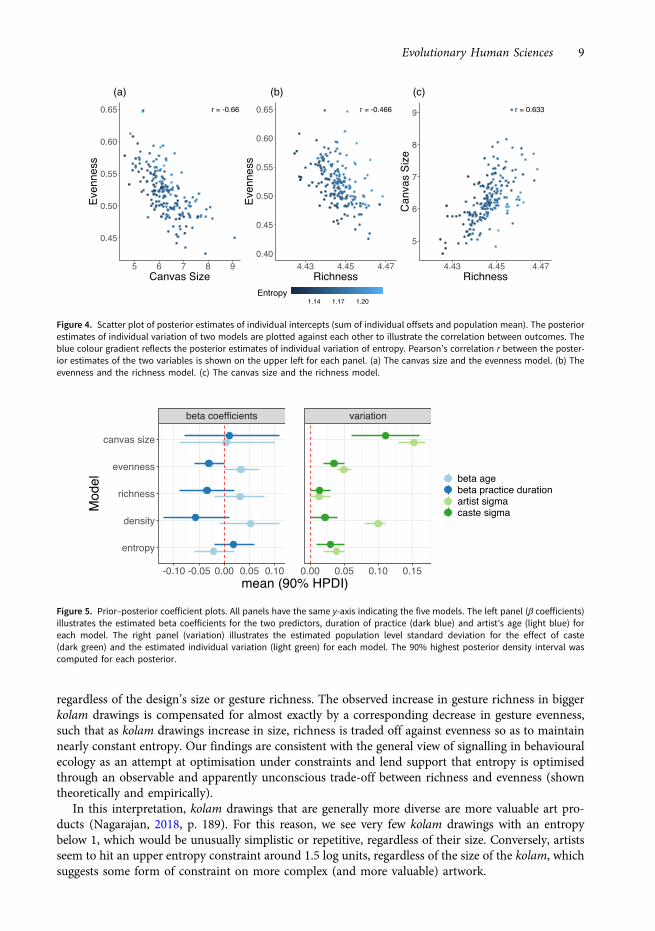
As indicated by Figure 5, there is also some small distinct variation between artists on the averageentropy of their kolam drawings (σartist = 0.04, 90% CI [0.02, 0.05]). This between-artist variability ismost pronounced in canvas size (σartist = 0.15, 90% CI [0.13, 0.17]) and in density (σartist = 0.10, 90%CI [0.08, 0.11]) with individuals showing differences in the average canvas size and density of theirkolam drawing. Between-individual variation the evenness (σartist = 0.05, 90% CI [0.04, 0.06]) andin the richness (σartist = 0.01, 90% CI [0.00, 0.03]) were estimated with high certainty to be non-zero,but very small (see right panel in Figure 5).
Evolutionary Human Sciences 7

We detected very small effects of caste membership on density, evenness, richness and entropy,with varying-effect deviations estimated near zero with high certainty as illustrated in Figure 5 (densityσcaste = 0.02, 90% CI [0.00, 0.04]; evenness σcaste = 0.03, 90% CI [0.02, 0.05]; and richness σcaste = 0.01,90% CI [0.00, 0.03]; entropy σcaste = 0.03 90% CI [0.01, 0.05] respectively). However, evidence for castedifferences in canvas sizes of kolam drawings was more pronounced (σcaste = 0.11, 90% CI [0.06, 0.16]).
Evidence for an effect of age and an effect of duration of practice on the five outcomes is also veryweak. Figure 5 shows that both predictor variables have a very small effect on the five outcome vari-ables. Age and the duration of practice are estimated with high uncertainty to be close to zero acrossthe five models.
Only a small amount of variation in the information statistics we employed can be accounted for byvariation in artists, their age, years of practice and caste membership: about 15% for canvas size, 13%of evenness, 11% of the variation in the gesture density, 0.01% for the richness and 0.03% for entropyas measured by the interclass correlation coefficient (Gelman & Hill, 2006; see SupplementaryMaterial for more details). Residential proximity and regional origin of artists hardly accounts forany variation in the structural and information-theoretic properties (see Supplementary Material).In contrast, the residual variance of the outcomes is large and dominates model inference morethan the variation explained by our fixed and random effects combined.
Discussion
Viewed at the population scale, the complexity of kolam drawings is quite invariant, suggesting theexistence of an entropy ‘sweet spot’ around which most artists and most kolam drawings centre,
Figure 3. Trade-off between evenness and richness. The grey lines measure maximum entropy isoclines. The raw kolam data arejittered and illustrated in blue (light blue = low density, dark blue = high density). The (90, 75, 50%) kernel density of the averagerichness and evenness for each canvas size of the data are depicted in the orange area (light orange to dark orange).
8 N.‐Han Tran et al.
regardless of the design’s size or gesture richness. The observed increase in gesture richness in biggerkolam drawings is compensated for almost exactly by a corresponding decrease in gesture evenness,such that as kolam drawings increase in size, richness is traded off against evenness so as to maintainnearly constant entropy. Our findings are consistent with the general view of signalling in behaviouralecology as an attempt at optimisation under constraints and lend support that entropy is optimisedthrough an observable and apparently unconscious trade-off between richness and evenness (showntheoretically and empirically).
In this interpretation, kolam drawings that are generally more diverse are more valuable art pro-ducts (Nagarajan, 2018, p. 189). For this reason, we see very few kolam drawings with an entropybelow 1, which would be unusually simplistic or repetitive, regardless of their size. Conversely, artistsseem to hit an upper entropy constraint around 1.5 log units, regardless of the size of the kolam, whichsuggests some form of constraint on more complex (and more valuable) artwork.
(a) (b) (c)
Figure 4. Scatter plot of posterior estimates of individual intercepts (sum of individual offsets and population mean). The posteriorestimates of individual variation of two models are plotted against each other to illustrate the correlation between outcomes. Theblue colour gradient reflects the posterior estimates of individual variation of entropy. Pearson’s correlation r between the poster-ior estimates of the two variables is shown on the upper left for each panel. (a) The canvas size and the evenness model. (b) Theevenness and the richness model. (c) The canvas size and the richness model.
Figure 5. Prior–posterior coefficient plots. All panels have the same y-axis indicating the five models. The left panel (β coefficients)illustrates the estimated beta coefficients for the two predictors, duration of practice (dark blue) and artist’s age (light blue) foreach model. The right panel (variation) illustrates the estimated population level standard deviation for the effect of caste(dark green) and the estimated individual variation (light green) for each model. The 90% highest posterior density interval wascomputed for each posterior.
Evolutionary Human Sciences 9
Although the nature and origin of these constraints are unclear, our analysis can rule out a fewpossibilities. Almost no meaningful information about caste stratification is visible in the informationmetrics we employ. Members of different caste categories tended to create distinct kolam drawings ofdifferent canvas sizes, but no clear differences in other major structural or information-theoretic prop-erties. Indeed, our findings are consistent with ethnographic accounts of kolam as a form of commu-nity knowledge, and suggest that, as a public art form drawn on a home’s threshold, kolam drawingsenjoy a relatively egalitarian information flow even in a stratified, multiethnic society (Waring, 2012a).
Based on the above, we believe that complexity in kolam design is more likely to be constrained byaesthetic preferences and cognitive limitations than by information networks or social hierarchies.Although we were able to observe variation in average entropy between artists, with some highly com-plex kolam above an entropy score of 1.5 log units, we were not able to map this variation to patternsof age or experience. This could reflect cultural selection pressures to make traditional practices of art-istic ornamentation and design, such as kolam art, more learnable or transmissable (Kirby et al., 2008;Müller & Winters, 2018; Ravignani et al., 2017; Tamariz & Kirby, 2015; Tylén et al., 2020) or limita-tions in procedural and working memory capacities (Oberauer, 2010; Oberauer & Kliegl, 2006) unre-lated to the action of experiential memory or cognitive senescence (Gurven et al., 2017).
An overly complex and large kolam with rich and diverse gestures might be too difficult, time-consuming or risky to execute successfully because options for revisions and corrections are limited.Artists might want to avoid highly complex kolam drawings because they draw them in front of theirhouse and hesitations, pauses or corrections could be interpreted by the audience as imperfection or asa lack of skill (Nagarajan, 2018, pp. 53, 156). This avoidance of maximally complex artistic designsowing to increased risk of deficiency and failure might also be relevant to other practices of ornamen-tation or decorations where mistakes often last and cannot be rectified easily (e.g. polychrome bowldesigns, Bowser, 2000 or Angolan sona drawings, Gerdes, 1990). Alternatively, it might also be thatmore diverse kolam drawings are simply not as aesthetically appealing to artists and their audiencebecause individuals often tend to prefer a certain extent of regularity and repetition rather than com-plete randomness and thus highly complex kolam drawings (Huang et al., 2018; Voloshinov, 1996).Other artistic design such as loop patterns for decorations in Japan or Angolan sand drawings havealready been known to be influenced by the aspiration for symmetry (Gerdes, 1990; Nagata, 2015).Therefore, the artist’s aesthetic preferences are the final constraint.
In fact, geometric art like kolam displays structural properties (e.g. symmetry, rotation, and repe-tition) and can correspond to distinct complexity measures (Sigaki et al., 2018). Aesthetic preferencescan determine these distinct structural properties and reflect shared attention and learning (Tomaselloet al., 1993). Artists can deliberately choose to impose structural constraints according to their andconsumers’ preferences onto an artwork. For instance, artists can strive for symmetry, only use thesame type of variants (i.e. gesture types) or decide to primarily use the same two variants (i.e. gestures)and only add very low frequencies of other, special variants as decoration. All of these decisions under-lie the time, skills and the aesthetic preferences of the artist and can profoundly shape the distributionof information-theoretic properties of the resulting artwork (Grasseni, 2018; Gustafsson, 2018).Beyond measures of entropy, we do not have direct ratings of the aesthetic quality of kolam drawingsor whether the artist has employed a particularly appealing style. Other information metrics, such asbilateral or rotational symmetry, or fractal scaling, might reveal specific details beyond diversity orcomplexity and discovering this should be an endeavour for future studies.
While the observed patterns in kolam art imply a certain degree of invariance in complexity acrossdifferent canvas sizes and only small traces of individual variation and social stratification, they exhibitwhat has been called ‘equifinal’ behaviour (Barrett, 2018; von Bertalanffy, 1969). Equifinality meansthat inferring the generative processes that might have given rise to the observed cultural frequencydata is difficult because we only have cross-sectional data (Barrett, 2018; Kandler & Powell, 2015).Temporal data could allow us to narrow the subset of causal mechanisms that underlie the observeddistribution of information-theoretic properties. Generative simulations could approximate temporaldata and provide more in-depth understanding on how artistic traditions could have theoretically
10 N.‐Han Tran et al.
evolved, specifically in regards to the diversity or the complexity and the stability of the kolam in thepopulation across time. In order to infer the underlying generative processes, a probabilistic model, inwhich the hypothesised causal mechanisms (i.e. cognitive constraints, aesthetic preferences or otherpotential constraints) are explicitly defined, needs to be built (Kandler & Powell, 2015). Such a prob-abilistic model can allow us to repeatedly simulate datasets with known parameters and compare theresulting distribution with observed data to infer the most likely hypothesised causal mechanisms.Furthermore, measuring the signalling value of specific kolam motifs for coordinating using classifi-cation tasks (Bell, 2020) could be a promising endeavour to explain the role of kolam art for socialcoordination. A comparison of the signalling value of culturally salient kolam motifs between theTamil population in South India and the Tamil diaspora in the USA could further reveal divergentfunctions of kolam art for different communities. Another promising future endeavour could be tofocus specifically on how kolam drawings are perceived and whether the processing efforts ofkolam drawings (visual complexity measured by perimetric complexity or algorithmic complexity;Miton & Morin, 2019; Pelli et al., 2006) are in alignment with the actual production efforts (e.g. ges-ture complexity measured by Shannon entropy) invested in kolams. These perception and processingefforts of a consumer or learner of kolams could even have implications on the transmission of kolamknowledge in terms of learning and reproduction (Tamariz & Kirby, 2015).
Our results on entropy trade-offs and various constraints on complexity operating on kolam artencourage us to distance ourselves from underspecified and vague attempts to explain the evolutionof art (Miller, 2011; Pinker, 2003) and think deeply about artistic traditions in terms of evolutionarysignalling theories of constrained optimisation. Further investigations of how evolutionary signallingtheories of constrained optimisation could be applied to other art forms in other communities,such as Vanuatuan sand art (Lind, 2017; Zagala, 2004), Angolan sand drawings (Gerdes, 1988,1993) or Islamic geometric art (Abdullahi & Embi, 2013), could advance our evolutionary understand-ing of investments in and constraints on art. A careful synthesis of evolutionary signalling theory withethnography can help us understand individual’s strategic investments into mastery of specific artisticskills and how they optimise their artistic displays (e.g. size, novelties, colour diversity) within certainconstraints (e.g. aesthetic preferences, cognitive constraints or motor constraints), allowing us to elu-cidate properties of art. Importantly, evaluating evolutionary constraints on cultural productionsbeyond functional sufficiency is integral to understanding how cultural productions have evolved(e.g. motor constraints in music production; Miton et al., 2020). All of these future directions willbe time consuming and computationally challenging, but we believe that the long-term gains for anevolutionary understanding of artistic traditions will make this enterprise worthwhile.
Conclusion
Using quantitative measures to systematically study material art in a large-scale anthropological data-set, our findings inform discussions on entropy trade-offs and various constraints on complexity oper-ating on artistic traditions.
In the case study of the hand-drawn Tamil artistic tradition, our findings are consistent with evo-lutionary signalling theories of constrained optimisation and lend support that artistic complexity,measured by Shannon information entropy, is optimised through an observable, apparently uncon-scious trade-off between two standard ecological and information-theoretic measures: richness andevenness. This trade off between richness and evenness can potentially be explained by cognitive con-straints and aesthetic preferences. Variation in structural and information-theoretic properties ofkolam drawings are small, and evidence of social structures reflected in the information measureswe employ is weak. This corroborates our understanding of kolam art as signal that does not primarilycommunicate social stratification or individual differences in age or practice, but rather aesthetic pre-ferences, dedication, time and skill, as well as constraints of human cognition and memory.
Supplementary material. To view supplementary material for this article, please visit https://doi.org/10.1017/ehs.2021.14
Evolutionary Human Sciences 11
Acknowledgements. We specifically want to thank the many Tamil kolam artists who were willing to share their reper-toires, and the local collaborators who participated in data collection, including Kousalia Devi, Subashini Vetrivel,Matthew, Shankar, Arun, Sudarshan, Senthil and Michael. We thank the team of transcribers Anja Becker, AnneBüchner, Carlotta Rück, Claudia Bavero, Franziska Meier, Kristina Kunze, Karin Kämmerling, Leonie Ette and MariaFröhlich. We thank Cody T. Ross for his Stan code review and the Department of Human Behavior, Ecology and Culturefor stimulating discussions and feedback.
Author contributions. TMW collected the data, designed the kolam lexicon and wrote the Netlogo transcription software.SA led the data transcription team. NHT, BAB and TMW designed the analysis. NHT wrote data processing and statisticalsoftware and conducted the analysis. NHT and BAB wrote the manuscript, and all authors provided edits and revisions.
Financial support. This work was supported by US NSF Doctoral Dissertation Research Improvement grant no. 0823416and the Max Planck Institute for Evolutionary Anthropology.
Conflict of interest. The authors declare that the research was conducted in the absence of any commercial or financialrelationships that could be construed as a potential conflict of interest.
Research transparency and reproducibility. The kolam data and code for this study are available and can be found onGitHub: http://github.com/nhtran93/kolam_signaling. The R package to analyse kolam drawings can be further found onGitHub: http://github.com/nhtran93/kolam.
ReferencesAbdullahi, Y., & Embi, M. R. B. (2013). Evolution of Islamic geometric patterns. Frontiers of Architectural Research, 2(2),
243–251. doi: 10.1016/j.foar.2013.03.002Barrett, B. J. (2018). Equifinality in empirical studies of cultural transmission. Behavioural Processes. doi: 10.1016/
j.beproc.2018.01.011Bell, A. V. (2020). A measure of social coordination and group signaling in the wild. Evolutionary Human Sciences, 2, e34.
doi: 10.1017/ehs.2020.24Bird, R. B., Scelza, B., Bird, D. W., & Smith, E. A. (2012). The hierarchy of virtue: Mutualism, altruism and signaling in Martu
women’s cooperative hunting. Evolution and Human Behavior, 33(1), 64–78. doi: 10.1016/j.evolhumbehav.2011.05.007Bird, R. B., Smith, E. A., & Bird, D. W. (2001). The hunting handicap: Costly signaling in human foraging strategies.
Behavioral Ecology and Sociobiology, 50(1), 9–19. doi: 10.1007/s002650100338Bliege Bird, R., & Douglas, W. (2002). Constraints of knowing or constraints of growing? Fishing and collecting by the chil-
dren of Mer. Human Nature, 13(2), 239–267. doi: 10.1007/s12110-002-1009-2Bowser, B. J. (2000). From pottery to politics: An ethnoarchaeological study of political factionalism, ethnicity, and domestic
pottery style in the Ecuadorian Amazon. Journal of Archaeological Method and Theory, 7(3), 219–248.Boyd, R., & Richerson, P. J. (1987). The evolution of ethnic markers. Cultural Anthropology, 2(1), 65–79. doi: 10.1111/
j.1468-1331.2008.02145.xBrown, D. (1991). Human universals. McGraw-Hill Professional.Bulbulia, J., & Sosis, R. (2011). Signalling theory and the evolution of religious cooperation. Religion, 41(3), 363–388. doi:
10.1080/0048721X.2011.604508Carpenter, B., Gelman, A., Hoffman, M., Lee, D., Goodrich, B., Betancourt, M., … Riddell, A. (2017). Stan: A probabilistic
programming language. Journal of Statistical Software, Articles, 76(1), 1–32. doi: 10.18637/jss.v076.i01Davies, S. (2012). The artful species: Aesthetics, art, and evolution. Oxford University Press.Efron, B., & Morris, C. (1977). Stein’s paradox. Scientific American, 236(5), 119–127. doi: 10.1038/scientificamerican0577-119Gabry, J., Simpson, D., Vehtari, A., Betancourt, M., & Gelman, A. (2019). Visualization in Bayesian workflow. Journal of the
Royal Statistical Society: Series A (Statistics in Society), 182(2), 389–402. doi: 10.1111/rssa.12378Gelman, A., & Hill, J. (2006). Data analysis using regression and multilevel/hierarchical models. Cambridge University Press.
doi: 10.1017/CBO9780511790942Gerdes, P. (1988). On possible uses of traditional Angolan sand drawings in the mathematics classroom. Educational Studies
in Mathematics, 19(1), 3–22. doi: 10.1007/BF00428382Gerdes, P. (1990). On ethnomathematical research and symmetry. Symmetry: Culture and Science, 1, 154–170.Gerdes, P. (1993). Exploring Angolan sand drawings (sona): Stimulating cultural awareness in mathematics teachers. The
Radical Teacher (43), 18–24.Gintis, H., Smith, E. A., & Bowles, S. (2001). Costly signaling and cooperation. Journal of Theoretical Biology, 213(1), 103–
119. doi: 10.1006/jtbi.2001.2406Granito, C., Tehrani, J., Kendal, J., & Scott-Phillips, T. (2019). Style of pictorial representation is shaped by intergroup con-
tact. Evolutionary Human Sciences, 1. doi: 10.1017/ehs.2019.8
12 N.‐Han Tran et al.
Grasseni, C. (2018). Beauty as skill and ‘common sensing’. In S. Bunn (Ed.), Anthropology and beauty – from aesthetics tocreativity (1st ed., p. 502). London: Routledge.
Gurven, M., Fuerstenberg, E., Trumble, B., Stieglitz, J., Beheim, B., Davis, H., & Kaplan, H. (2017). Cognitive performanceacross the life course of Bolivian forager–farmers with limited schooling. Developmental Psychology, 53(1), 160–176. doi:10.1037/dev0000175
Gustafsson, A. (2018). Beauty as a capacity. In S. Bunn (Ed.), Anthropology and beauty – from aesthetics to creativity (1st ed.,p. 502). London: Routledge.
Hawkes, K., & Bird, R. B. (2002). Showing off, handicap signaling, and the evolution of men’s work. EvolutionaryAnthropology, 11, 58–67. doi: https://doi.org/10.1002/evan.20005
Huang, Y., Xue, X., Spelke, E., Huang, L., Zheng, W., & Peng, K. (2018). The aesthetic preference for symmetry dissociatesfrom early-emerging attention to symmetry. Scientific Reports, 8(1), 1–8. doi: 10.1038/s41598-018-24558-x
Jost, L. (2006). Entropy and diversity. Oikos, 113(2), 363–375. doi: 10.1111/j.2006.0030-1299.14714.xJost, L. (2009). Mismeasuring biological diversity: Response to Hoffmann and Hoffmann (2008). Ecological Economics, 68(4),
925–928. doi: https://doi.org/10.1016/j.ecolecon.2008.10.015Kandler, A., & Powell, A. (2015). Inferring learning strategies from cultural frequency data. In A. Mesoudi & K. Aoki (Eds.),
Learning strategies and cultural evolution during the Palaeolithic (pp. 85–101). Tokyo: Springer Japan.Kirby, S., Cornish, H., & Smith, K. (2008). Cumulative cultural evolution in the laboratory: An experimental approach to the
origins of structure in human language. Proceedings of the National Academy of Sciences, 105(31), 10681–10686. doi:10.1073/pnas.0707835105
Laine, A. (2013). Kolam patterns as materialisation and embodiment of rhythms. Journal of Anthrovision. doi: https://doi.org/10.4000/anthrovision.607
Layard, J. (1937). Labyrinth ritual in south india: Threshold and tattoo designs. Folklore, 48(2), 115–182. doi: 10.1080/0015587X.1937.9718684
Lind, C. (2017). The beauty of sand-drawing in Vanuatu: Kinship and continuity on Paama Island. In S. Bunn (Ed.),Anthropology and beauty: From aesthetics to creativity (1st ed., pp. 418–433). London: Routledge.
Liu, L., Wang, Y., Sinatra, R., Giles, C. L., Song, C., & Wang, D. (2018). Hot streaks in artistic, cultural, and scientific careers.Nature, 559(7714), 396–399. doi: 10.1038/s41586-018-0315-8
Madden, J. R. (2003). Bower decorations are good predictors of mating success in the spotted bowerbird. Behavioral Ecologyand Sociobiology, 53(5), 269–277. doi: 10.1007/s00265-003-0583-6
Mayr, E. (1994). Typological versus population thinking. In E. Sober (Ed.), Conceptual issues in evolutionary biology (3rd ed.,pp. 157–160). MIT Press.
McElreath, R., Boyd, R., & Richerson, P. J. (2011). Shared norms and the evolution of ethnic markers. Current Anthropology,44(1), 122–130. doi: 10.1086/204143
Miller, G. (2011). The mating mind: How sexual choice shaped the evolution of human nature. Anchor.Miton, H., & Morin, O. (2019). When iconicity stands in the way of abbreviation: No Zipfian effect for figurative signals. PLoS
ONE, 14(8), 1–19. doi: 10.1371/journal.pone.0220793Miton, H., Wolf, T., Vesper, C., Knoblich, G., & Sperber, D. (2020). Motor constraints influence cultural evolution of rhythm:
Motor constraints on culture. Proceedings of the Royal Society B: Biological Sciences, 287(1937). doi: 10.1098/rspb.2020.2001rspb20202001
Moffett, M. W. (2013). Human identity and the evolution of societies. Human Nature, 24(3), 219–267. doi: 10.1007/s12110-013-9170-3
Müller, T. F., & Winters, J. (2018). Compression in cultural evolution: Homogeneity and structure in the emergence and evo-lution of a large-scale online collaborative art project. PLoS ONE, 13(9). doi: 10.1371/journal.pone.0202019
Nagarajan, V. (2018). Feeding a thousand souls: Women, ritual, and ecology in India – An exploration of the kolam. OxfordUniversity Press.
Nagata, S. (2015). Loop patterns in Japan and Asia. Forma, 30, 19–33. https://doi.org/10.5047/forma.2015.004Oberauer, K. (2010). Declarative and procedural working memory: Common principles, common capacity limits?
Psychologica Belgica, 50(3–4), 277–308.Oberauer, K., & Kliegl, R. (2006). A formal model of capacity limits in working memory. Journal of Memory and Language,
55(4), 601–626. doi: https://doi.org/10.1016/j.jml.2006.08.009Pavlek, B., Winters, J., & Morin, O. (2019). Ancient coin designs encoded increasing amounts of economic information over
centuries. Journal of Anthropological Archaeology, 56(October), 101103. doi: 10.1016/j.jaa.2019.101103Pelli, D. G., Burns, C. W., Farell, B., & Moore-Page, D. C. (2006). Feature detection and letter identification. Vision Research,
46(28), 4646–4674. doi: 10.1016/j.visres.2006.04.023Pinker, S. (2003). How the mind works. Penguin.Power, E. A. (2017). Discerning devotion: Testing the signaling theory of religion. Evolution and Human Behavior, 38(1), 82–
91. doi: 10.1016/j.evolhumbehav.2016.07.003Ravallion, M. (2014). Income inequality in the developing world. Science, 344(6186), 851–855. doi: 10.1126/science.1251875
Evolutionary Human Sciences 13
Ravignani, A., Delgado, T., & Kirby, S. (2017). Musical evolution in the lab exhibits rhythmic universals. Nature HumanBehaviour. doi: 10.1038/s41562-016-0007
R Core Team. (2019). R: A language and environment for statistical computing. R. F. for Statistical Computing.Schaedelin, F. C., & Taborsky, M. (2009). Extended phenotypes as signals. Biological Reviews of the Cambridge Philosophical
Society, 84(2), 293–313. doi: 10.1111/j.1469-185X.2008.00075.xSigaki, H. Y., Perc, M., & Ribeiro, H. V. (2018). History of art paintings through the lens of entropy and complexity.
Proceedings of the National Academy of Sciences of the United States of America, 115(37), E8585–E8594. doi: 10.1073/pnas.1800083115
Smith, E. A., Bird, R. B., & Bird, D. W. (2003). The benefits of costly signaling: Meriam turtle hunters. Behavioral Ecology, 14(1), 116–126.
Soler, M. (2012). Costly signaling, ritual and cooperation: Evidence from Candomblé, an Afro-Brazilian religion. Evolutionand Human Behavior, 33(4), 346–356. doi: 10.1016/j.evolhumbehav.2011.11.004
Sosis, R., Kress, H. C., & Boster, J. S. (2007). Scars for war: Evaluating alternative signaling explanations for cross-culturalvariance in ritual costs. Evolution and Human Behavior, 28(4), 234–247. doi: 10.1016/j.evolhumbehav.2007.02.007
Talts, S., Betancourt, M., Simpson, D., Vehtari, A., & Gelman, A. (2018). Validating Bayesian inference algorithms withsimulation-based calibration. arXiv preprint. https://arxiv.org/abs/1804.06788
Tamariz, M., & Kirby, S. (2015). Culture: Copying, compression, and conventionality. Cognitive Science, 39(1), 171–183. doi:10.1111/cogs.12144
Tomasello, M., Kruger, A. C., & Ratner, H. H. (1993). Cultural learning. Behavioral and Brain Sciences, 16(3), 495–511. doi:10.1017/S0140525X0003123X
Tylén, K., Fusaroli, R., Rojo, S., Heimann, K., Fay, N., Johannsen, N. N., … Lombard, M. (2020). The evolution of early sym-bolic behavior in homo sapiens. Proceedings of the National Academy of Sciences. doi: 10.1073/pnas.1910880117
Varella, M. A. C., & Fernández, A. M. (2015). Evolution of artistic and aesthetic propensities through female competitive orna-mentation (Vol. 1; M. L. Fisher, Ed.). Oxford University Press. doi: 10.1093/oxfordhb/9780199376377.013.46
Voloshinov, A. V. (1996). Symmetry as a superprinciple of science and art. Leonardo, 29(2), 109–113.von Bertalanffy, L. (1969). General system theory: Foundations, development, applications. George Braziller.Waring, T. M. (2012a). Cooperation dynamics in a multiethnic society: A case study from Tamil Nadu. Current Anthropology,
53(5), 642–649. doi: 10.1086/666942Waring, T. M. (2012b). Sequential encoding of Tamil kolam patterns. Forma, 27, 83–92.Winters, J., & Morin, O. (2019). From context to code: Information transfer constrains the emergence of graphic codes.
Cognitive Science, 43(3). doi: 10.1111/cogs.12722Zagala, S. (2004). Vanuatu sand drawing. Museum International, 56(1-2), 32–35. doi: 10.1111/j.1350-0775.2004.00455.xZahavi, A. (1975). Mate selection – A selection for a handicap. Journal of Theoretical Biology, 53(1), 205–214.Zoli, C. (1999). Intersecting generalized Lorenz curves and the Gini index. Social Choice and Welfare, 16(2), 183–196. doi:
10.1007/s003550050139
Cite this article: Tran N.-H, Waring T, Atmaca S, Beheim BA (2021). Entropy trade-offs in artistic design: A case study ofTamil kolam. Evolutionary Human Sciences 3, e23, 1–14. https://doi.org/10.1017/ehs.2021.14
14 N.‐Han Tran et al.
Copyright © 2022 FDOKUMEN