Vertical Directionality of Midfrequency Surface Noise in Downward-Refracting Environments
12
IEEE JOURNAL OF OCEANIC ENGINEERING, VOL. 32, NO. 3, JULY 2007 609 Vertical Directionality of Midfrequency Surface Noise in Downward-Refracting Environments Cathy Ann Clark, Member, IEEE Abstract—The vertical directionality of ambient noise due to sur- face agitation for frequencies between 2 and 5 kHz propagated to a subsurface receiver has a characteristic shape, knowledge of which may enhance shallow-water operations. In general, the noise level is highest at upward-looking angles and attenuated at down- ward-looking angles depending on the nature of the bottom. In en- vironments with a negative profile gradient, the noise level is also greatly reduced in a low-angle shadow zone or “notch” at angles around horizontal. This paper reviews the character of vertical noise directionality by examining two measured data sets and con- sidering the underlying physical mechanisms that drive the form of the distribution. A discussion of the implications of vertical noise directionality for design and operation of receiving sonar systems is presented. In particular, the effect of mainlobe beamwidth and sidelobe suppression are considered along with the directionality of the noise field. Finally, an overview of the derivation of a vertical noise model based on the integrated mode method of propagation prediction is followed by model reproduction of measurements. Index Terms—Acoustics, ambient noise, surface noise, under- water sound propagation, vertical noise distribution. I. INTRODUCTION I N the absence of near-shipping interference, the undersea ambient field in the frequency band of 0.5–10 kHz is dominated by noise due to sea surface roughness as shown in Fig. 1[1]. Although near and distant shipping along with other undersea acoustic effects such as internal waves are also factors in the ambient noise field, this paper addresses only the impact of midfrequency noise resulting from sea surface agitation near a submerged receiver in downward-refracting environments. The data sets studied were taken in scenarios dominated by sea surface noise, and the shipping components of the noise model described in Section IV are not discussed herein. A significant amount of research has been done in an attempt to quantify and explain the dependence of underwater noise on wind speed and surface agitation [2]–[4], yet the exact nature of the coupling of energy from surface agitation due to wind and sea state into acoustic pressure waves that propagate through the undersea environment is an area of ongoing research [5]–[7]. It is believed by several researchers that the source of surface noise is breaking waves and whitecaps which results in the projection of bubbles into the water column, e.g., [4]–[7]. It has been shown that dipole and monopole models of the source function tend to apply at high and low frequencies, re- Manuscript received September 28, 2005; revised March 29, 2007; accepted June 19, 2007. Associate Editor: D. P. Knobles. The author is with the Naval Undersea Warfare Center, Newport, RI 02841 USA (e-mail: [email protected]). Digital Object Identifier 10.1109/JOE.2007.903450 Fig. 1. Acoustic ambient noise in the ocean (adapted from [1] by the National Academy of Sciences). spectively [8]. For the purposes of this paper, we assume that bubbles from the surface radiate as monopoles. The location of a monopole source below a pressure-release surface results in a dipole-like propagation pattern from the perspective of a subsur- face receiver. Propagation of each source through the environ- ment and superposition of pressure (or intensity) at the position of a submerged receiver yield the noise distribution as a func- tion of vertical angle at a given azimuth. Further discussion of the source and propagation functions is given in Section IV-A. The ambient noise field in the undersea medium as perceived through a sonar system is tactically relevant with respect to a signal arriving simultaneously at the same sonar receiver. The 3-D convolution of the noise field with a given system beam yields the beam noise level associated with a given steer angle. Repetition over a set of vertically directional beams yields the distribution of beam ambient noise as a function of beam depression/elevation (D/E) angle. For operational use, ambient 0364-9059/$25.00 © 2007 IEEE
Transcript of Vertical Directionality of Midfrequency Surface Noise in Downward-Refracting Environments

IEEE JOURNAL OF OCEANIC ENGINEERING, VOL. 32, NO. 3, JULY 2007 609
Vertical Directionality of Midfrequency SurfaceNoise in Downward-Refracting Environments
Cathy Ann Clark, Member, IEEE
Abstract—The vertical directionality of ambient noise due to sur-face agitation for frequencies between 2 and 5 kHz propagatedto a subsurface receiver has a characteristic shape, knowledge ofwhich may enhance shallow-water operations. In general, the noiselevel is highest at upward-looking angles and attenuated at down-ward-looking angles depending on the nature of the bottom. In en-vironments with a negative profile gradient, the noise level is alsogreatly reduced in a low-angle shadow zone or “notch” at anglesaround horizontal. This paper reviews the character of verticalnoise directionality by examining two measured data sets and con-sidering the underlying physical mechanisms that drive the form ofthe distribution. A discussion of the implications of vertical noisedirectionality for design and operation of receiving sonar systemsis presented. In particular, the effect of mainlobe beamwidth andsidelobe suppression are considered along with the directionality ofthe noise field. Finally, an overview of the derivation of a verticalnoise model based on the integrated mode method of propagationprediction is followed by model reproduction of measurements.
Index Terms—Acoustics, ambient noise, surface noise, under-water sound propagation, vertical noise distribution.
I. INTRODUCTION
I N the absence of near-shipping interference, the underseaambient field in the frequency band of 0.5–10 kHz is
dominated by noise due to sea surface roughness as shown inFig. 1[1]. Although near and distant shipping along with otherundersea acoustic effects such as internal waves are also factorsin the ambient noise field, this paper addresses only the impactof midfrequency noise resulting from sea surface agitation neara submerged receiver in downward-refracting environments.The data sets studied were taken in scenarios dominated by seasurface noise, and the shipping components of the noise modeldescribed in Section IV are not discussed herein.
A significant amount of research has been done in an attemptto quantify and explain the dependence of underwater noise onwind speed and surface agitation [2]–[4], yet the exact nature ofthe coupling of energy from surface agitation due to wind andsea state into acoustic pressure waves that propagate through theundersea environment is an area of ongoing research [5]–[7]. Itis believed by several researchers that the source of surface noiseis breaking waves and whitecaps which results in the projectionof bubbles into the water column, e.g., [4]–[7].
It has been shown that dipole and monopole models of thesource function tend to apply at high and low frequencies, re-
Manuscript received September 28, 2005; revised March 29, 2007; acceptedJune 19, 2007.
Associate Editor: D. P. Knobles.The author is with the Naval Undersea Warfare Center, Newport, RI 02841
USA (e-mail: [email protected]).Digital Object Identifier 10.1109/JOE.2007.903450
Fig. 1. Acoustic ambient noise in the ocean (adapted from [1] by the NationalAcademy of Sciences).
spectively [8]. For the purposes of this paper, we assume thatbubbles from the surface radiate as monopoles. The location ofa monopole source below a pressure-release surface results in adipole-like propagation pattern from the perspective of a subsur-face receiver. Propagation of each source through the environ-ment and superposition of pressure (or intensity) at the positionof a submerged receiver yield the noise distribution as a func-tion of vertical angle at a given azimuth. Further discussion ofthe source and propagation functions is given in Section IV-A.
The ambient noise field in the undersea medium as perceivedthrough a sonar system is tactically relevant with respect to asignal arriving simultaneously at the same sonar receiver. The3-D convolution of the noise field with a given system beamyields the beam noise level associated with a given steer angle.Repetition over a set of vertically directional beams yieldsthe distribution of beam ambient noise as a function of beamdepression/elevation (D/E) angle. For operational use, ambient
0364-9059/$25.00 © 2007 IEEE

Report Documentation Page Form ApprovedOMB No. 0704-0188
Public reporting burden for the collection of information is estimated to average 1 hour per response, including the time for reviewing instructions, searching existing data sources, gathering andmaintaining the data needed, and completing and reviewing the collection of information. Send comments regarding this burden estimate or any other aspect of this collection of information,including suggestions for reducing this burden, to Washington Headquarters Services, Directorate for Information Operations and Reports, 1215 Jefferson Davis Highway, Suite 1204, ArlingtonVA 22202-4302. Respondents should be aware that notwithstanding any other provision of law, no person shall be subject to a penalty for failing to comply with a collection of information if itdoes not display a currently valid OMB control number.
1. REPORT DATE 29 MAR 2007 2. REPORT TYPE
3. DATES COVERED 00-00-2007 to 00-00-2007
4. TITLE AND SUBTITLE Vertical Directionality of Midfrequency Surface Noise inDownward-Refracting Environments
5a. CONTRACT NUMBER
5b. GRANT NUMBER
5c. PROGRAM ELEMENT NUMBER
6. AUTHOR(S) 5d. PROJECT NUMBER
5e. TASK NUMBER
5f. WORK UNIT NUMBER
7. PERFORMING ORGANIZATION NAME(S) AND ADDRESS(ES) Naval Undersea Warfare Center,Newport Division,Newport,RI,02841
8. PERFORMING ORGANIZATIONREPORT NUMBER
9. SPONSORING/MONITORING AGENCY NAME(S) AND ADDRESS(ES) 10. SPONSOR/MONITOR’S ACRONYM(S)
11. SPONSOR/MONITOR’S REPORT NUMBER(S)
12. DISTRIBUTION/AVAILABILITY STATEMENT Approved for public release; distribution unlimited
13. SUPPLEMENTARY NOTES
14. ABSTRACT The vertical directionality of ambient noise due to surface agitation for frequencies between 2 and 5 kHzpropagated to a subsurface receiver has a characteristic shape, knowledge of which may enhanceshallow-water operations. In general, the noise level is highest at upward-looking angles and attenuated atdownward- looking angles depending on the nature of the bottom. In environments with a negative profilegradient, the noise level is also greatly reduced in a low-angle shadow zone or ?notch? at angles aroundhorizontal. This paper reviews the character of vertical noise directionality by examining two measureddata sets and considering the underlying physical mechanisms that drive the form of the distribution. Adiscussion of the implications of vertical noise directionality for design and operation of receiving sonarsystems is presented. In particular, the effect of mainlobe beamwidth and sidelobe suppression areconsidered along with the directionality of the noise field. Finally, an overview of the derivation of avertical noise model based on the integrated mode method of propagation prediction is followed by modelreproduction of measurements.
15. SUBJECT TERMS
16. SECURITY CLASSIFICATION OF: 17. LIMITATION OF ABSTRACT Same as
Report (SAR)
18. NUMBEROF PAGES
11
19a. NAME OFRESPONSIBLE PERSON
a. REPORT unclassified
b. ABSTRACT unclassified
c. THIS PAGE unclassified
Standard Form 298 (Rev. 8-98) Prescribed by ANSI Std Z39-18
610 IEEE JOURNAL OF OCEANIC ENGINEERING, VOL. 32, NO. 3, JULY 2007
Fig. 2. NDABS used to collect GOM data (reproduced from [10]).
noise from the surface must be combined with other effects,such as flow noise, which depend on receiver characteristicsand speed.
This paper describes two sets of midfrequency measurementsof vertical noise directionality and characterizes the nature ofthe observed distributions. The basic physical acoustic mech-anisms determining noise directionality are reviewed and theimplications for sonar system design are considered. A verticalnoise model (VNoise) is described and shown to reproduce theshape of the measured data sets in the downward-refracting en-vironments studied.
II. MIDFREQUENCY DATA SETS
Measurements of the vertical directionality of midfrequencysurface noise have been made in a handful of experiments. Thetwo sample distributions included herein enable the general na-ture of the distribution to be characterized for downward-re-fracting environments, i.e., situations in which sound speed de-creases with depth. This type of environment was chosen in eachof the two experiments to obtain measurements of the low-angleshadow zone or “notch” region [9].
A. Data Set 1—Gulf of Mexico, June 1993
The first of the two data sets was obtained in the Gulf ofMexico (GOM) in June 1993 [10] during a sea test sponsored bythe Deployable Acoustic Sensor System (DASS) project. Thesite of the test was about 100 nmi west of Naples, FL, withthe receiver moored at 26 19 78 N, 84 23 08 W. Themeasuring array was part of the U.S. Naval Research Labora-tory (NRL, Washington, DC) digital acquisition buoy system(NDABS) and was provided by the Stennis Space Center Di-vision of the Naval Research Laboratory (NRL/SSC, StennisSpace Center, MS) [12]. It was a 31-element vertical line arraywith 28-dB sidelobes and 0.3-m spacing, and thus, a designfrequency of 2500 Hz. The array was moored with its center27 m above the bottom in 200 m of water as shown in Fig. 2.
Fig. 3. SSP for GOM environment.
Individual hydrophone receptions were transmitted to an instru-mented pressure vessel where they were digitized at a rate of6348 Hz and recorded for 30 min every 6 h over an 8-d period.
The array data was processed by performing a fast Fouriertransform (FFT) on data from each hydrophone with a transformsize of 1024 and a Hanning window, resulting in a 3-dB resolu-tion of approximately 9 Hz. The complex data were then beam-formed in each FFT bin using Taylor shading with 28-dB side-lobes. Finally, the beamformed data were magnitude-squaredand block-averaged over 128 transforms (approximately 20 s).
Sound-speed profiles (SSPs) were computed from sampledconductivity–temperature–depth (CTD) data at the beginningand end of the test and a fathometer survey indicated a slightbottom slope of about 0.1 . Information provided by theAcoustic Assessments Section of NRL/SSC indicated that thebottom was composed of muddy sand and that other sources ofambient noise such as shipping activity and oil drilling wereminimal. A plot of the SSP at the beginning of the test is shownin Fig. 3 with the depth of the receiving array center indicatedat 173 m.
A plot of beam power as a function of D/E angle (positiveangles are up) and frequency, measured during a time whenthere was no ambient contribution from biologics or shippingis shown in Fig. 4. The low-angle notch is evident between 500and 2500 Hz where the array beamwidth is narrow enough toresolve it. Also evident in Fig. 4 are striation patterns which arelikely due to a resonance effect in the bottom which consisted ofa layer of muddy sand over hard rock. Frequencies with wave-lengths which would be trapped in the sediment layer did not re-turn to the water column for multiples of some base frequency.A slice through Fig. 4 at 2473 Hz is shown in Fig. 5. This singlefrequency plot of beam noise versus D/E angle will be used inthe model comparison in Section V.
B. Measured Data Set 2 (DS2)—Tongue of the Ocean, Fall1988
The second data set was taken from an experiment inSeptember/October 1988 in the Tongue of the Ocean (TOTO)

CLARK: VERTICAL DIRECTIONALITY OF MIDFREQUENCY SURFACE NOISE IN DOWNWARD-REFRACTING ENVIRONMENTS 611
Fig. 4. GOM data as a function of D/E angle and frequency (reproduced from[10]).
Fig. 5. Slice of GOM data at 2473 Hz (reproduced from [10]).
in the Bahamas at a depth of 200 m in 700 m of water wherethe bottom depth was variable in the near proximity of theexperiment [8].
The measurement system was a deployable acoustic-moni-toring system (DAMS) which was specifically designed to mea-sure the vertical distribution of sea surface sound. The wide-band system (40 to 4000 Hz) was composed of seven nestedarrays of seven hydrophones each, with 18-dB sidelobes. Asketch indicating the hardware components of the system is re-produced from [13] in Fig. 6. The system consists of “seven oc-tavely coalesced four-wavelength acoustic line antennas” [13].Each antenna section transmitted hydrophone signals to a sub-merged data logger where they were digitally recorded. A fulldescription of the DAMS system and subsequent processing ofthe measured noise field is beyond the scope of this paper. An
Fig. 6. DAMS system used to collect TOTO data (reproduced from [13]).
Fig. 7. Illustration of the location of the hydrophone array relative to the oceansurface and ocean bottom for TOTO data (reproduced from [13]).
Fig. 8. TOTO vertical noise as a dunction of D/E angle and frequency (repro-duced from [15]).
overview can be found in [13] and a detailed system descriptionin [14]. The vertical noise distribution shown in Fig. 8 [15] was

612 IEEE JOURNAL OF OCEANIC ENGINEERING, VOL. 32, NO. 3, JULY 2007
Fig. 9. SSP for TOTO environment.
derived from the ensemble of cross-spectral density functionsfor all possible hydrophone pairs (see [15] and [16]). Nuttall[16] has assumed that the inversion method used captured thecomplete directional spectrum. Thus, the model prediction ofthe vertical directionality of the 4 kHz noise for the TOTO dataset in Section V assumes omnidirectional receive sonar beams.
A plot of the receiver orientation with respect to the slopingbathymetry in the TOTO environment is reproduced from [13]in Fig. 7, and the SSP is shown in Fig. 9 with the depth ofthe receiving array indicated at 200 m. The measured verticalnoise distribution as a function of frequency and vertical angleis shown in Fig. 8. Due to isolation of the TOTO water basin, theambient noise in the location of the experiment was dominatedby local sea surface conditions.
III. SONAR IMPLICATIONS
To illustrate the propagation effects which drive the subsur-face vertical directionality of surface noise and to investigatethe impact of beam geometry on received beam noise, a loca-tion in the Norwegian Sea with a receiver at a depth of 198 min a water column of 1774 m was used to compute the verticalnoise distribution and beam noise for a sample of hypotheticalbeam patterns. The downward-refracting profile for the sampleenvironment is shown in Fig. 10(a) with an enlarged plot of theshallow profile in Fig. 10(b). The bottom was modeled usinghigh-frequency bottom-loss (HFBL) province 5 and the windspeed was 13 kn, the historical level at this location in the Nor-wegian Sea for the month of September.
As indicated by the GOM and TOTO data sets discussedin Section II, surface noise at a submerged receiver in down-ward-refracting environments is vertically nonisotropic, withthe highest level at upward-looking beam angles and a lowerlevel at downward-looking beam angles, and is significantly qui-eter at near-horizontal angles. These three regions correspond,respectively, to noise arriving at the receiver on direct pathsfrom the surface, noise reflected to the receiver from the oceanbottom, and a low-angle notch in which ray paths from the sur-
Fig. 10. SSP for Norwegian Sea September sample environment.
Fig. 11. Ray traces corresponding to angular regions of a sample vertical noisedistribution.
face arriving at the receiver depth will originate at a great dis-tance from the receiver, and hence, be significantly attenuated.These three regions and their effects on the sample vertical noisecurve are depicted in Fig. 11.
The sonar array and beamformer spatially filter the incomingsignal and noise fields. The spatial filters or beam patterns areformed at a sufficient number of vertical and azimuthal steer di-rections to sample all potential signal directions. Both the widthof the filter mainlobe and the degree of sidelobe suppression sig-nificantly affect the received beam noise level. Fig. 12 depictsbeam noise as a function of D/E angle for a set of beams steeredat a sample of vertical D/E angles into the environmental ver-tical noise distribution as shown. The calculation of total beamnoise , depicted in Fig. 12, for a single steer angle, involvessumming the dot product of the vertical noise level as a func-tion of vertical angle and the vertical beam response as afunction of the same vertical angles , i.e.,

CLARK: VERTICAL DIRECTIONALITY OF MIDFREQUENCY SURFACE NOISE IN DOWNWARD-REFRACTING ENVIRONMENTS 613
Fig. 12. Beam noise level versus mainlobe beamwidth in sample environment.
Fig. 13. Beam noise level versus sidelobe level in sample environment.
The vertical axes in the plots in Fig. 12(a) and (b) are vertical di-rection , while the vertical axis in Fig. 12(c) is beam steer angle
. The beam pattern of the 0 D/E angle is shown with 1 , 2 ,and 6 beamwidths plotted in red, blue, and black, respectively.The received beam ambient noise levels are plotted for each D/Eangle for the 1 , 2 , and 6 mainlobe beamwidths. The suppres-sion of sound in the low-angle notch region increases with thenarrowing of the main beam. The comparative noise level be-tween upward- and downward-looking angles of approximately15 dB, however, is consistent across all three beamwidths. Theseresults suggest the following: 1) a narrow beam relative to thewidth of the notch improves notch resolution and 2) the dif-ference in gain between downward and upward D/E angles islargely independent of beamwidth.
Since the beam noise level at a given D/E angle representsnoise arriving at all vertical angles, sidelobe suppression alsosignificantly impacts the received beam noise level. Fig. 13shows beam noise as a function of D/E angle for a set of beamsagainst the same hypothetical noise distribution as in Fig. 12,
but with sidelobe suppressions of 13 and 26 dB shownin blue and red, respectively, for angles between 40 . As inFig. 12, the vertical axes in Fig. 13(a) and (b) are vertical direc-tion , while the vertical axis in Fig. 12(c) is beam steer angle
. The beam noise distributions in Fig. 13(c) differ in that thebeam with greater sidelobe suppression shows a lower noiselevel in the horizontal notch region (over 10 dB of gain) and thegain of 15 dB in downward-looking over upward-looking D/Eangles is consistent across beams with both sidelobe levels.These results suggest that increased sidelobe suppression aidsin resolution of the low-angle notch.
To further illustrate the effect of sidelobe suppression onbeam noise directionality, the noise arriving on the mainlobeof each beam versus that received on sidelobes is shown inFig. 14 for a beam with mainlobe beamwidth of 2 . At steeperangles in both upward- and downward-looking steer angles,the noise curve is dominated by acoustic energy received in themainlobe, as the beams in these regions are pointed towardsthe surface or bottom where the noise levels are highest. For

614 IEEE JOURNAL OF OCEANIC ENGINEERING, VOL. 32, NO. 3, JULY 2007
Fig. 14. Beam noise received on mainlobe and sidelobes in sampleenvironment.
beams steered towards the horizontal notch region, the beamnoise is dominated by energy impinging on the sidelobes whichare directed towards angular regions of higher noise level, i.e.,towards the surface and bottom. The change in sidelobe levelhas no effect on the upward-looking D/E angles where the highlevel of noise from the surface is received on the mainlobe ofthe beam, a major impact in the notch where energy is highestin the sidelobes, and a lesser effect on downward-looking D/Eangles where the highest level of energy is again received onthe mainlobe, but has been attenuated due to bottom reflection.
The previous discussion deals only with the reception of am-bient noise by the sonar system beams. In addition, there areother effects, notably flow noise, to be considered. In angularregions where the ambient noise level is low, e.g., in the notch re-gion or at downward-looking angles over an absorbing bottom,the total beam noise may be dominated by flow noise. Further-more, the tactical relevance of vertical directionality of ambientnoise depends on the extent to which it masks a signal of in-terest. Beam noise gain associated with a narrow mainlobe maybe accompanied by loss of signal due to energy splitting, with aresultant decrease in signal-to-noise ratio (SNR). The best SNRmay be in a direction that corresponds to neither the strongestsignal nor the quietest noise.
IV. MODEL DESCRIPTION
The noise field at a subsurface receiver due to wind noiseat the surface is modeled by integrating the effects of soundpropagating to a subsurface receiver from multiple monopole ordipole sources distributed throughout an area of the sea surface.This approach has been used successfully at high frequencies[17]. In this section, we discuss the theoretical development ofa vertical noise model based on the integrated mode method ofcomputing propagation documented in [18].
A. Dipole and Monopole Source Factors
In ambient noise modeling, the source of surface noise isgenerally treated as a field of uniformly distributed subsurface
Fig. 15. Overview of modeling approach.
Fig. 16. Source propagation pattern.
monopoles and/or dipoles distributed throughout an area of thesea surface [8], [17], as depicted in Fig. 15. The model com-putes an “intensity density” function that represents power perunit of cross-sectional area in units of decibels per micropascalper hertz per steradian. Since steradian measure corresponds tothe surface area intersected on a unit sphere with a total surfacearea of 4 , the conversion from the more familiar omnidirec-tional decibel level to decibels per steradian isor about 11 dB.
For purposes of this paper, we assume a monopole source atdepth below a pressure-release surface and a reflected pointsource equidistant above the surface as depicted in Fig. 16. Thecombination of direct and surface- reflected paths results in adipole-like or “doublet” propagation pattern from the perspec-tive of a subsurface receiver.
Assuming plane-wave propagation, the direct path contribu-tion from the source at is given by a plane wave
where and are the horizontal and vertical components ofthe wave number and is the depth of the receiver. The re-flected path contribution is another plane wave
where is the complex surface reflection coefficient
The total field of the two waves is
or

CLARK: VERTICAL DIRECTIONALITY OF MIDFREQUENCY SURFACE NOISE IN DOWNWARD-REFRACTING ENVIRONMENTS 615
Fig. 17. Steradian coverage of a ray bundle.
The field intensity is or
where the denotes complex conjugation, and and areassumed to be real quantities. Simplifying, the field intensity is
(1)
If , then in terms of angles at the surface, we can write, and the intensity reduces to the dipole pattern
(2)
In the noise model, we assume azimuthal invariance and use asource beam given by
(3)
For the monopole approximation, the two paths are summedrandomly in phase and the intensity is given by
(4)
B. Approximate Ray Theoretic Analysis
To illustrate the method in a simplified context, we first de-rive an expression for the vertical distribution of surface noiseat a submerged receiver based on ray theoretic considerations.Under certain conditions (e.g., high-frequency propagation with
30 ), the ray theoretical expression is valid, but for small(e.g., convergence zone propagation with 15 ), and es-
pecially at low frequencies, a propagation model such as theintegrated mode method which is capable of computing diffrac-tion is required.
Consider the intensity of a ray bundle of width emittedfrom a point at the surface at an angle of and arriving at asubsurface receiver at an angle of as depicted in Figs. 17 and18. The intensity along the ray bundle at a given horizontal rangeis related to the number of steradians per unit of cross-sectionalarea at that range, where the steradian measure of the ray bundleis equal to the surface area intersected on a unit sphere. The areais intersected approximated by as illustratedin Fig. 17.
Fig. 18. Cross-sectional area.
To compute the cross-sectional area that is covered by thesame ray bundle at range , consider the geometry of Fig. 18.The cross-sectional area is . The amount ofray bundle spreading as compared to that on the unit sphere isgiven by the ratio . The sound intensity, which expressesthe amount of spreading of the ray bundle after reaching range, is proportional to the reciprocal of the area ratio. Thus
By taking the reference intensity to be unity, then
Since we express angle relationships in terms of , we useSnell’s Law to replace by
where and are the sound speed at the surface and receiverdepth, respectively. Thus
(5)
Now consider an annular region on the surface with radiusand width as shown in Fig. 15.
Assuming, for the moment, a density of noise sources withunit strength per unit of area, the contribution of the differentialarea at the receiver is , which is given by substituting
into (5) as
Thus, the quantity in brackets represents an “intensity density”function in terms of . This expression can be extended to in-clude azimuthal variation by recognizing that the factor re-sults from integration over azimuthal angle , i.e.,
616 IEEE JOURNAL OF OCEANIC ENGINEERING, VOL. 32, NO. 3, JULY 2007
TABLE IMULTIPATH/ANGLE CORRESPONDENCE
Thus, the “intensity density” in both horizontal and ver-tical directions is given by
Since we wish to express the vertical angle density in terms ofthe receive vertical angle , we perform the change of variable
to obtain density in as
(6)
This result corresponds to the model presented in [19] and [20].
C. Integrated Mode Formulation of Vertical Noise Distribution
The discussion in Section IV-B describes the sequence of cal-culations used to construct the surface noise field at the receiverusing simple ray theory. In the VNoise model described herein,the same development applies except that the propagation of en-ergy from each source to the receiver is computed by the inte-grated mode method described in [18]. In particular, consider anintegral corresponding to path where as summarizedin Table I and ray path cycle where
(7)
where is a horizontal range, is a horizontal wave number,and identify upper and lower turning points or boundary
reflections, is an elapsed vertical phase along path ,and are wave amplitudes at receiver and
source, respectively, and a ray path cycle is defined as propa-gation from one upper turning point or reflection to the next.For convenience, we omit boundary losses for the moment sothe treatment parallels that of Section IV-B.
As in [18], the notation for path type is such that rep-resent propagation paths arriving at the receiver from above and
represent propagation paths arriving from below. Cyclerepresents the direct path, which proceeds from a given
surface source at depth to the receiver at depth . In the casedepicted in Fig. 16, the combined path arrives at the receiverfrom the upward direction and thus paths correspondto the two paths in Fig. 16. With a suitable boundary condition
accounted for, the coherent combination of these two paths pro-duces the acoustic field of a dipole-like or doublet source at thereceive point as discussed in Section IV-A.
In the VNoise model, the source function is includedin the integrations (7) and paths are omitted. With sur-face and bottom reflection coefficients and , respectively,the general integral form (7) with re-placed by becomes
(8)
where for and for , and indicatesvertical phase along path for path type and cycle .
The derivation of an expression for the vertical distribution ofsurface noise at the receiver proceeds in parallel with the devel-opment in Section IV-B, i.e., the integrals in (8) are converted tosound intensity and the contributions of individual sources areintegrated over surface area.
D. Calculation of Beam Noise and Noise Gain
Noise gain, or the improvement in SNR due to reduction inambient noise due to the directional discrimination of a givensonar beam, is given by [21] as a function of solid angle as
(9)
where is the receive beam pattern. In the VNoise model,the noise distribution is normalized so that integration over solidangle yields the midfrequency omnidirectional ambient noiselevel as a function of wind speed or sea state and frequencyaccording to the Wenz curves [1]. As a function of horizontaland vertical angles and , the total omnidirectional noise levelis given by
(10)
Beam ambient noise for a given frequency and envi-ronment is computed by convolving the noise with thebeam pattern at each steer D/E angle and integratingthe result over azimuth , i.e.,
(11)
Finally, total beam noise is the power sum of theambient noise with the flow noise for a given receive plat-form and speed. The SNR for a given target is computed bycomparing the noise to the received signal level on abeam-by-beam basis.
V. COMPARISON OF MODEL RESULTS
TO MEASURED DATA SETS
Plots comparing the modeled and measured vertical noise dis-tributions for the GOM and TOTO environments of Section IIare shown in Figs. 19 and 20, respectively. In both plots, themeasured values are shown as solid dots and the model predic-tion is represented by a solid line.

CLARK: VERTICAL DIRECTIONALITY OF MIDFREQUENCY SURFACE NOISE IN DOWNWARD-REFRACTING ENVIRONMENTS 617
Fig. 19. Modeled versus measured noise for the GOM environment (2473-HzDASS data).
Fig. 20. Modeled versus measured beam noise for the TOTO environment.
A sea state level of 2 was assumed for the GOM data set, anestimate obtained from [10], and the modeled beam pattern isshown in Fig. 21. The bottom was modeled as province 2 ac-cording to the HFBL data base from the Oceanographic and At-mospheric Master Library [22], which is valid for frequenciesbetween 1.5 and 4.0 kHz, because it most closely matches thebottom loss predicted by modified acoustic bottom loss evalua-tion (ABLE) [11] province 1 used in [10]. An unidentified noisesource resulted in a notch floor in the measurements of about25 dB which is not predicted by the model.
For the TOTO data set, a wind speed of 25 kn and HFBLprovince 2 were used. Since the model normalizes the verticalnoise distribution to match the overall omnilevel predicted for agiven sea state and frequency according to the Wenz curves [1],a wind speed of 25 kn and a bottom type of HFBL province 2resulted in a match to the level of the measured data. Althoughthere is no basis for these assumptions other than matching tothe data, the shape of the noise distribution has been success-fully reproduced by the model. The modeled distribution is
Fig. 21. NDABS beam pattern at steer angle 0 (horizontal).
rather than because no beam was applied. The inversionmethod used in processing the data is believed to have recoveredthe full directional spectrum of the measured noise field [16], asdiscussed in Section II.
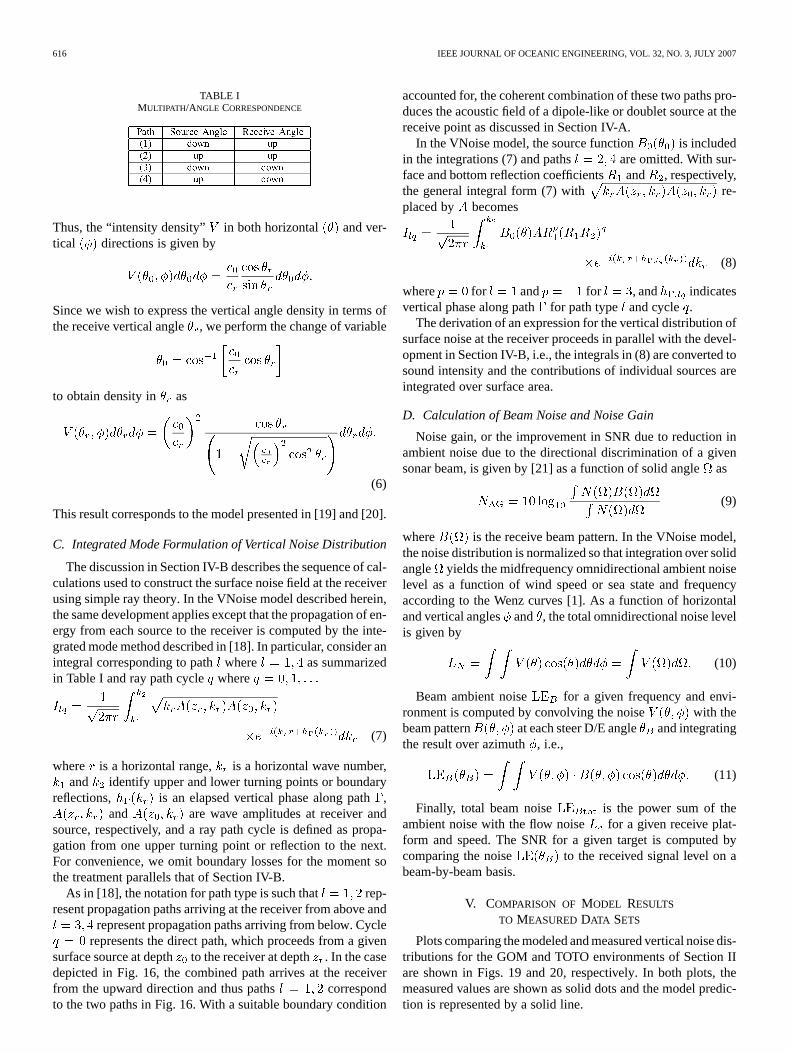
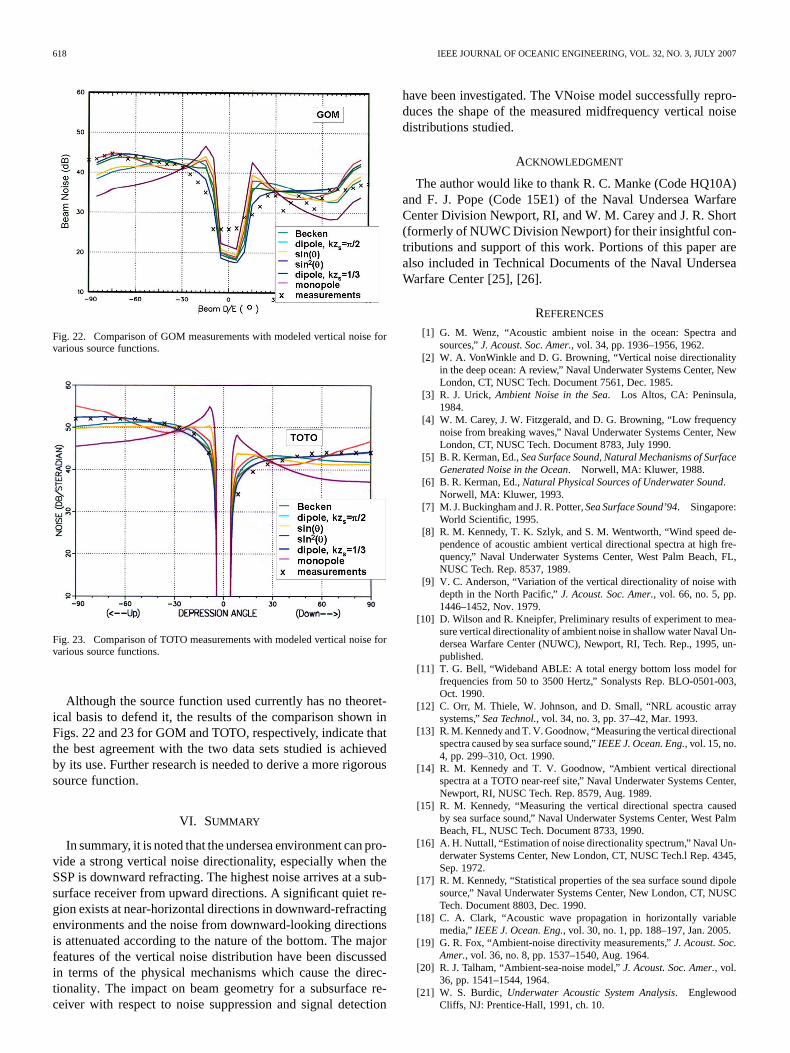
The source model is the effective dipole (3) ofSection IV-A, which represents the interference pattern be-tween a monopole located below the pressure-release surfaceand its image above the surface. To control phase interferencepatterns as frequency is increased, the product of horizontalwave number times source depth , which appears in (3)for the dipole, has been set equal to a constant value of 1/3,a constant previously chosen by comparison with measureddata. To test the effectiveness of this assumption with respectto the current data sets, the predictions for the GOM and TOTOenvironments were repeated using a number of possible sourcefunctions. The six functions modeled are as follows:
1) function proposed by Becken [23] given by
where
(12)
2) dipole pattern suggested by Carey [24] given by
where is a horizontal wave number and the source depthis set equal to where is a wavelength, i.e., the
product of is always equal to ;3) ;4) ;5) dipole used herein, i.e.,
where yard and ;6) monopole source function .
618 IEEE JOURNAL OF OCEANIC ENGINEERING, VOL. 32, NO. 3, JULY 2007
Fig. 22. Comparison of GOM measurements with modeled vertical noise forvarious source functions.
Fig. 23. Comparison of TOTO measurements with modeled vertical noise forvarious source functions.
Although the source function used currently has no theoret-ical basis to defend it, the results of the comparison shown inFigs. 22 and 23 for GOM and TOTO, respectively, indicate thatthe best agreement with the two data sets studied is achievedby its use. Further research is needed to derive a more rigoroussource function.
VI. SUMMARY
In summary, it is noted that the undersea environment can pro-vide a strong vertical noise directionality, especially when theSSP is downward refracting. The highest noise arrives at a sub-surface receiver from upward directions. A significant quiet re-gion exists at near-horizontal directions in downward-refractingenvironments and the noise from downward-looking directionsis attenuated according to the nature of the bottom. The majorfeatures of the vertical noise distribution have been discussedin terms of the physical mechanisms which cause the direc-tionality. The impact on beam geometry for a subsurface re-ceiver with respect to noise suppression and signal detection
have been investigated. The VNoise model successfully repro-duces the shape of the measured midfrequency vertical noisedistributions studied.
ACKNOWLEDGMENT
The author would like to thank R. C. Manke (Code HQ10A)and F. J. Pope (Code 15E1) of the Naval Undersea WarfareCenter Division Newport, RI, and W. M. Carey and J. R. Short(formerly of NUWC Division Newport) for their insightful con-tributions and support of this work. Portions of this paper arealso included in Technical Documents of the Naval UnderseaWarfare Center [25], [26].
REFERENCES
[1] G. M. Wenz, “Acoustic ambient noise in the ocean: Spectra andsources,” J. Acoust. Soc. Amer., vol. 34, pp. 1936–1956, 1962.
[2] W. A. VonWinkle and D. G. Browning, “Vertical noise directionalityin the deep ocean: A review,” Naval Underwater Systems Center, NewLondon, CT, NUSC Tech. Document 7561, Dec. 1985.
[3] R. J. Urick, Ambient Noise in the Sea. Los Altos, CA: Peninsula,1984.
[4] W. M. Carey, J. W. Fitzgerald, and D. G. Browning, “Low frequencynoise from breaking waves,” Naval Underwater Systems Center, NewLondon, CT, NUSC Tech. Document 8783, July 1990.
[5] B. R. Kerman, Ed., Sea Surface Sound, Natural Mechanisms of SurfaceGenerated Noise in the Ocean. Norwell, MA: Kluwer, 1988.
[6] B. R. Kerman, Ed., Natural Physical Sources of Underwater Sound.Norwell, MA: Kluwer, 1993.
[7] M. J. Buckingham and J. R. Potter, Sea Surface Sound’94. Singapore:World Scientific, 1995.
[8] R. M. Kennedy, T. K. Szlyk, and S. M. Wentworth, “Wind speed de-pendence of acoustic ambient vertical directional spectra at high fre-quency,” Naval Underwater Systems Center, West Palm Beach, FL,NUSC Tech. Rep. 8537, 1989.
[9] V. C. Anderson, “Variation of the vertical directionality of noise withdepth in the North Pacific,” J. Acoust. Soc. Amer., vol. 66, no. 5, pp.1446–1452, Nov. 1979.
[10] D. Wilson and R. Kneipfer, Preliminary results of experiment to mea-sure vertical directionality of ambient noise in shallow water Naval Un-dersea Warfare Center (NUWC), Newport, RI, Tech. Rep., 1995, un-published.
[11] T. G. Bell, “Wideband ABLE: A total energy bottom loss model forfrequencies from 50 to 3500 Hertz,” Sonalysts Rep. BLO-0501-003,Oct. 1990.
[12] C. Orr, M. Thiele, W. Johnson, and D. Small, “NRL acoustic arraysystems,” Sea Technol., vol. 34, no. 3, pp. 37–42, Mar. 1993.
[13] R. M. Kennedy and T. V. Goodnow, “Measuring the vertical directionalspectra caused by sea surface sound,” IEEE J. Ocean. Eng., vol. 15, no.4, pp. 299–310, Oct. 1990.
[14] R. M. Kennedy and T. V. Goodnow, “Ambient vertical directionalspectra at a TOTO near-reef site,” Naval Underwater Systems Center,Newport, RI, NUSC Tech. Rep. 8579, Aug. 1989.
[15] R. M. Kennedy, “Measuring the vertical directional spectra causedby sea surface sound,” Naval Underwater Systems Center, West PalmBeach, FL, NUSC Tech. Document 8733, 1990.
[16] A. H. Nuttall, “Estimation of noise directionality spectrum,” Naval Un-derwater Systems Center, New London, CT, NUSC Tech.l Rep. 4345,Sep. 1972.
[17] R. M. Kennedy, “Statistical properties of the sea surface sound dipolesource,” Naval Underwater Systems Center, New London, CT, NUSCTech. Document 8803, Dec. 1990.
[18] C. A. Clark, “Acoustic wave propagation in horizontally variablemedia,” IEEE J. Ocean. Eng., vol. 30, no. 1, pp. 188–197, Jan. 2005.
[19] G. R. Fox, “Ambient-noise directivity measurements,” J. Acoust. Soc.Amer., vol. 36, no. 8, pp. 1537–1540, Aug. 1964.
[20] R. J. Talham, “Ambient-sea-noise model,” J. Acoust. Soc. Amer., vol.36, pp. 1541–1544, 1964.
[21] W. S. Burdic, Underwater Acoustic System Analysis. EnglewoodCliffs, NJ: Prentice-Hall, 1991, ch. 10.

CLARK: VERTICAL DIRECTIONALITY OF MIDFREQUENCY SURFACE NOISE IN DOWNWARD-REFRACTING ENVIRONMENTS 619
[22] Oceanographic and Atmospheric Master Library Summary, , Oct.2002, Naval Oceanographic Office, Systems Integration Division,Stennis Space Center, MS.
[23] B. A. Becken, “The directional distribution of ambient noise in theocean,” Mar. Phys. Lab., Scripps Inst. Oceanogr., La Jolla, CA, MPLScripps 35283, Mar. 1961.
[24] W. M. Carey, “Near surface ambient noise sources,” Naval UnderseaWarfare Cntr., Newport, RI, NUWC Code 20, Jul. 2001.
[25] D. F. Yarger, C. A. Clark, and G. A. Leibiger, “Low frequency verticalnoise model,” Naval Underwater Syst. Cntr., New London, CT, NUSCTech. Rep. 8975, Oct. 1991.
[26] C. A. Clark and F. J. Pope, “Vertical directionality of mid-frequencysurface noise,” Naval Underwater Syst. Cntr., Newport, RI, NUWCTech. Memo 04-042A, Sep. 2004.
Cathy Ann Clark (S’03–M’04) received the B.S. de-gree in mathematics from Morehead State University,Morehead, KY, in 1970, the M.S. degree in mathe-matics from the University of Connecticut, Storrs, in1976, and the M.S. degree in electrical engineeringand the Ph.D. degree in applied mathematics with anemphasis on nonlinear rational difference equationsfrom the University of Rhode Island, Kingston, in2001 and 2004, respectively.
She was a Communications Systems Analyst atWestern Union Corporation, Mahwah, NJ, from
1969 to 1973. From 1973 to 1979, she was a Lecturer in mathematics at theUniversity of Connecticut and various community colleges in Connecticut.From 1979 to 1997, she was with Sonalysts, Inc., Waterford, CT, workingon underwater sound propagation modeling, satellite communications, andsubmarine tactical decision aid development. Since 1997, she has been withthe Sensors & Sonar Systems Department, Naval Undersea Warfare Center,Newport, RI. Her research interests include underwater acoustics, boundaryvalue problems, and difference equations.
Dr. Clark is a member of the American Mathematical Society, the Society forIndustrial and Applied Mathematics, and the International Society of DifferenceEquations.