Vertebrate neural stem cell segmentation, tracking and lineaging with validation and editing
21
Vertebrate Neural Stem Cell Segmentation, Tracking and Lineaging with Validation and Editing Mark Winter 1,2 , Eric Wait 1,2 , Badri Roysam 3 , Susan Goderie 4 , Rania Ahmed Naguib Ali 4 , Erzsebet Kokovay 4 , Sally Temple 4,* , and Andrew R. Cohen 1,* Mark Winter: [email protected]; Eric Wait: [email protected]; Badri Roysam: [email protected]; Susan Goderie: [email protected]; Erzsebet Kokovay: [email protected]; Sally Temple: [email protected]; Andrew R. Cohen: [email protected] 1 Department of Electrical Engineering and Computer Science, University of Wisconsin- Milwaukee, Wisconsin, USA 3 Department of Electrical and Computer Engineering, University of Houston, Texas, USA 4 Neural Stem Cell Institute, Rensselaer, New York, USA Abstract This protocol and the accompanying software program called LEVER enable quantitative automated analysis of phase contrast time-lapse images of cultured neural stem cells. Images are captured at 5 min. intervals over a period of 5 to 15 days as the cells proliferate and differentiate. LEVER automatically segments, tracks and generates lineage trees of the stem cells from the image sequence. In addition to generating lineage trees capturing the population dynamics of clonal development, LEVER extracts quantitative phenotypic measurements of cell location, shape, movement, and size. When available, the system can include biomolecular markers imaged using fluorescence. It then displays the results to the user for highly efficient inspection and editing to correct any errors in the segmentation, tracking or lineaging. In order to enable high- throughput inspection, LEVER incorporates features for rapid identification of errors, and learning from user-supplied corrections to automatically identify and correct related errors. Keywords stem cell; progenitor cell; clone; lineage; time-lapse recording; image sequence analysis; cell dynamics; lineage editing; stem cell tracking edit INTRODUCTION Understanding how neural stem cells (NSCs) give rise to different types of progeny is a fundamental question in developmental biology. Lineage analysis is a key aspect of quantifying the patterns of development for stem cells. The importance of gathering lineage * Correspondence to Sally Temple or Andrew R. Cohen. 2 authors contributed equally AUTHOR CONTRIBUTIONS M.W., E.W., B.R. and A.R.C. designed and implemented the computational tools and algorithms, prepared the figures and wrote the manuscript. R. A. N. A. did cell preparation and maintenance, helped with staining and verified lineage trees. S.K.G., E.K. and S.T. cultured and imaged the NSCs, provided manual lineage reconstructions for comparison, edited the automated lineages, made suggestions on the design of the software tools from a biological perspective and helped prepare figures and write the manuscript. COMPETING FINANCIAL INTERESTS The authors declare that they have no competing financial interests. NIH Public Access Author Manuscript Nat Protoc. Author manuscript; available in PMC 2012 June 1. Published in final edited form as: Nat Protoc. ; 6(12): 1942–1952. doi:10.1038/nprot.2011.422. NIH-PA Author Manuscript NIH-PA Author Manuscript NIH-PA Author Manuscript
-
Upload
independent -
Category
Documents
-
view
0 -
download
0
Transcript of Vertebrate neural stem cell segmentation, tracking and lineaging with validation and editing
Vertebrate Neural Stem Cell Segmentation, Tracking andLineaging with Validation and Editing
Mark Winter1,2, Eric Wait1,2, Badri Roysam3, Susan Goderie4, Rania Ahmed Naguib Ali4,Erzsebet Kokovay4, Sally Temple4,*, and Andrew R. Cohen1,*
Mark Winter: [email protected]; Eric Wait: [email protected]; Badri Roysam: [email protected]; SusanGoderie: [email protected]; Erzsebet Kokovay: [email protected]; Sally Temple: [email protected];Andrew R. Cohen: [email protected] of Electrical Engineering and Computer Science, University of Wisconsin-Milwaukee, Wisconsin, USA3Department of Electrical and Computer Engineering, University of Houston, Texas, USA4Neural Stem Cell Institute, Rensselaer, New York, USA
AbstractThis protocol and the accompanying software program called LEVER enable quantitativeautomated analysis of phase contrast time-lapse images of cultured neural stem cells. Images arecaptured at 5 min. intervals over a period of 5 to 15 days as the cells proliferate and differentiate.LEVER automatically segments, tracks and generates lineage trees of the stem cells from theimage sequence. In addition to generating lineage trees capturing the population dynamics ofclonal development, LEVER extracts quantitative phenotypic measurements of cell location,shape, movement, and size. When available, the system can include biomolecular markers imagedusing fluorescence. It then displays the results to the user for highly efficient inspection andediting to correct any errors in the segmentation, tracking or lineaging. In order to enable high-throughput inspection, LEVER incorporates features for rapid identification of errors, and learningfrom user-supplied corrections to automatically identify and correct related errors.
Keywordsstem cell; progenitor cell; clone; lineage; time-lapse recording; image sequence analysis; celldynamics; lineage editing; stem cell tracking edit
INTRODUCTIONUnderstanding how neural stem cells (NSCs) give rise to different types of progeny is afundamental question in developmental biology. Lineage analysis is a key aspect ofquantifying the patterns of development for stem cells. The importance of gathering lineage
*Correspondence to Sally Temple or Andrew R. Cohen.2authors contributed equallyAUTHOR CONTRIBUTIONSM.W., E.W., B.R. and A.R.C. designed and implemented the computational tools and algorithms, prepared the figures and wrote themanuscript. R. A. N. A. did cell preparation and maintenance, helped with staining and verified lineage trees. S.K.G., E.K. and S.T.cultured and imaged the NSCs, provided manual lineage reconstructions for comparison, edited the automated lineages, madesuggestions on the design of the software tools from a biological perspective and helped prepare figures and write the manuscript.COMPETING FINANCIAL INTERESTSThe authors declare that they have no competing financial interests.
NIH Public AccessAuthor ManuscriptNat Protoc. Author manuscript; available in PMC 2012 June 1.
Published in final edited form as:Nat Protoc. ; 6(12): 1942–1952. doi:10.1038/nprot.2011.422.
NIH
-PA Author Manuscript
NIH
-PA Author Manuscript
NIH
-PA Author Manuscript
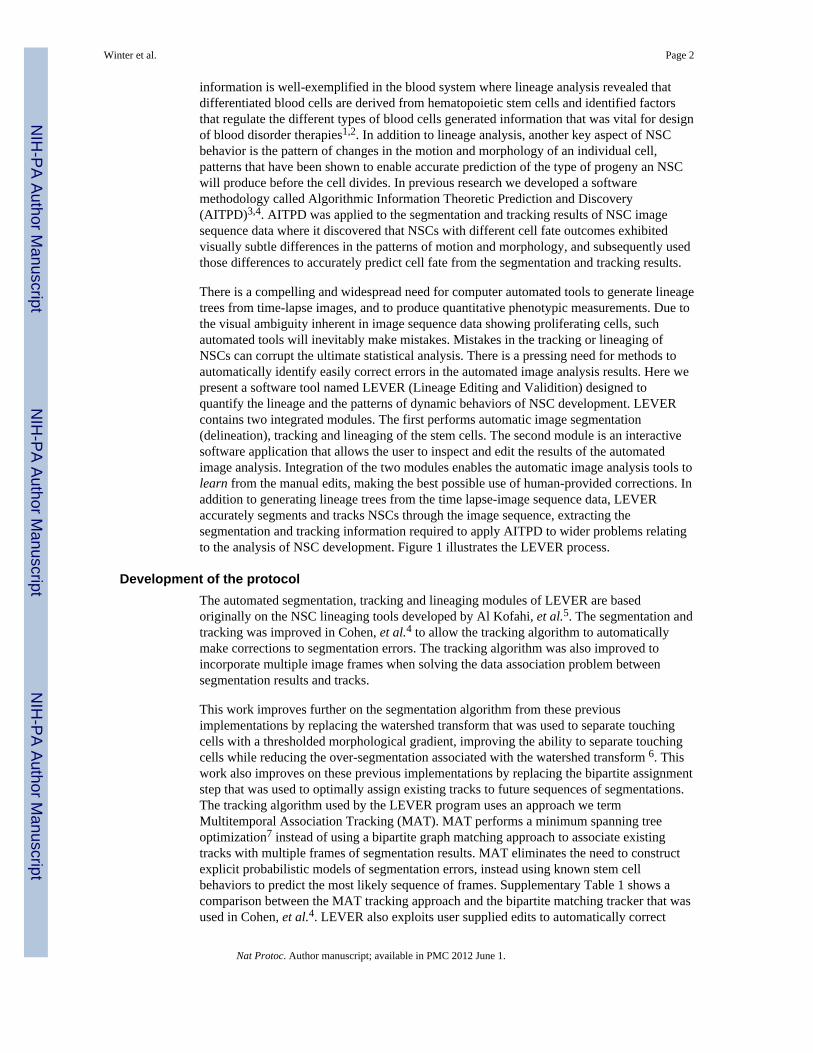
information is well-exemplified in the blood system where lineage analysis revealed thatdifferentiated blood cells are derived from hematopoietic stem cells and identified factorsthat regulate the different types of blood cells generated information that was vital for designof blood disorder therapies1,2. In addition to lineage analysis, another key aspect of NSCbehavior is the pattern of changes in the motion and morphology of an individual cell,patterns that have been shown to enable accurate prediction of the type of progeny an NSCwill produce before the cell divides. In previous research we developed a softwaremethodology called Algorithmic Information Theoretic Prediction and Discovery(AITPD)3,4. AITPD was applied to the segmentation and tracking results of NSC imagesequence data where it discovered that NSCs with different cell fate outcomes exhibitedvisually subtle differences in the patterns of motion and morphology, and subsequently usedthose differences to accurately predict cell fate from the segmentation and tracking results.
There is a compelling and widespread need for computer automated tools to generate lineagetrees from time-lapse images, and to produce quantitative phenotypic measurements. Due tothe visual ambiguity inherent in image sequence data showing proliferating cells, suchautomated tools will inevitably make mistakes. Mistakes in the tracking or lineaging ofNSCs can corrupt the ultimate statistical analysis. There is a pressing need for methods toautomatically identify easily correct errors in the automated image analysis results. Here wepresent a software tool named LEVER (Lineage Editing and Validition) designed toquantify the lineage and the patterns of dynamic behaviors of NSC development. LEVERcontains two integrated modules. The first performs automatic image segmentation(delineation), tracking and lineaging of the stem cells. The second module is an interactivesoftware application that allows the user to inspect and edit the results of the automatedimage analysis. Integration of the two modules enables the automatic image analysis tools tolearn from the manual edits, making the best possible use of human-provided corrections. Inaddition to generating lineage trees from the time lapse-image sequence data, LEVERaccurately segments and tracks NSCs through the image sequence, extracting thesegmentation and tracking information required to apply AITPD to wider problems relatingto the analysis of NSC development. Figure 1 illustrates the LEVER process.
Development of the protocolThe automated segmentation, tracking and lineaging modules of LEVER are basedoriginally on the NSC lineaging tools developed by Al Kofahi, et al.5. The segmentation andtracking was improved in Cohen, et al.4 to allow the tracking algorithm to automaticallymake corrections to segmentation errors. The tracking algorithm was also improved toincorporate multiple image frames when solving the data association problem betweensegmentation results and tracks.
This work improves further on the segmentation algorithm from these previousimplementations by replacing the watershed transform that was used to separate touchingcells with a thresholded morphological gradient, improving the ability to separate touchingcells while reducing the over-segmentation associated with the watershed transform 6. Thiswork also improves on these previous implementations by replacing the bipartite assignmentstep that was used to optimally assign existing tracks to future sequences of segmentations.The tracking algorithm used by the LEVER program uses an approach we termMultitemporal Association Tracking (MAT). MAT performs a minimum spanning treeoptimization7 instead of using a bipartite graph matching approach to associate existingtracks with multiple frames of segmentation results. MAT eliminates the need to constructexplicit probabilistic models of segmentation errors, instead using known stem cellbehaviors to predict the most likely sequence of frames. Supplementary Table 1 shows acomparison between the MAT tracking approach and the bipartite matching tracker that wasused in Cohen, et al.4. LEVER also exploits user supplied edits to automatically correct
Winter et al. Page 2
Nat Protoc. Author manuscript; available in PMC 2012 June 1.
NIH
-PA Author Manuscript
NIH
-PA Author Manuscript
NIH
-PA Author Manuscript
related segmentation errors. This inference-based approach to learning8 from user suppliededits was inspired by our prior work on retinal progenitor cells4, where tracking results wereused to automatically correct segmentation errors.
In the LEVER program we have combined the MAT algorithm with the inspection andediting tools in order to optimally utilize manual edits for correcting the segmentation andtracking results. Importantly, each time the user performs an edit operation, MATrecalculates the segmentation and tracking for all cells affected by the manual editthroughout the image sequence. Figure 2 shows the LEVER user interface, with the imagesequence data and automated segmentation and tracking results displayed in one window,and the lineage tree displayed in a second window. Edits and navigation of thespatiotemporal data can be done on either window. Figure 3 shows how a user can correct asegmentation error by simply specifying the correct number of cells in a region. Suchcorrections are then used to identify and correct related errors in subsequent image frames.
Experimental DesignHere we describe a protocol that uses the LEVER computer program to automate lineagingfor embryonic NSCs. To adapt the protocol for other cell types, the culture medium, growthfactors, and coating of tissue culture dishes must be optimized. In addition, the division rateand proliferative potential of the cells must be considered. For highly proliferative cells thatproduce large clones, the initial plating density should be low to minimize clonal progenyoverlapping and cells crawling on top of each other, which impedes tracking. In addition,cell motility is an important factor because cells can move out of the frame. If cells arehighly motile, conditions that limit cell movement to within the field of view can be used,for example by etching small islands of appropriate adhesive surfaces9. Increasing thetemporal resolution of imaging can make it easier to track highly motile cells. Depending onthe cell cycle length and motility, the time of recording should be adjusted. For some cells,live imaging for example with specific promoter driven fluorescent tags, such as eGFP, canbe acquired (e.g. once per hour). This is a useful technique that provides real-timeinformation on phenotype, but is limited by cell sensitivity to exciting wavelengths. Toelucidate the progeny phenotype at the end of clonal development, immunohistochemistry isperformed using specific markers appropriate for the particular cell type being imaged. TheLEVER program is applicable to any image sequence for which a human observer is able tospecify the correct tracking and lineaging. Applications of LEVER are limited to cell culturedensities at which it is possible for a human observer to validate and correct the automatedresults.
The segmentation algorithm described here is specific to phase contrast microscopy.Applications using a different imaging modality such as fluorescence microscopy willrequire a custom segmentation algorithm, or should investigate the use of either manuallineaging or the protocol developed by Murray et al. 10. Although the segmentationalgorithm has been optimized for mouse embryonic NSCs, it is still possible to applydirectly to other cell types. For example, in other current biological studies we have appliedthe segmentation algorithm to adult NSCs, and to hematopoietic stem cells. Because theadult NSCs tend to “clump” together, these image sequences require more manual editing toseparate touching cells. Since the adult NSC clones being analyzed are smaller thanembryonic clones, the overall editing time is similar. For the hematopoietic stem cells,because the cells are extremely motile we increased the temporal resolution of imaging toone frame per minute. This makes it easier for the tracker (and also for the human observer)to establish temporal correspondences between cells. The increased temporal resolutioncomes at a cost of decreased microscope throughput due to a reduction of the number ofmovies that can be captured simultaneously and also increases the data storage requirementand time required for application of the protocol. As a “rule of thumb”, temporal resolution
Winter et al. Page 3
Nat Protoc. Author manuscript; available in PMC 2012 June 1.
NIH
-PA Author Manuscript
NIH
-PA Author Manuscript
NIH
-PA Author Manuscript
should be chosen to be no less frequent than the cell radius divided by the maximum cellularvelocity. The use of phase contrast rather than fluorescence imaging has eliminated issuesrelated to phototoxicity for the cells imaged using this protocol, enabling long term highfrequency image capture. At the maximum temporal resolution of imaging, the use of a deepred filter in the light path has allowed long term survivability under continuous illuminationof a single field without impacting subsequent image analysis.
Controls—Experimental treatments and biological controls can be imaged from the sameculture plate during the same period of image acquisition. Software controls consist of thesample data and results (Data Sets 1 and 2, which are available for download along with theLEVER executables on the webpage: https://pantherfile.uwm.edu/cohena/www/lever.html.).In adapting the protocol to other applications, users should compare their images to thesample images for cellular appearance and dynamics, as well as for contrast, illuminationand background. Results can be compared to those obtained from the sample data.
Applications of the method—The full diversity of potential applications for thisprotocol include the segmentation, tracking and lineaging of proliferating cells imaged usingphase contrast microscopy. The software implementation of the protocol presented here hasbeen applied to segmenting, tracking and lineaging 2-D phase contrast image sequences ofadult and embryonic murine NSCs as well as to rat retinal progenitor cells andoligodendrocyte precursors4. The MAT tracking algorithm described here has also beenapplied to quantifying organelle transport deficiencies in Huntington’s disease11. The cellculture and staining steps of the protocol have been applied to the study of timing in corticalneurogenesis12. Our image analysis algorithms can adapt to normal variations in imagingconditions. In order to analyze other cell types imaged by other protocols, somemodifications and adjustments to the segmentation algorithm may be required. With theexception of the segmentation algorithm, all of the LEVER program including the tracking,lineaging and editing user interface, can be applied to any type of stem or tumorigenic cell.
Comparison with other methods—Recent research involving stem cell lineageanalysis has used manual tracking to follow individual cells through the image sequence andestablish parent-daughter cell relationships. In Gomes et al.13, thousands of rat retinalprogenitor cells were tracked manually to reconstruct their lineages. While manual trackingto generate lineages allows the analysis of population dynamics related to the lineage tree,the approach is not only tedious but it also fails to capture important properties of shape andmotion for the cells being analyzed. Additionally, manually generated lineages arechallenging to validate as it can be difficult to establish correspondences between the lineageand the image data. In Eilken, et al.14, a software tool was developed that allows users tomanually specify temporal correspondences between cells in every pair of image frames.This approach allows for the capture of attributes related to cell motion and shape, and alsoprovides correspondences between the lineage tree and the image data. This protocolrepresents a significant reduction in the amount of labor required compared to manualsegmentation approaches. The error rate for the automated image analysis portion of theprotocol is approximately 1–2% (see Supplementary Table 1). In contrast, manualsegmentation would require editing 100% of the image data.In order to enable highthroughput analysis of large quantities of stem cell data necessary for analyzing largepopulations, automated tools are required.
A number of automated stem cell lineaging trackers have been developed. In particular, asystem for automatically lineaging and editing the lineage for fluorescently image sequencesof C. elegans embryos was described in previous a Nature Protocols publication10. Theprotocol here differs in that it is designed for analyzing phase contrast vertebrate NSCsrather than fluorescence images of C. elegans embryos. Additionally, the tracking approach
Winter et al. Page 4
Nat Protoc. Author manuscript; available in PMC 2012 June 1.
NIH
-PA Author Manuscript
NIH
-PA Author Manuscript
NIH
-PA Author Manuscript
described in that protocol used a nearest neighbor strategy to associate segmentation resultswith tracks. Nearest neighbors data association approaches in multitarget tracking are error-prone under high target and noise density. The MAT tracking approach utilized by LEVERsolves the data association problem optimally across multiple image frames simultaneously,improving performance significantly under high target and noise density, as shown inSupplementary Table 1. Other sophisticated phase contrast vertebrate stem cell trackingprograms have also been developed, but to our knowledge none are available under an open-source freeware model. Li et al. describe a tracking approach that achieves an error ratecomparable to MAT but at the cost of significant implementation complexity 15. Chen etal.16 implemented segmentation and tracking for 3-D fluorescence image sequences ofthymocytes that included a statistically guided edit-based validation system similar to theprotocol described here, although the source code was not released. Our approach here isdesigned for phase contrast rather than fluorescence images and uses a more sophisticatedtracking algorithm (MAT) compared to their bipartite assignment tracking algorithm.Finally, the protocol presented here is unique in that the segmentation, tracking andlineaging algorithms are tightly coupled with the editing application allowing the program tolearn from user edits and automatically correct related errors. Here we are releasing both theautomatic image analysis and the user interface portions of the LEVER program under anopen-source license with the intention that future developments and improvements in stemcell segmentation and tracking can be integrated into the LEVER program in order to makethose improvements available to the wider biological community using a consistent userinterface.
LimitationsProgenitor cells that are difficult to grow as adherent cultures, that grow on top of oneanother, are highly motile or are particularly photosensitive will be challenging. In addition,dense cultures are difficult to segment and follow, so this protocol is most suitable for cellsthat can be plated initially at lower density then proliferate to form a low to moderatelydense culture.
One limitation of the current implementation of the LEVER computer program is that itrequires a computer running the Windows operating system. We do provide all of theLEVER source code so that anyone with access to a C++ compiler and the MATLABenvironment for a particular operating system should be able to use LEVER with thatoperating system. Our use of the GPL free software license will allow such a modifiedversion of LEVER to be redistributed. The authors are not aware of any issues that wouldprevent LEVER from running on a platform other than Windows, but this has not beentested to date.
There are two additional limitations to the protocol presented here. First, the segmentation isspecific to the visual appearance of the cells being segmented. For cells that are imaged byother imaging protocols, the segmentation algorithm may not work as well. Such image datamay still be processed but will require additional manual editing subsequent to theautomated image analysis. In order to mitigate this limitation, we have implemented thesegmentation in MATLAB in the hopes that it will ease the creation of new segmentationalgorithms for other types of stem cells. The second limitation is that the segmentationalgorithm can take a long time to run on older computers. On our reference computer whichcontains a dual quad core Intel Xeon X5570 with 16 processing cores and 24 GB of RAM,segmentation fully exploits the parallel processing capabilities of the machine and typicallytakes 5 to 15 min.
Winter et al. Page 5
Nat Protoc. Author manuscript; available in PMC 2012 June 1.
NIH
-PA Author Manuscript
NIH
-PA Author Manuscript
NIH
-PA Author Manuscript
MATERIALSREAGENTS
Tissue cultureDMEM (Invitrogen #11960-051)
L-Glutamine (Invitrogen #25030-081)
Na-Pyruvate (Invitrogen #15039-019)
N2 Supplement (Invitrogen #17502-04)
B27 Supplement (Invitrogen # 17504-044)
FGF2 (Invitrogen #13256-029)
Papain (Worthington #3126)
poly-l-lysine (Sigma #P4707)
DNAse (Sigma # DN25)
KCl (Sigma #P5405)
NaOH (Sigma #S5881)
NAH2PO4 (Sigma #S3139)
MgCL2 (Sigma #M2670)
Glucose (Sigma # G6152)
Sorbital (Sigma #S3889)
ImmunohistochemistryPIPES (Sigma #P1851)
HEPES (Sigma #H3375)
EGTA (Sigma #E4378)
MgCl2.6H2O (Sigma #M2670)
KOH (Fisher #P251)
Paraformaldehyde (PolyScience #380)
10X PBS (Invitrogen # AM9624)
Triton X-100 (Sigma T9284)
Normal goat serum (Vector #S-1000)
B-tubulin III antibody (Sigma #T8660)
Cy5-conjugated goat-anti-mouse IgG2b (Invitrogen # A21248)
DAPI (Invitrogen A21248)
EQUIPMENTImaging
Zeiss Axio-Observer Inverted Z1 microscope with phase contrast and fluorescencecapabilities
Winter et al. Page 6
Nat Protoc. Author manuscript; available in PMC 2012 June 1.
NIH
-PA Author Manuscript
NIH
-PA Author Manuscript
NIH
-PA Author Manuscript
Hamamatsu digital camera
Pecon incubation chamber with controlled temperature at 37°C, 98% humidity and 5%CO2
Motorized XYZ stage for imaging multiple points
Zeiss Axiovision software
Tissue cultureDissection hood
Dissection microscope
Brain dissection instruments
Biological safety cabinet
Centrifuge
Oven set at 37°C
CO2 incubator (37°C, 5% CO2 )
Refrigerator
−20° freezer
Certified fume hood
Hemocytometer
Pipettors
100mm petri dish (Krackeler 97-4002)
24 well flat bottomed tissue culture treated plates (Corning #83-3526)
15 ml conical tubes (Sarstedt-red cap #62.554.002)
50ml filter systems (Costar #430320)
5ml syringes (BD #301603)
0.22μm syringe filters (Krackler Scientific #431219)
25cm filter paper (Fischer #9-801G)
Computer equipmentSuggested computer system: Windows 7 operating system, dual quad core Xeon X5570processors (16 cores total with hyperthreading), 24 GB RAM, 2 TB ESATA external harddrive for image data storage, dual monitors. All timing information in the procedure belowis based on this reference system.
Minimal computer requirements: Windows operating system (XP or later) for runningLEVER.exe. Approximately 2 GB free disk space is required for the executables and sampledata.
Downloading the software: Compiled Windows executables as well as all of the LEVERsource code and sample image data and results (Data sets 1 and 2) can be downloaded fromhttps://pantherfile.uwm.edu/cohena/www/lever.html. The software will be released underthe GNU public license. Details of the license are described in the source code, but in
Winter et al. Page 7
Nat Protoc. Author manuscript; available in PMC 2012 June 1.
NIH
-PA Author Manuscript
NIH
-PA Author Manuscript
NIH
-PA Author Manuscript
essence it allows a user to use, modify and redistribute LEVER as long as the open sourceaspect is maintained.
REAGENTS SETUP1X PBS—Using aseptic technique in a biological safety cabinet, dilute 100mls of 10X PBSsolution with 900mls of sterile water. This can be stored at room temperature for up to threeyears.
Hibernation (HIB) Buffer—To 1L sterile water add 2.4g KCl, 0.2g NAOH, 0.6gNAH2PO4, 0.1g MgCL2, 2.2g Na-pyruvate, 1.0g glucose, and 36.4g sorbitol. pH to 7.3 withNAOH. This can be stored at room temperature for up to one month.
Serum Free Culture Medium—Prepare using aseptic technique in a biological safetycabinet. For every 10mls of medium use 9.5mls DMEM, add 100μl L-glutamine, 100μl Na-Pyruvate, 100μl N2 supplement, 200μl B27 supplement, 10μl FGF2. Sterile filter using a 50ml conical filter system. This can be stored at 4°C overnight.
Papain solution—To 5mls of DMEM add 10 units papain and 15μl DNase. Sterile filterthrough a 0.22μm syringe attached to a 5ml syringe. Incubate at 37°C for 30 minutes anduse within an hour.
2X Phem Buffer—In a flask add 450 ml sterile water and a magnetic stir bar. Place on astirrer. Add 40 pellets KOH (the KOH adjusts the pH to dissolve the PIPES buffer). Add inorder: 18.15g PIPES, 5.95g HEPES, 3.80g EGTA, 0.812g MgCl2.6H2O. Add pellets ofKOH one at a time until all PIPES is dissolved, then bring up to 500mls with sterile water.This should be used in the same day to make 4% Phem Fix. Recipe follows.
Paraformaldehyde—In a certified fume hood heat 450mls water to 60–70°C on a heatedstirrer, add 40g of paraformaldehyde while stirring with a magnetic stir bar. Turn off heatand allow to dissolve. Add 1–2 drops 10N NaOH (or 1 pellet) to clear the solution and coolto room temperature. This should be used in the same day to make 4% Phem Fix. Recipefollows.
4% PHEM Fix—Combine 500ml 2X Phem Buffer with 500ml Paraformaldehyde. CheckpH with pH strips in fume hood and adjust pH to 7.4 with NaOH. Vacuum filter throughfilter paper. This can be aliqouted and stored at −20°C up to 6 months.
Antibody Diluent—1X PBS with 0.1% Triton X-100 This can be stored at 4°C for 2weeks.
Blocking solution—1X PBS with 0.1% Triton X-100 plus 10% normal goat serum. Thiscan be stored at 4 °C for up to one week.
PROCEDUREPreparing and imaging NPCs ◆ timing : 5–15 days
1) In a biological safety cabinet, coat a 24 well plate with poly-l-lysine by pipetting500ul of poly-l-lysine into 8 wells and incubate at room temperature for 30minutes. Rinse plates three times with sterile water and allow to dry.
Winter et al. Page 8
Nat Protoc. Author manuscript; available in PMC 2012 June 1.
NIH
-PA Author Manuscript
NIH
-PA Author Manuscript
NIH
-PA Author Manuscript
2) To isolate NPCs from the cerebral cortex of embryonic day (E)12 SwissWebster mouse embryos, euthanize pregnant dams by cervical dislocation andremove E12 pups to a petri dish with HIB Buffer.
CRITICAL STEP!: All animal procedures were approved by the University atAlbany, Institutional Animal Care and Use Committee.
3) Under a dissection scope in a clean dissection hood, euthanize embryos bydecapitation and dissect cerebral cortices and place in HIB on ice.
4) Transfer cortices to a 15 ml conical tube and allow them to sink to the bottom ofthe tube.
5) Remove supernatant and add 5 mls papain solution and incubate on a rocker at37°C for 30 minutes.
6) Wash cells with DMEM three times by centrifugation at 405G for 10 minutes at4°C.
7) Count cells using a hemocytometer and plate at a density of 2000 cells/well in 8wells of a poly-l-lysine coated 24 well tissue culture dish (from Step 1) in serumfree culture medium as described previously17,18.
8) Allow cells to settle in an incubator and then place under the Zeiss Axio-Observer Inverted Z1 microscope equipped with an incubation chamber. Openthe Ziess Axiovision software and set up the experimental parameters using themultidimensional acquisitions tool. Specific instructions on how to use ZiessAxiovision can be found athttp://www.zeiss.de/C1256F8500454979/0/94C38663C2E22AD2C1256F8E00384B5B/$file/avguide.pdf. Image nine fields/well every five minutes with a 10X phaseobjective and 32ms shutter time for 5 to 15 days, refeeding every three days oras needed. CRITICAL STEP! Save all the field coordinates used.
9) Export zvi image files from the microscope software as individual TIFF files.The file names must be of the form “datasetname_tXXX.tif”, where XXX is thezero-padded time stamp for the image. For example, “E120527090025_05_t001.tif “ and “E120527090025_05_t500. tif “ are both appropriate filenames.CRITICAL STEP! LEVER is able to work with an arbitrary sized timestamp(number of X’s), but the number of digits in the timestamp must be fixed forevery image in the sequence. Users of microscope software other than the ZeissAxiovision may need to write a batch file or conversion script to make sure thefilename is in the appropriate format. A freeware imaging tool called“Irfanview” can be used for batch renaming.
10) To stain cells for cell type specific markers such as the neuronal marker β-tubulin III in order to identify the progeny, firstly remove culture medium andfix cells with 0.5mls per well 4% PHEM fix at room temperature for 20 minutes.
11) Incubate cells in 0.5 mls/ well blocking buffer for 30 minutes at roomtemperature.
12) Remove blocking buffer and incubate cells with 0.5mls/well anti-β-tubulin IIIantibody diluted 1:600 in antibody diluent (4.0mls total volume) overnight at4°C.
13) Remove antibody solution, rinse with 0.5–1.0mls/well PBS and then incubatewith 0.5mls/well Cy-5 conjugated goat anti-mouse IgG2B diluted 1:1000 inantibody diluents (4.0 mls total volume) for one hour at room temperature.
Winter et al. Page 9
Nat Protoc. Author manuscript; available in PMC 2012 June 1.
NIH
-PA Author Manuscript
NIH
-PA Author Manuscript
NIH
-PA Author Manuscript
14) Remove antibody solution and rinse three times in 0.5–1.0mls/ well PBS.
15) Remove PBS and incubate in 0.5mls/well DAPI diluted 1:1000 in antibodydiluents (4.0mls total) for 5 minutes at room temperature to label nuclei.
16) Register the staining information with the timelapse recording by placing thetissue culture dish back on the microscope and revisiting the fields that weretime-lapse recorded using the field coordinates saved in Step 1 in the Axiovisionsoftware. Capture fluorescent and phase contrast images for each marker perfield. This information can be edited into the final lineage tree (see Step 23).
Installing the software ◆ timing : 5–10 minutes17) Download the LEVER executables and/or source code from
https://pantherfile.uwm.edu/cohena/www/lever.html. An example data set (DataSet 1) is also available for download. A reduced size data set (Data Set 2) isavailable for download in cases where available disk storage space is limited.Install the Microsoft Visual C++ runtime from the link on the webpage. If youdo not have MATLAB version 2009b or later installed on your computer, youmust also download and install the MATLAB runtime (MCRInstaller.exe,170MB). Full instructions for installation are given on the webpage.
18) Launch the software by double clicking on the LEVER.exe program from thefolder where you installed the executables. The first time that the softwareexecutes there may be a one-time delay of up to 1 min. for LEVER to initialize.Alternatively, you may launch LEVER from within MATLAB by browsing tothe source code folder and executing LEVER.m.
? TROUBLESHOOTING
Segmenting, tracking and lineaging ◆ timing : 5–15 minutes19) Select the first image in the data set that you wish to edit or process by browsing
to the folder where you exported the image sequence data to (from Step 9). Afterthe first image is selected, a dialog box allows you to either “Run Segmentationand Tracking” or to “Use Existing Data”. To begin processing a new data set,choose “Run Segmentation and Tracking” and choose a location and filenamefor the segmentation, tracking and lineaging results file. To continue withediting an existing data set or to try the software with the sample data, choose“Use Existing Data” and proceed to Step 20. CRITICAL STEP! Note that thesegmentation algorithm utilizes all available computing resources. While thesegmentation is running, the performance of other applications on this computerwill be impacted. In particular, do not attempt to edit data while segmentation isrunning.
◆ Pause point. Tracking and lineaging results are stored at this point for laterediting. Proceed to Step 20 to begin editing these results.
? TROUBLESHOOTING
Editing segmentation, tracking and lineaging results ◆ timing : 30 minutes - 4 hours20) Select the results file for the image sequence of interest that was processed in
Step 19. The name of the image sequence is posted on the title bar of the openfile dialog box. If the data set name from the image data does not match thedefault naming convention LEVER will post a warning dialog.
Winter et al. Page 10
Nat Protoc. Author manuscript; available in PMC 2012 June 1.
NIH
-PA Author Manuscript
NIH
-PA Author Manuscript
NIH
-PA Author Manuscript
! CRITICAL STEP Check that the results file chosen at this step matches theimage sequence chosen in Step 19. LEVER will potentially allow (after postinga warning if the filenames do not match) segmentation, tracking and lineagingresults to be displayed on the wrong image sequence data.
? TROUBLESHOOTING
21) Visualize results and navigate around the LEVER image and lineage windowsusing both the mouse and keyboard. Ideally, maximize each of the LEVERwindows on separate displays. Activate the zoom-in tool and then click a pointin the window to zoom centered at that point. This tool is especially useful as itallows the image data to be viewed in large detail. It is also possible to click anddrag with the zoom-in tool activated to specify a rectangular region to zoom inon. Activate the pan tool and then click and drag to move the display data.Double-click with any of the zoom-in, zoom-out or pan tools selected to resetthe window view. Left clicking on a cell in the image data window will displaythe lineage for that cell in the lineage window. The current image frame forLEVER can be controlled from either window. The current image time isindicated by the red line in the lineage window. Left clicking in the lineagewindow will move the red line. It is also possible to change the current timeusing the keyboard up and down arrow keys or the mouse scroll wheel toincrement or decrement the current time. The PgUp and PgDn buttons move thecurrent time forward or backward by five image frames. Playing the movie as ananimation can be toggled by using the “Play” option from the “View” menu ineither window. The “View” menu also allows you to enter the image frame youwish to view. Additionally, the “View” menu allows you to toggle the display ofsegmentation and tracking results. This feature is particularly helpful whentrying to resolve visually ambiguous cell dynamics.
! CRITICAL STEP After you have completed using any of the view navigationtools you must be sure to deactivate that tool or subsequent keyboard or mouseinputs will be directed to the view navigation tool rather than to the LEVERapplication. Clicking an active tool button will deactivate the tool.
22) Editing of segmentation results, tracking results, or lineaging to correct errorscan be done following options A, B or C, respectively. Note that it is notnecessary to fully correct all segmentations. Correct the segmentation as neededto enable the lineage tree to be correctly captured. For example, in cases where amitosis is not visually apparent, a single segmentation can be split into two toallow the daughter cells to be labeled properly on the lineage tree.
A) Editing segmentation results to correct segmentation errorsi. If multiple cells were segmented as a single cell, right-click on the single cell,
select “Add Cells” from the context menu and then choose the number of cells toadd.
ii. If a segmentation was missed completely, right-click on the background at the pointwhere the segmentation should go, select “Add Cells” from the context menu andthen choose “1” cells to add.
iii. Holding down the “shift” key while clicking a cell will split a single cell into two.Holding down the “ctrl” key while clicking will select multiple cells, indicated bydashed lines, which can then be deleted (“del” key) or merged (“enter” key).
! CRITICAL STEP Some edit operations (particularly segmentation corrections)will impact future results. Once you are done editing a frame, be sure to click the
Winter et al. Page 11
Nat Protoc. Author manuscript; available in PMC 2012 June 1.
NIH
-PA Author Manuscript
NIH
-PA Author Manuscript
NIH
-PA Author Manuscript
“Learn from Edits”, if it is enabled, to propagate your changes to future imageframes.
B) Editing tracking results to correct tracking errorsi. Tracking errors can be corrected either using “drag and drop” or by entering the
correct tracking label directly. For “drag-and-drop”, if tracks were swappedbetween two cells, simply click on one cell and while holding the mouse drag overthe top of the other cell and release. To enter tracking label directly, right-click onthe cell and choose “Change Label”.
C) Editing lineage results to correct lineage errorsi. Lineage errors can be corrected by adding or removing mitoses on either window.
In the lineage window, right-click on the circular cell label and select “RemoveMitosis”. You will be prompted to select the daughter cell whose connection to theparent will be preserved. To add a mitosis, right-click on the vertical line definingthe cell on the lineage tree and select “Add Mitosis”. Specify the sister cell andselect “OK”. The same operations can be performed on the image data window aswell by right-clicking within the cell segmentation outline.
◆ Pause point. Editing may be saved and continued at any point until the lineage isfully corrected.
Exporting results ◆ timing: 5–15 minutes23) Phenotype information can be specified for individual cells. Right-click on a cell
and select the “Phenotype” option. The phenotype of “died” is included bydefault. Select “Create new phenotype…” to enter a new phenotype. Whentyping in the phenotype, standard LaTeX formatting applies, e.g. you can type“\beta” to display the symbol “β”. The phenotypes for the cells within a cloneare drawn on the lineage tree for that clone. Select “View/Labels” to hide thetracking colors on the lineage tree making phenotype data easier to visualize orfor export.
24) Once all phenotype information has been entered choose “File/Export LineageTree” to create a new window showing the lineage without tracking numbers.You can print or save this lineage to a file. Finally, the legend showingphenotype information can be manipulated using the “arrow” tool found on thetoolbar, allowing its location or font to be changed.
25) A log of every editing operation, the user that performed the edit and the time(in seconds) the edit operation required is stored in the log file. The log file isgiven the same name as the data set being edited, but with the extension“_log.csv”. This file is stored as a comma separated value file and can be openedviewed and edited directly using any spreadsheet application.
! CRITICAL STEP LEVER will be unable to write to the log file if it is openfor viewing in a spreadsheet program and will display a warning messageprompting you to either close the log file or create a new one.
26) Once a lineage has been completely edited, a movie combining the image datawindow with the lineage window using the current view settings can beexported. Choose “File/Export AVI” from the LEVER menu. The movie isexported as a cinepak compressed “.avi” file. The video shows the lineage treein one half of the frame and the image data with segmentation and trackingoverlaid in the other half. The current view settings from the lineage and image
Winter et al. Page 12
Nat Protoc. Author manuscript; available in PMC 2012 June 1.
NIH
-PA Author Manuscript
NIH
-PA Author Manuscript
NIH
-PA Author Manuscript

windows are preserved in the video; these should be set as desired prior toexporting. A free application for Microsoft called “Windows movie maker” canthen be used to provide additional compression for different playbackenvironments. Supplementary videos 1 and 2 were generated using thismechanism. Supplementary video 3 was generated by combining Supplementaryvideo 2 and an adult NSC image sequence using a custom MATLAB script.
27) The lineage data along with shape and motion parameters for each cell can beexported to a format suitable for opening with any spreadsheet program.Choosing “Export Cell Metrics” from the File menu will generate a commaseparated value (“.CSV”) file containing the tracking label, parent, siblingoffspring and root (originating cell for the lineage tree) labels, lifespan and themean, standard deviation, maximum and minimum values for cell velocity andsize. An example of this information is available in the Supplementary Results.
28) The tracking results can be exported for use by the Algorithmic InformationTheoretic Prediction and Discovery software tools4 by choosing “Export AITPDdata” from the File menu. Analysis of the stem cell dynamic behaviors usingAITPD requires additional MATLAB programming scripts. Details on usingAITPD can be found in Cohen, et al.4
ANTICIPATED RESULTSAt the completion of this protocol, a user can expect to have gone from time-lapse imagesequence data showing the development of one or more vertebrate NSCs imaged usingphase contrast microscopy to a fully corrected lineage tree. A log file containing a completelist of the edits, with time, date and the id of the user creating the edits is generated. A movieshowing the lineage tree simultaneously with the image sequence data with segmentationand tracking overlaid throughout the image sequence can be generated. Lineage statistics forevery cell in the movie including parent-daughter cell relationships, and cell lifetimes aswell as cell velocity and size information can be exported to a spreadsheet program forfurther analysis. Thus, digitization of the image sequence by LEVER will enable in depthstatistical analysis of parameters such as changes in cell cycle time, cell motility, cellphenotype and overall lineage structure.
Figure 4 shows an example of a LEVER generated lineage tree with phenotypic informationfor Data set 1 (left panel). This lineage required approximately 30 min. to fully correct.Figure 4 also shows an example plot generated from the exported data showing averagevelocity, size and cell cycle time for the each of the NSCs in the lineage tree arranged byincreasing order of division number (right panel). The full segmentation, tracking andlineaging results can also be exported for more sensitive analysis using the AlgorithmicInformation Theoretic Prediction and Discovery software tools4. These software tools werepreviously applied to predicting cell fate of individual NSCs, but have not yet been appliedto studying clonal properties of development because of the difficulty in obtaining fullycorrected lineages. The protocol presented here will enable the comprehensive study of thetemporal dynamics of cell cycle time and population growth, motion, morphology andassociations between cells across large numbers of clones.
TIMINGSteps 1–16: The image acquisition portion of the protocol typically requires 5 to 15 days forNSCs, but this could vary depending on the cell cycle time, proliferative potential andsurvival of the cell type under study. During this timeframe, the system can capture up to100 movies simultaneously. Each movie typically contains a few clones.
Winter et al. Page 13
Nat Protoc. Author manuscript; available in PMC 2012 June 1.
NIH
-PA Author Manuscript
NIH
-PA Author Manuscript
NIH
-PA Author Manuscript
Steps 17–18: installing the software takes 5–10 min.
Step 19: Obtaining segmentation, tracking and lineage results takes 5–15 min. Note that thetime requirement will depend on the specific image sequence and on the computer used. Thetime requirement will also scale (nearly) linearly with the number of processor coresavailable. It is suggested that these steps be run on a dual quad core processor if possible.
Steps 20–22: Editing results for a single clone takes from 30 min. to four hours dependingon the number of cells in the clone.
Steps 23–28: Exporting the results takes 5–15 min.
This sample timing information is for a 504 frame image sequence, with each imagecontaining 1344 × 1024 pixels, an average of 46 cells per frame, and a maximum of 120cells in a single frame.
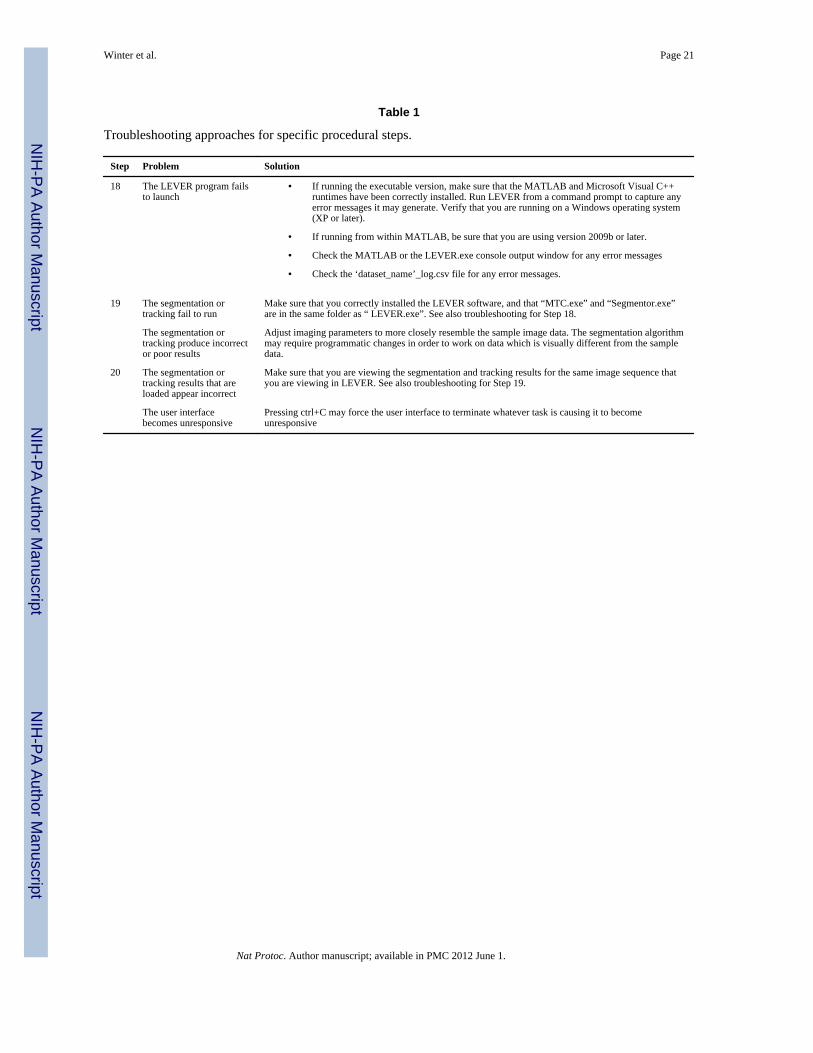
TROUBLESHOOTINGTroubleshooting advice can be found in Table 1.
Supplementary MaterialRefer to Web version on PubMed Central for supplementary material.
AcknowledgmentsThis project was supported by the University of Wisconsin-Milwaukee, and by grant number NS033529 from theNational Institutes of Health (NIH) and by New York State Department of Health (NYSDOH) Contract C024352from the Empire State Stem Cell Fund and the Regenerative Research Foundation. This project was also supportedby NIH grant number R01EB005157 and by Grant Number R01NS076709 from the National Institute OfNeurological Disorders And Stroke. The authors would like to thank Samareh Shahmohammadi, Ryan Ference,Aislyn DiRisio, Sarah Hardwick, Sarah M. Goderie, Erin McAuley, Raymond Futia and Claire Davenport for theirhelp with cell culture and lineage validation.
References1. Giebel B, Punzel M. Lineage development of hematopoietic stem and progenitor cells. Biological
chemistry. 2008; 389:813–824. [PubMed: 18627318]2. Ogawa M. Differentiation and proliferation of hematopoietic stem cells. Blood. 1993; 81:2844–
2853. [PubMed: 8499622]3. Cohen AR, Bjornsson C, Temple S, Banker G, Roysam B. Automatic Summarization of Changes in
Biological Image Sequences using Algorithmic Information Theory. IEEE Trans Pattern Anal MachIntell. 2009; 31:1386–1403. [PubMed: 19542574]
4. Cohen AR, Gomes F, Roysam B, Cayouette M. Computational prediction of neural progenitor cellfates. Nat Methods. 2010; 7:213– 218. [PubMed: 20139969]
5. Al-Kofahi O, et al. Automated cell lineage tracing: a high-throughput method to analyze cellproliferative behavior developed using mouse neural stem cells. Cell Cycle. 2006; 5:327– 335.[PubMed: 16434878]
6. Gonzales, R.; Woods, R.; Eddins, S. Digital Image Processing Using MATLAB. GatesmarkPublishing; Knoxville, TN: 2009.
7. Papadimitriou, CH.; Steiglitz, K. Combinatorial Optimization: Algorithms and Complexity. DoverPublications; Mineola, NY: 1998.
8. Koller, D.; Friedman, N. Probabilistic Graphical Models:Principles and Techniques. MIT Press;Cambridge, Massachusetts: 2009.
9. Ravin R, et al. Potency and fate specification in CNS stem cell populations in vitro. Cell Stem Cell.2008; 3:670–680. [PubMed: 19041783]
Winter et al. Page 14
Nat Protoc. Author manuscript; available in PMC 2012 June 1.
NIH
-PA Author Manuscript
NIH
-PA Author Manuscript
NIH
-PA Author Manuscript
10. Murray JI, Bao Z, Boyle TJ, Waterston RH. The lineaging of fluorescently-labeled Caenorhabditiselegans embryos with StarryNite and AceTree. Nat Protocols. 2006; 1:1468–1476.
11. Winter, M.; Fang, C.; Banker, G.; Roysam, B.; Cohen, A. Microscopic Image Analysis withApplications in Biology. Chicago IL: 2011. Axonal Transport Analysis Using MultitemporalAssociation Tracking. in press
12. Shen Q, et al. The timing of cortical neurogenesis is encoded within lineages of individualprogenitor cells. Nat Neurosci. 2006; 9:743–751. [PubMed: 16680166]
13. Gomes FLAF, et al. Reconstruction of rat retinal progenitor cell lineages in vitro reveals asurprising degree of stochasticity in cell fate decisions. Development. 2011; 138:227–235.[PubMed: 21148186]
14. Eilken HM, Nishikawa SI, Schroeder T. Continuous single-cell imaging of blood generation fromhaemogenic endothelium. Nature. 2009; 457:896–900. [PubMed: 19212410]
15. Li K, et al. Cell population tracking and lineage construction with spatiotemporal context. MedicalImage Analysis. 2008; 12:546–566. [PubMed: 18656418]
16. Chen Y, Ladi E, Herzmark P, Robey E, Roysam B. Automated 5-D analysis of cell migration andinteraction in the thymic cortex from time-lapse sequences of 3-D multi-channel multi-photonimages. J Immunol Methods. 2009; 340:65–80. [PubMed: 18992251]
17. Qian X, et al. Timing of CNS cell generation: a programmed sequence of neuron and glial cellproduction from isolated murine cortical stem cells. Neuron. 2000; 28:69–80. [PubMed:11086984]
18. Shen Q, et al. Endothelial cells stimulate self-renewal and expand neurogenesis of neural stemcells. Science. 2004; 304:1338–1340. [PubMed: 15060285]
Winter et al. Page 15
Nat Protoc. Author manuscript; available in PMC 2012 June 1.
NIH
-PA Author Manuscript
NIH
-PA Author Manuscript
NIH
-PA Author Manuscript
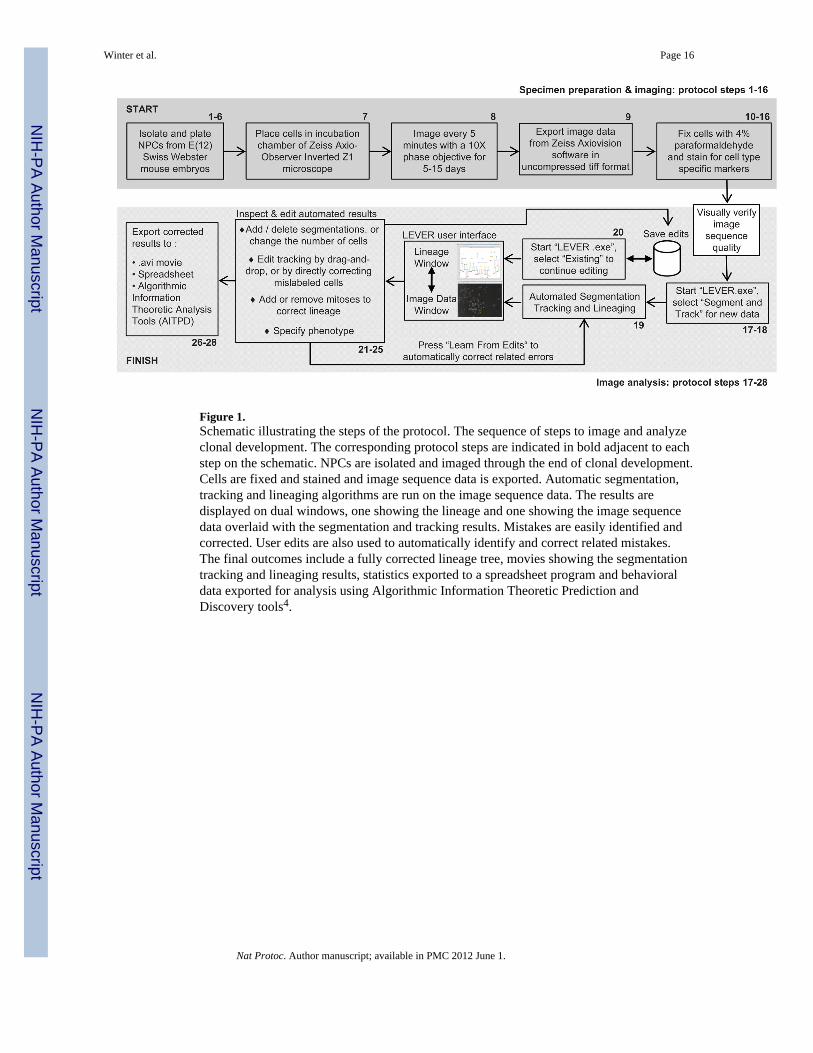
Figure 1.Schematic illustrating the steps of the protocol. The sequence of steps to image and analyzeclonal development. The corresponding protocol steps are indicated in bold adjacent to eachstep on the schematic. NPCs are isolated and imaged through the end of clonal development.Cells are fixed and stained and image sequence data is exported. Automatic segmentation,tracking and lineaging algorithms are run on the image sequence data. The results aredisplayed on dual windows, one showing the lineage and one showing the image sequencedata overlaid with the segmentation and tracking results. Mistakes are easily identified andcorrected. User edits are also used to automatically identify and correct related mistakes.The final outcomes include a fully corrected lineage tree, movies showing the segmentationtracking and lineaging results, statistics exported to a spreadsheet program and behavioraldata exported for analysis using Algorithmic Information Theoretic Prediction andDiscovery tools4.
Winter et al. Page 16
Nat Protoc. Author manuscript; available in PMC 2012 June 1.
NIH
-PA Author Manuscript
NIH
-PA Author Manuscript
NIH
-PA Author Manuscript
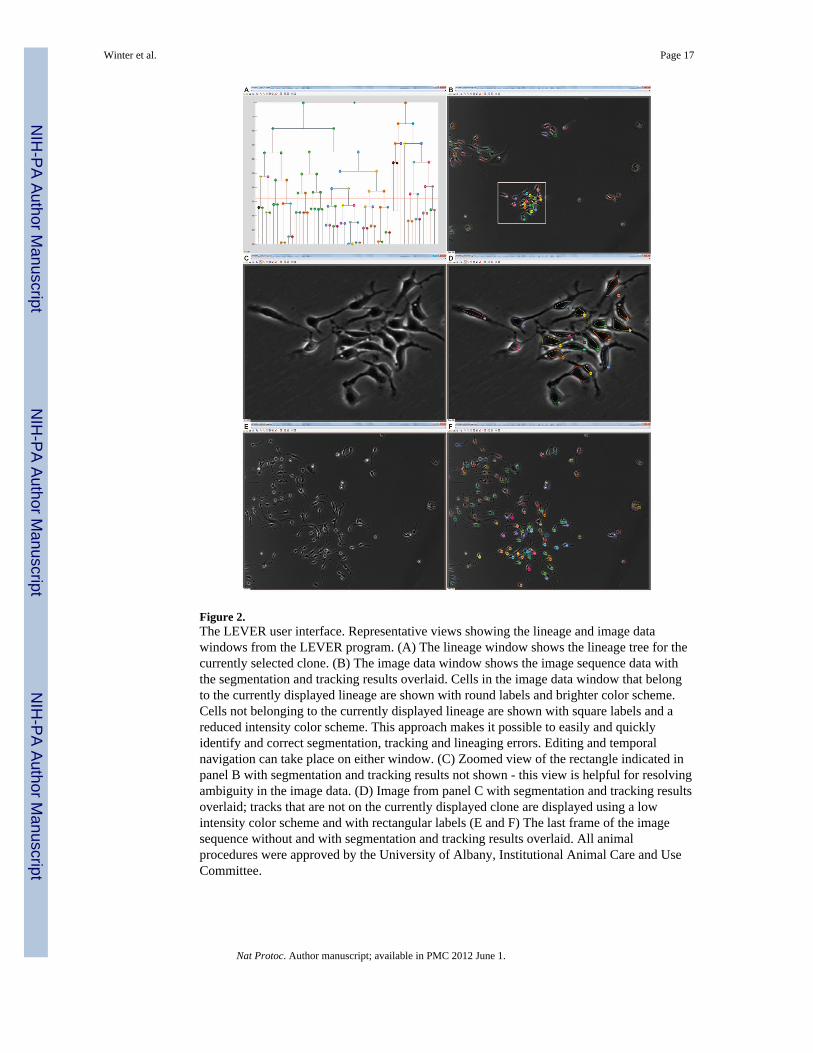
Figure 2.The LEVER user interface. Representative views showing the lineage and image datawindows from the LEVER program. (A) The lineage window shows the lineage tree for thecurrently selected clone. (B) The image data window shows the image sequence data withthe segmentation and tracking results overlaid. Cells in the image data window that belongto the currently displayed lineage are shown with round labels and brighter color scheme.Cells not belonging to the currently displayed lineage are shown with square labels and areduced intensity color scheme. This approach makes it possible to easily and quicklyidentify and correct segmentation, tracking and lineaging errors. Editing and temporalnavigation can take place on either window. (C) Zoomed view of the rectangle indicated inpanel B with segmentation and tracking results not shown - this view is helpful for resolvingambiguity in the image data. (D) Image from panel C with segmentation and tracking resultsoverlaid; tracks that are not on the currently displayed clone are displayed using a lowintensity color scheme and with rectangular labels (E and F) The last frame of the imagesequence without and with segmentation and tracking results overlaid. All animalprocedures were approved by the University of Albany, Institutional Animal Care and UseCommittee.
Winter et al. Page 17
Nat Protoc. Author manuscript; available in PMC 2012 June 1.
NIH
-PA Author Manuscript
NIH
-PA Author Manuscript
NIH
-PA Author Manuscript
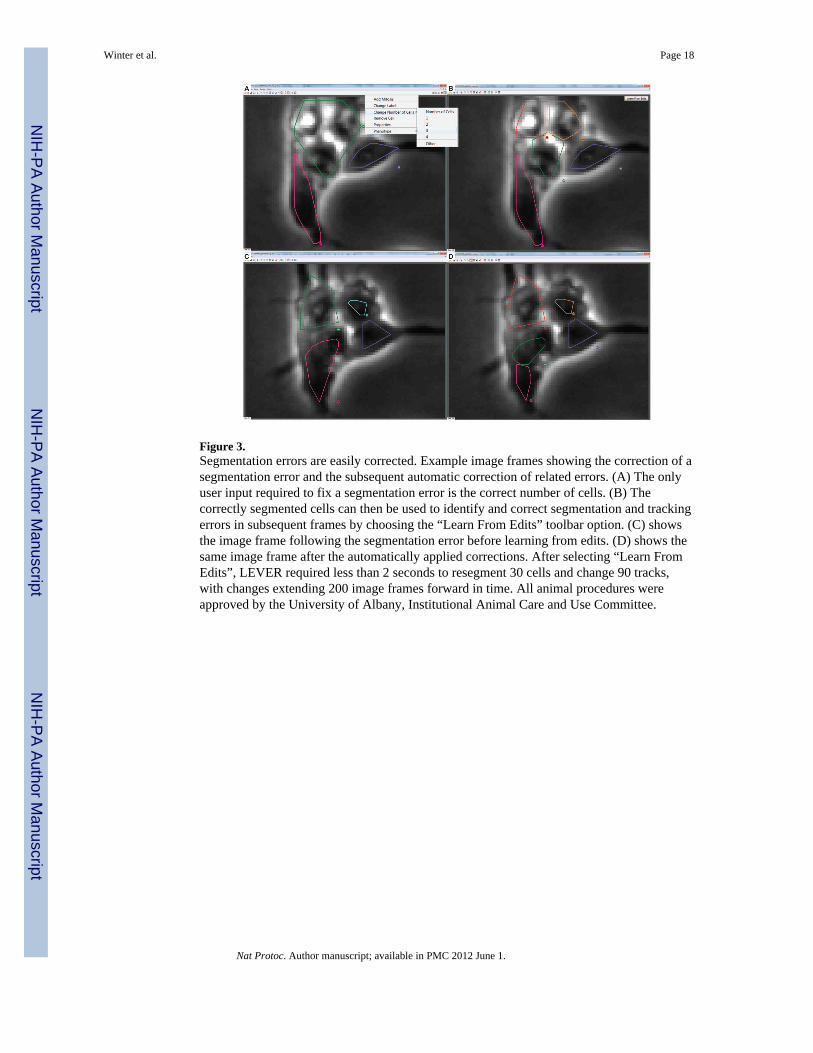
Figure 3.Segmentation errors are easily corrected. Example image frames showing the correction of asegmentation error and the subsequent automatic correction of related errors. (A) The onlyuser input required to fix a segmentation error is the correct number of cells. (B) Thecorrectly segmented cells can then be used to identify and correct segmentation and trackingerrors in subsequent frames by choosing the “Learn From Edits” toolbar option. (C) showsthe image frame following the segmentation error before learning from edits. (D) shows thesame image frame after the automatically applied corrections. After selecting “Learn FromEdits”, LEVER required less than 2 seconds to resegment 30 cells and change 90 tracks,with changes extending 200 image frames forward in time. All animal procedures wereapproved by the University of Albany, Institutional Animal Care and Use Committee.
Winter et al. Page 18
Nat Protoc. Author manuscript; available in PMC 2012 June 1.
NIH
-PA Author Manuscript
NIH
-PA Author Manuscript
NIH
-PA Author Manuscript
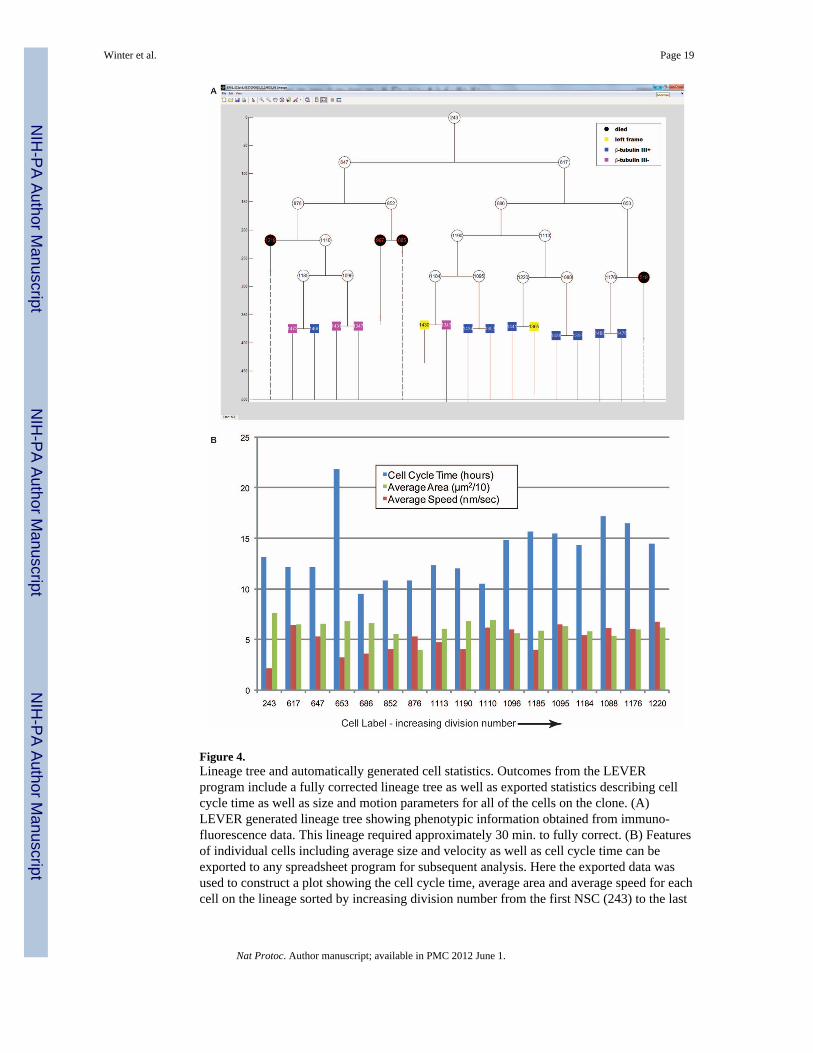
Figure 4.Lineage tree and automatically generated cell statistics. Outcomes from the LEVERprogram include a fully corrected lineage tree as well as exported statistics describing cellcycle time as well as size and motion parameters for all of the cells on the clone. (A)LEVER generated lineage tree showing phenotypic information obtained from immuno-fluorescence data. This lineage required approximately 30 min. to fully correct. (B) Featuresof individual cells including average size and velocity as well as cell cycle time can beexported to any spreadsheet program for subsequent analysis. Here the exported data wasused to construct a plot showing the cell cycle time, average area and average speed for eachcell on the lineage sorted by increasing division number from the first NSC (243) to the last
Winter et al. Page 19
Nat Protoc. Author manuscript; available in PMC 2012 June 1.
NIH
-PA Author Manuscript
NIH
-PA Author Manuscript
NIH
-PA Author Manuscript
pair of NSCs produced on the lineage (1176 and 1220). All animal procedures wereapproved by the University of Albany, Institutional Animal Care and Use Committee.
Winter et al. Page 20
Nat Protoc. Author manuscript; available in PMC 2012 June 1.
NIH
-PA Author Manuscript
NIH
-PA Author Manuscript
NIH
-PA Author Manuscript
NIH
-PA Author Manuscript
NIH
-PA Author Manuscript
NIH
-PA Author Manuscript
Winter et al. Page 21
Table 1
Troubleshooting approaches for specific procedural steps.
Step Problem Solution
18 The LEVER program failsto launch
• If running the executable version, make sure that the MATLAB and Microsoft Visual C++runtimes have been correctly installed. Run LEVER from a command prompt to capture anyerror messages it may generate. Verify that you are running on a Windows operating system(XP or later).
• If running from within MATLAB, be sure that you are using version 2009b or later.
• Check the MATLAB or the LEVER.exe console output window for any error messages
• Check the ‘dataset_name’_log.csv file for any error messages.
19 The segmentation ortracking fail to run
Make sure that you correctly installed the LEVER software, and that “MTC.exe” and “Segmentor.exe”are in the same folder as “ LEVER.exe”. See also troubleshooting for Step 18.
The segmentation ortracking produce incorrector poor results
Adjust imaging parameters to more closely resemble the sample image data. The segmentation algorithmmay require programmatic changes in order to work on data which is visually different from the sampledata.
20 The segmentation ortracking results that areloaded appear incorrect
Make sure that you are viewing the segmentation and tracking results for the same image sequence thatyou are viewing in LEVER. See also troubleshooting for Step 19.
The user interfacebecomes unresponsive
Pressing ctrl+C may force the user interface to terminate whatever task is causing it to becomeunresponsive
Nat Protoc. Author manuscript; available in PMC 2012 June 1.