Versa Router 950 - Control Data Systems
200
Revision 2.4 @2019 Control Data System Versa Router 950 User Manual Revision: 2.4
-
Upload
khangminh22 -
Category
Documents
-
view
1 -
download
0
Transcript of Versa Router 950 - Control Data Systems

Revision 2.4 @2019 Control Data System
Versa Router 950
User Manual
Revision: 2.4

Ref.no.: 003274/Revision 2.4 @2019 Control Data Systems Page 2 | 201
Table of Contents GENERAL NOTES ....................................................................................................................................... 6
COPYRIGHT ................................................................................................................................................. 6
INDEX OF TABLES ...................................................................................................................................... 7
INDEX OF FIGURES .................................................................................................................................... 7
1 DOCUMENT PURPOSE ..................................................................................................................... 12
2 TERMS AND ABBREVIATIONS ......................................................................................................... 12
3 REFERENCES AND RESOURCES .................................................................................................... 16
4 HARDWARE DESCRIPTION .............................................................................................................. 16
4.1 INTRODUCTION ............................................................................................................................... 16 4.2 BLOCK DIAGRAM ............................................................................................................................ 17 4.3 FEATURES OVERVIEW ..................................................................................................................... 17 4.4 MECHANICAL DIMENSIONS ............................................................................................................... 18 4.5 CONNECTOR INFORMATION ............................................................................................................. 19 4.6 COMPLIANCE INFORMATION ............................................................................................................. 19
4.6.1 Electromagnetic ........................................................................................................................ 19 4.6.2 Safety ....................................................................................................................................... 20 4.6.3 Hazardous area ........................................................................................................................ 20
5 QUICK START NETWORK CONFIGURATION ................................................................................. 21
5.1 VR950 CONFIGURATION ................................................................................................................. 21 5.1.1 Powering the VR950 Gateway ................................................................................................. 21 5.1.2 IP configuration ........................................................................................................................ 21
5.2 CONFIGURING A CDS VS210 FOR ISA100.11A ............................................................................... 23 5.2.1 Provisioning .............................................................................................................................. 25 5.2.2 Publishing ................................................................................................................................. 27
5.3 CONFIGURING A CDS VS210 FOR WIRELESSHART .......................................................................... 30 5.3.1 Provisioning .............................................................................................................................. 32 5.3.2 Joining ...................................................................................................................................... 34 5.3.3 Publishing: ................................................................................................................................ 35
5.4 CONFIGURING A HONEYWELL XYR6000 FOR ISA100.11A ............................................................... 38 5.4.1 Provisioning .............................................................................................................................. 40 5.4.2 Publishing ................................................................................................................................. 42
5.5 CONFIGURING A YOKOGAWA EJX110L FOR ISA100.11A ................................................................. 45 5.5.1 Provisioning .............................................................................................................................. 47 5.5.2 Publishing ................................................................................................................................. 49
5.6 CONFIGURING A EMERSON PT100/2WIRE FOR WIRELESSHART ..................................................... 52 5.6.1 Provisioning .............................................................................................................................. 54 5.6.2 Joining ...................................................................................................................................... 57 5.6.3 Publishing: ................................................................................................................................ 57
6 USING THE MONITORING CONTRO1 SYSTEM (MCS) FOR ISA 100 WIRELESS NETWORK ..... 60
6.1 ACCESS, AUTHENTICATION AND NAVIGATION ................................................................................... 60 6.2 NETWORK ...................................................................................................................................... 61

Ref.no.: 003274/Revision 2.4 @2019 Control Data Systems Page 3 | 201
6.2.1 Dashboard ................................................................................................................................ 61 6.2.1.1 Adding a Device to the Dashboard ................................................................................................... 62 6.2.1.2 Deleting a device .............................................................................................................................. 63
6.2.2 Topology ................................................................................................................................... 63 6.2.3 Devices ..................................................................................................................................... 68
6.2.3.1 Search devices ................................................................................................................................. 69 6.2.3.2 Device list ......................................................................................................................................... 70 6.2.3.3 Delete a device ................................................................................................................................. 70
6.2.4 Device Details .......................................................................................................................... 71 6.2.4.1 Information ........................................................................................................................................ 71 6.2.4.2 Settings ............................................................................................................................................. 73 6.2.4.3 Registration Log ............................................................................................................................... 75 6.2.4.4 Neighbors Health .............................................................................................................................. 76 6.2.4.5 Schedule Report ............................................................................................................................... 77 6.2.4.6 Channel Statistics ............................................................................................................................. 78 6.2.4.7 Run Commands ................................................................................................................................ 79
6.2.4.7.1 Read Value .................................................................................................................................. 80 6.2.4.7.2 Reset Device ................................................................................................................................ 80 6.2.4.7.3 Read Object Attribute ................................................................................................................... 81 6.2.4.7.4 Write Object Attribute ................................................................................................................... 82 6.2.4.7.5 Execute Object Method ................................................................................................................ 82
6.2.5 Network Health ......................................................................................................................... 83 6.2.6 Readings .................................................................................................................................. 84 6.2.7 Commands Log ........................................................................................................................ 85 6.2.8 Alerts ........................................................................................................................................ 87 6.2.9 Troubleshooting ........................................................................................................................ 89
6.2.9.1 Filters ................................................................................................................................................ 90 6.2.10 Bulk Transfers ...................................................................................................................... 92 6.2.11 Set Country Code ................................................................................................................. 94
6.3 CONFIGURATION ............................................................................................................................. 95 6.3.1 Basic ......................................................................................................................................... 95 6.3.2 Backbone Router ...................................................................................................................... 96 6.3.3 Gateway ................................................................................................................................... 97 6.3.4 System Manager ...................................................................................................................... 98 6.3.5 Device Management .............................................................................................................. 100
6.3.5.1 Configuring Backbones .................................................................................................................. 101 6.3.5.2 Configuring Gateways .................................................................................................................... 102 6.3.5.3 Configuring Devices ....................................................................................................................... 103
6.3.6 Configuring a Subnet .............................................................................................................. 104 6.3.7 Monitoring Host ...................................................................................................................... 104
6.3.7.1 Publishers ....................................................................................................................................... 105 6.3.7.2 Channels ........................................................................................................................................ 106 6.3.7.3 Autodiscover Publishers ................................................................................................................. 107
6.3.8 Modbus ....................................................................................... Error! Bookmark not defined. 6.3.8.1 Mapping Registers .......................................................................................................................... 109
6.3.9 Alert Subscription ................................................................................................................... 112 6.3.10 Advanced Settings .............................................................................................................. 112
6.3.10.1 Sections/variables .......................................................................................................................... 112 6.3.10.2 Restart/Stop .................................................................................................................................... 113 6.3.10.3 VR950 Settings ............................................................................................................................... 113
6.3.11 Bulk Transfers .................................................................................................................... 114 6.3.11.1 Adding a Bulk Transfer ................................................................................................................... 115

Ref.no.: 003274/Revision 2.4 @2019 Control Data Systems Page 4 | 201
6.3.11.2 Editing a Bulk Transfer ................................................................................................................... 116 6.3.12 System Status .................................................................................................................... 117
6.4 ADMINISTRATION .......................................................................................................................... 118 6.4.1 Device Firmware .................................................................................................................... 118
6.4.1.1 Updating the Firmware ................................................................................................................... 120 6.4.1.2 Canceling a Firmware Update ........................................................................................................ 121 6.4.1.3 Firmware files ................................................................................................................................. 122
6.4.1.3.1 Adding a Firmware file ............................................................................................................... 122 6.4.1.3.2 Editing a Firmware file ............................................................................................................... 123
6.4.2 System Upgrade ..................................................................................................................... 124 6.4.3 Custom Icons ......................................................................................................................... 125 6.4.4 Custom Settings ..................................................................................................................... 127
6.4.4.1 DateTime format ............................................................................................................................. 127 6.4.4.2 Interfaces Configuration ................................................................................................................. 127
6.5 SESSION ...................................................................................................................................... 127 6.5.1 Change Password .................................................................................................................. 127
7 USING THE MONITORING CONTROL SYSTEM (MCS) FOR WIRELESS HART NETWORK ...... 129
7.1 ACCESS, AUTHENTICATION, AND NAVIGATION ................................................................................ 129 7.2 NETWORK .................................................................................................................................... 130
7.2.1 Dashboard .............................................................................................................................. 130 7.2.1.1 Adding a Device to the Dashboard ................................................................................................. 131 7.2.1.2 Deleting a device ............................................................................................................................ 132
7.2.2 Topology ................................................................................................................................. 132 7.2.3 Devices ................................................................................................................................... 135
7.2.3.1 Search Devices .............................................................................................................................. 136 7.2.3.2 Device List ...................................................................................................................................... 137 7.2.3.3 Delete a Device .............................................................................................................................. 137
7.2.4 Device Details ........................................................................................................................ 137 7.2.4.1 Information ...................................................................................................................................... 138 7.2.4.2 Settings ........................................................................................................................................... 139 7.2.4.3 Registration Log ............................................................................................................................. 141 7.2.4.4 Neighbors Health ............................................................................................................................ 141 7.2.4.5 Schedule Report ............................................................................................................................. 142 7.2.4.6 Run Commands .............................................................................................................................. 144
7.2.4.6.1 WH General Command .............................................................................................................. 145 7.2.5 Network Health ....................................................................................................................... 146 7.2.6 Readings ................................................................................................................................ 148 7.2.7 Commands Log ...................................................................................................................... 149 7.2.8 Alerts ...................................................................................................................................... 150
7.3 CONFIGURATION ........................................................................................................................... 151 7.3.1 Access Point ........................................................................................................................... 151 7.3.2 Gateway ................................................................................................................................. 153 7.3.3 Network Manager ................................................................................................................... 154 7.3.4 Device Management .............................................................................................................. 155
7.3.4.1 Configuring Access Points .............................................................................................................. 157 7.3.4.1.1 Multiple Access Points ............................................................................................................... 158 7.3.4.1.2 Redundant Access Points .......................................................................................................... 158
7.3.4.2 Configuring Gateways .................................................................................................................... 158 7.3.4.3 Configuring Devices ....................................................................................................................... 158
7.3.5 Monitoring Host ...................................................................................................................... 159

Ref.no.: 003274/Revision 2.4 @2019 Control Data Systems Page 5 | 201
7.3.5.1 Burst Messages .............................................................................................................................. 160 7.3.5.2 Variables ......................................................................................................................................... 161 7.3.5.3 Triggers .......................................................................................................................................... 162
7.3.6 Modbus ....................................................................................... Error! Bookmark not defined. 7.3.6.1 Mapping Registers .......................................................................................................................... 164
7.3.7 Advanced Settings ................................................................................................................. 166 7.3.7.1 Sections/variables .......................................................................................................................... 166 7.3.7.2 Restart ............................................................................................................................................ 167 7.3.7.3 VR910 Settings ............................................................................................................................... 168
7.4 STATISTICS .................................................................................................................................. 168 7.5 ADMINISTRATION .......................................................................................................................... 170
7.5.1 System Upgrade ..................................................................................................................... 170 7.5.2 Custom Icons ......................................................................................................................... 171 7.5.3 Custom Settings ..................................................................................................................... 173 7.5.4 Device Codes ......................................................................................................................... 173
7.5.4.1 Adding a Device Code .................................................................................................................... 174 7.5.4.2 Editing a Device Code .................................................................................................................... 175 7.5.4.3 Deleting a Device Code .................................................................................................................. 175
7.6 SESSION ...................................................................................................................................... 176 7.6.1 Change Password .................................................................................................................. 176
8 WEB-BASED ADMINISTRATION /ADMIN/ ...................................................................................... 177
8.1 ACCESS, AUTHENTICATION AND NAVIGATION ................................................................................. 177 8.2 SYSTEM UPGRADE ....................................................................................................................... 178
8.2.1 Versa Router Firmware .......................................................................................................... 179 8.2.2 ISA Transceiver Firmware ...................................................................................................... 180 8.2.3 WHart TR Firmware ............................................................................................................... 181 8.2.4 Versa Router Application Website (Monitoring Control System) ............................................ 183
8.3 CONFIGURATION ........................................................................................................................... 185 8.3.1 Log Files ................................................................................................................................. 185 8.3.2 Reset Profile ........................................................................................................................... 186 8.3.3 Advanced Settings ................................................................................................................. 186 8.3.4 Network .................................................................................................................................. 187
9 COMMAND-LINE CONFIGURATION INTERFACE ......................................................................... 188
9.1 CHANGE VERSA ROUTER IP ADDRESS .......................................................................................... 188 9.2 UDP/TCP PORT CONFIGURATION ................................................................................................. 189 9.3 ACCESSING FILES THROUGH COMMAND-LINE INTERFACE ................................................................. 190
10 VERSA ROUTER CONFIGURATOR ............................................................................................ 190
10.1 CHANGING THE IP USING THE VERSA ROUTER CONFIGURATOR ...................................................... 190
APPENDIX A – COUNTRY CODES ......................................................................................................... 194

Ref.no.: 003274/Revision 2.4 @2019 Control Data Systems Page 6 | 201
General Notes CDS offers this information as a service to support its customers with applications and engineering for the products designed by CDS. The system validation of this product designed by CDS within a larger electronic system remains the responsibility of the customer or the customer’s system integrator. All specifications supplied herein are subject to change.
Copyright This document contains proprietary technical information which is the ownership of Control Data Systems SRL. The reproduction of this document entirely or partially is prohibited without the written approval from CDS. All rights are reserved in event of the grant of a patent or the registration of a utility model or design. All specifications supplied herein are subject to change without notice.
Copyright © Control Data Systems SRL, 2019

Ref.no.: 003274/Revision 2.4 @2019 Control Data Systems Page 7 | 201
Index of Tables
Table Name
Table 2.1 Terms-User Manual Table 2.2 Abbreviations-User Manual Table 4.1 General features Table 4.2 Hardware Interface description Table 4.3 Electromagnetic Compliance Table 4.4 Safety Compliance Table 4.5 Hazardous area Table 6.1 Signal Quality for Received Signal Quality Indicator (ISA 100) Table 6.2 Troubleshooting-Details explanations (ISA 100) Table 6.3 Troubleshooting Alerts-mapping (ISA 100) Table 6.4 Adding devices-role values and labels (ISA 100) Table 7.1 Signal level for RSL (HART) Table 7.2 General GW information (HART)
Index of Figures
Figure Name
Figure 4.1.1 VR950 Figure 4.2.1 VR950 Block Diagram Figure 4.4.1 VR950 dimensions Figure 4.5.1 VR950 connection ports Figure 5.1.1 Default admin website static IP configuration Figure 5.1.2 IP configuration example using the admin web interface Figure 5.1.3 VR Configurator Tool Figure 5.2.1 VS210 scheme Figure 5.2.2 CDS Field Tool Com Connection Figure 5.2.3 ISA Field Tool connection to Nivis Field Tool software Figure 5.2.4 Nivis Field Tool Device Provisioning Settings Figure 5.2.5 VS210 Radio and Default Reset Buttons Figure 5.2.6 ISA Publishers Autodiscovery Figure 5.2.7 Devices Publishers and Channels in Monitoring Host Figure 5.2.8 Monitoring Host Help Information Figure 5.2.9 Modbus Help Information Figure 5.3.1 VS210 scheme Figure 5.3.2 MicroLink Hart Protocol Modern Com Connection Figure 5.3.3 WirelessHART Provisioning tool COM Connection Figure 5.3.4 Network ID and Join Key setup example (the Network ID found in MSC will be 2020 – hexadecimal value) Figure 5.3.5 Burst Message example Figure 5.3.6 WirelessHART Provisioning Tool Join Status

Ref.no.: 003274/Revision 2.4 @2019 Control Data Systems Page 8 | 201
Figure 5.3.7 MCS Monitoring Host for WirelessHART, Burst Message and Variables example Figure 5.3.8 MCS WirelessHART, Readings for Burst Message 0 Figure 5.3.9 Monitoring Host Help Information Figure 5.3.10 Modbus Help Information Figure 5.4.1 Honeywell XYR6000 Figure 5.4.2 CDS Field Tool Com Connection Figure 5.4.3 ISA Field Tool connection to Nivis Field Tool software Figure 5.4.4 Nivis Field Tool Device Reset To Factory Defaults Figure 5.4.5 Nivis Field Tool Device Provisioning Settings Figure 5.4.6 ISA Publishers Autodiscovery Figure 5.4.7 Devices Publishers and Channels in Monitoring Host Figure 5.4.8 Monitoring Host Help Information Figure 5.4.9 Modbus Help Information Figure 5.5.1 Yokogawa EJX110L Figure 5.5.2 CDS Field Tool Com Connection Figure 5.5.3 ISA Field Tool connection to Nivis Field Tool software Figure 5.5.4 Nivis Field Tool Device Provisioning Settings Figure 5.5.5 Nivis Field Tool connected to device Figure 5.5.6 Yokogawa device in the process of joining to the Network Figure 5.5.7 ISA Publishers Autodiscovery Figure 5.5.8 Devices Publishers and Channels in Monitoring Host Figure 5.5.9 Monitoring Host Help Information Figure 5.5.10 Modbus Help Information Figure 5.6.1 Emerson PT100/2WIRE Figure 5.6.2 MicroLink Hart Protocol Modern Com Connection Figure 5.6.3 WirelessHART Provisioning tool COM Connection Figure 5.6.4 Network ID and Join Key setup example (the Network ID found in MSC will be 2020 – hexadecimal value) Figure 5.6.5 Burst Message example Figure 5.6.6 WirelessHART Provisioning Tool Join Status Figure 5.6.7 MCS Monitoring Host for WirelessHART, Burst Message and Variables example Figure 5.6.8 MCS WirelessHART, Readings for Burst Message 0 Figure 5.6.9 Monitoring Host Help Information Figure 5.6.10 Modbus Help Information Figure 6.1.1 Monitoring Control System login window Figure 6.1.2 Device list (ISA 100) Figure 6.2.1 Dashboard series of panes (ISA 100) Figure 6.2.2 Add device to dashboard-dialog window (ISA 100) Figure 6.2.3 Network Topology graphical representation (ISA 100) Figure 6.2.4 Contracts graphical representation (ISA 100) Figure 6.2.5 Devices list and search form for the network (ISA 100) Figure 6.2.6 Information window (ISA 100) Figure 6.2.7 Settings window (ISA 100) Figure 6.2.8 Registration Log-Timestamps window (ISA 100) Figure 6.2.9 Neighbors Health report window (ISA 100) Figure 6.2.10 Schedule Report window-Superframes and Links (ISA 100) Figure 6.2.11 Link's related information window (ISA 100) Figure 6.2.12 Channel Statistics window (ISA 100)

Ref.no.: 003274/Revision 2.4 @2019 Control Data Systems Page 9 | 201
Figure 6.2.13 Run Commands window (ISA 100) Figure 6.2.14 Read Value command window (ISA 100) Figure 6.2.15 Reset Device window (ISA 100) Figure 6.2.16 Read Object Attribute window (ISA 100) Figure 6.2.17 Write Object Attribute window (ISA 100) Figure 6.2.18 Execute Object Method window (ISA 100) Figure 6.2.19 Network Health sections (ISA 100) Figure 6.2.20 Readings window (ISA 100) Figure 6.2.21 Command Log window (ISA 100) Figure 6.2.22 Tracking Response window (ISA 100) Figure 6.2.23 Alerts window (ISA 100) Figure 6.2.24 Troubleshooting window (ISA 100) Figure 6.2.25 Edit filters button window (ISA 100) Figure 6.2.26 Bulk Transfer Status window (ISA 100) Figure 6.2.27 Transferred data window (ISA 100) Figure 6.2.28 Country Code settings window Figure 6.3.1 Basic Config Figure 6.3.2 Backbone Router configuration sections (ISA 100) Figure 6.3.3 Gateway configuration window (ISA 100) Figure 6.3.4 System Manager configuration window (ISA 100) Figure 6.3.5 Device Management window (ISA 100) Figure 6.3.6 Monitoring Host window (ISA 100) Figure 6.3.7 Modbus Server window (ISA 100) Figure 6.3.8 Alert Subscription window (ISA 100) Figure 6.3.9 Section/variables window (ISA 100) Figure 6.3.10 Restart/Stop/Reload window (ISA 100) Figure 6.3.11 VR950 Settings window (ISA 100) Figure 6.3.12 Bulk Transfer List window (ISA 100) Figure 6.3.13 Adding a Bulk Transfer window-UDO option (ISA 100) Figure 6.3.14 Adding a Bulk Transfer window-BTO option (ISA 100) Figure 6.3.15 Editing a Bulk Transfer window-UDO option (ISA 100) Figure 6.3.16 Editing a Bulk Transfer window-BTO option (ISA 100) Figure 6.3.17 Statistic sections window (ISA 100) Figure 6.4.1 Device Firmware window (ISA 100) Figure 6.4.2 Firmware Update window (ISA 100) Figure 6.4.3 Firmware files window (ISA 100) Figure 6.4.4 Add Firmware window (ISA 100) Figure 6.4.5 Edit Firmware window Figure 6.4.6 System Upgrade window Figure 6.4.7 System upgrade results window Figure 6.4.8 Custom icon window (ISA 100) Figure 6.4.9 Added icon-visibility (ISA 100) Figure 6.4.10 Interface Configuration window (ISA 100) Figure 6.5.1 Change password window

Ref.no.: 003274/Revision 2.4 @2019 Control Data Systems Page 10 | 201
Figure 7.1.1 Monitoring Control System login window Figure 7.1.2 Device list (HART) Figure 7.2.1 Dashboard series of panes (HART) Figure 7.2.2 Add device to dashboard-dialog window (HART) Figure 7.2.3 Network Topology graphical representation (HART) Figure 7.2.4 Services graphical representation (HART) Figure 7.2.5 Devices list and search form for the network (HART) Figure 7.2.6 Information window (HART) Figure 7.2.7 Settings window (HART) Figure 7.2.8 Registration Log-Timestamps window (HART) Figure 7.2.9 Neighbors Health window (HART) Figure 7.2.10 Schedule Report window (HART) Figure 7.2.11 Schedule Report window - individual link (HART) Figure 7.2.12 Run Commands window (HART) Figure 7.2.13 WH General Command window (HART) Figure 7.2.14 Commands Log window (HART) Figure 7.2.15 Network Health sections (HART) Figure 7.2.16 Readings window (HART) Figure 7.2.17 Command Log window (HART) Figure 7.2.18 Alerts window (HART) Figure 7.3.1 Access Point configuration sections (HART) Figure 7.3.2 Gateway configuration window (HART) Figure 7.3.3 Network Manager configuration window (HART) Figure 7.3.4 Device Management window (HART) Figure 7.3.5 Configuration settings window (HART) Figure 7.3.6 Monitoring Host window (HART) Figure 7.3.7 Modbus Server window (HART) Figure 7.3.8 Sections/variables window (HART) Figure 7.3.9 Restart window (HART) Figure 7.3.10 VR950 Settings window (HART) Figure 7.4.1 Statistic sections window (HART) Figure 7.5.1 System upgrade-firmware window (HART) Figure 7.5.2 System upgrade results window Figure 7.5.3 Custom icon window (HART) Figure 7.5.4 Added icon-visibility (HART) Figure 7.5.5 Custom Settings window (HART) Figure 7.5.6 Device Codes window (HART) Figure 7.5.7 Add Device Code window (HART) Figure 7.5.8 Edit Device Code window (HART) Figure 7.6.1 Change password window (HART) Figure 8.1.1 Login window Figure 8.1.2 User interface window Figure 8.2.1 Edge Router Firmware Upgrade window Figure 8.2.2 Activated Edge Router Firmware window

Ref.no.: 003274/Revision 2.4 @2019 Control Data Systems Page 11 | 201
Figure 8.2.3 ISA Transceiver Firmware Upgrade window Figure 8.2.4 Completed operation window for ISA Transceiver Firmware Upgrade Figure 8.2.5 WHart Transceiver Firmware Upgrade window Figure 8.2.6 Completed operation window for WHart Transceiver Firmware Upgrade Figure 8.2.7 Application Website Upgrade window Figure 8.2.8 Completed operation window for Application Website Upgrade Figure 8.3.1 Log Files window Figure 8.3.2 Advanced Settings window Figure 8.3.3 Variable type window Figure 8.3.4 Network Configuration section window Figure 10.1.1 Versa Router Configurator window Figure 10.1.2 Responses window for Search Network for Versa Routers button Figure 10.1.3 Properties options window for Set VersaRouter Properties button
Ref.no.: 003274/Revision 2.4 @2019 Control Data Systems Page 12 | 201
1 Document Purpose The purpose of this document is to offers specific information about Versa Router 950, including instructions for configuring the device’s various options and for monitoring the status of an ISA100.11a and/or WirelessHART network.
The document has eight chapters which contains seven main sections, as follows:
• a product overview containing information about the product and its hardware properties (Section 4);
• a guide for a quick network configuration, from the installation of the VR950 to reading data from devices in the field (Section 5);
• instructions for using the CDS ISA100.11a Monitoring Control System - access, authentication, navigation, network related information, configuration settings and administration (Section 6);
• instructions for using the WirelessHART Monitoring Control System - access, authentication, navigation, network related information, configuration settings and administration (Section 7);
• information about the system upgrade and the configuration of the web-based Versa Router 950 application (Section 8);
• commands regarding the configuration on the VR interface for accessing the Ethernet (Section 9);
• specifications for changing the IP of the VR950 configurator (Section 10).
The terms and abbreviations, and the references and resources used for the purpose of this User Manual are the subject of the Section 2 and Section 3.
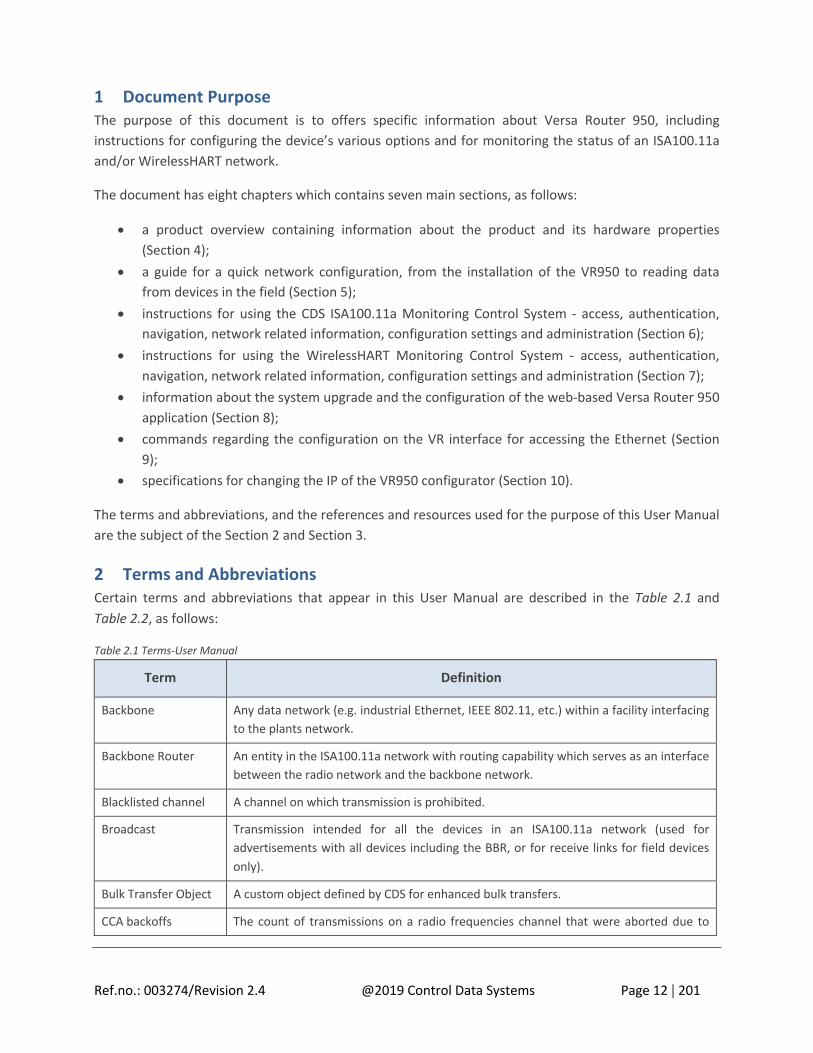
2 Terms and Abbreviations Certain terms and abbreviations that appear in this User Manual are described in the Table 2.1 and Table 2.2, as follows:
Table 2.1 Terms-User Manual
Term Definition
Backbone Any data network (e.g. industrial Ethernet, IEEE 802.11, etc.) within a facility interfacing to the plants network.
Backbone Router An entity in the ISA100.11a network with routing capability which serves as an interface between the radio network and the backbone network.
Blacklisted channel A channel on which transmission is prohibited.
Broadcast Transmission intended for all the devices in an ISA100.11a network (used for advertisements with all devices including the BBR, or for receive links for field devices only).
Bulk Transfer Object A custom object defined by CDS for enhanced bulk transfers.
CCA backoffs The count of transmissions on a radio frequencies channel that were aborted due to
Ref.no.: 003274/Revision 2.4 @2019 Control Data Systems Page 13 | 201
CCA.
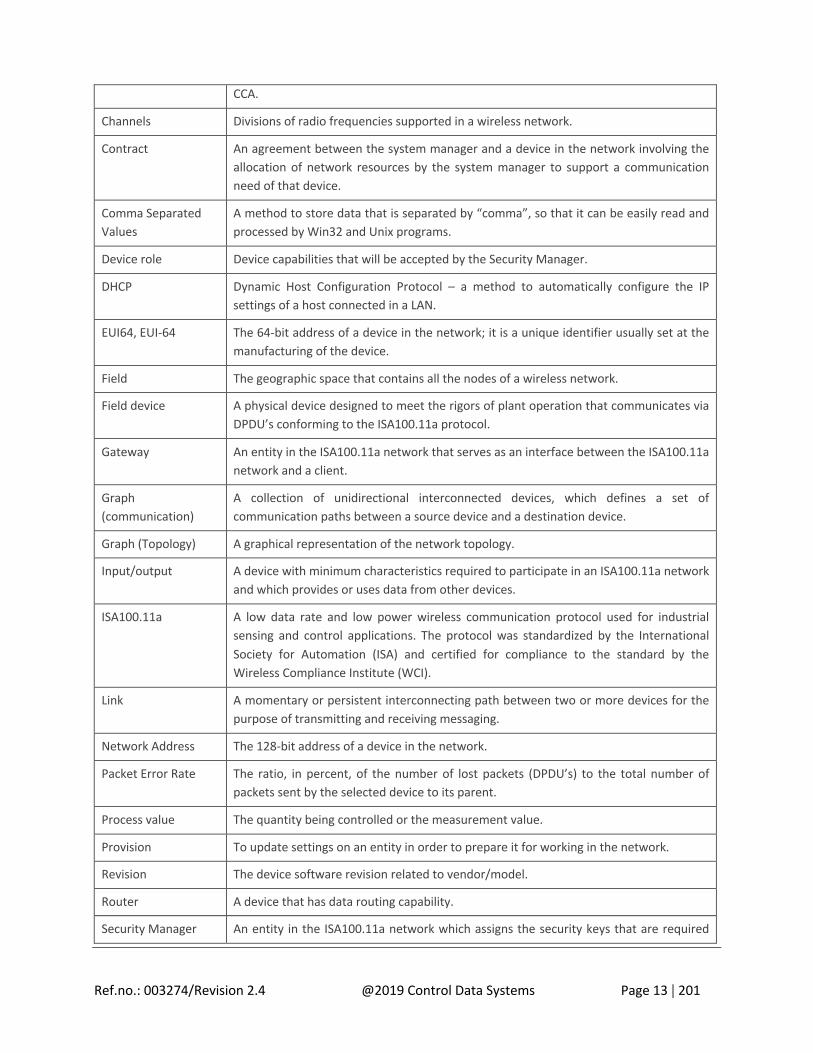
Channels Divisions of radio frequencies supported in a wireless network.
Contract An agreement between the system manager and a device in the network involving the allocation of network resources by the system manager to support a communication need of that device.
Comma Separated Values
A method to store data that is separated by “comma”, so that it can be easily read and processed by Win32 and Unix programs.
Device role Device capabilities that will be accepted by the Security Manager.
DHCP Dynamic Host Configuration Protocol – a method to automatically configure the IP settings of a host connected in a LAN.
EUI64, EUI-64 The 64-bit address of a device in the network; it is a unique identifier usually set at the manufacturing of the device.
Field The geographic space that contains all the nodes of a wireless network.
Field device A physical device designed to meet the rigors of plant operation that communicates via DPDU’s conforming to the ISA100.11a protocol.
Gateway An entity in the ISA100.11a network that serves as an interface between the ISA100.11a network and a client.
Graph (communication)
A collection of unidirectional interconnected devices, which defines a set of communication paths between a source device and a destination device.
Graph (Topology) A graphical representation of the network topology.
Input/output A device with minimum characteristics required to participate in an ISA100.11a network and which provides or uses data from other devices.
ISA100.11a A low data rate and low power wireless communication protocol used for industrial sensing and control applications. The protocol was standardized by the International Society for Automation (ISA) and certified for compliance to the standard by the Wireless Compliance Institute (WCI).
Link A momentary or persistent interconnecting path between two or more devices for the purpose of transmitting and receiving messaging.
Network Address The 128-bit address of a device in the network.
Packet Error Rate The ratio, in percent, of the number of lost packets (DPDU’s) to the total number of packets sent by the selected device to its parent.
Process value The quantity being controlled or the measurement value.
Provision To update settings on an entity in order to prepare it for working in the network.
Revision The device software revision related to vendor/model.
Router A device that has data routing capability.
Security Manager An entity in the ISA100.11a network which assigns the security keys that are required

Ref.no.: 003274/Revision 2.4 @2019 Control Data Systems Page 14 | 201
for communication between devices.
Superframe A collection of timeslots with a common repetition period and possibly other common attributes.
System Manager An entity in the ISA100.11a network that supervises the various operational aspects of a network other than security.
UTC Coordinated Universal Time – A universal timekeeping standard that is based on the Greenwich Mean Time (GMT). Local time is calculated in UTC and offset by the local time zone’s value.
Table 2.2 Abbreviations-User Manual
Abbreviation Explanation
AP Access Point
API Application Programming Interface
BBR Backbone Router
BTO Bulk Transfer Object
CCA Clear Channel Assessment
CGI Common Gateway Interface
CSV Comma Separated Values
DHCP Dynamic Host Configuration Protocol
DMAP Device Management Application Process
DPDU Data link layer Protocol Data Unit
GPDU Gateway Protocol Data Unit
EUI Extended Unique Identifier
FW Firmware
GSAP Gateway Service Access Point
GW Gateway
IO Input/output (with reference to devices)
LAN Local Area Network
LSB Least Significant Bit
MCS Monitoring Control System
MSB Most Significant Bit
NM Network Manager
NSDU Network layer Service Data Unit

Ref.no.: 003274/Revision 2.4 @2019 Control Data Systems Page 15 | 201
PER Packet Error Rate
RSQI Received Signal Quality Indicator
SAP Service Access Point
SM System Manager
SMAP System Manager Application Process
TSAP Transport layer Access Point
UAP User Application Process
VR Versa Router
UDO Upload/Download Object
UDP User Datagram Protocol

Ref.no.: 003274/Revision 2.4 @2019 Control Data Systems Page 16 | 201
3 References and Resources The previous reference and resource related to the present User Manual is as follows:
• 96-00006-01 ISA100.11a GSAP Interface Specification.pdf.
4 Hardware description 4.1 Introduction Designed for the global market, the VR950 is a wireless network controller, or Gateway, designed for mission critical, industrial applications in the oil & gas, mining1 and manufacturing sectors where safety, security and reliability are a must. The VR950 is an all-in-one, dual-standard infrastructure device architected to manage ISA100 and WirelessHART networks simultaneously. It contains all the necessary components for network management and comes with advanced features such as redundancy and network collocation.
The VR950 Gateway runs a Linux operating system and can be configured via a web application (MCS, or Monitoring and Control System) or a command line interface. For connectivity to the backend systems there is 1 GB Ethernet port available. Optionally, a 3G/4G modem or satellite modem (Orbcomm or Iridium) can be installed. The interface for accessing the data from the network devices can be Modbus TCP, GCI (for ISA100), Hart IP (for Wireless Hart) or OPC-UA (under development).
Custom applications for local data pre-processing can run in a sandbox accessible via an API that provides access to the connectivity and data storage functions.
The VR950 is shown in the following picture (Figure 4.1.1):
Figure 4.1.1 VR950
1 Not to be used in mines susceptible to firedamp, as defined in IEC 60079-0:2011 clause 4.1

Ref.no.: 003274/Revision 2.4 @2019 Control Data Systems Page 17 | 201
4.2 Block Diagram The following block diagram presents the most important subsystems of VR950 (Figure 4.2.1):
Figure 4.2.1 VR950 Block Diagram
4.3 Features Overview Table 4.1 General features
Feature Implementation
Power supply • 24V DC nominal • Voltage range from 20 to 27V DC • Maximum current draw 1A
CPU • TI SITARA AM5728 • RAM DDR3 2GB • Flash 4GB
WSN Radio Modules • 2xVN210 (one for ISA100 and one for WirelessHART) • 10 dBm nominal • 2.4 GHz ISM band • 16 channels • 802.15.4 physical layer
WSN antenna connectors • 2x SMA type RF connectors
Network management • ISA100 System Manager, Security Manager, Gateway
Ref.no.: 003274/Revision 2.4 @2019 Control Data Systems Page 18 | 201
software • WirelessHART Network Manager, Security Manager, Gateway
Connectivity software • Modbus TCP • GCI • HART IP
Redundancy • Master/Slave configuration • Hot redundancy with no device re-join
Operating conditions • Temperature range -40…+70 ⁰C • Humidity 95% RH non condensing
Physical characteristics • Size: 159 mm x 130 mm x 40 mm (L x W x H) • Weight: 400g • Enclosure material: Powder coated steel. • Ingress protection: IP20
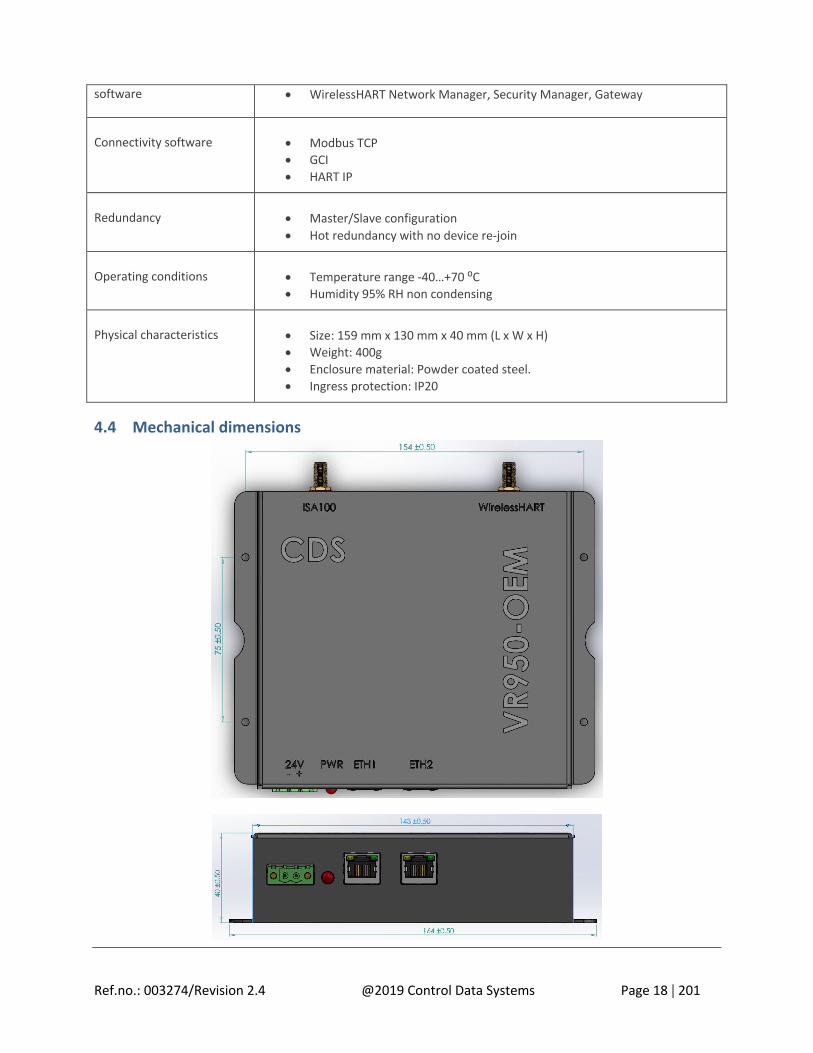
4.4 Mechanical dimensions

Ref.no.: 003274/Revision 2.4 @2019 Control Data Systems Page 19 | 201
Figure 4.4.1 VR950 dimensions
4.5 Connector information
Figure 4.5.1 VR950 connection ports
Table 4.2 Hardware Interface description
Name Description
PWR Main power connector
LED Main power LED indicator
ETH1 GB Ethernet connector for backend communication
ETH2 Ethernet connector used for redundancy configuration
4.6 Compliance information 4.6.1 Electromagnetic Table 4.3 Electromagnetic Compliance
Equipment Compliance Information
VN210 FCC: Part 15C
FCC ID: CDSVN210ISA
RED: EN 301 489-1 v2.1.1
EN 301 489-17 v3.1.1
EN 300 328 v2.1.1
Giteki: ID: 003-130207

Ref.no.: 003274/Revision 2.4 @2019 Control Data Systems Page 20 | 201
VR9502 FCC: Part 15, to cover ISED IC-ES003 (products containing FCC/IC Certified Radio Module)
RE: Emissions per EN 55032 (concurrent with FCC)
Immunity per EN 301 489: ESD per EN 61000-4-2
Radiated RF per EN 61000-4-3 and EN 61000-4-4
Conducted RF per EN 61000-4
4.6.2 Safety Table 4.4 Safety Compliance
Equipment Compliance Information
VR9502 RE: EN 62368
4.6.3 Hazardous area Table 4.5 Hazardous area
Equipment Compliance Information
VR9502 Certified per ATEX directive according the following standards:
• EN 60079.0:2011 Explosive atmospheres – Part 0: Equipment – General requirements
• EN 60079.7:2015 Explosive atmospheres – Part 7: Equipment protection by increased safety ''e''
• EN 60079.31:2013 Explosive atmospheres – Part 31: Equipment dust ignition protection by enclosure "t"
EN 60664-1:2007 Insulation coordination for equipment within low-voltage systems –Part 1: Principles, requirements and tests
2 Pending: Certification procedures are ongoing

Ref.no.: 003274/Revision 2.4 @2019 Control Data Systems Page 21 | 201
5 Quick Start Network Configuration
The aim of this section is to guide the user through a simple and rapid process of configuring the VR950 Gateway, for either ISA100.11a or WirelessHART, and to provision a device to send data and to read it using the Gateway web interface (Monitoring Control System) as well as Modbus TCP/IP external client.
5.1 VR950 Configuration
5.1.1 Powering the VR950 Gateway
The VR950 Gateway module is powered using a 24V, 1A Terminal Block power supply connector.
The ETH1 connector is used for network connection. The static default IP address is 192.168.0.101. The VR950 boards can obtain also a dynamic IP address is a DHCP server is active in the network.
The redundancy setup comprises two VR950 modules interconnected via a straight Ethernet cable using the ETH2 connector.
5.1.2 IP configuration
A new static IP address will be set using the admin web interface accessible at the following address: 192.168.0.101/admin/login.html. The default credentials are:
- Username: admin - Password: adminadmin
The static IP configuration is available in the website Configuration section under the Network tab as seen below:
Figure 5.1.1 Default admin website static IP configuration
After changing the IP, press the Hard Restart button underneath to reboot the VR950 and activate the new settings.

Ref.no.: 003274/Revision 2.4 @2019 Control Data Systems Page 22 | 201
Figure 5.1.2 IP configuration example using the admin web interface
(Optional) The VersaRouter Configurator Tool installed on a PC in the same network with the VR950 Gateway modules will scan the network and list the AN_ID, static IP address and the DHCP (dynamic) assigned IP address of each VR950 in the network.
Figure 5.1.3 VR Configurator Tool

Ref.no.: 003274/Revision 2.4 @2019 Control Data Systems Page 23 | 201
5.2 Configuring a CDS VS210 for ISA100.11a
Figure 5.2.1 VS210 scheme
In order to setup a VS210 to join an ISA100.11a network, the following steps must be taken (see Figure 5.2.1):
1. Connect JP203 jumper; 2. Connect JP501 jumper; 3. Switch S202.1 will be set to OFF and S202.2 will be set to ON; 4. If the device was previously configured for either WirelessHART or ISA100.11a, a reset from the
Reset application button.
The software used for provisioning the CDS VS210 ISA100.11a device is the Nivis Field Tool.
1. Go to Windows Start and open “Device Manager”. Roll down the options under “Ports (COM & LPT)”.
2. Plug into an USB port the CDS ISA100.11a Field Tool. The Field tool should now appear under “Ports” in the Device Manager as “Silicon Labs CP210x USB to UART Bridge”.

Ref.no.: 003274/Revision 2.4 @2019 Control Data Systems Page 24 | 201
Figure 5.2.2 CDS Field Tool Com Connection
3. Open the Nivis Field Tool software and provide the password. Under “Serial Port” choose the port to which the Field Tool is connected and set the Field Tool Radio Output Power on High.
4. Press the Connect To Field Tool button and wait until the tool is connected.
Figure 5.2.3 ISA Field Tool connection to Nivis Field Tool software

Ref.no.: 003274/Revision 2.4 @2019 Control Data Systems Page 25 | 201
5.2.1 Provisioning
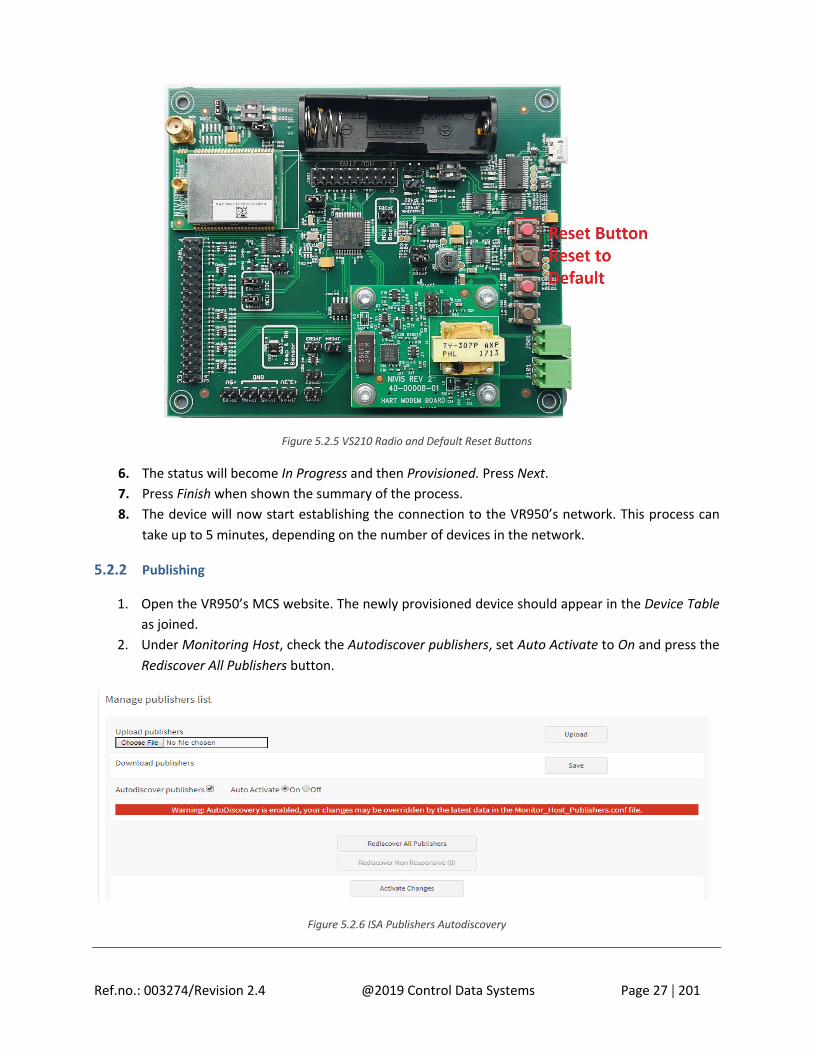
1. If the device that is being provisioned is already joined to a running network, it must be reset to its factory default settings, by pressing the Reset To Default button for 10 seconds (see Figure 5.2.5). After the LEDs have stopped blinking, continue to step 2.
2. If data about the device already exists, go to step 3. Under Device Provisioning, Manage Provisioning Data tab, add data about the device by clicking on the Add button. In the window provide the following: a. EUI-64 Address (found on a label on the device or on a tag attached to the device, e.g.
0022:FF00:0002:BA84) b. Device Tag (a representative name for the device, e.g. VS210_BA84) c. Network ID (can be found in the VR950’s MCS website, under Gateway, Subnet ID) d. Join Key (can be found in the VR950’s MCS website, under Gateway, App Join Key) e. Check Enable Simple APISupport:
• Data Publication Period (interval between 2 publishes) • Attribute ID:
- UAP_DATA_ANALOG_2 (provides temperature readings) - UAP_DATA_ANALOG_3 (provides humidity readings)
f. Press Save. g. Move to step 3.

Ref.no.: 003274/Revision 2.4 @2019 Control Data Systems Page 26 | 201
Figure 5.2.4 Nivis Field Tool Device Provisioning Settings
3. If data about the device already exists, go to Device Provisioning, Manage Provisioning Data tab, double click on the device information and check the device’s Network ID. In order for the device to connect to the network, the ID must be the same as the one found in the VR950’s MCS website, under Gateway, Subnet ID.
4. Under Device Provisioning, Device Provisioning tab, choose Over the Air (OTA) or Out Of Band (OOB) and maintain the Field Tool device aimed at the devices Infrared screen (IC301 – see Figure 5.2.1). Press Start.
5. Tick the line corresponding to the device being provisioned and press Next and Next again. While the status of the process is Waiting for connection, press the Reset Radio button on the VS210 device.
Ref.no.: 003274/Revision 2.4 @2019 Control Data Systems Page 27 | 201
Figure 5.2.5 VS210 Radio and Default Reset Buttons
6. The status will become In Progress and then Provisioned. Press Next. 7. Press Finish when shown the summary of the process. 8. The device will now start establishing the connection to the VR950’s network. This process can
take up to 5 minutes, depending on the number of devices in the network.
5.2.2 Publishing
1. Open the VR950’s MCS website. The newly provisioned device should appear in the Device Table as joined.
2. Under Monitoring Host, check the Autodiscover publishers, set Auto Activate to On and press the Rediscover All Publishers button.
Figure 5.2.6 ISA Publishers Autodiscovery

Ref.no.: 003274/Revision 2.4 @2019 Control Data Systems Page 28 | 201
Once the device is found, its configuration information will be populated in the Publishers and Channels fields (the Channels information is specific to each Publishers, so they will appear only when selecting a Publisher). From this moment forward, the device will start publishing data, which can be found under Readings.
Figure 5.2.7 Devices Publishers and Channels in Monitoring Host
3. To make the published data accessible through Modbus as well, under Modbus, complete the Input Registers fields. For a quicker configuration, in a new tab with the VR’s MCS, open the Monitoring Host page. Use the information under Help in both pages for guidance. Back in the Modbus fields, each line inserted will be completed as follows: a. For each device, there will be as least as many lines in the Input Registers as there are
channels in Monitoring Host; b. Each line will contain 9 values, separated by commas without spaces in between:
- start_address: represents the register address where the data will start to appear; - word_count: represents the number of registers held for that particular line (in this case 3:
first will represent the status of the data, the next two are hexadecimal values, composing the actual data from the sensor);
- EUI64: the device EUI, without the colons character (:); - The values for TSAPID, ObjId, AttrId, Idx1 and Idx2 are found in the Monitoring Host
channel lines of the device; - MethId: will be 0;

Ref.no.: 003274/Revision 2.4 @2019 Control Data Systems Page 29 | 201
- Status_byte: will be 2.
Figure 5.2.8 Monitoring Host Help Information Figure 5.2.9 Modbus Help Information
c. After each completed line, press Save; d. Press Activate after all the lines have been inserted
4. The Modbus values can be read using a Modbus client (recommended ModbusMaster from Farrellton Solar).

Ref.no.: 003274/Revision 2.4 @2019 Control Data Systems Page 30 | 201
5.3 Configuring a CDS VS210 for WirelessHart
Figure 5.3.1 VS210 scheme
In order to setup a VS210 to join a WirelessHART network, the following changes steps must be taken (see Figure 5.3.1):
1. Remove jumper from JP203; 2. Remove jumper from JP501; 3. Switch S202.1 will be set to ON and S202.2 will be set to OFF; 4. Power must be supplied through the USB or J101; 5. If the device was previously configured for either ISA100.11a or WirelessHART, a reset from the
Reset application button.
The software used for provisioning the Emerson WirelessHART device is the WirelessHART Provisioning Tool. Since the tool used for provisioning is a USB MicroLink Hart Protocol Modem provisioning, a software for it will also be required.
1. Go to Windows Start and open “Device Manager”. Roll down the options under “Ports (COM & LPT)”.
2. Plug the MicroLink Modem into an USB port. The Modem’s name should now appear under “Ports” in the Device Manager.

Ref.no.: 003274/Revision 2.4 @2019 Control Data Systems Page 31 | 201
Figure 5.3.2 MicroLink Hart Protocol Modern Com Connection
3. Connect the MicroLink hooks to the JP501 connectors on the device (see Figure 5.3.1).
Figure 5.3.3 WirelessHART Provisioning tool COM Connection
4. Open the WirelessHART Provisioning Tool software. Go to Settings and under “Com Port” choose the port to which the MicroLink Modem is connected and press Apply. Under Device
Ref.no.: 003274/Revision 2.4 @2019 Control Data Systems Page 32 | 201
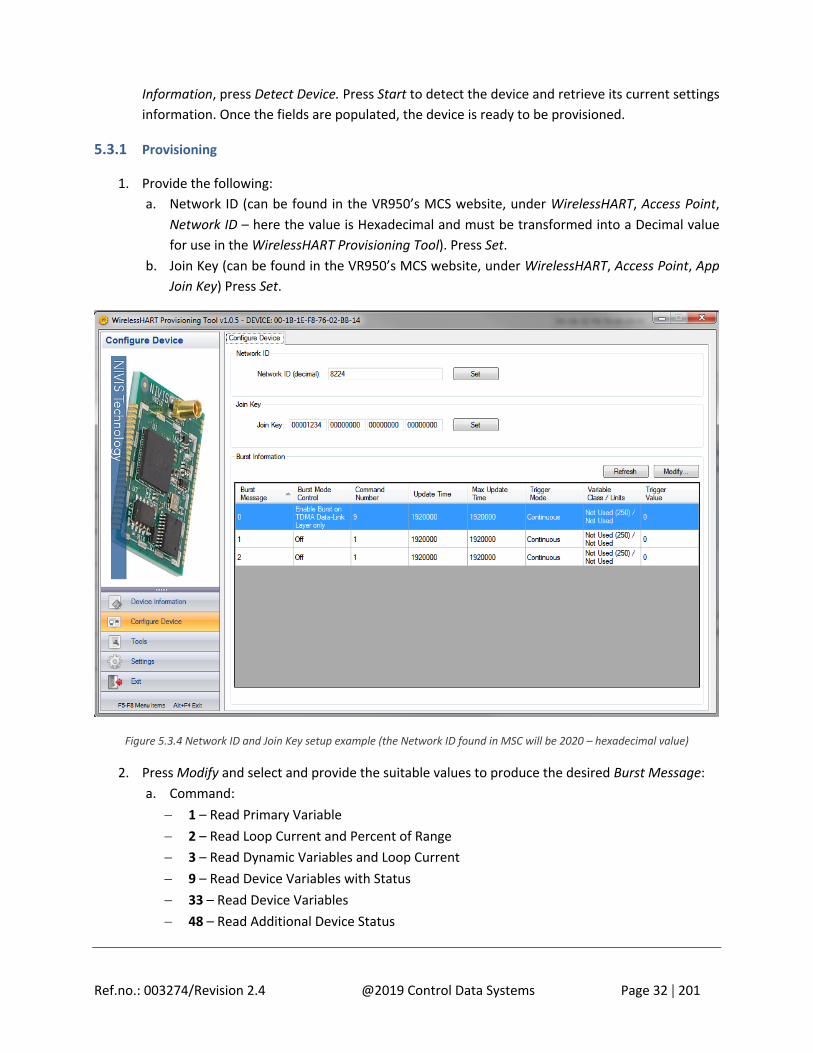
Information, press Detect Device. Press Start to detect the device and retrieve its current settings information. Once the fields are populated, the device is ready to be provisioned.
5.3.1 Provisioning
1. Provide the following: a. Network ID (can be found in the VR950’s MCS website, under WirelessHART, Access Point,
Network ID – here the value is Hexadecimal and must be transformed into a Decimal value for use in the WirelessHART Provisioning Tool). Press Set.
b. Join Key (can be found in the VR950’s MCS website, under WirelessHART, Access Point, App Join Key) Press Set.
Figure 5.3.4 Network ID and Join Key setup example (the Network ID found in MSC will be 2020 – hexadecimal value)
2. Press Modify and select and provide the suitable values to produce the desired Burst Message: a. Command:
- 1 – Read Primary Variable - 2 – Read Loop Current and Percent of Range - 3 – Read Dynamic Variables and Loop Current - 9 – Read Device Variables with Status - 33 – Read Device Variables - 48 – Read Additional Device Status

Ref.no.: 003274/Revision 2.4 @2019 Control Data Systems Page 33 | 201
b. Variables: the application will internally select the variables according to the chosen Command
c. Update Time: elapsed time between two source value updates (measured in 32.000 microsec, ex: for the update to be 10 seconds apart, the value will be 320.000)
d. Maximum Update Time: maximum elapsed time between two value updates (must be greater that Update Time)
e. Trigger Mode: - Continuous – the Burst Message is published continuously at the Update Time - Window – the Burst Message is triggered when the source value deviates more than the
specified Trigger Value - Rising – the Burst Message is triggered when source value Rises Above the specified
Trigger Value. - Falling – the Burst Message is triggered when the source value Falls Below the specified
Trigger Value. - On-Change – the burst message is triggered when any value in the message changes
(suitable for step signals). f. Trigger Variable Classification: represents the physical quantity of the source value
(optional) g. Units: the metric unit of the Trigger Value Classification (optional) h. Trigger Value: value used as threshold for certain Trigger Modes (Window, Rising, Falling) i. Press Apply after setting these values; j. Burst Mode Control:
- Off – the Burst Message will be configured, but it will not be published - Enable Burst on TDMA Data-Link Layer only – the Burst Message will be published.
k. Press Apply and Close when done; 3. The example in Figure 5.3.5 will produce:
Burst Message 0, with command 9, will contain values for the set variables (Primary Variable, Secondary Variable, Tertiary Variable and Quaternary Variable) and will be published every 60 seconds.

Ref.no.: 003274/Revision 2.4 @2019 Control Data Systems Page 34 | 201
Figure 5.3.5 Burst Message example
4. As many as 3 burst messages can be set to publish.
5.3.2 Joining
1. To join the device to the specified Network ID, go to Tools and press Start Assisted Join. Updates on the join status will appear in the table below. When the final status is Normal Operation Commencing, the device is fully joined to the network.

Ref.no.: 003274/Revision 2.4 @2019 Control Data Systems Page 35 | 201
Figure 5.3.6 WirelessHART Provisioning Tool Join Status
5.3.3 Publishing:
1. Open the VR950’s MCS website. The newly provisioned device should appear in the Device Table as joined.
2. Under Monitoring Host, the device’s configuration information will automatically be populated in the Burst Messages and Variables fields (the Variables information is specific to each Burst Message, so they will appear only when selecting a Message).

Ref.no.: 003274/Revision 2.4 @2019 Control Data Systems Page 36 | 201
Figure 5.3.7 MCS Monitoring Host for WirelessHART, Burst Message and Variables example
From this moment forward, the device will start publishing data, which can be found under Readings.
Figure 5.3.8 MCS WirelessHART, Readings for Burst Message 0
3. To make the published data accessible through Modbus as well, under Modbus, complete the Input Registers fields. For a quicker configuration, in a new tab with the VR’s MCS, open the

Ref.no.: 003274/Revision 2.4 @2019 Control Data Systems Page 37 | 201
Monitoring Host page. Use the information under Help in both pages for guidance. Back in the Modbus fields, each line inserted will be completed as follows:
a. For each device, there will be at least as many lines in the Input Registers as there are variables in Monitoring Host;
b. Each line will contain 6 values, separated by commas without spaces in between: • start_address: represents the register address where the data will start to appear (if no
Registers have been defined yet, it is recommended that you start from Register 0 or 1); • word_count: represents the number of registers held for that particular line (in this case
3: first will represent the status of the data, the next two are hexadecimal values, composing the actual data from the sensor);
• EUI64: the device EUI; • Register Type: “device_variable”; • The values for Burst Message and Device Variable Code are found in the Monitoring Host
variable lines of the device; • Device State: 2.
Figure 5.3.9 Monitoring Host Help Information Figure 5.3.10 Modbus Help Information
c. After each completed line, press Save; d. Press Activate after all the lines have been inserted.
4. The Modbus values can be read using a Modbus client (recommended ModbusMaster from Farrellton Solar).

Ref.no.: 003274/Revision 2.4 @2019 Control Data Systems Page 38 | 201
5.4 Configuring a Honeywell XYR6000 for ISA100.11a
Figure 5.4.1 Honeywell XYR6000
The software used for provisioning the Honeywell XYR6000 device is the Nivis Field Tool.
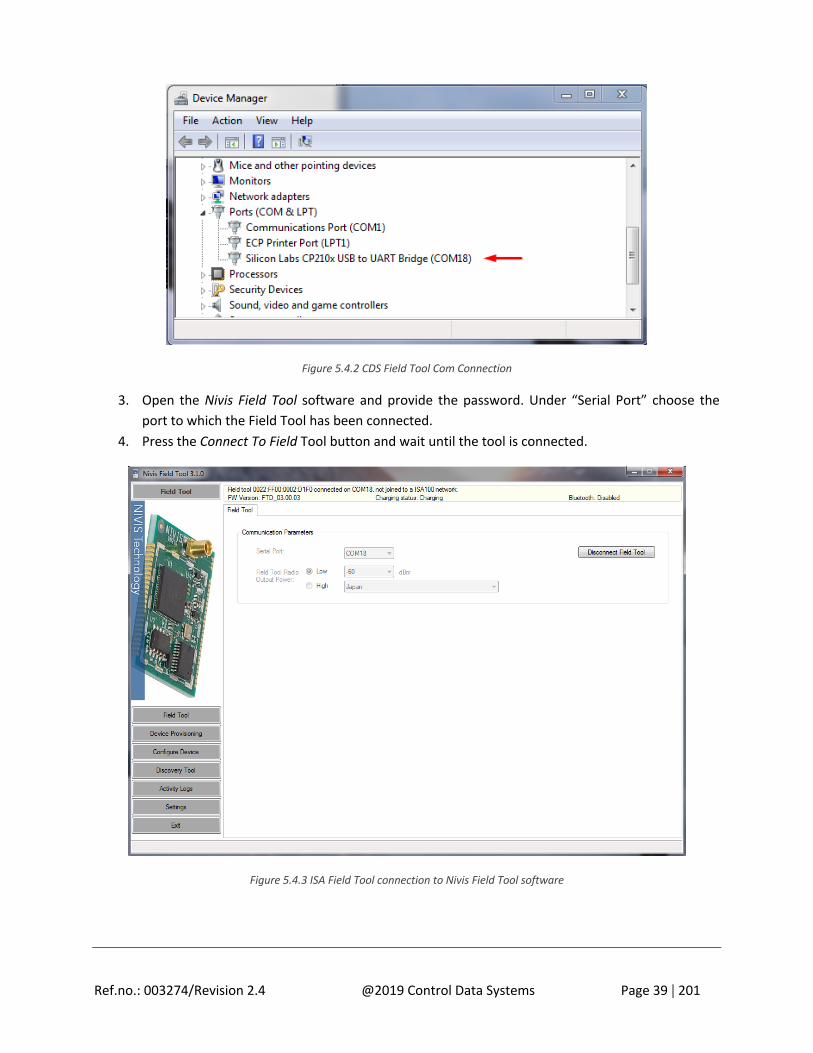
1. Go to Windows Start and open “Device Manager”. Roll down the options under “Ports (COM & LPT)”.
2. Plug into an USB port the CDS ISA100.11a Field Tool. The Field tool should now appear under “Ports” in the Device Manager as “Silicon Labs CP210x USB to UART Bridge”.
Ref.no.: 003274/Revision 2.4 @2019 Control Data Systems Page 39 | 201
Figure 5.4.2 CDS Field Tool Com Connection
3. Open the Nivis Field Tool software and provide the password. Under “Serial Port” choose the port to which the Field Tool has been connected.
4. Press the Connect To Field Tool button and wait until the tool is connected.
Figure 5.4.3 ISA Field Tool connection to Nivis Field Tool software
Ref.no.: 003274/Revision 2.4 @2019 Control Data Systems Page 40 | 201
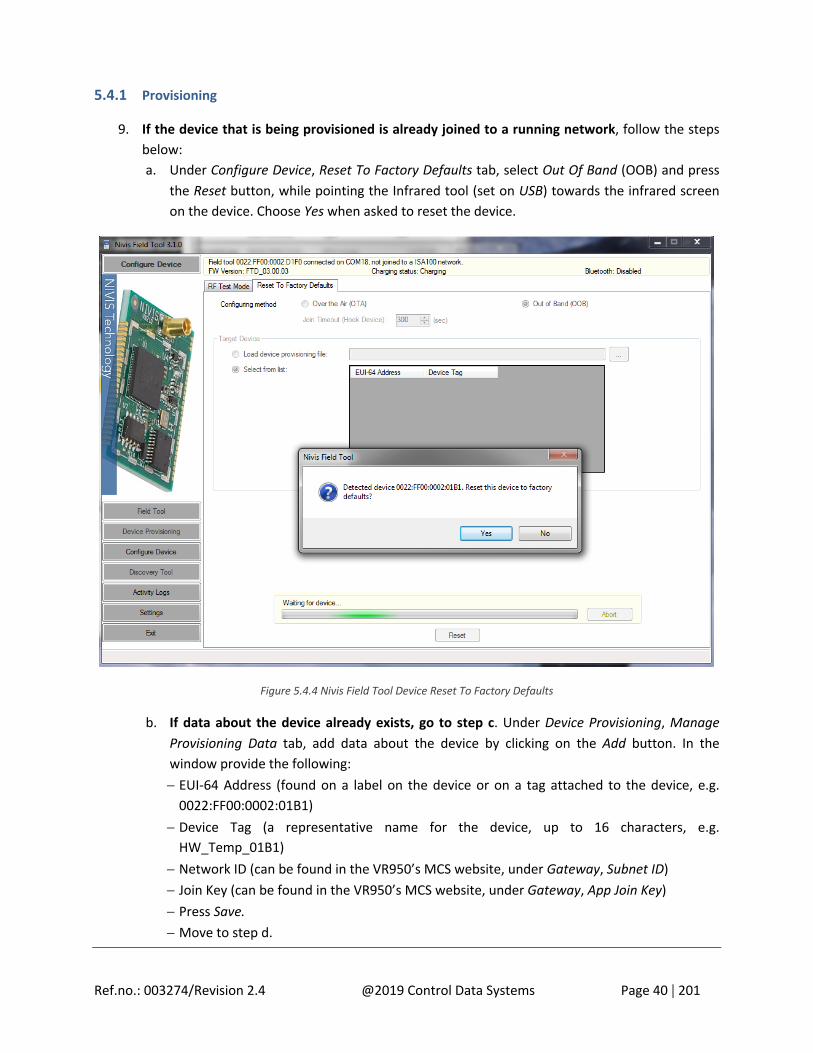
5.4.1 Provisioning
9. If the device that is being provisioned is already joined to a running network, follow the steps below: a. Under Configure Device, Reset To Factory Defaults tab, select Out Of Band (OOB) and press
the Reset button, while pointing the Infrared tool (set on USB) towards the infrared screen on the device. Choose Yes when asked to reset the device.
Figure 5.4.4 Nivis Field Tool Device Reset To Factory Defaults
b. If data about the device already exists, go to step c. Under Device Provisioning, Manage Provisioning Data tab, add data about the device by clicking on the Add button. In the window provide the following: - EUI-64 Address (found on a label on the device or on a tag attached to the device, e.g.
0022:FF00:0002:01B1) - Device Tag (a representative name for the device, up to 16 characters, e.g.
HW_Temp_01B1) - Network ID (can be found in the VR950’s MCS website, under Gateway, Subnet ID) - Join Key (can be found in the VR950’s MCS website, under Gateway, App Join Key) - Press Save. - Move to step d.

Ref.no.: 003274/Revision 2.4 @2019 Control Data Systems Page 41 | 201
Figure 5.4.5 Nivis Field Tool Device Provisioning Settings
c. If data about the device already exists, go to Device Provisioning, Manage Provisioning Data tab, double click on the device information and check the device’s Network ID. In order for the device to connect to the network, the ID must be the same as the one found in the VR950’s MCS website, under Gateway, Subnet ID.
d. Under Device Provisioning, Device Provisioning tab, choose Out of Band (OOB) and press Start while keeping the Infrared tool pointed towards the infrared screen on the device.
e. Once the device has been found, press Yes to continue to provisioning. Press Next when told that Provisioning information is available and Next when asked to review the Provisioning information.
f. Keep the infrared tool pointed towards the device while in the process of provisioning, until the status changes from In Progress to Provisioned. Press Next.
g. Press Finish when shown the summary of the process.

Ref.no.: 003274/Revision 2.4 @2019 Control Data Systems Page 42 | 201
h. The device will now start establishing the connection to the VR950’s network. This process can take up to 5 minutes, depending on the number of devices in the network.
10. If the device is being provisioned for the first time, follow the steps under point 1, without point a.
5.4.2 Publishing
1. Open the VR950’s MCS website. The newly provisioned device should appear in the Device Table as joined.
2. To make the device publish, under Devices, click on the EUI of the device and go to Run Commands. Depending on the type of Honeywell device, insert the following commands and values. Press Execute after each command.
a. Read Object Attribute: • TSAP ID (port): 2 • Object ID: 1 • Attribute ID: 9
b. Write Object Attribute: • TSAP ID (port): 2 • Object ID: 8 • Attribute ID: 2 • Values (HEX): FE8000000000000000004E7C7F000001F0B2000503003C3201
c. Write Object Attribute: • TSAP ID (port): 2 • Object ID: 8 • Attribute ID: 6 • Values (HEX): 0003000100000005
d. Write Object Attribute: • TSAP ID (port): 2 • Object ID: 3 • Attribute ID: 2 • Index1: 1 • Values (HEX): 10
3. Under Monitoring Host, check the Autodiscover publishers, set Auto Activate to On and press the Rediscover All Publishers button.

Ref.no.: 003274/Revision 2.4 @2019 Control Data Systems Page 43 | 201
Figure 5.4.6 ISA Publishers Autodiscovery
4. Once the device is found, its configuration information will be populated in the Publishers and Channels fields (the Channels information is specific to each Publishers, so they will appear only when selecting a Publisher).
Figure 5.4.7 Devices Publishers and Channels in Monitoring Host
5. From this moment forward, the device will start publishing data, which can be found under Readings.
6. To make the published data accessible through Modbus as well, under Modbus, fill the Input Registers fields. For a quicker configuration, in a new tab with the VR’s MCS, open the

Ref.no.: 003274/Revision 2.4 @2019 Control Data Systems Page 44 | 201
Monitoring Host page. Use the information under Help in both pages for guidance. Back in the Modbus fields, each line inserted will be completed as follows:
a. For each device, there will be as least as many lines in the Input Registers as there are channels in Monitoring Host;
b. Each line will contain 9 values, separated by commas without spaces in between: - start_address: represents the register address where the data will start to appear; - word_count: represents the number of registers held for that particular line (in this
case 3: first will represent the status of the data, the next two are hexadecimal values, composing the actual data from the sensor);
- EUI64: the device EUI, without the colons character (:); - The values for TSAPID, ObjId, AttrId, Idx1 and Idx2 are found in the Monitoring Host
channel lines of the device; - MethId: will be 0; - Status_byte: will be 2.
Figure 5.4.8 Monitoring Host Help Information Figure 5.4.9 Modbus Help Information
c. After each completed line, press Save; d. Press Activate after all the lines have been inserted.
7. The Modbus values can be read using a Modbus client (recommended ModbusMaster from Farrellton Solar).

Ref.no.: 003274/Revision 2.4 @2019 Control Data Systems Page 45 | 201
5.5 Configuring a Yokogawa EJX110L for ISA100.11a
Figure 5.5.1 Yokogawa EJX110L
The software used for provisioning the Yokogawa EJX110L device is the Nivis Field Tool.
1. Go to Windows Start and open “Device Manager”. Roll down the options under “Ports (COM & LPT)”.
2. Plug into an USB port the CDS ISA100.11a Field Tool. The Field tool should now appear under “Ports” in the Device Manager as “Silicon Labs CP210x USB to UART Bridge”.

Ref.no.: 003274/Revision 2.4 @2019 Control Data Systems Page 46 | 201
Figure 5.5.2 CDS Field Tool Com Connection
3. Open the Nivis Field Tool software and provide the password. Under “Serial Port” choose the port to which the Field Tool has been connected.
4. Press the Connect To Field Tool button and wait until the tool is connected.
Figure 5.5.3 ISA Field Tool connection to Nivis Field Tool software

Ref.no.: 003274/Revision 2.4 @2019 Control Data Systems Page 47 | 201
5.5.1 Provisioning
1. If data about the device already exists, go to step 2. Under Device Provisioning, Manage Provisioning Data tab, add data about the device by clicking on the Add button. In the window provide the following:
Figure 5.5.4 Nivis Field Tool Device Provisioning Settings
a. EUI-64 Address (found on a label on the device or on a tag attached to the device, e.g. 0022:FF00:0002:1F11)
b. Device Tag (a representative name for the device, up to 16 characters, e.g. YOKO_Temp_1F11)
c. Network ID (can be found in the VR950’s MCS website, under Gateway, Subnet ID)

Ref.no.: 003274/Revision 2.4 @2019 Control Data Systems Page 48 | 201
d. Join Key (can be found in the VR950’s MCS website, under Gateway, App Join Key) e. Press Save. f. Move to step c.
2. If data about the device already exists, go to Device Provisioning, Manage Provisioning Data tab, double click on the device information and check the device’s Network ID. In order for the device to connect to the network, the ID must be the same as the one found in the VR950’s MCS website, under Gateway, Subnet ID.
3. Under Device Provisioning, Device Provisioning tab, choose Out of Band (OOB) and press Start while keeping the Infrared tool pointed towards the infrared screen on the device (Fig 5).
4. Once the device has been found, press Yes to continue to provisioning. Press Next when told that Provisioning information is available and Next when asked to review the Provisioning information.
Figure 5.5.5 Nivis Field Tool connected to device
5. Keep the infrared tool pointed towards the device while in the process of provisioning, until you will be announced that the device has been provisioned. Press Next.
6. Press Finish when shown the summary of the process. 7. The device will now start establishing the connection to the VR950’s network. It will not start
publishing until the line at the top of its screen is full (in Figure 5.5.6, the device is a joining state). This process can take up to 5 minutes, depending on the number of devices in the network.

Ref.no.: 003274/Revision 2.4 @2019 Control Data Systems Page 49 | 201
Figure 5.5.6 Yokogawa device in the process of joining to the Network
5.5.2 Publishing
1. Open the VR950’s MCS website. The newly provisioned device should appear in the Device Table as joined.
2. Under Monitoring Host, check the Autodiscover publishers, set Auto Activate to On and press the Rediscover All Publishers button.
Figure 5.5.7 ISA Publishers Autodiscovery
Once the device is found, it’s configuration information will be populated in the Publishers and Channels fields (the Channels information is specific to each Publishers, so they will appear only when selecting a Publisher). From this moment forward, the device will start publishing data, which can be found under Readings.

Ref.no.: 003274/Revision 2.4 @2019 Control Data Systems Page 50 | 201
Figure 5.5.8 Devices Publishers and Channels in Monitoring Host
3. To make the published data accessible through Modbus as well, under Modbus, complete the Input Registers fields. For a quicker configuration, in a new tab with the VR’s MCS, open the Monitoring Host page. Use the information under Help in both pages for guidance. Back in the Modbus fields, each line inserted will be completed as follows:
a. For each device, there will be as least as many lines in the Input Registers as there are channels in Monitoring Host;
b. Each line will contain 9 values, separated by commas without spaces in between: - start_address: represents the register address where the data will start to appear; - word_count: represents the number of registers held for that particular line (in this
case 3: first will represent the status of the data, the next two are hexadecimal values, composing the actual data from the sensor);
- EUI64: the device EUI, without the colons character (:); - The values for TSAPID, ObjId, AttrId, Idx1 and Idx2 are found in the Monitoring Host
channel lines of the device (as seen in Figures 7 and 8); - MethId: will be 0; - Status_byte: will be 2.

Ref.no.: 003274/Revision 2.4 @2019 Control Data Systems Page 51 | 201
Figure 5.5.9 Monitoring Host Help Information Figure 5.5.10 Modbus Help Information
c. After each completed line, press Save; d. Press Activate after all the lines have been inserted.
4. The Modbus values can be read using a Modbus client (recommended ModbusMaster from Farrellton Solar).

Ref.no.: 003274/Revision 2.4 @2019 Control Data Systems Page 52 | 201
5.6 Configuring a Emerson PT100/2WIRE for WirelessHART
Figure 5.6.1 Emerson PT100/2WIRE
The software used for provisioning the Emerson WirelessHART device is the WirelessHART Provisioning Tool. Since the tool used for provisioning is a USB MicroLink Hart Protocol Modem provisioning, a software for it will also be required.
5. Go to Windows Start and open “Device Manager”. Roll down the options under “Ports (COM & LPT)”.
6. Plug the MicroLink Modem into an USB port. The Modem’s name should now appear under “Ports” in the Device Manager.

Ref.no.: 003274/Revision 2.4 @2019 Control Data Systems Page 53 | 201
Figure 5.6.2 MicroLink Hart Protocol Modern Com Connection
7. Connect the MicroLink hooks to the COM connectors on the device.
Figure 5.6.3 WirelessHART Provisioning tool COM Connection
8. Open the WirelessHART Provisioning Tool software. Go to Settings and under “Com Port” choose the port to which the MicroLink Modem is connected and press Apply. Under Device

Ref.no.: 003274/Revision 2.4 @2019 Control Data Systems Page 54 | 201
Information, press Detect Device. Press Start to detect the device and retrieve its current settings information. Once the fields are populated, the device is ready to be provisioned.
5.6.1 Provisioning
5. Provide the following: a. Network ID (can be found in the VR950’s MCS website, under WirelessHART, Access Point,
Network ID – here the value is Hexadecimal and must be transformed into a Decimal value for use in the WirelessHART Provisioning Tool). Press Set.
b. Join Key (can be found in the VR950’s MCS website, under WirelessHART, Access Point, App Join Key) Press Set.
Figure 5.6.4 Network ID and Join Key setup example (the Network ID found in MSC will be 2020 – hexadecimal value)
6. Press Modify and select and provide the suitable values to produce the desired Burst Message: a. Command:
- 1 – Read Primary Variable - 2 – Read Loop Current and Percent of Range - 3 – Read Dynamic Variables and Loop Current - 9 – Read Device Variables with Status - 33 – Read Device Variables - 48 – Read Additional Device Status

Ref.no.: 003274/Revision 2.4 @2019 Control Data Systems Page 55 | 201
b. Variables: the application will internally select the variables according to the chosen Command
c. Update Time: elapsed time between two source value updates (measured in 32.000 microsec, ex: for the update to be 10 seconds apart, the value will be 320.000)
d. Maximum Update Time: maximum elapsed time between two value updates (must be greater that Update Time)
e. Trigger Mode: - Continuous – the Burst Message is published continuously at the Update Time - Window – the Burst Message is triggered when the source value deviates more than the
specified Trigger Value - Rising – the Burst Message is triggered when source value Rises Above the specified
Trigger Value. - Falling – the Burst Message is triggered when the source value Falls Below the specified
Trigger Value. - On-Change – the burst message is triggered when any value in the message changes
(suitable for step signals). f. Trigger Variable Classification: represents the physical quantity of the source value
(optional) g. Units: the metric unit of the Trigger Value Classification (optional) h. Trigger Value: value used as threshold for certain Trigger Modes (Window, Rising, Falling) i. Press Apply after setting these values; j. Burst Mode Control:
- Off – the Burst Message will be configured, but it will not be published - Enable Burst on TDMA Data-Link Layer only – the Burst Message will be published.
k. Press Apply and Close when done; 7. The example in Figure 5.6.5 will produce:
Burst Message 0, with command 9, will contain values for the set variables (Primary Variable, Battery life, Percent Range, Secondary Variable and Tertiary Variable) and will be published every 4 seconds.

Ref.no.: 003274/Revision 2.4 @2019 Control Data Systems Page 56 | 201
Figure 5.6.5 Burst Message example
8. As many as 3 burst messages can be set to publish.

Ref.no.: 003274/Revision 2.4 @2019 Control Data Systems Page 57 | 201
5.6.2 Joining
2. To join the device to the specified Network ID, go to Tools and press Start Assisted Join. Updates on the join status will appear in the table below. When the final status is Normal Operation Commencing, the device is fully joined to the network.
Figure 5.6.6 WirelessHART Provisioning Tool Join Status
5.6.3 Publishing:
5. Open the VR950’s MCS website. The newly provisioned device should appear in the Device Table as joined.
6. Under Monitoring Host, the device’s configuration information will automatically be populated in the Burst Messages and Variables fields (the Variables information is specific to each Burst Message, so they will appear only when selecting a Message).

Ref.no.: 003274/Revision 2.4 @2019 Control Data Systems Page 58 | 201
Figure 5.6.7 MCS Monitoring Host for WirelessHART, Burst Message and Variables example
From this moment forward, the device will start publishing data, which can be found under Readings.
Figure 5.6.8 MCS WirelessHART, Readings for Burst Message 0
7. To make the published data accessible through Modbus as well, under Modbus, complete the Input Registers fields. For a quicker configuration, in a new tab with the VR’s MCS, open the

Ref.no.: 003274/Revision 2.4 @2019 Control Data Systems Page 59 | 201
Monitoring Host page. Use the information under Help in both pages for guidance. Back in the Modbus fields, each line inserted will be completed as follows:
e. For each device, there will be at least as many lines in the Input Registers as there are variables in Monitoring Host;
f. Each line will contain 6 values, separated by commas without spaces in between: • start_address: represents the register address where the data will start to appear (if no
Registers have been defined yet, it is recommended that you start from Register 0 or 1); • word_count: represents the number of registers held for that particular line (in this case
3: first will represent the status of the data, the next two are hexadecimal values, composing the actual data from the sensor);
• EUI64: the device EUI; • Register Type: “device_variable”; • The values for Burst Message and Device Variable Code are found in the Monitoring Host
variable lines of the device; • Device State: 2.
Figure 5.6.9 Monitoring Host Help Information Figure 5.6.10 Modbus Help Information
g. After each completed line, press Save; h. Press Activate after all the lines have been inserted.
8. The Modbus values can be read using a Modbus client (recommended ModbusMaster from Farrellton Solar).

Ref.no.: 003274/Revision 2.4 @2019 Control Data Systems Page 60 | 201
6 Using the Monitoring Contro1 System (MCS) for ISA 100 wireless network
6.1 Access, Authentication and Navigation To access the MCS, type http://<VR_IP>/app_isa/login.html in a web browser and replace <VR_IP> with the IP of the VR that supports the network. If the Gateway runs in standalone ISA100/WirelessHART mode, the corresponding URL is http://<VR_IP>/app/login.html.
Once the address is accessed, a login screen appears, as shown in the following screen capture (Figure 6.1.1):
Figure 6.1.1 Monitoring Control System login window
You must log into the MCS with a valid username/password. The default credentials stored on the VR950 are:
• Username: admin • Password: adminadmin
Once the credentials are entered and the access is granted, the browser will display the Device list by default as shown in the following screen capture (Figure 6.1.2). For a detailed description of the Device list, please see the Section 6.2.3.
The Monitoring Control System page with the Device list is shown in the following screen capture (Figure 6.1.2):

Ref.no.: 003274/Revision 2.4 @2019 Control Data Systems Page 61 | 201
Figure 6.1.2 Device list (ISA 100)
On a general level, the user interface consists of two sections:
• the menus on the left, which allow you to navigate through the pages of the website; • the main section, which displays the contents of the selected page.
6.2 Network 6.2.1 Dashboard The Dashboard page is a report zone that allows you to monitor reading variations for selected devices. The Dashboard consists in a series of panes added by the user, which provide a visual representation of the information published by the selected devices in the selected channels.
The information is refreshed automatically at regular intervals (10 seconds, 30 seconds, or 1 minute).
The Dashboard series of panes are shown in the following screen capture (Figure 6.2.1):

Ref.no.: 003274/Revision 2.4 @2019 Control Data Systems Page 62 | 201
Figure 6.2.1 Dashboard series of panes (ISA 100)
6.2.1.1 Adding a Device to the Dashboard To add a device to the Dashboard, you must perform the following actions:
1. click on the Add Device button; the Add device to dashboard dialog box will open, as shown in the following screen capture (Figure 6.2.2):
Figure 6.2.2 Add device to dashboard-dialog window (ISA 100)
2. choose a device from the drop-down list; 3. choose the channel that you wish to monitor, from the drop-down list; 4. type the desired gauge value range for the readings; if the selected values are out of range, a
message on the pane will notify you; 5. optionally, select the slot number (up to the current slot number); if you do not select a slot
number, the system automatically assigns the next available slot; 6. select the desired gauge type, then click OK to add the device to the dashboard.

Ref.no.: 003274/Revision 2.4 @2019 Control Data Systems Page 63 | 201
Notes: • You can also add a reading to the dashboard from the Device Details page: in the Information
pane, click on the Add to dashboard (ATD) icon , next to a reading. • Up to 9 devices are supported in the dashboard.
6.2.1.2 Deleting a device To delete a device from the Dashboard, click in the top right corner of the pane. No confirmation is required for the system to delete the pane.
6.2.2 Topology The Topology page displays a graphical representation of the current network topology and also allows users to view data about contracts and devices.
The graphical representation of the Network Topology is shown in the following screen capture (Figure 6.2.3):

Ref.no.: 003274/Revision 2.4 @2019 Control Data Systems Page 64 | 201
Figure 6.2.3 Network Topology graphical representation (ISA 100)
The system performs regular automatic updates of the topology information. When you load the page, the topology graph is generated based on the latest topology information available. The time of the last topology information update is indicated at the top of the page. To view the latest topology, press Refresh – this will generate a Request Topology command and will refresh the page.
In the SubnetID drop-down list located at the top of the topology window, select a subnet to view it.

Ref.no.: 003274/Revision 2.4 @2019 Control Data Systems Page 65 | 201
The registered devices are displayed on multiple levels represented as grey bands. The levels are numbered from 0 to n. The level number is indicated in the upper left corner of a level. The GW, the SM and the BBR are found on level 0. The level is given by the preferred clock source. A device is on level one, if its preferred clock source is a BBR. A device is on level 2 if its preferred clock source is on level 1 and so on.
Communication-wise field devices are linked to the BBR, which is the central device in the network, either directly or via other devices. The BBR further relays to the GW, while the SM organize the entire network. The field devices can have various sensors attached: temperature sensors, humidity sensors, etc.
The devices are identified in the topology by the last four characters of their EUI-64 address. For easier identification, the backbone router, the gateway and the system manager are identified with the abbreviations BBR, GW, and SM. The devices are placed within a level in the order of their EUI64 address. They can be moved freely within the range of their level by drag-and-drop to obtain better legibility of the topology.
In addition, they are represented by suggestive icons and against backgrounds of different colors, to distinguish their roles (also shown in the Devices legend at the bottom of the page):
• Gateway – purple background; • Backbone Router – blue; • System Manager – dark green; • IO/Router Devices – blue; • IO Devices – light green; • Routers – red.
By positioning the cursor on an icon, you can view the tooltip, which includes the following details for a device:
• the EUI-64 address; • the device role; • the subnet ID; • the device tag; • the manufacturer; • the model.
The available Topology page elements and viewing options are described in the following paragraphs.
Adjusting Width and Height You can adjust the size of the topology representation using the buttons and for height and width.

Ref.no.: 003274/Revision 2.4 @2019 Control Data Systems Page 66 | 201
You can also adjust the height and width to the size of the Topology pane by clicking , or revert to the original viewing settings by clicking .
Links When the page is loaded, the Links option located above the topology graph is selected by default. The BBR is also selected by default in the topology graph and the Preferred ClockSource links to it are displayed as green lines.
To view the Preferred ClockSource for a particular device, click on the device in the topology graph, or select the device in the drop-down list located on top of the Topology window. The MCS will display the device’s link to its Preferred Clocksource.
To view the Secondary ClockSource links for a selected device, check this option in the Links Legend. These links are displayed in blue in the topology graph.
To view the transmission links between a selected device and other, check the Links option in the Links Legend. The regular links are displayed in black in the topology graph.
To view all the other links formed between the network devices, check the Show all links option. This option is unchecked by default. To view the RSQI signal value for a device links, check the Show signal quality/PER option. The signal quality value is displayed next to each link and is colored in the color of the respective link. For more information about the signal see Section 6.2.4.2. To view the packet error rate for a device, you must perform the following actions:
1. check the Show signal quality/PER option; 2. in the Links Legend, select the desired ClockSource links to display (Preferred or Secondary, or
both); 3. click the Get PER for selected device button located in the Links legend; the PER is shown as a
percentage next to the respective link.
Contracts To view the contracts for a selected device, you must perform the following actions:
1. check the Contracts option located at the top of the topology graph; 2. choose a device by clicking on it in the topology graph or by selecting it in the Devices drop-down
list located above the graph; 3. in the Contracts drop-down list you will view the selected device inbound and outbound
contracts with the SM and the GW; to show a contract on the graph, select it in the list- the contract will be represented by a green line if it is periodic or by a blue line if it is aperiodic; the Contracts legend located at the bottom of the Topology page also indicates how the types of contracts and links are represented.

Ref.no.: 003274/Revision 2.4 @2019 Control Data Systems Page 67 | 201
Note: A device can have both a periodic and an aperiodic contract with the same SM or GW at the same time.
The graphical representation of the Contracts for a selected device is shown in the following screen capture (Figure 6.2.4):
Figure 6.2.4 Contracts graphical representation (ISA 100)
Contract details In addition, when you select a contract, information about the contract parameters will be shown in the Contract details section at the bottom of the page.
The contract information includes the following parameters:
• Contract ID – the contract identifier based on the contract owner; • Service Type – can be periodic or aperiodic;

Ref.no.: 003274/Revision 2.4 @2019 Control Data Systems Page 68 | 201
• Source/destination device – the EUI64 address of the requester, and the destination device respectively;
• Source/destination SAP – “0” is the default value for the DMAP on a device; “1” is the default value of a SMAP on the SM; the other values represent custom SAPs;
• Activation Time – the date and time when the contract was established; • Expiration Time – the date and time when the contract terminates; • Priority – indicates the base priority for all messages sent using the contract; • NSDU Size – the packet size at network layer; • Reliability – the requested reliability for delivering the transmitted packets to the destination; • Period – identifies the desired publishing period, for periodic contracts; • Phase – identifies the desired phase (within the publishing period) of publications, for periodic
contracts; • Deadline – the maximum end-to-end transport delay desired, in periodic communication; • Committed Burst – for long-term aperiodic communication; it specifies the bandwidth, as
follows: o a positive value specifies the packets transmitted per second (e.g. a committed burst of
2 indicates that two packets per second are guaranteed); o a negative value specifies the number of seconds per packet (e.g. a committed burst of -
15 indicates that a packet transmitted every 15 seconds is guaranteed); • Excess Burst – for short-term aperiodic communication; it has the same significance as the
Committed Burst, but is only used in exceptional situations where aggressive communication is needed on a short-term;
• MaxSendWindow – the maximum number of client requests that may be simultaneously awaiting a response, in the case of an aperiodic communication.
6.2.3 Devices The Devices page features the list of devices that exist in the network, and a search form that enables you to search devices based on their EUI-64 address, tag and/or state, as shown in the following screen capture (Figure 6.2.5):

Ref.no.: 003274/Revision 2.4 @2019 Control Data Systems Page 69 | 201
Figure 6.2.5 Devices list and search form for the network (ISA 100)
6.2.3.1 Search devices When the Device page is loaded, the registered devices are displayed by default.
You have the following options to search a device:
1. Search by EUI-64 address
To search a device by its EUI-64 address, you must type the address in the EUI-64 Address input field and click Search.
For partial search you must perform the following actions:
a. type part of the EUI-64 address in the EUI-64 Address input field; b. select the desired state from the Show Devices drop-down list and click Search; the system
will retrieve all the devices whose EUI-64 addresses contain the characters provided by the user.
To delete the search parameters, click Reset.
2. Search by device tag
A tag is a custom description that you can assign to a device in order to facilitate identification of that device in the plant. One tag can be assigned to a single device.
To search for devices based on their tag, type the tag in the Device Tag input field, and click Search. Note that the tag field is case sensitive.
To delete the search parameters, click Reset.

Ref.no.: 003274/Revision 2.4 @2019 Control Data Systems Page 70 | 201
3. Search by device state only
To display devices based on their state at a given time, select the desired state from the Show Devices drop-down list. The device list will update automatically.
A device can be in only one of the following states at a given moment in time:
• Registered – the device has successfully joined the network and is ready to operate; • Joining process – the device has been provisioned and is attempting to join the network; • Unregistered – the device has lost connection with its neighbors in the network.
6.2.3.2 Device list The Device list shows the network devices in a table, one item per line, with main information about each logical device, as follows:
• EUI-64 Address (the MAC address); • IPv6 Address; • Tag – the device tag; • Revision – the FW version available on the device; • Role (Gateway, System Manager, Backbone Router, Field Router) and Model (manufacturer
information); • Status (FULL_ JOIN for registered devices, JOINING for joining devices, NOT_JOINED for
unregistered devices); • Last Read (the date and time of the last reading from the device) and a link to the Readings
page for the device in question.
In addition, the Device list provides a quick link as the following icon - to the Run Commands page for that specific device.
When you load the page, the registered devices are displayed by default. To view unregistered or joining devices, select the corresponding option in the Show Devices drop-down list.
The total number of items in the table is indicated in the top left corner of the table. Here you can set the number of items to be displayed per page in the table. The default number of items displayed in a page is 50. Paging controls in the top right corner of the table also enable you to navigate through the other pages of the table.
The last time the page of a device was refreshed is also available by clicking on EUI-64 Address of the device, in the Device Details page. The page does not refresh automatically, therefore you must click Refresh to update it.
6.2.3.3 Delete a device In the Devices page you have the option of deleting an unregistered device. When you delete a device, it will be removed from the network and any related data, including previous readings, will be deleted from the database.

Ref.no.: 003274/Revision 2.4 @2019 Control Data Systems Page 71 | 201
To delete the device, click the icon located next to the device. The system will require confirmation to perform the action. Click OK to delete the device or Cancel to abort the action.
6.2.4 Device Details In this page you can see all the information available for the selected device and perform device-specific commands. The page is accessed by clicking on the device EUI-64 Address in the device list.
The page is organized into seven tabbed panes by types of information and features a Back button to allow you to quickly revert to the Devices page, as well as an indication of when the last page was updated, and a Refresh button (where applicable) that enables you to retrieve up-to-date information in the specific page.
6.2.4.1 Information The Information page displays general, as well as specific activity information about the device. When the page is loaded, it shows the latest information available. To update the information, click Refresh.
The following details are shown in addition to those already indicated in the Device List:
• Manufacturer – the name of the device manufacturer; • Model – manufacturer information of the device model; • Revision – the radio FW version; • Subnet ID – the ID of the subnet that includes the device; • Power Supply Status – represented as a battery with the following colors:
o green, when the device is line powered; o blue, when the device is battery powered, and the remaining capacity of the battery
is greater than 75%; o yellow, when the device is battery powered, and the remaining capacity of the
battery is between 25% and 75%; o red, when the device is battery powered, and the remaining capacity of the battery
is less than 25%; • Energy Left – remaining energy measured in days; • DPDUs – data transmission statistics, the number of transmitted/received packages and the
number of failed transmissions/receptions; • Process values – the parameters measured by the device.
The Information window for the device is shown in the following screen capture (Figure 6.2.6):

Ref.no.: 003274/Revision 2.4 @2019 Control Data Systems Page 72 | 201
Figure 6.2.6 Information window (ISA 100)
Process values The Process values are displayed in the bottom table of the previous screen capture (Figure 6.2.6) with the following related information:
• Name – the process value name; • M.U. – the unit of measurement for the process value; • Format – various formats are possible, defining the value range of the measured parameter:
int8, uint8, int16, uint16, int32, uint32, float32; • TSAP ID; • Object ID; • Attribute ID; • Two indices.
The total number of items in the table is indicated in the top left corner of the table. Here you can set the number of items to be displayed per page in the table. The default number of items displayed in a page is 10. Paging controls in the top right corner of the table also enable you to navigate through the other pages of the table.

Ref.no.: 003274/Revision 2.4 @2019 Control Data Systems Page 73 | 201
6.2.4.2 Settings The Settings page reflect the current operation of the CDS ISA100.11a stack on a device.
The type of information displayed in Settings window includes neighbor details, routes and graphs, as shown in the following screen capture (Figure 6.2.7):
Figure 6.2.7 Settings window (ISA 100)
Neighbors The Neighbors section lists the registered neighbors of the selected device, as well indicates their signal quality, and whether they are clock sources for the selected device.
A clock source neighbor can have one of the following roles:
• Preferred clock source – the reference clock source for the selected device; • Secondary clock source – a backup clock source that becomes preferred, when the reference
clock source is not available.
Multiple neighbors may be designated as clock sources for a selected device.
The Signal Quality column displays the received signal quality indicator (RSQI) values and their associated labels, as shown in the following table (Table 6.1):
Table 6.1 Signal Quality for Received Signal Quality Indicator (ISA 100)
RSQI Signal Quality

Ref.no.: 003274/Revision 2.4 @2019 Control Data Systems Page 74 | 201
1-63 Poor signal
64-127 Fair signal
128-191 Good signal
192-255 Excellent signal
Graphs The Graphs section lists all the graphs that include the selected device, with the specific Graph ID and Neighbor Addresses 64 within each graph.
Graph 1 is the inbound graph, while the other graphs are outbound graphs.
Routes The Routes section lists the routes of which the source is the selected device.
Routes can be classified into:
• Routes based on graphs, established between two field devices or a field device and the BBR; • Hybrid routes – established between the BBR and a joined device (the destination of the route)
for which an outbound graph has not been created yet; hybrid routes consist of the node’s parent’s outbound graph and the destination node.
Routes are listed in a table displaying the following information:
• Route ID – route identification data; IDs are given in the order of creation of the routes; route 1 is the default route established between field devices and the BBR;
• Alternative – a number ranging from 0 to 3 that enables you to differentiate between routes based on their source and destination:
o if the alternative is 0, the route is based on a contract requested by the SM or the GW (this feature will be available in future releases);
o if the alternative is 1, the route is established between two field devices; o if the alternative is 2, the BBR is the source of the route and a field device is the
destination; o if the alternative is 3, this is the device’s default route (Route 1) to the BBR.
• Selector – identifies the destination of the route; the selector varies based on the value of the alternative, as follows:
o if the alternative is 0, the selector indicates the contract ID and the address of the source (SM or GW);
o if the alternative is 1, the selector field indicates the contract ID; o if the alternative is 2, the selector field indicates the address of the destination device; o if the alternative is 3, the selector is null.
• Forward Limit – the maximum number of nodes that a route can include;

Ref.no.: 003274/Revision 2.4 @2019 Control Data Systems Page 75 | 201
• Route Element – indicates the ID of the graph that stands at the basis of the route, or the graph ID and the destination’s address for hybrid routes.
To view the updated device settings, click the Refresh button. The Request Topology and Get Contracts and Routes commands will be sent to the SM. To view the command status, go the Section 6.2.7.
When the command is generated, a message at the bottom of the Settings page will indicate that the device information is refreshing.
6.2.4.3 Registration Log The Registration Log page displays the registration history for the selected device, at different dates and times, commonly known as timestamps, as shown in the following screen capture (Figure 6.2.8):
Figure 6.2.8 Registration Log-Timestamps window (ISA 100)
Use the Search functionality to view the behavior of the device over a specific period, as follows:
• choose the status you wish to view from the Registration Status drop-down list; • optionally, fill in the Start Time and the End Time fields, and then click Search.
The results are displayed in a table that indicates the timestamp and the device status at that specific timestamp. A device can have one of the following statuses at a given moment:
• SEC_JOIN_Req – the security join request was received by the SM; • SEC_JOIN_Rsp – a security join response was sent to the device; • NETWORK_Req – the network join request was received by the SM; • NETWORK_Rsp – the network join response was sent to the device; • CONTRACT_Req – the join contract request was received by the SM; • CONTRACT_Rsp – the join contract response was sent to the device; • SEC_CNFRM_Req – the security join confirmation was received by the SM; • SEC_CNFRM_Rsp – the security join confirmation response was sent to the device; • FULL_JOIN – the device is joined and configured and all information about it is available; • NOT_JOINED – the device is not joined.

Ref.no.: 003274/Revision 2.4 @2019 Control Data Systems Page 76 | 201
The total number of items in the table is indicated in the top left corner of the table. Here you can set the number of items to be displayed per page in the table. The default number of items displayed in a page is 10. Paging controls in the top right corner of the table also enable you to navigate through the other pages of the table.
6.2.4.4 Neighbors Health This Neighbors Health page provides a communication health report about the selected device’s neighbors, as shown in the following screen capture (Figure 6.2.9):
Figure 6.2.9 Neighbors Health report window (ISA 100)
The report includes, as follows:
• the EUI-64 Address – neighbor identification information; • the Timestamp of the report request; • a general Link Status, which can be:
o Available – if the neighbor is available for communication; o Unavailable – if the neighbor is unavailable for communication;
• the communication health information: o the number of DPDU's Transmitted to the neighbor and the number of Failed
transmission attempts; o the number of DPDU’s received from the neighbor and the number of failed receptions
from the neighbor; • the neighbor Signal Strength (measured in dBm); • the Signal Quality (for the RSQI ranges and associated labels, see the Section 6.2.4.2.
The total number of items in the table is indicated in the top left corner of the table. Here you can set the number of items to be displayed per page in the table. The default number of items displayed in a page is 10. Paging controls in the top right corner of the table also enable you to navigate through the other pages of the table.

Ref.no.: 003274/Revision 2.4 @2019 Control Data Systems Page 77 | 201
6.2.4.5 Schedule Report The Schedule Report page provides information about time slot and channel allocation for the selected device.
Superframe and links The active superframes that the device uses for communication are listed in the page along with information regarding size (the number of time slots), start time, and the number of links allocated on each superframe, as shown in the following screen capture (Figure 6.2.10):
Figure 6.2.10 Schedule Report window-Superframes and Links (ISA 100)
Clicking on the number of Links will display a new page with link related information for each individual link allocated on the selected superframe, as shown in the following screen capture (Figure 6.2.11):
Figure 6.2.11 Link's related information window (ISA 100)

Ref.no.: 003274/Revision 2.4 @2019 Control Data Systems Page 78 | 201
In the previous screen capture (Figure 6.2.11) are shown the following details:
• Neighbor – the EUI-64 address of the neighbor or the broadcast address FFFF:FFFF:FFFF:FFFF (used only for advertisements and receive links);
• Slot Index – the ID of the slot within the superframe; • Link Period – the periodicity of a link (measured in number of slots) within a superframe cycle; • Slot Length – expressed as a multiple of 2-20 seconds; • Channel No; • Direction – reception or transmission; • Link Type, which can be:
o aperiodic data communication; o aperiodic management communication; o periodic data communication; o periodic management communication;
You can use the Search form on the top of the page to sort links based on: • neighbor device; • the link type; • the direction of the communication.
In addition, in both the Superframe and Links tables you can sort the information by the number of items listed per page. The default number of records displayed in a page is 10. Paging controls at the bottom of the table enable you to navigate through the pages of the table.
When the pages are loaded, the latest information available is shown. To update the information, click Refresh.
Channels The Channels of the device are represented at the bottom of the pane. The channels that are clear for communication are highlighted in blue (if in use) or grey (if Idle), while Blacklisted channels are highlighted in red. Channel 26 has been disabled by default for purposes of compliance in certain countries.
6.2.4.6 Channel Statistics The Channel Statistics page displays statistical information about CCA backoffs per channel, as shown in the following screen capture (Figure 6.2.12):

Ref.no.: 003274/Revision 2.4 @2019 Control Data Systems Page 79 | 201
Figure 6.2.12 Channel Statistics window (ISA 100)
The information is presented in a table, with the value column expressing the percentage (0% to 100%) of aborted transmissions for each channel.
To update the information, click Refresh.
6.2.4.7 Run Commands The Run Commands page enables you to perform device-specific commands.
In the following screen capture (Figure 6.2.13) is displayed the Run Commands window:
Figure 6.2.13 Run Commands window (ISA 100)
To go to a specific command, select it from the Commands drop-down list. After you generate the command, a message at the bottom of the screen will indicate its status (Command sent successfully,

Ref.no.: 003274/Revision 2.4 @2019 Control Data Systems Page 80 | 201
Command sent error). The tracking number of the command is also indicated, together with a link to the Commands Log (please see the Section 6.2.7., where you can view the results of the command.
In the following sections are described the available types of commands.
6.2.4.7.1 Read Value The command Read Value is available only for field devices and enables you to read a value of a particular channel of the selected device.
In the following screen capture (Figure 6.2.14) is displayed the Read Value window:
Figure 6.2.14 Read Value command window (ISA 100)
To generate the command, select the process value for which to request a reading and click Execute. The returned value will be displayed in the Readings page, in engineering units under the Value column as well as in the Command Log, under the Response column.
Note: When the device is unregistered, the Run Commands page is unavailable.
6.2.4.7.2 Reset Device The command Reset Device resets the firmware on the specific device.
Three types of resets can be performed on a device, as follows:
• Warm Restart – performs a software reset; therefore, the device will unregister and re-register;
• Restart as provisioned – resets the device while keeping provisioning information; • Reset to factory defaults – deletes the provisioning information and resets the device to its
manufacturing settings; the device must be re-provisioned in order to be able to join the network.
In the following screen capture (Figure 6.2.15) is displayed the Reset Device window with the Restart Types available:

Ref.no.: 003274/Revision 2.4 @2019 Control Data Systems Page 81 | 201
Figure 6.2.15 Reset Device window (ISA 100)
This command is available for all network devices with two exceptions:
1. the command cannot be performed on the SM;
2. the Reset to factory defaults option is not available on the GW.
6.2.4.7.3 Read Object Attribute By using Read Object Attribute command you can read attributes from an object on the selected device.
To read an attribute, type in the UAP specific TSAP ID, the object ID and the ID of the attribute that you wish to read and click Execute. Note that the values of the two indices are 0 by default and the value of the Committed Burst field is -15 by default.
In the following screen capture (Figure 6.2.16) is displayed the Read Object Attribute window:
Figure 6.2.16 Read Object Attribute window (ISA 100)

Ref.no.: 003274/Revision 2.4 @2019 Control Data Systems Page 82 | 201
The command returns the content of the attribute, which will be displayed in hex format in the Response column of the Commands Log page.
6.2.4.7.4 Write Object Attribute The Write Object Attribute command enables you to write/edit a value to an object on the selected device. Only certain attributes are editable.
In the following screen capture (Figure 6.2.17) is displayed the Write Object Attribute window:
Figure 6.2.17 Write Object Attribute window (ISA 100)
To write the attribute, type in the TSAP ID, the associated Object ID and the Attribute ID that you want to write or edit, then type the desired hex value(s) in the Values input field and click Execute. Note that the values of the two indices are 0 by default.
6.2.4.7.5 Execute Object Method The Execute Object Method command is used to execute a network visible method on an object on the selected device.
In the following screen capture (Figure 6.2.18) is displayed the Execute Object Method window:

Ref.no.: 003274/Revision 2.4 @2019 Control Data Systems Page 83 | 201
Figure 6.2.18 Execute Object Method window (ISA 100)
To execute the method, type in the TSAP ID, the associated Object ID and the Method ID that you wish to execute, then provide the method details in hex format in the Details input field and click Execute. Note that the values of the two indices are 0 and the value of the Committed Burst field is -15 by default.
6.2.5 Network Health The Network Health page provides a communication health report at network level.
The page consists of two sections containing the network summary statistics and the device-specific communication health information, respectively, as shown in the following screen capture (Figure 6.2.19):
Figure 6.2.19 Network Health sections (ISA 100)
In the network summary section, the following information is indicated:
• Network ID and Network Type – network identification data (where applicable);

Ref.no.: 003274/Revision 2.4 @2019 Control Data Systems Page 84 | 201
• Devices Count – the total number of registered devices, including the BBR; • Join Count – the total number of joins of all the devices in the network; • Current Date – the present time; • Start Date – the date and time the SM application was started; • DPDUs and GPDU – transmission and reliability statistics, based on the summary report per
device; • Averaging interval for GPDU statistics, reported in seconds.
The device communication report section consists of a table displaying the following information for each device:
• EUI-64 Address – the network address of the device; • Start Date – the date and time of the device’s first join; • DPDU’s Sent – the total number of packets sent by the device; • DPDU’s Lost – the total number of packets sent by the device which failed to reach destination; • GPDU Latency – the percentage of scheduled GPDU's that arrive later than expected; • GPDU Path Reliability – the percentage of GPDU’s transmitted successfully on a primary path; • GPDU Data Reliability – the percentage of successful GPDU’s (transmit GPDU’s that are
transferred correctly on the first attempt plus receive GPDU’s that pass integrity checks); • Join Count – the total number of joins per device.
The total number of items in the table is indicated in the top left corner of the table. Here you can set the number of items to be displayed per page in the table. The default number of items displayed in a page is 10. Paging controls in the top right corner of the table also enable you to navigate through the other pages of the table.
The last time the page was refreshed is also indicated in the page. To update the information, click Refresh.
6.2.6 Readings In the Readings page you can view the readings received from devices, which are generated either on demand by Read Value commands or by automatic Publish/Subscribe commands. The readings can be filtered by Device, Process Value, or Reading Type (Publish/Subscribe or On Demand), as shown in the following screen capture (Figure 6.2.20):

Ref.no.: 003274/Revision 2.4 @2019 Control Data Systems Page 85 | 201
Figure 6.2.20 Readings window (ISA 100)
To search for readings, select the desired Device and Process Value, as shown in the previous screen capture (Figure 6.2.20), and click Search. The results are displayed in a table that contains the following information for each reading:
• Device EUI-64 Address – MAC address of the device that reported the reading; • Timestamp – date and time of the reading; • Channel Name – the process value name; • Value – the value received on that particular reading, shown in engineering values; • Unit of Measurement (if applicable); • Reading type.
The total number of items in the table is indicated in the top left corner of the table. Here you can set the number of items to be displayed per page in the table. The default number of items displayed in a page is 10. Paging controls in the top right corner of the table also enable you to navigate through the other pages of the table. From this page you can also save the search results into a Microsoft Excel CSV file, by clicking Export.
6.2.7 Commands Log In Command Log page you can view all the commands issued on the registered devices in the system. The commands can be filtered by Device, Command (type), or Command Status (New-command posted in database, Sent-command sent to device, Responded-device responded successfully to the command, Failed-command failed to execute). These options are depicted in the following screen capture (Figure 6.2.21):

Ref.no.: 003274/Revision 2.4 @2019 Control Data Systems Page 86 | 201
Figure 6.2.21 Command Log window (ISA 100)
To search for commands, select the desired Device, Command and Command Status and click Search. The results will be displayed in a table, as shown in the previous screen capture (Figure 6.2.21), with the following information for each command:
• Tracking No. – internal ID of the command; • EUI-64 Address – MAC address of the command destination device; • Command – name of the executed command; • Parameters – description of the parameters chosen for the command, if applicable; • Status – current status of the command; • Posted Time – date and time when the command was generated; • Response Time – date and time when the command was responded successfully or not; • Response – the response for the issued command if the command was responded successfully
or the error reason if the command failed, which can consist of:
o the measured value expressed in engineering units for the Read Value command; o the hex value for Read/Execute Object Attribute commands; or o the mention success for all the other types of commands executed on devices.
If the length of the response exceeds the size of the Response cell, click on the response link to open the Tracking Response form and view the full response, as shown in the following screen capture (Figure 6.2.22):

Ref.no.: 003274/Revision 2.4 @2019 Control Data Systems Page 87 | 201
Figure 6.2.22 Tracking Response window (ISA 100)
Given the large number of commands generated automatically by the system at regular intervals, these commands are hidden by default. To view them, check the Show system generated commands option in the Search dialog and click Search.
The total number of items in the table is indicated in the top left corner of the table. Here you can set the number of items to be displayed per page in the table. The default number of items displayed in a page is 10. Paging controls in the top right corner of the table also enable you to navigate through the other pages of the table.
From this page you can also save the search results into a Microsoft Excel CSV file, by clicking Export.
6.2.8 Alerts The Alerts page enables you to view alarms and events generated by devices.
Alerts consist in application messages that advise or warn the recipient of the presence of an impending or existing situation of interest.
In the following screen capture (Figure 6.2.23) is shown the Alerts window:

Ref.no.: 003274/Revision 2.4 @2019 Control Data Systems Page 88 | 201
Figure 6.2.23 Alerts window (ISA 100)
Two types (classes) of alerts are supported in accordance with the ISA100.11a specification:
• Events – indicates that something happened with the device; • Alarms – indicates that a device has transitioned to an abnormal state or has returned to normal
from an abnormal state; an alert is sent to describe the change of state.
To search for alerts you must perform the following actions:
• select the Device, the alert Category, Priority and Class of alert; • optionally, fill in the Start Time and the End Time fields, and then click Search.
The results are displayed in a table depicted in the previous screen capture (Figure 6.2.23) that indicates the following information:
• EUI-64 Address – the MAC address of the device generating the alert; • TsapID and ObjID – identification of the application process and the associated object that
initiated the alert; • Time – the date and time when the alert condition was detected; • Class – the type of alert (alarm or event); • Direction – with the following values:
o Start/End – only for alarms, it indicates if the report is for an alarm condition, or a return to normal from an alarm condition;
o N/A – if the alert reports an event; • Category – device diagnostic, communication-related, security-related, or process related; • Priority – indicates the importance of the alert, with the following ranges and associated labels,
in compliance with the specification: o 0 - 2: Journal-only; o 3 - 5: Low;

Ref.no.: 003274/Revision 2.4 @2019 Control Data Systems Page 89 | 201
o 6 - 8: Medium; o 9 - 11: High; o 12 -15: Urgent.
• Value – indicates the value associated with the alert condition.
You can set the number of records to be displayed per page in the table. The default number of records displayed in a page is 10. Paging controls at the bottom of the table allow you to navigate through different pages of the search results. From this page you can also save the Search results into a Microsoft Excel CSV file, by clicking Export.
6.2.9 Troubleshooting The Troubleshooting page displays the latest alerts related to various events in the network.
In the following screen capture (Figure 6.2.24) is shown the Troubleshooting window:
Figure 6.2.24 Troubleshooting window (ISA 100)
The alerts are listed in a table as shown in the previous screen capture (Figure 6.2.24), with the following information:
• EUI-64/IPv6 Address/Device Tag – a drop down list allows you to choose the device identification information that will be displayed in the first column of the table; the drop-down box is set on EUI-64 by default;
• Timestamp – the date and time when the alert was generated; • Event – the alert type (please see the Section 6.2.9.1.).

Ref.no.: 003274/Revision 2.4 @2019 Control Data Systems Page 90 | 201
• Details – this column displays the following details, depending on the type of alert, as shown in the following table (Table 6.2):
Table 6.2 Troubleshooting-Details explanations (ISA 100)
Alert Type Details Explanations
Device Join Device IPv6 IPv6 address of the device
Device Type The tags GW, BB, or SM for field devices, the tag is not displayed
Device Join Failed Parent The IPv6 address of the parent device
Phase
Join Phase Join Phase Description
4 SECURITY_JOIN_Req
5 SECURITY_JOIN_Rsp
6 NETWORK_JOIN_Req
7 NETWORK_JOIN_Rsp
8 JOIN_CONTRACT_Req
9 JOIN_CONTRACT_Rsp
10 SECURITY_CONFIRM_Req
11 SECURITY_CONFIRM_Rsp
Reason The reason number and description
Device Leave Reason The reason number and description
• The time elapsed from the Last alert.
Notes: • The Topology Alerts will be implemented in a future version of the MCS. • For a description of the error reasons, see the Section 6.2.9.1.
The Display last N alerts drop-down list allows you to select the maximum number of alerts to display in the table. You can choose a value between 50, 100, 150, and 200.
To always view the latest alerts, enable the Autorefresh every N seconds checkbox. You can choose a value between 5, 10, 15, 30, and 60 seconds.
6.2.9.1 Filters The Edit filters button allows you to define the filters to apply for displaying the alerts. Click the button to expand the upper section of the page, as shown in the following screen capture (Figure 6.2.25):

Ref.no.: 003274/Revision 2.4 @2019 Control Data Systems Page 91 | 201
Figure 6.2.25 Edit filters button window (ISA 100)
Under Devices, select the devices for which you want to display alerts. Checking/unchecking the All checkbox in the table header will check/uncheck all the devices.
Under Alert Class & Types, you will view a hierarchy of application alerts and you can select the desired alerts combination.
Checking/unchecking an alert class will check/uncheck all the alert types in that class. Checking/unchecking the All checkbox in the table header will check/uncheck all the alerts.
Pressing Clear Filter will reset the filters to All for both the Devices list and the Alerts list.
Each alert is preceded by an icon indicating the severity of the alert, as follows:
- Information
- Warning
- Error
The Severity Icon is displayed for each Alert in the Troubleshooting table based on the following mapping (Table 6.3):
Table 6.3 Troubleshooting Alerts-mapping (ISA 100)
Alert Reason Severity
Device join/leave alerts
Device Join - info
Device Join Failed 1: Timeout (device does not respond to SM queries) warning
2: Re-join (new join request while joining) warning
3: Parent left the network during device join warning
8: Insufficient parent resources - will retry join trough another router warning
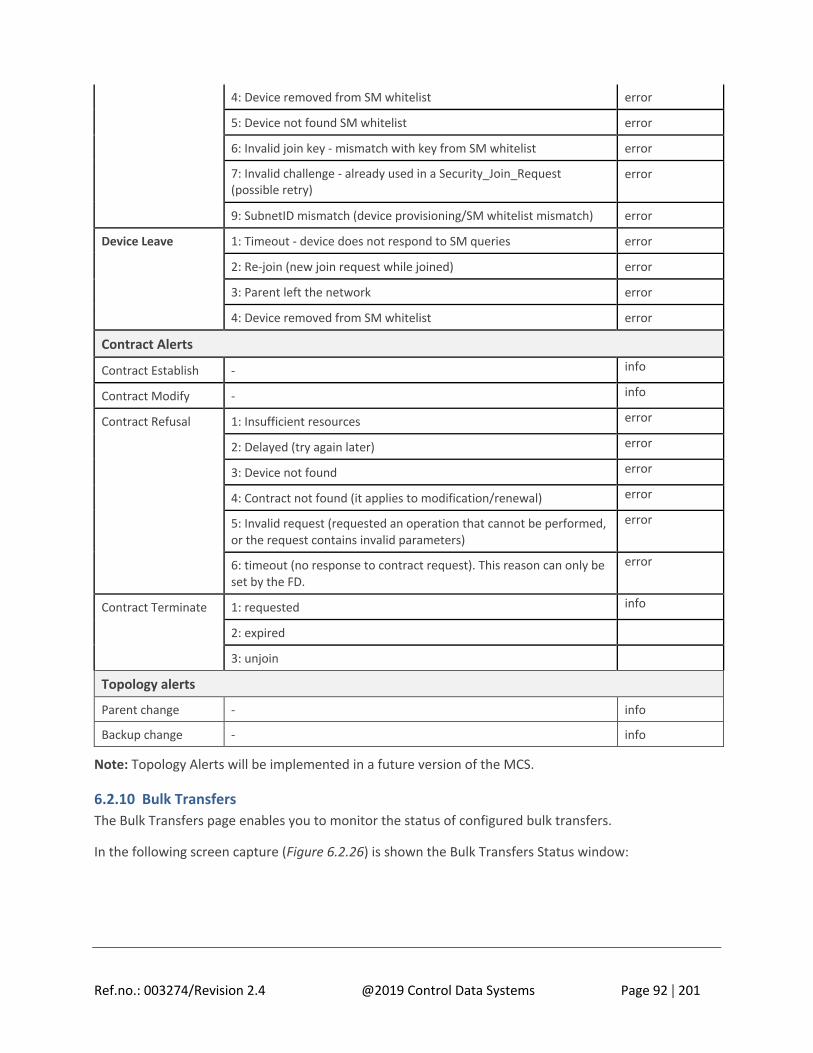
Ref.no.: 003274/Revision 2.4 @2019 Control Data Systems Page 92 | 201
Note: Topology Alerts will be implemented in a future version of the MCS.
6.2.10 Bulk Transfers The Bulk Transfers page enables you to monitor the status of configured bulk transfers.
In the following screen capture (Figure 6.2.26) is shown the Bulk Transfers Status window:
4: Device removed from SM whitelist error
5: Device not found SM whitelist error
6: Invalid join key - mismatch with key from SM whitelist error
7: Invalid challenge - already used in a Security_Join_Request (possible retry)
error
9: SubnetID mismatch (device provisioning/SM whitelist mismatch) error
Device Leave 1: Timeout - device does not respond to SM queries error
2: Re-join (new join request while joined) error
3: Parent left the network error
4: Device removed from SM whitelist error
Contract Alerts
Contract Establish - info
Contract Modify - info
Contract Refusal 1: Insufficient resources error
2: Delayed (try again later) error
3: Device not found error
4: Contract not found (it applies to modification/renewal) error
5: Invalid request (requested an operation that cannot be performed, or the request contains invalid parameters)
error
6: timeout (no response to contract request). This reason can only be set by the FD.
error
Contract Terminate 1: requested info
2: expired
3: unjoin
Topology alerts
Parent change - info
Backup change - info
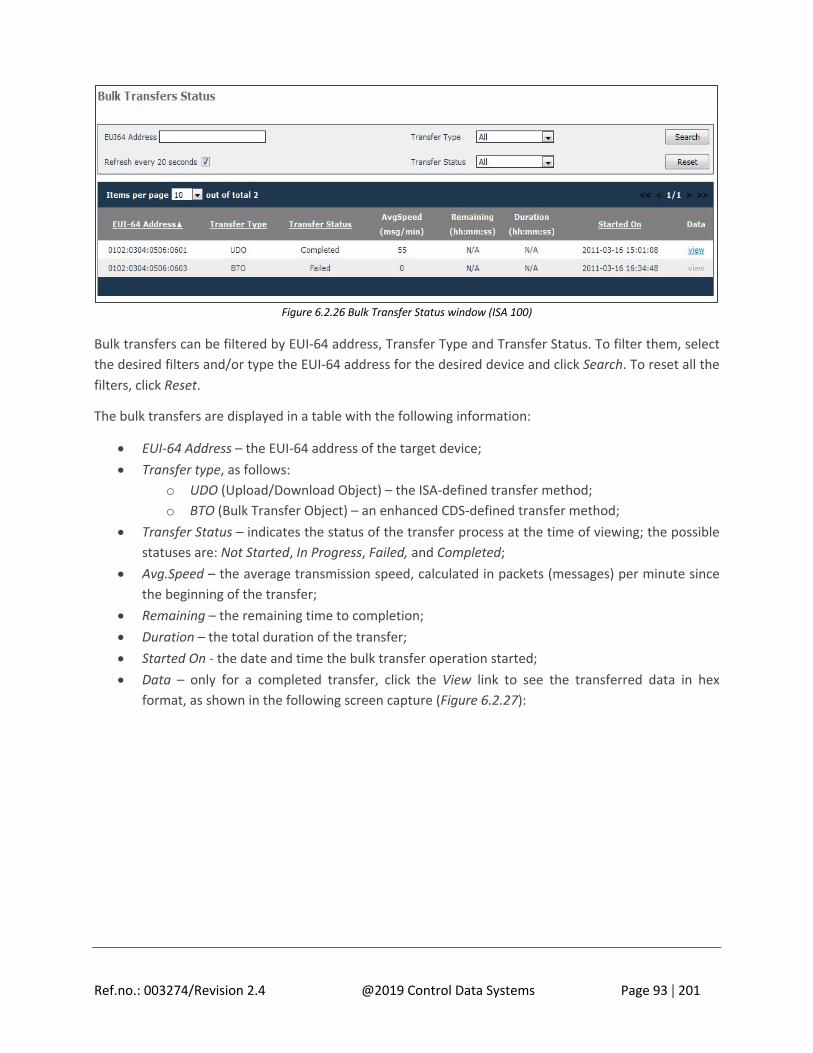
Ref.no.: 003274/Revision 2.4 @2019 Control Data Systems Page 93 | 201
Figure 6.2.26 Bulk Transfer Status window (ISA 100)
Bulk transfers can be filtered by EUI-64 address, Transfer Type and Transfer Status. To filter them, select the desired filters and/or type the EUI-64 address for the desired device and click Search. To reset all the filters, click Reset.
The bulk transfers are displayed in a table with the following information:
• EUI-64 Address – the EUI-64 address of the target device; • Transfer type, as follows:
o UDO (Upload/Download Object) – the ISA-defined transfer method; o BTO (Bulk Transfer Object) – an enhanced CDS-defined transfer method;
• Transfer Status – indicates the status of the transfer process at the time of viewing; the possible statuses are: Not Started, In Progress, Failed, and Completed;
• Avg.Speed – the average transmission speed, calculated in packets (messages) per minute since the beginning of the transfer;
• Remaining – the remaining time to completion; • Duration – the total duration of the transfer; • Started On - the date and time the bulk transfer operation started; • Data – only for a completed transfer, click the View link to see the transferred data in hex
format, as shown in the following screen capture (Figure 6.2.27):

Ref.no.: 003274/Revision 2.4 @2019 Control Data Systems Page 94 | 201
Figure 6.2.27 Transferred data window (ISA 100)
To refresh regularly the information in the table, check the Refresh every 20 seconds option in the Search form.
The total number of items in the table is indicated in the top left corner of the table. Here you can set the number of items to be displayed per page in the table. The default number of items displayed in a page is 10. Paging controls in the top right corner of the table also enable you to navigate through the other pages of the table.
6.2.11 Set Country Code The Set Country Code page allows you to set the country code for the checked devices in the list. The country code will set the maximum RF output power. In Appendix you can find the correlation between country code and maximum RF output power.
Notes:
• CDS VN310 is the first radio hardware model that supports variable RF output power. • Only users with Administrator or Power User role are permitted to use this feature.
To set the country code for one or more devices select the respective check boxes on the right side of the list, select the Country Code from the dropdown list and click Execute. If necessary, you can filter the device list by EIU-64 Address, Device Tag or by Revision, as shown in the following screen capture (Figure 6.2.28):

Ref.no.: 003274/Revision 2.4 @2019 Control Data Systems Page 95 | 201
Figure 6.2.28 Country Code settings window
6.3 Configuration The Configuration section enables you to view and edit certain settings for the configuration/provisioning of the devices and the network, including connection settings, publishers, alert subscriptions and Modbus register mapping.
This section is intended for users with thorough technical knowledge, and certain configurations require advanced expertise, therefore they should be carefully planned, as any inconsistencies may render the devices/network inoperative.
Note that the changes you perform in the settings for each separate entity will also be reflected in the Advanced Settings page and vice-versa.
6.3.1 Basic The Basic Config page provides the main configuration of the network Subnet ID and the Join Key. The user input values are as follows (Figure 6.3.1):
• Subnet ID (a decimal value between 2 and 65535); • Single Join Key (a hexadecimal value of 32 characters).
After changing either values, a Hardware Restart is needed.
The same join key must be provided to field devices in the provisioning phase (using FieldTool).

Ref.no.: 003274/Revision 2.4 @2019 Control Data Systems Page 96 | 201
Figure 6.3.1 Basic Config
6.3.2 Backbone Router The Backbone Router configuration page consists of four sections, as shown in the following screen capture (Figure 6.3.2):
Figure 6.3.2 Backbone Router configuration sections (ISA 100)
• In the General Settings section, you must perform the following action: o specify the EUI64 address and the BBR Tag.

Ref.no.: 003274/Revision 2.4 @2019 Control Data Systems Page 97 | 201
On hover over an edit box, a tooltip will appear indicating the allowed format and range for each value.
Note: If you change any of these settings, you must restart the BBR in order the new settings to take effect.
• In the Provision/security section you must perform the following actions: o specify the Subnet ID, which must be the same for all the devices in a subnet; o specify the Subnet Mask; o specify the App Join Key.
On hover over an edit box a tooltip will appear indicating the allowed format and range for each value.
Note: If you change any of these settings, you must restart the BBR in order the new settings to take effect.
• In the Logging section you must perform the following action: o select the application and Stack Logging level; the numbers suggest the degree of detail
provided in the BBR logs, as follows: - 1 (ERROR) for error messages only; - 2 (WARN) for error and warning messages; - 3 (DEBUG) for error, warning and debug messages.
• In the Time Settings section, you must perform the following actions: o select NTP servers if the VR950 has access to internet; o in case the VR950 does not have access to the internet, time synchronization can be
performed by using the transceiver clock TR as time source.
When you have finished editing the settings, click Save. As mentioned above, depending on the settings that you modify, the BBR may need to be restarted for the changes to take effect.
6.3.3 Gateway The Gateway configuration page consists of 3 sections, as shown is the following screen capture (Figure 6.3.3):

Ref.no.: 003274/Revision 2.4 @2019 Control Data Systems Page 98 | 201
Figure 6.3.3 Gateway configuration window (ISA 100)
• In the General Settings section, you must perform the following action: o specify the EUI64 address and the GW Tag.
On hover over an edit box a tooltip will appear indicating the allowed format and the range for each value.
Note: If you change any of these settings, you must restart the GW in order the new settings to take effect.
• In the Provision/security section you must perform the following action: o specify the Subnet ID and the App Join Key.
On hover over an edit box a tooltip will appear, indicating the allowed format and the range for each value.
Note: If you change any of these settings, you must restart the GW in order the new settings to take effect.
• In the Logging section you must perform the following action: o select the Application Logging level and the Stack Logging level; the numbers suggest the
degree of detail provided in the GW logs, as follows: - 1 (ERROR) for error messages only; - 2 (WARN) for error and warning messages; - 3 (DEBUG) for error, warning and debug messages
When you have finished editing the settings, click Save. As mentioned above, depending on the settings that you modify, the Gateway may need to be restarted for the changes to take effect.
6.3.4 System Manager The System Manager configuration page consists of 3 sections, as shown in the following screen capture (Figure 6.3.4):

Ref.no.: 003274/Revision 2.4 @2019 Control Data Systems Page 99 | 201
Figure 6.3.4 System Manager configuration window (ISA 100)
• In the General Settings section, you must perform the following action: o Specify the EUI64 address.
On hover over an edit box a tooltip will appear, indicating the allowed format and range.
Note: If you change this setting, you must restart the SM in order the new setting to take effect.
• In the Operational Settings section, you must perform the following actions:
o fill in the input fields with the desired/appropriate values; the following default values are used by the System Manager when no value is present in the field: - Max Device Number – 100 maximum number of devices that are allowed in the system; - Max Desired Latency (%) – 0 maximum desired latency (percentage of publication
period). Values in percentage of the publication period apply on each periodic contract. Default value of 0 means that the latency is limited only by the value from contract. Publication contracts request, with a latency required below this value will not be allocated with the requested latency (from contract) and will be allocated with the supplied value from settings. Each contract when is requested can specify a desired latency. The contract latency will be used by apply minimum between contract specified latency and Max Desired Latency settings. The Max Desired Latency is a global latency that can be applied on all contracts;
- Device Timeout Interval (s) – 120 seconds, integer in range [60-65535]; timeout in seconds used by SM to detect that a device is down;
Ref.no.: 003274/Revision 2.4 @2019 Control Data Systems Page 100 | 201
- Advertise Period (s) – 10 seconds; represents the period to be used by routers to send advertisement requests; the possible values for this field are: 1,4,7,8,9,10,11,13,14;
- Join Links Period (s) – 5 seconds; represents the period to be used by routers for the join links used during join process of other devices through these routers;
- Topology – choose between Mesh and Star topologies; - Channels – 12,20,24,23,18,25,21; represents the list of IEEE 802.15.4 channels that are
used for data communication in the whole setup; o enable the desired frequency channels for communication with the network devices.
On hover over an edit box a tooltip will appear, indicating the allowed format, range and a description (where necessary for disambiguation) for each value.
• In the Logging section, select the Logging level, which indicates the degree of detail provided in the logs, as follows: o ERROR for error messages only; o WARN for error and warning messages; o INFO for error, warning, and information messages; o DEBUG for error, warning, information, and debug messages;
When you have finished editing the settings, click Save.
6.3.5 Device Management This Device Management page enables you to edit the provisioning information in the system_manager.ini file for existing devices and to add new devices to the network.
WARNING! Do not change these settings unless you were specifically instructed by a CDS Technical Support representative! Incorrect values may render the devices dysfunctional or may cause difficulty to trace malfunctions.
Click Help in the upper right corner of the window to view information and examples of the accepted data formats in all the sections.
In the following screen capture (Figure 6.3.5) is shown the Device Management window:

Ref.no.: 003274/Revision 2.4 @2019 Control Data Systems Page 101 | 201
Figure 6.3.5 Device Management window (ISA 100)
Notes: 1. The EUI-64 address is unique in a network. 2. All the devices in a subnet must have the same security key and the same Subnet ID. 3. The number of BBR in a network equals the number of subnets in that network.
6.3.5.1 Configuring Backbones To add a BBR in the network, type its EUI64, security Key and Subnet ID in the empty edit box and click Save. The new BBR will be added to the backbones list.
Editing a BBR To edit a BBR you must perform the following actions:
1. click on the entry that you want to edit in the backbones list;

Ref.no.: 003274/Revision 2.4 @2019 Control Data Systems Page 102 | 201
2. edit the security key and/or subnet ID and click Save to save the changes in the system_manager.ini file.
Considering Note 1 above, if you try to edit the EUI64 address of an existing BBR, the SM will recognize it as a new entity and will add the new BBR to the list.
Considering Notes 2 and 3 above, if you edit a BBR, it will be removed from an existing subnet and the devices in that subnet will be unable to join the network, unless you edit the same parameters for all the field devices in that subnet.
Deleting a BBR To delete a BBR you must perform the following actions:
1. select the desired backbone router in the list and click Delete; 2. you will be asked for confirmation; click Yes to delete the backbone router or No to abort the
action.
Considering Note 3 above, when you delete a BBR, the devices in its subnet will be unable to join until a new BBR provisioned with the same security key and subnet ID is added to that subnet.
After you perform any of the above operations, click Activate to load the changes into the SM. The changes will be visible in the network topology and where applicable in the device list.
6.3.5.2 Configuring Gateways Note: By design, the VR950 supports only one GW, therefore it is not permitted to add more than one GW to the system.
Editing a GW To edit the GW, you must perform the following actions:
1. click on the entry that you want to edit in the GWs list; 2. edit the security key and/or subnet ID and click Save to save the changes in the
system_manager.ini file.
Deleting a GW To delete the GW, you must perform the following actions:
1. select the desired GW in the list and click Delete; 2. you will be asked for confirmation; click Yes to delete the GW or No to abort the action.
Caution! If you delete the GW, you will no longer be able to access the system and retrieve any data, although the network remains functional.
After you perform any of the above operations, click Activate to load the changes into the SM. The changes will be visible in the network topology and, where applicable, in the device list.

Ref.no.: 003274/Revision 2.4 @2019 Control Data Systems Page 103 | 201
6.3.5.3 Configuring Devices Adding devices You can add devices either individually, one device at a time, or you can add multiple devices at a time.
To add a single device in the network, type its EUI64, security key, and subnet ID in the empty edit box and click Save. The new device will be added to the devices list.
To add multiple devices with consecutive EUI-64 addresses type the range of EUI64 addresses corresponding to the devices that you wish to add; subsequently, type the security key, and the subnet ID and click Save.
The following example shows how a series of devices with consecutive EUI-64 address can be added to a subnet.
Example:
“6302:0304:0506:0B1A - 6302:0304:0506:0B1E, C0 C1 C2 C3 C4 C5 C6 C7 C8 C9 CA CB CC CD CE CF,17, 3“
Note: When you add a device or a range of devices into the network you can define their role, which is expressed as an integer value and is added after the subnet ID in the device format.
The following table (Table 6.4) details the role values and associated labels:
Table 6.4 Adding devices-role values and labels (ISA 100)
Integer Value Role
1 IO Device
2 Router Device
3 IO Routing Device
The following aspects must be taken into consideration when defining the role for a device, or range of devices:
1. upon join, each device states its capacity; 2. the roles of the BBR and the GW cannot be changed, therefore providing a role value in this
section is unnecessary; 3. the role selection for a field device is limited to the capacity stated by that device, i.e.:
• if a device has only the IO role, you cannot add the Routing role for that device in the Device Management section;
• if a device has both the IO and the routing roles, you can limit its role in the network to one of the two, by typing either 1 or 2 after the Subnet ID;
• if you do not specify a role in this section, the SM will admit the role(s) stated by the device;
4. if you add the Role for a range of devices, all the devices in question will have the same role; if any device in the range does not support the assigned role, the device will not join the network.

Ref.no.: 003274/Revision 2.4 @2019 Control Data Systems Page 104 | 201
Editing a device/multiple devices To edit a device/multiple devices you must perform the following actions:
1. in the device list, click on the entry that you want to edit; 2. edit the security Key and/or Subnet ID; see the previous Note on device Role if you want to edit
device roles; 3. click Save to save the changes in the system_manager.ini file.
Deleting a device/multiple devices To delete a device/multiple devices you must perform the following actions:
1. select the desired entry in the list and click Delete; 2. you will be asked for confirmation; click Yes to delete the device(s) or No to abort the action.
After you perform any of the above operations, click Activate to load the changes into the SM. The changes will be visible in the network topology and where applicable in the device list.
Loading a List of Devices You can add multiple devices at the same time by importing them from a file. The file will contain a list of devices with <EUI64>, <Key>, and <Subnet> comma separated values.
To load a list, you must perform the following actions:
1. click on Browse to locate the text file that you wish to load, and click Upload; 2. click Activate, to load the new device list into the SM; the current system_manager.ini file will be
overwritten, and all previous settings will be lost.
Exporting the Settings This page also enables to export the configuration settings, by clicking Save in the “Manage device list” section.
6.3.6 Configuring a Subnet To configure a Subnet, you must go through chapters 6.3.1, 6.3.2 and 6.3.4 and change the Subnet ID wherever it is required. Note that while at the Backbone Router page, the Subnet ID will be the hexadecimal value of the new Subnet ID, while everywhere else you will use the decimal value. When changing the Subnet at the Device Management page, click Save after each modification and when done, click Activate to make the changes permanent and to implement the new Subnet.
6.3.7 Monitoring Host The Monitoring Host page enables you to configure the devices publishing settings stored in the Monitor_Host_Publishers.conf file.
Click Help in the upper right corner of the window to view information and examples of the accepted data formats in all sections.

Ref.no.: 003274/Revision 2.4 @2019 Control Data Systems Page 105 | 201
In the following screen capture (Figure 6.3.6) is displayed the Device Management window:
Figure 6.3.6 Monitoring Host window (ISA 100)
6.3.7.1 Publishers Adding a publisher To add a publisher, you must perform the following actions:
1. in an empty edit box, type the parameters of the publishing device in the order and format indicated in the Help form: EUI64 address, concentrator TSAP ID, concentrator ID, data period, data phase, data stale limit (in multiples of data periods), data content version, and interface type;
2. click Save; the publisher will be added to the list and the changes will be saved in the Monitoring Host Configuration file.
3. add the process values to be published, by following the steps described under the Section 6.3.7.2.

Ref.no.: 003274/Revision 2.4 @2019 Control Data Systems Page 106 | 201
You can also add a publisher based on an existing publisher, by performing the following actions:
1. click on a publisher in the list; 2. in the edit box, change the EUI64 into that of the new publisher; 3. change other parameters, if applicable; 4. click Save; the publisher will be added to the list and the published channels of the original
device are preserved in the newly added device.
Note: The InterfaceType specifies whether the published attributes are size-prefixed or not. This parameter can have one of the following values:
• 1 – for a Full API, i.e. the published values are not size-prefixed (this is the native ISA100.11a publishing);
• 2 – for a Simple API, i.e. the published values are size-prefixed.
Editing a publisher To edit a publisher, you must perform the following actions:
1. in the publishers list, click on the entry that you want to edit; 2. edit the desired parameters and click Save; the changes will be stored in the
Monitor_Host_Publishers.conf” file.
Deleting a publisher To delete a publisher, you must perform the following actions:
1. select a publisher in the list and click Delete; 2. you will be asked for confirmation; click Yes to delete the publisher or Cancel to abort the action.
After you perform any of the above operations, click Activate to load the changes into the Monitoring Host.
6.3.7.2 Channels In the particular context of the Monitoring Host, the channels represent the attributes (values) that are being published.
Adding a channel for a publisher To add a channel for a publisher you must perform the following actions:
1. in an empty edit box, type the process value parameters in the order and format indicated in the Help form: TSAP ID, object ID, attribute ID, index1, index2, format, name, unit of measurement, and withstatus;
2. click Save; the channel will be added to the channels list for that specific publisher and the changes will be saved in the Monitoring Host Configuration file.

Ref.no.: 003274/Revision 2.4 @2019 Control Data Systems Page 107 | 201
Note: The withstatus indicates whether the values that are being published have a status or not. This parameter can have one of the following values:
• 0 – if the published value does not have a status; • Any other value – if the published value has a status.
Editing a channel To edit a channel, you must perform the following actions:
1. in the channels list, click on the entry that you want to edit; 2. edit the desired parameters and click Save; the changes will be stored in the
Monitor_Host_Publishers.conf file.
Deleting a channel To delete a channel, you must perform the following actions:
1. select a channel in the list and click Delete; 2. you will be asked for confirmation; click Yes to delete the channel or Cancel to abort the action.
After you perform any of the above operations, click Activate to load the changes into the Monitoring Host.
Loading a List of Publishers You can add multiple publishing devices at the same time by importing them from a file. The file will contain the list of devices and their published channels, with the associated parameters respectively expressed as comma separated values.
To load a list, you must perform the following actions:
1. click on Browse to locate the text file that you wish to load and click Upload; the current Monitor_Host_Publishers.conf file will be overwritten;
2. click Activate to load the new device list into the Monitoring Host.
Exporting the Publishers This page also enables to export the publisher list (including channels), by clicking Save in the Manage publisher list section.
6.3.7.3 Autodiscover Publishers By checking Autodiscover publishers box will start the process of automatic update of the Publishers list, by reading concentrator object info from all devices that does not have an entry in Publishers list. While checked, it will also read publisher information from devices that join the network afterwards. The auto discover process will also be triggered upon receiving a different DATA_CONTENTVERSION than the one already known for a publisher, or by clicking Rediscover All Publishers button.

Ref.no.: 003274/Revision 2.4 @2019 Control Data Systems Page 108 | 201
Because this is a continuous process it will avoid significant lags by building a blacklist of nonresponsive devices (i.e. routers which are not IO devices) and those will no longer be automatically queried on next join. When a device is added to this list the Rediscover Non Responsive button will be activated. Clicking this button will initiate publisher auto discovery process for those nonresponsive devices.
All publisher info gathered by the auto discovery process is added into the Publishers file (Monitor_Host_Publishers.conf) and the above Publisher list. The changes will become effective either by clicking the Activate Changes button, or by toggling Auto Activate radio button on. The changes also become effective on next application start (restart/reboot). Using Activate Changes button has the advantage of user control of the moment the changes become activated; it will only activate Publishers changes in the Monitor Host. The user will have to press Activate button in the Modbus and the configuration page to activate the changes in the respective module as well. Toggling Auto Activate radio button will ensure the changes become activated in all modules (Monitoring Host, Modbus) when discovery process ends. The application will decide the moment to activate, and in case of new devices joining the network later, the activation may happen several times.
Be aware that the Publishers discovery process use Client/Server to query the concentrator object in each device which does not have a properly configured entry in the Publishers file, nor it is in the blacklist. The necessary aperiodic contracts will be created – in some cases, to all devices in parallel. We currently using a narrow bandwidth: Committed Burst of one packet every 15 seconds (value: -15), for minimum impact on the bandwidth available to application.
Do not edit the Publisher list or Channels list while Autodiscover publishers is active.
We recommend using Autodiscover publishers and Auto Activate to automate the process and avoid inconsistencies.

Ref.no.: 003274/Revision 2.4 @2019 Control Data Systems Page 109 | 201
6.3.8 Modbus The Modbus page enables you to map ISA100.11a attributes to Modbus registers.
Click Help in the upper right corner of the window to view information and examples of the accepted data formats in all the sections.
In the following screen capture (Figure 6.3.7) is displayed the Modbus Server window:
Figure 6.3.7 Modbus Server window (ISA 100)
6.3.8.1 Mapping Registers The mapping area contains two sections listings the two different groups of registers: Input Registers and Holding Registers.
The mapping between a register and an ISA100.11a attribute is achieved by adding register line in the appropriate section. Please note that mapping read-only attributes to holding registers will not make the attributes themselves writable.
Adding a register line To add a register line, you must perform the following actions:

Ref.no.: 003274/Revision 2.4 @2019 Control Data Systems Page 110 | 201
1. in an empty edit box, type the parameters in the order and format indicated in the Help form: start address, word count, EUI64, TSAPID, object ID, attribute ID, index1, index2, method ID, and status byte type;
2. click Save to add the new register line in the Registers list.
Notes: 1. When mapping the Modbus registers on the ISA100.11a data entities, you must consider the size
of the ISA100.11a attribute and allocate a contiguous chunk of Modbus 16-bit registers in the Modbus addressing space to hold the entire data entity (plus an additional Modbus register to hold the auto-generated status, if applicable). When the chunk is bigger than the size of the data entity, it will be filled with the actual data from the lowest addressed register to the highest, and from the MSB of each register to the LSB. If the data entity does not entirely fill the last register, the register will have the data on the MSB, and the LSB will be set to zero.
2. The status byte type for the mapped register can have one of the following three values: • 0 or missing – if the attribute does not have a status byte; in this case, the ISA100.11a entity
is mapped onto the registers, starting at the address <start_address>.
Example:
169,2,6202030405060C04,2,1,66,0,0,0,0
In the above holding register line, DEVICE_ATTRIBUTE is 4 bytes data, no data status byte. When mapping to Modbus registers, it can have the Modbus status byte type set to 0; 2 words will be needed, as follows:
o First word: DEVICE_ATTRIBUTE (upper); o Second word: DEVICE_ATTRIBUTE (lower).
• 1 – only for standard ISA100.11a data types 65 (process value and status for analog value) and 66 (process value and status for binary value). In this case, the first byte in the ISA100.11a attribute is a status byte, so it must be expanded to one Modbus word (the first one), at the address <start_address>; the rest of the ISA100.11a reading bytes will be mapped to registers starting from the address <start_address>+1. After the expansion, the first Modbus word will have 0x00 as the MSB, and the status byte as the LSB.
Example:
140,3,620203040506FC09,2,130,1,0,0,0,1
In the above input register line, the analog process value is 1 byte data status + 4 bytes data. When mapping to Modbus registers, three words will be needed, as follows:
o First word: 0x00 + data status in PV; o Second word: data in PV (upper);

Ref.no.: 003274/Revision 2.4 @2019 Control Data Systems Page 111 | 201
o Third word: data in PV (lower).
• 2 – for all other data types (i.e. attributes without a status byte), with the status byte being auto-generated; in this case, the ISA100.11a entity is mapped onto the chunk of registers starting at address <start_address>+1. At address <start_address> there is a device status register generated by the Modbus server which reflects the state of the ISA100.11a communication, just like for value 1. This should not be used for mapping ISA100.11a attributes of types 65 and 66.
Example:
169,3,6202030405060C04,2,1,66,0,0,0,2
In the above holding register line, DEVICE_ATTRIBUTE is 4 bytes data, no data status byte. When mapping to Modbus registers, it can have the Modbus status byte type set to 2; three words will be needed, as follows:
o First word: 0x00 + status (U8); o Second word: DEVICE_ATTRIBUTE (upper); o Third word: DEVICE_ATTRIBUTE (lower).
3. If the address range of a register line overlaps an existing register line in the same group, or if it does not fit in the range 0-65535, it will be ignored.
Loading a List of Registers You can import the register map from a file that includes the input and holding registers lines with their parameters which are expressed as comma separated values.
To load the list, you must perform the following actions:
1. in the Manage Host list section click on Browse to locate the text file that you wish to load, and click Upload;
2. click Activate, to load the new host list into Modbus; the current Modbus_gw.ini file will be overwritten.
Exporting the Registers This page also enables to export the registers, by clicking Save in the Manage Host list section.

Ref.no.: 003274/Revision 2.4 @2019 Control Data Systems Page 112 | 201
6.3.9 Alert Subscription The Alert Subscription page enables you to subscribe to alerts generated in the system.
In the following screen capture (Figure 6.3.8) is displayed the Alert Subscription window:
Figure 6.3.8 Alert Subscription window (ISA 100)
To subscribe to an alert category, enable the checkbox preceding it, and click Save. When an alert to which you subscribed is generated, it will be listed in the Alerts page.
6.3.10 Advanced Settings 6.3.10.1 Sections/variables The Section/variables page enables you to change configuration settings at various levels, as follows:
• System – allows you to change or define system-wide settings; • All subnets – allows you to change or define common settings for all the subnets in the system; • Subnets – allows you to change or define settings for a particular subnet; this feature is not
applicable in an all-in-one network solution.
In the following screen capture (Figure 6.3.9) is displayed the Section/variables window:
Figure 6.3.9 Section/variables window (ISA 100)
These settings include the settings under the Backbone Router (see the Section 6.3.1.), Gateway (see the Section 6.3.3.) and System Manager (see the Section 6.3.4.) configuration sections.

Ref.no.: 003274/Revision 2.4 @2019 Control Data Systems Page 113 | 201
Changing settings To change settings, you must perform the following actions:
1. select the Configuration level in the drop-down box; 2. select the Variable type:
• Standard – for existing parameters; • Custom – for new settings; when you add a custom setting, it will be added to the Standard
settings list. 3. select a section in the Section drop-down list; the Variable list will change accordingly; 4. type the desired value in the Value field and click Set.
Note: The associated application must be restarted for the new settings to take effect.
6.3.10.2 Restart/Stop The Restart/Stop page enables you to restart or stop the applications running on the VR950, or to restart the VR950.
In the following screen capture (Figure 6.3.10) is displayed the Restart/Stop/Reload window:
Figure 6.3.10 Restart/Stop/Reload window (ISA 100)
Note: Use Stop Application button before power cycle the VR950 in order to avoid any file corruption on the machine.
6.3.10.3 VR950 Settings The VR950 Settings page enables you to change the network settings for the VR950.
In the following screen capture (Figure 6.3.11) is displayed the VR950 Settings window:

Ref.no.: 003274/Revision 2.4 @2019 Control Data Systems Page 114 | 201
Figure 6.3.11 VR950 Settings window (ISA 100)
Setting the VR950 To set VR950 you must perform the following actions:
1. edit the input fields for IP, Gateway and Mask; 2. you can also change the MAC of the VR, as follows:
• check the Update MAC option to enable the MAC edit field; • type the new MAC; • optionally, uncheck the Update MAC option to protect the field from being accidentally
edited; 3. use the Delete and Add buttons to remove or add name servers or NTP servers.
After you finish editing the settings, click Save and reset the board for the settings to take effect.
Note: If you change the IP address, the board will be accessible with the new IP after reset and will no longer be reachable at the previous IP.
6.3.11 Bulk Transfers The Bulk Transfers page enables you to create and configure bulk transfers. Bulk data transfers are used to transfer large items between wireless devices (sensor boards) and GW clients. This can be done via two methods:
• a transfer method described by ISA running on top of UDO; • a CDS enhanced bulk data transfer protocol.
For details about the two methods, see the document entitled: 96-00006-01 ISA100.11a GSAP Interface Specification.

Ref.no.: 003274/Revision 2.4 @2019 Control Data Systems Page 115 | 201
Already configured bulk transfers are displayed in a table, with the following information (Figure 6.3.12):
Figure 6.3.12 Bulk Transfer List window (ISA 100)
The information available in the Bulk Transfer list are, as follows:
• EUI-64 Address - the EUI-64 address of the source device; • Transfer Type – the selected transfer protocol (UDO or BTO); • TsapID; • Device Tag – the device tag for the source device; • Status – the status of the transfer.
The total number of items in the table is indicated in the top left corner of the table. Here you can set the number of items to be displayed per page in the table. The default number of items displayed in a page is 10. Paging controls in the top right corner of the table also enable you to navigate through the other pages of the table.
You can also delete a bulk transfer, by clicking the icon next to it. The system will require confirmation to perform the action. Click Yes to delete the bulk transfer or Cancel to abort the action.
6.3.11.1 Adding a Bulk Transfer To add a bulk transfer, you must perform the following actions:
1. click the Add Bulk Transfer button; the Add form will be displayed as shown in the following screen captures (Figure 6.3.13 and Figure 6.3.14):
Figure 6.3.13 Adding a Bulk Transfer window-UDO option (ISA 100)

Ref.no.: 003274/Revision 2.4 @2019 Control Data Systems Page 116 | 201
Figure 6.3.14 Adding a Bulk Transfer window-BTO option (ISA 100)
2. in the form, select the source device from the EUI64 Address drop-down list; 3. select the Transfer Type: UDO or BTO; the form will reload, displaying specific Parameters
depending on the transfer type you selected (as shown in the two previous screen captures); 4. type in the transfer Parameters in the dedicated fields; the default values for each transfer are,
as follows: • for UDO transfers:
o TsapID: 2; o ObjectID: 2;
• for BTO transfers:
o Period: 2; o Window: 30; o TsapID: 2; this value is read-only; o ObjectID: 7; this value is read-only; o Excess Burst: -15.
5. Click Save to create the bulk transfer operation, or Back to cancel the operation and return to the Bulk Transfers page.
6.3.11.2 Editing a Bulk Transfer To edit a bulk transfer, you must perform the following actions:
1. click on the device EUI-64 address, in the Bulk Transfers list; the Edit form will be displayed as shown in the following screen captures (Figure 6.3.15 and Figure 6.3.16):
Figure 6.3.15 Editing a Bulk Transfer window-UDO option (ISA 100)

Ref.no.: 003274/Revision 2.4 @2019 Control Data Systems Page 117 | 201
Figure 6.3.16 Editing a Bulk Transfer window-BTO option (ISA 100)
2. edit the desired parameters.
Note: You cannot edit the device address and you cannot change the transfer type for an existing transfer. In addition, the TsapID becomes read-only for the UDO transfer;
3. click Save to create the bulk transfer operation, or Back to cancel the operation and return to the Bulk Transfers page.
6.3.12 System Status The Statistics page displays statistical information regarding processor and memory usage, and load average on the VR950.
In the following screen capture (Figure 6.3.17) are shown the section of the Statistic page:

Ref.no.: 003274/Revision 2.4 @2019 Control Data Systems Page 118 | 201
Figure 6.3.17 Statistic sections window (ISA 100)
The first five sections indicate the status (Running or Not Running), memory usage and processor usage for the Backbone Router, Gateway, System Manager, Modbus and Monitor Host processes.
The following two sections display System memory and Flash memory available information.
The Load average section indicates, as follows:
• the system’s load average over the past one, five and fifteen minutes respectively; • the number of running processes out of the total number of processes; • the ID of the last started process.
If you wish to regularly update the system status information, enable the Auto refresh page option at the bottom of the page. The page will auto refresh at one-minute intervals.
6.4 Administration The Administration section encompasses tools for the management of the ISA100.11a based system. It allows the users to update device and system FW, to manage device icons and apply custom settings to their site.
6.4.1 Device Firmware The Device Firmware page is dedicated to FW updates for field devices and the BBR. FW updates require technical expertise and must be planned carefully, or the devices will be unable to communicate on the

Ref.no.: 003274/Revision 2.4 @2019 Control Data Systems Page 119 | 201
ISA100.11a network. We recommend that you contact a CDS Technical Support representative prior to executing such procedure.
This section provides a tool to upload binary firmware files into the system. These files will be used later to upgrade the device firmware.
In the Device Firmware page, you will view all the firmware update operations generated in the system. They can be filtered by Device, FW Type, and/or Download Status.
When the main page is loaded, the ongoing update operations (if any) are displayed by default. To search for firmware update operations, select the desired device, type and/or download status and click Search. The results will be displayed in a table, as shown in the following scree capture (Figure 6.4.1):
Figure 6.4.1 Device Firmware window (ISA 100)
The following information is available in the table from the previous screen capture:
• EUI-64 Address – the EUI-64 address of the target device; • Type – the type of FW uploaded on a device (for FW types please see the Section 6.4.1.3); • Status – indicates the status of the update process at the time of viewing; the possible statuses
are Completed, In Progress, Canceled, and Failed; • Completed – indicates the completion percentage at the time of viewing for ongoing operations,
or the percentage at which the operation stopped, for canceled or failed updates; for completed updates, the percentage is 100%;
• Avg Speed – the average transmission speed, calculated in packets (messages) per minute, since the beginning of the transfer;

Ref.no.: 003274/Revision 2.4 @2019 Control Data Systems Page 120 | 201
• Crt Speed – the last recorded transmission speed, calculated based on the smallest of the bandwidths reserved for the two contracts - from and to the device; it varies slightly from the last instantaneous transmission speed;
• Remaining – the remaining time to completion; • Duration – the total duration of the update; • Started On – the date and time the update operation started.
To refresh the information in the table regularly, check the Refresh every 20 seconds option in the Search form.
You can also cancel an ongoing firmware update by clicking the icon next to it or delete a completed/ failed/ canceled/ operation from the records by clicking the icon next to it. The system will require confirmation before performing the requested action.
The total number of items in the table is indicated in the top left corner of the table. Here you can set the number of items to be displayed per page in the table. The default number of items displayed in a page is 10. Paging controls in the top right corner of the table also enable you to navigate through the other pages of the table.
From this page you can export the search results into CSV format, for later use.
6.4.1.1 Updating the Firmware Firmware updates are available for all the devices in the network (excepting the GW and the SM) and can be performed on the device radio and/or the sensor board (where applicable).
To access the commands page, you must click Execute in the Device Firmware page. You will navigate to the Firmware Update page displayed in the following screen capture (Figure 6.4.2):
Figure 6.4.2 Firmware Update window (ISA 100)

Ref.no.: 003274/Revision 2.4 @2019 Control Data Systems Page 121 | 201
To initiate a FW update operation, you must perform the following steps:
1. select the FW type; the page will refresh to display the list of available devices matching your selection; the devices are listed in a table - the EUI-64 Address, the Device Tag, Device role/Model, Revision and Level are indicated for each device;
2. check the target device(s) for which you wish to update the firmware; to select all the devices, check All in the table header;
Note: In the Search form located on top of the device list you can search for a device by typing the EUI-64 Address or the device tag in the dedicated input fields. You can also filter devices by Revision or Level.
3. select a FW file from the drop-down list;
4. if you selected Sensor at step 1, you must select the bandwidth allocation and specify the TSAP ID and ID of the Object in charge of executing the FW update on the device side; otherwise, go directly to step 5;
Note: The bandwidth allocation is based on the CommittedBurst parameter of the GW -> Device contract. The device must set a similar value for the CommittedBurst parameter in the Device -> GW contract that is used to respond to BULK requests. The whole bulk transfer will be done at the lowest of the two transfer rates. The SM will decide the transfer rate for the Radio FW and may decide to modify the transfer rate based on availability. The transfer rate for the Sensor Board FW is determined by the user input and the parameter CommittedBurst set by the Sensor Board in the Device -> GW contract used to respond to bulk requests.
5. click Execute; the system will require confirmation to perform the action; click OK to start the update or Cancel to abort the action.
When the update starts, you will be redirected to the Device Firmware page, where you can monitor the progress of the update operation. In addition, a message is displayed at the bottom of the page, indicating that the FW upgrade operation(s) started for the selected devices.
A Firmware Update command is also generated. The command and its parameters can be viewed in the Commands Log (please see the Section 6.2.7.).
Note: If you execute a FW update on a device for which an update operation is already in progress, the following error message is displayed: “0 firmware upgrade operation(s) started! The following devices already have a firmware upgrade in progress: <Device_EUI64>”.
6.4.1.2 Canceling a Firmware Update To cancel an ongoing firmware update, go to the Device Firmware page. In the table displaying the ongoing operations click the icon located next to the operation you wish to delete.

Ref.no.: 003274/Revision 2.4 @2019 Control Data Systems Page 122 | 201
When you cancel the FW update, a Cancel Firmware Update command is generated in the system. The command and its parameters can be viewed in the Commands Log (please see the Section 6.2.7.).
6.4.1.3 Firmware files The Firmware files page contains all the FW files uploaded by the user, including current and previous versions. To access the files page, click Firmware Files in the Device Firmware page. You will navigate to the Firmware Files page, where the files are listed in a table. For each file you can view the following information: The File Name and Version, the Firmware Type (i.e. the destination device for a particular FW), the Upload Status, the FW Description (if provided), and the Upload Date.
In the following screen capture (Figure 6.4.3) is shown the Firmware files window:
Figure 6.4.3 Firmware files window (ISA 100)
You can also delete a FW file by clicking the icon next to it.
The following FW types are supported for the remote update of devices using the web interface:
• Backbone Router firmware, for the transceiver radio board of the BBR; • Device firmware, for the radio board of a field device; • Acquisition Board firmware, for the sensor board of a field device (therefore only applicable to
devices that are equipped with a sensor board).
The total number of items in the table is indicated in the top left corner of the table. Here you can set the number of items to be displayed per page in the table. The default number of items displayed in a page is 10. Paging controls in the top right corner of the table also enable you to navigate through the other pages of the table.
6.4.1.3.1 Adding a Firmware file To upload a Firmware File, you must perform the following actions:
1. click the Upload in the Firmware files page; you will navigate to the FW details page, where the Add Firmware dialog window will open, as shown in the following screen capture (Figure 6.4.4):

Ref.no.: 003274/Revision 2.4 @2019 Control Data Systems Page 123 | 201
Figure 6.4.4 Add Firmware window (ISA 100)
2. in the Add Firmware dialog window click Browse to locate the file you want to upload; 3. select the Firmware Type from the drop-down list; the Device type is used for uploading FW for
the versa node, the Acquisition Board should be used for uploading FW for the Application Processor/Sensor Board and the Backbone router type should be used for FW specific for the transceiver/BBR;
4. type the Firmware Version in the dedicated input field; 5. Optionally, provide a Description of the file; 6. Click Save to start the upload; the file is added to the FW list, and the upload status changes, as
follows: • New – when the upload has just been initiated; • Successfully Uploaded – when the file has been uploaded in the system; • Wait - Retrying – when the first attempt to upload the file has failed and the system
automatically retries to upload it; • Failed – when the upload process returned an error or when several repeated attempts
have failed; in this case the Command column will feature an Upload FW button to allow you to quickly resume the process.
To refresh the upload status, click Refresh.
When you add FW, the Firmware Type and the Firmware Version are read from the binary file. The binary upgrade file is generated internally by CDS, thus third-party upgrade files are not supported.
6.4.1.3.2 Editing a Firmware file To edit the description of a Firmware file you must perform the following actions:
1. click on the desired file in the list; the Edit Firmware dialog window will open, as shown in the following screen capture (Figure 6.4.5):

Ref.no.: 003274/Revision 2.4 @2019 Control Data Systems Page 124 | 201
Figure 6.4.5 Edit Firmware window
2. edit the Description field and click Save to save your changes.
6.4.2 System Upgrade The System Upgrade page enables you to upgrade the system components hosted on the connected VR.
The Firmware window indicates the Current Firmware version of the system on the VR950.
To initiate the upgrade, you must perform the following actions:
1. click Browse to locate and open the upgrade package that you wish to use, as shown in the following screen capture (Figure 6.4.6):
Figure 6.4.6 System Upgrade window
2. click Start to initiate the process; 3. when the upgrade is complete, a log is displayed in the page, indicating the result of the
upgrade, as shown in the following screen capture (Figure 6.4.7):

Ref.no.: 003274/Revision 2.4 @2019 Control Data Systems Page 125 | 201
Figure 6.4.7 System upgrade results window
6.4.3 Custom Icons The Custom Icons page enables you to assign custom icons for the devices in a network based on their role, with a view to better distinguishing them.
When the page is loaded, the existing custom icons are displayed in a table, with the following information:
• Model – the device model; • Role – the device role; • Icon – shows the existing picture.
The default icons are not listed.
Adding an icon To add an icon, you must perform the following actions:
1. click the Add Icon button; the Custom icon window will open, as shown in the following screen capture (Figure 6.4.8):

Ref.no.: 003274/Revision 2.4 @2019 Control Data Systems Page 126 | 201
Figure 6.4.8 Custom icon window (ISA 100)
2. select the Device Model (Role) from the drop-down list; 3. click Browse to locate the icon you want to use; the maximum icon size must be 32x32 pixels, the
maximum file size must be 100 Kb, and the supported formats are jpg, png, and gif; 4. click Add; a message will appear, indicating that the icon has been added successfully; 5. click Back in the form or Custom Icons under Administration to return to the Icons list. 6. the newly added icon will be visible in the Icons list, the Topology page, and the Devices page, as
shown in the following screen capture (Figure 6.4.9):
Figure 6.4.9 Added icon-visibility (ISA 100)
Deleting an icon To delete an icon, you must perform the following actions:
1. in the Icons list, click next to the icon entry; 2. you will be asked for confirmation; click OK to delete the icon or Cancel to abort the action.
Note: When you delete an icon, it will be automatically replaced with the default icon for the selected device model/role in the Topology and Devices pages.

Ref.no.: 003274/Revision 2.4 @2019 Control Data Systems Page 127 | 201
6.4.4 Custom Settings 6.4.4.1 DateTime format This feature will allow you to switch between UTC or Local Data and Time format.
6.4.4.2 Interfaces Configuration The Interface Configuration page allows you to enable or disable the interfaces running on the VR950. Use this section to disable all interfaces you are not using to minimize the security risks. YGSAP and YGSAM SSL can be left disabled.
Web access Http and Https can also be enabled or disabled, by changing the active radio button in the Web Access section. The default setup is for both Http and Https access.
In the following screen capture (Figure 6.4.10) is shown the Interface Configuration window:
Figure 6.4.10 Interface Configuration window (ISA 100)
6.5 Session 6.5.1 Change Password The Change Password page enables you to change your own password. In this order, you must perform the following actions:
1. in the window, type your current password in the Old Password field; 2. type the new password in the New password field; 3. retype the new password in the Confirm new password field, for verification. Please note that
passwords are case sensitive. 4. Click Save at the bottom of the page to save the new password, which will become your current
password.
In the following screen capture (Figure 6.5.1) is shown the Change Password window:
Ref.no.: 003274/Revision 2.4 @2019 Control Data Systems Page 128 | 201
Figure 6.5.1 Change password window

Ref.no.: 003274/Revision 2.4 @2019 Control Data Systems Page 129 | 201
7 Using the Monitoring Control System (MCS) for Wireless HART network
7.1 Access, Authentication, and Navigation To access the MCS, type http://<VR_IP>/app_whart/login.html in a web browser and replace <VR_IP> with the IP of the VR950 that supports the network. If the Gateway runs in standalone ISA100/WirelessHART mode, the corresponding URL is http://<VR_IP>/app/login.html.
Once the address is accessed, a login screen appears, as shown in the following screen capture (Figure 7.1.1):
Figure 7.1.1 Monitoring Control System login window
You must log into the MCS with a valid username/password. The default credentials stored on the VR950 are:
• Username: admin • Password: adminadmin
Once the credentials are entered and access is granted, the browser will display the Device list by default as shown in the following screen capture (Figure 7.1.2). For a detailed description of the Device list, please see the Section 7.2.3.
The Monitoring Control System page with the Device list is shown in the following screen capture (Figure 7.1.2):

Ref.no.: 003274/Revision 2.4 @2019 Control Data Systems Page 130 | 201
Figure 7.1.2 Device list (HART)
On a general level, the user interface consists of two sections:
• the menus on the left, which allow you to navigate through the pages of the website; • the main section, which displays the contents of the selected page.
7.2 Network 7.2.1 Dashboard The Dashboard page is a report zone that allows you to monitor reading variations for selected devices. The Dashboard consists in a series of panes added by the user, which provide a visual representation of the information published by selected devices on selected channels.
The information is refreshed automatically at regular intervals (10 seconds, 30 seconds, or 1 minute).
The Dashboard series of panes are shown in the following screen capture (Figure 7.2.1):

Ref.no.: 003274/Revision 2.4 @2019 Control Data Systems Page 131 | 201
Figure 7.2.1 Dashboard series of panes (HART)
7.2.1.1 Adding a Device to the Dashboard To add a device to the dashboard, you must perform the following actions:
1. click on the Add Device button. The Add device to dashboard dialog will open, as shown in the following screen capture (Figure 7.2.2):
Figure 7.2.2 Add device to dashboard-dialog window (HART)
2. choose a device from the drop-down list; 3. choose the channel that you wish to monitor, from the drop-down list; 4. type the desired gauge value range for the readings; if the selected values are out of range, a
message on the pane will notify you; 5. optionally, select the slot number (up to the current slot number); if you do not select a slot
number, the system automatically assigns the next available slot;

Ref.no.: 003274/Revision 2.4 @2019 Control Data Systems Page 132 | 201
6. select the desired gauge type, and then click OK to add the device to the dashboard.
Notes: • You can also add a reading to the dashboard from the Device Details page: in the Information
pane, click the Add to dashboard (ATD) icon , next to a reading. • Up to 9 devices are supported in the dashboard.
7.2.1.2 Deleting a device To delete a device from the dashboard, click in the top right corner of the pane. No confirmation is required for the system to delete the pane.
7.2.2 Topology The Topology page displays a graphical representation of the current network topology and allows users to view data about the devices and the links that form between them.
The graphical representation of the Network Topology is shown in the following screen capture (Figure 7.2.3):
Figure 7.2.3 Network Topology graphical representation (HART)
When you load the page, the topology graph is generated based on the latest topology information available. The system continuously updates this information in the background based on notifications sent by the Network Manager on network topology changes (device registering/leaving the network). The time of the last topology information update is indicated at the top of the page. To view the latest topology, press Refresh.
The registered devices are displayed on multiple levels represented as grey bands. The levels are numbered from 0 to n, where n is a natural number. The level number is indicated in the upper left

Ref.no.: 003274/Revision 2.4 @2019 Control Data Systems Page 133 | 201
corner of a level. The Gateway, the Network Manager, and the Access Point are found on level 0. For the field devices, the level represents the number of hops from device to Access Point on the clock source graph. A hop is a term used to describe the data being passed from one device to another to lengthen the transmit distance.
Communication-wise, field devices are linked directly or via other devices to the Access Point, which is the central device in the RF network. The Access Point further relays to the Gateway, while the Network Manager organizes the entire network. The field devices can have various sensors attached: temperature sensors, humidity sensors, etc.
The devices are identified in the topology by the last four characters of their EUI-64 address. For easier identification, the Access Point, the Gateway, and the Network Manager are identified with the abbreviations AP, GW, and NM. The devices are placed within a level in the order of their EUI64 address. They can be moved freely within the range of their level by drag-and-drop to obtain better legibility of the topology.
In addition, they are represented by suggestive icons and against backgrounds of different colors, to distinguish their roles:
• Gateway – purple background; • Access Point – light green; • Network Manager – dark green; • Field devices – blue.
By positioning the cursor over an icon, you can view the tooltip, which includes the following details for a device:
• the EUI-64 address, • the device role, • the device tag, • the manufacturer, • the model.
The available Topology page elements and viewing options are described in the following paragraphs.
Adjusting Width and Height You can adjust the size of the topology representation using the buttons and for height and weight.
You can also adjust the height and weight to the size of the Topology pane by clicking , or revert to the original viewing settings by clicking .
Links To show the links between devices, check the Links option located above the topology graph (this option is checked by default when the page is loaded).

Ref.no.: 003274/Revision 2.4 @2019 Control Data Systems Page 134 | 201
When the page is loaded for the first time, the AP is selected and its links to the devices and to the GW are shown as black lines.
To view the links for a particular device, click on that device in the topology graph, or select the device in the drop-down list located on top of the Topology pane. To view all the other links formed between the network devices, check the Show all links option. This option is unchecked by default. To view the RSQI signal values next to each link, check the Show signal quality option. For more information about the signal see Section 7.2.4.2.
Services To view the services for a selected device, you must perform the following actions:
1. check the Services option located at the top of the topology graph; 2. choose a device by clicking on it in the topology graph or by selecting it in the Devices drop-down
list located above the graph; 3. in the Services drop-down list, you will view the selected device’s inbound and outbound
services with the NM and the GW. 4.
a. to view all the inbound services for the selected device, click Inbound in the drop-down list;
b. to view all the outbound services for the selected device on the graph, click Outbound in the drop-down list;
c. to view a single service, select it in the list; there are four types of services, which are represented by differently colored lines: • Blue – for publish services; • Red – for event services; • Green – for maintenance services; • Black – for block transfer services.
The Services legend located in the lower right corner of the Topology page also indicates how the types of services and links are represented.
Note: A device can have multiple services with the same NM or GW at the same time.
The graphical representation of the Services for a selected device is shown in the following screen capture (Figure 7.2.4):

Ref.no.: 003274/Revision 2.4 @2019 Control Data Systems Page 135 | 201
Figure 7.2.4 Services graphical representation (HART)
Service details In addition, when you select a service, information about the service parameters will be shown in the Service details section at the bottom of the page.
The service information includes the following parameters:
• Service ID – the service identifier based on the service owner; • Application domain – the type of service; • Source/destination device – the EUI64 address of the source device, and the destination device
respectively; • SourceFlag – indicates if selected device is the source of the communication; • SinkFlag - indicates if selected device is the destination of the communication. If both SourceFlag
and SinkFlag are set, this indicate a bidirectional communication between selected device and the destination of service;
• IntermittentFlag - indicates if the service is used for acyclic/intermit communication; • Period – the frequency for generating packets for cyclic communication (burst messages); • RouteID – the ID of the route assigned to the service (each service having one Route ID assigned
by Network Manager); • Timestamp – the time and date the service was created.
7.2.3 Devices The Devices page features the list of devices that exist in the network and a search form that enables you to search devices based on their EUI-64 address, tag, and/or state, as shown in the following screen capture (Figure 7.2.5):
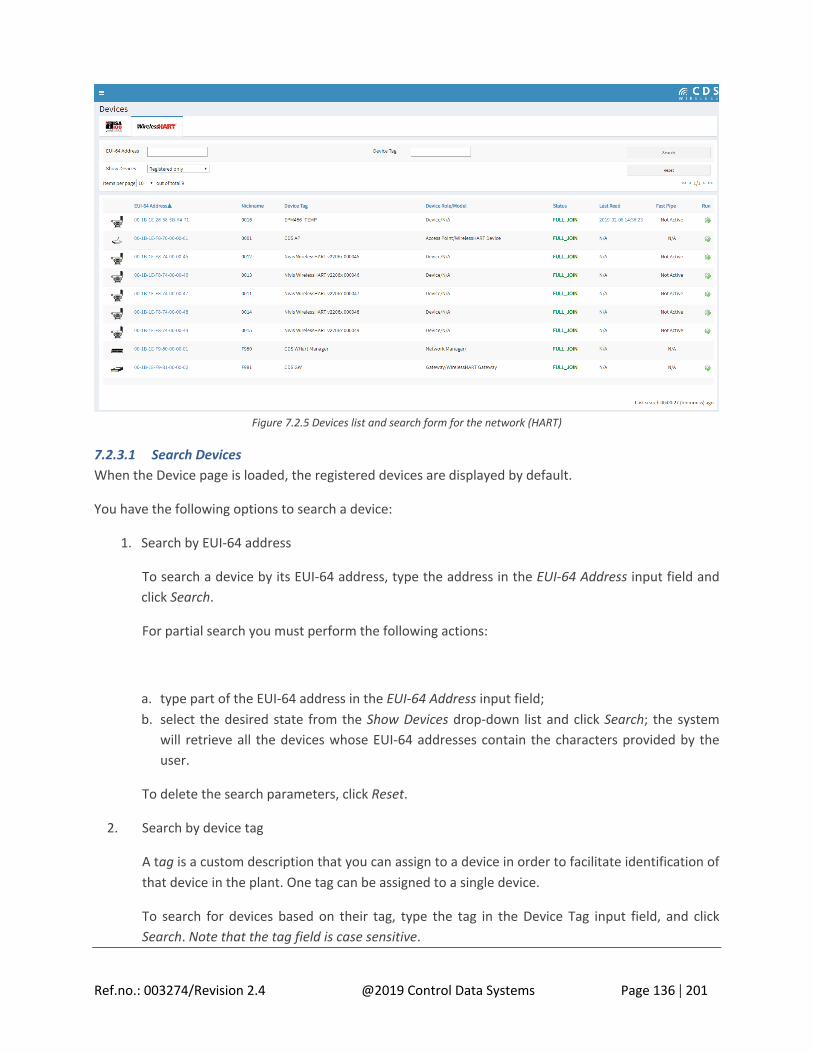
Ref.no.: 003274/Revision 2.4 @2019 Control Data Systems Page 136 | 201
Figure 7.2.5 Devices list and search form for the network (HART)
7.2.3.1 Search Devices When the Device page is loaded, the registered devices are displayed by default.
You have the following options to search a device:
1. Search by EUI-64 address
To search a device by its EUI-64 address, type the address in the EUI-64 Address input field and click Search.
For partial search you must perform the following actions:
a. type part of the EUI-64 address in the EUI-64 Address input field; b. select the desired state from the Show Devices drop-down list and click Search; the system
will retrieve all the devices whose EUI-64 addresses contain the characters provided by the user.
To delete the search parameters, click Reset.
2. Search by device tag
A tag is a custom description that you can assign to a device in order to facilitate identification of that device in the plant. One tag can be assigned to a single device.
To search for devices based on their tag, type the tag in the Device Tag input field, and click Search. Note that the tag field is case sensitive.
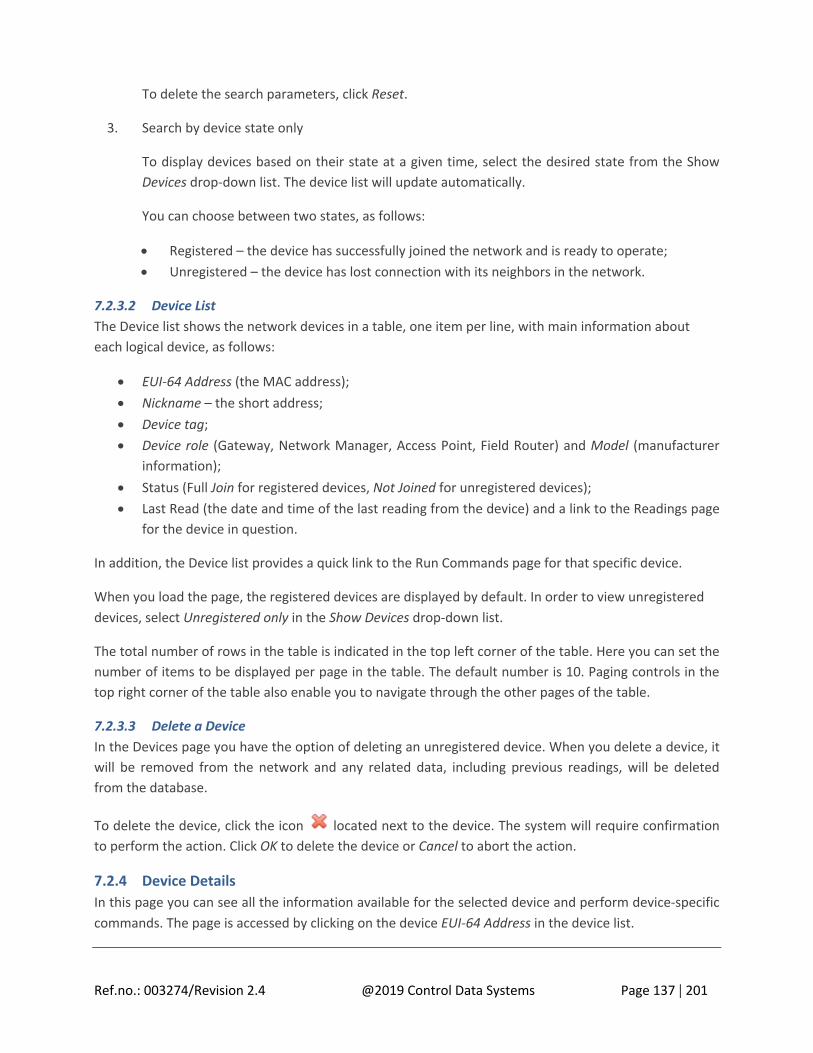
Ref.no.: 003274/Revision 2.4 @2019 Control Data Systems Page 137 | 201
To delete the search parameters, click Reset.
3. Search by device state only
To display devices based on their state at a given time, select the desired state from the Show Devices drop-down list. The device list will update automatically.
You can choose between two states, as follows:
• Registered – the device has successfully joined the network and is ready to operate; • Unregistered – the device has lost connection with its neighbors in the network.
7.2.3.2 Device List The Device list shows the network devices in a table, one item per line, with main information about each logical device, as follows:
• EUI-64 Address (the MAC address); • Nickname – the short address; • Device tag; • Device role (Gateway, Network Manager, Access Point, Field Router) and Model (manufacturer
information); • Status (Full Join for registered devices, Not Joined for unregistered devices); • Last Read (the date and time of the last reading from the device) and a link to the Readings page
for the device in question.
In addition, the Device list provides a quick link to the Run Commands page for that specific device.
When you load the page, the registered devices are displayed by default. In order to view unregistered devices, select Unregistered only in the Show Devices drop-down list.
The total number of rows in the table is indicated in the top left corner of the table. Here you can set the number of items to be displayed per page in the table. The default number is 10. Paging controls in the top right corner of the table also enable you to navigate through the other pages of the table.
7.2.3.3 Delete a Device In the Devices page you have the option of deleting an unregistered device. When you delete a device, it will be removed from the network and any related data, including previous readings, will be deleted from the database.
To delete the device, click the icon located next to the device. The system will require confirmation to perform the action. Click OK to delete the device or Cancel to abort the action.
7.2.4 Device Details In this page you can see all the information available for the selected device and perform device-specific commands. The page is accessed by clicking on the device EUI-64 Address in the device list.

Ref.no.: 003274/Revision 2.4 @2019 Control Data Systems Page 138 | 201
The page is organized into several tabbed panes by types of information and features a Back button to allow you to quickly revert to the Devices page.
7.2.4.1 Information The Information pane displays general, as well as specific activity information about the device. When the page is loaded, it shows the latest information available.
The Information window for the device is shown in the following screen capture (Figure 8.2.6):
Figure 7.2.6 Information window (HART)
The following details are shown in addition to those already indicated in the Device list:
• Manufacturer – the name of the device manufacturer; • Model – the model/type of the device; • Revision – the radio FW version; • Power Status – not available in the current version; • Data transmission statistics – the number of transmitted/received packages and the number of
failed transmissions/receptions; • Burst messages – the definition of burst messages that the device will publish to the Gateway.
Burst messages Burst messages are used to publish data to applications, in general to the GW, which is the entity providing access to the Wireless HART network and caching the data reported by devices.
The information about defined burst messages is displayed in a table with the following related information:
• Name – a user friendly name assigned to the published variable;

Ref.no.: 003274/Revision 2.4 @2019 Control Data Systems Page 139 | 201
• Burst Message – the value can be between 0 and 2, indicating the number of burst messages out of 3 burst messages currently supported by devices;
• Device Variable Slot – the value indicates the position of the variable in the burst packet; • Device Variable – will have one of the values described in Common Table 34 Device Variable
Code from HCF_Spec-183 specification document; • Classification – will have one of the values described in Common Table 21 Device Variable
Classification Codes from HCF_Spec-183 specification document; • Unit Code – will have one of the values described in Common Table 2 Engineering Unit Codes
from HCF_Spec-183 specification document; • Update Period – the value set through Command 103 at the configuration of burst message; • Max Update Period - the value set through Command 103.
The total number of rows in the table is indicated in the top left corner of the table. Here you can set the number of items to be displayed per page in the table. The default number is 10. Paging controls in the top right corner of the table also enable you to navigate through the other pages of the table.
7.2.4.2 Settings The settings reflect the current operation of the CDS Wireless HART stack on a device.
The type of information displayed in this pane includes service, neighbor, route, and graph details, as shown in the following screen capture (Figure 7.2.7):
Figure 7.2.7 Settings window (HART)
Services

Ref.no.: 003274/Revision 2.4 @2019 Control Data Systems Page 140 | 201
The Services section lists all the services for the selected device in a table, with the following information:
• Service – the service ID; • Peer – the destination device for the selected device; • Application Domain – the service type (publish, event, maintenance, block transfer); • Is Source – indicates whether the selected device is the source of the communication; • Is Sink – indicates whether the selected device is the destination of the communication; • Is Intermittent – indicates whether the communication on the service in question is intermittent
on not; • Period – the publishing period on the service in question; • Route – indicates the ID of the route of which the selected device is the source.
Routes The Routes section lists the routes of which the source is the selected device.
Routes are of two types, as follows:
• Graph routes – they are based on graphs, and therefore are a directed list of redundant communication paths that connect network endpoints;
• Source routes – they are single directed routes between a source and a destination device; the source route is statically specified in the packet itself.
Routes are listed in a table displaying the following information:
• Route – route identification data; ID’s are given in the order of creation of the routes; for every device, Route with ID 1 is the default route established between the field device and the Network Manager, and Route with ID 2 is the default route established between the field device and the Gateway;
• Peer – the destination device, which is either the GW or the NM; • Graph – the ID of the graph used by the route (only for graph routes); • Is Source Path – indicates whether the route is a source route; • Source Path – for a source route, it indicates the hops of the selected path (source device,
intermediate device and destination device).
To view the updated device settings, click the Refresh button. The Request Topology, Request Routes and Source Routes, and Request Services commands will be sent to the NM. To view the command status, go the Section 7.2.7.
When the command is generated, a message at the top of the screen will indicate that the device information is refreshing.
Graphs Neighbors

Ref.no.: 003274/Revision 2.4 @2019 Control Data Systems Page 141 | 201
This section lists the graph-neighbor pairs for the selected device, in a table. For each graph to which the selected device belongs, the table provides the ID of the graph and the ID’s of the device’s neighbors on the same graph.
7.2.4.3 Registration Log The Registration Log page displays the registration history for the selected device, at different dates and times, commonly known as timestamps, as shown in the following screen capture (Figure 7.2.8):
Figure 7.2.8 Registration Log-Timestamps window (HART)
Use the Search functionality to view the behavior of the device over a specific period, as follows:
• choose the status you wish to view from the Registration Status drop-down list; • optionally, fill in the Start time and the End time fields, and then click Search.
The results are displayed in a table that indicates the timestamp and the device status at that specific timestamp. A device can have one of the following statuses at a given moment:
• NOT_JOINED – the device is not joined; • JOIN_REQ – the NM received the join request from the device; • JOIN_FAILED – the device was removed by the NM from the network due to a timeout; • AUTHENTICATED – the Network Key and Network Manager Session were established; • NET_JOINED - normal superframes and links were obtained; • FULL_JOIN – the device is joined and configured and all information about it is available.
The total number of rows in the table is indicated in the top left corner of the table. Here you can set the number of items to be displayed per page in the table. The default number is 10. Paging controls in the top right corner of the table also enable you to navigate through the other pages of the table.
7.2.4.4 Neighbors Health The Neighbors Health page provides a communication health report about the selected device’s neighbors.

Ref.no.: 003274/Revision 2.4 @2019 Control Data Systems Page 142 | 201
The Neighbors Health window for the device is shown in the following screen capture (Figure 7.2.9):
Figure 7.2.9 Neighbors Health window (HART)
The report includes, as follows:
• neighbor identification information - the EUI-64 address; • the timestamp of the report request; • flags – this column indicates whether the neighbor is a clocksource for the selected device; the
values for this column are yes and no; • communication health information:
o the number of DPDUs transmitted to the neighbor and the number of failed transmission attempts;
o the number of DPDUs received from the neighbor; • the signal level – the RSL of the neighbor, expressed in dBm.
The following table (Table 7.1) indicates the RSL thresholds and the associated labels:
Table 7.1 Signal level for RSL (HART)
RSL Signal Level
-99 … -85 Poor signal
-84 … -73 Fair signal
-72 … -60 Good signal
-59… -10 Excellent signal
The total number of rows in the table is indicated in the top left corner of the table. Here you can set the number of items to be displayed per page in the table. The default number is 10. Paging controls in the top right corner of the table also enable you to navigate through the other pages of the table.
7.2.4.5 Schedule Report The Schedule Report page provides information about time slot and channel allocation for the selected device.

Ref.no.: 003274/Revision 2.4 @2019 Control Data Systems Page 143 | 201
Superframes and links The superframes that the device uses for communication are listed in the page along with the following information:
• Time slots – the size of the superframe, expressed in number of time slots; • Is Active – indicates whether the superframe is currently active (is being used) or not; • Is handheld – indicates whether the superframe in question is used for communication between
a handheld device and the selected device; • Links – the number of links allocated on each superframe.
The Schedule Report window for the device is shown in the following screen capture (Figure 7.2.10):
Figure 7.2.10 Schedule Report window (HART)
Clicking on the number of links, will be display a new page with information for each individual link allocated on the selected superframe, as shown in the following screen capture (Figure 7.2.11):

Ref.no.: 003274/Revision 2.4 @2019 Control Data Systems Page 144 | 201
Figure 7.2.11 Schedule Report window - individual link (HART)
For each individual link the following details are shown:
• Nickname of the neighbor – the short address of the neighbor or the broadcast address FFFF:FFFF:FFFF:FFFF (used only for advertisements and receive links);
• Slot index – the ID of the slot within the superframe; • Channel Offset – the channel offset in the superframe’ s underlying hopping pattern; • Direction – reception or transmission; • Shared – indicates whether the channel is shared with other devices for communication
purposes; • Link Type, which can be:
o Normal; o Broadcast; o Join; o Discovery.
You can use the search form on the top of the page to sort links based on the nickname of the neighbor device and the link type.
In addition, in both the Superframes and Links tables you can view the information by the number of items listed per page. The default number is 10. Paging controls at the bottom of the table enable you to navigate through the pages of the table.
7.2.4.6 Run Commands This Run Commands page enables you to execute device-specific commands on registered devices.
In the following screen capture (Figure 7.2.12) is displayed the Run Commands window:

Ref.no.: 003274/Revision 2.4 @2019 Control Data Systems Page 145 | 201
Figure 7.2.12 Run Commands window (HART)
To go to a specific command, select it from the Commands drop-down list. After you generate the command, a message at the bottom of the screen will indicate its status (Command sent successfully, Command sent error). The tracking number of the command is also indicated, together with a link to the Commands Log (please see the Section 7.2.7., where you can view the results of the command.
Note: Currently only the Wireless HART General Command is supported. Other commands may be added in the future.
7.2.4.6.1 WH General Command This set encompasses all the general commands that can be issued on the devices (e.g. 800 - read service list, 782 - read session list, etc.). To generate the command, follow the steps described below:
1. select the WH General Commands set from the Command drop-down list; 2. optionally, select the BypassIOCache value:
• Yes – if you wish to retrieve the response to the command directly from the device; • No – if you wish to obtain the response from the GW cache; • If you do not select a value, the default value No will be considered;
3. type the command number in the CommandNo field; 4. for commands that have parameters, type the content of the request in the Command (hex)
field; 5. press Execute; a message at the bottom of the screen will indicate the command status
(Command sent successfully, Command sent error); the tracking number of the command is also indicated, together with a link to the Commands Log, where you can view the response.
In the following screen capture (Figure 7.2.13) is displayed the WH General Command window:

Ref.no.: 003274/Revision 2.4 @2019 Control Data Systems Page 146 | 201
Figure 7.2.13 WH General Command window (HART)
6. follow the Commands Log link to see the response of the command.
In the following screen capture (Figure 7.2.14) is displayed the Commands Log window:
Figure 7.2.14 Commands Log window (HART)
7.2.5 Network Health The Network Health page provides a communication health report at network level.
The page consists of two sections containing network summary statistics and device-specific communication health information, respectively, as shown in the following screen capture (Figure 7.2.15):

Ref.no.: 003274/Revision 2.4 @2019 Control Data Systems Page 147 | 201
Figure 7.2.15 Network Health sections (HART)
In the network summary section, the following information is indicated:
• Devices Count – the total number of registered devices, including the AP; • Join count – the total number of joins of all the devices in the network; • Start Date – the date and time the NM application was started; • Current Date – the present time; • Transmission and reliability statistics based on the summary report per device.
The device communication report section consists in a table displaying the following information for each device:
• EUI-64 Address – the network address of the device; • Join Count – the total number of joins per device; • Power Status – the battery status for the device in question; the power status can have one of
the following values: o 0 – Nominal; o 1 – Low; o 2 – Critically low; o 3 – Recharging – Low; o 4 – Recharging – High.
Note: In version 1.x of the Wireless HART system, battery operation mode is not supported. All devices will report 0 – Nominal.
• Generated – the number of packets generated by the device; • All Tx – all the packets transmitted but the selected device (including for routing purposes); • No ACK – the number of packets that require acknowledgement and which were sent by the
selected device but not acknowledged by the destination device;

Ref.no.: 003274/Revision 2.4 @2019 Control Data Systems Page 148 | 201
• Terminated - the number of packets received by this device as a destination device; • All Rx – all the packets received by the selected device (including for routing purposes); • DLL Failure – the number of Data-Link Layer MIC (Message Integrity Check) failures detected; • CRC Error – the number of CRC (cyclic redundancy check) errors detected; • Nonce Lost – the number of Nonce Counter Values not received.
The total number of rows in the table is indicated in the top left corner of the table. Here you can set the number of items to be displayed per page in the table. The default number is 10. Paging controls in the top right corner of the table also enable you to navigate through the other pages of the table.
7.2.6 Readings In the Readings page you can view the readings received from the devices, which are generated either on demand by Read Value commands or by automatic Burst messages. The readings can be filtered by device, variable name, command number or the device variable code, as shown in the following screen capture (Figure 7.2.16):
Figure 7.2.16 Readings window (HART)
To search for readings, select a device or fill out the input fields as desired and click Search. The results are displayed in a table that contains the following information for each reading:
• Device EUI-64 Address - the MAC address of the device that reported the reading; • Timestamp – the date and time of the reading; • Name - the variable name; • Command No. - the number of the command triggering the reading; • Device Variable - the variable code as per the WirelessHART specification; • Value - the value received on that reading (shown in engineering values); • Classification - the type of variable (e.g. 64 - temperature); please consult the Wireless HART
Common Table No. 21 for a comprehensive list of variables and associated classification codes;

Ref.no.: 003274/Revision 2.4 @2019 Control Data Systems Page 149 | 201
• Unit Code - the unit of measurement of the variable in question; please consult the Wireless HART Common Table No. 2 for a comprehensive list of unit codes and their descriptions;
• Update Period - the frequency configured for data publishing, in seconds; • Last Update - the timestamp of the last value received in GW; • Received - the number of packets received by the device; • Missed - the number of packets that did not reach the device.
The total number of rows in the table is indicated in the top left corner of the table. Here you can set the number of items to be displayed per page in the table. The default number is 10. Paging controls in the top right corner of the table also enable you to navigate through the other pages of the table.
From this page you can also save the search results into a Microsoft Excel CSV file, by clicking Export.
7.2.7 Commands Log In Command Log page you can view all the commands issued on the registered devices in the system. The commands can be filtered by Device, Command (type), or Command Status (New – command posted in database, Sent – command sent to device, Responded – device responded successfully to the command, Failed – command failed to execute).
To search for commands, select the desired device, command, and command status and click Search. The results will be displayed in a table, as shown in the following screen capture (Figure 7.2.17) for each command:
• Tracking No. – the internal ID of the command; • EUI-64 Address – the MAC address of the command destination device; • Command – the name of the executed command; • Parameters – the description of the parameters chosen for the command, if applicable; • Status – the current status of the command; • Posted Time – the date and time when the command was generated; • Response Time date and time when the command was responded; • Response – the response for the issued command if the command was responded successfully
or the error reason if the command failed), which can consist of: o System generated commands:
§ success or the hex value representing the response payload (if any), in case of success;
§ error code and reason in case of command failure; o WH General Command:
§ two bytes representing the command code, followed by one byte representing the command return code, followed by a hex value representing the response payload (if any).

Ref.no.: 003274/Revision 2.4 @2019 Control Data Systems Page 150 | 201
Figure 7.2.17 Command Log window (HART)
Given the large number of commands generated automatically by the system at regular intervals, these commands are hidden by default. To view them, check the Show system generated commands option in the Search dialog and click Search.
The total number of rows in the table is indicated in the top left corner of the table. Here you can set the number of items to be displayed per page in the table. The default number is 10. Paging controls in the top right corner of the table also enable you to navigate through the other pages of the table.
From this page you can also save the search results into a Microsoft Excel CSV file, by clicking Export.
7.2.8 Alerts The Alerts page enables you to view alarms and events generated by devices.
Alerts consist in application messages that advise or warn the recipient of the presence of an impending or existing situation of interest.
In the following screen capture (Figure 7.2.18) is shown the Alerts window:
Figure 7.2.18 Alerts window (HART)
To search for alerts you must perform the following actions:
• select the device, the alert category, priority and type (class) of alert, • Optionally, fill in the Start Time and the End Time fields, and then click Search.

Ref.no.: 003274/Revision 2.4 @2019 Control Data Systems Page 151 | 201
The results are displayed in a table that indicates the following information:
• the Device Tag; • the device Nickname; • EUI-64 Address – the MAC address of the device generating the alert; • Alert Time – the date and time when the alert condition was detected; • Alert Type:
o Path Down – when the device’s path to a neighbor has failed; o Source Route Failed – when any neighbor is unreachable on a source route, hence the
source route has failed; o Graph Route Failed – when communication on any route of the graph has failed (in the
given example, graph ID 303); o Transport Layer Failed – when there has been a Transports Layer connection failure in
the communication between the selected device and its peer; • PeerAddress/Graph ID – the nickname of the neighbor, peer or graph, depending on the type of
alert; • MIC – the MIC value of the packet that failed routing on a source route that failed.
You can set the number of records to be displayed per page in the table. The default number is 10. Paging controls at the bottom of the table allow you to navigate through different pages of the search results.
From this page you can also save the search results into a Microsoft Excel CSV file, by clicking Export.
7.3 Configuration The Configuration section enables you to view and edit certain settings for the configuration/provisioning of the devices and the network, including connection settings, publishers, alert subscriptions and Modbus register mapping.
This section is intended for users with thorough technical knowledge, and certain configurations require advanced expertise, therefore they should be carefully planned, as any inconsistencies may render the devices/network inoperative.
Note that the changes you perform in the settings for each separate entity will also be reflected in the Advanced Settings page and vice-versa.
7.3.1 Access Point The Access Point configuration page consists of 4 sections, as shown in the following screen capture (Figure 7.3.1):
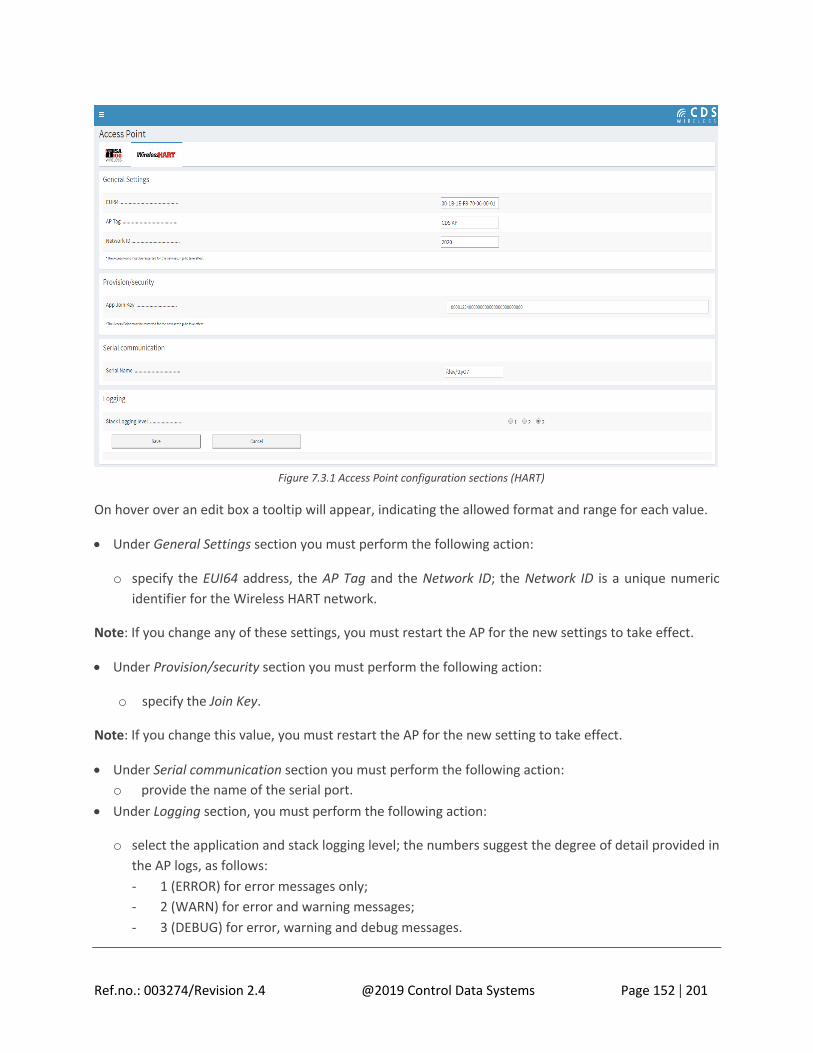
Ref.no.: 003274/Revision 2.4 @2019 Control Data Systems Page 152 | 201
Figure 7.3.1 Access Point configuration sections (HART)
On hover over an edit box a tooltip will appear, indicating the allowed format and range for each value.
• Under General Settings section you must perform the following action:
o specify the EUI64 address, the AP Tag and the Network ID; the Network ID is a unique numeric identifier for the Wireless HART network.
Note: If you change any of these settings, you must restart the AP for the new settings to take effect.
• Under Provision/security section you must perform the following action:
o specify the Join Key.
Note: If you change this value, you must restart the AP for the new setting to take effect.
• Under Serial communication section you must perform the following action: o provide the name of the serial port.
• Under Logging section, you must perform the following action:
o select the application and stack logging level; the numbers suggest the degree of detail provided in the AP logs, as follows: - 1 (ERROR) for error messages only; - 2 (WARN) for error and warning messages; - 3 (DEBUG) for error, warning and debug messages.
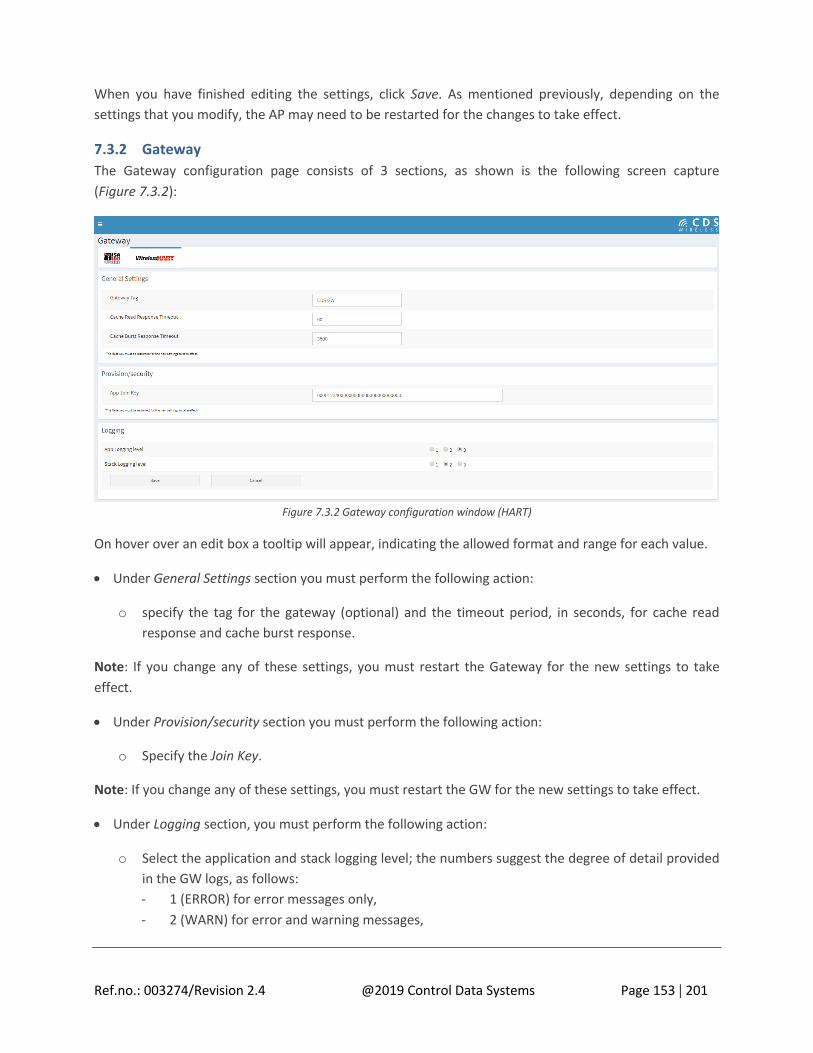
Ref.no.: 003274/Revision 2.4 @2019 Control Data Systems Page 153 | 201
When you have finished editing the settings, click Save. As mentioned previously, depending on the settings that you modify, the AP may need to be restarted for the changes to take effect.
7.3.2 Gateway The Gateway configuration page consists of 3 sections, as shown is the following screen capture (Figure 7.3.2):
Figure 7.3.2 Gateway configuration window (HART)
On hover over an edit box a tooltip will appear, indicating the allowed format and range for each value.
• Under General Settings section you must perform the following action:
o specify the tag for the gateway (optional) and the timeout period, in seconds, for cache read response and cache burst response.
Note: If you change any of these settings, you must restart the Gateway for the new settings to take effect.
• Under Provision/security section you must perform the following action:
o Specify the Join Key.
Note: If you change any of these settings, you must restart the GW for the new settings to take effect.
• Under Logging section, you must perform the following action:
o Select the application and stack logging level; the numbers suggest the degree of detail provided in the GW logs, as follows: - 1 (ERROR) for error messages only, - 2 (WARN) for error and warning messages,

Ref.no.: 003274/Revision 2.4 @2019 Control Data Systems Page 154 | 201
- 3 (DEBUG) for error, warning and debug messages.
When you have finished editing the settings, click Save. As mentioned above, depending on the settings that you modify, the Gateway may need to be restarted for the changes to take effect.
7.3.3 Network Manager The Network Manager configuration page consists of 3 sections, as shown in the following screen capture (Figure 7.3.3):
Figure 7.3.3 Network Manager configuration window (HART)
On hover over an edit box a tooltip will appear, indicating the allowed format and range for each value.
• Under General Settings section you must perform the following action:
o specify the tag of the Network Manager.
Note: If you change this setting, you must restart the NM for the new setting to take effect.
• Under Operational Settings section you must perform the following actions:
o fill in the bandwidth fields with the desired/appropriate values; o Enable/Disable Compatibility Mode for the old Emerson devices starting with revision 2; o Enable/Disable Dynamic Management Bandwidth for the NM to dynamically adjust devices
bandwidth.

Ref.no.: 003274/Revision 2.4 @2019 Control Data Systems Page 155 | 201
• Under Channel maps section you must perform the following actions:
o enable the desired frequency channels for communication with the network devices for each Network ID; click Add for a new Network ID or to remove it;
o if you are using more than one Network ID be sure that each channel is used only by one network.
When you have finished editing the settings, click Save.
7.3.4 Device Management This section enables you to edit network configuration information in the whart_provisioning.ini file for existing devices and to add new devices or access points to the network.
Manage those sections with care - incorrect values may render the devices dysfunctional or may cause difficulty to trace malfunctions.
Click Help in the upper right corner of the window to view information and examples of the accepted data formats in all the sections.
In the following screen capture (Figure 7.3.4) is shown the Device Management window:

Ref.no.: 003274/Revision 2.4 @2019 Control Data Systems Page 156 | 201
Figure 7.3.4 Device Management window (HART)
Notes:
1. The EUI-64 address is unique in a network. 2. All the devices in a network must have the Network ID of one of the AP.
When adding a device, you have the possibility to select whether the Join Key is unique per network or per device.
If the Join Key is unique per network, any device that has the correct key provisioned, regardless of its network address, will join the network.

Ref.no.: 003274/Revision 2.4 @2019 Control Data Systems Page 157 | 201
If the Join Key differs from device to device, you must enter the correct EUI-64 address and join key for each device, for the devices to be able to join. Afterwards, click Save to save the data in the whart_provisioning.ini file.
In the following screen capture (Figure 7.3.5) is shown the Configuration settings window:
Figure 7.3.5 Configuration settings window (HART)
At the end, click Activate, to activate the configuration settings.
If you have more than one Access Point set in the network, you can set one of them redundant for the other. Both will advertise the same Network ID.
7.3.4.1 Configuring Access Points To add an AP in the network, type its EUI64, security key, and Network ID in an empty edit box and click Save. The new AP will be added to the Access Points list.
Editing an AP To edit an AP, you must perform the following actions:
1. click on the entry that you want to edit in the Access Points list; 2. edit the security key and/or network ID and click Save to save the changes in the
whart_provisioning.ini file.
Considering Note 1 above, if you change the EUI64 address of an existing AP, the NM will recognize it as a new entity and will add the new AP to the current list.
Considering Notes 2 above, if you edit an Access Point, it will be removed from an existing network and the devices in that network will be unable to join the network, unless you edit the same parameters for all the field devices in that network.
Deleting an AP To delete an Access Point you must perform the following actions:
1. select the desired Access Point in the list and click Delete; 2. you will be asked for confirmation; click Yes to delete the AP or No to abort the action.

Ref.no.: 003274/Revision 2.4 @2019 Control Data Systems Page 158 | 201
When you delete an AP the devices in its network will be unable to join until a new AP provisioned with the same security key and network ID is added to that network.
After you perform any of the above operations, click Activate to load the changes into the Network Manager. The changes will be visible in the network topology and where applicable in the device list.
7.3.4.1.1 Multiple Access Points You can set up to five AP for the same NM instance. Those can advertise the same network ID or not.
7.3.4.1.2 Redundant Access Points To set up two redundant AP, use the following format for configuration: Access Point: {<EUI64>, <KEY>, <EUI64_REDUNDANCY>, <NETWORK_ID>}. The second EIU64 will be used as secondary AP. This will be continuously synchronized with the primary AP, but it will not send advertisements over the wireless network.
7.3.4.2 Configuring Gateways Note: In compliance with the Wireless HART standard, the VR950 supports only one GW; therefore, it is not permitted to add more than one GW to the system.
Editing a GW To edit the GW, you must perform the following actions:
1. click on the entry that you want to edit in the Gateways list; 2. edit the security key and/or Network ID and click Save to save the changes in the
whart_provisioning.ini file.
After you edit the GW section, click Activate to load the changes into the NM. The changes will be visible in the network topology and where applicable in the device list.
7.3.4.3 Configuring Devices Adding devices: You can add devices either individually, one device at a time, or you can add multiple devices at a time.
To add a single device in the network, type its EUI64, security key, and network ID in the empty edit box and click Save. The new device will be added to the Devices list.
Editing a device/multiple devices To edit a device/multiple devices you must perform the following actions:
1. in the device list, click on the entry that you want to edit; 2. edit the security key and/or network ID; 3. click Save to save the changes in the whart_provisioning.ini file.
Deleting a device/multiple devices To delete a device/multiple devices you must perform the following actions:

Ref.no.: 003274/Revision 2.4 @2019 Control Data Systems Page 159 | 201
1. select the desired entry in the list and click Delete; 2. you will be asked for confirmation; click Yes to delete the device(s) or No to abort the action.
After you perform any of the above operations, click Activate to load the changes into the NM. The changes will be visible in the network topology and where applicable in the device list.
Loading a List of Devices You can add multiple devices at the same time by importing them from a file. The file will contain a list of devices with the <EUI64>, <Key>, and <NetworkID> when appropriate, comma separated values.
Loading a List of Devices To load a list, you must perform the following actions:
1. click on Browse to locate the text file that you wish to load, and click Upload; 2. click Activate, to load the new device list into the NM; the current whart_provisioning.ini file will
be overwritten, and all previous settings will be lost.
Exporting the Settings This page also enables you to export the configuration settings, by clicking Save in the Manage device list section.
7.3.5 Monitoring Host This section enables you to configure burst messages (data publishing from devices to GW and visualization in MCS web interface). The configuration settings are stored in the Monitor_Host_Publishers.conf file.
By default, the system will automatically discover the settings for burst messages for devices joined to the network, provided that such information was not manually entered in Monitor_Host_Publishers.conf file or a discovery process was not run previously, filling the appropriate settings in the file.
Click Help in the upper right corner of the window to view information and examples of the accepted data formats in all the sections.
In the following screen capture (Figure 7.3.6) is displayed the Device Management window:

Ref.no.: 003274/Revision 2.4 @2019 Control Data Systems Page 160 | 201
Figure 7.3.6 Monitoring Host window (HART)
7.3.5.1 Burst Messages Adding a burst message definition To add a burst message definition, you must perform the following actions:
1. in the empty edit box, type the parameters of a burst message definition from a particular device, following the order and format indicated in the Help form: EUI64 address, the number of command of which response will be published through the burst message, the index of the burst message, the update period and maximum update period in 1/32 ms not exceed 3600s as configured through command 103;

Ref.no.: 003274/Revision 2.4 @2019 Control Data Systems Page 161 | 201
2. Click Save. The burst message definition will be added to the list and the changes will be saved in the Monitoring Host configuration file;
3. Add the variables to be published, by following the steps described under 8.3.5.2 Variables; 4. Add the burst trigger, by following the steps described under Section 7.3.5.3.
You can also add a burst message based on an existing one, by performing the following actions:
1. click on a burst message in the list; 2. in the edit box, change the EUI64 and burst message index into that of the new burst message; 3. change other parameters, if applicable; 4. click Save; the burst message will be added to the list; the variables and triggers of the original
burst message are preserved in the newly added burst message.
Editing a burst message To edit a burst message, you must perform the following actions:
1. in the burst message list, click on the entry that you want to edit; 2. edit the desired parameters and click Save; the changes will be stored in the
Monitor_Host_Publishers.conf file.
Deleting a burst message To delete a burst message, you must perform the following actions:
1. select a burst message in the list and click Delete; 2. you will be asked for confirmation; click Yes to delete the burst message or Cancel to abort the
action.
After you perform any of the above operations, click Activate to load the changes into the Monitoring Host.
7.3.5.2 Variables This section enables you to configure the Device Variables being published through the burst message. We will be calling these Variables for simplicity.
Adding a Variable To add a Variable to a burst message definition you must perform the following actions:
1. In an empty edit box, type the variable parameters in the order and format indicated in the Help form: the device variable code (see Common Table 34 and device family codes), the name on the variable to be displayed in the Readings page, the slot of device variable (value in 0-7 range: 0-3 for command 33 and 4-7 for command 9), the device variable classification (see Common Table 21 and Command 104; required for commands 3 and 33), the units code (see Common Table 2 and Command 4; required for commands 3, 9 and 33). The command number and burst message index are the same as those used in the burst message definition and are not editable in the interface;

Ref.no.: 003274/Revision 2.4 @2019 Control Data Systems Page 162 | 201
2. click Save; the variable will be added to the variables list for that specific burst message and the changes will be saved in the Monitoring Host configuration file.
Editing a Variable To edit a variable, you must perform the following actions:
1. in the variables list, click on the entry that you want to edit; 2. edit the desired parameters and click Save; the changes will be stored in the
Monitor_Host_Publishers.conf file
Deleting a Variable To delete a variable, you must perform the following actions:
1. Select a variable in the list and click Delete. 2. You will be asked for confirmation; click Yes to delete the variable or Cancel to abort the action.
After you perform any of the above operations, click Activate to load the changes into the Monitoring Host.
7.3.5.3 Triggers This section is optional and enables you to configure the trigger of a burst message.
Adding a Trigger To add a Trigger to a burst message definition you must perform the following actions:
1. In an empty edit box, type the trigger parameters in the order and format indicated in the Help form: the burst trigger mode selection, having one of the values: Continuous, Window, Rising, Falling, On-Change (see Cmd 104, Common Table 33), the device variable classification (see Common Table 21 and Cmd 104), the units code (see Common Table 2 and Cmd 4), the trigger level (float value). The command number and burst message index are the same as those used in the burst message definition and are not editable in the interface,
2. Click Save. The trigger will be added for the selected burst message and changes will be saved in the Monitoring Host configuration file.
Editing a Trigger To edit a trigger, you must perform the following action:
1. In the trigger edit box, edit the desired parameters and click Save. The changes will be stored in the Monitor_Host_Publishers.conf” file.
Deleting a trigger To delete a trigger, you must perform the following actions:

Ref.no.: 003274/Revision 2.4 @2019 Control Data Systems Page 163 | 201
1. click Delete button near the trigger edit box; 2. you will be asked for confirmation; click Yes to delete the trigger or Cancel to abort the action.
After you perform any of the above operations, click Activate to load the changes into the Monitoring Host.
Loading a List of Burst Message Definitions You can add multiple burst message definitions from different devices at the same time by importing them from a file. The file will contain the list of devices and their burst message definitions, with the associated parameters respectively expressed as comma separated values.
To load a list, you must perform the following actions:
1. click on Browse to locate the text file that you wish to load, and click Upload; 2. click Activate, to load the new burst messages list into the Monitoring Host; the current
Monitor_Host_Publishers.conf file will be overwritten.
Exporting the Burst Message Definitions This page also enables you to export the publisher list (including channels), by clicking Download in the Manage burst messages list section.
7.3.6 Modbus The Modbus page enables you to map Wireless HART data entities to Modbus registers.
Click Help in the upper right corner of the window to view information and examples of the accepted data formats in all the sections.
In the following screen capture (Figure 7.3.7) is displayed the Modbus Server window:

Ref.no.: 003274/Revision 2.4 @2019 Control Data Systems Page 164 | 201
Figure 7.3.7 Modbus Server window (HART)
7.3.6.1 Mapping Registers The mapping area contains two sections listings the two different groups of registers: Input Registers and Holding Registers.
The mapping between a register and a device variable is achieved by adding register line in the appropriate section. Please note that mapping read-only variables to holding registers will not make the variables themselves writable.
Adding a register line To add a register line, you must perform the following actions:
1. in an empty edit box, type the parameters in the order and format indicated in the Help form:

Ref.no.: 003274/Revision 2.4 @2019 Control Data Systems Page 165 | 201
a. start address - decimal integer, between 0 and 65535, representing the start address of the Modbus register;
b. word count - decimal integer, between 1 and 125, representing the number of 16-bit Modbus words allocated for this Wireless HART data element;
c. EUI-64 - string of 16 hex digits, representing the 8 bytes of a device’s EUI-64 address; d. register type: device_variable, gw_info or gw_code_word are the three register types
supported; When register type is device_variable, the following parameters must be specified:
e. the burst message you want to map; f. device variable code; g. device state - decimal integer, 0 and 2 with the following meaning:
• 0 – the Wireless Hart device variable is mapped onto the chunk of registers, starting from address <start_addr>. The value should be interpreted as 4 bytes float; Wireless Hart Communication errors (e.g. device not joined) will make addressing these registers return the Modbus exception 0x04 (slave device failure);
• 2 – the Wireless Hart device variable is mapped onto the chunk of registers, starting from address <start_addr>+1. The value should be interpreted as 4 bytes float. At address <start_addr> there is a device state register generated by the Modbus server which reflects the state of the Wireless Hart communication; the value should be interpreted as 16-bit big-endian integer with the following values:
o 128: Device Joined with fresh data; o 8: Device NOT joined, and no data read so far; o 20: Device NOT joined but with stale data; o 24: Device Joined but no data read so far; o 4: Device Joined but with stale data.
When register type is gw_info, general gateway information will be exposed to Modbus, using the following registers (Table 7.2):
Table 7.2 General GW information (HART)
Register Item exposed Observation
<start_addr> + 0 Number of devices currently connected.
16bit big-endian integer
<start_addr> + 1 Total number of burst messages. 16bit big-endian integer
<start_addr> + 2 Versa Router MAC. 3 words * 16bit big-endian unsigned integer
Note: For register type gw_info the <word_cnt> must be 5.
When register type is gw_code_word, the gateway’s code word will be exposed to Modbus; The code word is read-only.
Note: For register type gw_code_word, the <word_cnt> should be 16 or less.

Ref.no.: 003274/Revision 2.4 @2019 Control Data Systems Page 166 | 201
The <EUI64> in gw_info and gw_code_word register lines should identify the Wireless Hart Gateway. Accepted values: 001B1EF981000002, 0000000000000000, FFFFFFFFFFFFFFFF.
2. Click Save to add the new register line in the Registers list.
Notes:
a) When mapping the Modbus registers on the Wireless HART data entities, you must consider the size of the Wireless HART data entity and allocate a contiguous chunk of Modbus 16-bit registers in the Modbus addressing space to hold the entire data entity (plus an additional Modbus register to hold the auto-generated status, if applicable). When the chunk is bigger than the size of the data entity, it will be filled with the actual data from the lowest addressed register to the highest, and from the MSB of each register to the LSB. If the data entity does not entirely fill the last register, the register will have the data on the MSB and the LSB will be set to zero.
b) If the address range of a register line overlaps an existing register line in the same group, or if it does not fit in the range 0-65535, it will be ignored.
Loading a List of Registers You can import the register map from a file that includes the input and holding registers lines with their parameters which are expressed as comma separated values.
To load the list, you must perform the following actions:
1. In the Manage registers list section click on Browse to locate the text file that you wish to load, and click Upload;
2. click Activate, to load the new host list into Modbus; the current Modbus _gw.ini file will be overwritten.
Exporting the Registers This page also enables you to export the registers, by clicking Download in the Manage registers list section.
7.3.7 Advanced Settings 7.3.7.1 Sections/variables This Sections/variables page enables you to change various configuration sections for applications running on VR950. These settings include the settings under the Access Point, Gateway, and Network Manager configuration sections.
In the following screen capture (Figure 7.3.8) is displayed the Sections/variables window:

Ref.no.: 003274/Revision 2.4 @2019 Control Data Systems Page 167 | 201
Figure 7.3.8 Sections/variables window (HART)
Changing settings To change settings, you must perform the following actions:
1. select the configuration level in the drop-down box; 2. select the type of variable:
• Standard – for existing parameters; • Custom – for new settings; when you add a custom setting, it will be added to the Standard
settings list; 3. select a section in the Section drop-down list; the Variable list will change accordingly; 4. type the desired value in the Value field and click Set.
Note: The associated application must be restarted for the new settings to take effect.
7.3.7.2 Restart This Restart page enables you to restart the applications running on the VR950.
To restart an application, click the Restart button.
Note: When you restart any of the applications, the VR950 Monitoring Control System becomes inoperative for a few minutes.
In the following screen capture (Figure 7.3.9) is displayed the Restart window:
Figure 7.3.9 Restart window (HART)

Ref.no.: 003274/Revision 2.4 @2019 Control Data Systems Page 168 | 201
7.3.7.3 VR910 Settings The VR950 Settings page enables you to change the network settings for the VR950.
In the following screen capture (Figure 7.3.9) is displayed the VR950 Settings window:
Figure 7.3.10 VR950 Settings window (HART)
Setting the VR950 To set VR950 you must perform the following actions:
1. edit the input fields for IP, Gateway and Mask; 2. you can also change the MAC of the VR:
a. Check the “Update MAC” option to enable the MAC edit field, b. type the new MAC; c. optionally, uncheck the Update MAC option to protect the field from being accidentally
edited; 3. use the Delete and Add buttons to remove or add name servers or NTP servers.
After you finish editing the settings, click Save and reset the board for the settings to take effect.
Note: If you change the IP address, the board will be accessible with the new IP after reset and will no longer be reachable at the previous IP.
7.4 Statistics The System Status page displays statistical information regarding processor and memory usage, and load average on the VR910.
In the following screen capture (Figure 7.4.1) are shown the section of the Statistic page:

Ref.no.: 003274/Revision 2.4 @2019 Control Data Systems Page 169 | 201
Figure 7.4.1 Statistic sections window (HART)
The first five sections indicate the status (Running or Not Running), memory usage and processor usage for the Access Point, Gateway, Network Manager, Modbus, and Monitor Host processes.
The following two sections display system memory and flash memory availability information.
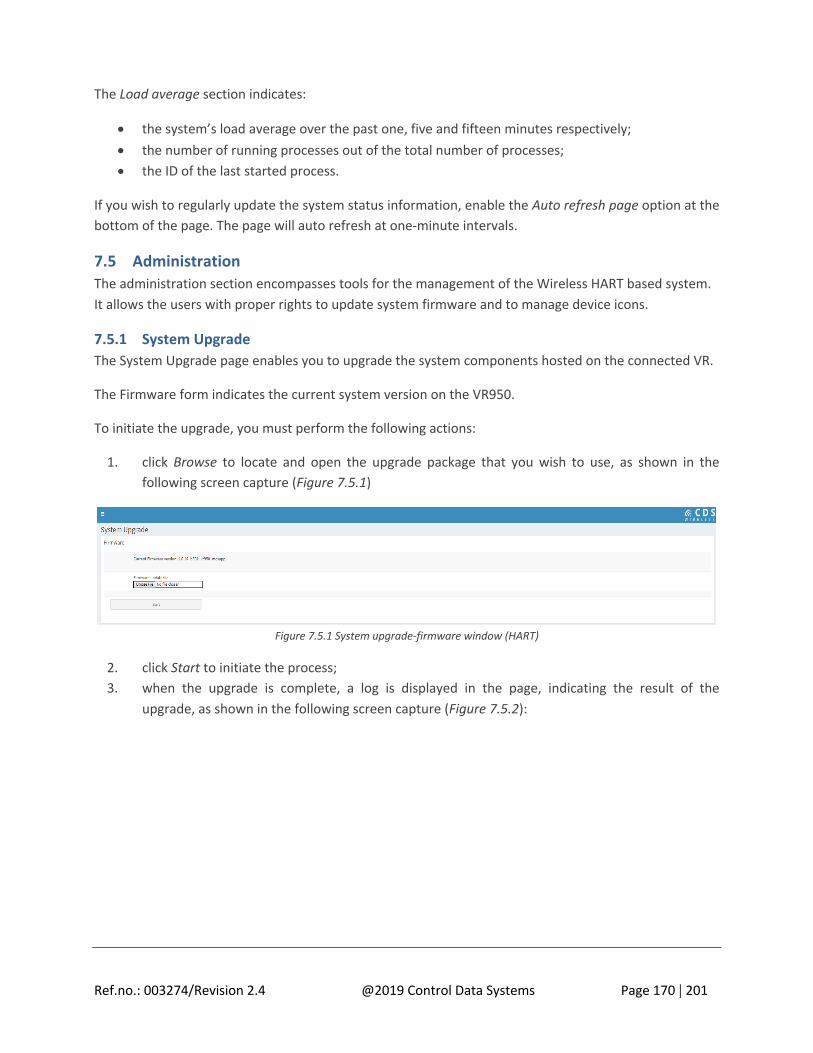
Ref.no.: 003274/Revision 2.4 @2019 Control Data Systems Page 170 | 201
The Load average section indicates:
• the system’s load average over the past one, five and fifteen minutes respectively; • the number of running processes out of the total number of processes; • the ID of the last started process.
If you wish to regularly update the system status information, enable the Auto refresh page option at the bottom of the page. The page will auto refresh at one-minute intervals.
7.5 Administration The administration section encompasses tools for the management of the Wireless HART based system. It allows the users with proper rights to update system firmware and to manage device icons.
7.5.1 System Upgrade The System Upgrade page enables you to upgrade the system components hosted on the connected VR.
The Firmware form indicates the current system version on the VR950.
To initiate the upgrade, you must perform the following actions:
1. click Browse to locate and open the upgrade package that you wish to use, as shown in the following screen capture (Figure 7.5.1)
Figure 7.5.1 System upgrade-firmware window (HART)
2. click Start to initiate the process; 3. when the upgrade is complete, a log is displayed in the page, indicating the result of the
upgrade, as shown in the following screen capture (Figure 7.5.2):

Ref.no.: 003274/Revision 2.4 @2019 Control Data Systems Page 171 | 201
Figure 7.5.2 System upgrade results window
7.5.2 Custom Icons The Custom Icons page enables you to assign custom icons for the devices in a network based on their role, with a view to better distinguishing them.
When the page is loaded, the existing custom icons are displayed in a table, with the following information:
• Model (Role) – the device model; • Icon – shows the existing picture.
The default icons are not listed.
Adding an icon To add an icon, you must perform the following actions:
1. click the Add Icon button; the Custom Icon window will open, as shown in the following screen capture (Figure 7.5.3):

Ref.no.: 003274/Revision 2.4 @2019 Control Data Systems Page 172 | 201
Figure 7.5.3 Custom icon window (HART)
2. select the Device Model (Role) from the drop-down list; 3. click Browse to locate the icon you want to use; the maximum icon size must be 32x32 pixels and
the maximum file size must be 100 Kb., and the supported formats are .jpg, .png, and .gif; 4. click Add; a message will appear, indicating that the icon has been added successfully; 5. click Back in the form or Custom Icons under Administration to return to the Icons list; 6. the newly added icon will be visible in the Icons list, the Topology page, and the Devices page, as
shown in the following screen capture (Figure 8.5.4):
Figure 7.5.4 Added icon-visibility (HART)
Deleting an icon To delete an icon, you must perform the following actions:
1. in the Icons list, click next to the icon entry; 2. you will be asked for confirmation; click OK to delete the icon or Cancel to abort the action.
Note: When you delete an icon, it will be automatically replaced with the default icon for the selected device model/role in the Topology and Devices pages.

Ref.no.: 003274/Revision 2.4 @2019 Control Data Systems Page 173 | 201
7.5.3 Custom Settings This section allows you to enable or disable the interfaces running on the VR950. Use this section to disable all interfaces you are not using to minimize the security risks. You can also switch between UTC and Local from Data Time format.
Figure 7.5.5 Custom Settings window (HART)
7.5.4 Device Codes This Device Codes page features a list of all the Wireless HART devices that have been approved by HART Communication Foundation (HCF). The devices are listed in a table with the following information:
• Code – the device code assigned by HCF; • Model – the device model (name) as given by the vendor; • Company – the device vendor.
In the following screen capture (Figure 7.5.6) is shown the Device Codes window:

Ref.no.: 003274/Revision 2.4 @2019 Control Data Systems Page 174 | 201
Figure 7.5.6 Device Codes window (HART)
When a new device joins the CDS Wireless HART network and reports a device code that is not part of the list, the new device code will be automatically added to the list, having the Model and Company fields populated with N/A. You must change the model and company names manually. To learn how to change these fields, see Section 7.5.4.2.
You can sort or search for entries in the table by code, model and company.
Searching specific entries To search for specific entries, you must perform the following actions:
1. in the search form located on top of the list, type the desired code, model, or company (or part of the selected criterion) in the corresponding field; Note that you can use multiple search criteria at the same time.
2. click Search; the MCS will display all the entries that match your search criteria; if no entries match your selected criteria, the system will display the message No records!
7.5.4.1 Adding a Device Code To add a device code, you must perform the following actions:
1. click the Add Device Code button located on top of the search form; the Add Device Code form will open;
In the following screen capture (Figure 7.5.7) is shown the Add Device Code window:

Ref.no.: 003274/Revision 2.4 @2019 Control Data Systems Page 175 | 201
Figure 7.5.7 Add Device Code window (HART)
2. in the form, fill in the edit fields with the desired information; 3. click Save to add the device to the list, or Back to cancel the action and return to the Device
Codes page.
7.5.4.2 Editing a Device Code To edit a device code, you must perform the following actions:
1. click on the code in the list; the Edit Device Code form will open; In the following screen capture (Figure 7.5.8) is shown the Edit Device Code window:
Figure 7.5.8 Edit Device Code window (HART)
2. in the form, edit the desired information under Model and Company,
Note that you cannot change the device Code in this form. To change a device code, you can delete the device code and add it again.
3. click Save to save your changes, or Back to cancel the action and return to the Device Codes page.
7.5.4.3 Deleting a Device Code
To delete a device code, click the icon located next to the corresponding entry in the table. The system will require confirmation to perform the action. Click OK to delete the device code or Cancel to abort the action.

Ref.no.: 003274/Revision 2.4 @2019 Control Data Systems Page 176 | 201
Note: When you remove a device from the Device Codes list, the device will no longer be visible in the MCS, even when it is joined.
7.6 Session 7.6.1 Change Password The Change Password page enables you to change your own password. In this order, you must perform the following actions:
1. in the form, type your current password in the Old Password field; 2. type the new password in the New password field; 3. retype the new password in the Confirm new password field, for verification;
Please note that passwords are case sensitive, 4. click Save at the bottom of the page to save the new password, which will become your current
password.
In the following screen capture (Figure 7.6.1) is shown the Change password window:
Figure 7.6.1 Change password window (HART)

Ref.no.: 003274/Revision 2.4 @2019 Control Data Systems Page 177 | 201
8 Web-based Administration /admin/
8.1 Access, Authentication and Navigation The web-based administration is the preferred method to administer/configure the VR. It requires a web browser and the IP of the VR. The VR must be connected to the local LAN and then powered on, and the IP/mask or the router must be accessible from the PC where the browser is running.
Note: Depending on the firmware running on the VR, fewer or additional features respectively may be available.
Please note that all web administration tasks require to login. The login step is presented here only once, and it is understood that all the following steps will require it.
In order to login you must perform the following actions:
1. open the following URL: http://<VR_IP>/admin/login.html replacing <VR_IP> with Versa Router IP; the window from the following screen capture (Figure 8.1.1) will appears:
Figure 8.1.1 Login window
2. type the following credentials in the input fields:
• User: admin • Password: adminadmin
3. click Login.
The following screen appears, allowing access to various tasks (Figure 8.1.2):

Ref.no.: 003274/Revision 2.4 @2019 Control Data Systems Page 178 | 201
Figure 8.1.2 User interface window
Notes: • Depending on the web browser you are using to login to the VR Administration, the graphical
representation of the page and some buttons related to the operations described in the following pages may differ slightly.
• For instance: the button Choose File in Google Chrome and Apple Safari is the same as the button Browse in Mozilla Firefox and Internet Explorer.
• The following screen captures were taken using Internet Explorer 9 and are only provided as examples.
8.2 System Upgrade In this section you can upgrade the three software components of the VR:
• the Versa Router firmware – using the file an_bin_r.r.vv_vr950_isa_lg.tgz; • the Versa Router ISA radio transceiver (BBR) firmware – Upg_CDS_Transceiver_vxx_xx_xx; • the Versa Router WirelessHART radio transceiver (BBR) firmware –
Upg_CDS_Transceiver_vxx_xx_xx; • the Monitoring Control System (MCS) website – vr950website_r.r.vv.tgz;
where r.r represents the release number (like 2.6 or 2.7) and the vv is the version number within the release.
Note: For a properly function of the MCS website or to have access to the full features of the VR firmware release, you must use the website versions for the same release. The radio FW (including the BBR), however, are backwards compatible with all releases. For this reason, the radio FW versions are not linked by the release number.

Ref.no.: 003274/Revision 2.4 @2019 Control Data Systems Page 179 | 201
8.2.1 Versa Router Firmware In order to upgrade the VR firmware, you must perform the following actions:
1. click Edge Router Firmware; the following screen capture shows the version currently installed (Figure 8.2.1):
Figure 8.2.1 Edge Router Firmware Upgrade window
2. if you intend to load a previous release version (like 2.5.xx or 2.6.xx) over a newer release, please check Reset DB box;
3. click Browse to locate and select a new FW file, then click Load (the versions must be different than the previous one);
4. wait until the FW is activated - this process will take a few minutes; do not power cycle the board or interrupt in any other way the upgrade process.
During the upgrade, the process log is displayed. When the operation is complete, the screen should look as shown in the following capture (Figure 8.2.2):

Ref.no.: 003274/Revision 2.4 @2019 Control Data Systems Page 180 | 201
Figure 8.2.2 Activated Edge Router Firmware window
Note: If the process fails to complete, please contact a CDS Technical Support representative.
8.2.2 ISA Transceiver Firmware In order to upgrade the VR ISA radio transceiver firmware, you must perform the following actions:
1. click ISA TR Firmware and the following screen will appears (Figure 8.2.3):
Figure 8.2.3 ISA Transceiver Firmware Upgrade window
2. in the dialog that appears, click Browse to locate and select the transceiver firmware file, then click Load;

Ref.no.: 003274/Revision 2.4 @2019 Control Data Systems Page 181 | 201
3. wait until the transceiver firmware is activated - this process will take a few minutes; do not power cycle the board or interrupt in any other way the upgrade process.
During the upload, the process log is displayed. When the operation is complete, the screen should look as shown below (Figure 8.2.4):
Figure 8.2.4 Completed operation window for ISA Transceiver Firmware Upgrade
8.2.3 WHart TR Firmware In order to upgrade the VR ISA radio transceiver firmware, you must perform the following actions:
1. click WHart TR Firmware and the following screen will appears (Figure 8.2.5):

Ref.no.: 003274/Revision 2.4 @2019 Control Data Systems Page 182 | 201
Figure 8.2.5 WHart Transceiver Firmware Upgrade window
2. in the dialog that appears, click Browse to locate and select the transceiver firmware file, then click Load;
3. wait until the transceiver firmware is activated - this process will take a few minutes; do not power cycle the board or interrupt in any other way the upgrade process.
During the upload, the process log is displayed. When the operation is complete, the screen should look as shown below (Figure 8.2.6):

Ref.no.: 003274/Revision 2.4 @2019 Control Data Systems Page 183 | 201
Figure 8.2.6 Completed operation window for WHart Transceiver Firmware Upgrade
Note: If the process fails to complete, please contact a CDS Technical Support representative.
8.2.4 Versa Router Application Website (Monitoring Control System) In order to upgrade the MCS website, you must perform the following actions:
1. click Application Website and the following screen will appears (Figure 8.2.7):

Ref.no.: 003274/Revision 2.4 @2019 Control Data Systems Page 184 | 201
Figure 8.2.7 Application Website Upgrade window
2. in the dialog that appears, click Browse to locate and select the file, then click Load; 3. during the upgrade, the process log is displayed; when the operation is complete, the screen
should look as shown in the following screen capture (Figure 8.2.8):
Figure 8.2.8 Completed operation window for Application Website Upgrade

Ref.no.: 003274/Revision 2.4 @2019 Control Data Systems Page 185 | 201
8.3 Configuration 8.3.1 Log Files In order to log files, please go to the Configuration section – Log Files, and the following screen will appear (Figure 8.3.1):
Figure 8.3.1 Log Files window
Please note that you have the option to download the logs currently stored on the VR. The storage space reserved for log on the VR is limited, so older log records will be overwritten by the new entries. To overcome this and to have access to all log entries you may set up FTP log upload. Here are the details for the elements that must be specified:
Host: the FTP server IP (please do not use the server name). It must be UNIX compatible and while FTP logs option is activated it must be available in the same network as the VR at all time, otherwise the VR may not function correctly;
User and Pass: there must be a user and password created on the FTP server; please do not use anonymous users;
Folder: An_xxxxxx folder (“xxxxxx” represents the Access Node ID) must exists on the FTP server at the path specified in the first (editable) box; you can find the Access Node ID in the next locked box or in the Advance Settings screen – section: GLOBAL – Variable: AN_ID.
By activating ISA Reading History will be saved all published values in the database. This will cause processor overload on fast-publishing networks. If the publish rate is aggressive, the result may be exceeding the available storage, or even flash corruption. We do not recommend using it on a VR production.

Ref.no.: 003274/Revision 2.4 @2019 Control Data Systems Page 186 | 201
8.3.2 Reset Profile This section allows you to reset the VR to the default FW profile or by preserving user dependent variables.
8.3.3 Advanced Settings This section allows you to view/set less common configuration variables, which cannot be changed using the classic MCS web interface, including BBR/GW/SM EUI64, JoinKey, subnetID (named FilterTargetID in the Backbone section).
This page is for advanced users only – do not use unless you have been instructed exactly by a CDS Technical Support representative regarding which values to be changed. Incorrect values may render the router dysfunctional or may cause difficulties in tracing malfunctions.
Please see the following screen capture for the Advanced Setting section (Figure 8.3.2) and follow the steps mention below:
Figure 8.3.2 Advanced Settings window
1. in the form, select a section in the drop-down list; the Variable list will change accordingly; 2. select a Variable in the drop-down list; 3. set/edit the Value field and then click Set.
Note: Do not change [GLOBAL].AN_ID under any circumstance.
For adding a new variable, please select Custom near Variable type; the form will be empty, as shown in the following screen capture (Figure 8.3.3):

Ref.no.: 003274/Revision 2.4 @2019 Control Data Systems Page 187 | 201
Figure 8.3.3 Variable type window
Type the desired information in the Section, Variable and Value fields and click Set.
8.3.4 Network This section allows you to view and set network-related settings: IP address/mask/gateway, name servers used, time servers used.
This page is for advanced users only – do not use it unless you know precisely how to configure the network. Any invalid values may render the router dysfunctional or may cause difficulties in tracing malfunctions.
If you make any settings configurations, please follow the instructions below:
• make sure you are not causing IP conflicts; • make sure the name servers used are functional and accessible from the VR; • make sure the NTP servers are functional and accessible from the VR.
Please see the screen capture for the Network section in the Figure 8.3.4.
In the form, you can edit the input fields for IP, Gateway and Mask.
You can also change the MAC of the VR. In this regard you must perform the following actions:
• check the Update MAC option to enable the MAC edit field; • type the new MAC; • optionally, uncheck the Update MAC option to protect the field from being accidentally edited.
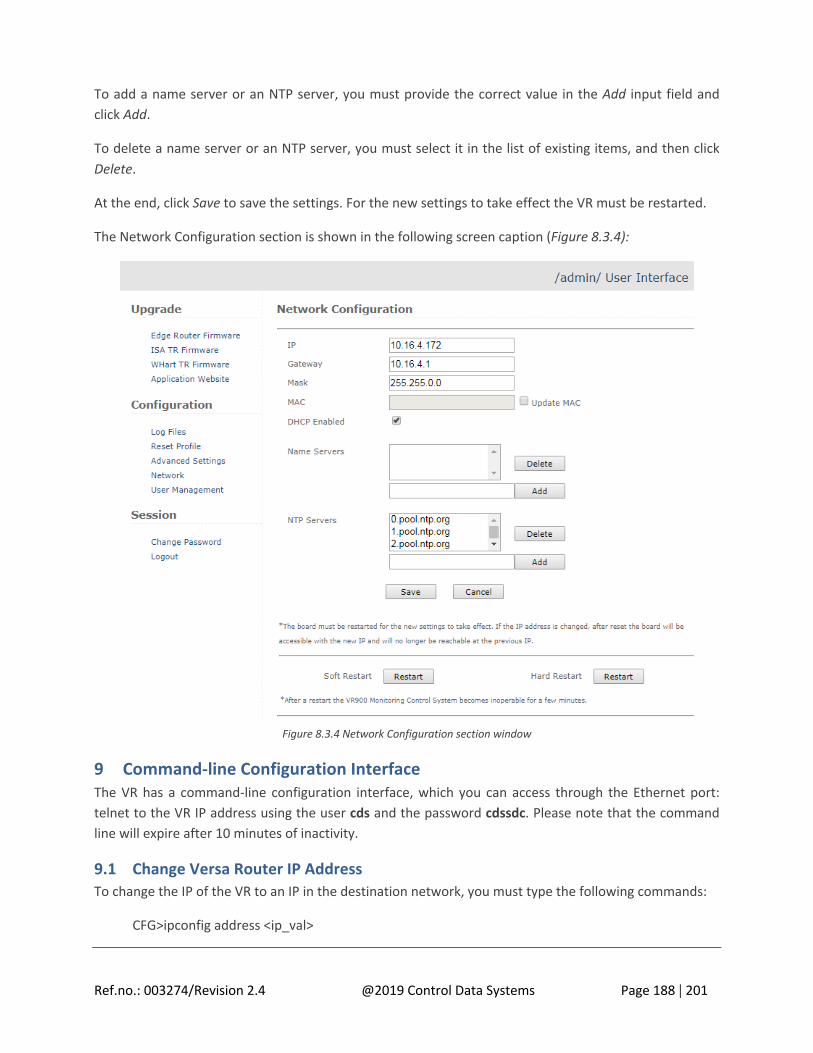
Ref.no.: 003274/Revision 2.4 @2019 Control Data Systems Page 188 | 201
To add a name server or an NTP server, you must provide the correct value in the Add input field and click Add.
To delete a name server or an NTP server, you must select it in the list of existing items, and then click Delete.
At the end, click Save to save the settings. For the new settings to take effect the VR must be restarted.
The Network Configuration section is shown in the following screen caption (Figure 8.3.4):
Figure 8.3.4 Network Configuration section window
9 Command-line Configuration Interface The VR has a command-line configuration interface, which you can access through the Ethernet port: telnet to the VR IP address using the user cds and the password cdssdc. Please note that the command line will expire after 10 minutes of inactivity.
9.1 Change Versa Router IP Address To change the IP of the VR to an IP in the destination network, you must type the following commands:
CFG>ipconfig address <ip_val>

Ref.no.: 003274/Revision 2.4 @2019 Control Data Systems Page 189 | 201
CFG>ipconfig mask <mask_val> CFG>ipconfig gateway <gw_val> CFG>ipconfig restart
Replace <ip_val>, <mask_val> and <gw_val> with the desired IP address, mask and gateway, in dots-and-numbers representation. The changes will become effective only after ipconfig restart is issued. Subsequently, the communication with the VR will be lost because of the IP address change.
9.2 UDP/TCP Port Configuration This step is not necessary, nor is it recommended. The router is shipped with an effective default configuration.
Note: Do not change the values unless instructed by a CDS Technical Support representative.
An optional step is required to change the UDP ports for SM, GW and BBR, and/or the TCP port for communication between the GW and the Monitoring Host applications.
The default UDP ports are (in decimal):
• 20091 for the System Manager, • 20092 for the Gateway, and • 20093 for the Backbone Router.
The default TCP port for communication between the Gateway and the Monitoring Host applications is 4900.
• To configure the UDP port of the SM, you must type the following commands:
CFG>ini SYSTEM_MANAGER SYSTEM_MANAGER_Port <SM_Port> CFG>device restart
Replace <SM_Port> with the desired UDP port the SM will use for UDP communication. The default port for the SM is 20091 (in decimal).
The SM application should run smoothly using the default configuration settings.
• To configure the UDP port of the BBR, you must type the following commands:
CFG>ini BACKBONE BACKBONE_Port <BBR_Port> CFG>device restart
Replace <BBR_Port> with the desired UDP port the Backbone router will use for UDP communication. The default port for the Backbone Router is 20093 (in decimal).
• To change the UDP/TCP port of the GW to a new port, you must type the following commands:

Ref.no.: 003274/Revision 2.4 @2019 Control Data Systems Page 190 | 201
CFG>ini GATEWAY GATEWAY_UDPPort <GW_Port> CFG>ini GATEWAY TCP_SERVER_PORT <GW_TCP_Port> Followed by: CFG>device restart
Replace <GW_Port> with the desired UDP port the GW will use for UDP communication. The default port for the Gateway is 20092 (in decimal). You can also change the TCP communication port by replacing <GW_TCP_Port> with the desired TCP port (default port is 4900), but this operation requires the reconfiguration of the Monitoring Host and any other GSAP clients which communicate with the GW using this TCP port.
9.3 Accessing files through command-line interface Another command accessible through CDS/admin command-line interface is file. This allows you, for example, to display live the last lines of a log file. In the following example the last 10 lines of isa_gw.log file is displayed:
CFG>file watch /tmp/isa_gw.log 10 follow
For all file command options use:CFG>file help
10 Versa Router Configurator
10.1 Changing the IP Using the Versa Router Configurator
The Versa Router Configurator is a Windows application which can be used to reconfigure the main IP address of the Ethernet interface on any VR in the LAN. The Configurator must be installed on a separate Windows-based machine, which must run in the same LAN as the VR.
The configuration interface can be used regardless of the IP/mask/gateway settings of the VR or PC running the Configurator. The only requirement is that the two machines to be in the same LAN.
Upon start, the Configurator submits the following window (Figure 10.1.1):

Ref.no.: 003274/Revision 2.4 @2019 Control Data Systems Page 191 | 201
Figure 10.1.1 Versa Router Configurator window
Click the Search Network for VersaRouters button to broadcast a request in the LAN, to which all VRs will respond. The responses are shown in the top list, as shown in the following screen capture (Figure 10.1.2):

Ref.no.: 003274/Revision 2.4 @2019 Control Data Systems Page 192 | 201
Figure 10.1.2 Responses window for Search Network for Versa Routers button
You can select one of the VR in the list and use the Set VersaRouter Properties button to change the IP, Mask and Default Gateway properties of the selected VR, as shown in the following screen capture (Figure 10.1.3). You should enter these exactly as directed by your network administrator.

Ref.no.: 003274/Revision 2.4 @2019 Control Data Systems Page 193 | 201
Figure 10.1.3 Properties options window for Set VersaRouter Properties button
If you do not have a network administrator, several rules must be considered when filling this dialog box, as follows:
1. each number represents one byte, so it can have values between 0 and 255; 2. the bitwise representation of the mask must have a single length of 1 bit followed by a single
length of 0 bits; 3. the IP address bitwise AND-ed with the mask must equal the gateway address bitwise AND-ed
with the mask; 4. the IP address bitwise AND-ed with the one’s complement of the mask must be neither 0 nor the
one’s complement of the mask; 5. the Gateway address bitwise AND-ed with the one’s complement of the mask must be neither 0
nor the one’s complement of the mask.

Ref.no.: 003274/Revision 2.4 @2019 Control Data Systems Page 194 | 201
Appendix A – Country Codes
Country Codes Country
Maximum Output Power
(in dBm)
4 AFG - AFGHANISTAN 9 8 ALB - ALBANIA 19 10 ATA - ANTARCTICA 9 12 DZA - ALGERIA (El Djazaïr) 9 16 ASM - AMERICAN SAMOA 9 20 AND - ANDORRA 9 24 AGO - ANGOLA 9 28 ATG - ANTIGUA AND BARBUDA 9 31 AZE - AZERBAIJAN 9 32 ARG - ARGENTINA 9 36 AUS - AUSTRALIA 30 40 AUT - AUSTRIA 19 44 BHS - BAHAMAS 9 48 BHR - BAHRAIN 9 50 BGD - BANGLADESH 9 51 ARM - ARMENIA 9 52 BRB - BARBADOS 9 56 BEL - BELGIUM 19 60 BMU - BERMUDA 9 64 BTN - BHUTAN 9 68 BOL - BOLIVIA 9 70 BIH - BOSNIA AND HERZEGOVINA 9 72 BWA - BOTSWANA 9 74 BVT - BOUVET ISLAND 9 76 BRA - BRAZIL 9 84 BLZ - BELIZE 9 86 IOT - BRITISH INDIAN OCEAN TERRITORY 9 90 SLB - SOLOMON ISLANDS 9 92 VGB - VIRGIN ISLANDS, BRITISH 9 96 BRN - BRUNEI DARUSSALAM 9 100 BGR - BULGARIA 19 104 MMR - MYANMAR (formerly Burma) 9 108 BDI - BURUNDI 9 112 BLR - BELARUS 9 116 KHM - CAMBODIA 9 120 CMR - CAMEROON 9 124 CAN - CANADA 20

Ref.no.: 003274/Revision 2.4 @2019 Control Data Systems Page 195 | 201
132 CPV - CAPE VERDE 9 136 CYM - CAYMAN ISLANDS 9 140 CAF - CENTRAL AFRICAN REPUBLIC 9 144 LKA - SRI LANKA (formerly Ceylon) 9 148 TCD - CHAD (Tchad) 9 152 CHL - CHILE 9 156 CHN - CHINA 9 158 TWN - TAIWAN 9 162 CXR - CHRISTMAS ISLAND 9 166 CCK - COCOS (KEELING) ISLANDS 9 170 COL - COLOMBIA 9 174 COM - COMOROS 9 175 MYT - MAYOTTE 9 178 COG - CONGO, REPUBLIC OF 9 180 COD - CONGO, THE DEMOCRATIC REPUBLIC OF THE (formerly Zaire) 9 184 COK - COOK ISLANDS 9 188 CRI - COSTA RICA 9 191 HRV - CROATIA (Hrvatska) 19 192 CUB - CUBA 9 196 CYP - CYPRUS 9 203 CZE - CZECH REPUBLIC 19 204 BEN - BENIN 9 208 DNK - DENMARK 19 212 DMA - DOMINICA 9 214 DOM - DOMINICAN REPUBLIC 9 218 ECU - ECUADOR 9 222 SLV - EL SALVADOR 9 226 GNQ - EQUATORIAL GUINEA 9 231 ETH - ETHIOPIA 9 232 ERI - ERITREA 9 233 EST - ESTONIA 9 234 FRO - FAEROE ISLANDS 9 238 FLK - FALKLAND ISLANDS (MALVINAS) 9 239 SGS - SOUTH GEORGIA AND THE SOUTH SANDWICH ISLANDS 9 242 FJI - FIJI 9 246 FIN - FINLAND 9 248 ALA - ÅLAND ISLANDS 9 250 FRA - FRANCE 19 254 GUF - FRENCH GUIANA 19 258 PYF - FRENCH POLYNESIA 19 260 ATF - FRENCH SOUTHERN TERRITORIES 19

Ref.no.: 003274/Revision 2.4 @2019 Control Data Systems Page 196 | 201
262 DJI - DJIBOUTI 9 266 GAB - GABON 9 268 GEO - GEORGIA 9 270 GMB - GAMBIA, THE 9 275 PSE - PALESTINIAN TERRITORIES 9 276 DEU - GERMANY (Deutschland) 19 288 GHA - GHANA 9 292 GIB - GIBRALTAR 9 296 KIR - KIRIBATI 9 300 GRC - GREECE 19 304 GRL - GREENLAND 19 308 GRD - GRENADA 9 312 GLP - GUADELOUPE 9 316 GUM - GUAM 9 320 GTM - GUATEMALA 9 324 GIN - GUINEA 9 328 GUY - GUYANA 9 332 HTI - HAITI 20 334 HMD - HEARD ISLAND AND MCDONALD ISLANDS 9 336 VAT - VATICAN CITY (Holy See) 19 340 HND - HONDURAS 9 344 HKG - HONG KONG (Special Administrative Region of China) 9 348 HUN - HUNGARY 19 352 ISL - ICELAND 9 356 IND - INDIA 9 360 IDN - INDONESIA 9 364 IRN - IRAN (Islamic Republic of Iran) 9 368 IRQ - IRAQ 9 372 IRL - IRELAND 9 376 ISR - ISRAEL 9 380 ITA - ITALY 19 384 CIV - CÔTE D'IVOIRE (Ivory Coast) 9 388 JAM - JAMAICA 9 392 JPN - JAPAN 9 398 KAZ - KAZAKHSTAN 9 400 JOR - JORDAN (Hashemite Kingdom of Jordan) 9 404 KEN - KENYA 9 408 PRK - KOREA (Democratic People’s Republic of [North] Korea) 9 410 KOR - KOREA (Republic of [South] Korea) 9 414 KWT - KUWAIT 9 417 KGZ - KYRGYZSTAN 9

Ref.no.: 003274/Revision 2.4 @2019 Control Data Systems Page 197 | 201
418 LAO - LAO PEOPLE'S DEMOCRATIC REPUBLIC 9 422 LBN - LEBANON 9 426 LSO - LESOTHO 9 428 LVA - LATVIA 9 430 LBR - LIBERIA 9 434 LBY - LIBYA (Libyan Arab Jamahiriya) 9 438 LIE - LIECHTENSTEIN (Fürstentum Liechtenstein) 19 440 LTU - LITHUANIA 9 442 LUX - LUXEMBOURG 19 446 MAC - MACAO (Special Administrative Region of China) 9 450 MDG - MADAGASCAR 9 454 MWI - MALAWI 9 458 MYS - MALAYSIA 9 462 MDV - MALDIVES 9 466 MLI - MALI 9 470 MLT - MALTA 19 474 MTQ - MARTINIQUE 9 478 MRT - MAURITANIA 9 480 MUS - MAURITIUS 9 484 MEX - MEXICO 9 492 MCO - MONACO 19 496 MNG - MONGOLIA 9 498 MDA - MOLDOVA 19 499 MNE - MONTENEGRO 9 500 MSR - MONTSERRAT 9 504 MAR - MOROCCO 9 508 MOZ - MOZAMBIQUE (Mozambique) 9 512 OMN - OMAN 9 516 NAM - NAMIBIA 9 520 NRU - NAURU 9 524 NPL - NEPAL 9 528 NLD - NETHERLANDS 19 530 ANT - NETHERLANDS ANTILLES (obsolete) 19 531 CUW - CURAÇAO 9 533 ABW - ARUBA 9 534 SXM - SINT MAARTEN 9 535 BES - BONAIRE, ST. EUSTATIUS, AND SABA 9 540 NCL - NEW CALEDONIA 9 548 VUT - VANUATU 9 554 NZL - NEW ZEALAND 30 558 NIC - NICARAGUA 9

Ref.no.: 003274/Revision 2.4 @2019 Control Data Systems Page 198 | 201
562 NER - NIGER 9 566 NGA - NIGERIA 9 570 NIU - NIUE 9 574 NFK - NORFOLK ISLAND 9 578 NOR - NORWAY 9 580 MNP - NORTHERN MARIANA ISLANDS 9 581 UMI - UNITED STATES MINOR OUTLYING ISLANDS 20 583 FSM - MICRONESIA (Federated States of Micronesia) 9 584 MHL - MARSHALL ISLANDS 9 585 PLW - PALAU 9 586 PAK - PAKISTAN 9 591 PAN - PANAMA 9 598 PNG - PAPUA NEW GUINEA 9 600 PRY - PARAGUAY 9 604 PER - PERU 9 608 PHL - PHILIPPINES 9 612 PCN - PITCAIRN 9 616 POL - POLAND 19 620 PRT - PORTUGAL 19 624 GNB - GUINEA-BISSAU 9 626 TLS - TIMOR-LESTE (formerly East Timor) 9 630 PRI - PUERTO RICO 20 634 QAT - QATAR 9 638 REU - RÉUNION 9 642 ROU - ROMANIA 19 643 RUS - RUSSIAN FEDERATION 9 646 RWA - RWANDA 9 652 BLM - SAINT BARTHÉLEMY 9 654 SHN - SAINT HELENA 9 659 KNA - SAINT KITTS AND NEVIS 9 660 AIA - ANGUILLA 9 662 LCA - SAINT LUCIA 9 663 MAF - SAINT MARTIN (French portion) 9 666 SPM - SAINT PIERRE AND MIQUELON 9 670 VCT - SAINT VINCENT AND THE GRENADINES 9 674 SMR - SAN MARINO (Republic of) 9 678 STP - SAO TOME AND PRINCIPE 9 682 SAU - SAUDI ARABIA (Kingdom of Saudi Arabia) 9 686 SEN - SENEGAL 9 688 SRB - SERBIA (Republic of Serbia) 19 690 SYC - SEYCHELLES 9

Ref.no.: 003274/Revision 2.4 @2019 Control Data Systems Page 199 | 201
694 SLE - SIERRA LEONE 9 702 SGP - SINGAPORE 9 703 SVK - SLOVAKIA (Slovak Republic) 19 704 VNM - VIET NAM 9 705 SVN - SLOVENIA 19 706 SOM - SOMALIA 9 710 ZAF - SOUTH AFRICA (Zuid Afrika) 9 716 ZWE - ZIMBABWE 9 724 ESP - SPAIN (España) 19 732 ESH - WESTERN SAHARA (formerly Spanish Sahara) 9 736 SDN - SUDAN 9 740 SUR - SURINAME 9 744 SJM - SVALBARD AND JAN MAYEN 9 748 SWZ - SWAZILAND 9 752 SWE - SWEDEN 19 756 CHE - SWITZERLAND (Confederation of Helvetia) 19 760 SYR - SYRIAN ARAB REPUBLIC 9 762 TJK - TAJIKISTAN 9 764 THA - THAILAND 9 768 TGO - TOGO 9 772 TKL - TOKELAU 9 776 TON - TONGA 9 780 TTO - TRINIDAD AND TOBAGO 9 784 ARE - UNITED ARAB EMIRATES 9 788 TUN - TUNISIA 9 792 TUR - TURKEY 19 795 TKM - TURKMENISTAN 9 796 TCA - TURKS AND CAICOS ISLANDS 9 798 TUV - TUVALU 9 800 UGA - UGANDA 9 804 UKR - UKRAINE 19 807 MKD - MACEDONIA (Former Yugoslav Republic of Macedonia) 19 818 EGY - EGYPT 9 826 GBR - GREAT BRITAIN (United Kingdom) 19 826 GBR - UNITED KINGDOM 19 830 - CHANNEL ISLANDS 9 833 IMN - ISLE OF MAN 9 834 TZA - TANZANIA 9 840 USA - UNITED STATES 20 850 VIR - VIRGIN ISLANDS, U.S. 20 854 BFA - BURKINA FASO 9

Ref.no.: 003274/Revision 2.4 @2019 Control Data Systems Page 200 | 201
858 URY - URUGUAY 9 860 UZB - UZBEKISTAN 9 862 VEN - VENEZUELA 9 876 WLF - WALLIS AND FUTUNA 9 882 WSM - SAMOA (formerly Western Samoa) 9 887 YEM - YEMEN (Yemen Arab Republic) 9 894 ZMB - ZAMBIA (formerly Northern Rhodesia) 9 902 CDS custom code 2 903 CDS custom code 3 904 CDS custom code 4 905 CDS custom code 5 906 CDS custom code 6 907 CDS custom code 7 908 CDS custom code 8