Vermont GPI 1960-2011: Findings and Recommendations (Executive Summary)
29
Vermont Genuine Progress Indicator 1960-2011 Findings and Recommendations Jon D. Erickson, Eric Zencey, Matthew J. Burke, Sam Carlson, and Zachary Zimmerman Gund Institute for Ecological Economics University of Vermont July 30, 2013 Vermont is leading the nation in the development, adoption, and implementation of new indicators that guide genuine economic progress. A central policy challenge is that economic benefits are often privately captured, market-based, and short-term, and thus relatively easy to count and guide decisions. However, many of the costs of economic activity are often borne by the general public, non-market, and long-term. To move towards full cost accounting and more informed policy-making, the Genuine Progress Indicator (GPI) was developed to measure the long-term, net benefits of economic activity. This summary reports on the 2011 estimate of Vermont GPI, trend analysis from 1960, and key findings among the economic, environmental, and social components. Recommendations are summarized for future improvements to GPI and policy application. A full technical review of the 26 components to GPI is available in a separate report.
Transcript of Vermont GPI 1960-2011: Findings and Recommendations (Executive Summary)
Vermont Genuine Progress Indicator1960-2011
Findings and Recommendations
Jon D. Erickson, Eric Zencey, Matthew J. Burke,Sam Carlson, and Zachary Zimmerman
Gund Institute for Ecological EconomicsUniversity of Vermont
July 30, 2013
Vermont is leading the nation in the development, adoption, andimplementation of new indicators that guide genuine economicprogress. A central policy challenge is that economic benefitsare often privately captured, market-based, and short-term, andthus relatively easy to count and guide decisions. However, manyof the costs of economic activity are often borne by the generalpublic, non-market, and long-term. To move towards full costaccounting and more informed policy-making, the Genuine ProgressIndicator (GPI) was developed to measure the long-term, netbenefits of economic activity. This summary reports on the 2011estimate of Vermont GPI, trend analysis from 1960, and keyfindings among the economic, environmental, and socialcomponents. Recommendations are summarized for futureimprovements to GPI and policy application. A full technicalreview of the 26 components to GPI is available in a separatereport.

Vermont Genuine Progress Indicator July 30, 2013
BACKGROUND
The global economic recession of 2008-2012 renewed a decades-olddebate on how to measure the genuine progress of an economy. Fornearly 70 years, economic recessions and expansions have beenmeasured by Gross Domestic Product (GDP) – the total economicoutput of an economy measured as the sum of household, business,government, and net export expenditures.1, 2 Two successivequarters of GDP decline in real terms (adjusted for inflation) isa recession. The U.S. economy experienced 18 months ofcontraction from December 2007 through June 2009 in what has beencalled the "Great Recession", the longest recession since theGreat Depression.
Throughout the recent recession, and since a very uneven recoverybegan, many have questioned the continued dependence on GDP as aguidepost for economic development. Editorials and newspaperarticles have questioned the relevance of 20th century indicatorsand policies to guide 21st century economies.3 High-levelnational and international meetings have called for new economicparadigms to address the integrated challenges of persistentpoverty, environment degradation, and social unrest.4 Andpolicy-makers are turning to a vast literature in macroeconomicsfor guidance on implementing new metrics of success.
Research on alternative macroeconomic indicators dates back tothe work of economists William Nordhaus and James Tobin (1972) ona Measure of Economic Welfare (MEW), followed by Herman Daly andJohn Cobb (1989) on the Index of Sustainable Economic Welfare(ISEW). These approaches developed monetized adjustments to GDPto investigate the sustainability of consumption and later becameincorporated into a more standardized Genuine Progress Indicator,or GPI (Cobb et al. 1995). The basic framework builds fromnational income accounting and involves multiple methods toestimate a level and value for each of 24 sub-indicators.Generally, GPI begins with personal consumption from GDP, adjustsfor income distribution, and then includes a series ofsubtractions for ignored and miscounted costs of economicactivity and additions of non-market benefits (see Table 1)
1
Vermont Genuine Progress Indicator July 30, 2013
In recent years, the GPI and ISEW have been estimated and refinedin over 20 countries,5 including a series of national estimatesfor the US (Cobb et al. 1995; Anielski and Rowe 1999; Talbreth etal. 2007). A significant literature has developed that isadvancing both the theory and application to policy (e.g.Neumayer 2000; Lawn 2003; Lawn 2005; Clarke and Lawn 2008). Atthe state-level, the first state GPI in the US was published forVermont in 2004 (Costanza et al.), which laid the groundwork forother published studies in Maryland (McGuire et al. 2011), Ohio(Bagstad and Shammin, 2012), Utah (Berik et al. 2011), andNorthern Forest counties (Bagstad and Ceroni 2008). A June 2013"GPI in the States" summit convened in Baltimore by the Governorof Maryland brought together 18 states with GPI accounts underconsideration; including forthcoming GPI tables for Hawaii,Massachusetts, and Oregon that will be comparable to Vermont andMaryland.
Current work on a Vermont GPI is guided by Act 113, signed intolaw on May 8, 2012 (see Appendix 1). The act directs theUniversity of Vermont's Gund Institute for Ecological Economicsto:
1. Build the database to produce annual GPI estimates;2. Work with Vermont's Secretary of Administration to institute
a data advisory group representing the broad public,private, and civil society interests included in GPI;
3. Develop and test the use of GPI in state public policy andbudget analysis; and
4. Review and propose additional factors to enhance thestandard GPI.
This report summarizes the initial effort by the Gund Instituteto build a Vermont GPI database with annual estimates for 1960through 2011. This initial effort benefited from data sharingfrom state agencies and Vermont non-profits (summarized inAppendix 2), building a foundation for a GPI Data Advisory Groupto be formed later this year. Comparability to the currentMaryland methodology was an overarching goal, using identical
2
Vermont Genuine Progress Indicator July 30, 2013
sub-indicators and aggregation methods, with only minorimprovements to some data sources (that the State of Maryland isincorporating in their next annual estimate). GPI trend andfactor share analysis are highlighted, with specific attention tochanges over the past decade. Initial recommendations areoffered for data improvements, policy application, andsignificant methodological improvements to develop in concertwith other states. A technical report is available withmethodology, data sources, policy applicability, andrecommendations for further work summarized for each of the 25GPI components.
RESULTS
Since 1960, the Gross State Product (GSP) per capita in Vermonthas grown each year in real terms (adjusting for inflation) by anaverage of 2.2%. In 2011, the average Vermonter's share of theeconomy (about $41,353 per person in 2011$) was about three timesthe size of the 1960 average. Assuming a similar proportion ofpersonal consumption expenditures found in the make-up of US GDP,Vermonters today consume two times more per capita than in 1970.That's two times the value of goods and services purchased byeach Vermonter each year. More cars on our streets and highways,bigger houses with more furniture and appliances, largerwardrobes in our expanding closets and storage areas, moredinners out or coffees on the road, and in general more materialthings to meet both our basic needs and our expanding consumerappetites.
The costs of this consumption is measured by dollars spent in themarketplace, and the size of these expenditures is often equatedwith the success of an economy in delivering economic welfare orwell-being. However, simply counting price times quantity ofprivate goods and services misses many dimensions of ourlivelihoods and choices over production and consumption that maybe more sustainable. GSP does not tally the effects of economicproduction on air and water quality, doesn’t count the depletionof non-renewable resources, ignores damage to the ozone layer and
3

Vermont Genuine Progress Indicator July 30, 2013
the global climate system, and sees no economic loss in thedegradation of our farms, forests and wetlands. To pay for thisconsumption only the value of compensated work is counted,missing the opportunity costs of time away from family,community, or leisure. As an accounting system, GSP also missesthe cost to society of underemployment, under-education, andincome inequality. Consuming things that wear out rapidly andneed to be replaced often, paying for defensive or remedialexpenditures from crime or pollution, repairing roads andhighways from storms, and supporting broken families to duplicatefor two households the consumption patterns they had with one,all register as positive contributions to society when GSP isused as a measure of economic wellbeing. All send signals to themarketplace to produce more without care to whether consumptionis desirable, who receives the benefits, and who bears the burdenin this and future generations.
The Genuine Progress Indicator was designed to address some ofthese deficiencies in standard economic accounting. Table 1presents the 2011 estimates for both the total and per capitaVermont GPI and its components (reported in 2000$). Table 2summarizes average annual growth rates for the 1980s, 1990s, and2000s, and annual growth for 2011. Figure 1 presents historicalestimates of per capita GPI and GSP in Vermont, and Figure 2disaggregates GPI into economic, environmental, and socialindicator sets.
Some highlights of the overall results include the following:
Large Gap between GPI and GSP. In 2011, per capita GPI was42.8% less than GSP (highlighted in Figure 1). This gap isup from a 20-year low of 38.0% in 2007 just before the GreatRecession. However, the gap the year before hit an 11-yearhigh at 45.6%, the 4th highest divergence between GPI andGSP over the 52-year estimation period. When compared toonly personal consumption expenditures – the largestcomponent of GSP and starting point for GPI calculations –the 2011 gap is 27.9%.
4
Vermont Genuine Progress Indicator July 30, 2013
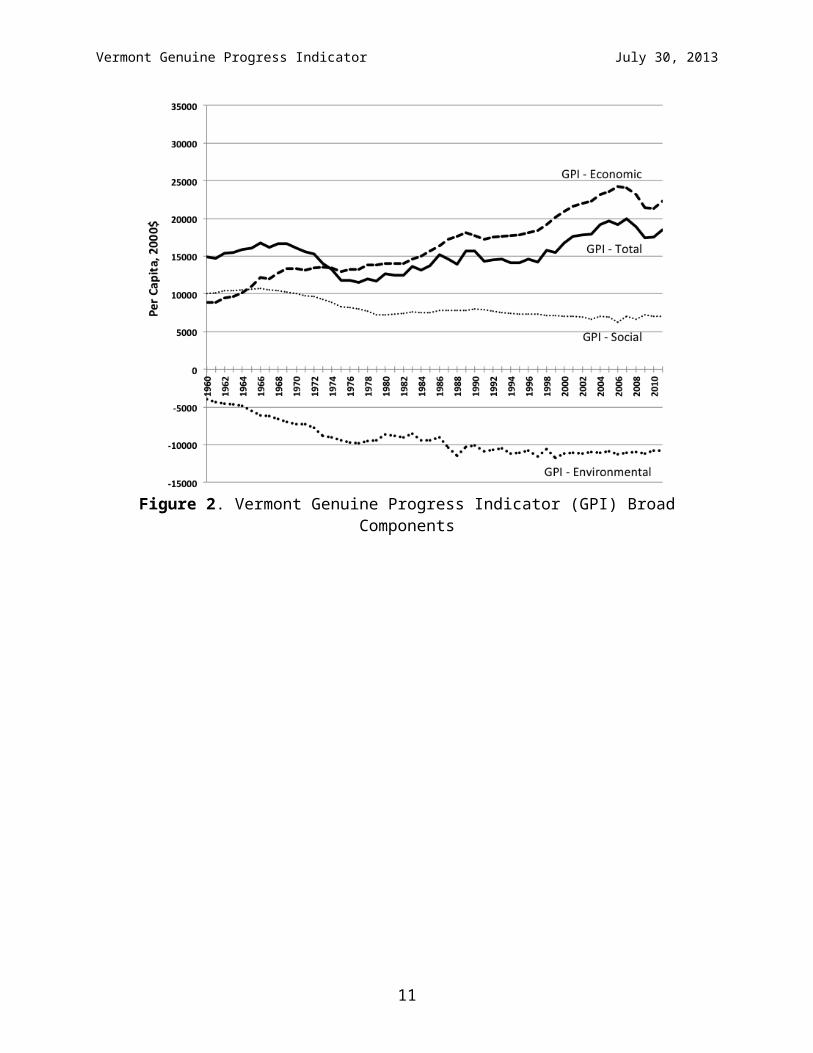
"Progress" Recovery Lags Behind. The economic,environmental, and social indicator groups plotted in Figure2 each sum to 120%, –58%, and 38% of GPI in 2011, resultingin an overall annual increase of Vermont GPI of 5.34% over2010. While this change is nearly 4.5 percentage pointsabove the average growth rate of the 2000 decade, the 2011GPI is still 7.3% below the historic peak in 2007, justbefore the recession. While Vermont GSP per capita hasnearly recovered to pre-recession levels, the GPI lags duein part to the unequal distribution of growth in thenational and state economy.
Peaking GPI? A recent compilation of national GPI studiesplaces a global per capita peak at 1978 (Kubiszewski et al.2013), the same year as the early per capita US GPI peak(surpassed slightly by 1983). The 2007 Vermont peak in percapita GPI occurred 30 years later (after an earlier peak in1966), and shows some signs of a post-recession rebound.However, the growth rate has clearly been leveling off.Decadal estimates of average annual per capita GPI growthrates for the 1980s, 1990s, and 2000s were 2.33%, 0.84%, and0.56%, respectively.
5
Vermont Genuine Progress Indicator July 30, 2013
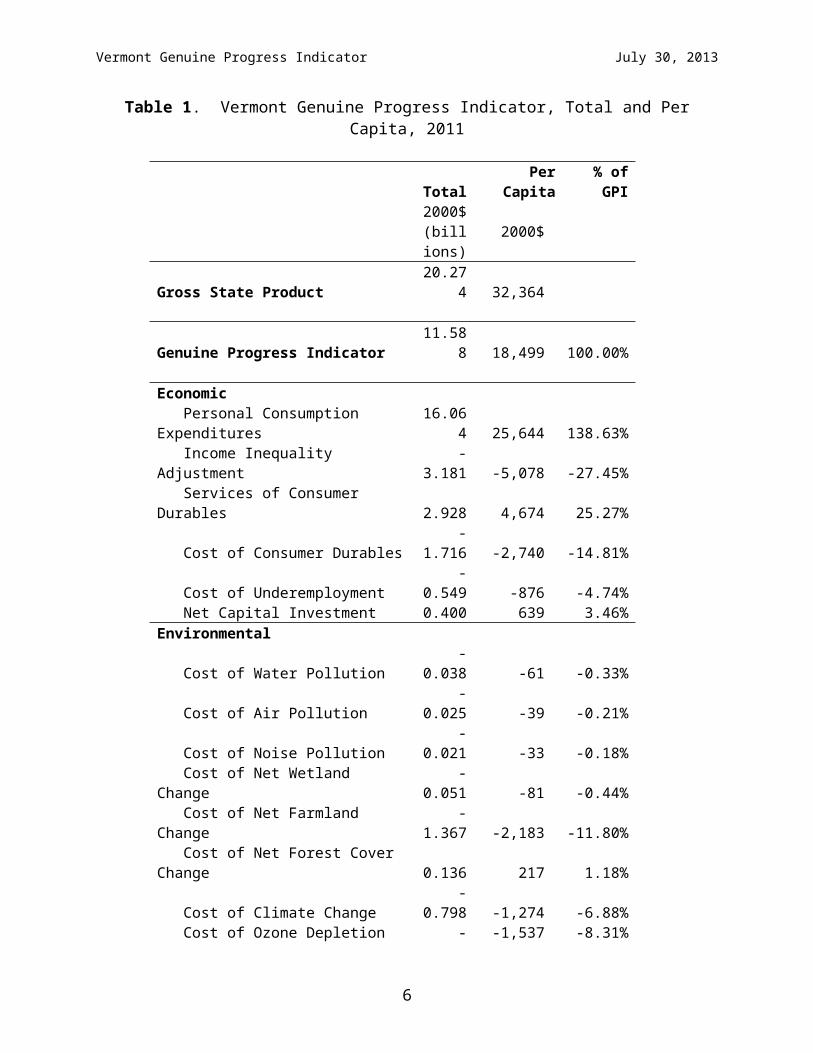
Table 1. Vermont Genuine Progress Indicator, Total and PerCapita, 2011
TotalPer
Capita% ofGPI
2000$(billions)
2000$
Gross State Product20.27
4 32,364
Genuine Progress Indicator11.58
8 18,499 100.00%
Economic Personal Consumption Expenditures
16.064 25,644 138.63%
Income Inequality Adjustment
-3.181 -5,078 -27.45%
Services of Consumer Durables 2.928 4,674 25.27%
Cost of Consumer Durables-
1.716 -2,740 -14.81%
Cost of Underemployment-
0.549 -876 -4.74% Net Capital Investment 0.400 639 3.46%Environmental
Cost of Water Pollution-
0.038 -61 -0.33%
Cost of Air Pollution-
0.025 -39 -0.21%
Cost of Noise Pollution-
0.021 -33 -0.18% Cost of Net Wetland Change
-0.051 -81 -0.44%
Cost of Net Farmland Change
-1.367 -2,183 -11.80%
Cost of Net Forest Cover Change 0.136 217 1.18%
Cost of Climate Change-
0.798 -1,274 -6.88% Cost of Ozone Depletion - -1,537 -8.31%
6
Vermont Genuine Progress Indicator July 30, 2013
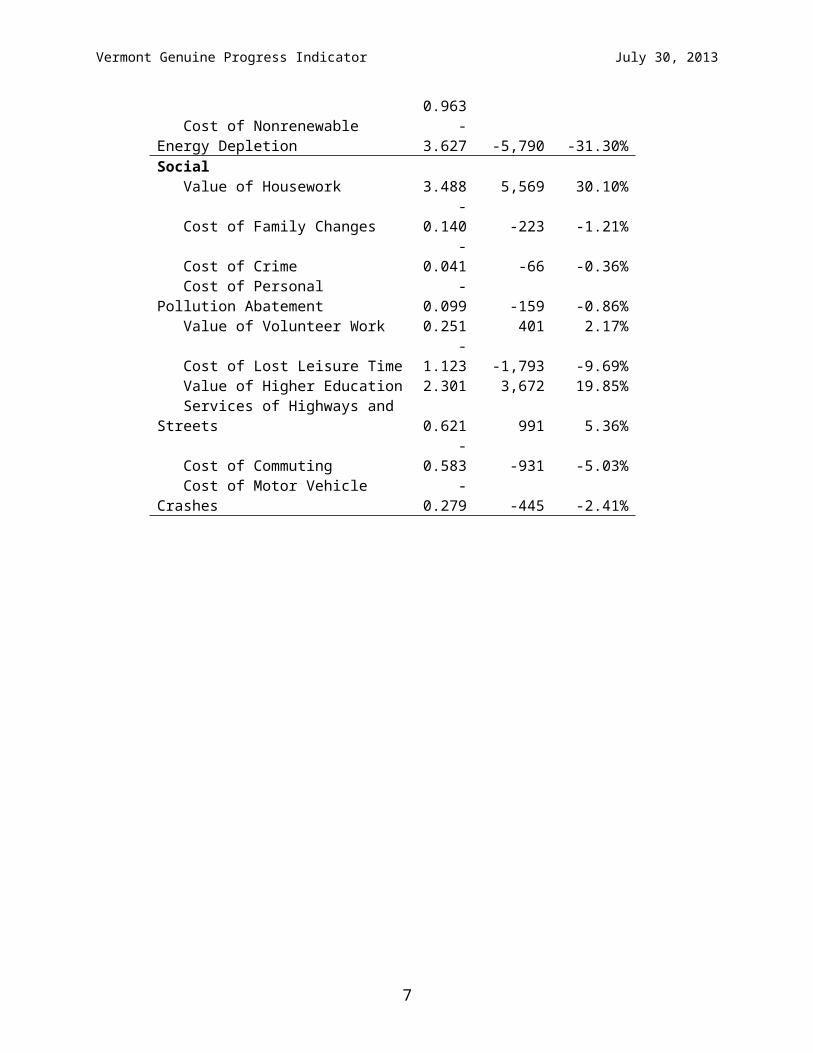
0.963 Cost of Nonrenewable Energy Depletion
-3.627 -5,790 -31.30%
Social Value of Housework 3.488 5,569 30.10%
Cost of Family Changes-
0.140 -223 -1.21%
Cost of Crime-
0.041 -66 -0.36% Cost of Personal Pollution Abatement
-0.099 -159 -0.86%
Value of Volunteer Work 0.251 401 2.17%
Cost of Lost Leisure Time-
1.123 -1,793 -9.69% Value of Higher Education 2.301 3,672 19.85% Services of Highways and Streets 0.621 991 5.36%
Cost of Commuting-
0.583 -931 -5.03% Cost of Motor Vehicle Crashes
-0.279 -445 -2.41%
7
Vermont Genuine Progress Indicator July 30, 2013
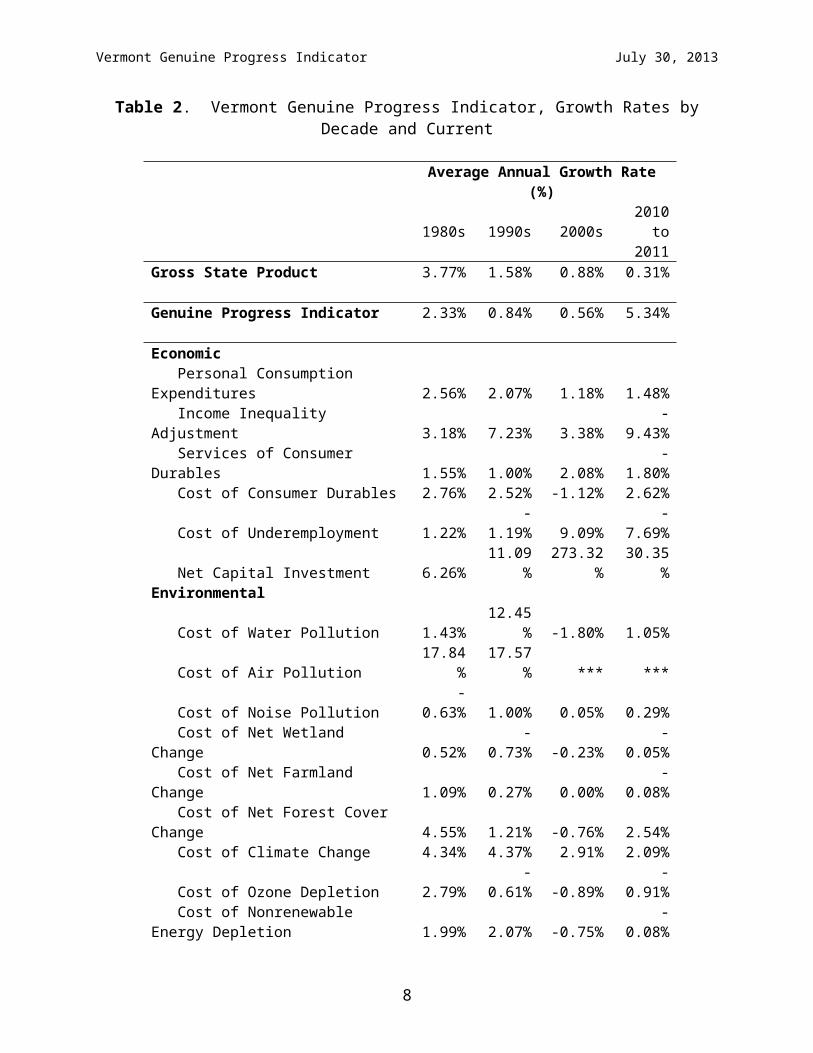
Table 2. Vermont Genuine Progress Indicator, Growth Rates byDecade and Current
Average Annual Growth Rate(%)
1980s 1990s 2000s2010
to2011
Gross State Product 3.77% 1.58% 0.88% 0.31%
Genuine Progress Indicator 2.33% 0.84% 0.56% 5.34%
Economic Personal Consumption Expenditures 2.56% 2.07% 1.18% 1.48% Income Inequality Adjustment 3.18% 7.23% 3.38%
-9.43%
Services of Consumer Durables 1.55% 1.00% 2.08%
-1.80%
Cost of Consumer Durables 2.76% 2.52% -1.12% 2.62%
Cost of Underemployment 1.22%-
1.19% 9.09%-
7.69%
Net Capital Investment 6.26%11.09
%273.32
%30.35
%Environmental
Cost of Water Pollution 1.43%12.45
% -1.80% 1.05%
Cost of Air Pollution17.84
%17.57
% *** ***
Cost of Noise Pollution-
0.63% 1.00% 0.05% 0.29% Cost of Net Wetland Change 0.52%
-0.73% -0.23%
-0.05%
Cost of Net Farmland Change 1.09% 0.27% 0.00%
-0.08%
Cost of Net Forest Cover Change 4.55% 1.21% -0.76% 2.54% Cost of Climate Change 4.34% 4.37% 2.91% 2.09%
Cost of Ozone Depletion 2.79%-
0.61% -0.89%-
0.91% Cost of Nonrenewable Energy Depletion 1.99% 2.07% -0.75%
-0.08%
8

Vermont Genuine Progress Indicator July 30, 2013
Social
Value of Housework 0.30%-
2.35% -0.52% 0.83%
Cost of Family Changes-
0.45%0.16% -2.15% 2.06%
Cost of Crime 2.03% 0.81% 0.65% 2.13% Cost of Personal Pollution Abatement
1.97% -1.95%
1.77% 1.79%
Value of Volunteer Work 1.34% 4.68% -0.61%
-13.50
% Cost of Lost Leisure Time 4.21% 3.97% 1.86% 1.22% Value of Higher Education 3.24% 2.42% 1.48% 1.55% Services of Highways and Streets
-0.99% 1.50% 4.56%
-0.08%
Cost of Commuting 2.13% 1.86% 0.66%-
0.26% Cost of Motor Vehicle Crashes
-3.81%
-3.56% 1.12% 0.20%
9

Vermont Genuine Progress Indicator July 30, 2013
Figure 1. Vermont Gross State Product (GSP) vs. Genuine ProgressIndicator (GPI)
10
Vermont Genuine Progress Indicator July 30, 2013
Figure 2. Vermont Genuine Progress Indicator (GPI) BroadComponents
11

Vermont Genuine Progress Indicator July 30, 2013
Highlights from the economic indicators include:
An Unequal Recovery. After a leveling of income inequalityin the earlier part of the decade, following a year 2000peak, Vermont income inequality reached a 50-year high in2010. The 2011 estimate saw a slight improvement. The incomeinequality adjustment in 2011 accounted for the secondlargest deduction to Vermont GPI.
Vermont's Underemployed. The cost of underemployment hasgrown from a 2.6% deduction to GPI in 2000 to 4.7% in 2011.The reported Vermont underemployment rate hit a nearly 50-year high in 2010 at 12.5% (only the 1975 estimate washigher), 6.1 percentage points higher than the unemploymentrate.6 The 2011 underemployment and unemployment ratesshowed some improvement, dropping to 11.6% and 5.6%,respectively. The most recent underemployment estimate fromthe Bureau of Labor Statistics for Vermont is 10.5%, the 7th
lowest of 50 states and well below the U.S. average of14.3%.7
Investing in Vermont Investment Data. Data for net capitalinvestment, and the cost of and services from consumerdurables, each have a strong influence on GPI estimates,however Vermont-specific data was not available for thisstudy. Net capital investment in particular is highlyvariable at the national level and a major driver of thebusiness cycle. Estimates for these three indicators arescaled down from national data and would benefit from theacquisition of future data from the state and privatesources available for purchase.
The environmental indicators together sum to a negative 58% impact onGPI. This is down considerably from the 1977 estimate, a yearwhen environmental indicators together accounted for an 85%impact and the cost of non-renewable energy depletion alone had a50% impact (a 52-year high). Some specific highlights include:
12

Vermont Genuine Progress Indicator July 30, 2013
Genuine Progress through Energy Efficiency and Renewability.The cost of nonrenewable energy depletion is currently thesingle largest deduction to GPI, accounting for a 31.3%deduction. However, this is a marked improvement from just15 years ago when the deduction hit a 30-year of 44% in1997. Total electricity consumption in 2011 was 91% of the1999 high of 25 billion kilowatt-hours. Fossil fuelconsumption outside of the electricity sector in 2011 was84% of the 2004 high of nearly 18 million barrelequivalents. Growth in renewable energy over the lastdecade has also contributed to lowering this significantcost. Achieving the renewable energy goals of Vermont's2011 Comprehensive Energy Plan reinforce this trend andresult in significant improvements to GPI.
Farm Acreage Down, Farms Numbers Up. Loss of farmland hasstabilized in recent years, slowing to an average of 8,000acres lost per year during the 2000s, down from 15,000 acreslost per year in the 1990s. This has decreased the 2011 GPIdeduction to 11.8%, down from a 25-year high of 15.2% in1997. The number of Vermont farms has slowly grown to a 25-year high of approximately 7000 farms, up from the 52-yearlow of 6100 farms in the early 1990s.
Forestlands Up and Down. Acreage of Vermont forestlandpeaked in 1997 at 4.6 million acres, about 643,000 moreforested acres than 1960 at the beginning of the timeseries. Forest acres over the last 15 years have been upand down, with residential use converting forest to housingin some parts of the state, and farmland converting back toforest in other parts of the state. It will be critical toget a more accurate accounting of Vermont forest cover andassess the full value of forest ecosystem services in futureGPI estimates, a study that the Gund Institute is beginninglater this year.
Clean Local Air with More Global Pollution. The cost of airpollution in Vermont continues to be low. The number ofdays exceeding ozone standards has varied between 0 and 5
13

Vermont Genuine Progress Indicator July 30, 2013
days for 11 of the last 15 years (and 0, 0, and 1 for thelast 3 years of the analysis). However, the state'scontribution to global pollution is mixed. Greenhouse gasemissions continue to grow, but at a slower annual rate thanthe 1980s and 1990s. Vermont is well behind it's greenhousegas reduction goals to reduce emissions below 1990 levels by25 percent by 2012, 50 percent by 2028, and 75 percent by2050 (codified in 10 V.S.A. § 578). Achieving these levelsin future years, while maintaining local air quality, wouldresult in a significant improvement to GPI.
Persistent Water Pollution. The annual increases in thecost of water pollution have leveled as compared to the1990s, however the poor quality of Vermont waterwayscontinues to be a drag on GPI. Nearly 11% of the mileage ofVermont rivers and streams was considered degraded in 2011,and nearly 87% of the acreage of Vermont lakes and ponds wasdegraded, the highest percentage in a decade. Majorimprovements to this indicator should occur throughcompleting current tasks of the Lake Champlain BasinProgram's Opportunity Action highlighted in the finalchapter on "Sustainable Economic Development in the LakeChamplain Basin".
Taken together, the social indicators boost Vermont's GPIconsiderably. One of the largest contributions is the value ofhousehold work, based on national estimates scaled to Vermont.Highlights of Vermont-specific trends include:
Volunteering in Vermont. According to statistics from theFederal Agency for Service and Volunteering, 32% of Vermontresidents volunteered in 2011, ranking Vermont 14th amongthe 50 States and Washington, DC. Vermonters contributed anaverage of 36 hours per resident to volunteer work in 2011,high by US standards, but a 10-year low for Vermont. Whenmultiplied by the Vermont population and mean hourlyearnings adjusted to year 2000 dollars ($13.63), theestimated value of volunteering to our genuine progress isover $250 million. An estimated 73% report doing favors for
14
Vermont Genuine Progress Indicator July 30, 2013
their neighbors (5th highest in the nation), 87.4% eatdinner with family a few times a week or more, and 59.1%discuss politics a few times a month or more.
Crime Costs Trending Downward. While the cost of crimecontinued to grow over the past decade, it is growing atless than half the annual rate of the 1980s. As apercentage of GPI, the estimated economic cost of crime wasat a 45 year low in 2011, comparable to low crime costs ofthe 1960s. A notable exception is the 635 aggravatedassaults recorded for 2011, surpassing 600 for the 2nd timein Vermont's history. Break-and-enter crimes in Vermontalso reached a 12-year high at 3,643.
Motor Vehicle Safety Holding Steady. The cost of motorvehicle crashes reached a 52-year low in 2001 followingsignificant declines through the 1980s and 1990s. Over thepast decade, overall costs have remained fairly flat, withmodest increases in recent years. In 2011, the lowestnumber of motor vehicle crashes with mortalities wasrecorded since data collection began in 1992.
Vermonters Love to Drive. The eight years with the highestcost of commuting in Vermont were the last eight years! Theestimated cost of commuting in 2011 was the third highestover the 52-year period (only 2008 and 2010 were higher).While the rate of change is slowing from the 1980s and1990s, costs continue to escalate. In 2011, Vermont had the7th highest level of vehicle-miles driven per capita in theUS at 11,630 (down from the 2nd highest a few years ago).The estimated percent of workers carpooling is 11%.
Higher Education Hits New High. The percent of Vermonterswith a bachelors degree or higher reached an all-time highin 2011 of 33.1%, an estimated 144,000 adults over the ageof 25. An educated citizenry significantly boosts GPIthrough the accrual of positive externalities. For example,a well-educated workforce can attract economic investmentthat benefits communities more broadly, and high levels of
15

Vermont Genuine Progress Indicator July 30, 2013
education will generally reduce social expenditures in otherareas, including crime and law enforcement. Significantwork remains to be done on the impacts of other investmentsin education, such documented benefits from early childhoodprograms.
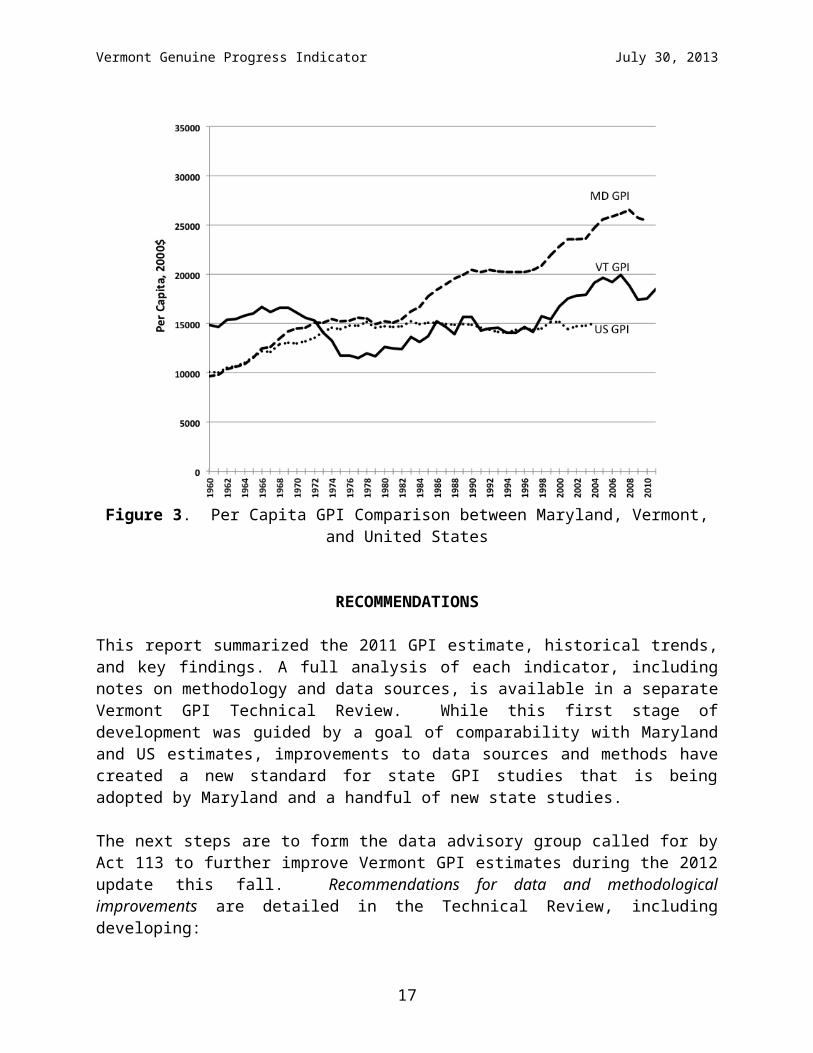
Lastly, Figure 3 provides a comparison between per capita GPIestimates for Vermont, Maryland, and US studies (all in billionsof 2000$). Vermont is the smallest state economy in the US,accounting for less than 0.18% of US GDP, while Maryland is the15th largest and accounting for more than 2% of the nationaleconomy. In per capita terms, Vermont climbs to 30th andMaryland to 14th. The larger per capita consumption in Maryland(the starting point for GPI aggregation) is the main reason forthe larger GPI per capita. Both Maryland and Vermont aretracking above the US average, extending their peaks into recentyears.
16
Vermont Genuine Progress Indicator July 30, 2013
Figure 3. Per Capita GPI Comparison between Maryland, Vermont,and United States
RECOMMENDATIONS
This report summarized the 2011 GPI estimate, historical trends,and key findings. A full analysis of each indicator, includingnotes on methodology and data sources, is available in a separateVermont GPI Technical Review. While this first stage ofdevelopment was guided by a goal of comparability with Marylandand US estimates, improvements to data sources and methods havecreated a new standard for state GPI studies that is beingadopted by Maryland and a handful of new state studies.
The next steps are to form the data advisory group called for byAct 113 to further improve Vermont GPI estimates during the 2012update this fall. Recommendations for data and methodologicalimprovements are detailed in the Technical Review, includingdeveloping:
17
Vermont Genuine Progress Indicator July 30, 2013
1. Vermont-specific data sets to replace variables thatpredominantly use national data;
2. Values for environmental variables that can be adjusted bygeographic context;
3. Time use data for social variables to account for Vermontdifferences from national trends; and
4. A joint strategy with other GPI states on the developmentand implementation of new methods leading to a new GPIstandard.
The most immediate needs for Vermont-specific data includeestimates for time use, net capital investment, personalconsumption, consumer durables, and ecosystem service values byland cover. Simultaneous to these improvements is the ongoingdevelopment of policy applications, including:
1. Application to outcomes-based budgeting through the use ofcomplementary population-level indicators incorporated intoGPI, such as education levels, volunteer rates, crime,public transit, and other social statistics;
2. Incorporation into the Governor's Dashboard as a cross-cutting, topline indicator of the health of themacroeconomy;
3. Evaluation of the economic, environmental, and social trade-offs of long-term policy goals, including the VermontComprehensive Energy Plan, greenhouse gas reduction goals,and a forthcoming Comprehensive Economic DevelopmentStrategy.
4. Creation of a GPI note, analogous to a fiscal note, toassess the impact of legislation on the 25 components ofGPI.
In summary, and in the words of John Talbreth from the nationalstudy, the GPI has the potential to become a "headline indicatorfor the new economy." Developing, evaluating, and ultimatelyusing GPI to help guide state policy can help shift thefundamental philosophy of economic development. Too often thegrowth economy has been focused on short-term profits, with the
18
Vermont Genuine Progress Indicator July 30, 2013
goal of squandering resources as fast as possible. The genuineeconomy is focused on generating long-term value, with the goalof sustaining profits, people, and planet. The conventionalgrowth model encourages the depletion of non-renewable resourcesand externalization of costs on distant people in distant landsand distant futures. Genuine progress occurs throughsubstituting renewable for non-renewable resources andinternalizing the full cost of economic activity. Progress can'tmean squeezing every last waking hour out of labor until workersare tired, sick, demoralized and in need of replacement by thenext in line. Progress is ultimately about striking a healthybalance between work, family, community, and leisure, andbuilding together a widely-shared well-being.
19
Vermont Genuine Progress Indicator July 30, 2013
NOTES
1. For an overview on national income accounting, see "Measuring theEconomy: a Primer on GDP and the National Income and ProductAccounts" by the U.S. Bureau of Economic Analysis, available at:www.bea.gov/national/pdf/nipa_primer.pdf (accessed on Jul. 28,2013).
2. The U.S. GDP for the Q1 of 2013 was composed of 71% consumption, 13%business investment, 19% government expenditures, and -3% netexports. See: Bureau of Economic Analysis, "Gross Domestic Product:First Quarter 2013 (Third Estimate)," BEA 13-30, Jun. 26, 2013,available at:www.bea.gov/newsreleases/national/gdp/2013/pdf/gdp1q13_3rd.pdf(accessed on Jul. 28, 2013).
3. See for example: T.L. Friedman, "The Inflection is Near," Op-Ed,New York Times, Mar. 8, 2009, p. WK12; E. Zencey, "G.D.P. R.I.P.," Op-Ed, New York Times, Aug. 10, 2009, p. A17; P. Krugman, "Building a NewGreen Economy," New York Times Magazine, Apr. 11, 2010, p. MM34; and J.Gertner, "The Rise and Fall of GDP," New York Times Magazine, May 16,2010, p. MM60.
4. For example, in 2007 the European Commission, European Parliament,Club of Rome, OECD and WWF hosted the high-level conference “BeyondGDP” which resulted in the 2009 European Commission roadmap "GDP andBeyond: Measuring Progress in a Changing World", available at:www.beyond-gdp.eu (accessed on Jul. 28, 2013). In 2008, the Frenchgovernment formed the "Commission on the Measurement of EconomicPerformance and Social Progress" chaired by Nobel laureate JosephStiglitz, available at: www.stiglitz-sen-fitoussi.fr/en/ (accessedon Jul. 28, 2013). And in 2012, the United Nations convened ameeting on "Happiness and Well-being: Defining a New EconomicParadigm" resulting in the adoption of UN Resolution 65/309 invitingmember states to "pursue the elaboration of additional measures thatbetter capture the importance of the pursuit of happiness and well-being in development with a view to guiding their public policies."
5. Studies of the GPI and ISEW at the national scale include:Australia, Austria, Belgium, Chile, China, Czech Republic, France,Germany, India, Italy, Japan, Netherlands, New Zealand, Poland,Scotland, Sweden, Thailand, United Kingdom, United States, Vietnam,
20
Vermont Genuine Progress Indicator July 30, 2013
and Wales. For a summary analysis of studies across multiple scales,see Posner and Costanza (2011).
6. Underemployment is measured as the U6 rate reported by the U.S.Bureau of Labor Statistics and includes, "Total unemployed, plus allpersons marginally attached to the labor force, plus total employedpart time for economic reasons, as a percent of the civilian laborforce plus all persons marginally attached to the labor force."
7. Reported as the average of the third quarter of 2012 through secondquarter of 2013 by the U.S. Bureau of Labor Statistics, availableat: data.bls.gov/cgi-bin/print.pl/lau/stalt.htm (accessed on Jul.29, 2013).
21
Vermont Genuine Progress Indicator July 30, 2013
REFERENCES
Anielski, M., and J. Rowe, J., The Genuine Progress Indicator – 1998 Update,Redefining Progress, San Francisco, CA, 1999.
Bagstad, K. J., and M. Ceroni, "The Genuine Progress Indicator: a NewMeasure of Economic Development for the Northern Forest," AdirondackJournal of Environmental Studies, 15(1), 2008.
Bagstad, K.J., and M.R. Shammin, M.R., "Can the Genuine ProgressIndicator Better Inform Sustainable Regional Progress?—A Case Studyfor Northeast Ohio," Ecological Indicators, 18, 330-341, 2012.
Berik, G., Gaddis, E., Bagstad, K., and J. Lowry, The Utah Genuine ProgressIndicator (GPI), 1990 to 2007, Utah Population and Environment Coalition, SaltLake City, UT, 2011.
Clarke, M., and P. Lawn, "A Policy Analysis of Victoria's GenuineProgress Indictor," Journal of Socio-Economics, 37(2), 864-879, 2008.
Cobb, C., Halstead, T. and J. Rowe, "The Genuine Progress Indicator,"Redefining Progress, San Francisco, CA, 1995.
Costanza, R., Erickson, J.D., Fligger, K., Adams, A., Adams, C.,Altschuler, B., Balter, S., Fisher, B., Hike, J., Kelly, J., Kerr, T.,McCauley, M., Montone, K., Rauch, M., Schmiedeskamp, K., Saxton, D.,Sparacino, L., Tusinski, W., and L. Williams, L., "Estimates of theGenuine Progress Indicator (GPI) for Vermont, Chittenden County andBurlington, from 1950 to 2000," Ecological Economics, 51(1), 139-155, 2004.
Daly, H. and J. Cobb, For the Common Good, Beacon Press, Boston, MA,1989.
Kubiszewski, Ida, et al. "Beyond GDP: Measuring and Achieving GlobalGenuine Progress," Ecological Economics, 93, 57-68, 2013.
Lawn, P.A., "A Theoretical Foundation to Support the Index ofSustainable Economic Welfare (ISEW), Genuine Progress Indicator (GPI),and Other Related Indexes," Ecological Economics, 44(1), 105-118, 2003.
Lawn, P.A., "An Assessment of the Valuation Methods used to Calculatethe Index of Sustainable Economic Welfare (ISEW), Genuine Progress
22

Vermont Genuine Progress Indicator July 30, 2013
Indicator (GPI), and Sustainable Net Benefit Index (SNBI)," Environment,Development and Sustainability, 7(2), 185-208, 2005.
McGuire, S., S. Posner, and H. Haake, "Measuring Prosperity:Maryland’s Genuine Progress Indicator," Solutions, 3, 50-58, 2012.
Neumayer, E., "On the Methodology of ISEW, GPI and Related Measures:Some Constructive Suggestions and Some Doubt on the ‘Threshold’Hypothesis," Ecological Economics, 34(3), 347-361, 2000.
Nordhaus, W.D., and J. Tobin, "Is Growth Obsolete?" Economic Research:Retrospect and Prospect, Vol 5: Economic Growth, National Bureau of EconomicResearch, 1972, pp. 1-80.
Posner, S. M., and R. Costanza, R., "A Summary of ISEW and GPI Studiesat Multiple Scales and New Estimates for Baltimore City, BaltimoreCounty, and the State of Maryland," Ecological Economics, 70(11), 1972-1980, 2011.
Talberth, J., C. Cobb, and N. Slattery, "The Genuine ProgressIndicator 2006," Redefining Progress, Oakland, CA, 2007.
APPENDICES
Appendix AVermont Act 113 – An act relating to the genuine progressindicator
It is hereby enacted by the General Assembly of the State of Vermont:
Sec. 1. PURPOSE, DEFINITION, AND INTENT(a) Purpose. The purpose of the genuine progress indicator (“GPI”) isto measure the state of Vermont’s economic, environmental, andsocietal well-being as a supplement to the measurement derived fromthe gross state product and other existing statistical measurements.
(b) Definition. The GPI is an estimate of the net contributions ofeconomic activity to the well-being and long-term prosperity of ourstate’s citizens, calculated through adjustments to gross stateproduct that account for positive and negative economic,environmental, and social attributes of economic development.
23
Vermont Genuine Progress Indicator July 30, 2013
(c) Intent. It is the intent of the general assembly that onceestablished and tested, the GPI will assist state government indecision-making by providing an additional basis for budgetarydecisions, including outcomes-based budgeting; by measuring progressin the application of policy and programs; and by serving as a tool toidentify public policy priorities, including other measures such ashuman rights.
Sec. 2. GENUINE PROGRESS INDICATOR(a) Establishment; maintenance.
(1) The secretary of administration shall negotiate and enter into amemorandum of understanding with the Gund Institute for EcologicalEconomics of the University of Vermont (the “Gund Institute”) towork in collaboration to establish and test a genuine progressindicator (GPI). The memorandum shall provide the process by whichthe GPI is established and, once tested, how and by whom the GPIshall be maintained and updated. The memorandum shall furtherprovide that in the establishment of the GPI, the secretary ofadministration, in collaboration with the Gund Institute, shallcreate a Vermont data committee made up of individuals with relevantexpertise to inventory existing datasets and to make recommendationsthat may be useful to all data users in Vermont’s state government,nonprofit organizations, and businesses.
(2) The GPI shall use standard genuine progress indicatormethodology and additional factors to enhance the indicator, whichshall be adjusted periodically as relevant and necessary.
(b) Accessibility. Once established, the GPI and its underlyingdatasets that are submitted by the Gund Institute to the secretary ofadministration shall be posted on the state of Vermont website.
(c) Updating data. The secretary of administration shall cooperate inproviding data as necessary in order to update and maintain the GPI.
Sec. 3. PROGRESS REPORTSBy January 15, 2013 and once every other year thereafter, thesecretary of administration shall report to the house committees ongovernment operations and on commerce and economic development and thesenate committees on government operations and on economicdevelopment, housing, and general affairs a progress report regarding
24

Vermont Genuine Progress Indicator July 30, 2013
the maintenance, including the cost of maintenance, and usefulness ofthe GPI.
Sec. 4. DATASETSAny datasets submitted to the secretary of administration pursuant tothis act shall be considered a public record under chapter 5 of Title1.
Sec. 5. EFFECTIVE DATEThis act shall take effect on passage.
Approved: May 8, 2012
25

Vermont Genuine Progress Indicator July 30, 2013
Appendix BGPI Collaborators (to date)
Ken Bagstad, Ph.D.U.S. Geological Survey
Tom BarefootGross National Happiness USA
Matthew J. BarewiczVT Department of Labor
Jessie Brosseau, MPHVT Department of Health
Ernest ChristiansonVT DEC Drinking Water & Groundwater Prot. Div.
Chris ColeVT Agency of Transportation
Andrea ColnesEnergy Action Network
Lew DalyDEMOS
Lauren-Glenn DavitianCommon Good Vermont
Shannon Fassett, & Holly HaydenVT Department of Motor Vehicles
David J. HealyStone Environmental, Inc.
Monica HuttVT Agency of Human Services
Kate Jellema, Ph.D.Benchmarks for a Better Vermont
Cathy KashanskiVT DEC Watershed Management Division
Shelley KathNatural Resources Defense Council
Anne LezakBenchmarks for a Better Vermont
Shayla Livingston, MPHVT Department of Health
Kate McCarthyVermont Natural Resources Council
Sean McGuire & Alfredo GoyburuMaryland Department of Natural Resources
Jeffrey R. MerrellVT DEC Air Pollution Control Division
Jon MooreChittenden County Transportation Authority
Shannon MorrisonVT DEC Watershed Management Division
Michael MoserCenter for Rural Studies, University
of Vermont
Jim MoultonAddison County Transit Resources
Costa Pappis, AICPVT Agency of Transportation
David PelletierVT Agency of Transportation
Jen Peterson, and Ryan TorresVermont Community Foundation
Steve Posner
26
Vermont Genuine Progress Indicator July 30, 2013
Gund Institute, University of Vermont
Erin RocheCenter for Rural Studies, University of Vermont
Ralph TinerU.S. Fish and Wildlife Service
Austin Troy, PhDUVM Transportation Research Center
Linda WheatleyVermont Leadership Institute & GNH USA
Mandy WhiteVT Agency of Transportation
27