veggielite – conjunction of agriculture, nutrition and health for ...
133
-
Upload
khangminh22 -
Category
Documents
-
view
0 -
download
0
Transcript of veggielite – conjunction of agriculture, nutrition and health for ...

1
SpencerMoore,SamikGhosh,SummerAllen,PKJoshi,SaibalRay,SrivardhiniJha,
DanielRoss&LauretteDubé
November2014–May2016
July20,2016
VEGGIELITE–CONJUNCTIONOFAGRICULTURE,NUTRITION
ANDHEALTHFORINCLUSIVEDEVELOPMENTOFWOMEN
2
TableofContentsIndex Chapters PageNo.
Acknowledgements 4
Authors 5
AbbreviationsandTerminology 6-7
ExecutiveSummary 8-11
Chapter1 Introductionandreportoverview 13-21
Chapter2 eKutirSocialBusiness,VeggieKartecosystem,andVeggieLiteinterventionfromanoperationalperspective,eKutirfinancialviability
22-40
Chapter3 HouseholdandIndividualImpact
Background,EvaluationDesign
UrbanandRuralSampleDescription
Evaluationinstruments-Baseline/endlineinterventionevaluationquestionnaire,Evaluationmeasures,Analysismethods
eKutirOperationalData,AnalysisApproach
Evaluationfindingsforurbanandruralprimaryoutcome-totalandhome-grownvegetableconsumption;psychologicalmotivesandbeliefs,andsocialcapital/network
Findingsforruralsecondaryoutcome-farming,outcomes-vegetableproduction,priceandincome
Findingsforfoodinsecurity,Multi-DimensionalPovertyIndex,householdexpenditure
eKuitroperationalanalysisonruralsales
Summaryanddiscussion
41-78
Chapter4 ConvergentInnovationProcessAnalysis:Producers&Organizations,EcosystemNetworkFormation,andCompetitiveDynamics
Strategicresearchquestions
Methods
Findingsforstrategicresearchconvergence,networkformation,andcompetitivedynamics
79-116
Chapter5 EarlyPrototypeDevelopmentforBehavioralEconomicIncentivesInterventionandRelatedEcosystemExtension
Behaviouralincentivesintervention
Recommendation
117-121
Chapter6 Discussion,learningandlimitations 122-126

3
References 127-129
Annexure#researchethics–IRB,studytools(attached) 130
Figuresandtables 131-132

4
Acknowledgements
This study brings together a multi-disciplinary consortium to evaluate an
innovationatthenexusofagriculture,nutrition,andhealth.Thefindings
and analysis in the pages that follow is the contribution of the key
participants of the consortium, who shared their knowledge, data, and
insightsfortheprogramandthereport.
Theauthorswouldliketoacknowledgeandthankthesponsorsundertheaegis
of Grand Challenges India – Bill and Melinda Gates Foundation and BIRAC,
Department of Biotechnology, India – for the award, their support and
financing of the program. Their time, direction, and energy put in to this
programhasbeenhighlyusefulforus.

5
AuthorsThe study report is authored by Dr. Spencer Moore [USC], Mr. Samik Ghosh
[IFPRI], Dr. Summer Allen [IFPRI], Dr. PK Joshi [IFPRI], Dr. Saibal Ray
[MCCHE],Dr.SrivardhiniK.Jha[IIMB&MCCHE],andDr.LauretteDube[MCCHE]
andincollaborationwithMr.DanielRoss[DAISA]andMr.K.C.MishraandMr.
SuvankarMishra,PrincipalInvestigatorsforeKutir.
AffiliationsandResearchCollaborationsMCCHE McGill Centre for Convergence of Health and Economics, McGill
University,Canada
USC ArnoldSchoolofPublicHealth,UniversityofSouthCarolina,USA
IFPRI InternationalFoodPolicyResearchInstitute,USAandIndia
IIMB IndianInstituteofManagementBangalore,India
DAISA DAISAEnterprises,LLC,USA
eKutir eKutirRuralManagementServicesPrivateLimited,India

6
AbbreviationsandTerminologyA4NH AgricultureforNutritionandHealth
AE Agri-Entrepreneurs
ANOVA Analysisofvariance
ASHA AccreditedSocialHealthActivist
ASPH ArnoldSchoolofPublicHealth,USA
AWW AnganwadiWorker
BA BajajAllianz
BIHS BangladeshIntegratedHouseholdSurveyQuestionnaire(BIHS)
BIRAC BiotechnologyIndustryResearchAssistanceCouncil
CCDCentreforCollectiveDevelopment(anon-profit,non-governmental
organization)
CGIAR ConsultativeGroupforInternationalAgriculturalResearch,USA
CI ConvergentInnovation
DAISA DAISAEnterprisesLLC,USA;apartnerrepresentingWholesomeWave
DALY DisabilityAdjustedLifeYear
DBT DepartmentofBiotechnology
D-COR LocalagencyforfieldworkinBhubaneswar,Odisha
DVCP DoubleValueCouponProgram
Ekjut Not-for-profit
eKutir eKutirRuralManagementServices(P)Limited,Odisha(India)
F&V FruitsandVegetables
F2C FarmtoConsumer
FIG FarmerInterventionGroups
FSG FarmerSupportGroup
GCI GrandChallengesofIndia
GDP GrossDomesticProduct
GPS GlobalPositioningSystem
HH Household
HHID HouseholdIdentification
ICDS IntegratedChildDevelopmentServices
ICT InformationCommunicationTechnology
IFPRI InternationalFoodPolicyResearchInstitute,USA

7
IRB InstitutionalReviewBoard
Mandi Localmarket
MCCHEMcGillCentrefortheConvergenceofHealthandEconomics,Canada
ME MicroEntrepreneur
MGM MGMAgrotechPrivateLimited
NCML NationalCollateralManagementServicesLimited
NGO Non-governmentalOrganization
Pratidhi eKutir-GCINutritionIncentiveProgram
PRSSP BangladeshPolicyResearchandStrategySupportProgram
PSU PrimarySampleUnit
SEED Localagencysupportedforfieldsurveyanddatamanagement
USC UniversityofSouthCarolina,USA
VE VeggieEntrepreneurs
VHND VillageHealthandNutritionDay
Wards Urbangeographicsettlements
WHO WorldHealthOrganization
WoS Whole-of-Society
WW WholesomeWave,USA

8
ExecutiveSummary
eKutir is a social enterprise that leverages local micro-entrepreneurial
motivations and processes to solve smallholder farmers’ poverty through a
distribution network of digitally-trained entrepreneurs, market linkages,
technology, and data. One of its initiatives is to increase agricultural
productionand/ornutritionalintakeamongresource-poorgroups,particularly
womenandchildren,inbothruralandurbancommunitiesinIndia.InNovember
2014, Grand Challenges India awarded eKutir pilot funding for the project
“VeggieLite–ConjunctionofAgriculture,NutritionandHealthforInclusive
DevelopmentofWomen.”FundingwasprovidedbyBMGFandBIRAC-DBT(Government
ofIndia).
The VeggieLite/VeggieKart intervention had several important propositions
consistent with the goals of the Grand Challenges India Agriculture &
Nutrition program, including Nutrition Innovation, Agricultural Innovation,
andSocialInnovation:
• Toincreaseconsumptionofhealthyvegetablesforbothurbanconsumers
andruralproducers,particularlywomen;
• Toimprovelivelihoodsofparticipatingsmallholderfarmers;
• Todemonstrateaninnovationinagriculturalvaluechainthroughsocial
enterprise, able to deliver sustained benefits to both underserved
producers and consumers, and Convergent Innovation, a framework for
multi-stakeholderaction.
This report provides a description of the impact and outcomes of the
VeggieLiteconvergentinnovationpilotprojectpursuanttothesegoals.
Chapter one describes the background and development of the eKutir
entrepreneurialmodelanditsapplicationinaddressingthetwinchallenges
ofruralpovertyandpoormaternalandchildnutrition.Chaptertwopresents
eKutir Social Enterprise, VeggieKart Ecosystem, and VeggieLite Intervention
fromanOperationalPerspective.ThischapterfurtherelaborateseKutirasa
9
social enterprise and its value and sustainability in delivering social
benefits. Chapter three presents the complex study design used to evaluate
theVeggieLitefieldprojectamongtheruralfarmingcommunitiesandthelow-
incomeurbanconsumers.Thedesignwasquasi-experimentalwithbaselineand
endlineassessments,aimedattheambitiousgoalofcapturingenvironmental
and household changes in vegetable production and consumption within a
limitedone-yearperiod.Thischapteralsopresentsthefieldresultsofthe
VeggieLite project in the rural and urban areas. Our report focuses on a
rangeofprocessandimpactindicatorsattheareaandhouseholdlevels,with
nutritionalimpactbeingmeasuredintermsofvegetableconsumption.Chapter
four provides the results of our study of the organizational dynamics and
inter-organizationalstructuresunderlyingandemergingduringthecourseof
the VeggieLite project. This chapter chronicles the creation of new
partnershipsandnetworksthatemergedinthedevelopmentandimplementation
of the VeggieLite program. Chapter five describes the behavioral incentive
mini-experiment designed to (i) improve the nutrition of pregnant and
lactatingmothersandtheirinfantsandpatientswithchronicconditionsand
(ii)fosterVeggieLitelinkstothemedicalandhealthcaresysteminOdisha.
Finally, chapter six summarizes overall discussion on successes, lessons
learnedandlimitations.
In summary, the VeggieLite project showed a number of successes in its
operationsandoutcomesparticularlyforfarmersandmicro-entrepreneurs,but
alsochallengesinincreasingtheconsumptionofvegetablesamongasampleof
consumersovertheprojectperiod.
eKutir successfully implemented the VeggieKart/VeggieLite intervention in
over five selected locations of rural and urban Odisha, engaging over 1350
farmersand90micro-entrepreneurs,morethandoublethenumbersprojectedin
theproposal.Roughly71%oftheruralVeggieLiteentrepreneurswerewomen,
and40%oftheurbanVeggieLiteentrepreneurswerewomenandoutofthetotal
farmers registered within this intervention women farmers constitute around
65℅.

10
Intheurbanareas,eKutirexceededprogramobjectivesforthedeploymentof
micro-entrepreneur vendors, with VeggieLite sales robust and increasing
steadilyinthetargetedwardsovertheyear.Inourparticularsampleof
consumers,however,wedidnotseeanincreaseinvegetableintakefrompre-
topost-testing.Therewereanumberoffactorsthatmayhelptoexplainthis
null finding. For example, disruptions in the services or locations of
certain VeggieLite vendors or even the broader range of consumer options
available to urban residents, including other eKutir offerings such as
VeggieKart or VeggieMart, could have weakened the intervention’s effect.
Nevertheless, in our sample of urban residents, we did find that those who
reported purchasing mainly from VeggieLite vendors at posttest increased
theirvegetableintakeandconsumedmoredailyvegetableservingsthanthose
thatdidnot.
In rural Odisha, there was stronger evidence of VeggieLite’s nutritional,
agricultural and social impacts. First, the intervention showed a
significantincreaseinthefruitandvegetableconsumptionofthosefarmers
participating in the eKutir program. These increases in consumption were
driveninlargepartthroughincreasedfruitconsumption.Yet,inaperiod
inwhichallfarminggroupsshowedadeclineintheirdailyvegetableintake,
eKutir farmers experienced the least decline and showed at end line a
significantly higher level of vegetable consumption than the other groups.
Second,VeggieLite’sagriculturalimpactwasalsonoticeable.Atbaseline,
farmers joining eKutir produced and sold more vegetables than the other
farmer groups. At end line, eKutir farmers still produced and sold more
vegetablesthantheotherfarmergroups,generatingover30.6MINRinsales
forparticipatingfarmers.ThishighvolumeofsalesamongeKutirfarmersis
particularlyofnotesinceeKutirfarmerswereatendlineorthegroupthat
alsoconsumedthegreatestpercentageoftheirownvegetables,withroughly
28% going to their consumption. Finally, there was also evidence of
VeggieLite’ssocialimpact.Thekeytothesuccessofanyinnovationisits
wider social acceptance. Our social network analysis showed the broader
11
acceptanceanddiffusionofeKutirprogrammingintothecommunity.Notonly
did the composition of the eKutir farmers’ networks change to include a
greaterpercentageoffarmersinthefarmerinterventiongroups(FIGs),but
so too did the composition of the non-eKutir farmers’ networks. In other
words,overtheone-yearinterventionperiod,regardlessofwhetherfarmers
participated directly in the intervention or not, all farmers in the
treatmentvillagescametodiscussfarmingmattersmoreandmorewithfarmers
intheFIGs.TheeKutirmodelthusseemstohaveincreaseditsacceptance
andbecomemorewidelydiffusedinthetargetedruralcommunities.
In the pilot period eKutir and partners learned many important lessons,
critical to success as a value chain social enterprise and nutrition
intervention. Increased numbers of eKutir-registered farmers are selling to
VeggieKartandtheirfarmingnetworkisgrowing.Intheruralareas,eKutir
farmersexhibitedahigherlevelofhomegrownconsumptionthanotherfarming
groups,suggestingthateKutirfarmersmayemployamoremixedproductionand
consumption strategy than other groups. In urban areas, the project found
that the availability of VeggieLite to certain consumers might be hampered
withtheclosingofspecificvendors,andthusgreaterattentionshouldfocus
more on developing client-vendor relationships and addressing consumer
loyaltyinthecomingageofmobilemarketing.
Organizationally,thestudyrevealedthatVeggieKart/VeggieLitehasbeenable
to create value for all the constituents in the system: farmers, micro-
entrepreneursandorganizationalpartners.Thenetworkstudyrevealedstrong,
collaborative ties among key eKutir business partners and strong vertical
ties among eKutir and its entrepreneurs. However, in order to capture the
value created and achieve economic profitability, VeggieKart needs to
increase its scale of operations and invest on consumer marketing and
behavioralchange.ICTcanplayacrucialroleinachievingthis.ICTisused
quite extensively on the supply side, especially between eKutir and agri
entrepreneurs.Itsusagecanbestrengthenedonthedemandsideaswell,to
supportrapidexpansion.Induecourse,asICTbridgesalltheactorsinthe
eKutir ecosystem, the information and collaboration networks can also be
12
expected to become dense. In terms of organizational lessons, the network
mapping suggests the need to better connect agri-entrepreneurs and veggie-
entrepreneurstooneanotherandlocalcommunityhealthworkerssothatthey
might learn best practices from each other and naturally integrate
agriculture,nutrition,andhealthaims.
Our analysis showed that eKutir made significant progress towards self-
sustainability as an enterprise, nearing scale and efficiency for
profitability, and making it a strong deployment model of ongoing public
benefits. Over the project period eKutir average monthly sales grew 45%,
while operational efficiencies increased. eKutir’s value chain that reduces
intermediaries and delays in bringing crops to urban consumers shows
significantadvantagesofreducedwastageandincreasedvaluetothefarmers
over the traditional supply chain. eKutir social enterprise is poised to
scaleupoftheVeggieLitemodeltootherregionsofOdishaandIndia.The
micro-experimentstestinginnovativenutritionincentiveprogramshaveshown
enough promise in promoting nutrition that they have attracted a private
sectorpartner(ApolloHospitalSystems)andwillworkwiththeASHAworkers
forlargerpilotsmovingforward,majorinitiativestoaddressdemand.

13
Chapter1:IntroductionThis document reports on the pilot project and associated research
“VeggieLite-ConjunctionofAgriculture,Nutrition,andHealthforInclusive
Development of Women, BIRAC/GCI/0013/01/13-AGN.” VeggieLite is a retail
channel in the broader VeggieKart business model and ecosystem that builds
uponthewell-establishedeKutirforprofitsocialenterprise.Theultimate
socialgoalistodesignandactivateaself-sustainingentrepreneurialmodel
to increase the availability, affordability, and consumption of fruits and
vegetables(F&V)targetedtolow-incomeruralandurbancommunitiesinlow-
and middle- income countries like India, while creating economic
opportunities for the poor as farmers, agri-, or retail- entrepreneurs,
throughoutthefarm-to-consumervaluechainandecosystem.Aspecialemphasis
is placed on progressively fostering inclusive development for women, in a
contextthatremainstoasignificantextentmen-dominated,beitathome,in
the farm, or in business. The pilot project unfolded in experimental and
controldistrictsinthestateofOdisha,IndiabetweenNovember2014andMay
2016, with endline surveys performed from March to April 2016. In this
chapter, we first review the project objectives in the funded proposal. We
then introduce the Convergent Innovation approach to evaluation in complex
systems,whichnotonlyevaluateimpactbutalsoinformstheadaptivedesign
ofaninterventionsuchasVeggieLitethattargetsbothbehavioralchangeand
ecosystem transformation. We also underscore the potential significance of
thepilotandresearchfindingsforgoingbeyondwhathasbeenpossiblethus
far in bringing solution at scale to nutrition, poverty alleviation, and
improvementinagricultureandeconomicoutcomesforsmallscalefarmingin
Odisha, the rest of India, and around the world. We conclude with some
informationontheorganizationofthisreport.
TheproposedpilotprojectobjectivesThepilotprojectgrantwasawardedtoIndianprincipalapplicant“eKutir”
and international partners; Wholesome Wave (now represented by DAISA) and
14
McGillUniversityCenterfortheConvergenceofHealthandEconomics(MCCHE),
on behalf of other partners of the Convergent Innovation Coalition
(CGIAR/AG4NH,IFPRI,UniversityofSouthCarolina).Thepilotprojectaimed
to link the VeggieKart/VeggieLite initiative -- which at the time of the
proposal was engaged in the daily sourcing of fresh vegetables from 300
smallholder farmers across 3 districts in Odisha -- to the eKutir model of
micro-entrepreneurs.Thismodelfocusesonusingtechnologytofacilitateand
monitortransactionstoprovidedirectmarketlinkagesforsellingproduce.
The vegetables procured are distributed through our delivery points of
vegetable entrepreneurs established in thoroughfares of the capital city,
local slums, and in rural clusters of villages. The functional number of
vegetableentrepreneursatthattimewas25,with25percentofwomenacting
as vegetable entrepreneurs. The proposed strategy for the present pilot
projectwastoleveragethisearlypenetrationtoachievethefollowing:
1. Increase farmer base to 1,000 farmers for vegetable procurement and
incorporategenderinclusivityinfarmingpractices;
2. Increase the number of vegetable entrepreneurs from 23 to 80 through
thisproposedpilot,with40percentofthembeingwomen;
3. Increase acceptance of good agricultural practices primarily among
womenfarmers;
4. Increase accessibility and affordability of fresh, nutritious fruits
andvegetables;
5. Measure fruits and vegetable intake and its impact on dietary
consumptionofwomenandchildhealth.
Beyond increasing the nutritional intake of rural and urban consumers, the
broadimpactwouldalsoinclude:
1. Creatingruralemploymentthroughmicro-entrepreneurs;
2. Providingmicro-entrepreneurswithtechnology-enabledtoolsonatablet
orPC;
3. Utilizingtoolstoaddressspecificneedforthevegetablefarmer;
4. MonitoringandMeasuringsuccessandfailureonareal-timebasis;

15
5. Promoting good agriculture practices among smallholder farmers for
vegetablecultivation;
6. Organizing the fragmented agriculture value chain through micro-
entrepreneursandtechnology;
7. Streamlining the un-organized groups of vegetable vendors, largely
women,todistributethevegetablesintheirlocalcommunitiesthrough
VeggieLite/VeggieKart;
8. Reaching out to woman of the household through woman vendors, to
distributegoodqualityandnutritiousvegetables;
9. Real-timedatamanagementallowingalltransactionstoberecordedand
shared.
Through VeggieKart/VeggieLite pilot, the detailed plans above established a
self-sustaining and enterprise-driven model for not only increasing
agricultureincomeandproductivity,butalsoprovidingacontinuouschainof
vegetable sourcing to improve nutritional consumption among consumers. The
targetwastoprocurevegetablesfrom1,000farmersanddistributeitthrough
150 vegetable entrepreneurs in rural and urban cluster by 2015/2016.
Henceforth, if proven efficacious, the VeggieKart/VeggieLite model will be
poisedforincreasedcapitalfrompublicandprivateinvestors,andscaling
throughout the region. A Convergent Innovation research framework described
inthenextsectionwasusedtoexamineboththedegreetowhichtheactual
operationaldeploymentoftheinterventionachievedtargetsfor(1)farmand
theVeggieLiteretailenterprisesand(2)thebehavioral/nutritionimpactin
termsofincreaseF&Vconsumptioninbothurbanandruralsample.
TheconvergentinnovationevaluationframeworkVeggieLiteinterventiontakesaholisticapproachtotheneeds,preferences,
and behaviours of individuals and households. Simultaneously, the
interventionalsotransformstheagro-ecological,social,andcommercialeco-
systemstomakenutritiouschoicesaccessible,affordable,andappealingin
aneconomicallysustainablemanner,evenforthepoor.Thecoreinnovationof
the project lies in this “integrative systemic approach” and the
16
“convergence” between the impacts on agriculture, nutrition, and health.
Farming communities are empowered economically by assistance at the
production end in the form of cultivation and marketing support and are
helpedinimprovingthenutritionthroughincreasedawareness,affordability,
accessibility, and availability of vegetables and other food products
[through VeggieLite]. Urban poor are also ensured access to vegetables at
affordableprices[VeggieMarts,VeggieWheels,VeggieLite].eKutirthroughits
network of micro-entrepreneurs and vegetable entrepreneurs at the heart of
theVeggieKartinterventionlinksproducersandconsumersinanequitableand
efficientvaluechainthatempowerstheminawaythatothermethodsfailto
address.
The VeggieLite intervention has much in common with what has been called
ConvergentInnovation(CI;Dubeetal2014;Jhaetal2014;seeappendix),an
approachthatbridgestechnological,social,andinstitutionalinnovationto
placethehealthofpeople,planet,andeconomyasacoredriveroffarmand
foodbymulti-levelactors,targetingbothbehaviouralchangeandecosystem
transformation. CI has been advanced as a solution-oriented paradigm to
address the complex human problems at the nexus of agriculture, food and
healthbydefiningnewpathsofconvergencebetweeneconomicgrowthandhuman
development. In such complex context and nature of intervention, the
traditional impact evaluation methods that relies on randomized clinical
trial (RCT) or quasi experimental design does not suffice. Complex systems
haveanumberofdefiningcharacteristics,includingthepossibilityofnon-
linear change, the existence of emergent properties, and the importance of
feedbackmechanismsintheunfoldingofanintervention(Shiell,Hawe,Gold,
2008). These characteristics have implications for evaluation strategy and
design. Complex systems approaches recognize the fact that new structures,
institutions, and relationships may emerge from intervention activities,
requiring mixed-method designs and the measurement of intervention outcomes
atmultiplelevels(HammondandDube2012;Mooreetal2015).
ThedeploymentstrategyandimpactoutcomesofthepilotprojectVeggieLite

17
thereforetookamulti-levelconvergentinnovationevaluationapproach(Fig.
1.1)thatusedmixedmethods(surveymethods,socialnetworkanalysis,value
chain analyses) to examine outcomes in terms of both behavioral change and
ecosystem transformation across multiple ecological levels – individual,
interpersonal,organizational,community,andsystems.
Figure1.1:Methods,LevelofAnalysisandKeymeasures
PotentialsocietalandscientificsignificanceTheagriculture-foodvaluechainisatthecoreofeconomicgrowthandhuman
development in developing countries and emerging economics like India.
Agriculture and food sectors contribute over 20% to India’s GDP and employ
morethan50%ofIndia’spopulation.Atthesametime,theagri-foodsectors
alsoshouldertheonusofsecuringthenutritionalsecurityforapopulation
that is simultaneously fighting under nutrition and over nutrition. These
challenges persist in spite of billions of dollars being allocated by the
Indiangovernmentandinternationalorganizationstoalleviateruralpoverty
Householdquestionnaireadministeredtoruralandurban
sample
Qualitativemethods
(Interviews,Focusgroups,ethnography)
SocialNetworkAnalysis(ego
network,wholenetwork)
Individuals(Farmers,Consumers)
Organizations(Micro-Enterprises,Input
Providers,Retailers)
Interventionprocess:Innovationsdeployed
#micro-entrepreneurs
#Veggie-entrepreneurs
#farmers/consumers
Individual:Totalvegetableconsumption,vegetableconsumptiondiversity
Interpersonal:Networksize,networkdiversity
Methods LevelsofAnalysis
KeyMeasures
InterpersonalNetworkDimensions
(NetworkSize,NetworkDiversity)
CommunityStructures
SystemsLevel-ValueChains
ValueChainand“SocialReturnonImpact”Analyses
18
and to secure mother/child nutrition (The Hindu News, 2013). This is
particularly critical for in the horticultural sector where the lack of an
organized supply chain for fruits and vegetables in India has substantial
impact on both the farmer and the consumer, which are the first and last
nodes of the supply chain. Yet, it is estimated that yearly 2.7 million
deaths(4.9%)and26.7milliondisabilityadjustedlifeyears(DALYs;1.8%)
wereattributabletolowfruitandvegetableintakeglobally.Lowintakeis
particularlyprevalentinpoorpopulation.Forexample,Odisha,astatein
easternIndia,hasaMMRof222/100,000livebirths,roughly17%higherthan
the national average, and neo-natal mortality greater than 30 deaths/1000
livebirths,tenhigherthanthenationalaverage.1
Despite support from State Government and pro-farmer policies, the
unorganized disaggregated F&V supply chain leaks value in every step from
smallholder farmer to consumer with spoilage, graft, fees, and excess
middlemen.Thecurrentvegetablevaluechainisineffective,unreliable,and
involvesconsiderablewastage(25-30percent),withlowpricerealizationfor
the farmers and lack of fresh, quality vegetables for the consumers. As
farmers reduce the inclination towards vegetable cultivation, a dearth of
vegetables in the market causes prices to increase, which affects the
consumer’sbudget.Duetothis,theconsumerreducesthechoicesinvegetable
consumption and procures as per affordability. This challenge keeps the
farmers and consumers at the expense of the middlemen or unorganized value
chainsystemthatretainsmostofthevaluewhilecreatingwastage,lowvalue
forfarmers,consumers,andnutritionalinsecurity.
The bulk of interventions that have catered to these issues have thus far
operatedinsilos,eachoneofthemworkingononeormoreissuesbutdoing
so in a disintegrated manner. The eKutir model aims at integrating the
ecosystem and making the communities evolve as active and responsible
1India.MinistryofStatisticsandProgrammeImplementation.MillenniumDevelopmentGoalsCountryReport,India2015.Availableathttp:mospo.nic.in/Mospi_New/upload/mdg_27feb15.pdf

19
participants.Theapproachisuniqueinitsunderstandingofagricultureand
nutritionaspartofaholisticsystemthatempowerslow-incomeindividuals
aseconomicactorsinthissystem,especiallywomen.Bylinkingsmallholder
producers directly to vegetable entrepreneurs and urban consumers, the
project aims to building a food system that delivers better access to
economicopportunitiesandnutrition.Itrecognizesthefarmernotonlyasa
producer,butalsoasaconsumertherebyensuringthenutritionalsecurityof
theproduceralso.ThetheoryofchangebehindtheVeggieLiteintervention
isanchoredintoconvergenceofeffortsamongdifferentcollaboratorsinan
ecosystemthatspansocialandcommercialsectors.Italsoreducesthenumber
of intermediaries through the introduction of micro-entrepreneurial
structures and a novel distribution channel, bypassing the Mandi market
systemandthebrokersassociatedwiththesemarkets,reducinglossesdueto
poorhandling,fees,rents,interest,andevengraft.
Therefore, the present pilot project and associated research on VeggieLite
Intervention will set up a solid scientific and strategic foundation for
integrating approaches of demand-driven vegetable production, distribution,
wastereduction,andpriceoptimization,whichhavethepotentialtocreate
self-sustaininghumanandeconomicdevelopmentforthemostvulnerablerural
andurbancommunities.
TheresearchteamandthereportorganizationDr. Dubé, MCCHE’s founding chair and scientific director spearheaded the
research team. She cumulates training in nutrition, behavioral decision
making,marketing,finances,andcomplexitysciences.MCCHEhasactedasthe
internationalresearchpartneronbehalfofothermembersoftheconvergent
innovation coalition (CGIAR-AG4NH/IFPRI and the University of South
Carolina).Dr.P.K.Joshi,Dr.SummerAllenandMr.SamikGhoshfromIFPRI
haveelaboratedandassessedmanyinitiativesaimingtoincreaseagricultural
production and nutritional knowledge and intake in developing countries,
amongstothers.ParticularlyDr.AllenandMr.Ghoshhaveplayedakeyrole
in hiring the research team in Odisha that administered the surveys and

20
collectedthedatafrombothfarmersandconsumers.Dr.Moore,Professorat
the University of South Carolina, is an expert in social networks and how
beingpartofacommunityhelpsprogramsthrive.Hehastakenaleadrolein
the quasi-experimental design study and diverse facets of individual,
household, and organizational assessment. The MCCHE team also include
management scholars Dr. Srivardhini Jha, at the time of the study post-
doctoral fellow at MCCHE supported by CGIAR-AG4NH/IFPRI and now a faculty
memberinstrategyandentrepreneurshipattheIndiaInstituteofManagement-
Bangalore, and Dr. Saibal Ray, a scholar in supply chain management and
analytical modeling from the Desautels Faculty of Management, McGill
University whom has brought highly valuable expertise in examining the
underlying competitive dynamics of the intervention. The research team has
worked in close collaboration with strategic consultant Mr. Ross who has
documented through close observation and field work with Veggie Kart/Light
and eKutir team the actual operational deployment of the various facets of
the intervention underlying ecosystem transformation. DAISA Enterprises
principals worked to develop the Wholesome Wave Healthy Food Commerce
Investments fund, a $3M initiative to capitalize and learn from a growing
class of enterprises in the US called “food hubs,” ecosystems much like
eKutir/Veggie Kart that are designed to maximize value for the smallholder
farmerstheyworkwithandcommunitystakeholders,aswellasfunctioningas
businesses. PI Suvankar Mishra and Krishna C. Mishra have also generously
provided key information and insights that have fueled research throughout
thewholeproject.
The remaining of the report is organized as follows: chapter 2 provides a
background on the eKutir social enterprises and describe the VeggieKart
business model and ecosystems, including but not limited to a value chain
mappingandcomparisonwithtraditionalmarkets.Chapter3reportsresearch
methods of the quasi-experiments and assess outcomes in terms of F&V
consumption and operational farming results. Chapter 4 reports on the
convergentinnovationprocessanalysisthatcombinesastrategicanalysisof
VeggieKart/VeggieLite intervention as a platform balancing both sides of
21
supplyanddemandoftheecosysteminthedirectionoftargetedoutcomeswith
afullnetworkanalysisoftheunderlyingsocialdynamicsinvolvedwiththe
VeggieKart/VeggieLite ecosystems. We also report key facets of analytical
model of the competitive dynamics underlying interaction of VeggieKart
ecosystems with traditional market actors. Chapter five describes the
behavioralincentivemini-experimenttoimprovenutritionofpregnantwomen,
lactatingmothersandinfantsandalsofosterVeggieLite’slinktothehealth
caresysteminOdisha.Finally,chaptersixsummarizesoveralldiscussionon
successes,lessonslearnedandlimitations.
22
Chapter2:eKutirSocialBusiness,VeggieKartEcosystem,andVeggieLiteInterventionfromanOperationalPerspective
Agri-entrepreneursprovideinputs,technicalassistance,andmarketlinkages
tosmallholderfarmerswhohavechosentoparticipateineKutiragricultural
programming. The Veggie Kart “Agri-Entrepreneurs” (AEs) provide inputs,
technicalassistance,marketlinkages,andhelpfuldemandinformationsothe
smallholder farmer can better plan their production and harvest, reducing
riskandincreasingvalue.Tofacilitatelocalizedinteractionswithfarmers,
agri-entrepreneurs organize eKutir farmers into groups of 15-25 members
calledFarmerInterventionGroups(FIGs),withpossiblymultiplegroupsper
village. As part of their activities, agri-entrepreneurs aggregate the
producecultivatedbythesegroupsatlocalaggregationpointsforinsertion
intoVeggieKartdistributionchannels.
TheVeggieKartDistributionChannel
VeggieKart purchases vegetables from eKutir farmers at local aggregation
points and transports them to a central warehouse, where quality control
checksareundertaken.Afterweighing,sorting,grading,packaging,andre-
weighing the vegetables, the produce is sent to the farmers’ markets
established in different parts of the capital city, Bhubaneswar. The
distributionchannelsofVeggieKartconsistofthefollowingstructures:
(1) Online:eCommerceplatformanddirectdoorstepdelivery;
(2) VeggieMart: converting existing small shops into farmers’ markets,
brandedbyVeggieKart;
(3) VeggieWheels: converting existing exploited vegetable vendors into
valuedvegetableentrepreneurswithpushcartsacrossthoroughfares
inthecity;
(4) VeggieLite: establishing vegetable entrepreneurs in low-income
communitiestosellvegetablesatreducedprices.
23
Through the diverse range of VeggieKart channels, farm-fresh food is made
accessibletoalltypesofconsumersataffordableprices.
As a for-profit social enterprise, and in order to build economic
sustainability to reach targeted impacts, eKutir must both be viable as a
businessaswelleffectiveindeliveringsocialbenefits.Thischapteroffers
abriefoverviewofeKutir’ssocialenterprisemodelandprovidesanin-depth
operational analysis of the VeggieKart business model and ecosystem, to
examine its differential positioning vis-à-vis traditional Mandi spot
markets.ThissetsthestageforapresentationofVeggieLiteinterventions
from a CI ecosystem perspective, leading to the anticipated economic
viabilityoftheenterprisesasseenthroughthelensesofeKutir/VeggieKart
managementandDAISAEnterprisesstrategicconsultant.
TheprocessofunderstandingtheeKutir/VeggieKartvaluechainstartedwith
interviewswitheKutirVeggieKartstaff.DAISAEnterprisesmappedthesteps
ofvegetablesupplychainforthetraditionalMandimarketsandcomparedto
eKutir’s VeggieKart procurement. DAISA gathered data from online market
postings, Mandi market visits, reviewing VeggieLite invoices and pricing
information, and conversing with farmers and venders, across 20 common
vegetables. We then compared data from pricing at various steps of these
supplychainsacrossseveraldaysandweeksin2015todeterminewherevalue
isbeingcapturedineachchain.

24
eKutirsocialenterprise
eKutir is a social enterprise that leverages a combination of local micro-
entrepreneurial motivations and processes, as well as modern digital
information and communication (ICTs) ecosystem platforms, to solve
smallholder farmers’ poverty through a distribution network of digitally-
trained entrepreneurs, market linkages, technology, and data. eKutir’s
missionistofindcatalytic,scalablesolutionstoglobalfarmingchallenges
andchangethewayagricultureandruraldevelopmentisviewedfromacharity
to a profitable enterprise perspective. eKutir has developed an
entrepreneurship model where digitally-trained micro-entrepreneurs support
groupsofsmallholderfarmersinfarmsoil-testing,fertilizers,seedsand
crop nutrient and pest management best practices recommendations, inputs
accessandmarketaccess.
Micro-entrepreneurs are selected, hired, and trained by eKutir to use
softwareapplicationstocapture,manage,andmonitoravarietyofdataand
transactions. These entrepreneurs are key actors in villages that have
received solid training in a multitude of components including
entrepreneurship and social business, as well as soil testing, supply of
vegetableseedswithpropercultivation,marketinglinkageswithbuyers,and
daily market price information literacy. Each micro-entrepreneur manages
between200smallholderfarmers,definedasfarmerswhoholdlessthanthree
acres of land. To facilitate localized interactions with farmers, micro-
entrepreneurs organize eKutir farmers into groups of 15-25 members called
FarmerInterventionGroups(FIGs)andregularlyorganizemeetingswiththem.
TheeKutirmodelservesasanengineforthecreationofmicro-entrepreneurs
inadiversityofsectors,includingveggie-entrepreneursplantingtheseed
for convergent innovation among rural villages. eKutir uses this model to
transform agriculture and nutrition linkages in rural communities, and
betweentheseareasandslums,aswellasotherpoorurbancommunitiesinthe
stateofOdisha,India.eKutiristhusworkingtoestablishanenterprise-
based, market-driven, agricultural production system that impacts the
25
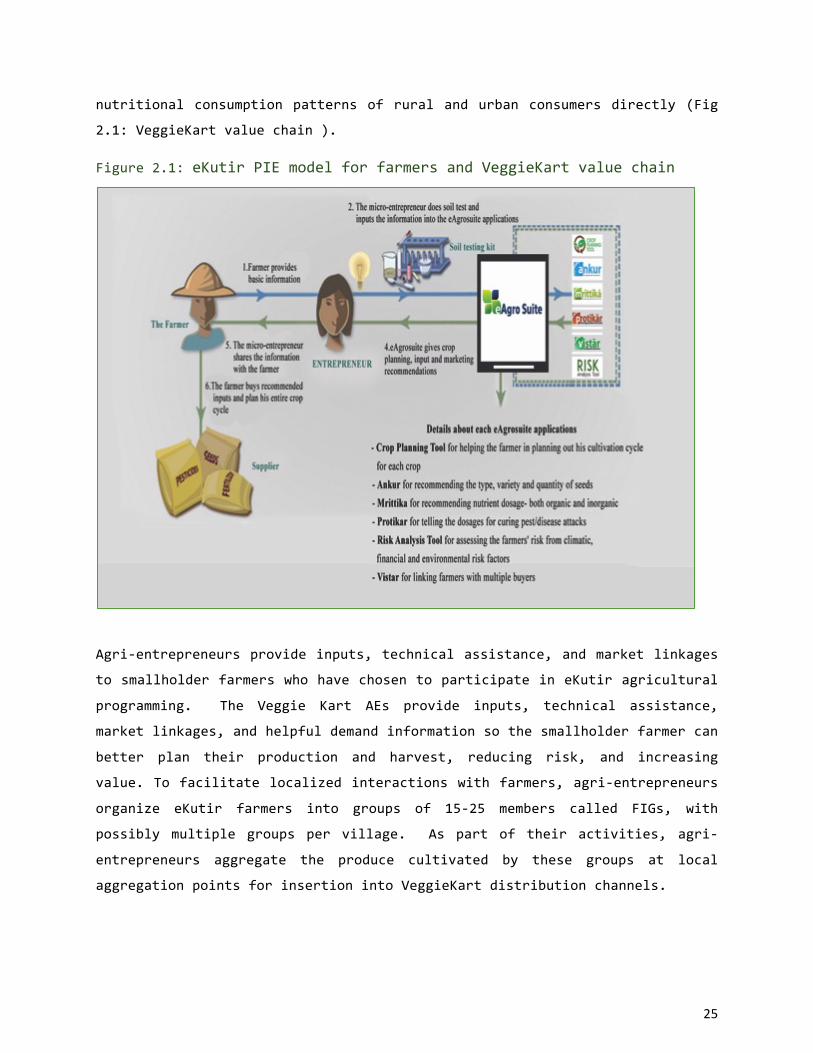
nutritionalconsumptionpatternsofruralandurbanconsumersdirectly(Fig
2.1:VeggieKartvaluechain).
Figure2.1:eKutirPIEmodelforfarmersandVeggieKartvaluechain
Agri-entrepreneursprovideinputs,technicalassistance,andmarketlinkages
tosmallholderfarmerswhohavechosentoparticipateineKutiragricultural
programming. The Veggie Kart AEs provide inputs, technical assistance,
marketlinkages,andhelpfuldemandinformationsothesmallholderfarmercan
better plan their production and harvest, reducing risk, and increasing
value.Tofacilitatelocalizedinteractionswithfarmers,agri-entrepreneurs
organize eKutir farmers into groups of 15-25 members called FIGs, with
possibly multiple groups per village. As part of their activities, agri-
entrepreneurs aggregate the produce cultivated by these groups at local
aggregationpointsforinsertionintoVeggieKartdistributionchannels.
26
TheVeggieKartEcosystem
The VeggieKart ecosystems has been designed with the intent to deliver
comparable or better pricing (compared to Bhubaneswar neighborhood venders)
toconsumersforthecommonvegetablesthroughitsprimaryVeggieKartchannel
and VeggieLite channel. VeggieKart pays the farmers an average of
approximately 20% more for the vegetables they purchase than middlemen and
brokers associated with the traditional supply chain (correlating with the
farmersurveydata),withfluctuationsbasedonmarketandclimateissues.
The VeggieKart micro-entrepreneurs serve as retail outlets and distribution
channels to make fresh, healthy, and safe vegetable produce by eKutir and
othersmallholderfarmersaccessibletolow-incomeruralandurbanconsumers
at competitive prices. VeggieKart purchases vegetables from eKutir farmers
andothersourceswhenneededatlocalaggregationpointsandtransportsthem
toacentralwarehouse,wherequalitycontrolchecksareundertaken.After
weighing, sorting, grading, packaging, and re-weighing the vegetables, the
produceissenttothefarmers’marketsestablishedindifferentpartsofthe
capitalcity,Bhubaneswar.
The capacity of Veggie Kart to procure affordable vegetables to consumers
livinginruralandurbanslumsisbasedonitsabilitytore-organizethe
entiredistributionchain.Assuch,allunsoldvegetablesarecollectedfrom
smallholder farmers at the end of the day in major centralized warehouses
where they are inspected. They are then re-distributed to particular
distributioncentersinresourcepoorareasfromwheretheyarepickedupby
vegetablevendorsandre-soldatcheaperpricestoconsumers.Bycoordinating
theentirevegetablevalue-chain,eKutirensuresthattherearemoreeconomic
benefits for farmers who would not otherwise be able to sell their
vegetables, while simultaneously increasing the availability of vegetables
forconsumers.
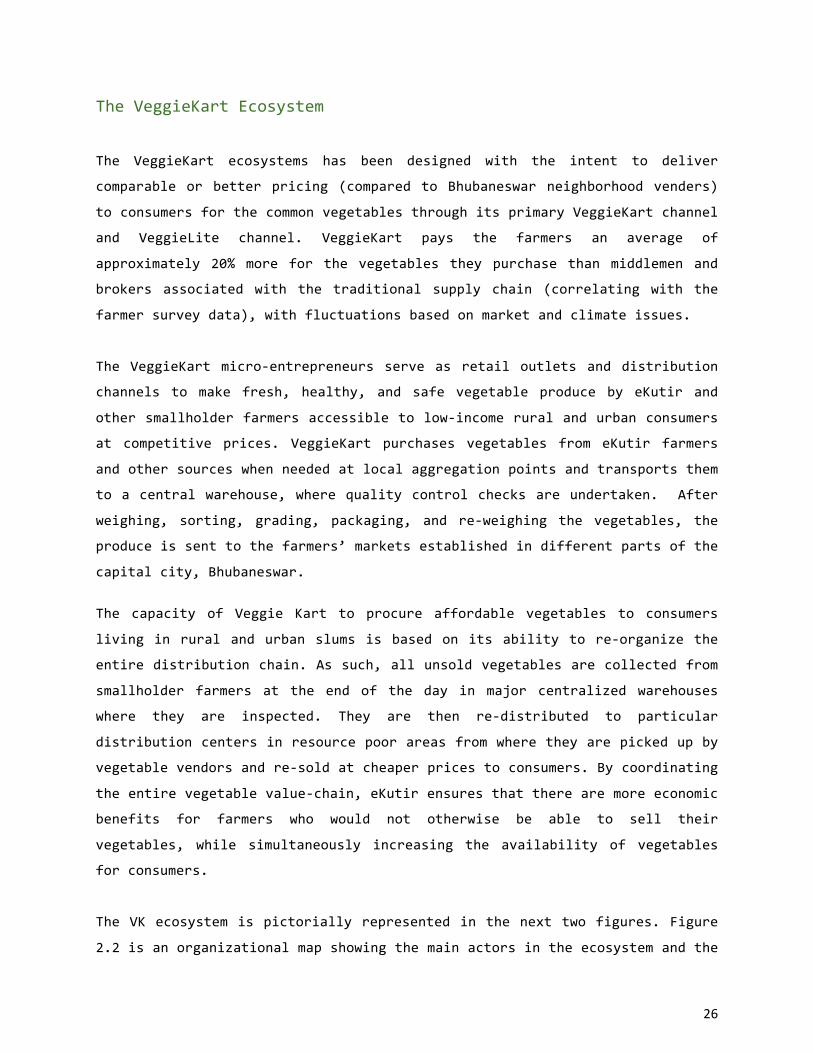
TheVKecosystemispictoriallyrepresentedinthenexttwofigures.Figure
2.2isanorganizationalmapshowingthemainactorsintheecosystemandthe

27
mannerinwhichinformationismeanttoflowamongthem,informationsuchas
supply/demandofvegetables,advisory,markettrends,andsoon.eKutiris
the central node that manages this flow between the actors on the farming
side, the distribution side, and other organizational partners. Figure 2.3
shows the flow of material, such as produce, within the system. In
particular,thediagramhighlightshowthevegetablesflowfromthefarmers
totheconsumersthroughmultipledistributionchannels.
Figure2.2:eKutir/VKEcosystemInformationflow
RURALHOUSEHOLDS
URBANHOUSEHOLDS
OperationsExecutive-VeggieLiteUrban
VeggieLiteRural
Entrepreneur
KartManufacturerandDesigner
AgriculturalInputProviders
eKjut
Advisors-OrissaTechnical
UniversityandDr.Konde
ExternalStakeholders
Agriculturalsupportservices-soiltesting,weather
forecasting,insurance
Fieldexecutives(1)eKutiremployees(2)Swati(3)CCD
VeggieLiteUrbanEntrepreneur
AgriEntrepreneur
OperationsManager-Agriculture
CEO-VeggieHealth
Global
CEO-VeggieKartand
CentreofExcellenceforAgriculture
MarketingManager-VeggieLiteUrban
28
Legend-keyformaterialflow
Inputinflow
Vegetablesoutflow
Figure2.3:MaterialFlow
TheVeggieKartValuechainvs.TraditionalChainVegetablefarmingyield,priceandincomes(farmersandmicroentrepreneurs)The VeggieKart value chain seems to deliver comparable or better pricing
(compared to comparable venders) to consumers for the common vegetables
through its primary VeggieKart channel and VeggieLite channel. VeggieKart
paysthefarmersanapproximately20%moreforthevegetablestheypurchase
than middlemen and brokers associated with the traditional supply chain
eKutir
VeggieLiteRural
EntrepreneurVeggieKart
VeggieMartsVeggieWheels
AgriInput
Suppliers
Fieldexecutives(3)eKutiremployees(1)Swati
AgriEntrepreneurs
RuralHousehold
s
VeggieLiteUrban
Entrepreneur
Online&Instituti
onalBuyers
UrbanSlumHouseholds
29
(correlatingwiththefarmersurveydata),withfluctuationsbasedonmarket
andclimateissues.
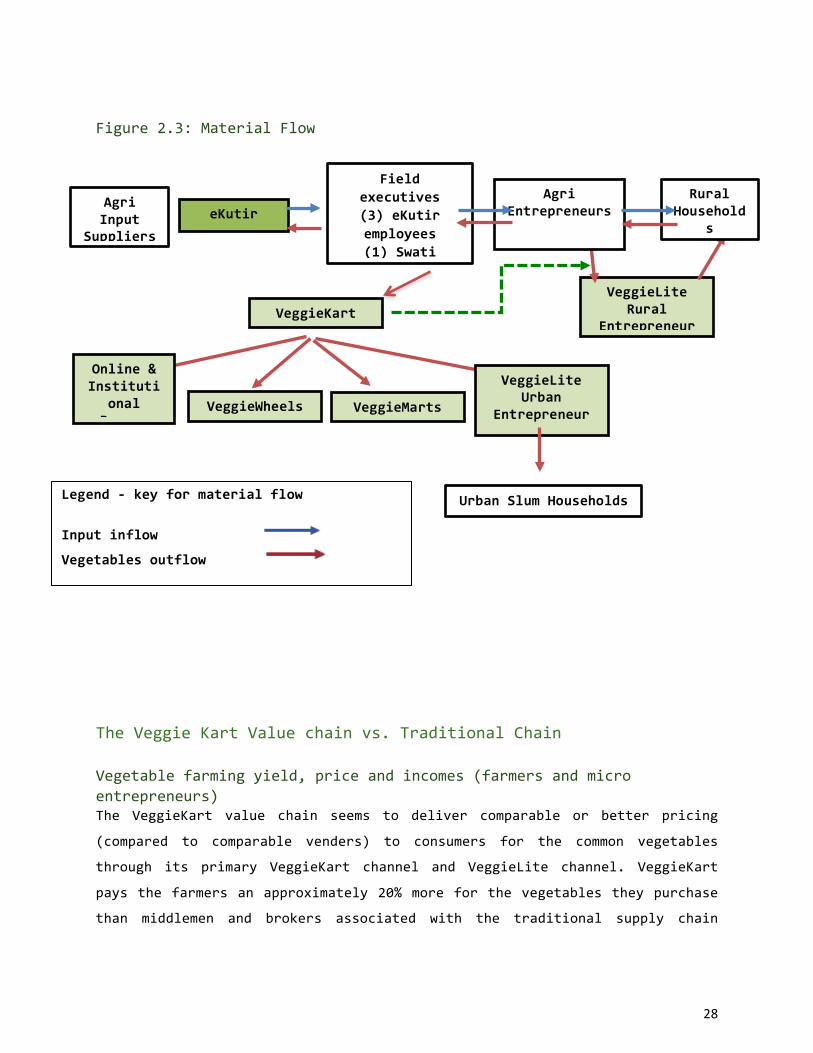
Figure2.4-ExampleComparisonforBeans,IndrahanuMktvs.
VeggieKart
VeggieKartmakesupthisdifferencethroughverticalintegrationofitsvalue
chain.VeggieKartaggregatestheproductsfromthefarmersthroughitsagri-
entrepreneurs, owns trucks to bring the products to Bhubaneswar to its own
distributionfacilitywithitsownemployeesdoingwashingandpacking,then
sendstheproductsouttoVeggieKartvendorswhoarelicensedbyeKutir.The
eKutirVeggieKartsystemremovesseveralintermediariesinthesupplychain,
and maintains ownership of the products throughout. eKutir returns the
savingsofthisdisintermediationtothefarmers.

30
Figure2.5-ExampleComparisonforBrinjal,IndrahanuMktv
VeggieKart
Figure2.6:RidgeGourdValueChain,IndrahanuMktVVeggieKart
31
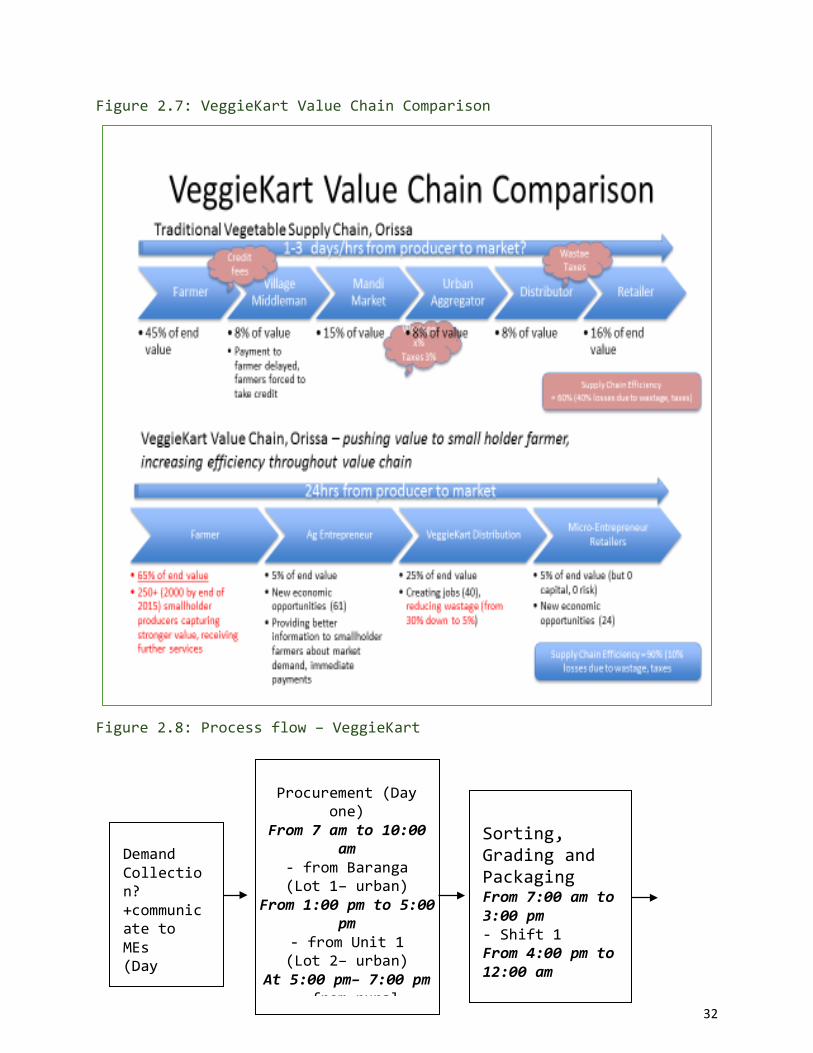
The following Value Chain Comparison diagram (figures 2.7 and 2.8) also
suggeststhattheVeggieKartintegratedvaluechainnotonlyallowsfarmers
to capture more portion of value from the end-product, but that the chain
itself retains more value. In the traditional supply chain, products are
lost to wastage as they sit without cold storage in villages and Mandi
markets, and there can be graft associated with the transactions in the
traditional supply chain where additional margins are captured away from
farmers, end-consumers, and worthy micro-entrepreneurs. While not fully
studied,eKutirseekstomanageitsintegratedvaluechaintominimizethese
losses,andhasstatedthatitreduceslossesdowntoaslowas9%,andis
strivingfor4%for2017.
32
Figure2.7:VeggieKartValueChainComparison
Figure2.8:Processflow–VeggieKart
Procurement(Dayone)
From7amto10:00am
-fromBaranga(Lot1–urban)
From1:00pmto5:00pm
-fromUnit1(Lot2–urban)
At5:00pm–7:00pm-fromrural
Sorting,GradingandPackagingFrom7:00amto3:00pm-Shift1From4:00pmto12:00am-Shift2
DemandCollection?+communicatetoMEs(Day

33
TheVeggieLiteInterventionTheeKutirteaminitiatedprojectimplementationinDecember2014.Thepilot
intervention took place in three stages. Stage one consisted of baseline
assessments of study participants (both case and comparison groups). Stage
two involved implementation of the micro-entrepreneurial and VeggieLite
intervention in the rural and urban areas. During this stage, eKutir
personnel and agents identified and recruited agricultural and vegetable
entrepreneurs, especially women, and engaged these entrepreneurs in social
enterprise activities. Micro-enterprise retail outlets and distribution
channelswereestablishedtoincreaseavailabilityandaccessibilityoffresh
and healthy produce. Stage three consisted of collecting endline or post-
intervention data from study participants. This project received a no-cost
extensionuntilJune2016sincetherewasadelayinthestart-upprocessand
logisticsarrangement.
TheinterventiontookplaceinthestateofOdisha.Ontheoperationsside,
thetotalnumberoffarmersengagedintheprojectasofMay2016was1,350
[almost double the target number proposed]. These farmers received
agricultural support products and services through the agri-entrepreneurs,
AmountCollection24hoursafterdeliveryforKarts,MartsandVeggieLite(Day2)CashPaymentforOnline(Day1)Flexibleforinstitutionalbuyers(basedontermsagreed
SupplyAt6amLot3-MartsandKartsAt10:30amLot1—OnlineAt4:00pmLot2-Marts,Karts,VeggieLiteOndemandforinstitutions
InventoryindentsandallocationAt9:30am
Lot1–OnlinecustomersAt3:30pm
Lot2–Marts,Karts,
VeggieLitesAt11:30pm
Lot3-MartsandKarts
34
who by now were well trained with farmer mobilization, procurement, and
marketing methodologies and ICT usage. On the marketing side, eKutir
establishedroughly90vegetableentrepreneursinthecityofBhubaneswarby
May2016.Thisfigureismorethan200%theprojectoriginaltarget.
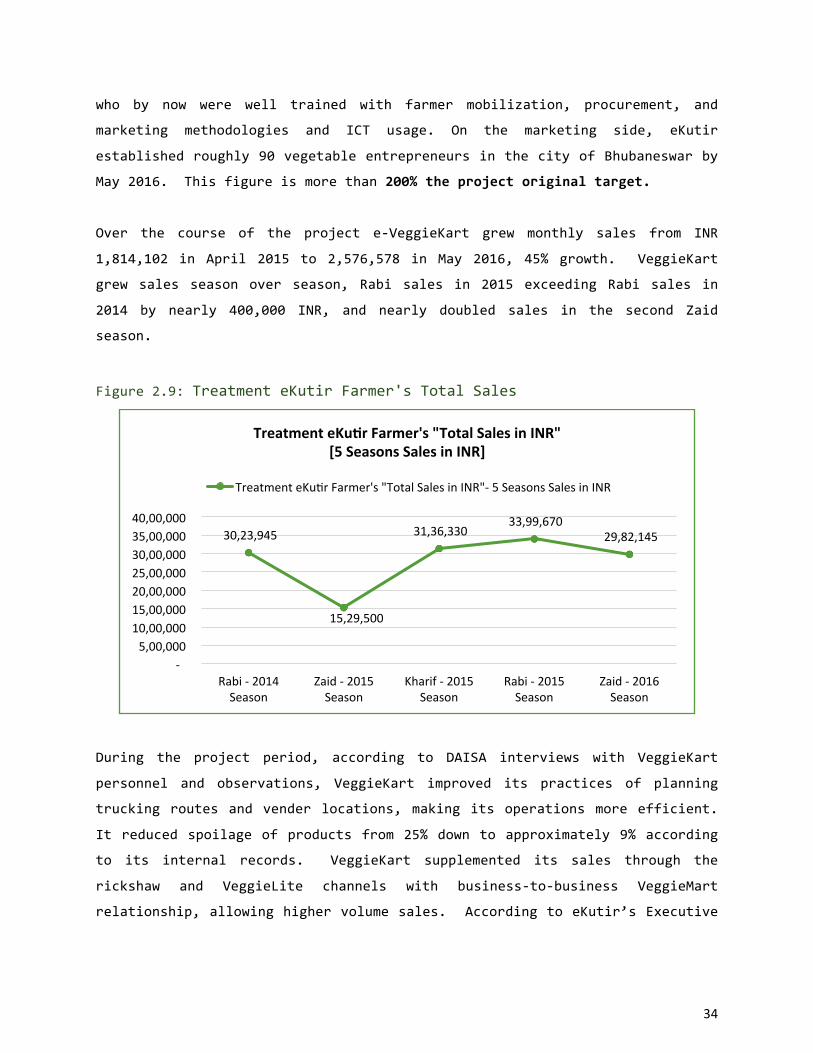
Over the course of the project e-VeggieKart grew monthly sales from INR
1,814,102 in April 2015 to 2,576,578 in May 2016, 45% growth. VeggieKart
grew sales season over season, Rabi sales in 2015 exceeding Rabi sales in
2014 by nearly 400,000 INR, and nearly doubled sales in the second Zaid
season.
Figure2.9:TreatmenteKutirFarmer'sTotalSales
During the project period, according to DAISA interviews with VeggieKart
personnel and observations, VeggieKart improved its practices of planning
truckingroutesandvenderlocations,makingitsoperationsmoreefficient.
Itreducedspoilageofproductsfrom25%downtoapproximately9%according
to its internal records. VeggieKart supplemented its sales through the
rickshaw and VeggieLite channels with business-to-business VeggieMart
relationship,allowinghighervolumesales.AccordingtoeKutir’sExecutive
30,23,945
15,29,500
31,36,33033,99,670
29,82,145
-5,00,00010,00,00015,00,00020,00,00025,00,00030,00,00035,00,00040,00,000
Rabi-2014Season
Zaid-2015Season
Kharif-2015Season
Rabi-2015Season
Zaid-2016Season
TreatmenteKuarFarmer's"TotalSalesinINR"[5SeasonsSalesinINR]
TreatmenteKugrFarmer's"TotalSalesinINR"-5SeasonsSalesinINR

35
Director, VeggieKart has reached operational break-even, though some
administrationcostsarecoveredbyphilanthropicgrants.
Figure2.10:VeggieKartSalesProjectPeriod
2.11:TotalsalesforallVeggieLiteCentersinBhubaneswarUrban
0
20000
40000
60000
80000
100000
120000
TotalsalesforallVeggieLiteCentersinBhubaneswarUrbanSalesValue(inINR)
SalesValue(inINR)

36
Figure2.12:TotalWeeklySales(kgs)forVeggieLiteServicesbyMonth
inselectWards
VeggieLiteOperationsatRurallocation
OverthecourseoftheprojecteKutirhasestablishedstronglocalnetworkof
rural Micro-entrepreneurs (5) and VeggieLite Entrepreneurs (7) across 5
projectinterventionlocations.Thereare7VeggieLitecenterstoreachlow-
incomecommunities.Fig.2.13representsallVeggieLitelocations’cumulative
salesincreasesinpast15monthsduringprojectintervention.TheVeggieLite
centerfunctionsasanintegralpartofthevegetablesupplychain.Produce
aggregatedinruralareasissortedandgraded.Eachproductisgradedonthe
basisofitssize,texture,andshape.Thosedeemedofthebestqualityare
senttothewarehouse,whereasthosegradedaslesserqualitybutstillgood
aresoldatthe“ruralVeggieLite”locations.Unsoldproduceisreturnedona
dailybasistothewarehousefromthesellingpoints[cartsandmarts].These
items are then sold at the urban VeggieLite at discounted prices. By
coordinatingtheentirevegetablevalue-chain,eKutirensuresthatthereare
more economic benefits for farmers who could have not otherwise sold their
0
500
1000
1500
2000
2500
3000
3500
4000
4500
Mar
-15
Apr
-15
May
-15
Jun-
15
Jul-1
5
Aug
-15
Sep-
15
Oct
-15
Nov
-15
Dec
-15
Jan-
16
Feb-
16
Mar
-16
Apr
-16
Total Sales (kgs)
Ward 2
Ward 14
Ward 1
ClosureofoneVLvendor(W2)
37
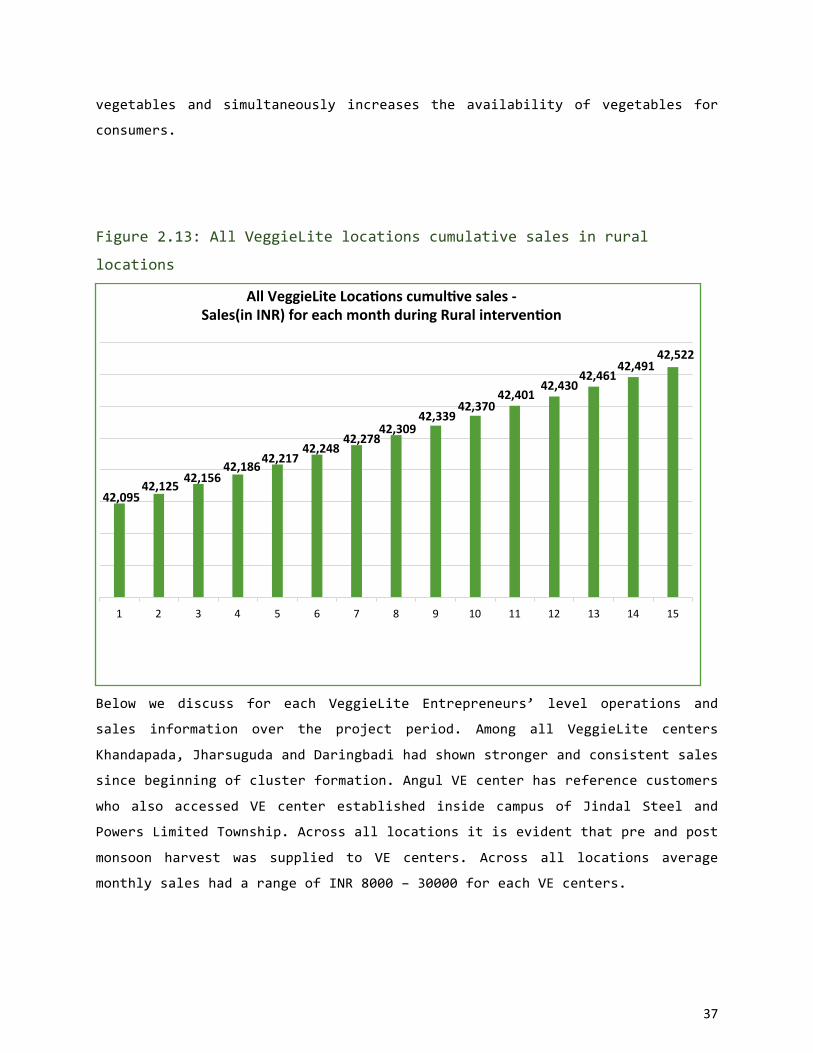
vegetables and simultaneously increases the availability of vegetables for
consumers.
Figure2.13:AllVeggieLitelocationscumulativesalesinrural
locations
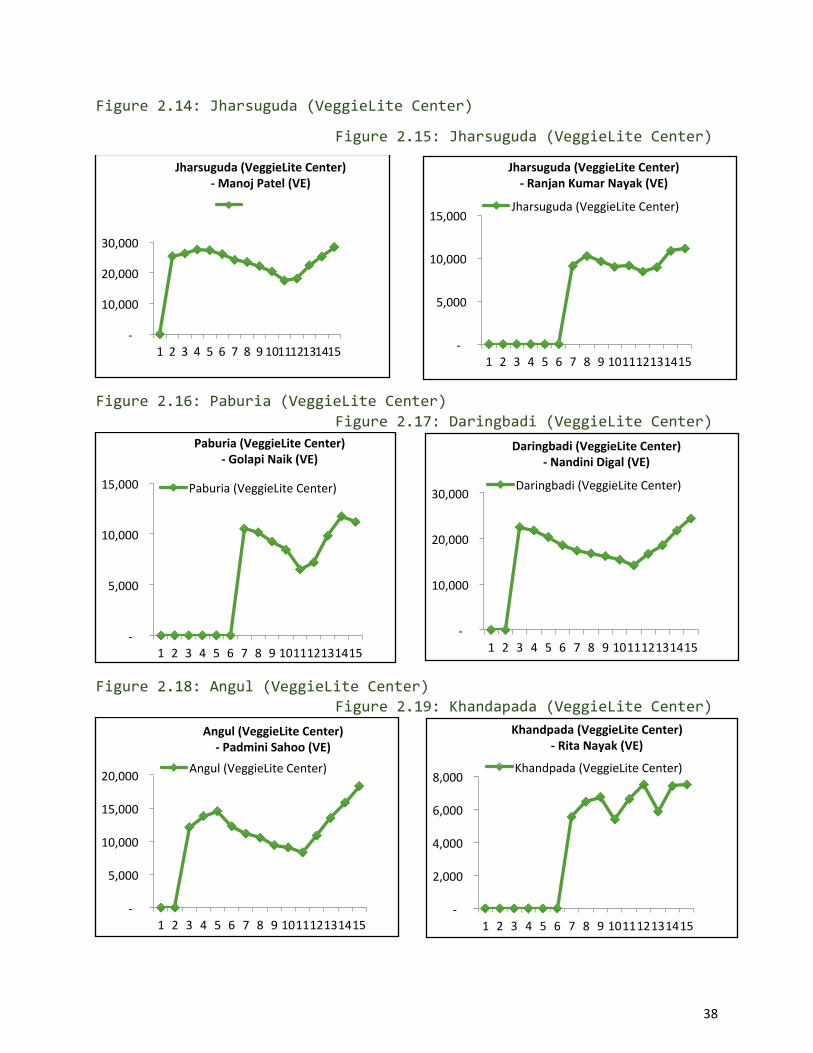
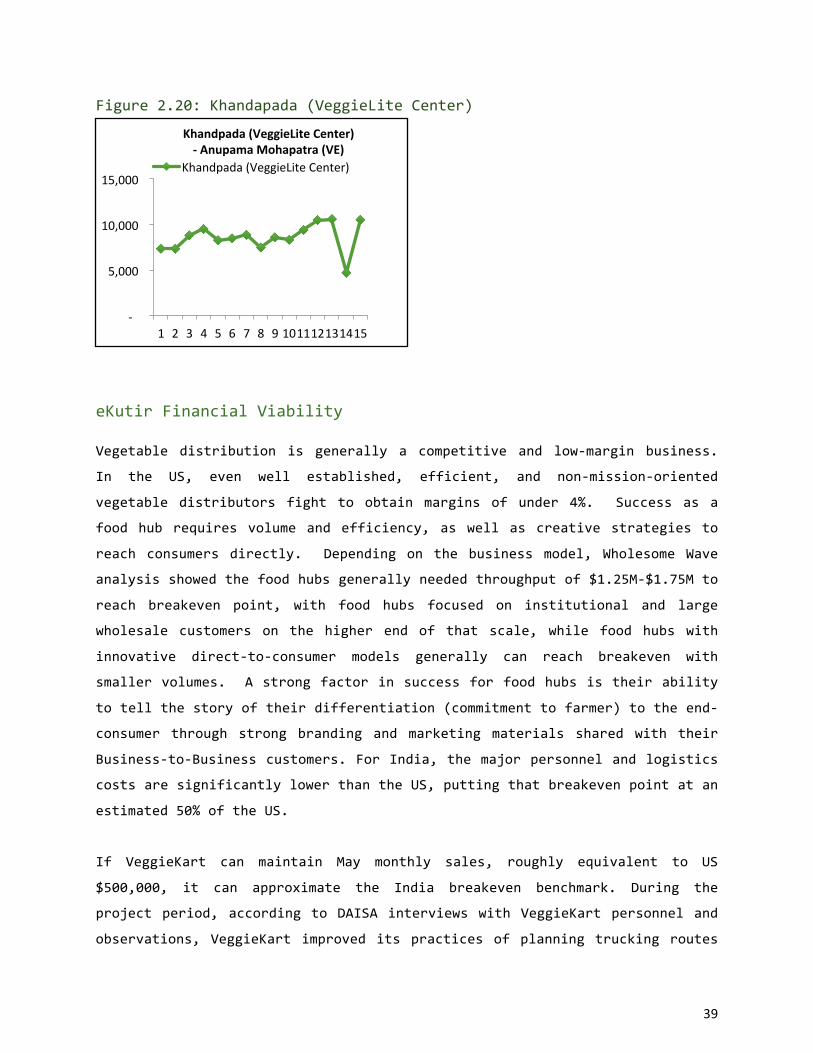
Below we discuss for each VeggieLite Entrepreneurs’ level operations and
sales information over the project period. Among all VeggieLite centers
Khandapada,JharsugudaandDaringbadihadshownstrongerandconsistentsales
sincebeginningofclusterformation.AngulVEcenterhasreferencecustomers
who also accessed VE center established inside campus of Jindal Steel and
PowersLimitedTownship.Acrossalllocationsitisevidentthatpreandpost
monsoon harvest was supplied to VE centers. Across all locations average
monthlysaleshadarangeofINR8000–30000foreachVEcenters.
42,09542,12542,156
42,18642,21742,248
42,27842,309
42,33942,370
42,40142,430
42,46142,491
42,522
1 2 3 4 5 6 7 8 9 10 11 12 13 14 15
AllVeggieLiteLocaaonscumulavesales-Sales(inINR)foreachmonthduringRuralintervenaon
38
Figure2.14:Jharsuguda(VeggieLiteCenter)
Figure2.15:Jharsuguda(VeggieLiteCenter)
Figure2.16:Paburia(VeggieLiteCenter) Figure2.17:Daringbadi(VeggieLiteCenter)
Figure2.18:Angul(VeggieLiteCenter) Figure2.19:Khandapada(VeggieLiteCenter)
-
10,000
20,000
30,000
1 2 3 4 5 6 7 8 9101112131415
Jharsuguda(VeggieLiteCenter)-ManojPatel(VE)
-
5,000
10,000
15,000
1 2 3 4 5 6 7 8 9101112131415
Paburia(VeggieLiteCenter)-GolapiNaik(VE)
Paburia(VeggieLiteCenter)
-
5,000
10,000
15,000
20,000
1 2 3 4 5 6 7 8 9101112131415
Angul(VeggieLiteCenter)-PadminiSahoo(VE)
Angul(VeggieLiteCenter)
-
5,000
10,000
15,000
1 2 3 4 5 6 7 8 9101112131415
Jharsuguda(VeggieLiteCenter)-RanjanKumarNayak(VE)
Jharsuguda(VeggieLiteCenter)
-
10,000
20,000
30,000
1 2 3 4 5 6 7 8 9101112131415
Daringbadi(VeggieLiteCenter)-NandiniDigal(VE)
Daringbadi(VeggieLiteCenter)
-
2,000
4,000
6,000
8,000
1 2 3 4 5 6 7 8 9101112131415
Khandpada(VeggieLiteCenter)-RitaNayak(VE)
Khandpada(VeggieLiteCenter)
39
Figure2.20:Khandapada(VeggieLiteCenter)
eKutirFinancialViabilityVegetable distribution is generally a competitive and low-margin business.
In the US, even well established, efficient, and non-mission-oriented
vegetable distributors fight to obtain margins of under 4%. Success as a
food hub requires volume and efficiency, as well as creative strategies to
reach consumers directly. Depending on the business model, Wholesome Wave
analysisshowedthefoodhubsgenerallyneededthroughputof$1.25M-$1.75Mto
reach breakeven point, with food hubs focused on institutional and large
wholesale customers on the higher end of that scale, while food hubs with
innovative direct-to-consumer models generally can reach breakeven with
smallervolumes.Astrongfactorinsuccessforfoodhubsistheirability
totellthestoryoftheirdifferentiation(commitmenttofarmer)totheend-
consumer through strong branding and marketing materials shared with their
Business-to-Businesscustomers.ForIndia,themajorpersonnelandlogistics
costsaresignificantlylowerthantheUS,puttingthatbreakevenpointatan
estimated50%oftheUS.
If VeggieKart can maintain May monthly sales, roughly equivalent to US
$500,000, it can approximate the India breakeven benchmark. During the
projectperiod,accordingtoDAISAinterviewswithVeggieKartpersonneland
observations, VeggieKart improved its practices of planning trucking routes
-
5,000
10,000
15,000
1 2 3 4 5 6 7 8 9101112131415
Khandpada(VeggieLiteCenter)-AnupamaMohapatra(VE)
Khandpada(VeggieLiteCenter)

40
and vendor locations, making its operations more efficient. It reduced
spoilage of products from 25% down to approximately 9% according to its
internalrecords.VeggieKartsupplementeditssalesthroughtherickshawand
VeggieLite channels with business-to-business VeggieMart relationship,
allowinghighervolumesales.

41
Chapter3:HouseholdandIndividualImpactsBackgroundIt is estimated that 2.7 million deaths (4.9%) and 26.7 million disability
adjustedlifeyears(DALYs:1.8%)areattributabletolowfruitandvegetable
(F&V) intake globally (Hall et al., 2009). Low vegetable intake is
particularly prevalent among poor, low-income populations. The VeggieLite
intervention aimed to change these figures by transforming the systems and
environments in which vegetables are produced, marketed, and sold. While
VeggieLite targets systems-level change, we aim in this part of our
evaluation to assess whether the intervention has ultimately impacted
individual and household levels of vegetable consumption in both urban and
ruralareasofOdisha,India.
In the urban areas, our evaluation at the household and individual level
soughttotestthefollowingmainhypotheses:
1) UrbanconsumersexposedtotheVeggieLiteinterventionwouldhavea
greater increase in their average vegetable servings per day than
thosenotexposedtotheintervention;
2) UrbanconsumersexposedtotheVeggieLiteinterventionwouldhavean
increase in the amount and diversity of vegetables purchased
comparedtothoseconsumersnotexposedtoVeggieLite.
Secondarily, the evaluation examined whether urban consumers exposed to
VeggieLite exhibited changes in their daily fruit servings, expenditure
patterns, beliefs about vegetables, and perceptions of the accessibility,
availability, and affordability of vegetables. The evaluation also assessed
possible changes in the social networks and social participation of those
consumers exposed to VeggieLite but did not expect significant changes in
networkvariables.
Inruralareas,theevaluationsoughttotestthefollowingmainhypotheses:

42
1) eKutirfarminghouseholdshaveagreaterincreaseintheiraverage
dailyservingsoffruitsandvegetablesthannon-eKutirfarmersin
thesamevillageandandthecomparisonvillages;
2) eKutirfarminghouseholdshaveagreaterincreaseintheiraverage
daily servings of vegetables than non-eKutir farmers in the same
villageandandthecomparisonvillages;
3) eKutir farming households have an increase in the amount and
diversityofvegetablespurchasedcomparedtonon-eKutirfarmersin
thesamevillageandthecomparisonvillages;
4) eKutir farming households have a greater increase in their average
daily fruit servings than non-eKutir farmers in the same village and
thecomparisonvillages;
5) eKutir farming households have an increase in their income from
vegetablesalescomparedtonon-eKutirfarmersinthesamevillageand
thecomparisonvillages.
Secondarily, the rural evaluation component examined whether rural eKutir
farmersalsoshowedchangesintheirbeliefsaboutvegetables,perceptionsof
theaccessibility,etc.aswithurbaneKutirfarmers.Sincetheintervention
didtargetaspectsofsocialrelations,e.g.,theformationofFIGs,wedid
anticipatechangesinthecompositionoffarmers’socialnetworks.
EvaluationDesignandProcess
ToassessthehouseholdandindividualimpactoftheVeggieLiteintervention
onruralandurbancommunities,theprojectusedaquasi-experimentaldesign
with baseline and endline measures in both areas. Since the selection of
urban wards and rural villages had to be made in conjunction with eKutir
operational requirements, and consumers and farmers purchase or participate
in VeggieLite voluntarily, a quasi-experimental design was selected. The
baseline and endline measures were taken after a one-year period so as to
capture possible seasonal variations in the effects of the VeggieLite
intervention on urban and rural households. As shown in 3.1 two study

43
samples were created: (1) a rural sample of producers/consumers, which
consistedoffarmersandtheirhouseholdmembers,and(2)anurbansampleof
consumers.
Figure3.1Methodology–Quasi-experimentalevaluationdesign
In urban areas, two quasi-experimental groups were formed: (1) consumers
residing in urban wards in which VeggieLite vendors would be located and
operate and (2) consumers residing in urban wards that VeggieLite vendors
would not service during the intervention period. Wards from which these
consumersaresampledwerematchedonthebasisofward-levelsocio-economic
characteristics,therebyimprovingcomparability.Giventheformativenature
of the VeggieLite program, it was unknown to us what the proportion of
VeggieLiteusersintreatedwardswasandwhatthepotentialproportionmight
reachovertheinterventionperiod.
Intheruralareas,threequasi-experimentalgroupswereformed:(1)eKutir
farmersinvillageswhereeKutirdeliverservices(hereafterreferredtoas
eKutiror‘treatment’villages);(2)acomparisongroupoffarmersresiding
in the eKutir treatment villages; and (3) a comparison group of farmers in
non-eKutirtreatedvillages.Villagesfromwhichthesefarmersaredrawnwere
matched on the basis of village-level, socio-economic development

44
characteristics and population size. The three-group design was meant to
enable a series of comparative assessments on the effectiveness of the
VeggieLiteinterventionontheconsumptionandproductionpatternsofrural
farming households. The design was meant to enable contrasts between (1)
“directly-treated”eKutirfarmersand“indirectly-treated”farmerswhomight
receive intervention benefits by residing in an eKutir village, (2)
“directly-treated”eKutirfarmersand“non-treated”farmerswhoresided,and
(3) “indirectly-treated” farmers and “non-treated” farmers. Contrasting
thesethreegroupsenablesamorecompleteassessmentofpossiblespillover
benefits of eKutir activities and gradated impacts among those farmers in
eKutir-treatedvillages.
Data on fruit and vegetable consumption from the 2002-2003 World Health
Organization Survey (WHS) in India and the 2011 (NSSO) survey are used to
calculate a priori sample size numbers. The WHS estimates average daily
surveysoffruitsandvegetablesinIndiaat4.7(1.8SD)and2.7(1.8SD)in
urban and rural areas respectively. The NSSO provides estimates of an
averageof2.5(0.45SD)vegetableservingsperdayinurbanareasofOdisha
and 2.3 (0.43 SD) vegetable servings per day in rural areas of Odisha.
Separatesamplesizesarecalculatedfortheurbanandruralareas.Asample
sizeof174households,withanequaldistributionof87households,existin
both comparison and treatment wards. A sample size of 360 households is
calculatedfortheruralevaluationcomponent,withanequaldistributionof
120householdsacrossthethreequasi-experimentalconditions.Forurbanand
rural areas, sample sizes are calculated to detect a 20% increase in the
number of vegetable and fruit servings per day per person. In other words,
for those persons consuming at the WHO recommended minimum level of 5
servingsperday,a20%increaserepresentsanincreaseof1servingperday.
Assuming the larger standard deviations found in the WHS, an increase of 1
servingperpersonperdayimpliesaneffectsizeof0.5,witha99%greater
chanceofbeingdetectable.Aneffectsizeof0.15wouldbedetectableata
95% chance. Given the pilot nature of the research and data from the
national surveys, we assume in our calculations generally low levels of

45
clusteringamongurbanwardsandruralvillages.
SelectionofStudySites
UrbansamplesitesandhouseholdsStudysiteswereselectedinrelationtoeKutiroperationalrequirementsin
boththeurbanandruralareas.Urbaninterventionandevaluationsiteswere
identifiedbyeKutirunderthetechnicalguidanceofIFPRIandMCCHE.Urban
wards were identified and included as possible sites according to the
followingcriteria:(i)lowincomearea,(ii)highpopulationdensity,(iii)
potentialmarketandprofitability,and(iv)accessiblelocation.
Working with a local data collection agency, enumerators were trained and
given information about households to be recruited in the city of
Bhubaneswar.Twourbanareas-SikharchandiandMaitrivihar-wereidentified
asstudyareas.InSikharchandi,twowardswereselectedastreatmentsites:
Sikharchandi(Ward2)andSitanathBasti(Ward14).InMaitrivihar,twowards
Figure3.2:BhubaneswarWards
46
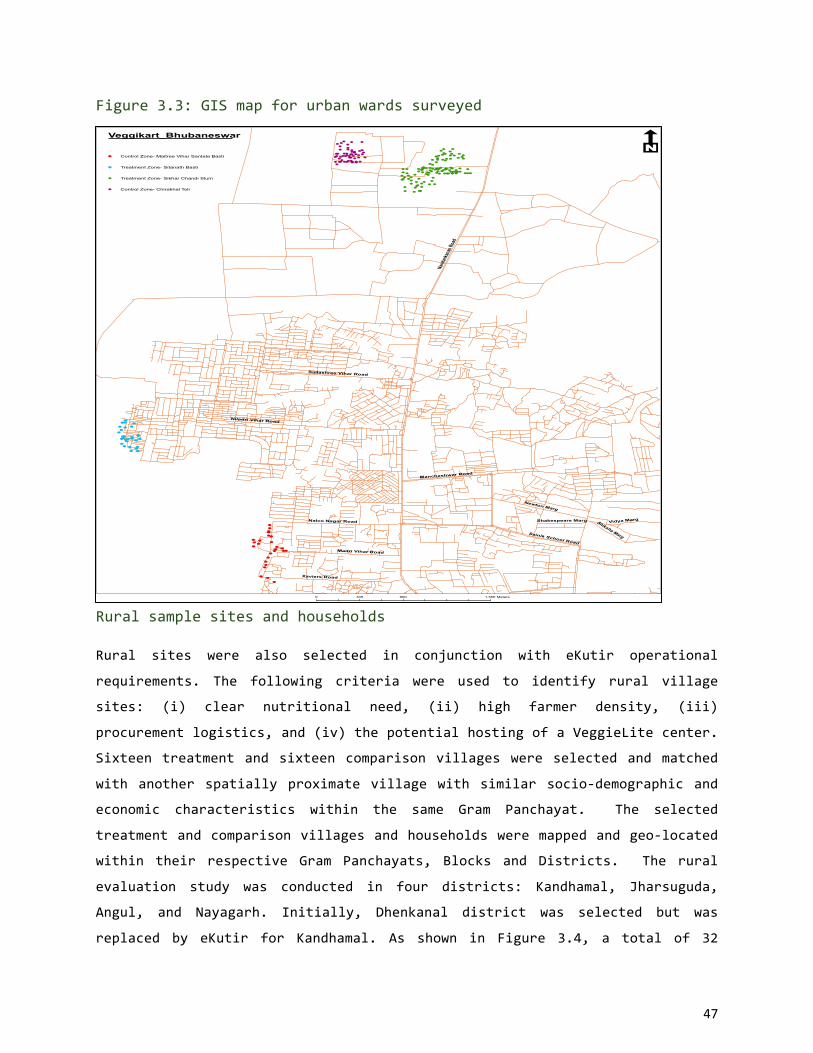
were selected as the comparison sites: ChirakhalToli (Ward 1) and Maitri
Vihar(Ward16).Thesewardsareshowninfigure3.2.
Intreatmentwards,householdsweredefinedaseligibleiftheywerewithina
onekilometercircularbufferzoneofapossibleVeggieLitecentrelocation.
Households were sampled systematically. The first household, which had the
nearestaccesstoapossibleVeggieLitecentre,wasrecruitedintothestudy
household samples. From that household, every tenth household in all
directionswasthenaskedtoparticipate.Ifthehouseholdrespondentrefused
to participate or did not answer, the eleventh household in distance was
selected.Householdswerenotscreenedorselectedonthebasisoftheiruse
orwillingnesstouseVeggieLiteservices.Inthecomparisonwards,asimilar
systematicsamplingprotocolwasused,withtheexceptionthatsamplingwas
initiated from an already existing vegetable vendor location. This vendor
was not affiliated with eKutir. All participating households were tagged
withgeo-coordinates(GPS)andassignedauniquehouseholdidentificationno.
(HHID) so that endline assessments could be conducted with the same
households.Figure3.3showsthelocationsofthehouseholdsparticipatingin
theurbanevaluation.
47
Figure3.3:GISmapforurbanwardssurveyed
RuralsamplesitesandhouseholdsRural sites were also selected in conjunction with eKutir operational
requirements. The following criteria were used to identify rural village
sites: (i) clear nutritional need, (ii) high farmer density, (iii)
procurementlogistics,and(iv)thepotentialhostingofaVeggieLitecenter.
Sixteentreatmentandsixteencomparisonvillageswereselectedandmatched
with another spatially proximate village with similar socio-demographic and
economic characteristics within the same Gram Panchayat. The selected
treatmentandcomparisonvillagesandhouseholdsweremappedandgeo-located
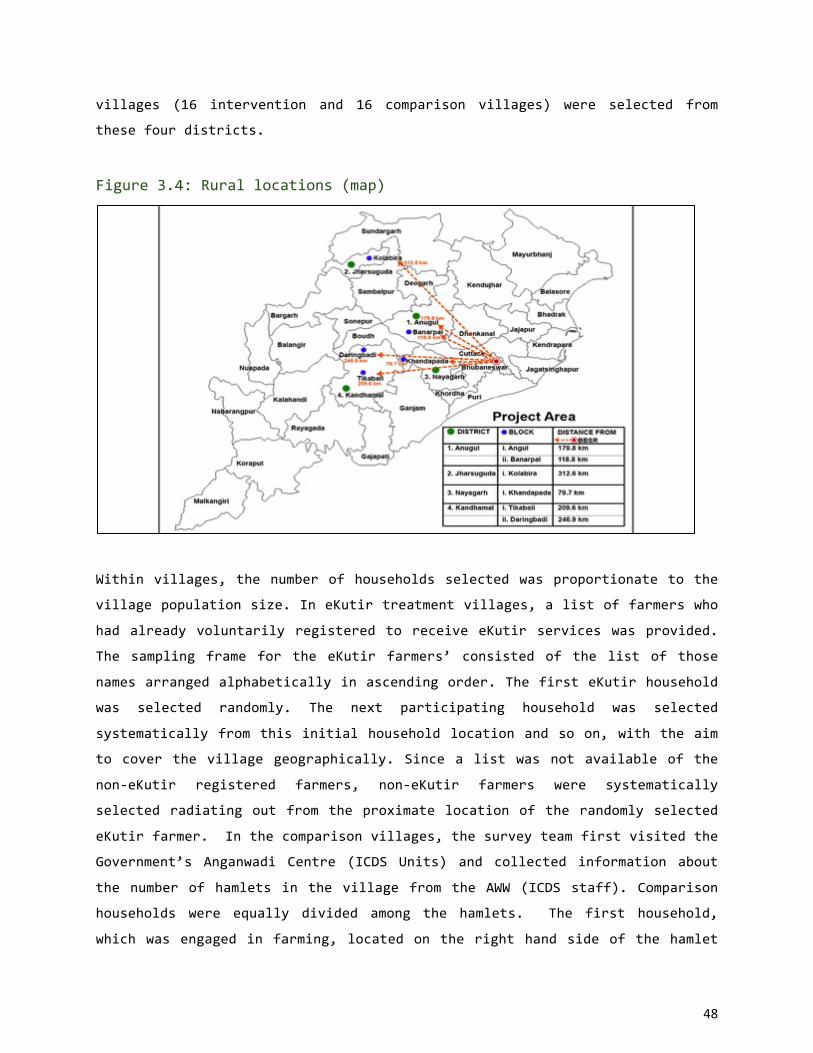
within their respective Gram Panchayats, Blocks and Districts. The rural
evaluation study was conducted in four districts: Kandhamal, Jharsuguda,
Angul, and Nayagarh. Initially, Dhenkanal district was selected but was
replaced by eKutir for Kandhamal. As shown in Figure 3.4, a total of 32
!(!(
!(!(
!(
!(
!(
!(
!(!(
!(
!(
!(!(!(
!(!(!(
!(!(!(
!(
!( !(!(
!(
!(
!(
!(!(
!(!(!(
!(!(!(
!(
!(
!(
!(
!(
!(
!(
!(
!(
!(!(!(
!(
!(!(
!(!(!(
!(!(
!(!(
!(
!(
!(
!(
!(!(!(
!(!(
!(!(
!( !( !(
!(
!(!(
!(
!(!(!(!(
!(!(
!(!(!(!(
!(!(!(
!(!( !(!(
!(
!(
!(!(!(
!(!(
!(
!(
!(!(!(
!(
!(
!(
!(!(
!(
!(!(
!(
!(!(
!(
!(
!(
!(
!(
!(!(
!(!(!(
!(
!(!(
!(!(
!(
!(
!(!( !(
!(
!(
!(
!( !(
!(
!(!(!(
!(
!(
!(
!(
!(
!(
!(
!(
!(!( !(!(!(
!( !(
!(
!(!(
!(
!(
!(!(
!(
!( !(!(
!(
!(
!( !(
!(
!(
!( !(!(
!(!(
!(!(!(
!(!(
!(
!(
!(
!(
!( !(
!(
!(
!(
!(
!(
!(
!(
!(
!(
!( !(
!(
!(
!(
!(
!(
!(
!(
!(
!(
!(
!(
!(
!(
!(
!(
Nand
ankana
n Road
Niladri Vihar Road
Xaviers Road
Newton Marg
Nalco Nagar Road
Sailashree Vihar Road
Vidya Marg
Maitri Vihar Road
Shiksha Marg
Mancheshwar Road
Sainik School Road
Shakespeare Marg
!( Control Zone- Maitree Vihar Santala Basti
!( Treatment Zone- Sitanath Basti
!( Treatment Zone- Sikhar Chandi Slum
!( Control Zone- Chirakhal Toli
Veggikart_Bhubaneswar
L
0 690 1,380345 Meters
48
villages (16 intervention and 16 comparison villages) were selected from
thesefourdistricts.
Figure3.4:Rurallocations(map)
Withinvillages,thenumberofhouseholdsselectedwasproportionatetothe
villagepopulationsize.IneKutirtreatmentvillages,alistoffarmerswho
hadalreadyvoluntarilyregisteredtoreceiveeKutirserviceswasprovided.
The sampling frame for the eKutir farmers’ consisted of the list of those
namesarrangedalphabeticallyinascendingorder.ThefirsteKutirhousehold
was selected randomly. The next participating household was selected
systematicallyfromthisinitialhouseholdlocationandsoon,withtheaim
to cover the village geographically. Since a list was not available of the
non-eKutir registered farmers, non-eKutir farmers were systematically
selectedradiatingoutfromtheproximatelocationoftherandomlyselected
eKutirfarmer.Inthecomparisonvillages,thesurveyteamfirstvisitedthe
Government’s Anganwadi Centre (ICDS Units) and collected information about
the number of hamlets in the village from the AWW (ICDS staff). Comparison
households were equally divided among the hamlets. The first household,
whichwasengagedinfarming,locatedontherighthandsideofthehamlet
49
was selected. From that household, every tenth household on the same side
wasselecteduntiltherequiredsamplesizefortheareawasachieved.
Evaluationinstruments,measures,andanalysismethodsHouseholdquestionnairesStructured questionnaires were administered to participating households and
respondents. Urban consumer questionnaires consisted of five modules,
whereas rural producer questionnaires consisted of an additional module on
agriculturalproductionandcropping.Table3.1liststhedifferentmodules
and their sub-sections. Module A asked participants about basic household
information and demographics, including the literacy and the educational
attainment of each household member. Module B, which was included only in
the rural farmer questionnaire, asked farmers about their cropping and
productionpatterns,plotutilization,marketingandcreditinformation,and
householddecision-making.ModuleCcollectedinformationonhouseholdfruit
and vegetable consumption patterns and food security. For consumption,
households were asked to name the top five vegetables, fruits, and pulses
that they had consumed in the past seven days. Follow-up questions asked
about the quantity, source, and the amount purchased versus home grown.
Module D asked participants about their perceptions on the availability,
affordability, and accessibility of vegetables, their beliefs and motives
regardingvegetableconsumption,andtheimportanceplacedonvegetablesasa
partoftheirdiets.ModuleEcollectedinformationonsocialparticipation
and perceptions of local social cohesion. In the rural questionnaire, two
name generator questions were asked: one on participants’ farming advice
networks and the other on cooking and dietary advice. This information
allowedustoassessthecompositionoftheruralhouseholdnetworks.Module
F asked participants about non-household food expenditures and household
assets.
50
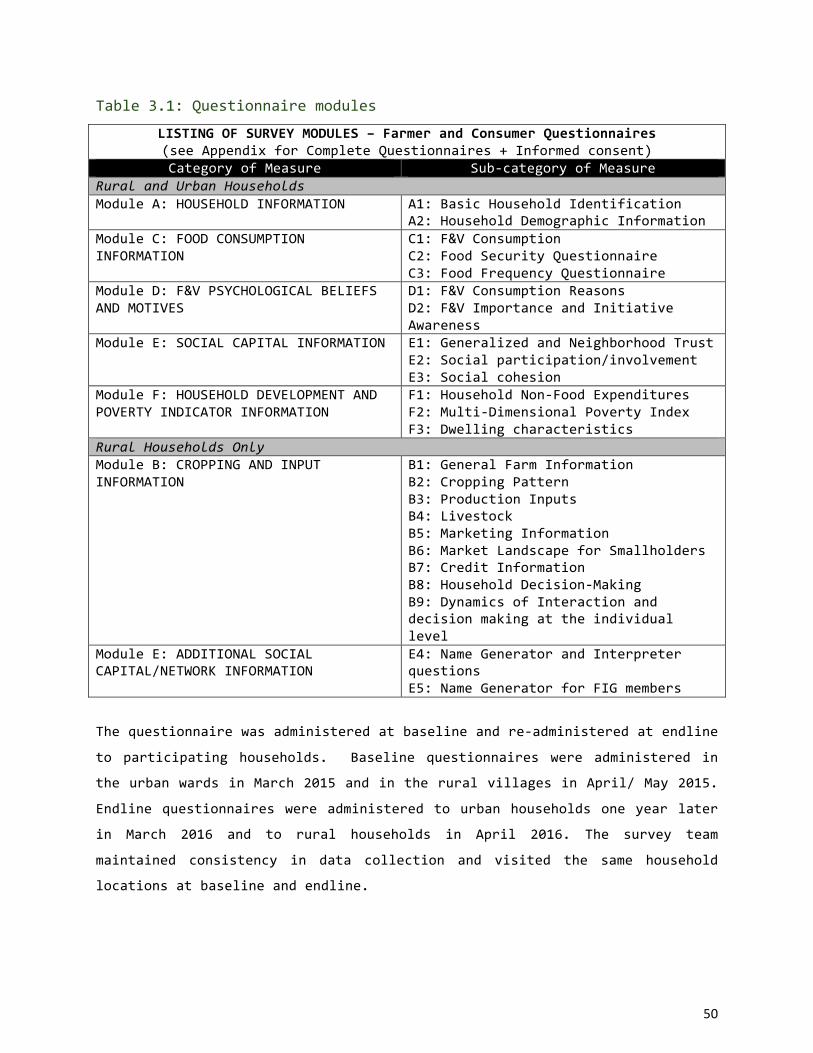
Table3.1:Questionnairemodules
LISTINGOFSURVEYMODULES–FarmerandConsumerQuestionnaires(seeAppendixforCompleteQuestionnaires+Informedconsent)CategoryofMeasure Sub-categoryofMeasure
RuralandUrbanHouseholdsModuleA:HOUSEHOLDINFORMATION A1:BasicHouseholdIdentification
A2:HouseholdDemographicInformationModuleC:FOODCONSUMPTIONINFORMATION
C1:F&VConsumptionC2:FoodSecurityQuestionnaireC3:FoodFrequencyQuestionnaire
ModuleD:F&VPSYCHOLOGICALBELIEFSANDMOTIVES
D1:F&VConsumptionReasonsD2:F&VImportanceandInitiativeAwareness
ModuleE:SOCIALCAPITALINFORMATION E1:GeneralizedandNeighborhoodTrustE2:Socialparticipation/involvementE3:Socialcohesion
ModuleF:HOUSEHOLDDEVELOPMENTANDPOVERTYINDICATORINFORMATION
F1:HouseholdNon-FoodExpendituresF2:Multi-DimensionalPovertyIndexF3:Dwellingcharacteristics
RuralHouseholdsOnlyModuleB:CROPPINGANDINPUTINFORMATION
B1:GeneralFarmInformationB2:CroppingPatternB3:ProductionInputsB4:LivestockB5:MarketingInformationB6:MarketLandscapeforSmallholdersB7:CreditInformationB8:HouseholdDecision-MakingB9:DynamicsofInteractionanddecisionmakingattheindividuallevel
ModuleE:ADDITIONALSOCIALCAPITAL/NETWORKINFORMATION
E4:NameGeneratorandInterpreterquestionsE5:NameGeneratorforFIGmembers
Thequestionnairewasadministeredatbaselineandre-administeredatendline
to participating households. Baseline questionnaires were administered in
theurbanwardsinMarch2015andintheruralvillagesinApril/May2015.
Endlinequestionnaireswereadministeredtourbanhouseholdsoneyearlater
in March 2016 and to rural households in April 2016. The survey team
maintained consistency in data collection and visited the same household
locationsatbaselineandendline.
51
Keyevaluationmeasures
VegetableandfruitconsumptionmeasuresTheWHOrecommendsaminimumoffiveservings,or400grams,offruitsand
vegetables per day, excluding potatoes and tubers: three servings of
vegetables and two servings of fruits per day. Since India’s dietary
guidelines include potatoes as vegetables, we considered potatoes as
vegetablesforourcalculation.Theaveragedailyservingsofvegetablesfor
each household was calculated by converting the total amount of vegetables
that was consumed over the last seven days into total grams per household.
Thetotalgramsperhouseholdwerethendividedbythehouseholdsizeforthe
averagegramsperperson.Toarriveataveragedailyservingsperperson,80
divided the average grams per person. The average daily servings of fruits
perpersonwerecalculatedinthesamefashion.Overallfruitandvegetable
consumptionisthesumofthevegetableandfruitservings.
The quantity of vegetables purchased is the total volume consumed by the
household without adjustment for household size. The number of different
vegetables consumed is the number of different types of vegetables that
households reported to consume. The questionnaire limits the number of
vegetables that could be named to five. For rural households, a fourth
measurerepresentingthepercentageofvegetablesconsumedthatwashomegrown
wasalsocalculated.
VegetableproductionandincomemeasuresFor the rural sample, household production measures were calculated. The
totalareadedicatedtovegetableproductionwasthesumofthecropacreage
dedicatedtogrowingdifferentvegetables.Vegetablesalesquantitywasthe
amountthathouseholdsproducedminustheamountthatwaseitherconsumedat
homeorgiftedorsoldininformalchannels.Householdincomegarneredfrom
vegetable production was the amount of vegetables sold multiplied by the
52
price.Inthequestionnaires,farmersreportedthepricethattheyreceived
fromthesaleofspecificvegetables.
BeliefsandperceptionsToassessbeliefsabouttheimportanceofvegetableconsumption,participants
were asked whether they believe vegetables are important for (i) improving
family health, (ii) good health and nutrition, (iii) your body, (iv) your
eyes and bones, (v) providing nutrients needed for the body, and (vi)
enhancingimmunityagainstdisease.Participantsrespondedusingafive-item
Likertscalefromnotimportant(1)toveryimportant(5).Summingthevalue
of the six responses created the “beliefs about vegetables” scale. Scores
couldthusrangefrom6to30.
In three separate questions, participants were also asked whether the (i)
affordability, (ii) availability, or (iii) accessibility of fruits and
vegetables impacted their decision to purchase fruits and vegetables.
Participantsrespondedonafive-pointLikertscalefromnotimportant(1)to
very important (5). The “perceptions” scale was constructed by summing the
threeitemstogether.Scorescouldrangefrom5to15.
Householdexpenditures(Urbanhouseholdsonly)Inurbanareas,participatinghouseholdswereaskedhowmuchtheyspentinan
averagemonthondifferentexpenditurecategories,including(i)fooditems
andbeverages,(ii)non-fooditems,and(iii)health.
Socialcohesion,socialnetworks,andparticipationTo assess social cohesion, participants were asked five items on whether
peopleintheirvillage(i)couldbetrusted,(ii)gotalongwitheachother,
(iii) were willing to help each other, (iv) could solve problems, and (v)
invited each other to family gatherings. Participants responded on a five-
point Likert scale from strongly agree (1) to strongly disagree (5). Items
53
werelaterreversecodedandsummedsothathigherscoresrepresentedhigher
perceptionsofsocialcohesion.Socialcohesionscorescouldrangefrom5to
25.Forsocialparticipation,respondentswereaskediftheyhadparticipated
in a village group or meeting in the past year. In urban wards, to assess
cognitivesocialcapital,participantswereaskediftheythoughtthatpeople
ingeneralcouldbetrustedornot.Inurbanwards,participantswereasked
howmanypeopletheydiscussedcookingordietarymatterswith,ingeneral,
overthepastsixmonths.Inruralvillages,namegeneratorquestionsasked
participants to name up to three people with whom they had discussed (i)
agriculturalandfarmingmattersinthepastthreemonthsand(ii)dietaryor
cooking matters in the last three months. Participants were then asked
informationaboutthosepersonswhomtheynamed,includingwhetherthey(i)
residedintheirvillage,(ii)werefarmers,and(iii)belongedtoeKutir’s
farmerinterventiongroups.
SocioeconomiccharacteristicsParticipantswereadministeredtenquestionitemsfromtheMulti-Dimensional
PovertyIndex.Usingtheresponsesfromthisindex,principalcomponentswas
used to construct a socioeconomic score for each household. Household
socioeconomic characteristics were considered a possible confounder in
certainanalyses.
eKutirOperationalDataTocomplimentthesamplesurveydata,eKutirprovidedsalesandoperational
data for VeggieLite vendors in urban wards and agricultural micro-
entrepreneursintheruralvillages.Intheurbanwards,salescouldnotbe
linkedtospecificsamplehouseholdsorrespondents.Assuch,theVeggieLite
vendorinformationintheurbanwardsservesmainlytosupplementourpicture
ofvegetablesalesinthoseareas.Intheruralvillages,micro-entrepreneur
datacouldbelinkedtotheresponsesofthoseeKutirfarmersselectedinto
thestudy.Thisallowedtheevaluationtocomparethefarmers’self-reported
production,priceandincomeinformationtoobjective,operationaldataand

54
assesswhethertheincomesofeKutirfarmerscomingfromvegetableproduction
objectivelyincreasedoverthepilotinterventionperiod.
AnalysisApproachTo assess the impact of the VeggieLite program, we elected to define
partipants’ exposure to the intervention in two ways. First, we used the
quasi-experimentalconditionsinwhichparticipantsfelltodefinewhethera
householdwasorwasnotexposedtotheintervention.Forexample,inurban
areas,thisrepresentedwhetheraparticipantresidedinatreatmentinstead
ofcomparisonward.Second,wealsoelectedtodefineexposureonthebasis
ofwhetherparticipantsengageddirectlyintheVeggieLiteprogrameitherby
purchasingvegetablesfromVeggieLitevendorsduringtheinterventionperiod
or participating in eKutir’s FIG groups. As shown in Tables (Table – 3.3,
3.4,3.5,3.7,3.8,3.11,3.12,3.13,3.14,3.15),separatesetsofanalyses
wereconductedforeachdefinitionofexposureforruralandurbansamples.
Foreachset,aseriesofthreestatisticaltestswereusedtoevaluatethe
nutritional,social,andeconomicimpactoftheVeggieLitemodelinruraland
urbanareasofOdisha.First,t-tests,ANOVA,andchi-squaretestswereused
toexaminewhetherthereweresignificantdifferencesatbaselineandendline
between treatment and comparison groups on the key measures. For these
analyses, we only examined the data for those respondents who replied at
baseline and endline to limit differences due to study attrition. Second,
variables representing the difference between endline and baseline (i.e.,
change) were constructed by subtracting baseline values from those at
endline.Positivevaluesthusreflectedanincreaseinthevariablefrom2015
to 2016. ANOVA and paired sample t-tests were then conducted using these
difference variables to assess whether there was a significant increase or
decrease in the treatment compared to the comparison group over the year.
Finally,regressionanalyseswereconductedwiththedifferencevariableson
vegetable consumption to examine whether treatment and comparison groups
differed significantly from one another after adjusting for possible
confounders,suchasthesocioeconomicanddecision-makingcharacteristicsof
the household. Statistical significance was marked at four p-value levels:

55
0.10, 0.05, 0.01, and 0.001. Analyses were conducted using Stata, version
14.
EvaluationFindingsThefollowingsectionprovidesthedescriptivestatisticsandtheevaluation
resultsofthepilotinterventionintheurbanandruralareas.
TheUrbanSampleFour Bhubaneswar wards were selected for the urban study: Ward 1
(ChirakhalToli),Ward2(Sikharchandi),Ward14(SitanathBasti),andWard16
(MaitriVihar).Asshownintable3.2,therewere218householdrespondents
recruited at baseline with 191 respondents participating again at endline.
Nine and eighteen respondents were lost to follow up in the treatment and
comparisonwardsrespectively.
Table3.2:Baselineandendlinesamplenumbersbyquasi-experimental
conditionandwardsite.
WardNo. Baseline Endline
TreatmentWard2 79 73Ward14 28 25
Total 107 98
ComparisonWard1 85 74Ward16 26 19
Total 111 93Total 218 191
Table 3.3 provides information on the socio-demographic characteristics of
the sample at baseline and endline stratified by experimental condition.
There was no significant difference between the treatment and comparison
groups at baseline but there was a difference noted at endline, with the
comparison groups having a larger household size. This suggests that
attrition was higher among households with smaller household size,
particularlyinthecomparisongroup.TheprimaryhouseholdlanguagewasOdia
withsimilarpercentagesinthetreatmentandcomparisongroups.Theaverage
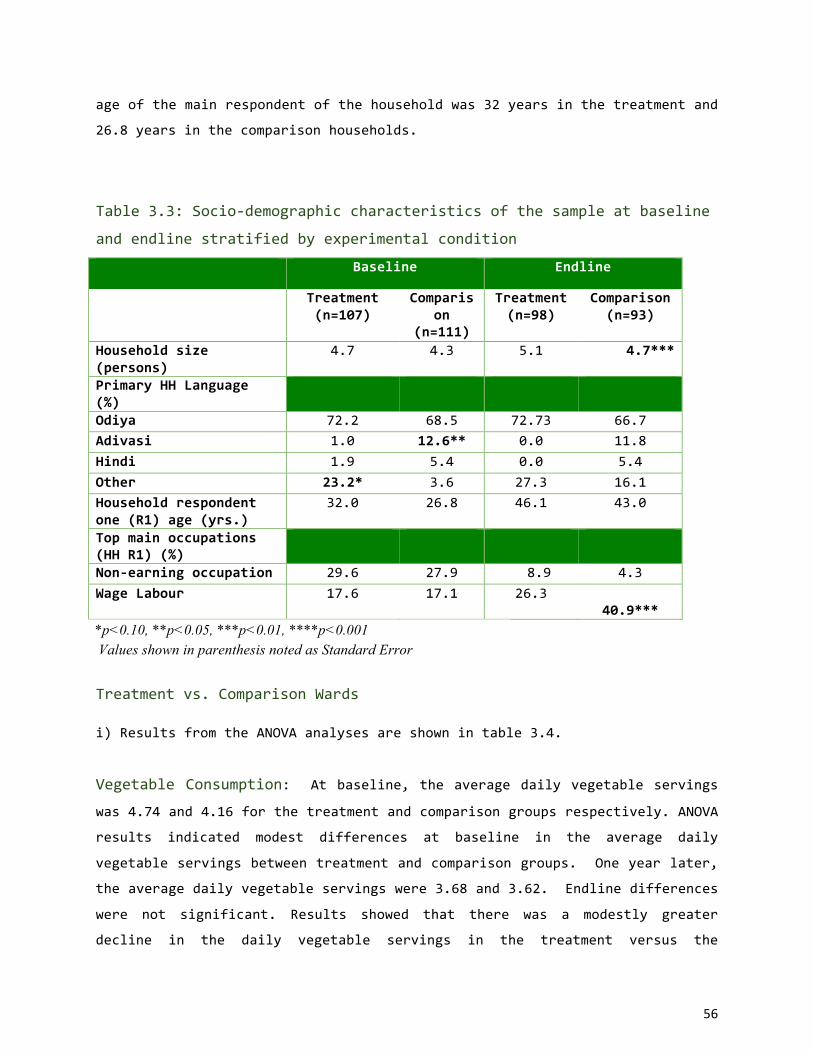
56
ageofthemainrespondentofthehouseholdwas32yearsinthetreatmentand
26.8yearsinthecomparisonhouseholds.
Table3.3:Socio-demographiccharacteristicsofthesampleatbaseline
andendlinestratifiedbyexperimentalcondition
Baseline Endline
Treatment(n=107)
Comparison
(n=111)
Treatment(n=98)
Comparison(n=93)
Householdsize(persons)
4.7 4.3 5.1 4.7***
PrimaryHHLanguage(%)
Odiya 72.2 68.5 72.73 66.7Adivasi 1.0 12.6** 0.0 11.8Hindi 1.9 5.4 0.0 5.4Other 23.2* 3.6 27.3 16.1Householdrespondentone(R1)age(yrs.)
32.0 26.8 46.1 43.0
Topmainoccupations(HHR1)(%)
Non-earningoccupation 29.6 27.9 8.9 4.3WageLabour 17.6 17.1 26.3
40.9****p<0.10, **p<0.05, ***p<0.01, ****p<0.001 Values shown in parenthesis noted as Standard Error
Treatmentvs.ComparisonWardsi)ResultsfromtheANOVAanalysesareshownintable3.4.
VegetableConsumption:Atbaseline,theaveragedailyvegetableservings
was4.74and4.16forthetreatmentandcomparisongroupsrespectively.ANOVA
results indicated modest differences at baseline in the average daily
vegetableservingsbetweentreatmentandcomparisongroups.Oneyearlater,
theaveragedailyvegetableservingswere3.68and3.62.Endlinedifferences
were not significant. Results showed that there was a modestly greater
decline in the daily vegetable servings in the treatment versus the

57
comparison groups (F=3.05, p<0.10). At baseline, results showed that
treatment groups purchased a higher quantity of vegetables with modest
declineinthequantitypurchasedbetweenbaselineandendline.Therewereno
differences between treatment and comparison groups in the number of
differentvegetablespurchased.Therewerealsonodifferencesshownbetween
the treatment and comparison groups in their average daily servings of
fruits.
Perceptions,Beliefs,andExpenditures:Therewerenodifferencesbetween
treatment and comparison groups on their perceptions of the accessibility,
affordability, and availability of vegetables in the local environment.
Resultsshowedsignificantbaselinedifferencesintheimportanceplacedon
vegetablesbetweentreatmentandcomparisongroups(F=2.79,p<0.10),with
the treatment group placing greater importance on vegetables. These
differenceswerestarkeratendlinebuttherewasnosignificantchangeshown
over the year. At baseline, results showed that the treatment group had
lower percentage of spending on food than the comparison group (F=2.86,
p<0.10). Yet, endline results indicated that the treatment group spent a
higher percentage on food and that the increase over the year differed
significantlybetweenthegroups(F=9.16,p<0.01).Atbaselineandendline,
treatmentgroupshadhigherexpendituresthanthecomparisongroup.
Table3.4:ResultsfromtheANOVAanalyses
Baseline Levels Endline Levels Mean Change (Endline-Baseline)
Treatment Compari
son F-Stat
Treatment
Comparison F-Stat
Treatment
Comparison F-
Stat (n=98) (n=93) (n=98) (n=93) (n=98) (n=93) Fruits and Vegetables (servings/day)
5.38 4.79 3.67* 4.51 4.50 0.00 -0.88 -0.18 4.08
** (0.28) (0.20) (0.20) (0.21) (0.26) (0.22)
Vegetable (servings/day)
4.74 4.16 3.57* 3.68 3.62 0.08 -1.05 -0.54 3.05
* (0.25) (0.18) (0.16) (0.17) (0.19) (0.20)
Fruit (servings/day)
0.65 0.53 0.56 0.82 0.88 0.24 0.17 0.35 1.49 (0.09) (0.08) (0.09) (0.08) (11.00) (0.10)
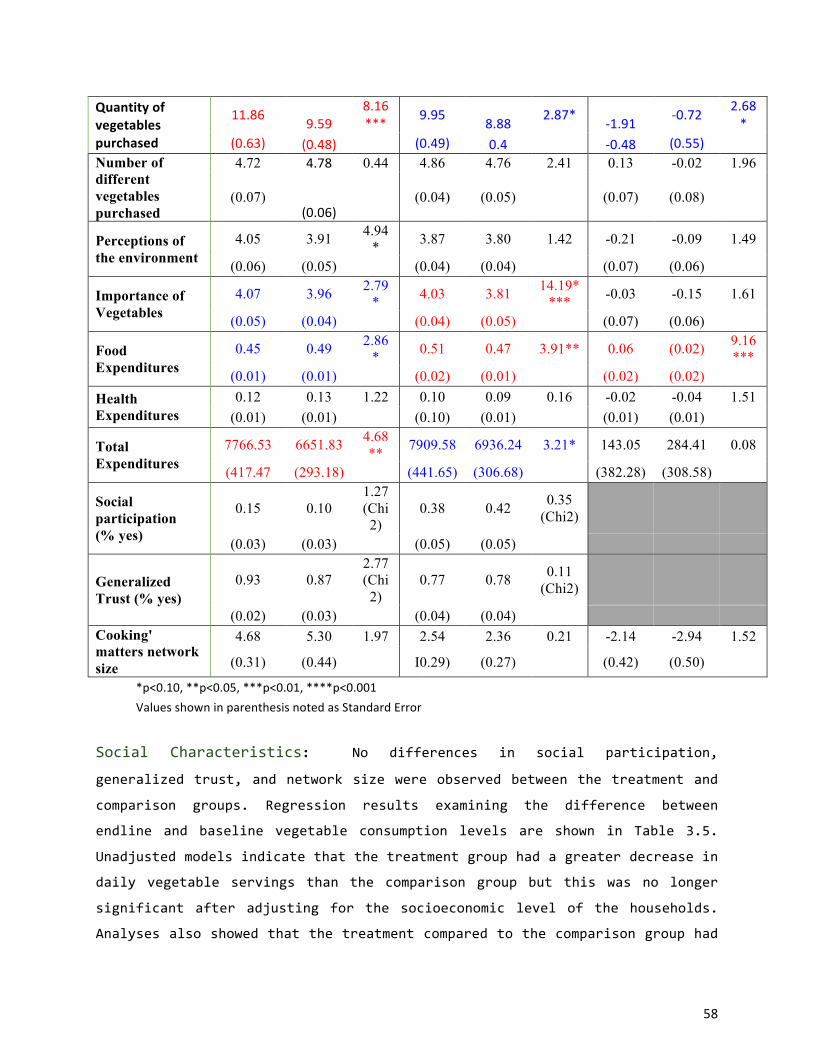
58
Quantityofvegetablespurchased
11.86 9.598.16*** 9.95 8.88 2.87* -1.91 -0.72 2.68
*(0.63) (0.48) (0.49) 0.4 -0.48 (0.55)
Number of different vegetables purchased
4.72 4.78 0.44 4.86 4.76 2.41 0.13 -0.02 1.96
(0.07) (0.06)
(0.04) (0.05) (0.07) (0.08)
Perceptions of the environment
4.05 3.91 4.94* 3.87 3.80 1.42 -0.21 -0.09 1.49
(0.06) (0.05) (0.04) (0.04) (0.07) (0.06)
Importance of Vegetables
4.07 3.96 2.79* 4.03 3.81 14.19*
*** -0.03 -0.15 1.61
(0.05) (0.04) (0.04) (0.05) (0.07) (0.06)
Food Expenditures
0.45 0.49 2.86* 0.51 0.47 3.91** 0.06 (0.02) 9.16
*** (0.01) (0.01) (0.02) (0.01) (0.02) (0.02)
Health Expenditures
0.12 0.13 1.22 0.10 0.09 0.16 -0.02 -0.04 1.51 (0.01) (0.01) (0.10) (0.01) (0.01) (0.01)
Total Expenditures
7766.53 6651.83 4.68** 7909.58 6936.24 3.21* 143.05 284.41 0.08
(417.47 (293.18) (441.65) (306.68) (382.28) (308.58)
Social participation (% yes)
0.15 0.10 1.27 (Chi2)
0.38 0.42 0.35 (Chi2)
(0.03) (0.03) (0.05) (0.05)
Generalized Trust (% yes)
0.93 0.87 2.77 (Chi2)
0.77 0.78 0.11 (Chi2)
(0.02) (0.03) (0.04) (0.04) Cooking' matters network size
4.68 5.30 1.97 2.54 2.36 0.21 -2.14 -2.94 1.52
(0.31) (0.44) I0.29) (0.27) (0.42) (0.50)
*p<0.10,**p<0.05,***p<0.01,****p<0.001 ValuesshowninparenthesisnotedasStandardError
Social Characteristics: No differences in social participation,
generalizedtrust,andnetworksizewereobservedbetweenthetreatmentand
comparison groups. Regression results examining the difference between
endline and baseline vegetable consumption levels are shown in Table 3.5.
Unadjustedmodelsindicatethatthetreatmentgrouphadagreaterdecreasein
daily vegetable servings than the comparison group but this was no longer
significant after adjusting for the socioeconomic level of the households.
Analysesalsoshowedthatthetreatmentcomparedtothecomparisongrouphad

59
agreaterdecreaseinthequantityofvegetablespurchased(B=-1.30,p<0.10).
Finally, adjusted results showed that the treatment group had a modest
increaseinthenumberofdifferentvegetablespurchasedovertheyear(B=
0.22,p<0.10).
Table3.5:Regressionresultsexaminingthedifferencebetweenendline
andbaselinevegetableconsumptionlevels
Variable VegetableServingsperDay
QuantityofVegetablesPurchased
NumberofdifferentVegetablesPurchased
TreatmentHouseholds(n=98)
-0.52(0.30)*
-0.51(0.31)
-1.19(0.73)
-1.30(0.76)*
0.15(0.11)
0.22(0.11)*
Controlhouseholds(n=91) REF REF REF REF REF REF
Socioeconomic/Povertylevel -0.01
(0.10) 0.14(0.25) -0.08
(0.04)**
Constant -0.54(0.20)
-0.54(0.22)
-0.72(0.52)
-0.66(0.53)
-0.02(0.08)
-0.05(0.08)
*p<0.10, **p<0.05, ***p<0.01, ****p<0.001 Values shown in parenthesis noted as Standard Error VeggieLiteConsumersvs.Non-VeggieLiteConsumersTable 3.6 provides information on the main sources from which respondents
reported purchasing vegetables in the different seasons at baseline and
endline.ThehighestpercentagewasamongtheVillageMandiatbothbaseline
and endline. The following analyses spotlight the nutritional impact of
VeggieLite on those households that reported VeggieLite as being the main
sourceforpurchasingvegetablesovertheinterventionperiod(n=7).
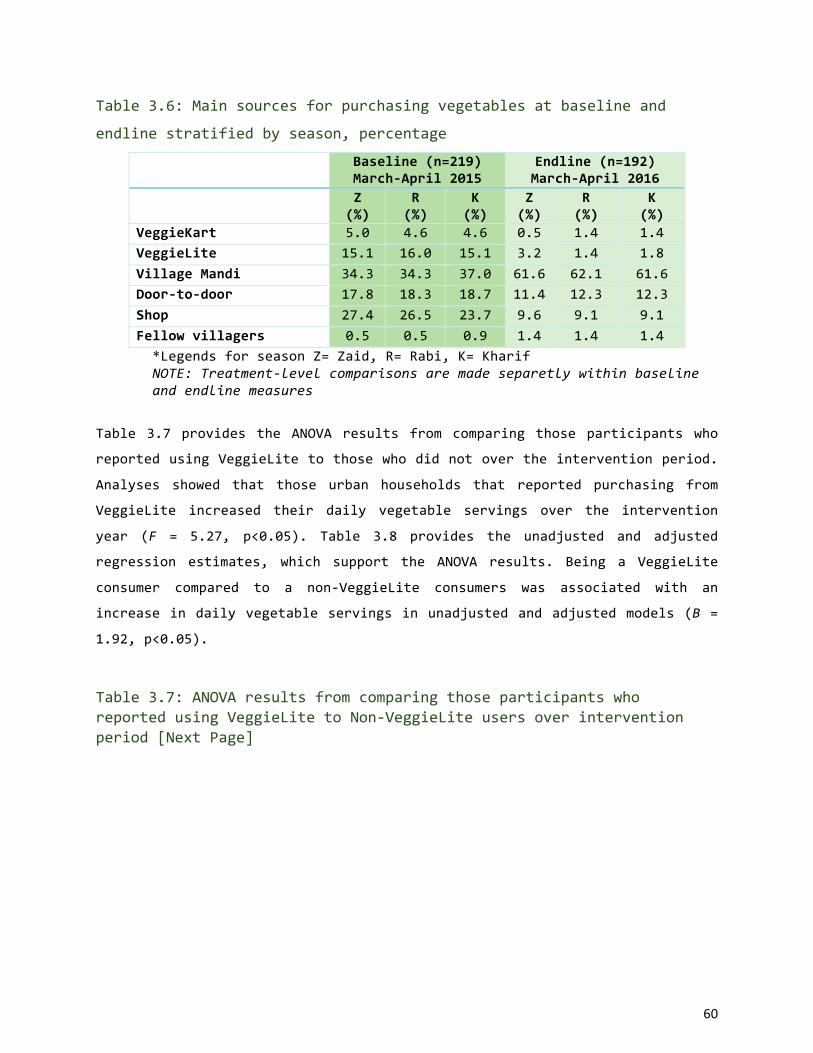
60
Table3.6:Mainsourcesforpurchasingvegetablesatbaselineand
endlinestratifiedbyseason,percentage
Baseline(n=219)March-April2015
Endline(n=192)March-April2016
Z(%)
R(%)
K(%)
Z(%)
R(%)
K(%)
VeggieKart 5.0 4.6 4.6 0.5 1.4 1.4VeggieLite 15.1 16.0 15.1 3.2 1.4 1.8VillageMandi 34.3 34.3 37.0 61.6 62.1 61.6Door-to-door 17.8 18.3 18.7 11.4 12.3 12.3Shop 27.4 26.5 23.7 9.6 9.1 9.1Fellowvillagers 0.5 0.5 0.9 1.4 1.4 1.4
*LegendsforseasonZ=Zaid,R=Rabi,K=KharifNOTE:Treatment-levelcomparisonsaremadeseparetlywithinbaselineandendlinemeasures
Table 3.7 provides the ANOVA results from comparing those participants who
reportedusingVeggieLitetothosewhodidnotovertheinterventionperiod.
Analyses showed that those urban households that reported purchasing from
VeggieLite increased their daily vegetable servings over the intervention
year (F = 5.27, p<0.05). Table 3.8 provides the unadjusted and adjusted
regression estimates, which support the ANOVA results. Being a VeggieLite
consumer compared to a non-VeggieLite consumers was associated with an
increaseindailyvegetableservingsinunadjustedandadjustedmodels(B=
1.92,p<0.05).
Table3.7:ANOVAresultsfromcomparingthoseparticipantswhoreportedusingVeggieLitetoNon-VeggieLiteusersoverinterventionperiod[NextPage]

61
Baseline Levels Endline Levels Mean Change (Endline-Baseline)
VL Buyers
Non-VL F-Stat
VL Buyers
Non-VL F-
Stat
VL Buyers
Non-VL F-Stat
(n=7) (n=184) (n=7) (n=18
4) (n=7) (n=184)
Fruits and Vegetables (servings/day)
4.02 5.11 1.49 5.02 4.49 0.49 0.99 ‘-0.60 2.96*
(0.74) (0.18) (0.51) (0.15) (1.03) (0.18)
Vegetables (servings/day)
3.19 4.50 2.56 4.12 3.63 0.62 0.93 -0.86 5.27** (0.48) (0.16) (0.57) (0.11) (0.87) (0.14)
Quantityofvegetablespurchased
9.92 10.79 0.16 11 9.37 0.92 1.08 -1.42 1.65
(3.256) (0.40) (1.32) (0.33) (3.02) (0.36) Number of different vegetables purchased
4.43 4.77 1.95 4.86 4.81 0.09 0.43 0.04 1.73
(0.43) (0.04) (0.14) (0.03) (0.48) (0.05)
Fruit (servings/day)
0.84 0.58 0.70 0.90 0.85 0.02 0.06 0.25 0.28 (0.50) (0.06) (0.22) (0.06) (0.33) (0.07)
Perceptions of the environment
4.43 3.97 4.16** 3.95 3.83 0.58 -0.48 -0.14 1.90 (0.14) (0.04) (0.13) (0.03) (0.18) (0.05)
Importance of Vegetables
4.05 4.01 0.04 4.07 3.92 0.79 0.02 -0.09 0.22 (0.17) (0.03) (0.08) (0.03) (0.15) (0.05)
Food Expenditures
0.46 0.47 0.00 0.49 0.49 0.01 0.02 0.02 0.00 (0.07) (0.01) (0.01) (0.04) (0.08) (0.01)
Health Expenditures
0.12 0.12 0.01 0.12 0.09 0.89 0.00 -0.03 0.55 (0.01) (0.01) (0.03) (0.01) (0.02) (0.01)
Total Expenditures
5435.71
7291.79 1.81 8378.57 7399.7
8 0.45 2942.86 107.98 4.76**
(789.12)
(267.09)
(1426.86)
(278.52) (919.14) (250.6
3) Social participation (% yes)
0.14 0.12 0.02 0.71 0.39 3.04 (0.14) (0.02) (0.18) (0.04)
Generalized Trust (% yes)
0.86 0.91 0.26 0.86 0.77 0.28 (0.14) (0.02) (0.14) (0.03)
Cooking' matters network size
6.14 4.93 0.81 3.57 2.41 1.23 -2.57 -2.52 0.00
(2.10) (0.26) (0.81) (0.20) (2.19) (0.33) *p<0.10, **p<0.05, ***p<0.01, ****p<0.001
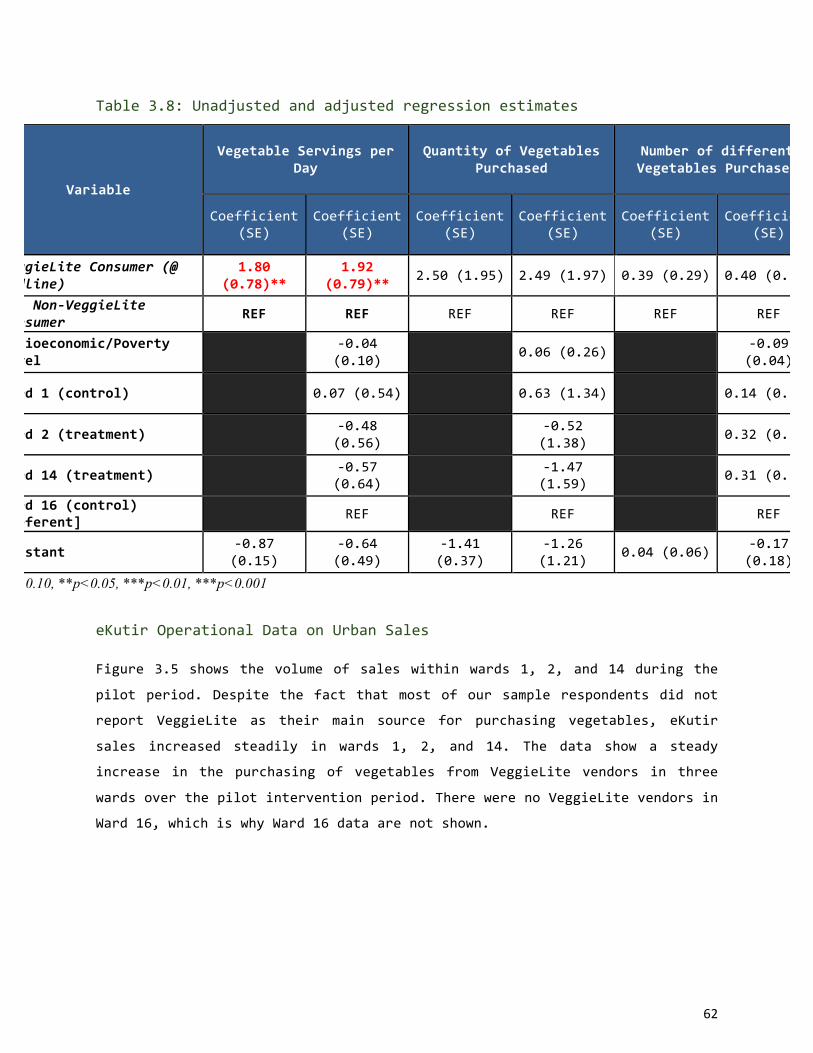
62
Table3.8:Unadjustedandadjustedregressionestimates
Variable
VegetableServingsperDay
QuantityofVegetablesPurchased
NumberofdifferentVegetablesPurchased
Coefficient(SE)
Coefficient(SE)
Coefficient(SE)
Coefficient(SE)
Coefficient(SE)
Coefficient(SE)
VeggieLiteConsumer(@Endline)
1.80(0.78)**
1.92(0.79)** 2.50(1.95) 2.49(1.97) 0.39(0.29) 0.40(0.29)
-Non-VeggieLiteConsumer REF REF REF REF REF REF
Socioeconomic/Povertylevel -0.04
(0.10) 0.06(0.26) -0.09(0.04)
Ward1(control) 0.07(0.54) 0.63(1.34) 0.14(0.20)
Ward2(treatment) -0.48(0.56) -0.52
(1.38) 0.32(0.21)
Ward14(treatment) -0.57(0.64) -1.47
(1.59) 0.31(0.24)
Ward16(control)[Referent] REF REF REF
Constant -0.87(0.15)
-0.64(0.49)
-1.41(0.37)
-1.26(1.21) 0.04(0.06) -0.17
(0.18)*p<0.10, **p<0.05, ***p<0.01, ***p<0.001
eKutirOperationalDataonUrbanSalesFigure 3.5 shows the volume of sales within wards 1, 2, and 14 during the
pilot period. Despite the fact that most of our sample respondents did not
report VeggieLite as their main source for purchasing vegetables, eKutir
sales increased steadily in wards 1, 2, and 14. The data show a steady
increase in the purchasing of vegetables from VeggieLite vendors in three
wardsoverthepilotinterventionperiod.TherewerenoVeggieLitevendorsin
Ward16,whichiswhyWard16dataarenotshown.

63
Figure3.5:TotalWeeklySales(kgs)forVeggieLiteServicesbyMonth
inselectWards
ThedeclineshowninWard2islikelyattributabletotheclosureofoneof
theVeggieLitevendorsinSeptember2015.Thisvendorhadalongestablished
relationshipwithlocalresidentsandwasstrategicallysituatedatanentry
location for Ward 2 residents. Although another vendor opened in this same
period,thenewlyopenedvendorwassituateddeeperintheWard2area.
TheRuralSampleTable3.9providesthebaselineandendlinesamplesizesbyquasi-experimentalconditionanddistrictsite.Therewere
0
500
1000
1500
2000
2500
3000
3500
4000
4500
Mar
-15
Apr
-15
May
-15
Jun-
15
Jul-1
5
Aug
-15
Sep-
15
Oct
-15
Nov
-15
Dec
-15
Jan-
16
Feb-
16
Mar
-16
Apr
-16
Total Sales (kgs)
Ward 2
Ward 14
Ward 1
ClosureofoneVLvendor(W2)
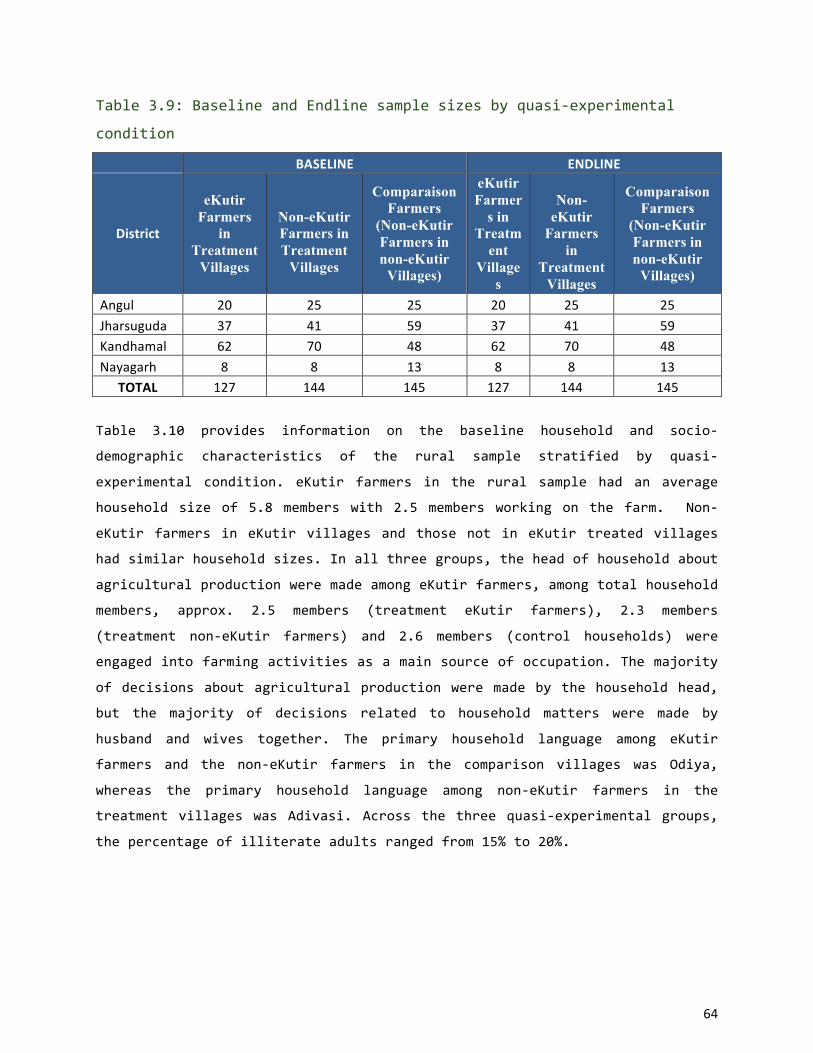
64
Table3.9:BaselineandEndlinesamplesizesbyquasi-experimental
condition
BASELINE ENDLINE
District
eKutir Farmers
in Treatment
Villages
Non-eKutir Farmers in Treatment
Villages
Comparaison Farmers
(Non-eKutir Farmers in non-eKutir
Villages)
eKutir Farmer
s in Treatm
ent Village
s
Non-
eKutir Farmers
in Treatment
Villages
Comparaison Farmers
(Non-eKutir Farmers in non-eKutir
Villages)
Angul 20 25 25 20 25 25Jharsuguda 37 41 59 37 41 59Kandhamal 62 70 48 62 70 48Nayagarh 8 8 13 8 8 13
TOTAL 127 144 145 127 144 145
Table 3.10 provides information on the baseline household and socio-
demographic characteristics of the rural sample stratified by quasi-
experimental condition. eKutir farmers in the rural sample had an average
household size of 5.8 members with 2.5 members working on the farm. Non-
eKutir farmers in eKutir villages and those not in eKutir treated villages
hadsimilarhouseholdsizes.Inallthreegroups,theheadofhouseholdabout
agriculturalproductionweremadeamongeKutirfarmers,amongtotalhousehold
members, approx. 2.5 members (treatment eKutir farmers), 2.3 members
(treatment non-eKutir farmers) and 2.6 members (control households) were
engagedintofarmingactivitiesasamainsourceofoccupation.Themajority
ofdecisionsaboutagriculturalproductionweremadebythehouseholdhead,
but the majority of decisions related to household matters were made by
husband and wives together. The primary household language among eKutir
farmers and the non-eKutir farmers in the comparison villages was Odiya,
whereas the primary household language among non-eKutir farmers in the
treatment villages was Adivasi. Across the three quasi-experimental groups,
thepercentageofilliterateadultsrangedfrom15%to20%.
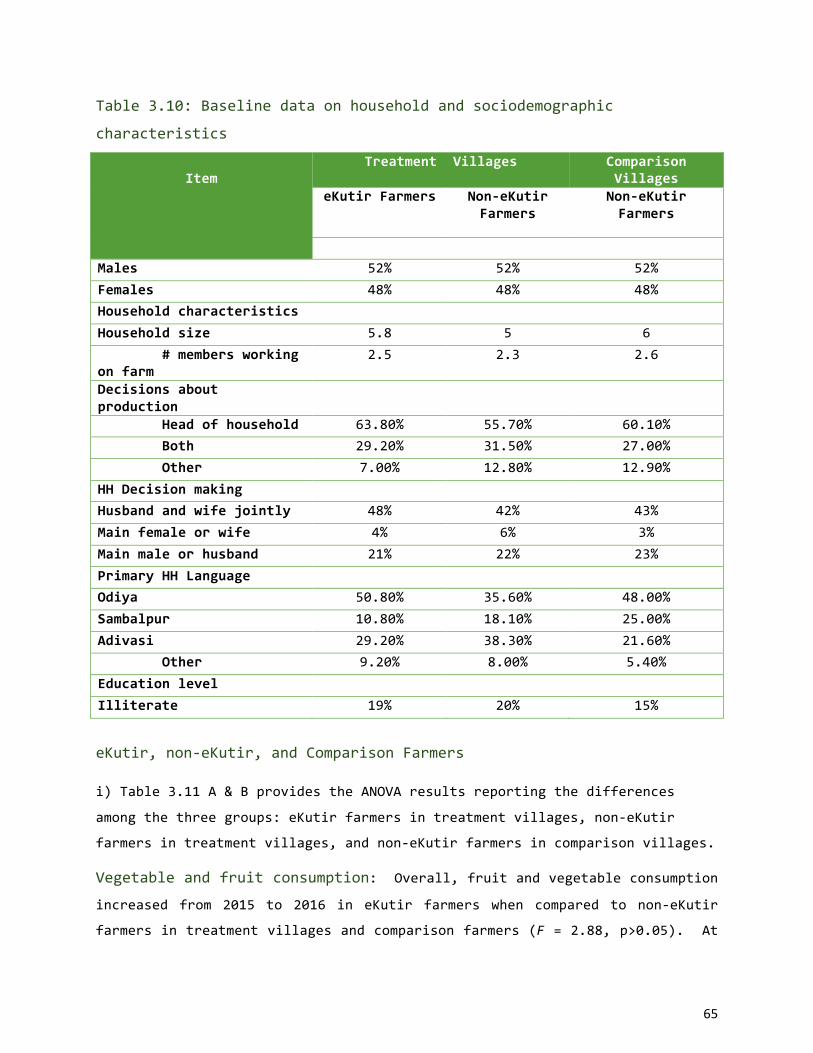
65
Table3.10:Baselinedataonhouseholdandsociodemographic
characteristics
Item
TreatmentVillages ComparisonVillages
eKutirFarmers Non-eKutirFarmers
Non-eKutirFarmers
(n=149) (n=148)Males 52% 52% 52%Females 48% 48% 48%Householdcharacteristics Householdsize 5.8 5 6#membersworkingonfarm
2.5 2.3 2.6
Decisionsaboutproduction
Headofhousehold 63.80% 55.70% 60.10%Both 29.20% 31.50% 27.00%Other 7.00% 12.80% 12.90%HHDecisionmaking Husbandandwifejointly 48% 42% 43%Mainfemaleorwife 4% 6% 3%Mainmaleorhusband 21% 22% 23%PrimaryHHLanguage Odiya 50.80% 35.60% 48.00%Sambalpur 10.80% 18.10% 25.00%Adivasi 29.20% 38.30% 21.60%Other 9.20% 8.00% 5.40%Educationlevel Illiterate 19% 20% 15%
eKutir,non-eKutir,andComparisonFarmersi)Table3.11A&BprovidestheANOVAresultsreportingthedifferences
amongthethreegroups:eKutirfarmersintreatmentvillages,non-eKutir
farmersintreatmentvillages,andnon-eKutirfarmersincomparisonvillages.
Vegetableandfruitconsumption:Overall,fruitandvegetableconsumption
increased from 2015 to 2016 in eKutir farmers when compared to non-eKutir
farmersintreatmentvillagesandcomparisonfarmers(F=2.88,p>0.05).At

66
baseline,theaveragedailyvegetableservingswere3.23,3.17,and2.98for
the eKutir farmer, non-eKutir farmers and the comparison farmers
respectively.Averagedailyservingsdecreasedinallthreegroupsoverthe
intervention with significant differences among groups at endline. eKutir
farmers had the highest daily vegetable servings and significantly higher
values than the comparison farmers. With regard to daily fruit servings,
analysesshowedthateKutirfarmerscomparedtootherfarmershadanincrease
intheirconsumptionoffruitsovertheyear(F=9.33,p<0.001).Atendline,
eKutir farmers had the highest average daily fruit servings (F = 7.83,
p<0.001). The comparison farmers reported consuming the most kilograms of
vegetables ANOVA results indicated modest differences at baseline in the
average daily vegetable servings between treatment and comparison groups.
Results showed a decline across all groups in the number of different
vegetables consumed, with eKutir farmers having the greater difference
between baseline and endline values (F = 2.78, p<0.05). All groups had a
declineintheirpercentageofhomegrownconsumption,althougheKutirfarmers
had the smallest decline over the year (F = 1.88, p<0.10). Nevertheless,
eKutirfarmersstillhadthehighestpercentageofhomegrownconsumptionat
endline(F=9.01,p<0.001).Withregardtodailyfruitservings,analyses
showedthateKutirfarmerscomparedtootherfarmershadanincreaseintheir
consumptionoffruitsovertheyear(F=9.33,p<0.001).Atendline,eKutir
farmershadthehighestaveragedailyfruitservings(F=7.83,p<0.001).
VegetableProduction:Comparedtotheothergroups,eKutirfarmershadthe
largest amount of acreage for vegetable farming at baseline (F = 5.97,
p<0.01) and endline (F = 3.16, p<0.001). At baseline and endline, eKutir
farmers had the highest the level of vegetable production compared to the
otherfarmergroups.
Perceptions,Beliefs,andExpenditures:Therewerenodifferencesbetween
rural farming group with regard to the importance that households place on
vegetables. Compared to non-eKutir farmers within treatment villages at
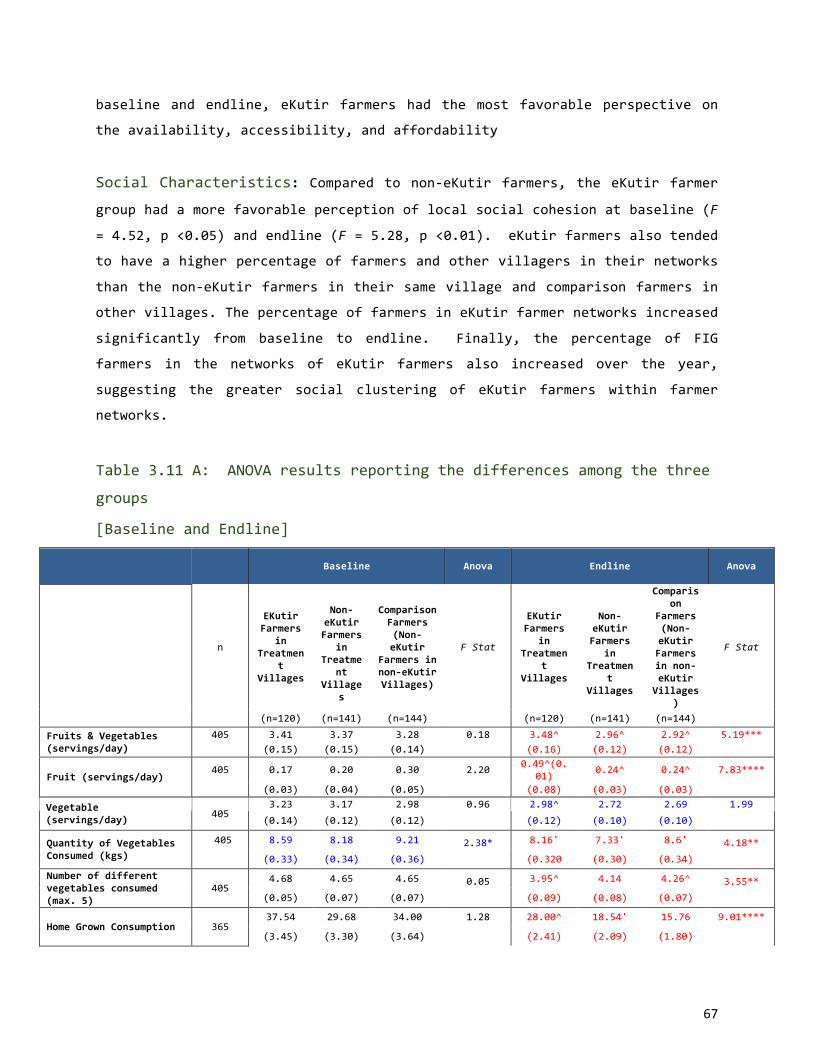
67
baseline and endline, eKutir farmers had the most favorable perspective on
theavailability,accessibility,andaffordability
SocialCharacteristics: Compared to non-eKutir farmers, the eKutir farmer
grouphadamorefavorableperceptionoflocalsocialcohesionatbaseline(F
=4.52,p<0.05)andendline(F=5.28,p<0.01).eKutirfarmersalsotended
tohaveahigherpercentageoffarmersandothervillagersintheirnetworks
thanthenon-eKutirfarmersintheirsamevillageandcomparisonfarmersin
othervillages.ThepercentageoffarmersineKutirfarmernetworksincreased
significantly from baseline to endline. Finally, the percentage of FIG
farmers in the networks of eKutir farmers also increased over the year,
suggesting the greater social clustering of eKutir farmers within farmer
networks.
Table3.11A:ANOVAresultsreportingthedifferencesamongthethree
groups
[BaselineandEndline]
Baseline Anova Endline Anova
n
EKutirFarmers
inTreatmen
tVillages
Non-
eKutirFarmers
inTreatme
ntVillage
s
ComparisonFarmers(Non-eKutir
Farmersinnon-eKutirVillages)
FStat
EKutirFarmers
inTreatmen
tVillages
Non-
eKutirFarmers
inTreatmen
tVillages
Comparison
Farmers(Non-eKutirFarmersinnon-eKutir
Villages)
FStat
(n=120) (n=141) (n=144) (n=120) (n=141) (n=144) Fruits&Vegetables(servings/day)
405 3.41 3.37 3.28 0.18 3.48^ 2.96^ 2.92^ 5.19*** (0.15) (0.15) (0.14) (0.16) (0.12) (0.12)
Fruit(servings/day)405 0.17 0.20 0.30 2.20 0.49^(0.
01) 0.24^ 0.24^ 7.83****
(0.03) (0.04) (0.05) (0.08) (0.03) (0.03)
Vegetable(servings/day) 405
3.23 3.17 2.98 0.96 2.98^ 2.72 2.69 1.99(0.14) (0.12) (0.12) (0.12) (0.10) (0.10)
QuantityofVegetablesConsumed(kgs)
405 8.59 8.18 9.21 2.38* 8.16' 7.33' 8.6' 4.18** (0.33) (0.34) (0.36) (0.320 (0.30) (0.34)
Numberofdifferentvegetablesconsumed(max.5)
4054.68 4.65 4.65 0.05 3.95^ 4.14 4.26^ 3.55**
(0.05) (0.07) (0.07) (0.09) (0.08) (0.07)
HomeGrownConsumption 36537.54 29.68 34.00 1.28 28.00^ 18.54' 15.76 9.01****
(3.45) (3.30) (3.64) (2.41) (2.09) (1.80)

68
Fruit(servings/day)405 0.17 0.20 0.30 2.20 0.49^(0.
01) 0.24^ 0.24^ 7.83****
(0.03) (0.04) (0.05) (0.08) (0.03) (0.03)
Vegetableproductionarea(Acre)
405 1.22^(n=405) 0.9' 0.64^' 5.97*** 1.72^'
n=372 1.3' 1.06^ 7.17****
372 (0.11) (0.11) (0.08) (0.15) (0.12) (0.09)
Vegetableproduction(Kg)
405 435.97^ 318.74 216.15^ 2.29 314.26' 152.04' 211.4 3.16**
372 (86.17) (75.19) (54.51) (65.68) (19.24) (42.39)
Vegetablesalesquantity(Kg)
372 408.3^ 283.04 180.79^ 2.61* 270.73' 129.02' 176.26 3.00*
372 (85.39) (73.39) (49.53) (60.08) (17.93) (36.83)
Incomefromvegetablesales(Rs.)
405 5100.52^ 4603.25 3157.36^ 1.15 3555.47 2145.62 2318.76 1.63
372 (859.49) (1140.25) (771.86) (832.42) (399.63) (497.93)
Vegetableprices(Rs./Kg)
303 16.69 16.25 15.08 0.24 15.41 17.05 16.35 1.12
315 (1.51) (1.57) (1.85) (0.71) (0.76) (0.94)
ImportanceofVegetables
401 3.96 3.93 3.7 0.75 3.9 3.97 3.94 1.7
(0.06) (0.11) (0.25) (0.03) (0.03) (0.03) PerceptionsofEnvironment(Affordability,Access,Availability)
400 11.63' 11.02' 11.29 4.52** 11.18' 10.72' 11.15' 5.28***
(0.12) (0.15) (0.14) (0.12) (0.12) (0.10)
PerceptionsofSocialCohesion(Village)
405 0.03 0.06 0.09 1.57 0.06 0.00 -0.05 0.63
(0.07) (0.07) (0.06) (0.05) (0.08) (0.06)
NetworkComposition(%ofFarmersinNetwork)
405 0.63 0.65 0.58 1.5 0.93^' 0.88' 0.88^ 2.52*
(0.03) (0.03) (0.03) (0.01) (0.02) (0.02) NetworkComposition(%ofVillagersinNetwork)
393 0.7 0.77 0.75 1.43 0.96^' 0.91' 0.91 2.41*
(0.03) (0.03) (0.03) (0.01) (0.02) (0.02)
NetworkComposition(%ofFIG/eKutirFarmersinNetwork)
385 0.29' 0.16' 0.23 3.54** 0.54^' 0.23' 0.09^' 58.42****
349 (0.04) (0.03) (0.03) (0.04) (0.03) (0.02) *p<0.10,**p<0.05,***p<0.01,****p<0.001^signifcantcontrastp<0.05betweentreatment(eKutirfarmer)andcontrol;'signifcantcontrastp<0.05betweeneKutirfarmerandnon-eKutirfarmerinsamevillageValuesshowninparenthesisnotedasStandardError

69
Table3.11B:ANOVAresultsreportingthedifferencesamongthe
threegroups(MeanDifference[Endline–Baseline])
MeanDifference(Endline-Baseline) Anova PairwiseContrasts
n
EKutirFarmersinTreatmentVillages
Non-
eKutirFarmers
inTreatmen
tVillages
ComparisonFarmers
(Non-eKutirFarmersinnon-eKutirVillages)
FStat
Compare:Treatment–eKutir
FarmersVSComparison
Compare:eKutir
Farmersv.non-EKutir
Compare:Non-eKutir
v.Compari
son
(n=120) (n=141) (n=144) (n=120) (n=141) (n=144)
Fruits&Vegetables(servings/day)
405 0.07 -0.41 -0.36 2.88** 3.95** 4.73** 0.05 (0.16) (0.15) (0.14)
Fruit(servings/day)405 0.32 0.04 -0.06 9.33***
* 13.94**** 8.41*** 1.96
(0.08) (0.04) (0.06)
Vegetable(servings/day) 405-0.25 -0.45 -0.30 0.57 0.06 0.99 0.64
(0.13) (0.14) (0.12)
QuantityofVegetablesConsumed(kgs)
405 -0.42 -0.85 -0.61 0.32 0.12 0.68 0.22
(0.38) (0.35) (0.38) Numberofdifferentvegetablesconsumed(max.5)
405-0.73^ -0.51 -0.39^ 2.78* 5.86** 2.21 0.75
(0.10) (0.10) (0.10)
HomeGrownConsumption 365-9.54 -11.14 -18.24
1.88 3.12* 2.26 0.12(3.45) (3.15) (3.52)
Fruit(servings/day)405 0.32 0.04 -0.06 9.33***
* 13.94**** 8.41*** 1.96
(0.08) (0.04) (0.06)
Vegetableproductionarea(Acre)
405 0.49(n=372) 0.28 0.35
0.73 0.62 1.15 0.19372 (0.15) (0.12) (0.09)
Vegetableproduction(Kg)
405 -121.71 -166.7 -4.751.08 0.93 0.12 2.87*
372 (106.15) (75.26) (58.93)
Vegetablesalesquantity(Kg)
372 -137.57 -154.02 -4.531.14 1.33 0.02 2.76
372 (102.60) (73.08) (52.63)
Incomefromvegetablesales(Rs.)
405 -1587.91 -3046.85 -1233.280.74 0.06 0.71 1.33
372 (1166.19) (1274.37) (920.70)
Vegetableprices(Rs./Kg)
303 15.41 17.05 16.351.12 0.63 2.46 0.34
315 (0.71) (0.76) (0.94)
ImportanceofVegetables401 -0.06 0.05 0.24
0.82 1.39 0.69 0.54 (0.06) (0.11) (0.25)
PerceptionsofEnvironment(Affordability,Access,Availability)
400 -0.43 -0.29 -0.150.69 1.41 0.29 0.41
(0.18) (0.17) (0.15)
PerceptionsofSocialCohesion(Village)
405 0.04 -0.06 0.040.4 0 0.55 0.56
(0.08) (0.10) (0.09)
NetworkComposition(%ofFarmersinNetwork)
405 0.31 0.22 0.292.06 0.11 2.65 3.36*
(0.04) (0.03) (0.03)

70
NetworkComposition(%ofVillagersinNetwork)
393 0.26 0.13 0.163.21* 3.28* 6.59** 0.45
(0.04) (0.03) (0.04)NetworkComposition(%ofFIG/eKutirFarmersinNetwork)
385 0.27 0.06 -0.17 21.33**** 40.86**** 8.13*** 14.00**
**349 (0.06) (0.05) (0.04)*p<0.10,**p<0.05,***p<0.01,****p<0.001^signifcantcontrastp<0.05betweentreatment(eKutirfarmer)andcontrol;'signifcantcontrastp<0.05betweeneKutirfarmerandnon-eKutirfarmerinsamevillageValuesshowninparenthesisnotedasStandardError
ii) Regression results examining the differences in fruit and vegetable
consumption from baseline to endline are shown in table 3.12. Regression
results showed that eKutir farmers compared to comparison farmers had a
higherincreaseinoverallfruitandvegetableservings(B=0.43,p<0.05).No
significantincreaseordecreasewasshowninthedailyvegetableservingsof
eKutir farmers compared to the other groups. There was a modest decline in
the number of different vegetables purchased by eKutir farmers compared to
theotherfarminggroups.Therewasanincreaseindailyfruitservingsin
eKutirfarmerscomparedtonon-eKutirandcomparisonfarmers.
Table3.12:Regressionresultsexaminingthedifferencesinfruitand
vegetableconsumptionfrombaselinetoendline
Variable
VegetableServingsper
Day
QuantityofVegetablesPurchased
Numberofdifferentveg
etablespurchased
FruitServingsperday
FruitandVegetable
Servingsperday
(n=405)
(n=338) (n=405) (n=33
8)(n=405)
(n=338) (n=405) (n=33
8)(n=405)
(n=338)
eKutirFarmers
0.04(0.19
)
0.01(0.20
)
0.19(0.53)
0.20(0.57
)
-0.34(0.14)**
-0.30(0.15)*
0.39****
(0.09)
0.42****
(0.10)
0.43**
(0.21)
0.43(0.23)*
non-eKutirFarmersinTreatmentVillages
-0.15(0.19
)
-0.09(0.20
)-0.24(0.51)
-0.02(0.57
)
-0.12(0.14
)
-0.12(0.15
)0.11
(0.09)
0.08(0.10
)
-0.04(0.83
)
-0.01(0.23
)
-ComparisonFarmers
REF REF REF REF REF REF REF REF REF REF
SocioeconomicIndex
0.04(0.06
)
0.13(0.47
)
-0.08(0.09
)
0.01(0.03
)
0.05(0.07
)HomeGrownConsumption
0.00(0.00
)
0.01(0.01)*
0.01(0.001)**
-0.001(0.00
0.002(0.002)
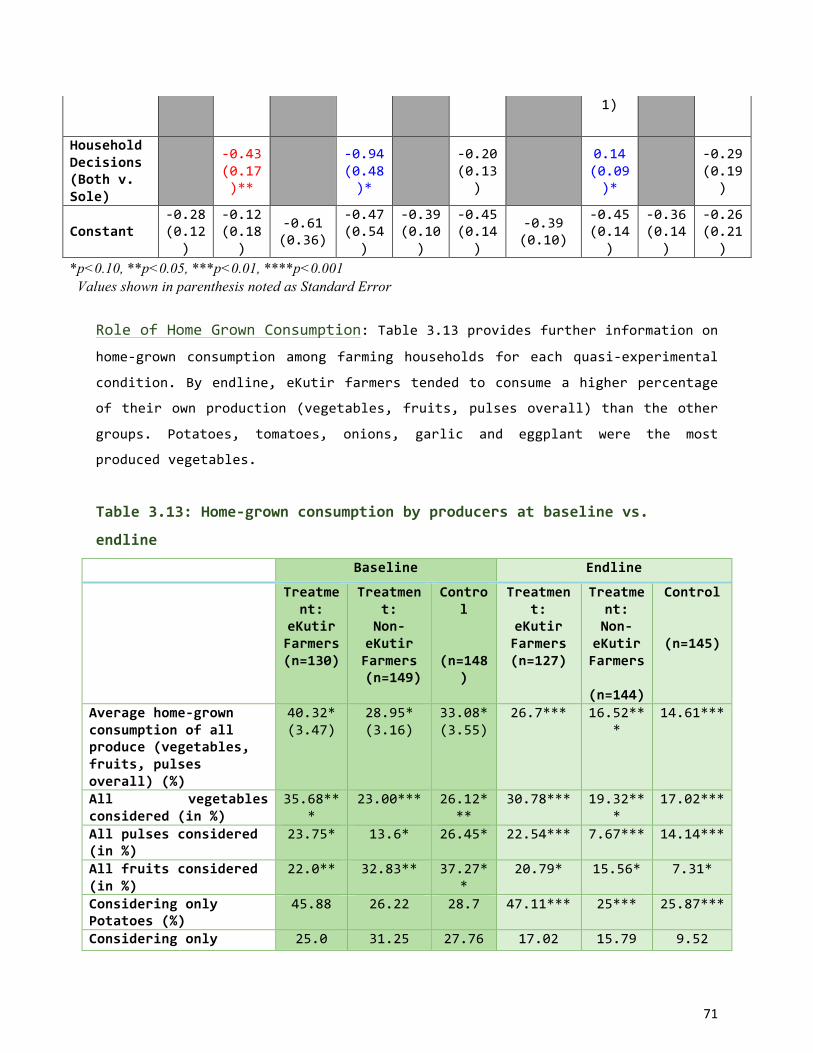
71
1)
HouseholdDecisions(Bothv.Sole)
-0.43(0.17)**
-0.94(0.48)*
-0.20(0.13
)
0.14(0.09)*
-0.29(0.19
)
Constant-0.28(0.12
)
-0.12(0.18
)
-0.61(0.36)
-0.47(0.54
)
-0.39(0.10
)
-0.45(0.14
)
-0.39(0.10)
-0.45(0.14
)
-0.36(0.14
)
-0.26(0.21
)*p<0.10, **p<0.05, ***p<0.01, ****p<0.001 Values shown in parenthesis noted as Standard Error
RoleofHomeGrownConsumption:Table3.13providesfurtherinformationon
home-grown consumption among farming households for each quasi-experimental
condition.Byendline,eKutirfarmerstendedtoconsumeahigherpercentage
oftheirownproduction(vegetables,fruits,pulsesoverall)thantheother
groups. Potatoes, tomatoes, onions, garlic and eggplant were the most
producedvegetables.
Table3.13:Home-grownconsumptionbyproducersatbaselinevs.
endline
Baseline Endline
Treatment:
eKutirFarmers(n=130)
Treatment:
Non-eKutirFarmers(n=149)
Control
(n=148
)
Treatment:
eKutirFarmers(n=127)
Treatment:Non-
eKutirFarmers
(n=144)
Control(n=145)
Averagehome-grownconsumptionofallproduce(vegetables,fruits,pulsesoverall)(%)
40.32*(3.47)
28.95*(3.16)
33.08*(3.55)
26.7*** 16.52***
14.61***
All vegetablesconsidered(in%)
35.68***
23.00*** 26.12***
30.78*** 19.32***
17.02***
Allpulsesconsidered(in%)
23.75* 13.6* 26.45* 22.54*** 7.67*** 14.14***
Allfruitsconsidered(in%)
22.0** 32.83** 37.27**
20.79* 15.56* 7.31*
ConsideringonlyPotatoes(%)
45.88 26.22 28.7 47.11*** 25*** 25.87***
Consideringonly 25.0 31.25 27.76 17.02 15.79 9.52

72
Banana(%)ConsideringonlyPigeonbean(%)
11.76* 10.53* 27.45* 6.89 1.61 7.56
ConsideringonlyMungbean(%)
45.31* 15.15* 24.24* 40.48 18.18 27.12
ConsideringonlyTomatoes(%)
- - - 17.0** 15.38** 5.74**
ConsideringonlyOnion(%)
- - - 33.33 19.77 18.6
ConsideringonlyOkra(%)
- - - 28.57 9.38 11.43
ConsideringonlyEggplant(%)
- - - 25.0 14.45 11.34
*p<0.05,**0<0.01,***p<0.001NOTE:Treatment-levelcomparisonsaremadeseparatelywithinbaselineandendlinemeasures.
Sincevegetableconsumptionathomeimpactstheamountavailabletosell,we
examinedwhetherthelevelofhomegrownconsumptionmightaltertheeffects
oftheinterventiononaveragevegetableservings.
eKutirOperationalDataonRuralSalesFarmers’ subjective reports of production, sales, and income may often
divergefromactualproduction,salesandincome.DatafromeKutir’srural
agricultural operations were used to examine the degree to which the
objective operational data corresponded to the farmers’ self-reported
information and whether the operational data might provide additional
insightsintotheeffectsoftheVeggieLiteinterventionontheagricultural
productionandrevenueofeKutirfarmers.Inparticular,weusedthesedata
toexamineif(i)therewereseasonaleffectstobefoundintheVeggieLite
intervention and (ii) there were differences between operational and self-
report farmer information. eKutir operational data were linked to the
responses of the eKutir farmers who participated in the rural evaluation.
Two sets of analyses were then conducted with these linked data. First,
paired-sample t-tests were used to compare agricultural production data at
baseline and endline in the Rabi and Zaid season. Endline data was not
availablefortheKharifseason.Additionalsubanalysesexaminedifthere
were certain villages in which intervention effects might be stronger.

73
Second,regressionanalyseswereusedtoexamineiftherewasanincreasein
different vegetable production variables over five seasons. Repeated
seasonalmeasuresoftheamountharvested,sold,andrevenuegeneratedwere
nested within each farmer for which we had data. Regression analyses were
stratifiedbywhetherthedatacamefromeKutiroperationsorfarmers’self
reports.
Table 3.14 shows the results from the paired sample t-tests. Results
indicated important seasonal differences in the effects of the VeggieLite
interventiononthevegetableproductivityandincomeofeKutirfarmers.In
Rabi, there were significant declines from 2015 to 2016 in the quantity of
vegetablesharvestedandsold.Thesedeclinesweremainlyinthevillagesof
Majhikia and Parmanpur. Yet, the prices and revenues that eKutir farmers
receivedincreasedintheRabi2016season.Priceandrevenueincreaseswere
generallysharedsimilarlyacrossthedifferenttreatmentvillages.InZaid,
therewasaconsistentincreasefromthe2015Zaidseasontothe2016Zaid
season.
Table 3.15 offers the results from the regression analyses. The self-
reported and operational data provide different pictures of the effects of
theVeggieLiteprogramoneKutirfarmersovertheinterventionperiod.Self-
reported information from the eKutir farmers suggests that there was a
decline in the amount that they produced and sold over the intervention
period, as well as the farmers’ revenues. In contrast, the eKutir
operationaldatashownoeffectoftimeontheamountofvegetablesharvested
and sold. The operational data also show that there was an increase in
revenue over the intervention period. The amount harvested, sold, and the
revenue generated among eKutir farmers was significantly less in Zaid
comparedtoKharif.
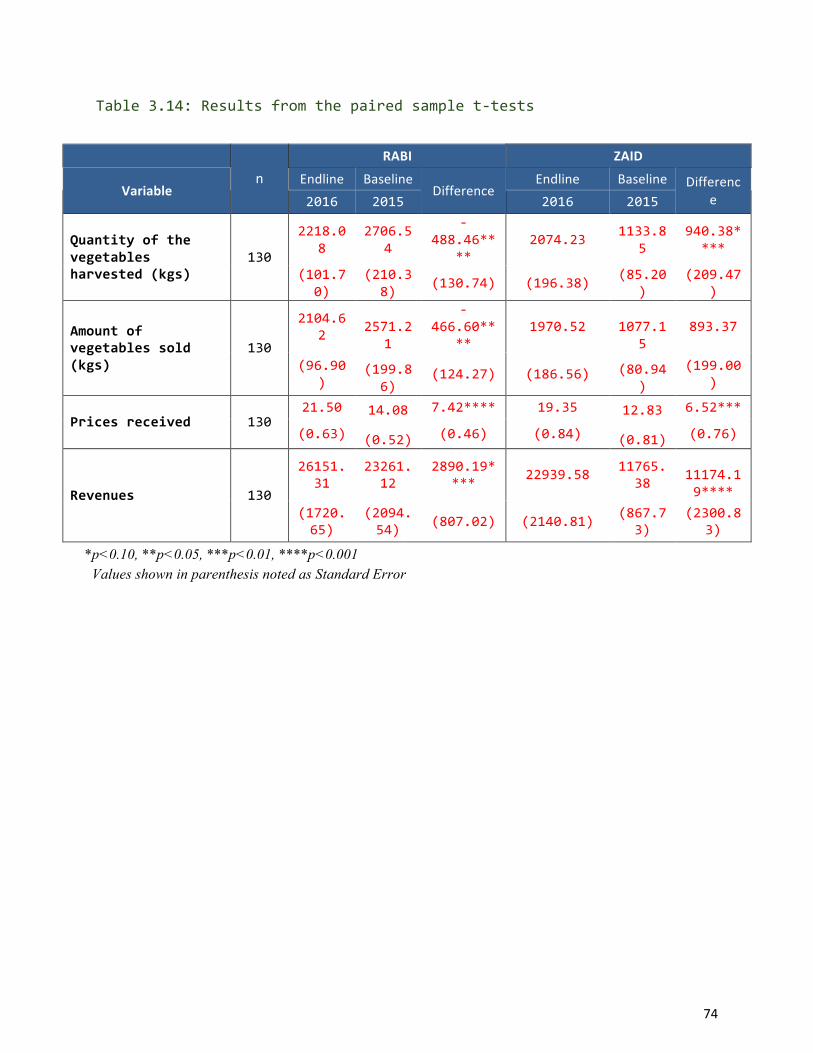
74
Table3.14:Resultsfromthepairedsamplet-tests
nRABI ZAID
VariableEndline Baseline
DifferenceEndline Baseline Differenc
e2016 2015 2016 2015
Quantityofthevegetablesharvested(kgs)
130
2218.08
2706.54
-488.46**
**2074.23 1133.8
5940.38*
***
(101.70)
(210.38) (130.74) (196.38) (85.20
)(209.47
)
Amountofvegetablessold(kgs)
130
2104.62 2571.2
1
-466.60**
**1970.52 1077.1
5893.37
(96.90)
(199.86)
(124.27) (186.56) (80.94)
(199.00)
Pricesreceived 13021.50 14.08 7.42**** 19.35 12.83 6.52***
(0.63) (0.52) (0.46) (0.84) (0.81) (0.76)
Revenues 130
26151.31
23261.12
2890.19**** 22939.58 11765.
38
11174.19****
(1720.65)
(2094.54) (807.02) (2140.81) (867.7
3)(2300.8
3)
*p<0.10, **p<0.05, ***p<0.01, ****p<0.001 Values shown in parenthesis noted as Standard Error
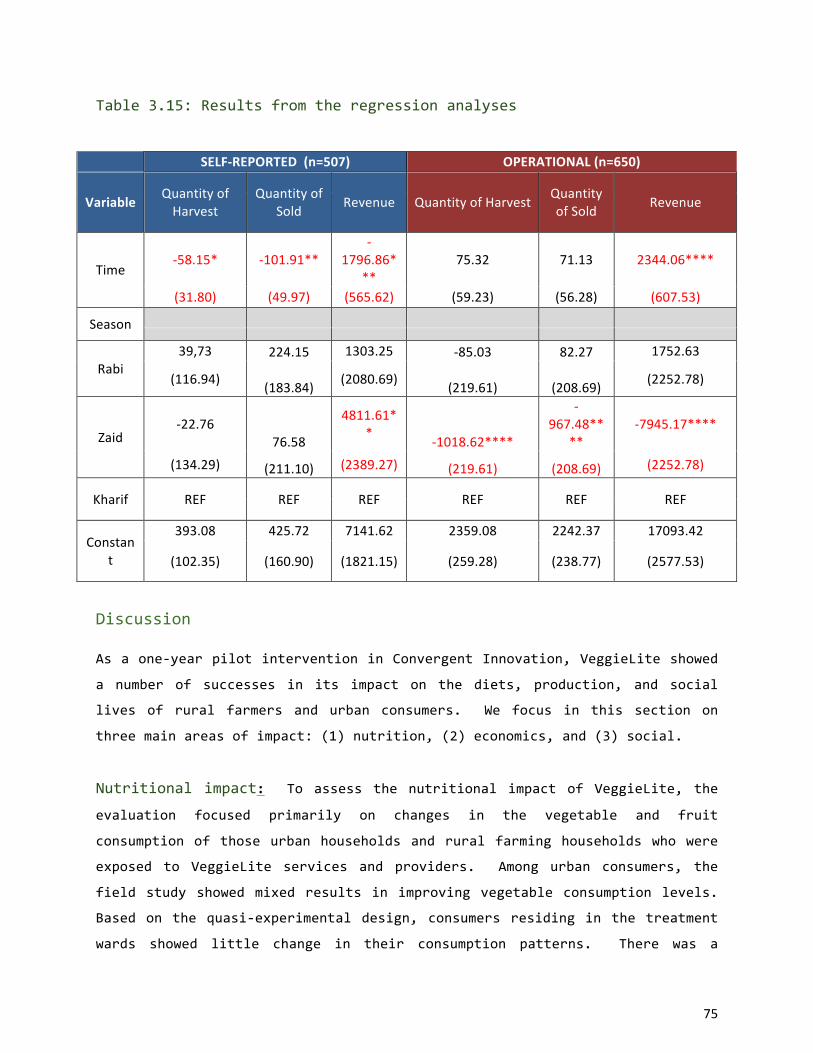
75
Table3.15:Resultsfromtheregressionanalyses
DiscussionAsaone-yearpilotinterventioninConvergentInnovation,VeggieLiteshowed
a number of successes in its impact on the diets, production, and social
lives of rural farmers and urban consumers. We focus in this section on
threemainareasofimpact:(1)nutrition,(2)economics,and(3)social.
Nutritional impact: To assess the nutritional impact of VeggieLite, the
evaluation focused primarily on changes in the vegetable and fruit
consumptionofthoseurbanhouseholdsandruralfarminghouseholdswhowere
exposed to VeggieLite services and providers. Among urban consumers, the
fieldstudyshowedmixedresultsinimprovingvegetableconsumptionlevels.
Basedonthequasi-experimentaldesign,consumersresidinginthetreatment
wards showed little change in their consumption patterns. There was a
SELF-REPORTED(n=507) OPERATIONAL(n=650)
Variable QuantityofHarvest
QuantityofSold Revenue QuantityofHarvest Quantity
ofSold Revenue
Time-58.15* -101.91**
-1796.86*
**75.32 71.13 2344.06****
(31.80) (49.97) (565.62) (59.23) (56.28) (607.53)
Season
Rabi39,73 224.15 1303.25 -85.03 82.27 1752.63
(116.94) (183.84) (2080.69) (219.61) (208.69) (2252.78)
Zaid-22.76
76.58
4811.61** -1018.62****
-967.48**
**-7945.17****
(134.29) (211.10) (2389.27) (219.61) (208.69) (2252.78)
Kharif REF REF REF REF REF REF
Constant
393.08 425.72 7141.62 2359.08 2242.37 17093.42
(102.35) (160.90) (1821.15) (259.28) (238.77) (2577.53)
76
general decline in vegetable consumption in the treatment and comparison
wards but consumers in treatment wards purchased a higher quantity of
vegetables at endline. The weak results from the quasi-experimental design
may be attributable to the tangling of consumers in the treatment and
comparisonwards,i.e.,consumersfromcomparisonwardscouldalsohavebeen
exposedtoVeggieLite.Furthermore,eKutiroperationaldecisionsledtothe
closing and relocating of certain vendors, which would have altered
consumer’sexposuretotheVeggieLiteservices.
Toaddressthismatter,theevaluationsoughttoexaminemorecloselythose
VeggieLite consumers that reported VeggieLite as their main source for
purchasing vegetables. While the number of respondents who reported
VeggieLiteastheirmainsourcewaslow,theevaluationsuggestedthatthose
consumers who did purchase from VeggieLite increased their daily vegetable
servings over the intervention period. This finding held in both the ANOVA
and regression analyses. eKutir operational data showed incremental and
stronggrowthovertheperiod.
ThenutritionalimpactofVeggieLiteintheruralareaswassharper.Compared
to both non-eKutir farmers in treatment villages and comparison farmers,
eKutirfarmersshowedanincreaseintheirdailyfruitandvegetableservings
over the intervention period. Daily vegetable servings decreased for all
farminggroupsovertheyearbuteKutirfarmer’smaintainedhigherlevelsof
daily vegetable servings at endline. The daily fruit servings of eKutir
farmerscomparedtonon-eKutirandcomparisonfarmersalsoincreasedoverthe
year. These findings were supported by both the ANOVA and regression
analyses. Yet, findings did also suggest that the number of different
vegetables that eKutir farmers purchased did decline over the intervention
period.Fortheinterventionperiod,theresultsdidnotsuggestsignificant
spillovereffectswithregardtoeKutirfarmerstransmittingbenefitstonon-
eKutirfarmersinthetreatmentvillagesbutthismaybeduetothefactthat
theevaluationwaslimitedtooneyear.

77
Economic impact: To assess the economic impact of VeggieLite on urban
consumers and rural farmers, the evaluation focused on the household
expenditures of urban households and the agricultural productivity and
revenue of rural farmers. Findings from the urban sample show little
indicationofeconomicbenefits.Giventhatmostparticipantsreportedthe
Village Mandi as the main source, this finding is not surprising. In the
ruralareas,theeffectsoftheinterventionagainseemclearer,particularly
InlightoftheeKutiroperationaldata.Whiletheself-reportdatasuggest
adeclineinquantityharvestedandsold,andinthefarmers’revenues,the
operational data show the opposite. The operational data indicated an
increaseintherevenueoftheeKutirfarmersovertime,eventhoughfarmers
hadlowerrevenuesinZaidcomparedtoKharif.UsingtheeKutiroperational
data,wefoundthateKutirfarmerstendedtounderreporttheiryield,price
and revenue information compared to their operational data. When examining
eKutir revenue and sales data separately for the seasons of Rabi and Zaid,
findingsshowsignificantincreasesinyield,pricesandrevenuesreceivedin
Zaid. eKutir data show also show an increase in the revenue of eKutir
farmersinRabi,althoughtherewasadeclineinthequantityofvegetables
harvestedandsoldinRabi.
Socialimpact:ToassessthesocialimpactoftheVeggieLiteintervention,
our evaluation used social network analysis to assess the degree to which
participants’socialnetworksandperceptionsofthesocialenvironmentmay
havechangedovertheyear.Whilethiswasnotacentralanalyticalfocus,
we viewed the intervention as possibly altering the way in which those
exposedtoVeggieLitesawtheirenvironmentormightinteractwithothersin
theircommunity.TherewasnosuggestionofasocialimpactofVeggieLitein
the urban sample. In the rural areas, there was however indication of a
social impact of the intervention on rural farmers. Among eKutir farmers,
theresultssuggestedasetofchangesinthenetworkcompositionofeKutir
farmers.First,thesocialnetworksofeKutirfarmerscametoconsistmore
heavily of other villagers in their agricultural and dietary networks.
Furthermore,thepercentageofFIGfarmerscomposingthenetworksofeKutir

78
farmers as well as the non-eKutir farmers in the treatment villages also
increasedovertheyear.Thislatterfindinghighlightsclearlythediffusion
andspreadoftheeKutirinnovationswithinthetreatmentvillages,andthe
promiseofVeggieLiteinspreadingmorewidelyintheruralareas.
Conclusion
The field evaluation indicates the VeggieLite intervention has produced
noticeable successes among rural farmers and villages. The rural quasi-
experimental groups were formed according to whether farmers participated
directly in the VeggieLite program or not. This may have given the rural
evaluationgreaterpowertodetectthedirectbenefitsofVeggieLiteonrural
farmers within the year. Detecting the effects of VeggieLite on urban
consumers was more challenging, particularly given the different consumer
optionsavailableandthegreaterdifficultyintrackingconsumerpurchasing
behaviorinurbanIndia.TheweakeffectsofVeggieLiteamongurbanconsumers
shouldthereforenotbeinterpretedasconclusive.Infact,VeggieLitesales
intheurbanwardssuggeststhatVeggieLitevendorsaredevelopingagrowing
consumerbase.Furtherresearchfocusingonawell-definedsetofVeggieLite
consumers compared to non-users would provide clearer evidence of the
nutritional,economicandsocialimpactofVeggieLiteinurbanareas.
79
Chapter 4: Convergent Innovation Process Analysis:Producers & Organizations, Ecosystem NetworkFormation,andCompetitiveDynamicsResearchquestionsThis chapter reports on the methods and results of a multi-component
convergent innovation evaluation analysis (Moore et al., 2015) designed to
uncoverthemechanismsinvolvedinbringingtogetherthevariousstakeholders
engagedinacollaborativeactiontargetingconvergentoutcomes(Dubeetal.,
2014) i.e., the simultaneous realization of improved agricultural and
economicreturnsforlow-incomeruralandurbancommunities.Weexaminedthe
eKutirsocialenterpriseVeggieKart(VK)systemanditscompetitivedynamics
with traditional commercial channels, with many middlemen operating in
informal spot markets. A team of management scholars in consumer behavior,
marketing,strategy,entrepreneurship,andcompletivedynamicmodeling(Drs.
Dube,Jha,andRay)joinedtheirexpertisewithDr.Moore’sinsocialnetwork
formation to collect field data in the months of December 2015 to January
2016. To collect primary data, specific criteria for identifying eligible
respondentswasusedandallactorsweresegmentedintovarioussub-groups.
The VK ecosystem has been pictorially represented in chapter 2 for the
ecosystem actors (Fig. 2.2, p.25), flow of material (Fig. 2.3, p.26) and
everydayoperationalprocessflow(Fig.2.9,p.31).Thesefiguresprovidea
comprehensiveoverviewoftheeKutir/VKsystemandsetthestageforfurther
analysis. The general expectation is that, vis-à-vis status quo with
traditionalMandisystems,aconvergentinnovationecosystemsuchaseKutir/
VKmicroenterprisemodelisgoodforbothfarmersandendconsumers,aswell
as for other actors involved. However, there has been very few scientific
studiesthatcombinethemanagementandsocialsciencestoexamineboththe
formation and outcomes of the ecosystem proper and the complex competitive
dynamics tied to its co-existence and co-evolution with the traditional
players.A3-componentstudywasthereforedesignedtoexaminethesecomplex
processes:(a)astrategicstudywithproducersandorganizations;(b)afull

80
social network analysis of the eKutir/ VK ecosystem formation; and (c) an
operationmanagementscienceanalyticalmodelofcompetitivedynamicsbetween
eKutir/ VK ecosystem and traditional commercial middlemen (Mandis and spot
market). Altogether, the 3 components of the CI process study aimed to
addressthefollowingresearchquestions:
- WhatarethemechanismsunderlyingeKutir/VKentrepreneurshipmodel?
- What processes drive supply and demand for farmers, consumers, and
other actors and foster engagement with the eKutir/ VK micro/
entrepreneurshipmodeland/orpartakeintheirecosystemevolution?
- How do networks form among various actors that need to be aligned in
ordertosupportthisentrepreneur-ledmodelastheecosystemevolves?
- Howdoes(Is/Why/When)anentrepreneurshipmodelcomparetotraditional
commercialchannels(Mandiandsportmarkets)intherisks,incentives,
andoutcomesitcreatesforfarmersandconsumersthatarepartofthe
eKutir/VKecosystem?Forthesewhooperateinalternativecompetitive
environment?Forthecommunityasawhole?Fortheruraleconomy?
- How should the incentives and governance be structured so that each
actorcreatesandderivesvalue?
- WhatisICT’sroleandwhatcanitdotofacilitatecomplexanddynamic
contexts?
The rest of this chapter recapitulates some of the key features of the
VeggieKart/VeggieLiteinterventionthatarerelevantforthethreecomponents
of the Convergent Innovation process analysis. We then present methods and
results of each CI analysis component to discuss how each component may
account for the results of the present pilot and provide insights for
transitiontoscaleoftheeKutir/VKentrepreneurshipmodel.
RecapoftheVeggieKart/VeggieLiteintervention
From a management perspectives, VeggieKart/VeggieLite is a venture by for-
profit social enterprise eKutir that focuses on providing innovative
products,services,andsustainablemodelstotheBottomofthePyramid(BoP)

81
market through the effective use of ICT (Information and Communication
Technologies)andadistributionnetworkoflast-mileentrepreneurs(Jhaet
al.,2016).VKaimstoreducetheaccesscostsforfarmersandconsumersby
using “micro-entrepreneurs,” which help marginal farmers sell their produce
and marginal retailers to reach end consumers (through handcarts and other
distributionchannels)inpoorruralandurbancommunitiesinOdisha.
eKutirruralmicro-entrepreneurs(calledagrientrepreneurorAEforshort)
operateatthelocal(villageorblock)level,workinacatchmentareaof15
kilometers,andcatertoamaximumof500-1000farmers.Recruitedandtrained
byeKutir,AEssupportvegetable-growingfarmersbyprovidingqualityinputs
andfarmingadvisorythroughamicro-entrepreneur,theAEisalocalperson,
well acquainted with the local context and the people. AEs also act as
“aggregators” of the produce to feed the different distribution systems in
theVKvaluechain.Onaverage,VKreachesoutto50-100farmers(oncritical
mass) per village, 250-300 farmers (on critical mass) per panchayat, in a
catchment area of at least 1,500 households in a block. To facilitate
localizedinteractionswithfarmers,micro-entrepreneursorganizeVKfarmers
into groups of 15-25 members called Farmer Intervention Groups (FIGs).
Depending on the number of VK farmers in a village, there may be multiple
FIGspervillage.Themicro-entrepreneursmaintainanattendanceregisterfor
each meeting that the farmers at the FIG meeting sign, thereby providing
informationaboutfarmers’levelsofparticipationandpossibleinteractions
withotherFIGmembers.InanygivenVKvillage,therearefarmerswhoare
linkedwithVKmicro-entrepreneursandotherswhoarenot.AEsworksclosely
witheKutir’sfieldexecutive’sand/orthelocalNGOstosupportthefarmers
through the crop cycle and procure their produce for the VeggieKart
distribution system. The AEs expect to make a tidy profit by facilitating
transactionsbetweeneKutir/inputprovidersandthefarmers.
TheVKMicro-Retailers(calledretailentrepreneurs[Res]forshort)arethe
local vegetable vendors who are converted into an organized chain of
vegetable entrepreneurs, earning a livelihood by selling the vegetables

82
sourced by the different VeggieKart distribution channels. These
entrepreneurs operate in small stores (Veggie Mart) or are stationed with
pushcarts on thorough fares (Veggie Wheel), both in geographically defined
urbanenvironmentonlyandcateringtothewalk-inconsumers.Anothersegment
of these vegetable entrepreneurs is part of the VeggieLite channel and
operatesinbothrural(VKvillages)andurbanareastodistributeandsell
the vegetables to resource-poor communities. The present intervention has
focusedonVeggieLitewhiledeploymentthroughtheotherchannelsoccurredin
parallel as part of the broader operational deployment. The different
channelscatertodifferenteconomicstrataofsociety.Theonlineandlarge
retailoutletscatertothehigh-incomeurbanpopulation.VeggieMarts(small
groceryshopsthatalsosellvegetables)andVeggieWheels(cartvendorswho
move through crowded thoroughfares) cater to the middle-class urban
population.VeggieLiteisachannelexclusivelyforurbanslumdwellersand
theruralpoor.
OthereKutir/VKecosystemactors:eKutir/VKhasalsopartneredwithlocal
andregionalgrassrootNGOs,agri-inputorganizations(e.g.seed,fertilizer
companies), agri-experts, cart manufacturers, cold storage suppliers, rural
banks, and other actors in the agriculture-food-ecosystem to both promote
demandontheconsumersideandtoimproveproductivityandefficiencyofthe
value chain on the supply chain. ICT enabled ecosystem: eKutir/ VK has
leveraged an Information and Communication Technology (ICT) platform to
enable seamless collaboration and coordination between the aforementioned
entitiesineKutir’secosystem(Jhaetal.,2016).
Direct interactions between farmers and consumers with no or minimal
intermediariesaregainingconsiderableinterestinboththedevelopingand
developed world (Dube et al., 2014). While intermediaries deliver critical
services to rural producers, they are also often exploitative and their
removalcanresultinlargeefficiencygains.However,researchontheITC
intervention in the soy value chain and market (Besley and Burgess, 2000)
showsthatitrequiresseriousinvestmenttobypassintermediariesbutthat

83
itispossible,andcanbebeneficial,forbothfarmersandfinalconsumers.
TheimmediatebenefittoITCLimitedofthisinterventionwastheimprovement
in quality of soybeans procured, from the creation of a direct marketing
channel, and a reduction in its transaction costs. The results in this
earlierstudy,muchinlinewiththetrendinoperationaldatainthepresent
intervention, suggest that there can be net welfare gains to farmers
resultingfromaredistributionofsurplusawayfromtraderstothefarmers.
Strategicstudywithproducersandorganizations
Datawasgatheredfromfarmers,microentrepreneurs,andrepresentativesfrom
the various organizational constituents in the ecosystem – eKutir and
organizations partnering with eKutir. This would not only allow us to
increase the internal validity of the study but reconcile and synthesize
multiple perspectives to give a fuller picture of the process. An embedded
case study design (Yin, 2009) was clearly suitable for studying such a
system.Thisdesigninvolvedanalyzingtheoverallsystembyanalyzingeach
individualcomponentofthesystem.Thebroadpropositionguidingthisstudy
was based on the theoretical exposition of convergent innovation (Dube et
al.,2014;Jhaetal.,2016)whichstatesthatjointrealizationofeconomic
and human development outcomes requires an ecosystem of actors spanning
societal sectors (individuals, firms, NGOs) to engage in collaborative
action,witheachactorcreatingandcapturingvalueinthesystem.
A concept-stakeholder grid (table 4.1) was constructed to guide the data
collection.Theconceptsareshownontherowsandtherespondentsareshown
on the column. Each cell indicates the sub-concepts those were studied for
theparticularrespondentcategoryandthepotentialsourcesthatcouldshed
lightonthatconcept.
Conceptsofinterestsincludethefollowing:
- Strategy, which captures key activities/ innovations, why they were
undertakenandwhatenabledthem;
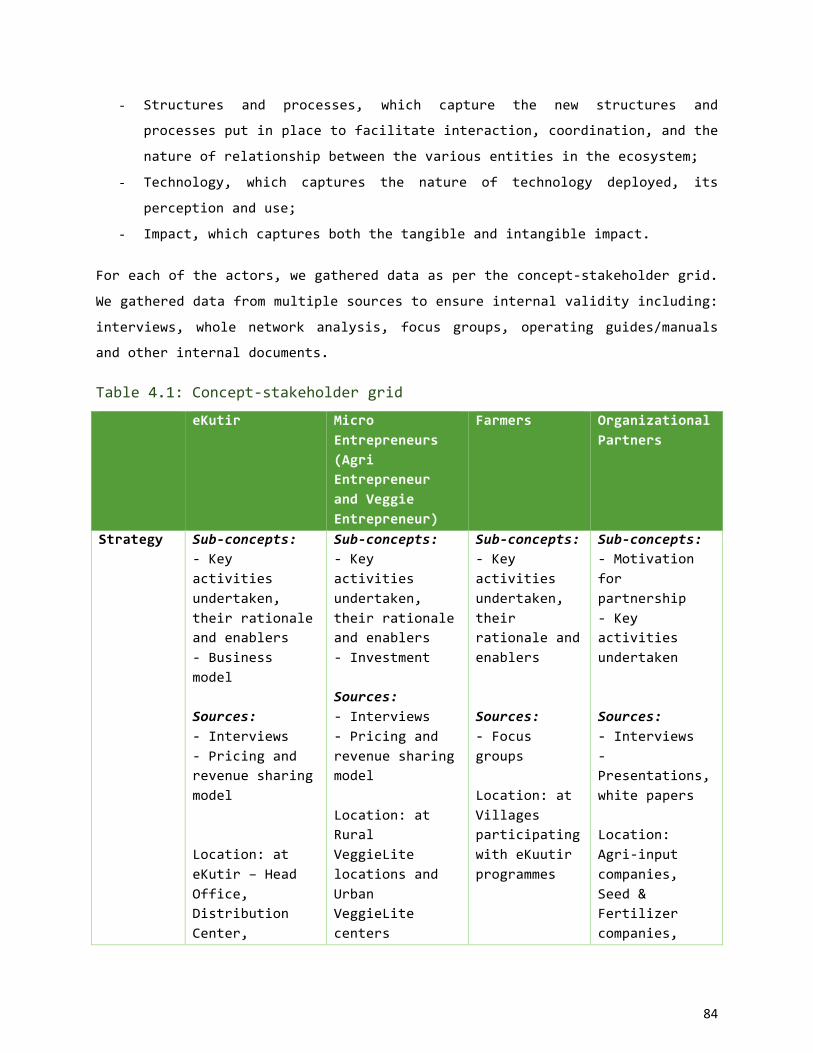
84
- Structures and processes, which capture the new structures and
processesputinplacetofacilitateinteraction,coordination,andthe
natureofrelationshipbetweenthevariousentitiesintheecosystem;
- Technology, which captures the nature of technology deployed, its
perceptionanduse;
- Impact,whichcapturesboththetangibleandintangibleimpact.
Foreachoftheactors,wegathereddataaspertheconcept-stakeholdergrid.
Wegathereddatafrommultiplesourcestoensureinternalvalidityincluding:
interviews, whole network analysis, focus groups, operating guides/manuals
andotherinternaldocuments.
Table4.1:Concept-stakeholdergrid
eKutir MicroEntrepreneurs(AgriEntrepreneurandVeggieEntrepreneur)
Farmers OrganizationalPartners
Strategy Sub-concepts:-Keyactivitiesundertaken,theirrationaleandenablers-BusinessmodelSources:-Interviews-PricingandrevenuesharingmodelLocation:ateKutir–HeadOffice,DistributionCenter,
Sub-concepts:-Keyactivitiesundertaken,theirrationaleandenablers-InvestmentSources:-Interviews-PricingandrevenuesharingmodelLocation:atRuralVeggieLitelocationsandUrbanVeggieLitecenters
Sub-concepts:-Keyactivitiesundertaken,theirrationaleandenablersSources:-FocusgroupsLocation:atVillagesparticipatingwitheKuutirprogrammes
Sub-concepts:-Motivationforpartnership-KeyactivitiesundertakenSources:-Interviews-Presentations,whitepapersLocation:Agri-inputcompanies,Seed&Fertilizercompanies,
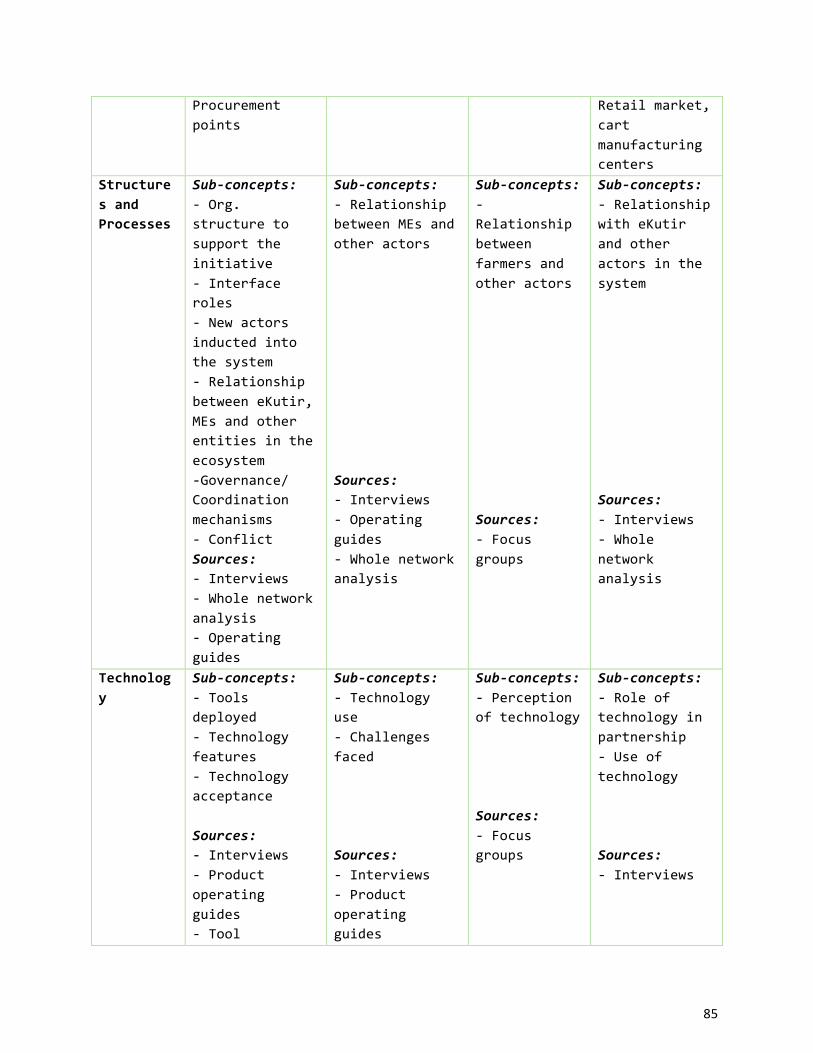
85
Procurementpoints
Retailmarket,cartmanufacturingcenters
StructuresandProcesses
Sub-concepts:-Org.structuretosupporttheinitiative-Interfaceroles-Newactorsinductedintothesystem-RelationshipbetweeneKutir,MEsandotherentitiesintheecosystem-Governance/Coordinationmechanisms-ConflictSources:-Interviews-Wholenetworkanalysis-Operatingguides
Sub-concepts:-RelationshipbetweenMEsandotheractorsSources:-Interviews-Operatingguides-Wholenetworkanalysis
Sub-concepts:-RelationshipbetweenfarmersandotheractorsSources:-Focusgroups
Sub-concepts:-RelationshipwitheKutirandotheractorsinthesystemSources:-Interviews-Wholenetworkanalysis
Technology
Sub-concepts:-Toolsdeployed-Technologyfeatures-TechnologyacceptanceSources:-Interviews-Productoperatingguides-Tool
Sub-concepts:-Technologyuse-ChallengesfacedSources:-Interviews-Productoperatingguides
Sub-concepts:-PerceptionoftechnologySources:-Focusgroups
Sub-concepts:-Roleoftechnologyinpartnership-UseoftechnologySources:-Interviews
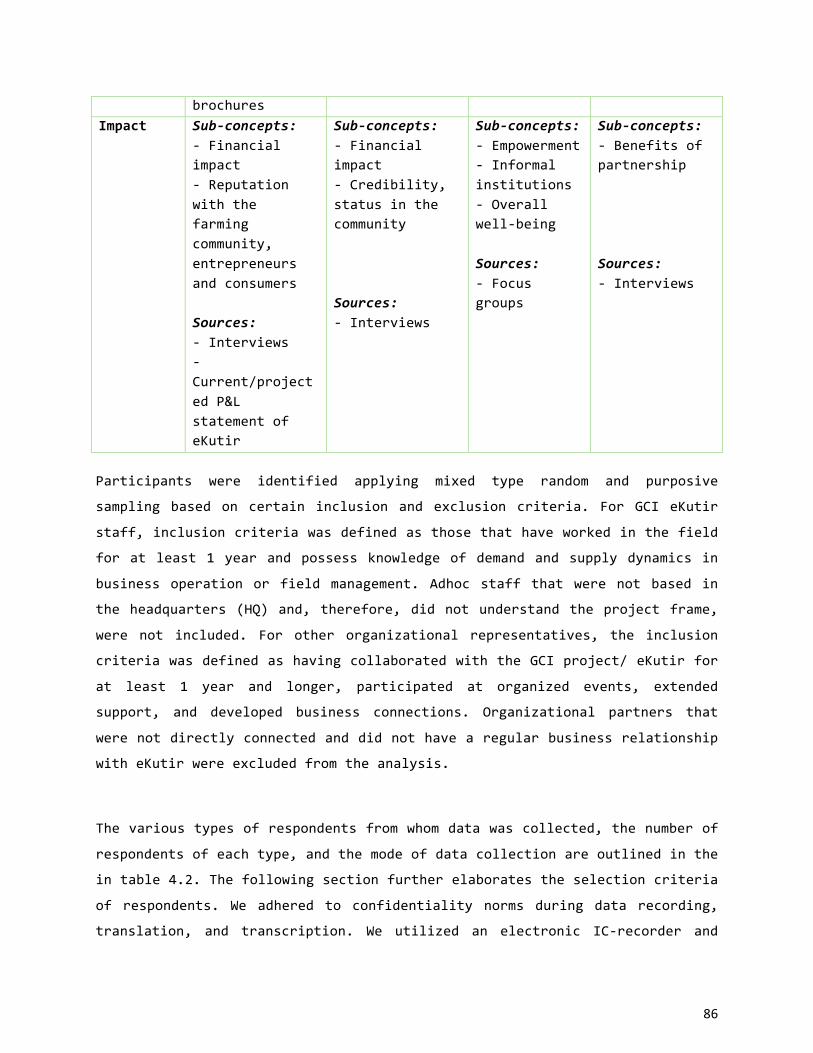
86
brochures Impact Sub-concepts:
-Financialimpact-Reputationwiththefarmingcommunity,entrepreneursandconsumersSources:-Interviews-Current/projectedP&LstatementofeKutir
Sub-concepts:-Financialimpact-Credibility,statusinthecommunitySources:-Interviews
Sub-concepts:-Empowerment-Informalinstitutions-Overallwell-beingSources:-Focusgroups
Sub-concepts:-BenefitsofpartnershipSources:-Interviews
Participants were identified applying mixed type random and purposive
sampling based on certain inclusion and exclusion criteria. For GCI eKutir
staff,inclusioncriteriawasdefinedasthosethathaveworkedinthefield
foratleast1yearandpossessknowledgeofdemandandsupplydynamicsin
business operation or field management. Adhoc staff that were not based in
theheadquarters(HQ)and,therefore,didnotunderstandtheprojectframe,
were not included. For other organizational representatives, the inclusion
criteriawasdefinedashavingcollaboratedwiththeGCIproject/eKutirfor
at least 1 year and longer, participated at organized events, extended
support, and developed business connections. Organizational partners that
werenotdirectlyconnectedanddidnothavearegularbusinessrelationship
witheKutirwereexcludedfromtheanalysis.
Thevarioustypesofrespondentsfromwhomdatawascollected,thenumberof
respondentsofeachtype,andthemodeofdatacollectionareoutlinedinthe
intable4.2.Thefollowingsectionfurtherelaboratestheselectioncriteria
of respondents. We adhered to confidentiality norms during data recording,
translation, and transcription. We utilized an electronic IC-recorder and
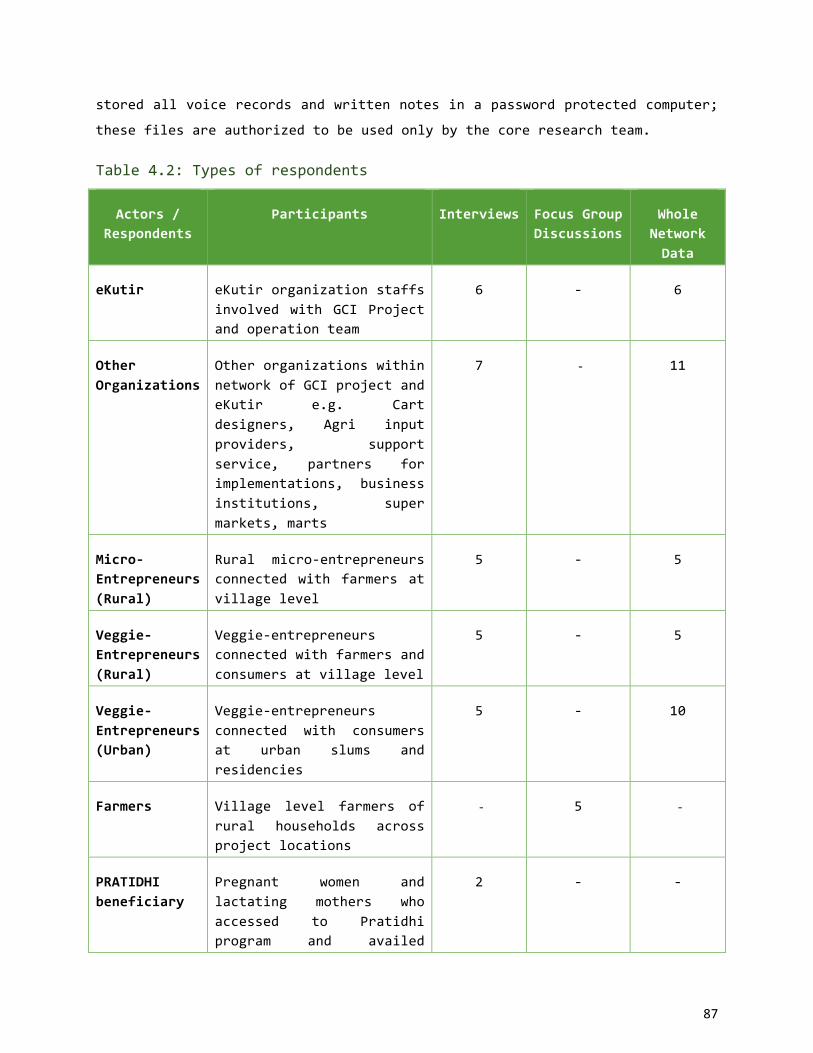
87
storedallvoicerecordsandwrittennotesinapasswordprotectedcomputer;
thesefilesareauthorizedtobeusedonlybythecoreresearchteam.
Table4.2:Typesofrespondents
Actors/Respondents
Participants Interviews FocusGroupDiscussions
WholeNetworkData
eKutir eKutirorganizationstaffsinvolved with GCI Projectandoperationteam
6 - 6
OtherOrganizations
OtherorganizationswithinnetworkofGCIprojectandeKutir e.g. Cartdesigners, Agri inputproviders, supportservice, partners forimplementations, businessinstitutions, supermarkets,marts
7 - 11
Micro-Entrepreneurs(Rural)
Rural micro-entrepreneursconnected with farmers atvillagelevel
5 - 5
Veggie-Entrepreneurs(Rural)
Veggie-entrepreneursconnectedwithfarmersandconsumersatvillagelevel
5 - 5
Veggie-Entrepreneurs(Urban)
Veggie-entrepreneursconnected with consumersat urban slums andresidencies
5 - 10
Farmers Village level farmers ofrural households acrossprojectlocations
- 5 -
PRATIDHIbeneficiary
Pregnant women andlactating mothers whoaccessed to Pratidhiprogram and availed
2 - -
88
nutrition incentivecoupons
We recruited a local agency for language interpretation, data translation,
and transcript preparations. In every phase of data collection, a local
language interpreter accompanied a researcher. For better quality data, we
haveusedmultiplelanguages(English,HindiandOdia)duringinterviewsas
perthecomfortoftherespondent.Forwholenetworkgrid-datacollection,we
havecollecteddatausingpenandpaperfirstandthencodedinpre-designed
locked Ms-Excel sheet. During this process researchers have travelled all
projectlocations–blocksanddistrictsandurbanproximitiesandcollected
requiredsamplesize.Adetailedaccountofeachtypeofdatacollectionis
below.
Interviews: This is a 15 month long project (extended until May 2016).
During this period, eKutir recruited new entrepreneurs, created vegetable
producingclusters,andlinkedthemtomarkets.Asthisprocessunfolded,we
interviewed eKutir staffs (senior management, executives, and field
coordinators), other organization partners, micro-entrepreneurs2, veggie-
entrepreneurs (urban and rural), pregnant women availed “Pratidhi” coupons
(seenextchapter).Theinterviewswereconductedduringmonths11-13asthe
project had reached a steady state. Location: at eKutir – head office,
distributioncenter,andprocurementpoints.
Theinterviewswerebasedonsemi-structuredquestionnairesdevelopedonthe
basis of the concept-stakeholder grid presented above. The questionnaires
were customized based on the respondent and the interview timing. Some
questions were common across respondents to increase internal validity of
data.Theinterviewswithmicro-entrepreneurshappenedtowardstheendofthe
project,whentheywereabletorecounttheirjourneythroughtheprojectand
articulate the benefits/ challenges. Similarly, the interviews with
2eKutir-VeggieKarthasmainly2typesofMicroEntrepreneurs–AgriEntrepreneurs(AE)andVeggie-Entrepreneurs(VE).
89
organizationalpartnerswerealsoconductedtowardstheendoftheproject,
whentheywereabletoprovideacompleteaccountoftheirassociationwith
eKutirandhowithasevolved.Weinterviewedonerepresentativefromeachof
the partnering organizations. These organizations included agri-input
companies, retailers, cart manufacturers, and technical support
organizations.
Focus groups: Focus groups were conducted with the farmer’s community to
understand the impact of the project on their lives. One focus group
conducted with the farmers of each AE interviewed i.e., 5 focus group
discussions across 5 locations. Each focus group had an average of 10-20
farmers participate. Inclusion criteria centered on having direct contact
withAEsandVEs,externalinputproviders,andparticipationintheFarmer
InterventionGroup.ThosewhoweremembersoftheFarmerInterventionGroup
forlessthan6months,hadnoregularcontactwithAEsorVEs,andwerenot
registeredfarmerswitheKutirwereexcludedfromthedata.
Operating guides and other internal documents: Finally, manuals,
checklists, operating guides, presentations, and other literatures were
reviewedateKutirforanalysis.Thishasprovidedusefulinsightsintothe
strategyandsupportingmechanismsofeKutir.
AnalysisAfter the data was collected, we grouped it based on respondents. For
instance,alltheAEinterviewtranscriptswereputtogetherinasub-folder.
WefirstlookedattheinterviewdatafromeKutir’srespondentsbecausethis
wouldgiveusanoverviewoftheentireVeggieKartoperation.Fromthis,we
createdseveralfiguresthatcapturetheVeggieKartsystem,theroleplayed
by the various actors, and the nature of interaction between them. Having
developedthisclarity,wewentontoisolatethekeyprocessesinvolvedin
buildingthissystem.Wedevelopedaninitialprocessframeworkbasedonthe
interviewswitheKutirpersonnel.Wethenanalyzedthedatafromotheractors
andprogressivelyrefinedtheframework,ensuringitsinternalvalidity.By
90
constantly iterating between data and analysis, we arrived at the final
framework.
ResultsIn this strategic analysis, we found VeggieKart to operate as platform
business that links farmers and vegetable retailers/ consumers i.e., it
servestwodistinctsetsofusersbyconnectingthem.Platformsaredefined
asproductsandservicesthatbringtogethergroupsofusersintwo-sidedor
multi-sided networks (Eisenmann et al., 2006). In two-sided platform
businesses,thetwousergroupsareattractedtooneanotheri.e.,thereisa
significant network effect. The more users there are in one network, the
highertheabilitytoattractusersintheothernetwork.Thisissoincase
ofVeggieKartaswell.IfVeggieKartcanmobilizealargenumberoffarmers,
itcanattractandservemoreretailers.Similarly,ifitcansignupmore
retailers/consumers,itcanleveragethemarketlinkagetoexpanditsfarmer
network. In such platform businesses, the challenge is to develop both
networkssimultaneouslyandtobeabletobalancethetwo.
Ouranalysisofthequalitativedataisolatestheprocessthroughwhichthe
farmernetworkandtheconsumernetworkaredeveloped.Thefarmernetworkis
the supply side of the equation while the consumer network represents the
demand side. Figure 4.1 below captures the processes playing out on the
supplyanddemandside.
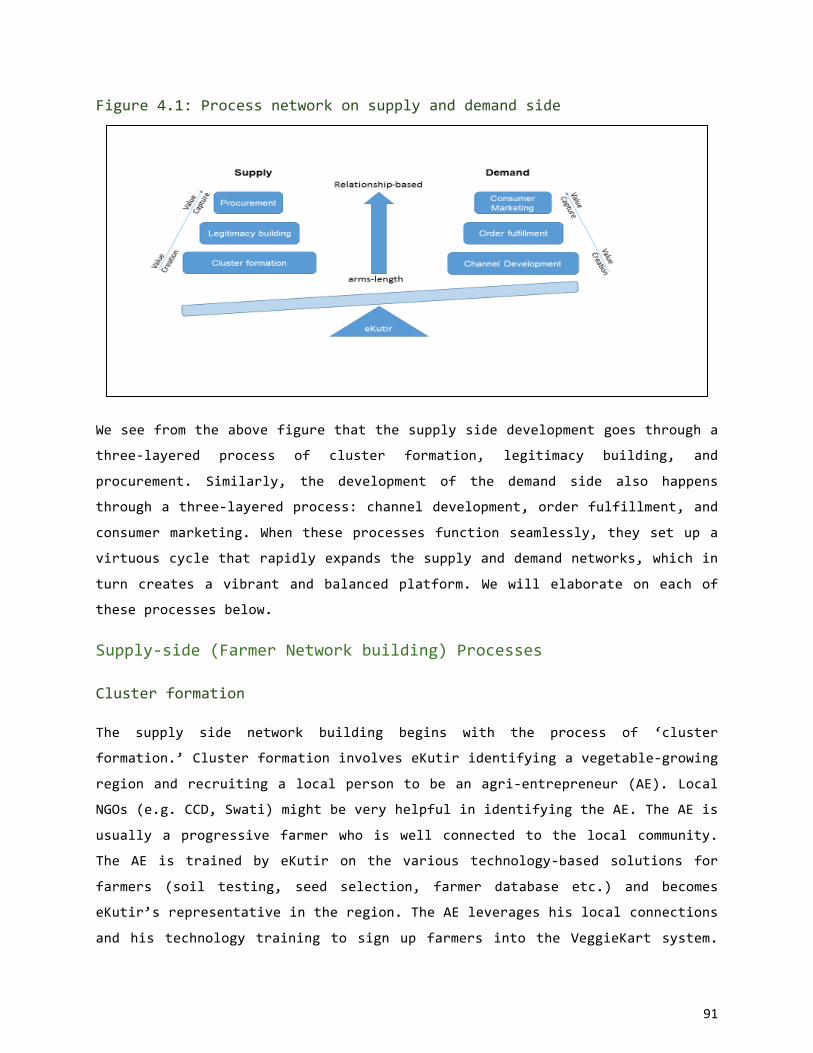
91
Figure4.1:Processnetworkonsupplyanddemandside
Weseefromtheabovefigurethatthesupplysidedevelopmentgoesthrougha
three-layered process of cluster formation, legitimacy building, and
procurement. Similarly, the development of the demand side also happens
throughathree-layeredprocess:channeldevelopment,orderfulfillment,and
consumermarketing.Whentheseprocessesfunctionseamlessly,theysetupa
virtuouscyclethatrapidlyexpandsthesupplyanddemandnetworks,whichin
turn creates a vibrant and balanced platform. We will elaborate on each of
theseprocessesbelow.
Supply-side(FarmerNetworkbuilding)ProcessesClusterformationThe supply side network building begins with the process of ‘cluster
formation.’ClusterformationinvolveseKutiridentifyingavegetable-growing
regionandrecruitingalocalpersontobeanagri-entrepreneur(AE).Local
NGOs(e.g.CCD,Swati)mightbeveryhelpfulinidentifyingtheAE.TheAEis
usually a progressive farmer who is well connected to the local community.
The AE is trained by eKutir on the various technology-based solutions for
farmers (soil testing, seed selection, farmer database etc.) and becomes
eKutir’srepresentativeintheregion.TheAEleverageshislocalconnections
and his technology training to sign up farmers into the VeggieKart system.
92
(S)he also aggregates farmers into smaller groups called ‘farmer support
groups’orFSGsandfacilitatesregularmeetingofthesegroups.Thegoalof
the FSG meetings is to enable free exchange of information, plan the crop
cycle, discuss best practices, and jointly solve farming issues. The
mobilizationoffarmersandthesubsequentformationofFSGscreatesawell-
knitclusterthatiscoordinatedbytheAE.Further,theFSGstructureallows
theAEtoeffectivelyreachouttoallthefarmersinhis/hercluster.The
key activities and actors in this process are captured in the table below.
The five clusters created for this pilot have about 200 farmers each, and
each cluster has an AE acting as the orchestrator. The qualitative data
indicatesthatFSGshavebeenformedandFSGmeetingsarebeingheld.Onan
ongoing basis, the key indicators of a vibrant cluster are the number of
farmersenrolled,thenumber/frequencyofFSGmeetings,andtheattendance
atthemeetings.Thisfirstprocessofclusterformationcreatestheplatform
toengagewiththeruralcommunity.ItisevidentthattheAEplaysapivotal
roleinthis.ThestatureoftheAEinthecommunityandabilitytomobilize
people play a crucial role in the effectiveness of this process. Table 4.3
belowrepresentsthesupplysideprocess.
LegitimacyBuildingAs the cluster falls into place, the next key process is ‘legitimacy
building’withtheruralcommunity.Technologyplaysacrucialroleinmaking
thishappen.TheAEcanleveragetech-enabledservicessuchassoiltesting,
seedselection,pestmanagementandotherstodecreasethecostincurredby
the farmers as well as improve their yield (Jha et al., 2016). Further,
eKutir’spartnershipwithvariousactorsintheecosystemenablestheAEto
createvalueforthefarmers.Forinstance,partnershipwithinputproviders
(seed,fertilizercompanies)allowstheAEtosourcehighqualityinputsto
thefarmersatreasonableprices.Similarly,theAEcanleveragetie-upswith
agri experts to provide timely resolution to farmers’ problems through the
cropcycle.
As the AE creates value for the farmers, there is a higher level of
legitimacy/trustthatthefarmershavefortheAEandeKutir.Thislegitimacy
93
buildingprocessisnecessarybecausetransactionsinruralcommunitiesare
oftenhingedonlegitimacyandtrust.AsoneofourAErespondentsmentioned,
farmerstendtobuyinputsandselltheirproducetolocaltraderswithwhom
they have a long-standing relationship. This relationship is based on
familiarityandtrustthatstemsfrommultipletransactionsovertheyears.
If eKutir is to get a foothold in these rural communities, it needs to be
perceivedasatrustedadvisorandallybythefarmers.
Fromthefarmerfocusgroupdiscussions,itisevidentthatthislegitimacy
for eKutir is beginning to take shape. Several farmers mentioned that they
aregratefulfortheadviceandhelptheyhavereceivedfromeKutirandit
has helped them lower costs and increase yield and diversify. They also
indicated their indebtedness and preference to sell to eKutir’s VeggieKart
(asopposedtolocalmarket/traders)ifprocurementweretohappenatsimilar
prices. The large sample survey also reveals that the production of
vegetables among eKutir farmers has shown a marginal increase, which is
likelytoenhanceeKutir’slegitimacyintheruralcommunities.
Table4.3:Supply-sideprocess[NextPage]
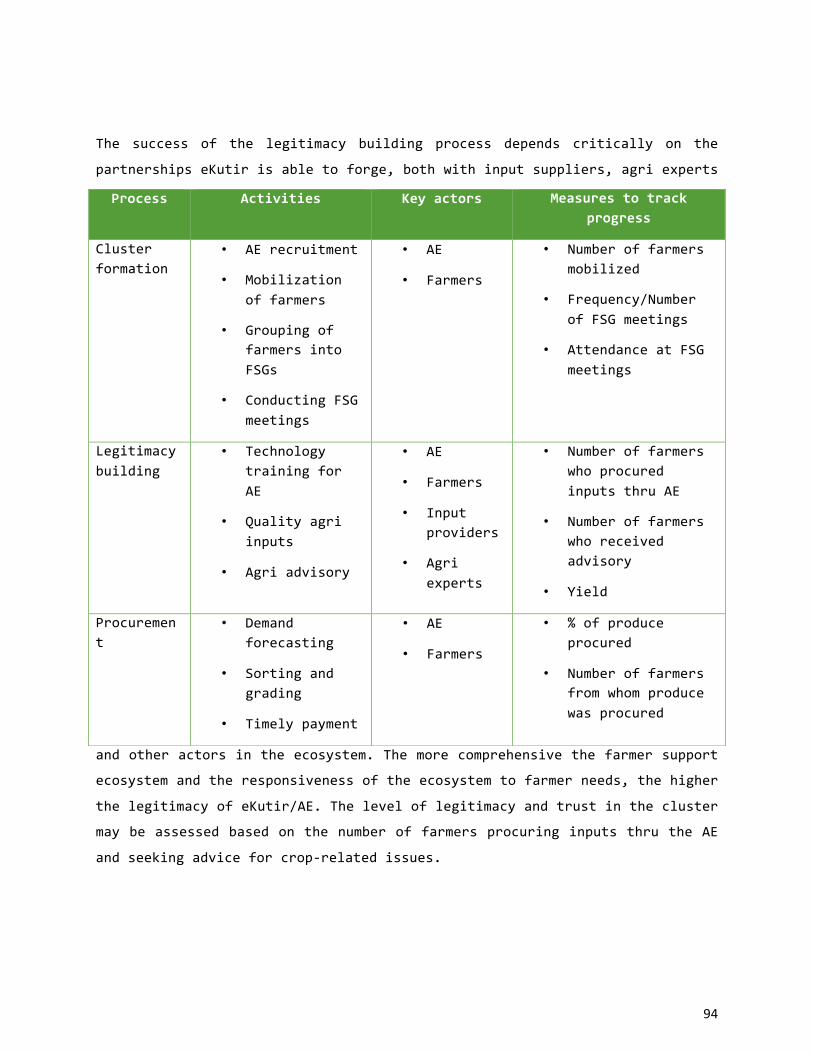
94
The success of the legitimacy building process depends critically on the
partnershipseKutirisabletoforge,bothwithinputsuppliers,agriexperts
andotheractorsintheecosystem.Themorecomprehensivethefarmersupport
ecosystemandtheresponsivenessoftheecosystemtofarmerneeds,thehigher
thelegitimacyofeKutir/AE.Theleveloflegitimacyandtrustinthecluster
maybeassessedbasedonthenumberoffarmersprocuringinputsthrutheAE
andseekingadviceforcrop-relatedissues.
Process Activities Keyactors Measurestotrackprogress
Clusterformation
• AErecruitment
• Mobilizationoffarmers
• GroupingoffarmersintoFSGs
• ConductingFSGmeetings
• AE
• Farmers
• Numberoffarmersmobilized
• Frequency/NumberofFSGmeetings
• AttendanceatFSGmeetings
Legitimacybuilding
• TechnologytrainingforAE
• Qualityagriinputs
• Agriadvisory
• AE
• Farmers
• Inputproviders
• Agriexperts
• NumberoffarmerswhoprocuredinputsthruAE
• Numberoffarmerswhoreceivedadvisory
• Yield
Procurement
• Demandforecasting
• Sortingandgrading
• Timelypayment
• AE
• Farmers
• %ofproduceprocured
• Numberoffarmersfromwhomproducewasprocured
95
Once eKutir has established itself as a legitimate player in the rural
communities, the next process is to leverage the farmer network for
‘procurement’ into VeggieKart. Procurement involves communicating demand
information, collecting the produce from the farmers and completing the
transactionwithpromptpayment.
Procurement not only feeds the VeggieKart business but it also sets up a
virtuouscyclewithintheruralfarmingcommunities.Themarketlinkageand
the resulting word-of-mouth will incentivize more farmers into the eKutir
system.
ThelargesamplesurveyindicatesthateKutirfarmersarekeentoaccessthe
marketsthroughtheVeggieKartvaluechain.However,currentlyVeggieKartis
procuring from a very small percentage of the farmers it is engaging with.
Though each cluster has about 200 farmers, totaling to 1000 farmers,
procurementisbeingdonefromfewerthan100farmers.Thisisunderscoredby
thefactthatseveralfarmersexpressedaninterestinsellingtoeKutirbut
lamented that they were not able to do so due to limited and selective
procurement. This could be because the business is still in the process of
rampingup.However,regularandextensiveprocurementfromtheclustersis
necessary for eKutir to recover its investments as well as strengthen its
farmernetwork.
On an ongoing basis, the effectiveness of the procurement process may be
measured by how many farmers in the network are touched by the procurement
processandthepercentageoftheirproduceprocuredbyVeggieKart.
Insummary,thesupplysidehasthreelayeredprocesses–clusterformation,
legitimacybuildingandprocurement.Thesecanbevisualizedasbuildingon
top of one another in a pyramid structure, as depicted in figure 2.2. The
flatterthetopofthepyramid,themoreeffectivethesupplysideprocess.
Inotherwords,ifeKutirisabletoprocurefrommostofthefarmersinthe
cluster,itiscapturingthevalueitiscreatingforthem.Ifnot,thevalue
created by mobilizing the farmers and linking them with various ecosystem
96
actors still benefits the farmers but does not contribute towards the
VeggieKart’sbusiness.
Table4.4inthenextpagerepresentstheprocurementprocess.

97
Table4.4:Procurementprocess
Process Activities Keyactors Measurestotrackprogress
Channeldevelopment
• VErecruitment
• Retailersignup
• VE
• Retailers
• Cartproviders
• NumberofVErecruited
• Numberofretailers
Orderfulfilment
• Ordercapture
• Vegetabledelivery
• VE
• Retailers
• Timelinessofdelivery
• Qualityperception
• Costperception
• Repeatorders
Consumermarketing
• VeggieKartbrandawareness
• Associationwithhealth/nutrition
• eKutir • Brandrecallamongcustomers
• Brandassociation
98
Demand-Side(Consumernetworkbuilding)ProcessChannelDevelopmentMirroringthesupplyside,athree-layeredprocessunfoldsonthedemandside
as well. The base process is that of ‘Channel development’. This involves
either opening new retail outlets or partnering with existing retailers to
carryVeggieKartproducts.
VeggieKart has multiple channels, both online and brick-and-mortar. The
brick-and-mortar channels come in different forms, catering to different
economic strata of society. These channels are depicted in figure 2.3. The
focus of this study is the VeggieLite centers, which are small-scale
vegetableshops,runbyamicro-entrepreneurcalled‘VeggieLiteEntrepreneur’
(VEforshort).
VeggieLitecentersaresetuptoservethelowereconomicstrataofsociety,
both in urban and rural areas. eKutir has setup more than 30 VeggieLite
centers.LiketheAE,theVEisalsoalocalperson,familiarwiththelocal
context. Often, the VE already has a small grocery shop and takes on
VeggieKart products to diversify. The VeggieLite centers receive vegetables
thataresortedoutofotherchannels(becauseoftheirsmallsize,oddshape
etc.). Traditionally, such vegetables would be discarded even though their
nutritivevalueisintact.ByopeningVeggieLitecentersthatcansellthese
vegetables to the low-income strata, significant amount of wastage in the
valuechainisprevented.
However, the VeggieLite channel is a low-volume channel i.e., each VE
procuresasmallquantityofvegetables(500-800Rsworthperday)andsells
itforasmallprofit.Whathe/sheisunabletoselliseitherconsumedby
the VE or discarded. Since the volume of procurement by VE is low, eKutir
willneedtoopenupalotofVeggieLitecentersiftheyaretosaturatean
area and bring about a tangible difference in vegetable consumption. This
aspect is underscored by the somewhat inconclusive results of the large
sample survey. While we find that the treatment households buying from
VeggieLitecentershaveincreasedvegetableconsumption(probablyduetothe
99
largevarietyofvegetablesavailabletoVLcenters),wealsofindthatthe
overallvegetableconsumptionhasremainedrelativelyflatacrosscontroland
treatmentgroups.ThiscouldbeattributedtothesmallnumberofVeggieLite
unitsandtheabsenceofsaturationinthetreatmentarea.
Opening up tens and hundreds of VeggieLite centers can be an operations-
intensive activity. The key activities and measures to track the channel
developmentprocessarecapturedintable4.6.
OrderfulfillmentWiththevariouschannelsandretailpointsforvegetabledeliveryinplace,
thenextprocessthatkicksinis‘Orderfulfillment’.Asthelabelsuggests,
itissimplytheprocessofaggregatingthedemandfromthevariouschannels
andfulfillingthedemandinatimelyandefficientmanner.
ForVeggieLite,thedemandinformationisgatheredonadailybasisoverthe
phone. An eKutir staff member calls the VE and writes down the requirement
forthefollowingday.ThisisthenaggregatedandpassedontotheAEswho
procure the vegetables from the farmers. Some vegetables that are not
availablefromthefarmingclustersareprocuredfromthelocalmarket.The
vegetablesaretransportedtothedistributioncenterwheretheyaregraded,
sorted, cleaned and packed before they are dispatched to various channels.
The online and large institutional buyers get the best quality vegetables.
The lower quality vegetables are sent to the other channels. VeggieLite
centersareatthebottomofthischainandgetvegetablesthatweresorted
outofotherchannelsand/orreturnedbytheinstitutionalbuyers.Figure2.8
captureshowthevegetablesflowthroughoutdifferentchannelsinVeggieKart
operation.
The success of the order fulfillment process depends on whether it is
creatingvalueforthecustomersontheparametersthataremostimportantto
them.Thekeyparametersarecost,qualityandconvenienceandtheyvaryby
channel.Forinstance,wefoundthatforVEs,costandconveniencemattered
100
the most and they were willing to compromise on quality. Whether the
procurementpricewascomparabletothepriceinthelocalmarketandwhether
the vegetables were delivered on time were important factors. In fact,
several VEs expressed that the quality of vegetables was very ordinary and
the cost was the same as in the local market. But, the fact that the
vegetablesweregettingdeliveredtotheirdoorstep(i.e.,convenience)made
VeggieKartattractive.Perhaps,fortheonlinechannel,qualitywouldbethe
keyconsideration.
Successfulorderfulfillmentiskeyforbuildingaloyalcustomerbase.Itis
important to note that the VEs and retailers have multiple sources for
procurement and the only way VeggieKart can recover the cost of channel
development is by securing repeat orders. Therefore, successful order
fulfillmentiskey.
ConsumerMarketingConsumer marketing is the third of the three processes on the demand side.
ThisprocessaimstocreateastrongbrandforVeggieKartwithendcustomers.
While the first two processes focus on direct customers (retailers), this
processes aims to reach out to the end consumers. However, the first two
processes need to be in place in order to service the demand created by
consumermarketing.Infact,thelargesamplesurveyresultssuggestthatthe
consumption of vegetables has increased in households that procure from
VeggieLite centers. This could be due to a larger variety of vegetables,
lower prices or a combination thereof. Therefore, consumer-marketing
activity,whichmaydriveupthefootfallintoVeggieLitecenters,islikely
tohaveanimpactontheend-consumervegetableconsumption.
VeggieKartisonlystartingtoexplorethisprocess.Anattemptwasmadein
the form of a pilot project called ‘Pratidhi’, which aimed to sensitize
pregnantmothersonnutritionalrequirementsandprovideavegetablebasket
tohelpthemachieveanutritionallybalanceddiet.But,consumermarketing
is still very limited, except for the online channel, which reaches out to
thehigh-incomeurbanconsumers.

101
ThisprocesswillinvolvecreatingawarenessabouttheVeggieKartbrandand
associatingitwithcertainattributessuchashealth/nutrition.Thisshould
lead to an increased demand for VeggieKart products, which will in turn
utilizethecapacityofthevariousretailchannelsandprovideimpetusfor
furtherexpansion.
In summary, the demand side or consumer side comprises three processes -
channel development, order fulfillment and consumer marketing. Here again,
eachprocessbuildsontheother.Throughthefirsttwoprocesses,VeggieKart
seekstocreateaninfrastructurethatcreatesvalueforretailers(VEsand
others).Thethirdprocess,consumermarketing,enablesVeggieKarttocapture
the value from this retailer network and further expand it by building a
brand.Hereagain,similartothesupplyside,theprocessesmovesfromvalue
creationtovaluecapture.Themoretheresourcesspentonconsumermarketing
(flatter pyramid), the higher the value capture. Of course, this can only
happenifthefoundationalprocessesareinplace.
ICT
ICTcanplayacrucialroleinstrengtheningtheconnectionsbetweenvarious
actorsintheeKutirecosystem.Asofnow,ICTisusedquiteextensivelyon
thesupplyside,especiallybetweeneKutirandtheAgrientrepreneurs.But,
mostotherinteractionsaremanual.AsthischangesandICTbridgesallthe
actors,theinformationandcollaboration(regularmeeting)networkscanalso
beexpectedtobecomedense.
NetworkMappingofEcosystemFormationTo assess the early formation of the VeggieKart/VeggieLite ecosystem, a
network mapping exercise was undertaken. The exercise was intended to
identify the structural features, including gaps, characterizing the
relationship among the various actors in the VeggieKart system. Interviews
were conducted with those actors who were involved (through regular
interaction) in the day-to-day business operations of VeggieKart. The
participants included eKutir executives, VeggieLite Distribution center
representatives, the agri- and veggie-entrepreneurs, and a range of other

102
organizational partners, such as cart manufacturers, input providers, MGM,
retailoutlets,governmentagencies.Inundertakingthenetworkanalysis,we
did not presume that there was an ideal network structure that the eKutir
ecosystem should assume. Instead, our aim was to map and document the
structure of the eKutir network at this early stage of its development so
that eKutir might use this knowledge to address important gaps in
connectivitywithinthenetworkandassessovertimehowthenetworkevolved
throughfuturescale-upactivities.
To gather these data, each partner was asked about their awareness and
exchange of information with the other partners in the ecosystem. In
addition,eachwasaskedhowimportantonascaleof1-5theythoughtthat
informationwastotheiractivitiesandlevelofcollaborationwiththeother
partners. Using this information, three different network dimensions were
mapped: (1) knowledge and awareness of network members; (2) information
sharing–a)sendingandb)receivinginformation);and(3)holdingmeetings.
Social connections within the network can be bi- or uni-directional,
dependingonwhetherthepartnersidentifytheirconnectiontotheotherina
similar manner. Each node was color coded to represent its specific role
within the eKutir ecosystem: (1) red – eKutir officials; (2) green – rural
micro-entrepreneurs;(3)blue–ruralveggie-entrepreneurs;(4)grey–urban
veggie-entrepreneurs;(5)pink–ASHAworkers;and(6)yellow–othertypes
of actors. Furthermore, this information was used to calculate the overall
density and level of centralization of the eKutir network. Density is
defined as the number of ties in the network divided by the number of
possiblenetworkties.Densityisthusaproportionthatrangesfrom0-1.A
densityof1.0impliesthateachactorisconnectedtoalltheotheractors
inthenetwork.Networkcentralizationisameasureofhowcentralthemost
central node(s) are in relation to all the other network members.
Centralizednetworksarethoseinwhichoneortwoactorshavethemajority
ofconnectionsinthenetwork.Lesscentralizednetworksarethoseinwhich
connectionsanddecision-makingismorediffusedthroughoutthesystem.The
values for each of these measures can vary depending on which network
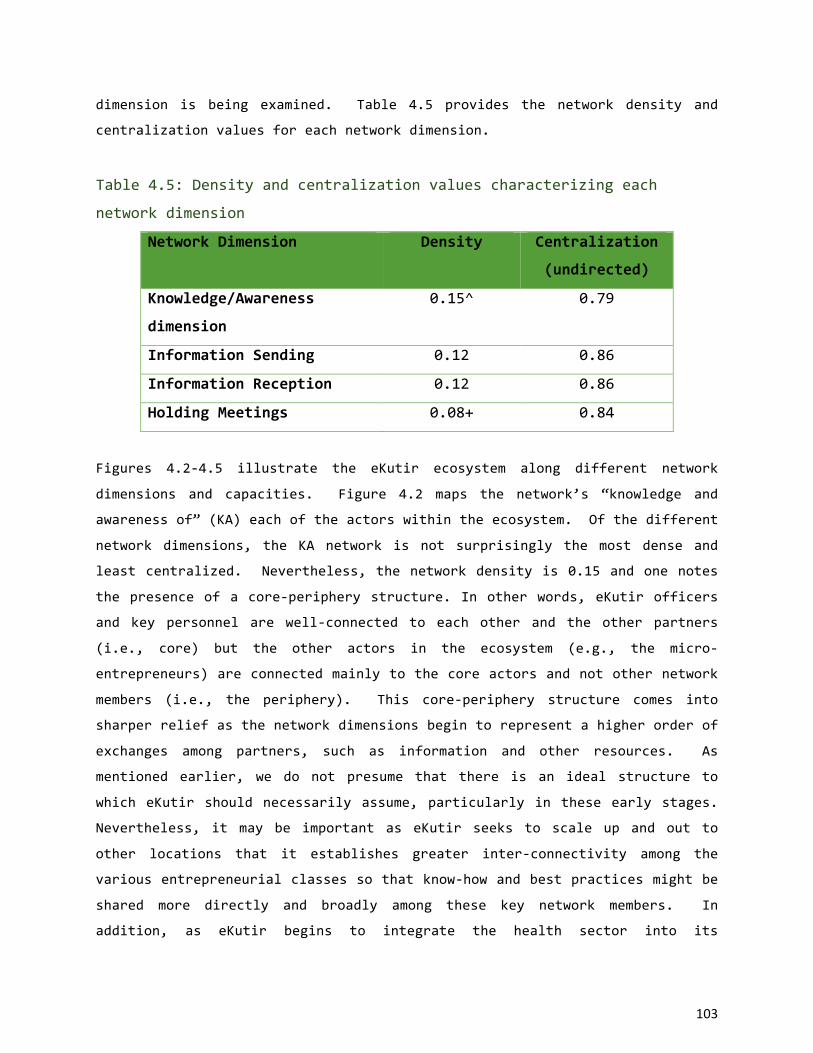
103
dimension is being examined. Table 4.5 provides the network density and
centralizationvaluesforeachnetworkdimension.
Table4.5:Densityandcentralizationvaluescharacterizingeach
networkdimension
NetworkDimension Density Centralization
(undirected)
Knowledge/Awareness
dimension
0.15^ 0.79
InformationSending 0.12 0.86
InformationReception 0.12 0.86
HoldingMeetings 0.08+ 0.84
Figures 4.2-4.5 illustrate the eKutir ecosystem along different network
dimensions and capacities. Figure 4.2 maps the network’s “knowledge and
awarenessof”(KA)eachoftheactorswithintheecosystem.Ofthedifferent
network dimensions, the KA network is not surprisingly the most dense and
leastcentralized.Nevertheless,thenetworkdensityis0.15andonenotes
thepresenceofacore-peripherystructure.Inotherwords,eKutirofficers
and key personnel are well-connected to each other and the other partners
(i.e., core) but the other actors in the ecosystem (e.g., the micro-
entrepreneurs)areconnectedmainlytothecoreactorsandnotothernetwork
members (i.e., the periphery). This core-periphery structure comes into
sharperreliefasthenetworkdimensionsbegintorepresentahigherorderof
exchanges among partners, such as information and other resources. As
mentioned earlier, we do not presume that there is an ideal structure to
whicheKutirshouldnecessarilyassume,particularlyintheseearlystages.
Nevertheless, it may be important as eKutir seeks to scale up and out to
other locations that it establishes greater inter-connectivity among the
variousentrepreneurialclassessothatknow-howandbestpracticesmightbe
shared more directly and broadly among these key network members. In
addition, as eKutir begins to integrate the health sector into its
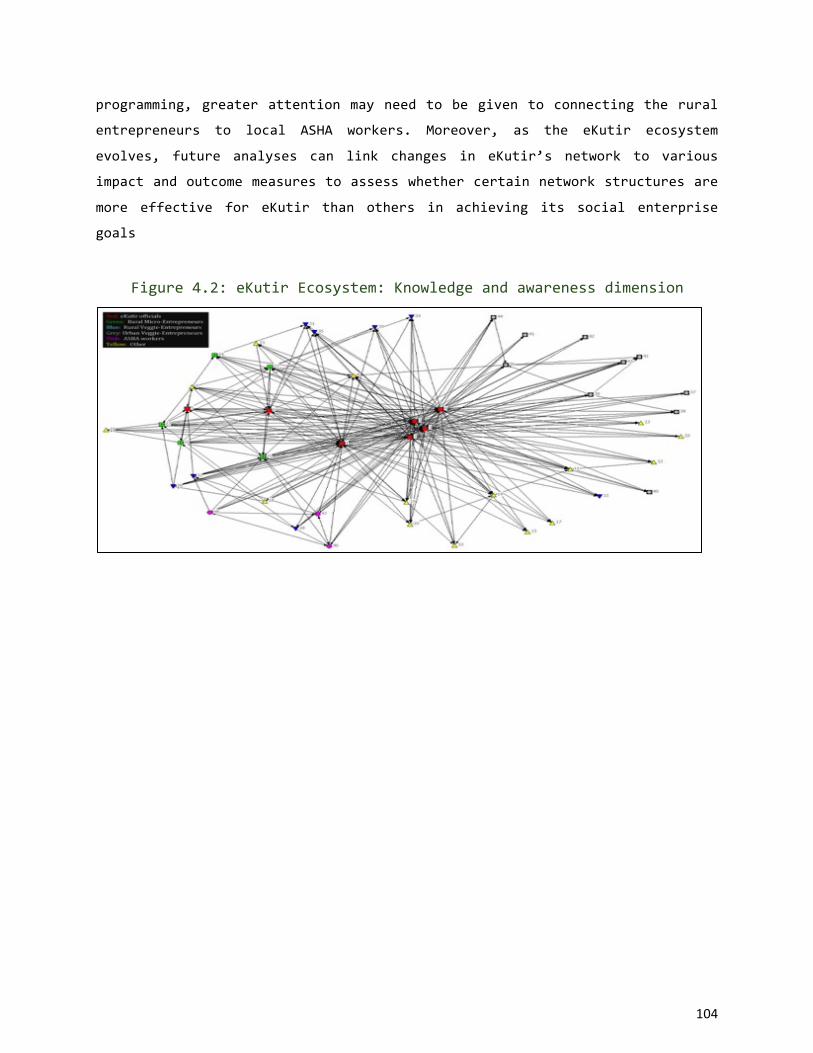
104
programming,greaterattentionmayneedtobegiventoconnectingtherural
entrepreneurs to local ASHA workers. Moreover, as the eKutir ecosystem
evolves, future analyses can link changes in eKutir’s network to various
impactandoutcomemeasurestoassesswhethercertainnetworkstructuresare
more effective for eKutir than others in achieving its social enterprise
goals
Figure4.2:eKutirEcosystem:Knowledgeandawarenessdimension

105
Figure4.3:eKutirEcosystem:Sendinginformationdimension
Figure4.4:eKutirEcosystem-Informationreceptionnetwork
Figure4.5:RegularMeetingsNetwork
106
Competitivedynamics(seeappendixfordetailedmodelsandresults)
Analyticalmodelstocapturethecompetitivedynamicsinsupply/valuechains
and markets have evolved from a long research tradition that has examined
competitive dynamics in industrial value chains and markets. VK aims to
reduce the access cost for the farmers (Fv) and for the consumers (Cv) by
using “micro-entrepreneurs and in this context the model will consider the
welfare of all stakeholders within the VK ecosystem (i.e., farmers,
VeggieKart and Consumer), as well as their competitive dynamics in
interaction with traditional commercial middlemen (Mandis). The research
questionsspecificallyaddressedinthecompetitivedynamicsanalysisforthe
VKenterpriseinthepresentanalyticalmodelare:
- How does a new ecosystem like VK compete with the traditional Mandi
channel and affect the farmers (prices received) as well as end
consumers (prices paid)? This will address how much to pay to the
farmers?;Howmuchamountofvegetabletocollect?;Howmuchtocharge
toendconsumers?;Howmuchstocktosell?;Howmanychannelstouse?;
How many micro-aggregators and micro-retailers to “hire” and their
coverageareas?;Howwillthetraditionalvaluechain(Mandi)respond
tothisbusinessmodelinnovation?;WhatadditionalservicesshouldVK
provide?; How should it charge for the additional service?; Is a
business innovation like VK good good for the farmers? Good for the
consumers?;WhoextractsthebenefitsfromaninnovationlikeVKinthe
valuechain?Morespecifically,
o How do the following factors shape the above dynamics for VK:
(a)Levelofyielduncertainty;(b)Costsofrecruitingmicro-
aggregatorstoprocurefarmer’sproduce;(3)Costsofselecting,
training and equipping micro-retailers for selling to the end
consumers?

107
ModelFrameworkInordertoevaluatetheimpactofVKontraditionalagri-foodsupplychains,
we develop a dual- channel supply chain model, where supply of producers
(i.e.,farmers)anddemandofconsumersaremet.Seefigure4.6forthehigh-
level representation of the dual-channel supply chain model considered in
thispaper.
Thefirstchannelcharacterizestraditional(Mandi)middlemenwhoseroleis
to collect goods from the farmers and sell them to the consumers. As
mentioned in introduction, farmers and consumers incur various costs to
accesstothistraditionalMandichannelduetoitsgeographicallimitations,
and lack of logistics and operational infrastructure. Later on, we will
normalize the total access costs of the farmers and consumers to this
traditionalchannelto1inordertobenchmarktheimpactofVK.Also,dueto
thefactthattheMandichannelishighlyfragmentedandconsistsofmany
smallplayers,itislogicaltoassumethattheplayersinMandichannelare
ofatomicnatureandhencedonotinfluencethepricingdecisionsrealizedat
thefarmerandconsumersidesofchannel.Wedenotetheunitpriceatwhich
the Mandi collects supplies of farmers by wM, and the unit price at which
collectedgoodsaresoldtotheconsumersattheMandibypM.Whenwepresent
thedetailsofsupplyanddemandfunctionsoffarmersandconsumers,wewill
derive pM and wM so that the supply and demand clear in every contingency
state. Note that this derivation procedure does essentially capture the
fragmentednatureofMandichannel.
Figure4.6:Dual-channelmodelconsideredinthepaper

108
The second channel between farmers and consumers is meditated by VK which
presentstwokeydifferencescomparedtoMandichannel.Inordertocapture
the first one, we define two key notations: fV and cV. The former (resp.,
latter) denotes the access cost of farmers (resp., consumers) to VK, and
takesvaluesbetween0and1.Duetotheabovenormalization,onecanthink
of VK getting closer to the farmers (resp., consumers) as fV (resp., cV)
decreasesfrom1to0.TheseconddifferencebetweenVKandMandichannelis
related to price formation. As opposed to price-taker nature of Mandi
channel,VKcanexertpricingpowertobothfarmersandconsumersduetoits
proximitytobothmarkets(ascapturedbyless-than-onefVandcV).Similar
toMandi,wedefinetwounitpricesforVK:oneforfarmersdenotedbywVand
oneforconsumersdenotedbypV.Also,sinceVKsetsthesepricesbeforethe
uncertainty realizes, the total supply collected by VK and total demand
satisfied by VK do not necessarily match in every contingency state (as
opposedtoMandichannel).
Next,inordertofocusontheoperationalrisksduetoweather,technology
andperishablenatureofthegoods(suchasfreshfruits,vegetables,etc.),
weconsideravailabilityriskatthesupplyside.Morespecifically,letSbe
thetotalamountoffreshgoodsthatwillbeavailabletothefarmersafter
supplyrisksrealize.Inordertoensuretractability,weassumethatScan
beeitherSH=1+aorSL=1−awithequalprobabilities(representing
highandlowsupplystates,respectively),where
a∈[0,1].Notethatameasuresthedegreeofexogenousrisksfacedbythe
farmers.
Thetimingofdecisionsandeventsinourmodelisillustratedinfigure4.7.
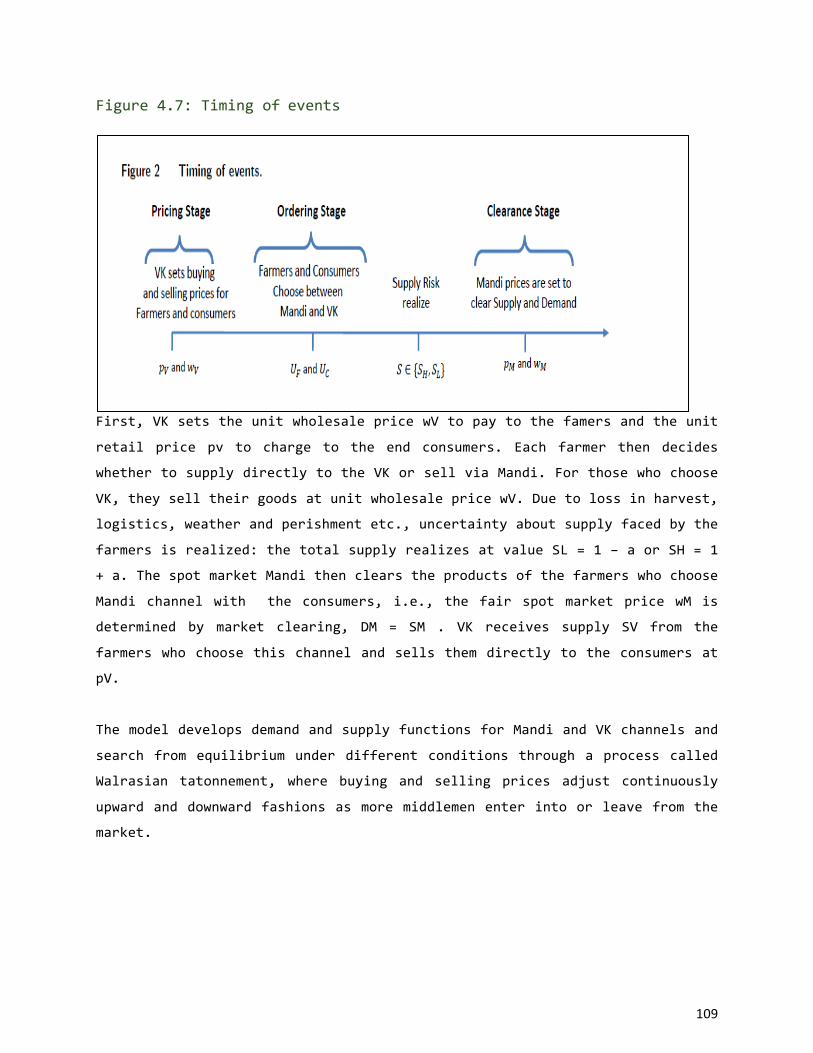
109
Figure4.7:Timingofevents
First,VKsetstheunitwholesalepricewVtopaytothefamersandtheunit
retail price pv to charge to the end consumers. Each farmer then decides
whethertosupplydirectlytotheVKorsellviaMandi.Forthosewhochoose
VK,theyselltheirgoodsatunitwholesalepricewV.Duetolossinharvest,
logistics,weatherandperishmentetc.,uncertaintyaboutsupplyfacedbythe
farmersisrealized:thetotalsupplyrealizesatvalueSL=1−aorSH=1
+a.ThespotmarketMandithenclearstheproductsofthefarmerswhochoose
Mandi channel with the consumers, i.e., the fair spot market price wM is
determined by market clearing, DM = SM . VK receives supply SV from the
farmerswhochoosethischannelandsellsthemdirectlytotheconsumersat
pV.
ThemodeldevelopsdemandandsupplyfunctionsforMandiandVKchannelsand
searchfromequilibriumunderdifferentconditionsthroughaprocesscalled
Walrasian tatonnement, where buying and selling prices adjust continuously
upwardanddownwardfashionsasmoremiddlemenenterintoorleavefromthe
market.
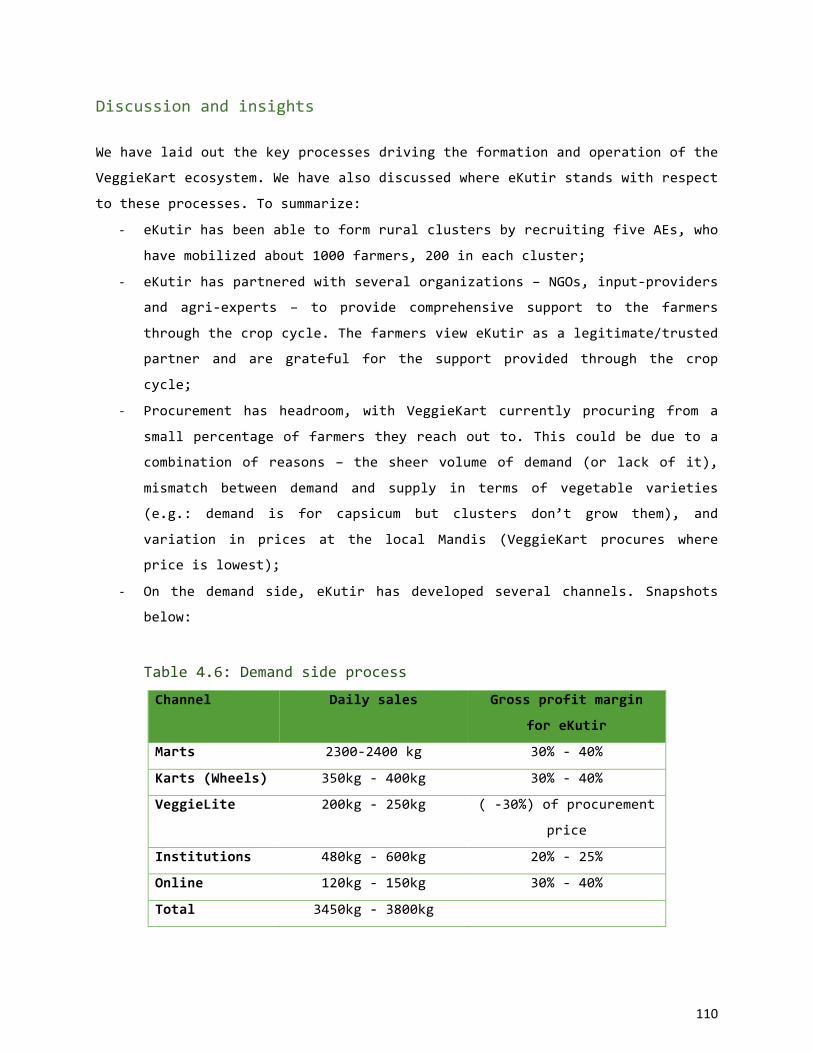
110
Discussionandinsights
Wehavelaidoutthekeyprocessesdrivingtheformationandoperationofthe
VeggieKartecosystem.WehavealsodiscussedwhereeKutirstandswithrespect
totheseprocesses.Tosummarize:
- eKutirhasbeenabletoformruralclustersbyrecruitingfiveAEs,who
havemobilizedabout1000farmers,200ineachcluster;
- eKutirhaspartneredwithseveralorganizations–NGOs,input-providers
and agri-experts – to provide comprehensive support to the farmers
throughthecropcycle.ThefarmersvieweKutirasalegitimate/trusted
partner and are grateful for the support provided through the crop
cycle;
- Procurement has headroom, with VeggieKart currently procuring from a
smallpercentageoffarmerstheyreachoutto.Thiscouldbeduetoa
combination of reasons – the sheer volume of demand (or lack of it),
mismatch between demand and supply in terms of vegetable varieties
(e.g.: demand is for capsicum but clusters don’t grow them), and
variation in prices at the local Mandis (VeggieKart procures where
priceislowest);
- On the demand side, eKutir has developed several channels. Snapshots
below:
Table4.6:Demandsideprocess
Channel Dailysales Grossprofitmargin
foreKutir
Marts 2300-2400kg 30%-40%
Karts(Wheels) 350kg-400kg 30%-40%
VeggieLite 200kg-250kg (-30%)ofprocurement
price
Institutions 480kg-600kg 20%-25%
Online 120kg-150kg 30%-40%
Total 3450kg-3800kg
111
VeggieLite, the channel focused on serving the rural and urban low-
incomecommunities,isalow-volume,negative-marginchannel.However,
the negative margin from VeggieLite is offset by the fact that these
vegetables would otherwise have to be discarded. Therefore, this
channelistobeviewedasonethatcanreducewastageasopposedto
onethatcangiveprofits.Fromthatperspective,theybringefficiency
tothevaluechainoverall.However,thesupplytotheVeggieLite-Rural
centersismanagedbythelocalAE,whomanytimeshastoprocuresome
varieties of vegetables for the VE from the local market. This seems
likeanoverheadfortheAE,whoseprimaryfunctionistosupportthe
farmers;
- Intermsoforderfulfillment,thelargeretailersaresatisfiedwith
thequalityofthevegetablesandtimelinessoftheorderfulfillment.
The VEs value the convenience of delivery to VeggieLite centers.
However, they do not perceive any advantage in terms of price or
quality. The value VeggieKart offers is different for different
channels;
- Consumermarketingisintheinitialphasesandneedstoberampedup.
Inessence,onthesupplyside,VeggieKartiscreatingvalueforthefarmers
andiswellpositionedtomonetizeonthegoodwillcreated.However,atthe
presentjuncture,thevalueisnotbeingfullycapturedduetolowlevelsof
procurement. On the demand side, eKutir is in the process of
building/expanding the retailer network and fulfilling the demand of the
variouschannels.Thediversesetofchannelsandtheiruniquerequirements
make this a tough terrain. Currently, the scale seems to be tilted towards
the supply side (as shown in figure 4.1) and more demand needs to be
generatedtobalanceitout.
InsightsfortransitiontoscaleBasedontheseobservations,wehavethefollowingrecommendationsforeKutir
toconsiderastheyscaleuptheirbusiness.

112
1. Focus on demand generation: The procurement levels have been
graduallyincreasingsincetheformationoftheclustersbutthereis
scopetofurtherenhanceprocurementlevelsfromtheexistingclusters.
This will also enable eKutir to recover the investments made into
creatingfarmerclusters.Thiscanbeaccomplishedusingacombination
ofthefollowingstrategies:
a. Invest more into consumer marketing to create VeggieKart brand
awareness and consumer pull. This will automatically result in
higherdemandfromexistingretailoutletsaswellasreducethe
effort involved in creating new outlets. Capacity building of
Agri-Entrepreneurs and Veggie-Entrepreneurs on product marketing
will add value in business growth and expansion. Appropriate
brand promotion and communication strategy needs to be adhered
withoperationchannelsacrossconsumersegment.
b. A second strategy could be to position VeggieKart as a
differentiatedbrand.Asitstandstoday,VeggieKartisageneric
provider of a whole range of vegetables, competing head-to-head
with several providers. Given VeggieKart’s linkage to farming
clusters, it could consider positioning itself as a provider of
exotic seasonal vegetables or provider of organic vegetables
i.e.,positionasanicheplayer.Suchapositioningwillallow
VeggieKart to leverage its farmer connect and differentiate
itself from its competitors by supplying vegetables that are
otherwise not easily available. During our interviews, farmers
indicatedawillingnesstoundertakefarmingofnewvarietiesof
vegetables (e.g. mushrooms). The focus on a limited basket of
vegetables might help increase the levels of procurement and
simplify logistics. This however involves significant
repositioningbutshouldbeevaluatedbeforescalingup.
2. Streamline the channels: VeggieKart has developed several channels,
both online and office. Offline channels include VeggieMart,
VeggieWheels and VeggieLite. As brought forward by our analysis, the
113
VeggieLiteisalow-volumechannel,witheachVEprocuringvegetables
worthjustafewhundredrupeesperday.Whilethischannelservesto
minimize the wastage in the value chain, it would be beneficial to
increase the volume of procurement of each VeggieLite channel.
Otherwise,astheoperationscalesup,thenumberofVeggieLitecenters
that would need to be opened would pose a logistical/distribution
challenge.
One possibility is to consider having fewer channels, in particular
foldingVeggieLiteintoVeggieWheels.VeggieWheelsaremobileandhence
morelikelytoreachalargernumberofconsumers.Thismeans,theVE
can procure more vegetables from VeggieKart. Further, more low-income
consumerscanbereachedwithfewernumberofVeggieWheelssincethey
aremobile.eKutirhasstartedtoexperimentalongtheselineswiththe
VeggieLiteExpress.Thisneedstobefurtherexplored.
3. HybridmodelforAgri-Entrepreneur:TheAE,asthenamesuggests,is
envisaged to provide a range of services to the farmers and get a
commission on each transaction facilitated. He can earn money from
sourcing inputs (seeds, fertilizer etc.) to the farmers or by
facilitatingprocurementbyVeggieKart.Ifheisabletodeliverboth
theseservices,hewillhaveasteadystreamofrevenueandcansustain
asamicro-entrepreneur.However,intheabsenceofactiveprocurement
fromtheclusters,theviabilityofthemicro-entrepreneurshipmodelis
low. The AE might not have enough incentive to continue, which might
leadtoattrition.
ThisproblemcanbeaddressedbyadoptingahybridmodelwheretheAE
ispaidafixedsalaryduringtheinitialclusterdevelopmentprocess
and is transitioned to a micro-entrepreneurship model only when
procurementhasreachedalevelwherehe/shecanearnatleastasmuch
as his fixed salary through commissions. eKutir is already
experimentingwiththismodel.However,itisbesttoformalizethisin
theAErecruitmentprotocol.

114
4. Use of ICT: eKutir has developed an ICT platform to support
VeggieKart.Thisplatformisbeingusedeffectivelyonthesupplyside
to capture farmer/crop data and provide various services (soil test,
seedselectionetc.).However,theuseofICTisverylimitedwhenit
comes to demand aggregation, forecasting and interfacing with the
various retail channels. eKutir staff calling them on a daily basis
capturestheVEdemand.Thiscanbecomeabottleneckduringscaleup.
Therefore, one of the important infrastructural elements to have in
placebeforescalingupisanICTbackbonetomanagethedemandsideof
thebusiness.
The project will be sustained from revenues from sales of produce, and
incentivefundingfrompublicandprivatepartnersinthehealthcaresector.
ThisprojectistestingandbuildingpartnershipswithOdishagovernmentas
well as other state governments, the federal ASHA program, and private
insurancecompanyBajajAllianz.
Due to its extensive distribution network of vetted and trained micro-
entrepreneurs,eKutirisanattractivepartnerformanycorporationstoreach
dispersed markets in both urban and rural areas of eastern India. eKutir
willcontinuetomakemutually-beneficialpartnershipstosustainthishigh-
impactproject.
Though still improving, VeggieKart has now established strong distribution
chainfromsmallholderfarmertoconsumer,andisreadytotaketheexpansion
steps required for sustainability and scaling. The project will take
learningsaboutthebestvenderpartnerships,andwillexpanddistributionto
anadditional50newbrandedretailpoints.VeggieKarthasfoundthatthe
VeggieMart (B2B) channel is beginning to offer the greatest volumes and
profitability,aswellasopportunitiesforscaling.Stillcontinuingahigh
proportion of micro-entrepreneur VeggieMart and VeggieWheels in underserved
neighborhoods, this project will help build out the partnership with chain
retail partners Big Bazaar, Home Shop, and Reliance Fresh in strategic
115
locations.Theexpansionofthisvendernetworkthroughtheprojectshould
getVeggieKarttoabreakeventhroughput(4.5MIR).
Further insights in accounting for the present results and preparing
transition to scale come from the competitive dynamics analytical model.
The model inform on different course of actions under different
competitive dynamics for addressing five types of risks Market,
Business,Regulatory,Financial,Operational)
1. Market Risks – Vegetables have great fluctuations of price due to
supply and climate factors, and enterprises face competition from
formal and informal venders. VeggieKart’s market risk has been
minimized by diversifying into different distribution channels with
both Business-to-Business relationships and direct consumer
relationships, and reducing volatility with longer-term relationships
withsuppliers.
2. Business Risks – Inadequate training and circumstantial situations at
the vegetable entrepreneur’s front. This is being tracked through
properselection,training,andtimelymonitoring.
3. Regulatory Risks – Within Odisha, the Department of Horticulture and
theHeadofStatesupportedthelaunchofVeggieKartandhavefavored
and created a feasible environment for the growth of VeggieKart.
OutsideOdisha,VeggieKartneedstoadheretotheAgricultureProducers
MarketingCommittee’spoliciesandtreaditsscaleaccordingly.
4. Financial Risks - Delayed contractual payments from the institutional
buyersandensuringallvegetableentrepreneursdocashsettlementona
daily basis needs to be tightened to control the inflow of cash and
outflowofsupply.
5. Operational Risks – VeggieKart needs to ensure 100% procurement from
the farmers, further optimize its supply chain, and model its state-
levelexpansion,andcontrolgraftand

116
In sum, for scalability, VeggieKart will have to increase sales volume
whilemaintainingleanoperations.Whiletherecouldbemultiplestrategies,
DAISAhasmadethefollowingrecommendations:
- Focus on increase procurement from existing eKutir farmers, and
existingvillages.Furthertrainingofagri-entrepreneursonoutreach
andcommunicationsskillstobuildfurthercontactonVeggieKartmarket
needs.
- Improve marketing at VeggieKart and VeggieLite locations. Train
vendersonproductdisplay,havemorebrandedpoint-of-salepromotional
materials, utilize nutrition incentives and promotions more
aggressively, have most successful venders share strategies with each
other.VeggieKartshouldhaveacentralmarketdepartmenttaskedwith
promotions,training,andsupportingallvendersmorepro-actively
- Maximize revenue and mitigate risks from the established network and
logistics systems, explore aggregation of products including
vegetables,fruits,pulses,grains,andmore.
117
Chapter5:EarlyPrototypeDevelopmentforBehavioralEconomic Incentives Intervention and RelatedEcosystemExtension
ThischapterreportsonconcurrentworkdonebyeKutirandDAISAEnterprises
inpreparationfortransitiontoscaleinearlyprototypedevelopmentforan
improvementtothepresentVeggieLiteintervention.Thekeyareaitfocuses
on is improving the behavioral change component by bringing in methods
anchored in behavioral economics and the integration of this effort with
existing community and health ecosystems to ensure affordable and self-
sustainingdeliveryoutsideofformalcommercialchannels.Wefirstintroduce
thesuccessfulUSAinterventiontheIndianprojectprototypebuildsuponand
thenwereportonlessonslearnedforfuturesteps.
Behavioralincentivesintervention
eKutir and partners set out to assess if it was possible to adapt the US-
originatedDoubleValueCouponProgram(DVCP)totheIndiancontextthrougha
limitedfeasibilitytest.TheDVCPwaspioneeredintheUnitedStatesbythe
nonprofit organization Wholesome Wave and eventually grew to encompass 26
states, subsequently becoming part of the federal Farm Bill with a $100M
allocation called the Food Insecurity Nutrition Incentive Program. This
program provides an incentive voucher for low-income participants to use
their Supplemental Nutrition Assistance Program benefits, an existing
governmental scheme in which benefits can also be used for purchases of
unhealthy foods, instead for vegetables purchased directly from a local
farmer.Theprogramgeneratesadditionalsalesforsmallholderfarmerswhile
improvingaffordabilityofhealthyfoodsforthosemostinneed.
The “SNAP Healthy Food Incentives Cluster Evaluation Final Report 2013,”
whichreviewedtheincentiveprogramsimplementedat518marketsthroughout
thecountry,foundthat“Thelargemajority(morethanthree-fourths)ofSNAP
recipients reported that they have increased their purchase of produce
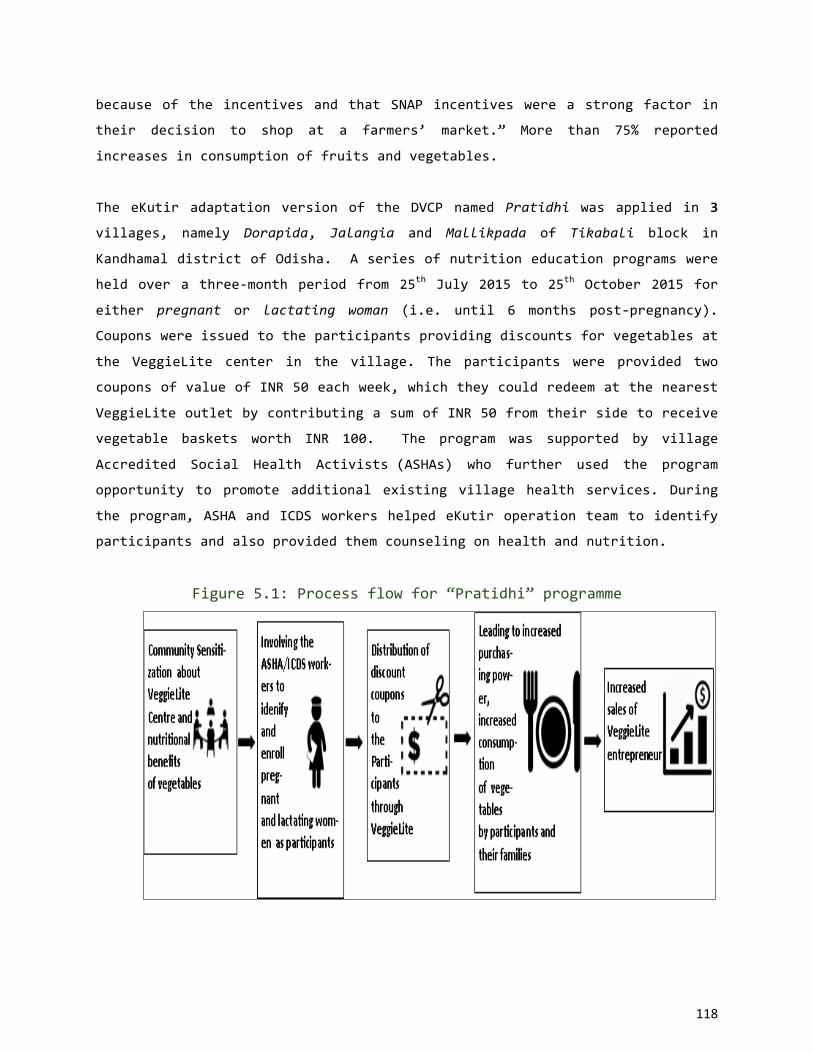
118
because of the incentives and that SNAP incentives were a strong factor in
their decision to shop at a farmers’ market.” More than 75% reported
increasesinconsumptionoffruitsandvegetables.
The eKutir adaptation version of the DVCP named Pratidhi was applied in 3
villages, namely Dorapida, Jalangia and Mallikpada of Tikabali block in
KandhamaldistrictofOdisha.Aseriesofnutritioneducationprogramswere
held over a three-month period from 25th July 2015 to 25th October 2015 for
either pregnant or lactating woman (i.e. until 6 months post-pregnancy).
Couponswereissuedtotheparticipantsprovidingdiscountsforvegetablesat
the VeggieLite center in the village. The participants were provided two
couponsofvalueofINR50eachweek,whichtheycouldredeematthenearest
VeggieLiteoutletbycontributingasumofINR50fromtheirsidetoreceive
vegetable baskets worth INR 100. The program was supported by village
Accredited Social Health Activists(ASHAs) who further used the program
opportunity to promote additional existing village health services. During
theprogram,ASHAandICDSworkershelpedeKutiroperationteamtoidentify
participantsandalsoprovidedthemcounselingonhealthandnutrition.
Figure5.1:Processflowfor“Pratidhi”programme
119
Out of the 23 program participants, 16 consistently participated in both
nutrition education sessions and redeemed their coupons at the VeggieLite
centerduringthe3-monthpilot.Intermsofoutcomes,forconsumptionthere
wasanimprovementintheconsumptionintakeoftheregularparticipantsdue
to easy availability of the vegetables (two times a week) at discounted
rates.Also,someparticipantsbegantoconsumeitemstheydidnotregularly
consume before the intervention. In terms of regularity of participation,
overthethree-monthperiodtherewasadeclineinthenumberofparticipants
coming to the VeggieLite center for purchasing the discounted vegetables.
Therefore,asurveywasconductedtounderstandthereasonsforthedecline
anditwasdiscoveredthatmostoftheparticipantshadfinanciallyunstable
conditions, and some just did not want to travel to the VeggieLite centre,
despite the close proximity. Out of all the 23 participants, 16 (67%)
regularlyaccessedtheprogramandhaveavailedtheprogrambenefitsforthe
whole period while the rest have been irregular due to the either of the
aforementionedreasons.Finally,althoughthemedicalparametersdependona
lotoffactorsotherthantheconsumptionofvegetables,theself-reportof
regular participants suggest that there have been improvements in their
hemoglobinlevelsandbodyweights(around3kg).
Thus this limited test provided some indications of viability for India: a
highpercentageofwomeninthetargetpopulationconsistentlyparticipated
in trainings and utilized the coupons; the VeggieLite vendors redeemed the
couponseffectively;theprogramsuccessfullyengagedASHAworkers;andthe
program showed potential to leverage further public and private support.
Insightsforimprovementsalsoemergedinthedesignoftheprogram:
- Introductionoffreedomofchoice--thepilothadpredefinedbaskets,
which were seen as a limiting factor in meeting the choices of
participantsandbeneficiaries.Thusforscale-upofthepilot,itis
learnt that the option of choosing vegetables should be left to the
customeritself;
- Definingapricerangeforincentives--duringthepilotitwasseen
thatsomefamilieswerenotabletoaffordanexpenseofINR50twicea

120
weekandtherebyforscale-up,possiblyamatchingcontributioncoupon
systemcanbefollowedwithnominimumcap.Also,consideringthatthe
contributionfromtheorganizationcannotbeindefinite,therecanbea
maximumcapofcontributingINR50(50%ofINR100)pertransactionper
customer,i.e.,ifthetransactionamountofthecustomerexceedsINR
100,thecompensationwouldnotbemorethanINR50.
Recommendations of the DVCP have been shared with the Women and Child
DevelopmentDepartment,alongwithadetailedproposalonincludingvegetable
baskets as a part of the ongoing Mamata Scheme in Odisha. Under Mamata
Scheme, monetary benefits are provided to pregnant and lactating women to
encourage healthy lifestyles and sufficient nutritional intake. eKutir also
presentedthisideatotheDepartmentofHealthandFamilyWelfare(Govtof
Orissa)tointegratenutrition-trainingprogramswiththeNationalProgramme
forPreventionandControlofCancer,Diabetes,CardiovascularDiseasesand
Stroke(NPCDCS).Currently,underNPCDCSthehealthinfrastructureisbeing
transformed and programmes aimed at creating awareness about good dietary
habits for preventing non-communicable diseases like hypertension and
cardiovascular diseases are being introduced. With Pratidhi initiative
successfully tested in the pilot phase, we have introduced another social
marketing initiative at the nexus of agriculture-nutrition-health. Called
AaharX,thisinitiativewillbepilotedinBhubaneswarandHyderabadduring
thetransition-to-scalephase.ApolloHospitalsandApolloSugarClinichave
agreedtopartnerwitheKutirtorunthepilotsandsubsequentlycollaborate
forpan-IndiaexpansionofAaharX.
Both Pratidhi and AaharX could potentially operate as social marketing
strategies at the nexus of agriculture-nutrition-health. This combined
innovation will allow consumers to remain nutritionally secure and enable
farmers to obtain fair and equitable return for their product. The
sensitization sessions for educating community members on the benefits of
healthy nutrition started in June 2015 in partnership with Ekjut India (a
not-for-profit). This six-month program worked in tandem with eKutir’s

121
marketingandoutreacheffortsincommunitiesusingcollateralpartnersand
theVeggieLiteentrepreneurs.
122
Chapter6:DiscussionandLimitations
Overthecourseofthisproject,eKutirhascontinuedbuildingcapacityfor
leveraged local micro-entrepreneurial motivations and processes to solve
smallholder farmers’ poverty through a distribution network of digitally
trained entrepreneurs, market linkages, technology, and data. eKutir has
established further linkages between vulnerable populations and local food
systems.ThisprojectwasimplementedoverfiveselectedlocationsinOdisha
including urban and rural locations, with most of the project components
being operational in nature, going above target in engaging 1,350 farmers.
Fromtheindividualandhouseholdleveltothesystemslevel,theevaluation
componentsusedmixedmethodstoidentifyandmeasurebehavioralandsocial
changesoccurringwithintheone-yearinterventionperiod.Asdescribedin
previous chapters, this involved the use of a quasi-experimental, pre- and
post-testdesigninbothurbanandruralsettings,(2)aprocessstudythat
included a network analysis, and (3) value chain analysis and modeling.
Among rural eKutir households, the evaluation showed multiple impacts on
thoseruralfarmersparticipatingintheVeggieLiteintervention.
123
Even though the pilot intervention was limited to one year, the evaluation
showedanincreaseinthefruitandvegetableintakeofeKutirfarmers,which
seemstohavebeendrivenbyincreasedfruitintake.Inaperiodinwhich
all farming groups showed declines in their daily vegetable intake, eKutir
farmers exhibited at endline a significantly higher level of vegetable
consumptionthantheothergroups.VeggieLite’sagriculturalimpactwasalso
noticeable.Atbaselineandendline,eKutirfarmersproducedandsoldmore
vegetablesthantheotherfarmergroups,generatingover30.6MINRinsales
forparticipatingfarmersovertheintervention.Thishighvolumeofsales
among eKutir farmers is particularly of note since eKutir farmers consumed
the greatest percentage of their own vegetables, with roughly 28% going to
their consumption. Finally, there was also evidence of VeggieLite’s social
impact. The key to the success of any innovation is its wider social
acceptance. Our social network analysis showed the broader acceptance and
diffusion of eKutir programming into the community. Not only did the
composition of the eKutir farmers’ networks change to include a greater
percentage of farmers in the farmer intervention groups (FIGs), but so too
did the composition of the non-eKutir farmers’ networks. In other words,
over the one-year intervention period, regardless of whether farmers
participated directly in the intervention or not, all farmers in the
treatmentvillagescametodiscussfarmingmattersmoreandmorewithfarmers
intheFIGs.TheeKutirmodelthusseemstohaveincreaseditsacceptance
andbecomemorewidelydiffusedinthetargetedruralcommunities.
124
Intheurbanareas,eKutirexceededprogramobjectivesforthedeploymentof
micro-entrepreneur vendors, with VeggieLite sales robust and increasing
steadilyinthetargetedwardsovertheyear.Inourparticularsampleof
consumers,however,wedidnotseeanincreaseinvegetableintakefrompre-
topost-testing.Therewereanumberoffactorsthatmayhelptoexplainthis
null finding. For example, disruptions in the services or locations of
certain VeggieLite vendors or even the broader range of consumer options
available to urban residents, including other eKutir offerings such as
VeggieKart or VeggieMart, could have weakened the intervention’s effect.
Nevertheless, in our sample of urban residents, we did find that those who
reported purchasing mainly from VeggieLite vendors at posttest increased
theirvegetableintakeandconsumedmoredailyvegetableservingsthanthose
that did not. VeggieLite program showed little effects on vegetable
consumptioninoursampleofurbanconsumers;thismayhavebeenduetothe
sample itself since VeggieLite showed robust and growing sales over the
intervention period. It is noteworthy that the very small number of urban
respondentswhoreportedprocuringtheirfruitsandvegetablesprimarilyfrom
Veggie-Litehadmorepositivechangeintheirconsumptionthatthosewhodid
not. This suggests that one of the key areas for improvement in moving
forwardistoreinforcethebehavioralchangestrategy.Thiscanpossiblybe
donebymorefocusedandpreciselydesignedinterventionthatusebehavioral
economics principles such as the Pratidhi intervention that has been the
object of prototype development in anticipation of transition-to-scale. It
couldalsobedonebyamorecomprehensivestrategytoenrollthenetworksof
NGOsthatsupportotherlivelihooddimensionsinthelocalcommunities.The
presentdeploymenthasfocusedprimarilyonthefarmingandfooddistribution
andscale.

125
The organizational study underscored the value being created by eKutir for
micro-entrepreneurs and farmers. The inter-organizational network analysis
revealedthestructureoftheeKutirVeggieLitenetworkintheearlystages
of its formation. While dense communication ties characterize the network
core,furtherattentionmayneedtobegiventodevelopingthetiesbetween
theperipheralmembers,e.g.betweenentrepreneurs,aseKutirexpands.The
growing scale of operations and increased spending on marketing and
behavioralchangewouldallowalsoeKutirtobettercapturethevaluebeing
createdthroughchangesinthebroaderecosystem.Itisalsonoteworthythat
in spite of strategic efforts to favor women in the role of farmers and
micro-entrepreneurs, the achievement remains modest in this regard. While
the difficulty of changing well-entrenched cultural and social norms like
men’spredominanceintheseareasmustbeacknowledged,itcouldbepossible
in moving forward to bring to bear in the intervention design more of
ethnographicknowledgeanddesignapproaches.
Limitations
Limitations to the pilot study itself and the evaluation strategy must be
acknowledged.First,theVeggieLitepilotinterventionwaslimitedtoaone-
year period. This limited the capacity of the evaluation to detect more
preciselyseasonalvariationsintheimpactofVeggieLiteonurbanorrural
households. eKutir operational data showed significant seasonal variations
intheyieldandsalesofeKutirfarmers.Yet,giventhepre-andpost-test
natureoftheevaluationdesign,thestudycouldonlydetectchangesattwo
time points, and not track consumption or production changes on a seasonal
basis.Inaddition,thepre-andpost-designlimitedthestudy’sabilityto
capture real-time changes in the consumption patterns of urban residents.
While the pre-and post-design served well for pilot evaluation purposes,
futureevaluationdesignsshouldaccountforseasonaleffectsandtherefore
trackconsumerbehavioronamoreregularbasis.
126
Second,theVeggieLiteprogramrepresentsacomplexinterventionintoreal-
lifesocialsettings.eKutiroperationalchoicesmaysometimesconflictwith
research evaluation goals. For example, the closure of certain VeggieLite
entrepreneursduetolossesincurredinthelastsixmonthsmeantthatother
delivery channels and activities came to serve certain urban residents.
VeggieWheel, which is a mobile van carrying vegetables in the urban wards,
replacedtheVeggieLiteincertainareas,indicatingthestrategicshiftfrom
thefixedplace&fixedtimemarketingsystemtoamobilemarketingsystem.
WhilethisimpactedVeggieLitesales,overallvegetablesalesincreased.More
generally,becauseVeggieLiteisacomplexintervention,itseffectsarenot
necessarilyconstrainedtospecificgroupsorsettings.
127
ReferencesAddyN.A.,PoirierA.,BlouinC.,DragerN.,andDubé,L.(2014).Wholeof‐
Society Approach for Public Health Policymaking: a Case Study of
Polycentric Governance from Quebec, Canada. Annals of the New York
AcademyofSciences,1331:216-229.
AroraN.K.,PillaiR.,DasguptaR.,andRaniGargP.(2014).Whole-of-society
monitoring framework for sugar, salt and fat consumption and
communicable diseases. Annals of the New York Academy of Sciences,
1331:157-173.
BesleyT.andBurgessR.(2000).LandReform,PovertyReduction,andGrowth:
EvidencefromIndia.TheQuarterlyJournalofEconomics,May:389-430.
DubéL.,AddyN.A.,BlouinC.,andDragerN.(2014).FromPolicyCoherenceto
21st Century Convergence: A Whole-of-Society Paradigm of Human and
EconomicDevelopment.AnnalsoftheNewYorkAcademyofSciences,1331:
201-215.
DubéL.,JhaS.K.,FaberA.,StrubenJ.,LondonT.,MohapatraA.,DragerN.,
Lannon C., Joshi P.K. and McDermott J. (2014). Convergent Innovation
for Sustainable Economic Growth and Affordable Universal Health Care:
Innovating the Way We Innovate. Annals of the New York Academy of
Sciences,1331:119-141.doi:10.1111/nyas.12548.
Dubé L., Pingali P., Webb P. (2012). Paths of Convergence for Agriculture,
Health, and Wealth. Proceedings of the National Academy of Sciences,
109(31):12294-12301.
DubéL.,WebbP.,AroraN.K.,andPingaliP.(2014).Agriculture,Health,and
Wealth Convergence: Bridging Traditional Food Systems and Modern
Agribusiness Solutions. Annals of the New York Academy of Sciences,
1331(2014):1-14.
Eisenmann T.R., Parker G.G., van Alstyn, M.W. (2006), Strategic Planning -
StrategiesforTwo-SidedMarkets.HarvardBusinessReview,October2006
Issue.
FAO2011.Evaluationofcertaincontaminantsinfood:Seventy-secondreport
of the Joint FAO/WHO Expert Committee on Food Additives (2011).
128
EditedbyJackC.Ng.Seventy-secondreportoftheJointFAO/WHOExpert
CommitteeonFoodAdditives,16-25February2010,Rome,Italy.
Hall J.N., Moore S., Harper S.B., Lynch J.W. (2009). Global variability in
fruitandvegetableconsumption.AmJPrevMed.2009May;36(5):402-
409.
Hammond R.A., Dubé L. (2012). A Systems Science Perspective and
Transdisciplinary Models for Food and Nutrition Security. Proceedings
oftheNationalAcademyofSciences,109(31):12356-12363.
Jha S.K., McDermott J., Bacon G., Lannon C., Joshi P.K., Dubé L. (2014).
Convergent Innovation for Affordable Nutrition, Health, and Health
Care: The Global Pulse Roadmap. Annals of the New York Academy of
Sciences,1331:142-156.
Jha S.K., Pinsonneault A., and Dube L. (2016). The evolution of an ICT
platform-enabled Ecosystem for poverty alleviation: The case of
eKutir. MIS Quarterly, Special Issue: ICT and Social Challenges, MIS
Quarterly,Vol.40No.2,pp.431-445.
NSSO2014.HouseholdConsumptionofvariousgoodsandservicesinIndia.68th
Round,20ll-12.
Shiell A., Hawe P., and Gold L. (2008). Complex interventions or complex
systems? Implications for health economic evaluation. BMJ : British
Medical Journal, 336(7656), 1281–1283.
http://doi.org/10.1136/bmj.39569.510521.AD
Spencer M., Jha S.K., Mishra S., Ross D., Allen S., and Dube L. (2015).
InnovationinEvaluationtoInformPolicyConvergence:ComplexSystems
Approach to Assess Entrepreneurship-driven Intervention in
eKutir’sVeggieKart, pp. 197-208, in Evaluations for Sustainable
Development: Experiences and Learning, New Delhi: Daya Publishing
House,2015.
The Hindu Website: World Bank promises big push to poverty alleviation
schemesinIndia.2013.TheHinduNews.March14th.Availableonline
at:http://www.thehindu.com/news/national/worldbank-promises-big-push-
to-poverty-alleviation-schemes-in-india/article4506331.ece
UN2009.TheMilleniumDevelopmentGoalsReport2009.

129
WEF2010.TheGlobalCompetitivenessReport.2010–2011.
Yin, Robert (2009). Case Study Research: Design and Methods. Sage
Publications.
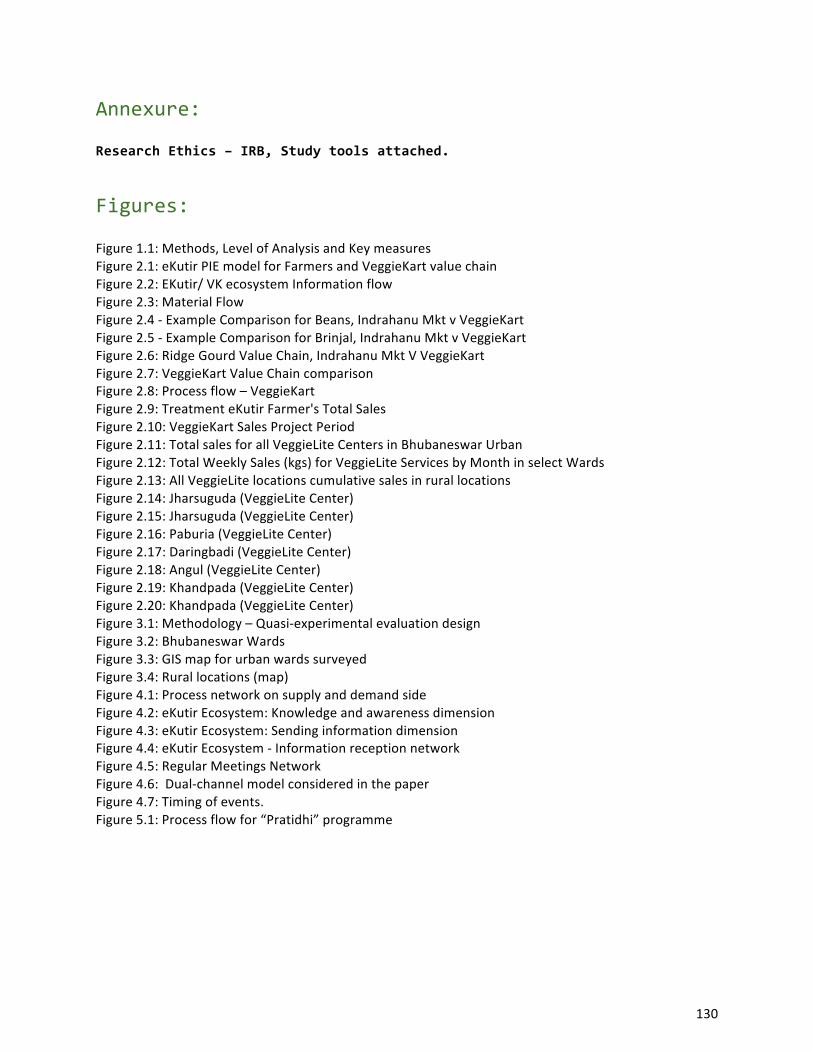
130
Annexure:ResearchEthics–IRB,Studytoolsattached.
Figures:Figure1.1:Methods,LevelofAnalysisandKeymeasuresFigure2.1:eKutirPIEmodelforFarmersandVeggieKartvaluechainFigure2.2:EKutir/VKecosystemInformationflowFigure2.3:MaterialFlowFigure2.4-ExampleComparisonforBeans,IndrahanuMktvVeggieKartFigure2.5-ExampleComparisonforBrinjal,IndrahanuMktvVeggieKartFigure2.6:RidgeGourdValueChain,IndrahanuMktVVeggieKartFigure2.7:VeggieKartValueChaincomparisonFigure2.8:Processflow–VeggieKartFigure2.9:TreatmenteKutirFarmer'sTotalSalesFigure2.10:VeggieKartSalesProjectPeriodFigure2.11:TotalsalesforallVeggieLiteCentersinBhubaneswarUrbanFigure2.12:TotalWeeklySales(kgs)forVeggieLiteServicesbyMonthinselectWardsFigure2.13:AllVeggieLitelocationscumulativesalesinrurallocationsFigure2.14:Jharsuguda(VeggieLiteCenter) Figure2.15:Jharsuguda(VeggieLiteCenter) Figure2.16:Paburia(VeggieLiteCenter) Figure2.17:Daringbadi(VeggieLiteCenter)Figure2.18:Angul(VeggieLiteCenter) Figure2.19:Khandpada(VeggieLiteCenter)Figure2.20:Khandpada(VeggieLiteCenter)Figure3.1:Methodology–Quasi-experimentalevaluationdesignFigure3.2:BhubaneswarWardsFigure3.3:GISmapforurbanwardssurveyedFigure3.4:Rurallocations(map)Figure4.1:ProcessnetworkonsupplyanddemandsideFigure4.2:eKutirEcosystem:KnowledgeandawarenessdimensionFigure4.3:eKutirEcosystem:SendinginformationdimensionFigure4.4:eKutirEcosystem-InformationreceptionnetworkFigure4.5:RegularMeetingsNetworkFigure4.6:Dual-channelmodelconsideredinthepaperFigure4.7:Timingofevents.Figure5.1:Processflowfor“Pratidhi”programme

131
Tables:Table3.1:QuestionnairemodulesTable3.2:Baselineandendlinesamplenumbersbyquasi-experimentalconditionandwardsite.Table3.3:Socio-demographiccharacteristicsofthesampleatbaselineandendlinestratifiedbyexperimentalconditionTable3.4:ResultsfromtheANOVAanalysesTable3.5:RegressionresultsexaminingthedifferencebetweenendlineandbaselinevegetableconsumptionlevelsTable3.6:Mainsourcesforpurchasingvegetablesatbaselineandendlinestratifiedbyseason,percentage.Table3.7:ANOVAresultsfromcomparingthoseparticipantswhoreportedusingVeggieLitetoNon-VeggieLitenotovertheinterventionperiodTable:3.8:UnadjustedandadjustedregressionestimatesTable3.9:BaselineandEndlinesamplesizezbyquasi-experimentalconditionTable3.10:BaselinedataonhouseholdandsociodemographiccharacteristicsTable3.11A:ANOVAresultsreportingthedifferencesamongthethreegroups[BaselineandEndline]Table3.11B:ANOVAresultsreportingthedifferencesamongthethreegroups[MeanDifference(Endline–Baseline)]Table3.12:RegressionresultsexaminingthedifferencesinfruitandvegetableconsumptionfrombaselinetoendlineTable3.13:Home-grownconsumptionbyproducersatbaselinevs.endlineTable3.14:Resultsfromthepairedsamplet-testsTable3.15:ResultsfromtheregressionanalysesTable4.1:Concept-stakeholdergridTable4.2:TypesofrespondentsTable4.3:SupplysideprocessTable4.4:ProcurementprocessTable4.5:DensityandcentralizationvaluescharacterizingeachnetworkdimensionTable4.6:Demandsideproc


![In conjunction with Venus [planetary radar astronomy]](https://static.fdokumen.com/doc/165x107/631a4f09bb40f9952b01f2bc/in-conjunction-with-venus-planetary-radar-astronomy.jpg)