Vegetable for Improved Nutrition and Livelihood in Southeast ...
550
Vegetable for Improved Nutrition and Livelihood in Southeast Asia Putrajaya Marriott Hotel, Malaysia Proceedings SOUTHEAST ASIA VEGETABLE SYMPOSIUM 2016 6 – 8 September 2016 Organised by Sponsored by Supported by Pauziah Muda, Theeba Manickam, Hasimah Hafiz Ahmad, Michael Henry Böhme, Siti Aishah Hassan, Fenton Beed, Pulakeshi Basayya Gaddagimath, K.R. Mallikarjuna Swamy and Prem Nath Editors
-
Upload
khangminh22 -
Category
Documents
-
view
0 -
download
0
Transcript of Vegetable for Improved Nutrition and Livelihood in Southeast ...

Vegetable for Improved Nutrition andLivelihood in Southeast Asia
Putrajaya Marriott Hotel,Malaysia
ProceedingsSOUTHEAST ASIA VEGETABLE SYMPOSIUM 2016
6 – 8 September 2016
Organised by
Sponsored by Supported by
Pauziah Muda, Theeba Manickam, Hasimah Hafiz Ahmad, Michael Henry Böhme, Siti Aishah Hassan, Fenton Beed, Pulakeshi Basayya Gaddagimath,
K.R. Mallikarjuna Swamy and Prem Nath
Editors

i
Proceedings
SEAVEG 2016Vegetable for Improved Nutrition and Livelihood in Southeast Asia
iii
SEAVEG 2016Vegetable for Improved Nutrition and Livelihood in Southeast Asia
06 – 08 September, 2016Putrajaya Marriott Hotel, Malaysia
EditorsPauziah Muda, Theeba Manickam, Hasimah Hafiz Ahmad, Michael Henry Böhme, Siti Aishah Hassan, Fenton Beed, Pulakeshi Basayya Gaddagimath, K.R. Mallikarjuna Swamy and Prem Nath
Malaysian Agricultural Research and Development Institute (MARDI)The World Vegetable Center (WorldVeg)Vegetable Science International Network (VEGINET)Department of Agriculture (DOA), ThailandASEAN-AVRDC Regional Network (AARNET)Department of Agriculture (DOA), MalaysiaFederal Agricultural Marketing Authority (FAMA), MalaysiaGreen World Genetics (GWG)
Published byMalaysian Agricultural Research and Development Institute (MARDI), MalaysiaP. N. Agricultural Science Foundation (PNASF), IndiaSoutheast Asia Vegetable Symposium (SEAVEG 2016)

iv
Malaysian Agricultural Research and Development Institute (MARDI), MalaysiaMARDI HeadquartersPersiaran MARDI-UPM43400 Serdang, SelangorMalaysiaTel: 603-89536000Fax: 603-89536011E-mail: [email protected]
©Malaysian Agricultural Research and Development Institute 2017
First Published 2017All rights reserved. No part of this publication may be reproduced, stored in a retrieval system, or transmitted, in any form or by any means, electronic, mechanical, photocopying, recording or otherwise, without the prior permission of MARDI.
Perpustakaan Negara Malaysia Cataloguing-in-publication Data
Proceedings SOUTHEAST ASIA VEGETABLE SYMPOSIUM (2016 : Putrajaya)Proceedings SOUTHEAST ASIA VEGETABLE SYMPOSIUM 2016 :Vegetable for Improved Nutrition and Livelihood in Southeast Asia ,6-8 September 2016, Putrajaya Marriott Hotel / Editors Pauziah MudaTheeba Manickam, Hasimah Hafiz Ahmad, Michael Henry Böhme,Siti Aishah Hassan, Fenton Beed, Pulakeshi Basayya Gaddagimath, K.R. Mallikarjuna Swamy and Prem Nath.ISBN 978-967-936-656-31. Vegetable--Tropics--Congresses.2. Agriculture innovations--Congresses.3. Government publications--Malaysia.I. Pauziah Muda. II. Theeba Manickam, III. Hasimah Hafiz Ahmad. IV. Böhme, Michael Henry. IV. Siti Aishah Hassan. V Beed, Fenton.VI. Pulakeshi Basayya Gaddagimath. VII. Swamy K.R. Mallikarjuna.VIII. Prem Nath. IX. Malaysia. Jabatan Pertanian, organizer.X. Title. XI. Title : SEAVEG 2016.613.2
Suggested citation:Pauziah Muda, Theeba Manickam, Hasimah Hafiz Ahmad, Michael Henry Böhme, Siti Aishah Hassan, Fenton Beed, P.B. Gaddagimath, K. R. M. Swamy, Prem Nath. Eds. 2017. Proceedings of the Southeast Asia Vegetable Symposium on Vegetable for Improved Nutrition and Livelihood in Southeast Asia (SEAVEG 2016), September 06-08, 2016, Kuala Lumpur, Malaysia. Malaysian Agricultural Research and Development Institute (MARDI), Kuala Lumpur, Malaysia.

v
Foreword
The want of food remained in the minds of the people ever since the origin of both. Among the natural resources, by observation the human-beings being the most intelligent, could search and hunt edible items like, plants, animals or fish. While the human beings and animals could walk on earth, fish could swim in water only. Human beings could talk to each other and animals could communicate among their own species. But what to talk about plants which could neither move nor talk to us but human needed them badly. This means that we have to reach the plants and animals because they could not reach us on their own. It took decades and centuries to understand each other by visual observations and practice of both humans and plants. Since the origin of earth and of the birth of both human beings and plants, the want and search for food have been in the minds of not only humans but also in the minds of animals which led them to hunt for it without which neither of them could survive. This points out that the food security has been in the minds of people ever since origin but was undefined and understood as we do to-date. The want and need for food have multiplied manifold with the multiplication of human beings coupled with the advancement of science and management which have given tremendous opportunity to understand the complexities of food and nutrition security. Among crop plants, vegetables are the richest source of micro-nutrients without which the healthy diet is impossible. Researches and analysis on food have provided deep insight into the mystery of ‘food’, which is a reservoir of chemical elements, required for betterment of human growth and development. We know now that these chemical substances are essential for human health and designated as ‘nutrients’. The situation is aggravated with the news of present ‘food and nutrient crisis’ facing particularly in the developing world. The reports of about 805 million hungry and malnourished people coupled with over three billion people suffering and signaling micro-nutrient deficiencies causing nutrient crisis demanding for serious action against these major maladies damaging human resources. We do not have time to wait and see but to respond without delay. Earlier the implementation of Millennium Development Goals (2000 – 2015) followed by the present Sustainable Development Goals (2015 – 2030) took serious observation of the food and nutrient insecurity situation and provided strategies and plans for nations to undertake. It should consider agriculture as source of livelihood including vegetable farming as source of income and job opportunities. We have successfully conducted SEAVEG 2012, SEAVEG 2014 and SEAVEG 2016 and look forward to the upcoming SEAVEG 2018 in the interest of all vegetable stakeholders in Asia and beyond.
Dr. Prem NathChairman, SEAVEG Coordination CommitteeChairman, PNASFChairperson, VEGINET

vi
The organising committees
COORDINATION COMMITTEE
Dr. Prem Nath – Chairman [Vegetable Science International Network (VEGINET)]Dr. Jacqueline d' Arros Hughes – Vice Chairman [World Vegetable Center (WorldVeg)]Dr. Fenton Beed – [World Vegetable Center (WorldVeg)]Datuk Dr. Sharif Haron – [Malaysian Agricultural Research and Development Institute (MARDI)]Somchai Charnnarongkul – [Department of Agriculture, Thailand (DOA Thailand)]Dr. Siang Ming Foo – [ASEAN-AVRDC Regional Network (AARNET)]
SCIENTIFIC COMMITTEE
Datuk Dr. Umi Kalsom Abu Bakar – Chairman (MARDI)Dr. Fenton Beed – Vice Chairman (WorldVeg)Dr. Mohamad Roff Mohd Noor (MARDI)Dr. Pauziah Muda (MARDI) Dr. Grisana Linwattana (DOA Thailand)Anna Marie Bahala (WorldVeg)Theeba Manickam (MARDI)
NATIONAL ORGANISING COMMITTEE
Dr. Omran Hashim – Chairman (MARDI)Hassan Said – Deputy Chairman (MARDI)Dr. Pauziah Muda (MARDI)Norhafizah Mohamad Yusof (MARDI)Dr. Zulhazmi Sayuti (MARDI)Wan Zaki Wan Mamat (MARDI)Abdul Rahman Abdul Razak (MARDI)Jariah Mohd Noor (MARDI)Mohd Arzairimeen Ariffin (MARDI)
CO-ORGANISERS:
Dr. Chua Kim Aik (GWG)Abdul Rashid Bahri (FAMA)Noor Zaini Ahmad (DOA)

vii
TECHNICAL SUB-COMMITTEE SECRETARIAT SUB-COMMITTEEDr. Pauziah Muda – Chairman (MARDI)Theeba Manickam – Secretary (MARDI)Dr. Rozlaily Zainol (MARDI)Hasimah Hafiz Ahmad (MARDI)Prof. Dr. Idris Abd Ghani (Universiti Kebangsaan Malaysia, UKM)Assc. Prof. Dr Siti Aishah Hassan (Universiti Putra Malaysia, UPM)Dr. Teoh Chin Chuang (MARDI)Prof. Shamsudin Jusoh (Universiti Putra Malaysia, UPM)Dr. Chubashini Suntharalingam (MARDI)Dr. Mohammud Che Hussain (Universiti Malaysia Perlis, UniMap)Dr. Sanimah Simoh (MARDI)Dr. Razali Mustaffa (MARDI)Dr. Zulhazmi Sayuti (MARDI)Nor Syahidah Md Sam (MARDI)Mohd Zafrul Arif Radhi (MARDI)Muhammad Zamir Abdul Rasid (MARDI)
Norhafizah Mohamad Yusof (Chairman)Hanisah Abu Hasan (Secretary)Mohamad Hafis Irzuan ZainolMariana Mat YasinJariah Abu BakarDayangku Rosfinar Awangku KadreeHaizan Abd RazakMohd Ariff AliasMuhd Amin RamlyMohd Raimi Abd KuadiNor Akma YusofSiti Aishah Abd KarimNurasyiqin Abd Rasid Nurul Amalina KasranNajwa Abd LatifAhmad HashimHazizi Abu YamanMuhamad Hashim Abdullah
TECHNICAL TOUR SUB-COMMITTEE
SPONSORSHIP, EXHIBITION AND ADVERTISEMENTSUB-COMMITTEE
Wan Zaki Wan Mamat (Chairman)Rosnani Abd Ghani (Secretary)Dr. Rozlaily ZainolAhmad Arif IsmailWan Khairul Anuar Wan AliMohamad Hafis Irzuan ZainolMuhd Amin Ramly
Dr. Zulhazmi Sayuti (Chairman)Farah Zaidat Mohd Nadzri (Secretary)Hafeifi BasirSuhana OmarNor Hazlina Mat Sa’atSakinah IdrisMasnira Mohammad YusoffPuteri Aminatulhawa Megat AmaddinWan Khairul Anuar Wan AliDr. Zaulia Othman

viii
PROTOCOL, PROMOTION AND LAUNCHING SUB-COMMITTEEAb Ghani MohammedAbdul Rahman Abdul RazakNur Akmal HassanMohamad Aizat Mohd ZawawiTheeba ManickamHazrul Amry Mohd NoorIllani Zuraihah IbrahimJackson Tan Hong SiangKester ChinMohd Syukry Neerawan @ NirwanJariah Mohd Noor

ix
Abbreviations
AA: Ascorbic Acid AARNET: ASEAN-AVRDC Regional Network for Vegetable Research and DevelopmentAAS: Atomic Absorption SpectrophotometerABS: Acrylonitrile Butadiene StyreneACIAR: Australian Centre for International Agricultural Research ACT: Arrest of Caries Technique AEs: Agri-Entrepreneurs AFTA: ASEAN Free Trade Area AMAF: ASEAN Ministers of Agriculture and Forestry ANC: Ammonium+Nitrate-N Compound Fertilizer ANDI: Aggregate Nutrient Density IndexANOVA: Analysis of Variance AOAC: Association of Official Analytical ChemistsAPDA: Acidified Potato Dextrose Agar AS: Ammonium SulphateASS: Alternaria Selective Media ASS: Alternaria Semi-Selective AVRDC: Asian Vegetable Research and Development Center AVRDC: The World Vegetable Center AVRDC-ESEA: The World Vegetable Center Asia BAZ: BMI-For-Age BAZ: BMI-for-Age Z-ScoreBBL: Bonbilasta BCR: Benefit Cost Ratio BMI: Body Mass IndexBMZ/GIZ: Federal Ministry for Economic Cooperation and Development BRIS soils: Beach Ridges Interspersed with SwalesC: CarbonCa: Calcium CACVEG: Regional Network on Vegetable System Research and Development Cd: CadmiumCEC: Cation Exchange Capacity CETDEM: Centre for Environment, Technology and Development, Malaysia CF: Cultivation Frequency CGIAR: The Consultative Group on International Agricultural ResearchCGM: Continuous Glucose Monitoring CGMs: Continuous Glucose Monitoring SystemCHD: Coronary Heart DiseaseCITES Regulation: International Trade Convention for Endangered Animal Species and Wild Plants

x
CLSU: Central Luzon State University CMC: Carboxyl Methyl Cellulose CMD: Cardio-Metabolic Diseases CMS: Cytoplasmic Male SterilityCMV: Cucumber Mosaic VirusCNE: Content of Nutrients in Relation to the Energy CoC: Certificate of Conformity CONFERTECH: National Conference of Technology Transfer CPI: Community Periodontal IndexCRBD: Completely Randomized Block Design CRD: Completely Randomized DesignCSR: Corporate Social ResponsibilityCS2: Carbon Disulphide Cu: CopperCuLCrV: Cucurbit Leaf Crumple Virus CVD: Cardiovascular DiseasesDALA: Days After the Last Application DAS: Days After SowingDAT: Days After TransplantingDFID: British Department for International Development DFID: UK Department for International Development DIY: Do-It-Yourself DM: Diabetes MellitusDM: Dry Matter DMFT: Decayed, Missing and Filled TeethDMRT: Duncan’s Multiple Range Test DNA: Deoxyribo Nucleic AcidDOA: Department of Agriculture, Malaysia DOA: Department of Agriculture, ThailandDOA: The Department of Agriculture DOLE: Department of Labor and Employment DOSM: Department of Statistic Malaysia EC: Electrical Conductivity EC: Entrepreneurial Competencies ECC: Early Childhood CariesECD: Electron-Captured Detector EDS: Edible Dried SampleEFS: Edible Fresh Sample EM: Effective MicrobeEO: Entrepreneurial Orientation EPN: Entomo Pathogenic NematodesFAMA: Federal Agricultural Marketing Authority, Malaysia

xi
FAO: Food and Agriculture Organization FFQ: Food Frequency Questionnaire FGD: Focused Group Discussions FPC: Farmers Producer CompanyFPO: Farmer Produce Organization FPO: Farmer Produce OrganizationFRCs: Food Retail Chains FVCC: Fruit and Vegetable Consolidation Center GAP: Good Agricultural PracticeGBIF: Global Biodiversity Information FacilityGC: Gas ChromatographyGC-ECD: Gas Chromatograph-Electron Capture Detector GC-MS/MS: Gas Chromatography-Mass Spectrometry/Mass Spectrometry GC-MS: Gas Chromatography with SQ8 Mass Spectrometry GDP: The Gross Domestic ProductGENESYS: Global Portal for Information about Plant Genetic Resources for Food and AgricultureGI: Glycemic IndexGIZ: Deutsche Gesellschaft für Internationale Zusammenarbeit GL: Glycemic Load GM: Genetic Modification GML: Ground Magnesium Limestone GMS: Greater Mekong Subregion GOI: Government of India GRSU: Genetic Resources and Seed Unit GWG: Green World GeneticsHAZ: Height-For-Age HAZ: Height-For-Age Z-ScoreHbA1c: Glycate Hemoglobin HFP: Homestead Food ProductionHIPV: Hebivory Induced Plant Volatiles HKI: Helen Keller InternationalHOPCOMS: The Horticulture Producers’ Co-operative Marketing and Processing Society Ltd. HP: Hot PepperHPS: High Pressure Sodium HSM: Hub and Spoke Model ICH-2009: International Conference on Horticulture ICP-OES: Inductively Coupled Plasma Optical Emission SpectrometryICT: Information and Communication Technology ICV-2002: International Conference on Vegetables-2002IDA: Iron Deficiency Anaemia

xii
IDD: Iodine Deficiency Disorders IFG: Impaired Fasting GlycemiaIGT: Impaired Glucose Tolerance IITA: International Institute of Tropical Agriculture IIVR: Indian Institute of Vegetable Research, VaranasiIJICTRDA: International Journal of ICT Research and Development in Africa ILO: International Labour Organisation IMO: Indigenous Microorganism IP: Innovation PlatformIPM: Integrated Pest Management ISTA: International Seed Testing Association ITC: Isothiocyannates IUGR: Intra-Uterine Growth Retardation IVTC: The International Vegetable Training Course K: Potassium LBW: Low Birth WeightLC: Liquid Chromatography LDL: Low Density Lipoprotein LECA: Light Expended Clay Aggregate LED’s: Light Emitting Diodes LICEJ: Literacy Information and Computer Education Journal LOD: Limit of Detection LSD: Least Significant DifferenceMA: Malt Agar MAAIF: Ministry of Agriculture, Animal Industry and Fisheries MAHAFPC: MAHA Farmers Producer Company Ltd. MAP: Modified Atmosphere Packaging MAQIS: Malaysian Quarantine and Inspection Services MARDI: Malaysian Agricultural Research and Development Institute MDG: Millennium Development Goals Mg: MagnesiumMLE: Market-Led ExtensionMOA: Ministry of Agriculture and Agro-based Industry, MalaysiaMRL: Maximum Residue Limit MRSG: Magnesium Rich Synthetic Gypsum MTBE: Methyl Tert-butyl Ether N: NitrogenNaClO: Sodium Hypochlorite NaClO: Sodium Hypochlorite Solution NAFRI: National Agriculture and Forestry Research Institute NaHCO3: Sodium Hydrogen Carbonate NAM: National Agro-food Policy

xiii
NAPs: National Agriculture Policies NARES: National Agricultural Research and Extension Systems NCDs: Directorate of Agriculture to State SecretariatNFHS-2: National Family Health Survey-2NFT: Nutrient Film Technique NGOs: Non-Governmental Organizations NGT: Normal Glucose ToleranceNH3: Ammonia NH4OA: Ammonium Acetate Solution NHA: Nitro Humic AcidNHB: National Horticultural BoardNOCELTSA: North Central Luzon Tomato Stakeholders Association NPANM-III: Third National Plan of Action for Nutrition Malaysia NPD: Nitrogen Phosphorus Detector NPV: Nuclear Polyhydrosis Virus NRC: National Research Council NSSO: National Sample Survey Organization NTC: Non-Treated Control NUF: Neutralized Underflow NUV: Near-Ultraviolet OAE: Office of Agricultural Economics OB: Occlusion Body OCCP: Organic Certification Center of the Philippines OGTT: Oral Glucose Tolerance TestOHE: Organic Herbal Extract OHRQoL: Oral Health-Related Quality of LifeOP: Open PollinatedOPTA: Organic Producers and Traders Association PCR: Polymerase Chain Reaction PDAs: Personal Digital Assistances PEM: Protein Energy Malnutrition PGPR: Plant Growth Promoting Rhizobacterial PHI: Pre-Harvest Interval PKS: Palm Kernel Shell PM: Poultry Manure PNASF: Dr. P.N. Agri. Sci. Foundation, Bengaluru, IndiaPNG: Papua New GuineaPOME: Palm Oil Mill Effluent POS: Private Sector Promoted PPAR: Peroxidase Proliferator-Activated Receptor PSA: Poly-Secondary Amine PUFA: Presence of Severely Decayed Teeth With Visible Pulpal Involvement, Ulceration

xiv
Caused By Dislocated Tooth Fragments, Fistula, AbscessQI: Quality Index QuEChERS: Quick, Easy, Cheap, Effective, Rugged, SafeR and D: Research and DevelopmentRCB: Random Complete BlockRCBD: Randomized Complete Block Design RDF: Recommended Dosage of Fertilizers RH: Rice Husk RHC: Rice Husk CharcoalRKKs: Rallis Kissan Kendras ROC: Republic of China RR: Relative RiskRRD: Red River Delta SAS: Statistical Analysis System SD: Standard DeviationSDG: Sustainable Development Goals SEA: South-East Asia SEACON: Southeast Asian Council for Food Security and Fair Trade SEAVEG: Southeast Asia VegetablesSEAVEG 2012: High Value Vegetables in Southeast Asia: Production, Supply and Demand SFI: Syngenta Foundation India SLA: State Level Association SMS: Short Message ServiceSOHO-5: Scale of Oral Health Outcomes for 5-Year-Old ChildrenSOM: Soil Organic MatterSPFS: Special Programme for Food SecuritySpltNPV: Spodoptera Litura Nuclear Polyhedrosis Virus SSA: Sub-Saharan AfricaSSC: Soluble Solids Concentration SSL: Self-Sufficiency LevelT2D: Type 2 Diabetes TA: Titratable Acidity TCA: Tarlac College of Agriculture TCDC: Technical Communication among Developing Countries TNAU: Tamil Nadu Agricultural University TNCSC: Tamil Nadu Civil Supply CorporationToLCVV: Tomato Leaf Curl Vietnam Virus TS: Tensile Strength TSP: Triple Super Phosphate TSS: Total Soluble Solids TTA: Total Titratable Acidity

xv
TYLCKaV: Tomato Yellow Leaf Curl Kanchanaburi Virus TYLCV: Tomato Yellow Leaf Curl Virus TYLCVNV: Tomato Yellow Leaf Curl Vietnam Virus UHPLC: Ultra High Performance Liquid Chromatography UNC: Urea-N Compound Fertilizer UPA-2005: Urban and Peri-urban Agriculture UPGMA: Unweighted Pair Group Method with Arithmetic Mean UPLC: Ultra High Performance Liquid ChromatographyUSAID: United States Agency for International Development USDA: US Department of Agriculture USEPA: US Environmental Agency’s VAD: Vitamin A DeficiencyVCM: Value Chain Model VEGINET: Vegetable Science International NetworkWA: Water Agar WAP: Weeks after Planting WAZ: Weight-For-Age WAZ: Weight-For-Age Z-ScoreWGS: Weight Gain StudyWHO: World Health OrganizationWTO: World Trade Organization WV: Wood Vinegar WVP: Water Vapour Permeability WVTR: Water Vapour Transmission Rate XCC: Xanthomonas Campestris pv. Campestris YDC: Yeast Dextrose Chalk YM: Young’s ModulusYSTs: Yellow Sticky Traps

xvii
Content
Foreword vThe Organising Committees viAbbreviations ixMessage from the Minister, Ministry of Agriculture and Agro-based Industry, Malaysia (MOA)
xxiii
Message from the Director General, Malaysian Agricultural Research and Development Institute (MARDI)
xxv
Message from Chairman, SEAVEG 2016 Coordination Committee xxviMessage from Chairman, SEAVEG 2016 National Organising Committee xxixMalaysian Agricultural Research and Development Institute (MARDI) – Corporate Profile
xxx
World Vegetable Center (WorldVeg) – Corporate Profile xxxiiVegetable Science International Network (VEGINET) – Corporate Profile xxxivDepartment of Agriculture (DOA), Thailand – Corporate Profile xxxviiASEAN-AVRDC Regional Network for Vegetable Research and Development (AARNET) – Corporate Profile
xxxix
Department of Agriculture (DOA), Malaysia – Corporate Profile xliFederal Agricultural Marketing Authority, Malaysia (FAMA) – Corporate Profile
xliii
Green World Genetics Sdn. Bhd. (GWG) – Corporate Profile xlvAbout Southeast Asia Vegetable Symposium 2016 (SEAVEG 2016) xlviExecutive Summary and Recommendations xlviiOpening Remarks by Malaysian Agricultural Research and Development Institute (MARDI)Dr. Mohamad Roff bin Mohd Noor, Deputy Director General MARDI
liii
Opening remarks by Ministry of Agriculture and Agro-based Industry Malaysia (MOA)Honourable Dato’ Nogeh Gumbek, Deputy Minister MOA
lvi
SYMPOSIUM FULL PAPERS 1Vegetables for Improved Nutrition 2Vegetables: Food and Nutrition SecurityPrem Nath
3

xviii
Evaluation of Vegetable Consumption Regarding its Nutritional Value and Consumer AwarenessMichael H. Böhme
22
Vegetables and Diabetes: Diversity for Nutritional and Health BenefitsJoão Carlos Da Silva Dias
33
Vegetables and Cardio-Metabolic Health: An Update of Recent EvidenceAmutha Ramadas
51
Home Gardening for Enhanced Vegetable ConsumptionPepijn Schreinemachers., Greg Luther and Ralph Roothaert
63
Vegetable Research and Development for Improved Nutrition and Livelihoods in Central Asia and The CaucasusRavza Mavlyanova
69
The Role of Child Health in Weight Gain: Making School Feeding Programs More EffectiveItchon, G.S.
81
Sweet Onion of Kumta: A Traditional Variety for Nutrition and SustainabilityBasavaraja, N., Shivanand Hongal, Shantappa, T. and Pushpa, P.
96
Metabolite Profiling of Maman (Cleome Gynandra) Extracted with Different Extraction Buffers Via LCMS-MSChandradevan Machap, Mohd Waznul Adly Mohd Zaidan, Muhammad Aizuddin Ahmad and Sanimah Simoh
101
Metabolite Profiling of Terung Asam’s (Solanum Ferox Linn) Oven-Dried Flesh and Seed Sample Using GC-MSMohd Waznul, A.M.Z., Muhammad Aizuddin, A., Chua, H.P., Chandradevan, M., Siti Maryam, O. and Sanimah, S.
104
A Comparative Study of Edible Film Properties Developed from Cocoyam (Xanthosoma Violaceum) and Taro (Colocasia Esculenta) StarchesA. Noor Zainah, G. Mohd Nor Faizal, U. Nor Azmah, Y. Yusnita, A.H. Khairol Nadia, A. Adawiyah, A. Muhammad Ramdhan, A.B. Mohammad Shafeq and S. Siti Suhaiza
111
Nutrient Composition and Mineral Content of Seagrape (Caulerpa Lentilifera L.) PowderTun Norbrillinda Mokhtar and Nur Elyana Noordin
117
Vegetables for Improved Livelihoods 122Linking Vegetable Farmers to Markets: Emerging Business OpportunitiesChengappa. P.G., Mamatha. N.C., Devika. C.M. and Vijayasarathy, K.
123

xix
Eggplants and Indigenous Leafy Vegetables for Food Diversity: Improving Farmers’ Livelihoods in Coastal Villages of Papua New GuineaPhilmah Seta-Waken, Peter A. Gendua, Paul Osilis, Norah Omot, Svein O. Solberg and Tania Paul
133
Application of Vegetable Grafting Technology to Improve Economic and Nutritional Security under Soil-Borne Disease Outbreak AreasGrisana Linwattana, Nutchanart Tungjitsomkid, Nuttima Kositjaroenkul, Apirat Sumrit, Taweepong Na-Nan and Wisarut Sanma-Air
143
The Evolution of Seed Industry and Its Impact on Food ProductivityChua Kim Aik and Fakhrul Anwar Zainol
158
Vegetable Production 2050Mike Nichols
164
Sustainable Vegetable Production Through MyGAP for Quality and Safety AssuranceRosmawati, S. and Siti Saudah, H.
172
Impact Assessment of Mobile Agro Market Advisories: A Study from Tamil Nadu, IndiaK.C. Siva Balan, B. Thiagarajan and B. Swaminathan
181
Research and Development of Vegetables Towards Adaptation to Climate Change in MalaysiaRozlaily Zainol, Suhana Omar, Nor Hazlina Mat Saad, Norfadzilah Ahmad Fadzil, Farahzety Abdul Mutalib, Rahayu Anang, Mohamad Abid Ahmad, Zauliah Othman, Nur Syafini Ghazali and Illias Mohd Khir
193
Linking Vegetable Farmers to Markets: Emerging Business OpportunitiesKavya, B.R. and Chengappa, P.G.
201
Vegetable Marketing: The Driver of Production and Source of Livelihoods for Smallholder Farmers in UgandaSylvia Namazzi, Mariette Mccampbell, Moses Makooma Tenywa, Anna Sole Amat, Moureen Awori, Perez Muchunguzi and Victor Afari-Sefa
211
Commercialization of Tomato Production TechnologiesRizalina M. Tablarin, Tessie A. Boncato and Joel Ellamar
222
The Integrated Pest Management (IPM) Strategy Against Bemisia Tabaci to Control Disease Caused by Tomato Yellow Leaf Curl Virus (TYLCV) in Thailand and VietnamYule, S., Srinivasan, R., Chiemsombat, P. and Nguyen, H.C.
234

xx
Comparison of Traditional Technology and Integrated Cultivation to Enhance Yield and Quality of Tomato, Chilli and Spring Onion Production in Nakhonphanom, ThailandNiyom Khaimuk, Naruatai Worasatit and Chumnan Kasiban
245
Investigation of Pumpkin Varieties Suitable for Highland Areas Nuengruethai Boonmala, Nittaya Nokham and Pedcharada Yusuk
256
Diversity of Indigenous Cucurbits in Vietnam – Situation and PotentialNguyen Chau Nien, Ina Pinker and Michael H. Böhme
262
Effect of Carboxyl Methyl Cellulose (CMC) Edible Coating on the Quality and Shelf Life of Chillies (Capsicum Annum Cv. Kulai)Joanna, C.L.Y, Nur Azlin, R., Nur Syafini, G., Syed Abas, S.A.R, Zaipun, M.Z., Habsah, M., Razali, M., Pauziah, M. and Wan Mahfuzah, W. I.
272
Producing Hybrid Chilli (Capsicum Annuum L.) Using Cytoplasmic Male Sterile (CMS) Genotypes – A Preliminary WorkNorfadzilah Ahmad Fadzil, Suhana Omar and Rozlaily Zainol
279
Rapid Determination of Leaf Net Photosynthetic Rate Using Correlated SPAD Relative Chlorophyll Content of Chilli (Capsicum Annuum L.) During Vegetative and Reproductive StageMohd Aziz Rashid, Nurul Atilia Shafienaz Hanifah, Noorsuhaila Abu Bakar, Mohamad Zabawi Abd Ghani and Rosmizan Abdul Rani
284
Evaluation of The Genetic Diversity in A Subset of Amaranth Germplasm (Amaranthus spp.) and Celosia Argentina from Africa Using Agro-Morphological TraitsTsvetelina Stoilova and Omary Mbwambo
288
Genetic Variability Studies on Cherry Tomato (Solanum Lycopersicum Var. Cerasiforme) Under Lowland EnvironmentNor Hazlina, M.S., Sharizan, A., Rozlaily, Z., Sebrina Shahniza, S. and Nor Afzan, R.
299
Physiological and Morphological Characteristics of Lettuces (Lactuca Sativa L.) Grown in Cadmium Polluted Hydroponic CultureSani Ahmad, J., Siti Aishah, H., Che Fauziah, I. and Puteri Edaroyati M.W.
306
Greenkit™– Growing Vegetables in Urban Home GardenI. Sakinah, S. Ab. Kahar and A.M. Farahzety
312
Urbankit for Urban CommunitiesMohd Johaary Abdul Hamid, Zulkefli Malik and Muhammad Suffian Abdul Karim
318

xxi
Effect of Soil Amendments on Growth Performance and Yield of Field Grown Sweet Corn (Zea Mays) Cultivated on Bris SoilNoorsuhaila, A.B., Faridah, M., Theeba, M., Mohd Hadi Akbar, B., Taufikurahman, B., Mohd Ridzuan, M.S., Nor Hazlina, M.S., Farah Huda, S.S, Mohd Aziz, R. and Arina Shairah, A.S.
323
Growth and Yield Responses of Cucumis Sativus to Biochar Based Organic Fertilizer and Biochar Soil AmendmentTheeba, M., Bachmann R.T., Zulkefli, M. and Illani, Z.H.
332
Effects of Biochar Application on The Growth and Yield of Lowland Cabbage Under Organic Production SystemNor Syahidah, M.S., Theeba, M. and Norziana, Z.Z.
349
Customised Low-Cost Cocopeat-Soil Growing Medium for Vegetable SeedlingsFong, S.L., Ong, P.H. and Poh, B.L.
354
Effect of Organo Mineral Fertilizer on Nutrients Uptake of Cabbage Dayang Safinah, N., Noor Haslizawati, A.B. and Theeba, M.
361
Effect of Three In One Nitrogen Fixer MARDI - All Cosmos Fertilizer on the Growth and Yield of AmaranthusIzyani, R., Norfadilah, A.H., Subahir, S. and Alias, M.Y.
367
Evaluation of Urea-N Sources on Yield of Dwarf Long BeanLim, A.H.
372
The Study of Types and Ratio of Bio-Extract for Increasing Productivity of Organic MustardNattaphon Kamon, Nittaya Nokham and Pedcharada Yusuk
376
Decline Trends of Propineb Residues (Expressed as Carbon Disulphide) in Leafy Vegetables Under Different Field Settings of Vegetables Production Ngan Chai Keong, Farah Huda Sjafni Suherman, Haslihana Yaacob, Mohammad Nazrulfahmi Abdul Rahim, Khairatul Azmah Mohamed and Mohammad Shahid Shahrun
383
Monitoring of Pesticide Residues Contamination in Malaysian Organic Produce of Peninsular MalaysiaKhairatul, A.M., Lim, A.H., Mohammad Shahid, S., Illani Zuraihah, I., Zulkefli, M. and Ngan, C.K.
389
Evaluation of Bio-Elements Using Herbal Extracts to Control Rhizopus Soft Rot on Purple Sweet PotatoMohd Nazri, B., Wan Zaki W.M. and Sauli, M.Y.
394

xxii
The Effects of Anthracnose Fruit Rot Disease Severity on Chilli After Supplementation of Copper, Boron and ManganeseNuradliza, B., Mohamad Roff, M.N. and Maizatulilyana R.
400
Response of Hemiptarsenus Varicornis Towards Different Levels of Damage Caused by the Leafminer Liriomyza Huidobrensis of TomatoNor Ahya Mahadi, Farah Huda Sjafni Suherman and Zurin Aida Jamilan
413
Steinernema Siamkayai, a Biological Control Agent to Control Phyllotreta spp. of Chinese Kale in Khon Khaen, ThailandKuson Thomma, Naruatai Worasatit and Nuchanart Tangchitsomkid
419
The Occurrence of Natural Enemies of Legume Pod Borer, Maruca Vitrata F. (Lepidoptera: Pyralidae) on Long Bean and French Bean in MalaysiaFarah Huda, S. S., Mohd Hanifah, Y., Siti Sakinah, A., Mohamad Roff, M. and Srinivasan, R.
424
Characterization, Prevalence and Control of Seed-Borne Bacterial and Fungal Pathogens of Leafy Brassica in Cambodia, Lao Pdr and VietnamR.R. Burlakoti, J.R. Chen, F.I. Ho, Z.M. Sheu, J.F. Wang, C.H. Nguyen, S. Khodsimouang and H.C. Hy
431
Trichoderma as a Biocontrol Agent for Tomato and Chilli ProductionNur Liyana Iskandar and Shazalwardi Shoib
443
Improving Visibility and Effectiveness of The International Vegetable Training Course to Promote Sustainable Production, Nutrition and LivelihoodsShriniwas Gautam, Supisra Arayaphong, Somchit Pruangwitayakun, Sorawit Limsiriwat, Fenton Beed and Maureen Mecozzi,
449
Videos to Enhance Local Vegetable Seed Production Knowledge and Improve Livelihoods for Small-Scale Farmers in Papua New GuineaPhilmah Seta Waken, Svein O. Solberg, Julien Curaba, Gregory C. Luther, Tien-Hor Wu, Bharath Krishnan and Tania Paul
457
Evaluation of Botanical Pesticides Against Insect Pests of Tomato Under Semi-Protected Structure in The PhilippinesManipon, A.O. Aganon, C.P and Nicolas, R.R.
462
Symposium Technical Tour 469SEAVEG 2016 Awards 477List of Participants 483List of Sponsors and Exhibitors 489Acknowledgement 491

xxiii
MESSAGE FROM THE MINISTER,MINISTRY OF AGRICULTURE AND AGRO-BASED INDUSTRY, MALAYSIA
I take this opportunity to extend a warm welcome to all participants of the Southeast Asia Vegetable Symposium 2016 (SEAVEG 2016). For this year’s event, Malaysian Agricultural Research and Development Institute (MARDI), The World Vegetable Centre (previously known as AVRDC), Vegetable Science International Network (VEGINET), Department of Agriculture, Thailand, ASEAN-AVRDC Regional Network for Vegetable Research And Development (AARNET), Department of Agriculture, Malaysia (DOA), Green World Genetics (GWG) and Federal Agricultural Marketing Authority (FAMA) have come together to jointly organize the symposium. I am confident, the collaboration will help to further strengthen the linkages between the
various agencies and enhance transfer of know how and business opportunities to the vegetable industry.
It is without a doubt, vegetable has an important role in our lives. Vegetables are rich with nutrients and this assist us maintain good well-being and prevent diseases. Hence, it is no wonder that vegetables have become vital for food and nutritional security in most Southeast Asian countries. This region collectively accounts for more than half of the world’s production of vegetables. To meet the global challenges of stagnating economic growth in developed countries, rising food prices and climate change, the Asia vegetable industry must continue to enhance production efficiency, food safety and product quality. The vegetable production should thus be done in an efficient, responsible and an environmentally sustainable manner to ensure adequate and affordable food supply for all.
Currently, there are many initiatives by the government to enhance and transform the agriculture sector. In this aspect, the role of the private sector in the development of the local vegetable industry is very important and more research collaboration should be conducted between industry and R and D organizations. The Malaysian vegetable industry is facing major challenges both domestically and globally and the theme for this symposium “Vegetables for Improved Nutrition and Livelihood in Southeast Asia” will hopefully address many of these challenges.

xxiv
This symposium should provide a forum for useful exchange of information, apart from strengthening linkages among researchers, producers and policy makers in Malaysia and other countries. I wish all of you a very successful symposium.
Thank you,
YB Dato’ Sri Ahmad Shabery Cheek,Minister,Ministry of Agriculture and Agro-Based Industry, Malaysia

xxv
MESSAGE FROM THE DIRECTOR GENERAL,MALAYSIAN AGRICULTURAL RESEARCH AND DEVELOPMENT INSTITUTE (MARDI)
On behalf of the Malaysian Agricultural Research and Development Institute (MARDI), I welcome all of you to the Southeast Asia Vegetable Symposium 2016 (SEAVEG 2016); jointly organized by Malaysian Agricultural Research and Development Institute (MARDI), The World Vegetable Centre (previously known as AVRDC), Vegetable Science International Network (VEGINET), Department of Agriculture, Thailand, ASEAN-AVRDC Regional Network for Vegetable Research and Development (AARNET), Department of Agriculture Malaysia (DOA), Green World Genetics (GWG) and Federal Agricultural Marketing Authority (FAMA). Since its inception, SEAVEG has helped to foster strong linkages; and dissemination of knowledge and
experience between vegetable industry participants and their counterparts in research, academia, regulatory and policy-making agencies for the betterment of the vegetable industries in Asia. The diversity of agro ecologies across Southeast Asia provides an ideal environment for the development and cultivation of a wide range of vegetable crops with the potential for inter-regional trade. MARDI believes that as most of the ASEAN countries are actively strengthening their research and development efforts, this symposium will provide the necessary platform to facilitate, exchange scientific information and knowledge on contemporary research and policy topics in Vegetable Research and Development. I hope the interactions at this symposium can help to identify constraints in the vegetable industry, recommend effective and practical approaches in developing high nutrition vegetables and increase vegetables in Malaysia. I take this opportunity to wish all participants a pleasant and successful symposium.
Thank You.
YBhg. Datuk Dr. Sharif Haron,Director General,Malaysian Agricultural Research and Development Institute (MARDI)

xxvi
MESSAGE FROM CHAIRMAN, SEAVEG 2016 COORDINATION COMMITTEE
It is a great coincidence that with the beginning of the New Year 2016, a fresh hope, challenges and vision have merged for the benefit of human kind. It has come in the name of Sustainable Development Goals (2016 – 2030) (SDG) coined and crafted by the only world body of human development, the United Nations. We all know that it is progressive and improvement over the first mission Millennium Development Goals (2000-2015) (MDG) which listed Goal no. 1 as “Eradicate extreme poverty and hunger”, whereas SDG Goal is no. 2 stated as “End hunger, achieve food security and improve nutrition and promote sustainable agriculture.”
In line with the above, all stakeholders of food, agriculture and humanity are committed to food and nutrition security for improved growth and health of human kind. It is considered that horticulture/vegetable is the major contributor to nutrition security. Along with other institutions of stakeholders on vegetables, Southeast Asia Vegetables (SEAVEG) has come forward with commitment to augment and accelerate steps on attaining food and nutrition security for the benefit of the people of the region. In this direction and in order to bring together the vegetable stakeholders of the region, the SEAVEG has organized the following regional symposia;
a) SEAVEG 2012: Regional Symposium on High Value Vegetables in Southeast Asia: Production, Supply and Demand, January 24 – 26, 2012, Chiang Mai, Thailand
b) SEAVEG 2014: Families, Farms, Food - Regional Symposium on Sustaining Small-Scale Vegetable Production and Marketing Systems for Food and Nutrition Security, February 25 – 27, 2014, Bangkok, Thailand.
c) SEAVEG 2016: Vegetable for Improved Nutrition and Livelihood in the Southeast Asia-South East Asian Vegetable Conference 2016, September 6 – 8, 2016, Kuala Lumpur, Malaysia
The idea of Southeast Asia Vegetables (SEAVEG) was conceived and initiated during 2010 by the institutions like AARNET, World Vegetable Center, VEGINET, DOA (Thailand), and FAO and expected to take its full shape and role in future with the support of all vegetable stakeholders. The gatherings of nations have succeeded in sharing their knowledge and science on vegetable and in connecting nations for attaining food and nutrition security. The participants have learnt lessons of success and failures improving vegetable production and in lowering the number of hungry and malnourished people.

xxvii
We have to adopt both classical and innovative approaches. We have seen the success in classical approaches of traditional breeding and now we have seen the results of biotechnological approach which provides hope to the future for higher production and consumption. In order to succeed with the new line of approach, the multi-sectorial stakeholders need to come together with the common goal to achieve food and nutrition security. Some of the early steps to be undertaken are mentioned below;
National planning and budget: The grain-based planning, budgeting and production and consumption data need to be replaced. We can not continue giving step-motherly treatment to nutritious crops like vegetables as against grain crops. We need to have detailed data on vegetable production and consumption to develop nutrition-based food requirements.
Breeding for nutritive values: While breeding, enhancing nutritive values should get priority similar to high yield. Along with nutritive value, the nutraceutical value where applicable should be considered.
Bridging yield gap: There is wide range of variation in yield per unit area in each vegetable crop between and among the countries of the Asian region which needs to be bridged.
More nutrient harvest: Along with the economic advantage, the farmers need to be educated to include nutritious crops like vegetables to obtain more nutrient harvest.
Bio-diversification of crops: In the cropping pattern the vegetables should find place not only as cash crop among cereals but also as important supplement to nutritious crops.
Awareness and education on nutrition: Traditionally extension workers in rural areas are engaged in extending technology and inputs but they never train rural people on consumption/nutrition of food. On the whole, the education on nutrition and consumption of food is almost minimal or absent surprisingly in both rural and urban areas. The national cadre of extension workers on nutrition is much needed if we need to attain food and nutrition security.
Price rise: We are all concerned about the price rise of vegetables which is a local or national or international cry. The governance has to address this major issue. Apart, the price rise in farm inputs should also be examined and considered. The vegetable crop production needs relatively more inputs.
Save food: Among the emerging issues, the loss and wastage of edible food has gained much significance wherein vegetables particularly leafy vegetables account for loss up to 50 percent. This can be arrested and utilized.

xxviii
Increase in urban population: Earlier, it has been stated that the vegetable is a major contributor to nutrition security. With growing urban population, the horticulture particularly vegetables has assumed greater importance in Urban and Peri-urban agriculture.
The list of emerging issues are not complete and likewise other relevant issues also need to be considered for the benefit of all stakeholders.
We need to recognize that we cannot ensure nutrition security followed by good health without the consumption of vegetables.
We have successfully conducted SEAVEG 2012 and SEAVEG 2014 and now holding SEAVEG 2016 in the interest of all vegetable stakeholders in Asia and beyond.
Dr. Prem NathChairman, SEAVEG 2016 Coordination CommitteeChairperson, VEGINETChairman, PNASF

xxix
MESSAGE FROM CHAIRMAN, SEAVEG 2016 NATIONAL ORGANISING COMMITTEE
On behalf of the Organising Committee, I am very pleased to welcome all participants to the Southeast Asia Vegetable Symposium 2016 (SEAVEG 2016).
SEAVEG 2016 will highlight the critical importance of vegetables in Southeast Asia and identify technologies to increase vegetable production, marketing and consumption and also to realise the potential of providing nutrition to rapidly growing and increasingly urbanised populations.
Organising an International Symposium requires a lot of financial commitments and we are very grateful for the financial sponsorship from United States Agency for International Development (USAID).
This Symposium provides an excellent platform for industry people, researchers, academicians, policy makers and vegetable producers to exchange ideas, review their work, discuss issues and provide solutions relevant to the vegetable sector.
Finally, I would like to thank my colleagues in the main organizing and sub-committees, as well as the co-organisers for their tireless efforts, suggestions and contributions to ensure a well organised event.
I look forward to your active participation and a successful conference.
Thank you.
Dr. Omran HashimChairman, SEAVEG 2016 National Organising Committee

xxx
CORPORATE PROFILE
MALAYSIAN AGRICULTURAL RESEARCH AND DEVELOPMENT INSTITUTE (MARDI)
MARDI was established with the main objectives of generating and promoting new, appropriate and efficient technologies towards the advancement of the food, agriculture, food and agro-based industries.
MARDI is managed and guided by the regulations and policies set by the MARDI Governing Board and consented by the Minister of
Agriculture And Agro-Based Industry. In matters pertaining to finance the consensus of the Minister of Finance is also obligatory.
Whereas, the Scientific Council ensures that MARDI technical programs attain the highest quality and level of competence.
MARDI is mandated to fulfill the following functions:-• To conduct researches in the fields of science, technical, economy and social with
regards to: – Production, utilization and processing of all crops (except rubber, oil palm and
cocoa), livestock and food – Integrated farming• To serve as a center for collecting and disseminating information and advisory
services pertaining to scientific matters, technical and economy related to food, agriculture and agro-based industry. These functions are accomplished through various methods inclusive of publication of reports, periodicals and related papers and organizing of exhibitions, conferences and seminars and lectures
• To serve as a center that provides expert services in food, agriculture and agro-based industry such as consultancy services, laboratory analysis, quality assurance and contract research and development (R and D)
• Provision of various forms of trainings to cater for the development of the food, agriculture and agro-based industry
• Provision of grant-in-aid for pure and applied scientific, technical and economic research and development related to food, agriculture and agro-based industry
• To maintain liaison with local and foreign public and private organizations engaged in scientific, technical, economic and social researches related to food, agriculture and agro-based industry
• To conduct commercial research and production• To develop, promote and exploit the research findings• To provide extension services to the agriculture, food and agro-based industries

xxxi
The MARDI leadership envisages had evolved from capacity building, establishment of farming and cropping systems towards technology commercialization, total quality management and culture of excellence in attaining national and international recognition
Contact:MARDI HeadquartersPersiaran MARDI-UPM43400 Serdang, SelangorMalaysiaTel: 603-89536000Fax: 603-89536011E-mail: [email protected]

xxxii
CORPORATE PROFILE
The World Vegetable Center, an international nonprofit vegetable research and development institute, seeks to alleviate poverty and malnutrition in the developing world through the increased production and consumption of safe, nutritious and health-promoting vegetables.
Founded in 1971 in Taiwan, the Center’s global network now covers East and Southeast Asia, Oceania, sub-Saharan Africa, South Asia and Central and West Asia. Activities are structured around four global themes – Germplasm, Breeding, Production and Consumption – to strengthen the entire vegetable value chain, from seeds and soil to market access and nutrition.
The Center’s research provides small-scale farmers with the knowledge, skills, technologies and opportunities to boost their vegetable yields and increase their incomes. The World Vegetable Center Genebank holds the world’s largest public-sector collection of vegetable seed and the Center’s advanced breeding lines with better pest and disease resistance that can tolerate extremes of flooding, drought and heat are used throughout the world by plant breeders to develop improved vegetable varieties.
By promoting sound research, good agricultural practices and safe production and postharvest methods through partnerships with national agricultural and research institutions, nongovernmental organizations and the private sector, the Center helps growers produce healthier harvests for themselves and consumers while protecting the environment. Integrated crop management strategies include improved vegetable lines, grafting, low-cost drip irrigation, safe pest management, protected cultivation and crop fertilization and rotation systems suited to smallholders.
The Center works with traditional vegetables—underutilized species with the potential to provide sustenance and much-needed micronutrients to balance staple-heavy diets – and conducts research on the nutritional and nutraceutical qualities of all vegetables for their potential to improve health for individuals, families and communities. Ongoing programs disseminate and extend these improved technologies to farmers, NGOs and national agricultural research systems.

xxxiii
People worldwide seek safe, reliable sources of quality vegetables. Research conducted by the World Vegetable Center supports a vibrant agri-food sector in rural and periurban areas that can tap into this demand and provide wholesome, affordable vegetables – and in the process, fight malnutrition, create employment and reduce poverty on-farm.

xxxiv
CORPORATE PROFILE
VEGETABLE SCIENCE INTERNATIONAL NETWORK (VEGINET)
ProfileTHE GENESIS
Six hundred and sixty one participants from 37 countries of the International Conference on Vegetables (ICV) held on November 11 – 14, 2002, at Bangalore, India, discussed over 600 papers presented under 13 theme areas of scientific, technological and economic importance including Theme Area XIII on Technical Communication among Developing Countries (TCDC). They strongly felt at the conclusion of the Conference that this phenomenal knowledge and much more of it that is globally available and will be available in the future should be collected, consolidated and shared for appropriate use by the stakeholders. Therefore, the General Assembly of the Conference ICV-2002 decided to establish the Vegetable Science International Network (VEGINET).
THE VISIONThe goal of VEGINET is to strengthen partnership and inter-institutional cooperation among the member organizations of the vegetable sector towards improved production and utilization of vegetables.
OBJECTIVESThe main objectives of VEGINET are: • Facilitate inter-and intra-regional and inter-institutional cooperation through exchange
of scientific, technological and related economic information. • Identifying priority areas of cooperative research and development. • Facilitate development of human resource through better education and training. • Promote improved and sustainable production and utilization of vegetables to achieve:
Food and Nutrition• Security and Economic empowerment of the farming community.

xxxv
ACTIVITIES UNDERTAKEN (2002 – 2016)
Organizing Regional Symposia/International Conferences:The VEGINET jointly organized the following events:• The VEGINET joined with the PNASF in holding the International Conference on
Horticulture (ICH-2009) during November 2009, Bangalore, India• With DOA, Thailand; AARNET; World Vegetable Center and others assisted in
organizing High Value Vegetables in Southeast Asia: Production, Supply and Demand (SEAVEG 2012) during 24 – 26 January 2012, Chiang Mai, Thailand.
• With World Vegetable Center, DOA (Thailand), HSST (Thailand), Kasetsart University, AARNET and others assisted in organizing SEAVEG 2014: Families, Farms, Food - Regional Symposium on Sustaining Small- Scale Vegetable Production and Marketing Systems for Food and Nutrition Security during 25 – 27 February 2014, Bangkok, Thailand.
• With World Vegetable Center, FAO, AARNET, DOA (Thailand), DOA (Malaysia), Green World Genetics assisted in organizing SEAVEG 2016: Southeast Asia Vegetable Symposium 2016-Vegetable for Improved Nutrition and Livelihood in Southeast Asia, during 6 – 8 September 2016, Kuala Lumpur, Malaysia.
Participation in International Conferences In order to disseminate the information on its existence and activities of the VEGINET, the Chairperson and members participated and made oral presentation during the following conferences:• FAO International Workshop on Urban and Peri-urban Agriculture (UPA-2005) June
29 – July 2, 2005 Bangalore, India• ASHS Annual Conference held during July, 2005, in Las Vegas, USA. • ISHS 3rd International Cucurbit Symposium held during September, 2005 in
Townsville, Australia. • ISHS IV Balkan Symposium on Vegetables held during September, 2008 in Plovdiv,
Bulgaria.
VEGINET International AwardsIn order to recognize outstanding vegetable scientists, VEGINET International Award was instituted to present during international events. The awards were presented to the following personalities;• Prof. Joao da Silva Dias, Portugal- Outstanding contribution in vegetable research and
development during SEAVEG 2012, January 24 – 26, 2012 Chiang Mai, Thailand.• Dr. O. P. Dutta, India – Outstanding contribution in vegetable research and
development during SEAVEG 2014, February 25 – 27, 2014, Bangkok, Thailand.• Prof. Michael H. Bohme, Germany – Outstanding Contribution to Vegetable Science,
during SEAVEG 2016, September 6 – 8, 2016, Kuala Lumpur, Malaysia.

xxxvi
Award for Best Oral and Poster Paper Presentation• Dr. Allan P. Bacho, Philippines – Best Oral Paper during SEAVEG 2012, January
24 – 26, 2012 Chiang Mai, Thailand.• Dr. Biswanath Mazumdar, India – Best Poster Paper Presentation during SEAVEG
2012, January 24 – 26, 2012, Chiang Mai, Thailand.• Dr. Akhilesh Sharma, India – Best Oral Paper presentation during SEAVEG 2014,
February 25 – 27, 2014, Bangkok, Thailand.• Ms. Sopana Yule, Thailand – Best Oral Paper presentation during SEAVEG 2016,
September 6 – 8, 2016, Kuala Lumpur, Malaysia. • Ms. Noor Syafini Binti Ghazali, Malaysia – Best Poster Paper presentation during
SEAVEG 2016, September 6 – 8, 2016, Kuala Lumpur, Malaysia.
CommunicationThe VEGINET is fully supported by the PNASF Secretariat.
VEGINET on Website: The VEGINET remained active on the PNASF website: http://www.pnasf.org/veginet.html beginning the year 2003 and through these years. The Secretariat, hosted by PNASF responded to the queries received across the globe. VEGINET in Newsletters: The news and activities of the VEGINET appeared in sixteen issues of the PNASF Newsletters published between 2003 and 2016. These were distributed among the members of VEGINET and PNASF. VEGINET Brochure: The brochure was prepared during 2003 and revised during 2011, published and distributed among the interested participants and VEGINET members and during the seminars and conferences.
Contact: VEGINET Central SecretariatDr. Prem Nath Agricultural Science Foundation (PNASF)#9, 1st Cross, 1st Main, 1st Block, Rajmahal Vilas (RMV) Extension,2nd Stage, Bangalore- 560094, Karnataka State, INDIATel: +91-80-2341 5188, Fax: +91-80-2351 1555E-mail: [email protected]://www.pnasf.org/veginet.html

xxxvii
CORPORATE PROFILE
DEPARTMENT OF AGRICULTURE (DOA), THAILAND
The Thailand Department of Agriculture (DOA), is envisioned as the Center of Excellence in the field of crops research and development and farm mechanization, in harmony with international standards and in adherence to the principles of natural resources conservation and environment protection. DOA’s mandates are as follows:
1. Conduct research and development studies on various agricultural disciplines concerning crops and farm mechanization.
2. Provide services on the analysis, inspection, quality certification and advises on soil, water, fertilizer, crops, agricultural inputs production and products quality export promotion and other areas of concerns.
3. Enforcement of the six Regulatory Acts under the Department’s jurisdiction; viz; the Plant Quarantine Act B.E. 2551 (2008), Plant Variety Protection Act B.E. 2542 (2009), Fertilizer Act B.E. 2550 (2007), Plant Variety Act B.E. 2550 (2007), Rubber Regulation Act B.E. 2542 (2009) and the Toxic Substances Act B.E. 2551 (2008)
4. Transfer of agricultural technology to concerned government officials, farmers and the private sector.
5. Implementation of urgent programs assigned to the Department of Agriculture by the Ministry of Agriculture and Cooperatives and the Cabinet Minister
DOA Thailand has an active involvement and graciously hosted SEAVEG 2012 and SEAVEG 2014 both events were successfully convened in Chiang Mai and Bangkok Thailand, respectively. The event gave an important stimulus to the regional vegetable industry. More than 24 countries around the world attended these important symposiums, harnessing the great and rare opportunity for relevant stakeholders to share their views and expertise. The SEAVEG 2012, had an in-depth vision on various aspects of vegetable production, supply and demand in the region, with particular emphasis on cross-sectoral issues. Two years later in SEAVEG 2014 affirmed that family farming and smallholder farming are important basis for sustainable food production aimed at achieving food and nutrition security. This was in accordance with the General Assembly of the United Nations Declaration for the year 2014 as the “International Year of Family Farming”,

xxxviii
recognizing the important contribution that family farming and smallholder farming can play in providing food and nutrition security and eradicating poverty in the attainment of the internationally agreed Sustainable Development Goals (SDGs).
Contact:
Somchai CharnnarongkulDirector General,Department of Agriculture (DOA),50 Phaholyothin Rd, Khwaeng Lat Yao, Khet Chatuchak, Krung Thep Maha Nakhon 10900, ThailandTel: +66-2579-0151; +66-2579-2445E-mail: [email protected]: http://www.doa.go.th/

xxxix
CORPORATE PROFILE
ASEAN-AVRDC REGIONAL NETWORK FOR VEGETABLE RESEARCH AND DEVELOPMENT (AARNET)
AARNET was established in 1998 during the 19th ASEAN Ministers of Agriculture and Forestry (AMAF) meeting in Vietnam. The network facilitates information sharing and the creation and implementation of research and development projects on vegetables in ASEAN member states. The World Vegetable Center (WorldVeg) from its regional (East and Southeast Asia/Oceania) office in Thailand collaborates with the AARNET Secretariat; Agri-Food and Veterinary Authority of Singapore (AVA), to link ASEAN partner organizations to identify regional priorities and to promote technology transfer and training initiatives.
The network meets annually, with the host country rotating between the 10 ASEAN countries; Brunei Darussalam, Cambodia, Indonesia, Lao PDR, Malaysia, Myanmar, Philippines, Singapore, Thailand and Vietnam. Routine benefits include exchange and evaluation of promising vegetable germplasm from the WorldVeg genebank. Standardised protocols are disseminated to enable trial results to be shared and for germplasm performance to be analysed and reported collectively.
Following each annual steering committee meeting there is an expert consultation meeting that invites regional leaders and country representatives to share their experiences on selected prominent issues. For 2015, the 10th AARNET session was hosted by National Agriculture and Forestry Research Institute (NAFRI), Lao PDR and the expert consultation tackled “Climate Change Mitigation and Adaptation Strategies for Vegetables in Southeast Asia”. Presentations highlighted each country’s strategy to gradual and drastic changes in climates and regional experts contributed their insights. Working groups identified that a key priority was to build regional capacity on how to harness, store and share the region’s diversity of vegetable genetic regional resources with traits to overcome changes in climate. In response; a two week training session was coordinated at WorldVeg HQ in Taiwan and designed to encapsulate germplasm collection, characterization, conservation and screening for resistance to abiotic and biotic stresses, as well as the sharing of standard protocols for wider use and adoption by ASEAN countries.

xl
In 2016 it was the turn of our current hosts for this symposium; Malaysian Agricultural Research and Development Institute (MARDI) to host AARNET. The Steering Committee Meeting was followed by an expert consultation workshop that focused on “Vegetables for Health: Essential Role in Supplying Micro-nutrients for Health”. Results from this expert consultation meeting, highlighted the need for regional approaches to increase linkages between vegetable consumption, nutrition and health through political partnerships between Ministries of Agriculture, Education, Health and Trade.
In 2017, AARNET members are looking forward to being hosted by Department of Agricultural Research for Steering Committee Meeting and Expert Consultation meetings in Yezin, Nay Pyi Taw, Myanmar.
Presentations shared during these AARNET meetings are available; http://avrdc.org/aarnet/.
Contact:
World Vegetable CenterP.O. Box 42Shanhua, Tainan 74199, TaiwanStreet address:60 Yi-Min LiaoShanhua, Tainan 74151, TaiwanTel: +886-(0)-6-583-7801Fax: +886-(0)-6-583-0009E-mail: info(at)worldveg.org

xli
CORPORATE PROFILE
DEPARTMENT OF AGRICULTURE (DOA), MALAYSIA
VISIONTowards creating a competitive agricultural industry, production of quality products, safe and environmentally friendly as well as export-oriented.
PRINCIPAL SERVICES• Provision of agricultural extension services through sufficient production of food
source that are of quality and safe for consumption.• Enforcement of Acts that safeguard the safety, quality and protect the country’s
agriculture industry from the threat of pests and foreign diseases and facilitate international trade.
MISSIONProvide quality and efficient services to agricultural entrepreneurs through the application of advance technologies and agricultural regulatory services to boost production capability and ensure the safety of the country’s agriculture sector.
OBJECTIVES• Provision of consultation services, technical support and professional advice in
various agricultural fields, especially in the field of food crop and downstream industry in order to ensure sufficient food production for the country’s needs.
• Provide guidance and nurturing of progressive agriculture entrepreneurs in order to increase farm productivity and eventually increase the country’s agriculture productivity.
• Development of trained and skilled workforce to cater to the needs of the agriculture industry.
• Protect crops (industrial and food crops) from threat such as pests and diseases through the crop protection programme and quarantine services.
• Determine the production of crops that are safe for consumption and control environmental pollution.
• Regulate the agricultural resources and the country’s plasma-generated materials from being transferred out of the country and from the threat of extinction.

xlii
FUNCTIONS• Evaluate, modify and generate a technology package derived from agencies/research
bodies according to the local environment and requirement and to disseminate these technologies to agriculture entrepreneurs.
• Provide consultation services and technical support in a package format to entrepreneurs, private organizations and agriculture development agencies.
• Develop Food Crops and Soil Information Centre for planning purposes and implement development programmes for agriculture sector.
• Conduct training at the agriculture Institute/Training Centre in order to fulfill the requirement for skilled workforce within the agriculture sector.
• Monitor the quality of the country’s agriculture resource/seedlings• Implement the enforcement of Pesticide Act 1974 to ensure that pesticides which
are imported, distributed and sold in our country are of quality and will not cause harm to consumers, livestock, food crops and the environment.
• Implement the enforcement of Plant Quarantine Act 1976 to prohibit the entrance of deadly foreign pathogen into our country and also to facilitate the export of our country’s products so that they comply with the quarantine regulations imposed by the importing country. Implement the enforcement of Custom Order (Export Restriction) 1988 and CITES regulation (International Trade Convention for Endangered Animal Species and Wild Plants) to ensure that agriculture resource and plasma generation are not threaten with extinction.
• Implement the enforcement of New Plant Variety Protection Act 2004 (Act 634) to protect the intellectual rights of local varieties for superior plant breeds such as oil palm, rubber, cocoa, coconut and flowers.
• Create liaison and working collaboration between organizations in the public sector and local/foreign private sectors that are involved in the development, enforcement and international trade.
CUSTOMER SERVICE MISSION“YOU ARE OUR PRIORITY”
Contact:Department of Agriculture (DOA), MalaysiaWisma Tani, Level 7-17No. 30, Persiaran PerdanaPresint 4, Putrajaya62624 Putrajaya, MalaysiaTel: 603-88703002Fax: 603-88885069Website: www.doa.gov.my

xliii
CORPORATE PROFILE
FEDERAL AGRICULTURAL MARKETING AUTHORITY (FAMA), MALAYSIA
The Federal Agricultural Marketing Authority, better known as FAMA, is a statutory body under the Ministry of Agriculture and Agro-Based Industry. FAMA’s responsibility is to improve the marketing of agro food products such as vegetables, fruits and agro-based industry products.
To drive the domestic and international marketing sector, FAMA in its role of marketing agro food products initiates to expand the market size of agro food products and increase agriculture and agro-based industry products to ensure it is available and can be obtained at affordable prices by consumers. To implement this role FAMA has been continuously intensifying efforts to enhance efficiency in the marketing chain by focusing on the following items;i. Strengthening supply through Contract Farming Program;ii. Expand market access; andiii. Improve the promotion of domestic and export markets.
VISIONThe leading authority on food and agricultural marketing
MISSIONTo develop an efficient and effective food and agricultural marketing chain to enhance value to clients.
OBJECTIVESi. Realisation of the National Vision and the National Agricultural Policy to make
Malaysia a major world producer of food through the efficient and effective marketing of food and agricultural products.
ii. Development of a marketing infrastructure and a marketing supply chain system that is effective and efficient.

xliv
iii. Improving the marketing and increasing the demand of food and agricultural products in the domestic and international markets.
iv. Leading human resource capacity building in agriculture marketing based on the latest knowledge and technology.
MAIN FUNCTIONSi. To coordinate agricultural marketing activities involving both the private sector and
the government departments/agencies.ii. To improve the marketing system and to expand as well as develop new markets
for agricultural produce of Malaysia.iii. To collaborate with the private sector and government departments/agencies in
creating an efficient and effective agricultural marketing system.iv. To develop and enhance efficient management in the agricultural industry related
to marketing activities or processing of agricultural products.v. To be directly involved in the agricultural industry, especially in marketing activities
or processing of agricultural products.
STRATEGYFAMA has developed a long term Strategic Plan for the period 2011 – 2020, consistent with the National Agro Food Policy to increase and expand the market for agro-food agricultural products as well as spurring the transformation of agro food marketing. FAMA’s Core Strategic Plan is in:• Increasing the supply of agricultural products• Increasing market access;• Increasing the number of entrepreneurs involved in the agro food sector;• Generating income of the target groups among the farming community and
agricultural entrepreneurs; and• Enhancing the efficiency of marketing services.
Contact:Federal Agricultural Marketing Authority (FAMA)FAMA Point BuildingLot 17304, Jalan Persiaran 1Bandar Baru Selayang68100 Batu Caves, SelangorMalaysiaTel: 603-61382210Fax: 603-61389710Website: www.fama.gov.my

xlv
CORPORATE PROFILE
GREEN WORLD GENETICS SDN. BHD.
Who We AreGreen World Genetics Sdn Bhd (GWG) is a well-integrated total food value chain organization, with strong focus on research and development of tropical hybrid seeds as well as improvement of agricultural produce.
Committed in providing the best quality products for our customers, we apply stringent quality control process and use only superior planting materials to significantly improve crops marketability besides developing new varieties. With operations spanning across the Asia Pacific region, GWG performs market-driven technical studies and commercial activities.
GWG products range from seeds to fresh produce covering field crops, fruits, vegetables and flowers. The hybrid seeds that have been developed by GWG are melon, watermelon, maize, sweet corn, cucumber, hot chili, tomato, sweet pepper, and rice. Since its incorporation in Malaysia, GWG has expanded its diversified operations across the Asia Pacific region. It is recognized as one of the very few pioneering organizations that engage in multi-disciplinary crop improvement research program. In addition, GWG is awarded with BioNexus status and is participating in few of the government initiated projects.
Contact:Green World Genetics Sdn. Bhd.,No. 40, Jalan KIP 10, Taman Perindustrian KIP, Kepong, 52200 Kuala Lumpur, Malaysia.Tel: +603-6277 5570 / 603-6275 9903; Fax: +603-6275 9908,E-mail: [email protected]: http://www.gwgenetics.com/store/

xlvi
ABOUT SOUTHEAST ASIA VEGETABLE SYMPOSIUM 2016
(SEAVEG 2016)
BACKGROUNDThe third in the pace setting series of symposia; SEAVEG, will focus on improved nutrition and livelihoods in Southeast Asia. This symposium will highlight the critical importance of vegetables in Southeast Asia and identify technologies for increased vegetable production, marketing and consumption; to realize the potential of providing nutrition to rapidly growing and increasingly urbanised populations. SEAVEG 2016 will focus on the role of vegetables to nurture a balanced and nutritious diet, helping to alleviate micronutrient malnutrition and assure better health. Vegetables are high value crops and thus growers are receptive to acquiring skills and technologies to ensure sustainable productivity of quality vegetables to satisfy market demand, hence, contributing to increased incomes and improved livelihoods. Further, vegetables require careful maintenance and are often managed by women; who are also responsible for household nutrition; therefore, benefits in production and vegetable affordability directly benefit household members through improved diets.
The symposium SEAVEG 2016: ‘Vegetable for improved nutrition and livelihoods in Southeast Asia’ comprises of oral papers, poster display and a trade exhibition. The organisers strongly encourage both types of presentation and will ensure that posters receive good visibility at the symposium.
OBJECTIVES• To promote food and nutrition security and livelihood• To provide a platform for the participants to communicate, discuss and share the
views and new ideas, innovations and products• To exchange ideas in addressing various issues in vegetables production sector

xlvii
Executive Summary andRecommendations

xlviii
EXECUTIVE SUMMARY
SEAVEG 2016
BACKGROUNDThe present world is faced with almost 805 million people suffering from hunger and malnutrition and at the same time over three billion people suffering from micro-nutrient deficiency across the globe. This challenge is alarming, needs to be addressed. Vegetables are the major contributor to nutrition security and supplement to food security, and the major provider of micro-nutrients required essentially for maintaining proper human health. Asia is the major producer of vegetables but, this region faces the serious threat of malnutrition and micro-nutrient deficiency. Vegetable production and consumption in this region is affected by large yield gap among nations, lack of research on nutritive values, low key awareness and education on nutrients and nutrition, continuance of grain-based food planning and estimates rather than nutrient-based, and need for promoting vegetable farming as a source of livelihood. In order to deliberate on above and related issues, Southeast Asia Vegetable Symposium 2016 (SEAVEG 2016) with the theme “Vegetables for Improved Nutrition and Livelihood in Southeast Asia” was organized during September 06 – 08, 2016 at Putrajaya Marriott Hotel, Malaysia. The event was initiated by SEAVEG and organized by Malaysian Agricultural Research and Development Institute (MARDI), in collaboration with AVRDC – The World Vegetable Centre, Taiwan, the ASEAN-AVRDC Regional Network (AARNET), the Vegetable Science International Network (VEGINET), Kasetsart University (KU). About 200 participants from 40 countries attended the symposium which covered 34 oral and 66 poster sessions. After deliberating on the key issues, following recommendations and policy issues were made.
RECOMMENDATIONS
Vegetable Research• Strengthen the vegetable genetic base through intensive inventorization and
characterization of germ plasma resources including introduction of exotic and wild germplasm by all the national and state research organizations and, develop and implement strategies for collecting germplasm identified as gaps in the collections at the national level.
• Review and update cost effective eco-friendly strategies viz., Integrated Production and Protection Management (IPPM), selection of the appropriate cultivars, quality seed, cultural practices and production technologies, Integrated Pest Management

xlix
(IPM) to promote production of high quality vegetables. • Recast research programmes and set priorities in particular crops and specific
problems through biotechnology interventions viz., pyramiding genes for disease resistance through molecular markers and integrate with conventional breeding to develop varieties with durable resistance.
• Enrich nutrient quality of vegetables through engineering metabolic pathways for increasing both macro- and micro-nutrients.
• Breeding for higher yield at the cost of nutrient quality must be avoided.• Develop varieties resistant to viruses, insect pests and diseases, and better post
harvest qualities through transgenic approaches. • Upgrade and scale-up technologies for urban and periurban vegetable production
suitable to home gardens, school gardens, rooftop gardens, organic gardens, close circuit vertical farming, hydroponics, aeroponics, sprout and microgreen production to mitigate seasonality of vegetables, dependency on off-farm resources and distant marketing.
• Improve market and supply chain infrastructure to facilitate regional trade among Asian nations.
VEGETABLES AND NUTRITION – DEVELOPMENT• Encourage and popularise vegetable consumption at the household, community and
national level, to develop and promote food based strategies to combat micronutrient deficiencies and integrate them with other community based nutrition programmes to ensure nutritional security.
• Establish community based support services (nursery, model garden) to get access to necessary inputs, training and technical knowhow and have vertical integration of centralized facilities to reduce cost of production by involving small and marginal farmers as beneficiaries.
• Initiate mass awareness programs on vegetable consumption particularly for women and their participation in income generation from house led gardening activities, and promote rural post harvest technology and strengthen the role of cooperatives for production and marketing.
• Regulate and popularise simple methods like washing with clean water, bio-detergent, pealing etc. to minimize or eliminate pesticide residues.
Steps ForwardExtension Education: Train the Agriculture Extension Workers, available in abundance in each country in the developing world on nutrition and make them as the messengers of nutrition security. Alternately establish a separate cadre of Nutrition Extension Workers nation-wide to create awareness about nutrition and nutrients and to execute programs on nutrition security. Research Orientation: Reorient research programs to improve the nutrient quality of vegetables. To the extent possible avoid research on breeding for higher yield at the

l
cost of nutrient quality. National Planning and Budget: Generate detailed data on vegetable production and consumption to develop nutrition-based food requirements to overcome step-motherly treatment to nutritious crops like vegetables as against grain crops in order to replace the data supporting grain-based planning, budgeting, and production and consumption. Bridge Yield Gap: Bridge the yield gap in vegetable crops as there is wide range of variation in yield per unit area in each vegetable crop between and among the countries of the Asian region.
LIVELIHOOD SECURITY A focus on three target groups for livelihood through employment be considered.
Target Group (a): Small land holders, landless farmers and isolated tribal population with subsistence farming• Create and ensure attractive credit facilities and crop insurance cover to the farmers
to cope up with production risk factors.• Provide training to the farmers on skill development in agro techniques and market
intelligence to get more profits.
Target Group (b): Small and Large scale commercial farmers• Generate and disseminate information on post harvest loss reduction, harvesting
index, processing technology, better storage, packaging and market intelligence of horticultural produce for higher profits.
• Streamline policy guidelines and encourage forward and backward linkage programs and develop supply chain to ensure consistent supply of horticultural products to these industries which also ensures assured market to the produces.
• Provide skill oriented training programs in the area of hybrid seed production in vegetables and ornamental crops and modernize nurseries with effective quality control system for ensured production and sale of genuine planting materials of horticultural crops.
• Set up international standards quality control, molecular biology and seed testing laboratories (ISTA Approved) at national level.
• Generate and promote information pertaining to organic farming in horticultural crop for income generation.
Target Group (c): Non farming population• Organize training and extension programs on gardening, nutrition and food safety
at community level.• Promote school gardens, home garden, homestead garden, terrace garden, community
garden and herbal gardens and also include gardening and education about health benefits of horticultural crops in school curriculum.

li
POLICY ISSUES• Develop special economic zones for vegetable production based on agro climatic,
biophysical and socioeconomic parameters.• Establish an efficient supply chain management system by linking smallholders and
producers to the main market and facilitate them with information on demand and supply of vegetables, consumers’ quality preferences, and sales and return figures in domestic, national and international markets on daily basis enabling them to place their produce effectively in the vibrant market.
• Enhance efficiency in transfer of technologies for different agro climatic conditions by strengthening Research-Extension-Farmer linkage through participatory approaches involving public and private sectors.
• Focus on multisectorial coordination among various preventive measures like availability of clean water, proper hygiene, good sanitation, health education, early child development and family planning through women empowerment programs and by linking these activities with existing government programs pertaining to health and education at the national level, to effectively address malnutrition apart from promoting vegetable consumption.
• Set up quality control molecular biology and seed testing laboratories (ISTA approved) by encouraging Public-Private Sector Companies with long term financial assistance with low interest rate.
• Prepare National Map of potential vegetable seed production centres for different vegetable crops indicating the ideal hybrid vegetable seed production zones and provide physical infrastructure facilities (irrigation, roads, power, credit facilities for construction of green houses, net houses, seed processing facilities, controlled seed storage), training facilities for personnel and support, subsidy for inputs etc. Simplify the national seed import and export procedures and policies.
• Cooperative efforts should be made globally by international organizations like FAO, AVRDC, IPGRI, VEGINET etc. to promote under-utilized crops for food and nutritional security.
• Establish strong linkages within and among countries through networking of institutes, and organizations for exchange of information and technologies, seed and planting material as well as expertise for mutual benefit and development of horticulture/vegetables. The FAO (Food and Agriculture Organization of the United Nations) under the umbrella of TCDC (Technical Cooperation among Developing Countries) may act as a facilitator for the formation and strengthening of such networks (eg. VEGINET).

lii
FOLLOW-UP ACTIONSThe General Assembly of SEAVEG 2016: Improved Nutrition and Livelihood, decided to:• Submit the proceedings and recommendations of the symposium to various
government and private sector organizations of Asian countries as well as to regional and international organizations like ASEAN, AARNET, VEGINET, AVRDC, FAO, ICRISAT, ICARDA and others for their considerations and actions.
• Hold the fourth SEAVEG Regional Symposium (2018), hosted by the Malaysian Agricultural Research and Development Institute (MARDI) pending authorities approval.
• Report on the actions taken on the recommendations of SEAVEG 2016 during SEAVEG 2018 to be held in 2018.

liii
OPENING REMARKS[Dr. Mohamad Roff Bin Mohd. NoorDeputy Director GeneralMalaysian Agricultural Research and Development Institute(MARDI)]
Yang Berhormat Dato’ Nogeh Gumbek, Deputy Minister, Ministry of Agriculture and Agro-based Industries, Malaysia (MOA)
His Excellency Dr. Marco Wopereis, Director General, World Vegetable Centre (AVRDC).
Dr. Prem Nath, Chairman, SEAVEG; Chairperson, Vegetable Science International Network (VEGINET).
Dr. Fenton Beed, Regional Director, World Vegetable Centre (AVRDC), Bangkok, Thailand.
Excellencies, Directors, Distinguished Delegates, Ladies and Gentlemen.
Assalamualaikum wrbth and a very good morning.
Let me first and foremost, welcome all of you to the 3rd Southeast Asian Vegetable Symposium, or is better known as SEAVEG 2016 held in the beautiful garden city of Putrajaya, in a truly warm and Malaysian hospitality. “Selamat datang”. I would also like to express my deep personal gratitude to the Minister of Agriculture and Agro-based Industries for being with us this morning to grace the occasion.
I am indeed honoured and privileged to welcome you to SEAVEG 2016. We are very grateful to The World Vegetable Centre (previously known as AVRDC) and Vegetable Science International Network (VEGINET) for choosing Malaysia as the venue for this important symposium. The decision to hold this symposium in this country is timely as the Government of Malaysia acknowledges the importance of developing horticulture, particularly vegetable production for better food and nutrition security in this region. The holding of this symposium is a positive initiative and we welcome all steps to enhance vegetable production in the region.
Vegetable are important from both the economics and health perspectives hence, the theme ‘Vegetable for Improved Nutrition and Livelihood in Southeast Asia’ for this year SEAVEG is very apt and relevant. I am happy to share that the Malaysian

liv
Agriculture Research and Development Institute (MARDI) is at tandem with this theme and is conducting research in the areas of improved varieties, improved production technology in farming systems, availability of quality seed and effective postharvest handling system including storage and transport facilities both for highland and low land vegetable farming at our research stations.
Excellencies, Ladies and gentlemen,
Realising that over four billion of the world’s people living in poor state are in ASIA, the availability of sufficient vegetable play an important role in reducing the levels of malnutrition and undernutrition in this region. Equally important issue to be addressed is the issue of food loss and waste where FAO estimates that almost half of all fruits and vegetables produced globally are wasted. This is an alarming figure especially because the world is also facing adverse climate changes which are affecting agriculture production. We are glad that this symposium has brought together a wide spectrum of renowned experts, large and small scale producers, farmer groups and other stakeholders to deliberate on the scientific, technical and policy issues related to the production of horticultural produce.
Excellencies, ladies and gentlemen,
I truly hope that this symposium will be fully utilized by the Asian countries, including Malaysia towards the improvement of research and development in vegetables. Several aspects such as information exchange, exchange of planting materials, capacity building such as training and workshop on related areas, technology transfer, could be discussed and deliberated together.
On behalf of the Organizing Committee, I would like to extend my heartiest appreciation to all of you, especially some who have travelled a long journey to our country. In this regard, I wish all of you an enjoyable stay here in Putrajaya throughout the meeting.
Despite our busy schedule during SEAVEG 2016, it is my sincere hope that you will also spare some time to explore our vibrant city of Putrajaya, which offers you picturesque scenery with modern and contemporary buildings surrounded by a man-made iconic Putrajaya’s lake. For instance, you may want to visit the Putra floating mosque, do a shopping spree in IOI City Mall or take a cruise tour around the lake in the evening. At night, consider hopping on a taxi to experience the metropolitan atmosphere that Kuala Lumpur may offer with the light lit up on the surrounding buildings and bridges. I am sure there is something for you to explore here in Malaysia’s Klang Valley.
lv
Excellencies, ladies and gentlemen,
Last but not least, I hope all of you who are present today will be benefited from this symposium by engaging in active discussions and seizing opportunities to build networking among colleagues from member countries. Also, this is a platform for all of us to share information on the topics discussed especially related to challenges and priority matters on vegetable affecting the region.
Thank you for your kind attention and I wish you all a successful symposium.

lvi
OPENING REMARKS[HONOURABLE DATO’ NOGEH GUMBEKDeputy Minister of Ministry of Agriculture and Agro-based Industry Malaysia(MOA)]
His Excellency Dr. Marco Wopereis, Director General, World Vegetable Centre (AVRDC).
Dr Prem Nath, Chairman, SEAVEG, Chairperson, Vegetable Science International Network (VEGINET).
Dr Fenton Beed, Regional Director, World Vegetable Centre (AVRDC), Bangkok, Thailand.
Dr. Mohamad Roff Bin Mohd. Noor, Deputy Director General, Malaysian Agricultural Research and Development Institute (MARDI)
Excellencies, Directors, Distinguished Delegates, Ladies and Gentlemen.
Assalamualaikum wrbth and a very good morning.
Let me begin by expressing my sincere thanks to the Organising Committee for inviting me, to officiate the 3rd. Southeast Asian Vegetable Symposium, or is better known as SEAVEG 2016. My warmest welcome to everyone, ‘Selamat Datang’ to the 3rd. SEAVEG which is jointly organized and sponsored by Malaysian Agricultural Research and Development Institute (MARDI), The World Vegetable Centre (previously known as AVRDC), Vegetable Science International Network (VEGINET), Food and Agriculture Organization (FAO), ASEAN-AVRDC Regional Network for Research and Development (AARNET), Department of Agriculture (DOA) Thailand, DOA Malaysia, Green World Genetics (GWG), Federal Agricultural Marketing Authority (FAMA) and United States Agency International Development (USAID). Thank you for taking time from your busy schedules to be here today. Your presence here means a lot to us and I hope this opportunity will be used to share ideas and strengthen networks so that we all can grow together as a region. I am happy to see the presence of all which is an indication of your commitment to the agenda and objectives of this symposium towards the development of the vegetable industry in this region.
Excellencies, ladies and gentlemen,
It is an honour for Malaysia to host this esteemed event and indeed my greatest pleasure

lvii
to be here amongst his Excellencies and distinguished delegates to share knowledge in this SEAVEG 2016 Symposium with the theme ‘Vegetables for Improved Nutrition and Livelihood in Southeast Asia’. The theme for this event is very timely indeed where the SEAVEG 2016 objectives are to promote food and nutrition security and improved livelihood, to provide a platform for participants to discuss opinions, new ideas, innovations and products and to exchange ideas in addressing various issues in vegetables production and market linkages.
It is without a doubt, vegetables have important roles in our lives. Vegetables are rich with nutrients and are able to assist us in maintaining good well-being and preventing diseases. Vegetables offer antioxidants that prevent the production of free radicals and protect us from the many harmful pathogens and environmental hazards that we are exposed to nowadays. Hence, it is no wonder that vegetables have become important for food and nutritional security in most South East Asian countries. This region collectively account for more than half of the world’s production of vegetables. It is expected that the demand for both fresh and processed vegetable will continue to expand, in line with growing population, rise in per capita income, better standards of living and increase awareness of healthy living.
Vegetables are considered as high value crops and vegetables growers are receptive to acquiring skills and technologies to ensure the sustainable production of quality vegetables. Sustainable vegetable production will satisfy market demand and in turn provide them increased income and improved livelihoods. The positive efforts over the years have resulted in the improvement of vegetables in terms of production and quality and now with the development of new varieties, use of cutting-edge technologies and efficient management systems we currently are able to produce high quality vegetables. However, the vegetable industry is still susceptible to challenges that affect agriculture and environment, such as climate change which includes rise of sea level, drought and flood. We hope that this symposium will offer a platform to all of you to discuss new ideas and technologies on managing these effects and make the vegetable industry more lucrative and prosperous.
Excellencies, ladies and gentlemen,
I was made to understand that several important aspects of vegetables such as nutritional security, awareness of health linkage to nutrition, empowerment of women for household nutrition and food safety will be discussed in SEAVEG−2016. The production system for rural, urban and peri-urban, pest and disease management, environmental management will also be a focus for the next couple of days. In addition, the symposium will highlight the critical importance of vegetables in Southeast Asia and identify technologies to increase vegetable production, marketing and consumption; to realize the potential of providing nutrition to rapidly growing and increasingly urbanized populations.

lviii
The diversity of agro ecologies across Southeast Asia provides an ideal environment for the development and cultivation of a wide range of vegetable crops with the potential for inter-regional trade. Malaysia realizes this and is actively pursuing our own biodiversity to identify potential commercial vegetable crops. I encourage all countries to do the same to further diversify and develop the potential of our region’s vegetable industry. This would be of great benefit as new vegetable crops can not only add more sources of nutrients to our plates but also add more business opportunities for more farmers in the future.
Excellencies, ladies and gentlemen,
I believe that this symposium will provide the necessary platform to facilitate, exchange scientific information and knowledge on contemporary research and policy topics important for our vegetable industry.as most of the ASEAN countries are actively strengthening their research and development efforts.
We do have a big task ahead of us in this symposium. Let us all put together our ideas and efforts to ensure the sustainability of vegetable production in our region. I am confident that with commitments from all of you here today, we will be able to work together to develop effective and efficient strategies concerning vegetable farming in the future.
Finally, I wish all of you a productive symposium and many thanks to the hardworking committee members from MARDI, AARNET, The World Vegetable Centre, DOA Malaysia and Thailand, GWG and FAMA, in ensuring the success of this symposium. To all our international participants do enjoy your stay in Malaysia and have a safe trip back home.
With that, I would like to officially open the SOUTHEAST ASIAN VEGETABLE SYMPOSIUM 2016 (SEAVEG 2016) and wish all of you a productive and fruitful symposium.

1
SYMPOSIUM FULL PAPERS

2
Vegetables for Improved Nutrition

3
Vegetables: Food and Nutrition Security
Prem NathVegetable Science International Network (VEGINET)Bengaluru, Karnataka State, IndiaE-mail: [email protected]
Abstract It has been recognized universally that food and nutrition security assumes a priority in human health without which human life is endangered. As of today, 805 million hungry and malnourished people demand priority attention. In this context, horticulture is recognized as a second line of defense with cereals and legumes in the front line of food domain. It is further recognized that horticulture is the major contributor of nutrition security and also adequately supplements food security. In horticulture, vegetables assume greater importance, because of its seasonal growing nature compared to fruits as perennial, containing wide range of minerals, vitamins, fibers, anti-oxidants etc., The production of vegetables per plant, per unit area and per unit time is relatively many times higher than any other crop plants including grains in the plant kingdom. In order to attain nutrition security, the consideration and contribution of vegetables on its availability, stability, accessibility and quality and safety need to be examined carefully. The presentation during SEAVEG 2016 will attempt to illustrate the above statements.
Keywords: food, vegetables, nutrition, food and nutrition security
PREAMBLE• Today the world produces adequate food for everyone but the unequal distribution
has created a gap between the countries who produce food more than they consume and those countries with deficit production.
• At present some 805 million people in the world do not have enough food to lead healthy active life. That’s about one in nine people on earth.
“Give me neither poverty nor riches but give me only my daily bread”, the hungry said.
• The vast majority of the world’s hungry people live in developing countries, where 13.5 percent of the population is undernourished.
• Asia is the continent with the most hungry people - two thirds of the total.• With the above scenario before us it would be appropriate to revisit ourselves and
dig into the root causes and adopt measures to mitigate food and nutrition insecurity. Vegetable is considered as one essential among all food commodities providing nutrients.
BASICS OF HUMAN CIVILIZATION Food is basic to human being and agriculture is the catalyst between the two which is basically supported by natural resources. The human being is entirely dependent on food and food is fully dependent on agriculture and agriculture is

4
Figure 1. Basics of human civilization-food, agriculture and humanity (Nath, 2016)
AgricultureMotherNature
Food
Humanity
dependent on human resources with humanity. Even though food, agriculture and humanity have their own entity; they are inseparable for the survival and existence of each other. Hence, the three pillars, viz; food, agriculture and humanity forming a triangle symbolize the roots of human civilization, which needs to be revisited in the present context as illustrated by Nath (2016) in the Figure 1 below. There is lot to learn about food itself which is not easy. The first thing to learn is, whether the nation has enough food for all – locally produced or imported. Secondly, whether we have all kinds of food to make healthy diet e.g. carbohydrates, proteins, fats, fibres, vitamins, minerals etc.? We have varieties of food available, but we forget that we have to eat healthy food for maintenance and growth of the body. We must know what to eat, how much to eat or when to eat towards better human health/Thirdly, do we have the knowledge on the sources of food? Fourthly, what essential elements they contain to consider them as healthy food? And Fifthly, we need to learn the composition which will make healthy diet.

5
Figure 2. Food and nutrition cycle
Human essential food
Carbohydrate, protein, fat, mineral, vitamin, water
Nutrient cycle (food)
Sources of food
Plant Livestock FishHuman consumption
ProductionAgriculture/Horticulture/Vegetables
HUMAN FOOD, NUTRIENTS AND SOURCES As a matter of fact, the visible food is a capsule of nutrients which essentially influences our body metabolism and health and consequently its growth and development.
• The seven major classes of food/nutrients required by human beings are carbohydrates, proteins, fats, fiber, minerals, vitamins and water.
The origin, production and consumption of food are illustrated in Figure 2. The food or nutrition cycle is a continuous process which repeats itself for the growth, development and maintenance of human body and health.
Definition: nourishing is the process by which an organism assimilates food and uses it for its growth and maintenance. In another words, food is something which provides nutrientsProperties: Nutrients are substances that provide: (a) energy for activity, growth and all functions of the body such as breathing, digesting
food and keeping warm.(b) materials for the growth and repair of the body and for keeping the immune system
healthy.

6
(cont.)
Nutrients: • Protein, fat and carbohydrates also referred as proximate principles are oxidized in
the body to yield energy.• All fresh vegetables, fruits, whole grains, legumes and beans, nuts, seeds and herbs
have high nutrients. Vitamins and minerals: • Do not supply energy but regulate metabolic activity and help in utilization of the
proximate principles; utilized in formation of body structure and skeleton.• Human body cannot synthesize vitamins and minerals (few exceptions), must be
supplied by food. Facts of Minerals• Minerals play a critical role in maintenance of good health,• Minerals can not be created by living things such as plants or animals,• Plants, animals and humans need minerals for maintaining their health,• Minerals are elements that originate in the soil and plants absorb minerals from the
soil,• Animals get their mineral requirements from the plants or other animals they eat,• Most of the minerals in human diet come from plants one eats; some minerals from
edible animals.
Nutrients, Properties and Vegetable Sources Since the present discussion is limited to vegetables only, Table 1 below lists the nutrients and its properties and vegetable sources.
Table 1. Nutrients, properties and vegetable sources
Nutrients/Minerals Properties Sources
Carbohydrates/Starch Energy giving Roots and TubersFats Source of energy containing
essential fatty acids and have vitamin (A, D, E, K), like functions.
Vegetable oils
Phytochemicals Ailment healing properties Garlic, onion, turmeric, tea, soybean, chilli, etc.,
Antioxidants (phytochemicals in human diet)
Prevents cancer, cardio-vascular diseases and degenerative diseases with oxidative stress
Abundant in fruits and vegetables
Vitamin C/Ascorbic acid/Anti-oxidant
Superstant anti-oxidant Cantaloupe, cabbage, broccoli, spinach, baked potato, sweet potato, tomato and every green vegetable.

7
Table 1. (Cont.)
(cont.)
Nutrients/Minerals Properties Sources
Vitamin E/alpha-tocopherol/Anti-oxidant
Low level in blood increases risk of cancers in gastro-intestinal tract, breast, prostrate, lung and colon
Soybean oils, broccoli.
Vitamin A/Retinol Deficiency include poor appetite, lack of vigor, frequent colds, eye infection, night blinders, skin disorders and poor susceptibility to infections
Beta-carotene- precursor of vitamin A in carrot, sweet potato leafy vegetables, gourds and pumpkins, etc.,
Vitamin C/Ascorbic Acid Essential for normal growth, maintenance of body issues; protection against infections; promotes healing.
Cantaloupe, brussels sprouts, broccoli, cabbage, baked potatoes, tomatoes, sweet potato, spinach and cauliflower
Vitamin K/Chlorophyll Prevents bleeding, promotes clotting in injury, makes bone dense.
Leafy green vegetables
Biotin/B-Complex Required for carbohydrate and protein metabolism and fat synthesis.
Plentiful in green vegetables
Boron Regulates use of calcium, phosphorus and magnesium by the body: deficiency may cause abnormal growth cystises or tumors.
Vegetables
Calcium Essential for formation and maintenance of strong bones and teeth; involved in regulation of heart beat muscle action, transmission of nerve impulses; deficiency causes cramps in muscles.
Dark green leafy vegetables, squash, artichoke, broccoli, cabbage, spinach, green beans, watermelon etc.,
Iron Essential for production of hemoglobin; increases resistance to stress, diseases and prevents fatigue; deficiency causes anemic.
Green leafy vegetables watermelon, legumes
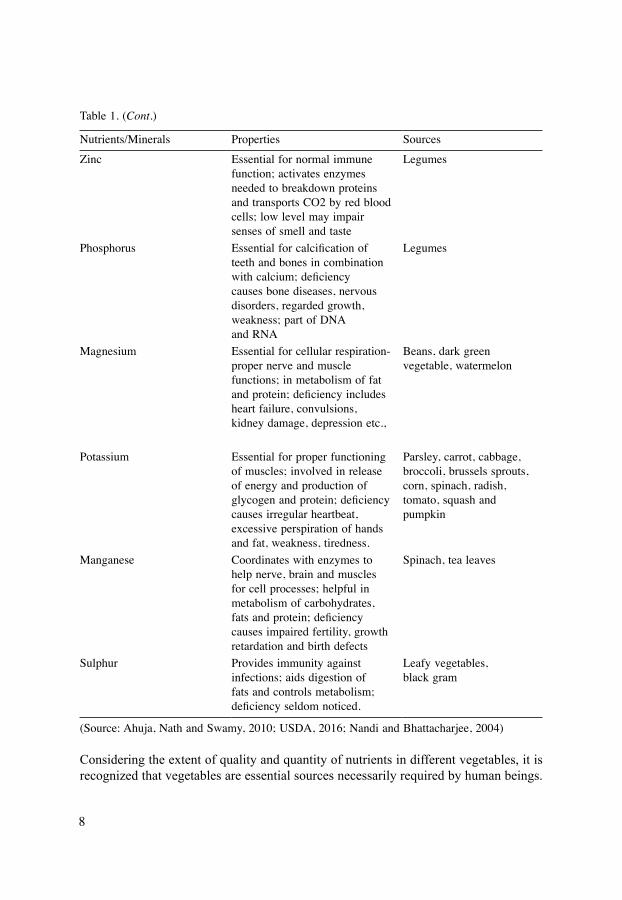
8
Table 1. (Cont.)
Nutrients/Minerals Properties Sources
Zinc Essential for normal immune function; activates enzymes needed to breakdown proteins and transports CO2 by red blood cells; low level may impair senses of smell and taste
Legumes
Phosphorus Essential for calcification of teeth and bones in combination with calcium; deficiency causes bone diseases, nervous disorders, regarded growth, weakness; part of DNA and RNA
Legumes
Magnesium Essential for cellular respiration-proper nerve and muscle functions; in metabolism of fat and protein; deficiency includes heart failure, convulsions, kidney damage, depression etc.,
Beans, dark green vegetable, watermelon
Potassium Essential for proper functioning of muscles; involved in release of energy and production of glycogen and protein; deficiency causes irregular heartbeat, excessive perspiration of hands and fat, weakness, tiredness.
Parsley, carrot, cabbage, broccoli, brussels sprouts, corn, spinach, radish, tomato, squash and pumpkin
Manganese Coordinates with enzymes to help nerve, brain and muscles for cell processes; helpful in metabolism of carbohydrates, fats and protein; deficiency causes impaired fertility, growth retardation and birth defects
Spinach, tea leaves
Sulphur Provides immunity against infections; aids digestion of fats and controls metabolism; deficiency seldom noticed.
Leafy vegetables, black gram
(Source: Ahuja, Nath and Swamy, 2010; USDA, 2016; Nandi and Bhattacharjee, 2004)
Considering the extent of quality and quantity of nutrients in different vegetables, it is recognized that vegetables are essential sources necessarily required by human beings.

9
EXPRESSION OF INAPPROPRIATE NUTRITION
Definition (Tontisirin, 2000)• Malnutrition is a broad term for a range of conditions that hinder good health,
caused by eating too little, too much or not the right food.• Under nutrition results from chronic food insecurity, in which people do not have
enough to eat satisfy their basic energy requirements.• Protein-energy malnutrition occurs when the body does not receive enough protein
and calories. The effects of protein-energy malnutrition include underweight (low weight for age), stunting (low height for age) and wasting (low weight for height.)
• In micronutrient deficiency, certain essential vitamins and minerals are lacking in the diet, leading to impaired growth and poor health.
• Eating too much, over-nutrition, an ever-growing threat as economies expand and lifestyles become sedentary, leads to health problems ranging from diabetes to heart disease.
• Health improvement: The contributions of fruits and vegetables to prevention of deficiencies are well-understood by scientists, the obstacles to resolving these problems are usually related to the availability, affordability and consumer awareness. The role of these foods in preventing several diet-related chronic diseases such as cardiovascular diseases, type 2 diabetes and cancers is very significant.
• Aging populations: Chronic diseases such as cardiovascular diseases, type 2. diabetes and cancer generally affect the middle aged and elderly segments of the population. Globally, the number of persons aged 60 years or over is expected nearly to triple, increasing from 673 million in 2005 to 2 billion by 2050 (UN, 2007).
Non-communicable Diseases and Micro-nutrient Deficiencies• Cardiovascular diseases: Although cardiovascular diseases (CVD) usually affect
middle age and elderly adults, the diets consumed early in life can influence the risk of stroke and coronary heart disease. Children’s consumption of a heart healthy diet can reduce the prevalence of obesity, high cholesterol and high blood pressure in adults. When fruits and vegetables replace foods that are high in animal fat, salt and sugar this can lower health risks.
• In adolescents and adults, high consumption of fruits and vegetables has been associated with lower risk of cardiovascular diseases.
• Type 2 diabetes It is estimated that there are 180 million cases of diabetes mellitus (DM) worldwide
(over 90% are type 2 DM); without strong preventive actions, this number may double by 2030 (Barnard et al., 2009 and Wylie-Rosett and Vinicor, 2007). Observational and clinical studies have shown that diets that are comprised of an appropriate diversity of plant foods (whole grains, legumes, vegetables and fruits) can improve the management of type 2 diabetes. (Barnard et al., 2009).
• Cancers: The International Agency for Research on Cancer, the World Cancer Research Fund and American Institute for Cancer Research believe that it is

10
probable that high fruit and vegetable intakes may reduce a number of cancers (viz; oesophageal, colo-rectal, oral, pharynx, stomach, larynx, lung, ovary and kidney cancers). More research is needed to identify the specific types of fruits and vegetables and their particular components, that have an impact on disease.
– Based on current knowledge, it appears that dark green leafy vegetables, yellow and red vegetables, cruciferous vegetables, as well as red and purple fruits and vegetables may be protective against cancer. It is plausible that the vitamins C, E and folate have an effect on cancer. The phytochemicals such as carotenoids, phenolics, isoflavonoids, isothiocyannates (ITC) and indoles also have anticarcinogenic effects (Kim and Park, 2009).
– Cruciferous vegetables, such as broccoli, cauliflower, cabbage, kale and mustard are common worldwide and they are rich in carotenoids, vitamin C, folate and soluble fibre. There is evidence from animal studies that these foods contain phytochemicals that have anticarcinogenic effects (Kim and Park, 2009). The latest research suggests that these vegetables, especially Brassicas, may lower the risk of gastric and lung cancers.
• Chronic energy deficiency: The Asia and Pacific region experienced continued improvement in alleviating chronic energy deficiency during the last 20 years, with the proportion of the population affected falling from 41 to 16 per cent in East and South East Asia and from 33 to 22 per cent in South Asia. Total numbers declined in East and South East Asia from 289 million to 258 million people, but South Asia experienced an increase from 237 million to 254 million. To support an active health life, dietary energy must come from diverse food sources (FAO, 1996).
• Compounding Factors: The severity of the problems of micronutrient deficiencies is a compelling reason to call for greater production and consumption of vegetables and fruits. It is well- documented that these foods can contribute to the prevention of deficiencies which can be debilitating and can lead to premature deaths.
• Population Rise: Current trends showed that another 1.5 billion people will be added to the population of developing Asian countries by 2025. More than half of the global increase towards 2025 is expected to take place in South Asia (FAO, 1996).
• Nutrition Issues• Protein Energy Malnutrition (PEM): Currently over three fourths (79%) of the
world’s malnourished children live in Asia. (FAO, 1996)• Stunting and Wasting are both highly prevalent in Asia and this is reflected in the
number of children who are underweight. According to ACC/SCN (2000), over a third of the world’s stunted children reside in the Asian region as a whole.
• Low Birth Weight: Regional data show that the incidence of intra- uterine growth retardation (IUGR) and LBW is highest in Asia (12.3%). Almost a third of all babies in South Asia are born with low birth weight which results from intrauterine malnutrition and from the cumulative effects of malnutrition among mothers during their infancy, childhood, adolescence and pregnancy.

11
• Major Micronutrient Deficiencies: Micronutrient deficiencies of nutritional concern in South East Asia are iron deficiency anaemia (IDA), iodine deficiency disorders (IDD) and vitamin A deficiency (VAD). Other micronutrient deficiencies such as rickets reportedly are a problem in certain parts of the Near East and Southern and East Asia. Zinc and selenium deficiencies are reported in China and some parts of Central Asia (Nandi and Bhattacharjee, 2004).
• Iron Deficiency Anaemia (IDA): South East Asian countries have the highest prevalence of anaemia, with almost 80% of pregnant women in the region being anaemic, of which countries of South Asia contribute to the bulk of anaemia (Criteria for determining the presence of anaemia in pregnant women and preschool children below Five years of age is Hb <11g/dl (WHO, 1998).
• Iodine Deficiency Disorders (IDD): The extent of goiter in the world is estimated to be as more than 200 million people, added to which should be six million overt cretinism. Around half of these are reportedly in South East Asia, including India. Iodine is absent from the soil in many Himalayan and alluvial regions and high land pressure has eroded top soil and with it iodine, that would be consumed with foods grown there.
Other Factors Influencing Nutrition• Challenges of Urbanization: Urbanization also profoundly affects dietary and food
demand patterns. It gives rise to growing concern about the quality and safety of food, particularly foods processed and purchased outside the home and to modification in food preferences caused by changing life styles (Gopalan, 1994; Seidler, 2000). New approaches are needed to promote locally produced foods, including research into the aspects of supply, processing and convenience which make food commodities preferable in the urban setting.
• Low Consumption of Fruits and Vegetables: The low consumption of fruits and vegetables in the vast Asian regions is a persistent phenomenon, confirmed by the findings of food consumption surveys. Nationally representative surveys in India (India Nutrition Profile, 1998) indicate a steady level of consumption of only 120 – 140 g/d, plus about other 100 grams of roots and tubers and some 40 grams of pulses. In China, on the other hand, a country that is undergoing a strikingly fast transition, the amount of fruit and vegetables has gone up from 344 g/d in 1982 to 369 g/d in 1992 (WHO and FAO, 2003), although it is still below the recommended goal.
MAJOR RISING CHALLENGES There are number of persisting and emerging challenges aggravating food and nutrition insecurity. Some of the major challenges are: • Migration of People The migration of people from rural to urban area is one the emerging challenges
where urban population is getting higher than the rural population and will demand more food and produce nil or much less food. United Nations Population Division

12
(UNPD) reported the projection of population as follows: 2030: Urban 60%+Rural 40%; 2050: Urban 70%+Rural 30%;
• Hunger and Malnutrition The greatest challenge of today is the number of hungry and malnourished people to
be fed. During 2009, 1020 million hungry and malnourished people were reported (FAO, 2009), whereas in 2015, 805 million people were hungry and malnourished with Asia-having two-third of total. The reduction in total is reported to be influenced by the implementation of the Millennium Development Goals.
• Price Rise The emerging challenge of price rise of food commodities in developing countries
has caused crisis among the common people and political circles in developing countries. Vegetable price rise of 30 to 80% and inputs price rise of 20 – 40% have become important cause of food insecurity.
• Job Opportunities This is one of the major challenges of the developing countries where food and
nutrition security is directly related to job security. According to FAO report, 770 million were unemployed or working poor below poverty lines (FAO, 2010).
FOOD AND NUTRITION SECURITY• Food and Nutrition Security is attained when all people, at all times, have the
physical and economic access to sufficiently safe and nutritious food to be healthy and active (FAO, 2004, 2006, 2014).
Essential Elements of Food and Nutrition SecurityAs indicated by FAO, the essential elements of food and nutrition security are identified as follows;• Availability: The availability of food is dependent on its production which is
governed by agriculture which is supported by research and development of efficient and cost-effective technology.
• Stability: This specifically relates to continuous supply of food every season and every year.
• Accessibility: The availability of food could be met by efficient production system, but it may not be accessible to all as it is happening today where 800 million people are hungry and malnourished. The change in policy must ensure that every individual has economic capacity to buy or access food.
• Quality and Safety: It is important and essential that the food available and consumed are nutritious and safe. Food safety laws need to be developed and enforced for the benefit of all consumers.
• Operational Mechanism: Keeping in mind the above essentials of FNS, the operational mechanism needs to be developed to ensure achieving the targets on specific areas. It is of serious concern to the operation management to employ these essential elements in developing operation strategy to achieve the aims and objectives

13
Figure 3. Essential elements of food and nutrition security (Nath, 2016)
Figure 4. The areas of operational focus (Nath, 2017)
Area-1Food Production, Inputs,
Extension, Supply, Marketing
Food and Nutrition Security
Area-2Nutrition intake,
Food Safety,Administration,
Food Loss & Waste, Education
Area-3Job for All
Food Accessibility
Area-5Resources Mobilisation
InvestmentCredit
Area-4Infra-Structure,
Irrigation,Farm implement,
Storage, Transport,Road
of the FNS. The Fig. 3 illustrates clearly the essential elements of food and nutrition security and lists ingredients or factors involved in fulfilling the objectives.
The Figure. 4 below is self-explanatory to five areas of field operation and related activities to meet the targets of food and nutrition security. The Figure 3 and 4, signify and identify the mode of field operation to ensure food and nutrition security objectives and targets.

14
FOOD UTILIZATION AND MINIMIZING WASTE Apart from making the food available, it is equally important to know how the food is being used by the consumers. The target should be to maximize its use in food consumption and minimizing its waste. Proper nutrition is essential to start people on the right path to a long, healthy life. All people should have sufficient quantities of nutrient-rich, safe foods in order to meet their energy and nutrient requirements. Without adequate nutrition, children start life at risk for a range of health problems; adults are unable to function fully in society. But nutrition is not merely an input that determines human well-being, it is also a reflection, quality of life improves and human potential is maximized, leading to increased productivity and economic strength.• Preventive Action is Needed: Public health agencies have stressed that at least
400 grams of fruits and vegetables should be eaten per day (WHO, 2003). Some recommend that the amount should be raised to 600 grams per day (World Cancer Research Fund /AICR 2009).
• Research on Fruits and Vegetables: Fruits and vegetables are very complex and recent research focuses on a few components. The particular components are beta carotene (precursor for vitamin A), lycopene, alpha- tocopherol (vitamin E), foliate and flavonoids. Current research suggests that each of these compounds may have great public health significance in terms of preventing disease, disability and premature mortality.
• One-third of food produced globally every year does not reach human mouths- it is either lost in transit or wasted by the consumers themselves. This amounts to a staggering 1.3 billion tonnes every year. These chilling figures are part of a report – Avoiding Future Famines – released by the UNEP at the Rio+20 summit on sustainable development.
• Consumers throw away nearly 222 million tonnes of food in edible condition every year in the rich countries of North America and Europe. This is very close to the total food production of Sub-Saharan Africa which is 230 million tonnes per year.
• In low-income countries, food is mainly lost during the early and middle stages of the food supply chain; much less food is wasted at the consumer level. In Europe and North America, 280 – 300 kg of food is wasted per head every year. In Sub-Saharan Africa and South and Southeast Asia, per-capita food wastage is 120 – 170 kg per year.
• According to a United Nations report, globally 33% of food produced goes waste. And each person wastes around 70 kg of food every year.
• Approximately 11 kg of food per person per year is wasted in developing Asian countries (FAO, 2010).
• Approximately 80 kg of food per person per year is wasted in developed Asian countries such as China, Japan and Republic of Korea (FAO, 2010).

15
Unused Food The philosophy and practical approach are to utilize as much edible food material as possible after it is produced, whether plant, animal or fish. As for example, mostly the root of radish or turnip is consumed but some people utilize also the tender leaves which are nutritious equally. In case of pumpkin, mostly fruit is utilized but some people consume flowers, tender leaves and seeds which are nutritious. Again, commonly drumstick fruit is consumed, but flowers and tender leaves are also nutritious and edible. In India, in Coccinia fruits only are consumed whereas in Thailand tender leaves are commonly used. The essence is that some edible parts are not being consumed or wasted in the absence of knowledge or because of food habit.
Underutilized Food There are several plants and animals which are being utilized well as food in one country and region but not in others. It is probably because of the fact that these fruits and vegetables were not produced in the region, hence, not known to consumers. As for example, spinach beet (Beta vulgaris var. bengalensis) is common nutritious spinach commonly grown and consumed in northern India is now getting popular in south India too, morning glory (Ipomoea aquatica) is so common in Southeast Asia is not commonly known in India; roundmelon (Praecitrullus vulgaris), so common in northern India, can be grown in other Asian countries; Mangalore cucumber (Cucumis sp.), so popular in south India, can be made popular in other parts of India.
INTERNATIONAL INTERVENTIONS Within three decades, there has been a number of international interventious on food and nutrition security which may be listed below.
Right to Food• The right to food was formally recognized in the very first international human
rights document, the Universal Declaration of Human Rights, adopted by the United Nations in 1948.
• The Preamble to the FAO Constitution sets “ensuring humanity’s freedom from hunger” as one of its basic purposes (Diouf, 1998).
International Conference on Nutrition-1992 (FAO and WHO, 1992)• During International Conference on Nutrition-1992 (ICN-1992), the Global Plan of
Action was designed to provide guidelines for governments, acting in partnership with non-governmental organizations, the private sector, local communities, families and households and the international community, including international organizations, multilateral financing institutions and bilateral agencies, to achieve the objectives of the World Declaration on Nutrition adopted by the International Conference on Nutrition.

16
Special Programme for Food Security (SPFS), FAO, Rome (1994).• The first ever field oriented global programme on food security was launched for low-
income- food deficit-countries by FAO during 2004. The project was implemented and succeeded in more than 100 countries over decades and included importantly vegetables among other food commodities.
World Food Summit 1996, Rome (FAO and WHO, 1996)• During World Food Summit 1996, the Rome Declaration on World Food Security
and the World Food Summit Plan of Action lays the foundations for diverse paths to a common objective - food security, at the individual, household, national, regional and global levels. Food security exists when all people, at all times, have physical and economic access to sufficient, safe and nutritious food to meet their dietary needs and food preferences for an active and healthy life. In this regard, concerted action at all levels is required.
The International Conference on Vegetables (ICV-2002), November 11 – 14, 2002, Bangalore, India.• The International Conference on Vegetables with the theme “Vegetables for
Sustainable Food and Nutrition Security in the New Millennium” held during November 11 – 14, 2002 in Bangalore, India marked the first milestone in the history of vegetable science and development by recognizing the role of vegetables as major supplement to food and nutrition security (Nath, Gaddagimath and Dutta, 2004).
Fruit and Vegetables for Health; Joint FAO/WHO Workshop, 1 – 3 September 2004, Kobe, Japan• According to The World Health Report 2002, low fruit and vegetable intake is
estimated to cause about 31% of is chaemic heart disease and 11% of stroke worldwide. Overall it is estimated that up to 2.7 million lives could potentially be saved each year if fruit and vegetable consumption was sufficiently increased.
• The Joint FAO/WHO Expert Consultation (2004) on diet, nutrition and the prevention of chronic diseases, recommended the intake of a minimum of 400g of fruit and vegetables per day (excluding potatoes and other starchy tubers) for the prevention of chronic diseases such as heart disease, cancer, diabetes and obesity, as well as for the prevention and alleviation of several micronutrient deficiencies, especially in less developed countries.
International Workshop on Urban and Peri-urban Agriculture for Asian Countries, June 29 to July 02, 2005, Bangalore, India (FAO and PNASF, 2005)• While emphasizing the role of Urban and Peri-urban Agriculture, the FAO/PNASF
workshop participated by Asian countries highlighting on policy and strategy issues, recognized the contribution of different food commodities in augmenting food and

17
nutrition security. Fruit and vegetables played an important role in providing nutrition security.
Regional Workshop on Strengthening Urban and Peri-urban Agriculture toward Resilient Food Systems in Asia (UPAFSA-2013), FAO and PNASF, January 28 – 30, 2013 Bangkok, Thailand.• It was recommended that in urban planning, the greener cities approach should be
on the agenda and UPA should remain the driving force for the same. The fruits and vegetables figured as important commodities to supplement food and nutrition security.
International Conference on Nutrition – 2014• During ICN-2, the Framework for Action was to guide the implementation of
the commitments of the Rome Declaration on Nutrition adopted by the Second International Conference on Nutrition held in Rome, Italy, on 19 – 21 November 2014. Building on existing commitments, goals and targets, this Framework for Action provided a set of policy options and strategies for governments to undertake.
The Millennium Development Goals (2000 – 2015) (UN, 2000) Goal 1) Eradicate extreme poverty and hunger• Target for 2015: Halve the proportion of people living on less than a dollar a day
and those who suffer from hunger.
Sustainable Development Goals (SDG) (2016 – 2030)• Sustainable development goal and targets (UN, 2015) relating food and nutrition
security are mentions below: – Goal 2) End hunger, achieve food security and improved nutrition and
promote sustainable agriculture
By 2030, end hunger and ensure access by all people, in particular, the poor and people in vulnerable situations, including infants, to safe, nutritious and sufficient food all year round. By 2030, end all forms of malnutrition, including achieving, by 2025, the internationally agreed targets on stunting and wasting in children under five years of age and address the nutritional needs of adolescent girls, pregnant and lactating women and older persons. By 2030, double the agricultural productivity and incomes of small-scale food producers, in particular women, indigenous peoples, family farmers, pastoralists and fishers, including through secure and equal access to land, other productive resources and inputs, knowledge, financial services, markets and opportunities for value addition and non-farm employment. By 2030, ensure sustainable food production systems and implement resilient agricultural practices that increase productivity and production, that

18
help maintain ecosystems, that strengthen capacity for adaptation to climate change, extreme weather, drought, flooding and other disasters and that progressively improve land and soil quality. By 2020, maintain the genetic diversity of seeds, cultivated plants and farmed and domesticated animals and their related wild species, including through soundly managed and diversified seed and plant banks at the national, regional and international levels and promote access to and fair and equitable sharing of benefits arising from the utilization of genetic resources and associated traditional knowledge, as internationally agreed. The international interventions have brought about significant awareness, education, guidelines and targets on food and nutrition activities for the benefit of the nations worldwide.
IN PROSPECTIVENational Planning and Budget: The grain-based planning, budgeting and production and consumption data need to be replaced. We cannot continue giving step-motherly treatment to nutritious crops like vegetables as against grain crops. We need to have detailed data on vegetable production and consumption to develop nutrition-based food requirements.
Breeding for Nutritive Values: While breeding, enhancing nutritive values should get priority besides, high yield. Along with nutritive value, the nutraceutical value where applicable should be considered.
Bridging Yield Gap: There is wide range of variation in yield per unit area in each vegetable crop between and among the countries of the Asian region which needs to be bridged.
More Nutrient Harvest: Along with the economic advantage, the farmers need to be educated to include nutritious crops like vegetables to obtain more nutrient harvest.
Bio-diversification of Crops: In the cropping pattern the vegetables should find place not only as cash crop like cereals but also as important supplement to nutritious crops.
Awareness and Education on Nutrition: Traditionally extension workers in rural areas are engaged in extending technology and inputs but they never train rural people on consumption/nutrition of food. On the whole, the education on nutrition and consumption of food is almost minimal or absent surprisingly in both rural and urban areas. The national cadre of extension workers on nutrition is much needed if we need to attain food and nutrition security.
Price Rise: We are all concerned about the price rise of vegetables which is a local or national or international concern. The governance has to address this major issue. Besides,

19
the price rise in farm inputs should also be examined and considered. The vegetable crop production needs relatively more inputs.
Save Food: Among the emerging issues, the loss and wastage of edible food has gained much significance wherein vegetables particularly leafy vegetables account for loss upto 50 percent. This can be arrested and utilized.
Increase in Urban Population: As mentioned earlier, the vegetable is a major contributor to nutrition security. With growing urban population, the horticulture particularly vegetables has assumed greater importance in Urban and Peri-urban agriculture.
MESSAGE• Food and Nutrition Security for all can not be attained unless everyone has food
accessibility and food accessibility can not be attained unless everyone has economic accessibility and economic accessibility can be attained only if every one has access to earning (Nath, 2015).
• It is recognized that horticulture crops including vegetables are the second line of defense with cereals and legumes as the first in the front line of food domain (Nath, 2009).
• We need to recognize that we can not ensure nutrition security followed by good health without the consumption of vegetables (Nath, 2016).
• During UN Day Celebrations 2014, the United Nations Secretary General, Mr. Ban Ki-moon stated “In a single world of plenty, no one, not a single person should go hungry. But almost one billion people in the world do not have enough to eat. I want to see an end to hunger everywhere within my life time”.
REFERENCESACC/SCN (2000). 4th Report on the World Nutrition Situation, Geneva, SwitzerlandAhuja, K.G. Nath, Prem and Swamy, K.R.M. (2010). Foods and Nutrition, P. N.
Agricultural Science Foundation (PNASF), Bangalore and Studium Press, New Delhi; pp 485
Barnard, N.D., Katcher, H.I., Jenkins, D.J.A., Cohen, J. and Turner-McGrievy, G., (2009). “Vegetarian and vegan diets in type 2 diabetes management” Nutrition Reviews, 67 (5): 255 – 263
Diouf, Jacques. (1998). News and Highlights – Fighting for the right to food, http: //www.fao.org/News/1998/981205-e.htm, 10 December 1998, FAO, Rome
FAO. (1996). The Sixth World Food Survey, FAO, RomeFAO. (1997). Special Programme for Food Security – Technical Fact Sheets, FAO
Activities and Prospects, FAO, RomeFAO. (2004). The State of Food Insecurity in the World, FAO, Rome, ItalyFAO. (2006). Policy Brief – Food Security, June 2006, Issue 2. Published by FAO’s
Agriculture and Development Economics Division (ESA) with support from the

20
FAO Netherlands Partnership Programme (FNPP) and the EC-FAO Food Security Programme FAO Agricultural and Development Economics Division: http: //www.fao.org/es/esa/
FAO. (2009). More People than Ever are Victims of Hunger, Background Note for Press Conference 19th June, 2009, FAO, Rome
FAO. (2010). United Against Hunger-World Food Day 2010, FAO/RAP Publ. 2010/23 Bangkok, Thailand
FAO. (2014). Food is Life-Save Food-Leaflet, FAO/RAP, Bangkok, Thailand, E-mail: [email protected]
FAO, IFAD and WFP. (2013). The State of Food Insecurity in the World 2013. The multiple dimensions of food security. Rome, FAO. p 13
FAO and PNASF (2005). Proceedings of the International Workshop on Urban and Peri-urban Agriculture for Asian Countries, June 29 to July 02, 2015, Food and Agriculture Organization the United Nations (FAO), Rome and P. N. Agricultural Science Foundation (PNASF), Bangalore, pp 257
FAO and PNASF (2013). Proceedings of Regional Workshop on Strengthening Urban and Peri-urban Agriculture towards Resilient Food Systems in Asia (UPAFSA-2013), FAO/RAP, Bangkok and PNASF, Bangalore, January 28 – 30, 2013, Bangkok, Thailand; pp Vol. I 100 – Vol. II 100
FAO and WHO. (1992). Action on Nutrition, International Conference on Nutrition, World Declaration and Plan of Action for Nutrition. Rome, December, 1992. Food and Agriculture Organization of the United Nations and World Health Organization. p. 53
FAO and WHO. (2004). Fruit and Vegetables for Health, 1 – 3 September 2004: Kobe, Japan, Report of a joint FAO/WHO workshop, World Health Organization. pp. 46
FAO andWHO. (2014). Framework for Action, Second International Conference on Nutrition, 19 – 21 November 2014 FAO and WHO; p. 8
Gopalan, C. (1994) Trends in food consumption patterns : Impact of developmental transition: Nutrition in the nineties – Policy India Nutrition Profile. (1998). National Family Health Survey-2 (NFHS-2), Govt. of India, New Delhi
Kim, M.K. and Yoon Park, J. H. (2009). Cruciferous vegetable intake and the risk of human cancer: epidemiological evidence, Conference on Multidisciplinary approaches to nutritional problems Symposium on ‘Nutrition and Health, Proceedings of the Nutrition Society. 68: 103 – 110
Kobakiwal, Abdul Q. (2004). Special Programme for Food Security (SPFS), Food Security and Vegetables-A Global Perspective, P. N. Agriculture Science Foundation, Bangalore; pg 85 – 100
Nandi, Biplab, K. and Bhattacharjee, Lalita. (2004). Emerging issues in nutritional security, Food Security and Vegetables – A Global Perspective, P.N. Agriculture Science Foundation (PNASF), Bangalore
Nath, Prem. (2009). Role of Horticulture in Livelihood Security, Horticulture and Livelihood Security, Scientific Publishers (India), Jodhpur and P.N. Agricultural Science Foundation (PNASF), Bangalore, pp 1 – 11

21
Nath, Prem. (2013). Concept and Implementation of Food Security and its Relevance to Urban and Peri-urban Agriculture, Proc. FAO/PNASF Regional Workshop on Strengthening Urban and Peri-urban Agriculture towards resilient food systems in Asia, January 28 – 30, 2013 in Bangkok, Thailand, pages 20 – 25
Nath, Prem. (2015). Introduction, Food Expectations of the People in the New Millennium, Dr. P.N. Agri. Sci. Foundation (PNASF), Bangalore; Westville Publishing House, New Delhi, pp 570
Nath, Prem. (2016a). Genesis, Messages and Considerations of the Basics of Human Civilization – Food, Agriculture and Humanity: Humanity in Humans, by Humans and for Humans in Securing Food for All, The Basics of Human Civilization – Food, Agriculture and Humanity; Vol. IV – Humanity. P.N. Agric. Sci. Foundation, Bengaluru; pp 250 – 258
Nath, Prem. (2016b). Attaining Food and Nutrition Security in the Developing World, Dr. P.N. Agri. Sci. Foundation (PNASF), Bangalore; and Westville Publishing House, New Delhi, (In press)
Nath, Prem, Gaddagimath, P.B. and Dutta, O.P. (Eds.) (2004), Food Security and Vegetables – A Global Perspective, P.N. Agricultural Science Foundation (PNASF), Bangalore; pp 412
Tontisirin, Kraisid. (2000). A Millennium Free from Hunger, World Food Day – 2000, FAO, Rome
UN. (2000). The Millennium Development Goals, http: //www.un.org/millenniumgoals/poverty.shtml. © United Nations. 2016
UN. (2007). World Population Prospects: The 2006 Revision, Highlights, Working Paper No. ESA/P/WP.202. United Nations Department of Economic and Social Affairs, Population Division, New York
UN. (2012). Zero Hunger Challenge – UN Secretary-General Message, June 19, 2012UN. (2015a).United Nations General Assembly, A/RES/70/1 Transforming our world:
the 2030 Agenda for Sustainable Development, September 25, 2015. p. 35UN. (2015b). Sustainable Development Goals (SDGs), http: //www.un.org/
sustainabledevelopment/hunger/ © United Nations. 2016USDA. (2016). United States Department of Agriculture (USDA), Agricultural Research
Service. 2011. USDA National Nutrient Database for Standard Reference, Release 24. Nutrient Data Laboratory Home Page, https: //www.ars.usda.gov/northeast-area/beltsville-md/beltsville-human-nutrition-research-center/food-surveys-research-group/docs/main-service-page
WHO. (1998). The World Health Report-Life in the 21st century: A vision for All, WHOWHO. (2003). WHO and FAO launched in 2003, a joint Initiative to promote fruit and
vegetables for health worldwide, WHO, Geneva and FAO, RomeWHO and FAO. (2003). Diet, nutrition and the prevention of chronic diseases. Report
of the joint WHO/FAO expert consultation, WHO Technical Report Series, No. 916 (TRS 916). Geneva, 28th January-1st February. 2002; p. 160

22
Evaluation of Vegetable Consumption Regarding its Nutritional Value and Consumer Awareness
Michael H. BöhmeHumboldt-University of Berlin, Dept. Horticultural Plant Systems, Lentzeallee 75, D-14195 Berlin, GermanyE-mail: [email protected]
Abstract Vegetables are known to provide considerable amount of vitamins, minerals, phytonutrients and bioactive compounds. They have many positive effects on health particularly in prevention of diseases such as cardiovascular illnesses, cancer, etc., Vegetable production has an increasing importance in most of the Asian countries indicated by enlarged vegetable cultivation areas and raised farmer’s income. Nevertheless, there are still some questions for producers and consumers too, concerning the required quantity of vegetables, assortment and its year round supply. Is the current slogan ‘five times a day’ sufficient for vegetables and fruits consumption or should we also consider the nutritive value of the produced and consumed vegetables even after storage and processing? Furthermore, for a high nutritive value the producers should select the right species and varieties and they should be aware that cultivation and post-harvesting methods affect the quality of its products. Also important is consumer awareness on the relationship between the consumption of vegetables and health. Data on social factors influencing vegetable consumption, e.g. gender, consumption of other foodstuff, as well as life habits such as smoking and weight loss diet were collected and evaluated. Currently the main vegetable production and consumption in the world and in particular in Asia, is based on a low number of “world” vegetable species such as cucumbers and tomatoes. The nutritional treasure of indigenous well adapted species is underutilized so far. Nowadays, the consumers are increasingly ready to take ‘health improving food’. This opens the market for diversification of the vegetable assortment including more vegetables with a high content of phytonutrients as found in indigenous vegetables. Breeding activities and the development of cultivation systems are necessary to offer so far underutilized vegetables on the market.
Keywords: awareness, bioactive compounds, health improving, phytonutrients, vegetable consumption
INTRODUCTION Looking at the food pyramid it is obvious that vegetables are one of the most important nourishments. Since the knowledge is available regarding the importance of vitamins and minerals, vegetables are consumed in an increasing amount. In the last decade furthermore the content of phytonutrients in vegetables and fruits have been highlighted because their bioactive non-nutrient compounds are helping to prevent and to reduce risk of major chronic diseases, such as cardiovascular illnesses, cancer etc., (Mohd Shukri, 2008). Most people are aware of the health benefits of consuming vegetables. For example, in the past it was recommended to feed children with spinach and carrots,

23
today it is recommended to also feed them with parsnip, pumpkin, summer squash, potatoes and sweet potatoes.Based on studies on production and consumption of vegetables three reasons for vegetable production can be structured as shown below.General reasons: • Appropriate growing conditions• Economic efficiency for the farmers• Good marketing situation, export possibility• Consumer demandReasons for consumption of vegetables: • Traditions, regional recipes• Consumer behaviour, self-sufficiency, tourists• Influence of globalisationAwareness of health linkages and serving of phytonutrients:• Feeding of babies, little children• Tolerance of vegetables, good digestion• Preparation for eating, cooking or preservation of vegetables• Proportion of vegetables with different health improving effects
One important reason for vegetable production is consumer demand; in this case it is to clarify what is influencing this demand. Is there awareness about the importance of vegetable and how specific is this awareness concerning quantity, vegetable commodities, their health improving linkages and way of serving. Furthermore it is important to know the specific function of the vegetables. But, even if the quantity, quality and diversity of consumed vegetables are clarified, it is to analyse the economic situation, is it possible to produce the vegetables in the country or should be imported. This paper focuses on different views on vegetable supply chain considering the cycle from Soil to Consumer (Figure 1). This paper will start with the availability of vegetables and area of production, discussing the nutritional value, in particular as phytonutrient and presenting selected results regarding the effect of lifestyle behaviours on vegetable consumption. Still not all factors influencing the production and consumption of vegetables in the different regions of the world and in particular in South Asia and Southeast Asia are investigated and their relationships are not clarified. Further studies are necessary in order to understand the demand of vegetable species in groups, as for raw consumption, cooking, fermenting and taste improving. In South Asia (SA), average vegetable consumption is low. Countries are classified into three groups. The first group consists of those with vegetable consumption of less than 60 kg per capita per year (Afghanistan, Bangladesh, Pakistan and Sri Lanka). The second group are those with consumption of more than 60 kg/capita/year (India, Maldives and Nepal). The third group is those with consumption of more than 120 kg/capita/year (Iran); only in this group the consumption per year is in line with the recommendation

24
of the FAO (FAOSTAT, 2016). In South-East Asia (SEA) the picture is similar; countries are also categorized into three groups. The first group is those with consumption of less than 60 kg per capita per year (Brunei Darussalam, Cambodia, Indonesia, Timor-Leste and Thailand). The second group is those with consumption of more than 60 kg/capita/year (Myanmar, Malaysia and Philippines). The third group includes those with consumption of more than 120 kg/capita/year (Lao PR and Vietnam) (FAOSTAT, 2016). It is obvious in most of South Asian and Southeast Asian countries that consumption of vegetable is too low compared to China at 332 kg/capita/year, EU at 116 kg/capita/year, USA at 113 kg/capita/year and Germany at 94 kg/capita/year (FAOSTAT, 2016). There is a need to analyse the reasons for low consumption of vegetables particularly in developing countries and to develop strategies to sustainably increase vegetable consumption in order to reach an acceptable level for human nutrition.
VEGETABLE PRODUCTION IN ASIAN REGIONS As shown in Figure 1, there are many factors influencing the production and the vegetable sector supply chain. There is a question, whether the relationship between the consumption and production of vegetables in SA and SEA countries affects the availability of vegetables. To understand this, it is important to analyse the vegetable species consumed and the production area of those vegetables. In Malaysia according to the FAO (FAOSTAT, 2013), the highest cultivation area is for watermelon with 12,009 ha, followed by cucumber at 4,630 ha, spinach at 4043 ha, brassicas at 3546 ha and
Figure 1. From soil to consumer – Factors influencing the production and the supply chain in vegetable sector

25
chilli and sweet pepper at 2870 ha. Cultivation of tomatoes is low at 1988 ha probably because of inadequate growing conditions. Furthermore, lettuce, cucurbits and okra are mentioned in this statistical overview. A completely different picture on cultivation and harvested area of different vegetable species is observed in Philippines. The country has more diverse vegetable crops and species. The largest cultivation area is indicated for eggplants at 21,282 ha, followed by tomatoes at 17,232 ha, onions at 15,415 ha, string beans at 13,766 ha, cucurbits at 12,759 ha, brassicas at 8,436 ha and watermelon at 6,920 ha. Cauliflower and broccoli, cucumbers, chilli and sweet pepper, garlic, onions, peas, carrots and okra are cultivated in smaller areas between 1,000 and 5,500 ha. Vegetables such as asparagus, lettuce, spinach and melons are cultivated in areas below 1,000 ha. Comparing Malaysia and Philippines, it is obvious that vegetable species and quantity produced differs. One possible reason is the difference in traditional daily diet. The growing condition could be another reason for differences in SA and SEA regions with different cropping patterns developed considering economic, ecological and social factors as well as the possibility of year round production and supply (Arsanti and Böhme, 2015; Long and Böhme, 2012). In the lowland area of the Red River Delta in Vietnam, the cropping patterns contains mainly indigenous vegetables (Table 1a), whereas in the upland areas of Java and Sumatra, Indonesia mainly carrots, chillies, headed cabbage, potatoes and tomatoes are cultivated (Table 1b). The latter production is for both domestic and international markets. These cropping patterns for vegetables in different regions show potentials, but also constraints in year round supply of vegetables. Investigations, in particular in the Mekong River Delta, concerning the cultivation and availability of cucurbits were showing surprising results (Nguyen Nien, 2016). The 126 growers in this area cultivated mostly vegetables belonging to the Cucurbitaceae family followed by Alliaceae, Solanaceae and Fabaceae. A survey in a larger area in southern Vietnam, interviewing 1,009 farmers regarding the cultivation frequency of cucurbits showed an unexpected ranking with highest frequency for bitter gourd, followed by watermelon and cucumbers and less cultivated were bottle gourd, wax gourd, loofah, pumpkin and angled loofah (Nien, 2016). The results of this study such as the high preference for bitter gourd could be traditional and associated to specific diets and recipes. It could also reflect the farmers’ high awareness on the health improving effects of bitter gourd.

26
Table 1. Cropping patterns for vegetables in Vietnam - low land (a); in upland areas of Indonesia (b) (Arsanti and Böhme, 2015; Long and Böhme, 2012)
a Jan Feb Mar Apr May June July Aug Sept Oct Nov Dec
AmarantBitter gourdChilliCorainderCucumberEggplants
GarlicHeaded cabbageLeafy cabbageLettuceMalabar spinachPumpkinKatuk, Rau ngotWater spinach
Yard long beanavailable
b O N D J F M A M J J A SPangalengan
Potatoes G G H P G G H P G G H PHeaded cabbage H H P G G G G
Tomatoes H H P G G G GKejajar
Potatoes G H P G G H P G G H P GHeaded cabbages G H P G G H P G G H P GChillies G H P G G H P G G H P G
BerastagiPotates G H P G G H P G G H P GHeaded cabbages P G G HCarrots P G G HNote: P = planting; G = growing, H = harvesting

27
Table 2. Efficiency of vegetables with reference to their biomass production and nutritional yield
Crop Assumed yield (t/ha)
Protein (kg/ha)
ß-Carotene equivalent(g/ha)
Ascorbic acid (kg/ha)
Rice 5.6 414 – –Soybean 2.5 167 1.9 0.28Sweet potato 24.6 216 116.9 6.7Potato 23.9 345 Tr 4.8Mustard 39.7 707 537 20.6Cauliflower 23.9 229 6.9 8.0Onion 59.5 941 Tr 2.8Garlic 9.5 565 0 0.6Tomato 60.1 535 299 20.2
EFFICIENCY OF VEGETABLES WITH REFERENCE TO NUTRITIONAL VALUE The importance of vegetables and herbs as food with high nutritive value is known (Böhme and Pinker, 2007). The area for vegetable cultivation is limited in most of SEA regions, e.g. in Vietnam average farm size is around 0.25 ha (Long and Böhme, 2012), in Indonesia in the upland average farm size is 0.56 ha and 0.93 ha (Arsanti, 2008). Therefore, it is important to cultivate crops with a high contribution to the nutrient supply, that means not only to evaluate the biomass yield, but also the yield, e.g. of ascorbic acid, protein and β-carotene per ha (Table 2). For the evaluation of the yield of medicinal and aromatic herbs it is common practice to count the amount of internal compounds and not the biomass, e.g. for thymus the amount of essential oil or thymol (Dudaš et al., 2002). Vegetables can be defined from several points of views, botanical, culinary and nutritional ones. They are also referred to as edible plants, as they are cultivated for their nutritional value for humans, since they contain a variety of vitamins and minerals (Kathleen et al., 2012). Vegetables can be classified in several categories depending on the part that is being utilized such as, root (radish, sweet potatoes), tuber (potato), bulb (onion, garlic), stem (bamboo, asparagus), leaf (cabbage, lettuce, spinach, parsley, celery), fruit (cucumber, eggplant, tomato, pepper, beans, okra, sweet corn) and flower (cauliflower, broccoli). In industrial countries, there is an increasing rate of obesity. Therefore, vegetables are often consumed because of their low energy content in comparison to meat and dairy products. The relationship between the energy of consumed vegetables and nutrients is of importance. Such values (content of nutrients in relation to the energy – CNE) are calculated for several vegetables and fruits (Table 3).

28
Table 3. Content of vitamin C and iron in relation to energy (cne) per 100 g fm
Species KJ Vit. Cmg
CNEmg/MJ
Ironmg
CNEmg/MJ
VegetablesCauliflower 94 70 745 0.6 6Broccoli 106 114 1,075 1.3 12Sweet pepper 94 400 4,255 0.8 9Spinach 87 52 597 4.1 47
FruitsApple 230 12 52 0.4 1Banana 377 11 2 0.6 1Strawberry 155 59 380 0.9 6Kiwi 255 150 638 0.7 3
Phytonutrients are the bioactive non-nutrient compounds that naturally occur in fruit, vegetables and other plant-based foods. Its content has been linked to reduced risk of major chronic diseases, by providing a range of potential health benefits to support immunity and body function (Anu Rahal et al., 2014; Mohd Shukri, 2008). Vegetables and fruits have strong health benefits because they contain polyphenols and pigments as evident in some fruits and vegetables with vibrant reds, yellows, greens and other rich colours. Certain fruits and vegetables contain higher levels of these compounds, making them more concentrated and potentially more effective sources of phytonutrients (Table 4). To understand the contribution of the phytochemicals towards health effects, some of the important phytochemicals should be highlighted, as flavonoids, carotenoids, vitamins and alkaloids (Anu Rahal et al., 2014; Mohd Shukri, 2008; Nutrilite, 2008).
STUDY OF CRITERIA FOR VEGETABLE CONSUMPTION IN LEBANON A cross sectional analysis of 390 Lebanese individuals aged between 20 and 65 years old located in six Mohafazat (Beirut, Mount Lebanon, North, South, Nabatieh and Bekaa) was conducted. Socio demographic, lifestyle, eating behaviour, food frequency questionnaire (FFQ) and awareness information were collected through a questionnaire specifically adapted for the purpose of the study (Sacre, 2016). The following criteria were analysed in relation to vegetable consumption: • Gender difference• Employment• Salary• Weight loss diet• Physical activities• Smoking• BMI

29
Regarding gender, no differences in the consumption of vegetables in whole amount and frequency could be determined. On the other hand, statistically differences were determined if the employment of the respondents was considered. Vegetable intake of employed consumers was significantly higher by 15%. This shows that salary has an influence on vegetable consumption, thus higher salary leads to higher vegetable consumption. The effect of lifestyle behaviors on the vegetable consumption is also remarkable. Those who are in a loss diet consumed 48.3% more vegetables compared to other respondents. Regarding physical activities, those involved in regular fitness exercise, around 44.10% of the respondents, tended to include more vegetables in their diet. Smoking also affected the level of fruits and vegetables consumption of the respondents. Heavy smokers, around 47.6 %, have low vegetable consumption (Sacre, 2016). Several other studies have shown that smokers have a poor quality diet compared to non-smokers and consumed significantly less fruits and vegetables leading to lower intake of folate and vitamin C, thus classifying them at higher risk for chronic diseases because of both dietary and smoking habits (Palaniappan et al., 2001; Nayga, 1995). The Body Mass Index (BMI) is a very important factor of the health and lifestyle characteristics. It is interesting to determine whether there is a relationship between BMI and vegetable consumption. The result of statistical evaluation between one categorical
Table 4. Phytonutrients and associated health benefits (Nutrilite, 2008)
Colour Pigment/Phytonutrient
Examples of associated health benefits
Examples of fruits and vegetables
Green Lutein/Zeaxanthin Vision health Spinach, lettuce, broccoliGreen Glucosinolates Cellular health Broccoli, cabbageRed Lycopene Prostate health, lung,
stomach, heart healthTomatoes, watermelon, red grape fruits
Red Ellagic acid Cell health StrawberriesWhite Quercetin Blood vessel and heart
health, bone and joint health
Onions, apples
Purple/Blue Anthocyanidins Heart health, cell health, skin health, digestive health, brain health
Eggplants, grapes, blueberries
Yellow/Orange Alpha carotene Vision health, healthy growth and development, heart health
Carrots, pumpkins
Yellow/Orange Beta carotene Vision health, healthy immune function, healthy growth and development, heart health, bone health
Carrots, cabbages

30
variable (three consumption levels) and another continuous one (BMI) showed that there is no significant link between BMI values and the level of vegetables consumption in Lebanon, therefore, the consumption of vegetables by the respondents of this study was not related to their weight (Figure 2). There are several activities to increase the awareness of the health linkages of vegetables through programmes in schools such as “Give me five” (Griffin, 2007) or the already worldwide known slogan “5 a day”. Several investigations are done to measure vegetable consumption awareness and its effect on improving health. In one survey on the effect of vegetables and fruits in the daily diet, 34% of the consumers were aware of the health benefits of vegetables (CDC, 2015). Often respondents were aware of some of the nutritive value of food and were giving positive response but they were not practising their knowledge. The knowledge questionnaire is divided into practical and theoretical parts. It is interesting to discover the resulting association between the theoretical knowledge and the practical realisation regarding the consumption of fruits and vegetables (Table 5).
Figure 2. Association between BMI and three levels of vegetable consumption in Lebanon (Sacre, 2016)
Medium consumptionHigh
consumption
Low consumption
0
150
100
50
Table 5. Association between the theoretical awareness and real consumption of vegetables Lebanon (Sacre, 2016)
Awareness knowledge Consumption in practiceLevel of consumption Awareness score Frequency Awareness score Frequency
Low 0.97 147 3.82 147Middle 0.81 91 3.92 90High 1.06 149 4.0 149
Score: (following Cronbach alpha test, <1.5 high awareness)

31
The awareness of the health improving effects of vegetable consumption in Lebanon was quite high, for the low level of vegetable consumption 12.63%, middle level 38.14% and for high level 49.23%. The corresponding awareness score are below 1.5, but comparing with the really frequency and amount of vegetables consumption, the awareness scores are higher, that means a lower effective awareness can be determined. So it can be concluded that still campaigns are necessary to convince the potential consumers to increase amount and frequency of vegetable consumption considering the content of phytonutrients.
CONCLUSION Currently the main vegetable production and consumption in the world and in particular in Asia, is based on a low number of “world” vegetable species as cucumbers and tomatoes. The nutritional treasure of indigenous well adopted species is underutilized so far. Nowadays, the consumers are increasingly ready to take ‘health improving food’. This opens the market for diversification of the vegetable assortment including more vegetables with a high content of phytonutrients as found in indigenous vegetables. Breeding activities and the development of cultivation systems are necessary to offer so far underutilized vegetables on the market.
We can still find many open questions: • What is the reason for low consumption of vegetables?• Tradition of recipes, availability, taste,• What is influencing the awareness of the people related to the consumption of
vegetables?• What for information of the health improving effect of vegetables are available?• Is the consumer aware about the nutritive value and the function of phytonutrients?• What for criteria are influencing the production of vegetables, as economical,
sociological geographical criteria?
REFERENCESAnu Rahal, Mahima, Amit Kumar Verma, Amit Kumar, Ruchi Tiwari, Sanjay Kapoor,
Sandip Chakraborty and Kuldeep Dhama (2014). Phytonutrients and Nutraceuticals in Vegetables and Their Multi-dimensional Medicinal and Health Benefits for Humans and Their Companion Animals: А Review, Journal of Biological Sciences 14 (1): 1 – 19, 2014 ISSN 1727-3048/DOI: 10.3923/jbs.2014.l .19
Arsanti, I.W. (2008). Evaluation of vegetable farming systems in upland areas of Indonesia. Dissertation (PhD thesis), Berlin, Germany, Humboldt University of Berlin. 209 pp
Arsanti I.W. and Böhme M.H. (2011). Profile of Vegetable Farming Systems in Upland Area of Indonesia. Proc. IIIrd IS on Improving the Performance of Supply Chains in the Transitional Economies, Acta Hortic. (ISHS) 895: 29 – 36

32
Arsanti, I.W. and Böhme M.H. (2015). Assessing vegetable cropping patterns in upland areas of Indonesia. Proc. XVII Int. Symp. on Horticultural Economics and Management and V Int. Symp. on Improving the Performance of Supply Chains in the Trans. Economies, Acta Hortic. (ISHS) 1103: 37 – 42
Böhme, M. and Pinker, I. (2007) Investigation regarding the potential for cultivation of indigenous vegetables in Southeast Asia. Acta Hortic. (ISHS) 752: 179 – 186
CDC (Centre for disease control and prevention) (2015). Mortality and morbidity weekly report. Cigarette smoking among adults-United States. Retried in December 2015 and found on the following link http: //www.cdc.gov/mmwr/preview/mmwrhtml/mm6444a2.htm
Dudaš, S., Böhme, M. und Heine, H. (2002). Der Standort- Ein wichtiger Faktor. Einflüsse auf Gehalt an ätherischem Öl und Drogenertrag bei Thymian. Das Taspo Magazin, 2: 16 – 18
FAOSTAT (2013). Economic and Social Development Department, Rome, ItalyFAOSTAT (2016). Economic and Social Development Department, Rome, ItalyGriffin L. (2007).TULSA schools score with “give me five” program to promote
increased consumption of fruits and vegetables wins over students. Food service director. TULSA schools, United States
Kathleen, L. Mahan, Raymond, Janice L., Escott-Stump Sylvia (2012). Krause’s Food and Nutrition of Diet Therapy. Elsevier, 13th edition. ISBN-13: 978-1437722338
Long, N.T. and M.H. Böhme (2012). Sustainability assessment of urban vegetable cultivation systems in Red River Delta, Vietnam. Holmer et al., (Eds.) SEAVEG Proceedings, p. 278 – 284, ISBN 92-9058-200-6
Mohd Shukri Mat Ali. (2008). Analysis of phenolics and other phytochemicals in selected Malaysian traditional vegetables and their activities in vitro, PhD theses, University Glasgow, 158
Nayga, R.M. (1995). Determinants of US household expenditures on fruit and vegetables: a note and update. Journal of agriculture and applied economics, 27: 588 – 04
Nguyen Nien, C., 2016. Survey, collection and characterization of indigenous and non-indigenous cucurbits in Vietnam. PhD. thesis, Humboldt University of Berlin (HU), Germany. 193 pp
Nutrilite. (2008). Global phytonutrient report, Health institute, center for optimal health. Retrieved on the 20th of April 2016 and available on http: //www.nutrilite.com/en- us/Media/AmericaPhytonutrientReport.pdf
Sacre, Y. Ch. (2016). Evaluation of Fruit and Vegetable Consumption as Source of Phytonutrients in the East Mediterranean Region, doctoral thesis (PhD); Humboldt University of Berlin, Faculty of Live Sciences, p.175
Palaniappan, U., Starkey, L., Loughlin, J. O., Gray Donald, K. (2001).Fruit and vegetable consumption is lower and fat intake is higher among Canadians reporting smoking. The journal of nutrition, 7: 1952 – 1958
Pollack, S.L. (1999). Consumer Demand for Fruit and Vegetables: The U.S. Example Changing Structure of Global Food Consumption and Trade/WRS-01-1

33
Vegetables and Diabetes: Diversity for Nutritional and Health Benefits
João Carlos da Silva DiasUniversity of Lisbon – Instituto Superior de AgronomiaTapada da Ajuda, 1349-017 Lisboa, PortugalE-mail: [email protected]
Abstract Vegetables are considered essential for well-balanced diets since they supply dietary fiber, vitamins, minerals and phytochemicals. Each vegetable group contains a unique combination and amount of these compounds, which distinguishes them from other groups and vegetables within their own group. In the daily diet, vegetables intakes has been strongly associated with improved gastrointestinal health, good vision and reduced risk of heart disease, stroke, some forms of cancer and chronic diseases such as diabetes. Type 2 diabetes is a lifestyle disease. Our vegetable choice and amount of dietary fiber, vitamins, minerals and phytochemical consumed can either prevent diabetes or promote insulin resistance. This article highlights the nutritional and health benefits of different vegetables and the proper level of dietary fiber, vitamin C, vitamin E, carotenoids, flavonoids, thiosulfides, magnesium, selenium, chromium and zinc contents that should be consumed to prevent and reverse diabetes. The proper order of eating vegetables before carbohydrate and its effect on postprandial plasma glucose and glycemic control is also discussed.
Keywords: vegetables, dietary fiber, phytochemicals, resistant starch, Type 2 diabetes, glucose control, healthier life
INTRODUCTION Vegetables play a significant role in human nutrition and health since they supply dietary fiber, vitamins, minerals and phytochemicals (Dias and Ryder, 2011; Dias, 2012 a,b). Besides, almost all vegetables are fat free, gluten free, cholesterol free, low calorie and very low in sodium. Until few years ago it was believed that 14 vitamins and 16 essential minerals were the key for human nutrition and health. Recently, with the progresses in chemistry, it is found that vegetables contain thousands of beneficial phytochemicals in addition to the 14 vitamins and 16 minerals. Some phytochemicals are strong antioxidants and are thought to reduce the risk of some chronic ailments by protecting against disease and free-radical damage, modifying metabolic activation and detoxifying carcinogens, or even influencing processes that alter the course of tumor cells (Craig and Beck, 1999; Herrera et al., 2009; Wargovich, 2000; Southon, 2000; Dias, 2012 b). However, phytochemicals in freshly harvested vegetables may be degraded by processing techniques, including cooking and long steaming (Verkerk et al., 2010; Palermo et al., 2014). The main causes of phytochemical loss from cooking and long steaming are thermal degradation which reduces their concentration and inactivation of the hydrolytic enzymes.
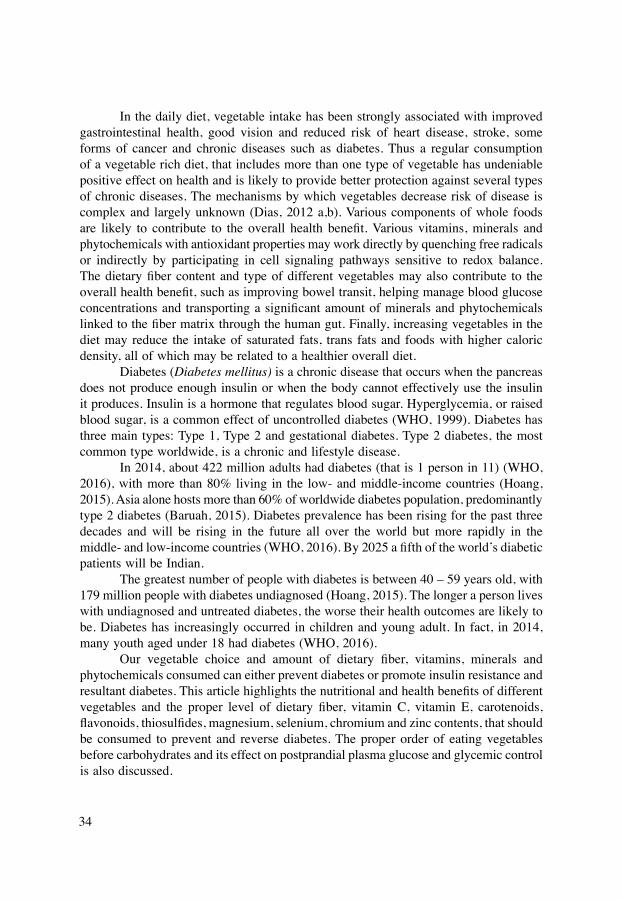
34
In the daily diet, vegetable intake has been strongly associated with improved gastrointestinal health, good vision and reduced risk of heart disease, stroke, some forms of cancer and chronic diseases such as diabetes. Thus a regular consumption of a vegetable rich diet, that includes more than one type of vegetable has undeniable positive effect on health and is likely to provide better protection against several types of chronic diseases. The mechanisms by which vegetables decrease risk of disease is complex and largely unknown (Dias, 2012 a,b). Various components of whole foods are likely to contribute to the overall health benefit. Various vitamins, minerals and phytochemicals with antioxidant properties may work directly by quenching free radicals or indirectly by participating in cell signaling pathways sensitive to redox balance. The dietary fiber content and type of different vegetables may also contribute to the overall health benefit, such as improving bowel transit, helping manage blood glucose concentrations and transporting a significant amount of minerals and phytochemicals linked to the fiber matrix through the human gut. Finally, increasing vegetables in the diet may reduce the intake of saturated fats, trans fats and foods with higher caloric density, all of which may be related to a healthier overall diet. Diabetes (Diabetes mellitus) is a chronic disease that occurs when the pancreas does not produce enough insulin or when the body cannot effectively use the insulin it produces. Insulin is a hormone that regulates blood sugar. Hyperglycemia, or raised blood sugar, is a common effect of uncontrolled diabetes (WHO, 1999). Diabetes has three main types: Type 1, Type 2 and gestational diabetes. Type 2 diabetes, the most common type worldwide, is a chronic and lifestyle disease. In 2014, about 422 million adults had diabetes (that is 1 person in 11) (WHO, 2016), with more than 80% living in the low- and middle-income countries (Hoang, 2015). Asia alone hosts more than 60% of worldwide diabetes population, predominantly type 2 diabetes (Baruah, 2015). Diabetes prevalence has been rising for the past three decades and will be rising in the future all over the world but more rapidly in the middle- and low-income countries (WHO, 2016). By 2025 a fifth of the world’s diabetic patients will be Indian. The greatest number of people with diabetes is between 40 – 59 years old, with 179 million people with diabetes undiagnosed (Hoang, 2015). The longer a person lives with undiagnosed and untreated diabetes, the worse their health outcomes are likely to be. Diabetes has increasingly occurred in children and young adult. In fact, in 2014, many youth aged under 18 had diabetes (WHO, 2016). Our vegetable choice and amount of dietary fiber, vitamins, minerals and phytochemicals consumed can either prevent diabetes or promote insulin resistance and resultant diabetes. This article highlights the nutritional and health benefits of different vegetables and the proper level of dietary fiber, vitamin C, vitamin E, carotenoids, flavonoids, thiosulfides, magnesium, selenium, chromium and zinc contents, that should be consumed to prevent and reverse diabetes. The proper order of eating vegetables before carbohydrates and its effect on postprandial plasma glucose and glycemic control is also discussed.

35
VEGETABLES AND NUTRITIONAL AND HEALTH BENEFITS A world vegetable survey showed that at least 402 vegetable crops are cultivated and commercialized worldwide (Kays and Dias, 1995; Kays, 2011). They represent 69 families and 230 genera. From these great diversity, leafy vegetables, of which the leaves or young leafy shoots are consumed, comprised 53% of the total, followed by vegetable fruits (15%) and vegetables with below ground edible organs (17%). Many vegetable crops have more than one part used. Most of the vegetables are marketed fresh with only a small proportion processed because most vegetables are perishable. Consumption shortly after harvest guarantees optimal vegetable quality. Each of these vegetables contains a unique combination and amount of dietary fiber, vitamins, minerals and phytochemicals, which distinguishes them from other vegetables. Nutrition is both a quantity and quality issue and vegetables in all their many forms ensure an adequate intake of dietary fiber, most vitamins, minerals and phytochemicals which can bring a much-needed measure of balance back to diets contributing to solve many nutrition problems (Dias, 2012 b,c). There is a general belief among nutritionists and health professionals that the health benefit of vegetables should not be linked to only one compound or one type of vegetable, but a balanced diet that includes more than one type of vegetable is likely to provide better protection. All the vegetables may offer protection to humans against chronic diseases. With the exception of glucosinolates and thiosulfides (which are unique phytochemicals of the crucifers and alliums), the vitamins, minerals and phytochemicals content of a number of other vegetables consist primarily in fiber, vitamin C, selenium, folate and polyphenolics (carotenoids and flavonoids) (Dias 2012 a,b). The main difference is that each vegetable group contains a unique combination and amount of these bioactive compounds, which distinguishes them from other groups and vegetables within their own group (Dias 2012 b, c). For example the Apiaceae family (carrot, parsnip, celery, celeriac, fennel, parsley, coriander, etc.,) is rich in flavonoids, carotenoids, vitamin C and vitamin E. The Asteraceae or Compositae family (lettuce, chicory, stem lettuce, globe artichoke, etc.,) is rich in conjugated quercetin, flavonoids and tocopherols. The Chenopodiaceae family (Swiss chard, spinach, garden beet, quinoa, etc.) are among the most oxalate dense vegetables (Prakash et al., 1993; Sienera, 2006), but also excellent sources of fiber, vitamins, calcium, manganese, flavonoids and carotenoids. The Cucurbitaceae family (e.g. pumpkin, squash, melon, cucumber, etc.) is rich in vitamin C, carotenoids and tocopherols (Dhillon et al., 2012). All the legumes (Fabaceae or Leguminosae family, e.g. bean, pea, soy-bean, chickpea, lentils, etc.), mature and immature seeds are good sources of dietary fiber, resistant starch, protein, isoflavonoids (Misra, 2012), calcium and iron. Cruciferous vegetables (Brassicaceae or Cruciferae family) which include, cabbage, broccoli, cauliflower, Brussels sprouts, kales, kailan, Chinese cabbage, turnip, rutabaga, radish, horseradish, rocket, watercress, mustards, among other vegetables, provide the richest sources of glucosinolates in the human diet, but also vitamin C, carotenoids, calcium and can accumulate selenium. The Alliaceae family (onions, garlic, shalots, leek, chive, Welsh onion, etc.) is rich in a wide variety of thiosulfides,

36
flavonoids, calcium, potassium, manganese, chromium and can accumulate selenium. Solanaceae family that includes tomato, potato, sweet and hot peppers, eggplant, etc., is very diverse and there are significant differences in the bioactive compounds content between solanaceous vegetables.
DIABETES
Types As mentioned diabetes come in three main types: Type 1, Type 2 and gestational. Type 1 diabetes, called insulin-dependent, juvenile or childhood diabetes, is characterized by deficient insulin production (something has damaged the pancreas’s ability to produce insulin) and requires daily administration of insulin, typically by injection. The cause of Type 1 diabetes is not perfectly known and it is not preventable with current knowledge. Today we only know that the damage of the insulin-producing cells is caused by the cells of the body’s immune system (our white blood cells that are supposed to fight bacteria and viruses) that instead of protecting they attack the cells of the pancreas destroying its ability to produce insulin. However, recent research has revealed a great deal about how diet changes can dramatically reduce the risk of serious complications that diabetes Type 1 brings (Barnard, 2007). Symptoms of Type 1 diabetes include excessive excretion of urine (polyuria), thirst (polydipsia), constant hunger, weight loss, vision changes and fatigue. These symptoms may occur suddenly (WHO, 1999). Type 2 diabetes, called non-insulin-dependent or adult-onset diabetes, results from the body’s ineffective use of insulin. Body produces insulin but can’t use it well. Type 2 accounts for the majority of cases of diabetes worldwide (about 9 out 10 people with diabetes have type 2). Symptoms may be similar to those of type 1 diabetes, but are often less marked. As a result, the disease may be diagnosed several years after onset, once complications have already arisen. Reports of Type 2 diabetes in children that was previously rare have increased worldwide. Gestational diabetes is characterized by hyperglycemia, or raised blood sugar, with values above normal but below those diagnostic of diabetes, during pregnancy (WHO, 2013). Women with gestational diabetes are at an increased risk of complications during pregnancy and at delivery. They and their children are also at increased risk of Type 2 diabetes in the future. Gestational diabetes is diagnosed through prenatal screening, rather than through reported symptoms. Impaired glucose tolerance (IGT) and impaired fasting glycemia (IFG) are intermediate conditions in the transition between normality and diabetes (WHO, 1999). People with IGT or IFG are at high risk of progressing to Type 2 diabetes, although this is not inevitable. Diabetes of all types can lead to complications in many parts of the body and increase the overall risk of dying prematurely (WHO, 2016). Diabetes is a major cause of blindness and vision loss (Bourne et al., 2013), kidney failure (Bethesda, 2014), heart attacks and strokes (Sarwar et al., 2010), lower limb amputation and nerve

37
damage (WHO, 2016), Alzheimer’s disease and dementia (Humpel, 2011, 2012; de la Monte, 2014; Heneka et al., 2015). “Type 3 diabetes” has been suggested as a term for Alzheimer’s disease as the underlying processes may involve insulin resistance by the brain (de la Monte, 2014). In 2014, diabetes was the direct cause of 1.5 million deaths. And an additional 3.7 million deaths were caused in the same year by higher than optimal levels of blood glucose, through an increased risk of cardiovascular and other diseases. Even when blood glucose levels are not high enough to warrant a diagnosis of diabetes damage can occur to the body. The risk of cardiovascular disease rises as blood glucose levels rise (WHO, 2016). WHO projects that diabetes will be the 7th leading cause of death in 2030 (Hoang, 2015). Typical Type 2 diabetes is caused by unhealthy diet and physical inactivity, which leads to overweight or obesity. Higher waist circumference and higher Body Mass Index (BMI) are associated with increased risk of type 2 diabetes, though the relationship may vary in different populations (WHO, 2016). Asians develop diabetes at younger ages and at lower degrees of obesity. Asians are known to have more fat per BMI unit which contributes to increased insulin resistance (Baruah, 2015). Among the three major Asian populations, Indians have substantially higher level of insulin resistance, followed by intermediate levels in Malays and the lowest level in Chinese population (p <0.001) (Baruah, 2015). Over a fifth of China’s adult population is overweight.
Diabetes tests and screening The three main diabetes tests and screenings are: blood glucose, hemoglobin A1c and Continuous Glucose Monitoring system (CGMs). The blood glucose test is also known as blood sugar test and fasting blood sugar test. It measures the amount of glucose (sugar) in a sample of blood. The blood glucose test may be used to detect high blood glucose (hyperglycemia) and low blood glucose (hypoglycemia), to screen for diabetes in people who are at risk before signs and symptoms are apparent, or to monitor glucose levels in people diagnosed with diabetes. The test is usually done after fasting (not eating anything for at least 8 hours) but can be done at any time of the day. It is carried out using a blood sample taken from a finger or can be taken from a blood sample from the arm. In the market there are blood glucose meters that allows people to do their blood glucose tests at home. It involves pricking the side of a finger with a finger-pricking device and putting a drop of blood on a testing strip. The fasting blood glucose level Values for a normal person without diabetes is 70 to 108 mg/dl (= 3.9 to 6 mmol/L); for a pre-diabetic is 108 to 125 mg/dl (= 6 to 7 mmol/L); and for a diabetic is higher than 125 mg/dl (>7 mmol/L). Blood sugar levels for those without diabetes should be below 7 mmol/L (125 mg/dl). In a person with signs and symptoms of diabetes or hyperglycemia, a non-fasting glucose level (random blood sample) that is equal to or greater than 200 mg/dl (11.1 mmol/L) indicates diabetes. The hemoglobin A1c test is also called HbA1c, glycated hemoglobin test, or glycohemoglobin. It is a better test than blood glucose, that shows how well the diabetes is being controlled.

38
Hemoglobin is found in red blood cells, which carry oxygen throughout the body. When the diabetes is not controlled (meaning that the blood sugar is too high), sugar builds up in the blood and combines with the hemoglobin, becoming “glycated”. The average amount of sugar in the blood can be found by measuring the hemoglobin A1c level. If the glucose levels have been high over recent weeks, the hemoglobin A1c test will be higher. In other words, hemoglobin A1c test measures the amount of glucose that is being carried by the red blood cells in the blood. Measuring HbA1c clinicians are able to get an overall picture of what the average blood sugar levels have been over a period of three months. For people without diabetes, the normal range for the hemoglobin A1c test is between 4% and 5.7% (= 20 to 40 mmol/mol). Hemoglobin A1c levels between 5.7% and 6.4% (= 40 to 45 mmol/mol) indicate increased risk of diabetes (pre-diabetes) and levels higher than 6.4% (>45 mmol/mol) indicate diabetes. Because studies have repeatedly shown that out-of-control diabetes results in complications from the disease, the goal for patients with diabetes is to have hemoglobin A1c levels less than 7%. The higher the hemoglobin A1c, the higher the risks of developing complications related to diabetes. CGMs is a device that uses a tiny sensor placed under the skin of the belly of the patient. It measures the amount of glucose in the fluid inside the body. A transmitter on the sensor then sends the information to a wireless-pager-like monitor that the patient can for example clip on its belt. The sensor continuously checks the glucose levels to detect highs and lows. Glucose reading is done every five minutes. It tracks the glucose levels throughout the day showing the effect of food, exercise and other activities. So a CGMs is capable of detecting hypoglycaemia and hyperglycaemia that may be undetected by self-monitoring blood glucose and glycate hemoglobin (HbA1c) tests (Klonoff 2005). It provides maximal information about shifting blood glucose levels throughout the day.
VEGETABLES AND DIABETES
Vegetable bio-compounds The vegetable bio-compounds usually associated to the reduction or reversion of Type 2 diabetes are dietary fiber, resistant starch, vitamins C and E, carotenoids, flavonoids, thiosulfides, magnesium, selenium, chromium and zinc. Dietary fiber is very important since it works to keep blood-sugar levels stable and transport a significant amount of polyphenols and carotenoids linked to the fiber matrix through the human gut (Dias 2012 a,b). Dietary fiber is classified into water soluble and water insoluble fiber. Non-cellulosic polysaccharides, such as pectin, gums and mucilages, are components of soluble fiber. Soluble fiber delays gastric emptying, slows glucose absorption and lowers serum cholesterol levels and is completely or partially fermentable in the large intestine (Anderson et al., 1990). Soluble fiber supplies a gelatinous-like material in the bowel. It is very important for diabetics, as it slows the absorption of glucose (Dias 2012 a,b). Insoluble fiber is important too. It is mainly cell

39
wall components, such as cellulose, lignin and hemicelluloses found in the vegetables. Health benefits of insoluble fiber include shortening of the bowel transit time and bulkier and softer feces. Resistant starch is the starch that it is resistant to stomach acid and digestive enzymes. It escapes digestion in the small intestine but passes to the large intestine, where it undergoes fermentation by bacteria in the colon. It acts like a fiber too. It supplies few calories and most of the calories do not raise glucose levels. When the bacteria in the bowel degrade the resistant starch it forms new compounds that have health benefits and beneficial effects for diabetics. Eating vegetables with dietary fiber and resistant starch will reduce hunger and appetite and for diabetics it is critical for lowering insulin requirement for starch digestion. Vitamins C and E have been inversely associated with diabetes since they are antioxidants that counterbalance the endothelial dysfunction and glutathione to normalize blood glucose pressure. Hyperglycemia activates has many pathways which lead to endothelial dysfunction and hence, to diabetes complications. Carotenoids such as α- and β-carotene, lycopene, lutein, zeaxanthin and β-cryptoxanthin, have a protective effect against development of diabetes by relieving oxidative stress that interferes with the glucose uptake by cells. Flavonoids such as anthocyanins, flavonols, flavones, isoflavonoids and syringic acid are associated with diabetes since their intake was found to be related to reduced Ttype 2 diabetes risk. Thiosulfides reduce blood glucose level by stimulating insulin secretion by the pancreas. Magnesium is important since insulin secretion and function requires magnesium. It helps to regulate blood sugar. It is also the relaxation mineral. Selenium is also important, but high selenium levels may contribute to diabetes (besides, hyperlipidemia, prostate cancer, cardiovascular disease and impaired immune and thyroid function). Chromium is an insulin cofactor that helps insulin work well since it helps the hormone escort glucose from the blood-stream into cells. Diabetic-promoting diets are low in chromium. Eating refined grains, sweets and processed foods leads to chromium deficiency and worsens diabetes. Zinc is necessary for the production of insulin which regulates blood sugar levels and interacts also with other nutrients.
ANDI and vegetables with anti-diabetic properties ANDI (Aggregate Nutrient Density Index) is a scoring system based on nutrient content, rated on a 1-1,000 scale, that was established by Dr. Fuhrman (Fuhrman, 2013). This index assigns scores to a variety of vegetables (and other foods) based on how many nutrients they deliver to our body in each calorie consumed. It was calculated by evaluating the content of dietary fiber, vitamins, minerals, phytochemicals, antioxidant capacities, etc., It is an index that estimates the nutritional quality of vegetables. It guides

40
on increasing the nutrient density of the diet. The higher the ANDI score and the greater percentage of those vegetables in the diet, the better our health and the probability of reversing the diabetes. Table 1 presents the highest ANDI scores in green vegetables. Looking to Table 1 we see that we have mainly vegetables of three families: i) Brassicaceae, with kale, collard greens, mustard greens, turnip greens, watercress, pak choy, Chinese cabbage, Brussels sprouts, rocket, cabbage and broccoli rabe; ii) Chenopodiaceae, with Swiss chard and spinach; and iii) Asteraceae, with green leaf lettuce, chicory and Romaine lettuce. Table 2 presents the highest ANDI scores in non-green vegetables. Table 2 also shows other Brassicaceae like radish, turnip, kohlrabi, cauliflower and rutabaga. Different vegetables from various families are also shown as well as differences among the peppers, where orange is better than red and red better than green. From both tables, leafy vegetables have the highest ANDI scores. They are high-nutrient and low glycemic load vegetables. Leafy vegetables are rich in dietary fiber, carotenoids, vitamin C and E, flavonoids, calcium, magnesium, etc., All the green leafy vegetables are good sources of magnesium as they contain chlorophyll. A recent meta-analysis found that greater leafy green vegetables intake was associated with 14% decrease in risk of Type 2 diabetes (Carter et al., 2010). Another previous study
Table 2. List of non-green vegetables with high ANDI scores
Vegetable ANDI Vegetable ANDI1. Radish 502 7. Cauliflower 3152. Turnip 473 8. Rutabaga 2963. Carrots 458 9. Bell pepper, Red 2654. Acorn/Winter squash 444 10. Bell pepper, Green 2585. Bell pepper, Yellow/Orange 371 11. Artichoke 2446. Kohlrabi 352 12. Asparagus 234
Table 1. List of identified green vegetables with high ANDI scores
Vegetable ANDI Vegetable ANDI1. Kale 1000 9. Chinese cabbage 7142. Collard greens 1000 10. Brussels sprouts 6723. Mustard greens 1000 11. Arugula/Rocket 6044. Swiss chard 1000 12. Lettuce, green leaf 5855. Turnip greens 1000 13. Chicory 5166. Watercress 1000 14. Romaine lettuce 5107. Bok choi/Pak choi 865 15. Cabbage 4818. Spinach 739 16. Broccoli rabe 455

41
reported that each daily serving of leafy green vegetables produces a 9% decrease in risk of Type 2 diabetes (Bazzano et al., 2008). The main ANDI leafy vegetables are Brassicaceae. They have fiber and are a rich source of glucosinolates and other phytonutrients and have a very high content in calcium and β-carotene. They are excellent sources of lutein and can also accumulate selenium. Khan et al., (1995) saw that oral feeding of B. juncea diet (10% w/w) for 60 days to normal rats led to significant hypoglycemic effect. This effect was attributed to stimulation of glycogen synthetase (leading to increase in hepatic glycogen content) and suppression of glycogen phosphorylase and other gluconeogenic enzymes. As it was said the other important family is Chenopodiaceae. A recent research has shown that Swiss chard leaves contain at least 13 different polyphenol antioxidants (Pyoa et al., 2004) including the flavonoids kaempferol and syringic acid that have blood sugar regulating properties (Bolkent et al., 2000; Pyoa et al., 2004; Mateljan, 2016). Syringic acid has been shown to inhibit activity of alpha-glucosidase. When this enzyme gets inhibited, fewer carbohydrates are broken down into simple sugars and blood sugar is able to stay more steady (Tundis et al., 2010). Beet leaves have the same properties, since beet and Swiss chard are both from the Chenopodiaceae family and are a unique source of antioxidant phytonutrients called betalains. In the reddish-purple stems and veins of the leaves of Swiss chard and beet were identified nine betacyanin pigments, including betanin, isobetanin and betanidin (Kugler et al., 2010). In the yellowish stems and veins of Swiss chard were identified 19 betaxantin pigments, including histamine-betaxantin, alanine-betaxantine, tyramine-betaxantine and 3-methoxytyramine-betaxantin (Kugler et al., 2010). Various glycosides isolated from the root extract of beet have been shown to increase glucose tolerance in an oral glucose tolerance test (OGTT) conducted in rats (Yoshikawa et al., 1996). OGTT measures the body’s ability to metabolize glucose, or clear it out of the bloodstream (ADA, 2016). In Asteracea, lettuces and chicories are the main vegetables used in raw salads. Leaf and Romain lettuces have higher ANDI scores (585 and 510 respectively) than iceberg lettuce (127). besides, the nutritive and diabetic value of leaf and Romaine lettuce are higher than head lettuces (butter and batavia). They have more dietary fibre, minerals, vitamins and phytochemicals. Raw vegetables are the healthiest food we can eat since some phytochemicals are only available if we eat the vegetables raw. In the non-green vegetables are radish and turnip (both Brassicaceae) and carrots. They are high in fiber and nutrient rich, but their glycemic index (GI) is 39±7 (Dias, 2014). Although carrots are a good example of the lack of precision in using only the GI as the measure of how food releases sugar into the bloodstream. Carrots are not a negative vegetable, even for the diabetic, as the glycemic load (GL) is only three. So GL is a more accurate measurement in this case. Carrots are relatively low in calories and when they are eaten raw their glycemic effect is lessened further as the body does not absorb all of the calories in raw foods. Recent research suggest that orange carrot with vitamin A-rich carotenoids (α- and β-carotene) might help diabetics to manage

42
their condition (Coyne et al., 2005; Dias, 2014). Purple carrots, rich in anthocyanin (flavonoid) and low in carotenoids, were also recently associated with reduction in impaired glucose tolerance (Poudyal et al., 2010). Another important non-green vegetable is potato. In general, potato is perceived only as a source of carbohydrates, but is also an excellent source of essential amino acids (such as lysine) and other metabolites. In addition to high quality proteins, potato tubers accumulate also significant amounts of vitamins and minerals, as well as an assortment of phytochemicals including phenolics, phytoalexins and protease inhibitors (Dias 2012b). Chlorogenic acid constitutes up to 90% of the potato tuber natural phenols. Other phenols found in potatoes are cryptochlorogenic acid, neo-chlorogenic acid and 3,4-dicaffeoylquinic and 3,5-dicaffeoylquinic acids. There are differences among varieties. A medium-size 150 g potato with the skin provides 45% of the daily allowance of vitamin C, 18% of potassium, 10% of vitamin B6 and trace amounts of thiamin, riboflavin, folate, niacin, magnesium, phosphorus, iron and zinc (Dias 2012 b). Potato contributes a small but significant amount of phytochemicals depending in the varieties. There are yellow, red and purple fleshed types with high phytochemical content. The purple potato has purple skin and flesh, which becomes blue once cooked. A mutation in the varieties’ P locus causes production of the antioxidant anthocyanin. Other antioxidants found in potato include α-tocopherol, lutein and β-carotene. Potato also contributes a small amount of selenium and folate to the human diet (Dias 2012 b). A good alternative to potato for diabetic patients are kohlrabi and rutabaga which are Brassicaceae, not starchy as potato and have higher ANDI scores. Both can be eaten raw and when sliced they do not produce discoloration (no oxidation as in potato). Other two families very important for diabetics are Alliaceae, Curcubitaceae and Leguminosae since they included several vegetables with anti-diabetic properties. Alliaceae are essential components of a diabetes prevention (or diabetes reversal) diet. Garlic lowers blood sugar levels in diabetic patients (Swamy et al., 2013) and administration of S-methyl cysteine sulfoxide isolated from onion controlled blood glucose and showed significant hypoglycemic effect in rats (Dias 2012 b,c). Onions and other Alliaceae also contain chromium that has been recently linked to diabetes prevention and appears to act as such by potentiating insulin receptor kinases (Wang et al., 2005) and to be a part of the glucose tolerance factor, involved in cellular responses to insulin (Dias 2012 b,c; Swamy et al., 2013). Clinical studies on diabetic patients have shown that chromium can decrease fasting glucose levels, improve glucose tolerance, lower insulin levels and decrease total cholesterol and triglyceride levels. Two hundred grams of onions contain up to 20% of the daily requirements in chromium (Dias 2012 b,c; Swamy et al., 2013). In Curcubitaceae, bitter gourd (Momordica charantia) has been intensively studied for its anti-diabetic properties and several studies have reported hypoglycemic and anti-hyperglycemic properties (Chen et al., 2003; Patil et al., 2012; Swamy et al.,
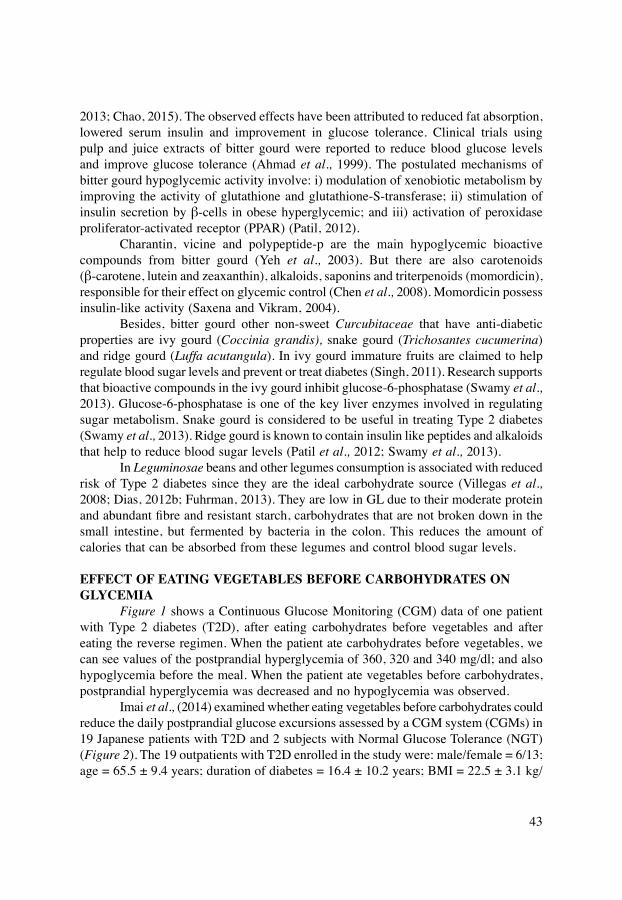
43
2013; Chao, 2015). The observed effects have been attributed to reduced fat absorption, lowered serum insulin and improvement in glucose tolerance. Clinical trials using pulp and juice extracts of bitter gourd were reported to reduce blood glucose levels and improve glucose tolerance (Ahmad et al., 1999). The postulated mechanisms of bitter gourd hypoglycemic activity involve: i) modulation of xenobiotic metabolism by improving the activity of glutathione and glutathione-S-transferase; ii) stimulation of insulin secretion by β-cells in obese hyperglycemic; and iii) activation of peroxidase proliferator-activated receptor (PPAR) (Patil, 2012). Charantin, vicine and polypeptide-p are the main hypoglycemic bioactive compounds from bitter gourd (Yeh et al., 2003). But there are also carotenoids (β-carotene, lutein and zeaxanthin), alkaloids, saponins and triterpenoids (momordicin), responsible for their effect on glycemic control (Chen et al., 2008). Momordicin possess insulin-like activity (Saxena and Vikram, 2004). Besides, bitter gourd other non-sweet Curcubitaceae that have anti-diabetic properties are ivy gourd (Coccinia grandis), snake gourd (Trichosantes cucumerina) and ridge gourd (Luffa acutangula). In ivy gourd immature fruits are claimed to help regulate blood sugar levels and prevent or treat diabetes (Singh, 2011). Research supports that bioactive compounds in the ivy gourd inhibit glucose-6-phosphatase (Swamy et al., 2013). Glucose-6-phosphatase is one of the key liver enzymes involved in regulating sugar metabolism. Snake gourd is considered to be useful in treating Type 2 diabetes (Swamy et al., 2013). Ridge gourd is known to contain insulin like peptides and alkaloids that help to reduce blood sugar levels (Patil et al., 2012; Swamy et al., 2013). In Leguminosae beans and other legumes consumption is associated with reduced risk of Type 2 diabetes since they are the ideal carbohydrate source (Villegas et al., 2008; Dias, 2012b; Fuhrman, 2013). They are low in GL due to their moderate protein and abundant fibre and resistant starch, carbohydrates that are not broken down in the small intestine, but fermented by bacteria in the colon. This reduces the amount of calories that can be absorbed from these legumes and control blood sugar levels.
EFFECT OF EATING VEGETABLES BEFORE CARBOHYDRATES ON GLYCEMIA Figure 1 shows a Continuous Glucose Monitoring (CGM) data of one patient with Type 2 diabetes (T2D), after eating carbohydrates before vegetables and after eating the reverse regimen. When the patient ate carbohydrates before vegetables, we can see values of the postprandial hyperglycemia of 360, 320 and 340 mg/dl; and also hypoglycemia before the meal. When the patient ate vegetables before carbohydrates, postprandial hyperglycemia was decreased and no hypoglycemia was observed. Imai et al., (2014) examined whether eating vegetables before carbohydrates could reduce the daily postprandial glucose excursions assessed by a CGM system (CGMs) in 19 Japanese patients with T2D and 2 subjects with Normal Glucose Tolerance (NGT) (Figure 2). The 19 outpatients with T2D enrolled in the study were: male/female = 6/13; age = 65.5 ± 9.4 years; duration of diabetes = 16.4 ± 10.2 years; BMI = 22.5 ± 3.1 kg/

44
Figure 1. Continuous Glucose Monitoring (CGM) data of one patient with Type 2 diabetes (T2D) after eating carbohydrates before vegetables and the reverse regimen
Figure 2. Effect of eating vegetables before carbohydrates on glucose concentration of 19 patients with T2D and 21 NGT subjects, Plotted mean of the daily glucose values in the T2D patients and in the NGT subjects NGT after eating carbohydrates before vegetables and the reverse regimen

45
m2; HbA1c = 7.2 ± 1.0%; and Fasting Plasma Glucose (FPG) = 8.06 ± 2.67 mM/l. And the 21 subjects with NGT were: male/female = 2/19; age = 29.8 ± 11.3 years; BMI = 20.8 ± 3.0 kg/m2; HbA1c = 5.4 ± 0.6%; and FPG = 4.89 ± 0.50 mM/l). All these 40 participants were assigned to a CGM system (Medtronic Minimed Gold, Northridge, CA) for 72 hours by eating test meals of vegetables before carbohydrates and carbohydrates before vegetables on the 2nd and the 3rd day in a randomized crossover design. The test meals consisted of 500 g of vegetables (tomato, spinach, broccoli and radish, etc.,), meat or fish as the main dish and rice or bread as carbohydrates and contained 21 grams of dietary fiber and 125.6 kJ.kg−1 per day. Energy intake was adjusted by the amount of rice and bread for each participant and the rest of the meals were identical. The energy ratio of protein, fat and carbohydrates was 17%, 25% and 58%, respectively. The subjects ate the first dishes of vegetables for 5 minutes, then the main dish for 5 minutes and consumed rice or bread for 5 minutes successively within a 15 to 20 minutes total eating time for each meal and vice versa. Figure 2 shows the plotted mean of the daily glucose values in the 19 patients with T2D and the 21 subjects with NGT after eating carbohydrates before vegetables and the reverse regimen. The results reveal significantly reduction in glucose excursions when the participants ate vegetables before carbohydrates compared to the reverse regimen in subjects with T2D and NGT. In addition to lowering acute postprandial glucose levels Imai et al., (2013) studied whether educating diabetic patients to eat vegetables before carbohydrates was effective on long-term glycemic control (Figure 3). To test this hypothesis they carried out another study in patients with T2D where they compared changes in HbA1c (NGSP-%) as the primary outcome. A total of 333 outpatients were divided into two groups: one educational group (n = 196) that received instructions about eating vegetables before carbohydrates; and a control group (n = 137) who underwent only on a medical examination by a doctor. In the educational group depending on the patient’s current dietary intake, intervention aimed to encourage increased consumption of vegetables, including seaweed and mushrooms and eating them first for 5 minutes, then the main dishes (meat, fish, soybeans, etc.) for 5 minutes and by last carbohydrates (rice or bread, but also potatoes, pumpkin, corn, etc.), successively within a 15 to 20 minutes eating time using an original educational brochure in the educational group. Student’s t tests were used to assess the difference between the changes in HbA1c (NGSP%) in the two study groups and paired t tests were performed to analyze them within groups over time. Improvements in HbA1c levels over 30 months were maintained from 8.6 to 7.5% (NGSP%) with the education group (p <0.001) while no change was observed with the control group (8.2 to 8.1%) and HbA1c levels in the education group were significantly lower than the control group after 3 to 30 months of the study period (Imai et al., 2013, 2015). The reason for the reduction of postprandial plasma glucose levels by eating vegetables before carbohydrates can be explained, partly, by the dietary fiber content

46
in the vegetables taken before the carbohydrates. Dietary carbohydrates consumed after vegetables were digested slowly and required less insulin for subsequent metabolic disposal (Wong and Jenkins, 2007). Other factors may influence the glycemic response and digestion of carbohydrates in the small intestine, including the rate of digestion, cooking method, transit time and rate of intestinal absorption. Vegetables given before carbohydrates might stimulate in cretin hormones (glucagon-like peptide-1 and glucose-dependent insulinotropic polypeptide) secretion, which leads to the reduction in glycemic excursions (Ma et al., 2009).
CONCLUSIONS All the vegetables may offer protection to humans against chronic diseases. A balanced diet that includes a diversity of vegetable is likely to provide better protection to chronic diseases like diabetes since each vegetable have their phytochemicals, vitamins and minerals. Greater intake of all green leafy vegetables is associated with a decrease risk of Type 2 diabetes since they have fiber and they deliver many phytochemicals, vitamins and minerals to our body in each calorie consumed. Other non-green and non-starchy vegetables are also rich in fiber and bioactive compounds and so keep also blood glucose
Figure 3. Effect of eating vegetables before carbohydrates on long-term glycemic control. Study carried out during 30 months (2,5 years) in two groups of patients with T2D: educational (n = 196), eating vegetables before carbohydrates and the control. It was compared changes in HbA1c (NGSP %). Data is expressed as mean±SD. Baseline vs. after intervention (months): *** = p <0.001. Educational group (Veg. before carbo.) vs. control group:# = p <0.05, ### = p <0.001

47
low. Raw vegetable salads should be eaten in large quantities at the beginning of each main meal. Raw vegetables are the healthiest food we can eat since phytochemicals may be degraded by cooking and long steaming, due to thermal degradation and inactivation of the hydrolytic enzymes. Both starchy and non-starchy vegetables are important for our diet. Legumes are a good carbohydrate source due to their protein, fiber and resistant starch content. Vegetable fruits rich in fiber and antioxidants are also excellent vegetables for diabetics if sugar levels are low. Some cucurbits like bitter gourd, ivy gourd, snake gourd and ridge gourd are recommended and considered useful in treating Type 2 diabetes. Eating vegetables before carbohydrates is effective to reduce postprandial hyperglycemia (and less hypoglycemia) in Type 2 diabetes patients. So Type 2 diabetes patients should eat vegetables before carbohydrates. This advice is also applicable to healthy people in order to prevent future diabetes. This easy approach of consuming vegetables before carbohydrates supports the new concept of the diabetic diet of eating first vegetables, as opposed to concentration on energy or carbohydrate restrictions.
REFERENCESADA (American Diabetes Association) (2016). Standards of Care. Diabetes Care 39
(Suppl. 1): S1 – S119Ahmad, N., Hassan, M., Halder, H. and Bennoor, K., (1999). Effect of Momordica
charantia (Karolla) extracts on fasting and postprandial serum glucose levels in NIDDM patients. Bangladesh Med. Res. Counc. Bull. 25: 11
Anderson, J.W., Deakins, D.A., Floore, T.L. et al., (1990). Dietary fiber and coronary heart disease. Crit. Rev. Food Sci. Nutr. 29: 95 – 147
Barnard, N.D., (2007). Dr. Neal Barnard’s Program for Reversing Diabetes. Rodale Inc., New York
Baruah, M.P., (2015). Type 2 diabetes in Asia population: regional similarities, differences and challenges in patient care. BIT’s 4th Annual World Congress of Diabetes-2015, Kaohsiung, Taiwan. pp. 222
Bazzano, L.A., Li, T.Y., Joshipura, K.J. et al., (2008). Intake of fruit, vegetables and fruit juices and risk of diabetes in women. Diabetes Care 31: 1311 – 1317
Bethesda, M.D., 2014. (2014). USRDS annual data report: Epidemiology of kidney disease in the United States. United States Renal Data System. National Institutes of Health, National Institute of Diabetes and Digestive and Kidney Diseases. Pp. 188 – 210
Bolkent, S., Yanarda, R., Tabakolu-Ouz, A. et al., (2000). Effects of chard (Beta vulgaris L. var. cicla) extract on pancreatic B cells in streptozotocin-diabetic rats: a morphological and biochemical study. J. Ethnopharmacol. 73: 251 – 259
Bourne, R.R., Stevens, G.A., White, R.A. et al., (2013). Causes of vision loss worldwide, 1990-2010: a systematic analysis. Lancet Global Health 1: e339 – e349
Carter, P., Gray, L.J., Troughton, J. et al., (2010). Fruit and vegetable intake and incidence of type 2 diabetes mellitus: systematic review and meta-analysis. BMJ 341: c4229

48
Chao, P.M., (2015). One more support for recruiting bitter melon in therapeutic diet for diabetes and its comorbidity management - bitter melon ameliorates hepatic steatosis related with hyperglycemia. BIT’s 4th Annual World Congress of Diabetes - 2015, Kaohsiung, Taiwan. Pp. 236
Chen, Q., Chan, L.L.Y. and Li, E.T.S., (2003). Bitter melon (Momordica charantia) reduces adiposity, lowers serum insulin and normalizes glucose tolerance in rats fed a high fat diet. J. Nutr. 133: 1088 – 1093
Chen, J., Tian, R., Qiu, M. et al., (2008). Trinorcucurbitane and cucurbitane triterpenoids from the roots of Momordica charantia. Phytochemistry 69: 1043 – 1048
Coyne, T., Ibiebele, T.I., Baade, P.D. et al., (2005). Diabetes Mellitus and serum carotenoids: findings of a population-based study in Queensland, Australia. Amer. J. Clinical Nutr. 82: 685 – 693
Craig, W. and Beck, L., (1999). Phytochemicals: health protective effects. Can. J. Diet. Pract. Res. 60: 78 – 84
de la Monte, S.M., (2014). Type 3 diabetes is sporadic Alzheimer’s disease: mini-review. Eur. Neuropsychoparmacol. 24: 1954 – 1060
Dias, J.S., (2012 a). Major classes of phytonutriceuticals in vegetables and health benefits: A Review. J. Nutr. Therap. 1: 31 – 62
Dias, J.S., (2012 b). 1. Vegetable breeding for nutritional quality and health benefits. In: Carbone K. (Ed.). Cultivar: chemical properties, antioxidant activities and health benefits. Nova Science Publishers, Inc., Hauppauge, New York. Pp.1 – 81
Dias, J.S., (2012 c). Nutritional quality and health benefits of vegetables: a review. Food Nutr. Sci. 3: 1354 – 1374
Dias, J.S., (2014). Nutritional and health benefits of carrots and their seed extracts. Food Nutr. Sci. 5: 2147 – 2156
Dias, J.S. and Ryder, E., (2011). World vegetable industry: production, breeding, trends. Hort. Rev. 38: 299 – 356
Dhillon, N.P.S., Monforte, A.J., Pitrat, M. et al., (2012). Melon land races of India: contributions and importance. Plant Breed. Rev. 35: 85 – 150
Fuhrman, J., (2013). The End of Diabetes: The Eat to Live Plan to Prevent and Reverse Diabetes. Harper Collins Publishers, New York
Heneka, M.T., Fink, A. and Doblhammer, G., 2015. Effect of pioglitazone medication on the incidence of dementia. Annals Neurol. 78: 284 – 294
Herrera, E., Jimenez, R., Aruoma, O.I. et al., (2009). Aspects of antioxidant foods and supplements in health and disease. Nutr. Rev. 67(1): S140 – S144
Hoang, T.D., (2015). Prevalence of diabetes mellitus in the world and updates of diabetes care 2015. BIT’s 4th Annual World Congress of Diabetes-2015, Kaohsiung, Taiwan. Pp. 220
Humpel, C., (2011). Chronic mild cerebrovascular dysfunction as a cause for Alzheimer’s disease. Rev. Exp. Gerontol. 46: 225 – 232
Humpel, C., (2012). Editorial to the special issue “Vascular dementia”. Rev. Exp. Gerontol. 47: 1
49
Imai, S., Fukui, M. and Kajiyama, S., (2014). Effect of eating vegetables before carbohydrates on glucose excursions in patients with type 2 diabetes. J. Clin. Biochem. Nutr. 54: 7 – 11
Imai, S., Fukui, M. and Kajiyama, S., (2015). Food order as a significant impact on postprandial glucose and insulin levels. Diabetes Care 38: e98 – e99
Imai, S., Fukui, M., Ozasa, N. et al., (2013). Eating vegetables before carbohydrates improves postprandial glucose excursions. Diabet. Med. 30: 370 – 372
Kays, S.J., (2011). Cultivated Vegetables of the World: A Multi-lingual Onomasticon. Wageningen Academic Publishers, The Netherlands
Kays, S.J. and Dias, J.S., (1995). Common names of commercially cultivated vegetables of the world in 15 languages. Economic Botany 49(2): 115 – 152
Khan, B.A., Abraham, A. and Leelamma, S., (1995). Hypoglycemic action of Murraya Koeingii (curry leaf) and Brassica juncea (mustard): mechanism of action. Ind. J. Biochem. Biophys. 32: 106 – 108
Klonoff, D.C., (2005). Continuous glucose monitoring: roadmap for 21st century diabetes therapy. Diabetes Care 28: 1231 – 1239
Kugler, F., Stintzing F.C. and Carle R., (2004). Identification of betalains from petioles of differently colored Swiss chard (Beta vulgaris L. ssp. cicla [L.] Alef. Cv. Bright Lights) by high-performance liquid chromatography-electrospray ion. J. Agric. Food Chem. 52: 2975 – 2981
Ma, J., Stevens, J.E., Cukier, K. et al., (2009). Effects of a protein preload on gastric emptying, glycemia and gut hormones after a carbohydrate meal in diet-controlled type 2 diabetes. Diabetes Care 32: 1600 – 1602
Mateljan, G., (2016). The World’s healthiest foods. George Mateljan Foundation, Glendale, California
Misra, S.K., (2012). Anti-nutritive bioactive compounds present in unconventional pulses and legumes. Res. J. Pharm. Biol. Chem. Sci. 3: 586 – 597
Palermo, M., Pellegrini, N. and Fogliano, V., (2014). The effect of cooking on the phytochemical content of vegetables. J. Sci. Food Agric. 94(6): 1057 – 1070
Patil, B., Jayaprakasha, G.K. and Vikram, A., (2012). Indigenous crops of Asia and Southeast Asia: exploring health-promoting properties. Hort Science 47: 821 – 827
Poudyal, H., Panchal, S. and Brown, L., (2010). Comparison of purple carrot juice and β-carotene in a high-carbohydrate, high-fat diet-fed rat model of the metabolic syndrome. British J. Nutr.104: 1322 – 1332
Prakash, D., Nath P. and Pal M., (1993). Composition, variation of nutritional contents in leaves, seed protein, fat and fatty acid profile of Chenopodium species. J. Sci. Food Agric. 62(2): 203 – 205
Pyoa, Y.H., Lee, T.C., Logendrac, L. et al., (2004). Antioxidant activity and phenolic compounds of Swiss chard (Beta vulgaris subspecies cycla) extracts. Food Chem. 85: 19 – 26
Saxena, A. and Vikram, N., (2004). Role of selected Indian plants in management of type 2 diabetes: A review. J. Alternative Comp. Med. 10: 369 – 378

50
Sarwar, N., Gao, P., Seshasai, S.R. et al., (2010). Diabetes mellitus, fasting blood glucose concentration and risk of vascular disease: a collaborative meta-analysis of 102 prospective studies. Emerging Risk Factors Collaboration. Lancet 26,375: 2215 – 2222.
Sienera, R., (2006). Oxalate contents of species of the Polygonaceae, Amaranthaceae and Chenopodiaceae families. Food Chem. 98(2): 220 – 224
Singh, L.W., (2011). Traditional medicinal plants of Manipur as anti-diabetics. J. Med. Plants Res. 5: 677 – 687
Southon, S., (2000). Increased fruit and vegetable consumption within the EU: Potential health benefits. Food Res. Int. 33: 211 – 217
Swamy, K.R.M., Nath, P. and Ahuja, K.G., (2013). 9. Vegetables for human nutrition and health. In: Nath P. (Ed.).; The Basics of Human Civilization-Food, Agriculture and Humanity, Volume-II-Food. Prem Nath Agricultural Science Foundation (PNASF), Bangalore and New India Publishing Agency (NIPA), New Delhi, India. Pp. 145 – 198
Tundis, R., Loizzo, M.R. and Menichini, F., (2010). Natural products as alpha-amylase and alpha-glucosidase inhibitors and their hypoglycaemic potential in the treatment of diabetes: an update. Mini Rev. Med. Chem. 10: 315 – 331
Verkerk, R., Knol, J.J. and Dekker, M., (2010). The effect of steaming on the glucosinolate content in broccoli. Acta Hort. 867: 37 – 45
Villegas R., Gao Y.T., Yang G. et al., (2008). Legume and soy food intake and the incidence of type 2 diabetes in the Shanghai women's health study. Am. J. Clin. Nutr. 87: 162 – 67
Yeh, G., Eisenberg D., Kaptchuk T. and Phillips R., (2003). Systematic review of herbs and dietary supplements for glycemic control in diabetes. Diabetes Care 26: 1277
Yoshikawa, M., Murakami T., Kadoya M. et al., (1996). Medicinal foodstuff III. Sugar beet. Hypoglicemic oleanolic acid oligoglycosides, betavulgarosides I, II, III and IV from the root of Beta vulgaris L. (Chenopodiaceae). Chem. Pharmaceut. Bull. 44: 1212 –1217
Wang, H., Kruszewki A. and Brautigan D.L., (2005). Cellular chromium activation of insulin receptor kinase. Biochemistry 44: 8167 – 8175.
Wargovich, M.J., 2000. Anticancer properties of fruits and vegetables. Hort Science 35: 573 – 575
WHO (World Health Organization), (1999). Definition, diagnosis and classification of Diabetes mellitus and its complications. Part 1: Diagnosis and classification of Diabetes mellitus. World Health Organization, Report Number: WHO/NCD/NCS/99.2. WHO, Geneva
WHO (World Health Organization), (2013). Diagnostic criteria and classification of hyperglycaemia first detected in pregnancy. World Health Organization, Report Number: WHO/NMH/MND/13.2. WHO, Geneva
WHO (World Health Organization), (2016). Global report on diabetes. WHO, Geneva.Wong, J.M. and Jenkins, D.J., (2007). Carbohydrates digestibility and metabolic effects.
J. Nutr. 137: S2539 – S2546

51
Vegetables and Cardio-Metabolic Health: An Update of Recent Evidence
Amutha RamadasJeffrey Cheah School of Medicine and Health Sciences, Monash University Malaysia, Jalan Lagoon Selatan, 47500 Bandar Sunway, Selangor Darul EhsanE-mail: [email protected]
Abstract Cardio-metabolic diseases such as diabetes, hypertension, obesity and cardiovascular disease have been associated with changes in dietary patterns and lifestyle behaviours. Vegetables contribute significantly towards human nutrition being an important source of micronutrients, dietary fibre and phyto-chemicals. However, there is conflicting evidence on the effectiveness of vegetables in reduction of cardio-metabolic health risks. A review of recent reviews on the association between vegetable consumption and cardio-metabolic health was conducted using Keywords ‘vegetables’ and [‘obes*’ or ‘metabolic syndrome’ or diabetes or hypertension or dyslipid* or cardiovascular], with limitation to ‘reviews’ published between 2010 and 2016. Databases searched include PUBMED, SCOPUS, MEDLINE and COCHRANE. The shortlisted systematic reviews and meta-analysis (n = 16) were qualitatively evaluated and findings were compared. Majority of the reviews studied the combined effect of vegetables and other plan-based elements such as fruits, legumes and whole grains. Collectively, vegetables and fruits have protective effect against metabolic syndrome, hypertension, cardiovascular diseases and body weight gain. Synergistic combination of fibre, antioxidants, lower glycemic index, minerals and phyto-chemicals may decrease systemic inflammation, oxidative stress, insulin resistance, blood pressure and plasma lipids. Although some level of evidence from observational studies support the benefits of vegetable consumption, dose-response relationship between vegetable consumption and cardio-metabolic diseases are yet to be established. There is also lack of studies supporting the protective effect of vegetables against these diseases in this region. Further exploration of vegetable-cardio-metabolic diseases relationship among SEA population should be conducted through large and high quality intervention trials.
Keywords: vegetables, obes, metabolic syndrome, diabetes and cardiovascular
INTRODUCTION Cardio-metabolic diseases (CMD) have become noticeable of late due to the prospects of epidemiological impact, cost and potential primary prevention (Kraushaar and Kramer, 2009). Reaven (1988) initially described CMD as a “clustering of disorders (abdominal adiposity, hypertension, dyslipidaemia, hyperinsulinaemia and glucose intolerance) that together lead to cardiovascular diseases (CVD) and type 2 diabetes (T2D). More recently, CMD has been extended to “describe the interface between cardiology and diabetes and to describe pharmacological interventions that would reduce cardiovascular and metabolic endpoints” (Fisher, 2006). Data from the Malaysian Non-Communicable Diseases Surveillance (n = 2,572) showed at least 68% of the respondents have at least three CVD risk factors (Ghazali et al., 2015). Males of older age and Indian ethnicity and older females with lower education

52
and housewives were found to be at a greater risk. Mortality due to CVD has been shown to be particularly higher in Asian continent and has reached between 239 – 362 deaths per 100,000 people in a year (WHO, 2011). The data also suggest more than 45% males and 51% females of South-East Asian countries have more than 20% risk for CVD. Taking CVD as a proxy of CMD impact on population health, CMD can be viewed as an important health aspect that has to be intervened immediately. CMD have been associated with changes in dietary patterns and lifestyle behaviours. Vegetables are an important source of micronutrients, dietary fibre and phyto-chemicals and contribute significantly towards human nutrition. Systematic review by Wang et al., (2014) showed a significant 25% reduction in the risk of mortally from all causes with consumption of three servings of vegetables in a day (HR = 0.75, 95% CI = 0.66-0.86). However, there is conflicting evidence on the effectiveness of vegetables in reduction of cardio-metabolic health risks. A review of recent evidence on the association between vegetable consumption and cardio-metabolic health may shed some light on this.
MATERIALS AND METHODS Keywords ‘vegetables’ and [‘obes*’ or ‘metabolic syndrome’ or diabetes or hypertension or dyslipid* or cardiovascular], with limitation to ‘reviews’ published between 2010 and 2016. Databases searched include PUBMED, SCOPUS, MEDLINE and COCHRANE. Cross-referencing provided additional reviews of interest. The shortlisted reviews including meta-analysis, narrative and systematic reviews were qualitatively evaluated and findings were compared excluding In vitro and animal studies, supplemental trials, reviews that reported a combined effect of vegetables with other food groups and publications in languages other than English. Data extraction was carried out using manual method and electronic sheets. For each study: citation, type of review, number of studies reviewed, number of participants and cases, factors studied and main findings were abstracted. A conclusion was made based on the findings. All information was extracted from the published articles.
RESULTS AND DISCUSSION Sixteen systematic reviews and/or meta-analysis (n = 16) were shortlisted based on the inclusion and exclusion criteria. Of these reviews, four reported CVD, two each on stroke and hypertension, seven on T2D and one on obesity. The number of studies reviewed ranged from 2 to 45, with sample size ranging from 79,236 to 1,344,416 participants. It has to be noted that some reviews did not report number of participants or incidences. Majority of the reviews assessed the association between disease risk with total vegetable intake (n = 10), green-leafy vegetables (Wang et al, 2014) and vegetable fibre (Ghazali et al., 2015). The reduction in the risk was expressed as relative risk (RR), with RR<1.0 indicating lower risk. Table 1 provides the summary of reviews retrieved for this discussion.
53
Cardiovascular diseases With every 600 g vegetable consumption per day, a 28% reduction in the risk for CVD was reported (Zhan et al., 2015). Each additional serving of vegetable could reduce the risk of CVD-related deaths by 4% (Wang et al, 2014). Green-leafy vegetables lowered the risk by more than 15% (Pollock, 2016). Daily consumption of at least 4g of vegetable fibre was reported to reduce the risk for CVD by 8% and coronary heart disease (CHD) by 6% (Threapleton et al., 2013). A minimum six servings of vegetables provided the lowest risk for CVD and CHD.
Stroke Every 200g increase in total vegetable intake was associated with an 11% reduction in risk for stroke (Hu et al., 2014) and highest intake of root and green-leafy vegetables resulted in 14% and 11% stroke risk reduction, respectively. A systematic review by Threapleton and colleagues (Threapleton et al., 2013) reported conflicting evidence associating highest intake of vegetable fibre and risk for stroke. However, the authors did find a 14% reduction in the risk for stroke in a randomised-controlled trial that was reviewed.
Hypertension There were conflicting evidence associating vegetable intake and risk for hypertension. While Li et al., (Li et al., 2016) did not find a significant reduction in the risk for hypertension, Wu et al., (2016) reported a 12% reduction in the risk with highest intake of vegetables. However, the dose-response analysis in the same meta-analysis did not support a linear vegetable-hypertension risk association. The authors went on to explain that poor cooking methods such as deep frying, with added fats and seasonings could have diminished the beneficial effect of vegetables.
Type 2 Diabetes A reduction of 25% in the risk for T2D among Asians was shown with three servings of vegetable intake (Wu et al., 2015). Meta-analysis by Wang et al.(2016) showed a drastic 28% reduction in T2D risk with highest intake of yellow vegetables. The same study reported 18% reduction in T2D risk with highest intake of cruciferous vegetables. Green-leafy vegetables have consistently shown to decrease the risk for T2D (Wang et al., 2016; Li et al., 2015; Cooper et al., 2012; Carter et al., 2010). While highest intake of green-leafy vegetables was associated with 13% reduction in the risk for T2D (Li et al., 2015), consumption of eight portions of green-leafy vegetables per week has been associated with a 16% risk reduction (Cooper et al., 2012). Significant dose-response association between green-leafy vegetables and T2D risk has been reported, with a reduction of 13% risk with 0.2 serving per day (Li et al., 2015) and 14% reduction with additional 1.3 servings per day (Carter et al., 2010). Vegetable fibre also has been reported to reduce T2D risk by 7% with every 10g intake per day (InterAct, 2015).

54
Tabl
e 1.
Sum
mar
y of
evi
denc
e
Cita
tion
Type
NSa
mpl
e si
zeC
ases
Fact
orMain findings
Con
clus
ion
Cardiovascular diseasePo
llock
et a
l.,
(201
6)M
A8
540,
000
26,1
73G
LVR
R =
0.8
42 (9
5% C
I =
0.75
3 –
0.94
1)
–15.
8% ri
sk fo
r CV
D w
ith e
ach
serv
ing
of G
LV
Zhan
et a
l.,
(201
5)
MA
451,
344,
909
35,4
16V
Hig
hest
vs
low
est i
ntak
e: R
R =
0.
87 (9
5% C
I = 0
.83
– 0.
91)
Low
est r
isk
for C
VD
see
n in
60
0g/d
ay in
take
: RR
= 0
.72
(95%
C
I = 0
.64
– 0.
80)
–13%
risk
for C
VD
with
hig
hest
V
inta
ke–2
8% ri
sk fo
r CV
D w
ith 6
00g/
day
V
Wan
g et
al.,
(2
014)
SR
and
M
A6
677,
674
9,74
4V
RR
= 0
.96
(95%
CI =
0.
93 –
0.9
9)–4
% ri
sk fo
r CV
D d
eath
s w
ith
each
add
ition
al V
ser
ving
Thre
aple
ton
et
al.,
(201
3)SR
and
M
A9 4
915,
273
597,
629
6,99
1
5,69
2
VF
CH
DR
R =
0.9
4 (9
5% C
I =
0.89
– 1
.00)
per
4g/
day
VF
CV
DR
R =
0.9
2 (9
5% C
I =
0.87
– 0
.96)
per
4 g
/day
VF
6 –
8 se
rvin
gs o
f V p
rovi
ded
low
est r
isk
for C
HD
and
CV
D
–6%
risk
for C
HD
with
4g/
day
VF
–8%
risk
for C
VD
with
4g/
day
VF
(con
t.)

55
Cita
tion
Type
NSa
mpl
e si
zeC
ases
Fact
orMain findings
Con
clus
ion
Stroke
Hu
et a
l.,
(201
4)M
A16 2 4
647,
204
129,
467
205,
063
14,5
99
4,35
5
4,72
1
V RV GLV
Hig
hest
vs
low
est i
ntak
e: R
R =
0.
86 (9
5% C
I = 0
.79
– 0.
93)
Hig
hest
vs
low
est i
ntak
e: R
R =
0.
86 (9
5% C
I = 0
.79
– 0.
93)
Hig
hest
vs
low
est i
ntak
e: R
R =
0.
88 (9
5% C
I = 0
.79
– 0.
98)
–14%
risk
for s
troke
with
hig
hest
V
or r
oot V
inta
ke–1
1% ri
sk fo
r eve
ry 2
00g/
day
incr
emen
t in
V–1
2% ri
sk fo
r stro
ke w
ith h
ighe
st
GLV
inta
ke–
no e
vide
nce
supp
ortin
g on
ion/
le
ek/ g
arlic
and
CV
Thre
aple
ton
et
al.,
(201
3)SR
and
M
A2
NA
NA
VF
Nur
ses’
Hea
lth S
tudy
Hig
hest
vs
low
est i
ntak
e:
RR
=0.9
2 ((
%C
I=0.
74-1
.14)
Alp
ha-T
ocop
hero
l Bet
a-C
arot
ene
Stud
yH
ighe
st v
s lo
wes
t int
ake:
R
R=0
.86
(95%
CI=
0.76
–0.9
9).
Conflicting evidence
Hypertension
Li e
t al.,
(201
6) M
A6
84,9
0619
,832
VH
ighe
st v
s lo
wes
t int
ake:
RR
=
0.97
(0.9
18 –
1.0
24)
–3%
risk
for H
PT w
ith h
ighe
st
V in
take
Wu
et a
l.,
(201
6)
MA
8N
AN
AV
Hig
hest
vs
low
est i
ntak
e: R
R =
0.
88 (0
.79
– 0.
99).
Dos
e-re
spon
se a
naly
sis
did
not
supp
ort V
-HPT
ass
ocia
tion:
RR
=
1.00
(95%
CI =
0.9
89 –
1.0
11)
–12%
risk
for H
PT w
ith h
ighe
st
V in
take
Tabl
e 1.
(Con
t.)
(con
t.)

56
Cita
tion
Type
NSa
mpl
e si
zeC
ases
Fact
orMain findings
Con
clus
ion
Type 2 diabetes
Wan
g et
al.,
(2
016)
M
A7 3 3 17
NA
NA
GLV
YV
CV
VF
Hig
hest
vs
low
est i
ntak
e: R
R =
0.
87 (9
5% C
I = 0
.81
– 0.
93)
Hig
hest
vs
low
est i
ntak
e: R
R =
0.
72 (9
5% C
I = 0
.57
– 0.
90)
Hig
hest
vs
low
est i
ntak
e: R
R =
0.
82 (9
5% C
I = 0
.67
– 0.
99)
Hig
hest
vs
low
est i
ntak
e: R
R =
0.
94 (9
5% C
I 0.8
6 –
1.03
)
–28%
risk
with
hig
hest
inta
ke
of Y
V (t
he g
reat
est r
educ
tion
in
risk)
–18%
risk
with
hig
hest
inta
ke
of C
V–1
3% ri
sk w
ith h
ighe
st in
take
of
GLV
Inte
rAct
C
onso
rtium
(2
015)
MA
1139
9,59
324
,428
VF
Hig
hest
vs
low
est i
ntak
e: R
R =
0.
96 (9
5%C
I = 0
.86
– 1.
07)
Per1
0g/d
ay V
F: R
R =
0.9
3 (9
5%
CI =
0.8
2 –
1.05
).In
vers
e as
soci
atio
n re
stric
ted
to a
ve
ry h
igh
inta
ke (1
2 –
14 g
/day
)
–4%
risk
with
hig
hest
VF
inta
ke
–7%
risk
with
10g
/day
VF
Wu
et a
l.,
(201
5)M
A7 2
NA
NA
NA
NA
VA
ll pa
rtici
pant
s2
serv
ings
/day
vs
no d
aily
co
nsum
ptio
n: R
R =
0.9
4 (9
5% C
I =
0.90
– 0
.98)
A
sia
3 se
rvin
gs/d
ay: R
R =
0.7
5 (9
5%
CI =
0.6
8 –
0.83
)
–25%
risk
with
3 s
ervi
ngs
V in
take
per
day
in A
sian
po
pula
tion
–6%
risk
ove
rall
with
2 s
ervi
ngs
V/d
ay
Li e
t al.,
(201
4)SR
and
M
A8 7
290,
927
251,
235
20,9
33
19,1
39
V GLV
1 se
rvin
g/da
y: R
R =
0.9
0 (9
5%
CI =
0.8
0 –
1.01
)0.
2 se
rvin
g/da
y: R
R =
0.8
7 (9
5%
CI =
0.8
1 –
0.93
)
–13%
risk
with
0.2
ser
ving
/day
in
crem
ent o
f GLV
inta
ke
Tabl
e 1.
(Con
t.)
(con
t.)

57
Cita
tion
Type
NSa
mpl
e si
zeC
ases
Fact
orMain findings
Con
clus
ion
Al-K
huda
iry e
t al
., (2
013)
SR
17N
AN
AV
Rou
tine
V in
take
sho
wed
a
prot
ectiv
e ef
fect
for t
he ri
sk
of T
2D (O
R =
0.4
, 95%
CI =
0.
2–0.
7)N
o ob
serv
ed p
rote
ctiv
e ef
fect
of
diet
div
ersi
ty s
core
of V
aga
inst
di
abet
es (O
R =
1.0
5, 9
5% C
I =
0.89
– 1
.34)
Conflicting evidence from
case-
cont
rols
con
duct
ed in
Mid
dle-
east
ern
coun
tries
Type 2 diabetes
Coo
per e
t al.,
(2
012)
) M
A5 3
NA
NA
NA
NA
GLV
RV
5 vs
<1
porti
on/w
eek
inta
ke: R
R
= 0.
92 (9
5%C
I = 0
.87
– 0.
97)
>8 v
s <1
por
tion/
wee
k in
take
: RR
=
0.84
(95%
CI =
0.7
4 –
0.94
)2
vs 0
por
tion/
wee
k in
take
: RR
=
0.80
(95%
CI =
0.6
1 –
0.99
)No significant association
betw
een
V a
nd ri
sk fo
r T2D
.
–16%
in ri
sk w
ith 8
por
tion/
wee
k of
GLV
Car
ter e
t al.,
(2
010)
SR a
nd
MA
5 4
213,
217
177,
229
8,56
3
7,42
2
V GLV
RR
= 0
.91
(95%
CI =
0.
76 –
1.1
0)
1.35
ser
ving
s/da
y vs
0.4
ser
ving
s/da
y: R
R =
0.8
6 (9
5% C
I =
0.77
– 0
.96)
–14%
risk
with
add
ition
al 1
.3
serv
ings
GLV
/day
Tabl
e 1.
(Con
t.)
(con
t.)

58
Cita
tion
Type
NSa
mpl
e si
zeC
ases
Fact
orMain findings
Con
clus
ion
Obesity
Schw
ings
hack
l et
al.,
(201
5)SR
and
M
A2
79,2
36N
AV
Adi
posi
tyH
ighe
st v
s lo
wes
t qua
rtile
of
inta
ke: O
R =
0.8
3 (9
5% C
I =
0.70
– 0
.99)
-17%
risk
for a
bdom
inal
obe
sity
w
ith h
ighe
st V
inta
ke
SR =
sys
tem
atic
revi
ew; M
A =
met
a-an
alys
isV = vegetables; GLV
= green-leafy vegetables; V
F = vegetable fibre; C
V = cruciferous vegetables; YV = yellow vegetables; RV = ro
ot
vege
tabl
esR
R =
rela
tive
risk
Tabl
e 1.
(Con
t.)

59
Obesity A single systematic review and meta-analysis by Schwingshackl et al. (2015) showed a significant reduction in the risk for abdominal adiposity by 17% with highest level of vegetable intake. Consumption of vegetables however, did not significantly alter other obesity-related factors. Higher intake of vegetables, along with fruits, has been associated with an increased intake of micronutrients, carbohydrate and fibre and lower intake of fat - all of which have been shown to be significantly associated with lower risk for stroke (Hu et al., 2014). Diets rich in fibre from cereal or vegetable sources were significantly associated with lower risk for CVD and CHD, signalling the need to maintain a high intake of this food component (Threapleton et al., 2013). Higher fibre intake was often associated with lower fat intake, which has been shown to influence lower risk for diabetes and hypertension (Kurotani et al., 2013). Dietary fibre has also been described to lower the risk for inflammatory markers, serum uric acid and γ-glutamyltransferase, which have been associated with increased risk of diabetes as well as higher concentrations of adiponectin that increases insulin sensitivity (InterAct, 2015). Intake of fibre can promote satiety and reduce consumption of energy-dense foods. However, evidence from observational studies supporting reduction of body weight due to the regulatory effect of fibre on blood glucose is still lacking((Wang et al., 2016; Li et al., 2015). Threapleton et al., (2013) noted that increased intake of fibre is often associated with other health behaviours which can influence stroke occurrence. These behavioural factors such as smoking and exercise habits are difficult to be controlled and this limitation has to be taken into account during data analysis and interpretation. Further studies exploring these associations are warranted. This review also highlighted the importance of green-leafy vegetables in reducing the risk for T2D and CVD. The potency of green-leafy vegetables in reducing CVD risk has been suggested due to bile acid binding capacity of these foods (Pollock, 2016). This has been associated with higher utilisation of cholesterol and reduced fat absorption, which in turn could reduce the risk of heart disease (Kahlon et al., 2008). Nitrate-containing green-leafy vegetables also ensure maintenance of nitrite and nitric oxide pools in blood and tissues. These compounds have been shown to have novel pharmacologic actions that benefit the cardiovascular system (Nossaman et al., 2010). Green-leafy vegetables are also rich in folate which may lower plasma homocysteine levels, a potential risk factor for heart diseases (Weir and Scott, 1998; Tucker et al., 1996). Omega-3 fatty acids, antioxidant molecules, nutraceuticals such as polyphenols and trace elements also contribute to vegetable’s cardioprotective effect. For example, these components may reduce blood pressure and blood glucose by improving endothelial function, increasing baroflex sensitivity and causing vasodilation, besides, protecting against lipid peroxidation, mitigating oxidative stress, reducing of inflammatory markers and inhibiting platelet aggregation (Zhan et al., 2015; Li et al., 2014; Cooper et al., 2012; Boeing et al., 2012; Gordon, 1996). However, it has been postulated that these

60
nutrients may result in a better effect when in combination with other constituents in vegetables (Zhan et al., 2015).
Limitations Different measurements and dietary assessments conducted in actual studies have made the comparison challenging. Wu et al., (2015) also pointed out discrepancies in standard portion sizes. Hence, the published reviews have resorted into categories such as high-medium-low intake of vegetables, without describing the actual intake and did not make dose-response comparisons.
CONCLUSION General consensus is that higher vegetable consumption is protective against most CMD. The evidence from observational studies seems overwhelming for T2D and to certain extent, CVD. However, there is a lack of evidence supporting vegetables as an independent protective factor against hypertension, dyslipidaemia and obesity among others. Although some level of evidence from observational studies are supporting the benefits of vegetable consumption, dose–response relationship between vegetable consumption and most CMD are yet to be established. Further exploration of vegetable-CMD relationship among SEA population should be conducted through large and high quality intervention trials or longitudinal studies.
REFERENCESBoeing, H., Bechthold, A., Bub, A., Ellinger, S., Haller, D., Kroke, A. (2012). Critical
review: vegetables and fruit in the prevention of chronic diseases. Eur J Nutr. 51(6): 637 – 63
Carter, P., Gray, L.J., Troughton, J., Khunti, K., Davies, M.J. (2010). Fruit and vegetable intake and incidence of type 2 diabetes mellitus: systematic review and meta-analysis. BMJ.341: c4229
Cooper, A.J., Forouhi, N.G., Ye, Z., Buijsse, B., Arriola, L., Balkau, B. (2012). Fruit and vegetable intake and type 2 diabetes: EPIC-InterAct prospective study and meta-analysis. Eur J Clin Nutr.;66(10): 1082 – 92
Fisher, M. (2006) Cardiometabolic disease: the new challenge? Practical Diabetes. 23(3):95 – 7.
Ghazali, S.M, Seman, Z., Cheong, K.C., Hock, L.K., Manickam, M., Kuay. L.K. (2015). Sociodemographic factors associated with multiple cardiovascular risk factors among Malaysian adults. BMC Public Health. 15: 68
Gordon, M. (1996). Dietary antioxidants in disease prevention. Nat Prod Rep. 13(4): 265 – 73
Hu, D., Huang, J., Wang ,Y., Zhang, D., Qu, Y. (2014). Fruits and vegetables consumption and risk of stroke: a meta-analysis of prospective cohort studies. Stroke. 45(6): 1613 – 9

61
InterAct, C. (2015). Dietary fibre and incidence of type 2 diabetes in eight European countries: the EPIC-InterAct Study and a meta-analysis of prospective studies. Diabetologia. 58(7): 1394 – 408
Kahlon, T.S., Chiu, M.C., Chapman, M.H. (2008). Steam cooking significantly improves in vitro bile acid binding of collard greens, kale, mustard greens, broccoli, green bell pepper and cabbage. Nutr Res.;28(6): 351 – 7
Kraushaar, L.E., Kramer, A. (2009). Are we losing the battle against cardiometabolic disease? The case for a paradigm shift in primary prevention. BMC Public Health. 9: 64
Kurotani, K., Nanri, A., Goto, A., Mizoue, T., Noda, M., Kato, M. (2013). Vegetable and fruit intake and risk of type 2 diabetes: Japan Public Health Center-based Prospective Study. Br J Nutr. 109(4): 709 – 17
Li, B., Li, F., Wang, L., Zhang, D. (2016). Fruit and vegetables consumption and risk of hypertension: a meta-analysis. J Clin Hypertens (Greenwich). 18(5): 468 – 76
Li, M., Fan, Y., Zhang. X,, Hou, W, Tang, Z. (2014). Fruit and vegetable intake and risk of type 2 diabetes mellitus: .meta-analysis of prospective cohort studies. BMJ Open.;4(11): e005497
Nossaman, V.E., Nossaman, B.D., Kadowitz, P..J. (2010). Nitrates and nitrites in the treatment of ischemic cardiac disease. Cardiol Rev. 18(4): 190 – 7
Pollock, R.L. (2016). The effect of green leafy and cruciferous vegetable intake on the incidence of cardiovascular disease: A meta-analysis. JRSM Cardiovasc Dis. 5:2048004016661435
Reaven, G. (1988) Role of insulin resistance in human disease. Diabetes 37: 1595-607Schwingshackl, L., Hoffmann, G., Kalle-Uhlmann, T., Arregui, M., Buijsse, B., Boeing,
H. (2015). Fruit and vegetable consumption and changes in anthropometric variables in adult populations: a systematic review and meta-analysis of prospective cohort studies. PloS one. 10(10): e0140846
Threapleton, D.E., Greenwood, D.C., Evans, C.E., Cleghorn, C.L., Nykjaer, C., Woodhead, C. (2013). Dietary fibre intake and risk of cardiovascular disease: systematic review and meta-analysis. BMJ. 347: f6879
Tucker, K.L., Selhub, J., Wilson, P.W., Rosenberg, I.H. (1996). Dietary intake pattern relates to plasma folate and homocysteine concentrations in the Framingham Heart Study. J Nutr. 126(12): 3025 – 31
Wang, P.Y., Fang, J.C., Gao, Z.H., Zhang, C., Xie, S.Y. (2016). Higher intake of fruits, vegetables or their fiber reduces the risk of type 2 diabetes: A meta-analysis. J Diabetes Investig. 7(1): 56 – 69
Wang, X, Ouyang, Y, Liu J, Zhu, M, Zhao, G, Bao, W. (2014). Fruit and vegetable consumption and mortality from all causes, cardiovascular disease and cancer: systematic review and dose-response meta-analysis of prospective cohort studies. BMJ. 349: g4490

62
Weir, D.G., Scott, J.M. (1998). Homocysteine as a risk factor for cardiovascular and related disease: nutritional implications. Nutr Res Rev. 11(2): 311 – 38
WHO (2011). Global Atlas on Cardiovascular Diseases Prevention and Control. Geneva: World Health Organisation
Wu, L., Sun, D., He, Y.(2016). Fruit and vegetables consumption and incident hypertension: dose-response meta-analysis of prospective cohort studies. J Hum Hypertens. 30(10): 573 – 80
Wu, Y., Zhang, D., Jiang, X., Jiang, W. (2015). Fruit and vegetable consumption and risk of type 2 diabetes mellitus: a dose-response meta-analysis of prospective cohort studies. Nutr Metab Cardiovasc Dis. 25(2): 140 – 7
Zhan, J., Liu, Y.J., Cai, L.B., Xu, F.R., Xie, T., He, Q.Q. (2015). Fruit and vegetable consumption and risk of cardiovascular disease: a meta-analysis of prospective cohort studies. Crit Rev Food Sci Nutr. 2015:[Epub ahead of print]

63
Home Gardening for Enhanced Vegetable Consumption
Pepijn Schreinemachers1., Greg Luther2 and Ralph Roothaert31World Vegetable Center, East and Southeast Asia/Oceania, P.O. Box 1010, Bangkok 10903, ThailandE-mail: [email protected] Vegetable Center, Headquarters, P.O. Box 42, Shanhua, Tainan 74199, TaiwanE-mail: [email protected] Vegetable Center, Eastern and Southern Africa, P.O. Box 10 Duluti, Arusha, TanzaniaE-mail: [email protected]
Abstract For poor people, small gardens can make a critical contribution to the household diet as well as provide many other benefits, yet the productivity of many household gardens is low because of poor quality seed, poor soil quality, lack of water, garden pests, diseases and many other reasons. The experience of the World Vegetable Center shows that these constraints can be overcome through targeted and need-based interventions. This paper presents the World Vegetable Center’s intervention approach aimed at reducing micronutrient undernutrition in rural areas of low income countries. The intervention chiefly targets women because they are usually in charge of both household food preparation and garden management. The intervention has three components: Women’s training in garden production (including hardy, nutritious and locally-adapted crops as well as good gardening practices), support systems (including seed supplies and community-based organizations such as women’s self-help groups) and training in nutrition and health to raise people’s awareness about the importance of eating a diversified diet including fruit and vegetables. The paper describes critical knowledge gaps in the underlying impact pathway of household gardens and calls for more and better coordinated research on this topic.
Keywords: human nutrition, home gardens, nutrition-sensitive agriculture
INTRODUCTION Household gardening of fruit and vegetables is an age-old practice that is common to low and high income countries alike. Yet researchers, agricultural extension officers and policy makers pay little or no attention to this form of subsistence-oriented agriculture, as they tend to perceive it as backward, inefficient and temporary in nature. The normative view of modern agriculture is one that is market-oriented, large-scale and technology-intensive; household gardening seems to be exactly the opposite. Yet household gardening is extremely important to food and nutrition security, particularly in low and middle income countries. Household garden interventions are one of the very few agricultural interventions that have a proven effect on nutritional outcomes (Ruel and Alderman 2013; DFID 2014; Iannotti et. al. 2009). In contrast, modern agricultural technologies that increase yields of staple food crops have been shown to increase farm incomes, but often this has not resulted in significant increases in the nutritional status of people in adopting households (Webb and Kennedy 2014; Turner et al., 2013).

64
The increased recognition of the potential of household garden interventions to contribute to nutritional outcomes has led to a recent surge of interest in the topic (e.g. Galhena et.al. 2013; Olney et al., 2013; Weinberger 2013; Zimpita et.al. 2015). The benefits of household garden interventions go well beyond nutritional outcomes as they contribute to at least eight of the 17 Sustainable Development Goals of the United Nations. Despite the surge in interest, there remains a lack of knowledge about how to implement a household garden intervention. Many organizations are currently running household garden projects without clear operational plans. This is worrisome because household garden interventions are complex and require a lot of local adaptation; there is no one-size-fits-all. Poorly implemented household gardens might increase food insecurity as households allocate scarce resources to it. For that reason, it is essential to carefully think through the design of a household garden project. This paper describes the World Vegetable Center’s approach to household garden interventions so that other programs can learn and adapt it to make their own household garden programs more impactful. The World Vegetable Center has worked on household gardening for more than 30 years (Midmore et. al. 1991; Keatinge et al., 2012; Schreinemachers et al., 2015; Chadha and Oluoch 2003; Gershon et.al. 1988) and this paper is based on the Center’s experience and published evidence of what works. For a more detailed overview of this approach we refer to World Vegetable Center (2016).
INTERVENTION DESIGN AND THEORY OF CHANGE The World Vegetable Center’s household garden intervention aims to improve the nutritional status of people vulnerable to micronutrient undernutrition by increasing the year-round supply of a diverse range of fruit and vegetables from a household-managed garden linked to complementary training in nutrition and health and to necessary support systems. We prefer to use the term ‘household’ rather than ‘home’ gardens because the garden has a functional relationship to the homestead, but could be located alongside fields, rail tracks, streams, or rivers. The household garden intervention chiefly targets women of child-bearing age in charge of meal preparation, as they usually decide what household members, especially young children, consume and are most likely to be in charge of the household garden. Sensitization of other household members through behavior change sessions, community mobilization activities and advocacy about the potential benefits of household gardening helps to broaden the support base. The Center’s household garden intervention has three synergistic components, each sub-divided into two smaller components: Garden Production: (a) A diverse range of nutrient-dense fruit and vegetable species, combining traditional and improved varieties, suited to prevailing environmental conditions; (b) garden management based on good agricultural practices to overcome production constraints.

65
Nutrition and Health: (a) Increased knowledge and awareness about the importance of fruit and vegetables for nutrition and health and knowledge about good food practices that enhance the preservation, uptake and utilization of micronutrients; (b) awareness raising about the importance of clean water, sanitation and hygiene for health and alignment of the household garden intervention with existing programs in this area. Support Systems: (a) Supply of high quality seed by commercial seed suppliers or community-based seed systems; (b) support from the community through involvement of community leaders and community-based groups such as women’s groups, or their establishment where they are absent. Each of these intervention components has been documented in more detail in World Vegetable Center (2016). Here we focus on describing the synergies between these components in the impact pathway. The theory of change, or impact pathway (Figure 1) shows how these intervention components are assumed to improve the nutritional status of poor households. Women of the selected households receive hands-on training in gardening linked to complementary training in nutrition and health. Concurrently, the supply of high quality seed is arranged, by working with private seed companies or by training people in the communities to
Source: World Vegetable Center (2016)
Figure 1. Theory of change of the World Vegetable Center household garden intervention

66
save their own seed. Sometimes starter seed kits are provided if quality seed is either unavailable or inaccessible. These starter kits given free of charge can serve as an incentive to start a household garden. The trained women will have gained knowledge about gardening and a better understanding of how the household garden can improve family nutrition and health. This, together with a one-time supply of minimally required inputs, is expected to motivate the women to establish and maintain their own household gardens. Implementing partners regularly visit the women to re-emphasize the message and provide technical advice. A well-planned and well-managed garden is expected to supply the household with a diverse range and year-round harvest of fruits and vegetables. Participative selection of crops by local communities in combination with nutrition and health training should give an incentive to consume rather than sell the garden produce. Sales from the household garden could potentially contribute to sustaining the garden as revenues can motivate people to venture into gardening and may be used to buy inputs. The cash earned could also contribute to nutritional outcomes if it is used to buy meat, dairy or other nutritive foods. However, there is a lack of evidence for such causal relationships. Nevertheless, nutrition rather than income is the main objective of a household garden intervention. This theory of change also highlights some critical gaps in our current understanding of household gardens. First, there remains a lack of robust evidence for the impact on nutritional outcomes, although several randomized controlled trials are ongoing to fill this gap and recent results of some of these studies are positive (e.g. Olney et al., 2015). Second, not much is known about what types of local support systems are effective in ensuring long-term sustainability of intervention impact. Third, it is unclear if and under what conditions, the sale of household garden produce contributes to nutritional outcomes or to the sustainability of the household garden: is there a trade-off, or is it a win-win? More research is needed to fill these key knowledge gaps.
CONCLUSION It is important that researchers, agricultural extension officers and policymakers pay more attention to household gardens because these systems make an essential contribution to household food and nutrition security in developing countries. Targeted interventions can help poor households to further exploit household gardens to improve the nutritional status of household members. The experience of the World Vegetable Center shows that such interventions need to include three synergistic components of garden production, nutrition and health and support systems. Partnerships and scaling approaches are important to scale the intervention in a cost-effective way to larger populations. Impact evaluation needs to be an integral part of any household garden project because of the current lack of knowledge about many of the causal links in the assumed impact pathway of household garden interventions.

67
ACKNOWLEDGEMENTS We thank the United States Agency for International Development (USAID) for providing financial support for various household garden projects at the World Vegetable Center. The opinions articulated in this paper are those of the authors and do not necessarily reflect the views of USAID. We are grateful to our colleagues at the World Vegetable Center for comments on an earlier version of this paper.
REFERENCESChadha, M.L. and M.O. Oluoch. (2003). Home-based vegetable gardens and other
strategies to overcome micronutrient malnutrition in developing countries.“ Review of. Food, Nutrition and Agriculture 32: 17 – 23
DFID. (2014). “Can agriculture interventions promote nutrition: Agriculture and nutrition evidence paper.” In. London: Department for International Development
Galhena, Dilrukshi, Russell Freed and Karim Maredia. (2013). “Home gardens: a promising approach to enhance household food security and wellbeing.” Review of. Agriculture and Food Security 2 (1):8
Gershon, Jack, Yen-Ching Chen and Jen-Fong Kou. (1988). “The AVRDC garden program 1983-84.” In Gardening nutritious vegetables, edited by Norma V. Llemit and Pura J. Lastimosa. Shanhua, Tainan: AVRDC
Iannotti, Lora, Kenda Cunningham and Marie Ruel. (2009). “Diversifying into healthy diets: Homestead food production in Bangladesh.” In Millions fed: Proven successes in agricultural development, edited by David J. Spielman and Rajul Pandya-Lorch. Washington, DC: International Food Policy Research Institute
Keatinge, J.D.H., M.L. Chadha, J.d’A. Hughes, W.J. Easdown, R.J. Holmer, A. Tenkouano, R.Y. Yang et al., (2012). “Vegetable gardens and their impact on the attainment of the Millennium Development Goals.” Review of. Biological Agriculture and Horticulture 28 (2): 71 – 85
Midmore, David J., Vera Niñez and Ramesh Venkataraman. (1991). Household gardening projects in Asia: past experience and future directions. Taipei: Asian Vegetable Research and Development Center (AVRDC)
Olney, D. K., S. Vicheka, M. Kro, C. Chakriya, H. Kroeun, L. S. Hoing, A. Talukder et al., (2013). “Using program impact pathways to understand and improve program delivery, utilization and potential for impact of Helen Keller International’s Homestead Food Production Program in Cambodia.” Review of. Food and Nutrition Bulletin 34 (2): 169 – 84
Ruel, Marie T. and Harold Alderman. (2013). “Nutrition-sensitive interventions and programmes: how can they help to accelerate progress in improving maternal and child nutrition?” Review of. The Lancet 382 (9891): 536 – 51

68
Schreinemachers, Pepijn, Marie Antoinette Patalagsa, Md Rafiqul Islam, Md Nasir Uddin, Shahabuddin Ahmad, Sitesh Chandra Biswas, Md Tanvir Ahmed et al., (2015). “The effect of women’s home gardens on vegetable production and consumption in Bangladesh.” Review of. Food Security 7 (1):97 – 107. doi: 10.1007/s12571-014-0408-7
Turner, Rachel, Corinna Hawkes, Jeff Waage, Elaine Ferguson, Farhana Haseen, Hilary Homans, Julia Hussein et al., (2013). “Agriculture for Improved Nutrition: The Current Research Landscape.” Review of. Food and Nutrition Bulletin 34 (4):369 – 77. doi: 10.1177/156482651303400401
Webb, Patrick and Eileen Kennedy. (2014). “Impacts of Agriculture on Nutrition: Nature of the Evidence and Research Gaps.” Review of. Food and Nutrition Bulletin 35 (1):126 – 32. doi: 10.1177/156482651403500113
Weinberger, Katinka. (2013). “Home and community gardens in Southeast Asia: Potential and opportunities for contributing to nutrition-sensitive food systems.” Review of. Food Security 5 (6):847 – 56. doi: 10.1007/s12571-013-0299-z
World Vegetable Center. (2016). The World Vegetable Center approach to household gardening for nutrition. Shanhua, Taiwan: World Vegetable Center
Zimpita, T., C. Biggs and M. Faber. (2015). “Gardening practices in a rural village in South Africa 10 years after completion of a home garden project.” Review of. Food and Nutrition Bulletin 36: 33 – 42

69
Vegetable Research and Development for Improved Nutrition and Livelihoods In Central Asia and The Caucasus
Ravza MavlyanovaWorld Vegetable CenterCentral Asia and the CaucasusP.O. Box 4375, Tashkent 100000, UzbekistanE-mail: [email protected]
Abstract Vegetable production is an important sector of the agricultural economy in Central Asia and the Caucasus. Recent agrarian reforms in Armenia, Azerbaijan, Georgia, Kazakhstan, Kyrgyzstan, Tajikistan, Turkmenistan and Uzbekistan are ensuring food security and improving nutrition for an increasing population, fostering sustainable agricultural practices to counter the effects of climate change, promoting research and capacity building and enhancing livelihoods. Although vegetable crops now cover an area of more than 800,000 ha across the region, vegetable yields on irrigated land remain below potential. Around 40 vegetable species are grown in the region, with tomato, cabbage, carrot, onions and melons accounting for 60% of overall vegetable production. The vegetable supply is highly seasonal. Regional research institutes carry out vegetable research funded by state grants and international donors. Climate change, water deficiency, land degradation, soil salinity and other concerns require more research attention to develop practical solutions, including new, well-adapted varieties and improved cultivation technologies. All countries need support for the collection and conservation of vegetable crop genetic resources and germplasm enhancement. Crop diversification, seed production, low-cost technology development and postharvest operations and marketing are other areas in need of attention. To assist in the development of market-oriented vegetable production systems and to promote vegetable research strategies, the World Vegetable Center (WorldVeg) collaborates with national agricultural research and extension systems (NARES) through the Regional Network on Vegetable System Research and Development (CACVEG), initiated in August 2005. The network, which celebrated its 10th anniversary in 2015, serves NARES through collaborative research on the development of well-adapted varieties, innovative technologies, seed production and regional variety trials. The network builds capacity through the involvement of young people for PhD and postdoctoral degrees in vegetable research, as well as through workshops, training courses, farmer field days and other promotional events for information dissemination. Vegetable research is increasing the vegetable supply, diversifying agriculture, increasing farmers’ income and encouraging greater consumption of vegetables for health and improved livelihoods of people throughout the region.
Keywords: Central Asia and the Caucasus, food security, vegetable production, vegetable research.
INTRODUCTION Over the past 50 years, growth in crop production has been driven largely by higher yields per unit of land and crop intensification. Over recent decades, global trends in food production per capita have been generally positive across most regions

70
of the world. In most countries and regions, high food availability is associated with relatively low prevalence of undernourishment (FAOSTAT, 2015). Europe and Central Asia produced 13.6% of the world’s vegetables in 2011, slightly less than the 14% harvested in 2010. Central Asia registered the fastest growth over the period, with 8.4% per annum. This region’s biggest producer, Uzbekistan, expanded production at the annual rate of 9.4%, followed by Kazakhstan at 7%. Tajikistan’s rate increased by almost 13%, but from a significantly smaller production base (FAOSTAT 2013, 2014). To continue this growth, Central Asia and the Caucasus will need to adopt climate-smart agriculture, an approach that requires site-specific assessments to identify suitable agricultural technologies and practices to increase productivity in challenging environments (United Nations, 2013). Enhanced breeding methods along with better phenotyping and variety testing methods can be deployed to shorten the time it takes to develop new varieties and to breed new varieties more precisely for specific environments. Intellectual property regimes and national variety release guidelines need to be modernized, harmonized and incentivized to rapidly release new varieties and encourage investment in breeding and seed businesses. Breeding programs need to include nutrition traits in their standard product profiles and variety evaluation schemes so that nutrition becomes part of main stream breeding (United Nations, 2013). Improving dietary diversity and nutrient management is a central element in meeting the challenge to increase food production, increase farm incomes, improve soil quality, reduce nutrient losses to the environment and protect natural ecosystems (United Nations, 2013 ; Hughes and Keatinge, 2013). Many unexploited income, productivity and resource efficiency gaps can be closed throughout the region by accelerating agricultural extension and transfer of new knowledge and technologies, enhancing access by farmers to markets and information, facilitating better interaction among farmers and knowledge providers and assisting farmers and small businesses to develop their own technical, organizational and management skills and practices (United Nations, 2013).
VEGETABLE PRODUCTION IN CENTRAL ASIA AND THE CAUCASUS The region of Central Asia and the Caucasus - comprising of Armenia, Azerbaijan, Georgia, Kazakhstan, Kyrgyzstan, Tajikistan, Turkmenistan and Uzbekistan - has a population of approximately 82 million people, an increase of 9.3% since 2006 (FAOSTAT, 2014). Vegetable production is an important sector of the agricultural economy in the region. Average yield increased from 18.9 t/ha in 2006 to 23.9 t/ha in 2013, but it is still below potential on irrigated areas (FAOSTAT, 2014). Uzbekistan and Tajikistan, the region’s two most populous countries, account for 45.4% and 22.4% of regional vegetable production, respectively (FAOSTAT, 2014). Table 1 summarizes vegetable production data in Central Asia and the Caucasus in 2006 and 20013.

71
Table 1. Vegetable production in Central Asia and the Caucasus in 2006 and 2013
Country Area, ha Production, t Yield, t/ha2006 2013 2006 2013 2006 2013
Armenia 29,178 30,686 914,984 1,084,181 31.3 35.3Azerbaijan 116,049 104,765 1,639,599 1,669,693 13.3 15.9Georgia 30,400 25,000 217,500 271,200 7.1 10.8Kazakhstan 154,200 216,390 2,757,055 4,954,990 17.8 22.8Kyrgyzstan 48,361 62,384 859,244 1,077,480 17.7 17.2Tajikistan 44,910 66,760 977,853 1,985,900 21.7 29.7Turkmenistan 40,804 53,376 814,000 1,006,588 19.9 18.8Uzbekistan 218,690 243,156 5,023,942 10,042,155 22.9 41.2Total: 682,592 802,517 12,290,107 22,092,187 18.9 23.9
Source: FAOSTAT, 2016
Around 40 vegetable species are grown in the region, with tomato, cabbage, carrot, onions and melons accounting for 60% of overall vegetable production. The vegetable supply is highly seasonal, especially in winter and spring. Recent agrarian reforms in the region aim to ensure food security and improve nutrition for the increasing population, foster sustainable agricultural practices to counter the effects of climate change, promote research and capacity building and enhance livelihoods.
RESEARCH FOR DEVELOPMENT Regional research institutes carry out vegetable research funded by state grants and international donors. To assist in the development of market-oriented vegetable production systems and to promote vegetable research strategies, the World Vegetable Center (WorldVeg) collaborates with national agricultural research and extension systems of the eight countries through the Regional Network on Vegetable System Research and Development (CACVEG), initiated in August 2005. The network celebrated its 10th anniversary in 2015. National coordinators for vegetable research and development are selected in each country and appointed by ministries of agriculture. Through collaborative research, each country achieved progress in vegetable research development, introducing new varieties and innovative technologies into vegetable production, building capacity and strengthening linkages with a wide range of stakeholders (Mavlyanova et al., 2014). All countries in the region lack a diversity of vegetable germplasm with valuable traits (Keatinge et al., 2015). The World Vegetable Center provides accessions from its gene bank and improved breeding lines to foster more rapid variety development

72
in regional trials. Through breeding research, partners have developed and introduced new vegetable varieties with commercially valuable traits.
Variety trials Improved lines of 26 vegetable species and more than 2000 accessions from the WorldVeg genebank have been introduced in the region since 2005. These included both global vegetable crops such as tomato and pepper and new crops for the region such as vegetable soybean. These accessions and lines have been studied under various soil and climatic conditions in the region, following standard research protocols.
New variety development Since 2005, a total of 64 new varieties of 15 species have been released in Central Asia and the Caucasus (Table 2). Many of these varieties are enrolled in State Variety Testing programs (Mavlyanova, 2015; Mavlyanova and Mecozzi, 2015). Armenia: The World Vegetable Center collaborates with the Scientific Center of Vegetable, Melon and Industrial Crops. New varieties of cherry tomato with various fruit shapes and colors were developed by scientists based on WorldVeg germplasm and improved lines, such varieties as Narek (VI006972), Janna (CLN2413D), Armine (VI006852) and Renesans (CLM2026M) with high yield of 60-70 t/ha, resistant to fusarium and late blight. Rubina (CLN1558B) and Zeytun (VI045665) with yield of 30 – 50 t/ha, are resistant to disease, have good transportability and are suitable for canning and drying. High yielding hybrid ‘Ellipse’ F1’ (L01448 x Eraz) was developed in Armenia – a first for the country. Sweet pepper with large fruits such as Loshtak (AVPP0701), yellow-colored Emili (0137-7041), round-shaped Mira (0537-7061) Mili ((VI032170) and orange-colored varieties Naring (AVPP0503) and Natali (0137-7025) were developed. High yielding (up to 45 t/ha) chilli pepper varieties with various fruit shapes suitable for processing include Artiv, Gita and Punj (elongated shape), Con (conical shape) and Zspanak (corrugated shape). Eggplant variety Vardenes resistant to fusarium and late blight was released. New varieties of non-traditional species such as vegetable soybean Gamma and basil Kananch were developed from WorldVeg germplasm. Traditional crops in the State Register are supplemented with new varieties with various colors and shapes for fresh consumption and processing. Georgia: Collaboration with the Research Institute of Crop Husbandry of Georgian State Agrarian University and LEPL Scientific Research Centre of Agriculture produced new vegetable soybean varieties Mtsvane parkiani (VI044024) and Sabostne-1 (VI045038), tomato varieties Saadreo (VI057641) Chinebuli (AVTO 1219), sweet pepper varieties Taiwaniri (ISPN 11-4) and Namgliseburi (AVPP0512), vegetable bean variety Mravalmartsvala (VI050120); all high-yielding, resistant to diseases and have been registered in Georgia. Azerbaijan: The Vegetable Scientific Research Institute of Azerbaijan conducted trials and released new tomato variety Alsu (CLN2545A), which is heat tolerant, resistant

73
Table 2. New varieties based on AVRDC lines and released in Central Asia and the Caucasus in 2007 – 2015
Crop Variety name (from AVRDC acc./line) Country, released year
Tomato Zeytun (VI045665) Armenia, 2010Tomato Armine (VI006852) Armenia, 2010
Tomato Narek (VI006972) Armenia, 2011
Tomato Janna (CLN2413D) Armenia, 2011
Tomato Saadreo (VI057641) Georgia, 2011Tomato Rubina (CLN1558B) Armenia, 2012Tomato Solnechnaya jemchujina (CLN2070C) Kazakhstan, 2013Tomato Zolotaya businka (CLN2071D) Kazakhstan, 2013Tomato Alsu (CLN2545A) Azerbaijan, 2014Tomato Serdtse Astani (CLN2264J) Kazakhstan, 2015
Tomato Chinebuli (AVTO 1219) Georgia, 2015Tomato Renesans (CLM 2026M) Armenia, 2015Tomato Ellipse F1 (L01448xEraz) Armenia, 2015Hot pepper Uchkun (0337-7069) Uzbekistan, 2009Hot pepper Tillarang (9955-15) Uzbekistan, 2010Hot pepper Zspanak (VI014204) Armenia, 2010Hot pepper Gita (0337-7546) Armenia, 2010Hot pepper Piquant (lPP0107-7058) Kazakhstan, 2010Hot pepper Kon (VI037591) Armenia, 2011Hot pepper Punj (VI013538) Armenia, 2012Hot pepper Erekshe (0337-7069) Kazakhstan, 2012Hot pepper Artsiv (AVPP9813) Armenia, 2014Hot pepper Dari Murch (AVPP0512) Kyrgyzstan, 2015Hot pepper Said (РР0337-7069) Uzbekistan, 2015Hot pepper Mumtoz (0407-7567) Uzbekistan, 2015Sweet pepper Natali (0137-7025) Armenia, 2010Sweet pepper Kaz-Tai (VI046956) Kazakhstan, 2010Sweet pepper Bayan Sulu (PP0037-7645) Kazakhstan, 2010Sweet pepper Emili (0137-7041) Armenia, 2011
(cont.)

74
Crop Variety name (from AVRDC acc./line) Country, released year
Sweet pepper Mili (VI032170) Armenia, 2012Sweet pepper Kozy-Korpesh (0237-7011) Kazakhstan, 2012Sweet pepper Sabo (PP0437– 7031) Uzbekistan, 2013Sweet pepper Narinj (AVPP0503) Armenia, 2013Sweet pepper Shodlik (0636-6056) Uzbekistan, 2014Sweet pepper Loshtak (AVPP0701) Armenia, 2014Sweet pepper Krasnoe chudo (РР0737-7016) Kazakhstan, 2015Sweet pepper Taiwaniri (ISPN 11-4) Georgia, 2015Sweet pepper Namgliseburi (AVPP0512) Georgia, 2015Sweet pepper Nabat (РР 0437-7031) Turkmenistan, 2015Eggplant Feruz (VI042320) Uzbekistan, 2013Eggplant Kuvonch (VI042717) Uzbekistan, 2015Eggplant Vardenes (Fullnes x EG224 sel) Armenia, 2015Mungbean Zilola (VC1178) Uzbekistan, 2008Mungbean Marjon (VC6492-59) Uzbekistan, 2008Mungbean Durdona (VI048592) Uzbekistan, 2011Mungbean Turon (VC6153B-20G) Uzbekistan, 2012Mungbean Zhasyl Dan (VC6492-59) Kazakhstan, 2012Mungbean Bereketli (VC6492-59) Turkmenistan, 2015Vegetable soybean Ilkhom (VI053823) Uzbekistan, 2007Vegetable soybean Universal (VI032661) Uzbekistan, 2008Vegetable soybean Mtsvane Parkiani (VI044024) Georgia, 2011Vegetable soybean Sabostne 1 (VI045038) Georgia, 2011Vegetable soybean Sulton (AGS423) Uzbekistan, 2011Vegetable soybean Inju (AGS437) Kazakhstan, 2012Vegetable soybean Gamma (VI025071) Armenia, 2015Yard-long bean Oltin soch (VI033934) Uzbekistan, 2011Chinese leafy cabbage Sharq guzali (sel.BP05) Uzbekistan, 2011Vegetable bean Mravalmartsvala (VI050120) Georgia, 2014Vegetable pea Sladkiy bob (VI034025) Kazakhstan, 2015
Table 2. (Cont.)
(cont.)

75
to fusarium, yields 50 t/ha and produces large fruits that retain marketability for 15 days. The fruit has good transportability and is suitable for canning. Kyrgyzstan: The Kyrgyz Research Institute of Agriculture is studying a few promising lines of sweet and hot pepper. Mid-maturity hot pepper variety Dari-murch (AVPP0512) with large fruits (22 – 35 g), resistant to fusarium and suitable for canning, has been released in the country. Kazakhstan: After careful evaluation, the Kazakh Research Institute of Potato and Vegetable Growing included a range of new varieties in the State Register. From 2007-2015, in cooperation with the World Vegetable Center, 18 locally bred new varieties of 11 vegetable species were developed, including tomato varieties for greenhouses (5), sweet peppers (3), hot pepper (2) and one variety each of eggplant, soybean, mungbean, vegetable pea, squash, lettuce, basil and celery. The importance of these varieties for vegetable production in Kazakhstan is undeniable. These varieties correspond to the requirements of the global market (Aitbaev, 2016). Tajikistan: The Institute of Horticulture and Vegetables Growing conducted trials and several few promising sweet pepper and hot lines have been submitted for state varietal trials. Farmers already grow WorldVeg sweet pepper lines AVPP0911 and AVPP0913, which are heat-tolerant and resistant to fusarium, with high yield of large fruits (130 g). Turkmenistan: Scientists of the Scientific Research Institute of Agriculture of Turkmenistan have developed new sweet pepper variety Nabat (РР0437-7031) with high yield up to 50 t/ha; heat tolerant, resistant to fusarium, with yellow-colored fruits that are suitable for canning. New mungbean variety Bereketli (VC6492-59) was released; a drought- and heat-tolerant erect type, resistant to fusarium and tolerant to high plant densities, with large seeds and pods that do not shatter when ripe. Farmers now have the opportunity to grow mungbean the country’s very hot and dry climate and generate income from this valuable crop. Uzbekistan: The Research Institute of Plant Industry, Research Institute of Vegetable, Melon Crops and Potato and Tashkent State Agrarian University participated in regional variety trials. A total of 20 18 new varieties of eight species were developed and included in the State Register from 2007 – 2015. Varieties include tomato, sweet
Crop Variety name (from AVRDC acc./line) Country, released year
Vegetable marrow Unumdor (09WVC-S1) Uzbekistan, 2015Custard squash Meduza (VI056234) Kazakhstan, 2015Lettuce Polezniy (VI046272) Kazakhstan, 2015Basil Balgyn (VI050022) Kazakhstan, 2015Celery Poleznaya zelen (VI046247) Kazakhstan, 2015
Table 2. (Cont.)

76
and hot pepper, eggplant and mungbean. For the first time, locally bred new varieties of vegetable marrow were added to the State Register. New varieties of non-traditional species such as vegetable soybean (Glycine max), Chinese cabbage (Brassica chinensis L.) and yard-long bean (Vigna unguiculata subsp. sesquipedalis) also have been included in the State Register, adding diversity to the local crop portfolio.
Mungbean It is well-known that legumes contribute to soil fertility through their ability to fix nitrogen in the soil. Research on WorldVeg varieties of vegetable soybean, yard-long bean and mungbean confirmed their useful influence on soil fertility (Mavlyanova and Djumaniyazova, 2013 (Mavlyanova et al., 2013). New varieties of mungbean developed from WorldVeg germplasm have been especially popular in Central Asia. Local varieties are late maturing, with lodging stems, cracked beans, low yield and small size grain, all of which make manual harvesting difficult. Central Asia now has new, high-yielding, large-seeded, disease-resistant varieties with upright grown habits and dehiscent beans. These new varieties have various maturation periods: Durdona (VI048592) at 70 days; Zilola (VC1178) and Marjon (VC6492-59) at 95 days; and Turon (VC6153B-20G) at 100 days. Farmers can now choose the most appropriate variety to use in crop rotation and for mechanized harvest. New mungbean varieties have opened opportunities for farmers to take up a winter wheat-mungbean crop rotation and seed production system, as recommended by the International Center for Agricultural Research in the Dry Areas (ICARDA) and WorldVeg within activities 1 and 2 on the CGIAR Collaborative Research Program (CRP 1.1. Dryland Systems – Central Asia). Mungbean farmers are growing new varieties as catch crops to provide income, improve soil fertility and promote food security (Kuzieva, 2015). In 2016, the total area under new mungbean varieties was 1000 ha; with mungbean seed production initiated by WorldVeg, the area is expected to increase by four times in 2017. Active research on new WorldVeg mungbean germplasm and lines is continuing through the project “Beans with Benefits: Integrating improved mungbean as a catch crop into the dryland systems of South and Central Asia for increased smallholder farmer income and more sustainable production systems” (2015 – 2017) funded by BMZ-GIZ. This project aims to improve farmer income and increase the sustainability of dryland production systems in Central Asia by conducting trials and encouraging adoption of improved farmer-preferred mungbean lines with increased resistance to viruses and bruchid pests and improved resilience to environmental stresses; testing and disseminating mungbean production technologies to increase soil fertility and enhance crop production; establishing a mungbean learning alliance; training NARES staff; building farmers’ capacity in soil improvement; and using mungbean as a catch crop.

77
NEW PRODUCTION TECHNOLOGIES Tomato is the most popular crop in the region, but yield remains low due to the hot climate and soil diseases. To overcome these issues, the World Vegetable Center introduced tomato grafting in Uzbekistan. Since 2013, 70 tomato accessions have been studied for their potential as rootstocks; four were identified as resistant to fusarium as well as tolerant to salt and drought (Karimov et al., 2015). Grafting allows farmers to increase yield and quality of tomato and increase their incomes. Uzbekistan has expanded grafting research to include cucumber and cucumber grafting is continuing in Armenia. Cultivation technologies for new varieties have been disseminated in all countries in the region. Cultivation technologies for year-round production and seed production of non-traditional species such Chinese cabbage introduced by WorldVeg have been shared (Asatov et al., 2014).
NUTRITION-SENSITIVE VEGETABLE TECHNOLOGIES Under the U.S. Government’s Feed the Future initiative, the Nutrition-Sensitive Vegetable Technologies Project (2014 – 2017) funded by the United States Agency for International Development (USAID) aims to improve nutrition outcomes by introducing improved production methods, including greenhouses, for extended season vegetable production, containerized seedling production and improved, nutritious vegetable varieties. These technologies go hand-in-hand. Greenhouses are the cornerstone of extended season production allowing for earlier and later production of vegetables in FTF’s geographical focus area in 12 districts of Khatlon Province, Tajikistan. The project has improved current greenhouse technologies and encouraged farmers to adopt greenhouse production for protected agriculture. Modern production techniques, including husbandry practices and postharvest technologies, have also been introduced. To engage women farmers, the project introduced new hybrids and WorldVeg vegetable varieties to address nutritional deficiencies. From March 2015 – 2016, a total of 43 greenhouses of various sizes were distributed to householders in Khatlon: 12 (2.5 х 8 m), 13 (5 x 20 m) and 18 greenhouses with drip irrigation systems (6 x 24m). Farmers produced 370,000 high quality containerized seedlings of various varieties and hybrids of sweet pepper, tomato and cucumber in these greenhouses, which increased productivity and quality of fruits. The availability of good seedlings encouraged more effective use of household gardens. Project activities were complemented with workshops and training seminars to strengthen capacity of local partners and farmers; introduce new vegetable growing technologies for use in household gardens; and encourage women to grow vegetables and improve nutritional status in the region.

78
NUTRITION Promotional activities to introduce two new varieties (Fayz baraka and Mujiza) of non-traditional species Heliantus tuberosus L. (Jerusalem artichoke, girasol, or topinambour) were conducted in Uzbekistan. This vegetable has antidiabetic properties and has been included in the list of crops recommended for consumption by the Ministry of Human Health Protection of Uzbekistan since 2014. Home, school and community gardens have been initiated to increase vegetable production knowledge and vegetable consumption among people living in vulnerable zones of Uzbekistan, including the Aral Sea Basin (Karauzyak), piedmont (Bostanlyk), steppe (Ramitan) and the Fergana valley. Activities promote vegetable cultivation and advocate for nutritionally effective use of vegetables. Nutritious non-traditional vegetables such as daikon, leaf cabbage, vegetable soybean and yard-long bean have improved and diversified local diets (Zuev et al., 2015; Mavlyanova et al., 2016).
CAPACITY BUILDING The CAC Network builds capacity by training young scientists in modern research methods and encouraging young people to pursue advanced degrees in vegetable research. Postdoctoral students study hot pepper, sweet pepper, tomato, cucumber, vegetable soybean and vegetable marrow. Vegetable research is increasing the local vegetable supply, diversifying agriculture, increasing farmers’ income and encouraging greater consumption of vegetables for health and improved livelihoods of people throughout the region. The fastest way to introduce new vegetable varieties and production technologies is through close cooperation with local governments, farmers’ associations and women’s groups. Knowledge is disseminated through farmers’ days, meetings, seminars, training sessions, distribution of leaflets and booklets and the use of mass and social media. Every year farmer field days are conducting across the region to demonstrate new WorldVeg vegetable varieties and to strengthen collaboration with farmers on vegetable production and seed multiplication. During these events, participants are encouraged to increase consumption of nutrient-rich vegetables and learn how to prepare vegetables for maximum nutritional benefit.
CONCLUSION Climate change, water deficiency, land degradation, soil salinity and other concerns require more research attention to develop practical solutions, including new, well-adapted vegetable varieties and improved cultivation technologies. All countries in Central Asia and the Caucasus need support for the collection and conservation of vegetable crop genetic resources and germplasm enhancement. Crop diversification, seed production, low-cost technology development and postharvest operations and marketing are other areas in need of attention. All of these measures will serve to increase the production of nutritious vegetables, increase farmers’ income and improve people’s well-being.

79
ACKNOWLEDGEMENT Support for this work comes from project donors and core donors to the World Vegetable Center: Republic of China (Taiwan), UK Department for International Development (DFID), United States Agency for International Development (USAID), Australian Centre for International Agricultural Research (ACIAR), Germany, Thailand, Philippines, Korea and Japan.
REFERENCESAitbayev, T.E. (2016). Main stages of development and scientific achievements of
the Kazakh Research Institute of Potato and Vegetable Growing for 70 years of activities. Proceedings of International Conference on “Scientific and Innovative Basis of Development of Potato, Vegetable and Melon Growing in the Republic of Kazakhstan” held on 22 – 23 July 2016, Kainar, Kazakhstan. p.11 – 22 (in Russian)
Asatov, Sh.I, Zuev, V.I., Mavlyanova, R.F. (2014). Chinese leaf cabbage and its cultivation technology elements. Tashkent, Uzbekistan, 104 p. (in Russian)
FAOSTAT. (2015). FAO Statistical Pocketbook. 2015. Rome, 236 pFAOSTAT. (2014). FAO STATISTICAL YEARBOOK. 2014. Europe and Central Asia
Food and Agriculture Food and Agriculture Organization of the United Nations. Regional Office for Europe and Central Asia, Budapest,130 p
FAOSTAT. (2013). FAO STATISTICAL YEARBOOK. 2013. World Food and Agriculture Food and Agriculture Organization of the United Nations, Rome, 307 p
Hughes, J.d’A, Keatinge, J.D.H. (2013). The nourished millennium: how vegetables put global goals for healthy, balanced diets within reach. Paper presented at: ASEAN Regional Symposium on High Value Vegetables in Southeast Asia: Production, Supply and Demand (SEAVEG 2012) (Chiang Mai, Thailand: (AVRDC)
Karimov, B., Lyan, E., Mavlyanova, R. (2015). Selection of promising rootstocks for grafting greenhouse tomato varieties for growing in greenhouses of Uzbekistan. Proceedings of the International Conference “The role of the seed breeding in ensuring of a food security” held on 20 September 2015 in Dushanbe, Tajikistan, p. 84-88 (in Russian)
Keatinge, J.D.H., Wang, J.F., Dinssa, F.F, Ebert, A.W., Hughes, J.d’A., Stoilova, T., Nenguwo, N., Dhillon, N.P.S., Easdown, W.J., Mavlyanova, R., Tenkouano, A., Afari-Sefa, V., Yang, R.Y., Srinivasan, R., Holmer, R.J., Luther, G., Ho F.I., Shahabuddin, A., Schreinemachers, P., Iramu, E., Tikai, P., Dakuidreketi-Hickes, A., Ravishankar, M. (2015). Indigenous Vegetables Worldwide: their Importance and Future Development. Acta Hort. 1102: 1 – 20
Kuzieva, D. (2015). Mungbean rejuvenate a soil and it is the most consumer product. J. Farmer. 1: 43 – 45. (in Uzbek)
Mavlyanova, R., Mecozzi, M. (eds.). (2015). Catalogue of released and promising vegetable varieties in Central Asia and the Caucasus. AVRDC - The World Vegetable Center, Tashkent, Uzbekistan. 25 p. (in English and Russian)
80
Mavlyanova, R. (2015). Improved vegetable varieties for Central Asia and the Caucasus developed from AVRDC – The World Vegetable Center germplasm. J. Ekin. Crop Breed and Gen. (1 – 2): 100 – 104
Mavlyanova, R.F., Yang, R.Y., Khusamitdinov, R.R., Nesterenko, V.P., Umarov, A. Kh. (2016). Central Asian and the Caucasus recipes with new vegetables. Ravza Mavlyanova and Ray-Yu Yang (eds.). Publishing Agency “Navruz”, Tashkent, Uzbekistan, 56 p.(in English, Uzbek and Russian)
Mavlyanova, R., Mecozzi, M., Begmuratov, A. (eds). (2014). AVRDC’s Partnership for Vegetable System Research and Development in Central Asia and the Caucasus. Tashkent, Uzbekistan, 52 p.(in English and Russian)
Mavlyanova, R.F., Djumaniyazova, G.I., Gafurova, L.A., Murodova, S.S., Pirnazarov, D.R. (2013). AVRDC vegetable legumes: new varieties for soil improvement. Soil-Water Journal, Vol.2, Number 2(1), p. 645 – 652
United Nations. (2013). Solutions for Sustainable Agriculture and Food Systems. Technical Report for the Post-2015 Development Agenda. 18 September 2013. Prepared by the Thematic Group on Sustainable Agriculture and Food Systems of the Sustainable Development Solutions Network (SDSN). A Global Initiative for the United Nations. 99 p

81
The Role of Child Health in Weight Gain: Making School Feeding Programs More Effective
Itchon, G.S.MD MMedScXavier University – Ateneo de CagayanPhilippinesE-mail: [email protected]
Abstract The popularity of school feeding programs makes it imperative that their effectiveness is assessed. While many studies have shown that these programs are effective in making underweight children gain weight, some studies have also shown that some children fail to gain weight despite being enrolled in a school feeding program. Children aged between 48 and 68 months, were admitted in from day care centers in municipalities in the province of Misamis Oriental, Northern Mindanao, Philippines. Data from the Weight Gain Study, a stepped wedge cluster randomized clinical trial of underweight Filipino children was used. Data on 145 children (mean age 61.4 months) were analyzed. There was a significant association between poor oral health and rate of weight gain. Children who slept better because their severely decayed teeth were extracted gained significantly more weight compared to children who reported sleeping problems after dental treatment (p <0.01). Extraction of severely decayed teeth in underweight Filipino children was associated with weight gain. Decreases in oral health impacts on sleeping appeared to be most strongly associated with weight gain. Emphasis on oral health and the provision of access to basic oral care should be one of the priorities of integrated health promotion programs to enhance children’s health. The total health of school children is a prerequisite to enhancing the effectiveness of school feeding programs and making children gain weight.
Keywords: children’s health, oral health, school feeding programs
INTRODUCTION Untreated severe dental caries in preschool children is very common in many low- and middle-income countries (Petersen et al., 2005). In Philippines, caries levels are among the highest in Southeast Asia. The 2006 Philippine National Oral Health Survey revealed that the mean number of decayed or missing teeth in 6-years-olds was 8.4 (Department of Education, 2008). Children had on an average 3.4 teeth where caries had progressed into the pulp. Severe dental caries affects young children’s quality of life and well-being. Children with untreated early childhood caries (ECC) had significantly poorer oral health-related quality of life (OHRQoL) than those without ECC (Abanto et al., 2011). Dental rehabilitation resulted in significant improvements in children’s OHRQoL with significant reductions in dental pain, sleeping and eating problems and their eating and appetite improved (Acs et al., 2001; Anderson et al., 2004; Malden et al., 2008; Alkarimi et al., 2012).

82
Poor oral health in children is associated with underweight and failure to thrive (Sheiham, 2006). Children requiring multiple extractions of severely decayed teeth had significantly lower body weights than caries-free children (Miller et al., 1982; Acs et al., 1992; Ayhan et al., 1996). Similar results were observed in the Philippine National Oral Health Survey (Benzian et al., 2011). Alkarimi demonstrated that there is a graded inverse relationship between severe dental caries and weight, height and BMI in Saudi children (Alkarimi, 2010). Dental rehabilitation of underweight children with severe dental caries was associated with an increased rate of weight gain (Acs et al., 1999; Malek et al., 2009). Extraction of pulpally involved primary teeth resulted in significant weight gain in underweight children participating in the Weight Gain Study (WGS), a cluster randomized clinical trial conducted in Philippines (Monse et al., 2012). There are several plausible mechanisms explaining why dental rehabilitation leads to an increased rate of weight gain. Severe dental decay can cause dental pain and that can negatively affect children’s ability to eat and sleep (Acs et al., 2001; Anderson et al., 2004). Impacts on eating may affect the quality and quantity of nutritious food consumed, resulting in inadequate caloric intake, while disturbed sleep due to dental pain can affect the secretion of growth hormones (van Cauter and Plat, 1998) or may cause excessive energy expenditure. Another theory is that dental inflammation from pulpally involved teeth suppresses growth through a metabolic pathway by reducing hemoglobin levels as a result of depressed erythrocyte production in the bone marrow (Means and Krantz, 1992). However, none of these theories have been thoroughly tested. The objective of this study was to assess whether the rate of weight gain after extraction of severely decayed teeth in underweight preschool Filipino children was related to reductions in oral health-related impacts and dental pain from severe dental caries affecting eating and sleeping.
METHODS
Study design The present study used data from the Weight Gain Study, which was a stepped wedge cluster randomized clinical trial (Hussey and Hughes, 2007; Brown and Lilford, 2006). In the WGS, thirteen-day care centers in ten municipalities in the province of Misamis Oriental were randomly divided into two groups; intervention Group A (six-day care centers) and waiting list control Group B (seven-day care centers). Children from Group A (n = 100) had all pulpally involved primary teeth extracted under local anesthesia (van Cauter and Plat, 1998). Their other carious teeth were treated with silver-diamine-fluoride Arrest of Caries Technique (ACT) (Yee et al., 2009). Children in Group B (n = 102) were treated four months later in the same way as Group A children. Anthropometric measurements, data on oral health-related impacts and blood samples were collected at the same time for both groups at the beginning of the study, four months after treatment of Group A children and four months after treatment of Group B children (Figure 1, Design I).

83
For this study data from the WGS were converted into a one-group pre-test-post-test study design where all children received treatment. Baseline data existed of the measurements of all children from Groups A and B, collected immediately before they received dental treatment. The follow-up data were measurements collected four months after the children were treated (Figure 1, Design II).
Study population Children in the WGS, aged between 48 and 68 months, were admitted in daycare centers in municipalities in the province of Misamis Oriental, Northern Mindanao, Philippines. All the children were underweight and had severe dental caries, with one or more pulpally involved primary teeth. Children were defined as underweight if their BMI was below the 5th percentile according to CDC Growth Charts. Children who tested positive for active tuberculosis infection at the screening stage were excluded and referred for treatment. Mentally handicapped children were also excluded for ethical reasons. None of the included children had systemic medical conditions and/or infectious diseases, according to parental reports. All parents or caregivers signed an informed consent. Written ethical approval was obtained from the Research Ethics Committee of Xavier University, Cagayan de Oro City, Philippines.
Data collection Prior to group assignment, all children were orally screened. Socio-demographic data were collected through a parental questionnaire and a face-to-face interview with parents at baseline. At each stage of the trial, data collection involved collection of
i.Weight gain study ii. One-group pretest-posttest
Screening
1st follow-up
Baseline
Tx
n = 179
n = 145*
2
1
2
Screening
Group ABaseline
Group BBaseline
1st follow-up 1st follow-up
2nd follow-up 2nd follow-up
Tx
Tx
n = 100 n = 102
n = 79
n = 70
n = 85
n = 74
2
2
1
2
2
2
2
1 Clinical dental examination 2 Anthropometric and OHRQol data* 10 excluded due to missing data (2 in Group A, 8 in Group B
Figure 1. Study design
n = 202

84
anthropometric measurements, completion of an interview-administered OHRQoL-questionnaire and collection of blood samples. Blood samples were taken to assess the effect of extraction of severely decayed teeth on hemoglobin levels to explore a metabolic pathway between severe dental caries and body growth, which will be reported in a separate paper. This paper reports only on the data relating to weight gain and oral health-related impacts.
Oral screening Clinical dental data were collected using standard WHO basic methods (WHO, 1997). One trained and calibrated general dentist carried out all examinations. Children were examined outside the day care centers, using the daylight as a direct light source. They were examined lying in a supine position on the carers’ and examiner’s laps (‘knee to knee’ position). Caries was scored when the ball end CPI probe could penetrate the dental caries cavity. Caries experience was recorded using the dmft-index. In addition, the severity of oral conditions resulting from untreated severe dental decay was scored using the pufa-index (Monse et al., 2010). The pufa-index records presence of severely decayed teeth with visible pulpal involvement (p), ulceration caused by dislocated tooth fragments (u), fistula (f) and abscess (a). The pufa-score per person is calculated in the same cumulative way as for the dmft-score and represents a number of teeth meeting pufa diagnostic criteria. Children with a minimum of one pulpally involved tooth (pufa-score of at least 1) were included in the study.
Data on oral health-related impacts Data on children’s oral health-related impacts were collected using the Scale of Oral Health Outcomes (SOHO-5); an interviewer-administered OHRQoL questionnaire developed for five-year-old children (Tsakos et al., 2012). Tsakos et al., demonstrated that the SOHO-5 is an internally consistent and valid questionnaire: SOHO-5 scores were significantly associated with different subjective oral health outcomes of 5-year old school children and scores discriminated between different clinical groups in relation to active caries lesions, pulp involvement and dental sepsis (Tsakos et al., 2012). The SOHO-5 was translated into Visayan, the local language and back-translated into English. A pilot study showed that the questionnaire could be used in the Philippine setting. The SOHO-5 questionnaire contained ten questions; seven of these assessed oral health-related impacts, including eating difficulty, drinking difficulty, speaking difficulty, playing difficulty, avoiding smiling (due to appearance), avoiding smiling (due to pain) and sleeping difficulty, two questions measured current and past toothache and one question assessed children’s satisfaction with oral health. All questions were assessed using a 3-point scale with the answering options ‘no’ (coded 0), ‘a little’ (coded 1) and ‘a lot’ (coded 2). A cumulative SOHO-5-score was calculated for the seven items on oral health-related impacts, which reflects the overall presence of oral health-related impacts, ranging from 0 (free from impacts) to 14 (most severe possible score). Only the question assessing current toothache was used in the present study.

85
Anthropometric data Weight and height were measured in duplicate by a trained nurse who was blinded as to which children had dental extractions first. She used the ‘WHO Anthropometric Indicators Measurements Guide’ (Cogill, 2001). The average of two readings was recorded. Weight was measured to the nearest 0.1 kg using portable hanging scales (Salter scale, UNICEF procurement) and calibrated after every five measurements. Standing height was measured to the nearest 0.1 cm using a stadiometer (‘Leicester’ Model, Children’s Growth Foundation, UK). Weight and height measurements were converted to z-scores, viz; weight-for-age (WAZ), height-for-age (HAZ) and BMI-for-age (BAZ) with the lmsGrowth Excel add-in (Medical Research Council, 2008), using 2006 (WHO, 2006) and 2007 (de Onis et al., 2007) WHO Growth Standards. Z-scores allow comparison of an individual’s weight, height or BMI, adjusting for age and sex relative to a reference population, expressed in standard deviations (SD) from the reference mean.
Statistical analysis Statistical analysis was carried out using STATA 10 (Stata Corp, College Station, Texas, USA). A p-value of <0.05 was regarded as significant. All children with missing data due to loss of follow-up or unrecorded data were excluded from the analysis. Oral health-related impacts and anthropometric measurements recorded before and after treatment were assessed using the paired T-test and the McNemar test. A series of simple linear regression analysis were performed to assess baseline associations between the presence of oral health-related impacts and WAZ at baseline and to assess the association between oral health-related impacts and weight gain after treatment. Weight gain was the outcome variable in the regression models, which was expressed as the difference in WAZ between before and after dental treatment. The explanatory variables referred to oral health-related impacts, which were analyzed one by one in simple linear regression model as the overall SOHO-5-score, eating impacts, sleeping impacts and dental pain. Oral health-related impacts were expressed in two ways; as changes in oral health-related impacts between, before and after treatment, categorized as ‘improvement’, ‘no difference’ or ‘deterioration’ and as the prevalence of oral health-related impacts after treatment (dichotomized as ‘present’ or ‘absent’). The categories ‘deterioration’ and ‘present’ were used as reference values. Then the number of teeth with dentally-related infections (pufa-score), WAZ at baseline and the time interval between treatment and follow-up were entered in the regression analysis to test whether these covariates moderated the association between oral health-related impacts and weight gain.
RESULTS Two hundred and two children participated in the WGS (100 children in Group A and 102 in Group B). Eighty-one percent of them (164 children; 85 in Group A and 79 in Group B) were reassessed at the first follow-up stage four months later and 71.3%

86
(144 children; 74 in Group A and 70 in Group B) completed all stages of the study. The frequent migration of families was the main reason for the loss to follow-up. For this study, data on 145 children (83 from Group A and 62 from Group B) were analyzed (71.8%), after excluding all children with missing data due to drop-out or unrecorded data (Figure 1, Design II).
Characteristics at baseline and follow-up The mean age of the children at baseline was 61.4 ± 5.1 months (Table 1). There were significantly more girls (62.1%) than boys (37.9%) (p = 0.02). The mean dmft of the children was 10.9 ± 4.4. All children had at least one pulpally infected tooth at baseline, with an average pufa-score of 2.3 ± 1.6. They had a mean of 2.0 ± 1.7 teeth with pulp involvement (88.7%), 0.2 ± 0.5 teeth with a fistula (9.1%) and 0.05 ± 0.02 teeth with an abscess (2.1%). In this study on average 2.2 ± 1.1 teeth were extracted per child, ranging from one to nine extractions. The mean time interval between the extraction of pulpally involved teeth and the follow-up was 4.5 ± 0.8 months. All children were underweight at baseline. The average WAZ, HAZ and BAZ z-scores were 2.14 ± 0.6, 1.58 ± 0.8 and 1.67 ± 0.5 SD, respectively, below the mean of the reference population (Table 2). All children gained a significant amount of weight and height between baseline and follow-up four months after surgical tooth extraction. The average WAZ and BAZ significantly increased after dental treatment, while HAZ significantly decreased. The increase in WAZ and BAZ from a negative value to a less negative value implies that children were closer to the weight-for-age and BMI-for-age of the reference population of the same age and sex after treatment, which means that children had an increased rate of weight gain. The decrease in HAZ implies that children gained less height than would be expected in four months based on their age and sex relative to the reference population. Seventy-eight percent of the
Table 1. Characteristics of the study population at baseline
Characteristics n %Male 55 37.9Female 90 62.1 Mean ± sd Range MedianAge (months) 61.4 ± 5.1 48 – 71 61.8dmft-score 10.9 ± 4.4 2 – 20 9Pufa-score* 2.3 ± 1.6 1 – 13 2
No. of extractions 2.2 ± 1.1 1 – 6 2Monthly income (US$)** 99 ± 56 12 – 331 83Time interval between baseline and first follow-up (months)
4.5 ± 0.8 2.9 – 6.4 4.5
*9 missing observations, **22 missing observations

87
Table 2. Anthropometric measurements before and after treatment
Before treatment After treatment Mean 95% CI Mean 95% CI p-value*Weight (kg) 13.9 (13.7, 14.1) 15.1 (14.8, 15.4) <0.001Height (cm) 102.7 (102.0, 103.4) 104.3 (103.5, 105.1) <0.001BMI (kg/m2) 13.2 (13.1, 13.3) 13.8 (13.7, 13.9) <0.001WAZ (SD)• −2.14 (−2.24, –2.04) −1.88 (−2.01, –1.75) <0.001HAZ (SD) • −1.58 (−1.72, –1.44) −1.67 (−1.82, –1.52) <0.001BAZ (SD)• −1.67 (−1.75, –1.52) −1.15 (−1.27, –1.03) <0.001*Paired T-test.• WAZ = weight-for-age, HAZ = height-for-age, BAZ = BMI-for-age (Z-scores)
children increased their WAZ after treatment, while the WAZ of 28% of the children decreased (results not shown in the table) Before treatment, the average SOHO-5-score was 4.1 ± 3.4 (Table 3); 120 children (82.8%) reported at least one impact. Four months after treatment the average SOHO-5-score significantly decreased to 1.4 ± 2.9, with only 40 children (27.6%) still reporting an impact. There was a significant reduction after surgical tooth extraction in the percentage of children having eating impacts, sleeping impacts and dental pain. The majority of children experienced less oral health-related impacts after dental treatment. However, 15.9%, 9.7%, 11.0% and 5.5% children reported deterioration in SOHO-5-scores relating to eating impacts, sleeping impacts and dental pain, respectively.
Baseline associations between oral health-related impacts and weight An increase of one in SOHO-5-score was significantly associated with a 0.03SD (0.00, 0.06) lower WAZ at baseline (Table 4). Children reporting eating impacts at baseline had significantly lower body weights than children who were free of eating impacts, yet no significant associations were found for sleeping impacts and for the presence of oral pain with WAZ at baseline (Table 4).
Associations between oral health-related impacts and weight gain after treatment Children with improved SOHO-5 scores after tooth extraction gained significantly more weight compared to children who deteriorated in SOHO-5 scores after treatment (Table 5). Having a lower SOHO-5 score after treatment was also associated with an increased rate of weight gain, compared to children with higher SOHO-5 scores after treatment (Table 6). Simple linear regression analysis of the influence of individual impacts on weight gain showed that children who improved or reported no difference in their ability to sleep, gained significantly more weight than children whose sleeping ability deteriorated (Table 5). A similar association was found between the presence or absence of sleeping

88
Table 3. Oral health-related impacts before and after treatment
Before treatment After treatmentMean 95% CI Mean 95% CI p-value*
Overall SOHO-5 score 4.1 (3.5, 4.7) 1.4 (0.9, 1.9) <0.001 n % n % p-value**Eating impact <0.001
Yes 104 71.7 31 21.4No 41 28.3 114 78.6
Sleeping impact <0.001Yes 86 59.3 29 20.0No 59 40.7 116 80.0
Dental pain <0.001Yes 36 24.8 12 8.3No 109 75.2 133 91.7
*Paired T-test, **McNemar test
Table 4. The association between oral health-related impacts and WAZ • at baseline
WAZβ-coefficient 95% CI p-value*
SOHO-5 score (continuous)i 0.03 (0.00, 0.06) 0.05Eating impactii 0.26 (0.04, 0.48) 0.02Sleeping impactii 0.16 (−0.05, 0.36) 0.14Dental painii 0.04 (−0.20, 0.27) 0.75
*Simple linear regressioniSOHO-5 score at baseline ii ‘absent’ regressed against ‘present’ (reference)•WAZ = weight-for-age (Z-score)
impacts after treatment and weight gain; children free from sleeping impacts after tooth extraction had a significantly increased rate of weight gain compared to children who reported sleeping impacts after extractions (Table 6). No significant associations were found between weight gain and changes in eating impacts and changes in dental pain experience after treatment. The number of teeth with dental infections, WAZ at baseline and the time interval between the extraction of severely decayed teeth and follow-up was not significantly related to the rate of weight gain (Table 7). Therefore, it was not necessary to adjust the association between oral health-related impacts and weight gain for these covariates in multiple regression models.

89
Table 5. The association between changes in oral health-related impacts between before and after treatment and weight gain after treatment
WAZ-difference• β-coefficient 95% CI p-value*
SOHO-5-score (continuous)i 0.01 (−0.01, 0.04) 0.23SOHO-5-score
No difference ii 0.21 (−0.06, 0.48) 0.13 Improvement ii 0.30 (0.10, 0.50) 0.003
Eating impact No difference ii 0.04 (−0.23, 0.32) 0.75 Improvement ii 0.11 (−0.14, 0.37) 0.39
Sleeping impact No difference ii 0.36 (0.12, 0.61) 0.004 Improvement ii 0.31 (0.07, 0.55) 0.01
Dental pain No difference ii 0.24 (−0.07, 0.55) 0.13
Improvement ii 0.19 (−0.14, 0.52) 0.25
*Simple linear regressioniDifference in SOHO-5 score between before and after treatmentii‘Improvement’ and ‘No difference’ regressed against ‘deterioration’ (reference)•Difference in weight-for-age (Z-score) between before and after treatment
Table 6. The association between oral health-related impacts after treatment (presence or absence) and weight gain after treatment
WAZ-difference• β-coefficient
95% CI p-value*
SOHO-5-score (continuous)i 0.04 (0.01, 0.05) 0.04Eating impactii 0.16 (−0.02, 0.33) 0.09Sleeping impactsii 0.26 (0.08, 0.44) 0.006Dental painii 0.17 (−0.10, 0.44) 0.21
*Simple linear regressioni‘SOHO-5-score after treatmentii‘absent’ regressed against ‘present’ (reference)•Difference in weight-for-age (Z-score) between before and after treatment

90
DISCUSSION Findings of this intervention study indicate that there was a statistically significant association between self-reported oral health-related impacts and the rate of weight gain after extraction of severely decayed teeth in preschool Filipino children. At baseline, eating impacts were related to reduce body weight. However, improvement in eating ability, or being free from eating impacts after surgical tooth extraction, was not associated with weight gain. On the other hand, reductions in the impacts on sleeping had a consistent significant association with increased rate of weight gain, suggesting that the impact on sleeping might be an important factor in the relationship between extraction of severely decayed teeth and weight gain. Impacts on sleeping can play an important role in growth retardation due to disturbance in the production of growth hormones resulting from lack of sleep (van Cauter and Plat, 1996). Based on theories of such a mechanism, it is expected that sleeping would have a stronger impact on height than on weight. However, in this study the height-for-age significantly decreased after dental treatment, suggesting that children grew less in height in four months than would be expected based on their age and sex, relative to a reference population. Height, however, takes longer to change than weight. The process of growth is described as saltation and stasis, whereby infant growth follows a series of rapid growth spurts (saltation), separated by periods of stasis (Lampl et al., 1992; Lampl and Thompson, 2007). This indicates that children first put on weight before growing in height. This complex process of catch-up growth and the short time pan between dental extractions and follow-up in this study may explain why height did not increase. Height measurements were not regularly monitored. That and the short time interval between baseline and follow-up that was necessary for ethical reasons, are reasons why it was not possible to rigorously assess the association between sleeping impacts and height gain after dental treatment. Dental pain was hypothesized to be the intermediate factor for the associations between impacts on eating and sleeping and weight gain. However, there was no association between oral pain and body weight. That may be related to how dental pain was measured. Dental pain was assessed as ‘do your teeth hurt now?’. Since dental decay leads mainly to dental pain that is not permanently present, not all children with severe dental decay reported having dental pain at baseline. The number of children
Table 7. The association between covariates and weight gain
Covariate WAZ-difference• β-coefficient 95% CI p-value*
pufa-score 0.02 (−0.03, 0.07) 0.48
WAZ at baseline 0.06 (−0.06, 0.18) 0.35
Time interval 0.05 (−0.04, 0.13) 0.30
*Simple linear regression•Difference in weight-for-age (Z-score) between before and after treatment

91
with dental pain at baseline and after dental treatment (n = 36 and n = 12, respectively) may have been too small to demonstrate a statistically significant association between dental pain and weight gain. Oral health-related impacts were assessed in two ways: as changes in impacts between before and after treatment (‘improvement’, ‘no difference’ or ‘deterioration’) and as the prevalence of impacts after treatment (‘present’ or ‘absent’). The findings of this study suggest that the absence of oral health-related impacts after dental treatment is a stronger and probably more accurate predictor of weight gain, compared to assessing a decrease in reported impacts between before and after treatment. Children who improved from having ‘a lot’ of impacts at baseline to ‘a little’ after treatment were still experiencing problems, while children who did not report a difference in impacts could have been free of impacts at both stages of the study. A notable finding was that in some children weight-for-age decreased after dental treatment. This may be related to other factors, such as dietary factors, poor environments and other social and medical factors that confounded the association between severe dental decay and weight gain. These factors are more likely to have a stronger influence on weight gain than dental treatment. For example, the prevalence of soil-transmitted helminths in under-5-year-old children in the Philippines ranged from 49% to 93% (Beasley et al.,1999). Worm infestation has a negative impact on nutrition. Other medical factors, such as anemia and infectious diseases including malaria and diarrhea, can negatively influence weight gain (Krugman and Dubowitz, 2003). Most children in this study were from very deprived municipalities, where access to food was the highest priority. This could contribute to parental stress, which is related to a child’s failure to thrive (Krugman and Dubowitz, 2003). The aforementioned factors were not assessed in this study and may have influenced the rate of weight gain and its association with oral health-related impacts. Other factors that were hypothesized to moderate the association were a number of pulpally infected teeth, weight-for-age at baseline and the time interval between treatment and follow-up. It was presumed that children with several infected teeth would benefit more from treatment, compared to children with only one tooth affected. Weight at baseline was hypothesized to be an important moderator, as there is a tendency for children who are taller, to grow slightly less than smaller children, a ‘regression to the mean’ (Cameron et al., 2005). The variation in time intervals between dental treatment and follow-up may have influenced the time for children to grow after tooth extractions. None of the above mentioned assumptions were supported by results of this study. Whether the relationship between the above mentioned covariates and weight gain are truly non-existent or if the non-significant findings resulted from the small sample size and effects of other medical, social and environmental factors, should be further investigated. One of the main strengths of this study was that the data were derived from a stepped wedge cluster randomized clinical trial, which demonstrated the benefit of weight gain of dental extractions. For this study, data were converted to a prospective cohort

92
design, allowing assessment of the relationship between oral health-related impacts and rate of weight gain over time. Some potential limitations of the study should, however, be taken into account. A fair number of children were lost to follow-up, which may have affected the results as children who dropped out may have responded differently to dental treatment than those children who completed all stages of the study. The unequal distribution of gender in the study sample may also have influenced the results. Although a validated questionnaire was used to collect information on oral health-related impacts, there may have been bias in children’s self-reports. The relatively small number of children in the study may have resulted in some weak associations between oral health-related impacts and weight gain and the time interval between surgical tooth extraction and follow-up may have been too short for children to gain much weight and height following treatment. A cause-effect relationship cannot be deduced from the one-group pretest-posttest design. More research is needed to further explore the causal mechanisms between severe dental decay and body growth in young children. Studies should also investigate the metabolic pathways and incorporate parameters related to general health, psychosocial relationships and environmental factors, as body growth is influenced by numerous factors. The time interval between dental treatment and follow-up should be longer and anthropometric measurements should be regularly monitored to investigate the relationships between severe dental decay and height.
CONCLUSION This study shows that after extraction of severely decayed teeth in underweight Filipino children, levels of oral health-related impacts were associated with the rate of weight gain. Decreases in oral health impacts on sleeping after tooth extraction appeared to be most strongly associated with weight gain. Despite the growing recognition that a common condition, such as untreated severe dental decay affects children’s growth and well-being, investment in improving oral health is still neglected in many low- and middle-income countries. If the evidence of an impact of oral health on body constitution can be further established by understanding its underlying causal mechanisms, then emphasis on prevention of dental decay and the provision of access to basic oral care needs to be one of the priorities of integrated health promotion programs to enhance growth and well-being of millions of underweight children.

93
REFERENCESAbanto, J., Carvalho, T.S., Mendes, F.M., Wanderley, M.T., Bönecker, M., Raggio, D.P.
(2011). Impact of oral diseases and disorders on oral health-related quality of life of preschool children. Community Dent Oral Epidemiol., 39: 105 – 114. 10.1111/j.1600-0528.2010.00580.x.View ArticlePubMedGoogle Scholar
Acs, G., Lodolini, G., Kaminski, S., Cisneros, G.J. (1992). Effect of nursing caries on body weight in a pediatric population. Pediatr Dent., 14: 302 – 305.PubMedGoogle Scholar
Acs, G., Pretzer, S., Foley, M., Ng, M.W. (2001). Perceived outcomes and parental satisfaction following dental rehabilitation under general anesthesia. Pediatr Dent., 23: 419 – 423.PubMedGoogle Scholar
Acs, G., Shulmann, R., Ng, M.W., Chussid, S. (1999). The effect of dental rehabilitation of the body weight of children with early childhood caries. Pediatr Dent., 21: 109 – 113.PubMedGoogle Scholar
Alkarimi, H.A. (2010). Impact of dental treatment on anthropometric and health outcomes: a randomised controlled trial amongst Saudi children. PhD Thesis., London: University College London Google Scholar
Alkarimi, H.A., Watt, R.G., Pikhart, H., Jawadi, A.H., Sheiham, A., Tsakos, G. (2012). Impact of treating dental caries on schoolchildren’s anthropometric, dental, satisfaction and appetite outcomes: a randomized controlled trial. BMC Public Health., 12: 706 – 10.1186/1471-2458-12-706.View ArticlePubMedPubMed CentralGoogle Scholar
Anderson, H.K., Drummond, B.K., Thomson, W.M. (2004). Changes in aspects of children’s oral-health-related quality of life following dental treatment under general anaesthetic. Int J Paediatr Dent., 14: 317 – 325. 10.1111/j.1365-263X.2004.00572.x.View ArticlePubMedGoogle Scholar
Ayhan, H., Suskan, E., Yildirim, S. (1996). The effect of nursing or rampant caries on height, body weight and head circumference. J Clin Pediatr Dent., 20: 209 – 212.PubMedGoogle Scholar
Beasley, N. M., Tomkins, A. M., Hall. A., Kihamia, C. M., Lorri, W., Nduma, B., Issae, W., Nokes, C., Bundy, D.A.P. (1999). The impact of population level deworming on the haemoglobin levels of schoolchildren in Tanga, Tanzania. Trop Med Int Health., 4: 744 – 750. 10.1046/j.1365-3156.1999.00486.x.View ArticlePubMedGoogle Scholar
Benzian, H., Monse, B., Heinrich-Weltzien, R., Hobdell, M., Mulder, J., van Palenstein-Helderman, W. (2011). Untreated severe dental decay: a neglected determinant of low Body Mass Index in 12-year-old Filipino children. BMC Public Health., 11: 558 – 10.1186/1471-2458-11-558.View ArticlePubMedPubMed CentralGoogle Scholar
Brown, C.A., Lilford, R. (2006). The stepped wedge trial design: a systematic review. BMC Med Res Methodol., 6: 54 – 10.1186/1471-2288-6-54.View ArticlePubMedPubMed CentralGoogle Scholar

94
Cameron, N., Preece, M.A., Cole, T.J. (2005). Catch-up growth or regression to the mean? Recovery from stunting revisited. Am J Hum Biol., 17: 412 – 417. 10.1002/ajhb.20408.View ArticlePubMedGoogle Scholar
Cogill, B. (2001). Anthropometric Indicators Measurement Guide., Washington DC: Food and Nutrition Technical Assistance Project, Academy for Educational DevelopmentGoogle Scholar
de Onis, M., Onyango, A.W., Borghi, E., Siyam, A., Nishida, C., Siekmann, J. (2007). Development of a growth reference for school-aged children and adolescents. Bull WHO., 85: 660 – 667.PubMedPubMed CentralGoogle Scholar
Department of Education. (2008). Health and Nutrition Center, National oral health survey among the public school population in the Philippines. Manila: Department of Education Google Scholar
Hussey, M.A., Hughes, J.P. (2007). Design and analysis of stepped wedge cluster randomized trials. Contemp Clin Trials., 28: 182 – 191. 10.1016/j.cct.2006.05.007.View ArticlePubMedGoogle Scholar
Krugman, S.D., Dubowitz, H. (2003). Failure to Thrive. Am Fam Physician. 68: 879 – 884.PubMedGoogle Scholar
Lampl, M., Thompson. A.L.(2007). Growth chart curves do not describe individual growth biology. Am J Hum Biol., 19: 643 – 653. 10.1002/ajhb.20707.View ArticlePubMedGoogle Scholar
Lampl, M., Veldhuis, J.D., Johnson, M.L. (1992). Saltation and stasis: a model of human growth. Science., 258: 801 – 803. 10.1126/science.1439787.View ArticlePubMedGoogle Scholar
Malden, P.E., Thomson, W.M., Jokovic, A., Locker, D. (2008). Changes in parent-assessed oral health-related quality of life among young children following dental treatment under general anaesthetic. Community Dent Oral Epidemiol., 36: 108 – 117. 10.1111/j.1600-0528.2007.00374.x.View ArticlePubMedGoogle Scholar
Malek Mohammadi, T., Wright, C.M., Kay, E.J. (2009). Childgrowth and dental caries. Community Dent Health., 26: 38 – 42.PubMedGoogle Scholar
Means, R.T., Krantz, S.B. (1992). Progress in understanding the pathogenesis of the anemia of chronic disease. Blood., 80: 1639 – 1647. PubMedGoogle Scholar
Miller, J., Vaughan-Williams, E., Furlong, R., Harrison, L. (1982). Dental caries and children’s weights. J Epidemiol Community Health. 36: 49 – 52. 10.1136/jech.36.1.49.View ArticlePubMedPubMed CentralGoogle Scholar
Monse, B., Duijster, D., Sheiham, A., Grijalva-Eternod, C.S., van Palenstein Helderman, W., Hobdell, M.H. (2012). The effects of extraction of pulpally involved primary teeth on weight, height and BMI in underweight Filipino children. A cluster randomized clinical trial. BMC Public Health., 12: 725-10.1186/1471-2458-12-725.View ArticlePubMedPubMed CentralGoogle Scholar

95
Monse, B., Heinrich-Weltzien, R., Benzian, H., Holmgren, C., van Palenstein Helderman, W. (2010). PUFA – An index of clinical consequences of untreated dental caries. Community Dent Oral Epidemiol., 38: 77 – 82. 10.1111/j.1600-0528.2009.00514.x.View ArticlePubMedGoogle Scholar
Petersen, P.E., Bourgeois, D., Ogawa, H., Estupinan-Day, S., Ndiaye, C. (2005). The global burden of oral diseases and risks to oral health. Bull World Health Organ., 83(2005): 661 – 669. PubMedPubMed CentralGoogle Scholar
Sheiham, A. (2006). Dental caries affects body weight, growth and quality of life in preschool children. Br Dent J., 210: 625 – 626.View ArticleGoogle Scholar
Tsakos, G., Blair, Y.I., Yusuf, H., Wright, W., Watt, R.G., Macpherson, L.M.D. (2012). Developing a new self-reported scale of oral health outcomes for 5-year old children (SOHO-5). Health Qual Life Outcomes., 10: 62-10.1186/1477-7525-10-62.ViewArticlePubMedPubMed CentralGoogle Scholar
van Cauter, E., Plat, L. (1996). Physiology of growth hormone secretion during sleep. J Pediatr., 128: 32 – 37. 10.1016/S0022-3476(96)70008-2.View ArticleGoogle Scholar
WHO. (2006). Multicentre Growth Reference Study Group WHO child growth standards based on length/height, weight and age. Acta Paediatr., 450 (Suppl): 76 – 85.Google Scholar
WHO. (1997). World Health Organization (WHO). Oral Health Surveys. Basic Methods., Geneva: World Health Organization, 4Google Scholar
Yee, R., Holmgren, C., Mulder, J., Lama, D., Walker, D., van Palenstein Helderman, W. (2009): Efficacy of silver diamine fluoride for arresting caries treatment. J Dent Res., 88: 644 – 647. 10.1177/0022034509338671.View ArticlePubMedGoogle Scholar

96
Sweet Onion of Kumta: A Traditional Variety for Nutrition and Sustainability
Basavaraja, N.1, Shivanand Hongal2, Shantappa, T.3 and Pushpa, P.41Professor of Horticulture and Dean, Post Graduate Studies, University of Horticultural Sciences, Bagalkot, 587104, Karnataka, India,3Professor, College of Horticulture, Sirsi,2 and 4Assistant Professors College of Horticulture, Sirsi, Karnataka, IndiaE-mail: [email protected] / [email protected]
Abstract India is traditionally known as land of spices, producing a large number of spice crops including onion. Onion is one of the important ingredients in most of the Indian culinaries, mainly because of its pungency and flavor. However, there is one local type grown on the sand banks of Arabian Sea coast, near Kumta, Karnataka State, India, which possess the unique sweet flavor. Cultivation of this local type is different compared to the conventional onion cultivation. In general, women folk undertake all the organic production practices and earn bumper yield with remunerative price in a span of 3 – 4 months period. Because of its sweet flavor and low pungency it gets a premium price in market. The preliminary trial conducted at Horticulture College, Sirsi indicated, recommended dosage of fertilizers (RDF) 125: 75: 100 kg NPK/ha, recorded highest yield (32.43 t/ha) and a spacing of 7.5 X 5.0 cm and additional supplement of bio-fertilizers enhance the quality TSS of (12.98 oB) onion.
INTRODUCTION India is traditionally known as land of spices producing a large number of spice crops viz., pepper, cardamom, clove, nutmeg, turmeric, ginger, chilli etc., Among these spices, Onion (Allium cepa L.) is most important commercial vegetable cum spice crop of India having an area of 11.74 m ha with a production of 18.93 metric ton (Anon., 2015). India stands first in area and second in production and third country in the export of onion in the world. In India, onions are consumed both in green form as well as in matured state. It is important ingredient in cooking due to its special taste, flavor and pungency, which is mainly due to the presence of sulphur containing alkaloid called allyl profile disulfide. Alliums are plants of open sunny, dry areas in fairly arid climates. In India, onions are being grown largely in rainy season (60 – 70%) followed by winter season (30 – 40%). Onions come with different types like, yellow onion, white onion, red onion, sweet onion, shallots, green onion, leek, sambar onion etc., Variation in onion could be observed throughout India and also in Mediterranean regions. There is one local sweet onion cultivar largely grown in coastal area of Karnataka. The cultivar is medium and uniform in size having very thin outer scales, sweet in taste with high water content than the normal pungent onions commonly cultivated consumed in India and are used mainly for salad and fish preparations (garnishing). This is cultivated by small and marginal farmers particularly by women folks in and around ‘Vanalli’, a hamlet village near Kumta (“Onion village”), who take up

97
the production organically on sand banks from January to April after harvest of paddy. Hence, the onions gets premium price mainly for their quality, thus they will have sustainable income during off season. This rare onion cultivar requires loose sandy coastal soils, more sunshine (10 – 12 hrs) with cool nights which promotes the specific flavor and taste. The women folk of the area who have very little land for cultivation take up this crop. The unique production practices and preservation of seeds have been passed from generations to generations as an indigenous knowledge. Studies were conducted at the College of Horticulture, Sirsi, coming under The University of Horticultural Sciences, Bagalkot, Karnataka, India to generate basic information of its cultivation and quality aspects. Efforts are also being made to get the geographical indicator tag for this great and unique sweet onion.
MATERIAL AND METHODS The experiment was conducted in sandy shallow soils at College of Horticulture, Sirsi during Winter-2015. The experiment consists of standardization of nutrition and planting geometry for yield and quality of Kumta Sweet Onion (Allium cepa L.)
The details of treatments are as follows;
I. Nutritional trial: T1 – Recommended dose of NPK (RDF) i.e., 125: 75: 100 kg NPK /ha (reference for this RDF is essential)T2 – 50% RDF (62.5: 37.5: 50 kg NPK /ha)T3 – 75% RDF (93.75: 56.25: 75 kg NPK/ha) T4 – 125% RDF (156.25: 93.75: 125 kg NPK/ha) T5 – T2 + Vermicompost (1t/ha) + PSB (5 kg/ha) + Azospirillium (5 kg/ha)The experiment was conducted in Randomized Block design with 4 replications.
II. Planting geometry trial (Spacing): indent.T1 – 10 X 10 cmT2 – 10 X 7.5 cmT3 – 7.5 X 7.5 cmT4 – 7.5 X 5.00 cmThe experiment was conducted in RBD with 5 replications.
OBSERVATIONS RECORDED The following observations were made at maturity stage from the randomly selected five plants in each treatment, replications wise and recorded in the standard units. Plant height (cm), number of leaves, bulb length (mm), bulb diameter (mm), bulb weight (g), yield (t/ha) and TSS (oB). The averages were computed and analyzed in a simple randomized block design.

98
RESULTS AND DISCUSSION
The study was conducted for standardization of nutrients and planting geometry for Kumta sweet onion during rabi-2015. The results indicated that the yield and its attributing characters were significantly influenced by different dosages of nutrients. The treatment consisting of T1 RDF (125:75:100) kg of NPK/ha recorded maximum plant height (42.43 cm), bulb length (44.43 mm), bulb weight (42.43g) and yield (32.43 t/ha). This could be mainly due to proper intake of NPK, which was readily available and was in optimum quantity. However, the treatment (T5) having Vermicompost (V.C) + Phosphorous solubalizing bacteria (PSB) and Azospirillium recorded maximum TSS (12.980B) followed by T2-50% RDF (12.730 B). This clearly indicates the growth promoting substances present in the vermicompost and easy availability of PSB and nitrogen from Azospirillium might have helped in accumulating more sugars in the bulbs at shortest period. Thus, it could be reasoned that better efficiency of nutrients could be obtained through optimum NPK doses in onions (Tripathy et al., 2013). The results obtained by planting geometry of Kumta sweet onion indicates that, a spacing of 7.5 x 5.0 cm (T4) produced highest yield of 44.05 t/ha, which was significantly different among the treatments. This was closely followed by T2 (10.00 x 7.5 cm) which produced second highest bulb yield (34.30 t/ha) and maximum content of TSS (13.080 B), maximum number of leaves (5.00), bulb diameter (33.84 mm). A glance of the results indicates that, closer spacing with shallow sandy soil were the most congenial conditions for producing optimum and uniform size of bulbs, since the plants utilized maximum opportunity to harvest sun light and uptake of nutrients in the limited area. This is mainly due to shallow rooting nature and upright growing habit of onions. Similar results were obtained by Nasir et al., (2007) and Mohd Rezaul et al., (2015) in onion. The scientists opined that more number of plants/unit area was ideal in obtaining maximum yield in onion with uniform bulb size. Yemane Kansay et al., (2014) reported that, as intra-row spacing decreases, there is an increase in total plant population and this in turn contributed to increase in total bulb yield, but the bulb dimension and weight decrease. Different varieties have different yield and quality potential based on geographic locations (Jilani and Ghaffor, 2003), thus the sweet onion of Kumta must have possessed the sweet flavor.
CONCLUSION A perusal of data presented in Table 1 and Table 2 reveals that maximum yield per hectare (44.05 t/ha) could be obtained by closer spacing which also resulted in uniform size of bulbs and maximum T.S.S. content. Further, it would also be concluded that optimum and quick availability of major nutrients (NPK) and additional supplements through bio-fertilizers could enhance the yield (32.43 t/ha) and quality (TSS of 12.98°B) of Kumta sweet onion.

99
Tabl
e 1.
Effe
ct o
f NPK
dos
e on
gro
wth
, yie
ld a
nd q
ualit
y in
Kum
ta s
wee
t oni
on (2
015)
Trea
tmen
tPl
ant h
eigh
t(c
m)
No.
of l
eave
sB
ulb
Leng
th
(mm
)B
ulb
diam
eter
(mm
)B
ulb
wei
ght
(g)
Yie
ld/h
a(t)
TSS
(OB
)T 1
42.4
36.
2044
.43
40.2
832
.43
32.4
311
.95
T 238
.09
5.55
41.1
636
.13
30.1
630
.16
12.7
3T 3
40.1
45.
8542
.45
43.7
124
.53
24.5
311
.96
T 437
.53
5.65
43.7
238
.26
26.6
026
.60
12.6
8T 5
38.8
66.
4042
.13
34.1
329
.90
29.9
012
.98
S. Em ±
0.06
40.
007
0.03
20.
082
0.09
00.
072
0.01
1C
.D (P
= 0
.05)
0.19
80.
021
0.10
10.
255
0.28
10.
223
0.03
5
Tabl
e 2.
Effe
ct o
f pla
nt g
eom
etry
on
grow
th, y
ield
and
qua
lity
in K
umta
sw
eet o
nion
(201
5)
Trea
tmen
tPl
ant h
eigh
t(c
m)
No.
of l
eave
sB
ulb
Leng
th (m
m)
Bul
b di
amet
er(m
m)
Bul
b w
eigh
t(g
)Y
ield
/ ha
TSS
(OB
)T 1:
10 X
10
cm37
.02
4.70
39.0
831
.83
28.5
528
.55
11.5
7T 2:
10 X
7.5
cm
43.1
05.
0034
.87
33.8
425
.73
34.3
013
.08
T 3: 7.
5 X
7.5
cm
39.7
54.
8534
.69
31.6
118
.75
33.3
012
.96
T 4: 7.
5 X
5.0
cm
45.1
54.
2035
.54
29.2
716
.52
44.0
511
.98
S. Em ±
0.84
0.10
0.73
0.64
0.46
0.72
0.25
C.D
(P =
0.0
5)2.
510.
292.
191.
921.
392.
150.
75

100
Figure 1. Kumta sweet onion
REFERENCESAnon., (2015). Technical Bulletin, National Horticultural Board, Govt of India, Gurgoan,
Haryana, IndiaJilani and Ghaffor, (2003). Screening of local varieties of onion for bulb formation. Int.
J. Agril Biol. 5(7), pallistanMohd. Rezaul Islam, Amrita Mukherjee, Khan Golam Quddus, Prashanta Kumar Sardar,
Moshrraf Hossain, (2015). Effect of spacing and fertilizers on the growth and yield of onion. International Journal of scientific and technology Research, 4(10): 308 – 312
Nasir Mahamood Dawar, Faridullah Khan Wazir, Manhaj-uel-Din Dawar and Shah Hussian Dawar. (2007). Effect of planting density on growth yield of onion varieties under climatic conditions of Peshawar. Sarhad. J. Agric. 23(4): 911 – 918.
Tripathy, P., Sahoo, B.N., Priyadashini, S.K., Das and Dash, D.K., (2013). Effect of sources and levels of sulphur on growth, yield and bulb quality in onion, International Journal of Bio resources Stress Management, 4(4): 641 – 644
Yemane Kansay, Derbew Belbew and Fetien Abay, (2014). Effect of intra-row spacing on plant growth and yield of onion varieties (Allium cepa L.) at Aksum, Northern Ethiopia, Afr. Jr. Agri. Res., 9(10): 931 – 940

101
Metabolite Profiling of Maman (Cleome gynandra) Extracted with Different Extraction Buffers Via LCMS-MS
Chandradevan Machap, Mohd Waznul Adly Mohd Zaidan, Muhammad Aizuddin Ahmad and Sanimah SimohBiotechnology and Nanotechnology Research Centre, Malaysian Agricultural Research and Development Institute (MARDI), MARDI Headquarters, Persiaran MARDI-UPM, 43400 Serdang, Selangor, MalaysiaE-mail: [email protected]
Abstract Cleome gynandra is a traditionally consumed herb (ulam) especially in rural area. Its bitterness permits the use of this leafy vegetable in culinary where it is normally pickled or used as an ingredient in making Malaysian rendang. This fast growing C4 photosynthetic plant was previously reported rich in certain nutrients such as beta-carotene, folic acid, vitamin E, iron, ascorbic acid and calcium. Maman extract was previously reported to have anti-oxidant, anti-cancer, anti-inflammatory, anti-bacteria and immunomodulatory activity. However to date, studies on the metabolite profiles of maman extracted with different extraction buffers are still lacking. Therefore, two extraction buffers (absolute methanol and 20% methanol in water extraction buffer) were used for the extraction. Qualitative analysis from both extracts showed that extraction of maman leaves via 20% methanol in WEB has the ability to extract more phytochemicals compared to absolute methanol. Rutin was identified as one of the main marker compounds in maman where studies have shown that rutin has a strong anti-inflammatory property and therefore, maman was suggested to be used as an anti-inflammation herb.
INTRODUCTION The rises in non-communicable diseases are in stake now. Diseases such as diabetes, cardiovascular and stroke are racing towards the chart as the most occurring diseases in Malaysia (Zainal et al., 2012). As such, finding a cure for these diseases by means of modern medicines/drug is crucial. However, subsequent studies have shown that modern medicines may cause unwanted side effects (Phurpa, 2008, Haidan et al., 2016) thus herbal based products were sought after as the alternative treatment. Maman which was consumed as salad or ‘ulam’, was thought to relief stomachache, epileptic fits, arthritis etc. traditionally (Mishra et al., 2011). Scientific studies suggested that it has a strong anti-oxidant, anti-inflammatory, anti-cancer and anti-diabetic properties4. Little is known on the optimisation of metabolite extractions from maman. For the preliminary stage, maman was extracted with two different extraction buffers and the results are presented here.
MATERIALS AND METHODS Fresh maman sample was collected from a local farmer at Rompin, Negeri Sembilan. Sample was ground with liquid nitrogen and freeze dried prior to extraction. Dried sample (0.5 g) was extracted either with absolute methanol or 20% methanol in

102
water extraction buffer. In both extractions, sample was homogenized, vortexed and centrifuged to separate the supernatant from the residue. Collected supernatant was concentrated and reconstituted with 30% methanol prior to analysis via LCMS-MS (Agilent 1200 series HPLC coupled with ABSciex 3200 QTrap mass spectrometer) for 45 min. Sample was analysed at 280nm and 360nm using APCI probe.
RESULTS AND DISCUSSION Three major phytochemicals from maman have been identified tentatively based on the fragmentation patterns generated via LCMS-MS. Peak at retention time (Rt) ~8min generated mass/charge ratio (m/z) [M-H]- 189 to 161 which indicated a loss in ethyl precursor. Subsequent loss of a hydroxy precursor produced a daughter ion at [M-H-ethyl-hydroxy]- 145, which could be a coumaric acid. Thus it was identified as ethyl hydroxycoumarin. Peak at Rt ~12min has a mother ion at [M-H]- 609. A loss in rhamnose sugar yielded ion m/z 463 as the precursor ion. A subsequent loss of glucose moiety yielded ion m/z 301. This fragmentation pattern matches rutin. At Rt ~ 13min, the [M-H]- 593 has m/z 285 as the most intense daughter ion. A loss in rutinoside (m: 308) would yield such fragmentation pattern. As such it was identified as Kaempferol rutinoside. When comparison between extraction buffers was made, 20% methanol in WEB has a better extraction ability compared to absolute methanol only. Hydroxycoumarin was eluted almost 18 times higher in 20% methanol in WEB compared to absolute methanol. Other peaks were also detected abundantly in 20% methanol in WEB compared to absolute methanol (Figure 1).
CONCLUSION This study indicates the importance of using different extraction buffers in extracting health benefiting metabolites from herbs. Extraction buffer (20% methanol in WEB) extracted out more metabolites compared to absolute methanol. Besides, for commercialisation purpose, herbal products need to be extracted at minimal level of methanol due to its toxicity and are easily combustible. As such, extraction buffer at 20% methanol in WEB is an ideal choice.

103
REFERENCESHaidan, Y., Qianqian, M., Li. Y., and Guangchun, P. (2016). The traditional medicine
and modern medicine from natural products. Molecules 21Mishra, S.S., Moharana, S.K., and Dash, M.R (2011). Review on Cleome gynandra.
IJRPC 1(3): 681 – 689Phurpa Wangchuk. (2008). Health impacts of traditional medicines and bio – prospecting:
A world scenario accentuating Bhutan’s perspective. Journal of Bhutan Studies. 18:116 – 134
Zainal, A.O. and Feisul, I.M. (2012). Status of noncommunicable disease (NCDs) in Malaysia: An urgent call for action. Paper presented at UPM-Mead Johnson 3rd Nutrition Seminar, 8 Nov 2012
Figure 1. Comparison of metabolites distribution in maman extracted with different extraction buffers. Chromatograms were obtained at 280nm and 360nm absorbance

104
Metabolite Profiling of Terung Asam’s (Solanum ferox Linn) Oven-Dried Flesh And Seed Sample Using GC-MS
Mohd Waznul, A.M.Z.1, Muhammad Aizuddin, A.1, Chua, H.P.2, Chandradevan, M.1, Siti Maryam, O.1 and Sanimah, S.11Biotechnology and Nanotechnology Research Centre,Malaysian Agricultural Research and Development Institute (MARDI), MARDI Headquarters, Persiaran MARDI-UPM, 43400 Serdang, Selangor, Malaysia2Food Science and Technology Research Centre,Malaysian Agricultural, Research and Development Institute (MARDI),MARDI Headquarters, Persiaran MARDI-UPM, 43400 Serdang,Selangor, MalaysiaE-mail: [email protected]
Abstract Terung Asam (Solanum ferox Linn) is a plant indigenous to Southeast Asia and is confined in the Solanaceae family. This plant is widely grown in East Malaysia especially in the state of Sarawak and its fruit is always incorporated as an ingredient in the traditional food gravy or in curry. The sourness of this plant is also suitable to be incorporated in the traditional Sarawak’s layer cake and it was reported to have an anti-obesity activity. However, to date, there is a lack of complete database on the phytochemicals content in Terung Asam fruit. Therefore, an attempt was made to identify the phytochemicals of Terung Asam’s oven-dried flesh and seed powder using GC-MS. Based on the GC-MS analysis, it was found that both Terung Asam’s oven-dried flesh and seed samples extracted in Methyl Tert-butyl Ether (MTBE) buffer contained almost similar metabolites. In the oven-dried flesh sample, the main metabolites were α-tocopherol, hexadecanoic acid (palmitic acid), stigmasterol and α-sitosterol whereas in the oven-dried seed sample the main metabolites were α-sitosterol, hexadecanoic acid (palmitic acid), tocopherol and 6-octadecanoic acid (stearic acid). In the oven-dried flesh sample, stigmasterol was found abundant when compared to the oven-dried seed sample. However, in the oven-dried seed sample, fatty acid content was more abundant when compared to the oven-dried flesh sample. Therefore, based on the GC-MS analysis, both oven-dried flesh and seed samples were rich in phytosterols and long-chain saturated fatty acid where some of these metabolites were reported to have an effect in lowering and maintaining low density lipoprotein cholesterol.
Keywords: Terung Asam, Solanum ferox Linn, phytochemicals, GC-MS
INTRODUCTION Solanum ferox Linn or locally known in Malaysia as a Terung Asam or Terung Dayak is an indigenous fruit vegetable in Southeast Asia, widely consumed among local people especially in the rural areas of East Malaysia. This plant was found naturally distributed ranging from tropical India east through Indochina, extreme southern China, Malaysia and Indonesia to the Philippines and New Guinea. It was reported that this plant existed at low to middle elevations ranging from 0 – 1000 meter and occurred in rain forest or monsoon forest, near roads, humid places and wet places in ravines and valleys second growth thickets (Lim, 2013).

105
The Terung Asam plant is a thorny and woody lignescent perennial shrub and it is described as a 1.0 – 2.5 meter tall and densely pubescent throughout the whole plant. It has erect and spreading shoots bearing large green leaves, shallowly lobed, and alternate arranged. The inflorescence consists of approximately 2 – 6 flowers. It has small white flowers with star-like petals arrangement. The fruit is small to large being oval in shape. Immature fruit is green in colour and will turn yellowish-orange when ripe. Some lines/accessions have a yellow colour fruit with tints of dark purple colour while other lines/accessions are purplish black or cream to brownish black in colour (Umar, 2012). Terung Asam was reported to be immune to bacterial wilt pathogen (Pseudomonas solanacearum) and it has potential for creation of resistant commercial eggplant hybrid or can be used as a root stock for eggplant cultivation (Ali et al., 1990). The fruit, stem and leaf extract of Terung Asam was reported to exhibit toxicity against Red Flour Beetle (Tribolium castaneum) within 30 minutes of exposure and it is a promising discovery as a biocontrol agent to overcome infestation of Red Flour Beetle (Abdullah et al., 2012). Based on ethnobotanical studies, Terung Asam’s fruit is usually consumed and incorporated in local culinary not only in Sarawak, Malaysia but also is popular among Indonesian people in Kalimantan dan Riau province (Chotimah et al., 2013, Supriana et al., 2014). Terung Asam has also undergone commercialization and value added process where it was further developed into high quality product ingredient (Razili et al., 2015). The great prospect for Terung Asam have promoted its potential as a niche product of Sarawak and many products have already been developed based on Terung Asam as an ingredient. Ethnomedically Terung Asam’s leaves are used as poultices for swellings in Philippines. In Malaysia, a decoction of the roots is prescribed for violent pains all over the body and discomfort after meals. Also, a root decoction is taken to treat syphilis by Tonchongya tribe in Bangladesh (Hossan et al., 2012). The roots are used externally in a bath for fever at night and in a poultice for itches, cuts, wounds and severe bruises. The seeds are used for treating toothache by burning them and inhaling the fumes. In Bangladesh traditional folk medicine, S. ferox is used as a remedy for coughs, asthma, fever, vomiting, sore throat and gonorrhoea (Lim 2013). To date, there is lack of database on phytochemicals content of Terung Asam. According to Hoe et al., (1999), Terung Asam’s fruit consist of 89.5% moisture, 1.1% protein, 0.9% fat, 5.9% carbohydrate, 1.7% crude fibre and 0.5% ash. Moreover, every 100 g of Terung Asam’s fruit also contains 27 mg phosphorus, 188 mg potassium, 3 mg calcium, 6 mg magnesium, 0.6 mg iron, 8 mg vitamin C (Hoe et al., 1999). Based on biochemical analysis, Terung Asam’s fruit give positive result for saponin test (Supriana et al., 2014). Chemical examination of Terung Asam’s seed content revealed that the main compositions of oil in seed are palmitic acid (12.5%), stearic acid (9.96%), oleic acid (39.83%) and linoleic acid (38.06%) (Garg and Gupta et al., 1966). Little research has been carried out on identification of phytochemical content in Terung Asam. Therefore, profiling and identification of phytochemical content in Terung Asam is currently being carried out in MARDI to discover the compounds beneficial to human health.

106
MATERIALS AND METHODS
Chemical and plant material Methyl tert-butyl ether (MTBE) was purchased from Sigma Aldrich (St. Louis, MO, USA). Terung Asam’s oven dried ground flesh sample and oven dried seed samples were supplied by Dr. Chua Hun Pin from MARDI, Kuching. The oven dried seed sample was further finely ground using a commercial grinder.
Extraction of oven-dried Terung Asam sample using MTBE The extraction of Terung Asam’s oven dried sample was performed according to the method by Jiang et al., (2005) with a slight modification. Briefly, 10 mL MTBE was added to a glass vial containing 1.0 g of oven dried sample and the mixture was then incubated with shaking for 6 hours at room temperature. After sonication for 10 minutes, the sample further centrifuged using the GSA centrifuge rotor at 5400 rpm for 10 minutes. The supernatant obtained was then filtered using a 0.2 µm polytetrafluoroethylene filter membrane. A total of 200 µL of filtrate was injected directly to the gas chromatography-mass spectrometry/mass spectrometry (GC-MS/MS).
GC-MS profiling of Terung Asam’s oven-dried sample A sample volume of 1 µL was injected with a splitless mode into a GC-MS/MS system consisting of TSQ Quantum XLS GC-MS/MS. The GC column used for the analysis was TG-5MS with an inner diameter of 0.25 mm, 30 m length and 0.25 µm film thicknesses. Helium gas was used as carrier at a flow rate of 1 mL/min. The extracted sample using M/C technique was then analyzed under the following oven temperature program: injection at 70 °C followed by 1 °C/min oven temperature ramp to 76 °C and then by 6 °C/min to 330 °C and finally with 10 min isothermal at 330 °C. For the MTBE samples, the temperature program was set according to Jiang et al., (2005). Mass spectra were acquired using full scan monitoring mode with a mass scan range of 50 – 700 m/z. The chromatogram and mass spectra were evaluated using the Xcalibur™ software embedded in the GC-MS/MS system.
Identification of phytochemical constituents in Terung Asam’s oven-dried sample Identification of the compounds including their name, molecular formula and molecular weight was performed by matching the spectra of all chromatogram peaks with the spectrum of the known compounds in the NIST 08 mass spectral library.
RESULTS AND DISCUSSION Based on the analysis of GC-MS, Terung Asam’s oven dried flesh and seed sample extracted in MTBE buffer have identified compounds which fall in the group of unsaturated fatty acid, saturated fatty acid, plant sterols and also vitamin E. In oven-dried flesh sample, the main compound identified using GC-MS was α-tocopherol indicating that the fruit’s flesh is rich in vitamin E. Other main compounds identified using GC-

107
MS in terung asam’s flesh were stigmasterol, palmitic acid, α-sitosterol, D-turanose and oleic acid (Figure 1, Table 1). Analysis of GC-MS has identified α-sitosterol, a beneficial plant sterol as a main compound in Terung asam’s seed powder sample. The analysis also found other main compounds such as palmitic acid, tocopherol derivative, Citrost-7-en-3-ol (4-Methylstigmast-7-en-3-ol), stearic acid, stigmasterol, linoleic acid, arachidonic acid and dehydroabietic acid which were extracted in MTBE buffer (Figure 2.0, Table 2.0). In comparison with Terung Asam’s seed extract, the flesh contained higher amount of α-Tocopherol which is a type vitamin E that is preferentially absorbed and accumulated in humans. When compared to its close relative species Brinjal (Solanum melongena), Terung Asam is a good source of vitamin E since brinjal’s fruit was reported not having α-tocopherol when analysed using HPLC (Ching and Mohamed 2001). The flesh also contained high amount of stigmasterol a type of plant sterol which is accounted as a second most abundant metabolite when profiled using GC-MS. The percentage area of stigmasterol detection in Terung Asam’s flesh is much higher than in the seed extract indicating that the flesh has more stigmasterol content. Stigmasterol was previously reported as a beneficial plant sterol which exhibited an anti-osteoarthritic properties (Gabay et al., 2010), thyroid inhibitory, anti-peroxidative and hypoglycemic effects (Panda et al., 2009).
Table 1. List of major phytochemicals in Terung Asam’s oven-dried flesh extracted in MTBE buffer and identified using GC-MS
Retention Time Probability Compound Name Area%
72.19 64.28 α-Tocopherol 20.7575.23 64.22 Stigmasterol 9.6944.95 95.29 Hexadecanoic acid (Palmitic acid) 8.3076.69 63.11 α-Sitosterol 8.1262.40 17.60 D-turanose 3.8349.73 41.04 Octadecenoic acid (Oleic acid) 2.05
Figure 1. GC-MS chromatogram of Terung Asam’s oven-dried flesh powder extracted using MTBE buffer

108
Table 2. List of major phytochemicals in Terung Asam’s oven-dried seed extracted in MTBE buffer and identified using GC-MS
Retention Time Probability Compound Name Area%76.72 74.63 α-Sitosterol 10.6744.62 89.19 Hexadecanoic acid (Palmitic acid) 5.5469.18 94.75 Tocopherol derivative 5.1278.49 49.37 Citrost-7-en-3-ol (4-Methylstigmast-7-en-3-ol) 4.7249.65 52.54 Octadecanoic acid (Stearic acid) 3.6375.25 49.78 Stigmasterol 3.0949.48 59.37 Octadecadienoic acid (Linoleic acid) 2.4853.45 70.39 Eicosatetraynoic acid (Arachidonic acid) 2.1754.34 72.40 Dehydroabietic acid 1.45
Figure 2. GC-MS chromatogram of Terung Asam’s oven-dried seed powder extracted using MTBE buffer
Meanwhile in Terung Asam’s seed extract, GC-MS has detected more types of fatty acid when compared to the flesh extract. In seed extract, the main fatty acids detected were palmitic acid, stearic acid, linoleic acid and arachidonic acid while in flesh extract the main fatty acids detected were only palmitic acid and oleic acid. Mono and poly-unsaturated fatty acids from Terung Asam such as linoleic acid, arachidonic acid and oleic acid reported to have many benefits to human health especially in reducing low density lipoprotein (LDL) (Mattson and Grundy 1985, Wang and Oram 2002). The stigmasterol, palmitic acid, stearic acid and linoleic acid which were detected in Terung Asam’s seed were also reported present in Solanum torvum’s seed extract (Khatoon et al., 2015).

109
CONCLUSION As conclusion, Terung Asam’s oven dried flesh and seed powder contains large amount of plant sterol, tocopherol and its derivatives and also many types of fatty acids. Some of the metabolites such as plant sterol and unsaturated fatty acid are very nutritious and beneficial to human health
REFERENCESAbdullah, M., Nesa, M., Islam, R., Banu, J., Sarkar, J. and Islam, N. (2014). Bioactivity
studies of Solanum Ferox L. against Tribolium Castaneum (Herbst) Adults. Journal of Life and Earth Science 7(29 – 32)
Ali, M., Quadir, M.A., Okubo, H. and Fujieda, K. (1990). Resistance of eggplant, its wild relatives and their hybrids to different strains of Pseudomonas Solanacearum. Scientia Horticulturae 45(1): 1 – 9
Ching, L.S., and Mohamed, S. (2001). Alpha-tocopherol content in 62 edible tropical plants. Journal of Agricultural and food Chemistry, 49(6), 3101 – 3105.
Chotimah, H., Kresnatita, S. and Miranda, Y. ( 2013). Ethnobotanical study and nutrient content of local vegetables consumed in central Kalimantan, Indonesia. Biodiversitas 14(2): 106 – 111.
Gabay, O., Sanchez, C., Salvat, C., Chevy, F., Breton, M., Nourissat, G., and Berenbaum, F. (2010). Stigmasterol: a phytosterol with potential anti-osteoarthritic properties. Osteoarthritis and cartilage, 18(1), 106 – 116
Garg, S. and Gupta, D. (1966) . Chemical examination of the seed fat of Solanum Ferox L. Fette, Seifen, Anstrichmittel 68(6): 449 – 450.
Hoe, V.B. and Siong, K.H. (1999). The nutritional value of indigenous fruits and vegetables in sarawak. Asia Pacific Journal of Clinical Nutrition 8(1): 24 – 31
Hossan, M.S., Roy, P., Seraj, S., Mou, S.M., Monalisa, M.N., Jahan, S., Khan, T., Swarna, A., Jahan, R. and Rahmatullah, M. (2012). Ethnomedicinal knowledge among the tongchongya tribal community of roangchaari upazila of Bandarban District, Bangladesh. American Eurasian Journal of Sustainable Agriculture 6(349 – 359
Jiang, H., Xie, Z., Koo, H.J., McLaughlin, S.P., Timmermann, B.N., and Gang, D.R. (2006). Metabolic profiling and phylogenetic analysis of medicinal Zingiber species: Tools for authentication of ginger (Zingiber officinale Rosc.). Photochemistry, 67(15), 1673 – 1685
Khatoon, N., Jain, P. and Choudhary, A.K. (2015). Phytochemical studies on seed and leaf extracts of Solanum Torvum Sw. Indo American Journal of Pharmaceutical Research, 5(5), 1649 – 1656
Lim, T. (2013). Solanum Lasiocarpum. Dlm. (pnyt.). Edible medicinal and non-medicinal plants, pg. 333 – 335. Springer
Mattson, F.H. and Grundy, S.M. (1985). Comparison of effects of dietary saturated, monounsaturated and polyunsaturated fatty acids on plasma lipids and lipoproteins in man. Journal of lipid research, 26(2), 194 – 202

110
Panda, S., Jafri, M., Kar, A., and Meheta, B. K. (2009). Thyroid inhibitory, antiperoxidative and hypoglycemic effects of stigmasterol isolated from Butea monosperma. Fitoterapia, 80(2), 123 – 126
Razili, R., Umar, S. and Sallehuddin, R. (2013). Quality product from terung asam (Solanum Lasiocarpum Dunal): A popular indigenous fruit-vegetable of Sarawak, Malaysia. II Southeast Asia Symposium on Quality Management in Postharvest Systems 1088, pg. 569 – 572
Shariah, U. (2012). ‘Terung Asam Sarawak’, A Geographical indications (GI) – registered product of sarawak. New Sunday Tribune, 10 June 2012
Supriani, S., Fitmawati and Sofiyanti, N. (2014). Studi etnobotani dalam budaya kuliner melayu riau di kabupaten siak dan uji fitokimia. Jurnal Online Mahasiswa, 2(1):238 – 247
Wang, Y. and Oram, J.F. (2002). Unsaturated fatty acids inhibit cholesterol efflux from macrophages by increasing degradation of ATP-binding cassette transporter A1. Journal of Biological Chemistry, 277(7), 5692 – 5697

111
A Comparative Study of Edible Film Properties Developed from Cocoyam (Xanthosoma violaceum) and Taro (Colocasia esculenta) Starches
Noor Zainah, A.1, Mohd Nor Faizal, G. 2, Nor Azmah, U.1, Yusnita, Y.1, Khairol Nadia, A.H.1, Adawiyah, A.1, Muhammad Ramdhan, A.1, Mohammad Shafeq, A.B. 1 and Siti Suhaiza, S.11Food Science Technology Research Center,Malaysian Agricultural Research and Development Institute (MARDI), MARDI Headquarters, Persiaran MARDI-UPM, 43400 Serdang, Selangor, Malaysia2Management and Conservation of Plant Genetic Resources,Malaysian Agricultural Research and Development Institute (MARDI), MARDI Headquarters, Persiaran MARDI-UPM, 43400 Serdang, Selangor, MalaysiaE-mail: [email protected]
Abstract The various cocoyam and taro varieties consumed in Malaysia were differentiated based on their morphological and secondary data obtained from the research area. Names like Mawar, Minyak (Colocasia esculenta) and Musang (Xanthosoma violaceum) are the names of the collected accessions or cultivars given by the villagers. The tuber from these three varieties of cocoyam and taro was one of the materials that can be used as a basic material for edible film. Edible films from cocoyam and taro were developed through a casting technique and their properties were evaluated. All edible films were transparent. The water vapor permeability (WVP) of Mawar edible film was lower (p <0.05) than that of the Musang and Minyak edible films. However, Minyak edible film had the highest Tensile Strength (TS) and Young’s Modulus (YM) but lower elongation at break (%E) compared to Mawar and Musang edible films which possessed similar%E and YM (p>0.05). The edible film developed has an advantage over plastic packaging materials as the edible film can be consumed along with the food product which is packaged in the film. Furthermore, it can be degraded if it is removed because the edible film is produced from starch which is a renewable resource, unlike plastic which cannot be degraded and thus cause environmental pollution.
Keywords: edible film, cocoyam, taro, starch, bioplastic
INTRODUCTION Edible films and coating have received considerable attention in recent years due to their advantages over synthetic films. The main advantage of edible films over traditional synthetics is that they can be consumed with the packaged products. Hence, no package to dispose even if the films are not consumed they could still contribute to the reduction of environmental pollution (Bourtoom, 2008). Several studies have been done to develop and analyse the properties of edible film made of starch such as corn, cassava, wheat, rice and others. This is because this biopolymer is cheap, abundant, biodegradable and edible (Mali and Grossmann, 2003). Apart from that, yam starch also has some interesting properties even though it is not commercially available (Alves et al., 2002). Recently, many works dealt with native yam starch (Dioscorea alata) for film production but research on cocoyam and taro in edible film production has not

112
been conducted. The various cocoyam and taro varieties consumed in Malaysia were differentiated based on their morphological and secondary data obtained from the research area. ‘Mawar’, ‘Minyak’ (Colocasia esculenta) and ‘Musang’ (Xanthosoma violaceum) are the names of the collected accessions or cultivars given by the villagers. The tubers from these three varieties of cocoyam and taro are some of the materials that can be used as a basic material for edible film. Taking into this account, the aim of this study was to develop and evaluate the properties of edible film from Mawar, Musang and Minyak cultivars.
MATERIALS AND METHODS
Materials Two varieties of Taro (Colocasia esculenta) and Cocoyam (Xanthosoma sagittifolium) were obtained from Centre of Genebank and Seeds, MARDI Serdang, Selangor. The two varieties of Taro are called in Malay as Mawar and Minyak while Cocoyam as Musang. The names were given by the villagers. Sodium metabisulphite was bought from Meilun Food Chemical Sdn. Bhd. (Selangor, Malaysia). Magnesium nitrate, Mg (NO3)2 was supplied from Systerm® (Selangor, Malaysia). Glycerol was purchased from Sigma-Aldrich (Kuala Lumpur, Malaysia).
Isolation of starch The starches were isolated according to Khatijah and Patimah (1997). The taro and cocoyam tubers were washed, peeled and cut into small pieces and immediately suspended in 0.02% (w/v) sodium metabisulphite solution to prevent enzymatic browning. The samples were ground with the addition of water to form slurries using warring blender and filtered. The filtrate was then transferred to a cold room overnight at 4 °C in order to allow the starch to settle down. Supernatant was decanted and the sediment or starch was washed repeatedly. This procedure was repeated four times and the recovered white coloured of starch was then oven dried at 45 – 50 °C before it was ground into powder form.
Film preparation Starch solution (2% w/v) of Mawar, Musang and Minyak were prepared by dissolving 2g of starch in 100 mL distilled water while stirring on the hot plate with magnetic stirrer (Lab Companion, Model HP 3000) for 15 minutes. Glycerol (30% w/w of starch) was added to the starch solution and the mixture was stirred for 30 min. Then, each of the film-solution was casted on a casting plate (24 x 24 cm), dried in a lab dryer (Protech Model FSD-380, Tech-Lab Mfg Sdn. Bhd, Malaysia) at 45 °C. The dried films were peeled-off and conditioned in desiccators at 23 °C and 51% relative humidity (RH) for 72 h. A saturated magnesium nitrate Mg (NO3)2 solution was used to meet the required RH.

113
Film characterisation
Thickness The thicknesses of the taro and cocoyam starch films were determined using a thickness gauge (Mitutoyo, Japan). Five thickness measurements were taken randomly for each film and averaged.
Moisture content Each of the taro and cocoyam starch film was cut into pieces of 1 x 3 cm, weighed to the nearest 0.0001 g (value recorded as initial weight) using an analytical balance (Shimadzu, Model ATY 224) and dried in an oven at 110oC to a constant weight (value recorded as final weight). The moisture content of the films was calculated using the following equation:
Initial weight – Final weight Moisture content (%) = ––––––––––––––––––––––––– x 100 Initial weight
Colour Colour was determined using a Chroma Meter CR-400/410. The measurement was based on the CIE L*,a*, b* colour system where L* represents lightness (ranging from black to white), a* and b* represent the chromatic coordinates (ranging from -a: greenness, +a: redness. –b: blueness and +b: yellowness). The films were placed on the surface of a white standard plate. Five colour measurements were taken for each film and averaged.
Water vapour permeability (WVP) Water vapour transmission rate (WVTR) of starch edible films was measured in accordance with the modification of ASTM Standard Method E96-80 (ASTM, 1980). The film samples were sealed over the permeation cell with high vacuum grease. The permeation cells made of stainless steel were filled with silica gel (0% RH) and placed at 30 °C and 72%RH. The weights of the cells were recorded daily. Linear regression-derived slopes of the steady state (linear) portion of weight gain versus time curves were used to estimate WVTR. Water vapour permeability was calculated using the following equation:
WVTR WVP = ––––––– x t ΔPWhere WVP is water vapour permeability (kgm/m2secPa), WVTR is water vapour transmission rate (kg/m2sec), t is thickness of the films (m) and ΔP is the partial pressure different (Pa).

114
Mechanical properties The tensile strength (TS), elongation at break (%E) and Young’s Modulus (YM) of the edible films were measures using an Instron Universal Testing Machine (Model 5567) with a 500N load cell in accordance with the ASTM Standard Method D 882 – 12 (ASTM, 2012). The grip separation and crosshead speed were set at 25.4 mm and 12.7 mm/min, respectively. The films were cut into rectangular shapes (1.3 cm wide and 5 cm long) using a cutter. Testing was performed in a controlled environment of 23 °C, 50%RH.
Statistical analysis The statistical analysis of Minitab 16 (Minitab Inc., State College, PA, USA) was used to perform a one-way analysis of variance (ANOVA; Tukey test; p <0.05)
RESULTS AND DISCUSSIONS
Film characterization Three edible films from different varieties of taro and cocoyam (Mawar, Musang and Minyak) had homogeneous surface with no air bubbles as depicted in Figure 1. The results of thickness (µm), moisture content (%), water solubility (%) and colour, were shown in Table 1. All the edible films had the same thickness and moisture content (p >0.05). However, Mawar and Minyak edible films had higher water solubility (values ranged from 24% – 28%) than that of the Musang edible film (14%). All the edible films were transparent and tended towards a red colour according to the L and +a values respectively. The parameter of -b indicates a tendency towards a blue coloration for Minyak edible films while yellow (+b) coloration for Mawar and Musang edible films.
Water vapor permeability (WVP) Water vapor permeability (WVP) was studied since water is one the main factors affecting the shelf life of food products. The WVP of Mawar edible film was 5.10 x 10⁻¹⁴ kgm/m
2secPa which was lower (p <0.05) than that of the Musang (6.96 x 10⁻¹⁴
Figure 1. Edible films from different cultivars
Mawar edible film Musang edible film Minyak edible film

115
kgm/m2secPa) and Minyak (1.02 x 10⁻¹³ kgm/m2secPa ) (Table 1). This lower WVP of Mawar edible film indicates good capability in protecting moisture sensitive food product during the storage period; hence, product shelf life can be increased.
Mechanical properties The flexibility and strength of all edible films were determined using the mechanical properties: tensile strength (TS), elongation at break (%E) and Young modulus (YM). As shown in Figure 2, Minyak edible film had the highest TS (6.27 MPa) compared to Mawar and Musang edible films (4.62 MPa and 3.94 MPa) respectively. In addition, Mawar and Musang edible films had similar%E and YM (p 0.05) while
Table 1. Thickness (um), moisture content (%), water solubility (%) and colour of edible films from different cultivars
Edible film from differentcultivars
Thickness (µm)
Moisture content (%)
Water solubility (%)
ColorWater vapor permeability (kgm/m2secPa)
L* a* b*
Mawar0.044 25.339 28.065 87.58 1.96 –0.56 5.10 x 10⁻¹⁴
±0.003a ±0.76a ±2.654a ±0.67a ±0.23c ±0.42b ±2.78 x 10⁻¹⁵b
Musang0.047 26.41 13.99 87.33 2.2 –0.88 6.96 x 10⁻¹⁴
±0.005a ±5.53a ±4.185b ±0.87a ±0.13b ±0.64b ±2.04 x 10⁻¹⁵a
Minyak0.047 26.864 24.562 85.86 2.6 2.16 1.02 x 10⁻¹³
±0.005a ±0.84a ±3.087a ±0.71a ±0.16a ±0.81a ±4.84 x 10⁻¹⁶cValues are given as mean ± standard deviation. Different letters in the same column indicate significantly different (p <0.05)
300
250
200
150
100
50
0
Tensile strenght (MPa)Elongation at break (%)Young modulus b(MPa)
Tens
ile p
rope
rties
Mawar Musang MinyakEdible films
b
b
b
b
ba aa
a
Figure 2. Tensile properties of edible films

116
Minyak edible film had a much lower%E (17%) and higher YM (150 MPa) values respectively.
CONCLUSION Mawar, Minyak and Musang edible films seem to be very promising materials for the development of films. However, Mawar edible film had shown better properties compared to Musang and Minyak edible films and suitable to be used for moisture sensitive products due to low WVP value.
REFERENCESAlves, R.M.L., Grossmann, M.V.E., Ferrero, C., Zaritzky, N., Martino, M. and Sierakoski,
M. R. (2002). Chemical and functional characterization of products obtained from yam tubers. Starch/Stärke, 54(10), 476 – 481
ASTM (1980). Standard test methods for water vapour transmission of materials, E96-80. In: Annual book of ASTM standards. Philadelphia, PA: American Society for Testing and Materials
ASTM (2012). Standard test methods for tensile properties of thin plastic sheeting, D882-12. In: Annual book of ASTM standards. Philadelphia, PA: American Society for Testing and Materials
Bourtoom, T. and Chinnan, M.S. (2008). Preparation and properties of rice starch-chitosan biodegradable composite film. Lebensmittel-Wissenschaft und-Technologie (in press)
Khatijah, I. and Patimah, H. (1997). Physico-chemical properties of cross-linked sago starch. J. Trop. Agric. Food. Sc. 25(2): 173 – 178
117
Nutrient Composition and Mineral Content of Seagrape (Caulerpa lentilifera L.) Powder
Tun Norbrillinda Mokhtar and Nur Elyana NoordinFood Science Technology Research Centre, Malaysian Agricultural Research and Development Institute (MARDI), MARDI Headquarters, Persiaran MARDI-UPM, 43400 Serdang, Selangor, MalaysiaE-mail: [email protected]
Abstract Seagrape (Caulerpa lenlifera L.) is a genus of seaweed in the family of Caulerpaceae which is categorized as green seaweed. Seagrape is usually used in the form of fresh vegetable or salad. Seagrape is high in nutrient and mineral content. Seagrape is perishable due to its soft, fragile and succulent texture. Therefore, seagrape powder was developed in order to prolong the shelf life and to retain its nutritional as well as mineral content. Fresh seagrape was dried using air-dryer at a temperature of 80 ˚C for 10 hours. The powder was produced by grinding the dried seagrape into powder using a grinder with 0.25 µm sieves. Determination of nutrient composition (moisture, ash, protein, crude fibre, fat, carbohydrate) and minerals (iodine, calcium, iron, magnesium, potassium and phosphorus) was conducted. The nutrient analysis showed that, seagrape powder had high protein and crude fibre content, but low moisture content (< 5%) and ash compared (< 10%) with previous study. It was also high in iodine with >7mg iodine/100g powder. Understanding of proximate and mineral contents of seagrape powder will help to diversify its application in functional food and pharmaceutical products.
Keywords: seagrape powder, proximate, mineral
INTRODUCTION Seagrape (Caulerpa lentillifera L.) family of Caulerpaceae is a type of Chlorophyta, which is a green seaweed. Seagrape is also known as lato, lelato, green caviar, ararusip and umi-budo. In Sabah, seagrape is usually used in the form of fresh vegetables or salad by the local people. Due to the soft and succulent texture, seagrape is very fragile and easily ruptured, hence, limiting its use in food products development. This seaweed has less commercial value, but rich in iodine content and other minerals that could be beneficial to human health. Seagrape consists of small globules at each stem and has a grape-like appearance. The globules are slimy and contain minerals such as sodium, potassium, calcium, magnesium and iodine (Gupta and Abu-Ghannam, 2011). Seagrape has antibacterial and anti-fungal properties. Furthermore, seagrape may help in rheumatism treatment and in making it as a food additive; it might also help in preventing metabolic syndrome. Seagrape has shown a high content of protein, total dietary fibre and amino acid compared with Eucheuma cottani which is also a green type of seaweed (Aslinah and Salahuddin, 2012).

118
Seagrape can be cultivated easily and harvested within 2 to 8 weeks after cultivation, depending on its growth rate and relative conditions of the seawater (Aslinah and Salahuddin, 2012). Food product from seagrape with functional properties will diversify and promote its utilization. There are efforts being carried out to exploit the nutraceutical benefits of seaweeds by adding them to various food products such as noodles. The addition of seaweeds to noodles was used as a means to provide added flavor, color and functionality, as well as to increase nutritional value due to their iodine content (Ratana-arporn and Chirapart, 2006). The supplementation of seaweeds in foods will also make it popular amongst non-seaweed eating population. In addition, it will create new economic and employment activities for farmers.
MATERIALS AND METHODS
Sample preparation Fresh Caulerpa lentilifera L. (seagrape) collected from Semporna and Sabah, Malaysia, were thoroughly washed with filtered tap water and cleaned by removing their holdfasts and epiphytes. The seagrape were strained and dried in a forced draft oven at a temperature of 80 °C for 10 hours, until the moisture content was tested <5%. Dried samples were ground into powder (RETSCH ZM200 grinder with 0.25 µm sieve). Seagrape powder was then packed in an oriented polypropylene/aluminum/polyethylene (OPP/Al/PE) packaging (10 x 15 cm) approximately 10 g of sample per pack. The sample was stored at 4 °C prior to analysis. Triplicate determination was performed for each nutrient analysis. All chemicals were from Merck, Germany.
Nutrient analysis Moisture content: Moisture content was analyzed using oven method at 105 °C according with AOAC 950.46 method.Ash: Ash was analyzed according to AOAC 923.03 method at a temperature of 550 °C.Fat: Fat was determined using soxhlet extraction with diethyl ether, following the method of AOAC 991.36.Crude protein: Crude protein was analyzed by the micro-Kjeldhal method system (Nx6.25), AOAC 981.10 method.Crude fiber: The analysis was conducted through successive hydrolysis with 100 °C 0.05 N H2SO4 and 0.05 N NaOH for 30 min each.Carbohydrate: Carbohydrate content was calculated from the sum of the percentages of crude protein, ash, fat and crude fiber and subtracted from 100.The proximate composition was reported based on dry weight of Caulerpa lentilifera L. (seagrape powder).

119
Mineral content analysis Iodine content analysis was conducted following the method employed by Jaas (1998), using microwave digestion with nitric acid followed by an ICP-MS analysis.Phosphorus was analysed by ICP-MS analysis while calcium, iron, magnesium and potassium was analysed by AAS analysis.
RESULTS AND DISCUSSION
Nutrient composition The moisture and ash content of seagrape powder were found to be lower (1.60% and 9.40%, respectively) than that reported by Matanjun et. al., (2009) and Ratana-arporn and Chirapart (2006; Table 1). Differences in values reported might be due to difference in drying method and technique used, season and geographic area. The moisture content value indicated that the powders produced are microbiologically stable since the moisture content was <6%.
Table 1. Nutrient composition of seagrape (Caulerpa lentilifera L.)a,b,c
Composition Seagrape powdera Seagrape (dried)b Seagrape (dried)c
Moisture (g/100g) 1.60 ± 0.17 10.76 ± 0.80 25.31 ± 1.15 Ash (g/100g) 9.40 ± 0.00 37.15 ± 0.64 24.12 ± 1.70 Crude protein (g/100g) 18.70 ± 3.72 10.41 ± 0.26 12.49 ± 0.30 Fat (g/100g) 1.23 ± 0.16 1.11 ± 0.05 0.86 ± 0.10Carbohydrate (g/100g) 69.10 ± 3.00 38.66 ± 0.96 59.97 ± 0.00 Crude fibre (g/100g) 6.45 ± 0.08 1.91 ± 0.00 3.17 ± 0.21
*Mean values, n = 3, dry weight basisaValues from this studybValues from Matanjun et. al. (2009)cValues from Ratana-arporn and Chirapart (2006)
Table 2. Mineral content in seagrape (Caulerpa lentilifera L.)a,b,c
Mineral content Seagrape powdera Seagrape (dried)b Seagrape (dried)c
Iodine (µg/100g) 7,586.67 ± 5774 478 ± 59 1,424 Calcium (mg/100g) 1,191.62 ± 70.28 1,874.74 ± 0.20 780 Iron (mg/100g) 15.54 ± 0.44 21.37 ± 0.00 9.30Magnesium (mg/100g) 178.22 ± 5.75 1,028.62 ± 0.58 630Potassium (mg/100g) 115.94 ± 7.38 1,142.68 ± 0.00 970 Phosphorus (mg/100g) 88.06 ± 15.74 NR 1,030
*NR = Not reported; Mean values, n = 3, dry weight basisaValues from this studybValues from Matanjun et. al. (2009)cValues from Ratana-arporn and Chirapart (2006)

120
Crude protein and fat content of seagrape powder in the study were slightly higher (18.70% and 1.23%, respectively) than that reported by Matanjun et. al., (2009) and Ratana-arporn and Chirapart (2006), due to the lower moisture content in the powder. Fat content of seagrape powder was also found to be in a range of most seaweed which is 1 – 3% dry weight (Chapman and Kirst, 1979; Mabeau and Fleurence, 1993). Similarly this was also found for crude fibre (6.45%). The amount of fibre present in seagrape powder is slightly higher than in soybean (5.5%) and red chilli (4.8%) but is much higher than that in green bean sprouts, peas, red spinach and broccoli which is in a range of 0.7 – 2.7% as reported by Tee et. al., (1988). The carbohydrate content of seagrape powder was found to be comparable with that reported by Ratana-arporn and Chirapart (2006) but higher when compared with Matanjun et. al. (2009).
Mineral content In this study, seagrape powder had the highest iodine content (7586 µg/100g) compared with values reported by Pattama and Anong (2006) (1424 µg/100g) and Matanjun et. al. (2009) (478 µg/100g). The iodine content of seagrape powder was also much higher compared with that in terrestrial vegetables and fruits which are reported in the range of 2 – 88 µg/100g (Mahesh et. al., 1992). With these results, this seagrape powder could be used as potential ingredients and source of dietary iodine in food and pharmaceutical products. The results showed that seagrape powder had low calcium, iron, magnesium, potassium and phosphorus than that reported by Matanjun et. al. (2009) and Ratana-arporn and Chirapart (2006). However, the values of calcium and iron content in seagrape powder were much higher compared to some vegetables reported by Tee et. al., (1988) such as green bean sprouts, soybean, peas, red spinach, broccoli and red chilli which were in a range of 25 – 200 mg/100g for calcium and 0.7 – 6.0 mg/100g for iron. The high values of these minerals in seagrape powder might be due to its metabolic system which was capable of absorbing elements directly from seawater (Norziah and Ching, 2000).
CONCLUSION Nutrient analysis and minerals content of seagrape powder demonstrate high values of protein, carbohydrate, crude fibre and iodine, indicating it as a potential food source for health benefits. Air-dried seagrape powder could be an alternative ingredient to food production as a source of dietary iodine.

121
REFERENCESAOAC International. (2000). Association of Official Analytical Chemists. Official
Methods of Analysis of AOAC. Washington DC: AOAC InternationalAslinah, L. and Salahuddin, T. (2012). Lato: Anggur dari laut. In Agromedia, Bil. 34,
p. 6 – 7Gupta, S. and Abu-Ghannam, N. (2011). Recent developments in the application of
seaweeds or seaweed extracts as a means for enhancing the safety and quality attributes of foods. Innovative Food Science and Emerging Technologies 12: 600 – 609
Mahesh, D.L., Deosthale, Y.G. and Narasinga Rao, B.S. (1992). A sensitive kinetic assay for the determination of iodine in foodstuffs. Food Chemistry 43: 51 – 56
Matanjun, P. and Mohamed, S. (2009). Nutrient content of tropical edible seaweeds, Euchema Cottonii, Caulerpa lentilifera and Sargassum Polycystum. Journal of Applied Phycology 21: 75 – 80
Norziah, M.H and Ching, C.Y. (2000). Nutritional composition of edible seaweed Gracilaria changgi. Food Chemistry 68: 69 – 76
Ratana-arporn, P. and Chirapart, A. (2006). Nutritional evaluation of tropical green seaweeds Cauperpa lentilifera and Ulva reticulata. Journal of Kasersart (National Science) 40 (Suppl.): 75 – 83
Tee, E.S., Mohd Ismail, N., Mohd Nasir, A. and Khatijah, I. (1988). Nutrient composition of Malaysian foods. Kuala Lumpur: ASEAN Sub-Committee on Protein, Food Habits Research and Development

122
Vegetables for Improved Livelihoods

123
Linking Vegetable Farmers to Markets: Emerging Business Opportunities
Chengappa, P.G., Mamatha, N.C., Devika, C.M. and Vijayasarathy, K.Institute for Social and Economic Change, Bangalore, India, 560072E-mail: [email protected]
Abstract The agrarian scenario in India is dominated by small producers and vegetable production is no exception. Vegetables being bulky and perishable, markets fragmented and unorganised with superfluous intermediaries pose multiplicity of problems in linking vegetable growers to markets. The absence of infrastructure further aggravates by limiting access to markets and supply chain issues. There have been efforts to link vegetable farmers to markets by following innovative institutional approaches. The supermarkets or food retail chains (FRCs) are making efforts to link vegetable farmers to markets by establishing backward and forward linkages. The concept of ready to retail adopted by the FRC benefiting of the farmers as they realiz higher returns by adopting improved technology and growing high value vegetables. Direct supply by farmers allowed the retail chains to simultaneously increase control over quality, supply reliability and price stability. Contract farming is also touted as a strong viable alternate channel linking vegetable growers to markets. Contracting institutions provide quality inputs and technical support in production and marketing. This enabled vegetable growers to reduce their working capital needs and transaction cost per unit of output. In spite of several advantages, the farmers under contract faced problems like delay in payments and delivery of inputs and rejection of produce on quality ground. In addition, forming producer collectives such as cooperatives, associations, self help groups and producer companies have proved successful in terms of procuring required quality inputs at competitive prices and sale of the produce in an efficient manner. These emerging institutional arrangements have helped farmers to break away from the clutches of traditional players - brokers/wholesaler/commission agents to some extent. However, whether these linkage interventions are sustainable, replicable and up-scalable needs an indepth analysis.
INTRODUCTION Linking farmers to markets can seize a whole range of activities, from the very small and localized to the very large. The concept does, however, assume the development of long-term business relationships rather than support for ad hoc sales (Shepherd, 2007). Linkages between farmers and market players call for priority attention to issues on access to technology, information on institutional arrangements, support services, policies, capacity building, identification and development of markets (MANAGE, 2013). The linkages between vegetable producers under Indian conditions is rather weak and is attributed to reasons like small scale and dispersed nature of producers, inadequate arrangements for supply of quality inputs at right time, unorganized and fragmented markets, superfluous middlemen in the supply chain, low infrastructure support contributing to higher logistic costs and absence of corporate involvement in establishing forward and backward linkages. In the recent years, there have been

124
concerted efforts to link farmers to the markets. These efforts include creation of alternate marketing channels which provide better pricing and reducing the transaction costs. Horticulture, comprising of number of fruits, vegetables, flowers, spices and medicinal and aromatic crops is a key sector in the Indian economy. More than 60 types of vegetables are grown in India in tropical, subtropical and temperate agro-climates. India accounted for 13.6% and 14% of the world’s production in fruits and vegetables respectively in 2013-14 (NHB, 2015). Even though India is the second largest producer of fruits and vegetables its share in the global market is only about 1% (IIVR, 2016). India is the largest producer of okra and ranks second in the production of potato, onion, cauliflower and cabbage. The bulkiness and perishability of fruits and vegetables, fragmented and unorganised markets with superfluous intermediaries pose multiplicity of problems in linking vegetable growers to markets. The marketing channel for vegetables involves a number of intermediaries like the pre harvest contractor, commission agent, wholesalers and retailers that operate between the producer and the final consumer. Moreover, lack of efforts in transmission of market information has been a major constraint in improving the efficiency of the vegetable marketing system. In developed countries there is a rapid shift of sales through open market to direct sales that involve effective linkages and alliances from production to consumption. Whereas, in developing countries farmers are linked to buyers through traders/ agents or small-scale traders seek out new suppliers or work with existing suppliers to develop new or improved products or markets (Shepherd, 2007). Linkage can be categorized in various ways; farmers to domestic trader, farmer to retailer, linkages through leading farmers, through cooperatives, through agro processor, through exporter and contract farming (Shepherd, 2007). In India the dynamics of fast changing agri-food marketing system clearly indicates that farms are fragmenting while all other segments are scaling up rapidly (Figure 1). In this paper we have concentrated on three types of linkages witnessed in India:a) Linkage through food retail chains (super markets)b) Contract Farming andc) Producer collectives.
BACKWARD MARKET LINKAGE THROUGH FOOD RETAIL CHAINS (FRC) The first section discusses backward market linkage involving FRC. Retailing in India is highly unorganized, fragmented and predominantly small due to family owned nature of business and poor access to capital, technology and regulations. Retailing has undergone transition with the rise of FRCs or super markets. During the process of evolution there was a gradual shift from fragmented local markets to larger centralized wholesale markets. The emergence of organized FRCs were witnessed after liberalization and the entry of corporate entities during the beginning of the 1990s. Its development is due to changing political, demographic and economic features like rise in economic growth and income, proliferation of brands and consumer awareness.

125
Figure 1. Dynamics of fast changing agri-food marketing system- consolidating top and fragmenting bottom
Improving vegetable farmers’ access to markets through FRCS During recent years, organized retail sector have adopted various formats to source food commodities including vegetables. These mainly include backward integration with vegetable growers’ for procurement either directly or indirectly and selling through the outlets of the FRCs with in-house brands such as Spencer’s, Reliance Fresh, More, Namdhari’s Fresh, Food Bazar and few others. These FRCs have attempted many changes in the supply chain management and logistics of vegetables through the use of quasi-formal and formal contracts to ensure timely delivery of products with desired quality attributes. Therefore, they can be viewed as new institutional mechanisms for linking farmers with modern markets and improving supply chain efficiency and farmer livelihoods. Since the FDI in retailing is allowed only in single brand chains, most of the supermarket growth in India has been driven by the domestic players unlike in many other developing countries of Asia and Latin America (Singh and Singla, 2011). In India, the organised retailers pursue two different business models in vegetables: Hub and Spoke Model (HSM) and Value Chain Model (VCM). Organized retailers like Spencer’s Retail, More and Food Bazaar are adopting ‘Hub and Spoke’ business model of retailing vegetables,, where farmers, organised retailers, wholesalers and customers form this chain. Small farmers and contract farmers who executed a trade contract with the organised retailers are the primary source of supply of vegetables to the organized retailers. The Reliance Fresh follows VCM of procuring the vegetable directly from farmers and sell to customers by avoiding intermediaries. This model is based on its core growth strategy of backward integration and progressing towards building an entire value chain starting from the farmers to the end consumers. Here farmers, organised retailers and customers form the value chain. Small farmers, contract farmers and lease farmers are the primary source of supply of vegetables to the organised retailers in this chain. Independent farmers supply their vegetables to the centralized
InputSuppliers
Farmers
Wholesalers, Logistic & warehouse
AgroProcessor
Farmers

126
consolidation centres from where it is distributed to multiple hubs, depending upon the demand for the vegetables.
FRC Consolidation Centre The establishment of Fruit and Vegetable Consolidation Centre (FVCC) has helped FRCs to exercise control over quality, supplier reliability and price stability. Farmers are provided with package of Good Agricultural Practices (GAP). Specifically, farmers who made investments in irrigation systems are preferred, as it provides greater control over quality and allows them to produce vegetables round the year. The company has no system of providing credit, but provides technical guidance for vegetable production: choice of vegetables, planting, crop production, plant protection, management of irrigation facility, harvest time and quantity to be harvested per unit of area (acre) to ensure quality and marketability. The agreement is informal and there are hardly any written contracts between farmer-vendor and company. The consolidation centre procures only good quality vegetables on an indent basis. As such, farmers face the problem of rejection due to non-compliance of quality. The rejection rate was as high as 10 per cent in some cases as indicated in our survey. This forces the farmer to approach the traders in the traditional marketing to dispose off their rejected quantity at a much lower price. Moreover, all the vegetables produced by the farmers are not purchased by the FRCs as they buy based on their need. Prices of fresh fruits and vegetables at FVCC are determined on the basis of the prices prevailing at different markets of that region. It was found that farmers preferred to supply their produce to the FVCC, as it provided them stable prices and assured market, compared to the highly volatile prices at the wholesale market (Chengappa and Mangala and Dega, 2016). The model of FVCC operated by the Spencer’s Retail supply chain for fresh vegetables is depicted in Figure 2.
Profitability of FRC and non FRC farmers Profitability and transaction costs of FRC and non FRC farmers for four major vegetables, viz; cabbage, cauliflower, carrot and tomato are compared in in table 1. Market price received by FRC farmers are comparatively higher than non FRC farmers. Further FRC farmers had considerable lower transaction costs as compared to non FRC farmers as they avoided middlemen. For example, the transaction cost worked out Rs 180/ton in Cabbage, Rs 189/ton in Cauliflower. Rs 775/ton in carrot and Rs 640/ton in tomato compared to Rs 700/ton, Rs 1200/ton, Rs1905/ton and Rs1000/ton for non FRC farmers, respectively. Net returns realized was higher in all crops for FRC farmers compared to non FRC farmers. This clearly indicated that the FRC linkage has been able to change the method of farming. Farmers through intensive cultivation and crop diversification have been able to earn higher incomes with lower transaction cost by avoiding middlemen contributing to higher returns.

127
Source: Chengappa, Mangala and Dega, 2016
Figure 2. Supply chain of spencers for fresh vegetables
FVCC farmer-vendors
FVCC Weighed, bar coded, labeled and packed
Sorted, graded, p a c k e d F F V
Warehouse 1 Warehouse 2 Warehouse 3
Retail outlets in cities
MARKET LINKAGE THROUGH CONTRACT FARMING IN VEGETABLES Another form of linkage addressed in this paper is through contract farming which is basically an agreement between farmers and processing and/or marketing firms for the production and supply of agricultural products under forward agreements, frequently at predetermined prices (Eaton and Shepherd, 2001). Basically, contract farming is aimed at assured buy back and hence, assured price and supply chains for creating and sustaining value addition for the produce (Dileep et al., 2002). The basic elements of contract farming include pre-agreed price, quality, quantity and timely delivery of produce. Eaton and Shepherd (2001) classified five major models in which contractual arrangements occur between the firm and farmers. A sponsor (defined as the contracting firm or corporation) decides to follow a model depending on the market demand, production and processing requirements and economic and social viability of the farmers (Paty, 2005).• Centralized model: Here a sponsor buys from large number of small farmers.
The firm provides inputs such as seeds, fertilizers, pesticides, credit and machines. This model was used for annual crops and other crops which often require a high degree of processing. Tomato processing by Pepsi Co in Punjab taking control of most of the production involving a group of farmers, processing and marketing is a typical example of centralized model.
• Nucleus Estate model: It is a variation of the centralized model where the sponsor also manages a central estate or plantation. It is mainly found in case of fresh vegetables and fruits for export. Namdhari’s Fresh, a unit of Namdhari Seeds started in year 2000 at Bangalore practices contract farming for export fresh vegetables and

128
Tabl
e 1.
Net
retu
rns
in v
eget
able
s pr
oduc
tion
unde
r FR
C a
nd n
on F
RC
farm
ers
Parti
cula
rsC
abba
geCauliflow
erC
arro
tTo
mat
oFR
C
farm
ers
Non
FR
C
farm
ers
FRC
fa
rmer
sN
on F
RC
fa
rmer
sFR
C
farm
ers
Non
FR
C
farm
ers
FRC
fa
rmer
sN
on F
RC
fa
rmer
s
Yie
ld (t
onne
/acr
e)33
3012
.52
213
025
Pric
e re
ceiv
ed(R
s/to
nne)
3490
3000
8430
7000
1550
014
000
6540
5500
Inpu
t cos
t/ton
ne(R
s)89
7(8
3)10
39 (60)
1871 (91)
2019 (63)
2589 (77)
2188 (53.
5)13
96 (69)
1550 (61)
Tran
sact
ion
cost
/ ton
ne
(Rs)
180
(17)
700
(40)
189 (9)
1200 (37)
775
(23)
1905 (46.
5)64
0(3
1)10
00 (39)
Tota
l cos
t/ to
nne
(Rs)
1077
1739
2060
3219
3364
4093
2036
2550
Net
retu
rn/ t
onne
(Rs)
2413
1261
6370
3781
1213
699
0845
0429
50
Figu
res
in p
aren
thes
es in
dica
tes
perc
enta
ges
to to
tal c
ost
Sour
ce: C
heng
appa
, Man
gala
and
Deg
a, 2
016

129
provide a premium quality produce to domestic customers. Presently, more than 40 different vegetables and fruits are being cultivated by Namdhari’s Fresh at various productions centers across the country. The different agro-climatic zones enable them to produce most vegetables all round the year. European standards of Good Agriculture Practices (GAP) are strictly followed at production level. In addition to their own captive production Namdhari’s Fresh has contract production involving farmers. The company supplies quality input, provides technical backstop and buys back the vegetable produced by the contract farmers. Multi-partite Model: This model usually involves the government, statutory bodies and private companies jointly participating with the local farmers. Each entity may be responsible for providing different goods and services such as credit, inputs, equipments, transportation, processing and marketing facilities. A example, Rallis, another firm provides all inputs, technical support and finance to registered growers for a specific crop and facilitates the sale of produce at reasonable prices. The company follows a consortium approach. It has tied up with banks and buyers. The system is run through a network of 10 Rallis Kissan Kendras (RKKs) across the country.
• Informal model: it is followed by individual entrepreneurs and small companies. The crops usually require only a minimal amount of processing or packaging for resale to the retail trade or local markets. Typically, the firm’s involvement in actual production and input procurement is very minimal. Many supermarket chains in India follow this model to ensure a steady supply of produce (Manjunatha, 2016).
• Intermediary model: this involves sponsors subcontracting linkages of farmers with intermediaries like collectors, farmer groups and NGOs. The intermediaries have informal arrangements with farmers.The main disadvantage of this model is that it disconnects the link between company and farmer.
Positive and negative impacts of contract farming Given the variety and flexibility of adopting any of the models accessible to stakeholders under contract farming, the proponents of contract farming argue that there is an increase in income of participating farmers due to improved access to market, employment in farm, better use of resources and better management practices. Firms enable the farmers to reduce their price risk through predetermined prices, production risk through provision of technology and extension services. Further, farmers use the contract agreement as a collateral to arrange credit with a commercial bank in order to fund inputs. In addition, the potential advantage for sponsors could be overcoming land constraints, political acceptability, production reliability and shared risk and quality consistency. On the other hand they also face problems from social and cultural constraints, land availability, farmers’ discontent, extra-contractual marketing and input diversion. Forecast of market size or price levels are not accurate. As small farmers grow vegetables under contract, processing may include grading, sorting and packaging as well as the provision of cold storage facilities. It is important that farmers fully understand the reasons for standards and the fact that acceptance of poor quality produce
130
from some farmers will ultimately affect the entire project (Eaton and Shepherd, 2001). Particularly when growing new crops, farmers face the risks of both market failure and production problems. Most contract farming schemes occur only in the regions where, commercial agriculture are already established and offering reliable infrastructural access to markets (Manjunatha, 2016). Due to unequal power in terms of bargaining, negotiating, or contract enforcement contracts between agribusiness firms and farmers tend to be unfair and lead to exploitation. Domination by one or two companies and over reliance on advances are the problems faced by the farmers.
LINKING TO MARKET THROUGH PRODUCER COLLECTIVES Producer collectives are a new avenue for the small holder producers by bridging the gap between productivity and market accessibility through a guaranteed market for produce and access to machinery and modern technologies (Raju and Singh, 2014). Collectives are consistent, reliable and generally pay higher price to their farmer suppliers than local middlemen through signing forward purchase contracts several months in advance of the harvest to supply products to buyers. Producer collectives include rural cooperatives, agricultural /horticultural cooperatives, Farmer Produce Organization (FPO), private sector promoted (POs), Non Government Organizations (NGOs), civil society organizations, Self-help Groups and producer companies. A brief discussion below traces the features of these collectives. Cooperatives: Cooperatives are formal, legal and registered organizations, with the objectives to meet common economic, social and cultural needs. They are jointly-owned and democratically controlled enterprises. Most rural cooperatives are engaged in supply of inputs with only few in marketing. One successful cooperative in vegetable marketing is the Horticulture Producers’ Co-operative Marketing and Processing Society Ltd. (HOPCOMS), founded in 1959 in Bangalore to tackle farmers’ poor bargaining power and reduce middlemen’s commission and provide vegetables to consumers through their own retail outlets. The Board of HOPCOMS consists of I6 members, of which 11 members are elected from among the producers and the rest are the Government nominees. As of 2012 the HOPCOMS has 16221 growers as members. HOPCOMS handles around 100 metric tonnes of fruits and vegetables every day. The member farmers bring their produce to the Society, where the produce is graded, weighed and the payment is made to the farmers immediately. To help the growers for transporting their produce, the Society has procurement centres in major supply areas. The procured fruits and vegetables are supplied to consumers through the Society’s 257 retail outlets in Bangalore and Kolar districts. The Society has also taken the lead in supplying quality vegetables and fruits to all the Government Hospitals, Hostels, Major Factories, Clubs etc., HOPCOMS also undertakes bulk supplies to marriages and other social functions. Farmer Producer Organisations: FPOs are formed to collectivize small farmers for backward linkage for inputs like seeds, fertilizers, credit, insurance, extension services and forward linkages such as collective marketing, processing and market-led

131
agriculture production (Mondal, 2010). These are perceived to empower farmers through collective bargaining along with instilling an entrepreneurial quality in farming. Some are formally registered, while others are not – operating in an informal way. Scaling of operation and sustainability is a problem in such a model. Non Governmental Organisations: NGOs and Civil society organizations are largely organized on broad farmers welfare goals. Their activities include capacity-building, agricultural extension, community projects and participation in local government decision-making. It strengthens and influences creation of new market segments like fair trade, organic markets and environment friendly markets. However, long run sustainability is a problem. Corporate Social Responsibility (CSR): Private sector organizations under their CSR program promote POs by providing input, credit and delivery of extension services. Corporate provides link to POs for supply of agricultural products or raw materials. They are engaged in out-grower schemes or contracts for the production and delivery of specific products like seeds and vegetables. These POs do not face the challenge of sustainability as a part of the corporate profit is earmarked for such activities. During 2009-13, Syngenta Foundation India (SFI) embarked a market-led extension’(MLE) model, where the emphasis was to ‘produce together and sell together’. Essential features of this approach included linking vegetable producers’ groups with markets through fewer intermediaries. The major components of MLE in vegetables include facilitating purchase of agri-inputs, providing knowledge of production and marketing of vegetables and linking farmers to markets. In addition Syngenta diversified using agri-entrepreneurs (AEs) to anchor market-led extension in vegetables. SFI supports the entrepreneurs at business start-up. Thereafter, they work independently with neighboring farmers on a commercial basis. SFI connects the entrepreneurs to bank, which provides the credit both to the AEs and their farmer clients. Producer Companies: The name ‘Producer Company’ is provided in order to indicate that the members have to necessarily be a primary producer. It is a hybrid between a Private Limited Company and a Cooperative Society. It minimizes interference from other external bodies thus ensuring that the real power rests with members of the company itself. Such a company functions like any other private limited company with only difference being that the profit incurred flows back to farmers who own the company. MAHA Farmers Producer Company Ltd. (MAHAFPC) in Maharashtra is one such example of a successfully running FPO. These State Level Association (SLA) is involved in agriculture and allied value chain. The SLA would be a for-profit or not-for-profit making entity, working directly with Farmer Organizations to help to mitigate the difficulty of farmers through institutional development services, capacity building services, system and process integration, technical training dissemination, financial intermediation, market linkage development, policy advocacy and facilitating social security and economic development.

132
CONCLUSION Vegetables are invariably produced by small and marginal farmers in India contributing significantly for increasing their income and employment. However, the linkage between farmers to markets for vegetables has been poor. Market intermediaries like pre-harvest contractors and commission agents dominate in the marketing chain of vegetables. In recent years, some institutional arrangements such as backward integration by food retaiul chains, contract farming and producer collectives are enabling farmers to participate in the changing marketing scenario. New value chains are emerging due to alternate institutional arrangements but are highly regional in nature limiting the market access and development of markets. Moving up in the value chain is necessary especially for small farmers to reap the changing markets.
REFERENCESChengappa, P.G., Mangala, K.P., and Dega, V. (2016). Is Farmer–Food Retail Chain
Linkage Feasible? Organised Retailing and Agri-Business, Springer India. 241 – 250Dileep, B.K., Grover, R.K. and Rai, K.N. (2002), Contract farming in tomato: An
economic analysis. Indian J of Agricultural Economics, 57(2): 197 – 210Eaton, C. and Shepherd. A. (2001). Contract farming: Partnerships for growth.
Agricultural Services Bulletin 165. Food and Agriculture Organization. RomeMANAGE. (2013). Training Programme on Linking Farmers to Market. Accessed from
http://www.manage.gov.in/studymaterial/LinkingFarmers-E.pdf Manjunatha, A.V. (2016). Present status and prospects of contract farming in
India. International Journal of Agriculture Sciences, ISSN, 0975 – 3710Mondal, A. (2010) ‘Farmers’ Producer Company (FPC) Concept, Practices and Learning:
A Case from Action for Social Advancement. Financing Agriculture, 42(7): 29 – 33Paty, B.K. (2005), Contract farming in India - Progress and Potential. Journal on
Agricultural Marketing, 48(1): 13 – 20Raju, K.V. and Singh, P.K. (2014). Producers’ Collectives in Sustainable Agri-value
Chain, Rural Entrepreneurship and Enterprise for Inclusive Growth, 3rd National Rural Management Symposium, 20-21 November, KIIT University Bhubaneswar
Shepherd, A. (2007). Approaches to linking producers to markets (Vol. 13). Food and Agriculture Org
Singh, S. (2003). Contract farming in India: impacts on women and child workers. International Institute for Environment and Development
Singh, S. and Singla, N. (2011). Fresh Food Retail Chains in India: Organisation and Impacts, CMA Publication No. 238 (1). Allied Publishers

133
Eggplants and Indigenous Leafy Vegetables for Food Diversity: Improving Farmers’ Livelihoods in Coastal Villages of Papua New Guinea
Philmah Seta-Waken1, Peter A. Gendua1, Paul Osilis1, Norah Omot1, Svein O. Solberg2 and Tania Paul31National Agricultural Research Institute, Papua New Guinea; E-mail: [email protected] Vegetable Center, Taiwan; E-mail: [email protected] Darwin University, Australia; E-mail: [email protected]
Abstract Maintaining food crop diversity is an important ongoing issue in the coastal region of Central Province, Papua New Guinea (PNG). This region is hot and seasonally dry with April to September temperatures ranging from 23° to 36 °C. Common food crops are cassava and plantain bananas, occasionally complemented with fish. To improve nutrition, income and livelihoods, new cultivation techniques, new crops and varieties were examined in two separate studies. In study A, open pollinated eggplant varieties developed by World Vegetable Center (WorldVeg) were evaluated in Hisiu Village in Central Province (9° 2’ S, 146° 46’ E). Seven varieties were scored for early maturing, pest and disease tolerance, yield and market preferences. Variety TS00567 was superior in yield and had early maturing characteristics, but was not popular in the market. Four varieties—S00008, S00021, S00345 and S00658 were promising, in several good traits. To increase diversity, in study B, five indigenous leafy vegetables were surveyed: amaranth (Amaranthus spp.), black nightshade (Solanum nigrum), vegetable fern (Diplazium esculentum) and tree leaves from Ficus copiosa and Gnetum gnemon. Amaranth and nightshade are fast growing and suitable for small plots. Vegetable fern and tree leaves are widely enjoyed but harvested from the wild. Except for amaranth, other target crops are not registered in the plant genetic resources conservation system in the world and very few accessions exist globally. To progress, germplasm collection and cultivation trials have been initiated. Trainings to farmers on seed saving, propagation techniques and establishment of community genebanks have been launched and will continue until the end of project in 2018. Equipped with this knowledge, skills and technologies, it is hoped that farmers in coastal areas of PNG can nutritionally diversify their diets and earn additional incomes to help contribute to improved livelihoods.
Keywords: crop diversification, diversify diet, eggplants, food security, income, nutrition, traditional leafy vegetables and vegetables
INTRODUCTION Crop diversity refers to crops and varieties that farmers cultivate and use as part of their subsistence (FAO, 2011). It consists of local farmers’ varieties (land races), modern varieties of traditional crops bred by commercial seed companies, introduced crops, as well as the crop wild relatives, weedy forms of crops and wild species used by communities for food and agriculture (Engels et al., 2014). Within a cropping system, increased diversity of a given crop may improve the chances to cope with incursions

134
of pests and diseases, or with natural hazards such as drought, heat, or floods. Different characteristics of diverse crop varieties can potentially buffer against the threat of genetic losses posed by these hazards. With a smaller crop genetic base, there would be a higher risk of genetic losses and hence, a greater threat to food security. Whilst the expected climatic and environmental changes will place unprecedented stress on agricultural systems, the most diverse cropping systems, (i.e. those with wide crop genetic base) will prove to be the most adaptable. The benefits of an adequate range of crop and varietal diversity are; increase in food security, climate resilience, safe guarding biodiversity and protecting nutritional security, reducing poverty and ensuring sustainable agriculture (Crop Trust, 2016). Subsistence farmers in PNG grow a diversity of food crops in their gardens. Different crop species are planted in a mixed cropping system, usually at very high densities. The leafy vegetables are planted first, followed by root crops and then the tree crops like bananas, fruits and nut tree species. In any subsistence gardens there is always a crop that is predominant than others. Sweet potato (Ipomoea batatas) is the most predominant crop in the Highland areas of the country thus subsistence farmers in the Highland region follow a Sweet potato based system. While in the Lowlands the cropping system are diverse and varies from one area to another. The dry coastal areas of the Central Province follow a Banana-Yam-Cassava based system. Yams (Dioscorea spp.) are usually harvested first, followed by number of harvests of banana (Musa spp.) and cassava (Manihot esculenta). The Central Province of PNG has a population of about 300,000 people of which 80% come from the coastal areas. The banana-yam-cassava based system, gives rise to the issue of poor nutrition because the traditional diet is low in protein, vitamins and minerals from little to minimal amount of vegetables and high energy content from starchy root crops. Hisiu Village is one area in Central Province where this issue is being faced. In a 1982 – 83 National Nutrition Survey, statistics for coastal dry areas of Central Province showed that malnutrition in children under five years was assessed as poor; 30 percent of children were stunted and six percent were under weight (Hanson et al., 2001). Although there is no current updated data on nutrition statistics, it is believed that the situation is still the same, or even has worsened, given the increase in population. Hisiu has also been vulnerable to the effects of natural climate variations with crop production being disrupted by prolonged dry periods, affecting food production and increasing the risk of household food, income and nutrition insecurity. In the light of these challenges, opportunities emerge for Hisiu farmers to diversify their cropping systems with the introduction of new crops, such as the nutritionally rich vegetables, both introduced and traditional. This crop diversification gives farmers dietary enrichment as well as a means for income generation by supplying fresh vegetables to the ever growing demand in Port Moresby, the biggest vegetable market in PNG, which is just two hours’ drive from Hisiu. As part of the effort in addressing nutrition, food and income security, two separate studies looking at promoting crop diversity were conducted. The first study aims to increase

135
the diversity of introduced vegetables. The second study aims to increase the diversity of traditional vegetables in the gardens of Hisiu farmers.
MATERIALS AND METHODS
Study A: Eggplant diversity trial Open pollinated eggplant varieties from the World Vegetable Centre, Taiwan were introduced and variety trials were conducted in farmer’s fields in Hisiu village, Central Province, PNG. This is to determine which variety performs well in terms of earliness to maturity, yield, quality and pest and disease tolerance under local conditions. Hisiu is located about 100 kilometers (62 miles) northwest of Port Moresby (9° 2’ 57S and 146° 46’ 3E, 3 masl; annual average temperature- max 36 – 32°C and min 25 – 23 °C) (GEOVIEW, 2016). Hisiu’s climate is characterized by a marked dry season with dry southeast winds from May to October (PNG National Weather Service, 2009). The wet season with variable northwest winds is from December to April. The area has an average annual rainfall of 1,100 mm. The soil profile comprised of sandy loam soil with well to excessively drained soils on stable flood plains under grassland vegetation (Allen et al., 1996). Seven varieties of egg plants were compared in a randomized complete block design (RCBD) with three replications. Land preparation was done manually and crops were planted on raised beds. Weeding was mostly done by hand. Spraying of Karate (2.5 a.i./ha) and Othin (0.75 a.i./ha) were applied to control pests on the eggplant as recommended on need to use and as per observations. Fertilizer application of N-P-K-Mg (12:12:17:2.5) was done in two equal splits at two weeks after transplanting and at flowering. All plots were mulched and hand watered on a daily base for the first week and then on need basis thereafter. All seedlings were hand raised in a nursery and transplanted at the five true leaf stages. Eggplants were harvested 65 – 86 days after transplanting (DAT) from 30th March – 26th June 2015. The eggplants were planted within rows at 0.6m and between rows at 0.8m. Experimental units were 3.6m x 2.4m and data were collected from 0.8 m x 2.4 m area within each plot. During crop development stage, on fortnightly basis and at each harvest time, multiple variables were measured and recorded. These included crop phenology (fruit appearance), fruit characteristics and quality, yield and pest and disease incidence. Eggplants were harvested when they had attained marketable stage. ANOVA was used to analyze continuous data of eggplant using Statistix version 8. The significant difference among the varietal plots was determined by using 95% Least Significant Difference (LSD) test.
Study B: Germplasm survey on indigenous vegetables Out of over thirty identified indigenous vegetable crops, five were selected as target crops for future research and development. These vegetables were selected because although they are amongst the more popular demand by both urban and rural consumers, the supply is limited. Amaranth (Amaranthus sp.) and black berried nightshade (Solanum

136
nigrum) are fast growing leafy vegetables suitable for small plots. Vegetable fern and tree leaves from Ficus copiosa and Gnetum gnemon are widely enjoyed but harvested from the wild. A desk top survey using The Global Gateway to Genetic Resources (GENESYS, 2016) was used to survey germplasm conserved around the globe while the Global Biodiversity Information Facility (GBIF, 2016) was used to check georeferenced occurrences of these species around the world. GENESYS and GBIF are two database portals containing collated data of plant genetic resources from around the world. The potential of traditional vegetables for nutrition, food and income security through diversification were then introduced and promoted to the farmers through a series of trainings on how to establish community seed banks, cooking demonstrations, seed production and saving and improved production techniques.
RESULTS
Eggplant diversity trials Data on crop phenology, growth and pest and disease reactions are summarised in Table 1, while data on yield and fruit characteristics of the seven eggplant varieties are presented in Table 2. Varieties S00008, S00021, S00345 and TS000567 flowered 25 days after transplanting, set fruit at 35 days and reached maturity 49 days after transplanting. Varieties S00658, S00711 and S00736 were similar in days to flowering, days to fruit set and days to maturity, all comparatively later than that of S00008, S00021, S00345 and TS000567. Varieties S00658, S00711 and S00736 reached the respective stage of crop growth and development three days later than the other varieties (S00008, S00021, S00345 and TS00567). All entries showed moderate pest and disease infestation rates at score of two for, with all varieties rated on a 1 – 5 scale, where scale of one represented no infestation, scale of 2 – 3 showed moderate infestation while 4 – 5 showed high to severe infestation. Fruit size, measured as fresh fruit weight, ranged from average values of 100g to 250g; with variety S00008 and TS000567 producing the heaviest fruits. Variety TS00567 (9.6ton/ha) produced the highest fresh fruit yield followed by S000736 (8.7ton/ ha) and followed closely by S00711 (8.4ton/ha) compared to all the varieties. Although varieties S00711, S00736 and TS00567 produced much higher yields (8.4 – 9.6 ton/ha) compared to other varieties, consumers did not like these varieties because of the fruit colours (Figure 1). Fruits of these varieties were whitish, creamy or light green colour. Other four varieties S00008, S00021, S00345 and S00658 produced yield levels ranging from 6.3 to 8.1 ton/ha with glossy purple/black colour and were preferred by consumers (Figure 1). Varieties S00008, S00736 and TS00567 produced large sized fruits while the other four varieties had medium size fruits. These eggplants came in round, tear drop/egg shaped and mostly the common cylindrical (elongated) shapes according to World Vegetable Centre’s eggplant fruit shape guide.
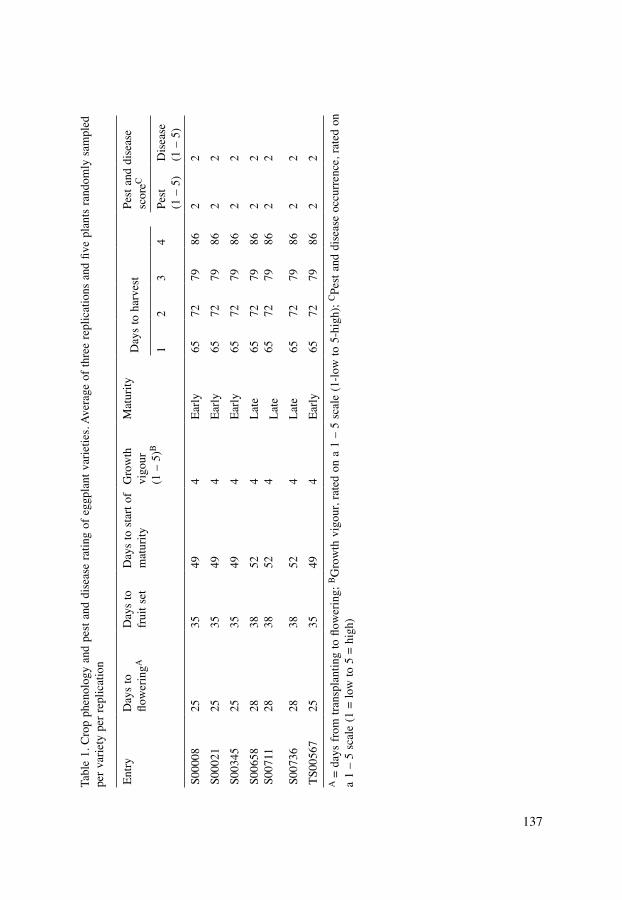
137
Table 1. Crop phenology and pest and disease rating of eggplant varieties. Av
erage of three replications and five plants random
ly sam
pled
per v
arie
ty p
er re
plic
atio
n
Entry
D
ays
to
floweringA
Day
s to
fr
uit s
etD
ays
to s
tart
of
mat
urity
Gro
wth
vi
gour
(1 –
5)B
Mat
urity
Day
s to
har
vest
Pest
and
dis
ease
sc
oreC
12
34
Pest
(1 –
5)
Dis
ease
(1 –
5)
S000
0825
3549
4Ea
rly65
7279
862
2S0
0021
2535
494
Early
6572
7986
22
S003
4525
3549
4Ea
rly65
7279
862
2S0
0658
S007
1128 28
38 3852 52
4 4La
te65 65
72 7279 79
86 862 2
2 2La
teS0
0736
2838
524
Late
6572
7986
22
TS00
567
2535
494
Early
6572
7986
22
A = days from
transplanting to flow
ering; B
Gro
wth
vig
our,
rate
d on
a 1
– 5
sca
le (1
-low
to 5
-hig
h); C
Pest
and
dis
ease
occ
urre
nce,
rate
d on
a
1 –
5 sc
ale
(1 =
low
to 5
= h
igh)

138
Figure 1. Seven different eggplant varieties tested under local lowland condition in a coastal village in Papua New Guinea
Table 2. Yield, yield attributes and fruit characteristics of eggplant varieties
Entry Fresh weight/fruit (g)
Total Yield (ton/ha)
Fruit characteristics
Fruit shape Fruit size Fruit colour
S00008 250a 8.1abc Round Large Purple/black
S00021 100b 6.3d Cylindrical (elongated) Medium Purple/black
S00345 150ab 7.4bcd Cylindrical (elongated) Medium Purple/black
S00658 150ab 6.9cd Cylindrical (elongated) Medium Light Purple
S00711 150ab 8.4abc Cylindrical (elongated) Medium Green/purple
S00736 200ab 8.7ab Egg/teardrop Large Green
TS00567 250a 9.6a Cylindrical (elongated) Large White
SE 18.5 0.3
P-value 0.0007 0.0001
SE = Standard Error of the Mean. Values within columns followed by the same letter do not differ significantly at a P = 0.05 level.

139
Germplasm survey The results of the survey of germplasm conservation of PNG indigenous leafy vegetables in seedbanks showed that there are currently no accessions of vegetable fern or the two tree species (Ficus copiosa and Gnetum gnemon) found in GENESYS. Georeferenced occurrences showed that vegetable fern and the tree species Ficus copiosa and Gnetum gnemon were concentrated in Oceania (Figure 2). The latter two are endemic to PNG and Indonesia. The search also revealed that whilst there are currently 180 accessions of black berried nightshade and 6,380 amaranth accessions worldwide, there are currently no PNG black berried nightshade in any collection of the world and only seven PNG amaranth spp. conserved (Table 3). From the GENESYS database, it is possible to retrieve where the seven amaranth accessions from PNG are conserved; two are kept at World Vegetable Centre (Taiwan), two at USDA (USA) and three at Leibniz Institute of Plant Genetics and Crop Plant Research (Germany).
DISCUSSION
Study A: Eggplant diversity trial The eggplant study showed considerable variation in phenology, yield and susceptibility to pests and diseases within the experimental site. Insect and disease damage was limited amongst all the varieties. Low incidence in pest and disease amongst these varieties were due to good sanitation and crop rotation practices in the experimental plots. The results on pests and disease also confirm initial findings from World Vegetable Centre’s gene bank that most of the varieties tested were tolerant to most pests and disease infestation. All varieties performed well in the field although there was a prolonged dry period within the duration of the trial. When farmers sold surplus of the eggplants from the trials, they found that the glossy purple/black varieties S00008, S00021, S00345 and S00658 were more preferred compared to the green and white varieties even though these varieties yielded lower compared to the other coloured varieties. Consumer’s reason was that they are more familiar with the purple coloured varieties and the elongated shaped fruits. Hence, it should be noted that particular varieties with fruit traits that are in demand by some niche markets might be more important than high yielding ones. Growers may want to pay attention to those varieties with very attractive fruits in addition to those with high yielding potentials. It is also important to note that all eggplant varieties tested are open pollinated (OP) varieties. Unlike hybrid varieties, OP varieties are capable of producing seeds that will produce seedlings just like the parent plant. As much as possible, farmers must have access to high quality open pollinated seeds. These OP eggplant varieties tested can produce thousands of highly viable quality seeds if proper seed saving and storing techniques are followed. Thus, farmers should be taught proper and improved propagation and seed saving techniques in order to maintain their seed stock for future plantings. As a result, farmers can save time and money from going a long way into towns to purchase

140
Figure 2. Maps showing georeferenced occurrences of vegetable fern (Diplazium esculentum) and the tree species Ficus copiosa and Gnetum gnemon
Table 3. Survey results for ffive indigenous leafy vegetables
Species Traditional use Georeferenced occurrences reported (GBIF 2016)Globally (PNG)
Accessions in gene-banks (GENESYS 2016)Globally (PNG)
Amaranth (A. hypochondriacus, A. Cruentus, A. tricolor and A. hybridus)
Cultivated annual plant. Leaves harvested and used as vegetables
29,948 (36) 6,830 (7)
Black nightshade (Solanum nigrum L.)
Cultivated annual plant. Leaves harvested and used as vegetables
99,479 (0) 180 (0)
Vegetable fern (Diplazium esculentum (Retz) Sw.)
Young leaves collected from the forest. Used as vegetable
312 (37) 0 (0)
Ficus copiosa Steud. Young leaves collected from trees in the forest, used as vegetables
594 (202) 0 (0)
Gnetum gnemon L. Young leaves collected from trees in the forest, used as vegetables
848 (523) 0 (0)
A Georeferenced record in total (all species) from Papua New Guinea (PNG) is 813,651 results according to GBIF (2016); Number of conserved accessions (all species) from PNG is 1,437 results according to GENESYS (2016).

141
seeds and grow eggplants to sell as income generating activity, in addition to diversify their diets.
Study B: Germplasm survey on indigenous vegetables The germplasm survey highlighted that except for amaranth, indigenous vegetables identified as relevant for PNG are not part of the global food plant conservation system and very few accessions exist globally. To progress, germplasm collection and cultivation trials have been initiated to have access to genetic material by the National Agricultural Research Institute, PNG and World Vegetable Centre, Taiwan for research. Activities to teach farmers on how to establish community seed banks are ongoing such as farmer trainings, site visits and germplasm collection trips. Hence, the introduction of open pollinated varieties of eggplants and indigenous leafy vegetables, such as amaranths, black berried nightshade, vegetable ferns and tree leaves from Ficus copiosa and Gnetum gnenom into the gardening systems of these farmers will enable them to diversify their diet, improve nutritional intake and increase income generation opportunities.
CONCLUSION Amaranth and black berried nightshades are annual crops. The young shoots and leaves are harvested and used as vegetables in PNG. Additionally amaranth recently has come to attract interest because of its useful nutritional qualities. Leaf and tender stems are rich in vitamins A, C, E, B2, folic acid, calcium, iron and protein (FAO, 1998). Therefore, developments such as conservation and promotion for consumption are important as food consumption patterns in rural areas have changed in recent decades in PNG with an increasing consumer preference for imported foods such as tinned meats, rice, flour and tinned fish. Following this trend, micronutrient rich traditional garden foods are increasingly being replaced by store bought foods which are energy dense and nutritionally poor (Saweri, 2001). Based on field observation and the performance and productivity data from Tables 1 and 2, the eggplant varieties S00008, S00021, S00345 and S000658 will be further tested for a minimum of two seasons at several locations for their yields, disease and pest reactions, nutritive value and consumers’ preferences. However, S00711, S00736 and TS00567 will be kept for potential future varietal development programs in PNG. Consumers’ preference may change in due course if fruit color is the only reason for not accepting these varieties. On-farm trial and training activities, all of which will have been completed by end of 2018, will enable farmers to establish germplasm collection of eggplant and selected indigenous leafy vegetables. They will learn seed saving and propagation techniques as well as how to establish community seed banks. Equipped with this knowledge, farmers in coastal areas of PNG can diversify their diets and improve their livelihoods.

142
ACKNOWLEDGEMENT The financial support of the Australian Centre for International Agricultural Research and the European Union Agricultural Research and Development are gratefully acknowledged.
REFERENCESAllen, B.J., Nen, T., Bourke, R.M., Hide, R.L., Fritsch, D., Grau, R., Hobsbawn, P. and
Lyon, S. (1996). Agricultural Systems of Papua New Guinea. Working Paper No. 15. Central Province: Text summaries, maps, code lists and village identification. The Australian National University, Papua New Guinea Department of Agriculture and Livestock and University of Papua New Guinea
Crop Trust. (2016). Crop Diversity: Why it matters? http://www.croptrust.org (Last retrieved 15 August, 2016)
Engels, J., Diulgheroff, S. and Alvarez, J. S. (2014). Management of Crop Diversity: Key Practices for DRR Implementers. FAO, Rome, Italy
FAO. (2011). Second Global Plan of Action for Plant Genetic Resources for Food and Agriculture. Commission on Genetic Resources for Food and Agriculture, FAO. Rome, Italy
FAO. (1998). Traditional Food Plants. FAO. Food and Nutrition. p.2, Rome, ItalyGBIF. (2016). The Global Biodiversity Information Facility, online database search
from http://www.gbif.org (Last retrieved 20 June, 2016)GENESYS. (2016). The Global Gateway to Genetic Resources, online database search
from https://www.genesys-pgr.org (Last retrieved 20 June, 2016)GEOVIEW. (2016). Hisiu, Papua New Guinea. http://pg.geoview.info/hisiu,2096121
(Accessed 12 March, 2015)Hanson, L.W., Allen, B.J., Bourke, R.M. and McCarthy, T.J. (2001). Papua New
Guinea Rural Development Handbook. Research School of Pacific and Asian Studies, Department of Human Geography, Australian National University, Canberra
PNG National Weather Service, (2009). http://pg.png_weather_service.info (Last retrieved 12 March, 2015)
Saweri, W. (2005).The rocky road from roots to rice: a review of the changing food and nutrition situation in Papua New Guinea. PNG Med J (Sep-Dec); 44 (3 – 4): 151 – 163

143
Application of Vegetable Grafting Technology to Improve Economic and Nutritional Security Under Soil-Borne Disease Outbreak Areas
Grisana Linwattana, Nutchanart Tungjitsomkid, Nuttima Kositjaroenkul, Apirat Sumrit, Taweepong Na-Nan and Wisarut Sanma-AirHorticulture Research Institute, Department of Agriculture (DOA), Thailand
Abstract Soil borne diseases such as fusarium wilt, bacterium wilt and nematode root gall are affecting vegetables production in Thailand. Vegetable grafting technology to improve economic and nutritional security under soil-borne disease outbreak areas were carried out in three steps i.e., survey and collection accessions having disease tolerance (to be used as rootstocks), confirming tolerance under green house conditions and field trials by using them as root stocks on commercial variety station trail as well as on farm trial. Survey and collection rootstocks was carried out, several chilli peppers and cucurbits varieties were collected from the planting areas which are/use to grow under outbreak of those diseases. 7 Accessions of cucurbits and 9 Accessions of chilli were identified as tolerant to dieases in the survey. Trials for confirming tolerance of such accessions to soil born disease 1) nematode root gall (chillies and cucurbits) 2) fusarium wilt (cucurbits) 3) bacterium wilt (chillies) at the Department of Agriculture, Bangkok during 2012 – 2014. Inoculations were done at two plant growth stages after transplanting at early vegetative stage and before flowering stage. Score cards for measurement disease incidence were setting up aside from growth and yield measurements. In the next step, trials were carried out at the Nan Agriculture Research and Development Center, Nan province and also in farmers field by using the tolerant accessions as root stocks during 2014 – 2016. The results from green house experiments showed that accessions collected from pumpkins from Nan and SAAS from China gave significant tolerance to fusarium wilt. Likewise, in chilli peppers, the accession number No. 2, 7 and 8 showed significant tolerance to bacterium wilt. In last step, trials were conducted in Experimental Station (I) and farmers field by using commercial verity of chilli and when grafted as scions to the selected rootstock. Though the results showed non-significant difference in the experiment station trial, but performed very well under farmers field in Nan Province by showing better growth and giving higher yield than the control commercial variety. Cost benefit analysis showed that the grafting technology of using tolerant root stocks resulted in additional net income of 2,954 Thai Baht per 1,600 m2 more than the control. IN view of this, there is a great potential to use the vegetable grafting technology to overcome soil borne diseases and also to increase yield and income of farmers.
Keywords: soil-borne disease, Fusarium wilt, Bacterium wilt, Tolerance rootstock, Benefit cost ratio
INTRODUCTION Vegetable production in Thailand is hampered due to soil-borne diseases. Soil-borne diseases are usually caused by biotic organisms such as Fusarium, Pythium, Rhizoctonia species, root rot, vascular wilts and nematodes root gall. While biotic factors such as stress condition e.g. drought and floods also contribute to yield reduction. Root
144
rots can affect plants beyond the seedling stage when the fungi invades internal root tissue, interfering the supply of water and nutrients. Leaf yellowing, leaf drop, wilt at the growing tip, twig dieback and sudden death are complex symptoms and finally affecting loss of vigor of the plants. Vascular wilts are characterised by plant wilt and discoloration of the vascular system in stems or trunks and branches. Likewise, nematodes are microscopic, unsegmented worms. Root knot nematodes invades roots of the plants and cause gall-like lesions that restrict water and nutrient uptake which ultimately causes wilt. Whereas bacterial wilt, caused by Ralstonia solanacearum is a problematic soil-borne disease in many crops, including chilli pepper, tomato, potato, tobacco and eggplant. Many reports indicate that grafting resistant/tolerant rootstocks to high yielding varieties soil borne disease can significantly reduce disease incidence and increase crop yield. Under this technology two plants, the scion and the rootstock, are combined by grafting to create a plant with desirable features from both parts. While the scion will produce fruit with the desired characteristics, the rootstock will provide resistance against soil-borne diseases and/or nematodes. A brief history of vegetable grafting is given by Sanjun Gu (2017) and Ozores-Hampton and Frasca (2017). Grafting technology was initially introduced in Japan in 1920. First they used water melon (Cucubita moschata) as a rootstock. Later it was changed to bottle gourd (Tateishi, 1927; Sato and Takamatsu, 1930; Kijima, 1933; Murata and Ohara, 1936; Sakata et. al., 2007). Asian Vegetable Research and Development Centre (AVRDC), the World Vegetable Center applied this technology to tomato, egg plant, chilli pepper and sweet pepper and it is widely used in Taiwan, Korea and Viet Nam (AVRDC (2017). Davis et al., (2008) reported that grafting technology in Cucuerbitaceae can be used for disease control, against biotic stresses like cold and hot weather, to improve land use efficiency, to accelerate flowering and harvesting and to maximise N use efficiency. Many papers have reported the control of out-break of soil-borne diseases of vegetables caused by more than ten species of fungus, nematodes (root gall) and bacteria in Mediterranean and South East Asia through vegetable grafting technology. This technology can also be used against virus and fungus diseases occurring above ground or on leafs of the plant (King et al., 2008). In this study an effort was made to introduce this vegetable grafting technology to selected areas in Thailand where soil-borne diseases are very serious. Specific objectives are to find rootstocks/varieties tolerant 1) nematode root gall (chilli peppers and cucurbits) 2) fusarium wilt (cucurbits) and 3) bacterial wilt (chilli peppers).
METHODOLOGY The studies were conducted in three main step, survey and collection of disease tolerant accessions, confirming disease tolerance under green house conditions and field trials (in experiment station and farmers field.1. Survey for rootstocks selection and collection: First a survey was made and it was found that soil-borne disease caused by i.e. Ralstonia solanacearum, Fusarium

145
oxysporum and Meloidogyne spp. were often out-break in chilli and cucurbits. Seeds from healthy and well performing chilli peppers and cucurbits from these areas were collected and reproduced. These will be later used as rootstocks the treatments in the greenhouse experiment. Criteria for selecting in general, practically healthy plant as the score cards indicating below.2. Greenhouse experiment for selecting rootstocks: Four Green house experiments were taken in Department of Agriculture, Bangkok during 2012 – 2014. Greenhouse Experiments I and II were taken to confirm the tolerance of selected accessions of cucurbits to Fusarium wilt and Nematode root gall diseases, The experiment was laid in RCBD, replicated 3 times and the treatment were: 1) Pumpkin (SAAS) 2) Wax gourd 3) Bottle gourd 4) Pumpkin (Nan) 5) Bitter gourd 6) Balsam apple (1) 7) Balsam apple (2) Greenhouse Experiments III and IV were taken to confirm the tolerance of collected chilli pepper accessions to bacterial wilt and nematode root gall diseases. These experiments were also taken in RCBD, replicated three times. The treatment were: (chilli pepper accessions 1 – 9 (identified as tolerant))
Scoring of disease incidences: Scorecard given in Table 1 were used for scoring of soil borne disease incidence in a scale of 1 to 5. They were taken at 50 days after innoculation and fruiting stage for cucurbits and at harvest for chilli peppers, Growth and yield parameters of the plants were also collected.
Table 1. Score card for measuring Soil borne disease incidence
Bacterium wilt(R. solanacearum)
Nematode root gall(Meloidogyne spp.) (Kinloch,1990)
Fusarium wilt(F. oxysporum sp. lycopersici)
practically healthy plant = 11 leave of the plant wilt = 21/3 of the plant wilt = 32/3 of the plant wilt = 4the whole plant wilt = 5
practically zero root gall developed = 0,slightly root gall developed = 15 – 25% root gall developed = 225 – 50% root gall developed = 350 – 75% root gall developed = 4>75% root gall developed = 5
practically healthy plant = 11 leave of the plant wilt = 21/3 of the plant wilt = 32/3 of the plant wilt = 4the whole plant wilt = 5
Crop care: Sowing seeds of seven species of cucurbits and nine chilli pepper accessions collected as tolerant was done in seeding tray. At two-leaf stage, the seedlings transplanted in to container. After 2 weeks of transplanting, following soil borne disease causing organism were inoculated:• F. oxysporum sp. lycopersici in the form of sorghum media were inoculated (three
spoons at 14 days after transplanting for experiment I for cucurbits).• Root gall causing nematode (Meloidogyne spp.) were inoculated (1,500 eggs/plant
at 14 days after transplanting in experiment II for cucurbits and chillis.• R. solanacearum was inoculated with 106 colonies/g. of soil/plant as the same
timing as per experiment I (For chillis)

146
Experimental Station (I): After identification of suitable accessions tolerant to diseases from the greenhouse experiments, field trials were carried out in chilli only using selected accessions as root stocks for commercial chilli peppers at the Nan Agriculture Research and Development Center Experimental Station (I), Nan province between 2012 and 2014. In this trial only 3 tolerant accessions were used as given below. When the tolerant selections were at two- leaf stage, commercial chilli pepper variety as scion were grafted using cleft grafting technique. The grafted plants were then transplanted to the field in a plot size of 1.2 X 6 meter. The experiment was laid out in RCBD, replicated seven times with four treatments. The treatments are as follows:1). Chilli Accession No. 22). Chilli Accession No. 73). Chilli Accession No. 84). Commercial Variety
Farmers field trial Experimental Station (II): This experiment was almost the same as previous experiment conducted at Experiment station (I) but was conducted in famer’s field in Pua District Nan Province, during 2015. Treatments were the same as in Experimental Station (I) trial. Crop care and data collection were carried on as same as a previous experiment. Cost and return benefit analysis in farmer field was also done in this trial.
RESULTS AND DISCUSSIONSI Survey and collection: A survey to identify and collect tolerant chilli pepper and cucurbit varieties/cultivars to soil borne diseases caused by R. solanacearum and F. oxysporum sp. lycopersici was done across the Thailand. Nine chilli types/species which were apparently healthy and showed good performance were collected (Table 1). (Note: The acc. No. 10 Solanum aculeastissimum given in the table should be deleted as this is not pepper accesion. This does not justfy inclusion in this paper on chilli pepper and cucurbits.) Similarly, seven cucurbit accessions which exhibited healthy and good performance were also collected (Table 2). After documenting them by giving accession numbers and passport data, seeds of these were divided into two portions, first portion was stored and the other portion was used in the greenhouse experiment.

147
Table 2. Different types/species of cucurbits identified as tolerant to soil borne diseases
Acessing number
Varieties Scientific name Common name Location finding/sources
001 Cucurbit 1 Cucurbita moschata Decne.
Pumpkin SAAS, (China)
002 Cucurbit 2 Benincasa hispida Wax gourd, winter melon
Nan
003 Cucurbit 3 Lagenaria sicerarai (Molina) Standl.
Bottle gourd Pichit
004 Cucurbit 4 Cucurbita moschata Decne.
Pumpkin Nan
005 Cucurbit 5 Momordica charantia L Bitter gourd Commercial Var.006 Cucurbit 6 Momordica charantica Balsam apple 1
Balsam apple,Balsam pear,Bitter cucumber,Bitter gourd,Bitter melon
Chiang Mai (Fang)
007 Cucurbit 7 Momordica charantia L Balsam apple 2Balsam apple,Balsam pear,Bitter cucumber,Bitter gourd,Bitter melon
Nan (ThawangPha)
Table 1. Different types/species of chilli peppers identified as tolerant to soil borne diseases

148
II Rootstock selection in greenhouse experiments:Identification of nematode and Fusarium tolerant lines of Cucurbits under green house conditions: The results from the greenhouse experiments conducted showed that, Pumpkin from Nan and SAAS (China) gave very good and positive performance to both Fusarium wilt (Table 3) and nematode root gall disease (Table 4). Pumpkin from SAAS and from Nan showed low incidence of wilt responding from the fungi inoculation at 2.36 and 2.86 score cards, respectively which cannot comparing to 4.22 of Bitter gourd (Table 3). Although wax gourd showed similar low degree of incidence, it has undesirable character due to showing slither limb shape/creeping branches or longer internodes length at 25.40 cm (Table 5 and Figure 1). Similarly, result of root gall disease incidence was at 2.44 and 2.33, of Pumpkins from SAAS and from Nan, respectively compared to as high 3.44 as bitter gourd (Table 4). Chilli Accession No. 7 and chilli Accession No. 10 showed a score of 1 (or slightly root gall developed) and 3 (or 25 – 50% root gall developed), respectively (Figure 2). Likewise, chilli Accession No. 2 and chilli Accession No. 8 showed positive/well performance to bacterium wilt disease giving a score of 3.01and 2.48 (both are expressed at between 1 leave of the plant wilt to 1/3 of the plant wilt), respectively (Table 6). Whereas chilli Accession No. 2, 8 and 7 also gave relatively well/positive response to nematode root gall which gave average scores of 1.83, 2.22 and 2.58, respectively (Table 7). According to the report of Li Wu and Palada (2008) in on-farm evaluation of pepper grafting technology for managing soil-borne diseases, the overall goal were to overcome the damaging effect of soil born diseases and increase yield of sweet pepper during the hot-wet season. In highland Nan-tou, fruits yield averaged over four sweet pepper cultivars (scions) were significantly (p >0.05) higher (39 – 48 t/ha) in plants grafted onto nine chilli peppers rootstock lines compared to non-grafted plants. Therefore, those chilli peppers were then used as the tolerance root stock for the field trial in the consequence experiments.
III Experimental Station (I): Tolerance rootstocks trials of chilli peppers Rootstock trials of selected chilli pepper accessions was conducted at Experimental Station at Nan Agriculture Research and Development Center, Nan Province. The treatments comprising of commercial verity of chilli peppers grafted onto the selected rootstocks based on the greenhouse experiments and the non-grafted one (control) were evaluated. Result showed non-significant difference in all the treatments d (Table 8). The reason behind possibly because of the soil in the experiment station were fertile since it was often and previously continue adding compost fertilizer as well as chemical fertilizer meaning that soil condition is unfavorable to soil-borne disease. Consequence in term of productivity, there is non-significant difference among the treatments. Disease usually occurs when conditions like moisture are particularly unfavourable as mentioned, or when a soil organism is accidentally introduced where a highly susceptible plant species occurs. Intensive production in agriculture, horticulture
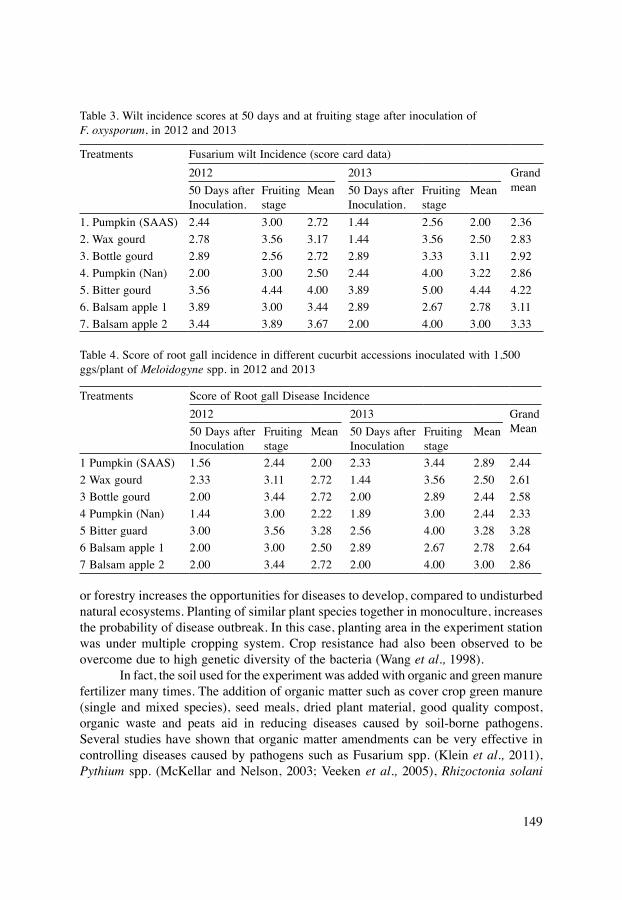
149
Table 3. Wilt incidence scores at 50 days and at fruiting stage after inoculation of F. oxysporum, in 2012 and 2013
Treatments Fusarium wilt Incidence (score card data) 2012 2013 Grand
mean 50 Days after Inoculation.
Fruiting stage
Mean 50 Days after Inoculation.
Fruiting stage
Mean
1. Pumpkin (SAAS) 2.44 3.00 2.72 1.44 2.56 2.00 2.36 2. Wax gourd 2.78 3.56 3.17 1.44 3.56 2.50 2.83 3. Bottle gourd 2.89 2.56 2.72 2.89 3.33 3.11 2.92 4. Pumpkin (Nan) 2.00 3.00 2.50 2.44 4.00 3.22 2.86 5. Bitter gourd 3.56 4.44 4.00 3.89 5.00 4.44 4.22 6. Balsam apple 1 3.89 3.00 3.44 2.89 2.67 2.78 3.11 7. Balsam apple 2 3.44 3.89 3.67 2.00 4.00 3.00 3.33
Table 4. Score of root gall incidence in different cucurbit accessions inoculated with 1,500 ggs/plant of Meloidogyne spp. in 2012 and 2013
Treatments Score of Root gall Disease Incidence2012 2013 Grand
Mean 50 Days after Inoculation
Fruiting stage
Mean 50 Days after Inoculation
Fruiting stage
Mean
1 Pumpkin (SAAS) 1.56 2.44 2.00 2.33 3.44 2.89 2.44 2 Wax gourd 2.33 3.11 2.72 1.44 3.56 2.50 2.61 3 Bottle gourd 2.00 3.44 2.72 2.00 2.89 2.44 2.58 4 Pumpkin (Nan) 1.44 3.00 2.22 1.89 3.00 2.44 2.33 5 Bitter guard 3.00 3.56 3.28 2.56 4.00 3.28 3.28 6 Balsam apple 1 2.00 3.00 2.50 2.89 2.67 2.78 2.64 7 Balsam apple 2 2.00 3.44 2.72 2.00 4.00 3.00 2.86
or forestry increases the opportunities for diseases to develop, compared to undisturbed natural ecosystems. Planting of similar plant species together in monoculture, increases the probability of disease outbreak. In this case, planting area in the experiment station was under multiple cropping system. Crop resistance had also been observed to be overcome due to high genetic diversity of the bacteria (Wang et al., 1998). In fact, the soil used for the experiment was added with organic and green manure fertilizer many times. The addition of organic matter such as cover crop green manure (single and mixed species), seed meals, dried plant material, good quality compost, organic waste and peats aid in reducing diseases caused by soil-borne pathogens. Several studies have shown that organic matter amendments can be very effective in controlling diseases caused by pathogens such as Fusarium spp. (Klein et al., 2011), Pythium spp. (McKellar and Nelson, 2003; Veeken et al., 2005), Rhizoctonia solani

150
Table 5. Plant height at flowering stage and internode length of selected accessions of cucurbits in 2013
Treatment Plant Height (cm) Internodes length at flowering stage (cm)
Trunk circle at flowering stage14 Day after
plantingAt flowering stage
1 .Pumpkin (SAAS) 26.46a 144.6ab 22.80b 3.77a2. Wax gourd 23.70ab 132.3b 25.40a 3.43ab3. Bottle gourd 26.50ab 141.3ab 21.73b 3.21bc4. Pumpkin, (Nan) 26.23a 156.0a 22.86b 3.76a5. Bitter gourd 25.86a 131.0b 22.00b 2.97cd6. Balsam apple 1 21.90b 127.6b 20.66 2.54e7. Balsam apple 2 21.13b 126.6b 20.96 2.64deC.V. (%) 7.24 6.75 5.28 6.36Means follow with the same letter are not significantly difference at 95% level of confidence by DMRT.
Figure 1. Treatment No. 2 (wax gourd) although gave good crop performance but showing characteristic of slither limb shape/ creeping branches which is not acceptable

151
Table 6. Wilt incidence of chilli peppers after inoculation with the R. solanacearum in 2012 and 2013
Accession/Treatments Wilt Incidence (Score)2012 2013 Means
1. Chilli Acc. No.7 4.66 3.17 3.922. Chilli Acc. No. 12 3.52 3.56 3.543. Chilli Acc. No. 2 4.18 1.83 3.014. Chilli Acc. No. 9 4.47 – 4.475. Chilli Acc. No. 1 4.30 3.67 3.996. Chilli Acc. No. 10 5.00 4.17 4.597. Chilli Acc.No. 11 5.00 2.50 3.758. Chilli Acc. No. 8 3.20 1.75 2.489. Chilli Acc.No. 4 5.00 4.67 4.84
Figure 2. Root gall developing of chilli peppers as responding to Meloidogyne spp., between chilli No. 7 and chilli No. 10, (A) shows slightly root gall developed = 1 and (B) shows root gall developed = 3 (25-50%), respectively
A
B

152
Table 7. Incidence of root gall nematode in chilli accessions at 50 days and at harvest after inoculation with Meloidogyne spp. at 1,500 eggs/plant
Accession/Treatments Incidence of Root gall Nematode (score cards)2012 2013
50 Days after Inoculation
At harvest 50 Days after Inoculation.
1. Chilli Acc. No. 7 2.13 4.33 1.832. Chilli Acc. No. 12 0.67 4.33 2.353. Chilli Acc. No. 2 0.33 4.33 2.224. Chilli Acc. No. 9 0.00 4.00 1.005. Chilli Acc. No. 1 1.00 4.00 2.616. Chilli Acc. No. 10 1.93 4.33 3.667. Chilli Acc.No. 11 2.43 4.67 3.228. Chilli Acc.No. 8 2.78 4.00 2.589. Chilli Acc.No. 4 2.50 4.67 2.50
Table 8. Plant height, yield and incidence of R. solanacearum in chilli peppers when tolerant accession root stocks were grafted to commercial variety
Treatments Symptomincidence
Plant height (cm) at 7 days after planting
Plant height(cm) at harvest
Yield(kg/1600 m2)
Chilli No. 2* negative 69.06 a 87.2a 1,600b Chilli No. 7* negative 70.00 a 85.5a 1,240c
Chilli No. 8* negative 61.47 a 88.0a 1,960a Control(Commercial variety)
negative 51.70 b 97.6a 1,828ab
CV. (%) 11.00 9.30 13.35
*Indicates that these were used as root stocks and were grafted to commercial variety scionsMeans follow with the same letter are not significantly different at the 95% level of confidence.
(Diab et al., 2003) and Sclerotinia spp. (Lumsden et al., 1983). Organic matter improves soil structure, water and nutrients holding capacity and supports activities of some of the good microorganisms that contribute to biological control. Baysal et al., (2008) report that our study has shown that mixed-hay cropping during the transition periods can enhance soil suppressiveness to damping-off caused by Pythium and Phytophthora however, the effects of soil fertility on soil-borne diseases were not predictable, although compost amendments applied could improve crop vigor that has been known enhancing to certified organic production.
153
IV Experimental Station (II): Tolerance of rootstocks of chilli peppers (in farmers field) Experimental Station (II), tolerance rootstocks trials of chilli peppers was conducted in farmers field of Pua district, Nan Province. Cost and return benefit analysis was also carried out. Result showed higher cost than using rootstock (RS) as 7.74% as compared to non-rootstock (NRS) of material cost (seed) (Table 9). However, the yield per 1,600 m2 of grafted chilli was 214 kg higher than control (Commercial variety). This resulted in additional net income of 2,954 Thai Baht per 1,600 m2 more than the control. The performance of grafted chilli peppers in the disease prone areas was very good (Figure 5). There are several reports about the advantage of grafting scion on to tolerant root stock. Grafting can be used to manage soil-borne diseases such as bacterial wilt and root knot nematode of solanaceous vegetables and fusarium wilt of cucurbits (Bruton, 2005; Rivard and Louws, 2006). While grafting can protect vegetable crops from some soil-borne diseases, rootstocks are not resistant to all diseases. Some researchers have found that grafting is a good alternative to methyl bromide treatment to reduce disease incidence, reduced environmental impact and also improved performance in addition to disease resistance and reduced cost (Miguel et al., 2004). The perceived cost is the major factor limiting grafting in the United States. The Environmental Protection Agency web site on methyl bromide alternatives lists the costs of grafting vegetables as ranging between $1.80 and $2.28 per plant and the cost of methyl bromide fumigation is listed as $0.41 to 0.92 per plant, but the references date back to at least 1992 and 1996 (U.S. Environmental Protection Agency, 2007). In term of economic impact, although no statistical analysis done, application of the vegetable grafting technology has overcome soil-born disease problems in the disease prone planting areas and thereby economics of farmers adopting the technology can be improved as yield of chilli peppers has increased. Moreover, applying grafting technology can also reduce the cost of using chemical (pesticide) from 650 lowering to 50 TBH as shown in Table 9. In general, the grafting technology is an alternative way in substitution of chemical substances. Nation-wide applications, would dramatically reduce volume and value of chemical substance importing from abroad.
CONCLUSIONS Ten (Nine is the correct number) accessions of chilli peppers tolerant to bacterial wilt were identified in disease prone areas of Thailand. Similarly, seven accessions of cucurbits were collected from the Fusarium and root knot nematode prone areas. Chilli No. 2, 7 and 8 showed tolerance to bacterial wilt (caused by R. solanacearum) under green house conditions. Wherein in cucurbits, pumpkin showed resistance to fusarium wilt (caused by Fusarium oxysporum f. sp. lycopersici). Likewise, chilli accession No. 7 and 10 gave good performance against root gall nematode disease. However, from the greenhouse experiment conducted as on station experiment, chilli accession No. 8 gave good performance as a rootstock. Cost and return benefit analysis of using grafted tolerant chilli peppers rootstock, showed better result in term of net income. Though we

154
Table 9. Cost and return benefit analysis of chilli peppers production (TBH per 1600 m2) with rootstock and without rootstock
Items Cost TBH Cash Non cash Total (TBH) PercentageNRS Root
stock NRS RS NRS RS NRS RS
1. Variable cost Land preparation
– – 120 120 120 120 0.34 0.34
Transplanting – – 720 720 720 720 2.06 2.03 Weeding – – 120 120 120 120 0.34 0.34 Irrigation – – 2250 2250 2250 2250 6.45 6.36 Fertilization – – 150 150 150 150 0.43 0.42 Harvesting 8100 8100 8100 8100 23.22 22.89 Total 8100 8100 3360 3360 11460 11460 32.86 32.38 2. Material cost Seed 40 2800 40 2800 0.11 7.74 Plastic cover 1200 1200 1200 1200 3.44 3.32 Organic Fer. 3390 3390 3390 3390 9.72 9.37 Chemical Fer. 6600 6600 6600 6600 18.92 18.24 Insecticide 2100 2100 2100 2100 6.02 5.80 Herbicide 180 180 180 180 0.52 0.50 Pesticide 650 50 650 50 1.86 0.14 Fuel 150 150 150 150 0.43 0.41 Electrical 2000 2000 2000 2000 5.73 5.53 Total 16310 17670 16310 17670 46.76 51.03 Grand TOTAL 25216 25770 3400 3400 28616.96 29930 82.04 82.69 3. Fixed cost Machinery depreciation
6263.33 6263.33 6263.33
Grand Total 6263.33 6263.33 6263.33 Total cost /Rai 25216.96 9663.33 34880.29 36193.33 100 100 Yield/Rai 2236.74 2450.11 214 Cost Price/Kg. 15.59 14.77 Selling/Rai 20 20 Income/Rai 44734.8 49002.2 Income/Cash 16117.84 23232.2 Income/ Non cash
19517.84 1982.2
Net Income 9854.51 12808.87 2954.36 NRS – without root stock, RS – with root stock, TBH – What is this?, Rai – what is this?

155
Figure 5. Performance of grafted chilli plants with tolerant rootstock (A) and non-grafted plant (B)
A B
have identified pumpkin accessions tolerant to Fusarium and nematode diseases, further testing them as root stocks have to be done. Application of vegetable grafting technology in the out-break area of soil-borne disease will indirectly benefit environment and can be used to give food and nutrition security to farmers as it increases yield without much pesticide use and also increases yield. It is suggested to find more and more tolerant root stocks to overcome the problem of them becoming susceptible to diseases over a period of time due to the emergence of new biotype and races. Transferring grafting technologies to the farmers through participatory RandD approach as well as conducting training courses, field visits is also suggested.
REFERENCESAVRDC (2017). World Vegetable Centre. https://avrdc.org/on-farm/business-
opportunities/vegetable-grafting/(Retrieved on 15 June 2017)Baysal, F., M.S. Benitez, M.D. Kleinhenz, S.A. Miller and B. McSpadden Gardener.
(2008). Field management effects on damping-off and early season vigor of crops in a transitional organic cropping system. Phytopathology 98: 562 – 570. (Available online at: http://dx.doi.org/10.1094/PHYTO-98-5-0562) (Accessed 20 June, 2016)
Bruton, B. (2005). Grafting watermelon onto squash or gourd rootstock makes firmer, healthier fruit. Agricultural Research 53(7): 8 – 9. (Available online at: www.ars.usda.gov/is/AR/archive/jul05/fruit0705.htm) (Accessed 20 June, 2016)
Davis, A.R., Perkins-Veazie, P., Hassell, R., Levi, A., King, S.R. and Zhang, X. (2008). Grafting effects on vegetable quality. HortScience.

156
Kijima, J. (1933). watermelon grafting using bottle gourd rootstock. J. Okitsu hort. Soc. 29: 111 – 115. (English abstract)
King, S.R., Davis, A.R., LaMolinare, B., Lin, W. and Levi, A. (2008). Grafting for disease resistance. Hortsci.
Kinloch, G.C. (1990). A comparative study of relative open, harmonious societies. International Journal of Group Tensions, 20(2), 167 – 177
Li Wu, D. Palada, M.C. (2008). On-farm evaluation of pepper grafting technology for managing soil-borne diseases Asian Vegetable Research and Development Center-The World Vegetable Center, 60 Yi-min Liao, Shanhua, Taiwan 74199 (Taiwan). Crop and Ecosystem Management Unit University Library, University of the Philippines at Los Baños HOMEPAGE: http://www.uplb.edu.ph
Lumsden, R.D., J.A. Lewis and P.D. Millner. (1983). Effect of composted sewage sludge on several soilborne pathogens and diseases. Phytopathology 73: 1543 – 1548. (Available online at http://www.apsnet.org/publications/phytopathology/backissues/Documents/1983Abstracts/Phyto73_1543.htm) (Accessed 20 June, 2016).
McKellar, M.E. and E.B. Nelson. (2003). Compost induced suppression of Pythium damping-off is mediated by fatty-acid metabolizing seed-colonizing microbial communities. Applied and Environmental Microbiology 69: 452 – 460. (Available online at: http://dx.doi.org/10.1128/AEM.69.1.452 – 460.2003 (Accessed 20 June, 2016)
Miguel, A., Maroto, J.V., San Bautista, A., Baixauli, C., Cebolla, V., Pascual, B., Lopez, S., Guardiola, J.L. (2004). The grafting of triploid watermelon is an advantageous alternative to soil fumigation by methyl bromide for control of Fusarium wilt. Sci. Hort. 103: 9 – 17
Murata, J. and Ohara, K. (1936). Prevention of watermelon fusarium eilt by grafting Lagenaria. Jpn. J. Phytopathol. 6: 183 – 189. (English abstract)
Ozores-Hampton, M. and Frasca, A. Coelho. (2017). Healing Chamber for Grafted Vegetable Seedlings in Florida. http://edis.ifas.ufl.edu/pdffiles/HS/HS123200.pdf (Retrieved on 16 June 2017
Rivard, C. and F. Louws. (2006). Grafting for disease resistance in heirloom tomatoes. North Carolina, USA, North Carolina Cooperative Extension Service, North Carolina State University. (Available online at: http://www4.ncsu.edu/~clrivard/TubeGraftingTechnique.pdf) (Accessed 20 June, 2016)
Sakata, Y., Takayoshi, O. and Mitsuhiro, S. (2007). The history and present state of the grafting of cucurbitaceous vegetables in Japan. Acta Hort. 731: 159 – 170.
Sanjun Gu. (2017). Vegetable grafting. North Carolina Agricultural and Technical State University.78p http://hos.ufl.edu/sites/default/files/faculty/gdliu/VegetableGraftingUF2-25-2015Compressed.pdf (retrieved on 16 June 2017)
Sarkar, S. and S. Chaudhuri, (2016). Bacterial wilt and its management, Current Science, Vol. 110, NO. 8
Sato, N. and Takamatsu, T. (1930). Grafting culture of watermelon. Nogyo sekai 25: 24 – 28. (English abstract)

157
Tateishi, K. (1927). Grafting watermelon onto pumpkin. Japanese Journal of Horticulture (Nihon-Engei Zasshi) 39:5 – 8. (In Japanese)
U.S. Environmental Protection Agency. (2007). Plant grafting as a tool to help reduce the need for soil fumigation with methyl bromide. <http://www.epa.gov/spdpublc /mbr/casestudies/volume3/graftng3.html>.34
Veeken, A.H.M., W. J. Blok, F. Curci, G.C.M. Coenen, A. J. Temorshuizen and H.V.M. Hamelers. (2005). Improving quality of composted biowaste to enhance disease suppressiveness of compost-amended, peat based potting mixes. Soil Biology and Biochemistry 37: 2131 – 2140. (Available online at http://dx.doi.org/10.1016/j.soilbio.2005.03.018) (Accessed 20 June, 2016)
Wang, J. F., Hanson, P. and Barnes, J. A, (1998). Worldwide evaluation of an international set of resistance sources to bacterial wilt in tomato In Bacterial Wilt Disease. Molecular and Ecological Prior, Edt. P., Allen, C. and Elphinstone, J.), Springer, Berlin, 1998, pp. 269 – 279

158
The Evolution of Seed Industry and its Impact on Food Productivity
Chua Kim Aik1 and Fakhrul Anwar Zainol21Green World Genetics Sdn Bhd., 40, Jalan KIP 10, Taman Perindustrial KIP, Kepong 52200, Kuala Lumpur, Malaysia.E-mail [email protected] of Economics and Management Science, Univerisity of Zainal Abidin, 21300 Kuala Terengganu, Malaysia.E-mail: [email protected]
Abstract The growing world population and the scarcity of land has created enormous stress to all nations in food supply. To be self-sufficient and to attain food security, they have to produce more food from less land. It became an issue of great importance and challenge, that have been brought to the attention of all policy makers, to realize the importance of agriculture. This has also brought to a renewed emphasis on domestic food production and declared food self-sufficient as their strategy to attain food security. The global challenge to attain sustainable development has triggered many changes in agriculture industry and thus resulted in the evolution of seed industry. The emphasis is in developing high yielding variety or hybrids. High quality seed is the most important input for productive agriculture. The seed industry has undergone three major changes. It began with seed selection, followed by conventional hybrid breeding and introduction of biotechnology in breeding. The changes and exploitation of these scientific advances has led to the development of many new varieties and resulted in substantial increase in the yield of most of the crops.
Keywords: seeds, food security, self-sufficient, yield, productivity
INTRODUCTION The world is facing dramatic increase in basic food prices in the last few years. It started to increase sharply in 2006 and 2007, continuing to rise even further in early 2008 (Bello and Baviera, 2009). The rapid rise in food prices has been a burden on the poor vulnerable groups in developing countries, who spend roughly half of their household incomes on food. In Malaysia, 90% of the households, find it hard to cope with the increase in food prices (The Star-Asia News network, 2015) The situation has led to serious problems, affecting nearly three billion people, particularly those earning less than US $ 2 per day (Aziakou, 2008). Hundreds of million people in the developing countries still go hungry and are undernourished. The food and Agriculture Organization of the United Nations in its most recent estimate indicated that, globally, 842 million people, or approximately 12% of the global population were unable to meet their dietary energy requirements in the years 2011 to 2013, down from 868 million reported for the years 2010 to 2012 in last year’s report. The ongoing financial crisis may further deteriorate, and might hit the economy which could tip even more people into hunger and poverty, FAO warned.

159
This has been a global phenomenon with varying degrees of severity in international regions, with sub-Saharan Africa (SSA) being the worst hit. Thirty one per cent of the population in SSA (203.5 million Individuals) and twelve per cent in South East Asia are classified as being undernourished (Table 1).
Table 1. Food Insecurity by International Region
% Under – nourished by region 1990 – 1992 1995 – 1997 2001 – 2003 2015 TargetSub-Saharan Africa 33 34 31 18Southern Asia 25 23 21 14CIS*, Asia 16 NA 20 9Eastern Asia 16 12 12 9South East Asia 18 14 12 10Oceania 15 14 12 8Latin American and Caribbean 13 11 10 7Western Asia 6 9 9 4Northern Africa 4 4 4 3CIS, Europe 4 NA 3 2.8Source: FAO, 2008
The undernourished scenario has been brought to the worldwide attention and raises the question about the efficiency of global food management system to ensure household food security. This is becoming very important to the many million people worldwide who are suffering from persistent hunger and under nourishment and to others who are at the risk of doing so in the future, including coming generations. Food security being a widely debated issue, encompasses issues mainly built on four dimensions; food availability, food stability, food accessibility and food utilization. The world summit 1996 held in Rome, Italy defined food security as “ Food security exists when all people, at all times, have physical and economic access to sufficient, safe and nutritious food to meet their dietary need and food preferences for an active and healthy lifestyle.” The challenge of food security must be addressed immediately. Achieving a sufficient food supply is a global challenge and a complex sustainable development issue to most of the developing countries. The current difficulties that emerged were accelerated by the growing world population, speculation in commodity and the growing affluent society. In addition, the conversion of farmland into urban real estate has resulted to the mismatch in supply and demand, further leading to food shortage. As a result, riots and civil disturbances, have taken place in many developing countries (Demeke et.al., 2009). A crisis of this nature has triggered a wide variety of policy responses around the world (Demeke et al., 2009). This has been brought to the attention of all nations, to realize the importance of agriculture and the vulnerability of supply of food and price. Food should not be treated the as any other commodity. In addressing the current situation, it was recognized that immediate action is needed from all concerned.

160
The crisis has also brought a renewed emphasis on domestic food production. Many countries including Malaysia have declared self sufficiency in food as their strategy (Mohammed, 2009). As a result, many countries initiated an short term action to ensure an adequate food supply locally to keep the prices low and protect the most vulnerable people through providing support towards reducing poverty and hunger (Ghanem, 2008). In long term to over come the poverty, hunger and to cope with the growing population, a healthy agriculture sector is essential to increase food production. As such, this is an exciting time to be in Agriculture. The world population that is projected to be 9.2 billion in 2050 (Diouf, 2009). To meet the demand of this population, we need to grow double the amount of food. A doubling demand poses huge challenge for the sustainability of food production. As such it is vital to have a medium and long term strategy, to increased productivity and food supplies through increase investment in agriculture. These challenges have gained the support from the G8 leaders, calling for decisive action, encouraging shift of policy to help the poor and hungry to produce their own food to be free from hunger and poverty by promoting sustainable production with increased agriculture productivity. There is evidence of their concern with food supplies and have committed themselves to mobilize US $ 20 billion over three year for a comprehensive strategy focusing on sustainable agriculture development (Matthews, 2009). Success in responding to these challenges relies on dynamic agriculture and robust seed Industry
SEED INDUSTRY The most important characteristic of the seed industry is its heterogeneity in many dimensions. The product segments correspond to all the major field crops and vegetables. With respect to product type, a major distinction is between hybrids and open-pollinated varieties. Seeds of varieties can be reproduced for many generations with little deterioration in quality. As a result, after the initial purchase, farmers can multiply their own seeds. This is not a viable strategy with hybrids because they suffer noticeable declines in yields in subsequent generations. As a result, hybrid seeds have to be repeatedly purchased. Good quality seed is the most important input for productive agriculture. It forms the fundamental component of the total food supply chain. The total food supply chain component includes seed, farming, processing and distribution. For any agriculture production activity, seed is the critical determinant of agriculture production, the most important input and the vital thing to have for a successful crop, productivities or the output(Singh et al., 1990). Much of the success in achieving self-sufficient, food security and improve productivity has been due to the development of quality seeds. The history of seed development in the olden days was achieved through the cultivation of indigenous plants, followed by selection of superior types from cultivated plants constituted the next stage of progress. In the course of time many useful selections were made and there was gradual progress in crop improvement. Later, through the use of well-known scientific technique of selection, the exploitation of hybrid vigor through

161
hybridization and polyploidisation became the basic for attaining significant advances in yield. The seed industry plays a major role in dissemination of the latest agriculture technology to the farmers through quality seeds. Earlier, most of the farmers depended on seeds produced within the farm and did not purchase significant quantities of seeds from commercial sources. It changed dramatically over the past century, as farmers started purchasing seeds from the commercial suppliers instead of using farm saved seed from the previous harvest. In the early 20th century most commercial seed companies were small and mostly family-owned private business. The lack of the finance was the main constraint in pursuing R and D activities. Their primary role was to multiply and sell seeds of varieties developed in the public domain (Duvick, 1998; McMullen, 1987). Hence, these small seed companies’ weakness open up the opportunity and gave way to larger enterprises that integrated plant breeding, seed production, seed processing and marketing functions. The seed industry over the past decade has been radically transformed, it began the transformation of traditional commodity business to a differentiated products business. With the mergers and acquisitions the seed industry changed dramatically in the last 40 years. It transformed from competitive sectors of agribusiness, composed primarily of small, family-owned firms, to an industry dominated by a few multinational chemical corporations. The multinational corporations, which in the later part of the 20th century, focused actively on Research and Development. The rapid growth in private research and development, shifted roles of public and private Research and Development Organisations, and introduced biotechnology in agriculture. These changes in strategy had a strong impact in production of high quality and high yielding seeds.
BIOTECHNOLOGY IN PLANT BREEDING Biotechnology is the process of applying biological knowledge and techniques to develop products and services with techniques that uses living organisms to make or modify products, improve plants or animals, develop micro-organism for specific use. The technology factors in either its embodies or disembodies form, is increasingly recognized as a major sources of productivity and welfare overtime and among nation (Yujiro and Ruttan, 1970).
The biotech industry is expected to grow at CAGR 12.3% globally reaching USD 270.5 billion in 2013 Biotechnology has many applications in agriculture, is a mega-force in seed development programs, particularly in plant breeding, the vital component of effective agriculture system. Agriculture biotechnology is an important tool, which along with conventional method in plant breeding, and improved resource management can enhance crop productivity. The term agriculture biotechnology encompasses a variety of technology used in agriculture, for a range of difference purposes such as the genetic

162
improvement of plant varieties, characterization and conservation of genetic resources, plant disease and improvement of higher value crops (FAO, 2009). Some of these common tools may be applied to all agriculture sectors, such as use of DNA fingerprinting for identifying specific plant varieties, molecular markers and genetic modification (GM), and other are more sectors specific, such as tissue culture and embryo culture. In the past, crops selection being the main approach to select crops for higher productivity, and it had been adopted to sustain the agriculture system for thousands of years. Yet, very little is known about the function and distribution of each gene. The presumably shallow elite gene pools often continue to yield genetic gain which the exotic pools remain untapped, uncharacterized, and underutilized. However, the concept and content of crop gene pools are changed by the advancement in plant science and biotechnology. This technology enables scientists to evolve varieties with the desired traits like high yield and better values like resistance to plant diseases, pests, tolerance to climate change etc., (USAID). These innovations can reduce excess use of pesticides and fertilizers that are threat to biodiversity and health. This yield increase (Figure 1) contribution pose large ramification for agriculture, for farmers, seed companies and consumers. With the recent advances in the plant science, many plant genomes became known, the power of genomics for applied breeding has become extremely valuable to breeders, enabled them to genotype their collections and develop new varieties in a shorter time through early detection of the desired trait. This also boosted the level of commercialization within the industry. Advances in plant biotechnology has lead to more
Figure 1. The evolution of seed breeding
Revolution # 2Biotech-ledstep change
(i.e., Bt corn)
US Average Corn Yield
Revolution # 1Introduction of corn
hybridisation imporved agriculture productivity
Double crosshybrid
Single crosshybrid
The role of seeds in agriculture
Traitse.g. Bt corn
Seed treatments
Marker-assistedbreeding
1920 1930 1940 1950 1960 1970 1980 1990 2000 2010E
39.36 bushels = 1 MTSources: USDA
Bus
hels
/acr
e
200
150
100
50
0

163
agri-food chains. Access to propriety genes and technology is essential for developing and commercializing high value products.
CONCLUSIONS In conclusion, we can say that the constant evolution that the Seed Industry has been experiencing since the day it emerged, has undoubtedly, as a consequence of a great number of factors; factors that have forced it to adapt to different trends, markets and demands that have been appearing since the human civilization. It is quite interesting to see, how fast all these changes can occur; as well as to notice that the evolving technology, the constant research and the broad network between any person of the world, can be significantly helpful for trying to satisfy this unstable demand that grows and each time asks for better stuff.
REFERENCESAziakou, G. (2008). World facing rising food, energy prices volatility, war, Bangkok
Post, 2008, p. 11Barraclough, S.L. (2000). Meaning of Sustainable Agriculture. Some Issues for the
South., South Centre., GenevaBello, W. and Baviera, M. (2009). Food Wars, Monthly Review, July-August,Choudhary, B. and Gaur, K. (2008). Trust in the Seed, International Service for the
Acquisition of Agri-biotech Application, pp. 1 – 20Clinton, B. (2008). Food, Energy, Financial woes links, World Food Summit on Food
Security, FAO, RomeDemeke, M., Pangrazio, G. and Maetz, M. (2009). Country response to the food security
crisis: Nature preliminary implication of the policy pursued, FAODiouf, J. (2009). FAO Initiayes debate on declaration for World Summit on Food
security, FAO, RomeGhanem, H. (2008). The State of Food Insecurity in the World 2008, Food and Agriculture
Organisation of the United Nations, RomeGollin, D., Parente, S. and Rogerson, R. (2002). The Role of Agriculture in Development,
The American Economic Review, 92, 2, pp. 160 – 164Matthews, C. (2009). FAO Welcome G8 Food Security initiativeMelor, R. (2003). Varieties, Improvement of Solanaceous Vegetable: Current
Achievement, Constraint and Strategies, 3rd National Seed Symposium, University Putra Malaysia, Kuala Lumpur, Malaysia, pp. 51 – 57
Mohammed, M. (2009). Status of Food Security in Malaysia, Kuala LumpurPardey, P.G. and Beintema, N.M. (2001). Slow Magic: Agriculture R and D a Century
after Mendel, International Food Policy Institute, WashingtonSingh, G., Asokan, J.K. and Asopa, V.H. (1990). Seed Industry of India: A Management
Perspectives, Oxford and IBH Pvt., New DelhiThe Star-Asia News Network: (2015). Malaysia Food Price. The Star Online, 3 November
2015

164
Vegetable Production 2050
Mike NicholsHonorary Research Associate, Massey University, New Zealand.Postal address: 10 Newcastle St, Palmerston North, New Zealand 4410E-mail: [email protected]
Abstract The world population is predicted to increase from the current 7 billion to 9.5 billion by the year 2050. The population of South East Asia is expected to rise from 4.3 billion to 5.2 billion by 2050. This will put enormous pressure on resources, including land, fresh water and food. Global warming also has the potential to reduce available land areas, particularly for low lying countries such as Bangladesh. More land will be required for housing and thus there will be need for a marked intensification of crop production on the remaining land. It is suggested that “Plant factories” (vertical farming), protected cultivation and hydroponics should be considered in order to increase productivity close to the centers of consumption. In Japan and ROC (Taiwan) the average age of farmers is over 60 years. A similar pattern is likely to occur throughout Asia. Who will then produce this food? Growing vegetables is essentially harvesting the sun. Vegetable plants do this extremely inefficiently, because for much of their life they are surrounded by bare soil. Fresh water is an essential resource in the future. Recirculating hydroponic systems under protected cultivation are some 3 – 4 times more water efficient than conventional irrigation. Two major fertilizers (potassium and phosphorous) are essentially non-renewable. We must also learn to use these much more efficiently through hydroponics.
Keywords: protected cropping, plant factories, population.
INTRODUCTION In addition to providing the society with carbohydrates, proteins and oils, vegetables have an important (major) role in suppling vitamins, minerals and fiber which are not always present in the major cereal foodstuffs. Obviously improving the nutritional value of vegetables is important, but the efficient production of vegetables close to centers of population (the mega cities of the future?), is equally important. This problem may already be there if one looks at Tokyo, Kobe/Osaka, Shanghai, Singapore, Mumbai or Beijing. An increasing population means, more land required for housing (for factories) and for the required infrastructure of cities. In many countries fresh water is another scarce resource and currently (world-wide) irrigation for agriculture takes the higher proportion, followed by industry and finally by people. This will obviously change with the pressure of increased population. There are two major chemical elements, essential for successful vegetable production, which are non-renewable. These are; potassium and phosphorous and these need to be conserved to safeguard future agricultural production. Using these on the land is wasteful, as only a small proportion is taken up by the crop plant and the rest is either fixed in the soil, or leached through the soil profile and eventually finds its way into the ocean, where it eventually precipitates out. Moving production away from the cities will markedly increase transport costs and

165
it is therefore, the solution will be to develop protected cultivation systems and plant factories (both with hydroponics) in order to increase productivity close to the centers of consumption. Protected cultivation involves the growing of crops in an artificial environment, in which the plants are sheltered from weather extremes. This may involve a simple plastic structure as a rain shelter, through to a “high Tech” environmentally controlled greenhouse and ultimately a “plant factory“, in which the plants are grown fully under artificial lights with near total control of the major environmental factors such as temperature, light intensity/light quality/light duration, etc. Another point to consider is that in Japan and ROC (Taiwan) the average age of farmers is over 60 years. A similar pattern is likely to occur throughout Asia. Who will then produce this food? Young people prefer to work in a less stressful occupation and without daily exposure to sun and hard manual work and protected cropping and plant factories fill this niche. Growing vegetables is essentially harvesting the sun. Crop plants do this extremely inefficiently, because for much of their life they are surrounded by bare soil. This is because in most cases they begin life as small seedlings, but eventually they have to be grown at the spacing they will mature. This leaves considerable areas of bare soil between plants for much of their life. Fresh water is an essential resource in the future. Re-circulating hydroponic systems under protected cultivation are some 3 – 4 times more water efficient than conventional irrigation. (Stagellini et al., 2003). Two major fertilizers (potassium and phosphorous) are essentially non-renewable. We must also learn to use these much more efficiently through hydroponics.
PROTECTED CROPPING Protected cropping offers considerable advantages over field production in a large number of ways, for example:-1) Productivity and quality is enhanced, because the crops are sheltered from extreme
weather conditions.2) Pest and disease management using biological control measures is simpler3) Workers are sheltered from the weather4) Water efficiency per unit yield is improved compared with field production, due to
improved methods of water supply (eg furrow irrigation compared with recirculating hydroponic systems) and a reduction in transpiration due to protection from wind and low humidity.
5) Precipitation on the roof can be stored in reservoirs for later use as irrigation
HYDROPONICS Hydroponics has only “come of age” in the past 50 years, prior to that it was limited to being an interesting (and useful) research tool. Crop yield is a function of genotype and environment and until the development of commercial hydroponic systems in the 1960’s growers had little control of the root environment. In most situations

166
soil is not the ideal medium to grow crops. Sandy soils tend to be well aerated, but pose problems of adequate water availability, whereas clay soils are the reverse with adequate water, but poor aeration. Artificial media (such as coir (coconut fiber), or rock wool (mineral fiber)) with appropriate irrigations systems offer media more optimal for plant roots. The other important advantage of using hydroponics is that fertigation (including all the mineral nutrients in the water supply) and optimizing the pH are relatively simple. Thus the roots receive not only the water and nutrients they require (at the correct pH) but also adequate oxygen for root respiration to enhance nutrient uptake. The sophistication of the system can vary from an “idiot proof” method such as that demonstrated for lettuce in Peru (see Nichols, 2009) to very complex greenhouse recirculating systems managed by computer, as in the Netherlands. The rewards from hydroponics are quite clear where a move away from cold house (soil grown?) crops when hydroponics was introduced in 1980 resulted in an increase in productivity of 6.4% per year, compared with 1.7% for cold house crops (Figure 1). Idiot proof systems have been developed for some crops which require a minimum of control equipment (e.g. Nichols, 2009, 2011b) whereas other systems may involve complex single ion analysis and total control of the nutrients in the solution and a totally re-circulating system. Kim et al., (2013).
Figure 1. Comparison of greenhouse tomato yields in UK, following introduction of hydroponics in 1980 (Lim Ho (2004)
▼ ▼▼
▼
▼ ▼ ▼ ▼
● ●● ● ● ● ● ●
●● ●
● ● ● ● ●● ● ● ● ● ● ●● ● ● ●
●
● ●
■ ■■ ■
■■
■ ■■
■■
■ ■■ ■ ■
■■ ■
700
600
500
400
300
200
100
0
Yie
ld (t
/ha)
1970 1980 1990 2000Years
Cold + heated house (+ 4.2% p.a.)
Cold house (+ 1.7% p.a.)
Heated house (+ 6.4% p.a.)
CHP●
Best yield
High standHydroponicsHeating
Winter CO2 enrichment
Summer CO2 enrichment
Integrated pest control
Computercontrol system

167
WATER EFFICIENCY In future, getting maximum productivity per liter of water will become increasingly important. Moving away from soil grown conventionally irrigated production systems towards protected cropping with recirculating hydroponic methods will play a major role in improving water use efficiency. Here the key is not the number of liters used per hectare, but the number of liters used to produce one kg of marketable crop. (see Figure 2, produced by Wageningen University). Although these systems are in different countries the basic principles still apply.
PLANT FACTORIES The ultimate goal is the development of plant factories, which are essentially fully insulated buildings (or rooms) from the outside environment, in which plants can be grown (almost always hydroponically) in a totally controlled environment. Light is provided artificially by using High Pressure Sodium (HPS) lights and more recently Light Emitting Diodes (LED’s), which have the advantage of providing specific wavelengths, rather than energy is likely to further improve the efficiency of the production system in the future.
Figure 2. Effect of growing system on water efficiency (Stagellini et al., 2003)

168
When I was an undergraduate (some 60 years ago) I was taught that yield is a function of genotype and environment. The plant environment involves both the root and the above ground part of the plant. Hudson (1961) looked at the average yield of two crops (potatoes and greenhouse tomatoes), then at the yield of the best 10% of growers and finally at the record yield for the crop. A clear pattern emerged. The increase in yield from the best growers (due to adequate capital and know-how) was greatest for the greenhouse producer, with the ability to modify the environment, whereas the good luck bonus was greatest for the field grown crop, over which the grower had little control (Figure 3a). Over the years (from 1950 to 2010) there has been a steady improvement in our ability to modify and control the environment within the greenhouse, but a major constraint has always been the variation of the outdoor environment (particularly that of radiation (light) due to latitude, time of year, time of day and the amount of cloud cover. To a large extent it is possible to control temperature, by means of heating and/or cooling systems, but light intensity is really dependent on the sun, over which we have little or no control, apart from shading. Of course not all the improvements have been due to improved environmental control. An improvement in the genetics of crops has also played an important role. (Figure 3b, 3c, and 3d). In any case, one factor is very clear, it is impossible to have more than 12 hours of sunlight daily anywhere in the world over a 12 month period. Of course at high latitudes the day length is much greater during the summer, but commensurately shorter in the winter, whereas near the equator the day length is approximately 12 hours per day every day of the year. Plant factories allow us to provide the plant with light for 24 hours and also the optimum CO2 level and temperature, so that potential yield might well be increased up to 300% more than current record greenhouse yields. (Duggan-Jones and Nichols, 2015). An additional advantage of plant factories (apart from their small footprint) is that they are very water efficient as transpired water by the crop is condensed and then recirculated in the irrigation system. Also pathogen control should (theoretically) be unnecessary as all air entering the system can be filtered to exclude infecting propagules. The product is therefore, very clean and providing hygienic standards are implemented, does not require washing and is therefore, ideal for anyone with poor immune systems (such as hospital patients) (Kozai, 2013). Of course there is the potential problem of increasing carbon emissions compared with field production, but these are predominantly caused by the need for electricity, which more and more is being produced by environmentally friendly means, such as solar panels etc. To date lettuce, leafy greens and herbs have been the main crops grown in plant factories (Kozai, 2013), but eventually the “more difficult” fruit vegetables such as tomatoes will be grown. They are already becoming an important production system in North America and Japan (Kozai, 2013). In the short term I suspect their main role will be in the production of high quality vegetable seedlings (Nichols, 2013) which are then transferred into mobile gulleys in greenhouses. (Nichols 2011a). The timing of

169
1 2 3 4 5 6 7 8 92010
Potato
G/H Tomato100
80
60
40
20
0
1,250
1,000
750
500
250
0
Nationalaverage
Bestgroweraverage
Recordyield
Genetic potential
GoodluckbonusGoodmanagementbonus
1 2 3 4 5 6 7 8 9
200
150
100
50
Hyp
othe
tical
yie
ld
0
AverageBest growersRecord
1,000
800
600
400
200
0
Yie
ld (t
/ha)
1 2 3 4 5 6 7 8 9
G/H Tomato yields
Yie
ld (t
/ha)
1950
Goodluckbonus
Goodmanagementbonus
Potato 70g/h Tomato70
60
50
40
30
20
10
0 1 2 3 4 5 6 7 8 9
Yie
ld (t
/ha)
400
350
300
250
200
150
100
50
0
2010
3a. Hypothetical graph 3b. Yields in 1950
3b. Yield in 2010 3b. G/H Tomato yields

170
maturity of vegetables is an important production/marketing requirement and producing seedlings in a plant factory under highly controlled conditions ensures that only a small portion of the growing time is dependent on the natural environment. Thus the timing of sowings in relation to crop maturity date can be more precise.
HARVESTING THE SUN Essentially when we grow vegetables we are converting solar radiation into chemical energy. The efficiency with which this is done depends on a large number of different factors; a major one being how much of the solar radiation is falling on photosynthetic leaf material and how much is falling on bare ground. It is essential for this part of the system to be efficient, that the majority of the land surface is covered with leaves. In conventional vegetable production seed is sown in situ at the final spacing the crop will be grown at, or else young seedlings are transplanted from nursery beds to their final spacing density. In both cases large amounts of bare soil result for some considerable time. One approach to overcoming this problem is to make use of mobile gulleys, in which plants are transplanted into hydroponic gulleys at a fixed row spacing and the gulleys spaced out wider apart as the plants develop. This enables any one area of land to double production. In Europe such systems can be completely automated, with only the harvesting being manual. However, the system can also be made totally manual if required.
CONCLUSION Asia will need to increase productivity of vegetables in the future if starvation is to be avoided. This can only be achieved using modern technology to increase productivity per hectare and per liter of water. Plant factories are an attractive but currently very expensive solution, except for the production of high quality vegetable seedlings and the short term solution would appear to be to make increased use of protected cultivation systems and hydroponics.
REFERENCESD.I. Duggan-Jones and M.A. Nichols (2015). Determining the optimum temperature,
irradiation and CO2 enrichment on the growth of lettuce and cabbage seedlings in plant factories Acta Hort., 1107, 187 – 194
Ho, L. (2004). “The contribution of plant physiology in glasshouse tomato soilless culture”. Acta Hort., 648, 19 – 25
Hudson, J.P (1961). “Need bad weather mean poor crops?” New Scientist, 218, 142 – 143.H-J Kim, W-K Kim, M-Y Roh, C-I Kang, J-M Park, K A. Sudduth, (2013). “Automated
sensing of hydroponic macronutrients using a computer-controlled system with an array of ion-selective electrodes.” Computers and Electronics in Agriculture, 93, 46 – 54
Kozai T. (2013). Plant factory in Japan-current situation and perspectives. Chronica Horticulturae, 53, 8 – 11

171
Nichols, M.A. (2003). Eliminating salinity problems with the greenhouse of the future. Acta Horticulturae, 609, 285 – 288
Nichols, M.A. (2009). Hydroponia Peru” Practical Hydroponics and Greenhouses, 104, 21 – 28
Nichols, M.A. (2011a), Mobile Gulleys in Belgium Practical Hydroponics and Greenhouses, 116, 54 – 57
Nichols, M.A. (2011b). Idiot-proof hydroponics Practical Hydroponics and Greenhouses, 118, 23 – 27
Nichols, M.A. (2013). Quality Vegetable Seedling Production Practical Hydroponics and Greenhouses, 128, 26 – 28
Stanghellini, C., Kempkes, F.L.K. and Knies, P. (2003). Enhancing environmental quality in agricultural systems. Acta Hort. 609: 277 – 283

172
Sustainable Vegetable Production Through MyGAP for Quality and Safety Assurance
Rosmawati Selamat and Siti Saudah HassimDepartment of Agriculture Malaysia, PutrajayaE-mail: [email protected]
Abstract Food safety has become more important following liberalization in the world trading system. In addition, increased awareness among consumers on their food choices and preferences for healthy, nutritious and safe food and environmental issue has also underlined the need to address the issue of food safety and sustainable production.In order to compete in the world marketand to meet consumers higher expectations efforts have been taken to enhance our food safety and quality standards. Therefore, Certification of Good Agricultural Practice (GAP) is a method to ensure the produce are safe and good quality, In Malaysia GAP certification known as myGAP is a certification scheme to give recognition to the farms that adopt Good Agricultural Practices (GAP) based on the Malaysian Standard MS 1784: 2005 Crop Commodities – Good Agricultural Practice (GAP) to produce safe and quality product. Requirements of myGAP are site selection, crop protection, crop and variety selection, soil and substrate management, crop protection management, fertilizer management, water supply and quality, harvesting and post harvesting handling, worker health, safety and welfare, waste and pollution management, recycling and re-use and environmental issues such as wildlife and biodiversity conservation and impact of farming on the environment. Sustainable vegetable production with the goals to environmental health, economic profitability and social and economic equity can be achieve through myGAP.
Keywords: GAP, sustainable production, food safety and quality
INTRODUCTION Food safety has become more important following liberalization in the world trading system. At the regional level, Malaysia has become a competitive player in the ASEAN food market. With the full implementation of ASEAN Free Trade Area (AFTA) by January 2003 and the World Trade Organization (WTO) regulation, greater attention is given to food safety. In addition increased awareness among consumers on their food choices and preferences for healthy, nutritious and safe food has also underlined the need to address the issue of food safety. There are many efforts was taken to enhance our food safety and Quality standard in order to compete in the world market and also to meet consumers higher expectations. With the expending world economy, liberalization of food trade, growing consumer demands, developments in food science and technology and improvements in transport and communication, international trade in fresh and processed food is increasing rapidly. Access to food export markets will continue to depend on our capacity to meet regulatory requirements of importing countries. Creating and sustaining demand for our food products lies in our ability to build the trust and confidence of importers and consumers in the safety and quality of our produce.

173
Therefore, Certification of Good Agricultural Practice (GAP) is a method to ensure the food safety and quality and the environmental sustainability of Agriculture. In Malaysia, GAP certification known as myGAP is a certification scheme to give recognition to the farms that adopt Good Agricultural Practices (GAP),operate in a sustainable and an environmentally friendly way, considering workers health and safety; and yield produces that are of quality and safe for consumption. myGAP based on the Malaysian Standard MS 1784: 2005 Crop Commodities – Good Agricultural Practice (GAP) to produce safe and quality product. myGAP provides guidelines on Malaysian sustainable production of safe and healthy vegetables, fruits and other crops such as herbs, paddy and mushrooms. Sustainable vegetable production with the goals to environmental health, economic profitability and social and economic equity can be achieve through myGAP.
CERTIFICATION OF MyGAP There are many activities that take place as vegetables move from farm to the tables. These include activities related to production, harvesting, post-harvest operations, packaging, transpotation and storage. Implementing GAP are important steps in sustainable production and in reducing possible hazard associated with the produce throughout the production and dstribution chain. The flow diagram of myGAP certification describe the various stages, from site selection to distribution. It is used to; evaluate the potential aspects that affect the production; evaluate the potential risks and dangers at exactly where control actions are needed to design top-to-bottom and bottom-to-top traceability
Site selection
Planting
Irrigation
Crop management – Fertilization
Crop management – Crop protection
Harvesting and post-harvesting
Retailer/Consumer
Figure 1. Flow diagram for myGAP certification

174
ELEMENTS OF MyGAP
Site selection myGAP adhere to appropriate soil management as an important tool to maintain and improve soil productivity and should aim to improve availability and plant uptake of wate and nutrients. Activities such as replenishing soil organic matter and soil moisture and minimizing soil erosion are fundamenal for sustainable vegetable production. For all new agricultural sites, a risk assessment shall be carried out, taking into account the prior use of the land, potential impacts of the production on adjacent crops and areas and potential impact of activities carried out at adjacent areas. The farm must developed a corrective action, setting out strategies to minimize all identified risks in new agricultural sites and record system shall be established for the site history and the layout of fields of their crop history. It is necessary to identify possible sources of microbial and chemical contamination associated with the prior use of land that is being used for agricultural production. Vegetables farm should not be located on steep slopes and not be located more than 1000 meters above sea level unless the land was developed prior to 1st January 2002 or comply with legislation. Where farms are located on sloping land (within the permissible level), appropriate soil conservation measures shall be undertaken to prevent soil erosion and silt deposition into drains, waterways etc., The farm management shall demonstrate that it has legal rights to the cultivation of the land and all necessary regulatory approvals.
PLANTING The main consideration in selecting the vegetables that are most suitable for production is of course the demands of the markets. However, among vegetables for which is sure demand, some require agronomic practices or environmental controls that make them particularly suitable or particularly unsuitables for smallholders. The used of pure certified seeds and rootstocks is essentials for obtaining the quality and uniformity of the product that the market demands. Producers should known the quality of the seed before use and need to consider taste, visual appearance, shelf-life, agronomic performance, environmental impact, minimal dependence on agrochemicals and possess resistance or tolerance to major pests and diseases when selecting the vegetables to plant. A record of the variety name, varietal purity, batch number and seed vendor should be kept for traceabilty. If seed treatments are carried out, the use of these treatments shall be justified and shall be recorded. Where grafted planting materials are used, records of the variety of the rootstock should also be kept. The use of genetically modified planting materials shall be avoided unless written permission has been given by the relevant authorities and shall comply with existing regulations in the country of the final consumers and Crop producers and customers must be agreed before planting.

175
Where protected varieties are used, the farm shall respect intellectual property right legislation on plant variety protection.
IRRIGATION Vegetables production carries a high responsibility for the management of water resources in quantitative and qualitative terms. Careful management of water resources and efficient use of water for rainfed crop, for irrigation where applicable are criteria of myGAP. Efficient irrigation technology and management will minimize water and will avoid excessive leaching and salinization. Vegetable producers are recommended to used most efficient and commercially practical water delivery system to ensure the best utilization of nutrient and water resources based on sound historical and scientific data. Producer should be given to consideration a water management plan to optimize water and nutrient usage and reduce wastage (e.g. systems for re-use, application at night, maintenance of equipment to reduce leakage, rain water harvesting etc.). Water should be derived from sustainable sources and untreated sewage water is prohibited for use. Based on risk assessments, water sources should be analyzed at least once a year for microbial, chemical and mineral pollutants.
CROP MANAGEMENT – FERTILIZATION myGAP related to soil fertility improvement include maintaining and improving organic matter, appropriate crop rotation, manure application, rational mechnical and conservation tillage, maintaining soil cover, minimizing soil erosion losses by wind and water and application of organic and inorganic fertilizers in amount and timing and by methods appropriate to agronomic, environment and human health requirement. Fertilizer application should be based on the requirements of the crop as well as maintaining soil fertility. Fertilizer application must be planned with precision in accordance with science based recommendations or best developed practice so that the dosage of each nutrient, type of fertilizer, method, timing and frequency of fertilizer application is appropriate to actual conditions in each field to maximize benefits and minimize losses. It is important to organize full traceability of fertilizer application. The following information at least needs to be recorded for each application: name of producer/or person responsible for application. Farm block and size (ha), date of application, type of fertilizer, origin of fertilizer, quantity applied and method of application. Vegetables producer are encourage to practice the cultivation techniques that proven to improve or maintain soil structure and soil compaction; and to minimize soil erosion to sustain the production. myGAP prohibited the use of untreated and treated human sewage sludge and pig waste.

176
CROP MANAGEMENT – CROP PROTECTION Pest management is part of the GAP framework and for optimum crop protection, specific control methods must be used in association with the complete range of available cultural techniques (rotation, soil tillage, fertilizing etc.,), emphasizing the role and impact of agrochemical and ecological factors. For crop proctection to be meaningful, it must be conceived as part of comprehensive approach or strategy carefully thoughtout and built on a sound base fundamental knowledge:• crop agronomy, crop sensitivity to surrounding conditions and to pests,• knowledge of the biological, physical dan chemical properities of plant protection
products including mode of action, effective dose, persistence and side-effect, formulations;
• knowledge of regulations: approved and prohibited substances, restrictions on use, acceptable dose level, preharvest interval (PHI), authorized maximum residue imits (MRLs)
Producers should implementing different methods to keep the crops healthy without solely relying on spray of pesticides such as Integrated Pest Management (IPM). IPM includes cultural, physical, biological and chemical methods to manage the pests.
Crop protection using pesticide Factor to consider when choosing pesticide are;• efficacy of active ingredient,• safer active ingredients,• safer formulation,• safer packing,• mode of action,• resistance – change the type of pesticide active ingredient regularly to prevent pest
resistance building up.
GAP BEFORE, DURING AND AFTER SPRAYING PESTICIDE It is important to follow label instructions for mixing, loading and handling of the spesific pesticide being used and the actual conditions used. Operators shall be trained on safe and proper use of pesticides and shall be equipped with suitable personal clothing and equipment appropriate to the danger posed to health and safety. They should be reminded that adverse health effects caused by pesticides are often not noticeable in the short term but can develop over time if expose is not reduced. Spray equipment shall be suitable for use on crop and farm in question and shall be kept in good working condition and calibration shall be carried out as and when necessary to ensure accurate delivery of the required quantity of spray.

177
After spraying, the sprayers should be washed at the special designated area to avoid contamination. Surplus spray mix and tank washings should be sprayed over an untreated part of the crop as long as the recommended dosage has not been exceeded or on designated fallow land. Each area of application should be marked with appropriate warning sign and Pre-harvest intervals as prescribed on pesticide labels shall be strictly adhered so that the residue level does not exceed the acceptable limit. As for other cultivation operations, it is important to organized full pesticide traceability of pesticide application. The following information should be record for each application:• date of application;• the product use (full name, supplier, formulation, batch number, etc.);• the dose actually used (measurement made);• the volume mix (per ha);• the type of application (apparatus, nozzle, volume per ha, speed) and spraying
conditions (rain, wind, etc.).
Pesticide storage The pesticide storage facility should;• be properly identified;• be away from children, animals and all water resources;• have concerate floor to facilitate clean up in the event of spill or leak, well ventilated
and have enough light;• not include foodstuff, animal feed or other articles such as clothing, medicines,
cosmetics, etc., If storage of pesticides in the same warehouses other merchandise is unavoidable, they should be separated by a permanent partition wall at least 3 m high.
• Store pesticides in group according to their hazard category.• Clearly post a warning sign with words: DANGER PESTICIDE – NO SMOKING,
DRINKING OR EATING; a skull and crossbones symbol at least 20 cm high should be appear on the sign.
Disposal of empty packaging containers Empty containers shall be rinsed at least three times with water and the washings returned to the spray tank. Well-rinsed pesticide container should be punctured and kept secure until disposal is possible.

178
HARVESTING, POST-HARVESTING AND STORAGE
Basic principle for harvesting• Harvest good quality crop.• Maintain hygiene and quality standards during harvesting and throughout the post-
harvest chain.• Harvest during the coolest part of the day-early morning or late evening under light
condition.• Protect the harvested produce in the field by keeping it in a shaded environment.
Either the whole or parts of vegetative growth can be harvested by hands only or sharp knives. Knives must be kept sharp and clean at all times to prevent from spreading virus diseases from plant to plant. Harvesting methods vary with plant parts harvested. Harvested produce must not come into contact with the soil or contaminated surfaces, e.g. surfaces that are visibly contaminated with dirt, oil or chemicals, not be dropped and must gently transferred to collection bins and protected from sun or sun until such time that it can be transported to the pack house. Cuts and bruises must be avoided during harvesting operation. Potable water shall be used for washing of produce and based on risk assessments, source of water for post harvest washing should be analyzed at least once a year for microbial, chemical and mineral pollutants to ensure that it is potable.Post harvest treatments using chemical should be minimize. When used chemical it shall be in accordance with product label or established recommendations and shall be in accordance with the Malaysia Food Act and Food Regulations Packaging material shall be stored to avoid contamination by physical and chemical hazards, as well as pests. If use re-usable crates, shall be cleaned to ensure that they are free from foreign materials which may be detrimental to the produce and/or consumers’ health.
WORKERS WELFARE, HEALTH AND SAFETY myGAP related to human welfare, health and safety include those that direct all farming practices to achieve an optimum balance between economic, environmental and social goals; and provide adequate household income and food security. Occupational Safety and Health Act 1994 (ACT 514 ) gives provisions for safety and health of a person at a workplace and includes agricultural workers. Each farm required to have a healthy and safety policy statement that represent the policy and system against employers will monitor and assess its health and safety performance. Every person has legal responsibility to look after his own health and safety and to others. This policy is mandatory for all employees, contractors and visitors. The policy statement associated prosedures and practices should be subject to regular reviewed annually and amended to ensure health and safety performance is continually improved.

179
Training for each category of staff must be undertaken and records filed, and this includes:• basic hygiene training for the handling of produce.• basic pesticides handlers training for each spray worker.• training for the machine operator.
First Aid boxes must be present in the vacinity of the workplace and secured against the risk; all separate buildings and permanent installations on the farm shall be equipped with complete First Aid kit, which would be available and accessible in case of emergency. Accident and emergency procedure must be displayed on all farm notice boards. Potential hazards in the farm, e. g. fuel tanks,workshops as well astreated crops must be clearly identified by warning signs. Living quarters if provided should be located at proper distance from the fields so not to pose a health risk to persons. The quarters must be habitable with the basic services facilities, such as running water and toilets. Adequate toilets with hand wash facilities must be provided near grading areas, living quarters and production areas. Toilets must be regularly cleaned. Farm workers who are in direct contact with vegetables must have good habits of hygiene and wear clean clothes. Any farm worker with cuts or wounds and have health problem involving dierrhoes or carry certain diseases or infection must not authorized to go into zone where products are handled. Farm worker must avoid behaviour that can lead to contaminating produce such as smoking, spitting, eating, sneezing or coughing near non-protected vegetables.
TRACEABILITY AND RECORD KEEPING The traceability system provides an important element of quality and safety assurance in the vegetables chain. The product can be traced back through the supply chain to the site of the production, including the inputs used, operation undertaken during production, post-harvesting and marketing (Figure 2). It allows the product to be tracked as its moves through the chain from the producer to consumer. In doing
Figure 2. Traceability in vegetable supply chain
Tracking
Grow Packhouse Supplier Retailer/ Consumer
Grow Packhouse Supplier Retailer/ Consumer
Tracing

180
so, the traceability system can facilitate product recall and withdrawn and assist the management to identify the origin of the food safety problem. A traceability system includes a documentation and mechanism for marking the produce, allowing it to follow from farm to the consumer. A record must be kept at each step of the supply chain, i.e, in the field, at the pack house, at the supplier and the retailer and during the transit fromeach of these points. At small farmer’s level, a simple handwritten product labeland hand writen records held at various steps in the chain is recommended,
CONCLUSION myGAP certification is a tool for sustainable production of vegetables and to assured quality and food safety of the produce.
REFERENCESDepartment of Standard Malaysia, (2001). MS 1784 – Good Agricultural Practice :
Crop comodities. Shah Alam SelangorFAO. (2010). Good Agricultural Practice (GAP) on horticultural production for extension
staff in Tanzania. FAO GAP working paper series 13, Rome. Available via the internet at http://www.fao.org
Gardner, S. (1993). Consumer and food safety: A food industry perspective. In Food, Nutrition and agriculture – consumer participation in food control. J.L Albert, ed. FAO Rome. Available via the internet at http://www.fao.org
Jabatan Pertanian, (2013). Pensijilan Amalan Pertanian Baik Malaysia (myGAP. Dokumen Pengawai. Putrajaya
Department of Occupational Safety and Health, Malaysia. (1994). Occupational Health and Safety Act 1994 (Act 514), Kuala Lumpur. Available via internet at http://www.dosh.gov.my/index.php/en/legislation/acts/23 – 02-occupational-safety-and-health-act-1994-act-514/file
Kementerian Pertanian dan Industri Asas Tani Malaysia, (2011). Dasar Agromakanan Negara 2011 2020 (DAN). Putrajaya. Available via internet at http://www.moa.gov.my/web/guest/dasar-agromakanan-negara-2011 – 2020

181
Impact Assessment of Mobile Agro Market Advisories: A Study from Tamil Nadu, India
K.C. Siva Balan1, B. Thiagarajan2 and B. Swaminathan31PRIST University, Tamil Nadu, India.2AD AC and RI, Trichy, (TNAU), Tamil Nadu, India.3Junagadh Agricultural University, Junagadh, Gujrat, India.E-mail: [email protected]
Abstract In in India, though the farming community struggles hard to get the best out of crop production, price realization is in the hands of other market players’ viz., traders and commission agents only. The small holders who do not get market information like prevailing market demand and supply tend to sell their produce in farm gate itself or in low paying markets. This opportunistic behavior of traders results in meager profit margins and uncertain farm profitability of the producers. Hence, the market information should reach the farmers so as to make needed and quicker decisions to supply the commodities where they could get better prices. To accelerate the technology transfer and to bridge the information asymmetry, Information and Communication Technology (ICT) tools can play a major role. Among the Information and Communication Technology (ICT) tools, Mobile technology has many advantages such as personalized information sharing, instant delivery of message, mobility of devices and cheaper cost for deployment than any other ICT devices such as computers, internet etc., In the present study, majority of the respondents (88.33%) reported that mobile market advisories enhanced their access to market information and services. A vast majority of the advisory users (92.78 %) reported that their storage and selling decision power was enhanced by mobile market advisories.
Keywords: small holders, Market information, Information and Communication Technology (ICT) tools, Mobile advisory and Value chain management
INTRODUCTION The Indian farm sector is confronted with challenges of declining farm profitability, climate change, loss of biodiversity, scarcity of natural resources and widening technology divide. The agricultural communication sources which farmers use varies from agricultural extension officers to neighbors and relatives. The National Sample Survey Organization (NSSO) has documented that at the all-India level, only 40% of farmer households have access to one or more sources of information (NSS, 2005).The NSSO found that of the sixteen different sources for accessing information on modern technology for farming, about 16.7% of the farmers got their information on a daily basis from other progressive farmers in their villages. When the farmers are striving hard to bring out best yield levels, the profitability is decided only by the market forces. Many earlier studies (Ferrsi, 2008; Jensen 2007; Aker and Mbiti, 2010; Goyal, 2013) documented that farmers rarely sell directly to consumers and there are significant price variations in the village markets. Hence, it is vital to keep the farmers with profitable and remunerative agriculture through Information and Communication

182
Technology (ICT) tools. The ICT tools (comprising of wide range of modern gadgets such as community radio broadcasts, computer based information and decision support systems, community video programmes, touch screen kiosks, interactive voice response systems and mobile messaging systems) have tremendous potential to facilitate technology transfer to the individual in remote corners of the country. Among the ICT tools, with increasing mobile ownership of 951.37 million, Mobile Technology holds great promise in rural development with advantages such as personalized information sharing, instant delivery of message, mobility of devices and cheaper cost for deployment than any other ICT devices. Mobile Technology tools includes all kinds of portable devices like basic mobile phones, smart phones, Personal Digital Assistances (PDAs) or tablet devices (e.g. iPad). Mobile Technology also facilitates reduced travel cost, market information seeking cost and there by ensures transparent trade practices. On realizing the importance of mobile telephony, both public extension organizations and private players have initiated mobile based agro advisory services for the benefit of farmers. For instance, Tamil Nadu Agricultural University (TNAU), Coimbatore, Tamil Nadu, India along with the state department of Agricultural Marketing, Tamil Nadu, India has started delivery of Short Message Service (SMS) based market Intelligence advisories to 22 lakhs farmers in Tamil Nadu state through web based farmers portal. At the same time, the users’ face difficulties in benefitting out of mobile advisories services due to affordability, lack of awareness and lack of familiarity of using the devices. The assessment of impact of the advisory services is imperative so as to upscale the advisory system quality and sustainability of the services. Therefore, the present study was carried out to assess and to know how far the mobile interventions could contribute for the profitability of small holder farmers in Tamil Nadu, India.
METHODOLOGYThe research study was conducted in the three districts viz., Tiruchirapalli, Dindigul and Pudukottai districts of Tamil Nadu, India. From each district, 60 beneficiaries (180 in total) who enrolled for the mobile agro market advisory services (service provider - department of marketing, Government of Tamil Nadu) were selected as the respondents of the study based on the simple random sampling technique. The constraints faced by the users and suggestions to overcome the hurdles were also discussed and documented after indepth interviews and Focused group discussions (FGD) conducted among the crop growers of Trichy district. Data were collected through a well- structured and pre-tested interview schedule. The statistical tools of cumulative frequency, arithmetic mean, percentage analysis, simple correlation, were used to analyze the collected data by using with STRATA software and SPSS 16.0 software packages thereby meaningfully interpreted and relevant conclusions were drawn.

183
RESULTS AND DISCUSSION The preferences of user respondents over mobile advisory services. The preference of farmers over mobile advisories was tabulated using Garrett’s score and ranked accordingly in the Table 1. From the results of the Table 1 it is inferred that nearly three-fourth (72.32%) of the respondents ranked market information in first place. Though the farmers adopted the latest technologies, the profitability out of farming could be realized only through better market decisions. The market forces viz. middlemen and traders could exploit the price margin of the farmers, if the farmers were unaware about the prevailing price and market environment. Hence, knowing the price of the commodities and better market details could enhance the market arbitrage and price arbitrage. This might be the reason for ranking market information as the prime spot. The crop cultivation practices and severity of pest and diseases information were preferred by two-third (65.17%) and less than two-third (59.21%) of the respondents. A little more than half of the respondents (58.55%) ranked information on farm subsidies on seed, agro inputs and agro infrastructure utilities like green house nets etc., The information on new arrivals of farm machinery and wheeled vehicles were preferred by more than two-fifth (46.89%) of the respondents. Little more than one-third (35.44%) of the respondents opted availability of farm inputs in the sixth rank where as only 15.03 per cent of the respondents preferred for weather information. The reason for least preference might be due to freely available information about farm inputs and weather in print media, electronic media and face to face communication channels. The results of the present study were in accordance with Dhaliwal and Joshi (2010) who reported that information in marketing domain was preferred most by the Punjab farmers than production and weather alerts. The present finding is also supported by finding of Mittal and Tripathi (2009) who observed that majority of the respondents (70%) preferred for market information as most important category.
Table 1. Preferences of farmers over mobile advisory services (n = 180)
Sl. No. Preferences User respondents
Garrett’s Score Rank1. Market Information 72.32 I2. Cultivation practices 65.17 II3. Severity of pest and diseases 59.21 III4. Farm subsidies 58.55 IV5. Farm mechanization 46.89 V6. Availability of farm inputs 35.44 VI7. Weather 15.03 VII

184
MOBILE AGRO MARKET ADVISORY PREFERENCES The preferences over mobile agro market advisory were drawn from the respondents are presented in the Table 2. On perusal of the Table 2, it is clear that overwhelming majority of the respondents 90 per cent, 73.33 per cent and 72.78 per cent preferred for market information, place intelligence and price intelligence details over mobile respectively. The reason for preference may be due to the reason that real-time market information might help growers for market selection, price bargaining over traders whereas place and price intelligence helps selection of crop, selling and storing decisions. A little above one -third (35.56%) of the respondents preferred for buyer contact details for direct marketing followed by 16.11 per cent opted for product intelligence. The export market details and government procurement details were preferred by meager per cent (2.78 and 1.67% respectively) of the respondents only.
Mobile apps The mobile application software popularly called as ‘Apps’ could help the farmers in decision making as well as in basic conversions and measurements of crop prices, weather conditions and inventory management. (Sivabalan et al., 2014) Since the application commands are inbuilt, no prior knowledge and skills are needed for the farmers. (Examples: measurement of land area, number of seedlings needed and fertilizer dose etc.,). The distributions of respondents based on awareness on mobile apps are presented in the Table 3. It could be inferred from the Table 3 that half of the respondents (51.66%) were aware about the mobile applications where as, 48.34 per cent were unaware about the mobile apps.
Table 2. Distribution of respondents based on mobile agro market advisory preferences (n = 180) (Multiple responses)
Sl. No Advisory services Frequency Percentage1. Price Intelligence 131 72.782. Product Intelligence 29 16.113. Place Intelligence 132 73.334. Market Information 162 90.005. Buyer contact details 64 35.566. Export market details 5 2.787. Government procurement details 3 1.67

185
MOBILE APPS PREFERENCE The preference over mobile apps were drawn from the respondents are presented in the Table 4. From the Table 4, it is known that majority of the user respondents (74.19%) preferred for farm technology based mobile apps. The input and subsidy based apps were preferred by 63.44 per cent followed by 34.41 per cent respondents opted for weather based apps. Among the non-users half of the non-user respondents (50%) opted for input and subsidy details followed by 37.5 per cent preferred for farm technology details. Many selected mobile apps incur zero internet charges since it could be operated in the offline mode also. Thus it could be concluded that preference for mobile apps is a welcome sign for making farm decision using mobile technology in future.
DISTRIBUTION OF FARMERS BASED ON SALES OF COMMODITIES TO THE DIFFERENT MARKETS Market arbitrage is a market activity for realizing profit margin by utilizing of price differences across market places, time and buyers/sellers of different kinds. The farmers tend to sell commodities to the village traders which would incur them less transport cost and handling costs. In the primary markets (in the centre of the district), price margin would be more than the village markets with commission and toll charges. In the secondary markets the regional wholesalers purchase commodities for transporting to distant consumer markets. Though the farmers were afford to reach primary and secondary markets, they have to search for highest bidder among the buyers in the markets which might consume much time. The mobile phones could help
Table 3. Distribution of respondents based on awareness on mobile apps
Sl. No Awareness on Mobile Apps Users (n = 180) Non-Users (n = 30) Users (n = 180) Non-Users
(n = 30)No. Per cent No. Per cent
1. Yes 93 51.66 8 26.672. No 87 48.34 21 73.33
Table 4. Distribution of respondents based on mobile apps preference
Sl.No. Mobile Apps Categories Users (n=93) Non-Users (n=8)No. Per cent No. Per cent
1. Money Transfer 23 24.73 – 2. Input and Subsidy details 59 63.44 4 503. Farm Technology details 69 74.19 3 37.54. Weather 32 34.41 – –5. Education 17 18.28 1 12.56. e-Governance 28 30.11 – –(Multiple responses)

186
the farmers by facilitating selling decisions to sell commodities either at the farm gate (predominantly village traders) or primary in market. Anyhow the farmers’ choice of marketplaces varies across commodities. It is inferred from the Table 5 that farmers sell paddy and bhendi predominantly at the farm gate. In delta areas, paddy procurement is carried out by Tamil Nadu Civil Supply Corporation (TNCSC) Ltd, Government of Tamil Nadu and this might be the reason for paddy selling at the farm gate itself. The perishable commodities like tomato, lab lab and cotton were sold in primary markets. The users on receipt of market advisories might compare local prices with far away markets and could choose better price markets. This might be reason for users going to primary markets as in the case of cowpea and secondary markets sales as in the case of onion. Since the non-users were not aware of market information, they sold predominantly at the farm gate itself at reduced price margin. The results are in accordance with Tadesse and Godfrey Bahiigwa (2015) who found that low-value (maize, wheat and barley) and bulky (vegetables) commodities are sold at nearest markets, high-value commodities (teff, peas and beans) are being sold at distant markets.
FREQUENCY OF TRANSACTION Table 6 shows the frequency of transaction of various commodities by the sample respondents. It is evident from the Table 6 that perishable commodities like vegetables (bittergurad, bhendi, brinjal and cowpea) are sold more frequently than the storable commodities. There exists significant difference in frequent selling of the same commodity apart from the storability and perishability factors. The reason might be
Table 5. Distribution of farmers based on sales of commodities to the different markets
Commodity-Frequencygiven as U/NU
Users (n=180) Non-Users (n=30)
Farm gate Primary Market
Secondary Market
Farm gate
Primary Market
Secondary Market
Onion (49/11) 65.30 28.57 6.13 83.33 16.67 –Brinjal (15/1) 33.33 66.67 0.0 100.0Paddy(42/7) 100.0 0.0 0.0 100.0 0.0 0.0G.nut (9/0) 69.2 30.8 0.0 – – –Bhendi (1/5) 100.0 0.0 0.0 100.0Sorghum( 5/0) 83.3 16.7 0.0 – – –Cowpea(16/2) 28.57 71.43 0.0 100.0 – –Tomato (10/0) 0.0 100.0 0.0 – – –Lab lab (9/0) 0.0 100.0 0.0 – – –Cotton (10/0) 0.0 100.0 0.0 – – –Maize (12/4) 33.34 66.66 – 100.0 – –Bitter guard (2/0) 0.0 100.0 0.0 – – –

187
if the farmers incur higher market information searching cost and overhead cost viz., transport cost (from farm gate to market) and incidental charges for every transaction, they intend to sell less frequently. If the cost incurred is less, the famers tend to sell more frequently. Being pre-informed of the market prices, the market information helps the farmer for better market identification and price negotiation for perishable commodities. The storing and selling decision could be imparted for storable commodities like onion, maize and paddy. From the Table 6, we could infer that there is unique difference in frequency of transaction of commodities except bhendi and lablab between the users and non-users in the study area.
PERIOD OF CHECKING THE MARKET PRICE The conceptual argument about advance information on commodity prices is that farmers tend to negotiate for the correct prices with the traders. The distribution of respondents based on the period of checking the prevailing price for their commodity was estimated and presented in the Table 7. Table 7 has clearly brought out the detailed pattern of price checking for the commodity grown by the farmers. Majority of the user respondents (65.56%) opined that they came to know the price just a day before the sales, where as a little more than one-fourth of the users (23.89%) were checking the prices one week before the sales. The user respondents who were checking the price before a month and even in
Table 6. Distribution of respondents based on the frequency of transaction (n = 210)
Commodities Transaction frequencyUsers (%)
Transaction frequencyNon-Users (%)
N Onceper year
Twice per year
More than twice per year (multiple harvest and sales)
N Onceper year
Twice per year
More than twice per year (multiple harvest and sales)
Onion 49 67.35 20.41 12.24 11 100 – –Sorghum 5 40.00 20.00 40.00 – – – –Maize 12 91.67 8.33 – 4 100 – –Cow pea 16 – – 100 2 – – 100Paddy 42 69.05 30.95 – 7 85.71 14.29 –Brinjal 15 – – 100 1 – – 100Ground nut 9 88.88 – 11.12 – – – –Cotton 10 40.00 30.00 30.00 – – – –Bhendi 1 – – 100 5 – – 100Lablab 9 22.22 11.11 66.67 – – – –Tomato 10 – – 100 – – – –Bitter guard 2 – – 100 – – – –

188
the planting itself constitute a meager per cent of 8.33 and 2.22 per cent respectively. Among the non-users, vast majority of the respondents agreed that they would check the price only one day before the sales, followed by 26.67 per cent of the non-users checked the commodity price a week before the sales. If the farmers are getting the market intelligence (anticipated price hike or fall) services, they could plan well in advance of the crop area and could take farm diversification decisions. Though the farmers check the prices during planting or after harvest, while marketing they do really engage in arbitrage between buyers in each market. In the present study also, half of the respondents (52.22%) opined that the market information helps for price bargaining with traders supporting the conceptual argument.
ECONOMIC IMPACT Based on the financial gain or loss incurred by adopting market decisions, the registered users of mobile market advisories were categorized and the results were presented in the Table 10. For measuring the economic impact of the registered users, partial budgeting analysis was carried between cost and return of users and non users of mobile advisories.
Direct measure – partial budgeting The partial budgeting analysis is the direct measure of economic impact by using mobile advisory services. The partial budgeting analysis was done for onion growers since onion growers were more in number among the sample and number of advisories given for onion were more than the other commodities. The results of partial budget analysis for onion are presented in Table 8. It is seen from Table 8 that the expenditure incurred by the market advisory non-users with respect to the information cost was higher than the users with assumption that cost incurred were same in the headings of agro input cost, irrigation, weeding, pest management, disease management and labour charges. Though the advisory services are free of cost for farmers, they might check the prices with extension functionaries or traders in different markets. Thus farmers may incur mobile call charges. Meanwhile, the non-users have to travel to nearby markets to check the prices there by incurring transportation and food expenditures for every trip. In addition, with respect to transportation cost, it is noticed that the users spent INR.3,600 whereas the non -users
Table 7. Distribution of respondents based on period of checking the market price
Sl.No Period Users Non-Users No.( n = 180) Per cent No. (n = 30) Per cent
1. The day before the sales 118 65.56 22 73.332. Week before the sales 43 23.89 8 26.673. Month before the sales 15 8.33 – –4. When planting itself 4 2.22 – –

189
sell at their farm gates. The users also spent INR. 300 for refreshments, food etc., during their travel. The users who sell the commodities in better price realization markets, gain INR.6 per kilogram without even accounting for time and money saved for every information searching cost. However, farmers who were not aware of the market information were likely to gain less due to farm gate sales. This would have resulted in reduced profit whereas, in the case of beneficiaries, they would have followed the exact market recommendations of the Tamil Nadu Agricultural University (TNAU) and AMI and BPC scientists, which would have resulted in more profit than non-users with less expenditure. This may be one of the reasons for higher net gain INR.44, 690 for users when comparing the non-users (Table 9). Moreover, state department of agriculture and farm science centres disseminate crop management and protection advisories in addition with the agro market advisories to the subscribers of farmers’ portal managed by Government of India (GOI). The message on exact dose and time of application of inputs considerably reduces the input cost and crop protection cost of the advisory users. Thus the mobile interventions have the potential to realize better price margin as well as to reduce the direct cost in every stage of the crop value chain. De’ Silva et al., (2008) reported that the information related costs constitutes 70 per cent of the total transaction costs, which is 15 percent of the total production cost incurred by these farmers. Mittal and Tripathi (2009) found that by the mobile interventions farmers skiped the physical travel and saved the money in the range of INR. 100 to INR. 200 for every trip since there is no need to spend for food, travel and miscellaneous expenditures while travelling. If the information searching cost was lowered, then considerable increase in net return is possible. In case of market advisories, the users could reap economic returns by taking wise selling or storing decisions.
INDIRECT MEASURE The indirect measure of economic benefits was estimated by increased income, income diversification, increased market share and reduction of commercial risks as reported by the respondents and presented in the Table 10. The results shown in the Table 10 revealed that majority of the respondents (88.33%) reported that mobile market advisories enhanced their access to market information and services. The reason might be that the users could receive the market information their finger tips without any travel and information searching costs. In the present study we found that a farmer makes on an average four trips per month and during the value chain period of six months, he would make 24 trips for purchase of seeds, inputs, market information etc. For instance for a 10 km travel (to and fro 20 km) to the nearby market/agricultural officer office, a farmer incur INR. 50 – 55 per trip as average cost of expenditure including transport, food and other charges. Thus it could be summarized that if the mobile market advisories substitute the physical travel and information searching cost.

190
Table 8. Cost and return analysis comparison between users and non-users of mobile market advisories
Average Cost and Return (collected from field – INR/Acre)
Users Non-Users
Information searching cost 10 600Seed cost 11,400 11,400Agro input cost 8,300 8,300Irrigation cost 2,000 2,000Weed management 1,100 1,100Pest Management 500 500Disease Management 1,200 1,200Labour charge 2,700 2,700Yield (Kgs) 8,000 8,000Selling Price (INR//Kg) 22 16Transportation cost 3,600 –Others costs (like refreshments/food etc.) 300 –
Table 9. Results of partial budgeting analysis for onion (INR./Acre)
S.No. Debit (A) Value Credit (B) Value1. Added Costs Reduced Costs
TransportationOther costs
3,600 300
Information Cost 590
2. Reduced Returns Added Returns– Nil. Price of the commodity
[@ INR. 6 (higher) for 8000Kgs]48,000
Total 3,900 Total 48,590Net Gain = (B – A) 44,690
Table 10. Indirect measure of economic impact of mobile market advisory services (n = 180)
Sl. No Categories Response Yes Response NoNo. % No. %
1. Enhanced access to market information and/or services
159 88.33 21 11.67
2. Increased farm income 38 21.11 142 78.893. Income diversification 23 12.78 157 87.224. Increased marketed surplus 65 36.11 115 63.895. Reduced commercial risks 94 52.22 86 47.786. Enhanced storage and selling
decision167 92.78 13 7.22

191
It is known from the Table 10 that one-fourth (21.11%) of the respondents incurred increased income by advisory services where as 78.89 per cent not mentioned so. They might have felt difficult in reasoning out one particular factor for price realization. The income diversification was carried out in allied agro, business ventures etc., by 12.78 per cent of the respondents where as 87.22 per cent were not in a position to do so. The present day challenges like labour issues, climate change and credit access might be the reasons. A little above one-third (36.11%) opined that their marketed surplus was increased by market advisories followed by 63.89 per cent were against the fact. The farmers though pre informed about the market trends, he may not afford to go far away markets or stores the commodity for anticipation of price rise. Thus the market surplus increase depends on the socio-economic conditions of the farmers. The reduction of commercial risks by advisory usage was accepted and rejected by 52.22 and 47.78 per cent of the respondents respectively. A vast majority of the users (92.78%) reported that their storage and selling decision power was enhanced by mobile market advisories. They could even compare the prices offered by two traders thereby facilitate storing and selling decisions. In many situations, market demands for a particular variety or brand, seasonal failures, market glut and even legislative policies might play a role in farm profitability. The farmers, who entirely relayed on the traders for market information, now can take their own market decisions based on the public sector based market advisories.
CONCLUSION The upliftment of rural mass depends only on the remunerative prices for the commodities, which in turn depends on market forces, transparency in trade and bargaining power of the farmers. In India, the small and marginal farmers accessed less information and from fewer sources than did medium- and large-scale farmers. In most developing countries, information search costs constitutes around 11 percent of the total cost incurred by farmers during the agricultural cycle, starting from the sowing decision to marketing of produce. Therefore, the market information should reach the farmers in affordable cost so as to make needed and quicker decisions. By mobile advisories smallholders could supply the commodities to a market of better price margin. By market information dissemination via mobile handsets, the access to markets would be possible with reduction in the information searching cost, time and manpower. This may lead to utilization of time and resources in productive farming, diversification and transition of farming as farm enterprise. The farm profitability could be increased only when the farmers are linked directly with the markets. Thus the mobile market advisories services would facilitate farmers for direct participation and reduces the middlemen interferences there by reaping better returns.

192
REFERENCESAker, J.C. and M. Mbiti. (2010). Mobile Phones and Economic Development in Africa.
Journal of Economic Perspectives. Vol.24 (3): 207 – 232De’ Silva, H and Ratnadiwakara, D. (2010). ICT Policy for Agriculture Based on a
Transaction Cost Approach: Some Lessons from Sri Lanka. International Journal of ICT Research and Development in Africa (IJICTRDA) Vol.1(1): 51 – 64
Dhaliwal, R.K and Vister Joshi. (2010). Mobile Phones – Boon to Rural Social System. Literacy Information and Computer Education Journal (LICEJ), Vol. 1(4): 261 – 265
Fafchamps, M. and Minten, B. (2011). Impact of SMS based agricultural information on Indian farmers. The World bank Economics Review. 26: 383 – 414. Ferris S, Engoru P, Kaganzi E. (2008). Making market information services work better for the poor in Uganda. CAPRI Working papers no 77. http://www.capri.cgiar.org/pdf/capriwp77.pdf. Accessed on December 10, 2014
Goyal, A. (2013). Improving Agricultural Productivity and Market Efficiency in Latin America and the Caribbean: How ICTs can make a Difference? Journal of Reviews on Global Economics.Vol 2: 172 – 182
Jensen, Robert. (2007). The Digital Provide: Information Technology, Market Performance and Welfare in the South Indian Fisheries Sector. The Quarterly Journal of Economics. Volume CXXII, Issue 3: 879 to 924
Mittal. S and G. Tripathi. (2009). Role of Mobile Phone Technology in improving Small Farm Productivity. Agricultural Economics Research Review, Vol. 22: 451 – 459
NSSO Report. (2005). Situation assessment survey of farmers, access to modern technology for farming, NSS 59th Round, Report No.499(59/33/2). Ministry of Statistics and Programme Implementation. GOI. New Delhi
Sivabalan.K.C and B.Swaminathan. (2014). Farm Profitability and Value Chain Management: Case Study from India: Families, Farms and Food. Proceedings of SEAVEG 2014, Regional symposium. Bangkok, Thailand. Pp. 298 – 309
Tadesse. G and Godfrey Bahiigwa. (2015). Mobile Phones and Farmers’ Marketing Decisions in Ethiopia. World Development, 68: 296 – 307
Telecom Regulatory Authority of India (TRAI) Report. (2015). Retrieved on December 15th, 2015 http://trai.gov.in/Content/index.aspx
193
Research and Development of Vegetables Towards Adaptation to Climate Change in Malaysia
Rozlaily Zainol, Suhana Omar, Nor Hazlina Mat Saad, Norfadzilah Ahmad Fadzil, Farahzety Abdul Mutalib, Rahayu Anang, Mohamad Abid Ahmad, Zauliah Othman, Nur Syafini Ghazali and Illias Mohd KhirHorticulture Research Centre, Malaysian Agricultural Research and Development Institute (MARDI), MARDI Headquarters, Persiaran MARDI-UPM, 43400 Serdang, Selangor, MalaysiaE-mail: [email protected]
Abstract Global climate change has adverse impact on agricultural productivity caused by the increase and prevalence of extreme events such as unpredictable weather patterns that affect crop yield and quality. The abrupt change in temperature and rainfall patterns have been recognized as one of the main factors affecting vegetable production in Malaysia. This includes the biotic stress factors such as pest and diseases. With regard to these issues, the vegetable research in Malaysian Agricultural Research and Development Institute (MARDI) are focusing on the advancement of breeding genotypes and production technology that can withstand extreme weather such as high temperatures and resistance to pest and diseases. chilli research works include varietal development for high yield and resistance to anthracnose and virus. Research work on tomatoes focusing on the development of variety for ‘heat-tolerance’ or low land cultivation as about 88% of cultivated tomatoes in Malaysia are produced from the very limited high land areas in Cameron Highlands. The technology of low land cabbage cultivation has also been emphasized to cater the high local demand for this temperate vegetable thus, enabling to reduce the extreme usage of limited land areas in the Cameron Highlands. In addition, the utilization of local traditional vegetables grown as a back yard or collected from the wild is being domesticated for large scale commercialization production. These indigenous vegetables with high nutritious value are easily adaptable to our local climate and soil conditions. This paper describes an over view of recent research of vegetables conducted in MARDI towards adaptation to the climate change in Malaysia.
Keywords: heat-tolerant, tomato, chilli, low-land cabbage, traditional vegetable
INTRODUCTION Vegetable industry in Malaysia is increasing ever year at about 41% for the past 5 years from 2011 to 2015 with the production of 1,586,538 metric tons (mt) from 80,707 ha areas in 2015 (DOA, 2015). The present per capita consumption of vegetables locally is at 58.5 kg. In 2015 Malaysia imported about 1,475,000 mt vegetables and mainly were temperate type (DOA, 2015). Vegetable production in Malaysia comprises of the tropical and temperate types and there are more than 20 types of vegetables grown in Malaysia. chilli, tomato and cabbage are among the most important and highly demand. It was reported that in 2012 the local consumption per capital for chilli was 1.4 kg, 2.7 kg for tomato and 4.6 kg for cabbage (FAMA, 2014). The production area of these high demand vegetables kept increasing every year. From 2012 to 2013 the

194
production of chilli increased 49% (40,097 mt to 59,775 mt), tomato 47% (129,572 mt to 190,977) and cabbage 36% (94,886 mt to 129,148 mt) (DOA, 2015). However, the supply is still insufficient thus allowing high and increasing import of these vegetables annually. The import of chilli, tomato and cabbage in 2013 was valued at RM136.16 million, RM58.92 million and RM122.96 million respectively.
IMPACT OF CLIMATE CHANGE Malaysian agriculture is very much dependent on its tropical climate. As it is located in the equatorial region, Malaysian weather is hot and humid throughout the year. The temperature fluctuates between 25 – 35 °C with an average rainfall of 250 cm per year. However, in the Cameron Highlands with an elevation ranging from 1,100 to 1,600 meter above sea level, the temperature does not exceed 25 °C, thus enables temperate vegetables to be grown there. In fact more than 80% of our temperate vegetable are being cultivated and produced in the Cameron Highlands. Climate factors such as temperature, rainfall, moisture, drought and flood are important components contributing to the agriculture productivity and sustainability. Changes in climate may have adverse impact on the productivity of the crop due to unpredictable weather patterns affecting crop yield and quality. Malaysia experienced climate changes for the past few years. The unusual and unpredictable weather for the past few years such as dry season contributed to the prolonged dry period and water shortage, excessive heavy rainfalls which caused flashfloods and landslides at some parts including the Cameron Highlands, the main area of local vegetable production for the temperate vegetables (Yen Yi Loo et al., 2015). The abrupt changes in temperature and rainfall patterns have been recognized as the main factors adversely affecting crop production in Malaysia including vegetable crops. It was reported that incidence of crop pests and diseases also increased due to favorable environment wascreated by such changes. With regards to these issues, the Vegetable Research Program in Malaysian Agriculture Research and Development Institute (MARDI) are focusing on the advancement of breeding genotypes and production technology of vegetables that can withstand extreme weather such as high temperatures and resistance to major pest and diseases. Local indigenous vegetables are to be domesticated for their high adaptability and nutrition value which could contribute to the food safety.
ADAPTATION OF CLIMATE CHANGE THROUGH BREEDING Vegetable breeding work in MARDI is being prioritized on chilli and tomato as these are the most important and highly demanded vegetables locally. For the past few years, research in breeding and selections of chilli and tomato varieties in MARDI involved in the development of of inbred lines for varietal improvement. The advantage of hybrid vigor or heterosis in the F1 progeny creates new area of hybrid seed production/breeding for local vegetables. Crops raised from seeds of F1 hybrid showed advantage in terms of yield, adaptability, uniformity and reactions to certain stresses in comparison

195
to crop raised from the seeds of improved pure line or population (Sanjeet Kumar and P.K. Singh, 2005). The traits aimed for MARDI’s chilli and tomato breeding program which are also the aims of most vegetable breeders are high yield, long storage or shelf life and resistant to major pest and diseases. In addition, ‘heat-tolerance’ becomes a major additional trait aimed in vegetable breeding. Thus, this will enable the crops especially the temperate type to be grown under higher temperature for production of vegetables at the lowland areas.
Chilli (Capsicum annum) Breeding and selection of chilli is aimed for the development of varieties resistant to anthracnose and cucumber mosaic virus (CMV), the most common diseases in our local vegetable farms. The local chilli varieties, ‘MC11’ and ‘MC12’ were used as parents due to their high yielding and adaptability (good agronomic characteristics, early maturity and acceptable pungency). As a result, an inbred line ‘L5’ was selected from a cross between ‘MC11’ and ‘CH231’ (a Thai variety resistant to anthracnose) (Suhana O. and Nor Hazlina, 2013, Suhana et. al., 2014). ‘L5’ showed prolific fruiting in which the yield could gain more than 2 kg per plant and it is expected to produce total yield of 20 – 30 metric tons per hectare. The plants showed moderately tolerance to anthracnose and CMV. ‘L5’ is not only suitable to be used as fresh but also good for processing. The chilli sauce or ketchup made from ‘L5’ chilli has better quality in term of taste and cosmetic appearance; good natural colour, good colour retention and flavor and perfect capsaicin content for processing purposes (Suhana et al., 2015). Genetic studies of cucumber mosaic virus (CMV) resistance in chilli were carried out using the F1 and F2 populations, generated from two local chilli genotypes (MC11 and Kulai) and two resistant genotypes from AVRDC or World Vegetable Center (CH17 and CH21) (Norfadzilah et. al, 2012, 2014, 2015). Studies conducted included genotype screening for CMV resistance, genetic heritability, heterosis, inbreeding depression and trait correlations related to CMV resistance. It was found that the genetic control of CMV is governed by a single and double recessive genes. CMV resistant was negatively correlated with other good agronomic traits (plant size, time of flowering and maturity, fruit size and yield). To develop good chilli variety of CMV resistance, it is suggested to use parental lines with high yield and good fruit quality. An interesting result found that period of fruit maturity could be one of the important traits in the selection of CMV resistant genotype. For the development of hybrid seed production, mechanism of cytoplasmic male sterility (CMS) is important to produce pure hybrid seeds at commercial scale. Therefore, genetic study on the CMS trait of chilli would be using genetic source from World Vegetable Center and this would then followed up with the development of new chilli hybrids.

196
Tomato (Solanum lycopersicum) Research work on tomato is focussed on the development of variety for ‘heat-tolerance’ for lowland cultivation where about 88% of cultivated tomatoes in Malaysia are produced from very limited high land areas in the Cameron Highlands. Two local tomatoes, ‘MT1’ and ‘MTII’ were used as base varieties in breeding (Nor Hazlina et al., 2013). The ‘MTI’ is resistant to bacterial wilt but has small fruit size with orange red flesh colour, whereas the ‘MTII’ has similar flesh colour but bigger fruit size and tolerant to bacterial wilt disease. A new inbred line coded as ‘No. 32’ was developed from ‘MTI’ and ‘Fumikura’ genotypes. ‘No. 32’ has similar characteristics to its parent, the ‘MTI’ but could produce higher yield i.e. more than 1.8 kg per plant with the fruit size 25 – 30 g per fruit (Nor Hazlina et al., 2015). It is expected to produce a total average yield of 25 metric tons per hectare (21,000 plants/ha). The plants showed high tolerance to bacterial wilt disease with more than 93% survived and showed better performances when grown on the peat soil as compared to the mineral soil. In addition, the fruits contain high β-carotene as compared to the other eight genotypes or commercial varieties tested (Figure 1). Screening for heat-tolerant tomato is being extended onto 15 tomato genotypes obtained from the World Vegetable Research (AVRDC) for their adaptability to local environment. Preliminary studies showed that four genotypes (CLN3125E, CLN3125Q, CLN3078A and CLN3078C) did not grow well and died at very early stage, two (CLN2026D and CLN1621F) showed low incidence of bacterial wilt and can performed well under the hot or stress environment and seven genotypes (CLN3125L, CLN2071D, CLN2413D, CLN2366B, CLN2026D, CLN1621F, CL5915-206D4) showed good growth in terms of adaptability to lowland cultivation (Table 1).
ADAPTATION OF CLIMATE CHANGE THROUGH PRODUCTION TECHNOLOGY
Low Land Cabbage Cultivation Cabbage especially the round or headed type is one of the Malaysian favorite vegetables due to its easy handling and long shelf life. It contains high vitamins and minerals and usually served fresh as salad or in cooking dish. The technology of lowland cabbage cultivation was given more emphasis due to the issue of extreme usage and limited land areas in the Cameron Highlands. As a temperate vegetable, more than 90% of the Malaysian round cabbage production is from the Cameron Highlands. The total production of round cabbage was 119,648 metric tons from 4190 hectare area in 2013 (DOA, 2015). MARDI has developed a technology of lowland cabbage production since 2004 (Leong et al., 2004; Illias and Vimala, 2005; Vimala et al., 2006). Screening of several genotypes had identified two varieties, the ‘KK Cross’ and ‘F1 Hybrid 311’ enabling cabbage planting in the lowland under Malaysian weather. The F1 Hybrid 311 performed well when grown in an open area producing a good yield with a head sized average of

197
Table 1. Fruit quality and bacterial wilt scoring incidence of 15 tomato lines evaluated under lowland environment and 7 genotypes were selected (in bold)
Tomato lines Fruit weight
Fruit length
Fruit width
TSS pH Yield Bacterial wilt incidence*
Colour
CLN3125ACLN3125ECLN3125LCLN3125QCLN3078ACLN3078CCLN3078GCLN2514BCLN2071BCLN2071DCLN2413DCLN2366BCLN2026DCLN1621FCL5915 – 206D4
105.06–
57.18–––
36.8415.8722.1716.9593.9137.6461.2234.0656.90
5.08–6.59–––5.004.813.263.665.103.945.424.294.36
5.73–3.92–––3.532.603.392.875.743.974.403.784.69
4.11–3.98–––3.082.033.394.124.374.083.872.774.63
4.14–4.19–––3.943.913.753.883.813.903.974.053.65
513.29–497.50–––221.05100.85169.37234.30759.46406.06520.54573.84606.86
343444333333223
Orange–Orange–––RedRedOrangeRedOrangeOrangeRedRedOrange
*1 = Perfect condition, 2 = Slight (less than 15% of foliage or plant affected), 3 = Moderate (between 16 – 40% of foliage or plant affected), 4 = Extreme (over 41% of foliage or plant affected)
GHB5 L8 L9 MT1 MT11 No3 No32 PH85
Tomato
ß-ca
rote
ine
Figure 1. ß-carotene content of eight tomato lines/cultivars (mg/kg)

198
1.5 kg with 19.4 cm diameter (Illias and Farahzety, personal communication unpublished report, 2015). The yield could be harvested 10.5 – 12 weeks after planting With good agronomic practices the total yield per hectare (22,220 plants) was calculated to be 30 tons.
Cabbage Sprout Cabbage sprout (Brussels sprout)is becoming popular and getting higher demand in Malaysian dish. It has better taste and highly nutritious which adds value for better price market. The discovery of lowland cabbage cultivation enables a new production technology of cabbage sprout through ‘sprout harvesting’ which could be done through agronomic practices and application of fertilizers rates. The studies are still ongoing.
Continuously Leaf-harvesting Technique Study on an intensive production of leafy vegetables using the technique of ‘continuous leaf-harvesting’ is being applied on high value leafy vegetables such as Chinese kale or known as Kai-lan (Brassica oleracea var. alboglabra). This technique involved harvesting of leaves and tender shoots of leafy vegetables for several times. Frequent harvesting of leaves and shoots delay the onset of flowering and prolong the harvesting period, thus could reduce the production cost. The idea is to have an intensive production of high value leafy vegetables for maximum yield and good quality, targeted for premium price. Research on this technique is still ongoing.
Domestication of Traditional Vegetables The traditional vegetables comprise of indigenous species which could be found growing wild or semi-cultivated at back yard. These often have high nutritious value such as vitamins and minerals as well as antioxidants and they are popularly used as ulam. Most of these traditional vegetables are hardy plants and the plants are easily grown and well adaptable to local climate and soil conditions. However, productivity is not good due to unorganized and lack of good agronomic cultural practices which lead to low yield and low product quality. The demand for these traditional vegetables is increasing as consumer awareness of their importance in diet. Thus, domestication of these traditional vegetable for large scale production is necessary to improve their productivity for commercialization. Two indigenous species, Melicope ptelefolia (Tenggek Burung) and Stenochlaena palustris (Paku Midin) were identified, have potential for cultivation on a commercial scale. Both these traditional vegetables have some good properties either as a traditional medicine or antioxidant functions besides, their high nutritional value and good taste. Besides, they are among the most popular vegetables or ulam in the Malaysian community. Availability of planting materials is one of the main limitation in the cultivation of traditional vegetables. The propagation of Melicope ptelefolia is limited by seed viability and inconsistency of germination whereas the Stenochlaena palustris performed very
199
slow growth. The micro-cuttings propagation technique has been developed for mass propagation of Melicope ptelefolia and showed very promising results (Farahzety et al., 2014; 2017). Propagation through rhizome division on peat medium was most suitable for Stenochlaena palustris (Farahzety, personal communication unpublished report, 2015). This technique enabled to produce mass planting materials of good quality with increased uniformity and less variation. These propagation techniques of indigenous vegetables enable the commercial production of Melicope ptelefolia and Stenochlaena palustris. The availability of sufficient plant materials, proper planting system and nutrient management would lead the local and traditional ulam to achieve higher yield, better quality and safe to consume.
CONCLUSION Development of genotypes and production technologies enable to withstand extreme weather such as high temperatures and disease resistance become main focus of vegetable research in MARDI. Other approach is to utilize the indigenous species via domestication of traditional vegetables through improvement of production technologies at the large scale for commercialization.
REFERENCESDepartment of Agriculture Malaysia. (2015). Booklet Statistic Tanaman (Sub-sector
Tanaman Makanan) 2015. The Statistical Unit, Department of Agriculture Malaysia (DOA)
Farahzety Abdul Mutalib, Ab Kahar Sandrang and Mustafa Kamal Abd Ghany. (2014). Pembiakan tanaman tenggek burung (Propagation of tenggek burung). Buletin Teknologi MARDI 5: 17 – 23
Farahzety Abdul Mutalib, Mohd Khairul Anuar Sumardi and Mustafa Kamal Abd Ghany. (2017). Influence of Micro – Cuttings Size and Propagation Media for Multiplication of Melicope Ptelefolia. Paper presented at MARDI Science and Technology Exhibition (MSTE2017)
FAMA. (2014). Statistik Utama Pemasaran. Federal Agricultural Marketing Authority (FAMA)
Illias, M.K. and Vimala,. P. (2005). Application of chicken manure on lowland cabbage (Brassica oleracea var pitata) grown on peat soil under rainshelter. J. Trop. Agric. and Fd. Sc. 33(1): 25 – 32
Leong, A.C., H. Salbiah and A. Izham. (2004). N and K requirements of lowland cabbage (Brassica oleracea L. var. capitata) on peat, grown under netted structure. J. Trop. Agric. and Fd. Sc. 32(1): 9 – 14
MOA. (2015). Dasar Agromakanan Negara 2011 – 2020, Kementerian Pertanian dan Industri Asas Tani Malaysia. Ministry of Agriculture and Agro Based Industry Malaysia (MOA)
Norfadzilah Ahmad Fadzil, Ghizan Saleh, Siti Aishah Hassan, Nur Ashikin Psyquay Abdullah, Mohamad Roff B. Mohd Noor. (2012). Varietal performance,resistance to

200
CMV and correlation among traits in chilli (Capsicum annuum). Paper presented at the International Agriculture Congress 2012 (IAC2012), Putrajaya Malaysia 4 – 6 September 2012
Norfadzilah A.F., Ghizan S., Siti Aishah H., Nurul Ashikin P.A and Mohd Roff M.N. (2015). Inheritance of Resistance to Cucumber Mosaic Virus in chilli (Capsicum annuum L.). Paper presented at the 11th. Malaysia Genetic Congress, Perdana University, Serdang, Selangor Malaysia 12 – 13 August 2015
Norfadzilah A.F., Ghizan S., Siti Aishah H., Nurul Ashikin P.A and Mohd Roff M.N. (2014). Selection of Parental Lines for Virus-Free chilli. Paper presented at the National Urban Horticulture Conference. Johor Bharu Malaysia 14 – 17 April 2014
Nor Hazlina, M. S., Sebrina Shahniza, S., Rozlaily, Z. (2013). Evaluation and selection of tomato lines for lowland cultivation. Paper presented at the 10th. Malaysia Genetics Congress. Putrajaya Malaysia 3 – 5 Disember 2013
Nor Hazlina, M.S., Sharizan, A., Rozlaily, Z., Suhana, O., Norfadzilah, A.F. (2015) TOMATO ‘NO.32’ – Tomato pilihan untuk tanah rendah. Paper presented at the National Conference of Technology Transfer (CONFERTECH), Kuching, Sarawak 7 – 9 April 2015
Sanjeet Kumar and P. K. Singh (2005). Mechanisms for Hybrid Development in Vegetables. Journal of New Seeds 6(4): 381 – 407. Taylor and Francis. http://www.tandfonline.com/doi/abs/10.1300/J153v06n04_05
Suhana O. and NorHazlina, M.S (2013). Preliminary studies on reaction to anthracnose and yield performance of selected chilli varieties. Paper presented at the Post harvest losses and food waste Conference 2013, Lumut Perak, Malaysia
Suhana, O., Fadzilah, A. F., Umikalsum, M. B., Farahzety, A.B., Norhazlina, M. S., NurIzalin, M. Z, Salmiah, M., Mohd Isa D. (2015). L5: Cili Baru Berhasil Tinggi. Paper presented at the National Conference of Technology Transfer (CONFERTECH), Kuching, Sarawak 7 – 9 April 2015
Suhana, O., Melor, R. and Norfadzilah, A.F. (2014). Yield performance and stability of new promising chilli genotypes over different agro-ecological environments in Malaysia. ISHS Acta Hort. 1127: XXIX International Horticultural Congress on Horticulture: Sustaining Lives, Livelihoods and Landscapes (IHC2014): International Symposium on Plant Breeding in Horticulture. DOI 10.17660/ActaHortic.2016.1127.76
Vimala, P., Illias M.K. and Salbiah. H. (2006). Effects of rates of organic fertilizer on growth, yield and nutrient content of cabbage (Brassica oleracea var. capitata) grown under shelter. J. Trop. Agric. and Fd. Sc. 34(1): 17 – 25
Yen Yi Loo, Lawal Billa and Ajit Singh. (2015). Effect of climate change on seasonal monsoon in Asia and its impact on the variability of monsoon rainfall in Southeast Asia. Geoscience Frontiers 6 (6): 817 – 823

201
Linking Vegetables Farmers to Markets: Emerging Business Opportunities
Kavya, B.R. and Chengappa, P.G. Department of Agricultural Marketing and Business Management, University of Agricultural Sciences, Bangalore 560065, IndiaE-mail: [email protected], P.G.ICAR National Professor, Institute for Social and Economic Change (ISEC), Bangalore 560072, India
Abstract The agrarian scenario in India is dominated by small producers and vegetable production is no exception. Vegetables being perishable, markets being fragmented and unorganised with superfluous intermediaries pose multiplicity of problems in linking vegetable growers to markets. The absence of infrastructure further aggravates by limiting access to markets and supply chain issues. There have been many efforts in linking vegetable farmers to markets by following innovative institutional approaches. The supermarkets or food retail chains (FRCs) are making efforts to link vegetable farmers to markets by establishing backward and forward linkages. The concept of ready to retail adopted by the FRC is to the benefit of the farmers as they realized higher returns by adopting improved technology and growing high value vegetables. Direct supply by farmers allowed the retail chain to simultaneously increase control over quality, supply reliability and price stability. Contract farming is touted as a strong viable alternate channel linking vegetable growers to markets. Contracting institutions provide quality inputs and technical support in production and marketing. This enabled vegetable growers to reduce their working capital needs and transaction cost per unit of output. In spite of several advantages, the farmers under contract faced problems like delay in payments and delivery of inputs and rejection of produce on quality ground. Forming producer collectives such as cooperatives, associations, self help groups and producer companies have proved successful in terms of procuring required quality inputs at competitive prices and sale of the produce in an efficient manner. These new emerging institutional arrangements have helped farmers to break away from the clutches of traditional players – brokers/wholesaler/commission agents to some extent. However, whether these linkage interventions are sustainable, replicable and up-scalable needs an indepth analysis.
INTRODUCTION Linking farmers to markets can seize a whole range of activities, from the very small and localized to the very large. The concept does, however, assume the development of long-term business relationships rather than support for ad hoc sales (Shepherd, 2007). Linkages between farmers and market players call for priority attention to issues on access to technology, information on institutional arrangements, support services, policies, capacity building, identification and development of markets (MANAGE, 2013). The linkage between vegetable producers is rather weak under Indian conditions attributable to reasons like small scale and dispersed nature of producers, inadequate arrangements for supply of quality inputs at right time, unorganized and fragmented

202
markets, superfluous middlemen in the supply chain, low infrastructure contributing to higher logistic costs and absence of corporate involvement in establishing forward and backward linkages. In the recent years, there have been concerted efforts to link farmers to the markets. These efforts include creation of alternate marketing channels which provide better pricing and reducing the transaction costs. Horticulture, comprising of number of fruits, vegetables, flowers, spices, medicinal and aromatic crops is a key sector in the Indian economy. More than 60 types of vegetables are grown in India in tropical, subtropical and temperate agro-climates. India is the second largest producer of vegetables: during 2013 – 2014, India produced 162.19 million tonnes of vegetables. However, its share in global market is only about 1% (IIVR, 2016). India is the largest producer of okra and ranks 2nd in the production of potato, onion, cauliflower and cabbage. Vegetables being perishable, markets being fragmented and unorganised with superfluous intermediaries pose multiplicity of problems in linking vegetable growers to markets. The marketing channel for vegetables involves a number of intermediaries like the pre harvest contractor, commission agent, wholesaler and retailer operating between the producer and the final consumer. Moreover, lack of efforts in transmission of market information has been a major constraint in improving the efficiency of the vegetable marketing system. In developed countries there is a rapid shift of sales through open market to direct sales that involve effective linkages and alliances from production to consumption. Whereas, in developing countries farmers are linked to buyers by identifying traders/agents or small-scale traders seek out new suppliers or work with existing suppliers to develop new or improved products or markets (Shepherd, 2007). Linkage can be categorized in various ways; farmers to domestic trader, farmer to retailer, linkages through leading farmer, through cooperatives, through agro processor, through exporter and contract farming (Shepherd, 2007). In addition, government marketing boards plays an important role in some countries. In India the dynamics of fast changing agri-food marketing system clearly indicates that farms are fragmenting while all other segments are scaling up fast (Figure 1).In this paper we have concentrated on three types of linkages witnessed in India:a) Linkage through retail food chains (super markets)b) Contract Farming andc) Producer collectives
Figure 1. Dynamics of fast changing agri-food marketing system: comsolidating top and fragmenting bottom
Input supplies
Farmers
Wholesalers, Logistic & Supplies
Agro processor
Farmers
▼ ▼
▼ ▼
▼ ▼ ▼ ▼
▼

203
I. BACKWARD MARKET LINKAGE THROUGH FOOD RETAIL CHAINS (FRC) Retailing in India is highly unorganized, fragmented and predominantly small due to family owned business and poor access to capital, technology and regulations. Retailing has undergone transition with the rise of FRCs or super markets. During the process of evolution there was gradual shift from fragmented local markets to larger centralized wholesale markets. Emergence of organized FRCs were witnessed after liberalization and entry of corporate entities during the beginning of 1990s. Emergence of FRCs is due to changing political, demographic and economic features like rise in economic growth and income, proliferation of brands and consumer awareness.
Improving Vegetable Farmers’ Access to Markets During recent years, organized retail sector has adopted various formats to source food commodities including vegetable. These mainly include backward integration with vegetable growers’ for procurement either directly or indirectly and selling through the outlets of the FRCs with in-house brands like: Spencer’s, Reliance Fresh, More, Namdhari’s Fresh, and few others. These FRCs have attempted many changes in the supply chain management and logistics of vegetables through the use of quasi-formal and formal contracts to ensure timely delivery of products with desired quality attributes. Therefore, they can be viewed as new institutional mechanisms for linking farmers with modern markets and improving supply chain efficiency and farmer livelihoods. Since the FDI in retailing is allowed only in single brand chains, most of the supermarket growth in India has been driven by the domestic players unlike in many other developing countries of Asia and Latin America (Singh and Singla, 2011). The organised retailers pursue two different business models in vegetables: Hub and Spoke Model (HSM) and Value Chain Model (VCM). Organized retailers like Spencer’s Retail, More and Food Bazaar are adopting ‘Hub and Spoke’ business model of retail vegetables marketing. Here Farmers, organised retailers, wholesalers and customers form this chain. Small farmers and contract farmers who executed a trade contract with the organised retailers are the primary source of supply of vegetables to the organized retailers. The Reliance Fresh follows VCM of procuring the vegetable directly from farmers and sell to customers by avoiding intermediaries. This model is based on its core growth strategy of backward integration and progressing towards building an entire value chain starting from the farmers to the end consumers. Here farmers, organised retailers and customers form the value chain. Small farmers, contract farmers and lease farmers are the primary source of supply of vegetables to the organised retailers in this chain. Independent farmers supply their produces to the consolidation centres; contract farmers and lease farmer’s produces are picked up by consolidation centres. The consolidated centre supplies vegetables to multiple hubs, depending upon the demand for the product.

204
FRC Consolidation Centre The FRC consolidation centre has introduced changes in the way vegetables are cultivated. Establishment of Fruit and Vegetable consolidation Center (FVCC) has helped FRCs to exercise control over quality, supplier reliability and price stability. Farmers are provided with package of Good Agricultural Practices (GAP). Investments in irrigation systems are preferred, as it provides the farmers greater control over quality and allows them to produce round the year. The company has no system of providing credit but provides technical guidance for vegetable production: choice of vegetables, planting, crop production, plant protection, management of irrigation facility, harvest time and quantity to be harvested per unit of area (acre) to ensure quality and marketability. The agreement is informal and there are hardly any written contracts between farmer-vendor and company. The FVCC has no system of providing production credit to the farmers, but helps them in procuring inputs from suppliers at reduced rates. The consolidation centre procures good quality vegetables on an indent basis. As such, the farmers face the problem of rejection due to non compliance of quality. The rejection rate was as high as 10 per cent in some cases. This forces the farmer to approach the traders in the traditional marketing to dispose their rejected quantity at much lower prices. Moreover, all the vegetables produced by the farmers are not purchased by the FRCs as they buy based on their need. Prices of fresh fruits and vegetables at FVCC are determined on the basis of the prices prevailing at different markets of that region. It was found that farmers preferred to supply their produce to the FVCC, as it provided them stable prices and assured market, compared to the highly volatile prices at the wholesale market (Chengappa and Mangala, 2016). The model of FVCC operated by the Spencer’s Retail supply chain for fresh vegetables is depicted in Figure 2.
Source: Chengappa and Mangala, 2016
Figure 2. Supply chain of Spencers for Fresh Vegetables
FVCC farmer-vendors
Sorted, graded, packed FFV
FVCC Weighed, bar coded, labeled and packed
Warehouse 1 Warehouse 2 Warehouse 3
Retail outlets in cities

205
Profitability of FRC and non FRC farmers Profitability and transaction costs of FRC and non FRC farmers for four major vegetables, viz;, cabbage, cauliflower, carrot and tomato are depicted in Table 1. Market price for FRC farmers are comparatively higher than non FRC farmers. Further FRC farmers had considerable lower transaction costs as compared to non FRC farmers. For example, the transaction cost worked out Rs 180/ton in Cabbage, Rs 189/ton in cauliflower, Rs 775/ton in carrot and Rs 640/ton in tomato compared to Rs 700/ton, Rs 1200/ton, Rs1905/ton and Rs1000/ton for non FRC farmers respectively. Net returns was higher in all crops for FRC farmers compared to non FRC farmers. This clearly indicated that the FRC linkage has been able to change the method of farming. Farmers through intensive cultivation and crop diversification have been able to earn higher incomes with lower transaction cost contributing to higher returns.
II. MARKET LINKAGE THROUGH CONTRACT FARMING IN VEGETABLES Contract farming is an agreement between farmers and processing and/or marketing firms for the production and supply of agricultural products under forward agreements, frequently at predetermined prices (Eaton and Shepherd, 2001). Basically, contract farming is aimed at assured buy back and hence, assured price and supply chains for creating and sustaining value addition for the produce (Dileep et al., 2002). The basic elements of contract farming include pre-agreed price, quality, quantity and timely delivery of produce. Eaton and Shepherd (2001) classified five major models in which contractual arrangements occur between the firm and farmers. A sponsor (defined as the contracting firm or corporation) decides to follow a model depending on the market demand, production and processing requirements and economic and social viability of the farmers (Paty, 2005).
Table 1. Net returns in vegetables production under FRC and non FRC farmers
Particulars Cabbage Cauliflower Carrot TomatoFRC farmers
Non FRC farmers
FRC farmers
Non FRC farmers
FRC farmers
Non FRC farmers
FRC farmers
Non FRC farmers
Price received (Rs/tonne)
3,490 3,000 8,430 7,000 15,500 14,000 6,540 5,500
Transaction cost/tonne (Rs)
180 700 189 1,200 775 1,905 640 1,000
Total cost/tonne (Rs)
1,077 1,739 2,060 3,219 3,364 4,093 2,036 2,550
Net return/tonne (Rs)
2,413 1,261 6,370 3,781 12,136 9,908 4,504 2,950
Source: Chengappa and Mangala, 2016

206
1. Centralized model: Here a sponsor buys from large number of small farmers. The firm provides inputs such as seeds, fertilizers, pesticides, credit and machines. This model was used for annual crops and crops which often require a high degree of processing. Tomato processing by PepsiCo in Punjab taking control of most of the production involving a group of farmers, processing and marketing is a typical example of centralized model.
2. Nucleus estate model: It is a variation of the centralized model where the sponsor also manages a central estate or plantation. It is mainly used found in case of fresh vegetables and fruits for export (Badodiya et al., 2012). Namdhari’s Fresh, a unit of Namdhari Seeds started in year 2000 at Bangalore practices contract farming for export fresh vegetables and provide a premium quality produce to domestic customers. Presently, more than 40 different vegetables and fruits are being cultivated by Namdhari’s Fresh at various productions centers across the country. The different agro-climatic zones enable them to produce most vegetables all round the year. European standards of Good Agriculture Practices (GAP) are strictly followed at production level. In addition to their own captive production Namdhari’s Fresh has contract production involving farmers. The company supplies quality input, technical backstop and buys back the vegetable produced by the contract farmers.
3. Multi-partite model: The multipartite model usually involves the government, statutory bodies and private companies jointly participating with the local farmers. Each entity may be responsible for providing different goods and services such as credit, inputs, equipments, transportation, processing and marketing facilities. A example is the firm, Rallis which provides all inputs, technical support and finance to registered growers for a specific crop and facilitates the sale of produce at reasonable prices. The company follows a consortium approach. It has tied up with banks and with buyers. The system is run through a network of 10 Rallis Kissan Kendras (RKKs) across the country.
4. Informal model: It is characterized by individual entrepreneurs and small companies. The crops usually require only a minimal amount of processing or packaging for resale to the retail trade or local markets like as vegetables. Typically, the firm’s involvement in actual production and input procurement is very minimal. Many supermarket chains in India usually follow this model to ensure a steady supply of produce (Manjunatha et al., 2016).
5. Intermediary model: This involves sponsors in subcontracting linkages of farmers with intermediaries like collectors, farmer groups and NGOs. The intermediaries have informal arrangements with farmers, thus it disconnects the link between company and farmer which is the main disadvantage of this model.

207
Positive and negative impacts of contract farming The proponents of contract farming reveal that there is increase in income of participating farmers due to improved access to market, employment in farm, better use of resources and better management practices. Firms enable the farmers to reduce their price risk through predetermined prices, production risk through provision of technology and extension services. Further, farmers can use the contract agreement as collateral to arrange credit with a commercial bank in order to fund inputs (Badodiya et al., 2012). In addition, the potential advantage for sponsors could be overcoming land constraints, political acceptability, production reliability and shared risk and quality consistency. On the other hand they also face problems from social and cultural constraints, land availability, farmers’ discontent, extra-contractual marketing and input diversion. Farmers face increased risk when a new crop is introduced. Forecast of market size or price levels will not be accurate. Most contract farming schemes occur only in the regions where, commercial agriculture are already established and offering reliable infrastructural access to markets (Manjunatha et al., 2016). Due to unequal power in terms of bargaining, negotiating, or contract enforcement contracts between agribusiness firms and farmers tend to be unfair and lead to exploitation. Domination by one or two companies and over reliance on advances are the problems faced by the farmers.
III. LINKING TO MARKET THROUGH PRODUCER COLLECTIVES Producer collectives are a new avenue for the smallholder producers by bridging the gap between productivity and market accessibility through a guaranteed market for produce and access to machinery and modern technologies (Raju and Singh, 2014). Producer collectives include rural cooperatives, agricultural/horticultural cooperatives, Farmer Produce Organization (FPO), private sector promoted POs, Non Government Organizations (NGOs), civil society organizations, Self-help Groups and producer companies. Collectives are consistent, reliable and generally pay higher price to their farmer suppliers than local middlemen through signing forward purchase contracts several months in advance of the harvest to supply products to buyers.
Cooperatives: Cooperatives are formal, legal and registered organizations, with the objectives to meet common economic, social and cultural needs. They are jointly-owned and democratically controlled enterprises. Most rural cooperatives are engaged in supply of inputs with only few in marketing. The Horticulture Producers’ Co-operative Marketing and Processing Society Ltd. (HOPCOMS), established in Bangalore was founded in 1959 to tackle farmers’ poor bargaining power and reduce middlemen’s commission and provide vegetables to consumers through their retail outlets. The Board of HOPCOMS consists of I6 members, of which 11 members are elected from among the producers and the rest are the Government nominees. As of 2012 the HOPCOMS has 16221 growers as members. HOPCOMS handles around 100 metric tonnes of fruits and vegetables every day. The member farmers bring their produce to the Society, where the produce is graded, weighed and the payment is made to the farmers immediately.

208
To help the growers for transporting the produce, the Society has procurement centres in major supply areas. The procured fruits and vegetables are supplied to consumers through the Society’s 257 retail outlets in Bangalore and Kolar districts. The Society has also taken the lead in supplying quality vegetables and fruits to all the government hospitals, hostels, major factories, clubs etc., It also undertakes bulk supplies to marriages and other social functions.
Farmer Producer Organisations: FPOs are formed to collectivize small farmers for backward linkage for inputs like seeds, fertilizers, credit, insurance, extension services and forward linkages such as collective marketing, processing and market-led agriculture production (Mondal, 2010). These are perceived to empower farmers through collective bargaining along with instilling an entrepreneurial quality to farming. Some are formally registered, while others are not – operating in an informal way. Scaling of operation and sustainability is a problem in such a model.
Non Governmental Organisations: NGOs and Civil society organizations are largely organized on a broad farmers welfare goals. Their activities include capacity-building, agricultural extension, community projects and participation in local government decision-making. It strengthens and influence to create new market segments like fair trade, organic markets and environmentally friendly markets. However, long run sustainability is a problem.
Corporate Social Responsibility (CRS): Private sector organizations under their CSR program promote POs by providing input, credit and delivery of extension services. Corporate provides link to POs for supply of agricultural products or raw materials. They are engaged in out-grower schemes or contracts for the production and delivery of specific products like seeds and vegetables. These POs do not face the challenge of sustainability as a part of the corporate profit is earmarked for such activities. Syngenta is a strong and unique position to address the increasing complexity of the challenges faced farmers. During 2009-13, Syngenta Foundation India (SFI) embarked a market-led extension’(MLE) model, where the emphasis was to ‘produce together and sell together’. Essential features of this approach included linking vegetable producers’ groups with markets through fewer intermediaries. The major components of MLE in vegetables include facilitating purchase of agri-inputs, providing knowledge of production and marketing of vegetables and linking farmers to markets. In addition Syngenta diversified using agri-entrepreneurs (AEs) to anchor market-led extension in vegetables. SFI supports the entrepreneurs at business start-up. Thereafter, they work independently with neighboring farmers on a commercial basis. SFI connects the entrepreneurs to bank, which provides the credit both to the AE and their farmer clients.

209
Producer companies: The name ‘Producer Company’ is provided in order to indicate that the members have to necessarily be a primary producer. It is a hybrid between a Private limited Company and a Cooperative society as it minimizes interference from other external bodies thus ensuring that the real power rests with members of the company itself. Such a company functions like any other private limited company with only difference being that the profit incurred flows back to farmers who own the company. MAHA Farmers Producer Company Ltd. (MAHAFPC) in Maharashtra is one such example of a successfully running FPO. These State level Association (SLA) are involved in agriculture and allied value chain. The SLA would be a for-profit or not for profit making entity, working directly with Farmer Organizations to help to mitigate the difficulty of farmers through institutional development services, capacity building services, system and process integration, technical training dissemination, financial intermediation, market linkage development, policy advocacy and facilitating social security and economic development.
CONCLUSION Vegetables have been a thrust area for increasing income and employment in India. However, the linkage between farmers to markets for vegetables in India has been poor. Domination of pre harvest contractors and commission agents still persists in the marketing chain of vegetables. In recent years, some institutional arrangements such as backward integration by FRCs, contract farming and producer collectives are enabling farmers to participate in the changing marketing scenario. New value chains are emerging due to alternate institutional arrangements but are highly regional in nature limiting the market access and development of markets. Moving up in the value chain is necessary especially for small farmers to reap the changing markets.
REFERENCESChengappa, P. G., Mangala, K. P., and Dega, V. (2016). Is Farmer–Food Retail Chain
Linkage Feasible?. In Organised Retailing and Agri-Business, Springer India. 241 – 250
Dileep, B.K., Grover, R.K. and Rai, K.N. (2002), Contract farming in tomato: An economic analysis. Indian J of Agricultural Economics, 57(2): 197 – 210
Eaton, C. and Shepherd. A. (2001). Contract farming: Partnerships for growth. Agricultural Services Bulletin 165. Food and Agriculture Organization. Rome
IIVR. (2016). Indian Institute of Vegetable Research, Department of Agricultural Research and Education, Government of India
MANAGE. (2013). Training Programme on Linking Farmers to Market. Accessed from http://www.manage.gov.in/studymaterial/LinkingFarmers-E.pdf
Manjunatha, A.V. (2016). Present Status and Prospects of Contract Farming In India. International Journal of Agriculture Sciences, ISSN, 0975 – 3710
Mondal, A. (2010). Farmers’ Producer Company (FPC) Concept, Practices and Learning: A Case from Action for Social Advancement’, Financing Agriculture, 42(7): 29 – 33

210
Paty, B.K. (2005), Contract farming in India – Progress and Potential. Journal on Agricultural Marketing, 48(1): 13 – 20
Raju, K.V. and Singh, P.K. (2014). Producers’ Collectives in Sustainable Agri-value Chain, Rural Entrepreneurship and Enterprise for Inclusive Growth, 3rd National Rural Management Symposium, 20 – 21 November, KIIT University Bhubaneswar
Shepherd, A. (2007). Approaches to linking producers to markets (Vol. 13). Food and Agriculture Org
Singh, S. and Singla, N. (2011). Fresh Food Retail Chains in India: Organisation and Impacts CMA Publication No. 238 (1). Allied Publishers

211
Vegetable Marketing: The Driver of Production and Source of Livelihoods for Smallholder Farmers in Uganda
Sylvia Namazzi1, Mariette McCampbell2, Moses Makooma Tenywa3, Anna Sole Amat2, Moureen Awori2, Perez Muchunguzi2 and Victor Afari-Sefa 41World Vegetable Center, Eastern and Southern Africa, c/o IITA – Uganda |Plot 15, East Naguru Road, P.O. Box 7878, Kampala, Uganda2IITA – International Institute for Tropical Agriculture, Uganda |Plot 15, East Naguru Road; P.O. Box 7878 Kampala, Uganda3Makerere University, P.O. Box 7062, Kampala, Uganda4World Vegetable Center, Eastern and Southern Africa, P.O. Box 10, Duluti Arusha TanzaniaE-mail address: [email protected]
Abstract Marketing is an important factor in the success and sustainability of vegetable farming. It is hypothesized that when farmers are assured of income, they increase production; the increased yield and diversification results in improved food security and nutrition. Whereas most crops require 3 to 6 months to mature, farmers start harvesting vegetables from three weeks after planting. Although quick maturation of vegetables offers opportunities for food security, nutrition and fast income, farmers may be vulnerable to losses if they produce too much of a crop. The usual tendency is to consider marketing after production, resulting in gluts in villages and market places, especially during the rainy season. Not all surpluses are consumed in the household and means of preservation are scarce. A robust marketing strategy initiated prior to crop production can help solve the problem. The humidtropics innovation platform (IP) of Mukono and Wakiso districts in Uganda is the focus of this study. The platform evaluates how a solid market strategy resulted in increased income, food and nutrition security. The platform, located in Uganda’s rapidly urbanizing Central region, put vegetable marketing on the agenda right from the start of production. Farmers were able to sell their produce directly after harvest, securing the crop’s value and satisfying market demand for high quality produce. While the innovation platform focused on women and youth to produce vegetables, the youth took the opportunity to sell vegetables to Kampala’s high end market. In doing so, the livelihoods of vulnerable women and youth were improved. The objective of this study is to highlight how vegetable marketing increased incomes and nutrition of farm households in Mukono and Wakiso.
Keywords: innovation platform, vegetables, youth and marketing
INTRODUCTION The growing awareness of health promoting and protecting properties of non-nutrient bioactive compounds found in fruits and vegetables has directed increased attention to vegetables as vital components of daily diets (Smith and Eyzaguirre, 2007; Habwe and Walingo, 2008; György et al., 2015). Traditional leafy vegetables are important for household food consumption and income generation, as they can easily be maintained in home gardens of the poorest households (Gockwski et al., 2003). For example, African eggplant (S. aethiopicum) as a fruit and leafy vegetable has been cultivated in Tanzania because of its economic and nutritional importance (Muhanji et

212
al., 2011). In order to realize economic benefits, the produced vegetables must be brought to the market. Farmers’ markets have been reported as an attractive outlet for farmers elsewhere because they are held in an established location on specified days, with an established customer base (Miles and Sterrett, 2010). However, farmers’ markets are not well developed in Uganda; few such markets are available and only for limited hours. The Ugandan Ministry of Agriculture aims to improve food and nutrition security by emphasizing strategies for rural households to pursue income-enhancing activities and increase their purchasing power (Ministry of Agriculture, Animal Industry and Fisheries (MAAIF), 2010). The ability of agriculture to generate income for the poor, particularly women, is more important for food security than its ability to increase local food supplies (MAAIF, 2010). However, vegetables are not priority crops of the government of Uganda, thus not emphasized in national research programmes. The key crops and enterprises approved by the cabinet include coffee, tea, bananas, cassava, beans, rice, cotton, dairy cattle, beef cattle, fish farming, Irish potatoes, poultry, goats, citrus, maize and pineapples. These priority crops are successfully and commercially cultivated in rural areas where vast land still exists. However, with increasing urban population, changing climate and competing land use demands, vegetable production is becoming a priority in peri-urban areas, such as the districts close to the city (e.g. Mukono and Wakiso, where the study was carried out). Most farmers in peri-urban areas cultivate vegetables on a small scale-less than half an acre-for consumption and sale. Vegetables can be grown on very small plots of 0.1 acres and less, unlike commercial production of maize and cassava (Gockwski et al., 2003; Tavonga, 2014). Vegetables mature in a short time, providing food and a source of quick income to many farm households. Although horticulture is considered a secondary activity to field crop production, it is an important activity for many smallholder farmers. For example, in Shonaland, Zimbabwe, it creates employment, improves household food security and nutrition and enhances livelihoods (Tavonga, 2014).
Vegetable marketing Small-scale farmers often lose their produce due to challenges that make it difficult to explore their full market potential (Matsane and Oyekale, 2014). They lack access to adequate marketing facilities and markets that do exist are grossly underdeveloped and inefficient (Adeleke et al., 2010). In addition, lack of access to credit and financing, storage facilities, market information; poorly developed village markets; poor producer prices; high perishability of produce; low patronage; inadequate access roads; small size of transport vehicles and high transportation costs; poor handling; and poor storage infrastructure contribute to vegetable losses (Baloyi 2010; Matsane and Oyekale, 2014; Murithi and Matz 2015; Sanga and Mgimba, 2016). Efficient markets would be one way to cut down these losses and increase farmer incomes (Adeleke et al., 2010). Concerns regarding the efficiency of marketing fruit and vegetables have been raised by various scholars such as Gandhi and Namboodiri (2004), Mukwevho and Anim (2014) and Murithi and Matz (2015). Marketing horticultural crops is complex and risky due to perishability, seasonality and bulkiness (Mukwevho and Anim, 2014). These challenges

213
cause many smallholder farmers to shy away from vegetable production. In addition, the spectrum of prices from producer to consumer – an outcome of demand and supply of transactions between various intermediaries at different levels in the marketing system – is unique for fruit and vegetables (Ribbink et al., 2005). Marketing arrangements at different stages play an important role in price levels from farm gate to the ultimate user (Ribbink et al., 2005). These features make the marketing system of fruit and vegetables different from that of other agricultural commodities, particularly in providing time, form and space utilities (Gandhi and Namboodiri, 2004). Youth participating in the humidtropics IP of Mukono and Wakiso districts created a system to market vegetables from smallholder farmers. They set up a collection center where produce from different farmers was bulked before preparing it for the market. They organized transportation from the farmers to the market in Kampala, the capital city of Uganda, where they supplied vegetables on order. This paper shows how an organized vegetable marketing system was able to increase revenues of participating farmers and foster their production plans. The study focused on farmers from Mukono and Wakiso districts participating in the humidtropics IP of Uganda. The marketing system contributed to the sustainability of the project in the area.
Role of innovation platform in vegetable marketing Innovation platform (IP) is a space for learning and change. It is a group of individuals with different backgrounds and interests; farmers, traders, food processors, researchers and government officials. Members of the IP come together to diagnose problems, identify opportunities and find ways to achieve their goals (Tui et al., 2013). Agricultural research for development (RandD) organisations have increasingly used IPs to push forward different agenda among stakeholders. The humidtropics program is a CGIAR Research Program that moves component research into systems approach to respond to the needs of smallholder farmers. The Research Program, aimed to help poor farm families in tropical Africa, Asia and America to boost their income from integrated agricultural systems’ intensification while preserving their land for future generations. It is a multi-disciplinary, multi-institutional and multi-sectoral program working with innovation platforms. The Mukono-Wakiso humidtropics innovation platform was a multi-product/multistakeholder platform that worked on crops, livestock and trees. This platform was initiated in 2014 and worked with farmers in collaboration with various organisations (Namazzi et al., 2016). The innovation platform linked farmer groups to market opportunities and input providers. It was responsible for identifying farmer needs and finding working solutions to those needs. The IP acted as a fallback position for farmers to consult as they moved forward with the production and marketing of vegetables. All the work was done in collaboration with other partner organizations such as the International Institute of Tropical Agriculture (IITA), which is instrumental in the capacity building of the youth, while the World Vegetable Center was responsible for all vegetable-related research.

214
DATA AND DESCRIPTIVE STATISTICS Data on the sale of vegetables was collected weekly since June 2015. Customers use Google Forms to place their orders online. Records of what was sold and obtained from the farmers is managed in Google Sheets. Customers receive an E-mail message once a week with a link to the order form (Figure 1). The customers then select which items they want to buy in that week. At the same time, they indicate other items they are interested in. Based on the information gathered from the submitted forms, the youth group (who were also farmers) members check which farmers in the community have the requested products to provide to the customers. The range of products demanded thus increases and changes from time to time. The sales data was followed by a household survey to monitor the change in income and hence, livelihoods of the participating farmers. The survey was carried out by Farmgain Africa; a private consulting firm in Uganda. The data was analysed using SPSS version 20 to obtain descriptive percentages and means of incomes of the participating house holds.
RESULTS AND DISCUSSION The youth handled a variety of agricultural products (Table 1), all sold on demand. The vegetables produced ranged from traditional to global vegetables. Production was initiated with traditional African vegetables such as spider plant, amaranth and others provided by the World Vegetable Center, but when demand for other vegetables increased, the farmers also produced crops such as carrots, spinach and courgettes. Overall, the number of orders made and the quantities supplied tallied (Figure 2), which means the youth sold all the vegetables that they brought to the market. The price at farm gate and the consumer/market price (Figure 3) did not vary much for most vegetable items except for broccoli, carrot, courgettes, French beans
Figure 1. E-mail message sent to participating customers to order vegetables

215
Table 1. Agricultural products produced by farmers and marketed by youth (Uganda Youth Agripreneurs), in Mukono and Wakiso in March and April 2016
Vegetable Qty (Packs)** Farm gate unit price (UGX)*
No. of Orders
Market unit price (UGX)*
Income (UGX)*
African eggplant – Katunkuma
35 1,000 26 1,500 52,500
African eggplant – White Ntula
41 1,000 29 1,000 4,1000
Amenvu 57 1,200 50 2,000 114,000Avocado 139 217 97 400 55,600Red amaranth 67 1,000 66 1,500 100,500Bogoya 19 2,000 20 4,000 76,000Broccoli 11 2,000 13 4,000 44,000Cabbages 60 1,205 58 1,600 96,000Carrots 139.5 1,068 125 3,000 418,500Cassava 39 2,103 36 3,000 117,000Cauliflower 33 2,394 30 3,000 99,000Courgettes 65 1,292 47 3,000 195,000Cow pea leaves 10 800 10 1,500 15,000Cucumber 57.5 835 52 1,000 57,500Eggs 61 525 61 1,500 91,500French beans 39 1,000 35 2,000 78,000Gowa sugar cane 14 1,279 14 2,000 28,000Green pepper 126 690 115.5 1,000 126,000Groundnuts 7 4,429 7 5,500 38,500Honey 9 6,389 9 9,000 81,000Hot pepper 11 900 13 1,000 11,000Irish potatoes 69.5 1165 68.5 2000 139000Jobyo – Spider plant 25 1000 19 1500 37500
Maize 48 316 48 500 24,000Matooke 3 7,667 2 26,000 78,000Nakati 68 1,000 64.5 1,000 68,000Okra 35 671 31 1,000 35,000Onions 57 1,228 98 1,000 57,000Orange sweet potatoes 47 1,043 42 3,000 141,000Papaya 6 4,500 6 4,500 27,000Pumpkin, small 54 1,926 71.5 2,000 108,000Red cabbage 8 1,500 7 4,000 32,000
(cont.)

216
Vegetable Qty (Packs)** Farm gate unit price (UGX)*
No. of Orders
Market unit price (UGX)*
Income (UGX)*
Spinach 122 1,000 98 2,000 244,000Sugar cane ‘red’ 14 486 13 1,500 21,000Sukuma wiki 108 500 82.5 1,500 162,000Sweet pepper, yellow 32 4,000 23 5,000 160,000
Sweet potatoes 40 1,425 35.5 3,000 120,000Tomatoes 231 636 227 1,000 231,000Yams 50 1,680 49 2,800 140,000
Source: own data 2015*1 USD = 3370 Ugandan shillings**A pack ranges from 0.25 – 1.0kg depending on the bulkiness and weight of vegetable
Table 1. (Cont.)
Figure 2. Variation in the quantity of vegetables supplied compared to the quantity of vegetables ordered
No
of p
acks
*
250
200
150
100
50
0
Afri
can
eggp
lant
Am
envu
Bbug
ga re
dBr
ocol
liCa
rrots
Caul
iflow
erCo
w p
ea le
aves
Eggs
Gow
a su
ger c
ane
Gro
undn
uts
Hot
pep
per
Joby
o - S
pide
r pla
mts
Mat
ooke
Okr
aO
rang
e sw
eet
Pum
pkin
smal
lSp
inac
hSu
kum
a w
iki
Swee
t pot
atoe
s
Quantity suppliedQuantity ordered
Vegetable item
and red cabbage. These vegetables are majorly bought by a small portion of the market population mainly the expatriates in the country. This implied that farmers received a fair share of the income received from the sale of most vegetables. This might not have been the case if the marketing was done by individual freelance middlemen. The assumption here is that the income received by farmers was utilized at home to improve their livelihoods. The income was received on a weekly basis, although some farmers preferred to receive it at the end of the month, when it had accumulated.

217
Afri
can
eggp
lant
Am
envu
30,000
25,000
20,000
15,000
10,000
5000
0
Am
ount
(UG
X)
Vegetable items
Bbug
ga re
dBr
ocol
liCa
rrots
Caul
iflow
ers
Cow
pea l
eave
sEg
gGo
wa S
uger
cane
Grou
ndnu
tsHo
t pep
per
Joby
a - S
pide
r plan
tM
atook
eO
kra
Ora
nge s
wee
tPu
mpk
in sm
all
Spin
ach
Saku
ma w
iki
Swee
t pot
atoe
sYa
ms
Farm gate priceMarket price
Figure 3. Variations in farm gate and market price
Sale of traditional vegetables vs. global vegetables Overall traditional vegetables were less competitive compared to global vegetables. Tomatoes, carrots, green pepper and spinach were the global vegetables in highest demand compared to all others, while Nakati (Solanum aethiopicum) and amaranth were the traditional vegetables in highest demand (Figure 4). This is the case in many other African countries like Cameroon, where global vegetables are preferred over traditional vegetables (Gockwski et al., 2003). Production thus tends to be skewed to global vegetables. The farmers adopted a demand-driven production schedule to ensure there were enough vegetables in the market for a sustained supply throughout the year, as was reported by Muhanji et al., (2011) in Tanzania, where the production was market-led.
Farmers’ income sources The farmers in the humidtropics region had various income sources for their livelihood. The livelihood strategies were grouped by the proportion of income obtained from activities taken to obtain household income. The households were categorized depending on incomes from on-farm, off-farm and non-farm activities. The on-farm activities focused on crop and livestock production, the off-farm activities were those agricultural activities done outside personal farm, while the non-farm activities are those that are non-agricultural in nature. This resulted in four livelihood categories (Figure 5) of which most of the farm households (56%) depended only on income from

218
Figure 4. Demand of traditional (left) and global vegetables (right)
250
200
150
100
50
0
Afr
ican
egg
plan
t
Red
am
aran
thC
oe p
ea le
aves
Spid
er p
lant
Afr
ican
egg
plan
tO
kra
Bro
ccol
iC
abba
ges
Car
rots
Cau
liflo
wer
Cou
rget
tes
Cuc
umbe
rFr
ench
bea
nsG
reen
pep
per
Hot
pep
per
Oni
ons
Red
cab
bage
Spin
ach
Kal
eYe
llow
swee
t pep
per
Tom
atoe
s
Vegetable item
Qua
ntitu
(pac
ks)
Figure 5. Livelihood strategies by farmers
On farm 50%
On farm + Off farm5%
On farm + Non farm 39%
the farm while 39% depended on on-farm and off-farm income sources. Only 5% of the households had income from the farm and non-farm activities. Overall income from production activities contributed more (71%) to farmers’ annual income compared to income from non-farm activities (Table 2). In addition, the income from production activities after engagement with the humidtropics program is higher than the income prior to the engagement with the platform implying that the platform activities had impact on the livelihoods of farmers. The incomes of Wakiso were observed to be relatively higher than those of Mukono farmers (Figure 6), this is likely so because Wakiso is closer to Kampala than Mukono and is also a prominent vegetable producer.
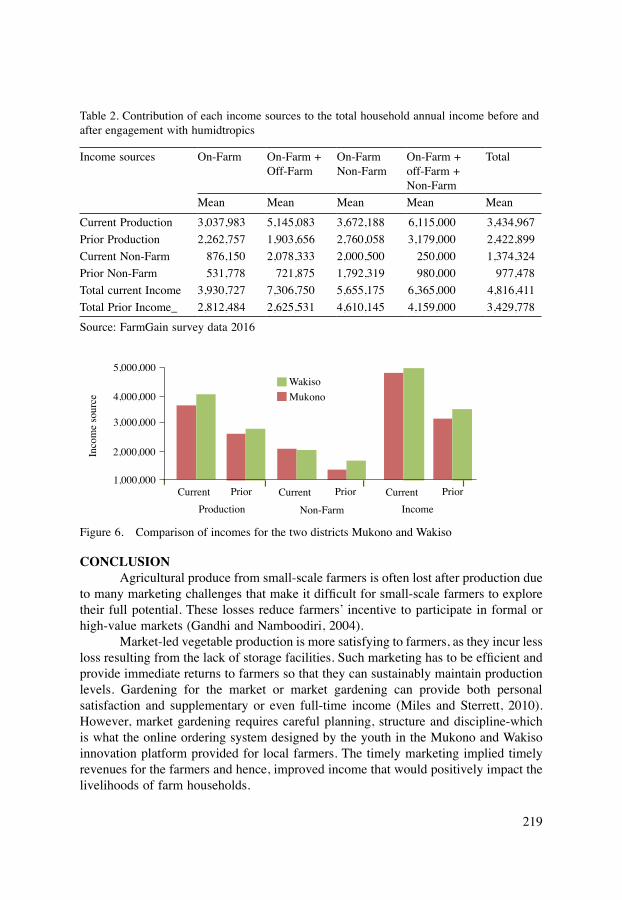
219
Figure 6. Comparison of incomes for the two districts Mukono and Wakiso
Current Prior Current Prior Current PriorProduction Non-Farm Income
WakisoMukono
5,000,000
4,000,000
3,000,000
1,000,000
2,000,000Inco
me
sour
ce
CONCLUSION Agricultural produce from small-scale farmers is often lost after production due to many marketing challenges that make it difficult for small-scale farmers to explore their full potential. These losses reduce farmers’ incentive to participate in formal or high-value markets (Gandhi and Namboodiri, 2004). Market-led vegetable production is more satisfying to farmers, as they incur less loss resulting from the lack of storage facilities. Such marketing has to be efficient and provide immediate returns to farmers so that they can sustainably maintain production levels. Gardening for the market or market gardening can provide both personal satisfaction and supplementary or even full-time income (Miles and Sterrett, 2010). However, market gardening requires careful planning, structure and discipline-which is what the online ordering system designed by the youth in the Mukono and Wakiso innovation platform provided for local farmers. The timely marketing implied timely revenues for the farmers and hence, improved income that would positively impact the livelihoods of farm households.
Table 2. Contribution of each income sources to the total household annual income before and after engagement with humidtropics
Income sources On-Farm On-Farm + Off-Farm
On-FarmNon-Farm
On-Farm + off-Farm + Non-Farm
Total
Mean Mean Mean Mean Mean
Current Production 3,037,983 5,145,083 3,672,188 6,115,000 3,434,967Prior Production 2,262,757 1,903,656 2,760,058 3,179,000 2,422,899Current Non-Farm 876,150 2,078,333 2,000,500 250,000 1,374,324Prior Non-Farm 531,778 721,875 1,792,319 980,000 977,478Total current Income 3,930,727 7,306,750 5,655,175 6,365,000 4,816,411Total Prior Income_ 2,812,484 2,625,531 4,610,145 4,159,000 3,429,778
Source: FarmGain survey data 2016

220
ACKNOWLEDGEMENTS This work was done with funding from Integrated Agricultural Systems of the humid tropics program (Humid tropics), a CGIAR Research Program. Thanks to colleagues from IITA – Uganda and World Vegetable Center. Special thanks to the Farmgain team for collecting and availing survey data and the platform members for the work well done. The Uganda youth agripreneurs for availing the information on the sale of vegetables.
REFERENCESBaloyi, J.K. (2010). An analysis of constraints facing smallholder farmers in the
Agribusiness value chain: A case study of farmers in the Limpopo Province. Unpublished dissertation retrieved on 16th August 2016 from: http://repository.up.ac.za/dspace/bitstream/handle/2263/29038/dissertation.pdf?sequence=1andisAllowed=y
Gandhi, V.P. and Namboodiri, N.V. (2004). Marketing of Fruits and Vegetables in India: A Study Covering the Ahmedabad, Chennai and Kolkata Markets. http://www.iima.edu.in/assets/snippets/workingpaperpdf/2004-06-09vpgandhi.pdf
Gockwski, J., Mbazo’s, J., Mbah. G. and Moulende T.F. (2003). African traditional leafy vegetables and the urban and peri-urban poor. International Institute of Tropical Agriculture (IITA), Yaoundé. http://www.scienceinafrica
György, B., Barna, M., Kopeć, A., Lajos, B., Malinowska, A.M., Piątkowska, E. (2015). Review of current practices to increase the intake of fruit and vegetables. European Union. Retrieved on 18th august 2016, 10.58 from: http://ec.europa.eu/health/nutrition_physical_activity/docs/2015_myhealthyfamily_literaturereview_en.pdf
Habwe, F.O. and Walingo, K.M. (2008). Food processing and preparation technologies for sustainable utilization of African indigenous vegetables for nutrition security and wealth creation in Kenya. In Chapter 13, Using Food Science and Technology to Improve Nutrition and Promote National Development. Robertson, G.L. and Lupien, J.R. (Eds), © International Union of Food Science and Technology
Habwe, F.O., Walingo, K.M., Abukutsa-Onyango, O.M. and Oluoch M.O. (2009). Iron content of the formulated East African indigenous vegetable recipes. African Journal of Food Science. 3(12). Available online http://www.academicjournals.org/ajfs
Matsane, S.H and Oyekale, A.S. (2014). Factors affecting marketing of vegetables among small-scale farmers in Mahikeng local municipality, North West province, South Africa. Mediterranean Journal of Social Sciences MCSER Publishing, Rome-Italy 5 (20)
Miles, C. and Sterrett, G. (2010). Market vegetable gardens: Planning for success. Department of Horticulture and Landscape Architecture, Northwestern Research and Extension Center, WSU Mount Vernon Mykel Taylor and Douglas Young, School of Economic Sciences, WSU Pullman
Ministry of Agriculture, Animal Industry and Fisheries (MAAIF) (2010). Agriculture for Food and Income Security: Agriculture Sector Development Strategy and Investment Plan: 2010/11-2014/15. P.O. Box 102 Entebbe, Uganda

221
Muhanji, G., Roothaert, L.R., Webo C. and Mwangi S. (2011). African indigenous vegetable enterprises and market access for small-scale farmers in East Africa. International Journal of Agricultural Sustainability, 9(1) http://dx.doi.org/10.3763/ijas.2010.0561
Mukwevho, R. and Anim, F.D.K. (2014). Factors affecting small scale farmers in accessing markets: A case study of cabbage producers in the Vhembe district, Limpopo province of South Africa. J Hum Ecol, 48(2)
Muriithi, B.W. and Matz, J.A. (2015). Welfare effects of vegetable commercialization: Evidence from smallholder producers in Kenya. Food policy Elsevier. 50
Namazzi, S., Muchunguzi, P., Lamers, D., Sole-Amat, A., VanAsten, P., Dubois, T., Afari-Sefa, V., Tenywa, M., Mugisa. I., McCampbell, M. and Sartas, M. (2016) Crop – livestock-tree integration in Uganda: the case of Mukono-Wakiso innovation platform. Chapter 5 In: Dror, I., Cadilhon, J., Schut, M., Misiko, M. and Maheshwari, S. 2016, Innovation platforms for agricultural development. Evaluating the mature innovation platform landscape. Routledge, London and New York
Ribbink, G., Nyabuntu P. and Kumar S. (2005). Successful supply chains in Uganda. A study of three successful chains in the coffee, dried fruit and fresh vegetables sectors. International Labour Organisation (ILO) or the British Department for International Development (DFID)
Sanga, A. and Mgimba C. (2016). An analysis of constraints that affect smallholder farmers in the marketing of tomatoes in Mbeya urban and peri-urban, Tanzania Imperial Journal of Interdisciplinary Research 2(3). http://www.onlinejournal.in
Adeleke, S. Abdul B.K., and Zuzana B. (2010). Smallholder Agriculture in East Africa: Trends, Constraints and Opportunities. African development group, working paper series No. 105 African Development Bank, Tunis, Tunisia. Internet file retrieved on 16th August 2016 from:http://www.afdb.org/fileadmin/uploads/afdb/Documents/Publications/WORKING%20105%20%20PDF%20d.pdf
Smith, F.I. and Eyzaguirre, P. (2007). African leafy vegetables: their role in the world health organization’s global fruit and vegetables initiative. African journal of food agriculture nutrition and development 7(3)
Tavonga N. (2014). The economics of fruit and vegetable marketing by smallholder farmers in Murehwa and Mutoko districts in Zimbabwe. International Journal of Research in Humanities and Social Studies 1(1)
Tui, S.H., Adekunle, A., Lundy, M., Tucker, J., Birachi, E., Schut, M., Klerkx, L., Ballantyne, P., Duncan, A., Cadilhon, J. and Mundy, P. (2013). ILRI – Innovation practice brief 1
UBOS (Uganda Bureau of Statistics). (2010). National Household Survey 2009/10. www.ubos.org/UNHS0910/unhs2009/10.pdf

222
Commercialization of Tomato Production Technologies
Rizalina M. Tablarin, Tessie A. Boncato and Joel EllamarFaculty Researcher (Socio-economist) /Associate ProfessorDepartment of Economics, College of Business and EconomicsTAU, Malacampa, Camiling, Tarlac 2306 Philippines
Abstract This research is aimed to assess the commercialization of off season tomato production technologies as means of alleviating poverty among farming households in the study area. A total of 10.4 hectares were cultivated for off season tomato production utilising around 5,200 man days resulting in more than 1.8M wage income to farm labor. A total of 8.8 hectares was added to the production area of the 35 off season tomato growers wherein around 60% are considered marginal. Off season tomato production has around 20 tons yield per hectare compared to the national average yield of 11.125 tons per hectare and 40 tons during the regular planting season. The existing off season produce is short by 70 tons (2014) and 18 million tons (2015) to supply the requirements of a processing plant. The series of production trials show that off season tomato planting is profitable. Diamante Max offers 199% ROI, next is AVTO (150%) and Fantastic (137%). The major constraints include erratic weather conditions, seasonality of production, limited resources, increasing production cost, lack of production planning, limited access to credit and financing, weak market linkage while greater opportunities are open due to increasing demand, nutritional benefits of tomato, emergence of institutional markets and value-adding activities. The formation and strengthening North Central Luzon Tomato Stakeholders Association (NOCELTSA) is the best strategy to limit constraints, maximize opportunities, sustain the promotion of off season tomato technologies and ensure year round supply of high quality and affordable tomato. An estimated 350% increase of stakeholders was registered forming the value chain players of tomato.
Keywords: poverty, seasonality, commercialization, off season technologies
INTRODUCTION Tomato is an important cash crop among vegetable growers in the province of Tarlac, Philippines. However, production in the area is concentrated during the dry season which causes market gluts during the dry season and shortage during the rainy season. Moreover, typhoons make production risky resulting in low supply of fresh tomatoes generally and price hikes. Thus, the season is a constraint to tomato production. Hence, grafted tomato technology developed by the Asian Vegetable Research and Development Center (AVRDC) in Central Luzon was introduced. This tomato variety produced by grafting tomato to an eggplant variety EG203 is tolerant to flooding and showed considerable resistance to bacterial wilt. Moreover, since 2001 Tarlac College of Agriculture (TCA) involved in grafted tomato or “kamlong” research, development and production projects through the collaborative effort of AVRDC and allies from Bureau of Plant Industry (BPI), Los Banos, Laguna and Central Luzon State University (CLSU), Munoz, Nueva Ecija. The

223
continuous conduct of Asian Vegetable Research and Development Council sponsored projects (Succession of AVRDC sponsored projects )were conducted before TCA assumed commercial seedling production complemented by technology promotion through trainings and series of techno demo among interested farmers in Tarlac and nearby localities. Since 2002, farmer-adopters from Sta Ignacia and Mayantoc, Tarlac continuously plant kamlong and even expanded their production areas with increased income and benefits. An average ROI ranging from 80 – 130% was generated from a 200 sq m tomato fruit production area. With this, TCA along with the sole trained producer-supplier of grafted tomato seedlings in Tarlac faced another challenge of tapping interested partners to engage in a similar endeavour on a commercial basis. Its average ROI of 43% considering its high investments on capital equipments can be heightened to promote the said venture by considering/designing alternative facilities suitable to the budget/financial capability of partner-cooperators. Likewise, several varieties with different traits can be tried to meet growers and target markets diversified demand that can be adopted even in the village level. As such, the exigency of promoting these proven technologies in a commercial scale is essential in order to increase and/or sustain off-season tomato production, maximize available resources, increasing farming household’s productivity and income and eventually broaden impact while year round supply of affordable fresh tomato is ensured.
The objectives of the study were:1. To determine the capacity of existing and potential market vis-a-vis tomato growers
in Tarlac and nearby provinces;2. To undertake production trials of available tomato varieties to meet existing and
potential demand of market and tomato growers;3. To ascertain the socio-economic viability of off season tomato production, distribution
and utilization in various settings;4. To identify the constraints and opportunities of operation encountered as basis
in formulating development plan of improving the adoption of off season tomato technologies; and
5. To increase the involvement of various stakeholders in commercialization of off-season tomato production technologies
MATERIALS AND METHODS This development project was conducted with the recognition and focus towards the interplay of several factors affecting the farmers’ livelihood systems with particular emphasis on the production of off season tomato. The promotion, adoption and commercialization of market driven tomato varieties in the province of Tarlac depends on how the farm households and communities respond to this new technological

224
opportunity apart from the market (both fresh and institutional buyers, processors or industries), bio-physical, socio-economic, political and institutional environment in which they operate. There is a need to understand the conditions under which farmer-adopters operate to accurately diagnose constraints and opportunities and to make technologies, interventions and strategies more relevant to their goals, needs and priorities and well attuned to the present needs and realities of their existing livelihood systems, hence, ensure greater project impact among various stakeholders.
RESULTS AND DISCUSSIONI. Capacity of existing and potential market vis-a-vis tomato growers in Tarlac and nearby provinces
The commercialization project on off season tomato production technologies aims to ensure year round supply of quality and affordable tomato, provide avenue to empower farmers, maximize their marginal lands, increase employment opportunities in the area and eventually raise their income. Table 1 shows the production data of tomato during regular planting season covers the month of January to June and off season from July to December. On the overall set up it is evident that shortage of supply is observed during off season that caused price hikes with meagre share (24%) from the total annual produce due to natural calamities among others. Hence, the seasonality of this crop results in major constraints such as higher price during off-season and lack of supply of fresh and processed tomato products for the local and international markets. These data were complemented by continuous market survey to determine the demand of existing and potential market (both fresh and processed tomato market) during off season in comparison to the supply of tomato in the four western towns of Tarlac and nearby provinces. The major wholesalers were reached from the major trading post in the study areas as complemented by actual observations and interviews to establish market data
Table 1. Tomato production data per season, top 5 producing regions 2014
REGION In Metric Tons (MT)
REGION July – Dec. % Share Jan – June % Share
PHILIPPINES 214,572.91 PHILIPPINES 54,282 0.253 160,291 0.747Ilocos Region 72,511 Northern
Mindanao34,902 0.481 37,609 0.519
NorthernMindanao
47,923 Ilocos Region 2,778 0.058 45,145 0.942
Central Luzon 23,832 Central Luzon 1,851 0.078 21,981 0.922CALABARZON 19,299 Cagayan Valley 1,583 0.082 17,716 0.918Cagayan Valley 9,903 CALABARZON 1,165 0.118 8,738 0.882
*Source PSA 2014/DA HVCDP RFO 1

225
Figure 1. Paradigm of the study
Input Process Output
Needs ID and Collaborative
Planning
Capable and Organised farmer-producers
Sustainable tomato industry in Central Luzon
Year round supply of tomato for fresh market and industries
Market Linkaging and Commercialisation of off season tomato production technologies
Awareness and Capability
Building
Constraints and Opportunities
• Tomato Growers' Capacity Check
• Market Check (Fresh and Industries)• Biophysical Check• Socio-Economics• Political Check• Others
hence, the off season tomato distribution flow was established. Figure 1 depicts the two (2) major suppliers of off season tomato in 2013 to 2015. Greater percentage (60%) of supply of off season tomato in the fresh market in Luzon is from Cagayan Valley (Nueva Vizcaya) while the remaining 30% is from the Northern Mindanao (Cagayan de Oro City) and the rest (10%) is from the local growers in the North Central Luzon. The project implementation had contributed considerable increase of around 12 tons (2014) and 98 tons (2015) of local tomato considering the more than one hectare (2014) to almost nine hectares in 2015 apart from the 26.5 hectares planted during regular planting season in partnership with RAM Food Corporation in November 2015. On the other hand, the price of tomato is more stable and lower than P120 per kilo when compared to only P60 per kilo as the registered highest retail price in the fresh market as of 2014 hence, shows almost 100% reduction in the price.
OFF SEASON TOMATO DEMAND AND SUPPLY Based on the 2014 – 2015 production and market data from the Philippines Statistics Authority and High Value Crop Development Program in Region 1 and the actual market survey result, the registered supply-demand gap is more than 40 tons fresh and 30 tons processed tomatoes. It is evident to note that the actual demand for fresh produce during the off season is higher than processed tomato specifically in the subject area (Tarlac, Pangasinan and Nueva Ecija) in 2014 considering that very few are engaged in tomato processing. But,

226
GAP
Supply
Demand
-50,000 0 50,000 100,000 150,000
Potential (processed)Actual (fresh)
Figure 2. Off Season Tomato Demand (D), Supply (S) and SD Gap (2014)
Figure 3. Off Season Tomato Demand (D), Supply(S) and SD Gap (2015)
GAP
Supply
Demand
Actual(fresh),–41670.8
Potential(processed).–18021670.8
–200000000 –10000000 0 10000000 20000000
MAJOR TOMATO SUPPLIERS
TOMATO WHOLESALER – RETAILERS – GROWERS GROWER – RETAILERS
NUEVA VISCAYA BULACAN
PAMPANGA
BATAANBATAAN/
PAMPANGA
TARLACPROVINCE
PENGASINANTARLAC
CITY
GagayanDE ORO
CITY
PENGASINAN
URDANETACITY,
PANGASINANDIVISORAI
NUEVA ECIJA
Figure 4. Market Channels of Tomato
this was later reversed in 2015 specifically in the case of Nueva Ecija considering that the newly established processing plant in the area intends to try year round operation. Figure 2 and 3 depicts a very sharp increase in the supply gap for processed tomato added to the fresh tomato. This signifies potential for the expansion of off-season tomato production area of 900 to 1,636 hectares apart from the almost 7 hectares to meet the supply gap in the fresh market considering the average tomato production capacity of 11 tons per hectare, PSA,2014/DA HVCDP RFO1,2015. The said processing plant considers Tarlac and Pangasinan growers where majority of the North Central Luzon Tomato Stakeholders Association members and officers reside and eventually sustain the supply of tomato in the processing plant of Rizal, Nueva Ecija as shown in Figure 4.

227
II. Production trials of available tomato varieties to meet existing and potential demand of market and tomato growers Tomato varieties with the highest demand was found most profitable, were tried and promoted while other varieties with market potentials was also tried with the end of satisfying other markets. The result will provide greater options to farmers considering proper production technologies, accurate timing and market driven varieties. There are around 1,046 trainees who tried and allocated almost nine hectares for off season tomato production and had conducted training on tomato processing for the value adding component. Majority are members of the newly organized North Central Luzon Tomato Stakeholders Association (NOCELTSA) whose main objective was to promote year round supply of quality and affordable tomato for consumers and profitable off season production. It is registered at the Department of Labor and Employment (DOLE) as a legitimate rural workers association that promotes the welfare of its members and ensure a successful tomato industry. These efforts confirmed that majority of the growers prefer Diamante Max, few tried AVTO (Cherry) and Fantastic variety to satisfy specific market identified and at the same time determine their socio-economic potential on commercial scale. Initially, RAM Food Products, Inc prefer to process fantastic variety which encouraged some farmers to try until their seed provider introduced the Avatar variety which is expected to offer higher yield and return. Moreover, Table 8 reveals the detailed yield performance and the cost and return of the top three (3) off season tomato varieties. It is evident that Diamante Max has the highest return on investment (ROI-199%) given the price during off season while Fantastic and AVTO variety have 150 to 137% ROI considering the smaller area of production along with the price of Fantastic.
III. The socio-economic viability of off season tomato production, distribution and utilization in various settings. The case of one technology adopter is being highlighted since the whole family was involved in seedling production, distribution and utilization primarily to sustain the off-season tomato fruit production in the area. It is evident in the following table that the technology adopter maximizes the opportunity to tap available resources in the area specifically the interest and skills of every member of his own family. A year-long training on actual grafting was held for the whole family. They invested their quality time worth P55, 805.74 in setting up their own nursery project plus P9,000 worth of local resources which are both classified as non-cash yet considered as actual production cost. On the other hand, they spend around P40,849.40 for the supplies and materials in constructing an improvised grafting chamber and nursery paraphernalia in about 80 sq m in their own backyard. This effort resulted to around 165% ROI during their first year operation considering that 50% of their produce was utilized/planted in their own fruit production sites.

228
Tabl
e 2.
Cos
t and
Ret
urn
of O
ff Se
ason
Tom
ato
Varie
ties
(201
4)
PART
ICU
LAR
SD
IAM
AN
TE M
AX
CH
ERRY
(AV
TO)
FAN
TAST
IC2,
000
sqm
200
sqm
1000
sqm
Cas
hN
-Cas
hC
ash
N-C
ash
Cas
hN
-Cas
h
I. Y
ield
/Sal
es6,
290
x Ph
P60/
kg
= P
377,
400
1,11
0 x
PhP3
0/kg
=
P33,
300
3655
0 x
PhP1
00/k
g =
P73,
100
110
x Ph
P50/
kg
= P5
,500
2,55
0 x
PhP5
0/kg
=
P127
,500
450
x Ph
P25/
kg
= P1
1,25
0TO
TAL
P410
,700
.00
P78,
600
.00
P 13
8,75
0.00
II. P
rodu
ctio
n Ex
pens
es
Labo
r3,
5161
.148
6,51
6.10
17,5
80.5
74Su
pplie
s an
d M
ater
ials
6,72
07.8
89,
720.
7923
,154
.11
Ove
rhea
d Ex
pens
e36
,962
.00
739.
243,
696.
20TO
TAL
EXPE
NSE
S13
9,33
1.03
16,9
76.1
344
,430
.884
III .
NET
INC
OM
E27
7,36
8.97
25,4
01.1
161
,053
.32
V. R
OI
1.99
1.50
1.37

229
Tabl
e 3.
Cos
t and
Ret
urn
of O
ff Se
ason
Tom
ato
Fam
ily E
nter
pris
e (2
014)
PART
ICU
LAR
SSE
EDLI
NG
PR
OD
UC
TIO
N(P
hP)
SEED
LIN
G
DIS
TRIB
UTI
ON
(PhP
)
FRU
IT P
RO
DU
CTI
ON
(U
TILI
ZATI
ON
)(Ph
P)
Cas
hN
-Cas
hC
ash
N-C
ash
Cas
hN
-Cas
hI.
Yie
ld/S
ales
20,0
00 x
8 =
60
,000
20,0
00 x
6 =
20
,000
20,0
00 x
10
200,
000
4,50
0 x
50 =
22
5,00
04,
500
x 25
=
112,
500
TOTA
L28
0,00
016
0,00
040
,000
037
,500
II. P
rodu
ctio
n Ex
pens
esLa
bor
55,8
05.7
4P3
,000
P5,8
00P7
0,00
5.74
Supp
lies
and
Mat
eria
ls24
,039
.40
9,00
02,
000
11,0
0020
,541
Ove
rhea
d Ex
pens
e16
,810
.00
1,75
0.00
14,8
10TO
TAL
EXPE
NSE
SP1
05,6
55.1
4P6
,750
P122
,156
.84
III.
NET
INC
OM
EP1
74,3
44.8
6P3
3,25
0P2
15,3
43.1
6IV
. RET
UR
N O
N IN
VES
TMEN
T(R
OI)
165%
46%
176%

230
The project team’s continuous monitoring, minimal material and technical assistance and other support services among others were extended to the family plus their membership in two farmers association paved the way for the father, being a farmer-leader to facilitate the distribution of their off season tomato grafted seedlings and fruit produce. Their combined efforts had resulted to 46% and 176% ROI from seedling distribution and seed utilization/off season tomato fruit production with a total of P 348,689.72 net income for their six months operation as a family enterprise. Non-cash inputs and cost such as family labor and local materials used were also considered to account the total cost and return of operation. Their efforts was sustained to plant tomato all year round as the couple decided to engage in contract growing with RAM Food Corporation during the regular planting season through the efforts of the project team and NOCELTSA. The couple devoted three hectares and almost P200,000 capital to plant Avatar, a processing variety and eventually realized a P80,000 meagre profit considering the time pressure employed by the processing company hence, a greater portion of the yield were not accommodated instead channeled the greater volume of produce to the fresh market to generate cash return after delivering 50 tons at P5/kg to RAM and claimed to realize as high as P350,000 to P500,000 net income by meeting the delivery deadline.
IV. The constraints and opportunities of operation encountered as basis in formulating development plan of improving the adoption of off season tomato technologies The major constraints identified were, limited resources, increasing production, lack of production planning, lack of clustered production, limited access to credit and financing, weak market linkage between producers and buyers and market information
Figure 5. Value chain off-season tomato industry

231
system while greater opportunities were open due to increasing demand (population), nutritional benefits of tomato, emergence of institutional markets, of improved varieties and value-adding activities for processed tomatoes. On the other hand, the formation/strengthening NOCELTSA was the best move to limit if not to negate constraints, maximize opportunities, sustain the promotion of off season tomato technologies in the area, ensure year round supply of high quality and affordable and make tomato industry flourish.
V. Increased involvement of various stakeholders in the commercialization of off-season tomato production technologies An estimated 1,890 stakeholders were identified forming the value chain players of the tomato industry who were active agents in the commercialization of off-season tomato production technologies composed of individuals, associations, agencies/institutions, among others promoting their respective mandates and objectives that have contributed synergy ensuring profitable operation.
CONCLUSION The existing capacity (24% of the overall tomato production data) of off season tomato growers do not satisfy actual demand of both fresh and processed by seventy tons in 2014 and more than 18million MT in 2015 as a processing plant in Nueva Ecija contemplates to try year round or longer operation. These resulted to price hikes (Php120/kg) and registered an overall net import of more than 29 metric tons. Production of tomato in the fourth quarter of 2015 is 2.3 percent lower than in 2014 due to lack of financial assistance from private traders in Bukidnon and Misamis Oriental and the effect of Typhoon “Lando” in CAR, Ilocos Region, Cagayan Valley, and Central Luzon. Generally, production trials based on the Rosario family enterprise case, off season tomato production is profitable. Diamante Max offers the highest ROI of 199%, next is AVTO (150%) then Fantastic (137%) variety considering the sizes of production area and the prevailing selling price per kilo in the market. The off season tomato production, distribution and utilization case is found most viable in a family enterprise setting with an aggregate earnings of P348,689.72 in their six months operation. The major constraints identified were limited resources, increasing production, lack of production planning, lack of clustered production, limited access to credit and financing, weak market linkage between producers and buyers and market information system while greater opportunities open due to increasing demand (population), nutritional benefits of tomato, emergence of institutional markets, improved varieties and value-adding activities for processed tomatoes. The formation/strengthening NOCELTSA was the best move to limit if not to negate constraints, maximize opportunities, sustain the promotion of off season tomato technologies in the area, ensure year round supply of high quality and affordable and make tomato industry flourish. An estimated 1,890 stakeholders were identified forming the value chain players of tomato who are active agents in the commercialization of off-season tomato production technologies composed of individuals, associations, agencies/institutions, others promoting their respective mandates and objectives.

232
REFERENCES AGANON, C.P. (2003). Off-Season Tomato Production through Grafting Technology.
Central Luzon State University (CLSU), Science City of Munoz, Nueva EcijaAnonymous. (1999). The Tomato Industry. 1999. PCARRD-DOST. Los Banos, Laguna.PNPVRD. (2000). The Philippine National Program on Vegetable Research and
Development (PNPVRD) and Extension Progress Report Year 1BAS. (2000). Agricultural Exports and Imports Bureau of Agriculture Statistics (BAS)
Department of Agriculture (DA) Report No. 2002.10AVRDC. (1992). Grafting Reduces Soil borne Diseases in Eggplant. International
Program, AVRDC, Taipei, Taiwan, ROCAVRDC. (1999). Control of Bacterial Wilt in Tomato by Grafting. Pp 71 – 74 in:
AVRDC Report 1998. Asian Vegetable Research and Development Center, Shanhua, Tainan, Taiwan ROC
AVRDC Report. (1999). Grafting Promises Year-round Supply . Semi- annual Newsletter. 17 (2) pp 5 – 6
Bautista, O.K. and R.C. Mabesa. (1997). Vegetable Production. College of Agriculture, UP Los Banos, Laguna. p 129
Black, L.L., Wu, D.L., Wang, J.F. and J.H. Chen. (2003). Grafting Tomatoes for Production in the Hot-wet Season. AVRDC International Cooperator’s Guide Pub No. 03 – 551
Black, L.L., J.F. Wang and D.L. Wu. (1999). Grafting Tomatoes for Production in the Hot-wet Season. AVRDC International Cooperator’s Guide Publication.
Burleigh, J.R., L.L. Black, L.G. Mateo, D.R. Cacho, C.L. Aganon, T.A. Boncato, C. Ulrichs and D.R. Ledesma. (2003). Performance of Grafted Tomato in Central Luzon, Philippines: A Case Study on the Introduction of a New Technology Among Resource-limited Farmers.
Ciba-Geigy. (1991). Tomatoes. Field and Protected Crops. Plant Protection Vegetable.Dost. (2002). Mature Technologies. Off-season Tomato Production. DMMSU, Mid
Tomato. La Union.FAO. (2000). Tomato Integrated Pest Management. An Ecological Guide. Inter-Country
Programme for the Development and Application of Integrated Pest Management in Vegetable Growing in South and South-East Asia.
FRLD. (1995). The Tomato, Marketing System in Major Production and Demand Areas in the Philippines. Department of Agriculture.-Agribusiness System Assistance Program and United States Agency for International Development
HARBEST.COM. (2000). Field Guide in Tomato Production. Harbest Agribusiness Corporation, Pasig City.
Harbest agribusiness corporation. (2000). Field Guide in Tomato Production (Determinate Type).

233
Janick, J. (1972). Horticultural Science. 2nd edition. W.H. Freeman and Company, San Francisco. pp 110 – 11
PCARRD. (2000). Tomato Production Guide. Information Bulletin. 157/2000Ridge, I. (2002). Oxford University Press Inc. New York p 267Rick, C. M. (1978). The Tomato. Scientific Am. J. 239 (8): 6776Singh, S. P. (1991). Breeding for Seed Yield Research for Crop ImprovementWu, D.L. and J.F. Wang. (1999). Tomato Seedlings Grafted with Eggplant. Producer’s
Manual. AVRDC, Tainan, Shanhua, Taiwan, ROC
234
The Integrated Pest Management (IPM) Strategy Against Bemisia Tabaci to Control Disease Caused by Tomato Yellow Leaf Curl Virus (TYLCV) in Thailand and Vietnam
Yule, S.1, Srinivasan, R.2, Chiemsombat, P.3, Nguyen, H.C.41World Vegetable Center, East and Southeast Asia, Research and Tranining Station,Kasetsart University, Kamphaeng Saen Campus, Kamphaeng saen, Nakhon Pathom 73140, Thailand2World Vegetable Center, Shanhua, Tainan 74151, Taiwan3Kasetsart University, Kamphaeng Saen CampusKamphaeng Saen, Nakhon Pathom 73140, Thailand4Vietnam Academy of Agricultural Sciences, Plant Protection Research InstituteDong Ngac, Tu Liem, Hanoi, VietnamE-mail: [email protected]
Abstract Tomato yellow leaf curl virus (TYLCV) transmitted by whitefly (Bemisia tabaci) is a major biotic constraint. The disease causes severe yield losses in tomato in Southeast Asia. Currently, tomato growers rely predominantly on chemical pesticides to control whitefly. Indiscriminate use of chemical pesticides leads to the development of resistance in whitefly and poses threats to human and environmental health. Controlling whitefly through alternative approaches can help reducing virus outbreaks and pesticide misuse. The objective of the study was to test the effectiveness of an integrated pest management (IPM) strategy based on healthy seedling production, mulching, yellow sticky traps, maize as barrier crop and sequential application of bio-pesticides and chemical pesticides on tomato in Thailand and Vietnam during 2014 – 2016. In Thailand, sequential application of bio-pesticides (neem, petroleum oil, Paecilomyces lilacinus) and a chemical pesticide (thiamethoxam 25%WG) or sequential application of bio-pesticides (neem followed by petroleum oil, or Beauveria bassiana and Metarhizium anisopliae, or P. lilacinus) alone controlled disease incidence to levels comparable to chemical pesticides alone. Similar whitefly population (~400 insects) and disease incidences (<35%) were detected in IPM and chemical pesticides. In Vietnam, the disease infection was on par (53 – 62%) between IPM and chemical pesticide practices. Furthermore, the study revealed that the IPM practice in Nakhon Pathom, Thailand significantly reduced (P=0.013) the non-marketable crop yield. This study indicated that bio-pesticides had provided a level of efficacy similar to chemical pesticides and thus could be served as possible alternatives to reduce TYLCV disease incidence and unmarketable yield in tomato.
Keywords: Bemisia tabaci, tomato yellow leaf curl virus, integrated pest management
INTRODUCTION Tomato (Solanum lycopersicum L.) is an important vegetable crop in Southeast Asia, which is being cultivated around 15,000 – 17,000 ha annually in Vietnam (Tuan and Mao, 2015) and 6,020 ha in Thailand (Office of Agricultural Economics (OAE),

235
2014). However, tomato yield has been declining recently due to insect pests and diseases (Tuan and Mao, 2015). Tomato yellow leaf curl virus (TYLCV) transmitted by whiteflies, Bemisia tabaci, is one of the major diseases, causing serious damage on tomato crop in tropical and subtropical regions. This virus belongs to the largest family Geminiviridae (Kenyon et al., 2014). In Vietnam, three different begomovirus species have been identified as naturally infecting tomato to date: Tomato yellow leaf curl Kanchanaburi virus (TYLCKaV), Tomato leaf curl Vietnam virus (ToLCVV) and Tomato yellow leaf curl Vietnam virus (TYLCVNV) (Ha et al., 2008). Similarly, begomovirus diseases are considered to be the greatest constraint to Solanaceous crop production in Thailand (Ali, 2006). Nowadays, farmers in Thailand and Vietnam rely mostly on synthetic chemical pesticides to control insect pests which led to adverse impacts on human and environmental health (Schreinemachers et al., 2015; Praneetvatakul et al., 2016). Various alternative pest management practices provide effective whitefly control. Physical control methods such as yellow sticky traps (YSTs) successfully suppressed whitefly in greenhouse but it was not sufficient enough to control whitefly in open field conditions due to continuous migration of whitefly from neighboring areas, which influence the population dynamics. Therefore, YSTs should be used along with other pest control options such as biological control, cultural control and selective insecticides (Lu et al., 2012; Pinto-Zevallos and Vänninen, 2013). Reflective silver mulch was also reported to reduce whitefly incidences significantly compared to black mulch on watermelon (Simmons et al., 2010). Similarly, various entomopathogenic fungi including Beauveria bassiana and Metarhizium anisopliae are being commonly used against whitefly (Mascarin et al., 2013; Norhelina et al., 2013; Wraight et al., 2000). In order to achieve a satisfactory control of whiteflies, various control options need to be integrated in an appropriate way and thus reducing the TYLCV significantly. Hence, this study focused on developing an integrated pest management (IPM) strategy to reduce TYLCV disease through preventing infestation of its insect vector (B. tabaci). The combination of various recommended practices consisting of healthy seedling technique, yellow sticky traps, cover mulch, barrier crop, sequential application of bio-pesticides and chemical pesticides, was evaluated.
MATERIALS AND METHODS The studies were conducted on tomato in three field locations in Thailand [two at Research and Training Station, World Vegetable Center, Nakhon Pathom (TH-NP) and Research Station and one at Hortigenetic research (S.E. Asia) Limited, Suphan Buri (TH-SB)] and Vietnam [Farmer’s field in Hanoi (VN-H)] during 2014 – 2016. Experiments were conducted following a randomized complete block design (RCBD) with three replications using the plot of 2.4 x 10 m in Thailand and 2 x 3 m in Vietnam. Healthy seedling technology was applied by sowing the seeds under 60-mesh plastic net covering and then seedlings were treated with thiamethoxam 25% WG through soil drenching three days before transplanting at four-weeks after sowing. Silver black

236
cover mulches and yellow sticky traps were used for repelling and attracting insects, respectively. Moreover, maize was planted as barrier crops. TYLCV infected plants were grown at the border rows, a week before transplanting tomatoes in TH-SB and TH-NP, which are not virus hot spot areas. This would increase the probability of disease spread so that the true potential of IPM strategy can be validated. Sequential application of bio- and chemical pesticides were followed as listed in Table 1. In TH-SB, the treatments were started 15 days after transplanting and continued until fruit setting. In TH-NP and VN-H, spraying was scheduled when the whitefly population exceeded the threshold levels. The bio-pesticides and chemical pesticides were applied in a sequence for first four sprayings and then the same sequence was followed from fifth spraying, if necessary. In VN-H, the IPM trial was conducted in ten farmers’ fields, whereas the farmers’ practice was followed in another ten fields. Each field was considered as a replication. Untreated control plots were treated with water. The bio-pesticide or chemical pesticide was applied following the recommended doses: neem (Thai neem 111®) @ 50 cc/20 l-1 water, petroleum oil (SK EnSpray99®) @ 20 cc/20 l–1 water, Paecilomyces lilacinus (Laicinus®) @ 200 g/20 l–1 water, Beauveria bassiana and Metarhizium anisopliae (Bio Beauveria Plus®) @ 100 g/20 l–1 water, thiamethoxam 25%WG (Actara WG®) @ 2 g/20 l–1 water and imidacloprid 70%WG (Provado®) @ 3 g/20 l–1 water.
Table 1. Treatments applied in tomato trials at Kamphaeng Saen and Suphan Buri (Thailand) and Hanoi (Vietnam)
Place Treatment Spraying order of pesticides
TH-SB and TH-NP (1)Nm1 Neem – petroleum oilNm2 Neem – Beauveria bassiana and Metarhizium
anisopliae
Nm3 Neem – Paecilomyces lilacinus
CM Thiamethoxam – imidaclopridCK Untreated control
TH-NP (2)IPM Neem – petroleum oil – P. lilacinus –
thiamethoxamCM Imidacloprid – thiamethoxamCK Untreated control
VN-HIPM Neem – petroleum oil – P. lilacinus –
thiamethoxamCM Imidacloprid – thiamethoxam

237
Number of adult whiteflies on YSTs and the number of whitefly developmental stages (egg, nymph and puparium) on three levels (bottom, middle, top) of leaf in randomly selected plants were recorded. Disease incidence (DI) was recorded using the typical virus symptoms with cup-shaped leaves and yellow vein. In Thailand, the percentage flowering and fruiting plants were also recorded on 3 and 6 weeks after transplanting, respectively. Yield was recorded at every harvest and the total marketable and non-marketable yields were estimated. Data was transformed using square root (!x + 0.5) or log10 transformation for whitefly population and yield and arc-sin transformation for percentage of disease incidence. The data were analyzed using Student’s t-test or one-way ANOVA in SAS (version 9).The treatment means were compared using Tukey’s LSD test.
RESULTS Hundreds of adult whiteflies were trapped in YSTs in the trial in Suphan Buri, Thailand, however, only few whitefly adults were found on tomato plants. The number of whiteflies on plants, or on yellow sticky traps, percentage of flowering or fruiting, disease incidence and the yield did not differ significantly among the treatments (Table 2). Similar results were also recorded in the trials in Kamphaeng Saen, Thailand (TH-NP1) (Table 3). Because of the very low incidence of the whiteflies in this trial, the disease incidence was not observed. In Nakhon Pathom (Thailand), the number of whiteflies on plant and YSTs did not differ significantly among the treatments (Table 4) and leaf curl virus infected plants were lower than 10% (Table 5). Its marketable yields were higher in IPM and chemical pesticide plots compared to non-IPM practice, but did not differ significantly. However, non-marketable yield was significantly lower in IPM practice (p = 0.013) (Table 5). In Hanoi (Vietnam), there were no significant differences in whitefly incidences and virus disease severity between IPM and the farmers’ practices (Table 6). Virus infection of IPM practice was very high up to 75% during reproductive stage of the crop, which indicated that IPM practice was not able to reduce insect vector population and thus the disease severity. Healthy seedling and maize barrier crop had been combined with other practices for reducing whitefly infestation. However, there was no significant reduction in whitefly population in all the three locations. In TH-SB, although healthy seedling was combined with IPM (Nm1-Nm3) or chemical treatment, whitefly populations (from egg to adult) per leaf among these four treatments was similar to non-IPM practices (CK), with 0.87 – 2.33 whiteflies (Table 2). Similar results were also obtained from the trial in TH-NP1 with 0.03 – 0.47 whiteflies (Table 3). When healthy seedling and maize barrier crop were combined with IPM treatment in TH-NP2 trial, they were still unable to reduce whitefly population significantly based on whitefly population on plant and YST, which ranged from 0 – 13.75 whiteflies and 408–419 adult whiteflies, respectively (Table 4). The same treatments were followed in VN-H trial, which was the hot-spot for TYLCV disease. Whitefly populations (egg and nymphs) on plant were slightly lower from the

238
Table 3. Effect of different treatments on whitefly and leaf curl virus diseases on tomato in ESEA Farm, Kamphaeng Saen (TH-NP1)
Treatment No. ofwhitefly/leaf
Flowering (%)at 3 WAP
Fruiting (%)at 6 WAP
Yield(kg/plant)
Neem – Petroleum oil 0.11a 68.33a 78.33a 9.45aNeem –Beauveria bssiana –Metarhizium anisopliae
0.03a 70.00a 78.33a 9.49a
Neem –Paecilomyces lilacinus
0.09a 45.00a 80.00a 10.53a
Imidacloprid 70%WG – Thiamethoxam 25%WG
0.47a 60.00a 73.33a 8.00a
Untreated 0.14a 53.33a 58.33a 7.12aF value 0.80 0.96 0.84 2.36P value 0.60 0.50 0.57 0.13In a column, means followed by same letter(s) are not significantly different(Tukey’s LSD test)
Table 2. Effect of different treatments on whitefly and leaf curl virus diseases on tomato in Suphan Buri, Thailand
Treatment No. of whitefly Flowering (%) at 3 WAP
Fruiting (%) at 6 WAP
Disease incidence (%)on week 9
Yield(kg/plant)Whitefly/leaf Adult/trap
Nm1 0.70a 580.55a 98.33a 68.33a 26.67a 2.35aNm2 1.42a 577.87a 88.33a 56.67a 30.00a 2.54aNm3 2.33a 658.05a 93.33a 66.67a 33.33a 2.32aCM 2.08a No trap 95.00a 61.67a 31.67a 2.22aCK 0.87a No trap 96.67a 66.67a 30.00a 2.51aF value 2.08 0.35 1.79 1.70 3.97 0.76P value 0.17 0.72 0.22 0.24 0.94 0.62In a column, means followed by same letter(s) are not significantly different (Tukey’s LSD test)

239
Table 4. Effect of IPM treatment on whitefly in tomato in ESEA Farm, Kamphaeng Saen, Nakhon Pathom, Thailand (TH-NP2)
Treatment No. of whitefly
Egg/plant
Nymph/plant
Adult/plant
Adult/trap
IPM 3.75 a 10.50 a 0.25 a 419 aCM 1.50 a 13.75 a 3.25 a 433 aCK 0.00 a 10.50 a 0.25 a 408 aF value 1.42 0.11 1.33 0.32p value 0.73 0.90 0.31 0.73
In a column, means followed by same letter(s) are not significantly different (Tukey’s LSD test).
Table 5. Effect of IPM treatment on leaf curl virus disease incidence and yield on tomato in ESEA Farm, Kamphaeng Saen, Nakhon Pathom, Thailand (TH-NP2)
Treatment Disease incidence (%)on week 11
Yield
Marketable (kg/plant)
Non-marketable (kg/plant)
IPM 7.50 a 9.13 a 2.68 a
CM 7.50 a 9.57 a 6.85 b
CK 0.00 a 3.79 a 5.54 b
F value 2.92 0.98 7.32
p value 0.105 0.41 0.013
In a column, means followed by same letter(s) are not significantly different (Tukey’s LSD test)
Tabl
e 6.
Effect of IPM
treatment on whitefly, leaf curl virus disease incidence and yield on tomato in Hanoi, V
ietnam
Trea
tmen
tNo
. of w
hitefly e
ggs/p
lant
No. of w
hitefly n
ymphs/p
lant
Disea
sed pl
ants
(%)
10 –
Mar
– 15
24 –
Mar
– 15
7 – A
pr – 1
521
– Ap
r – 15
10 –
Mar
– 15
24 –
Mar
– 15
7 – A
pr – 1
521
– Ap
r – 15
10 –
Mar
– 15
24 –
Mar
– 15
7 – A
pr – 1
5IP
M13
.1062
.7373
.7733
.7711
.3315
.5016
4.57
149.2
729
.9053
.8675
.83CM
38.74
264.5
029
7.90
24.10
15.27
98.00
218.9
021
4.80
44.38
61.04
80.63
F valu
e1.6
51.1
30.8
41.6
61.8
80.4
60.6
21.9
32.6
11.3
72.4
0p v
alue
0.23
0.43
0.61
0.23
0.18
0.88
0.77
0.17
0.08
0.32
0.10
In a c
olumn
, means fo
llowe
d by s
ame letter(s) are
not sign
ificantly differen
t (Tukey’s
LSD
test).

240
beginning until ending of crop with 11.33 – 164.57 and 15.27 – 297.90 whiteflies in IPM treatment and chemical treatment, respectively (Table 6).
DISCUSSION The study indicated that leaf curl virus incidence under field condition is proportionate to whitefly vector population on plants. Lower whitefly population in two locations in Thailand and high whitefly population in one location in Vietnam caused low and high virus infection, respectively. In contrast, number of whitefly on YSTs could not be used to predict virus incidences on tomatoes since all the treatments (with or without YSTs) in TH-SB showed similar disease incidence value (Table 2). Earlier studies indicated that YSTs can be used as an efficient tool in whitefly control in greenhouses while in the field it can be used for whitefly monitoring only (Lu et al., 2012). YSTs were more attractive to whiteflies compared to trap crops such as eggplant. Although YSTs alone could not reduce adult whitefly population on the target crop, they were able to reduce oviposition in pepper (Moreau and Isman, 2011). This has given a clue in this study that whitefly population on YSTs in TH-NP 2 trial was very high which could have led to subsequent oviposition reduction and thus causing very low whitefly population on plant (Table 4). In Vietnam also, the number of whitefly eggs and nymphs was relatively lower in IPM fields, where YSTs were installed. Thus, YSTs can be used to monitor the whitefly populations on tomato under open field conditions, although they cannot be used as a control tool as in greenhouses. Secondly, trapping of higher number of whitefly adults in YSTs could potentially reduce the whitefly oviposition and subsequent nymphal population on plants in the field. But it may not be sufficient to reduce the leaf curl virus disease incidence since relatively lower number of viruliferous whiteflies can transmit the disease effectively. Interestingly, the study in TH-NP2 showed that YSTs were able to interfere in host searching ability of whitefly. More than 400 adult whiteflies were trapped on YST and hence, a whitefly population of less than 20 was detected on the plants (Table 4) and thus recording a very low disease incidence (<10%) in all three treatments, viz., IPM, CM and CK. In contrast to the marketable yield where no significant differences observed, non-marketable yield was significantly lower in IPM plots (Table 5). It may be possible that entomopathogenic fungi and neem could have enhanced plant growth or increased natural enemies which could reduce non-marketable yield. Nahak and Sahu (2014) revealed that neem leaf extract was not only having the potential on controlling leaf spot and wilt of eggplant, but also having positive effect on plant growth parameters. Additionally, high natural enemies were observed in plots treated with neem seed extract to control rice stem borer, comparing with synthetic insecticide, carbofuran (Ogah et al., 2011). Although the IPM treatments included various components such as healthy seedling production based on nylon nets and neonicotinoids, barrier crops, mulches, bio-pesticides including neem and petroleum oils and chemical pesticides, it did not show its efficiency in terms of reducing the whitefly populations and/or leaf curl virus

241
infection on tomato, compared to the chemical pesticide application in the current study. Earlier studies have indicated that UV reflective mulch and paddy husk mulch were effective in bringing down the leaf curl virus disease incidence and also increasing the total marketable fruit yield in tomato (Rajasri et al., 2011). Reflective mulch and live mulch of buckwheat (Fagopyrum esculentum Moench) with or without imidacloprid combination, suppressed whitefly and reduced begomovirus diseases such as cucurbit leaf crumple virus (CuLCrV) in zucchini (Nyoike et al., 2008). Besides, applying cover mulches, trap crop was found to reduce insect pest infestation, because it interferes with host plant searching of insect pests while simultaneously attracting more natural enemies. For example, maize showed to be highly effective in reducing major insect pest populations (aphid, thrips, whitefly, mealybug and Helicoverpa armigera) on chillies, by the trap crops as sunflower and peas. Additionally, some predators such as spider, green lacewing, ladybird beetle including Brunus suturalis, were found on these trap crops (Gary, 2000; Baloch et al., 2016). Various researches have showed that systemic chemicals and bio-pesticides can be implemented in different ways on sucking insect control. Zidan (2012) reported that seed treatment with neonicotinoid such as imidacloprid (Gaucho®) led to high reduction of thrips (89.9%), aphid (90.5%), leafhopper (100%) and whitefly (95%) at two week post treatment compared with two thiamethoxam formulations (Cruiser® and Actara®). With foliar application, neonicotinoid (imidacloprid/acetamiprid) also showed the best efficiency to reduce whitefly population by 78.32 – 96.62% followed by neem leaf extract by 67.53 – 82.60% on eggplant (Ali et al., 2016). Under glasshouse condition, petroleum horticultural oil and B. bassiana alone were reported to exert high mortality in egg and second instar nymphs of B. tabaci by 100% and 69% and 74% and 65%, respectively. The mortality of second instar nymphs increased significantly (95.5%), when these two products were mixed together (Cuthbertson and Collins, 2015). Furthermore, nematophagous fungus, P. lilacinus was first reported by Fiedler and Sosnowska in 2007 about its potential to suppress cotton aphid (Aphis gossypii), nymphal stage of greenhouse whitefly (Trialeurodes vaporariorum) and pre-pupal and pupal stages of western flower thrips (Frankliniella occidentalis). Even glasshouse spider mite (Tetranychus urticae) was possibly decreased by 60% when the P. lilacinus was applied at temperature below 10 °C. The P. lilacinus strain PlTS01 and Lecanicillium psalliotae strain LpTS01 were most virulent against B-biotype whitefly (Dong et al., 2016). The results of the study were still far from implementing IPM component technologies to suppress TYLCV through the control of B. tabaci. Several factors can interfere the efficiency of IPM components. As the results from Vietnam showed that whitefly population increased gradually in IPM treatment in April 2015 compared to the population in March (Table 6), it is possible that temperature might had an effect on biopesticide efficiency. As reported earlier, abiotic factors such as temperature, relative humidity and solar radiation were detected to have negative effects on biopesticides.

242
For example, B. bassiana, Verticillium lecanii, M. anisopliae, Nomuraea rileyi and P. fumosoroseus could cause significantly high mortality on aphid at 25 ºC and the mortality decreased with decreasing relative humidity (75, 85, 90 and 95%) (Derakhshan et al., 2007). Full-spectrum sunlight, UVA as well as UVB caused reduction in relative culturability of M. anisopliae, depending on the fungal strain (Braga et al., 2001). Multi-stress tolerant and virulent strain of entomopathogenic fungi, therefore, should be taken into account. On the other hand, high temperature could raise growth rate of insect development as well and thus increasing the number of generations due to its shorter life cycle. Yang and Chi (2006) found that the generation time of silverleaf whitefly decreased from 81.9 to 18.2 d, when temperature rose from 15 to 35 ºC, respectively.
CONCLUSION Thus, different IPM component technologies such as mulch, trap crops, bio-pesticides and neonicotinoids were found to reduce the whitefly significantly. However, when combined them into an IPM package in the current study, they did not reduce the whitefly population and/or the leaf curl virus disease substantially. This may be due to the fact that even a low population of viruliferous whitefly population can transmit the virus disease effectively. But, it should be noted that the trials were conducted only for a single season. Hence, they should be repeated across the locations in different seasons to ensure the effectiveness of this newly developed IPM package. Nowadays, IPM practices are not implemented broadly due to inconsistent efficiency being influenced by various factors. Its major factors are local environment, cropping system and cultural practices; hence, they should be considered carefully when this newly developed IPM strategy is validated.
ACKNOWLEDGEMENTS This study was carried out under the Beating Begomoviruses project, which was funded by Federal Ministry for Economic Cooperation and Development (BMZ) through Deutsche Gesellschaft für Internationale Zusammenarbeit (GIZ) GmbH.
REFERENCESAli, M. (2006). chilli (Capsicum spp.) food chain analysis: setting research priorities
in Asia. In AVRDC Technical Bulletin No.38, pp. 245. Shanhua, Tainan: AVRDC – The World Vegetable Center.
Ali, S.S., Ahmad, S., Ahmed, S.S., Rizwana, H., Siddiqui, S., Ali, S.S., Rattar, I.A. and Shah, M.A. (2016). Effect of biopesticides against sucking insect pests of brinjal crop under field conditions. Journal of Basic and Applied Sciences. 12: 41 – 49.
Baloch, T.A., Mari, J.M., Jatoi, G.H., Soomro, S.P., Soomro, M.P. and Soomro, M.R. (2016). Study on pest and predators population in chilli agro-ecosystem by using different trap crops. American research thoughts 2 (5): 3726 – 3736
Braga, G.U., Flint, S.D., Miller, C.D., Anderson, A.J. and Roberts, D.W. (2001). Both solar UVA and UVB radiation impair conidial culturability and delay germination

243
in the entomopathogenic fungus Metarhizium anisopliae. Photochemistry and Photobiology. 74(5): 734 – 739
Cuthbertson, A.G.S. and Collins, D.A. (2015). Tri-Tek (Petroleum Horticultural Oil) and Beauveria bassiana: use in eradication strategies for Bemisia tabaci mediterranean species in UK glasshouses. Insects 6: 133 – 140
Derakhshan, A., Rabindra, R.J. and Ramanujam, B. (2007). Efficacy of different isolates of entomopathogenic fungi against Brevicoryne brassicae (linnaeus) at different temperatures and humidities. Journal of Biological Control. 21(1): 65 – 72
Dong, T, Zhang, B, Jiang, Y. and Hu, Q. (2016). Isolation and classification of fungal whitefly entomopathogens from soils of Qinghai-Tibet Plateau and Gansu Corridor in China. PLoS ONE 11(5): e0156087. doi:10.1371/journal.pone.0156087
Fiedler, Z. and Sosnowska, D. (2007). Nematophagous fungus Paecilomyces lilacinus (Thom) Samson is also a biological agent for control of greenhouse insects and mite pests. Bio Control. 52: 547–558
Gary, P.F. (2000). An Australian approach to IPM in cotton: integrating new technologies to minimize insecticide dependence. Crop Protection, 19 (8): 793 – 800
Ha, C., Coombs S., Revill P., Harding, R., Vu, M. and Dale, J. (2008). Molecular characterization of begomoviruses and DNA satellites from Vietnam: additional evidence that the new world geminiviruses were present in the old world prior to continental separation. J. Gen. Virol. 89: 312 – 326
Kenyon, L., Tsai, W-H., Shih, S-L. and Lee, L-M. (2014). Emergence and diversity of begomoviruses infecting solanaceous crops in East and Southeast Asia. Virus Research 186: 104 – 113
Lu, Y., Bei, Y. and Zhang, J. (2012). Are yellow sticky traps an effective method for control of sweet potato whitefly, Bemisia tabaci, in the greenhouse or field? Journal of Insect Science 12:113. Available online: http://www.insectscience.org/12.113
Mascarin, G.M., Kobori N.N., Quintela E.D. and Delalibera I. Jr. (2013). The virulence of entomopathogenic fungi against Bemisia tabaci biotype B (Hemiptera: Aleyrodidae) and their conidial production using solid substrate fermentation. Biological Control 66: 209 – 218
Moreau, T.L. and Isman, M.B. (2011). Trapping whiteflies? A comparison of greenhouse whitefly (Trialeurodes vaporariorum) responses to trap crops and yellow sticky traps. Pest Management Science 67(4): 408 – 13
Nahak, G. and Sahu, R.K. (2014). Bioefficacy of Leaf Extract of Neem (Azadirachta indica A. Juss) on Growth Parameters, Wilt and Leaf Spot Diseases of Brinjal. Research Journal of Medicinal Plants.8: 269 – 276
Norhelina, L., Sajap, A.S., Mansour, S.A. and Idris, A.B. (2013). Infectivity of five Metarhizium anisopliae (Deuteromycota: Hyphomycetales) strains on whitefly, Bemisia tabaci (Homoptera: Aleyrodidae) infesting brinjal, Solanum melongena (Solanaceae). Academic Journal of Entomology 6 (3): 127 – 1
Nyoike, T.W., Liburd, O.E. and Webb, S.E. (2008). Suppression of whiteflies, Bemisia tabaci (Hemiptera: Aleyrodidae) and incidence of cucurbit leaf crumple virus,

244
A whitefly – transmitted virus of zucchini squash new to Florida, with mulches and imidacloprid. Florida Entomologist. 91(3): 460 – 465
Office of Agricultural Economic (OAE). (2014). Agricultural import export. Available source: http://www.oae.go.th/oae_report/export_import/export_result.php, September 10, 2015
Ogah, E.O., Omoloye, A.A., Nwilene, F.E. and Nwogbaga, A.C. (2011). Effect of neem seed kernel extracts in the management of rice stem borers in the field in Nigeria. Nig J. Biotech. 23: 13 – 21
Pinto-Zevallos, D.M. and Vänninen, I. (2013). Yellow sticky traps for decision-making in whitefly management: what has been achieved? Crop protection. 47: 74 – 84
Praneetvatakul, S., Schreinemachers, P. and Laitae, C. (2016). Pesticide risk behavior and knowledge of chilli and tomato farmers. International journal of vegetable science 22 (4): 333 – 345
Rajasri, M., Vijayalakshmi, K., Prasada, R.R.D.V.J., Loka, R.K. (2011). Effect of different mulches on the incidence of Tomato leaf curl virus and its vector whitefly Bemisia tabaci in tomato. Acta. Hort. 914: 215 – 222
Schreinemachers, P., Balasubramaniam, S., Boopathi, N.M., Ha, C.V., Kenyon, L., Praneetvatakul, S., Sirijinda, A., Le, N.T., Srinivasan, R. and Wu M-H. (2015). Farmers’ perceptions and management of plant viruses in vegetables and legumes in tropical and subtropical Asia. Crop Protection 75: 115 – 123
Simmons, A.M., Kousik, C.S. and Levi, A. (2010). Combining reflective mulch and host plant resistance for sweetpotato whitefly (Hemiptera: Aleyrodidae) management in watermelon. Crop Protection. 29: 898 – 902
Tuan, N.M. and Mao, N.T. (2015). Effect of plant density on growth and yield of tomato (Solanum lycopersicum L.) at Thai Nguyen, Vietnam. International Journal of Plant and Soil Science. 7(6): 357 – 361
Wraight, S.P., Carruthers, R.I., Jaronski, S.T., Bradley, C. A., Garza, C. J. and Wraight, S.G. (2000). Evaluation of the entomopathogenic fungi Beauveria bassiana and Paecilomyces fumosoroseus for microbial control of the silverleaf whitefly, Bemisia argentifolii. Biological control 17: 203 – 217
Yang, T-C and Chi, H. (2006). Life tables and development of Bemisia argentifolii (Homoptera: Aleyrodidae) at different temperatures. J. Econ. Entomol. 99(3): 691 – 698
Zidan, L.T.M. (2012). Bio-efficacy of three new neonicotinoid insecticides as seed treatment against four early sucking pests of cotton. American-Eurasian J. Agric. and Environ. Sci. 12(4): 535 – 540
245
Comparison of Traditional Technology and Integrated Cultivation to Enhance Yield and Quality of Tomato, Chilli and Spring Onion Production in Nakhonphanom, Thailand
Niyom Khaimuk1, Naruatai Worasatit2 and Chumnan Kasiban11NakhonPhanom Agricultural Research and Development Center, ThailandE-mail: [email protected] of Agricultural Research and Development Region 3, ThailandE-mail: [email protected]
Abstract Set of farm trials were conducted in farmers’ field in Muang, Renunakhon and Phonsawan district, Nakhon Phanom province to test for food safety production technology of tomato and chilli during the year 2008 – 2010 and spring onion during 2012 – 2014. The technology comprised of application of compost at 130 – 150 g/plant for tomato and chilli and 6,250 kg/hectare for spring onion, incorporated with chemical fertilizer at 87 – 94 kg N and P2O5 and 94 – 113 kg K2O per hectare. The technology included trapping prior to chemical and biological control application to control insect pests and diseases. This was compared to farmers’ technology in which various chemicals were used to control plant pests. It was found that the recommended technology prominently increased vegetables yield without chemical residue. Average yield of tomato, chilli and spring onion of the recommended technology was 51,562, 11,650 and 23,469 kg/hectare which was higher than farmer’s technology of 4,294, 1,256 and 1,544 kg/hectare, respectively. No chemical residue was detected when applied with recommended technology whereas 0.01 – 1.91 mg/kg of cypermethrin and chlorpyrifos were detected on tomato, chilli and spring onion and 1.05 mg/kg of dimethoate was detected on spring onion of farmer’s technology.
Keywords: food safety, organic fertilization, biological control, integrated pest management (IPM)
INTRODUCTION Chilli (Capsicum frutescences L.) is one of the most important and largest produced spice crops in Asia. Basically chillies contain capsaicin, a phenolic compound which gives strong burning sensation. Tomato (Lycopersicon esculentum Miller.), a fruit vegetable crop is consumed in diverse ways, including raw, sauces and drinks, widely known for their antioxidant content, lycopene. Spring onion or multiplier onion (Allium cepa L.) is one variation of the more common green onions (or spring onion or shallot), that produces more than one bulb per plant. Chilli, tomato and multiplier onion are the major important vegetable crops in Naknon Phanom province in the Northeastern region of Thailand. Farmers usually grow them once a year as a crop after rice. The major cultivar groups of chilli is Birds Eye Chilli Group, it represents the most pungent chillies grown for fresh market as well as for processing into dried chilli. The fruit size is rather small, 2 – 3.5 cm long. Popular names of this group are Jinda, Yodsoen, Huarea and Huaysithon. In the year 2007, chilli planted on an area were 572 hectares, with an average yield of 11,100 kg/hectare. A grower in Phonsawan district

246
planted three chilli varieties i.e. Huarea, Jinda and Yodsoen and earned an income of about 4,062 $/hectare whereas cost of production was about 1,682 $/hectare. Therefore, the net income achieved from chilli production was about 2,380 $/hectare. (Phonsawan Agricultural Office, 2007) Tomato is one of the economic crops of which Thailand exports to neighbor countries in large quantity as canned tomato and in small quantity as fresh tomato. There are two types of tomatoes cultivated in local area of the province i.e., processing tomato and table tomato. The major type is processing tomato, that’s grown once a year as a crop after rice, while the small-fruit table tomato is grown all year round. In the year 2007, there was 161 hectares of table tomato planted area, having average yield of 21,546 kg/hectare. The processing type cultivars are F-1 hybrids such as VF-134, Roma-VF, Lima-VF, Peto 4165 and Peto 4225. In the same year, processing type tomato planted areawas 460 hectares, having average yield of 31,862 kg/hectare. Eighty-five percent of spring onion planted in Nakhon Phanom Province was green multiplier onions which grows twice a year, during November-April. The growers use about 375 – 500 kg/hectare of onion bulbs for planting and obtained the yield averaging from 6,250 to 12,500 kg/hectare. The major problems of chilli, tomato and spring onion cultivation in Nakhon Phanom are; improper use of fertilizer, widespread insect pests and diseases leading to yield loss, low quality product, pestiside residue and high production cost. Therefore, appropriate technologies needed to be applied are to overcome low soil fertility, inefficient use of fertilizer and inefficient pest control. The major insect pests of chilli are thrips, aphids, mites, fruit borer and fruit fly whereas the major diseases are anthracnose, Fusarium wilt, bacterial wilt, crown rot, leaf spot and damping off, which cause serious problem to all growers. Fruit borer, white fly, leaf miner and aphids are the major insect pests of tomato, whereas Fusarium wilt, bacterial wilt, leaf spot, crown rot and blossom rot are the major diseases. Among them, Fusarium wilt and bacterial wilt are the most serious ones. For multiplier onion, the major insect pests are Lesser armyworm and mite, while wilt, bulb rot, crown rot, leaf spot and leaf blight are the serious diseases (Department of Agriculture, 2010). The growers often spray pesticides frequently at high dose to control these insect pests and diseases. This lead to the problem of pesticide residues detected in vegetable and fruit crops produced in local plantation during the year 2004 – 2008. The major pesticides were chlorpyrifos, cypermethrin, profenofos and methomyl. The number of plant samples detected residue at the safety level was 26.90% and the number of samples higher than the safety level was 10.15% of 197 samples. (Niyom et al., 2011). Therefore, experiments were set up to test the recommended technologies of Integrated Pest Management (IPM) to control insect pests and diseases and application of compost incorporated with chemical fertilizer to improve soil properties and fertility in order to increase yield of chilli, tomato and spring onion of the local farmers. The experiments were conducted in farmer fields to compare recommended and famer technologies. The results achieved could then be learnt and practiced by the farmers.

247
MATERIALS AND METHOD Three experiments were conducted on each crop i.e.
1. Chilli production The experiment was conducted in five chilli farmers’ fields in Phonsawan District, Nakhon Phanom Province, in December 2008. The chilli variety, Huarea which is in the group of Birds Eye chilli, commonly grown by local farmers was used in the experiment. The experiment was designed in RCB (Random Complete Block) with two replications of two treatments where T1 is the recommended technology and T2 is farmer’s technology as details in Table 1. Each treatment consists of four plots of 3.5x6.5 m2 in which 80 plants were grown and evaluated for their growth, insect pests and diseases every second week while yield was evaluated at harvest. Agronomic analysis was used for yield indicators while economic analysis was used to evaluate the income and return using the formula below
Δp = ΔR – ΔC
Where ΔR is revenue, ΔC is total cost. The higher Δp (additional net income) represents the better treatment.
2. Tomato production The experiment was carried out in 10 famers’ fields of processing tomato cultivation in Renu Nakhon District, Nakhon Phanom Province in December-March, 2008 – 2010. This area has a serious problem of pesticide residues as well as imbalance of fertilizer application. F1 hybrid variety of processing tomato types, Perfected Gold which was commonly grown in this area was used in the experiment. The experiment was designed in RCB with two replications, two treatments where T1 is the recommended technology and T2 is farmer’s technology as detailed in Table 2. The data collected and data analysis was carried out in the same manner as on chilli experiment.
3. Spring onion production The experiment was carried out in 10 famers’ fields of spring onion cultivation in Maung District, Nakhon Phanom Province in December – April, 2008 – 2012. This area has a serious problem of pesticide residues as well as imbalance fertilizer application. F1 hybrid of spring onion, variety Perfected Gold which was commonly grown in this area was used in the experiment. The experiment was designed in RCB with two replications, two treatments where T1 is the recommended technology and T2 is farmer’s technology as detailed in Table 3. The data collected and data analysis was carried out in the same manner as in chilli experiment.

248
Table 1. The details of activities of chilli cultivation between recommended technology (T1)and Farmers’ technology (T2)
Activityof cultivation
Recommended technologyT1
Farmers’ technologyT2
Organic fertilizer application
Supplement compost mixed with Trichoderma harzianum, a bio-control agent in a ratio of fresh Trichoderma : compost at 25 g : 10 kg applied at 130 – 150 g/plant at transplantingSpray liquid organic fertilizer at a week after transplanting the seedlings to the early flowering stage
Apply manures at 100 g/plant into the soil at planting
Chemical fertilizer N : P : K in a ratio of 94 kg : 94 kg : 94 kg/hectare. Apply in 3 equal doses, 1st time at transplanting, second and third at the 3rd and 7th week after transplanting the seedlings.
Chemical fertilizer, N : P : K ; in a ratio of 117kg : 117 kg : 117kg/hectare. Apply 1st time at transplanting, 2nd to 8th at a week after transplanting the seedlings to early fruiting stage (once a month in fruiting stage)Spraying of liquid chemical fertilizer (N : P : K in a ratio of 25 kg : 7 kg : 7 kg (40 g/20 liter of water) 1 – 2 times at the fruiting stage
Control of damping off, Fusarium wilt and crown rot disease
T. harzianum, bio-control agent mixed with compost in a ratio of fresh Trichoderma : compost at 25 g : 10 kg applied at 50 – 100 g/plant, at the early stage of infection or applied into the soil after removal of infected plant
Remove of infected plant
Fauit anthracnose, Fruit tip drying management
Application of calcium nitrate at the fruiting stage
No application
Control of fruit borer Trapping No applicationControl of aphid, thrips, mites and white fly
Chemical application, carbosulfan at 20 – 30 ml/20 liter of water and sulfur at 60 – 80 g/20 liter of water and spraying of herbal sap alternate by insecticide, 4 – 6 times
Chemical application, beta-cyfluthrin and methomyl spray at 30 – 40 ml/20 liter of water, 4 – 6 times

249
Table 2.The details of activities of tomato cultivation between recommended technology (T1) and Farmers’ technology (T2)
Activity of cultivation Recommended technologyT1
Farmers’ technologyT2
Soil preparation Application of lime 6,250 – 12,500 kg/hectare
No application
Organic fertilizer application
Supplement compost mixed with Trichoderma, bio-control agent in a ratio of fresh Trichoderma : compost at 25 g : 10 kg applied at 130 – 150 g/plant at transplanting
Apply manures 50 100 g/plant, at time of transplanting
Chemical fertilizer application
Apply chemical fertilizer, N : P : K at a ratio of 37.5 kg : 37.5 kg : 37.5 kg/hectare at 15 days after transplanting seedling and in a ratio of 32.5 kg : 32.5 kg : 52.5 kg/hectare at 30 days after transplanting seedlingApply calcium boron at 40 ml/20 liter of water, 2 times at the fruiting stage
Apply chemical fertilizer, N : P : K in a ratio of 47 kg : 47 kg : 47 kg/hectare at 7 days after transplanting seedling and in a ratio of 41 kg : 41 kg : 65 kg/hectare at 30 days after transplanting seedlingApply liquid chemical fertilizer N : P : K in a ratio of 25 : 5 : 5 at 40 g/20 liter of water 1 – 2 times at the early fruiting stage
Bacterial wilt disease management
Remove infected plant and treat with lime and urea fertilizerStop furrow irrigation
No application
Damping off, fusarium wilt and crown rot disease management
Remove infected plant and apply with Trichoderma : compost at 25 g : 10 kg apply at 130 150 g/plant
Remove infected plant
Blossom rot or end rot disease management
Application of calcium boron, 40 ml/20 liter of water at the fruiting stage
No application
Fruit borer management Trapping Pesticide application, abamectin or methomyl 20 – 30 ml/20 liter of water, 2 4 times
Aphid, white fly and leaf miner management
Chemical application, imidachloprid and sap of herbal insecticide spray alternatively, at 5 – 7 days, 1 – 2 times
Chemical control, spray pesticide ,cabosulfan, profinofos, 20 30 ml/20 liter of water or chlorpyrifos and cypermethrin, 30 – 40 ml/20 liter of water, 4 – 6 times

250
Table 3. The details of activities of spring onion cultivation between recommended technology (T1) and Farmers’ technology (T2)
Activity ofcultivation Recommended technologyT1
Farmers’ technologyT2
Soil preparation and organic fertilizer application
Apply lime at 6,250kg/hectareCompost application at 6,250 kg/hectare
No application
Manures application at 6,250 kg/hectare
Bulb treatment Soak multiplied bulb in 40°C of water for 4 hours
Non-treated
Chemical fertilizer application
Chemical fertilizer, N : P : K ; in a ratio of 47 kg : 47kg : 47 kg/hectare at 15 and 30 days after planting
Chemical fertilizer, N : P : K ; in a ratio of 47 kg : 47kg : 47 kg/hectare at 15 and 30 days after planting
Yellow wilt, crown rot
Application of Trichoderma : compost at 50 – 100 g/m2 during soil preparation before plantingTreat multiplied bulb with fresh Trichoderma in a ratio of 1 kg/10 g of TrichodermaSpraying with Trichoderma suspension in a ratio of 1 kg/200 liter of water onto the plant when disease symptom was noticed
Fungicide spraying, Carbendazim
Lesser armyworm Trapping and spray with Nuclear Polyhydrosis Virus (NPV) at 30 ml/20 liter of water in the evening when insect number reach ET level
Pesticide application, cypermethrin,chlorpyrifos or methomyl 20 – 30 ml/20 liter of water, 4 – 5 times

251
RESULTS AND DISCUSSION
Chilli and tomato production Similar phenomenon was noticed in both experiments on chilli and tomato. chilli of T1, in which recommended technology was applied performed will with good growth and gave higher yield than that of farmers’ technology (T2). Calcium nitrate application at 40 – 60 ml/20 liters of water, two times at early fruiting stage decreased the symptom of calcium deficiency, blossom end rot of tomato and anthracnose like disease (fruit tip drying) of chilli. Integrated Pest Management (IPM) showed the effective control against aphid, mites and thrips. Trapping with molasses solution in a ratio of molasses: water at 1:1 by volume, efficiently trapped adult of fruit borers. The control was even more effective when Nuclear Polyhydrosis Virus (NPV) sprayed at 30 ml/20 liters of water in the evening. The application of Trichoderma harzianum, antagonistic fungi as a biological control agent showed better results to control wilt and crown rot disease. Consequently, yield of T1 was higher than that of T2. chilli yield of T1 was ranging between 10,149 – 12,831 kg/hectare (average 11,437 kg/hectare) while yield of T2 treatment was 9,438 – 10,900 kg/hectare (average 10,181 kg/hectare. Tomato yield of T1 in the year 2008, 2009 and 2010 were 48,562, 52,937 and 53,125 kg/hectare (average 51,562 kg/hectare) while yield in the T2 were 45,937, 48,312 and 47,500 kg/hectare (average 47,250 kg/hectare) (Table 4). The total cost of tomato production in the year 2008, 2009 and 2010, of T1 were 2,204, 2,288 and 2,554 $/hectare (average 2,349 $/hectare) while total cost of T2 were 2,580, 2,663 and 2,644 $/hectare (average 2,648 $/hectare). Production cost of the recommended technology was lower than farmers’ technology as it used less chemical fertilizers, insecticide and fungicides. The cost of chilli production of T1 ranged from 0.21 – 0.22 $/kg (average 0.21 $/kg) while the cost of T2 ranging from 0.19 – 0.20 $/kg (average 0.20 $/kg). The cost of chilli production of farmers’ technology was lower than recommended technology between 1.75 – 6.75% (average 4.48%). However, the benefit cost ratio (BCR) of recommended technology were higher than that of farmers’ technology (Table 4). Pesticide residues were not found in tomato and chilli samples of both treatments as trapping and other prevention method may also affect the plot in which farmers’ technology was applied. The residues, however, were detected on products from other farms nearby (Table 5). Moreover, the detection of pathogenic bacteria, Escherichia coli and Salmonella were not found in all of samples (The office of Agricultural Research and Development Region 3, 2009 a -2009 f.)
SPRING ONION PRODUCTION The results showed that T1 treatment could control the major insect pests. Application of fresh Trichoderma completely decreased crown rot, leaf spot and leaf blight diseases of spring onion. Thus, the yield of spring onion of T1 was higher than T2, in the range of 344 – 3,538 kg/hectare (average 1,544 kg/hectare) or 1.50 – 16.50% higher

252
Table 4. Yield, income, production cost net income and benefit cost ratio (BCR) of tomato, chilli andspring onion of T1, recommended technology and T2, farmers’ technology
Treatment Yield(kg.ha–1)
Income ($.ha–1) Prod. cost ($.ha–1) Net income ($.ha–1) BCR
Tomato T1 51,562 4,297 2,349 1,948 1.65T2 47,250 3,938 2,648 1,290 2.04chilli T1 11,438 3,813 2,249 1,563 1.70T2 10,181 3,394 2,153 1,241 1.58Spring T1 23,469 9,596 3,930 5,666 2.4Onion T2 21,925 8,770 4,198 4,572 2.1
Table 5. Pesticide residues in sample of tomato and chilli of T1, T2 and other farms in Nakhon Phanom Province in the year 2009 – 2010
Plant ND chlorpyrifos cypermethrin deltamethrin
≤MRL >MRL ≤MRL >MRL ≤MRL >MRL
ChilliRecommended technology
5 – – – – – –
Farmers’ technology
5 – – – – – –
Other farms 20 16 1 2 – 4 –Detected amount (mg/kg)
– 0.008 – 0.467 0.793 0.045, 0.135 0.005 – 0.028
TomatoRecommended technology
5 – – – – – –
Farmers’ technology
5 – – – – – –
Other farms 24 4 – 2 – – –Detected amount (mg/kg)
– 0.01 – 0.08 – 0.01, 0.02 – – –
MRL (mg/kg) 0.5, Codex MRL 0.5, Codex MRL 0.5, Codex MRL
Note: ND is non detected, – is non detected samplesSource: The office of Agricultural Research and Development, Region 3, 2009 c; 2010 d; 2010 a; 2010 c.; 2011; 2013.

253
(average 7.04%). Spring onion yield of T1 in each field ranged from 22,106 – 24,975 kg/hectare (average 23,469 kg/hectare) while yield of T2 ranged from 21,319 – 22,850 kg/hectare (average 21,925 kg/hectare) (Table 4). The cost of spring onion production of T1 was lower than that of T2 for 12.5%. It was 167 $/ton for T1 and 191 $/ton for T2. The benefit cost ratio of T1, therefore, was higher than T2 (2.4 and 2.1, respectively) (Table 4) Pesticide residues were not detected in the product of T1 while it was detected in seven of 10 spring onion samples of T2. There were cypermethrin in three samples at 0.05, 1.21 and 1.91 mg/kg (Thai MRL, 0.01 mg/kg), chlorpyrifos at 0.10 mg/kg in one sample (Thai MRL, 0.20 mg/kg), dimethoate in one sample at 1.05 mg/kg (Thai MRL, 0.05 mg/kg), methomyl in one sample at 0.01 mg/kg (Thai MRL, 0.05 mg/ kg) and carbosulfan in one sample at 0.05 mg/kg (EU MRL, 0.02 mg/kg) (Table 6).
Table 6. Pesticide residues in sample of spring onion of T1, T2 and otherfarms in Nakhon Phanom Province in the year 2011 – 2012
Plant ND chlorpyrifos cypermethrin dimethoate methomyl carbosulfan≤MRL >MRL ≤MRL >MRL ≤MRL >MRL ≤MRL >MRL ≤MRL >MRL
Recom. technology
10 – – – – – – – – – –
Farmers’ technology
3 1 – – 3 – 1 1 – – 1
Detected amount(mg/kg)
– 0.05, 1.21, 1.91
1.05 0.01 0.05
Other farm 4 – – 2 2 – – – – – –Detected amount(mg/kg)
– – 0.01–0.08
1.21, 1.91
– – – – –
MRL (mg/kg)
– 0.2,Thai MRL
0.01,Thai MRL
0.05,Thai MRL
0.05,Thai MRL
0.02,EU MRL
Note; ND is non detected, – is non detected samplesSource: The office of Agricultural Research and Development, Region 3, 2009 c; 2010 d; 2010 a; 2010 c; 2011; 2013.

254
REFERENCESChoosri Chumlee, Niyom Khaimuk, Manit Saruna and Chumnan Kasiban. (2010).
Trial Set of Technologies in Nakhon Phanom Province. The Research Report in the year, 2010. Nakhon Phanom Agricultural Research and Development Center. 15 p.
Department of Agriculture. (2004). Good Agriculture Practice for Onion. Department of Agriculture, Ministry of Agriculture and Cooperative. 11 p.
Department of Agriculture. (2007). Good Agriculture Practice for Tomato. Department of Agriculture, Ministry of Agriculture and Cooperative. 30 p.
Department of Agriculture. (2008). Good Agriculture Practice for chilli. Department of Agriculture, Ministry of Agriculture and Cooperative. 43 p.
Department of Agriculture. (2010). Pest and Zoological Pest Control. Plant Protection Research and Development Office. 303 p.
Department of Agriculture. (2012). Pest Control with NPV Application.Kanjan Sea-eab, Suntisook worawatanathum and Lalita Lerksamran. (2010). Production
and Application of Technology by Multiplier Onion Growers in Muang District and That Pranom District of Nakhon Phanom Province. Research and Development Institute, Nakhon Phanom University. 10 p.
Nakhon Phanom Provincial Agricultural Extension Office. (2011). Planted area of vegetable crops, damaged area, harvested area, production, in the year, 2010/2011.
Niyom Khaimuk, Choosri Chumlee and Chumnan Kasiban. (2010). Trial and Application of Integrated Technology for Safety Product of chilli. The Research Report in the year, 2010. Nakhon Phanom Agricultural Research and Development Center. 20 p.
Porntip Pangjan, Saksit Chanyakorn, Orapan Wisetsung, Yenruedee Suprama and Khajohnwit Phanyangnoi. (2007). The Integrated Production of chilli for Increasing Yield Quality, (p. 217 – 227) In The Research Report, Of Department of Agriculture, in the year 2007. 317 p.
The office of Agricultural Research and Development, Region 3. (2009 a). Detection Report of Pathogenic Bacteria. 21th January 2009.
The office of Agricultural Research and Development, Region 3. (2009 b). Detection Report of Pathogenic Bacteria. 11th February 2009.
The office of Agricultural Research and Development, Region 3. (2009 c). Detection Report of Pesticide Residue. 13th February 2009.
The office of Agricultural Research and Development, Region 3. (2009 d). Detection Report of Pesticide Residue. 11th March 2009.
The office of Agricultural Research and Development, Region 3. (2009 e). Detection Report of Pathogenic Bacteria. 9st April 2009.
The office of Agricultural Research and Development, Region 3. (2009 f). Detection Report of Pesticide Residue. 20th April 2009.
The office of Agricultural Research and Development, Region 3. 2010 a. Detection Report of Pesticide Residue. 3rd March 2010. 2 p
The office of Agricultural Research and Development, Region 3. (2010 b). Detection Report of Pathogenic Bacteria. 3rd March 2010. 3 p.

255
The office of Agricultural Research and Development, Region 3. (2010 c). Detection Report of Pesticide Residue. 10th March 2010. 2 p.
The office of Agricultural Research and Development, Region 3. (2010 d). The Detection Report of Pathogenic Bacteria. 23th March 2010. 3 p.
The office of Agricultural Research and Development, Region 3. (2011). Detection Report of Pesticide Residue. 9th Marh 2011. 2 p.
The office of Agricultural Research and Development, Region 3. (2012). Detection Report of Pesticide Residue. 9th January 2012. 2 p.
Thitakorn Parninn, Niyom Khaimuk. Sathaporn Chandone and Somporn Ar-sadee. (2013). Research Report in the year, 2010. Nakhon Phanom Agricultural Research and Development Center. 13 p.

256
Investigation of Pumpkin Varieties Suitable for Highland Areas
Nuengruethai Boonmala, Nittaya Nokham and Pedcharada YusukHighland Research and Development Institute (Public Organization)65 Moo 1 Suthep Road, Muang, Chiang Mai 50200, ThailandE-mail: [email protected]
Abstract An investigation of pumpkin varieties suitable for highland areas was conducted by a cooperation of two institutes viz; the Highland Research and Development Institute (Public Organization) and the World Vegetable Centre (AVRDC-ESEA), both located in Thailand. The purpose of this investigation was to motivate highland people to grow high nutritious vegetables and to select pumpkin varieties suitable for highland area. Five pumpkin varieties, viz;, AVPU 1394, AVPU 1504, AVPU 1505, AVPU 1508 and AVPU 1509 were tested at Highland Development Project using Royal Project System HuayPao by planting 10 plants of each variety. The results showed differences in fruit numbers, plant weight, fruit sweetness and nutritive value among the five varieties and AVPU 1504 was the most productive where it produced 5 fruits/plant. In terms of weights per plant, AVPU 1508 had the highest weight at 5.97 kg/plant. In terms of sweetness, AVPU 1505 had the highest total soluble solids (TSS) at 14.20 °Brix. In terms of nutritive value, AVPU 1504 had the highest vitamin C at 8.09 mg/100 g of fresh weight and AVPU 1394 had the highest Beta-carotene at 3,694.94 μg/100 g of fresh weight. It was concluded that two pumpkin varieties were suitable for highland areas AVPU 1504 and AVPU 1505 due to the highest sweetness, firmness and nutritive value.
Keywords: pumpkin, highland areas, nutritive value
INTRODUCTION Pumpkin (Cucurbitamoschata Decne) belongs to the Cucurbitaceae family, the subtribe Cucurbitinae and the genus Cucurbita. This species can grow either in tropical or subtropical climate conditions. Great amount of highland farmers in Thailand choose to cultivate pumpkin due to their high price the market and high nutritive value, in particular beta-carotene a substance against cancer and other diseases. Moreover, it consists of propionic acid which has ability to debilitate impact of cancer cells (Kerdpiboon et al., 2011). Currently, for pumpkin cultivation in highland, farmers normally use commercial seeds, which are expensive and only small number of cultivars (varieties) are provided. The World Vegetable Center Asia (AVRDC-ESEA) has established a research project in order to improve the vegetable farming system in Thailand. This program includes investigation to the vegetable land races (or cultivars) used in the region and in particular included land races of pumpkin. Some of the selected land races also had antiviral ability. The (AVRDC-ESEA) has started to produce seeds of many new varieties and provides them to other research organizations and local institutions under this project since the last five years. In this way the new pumpkin varieties with better characteristics can be popularized. The new pumpkin varieties produced from AVRDC are open pollinated, which allow the farmers to produce their own seeds for cultivation in the

257
next generation. In 2016, Highland Research and Development Institute (HRDI) and The World Vegetable Center Asia (AVRDC-ESEA) started with a research agreement related on improved farming systems for pumpkins and bitter gourds and new varieties produced by AVRDC. The investigations presented in this paper are a result of this collaboration in order to find pumpkin varieties suitable for highland areas with stable and high yield, high quality and nutritive value.
MATERIALS AND METHODS The experimental plots were conducted at Highland Development Project Using Royal Project System HuayPao, Chiang Mai, Thailand. This experiment was carried out in winter, from October 30, 2015 – February 2016, as follow:Meeting with famers and officers to select the appropriate varieties from 10 pumpkin varieties, considering the fruit characteristics and the market demand.Each planting plot was set to be 25 – 30 cm height, 4.5 m width and 1 m space between each row. The dimensions of each planting pits was 30 cm x 30 cm x 25 cm. The pit was filled with, bottom part composted cowdung, chicken and pig manure and Trichoderma sp. mixture 500 g/hole.Proceeded the experiment by planting 10 plants of each pumpkin varieties viz; AVPU1394, AVPU1504, AVPU1505, AVPU1508 and AVPU1509.
Plants cultivation Irrigation: sprinkler system was used regularly to prevent any damage from fruit cracking.Fertilization: first time: 7 – 10 days after transplanting. Application of chemical fertilizer (N, P, K) 46 – 0 – 0 in the amount of 30 – 50 g/plant and (N, P, K) 15-15-15 at 20 g/plant, respectively.Second time: 30 days after transplanting. Application of mineral fertilizer (N, P, K) 15-15-15 at 40 g/plant.Third time: 40 days after transplantings. Application of chemical fertilizer (N, P, K) 13-13-21 at 80 g/plant.
Data collecting Number of days after planting for 1st male and female flowers started blooming. Number of nodes at 1st female blooming, vine length, date of harvesting and their reactions to all disease (virus, gummy stem blight and powdery mildew) which observed and diagnosis symptom by plant pathologist.Product quality: measured from characteristic of fruits such as shape, ribs, skin, averaging weight (kg), skin color, pulp color, TSS (%B), eating quality, fruit’s length (cm), fruit’s width (cm), seed’s length (cm), seed’s width (cm), pulp’s thickness (cm) and yield (per plot),Nutritional analysis: vitamin C and β-carotene,Production factor: compost, chemical fertilizer, pesticide etc.,

258
RESULTS AND DISCUSSION Flowers blooming date records showed that the male flowers of all varieties were blooming after 40 days of planting and the female flowers were blooming before male flowers, approximately 2 – 3 days. On vine length study, the result showed that AVPU 1505 had the highest vine length at 447.00 cm followed by AVPU 1504 at 441.00 cm, respectively, (Table 1). According to the result of disease assessment, it indicated that only AVPU 1504 was uninfected by plant virus. Other varieties were 100% infected by virus disease. Studies on fruit shape of each variety was considered, AVPU 1394 and AVPU 1505 have flattened shape with rough skin, whereas, AVPU 1504 were in dumbbell shape with ribs and smooth skin. AVPU 1508 and AVPU 1509 were in globular shape with ribs and smooth skin. (Table 1 and Figure 1) Pulp color study showed that AVPU 1394, AVPU 1504, AVPU 1508 and AVPU 1509 were in orange color, whereas, AVPU 1505 were in yellow color. According to Kubicki and Walczak (1976), pumpkins with yellow or orange pulp color are of high quality. They also have high total soluble solid value. (Table 2) Production yield analysis showed that AVPU1504 gave the highest average yield of 5 fruits/plant. AVPU 1508 had the highest average weight at 5.97 kg/plant followed by AVPU 1509, AVPU 1505, AVPU 1504 and AVPU 1394 at 3.80, 3.28, 2.88 and 1.09 kg/plant, respectively (Table 3 and Figures 1). Studies on total soluble solid (TSS) value showed that AVPU 1505 had the highest TSS value at 14.20 °Brix followed by AVPU 1504, which had 12.90 °Brix. Most of the selected pumpkins had TSS value more than 11% which is the acceptable level to consumers (Loy, 2006). This result was corresponding with previous study by Khanobdee (2003), who found that TSS value of immature and mature local pumpkins were 14.7 and 11.0 Brix, respectively (Table 2). The assessment of customer satisfaction towards five pumpkin varieties indicated that both farmers and officers prefer the taste, color, smell, firmness, sweetness and shape of AVPU1504 and AVPU 1505 (Table 3) Regarding the nutritional value two parameters were analyzed. It could be detected that AVPU 1504 had the highest vitamin C compared with the other varieties at 8.09 mg/100 g fresh weight and AVPU 1394 had the highest beta-carotene at 3,694.94 µg/100 g fresh weight. (Table 4)
CONCLUSION The results showed differences among the five varieties and AVPU 1504 was the most productive where it produced 5 fruits/plant. In terms of weights per plant, AVPU 1508 had the highest weight at 5.97 kg/plant. In terms of sweetness, AVPU 1505 had the highest total soluble solids (TSS) at 14.20 °Brix. In terms of nutrition, AVPU 1504 had the highest vitamin C at 8.09 mg/100g of fresh weight and had the highest

259
AVPU 1394 AVPU 1504
AVPU 1505 AVPU 1504
Figure 1. Characteristics of five pumpkins varieties cultivated in the highland in the north of Thailand
Table 1. Data and productivity of Pumpkin in HuayPoa (Date of plant 30 October 2015)
AVRDC code
1st male flower (days)
1st female flower (days)
Node No. 1st female
Vine length(cm)
Disease reaction Fruit shape
FruitribsVirus Gummy
stemblight
Powdery mildew
AVPU1394 9 Dec2015
3 Dec2015
9 237.00 √ – – Flattened √
AVPU1504 13 Dec2015
13 Dec2015
17 441.00 – – – Dumbbell √
AVPU1505 13 Dec2015
11 Dec2015
14 447.00 √ – – Flattened √
AVPU1508 6 Dec2015
2 Dec2015
12 354.00 √ – – Globular √
AVPU1509 11 Dec2015
9 Dec2015
14 327.00 √ – – Globular √

260
Table 3. Data and productivity of Pumpkin in HuayPoa (Date of plant 30 October 2015)
AVRDC code Eating quality (%) Fruit
width (cm.)
Fruit length (cm.)
Seed cavity width (cm.)
Seed cavity length (cm.)
Flesh thickness (cm.)
Yield per plant
Sweetness Firmness Fiber No. Weight (kg.)
AVPU 1394
– – – 12.26 6.26 7.90 3.74 2.38 2 1.09
AVPU 1504
P P – 9.10 13.98 5.60 5.72 1.68 5 2.88
AVPU 1505
P P – 18.62 8.06 11.70 5.10 3.60 2 3.28
AVPU 1508
– – – 17.90 14.90 11.06 9.14 3.42 2 5.97
AVPU 1509
– – – 17.92 10.50 12.46 6.90 2.48 2 3.80
Table 4. The results of Vitamin C and Beta – Carotene in five pumpkin varieties
AVRDC code Vitamin C(mg/100 g Fresh weight)
Beta Carotene(µg/100 g Fresh weight)
AVPU1394 0.63 3,694.94
AVPU1504 8.09 1,342.87
AVPU1505 3.37 1,544.11
AVPU1508 3.17 1,242.88
AVPU1509 0.25 2,023.79
Table 2. Data and productivity of Pumpkin in HuayPoa (Date of plant 30 October 2015)
AVRDC code
Fruit skin Average fruitweight (kg)
Skin color Flesh color
TSS (%B)Smooth Ridged Rough Main Secondary
AVPU1394 √ 0.62 cream green orange 9.30 AVPU1504 √ 0.58 orange cream orange 12.90AVPU1505 √ 1.87 green cream yellow 14.20 AVPU1508 √ 2.69 green cream orange 10.90 AVPU1509 √ 2.17 brown green orange 9.30

261
Beta-carotene at 3,694.94 μg/100 g of fresh weight. It can be concluded that pumpkin varieties suitable for highland area were AVPU 1504 and AVPU 1505 due to the highest sweetness, firmness and nutritive value.
ACKNOWLEDGMENT Authors acknowledge the support given by World Vegetable Center (AVRDC-ESEA), Highland Development Project using Royal Project System HuayPao and theHighland Research and Development Institute (Public Organization).
REFERENCESKerdpiboon, S.,C. Sovaphan, P. Phiwthongand, O.Thapanapunnitikul. (2011). Effects
of emulsifiers and mixing time on physical properties of pumpkin spread. KKU Research Journal (Thailand). 16 (1): 32 – 40
Khanobdee, J., S. Tangteerawattana, S. Mulalin and JirapaPongjanta. (2003). High quality of pumpkin (Cucurbitamoschata Duch. Ex Poir.) lines. Proceedings of 41th Kasetsart University Annual Conference: Plants, Agricultural Extension and Communication, Thailand, 3 – 7 February 2003. 605 p.
Kubicki, B. and Walczak, B. (1976). Variation and heribility of B-carotene content in some cultivars of the Cucurbita species. Genet. Pol 17: 531 – 544.
Loy, J.B. (2006). Harvest period and storage affect biomass partitioning and attributes of eating quality in acorn squash (Cucurbitapepo), pp. 568 – 577. In G.J. Holmes(ed.), Cucurbitaceae Proceedings 2006. Universal Press, Raleigh, North Carolina
262
Diversity of Indigenous Cucurbits in Vietnam – Situation and Potential
Nguyen Chau Nien1, Ina Pinker2 and Michael H. Böhme21Faculty of Agronomy, Nong Lam University, Ho Chi Minh City, Linh Trung Ward, Thu Duc District,Ho Chi Minh City, Vietnam, E-mail: [email protected] of Berlin, Dept. Horticultural Plant Systems, Lentzeallee 75, D-14195 Berlin, GermanyE-mail: [email protected]
Abstract Cucurbits are among the most important vegetables for cultivation and consumption in Vietnam. This paper focuses on indigenous cucurbits in Vietnam as Cucumis sativus, Momordica charantia and Luffa cylindrica. A survey was conducted in Mekong River Delta in southern Vietnam, interviewing 1,009 farmers. The results showed that nine cucurbit species are commonly cultivated and five of them are indigenous. Among them bitter gourd (Momordica charantia) was the most frequently cultivated cucurbit while loofah (Luffa cylindrica) was the least grown. It was obvious that cultivation of land races (with seeds reproduced by the farmers) are more and more substituted by commercial cultivars. Therefore, local genetic resources were collected and evaluated. In total, 106 collected accessions of land races of the three indigenous species; cucumber (Cucumis sativus), bitter gourd and loofah were analysed based on morphological characteristics by UPGMA (Expand) clustering. For all investigated species, diversity among the accessions was identified. The 25 cucumber accessions were grouped in three clusters by Unweighted Pair Group Method with Arithmetic Mean (UPGMA), as well as 39 loofah accessions and 42 bitter gourd accessions. Some of the accessions exhibit characteristics important for consumer acceptance. The collected and characterized accessions should be preserved and integrated in breeding programmes.
Keywords: indigenous crops, land races, UPGMA clustering, morphological characteristics
INTRODUCTION The plant family Cucurbitaceae is highly diverse and comprises about 95 genera and 950 – 980 species (Schaefer and Renner, 2011). Many species in this plant family are important vegetables in Vietnam (Trinh et al., 2003; Huong et al., 2013). Some cucurbit species are indigenous, but many of the non-indigenous ones are also well adapted to different geographical regions in Vietnam and have been cultivated for a long time. Vegetables enable better income in rural and urban areas. Having the advantages of short growing cycles and with appropriate cultivation techniques, vegetables have become important cash crops in Vietnam (Jansen et al., 1996). Moreover, vegetables are rich in minerals, vitamins and other bioactive metabolites that improve nutrition and health, which is especially important for the low-income households that are having daily meals lacking animal protein (Siemonsma and Piluek, 1994; Krawinkel and Keding, 2006; Böhme and Pinker, 2007). Therefore, already a decade ago, more than 60% of
263
households in Mekong villages and almost all households in Central Highland were growing vegetables (Ogle et al., 2003). Mekong River Delta, with agricultural land of more than 1.6 million ha, is the major vegetable area in southern Vietnam (GSO, 2013). Vegetables are produced to supply 17.4 million local people, especially citizens in some large cities nearby, such as Ho Chi Minh City, Thu Dau Mot and Bien Hoa. The vegetable production has increased in relation to the growth of population in the area (Figuireé, 2003; Mergenthaler et al., 2009). Various studies have been carried out to investigate the diversity of species in vegetable production and markets in Vietnam (Siemonsma and Piluek, 1994; Khiem et al., 2000). These studies indicate that 13 cucurbit species, among about 75 different vegetable species, are commonly cultivated. Among the cucurbit species we find ash gourd (Benincasa hispida), watermelon (Citrullus lanatus), melon (Cucumis melo, C. melo var. conomon), cucumber (Cucumis sativus), summer squash (Cucurbita pepo), pumpkin (C. moschata), bottle gourd (Lagenaria siceraria), loofah (Luffa cylindrica, L. acutangula), bitter gourd (Momordica charantia), chayote (Sechium edule) and snake gourd (Trichosanthes cucumerina). A recent survey in Hung Yen, a province in Red River Delta specialized in vegetable cultivation, has shown that the area used for cultivating cucurbits covered 16% of the total cultivated area and represented 18% of the total vegetable production (FAVRI, 2010). So far, the situation in Mekong River Delta is not well described. Therefore, this research was conducted with the aim to determine the importance and the diversity of cucurbit species cultivated in that area.
MATERIALS AND METHODS
Field survey A questionnaire was developed in order to collect same information from all interviewed farmers. Growers in the eight selected districts (including 20 communes) in Mekong River Delta in southern Vietnam were selected randomly considering the following criteria: (1) grower had at least five years of experience in commercial cultivation of vegetables, (2) the area used for cultivating vegetable crops was of 500m2 minimum and (3) grower had cultivated vegetable in previous three crop cycles. Concerning the confidence level of 95% accompanied by a 3% margin of error, 120 farmers were required for each of the eight districts. To compensate for 5% of unresponsiveness, it was planned to interview 126 farmers from each district with the given questionnaire. The questionnaire was focused to classify the diversity of vegetable species and its cultivated areas in the dry season (current crop) and whole year (year-round crop). Chi-square (c2) test, t-test, permutation test (non-parametric statistics) and analysis of variance (ANOVA) were applied depending on the distribution of variables and number of groups in variables. All statistical significant levels were tested at P ≤ 0.05. The cultivation frequency (CF) of cucurbit species was determined for the time during the survey and the year round cultivation as percentage of the farmers producing these species as the main crop. These analysis were performed with the R software version 3.1.3 (R Core Team, 2013).

264
DETERMINATION OF DIVERSITY OF CUCURBIT ACCESSIONS Cucurbit accessions were collected in different places in southern Vietnam as described by Nguyen (2016). In total, 106 local accessions including cucumber (25 accessions), loofah (39 accessions) and bitter gourd (42 accessions) were included in study regarding diversity in morphological characteristics. The selected morphological characters (39 for cucumber, 27 for loofah and 37 for bitter gourd) were evaluated based on UPOV guidelines (2013). The field evaluation was carried out at the research farm of TH Company, located in Dong Nai Province, Southeast Vietnam (150 km northeast of Ho Chi Minh City). Soil type at the site is basaltic, with good drainage, pH = 6.0, organic matter = 2.6%, solution salts = 130ppm, 100% base saturation and cation exchange capacity (CEC) = 8.5 meq/100 cm3. Fertilizer added (kg/ha): 50 K2O, 200 N, 135 P2O5, 50 S and 0.5 B. Plastic mulch and integrated pest management were applied. The temperature, relative humidity and sunshine hours during field experiment were 26.7 – 29.6 °C, 73 – 98% and 6.6 – 9.9 h/day, respectively. The experiments were organized in Randomized Complete Block Design with two replications, with different plant densities dependent on the species (0.4 x 1.5 m, 0.6 x 1.6 m and 0.5 x 1.5 m for cucumber, loofah and bitter gourd, respectively). Trellis was made to support plants for climbing. Female flowers were hand pollinated by male flowers of other plants in the same accession. Binomial coding was used for coding categorical variables with number 1 was present and number 0 was absent of the observed characteristics. For categorical variables that included more than two assessment levels, cardinal numbers were used for coding, i.e. a variable with three levels: small, medium and large were then converted to numbers 1= small, 2 = medium, 3 = large. The data were set as rectangular data matrix and then standardized following characteristic to get average values = 0 and variance values = 1 before clustering. The matrix with standardisation values transformed to symmetric dissimilarity matrix with distance coefficient was used. Un-weighted pair group method using arithmetic averages (UPGMA) was applied to analyse the relationships of accessions.
RESULTS AND DISCUSSION
Field survey The field survey based on the 1,009 interviews of farmers in Mekong River Delta indicated that nine cucurbit species were frequently cultivated and that five of them indigenous, belonging the genera Cucumis, Luffa and Momordica. The average farmers were 45.5 years, with range from 39 to 52 years. Each household had 4.4 members in average. The average education levels, of farmers was 6.0 grades, which means they had the first level of secondary education. Among the 20 communes, there were no significant difference regarding age, education levels and members in a household (c2 significantly different and ranged from 1,656m2 per farm in Tan Thuy to 7,437m2 per

265
farm in Phu Nhuan. Similarly, the average areas of vegetable land in these communes were also significantly different. The lowest value was 982m2 per farm in Phu Long and the highest value was 4,225m2 per farm in An Thuy (Nguyen, 2016). Cucurbitaceae occupied 56.5% of the total available land during the dry season; this can be due to the plant size of the cucurbits or maybe due to other reasons, such as their adaptation and economic importance (Nguyen Nien, 2016). Regarding the cultivation frequency of cucurbit species in relation to all vegetable species, the results are given in Table 1. Nine cucurbit species belonging to seven genera were cultivated in current crop (42.8%) and in year-round crop (38.2%). Bitter gourd, watermelon (Citrullus lanatus), cucumber, melon (Cucumis melo var. conomon) and bottle gourd (Lagenaria siceraria) were cultivated with high frequency as the main crop (Table 1). This could be a response to the increased market demands (Khiem et al., 2000; Figuié, 2003; Mergenthaler et al., 2009). In contrast, the low using frequencies of pumpkin (Cucurbita moschata) and angled loofah (Luffa acutangula) found in this survey (Table 1) could be explained by their traditional cultivation in home gardens (Trinh et al., 2003; Pham and Vo, 2013). The two species can be cultivated easily in home gardens and this production can satisfy the current market needs. Three other species; summer squash (Cucurbita pepo), chayote (Sechium edule) and snake gourd (Trichosanthes anguina), that by others have been determined as frequently cultivated crops in Vietnam (Siemonsma and Piluek, 1994; Pham, 1999), were not found in this study. These three species are mainly produced in North central coast, Central highland and North Vietnam (Pham, 1999) and therefore, they were not found in the study area. Regarding to chayote and snake gourd, moreover, they are not cultivated in South Vietnam because they are rarely used in cuisine style of southerners.
Table 1. Cultivation frequency (CF) of cucurbit species related to all vegetable species (100%) during the survey (current crop in the dry season) and the year-round cultivation in Mekong River Delta
Scientific name Common name Current crop Year-round cropCF (%) CF (%)
Benincasa hispida Ash gourd 0.7 1.6Citrullus lanatus Watermelon 11.5 10.6Cucumis melo var. conomon Melon 5.2 3.6Cucumis sativus Cucumber 6.7 5.5Cucurbita moschata Pumpkin 0.5 0.3Lagenaria siceraria Bottle gourd 1.8 2.2Luffa acutangula Angled loofah 0.2 0.1Luffa cylindrica Loofah 0.9 1.2Momordica charantia Bitter gourd 15.3 13.1Total 42.8 38.2

266
For genetic diversity within the species the seed source is very important. As found in the farmer interviews, cucurbit seeds came from two main sources: the farmers bought the commercial seed cultivars from seed agencies (60.6%) or the farmers maintained their own seeds from previous crops as open pollinated land races (39.4%). The contribution of both seed sources varied among the cucurbit species as given in Figure 1. More than 98% of the seeds of cucumber and watermelon of the current crop was bought. Also for pumpkin about 80% seeds was bought. In contrast, 88% seeds of loofah and melon were based on seeds kept from previous crops. Also more than 60% of the seeds of bitter gourd were maintained from previous crops. The ratios of both seed sources were equal for angled loofah and bottle gourd.
Evaluation of diversity It was obvious that for some of the cucurbit crops land races that were produced by the Vietnamese farmers themselves are being largely substituted by commercial cultivars. Therefore, local genetic resources were collected and evaluated (Nguyen, 2016). The current study concentrated on local accessions of cucumber, loofah and bitter gourd. Accessions were morphological characterized and analysed where a variability of the morphological traits could be.
Cucumber Among the 39 characters (variables) seven did not differ among the accessions. All accessions were determinate in growth type. The plants were determined as monoecious, except accessions TiGi02 and TiGi03. In the young stage, fruits grew with prickles and then these prickles dropped down when fruits became mature. In the marketable stage, fruits were green in skin colour with small white dots and the fruits of all accessions had obtuse shape of fruit base. Moreover, fruits’ skin at harvest stage of all accessions had no
0% 20% 40% 60% 80% 100%
Commercial seeds Own seeds
Angled loofah
Pumpkin
Ash gourd
Loofah
Bottle gourd
Melon
Cucumber
Watermelon
Bitter gourd
Figure 1. Seed sources for cucurbit cultivation in Mekong River Delta, Vietnam, current crop

267
sutures, creasing, glaucosity and warts. The dendrogram representing the relationships of the 25 cucumber accessions shows three main groups, meeting at coefficient value 1.44 (Figure 2). The first group consists only of two accessions collected in the same provinces (TiGi02 and TiGi03). The second group consists of six accessions (QuNg01, DoNa01, DoNa02, DoNa03, BiPh01 and QuNa05). The largest group consists of 17 accessions. The differing characters were e.g. sex expression, time of first female flower and time to first male flower.
Loofah From the 27 considered characters three were not differing among the accessions. e.g. all accessions had cotyledons colour in dark green and angular in stem shape. Leaf margin was dented and shape of fruits in transversal section was round. Based on the differing characters as fruit weight, fruit length and fruit skin colour, by UPGMA clustering (Figure 3) three main groups were determined, one with only one single accession CaTh01 and another also with a single accession (HemCO3) and a large group including the rest of the accessions.
QuNa01 QuNa03 BrVt01
QuNa02 ViLo01 LaDo01 BiTh02 BiTh01 DoTh01 TiGi04
HcmC01 HaGi01 TaNi01
QuNa04 BeTr01 NiTh02 TiGi01
QuNa05 BiPh01
DoNa03 DoNa01 DoNa02 QuNg01 TiGi02 TiGi03
0.99 1.16 1.33 1.50 1.67
Distance Coefficient
Figure 2. Dendrogram of 25 cucumber accessions (Cucumis sativus) clustered from 32 varying variables (the red line is level of cut for three groups)

268
BITTER GOURD From the 37 characters evaluated 34 exhibited variation. No difference among the accessions was found regarding the number of leaf lobes; the fruit had warts and spines and a large indentation of edger of seeds, except accession HcmC01. The UPGMA dendrogram based on the variable characters as stem length, indentation of seed edges, length of fruit ridge and cluster of fruit skin shows three groups that meet at coefficient value 1.65 (Figure 4). The first group had only one accession (HcmC01), the second too (QuNa01) whereas the largest group included 40 accessions
Distance Coefficient
0.68 0.91 1.14 1.38 1.61
QuNa01 BiDu02 TiGi01
NiTh02 CaTh02 QuNa02 LoAn01 HaGi05 KiGi01
HcmC02 BiTh01 BeTr02
DoNa02 HaGi02 NiTh03
QuNg01 BeTr01 NiTh01
QuNa04 LoAn02 ViLo01
QuNa03 QuNa05 HaGi04 BaLi02 HaGi01
QuNa06 PhYe01 BiPh01 BiDu01 HaGi03 NiTh04
HcmC04 HcmC01 DoNa01 BrVt01 BaLi01
HcmC03 CaTh01
Figure 3. Dendrogram of 39 loofah accessions (Luffa cylindrica) calculated from 23 varying variables (the red line is level of cut for three groups)

269
Distance Coefficient
0.66 1.09 1.52 1.96 2.39
BrVt01 BiPh01
DoNa02 BiDu04 BiDu05 NiTh02 TiGi02 NiTh01 BiPh02 BrVt06 BiPh05 AnGi02 BrVt05 BiPh04 TiGi03 BiPh03 BiDu01
HcmC03 SoTr01
HcmC02 DoNa04 QuNa04 TaNi01 TiGi01
BiDu03 BrVt02 BrVt04 BrVt03
DoNa05 BiDu02 DoNa01 DoNa03 QuNa02 TiGi04
NiTh03 QuNa03 DaLa01 BiTh01 AnGi01 TiGi05
QuNa01 HcmC01
Figure 4. Dendrogram of 42 bitter gourd accessions (Momordica charantia) calculated from 34 varying variables (the red line is level of cut for three groups)

270
CONCLUSION The field survey highlighted the importance of cucurbits as vegetables in Mekong River Delta in Vietnam. The results showed, water melon and bitter gourd were the most important species for commercial production, which differ somewhat from other surveys from Vietnam. For commercial vegetable production, farmers in Mekong River Delta, more and more rely on commercial cultivars that they buy from year to year. The level varied among the crop but genetic diversity, as represented by land races or locally cultivated material, may be threatened. So far, there are land races reproduced by the farmers and the present study examined 106 such accessions that are exhibiting variability in morphological traits. The still existing variability should be preserved and incorporated in breeding programs.
REFERENCESBöhme, M. and Pinker, I., (2007). Investigation regarding the potential for cultivation
of indigenous vegetable in Southeast Asia. Proc. Indig. Veg. and Legumes. Acta Hortic.752: 179 – 185
FAVRI, (2010). Fruit and Vegetable Research Institute. Vegetable market research in Vietnam: Strengthening Vietnamese SPS capacities for trade – improving safety and quality of fresh vegetables through the value chain approach. Fruit and Vegetable Research Institute, Hanoi, Vietnam, 14 pp
Figuié, M., (2003). Vegetable consumption behaviour in Vietnam. Research report. Sustainable development of peri-urban agriculture in Southeast Asia (Susper). Kingdom of Cambodia, Lao PDR, Vietnam RS. 22 pp
GSO (General Statistic Office of Vietnam), (2013). Statistical yearbook of Vietnam, 2012. Statistical Publishing House. pp. 15 – 470.
Huong, P.T.T., Everaarts, A.P., Neeteson, J.J. and Struik, P.C. (2013). Vegetable production in Red River Delta of Vietnam. II. Profitability, labour requirement and pesticide use. NJAS – Wageningen Journal of Life Sciences 67: 37 – 46
Jansen, H.G.P., Midmore, D.J., Binh, P.T., Valasayya, S. and Tru, L.C., (1996). Profitability and sustainability of peri-urban vegetable production systems in Vietnam. Netherlands Journal of Agricultural Science 44: 125 – 143
Khiem, N.T., Tien, T.D. and Thuy, N.T.T., (2000). Vietnam. In: Ali, M. (ed.) Dynamics of vegetable production, distribution and consumption in Asia. Shanhua, Taiwan, Asian Vegetable Research and Development Center, AVRDC Publication No.00-498: 445 – 467
Krawinkel, M.B. and Keding, G. B., (2006). Bitter Gourd (Momordica charantia): A Dietary Approach to Hyperglycemia. Nutrition Reviews 64 (7): 331 – 337
Mergenthaler, M., Weinberger, K. and Quam, M., (2009). The food system transformation in developing countries: A disaggregate demand analysis for fruits and vegetables in Vietnam. Food Policy 34: 426 – 436

271
Nguyen Nien, C., (2016). Survey, collection and characterization of indigenous and non-indigenous cucurbits in Vietnam. PhD. thesis, Humboldt of Berlin (HU), Germany. 193 pp
Ogle, B.M., Tuyet, H.T., Duyet, H.N. and Dung, N.N.X., (2003). Food, feed or medicine: The multiple functions of edible wild plants in Vietnam. Economic Botany 57(1): 103 – 117
Pham, H.H., (1999). An illustrated flora of Vietnam: Volume 1.Tre Publishing House. pp. 563 – 576
Pham, N.H. and Vo, D.T., (2013). Land use planning for safe vegetables cultivation in Ben Tre province. Department of Science and Technology, Ben Tre province, Vietnam. 126 pp
R Core Team, (2013). R: A language and environment for statistical computing. R Foundation for Statistical Computing. Vienna. Austria. URL http://www.R-project.org/.
Schaefer, H. and Renner; H. H., (2011). Cucurbitaceae. In: Kubitzki, K. (ed.), The families and genera of vascular plants, vol. 10, Sapindales, Cucurbitales, Myrtaceae. Berlin: Springer. pp. 112 – 174
Siemonsma, J. S. and Piluek K. (Editors), (1994). Plant resources of South-East Asia. No.8: Vegetables. Bogor Indo. 415 pp
Trinh, L.N., Watson, J.V., Hue, N. N., De, N.N., Minh, N.V., Chu, P., Sthapit, B.R. and Eyzaguirre, P.B., (2003). Agrobiodiversity conservation and development in Vietnam home gardens. Agriculture, Ecosystems and Environment 97: 317 – 344.
UPOV, (2013). International Union for the Protection of New Varieties of Plants – Guidelines for the conduct of tests for distinctness, uniformity and stability

272
Effect of Carboxyl Methyl Cellulose (CMC) Edible Coating on The Quality and Shelf Life of Chillies (Capsicum Annum Cv. Kulai)
Joanna, C.L.Y, Nur Azlin, R., Nur Syafini, G., Syed Abas, S.A.R, Zaipun, M.Z., Habsah, M., Razali, M., Pauziah, M. and Wan Mahfuzah, W.I. Horticulture Research Centre, Malaysian Agricultural Research and Development Institute (MARDI), MARDI Headquarters, Persiaran MARDI-UPM, 43400 Serdang, Selangor, MalaysiaE-mail: [email protected]
Abstract The objective of the present study was to develop a suitable edible coating treatment to improve the postharvest qualities of chillies during storage. Shelf life of chillies ends with fungal infection that usually begins at the peduncle and can rapidly spread to the fruit and encourage soft rot. Effect of Carboxyl Methyl Cellulose (CMC) coating at different concentrations on postharvest qualities of chillies was studied. chillies were subjected to a 30 seconds dip into a CMC-based (0.5, 1.0 and 1.5%, w/v) coating solution, while the uncoated chillies served as control. Uncoated and coated chillies were then packed in unsealed low density polyethylene (0.04 mm thickness) bags and stored at 10 °C (85-90% relative humidity) for four weeks. Physical characteristics (firmness, disease incidence and colour) and chemical characteristics (pH, titratable acidity and ascorbic acid content) were assessed. From the study, no significant differences were found for firmness and chemical variables among treatments except for ascorbic acid content and disease incidence. Fungus started to form on the peduncles of uncoated chillies which later spread to the fruit after two weeks of storage. Coated chillies were found to retain its colour and freshness better compared to uncoated chillies. At week three, chillies coated with 0.5% CMC were found to have less fungal infection compared to 1.0 and 1.5%. Thus it may be concluded from the experiment that coating chillies with 0.5% CMC may help in delaying the onset of fungal infection and to retain quality of chillies up to three weeks compared to uncoated chillies stored at 10 °C that could last for only two weeks.
Keywords: storage, edible coating, colour, disease incidence, peduncle
INTRODUCTION Chilli (Capsicum annuum L.) being a non-climacteric fruit, is highly perishable with short shelf-life. Common postharvest problems associated with chillies during storage are quality degradation, chilling injury (when stored below 7 °C), shrivelling and rapid loss of weight due to transpiration, postharvest diseases, improper postharvest handling and senescence. Storage at 7 – 10 °C is recommended to minimise the risk of chilling injury in chillies with storage life at about 2-3 weeks (Rico et al., 2002). However, decay was higher at 10 °C (Lin, 2005) with fungal infection that usually begins at the green peduncle that can rapidly spread to the fruit resulting in short storage life. chillies are susceptible to postharvest diseases caused by various pathogenic fungi. Like all other types of fresh fruits and vegetables, short storage life represents a serious

273
constraint for efficient handling, transportation and marketing of chillies which lead to postharvest losses. The loss of fresh produce due to fungal decay can be ameliorated by using synthetic fungicides. However, prolonged usages of these synthetic fungicides have created a negative impact on the environment as well as health. Hence, natural biodegradable edible coatings have become an effective method in extending the postharvest shelf-life of many fresh fruits and vegetable (Fagundes et al., 2014) by reducing moisture loss and respiration rate, preventing physical damage and enhancing product appearance. Edible coatings based on polysaccharide materials such as starch, carrageenan, chitosan and carboxyl methyl cellulose have been studied for delaying ripening, senescence and decay during storage. Carboxyl methyl Cellulose (CMC) is categorized as a type of linear, long-chain, water-soluble, anionic polysaccharide that can be safely used as fruit coating (Gol et al., 2013). Shelf-life and quality of strawberry (Gol et al., 2013), cucumber (Oluwaseun et al., 2013), plum (Hussain et al., 2015) and citrus (Arnon et al., 2014) were prolonged by using CMC. There have been a few researches that investigated the effect of CMC-based coating on chillies to inhibit fungal growth on the peduncle. Therefore, the objective of this study was to determine the optimum concentrations of CMC-based edible coating treatment to improve the postharvest qualities and to prolong shelf-life of chilli var Kulai.
MATERIALS AND METHODS
Materials Chillies (Capsicum annuum var Kulai) were harvested at index 4/5 from a farm in Ulu Yam, Selangor, Malaysia. Upon arrival, the fruits were washed, dried and sorted for uniformity of colour, shape, size and absence of defects.
Preparation of edible coating solutions Coating solutions were prepared by dissolving CMC powder (0.5, 1.0 and 1.5%, w/v) in 2L distilled water at 25 ± 2 °C and were homogenised (using Polytron, PT-MR2100, USA) for 15 min until the solution became clear. Glycerol (0.1% w/v) and Tween 20 (0.01%) were added to each of the solutions. The coating solutions were kept overnight. Prior to surface coating of chillies, pH of the coating solutions was adjusted to 5.6 using 50% (w/v) citric acid.
Edible coating application on chillies Chillies were then subjected to the respected treatments and were dipped in the following solutions for 30 seconds, T1: 0% CMC (Control), T2: 0.5% CMC, T3: 1.0% CMC, T4: 1.5% CMC. Following, all fruits were air-dried at room temperature and then packed in polyethylene bag 0.04 mm (average 200 g/bag). Approximately ten fruits in each packaging with three replications were used at each sampling stage. All

274
treatments were stored at 10 °C (85 – 90% relative humidity) and analysed at weekly interval for a month.
Physical and chemical determination Colour of chillies was determined by measuring lightness (L*), chroma (C*) and hue angle (h°) using a Minolta Chroma Meter (Model 300, Osaka, Japan). The texture of fresh fruit was measured using a texture analyser (TA.xt.Plus,Stable Micro Systems), fitted with a needle stainless steel cylindrical probe (P2N) and travelled 10 mm of the depth of the sample with penetration speed of 5 mm/sec. Values were expressed as Newton (N). The tissue firmness was determined at three different places on the fruits. The pH value was determined by a microprocessor pH meter (Orion, USA). Total titratable acidity (TTA) was determined by neutralizing sample juice with 0.1 N NaOH to an end point of pH 8.2 (Nerd et al., 1999) and the results were expressed in % citric acid (Ranggana, 1977). Soluble solids concentration (SSC %) was determined on the juice obtained from each sample using a digital refractometer (ATAGO DBX-55, Japan) and was expressed as % SSC. Ascorbic acid content was determined by titrating juice with 2, 6- dichlorophenol indophenol. Total ascorbic acid content was expressed as g ascorbic acid per 100 g fresh weight (Ranggana, 1977).
Statistical analysis The experiment was conducted in a completely randomized block design. All results were tested by analysis of variance (ANOVA) using SAS 9.2 (SAS Institute, Cary NC USA). Mean values from three replicates were compared by the least significance difference (LSD) at p <0.05.
RESULTS AND DISCUSSION Colour is considered as one of the major quality attributes considered during purchasing of any fresh produce. Among all treatments, chillies coated with 0.5% CMC possessed the highest lightness value of 35.60 (Table 1) during three weeks of storage at 10 °C. However, there were no significant differences (p>0.05) of lightness value during storage week for all treatments. Chroma values were found to be significantly different (p <0.05) among all treatments (Table 1). Chroma values were the lowest in chillies coated with 0.5% followed by 1.5%, control and 1.0%. Higher chroma values on coated samples indicated the same colors but with higher purity or saturation. During storage, fresh chillies in week 0 had the lowest chroma values and increased significantly (p <0.05) at week one during storage. At week two and three, chroma values of all treatments decreased slightly during storage. Hue angle values for skin colour were found to be significantly higher (p <0.05) in control and chillies coated with 0.5% CMC compared to chillies coated with 1.0 and 1.5% CMC. Fresh chillies in week 0 had the highest Hue angle value compared to other weeks and decreased

275
significantly with storage time which is probably due to the colour development that occurred more prominently as the maturity progressed and with longer storage period (Nur Azlin et al., 2014). There were no significant difference (p >0.05) in firmness among treatments except days of storage (Table 2). Firmness of chillies was found to decrease significantly at week three indicating the softening of chillies due to extended storage. Most of the chillies have developed soft rot and fungal infection which reduced its marketability. Fruit softening is triggered by various hydrolytic reactions of enzymes during ripening (Payasi et al., 2009). The mean fruit firmness progressively decreased with increase in storage time (Table 2). This could be due to high respiration rate and weight loss due to prolonged storage (Lahay et al., 2013; Cantwell et al., 2009). Coating application did not significantly affect pH, TA and SSC (p >0.05) of chillies among treatments (Table 2). The pH increase was attributed to the loss of citric acid (Table 2) in chillies as fruit ripened. Organic acid tends to decline after harvest or during storage as they are respired or converted into sugar (Wills et al., 2007). The decrease of SSC during storage was probably due to it being used as a respiratory substrate during the metabolic process (Kays, 1991). Furthermore, chillies selected for this experiment had a full-developed red color, which could also explain the small changes observed in chemical variables during storage. Ascorbic acid content was
Table 1. Effects of Carboxyl Methyl Cellulose (CMC) edible coating on lightness (L*), chroma (C*) and hue angle ( h°) on the quality and shelf life of chillies (Capsicum annum cv. Kulai) during storage at 10 °C
CMC coating (C) L* C* h°T1 (Control-0%) 34.67b 37.24ab 26.69aT2 (0.5%) 35.60a 35.35c 25.89aT3 (1.0%) 34.73b 38.02a 24.60bT4 (1.5%) 34.84b 36.58b 23.21cF-significant ** ** **Storage Week (W)0 34.81 35.30c 27.71a1 34.54 38.09a 25.02b2 34.75 37.36ab 24.30b3 34.55 36.44b 23.35cF-significant ns ** **Interaction (CxW) ** ** **
Means followed by different small letters within columns are significantly different between coating treatments and storage duration at 5% level (p <0.05) by using least significance difference. ns, *,** non significant, significant at p <0.05 or highly significant at p <0.01.

276
Table 2. Effects of CMC edible coating on weight loss, firmness, pH, titratable acidity (% citric acid) and soluble solids concentration (SSC) on the quality and shelf life of chillies (Capsicum annum cv. Kulai) during storage at 10 °C
CMC coating (C) Firmness (N) pH Citric acid (%) SSC (%)T1 (Control-0%) 4.07 5.48 1.58 7.37T2 (0.5%) 3.97 5.48 1.57 7.35T3 (1.0%) 4.07 5.50 1.55 7.34T4 (1.5%) 4.05 5.47 1.56 7.36F-significant ns ns Ns nsStorage Week (W)0 4.03a 5.11 b 1.72a 7.84 a1 4.19a 5.80 a 1.36c 7.61 b2 3.90a 5.78 a 1.52 b 7.25 c3 3.75b 5.79 a 1.53 b 7.42 bcF-significant * ** ** **Interaction (CxW) ns * * ns
Means followed by different small letters within columns are significantly different between coating treatments and storage duration at 5% level (p <0.05) by using least significance difference. ns, *,** non significant, significant at p <0.05 or highly significant at p <0.01.
Figure 1. Effects of CMC edible coating on ascorbic acid content during storage at 10 °C
14.50
15.00
15.50
16.00
16.50
17.00
17.50
18.00
18.50
Asc
orbi
c ac
id (A
A) c
onte
nt m
g/10
0 g
WO W1 W2 W3
Storage week
cc
bc
aa a a
aa
aa
a
b
b
bb
T1: ControlT2: 0.5% CMC
T4: 1.5% CMCT3: 1.0% CMC
found to be significantly higher (p <0.05) in chillies coated with CMC during storage (Figure 1) compared to control. Edible coating functioned like modified atmosphere packaging (MAP) that may reduce O2 diffusion thus slowing down the respiration rate.

277
This delays the deteriorative oxidation reaction of ascorbic acid of fruit (Oluwaseun et al., 2013; Gol et al., 2013). The concentration of ascorbic acid during storage decreased significantly (Figure 1) in all treatments. Reduction in ascorbic acid is associated with quality degradation of chillies after prolonged storage due to decay and softening (Nur Azlin et al., 2014). The primary reasons for the deterioration of chillies quality are water loss and microbial decay that is mainly caused by Alternaria alternata and Botrytis cinerea (Fallik et al., 1999). In uncoated chillies, fungus infection started to appear on the chilli peduncle resulting in detached stalk and soft rot after two weeks of storage at 10 °C. Whereas, CMC coated chillies had a positive effect on the shelf-life, colour and marketability when kept at ambient temperature for 3 – 4 days compared to uncoated chillies. The control of decay in coated chillies may also be attributed to the modified atmosphere due to coating (Dutta et al., 2009).
CONCLUSION In conclusion, maintaining quality and prolonging the shelf life of chillies by carboxyl methyl cellulose coating may help in delaying the onset of fungal infection compared to uncoated chillies. Coating chillies with 0.5% CMC was able to retain quality of chillies up to 3 weeks compared to uncoated chillies which could last for only two weeks during storage at 10 °C. Further studies need to be done to optimise the application of CMC-based edible coating and their effectiveness on prolonging the shelf life of chilli.
REFERENCESArnon, H., Zaitsev, Y, Porat, R. and Poverenov, E. (2014). Effects of carboxymethyl
cellulose and chitosan bilayer edible coating on postharvest quality of citrus fruit. Postharvest Biology and Technology, 87: 21 – 26
Dutta PK, Tripathi, S, Mehrotra, GK, Dutta, J. (2009) Perspectives for chitosan based antimicrobial films in food applications. Food Chemistry. 114, 1173 – 1182
Fagundes, C., Palou, L., Monteiroa, A.R. and Perez-Gago, M.B. (2014) Effect of antifungal hydroxypropyl methylcellulose-beeswax edible coatings on gray mold development and quality attributes of cold-stored cherry tomato fruit. Postharvest Biology and Technology, 92: 1 – 8
Fallik, E., Grinberg, S., Alkalai, S., Yekutieli, O., Wiseblum, A., Regev, R., Beres, H. and Bar-Lev, E. (1999) A unique rapid hot water treatment to improve storage quality of sweet pepper. Postharvest Biology and Technology, 15: 25 – 32
Gol, N.B., Patel, P.R. and Rao, T.V.R. (2013) Improvement of quality and shelf-life of strawberries with edible coatings enriched with chitosan. Postharvest Biology and Technology, 85:185 – 95

278
Hussain, P.R., Suradkar, P.P, Wani, A.M. and Dar, M.A. (2015) Retention of storage quality and post-refrigeration shelf-life extension of plum (Prunus domestica L.) cv. Santa Rosa using combination of carboxymethyl cellulose (CMC) coating and gamma irradiation. Radiation Physics and Chemistry, 107: 136 – 148
Kays, S.J. (1991) Postharvest physiology of perishable plant products. New York: AVI Publishing, Van Nostrand Reinhold
Lin, W.C. (2005) Quality of stored greenhouse sweet peppers influenced by storage temperatures and pre-harvest factors. Information and Technology for Sustainable Fruit and Vegetable Production (pp 101-110), FRUTIC 05, 12 – 16, Montpellier France
Nerd, A., Gutman, F. and Mizrahi, Y. (1999) Ripening and postharvest behaviour of fruits of two Hylocereus species (Cactaceae). Postharvest Biology and Technology 17: 39 – 45
Nur Azlin, R., Razali, M., Zaipun, Z. and Habsah, M. (2014) Preconditioning treatments for shelf-life extension of chilli. Journal of Tropical Agricultural and Food Science, 42(2): 135 – 142
Oluwaseun, A.C., Kayode, A., Bolajoko, F.O., Bunmi, A.J. and Olagbaju, A.R. (2013) Effect of edible coatings of carboxy methyl cellulose and corn starch on cucumber stored at ambient temperature. Asian Journal Agricultural Biology, 1(3): 133 – 140
Payasi, A., Mishta, N.N., Chaves, A.L.S. and Singh, R. (2009) Biochemistry of fruit softening: an overview. Physiology and Molecular Biology of Plants 15(2): 103 – 113
Ranggana, S. (1977) Manual of analysis of fruits and vegetable products. New Delhi: Tata McGraw-Hill Pub. Co. Ltd.
Rico, D., Martin-Diana, A.B., Barat, J.M. and Barry-Ryan, C. (2002) Extending and measuring the quality of fresh cut fruits and vegetables: A review. Trends in Food Science and technology, 18: 378 – 386
Wills, R.B.H., Lee, T.H., Graham, D., McGlasson, W.B. and Hall, E.G. (2007) Postharvest: An introduction to the physiology and handling of fruit and vegetables. 5th edition. Australia: New South Wales University Press Limited
Xing, Y., Li, X., Xu, Q., Yun, Y., Lu, Y. and Tang, Y. (2011) Effects of chitosan coating enriched with cinnamon oil on qualitative properties of sweet pepper (Capsicum annuum L). Food Chemistry, 124: 1443 – 1450
279
Producing Hybrid Chilli (Capsicum Annuum L.) Using Cytoplasmic Male Sterile (CMS) Genotypes – A Preliminary Work
Norfadzilah Ahmad Fadzil, Suhana Omar and Rozlaily ZainolHorticulture Research Centre,Malaysian Agricultural Research and Development Institute (MARDI), MARDI Headquarters, Persiaran MARDI-UPM, 43400 Serdang, Selangor, MalaysiaE-mail: [email protected], [email protected], [email protected]
Abstract This paper reports the preliminary assessment that was conducted to test the stability of cytoplasmic male sterile (CMS) chillies obtained from AVRDC under local environment. Five CMS lines with their maintainer lines were planted in MARDI Serdang Vegetable Research Plot. Isolation of the CMS plants from other pollen source was maintained by caging to test the level of sterility in the lines. The characters of pollen and sterile flowers were observed and documented for future reference. The preliminary results showed that all the sterile genotypes tested maintained their sterile characters under the local environment in Serdang. Several F1 hybrid seeds were obtained using the sterile lines. This preliminary work offers the possibility of producing hybrid seed for local chilli production.
Keywords: cytoplasmic male sterile, Capsicum annuum, F1 hybrid, vegetable
INTRODUCTION Chilli is one of the important vegetable crops in Malaysia with annual per capita consumption of about 1.7 kg. Despite its popularity, more than half (52.7%) of the local consumption is imported (DOS, 2013). Therefore, the price of chilli is undeniably high compared to other common vegetables in the market. At present, local farmers are planting both pure line varieties and F1 hybrid varieties. F1 hybrid chillies are more popular due to its vigour, higher yield and superior fruit quality. However, the price of hybrid seed is high (RM10.00/g) compared to pure lines seed (RM2.00/g). This is due to the additional cost in production of hybrid seed that need stringent procedures including emasculation and isolation requiring trained workers to produce uniform, uncontaminated hybrid seed. Therefore, an easier and cheaper way of producing hybrid seed must be worked out. Cytoplasmic male sterility (CMS) is an important tool for hybrid seed production (Kumar and Singh 2004). In Malaysia, manipulation of male sterile in producing hybrid chilli seed in large scale has never been done even by the seed company (Pers. Comm. With whom?) CMS is the abnormal pollen development in a plant. Interaction between recessive fertility restorer gene (rfrf) in nucleus and sterile gene (S) in mitochondria will stop the formation? of male reproductive system thus, minimize the task of emasculation and isolation of the flowers of female plants for hybridization in chilli (Kumar and Singh 2004). Although this character is governed by certain special genes, the expression of sterility is also influenced by the environmental factors especially the fluctuation of temperature and weather conditions (Gulyas et al., 2006).

280
Therefore, this research was conducted to study the characters of CMS genotypes obtained from AVRDC under local environments and to cross the CMS lines with the local varieties
MATERIALS AND METHODS Five CMS chilli genotypes, its maintainer lines and local varieties viz; MC 11, MC 12, Kulai, Semerah and L5 were planted in Horticulture Vegetable Research Plot, in MARDI, Serdang. Five plants were planted for each genotype. Morphological characters of anthers were assessed and classified following Peterson (1958) with some modification. Five flowers were plucked at anthesis stage and placed in clean containers for each genotype before examining in the lab. The pollen viability was assessed using aceto-carmine and pollen quantifications were done using scoring method as shown in Table 2. The readings were conducted twice. The results were analysed using Analysis of Variance. The assessment on fruit set of CMS genotypes to test the stability of sterility was conducted by caging the plant for four weeks. Prior to that, all open flowers and fruit buds (if any) were pinched off before the plants were caged. The cages were removed after one month and formation of fruits, if any, was recorded. The ability to cross for CMS lines was tested using the local chilli varieties. Each CMS line was crossed with MC11, MC12, Kulai, Semerah and L5 lines. Crossing was done in cage where the CMS and local chilli genotypes were planted side by side. The mature fruit from the CMS plants were harvested to extract the seed.
RESULTS AND DISCUSSION
1. CMS flower morphology Observations were recorded for the following characters of CMS flowers and normal chilli flowers from the local variety, MC11, Kulai and MC12 (Table 3). These findings are in line with the reports by Peterson (1958) on the morphology of CMS anther where the structure of anther can be abnormal with shrunken and smaller compared to the normal fertile anther. All, except S3 had shown this kind of anther morphology. For S3, further analysis will be conducted to check its sterility.
2. Pollen scoring The results on the scoring of pollen are shown in the bar graphs 1 and 2. Based on the scoring, all the CMS lines were in non-viable category based on the classification made by Peterson (Graph 1). The highest score was recorded for S3 with the scoring mean of 1.8. In Graph 2, result of pollen scoring of the local and hybrid plant showed significant difference. This result showed that all the local fertile plants including the hybrid obtained from crossing with CMS mother plant have significantly more pollen than the CMS plant. This result verified that the CMS lines used in this study are

281
Table 2. The score used in quantification of pollen method
Score 0 1 2 3Indicator No pollen observed Very little pollen Half of normal NormalClass 1 2Interpretation Non viable Viable
Table 3. Morphology of chilli flowers
Structure Colour SizeCMS (sterile) Shrunken Pale yellow ≤ normal sizeLocal (fertile) Well developed Purplish Well developed
The CMS flower (left) and the normal fertile flower (right)
Anther from normal fertile flower (up) and CMS flower (down)
Table 1. List of the chilli genotypes used in this study
CMS lines Restorer Maintainer LinesAVRDC Code MARDI code Local varieties AVRDC Code MARDI codeAVPP9606-S S1 MC11 VI046844; TC06683 M1
AVPP9907-S S2 MC12 AVPP9907 M2
AVPP0709-S S3 Kulai VI060627;C05606 M3
AVPP9910-S S4 Semerah AVPP9910 M4
AVPP9706-S S5 L5 AVPP9706 M5

282
Scor
e
1.5
0.5
1
2
0S1 S2 S3 S4 S5
Chilli genotype
Graph 1. Mean of pollen score comparing between the sterile genotype
MC11 KULAI S5XL5 KANDISL5 s5 s4 s1
Chilli genotype
Scor
e
0
0.5
1
1.5
2
2.5
3
3.5
Graph 2. Mean of pollen score comparing between the some of sterile genotype and normal genotypes
significantly different from the local plants in terms of its fertility level, thus it indicates that sterility of the CMS lines is maintained under the local environment. Unfortunately the S3 plant was not available during the observation done for this comparison.
3. Fruit set No formation of fruit in S1, S2, S3 and S4 were observed after one month in cage. One malformed fruit was found in S5 but had no seed. This result has confirmed the sterility of the CMS lines provided by AVRDC. The single fruit obtained in S5 however, was only paternocarpic fruit.
4. Ability to hybridize with local genotypes A number of F1 seeds were obtained from the crosses between CMS lines and the local lines including S1 x L5, S2 x L5, S3 X MC12, S4 X MC12 and S5X L5.

283
CONCLUSION The sterility of selected CMS lines obtained from AVRDC was determined and it is reliable to be used in Serdang environment for breeding work. These lines also could be used as the parent materials for producing F1 hybrid seed in future breeding programs.
REFERENCESDOS. (2013). Supply and utilization accounts of selected agricultural commodities
2008 – 2012. Department of Statistics MalaysiaGulyas, G., Pakozdi K., Lee J.S. and Hirata, Y. (2006). Analysis of fertility restoration
by using cytoplasmic male sterile red pepper (Capsicum annuum L.) lines. Breeding Science. 56: 331 – 334
Kumar, S. Singh, P.K. (2004). Mechanisms for hybrid development in vegetable. Journal of New Seeds. Vol. 6. No.4 pp 381 – 407
Peterson, P.A. (1958). Cytoplasmically inherited male sterility in Capsicum. The American Naturalist. Vol XCII. No 863. 111 – 119

284
Rapid Determination of Leaf Net Photosynthetic Rate Using Correlated SPAD Relative Chlorophyll Content of Chilli (Capsicum Annuum L.) During Vegetative and Reproductive Stage
1Mohd Aziz Rashid, 2Nurul Atilia Shafienaz Hanifah, 1Noorsuhaila Abu Bakar, 3Mohamad Zabawi Abd Ghani 1Rosmizan Abdul Rani1Crop and Soil Science Research Centre,Malaysian Agricultural Research and Development Institute, Persiaran MARDI-UPM, 43400 Serdang, Selangor2Genebank and Seed Centre, Malaysian Agricultural Research and Development Institute, MARDI Klang, Peti Surat 186, Pejabat Besar Pos, 41720 Klang Selangor3Director General Office Programme, Malaysian Agricultural Research and Development Institute (MARDI), MARDI Headquarters, Persiaran MARDI-UPM, 43400 Serdang, Selangor, MalaysiaE-mail: [email protected]
Abstract Leaf net photosynthetic rate and chlorophyll contents are major factors that influence plant growth and yield. Information on plant photosynthetic activity will provide a valuable insight into plant growth performance, health and its adaptation to environment variabilities. However, measurement of leaf net photosynthetic rate requires specialized and expensive equipment that often limits extensive in-field application while determination of chlorophyll content requires destructive analysis, chemical assay and lengthy procedures. SPAD chlorophyll meter gives measurement of leaf relative chlorophyll content in a rapid, easy and non-destructive technique. In this study, the correlation between leaf net photosynthetic rate and SPAD relative chlorophyll content of chilli during vegetative and reproductive stage was determined. Results showed that leaf net photosynthetic rate of chilli was highly correlated to SPAD relative chlorophyll content with R2 of 0.8201 and 0.8033 during vegetative and reproductive stage, respectively. This indicated that SPAD relative chlorophyll content can be used as a rapid determination to provide indirect measurement of leaf net photosynthetic rate of chilli.
Keywords: photosynthesis, relative chlorophyll content, SPAD, chilli, Capsicum annuum L.
INTRODUCTION Measurement of leaf net photosynthetic rate using specialized and expensive equipment is tedious to operate and limits extensive in-field application. The determination of leaf chlorophyll content is a lengthy procedure that involves destructive analysis, chemical solvents and laborious as well. SPAD meter which was originally developed in Japan for nitrogen management in rice (Oryza sativa) production (Wood et al., 1993) is now commonly used for rapid and non-destructive estimation of leaf chlorophyll concentrations (Sim et al., 2015). SPAD meter is now widely accepted in the agronomy industry due to its excellent correlation between SPAD readings with chlorophyll and nitrogen content (Loh et al., 2002).

285
Rapid, non-destructive and convenient technique to determine leaf photosynthetic activity through correlated SPAD chlorophyll index will be very helpful for researchers and farmers as well. Sim et al., (2015) have determined that leaf photosynthetic rate and SPAD chlorophyll index of oil palm were highly correlated with R2 of above 0.80. In this study, the correlations between leaf photosynthetic rate and SPAD chlorophyll index of chilli at vegetative and reproductive stage were investigated.
MATERIALS AND METHODS This study was conducted under a rain shelter at the Malaysian Agricultural Research and Development Institute (MARDI) Serdang. chilli Red Kulai 151 F1 hybrid was used in this study. Seeds were sown in plug trays filled with peat moss and seedlings were transplanted in soilless growing trough after 25 days. Growing media was the mixture of coco-peat, burnt paddy husk and perlite at 7:2:1 in volume. Water and nutrient were supplied by fertigation system based on planting manual from MARDI (Mahamud et al., 2009). Fertigation EC were maintained at 2.0 – 2.5 (dS/m) throughout the growing season. Relative leaf chlorophyll content were determined using a SPAD, portable chlorophyll meter (SPAD-502, Konica-Minolta, Japan) and net photosynthetic rate (A) were determined using a LI-COR 6400 Portable Photosynthesis System (LICOR Inc. Nebraska, USA). The measurements were done on week eight and 16 after transplanting. At week eight, chilli plants were in vegetative stage while at week 16, the plants were in reproductive stage. The SPAD and net photosynthetic rate were done on the same leaves. Leaves chosen for measurements were mature, unshaded and completely expanded leaves. The measurements were carried in 15 plants for each plant stage. Two leaves near the shoot apex of each plant were randomly selected for SPAD measurement. Three SPAD values per leaf were measured around the midpoint of leaf blade and were averaged as the mean SPAD value of the leaf. SPAD meter was calibrated each time before measurement. For net photosynthetic rate measurements, light intensity (photosynthetically active radiation, PAR) of the leaf chamber was set at 1200 μmolm-2s-1. The chamber temperature was maintained at 30 oC and the reference CO2 concentration was 400 ppm (µmolmol-1). Relative humidity was controlled between 50 – 70% with air flow rate at 500 µmols-1. This gas exchange measurements were done between 0800 to 1100 h, which was presumed that photosynthetic rates would be maximal (DiCristina and Germino, 2006). Data was analysed using linear regression analysis of statistical analysis software (SAS version 9.3) to determine the correlation between SPAD-relative chlorophyll content and net photosynthetic rate of chilli.

286
Net
pho
tosy
nthe
tic ra
te (A
) μ
mol
m-2
s-1
SPAD chlorophyll index (8 weeks)
0
5
10
15
20
0 10 20 30 40 50 60 70 80
y = 0.2089x – 0.665R2 = 0.82013
Figure 1. Correlation between net photosynthetic rate (A) and SPAD-502 chlorophyll index of chilli at 8 weeks after transplanting (plants in vegetative stage)
Figure 2. Correlation between net photosynthetic rate (A) and SPAD-502 chlorophyll index of chilli at 16 weeks after transplanting (plants in reproductive stage)
Net
pho
tosy
nthe
tic ra
te (A
) μ
mol
m-2
s-1
y = 0.2267x – 4.7751R2 = 0.80327
0
5
10
15
20
0 10 3020 40 50 7060 80SPAD chlorophyll index (16 weeks)

287
RESULTS AND DISCUSSION At week eight, when the plants were in vegetative stage, the regression coefficient, R2 was 0.8201 (Figure 1). At week 16, when the plants in reproductive stage, R2 was 0.8033 (Figure 2). These results showed that leaf net photosynthetic rate (A) of chilli were highly and positively correlated with SPAD relative chlorophyll content. The results also indicate that photosynthetic rate is affected by the chlorophyll concentration. Photosynthetic rate can be expected to correlate well with chlorophyll concentration as chlorophyll concentration correlates well to SPAD chlorophyll index (Sim et al., 2015).
CONCLUSION Leaf net photosynthetic rate of chilli was found to be highly correlated to SPAD relative chlorophyll content during vegetative and reproductive stage. It can be concluded that due to good correlation between photosynthetic rate and SPAD chlorophyll index, rapid determination of leaf photosynthetic activity can be done by measuring SPAD chlorophyll index.
REFERENCESDiCristina, K. and M. Germino. (2006). Correlation of neighbourhood relationships,
carbon assimilation and water status of sagebrush seedlings establishing after fire. Western North American Naturalist 66(4): 441 – 449.
Loh, F.C.W., Grabosky, J.C. and Bassuk, N.L. (2002). Using the SPAD 502 meter to assess chlorophyll and nitrogen content of Benjamin Fig and Cottonwood leaves. HortTechnology 12: 682 – 686.
Mahamud, S., Jamaludin, S., Roff, M.M.N., Halim, A.H., Mohamad, A.M. and Suwardi, A.A. (2009). Manual Teknologi Fertigasi Penanaman Cili, Rockmelon dan Tomato. Penerbit Institut Penyelidikan dan Kemajuan Pertanian Malaysia.
Sim, C.C., Zaharah, A.R., Tan, M.S. and Goh, K.J. (2015). Rapid determination of leaf chlorophyll concentration, photosynthetic activity and NK concentration of Elaies guineensis via correlated SPAD-502 chlorophyll index. Asian Journal of Agricultural Research 9 (3): 132 – 138.
Wood, C.W., Reeves, D.W. and Himelrick, D.G. (1993). Relationships between chlorophyll meter readings and leaf chlorophyll concentration, N status and crop yield: A review. Proc. Agron. Soc. N. Z. 23: 1 – 9.

288
Evaluation of the Genetic Diversity in a Subset of Amaranth Germplasm (Amaranthus spp.) and Celosia Argentea from Africa Using Agro-Morphological Traits
Tsvetelina Stoilova and Omary MbwamboWorld Vegetable Center, Eastern and Southern Africa, P.O. Box 10, Duluti, Arusha, TanzaniaE-mail: [email protected]
Abstract Amaranth (Amaranthus spp.) is among the most common leafy vegetables grown in Africa. Amaranth is usually grown in small plots in rural and peri-urban areas. The leaves are consumed as a vegetable and the seeds are ground into flour. However, agronomic traits of amaranth vary widely and the aim of this study is to characterize this diversity. Thirty amaranth accessions from seven countries belonging to six different species (A. cruentus, A. hypochondriacus, A. dubius, A. tricolor and A. caudatus) and one accession of Celosia argentea were included in an evaluation field trial during 2014 – 2015. Morphological characterization was carried out using standard descriptors and included days to flowering, plant height, leaf length and leaf width and fresh and dry leaf weight. The field trial was laid out in a randomized complete block design with three replications. Early-maturing accessions IP 6 (A. cruentus) and Melange (A. cruentus) started flowering after 28.3 and 29.7 days, respectively, while late-maturing accessions Tropical (A. cruentus), TZ SMN102 (A. hypochondriacus) and Bresil (A. cruentus) needed 50.3 days to reach flowering stage. Significant diversity was found among the accessions on qualitative characters during vegetative and seed maturation stages. This information will be used to identify plant material with specific characters that could be exploited by plant breeders, other researchers or farmers.
Keywords: amaranth, genetic diversity, morphological, characterization
INTRODUCTION Amaranth (Amaranthus spp.) is widely spread in all tropical and subtropical regions of the world (Ebert et al., 2011). Amaranth plants are usually distinguished as grain types, vegetable types, ornamental or weedy (Brenner et al., 2000). Vegetable amaranth has been largely ignored by the world of science (National Research Council (NRC), 2006) and is generally considered poor people’s food. However, amaranth is among the most common leafy vegetable grown in the lowland tropics of Africa (Shippers, 2002) and forms part of the diet of many people in Africa and other parts of the world. Traditional vegetables including amaranth are particularly attractive for smallholder farmers (Weinberger and Msuya, 2004; Keding et al., 2007). In general, traditional vegetables require less production inputs compared to exotic vegetables. The main component of fixed cost is family labor (Keding et al., 2007). Amaranth is a quick-growing leafy vegetable crop and it is often uprooted when plants are 8 – 10 cm tall (3 – 4 weeks after sowing). A distinct advantage of amaranth is that it can be harvested repeatedly. Early maturity (21 days for leafy crops) and a prolonged harvest period are advantageous quality traits of different traditional leafy vegetables. First

289
harvesting can occur three weeks after sowing with subsequent harvesting at 10 – 15 day intervals depending on the vegetative growth and crop management. Amaranth has received significant attention in many countries because of its high nutritional value and its importance as a source of food, either as a vegetable or as grain (Srivastava, 2011). The leaves are consumed as a vegetable and the seeds are ground into flour. Amaranth is recognized as one of the most nutritious traditional leafy vegetables due to its high protein content and richness in lysine, which usually is a limiting amino-acid in cereals (Grobelnik et al., 2009). Amaranth leaves provide calcium, iron, folic acid and other important nutrients to the diet (Yang and Keding, 2009). Knowledge of morphological diversity and trait variations in populations is useful in plant breeding and for developing ex situ conservation strategy for plant genetic resources (Bartish et al., 2000; Engles et al., 2002). Good characterization and evaluation of germplasm collections can provide valuable information to breeders and users and increase utilization of plant genetic resources. The World Vegetable Center Eastern and Southern Africa plays a major role in conservation, utilization and distribution of traditional African and global vegetables in sub-Saharan Africa. The Center’s seed repository in Arusha holds the largest vegetable collection in Africa, consisting of about 2600 accessions of 20 vegetable crops, including amaranth. The purpose of this study was to assess morphological diversity among 29 accessions of amaranth and one accession of Celosia argentea.
MATERIALS AND METHODS
Plant material Twenty nine accessions of amaranth and one Celosia argentea were included in this study. The accessions were selected based on their origin and species (Table 1). All accessions were obtained from the amaranth collection maintained at the WorldVeg Eastern and Southern Africa seed repository located in Arusha, Tanzania. The accessions originated from seven different countries and belonged to six different species: A. cruentus (11 accessions), A. hypochondriacus (seven accessions), A. tricolor (two accessions), A. dubius (four accessions), A. caudatus (one accession), Amaranthus spp. (four accessions of non-identified species) and one accession belonging to Celosia argentea, a wild species of the Amaranthaceae family.
Phenotypic characterization Two field trials were conducted in the WorldVeg experimental fields located at 04.8° S; 37°47’E and 1290 masl. Trials were laid out in a randomized complete block design with three replications. Each trial was planted with 12 plants per row in two rows per plot and with a spacing of 25 cm between plants and 60 cm between rows. Plants were sown in February 2015 and 2016 and were transplanted to the field one month later. NPK (16 N, 16 P, 16 K) fertilizers (Falcon brand, ACF Russia) were applied one week after transplanting at a rate of 200 kg/ha. Weeds were controlled by hand weeding and hoeing at 10-day intervals and as necessary. Supplement furrow irrigation was applied

290
Table 1. Origin of 30 amaranth accessions
No RVI Code Species Accession name Origin1 RVI00002 A. cruentus IP 5 Tanzania2 RVI00130 hypochondriacus HTT Kenya3 RVI00021 hypochondriacus TZ SMN82 Tanzania4 RVI00138 cruentus Bresil Madagascar5 RVI00098 tricolor DB2003889 USA6 RVI00097 tricolor Arkasuguna India7 RVI00005 dubius Gare Tanzania8 RVI00117 Amaranthus spp. Simon’s Farm Sudan9 RVI00011 dubius Ex Zan Tanzania10 RVI02433 Celosia argentea Ex Mwanga Tanzania11 RVI00101 cruentus IP 6 Unknown12 RVI00111 cruentus Madiira 2 Zimbabwe13 RVI00019 hypochondriacus TZ SMN 60-4 Tanzania14 RVI00095 cruentus Tropical Madagascar15 RVI00006 dubius Kongei Tanzania16 RVI00110 cruentus Madiira 1 Tanzania17 RVI02672 Amaranthus spp. Local check ‘Mchicha’ Tanzania18 RVI00121 hypochondriacus AH NL Unknown19 RVI00001 cruentus AM 25 Tanzania20 RVI00016 Amaranthus spp. TZ SMN 50-7 Tanzania21 RVI00089 cruentus Melange Madagascar22 RVI00007 hypochondriacus AH TL Tanzania23 RVI00159 hypochondriacus Same Tanzania24 RVI00022 hypochondriacus TZ SMN 102 Tanzania25 RVI00157 caudatus INCA Unknown26 RVI00003 cruentus AC NL Tanzania27 RVI00004 dubius FUNE Tanzania28 RVI00116 cruentus DB2006306 USA29 RVI00154 Amaranthus spp. Red Inflorescence Unknown30 RVI00090 cruentus Paris A Madagascar

291
as required. During vegetative and reproductive stages, plants were characterized for morphological and agronomic traits using standard descriptors (AVRDC 2008). Biometric measurements were taken from 10 plants per replication. Days to 50% flowering was recorded. Both fresh and dry yield from 10 plants per replication were recorded and converted to t/ha. At harvest, plant height, leaf length and width and leaf shape and number of leaves harvested were recorded.
Data analysis Means, minimum and maximum values were used to measure tendency and variation of quantitative characters recorded. ANOVA (CoStat version 6.311) analysis was used to compare means of various parameters. A dendrogram was built based on groupings produced by cluster analysis. The cluster analysis was performed using the statistical package R console version 2:13.0 (2010).
RESULTS AND DISCUSSION
Quantitative characters Plants of different accessions showed different morphological characters. There were highly significant differences among the accessions with regards to leaf width, leaf length, plant height (p <0.001), number of leaves harvested (p <0.001), days to 50% flowering (p <0.001) and for dry weight (p <0.01) (Table 2). Amaranth accessions Bresil (A. cruentus) and Paris A (A. cruentus) produced the longest leaf length, which did not differ significantly from accessions AC NL (A. cruentus) and Madiira 2 (A. cruentus) (p <0.05). Bresil had the longest leaf width (10.4 cm) and it did not differ significantly from accessions Ex Zan (A. dubius) and Paris A (p <0.05). Two amaranth accessions, Fune (A. dubius) and DB2003889 (A. tricolor) differed significantly in leaf length showing the lowest values of this parameter compared with other accessions in the group. With regard to plant height, Bresil developed the tallest plants. Madiira 1 (A. cruentus), AH TL (A. hypochondriacus) and Bresil showed no significant difference in plant height compared to other accessions (p <0.05). Within the studied accessions, the number of branches differed widely, ranging from zero (amaranth accessions without any basal branches and with the main stem only, like Melange (A. cruentus), Same (A. hypochondriacus) and Bresil. Across the accessions, the mean number of branches was 2.1 (Table 2). An important trait for leafy vegetables is the period between emergence and flowering stage (50% flowered plants). Days to 50% flowering has been shown to vary significantly among the accessions (Figure 1). Early and late flowering accessions were identified. Late flowering has been reported to be an advantage to vegetable amaranths (Varalakshmi, 2004). Amaranth accession IP 6 (A. cruentus) began flowering 28.3 days from emergence with no significant difference from other accessions in the studied group (p <0.05). Melange flowered 29.7 days after emergence with no significant difference from the other accessions. The longest period from emergence to flowering was registered with accessions Tropical (A. cruentus), TZ SMN 102 (A. hypochondriacus)

292
Table 2. Mean and standard deviation for the quantitative traits
Traits Mean St. Dev Min MaxDays to 50% flowering 37.5 6.2 28.3 50.3Leaf length (cm) 13.0 3.1 8.0 19.5Leaf width (cm) 7.1 1.5 3.7 10.4Number of brunches/plant 2.1 0.9 0.0 3.4Number of leaf harvested 95.1 13.1 38.1 136.4Plant height(cm) 68.2 18.4 36.1 87.1Leaf fresh weight t/ha 1.4 0.4 3.76 10.4Leaf dry weight t/ha 1.4 0.3 0.73 t/ha 1.7 t/ha
0
10
20
30
40
50
60
Mad
iira
1H
TT IP 6
Sim
on’ F
arm
Loca
l Che
ckA
rkas
ugun
aTZ
SMN
60-
4A
H-T
LTr
opic
alG
are
IP 5
TZSM
N 8
2A
C-N
LA
M 2
5TZ
SMN
102
AH
NL
Mad
iira
2TZ
SMN
50-
7R
ed in
flore
scen
ceFU
NE
INC
AK
onge
iD
B22
0038
89D
B20
0630
6Ex
Zan
Ex M
wan
gaM
elan
geSa
me
Paris
AB
resi
lFigure 1. Days to 50% flowering
and Bresil with 50.3 days from emergence; these accessions were also the last ones to flower among all the studied accessions. Late flowering is a benefit for farmers as they can harvest leaves for longer periods before harvesting grain (Oboh, 2007). There are many environmental factors that affect leaf productivity of traditional leafy vegetables. Brown (1995) reported that the availability of water was the most important environmental factor limiting growth and survival of range plants. Temperature is the second limiting factor influencing growth and development of plants. These two factors limit the duration of the vegetative period and indicate early and prolific flowering, which consequently leads to fruit and seed production - a particular concern for leafy vegetables (Ojiewo et al., 2012).
Leaf yield High leaf yield is one of the most important characteristics for vegetable production. Leaf yield is associated with different yield components as number of leaves harvested, leaf size, plant height and number of branches. High values of plant height,

293
Tabl
e 3.
Mor
phol
ogic
al c
hara
cter
s of
am
aran
th a
cces
sion
s
Acc
essi
onN
ame
Aver
age
leaf
le
ngth
(cm
)Av
erag
e le
afw
idth
(cm
)Av
erag
e nu
mbe
r of
bra
nche
s pe
r pl
ant
Aver
age
num
ber
of le
af h
arve
sted
Fres
h w
eigh
tt/h
aD
ry w
eigh
tt/h
aPl
ant h
eigh
t(c
m)
Mad
iira
115
.9bc
d3.
67j
2.2e
-i 10
1.93
a-f
4.51
def
1.03
bc86
.6a
HTT
10.9
3h-k
7.8c
-g2.
13f-
i13
6.36
a6.
07b-
f0.
98bc
65.8
2bcd
e
IP 6
11.8
6f-j
8.56
a-e
3.4a
90.7
6a-g
7.99
abcd
1.59
bc58
.85d
eSi
mon
’s F
arm
13.3
3c-h
6.
36gh
i3.
2ab
100.
73a-
f7.
37a-
e1.
42bc
63.3
5cde
Loca
l Che
ck
‘Mch
icha
’12
.23e
-j6.
9d-i
1.66
ijk11
6.73
a-d
6.06
b-f
1.16
a 79
.83a
bc
Ark
asug
una
12.9
6d-i
8.03
b-g
3abc
d13
0.5a
b8.
51ab
c 1.
55bc
80.7
4abc
TZSM
N 6
0-4
11.4
3f-j
6.4f
-i2.
33d-
i11
9.56
a-d
6.76
a-f
1.43
bc64
.87b
cde
AH
-TL
11.4
6f-j
6.8d
-i1.
8g-k
117.
06a-
d10
.3a
1.47
bc86
.96a
Trop
ical
15.1
bcde
6.5e
-i2.
26d-
i96
.36a
-f
6.01
b-f
1.2b
c68
.21a
bcde
Gar
e9.
33jk
6.56
e-i
3abc
d92
.83a
-g6.
02b-
f1.
2bc
75.2
1abc
de
IP 5
14.5
3b-f
7.13
d-h
2.4c
-i 10
3.73
a-f
7.29
a-e
1.58
bc65
.7bc
de
TZSM
N 8
29.
9ijk
7.03
d-i
2.46
b-h
129.
4abc
7.
36a-
e1.
19bc
78.6
abcd
AC
-NL
16.7
ab7.
7d-g
2.2e
-i10
9.4a
-e6.
46b-
f1.
21bc
63.0
3cde
AM
25
11.5
3f-j
6.3g
hi1.
73h-
k10
5.93
a-f
5.5b
-f0.
96bc
73.1
8abc
de
TZSM
N 1
0211
.17h
ij6.
6e-i
2.06
g-j
112.
1a-d
6.51
b-f
1.28
bc75
.12a
bcde
AH
NL
10.8
6h-k
6.3g
hi1.
73h-
k93
.53a
-g6.
47b-
f0.
97bc
76.7
abcd
e
Mad
iira
216
.86a
b8.
73a-
d2.
86a-
f85
.5a-
h8.
64ab
c 1.
64bc
58.1
6e
TZSM
N 5
0-7
14.3
3b-g
8.46
b-f
1.8g
-k77
.26d
-h4e
f1.
07bc
37.6
8f
(con
t.)

294
Acc
essi
onN
ame
Aver
age
leaf
le
ngth
(cm
)Av
erag
e le
afw
idth
(cm
)Av
erag
e nu
mbe
r of
bra
nche
s pe
r pl
ant
Aver
age
num
ber
of le
af h
arve
sted
Fres
h w
eigh
tt/h
aD
ry w
eigh
tt/h
aPl
ant h
eigh
t(c
m)
Red inflorescence
11.4
g-j
5.46
hij
1.33
jk82
.3b-
h6.
52b-
f1.
35bc
64.2
cde
FUN
E7.
96k
5.26
hij
2.93
a-e
86.6
a-h
3..8
3f1.
68bc
70.1
8abc
de
INC
A9.
56jk
5ij
2.2e
-i 13
4.83
a5.
94b-
f0.
92bc
78.9
abcd
Kon
gei
10.6
3h-k
7.56
d-g
3.13
abc
104.
26a-
f6.
19b-
f1.
36bc
74.9
3abc
de
DB
2003
889
8.03
k6.
23gh
i3.
4a77
.6d-
h3.
76ef
0.73
c40
.63f
DB
2006
306
15.7
3bcd
7.93
c-g
1.93
g-k
78.2
3c-h
8.35
abc
1.65
bc68
.2ab
cde
Ex Z
an16
.36b
c10
ab2.
46b-
h 94
.33a
-g10
.43a
1.9b
59.6
4de
Ex M
wan
ga15
.06b
-e6.
66d-
i2.
53b-
g79
.33b
-h5.
41cd
ef0.
95bc
36.1
f
Mel
ange
11.5
3f-j
5.23
hij
0l58
.26e
-h4.
39de
f0.
92bc
65.6
bcde
Sam
e15
.23b
-e8.
3b-g
0l55
.7fg
h7.
8abc
d 1.
51bc
84.7
ab
Paris
A19
.5a
9.76
abc
1.26
k38
.13h
9.26
ab1.
68bc
78.9
4abc
d
Bre
sil
19.5
3a10
.43a
0l44
.96g
h9.
23ab
1.
58bc
87.1
a
Mea
n13
.03
7.12
2.12
95.1
46.
751.
3768
.16
F-te
st**
***
***
***
***
***
***
LSD
(5%
)2.
631.
730.
6541
.94
3.09
40.
8616
.35
CV
(%)
12.3
714
.84
18.7
26.9
728
.02
38.3
714
.68
s non-significant; * significant (
p <0.05); ** highly significant (
p <0.01); *** highly significant (p
<0.
001)
. Mea
ns w
ithin
the
sam
e co
lum
n followed by the same letter(s) are not significantly different at 5% probability level based on DMRT
Tabl
e 3.
(Con
t.)

295
leaf size and number of leaves determined high leaf yield production. Table 3 shows the morphological characters of amaranth accessions. Among all amaranth accessions amaranth accession AH TL was among the tallest and latest flowering which allowed for a long period of leaf harvesting. Amaranth accession Ex Zan was among the accessions which produced the largest leaves. Amaranth accession DB2003889 showed the lowest productivity of fresh and dry leaf weight, which was result from the associated yield components, like shortest plant height, low value of leaf length and comparatively less number of leaves harvested. Highly significant differences were observed among all studied amaranth accessions in fresh and dry leaf weight (p <0.001 and p <0.01).
Cluster analysis A dendrogram based on morphological data is shown in Figure 2. The 29 amaranth accessions and one Celosia argentea (Ex Mwanga) formed four clusters (cluster I to IV). The first cluster (cluster I) contains three amaranth accessions, Same, Paris A and Bresil. The origin of accessions Paris A and Bresil was Madagascar while the origin of Same was from Tanzania. These three accessions have no significant differences in leaf length and leaf width, fresh and dry weight. Cluster II is the biggest cluster, which contains 12 amaranth accessions grouped in three sub clusters. One of the sub clusters contains four amaranth accessions; Tropical, TZSMN 102, Local check ‘Mchicha’ (Amaranthus spp.) and AH-TL. These originated from Tanzania, except Tropical, which was from Madagascar. These accessions have no significant differences in leaf length and leaf width and average number of leaves harvested. The other subcluster of cluster II contains three accessions; Fune, Gare (A. dubius) and Kongei (A. dubius), which
Figure 2. Dendrogram for 30 amaranth accessions showing similarities among them
0.0
0.2
0.4
0.6
0.8
1.0
1.2
Diff
eren
ces
Cluster dendrogram
Similaritieshclust (*, “ward.D”)
Sam
ePa
ris A
Bre
sil
Cluster I Cluster II Cluster III Cluster IV
Trop
ical
TZSM
N 1
02
TZSM
N 6
0-4
TZSM
N 8
2
Loca
l che
ckA
H-T
LFU
NE
Gar
eK
onge
iA
rkas
ugun
aIN
CA
HTT IP 6
IP 5
Sim
on’s
Far
m
Mad
iira
2Ex
Zan
DB2
0063
06
DB
2200
3889
TZSM
N 5
0-7
Ex M
wan
gaM
adiir
a 1
AC
-NL
Mel
ange
Red
inflo
resc
ence
AM
25
AH
NL

296
originated from Tanzania and belong to the same species (Table 1). These accessions have no significant difference in plant height. The last subcluster of cluster II contains five accessions; Arkasuguna (A. tricolor), INCA (A. caudatus), HTT (A. hypochondriacus), TZSMN 60-4 (A. hypochondriacus) and TZSMN 82 (A. hypochondriacus). TZSMN 60-4 and TZSMN 82 originated from Tanzania, while Arkasuguna was from India, HTT from Kenya and INCA was of unknown origin. These accessions have no significant differences in number of branches, number of harvested leaves and dry weight. The highest average number of leaves was collected from the accessions of this sub cluster. Cluster III contains six accessions; IP 6, Simon’s farm (Amaranthus spp.), IP 5 (A. cruentus), DB2006306 (A. cruentus), Madiira 2 and Ex Zan. The accessions in have different origins (Tanzania, Zanzibar, Zimbabwe, USA and Sudan, respectively) and have no significant differences in fresh weight, dry weight and plant height. The next nine accessions, DB2003889, TZSMN 50-7 (Amaranthus spp.), Ex Mwanga (Celosia argentea), Madiira 1, AC-NL, Melange, Red Inflorescence (Amaranthus spp.), AM 25 (A. cruentus) and AH NL (A. hypochondriacus) compose cluster IV. These accessions have no significant difference in fresh weight and dry weight. Accession DB2003889 is located at a distance from the other accessions and has highly significant differences in leaf length, number of branches and plant height (p <0.001) compared with the rest of the group. The accession DB2003889 belongs to different species A. tricolor which expressed different morphology. In the dendrogram, accessions Melange and Red Inflorescence are located separately from accessions AM 25 and AH NL and they have highly significant differences in number of leaves harvested (p <0.001).These two accessions showed no significant differences in all other parameters compared with the rest of the accessions.
CONCLUSION The results confirmed existing morphological variability among 29 amaranth accessions and one accession of Celosia argentea. Most of the amaranth accessions were suitable for leaf use as a vegetable. In this subset of the WorldVeg amaranth collection, there were accessions with higher fresh leaf productivity, such as Ex Zan (A. dubius) and AH TL (A. hypochondriacus) and higher dry yield such as Fune, Paris A and IP 5. The accessions evaluated in this research provide an interesting starting point for future breeding work to develop new varieties with desirable traits such as earliness, rapid growth, longer vegetative period and larger leaves.
ACKNOWLEDGMENTS This research was supported by core donors of the World Vegetable Center: Republic of China (ROC), UK Department for International Development (DFID), United States Agency for International Development (USAID), Australian Centre for International Agricultural Research (ACIAR), Germany, Thailand, Philippines, Korea and Japan.

297
REFERENCESAVRDC. (2008). AVRDC – The World Vegetable Center, Genetic Resources and Seed
Unit (GRSU). Characterization records sheets. AVRDC-The World Vegetable Center, Shanhua, Taiwan
Bartish, I.V., Garkava, L.P., Rumpunen, K. and Nybom, H. (2000). Phylogeneticrelationships and differentiation among and within populations of Chaenomeles Lindl. (Rosaceae) estimated with RAPDs and isozymes. Theor. Appl. Genet., 101: 554 – 563
Brenner, D.M., Baltensperger D.D., Kulakow P.A., Lehmann J.W., Myers R.L., Slabbert, M.M. and Sleugh B.B. (2000). Genetic resources and breeding of Amaranthus. In: Plant Breeding Reviews, vol. 19, (ed. J. Janick), John Wiley and Sons, Inc., Oxford, UK, p. 227 – 285
Brown, R.W. (1995). The water relations of range plants: adaptations of water deficits, pp. 291 – 413. In: D.J. Bedunah and R.E. Sosebee (eds.). Wildland plants: physiological ecology and developmental morphology. Society for Range Management. Denver, CO. Amaranth biology, chemistry and technology. CRC Press, Boca Raton, p. 23 – 38
Ebert, W.A., Tien-hor Wu and San-tai Wang. (2011). International Cooperator’s Guide, Vegetable amaranth (Amaranthus L.). AVRDC-The World Vegetable Center, AVRDC Publication No 11 – 754
Engles, J.M.M., Rao, V.R., Brown, A.H.D. and Jackson, M.T. (2002). Managing Plant Genetic Diversity, CABI Publishing:Oxford, UK, 2002, p. 487
Grobelnik, M.S., Turinek, M., Jakop, M., Bavec, M. and Bavec, F. (2009). Nutrition value and use of grain amaranth: potential future application in bread making. Agricultura 6: 43 – 53
Keding, G., Weinberger, K., Swai, I., Mndiga, H. (2007). Diversity, traits and use of traditional vegetables in Tanzania. Technical bulletin No 40, Shanhua, Taiwan: AVRDC-The World Vegetable Center. 53 pp
National Research Council. (2006). National Academy of Sciences, 2006. Lost Crops of Africa,Volume II, Vegetables, National Academies Press, Washington, D.C., pp.33 – 51, www.nap.edu.
Oboh, B. (2007). Multivariate analysis of the diversity among some Nigerian accessions of Amaranthus hybridus. International Journal of Plant Breeding and Genetics 1 (2): 89 – 94
Ojiewo, O.C., Mwai, N.G., Abukutsa-Onyango, O.M., Agong, G.S. and Nono-Womdim, R. (2012). Exploiting the genetic diversity of vegetable African nightshades. Bioremediation, Biodiversity and Bioavailability 7(1): 6 – 13
R Console, Version 2:13.0. (2010). A language and environment for statistical computing, Vienna, Austria. R Foundation for Statistical Computing Retrieved from:http://www.R-project.org.
Shippers, R.R. (2002). African Indigenous Vegetables. An Overview of the cultivated species, 2002. Revised version on CD-ROM. Natural Resources International Limited, Aylesford, UK

298
Srivastava R. (2011). Nutritional quality of some cultivated and wild species of Amaranthus. Inter. J. of Pharmaceutical Sciences and Research. 2(12):www.ijpsr.com, pp. 3152
Varalakshmi, B. (2004). Characterization and preliminary evaluation of vegetable amaranth (Amaranthus sp.), germplasm. Plant Genetic Resources Newsletter, 137: 55 – 57
Weinberger, K. and Msuya, J. (2004). Indigenous Vegetables in Tanzania. AVRDC – The World Vegetable Center, Technical Bulletin No. 31, AVRDC Publication 04-600, p. 63 – 67
Yang, R.Y. and Keding, G.B. (2009). Nutritional contribution of important African indigenous vegetables, p. 105 – 144. In: C.M. Shackleton, M.W. Pasquini and A.W. Drescher (eds.), African indigenous vegetables in urban agriculture. Earthscan
299
Genetic Variability Studies on Cherry Tomato (Solanum Lycopersicum var. Cerasiforme) Under Lowland Environment
Nor Hazlina, M.S., Sharizan, A., Rozlaily, Z., Sebrina Shahniza, S., Nor Afzan, R.Horticulture Research Centre,Malaysian Agricultural Research and Development Institute (MARDI), MARDI Headquarters, Persiaran MARDI-UPM, 43400 Serdang, Selangor, MalaysiaE-mail: [email protected]
Abstract Genetic variability of fourteen cherry tomato genotypes consisting of eleven locals and three from World Vegetable Centre was investigated. The experiment was conducted under both rain shelter and open field in the lowland environment at MARDI Serdang. The seedlings were planted accordingy to Randomized Complete Block Design with four replications. Data on quantitative traits which included fruit yield per plant, fruit weight, fruit length, fruit width, fruit pericarp thickness, pH, total soluable solid (TSS), fruit skin colour and the incidence of bacterial wilt were recorded. Analysis of variance revealed the differences among all tested tomato genotypes under rain shelter and open field. Tomato under rain shelter produced higher yield (569.07 g/plant) and smaller fruits compared to open field (360.44 g/plant). The average of tomato fruit weight in the shelter was 8.34 g while 11.77 g in the open field. The broad genetic variability of these cherry tomatoes in both rain shelter and open field can give the potential in tomato breeding programme for traits associated with fruit production and quality under lowland cultivation.
Keywords: tomato cultivars, lowland, highland, rain shelter, open field
INTRODUCTION Cherry tomato (Solanum Lycopersicum var. Cerasiforme) is a variety of cultivated tomato, which has become more popular all over the world. It has favourable characteristics such as good source of vitamin A and C, sugars, taste, low calories and higher fruit sets even at high temperature. Considering the importance of tomato as one of the potential vegetable crops for domestic consumption as well as export markets, it is important to increase its productivity along with desirable attributes through a breeding programme. For improving yield potential of tomato, there is a need of systemic breeding approach. Systematic study and evaluation of tomato genotypes is of great importance for current and future agronomic and genetic improvement of this crop. Furthermore, if an improvement program is to be carried out, evaluation of genotypes is imperative, in order to understand the genetic background and the breeding value of the available genotypes (Agong et al., 2000). For production of hybrids/cultivars with better yield and good fruit quality, identification and selection of suitable cherry tomato genotypes is needed. Therefore, the present study was undertaken to identify growth, yield and quality parameters in cherry tomato genotypes under lowland environment. This research aims to evaluate agronomic performance and fruit quality of selected cherry tomato introductions from

300
the World Vegetable Centre and MARDI’s collection to select promising genotypes that could grow well under Malaysian environment under lowland condition.
MATERIALS AND METHOD Fourteen tomato genotypes consisting of eleven from local (TC1, TC7, TC9, TC10, TC11, TC12, TC13, TC14, TC15, TC20, TC26) and three from World Vegetable Centre (2514B, 3125L, 2071D) were planted and evaluated in MARDI’s Station at Serdang (Table 1). Experiments were conducted under rain shelter and open field in a Randomized Completely Block Design (RCBD) with four replications. Twenty plants per variety per replication were planted in a single row bed at a planting distance of 60 cm within row and 150 cm between beds (60 cm x 150 cm). The single row bed was covered with double-coated silver plastic mulch with black side facing downwards, whereas the silvery surface facing upwards. Individual plant staking was adopted and minimal pruning was done at early growth stage to remove the unwanted shoots. Pest and disease management and standard fertilizer regime was adopted and monitored accordingly. The data were recorded on fruit yield per plant, fruit weight, fruit length, fruit width, fruit pericarp thickness, pH, total soluable solid (TSS) and fruit skin colour. The incidence of bacterial wilt on the plants was also recorded.
Table 1. Plant materials and source of the tomato genotypes used in this study
No Tomato genotypes Label Source Growing habit1 TC1 A MARDI / local Determinate2 TC7 B MARDI / local Determinate3 TC9 C MARDI / local Determinate4 TC10 D MARDI / local Determinate5 TC11 E MARDI / local Determinate6 TC12 F MARDI / local Determinate7 TC13 G MARDI / local Determinate8 TC14 H MARDI / local Determinate9 TC15 I MARDI / local Determinate
10 TC20 J MARDI / local Determinate11 TC26 K MARDI / local Determinate12 2514B L AVRDC / Taiwan Determinate13 3125L M AVRDC / Taiwan Determinate14 2071D N AVRDC / Taiwan Determinate

301
RESULTS AND DISCUSSION
Fruit yield Analysis of tomato fruit yield showed that there were significant differences among the fourteen genotypes. Tomato planted under rain shelter produced higher yield (569.07 g/plant) compared to open field (360.44 g/plant). Three local genotypes were not growing well under open field viz; TC7,TC12 and TC20. The local genotype TC9 gave the highest yield in the shelter (1740.25 g/plant), followed by TC7 (1240.50 g/plant) and TC10 (1150.40 g/plant). The local genotype TC12 (24.65 g/plant) gave the lowest yield followed by TC1 (53.00 g/plant) and TC13 (102.23 g/plant). However, six local genotypes including TC7,TC9,TC10,TC14,TC15 and TC26 out yielded significantly the three introductions from World Vegetable Centre, indicating better adaptability of the local genotypes under lowland conditions (Figure 1).
Fruit weight Statistically significant differences in fruit weight indicated the presence of good variability among the genotypes. The result showed that the fruit size in the open field was much better compared to the rain shelter. The average of tomato fruit weight in the open field was 11.77 g while 8.34 g under rain shelter (Table 3). The World Vegetable Centre genotype 2071D produced the highest fruit weight, whereas TC26 was the lowest. The fruit weight among the three genotypes from World Vegetable Centre was
Yield MEAN18001600140012001000800600400200
0
Var
Var
open shelter locationTC1TC13TC26
3125LTC12TC20
2514BTC11TC15TC9
2071DTC10TC14TC7
2071D
2514B
3125L
TC1
TC10
TC11
TC12
TC13
TC14
TC15
TC20
TC26
TC7
TC9
2071D
2514B
3125L
TC1
TC10
TC11
TC12
TC13
TC14
TC15
TC20
TC26
TC7
TC9
Figure 1. Fruit yield per plant of fourteen tomato genotypes under open field and rain shelter

302
Tabl
e 2.
Fru
it qu
ality
cha
ract
eris
tics
and
bact
eria
l wilt
sco
ring
inci
denc
e of
four
teen
tom
ato
geno
type
s
1 =
Perf
ect c
ondi
tion
2 =
Slig
ht; l
ess
than
15%
of f
olia
ge o
r pla
nt a
ffect
ed3
= M
oder
ate;
bet
wee
n 16
%=4
0% o
f fol
iage
or p
lant
affe
cted
4 =
Extre
me;
ove
r 41%
of f
olia
ge o
r pla
nt a
ffect
ed
Tom
ato
lines
Yie
ld(g
m)
Frui
t w
eigh
t(g
m)
Frui
t le
ngth
(cm
)
Frui
t w
idth
(cm
)
TSS
(o brix
)pH
Peric
arp
Locu
leB
acte
rial w
ilt
inci
denc
eC
olou
r
3125
L25
14B
2071
DTC
1TC
7TC
9TC
10TC
11TC
12TC
13TC
14TC
15TC
20TC
26
438.
50f
107.
10i
231.
98g
53.0
0j
1240
.50b
1740
.25a
1150
.40c
112.
10i
24.6
5k
102.
23i
840.
55e
850.
32e
135.
12h
940.
30d
15.2
8a
15.3
9a
17.0
0a
4.70
ef
5.00
def
11.0
0b
7.20
c
6.80
cd
5.20
def
9.80
b
3.70
f
5.20
def
5.90
cde
4.60
ef
6.37
a
4.70
c
3.66
d
2.18
g
2.42
fg
3.54
d
2.83
e
2.35
g
5.09
b
2.76
ef
2.14
g
2.44
fg
2.32
g
2.13
g
3.84
a
2.58
c
2.87
b
1.59
g
1.75
fg
2.40
c
2.02
de
2.16
d
2.11
d
2.53
c
1.68
g
1.91
ef
2.03
de
1.70
g
3.83
f
2.12
g
4.12
ef
6.10
d
7.79
b
6.03
d
6.41
cd
3.83
f
4.96
e
4.96
e
7.80
b
6.63
cd
9.22
a
7.00
bc
3.58
cd
4.06
bcd
4.34
bc
3.59
cd
6.72
a
4.47
b
4.56
b
3.30
d
3.42
d
3.43
d
3.82
bcd
4.55
b
6.72
a
6.72
a
0.32
ab
0.28
cde
0.23
f
0.27
def
0.34
ab
0.32
abc
0.23
f
0.25
ef
0.28
cde
0.28
cde
0.23
f
0.31
bcd
0.35
a
0.34
ab
2.0c
2.0c
2.0c
2.1bc
2.3ab
c
2.5a
2.6a
2.6a
2.0c
2.0c
2.1bc
2.4ab
2.3ab
c
2.3ab
c
3 3 3 4 2 3 3 3 2 2 2 2 2 2
Ora
nge
Red
Red
Dar
k pu
rple
Red
Red
Red
Red
Red
Dar
k pu
rple
Red
Red
Red
Red
Means within a colum
n with the same letters are not significantly different at p
<0.
05 a
ccor
ding
Dun
can’
s M
ultip
le R
ange
Tes
t (D
MRT
)

303
significantly higher than the local genotypes, indicating better adaptability of the World Vegetable Centre genotypes in the open field under lowland conditions (Figure 2).
Fruit length There were no significant differences among 14 tomato genotypes planted under both shelter and open field. The mean value of the fruit length under open field and rain shelter was 3.61 and 3.21 respectively.
Fruit width The mean value of fruit width in the open field and shelter was 2.87 cm and 2.23 cm respectively. The World Vegetable Centre tomato genotype, 3125L gave higher fruit width (3.84 g/fruit) followed by 2.87 (2071D) and 2.58 (2514B) under open field.
2071D
2514B
3125L
TC1
TC10
TC11
TC12
TC13
TC14
TC15
TC20
TC26
TC7
TC9
2071D
2514B
3125L
TC1
TC10
TC11
TC12
TC13
TC14
TC15
TC20
TC26
TC7
TC9
var
var
2071D 2514BTC10TC14TC7
TC1
TC9TC15TC11
3125LTC12 TC13
TC26TC20
open shelter location
wg MEAN1816141210
86420
Figure 2. Fruit weight of fourteen tomato genotypes under open field and rain shelter
Table 3. Fruit characters of fourteen tomato genotypes under open field and rain shelter
Fruit characters Open field Rain shelterFruit weightFruit lengthFruit widthTSSpHPericarp thicknessNo. of loculeFruit yield per plant
11.77a
3.61a
2.87a
6.06a
4.24a
0.28b
2.24a
360.44b
8.34b
3.21a
2.23b
5.78a
4.51a
0.29a
2.23a
569.07a
Means within a row with the same letters are not significantly different at p <0.05 according Duncan’s Multiple Range Test (DMRT)

304
According to the analysis of variance, the results showed statistical differences among 14 tomato genotypes for both shelter and open locations. Genotypes differed significantly among themselves and it ranged from 1.59 (TC1) to 3.84 (3125L) (Table 2).
Fruit pericarp thickness Analysis of the tomato pericarp thickness showed that there were significant differences among 14 tomato genotypes planted under both shelter and open field. The highest mean value was recorded under rain shelter in TC20 with 0.35 mm while the lowest was 0.23 (TC10 and TC14).
pH Analysis of the pH showed that there were no significant differences among the genotypes under open field and rain shelter. The average pH value was 4.24 (open field) and 4.51(rainshelter), with a minimum value 3.30 (TC11) and a maximum, 6.72 (TC20 and TC26) respectively. High total soluble solids (TSS) and low acidity are the major factors considered in tomatoes for manufacture of processed products.
Total Soluable Solid (TSS) The average of total soluble solids was 6.06 °Brix under open field and 5.78 oBrix (shelter). The values ranged from 2.12 to 9.22 °Brix. TC20 had the highest TSS value (9.22 °Brix) while 2514B was the lowest (2.12 °Brix). All the local genotypes were having better TSS and can contribute significantly for the development and improvement of tomato process (Table 2).
Fruit skin colour The fruit colours among the 14 cherry tomato genotypes were orange, dark purple and red. Genotype 3125L was grouped as orange; TC1 and TC13 were grouped as dark purple while other 11 genotypes were grouped as reddish fruit skin colour. The orange coloured tomato genotype-3125L was unique from nutrition point of view. In general , the red coloured tomatoes accumulate lycopene in the trans configuration, whereas, the orange coloured tomatoes accumulate lycopene in cis form which is more easily absorbed in to the body on consumption (Jessica L cooperstone et al., 2013). The purple coloured tomato genotypes TC1 and TC13 were important from health point of view. Purple colour in tomato is due to the accumulation of anthocyanin which has antioxidant properties, thus reducing the risk of cardiovascular diseases (S.Achterfeldt et al., 2015). Anthocyanin pigment also extends the shelf life of tomato (Laura Bassolino et al., 2013).
Locule Genotypes differed significantly among themselves for number of locules per fruit with ranged values from 2.0 to 2.6. The highest was recorded in TC9, TC10 and TC11 while the lowest was 3125L, 2514B, 2071D, TC12 and TC13.

305
Bacterial wilt incidence All the 14 tomato genotypes performed well under lowland environment. TC1 showed high incidence of bacterial wilt compared to others. Seven local genotypes having lower bacterial wilt score of 2, may prove as a valuable source of resistance/tolerance to bacterial wilt (Table 2).
CONCLUSION There was a good range of variability on fruit size among the fourteen cherry tomato genotypes tested in this study. The analysis of variance revealed significant differences among morphological and agronomical attributes. The local tomato genotypes showed good performances in term of fruit yield and its components (fruit weight, fruit length, fruit width, fruit pericarp thickness, pH, TSS and fruit skin colour). In addition, the orange coloured and purple coloured genotypes might prove valuable from nutrition point of view. Genotypes with higher TSS value might contribute for the improvement of processing tomatoes.
REFERENCESAgong, S.G., Schittenhelm S., Friedt, W. (2000). Genotype variation of Kenyan tomato
(Lycopersicon esculentum L.) germplasm. Plant Genet. Resour. Newsl. 123: 61 – 67Anon (2008). Situation and Outlook. Vegetable Industry. Economic and Technology
Research Centre, MARDI. http://faostat.fao.orgLaura Bassolino, Yang Zhang, Henk-jan Schoonbeek, Claudia Rferle, Pierdomenico
Perata,Cathie Martin. (2013). Accumulation of anthocyanin in tomato extends shelf life. New phytologist, 200(3), 650 – 655
S. Achterfeldt, M.T. Raka, C Martin, D.Vanzoura and P.A. Kroon. (2015). Do anthocyanins in purple tomatoes reduces the risk of cardiovascular disease. Proceedings of the Nutrition Society (2015) 74 (OCEI), 85
Jessica L. Cooperstone, Robins A Ralston, Ken M Riedl, David M Francis, Gregory B Lensinski, Steven K. Clinton and Steven J Schwertz. (2013). Increased carotenoid bioavalability from a unique cis lycopene containing tangerine-type tomato. The FASEIB Journal, 27(1) Suplement 38.1

306
Physiological and Morphological Characteristics of Lettuces (Lactuca Sativa L.) Grown in Cadmium Polluted Hydroponic Culture
Sani Ahmad, J.1, Siti Aishah, H.1, Che Fauziah, I.2 and Puteri Edaroyati M.W.11Crop Science Department, 2 Department of Land ManagementUniversiti Putra Malaysia, 43400 Serdang, Selangor, MalaysiaE-mail: [email protected]
Abstract Hydroponic system using nutrient film technique was employed to grow two varieties of lettuce (Bonbilasta-BBL and Italian 167). The plants were treated with cadmium concentrations of 0, 3, 6, 9 and 12 mg/L given in form of CdCl2 after nine days of transplanting to study its toxicity on morphology and physiology of the lettuce. Plant height, number of leaves, fresh and dry leaf weights and dry root weight of both lettuce varieties were significantly affected by Cd. Highest cadmium concentration significantly reduced all morphological characteristics measured. Different concentration levels of cadmium significantly effected on all physiological characteristics of the two lettuce varieties studied; affecting variety BBL more than variety Italian 167 with interactions in stomatal conductance, chlorophyll a and b and total chlorophyll.
Keywords: cadmium toxicity, lettuce, physiological, morphological, chlorophyll, photosynthesis
INTRODUCTION A lot of researches on different crop plants have indicated that excessively absorbed heavy metals interfere with various biochemical, physiological and structural aspects of plant processes that not only lead to inhibited growth but sometimes result in plant death. The toxic levels of heavy metals affect structural and permeability properties of inner membranes and organelles, causes inhibition of enzymatic activities, nutrient imbalances, decrease in rates of photosynthesis and transpiration (Prasad, 2004; Azevado et al., 2005). Cadmium (Cd) is a strong heavy metal pollutant of the environment having widespread occurrence. It is released naturally in soils and through anthropogenic emissions, mostly due to mining activities, burning of fossil fuels, metallurgical industry and frequent use of phosphate fertilizers (Singh and Agrawal, 2007). Application of untreated wastewater from these sources in irrigation of agricultural crops pose danger to both flora and fauna as it contains high amounts of trace elements and heavy metals in phototoxic concentrations which may adversely affect human and plant metabolism. According to Sanita di Toppi and Gabriella, (1999) cadmium is taken up into plants more readily from nutrient solutions than from soils. Das et al., (1997), have showed that cadmium interfered with the uptake, transport and use of several elements like Ca, Mg, P and K by water plants. Among cultivated vegetable species, lettuce is known for displaying comparatively high Cd contents in leaves (Mensch and Baize, 2004; Kim et al., 1988). Hence, it has been proposed as an indicator crop for testing the potential human dietary risk associated

307
with ingesting food crop grown on cadmium polluted soils (Brown et al., 1996). Hence, a study was conducted to determine the physiological and morphological changes due to cadmium stress that may occur in hydroponically grown lettuce varieties under hot and humid tropical conditions.
MATERIALS AND METHODS Lettuce (Lactuca sativa L.) seeds of Italian variety 167 and Bonbilasta (BBL) were planted and raised for two weeks under a rain shelter with a temperature range of 24 – 38 °C and relative humidity of 52 to 94 % under light intensity of 300 µmol m-2s-1. Seedlings were transferred to circulating troughs irrigated with Cooper’s nutrient formulation solution (Cooper, 1979) of mg/L: 236 N, 60 P, 300 K, 185 Ca, 50 Mg, 68 S, 12 Fe (EDTA), 2.0 Mn, 0.1 Zn, 0.1 Cu,0.3 B and 0.2 Mo, using a nutrient film technique; maintaining a pH of 5.5 – 6.5 and E.C. of 1.5 – 2.5 dS/m. Plants were subjected to different concentrations of Cd (0, 3, 6, 9 and 12 mg/L) supplied in the form of CdCl2 after nine days of transplanting. This factorial experiment was arranged in a randomized complete block design with three replications. The number of leaves and plant height were recorded at harvest, after six weeks of transplanting. Six plants per replication per treatment were randomly selected for fresh and dry weights. Roots were separated from the aerial part and oven dried at a temperature of 65 °C for dry mass. Chlorophyll content in the newly expanded leaves was determined according to Coombs et al., (1985) at day 14 of exposure to Cd treatment. Photosynthetic rate, stomatal conductance and transpiration rate were measured on the third fully expanded leaves in the morning between 9 to 11 am using portable Photosynthesis System (Model LICOR – 6400). Data generated were means of three replicates. Statistical analysis was performed using statistical software package (SAS version 9.2, SAS Institute Incorporated, Cary, North Carolina, USA). Comparison among treatments were evaluated by ANOVA and least significant difference (LSD) was used in separating means. Differences between the treatments were considered significant at p <0.05.
RESULTS AND DISCUSSION Morphological and physiological characteristics of two lettuce varieties were significantly affected by cadmium (Table 1 and 2). Negative effect was recorded in terms of plant height, aerial and root growth. Cadmium toxicity caused yellowing of leaves, stunted growth and reduction of biomass. Regardless of lettuce varieties, plant height was significantly reduced at maturity. Respectively to Cd concentration of 3, 6, 9 and 12 mg/L, the number of leaves was reduced in the order of 28.7%, 44.7%, 55.7% and 64.4% over the control. The highest reduction of fresh leaf weight (78.6%) was recorded at the highest Cd level. Plant biomass was similarly affected by Cd treatment. Dry leaf weight was reduced to 23.26%, 35.47% and 56.40% respectively, after treatment with 6, 9 and 12 mg/L of Cd stress compared with the control. At the highest Cd level, reduction in dry root weight was 93.2% in

308
Table 2. Effect of cadmium concentrations on physiological characteristicsof lettuce varieties
Treatment Photosynthesis rate(µmolm-2s-1)
Stomatal conductance (molm-2s-1)
Transpiration rate(mmolm-2s-1)
VarietyBonbilasta 12.26bz 1.05b 5.65bItalian 167 13.31a 1.45a 6.68aSignificance ** ** **Cd level (mg/L)0 16.17a 1.80a 8.00a3 14.77b 1.56b 7.36b6 12.84c 1.30c 6.63c9 11.22d 0.91d 5.02d
12 8.91e 0.70e 3.82eSignificance ** ** **InteractionVariety x Cd ns ** ns
*, **, ns, denotes significant at 5% and not significant, respectively. zMeans followedby same letters are not significantly different by LSD test.
Table 1. Effect of cadmium concentrations on morphological characteristics of lettuce varieties
Treatment Plant height (cm)
No. of leaves Fresh weight (g) Dry weight (g)
Leaf Root Leaf RootVarietyBonbilasta 26.2az 25.3 85.5b 21.9a 19.9b 2.6aItalian 167 18.2b 24.6 109.8a 15.2b 24.0a 1.3bSignificance ** ns ** ** ** **Cd level (mg/L)
0 28.7a 40.7a 151.5a 42.3a 28.7a 7.0a3 27.2b 29.0ab 136.8a 17.0b 28.0a 2.4b6 21.2c 22.5bc 104.0b 14.5b 22.0b 1.0c9 18.3d 18.0bc 63.5c 11.0bc 18.5c 0.8cd
12 15.7e 14.5c 32.5d 8.0c 12.5d 0.5dSignificance ** ** ** ** ** **InteractionVariety x Cd ** ns ns ns ns ns
*, **, ns, denotes significant at 5% and not significant, respectively. z Means followed by same letters are not significantly different by LSD test.

309
comparison with the control. This could be attributed to high metal concentrations that damaged plant roots and inhibited nutrients uptake, consequently, inhibiting normal plant growth (Argese et al., 2001; Zong et al., 2007; and Yang et al., 2011). A difference of 24.3g and 4.1g was recorded in terms of fresh and dry leaf weights; while 6.7g and 1.3g in fresh and dry root weights was obtained between variety BBL and Italian 167 respectively. This indicates that the plant biomass was negatively affected by Cd treatment. Respectively to Cd concentration of 3, 6, 9 and 12 mg/L, photosynthetic rate was reduced from 8.66%, 20.59%, 30.61%, up to 44.90% compared with the control (Table 2). Declining in photosynthetic rates may be explained as a result of distorted chloroplast ultrastructure; restraining the synthesis of chlorophyll, plastoquinone and carotenoids; at the same time obstructs electron transport; inhibits enzyme activities of the Calvin cycle; and CO2 deficiency as a result of stomatal closure when exposed to Cd stress (Seregin and Ivanov, 2001). This was proved by our data where reduction in stomatal conductance was found at higher Cd concentrations. Chlorophyll a, chlorophyll b and total chlorophyll were affected by Cd treatment in a similar pattern. Interactions were observed in stomatal conductance, chlorophyll a, chlorophyll b and total chlorophyll. Although both varieties showed a similar pattern in response to Cd however, BBL variety was the most affected (Figure 1 and 2). For both the varieties, chlorophyll a was less affected by Cd as compared to chlorophyll b. Many workers have reported similar results (Singh et al., 2012; Preeti and Tripathi, 2011).Treatment with heavy metal on lettuce, cucumber and bean plants by Vassilev et al., (2007) in support of the above results, indicated that the content of all pigments get diminished and to some extent tend to change their ratios.
3 6 9 120
Cadmium concentration (mg/l)
Chl
orop
hyll
cont
ent (
mg/
ml)
0.00
2.00
4.00
6.00
8.00
10.00
12.00
◆◆
◆◆
◆
■
■
■
■
■
▲
▲
▲
▲
▲
Chl a Chl b
y = 12.92 – 2.06xR2 = 0.98y = 6.99 – 1.19x
R2 = 0.96
y = 5.92 – 0.87xR2 = 0.97
Figure 1. Effect of Cd concentrations on chlorophyll a, b and total chlorophyll contents in lettuce variety bombalista (BBL)

310
Figure 2. Effect of Cd concentrations on chlorophyll a, b and total c h l o r o p h y l l contents in lettuce variety Italian 167
▲▲
▲
▲
▲
■
■
■■
■◆ ◆
◆◆
y = 15.81 – 2.47xR2 = 0.97
y = 8.69 – 1.53xR2 = 0.97
y = 7.13 – 0.94xR2 = 0.96
Chl a Chl b Total Chl
0.00
2.00
4.00
6.00
8.00
10.00
12.00
14.00
16.00
Chl
orop
hyll
cont
ent (μ
g/m
l)
Cadmium concentration (mg/l)0 3 6 9 12
CONCLUSION This result has demonstrated the adverse effect of Cd toxicity on various aspects of plant physiological and morphological characteristics. The effects are not limited to only structural changes in the plants body but also alterations and reductions in plant biomass and ultimately affecting their productivity. Generally, variety BBL was more affected than Italian 167, indicating that Italian 167 absorbed and resisted the effect of Cd stress more than variety BBL. Therefore, variety 167 should not be recommended for planting in Cd polluted environments. Above all, a desirable means is required to minimize the uptake of heavy metals in food crops especially vegetables irrigated with polluted wastewater to protect food quality.
REFERENCESArgese, E., Delaney, E., Agnoli, F., Faraon, F., Sorgano, A. and Cacco, G. (2001).
Variation of morpho-physiological parameters of barley and oat plants grown on heavy metal treated microcosms. Bollettino della Societa Italiana della Scienza del Suolo 50 (3): 709 – 722
Azevado, H., Pinto, C.G.G., Farnandes, J., Loureiro, S. and Santos, C. (2005). Cadmium effects on sunflower growth and photosynthesis. J. Plant Nutr. 28: 2211 – 2220
Brown, S.L., Chaney, R.L., Llyod, C.A., Angle, J.S. and Ryan, J.A. (1996). Relative uptake of cadmium by garden vegetables and fruits grown on long-term biosolid-amended soils. Environ. Sci. Technol. 30: 3508 – 3511
Coombs, J., Hall, D.O., Long, S. and Scurlock, J. (1985). Techniques in bioproductivity and photosynthesis. Pergamon Press

311
Cooper, A.J. (1979). The ABC of Nutrient Film Technique. London: Grower Books.Das, P., Samantaray, S. and Rout, G.R. (1997). Studies on cadmium toxicity in plants:
A review. Environ. Pollution. 98: 29 – 36 Kim, S.J., Chang, A.C., Page, A.L. and Warmeke, J.E. (1988). Relative concentrations
of cadmium and zinc in tissues of selected food plants grown on sludge treated soils. J. Environ. Qual. 17: 568 – 753
Mensch, M. and Baize, D. (2004). Contamination des sols et de nos aliments d’origine végétale par les éléments en trace, mesures pour réduire l’exposition. Courrier de l’Environnement de l’INRA 52: 31 – 5
Prasad, M.N.V. (2004). Heavy metal stress in plants. Berlin Heidelberg: Springer-Verlag Springer-Verlag, Heidelberg N.Y., Raskin I., Kumar P.B.A.N., Dushenkov, S. and Salt
D.E. (1994). Bioconcentration of heavy metals by plants. Curr. Opin. Biotechnol. 5: 285 – 290
Preeti, P. and Tripathi, A.K. (2011). Effect of heavy metals on morphological and biochemical characteristics of Albizia procera (Roxb.) Benth seedlings. International. J. Environmental. Science. 1(5): 1009 – 1018
Sanita di Toppi, L. and Gabbriella, R. (1999). Response to cadmium in higher plants. Environ. Exp. Bot. 41: 105 – 130
Seregin, I.V. and Ivaniov, V.B. (2001). Physiological aspects of cadmium and lead toxic effects on higher plants. Russian J. Plant Physiol. 48: 606 – 630
Singh, R.P. and Agrawal, M. (2007). Effects of sewage sludge amendment on heavy metal accumulation and consequent responses of Beta vulgaris plants. Chemosphere 67: 2229 – 2240
Singh, G., Agnihotri, R.K., Reshma, R.S. and Ahmad, M. (2012). Effect of lead and nickel toxicity on chlorophyll and proline content of Urd (Vigna mungo L.) seedlings. Int. J. Plant Physiol. Biochem. 4 (6): 136 – 141
Vassilev, A., Koleva, L., Berova, M. and Stoeva, N. (2007). Development of a plant test system for evaluation of the toxicity of metal contaminated soils. I. Sensitivity of plant species to heavy metal stress. J. Central Euro. Agri. 8 (2): 135 – 140
Yang, Y., Nan, Z., Zhao, Z., Wang, Z., Wang, S., Wang, X., Jin, W. and Zhao, C. (2011). Bioaccumulation and translocation of cadmium in cole (Brassica campestris L) and celery (Apium graveolens) grown in the polluted oasis soil, Northwest China. J. Environ. Sci. 23 (8): 1368 – 1374
Zong, L.G., Sun, J.K., Shen, Q.Y. and Zhang, X.P., (2007). Impacts of cadmium and lead pollution in soil on shoot vegetables growth and toxic-symptoms. Asian J. Ecotoxicol. 2 (1): 63 – 68

312
Greenkit™–Growing Vegetables in Urban Home Garden
I. Sakinah, S. Ab. Kahar and A.M. FarahzetyHorticulture Research Centre,Malaysian Agricultural Research and Development Institute (MARDI), MARDI Headquarters, Persiaran MARDI-UPM, 43400 Serdang, Selangor, Malaysia E-mail: [email protected]
Abstract Home gardening is becoming popular among gardening hobbyists, housewives and busy city dwellers. Malaysian government also encourages vegetables and ‘ulam’ cultivation through its local agriculture campaigns called ‘Bumi Hijau’ and garden landscaping. However, most of the gardening enthusiasts are facing limitations to participate due to several factors such as limited space, lack of skill and time for crop maintenance, especially watering. A growing system called ‘GreenKit™’ was developed and introduced to overcome these limitations thus making home gardening easy and convenient. GreenKit™ is a self-watering container, which does not require frequent watering. GreenKit™ consists of two separate compartments, which is the water reservoir at the bottom and growing media at the top. Principles and methods of planting with GreenKit™ is like planting in the natural terrain, the groundwater rises to the top by capillary action. Reservoirs in GreenKit™ could hold eight liters of water that is capable of supplying water for 5 to 7 days. Thus by using GreenKit™ watering activity can be reduced from 2 times a day to 1-2 times a week. GreenKit™ makes gardening easier for those lacking in gardening knowledge, time and space. If practiced wisely, substantial harvest of fresh nutritious vegetables can be obtained, sufficient for the household consumption and kitchen expenses can be reduced. Application of GreenKit™ can make urban farming sustainable and if carried out seriously can increase the nation’s food security. A comparative study was made between GreenKit™ and conventional container. Seeds of leafy vegetables such as amaranth and water spinach were directly sown on GreenKit™ media (perlite + vermiculite + peat-moss in the ratio (v/v) 1: 1: 1) and conventional soil mixture filled in container (top soil + coco-peat + sand in the ratio (v/v) 3: 2: 1). Results showed high seed germination percentage for both species in Greenkit™ (amaranth 65% and water spinach 42%) as compared to conventional container (amaranth 40% and water spinach 30%). Vegetables planted in GreenKit™ were larger at harvest. The dry weight of both species in Greenkit™ per plant was 50% higher (amaranth 3 g and water spinach 6 g) as compared to conventional container (amaranth 1.5 g and water spinach 3.2 g).
Keywords: GreenKit, vegetables, growing media
INTRODUCTION MARDI has innovated a simple and inexpensive growing system for home gardening called GreenKit™. It is a self-watering container, which does not require frequent watering. GreenKit™ makes gardening simple for those lacking in gardening knowledge, time and space. If practiced wisely, substantial harvest of fresh nutritious vegetables can be obtained, sufficient for the household consumption, thus kitchen spending can be reduced. Application of GreenKit™ contributes to sustainable

313
urban home gardening and has the potential to increase the nation’s food security when implemented in large community scale. GreenKit™ consists of two separate compartments, the water reservoir on the bottom and growing media at the top. Principles and methods of planting with GreenKit™ is like planting in the natural terrain, the groundwater rises to the top by capillary action. Reservoirs in GreenKit™ could fit eight, liters of water that is capable of supplying water for five to seven days. Thus by using GreenKit™ can reduced the watering activity from two times a day to 1 – 2 times a week. Water level should be checked every five days.
MATERIAL AND METHODS A comparative study was made between GreenKit™ and conventional container. GreenKit™ is made from plastic with a size of 54 cm (L) x 24 cm (W) x 21 cm (H) without holes in the bottom. Fig.1 shows the components of GreenKit™ from the top view. Bottom compartments are, water reservoir with size of 40 cm (L) x 12 cm (W) x 7 cm (H) and can accommodate 3.4 liters of water, while at the bottom of the walls there are small holes for water out to capillary area. Capillary area which houses particles, also can hold 1.6 liters of water. Amount of water that can be saved in one Greenkit™ is five liters. If the hole in the bottom is closed (to add more water reservoir), water reservoir can hold 1.5 liter. Thus the total amount of water in one GreenKit™ is 6.5 liters without any growing media. Growing media is an important factor to ensure a good crop production (Farahzety and Ab. Kahar, 2014). Growing media typically used in the GreenKit™ is peatmoss, perlite and vermiculite in the ratio of 1:1:1. These media were commercially used and available in plant nurseries. Fig. 3 shows three growing media used in Greenkit™. Each GreenKit™ requires about 10 – 12 liters of growing media. This growing media mixture can hold about 1.5 liters of water. The total water volume in one GreenKit is eight liters. Growing media can be used repeatedly, but requires to be rotated with various plants cultivation to avoid pests and diseases problem (Ab. Kahar, S et al., 2015) Particle capillaries are an important material in GreenKit™. The function of the material is bringing up water from the reservoir to the growing media by capillary action. The water flow depends on the type of material, shape and size of the particles used (Sakinah and Ab. Kahar, 2012). The material frequently used as particle capillaries is ‘light expended clay aggregate (LECA)’ or Oil palm shell (Fig. 2). Thus moisture in the growing medium was maintained sufficiently and at the same time avoiding excess moisture in the medium (Ab Kahar et al., 2010). Thirty seeds of both amaranth and water spinach were directly sown in each GreenKit™ with soilless media mixture (perlite + vermiculite + peat-moss in the ratio (v/v) 1:1:1) and conventional soil mixture in conventional container (top soil + coco-peat + sand in the ratio (v/v) 3:2:1).

314
Figure 1. Components of GreenKit™ from the top view
Water indicator
Water reservoir
Capillary area
Water inlet
Overflow holes
Figure 2. Particle capillaries
Expanded clay Oil palm shell
Figure 3. Three media (Peat-moss, Perlite, Vermiculite) used in Greenkit
Peat-moss Perlite Vermiculite

315
RESULTS Figure 4 shows seed germination percentage of amaranth and water spinach. Results showed high seed germination percentage for both species in Greenkit™ (amaranth 65% and water spinach 42%) as compared to conventional container (amaranth 40% and water spinach 30%). Vegetables planted in GreenKit™ were larger at harvest. The dry weight at four weeks after sowing for both species in Greenkit™ was 50% higher (amaranth 3 g and water spinach 6 g) as compared to in conventional container (amaranth 1.5 g and water spinach 3.2 g) (Fig. 5). Figure 6 showed seed germination amaranth and water spinach in Greenkit™ and conventional container at two weeks. Physical and chemical properties of the two growing media differed significantly (Table 1). Bulk density and pH (1.65 g cm–³ and pH 6.50) of conventional soil mixture were greater compared to the soilless media mixture (0.27g cm–³ and pH 6.03). While, total porosity and air space were higher in Greenkit media mixture (37.60% and 18.23%) as compared to conventional soil mixture (31.85% and 12.66%).
Figure 4. Seed germination percentage of amaranth and water spinach
GreenKit Conventional pot
0102030405060708090
100Germination % of Amaranth
3 7 14 days 3 7 14 days
Green Kit Conventional pot
0102030405060708090
Germination % of water spinach
Figure 5. Dry weight amaranth and water spinach at four weeks.
Amaranth Water spinach
GreenKit Conventional pot
01234567
Dry weight of Amaranth & Water spinach

316
Figure 6. Seed germination amaranth and water spinach in Greenkit™ (A) and conventional container (B) at two weeks
Table 1. Physical and chemical properties of the two growing media
Media Substrates Total Porosity (%)
Air space(%)
Bulk density(g cm-3)
pH (1:5)
Greenkit with Peat+Perlite+vermiculite (1:1:1)
37.60 a 18.23 a 0.27 b 6.03 b
Conventional container with top soil + cocopeat + sand (3: 2: 1)
31.85 b 12.66 b 1.65 a 6.50 a
Values in a column with the same letter are not significantly different at P <0.05 according to the LSD
DISCUSSION GreenKit™ offers many benefits such as portability, flexibility, aesthetics and controlled growing environment for home gardener within any space. The most challenges with container gardens are to keeping the plants adequately watered. Thus, GreenKit™ is a water reservoir for the plants and aeration screen to ensure the roots have enough oxygen and to keep the roots and substrate separate from the reservoir and from getting waterlogged. The use of suitable soilless media substrate alternatively to soil into this system were developed in order to support plant and root growth. Soilless media are lighter and easier to handle and may provide a better growing environment as compared to soil. The advantage of the light weight material is that it allows ease of handling and transport, which is a very important commercial or economic consideration during handling and transport. The total porosity and air space for GreenKit™ soilless media mixture was higher than in conventional container media mixture (Table 1). Therefore, this media should have sufficient amounts of air and available water for plant growth. Porosity is the physical property that has a direct effect on plant growth. The air content of the medium is particularly important when plants are grown for long periods of time in containers. Media mixture in conventional container is more alkaline (pH of 6.5) as compared to GreenKit™ soilless media mixture (pH 6.0). However, the values were within the range of 5.3 and 6.5, the recommended pH range for an ideal substrate (Abad

317
et al., 2001). The observed superiority exhibited by the soilless media mixture could probably be attributed to its good physical properties that supported the germination of amaranth and water spinach seeds. Plants grown in the conventional soil mixture were significantly shorter than plants grown in the soilless media mixture. Dry weight tended to be lower among plants grown in the conventional soil mixture relative to plants grown in the soilless media mixture. The present findings are in agreement with studies conducted elsewhere using other plants which obtained similar results for lemon balm, peppermint, rosemary and sage produced in soilless and soil-based media (Bell and Coorts, 1979 and Thomas et al., 1991). Commercial mixtures are often used because they are sterilized, ready to use and may even contain some fertilizer. Short-term and long-term crops can be planted in GreenKit™. For the short-term crops such as leafy vegetables and ornamentals, the seeds can be sown directly into the GreenKit™. While for long-term crops such as fruit vegetables, herbs and small shrubs such as pandan and curry plant, planting materials were transplanted into GreenKit™. Combination of several types of plants is recommended but plants must have similar requirements of light and water.
REFERENCESAbad, M., Noguera, P. and Bures, S. (2001). National inventory of organic wastes for
use as growing media for ornamental potted plant production: Case study in Spain. Bioresource Technology 77: 197 – 200
Ab Kahar, S., Farahzety, A. M., Sakinah, I., Zabedah, M. dan Mohamad Rais, H. (2015). GreenKit: Memudahkan aktiviti pertanian bandar. Buletin Teknologi MARDI, Bil. 8 (2015): 107 – 115
Ab Kahar, S., Sakinah, I. dan Zabedah, M. (2010). GreenKit. Dalam: EdibelGarden, m.s 25 – 33. Serdang: MARDI
Bell, S.M. and Coorts, G.D. (1979). The effects of growth mediums on three selected herb species. Florists’ Rev. 163: 48 – 49
Farahzety, A.M. and Ab. Kahar, S. (2014). Media substrates for vegetable gardening in self-watering container for urban areas.Kertaskerjayang dibentangkan di National Urban Horticulture Conference, 15 – 17 April 2014, Johor Baharu
Thomas, H., Boyle and Lyle, E. C. (1991). Growing Medium and Fertilization Regime Influence Growth and Essential Oil Content of Rosemary Thomas. HORTSCIENCE 26(1): 33 – 34
Sakinah, I. dan Ab. Kahar, S. (2012). Greenkit: Pilihan perkebunan laman, mengatasi masalah penyiraman. Kertas kerja yang dibentang di Confertech 2012, Disember 2012, Serdang

318
Urbankit for Urban Communities
Mohd Johaary Abdul Hamid, Zulkefli Malik, Muhammad Suffian Abdul KarimStrategic Planning and Innovation Management CentreMalaysian Agricultural Research and Development Institute (MARDI), MARDI Headquarters, Persiaran MARDI-UPM, 43400 Serdang, Selangor, MalaysiaE-mail: [email protected]
Abstract Food supply needs in urban areas is expected to increase by 2020, in line with the expected increase in population to 85%. Appropriate methods should be sought for in order to increase agricultural production in urban areas where the terrain is very limited and small. A new technology known as ‘Urbankit’ was developed by MARDI as an alternative technology for urban communities. It is specifically designed to provide opportunities for urban communities to reduce expenses as well kitchen household income. This kit is suitable for cultivation of herbs, vegetables and freshwater fish. Some vegetables such as peppermint, salad, spinach, cucumber, kale, ladies finger and lemongrass have been tested with this system. For freshwater fish, red tilapia was chosen because it is tolerant to water conditions such as pH, temperature, oxygen and nitrate. The results showed that there is conservation of water resources and plant nutrients by using a bio-filter. Analysis of water samples showed a pH (7.57), ammonia (0.02 ppm), nitrite (6.16 ppm) and nitrate (20.54 ppm). All of these values were found to be safe to eat and below the level of maximum tolerance for fish culture and growing vegetables and herbs. The Urbankit was developed as a Do-it-Yourself (DIY) approach measuring 5.5 ft by 2 ft and can be operated indoors as well as outdoors. This design kit uses Acrylonitrile Butadiene Styrene (ABS) pipes for framework as it is strong, lightweight, durable and has anti-rusting properties. It is portable, affordable and adaptable to customer needs. It can indirectly help improve livelihoods and may be recommended as a teaching tool in schools. This technology has been granted a patent (industrial design: 12-E0171-0101 and trademark: 2014011787) and is commercialised by TMEH Marketing Sdn. Bhd.
Keywords: Urbankit, new technology, urban communities
INTRODUCTION By the year 2020, the percentage of urban population in Malaysia is projected to achieve 75% as compared to 62% in 2000 (DOSM, 2014). In the meantime, FAO (2014) faced the challenge of finding a method to maximise the production of vegetables in areas where land is very limited and small. However, the issues on the cultural system for aquaponic in limited space are currently costly, high maintenance, time consuming and labour intensive. Therefore, Urbankit is designed to provide an opportunity for the urban community to reduce household expenditures while increasing revenue for community projects. This kit is suitable for cultivation of herbs, vegetables and freshwater fish. Some plants such as peppermint, pennywort (herbs), lettuce, spinach, kale coelomic, parkchoy (leafy vegetables), chilli, brinjal, okra, onion, lemongrass, turmeric and beans (fruit vegetables) have been tested and adapted for this kit. For freshwater fish, red

319
tilapia was chosen because it is tolerant to water conditions such as pH, temperature, oxygen and nitrate.
MATERIALS AND METHODS Urbankit was developed as a proof of concept and as a Do-It-Yourself (DIY) kit. The kit measures 5.5 feet in length and 2 feet in width and can be used indoors and outdoors. The design kit uses Acrylonitrile Butadiene Styrene (ABS) pipe and polybox which are strong, lightweight, durable and anti-rust. This kit is portable and can be moved from one place to another thus meet’s customer needs.
RESULTS AND DISCUSSION This system has proved to be successful in fulfilling nutrient requirements of vegetables and fish. The waste from fish rearing and excess food (pellets) from the pond containing ammonia (NH3) is pumped into the bio-filter. The bio-filter function produces good bacteria such as Nitrosomonas sp. to decompose ammonia into nitrite. The nitrite produced is parsed by the bacteria Nitrobacter sp. to nitrate. The root of vegetables absorbs nitrites and nitrates for growth. Finally, clean nutritive fresh water nutrient filtered by plant roots flows back into the pond and the process is repeated. The kit has proved to fulfil the concept of green technology as its produce is organic and does not require chemical fertilizers and pesticides. The results of the experiment indicated a water pH of 7.57, ammonia 0.02 ppm, nitrite and nitrate 6.16 ppm and 20.54 ppm. The water quality result values are within the tolerance limits and not harmful for
Figure 1. Process flow of Urbankit
How Urbankit works
Water, mixed with waste from a fish tank, fills the flood tank
The tank empties nutrient-rich water into a grow bed, feeding the plants. The grow medium and the plants help filter the water Bacteria is cultured in the grow
beds and fish tank to break ammonia into nitites and then nitrates
Aerated, clean water returns to the fish tank
Water and fish waste are pumped from the fish tank back to the flood tank and the cycle repeats
Fish produce ammonia rich waste. Too much waste is toxic to the fish, but they can withstand high level of nitrates
Molly Zink / The Register
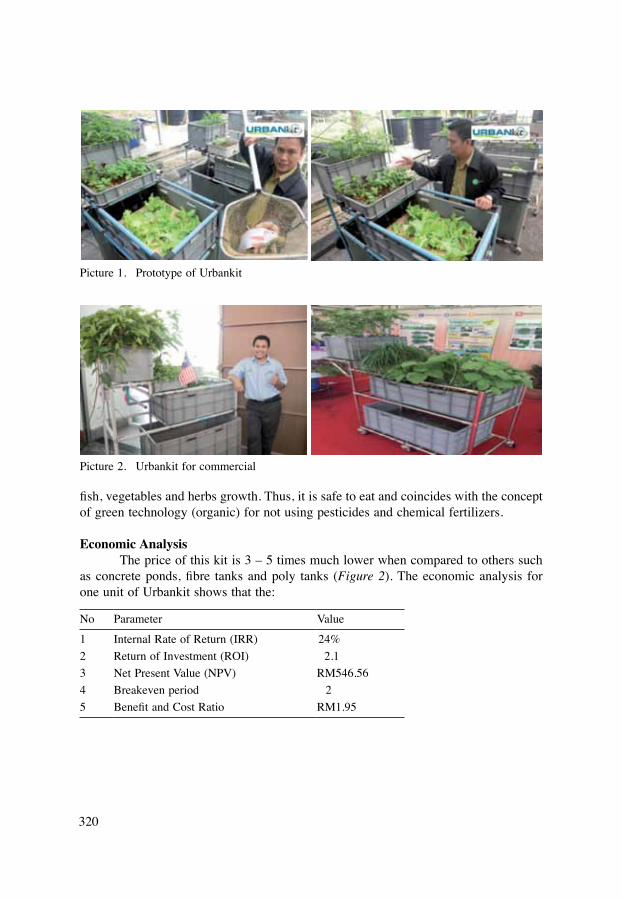
320
Picture 1. Prototype of Urbankit
Picture 2. Urbankit for commercial
fish, vegetables and herbs growth. Thus, it is safe to eat and coincides with the concept of green technology (organic) for not using pesticides and chemical fertilizers.
Economic Analysis The price of this kit is 3 – 5 times much lower when compared to others such as concrete ponds, fibre tanks and poly tanks (Figure 2). The economic analysis for one unit of Urbankit shows that the:
No Parameter Value
1 Internal Rate of Return (IRR) 24%2 Return of Investment (ROI) 2.13 Net Present Value (NPV) RM546.564 Breakeven period 25 Benefit and Cost Ratio RM1.95
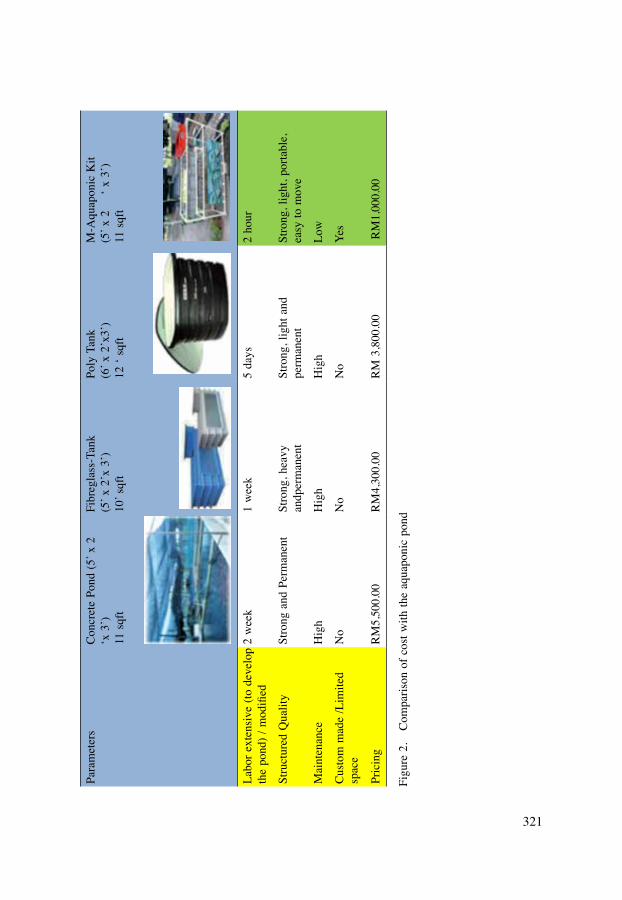
321
Para
met
ers
Con
cret
e Po
nd (5
’ x 2
½
‘x 3
’)11
sqf
t
Fibr
egla
ss-T
ank
(5’ x
2’x
3’)
10’ s
qft
Poly
Tan
k(6
’ x 2
’x3’
)12
‘ sq
ft
M-A
quap
onic
Kit
(5’ x
2 ½
‘ x
3’)
11 s
qft
Labo
r ext
ensi
ve (t
o de
velo
p the pond) / modified
2 w
eek
1 w
eek
5 da
ys2
hour
Stru
ctur
ed Q
ualit
ySt
rong
and
Per
man
ent
Stro
ng, h
eavy
an
dper
man
ent
Stro
ng, l
ight
and
pe
rman
ent
Stro
ng, l
ight
, por
tabl
e,
easy
to m
ove
Mai
nten
ance
Hig
hH
igh
Hig
hLo
w
Cus
tom
mad
e /L
imite
d sp
ace
No
No
No
Yes
Pric
ing
RM
5,50
0.00
RM
4,30
0.00
RM
3,8
00.0
0 R
M1,
000.
00
Figu
re 2
. C
ompa
rison
of c
ost w
ith th
e aq
uapo
nic
pond

322
CONCLUSION The usage of Urbankit, can indirectly help supplement the community’s income and reduce kitchen expenditures. It is also applicable for home gardening as well as a tool for teaching gardening in schools. It may also be promoted in national programme such as Green Earth campaign, the edible gardens, PR1MA (1Malaysia People’s Housing) and Corporate Social Responsibility (CSR). The Urbankit has been granted a patent (industrial design: 12-E0171-0101 and trademark: 2014011787) and is being commercialised by TMEH Marketing Sdn. Bhd through an exclusive licensing method.
REFERENCESAnon. (2014).Department of Statistic Malaysia (DOSM).FAO (Food and Agriculture Organization of the United Nations) (2014). Urban and
Periurban Agriculture, Household Food Security andNutrition (http://www.fao.org/fcit/upa/en/)
Mohd Johaary, A.H. (2014). M-Aquaponic kit: Potential Technology for Urban Agriculture.Proceeding National Urban Horticulture Conference at Berjaya Waterfront Hotel, Johor Bahru 15 – 17 April 2014 pp 90 – 93

323
Effect of Soil Amendments on Growth Performance and Yield of Field Grown Sweet Corn (Zea mays) Cultivated on Bris Soil
Noorsuhaila, A.B.1, Faridah, M.1, Theeba, M.1, Mohd Hadi Akbar, B.2, Taufikurahman, B.3, Mohd Ridzuan, M. S.3, Nor Hazlina, M.S.4, Farah Huda, S.S4, Mohd Aziz, R.1, Arina Shairah, A.S.51Crop and Soil Science Research Centre, Malaysian Agricultural Research and Development Institute, Persiaran MARDI-UPM, 43400 Serdang, Selangor, Malaysia2Felda Agricultural Services Sdn. Bhd. 3MARDI Cherating, P.O. Box No. 3, Balok Post Office, 26100 Kuantan, Pahang, Malaysia.4Horticulture Research Centre, Malaysian Agricultural Research and Development Institute,Persiaran MARDI-UPM,43400 Serdang Selangor, Malaysia5Department Land Management, Faculty of Agriculture, Universiti Putra Malaysia, 43400 Serdang, Selangor, Malaysia
Abstract The decline in soil fertility in agricultural land is a major problem that causes decrease in the production of food crops. One of the causes of decline in the production of food crops is availability of the nutrients in the soil. Cultivation of the Hibrimas sweet corn is a challenging task when grown on BRIS soils (Beach Ridges Interspersed with Swales). A field study was conducted at MARDI Cherating, Kuantan, Pahang, Malaysia to assess the influence of alternative liming materials derived from magnesium rich synthetic gypsum (MRSG), iron phosphogypsum (IPG) and palm oil mill effluent in combination ratio of 2:1:7, respectively as a waste product (WP). This waste product was used to improve soil properties and yield production of sweet corn. There were five treatments: T1 as a control treatment comprise of 100% chemical fertilizer (15:15:15) at rate 400 kg/ha, T2 comprise of WP at rate 5 t/ha + 100% chemical fertilizer, T3 comprise of WP at rate 10 t/ha + 100% chemical fertilizer, T4 comprise of WP at rate 15 t/ha + 100% chemical fertilizer and T5 comprise of Ground Magnesium Limestone (GML) at rate 2 t/ha + 100% chemical fertilizer as a conventional practice were used in this study. The treatments were laid out in a randomized complete block design with four replications. Results showed better growth performance of sweet corn on conventional practice (T5) compared to other treatments at 6 to 8 weeks after planting (WAP) in term of plant height, stem diameter and number of leaves per plant. However, the effect of soil amendments could be seen during yield harvesting. Application of WP at rate 15 t/ha (T4) improved yield and yield component parameters which showed highest cob weight, cob length, cob diameter and grain yield except 1000-seed weight compared to conventional practice (T5). The greater grain yield was obtained from T4 was 191.05 kg/ha compared to other treatments. Thus, it can be suggested that this WP at rate 15 t/ha could be used as alternative liming materials for cultivation of sweet corn on BRIS soil in order to obtain high yield and indirectly may reduce the cost of fertilization.
Keywords: soil amendments, BRIS soil, waste product, growth performance
INTRODUCTION Nutrient availability becomes a major problem in crop productivity especially for BRIS soil which influences soil pH especially in availability of micronutrients for

324
plant uptake. In BRIS soil, nutrient deficiencies become a major problem especially for plant growth. The low soil pH, low organic matter, low water holding capacity of BRIS soil might cause decrease in crop productivity. Thus, the production of food crops in BRIS soil requires a great effort to improve the soil in terms of nutrients to produce optimally. According to Hokmalipour and Darbandi (2011) the plants produce yield optimally based on its soil properties like soil pH, nutrient availability, CEC and others. Various soil amendments were used in improving soil fertility and increasing soil pH like lime which is easily available and able to retain long time in soil (Aliu et al., 2010). However, it is costly and in limited supply. Recently a new approach was introduced to replace limestone by using earth waste product as an alternative of soil amendment. This is due to its availability and cheaper than limestone. Gypsum is a natural salt derived as by-product of several industries. According to Finck (1982) gypsum is more soluble in water and good to agricultural applications as soil conditioner. Gypsum is a good source of calcium and sulphur for plants and may have favourable effect on soil structure. Alva et al., (1991) stated that application of gypsum into soil is beneficial to peanuts because it induces leaching of magnesium and potassium in the fruit zone. Thus, application of gypsum resulted in increase in rooting depth and enhanced root calcium relationship (Summer and Carter, 1998). Further research needs to be considered to increase utilization of gypsum in response to crop performance especially for sandy soil. Besides, palm oil mill effluent (POME) is another by product of palm oil processing industry and has become polluting potential. However, POME is easily biodegradable and could be used as soil organic amendment to improve soil productivity (Nwoko and Ogunyemi, 2010). According to Akinyele et al., (2009) POME contains Ca, Mg, N, P and K and is a good source of organic matter. Therefore, the objective of this study is to evaluate potential gypsum and POME as an alternative liming material in improving growth and yield of sweet corn.
MATERIALS AND METHODS
Experimental site This study was conducted in open field at Malaysian Agriculture Research and Development Institute (MARDI), Cherating, Pahang. This soil was classified as Typic Quartzipsamments. The soil had a very high sand content exceeding 90% and had low cation exchange capacity (CEC) value at 1.69 meq/100 g soil.
Physicochemical characteristics of waste product Magnesium rich synthetic gypsum (MRSG) also known as neutralized underflow (NUF) was collected from a rare-earth processing factory, Lynas Advanced Material Plant (LAMP), Kuantan, Pahangas a waste product from the factory. The samples were air dried and sieved to pass through a 2 mm sieve. MRSG was analyzed for pH, total nitrogen, phosphorus, potassium, calcium, magnesium and cation exchange capacity

325
(CEC). Soil pH was measured in a 1:2.5 soil: water suspension using a glass electrode pH meter. Available P was determined by extraction using the Bray and Kurtz No. 2 method and the content was determined by UV-Visible Spectrophotometer (Bray and Kurtz, 1945). Total nitrogen was determined by Kjeldahl method. Exchangeable bases (potassium (K), calcium (Ca) and magnesium (Mg)) and cation exchange capacity (CEC) were determined by the leaching method with 1.0 M ammonium acetate solution (NH4OA) buffered at a pH 7 (Lavkulich, 1981). Concentration of exchangeable bases, Ca and Mg were analyzed using Atomic Absorption Spectrophotometer (AAS) (Model AA-700, Shimadzu) and K using the flame photometer (Model FP8000, Gemany). The characteristics of waste product are presented in the Table 1.
Experimental treatments and design The field was ploughed and hart\rowed before laying out the plots. The plot size was 69.8 m × 54.4 m. The experiment included five treatments; T1 as a control treatment comprise of 100% chemical fertilizer (15:15:15) at rate 400 kg/ha, T2 comprise of WP at rate 5 t/ha + 100% chemical fertilizer, T3 comprise of WP at rate 10 t/ha + 100% chemical fertilizer, T4 comprise of WP at rate 15 t/ha + 100% chemical fertilizer and T5 comprise of Ground Magnesium Limestone (GML) at rate 2 t/ha + 100% chemical fertilizer as conventional practice. The plots were laid out in a randomized completely block design (RCBD). Waste product and GML were applied to the respective plots and incorporated into the soil before sowing. Seeds were sown at a density of 5.33 x 10⁴ plants ha-1 with spacing of 25 cm x 75 cm. Seedling was done manually on the ridge in 5 cm depth of soil after land preparation followed by basal fertilizer application (MARDI, 2005). The plot was kept weed-free and plant-protection measures were taken when required.
Measurement of growth characteristics Plants were randomly selected from each plot and tagged for the measurement of growth characteristics as follows:
Table 1. Physio-chemical characterisation of waste product
Parameters Value + Std ErrorpH 7.16 ± 0.012Total Nitrogen (%) 1.29 ± 0.027Total Phosphorus (%) 2.62 ± 0.143Total Potassium (%) 2.24 ± 0.033Exc. Ca (cmol + /kg) 65.60 ± 5.205CEC (cmol + /kg) 24.31 ± 0.257Moisture (%) 13.79 ± 0.052

326
Plant height (cm): Plant height was measured from the base to top at 6, 8 and 10 weeks after planting (WAP) using measuring tape. Stem diameter (mm): Stem diameter was taken from the ground of the sweet corn at 6, 8 and 10 WAP using digital vernier calliper. Number of leaves per plant: The number of leaves per plant was determined by counting manually at 6, 8 and 10 WAP. Biomass (dry matter) yield per plant (g): Plants were randomly selected and destructively sampled by harvesting the part of leaf and stem at 6, 8 and 10 WAP. The biomass was oven-dried at 70C for three days and weighed using electrical weighing machine, Model OXD-844-2200K.
Measurement of yield traits The sweet corn was harvested using 1m x 1m square quadrate at maturity and the following yield data were taken:Ear weight (g): The fresh weight of the peeled ear was measured using weighing machine, Model OXD-844-2200K.Ear length (cm): The length of the peeled ear was measured using measuring tape and ruler.Diameter of ear (cm): The diameter of the peeled ear was measured using digital vernier calliper, Model 500-196-20.Weight of 1000 seeds (g): The weight of 1000 seeds was oven-dried to 13 – 14% moisture content and weighed using analytical balance, Model EWJ 300-3.Grain yield per hectare (kgha–1): The total grain yield in quadrate sample was oven dried at 13 – 14% of moisture content and computed the grain yield in kilograms per hectare.
Statistical analysis All data collected were statistically analyzed using the analysis of variance (ANOVA) procedure. Least significant difference (LSD) was used for mean comparison at 0.05 probability level.
RESULTS
Physiochemical characteristics of waste productTable 1 shows that the waste product is a neutral material with pH 7.1 and acceptable moisture content for soil amendment. This product has moderately high cation exchange capacity of 24 cmol+/kg and suitable to be used as soil enhancer for soil conditions with low CEC.
Growth characteristics Table 2 presents the results of growth parameters of sweet corn. In six weeks after planting, sweet corn vegetative growth parameters showed that plant height, stem diameter and number of leaves per plant decreased significantly with increase rates of soil
327
amendment application from 0 t/ha to 10 t/ha as shown in T1 to T3 (Table 2). However, plant height and stem diameter increased up to 84.19 cm and 13.44 mm, respectively at 15 t/ha level of soil amendment application (T4). Plant height, stem diameter and number of leaves per plant increased in all plots treated with T5, indicating that application of current practise by farmers generally enhanced vigorous plant growth in four and six weeks after planting (WAP). However, no significant difference was observed at 10th WAP for all treatments. It indicates that this soil amendment already has interaction between soil and plant relationship same like current practice (T5) and gave similar improvements in growth parameters except plant height. For the plant height, the tallest plants were observed in T5 followed by T3>T1>T4>T2 in 10th WAP. For stem diameters, no significant difference was observed between treatments from 6th to 10th WAP. Stem diameter increased as the age of plant increased as shown in Table 2. The order in which stem diameter increased according to treatments was TR>T1>T2>T4>T3. The smallest stem girth was recorded in T3 at 6th to 10th WAP. The effect of application of soil amendments can be observed at 10th WAP on plant height and number of leaves especially for T4. It indicates that this application can give better growth performance same like conventional practice.
Yield and yield components The dry matter of the sweet corn as shown in Table 3 indicates that the control treatment (T1) had the highest dry matter weight of 5.34 and 2.51 g per plant for leaf and stem dry weight, respectively at 6th WAP. Meanwhile, T5 showed the highest dry matter of leaf and stem followed by T4 and T2. No significant difference was observed for leaf dry matter at 8th WAP. Leaf dry matter was observed significantly high at 10th WAP where T5 produce more leaf compared to other treatments. It shows that accumulation of dry matter partitioning was greater in leaf rather than in stem for enhancing their photosynthetic activity during maturity stage (10 WAP) (Figure 1). Table 4 shows that T4 gave better yield and yield components of sweet corn even no significant difference was observed between treatments except 1000-seed weight. However, the use of soil ameliorant at any rate of application gave better grain yield compared to control (T1) and normal practices (T5) even no significant difference was observed on grain yield. Thus, the highest sweet corn grain yield of 191.05 t/ha was obtained from T4 followed by T3 (184.91 kg/ha) and T2 (178.33 kg/ha). When compared with the farmers practise (T5), the average increase of yield was 56%. Thus, soil ameliorant application may increase grain yield production.
DISCUSSION The observed performance in growth and yield parameters with the application of soil amendments could be attributed to application of soil amendments. The results of this study showed that soil amendments application gave better yield compared to farmer practices. Thus, the effect of this application should be further investigated to determine the efficiency of this soil amendment in improving soil structure, growth performance and yield production.

328
Tabl
e 2.
Effe
ct o
f tre
atm
ents
on
the
grow
th p
aram
eter
s of
sw
eet c
orn
at 6
, 8 a
nd 1
0 W
AP
Trea
tmen
t6
WAP
8 W
AP10
WAP
Plan
t heig
ht
(cm
)St
em d
iamete
r (m
m)
No. o
f lea
ves
per p
lant
Plan
t heig
ht
(cm
)St
em d
iamete
r (m
m)
No. o
f lea
ves
per p
lant
Plan
t heig
ht
(cm
)St
em d
iamete
r (m
m)
No. o
f lea
ves
per p
lant
Mean ± Std
Erro
rMean ± Std
Erro
rMean ± Std
Erro
rMean ± Std
Erro
rMean ± Std
Erro
rMean ± Std
Erro
rMean ± Std
Erro
rMean ± Std
Erro
rMean ± Std
Erro
rT1
84.75 ± 11.59a
b12.94 ± 1.97
ab6.75 ± 1.65b
119.25 ±10.47a
b15.10 ± 0.67
ab10.25 ± 0.25
b124.25 ± 8.09a
b16.13 ± 0.80
a10.09 ± 0.25
b
T284.22 ± 6.16
ab 13.6 ± 1.15
ab8.00 ± 0.41a
b117.09 ± 6.69a
b14.52 ± 0.44
ab10.75 ± 0.48
b119.58 ± 3.81b
15.98 ± 0.70
a10.58 ± 0.37
b
T377.01 ± 3.86
b12.54 ± 0.52
b7.50 ± 0.50a
b111.00 ± 9.79b
14.14 ± 0.23
b11.00 ± 0.41
b126.42 ± 4.24a
b15.42 ± 0.51
a10.84 ± 0.42
b
T484.19 ± 5.83
ab13.44 ± 1.20
ab7.50 ± 0.29a
b125.50 ± 7.82a
b14.80 ± 0.95
ab11.50 ± 0.65
ab126.08 ± 5.74a
b15.64 ± 1.10
a11.00 ± 0.41
b
T596.38 ± 6.28
a15.65 ± 1.16
a9.00 ± 0.41a
132.92 ±10.80a
16.19 ± 0.34
a12.75 ± 0.48
a136.25 ± 3.91a
17.12 ± 0.32
a12.00 ± 0.27
a
Means with the same letters in the same column were not significant at P
≥0.05. Note: T
1:100
% c
hem
ical
ferti
lizer
, T2:
WP
at ra
te 5
t/ha
+
100%
che
mic
al fe
rtiliz
er, T
3: W
P at
rate
10
t/ha
+ 10
0% c
hem
ical
ferti
lizer
, T4:
WP
at ra
te 1
5 t/h
a +
100%
che
mic
al fe
rtiliz
er a
nd T
5: G
ML+
100
% c
hem
ical
ferti
lizer
.
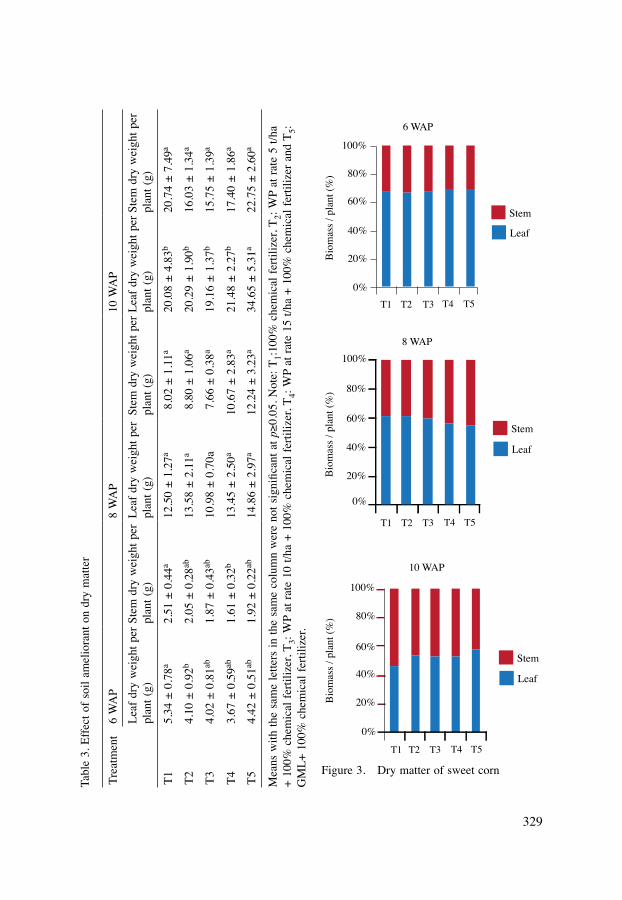
329
Tabl
e 3.
Effe
ct o
f soi
l am
elio
rant
on
dry
mat
ter
Trea
tmen
t6
WA
P8
WA
P10
WA
PLe
af d
ry w
eigh
t per
pl
ant (
g)St
em d
ry w
eigh
t per
pl
ant (
g)Le
af d
ry w
eigh
t per
pl
ant (
g)St
em d
ry w
eigh
t per
pl
ant (
g)Le
af d
ry w
eigh
t per
pl
ant (
g)St
em d
ry w
eigh
t per
pl
ant (
g)
T15.34 ± 0.78a
2.51 ± 0.44a
12.50 ± 1.27
a 8.02 ± 1.11
a20.08 ± 4.83
b20.74 ± 7.49
a
T24.10 ± 0.92b
2.05 ± 0.28a
b13.58 ± 2.11
a 8.80 ± 1.06
a20.29 ± 1.90
b16.03 ± 1.34
a
T34.02 ± 0.81a
b1.87 ± 0.43a
b10.98 ± 0.70a
7.66 ± 0.38
a19.16 ± 1.37
b15.75 ± 1.39
a
T43.67 ± 0.59a
b1.61 ± 0.32b
13.45 ± 2.50
a10.67 ± 2.83
a21.48 ± 2.27
b17.40 ± 1.86
a
T54.42 ± 0.51a
b1.92 ± 0.22a
b14.86 ± 2.97
a12.24 ± 3.23
a34.65 ± 5.31
a22.75 ± 2.60
a
Means with the same letters in the same column were not significant at p≥0.05. Note: T
1:100
% c
hem
ical
ferti
lizer
, T2:
WP
at ra
te 5
t/ha
+
100%
che
mic
al fe
rtiliz
er, T
3: W
P at
rate
10
t/ha
+ 10
0% c
hem
ical
ferti
lizer
, T4:
WP
at ra
te 1
5 t/h
a +
100%
che
mic
al fe
rtiliz
er a
nd T
5: G
ML+
100
% c
hem
ical
ferti
lizer
.
Figure 3. Dry matter of sweet corn
6 WAP
Bio
mas
s / p
lant
(%)
Stem
Leaf
100%
80%
60%
40%
20%
0%T1 T2 T3 T4 T5
8 WAPB
iom
ass /
pla
nt (%
)
Stem
Leaf
100%
80%
60%
40%
20%
0%
T1 T2 T3 T4 T5
10 WAP
Bio
mas
s / p
lant
(%)
Stem
Leaf
100%
80%
60%
40%
20%
0%
T1 T2 T3 T4 T5

330
Tabl
e 4.
Effe
ct o
f tre
atm
ents
on
the
yiel
d pa
ram
eter
s of
sw
eet c
orn
Trea
tmen
tM
ean
cob
wei
ght (
g)M
ean
cob
leng
th (c
m)
Mea
n co
b di
amet
er (c
m)
1000
-see
d w
eigh
t (g)
Gra
in y
ield
(kg/
ha)
T1 93.10 ± 12.21
a13.10 ± 1.16
a39.29 ± 5.03
a72.55 ± 7.57
a137.81 ± 27.52
a
T2
121.21 ± 12.91
a13.60 ± 0.65
a38.67 ± 0.93
a76.29 ± 6.25
a178.33 ± 27.62
a
T3121.25 ± 17.12
a14.22 ± 1.07
a38.38 ± 1.08
a71.01 ± 6.00
a184.91 ± 33.22
a
T4125.62 ± 18.79
a14.88 ± 0.52
a39.46 ± 0.90
a69.35 ± 7.38
a191.05 ± 36.87
a
T5 88.36 ± 9.51a
13.22 ± 0.53
a35.92 ± 1.52
a64.57 ± 20.45a
122.30 ± 21.77
a
Means with the same letters in the same column were not significant at P
≥0.05. Note: T
1:100
% c
hem
ical
ferti
lizer
, T2:
WP
at ra
te 5
t/ha
+
100%
che
mic
al fe
rtiliz
er, T
3: W
P at
rate
10
t/ha
+ 10
0% c
hem
ical
ferti
lizer
, T4:
WP
at ra
te 1
5 t/h
a +
100%
che
mic
al fe
rtiliz
er a
nd T
5: G
ML+
100
% c
hem
ical
ferti
lizer
.

331
CONCLUSION From the above results, it could be concluded that yield advantages were gained by cultivating sweet corn with high rate of soil amendments. The high rate of soil ameliorant is equivalent to current practices by farmers which may reduce cost of fertilization. This waste product could be used as alternative lime material for BRIS soil to improve soil fertility and crop productivity.
REFERENCESAliu, S., Fetahu, S., Rozman, L. (2010). Variation of physiological traits and yield
components of some maize hybrid (Zea mays L.) in agroecological conditions of Kosovo. Acta Agriculturae Slovenica, 95(1): 35 – 41
Alva, A.K., Gasho, G.J., Guang, Y. (1991). Soil solution and extractable calcium in gypsum-amended Coastal Plain soils used for peanut culture. Comm. Soil Sci. Plant Annal., 22: 99 – 116
Bray, R.H. and Kurtz, L.T. (1945). Determination of total organic and available forms of phosphorus in soil. Soil Science, 59: 39 – 45
Finck, A. (1982). Fertilizers and fertilization. Verlag Chemie, Deerefield Beach, FlaHokmalipour, S. and Darbandi, M.H. (2011). Physiological growth indices in corn
(Zea mays L.) cultivars as affected by nitrogen fertilizer levels. World Applied Sciences Journal, 15 (12): 1800 – 1805
Lavkulich, L.M. (1981). Methods manual, pedology laboratory. Department of Soil Science, University of British Columbia, Vancouver, British Columbia, Canada
Malaysian Agricultural Research and Development Institute (MARDI).( 2005). Manual Teknologi Penanaman Jagung Manis,MARDI, Kuala Lumpur, Malaysia
Nwoko, C.O. and Ogunyemi, S. (2010). Evaluation of palm oil mill effluent to maize (Zea mays L) crop: yields, tissue nutrient content and residual soil chemical properties. Australian Journal of Crop Science, 4(1): 16 – 22
Summer, M.E. and Carter, E. (1998). Ameliorant of subsoil activity. Commm. Soil Sci. Plant Anal., 19: 1309 – 1318
332
Growth and Yield Responses of Cucumis Sativus to Biochar Based Organic Fertilizer and Biochar Soil Amendment
Theeba, M.1, Bachmann, R.T.3, Zulkefli M.2 and Illani Z. H.11Crop and Soil Science Research Centre,Malaysian Agricultural Research and Development Institute (MARDI), MARDI Headquarters, Persiaran MARDI-UPM, 43400 Serdang, Selangor, Malaysia2Corporate Communication & Quality Centre,Malaysian Agricultural Research and Development Institute (MARDI), MARDI Headquarters, Persiaran MARDI-UPM, 43400 Serdang, Selangor, Malaysia3Universiti Kuala Lumpur, Malaysian Institute of Chemical and Bioengineering Technology (UniKLMICET), 78000 Alor Gajah, Melaka, MalaysiaE-mail: [email protected]
Abstract Rice husk charcoal (RHC), a major by-product of the rice processing mill, is abundantly available and very low in cost. RHC was observed to increase crop growth and yield when used as poly bag or potting media by farmers in Kedah. However, it is found underutilized and paid to be disposed by mill owners in some area especially in Kelantan state. Therefore, a study was undertaken at MARDI’s integrated organic farm to assess the effects of this waste on cucumber (Cucumis sativus) production and changes in soil physico-chemical properties with the aim to increase the utilization of RHC for good agronomic return. RHC was applied to crop which was grown on soil under rain shelter in two ways, 1) co-composted with biomass with different rates and applied as fertilizer and 2) fresh and applied during soil bed preparation at different rates. Evaluation on crop growth, yield, nutrient uptake and chemical and physical properties of soil over two harvesting seasons was carried out. Results showed that crop performed better in plots receiving treatments in order: 5% RHC compost, >10% RHC compost, >3% fresh RHC, >1% RHC and 0% (Control). (instead of >10%, the quantity applied per unit area may be given) the plots treated with 10 % RHC compost gave the highest yield in season one (51.2 ± 2.8 t/ha) closely followed by 5% RHC compost (49.5 ± 2.7 t/ha) and fresh RHC 3% (49.4 ± 2.6 t/ha), while for season two, the highest crop production was in 5% RHC compost (45.9 ± 1.6 t/ha), followed by 10% RHC compost (45 ± 2.5 t/ha) and fresh RHC 3% (41 ± 2.5 t/ha). The crop yield was strongly correlated with crop nutrient uptake of N, P and K as well as dry root mass which were highest in plots under RHC compost 5% and 10%, followed by fresh RHC at 3% amendment. Cation exchange capacity (CEC), pH, water holding capacity and porosity were in plots treated with 3% RHC.
Keywords: rice husk charcoal, Cucumis sativus, yield, physio-chemical, nutrient uptake
INTRODUCTION Total production of milled rice in year 2011 was 1,648,632 tonnes which comprised about 64% of the total paddy production (Department of Agriculture, 2011). The remaining 36% consisted of rice straw and rice husk that was removed during the rice processing operations. Rice husks constitute 23% of the removed biomass waste (Padi Beras Nasional Berhad, 2011). Thus, it is estimated that in 2011 alone, a

333
total amount of 213,292 tonnes of rice husk was generated were during rice milling operation. In major rice processing mills such as BERNAS owned rice mills, the rice husks generated are gasified using cyclone furnaces to generate heat for the rice drying purpose. During the gasification process approximately 30 kg of rice husk charcoal (RHC) produced per hour per rice mill from 100 kg rice husks at temperatures ranging from 350 – 550 °C (BERNAS, 2007). A total of about 650 tons of RHC per mill was produced yearly. Based on surveys done in Kedah, Kelantan and Sekinchan, more than 50 mills were identified in producing RHC, thus an estimated amount of 32,000 tonnes of RHC were generated in these states in 2011. In Kedah, RHC is widely utilized in transplanting beds for rice seedlings as it encourages high rooting capacity, water and nutrient retention. However, the waste is still found accumulated in the mill due to its abundance. While in Kelantan, due to absence of demonstrated use for the RHC, lack of knowledge of the properties of the char and the lack of enforcement of waste management regulations in Malaysia, the material tends to accumulate adjacent to the gasification units and required to be disposed. It is paid to be disposed to landfills by the rice mills costing approximately RM8000/mill/year (BERNAS, 2011). Therefore, RHC utilization required to be increased for better agronomic return and to reduce the waste problem in the mills. Some studies have been carried out on the application of RHC from various production mechanisms for soil improvement and crop production. The benefits of rice husk charcoal include absorption, nutrient retention and deodorization of excreta (Ogawa, 1991). Karmakar et al., (2009) study on the effect of application and RHC showed that the applications improved soil properties by decreasing soil bulk density and increasing soil pH, organic carbon, available nutrients and crop yield. RHC shares some of the characteristics of biochar, which has been defined as the porous carbonaceous solid produced by thermo chemical conversion (usually slow pyrolysis) suitable for safe and long-term storage of carbon (Shackley and Sohi, 2010). RHC also meets the requirement of the International Biochar Initiative (IBI) that the molar H to organic C ratio should have a maximum value of 0.7 (Shackley et al., 2012). In cases, where biochar is used in combination with organic fertilizers such as manure and compost, crop yields are increased from improved fertilizer efficiency as nutrient loss by leaching is reduced (Ray and Rush, 2007). Therefore, with the aim of increasing the utilization of RHC, a study was designed to assess the effects of RHC on vegetable crop production and soil properties. The effects were studied through co-composted biomass with RHC as an organic fertilizer and fresh RHC application into the soil.
MATERIALS AND METHODS RHC was collected from a local mill which operates BERNAS cyclone husk furnaces to generate heat for rice drying activity. Physico-chemical characteristics of the RHC are shown in Table 1. Field assessment was carried out at the MARDI Integrated Organic Farm, Serdang, on production of cucumber (C. sativus) over two cropping cycles with six treatments and four replicates using a completely randomized design. The treatments used for these

334
Table 1. Physico-chemical characteristics of RHC in this study
Characteristics ValuespH 8.9 ± 1.1Bulk density (g/cm3) 0.17±0.3Moisture content ,(%) 7.1 ± 0.3CEC (cmol/kg soil) 17.0 ± 1.3Total Carbon, (%) 16.0 ± 0.5Total N, (%) 0.1 ± 1.2Ash (Armophous Silica) (%) 78.8 ± 0.8Atomic ratio (H/C) 0.534Atomic ratio (O/C) 0.173Methylene blue adsorption capacity (mg/g) 38.5BET surface area (m2 g-1) 401.1 ± 0.76Pore volume at P/P0 0.95 (cm3 g–1) 0.322BET Average pore diameter (nm) 2.7SEM pore diameter (µm) 10Water Holding Capacity % (pF 2 – pF 4) 101 – 89.1
Table 2. Treatments used for this study
Treatments Description MethodsC Control No fertilization, no addition of RHCBC Biomass compost Addition of biomass compost produced without
addition of RHCRHC-C10 RHC – compost 10% Biomass co-composted with RHC at 10%RHC-C5 RHC – compost 5% Biomass co-composted with RHC at 5%RHC-F 3 Fresh RHC 3% Applied during bed preparation and followed by
biomass compost as in T2RHC-F1 Fresh RHC 1% Applied during bed preparation and followed by
biomass compost as in T2
experiments are shown in Table 2, consisting of control, biomass compost, biomass co-composted with RHC at two rates and fresh RHC application on the raised bed at two rates. RHC was utilized in two different ways in this study; 1) as organic fertilizer (treatment RHC-C10 and RHC-C 5) and 2) as soil amendment (treatment RHC-F 3 and RHC-F 1). RHC which was co-composted with biomass waste such as chicken dung is expected to release the nutrients more efficiently for crop uptake as it was able to retain nutrients in its pores during composting process (Theeba et al., 2012). On the other hand, fresh char was applied into soil as soil amendment in other treatments to determine its effects in retaining nutrients and water supplied to the crop. In detail, biomasses were

335
co-composted with RHC at 10% and 5% respectively using 5% of effective microbes (Theeba et al., 2012) in treatment RHC-C10 and RHC-C 5. C. sativus cropping cycle is about 60 days after planting. Three applications of fertilizers (compost) of 5t/ha per cycle were applied to the crop, the recommended rate for organic fertilizer for C. sativus in mineral soils (Vimala and Chan, 1992). The first application was carried out during bed preparation approximately one week before planting by mixing it with the topsoil up to a depth of 15 cm. The second application was made in third week of cropping and third application on the fifth week of cropping, where the compost was applied around the rooting area. As for treatment RHC-F 3 and RHC-F 1, fresh RHC according to the selected rate was applied during planting bed preparation at a depth of 20 cm followed by application of compost in T2 (non-amended). Treatment C is a control plot which did not receive any RHC or fertilization for both cropping cycles and treatment BC is biomass compost which was produced without RHC amendment. As for the second cropping cycle BC, RHC-C10, RHC-C5, RHC-F3 and RHC-F1 were treated with the same amount of compost except for non-repeated application of RHC in RHC-F3 and RHC-F1 during bed preparation to determine its recalcitrant effects in the following season.
Crop growth, yield and nutrient analysis The crop growth parameters were carried out throughout the cropping cycle at two weeks interval. Destructive foliar samplings were carried out during crop harvesting period and crop yield was measured during each harvesting time. Crop growth performances were evaluated based on plant height and chlorophyll index using SPAD 502 Plus Chlorophyll Meter (model 2900P). The yield performance of C. sativus was determined on a harvested fresh fruit weight per hectare basis. Crop nutrient content was measured from matured leaves near the base of the main stem. In analyzing the crop tissue total nitrogen content, the Kjeldhal procedure was carried out (Jones, 2001). Total phosphorus was analysed following the recommended methods for plant chemical analysis (MS677: pt I to VIII: 1980, Part IV) and potassium using procedure (MS677: pt I to VIII: 1980, Part V). The above ground portion of sampled crop and below ground portion (root) was cleaned and oven dried at 60 °C to obtain its dry weight biomass for the analysis of nutrient uptake according to Motsara and Roy (2008). Crop nutrient uptake was calculated by multiplying plant dry weight with nutrient concentration (Rehm, 2006). Partial factor productivity (PFP; kg crop yield per kg nutrient applied) indicator was used to evaluate nutrient use efficiency of all the treatments (Mosier et al., 2004).
Soil physico-chemical analysis Soil samplings were carried out randomly and bulked into five samples before soil preparation at 20 points in the field. At the end of the second cropping cycle, soil samplings were carried out at three sampling points on each raised bed (treatment). At each sampling point, 0 – 20 cm depth of topsoil was sampled using an auger, air

336
dried and ground and sieved to pass through a 2 mm sieve. The soil pH was measured using a calibrated pH meter (Mettler Toledo, Delta 320). 100g of air dried and sieved (2 mm), soil samples were weighed into crucibles and placed in the sampler for C and N determination using CHNOS analyser (ELEMENTAR-Vario Macro Modules 11.44-5201). Available phosphorus in the soil was determined using Bray and Kurtz No.1 extraction method (Bray and Kurtz, 1945). Soil exchangeable bases (K+, Ca2+ and Mg2+) were determined by the replacement of exchangeable cations with ammonium acetate (1N NH4OAc) adjusted to pH 7.0 (Thomas, 1982). The determination of cation exchange capacity (CEC) was done through washing of the absorbed NH4
+ with 100 ml ethanol to remove excess NH4
+ and consequently replaced by 100ml 1N K2SO4. CEC was determined by analyzing the displaced NH4
+with an auto analyzer (AA).The porosity (e) of sampled soils was estimated based on Christopher and Jamal (2006), while soil water holding capacity in this study was carried out using a simple laboratory method by Trautmann and Krasny (1997) to determine the ability of a soil to retain moisture against the drainage due to the force of gravity.
Statistical analysis All data were subjected to statistical analysis using one-way ANOVA. Treatment means were compared using Least Significant Difference Test at p <0.05 using SAS version 9.3. Pearson correlation analysis were carried out for field assessment variables at p <0.01 and p <0.05.
RESULTS AND DISCUSSION
Crop growth performance Mean values of crop height were plotted against days after planting for two cropping seasons (Figure 1). Crop height was found to be statistically significantly lowest (p <0.05) in control (T1) throughout the study period compared to other treatments. Meanwhile, SPAD readouts as in Figure 2, which indicate the chlorophyll index in crop tissue and its photosynthetic activity (Netto et al., 2005), showed significant differences between treatments 70 days after planting in T3 (47) followed by T5 (45), T4 (44.5) and T6 (43.8). T2 showed significantly lower value (40.7) during this period. Treatments without composted RHC (T1) had the lowest values. The best crop growth performances in relation to the height and chlorophyll index were obtained in T4, T3 and T6 indicating nutrients were used up efficiently for the growth of crops in treatments with RHC. However, there were no significant differences between these treatments and in this study T6 (1% RHC) found may not be sufficient to give the positive effects to crop. Mean values of dry root biomass for two cropping cycles showed statistically significant differences between treatments according to LSD 0.05 (Table 3). Lowest crop root mass was detected in T1 (control) and the highest in T4 followed by T3 and T6. However, there were no significant differences between the values of T4, T3 and T5.

337
807060504030200
50
100
150
200
250
300
350
Cro
p he
ight
(cm
)
Cropping days
Crop height
T1T2T3T4T5T6
Figure 1. Mean values of plant height for two cropping cycles. Bars represent standard error (N = 4). Bars represent standard error (N = 4). Means with different letters are significantly different by LSD at p <0.05 for treatments in each cropping season.
Figure 2. Mean values of SPAD chlorophyll index for two cropping cycles. Bars represent standard error (N = 4). Bars represent standard error (N = 4). Means with different letters are significantly different by LSD at p <0.05 for treatments in each cropping season
T1T2T3T4T5T6
SPAD Readouts
SPA
D C
holo
roph
yll I
ndex
20 30 40 50 60 700
10
20
30
40
50
60
Cropping days

338
Table 3. Mean values of root biomass dry weight for two cropping cycles with standard error (N = 4)
Treatments Root dry weight (gm)T1 1.09 ± 2.75c
T2 3.41 ± 4.20b
T3 5.18 ± 3.79a
T4 5.74 ± 1.15a
T5 5.01 ± 5.10a
T6 3.75 ± 2.61b
Note: Means with different subscripts letter are significantly different by LSD t-test at p <0.05
Results suggest treatments with 5 % RHC compost (T3), 10% (T4) and 3 % fresh RHC (T5) should be used in organic farming of C. sativus. Root growth and development are highly plastic because they are primary sites for the uptake of all mineral elements and water required for crop growth (Neumann and Martinoia, 2002). Jackson et al., (1997) reported that plants allocate much of their photosynthetic activity to root production and maintenance and estimated that 33% of global annual net primary production is used for finer root production while Lambers (1987) estimated up to 50% of daily photosynthetic activity in crop plants may use for the growth and maintenance of fine roots. Since higher SPAD readouts are an indication to higher photosynthetic chemical activity in crop leaves (Netto et al., 2005) a correlation with root growth may exist. Table 8 summarises the correlation between various variables and demonstrates that crop dry root mass was positively correlated with crop yield, soil porosity and soil nutrient content such as total N, P and K. These findings suggest that treatments with RHC applied to soil either as amendment in compost or directly, have positive effects on crop growth in relation to its height, chlorophyll content and root growth through various factors which will be discussed at the end of the paper.
Crop yield performance Yield performance in this study is reported as mean value of total fresh fruit weight of C. sativus for two cropping seasons with its nutrient use efficiency index (Figure 3) and mean values of fresh fruit weight at every harvest (Figure 4). Total fruit weight of C. sativus over first cropping cycle was found to be highest in T4 (51.2 t/ha) followed by T5 (49.5 t/ha), T3 (49.4 t/ha), T2 (40.6 t/ha) and T6 (40.2 t/ha). As for cropping cycle two, highest yield was obtained from T3 (45.9 t/ha) followed by T4 (45 t/ha), T5 (41.3 t/ha), T6 (40.2 t/ha) and lastly T2 (39.2 t/ha). T1 showed the lowest yield for both seasons. Meanwhile the same trend of nutrient use efficiency (yield/ fertilizer input) was found in the yield for the 2nd cropping season. Figure 4 showed the sustainability in treatments T4, T3, T5 and T6 that reached the 11th harvesting time as compared with

339
Figure 4. Mean values of fresh weight of C. sativus at different harvesting time for two cropping cycle
10
8
6
4
2
20
0 6 8 10 12
Fres
h w
eigh
t (t/h
a)
Harvesting time
T1T2T3T4T5T6
▼
▼
▼
▼
▼
▼
▼
▼
▼
▼
▲▲
▲
▲
▲▲
▲
▲
▲
▲4
▲
▲
▲
▲ ▲
Fres
h w
eigh
t (t/h
a)
0
10
20
30
40
60
50
T1 T1T2 T2T3 T3T4 T4T5 T5T6 T6
Crop cycle 1 Crop cycle 1
Cropping cycles
0.0
0.5
1.0
1.5
2.0
2.5
Yield Production and NUE of Cucumis Sativus
Nut
rient
use
effc
icie
ncy
(yie
ld /
com
post
app
lied-
t/ha)▲
Figure 3. Mean values of total fresh weight of C. sativus and nutrient use efficiency (partial factor) for two cropping seasons. Bars represent standard error (N = 4). Means with different letters are significantly different by LSD at p <0.05 for treatments in each cropping season

340
treatments without RHC which stopped at 9th harvesting time (T1 and T2). In addition, crops in compost treatments without RHC (T2) were observed, started to dry up sooner as compared to treatments with RHC. Overall yield performances of C. sativus were lower in the second season mainly due to pest infestations and high rainfall condition with less sun radiation. Crop yield however, followed a similar trend as cropping cycle one. For both seasons, crops with T4 and T3 had the best yield performances and nutrient use efficiency. The crop yield was found to positively correlate with treatments, soil porosity and crop nutrient uptake for N, P and K and root biomass.
Crop nutrient uptake Mean values of crop nutrient uptake for total N, total P and total K for two cropping seasons are shown in Table 4. As for total N uptake, there were significant differences in treatments T3, T4, T5 and T6 with T1 and T2. Total P uptake by crop was not significantly different for treatments T3, T4 and T6 but significantly higher than treatments T5, T2 and T1. Crop uptake for nutrient K was significantly higher in treatments T3, T4 and T6 as compared to treatments T5, T2 and T1 showing the entire major nutrient uptakes by crop were following the same trend. Overall, of the treatments that were amended with RHC, treatment T4 had the highest nutrient uptake for N, treatment T5 for P and T3 and T4 for K. The results of nutrient uptake analysis in this study were compared with standard leaf uptake of field grown cucumbers by Ankerman and Large (1992). It was found that, total N uptake by C. sativus for treatment T3 and T4 was in normal range (3.5 – 5.5%), meanwhile treatment T5 and treatment T6 followed the intermediate low- normal range (2.5 – 3.5%) and treatment T2 was at low range (1.8 – 2.5%) meanwhile control plot showed deficient nutrient status. As for nutrient P uptake, treatments T5, T3 and T4 fall under normal range (0.3 – 0.7%), treatment T6 and treatment T2 were in lower range (0.2 – 0.3%) and control showed deficiencies. For nutrient K uptake, all the treatments showed low levels (<2.0%). This may be due to accumulation of K in the crop and overall crop demand of K at the early development stage. The crop sampling in this study was carried out after
Table 4. Mean values of plant nutrient uptake for two cropping cycle with standard error (N = 4)
Treatments TN % TP % K%T1 1.15 ± 0.55c 0.11 ± 0.07d 0.61 ± 0.44d
T2 2.21 ± 0.81b 0.21 ± 0.09c 1.14 ± 0.32c
T3 3.05 ± 0.83a 0.31 ± 0.07ab 1.82 ± 0.56a
T4 3.10 ± 0.65a 0.30 ± 0.08ab 1.82 ± 0.24a
T5 2.74 ± 0.52ab 0.36 ± 0.09a 1.72 ± 0.42ab
T6 2.53 ± 1.03ab 0.25 ± 0.11bc 1.37 ± 0.53bc
Note: Means with different subscripts letter are significantly different by LSD t-test at p <0.05

341
fruiting stage. This statement is supported by Iwahashi et al., (1982) who reported the accumulation dynamics of K in cucumber leaf as related to its age. However, the K uptake in treatments T3, T4 and T5 were significantly higher than control at T2 plot. This observation suggested that treatments with RHC amended in composts (at 5% and 10% rates) and freshly applied into soil at 3% had higher efficiency in supplying nutrients to the crop. The positive correlation between nutrient uptake and crop root biomass suggested better root development and growth which led to better nutrient uptake by crop and positive correlations with yield too.
Changes in soil physiochemical properties Changes in soil properties have been studied for total nutrient content, CEC, pH and porosity of the soil before treatment application and during harvesting. According to soil profiles taken from ‘Soils of Malaysia’, (Paramanathan, 2000), the Serdang Series in this study location was characterized by deep profiles having sandy loam to sandy clay loam textures, with the clay content increasing with depth. The characteristic of the soil that has been clearly stated in the book was compared with the results obtained in this study. The soil properties before the application of composts and RHC were shown in Table 5. It was found that the soil was slightly acidic with a pH between 5.5 – 5.9 similar to the data stated in ‘Soils of Malaysia’. Meanwhile the nutrient contents (N, P, K, Ca and Mg) and CEC were found to be lower than study by Paramanathan (2000). The study site had been farmed organically for many years. Hence, variations in the soil properties could be due to continuous disturbance of the soil physically and chemically for the organic farming activities. The soil is generally deep and friable to be well suited for a wide range of crops. However, these soils on account of their loamy texture and friable consistence are prone to erosion. Thus the terrain and consequently their erodibility are limitations for the utilization of these soils. These soils also have a low fertility status and moisture retention capabilities. Thus in areas prone to moisture stress, these soils are to be managed more carefully. In this study, the observation in the field showed the soils are very clayey and loamy and susceptible to water stress. Poor water supply leads to negative impact on crop growth and production. In this study the field water holding capacity is between 9.1 – 10% which is considered lower than the study by Paramanathan 2000 (18.6%). Thus, soil enhancement or conditioning is required in order to achieve high crop production. The results of physico-chemical changes in soil properties are shown in Table 6 and Table 7. Generally, all the characteristics showed an increase except for T1 (control) which has significantly lowest value in this experiment. pH value of the soil was increased in treatment T5 and T6, where the application of fresh RHC was done during soil bed preparation however, they were not significantly different with other treatments. Soil variables which showed significant differences between treatments in this study were available P, CEC, porosity and water holding capacity. Soil available P was found to be significantly higher in treatments T3, T4, T5 and T6 as compared to T2 and strongly correlates with crop yield. Meanwhile soil in T5 has the highest cation

342
Tabl
e 5.
Soi
l pro
perti
es a
t exp
erim
enta
l plo
t (be
fore
cro
ppin
g cy
cle)
%pp
mm
eq/1
00g
Cm
ol(+
) kg
/ soi
l%
%
pHC
NC
/NAv
PK
Ca
Mg
CEC
Poro
sity
WH
C5.
5 –
5.9
5.5
– 5.
90.
0413
– 1
58.
1 –
11.1
0.11
– 0
.13
0.9
– 1.
81.
45 –
1.7
27.
8 –
842
– 4
79.
2 –
10.0
Tabl
e 6.
Mea
n va
lues
of s
oil c
hem
ical
pro
perti
es a
fter c
ropp
ing
cycl
e w
ith s
tand
ard
erro
r (N
= 3
)
%pp
mm
eq/1
00g
Trea
tmen
tsC
*N
Av P
*K
*C
a*M
g
T15.9 ± 0.22
b0.021 ± 0.23
17.6 ± 9.21c
0.21 ± 0.12b
1.0 ± 0.13
b0.18 ± 0.32b
T27.0 ± 0.20
a0.021 ± 0.44
56.3 ± 7.55b
0.59 ± 0.14a
1.82 ± 0.68a
0.90 ± 0.40a
T37.9 ± 0.05
a0.022 ± 0.35
76.3 ± 14.23
a0.55 ± 0.15a
1.81 ± 0.51a
b1.08 ± 0.55a
T47.2 ± 0.19
a0.023 ± 0.30
67.7 ± 17.17
ab0.54 ± 0.10a
1.92 ± 0.72a
0.83 ± 0.30a
T57.3 ± 0.25
a0.023 ± 0.18
58.0 ± 4.09a
b0.52 ± 0.13a
1.89 ± 0.25a
0.63 ± 0.21a
T67.7 ± 0.35
a0.023 ± 0.19
64.0 ± 12.58
ab0.55 ± 0.14a
1.56 ± 0.18a
0.97 ± 0.52a
Note: Variables indicated * and means with different subscripts letter are significantly different by LS
D test at p
<0
.05

343
Table 7. Mean values of soil pH, CEC and porosity after cropping cycle with standard error (N = 3)
Cmol(+) kg/ soil % %
Treatments pH CEC* Porosity* WHC*
T1 5.45 ± 1.12 7.85 ± 3.21b 48.9 ± 3.76b 9.17 ± 0.33e
T2 5.64 ± 0.80 7.82 ± 4.07ab 52.1 ± 1.77b 11.70 ± 0.29d
T3 6.1 ± 1.01 8.87 ± 2.01ab 56.0 ± 0.73ab 13.8 ± 0.29c
T4 5.9 ± 0.90 8.27 ± 2.74ab 54.9 ± 1.44ab 13.5 ± 0.24c
T5 6.17 ± 0.14 9.90 ± 1.60a 57.7 ± 0.46a 17.50 ± 0.76a
T6 6.03 ± 0.95 9.00 ± 1.64ab 56.2 ± 1.08ab 15.30 ± 0.84b
Note: Variables indicated * and means with different subscripts letter are significantly different by LSD test at p <0.05
exchange capacity, followed by T6, T4 and T3 but these values are not significantly different between these treatments but with T 2. On the other hand, soil was found to be most porous in T5, followed by T6, T4 and T3 and with significantly higher values as compared to T2. Similar trends were found in soil water holding capacity data where significantly highest value was observed in T5, followed by T6, T4 and T3. In this case it is clear that the amount of RHC applied either in the compost or directly into soil has direct influence in total porosity and water holding capacity. However, the period of eight months or two cropping cycles may not be sufficient enough to determine the long term effects of the treatments but the trend of changes was managed to achieve during this period.
Correlations between treatments, crop and soil variables Overall field assessment on C. sativus showed treatments with RHC added either in compost or also directly into soil gave significantly higher values for crop growth, yield and soil properties. Treatments applied with 10% and 5% RHC in compost, T3 and T4 respectively and fresh RHC applied into soil at 3% (T5) showed the best outcome even though the variables detected were not significantly different. In T2 (compost without RHC) was showing significant lower values for most of the variables. This showed that addition of RHC into the soil and composts had positive effects for the crop uptake, growth and yield. The correlations between all the variables in this study are shown in Table 8. It was found that positive correlations occurred between crop growth performances in relation to root biomass, crop yield, nutrient use efficiency and soil water holding capacity at a significant level of p <0.01 and with soil porosity and nutrient uptakes at significant level p <0.05. Crop yield positively correlated with available P and nutrient uptake at p <0.05 and with soil porosity and root biomass. As for crop N, P, K nutrient

344
uptake, positive correlation was found with the soil N, P, K, C, Mg nutrient content, soil porosity and soil cation exchange capacity. Crop uptake for P, K and N were strongly correlated with each other. Soil cation exchange capacity was found to have positive effects with soil nutrient content especially total carbon and nitrogen , crop nutrient uptake, soil porosity and crop root mass at p <0.05 but does not significantly correlated with yield. Soil water holding capacity strongly correlated at p <0.01 with soil porosity, crop root mass, yield and nutrient use efficiency of the crop. It also correlated with K uptake at p <0.05 and not significant with other nutrient uptakes. Soil porosity was found to have strong correlation with soil cation exchange capacity, soil water holding capacity, soil available P, crop root mass, nutrient uptake, crop yield and crop nutrient use efficiency. In this study, soil pH does not have significant correlations with any other variables. Based on these correlations, it was quite clear that treatments T3, T4 and T5 in this experiment which were high in values such as soil porosity, water holding capacity and cation exchange capacity had the most effects on nutrient availability through the nutrient uptakes, root development, crop development and yield. The amendment of RHC through compost and directly into soil failed to show any significant differences. Amendment of RHC irrespective of the rates and the technique applied into the soil improved all the measured parameters as compared to treatments without RHC. Soil porosity is especially important for crop growth and health because it influences the soil water distribution for healthy vegetative growth. In the study location, the initial soil porosity and water holding capacity was increased through the application of RHC compost and fresh RHC into soil after two cropping cycles (8 months). RHC in this study has numerous meso and macro -pores structure (2.7 nm – 10 µm) which may have contributed to the increase in porosity level of the soil. RHC also has been characterised to have high plant available water holding capacity of 101% at pF 2 up to 89% at wilting point (pF4). In treatments with RHC added to compost at 10% and 5%, though the amount of RHC is less compared to T5, the soil porosity increase may have been contributed by both RHC and the organic matters of the compost substrates. Soil with large macro pores volume allows the ready movement of drainage and permits fast infiltration and percolation of water through a soil horizon. Meanwhile soil with micro pores exhibit attractive forces strong enough to hold water in the pore. These pores function as water retention system of the soil which provides water storage for plant roots (Brady and Weil, 1999) by allowing deep rooting, drains excess water and circulates air to the roots. The statement proves to be true in this study by strong correlations between soil porosity, water holding capacity, root biomass and nutrient uptake. Munshower (1994) reported that plants perform best in intermediate soil texture where the soils contained a mixture of micro, meso and macro pores. In this study, increase in cation exchange capacity also strongly supported that RHC has the capacity in trapping the nutrients physically and chemically attracting the nutrient to its surface. Meanwhile the fresh RHC application into soil may have the same interactions in the soil but the nutrient uptake and yield performances were lower as

345
Table 8. Relationships between different variables under field assessment of C
. sativus by Pearson Correlation Coefficient (N = 24)
Tr
eatm
ents
pHTC
TNP
KCa
Mg
CEC
Por
Nup
Pup
Kup
root
yld
NU
E
pHN
S
TCN
SN
S
TNN
SN
S0.
48*
PN
SN
SN
SN
S
KN
SN
S0.
50*
0.54
**N
S
CaN
SN
S0.
43*
0.70
*N
S0.
45*
Mg
NS
NS
0.40
*0.
54*
NS
NS
NS
CEC
NS
NS
0.79
**0.
767*
*0.
42*
0.50
*0.
68*
NS
Por
0.78
**N
SN
SN
S0.
44*
NS
NS
NS
0.44
*
Nup
0.52
*N
S0.
54*
0.45
*0.
49*
0.47
*0.
40*
0.41
*0.
64*
0.64
*
Pup
0.58
*N
S0.
61*
0.45
*0.
55*
0.53
*N
S0.
40*
0.69
*0.
644*
0.92
**
Kup
0.54
*N
S0.
43*
NS
0.47
*N
SN
S0.
44*
0.56
*0.
62*
0.94
**0.
91**
root
0.54
*N
SN
SN
SN
SN
SN
SN
SN
S0.
67*
0.59
*0.
49*
0.60
*
yld
0.53
*N
SN
SN
S0.
42*
NS
NS
NS
NS
0.72
**0.
65*
0.59
*0.
68*
0.83
**
NU
EW
HC
0.59
*0.
76*
NS
NS
NS
NS
NS
NS
NS
NS
NS
NS
NS
NS
NS
NS
NS
NS
0.71
**0.
75**
0.66
*N
S0.
59*
NS
0.67
*0.
41*
0.83
**0.
60**
0.97
**0.
62 *
*0.
64**
Note: M
eans are significantly different at *
p <0
.05
and
** p
<0.
01TC
= T
otal
car
bon,
TN
= T
otal
Nitr
ogen
, P =
Ava
ilabl
e Ph
osph
orus
, K =
Pot
assi
um, C
a =
Cal
cium
, Mg
= M
agne
sium
, CEC
= C
atio
n Ex
chan
ge C
apac
ity, P
or =
Por
osity
, Nup
= N
itrog
en u
ptak
e, P
up =
Pho
spho
rus
upta
ke, K
up =
Pot
assi
um u
ptak
e, R
oot =
root
bio
mas
s weight, yld = yield and NUE = nutrient use efficiency and W
HC = soil w
ater holding capacity

346
in N uptake (18%), K uptake (5%) and crop yield by 3% in season one and by 10% in season two, though not significantly than different treatments with RHC compost. Apart from that, soil available P was also found to be highest in T3 and strongly correlated with crop yield. Several studies have reported the enhanced P uptake contributed by soil P availability, is strongly related to biochar modification in the soil pH. P availability in T3 was significantly higher than other treatments partly due to increase in pH and higher retention through absorption during composting. This suggests that addition of RHC into compost may have better nutrient supply to crop as it has already retained the nutrient particles and will be released efficiently after the application into soil. Meanwhile treatment without RHC (T2) clearly showed to have lower yield, lower nutrient uptake due to lower CEC, soil porosity and water holding capacity showing that the treatment did not have positive effects of RHC.
CONCLUSION Overall, it can be concluded that application of RHC amended biomass compost as fertilizer and fresh RHC as soil amendment has its positive effects on its own ways. The addition of RHC into compost may enhance nutrient supply to crop as the nutrient particles been retained and will be released efficiently after its application into the soil contributing to a higher and more sustainable yield. On top of that, addition of RHC in compost substrates helps in accelerating the composting process, minimising nitrogen losses during composting due to higher moisture and nutrient retention. Fresh RHC application at 3% as soil conditioner has higher positive effects on soil physical properties such as soil porosity and water holding capacity and helps in soil aggregation stability. Meanwhile application of RHC at 1% does not showed any significant effects on crop growth and crop production when compared to non -amended compost plot.
ACKNOWLEDGEMENT The author would like to thank the Ministry of Science, Technology and Innovation, Malaysia and MARDI for supporting this study via E-Science Fund (Research Grant 05-03-08 SF1032). Sincere appreciation also goes to all the supporting staffs in Soil and Water Management Programme, MARDI for actively involved in laboratory analysis and field works for this study.
REFERENCESAnkerman, D. and Large, R. (20009). Plant Analysis, In Agronomy Handbook
(pp. 99- 130), Midwest LaboratoriesBERNAS. (2007), Operasi “Cylonic Husk Furnace”, Pekeliling BERNAS Production
Sdn. Bhd. (BEPRO-1). pp 17Brady, N. C. and Weil, R. R. (2002). The Nature and Properties of Soils, 13th edition.
Prentice Hall, Upper Saddle River, N.JBray, R. H. and Kurtz, L. T. (1945). Determination of total organic and available forms
of phosphorus in soils. Soil Science. 59: 39 – 45

347
Christopher, T. B. S. and Jamal, T. (2006). Bulk density, Water Content and Porosity, In Chapter 3, Soil Physics Analysis, Volume 1, University Putra Malaysia, pp 11 – 13
Department of Agriculture. (2011), Purata Harga Runcit Beberapa Jenis Baja di Malaysia Bagi Tahun 2012
Iwahashi, M., Tachibana, Y. and Ohta, Y. (1982). Accumulation of calcium, magnesium, potassium and sodium with growth of individual leaves, petioles and stems of cucumber plants. Soil Science Plant Nutrition. 28: 441 – 449
Jackson, R. B., Mooney, H. A. and Schulze, E. D. (1997). A global budget for fine root biomass surface area and mineral nutrients. Proc. Natl. Acad. Sci. USA., 94: 7360 – 7366
Jones, J. B. Jr. (2001). Laboratory Guide for Conducting Soil Tests and Plant Analysis. Chapter 3. pp 191 – 239
Lambers, H. (1987). Growth Respiration Exudation and Symbiotic Association the Fate of Carbon Translocated to Roots. In: Root Development and Function, Greosy, P.J., J.V. Lake and D.A. Rose (Eds.). Cambridge University Press, London, UK
Mosier, A. R., J. K. Syers and J. R. Freney. (2004). Agriculture and the Nitrogen Cycle. Assessing the Impacts of Fertilizer Use on Food Production and the Environment. Scope-65. Island Press, London
Motsara, M. R. and Roy, R. N. (2008). Technology and Engineering. Food and Agriculture Organization of the United Nations
MS677: Pt I to VIII: 1980, Part IV: Determination of Phosphorus, Recommended Methods for Plant Chemical Analysis
MS677: Pt I to VIII: 1980, Part V: Determination of Potassium, Recommended Methods for Plant Chemical Analysis
Munshower, F. F. (1994). Practical Handbook of Disturbed Land Revegetation. CRC Press, Inc., Boca Raton, Florida, USA
Netto, A. T., Eliemar, C., Jurandi, G. O. and Ricardo E. B. (2005). Photosynthetic pigments, nitrogen, chlorophylla fluorescence and SPAD 502 readings in coffee leaves. Scientia Horticulturae. 104: 199 – 209
Neumann, G. and Martinoia, E. (2002). Survival cluster roots an underground adaptation for survival in extreme environment. Trends Plant Science. 7: 162 – 167
Ogawa M. (1991). Effective utilization of charcoal as a material for soil amendment. AICAF Expert Bulletin 12(3): 1 – 13
PadiBerasNasionalBerhad. (2011). Rice Pedia, Standard sequence of rice processing http://www.bernas.com.my/index.php?option=com_contentandview=articleandid=90andItemid=103
Paramanathan, S. (2000). Soils of Malaysia: Their characteristic and identification. 1st ed., Academy of Science Malaysia and Param, Agriculture Soil Science Surveys, p. 616
Rehm, G. (2006). Plant analysis in today’s agriculture. Minessota Crop News, 2001 – 2008 archive, http://www.extension.umn.edu/cropEnews/2006/06MNCN37.htm
Shackley, S., Sohi, S. P. (2010). An Assessment of the Benefits and Issues Associated with the Application of Biochar to Soil, Report to the Department for Environment,
348
Food and Rural Affairs and the Department of Energy and Climate Change, London, UK, 14 – 132
Shackley, S., Carter, S., Knowles, T., Middelink, E., Haefele, S., Sohi, S., Cross, A., Haszeldine, S. (2012). Sustainable gasification-biochar systems, A case study of rice-husk gasification in Cambodia Part I, Context, chemical properties, environmental and health and safety issues. Energy Policy, 42: 49 – 58
Theeba, M., Robert, T. B., Illani, Z. H., Husni, A. H. and Samsuri A.W. (2012). Characterization of local mill rice husk charcoal and its effects on composting properties. Malaysian Journal of Soil Science.16: 85 – 97
Thomas, G. W. (1982). Exchangeable cations. In A. L. Page (ed.). Methods of soil analysis, Part 2, Second Edition, Agronomy Monograph 9, American Society of Agronomy, Madison, WI.
Trautmann, N. M. and Krasny. M. E. (1997). Compost Properties. In Chapter 5: Composting in Classroom (pp 70 – 92). Cornell University
Vimala, P. and Chan, K. (1992). Tanah danPembajaan, In Chapter 5, PanduanPengeluaran Sayur- Sayuran (pp 29 – 40). Institut Penyelidikan dan Kemajuan Pertanian Malaysia

349
Effects of Biochar Application on the Growth and Yield of Lowland Cabbage Under Organic Production System
Nor Syahidah M.S., Theeba M. and Norziana Z.Z.Crop and Soil Science Research Centre,Malaysian Agricultural Research and Development Institute (MARDI), MARDI Headquarters, Persiaran MARDI-UPM, 43400 Serdang, Selangor, MalaysiaE-mail address: [email protected]
Abstract Biochar from rice husk is a by-product of rice processing mills that can be found in very large quantities. Utilization of biochar as soil amendments for some crops showed significant improvement on root distribution and increased biomass yield by 30%. A study was conducted in Integrated Organic Farm at Malaysian Agricultural Research and Development Institute, Serdang to evaluate the effects of biochar derived from local rice processing mill as soil amendment for growing lowland cabbage cultivated organically. Treatments applied were as follows: (T1) Biochar incorporated into soil during soil preparation at 50%, (T2) Biochar 50% with EM (Expand once) 5%, (T3) Biochar 80% with EM 5% and (T4) Biochar 0% as the control treatment. There were no differences in cabbage head diameter and on the ground biomass weight among biochar treatment and control. The same trend was observed with head height, but application of 80% (v/v) of biochar and 5% EM significantly higher than no biochar treatment. At various combination of rates and application frequencies of biochar, ground biomass weight ranged from 648.7 – 710.7 g, which are similar to control treatment (677.1 g). Height weight and yield were in general similar among biochar and without biochar treatments, ranged from 676.3 – 827.4 g and 16.9 – 20.7 tan/ha respectively. Biochar treated plants did not show any difference in root length, ranging from 4.9 – 29.2 cm. Although treatment three (80% (v/v) of biochar with 5% of EM) had a significantly higher root length than control, root length was generally similar among biochar treatments. Significant difference was observed for the results of Cation Exchange Capacity (CEC) for treatment of 50% of biochar and 80% biochar with 5% EM and control. Soil CEC values in all biochar treatments were also higher than the soil CEC before experiment. From this study, yield of cabbage did not show any significant difference between treatments with biochar and without biochar. However, results of head height, root length and CEC showed incorporation of biochar in the soil gave significantly higher result than treatment with no biochar in the soil. However, the lowest application of biochar of all of the treatment is found sufficient to give some increase in crop growth and soil parameters.
Keywords: soil amendment, organic farming, lowland cabbage
INTRODUCTION Biochar is a heterogeneous substance rich in aromatic carbon and minerals. It is produced by pyrolysis of sustainably obtained biomass under controlled conditions with clean technology and is used for any purpose that does not involve its rapid mineralization to CO2 and may eventually become a soil amendment (Schmidt et al., 2015). Biochar is produced by biomass pyrolysis, a process whereby organic substances

350
are broken down at temperatures ranging from 350 °C to 1000 °C in a low-oxygen thermal process. Biochar from rice husk is a byproduct of rice processing mills that can be found in very large quantities. It is not a fertilizer, but it could retain nutrients in soil and can be a host for microorganisms. It also can increase soil surface area (Ch. Srinivasarao et al., 2013). Studies show that biochar could act as a soil conditioner, improves crops growth by supplying and retaining nutrients and thus improving the soil’s physical and biological properties (Sohi et al., 2010). Several studies have been reported that the application of biochar to the soil can improve crop production, grain yield and dry matter (Chan et al 2008, Chan and Xu, 2009; Major et al 2009 and Spokes et al 2009). Yield of maize increased significantly by introducing biochar prepared from wheat straw (1.9 tan/ha) with combination of recommended doses of fertilizer (Purakayastha, 2010). Study reported that the combination of agrowaste charcoal (10t/ha) and basal organic fertilizer increased crop yield by 30%, whereas addition of basal chemical fertilizer increased crop yield by 39% (Ray and Rush, 2007). Moreover, with the expanding demand for organic vegetables in the country, there is potential in increasing the organic cultivation of cabbage in lowland (P. Vimala et al., 2006). This study was conducted in MARDI Serdang to evaluate effects of biochar derived from rice processing mill as soil amendment on the growth and yield of lowland cabbage cultivated organically.
MATERIALS AND METHODS The experiment was conducted under a rain shelter in Integrated Organic Farm at Malaysian Agricultural Research and Development Institute, Serdang, Malaysia. Treatment consisted of varying rate of biochar and effective microbes. Treatment one consisted of 50% (v/v) biochar with no incorporation of effective microbes (EM), treatment two possessed of 50% (v/v) biochar with 5% of EM and treatment three consisted of 80% (v/v) of biochar with 5% of EM. Treatment four consisted of soil with no incorporation of biochar which was used as control treatment. Biochar on each treatment was mixed into soil two weeks before planting. Ratio of biochar was measure using biochar and soil volume in basin container before ploughed into soil at about 15 cm depth. Effective microbes were prepared by mixing 1L of effective microbes EM.1®?, 1 L of molasses and 18 L of dechlorinated water five days before the usage. The activated effective microbes were used at 5% in volume for faster degradation by spraying on the biochar three days after the preparation of the basal. Fertilization using 4.8 kg of fortified organic fertilizer NPK 5:5:5 was applied two weeks after the transplanting and at 42 days after transplant when diameter of cabbage head was 3 cm. Natural pesticides were applied when needed. Plot size used was 6 m x 6 m. One month old cabbage seedlings variety KK cross were transplanted on raised beds at 0.7 m x 1.5 m to give 48 plants/plot. The treatment was arranged in a complete randomized design CRD with three replications. Canopy diameter, number of leaves and plant height of two randomly selected plants in every replication were measured every two weeks after transplanting day. Harvesting

351
starts 11 weeks after transplanting and was spread over one week.Yield of crop and cabbage growth performance data: height of cabbage and root length were collected during harvest. Soil samples were collected before planting and after harvest for the soil chemical and physical properties analysis.
Data analysis Data obtained were subjected to statistical analysis using analysis of variance procedures to test the significant effect of all the variables investigated. Means were separated by the least significant difference (LSD) method using the statistical package of SAS Institute Inc. USA.
RESULTS AND DISCUSSION
Crop growth and yield Result of growth performance of cabbage is shown in Table 1. There were no significant differences in head diameter and on the ground biomass weight among biochar treatment and without biochar treatment (control). The same trend was observed with head and height of cabbages. However, application of 80% (v/v) of biochar and 5% EM gave significantly higher results for root length than control. The height and weight of cabbages were not significantly different among biochar treatments and control. Similar result was observed in yield of cabbage (Table 2) treated with all level of biochar and EM rates, where the yield of cabbage did not show significantly higher results as compared to control. Similarly, there were no differences in results of dry biomass root weight and root height of cabbage treated with several levels of biochar rates as compared to control. Despite the insignificant higher results shown by the treatments of various biochar rates with EM when compared to control, the treatments with biochar especially T3 (80% biochar with 5% EM) however, demonstrated higher value (trend) for all the parameters analysed. The higher value of crop growth parameters showed a positive relation with higher cabbage yield in T3 even though they were not significantly different than other treatments.
Changes in soil properties Soil properties in relation to Electrical conductivity (EC), Cation Exchange Capacity (CEC) and pH are shown in Table 3 (before treatments application) and Table 4 after harvesting period. Control without biochar application demonstrates significantly higher soil pH as compared to biochar treatments. It has also increased pH value from before planting which were 6.97. No significant increase was contributed by biochar amendments in relation to soil pH before and after planting. Meanwhile, significant difference was observed for the results of cation exchange capacity for treatment of 50% of biochar and 80% biochar with 5% EM and no biochar. Soil cation exchange capacity values in all biochar treatments were also higher than the CEC before experiment. Results indicated that, amendment of biochar at 80% with 5% EM into the soil was able to

352
Table 2. Yield of cabbage
Treatment Biochar rate (v/v) and EM rate Head weight (g) Yield (tan/ha)
1 50% biochar + 0% EM 832.2 20.62 50% biochar + 5% EM 765.5 18.23 80% biochar + 5% EM 844.6 20.74 0% biochar 720.4 16.9
Table 4. Soil parameters before and after treatment
Treatment Biochar rate (v/v) and EM rate pH EC (µS/m) CEC (meg/100 g)1 50% biochar + 0% EM 6.92ab 323.5 10.00a
2 50% biochar + 5% EM 6.81b 289.3 8.91ab
3 80% biochar + 5% EM 6.74b 325.3 10.94a
4 0% biochar 7.17a 282.7 5.80b
*Significant at 5%
Table 3. Soil chemical characteristics before the start of the experiment
Characteristic ValuepH 6.97EC 277.9 (µS/m)CEC 5.39 (meg/100 g)
Table 1. On the ground biomass weight, dry biomass root weight, root height and root length of harvested cabbage
Treatment Biochar rate (v/v) and EM rate Dry biomass root weight (g)
Root height (cm)
Root length (cm)
1 50% biochar + 0% EM 11.4 10.4 *24.9ab
2 50% biochar + 5% EM 10.7 9.3 *25.9ab
3 80% biochar + 5% EM 12.4 10.6 *29.2a
4 0% biochar 12.2 9.7 *22.5b
*Significant at 5%
improve CEC value of the soils which could be an important factor in improving soil nutrient uptake by crop.
CONCLUSION From this study, yield of organic lowland cabbage did not have any significant difference between treatment with and without biochar. However, results of cabage head height, root length and soil CEC changes showed incorporation of biochar in the soil gives higher value than control.

353
ACKNOWLEDGEMENT The author would like to thank to the Director General of MARDI and the Director of Crop and Soil Science Research Centre for their support. The author also thanks Mr. Abdul Majid, Mr. Abdul Rahaman and Mrs. Ramalah for their assistance throughout the field experiment and laboratory analysis.
REFERENCESChan, Y., Van Zwienten, L., Meszatos, I., Downie, A. And Joseph, S. (2008). Using
poultry litter biochars as soil amendments. Australian Journal of Soil Research, 46: 437 – 444
Chan, K.Y. and Xu, Z. (2009). Biochar: nutrient properties and their enchancement. In: Biochar for environmental management (J. Lehmann and S. Joseph eds.), Science and Technology, Earthscan, London. Pp 67 – 84
Kimatsu, J.M., Lehmann, J., Ngoze, S.O., Mugendi, D.N., Kinyangi, J.M., Riha, S., Verchot, L., Recha, J.W. and Pell, A.N. (2008). Reversibility of soil productivity decline with organic matter of differing quality along a degradation gradient. Ecosystem, 11: 726 – 739
Major, J., Steiner, C., Downie, A. and Lehmann, J. (2009). Biochar effects on nutrient leaching. In: Biochar for environment management (J. Lehmann and S. Joseph eds.), Science and Technology, Earthscan, London. Pp 271 – 287
Purakayastha, T.J. (2010). Effect of biochar on yield of different crops. IARI. Annual Report 2010-11, Indian Agricultural Research Institute, New Delhi-110012, India. Pp 55
Ray O’Grady and Rod Rush. (2007). Managing the Carbon Cycle Katanning Workshop 21 – 22 March 2007, The Terra Preta Phenomenon.
Schmidt, H.P., Kammann, K., Glaser B., Abiven, S., Leifeld, J., EBC. (2012). ‘European Biochar Certificate - Guidelines for a Sustainable Production of Biochar.’ European Biochar Foundation (EBC), Arbaz, Switzerland. Version 6.1 of 19th June 2015
Sohi, S., Lopez-Capel, E., Krull, E. and Bol, R. (2010). A review of biochar and its use and function in soil. Advanve in Agronomy, 105: 47 – 82
Spokes, K.A., Koshinen, W.C., Baker, J.M. and Reicosk, D.C. (2009). Impacts of woodchip biochar additions on greenhouse gas production and sorption/degradation of two herbicides in a Minnesota soil. Chemosphere, 77: 574 – 581
Srinivasarao, C.H, Gopinath, K.A, Venkatesh, G., Dubey, A.K, Harsha Wakudkar, (2013). Use of Biochar for Soil Health Enhancement and Greenhouse Gas Mitigation in India:et al., Potential and Constraints.NICRA Bulletin 1/2013
Vimala, P, Ilias, M.K and Salbiah, H.S ,(2006). Effects of rates of cabbage (Brassica Oleracea var. Capitata) grown under shelter. J.Trop. Agric. And Fd. Sc. 34(1): 17 – 25

354
Customised Low-Cost Cocopeat-Soil Growing Medium for Vegetable Seedlings
Fong, S.L, Ong, P.H and Poh, B.L.Horticulture Technology Department Agri-Food and Veterinary Authority of SingaporeSembawang Research Station, Lorong Chencharu, Singapore 769194E-mail: [email protected]
Abstract Trials were conducted at Sembawang Research Station, Agri-Food and Veterinary Authority of Singapore to develop an effective, low-cost and sustainable alternative to peat for growing vegetable seedlings and increase subsequent vegetable yields. The customised growth medium was formulated using sandy loamy soil, cocopeat and enriched with mineral fertilizer. The ratio of soil to cocopeat and type of chemical fertilizer for fortification were determined. Growth parameters including germination rate, plant height, plant weight, number of leaves, chlorophyll (SPAD reading) and yield were evaluated. Results showed that the customised growth medium consisting of 75% soil (by volume), 25% cocopeat and fortified with 2.5 g/litre NPK 15-5-20 fertilizer can grow Xiaobaicai (Brassica rapa subsp. chinensis) seedlings in a 100-cell plug tray till 14 days without the need to supplement with additional fertilizer. Xiaobaicai grown from these seedlings showed 25% higher yields compared to seedlings grown from commercial peat substrate (i.e. 2.23 kg/m2 vs 1.79 kg/m2 for planting tray). In addition, customised growing medium is three-fold lower in costs. Consistent nutrient levels in the customised growing medium sustain seedlings growth to produce stronger and healthier transplants that boost productivity.
Keywords: customised growing medium, low-cost, cocopeat, yield
INTRODUCTION Suitable growing media for seedling production is important because it determines the early growth of strong and healthy transplants for subsequent good vegetable growth and yield. Since seed plugs are small, the growing medium should have good aeration, water holding capacity, drainage and proper pH level (Styer and Koranski, 1997). Most importantly, the growing medium must have sufficient nutrients to sustain growth until transplanting. Currently, there are two main sources of growing media available in local market in Singapore: imported peat substrate or compost. However, these growing media often could not sustain seedling growth till transplanting and foliar fertilizer is needed one week after sowing. Peat substrate holds water and air better than most other materials, as it is lightweight and does not decompose quickly. However, it does not contain sufficient nutrients to sustain seedling growth until transplanting. Furthermore, it is acidic and lime must be added to balance the pH (Wallace, 2012). Peat substrate is not environmentally sustainable because it is harvested or mined from wetlands, which are sensitive and often threatened ecosystems. Peat accumulates at a meagre rate of about a millimetre per year, so it is not renewable within the short term. Peat acts as a sink for carbon dioxide; therefore, harvesting peat may contribute to global warming (Wallace, 2012).

355
Besides, that quality of imported growing media is not consistent, with tendency to deteriorate with time particularly when it has been stored for a long time or under inappropriate storage condition. For long term usage for seedling production, growing media could be a significant cost as imported media are expensive. Seeing the need for good consistent quality and affordable growing medium, we explored the feasibility of customising our own growing medium using readily available local alternatives to peat substrate, such as cocopeat. The use of cocopeat as an alternative to peat media for vegetable transplant production has been reported widely (Vavrina et al., 1996, Noguera et al., 2000, Arenas et al., 2002, Richards 2006, Lanzi et al., 2009, Holman et al., 2005). Cocopeat is derived from coconut husks and is a more sustainable source of growing medium compared to peat. With customisation, there is better control of the quality and fertilizers could be added to enrich the growing medium, eliminating the need for additional fertilizer application. This could translate to cost savings from reduction in manpower in local vegetable farms. This paper aims to develop an effective, low-cost and sustainable growing medium for raising vegetable seedlings without the need to supplement with additional fertilizer after seed sowing.
METHODS AND MATERIALS Trials were conducted at the Sembawang Research Station, AVA, in PVC-roof net-house. Four types of mineral fertilizers viz; NPK 15-15-15, NPK 18-6-5, NPK 12-12-17 and NPK 15-5-20 (all at 2.5g/litre growing medium) were tested to enrich the customised growing medium, which was also compared to three commercial growing media viz; peat substrate, seed and cutting compost and seed compost. Three stages of trials were conducted to determine the right ratio of soil and cocopeat (the ratios tested are shown in Table 1), the right mineral fertilizer to fortify the growing medium and to compare growth performance of transplants raised in different growing media in order to develop the most efficient growing medium for optimum vegetable seedling growth and subsequent good yield at harvest. Xiaobaicai (Brassica rapa subsp. chinensis) seedlings were grown in 100-cell plug tray (different types of seedling growing media were tested as shown in Table 3) for 14 days. The seedlings were transplanted at spacing of 10 cm x 10 cm into a 10-L planting tray (0.54 m x 0.34 m x 0.08 m) filled with thoroughly mixed growing mixture consisting of five parts sandy loamy soil, two parts cocopeat and 0.1 part dried chicken manure. Seedlings grown in the three tested commercial growing media viz; peat substrate, seed and cutting compost and seed compost were provided with foliar fertilizer of NPK 21-21-21 at day-7 after seed sowing, where seedlings grown in the customised growing medium are without foliar fertilizer. There were three replications per treatment. Xiaobaicai were harvested after 16 days in planting trays, which is at 30 days after sowing, where yields were recorded. Growth parameters including plant height, number of leaves, plant weight and biological yield were taken at harvest. Chlorophyll content (represented by the measured SPAD value) was also evaluated.

356
RESULTS AND DISCUSSION The right ratio of soil and cocopeat was determined by comparing growth performance of 14-day old Xiaobaicai seedlings in different ratios of soil and cocopeat mixtures. Results showed that seedlings grown in the mixture of 75% soil and 25% cocopeat (by volume) have the highest germination rate, with promising plant height, bigger leaf size, longest root length and higher root density among the tested mixture ratio (Table 1 and Fig.1). Using a mix of 75% soil and 25% cocopeat, four types of chemical fertilizers were added while preparing the growing medium in order to enhance early root and leaf growth and boost seed germination. Potassium plays an important role in early root growth. Reports showed that potassium promotes strong early growth of seedling (Rehm and Schmitt, 2002; Imas, 2003; Johnston, 2006). Time of potassium uptake varies with different plants. However, plants generally absorb the majority of their potassium needs at an earlier growth stage than they do nitrogen and phosphorus. Hence, we are fortifying the growing medium for seedlings with high potassium fertilizer. When enriched with the high potassium fertilizer, NPK 15-5-20, germination rate was the best and seedlings grew better with longer root length and higher root density, bigger leaves and taller plants (Table 2 and Fig. 2). Research in Australia found that when comparing nitrogen, phosphorus and potassium deficiencies, it was a shortage of potassium that most severely affected root growth (Johnston, 2006). Fageria and Moreira (2011) also reported how the effects of potassium deficiency reduced root growth in wheat, rice, dry bean, corn and soybean and subsequently affected crops yields. Therefore, high potassium fertilizer, NPK 15-5-20 used in this study could promote early growth of roots, resulting in sustained growth and stronger seedlings. The customised growing medium of 75% soil, 25% cocopeat with 2.5 g/litre mineral fertilizer NPK 15-5-20 was then compared to three commercial growing media viz; peat substrate, seed and cutting compost and seed compost. The 14-day old seedlings grown in customised growing media were stronger with bigger leaves and stronger roots (Fig. 3). Foliar fertilizer of NPK 15-15-15 was provided for the commercial growing media at day-7 after seed sowing. With the stronger and healthier seedlings raised from customised growing medium, vegetables harvested after 16 days of transplanting showed 25% higher yields (i.e. 2.23 kg/m2 vs 1.79 kg/m2) compared to vegetables raised from commercial growing media (Table 3 and Fig. 4). The cost for customised growing medium is three times lower than peat substrate which makes it a potential alternative to peat substrate (Table 3).
CONCLUSIONS The customised growing medium (75% of soil, 25% of cocopeat and 2.5 g/litre of fertilizer NPK 15-5-20) showed better seedling growth and its transplants also showed 25% increase in biological yield at harvest. Customised growing medium is three-fold lower in cost compared to peat substrate per seed plug tray. Hence, customised growing
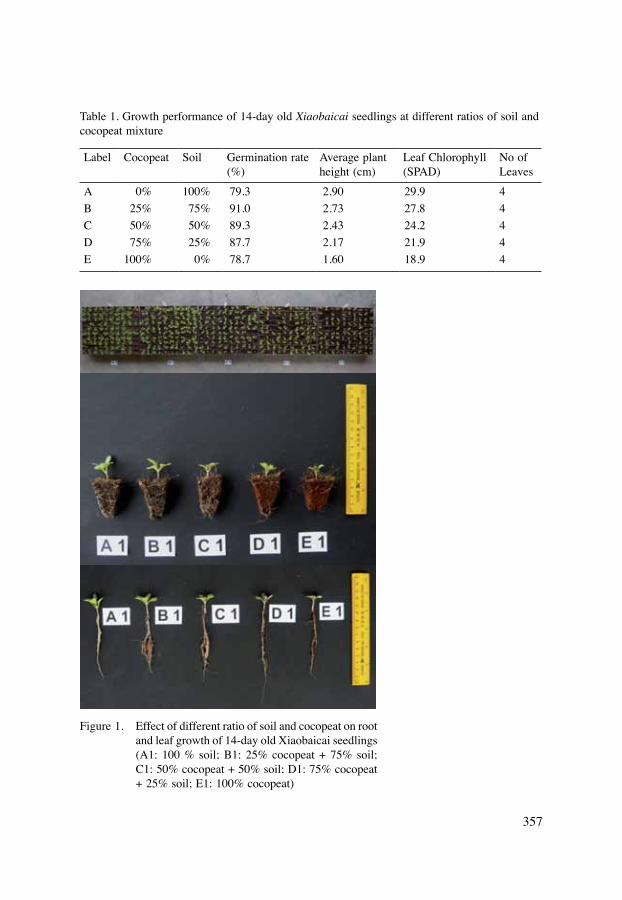
357
Table 1. Growth performance of 14-day old Xiaobaicai seedlings at different ratios of soil and cocopeat mixture
Label Cocopeat Soil Germination rate (%)
Average plant height (cm)
Leaf Chlorophyll (SPAD)
No of Leaves
A 0% 100% 79.3 2.90 29.9 4B 25% 75% 91.0 2.73 27.8 4C 50% 50% 89.3 2.43 24.2 4D 75% 25% 87.7 2.17 21.9 4E 100% 0% 78.7 1.60 18.9 4
Figure 1. Effect of different ratio of soil and cocopeat on root and leaf growth of 14-day old Xiaobaicai seedlings (A1: 100 % soil; B1: 25% cocopeat + 75% soil; C1: 50% cocopeat + 50% soil; D1: 75% cocopeat + 25% soil; E1: 100% cocopeat)

358
Table 2. Growth performance of 14-day old Xiaobaicai seedlings in soil and cocopeat mixture fortified with different chemical fertilizers
Fertilizer Germination rate (%)
Average plant height (cm)
Leaf Chlorophyll (SPAD)
No. of Leaves
No NPK (V) 81.0 4.8 32.8 6NPK 15-15-15 (W) 78.3 4.5 31.8 6NPK 18-6-5 (X) 76.7 6.0 33.2 6NPK 12-12-17 (Y) 69.7 4.6 31.9 6NPK 15-5-20 (Z) 82.0 6.3 33.6 6
Figure 2. Effect of different chemical fertilisers on root and leaf growth of 14-day old Xiaobaicai seedlings (V1: No NPK; W1: NPK 15-15-15; X1: NPK 18-6-5; Y1: NPK 12-12-17; Z1: NPK 15-5-20)
Figure 3. 14-day old Xiaobaicai seedlings raised in different growth medium (J: peat substrate; K: seed & cutting compost; L: seed compost; M: customised growth medium)

359
Table 3. Growth performance of Xiaobaicai from transplants raised in different growing media and their costs
Growing Medium Average plant fresh weight (g)
Average plant height (cm)
Leaf Chlorophyll (SPAD)
No. of Leaves
Bio yield(kg/m2)
Cost/seed plug tray (2L)
Peat substrate (J) 22.1 17.23 36.4 9.6 1.79 $0.32Seed and Cutting Compost (K)
23.9 17.20 36.7 9.8 1.93 $1.08
Seed Compost (L) 16.8 16.67 36.8 8.0 1.36 $1.49Customised growth medium (M)
27.6 18.30 36.5 10.2 2.23 $0.10
J K L M
Figure 4. 30-day old Xiaobaicai grown from transplants using different growth media (J: peat substrate; K: seed & cutting compost; L: seed compost; M: customised growth medium)

360
medium could be a potential alternative for vegetable seedlings where farmers could benefit from the consistent quality of the optimum nutrient levels in the customised growing medium that are able to sustain seedling growth, produce stronger and healthier transplants that could boost vegetable growth and yields.
REFERENCESArenas, M., Vavrina, C.S., Cornell, J.A., Hanlon, E.A. and Hochmuth, G.J. (2002).
Coir as an alternative to peat in media for tomato transplant production, HortScience 37(2): p309 – 312
Fageria, N.K. and Moreira, A., (2011). The Role of Mineral Nutrition on Root Growth of Crop Plants. In Donald L. Sparks, editor: Advances in Agronomy, Vol. 110, Burlington: Academic Press, 2011, pp. 251 – 331
Holman, J., Bugbee, B. and Chard, J. (2005). A comparison of coconut coir and sphagnum peat as soil-less media components for plant growth. Utah State University Publication. http://cpl.usu.edu/files/publications/factsheet/pub__9468201.pdf
Imas, P. (2003). Potassium helps crops during drought conditions, Fertilizer Focus; July/August 2003, p50
Johnston, A.M. (2006). Role of Potassium in Crop Establishment, Agri-Briefs Spring 2006, No. 2
Lanzi, A., Incrocci, L., Pulizzi, R., Pardossi, A. and Marzialetti, P. (2009). Evaluation of some peat-alternative substrates in horticultural crops. Acta Hort. (ISHS) 807: 553 – 558
Noguera, P., Abad, M., Noguera, V., Puchades, R. and Maquieira, A. (2000). Coconut coir waste, a new and viable ecologically-friendly peat substitute. Acta Hort. (ISHS) 517: 279 – 286
Rehm, G. and Schmitt, M. (2002). Nutrient Management: Potassium for crop production, university of minnesota extension
Richard, D. (2006). Coir is sustainable alternative to peat moss in the garden. http://extension.oregonstate.edu/gardening/node/819/print
Styer, R.C. and Koranski, D.S. (1997). Plug and Transplant Production: A Grower’s Guide, Ball Publishing, Batavia
Vavrina, C.S., Armbrester, K., Arenas, M. and Pena, M. (1996). Coconut coir as an alternative to peat media for vegetable transplant production. SWFREC Station Report-VEG 96.7. Immokalee, Florida.Wallace, J. 2012, Perfecting the Potting Mix. Canadian Organic Grower; Summer 2012, Vol. 9 Issue 3, p52

361
Effect of Organo Mineral Fertilizer on Nutrients Uptake of Cabbage
Dayang Safinah, N.1, Noor Haslizawati, A.B.2 and Theeba, M.11Crop and Soil Science Research Center,Malaysian Agricultural Research and Development Institute (MARDI), MARDI Headquarters, Persiaran MARDI-UPM, 43400 Serdang, Selangor, Malaysia2Crop and Soil Science Research Center, MARDI Cameron Highlands, Pahang, MalaysiaE-mail: [email protected]
Abstract Understanding nutrient uptake of crops is important for deciding the optimal fertilizer management. Hence, a lysimeter trial was carried out in the open plot at MARDI Cameron Highlands, Pahang, Malaysia to assess the effects of organo-mineral fertilizers on nutrients uptake of cabbage. Three organo mineral fertilizer granule formulations (For1, For2 and For3) were developed through a combination of organic matters and minerals at selected rates. Each formulation was tested at three different rates (Rat1, Rat2 and Rat3). In total 12 treatments were tested including current farmer’s practices (FP1 and FP2) and control (no fertilizer). Based on lysimeter trial, it was concluded that For1Rat1 (what about For2 Rar2). Please see conclusion part) is the best practice among the organo-mineral fertilizer formulations specifically in optimizing nutrients uptake and maximizing yield. Although in existing farmer’s practice (FP1), is seen higher in nutrient uptake and yield, organo-mineral formulations with lower NPK at 10:10:10, are comparable. In fact, with an organic component in the fertilizer, it is good for soil health in the long term compared to current farmer’s practices which utilize inorganic fertilizer entirely.
INTRODUCTION Cameron Highlands produce 92% of the total cabbage production in Malaysia (Norida and John, 2005). Over the years, Cameron Highlands have been cultivated more intensively to meet the increasing demand. The intensified farming of cabbage has led to excessive application of chemical fertilizers. Production of a combination of organic and mineral fertilizer is one possible solution to overcome this issue. Formulations of organo mineral fertilizers were developed through a combination of organic matters and minerals at selected rates. The formulations are expected to give more efficient release of nutrient to crop contributed by the organic portion in the fertilizer. Use of organic or organo mineral nutrient sources has the added advantage of supplying a range of macro-nutrients and micro-nutrients and organic matter. It also might improve physical and chemical properties of the soil. The new organo mineral fertilizer formulations are expected to be efficient alternatives to current NPK compound fertilizers i.e. (15:15:15 and 12:12:17) used by farmers in excessive amount particularly for highlands cabbage production. Understanding nutrient uptake by crops is important to determine the optimal fertilizer management. Hence, the objective of this trial was to assess the effects of organo mineral fertilizers on nutrients uptake of highland cabbage.

362
MATERIALS AND METHOD
Lysimeter trial Cabbages were grown in lysimeter and this trial was carried out from 2nd March until 1st July 2015 in the open plot at MARDI Cameron Highlands, Pahang, Malaysia. Lysimeter were used to measure nutrients leached out along the growing period. However, that data won’t be discussed in this paper. There are three formulations of organo-mineral fertilizer viz; For1 (10% N, 10% P2O5, 10% K2O with Nitro Humic Acid (NHA)), For2 (10% N, 10% P2O5, 10% K2O with biochar) and For3 (10% N, 10% P2O5, 10% K2O with biochar and NHA). Each formulation was tested at three different rates. i.e. rat1, rat2 and rat3. In total, there were 12 treatments including current farmer’s practices (FP1 and FP2) and control (no fertilizer). Difference between FP1 and FP2 is at the rate of fertilizer used. Some farmers tend to apply excessive fertilizer in order to get higher yield. The experiment was in randomized complete block design (RCBD) with three replications and every treatment consisted of four cabbage plants. Plants were watered daily and fertilizers were applied according to assigned treatments as mentioned in Table 1.
Table 1. Treatments for lysimeter trial at MARDI Cameron Highlands, Pahang
Treatment Basal(g/plant chicken manure)
1st application (g/plant)(14 – 20 DAP)
2nd application (g/plant)(44 – 50 DAP)
Control – – –FP1 25 22.4 of NPK Green
(15%N: 15%P2O5: 15%K2O)
22.4 of NPK Blue (12%N: 12%P2O5: 17%K2O)
FP2 25 18.8 of NPK Green (15%N: 15%P2O5: 15%K2O)
18.8 of NPK Blue (12%N: 12%P2O5: 17%K2O)
For1Rat1 25 22.4 22.4For2Rat1 25 22.4 22.4For3Rat1 25 22.4 22.4For1Rat2 25 18.2 18.2For2Rat2 25 18.2 18.2For3Rat2 25 18.2 18.2For1Rat3 25 33.6 –For2Rat3 25 33.6 –For3Rat3 25 33.6 –DAP: days after planting

363
Destructive plant sampling Destructive plant samples were taken at harvest (1st July 2015) from each replication of the treatments. Each plant was cut into four parts (roots, stem, head and leaves). Each Fresh part was weighed separately.
Nutrient uptake determination Plant parts of each replicate were dried at 60 °C, weighed for determination of dry mass and ground to a fine powder. For P and K determination, dried tissue samples were digested using HNO3 and HCl and analysed by Perkin Elmer Inductively Coupled Plasma (ICP-OES) Optima 7300DV. Meanwhile total N concentration was determined using an elemental analyzer (vario MACRO cube CNS; Elementar Analysensysteme GmbH, Germany). Nutrient uptake was calculated by multiplying nutrient concentration with dry weight of each plant parts. All data were statistically analysed using SAS 9.4 software and the mean value of each treatment were subjected to multiple comparison analysis using the Tukey test and a significance level of p <0.05.
RESULTS AND DISCUSSION Nutrients uptake by cabbage under varying fertilizer management regimes is shown in Figure 1. Based on N uptake, the highest uptake recorded in the following order: For1Rat3> For2Rat2> For2Rat3> For1Rat1> Farmer’s practice 1> For2Rat1> For3Rat1> Farmer’s practice 2> For3Rat2> For3Rat3> Control. Two organo mineral fertilizer treatments (For2Rat2 and For1Rat3) show the highest N uptake compared to farmer’s practices. However, there no significant difference in N uptake between other organo mineral fertilizers treatment with farmer’s practice, except for For3Rat3. Minimal leaching of N from the organo mineral fertilizer might be the reason of higher N uptake by plants. Commonly, raw material for N (e.g. urea, ammonium sulphate, etc.) in the existing NPK compound fertilizer is highly water soluble and easily leaches down and increases the risk of environmental loses of N. Whereas, in organo-mineral. Meanwhile, for P uptake, the sequence starting from the highest were: Farmer’s practice 1> For2Rat1> For1Rat1> Farmer’s practice 2> For1Rat3> For1Rat2> For2Rat3> For2Rat2> For3Rat1> For3Rat2> For3Rat3> Control. Farmer’s practice 1 (FP1) has the highest P uptake, followed by For1Rat1 and For2Rat1. Based on Guppy et al (2004), the incorporation of organic matter in soils able to rapidly sorb applied P from the fertilizer and increases P availability to plants. However, it was not seen in this case since the P uptake from FP1 is the highest. Perhaps, more field testing should be done to see a more significant effect. Finally, for K uptake, their sequences from high to low were as follows: Farmer’s practice 1> For2Rat1> For1Rat1> Framer’s practice 2>For1Rat2> For1Rat3>For2Rat2> For3Rat1> For2Rat3> For3Rat2> For3Rat3> Control. Same with P, FP1 still has the highest K uptake, followed by For1Rat1 and For2Rat1. From this it was found that For1Rat1 and For2Rat1 were the best organo mineral fertilizer formulations in terms of nutrients uptake for highlands cabbage production since they had better P and K uptake and show no difference in N uptake as compared to FP1.

364
Nitrogen uptake by cabbage under varying fertilizer management (A)
N u
ptak
e (g
/pla
nt)
5.00
4.00
3.00
1.00
0.00
2.00
Con
trol
FP1
FP2
For1
Rat
1
For1
Rat
2
For2
Rat
2
For2
Rat
3
For3
Rat
3
For1
Rat
3
For3
Rat
2
For3
Rat
1
For2
Rat
1
c
abab
abab ab ab ab
abaa
bc
Con
trol
For1
Rat
1
For1
Rat
2
For2
Rat
2
For2
Rat
3
For3
Rat
3
For1
Rat
3
For3
Rat
2
For3
Rat
1
For2
Rat
1
FP1
FP2
P up
take
(g/p
lant
)
0.100.200.300.400.500.60
0.00
Phosphorus uptake by cabbage under varying fertilizer management (B)
f
aabc ab ab
cde bcd dcedef
bc cde
ef
Con
trol
FP1
FP2
For1
Rat
1
For1
Rat
2
For2
Rat
2
For2
Rat
3
For3
Rat
3
For1
Rat
3
For3
Rat
2
For3
Rat
1
For2
Rat
1
K u
ptak
e (g
/pla
nt) 4.00
3.503.00
2.001.50
2.50
Head StemLeavesRoot
1.000.500.00
Potassium uptake by cabbage under varying fertilizer management (C)
e
a
ab ab ab
abcd abcd abcdbcdcde
abc
de
Means with the same letter are not significantly difference at p <0.05
Figure 1. Nutrients uptake A) nitrogen B) phosphorus and C) potassium by cabbage under varying fertilizer management

365
Apart from nutrients uptake, fresh weight of cabbage also was recorded during the harvest period. The sequence starting from the highest weight is as follow: Farmer’s practice 1> Farmer’s practice 2> For1Rat1> For2Rat2> For3Rat1> For1Rat2> For2Rat3> For2Rat2> For3Rat2> For3Rat3> Control. In line with the nutrients uptake, FP1 also showed significantly higher fresh weight data. Meanwhile For1Rat1 and For2Rat1 were still among the best organo mineral fertilizer management, because both were at par with FP1 in terms of fresh weight data.
CONCLUSION It can be concluded that For1Rat1 and For2Rat1 are the best among the organo-mineral fertilizer treatments in optimizing nutrients uptake and maximizing yield. Although FP1 is seen higher in nutrient uptake and yield, organo-mineral formulations, viz; For1Rat1 and For2Rat1 with lower NPK at 10:10:10, were comparable with it. Organic component in the organo mineral fertilizer contribute to soil health in the long term as compared to current farmer’s practices which utilize inorganic fertilizer entirely. With further field testing, optimal application technique of organo-mineral fertilizer will be obtained. In fact, it can replace the existing NPK fertilizers (15:15:15 and 12:12:17) which were widely utilized by the farmers for highlands cabbage production. However, further work is required to improve the organo- mineral formulations before recommendations can be made.
ACKNOWLEDGEMENT The authors wish to thank Mr Muhammad Hazwan Husaimi for his assistance during this project and also the staffs at Station MARDI Cameron Highlands, Pahang.
Head StemLeavesRoot
Con
trol
For1
Rat
1
For1
Rat
2
For2
Rat
2
For2
Rat
3
For3
Rat
3
For1
Rat
3
For3
Rat
2
For3
Rat
1
For2
Rat
1
Fres
h w
eigh
t (g)
2000.00
1500.00
1000.00
500.00
0.00
Fresh weight of cabbage under varying fertilizer management
FP1
FP2
e
aab abab
abcdabcd
abcdbcd
cde
abc
de
Means with the same letter are not significantly difference at p <0.05
Figure 2. Fresh weight of cabbage under varying fertilizer management

366
REFERENCESGuppy, C.N., Menzies, N.W., Moody, P.W., Blamey, F.P.C. (2004). Competitive sorption
reactions between phosphorus and organic matter in soil: a review. Soil Research 43 (2): 189 – 202
Keith, C., Grace, S. and Charles, M. (2013). Nutrient Management with Organo Mineral Fertilizer. Slide presentation during the meeting of International Conference on Biochars, Composts and Digestates Venue: Bari, Italy on 18th October 2013
Norida M. and John M. (2005). Insecticide use in cabbage pest management in the Cameron
Highlands, Malaysia. Crop Protection 24: 31 – 39Zebarth, B.J., Chabot, R., Coulombe, J., Simard, R.R., Douheret, J. and Tremblay, N.
(2005). Pelletized organo-mineral fertilizer product as a nitrogen source for potato production. Canadian Journal of Soil Science: 387 – 395 (Downloaded from www.nrcresearchpress.com by 58.26.127.144 on 03/13/16)

367
Effect of Three in One Nitrogen Fixer MARDI-All Cosmos Fertilizer on the Growth and Yield of Amaranthus
Izyani, R., Norfadilah, A.H., Subahir, S. and Alias, M.Y.Crop and Soil Science Research Centre,Malaysian Agricultural Research and Development Institute (MARDI), MARDI Headquarters, Persiaran MARDI-UPM, 43400 Serdang, Selangor, MalaysiaE-mail: [email protected]
ABSTRACT A glasshouse experiment was setup to evaluate the effect of MARDI fertilizer formulation three in one nitrogen fixer mardi-all cosmos on the growth and yield of Chinese spinach (Amaranthus sp.). The experiment was laid out in a Completely Randomized Block Design (CRBD) consisting of four treatments and four replications and the crop was grown for a period of 28 days after sowing (DAS). Four different fertilizer treatments viz; T1 (control), T2 (commercial fertilizer; NPK: 15:15:15), T3 (ALL COSMOS) and T4 (three in onenitrogen fixer MARDI-ALL COSMOS) were tried in the study. Sixteen plants were measured weekly for growth parameters for four weeks and the final samples were pulled out at harvest after four weeks. The maximum leaf area, total fresh weight, relative chlorophyll content and photosynthetic rate were observed in Chinese spinach treated with three in onenitrogen fixer MARDI-ALL COSMOS fertilizer. From this study, it is clear that application of three in oneN fixer (T4) has shown maximum values for all parameters studied. The other two fertilizer treatments, commercial fertilizer (T2) and ALL COSMOS (T3) were also on par with T4, suggesting that T4 could be an alternative to commercial fertilizer.
Keywords: chinese spinach, nitrogen fixer, fertilizer
INTRODUCTION Chinese spinach (Amaranthus sp.) is one of the popular leafy vegetables in Malaysia (Lim and Vimala, 2012). It forms a high percentage of the daily consumption of leafy vegetables (Palada and Chang, 2003). Three in one N-Fixer MARDI-ALL COSMOS fertilizer was designed for all crops especially green vegetables like Amaranthus caudatus. This fertilizer contains free-living nitrogen fixing bacteria and plant based organic matter. The composition of the fertilizer is: organic 65%, chemical 30% and zeolite 5%. This study was taken up to evaluate the effect of this fertilizer on the growth and yield of Chinese spinach (Amaranthus sp.) under controlled environment production.
MATERIAL AND METHODS This study was conducted in a glasshouse at MARDI Serdang. Seeds of Chinese spinach were sown in test beds with 1.3 m spacing between beds and 0.3 m within a row. Water was supplied by fertigation system throughout the study two times daily (2 l/plant). The experiment was laid out in a Completely Randomized Block Design

368
(CRBD) consisting of four treatments and four replications and the crop was grown for a period of 28 days after sowing (DAS). Four different fertilizer treatments viz; T1 (control), T2 (commercial fertilizer; NPK: 15:15:15), T3 (ALL COSMOS) and T4 (three in onenitrogen fixer MARDI-ALL COSMOS) were tried in the study. Photosynthesis rate and stomata conductance was measured weekly, between 0930 – 1030 AM, with three readings for each leaf per plants. Net photosynthetic rate and stomata conductance were measured with a portable steady-state photosynthesis system (LI-COR LI-6400) (Lincoln, Nebraska, USA). Light intensity within sampling chamber was 1200 µmolm-2s-1. The reference CO2 concentration was 400 ppm (µmolmol-1), the leaf chamber temperature was maintained at 30oC and humidity flow was fixed at 500 µmol s-1. For relative chlorophyll content, data were determined using a SPAD-502, portable chlorophyll meter (Konica-Minolta, Japan). Plant leaf area was measured using area meter (LI-COR LI-31 00) (Lincoln, Nebraska, USA) and samples for fresh weight, were weighed using Smart weigh portable electronic balance (SQW-3, New York, USA). Data obtained were subjected to statistical analysis, using Analysis of Variance (ANOVA) to test the significant effect of all variables investigated. Means were separated by the least significant difference (LSD) method using the statistical package of SAS Institute Inc. U.S.A.
RESULTS AND DISCUSSION The potential of three in onenitrogen fixer MARDI-ALL COSMOS fertilizer for production of Chinese spinach was examined. In this study, plant height, green leaf area, total shoot fresh weight, relative chlorophyll content and photosynthetic rate increased steadily with time in all treatments. The results show that effects of the fertilizer on most of the treatments were not significant (Figure A, B, C, D, E). Application of three in onenitrogen fixer MARDI-ALL COSMOS fertilizer (T4) produced maximum fresh weight, leaf area, plant height, relative chlorophyll content and photosynthetic rate at each harvest for Chinese spinach grown under controlled environment production. Therefore, this study suggests that MARDI-ALL COSMOS fertilizer has a potential and can be used as an alternative to commercial fertilizer and cosmos for production of Chinese spinach.

369
Figure. A (Plant Height); B: (Leaf Area); C: Fresh Weight; as affected by different fertilizers for Chinese spinach
B
A
C
Week
Week
Week
Plant height
Leaf area
Fresh weight

370
Figure: D. Photosynthesis Rate; E: Relative Chlorophyll Content as affected by different fertilizers for Chinese spinach
Photosynthetic rate D
E
Week
Week
SPAD

371
CONCLUSION This experiment has indicated that application of three in onenitrogen fixer MARDI-ALL COSMOS fertilizer (T4), resulted in maximum values for leaf area, total fresh weight, relative chlorophyll content and photosynthetic rate. Therefore, this study suggests that T4 has a potential and could be used as an alternative to commercial fertilizer for production of Chinese spinach instead of other conventional fertilizers.
REFERENCESLim, A.H. and Vimala, P. (2012). Growth and yield responses of four leafy vegetables
to organic fertilizer. J. Trop. Agric and Fd Sc. 40(1): 1 – 11Palada, M.C. and Chang, L.C. (2003). Suggested cultural practices for vegetable
amaranths. International Cooperators’Guide 03 – 552, Asian Vegetable Research and Development Centre

372
Evaluation of Urea-N Sources on Yield of Dwarf Long Bean
Lim, A.H.Crop and Soil Science Research Centre,Malaysian Agricultural Research and Development Institute (MARDI), MARDI Headquarters, Persiaran MARDI-UPM, 43400 Serdang, Selangor, MalaysiaE-mail: [email protected]
Abstract This study evaluated the yield of dwarf long bean grown on clay soil. Treatments consisted of urea and ammonium sulphate applied at 200 kg N/ha with poultry manure (PM) at 20 t/ha. Phosphorus was applied at 200 kg/ha P2O5 as triple super phosphate and potassium at 285 kg/ha K2O, as muriate of potash. A locally produced urea-N compound fertilizer (UNc) and an imported ammonium+nitrate-N compound fertilizer (ANc), both with the same formulation (N:P2O5:K2O:MgO = 12:12:17:2) were also evaluated at the equivalent rate. Poultry manure was applied as basal and worked into the soil on 6 m x 1 m plots. The treatments were arranged in a randomized complete block design with three replicates. Results showed that the mean fruit weight ranged from 9.5 – 10.0 g and did not differ significantly between treatments. The yield obtained for urea was 10.15 kg/plot and ammonium sulphate was 9.58 kg/plot. For the imported ammonium-N compound the yield was 8.77 kg/plot and for the locally produced urea-N compound the yield was 9.04 kg/plot. There was no significant difference between any of the treatments. The fruit number obtained for urea was 1069 and ammonium sulphate was 956. Fruit number obtained for urea-N compound was 944 and ammonium-N compound was 910. Again, results of fruit number showed no significant difference between treatments. This showed that urea-N can fix substantial amount of N for dwarf long bean vegetable. Therefore, any of the N-fertilizer can be recommended as the nitrogen source for dwarf long bean on clay soil.
Keywords: urea, ammonium sulphate, vegetable, poultry manure, compound fertilizer
INTRODUCTION Dwarf long-bean that originated from Philippines has good potential for large scale cultivation in Malaysia. The main advantage of the dwarf variety is that of staking, a major cost in the cultivation of the climbing variety, can be dispensed with, as the plants are upright and only about half a meter tall. This study was an attempt to evaluate the yield of dwarf long bean on different N source fertilizers on clay soil. MARDI has in the past established dwarf long bean on sand tailings (Lim, A.H. and Vimala, P. 2008) and evaluated of urea-N sources on chilli grown on peat (Lim, A.H. and Vimala, P. 2008). The paper presents the yield of dwarf long bean grown on clay soil to urea, ammonium sulphate (AS), ammonium+nitrate N compound (ANC) and a locally produced urea-N compound (UNC).

373
MATERIALS AND METHODS Urea, ammonium sulphate (AS), ammonium+nitrate N (ANc) compound and urea-N compound (UNc) were evaluated on the yield of dwarf long bean grown on clay soil at the MARDI Station, Serdang. Treatments consisted of urea and ammonium sulphate applied at 200 kg N/ha with poultry manure (PM) at 20 t/ha. Phosphorus was applied at 200 kg/ha P2O5 as triple super phosphate and potassium at 285 kg/ha K2O, as muriate of potash. A locally produced urea-N compound fertilizer (UNc) and an imported ammonium + nitrate-N compound fertilizer (ANc), both with the same formulation (N:P2O5:K2O:MgO = 12:12:17:2) were also evaluated at the equivalent rate. Poultry manure was applied as basal and worked into the soil on 6 m x 1 m plots. The treatments were arranged in a randomized complete block design with three replicates. Dwarf long-bean seeds were sown in two rows at a planting distance of 30 cm x 60 cm to give 40 plants/plot. Harvesting was on alternate days with the first harvest at 48 days after sowing (DAS) and the last harvest at 77 DAS. Plate 1 shows the dwarf long bean experiment on clay soil.
RESULT AND DISCUSSION
Yield First harvest of fruits was at 48 days after sowing (DAS). Total yield (t/ha), fruit number/ha and mean fruit weight (g) obtained for the various treatments are presented in Table 1. There were no significant differences in yield, fruit number and mean fruit weight between urea and ammonium sulphate. Neither was there any significant difference between the urea-N compound (UNc) and the ammonium+nitrate-N compound (ANc). The highest yield of 11.28 t/ha was obtained with urea. However, treatment with ammonium+nitrate-N compound yielded the lowest (9.75 t/ha). Generally, the fruit number/ha followed the same trend as yield/ha which ranged from 1011111 – 1187778. The mean fruit weight ranged from 9.5 – 10 g. The average yield/plant ranged from 438.7 – 507.43 g. The plot yield (kg/plot) obtained for the various treatments are presented in Figure 1.
Plant heightPlant height at 25 DAS, 38 DAS and 48 DAS are presented in Table 2. There were no significant differences between treatments. Plant height at 25 DAS ranged from 10.58 – 11.17 cm. At 38 DAS, plant height ranged from 21.67 – 25.33 cm. Plant height at 48 DAS ranged from 33.83 – 38.33 cm.
Harvest trendThe first harvest at 48 days after sowing (DAS) yielded 0.27 kg/plot (Figure 2). Yields rose to a peak of 1.3 kg/plot at 55 DAS. Then, yields hovered between 0.73 – 0.92 kg/plot until 67 DAS. Thereafter, there was a gradual decline in yield until the last harvest at 84 DAS. The yield trend enables the grower to estimate the expected yield at each

374
Plate 1. Field view of dwarf long bean on clay soil
Table 1. Yield of dwarf long bean
Treatments Yield (t/ha) Average yield/plant (g)
Fruit number/ha Mean fruit weight (g)
Urea 11.28a 507.43a 1187778a 9.5aAmmonium sulphate 10.65a 479.10a 1062222a 10.0aAmmonium+nitrate-N compound(ANc)
9.75a 438.70a 1011111a 9.6a
Urea-N compound (UNc)
10.04a 451.80a 1049259a 9.5a
Mean values in each column with the same letter are not significantly different by DMRT at 5%
Figure 1. Yield of dwarf long bean (kg/plot)
Yie
ld (k
g/pl
ot)
12
10
8
6
4
2
0Urea AS ANc UNc
10.1 9.68.8 9.0

375
Table 2. Height of dwarf long bean
Treatments Height (cm)25 DAS
Height (cm)38 DAS
Height (cm)48 DAS
Urea 11.17a 22.83a 33.83aAmmonium sulphate 11.00a 22.50a 37.33aAmmonium+nitrate-N compound (ANc)
10.58a 21.67a 34.50a
Urea-N compound (UNc) 11.00a 25.33a 38.33a
Mean values in each column with the same letter are not significantly different by DMRT at 5%
Figure 2. Harvest trend of dwarf long bean yield (kg/plot)
harvest. With this information he can estimate the labour required, as well as plan for marketing of the produce.
CONCLUSIONThere is no significant difference between urea and ammonium sulphate as the N source. There is also no significant difference between the locally produced urea-N compound (UNc) and the imported ammonium+nitrate-N compound (ANc). This showed that urea-N can fix substantial amount of N for dwarf long bean vegetable. Thus, any of the N-fertilizer can be recommended as the nitrogen source for dwarf long bean on clay soil.
REFERENCESLim, A.H. and Vimala, P. (2008). Establisment of dwarf long-bean on sand-tailing.
Proc. SOIL2008: Sustaining soil ecosystem with emphasis on coastal soils, Mal. Soc. of Soil Sci. Conference, 15-17 April 2008, Ipoh, Perak, Malaysia; p 109 – 112
Lim, A.H. and Vimala, P. (2008) Evaluation of urea-N sources on chilli grown on peat International Symposium and workshop on Tropical Peatland, Kuching 2008. 19 – 22 Aug 2008. p 58

376
The Study of Types and Ratio of Bio-Extract for Increasing Productivity of Organic Mustard
Nattaphon, K., Nittaya, N. and Pedcharada, Y.Highland Research and Development Institute (Public Organization)65 Moo 1 Suthep Road, Muang, Chiang Mai 50200, ThailandE-mail of corresponding author: [email protected]
Abstract An experiment was conducted to study the effect of the different types of bio-extracts on the productivity of mustard, grown under organic farming system. The experiment was conducted at The Royal Agricultural Station Angkhang, Chiang Mai, Thailand. Experimental design was Randomized Complete Block Design (RCBD) with seven treatments and three replications; (1) control (farmer’s practice, spraying fish bio-extract in a ratio of 1:500,) (2) spraying egg bio-extract in a ratio of 1:500 (3) spraying vegetable bio-extract in a ratio of 1:500 (4) spraying fruit bio-extract in a ratio of 1:500 (5) spraying egg bio-extract in a ratio of 1:1000 (6) spraying vegetable bio-extract in a ratio 1:1000 (7) spraying fruit bio-extract in a ratio of 1:1000. Overall results showed that spraying of bio-extracts in the ratio of 1:500 is better than 1:1000 ratio. Spraying egg bio-extract in the ratio 1:500 significantly increased organic mustard height and yield compared to other treatments. Spraying bio-extract of fruits and vegetables in the ratio 1:500 also increased yield of mustard and they were either at par or better than farmers practice when yields were considered. Therefore, there is a need for further studying the effect of these bio-extracts in increasing yield of organic mustard.
Keywords: bio-extracts, egg bio-extract, vegetable bio-extract, fruit bio-extract, organic mustard
INTRODUCTION Mustard or Chye Sim (Brassica chinensis var. parachinensis) is a member of Genus Brassica and Brassicaceae (mustard) Family. It has yellow flowers and erect stem of 0.5 – 1 cm diameter and is about 15 – 20 cm height with light to dark green leaf. Chye Sim is an economically important vegetable extensively grown in Northern of Thailand. The Royal Project Foundation had promoted their farmers to cultivate this plant because it is easy to grow, comes to be a short-cycle crop (25 – 30 days), contains high nutrition (Ca and P), vitamin (A and C) and gives high profits (Yodphet, 1999). The Royal Project Foundation focuses on organic agriculture production system that brings sustainability to soil, eco-system and human living. Organic agriculture could be done in specific location because it relied on ecological system and biodiversity of each area. It is the combination of traditional knowledge, science, technology and innovation in environmental conservation. Organic agriculture is an alternative production system that avoids using synthetic substances such as chemical fertilizers, chemical pesticides, hormones that stimulate plant growth and genetically modified organisms. It focuses on using organic materials such as manure and compost to improve soil fertility (McEvoy, 2012)

377
An organic fertilizer derived from plant contains many nutrients and hormones which could be beneficial to plant growth, animal and also microorganisms. The organic fertilizer derived from fish is also a good source of nitrogen and also facilitates microbe activities and vegetative growth on plant. They could also be used as repellents against pest insects and mites (Tuncho, 2005). Bio-extract could be obtained from fermentation process or many kinds of waste, including agricultural residues (vegetable, fruit, animal) and by products from agricultural industry such as fruit peel, meat scraps mixed with any sweeteners such as honey, syrup and molasses (Sarka et al., 2012). Molasses contains lots of substrates which benefits microorganisms, as the microorganism uses it as a substrate to transform organic materials into smaller molecules, for instance; humic compounds, amino acids and nutrients. Plants could utilize these small molecules practically. In addition, the bio-extract can be used as plant growth regulator, hormone, insecticide and fungicide. However, the quality and quantity of that bio-extract is depending on the material used. Most bacteria and yeast produce lactic acid and generate lots of beneficial nutrients such as proteins, carbohydrates, phosphorus, potassium, iron, vitamin A and thiamine. Fruit bio-extract is rich with vitamins and plant hormones such as auxin and cytokinin which stimulate plant growth as well as improve soil fertility. (Ruchirasak, 2013) Bio-extract from various materials, especially from fermented vegetables or green plants is rich with nutrition, cell, chlorophyll, hormones, fiber and beneficial microorganisms. Egg bio-extract contains high plant growth regulators and hormones such as auxin, gibberellin and cytokinin. It also contains plant nutrients such as Mg, Zn, Bo, Fe, Cu and Si, able to stimulate plant growth, improve floral bud and decrease fruit drop. Earlier reports have showed that bio-extract can accelerate organic matter decomposition and prevent pests (Edwards et al., 2010). Yusuk et al., (2011) reported that alternated spraying of Trichoderma and Bacteria BK33 every five days and watering egg bio-extract ratio 1:500 every seven days increased Baby Pok Choi yield by 359.46%. This method also reduced powdery mildew and damping off diseases compared with control. However, studies on types and optimum ratio of each bio-extract is important for growing organic vegetables in order to persuade the high land famers heading to the sustainable agricultural system.
MATERIALS AND METHODSThe experiment was conducted in green house of The Royal Project Angkhang Research Station, Chiang Mai, Thailand. The experiment design was randomized complete block design (RCBD) with seven treatments as follows; 1. Control (farmer practice; fish bio-extract in a ratio of 1:500)2. Spraying egg bio-extract in a ratio of 1:5003. Spraying vegetable bio-extract in a ratio of 1:5004. Spraying fruit bio-extract in a ratio of 1:5005. Spraying egg bio-extract in a ratio of 1:1000

378
6. Spraying vegetable bio-extract in a ratio of 1:1000 7. Spraying fruit bio-extract in a ratio of 1:1000
The mustard plants (Chye Sim) were grown in the 3 m2 plot for a replication was included 108 plants. All the treatments were given once a week. i. Preparing bio-extract: 1. Vegetable bio-extract: 30 kg of fresh green vegetable such as cos, head lettuce
and cabbage mixed with 10 kg of molasses and 10 L of water. 2. Fruit Bio-extract: 30 kg of ripened fruit such as banana, pineapple and papaya
mixed with 10 kg molasses and 10 L water. 3. Egg Bio-extract: 5 kg of egg mixed with 5 L molasses, 200 ml of yogurt and
100 mg of yeast. 4. Fish Bio-extract recommended by The Land Development Department of
Thailand: 30 kg of fish waste mixed with 10 L of molasses and 10 L of water. All bio-extracts from vegetable, fruit and egg were fermented for 14 days whereas bio-extract from fish was fermented for 30 days. Later they were filtered before application to the plants. (Figure 1 and 2).
Figure 1. Vegetables and fruits mixed with molasses
Figure 2. Eggs mixed with molasses

379
Nutrition status (Nitrogen, Phosphorus and Potassium) and plant hormones (Auxin, Gibberellin and Cytokinin) in the bio-extracts were analysed in the laboratory ii. Data collection 1. Stem height (cm): the data was collected after seven days of transplanting (1st
week) and then collected once a week until 29 days. 2. Yield (kg): fresh weight (before cutting) and after cutting by trimming bad leaves
and ready for sale.
RESULTS Plant nutrients (Nitrogen, Phosphorus and Potassium) and plant hormones (Auxin, Gibberellin and Cytokinin) were analyzed from each bio-extract. All the bio-extracts trended to have different amount of nutrients. Egg bio-extract showed the highest amount of GA by 123.68 mg/l (Table 1). It was also found rich with Fish extract had maximum Phosphorus (259.17 mg/l). Fruit extract was rich with Potassium (1.09 mg/l). The result of plant growth showed that after 1st week spraying vegetable bio-extract in a ratio of 1:500 gave the highest height by 11.34 cm. But it was at par with farmers practice of spraying fish bio-extract in a ratio of 1:500 and spraying egg bio-extract in a ratio of 1:500. In 2nd, 3rd and 4th week, the highest height was found in spraying egg bio-extract in a ratio of 1:500 ranged from 19.53, 30.56 and 40.88 cm, respectively (Table 2). Spraying egg bio-extract; in a ratio of 1:500 gave significantly greater yield than other bio-extracts by giving 10.71 kg/3 m2 before cutting and 7.84 kg/3 m2 after cutting (Table 3). The next best treatment was spraying fruit bio-extract in a ratio of 1:500 by yielding 10.11 kg/3 m2 before cutting and 7.13 kg/3 m2 after cutting and was at par with spraying egg bio-extract in a ratio of 1:500. This treatment was also better than farmers practice when weight after cutting was considered. Vegetable bio-extract in a ratio of 1:500, was at par with these two treatments though it recorded lower yield of 10.42 kg/3 m2 and 6.71 kg/3 m2.
Table 1. Nutrient composition of bio-extracts
Nutrient Bio-extract (mg/l)Fish Vegetable Fruit Egg
Nitrogen (%) 0.20 0.37 0.33 0.77Phosphorus (%) 259.17 0.04 0.04 0.23Potassium (%) 0.43 0.53 1.09 0.90Auxin; IAA (mg/l( 0.12 0.441 0.26 5.81Gibberellin; GA (mg/l) 17.76 1.08 2.78 123.68Cytokinin (mg/l) 0.15 2.74 3.21 0.26

380
Table 2. Height of organic mustard under different treatments after transplanting
Treatments Height (cm)1stweek 2ndweek 3rdweek 4thweek
1. Control (spraying fish bio-extract from farmer practice in a ratio of 1:500)
11.14a 17.38b 27.90b 36.85d
2. Spraying egg bio-extract in a ratio of 1:500
11.33a 19.53a 30.56a 40.88a
3. Spraying vegetable bio-extract in a ratio of 1:500
11.34a 16.54bcd 27.25bc 38.48bcd
4. Spraying fruit bio-extract in a ratio of 1:500
9.35c 14.98e 25.51cd 37.13cd
5. Spraying egg bio-extract in a ratio of 1:1000
9.39c 16.18cd 25.93cd 38.78bcd
6. Spraying vegetable bio-extract in a ratio of 1:1000
9.12c 15.56de 24.77d 34.96e
7. Spraying bio-extract from fruit in in a ratio of 1:1000
10.04b 16.80bc 27.07bc 38.99b
LSD. 0.6350 1.0700 1.8426 1.8445
Means with the same letter are not statistically different from each other (p <0.05)
Table 3. Yield and weight loss of organic mustard
Treatments Yield (kg/3m2)
Fresh weight before cutting
Fresh weight after cutting
1. Control (spraying fish bio-extract from farmer practice ratio1:500)
9.67ab 6.22c
2. Spraying egg bio-extract ratio 1:500 10.71a 7.84a3. Spraying vegetable bio-extract ratio 1:500 10.42ab 6.71 abc4. Spraying fruit bio-extract ratio 1:500 10.11ab 7.30ab5. Spraying egg bio-extract ratio 1:1000 9.60ab 6.21c6. Spraying vegetable bio-extract ratio 1:1000 9.22b 6.40bc7. Spraying bio-extract from fruit in ratio 1:1000 9.33ab 5.80cLSD. 1.48 1.28Means with the same letter are not statistically different from each other (p <0.05)

381
Figure 3. Experimental plots of the organic mustard
DISCUSSION The study of types and ratio of bio-extract from vegetables, fruits, egg and fish showed egg bio-extract had stimulated greater growth of organic mustard than other treatments. In general, results showed that spraying of bio-extracts in the ratio of 1:500 is better than 1:1000. Spraying of egg bio-extract in the ratio of 1:500 was the best treatment in increasing plant height (Table 2) and yield (Table 3). The next best treatment was spraying fruit bio-extract ratio 1:500 followed by vegetable bio-extract in a ratio of at 1:500 when yields were considered. These treatments were superior to farmers practice of spraying fish extract when yields were considered. Egg bio-extract contained higher amount of plant hormones; IAA and GA than others. The hormones IAA and GA had effected on internodes elongation, leaves expansion and accelerate cell enlargement by visually observed. According to Yusuk et al., (2011) study, spraying egg bio-extract in a ratio of 1:1000 before harvest at 8 day had increased yield of an organic pointed cabbage by 5.54% compared with spraying earthworm bio-extract. The report of K. Soytong et al., (2010) showed that bio-product applications (biological fertilizer in powder and liquid formulations, bio-humus, ketomium for disease control, neem’s extract for insect control) applied with organic vegetables for instance, Kale, Pakchoi and Chinese cabbage had the effective on yield increasing by 45.84, 51.76, 60.73 and 58.57%, respectively. It was found that spraying of egg bio-extract in the ratio of 1:500 was the best treatment in increasing plant height and yield as compared to other treatments. Plants were able to transform the components of organic solutions to vitamins, organic acids and other compounds for their growth, thus, when spraying bio-extract on plants, these nutrients immediately get absorbed into the leaves. (Kamla et al., 2007). There is a potential to use fruit and vegetable bio-extracts also in the ratio of 1:500 as these also increased yield and were better or at par with farmers practice of spraying fish bio-extract in the ratio of 1:500.

382
CONCLUSION The results showed that spraying egg bio-extract in the ratio 1:500 helped organic mustard to grow rapidly and increase the yield as compared with farmer practice of spraying fish bio-extract in a ratio of 1:500. There is a need to further study the effect of spraying bio-extract of fruits and vegetables along with egg bio-extract on increasing yield of mustard as they were either at par or better than farmers practice.
ACKNOWLEDGMENTS Authors gratefully acknowledge the support given by The Royal Agricultural Station Angkhang, Chiang Mai, Thailand, The Royal Project Foundation and Highland Research and Development Institute (Public Organization)
REFERENCESEdwards, C.A., Arancon, N.Q., Vasko-Bennett, M., Askar, A. and Keeney, G. (2010).
Effect of aqueous extracts from vermicoposts on attacks by cucumber bettles (Acalymna vittatum) (Fabr.) on cucumbers and tobacco horn worm (Manduca sexta) (L.) on tomatoes. Pedobiol. 53: 141 – 148
Kamla, N., V. Limpinuntana S. Ruaysoongnernand Richard, W. Bell. (2007). Role of fermented bio-extracts produced by farmers on growth, yield and nutrient contents in cowpea (Vigna unguiculata (L.) Walp.) in Northeast Thailand. Biological Agriculture and Horticulture 25(4): 353 – 368
McEvoy, M. (2012). Organic 101: Allowed and Prohibited Substances. Retrieved February 20, 2017 from http://blogs.usda.gov/2012/01/25/organic-101-allowed-and-prohibited-substances
Ruchirasak, M. (2013). The application of fermented bio-extract produced from egg of golden apple snails (Pomacea canaliculata) to enhance yield of rice. Princess of Naradivat University Journal, 6: 73 – 80
Sarka, E., Bubnik, Z., Hinkova, A., Gebler, J. and Kadlec, P. (2012). Molasses as a by-product of sugar crystallization and a perspective raw material. Proc. Eng. 42: 1219 – 1228
Soytong, K., P. Sibounnavong, P. Sysouphanthong, Xay ly, P. Phoutasay, K. Promrin and W. Pongnak. (2010). Application of Biological Products for Organic Crop Production in the Field. Faculty of Agricultural Technology, King Mongkuts Institute of Technology Ladkrabang.133p.
Tuncho, A. (2005). Natural Agricultural Apply, Principles, Conceptsand Technical Compliance in Thailand. 2nd edition. National Science and Technology Development Agency. 380 p.
Yodphet, C. (1999). Cruciferous croups.Ruekaew Printed. Bangkok. 195 p.Yusuk, P., N. Nokham, K. Vichitrakulthavorn and B. Thongchot. (2011).Trial on Bio
Material for Increasing Yield on Organic Vegetable Production. Highland Research and Development Institute (Public Organization). 38 p.
383
Decline Trends of Propineb Residues (Expressed as Carbon Disulphide) in Leafy Vegetables Under Different Field Settings of Vegetables Production
Ngan, C.K.1, Farah Huda, S.S.2, Haslihana, Y.3, Mohammad Nazrulfahmi, A.R.3, Khairatul Azmah, M.1 and Mohammad Shahid, S1.1Crop and Soil Science Research Centre,Malaysian Agricultural Research and Development Institute (MARDI), MARDI Headquarters, Persiaran MARDI-UPM, 43400 Serdang, Selangor, Malaysia2Horticulure Research Centre, Malaysian Agricultural Research and Development Institute (MARDI), MARDI Headquarters, Persiaran MARDI-UPM, 43400 Serdang, Selangor, Malaysia3Pesticide Control Division, Department of Agriculture, Kuala LumpurE-mail: [email protected]
Abstract In Malaysia leafy vegetables are cultivated in different field settings such as open field, netted structure, rain shelter, etc., There is speculation that pesticide residues in vegetables cultivated under rain shelter are more than vegetables cultivated in open field. The objective of the study was to determine residue decline trends of dithiocarbamate fungicide (expressed as carbon disulphide) in different field settings. Residues of propineb as carbon disulphide decline on leafy vegetables (mustard and red spinach) were studied under four different field settings, viz; open field-lowland (Trial one in Sepang, Selangor), netting structure-lowland (Trial two in Ulu Tiram, Johor) and rain shelter-lowland (Trial three in Serdang, Selangor) and rain shelter-highlands (Trial four in Cameron Highlands, Pahang). Propineb was applied two times (one week interval between the first application and the second application) within mustard and spinach growing period. Leafy vegetables were collected according to sampling intervals and sent to analytical laboratory in Department of Agriculture in Kuala Lumpur for residue analysis. Residues of propineb in samples were analysed as carbon disulphide by Gas Chromatograph-Electron Capture Detector (GC-ECD). The residues were detected in mustard (<0.04 mg/kg – 8.1 mg/kg) and spinach (<0.04 mg/kg – 9.2 mg/kg). Samples from all the field trials showed residues of carbon disulphide below the national Maximum Residue Limit of 10 mg/kg. Residue findings from this study on mustard and spinach indicated that two sprays of propineb on spinach and mustard at weekly intervals is within MRL and safe for consumption. The order of residue decline was highest in open field-lowland followed by netting structure-lowland. This was followed by rain shelter-lowland and rain shelter-highlands in that order.
Keywords: pesticide residues, propineb, leafy vegetables, spinach, mustard
INTRODUCTION Dithiocarbamate fungicides is used widely all over the world due to its strong fungicidal activity and low cost (Lishaut and Schwack 2000). Dithiocarbamate residue in food crops resulting from application of all types of dithiocarbamate fungicides is detected as carbon disulphide (Ahmad et al., 1996). Few incidences of detection of dithiocarbamate residues exceeding Maximum Residue Limit (MRL) were reported

384
locally (Jipanin et al., 2001) and in countries such as Egypt (Dogheim et al., 1995) and Spain (López-Fernández et al., 2012). Reason of MRL exceedance could be due to overdose of fungicides or/and harvesting crops earlier than Pre-Harvest Interval (PHI). Apart from these factors, field settings where crops were grown could influence the residue decline rate. In Malaysia, leafy vegetables are grown under different field settings such as open field, netted structure and rain shelter. It is suspected that crops grown under protected shelter (netting or rain shades) have more pesticide residues due to less impact of rain droplets onto crop surface and subsequently less residue surface runoff. Hence, a study was conducted to determine residue decline trends of propineb (expressed as carbon disulphide) in the above field settings.
MATERIALS AND METHOD Four supervised residue field trials were conducted in 2015 on leafy vegetables (mustard and red spinach) grown under different field settings. The locations and field setting of the trials are shown in Table 1. Trial no. three was conducted in highlands (elevation about 1500 m above sea level) and others were conducted in lowlands. In each trial, control and treated plots were established with the minimum plot size of 10 m2. No application of propineb was done on the control plot throughout the duration of trials. As for the treated plots, two applications of propineb were applied using the knapsack sprayer that was equipped with hollow cone nozzle. The interval between the two applications was one week. Propineb was applied according to manufacturer recommendation (1050 g a.i./ha ) @ of 1000 L/ha. Leaf samples (at least 1 kg per sample) were collected in single replicate at 0 (after 2 hours of spray), 1, 3, 7 and 14 days after the last application (DALA), i.e. after the second spray of the fungicide. All the samples were sent to the analytical laboratory in the Department of Agriculture. Analytical method by Česnik and Gregorčič (2006) was used for analysis and residue quantification. Residues of propineb in samples were analysed as carbon disulphide (CS2) by Gas Chromatograph-Electron Capture Detector (GC-ECD).
RESULTS AND DISCUSSION Prior to the analysis of samples, the analytical procedure was validated with acceptable recovery of 93 – 121% with Relative Standard Deviation of 9.5%. The ‘limit of quantification’ of the analytical method was 0.04 mg/kg. The residues were detected
Table 1. Location and field setting of the field trials
Trial no. Location/Field setting*/crop Period1 Sepang, Selangor/open field/spinach Jun – Jul 20152 Ulu Tiram, Johor/netted structure/mustard Aug 20153 Brinchang, Cameron Highlands, Pahang/rain shelter/mustard Sep – Oct 20154 Serdang, Selangor/rain shelter/mustard Nov – Dec 2015* Field settings of the trials are shown in the Figure 1

385
in mustard (<0.04 mg/kg – 8.1 mg/kg) and spinach (<0.04 mg/kg – 9.2 mg/kg). In terms of ranges of residue detected, not much difference in term of residue magnitude was found for mustard and spinach. The residue levels in mustard and spinach are shown in Table 2 and Table 3, respectively. In trial no. two (netted structure), three (rain shelter-highlands) and four (rain shelter-lowland) (refer to Table 3), there was no data according to the planned interval of sampling due to sample loss caused by freezer breakdown. Comparison of residue decline trends for all the trials are shown in Figure 2. The residue levels are compared against national MRL (10 mg/kg) and Singapore’s MRL (2 mg/kg) of dithiocarbamate residue in leafy vegetables. Codex MRL of dithiocarbamate residue on vegetables is also 10 mg/kg. The comparison to Singapore’s MRL is made because significant amount of vegetables are mainly exported to Singapore from Malaysia. Notably, the difference of MRLs of dithiocarbamate residues between Malaysia and Singapore could affect the export of vegetables. In all the four trials, dithiocarbamate (expressed as CS2) residues declined rapidly and by seven days. After Last Application (DALA), residue levels were less than 2 mg/kg. Thus application of propineb according to manufacturer recommendation under the studied field settings would not lead to violation of Singapore’s MRL. The current Pre-Harvest Interval (PHI) for the use of dithiocarbamate fungicide on leafy vegetables is 14 days. In trial no. one (Sepang, Selangor) which was conducted on open field, residue detected at 9.18 mg/kg at 0 DALA dissipated rapidly to 5.33 mg/kg at 1 DALA and 0.06 mg/kg at 3 DALA. At 7 and 14 DALA, residues were below the LOQ of the
Figure 1. Field settings for the field trials

386
Table 2. Propineb residue (expressed as CS2) in spinach (trial one – open field)
Days After Last Application (DALA) Concentration (mg/kg)
0 9.181 5.333 0.067 <0.04
14 <0.04
Table 3. Propineb residue (expressed as CS2) in mustard
Days After Last Application (DALA)
Concentration (mg/kg)
Trial 2 (netted structure)
Trial 3 (rain shelter – highlands)
Trial 4 (rain shelter – lowlands)
0 n/s n/s 7.001 n/s n/s 6.013 0.54 8.06 5.787 0.07 5.48 1.87
14 0.07 0.07 n/sn/s: no sample
Figure 2. Propineb residue (expressed as CS2) decline in leafy vegetables, [no data available for 0 and 1 DALA for rain shelter (highlands) and netted structure]

387
analytical method. In trial no. two (Ulu Tiram, Johor) which was conducted under netted structure, (no sample taken on 0 and 1 DALA) 0.54 mg/kg was detected at 3 DALA. This declined to 0.07 mg/kg at 7 DALA and at 14 DALA, residue level was still at 0.07 mg/kg. In trial no. three (Brinchang, Cameron Highlands) which was conducted under rain shelter at higher elevation and colder climate as compared to lowland, notable decline trend was observed with decline level from 8.06 mg/kg (3 DALA) to 5.48 mg/kg (7 DALA) and 0.07 mg/kg (14 DALA). In trial no. four (Serdang, Selangor) which was conducted under rain shelter, the highest residue was detected at 0 DALA (7.00 mg/kg) and residue declined to 6.01 mg/kg at 1 DALA and further declined to 5.78 mg/kg (3 DALA) and 1.87 mg/kg (7 DALA). No sample taken at 14 DALA in the trial no. four. It is noticeable that residue decline in Trial no. four was slower than Trial no. one and two. This could be due to lack of surface runoff from rainwater in the rain shelter structure. In comparison of residue decline between open field and netted structure, residue decline was relatively slower in netted structure as compared to open field. It could be the netted structure somehow reduced the volume of rainfall onto the vegetables and thereby relatively less residue dissipation due to surface runoff effect in vegetables grown under netted structure. According to Margaret and Chai (2006), violation of MRLs of pesticides is generally relatively lower for vegetables cultivated under netted house as compared to open field. There were studies by Fujita et al., (2014) and Tao et al., (2010) that compared residue decline in crops from open field and glasshouse. The two studies implied that residue declined slower in glasshouse as compared to the open field. It is interesting to note that in comparing trial no. three and trial no. four, in which both trials were conducted under the rain shelter with the only difference that trial no. three was conducted in highlands (altitude of about 1500 m and colder daily average temperature of about 18 °C), residue in the highlands seem to decline slower than residue decline trend in lowland. It seem that the temperature could affect decline rate. According to Racke (2003), field investigations on pesticide fate in temperate and tropical soil and water indicated that residues were dissipated more rapidly in tropical condition as compared to temperate. Overall, based on the decline trends from the four field trials, residue dissipated fastest in the open field, followed by netted structure and rain shelter.
CONCLUSION Study conducted on the dissipation of proipineb residues in mustard and spinach at different locations showed that the order of residue decline from the fastest decline to the slowest decline (within 14 days after the last treatment of propineb) under the four different field settings was; the fastest dissipation was open field-lowland, followed by netting structure-lowland, rain shelter-lowland and rain shelter-highlands.

388
ACKNOWLEDGMENTS The authors are grateful to the farmers who co-operated in the study and the support from the officers and support staff of Department of Agriculture, Malaysia and Malaysian Agriculture Research and Development Institute.
REFERENCESAhmad, N., Guo L., Mandarakas, P., Farah, V., Appleby, S. and Gibson, T. (1996).
Headspace gas-liquid chromatographic determination of dithiocarbamate residues in fruits and vegetables with confirmation by conversion to ethylenethiourea. J. AOAC Int. 79(6): 1417 – 1422
Česnik, H.B. and Gregorčič, A. (2006). Validation of the method for the determination of dithiocarbamates and thiuram disulphide on apple, lettuce, potato, strawberry and tomato matrix. Acta Chim. Slov. 53: 100 – 104
Dogheim, S.M., Gad Alla, S.A., el-Marsafy, A.M. and Fahmy, S.M. (1999). Monitoring pesticide residues in Egyptian fruits and vegetables in 1995. J. AOAC Int. 82(4): 948 – 55
Fujita, M., Yajima, T., Tomiyama, N., Iijima, K. and Sato, K. (2014). Comparison of pesticide residue levels in headed lettuce growing in open fields and greenhouses. J. Pestic. Sci. 39(2): 69 – 75
Jipanin, J., Alinah A.R., Jaimi, R.J. and Phua, P.K. (2001). Management of pesticide use on vegetable production: Role of Department of Agriculture Sabah. 6th SITE Research Seminar, Sabah, 13-14 September 2001
Lishaut, H.V. and Schwack, W. (2000). Selective trace determination of dithiocarbamate fungicides in fruits and vegetables by reversed-phase ion-pair liquid chromatography with ultraviolet and electrochemical detection. J. AOAC Int. l 83(3): 720 – 727
López-Fernández, O., Rial-Otero, R., González-Barreiro, C. and Simal-Gándara, J. (2012). Surveillance of fungicidal dithiocarbamate residues in fruits and vegetables. Food Chem. 134(1): 366 – 374
Margaret, A. and Chai, L.K. (2007). Pesticide residues in local vegetables in Sarawak is under control: Trend analysis from 2000 to 2006. Proc. Senior Officers’ Conf., 11 – 14 Dec. 2007, Kuching, Dept. Agric., Sarawak. pp. 398 – 407
Racke, K.D. (2003). What Do We Know about the Fate of Pesticides in Tropical Ecosystems? Environmental Fate and Effects of Pesticides. ACS Symposium Series 853: 96 – 123
Tao, C., Li, D., Zhang, X., Chen, S., Fu, L., Piao, X., Shi, J., Jiang, H., Li, C. and Li, J. (2010). Residue analysis of acephate and its metabolite methamidophos in open field and greenhouse pakchoi (Brassica campestris L.) by gas chromatography-tandem mass spectrometry. Environ. Monit. Assess. 165: 685 – 692

389
Monitoring of Pesticide Residues Contamination in Malaysian Organic Produce of Peninsular Malaysia
Khairatul, A.M.1, Lim, A.H.1, Mohammad Shahid, S.1, Illani Zuraihah, I.1, Zulkefli, M.2 and Ngan, C.K.11Crop and Soil Science research Centre,Malaysian Agricultural Research and Development Institute (MARDI), Persiaran MARDI-UPM, 43400 Serdang, Selangor, Malaysia2Corporate Communication and Quality Centre, Malaysian Agricultural Research and Development Institute (MARDI), Persiaran MARDI-UPM, 43400 Serdang, Selangor, MalaysiaE-mail: [email protected]
Abstract A two year study was conducted for monitoring the pesticide contamination in organically produced fresh fruits and vegetables to establish MARDI’s chemical-free primary food database. From March 2013 until September 2015, a total of 125 fresh organic produce was sampled across Peninsula Malaysia. All samples were collected from hypermarkets (64.8%), organic-certified farms (25.6%) and organic retail stores (9.6%). Only samples labelled with Skim Organik Malaysia (SOM)’s logo or declared as pesticide-free produce were sampled throughout the study. Types of samples were categorized into five classes, viz; leafy vegetables (40.8%), fruity vegetables (34.4%), fruits (16.0%), rhizomes (5.6%) and mushrooms (3.4%). Northern region of Peninsula Malaysia recorded the highest number of samples (46.4%) followed by East Coast region (25.6%), Southern region (19.2%) and Central region (8.8%). Groups of pesticides analysed include organochlorines, organophosphorus, synthetic pyrethroids and strobilurins. Chlorpyrifos, an organophosphorus insecticide, was detected in five samples. However, the residues detected did not exceed the national and Codex Maximum Residue Limit (MRL).
Keywords: agrochemical, pollution, profile, nature, farming
INTRODUCTION Environmental and food safety issues are the main reasons why people opt for organic farming. Nowadays consumers wish to buy food that are safe to eat and of top quality. In Malaysia, organic agriculture was introduced by non-governmental organizations (NGOs) as a result of environment issues, plantation workers’ pesticide-related rights, consumer awareness and low input sustainable agriculture. The first known organic farm was introduced by the Centre for Environment, Technology and Development, Malaysia (CETDEM) in 1986. In year 2000, total area under organic farming was 131 ha (Aini, 2005). To date, there are a total of 191 agricultural farms implementing organic farming over an area of 933 hectares across Peninsular Malaysia Of the 191 farms, 28% are fruit farms, 32% vegetable farms and 40% other crops (Zhen, 2013). Although the use of synthetic agents or agrochemicals in organic farming is prohibited, the organic produce may not be completely free of chemical residues, since it may be subject to air, water and soil pollution beyond the growers’ control.

390
Due to this, pesticide residues and/or other contaminants can occasionally be found in certified organic food. Presence, however, does not necessarily preclude the food from being labelled organic, providing all requirements related to the production process and regulations have been fulfilled (Greene, 2001). In view of this, a two year study was conducted to monitor presence of pesticide residues in Malaysian organic produce. The data generated can be used to establish MARDI’s chemical-free primary food database.
MATERIALS AND METHODS Only ‘Skim Organik Malaysia’ (SOM) or recognized international certification bodies-labelled organic or pesticide-free labelled vegetables and fruits were sampled for the purpose of the study. A simultaneous multi-residue methodology, Quenchers Method was used in this study in determining selected pesticide residues in the collected samples. This validated in-house method is able to detect 23 types of pesticides in one run. About 30 g of homogenized sample was weighed and five grams of Sodium Hydrogen carbonate (NaHCO3), 60 ml acetonitrile and 30 g anhydrous Sodium Sulfate (Na2SO 4) was added into the sample. The mixture was then shaken in an orbital shaker for two hours. After that, 10 ml of the extract was decanted and transferred into a centrifuge tube along with 0.25 g dispersive Poly-Secondary Amine (PSA) powder, 1.5 g Magnesium Sulfate (MgSO4). The extract was centrifuged for two minutes at 2000 rpm. Extract was reduced to 2 ml under nitrogen and later was injected into the Gas Chromatography (GC) equipped with Electron-Captured Detector ECD) and Nitrogen Phosphorus Detector (NPD). Analysis of Variance (ANOVA) was used for statistical analysis.
RESULTS AND DISCUSSION A total of 125 samples were collected from March 2013 to September 2016. About 62.7% of the samples were purchased from hypermarkets, followed by the organic-certified farms (27.1%), while the rest were collected from organic retail stores (10.2%) (Figure 1). Samples collection from hypermarkets and organic-certified farms were preferred due to their traceability as compared to samples from organic retail stores. Types of samples were categorized into five classes, which are leafy vegetables (48.3%), fruity vegetables (36.4%), fruits (5.1%), rhizomes (6.8%) and mushrooms (3.4%). Number of samples according to classes is as Figure 2. Number of samples according to regions is as Figure 3. Residues of chlorpyrifos were detected (>LOQ) in 18 samples of leafy and fruity vegetables, fruits and rhizomes (Table 1). Chlorpyrifos, an organophosphorus and broad spectrum insecticide was registered in Malaysia for various crops in controlling the infestations of insect pests such as diamondback moth, hoppers, borers and leaf folders. The insecticide is very common amongst farmers due to its cheap price and easy to obtain. However, residues detected in some of the 18 samples did not exceed the National Maximum Residue Limit (MRL) allowed by the Food Act (1983) and Regulation (1985). However, MRLs are not fixed for certain crops such as bitter gourd,

391
Figure 1. Number of samples according to sampling locations
Figure 2. Number of samples according to its types
pea sprout, pineapple, asparagus, French beans, papaya, babycorn and purple cabbage, either in National MRLs or Codex MRLs. The organic produce may not be completely free of chemical residues, since it may be subjected to environmental pollution. Therefore, some international certification bodies do allow permitted chemical residues in their fresh produce. For example, the US Department of Agriculture (USDA) regulates allowable residues of prohibited pesticides up to 5% of the US Environmental Agency’s (USEPA) tolerance (or widely known as MRL) (USDA, 2012). However, no specific allowed tolerance of chemical residues was established by myOrganic Scheme or previously known as ‘Skim Organik Malaysia’ (SOM) (Skim, 2017).*Packages were using SOM labels at the time of sample collection and analysis.

392
Figure 3. Number of samples according to regions
Table 1. Residue levels of chlorpyrifos in contaminated samples a = Food Act (1983) and Regulation (1985)
Type of vegetable/fruit Pesticide (concentration; mg/kg) National MRLa/Codex MRLb
(is it in ppm or mg/kg)
Bitter gourd Chlorpyrifos (0.056) N.A.Pea sprout Chlorpyrifos (0.039) N.A.Runner beans Chlorpyrifos (0.032) N.A.Lemon Chlorpyrifos (0.054) 1.0a
Babycorn Chlorpyrifos (0.027) N.A.Papaya Chlorpyrifos (0.024) N.A.Beet root Chlorpyrifos (0.017) 0.2a
French beans Chlorpyrifos (0.036) N.A.Lemon Chlorpyrifos (0.025) 1.0a
Pineapple Chlorpyrifos (0.032) N.A.White mustard Chlorpyrifos (0.037) 1.0a
Asparagus Chlorpyrifos (0.031) N.A.Cauliflower Chlorpyrifos (0.035) 0.05a
Purple cabbage Chlorpyrifos (0.056) N.A.Lemongrass Chlorpyrifos (0.200) 0.20a
Water convulvulus Chlorpyrifos (0.031) 1.0a
b = Codex Alimentarius International Food Standards (Give Year)

393
CONCLUSION Of all the 125 samples, 14.4% of the samples analyzed contained residues of chlorpyrifos, an organophosphorus insecticide. Only one sample contained residue in levels approaching the National Pesticide MRL value and some of the residue levels detected for certain crops are not listed in National MRLs list or Codex MRLs International Standards. Unlike the Australian Department of Agriculture and the USDA, there is no specific allowable tolerance residue limit of pesticide established by myOrganic Scheme. Therefore, it is recommended that there is a need to establish threshold levels or allowable tolerance of pesticide residues in Malaysian certified fresh organic produce.
REFERENCESAini, Z. (2005). Organic Cultivation in Malaysia. pp. 10 – 25. MARDIGreene, C. (2001). Organic labeling. In: Economics of Food Labeling (Goken, E.,
Lruchler, F., Mitchell, L., Grrene, C and Jessup, A., eds.,) p. 26-29. Washington DC:USDA/Economic Research Service (2012). 2010 – 2011 Pilot Study: Pesticide Residue Testing of Organic Produce. p. 1 – 31. USDA National Organic Program and USDA Science and Technology Program. Retrieved on 23 October 2013 from www. ams.usda.gov/AMSv1.0/.
Zhen, M. (2013). Organic Farming in Malaysia-What needs to be done. Retrieved on 23 October 2013 fromwww.businesscircle.com.my/organic-farming-in-Malaysia-what-needs-to-be-done
Food Act (1983) and Regulations (1985). (2006). Regulation 41. Sixteenth Schedule. The Comissioner of Law Revision, Malaysia in collaboration with Percetakan Nasional Berhad
Codex Alimentarius Pesticide MRLs International Standards. Retrieved on 25th April 2017 from www.fao.org/fao-who-codexalimentarius/standards/pesters/pesticide-detail/en/?p_id=17
Skim Pensijilan Organik Malaysia (myOrganic). Retrieved on 25th April 2017 from www.doa.gov.my/index.php/pages/view/377?mid = 70

394
Evaluation of Bio-Elements Using Herbal Extracts to Control Rhizopus Soft Rot on Purple Sweet Potato
Mohd Nazri, B.1, Wan Zaki, W.M.2 and Sauli, M.Y.1,1Herbal Programme, Crop and Soil Science Research Centre,Malaysian Agricultural Research and Development Institute (MARDI), MARDI Bachok, 16310 Bachok, Kelantan2Herbal Programme, Crop and Soil Science Research Centre,Malaysian Agricultural Research and Development Institute (MARDI), MARDI Headquarters, Persiaran MARDI-UPM, 43400 Serdang, Selangor, MalaysiaE-mail: [email protected]
Abstract Sweet potato (Ipomeae batatas) is one of the Convolvulaceae family cultivated in tropical regions for its edible tubers, sweet and starchy. Field grown sweet potato under improper management normally will have problem with pest and disease infestation. One of the major diseases on purple sweet potato is Rhizopus soft rot. This disease is the most destructive and widespread postharvest disease of sweet potato worldwide including United States. A study was carried out to evaluate bio-element using herbal extracts to control Rhizopus soft rot on purple sweet potato. Leave sample with Rhizopus soft rot symptom were collected and isolated to identify causal agent. After doing the pathogenicity test, the causal agent was identified as Rhizopus stolonifer based on their morphological characteristic. After seven days, the spores showed similar characteristics to those isolated from the field. Laboratory evaluation of herbal extracts (neem, garlic and citronella) indicated the effectiveness to biologically control of R. stolonifer was in the order of garlic & gt; citronella & gt; neem. Based from data of a field study taken for disease severity, purple sweet potato cultivar K5 was highly susceptibility to Rhizopus soft rot disease compared to K2 and K6 cultivars. Herbal extracts using garlic solution are the most effective to prevent the spreading of R. stolonifer. Percentage disease incidence and disease severity were decrease in T2 (Garlic + R. stolonifer). The result of disease incidence and disease severity using plant extracts from neem, garlic and citronella were varied and might be influenced by environmental factor for the suitable growth of pathogen. In summary, even thought results from laboratory test indicated some degree of control against R. stolonifer buts the effect were no significant differences was observe in the field among the three extracts and to the control treatment.
Keywords: Ipomeae batatas, purple sweet potato, Rhizopus stolonifer, bio-element, neem,garlic, citronella
INTRODUCTION Sweet potato, also known as tuberous morning glory, is one of the most important tuber crops belonging to the family Convolvulaceae. It is mostly cultivated in tropical regions for its edible tubers, sweet and starch. It is a staple food crop for fresh consumption in Malaysia. The local climate is suitable for sweet potato growing due to three month’s long hot tropical temperature and adequate sunlight throughout the year. This crop is not capable of surviving on waterlogged area and requires excellent
395
drainage system. Hence, it is better to grow sweet potato on raised beds of about 2 – 3 feet height. Most sweet potatoes are cultivated by small farmers for fresh market. Sweet potato is widely grown in Malaysia and is available in different colors like purple, yellow and orange and purple sweet potato (utusan.com.my, 2017) is the main focus of this study. It contains high anthocyanin content. Sweet potato plants that were not closely monitored in the field will normally have plant diseases problems. Chronic disease problems in sweet potato production are foot rot, black rot, Fusarium root rot, stem canker, scurf, Sclerotial blight and Rhizopus soft rot Curtis Consulting Inc. (2003). A survey carried out at five locations in Bachok in Kelantan state of Malaysia, revealed the presence of five major diseases (Rhizopus soft rot, Altenaria leaf spot, leaf scab, Fusarium stem rot and bacteria soft rot and among them Rhizopus soft rot was the most frequently recorded at all locations. Rhizopus soft rot was also reported as the most destructive and widespread postharvest disease of sweet potato worldwide (Edmunds, 2008). In our preliminary survey, this fungus was found capable of severely attacking the leaves of purple sweet potato. Hence, studies were conducted to know whether herbal extracts can be used to manage this important disease of sweet potato. Garlic extracts and clove oil were reported to reduce the effect of postharvest decay on apples caused by Botrytis cinerea and Penicillium expansum (Daniel et al., 2014). The bioactive compounds of Cymbopogon nardus (citronellal and linalool) were potent inhibitors of various fungi at ambient temperature (Nakahara et al., 2003; Schumutterer, 2002). Therefore, extracts of these were tested for their bio-efficacy under laboratory and field conditions. The results of these trials are reported here.
MATERIALS AND METHOD
Isolation and identification of Rhizopus stolonifer Leaf samples of purple sweet potato were collected from the east coast area in Peninsular Malaysia, that have symptom of the disease. The infected leaves of purple sweet potato were collected from the field and brought to the lab for isolation. Blotting or tissue paper was used to keep the samples and store them in plastic bag with adequate supply of distilled water for retaining the moisture. The diseased leaves were cut into sections of 0.5 cm2 and sterilized in 10% Clorox for one minute and then rinsed three times with distilled water. Leaf sections were transferred into water agar (WA) and incubated for 24 hours. After mycelium started to grow, the samples were transferred into acidified potato dextrose agar (APDA) and incubated at room temperature for seven days. All the morphological data were collected for identification of the fungus.

396
Laboratory test for efficacy of herbal extracts against Rhizopus soft rot Extraction of herbal plant extracts, preparation of modified PDA and efficacy tests were conducted at MARDI Bachok laboratory. Leaf/rhizome sample of all herbal plants (neem, garlic and citronella) were out-sourced from local nursery/market. All the leaf samples were macerated in warring blender with one liter of distilled water and sieved with cloth to obtain the extract. Different concentrations of neem, garlic and citronella extracts were incorporated in water agar. Five treatments were evaluated for their efficacy to inhibit the R. stolonifer in four replicates:- T1: PDA neem extract + R. stolonifer; T2: PDA garlic extract + R. stolonifer; T3: PDA citronella extract + R. stolonifer; T4: PDA with commercial product 1 + R. stolonifer; T5: PDA + R. stolonifer (control). Agar plugs (1 cm2 size) of R. stolonifer were placed in the relevant treatments and growth of pathogen was recorded after 24 hours.
Field test for efficacy of bio-elements against Rhizopus soft rot Three cultivars of purple sweet potato (K2, K5 and K6) were used for testing field efficacy of bio-elements against Rhizopus soft rot. The design used for this trial is RCBD with three replicates. Five treatments were used in this trial; T1: R. stolonifer + spray with Neem; T2: R. stolonifer + spray with Garlic; T3: R. stolonifer + spray with Citronella; T4: spray with R. stolonifer (negative control); T5: spray with water (positive control). The cuttings of purple sweet potato were planted in the field on beds of size 1.5 m x 5 m. Disease incidence and disease severity were recorded at weekly intervals. Yield data was recorded at harvest.
Statistical analysis All data were analyzed with statistical analysis software using ANOVA. All means were separated with Duncan’s multiple range test (DMRT).
RESULTS AND DISCUSSIONS
Isolation and identification of Rhizopus stolonifer The leaf samples with symptoms of Rhizopus soft rot subjected to APDA revealed the presence of one fungus. It was positively identified as the soft rot fungus, R. stolonifer. All morphological characters of this fungus (mycelium, sporangium and sporangiophores) were similar as described by Campbell et al., (2008).
Laboratory test for efficacy of herbal extracts against Rhizopus soft rot Garlic and citronella oils were pathogenic to R. stolonifer, since the fungus growth was inhibited at various concentrations (Figure 1). The growth of R. stolonifer on PDA was effectively inhibited for 4, 3 and 1 day by garlic, citronella and neem extracts at all concentrations, respectively.

397
Figure 1. Growth performance of Rhizopus stolonifer after seven days evaluation in poisoning agar test: (A) Effect of neem extracts on R. stolonifer growth, (B) Effect of garlic extracts on R. stolonifer growth, (C) Effect of citronella extracts on R. stolonifer growth.
Notes:-* – original solution2x – two times of series dilution4x – fourth times of series dilution6x – sixth times of series dilution8x – eight times of series dilution10x – ten times of series dilution
Table 1. Yield (kg/ha) performance on purple sweet potato in field evaluation
The Anova Procedure
Level of -----------k2---------- -----------k5----------- -----------k6-----------trt N Mean Std Dev Mean Std Dev Mean Std Dev
T1 3 20722a 6201 19805a 1922 27999b 3214T2 3 18111a 9347 21555a 4426 27888b 3595T3 3 16722a 4130 21222a 693 37055a 5271T4 3 14738a 4607 24555a 2589 29166b 4867T5 3 21000a 6489 25555a 4194 32333ab 5033Notes: T1 – Neem + R. stoloniferT2 – Garlic + R. stoloniferT3 – Citronella + R. stoloniferT4 – R. stolonifer (negative control)T5 – Distilled water (positive control) (Editor’s comment :As this treatment was not
sprayed with R. stolonifera it has given higher yield.Notes:-Means were separate with DMRT

398
Figure 2. Disease incidence and disease severity of Rhizopus soft rot on purple sweet potato in field evaluation. (Statistical parameters are not given here. It is required for comparing)
Field test for efficacy of herbal extracts against Rhizopus soft rot The yield of K6 variety of purple sweet potato was highest in Citronella + R. Stolonifer (37 tons/ha), followed by Distilled water (32 tons/ha), and R. stolonifer (29 tones/ha) (Table 1). The treatment Citronella + R. stolonifer gave significantly higher yield over other treatments. However, the yields are not significantly different among different treatments in K2 and K5 varieties.
The disease incidence and disease severity were highest in K5 variety and least in K2 variety of purple sweet potato (Figure 2). Herbal extracts of garlic were most effective in preventing the spreading of R. stolonifer. The garlic extract was also most effective in reducing the disease incidence and disease severity.
CONCLUSION Laboratory test showed that water agar containing neem extract was less effective compared to garlic and citronella. Garlic extract was observed to be more effective compared to the citronella throughout the treatment period. Observations on disease incidence and disease severity using plant extracts of neem, garlic and citronella showed variable results. which might be influenced by environmental factors for growth of the pathogen. Garlic and citronella extracts gave better efficacy against Rhizopus soft rot disease as compared with neem extract. Based on disease severity data of different varieties, variety K5 was highly susceptible to Rhizopus soft rot disease as compared to K2 and K6 varieties.
REFERENCESCambell, N., Reece, J., Urry, L., Cain, M., Wasserman, S., Minorsky, P. and
Jackson, R. (2008). Biology. San Francisco, CA: Pearson Education, Inc.Curtis consulting inc. (2003). Strategic Plan for Pest Management Research
and Education in Southern Sweetpotato Production Systems. Summary of Workshops, October 2001 and January, February and August 2002. Sponsored by North Carolina State University Department of Horticultural Science.

399
Daniel, C.K. (2014). The effect of garlic extracts on the control of postharvest pathogens and postharvest decay of apples. Thesis paper. Stellenbosch University Edmunds, B.A. (2008). Factors Affecting Susceptibility to - and Management of - Postharvest Soft Rot of Sweetpotatoes Caused by Rhizopus stolonifer. Thesis paper, Raleigh, North Carolina. North Carolina State University. http://jpn.penang.gov.my/index.php/teknologi-tanaman-2/kontan/87-keledek
Nakahara, K., Alzoreky, N.S., Yoshihashi, T., Nguyen, H.T.T. and Trakoontivakorn, G. (2003). Chemical Composition and Antifungal Activity of Essential Oil from Cymbopogon nardus (Citronella Grass), Japan International Research Center for Agricultural Sciences (JIRCAS) (Tsukuba, Ibaraki 305–8686, Japan)
Schumutterer, H. (2002). The Neem Tree, Azadirachta indica A. Juss and other Meliaceous Plants. IInd Edition. Neem Foundation, Mumbai, India

400
The Effects of Anthracnose Fruit Rot Disease Severity on Chilli After Supplementation of Copper, Boron and Manganese
NurAdliza, B1, Mohamad Roff, M.N.2 and MaizatulIlyana, R.11Horticulture Research Centre, Malaysian Agricultural Research and Development Institute (MARDI), MARDI Headquarters, Persiaran MARDI-UPM, 43400 Serdang, Selangor, Malaysia2Directorate,Malaysian Agricultural Research and Development Institute (MARDI), MARDI Headquarters, Persiaran MARDI-UPM, 43400 Serdang, Selangor, MalaysiaE-mail: [email protected]
Abstract Anthracnose fruit rot is one of the major limiting factors that have been reported to cause great yield reduction on chilli (Capsicum annuum) production. To help reduce anthracnose fruit rot disease of chilli, supplementation of selected micronutrients is needed. Copper (Cu), boron (B) and manganese (Mn) have been reported to play a major role in lignin biosynthesis. Fungal penetration into the plant cells can be prevented and can be reduce by increasing lignin content of plant cells. An experiment was carried out i) to evaluate the effects of Cu, B and Mn supplementation in increasing lignin content in chilli and ii) to evaluate the effects of the treatments on the suppression of anthracnose fruit rot disease of chilli. The experiment was conducted under glasshouse conditions at MARDI Klang, Selangor. In this trial, chilli variety of MC11 were used with eight treatments, viz., T1 = positive control (standard recommendation NPK application for chilli), T2 = standard NPK supplemented with Cu, T3 = standard NPK supplemented with B, T4 = standard NPK supplemented with Mn, T5 = standard NPK supplemented with Cu and B, T6 = standard NPK supplemented with Cu and Mn, T7 = standard NPK supplemented with Mn and B and T8 = standard NPK supplemented Cu with B and Mn. The treatments were arranged in Randomized Complete Block Design (RCBD) with four replications. The lignin contents in fruits and roots of chilli were quantified based on the Acid Detergent Lignin method. From the trial, it was found that T8 produced significantly the highest at P <0.05 lignin content in fruits and roots of chilli when compared with positive control. The lignin contents of fruits and roots of chilli with T8 treatment were the highest (19.54% and 43.11%) as compared with T1 (16.22% and 29.69%, respectively). T8 also showed significantly at P <0.05, the lowest percentage of disease scoring index after artificial inoculation with pathogen (Colletotrichu capsisi) as compared with positive control (T1) (23.5% and 78.6%, respectively). These initial findings have proved that supplementation of Cu, B and Mn together with standard NPK application is able to increase lignin content in the fruits and roots of chilli and subsequently help in reducing disease severity.
Keywords: chilli, anthracnose, disease severity, lignin, copper, boron, manganese

401
INTRODUCTION Chilli (Capsicum annuum) is a fruit vegetable and one of the popular vegetables grown in Malaysia. The common chilli varieties grown in Malaysia are Kulai, MC 11, MC 12, Bangi and hybrid varieties. Annually, the local production of chilli is around 47, 105 tons/year (DOA, 2015). However, the amount of chilli produced is not sufficient to meet the local demand which is about 33,000 tons/year. The import dependency ratio for chilli is 52.9 per cent for 2014 (DOA, 2014). The high import dependency ratio showed that domestic production was still low and substantial imports are still needed to support the country’s consumption. Pest and diseases are often cited as the major limiting factors in the cultivation of chilli. Anthracnose fruit rot is one of the major limiting factors that has been reported to cause great yield reduction (Mahasuk et al., 2013; Saxena et al., 2008) . The reduction in yield of marketable fruits due to anthracnose generally ranged from 10 to 60%. Anthracnose commonly caused by fungus Colletotrichum spp. and it can infect a wide range of hosts (Jeffrey et al., 2016). Typical anthracnose symptoms on chilli fruit include sunken necrotic tissue, with concentric rings of acervuli. Fruits showing even the smallest anthracnose lesions will reduce marketability. Therefore, in order to meet the local demand, losses due to anthracnose need to be minimized. In current practices, farmers used pesticides to control the disease. However, an alternative approach in controlling the disease need to be developed. Due to the continuous, removal of micronutrients after harvesting, as well as losses due to leaching or surface run off the sole application of NPK fertilizer is no longer practical. Mineral nutrients are the primary lines of plant defence and it affects the disease resistance by inducing defence mechanism which includes the production of toxins, metabolites and lignification (Biviet al., 2016). Therefore, to help improve the crop productions as well as protecting plants against new infection, supplementation of selected micronutrients are needed. Cu, B and Mn have been previously claimed to be involved in lignifications (Datnoff et al., 2007, Evans et al., 2007; Fairhurst and Härdter, 2003 and Marschner, 1995). Lignin, a major component of cell walls of vascular plants is considered a first line defence against successful penetration of invasive pathogens (Bhuiyan et al., 2009). Lignification renders the cell wall more resistant to mechanical pressure applied during penetration by pathogens and less accessible to cell wall-degrading enzymes and also the process of plants resistance towards pathogen infection which are constitutively present or induced after pathogen attack (Miedies et al., 2014). During defence responses, lignin or lignin-like phenolic compounds accumulation was shown to occur in a variety of plant-microbe interactions. By increasing the lignin content in chilli particularly found around the xylem, pathogen infection can be suppressed. Lignification of plant cells at sites of infection or lesions are also a defence response of plants to decrease pathogen spread (Paterson et al., 2009). The hyphal tips of fungi penetrating a cell wall and growing into the cell lumen are enveloped by cellulosic (callose) materials that later become infused with phenolic substances and form a sheath or lignituber around the hypha (Agrios, 2005). Lignified cell walls subsequently serve as a barrier against initial

402
pathogen colonization in response to biotic and abiotic stress. These mechanisms of defence show that lignin serve as an active resistance against pathogens infection (Bi et al., 2011). Supplementation of selected micronutrients amplified lignin production and at the same time induced defence related enzymes peroxidase. Peroxidase is one of the defence related enzyme produced by the plant and its functions cooperatively in lignin biosynthesis (Lin et al., 2005) and become important enzyme during lignification (Mayer and Richard, 2002). Peroxidase within the cell wall was involved in monolignol polymerisation, thus participate in lignification (Wang et al., 2013). In view of these findings, the objective of the present work is to evaluate the effect of Cu, B and Mn on the lignification of chilli and its roles on the suppression of anthracnose fruit rot disease.
MATERIALS AND METHODS
Planting materials and experimental design One month old chilli seedlings of MC11 variety were used. The seedlings were grown in 16 cm x 16 cm polybags filled with NPK @ 3:2:1 ratio. The seeds were sown directly in seedling trays filled with soil and kept in an insect proof nursery. After 30 days, the seedlings were transplanted into polybags. Soil analysis was carried out prior
Table 1. Chemical properties of the soil samples
Chemical Properties Values ProceduresSoil pH 5.7 1:1(soil weight/water volume),pH meterNitrogen (%) 0.06 Kjedahl MethodPhosphorus (%) 0.01 Bray and Kurtz No.2Potassium (%) 0.04 Shaking(1M.NH4OAc, pH 7.0), AASManganese (ppm) 46.44 Mehlich No.1, ICPCuprum (ppm) 0.24 Mehlich No.1, ICPBoron (ppm) Not Detected Hot Water, ICP
Table 2. Critical nutrients concentration for chilli in soil
Chemical Properties ValuesSoil pH 5.5 – 6.5Nitrogen (%) 2.5 – 4.5Phosphorus (%) 0.20 – 0.75Potassium (%) 1.5 – 5.50Manganese (ppm) 4Cuprum (ppm) 0.5Boron (ppm) >1
Source: Daryl et al., 2004

403
to planting to avoid toxicity. The initial soil analysis showed that the soil used were lower in N, P, K , Cu and B while Mn is at adequate level, as compared with the critical nutrients range required by chilli as reported by (Daryl et al., 2004) (Table 2). Soil pH was measured and no lime was added as chilli grows well at soil pH ranging between 5.5 and 6.5. Randomized complete block designs with four replications was used. Eight treatments of Cu, B and Mn were used, singly or mixture together with N, P and K. The treatments were T1 = positive control (recommended dose of NPK application for chilli), T2 = NPK supplemented with Cu, T3 = NPK supplemented with B, T4 = NPK supplemented with Mn, T5 = NPK supplemented with Cu and B, T6 = NPK supplemented with Cu and Mn, T7 = NPK supplemented with Mn and B and T8 = NPK supplemented with Cu, B and Mn (Table 3). The NPK fertilizers used were urea, triple superphosphate (TSP) and muriate of potash (MOP) to supply N, P and K respectively in all the treatments. Recommended doses of N, P and K fertilizers were applied in all treatments. Cu, B and Mn were given in a form of sulphate and were applied in the form of soil application. The fertilizers were given at 2, 8 and 14 days after transplanting based on standard practices. The seedlings were watered daily. Adequate plant protection measures were taken to avoid losses due to pests. However, there was no fungicide application throughout the experimental period.
Isolations of Pathogen Pathogens were isolated from the anthracnose infected fruits with typical symptoms obtained from the farmer’s field. chilli was washed in running tap water and was cut in to a size of approximately 3 mm2. The samples were then dipped in 1% sodium hypochlorite for 5 minutes and then dipped in sterilized distilled water for 2 minutes and were dried on sterile filter paper. The tissue was placed on potato dextrose agar (PDA). Pathogen was identified based on the morphology of culture medium and macroscopic observations.
Inoculations of chilli with Colletotrichum capsici After Cu, B and Mn supplementation, the seedlings were challenged with Colletotrichum capsici. Artificial inoculations was done by spraying the spore suspension (5 x 10^6 conidia ml-1 water) onto the chilli evenly using hand sprayer as described by Denoyes-Rothan and Guerin (1996) with slight modification. Uninoculated seedlings served as control.
Determination of lignin content Lignin was quantified using Acid Detergent Method at harvest stage. All samples were dried at 55 °C in a cabinet-type forced air-dryer for 12 – 16 hours. After drying, the samples were ground to pass through a 1 mm forage mill. A subsample was then dried at 105 °C for 3 hours to determine laboratory dry matter (DM) content. The analysis was carried out as described by Khalil et al., (2008).

404
Table 3. Cu, B and Mn application rate used in glasshouse trial
Treatments Descriptions Fertilizer rate(g/polybags)
T1 NPK
0.520.210.40
T2 NPKCu
0.520.210.400.03
T3 NPKB
0.520.210.400.07
T4 NPKMn
0.520.210.400.08
T5 NPKCuB
0.520.210.400.030.07
T6 NPKCuMn
0.520.210.400.030.08
T7 NPKMnB
0.520.210.400.080.07
T8 NPKCuMnB
0.520.210.400.030.080.07

405
Table 4. ANOVA for lignin contents in fruits and roots of chilli
Treatments Descriptions Fruits Roots
T1 NPK
16.22 ± 0.38e 29.69 ± 10.35a
T2 NPKCu
18.10 ± 0.28bc 26.72 ± 4.43a
T3 NPKB
19.28 ± 0.46a 43.05 ± 23.15a
T4 NPKMn
17.78 ± 0.31cd 33.08 ± 4.67a
T5 NPKCuB
16.37 ± 0.14e 33.31 ± 14.86a
T6 NPKCuMn
17.03 ± 0.22de 36.56 ± 16.02a
T7 NPKMnB
18.69 ± 0.50ab 30.42 ± 10.68a
T8 NPKCuMnB
19.54 ± 0.92a 43.11 ± 7.97a
*Lignin content in fruits and roots of chilli were compared using one way ANOVA and Duncan Multiple Range Test (DMRT)*Means with different letters were significantly difference at p <0.05

406
Disease assessment After 3 times supplementation with Cu, B and Mn, the seedlings were assessed for disease development. After the inoculation, the seedlings were monitored in terms of disease severity. The disease severity was determined to alternative rating scale proposed by Bowen, (2007) (with modification) in which scale 0 = no symptom, scale 1 = 0 – 20%, scale 2 = 20 – 40%, scale 3 = 40 – 60%, scale 4 = 60 – 80% and scale 5 = 80 – 100%, respectively. DS refers to the total area or volume of plants tissue that is diseased (Kranz, 1988). The data were taken daily. Diagrammatic scale rating for evaluation of anthracnose fruit rot disease were carried out according to Montri et al., 2009 with slight modification.
Number of seedlings in the rating ^ rating number Disease severity = –––––––––––––––––––––––––––––––––––––––––– x 100 Total numbers of seedlings assessed v highest rating
Statistical analysis Data collected were subjected to analysis using Analysis of Variance (ANOVA) by Statistical Analysis System (SAS). Means were compared using Duncan Multiple Range Test (DMRT) at ≤0.05. Meanwhile, the relationship between lignin content and disease severit were analyzed by correlation analysis.
RESULTS AND DISCUSSION
Enhancement of lignification after supplementation of copper, boron and manganese The lignin contents of fruits and roots of chilli at T8 were the highest with 19.54% and 43.11%, respectively as compared to T1 with 16.22% and 29.69%, respectively. These results showed that the lignification in chilli can be enhanced through supplementation of Cu, B and Mn either singly or as a mixture. However, combination of Cu, B and Mn gave the best combination result in enhancing lignification in chilli. It is important to note that the combined treatments of Cu, B and Mn demonstrated significantly highest lignin content among all other treatments. Earlier report by previous studies claimed that Cu and Mn are required for biosynthesis of lignin in root tissue while deficiency of Cu and Mn will resulted in impairment of lignifications of cell walls (Fairhurst and Hardter, 2003; Marschner, 1995 and Rengel et al., 1994, Graham and Webb, 1991). Mn is a cofactor for phenylalanine ammonia lyase that mediates production of cinnamic acid and various other phenolic compounds and peroxidase involved in polymerization of cinnamyl alcohols into lignin (Burnell, 1988). Deficiency of Mn may prevent plants from effectively building up phenolics and lignin content which is considered the primary defence against pathogen infection. Based on the soil analysis results shown in Table 2 the nutrient range required by chilli for Mn is at adequate level and the readily available Mn in the soil is used by the plants to regulate the lignification. Cu also has been reported to be involved in the enhancement of peroxidase in rice leaves (Fang and Kao, 2000) and lignin biosynthesis
407
in soybean roots (Lin et al., 2005) while B is reported to be involved in keeping cell wall structure and maintaining membrane function (Liew et al., 2012). B is also involved in physiological and biochemical processes which allow plants to respond to pathogen invasion (Liew et al., 2012; Evan et al., 2007 and Marschner, 1995). In view of these findings, lignifications were indeed present in chilli and supplementation of Cu, B and Mn induced the lignification, thus increasing the lignin content. Due to the limited information on lignin distribution in monocotyledonous species, there is limited knowledge of lignin distribution in chilli. However, from this study we can conclude that lignification in chilli can be enhanced through supplementation of Cu, B and Mn and combination of Cu, B and Mn as a mixture increased significantly higher lignin content as compared to other treatments.
Suppression of anthracnose fruit rot disease after Cu, B and Mn supplementation Supplementation of Cu, B and Mn as a mixture (T8) reduced the severity of infection at 23.5% as compared with control (T1) at 78.6% (Table 5). These results showed that due to sufficient Cu, B and Mn content and the tricidal effect of the mixture, the host cell membrane can reinforces its cell wall quickly and reduce the severity of the infection. Reinforcement of the cell wall, begins very quickly after a pathogen attempts to penetrate a host cell. If the host cell can reinforce its cell wall quickly enough, it will reduce the penetration efficiency of the pathogen. Donaldson (2001) stated that host cell membrane is the earliest stage to be involved in pathogen recognition and signal transduction. The lower disease severity in chilli supplemented with Cu, B and Mn also suggests that the chilli plants have acquired a level of tolerance to the anthracnose disease. Rapid deposition of lignin following the infection increases resistance to pathogens in many plants (Bhuiyan et al., 2009), thus adequate Cu, B and Mn in chilli gave better resistance against Colletotrichum capsici infection. The presence of high lignin content in seedlings treated with T8 offers great difficulties to the invading hyphae of Colletotrichum capsici, where the lignified cell walls offer an impassable barrier thus protecting the seedlings from pathogen attack (Punja, 2001 and Hitwegen, 1963). The combined soil treatments of Cu, B and Mn demonstrated a significantly suppressing effect on anthracnose fruit rot disease infection compared with other treatments thus yield the best disease control. Cu, B and Mn play key roles in phenol metabolism and lignin biosynthesis (Huber and Graham, 1999). In view of these findings, Cu and Mn also play an important role during lignification by producing peroxidase which is defence related enzyme (Mayer and Richard, 2002). Cu and Mn are both involved in enhancement of peroxidase activities. Peroxidase is known to be induced by both abiotic and biotic stresses, including heavy metal stress and pathogen attack (Passardi et al., 2005). Previous study by Wee et al (2014) showed that peroxidase gene was expressed at early stage of infection. Peroxidase was found to regulate at the early stage of infection and was greatly induced immediately after infection. A lower value of disease severity in the plants supplemented with Cu, B and Mn suggested that Cu,

408
Table 5. Effect of treatments on disease severity
Treatments Descriptions Disease Severity (%)
T1 NPK
23.5
T2 NPKCu
68.3
T3 NPKB
72.3
T4 NPKMn
65.4
T5 NPKCuB
64.1
T6 NPKCuMn
49.6
T7 NPKMnB
63.3
T8 NPKCuMnB
78.6

409
B and Mn play an important role during lignification by producing peroxidase, which later act as an important substrate for monolignol polymerisation. These lignified cell walls subsequently serve as a barrier to C. capsici penetration. This result suggests that supplementation of Cu, B and Mn showed a good level of disease suppression and at the same time increased the production of the lignin related enzyme, peroxidase thus amplified lignin production (Nur Sabrina et al., 2012). The induction of peroxidase due to lignin accumulation confers tolerance to the fruit rot disease. We can presume that the expression of defence related enzymes at early stage of infection is responsible for inducing further defence responses from the plants. Therefore, it is important for the plant itself to have strong defence mechanism system to fight the infection process. This has been previously showed in the induction of peroxidase activity in pepper by Cu stress due to lignin accumulation and it gave tolerance to Verticilium dahlia in pepper (Pomar et al., 2014). Previous studies done by Nur Sabrina et al (2012) also showed that supplementation of Cu and Ca suppresses Ganoderma boninense infection in oil palm seedlings. In addition, a reduction of disease severity in rice was found when combined formulation of Cu and B were given (Liew et al., 2012). Cu has also been reported to be involved in enhancement of peroxidase activity and lignin content in Raphanus (Chen et al., 2002). In Mn-deficient plants, the capacity of the roots to restrict penetration of fungal hyphae into the root tissue by enhanced lignification at the infection site is impaired because Mn is required for the biosynthesis of phenolics, phytoalexins and lignin (Huber and Graham, 1999). Balanced nutrition does help in achieving better yield in crop production and also allows plants to protect themselves from new infection (Agrios, 2005; Liew et al., 2012).
Relationship between plant parameters The coefficient of correlation analysis between lignin content and disease severity, are shown in Table 6. A significant correlation exists between lignin content and disease severity (DS). Highly significant correlation exists between lignin content and disease severity, indicating the importance of the high lignin content in reducing disease severity.
Table 6. Correlation coefficient(r value) between lignin content and disease severity
Disease severity
Plant parameter Coefficient correlationLignin content 0.8213**
** = Highly significant

410
CONCLUSION The findings of this study show that Cu, B and Mn are able to enhance lignification in chilli. Moreover, the supplementation of Cu, B and Mn has also been found to effectively reduce disease severity of anthracnose fruit rot disease. However, further research needs to be carried out to evaluate the effectiveness of the supplementation of Cu, B and Mn under field condition.
REFERENCESAgrios, G.N. (2005). Chapter six - How plants defend themselves against pathogens.
In: G.N. AGRIOS (Ed.), Plant Pathology (Fifth Edition) (pp. 207-248). San Diego: Academic Press. doi:http://dx.doi.org/10.1016/B978-0-08-047378-9.50012-9
Bi, C., Chen, F., Jackson, L., Gill, B.S. and Li, W. (2011). Expression of lignin biosynthetic genes in wheat during development and upon infection by fungal pathogens. Plant molecular biology reporter, 29(1), 149–161. https://doi.org/10.1007/s11105-010-0219-8
Bhuiyan, N.H., Selvaraj, G., Wei, Y. and King, J. (2009). Role of lignification in plant defense. Plant Signaling and Behavior, 4(2), 158 – 159
Bivi, M.S.H.R., Paiko, A.S., Khairulmazmi, A., Akhtar, M. S. and Idris, A.S. (2016). Control of basal stem rot disease in oil palm by supplementation of calcium, copper and salicylic acid. The Plant Pathology Journal, 32(5), 396 – 406. https://doi.org/10.5423/PPJ.OA.03.2016.0052
Burnell, J.N. (1988). The biochemistry of manganese in plants. In: Manganese in Soils and Plants. Eds. R.D. Graham, R. J Hannam and N C Uren, pp 125 – 137.Kluwer Academic Publication
Bowen, K.L. (2007). Plant Disease Epidemiology. In : plant pathology, concepts and laboratory excercises, trigiano, R.N., M.T Windham and A.S Windham (eds). 2ndEdn., CRC Press, New York, pp: 281 – 294
Chen, E.L., Chen, Y.A., Chen, L.M. and Liu, Z.H. (2002). Effect of copper on peroxidase activity and lignin content in Raphanussativus. Plant Physiology Biochemistry, 40, 439 – 444
Evans, I., Solberg, E. and Huber, D.M. (2007). Copper and Plant Disease. In Datnoff, L. E., Elmer, W.H., and Huber, D.M. (Eds.). Mineral Nutrition and Plant Disease (p. 177 – 188). USA: The American Phytophathological Society
Datnoff, L.E., Rodrigues, F.A. and Seebold, K.W. (2007). Silicon and Plant Disease. In: Datnoff LE, Elmer WH, Huber DM (Eds.) Mineral nutrition and plant disease. Saint Paul MN. APS Press. pp. 233 – 246
Darryl Warncke, Jon Dahl and B.Z. (2004). Nutrient Recommendations for Vegetable Crops in Michigan
Department of Agriculture.(2015). Statistik Tanaman Sayuran dan LadangDepartment of Agriculture. (2014). Booklet Statistik Tanaman (Sub Sektor Tanaman
Makanan)

411
Denoyes-Rothan, B., and Guérin, G. (1996). Comparison of six inoculation techniques withColletotrichumacutatum on cold stored strawberry plants and screening for resistance to this fungus in French strawberry collections. European Journal of Plant Pathology, 102(7), 615–621. https://doi.org/10.1007/BF01877242
Donaldson, L.A. (2001). Lignification and lignin topochemistry – An ultrastructural view Phytochemistry, 57(6), 859 – 873
Fang, W.C., and Kao, C.H. (2000). Enhanced peroxidase activity in rice leaves in response to excess iron, copper and zinc. Plant Sci. 158, 71 – 76
Fairhurst, T.H. and Härdter R. (2003). Oil Palm - Management for large and sustainable yields. J. Plant Nutr. Soil Sci.167: 356 – 366
Graham, R.D., and Webb, M.J. (1991). Micronutrients and Plant Disease Resistance and Tolerance in Plants. In : Mortvedt, J.J., Cox F.R., Shuman, L.M., and Welch, R.M. (Eds.), Micronutrients in Agriculture (p. 329 – 370). Madison, Wis., USA: Soil Science Society of America
Heng, J.L.S., Shah, U.K., Rahman, N.A.A., Shaari K. and Hamzah, H. (2015). Streptomyces ambofaciens S2 - a potential biological control agent for colletotrichum gleosporioides the causal agent for anthracnose in red chilli fruits. J Plant Pathol Microbiol S1: 006. doi:10.4172/2157-7471.S1-006
Hitwegen, T. (1963). Lignification, a possible mechanism of active resistance against pathogens. European Journal of Plant Pathology, 69(6), 314 – 317
Huber, D.M., Graham, R.D. (1999). The role of nutrition in crop resistance and tolerance to diseases. In: Rengel Z (ed) Mineral nutrition of crops: fundamental mechanisms and implications. New York : Food Products Press, pp 169 – 206
Kranz, J., (1988). Measuring Plant Disease. In: Experimental Techniques in Plant Disease Epidemiology, Kranz J and J.Rotem (eds.), Springer, Berlin. pp: 35 – 50
Khalil, H.P.S. Abdul, Alwani, M. Siti, Ridzuan, R., Kamarudin, H. and Khairul, A. (2008). Chemical Composition, Morphological Characteristics and Cell Wall Structure of Malaysian oil palm Fibers, Polymers-Plastics Technology and Engineering, 47(3), 273 – 280
Liew, Y.A., Syed Omar, S.R., Husni, M.H.A., Zainal, A.M.A. and Nurul Ashikin, P.A. (2012). effects of foliar applied copper and boron on fungal diseases and rice yield on cultivar MR219. Pertanika J. Trop. Agric. Sci, 35(2), 339 – 349
Lin, C.C., Chen, L.M. and Liu, Z.H. (2005). Rapid effect of copper on lignin biosynthesis in soybean root. Plant Science, 168, 855 – 861
Mahasuk, P., Chinthaisong, J. and Mongkolporn, O. (2013). Differential resistances to anthracnose in Capsicum baccatum as responding to two Colletotrichumpathotypes and inoculation methods.Breeding Science, 63(3), 333 –338.https://doi.org/10.1270/jsbbs.63.333
Marschner, H. (1995). Diagnosis of deficiency and toxicity of mineral nutrients.Mineral nutrition of higher plants (second edition) (pp. 461 – 479). London: Academic Press.

412
Mayer, A.M. and Richard, C.S. (2002). Laccase: new functions for an old enzyme. Phytochemistry, 60(6), 551-565. doi:http://dx.doi.org/10.1016/S0031-9422(02)00171-1
Miedes, E., Vanholme, R., Boerjan, W. and Molina, A . (2014). The role of the secondary cell wall in plant resistance to pathogens. Front. Plant Sci. 5:358. doi: 10.3389/fpls.2014.00358
Nur Sabrina,A.A, Sariah, M. and Zaharah, A.R. (2012). Suppression of basal stem rot disease progress in oil palm (elaisguineensis) after copper and calcium supplementation.Pertanika J.Trop.Agric.Sci.35(S): 13 – 24
Paterson, R.R.M., Sariah, M. and Lima, N. (2009). The feasibility of producing oil palm with altered lignin content to control Ganoderma disease.
Passardi, F., Cosio, C., Penel, C. and Dunand, C. (2005). Peroxidases have more functions than a Swiss army knife. Plant Cell Reports, 24: 255 – 265
Pomar, F., Novo, M., Bernal, M.A., Merino, F. and Ros Barcelo, A. (2004). Changes in stems lignin(monomer composition and crosslinking) and peroxidase are related with the maintenance of leaf photosynthetic integrity during Verticilium wilt in Capsicum annuum L. New Pathologist, 163: 113 – 123
Punja, Z.K. (2001).Genetic engineering of plants to enhance resistance to fungal pathogens – a review of progress and future prospects. Can J Plant Pathol, 23: 216 – 235
Rengel, Z., Graham, R.D. and Judith, F.D. (1994).Time-course of biosynthesis of phenolics and lignin in roots of wheat genotypes differing in manganese efficiency and resistance to take all fungus.Annals of Botany, 74: 471 – 477
Saxena, A., Raghuwanshi, R., Gupta, V.K. and Singh, H.B. (2016).Chilli anthracnose: the epidemiology and management. Frontiers in microbiology, 7, 1527.http://doi.org/10.3389/fmicb.2016.01527
Wang, Y., Chantreau, M., Sibout, R. and Hawkins, S. (2013). Plant cell wall lignification and monolignol metabolism. Frontiers in Plant Science, 4,220.https://doi.org/10.3389/fpls.2013.00220
Wee, C.Y., Muhammad Hanam,H., Mohd Waznul Adly, M.Z and Khairun, H.N. (2014). Expression of defense related genes in papaya seedling infected with Erwinia mallotivora using real-time PCR. J. Trop. Agric. and Fd. Sc. 42(1)(2014): 73 – 82

413
Response of Hemiptarsenus Varicornis Towards Different Levels of Damage Caused by the Leafminer Liriomyza Huidobrensis of Tomato
Nor Ahya, M.1, Farah Huda, S.S.2 and Zurin Aida, J.1Crop and Soil Science Research Center,Malaysian Agricultural and Research Development Institute (MARDI)MARDI Cameron Highlands, 39000 Tanah Rata, Cameron Highlands, Pahang, Malaysia2Crop and Soil Science Research Center,Malaysian Agricultural Research and Development Institute (MARDI), MARDI Headquarters, Persiaran MARDI-UPM, 43400 Serdang, Selangor, MalaysiaE-mail: [email protected]
Abstract Searching behavior of a parasitoid is one of the important factors in evaluating its efficiency in managing pests. Theoretically, the shorter time taken by the parasitoid to search for its host will provide more time for the natural enemy to locate more hosts. The crucial part in host searching activity depends on the ability of the parasitoid to detect the pest within the environment using semiochemicals emitted through herbivory activity of the pest. A study was conducted to evaluate the response of Hemiptarsenus varicornis, a parasitoid of leaf miner (Liriomyza huidobrensis) towards several levels of damage on tomato plants to arrive at the least damage level that can stimulate the parasitoid’s searching response. The trial was done using 10 mated females of H. varicornis introduced into Y-tube attached to the olfactometer. Three levels of damage symptoms (10%, 20% and 30%) caused by leaf miners on six weeks old tomato plants were tested on the mated females. Results showed that no females responded towards the 10% damaged plants. Total of 12% and 36% females significantly showed response towards 20% and 30% damage respectively (at p <0.05). This variation could be attributed by the amount of volatile substances emitted by the herbivore activity of leaf miner or known as herbivore-induced plant volatile (HIPV). However, primary source of odour that trigger the response is to be identified and it should be studied further. This initial study suggests that 20% damages caused by leaf miner is an acceptable level of damage if augmentative program is going to be considered.
Keywords: Y-tube experiment, olfactometer, herbivore-induced plant volatile (HIPV), behaviour stimulation, searching activity, Liriomyza huidobrensis, Hemiptarsenus varicornis
INTRODUCTION Cameron Highlands, Pahang is the main producer of tomato in Malaysia with total production of 115,235.3 metric tons per annum. Even though tomato has achieved the Self-Sufficiency Level (SSL) (129.6% in 2011) (Department of Agriculture Malaysia, 2012), increased in productivity of better quality has not been achieved to enable access to premium markets. Since the fertigation system was introduced to local farmers, most of tomato producers are practicing it to increase their production as well as reducing pest and disease infestations. However, due to continuous monocroping, incidences of leafminer is increasing (Nor Ahya and Nur Liyana, 2015). A survey conducted in 2012 showed

414
that leafminer as the most important pest recorded infesting tomato with 56% infestation (Nur Liyana e.t al., 2012). Chemical pesticide is the primary control mean of control of leafminer. However, records have shown that this pest has developed resistance against several types of pesticides (Ferguson, 2004). Thus, there is dire need of alternative control method such as biological control of this pest. Hemiptarsenus varicornis is a solitory parasitoid of leafminer, Liriomyza sp., naturally present in tomato planting area in Cameron Highlands, Pahang (Nor Ahya and Nur Liyana, 2015). Based on a study conducted in 2015, H. varicornis could achieve about 23.25% parasitism level under normal agriculture practice with regular chemical pesticide application (Nor Ahya, et. al., 2016). The parasitoid also compatible to be incorporated with cyromazine treated agroecosystem if Integrated Pest Management (IPM) practice is to be considered (Prijono, et. al., 2004). Several studies have been done on the biological aspect of the parasitoid (Susila, et. al., 2007; Thu and Ueno, 2002) but very limited information in found on the ecological aspect of this parasitoid-host interaction including their communication means. According to Rehman and Powell (2010), parasitoid-host selection is determined by the female hich locates and selects a potential host for oviposition. To locate its host, it depends on the detection of semiochemicals emitted by the foraging activity of the hosts. Many workers have reported the importance of volatile substances associated with hosts that functions as chemical signals for parasitoids to search for its host (Neveu et. al., 2002; Storeck et. al., 2000). On the contrary, information on the parasitoid’s response that triggers its searching activity to look for its hosts i.e leafminer is still scarce. Therefore, this study was conducted to investigate response of H. varicornis towards different level of damaged caused by leafminer, an important pest of tomato.
MATERIALS AND METHODS
Preparation of plant materials Hybrid tomato seeds were raised in a tray and watered daily. After one month, seedlings were transferred into small pots using soil and coco-peat as growing media. They were watered, fertilized and ensured to be free of pest and disease infestations. Thirty days old, healthy and viable seedlings were brought to lab and placed in five wooden cages individually. Thirty adult leafminers (L. huidobrensis) were released per cage and allowed to infest the seedlings until the desirable damage levels were achieved. All potted tomato seedlings were labeled as undamaged, 10%, 20% and 30% based on number of damaged leaves as follows:
Undamaged = no damage on leaves10% damage = 1 – 2 damaged leaves20% damage = 3 – 4 damaged leaves30% damage = 4 – 5 damaged leaves

415
Preparation of olfactometer Y-tube olfactometer was prepared according to Hassan et. al. (2012) with some modifications. The olfactometer set up consists of two glass jars, glass Y-tube, silicon tube, air-flow meter, charcoal, plastic tray and air compressor as shown in Figure 1.
Collecting of parasitoids Leafminer-infested tomato leaves were collected from local tomato farms and brought back to the laboratory. The leaves were observed under light and leafminer larvae that turned blackish were presumed to be parasitized were later placed on Petri dish and covered with the lid. Petri dishes were observed daily until emergence of parasitoid H. varicornis. The females of H. varicornis which were identified by presence of ovipositor were carefully taken out using aspirator and allowed to mate for 36 hours (Nor Ahya and Farah Huda, 2016). All parasitoids were fed with 20% honey.
Experimental set-up One damaged seedling (10% or 20% or 30%) was placed inside the air-tight glass jar of the olfactometer and one undamaged seedling was placed inside the other jar. For control treatment, one jar was used to place undamaged seedling while the other jar was left empty. Air compressor was turned on for 15 minutes to allow flow of air inside the olfactometer. Air-flow meter was adjusted to acquire 50 milliliter/min of air flow. A total of ten mated female parasitoids were released into the glass vial attached to the main arm of Y-tube. The parasitoids were allowed to move into the Y-tube and make decision to choose either damaged or undamaged seedlings. The behavior of the parasitoids was also observed and recorded. Observations were done for one hour with five replications.
Figure 1. Olfactometer set-up

416
Analysis Number of parasitoids showed response towards the damaged/undamaged or unresponsive parasitoids were recorded and data were analyzed using ANOVA and LSD at alpha 0.05.
RESULTS AND DISCUSSIONS Visual response of the parasitoids in the olfactometer: H. varicornis females were moving faster and shaking their antenna (antennation) upward upon release into the main arm. Almost all of the parasitoids spent their time moving through the arm and occasionally flying forward. When they reached the ‘Y-junction’, the antennae were pointed downward and antennation became more frequent and more vigorous. Some of the females moved toward the treated arm while the other into untreated arm. Occasionally, one to two females make u-turn and headed into the other arm but soon headed back into previous route. The parasitoids considered making decision after they reached the end of the Y-tube’s arm. Choice of the Parasitoid to damaged plants: The results on the choice of the parasitoids given in Figure 1 showed that 2%, 12% and 36% of the tested parasitoids chose the control treatment, 20% and 30% damaged seedlings respectively. All of the other individuals were either remained in the main arm of the Y-tube (unresponsive) or chose the other jar. Overall, numbers of parasitoids responsive to treatments are significantly different (Figure 1) except for control and 10% damaged treatment. The differences could be attributed by the amount of volatile substances emitted through herbivory activity of leafminer or known as hebivory induced plant volatiles (HIPV). Many previous studies have highlighted the importance of infested plant cues for parasitoids to detect presence of their hosts within the environment (Jönsson and Anderson, 2008; Eriksson, 2009). Some of them also reported that parasitoids were able to exploit quantitative and qualitative differences in volatile emissions (Girling et. al., 2011). Based on the results, odour emitted from 30% damaged seedlings is more likely appealing to H. varicornis (36%). However, the damage level covered about 1/3 of the seedlings which could harm the growth of the seedlings. Thus, 20% damaged should be an acceptable level to trigger parasitoid’s searching response if parasitoid release is to be considered.
CONCLUSION In conclusion, 20% damage is an acceptable level to consider H. varicornis release to trigger searching of L. huidobrensis larvae on tomato. It is also suggested to test the parasitoid olfactory responses in choice experiments. The primary compound/mixture functioned as source of odour that trigger the response should be further studied. Studies should also be done to know the parasitism level at different damage levels.

417
REFERENCESDepartment of Agriculture Malaysia (2012). Vegetables and cash crops statistics.Eriksson, A. (2009). Olfactory responses of the parasitic wasp, Trybliographarapae
(Hymenoptera: Figitidae). Master Thesis. SLUFerguson, J.S. (2004). Development and stability of insecticide resistance in the leaf
miner Liriomyza trifolii (Diptera: Agromyzidae) to cyromazine, abamectin and spinosad. Journal of Economic Entomology 97(1): 112 – 119
Girling, R.D, Stewart-Jones, A., Dherbecourt, J., Staley, J.T., Wright, D.J. and Poppy, G.M. (2011). Parasitoids select plants more heavily infested with their caterpillar hosts: a new approach to aid interpretation of plant headspace volatiles. Proceeding of Royal Society Biology 278, 2646 – 2653
Hassan, S., Rita, M., Dzolkhifli, O. and Hee, A.K.W. (2012). Esponse of Diphorina citri Kuwayama (Hemiptera: Psyllidae) to volatiles emitted from leaves of two rutaceous plants. Journal of Agriculture Science Vol. 4(6). http://dx.doi.org/10.5539/jas.v4n6p152
Jönsson, M. and Anderson, P. (2008). Emission of oilseed rape volatiles after pollen beetle infestation; behavioural and electrophysiological responses in the parasitoid Phradismorionellus. Chemoecology 17: 201 – 207
Neveu, N., Grandgirard, J., Nenon, J. P. and Cortesero, A.M. (2002). Systemic release of herbivore-induced plant volatiles by turnips infested by concealed root-feeding larvae Delia radicum L. Journal of Chemical Ecology 28: 1717 – 1732
Nor Ahya, M. and Nur Liyana, I. (2015). The potential of natural enemies to control leafminer infestations on tomato in Cameron Highlands. Paper presented at Hari Inovasi MARDI: MARDI Science and Technology Exhibition held at Malaysia Agro Exposition Park, 25 – 27 August 2015 (pp. 81).Serdang, Selangor: MARDI
Figure 2. Difference of percentage of H. varicornis response towards damage levels on tomato
Control 10% 20% 30%
Damage levels
50
40
30
20
10
0
–10
% o
f res
pons
e

418
Nor Ahya, M. and Farah Huda, S.S. (2016). Mating behavior of two parasitoid species of leafminer Liriomyza huidobrensis. Proceeding of 3rd Kuala Lumpur Agriculture, Forestry and Plantation, May 21 – 22, 2016, Kuala Lumpur, Malaysia. pp 28 – 31
Nur Liyana, I., Abu Zarim, U., Mohamad Roff, M.N. and Saiful Zami, J. (2012). Survey on pests and diseases of tomato and its management in Cameron Highlands. Proceeding of 5th International Integrated Pest and Disease Management (IPM) Conference (18 – 20 Disember 2012, Kota Kinabalu). pp 124 – 126
Prijono, D., Robinson, M., Rauf, A., Bjorksten, T. and Hoffmann, A.A. (2004). Toxicity of chemicals commonly used in Indonesian vegetable crops to Liriomyza huidobrensis populations and the Indonesian parasitoids Hemiptarsenus varicornis, Opius sp. and Gronotoma micromorpha, as well as the Australian parasitoids Hemiptarsenus varicornis and Diglyphus isaea. Journal of Economy Entomology. 97(4): 1191 – 1197
Rehman, A. and Powell, W. (2010). Host selection behaviour of aphid parasitoids (Aphidiidae: Hymenoptera). Journal of Plant Breeding and Crop Science Vol. 2(10): 299 – 311
Storeck, A., Poppy, G.M., Van Emden, H.F. and Powel, W. (2000). The role of plant chemical cues in determining host preference in the generalist aphid parasitoid Aphidius colemani. Entomologia Experimentalis et Applicata 97: 41 – 46
Susila, W., Sumiartha, K.T. and Jayanti, H. (2007). Biological aspects of the ectoparasitoid Hemiptarsenus varicornis (Girault) (Hymenoptera: Eulopidae) which emerged from some host plant on leaf miner, Liriomyza sativae Blanchard (Diptera:Agromyzidae). Journal of the International Society for Southest Asian Agricultural Sciences 13(2): 141 – 145
Thu, T.H.G. and Ueno, T. (2002). Biology of Hemiptarsenus varicornis (Hymenoptera: Eulophidae), a parasitoid wasp of the leafminer Liriomyza trifolii (Diptera: Agromyzidae). Journal of Faculty of Agriculture, Kyushu University 47: 45 – 54

419
Steinernema Siamkayai, a Biological Control Agent to Control Phyllotreta spp. of Chinese Kale in Khon Khaen, Thailand
Kuson, T.1, Naruatai, W.1 and Nuchanart, T.21Office of Agricultural Research and Development Region 3, ThailandE-mail address: [email protected]; [email protected] Research and Development Office, ThailandE-mail address: [email protected]
Abstract In 2014, vegetable growers in Khon Khaen faced with the widespread occurrence of Phyllotreta chontalica and P. sinuate in Brassicaceae crop. They caused serious damage and were difficult to control as they were resistant to insecticides. The Department of Agriculture (DOA), conducted the trial to evaluate the effectiveness of Steinernema siamkayai, an entomopathogenic nematode and azadirachtin to control these pests. The trial was conducted on Chinese kale by spraying infective juveniles (J2) at 4x 10⁸ juveniles per hectare, alternated with 0.01% azadirachtin, 5 – 7 times per crop season. Results showed that the population of P. chontalica and P. sinuate, counted at three days after spraying, was reduced up to 46 – 75% and 29 – 85%, respectively. The chemical control treatments like chlorpyrifos and cypermethrin reduced the pest population by 36 – 100% and 43 – 100%, respectively. Although chemical control was more effective than biological control method, it had adverse effect as chlorpyrifos residue was detected at 0.02 milligram per kilogram. Hence, farmers have accepted this technology and learnt to multiply S. siamkayai for their own use. They managed to produce and apply S. siamkayai to control Phyllotreta spp. effectively and increased yield up to 14,475 kilogram per hectare.
Keywords: Phyllotreta chontalica, Phyllotreta sinuate, Steinernema siamkayai, biological control agent, Chinese kale
INTRODUCTION Flea beetles are common pests throughout the Northeast and the warmer area of Thailand and sometime they are the most devastating pests. For example in 2012 – 2013, about 400 Chinese kale growers in Khon Khaen Province, Thailand, confronted with excessive dissemination of flea beetles in Brassicaceae crop. They attacked plants in family Brassicaceae especially Chinese kale (Brassica alboglabra Bailey) which farmers usually grow all the year round and spread in vegetable growing area of 8,539 hectares. Among the flea beetles, Phyllotreta chontalica and P. sinuata Step. (Fig. 1) are the major insect pests since they feed on all portions of hosts; root, leave, stem and flower. Besides, the adult is extremely mobile, speedily migrates from field to field, actively search for emerging host plants by visual as well as chemical olfactory (Joyce, 2012). Severe damage on leaves can cause death of seedlings and young transplants, reduction in size and weight of old plants which lead to the loss of productivity and marketability. Continuous use of pesticides leads to harmful residues in vegetables, development of resistance of plant pest population and becomes ineffective and uneconomical. For

420
solving these problems, biological control has been considered as one of the most alternative control measures. Entomopathogenic nematodes (EPN) in Thailand were discovered since 1998 (Tangchitsomkid and Sontirat, 1998). Steinernema siamkayai Kamphaeng Phet strain has been reported as an effective bio-control agent against Phyllotreta spp. and Plutella xylostella Linnaeus (Fig. 2), Spodoptera litura Fabricius, Spodoptera exigua HÜbner and Helicoverpa armigera HÜbner (Tangchitsomkid, 2000). In addition, this nematode is tolerant to high temperatures up to 35 °C. Department of Agriculture, Thailand, supported the research on the development of simple artificial media technique for multiplication of the nematode which can be easily grown. The technology was transferred to the farmers who can learn to multiply it for their own use (Tangchitsomkid, 2011; 2015). Further studies indicated that plant extract such as azadirachtin acts as an anti-feedant suppress moulting of insects especially P. xylostella, H. undalis, S. litura, S. exigua, Trichoplusia ni Hubner, flea beetles, aphids and thrips (Sukolthapiromnapattalung, 2000; Department of Agriculture, 2010). This trial aims to find out the efficacy of S. siamkayai for the control of Phyllotreta spp. and compare it with the conventional chemical control.
MATERIALS AND METHOD Two experiments were conducted to compare the effectiveness of azadirachtin + S. siamkayai (as biocontrol) with chlorpyrifos + cypermethrin (as conventional chemical control). The experiment was conducted in Chinese kale in Khon Khaen Province, the first one in summer (February 2015) and the second one in rainy season (April 2015). The plants were grown in the field with plot size 1.2 x 22 meters. Monitoring of P. chontalica and P. sinuate was performed daily by counting the number of flea beetles in one square meter area. When more than two flea beetles were found in one square meter, the control measures were applied. Neem extract; azadirachtin 0.01% (w/v) was sprayed two times at three days interval and later S. siamkayai at 4 x 10⁸ juveniles per hectare was applied at seven days interval. The chlorpyrifos + cypermethrin (50 + 5%) at 20 milliliters per 20 liters of water was sprayed. Every three days after spraying, number of pests in 10 square meter plot of each treatment was counted (Fig. 3). Analysis of pesticide residues in Chinese kale samples was estimated by Quecher’s method with GC and HPLC. The yield of Chinese kale per square meter was recorded (Fig. 4).

421
Figure 1. The flea beetles, Phyllotreta chontalica (a) Phyllotreta sinuate and severe damage by Phyllotreta spp.(c)
a b c
a b c
Figure 2. The Steinernema siamkayai (Kamphaeng Phet strain) (a) infected and killed Plutella xylostella (b) infected and killed Phyllotreta sinuate (c)
Figure 3. Counting the population of Phyllotreta spp. in square meter plot
a b
Figure 4. The stand of Chinese kale in the field trials (a) harvesting and weighingof the produce (b)
a b

422
RESULTS AND DISCUSSION In summer (1st crop), the bio-control treatment S. siamkayai + azadirachtin reduced the population of P. chontalica and P. sinuata by 46 and 42%, respectively after first application; by 74 and 29%, respectively after second application; and by 75 and 85%, respectively after the third application on Chinese kale. The chemical treatment chlorpyrifos + cypermethrin 50 + 5% (w/v) decreased the population of P. chontalica and P. sinuata by 36 and 43%, respectively after first application; by 100%, after the second application on Chinese kale (Table 1). In first crop of Chinese kale, chemical control treatment gave an yield of 16,400 kilogram per hectare which was higher than bio-control treatment (11,756 kilogram per hectare); while in the second crop, biocontrol treatment gave higher yield (14,475 kilogram per hectare) as compared to the chemical treatment (11,600 kilogram per hectare). Further, the chlorpyrifos residues were detected in the chemical treatment (0.02 milligram per kilogram), while there were no residues in the biocontrol treatment. However, the chlorpyrifos residues were lower than the codex standard (less than 1 milligram per kilogram). Besides, the produce from the biocontrol treatment fetc.hed 50% more income as compared to the produce from the chemical treatment. Hence, it is concluded that S. siamkayai is a potential bio-control agent which can effectively control the flea beetles P. chontalica and P. sinuate on Chinese kale in the farmer’s field.
Table 1. The average number of flea beetles per square meter in the field trial and decreasing percentage after treatment
Treatments Type of flea beetle
Number offlea beetle/m2
1st spray
Dec
reas
e(%
)
Number of flea beetle/m2
2nd spray
Dec
reas
e(%
)
Number of flea beetle/m2
3rd sprayD
ecre
ase
(%)
before after before after before after
Biocontrol P. chontalica 5.0 2.7 46 2.7 0.7 74 0.4 0.1 75P. sinuata 2.4 1.4 42 1.4 1.0 29 1.3 0.2 85
Chemical control
P. chontalica 2.2 1.4 36 1.4 0.0 100 0.0 * 2.3 –P. sinuata 3.7 2.1 43 2.1 0.0 100 0.0 * 0.3 –
* No spray of the chemical

423
REFERENCESChongchitmate, P., V. Somsook, P. Hormchan and N. Visarathanonth. (2005). Bionomics
of entomopathogenic nematode Steinernema siamkayai Stock, Somsook and Reid (n. sp.) and its efficacy against Helicoverpa armigera HÜbner (Lepidoptera: Noctuidae). Kasetsart Journal (Nat. Sci.) 39: 431 – 439
Department of agriculture. (2010). The production technology and use of renewable chemicals by plant extracts. 2288-2305. In The Project Plan Report 2006 – 2010
Joyce, P., C.A. Miles, T. Murray and W. Snyder. (2012). Organic Management of Flea Beetles. Pacific Northwest Extention Publication PNW460. Washington State University
Sukolthapiromnapattalung, S. (2000). Study on efficacy of neem seed extract formulated by DOA on common cutworm
Tangchitsomkid, N. (2000). A new entomopathogenic nematode (Rhabditida: Steinernematidae) in Thailand: Taxonomy, Biology and its Potential for Biological Control. Ph.D. thesis, Kasetsart University, Bangkok
Tangchitsomkid, N. (2011). Research and development of entomopathogenic nematodes in Thailand. In:International Conference in Biopesticides 6 (ICOB 6) pp. 76. Imperial Mae Ping, Chiang Mai
Tangchitsomkid, N. (2015). The Culture Method of Steinernema sp. Thai Isolate to Control Vegetable Pest. 2nd ed. 32 pp

424
The Occurrence of Natural Enemies of Legume Pod Borer, Maruca Vitrata F. (Lepidoptera: Pyralidae) on Long Bean and French Bean in Malaysia
Farah Huda, S.S.1, Mohd Hanifah, Y.1, Siti Sakinah, A.1, Mohamad Roff, M.2 and Srinivasan, R.31Horticulture Research Centre,Malaysian Agricultural Research and Development Institute (MARDI), MARDI Headquarters, Persiaran MARDI-UPM, 43400 Serdang, Selangor, Malaysia2Directorate, Malaysian Agricultural Research and Development Institute (MARDI), MARDI Headquarters, Persiaran MARDI-UPM, 43400 Serdang, Selangor, Malaysia3AVRDC - The World Vegetables Centre, P.O Box 42, Shanhua, Tainan 74199, TaiwanE-mail: [email protected]
Abstract Maruca vitrata Fabricius (Lepidoptera: Pyralidae) is an important insect pest of vegetable legumes and it can cause great yield loss if left without proper pest management practices. A study was conducted to identify the natural enemies of Maruca vitrata from sampled vegetable legumes. The occurrence of parasitoid of pod borer on long bean and French bean were assessed during surveys in farmers’ field in Peninsular Malaysia, Sabah and Sarawak during 2012 – 2013. The larvae of Maruca vitrata were collected from infested flower parts and beans pod and held until natural enemies emerged. Six (6) species of parasitoid were found on long bean, where five out of six species belongs to the family Hymenoptera: Therophilus javanus (Braconidae), Therophilus marucae (Braconidae), Phanerotoma leucobasis (Braconidae), Bracon sp. (Braconidae), Trathala flavoorbitalis (Ichneumonidae) and one (1) belongs to the family Diptera, which is Argyrophylax sp. (Tachinidae). The three (3) species of parasitoid belong to Hymenoptera were also found and recorded for French bean viz. Therophilus javanus (Braconidae), Therophilus marucae (Braconidae) and Triclistus sp. (Ichneumonidae). The survey indicated that the major parasitoids for both long bean and French beans were Therophilus marucae and Therophilus javanus. Parasitoid species of Trathala flavoorbitalis however, only found (frequently) on long beans in Klang, Selangor and none were detected from the other survey locations. This baseline information is very useful for researchers particularly entomologists for future integrated pest management (IPM) strategy for vegetable legumes.
Keywords: Maruca vitrata, legume pod borer, long bean, French bean, natural enemies
INTRODUCTION The legume pod borer, Maruca vitrata Fabricius (syn. Maruca testulalis) (Lepidoptera: Pyralidae), is important lepidopteran pest of grain and vegetable legume in Asia, Africa, Australia, North and South America (Sharma, H.C., 1998). In Southeast Asia, major legume crops such as yard-long bean, cowpea and mung bean reported as a seriously attacked by M. vitrata (Sharma, 1998; Srinivasan, R., 2012; Tamo, M., 2003; Zahid, M.A, 2008). In Malaysia, the main production of vegetable legumes is

425
Long bean (Vigna unguiculata L. subsp. sesquipedalis) and French bean (Phaseolus vulgaris) where the production area is about nine percent (9%) of the total production area of main vegetables grown. The local production for both long bean and French bean are 69,295 metric tonne and 15,342 metric tonne per annum with an acreage of 4,799 ha and 1,182 ha (DOA, 2015) respectively. French bean is mainly grown in the highlands, located at Cameron Highlands, Pahang. Maruca vitrata larvae attack on the flowers and bean pods. They more prefer on flower buds and mature pods rather than open flowers and immature pods (Sharma et al., 1999; Jayasinghe, 2015). Calendar spray of chemical pesticides is the most being practised to control this insect pest; however, the use of contact insecticides may be less effective to control legume pod borer as the larvae is inside the flower buds and in the mature pods where the structural plant parts are protecting them. Thus, can lead to the increased spraying chemical pesticides harmful to the environment, human as well as natural enemies. The natural enemies of M. virata have been explored and reported in others countries such as West Africa, Thailand, Phillipines. However, the natural enemies of M. vitrata in Malaysia have not been reported. Therefore, the main objectives of this study were to explore and identify the natural enemies of M. virata and their field parasitism in different localities of Peninsular Malaysia and East Malaysia.
MATERIALS AND METHODS The study was carried out during 2011 – 2012 in several vegetable legumes farmers’ field of Peninsular Malaysia, Sabah and Sarawak. Plants were randomly selected based on 50% populations of each plot. All instars of Maruca vitrata were collected from infested flower parts and bean pods of long bean (Vigna subseiquillas) and French bean (Phaseolus vulgaris). The farmers may apply the pesticides for pest management based on recommendation. The collected flowers and bean pods were dissected to examine the total number of M. vitrata larvae and the presence of parasitized larvae and the larvae were transferred to the plastic container with ventilated cover lid and wet saw dust at the bottom of the container. Collected larvae then were brought to the laboratory at Entomology Laboratory, Horticulture Research Centre, Malaysian Agricultural Research and Development Institute and kept at temperature 26.0 ± 1.0 °C and > 60.0% relative humidity. The emergence of parasitoids was observed daily and recorded. The parasitoids obtained were identified using stereomicroscope and the samples were sent to National History Museum of United Kingdom for further confirmation of identification the species. The parasitoids were sent as a dry sample. Percentage of parasitism was calculated based on the total number of parasitized larvae or parasitoid emergence:
Percentage of parasitism = number of parasitized larvae or parasitoid emergence ––––––––––––––––––––––––––––––––––––––– x 100 Total numbers of larvae collected

426
RESULTS AND DISCUSSION The larvae of Maruca vitrata were collected from flower parts and bean pods from farmers plot in different states of Peninsular Malaysia (Kedah, Perak, Pahang, Selangor, Negeri Sembilan, Kelantan, Terengganu and Johor) and East Malaysia (Sabah and Sarawak) during November 2011 until November 2012. However, from this study, the natural enemies found from several states was Selangor, Negeri Sembilan, Pahang and Sabah. A total numbers of 2,161 M. vitrata larvae were collected from six locations with one or more than two plots per location. A sample of 360 M. vitrata larvae was found to be parasitized out of 2,161 larvae, where only 148 parasitoids emerged from parasitized larvae (Table 1). The natural enemies comprise the species of braconids and ichneumonid (Hymenoptera) and tachinids fly (Diptera) (Table 2). Seven species of natural enemies were found on M. vitrata larvae from both long bean and French bean, where a, five species were found on long bean: Therophilus javanus (Hymenoptera: Braconidae), Therophilus marucae (Hymenoptera: Braconidae), Phanerotoma leucobasis (Hymenoptera: Braconidae), Bracon sp. (Hymenoptera: Braconidae), Trathala flavoorbitalis (Hymenoptera: Ichneumonidae) and Argyrophylax sp. (Diptera: Tachinidae). Three species of parasitoid were also found and recorded for French bean: Therophilus javanus (Hymenoptera: Braconidae), Therophilus marucae (Hymenoptera: Braconidae) and Triclistus sp. (Hymenoptera: Ichneumonidae). All the samples were identified at the Natural History Museum, United Kingdom. The results showed that a larval parasitoids, Therophilus marucae, T. javanus and Trathala flavoorbitalis were the major constituents of parasitoids emerged from M. vitrata larvae (Table 2). These results were similar with those reported in Vietnam where these three parasitoids were reared from M. vitrata larvae (Kuat Dang Long, 2012). Srinivasan et al., (2012) reported that, they found T. javanus as a major parasitoid during survey on 2012 in Southern Taiwan and this parasitoid was also found in Lao PDR and Vietnam. Egg larval parasitoids Phanerotoma leucobasis were found from this study, however in Thailand Phanerotoma phillipinensis was found as a major parasitoid (Srinivasan et al., 2012). Meanwhile, Phanerotoma hendecasisella Cameron was recorded and reared in Southern India (Gupta, A. et al., 2013). Triclistus sp. is a larval-pupal parasitoids of lepidoptera larvae.There are many species of Triclistus and most of the Southeast Asian species are undescribed and none have been recorded from M. vitrata. One species of braconid, Bracon sp. was found and deposited at Natural History Museum, United Kingdom. Bracon greeni Ashmead, has been reared from Maruca vitrata and has been recorded from Bangladesh and India (Das, G.P, 1985; Borah, B. L, 2004). Although parasitoid, Apantheles taragame (Hymenoptera: Braconidae) was reported as the major parasitoid and potential biological control agent in Taiwan and Benin (Huang et. al, 2003; Dannon, et. al, 2012), the results obtained show the diversity of parasitoids occurrence in Malaysia.

427
Table 1. Occurence of natural enemies of Maruca vitrata on vegetable legumes in Malaysia during 2011 – 2012
State Location (District)
Host Total No. of larvae
ParasitoidsParasitized larvae
Parasitoid emerged
Parasitism (%)
Selangor Klang Long bean 675 231 66 34.22Serdang Long bean 323 5 3 3.16
Negeri Sembilan
Jelebu Long bean 123 17 16 13.82
Pahang Cameron Highlands
French bean 579 84 49 14.51
Kuala Lipis Long bean 225 15 9 14.72Sabah Ranau Long bean 236 8 5 3.39Total 2161 360 148 16.66
Table 2. Natural enemies of Maruca vitrata found in long bean and French bean in Malaysia
Parasitoids State Total Parasitism (%)Selangor Negeri
SembilanPahang Pahang*
(Cameron Highlands)
Sabah (East Malaysia)
HymenopteraBraconidaeTherophilus marucae
2 2 7 44 2 57 2.63
Therophilus javanus
29 12 0 3 0 44 2.04
Phanerotoma leucobasis
7 2 0 0 2 11 0.51
Bracon sp. 0 0 0 0 1 1 0.05IchneumonidaeTrathala flavoorbitalis
31 0 0 0 0 31 1.44
Triclistus sp. 0 0 0 2 0 2 0.09DipteraTachinidaeArgyrophylax sp. 0 0 2 0 0 2 0.09Total 69 16 9 49 5 148 0.07
*All samples were long bean excluding French bean in Cameron Highlands, Pahang

428
Figure 6. Argyrophylax sp.Figure 5. Triclistus sp. a larval parasitoid
Figure 3. Trathala flavoorbitalis, a larval parasitoid
Figure 4. Phanerotoma leucobasis, an egg larval-parasitoid
Figure 1. Therophilus marucae, a larval parasitoid
Figure 2. Therophilus javanus, a larval parasitoid

429
CONCLUSION Our findings indicated that the major parasitoids for both long bean and French beans were Therophilus marucae and Therophilus javanus. Parasitoid species of Trathala flavoorbitalis however, only found frequently on long beans in Klang, Selangor and none were detected from the other survey locations.
ACKNOWLEDGEMENT The authors thank the Deutsche Gesellschaft für Internationale Zusammenarbeit (GIZ) GmbH for financially supporting this study through the project “Less loss, more profit, better health: Reducing the losses caused by the pod borer (Maruca vitrata) on vegetable legumes in Southeast Asia and sub-saharan Africa by refining component technologies on sustainable management strategy” by AVRDC-The Vegetables World Centre. The authors also thank the Department of Agriculture, Malaysia for the locations of survey and their assistance and also grateful to the curators of Natural History Museum, United Kingdom for identification and species confirmation of the parasitoids.
REFERENCESBorah, B.K. and Sarma, K.K. (2004). Record of parasitoids of legume pod borer Maruca
testulalis (Geyer) in Assam. Insect Environment 2004; 10(2): 77 – 78 Dannon, E.A., Tamo, M., van Huis, A. and Dicke, M. (2012). Assesing non-target effects
and host feeding of the exotic parasitoid Apanteles taragamae, a potential biological control agent of the cowpea pod borer Maruca vitrata. BioControl 57: 415 – 425
Das, G.P. and Islam, M.A. (1985). Maruca testulalis (Lepidoptera: Pyralidae): An important pest of country bean in Bangladesh. Bangladesh Journal of Agriculture
Department of Agriculture. (2015). Statistik Tanaman Sayuran dan Ladang Gupta, A., Sujayanand, G. K. and Bakthavatsalam N. (2013). Record of three
larval parasitoids (Hymenoptera: Ichneumonoidea) of Maruca vitrata (Fabricius) (Lepidoptera: Crambidae) from southern India. Reserach note. Journal of Biological Control, 27 (1): 53 – 55
Huang, C.C., Peng, W.K. and Talekar, N.S. (2003). Parasitoids and other natural enemies of Maruca vitrata feeding on Sesbania cannabina in Taiwan. Biol. Control 48: 407 – 416
Jayasinghe, R.C., Dammini Premachandra, W.T.S. and Roy Neilson. (2015). A study on Maruca vitrata infestation of Yard-long beans (Vigna unguiculata subspecies sesquipedalis). http://dx.doi.org/10.1016/j.heliyon.2015.e00014
Khuat Dang Long and Dang Thi Hoa (2012). Notes on parasitoids assemblage reared from legume pod borers Maruca vitrata (Fabricius) and Etiella zinckenella Treitschke. Tap chi Sinh hoc, Vol.34, No.1. https://vcgate.vnu.edu.vn/journals/tap-chi-sinh-hoc/articles
Sharma, H.C. (1998). Bionomics, host plant resistance and management of the legume pod borer, Maruca vitrata—a review. Crop Prot. ; 17: 373 – 386

430
Sharma, H.C., Saxena, K.B. and Bhagwat,V.R.(1999). The legume pod borer, Maruca vitrata: Bionomics and Management. Information Bulletin No.55, International Crops Research Institute for the Semi-Arid Tropics (ICRISAT), Patancheru, India. 40 pp
Srinivasan, R., Yule, S., Chang, J.C, Malini, P., Lin, M.Y., Hsu, Y.C. And Schafleitner, R. (2012). Toward developing a sustainable management strategy for legume pod borer, Maruca vitrata on yard-long bean in Southeast Asia. SEAVEG 2012 Regional Symposium
Tamo, M., Srinivasan, R., Dannon, E., Agboton, C., Datinon B., Dabire, C., Baoua, I., Ba, M., Haruna, B. and Pittendrigh, B. (2012). Biological control: A major component for the long term cowpea pest management strategy. Proceedings of the Fifth World Cowpea Conference. 249 – 259 pp
Zahid, M.A., Islam, M.M. and Begum, M.R. (2008). Determination of economic injury levels of Maruca vitrata in mungbean. J Agric Rural Dev 6 (1 and 2), 91 – 97

431
Characterization, Prevalence and Control of Seed-Borne Bacterial and Fungal Pathogens of Leafy Brassica in Cambodia, Lao Pdr and Vietnam
Burlakoti, R.R.1*, Chen, J.R.1, Ho, F.I.1, Sheu, Z.M.1, Wang, J.F.1, Nguyen, C.H.2, Khodsimouang, S. 3 and Hy, H.C. 41 World Vegetable Center (WorldVeg), Shanhua, Tainan 74199 Taiwan2 Vietnam Academy of Agricultural Science, Hanoi, Vietnam3 Department of Agriculture, Vientiane, Lao PDR4 General Directorate of Agriculture, Phnom Penh, CambodiaE-mail: [email protected].
Abstract Seed-borne diseases, such as black rot (Xanthomonas campestris pv. campestris, Xcc) and Alternaria spot (Alternaria spp.) are problematic in leafy Brassica in Vietnam, Cambodia and Lao PDR. However, contamination rates by these pathogens in commercial seed lots were unknown and effective seed treatment methods are not available to growers. The objectives of this research were: (i) to detect seed-borne pathogens and their contamination rates in seed samples of leafy Brassica vegetables used by smallholder farmers and (ii) identify seed treatment methods to reduce seed infection levels. Sixty-nine seed samples were collected from commercial seed lots of leafy mustard, pak choi, choy sum, cabbage, Chinese cabbage and kale from three countries in 2014. Standard methods developed by the International Seed Testing Association (ISTA) were used to identify and characterize seed-borne Alternaria spp. and Xcc. Seed infection was determined by counting bacterial colonies on seeds for Xcc, using two types of selective media (FS / mCS20ABN and yeast dextrose chalk), then confirmed by molecular polymerase chain reaction (PCR) assays using Xcc-specific markers and pathogenicity tests and for Alternaria spp. by counting number of fungal spores per seed on malt agar media using a binocular microscope. The samples from the Alternaria-positive seed lots identified on malt agar (MA) media were further evaluated using Alternaria semi-selective (ASS) media to reduce contamination by saprophytic Alternaria spp. Xcc was isolated only from Lao PDR in three seedlots (one from cabbage, two from pak choi). In Vietnam, seed lots contamination levels with Alternaria spp. were 70% on ASS to 100% on MA media. Whereas in Lao PDR contamination levels in seed lots ranged between 16% on ASS to 38% on MA and for Cambodia 20% on MA and none on ASS medium. Three pathogenic Alternaria species were identified based on conidia and culture morphology. Among the three Alternaria species; A. alternata, A. brassicicola and A. japonica accounted for 76%, 14% and 11%, respectively. Two seed treatment methods, 1% sodium hypochlorite (NaClO) for three minutes and 50 ºC hot water for 25 minutes, were evaluated and percent reduction in seed infection was calculated by comparison with the non-treated control. Both treatments successfully eliminated the Xcc level significantly in the Xcc-infected cabbage and pak choi seed lots, ranging from 95% reduction to an undetectable level. Compared to 1% NaClO (6.5 to 40% reduction), the hot water treatment (99 to 100% reduction) was more effective in eliminating Alternaria from seeds of cabbage, Chinese cabbage, kale, pak choi, leafy mustard and choy sum. Seed germination was higher (85 to 90%) in seed lot treated with 1% NaClo than the seed lot treated with hot water (77 to 83%). The hot water treatment is recommended to reduce both Xcc and Alternaria spp. on leafy Brassica seeds.
Keywords: Xanthomonas campestris, Alternaria, Seed-borne pathogens, Brassica

432
INTRODUCTION Vegetables are the second most important food commodity in Cambodia and Lao PDR after rice (Buntong and Vanndy, 2009; Chanthasombath, 2009) and are also an important source of income in rural and peri-urban areas in Vietnam (Huong et al., 2013). Among vegetable crops, leafy Brassicas, such as leafy mustard (Brassica juncea), pak-choi (B. rapa var. chinensis), choi sum (B. rapa var. parachinensis), Chinese cabbage (Brassica rapa var. pekinensis) and Chinese kale (B. oleracea var. alboglabra) are economically important crops in these countries (Buntong and Vanndy, 2009; DOA, 2011; Huong et al., 2013). Leafy vegetables are mainly grown in the rural and peri-urban areas of the Greater Mekong Subregion (GMS) in Cambodia and Lao PDR (Buntong and Vanndy, 2009; Chanthasombath, 2009) and Red River Delta (RRD) region in Vietnam (Huong et al., 2013). Leafy vegetables are mainly grown in the regular season, from October to March. During the regular season, cool and dry weather occurs from October to January, followed by cooler and more humid conditions in February and March. Leafy vegetables also are grown in the off-season from April to September, when vegetable prices are high. Weather conditions in the vegetable growing areas of South East Asian countries are conducive for bacterial and fungal diseases. Heavy rainfall and hot and humid weather during the off-season (May to September) favor the development and spread of several tropical diseases. Limited rainfall occurs during the regular season; however, crops are irrigated, which can create suitable micro-environments for disease development. Limited information is available about major diseases of leafy vegetables in these countries. In collaboration with national partners, World Vegetable Center organized a workshop in Hanoi, Vietnam in April 2014 to understand the diseases and pests of leafy vegetables in the region. Based on consultation with national experts, farmers and industry stakeholders, seed-borne diseases in the workshop organized by World Vegetable Center, such as black rot (Xanthomonas campestris pv. campestris, Xcc) and Alternaria leaf spot (Alternaria spp.) were identified as important diseases in leafy vegetables. Both diseases are seed-borne and contaminated seeds are the major sources of initial inoculum for disease development (Degenhardt, 1982; Berg et al., 2005; Reis and Boiteux, 2010). Once seed transmitted initial disease symptoms appeared in fields, water splash from rain or artificial irrigation favors disease spread (Kocks et al., 1999). Precise detection of contamination of leafy vegetable seeds by Xanthomonas and Alternaria and applying effective seed treatment methods can reduce disease pressure in fields. The objectives of the study were: (i) to detect seed-borne pathogens and their contamination rates in seed samples of leafy vegetables used by smallholder farmers and (ii) identify seed treatment methods to reduce seed infection levels.

433
MATERIALS AND METHODS
Sample collection Sixty-nine samples of leafy Brassicas seeds were collected in 2014 from retail markets or from local farmers in Cambodia, Lao PDR and Vietnam. Fourteen seed samples, Chinese cabbage (n = 4), leafy mustard (n = 5) and pak-choi (n = 5), were collected from retail markets of Phnom Penh in Cambodia. Ten seed samples, leafy mustard (n = 7) and choy sum (n =3), were collected from peri-urban areas of Hanoi and Son La province in Vietnam. Forty-five seed samples, leafy mustard (n = 16), pak-choi (n = 13), cabbage (n = 5), Chinese cabbage (n = 5), Chinese kale (n = 5) and kale (n = 1) were collected from retail markets or farmers in Vientiane peri-urban area, Luangnumtha province and Pakse province in Lao PDR. These seed samples include the major cultivars of leafy vegetables grown by local farmers in the three countries. The seed samples were brought to World Vegetable Center headquarters in Taiwan for the detection of seed-borne pathogens. Two seed-borne pathogens, Xanthomonas campestris pv. campestris (Xcc) and Alternaria spp. were selected as target pathogens for detection.
Detection of Xanthomonas campestris pv. campestris (Xcc) The protocol recommended by the International Seed Testing Association (ISTA) was followed to detect Xcc (Roberts and Koenraadt, 2014). Randomly sampled 1000 seeds from each seedlot were used for pathogen detection and experiments were repeated twice. Seed samples were suspended in 10 ml of pre-chilled (at 4 °C) sterile saline solution (0.85% NaCl) containing 0.02% (v/v) Tween 20 and were shaken for 2.5 hr on an orbital shaker at 100 rpm. Thereafter, two serial ten-fold dilutions were made from the seed suspension and plated on FS and mCS20ABN media (Roberts and Koenraadt, 2014). The media plates were incubated at 28 to 30 °C for 3 to 4 days and numbers of suspected bacterial colonies were recorded. The colonies with clear zones due to starch hydrolysis were selected for identification. The suspected colonies were further cultured on yeast dextrose chalk (YDC) agar medium (Yeast Extract 10 g, D-Glucose 20 g, CaCo3 20 g and Agar 15 g in 1 L of distilled water) for 2 days at 30 °C to confirm the Xcc. A pure colony of a known strain of Xcc was used as a positive control. The amount of Xcc in each seed lot was estimated by counting colonies in media and presented as colony forming unit per milliliter (cfu ml-1).
Confirmation of Xanthomonas campestris pv. campestris (Xcc) with molecular markers and pathogenicity test Xanthomonas campestris pv. campestris was further confirmed with multiplex polymerase chain reaction (PCR), which uses Xcc-specific PCR primers (Rijlaarsdan et al., 2004; Berg et al., 2005) and universal primers (Eden et al., 1991). Methods for bacterial DNA extraction, PCR reactions and thermal conditions were used as described by Roberts and Koenraadt (2014).

434
Bacterial strains were further confirmed with a pathogenicity test in the greenhouse. Black rot susceptible cabbage accession S-0A01 (K-Y cross; Takii and CO.LTD, Kyoto, Japan) was grown in the greenhouse. Two leaves of four plants (eight leaves) were inoculated with each bacterial strain. The experiments followed a randomized complete block design. An Xcc strain freshly grown on YDC media was inoculated on seedlings at the 3 – 4 true leaf stage using sterile steel scissors dipped in a bacterial suspension of 108 cfu ml-1 (OD590 of 0.3) to cut plant leaves at their edges. The black rot symptoms were recorded at ten days after inoculation. If the inoculated leaf showed V-shaped yellow and/or necrotic lesions, the suspected colony was confirmed as Xcc.
Detection of Alternaria species To detect the seed infection with Alternaria spp. on leafy vegetables, the ISTA protocol as described by Van Bilsen et al., (2014) was followed using 400 seeds per seed lot. The experiment was repeated twice and arranged in a completely randomized design. Ten seeds were evenly spaced on the surface of malt agar plate (MA; 1 L of malt agar with 50 mg of streptomycin sulphate). The plates were incubated for 10 days at 20 ± 2 ºC with alternating 12 h periods of darkness and near-ultraviolet (NUV) light. Plates were examined visually and under a binocular microscope at 10 to 50 x magnification for fungal growth and identification of conidia morphology. Percentage of seeds infected with Alternaria spp. was recorded. For further identification of specific Alternaria species, Alternaria positive seedlots were further evaluated on Alternaria semi-selective (ASS) medium (Glucose 20 g, (NH4)2SO4 3 g, KH2PO4 3 g, MgSO4·7H2O 0.5 g, peptone 15 g, agar 20 g in 1 L distilled water) (Huang et al., 1981). The ASS media is suitable to identify pathogenic Alternaria spp. on seed. Twenty ppm of neomycin (Sigma-Aldrich, St. Louis, MO, USA) and 50 ppm of chloramphenicol (Sigma-Aldrich, St. Louis, MO, USA) dissolved in distilled water and 50 ppm of dithane® A-40 (Rohm-Haas, Tainan, Taiwan) and 50 ppm, benomyl (Sigma-Aldrich, St. Louis, MO, USA) dissolved in Acetone were added to ASS media. Ten seeds were equally placed on one plate with ASS media and incubated for seven days at 24 ± 2 ºC in darkness. The colonies were further transferred on 10% V8 agar medium and grown for four to five days. Identification of Alternaria species was done based on morphological characteristics of colonies and conidia, including the presence or absence of conidial chain, color and numbers of septa of mature conidia, presence or absence of the beak in conidia and their length etc., (Ellis, 1971; Simmons, 2007).
Evaluation of seed treatment methods Two seed treatment methods: (i) 1% sodium hypochlorite solution (NaClO) and (ii) 50 °C hot water treatment were evaluated for efficacy in reducing Xcc and Alternaria spp. present on seeds.

435
Seed treatment for Xcc infected seeds Two pak-choi seed lots from Lao PDR contaminated with Xcc were used for seed treatment experiments. A completely randomized design (CRD) with three replications was used to set up the experiment, with 400 seeds used in each replicate. NaClO (1%) and hot water treatment at 50 °C were compared with a non-treated control (NTC). For NaClO treatment, seeds were soaked in a conical flask with 1% NaClO solution for 3 min, then washed with sterile water three times to remove the residual chloride and dried on sterile filter paper before plating. For the hot water treatment, seeds were soaked in 50 °C hot water for 25 minutes followed by cooling at room temperature. The seeds treated with two methods and NTC seeds were plated on mCS and MS media and Xcc detection methods were followed as described in earlier sections (Roberts and Koenraadt, 2014). The germination percentage of treated seed and NTC was evaluated in water agar media.
Seed treatment for Alternaria-infected seeds Six seed lots (three from Lao PDR and three from Vietnam) contaminated with different Alternaria spp. (Table 3 were selected for seed treatment experiments. Experiments were set up using CRD with 4 replications. The experiments were repeated twice. Seedlots were treated with 1% NaClO and hot water (50 °C) as described above and compared with NTC. After seed treatments, seeds were plated on ASS medium, incubated for seven days and infected seeds were recorded. Alternaria spp. was identified based on morphological characteristics as described above (Ellis, 1971; Simmons, 2007).
RESULTS AND DISCUSSION
1. Detection of X. campestris pv. campestris Xanthomonas campestris pv. campestris was not detected in seed samples of leafy brassicas collected from Cambodia (n = 13) and Vietnam (n = 14). In Lao PDR, Xcc was detected in three seed lots (one from cabbage, two from pak-choi) out of 45 seed lots. The contaminated seedlot of cabbage was collected from a seed market in Pakse, in the southern province of Champasak of Lao PDR. The other two Xcc-positive pak choi seedlots were collected from farmers in Luang Namtha (Northern Province) and Vang Vieng in Vientiane province. The lowest amount of Xcc (17 cfu ml–1) was found in cabbage seedlot and pak choi seed lot from Vang Vieng had the highest amount (146112 to 150133 cfu ml–1). Colonies of untargeted bacteria were also found in these three seedlots. Figure 1 shows the result of seed detection of X. campestris pv. campestris on leafy brassicas. The Xcc colonies from these seedlots showed typical pale yellow fluidal growth on YDC media (Figure 1D). In multiplex PCR assay, DNA from a suspected colony of Xcc amplified three bands of 370, 441 and 619 bp (Figure 1E), which confirmed the bacterial colonies detected on these seed lots were Xcc. In a pathogenicity test in the greenhouse, all three strains of Xcc, one isolated from cabbage seed lot and two from pak-choi seed lot, produced typical V-shaped black rot symptoms on cabbage leaves (Figure 1F).
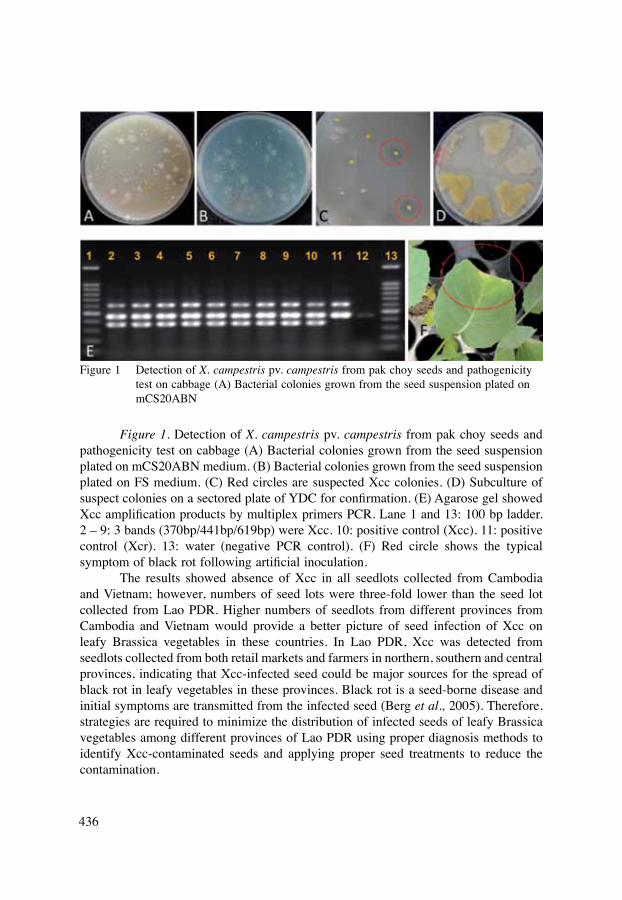
436
Figure 1. Detection of X. campestris pv. campestris from pak choy seeds and pathogenicity test on cabbage (A) Bacterial colonies grown from the seed suspension plated on mCS20ABN medium. (B) Bacterial colonies grown from the seed suspension plated on FS medium. (C) Red circles are suspected Xcc colonies. (D) Subculture of suspect colonies on a sectored plate of YDC for confirmation. (E) Agarose gel showed Xcc amplification products by multiplex primers PCR. Lane 1 and 13: 100 bp ladder. 2 – 9: 3 bands (370bp/441bp/619bp) were Xcc. 10: positive control (Xcc). 11: positive control (Xcr). 13: water (negative PCR control). (F) Red circle shows the typical symptom of black rot following artificial inoculation. The results showed absence of Xcc in all seedlots collected from Cambodia and Vietnam; however, numbers of seed lots were three-fold lower than the seed lot collected from Lao PDR. Higher numbers of seedlots from different provinces from Cambodia and Vietnam would provide a better picture of seed infection of Xcc on leafy Brassica vegetables in these countries. In Lao PDR, Xcc was detected from seedlots collected from both retail markets and farmers in northern, southern and central provinces, indicating that Xcc-infected seed could be major sources for the spread of black rot in leafy vegetables in these provinces. Black rot is a seed-borne disease and initial symptoms are transmitted from the infected seed (Berg et al., 2005). Therefore, strategies are required to minimize the distribution of infected seeds of leafy Brassica vegetables among different provinces of Lao PDR using proper diagnosis methods to identify Xcc-contaminated seeds and applying proper seed treatments to reduce the contamination.
Figure 1 Detection of X. campestris pv. campestris from pak choy seeds and pathogenicity test on cabbage (A) Bacterial colonies grown from the seed suspension plated on mCS20ABN

437
2. Detection of Alternaria species Infections with Alternaria spp. in leafy Brassica seed were detected using MA and ASS media. Higher percentages of Alternaria-positive seed lots and seed infection range were detected using MA media compared to ASS media. Seed lots from Vietnam had the highest Alternaria-positive seed lots (100% on MA and 70% on ASS) followed by seed lots from Lao PDR (38% on MA and 16% on ASS) (Table 1). Seed infection percentages were also high in the seed lots in these countries. Highest seed infection was found in leafy mustard seeds collected from Paske in southern Lao PDR (57% on MA) and from Moc Chau district of Son La, northwest province in Vietnam (58% on MA). Numbers of Alternaria-positive seed lots were lower in the samples from Cambodia (21% on MA) compared to samples from Lao PDR and Vietnam. Alternaria spp. were
Table 1. Detection of Alternaria spp. on leafy brassica seeds using Malt Agar (MA) and Alternaria semi-selective medium (ASS)
Seed samples % Seedlot infection
% Seed infection range
No. of colonies and percentage of Alternaria spp.a
Countries Crops n MA ASS MA ASS Ab Aj Aa
Vietnam Choy- sum 3 100b 34 0.2 – 19 d0 – 4 0 (0)e 1 (8) 11 (92)Leafy mustard
7 100 86 0.2 – 58 0 – 20 13 (12) 7 (7) 87 (81)
Subtotal 10 100 70Lao PDR Cabbage 5 40 40 0 – 4 0 – 0.5 2 (67) 1 (33) 0(0)
Chinese cabbage
5 40 20 0 – 6 0 – 0.5 1 (50) 0 (0) 1 (50)
Chinese kale 6 17 17 0 – 8 0 – 3 5 (45) 0 (0) 6 (55)Leafy mustard
16 19 13 0 – 57 0 – 0.5 2 (67) 0 (0) 1 (33)
Pak-choi 13 54 8 0 – 29 0 – 21 7 (8) 15 (18) 61 (74)Subtotal 45 38 16
Cambodia Chinese cabbage
4 20 0.0 0 – 0.2 0
Leafy mustard
5 25 0.0 0 – 0.5 0
Pak-choi 5 20 0.0 0 –0.2 0Subtotal 14 21 0.0
Total 67 30 (14) 24 (11) 167 (76)a Ab - Alternaria brassicicola, Aj - A. japonica, Aa - A. alternata. The values in parenthesis are the percentage of each species out of total Alternaria isolates.b % positive seedlots of leafy Brassica with Alternaria infections.d Range of % seed infection with Alternaria in different seedlots.e Values are in parenthesis is percentage of Alternaria spp.

438
not detected in Alternaria selective media (ASS) from any of the 14 samples from Cambodia, indicating that seed contamination with Alternaria is not a big problem in Cambodia; however, to draw a firm conclusion, larger numbers of samples from diverse vegetable growing areas would need to be monitored. Detection of Alternaria spp., was greatly reduced using ASS media up to 3-fold compared to MA media in samples from Vietnam, up to 7-fold in samples from Lao PDR (Table 1). In Cambodia, 20 – 25% Alternaria seed lots were detected in MA media, but no Alternaria was detected on ASS media. These results suggest that ASS media is more specific to detect Alternaria spp., Based on conidia morphology and colony characters in V8 Agar media, three species of Alternaria were identified. Alternaria brassicicola had dark, olivaceous brown to dark blackish brown colonies and small conidia, mostly in chains of up to 20 or more and sometimes branched. Alternaria japonica had pale to dark olivaceous brown colonies with loose hyphae. Conidia of A. japonica are large and formed in single or in short chains of 2 – 4 conidia. Colonies of A. alternata had pale to dark brown conidia, mostly in chains and sometimes branched. Among three species, the incidence of A. alternata was highest (76%). Incidences of A. brassicicola and A. japonica were 14% and 11% respectively (Table 1).
3. Evaluation of seed treatment methods Both seed treatments, hot water treatment at 50 °C and 1% NaClO, significantly (p <0.001) reduced the amount of Xcc infection compared to the non-treated control (NTC) (Table 2). Both treatments reduced 100% Xcc on seedlot one (119 to 127 cfu ml–1 in NTC) after treating seed with both methods and reduced 95.1% to 92.5% of Xcc inoculum in seedlot two which had a higher amount of Xcc (16681 to 36059 cfu ml–1 in NTC). Seed germination was increased in seedlot two, which was heavily contaminated with Xcc, when treated with 1% NaClO, while seed germination was slightly reduced in seed treated with hot water. To evaluate seed treatment methods to reduce Alternaria infection in leafy vegetable seeds, three seed lots from Lao PDR (one from choy sum and two from cabbage) and three seed lots from Vietnam (one from choy sum and three from leafy mustard) were selected. These seed lots had higher levels of seed infection. The hot water treatment eradicated Alternaria infection (99 to 100% reduction) in both experiments and showed significantly better results (p <0.001) than the 1% NaClO (Table 3). Seed treated with 1% NaClO also significantly reduced (p <0.01) Alternaria infection in experiment one (first replicate). NaCIO treatment reduced about 6.5% to 40% infection in different seedlots. However, the number of Alternaria colonies increased slightly in one seedlot after the treatment, which also had high contamination with Aspergillus. NAClO treatment significantly increased the seed germination percentage (90%) than the NTC (86%). Hot water treatment did not have adverse effect in seed germination except in cabbage. Nega et al., (2003) found that cabbage seed treated with hot water at 50 °C for 25 minutes reduced A. brassicicola infection by 92 – 99% and Leptosspaeria maculans by 87 – 92%. They also found reduction and delay in seedling germination

439
Table 2. Evaluation of seed treatment to reduce X. campestris pv. campestris inoculum in leafy Brassica seeds. Two Xcc-contaminated seedlots from pakchoi collected from Lao PDR were used. Seed lot one and two were collected from Luang Namtha, Northern Province and Vang Vieng, Vientiane province
Density of Xcc (cfu ml-1) % Seed GerminationTreatment Seedlot
1Seedlot 2
Treatment Mean
Treatment Seedlot1
Seedlot 2
Treatment Mean
mCS Media Water AgarNTCa 127† 36059 18093a NTC 93 80 86a1% NaClO 0 30 15b 1% NaClO 91 82 87aHot water (50 °C)
0 119 60b Hot water (50 °C)
89 75 82b
Seedlot Mean 42b‡ 12069a Seedlot Mean
91 a‡ 79 b
FS mediaNTC 119 16681 8400a1% NaClO 0 73 37bHot water 0 23 12bSeedlot Mean 40b 5593a† Data were transformed with log10 (x + 0.5), original means are presented in the table‡ Means with the same letter do not differ significantly at p <0.05a non-treated control
in cabbage. Reducing the duration of hot water treatments may help to improve seed germination.
CONCLUSION Surveyed and examined seedlots from farmers and retail markets from diverse geographical regions of Cambodia (n = 14), Lao PDR (n = 45) and Vietnam (n = 10). Xcc-infected seeds were only found in Lao PDR from northern, southern and central provinces. In Lao PDR, Alternaria infections were found in 16 to 38% of seed lots of major leafy brassicas. Xanthomonas seed infection was not found in seedlots from Vietnam; however, Alternaria infection was found in 70 to 100% of seed lots. Seed infection was lower (0 – 21%) in Cambodia than in the other countries, but conclusions cannot be drawn due to the low number of samples. Xanthomonas campestris pv. campestris and Alternaria spp. are seed-borne pathogens and contaminated seeds can be a major source of disease among provinces within a country and among countries via the seed trade. Also evaluated simple and effective seed treatment methods to eradicate both pathogens and found that hot water treatment at 50 °C for 25 min completely eradicated (99.2 – 100%) both Xcc and Alternaria spp.. The hot water treatment is recommended to growers as an effective seed treatment method. However, seed germination percentage

440
Tabl
e 3.
Eva
luat
ion
of s
eed
treat
men
ts to
redu
ce A
ltern
aria
inoc
ulum
in le
afy
bras
sica
see
ds. S
eedl
ots
one
to th
ree
wer
e co
llect
ed fr
om
Lao
PDR
and
see
dlot
s fo
ur to
six
wer
e fr
om V
ietn
am
Exp
erim
ent 1
Ex
perim
ent 2
Seed
lot
Cro
pN
TC a
1%
NaO
Cl
Hot
wat
erSe
edlo
t M
ean
N
TC1%
N
aOC
lH
ot w
ater
Seed
lot
Mea
n%
See
d In
fect
ion
1C
abba
ge1†
00
0.3c
†
00.
30
0.1d
2C
hine
se c
abba
ge0.
30
00c
0
00
0d3
Pak-
choi
2720
016
a
2428
017
a4
Leaf
y m
usta
rd7
40
3b
117
06c
5C
hoy
sum
67
04b
10
70
5c5
Leaf
y m
usta
rd21
220
14a
16
290.
315
b
Trea
tmen
t Mea
n
11a†
9b0c
10a
11a
0.1b
%
See
d G
erm
inat
ion
1C
abba
ge92
8869
83c
87
8965
80c
2C
hine
se c
abba
ge94
100
9797
a
9210
085
92a
3Pa
k-ch
oi88
9288
89b
90
8685
87ab
4Le
afy
mus
tard
7085
7276
a
5967
6162
c5
Cho
y su
m90
8888
89b
89
9186
88ab
6Le
afy
mus
tard
8386
8183
c
7981
7980
cTr
eatm
ent M
ean
86
b90
a83
c
83
a85
a77
b
† D
ata
wer
e tra
nsfo
rmed
with
log1
0 (x
+ 0
.5),
orig
inal
mea
ns a
re p
rese
nted
in th
e ta
ble
‡ Means with the same letter d
o not differ significantly at P
<0.
05a n
on-tr
eate
d co
ntro
l
441
was reduced in cabbage seed lots treated with hot water. Seed germination percentage was not reduced in other crops. Further research is required to specify the duration of hot water treatment to effectively eradicate seed-borne infection without negative impact on germination.
ACKNOWLEDGEMENTS Funding for this research was provided by the Federal Ministry for Economic Cooperation and Development (BMZ/GIZ) and core donors to the World Vegetable Center: Republic of China (Taiwan), UK Department for International Development (DFID), United States Agency for International Development (USAID), Australian Centre for International Agricultural Research (ACIAR), Germany, Thailand, Philippines, Korea and Japan.
REFERENCESBerg, T., Tesoriero, L. and Hailstones, D.L. (2005). PCR-based detection of Xanthomonas
campestris pathovars in Brassica seed. Plant Pathology 54: 416 – 427Buntong, B. and Vanndy, M. (2009). Problems and needs of leafy vegetable value
chains in selected upland areas in Cambodia and available country interventions. In: Acedo Jr. A.A. and Weinberger, K. (Eds.) Best practices in postharvest management of leafy vegetables in Greater Mekong Subregion countries. Proceedings of a GMS workshop 25 – 27 October 2007, Hanoi, Vietnam. AVRDC Publication No. 09 – 731. AVRDC-The World Vegetable Center, Taiwan, pp 2 – 8
Chanthasombath, T. (2009). Problems and needs of leafy vegetables in value chains in selected upland areas in Lao PDR and available country interventions. In: Acedo Jr. A.A. and Weinberger, K. (Eds.) Best practices in postharvest management of leafy vegetables in Greater Mekong Subregion countries. Proceedings of a GMS workshop 25 – 27 October 2007, Hanoi, Vietnam. AVRDC Publication No. 09 – 731. AVRDC-The World Vegetable Center, Taiwan pp 9 – 16
Degenhardt, K.J., Petrie, G.A., Morral, R.A.A., (1982). Effects of temperature on spore germination and infection of rapeseed by Alternaria brassicae, A. brassicicola and A. raphani. Canadian Journal of Plant Pathology 4: 115 – 118
Department of Agriculture, (2011). Department of Agriculture Yearly Report 2011, Ministry of Agriculture and Forestry, Vientiane, Lao PDR.
Eden, P.A., Schmidt, T.M., Blackemore, R.P. and Pace, N.R. (1991). Phylogenetic analysis of analysis of Aquaspirillum magnetotacticum using polymerase chain reaction amplified 16S rRNA specific DNA. International Journal of Systematic Bacteriology. 41: 324 – 325
Ellis, M.B. (1971). Dematiaceous Hyphomycetes. Common-wealth Mycological Institute, Kew, UK
Huang, J.W., Sun, S.K. and Wu, R.H. (1981). Studies on semi-selective medium and survival of cruciferous black spot pathogens, Alternaria brassicicola and A. brassicae. Plant Protection Bulletin 23, 279 (in chinese)
442
Huong, P.T.T., Everaats, A.P., Neeteson, J.J. and Struik, P.C. (2013). Vegetable production in the Red River Delta of Vietnam. I. Opportunities and constraints. NJAS-Wageningen Journal of Life Sciences 67: 27 – 36
Kocks, C.G., Zadoks J.C. and Ruissen, M.A. (1999). Spatio-temporal development of black rot (X. campestris pv. campestris) in relation to initial inoculum levels in field plots in the Netherlands. Plant Pathology 48: 176 – 188
Nega, E., Ulrich, R., Werner, S. and Jahn, M. (2003). Hot water treatment of vegetable seed-an alternative seed borne pathogens in organic farming. Journal of Plant Disease Protection 110: 220 – 234
Reis, A. and Boiteux, L.S. (2010). Alternaria species infecting Brassicaceae in the Brazilian neotropics: Geographical distribution, host range and specificity. Journal of Plant Pathology. 92: 661 – 668
Rijlaarsdam, A., Woudt, B., Simons, G., Koenraadt, H., Oosterhof, J., Asma, M., Buddiger, P., Roorda, P., Grimault, V. and De Koning, J. (2004). Development of specific primer for the molecular detection of Xanthomonas campestris pv. campestris in Brassica seeds. Seed ScienceTechnology. 33: 115 – 125
Roberts, S.J. and Koenraadt, H. (2014). 7 – 019a: Detection of Xanthomonas campestris pv. campestris on Brassica spp. The International Seed Testing Association (ISTA).http://seedtest.org/upload/cms/user/SH-07-019a-2014.pdf. Retrieved on February 1, 2014.
Simmons, E.G. (2007). Alternaria: An Identification Manual. CBS Biodiversity Series, No. 6. Utrecht, The Netherlands
Van Bilson, J., Cockerell, V., Roberts, S.J. (2014). 7-001b: Malt agar method for the detection of Alternaria dauci on Daucus carota (carrot). The International Seed Testing Association (ISTA). https://www.seedtest.org/upload/cms/user/SH-07-001b-2014.pdf Retrieved on February 1, 2014
443
Trichoderma as a Biocontrol Agent for Tomato and Chilli Production
Nur Liyana, I. and Shazalwardi, S.Crop and Soil Science Research Centre, Malaysian Agricultural Research and Development Institute (MARDI), MARDI Headquarters, Persiaran MARDI-UPM, 43400 Serdang, Selangor, MalaysiaE-mail: [email protected]
Abstract Plant diseases caused by pathogenic fungi may result in significant yield losses of agricultural crops. In Cameron Highlands, tomato and chilli are the second and fourth largest of plantation area after cabbage with plantation area about 800 and 300 hectare. Late blight disease is affecting the tomato yield production, as this disease can attack the plant part including stem, leaves and fruits. Anthracnose disease caused by Colletotrichum sp. has been known to be a serious problem faced in chilli cultivation. Losses can occur in the field, during transit and storage. The use of biological control of with beneficial microorganisms to control diseases of vegetable crop has gained attention among farmers and vegetable producers in Malaysia. Excessive and prolonged usage of pesticides is dangerous and leads to adverse impact on human health and the environment. In vitro efficacy studies have shown 100% inhibitory effect performed by Trichoderma asperellum on the growth of anthracnose disease of chilli and late blight of tomato. Thus, the objectives of this study were to determine the effectiveness of talc formulation of Trichoderma to control disease of chillies and tomatoes in the field and to identify the most effective way of application of the biological control agent. Seed coating, root dip and media treatment with T. asperellum were used to identify the best method of application. It was found that the seed coating prevented the anthracnose infection of the seedlings in the nursery up to 90% as compared to untreated seeds. Root dip and media treatment of tomato seedlings were able to reduce the infection up to the stage of fruiting. At the post harvest stage, tomato and chilli fruits treated with T. asperellum delayed the disease infection up to 14 days as compared to untreated fruits with Trichoderma. This indicated that Trichoderma is effective as an alternative to chemical pesticide to control anthracnose of chilli and late blight of tomato.
Keywords: Trichoderma, biocontrol, late blight, anthracnose, formulation
INTRODUCTION Agriculture industry has been facing destructive activities of numerous pests and pathogens which lead to reduction in yield of crops. The extensive use of synthetic chemicals has raised a number of health and environment problems. Therefore, from the last two decades, scientists have directed their attention towards the potential of beneficial microbes which are environmentally safe. The successful use of fungi as biocontrol agents such as Trichoderma for the control of foliar and soil borne diseases in several crops have been reported. For successful disease control, establishment of formulation and delivery to the site of infection is very important. Though Trichoderma has a very good potential in the management of diseases, it could not be used as spore suspension under field conditions. The culture of Trichoderma should be immobilized in certain carriers

444
and should be prepared as formulations for easy application, storage, commercialization and field use (Kumar et al., 2014). In this study, Trichoderma asperellum was formulated in talc powder formulation and was applied to manage late blight disease of tomato and anthracnose disease of chilli. In an eaelier study, Trichoderma asperellum showed 100% of inhibition effects on the growth of Colletotrichum capsici and Phytophthora infestans in in vitro study and in this study, its effectiveness in controlling both diseases in the field. The inoculums of T. asperellum was produced by using liquid fermentation and subsequently formulated in talc powder. It was applied to the plant as early as at the seed, seedling stage and in preparation of the growing media. Therefore, the objective of this study was to evaluate the application methods of T. asperellum talc powder to control anthracnose of chilli (causal agent: Colletotrichum capsici) and late blight of tomato (causal agent: Phytophthora infestans) in the field.
MATERIAL AND METHODS
In vitro study This study was conducted in Plant Pathology Laboratory and in the experimental plot di MARDI Cameron Highlands. The assay for antagonism was performed on potato dextrose agar (PDA) in petri dishes by the dual culture method. The mycelia plugs (0.5 cm diameter) of pathogens, P. infestans and C. capsici and antagonist, T. asperellum were placed in the same petri dish, 6 cm from each other. Observation on the inhibition of growth of fungal pathogen was recorded after three days of incubation. For comparison, PDA plates were inoculated with only the fungal pathogen. Percentage of reduction in growth was calculated using the following formula (Begum and Nath, 2015):
The percentage of inhibition growth (%) = (R-r / R) x 100,
Where R represents the radius of the control pathogens and r the radius of the pathogen’s growth towards the antagonist fungal pathogen.
Preparation of talc-based formulation A 5 mm mycelia disc of T. asperellum was inoculated into 500 ml of sterilized molasses yeast broth and incubated at room temperature (28 ± 2 °C) for 15 days. 10 g of carboxyl methyl cellulose (CMC) was added to one kg of talc powder and mixed well and the mixture was autoclaved for 30 minutes on each of two consecutive days. Five hundred ml of T. asperellum mass were mixed with sterilized talc powder under aseptic conditions and the spore concentration was adjusted to 1.5 x 10⁸ cfu g-1. After shade drying overnight, the formulation was packed in polypropylene bag and sealed (Karthikeyan et al., 2006).

445
Delivery and field evaluation of T. asperellum for disease management For successful diseases control, delivery and establishment of T. asperellum to the site of action is very important. The methods of application of T. asperellum in this study were seed coating, media treatment and seedling dip. In this study, T. asperellum formulated in the form of talc powder was used for the management of tomato and chilli diseases. The technique used was seed coating, media treatment and seedling dip (Figure 2). The talc was mixed with water in advance and used for soaking seeds and roots of tomato and chilli seedlings for 30 minutes before being transferred into the polybags. For media preparation, the media were mixed with soil and chicken manure or dung in polybags before transferring the one month old seedlings. For disease incidence evaluation, all growing media were artificially inoculated with the pathogens. The percentage of seed germination, post emergence mortality and disease incidence were evaluated. Disease incidence was calculated as follow (Cooke, 2006):
Number of fruit/leaves infected% Fruit/leaves infected = ––––––––––––––––––––––––– x 100 Total fruit/leaves counted
Figure 1. Plate confrontation test of T. asperellum against; A) P. infestans and B) C. capsici performed on PDA medium (100% inhibition by arrow mark in A and B)
Figure 2. Application and treatment used with T. asperellum talc powder; A) seed coating; B) media treatment and C) seedling dip

446
RESULTS AND DISCUSSION Results showed 100% of inhibition effects of T. asperellum on the growth of both pathogen, P. infestans and C. capsici (Figure 1). The potential of T. asperellum as a biocontrol agent to both diseases was developed into a talc powder formulation. The availability of an effective and cheap method to mass produce Trichoderma spp. is essential for commercial use of Trichoderma as a biopesticide. There are abundant literature on the use of expensive conventional synthetic media like glucose, cellulose, soluble starch and mollases to mass produce Trichoderma spp. In this study, we used talc powder and carboxymethyl cellulose to formulate the desired biofungicide. Seed coating with Trichoderma was one of the easiest and effective methods of delivering the antagonist for the management of seed or soil-borne diseases. Seed is coated with Trichoderma just before sowing. Seedling roots were treated with Trichoderma by dipping roots in Trichoderma talc powder solution before transplanting. Root dipping not only reduces disease severity but also enhances seedling growth in chilli and capsicum (Singh and Zaidi, 2002). Delivering of Trichoderma spp. in to soil will increase the population dynamics of augmented fungal antagonists and thereby would suppress the establishment of pathogenic microbes onto the infection court. Soil application of organic preparation of Trichoderma was effective in managing seed borne pathogenic fungi such as Fusarium oxysporum, F. solani, Botryodiplodia theobromae, Alternaria alternata and Rhizoctonia solani (Mustafa et al., 2009). It was found that T. asperellum talc formulation successfully reduced the incidence of both diseases. It was found that 87.3% and 90.6% of tomatoes and chilli seeds coated with T. asperellum successfully germinated (Table 1). After 4 weeks of observation, less mortality emergence occurred for seeds treated with Trichoderma as compared to non-treated seeds. This suggests that coating can protect the seeds from disease infection preferably seed borne disease. Media treatment was suggested as the most appropriate methods for tomato late blight disease as the pathogen is soil borne. According to Kumar et al., (2014), Trichoderma colonize farm yard manure (FYM) and therefore, application of colonized FYM to the soil is more appropriate and beneficial. The addition of chicken dung and soil with talc formulation into the growing media is suggested as most effective method of application of Trichoderma particularly for the management of soil-borne diseases. For seedling dip method, four week old tomato seedlings were uprooted and were dipped in T. Asperellum talc solution for 30 minutes before being transferred into polybags which has been inoculated with the pathogens earlier. It was found that seedlings treated using the technique of root dipping and media preparation showed lower disease incidence (Table 2). From this study, it can be suggested that the use of biopesticide has significantly brought down the disease incidence as compared to check i.e., pathogen treatments. Biopesticides can be a substitute for pesticides to a certain extent. They can bring down the pesticide load to a great extent. This shows the great potential of this biofungicide to be used at once to replace and reduce the use of chemical pesticides.

447
Table 1. Effect of seed coating treatment on seed germination and emergence mortality of tomato and chilli seeds as compared to non coating seeds
Treatment Seed coating treatment
Seed germination (%) Emergence mortality after 30 days (%)Tomato chilli Tomato chilli
Tricho + pathogen 87.3a 90.6a 5.27a 4.38a
Patogen only 40.7b 38.7b 21.8b 19.6b
* values followed by different letters within a column differ significantly, p <0.05
Table 2. Effect of seedlings dip, media preparation and azoxystrobin on late blight and anthracnose disease incidence on tomato and chilli
Treatment Seedlings dip Media treatment
Tomato late blight
chilli anthracnose
Tomato late blight
chilli anthracnose
Trichoderma + pathogen 20.3b 25.3a 18.3a 28.3b
Pathogen only 69.7b 71.9c 78.3b 58.7c
Amistar (active ingredient: Azoxystrobin)
16.8a 24.7a 15.6a 22.8a
* values followed by different letters within a column differ significantly, p <0.05
CONCLUSION This is the first study conducted for determining the efficient methods of Trichoderma application in controlling tomato late blight and chilli anthracnose diseases in Malaysia. Seed coating is a promising method in controlling anthracnose, while for soil borne disease it is suggested to use soil treatment and seedling dip methods. An important aspect in the success of biological control is the formulation and application of effective systems to enhance the ability of these agents in controlling the disease. There is potential to use these formulations in other crops and further studies have to be taken up in this regard. It is shown that all the methods tried in the experiment gave a significant diseases reduction as compared to nontreated plants. The results have also indicated that it will be necessary to apply weekly sprays for highly effective control for both diseases.

448
REFERENCESBegum, S. and Nath, P.S. (2015). Eco-friendly management of anthracnose of chilli
caused by Colletotrichum capsici. Journal of Applied and Natural Science 7 (1): 119 – 123
Cooke, B.M. (2006). Disease assessment and yield loss. In: Cooke, B.M., Gareth Jones, D. and Kaye, B. (Eds.), The Epidemiology of Plant Diseases, 2nd edition,. Springer, pp: 43 – 80
Kumar, S., Thakur, M. and Rani, A. (2014). Trichoderma: Mass production, formulation, quality control, delivery and its scope in commercialization in India for the management of plant diseases. African Journal of Agricultural Research. 9(53): 3838 – 3852
Singh, U.S. and Zaidi, N.W. (2002). Current status of formulation and delivery of fungal and bacterial antagonists for disease management in India, pp 168-179. In: Microbial Biopesticide Formulations and Application (Eds Rabindra RJ Hussaini SS Ramanujam B) Project Directorate of Biological Control, Bangalore P. 269
Mustafa A., Khan, M.A. and Inam-ul-Haq, M., Khan, S.H. and Pervez, M.A. (2009). Mass multiplication of Trichoderma spp. on organic substrate and their effect in management of seed borne fungi. Pakistan Journal of Phytopathology. 21(2): 108 – 114

449
Improving Visibility and Effectiveness of the International Vegetable Training Course to Promote Sustainable Production, Nutrition and Livelihoods
Shriniwas, G.1, Supisra, A.1, Somchit, P.1, Sorawit, L.1, Fenton, B.1 and Maureen, M.1 World Vegetable Center East and Southeast Asia/Oceania, Thailand 2 World Vegetable Center, Taiwan
Abstract The International Vegetable Training Course (IVTC) is the World Vegetable Center’s annual training program being held in Thailand since 1982 and has benefited 850 agriculture research and development professionals from almost 50 countries. The course is structured in three interrelated modules lasting four weeks each, with the first focusing on production, the second on postharvest and the third on development issues to encompass the whole value chain from “Seed to Harvest to Table and Beyond”. Vegetables are vital for human nutrition and provide attractive revenues per unit area for producers. Careful, knowledge-intensive management helps to reap such benefits. The IVTC was established to provide such knowledge through participatory learning with expert resource persons. Over the years the Center has learned significant lessons from implementing the course. We are assessing the course structure and curriculum to make it more visible and to realign its focus to emphasize sharing credible information on sustainable production, marketing and consumption of vegetables. This will help ensure the course effectiveness and can achieve the intended impact. The new IVTC web portal (ivtc.avrdc.org) enables greater visibility for global recruitment, improved outreach to stakeholders and demand-driven topic selection. Feedback from participants and agricultural experts will be synthesized to enrich the IVTC curriculum with topics on biodiversity, sustainable and resilient production, nutrition and gender. These additions will equip participants with more comprehensive knowledge to better address poverty and malnutrition issues though the promotion of sustainable vegetable production, consumption and market linkages in developing countries.
Keywords: vegetable, training, production, nutrition, livelihoods
INTRODUCTION Vegetables are vital for human nutrition and provide attractive revenues per unit area for producers. Careful and knowledge-intensive management helps to reap such benefits. The World Vegetable Center (WorldVeg) started its Thailand based five-month vegetable training program in 1982 but the course duration was shorted to three months in 2006 (Keatinge et al., 2013).The training is available to trainees from all nations and 850 agriculture research and development professionals from almost 50 countries have benefited. The training course currently called International Vegetable Training Course (IVTC) is WorldVeg’s only annual training program and is structured in three interrelated modules each of four weeks duration, with the Module I focusing on production, Module II on postharvest and Module III on development issues to encompass the whole value chain from “Seed to Harvest to Table and Beyond”.

450
IVTC strives to refine its curriculum regularly to educate the participants on potential of the vegetable sector to alleviate poverty and malnutrition in the developing world. As illustrated in the IVTC’s impact pathway in Figure 2, the goal of the course is to develop cadre of vegetable experts who can promote sustainable production and consumption of nutritious and health-promoting vegetables for better income and better health ultimately resulting better livelihood.
MATERIALS AND METHODS1. IVTC web-portal, promotional materials, user-friendly online registration for greater
visibility, outreach and networking.2. Review of past curriculum and survey of participants and experts for curriculum
refinement. Figure 3 illustrate the course refinement approach adopted. About 30% of the curriculum has been revised, based on feedback from the 34th
IVTC participants and WorldVeg experts. New topics focus on sustainable production, postharvest issues and value chains and nutrition and food safety. A quarter of each module is reserved for on-site visits.
1. Periodic assessment of training effectiveness and impacts. Databases of past and current IVTC participants are being compiled. This list will
be used for online surveys, to ensure that the IVTC impact pathway is realized to address poverty and malnutrition in developing countries. Figure 4 shows database organization and processes for impact assessment of IVTC.
Figure 1. Global distribution of the past participants (1982 – 2015)

451
Figure 2. IVTC impact pathway
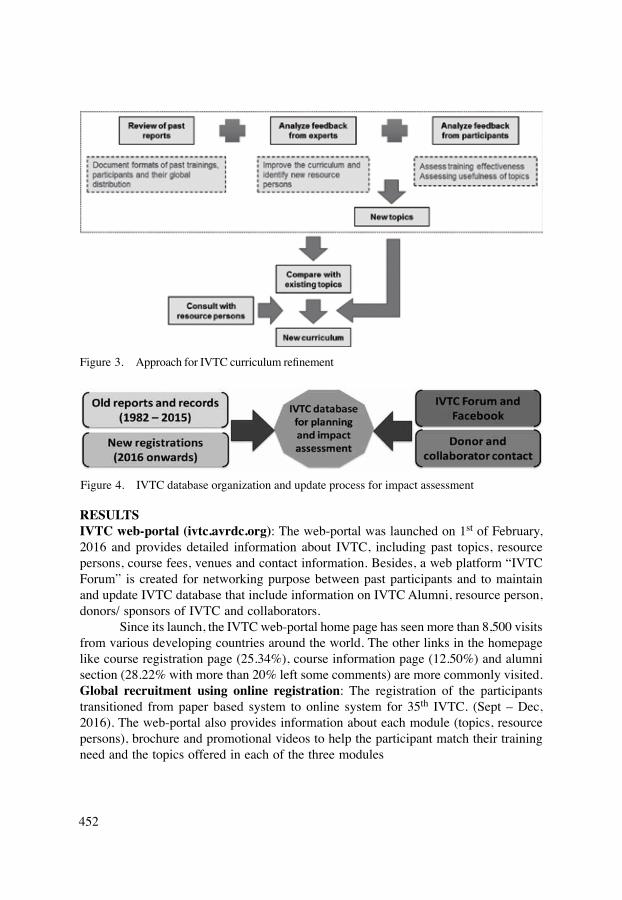
452
RESULTSIVTC web-portal (ivtc.avrdc.org): The web-portal was launched on 1st of February, 2016 and provides detailed information about IVTC, including past topics, resource persons, course fees, venues and contact information. Besides, a web platform “IVTC Forum” is created for networking purpose between past participants and to maintain and update IVTC database that include information on IVTC Alumni, resource person, donors/ sponsors of IVTC and collaborators. Since its launch, the IVTC web-portal home page has seen more than 8,500 visits from various developing countries around the world. The other links in the homepage like course registration page (25.34%), course information page (12.50%) and alumni section (28.22% with more than 20% left some comments) are more commonly visited. Global recruitment using online registration: The registration of the participants transitioned from paper based system to online system for 35th IVTC. (Sept – Dec, 2016). The web-portal also provides information about each module (topics, resource persons), brochure and promotional videos to help the participant match their training need and the topics offered in each of the three modules
Figure 3. Approach for IVTC curriculum refinement
Figure 4. IVTC database organization and update process for impact assessment

453
Refinement of curriculum: The initial feedback collected from past participants and vegetable experts suggest for realignment of the curriculum as follows: 1. Continue focus on sustainable production, revise and add topics on human nutrition
including topics on home and community gardening and safe vegetable production.2. Enhanced focus on value chain and postharvest operations to ensure better revenues
for small scale farmer for improved livelihood through sustainable production and marketing of vegetables.
3. Put more emphasis on hands-on sessions through demonstrations, practical and on-site visit and trainings to show technologies and improved practices in action.
Heeding to these feedbacks collected from the participants and experts, the following changes have been made in 35th IVTC (2016) compared to 34th IVTC (2015):1. 30% of the topics in the curriculum are either revised or are new topics.2. Number of sessions has been added in topic areas like sustainable production,
postharvest and value chain, nutrition and food safety issues related to vegetables (Figure 6).
3. In comparison to previous years, 35th IVTC will spend more time on practical sessions and on-site trainings. Of the four weeks for each module, one week will be devoted exclusively for on-site visits.
4. IVTC database will be created. This will start from compiling data on IVTC alumni, topics and resource persons, donor/sponsors and collaborators from previous years (based on reports and documents) and will be updated every year. This database will be used for regular assessment of training effectiveness and impact evaluation through online surveys.
Picture 1. IVTC Web-portal main page (right) and online registration form of the 35th IVTC (left)

454
Source: From web access
Figure 5. Geolocation of IVTC web-portal visitors (As of August, 2016)
Picture 2. IVTC promotional video (left) and 35th IVTC brochure (right)
Figure 6. Comparison of number of sessions for selected topic areas for 34th and 35th IVTCRemark: 1 session = 1.5 hours and 1 day = 4 sessions

455
DISCUSSION The IVTC web-portal will be a means to overcome the distance barrier to reach more diversified, global audient, especially the growing demographic of educated youth and technology-savvy agricultural professionals in developing world outside East and Southeast Asia where IVTC is relatively less known. IVTC database of IVTC clients (participants, donors, collaborators, resource persons) will help for robust planning, monitoring and evaluation of IVTC. Since, training is not the end but only the means to attend the intended impacts, it is essential to scientifically evaluate the impacts made by the IVTC trained cadre in addressing poverty and malnutrition issues in developing countries. The IVTC database of Alumni will be valuable for such impact evaluation. Online surveys of these alumni will be a cost-effective approach for bottom-up planning and evaluation of IVTC on regular basis. Initial responses from limited participants and experts provide some indication on the need to realign the course structure and curriculum. It is essential to reach out to more participants and stakeholders to periodically reassess the content and approach, improve visibility and ensure IVTC responds to the global challenges of poverty and malnutrition though sustainable production, distribution and consumption of vegetables especially in the developing world.
CONCLUSION Vegetable production requires careful, knowledge-intensive management. The IVTC is building a cadre of global professionals to promote sustainable vegetable production, consumption and market linkages in developing countries and to address issues of poverty and malnutrition. The new IVTC web portal (ivtc.avrdc.org) enables greater visibility for global recruitment, improved outreach to stakeholders and demand-driven topic selection. Feedback from participants and agricultural experts will be synthesized to enrich the IVTC curriculum with topics on biodiversity, sustainable and resilient production, nutrition and gender. These additions will equip participants with more comprehensive knowledge to better address poverty and malnutrition issues though the promotion of sustainable vegetable production, consumption and market linkages in developing countries. With these improvements on web-based outreach, continuous course refinement, a database of engaged alumni and other clients and ongoing impact assessment, the IVTC will be positioned as a global leader in vegetable training.

456
ACKNOWLEDGEMENT Funding was provided by the WorldVeg Innovations Fund through core donors to the World Vegetable Center: Republic of China (ROC), United Kingdom Department for International Development (DFID), United States Agency for International Development (USAID), Australian Centre for International Agricultural Research (ACIAR), Germany, Thailand, Philippines, Korea and Japan.
REFERENCESKeatinge, J.D.H., Luther, G.C., Holmer, R.J., Easdown, W.J., Tenkouano, A., Mavlyanova,
R., Mecozzi, M. (2013). Acknowledging gender in providing knowledge resources and capacity building for men and women to support smallholder horticulture in the developing world over the last 40 years by AVRDC. [online] Available at
http://www.globalhort.org/media/uploads/File/Learning/HQ_Keatinge%20et%20al_AVRDC-Summerland13.pdf [Accessed 05 May 2015]

457
Videos to Enhance Local Vegetable Seed Production Knowledge and Improve Livelihoods for Small-Scale Farmers in Papua New Guinea
Philmah, S.W.1, Svein, O.S.2, Julien, C.2, Gregory, C.L.2, Tien-hor, W.2, Bharath, K.2 and Tania, P.31National Agricultural Research Institute, Papua New Guinea, E-mail: [email protected] Vegetable Center, Taiwan, E-mail: [email protected] Darwin University, Australia, E-mail: [email protected]
Abstract In Papua New Guinea, small-scale farmers’ access to good quality vegetable seeds is limited. Major distributors of vegetable seeds often lack adequate quantities of seeds and many available varieties are not tested under local conditions. To move forward and diversify production, farmers need to understand the best methods for vegetable seed production, saving and storage to sustainably maintain their seed stocks for food and income security. Farmers are now able to access videos and factsheets of simple step-by-step instructions on seed production targeted especially for them, by using smart phones. Smart phones are becoming increasingly popular among people in rural areas of Papua New Guinea. Videos are an engaging medium for farmers to gain new knowledge. To facilitate development with this available technology, simple, short video clips emphasizing how to cultivate, harvest, process and store seeds of crops like amaranth (Amaranthus spp.), black nightshade (Solanum spp.), eggplant (Solanum Melongena), pumpkin (Cucurbita spp.) and tomato (Solanum Lycopersicum) were developed and shared with farming communities. The video clips are accessible online and can easily be shared. With access to improved seed production techniques through simple step-by-step videos, farmers will be empowered to sustainably maintain their vegetable seed stocks and improve their livelihoods. This work is integrated into a broader context of efforts to develop vegetable production in Papua New Guinea.
Keywords: biodiversity, germplasm, seed system, quality seeds, open pollinated seeds, smartphone, technology dissemination, vegetables, videos
INTRODUCTION Quality seeds of adapted and improved varieties are the most important technology required for improving crop productivity and ensuring food security in developing countries (FAO, 2001). Adapted and improved crop varieties available to farmers at the right time will make a significant contribution to yield increase necessary to meet the demands of a growing global population. High quality seeds of adapted and improved varieties are essential to increase the efficiency in use of nutrients and water; increase resistance to insect pests and diseases and provide greater tolerance to drought, flood, frost and higher temperatures associated with climate change; improve nutritional value and quality and improve provision of ecosystem services (FAO, 2001). A case study on “Plant Genetic Resources Access and Utilization: Understanding and Contributing

458
to Sustainable Livelihoods in Lao PDR”, showed that there are gaps between farmer needs and access to seeds (FAO, 2007). Some examples that illustrate linkages between access to seeds and livelihood strategies are the demands from consumers in city markets which require farmers to look for crop varieties with new traits and quality standards of seeds that cannot be produced by and accessed in local seed systems. Farmers need to rely on quality hybrid seed that is imported. These seeds become external inputs over which farmers have little control. Farmers reported that generally, seed supply is ad hoc and the main source of vegetable seed is through the import from private sector companies. The disadvantage of imported seed is that it is not well adapted to their agro-ecological conditions, thereby increasing the risk of crop failure compared to local varieties. Increasing intensive market oriented farming leaves fewer resources available for the cultivation of local crop varieties; as a result the genetic base of crops cultivated under these intensive systems is becoming narrow (FAO, 2007). Farmers in Papua New Guinea also share these challenges identified. Hence, for seed-saving purposes, farmers in Papua New Guinea and other developing countries can save true-to-type seed from quality open-pollinated varieties, but not hybrids. Open-pollination is when pollination occurs by insect, bird, wind, humans, or other natural mechanisms. Because there are no restrictions on the flow of pollen between individuals, open-pollinated plants are more genetically diverse. This can cause a greater amount of variation within plant populations, which allows plants to slowly adapt to local growing conditions and climate year-to-year. As long as pollen is not shared between different varieties within the same species, then the seed produced will remain true-to-type year after year. Hence, as a part of addressing the issue of having access to quality seeds in Papua New Guinea, a small project on utilizing Information and Communication Technology (ICT), especially videos through smart phones to train local farmers on seed production and saving techniques using quality open pollinated seeds from the World Vegetable was embarked on. Information and Communication Technology in agriculture also known as e-agriculture is developing and applying innovative ways to use ICTs in the rural domain, with a primary focus on agriculture (Wikipedia, 2016). In this context, ICT is used as an umbrella term encompassing all information and communication technologies including devices, networks, mobiles, services and applications; these range from innovative Internet-era technologies and sensors to other pre-existing aids such as fixed telephones, televisions, radios and satellites (Wikipedia, 2016). In this project we focus on videos to be distributed through mobile phones as a means of dissemination of improved technologies of seed production and saving. Research has shown that there are now almost as many mobile phones in the world as there are people, but great variations in access to mobiles between different parts of the world. In many developing countries, the percentage of households with mobile phones is far greater in urban areas than in the countryside (Uphoff, 2012). That is not to say that at least farmers in the rural areas do have access to some kind of mobile phone. Most farmers in the rural areas of Papua New Guinea have very little education, thus, a video may say more than a thousand words especially being so in a local language

459
that is understood by most of the farmers. Videos are an engaging medium for farmers to gain new knowledge, especially for those who are not inclined to read extensively. Therefore, the aim of this project is to address farmers’ access to quality seed of new varieties through enhancement of skills and knowledge of improved technologies of seed production and saving through simple, easy to follow videos that can be viewed on smart phones. This project will enable farmers to gain information and share within their communities to enable access to quality seeds of plant varieties to farmers to enable increase crop productivity, food security and economic development.
MATERIALS AND METHODS Five crops were selected as target crops: amaranth (Amaranthus spp.), nightshade (Solanum spp.), eggplant (Solanum melongena), pumpkin (Cucurbita spp.) and tomato (Solanum lycopersicum) (Table 1). These vegetables were selected because although they are amongst the more popular demanded by consumers, seed suppliers as well as farmer’s local seed supply are limited. The video footages were taken at the World Vegetable Center in Taiwan (23 °N, 120 °E). Footages of seed production of these crops were taken at the seed regeneration field of the Genetic Resources and Seed Unit (GRSU) while video footage of the processes of seed harvesting, extracting and storage were taken at the GRSU laboratories. The video footages were taken in March 2016 and were published in June – July 2016. The videos were made using Adobe Premiere Pro software. The profile was a low-cost footage where text and comments were translated
Table 1. Species selected for production of videos
Species Traditional use, nutritional value and seed production challengesAmaranth (A. hypochondriacus,A. cruentus, A. tricolor,A. hybridus)
Leaves and seeds used. Rich in vitamins and minerals. The plants produce a lot of seed, but the seeds need to be dried and stored properly. Storage in a dry, cool place helps to maintain seed viability.
Black nightshade(Solanum spp.)
Leaves and fruits used. High concentration of vitamins and minerals. Seeds need to be washed out from fruits and then dried and stored properly.
Pumpkin (Cucurbita spp.)
Fruits used, shoots are also consumed. Rich in β-carotene and other nutrients. Seeds need to be scraped out of fruits and cleaned and dried properly. Most commercial cultivars are hybrids and not possible or not recommended for seed saving.
Eggplant(Solanum melongena)
Fruits used. Rich in β-carotene and other nutrients. Most commercial cultivars are hybrids and not possible or not recommended for seed saving. Seeds need to be washed out as for nightshade.
Tomato(Solanum lycopersicum)
Fruits used. Rich in β-carotene, lycopene and other nutrients. Most commercial cultivars are hybrids and not possible or not recommended for seed saving.

460
into four different languages. The videos have been shared with farmer communities and tested during farmer field days. The feedback was positive but so far we have no data on how the videos have made impact on the livelihood of small-scale farmers.
RESULTS AND DISCUSSION The videos were produced in English, French, Indonesian and Tokpisin. The latter is the common language in Papua New Guinea. The videos are available on line and can be accessed on You Tube and the World Vegetable Center’s website. They can be downloaded from: http://www.youtube.com/WorldVegetableCenter ; http://avrdc.org/saving-seed/ These videos can be used for free information sharing among farmers, agricultural extension workers, schools or other learning alliances through school projects, extension work, farmer’s training and on-farm trials conducted by seed companies, national research institutes and or other international and local organizations. As much as possible, smallholder farmers in developing countries in the tropical region need to be empowered with access to improved seed production techniques and knowledge. These techniques and knowledge are crucial for farmers to sustainably maintain their vegetable seed stocks for conserving diversity within a plant population for maintenance of germplasm. Seeds of adapted varieties are a prerequisite for any plant production. Ideally, farmers should have access to high-yielding, locally-adapted and tested varieties and the access should be stable over time. In practice this is not always the case. Seed companies tend to focus on the major crops. Traditional vegetables and especially the indigenous ones are not among these, or if so, the varieties may not have been tested locally. Hence, seed companies, national research institutes and international organizations should work together to address this. In order to maintain their seed stock or produce seeds for a seed company, farmers should be equipped with proper knowledge, in this case how to cultivate, harvest, process and store seeds. Such knowledge can be shared in a modern society where videos can be disseminated through smart phones which are becoming increasingly popular among rural residents in developing countries like Papua New Guinea. Technology dissemination through a video may say more than a thousand words. The current work with seed production videos is included in a broader context to develop vegetable production in developing countries and to empower smallholder and household gardeners, especially women (UNFPA, 2007). Indeed, knowledge on seed production is essential to meet the grand challenges ahead for global agriculture and videos and smart phones can be used to effectively disseminate such knowledge.
CONCLUSION Smart phones are common, also in rural areas of developing countries. In such areas access to good quality seeds may be limited, especially for minor crops such as the traditional vegetables. Short video clips have been developed and shared with farming communities, emphasizing how to produce and store seeds. The videos are part of a broader work on developing vegetable production in Papua New Guinea.

461
ACKNOWLEDGEMENT The financial support of the Australian Government through the Australian Centre for International Agricultural Research, Project Number HORT/2012/084 is gratefully acknowledged.
REFERENCESFAO. (2007). Farmer access to seeds and their contribution to sustainable rural livelihoods in the Vientiane Province of Lao PDR, available at www.fao.org/biodiversity (Last
retrieved 27 September, 2016)FAO. (2001). World Seed Project, available at www.un.org/en/ecosoc/julyhls/pdf13/
imp_forum_fao.pdf (Last retrieved 27 September, 2016).Uphoff, Norman. (2012). Empowerment of farmers through ICT. ECOSOC Expert Group Meeting on Promoting Empowerment of People in Advancing Poverty Eradication, Social Integration and Decent Work for All, UN HQ, NYC, September 10 – 12, 2012
Wikipedia, (2016). Information and Communication Technology in Agriculture, available at https://en.wikipedia.org/wiki/Information_and_communications_technology_in_agriculture (Last retrieved 27 September, 2016)
UNFPA, (2007). Women’s Economic Empowerment: Meeting the Needs of Impoverished Women, available at http://www.unfpa.org/public/global/pid/382 (Last retrieved 31 August, 2016)

462
Evaluation of Botanical Pesticides Against Insect Pests of Tomato Under Semi- Protected Structure in The Philippines
Manipon, A.O. Aganon; C.P. and Nicolas, R.R.Central Luzon State University Science City of Munoz, Nueva Ecija, PhilippinesE-mail: [email protected]
Abstract Greenhouse technology provides unique opportunity in producing high quality vegetables whether in-season (dry) or off-season (rainy). This technology showcases application of modern agricultural technology for increased production efficiency and income for high value crops and off-season vegetables in a piece of agricultural land. The research is aimed to evaluate botanical pesticides against insect pests of tomato. The botanical pesticides treatments evaluated were: T1 = Hot Pepper, T2 = Wood Vinegar, T3 = Hot Pepper + Wood Vinegar, T4 = Organic Herbal Extract, T5 = Organic Herbal Extract + Hot Pepper and T6 = Hot Pepper + Wood Vinegar + Organic Herbal Extract. Treatments were applied at the rate of T1 =50 ml HP/liter of water, T2 = 20 ml WV/liter of water, T3 = 50 ml HP + 20 ml WV/liter of water, T4 = 20 ml OHE/liter of water, T5 = 20 ml OHE + 50 ml HP/liter of water and T 6 = 50 ml HP + 20 ml WV + 20 ml OHE/liter of water. Applications of botanical pesticides were done at weekly interval and insect pest count was done one day before and three days after treatment. Percent control, yield and yield components and cost and return analysis were determined. Results showed that there were insignificant differences on the number of days to first picking of fruits, number of fruits/plant and number of fruits/kg. However, these organic pesticides and the combinations of Organic Herbal Extract + Hot Pepper and Hot Pepper + Wood Vinegar significantly reduced the population of leaf miner, whiteflies, aphids and cutworm three days after spraying. Regarding the adjusted yield per hectare, application of Organic Herbal Extract + Hot Pepper recorded the highest yield/ ha (89.8 tons/ha). The lowest yield of tomato was noted on treatments applied with Hot Pepper + Wood Vinegar (80.4 tons/ha). Cost and return analysis showed that the highest net income of Php 12, 216.62/100 m2 was obtained by application of Organic Herbal Extract + Hot Pepper and the cost of production was Ph 3.42/kg.
Keywords: Protected structure, high value, botanical pesticides, botanical extracts, cost and return
INTRODUCTION Greenhouse is a structure covered with a transparent polyethylene plastic material for admitting natural light for plant growth. Greenhouse technology provides unique opportunity in producing high quality vegetables whether in-season (dry) or off-season (rainy). This technology showcases application of modern agricultural technology for increased production efficiency and income by growing high value crops/off-season vegetables in a small piece of agricultural land.

463
OBJECTIVES The research undertaken aims to evaluate botanical pesticides against insect pests of tomato. Specifically the study would like to come up with the best combination of botanical pesticides for insect pest control and to determine the cost and return analysis using botanical pesticides in tomato production.
METHODOLOGY A listing of organic pesticides and biological control agents together with the manufacturers was taken from FPA, Organic Producers and Traders Association (OPTA) and Organic Certification Center of the Philippines (OCCP). A written request to the manufacturers was sent for a plant visit. During plant visit of the researchers, a representative from FPA present with the team to make visit legal. Samples of the different pesticides and biological control agents were evaluated for potency evaluation. Evaluation was done in the form of testing the compound for the control of insect pests and diseases. To carry out the evaluation, the test crops were tomato, pak-choi, cucumber and broccoli in that cropping sequence. The organic pesticides were applied to control/suppress different pests and diseases attacking the plants. Percent insect control and percent suppression were used as indicators of potency and effectiveness. Moreover, the mode of action was also be noted by observing the insect pests for one to five days after application. This was also carried out for biological agents intended for specific pests and crops. All observations were recorded. At the end of the project, a compendium of organic pesticides would be prepared and published with the corresponding manufacturer, active ingredients, target pest and mode of action. Furthermore, continuous formulation of botanical pesticides was undertaken throughout the duration of the project by utilizing botanical plants such as yellow ginger, native hot pepper, mint, sunflower leaf extract and other herbs and botanicals. The developed formulations were evaluated for their potency against insect pests and diseases. Percent pest control, yield and yield components were collected and analyzed using analysis for randomized complete block design. A correlation between yield and percent pest control by the different formulations was made.
Treatments: T1 – Hot Pepper (HP) T2 – Wood Vinegar (WV) T3 – Hot Pepper + Wood Vinegar T4 – Organic Herbal Extract (OHE) T5 – OHE + HP T6 – HP + WV + OHE

464
Data gatheredNumber of days to 1st pickingNumber of fruits/plantNumber of fruits/kgComputed yield/haInsect pest count
RESULTS AND DISCUSSIONS As shown in Table 1, there was no significant difference between treatments Hot Pepper, Wood Vinegar, Hot Pepper + Wood Vinegar, Organic Herbal Extract, Organic Herbal Extract + Hot Pepper and Hot Pepper + Wood Vinegar + Organic Herbal Extract with reference to the number of days for first picking of fruits, number of fruits/plant and number of fruits/kg. In terms of adjusted yield/ ha, application of Organic Herbal Extract + Hot Pepper produced significantly highest yield/ha (89.8 tons/ha), followed by application of Hot Pepper + Wood Vinegar + Organic Herbal Extract (85.8 tons/ha). However, similar yields were produced with the application of Hot Pepper and Wood Vinegar alone (83.1 and 82.7 tons/ha, respectively). The lowest yield was noted with the application of Hot Pepper + Wood Vinegar (80.4 tons/ha).
Table 1. Days to 1st picking, number of fruits/plant and number of fruits/kg as affected by the different botanical pesticides
TreatmentDays to 1st picking
No. of fruits per plant
No. of fruit to a kg
Adjusted Yield/plot/ha (t)
T1-Hot Pepper (HP) 70a 38a 26a 83.1cdT2-Wood Vinegar (WV) 70a 37a 27a 82.7cdT3-HP + WV 69a 39a 28a 80.4dT4-Organic Herbal Extract 71a 37a 29a 83.4bcT5-OHE + HP 73a 41a 25a 89.8aT6-HP + WV + HP 71a 40a 28a 85.8bIn a column, means followed by a common letter are not significantly different at the 5% level of DMRT

465
Tabl
e 2.
Num
ber o
f Lea
f min
ers
one
day
befo
re a
nd th
ree
days
afte
r spr
ayin
g as
affe
cted
by
diffe
rent
bio
pest
icid
es
Trea
tmen
t1st
Spr
ayin
g2nd
Spr
ayin
g3rd
Spr
ayin
g4th
Spr
ayin
g5th
Spr
ayin
g6th
Spr
ayin
g7th
Spr
ayin
g
1 D
B3
DA
1 D
B3
DA
1 D
B3
DA
1 D
B3
DA
1 D
B3
DA
1 D
B3
DA
1 D
B3
DA
T1-H
ot P
eppe
r(H
P)4
24b
4a1c
2abc
3cd
2.3a
5b0.
0c6b
1bc
5ab
2bc
T2-W
ood
Vin
egar
(WV
)31
1c1b
6a0c
7a1.
0b2b
1.0a
b3c
0c5a
b2b
c
T3-H
P +
WV
42
11a
0b5a
b2a
bc5b
c1.
7ab
4b1.
0ab
2cd
3a3b
4ab
T4-O
rgan
ic H
erba
l Ex
tract
30.
31b
c0b
2bc
0.0b
c2d
0.3b
21a
2.7a
7ab
3a7a
1c
T5-O
HE
+ H
P3
21c
0b3a
bc0c
6ab
1.7a
b1b
1ab
0d0c
3b1c
T6-H
P +
WV
+ O
HE
41
11a
0b4a
bc4a
4bc
1.5a
b2b
2.3a
9a0c
3b2b
c
In a colum
n, means fo
llowed by a common letter are not significantly different at the 5% level of D
MRT
Table 3. Num
ber o
f whiteflies one day before and three days after spraying as affected by different biopesticides
Trea
tmen
t1st
Spr
ayin
g2nd
Spr
ayin
g3rd
Spr
ayin
g4th
Spr
ayin
g5th
Spr
ayin
g6th
Spr
ayin
g7th
Spr
ayin
g
1 D
B3
DA
1 D
B3
DA
1 D
B3
DA
1 D
B3
DA
1 D
B3
DA
1 D
B3
DA
1 D
B3
DA
T1-H
ot P
eppe
r(H
P)1.
70.
40.
70.
42.
71.
61.
31.
42.
8ab
0.3b
3.0b
1.8
1.3a
0.4
T2-W
ood
Vin
egar
(WV
)2.
01.
20.
72.
44.
02.
42.
31.
62.
0a1.
3b1.
0b0.
61.
3a1.
2
T3-H
P +
WV
0.3
0.2
2.0
1.2
2.0
1.2
2.3
1.0
0.8b
0.3b
2.0b
1.2
0.3a
b0.
2
T4-O
rgan
ic H
erba
l Ex
tract
1.0
0.6
5.3
1.2
2.7
1.6
0.7
1.4
1.0b
1.0b
9.7a
5.8
1.0a
b1.
8
T5-O
HE
+ H
P0.
70.
44.
00.
44.
02.
41.
00.
04.
6a1.
0b3.
7ab
2.2
0.0b
0.0
T6-H
P +
WV
+ O
HE
0.7
0.7
3.0
1.8
5.0
3.0
1.0
0.6
2.7a
1.6b
7.2b
1.2
1.3a
1.2
In a colum
n, means fo
llowed by a common letter are not significantly different at the 5% level of D
MRT

466
Tabl
e 4.
Num
ber o
f aph
ids
in c
olon
y on
e da
y be
fore
and
thre
e da
ys a
fter s
pray
ing
as a
ffect
ed b
y di
ffere
nt b
iope
stic
ides
Trea
tmen
t1st
Spr
ayin
g2nd
Spr
ayin
g1
DB
3 D
A1
DB
3 D
AT1
-Hot
Pep
per(
HP)
1.3
0.3
5.0
0.0
T2-W
ood
Vin
egar
(WV
)2.
00.
72.
30.
67T3
-HP
+ W
V1.
30.
31.
00.
0T4
-Org
anic
Her
bal E
xtra
ct1.
00.
31.
71.
3T5
-OH
E +
HP
1.3
0.3
0.7
0.0
T6-H
P +
WV
+ O
HE
3.0
1.0
3.3
0.0
In a colum
n, means fo
llowed by a common letter are not significantly different at
the
5% le
vel o
f DM
RT
Tabl
e 5.
Num
ber o
f cut
wor
m o
ne d
ay b
efor
e an
d th
ree
days
afte
r spr
ayin
g as
affe
cted
by
diffe
rent
bio
pest
icid
es
Trea
tmen
t1st
Spr
ayin
g2nd
Spr
ayin
g3rd
Spr
ayin
g4th
Spr
ayin
g5th
Spr
ayin
g6th
Spr
ayin
g7th
Spr
ayin
g1
DB
3 D
A1
DB
3 D
A1
DB
3 D
A1
DB
3 D
A1
DB
3 D
A1
DB
3 D
A1
DB
3 D
AT1
-Hot
Pep
per (
HP)
10.
5ab
0.5
0a0b
00.
70.
30
00.
51
1ab
0bT2
-Woo
d V
ineg
ar
(WV
)1
1a1
0b0b
00.
71
00
11.
51.
3a2a
T3-H
P +
WV
11a
10c
0b0.
51
0.7
00.
51.
51
0.3a
b0b
T4-O
rgan
ic H
erba
l Ex
tract
0.5
0.5a
b0.
50d
0.5a
b0
1.7
0.3
0.5
02.
50.
40.
7ab
0.3b
T5-O
HE
+ H
P0.
51a
10e
0.5a
b0.
51.
70.
30.
50.
52.
50.
50b
0bT6
-HP
+ W
V +
OH
E0.
00b
0.5
0f2a
0.5
20.
71
0.5
31
0b0b
In a colum
n, means fo
llowed by a common letter are not significantly different at the 5% level of D
MRT
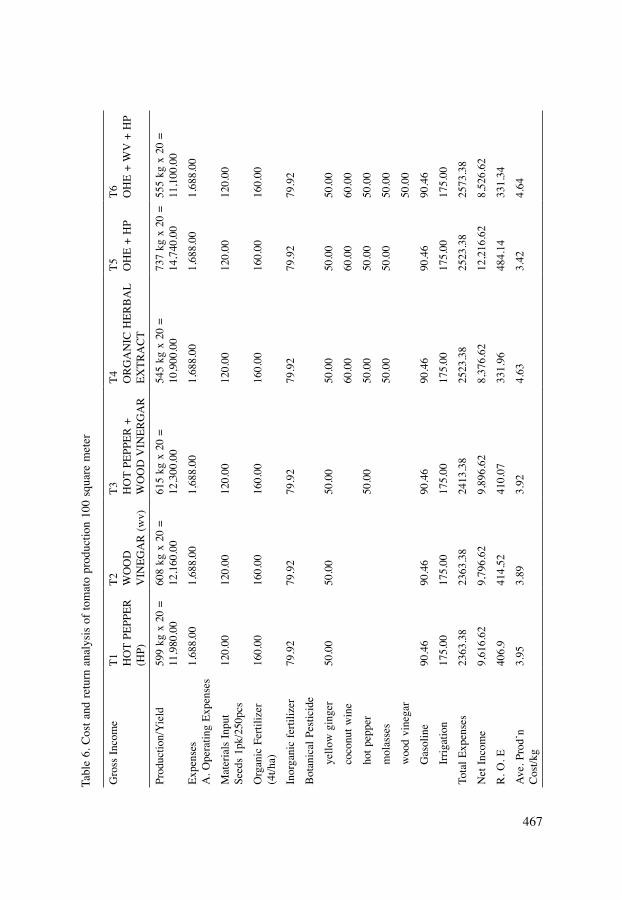
467
Tabl
e 6.
Cos
t and
retu
rn a
naly
sis
of to
mat
o pr
oduc
tion
100
squa
re m
eter
Gro
ss In
com
eT1 H
OT
PEPP
ER
(HP)
T2 WO
OD
V
INEG
AR
(wv)
T3 HO
T PE
PPER
+
WO
OD
VIN
ERG
AR
T4 OR
GA
NIC
HER
BA
L EX
TRA
CT
T5 OH
E +
HP
T6 OH
E +
WV
+ H
P
Prod
uctio
n/Y
ield
599
kg x
20
= 11
,980
.00
608
kg x
20
= 12
,160
.00
615
kg x
20
= 12
,300
.00
545
kg x
20
=10
,900
.00
737
kg x
20
= 14
,740
.00
555
kg x
20
= 11
,100
.00
Expe
nses
A. O
pera
ting
Expe
nses
1,68
8.00
1,68
8.00
1,68
8.00
1,68
8.00
1,68
8.00
1,68
8.00
Mat
eria
ls In
put
Seed
s 1p
k/25
0pcs
120.
0012
0.00
120.
0012
0.00
120.
0012
0.00
Org
anic
Fer
tiliz
er(4
t/ha)
160.
0016
0.00
160.
0016
0.00
160.
0016
0.00
Inor
gani
c fe
rtiliz
er79
.92
79.9
279
.92
79.9
279
.92
79.9
2
Bot
anic
al P
estic
ide
yello
w g
inge
r50
.00
50.0
050
.00
50.0
050
.00
50.0
0
coco
nut w
ine
60.0
060
.00
60.0
0
hot p
eppe
r50
.00
50.0
050
.00
50.0
0
mol
asse
s50
.00
50.0
050
.00
woo
d vi
nega
r50
.00
Gas
olin
e90
.46
90.4
690
.46
90.4
690
.46
90.4
6
Irrig
atio
n17
5.00
175.
0017
5.00
175.
0017
5.00
175.
00
Tota
l Exp
ense
s23
63.3
823
63.3
824
13.3
825
23.3
825
23.3
825
73.3
8
Net
Inco
me
9,61
6.62
9,79
6.62
9,89
6.62
8,37
6.62
12,2
16.6
28,
526.
62
R. O
. E40
6.9
414.
5241
0.07
331.
9648
4.14
331.
34
Ave.
Pro
d’n
Cos
t/kg
3.95
3.89
3.92
4.63
3.42
4.64

468
Insect count Application of different biopesticides significantly reduced the population of different insect pests of tomato like leaf miner, whiteflies, aphids and cutworm. The reduction was observed at three days after each application.
CONCLUSION Combination of organic herbal extracts and hot pepper effectively reduced insect pest populations in tomato resulting in higher yields. Botanical pesticides can be used as an alternative measure in controlling insect pests of tomato
REFERENCESBaimark, Y. and Niamsaa, N. (2009). Study on wood vinegars for use as coagulating
and antifungal agents on the production of natural rubber sheets. Biomass and Bioenergy 33: 994 – 998
Isman, M.B. (2006). Plant essential oils for pest and disease management. Crop Prot. 19: 603 – 608
Isman, M.B. (2006). Botanical insecticides, deterrents and repellents in modern agriculture and an increasingly regulated world. Annu. Rev. Entomol. 51: 45 – 66
Isman, M.B. (2008). Botanical insecticides: for richer, for poorer. Pest Manage. Sci. 64: 8 – 11
Khater, H.F. (2014). Prospect of Botanical Biopesticides in Insect Pest Management. Department of Parasitology, Faculty of Veterinary Medicine, Benha University, Moshtohor, Toukh, 13736, Egypty, Pharmacologia 3 (12):641-656,2012. ISSN 2044 – 4648/ DOI: 10.5567 Copyright ©2012 Science Reuters, UK
Sowmya, B.J. and Sujatha, S. (2012). Insight of botanical based biopesticides against economically important Pest. Intl. J.Phar and life Scs. Nov. 3(11)
Sukontason, K.L., Mulla, M.S., Wongsiri, S., Trumble, J.T. and Murphy, J.R. (2012). Selected Papers from the International Conference on Biopesticides 6 (ICOB6) Psyche-Journal of Entomology. Volume 2012. Article ID 436898, 2 pages

469
SymposiumTechnical Tour

470
Plate 1. Open field planting with sprinkler irrigation system (top) and vagetable planting (bottom)
SEAVEG 2016 TECHNICAL TOUR
The SEAVEG 2016 Symposium ended with two tours to extend participants understanding of the local industry and its management. The two places of interest were Green World Genetics (GWG) situated north of Kuala Lumpur at Batu Arang, Selangor and Titi Eco Farm Resort in the south east of Kuala Lumpur in Jelebu, Negeri Sembilan.
1. Green World Genetics (GWG)In line with the conference objectives, Green World Genetics Sdn. Bhd. (GWG) was selected to expose participants in seed technology production. This local tropical hybrid seed company is located at the foothills of the main range of Malaysia, at Batu Arang, Rawang, Selangor, a 2 hour drive from the conference venue. GWG is the pioneer in hybrid seed production in Malaysia and also delve in the improvement of agricultural produce. Established in 2007, GWG has its own team of plant breeders to execute R&D in order to develop new varieties and increase crop marketability by using superior planting material. Depending on the type of crops, the R&D plots were sited mostly on open fields and in plastic houses with side nettings for protection against pests. Plants are meticulously tagged to enable the breeders to determine the lines of hybrids to be produced. For plants that are sensitive to water requirements (melons for instance) they are placed under the plastic houses. GWG products are Home Garden and Fresh Produce. Home Garden products (Little Garden and Green World), include simple tools for home gardening and vegetable seeds. Home gardeners in Malaysia are familiar with seeds produced by GWG which goes under the brand name of Green World. Fresh produce from the farm are sold under

471
Plate 2. The technique employed for greenhouse planting for melon (left) and sensory evaluation of corn (right)
Plate 3. Display of seeds produced at the facility (top) and fresh produce of field crops, fruits and vegetables (middle and bottom)

472
Plate 1. Upon ar r iva l a t Ti t i Eco Fa rm, participants were b r i e f e d b y t h e farm owner on the overall operation and activities of the farm
the brand name G-Fresh. Seeds and fresh harvest include field crops, fruits, vegetables and flowers. The hybrid seeds developed by GWG are melon, watermelon, maize, sweet corn, cucumber, hot chili, tomato, sweet pepper, and rice. GWG has expanded its operations across the Asia Pacific region. This company is also recognized as one of the very few pioneering organizations that engage in multi-disciplinary crop improvement research program. They are willing to share knowledge on seeds, vegetables, fertilization, growing processes, the equipment (irrigation system, etc.), the techniques of planting, greenhouse and facilities used in the research and commercialization of vegetables, flowers and fruits.
2. Titi EcofarmCovering an area of 40 acres, Titi Eco Farm Resort is nestled in the southern tip of the main range of Malaysia in Jelebu, Negeri Sembilan. After a two hour drive from south east of Kuala Lumpur, participants were greeted by the lush greenery and the breathtaking mountain scenery. Besides being an organic farm, Titi Ecofarm also double up as a resort especially those in need of therapeutic treatment. It is the first organic resort farm and also one of the oldest organic farm in Malaysia. The nearest town, Kuala Klawang, is located 12km away. Its 40 acre farm is organically grown with tropical fruits, vegetables and herbs integrated with fish ponds, poultry, rabbits and goats. Some vegetables were grown under plastic houses of varying size and model. The irrigation

473
Plate 2. During the field visit, participants observed many crops grown under organic scheme and experienced hands-on harvesting of organic vegetable
Plate 3. Few types of field crops grown at Titi Eco Farm
system is fed through use of various sprinklers. A recreational area with flying fox and hanging bridge await those seeking some form of adventure. The management of Titi Eco Farm believes that an ecological balance system is the ultimate way to run an organic farm. As a means of education, visitors not only

474
Plate 4. Structures and nettings used at the farm to protect the crops grown from direct rainfall
Plate 5. Integrated organic farming practice with animals
walk around the resort grounds but they are encouraged to experience organic farming activities. This way the public will be more conscious in caring for the earth, appreciate nature and be concerned on safe, healthy food. All crops in the farm are grown in a chemical-free environment adhering to the IFOAM standards. Titi Eco Farm has an in-house self-monitoring composting system for producing the highest quality organic fertilizer, the key success to the healthy state of crops grown in the farm. All produce are certified by the International Organic Certifier, NASAA. The farm produce such as vegetable and fruits are distributed for sale to some organic shops in the Klang Valley and also at its own Mini Shop at the farm. Processed foods such as curry paste, fruit enzymes and handmade soaps are also sold. Participants visited the compost house and had a fun time petting the rabbits and goats. The participants that were adventurous though, set their adrenaline spiralling
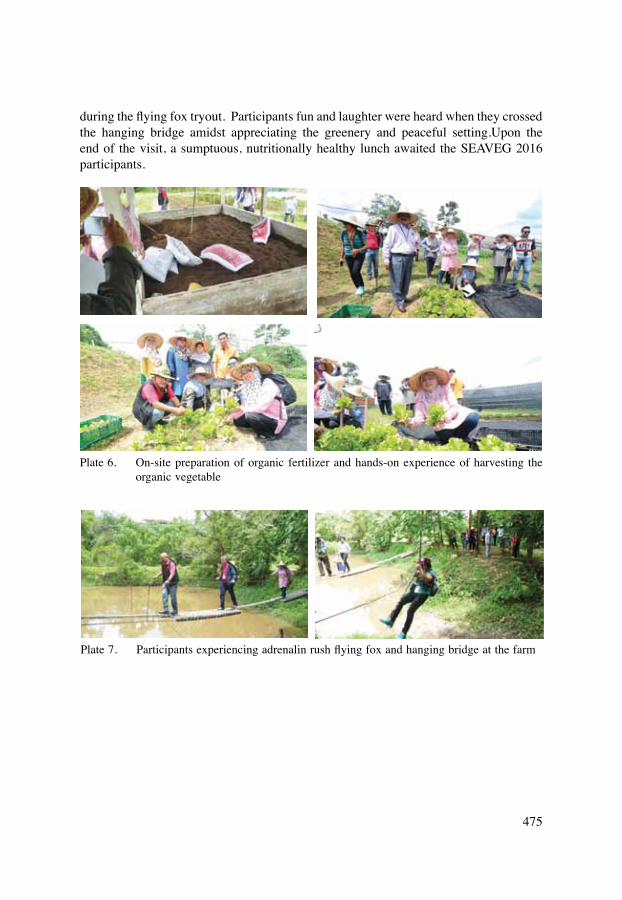
475
Plate 6. On-site preparation of organic fertilizer and hands-on experience of harvesting the organic vegetable
Plate 7. Participants experiencing adrenalin rush flying fox and hanging bridge at the farm
during the flying fox tryout. Participants fun and laughter were heard when they crossed the hanging bridge amidst appreciating the greenery and peaceful setting.Upon the end of the visit, a sumptuous, nutritionally healthy lunch awaited the SEAVEG 2016 participants.

476
Plate 9. Group photograph during the visit
Plate 8. At the end of visit, visitor has been briefed about how to prepare a healthy organic food and lunch was served in the farm

477
SEAVEG 2016 AWARDS
VEGINET INTERNATIONAL AWARD
• VEGINET InternationalAward for 2015 was presented by the Chief Guest, Deputy Minister of Agriculture and Agro-based Industry to Prof. Michael Böhme (Germany).
In the series of VEGINETInternationalAwards, the award for 2015 was presented to Prof. Michael H. Böhme, Senior Researcher, Humboldt University of Berlin, Germany for his outstanding contribution in Vegetable Science on September 06, 2016. The citation was read by Prof. Chengappa, plaque and certificate was handed over to the Chief Guest YB Dato' Nogeh Gumbek, Deputy Minister of Agriculture and Agro-Based Industry (MOA), Malaysia during The Southeast Asian Vegetable Symposium 2016, September 06-08, 2016 at Marriott Hotel, Putrajaya, Malaysia.
• Presentation of awards: The awards by VEGINET, PNASF and MARDI were presented to recipients of best program contributors, oral and poster papers presented. The Closing remark was delivered by Dr. Mohamad Roff Bin Mohd Noor, Deputy Director General, MARDI.
• VEGINET&MARDI/SEAVEG2016AwARDS
TheBestOralPaperofSEAVEG2016was presented to Ms. Sopana Yule, World Vegetable Center, East and Southeast Asia, Kasetsart University, Kamphaeng Saen
Prof. Michael H. Böhme receiving VEGINET International Award-2015 by the Chief Guest

478
MD. Amin Uddin receiving 3rd Best Oral Paper MARDI Award
Ms. Sopana Yule receiving 1st Best Oral Paper VEGINET Award
Dr. Mohinder Singh Dahiya receiving 2nd Best Oral Paper MARDI Award
Campus, Nakhon Pathom, Thailand for the paper entitled, S02-17 “The integrated pest management (IPM) strategy against Bemisia tabaci to control disease caused by Tomato Yellow Leaf Curl Virus (TYLCV) in Thailand and Vietnam.”Dr. Mohinder Singh Dahiya receiving 2nd Best Oral Paper MARDI Award.MD. Amin Uddin receiving 3rd Best Oral Paper MARDI Award.

479
Ms. Joanna Cho receiving 2nd Best Poster Paper MARDI Award
Ms. Suhana binti Omar receiving 3rd Best Poster Paper MARDI Award
TheBestPosterPaperofSEAVEG2016 was presented to Ms. Noor Syafini Binti Ghazali of MARDI. Ms. Joanna Cho Lee Ying received 2nd Best Poster Paper MARDI Award and Ms. Suhana Binti Omar received 3rd Best Poster Paper MARDI Award.

480
Travel Grant to Dr. Grisana Linwattana
•VEGINETTRAVElGRANT
The travel grant to present paper entitled “Application of Vegetable Grafting Technology to Improve Economic and Nutritional Security Under Soil-Borne Disease Outbreak Areas” during SEAVEG 2016 in Kuala Lumpur, Malaysia was granted to senior horticulturist Dr. Grisana Linwattana (Thailand).
•PNASFINTERNATIONAlAwARDS
Awardees with PNASF International Award-2015

481
Dr. Fenton D. Beed receiving the PNASF International Award
Dr. Pauziah Muda receiving the PNASF International Award
Theeba Manickam receiving the PNASF International Award
DuringSEAVEG2016heldinKualalumpurinAugust6-8,2016,thefollowingawardswerepresented.

482
For Outstanding Contribution to SEAVEG 2016 and Vegetables Science to Dr. Fenton D. Beed, Regional Director-East and Southeast Asia, AVRDC-The World Vegetable Center, Bangkok, Thailand presented by Dr. Prem Nath Chairperson, VEGINET and Chairman, SEAVEG.
For Outstanding Contribution to SEAVEG 2016 and Vegetables Science to Dr. Pauziah Muda, Director, Horticulture Research Centre, MARDI, Selangor, Malaysia presented by Dr. Prem Nath Chairperson, VEGINET and Chairman, SEAVEG.
For Outstanding Contribution to SEAVEG 2016 and Vegetables Science to Mrs. Theeba Manickam Senior Scientist MARDI, Selangor, Malaysia presented by Dr. Prem Nath Chairperson, VEGINET and Chairman, SEAVEG.

483
lISTOFPARTICIPANTS
NATIONAlPARTICIPANTS
1. Ah Hong Lim, MARDI, [email protected] 2. Ahmad Fikri Mohd Samsudin, DOA, [email protected] 3. Ahmad Tarmizi, MARDI 4. Akbarudin Nasudin, FAMA 5. Amin Ismail, University Putra Malaysia, [email protected] 6. Amutha Ramadas, Monash University Malaysia, amutha.ramadas@monash edu 7. Anni Mitin, Southeast Asian Council For Food Security and Fair Trade
(SEACON), [email protected] 8. Anuarazman Amirullah, FAMA 9. Aryo Feldman, Crops For The Future, [email protected] 10. Azwan Abdul Rashid, FAMA 11. Chai Keong Ngan, MARDI, [email protected] 12. Chai Koh Heen, GWG 13. Chan Li Jin, Subur Community Gardens, [email protected] 14. Chandradevan Machap, MARDI, [email protected] 15. Chester, Greenearth (Intl) Holdings Sdn Bhd, [email protected] 16. Chin Yin Chong, Nestle Manufacturing (M) Sdn. Bhd., chinyin.chong@
my.nestle.com 17. Chong Jing Kai, Perkin Elmer Sdn. Bhd., [email protected] 18. Chong Seng Kiet, DOA, [email protected] 19. Chua Kim Aik, Green World Genetics, [email protected] 20. Chubashini Suntharalingam, MARDI, [email protected] 21. Dayang Safinah Nayan, MARDI, [email protected] 22. Deena Khaleeda Marhalim, University of Malaya, [email protected] 23. Enrico Perotti, Australian High Commission, [email protected] 24. Erny Sabrina Mohd Noor, MARDI, [email protected] 25. Farah Huda Sjafni Suherman, MARDI, [email protected] 26. Farahzety Abdul Mutalib, MARDI, [email protected] 27. Faridah Hussin, MARDI, [email protected] 28. Faridah Manaf, MARDI, [email protected] 29. Ganisan Krishnen, MARDI, [email protected] 30. Hazila Khalid, MARDI, [email protected] 31. Illani Zuraihah Ibrahim, MARDI, [email protected] 32. Intan Nadhirah Masri, MARDI, [email protected] 33. Izyani Raship, MARDI, [email protected] 34. Jackson, Greenearth (Intl) Holdings Sdn. Bhd., [email protected] 35. Joanna Cho, MARDI, [email protected] 36. Khairatul Azmah Mohamed, MARDI, [email protected]

484
37. Khalid Mustafa, Universiti Kebangsaan Malaysia, [email protected] 38. Khazana Ibrahim, Jabatan Pertanian, Malaysia, [email protected] 39. Meei Kee Chia, Agricultural Chemicals (M) Sdn. Bhd., azleena@agrichem.
com.my 40. Mohamad Fakhri Musa, MARDI, [email protected] 41. Mohamad Norismadi Ishak, FAMA, [email protected] 42. Mohamad Roff Mohd Noor, MARDI, [email protected] 43. Mohamed Hafeifi Basir, MARDI, [email protected] 44. Mohd Aziz Rashid, MARDI, [email protected] 45. Mohd Firdaus Abd Aziz, FAMA 46. Mohd Johaary Abdul Hamid, MARDI, [email protected] 47. Mohd Nazri Baharon, MARDI, [email protected] 48. Mohd Saiful Bahrin Baharudin, FAMA 49. Mohd Seth Selamat, MARDI, [email protected] 50. Mohd Shahril Ahmad Zaki, FAMA 51. Mohd Waznul Adly Mohd Zaidan, MARDI, [email protected] 52. Mohd Zulkhairi Azid, MARDI, [email protected] 53. Muhammad Ridzuan Ariffin, GWG 54. Mustafa Kamal Hanafiah, MARDI, [email protected] 55. Mustaffa Kamal Yusuff, FAMA 56. Najwa Abdul Latif, MARDI, [email protected] 57. Noor Faezah Abdul Jalil, MOH 58. Noor Haslizawati Abu Bakar, MARDI, [email protected] 59. Noor Ismawaty Nordin, MARDI, [email protected] 60. Noor Zainah Adzaly, MARDI, [email protected] 61. Noorsuhaila Abu Bakar, MARDI, [email protected] 62. Nor Ahya Mahadi, MARDI, [email protected] 63. Nor Hazlina Mat Saat, MARDI, [email protected] 64. Nor Sam Alwi, Jabatan Pertanian Malaysia, [email protected] 65. Nor Syahidah Md Sam, MARDI, [email protected] 66. Norfadzilah Ahmad Fadzil, MARDI, [email protected] 67. Norma Hussin, MARDI, [email protected] 68. Norziana Zin Zawawi, MARDI, [email protected] 69. Nur Adliza Baharom, MARDI, [email protected] 70. Nur Azwani Abdul Rahim, Agrobank, [email protected] 71. Nur Izzati Abdullah Suki, University of Malaya, [email protected] 72. Nur Liyana Iskandar, MARDI, [email protected] 73. Nur Syafini Ghazali, MARDI, [email protected] 74. Nurul Atilia Shafienaz Hanifah, MARDI, [email protected] 75. Omran Hashim, MARDI, [email protected] 76. Phebe Ding, UPM, [email protected] 77. Rahayu Anang, MARDI, [email protected]

485
78. Ramli Mat Sani, FAMA, [email protected] 79. Razali Mustaffa, MARDI, [email protected] 80. Rosalizan Md Saleh, MARDI, [email protected] 81. Rosmawati Selamat, Department of Agriculture (DOA) Malaysia,
[email protected] 82. Rosnani Abd Ghani, MARDI, [email protected] 83. Rozhan Abu Dardak, MARDI, [email protected] 84. Rozlaily Zainol, MARDI, [email protected] 85. Ruzainizikri Yaacob, Lembaga Pemasaran Pertanian Persekutuan, ruzainizikri@
fama.gov.my 86. Sakinah Idris, MARDI, [email protected] 87. Sanimah Simoh, MARDI, [email protected] 88. Saufi Hezree Mat Safian, Cmp Global Ventures Sdn. Bhd., cmpgventures@
gmail.com 89. Saw Lay Hoon, GWG 90. Shariah Umar, Department of Agriculture Sarawak, [email protected] 91. Siti Adirah Mohamad Zaidun, MARDI, [email protected] 92. Siti Aishah Hassan, UPM, [email protected] 93. Siti Aisyah Abdullah, MARDI, [email protected] 94. Siti Noor Aishikin Abdul Hamid, MARDI, [email protected] 95. Sobri Abd Hamid, Federal Agricultural Marketing Authority (FAMA), sobri@
fama.gov.my 96. Suhana Omar, MARDI, [email protected] 97. Suhana Safari, MARDI, [email protected] 98. Suriana A. Razak, FAMA, [email protected] 99. Theeba Manickam, MARDI, [email protected] 100. Tun Norbrillinda Mokhtar, MARDI, [email protected] 101. Wan Mahfuzah, MARDI, [email protected] 102. Zaiton Daud, Nutrition Division, Ministry Of Health Malaysia, zaiton_daud@
moh.gov.my 103. Zaulia Othman, MARDI, [email protected]

486
INTERNATIONAlPARTICIPANTS
1. Amin Uddin, Hellen Keller International Bangladesh, [email protected], Bangladesh
2. Aminuzzaman Talukder, Hellen Keller International Cambodia, [email protected], Canada
3. Anil Kumar Anal, Asian Institute of Technology, [email protected], Thailand 4. Aniruddha Roy, USAID/Bangladesh, [email protected], Bangladesh 5. Anna Marie Bahala, World Vegetable Center, [email protected],
Thailand 6. Anothai Choomsai, Green World Genetics, Thailand 7. Arturo Manipon, Central Luzon State University, [email protected],
Philippines 8. Britta Hansen, Horticulture Innovation Lab, [email protected], United States 9. Chengappa Padinjaranda, Institute For Social And Economic Change,
[email protected], India 10. Damian Duggan-Jones, Private, [email protected], New Zealand 11. Daniel Fyffe, Smallholder Agriculture International, daniel.fyffe@optusnet.
com.au, Australia 12. Davis, [email protected], United States 13. Dimple Sokartara, East West Seed, [email protected], Thailand 14. Elizabeth Mitcham, Horticulture Innovation Lab/University Of California 15. Fadhlina Suhaimi, Agri-Food and Veterinary Authority Of Singapore, Singapore,
[email protected], Singapore 16. Fenton Beed, WorldVeg, Thailand, [email protected], Thailand 17. Fred Davies, Texas A and M University, [email protected], United States 18. Gina S.Itchon, Xavier University Philippines, [email protected], Philippines 19. Grisana Linwattana, DOA Thailand, [email protected] 20. Harish Devkota, Nepal – USAID – Kisan Project (Winrock) 21. Hsiao-Pu Chen, World Vegetable Center, [email protected], Taiwan,
Province of China 22. Ina Pinker, Humboldt University Of Berlin, [email protected],
Germany 23. João Carlos Da Silva Dias, University Of Lisbon, [email protected], Portugal 24. John Bowman, USAID, [email protected], United States 25. Kanokwan Rattanamung, World Vegetable Center, kanokwan.rattanamung@
worldveg.org, Thailand 26. Karen Legrand, UC Davis and Royal University Of Agriculture, karen.legrand@
gmail.com, United States 27. Krissada Hongthong, Royal Project Foundation, [email protected],
Thailand

487
28. Kuson Thomma, Office Of Agricultural Research And Development Region 3, [email protected], Thailand
29. Lam Wang Hong, East West Seed, [email protected], Thailand 30. Leilani De Guzman, Saint Louis University, Philippines 31. Marco Wopereis, WorldVeg, Taiwan, [email protected], Taiwan,
Province of China 32. Michael Böhme, Humboldt University Berlin, [email protected].
de, Germany 33. Mike Field, Bangladesh - AVC Project (DAI) 34. Mike Nichols, University Of New Zealand, [email protected],
New Zealand 35. Mohinder Sing Dahiya, CCS Haryana Agricultural University, dr.msdahiya@
gmail.com, India 36. Mukhiddindzhon Nurmatov, USAID Tajikistan Country Office, kanokwan.
[email protected], Tajikistan 37. Nancy Haselow, Hellen Keller International, USA, [email protected], USA 38. Nattaphon Kamon, Highland Research And Development Institute (Public
Organization), [email protected], Thailand 39. Navin Hada, Nepal – USAID 40. Ngui Chin Kam, East West Seed, [email protected], Thailand 41. Nirthadi Basavarajah, University Of Horticultural Science, nbraja2010@gmail.
com, India 42. Nuengruethai Boonmala, Highland Research And Development Institute (Public
Organization), [email protected], Thailand 43. Ong Pang Hwa, Agri-Food and Veterinary Authority Of Singapore, ong_pang_
[email protected], Singapore 44. Pepijn Schreinemachers, World Vegetable Center, pepijn.schreinemachers@
worldveg.org, Taiwan, Province of China 45. Philma Seta -Waken, National Agriculture Research Institute,Papua New
Guinea, [email protected], Papua New Guinea 46. Poon Kasemsap, Thailand – USA – Horticulture Innovation Lab, Kasetsart
University 47. Prem Nath, Vegetable Science International Network (VEGINET),
[email protected], India 48. Ratchada Thongkrailad, World Vegetable Center, ratchada.thongkrailad@
worldveg.org, Thailand 49. Ravza Mavylova, WorldVeg Uzbekistan, [email protected],
Uzbekistan 50. Ra-Yu Yang, World Vegetable Center, [email protected], Taiwan,
Province of China 51. Realm Alis, Hohenheim University, [email protected], Germany 52. Richard Brettell, ACIAR, [email protected], Australia

488
53. Richard Pluke, Fintrac Inc., [email protected], Puerto Rico 54. Rishi Burlakoti, World Vegetable Center, [email protected], Taiwan 55. Rizalina M. Tablarin, Tarlac Agricultural University,Philippines, kleinelizar@
yahoo.com, Philippines 56. Rob Turner, Thailand, USAID Regional 57. Ruben Sakrabani, Cranfield University, [email protected],
United Kingdom 58. Samuel Duyan, Saint Louis University, Philippines 59. Serajul Islam, Bangladesh, AVC Project (DAI) 60. Shakuntala Haraksingh Thilsted, Worldfish, [email protected], Cambodia 61. Shriniwas Gautam, World Vegetable Center, [email protected],
Thailand 62. Sopana Yule, World Vegetable Center, [email protected], Thailand 63. Sorawit Limsiriwat, World Vegetable Center, [email protected], Thailand 64. Stuart Morris, East West Seed, [email protected], Thailand 65. Supisra Arayaphong, World Vegetable Center, supisra.arayaphong@worldveg.
org, Thailand 66. Surender K.Dhankar, CCS Haryana Agricultural University, dhankharsk@
gmail.com, India 67. Sutthinan Prasatsuwan, Department of Agriculture, sorawit.limsiriwat@
worldveg.org, Thailand 68. Sylvia Namazzi, World Vegetable Center, [email protected],
Uganda 69. Tristan Nondah, FAO, Italy, [email protected], Italy 70. Wilawan Khoma, Royal Project Foundation, [email protected],
Thailand

489
UNITEDSTATESAGENCYFORINTERNATIONAlDEVElOPMENT(USAID)https://www.usaid.gov/
EAST WEST SEEDwww.eastwestseed.com
PERKIN ELMER SDN BHD#2.01, Level 2, Wisma Academy, Lot 4A, Jalan 19/1,46300 Petaling Jaya, Selangor, MalaysiaTel: 03-79491118/ 019-3356028
ASIA TURFQUIP SUPPLIES (M) SDN BHDNo.13, Jalan SP 4/3, Taman Subang Perdana, 40150 Shah Alam, Selangor, MalaysiaTel: 603-78463343Fax: 603-78465411
MARDICAMERONHIGHlANDSPeti Surat No. 19, Pejabat Pos Tanah Rata,39007 Cameron Highlands, Pahang, MalaysiaTel: 05-4911255/ 5945Fax: 05-4912170
lISTOFSPONSORSAND EXHIBITORS

490
GREENEARTH (INTL) HOLDINGS SDN BHDGreenearth Intl Holdings Sdn. Bhd.132, Jalan Sultan Alam Shah, 42700 Banting E-mail: [email protected] Tel: 03- 3187 6878Fax: 03-3181 6333
WORLD VEGETABLE CENTER P.O.Box 1010 (Kasetsart University) Bangkok, 10903 Thailand
GREEN WORLD GENETIC No.40, Jalan KIP 10, Taman Perindustrian KIP, Kepong, 52200 Kuala Lumpur, Malaysia.Tel: +603-6277 5570 / 603-6275 9903Fax: +603-6275 9908E-mail: [email protected]
DEPARTMENTOFAGRICUlTURE(DOA)MAlAYSIA Aras 7-17, Wisma Tani, No. 30 Persiaran Perdana, Persint 4,Pusat Pentadbiran Kerajaan Persekutuan, 62624 Putrajaya Malaysia,Tel: 03-88703000 Fax: 603-88885069E-mail: [email protected]

491
ACKNOwlEDGEMENT
The Main Organising Committee for the SOUTHEASTASIAVEGETABlESYMPOSIUM2016(SEAVEG)
expresses gratitude to the following dignitaries and agencies for their support and commitment:
Ministry of Agriculture and Agro-based Industry (MOA), MalaysiaMalaysian Agricultural Research and Development Institute (MARDI), Malaysia
World Vegetable Center (WorldVeg)Vegetable Science International Network (VEGINET)
ASEAN-AVRDC Regional Network for Vegetable Research and Development (AARNET)
Department Of Agriculture (DOA), ThailandDepartment of Agriculture (DOA), Malaysia
Federal Agricultural Marketing Authority (FAMA), MalaysiaGreen World Genetics Sdn. Bhd
Distinguished session chairmen, speakers, poster presenters, participants, participating agencies and institutions
Exhibitors, sponsors and advertisers
United States Agency for International Development (USAID)East West Seed
Perkin Elmer Sdn. Bhd.Asia Turfquip Supplies (M) Sdn. Bhd.Greenearth (Intl) Holdings Sdn. Bhd.
MARDI Cameron Highlands, MalaysiaMalaysian Agricultural Research and Development Institute (MARDI), Malaysia
Department of Agriculture (DOA), MalaysiaGreen World Genetics Sdn. Bhd.
All subcommittee members for their time and efforts
All relevant parties and individuals who have contributed to the success of this event in one way or another.
We look forward to meeting you again
THANKYOUVERYMUCH

492
Malaysian Agricultural Research and Development Institute (MARDI), MalaysiaMARDI HeadquartersPersiaran MARDI-UPM43400 Serdang, SelangorMalaysiaTel: 603-89536000Fax: 603-89536011E-mail: [email protected]
Participants of SEAVEG 2016

Malaysian Agricultural Research and Development Institute (MARDI)AVRDC - The World Vegetable Center
Vegetable Science International Network (VEGINET) Department of Agriculture (DOA), Thailand
ASEAN-AVRDC Regional Network (AARNET)Department of Agriculture (DOA), Malaysia
Federal Agricultural Marketing Authority (FAMA)Green World Genetics (GWG)