Actively Managed Volatility Strategies - CBS Research Portal
Upload
independentCategory
view
0download
0
International Journal for Quality in Health Care 2004; Volume 16, Number 4: pp. 293–301 10.1093/intqhc/mzh057
International Journal for Quality in Health Care vol. 16 no. 4© International Society for Quality in Health Care and Oxford University Press 2004; all rights reserved 293
Variations in risk-adjusted outcomes in a managed acute/long-term care program for frail elderly individualsDANA B. MUKAMEL1, DERICK R. PETERSON2, ALINA BAJORSKA3, HELENA TEMKIN-GREENER3, STEPHEN KUNITZ3, DIANE GROSS3 AND T. FRANKLIN WILLIAMS4
1University of California, Department of Medicine, Division of General Internal Medicine and Primary Care, Irvine, CA, and2Department of Biostatistics,3Department of Community and Preventive Medicine, and 4Department of Medicine, University of Rochester, Rochester, NY, USA
Abstract
Objective. To develop and investigate the properties of three performance measures based on risk-adjusted health outcomesfor a frail, elderly, community-dwelling population enrolled in a managed, acute, and long-term care program.
Design. Retrospective analyses of an administrative dataset containing individual level records with information about socio-economics, health, functional and cognitive status, diagnoses, and treatments. We estimated risk-adjustment models predictingmortality, decline in functional status, and decline in self-assessed health. Each model includes individual risk factors and indicatorvariables for the program site in which the individual enrolled. Sites were ranked based on their performance in each risk-adjustedoutcome, and the properties of these performance measures were investigated.
Setting. Twenty-eight sites of the Program of All-Inclusive Care for the Elderly (PACE) that provide primary, acute, and long-termcare services under capitated Medicare and Medicaid payment to a nursing home certifiable, and functionally and cognitively frailcommunity-dwelling elderly population.
Study participants. Three thousand one hundred and thirty-eight individuals who were newly enrolled between 1 January 1998and 31 December 1999. The average age of these enrollees was 78 years, 27% were male, 50% were diagnosed with dementia,and they had approximately 4 Activities of Daily Living limitations and 7.4 Instrumental Activities of Daily Living limitations.
Main outcome measures. Risk-adjustment models, performance ranking for each site, and correlations between performancerankings.
Results. We present risk-adjustment models for mortality, change in functional status, and self-assessed health status. Wefound substantial variation across sites in performance, but no correlation between performance with respect to differentoutcomes.
Conclusions. The variations in outcomes suggest that sites can improve their performance by learning from the practices ofthose with the best outcomes. Further research is required to identify processes of care that lead to best outcomes.
Keywords: elderly, long-term care, PACE, quality indicators, risk-adjustment
Assessment of quality of medical care based on risk-adjustedhealth outcomes has become an important component ofefforts to evaluate, regulate, and inform consumers about qua-lity [1]. Examples include the New York State Cardiac Surgeryreports, which provide risk-adjusted mortality rates for hospi-tals and surgeons, and the Nursing Home Compare website,which reports on 14 risk-adjusted outcomes. Much of thedevelopment work and reporting to date has focused on insti-tutionalized patients in hospitals or nursing homes. In this
study we apply the risk-adjustment methodology that has beenused in those settings to a frail, disabled population, living forthe most part in the community with the support of a compre-hensive system of care—the Program of All-Inclusive Care forthe Elderly (PACE). We demonstrate that administrative datacollected by each PACE site can be used to measure relativeperformance of sites based on risk-adjusted health outcomes.We examine properties of these measures and the implicationsfor the quality of care that PACE provides its enrollees.
Address reprint requests to Dana B. Mukamel, Department of Medicine, University of California, Division of General Internal Medicine and Primary Care, Irvine, CA, USA. E-mail: [email protected]
at University of P
ortland on May 23, 2011
intqhc.oxfordjournals.orgD
ownloaded from

D. B. Mukamel et al.
294
Description of PACE
PACE offers comprehensive care to frail elderly individualswho are nursing home certifiable, but prefer to remain in thecommunity. It is a managed care program, combining Medi-care and Medicaid capitated payments to cover all the healthcare needs of its enrollees: primary, acute, and long-term care.For detailed descriptions of PACE see Bodenheimer [2] andEng et al. [3]. There are currently >30 sites around the coun-try serving ∼ 10 000 individuals [4]. All sites share the goal ofmaintaining patients in the community as long as possible,through provision of in-home and day care services. All followthe same philosophy of care, emphasizing close relationshipsbetween the primary care providers and the patient, with caregiven by an interdisciplinary team.
Methods
Risk-adjusted health outcomes as measures of quality
Health outcomes are important measures of performance ofmedical care providers because they offer patients the inform-ation that is of most concern to them, i.e. how likely they areto get better if they receive care from a particular provider.Not all outcomes, however, are informative about quality. Forexample, mortality for a terminally ill patient is not a usefuloutcome measure because all patients are expected to die. Forthese patients, a measure based on pain control may be morerelevant. To be useful, performance measures based on out-comes should meet several criteria [5]: the outcome should beof importance to patients and should contribute to their well-being; the outcome can be affected by care and thus influencedby the medical care provider; the outcome-based performancemeasure should account for differences in patient risks that theprovider has no control over, such that programs that haveworse outcomes because they are treating sicker patients are notpenalized; and they should be calculated over a large numberof patients, thus increasing the precision of the measure.
In this paper we investigate three health outcomes: mortality,change in functional status and self-assessed health status. Thesewere chosen because they are central to the well-being ofenrollees and because high quality medical care can be expectedto impact favorably upon each of them. In fact, measures basedon mortality [6] and changes in functional status [5,7] havebeen developed for use in nursing homes, which serve popu-lations similar to PACE.
Patient health outcomes depend on two types of factors:patient risks and the quality of the care the patient receives[8]. Therefore, to be able to make inferences about quality ofcare from information about outcomes, one needs to separatethe effect of patient risks and the effect of quality. This is typi-cally done by statistically modeling the effect of patient risksand provider effect on the outcome, through estimation ofrisk-adjustment models. These models generally assume thatdifferences in outcomes across providers that cannot beexplained by differences in patient risks (i.e. the residual)reflect differences in quality of care. In this paper we estimate
hierarchical risk-adjustment models of the following generalform:
Outcomei,j = f(α + βPRi,j + ΣγjDj + εi ) (1)
where outcomei,j is the outcome experienced by patient iwhen treated in program j (e.g. functional status at 3 monthspost-admission), PRi,j is a vector of risk factors for patient i inprogram j (e.g. age, comorbidities) and Dj are indicator vari-ables for each program j. The functional relationship betweenthe outcome and patient risks may vary, as indicated by thefunction f. In this model, the estimated coefficients for theprogram indicator variables, i.e. the γj, can be interpreted asthe effect of each program, relative to a baseline PACE pro-gram, on the outcome for a patient with the same risk factorsat enrollment. Thus, the γj provide a measure of the quality ofprogram j relative to other programs in the domain that isrelevant to the specific outcome.
Sample
The study included participants from 28 of the 33 existingsites who enrolled between 1 January 1998 and 31 December1999. The sample used for the mortality outcome included3138 participants out of 4006 (78%). Excluded were thosewho left and re-entered (100), those who did not have healthand functional assessment done within 31 days from enroll-ment (598), participants whose data indicated chemotherapyand no cancer (14), and those with more than three riskfactors missing (156). When less than three risk factors weremissing, values were imputed by the site-specific means of theobserved values for each variable.
The measures based on changes in functional status andself-assessed health were based on a subsample of 1874 (68%)new enrollees who had a functional and health assessmentdone at 3 months following enrollment. This subsample wasvery similar to the full sample in terms of all risk factors, ascan be seen in Table 1.
Data and variables
We obtained information about each participant from apatient level administrative database collected by all sites. Allsites used the same variable definitions and all received train-ing in data collection [9]. The dataset included informationabout enrollees’ demographics, socioeconomics, health statusand disability, medical history, utilization of health services,and date of death.
Activities of daily living (ADL) limitations included: bathing,dressing, grooming, toileting, transfer, walking, and feeding.Instrumental activities of daily living (IADL) included: mealpreparation, shopping, housework, laundry, heavy chores, man-aging money, taking medications, and transportation. Cogni-tive status was measured by the number of errors in respondingto the Short Portable Mental Status Questionnaire [10], whichcan range from 0 to 10. The self-assessed health informationwas based on a question asked of the participant with fivepossible responses: excellent (coded as 1), good, fair, poor(coded as 4), and not answered or missing.
at University of P
ortland on May 23, 2011
intqhc.oxfordjournals.orgD
ownloaded from

Performance outcome measures for long-term elderly care
295
Table 1 Risk factors hypothesized to influence the outcome and included in the initial analyses (means and standard deviationsof continuous variables are shown in parentheses)1
continued
Risk factor present at enrollment...................................................................................................................Percent of sample that experiences the risk factor
Sample for mortality outcomes
Sample for functional change and self-assessed health outcomes
.........................................................................................................................................................................................................................
Age (years) 78.57 (9.37) 78.19 (9.45)Male 26.96% 27.37%Living arrangements
Living alone 33.15% 31.64%Spouse 13.30% 12.77%Nursing home 1.98% 1.95%Home with relatives 41.05% 42.09%Other 10.52% 11.55%
EthnicityWhite 46.67% 43.61%Black 30.95% 33.19%Hispanic 14.78% 14.28%Asian 6.54% 7.90%Other 1.06% 1.02%
Education (years) 8.69 (4.21) 8.65 (4.20)Activities of daily living limitations
Bathing 82.88% 82.18%Dressing 68.29% 68.35%Grooming 71.69% 71.50%Toileting 47.90% 48.61%Transfer 44.82% 46.05%Walking 50.54% 51.54%Feeding 29.13% 29.60%
Instrumental activities of daily living limitations (n) 7.40 (1.23) 7.38 (1.27)Incontinence
Urinary 58.77% 58.82%Bowel 27.59% 26.42%
Short Portable Mental Status Questionnaire (number of errors)
4.48 (3.13) 4.51 (3.10)
DiseasesCardiac 77.60% 77.21%Respiratory 19.98% 17.93%Cerebrovascular 29.13% 29.77%Infections 3.25% 3.09%Dementia 50.51% 50.11%Depression 32.50% 31.96%Cancer 10.77% 9.71%Other 95.86% 95.41%
Behavior disordersWandering 12.52% 12.17%Verbal disruption 9.79% 9.50%Physical aggression 5.73% 6.12%Regressive behavior (e.g. childish behavior) 7.97% 7.97%Treatment
Parenteral medication or fluids 10.39% –Nursing treatment such as tube feeding,
parenteral fluids, dialysis, and suctioning– 8.70%
Oxygen daily 4.85% –
at University of P
ortland on May 23, 2011
intqhc.oxfordjournals.orgD
ownloaded from

D. B. Mukamel et al.
296
For the model of functional status outcome, the outcomevariable was defined as the change in the number of ADLlimitations between enrollment and 3 months followingenrollment. For the self-assessed health model, the outcomewas self-assessed health at 3 months following enrollment,adjusted for self-assessed health at enrollment. This is similarto modeling the change in self-assessed health, but is moreefficient in that it allows use of data on participants missingself-assessed health at enrollment, but not at 3 months afterenrollment, without making any assumptions about wheremissing self-assessed health should fall on the ordered scaleof self-assessed health at enrollment. For the mortality model,the outcome was the number of days from enrollment tilldeath, censored at 31 December 1999.
Independent variables included individual characteristics(listed in Table 1) that were chosen by the project clinicians asthose likely to be important determinants of the probability ofeach outcome. Also included were indicator variables for eachone of the sites. These are the variables capturing the per-formance of each site, as discussed above. All risk factorswere measured at the time of enrollment in the program.
Analyses
We estimated three regression models, one for each outcome.All models were based on individual level data (see equation 1above). The probability of mortality was modeled with a semi-parametric Cox proportional hazards model, assuming a com-mon but non-parametric baseline hazard function, so that theeffects of site and participant level risks can be easily summa-rized by the relative hazards. The method of maximum partiallikelihood was used to estimate the Cox regression parameters.Self-assessed health at 3 months and change in functional statuswere modeled linearly, using ordinary least squares.
We initially fit models that included all risk factorshypothesized to influence the outcome. For those predic-tors that were significant at the two-sided significance levelof 0.15, we tested for potential interactions with all otherrisk factors. The final models we present are those thatinclude only risk factors that were significant at the two-sided significance level of 0.05. An F-test, or a likelihoodratio test in the case of the Cox model, was used to test thehypothesis that all non-significant variables were also jointlynon-significant, and can therefore be excluded from themodels.
Results
Table 1 shows averages for all variables used in the initialanalyses. Most variables were included in the initial esti-mation of all three models. The only exceptions were severaltreatment variables. We have included only treatment varia-bles that the project clinicians considered unlikely to be dis-cretionary and therefore not subject to variations in practicestyles.
Tables 2–4 present the estimated models for each of theoutcomes, showing only the estimates for the individual riskfactors. Table 2 presents mortality hazard ratios for each riskfactor. For example, male gender has a hazard ratio of 1.50,indicating that the risk of death of a male enrollee is 50%higher than for a female, the reference group. The risk ofmortality increases with age, being male, being Asian or white,limitations in toileting or walking, more than seven IADLlimitations, cognitive dysfunction as measured by a score >8on the Short Portable Mental Status Questionnaire, poor self-assessed health, bowel incontinence, cancer, diabetes, renalfailure, and daily use of oxygen. The risk of mortality is lower
Table 1 continued
1We report separately for mortality and the two other outcomes because the sample for functional change and self-assessed health were asubset of the mortality sample.‘–’, values are not shown because these variables were not considered to be a risk factor for the respective outcomes and were not includedin the initial analyses.
Risk factor present at enrollment...................................................................................................................Percent of sample that experiences the risk factor
Sample for mortality outcomes
Sample for functional change and self-assessed health outcomes
.........................................................................................................................................................................................................................
Chemotherapy 0.42% –Dialysis 1.28% –Suctioning 0.22% –
Self-assessed healthExcellent 6.88% 7.47%Good 38.18% 37.09%Fair 29.38% 30.58%Poor 11.85% 11.85%Not reported 13.70% 13.02%
Sample size 3138 (430 deaths) 1874
at University of P
ortland on May 23, 2011
intqhc.oxfordjournals.orgD
ownloaded from

Performance outcome measures for long-term elderly care
297
for enrollees who exhibit wandering behavior. The mortalitymodel explained 12.1% of the variation (based on a normal-ized pseudo R2).
Table 3 shows the model predicting changes in functionalstatus within 3 months. The model explained 16.7% of thevariation. A positive coefficient indicates an increase in
Table 2 Mortality risk-adjustment model1
1Estimated model included site indicator variables, not shown.2The hazard ratio is the relative risk of mortality per unit increase in the variable. For example, a male is 50% morelikely to die than a female.3Self-assessed health in this model is defined as a variable that can take the values of 1 = excellent, through 4 = poorand 5 = missing.
Risk factors measured at enrollment Hazard ratio2 P-value...................................................................................................................................................................................
Age (years) 1.03 0.001Male 1.50 0.001Ethnicity (reference group includes blacks, hispanics, and other)Asian or white 1.54 0.001Activities of daily living limitations: toileting and/or walking 1.86 0.001Instrumental activities of daily living limitations >7 1.26 0.070Short Portable Mental Status Questionnaire >8 1.33 0.040Self-assessed health3 1.13 0.006Bowel incontinence 1.22 0.068
Patient with diabetes 1.28 0.021Patient with renal failure 1.71 0.001
Cancer diagnosis and chemotherapy (reference group has no cancer and no chemotherapy)Patients with cancer, no chemotherapy 1.89 0.001Patients with cancer and chemotherapy 11.71 0.001
Daily oxygen 2.59 0.001Patient is wandering 0.68 0.019
Table 3 Functional decline (within 3 months of admission) risk-adjustment model1
1Estimated model included site indicator variables, not shown. The dependent variable is defined as the differencebetween number of activities of daily living at 3 months and enrollment. Thus, higher values indicate decline infunctional status.2The coefficient indicates the average change in number of activities of daily living limitations per unit increase inthe variable. For example, the average participant with bowel incontinence will have an average increase of 0.24activities of daily living limitations compared with a participant who is continent.
Risk factor measured at enrollment Coefficient2 P-value...................................................................................................................................................................................
Age (years) 0.01 0.008Living arrangement (reference group = living alone):
With spouse or other relatives 0.23 0.002In a nursing home 0.76 0.002
Total number of activities of daily living limitations −0.28 0.001Total number of instrumental activities of daily living
limitations (reference group = 8 instrumental activities of daily living limitations)<7 −0.43 0.0017 −0.26 0.004
Short Portable Mental Status Questionnaire 0.05 0.001Patient is wandering −0.25 0.019Bladder incontinence 0.16 0.034Bowel incontinence 0.24 0.004Patients with cancer diagnosis 0.23 0.037
at University of P
ortland on May 23, 2011
intqhc.oxfordjournals.orgD
ownloaded from
D. B. Mukamel et al.
298
number of ADL limitations, i.e. a deterioration in functionalstatus. For example, living in a nursing home increases ADLlimitations at 3 months by 0.76 compared with an enrollee wholives alone. Functional status at 3 months is likely to deterioratefor older individuals, those living with others or in a nursinghome, and those with cognitive dysfunction, bowel or bladderincontinence, or cancer. Individuals entering the program witha higher number of ADL limitations are less likely to experi-ence decline (a ceiling effect), as are those who wander.
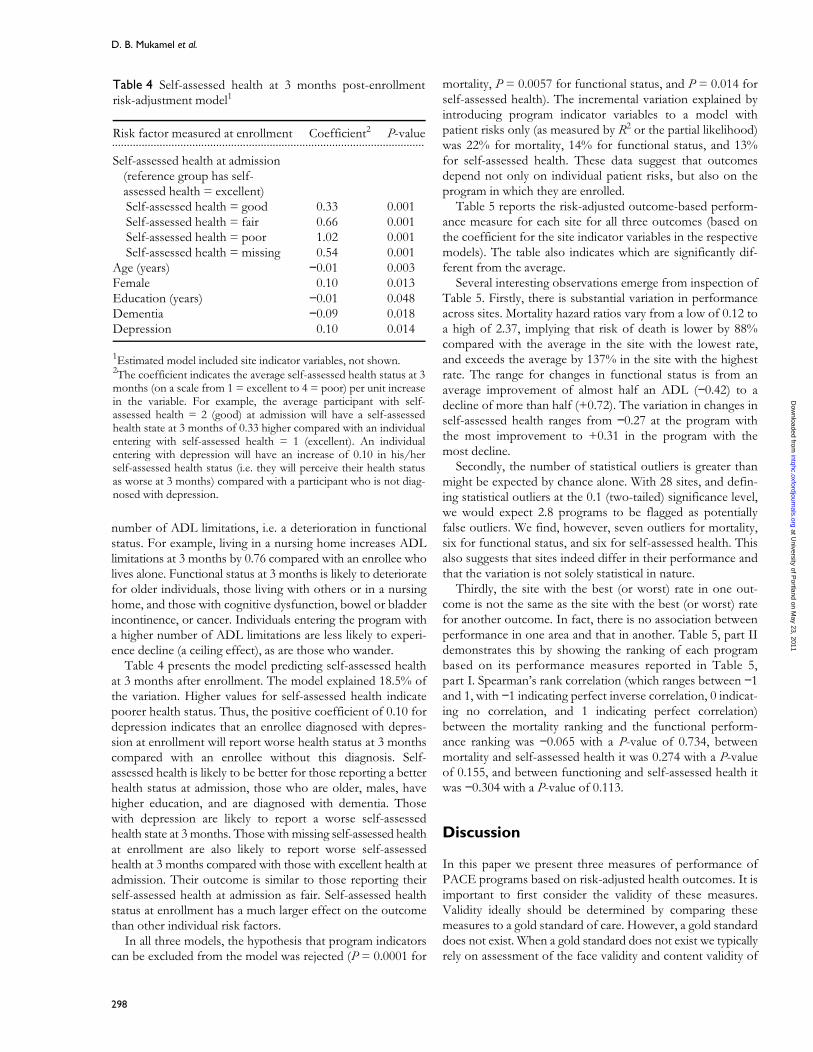
Table 4 presents the model predicting self-assessed healthat 3 months after enrollment. The model explained 18.5% ofthe variation. Higher values for self-assessed health indicatepoorer health status. Thus, the positive coefficient of 0.10 fordepression indicates that an enrollee diagnosed with depres-sion at enrollment will report worse health status at 3 monthscompared with an enrollee without this diagnosis. Self-assessed health is likely to be better for those reporting a betterhealth status at admission, those who are older, males, havehigher education, and are diagnosed with dementia. Thosewith depression are likely to report a worse self-assessedhealth state at 3 months. Those with missing self-assessed healthat enrollment are also likely to report worse self-assessedhealth at 3 months compared with those with excellent health atadmission. Their outcome is similar to those reporting theirself-assessed health at admission as fair. Self-assessed healthstatus at enrollment has a much larger effect on the outcomethan other individual risk factors.
In all three models, the hypothesis that program indicatorscan be excluded from the model was rejected (P = 0.0001 for
mortality, P = 0.0057 for functional status, and P = 0.014 forself-assessed health). The incremental variation explained byintroducing program indicator variables to a model withpatient risks only (as measured by R2 or the partial likelihood)was 22% for mortality, 14% for functional status, and 13%for self-assessed health. These data suggest that outcomesdepend not only on individual patient risks, but also on theprogram in which they are enrolled.
Table 5 reports the risk-adjusted outcome-based perform-ance measure for each site for all three outcomes (based onthe coefficient for the site indicator variables in the respectivemodels). The table also indicates which are significantly dif-ferent from the average.
Several interesting observations emerge from inspection ofTable 5. Firstly, there is substantial variation in performanceacross sites. Mortality hazard ratios vary from a low of 0.12 toa high of 2.37, implying that risk of death is lower by 88%compared with the average in the site with the lowest rate,and exceeds the average by 137% in the site with the highestrate. The range for changes in functional status is from anaverage improvement of almost half an ADL (−0.42) to adecline of more than half (+0.72). The variation in changes inself-assessed health ranges from −0.27 at the program withthe most improvement to +0.31 in the program with themost decline.
Secondly, the number of statistical outliers is greater thanmight be expected by chance alone. With 28 sites, and defin-ing statistical outliers at the 0.1 (two-tailed) significance level,we would expect 2.8 programs to be flagged as potentiallyfalse outliers. We find, however, seven outliers for mortality,six for functional status, and six for self-assessed health. Thisalso suggests that sites indeed differ in their performance andthat the variation is not solely statistical in nature.
Thirdly, the site with the best (or worst) rate in one out-come is not the same as the site with the best (or worst) ratefor another outcome. In fact, there is no association betweenperformance in one area and that in another. Table 5, part IIdemonstrates this by showing the ranking of each programbased on its performance measures reported in Table 5,part I. Spearman’s rank correlation (which ranges between −1and 1, with −1 indicating perfect inverse correlation, 0 indicat-ing no correlation, and 1 indicating perfect correlation)between the mortality ranking and the functional perform-ance ranking was −0.065 with a P-value of 0.734, betweenmortality and self-assessed health it was 0.274 with a P-valueof 0.155, and between functioning and self-assessed health itwas −0.304 with a P-value of 0.113.
Discussion
In this paper we present three measures of performance ofPACE programs based on risk-adjusted health outcomes. It isimportant to first consider the validity of these measures.Validity ideally should be determined by comparing thesemeasures to a gold standard of care. However, a gold standarddoes not exist. When a gold standard does not exist we typicallyrely on assessment of the face validity and content validity of
Table 4 Self-assessed health at 3 months post-enrollmentrisk-adjustment model1
1Estimated model included site indicator variables, not shown.2The coefficient indicates the average self-assessed health status at 3months (on a scale from 1 = excellent to 4 = poor) per unit increasein the variable. For example, the average participant with self-assessed health = 2 (good) at admission will have a self-assessedhealth state at 3 months of 0.33 higher compared with an individualentering with self-assessed health = 1 (excellent). An individualentering with depression will have an increase of 0.10 in his/herself-assessed health status (i.e. they will perceive their health statusas worse at 3 months) compared with a participant who is not diag-nosed with depression.
Risk factor measured at enrollment Coefficient2 P-value..........................................................................................................
Self-assessed health at admission(reference group has self-assessed health = excellent)Self-assessed health = good 0.33 0.001Self-assessed health = fair 0.66 0.001Self-assessed health = poor 1.02 0.001Self-assessed health = missing 0.54 0.001
Age (years) −0.01 0.003Female 0.10 0.013Education (years) −0.01 0.048Dementia −0.09 0.018Depression 0.10 0.014
at University of P
ortland on May 23, 2011
intqhc.oxfordjournals.orgD
ownloaded from

Performance outcome measures for long-term elderly care
299
Table 5 Site average outcomes and ranking, based on models adjusting for individual participant risks
Site1 Mortality2 Functional status change3 Self-assessed health at 3 months4
........................................................................................................................................................................................................................
I. Site average outcomes5
A 0.127 (best) −0.004 0.145B 0.29 −0.128 −0.085C 0.35 0.4107 −0.078D 0.436 0.7168 (worst) −0.114E 0.62 0.002 −0.1686
F 0.68 −0.109 0.000G 0.83 −0.164 −0.114H 0.88 −0.1967 0.1407
I 0.88 0.250 0.020J 0.95 −0.002 −0.210K 0.99 0.015 0.061L 1.04 0.067 0.102M 1.11 −0.203 0.037N 1.11 −0.007 −0.267
O 1.17 0.167 −0.2708 (best)P 1.19 −0.118 0.061Q 1.24 −0.4186 (best) 0.092R 1.34 0.037 −0.006S 1.35 −0.194 0.3078 (worst)T 1.36 −0.148 −0.1717
U 1.44 0.087 −0.006V 1.48 0.020 −0.075W 1.48 −0.3197 0.031X 1.836 −0.089 0.015Y 2.138 0.145 0.072Z 2.168 0.3246 0.028AA 2.168 −0.260 0.195BB 2.378 (worst) 0.119 0.066
II. Site rankings5
A 17 (best) 14 26B 2 9 7C 3 277 8D 46 288 (worst) 6E 5 16 46
F 6 11 13G 7 7 5H 8 56 257
I 9 25 15J 10 15 10K 11 17 19L 12 20 24M 13 4 18N 14 13 27
O 15 24 18 (best)P 16 10 20Q 17 16 (best) 23R 18 19 12S 19 6 288 (worst)T 20 8 37
U 21 21 11V 22 18 9
continued
at University of P
ortland on May 23, 2011
intqhc.oxfordjournals.orgD
ownloaded from

D. B. Mukamel et al.
300
the measures [11]. Face validity relates to whether an indicatorseems to measure the domain of interest. Content validityaddresses the question of whether a measure contains all therelevant items of interest. The measures we developed herehave face validity because they meet the four criteria dis-cussed at the beginning of the Methods section [5]. Their con-tent validity is derived from the large number of risk factorsthat were considered in the initial analyses, although some riskfactors may be limited (e.g. depression tends to be underdiag-nosed). Another aspect of validity, construct validity, which isbased on demonstrating the link between the measures andprocesses of care, is outside the scope of this study. Thus,these measures should not be viewed as fully validated andshould not be used in public reporting of quality of individualsites. They can, however, be useful in guiding efforts tounderstand better the performance of PACE and to identifyopportunities for improvement.
The variations we find in these three health outcomes sug-gest that there is room for improvement in the care practicedin different sites. Programs with the best risk-adjusted out-comes can serve as best practice models for others, thusoffering the opportunity for all to achieve better outcomes.
Translating the variations in outcomes that we find intopractical guidelines that sites can adopt in order to bringabout improvement requires an understanding of the struc-ture and process of care, and of the relationships betweenthem and outcomes. Several approaches to making these link-ages exist. Firstly, clinical and statistical studies of the rela-tionships between structure, process, and outcomes canidentify best practices. For example, studies of the relation-ships between the characteristics of the care team, consideredto be one of the hall marks of the PACE model, and out-comes would help identify ways in which teams can changetheir operations to improve enrollees’ outcomes.
A second approach, which has been in place for some timenow, is to encourage sharing of successful experiences. TheNational PACE Association holds meetings twice a year.Most sites send individuals, including the administrators,
medical directors, directors of nursing, and others. Thesemeetings offer opportunities to share experiences, both formallythrough presentations at scientific meetings, and informallythrough interactions between meeting participants. To enhancethese activities and focus them on quality improvement possi-bilities, the National PACE Association may wish to considerspecific sessions featuring sites with the best outcomes.
Another intervention that has been shown to be effectivein improving outcomes for coronary artery bypass graft sur-geries is to learn by observation. The Northern New EnglandCardiovascular Disease Study Group conducted an inter-vention study, where participating hospitals sent teams toobserve the process in other participating hospitals [12].These visits, in conjunction with training in quality improve-ment techniques and feedback of outcome data to each car-diac surgeon, have led to a decrease in risk-adjusted mortalityrates in these hospitals. PACE could adopt a similarapproach, sending personnel to visit and observe practices inthose sites with the best outcomes.
Implementing a program of learning from the best may becomplicated by the fact that, as suggested by the data, there isno single best program. Those that excel in terms of mortalityare not the ones that excel in terms of functional decline or interms of self-assessed health. This lack of correlation betweenperformance measures for the different outcomes has beenfound in other settings as well: in nursing homes [13], hospi-tals [14], and ambulatory care clinics [15]. Recognizing thismultidimensionality of quality, efforts at improvement alsoneed to be multifaceted, with lessons learned from the best ineach dimension of performance. Furthermore, research isneeded to understand the interactions between processes ofcare that lead to different outcomes and the reasons that theymay not be correlated. For example, for mortality outcomes,information about advance directives may be important.
One additional caveat is noteworthy. In this study we eval-uate short-term outcomes, within 2 years of enrollment formortality and within 3 months for the two other outcomes.Programs’ ability to maintain health over longer periods may
Table 5 continued
1Sites are sorted by ranking for mortality outcome.2Mortality hazard ratio for the average participant in a site relative to the average for all sites.3Change in activities of daily living limitations for the average participant in a site relative to the average for all sites.4Self-assessed health at 3 months post-enrollment for the average participant in a site relative to the average for all sites.5As all the outcomes are adverse (e.g. decline in functional or self-assessed health status), high positive values indicate worse outcomes thanlower values.Ranking significantly different from the average: 60.1 > P > 0.05; 70.05 > P > 0.01; 8P < 0.01.
Site1 Mortality2 Functional status change3 Self-assessed health at 3 months4
........................................................................................................................................................................................................................
W 23 27 17X 247 12 14Y 258 23 22Z 268 266 16AA 278 3 27BB 288 (worst) 22 21
at University of P
ortland on May 23, 2011
intqhc.oxfordjournals.orgD
ownloaded from

Performance outcome measures for long-term elderly care
301
be different, as different processes of care might be requiredfor maintenance as opposed to affecting change within ashort time after enrollment. Thus, this analysis does not pro-vide information about long-term outcomes in PACE and aseparate assessment is required to evaluate this type of care.
Acknowledgements
The Authors gratefully acknowledge financial support fromthe National Institute on Aging (grant no. RO1 AG1755).
References
1. Donabedian A. The quality of care: how can it be assessed?JAMA 1988; 260: 1743–1748.
2. Bodenheimer T. Long-term care for frail elderly people—the OnLok Model. New Engl J Med 1999; 341: 1324–1328.
3. Eng C, Pedulla J, Eleazer GP, McCann R, Fox N. Program of All-inclusive Care for the Elderly (PACE): an innovative model ofintegrated geriatric care and financing. J Am Geriatr Soc 1997; 45:223–232.
4. Gross D, Temkin-Greener H, Kunitz S, Mukamel DB. The grow-ing pains of integrated health care for the elderly: lessons fromthe expansion of PACE. Milbank Mem Fund Q 2004; 28: 257–282.
5. Mukamel DB. Risk adjusted outcome measures and quality ofcare in nursing homes. Med Care 1997; 35: 367–385.
6. Mukamel DB, Spector WD. Nursing home costs and riskadjusted outcome measures of quality. Med Care 2000; 30: 78–95.
7. Rosen A, Berlowitz DR, Anderson JJ, Ash AS, Kazis L,Moskowitz MA. Functional status outcomes for assessment ofquality in long-term care. Int J Qual Health Care 1999; 11: 37–46.
8. Mukamel DB, Dick A, Spector WD. Specification issues inmeasurement of quality of medical care using risk adjusted out-comes. J Econ Soc Measure 2000; 26: 267–281.
9. Mukamel DB, Temkin-Greener H, Clark M. Stability of disabi-lity among PACE enrollees: financial and programmatic implica-tions. Health Care Financ Rev 1998; 19: 83–100.
10. Pfeiffer EA. A short portable mental status questionnaire for theassessment of organic brain deficit in elderly patients. J Am
Geriatr Soc 1975; 23: 433–441.
11. Iezzoni LI. Risk Adjustment for Measuring Health Care Outcomes, 1stedition. Ann Arbor, MI: Health Administration Press, 1994.
12. O’Connor GT, Plume SK, Olmstead EM et al. A regionalintervention to improve the hospital mortality associated withcoronary artery bypass graft surgery. The Northern New EnglandCardiovascular Disease Study Group. JAMA 1996; 275: 841–846.
13. Mukamel DB, Brower CA. The influence of risk adjustmentmethods on conclusions about quality of care in nursing homesbased on outcome measures. Gerontologist 1998; 38: 695–703.
14. Rosenthal GE. Weak association between hospital mortalityrates for individual diagnoses: implications for profiling hospitalquality. Am J Publ Health 1997; 87: 429–433.
15. Gandhi TK, Cook EF, Puopolo AL, Burstin HR, Haas JS,Brennan TA. Inconsistent report cards. assessing the compar-ability of various measures of the quality of ambulatory care.Med Care 2002; 40: 155–165.
Accepted for publication 14 April 2004
at University of P
ortland on May 23, 2011
intqhc.oxfordjournals.orgD
ownloaded from

at University of P
ortland on May 23, 2011
intqhc.oxfordjournals.orgD
ownloaded from
Copyright © 2022 FDOKUMEN


![[2021] 45 IAC 3.1 Adjusted Gross Income Tax - IN.gov](https://static.fdokumen.com/doc/165x107/631ecbe61aedb9cd850feba1/2021-45-iac-31-adjusted-gross-income-tax-ingov.jpg)