Frail homebound elderly: basic nursing challenges of home care
126
Frail homebound elderly: basic nursing challenges of home care A comparative study across 11 sites in Europe Liv Wergeland Sørbye University of Tromsø Faculty of Medicine Department of Clinical Medicine Section for Nursing and Health Sciences February 2009 A dissertation for the degree of Philosophiae Doctor in Health Sciences
-
Upload
khangminh22 -
Category
Documents
-
view
1 -
download
0
Transcript of Frail homebound elderly: basic nursing challenges of home care
Frail homebound elderly: basic nursing challenges
of home care
A comparative study across 11 sites in Europe
Liv Wergeland Sørbye
ISBN 978-82-7589-221-6
Liv Wergeland Sørbye Frail hom
ebound elderly: basic nursing challenges of home care
2009
University of TromsøFaculty of Medicine
Department of Clinical Medicine Section for Nursing and Health Sciences
February 2009
A dissertation for the degree of Philosophiae Doctor in Health Sciences

Frail homebound elderly: basic nursing challenges
of home care A comparative study across 11 sites in Europe
Liv Wergeland Sørbye
A dissertation for the degree of Philosophiac Doctor in Helth Sciences
UNIVERSITY OF TROMSØ
Faculty of Medicine Department of Clinical Medicine
Section for Nursing and Health Sciences

Photo on the front page: Arne Gjone
2
PREFACE
In 2001, the Fifth Framework in the EU gave funding to a European research group called
aged in home care (AD HOC). As an associate member of the group, I took responsibility for
planning and carrying out the Norwegian part of the project.
I was in the process of analysing the data and writing articles when, in the autumn of 2005, I
was granted a sabbatical and chose to become affiliated with the Centre for Research on
Aging in Tromsø. Here I had the opportunity to immerse myself in research related to
municipal health services and began to understand what unique material this was. I had data
from 4,010 home care patients in 11 European countries. At the Centre for Research on Aging
I was inspired to obtain formal research competency, and applied for PhD studies at the
Faculty of Medicine at the University of Tromsø.
This thesis is concerned about home as the arena for care. What happened to those who were
homebound, or in need of extensive assistance to move about outside the home?
Common expressions for home care patients in health administration are ‘older people
receiving home care’ or ‘users’. Research projects are using expressions like participants or
respondents. In the AD HOC study about one third of the sample consisted of older people,
age 65 or more, who were receiving home service; for them, a common international
expression is ‘clients’. About two third of the participants were receiving nursing procedures;
according to the Norwegian nursing association’s guidelines, they are defined as patients.
Liv Wergeland Sørbye
September 2008
3

4
SUMMARY ............................................................................................................................... 7 SAMMENDRAG ....................................................................................................................... 9 ABBREVIATIONS .................................................................................................................. 12
Definition of variables ...................................................................................................... 13 INTRODUCTION .................................................................................................................... 15
Norwegian policy ................................................................................................................. 17 Priorities ........................................................................................................................... 19
User participation - equality and justice ............................................................................... 20 Caregivers ......................................................................................................................... 22
HOME AS THE ARENA FOR CARE .................................................................................... 24 Attachment to home ............................................................................................................. 24 Basic needs ........................................................................................................................... 25 LITERATURE REVIEW ..................................................................................................... 26
Unintended weight loss .................................................................................................... 26 Obesity ............................................................................................................................. 30 Urinary incontinence, and the use of pads and indwelling urinary catheters ................... 34 Faecal Incontinence .......................................................................................................... 39 When basic physiological needs are not met, could the patients be ‘better off elsewhere’? ...................................................................................................... 41 The Resident Assessment Instrument for Home Care (RAI-HC) .................................... 46
SCIENTIFIC APPROACH .................................................................................................. 48 Study Sample and Methods .............................................................................................. 49 The Norwegian contribution ............................................................................................ 50 Results .............................................................................................................................. 54
DISCUSSION ...................................................................................................................... 69 Introduction ...................................................................................................................... 69 Risk factors related to nutrition ........................................................................................ 76
Conclusion ............................................................................................................................ 88 ACKNOWLEDGEMENTS ................................................................................................... 103 ARTICLES 1-VI APPENDIXES
1. RAI-HC 2. Informed consent 3. Legal and ethical approval 4. Appendix tables 5. PhDs from Section for Nursing and Health Sciences
5

6
SUMMARY Background Norway’s official policy is that older people in need of long-term care services should have the opportunity to live in their own homes. The formal health service is responsible for ensuring each individual a private and autonomous life, with security and dignity. The Norwegian system of long-term care is decentralised, with municipalities administering both institutional and community-based care. The Municipal Health Service Act, Social Service Act, and the Patients’ Rights Act govern long-term care on the national level. Objectives The overall purpose of this thesis is to describe, analyse, and compare characteristics of the basic needs (nutrition and elimination) and clinical features of the elderly receiving home care in Europe. During data analysis, the variable ‘homebound’ emerged as a common measure for the research articles that are included in this thesis. Nursing challenges When basic needs of the patients are not met, the situation may be perceived as threatening, and physical or psychosocial distress and illness may result. Meeting patients’ nutrition and elimination needs should be a central concern for nurses in home care. If basic needs are not met for a frail older patient, the question of nursing home placement may arise. A comprehensive geriatric assessment (CGA) is necessary to provide a broad spectrum of variables to better understand patients’ situations. Material and methods This thesis is using data from the aged in home care (AD HOC) project, a cross-sectional population-based study at 11 urban sites in Europe (2001/2003): Copenhagen, Denmark (DK); Helsinki, Finland (FI); Reykjavik, Iceland (IS); Oslo/Bærum, Norway (NO); Stockholm, Sweden (S); Prague, Czech Republic (CZ); Amiens, France (F); Nurnberg/Bayreuth, Germany (D); Monza, Italy (I); Amsterdam, Netherlands (NL); and Maidstone/Ashford, England (UK). Patients 65 years old or older, already receiving home care services within the urban areas selected in each country were randomly sampled; 4,010 respondents participated (refusal rate 19.6%). The comprehensive geriatric assessment Resident Assessment Instrument for Home Care (RAI-HC) was used. This is a widely accepted, standardised, cross-cultural instrument. RAI-HC includes variables assessing patients’ socio-demographic, physical, and cognitive characteristics as well as medical diagnoses and medications. These data were linked to information on care setting, service structure, and service utilisation including both hospitalisation and long term care. Results In the total sample, 74% of participants were women. The mean ages were 80.9 ± 7.5 years for men and 82.8 ± 7.3 years for women. A total of 60.5% of home care patients lived alone; this figure was 73.5% for Oslo and 12.9% for Monza. Nutrition and other health-related factors are discussed in articles I-II. Individuals with a Cognitive Performance Scale (CPS) value > 3 (impaired) had increased risk of unintended weight loss (UWL) (OR = 2.0) compared with those scoring < 3 (less impaired). Only in the oldest group (85 or older) was there a significant association between UWL and reduction in ADL and IADL functions, comparing those who scored 3 or less with those who scored more than 3 (disabled).
7
A binary logistic regression model explained 26% of unintended weight loss: fewer meals per day, reduced appetite, malnutrition, reduced social activity, a flare up of a recurrent or chronic problem, and hospitalisation were important indicators (I). Extreme obesity was assessed in 4.0% of the women. Extremely obese women were, on average, five years younger than their thinner counterparts, and they received home care longer than the non-extremely obese (II). Elimination and health- related factors are discussed in articles III-V. The highest prevalence of urinary incontinence as well as the use of pads was found in Amiens, while the lowest prevalence was found in Helsinki (III). The most frequent use of a urinary catheter was found in Monza; the lowest rates of urinary catheter use were found in Helsinki and Stockholm (IV). Caregivers of individuals with urinary and faecal incontinence reported stress more often than caregivers of continent individuals (III &V). The determining factor for how long an older patient could stay at home was his degree of the faecal continence. Patients with faecal incontinence required the greatest amount of visiting nurse care (V). The highest frequencies of faecal incontinence were in Monza and Amiens. The prevalence of faecal incontinence was low in the Nordic countries (from 4.7% in Helsinki to 11.7% in Copenhagen). In Monza, Amiens, and Nurnberg/Bayreuth, the prevalence of faecal incontinence was 31%, 28%, and 15%, respectively. Article VI describes the characteristics of home care users in the Nordic countries and their needs for assistance with nursing home placement and death. A logistic regression model gave an explanatory value of 19.3 % for being better off living in another place. Risk factors included CPS ≥ 1, care burden stress, self-rated poor health, dizziness, or living in Reykjavik. The strongest predictor of Long Term Care Facility (LTCF) use was receiving nursing procedures (OR = 3.7, CI 1.7-7.8; chi-square p < 0.001). Older people with unintended weight loss at baseline were twice as likely to die within 12 months compared to those with no unintended weight loss (p < 0.001). A significant association between being homebound and the clinical features of nutrition and elimination problems was identified. Relative risks derived from the corresponding odds ratios were all statistically significant. A stepwise logistic regression model explained approximately 51% of the estimated risks for being homebound (95% confidence intervals). Conclusions Community care in Oslo and the other Nordic capitals generally provides services for individuals with lighter care needs compared to other sites in this study. In the Nordic sample, a higher frequency of older patients of both sexes lives alone, independently, for longer than their counterparts in other AD HOC sites. Being homebound was significantly associated with nutrition and elimination problems. Key words: Unintended weight loss, extreme obesity, urinary and faecal incontinence, homebound, cross-national, elderly, RAI-HC
8
SAMMENDRAG Bakgrunn Norsk helsevesen har som målsetting at eldre pleietrengende skal få anledning til å bo hjemme så lenge som mulig, og helsevesenet tar sikte på å sikre et trygt, verdig og selvstendig liv. Den norske langtidspleien er desentralisert og kommunene administrerer både institusjons- og hjemmebasert pleie. Lov om kommunehelsetjenesten, lov om sosialtjenester og lov om pasientrettigheter, regulerer langtidspleien på det nasjonale nivå. Målsetning Den overordnede målsetning med denne studien er å beskrive, analysere og sammenlikne karakteristiske grunnleggende behov (som ernæring og eliminasjon) og kliniske trekk hos et utvalg av eldre mennesker som mottok hjemmesykepleie i Europa. I arbeidet med å analysere data viste variabelen ”lenket til hjemmet” (homebound) å være et samlende begrep for de seks forskningsartiklene artiklene som inngår i avhandlingen. Sykepleieutfordringer Når en pasients grunnleggende behov ikke dekkes, kan situasjonen oppfattes som truende, og fysiske eller psykososial stress og sykdom kan utvikle seg. Å sikre pasientens behov for ernæring og eliminasjon en et sentralt anliggende for hjemmesykepleien. Hvis ernæring og eliminasjon skaper alvorlige problemer for den svekkede eldre, kan det bli aktuelt med innleggelse i sykehjem. En grundig geriatrisk utredning (CGA) vil gi et vidt spektrum av variabler som kan gjøre sykepleieren bedre i stand til å forstå pasientens situasjon. Materiale og metode Data er hentet fra Aged in Home Care (AD HOC) prosjektet, en befolkningsbasert undersøkelse i 11 byområder i Europa (2001/2003): de nordiske landene – København, Danmark (DK); Helsingfors, Finnland (FI); Reykjavik, Island (IS); Oslo/Bærum, Norge (NO); Stockholm, Sverige (S); Praha, Tsjekkia (CZ); Amiens, Frankrike (F); Nürnberg/Bayreuth, Tyskland (D); Monza, Italia (I); Amsterdam, Nederland (NL); og Maidstone/Ashford, England (UK). Et randomisert utvalg av 4010 respondenter over 65 år ble valgt ut fra et urbant strøk i hvert land (80, 4% av forespurte). Respondentene skulle motta hjemmetjenester ved oppstart av prosjektet. Vi valgte å bruke det omfattende geriatriske utredningsverktøyet: Resident Assessment Instrument for Home Care (RAI-HC). Dette er et anerkjent, standardisert og tverrkulturelt instrument. RAI-HC inkluderer variabler som omfatter sosio-demografiske, fysiske og kognitive karakteristika hos pasientene så vel som medisinske diagnoser og medisinering. Disse data ble knyttet til informasjon om omgivelse, servicestrukturer og servicebruk, inklusiv bruk av hospitalisering og langtidspleie. Resultater I det totale materialet var 74 % kvinner. Gjennomsnittsalder var 80,9 ± 7,5 år (menn) og 82,8 ± 7,3 år (kvinner). I alt bodde 60,5 % av de som mottok hjemmesykepleie alene; dette tallet var 73,5 % for Oslo og 12,9 % for Monza. Ernærings- og helserelaterte faktorer diskuteres i artiklene I-II. Personer som hadde moderat til alvorlig kognitiv svikt målt med ”Cognitive Performance Scale” (CPS) hadde en økt risiko for utilsiktet vekttap (UWL) (OR = 2,0) sammenlignet med dem som var mindre kognitivt svekket. Bare i den eldste aldersgruppen (85+) var det en signifikant assosiasjon mellom UWL og reduksjon i ADL og IADL funksjoner (≥ 3), sammenlignet med dem som skåret < 3. En binær logistisk regresjons-modell forklarte 26 % av ikke-planlagt vekttap: færre måltider per dag, redusert appetitt, feilernæring, redusert sosial aktivitet, gjenoppblussing av tidligere sykdom eller kronisk
9
problem, og hospitalisering var viktige riskofaktorer (I). En fant ekstrem overvekt hos 4,0 % av kvinnene. De var gjennomsnittlig fem år yngre enn sine tynnere medsøstere og de mottok hjemmesykepleie over en lengre periode enn de ikke-ekstremt overvektige (II). Eliminasjon og helserelaterte faktorer blir diskutert i artiklene III-V. Den høyeste forekomst av urininkontinens og bruk av bleier ble funnet i Amiens mens den laveste forekomst var i Helsingfors (III). Hyppigst bruk av blærekateter var i Monza, den laveste var i Helsingfors og Stockholm (IV). Omsorgsgivere til personer med urin- og avføringsinkontinens rapporterte utslitthet eller stress oftere enn de som stelte personer uten inkontinens (III & V). Pasienter med avføringsinkontinens (høyeste frekvens Monza og Amiens) var storforbrukere av hjemmesykepleietimer. Graden av avføringsinkontinens var medvirkende faktor for hvor lenge en pasient kunne bo hjemme. Prevalensen for inkontinens for avføring var lav i de nordiske landene (fra 4,7% i Helsingfors til 11,7% i København). I Monza, Amiens og Nürnberg/Bayreuth, var prevalensen for inkontinens for avføring henholdsvis 31, 28 og 15% (V). I artikkelen VI var målet å beskrive brukerne av hjemmetjenestene i hovedstedene i de nordiske landene og deres behov for assistanse ved oppstart av prosjektet relatert til sykehjemsinnleggelse og død i løpet av de 12 månedene prosjektet varte. En binær trinnvis logistisk regresjonsmodell forklarte 19 % av at pasienten eller primær omsorgsperson føler at brukeren vil få det bedre i en annen bosituasjon. Risikofaktorer var CPS ≥ 1, stress eller utslitthet hos omsorgspersoner, selvrapportert dårlig helse, svimmelhet eller om pasienten var boende i Reykjavik. Det å motta sykepleieprosedyrer var den sterkeste predikator for innleggelse i sykehjem (OR= 3,7 CI; 1,7-7,8). Pasienter med utilsiktet vekttap ved første vurdering hadde doblet dødelighet i løpet av 12 måneder, sammenlignet med de som ikke hadde hatt utilsiktet vekttapt p < 0,001 (95% konfidensintervall). ”Lenket til hjemmet” Det var en signifikant assosiasjon mellom det å være ”lenket til hjemmet” og variabler som representer tegn og symptomer på problemer med ernæring og eliminasjon. Den relative risiko utledet fra odd ratio var alle statistisk signifikante (95% konfidens intervall). En logistisk regresjonsmodell forklarte nærmere 51% av beregnet risiko for å bli lenket til hjemmet. Konklusjoner Den kommunale omsorgstjenesten i Oslo og de andre nordiske hovedstedene gir generelt pleie til personer med mindre pleiebehov sammenliknet med andre steder i Europa. I det nordiske materialet, bor en større andel av eldre mennesker for seg selv uavhengige av hjelp, og lenger enn sine jevnaldrende på andre steder i AD HOC studien. Plassering i sykehjem er hyppigere i de nordiske landene. Å være lenket til hjemmet var signifikant assosiert med ernærings- og eliminasjonsproblemer. Nøkkelord Utilsiktet vekttap, fedme, blære- og tarminkontinens, bosituasjon, prediktorer for sykehjemsplassering eller død, ”lenket til hjemmet”, cross-national, eldre, RAI-HC
10
ORIGINAL ARTICLES This thesis is based on the following articles, which will be referred to in the text by their
respective Roman numerals:
I. Sørbye LW, Finne-Soveri H, Schroll M, Jónsson PV, Topinkova E, Ljunggren G,
Bernabei R (AdHOC Project Research Group). Unintended weight loss in the elderly living at
home: the Aged in Home Care Project (AdHOC) J Nutr Health Aging 2008; 12(1): 10-6.
II. Sørbye LW, Schroll, M, Finne-Soveri H, Jónsson PV, Ljunggren G,
Topinkova E, Bernabei R for the AD-HOC Project Research Group. Home care needs of
extremely obese elderly European women. Menopause Int 2007; 13(2): 84-7.
III. Sørbye LW, Finne-Soveri H, Ljunggren G, Topinkova E, Garms-Homolova V,
Jensdóttir AB, Bernabei R for AD-HOC Project Research Group (in press 2008). Urinary
incontinence and use of pads - clinical features and need for help in home care at 11 sites in
Europe. Scand J Caring Sci. doi: 10.1111/j.1471-6712.2007.00588.x
IV. Sørbye LW, Finne-Soveri H, Ljunggren G, Topinkova E, Bernabei R. Indwelling
catheter use in home care: aged 65 +, in 11 different countries in Europe. Age Ageing 2005;
34(4): 377-81.
V. Finne-Soveri H, Sørbye LW, Jónsson PV, Carpenter I, Bernabei R. Increased work-load
associated with faecal incontinence among home care patients in 11 European countries. Eur
J Public Health 2007; 1(1): 1-6.
VI. Sørbye LW, Hamran T, Henriksen N, Norberg A. A comparative study of characteristics
of older home care users in Nordic countries - would patients be better off living in another
environment? (In progress of resubmitting 2008).
The printed or accepted articles have been reprinted in this thesis with kind permission from
each journal.
11
ABBREVIATIONS AD HOC Acronym for the aged in home care1
ADL Activity of Daily Living
BMI Body Mass Index
CGA Comprehensive Geriatric Assessment
CPS Cognitive Performance Scale
EO Extremely Obese
FI Faecal Incontinence
IADL Instrumental Activity of Daily Living
IUC Indwelling Urinary Catheter
LTCF Long-Term Care Facility
MAPLe Method for Assigning Priority Levels
MMSE Minimum Mental State Examination
NH Nursing Home
RAI-HC Resident Assessment Instrument for home care
UI Urinary Incontinence
UWL Unintended weight loss
1 This was the original acronym, but later on different use of big and small letters occurred. http://cordis.europa.eu/data/PROJ_FP5/ACTIONeqDndSESSIONeq112482005919ndDOCeq2644ndTBLeqEN_PROJ.htm
12

DEFINITIONS
Definition of variables The attached RAI-HC instrument contains a short text for the different values of the items.
Each article will specify if algorithms, scales, or cut-off points were used. In the following
summary, the dependent variable in each of the articles is presented.
Unintended weight loss was defined as weight loss of 5% or more in the last 30 days (or 10%
or more in the last 180 days).
Extreme obesity was defined as obesity to such a degree as to interfere with normal activities
including respiration. This corresponds to the World Health Organisation’s Class 2 (BMI
between 35 and 39.9) and Class 3 (BMI ≥ 40) definitions (1).
Urinary incontinence (UI) and pads. Urinary incontinence is defined as the presence of at
least one episode of urinary leakage per week. In addition, patients using indwelling,
intermittent, or condom catheters are classified as incontinent because most of them would
have had leakage if the catheter were not in place. In this article, various incontinence
products such as briefs, pads, and diapers will be collectively referred to as ‘pads’ or
‘protective garments’.
Indwelling urinary catheter (IUC). Did the patients use IUC? ‘Yes’ or ‘No’.
Faecal incontinence was defined as ‘being faecally incontinent once per week or more’ (with
or without stomia).
The Cognitive Performance Scale (CPS) is used to determine an individual’s ability to make
everyday decisions. It is based on: memory, cognitive skills of daily decision making,
expressive communication, and ability to eat. The CPS measures the level of cognitive
performance on a range from 0 to 6. A crosswalk between the CPS and the Minimum Mental
State Examination (MMSE) has been conducted (2, 3).
13
The MMSE ranges from 30, indicating an absence of cognitive impairment, to 0, indicating
severe cognitive impairment; a value between 6 and 0 corresponds to a score of 4 to 6 in the
CPS.
Nursing procedures. The following variables were dichotomised and recoded into a ‘nursing
procedures’ variable: a nurse visiting at least daily in the last 7 days, and need of assistance
with medication, injections, oxygen, intravenous, catheter and stoma care, or wounds and skin
care.
Caregiver was defined as a private person who gives care (informal caregiver).
Caregiver stress was coded as a response to any one of the following statements in the RAI-
HC instrument: a) the caregiver is unable to continue, b) the caregiver is dissatisfied with
support, or c) the caregiver expresses distress.
Better off in another living environment2 was coded as a response to this question by any one
of the following: a) the patient, or b) the caregiver, or c) the patient and the caregiver.
Method for Assigning Priority Levels (MAPLe) classifies clients into five priority levels,
based on their risk of adverse outcomes. The MAPLe algorithm is based on a broad range of
clinical variables in the RAI-HC. Patients in the low priority level have no major functional,
cognitive, behavioural, or environmental problems connected to their home. They can be
considered self-reliant. The high priority level is based on the presence of ADL impairment,
cognitive impairment, wandering, behaviour problems, and nursing home risk care-planning
protocol (4).
Homebound. In the RAI-HC, the following instruction was posed: ‘In a typical week, during
the last 30 days (or since last assessment), code the number of days the client usually went out
of the house or building in which client lives (for any period of time).’ In this thesis,
homebound was defined as ‘no days out of the house or building during the last week’ or
‘needed extensive assistance for outside locomotion’.
2 RAI-HC uses the expression ‘Better off elsewhere’.
14
INTRODUCTION
The home has always been the place for care for older patients. Medical technology was first
developed for use in institutions; patients that were in need of such medical assistance had to
be admitted to a hospital or a nursing home. Now, medical progress has made it possible for
patients with multiple diseases to be treated in their own homes. The quality of available
housing and technical equipment has enabled people with severe impairments to manage at
home even if they live alone. In the European countries, different welfare models have been
developed, which may influence the situation for the home care patients at the different sites
in the AD HOC study. This thesis presents ‘home’ as a value and discusses nursing challenges
related to the basic physiological needs of patients receiving home care. The experiences and
results from the six research articles that are included in this current thesis will be related to
the concept of being homebound.
Research design
The research design for the European study of older patients in home care had already been
created by the time the Norwegian inter-RAI group was accepted as a partner. The AD HOC
study was designed as a randomised, multi-centre, cross-national population study, where
demographic characteristics, as well as functioning and service utilisation were integrated.
The overall aim of the AD HOC study was to identify and recommend a model for home
services for older patients, based on the organisational characteristics of the home care
services at 11 sites in European countries. The model should be based on patients’ clinical and
functional characteristics. By identifying factors correlating with positive outcomes, after one
year, the AD HOC group intended to create the first ‘evidence based’ model for home care
(5). The study used a structured comparison of services and a comprehensive, standardised
assessment instrument. The research project generated a huge amount of data in a
depersonalised file. Any improvements as a result of this study would rarely change anything
for those who had participated. However, the knowledge that has been generated through this
study could lead to improvement for older patients in home care settings.
On the front page of this thesis is a photo of Stein. Stein was one of the patients from the AD
HOC study. He was 78 years old, 46 kg. He recounted that for the last three years he had been
socially isolated. Because of pain, he had not been able to take any initiative himself. The
15
only visits came from the home care team, once or twice a week. He had almost reduced his
bodyweight by half. ‘I have nobody. I have so little contact with other people. How could one
be able to eat?’ (6).
The photo of Stein personalises the content of the tables and statistical analyses in this thesis.
Respect for the older patients´ lives and their current needs for assistance and care are the
main motivations behind this thesis.
Welfare models
Individual countries in Europe have developed their own welfare systems. Some countries in
close geographic proximity to each other and with common cultural histories have developed
similar welfare systems.
The European countries can be categorised according to four welfare models: the Nordic
model, the Anglo-Saxon model, the Central European model, and the Southern European or
Catholic model. The Nordic model has three essential features: social policy is
comprehensive; the social entitlement principle has been institutionalised (social rights); and
social legislation has a universal nature (7). This model is also referred to as the Scandinavian
model, the Social Democratic model, or the institutional model (7-9). The Anglo-Saxon
model offers social benefits only to those in greatest need. It is also called the liberal model,
the residual welfare model, or the Beveridge model, after the British civil servant who devised
the principle on which this model is based. The Central European model is built upon the
principle that social benefits are only provided to those who participated in the labour market.
This model is also known as the conservative, the achievement-oriented, or the Bismarck
model, after the German Chancellor who was responsible for the first social insurance laws.
The basis for the Southern European or Catholic model is that social responsibilities must be
fulfilled by the family, or as close to the family as possible. This model is also called the
subsidiary model (10).
In the last decades, the usefulness of these welfare models has been questioned (8). However,
as a background for the home care services at 11 different sites in Europe in 2001-2, these
models could be useful in explaining the differences in the home care populations in the
participating sites.
16
Norwegian policy
After the Second World War, the Social Democrats in Norway pursued several important
ideals including home ownership. ‘Husbanken’ (the house-bank) was founded for this purpose
in 1946. People with ordinary incomes could secure loans with a low interest rate to purchase
a home.3 When the ‘Folketrygden’ (11) was introduced in 1967, older people received their
own money, independent of earlier working activity. All citizens of Norway were, by law,
ensured benefits if they lost their income due to age, impairment, illness, loss of a
breadwinner, or loss of a job.4 The principle was that no one should be dependent on close
family, relatives, or the social welfare norms (formal and informal) in the local community
(12). This same trend is also found in other Western countries. Traditional patterns of care for
the older generation are changing. Today many older people choose to live independently,
without assistance from their families. The provision of care is also shifting from institution
toward home care. Increased life expectancy is accompanied by a rise in disability-free life
expectancy, although the relative proportion of years lived with disability to years lived
without disability varies across countries (13, 14).
Governments worldwide are greatly concerned with how care for older people, both with and
without disability, can best be delivered (15). The official policy in Norway has been to
reduce the number of institutional beds. The Gjærevold Committee was the first to use
‘Hjemliggjøring’5 as a concept in caring for older people (16). Those dependent on care
should have the ability to live a private and autonomous life with security and dignity at home
(17). The white paper ‘Handlingsplan for eldreomsorgen’ (18) emphasised the priorities of
housing and home in the care of older people. In Denmark, attractive, supportive housing for
older people has been a key element in housing policy development. However, older
3 Today ‘Husbanken’ is functioning as a welfare service, with monthly subsidies to low income families or individuals to pay housing expenses. 4 In 1923 the first pension act was passed, but it was never put into effect due to economic crises. In 1936 the first old age pension started, given according to need. In 1959 a need-blind pension was introduced. 5 It has been difficult to find a good translation to English. Haggard (1885) writes in his famous book King Solomon’s Mines: ‘…a white house, smiling out at the placid sea, puts a finish and gives an air of homeliness to the scene.’ Hawthorne (1851) wrote in The House of the Seven Gables: ‘There was homeliness in it which warmed the heart.’
17
generations have displayed a low propensity to move to new housing designed to meet the
needs of older populations (19).
In Norway there have been relatively few voices critical of the commonly accepted idea that
home is the best place to stay. Hjort (20) has emphasised that it is a great mistake that care of
the elderly has turned into a question about housing (‘boliggjøring av eldreomsorgen’). Hjort
knew that home service could never give the continuity and quality of care that frail older
people are supposed to get in a nursing home. The politicians had invested in housing and
technical help instead of better staffing (21).
Many older people enjoy living in their own dwelling. When functional decline occurs due to
illness or old age, the family or the social community may assist or take over responsibility
for care.
This thesis compares formal and informal care across the sites related to care burden. Home is
looked upon as the lowest level of care. However, the care often carried out from the patient’s
female, significant others may not be measured in money.
Lowest effective level of care
The principle of the lowest effective level of care (LEON6) was first introduced in a White
Paper (22) and has since been one of the basic principles of Norwegian health care policy. In
this policy, the popular usage of Bentham’s utility philosophy may be recognised: ‘we ought
to promote the greatest good of the greatest number of people’ (23). The consequences of this
philosophy led to huge changes. All health care that the state or the county could delegate had
to be handled within the municipalities. Central care institutions were closed down as a
consequence of the mental health care reform (22, 24-27). However, it was difficult for
impaired individuals to find suitable living conditions in ordinary apartments, which required
economic and personal sacrifices for them. A continuous chain of care was needed, and was
difficult to establish. Older people usually lived in their own homes. The challenge was
enabling them to cope outside an institution, even when they needed assistance in the
activities of daily living. The demand for home care services was increasing among younger
users and the lack of qualified health personnel was growing. Policymakers were forced to
6 LEON is an abbreviation in Norwegian: Lavest Effektive Omsorgs Nivå: Lowest Effective Care Level.
18
make decisions about what types of patients should be prioritised according to what types of
needs.
Priorities
Norway was the first of the industrialised countries to adopt official guidelines concerning
priorities in the health care sector (28). The aim was to develop the principles for ranking
patients and the criteria for appeal. Situations that were imminently life threatening for
individuals, groups, or society were assigned first priority: acute medical and psychiatric
emergencies, newborn medicine, infectious diseases, and emergency preparedness. Situations
that were potentially life threatening in the long-term for individuals, groups, or society were
second priority. Community care and nursing were included in this category. The ethical
mantra was justice, and this was explained using three different dimensions of equality:
social, geographical, and age. These principles were later integrated into the priority
guidelines of the other Nordic countries (29-31). The Swedish Commission relied on three
ethical principles: human dignity, need, and cost-efficiency (29).
Over the decade that followed, the gap between the need for care for impaired older people
and the capacity for care increased in Norway. Waiting lists for hospital treatment were too
long. In nursing and other care professions, the lack of qualified personnel was growing. The
definitions of the different priority categories made in 1987 (28) were not sufficiently clear.
Another task force was appointed with the responsibility of developing more detailed criteria
and improving cost effectiveness. As in 1987, justice and equality were prominent values
(28). However, the resulting recommendations had little effect on the users of community
health care services. Liss (32) has discussed the problems with the value platform for the
setting of priorities in health care in Sweden; problems the other Nordic countries may share.
The social democratic tradition does not allow health politicians to give priority to some
people because they deserve it, or as Liss continues, because they are important to other
people or to the public economy.
Otterstad & Tønseth (33) used data from Statistics Norway and documented that the principle
of equality was not applied. A comparison of Finnmark and Østfold showed that the
municipalities in Finnmark prioritised nursing home beds more frequently than housing like
‘assisted living’ compared to the municipalities in Østfold. People in Finnmark entered an
19
institution, on average, five years earlier than people in Østfold.7 The researcher discussed
three explanatory factors for people age 80 years or older that were tested: geography, health
status, and the economic framework in the communities. Their conclusion was that the greater
access to services in Finnmark, could reduce the elderly’s self-care and autonomy. This study
describes variation in user participation, but does not reveal anything about the informal care
burden.
User participation - equality and justice
Various values have been highlighted in bioethics and health policy. Norwegian official
documents have, to date, integrated user participation, equality,8 and justice9 as basic
concerns. The principles of biomedical ethics described by Beauchamp & Childress (23) may
be useful tools in resolving actual ethical problems. The principles of autonomy, non-
malevolence and beneficence have been integrated into professional ethical codes (34). The
principle of autonomy has been strengthened through laws enacted in a number of different
countries. In Norway, national laws and health policy guidelines - such as the Municipal
Health Services Act, the Social Service Act, and the Patients’ Rights Act (35-37) - promote
equal treatment and justice.
The ethical principle of autonomy is manifested today in the concept of user involvement.
The municipality has the obligation to consult with the client during assessment and care
planning. Municipalities are obligated to respect the client’s opinion and preferences (Social
Service Act 1991§ 4.3 a) (36). According to current regulations, patients have the right to an
individual plan that describes both actual health care and social services that are offered from
the community (36), recognising that motivation and customised efforts are important to
patient success. Several methods have been developed to increase the involvement of older
patients in care planning.
The objectives for Nilsen et al. (38) in their Cochrane review were to assess the effects of
consumer involvement and compare different methods of involvement in developing health
care policy and research, clinical practice guidelines, and patient information material. To be
7 This could be due to poor health conditions and geographical distance from the home care administration. 8 Equality commonly refers to the idea of equal treatment. 9 Justice refers to the distribution of things and position of people within society. Closely linked to fairness, views of what constitutes justice vary from society to society (and person to person). http://en.wikipedia.org/
20
included in their review, a study must have included a quantitative measure of at least one
relevant, measurable outcome using a validated instrument. Five randomised, controlled trials
of moderate or low methodological quality involving 1,031 participants were included. The
authors’ main conclusion was that there is little evidence from comparative studies of the
effects of consumer involvement in health care decisions.
Bastiaens et al. (39) conducted a qualitative study of primary health care in 11 European
countries.10 The researchers asked older patients about their views on patient involvement in a
face-to-face interview. They concluded their study as follows: ‘People over 70 do want to be
involved in their care, but their definition of involvement is more focused on the caring
relationship - the person-centred approach - and on receiving information than on active
participation in decision making’.
Geest et al. (40) carried out a qualitative study in seven European countries11 about elderly
patients’ and General Practitioners’ (GP’s) views on different methods for patients
involvement (N=284, patients’ mean age was 79 years). Patients were given different
information leaflets. The barrier to getting adequate information was cognitive impairment
among patients; the fear among the GPs was that they would give patients a false impression
of what to expect.
In Norway, an important goal of health policy is to ensure equal access to health services for
everyone, independent of diagnosis, geography, or economic and living situation (41).
Individual municipalities, however, have the power to decide how many patients they want to
serve in institutions and how much home care they are able to provide.12 Several
municipalities have adapted the New Public Management (NPM) ideology or ‘Ny offentlig
styring (NOS)’ (42). This ideology promotes the implementation of a Principal-Agent
model.13 If clients are dissatisfied with their services, the Principal-Agent model requires that
the patients themselves pursue their claims. The services have turned from being descriptive
10 Austria, Belgium, Denmark, France, Germany, Israel, The Netherlands, Portugal, Slovenia, Switzerland, and UK. 11 Austria, Denmark, Germany, The Netherlands, Portugal, Slovenia, and Switzerland. 12 Due to geographical distance the cost of home care compared to institutional care will differ. On average, four or less visiting nurses per day will make a cheaper outcome. 13 Bestiller – utfører modellen here: Ursin’s translation (44).
21

to prescriptive. Vabø emphasised that the formal caregivers have to be aware of the patients’
individual needs (43).
Ursin (44) interviewed recipients of municipal home-based care services in the context of the
Principal-Agent organisational model. Her findings revealed that patients (with a few
exceptions) had not been included in either the planning or the implementation of services.
She emphasised that many of the interviewed clients lacked the competence necessary to be
active citizens. Ursin also found that only a small fraction of clients exercised their right to
lodge a complaint.
In 2003, the Norwegian Board of Health Supervision conducted a comprehensive evaluation
of health care; more than 13,000 clients in 73 municipalities were included in the survey
sample (45). The report concluded that, at the national level, there seems to be a positive
relationship between the need for care and the supply of services. Clients who live in their
own homes received help for physical needs such as nutrition and hygiene. Romøren, who
was responsible for the data analyses, found that people who lived in their own home got less
sufficient services, all things being equal, than those who had other living conditions. The
survey only examined health care services that were actually provided and the extent to which
staff assessed this assistance to be adequate. The survey did not screen participants for
different symptoms, nutritional status, problems with elimination, or degree of isolation.
Caregivers
Advanced technologies, medical interventions, specialised staff, and demands for quality
increase the cost of care in hospitals and other institutions. Despite reorganisation and new
strategies for health administrators, cost-effectiveness has not improved. The only way to save
money in the formal health system is to shift some of the burden of care to the family.
Romøren (46) describes different care activities families might provide, such as social
contact, practical help, and personal care. Jeppsson-Grassman (47), however, has identified
and profiled three categories of informal caregivers: 1) the engage citizen, 2) the external
caregiver (from outside the client’s household), and 3) the family caregiver.
One of the most basic developmental tasks of the adult family is the acceptance by adult
children of filial responsibility for their elderly parents (48). In the Nordic countries, as in
22
many countries in Continental Europe, adult children have no legal obligation to provide care
or financial support for their parents (49). Research data show that the sons and daughters of
‘the long lives’ cared for their old parents. Romøren (50) followed more than 400 individual
patients in a twenty-year period from when they were 80 and, for some, up to 102 years old.
He documented changes in health status, health service utilities, and informal care. The
caregivers felt that sometimes it became too much to handle. The most common cause of
‘feeling overload’ was when the patient’s health worsened. Some got tired of being the
caregiver, and strain was added when new caregiving tasks were required. Some persons
answered that it became too much when they became ill themselves. Relatively few (6%) told
that the reason for ‘feeling overload’ was that their own health was declining. Daatland &
Herlofsen (51) documented that the threshold for an institutional bed in Norway was low
compared to other European countries.
Rees et al. (52) stated that few older caregivers know their financial rights or know where to
find support to cope with the physical and emotional stress of caring for a person with a
chronic physical illness. Lim & Zebrack (53) stated, after a critical review of literature
concerning caregivers´ situations that too little is known about the outcomes of stress-related
variables over time. Women, who had cared for a husband after his stroke, recounted heavy
lifting and struggling to assist the husband with toileting. Their backs were worn out. Other
women described the continuing strain of caring for a husband after his several heart attacks.
The insecurity and fear they lived with for years did not disappear after the husband’s death.
It is a common belief that older people do not like to bother others with their problems. Many
feel proud to be autonomous and able to take care of themselves. In assessing a client’s
situation, it is important to determine the status of the primary caregiver.
In Norway, most of the formal support systems serve patients rather than informal caregivers.
‘Omsorgslønn’ is a wage paid by the municipality to caregivers servicing patients with
extensive care needs. In principle, there is no age limit for receiving ‘omsorgslønn’, but, in
practice, the frequency of caregivers 65 and older receiving such support is very low (54)14.
14 In Asker, few persons got ‘omsorgslønn’. In Bærum, 230 persons got ‘omsorgslønn’ in 2005. Exact numbers were lacking, but the staff meant that most were assisting patients that were cognitively impaired.
23
During times of chronic disease, a person’s network decreases or disintegrates. Older people
may become isolated, but they do not want to move away from home. For adult children, it
may be hard to overrule their parents’ decisions or wishes, although this may be better than
waiting until neighbours interfere. One quarter of new home services clients begin receiving
services after a hospital stay (55). Some municipalities or voluntary organisations have a
home visit program to try to identify need. Offering help is a matter of ethical consideration.
What may seem like a poor quality of life may be what the patient prefers. Respect for a
client’s autonomy could lead to burdens on the caregiver. How caregiver burden is associated
with impairments in the patients, especially connected to elimination, should be analysed.
HOME AS THE ARENA FOR CARE
The setting for ‘home care’ is, as named, the patient’s own home. Staff must respect the
patient’s privacy and intimate zone. A short historical and socio-demographical introduction
about the concept of home follows. The results that are presented in the six research articles
that make the body of this thesis are manifesting ‘home’, for better or worse.
Attachment to home
The concept of home evokes numerous associations. ‘Longing for home’ or ‘the feeling of
home’ has become a central part of our everyday understanding of the word home (56, 57).
Sir Edward Coke (1552–1634) is credited with the famous statement ‘For a man's house is his
castle’.15 Solheim (58) uses both the concept of castle and prison in her book about home
care. Moore (56) has documented how the concept of home changed from a native village,
birthplace, or country to a private dwelling during the 19th century. In the early 20th century, a
romantic concept of home emerged. Somerville (59) identified three important phenomena as
domestic constructs: privacy, identity, and familiarity. Somerville emphasised the complexity
in these concepts connecting to either a sociological or psychological framework. Security is
another value that people associate with the concept of home. Heggdal (60) has described
how chronically ill patients felt their home was like a castle. Here, they could be sheltered
from stress that would worsen their condition. At home, people feel like themselves; there is
15 ‘et domus sua cuique tutissimum refugium’ (and where shall a man be safe if it be not in his own house?) http://www.answers.com/topic/edward-coke (access Aug. 2008).
24
no need to show off, one may dress comfortably. In the home, families provide comfort and
protection against external threats.
Case (61) emphasised that the simultaneous act of being in a familiar place and doing familiar
activities with familiar objects is what evokes the sense of ‘being at home’. Home is
associated with other people: one is surrounded by loved ones, by those who are significant
others. In a study of home-dwelling elderly (80 years old or older), study participants reported
that they wanted to stay in their own home; they did not want to move into sheltered living
(care dwellings). ‘When you are as old as me, one does not want to move’ (62). Home is more
than a building, the feeling of ‘being at home’ is important. Zingmark et al. (63) used
narratives from people age 2-102 and analysed the concept of home through the lifespan. The
experience of being at home at any time was common values. Integral parts were ‘being given
a home’, ‘creating a home’, ‘sharing a home’, and ‘offering a home’.
In building a home, nobody starts from scratch; rather, individuals bring their own histories
with them (57). Part of the complexity of caring for older people is their ties to a place and/or
house that may no longer be practical for them (64). Apartment buildings without elevators
are commonly a problem. To climb stairs, one needs good lung capacity and movable hips
and legs.
Some research papers have focused on negative aspects of the concept of home. Older people
tend to live in older dwellings, which are harder and more expensive to heat and maintain
than newer ones. The concept of home as a sanctuary or place of secure retreat does not
necessarily hold true for those in a weaker position, like the homebound (65). The key issues
for homebound elders are security and accidents: falls are the most common home injuries
among the elderly (66).
In this thesis the author is going to discuss how nutrition and elimination problems are risk
factors for reporting homebound status among community-dwelling older persons.
Basic needs
When basic needs are not met, the situation may be perceived as threatening, and physical or
psychosocial distress and illness may occur. In home care different types of needs are
considered, such as health, mental health, environmental, psychological, spiritual, and
25
economic, as well as patient preferences (67). This thesis is concerned about health care needs
related to basic physical needs. It will describe and analyse nutrition and elimination problems
and their associations with medical conditions, and with physical and cognitive functioning.
Caregiver burden and welfare models connected to the different sites will illustrate priories
for levels of care.
Human beings develop different skills in order to be independent in their activities of daily
living. However, at the beginning and often at the end of life, human beings are in need of
assistance. Katz et al. (68, 69) began early to develop a standardised measure of biological
and psychosocial function. Frail older people may start with home care due to a need for
assistance with bathing or showering, then progressively require help with dressing the lower
and upper body, with locomotion (including moving around in their own apartment or being
able to transfer from a bed to a chair), with incontinence and toileting, and eventually with
eating.
LITERATURE REVIEW
Each of the six chosen topics for the research articles that are included in this thesis required a
broad literature search. Common keywords for all the topics were: 65 years or older, home
care, community care, frequency, prevalence, cross-national, and multi-centre. Limitations
were: ‘last ten years’ and ‘English language’. PubMed and CINAHL were chosen as primary
databases. Some of the articles describing practical guidelines and nursing skills were
included. In the actual articles (I-VI), due to word limitations, only a few of the studies
referred to here have been described. Additional information obtained from the literature
review is presented here. Due to the long delay between editing, publishing, and this
dissertation, the literature was updated during the spring of 2008.
Unintended weight loss Lack of nutrition in home-dwelling older people
Several studies have documented that older people are especially at risk for malnutrition. The
SENECA study sampled a cohort of community-dwelling individuals born between 1913 and
26
1918, in 12 European countries16, at baseline (1988), follow-up (1993), and final (1999)
surveys (1,091 men and 1,109 women ages 70-75). It found a relatively high risk of
malnutrition despite a low incidence of actual malnourishment (70). Guigoz (71) conducted a
literature review of research articles using the Mini Nutritional Assessment (MNA). The
MNA was validated against two principal criteria: clinical status and comprehensive nutrition
assessment using principal component and discriminated analysis. Twenty-five studies (n =
3,119) of the elderly in out-patient and home care showed the frequency of malnutrition to be
9% ± 0.5 (mean ± SE, range 0%-30%) and the risk of malnutrition to be 45% ± 0.9 (range
8%-65%).
Charles et al. (72) recruited 49 patients, age 65 or older, who were admitted to an acute
geriatric medical service in Ireland. Their aim was to identify and assess these patients’ risk of
malnutrition and to quantify the necessary nutritional intervention; 23 parameters were
assessed: 84% of the recruited patients were at risk of malnutrition on admission, and 80%
were moderately-to-severely at risk, with a BMI of 19.2 ± 3.7 (12.4-26). This study concluded
that the frequency of malnutrition on admission to the hospital and during treatment is an
indicator of the need for nutritional services and screening for all older people upon
admission. Beck et al. (73) used the MNA (74) to assess the frequency of old people at risk
for malnutrition in Denmark. They used a cross-sectional prospective study design in the
clinic of a general practitioner. Sixty-one subjects without any acute disease agreed to
participate at baseline, and 34 (56%) participated in the follow up 6 months later. At baseline,
23 participants (38%) were assessed as being at risk for malnutrition with a BMI < 20 kg/m2.
Paulsen (75) examined 196 newly admitted hospital patients in Denmark, mean age 83.7
years, for nutritional risk factors as assessed by the nursing staff. Malnutrition was present in
41% of the patients, using a BMI < 22 kg/m2 as the definition of malnutrition.
Risk factors for malnutrition
Nutrition screening of older persons living in their own homes may require more detailed
evaluation. Todorovic (76) conducted a literature review on this topic. She emphasised that
underweight individuals, with a BMI < 20 kg/m2, consume more health care resources than
16 Belgium, Denmark, France; Greece, Hungary, Italy, Norway, Poland, Portugal, Spain, Switzerland, and The Netherlands.
27
individuals of normal weight. Effective nutrition screening is therefore needed to reduce the
frequency of malnutrition. A wide range of risk factors has been identified as associated with
weight loss and/or malnutrition. Pirlich & Lochs (77) emphasised the role of (a) medical
diagnoses such as heart failure, stroke, cancer, and Alzheimer’s and Parkinson’s diseases; (b)
psychological factors: social deprivation and loneliness, depression, grief, and reduced
appetite; and (c) oral problems with chewing or swallowing, dry mouth, or dental problems.
Malnutrition may lead to severe consequences including reduced self-care and co-morbidity.
Mowé et al. (78) included 311 persons admitted to a hospital and 130 elderly at home, age 70
or older, in a nutrition study in Norway. They stated that nutrition problems among home-
dwelling elderly may lead to disease and hospitalisation. Low body weight causes infections.
Lesourd (79) and Mazari & Lesourd (80) examined healthy elderly (age 80 ± 5) with different
nutritional statuses and compared the data to young, healthy adults (age 25 ± 5) in France.
The results showed an association between nutrition and immunity. Aging and malnutrition
exert a cumulative influence on immune responses. Older people have poor cell-mediated
immune responses and therefore have a high risk of infection. Nourissat et al. (81) carried out
a cross-sectional survey for 2 weeks on 477 patients with cancer in France. Their result
showed that 30.2% of the patients had lost more than 10% of their body weight since the start
of the illness.
Martin et al. (82) carried out a cross-sectional exploratory study to describe nutritional risk
and low weight in community-dwelling elderly in the US. They used in-depth interviews
conducted on 130 older adults with a BMI < 24 kg/m. In a multivariate logistic regression
analysis, 3 variables were statistically significantly associated with being severely
underweight: an illness or condition that changed the kind and/or amount of food eaten, an
unintentional weight loss of 10 pounds in the last 6 months, and a need for assistance with
travelling outside the home.
Malnutrition and the risk of hospitalisation and death
Mowé & Bøhmer (83) showed in their study of geriatric patients (70 or older) in Norway that
undernourished patients had a longer stay in the hospital and a higher mortality rate, one year
after a hospital stay, than had patients who were well nourished. Actual situation at admission
or diagnoses at discharge could not explain this difference. Liu et al. (84) did a one-year
follow-up study of 660 elderly patients (average age 73 ± 6) discharged from a university-
28
affiliated hospital in the US. Associations between patient characteristics at hospital discharge
and mortality were identified; 85 subjects (13%) had died. After adjusting for illness severity
(Acute Physiology and Chronic Health Evaluation II score) and functional status (Katz Index
of Activities of Daily Living score), a BMI ≤ 20 kg/m2 was strongly associated with mortality
(adjusted relative risk, 95% confidence interval). Inoue et al. (85) studied 371 persons, 65
years or older, in a general health screening program in Japan. Subjects’ height and weight
were measured directly by medical staff. Subjects were classified into three groups according
to their BMI values: low, BMI < 18.5; normal, BMI = 18.5-25.0; and high, BMI > 25.0. All
subjects were followed for mortality. Over the next five years, the mortality rate in the low
BMI group was about twice that in the normal BMI group.
Prevention of malnutrition
Poulsen (75) stated in her thesis that simple questions and clinical examinations at hospital
admission could identify risk factors for malnutrition. Older individuals who receive home
care services in Denmark had already shown signs of frailty, insofar as they had demonstrated
impaired functional capacity. She suggested that to avoid unnecessary, additional loss of
function, it is, therefore, of great clinical importance to find out whether malnutrition or risk
of malnutrition is prevalent in this population. Wilson et al. (86) carried out a cross-sectional
measurement study conducted on long-term care residents and community-dwelling adults in
the US. They found that short, simple appetite assessment tools predicted weight loss in
community-dwelling adults and long-term care residents.
Izawa et al. (87) did a follow-up cohort analysis of 952 community-dwelling elderly in Japan.
Among the participants, 342 had missing data for weight at baseline. Multivariate Cox
proportional hazards models adjusted for potential confounders showed that the lack of data
on weight was associated with 2-year mortality as well as with hospitalisation.
Thompson et al. (88) carried out content analysis on semi-structured interviews with
community-dwelling elderly in the US, age 65 or older (n = 130), with a BMI < 24 kg/m2.
The majority of the participants were unaware that they were at risk for poor nutritional status
and low weight; they reported receiving little information from their health care provider on
preventing weight loss.
29
Comments
In research literature, different concepts are used to describe nutrition insufficiency in older
people, like under-nutrition, malnutrition, low body weight, and weight-loss. BMI is used
with different values for being at risk for having nutrition problems. There are several risk
factors for nutrition insufficiency that may lead to hospitalisation and death. When basic
patient data like weight is lacking, other important data might be missing as well and those
patients are at higher risk than their counterparts who have had their weight controlled (82).
Given this, the AD HOC data was analysed, using unintended weight loss as the dependent
variable and a broad spectrum of relevant independent variables from the RAI-HC instrument,
with the aim of confirming the results from other research studies or revealing new
associations.
Obesity
Obesity as a growing problem
Obesity means excessive body fat. The term obese, derived from Latin, means ‘fattened by
eating’. The amount of fat tissue may increase to such an extent that mental and physical
health is affected and life expectancy is reduced. In the AD HOC study, Extreme Obesity
(EO) was defined as ‘Obesity of such a degree as to interfere with normal activities, including
respiration.’ This corresponds to the World Health Organisation’s Class 2 (BMI between 35
and 39.9) and Class 3 (BMI ≥ 40).
Morabia & Constanza (89) have described an obesity epidemic in Europe. They analysed data
from random surveys (1993–2003) of 6,164 men and 6,107 women. They found that
overweight and obesity increased in both men and women, hypercholesterolemia prevalence
rose, and diabetes treatment increased in men. Haslam & James (90) stated that the US is
about 10 years ahead in terms of its obesity problem compared to the UK, and Norway is
probably behind the UK. The result from the Oslo Health Study among elderly ages 75-76
(HUBRO 2000-2003) showed that men had an average BMI between 26 and 27, and women
between 26 and 29 (91). Das et al. (92) studied 93,290 US veterans, women age 18 and older:
37.4% were classified as obese, defined as a body mass index (BMI) of 30 kg/m2 or more, and
6% as Class 3 obese (BMI ≥ 40 kg/m2). Callen & Wells (93) used BMI categories and UWL
for measuring nutritional status among elders age 80 or older still living independently in
30
Tennessee. This cross-sectional descriptive study included 68 community-dwelling ‘old-old’
(average age 85.7). In this sample, 25% were obese.
Consequences of obesity
Hippocrates wrote that ‘Corpulence is not only a disease itself, but the harbinger of others’,
recognising that obesity is a medical disorder that also leads to many co-morbidities (90, 93).
Horani & Mooradian (94) looked at special considerations concerning management of obesity
in the elderly. He stated that only population-based interventions can prevent the impending
epidemic of obesity-related disorders.
Haslam et al. (90) looked at the relative risk of different diagnoses and clinical symptoms:
diabetes, hypertension, dyslipidaemia, breathlessness, sleep apnoea, gall bladder disease
(relative risk > 3), coronary heart disease or heart failure, and osteoarthritis (relative risk
about 2-3). Results from 13,297 persons in the Health Survey for England (95) revealed that
obesity is associated with an increased risk of health problems. Obese women are almost 13
times more likely to develop Type 2 Diabetes than non-obese women, while obese men are
nearly 5 times more likely to develop the disease.
Obesity is becoming an increasingly recognised health issue in older people and is associated
with greater care needs. Reidpath et al. (96) did a secondary analysis of weight data from the
National Health Survey in Australia. The sample consisted of 17,174 adults over 20 years of
age. Specifically, women who were overweight used medical health services more frequently;
this use increased with the severity of the obesity. For women, there was a negative
relationship between BMI and preventive health services. Camden & Gates (97) conducted a
literature review: 30% of Americans between the ages of 70 and 79 are obese. Their review
documented that obesity, coupled with the challenges of aging, and may lead to an
unfortunate burden of chronic disease, functional decline, poor quality of life, and an
increased risk of being homebound.
Quality of life
León-Muñoz et al. (98) carried out a prospective study on a cohort of 2,364 persons, age 60 or
older, in Spain from 2001-2003. The study focused on measuring health-related quality of life
(HRQL). Among obese women, with a BMI > 30 kg/m2, weight gain led to a reduction in
31

HRQL for four of the eight SF-36 scales17, while weight loss was associated with worse
scores in role-emotional and mental health scales. Results were usually similar for men,
although men showed a lower magnitude of HRQL response to weight changes. Banegas et
al. (99) conducted a population-based study covering 3,567 participants in Spain. Data were
gathered from home-based interviews and from measurement of blood pressure and other
anthropometric variables and SF-36. In general, patients with obesity, hypertension, and
diabetes, or a combination of these factors, were associated with a worse health-related
quality of life, on both the physical and the mental scales, than those without these factors.
Keith et al. (100) conducted a cross-sectional analysis of 11 datasets (Silver Spring, US). The
women (220,370 in total) were age 18 or older and had reported their headache or migraine
status. Mild obesity (BMI of 30) was associated with a roughly 35% increase in the odds for
experiencing a headache, whereas severe obesity (BMI of 40) was associated with roughly an
80% increase.
Increased use of health care services
Trakas et al. (101) analysed data from the Canadian National Population Health Survey
(NPHS), a cross-sectional survey conducted in 1994, administered to 17,626 ‘healthy’
Canadians age 12 and older. The odds of being obese significantly increase as individuals
age; 23.2% of people age 20-34 were obese, versus 40.1% age 55-56. The result from this
health survey showed that obesity represented a substantial burden on the health of Canadians
and on Canada’s health care resources. Quesenberry et al. (102) found a strong association
between morbid obesity (BMI ≥ 35) and the use of health services in the US; people in the
age group over 75 years had the lowest relative rates of out- and inpatient visits.
The studies above anticipate that the BMI of industrialised populations is going to increase.
This predicted increase has important ramifications for health service planning and reinforces
the need for obesity prevention strategies at the population level. In the Health Survey for
England, 2005, the direct cost of treating obesity was estimated to be between 45.8 million
and 49.0 million British pounds, and for treating the consequences of obesity, it was estimated
to be between 945 million and 1,075 million British pounds (95). Schafer & Ferraro (103)
17 The SF-36 (Medical Outcomes Trust, Boston, MA) is a multipurpose, short-form health survey with only 36 questions. 20008 : http://www.qualitymetric.com/sf36/spine.pdf
32
analysed hospital records over 20 years from a national survey in the US of adults ages 44-77
at baseline (N = 4,574). People with obesity at any time during the study increased the length
of stay (LOS); years of obesity increased the LOS. Calculation done for the WHO European
region stated that obesity is responsible for 2-8% of health costs and 10-13% of deaths in
different parts of the WHO European Region (104).
Prevention and treatment
The benefit of surgery and drug therapy in older obese people still requires further study.
Røssner (105), however, concluded in his literature review that recent studies suggest that
bariatric surgery (weight loss surgery), previously considered contraindicated in obese
patients above age 60, can be safely performed even in patients above age 70 and results in
the same benefits for older adults as for younger subjects. In their review article, Horai &
Mooradian (94) emphasised the importance of an individualised approach to reducing obesity
in older people. Management should emphasise lifestyle modifications, while the use of
pharmacologic agents such as ‘sibutramine’ and ‘orlistat’ should be reserved for selected
groups of patients who do not respond to lifestyle modification. Rhew et al. (106) conducted a
randomised, controlled trial that included 173 sedentary, overweight women, age 50 to 75, in
the US. Measurements were done at baseline, and at 3- and 12-month follow ups between
exercise and control groups. The results revealed that participation in a yearlong exercise
intervention trial among post-menopausal women has little effect on other health behaviours.
Berke et al. (107) used data from the Adult Changes in Thought cohort study for a cross-
sectional analysis of 936 participants ages 65-97 in the US. They examined whether older
people who live in areas that are conducive to walking are more active or less obese than
those living in areas where walking is more difficult. Higher ‘walkability’ scores were
associated with significantly more walking for exercise across buffers (circular zones around
each respondent's home) of varying radii. Their findings suggested that neighborhood
characteristics are associated with the frequency of walking for physical activity in older
people. Whether frequency of walking reduces the prevalence of obesity is less clear.
Comments
Politicians and medical experts have been worried about the increased prevalence of obesity.
The literature has been painting a dark picture of this group of people. As in other life style
diseases, prevention is better than intervention. For older people change in lifestyle is difficult
33
to achieve. The AD HOC data gave an opportunity to analyse the situation for the extremely
obese home care patients across the different sites in the Europe and to generate new
knowledge in this important home care issue.
Urinary incontinence, and the use of pads and indwelling urinary catheters
Urinary incontinence
Several studies document that Urinary Incontinence (UI) affects older people much more than
any other population. Klausner & Vapnek (108) conducted a literature review and stated that
urinary incontinence affects 15-30% of elderly individuals in the community. Landi et al.
(109) analysed data from a large collaborative observational study group, the Italian Silver
Network Home Care project, that collected data using RAI-HC (n = 5,418); 60% were women
and the average age was 78.6 ± 9.5. Urinary incontinence was assessed in 51% of patients and
was more common in women than men (52% versus 49%, respectively; p = 0.01). Roberts et
al. (110) conducted a cross-sectional, community-based study in the US. Participants age 50
or older were randomly selected from the population; 778 men and 762 women were
included. The occurrence of UI in the previous year was 11.1% (95% CI, 8.8-13.5) in men
and 15.2% (95% CI, 12.5-17.9) in women. Tseng et al. (111) interviewed 504 randomly
selected elders, age 65 or older in Taiwan. About 22% of respondents reported that they had
experienced involuntary loss of urine in daily life. Li et al. (112) analysed data from a total of
28,724 community-dwelling patients in US, age 65 or older that had had self-reported UI
problems in the last 6 months. They found that older women with UI problems were less
likely to seek professional help than men. However, after a health professional is consulted,
the women were more likely to be treated than their male counterparts. Harris et al. (113) used
data from a younger population, age 30 to 79, from the Boston Area Community Health
Survey. Data obtained during a 2-hour in-home interview and included the 331 women and
128 men who reported weekly (or more frequent) urinary incontinence. 45% of the women
and 22% of the men with weekly incontinence reported ever having sought care for it. Cheater
et al. (114) administered a survey to patients with incontinence as identified from community
nurses' caseloads in the UK, 999 patients or 92.7% (median age 79.0 years, range 69-68)
returned completed questionnaires. Most patients had had incontinence for 1 to 5 years. Most
patients reported that their symptoms had a strong impact on many aspects of their quality of
life, and 45.7% would be very dissatisfied to continue ‘the way they are now’.
34
Boyle et al. (115) used a standard questionnaire on 4,979 randomly selected men, age 40-79.
Questions were asked about the frequency and amount of urine loss and stress incontinence;
responses were used to measure the prevalence of UI among men in four centres.18 Hunskaar
et al. (116) looked at the prevalence of urinary incontinence in 17,080 participants in four
European countries.19 In response to a postal survey to women over 18, 35% reported UI. The
average use of pads for women with UI was 50% (40% in France and 59% in Germany). In a
population study of urinary incontinence in the age group 70-97, Molander et al. (117)
documented that prevalence of urinary incontinence was 17% among men and 48% among
women in Sweden. Song & Bae (118) analysed data from a population study and looked at
the prevalence of Urinary Incontinence (UI) in the ‘oldest old’ in South Korea, N = 218. UI
was defined as urine loss once a week or more. UI was registered in the following age groups:
85-87, 25%; 88-89, 31%; and 90 and over, 44%.
Use of pads
In this thesis, various incontinence products such as briefs, pads, and diapers will be
collectively referred to as ‘pads’ or ‘protective garments’. Boiko (119) used the concept ‘the
diaper-wearing population’ to describe the elderly as early as 1997, and intervention studies
have described how to reduce the indiscriminate use of absorbent pads and garments.
Hunskaar et al. (116) described the use of pads in their study in four European countries17.
The average pad usage for women with UI was 50% (40% in France and 59% in Germany).
Gotoh et al. (120) conducted a questionnaire survey of 2,322 elderly people (1,023men and
1,299 women) receiving care at home from 40 home nursing stations in Japan. The survey
focused on urinary management and practical problems at home; 1,301 (56.0%) of the elderly
wore diapers (pads).
Use of Indwelling Urinary Catheter (IUC)
Smith (121) concluded after a literature review that the prevalence of IUCs was 4%. The rate
of people manage by an indwelling catheter or diapers widely varied among home nursing
stations. In 25.3% of cases in which a patient was manage by an IUC, the catheter was used
18 Boxmeer, The Netherlands; Auxerre, France; Birmingham, UK; and Seoul, Korea. 19 France, Germany, Spain, and the UK.
35
because of UI. Gotoh et al. (120) found that the number of the elderly using an indwelling
catheter was 225 (9.7%). Molander et al. (117) found that IUC use was uncommon in
community dwelling elderly (age 70-97 years) individuals. She stated that those with a
catheter had a high mortality rate, probably due to the fact that only the very ill use an IUC in
Sweden today.
The literature revealed cross-national variations in the frequency of use of IUCs. This thesis is
going to investigate practice across the different participant sites in the AD HOC project.
Risk factors for UI, use of pads, and IUCs
Urinary incontinence is a significant cause of disability, dependency, and death. Johnson et al.
(122) analysed data from the National Survey on Self Care and Aging (N = 3,485).
Participants with mild to moderate UI (hazard ratio (HR) = 1.51, CI = 1.09-2.08) and severe
UI (HR = 1.54, CI = 1.03-2.29) had a higher risk of death. The relationship between UI and
mortality in older adults can largely be understood as a result of increased frailty in
incontinent individuals. Smith (121) emphasised that evidence-based catheter management
strategies may reduce the rate of catheter-associated urinary tract infection, catheter
encrustation, and leakage, as well as the discomfort and costs associated with these
complications.
Incontinence as a part of ‘normal aging’
Older women often do not talk about their incontinence because they are embarrassed or
believe there is no cure. Therefore, it is important for clinicians to ask about involuntary loss
of urine. Specht (123) expressed her worries about the myths of incontinence in older adults.
She wrote in a review article that, despite the progress made in the research and treatment of
urinary incontinence, its incidence is rising among older adults. Butler et al. (124) emphasised
that a careful case history alone can often reveal 80-90% of the diagnosis. Bradway & Barg
(125) used a narrative approach within a cultural models framework; the specific aims were to
describe and analyse what urinary incontinence meant and how 17 community-dwelling
women, age 65± 17.3, were coping with urinary incontinence. The informants´ were focusing
on the unpleasant and dirty aspects of UI. They needed to ‘normalize’ UI as a part of growing
older. Women's narratives provide a method for accommodating similarities and differences
between lay and professional models.
36
Dugan (126) conducted a randomised, prospective controlled trial with a sample of 49 adults,
age 60 or older, not previously screened for UI by a primary care doctor in Philadelphia. The
two main reasons why patients did not seek help were the perception that UI was not a big
problem (45%) and the perception that it was a normal part of aging (19%). Hannestad et al.
(127) used secondary data from a large cross-sectional population-based survey performed in
the county of Nord-Trøndelag during 1995-97; 6,625 women (out of 27,936) were categorised
as urinary incontinent, according to their answers to the questionnaire. The medical
consultation and treatment rates were lower for older people who suffered from UI than for
younger. Monz et al. (128) use data from the PURE study (14 countries)20, a non-
interventional, observational study of patients seeking treatment for UI in an outpatient setting
(N= 9,487, mean age 60.7 years, and 34% of the sample was age 65 or older). Monz et al.21
found that younger women who sought treatment were bothered more by their symptoms than
older women with similar symptoms. Younger women reported that in working and travelling
UI was a problem. Papanicolaou et al. (129) used data derived from PURE (five countries).
The results for medical resource use and cost of treatment in Germany, Spain, and the
UK/Ireland were recorded retrospectively for the preceding 12 months at the enrolment visit.
In all three countries, most patients had used protective pads, with more than half paying for
them out-of-pocket, despite potential health care reimbursement schemes.
Intervention studies
Borrie et al. (130) conducted a 6-month randomised, controlled trial in England with a sample
of 421 patients to determine whether UI and pad use in an outpatient population could be
reduced using a model of service delivery that included lifestyle and behavioural interventions
led by ‘nurse continence advisers’ in collaboration with a physician with expertise in
continence management. On average, patients in the treatment group experienced 2.1
‘incontinent events’ per 24 hours before treatment and 1.0 ‘incontinent events’ per 24 hours at
the end of the study. The mean number of events of incontinence (p = 0.001) and the use of
pads decreased significantly in the treatment group compared to the control group (p = 0.001
and p = 0.021 respectively). Cheater et al. (131) used a factorial designed, cluster randomised,
controlled trial to evaluate 194 community nurses in 157 family practices in UK. Information
included type and severity of urinary symptoms, impact on quality of life, help with coping,
20 Australia, Belgium, Denmark, Finland, France, Germany, Greece, The Netherlands, Norway, Portugal, Spain, Sweden, Switzerland, and UK/ROI. 21 Germany, Spain, and UK/ROI.
37
use of continence products and health service resources. The study included 1,078 patients
with a diagnosis of UI. The nurses’ practices were divided in four arms. One arm was a
control and three were intervention arms: audit and feedback only (AF), education outreach
only (EO) and AF with EO. They concluded that the different intervention methods for nurses
did not lead to any significant improvement at 6-month follow up. Printed educational
materials alone may be as effective as audits, feedback, and educational outreach in
improving nurses' performance and outcomes for patients suffering from UI. The authors
suggest that multidisciplinary teams warrant further, theory-driven studies with ‘no
intervention’ control groups and longer follow up. Vinsnes et al. (132) made a quasi-
experimental study of nursing home residents with UI in Norway (16 women and 2 men).
Baseline data were collected 24 hours before the unit-based educational program and three
months after completion of the program. Their results showed both the average and the
maximum incontinent pad weights to be less. However, there had been an increase in drinking
frequency per night. The average minimum post-voiding residual urine amount per resident
fell significantly.
Du Moulin et al. (133) did a systematic review of analyses of the effect of nursing treatments
on clinical and economic outcomes related to community-dwelling incontinent patients. They
found 12 randomised, controlled trials. The trials varied in terms of population, setting,
outcome measurement, and control/intervention. They concluded that there was limited
evidence that treatment by nurses results in a decrease in incontinence. They found no
evidence of cost reduction.
Caregiver burden
Urinary incontinence may have a serious impact on informal caregivers. Higher levels of
stress were reported by spouses caring for individuals with UI. Cassells & Watt (134) carried
out a qualitative study based on grounded theory in Victoria, Australia. Eight home-based
caregivers of spouses with IU were interviewed. Data analysis revealed three major themes:
underpinnings, processes, and consequences. The underpinnings were lifelong love,
friendship, and acceptance; the processes were problem-solving and constant watchfulness.
The consequences were role change, financial cost, decreased intimacy, emotional responses,
sleeping issues, and social isolation. The research revealed the complexity of the relationship
between patients and caregivers; however, simple interventions could make a substantial
difference.
38
Urinary incontinence has been described as a predictor of an urgent need for home care and
institutionalisation. Santos-Eggimann et al. (135) analysed a one-year case series and
performed a longitudinal (4-month) cohort analysis of 3,816 urgent requests made to home
care agencies by and for their clients age 65 or older. Among home care users, the presence of
a urinary catheter, UI, and the need for assistance in bathing were predictors of unscheduled
services.
Akamigbo & Wolinsky (136) used data from 6,242 self-respondents, 70 years or older. The
expectations of nursing home placement over the next 5 years were modelled with health
status, as well as actual placement status, using multivariable multinomial and binomial
logistic regression models. Urinary incontinence (OR = 1.76; p < 0.01) was one of the
variables included in the logistic regression model that predicted actual nursing home
placement.
Comments The literature review revealed that UI and use of pads seems to be a common phenomenon
both cross-nationally and cross-culturally. Use of an IUC however, was mentioned less. Little
was done in a home care setting to examine the causes of individual’s problems and to offer a
proper treatment. Nurses´ intervention for reducing UI was absent, as observed. Would this
passive accepting of UI as a part of natural aging influence the results across the participant
sites?
Faecal Incontinence The unvoiced symptom
Faecal incontinence (FI) has complex implications and leads to personal and practical
problems for both home care clients and their formal and informal caregivers. More than 20
years ago, Leigh & Turnberg (137) characterised faecal incontinence as ‘the unvoiced
symptom’. More recent writers describe FI among community-dwelling older individuals as a
silent problem (138, 139). In this search in PubMed, the following keywords were used
separately or in combination: faecal, bowel, anorectal and anal incontinence, home care,
cross-national, or international. The literature search produced few results and did not include
any studies that explicitly reported the rate of FI in home care populations.
39
Definitions of FI
This literature review revealed several ways to define faecal incontinence (Appendix Table 1).
Perry et al. (140) found that 2.3% of adults age 65 or older that were living in the community
in the UK had major faecal incontinence. Teunissen et al. (141) conducted a postal
questionnaire (N = 4,882) in the Netherlands. Their results showed that 6% had involuntary
loss of faeces twice a month or more (the demented diseased patients were excluded from the
sample). Bliss et al. (142) found that approximately 19% of those age 75 + 6 years reported
having FI one or more times within the past year in a home-dwelling study in the UK.
The prevalence of faecal incontinence among individuals living in the community is difficult
to estimate. The frequency found in different samples varies (141, 143-148). The definitions,
age groups, and settings that are used in different studies are not easy to compare. There is no
clear evidence of a difference in the prevalence of FI between the sexes (140, 141).The rate of
solid and liquid faecal incontinence in older people is significantly higher compared to their
younger counterparts (149).
Associations with poor health
Faecal incontinence (FI) is strongly associated with poor general health, physical limitations,
and psychosocial conditions (141, 148-149) and leads to a reduced quality of life (140, 142)
and a heavy care burden (125, 142-145). Roberts et al. found that FI was often combined with
UI, in results from a community-based study in the US (110). Older people with FI may have
a poorer quality of life than non-FI elderly. In addition to measuring physical functioning in a
self-rated study of 732 women in the US, Fialkow et al. (150) used The Depression Port, a
medical co-morbidity scale and I-QOL (incontinence-specific) in the US. The study
concluded that FI further reduces the functional status and quality of life for women with
urinary incontinence. Perry et al. (140) concluded that just over one half of those with major
faecal incontinence reported that bowel symptoms had a substantial impact on their quality of
life and about a third felt that they needed help with these symptoms. Brittain & Shaw (151)
carried out qualitative interviews in the UK about the impact of incontinence for both the
survivor of a stroke and the caregiver. Their findings showed that the embarrassment of
leakage and the danger of odour can lead some caregivers and survivors to make decisions
that can isolate both within the confines of their home: the very meaning of home is
transformed into an isolated and marginalised space. Roach & Christie (152) suggested from
40
their experiences in general medicine that there are many treatment options for FI. They
emphasised that appropriate treatment can result in an improvement of the quality of life.
Comments
Faecal incontinence has a great impact both on the patient’s quality of life and the situation
for the formal and informal caregiver. Faecal incontinence is often related to fragility and
cognitive impairment. As for patients suffering from UI, it is not acceptable that the situation
for the home care patients with FI could not be improved. If a patient with FI can no longer
live in his or her own home, an institutional bed could be offered; not only for the benefit of
the patient, but for the caregiver as well. A comparison between the different sites in the AD
HOC project could reveal ‘best practice’.
When basic physiological needs are not met, could the patients be ‘better off elsewhere’?
An important issue for community care is how to predict the level of care. Health care
managers, home care agencies, patients, and their families want to plan ahead to avoid
insecurity and frustration for all involved. In this thesis, some common features in the Nordic
data are presented. The samples from the Nordic capitals were unique compared to most of
the other participant sites (5). The patients in the Nordic sample were less cognitively and
physically impaired than their counterparts. Adult children have no legal obligation to provide
care or financial support for their parents in the Nordic countries (49), and municipalities are
now primarily responsible for the provision of both institutional and non-institutional services
(153).
The Nordic council has published an overview of research on elder care. In the report, elder
care was interpreted in a broad sense as related to the social sciences and humanities. The
report was published during the last decade, and it dealt with the topics of public elder care,
informal care, and services provided by voluntary organisations. An important result was a
common trend that the traditional care institutions (nursing homes, residential homes) had
been replaced with assisted living communities. However, the lack of commonly defined
categories made it difficult to compare data concerning home help services provided in
ordinary homes with services provided in elderly housing. It was not documented whether the
differences found between the Nordic countries regarding the distribution of institutional care,
41
dwellings, and home-based care services corresponded equally well to the everyday needs of
elderly people (49).
The Nordic countries have been represented in other European studies. In the OASIS project,
five European countries participated.22 Approximately 1,200 people participated in the
national samples, 400 were age 75 and over. Older Norwegians preferred residential living to
living with a child. Norwegians were more likely than other European participants to place
primary responsibility for care of older people on the welfare state. The threshold for an
institutional bed in Norway, however, is low compared to other European countries (49, 154,
155). The same tendency would be found in the other Nordic countries.
Universalism is one of the central philosophical cornerstones of the Nordic welfare model.
Kildal & Kuhnle (9) have discussed how the idea of universalism has been realised in
practical life. Access to home care may be a question of local criteria concerning capacity and
resources. Any inhabitant may apply for health care, but it is the administrative staffs in the
municipalities that assess and decide the amount of help that will be given.
Larsson (156) made a review study in Sweden concerning the housing situation for older
people in Sweden. In Sweden there has been a tendency not only to reduce the use of
traditional nursing homes and to use assisted living instead, but between 2000 and 2005 the
number of people in assisted living decreased by 18,000. The formal health care service was
not able to give proper assistance, and housing was rebuilt into senior dwellings with high
technical resources but without staffing. Larsson emphasised that it still remains to be seen
whether frail older people manage to remain at home or whether they have to move in their
last days of life. She stated that data to identify home care patient or caregiver variables
predicting residential care utilisation were lacking in Sweden. Some of the older home care
users could perhaps manage better if they would move to a more convenient apartment.
A study of the fifteen EU member states and Norway addressing social protection for
dependency in old age concluded that there is sparse information available about the needs of
older individuals. The lack of a standardised gathering system precludes data collection and
cross-national comparisons (157). Gaugler et al. (158) conducted a meta-analysis of published
22 Norway, United Kingdom, Germany, Spain, and Israel.
42
research articles with the following keywords: nursing home placement, nursing home entry,
nursing home admission, and predictors/institutionalisation; the aim was to identify predictors
of nursing home (NH) admission in the US. Among the strongest predictors were
dependencies in three or more ADL functions, cognitive impairments, and prior NH use.
Comments
The data from Nordic capitals were unique in the AD HOC setting. Patients who were
enrolled in home care were less impaired both physiologically and cognitively than their
counterparts in most of the other participant sites. The Nordic welfare model has been looked
upon as an ideal within health and social planning. In the Nordic countries the older people
have an old age pension that covers housing and living expenses. Is independent living always
‘Paradise for older people’? What happens when the need for moderate to extensive assistance
arises? Perhaps the Southern European or Catholic model, integrated family living, is a better
solution than the Nordic nursing homes or ‘around the clock care dwellings’.
Classification system and screening tools
The demand for documentation and evidence-based practice has increased with the adoption
of electronic record systems. International Classification of Diseases (ICD) gives users an
etiological framework for classification by diagnosis of diseases, disorders, and other health
conditions. The World Health Organisation (WHO), wanting to take the focus away from
medical diagnoses, has developed the International Classification of Functioning, Disability,
and Health (ICF). In short, ICD-10 is mainly used to classify causes of death, while ICF
classifies health (159).
Several screening tools have been developed for the same conditions. A common problem in
comparing different research studies is that the inclusion criteria or the definition of specific
phenomena vary from tool to tool. It seems as if the tool that is used most often is the one that
requires the shortest amount of time to complete. However, if a tool is not able to prove its
validity and reliability, it is likely to be rejected over time. Visschedijk et al. (160) stated that
in the elderly, more complicated parameters and tools to assess nutritional status have not
shown substantial value-added compared with relatively simple parameters, such as food
records, weight loss, and Body Mass Index.
43
In Norway, the Directorate for Health and Social Affairs developed an instrument, IPLOS, to
collect national statistics linked to individual care needs (161). In 2006, all municipalities
were supposed to report on all their users. IPLOS includes seventeen items assessing
functional ability. Functional ability is rated on a scale from 1 to 5: 1 indicating independence
and 5 indicating total dependence. Two items are related to nutrition (meal preparation and
eating) and one to elimination (toileting). In addition, ‘meals on wheels’ is an option23 in the
service delivery section. The screening by IPLOS does not assess the patient’s nutritional
status or bladder and bowel incontinence.
Unintended weight loss is a negative prognostic factor in the health status of older people, and
several screening instruments exist. The European Society for Clinical Nutrition and
Metabolism (ESPEN) and the National Institute for Health and Excellence (NICE) have
developed guidelines for nutrition screening inside and outside the hospital (162, 163).24
Screening results may indicate that a patient is at risk for malnutrition and requires a
comprehensive assessment. Unintended weight loss may be the first sign of a cancer. A
systematic review of the evidence on the use of a CGA in cancer patients concluded: ‘A
CGA, with or without screening, and with follow up, should be used in older cancer patients,
in order to detect unaddressed problems, improve their functional status, and possibly their
survival’ (164). Jensen (165) emphasised that older patients should be screened for obesity.
She suggested using a simple nutrition risk screen including Body Mass Index (BMI). A
literature review of research concerning faecal incontinence offered different ways of
screening. A commonly used instrument is the Barthel ADL Index and its sub-score on bowel
incontinence: 0, moderate-to-severe degree of bowel incontinence; 1, bowel incontinence
about once per week; 2, no bowel incontinence last week (166). The International Continence
Society (ISS) defines urinary incontinence as ‘the complaint of any involuntary leakage of
urine’ (167). However, incontinence is a symptom of many different conditions and must be
followed up with a comprehensive assessment.
A comprehensive geriatric assessment
23 In Norway, ‘meals on wheels’ means dinner in vacuum plastic bags ready for heating. 24 In Norway, the Directorate for Health and Social Affairs is working on Norwegian guidelines http://www.shdir.no/ernaering (June 2008).
44
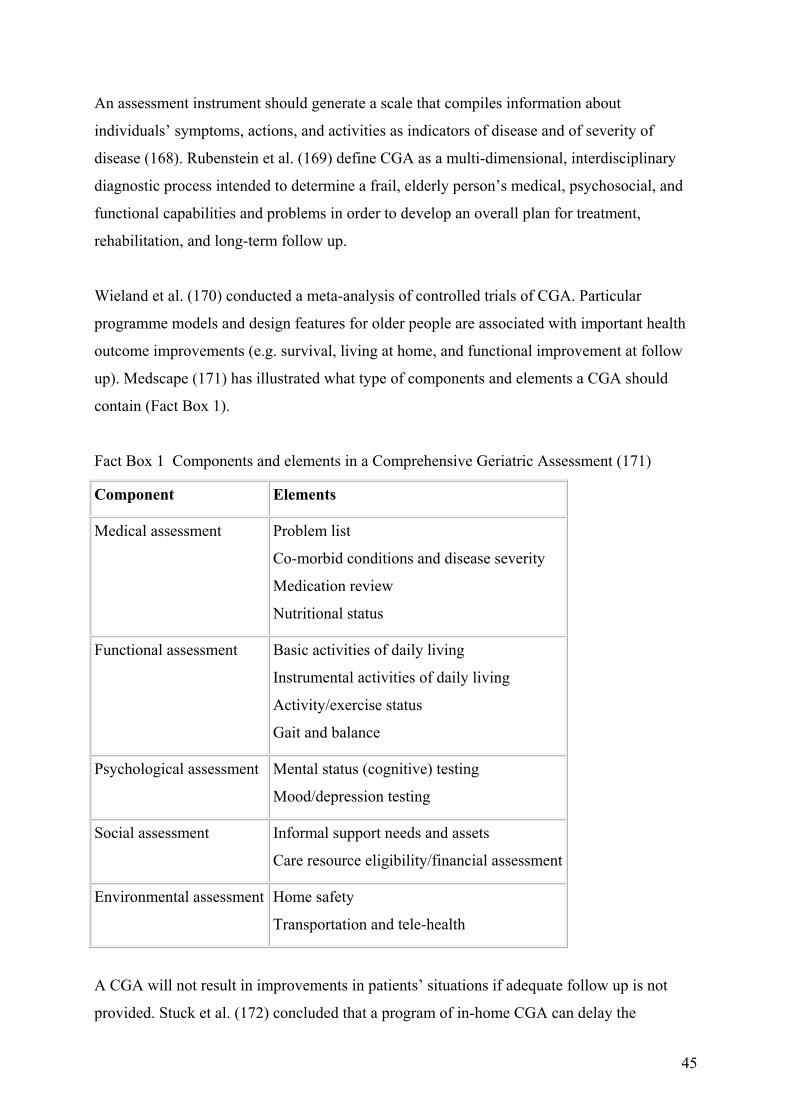
An assessment instrument should generate a scale that compiles information about
individuals’ symptoms, actions, and activities as indicators of disease and of severity of
disease (168). Rubenstein et al. (169) define CGA as a multi-dimensional, interdisciplinary
diagnostic process intended to determine a frail, elderly person’s medical, psychosocial, and
functional capabilities and problems in order to develop an overall plan for treatment,
rehabilitation, and long-term follow up.
Wieland et al. (170) conducted a meta-analysis of controlled trials of CGA. Particular
programme models and design features for older people are associated with important health
outcome improvements (e.g. survival, living at home, and functional improvement at follow
up). Medscape (171) has illustrated what type of components and elements a CGA should
contain (Fact Box 1).
Fact Box 1 Components and elements in a Comprehensive Geriatric Assessment (171)
Component Elements
Medical assessment Problem list
Co-morbid conditions and disease severity
Medication review
Nutritional status
Functional assessment Basic activities of daily living
Instrumental activities of daily living
Activity/exercise status
Gait and balance
Psychological assessment Mental status (cognitive) testing
Mood/depression testing
Social assessment Informal support needs and assets
Care resource eligibility/financial assessment
Environmental assessment Home safety
Transportation and tele-health
A CGA will not result in improvements in patients’ situations if adequate follow up is not
provided. Stuck et al. (172) concluded that a program of in-home CGA can delay the
45
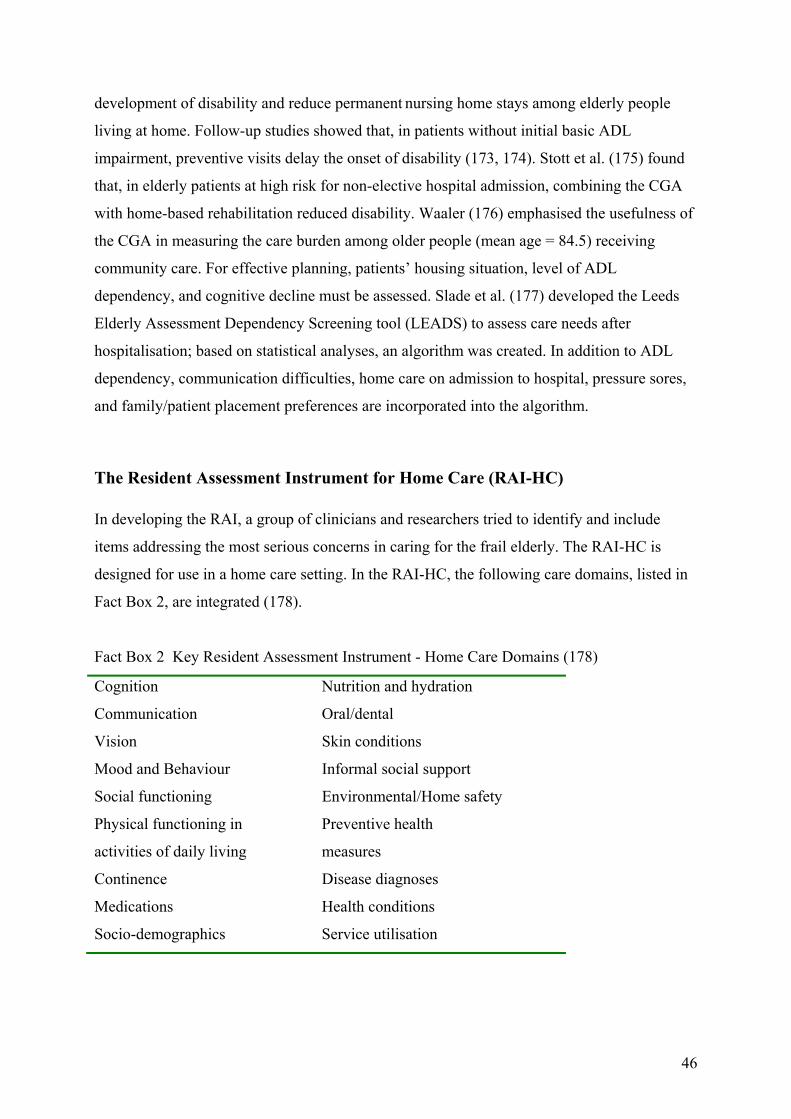
development of disability and reduce permanent nursing home stays among elderly people
living at home. Follow-up studies showed that, in patients without initial basic ADL
impairment, preventive visits delay the onset of disability (173, 174). Stott et al. (175) found
that, in elderly patients at high risk for non-elective hospital admission, combining the CGA
with home-based rehabilitation reduced disability. Waaler (176) emphasised the usefulness of
the CGA in measuring the care burden among older people (mean age = 84.5) receiving
community care. For effective planning, patients’ housing situation, level of ADL
dependency, and cognitive decline must be assessed. Slade et al. (177) developed the Leeds
Elderly Assessment Dependency Screening tool (LEADS) to assess care needs after
hospitalisation; based on statistical analyses, an algorithm was created. In addition to ADL
dependency, communication difficulties, home care on admission to hospital, pressure sores,
and family/patient placement preferences are incorporated into the algorithm.
The Resident Assessment Instrument for Home Care (RAI-HC) In developing the RAI, a group of clinicians and researchers tried to identify and include
items addressing the most serious concerns in caring for the frail elderly. The RAI-HC is
designed for use in a home care setting. In the RAI-HC, the following care domains, listed in
Fact Box 2, are integrated (178).
Fact Box 2 Key Resident Assessment Instrument - Home Care Domains (178)
Cognition Nutrition and hydration
Communication Oral/dental
Vision Skin conditions
Mood and Behaviour Informal social support
Social functioning Environmental/Home safety
Physical functioning in
activities of daily living
Preventive health
measures
Continence Disease diagnoses
Medications Health conditions
Socio-demographics Service utilisation
46
A CGA like the RAI-HC could analyse functional decline and its associations with other
clinical factors related to basic needs like nutrition and elimination.
RAI-HC items and scales are highly correlated to the Barthel ADL Index and the Lawton
Instrumental Activities of Daily Living Scale (both have a Pearson correlation of 0.74). The
Cognitive Performance Scale (CPS) in the RAI-HC has a correlation of 0.81 with the
Minimum Mental State Examination (MMSE) (2).
Landi et al. (179) used the RAI-HC in a controlled clinical trial on the functioning and
hospitalisation of homebound older people. They concluded that the instrument may provide a
cost-saving approach to reducing institutionalisation and functional decline in older people
living in the community.
The data from the RAI instruments have demonstrated validity, reliability, specificity, and
sensibility, and have been published in refereed scientific journals (4, 180, 181). Several PhD
students have used RAI-instruments for their theses. In this current thesis, studies from
Sweden and Denmark are used as references (182-185). The main aim for interRAI was not to
make a feasible research instrument, but to address the health needs for frail elderly people
and use the data for clinical improvement in daily care (186).
The Milbank Memorial Fund (187) evaluated the implementation of the RAI instruments.
Case studies of policymaking for long-term care in eight countries25 were used. The report
gave a positive view of the assessment tool’s potential for policy-making. The report gave
concrete examples of how to improve the quality and use of the results from the assessments.
Research was specifically mentioned as playing a critical role in policy formation and
implementation. The Milbank report emphasised that most people have not suffered from
poor quality in long time care, and even groups that represent older people are not eager
enough to place this topic high on their policy agenda. Moreover, poor quality of care could
be costly to change and should not be highlighted, and politicians are not willing to take the
economic consequences. The report emphasised that the researchers can help keep a level of
attention to older people’s needs by publishing their results in terms of policy issues.
25 US, Canada, Iceland, Israel, Italy, Japan, Spain, and the UK.
47
SCIENTIFIC APPROACH
In the last few decades, community care for older people has increased dramatically in most
European countries. Home care is the preferred, long-term care option. So far, there have been
few studies of the characteristics of community care recipients or of the organisation of
services that produce the best outcomes for recipients and their informal caregivers. The AD
HOC study was designed to compare outcomes of different community care models across 11
European countries using a structured measure of services and a comprehensive, standardised
assessment instrument. Comprehensive data were collected on clients receiving home care
services from 11 sites in European countries. Analysis of the data revealed the complex
challenges faced by the older, single, homebound person, such as being unable to perform
normal activities of daily living. The most basic activities of daily living are the ability to get
sufficient nutrition and to cope with elimination.
An important aim for the AD HOC project was to consider how health personnel could use a
CGA to establish health policy priorities based on individual basic needs, and not on a
misguided concept of equality (5, 188). The AD HOC project has generated several research
articles and, in addition to this thesis, five other AD HOC articles (5, 181, 189-191). The six
research articles that shape the body of this thesis address basic needs related to nutrition and
elimination. These needs may seem so obvious that they are invisible until they cause serious
problems for individuals in need of assistance. This thesis struggles to create a suitable head
for this body: a head with a logical and structured brain that could provide a new
understanding of the home care patients´ situation. Such an understanding will be built on
analyses of the AD HOC data and discussions based on relevant research articles.
48
AIMS FOR THIS THESIS AND RESEARCH QUESTIONS
The overall purpose of this thesis is to describe, analyse, and compare the basic needs’
characteristics (such as nutrition and elimination) and the clinical features of older people
receiving home care in Europe. Each of these research questions represents one article. In
each article, more specific questions are derived.
All questions concern older people, age 65 or older, receiving home care at 11 sites in Europe:
Article I What are the characteristics of the elderly with unintended weight loss?
Article II What are the home care needs of elderly women with extreme obesity?
Article III What are the clinical features and needs of home-dwelling patients with
urinary incontinence?
Article IV What are the characteristics of indwelling catheter use in home care?
Article V To what degree is workload and subjective caregiver burden associated with
faecal incontinence, among home care patients?
Article VI What are the characteristics of home care users and their needs in the Nordic
capitals, and what are the predictors for nursing home (NH) placement and
death in a 12-month follow-up period?
Study Sample and Methods
Sample
The AD HOC study, a cross-sectional study conducted in 2001-2, is the basis of this
contribution. The participants were older home care clients in different European cities:
Copenhagen, Denmark (DK); Helsinki, Finland (FI); Reykjavik, Iceland (IS); Oslo/Bærum,
Norway (NO); Stockholm, Sweden (S); Prague, Czech Republic (CZ); Amiens, France (F);
Nurnberg/Bayreuth, Germany (D); Monza, Italy (I); Amsterdam, Netherlands (NL) and
Maidstone/ Ashford, England (UK) (Figure 1).
49
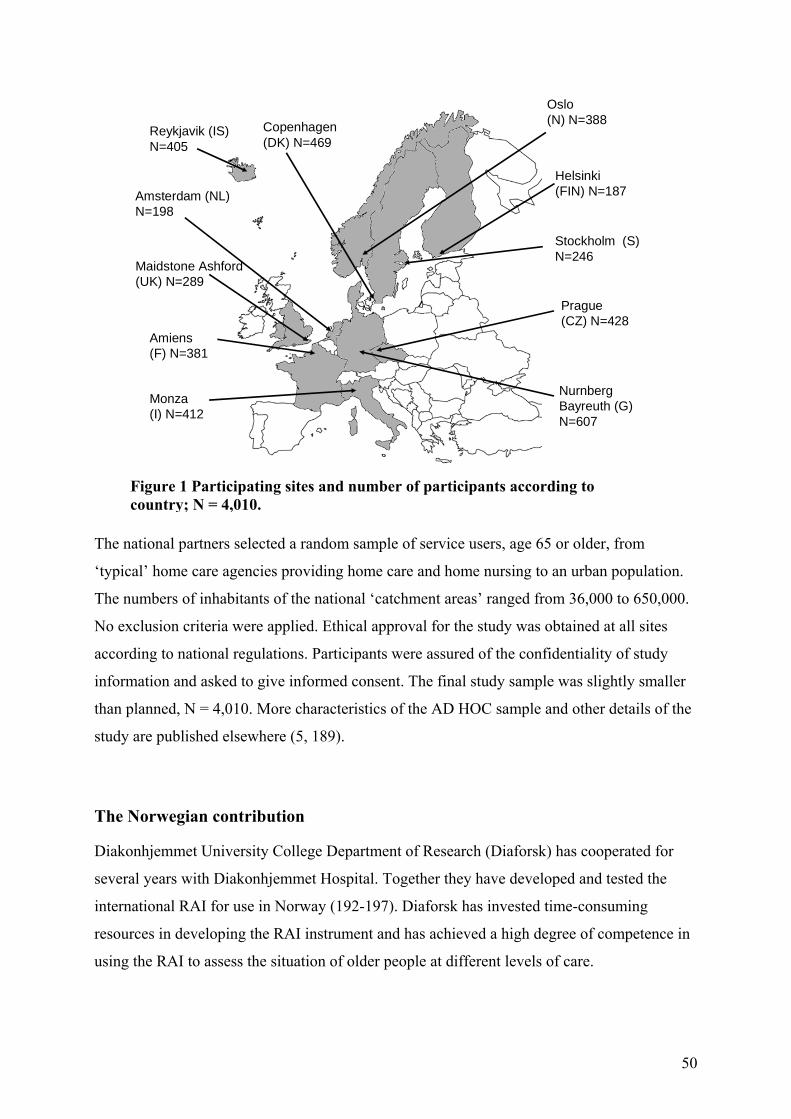
Monza (I) N=412
Prague(CZ) N=4
Helsinki (FIN) N=18
Amiens(F) N=381
Copenhagen(DK) N=469
Maidstone Ashford(UK) N=289
Amsterdam (NL) N=198
Reykjavik (IS) N=405
Oslo (N) N=388
StockholmN=246
NurnbergBayreuthN=607
28
7
(S)
(G)
Figure 1 Participating sites and number of participants according to country; N = 4,010.
The national partners selected a random sample of service users, age 65 or older, from
‘typical’ home care agencies providing home care and home nursing to an urban population.
The numbers of inhabitants of the national ‘catchment areas’ ranged from 36,000 to 650,000.
No exclusion criteria were applied. Ethical approval for the study was obtained at all sites
according to national regulations. Participants were assured of the confidentiality of study
information and asked to give informed consent. The final study sample was slightly smaller
than planned, N = 4,010. More characteristics of the AD HOC sample and other details of the
study are published elsewhere (5, 189).
The Norwegian contribution
Diakonhjemmet University College Department of Research (Diaforsk) has cooperated for
several years with Diakonhjemmet Hospital. Together they have developed and tested the
international RAI for use in Norway (192-197). Diaforsk has invested time-consuming
resources in developing the RAI instrument and has achieved a high degree of competence in
using the RAI to assess the situation of older people at different levels of care.
50
For Diaforsk, it was a great opportunity to have the challenge to participate in an
international, prospective observation study of older people in large cities, preferably capitals,
who are receiving home nursing or other services from home care agencies. All information
was entered in a database. The database contained the characteristics of the patients/users of
home care and the structural and organisational characteristics of each country in the study.
Material and methods
The catchment area for Diakonhjemmet was comprised of four municipalities (‘city parts’)
with a total of 91,338 inhabitants. 14.6% of these inhabitants were over the age of 67. City
part no. 25, Ullern, has 25,000 inhabitants; 19.4% are 65 or older. Home care services, home
nursing, and home help are provided for approximately 700 users per year. A random sample
of 405 home care users was selected. The data collection began in August 2001 and, by April
2002 the patients were systematically contacted via electronic lists. As the number of patients
using home nursing services was less than anticipated (the home help service was used most
frequently); the decision was made to include home care patients from Bærum, a
neighbouring municipality.
Bærum has 101,000 inhabitants, 15.1% are 65 or older. The home care service had
approximately 3,000 users per year (SSB 2001). Formal permission was obtained.
Participating nurses were provided with information and instructions. In Bærum, nurses were
used to complete several types of assessments and were well organised. The refusal rate for
the Norwegian sample was 7% (Table 2).26
Each client received three visits. On the first visit, a ‘base line’ interview was conducted using
the RAI-HC. Half a year later, a less comprehensive interview took place, followed by a
complete assessment after one year. One person at each service office was responsible for
providing information about the participant’s current status: a) dead; b) moved to a nursing
home or in a long-term hospital stay; or c) hospitalised in an acute ward, and discharged from
the service.
In addition to the RAI-HC, a special assessment instrument for home care (EU-HCS) was
completed. This was used to gather information about service utilisation and organisation.
26 In total, Ullern had 296 participants and Bærum 92, in text, tables and figures the Norwegian sample is called ‘Oslo’.
51
Important variables including demographic data, economic and organisational structure,
different levels of care, and type of services rendered were registered. Personal identifiers
were not registered electronically.
Ethical and legal approval
The AD HOC group developed a common design for the informed consent for the
participants. Those responsible for each participant site had to follow their local legal and
ethical rules. Diaforsk used this as a model and adapted it to accommodate Norwegian rules
and guidelines. There was concern about older patients’ ability to understand the informed
consent process. The informed consent process could be a conflict of interest between
assessors and the older patients, because of the aim to get the highest possible participation
rate. However, the project had no experimental design; the patients were to receive their
ordinary home services, care, and treatment. Some of the questions - about mood, behaviour,
self-reported health, abuse, and informal caregivers - could provoke different reactions. The
assessors were trained health personal and were informed how to get follow-up assistance if
needed. It was assumed that when the older patients were able to live in their own home and
cope with activity of daily living, they understood the reason for the assessment. In border-
line cases the significant other was consulted. This view corresponds with Bucklets et al.
(198). The informed consent stated that the patient may feel free at any time to withdraw from
the study without stating a reason.
Diaforsk applied for permission from the Data Inspectorate and The National Committee for
Medical Research Ethics. Both institutions approved the study.
Measurement
Clients were assessed using the International Resident Assessment Instrument for Home Care
(RAI-HC), version 2.0. The InterRAI is a collaborative network of researchers in over 20
countries committed to improving healthcare for persons who are older, frail, or disabled. The
RAI-HC is an instrument in the InterRAI family of tools. For particular populations,
applications of the RAI have been developed, designed to work together to form an integrated
health information system. InterRAI instruments all share a common language, that is, they
refer to the same clinical concept in the same way across instruments (188).
52
The RAI-HC was translated into the language of each participating country (and, for
methodological purposes, also back-translated). It consists of about 300 items (functional
status, cognitive abilities, morbidity and symptoms, social contacts, communication,
utilisation of selected services and treatments, informal help, and socio-demographic
background), and is reliable and validated (199). All assessments took place in the client’s
home. Assessors were trained to become familiar with the MDS and the entire RAI-HC (200).
In some countries, like Norway, the ‘normal staff’ of home care agencies responsible for
providing services was involved in data collection, usually with the assistance of special
research nurses.
Each of the six attached articles used its own set of selected variables from the RAI-HC
depending on the research question presented. These main topics and their associated
variables were combined in a chi-square test with ‘being homebound’ as the dependent
variable. Those variables determined to be statistically significant in association with being
homebound were incorporated into a regression model (Table 3).
Practical approach
The author had the responsibility for organising the Norwegian part of the research project. In
June 2001, she joined the home care team in Ullern for two weeks to get acquainted with the
staff, their routines, and their workload. Training key staff to use the assessment was done in
groups and with individual counselling. During data collection, the author was in the home
care unit following up on 2nd year nursing students from Diakonhjemmet University College.
These students participated in the assessment procedure for their primary care patients. She
went through all of the assessments to ensure that the proper protocol was followed. Study
participants were chosen by charge nurses from their lists. The author knew the home care
teams in Bærum from earlier teaching experience with nursing students. The actual date for
the baseline interview determined when the 6- and 12-month assessments were completed.
Statistical Analyses
Statistical analyses were performed using SPSS v. 15 (201). The results were statistically
assessed using univariate, bivariate, and multivariate methods. Chi-square analysis for
dichotomous variables was used to test the difference between those study participants who
received nursing procedures and those who received social services. Differences were
considered significant at a level below 0.05.
53
54
In this methodological article, characteristics of the participants were analysed. Three clusters
of countries were identified based on socio-demographic, functional, and clinical variables.
Cluster 1 included sites in the Czech Republic, the Nordic countries (Denmark, Finland,
Iceland, Norway, and Sweden), and the Netherlands. Cluster 2 included sites in Italy and
France, and Cluster 3 included sites in Germany and the United Kingdom (5). Odds ratios
(ORs) with 95% confidence intervals (CI) were used for risk estimates. Logistic regression
models were developed for the six research articles with the following dependent variables:
unintended weight loss, extreme obesity, urinary incontinence, indwelling catheter, faecal
incontinence, and ‘better off in another living environment’.
For the final logistic regression, homebound (dichotomous) was used as a dependent variable.
Those clinical variables from each of the research articles (I-VI) that were found to be
significant in the chi-square analysis were used as independent variables.
Results
Study population
In Table 1, site characteristics and functional and clinical parameters are presented. A total of
11 sites from different European countries participated. N = 4,010; 26% of participants were
men (M) and 74% were women (F). The mean age was 82.3 years ± 7.3; for men it was 80.9
± 7.5 and for women it was 82.8 ± 7.2.
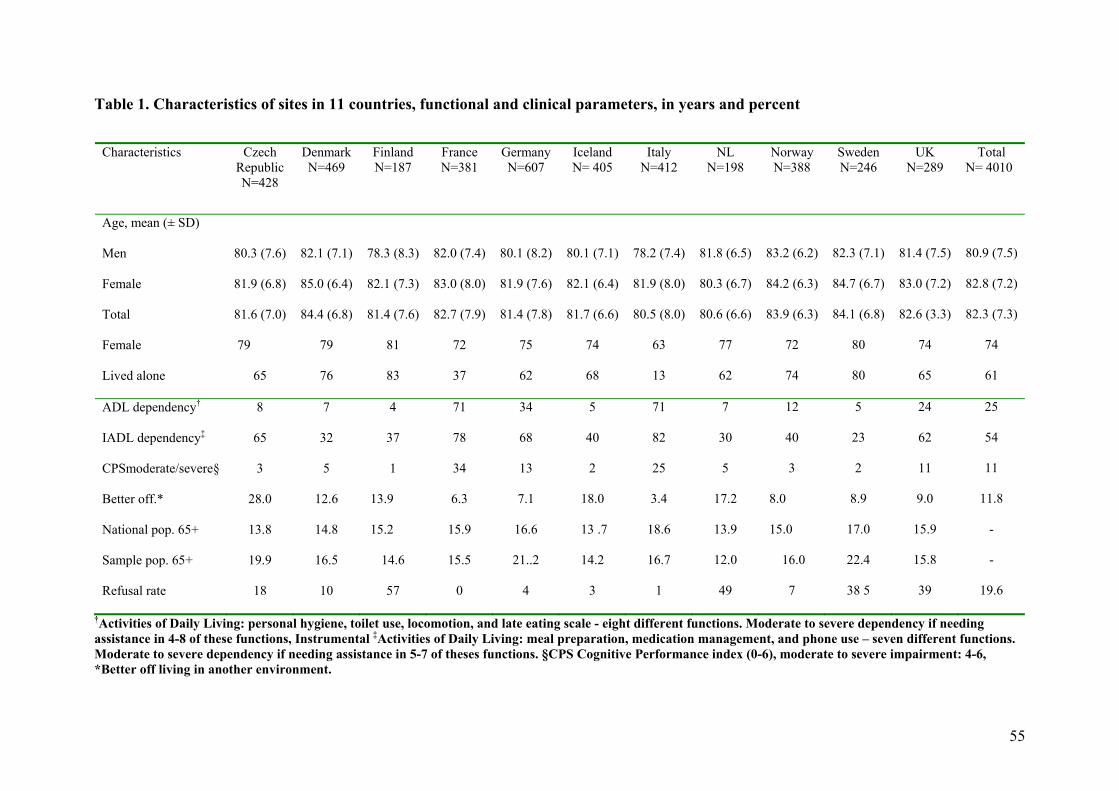
Table 1. Characteristics of sites in 11 countries, functional and clinical parameters, in years and percent
†Activities of Daily Living: personal hygiene, toilet use, locomotion, and late eating scale - eight different functions. Moderate to severe dependency if needing assistance in 4-8 of these functions, Instrumental ‡Activities of Daily Living: meal preparation, medication management, and phone use – seven different functions. Moderate to severe dependency if needing assistance in 5-7 of theses functions. §CPS Cognitive Performance index (0-6), moderate to severe impairment: 4-6, *Better off living in another environment.
Characteristics Czech Republic N=428
Denmark N=469
Finland N=187
France N=381
Germany N=607
Iceland N= 405
Italy N=412
NL N=198
Norway N=388
Sweden N=246
UK N=289
Total N= 4010
Age, mean (± SD)
Men
Female
Total
Female
Lived alone
80.3 (7.6)
81.9 (6.8)
81.6 (7.0)
79
65
82.1 (7.1)
85.0 (6.4)
84.4 (6.8)
79
76
78.3 (8.3)
82.1 (7.3)
81.4 (7.6)
81
83
82.0 (7.4)
83.0 (8.0)
82.7 (7.9)
72
37
80.1 (8.2)
81.9 (7.6)
81.4 (7.8)
75
62
80.1 (7.1)
82.1 (6.4)
81.7 (6.6)
74
68
78.2 (7.4)
81.9 (8.0)
80.5 (8.0)
63
13
81.8 (6.5)
80.3 (6.7)
80.6 (6.6)
77
62
83.2 (6.2)
84.2 (6.3)
83.9 (6.3)
72
74
82.3 (7.1)
84.7 (6.7)
84.1 (6.8)
80
80
81.4 (7.5)
83.0 (7.2)
82.6 (3.3)
74
65
80.9 (7.5)
82.8 (7.2)
82.3 (7.3)
74
61
ADL dependency†
IADL dependency‡
CPSmoderate/severe§
Better off.*
National pop. 65+
Sample pop. 65+
Refusal rate
8
65
3
28.0
13.8
19.9
18
7
32
5
12.6
14.8
16.5
10
4
37
1
13.9
15.2
14.6
57
71
78
34
6.3
15.9
15.5
0
34
68
13
7.1
16.6
21..2
4
5
40
2
18.0
13 .7
14.2
3
71
82
25
3.4
18.6
16.7
1
7
30
5
17.2
13.9
12.0
49
12
40
3
8.0
15.0
16.0
7
5
23
2
8.9
17.0
22.4
38 5
24
62
11
9.0
15.9
15.8
39
25
54
11
11.8
-
-
19.6
55
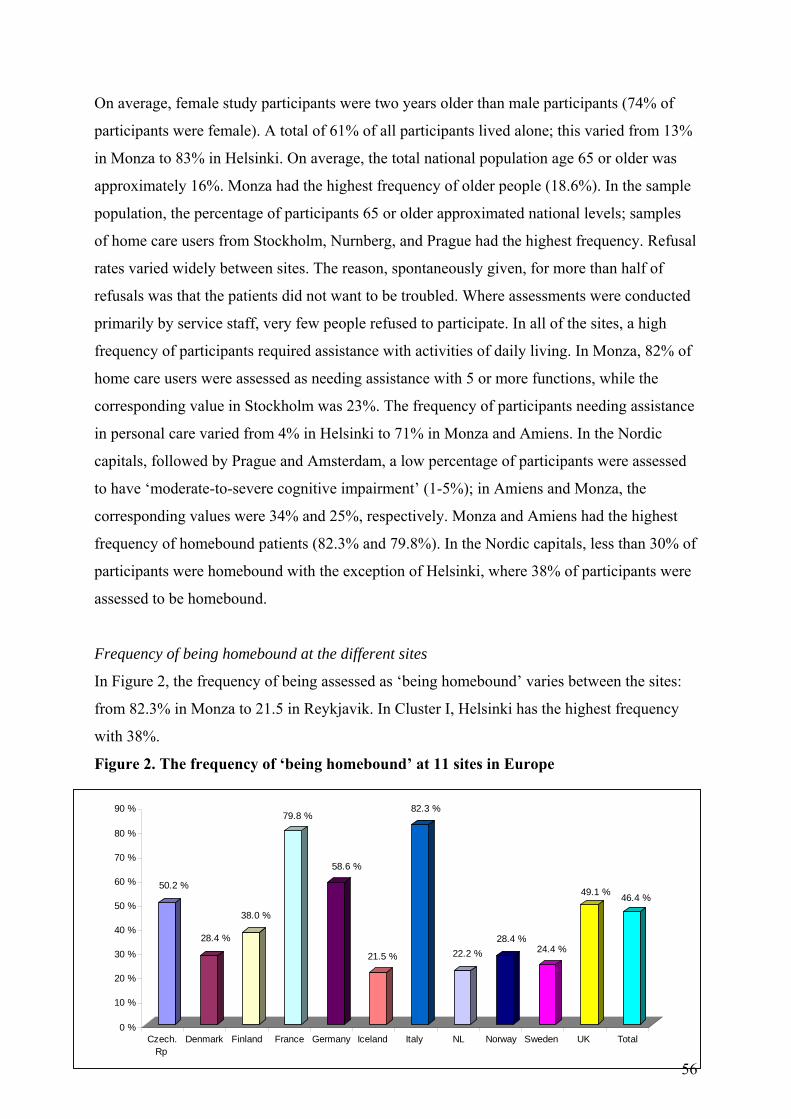
On average, female study participants were two years older than male participants (74% of
participants were female). A total of 61% of all participants lived alone; this varied from 13%
in Monza to 83% in Helsinki. On average, the total national population age 65 or older was
approximately 16%. Monza had the highest frequency of older people (18.6%). In the sample
population, the percentage of participants 65 or older approximated national levels; samples
of home care users from Stockholm, Nurnberg, and Prague had the highest frequency. Refusal
rates varied widely between sites. The reason, spontaneously given, for more than half of
refusals was that the patients did not want to be troubled. Where assessments were conducted
primarily by service staff, very few people refused to participate. In all of the sites, a high
frequency of participants required assistance with activities of daily living. In Monza, 82% of
home care users were assessed as needing assistance with 5 or more functions, while the
corresponding value in Stockholm was 23%. The frequency of participants needing assistance
in personal care varied from 4% in Helsinki to 71% in Monza and Amiens. In the Nordic
capitals, followed by Prague and Amsterdam, a low percentage of participants were assessed
to have ‘moderate-to-severe cognitive impairment’ (1-5%); in Amiens and Monza, the
corresponding values were 34% and 25%, respectively. Monza and Amiens had the highest
frequency of homebound patients (82.3% and 79.8%). In the Nordic capitals, less than 30% of
participants were homebound with the exception of Helsinki, where 38% of participants were
assessed to be homebound.
Frequency of being homebound at the different sites
In Figure 2, the frequency of being assessed as ‘being homebound’ varies between the sites:
from 82.3% in Monza to 21.5 in Reykjavik. In Cluster I, Helsinki has the highest frequency
with 38%.
Figure 2. The frequency of ‘being homebound’ at 11 sites in Europe
0 %
10 %
20 %
30 %
40 %
50 %
60 %
70 %
80 %
90 % 82.3 %79.8 %
58.6 %
50.2 %49.1 % 46.4 %
38.0 %
28.4 % 28.4 %24.4 %22.2 %21.5 %
Czech.Rp
Denmark Finland France Germany Iceland Italy NL Norway Sweden UK Total
56
Article I Diagnosis and unintended weight loss (UWL)
In the first analysis of the data, cancer was the only diagnosis that was statistically significant
for association with UWL (OR = 2.0, CI = 1.5-2.7, p < 0.001). Thereafter, patients with this
diagnosis were excluded from the rest of the analysis. Health indicators - fluctuations in
function and flare ups of chronic conditions - had a strong association (p < 0.001) with UWL,
with OR = 1.4, CI = 1.2-1.7 and OR = 2.2, CI = 1.7-2.9, respectively.
The following types of infections were reported among clients: 201 (5%) had urinary tract
infections, 113 (3%) had pneumonia, and 36 (1%) had tuberculosis (Appendix Table 2). On
average, 20% received ‘meals on wheels’ at least once per week. The frequency varied from
1% to 61% among the different sites; Stockholm had the lowest frequency and Prague had the
highest. The frequency of UWL and selected conditions did not fit into the grouping of
clusters.
The sample without cancer patients
After excluding participants with a cancer diagnosis, the age and gender data (n = 3,689)
changed only slightly. Of the clients, 935 (25%) were men and 2,754 (75%) were women, and
the mean age was 82.5 years ± 7.3; for men, it was 81.0 ± 7.4 years and for women, it was
82.9 ± 7.2 years (Appendix Table 3). There was a statistically significant association (p =
0.05) between UWL and advanced age (more than 75 years). The clients with UWL were
more likely to have received help from a visiting nurse one or more days during the last week
than those without UWL. Clients with UWL received more hours of informal help then did
those without UWL. Recent health service use (hospitalisation for either emergency visits or
stays) was statistically associated with UWL.
Risk factors for unintended weight loss
In those clients with UWL, all the other signs of malnutrition were present and statistically
significant more often, whereas the opposite was true for those without UWL. The
concentration of home care clients who had eaten one or fewer meals/day, and/or had reduced
appetite, and/or had a smaller intake of food and fluids, had a statistically significant increase
in the group with UWL. Self-reported poor health, physical dependency, impaired cognition,
falls, visual decline during last 90 days, pain, and pressure ulcers were statistically significant
57
more frequently in clients with UWL. Prognosis of less than 6 months was associated with
UWL. Patients with feeding tubes had a higher incidence of UWL. With regard to the
different sites, there was a statistically significant, higher incidence of UWL in Cluster 2
(Monza and Amiens).
Independent predictors of unintended weight loss
In order to identify independent predictors of UWL, a logistic model was developed. The
model confirms the strong statistical association between UWL and oral or gastrointestinal
symptoms or conditions. In addition, reduced social activity, hospitalisations, falls, daily pain,
and pressure ulcers were included in the model. The model summary gave an explanatory
value of 26%; the three different site clusters gave no additional explanatory value. First
malnutrition and then both malnutrition and ‘fewer meals’ were excluded from the regression
model, reducing the explanatory value to 24% and 22%, respectively.
Article II Frequency of extreme obesity (EO)
120 women (4.0%) and 22 men (2.1%) were extremely obese (EO) (further analysis was
confined to women). Extremely obese women receiving home care were younger than the
non-extremely obese (N-EO): median age was 78.3 (range was 64.3-94.9) versus 83.3 (range
of 64.4-104.5). The EO received home care for longer periods of time (median = 36.6
months) than the N-EO (median = 28.7 months) and needed more help with personal care
than the other group, but they were less cognitively impaired.
Clinical conditions
The OR indicates the risk for each clinical condition. The EO group had a statistically
significant greater incidence of shortness of breath, oedema, and urinary incontinence. Due to
diabetes, the EO clients needed more dietary consultations; five of them were treated with
insulin injections.27 They required more help when moving outside the home and more
specialist skin care, and they reported multiple heath complaints more often than non-obese
women.
27 This data about insulin is given by Fialova who has been responsible for the medication analyses in AD HOC.
58
Logistic regression
A logistic regression model showed that EO was statistically significant (p < 0.05) in
association with increased care needs related to: diabetes (OR = 1.81, CI = 1.20-2.72),
shortness of breath (OR = 2.26, CI = 1.52-3.37), oedema (OR = 1.56, CI = 1.04-2.32),
multiple health complaints (OR = 1.73, CI = 1.05-2.84), and urinary incontinence (OR = 2.16,
CI = 1.45-3.22). The EO patients were also more likely to need assistance with locomotion
outside the home: use of a frame (OR = 1.73, CI = 1.10-2.71), and help with moving about
(OR = 1.56, CI = 1.03-2.37).
Article III Incidence of urinary incontinence (UI) and the use of pads
In the study sample, the incidence of UI was 47%28 and of pad use was 39%, but the variation
across the 11 countries was enormous. In Oslo, 37% suffered from UI, whereas in Monza, the
figure was 63%. The frequency of pad use differed across countries from 29% in Prague and
Oslo to 52% in Amiens.
40% of women suffered from UI, with the highest rate (44%) among women ages 75-84. The
incidence of UI with leakage at least once a week was 38% (N = 1,513); 9% (N = 362) of
participants had an indwelling, intermittent, or condom catheter. The prevalence of such
devices was twice as high among male participants (15%) as among female (7%). The highest
rates of UI as well as pad use were found in Amiens (50.5% for both), while the lowest rates
occurred in Helsinki (20.0% for UI and 5.7% for pad use).
The most frequent use of catheters was found in Monza (35.9% of men), while the lowest
rates were found in Helsinki (2.9%) and Stockholm (3.0%). In most countries, women
suffered from UI more often than men. Pad use was also higher among women than men, but
the application of catheters was less prevalent in women. The highest incidence of UI was in
Amiens (50.7%) and the lowest in Oslo (32.7%), where only 30.9 % of home care clients used
pads for incontinence. In Copenhagen and Maidstone/Ashford, half of the study population
used pads (51.5% and 51.2% respectively). Paradoxically, these numbers are higher than the
rates of UI. In other sites, e.g. in Monza, the application of catheters was particularly frequent
28 Urinary incontinence included different types of catheters
59
(27.4% of women participants). The lowest rates of catheter application were found in Prague
(0.6%).
The need for toileting assistance
The percentage of people needing assistance in toileting varied from one region to the other.
In the Nordic capitals, as well as in Prague and Amsterdam, most of the clients were toileting
independently.
The association between the need for assistance during toileting and pad use was statistically
significant in many countries. This means that participants who needed assistance with
toileting were statistically significantly more likely to wear pads than persons who manage to
use a toilet independently (p < 0.001). Results for Maidstone/Ashford showed an OR of 2.0,
CI = 1.1-3.6, p = 0.02.
Cognitive impairment and urinary incontinence
Those individuals who were assessed as moderately-to-severely cognitively impaired were
6.3 times more likely to suffer from UI than cognitively independent individuals. The
association between cognitive impairment and UI was statistically significant at p < 0.000 for
all ‘regions’.
Variables independently associated with urinary incontinence
Logistic regression using forward conditional selection was used to identify characteristics
independently associated with UI. Data from all 11 sites were analysed together. Those
11 characteristics that were statistically significant in association with UI (p < 0.05) in
bivariate analysis were entered into the model. Those characteristics that were associated with
UI, four of which increased the occurrence of UI by more than 2.0 (OR), included: faecal
incontinence, urinary tract infections, EO, and the need for toileting assistance. The model
summary gave an explanatory value of 26% for the association between selected variables and
UI (Nagelkerke R2 coefficient of 0.26).
UI and the utilisation of formal health services
Clients with UI were statistically significantly more likely to be users of health services than
those who were continent. This is true with regard to hospital stays (OR = 1.5, CI = 1.3-1.8),
home care visits (OR = 1.4, CI = 1.2-1.8), the services of visiting nurses (OR = 1.6, CI = 1.4-
60
1.8), and other formal services (OR = 1.3, CI = 1.1-1.5). ‘Emergency visits’ (no overnight
stay) and ‘home help’ did not statistically significantly differ between participants with and
without UI.
Informal help and caregiver burden
Participants without sufficient bladder control were statistically significantly more likely to
receive more informal assistance than those who could control their bladder properly (for
weekdays OR = 1.7, CI = 1.5-1.9; for weekends OR = 1.6, CI = 1.4-1.8). In 439 cases
(10.9% of the sample), caregivers reported symptoms of burden or stress. Those who cared
for participants with UI were 2.2 times more likely to feel burdened or distressed than those
who cared for continent participants (OR = 2.2, CI = 1.8-2.7).
Article IV Frequency of indwelling urinary catheter (IUC)
Of the 4,010 individuals in the study, an IUC was used in 216 persons (5.4%). The frequency
varied between sites. In Monza, 23% of the home care clients were using a catheter compared
with 0% in the Amsterdam. An IUC was used more often in men than in women (11.5%
versus 3.3%, p < 0.0001). Catheter use was not higher with advancing age in women;
however, an increase of catheter use was seen in aging men.
Clinical features
Use of an IUC was statistically significantly correlated to clinical features; this shows the type
of dependency on services for clients with an IUC compared to those without it.
Diseases like stroke with hemiplegia, any type of diagnosed dementia disease, multiple
sclerosis, Parkinsonism, any cancer, and urinary tract infections were associated with an IUC.
The same was true for symptoms like difficulties in urinating, worsening of bladder
incontinence, fever, pressure ulcers, terminal prognosis, and decline in mood. Patients with an
IUC were statistically significantly more functionally impaired than their non-IUC using
counterparts, with ADL > 3 (scale = 0-6) and CPS > 3 (scale = 0-6). Issues related to quality
of life, caregiver burden, and the use of formal services were statistically significantly
correlated with use of an IUC: the client was alone most of the day, he/she did not go out of
61
the home, and the informal caregiver was distressed, was more often dissatisfied with the
support provided, or was unable to continue.
Explanatory value
Different regression models were developed. For the first model the samples collected from
Amsterdam and Stockholm were compared to samples from the other nine sites. This gave an
explanatory value of 17%. The explanatory value for the model consisting of diagnoses was
7%, for cognitive and physical functional capacity it was 23%, and for symptoms, 14%. The
total explanatory value for these findings was 37% (r2 = 0.37).
Article V Prevalence of faecal incontinence (FI)
The incidence of faecal incontinence by sex ranged from 1.1% to 30.8% (overall 10.3%). Of
those 411 individuals with FI, 24.1% suffered from it not more than once per week, 23.8%
suffered two or three times per week, and 52.1% were suffering daily. For women, the
corresponding figures were 27.3%, 22.9%, and 49.8%, and for men, the corresponding figures
were 16.1%, 26.3%, and 57.4%, respectively.
Clinical features
A strong relationship was found between FI and diagnoses like stroke, dementia disease, and
Parkinsonism (p < 0.0001), and, consequently, between FI and cognitive or physical
impairment. Similarly, a statistically significant association was found between FI and
conditions often seen in persons suffering from dementia disease or stroke including UI,
delusions, signs of depression, and behavioral problems (p < 0.0001). Statistically significant
associations were found between FI and diarrhoea, pressure ulcers, fever, terminal prognosis,
and any pain (each p < 0.0001). In addition, statistical association was found between FI and
the use of hypnotic and anti-psychotic medications.
Formal care
The mean number of professional care hours was greater for patients with FI than for patients
without FI. The mean number of total care hours was statistically significantly higher among
patients with FI compared with those without FI (39.0 hours versus 18.4 hours, p < 0.0001).
62
A multiple logistic regression analysis revealed that the association between FI and most of
the diagnoses is weaker than the association between FI and the severity of dementia disease
or the degree of physical impairment. The same was true for the statistical significance
between FI and psychotropic medication, caregiver burden, and the time informal caregivers
allocated to their patients. When an additional multiple logistic regression model was created
using a high workload of the visiting nurses (5 hours/week or more) as a dependent variable,
faecal incontinence explained the working time (OR = 1.86, CI = 1.22-2.85) even when
adjusted for physical and cognitive impairments, site, age, and sex. The same was true when
the workload of home health care providers (5 hours/week or more) was used as a dependent
variable; FI explained provider workload (OR = 2.23, CI = 1.34-3.73) when adjusted for the
same variables.
Article VI Background data
This article is a spin-off project derived from the European AD HOC study. The aim was to
describe characteristics of home care users and their need for assistance in sites in the Nordic
countries. The sample was randomly selected from individuals, age 65 or older, receiving
visiting nurse and/or social services in urban areas. The Nordic study population included
1,695 participants from all five capitals; 414 (24%) were men (M) and 1,281 (76%) were
women (F). The mean age was 83 years ± 6.9; 82 ± 7.1 for men and 84 ± 6.7 for women. The
use of nursing procedures29 varied across countries, from 41% to 85%. On average, 75% of
the sample lived alone and 27% were assessed as being homebound. Of those patients who
received nursing care, the number of days of visiting nurse service in the last week varied
from 4.2 ±3.0 days in Oslo to 0.5±1.1 days in Stockholm. On average, 12% of patients were
assessed to be better off in another environment. In 56 cases (3.4%), informal caregivers
indicated that they wanted the older patient to move, against their expressed wishes
(Appendix Table 4).
Level of care
Using the MAPLe algorithm, few patients (3%) were determined to be a very high priority for
a long-term care facility (LTCF). After 12 months, 153 patients (10%) had moved to a LTCF,
29 Nurse visiting daily or less than daily in the last 7 days, help with medication, injections, oxygen, IV, with catheter and stoma care, or with wounds and skin care.
63
while 198 (13%) had died. Of those patients who died during the study period, 20 had moved
to a LTCF prior to death.
Nursing procedures vs. social services
For patients receiving nursing care, Copenhagen and Oslo had the most dependent patients,
based on ADL function, while Helsinki had the most dependent patients among those
individuals receiving social services. On average, relatively few people with cognitive
impairment remained in home care. The differences between ADL, IADL, and CPS scores
were statistically significant (p < 0.001) between those patients who received nursing services
and those who received social services, except for the average CPS score in the Finnish
sample.
Cognitive impairment and level of care
Overall, 21 patients receiving social services had a CPS ≥ 3; the frequency varied from 1% to
4% between the sites with one exception, Helsinki. This capital had 11% of patients with
moderate-to-severe dementia disease in the social service group. Copenhagen had the highest
percentage of patients with cognitive impairment among those patients receiving nursing
services (21%), followed by Oslo (18%).
Better off living in another environment
‘Better off living in another environment’ was either self-reported or reported by an informal
caregiver. A total of 15% of study participants receiving nursing services at home were
assessed to be better off living in another environment. This percentage varied from 11% in
Stockholm and Oslo to 21% in Reykjavik. A total of 8% of the subjects receiving nursing
procedures were assessed to be better off living in another environment; this varied from 0%
to 13% in Oslo and Reykjavik, respectively. Of all the actual medical diagnoses, only
Alzheimer’s disease or other dementias were statistically significantly associated with the
assessment of patients ‘being better off living in another environment’, OR = 2.0, CI = 1.3-
2.9, p < 0.001; this corresponded to CPS ≥ 1, OR = 2.4, CI = 1.8-3.1. Caregiver stress was the
strongest risk factor associated with being assessed to be better off living in another
environment; OR = 4.6, CI = 2.7-7.9. Of the different sites, Reykjavík had an OR = 1.8, CI =
1.3-2.5; in contrast, Oslo had an OR = 0.5, CI = 0.4-0.8.
64
Risk factors associated with being assessed to be better off living in another environment
were incorporated into a logistic regression model. The model had an explanatory value of
19.3%. Risk factors included: CPS ≥ 1, caregiver stress, self-rated poor health, dizziness, and
living in Reykjavik.
Predictive factors of LTCF placement or death30
Using placement in a LTCF during the 12-month follow-up period as the dependent variable,
the logistic regression model had an explanatory value of 25.0%. Predictors included in the
final model were: better off living in another environment, IADL ≥ 4, using nursing
procedures, CPS ≥ 1, being homebound, incontinence (bowel or bladder), and age 85 or older.
MAPLe gave an estimated risk for LTCF placement: OR = 2.9, CI = 2.00-4.27, p <0.001.
When death during the 12-month follow-up period was the dependent variable, the logistic
regression model had an explanatory value of 14.8%. The predictors that were included in the
final model were: ADL ≥ 1, unintended weight loss, receiving nursing procedures, and
receiving home care in Stockholm or Oslo.
Homebound and associated features
In this thesis, home is the arena for care. The articles that are included address the basic needs
of nutrition and elimination. In this thesis, ‘homebound’ is used as the dependent variable for
integrating the different articles. Central variables related to nutrition and elimination are used
as independent variables. Table 2 presents the characteristics and clinical features of nutrition
and elimination associated with being homebound. Older age, 85 or older, was statistically
significant in association with being homebound, OR = 1.4, CI = 1.20-1.55, p < 0.001. Living
alone was inversely statistically associated with being homebound, OR = 0.4, CI = 0.32-0.41.
The most severe clinical features related to nutrition and associated statistically with being
homebound were pain in the mouth (OR = 3.6, CI = 2.87-4.58), eating and drinking less (OR
= 3.1, CI = 2.20-4.41), severe malnutrition (OR = 2.5, CI = 1.67-3.89), feeding by tube and IV
(OR = 2.4, CI = 1.65-3.58), or swallowing problems (OR = 2.0, CI = 1.67-2.38). In addition,
assistance with transportation (OR = 32.3, CI = 22.72-45.79), shopping (OR = 25.6, CI =
17.84-35.75), and meal preparation (OR = 5.6, CI = 4.86-6.53) were statistically significantly
associated with being homebound.
30 Data for this analysis were missing from Helsinki.
65
Also statistically significantly associated with being homebound were: urinary incontinence
with an IUC (OR = 8.5, CI = 5.69-12.73), faecal incontinence (OR = 10.1, CI = 7.46-13.68),
and toileting assistance (OR = 22.7, CI = 17.18-29.90). Living in a capital in Cluster 2 was
statistically significantly associated with being homebound (OR = 7.0, CI = 5.81-8.52).
66
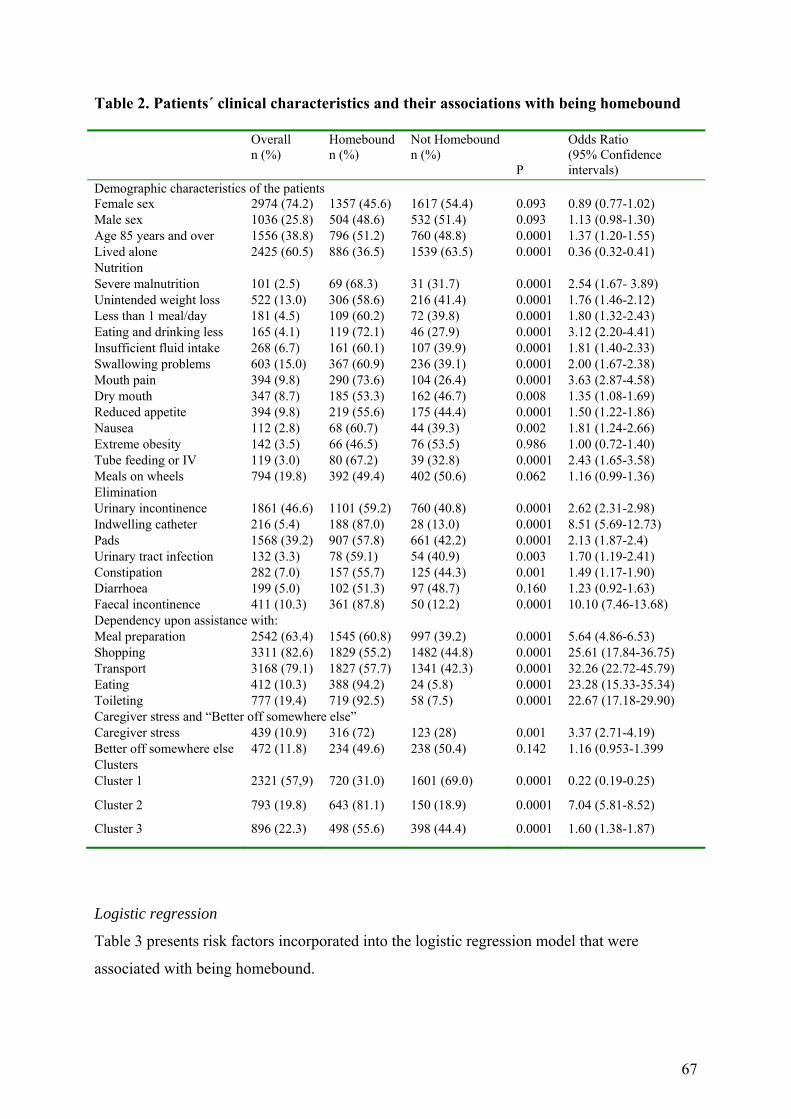
Table 2. Patients´ clinical characteristics and their associations with being homebound
Overall n (%)
Homebound n (%)
Not Homebound n (%)
P
Odds Ratio (95% Confidence intervals)
Demographic characteristics of the patients Female sex 2974 (74.2) 1357 (45.6) 1617 (54.4) 0.093 0.89 (0.77-1.02) Male sex 1036 (25.8) 504 (48.6) 532 (51.4) 0.093 1.13 (0.98-1.30) Age 85 years and over 1556 (38.8) 796 (51.2) 760 (48.8) 0.0001 1.37 (1.20-1.55) Lived alone 2425 (60.5) 886 (36.5) 1539 (63.5) 0.0001 0.36 (0.32-0.41) Nutrition Severe malnutrition 101 (2.5) 69 (68.3) 31 (31.7) 0.0001 2.54 (1.67- 3.89) Unintended weight loss 522 (13.0) 306 (58.6) 216 (41.4) 0.0001 1.76 (1.46-2.12) Less than 1 meal/day 181 (4.5) 109 (60.2) 72 (39.8) 0.0001 1.80 (1.32-2.43) Eating and drinking less 165 (4.1) 119 (72.1) 46 (27.9) 0.0001 3.12 (2.20-4.41) Insufficient fluid intake 268 (6.7) 161 (60.1) 107 (39.9) 0.0001 1.81 (1.40-2.33) Swallowing problems 603 (15.0) 367 (60.9) 236 (39.1) 0.0001 2.00 (1.67-2.38) Mouth pain 394 (9.8) 290 (73.6) 104 (26.4) 0.0001 3.63 (2.87-4.58) Dry mouth 347 (8.7) 185 (53.3) 162 (46.7) 0.008 1.35 (1.08-1.69) Reduced appetite 394 (9.8) 219 (55.6) 175 (44.4) 0.0001 1.50 (1.22-1.86) Nausea 112 (2.8) 68 (60.7) 44 (39.3) 0.002 1.81 (1.24-2.66) Extreme obesity 142 (3.5) 66 (46.5) 76 (53.5) 0.986 1.00 (0.72-1.40) Tube feeding or IV 119 (3.0) 80 (67.2) 39 (32.8) 0.0001 2.43 (1.65-3.58) Meals on wheels 794 (19.8) 392 (49.4) 402 (50.6) 0.062 1.16 (0.99-1.36) Elimination Urinary incontinence 1861 (46.6) 1101 (59.2) 760 (40.8) 0.0001 2.62 (2.31-2.98) Indwelling catheter 216 (5.4) 188 (87.0) 28 (13.0) 0.0001 8.51 (5.69-12.73) Pads 1568 (39.2) 907 (57.8) 661 (42.2) 0.0001 2.13 (1.87-2.4) Urinary tract infection 132 (3.3) 78 (59.1) 54 (40.9) 0.003 1.70 (1.19-2.41) Constipation 282 (7.0) 157 (55.7) 125 (44.3) 0.001 1.49 (1.17-1.90) Diarrhoea 199 (5.0) 102 (51.3) 97 (48.7) 0.160 1.23 (0.92-1.63) Faecal incontinence 411 (10.3) 361 (87.8) 50 (12.2) 0.0001 10.10 (7.46-13.68) Dependency upon assistance with: Meal preparation 2542 (63.4) 1545 (60.8) 997 (39.2) 0.0001 5.64 (4.86-6.53) Shopping 3311 (82.6) 1829 (55.2) 1482 (44.8) 0.0001 25.61 (17.84-36.75) Transport 3168 (79.1) 1827 (57.7) 1341 (42.3) 0.0001 32.26 (22.72-45.79) Eating 412 (10.3) 388 (94.2) 24 (5.8) 0.0001 23.28 (15.33-35.34) Toileting 777 (19.4) 719 (92.5) 58 (7.5) 0.0001 22.67 (17.18-29.90) Caregiver stress and “Better off somewhere else” Caregiver stress 439 (10.9) 316 (72) 123 (28) 0.001 3.37 (2.71-4.19) Better off somewhere else 472 (11.8) 234 (49.6) 238 (50.4) 0.142 1.16 (0.953-1.399 Clusters Cluster 1 2321 (57,9) 720 (31.0) 1601 (69.0) 0.0001 0.22 (0.19-0.25)
Cluster 2 793 (19.8) 643 (81.1) 150 (18.9) 0.0001 7.04 (5.81-8.52)
Cluster 3 896 (22.3) 498 (55.6) 398 (44.4) 0.0001 1.60 (1.38-1.87)
Logistic regression
Table 3 presents risk factors incorporated into the logistic regression model that were
associated with being homebound.
67

Table 3. Independent factors significantly associated with being homebound
Model description
Dependent variable
Independent variable
B Wald χ2 Wald P Estimated odds ratio
95% Wald CI
Wald χ2 (14) =197.430, P < 0.001; Nagelkerke R2 = 0.509
Homebound Eighty-five+ 0.267 10.155 .001 1.306 1.108-1.540 Nutrition related problems
Swallowing problems
0.398 12.015 .001 1.488 1.189-1.864
Reduced appetite
0.332 6.050 .014 1.394 1.070-1815
Mal preparations
0.377 15.262 .000 1.459 1.207- 1.763
Shopping 1.727 73.654 .000 5.625 3.792-8.346 Transport 2.207 136.666 .000 9.084 6.275-
13.150 Meal one wheels
0.215 4.387 .036 1.240 1.014- 1.516
Elimination Faecal incontinent
0.706 11.336 .001 2.025 1.343-3.053
Urinary incontinence
0.222 6.855 .009 1.249 1.057-1.474
Dependency in toileting
1.782 120.293 .000 5.943 4.322-8.172
Caregiver stress/Better off somewhere else Caregiver stress 0.386 7.383 .007 1.472 1.114-1.944 Better off somewhere else
0.256 4.503 .034 1.292 1.020- 1.638
Cluster Cluster 1 -1.146 75.827 .000 0.318 0.246- 0.411
Cluster 3 - 534 14.869 .000 0.586 0.447- 0.769
* Excluded variables: gender, living alone, unintended weight loss, malnutrition, less meals, eating less, less fluid, pain in mouth, pain in swallowing, dry mouth, nausea, extremely obese, dependency in eating , IV/tube assistance in feeding, pads, urinary track infection, diarrhoea, constipation, Cluster 2 (France and Italy)
The model had an explanatory value of 51%. Statistically independent factors associated with
being homebound included: age 85 or older, dependence on assistance for shopping,
transportation, meal preparation, toileting, getting ‘meals on wheels’, faecal and urinary
incontinence, having reduced appetite and problems with swallowing, caregiver stress, and to
being better off somewhere else. Homecare patients at the sites in Northern and Central
Europe were less at risk for being homebound than those at sites in Southern Europe.
68
DISCUSSION
Introduction This thesis uses data derived from the Aged in Home Care study (AD HOC). The study
included 4,010 participants over the age of 65 who were receiving home care at 11 sites in
Northern, Central, and Southern Europe (5). Using these data, different challenges facing
older people in Europe are described and analysed through baseline and 12-month follow-up
data, collected using a comprehensive assessment instrument. At present, this research is the
largest comparative cross-national study of home care clients.
This research presents a unique opportunity to compare cross-national praxis and to discuss
strengths and weaknesses in home care services in different parts of Europe. Caring for the
elderly is an important indicator of how a society prioritizes its welfare services. How the four
‘prototype’ traditional welfare models31 meet home care patients’ needs for assistance at the
different participating sites is illustrated. In this discussion, the concept of ‘being homebound’
is used as a key variable for measuring the complexity of nutrition and elimination problems,
both for older home care patients and for their caregivers.
Three demographic variables are highlighted: age, gender, and ‘living with’ (Table 1). The
average age of study participants was quite similar across the sites. In the total sample, the
average age for men was 82.3 years, ranging from 80.5 years in Monza to 84.4 years in
Copenhagen. Sites with a lower average age may be presumed to have fewer dependent home
care patients; however, there was no such association between age and dependency.
The second background variable is gender. Older women are the primary users of home care
services. A total of 74% of the participants were women; the percentage of women varied
from 63% in Monza to 81% in Helsinki. Women in the Western world live, on average, five
to six years longer than men (202, 203), and women are often married to men older than
themselves. Widowers remarry more frequently than widows. Few significant others are able
to undertake the care burden typically placed on a wife (204). Enabling these older women to
live in their own homes with an acceptable quality of life is an important socioeconomic
concern. In the AD HOC study, women were, on average, two years older than the men.
These age differences in the general population and in home care could indicate that men, 31 The Nordic model, the Anglo-Saxon model, the Central European model, and the Southern European or Catholic model.
69
who experience a slow health decline and become heavily impaired over time, receive home
care. However, men whose health declines more quickly are cared for by their wives until
they die in a hospital. These women may be able to cope with such a care burden for a limited
period of time. It is interesting to compare the relative stability in average age in the AD HOC
study between men and women across the sites.
The third background variable highlighted is living situation. Study participants were asked
this common question: “Who do you live with?’ A total of 61% of all participants lived alone;
this varied from 13% in Monza to 83% in Helsinki. Each of the five Nordic capitals has a
higher frequency of home care patients who live alone than their counterparts in other
participating sites (Table 1). In these data, the contours of the different welfare models may be
visible. In contrasting the Nordic (social democratic) welfare model and the Southern
(Catholic or family) welfare model, the AD HOC data confirms the findings of other studies.
In the Nordic countries, as in many countries in continental Europe, adult children have no
legal obligation to provide care or financial support for their parents (149). In their analysis of
the OASIS project, a study including sites in five European countries,32 Daatland & Herlofsen
(154, 155) found that with respect to issues such as whether adult children should live close to
their parents, Norwegians subscribed to a norm of independent living. Older Norwegians
preferred residential living to living with their children, and this preference was highest
among the oldest age group (75 years or older). Norwegians were more likely than other
European participants to place primary responsibility for care of the elderly on the welfare
state. The same tendency may be observed in the other Nordic countries.
Carpenter et al. (5) used socio-demographic and functional status variables to divide the AD
HOC sites in three clusters: Cluster 1 (The Nordic capitals, Amsterdam and Prague), Cluster 2
(Amiens and Monza), and Cluster 3 (Maidstone/Ashford and Nürnberg/Bayreuth). The AD
HOC data revealed that homecare patients in the Nordic capitals appeared to be generally less
dependent than those cared for in other sites. These patients also had lower levels of ADL and
cognitive impairment, and the patients in Cluster 2 were in need of a high level of assistance,
while the patients in Cluster 3 made a middle group of dependency in caring. Amsterdam had
the same case-mix as the Nordic capitals due to their adapted social democratic welfare
32 Norway, United Kingdom, Germany, Spain, and Israel.
70
model. However, it was difficult to explain why Prague should belong to Cluster 1. Could the
concept of being homebound change the composition of the different clusters?
The parameters for ‘homebound’ were ‘no days out of the house or building during the last
week’ or ‘needed extensive assistance in locomotion outside the home’. In Figure 2, the
frequency of being assessed to be homebound varied between the sites from 82.3% in Monza
to 21.5 in Reykjavik. In Cluster 1, Helsinki had the highest frequency with 38%, if Prague
(50.2%) is ‘excluded’ from Cluster 1 and moved to Cluster 3, where Maidstone/Ashford has
49.1% and Nürnberg/Bayreuth has 58.6%. In Cluster 2, 79.8% in Amiens and 82.3% in
Monza were assessed to be homebound. These figures show that being homebound is strongly
associated with the ADL and cognitive impairment that was the basis for the clustering by
Carpenter et al. (5).
Figure 2 depicts the traditional European welfare models. The Nordic or the social democratic
model is represented by samples from the Nordic capitals and Amsterdam. The Central
European or the Bismarck model is represented by the sites in Germany and the Czech
Republic.33 For most of the central variables in this thesis including those shown in Figure 2,
the sites in the UK have almost the same frequency as the average value for all of the
participating sites. The Anglo-Saxon model may have a homecare population age 65 years or
more that is representative of the average European AD HOC participant. The sites in France
and Italy reflect the influence of the Southern European or Catholic model; in those sites,
homecare patients have the highest frequency of being homebound. Esping-Anderson (8) has
focused on the need for a welfare society instead of a welfare state. To date, the Nordic
countries have had a relatively homogenous population and a ‘genuine’ commitment to caring
for marginalised citizens.
Table 2 shows the results of a univariate analysis of estimated risks of being homebound.
Living alone was inversely associated with being homebound. If a single, homebound person
becomes dependent on care and has a limited social network, formal home care services may
be unable to meet that individual’s needs. There was no significant gender difference in being
homebound. Older age, 85 years or more, was significantly associated with being homebound. 33 The author is only referring to the result from the AD HOC data, and is not able to give any further explanation. However, it is interesting that the Czech Republic has been included in Cluster 1. In analysing other data like use of inappropriate drugs, the Czech Republic turned out to have less favourable results than other sites (181).
71
Each of the six articles included in the present thesis address cognitive impairment. Patients
with moderate to very severe cognitive impairment (CPS ≥ 4) had a risk of being homebound
8 times higher or p < 0.0001 (OR = 7.98, CI = 6.04-10.53) (Appendix Table 5). In the
statistical analyses, where homebound was assigned as the dependent variable, Alzheimer’s
disease or other central diagnoses were not included, nor were apoplexia cerebri, cancer or
other diagnoses that often cause dependency in eating and toileting. These concerns are
discussed in I-VI. In homecare, staff may not be informed about the patients’ medical history,
but they nonetheless have to assist patients with their physiological needs.
Being homebound was significantly associated with risk factors connected to nutrition and
elimination discussed in I-VI (Table 2). Homecare patients generally required assistance with
basic activities such as nutrition and elimination. Independent factors significantly associated
with being homebound are shown in Table 3. Using a stepwise process, every variable
presented in Table 2 was tested. The main results of this logistic regression are presented in
the context of relevant research literature.
Elimination
Faecal incontinence reduces patients’ quality of life and increases the workload of the formal
and informal caregivers (V). Patients with FI were estimated to be ten times more likely to be
homebound compared to their non-FI counterparts (Table 2). The association between FI and
being homebound was weaker after adjusting for other variables as shown in Table 2.
However, FI turned out to be significantly associated with being homebound in the logistic
regression model (OR=2.03, CI=1.34-3.05, p=0.001) (Table 3).
Faecal incontinence is characterised as the ‘unvoiced symptom’ or the ‘silent problem’ among
community-dwelling older individuals (137-139). Brittain & Shaw’s (151) qualitative study
showed that embarrassment from leakage and odour can transform the home into an isolated
and marginalised space. They found that loss of anal sphincter control may result in shame
and poor self-image.
The overall frequency of FI was 411 (10.3%). This varied between sites from 1.1% in
Helsinki to 30.8% in Monza. In the sample from Helsinki, Amsterdam, and Stockholm, FI
was not seen in men. The prevalence of FI was very low in all of the Nordic countries. Walter
et al. (144) showed a frequency of ‘soiling underclothes once a week or more’ from 6% to 9%
72
in their population study at Gotland (Appendix Table 1). Even with the same definition of FI,
these results show how difficult it is to compare different studies. The average frequency of FI
in the Nordic capitals was 3.0% (V). It can be assumed that the prevalence of FI in the home
care population ought to be higher than in the ordinary population. Walter et al. (144)
concluded that FI was a common problem in a general Swedish population. The AD HOC
data can only say something about the homecare population, not the general population.
Patients that are enrolled in homecare may perhaps more often be offered a bed in an
institution. These findings may support the conclusion that, in the Nordic sites, home care
patients with moderate-to-severe FI will more often receive a higher level of care than their
counterparts in other European sites.
The definition of urinary incontinence (UI) used in Article III included use of all types of
catheters. A total of 1,861 (47%) older patents were assessed to have UI. This varied between
37% in Oslo to 63% in Monza. The logistic regression showed that UI was a significant
independent factor associated with being homebound (OR=1.25, CI=1.06-1.47, p=0.009)
(Table 3).
Urinary incontinence (UI) among home care patients is often incorrectly attributed to normal
aging (109). Older patients may try to cope with UI on their own (110, 112), and physicians
do not always ask if they need help (126). The management of UI is directly related to the
client’s quality of life. It is also an indicator of the quality of formal healthcare services (4).
Urinary incontinence is a symptom of many different conditions. Du Moulin et al. (133)
systematically reviewed 12 studies on the effects of nursing intervention on UI. This review
revealed evidence that nursing interventions can effectively reduce UI in community-dwelling
individuals. One of the major limitations of these studies was a lack of long-term observations
to determine the sustainability of short-term benefits over time.
The use of an indwelling urinary catheter (IUC) is the research theme in IV and is closely
related to the problems discussed in III: UI, the use of pads or an IUC, and UTI are
significantly associated with being homebound. A total of 216 (5.4%) clients used an IUC.
Catheter use was more common in men than in women (11.5% versus 3.3%). The frequency
of IUC use is consistent with previously estimated figures (205). In Monza, 23% of patients
used an IUC compared with 0% in Amsterdam. There was a tendency to insert catheters in
73
men in older age groups with advanced dementia, pressure ulcers, and poor functional ability.
This was especially true if the client suffered from cancer, multiple sclerosis, or if he resided
in one of the following three sites: Amiens, Nürnberg/Bayreuth, or Monza. The explanatory
value for these findings was 37% (r2 = 0.37) (IV).
The presence of cognitive decline, more serious than moderate dementia disease, increased
the risk of receiving an IUC almost two-fold; at the same time, a diagnosis of dementia
disease ceased being significant in the multivariate model. Thus, it is not the disease per se,
but the severity of it that is an important predictive factor. The presence of severe functional
decline increased the risk of receiving an IUC a little over four-fold. The presence of pressure
ulcers almost doubled the risk of an IUC. Multiple sclerosis was not a prevalent disease in the
study population, whereas cancer was seen slightly more often. When multiple sclerosis and
cancer are present, the risk of receiving a catheter increases six- and two-fold respectively.
More frequent use of the IUC in men than in women is most certainly explained by prostate
problems that increase with advancing age.
Variations from site to site in the prevalence of the use of IUC may also be partially explained
by the case-mix of clients. It is interesting that when adjusting the regression model for
dementia disease and functional capacity in addition to diseases, the differences vanished
between sites in the Nordic capitals, Amsterdam, and Maidstone/Ashford - the northern parts
of Europe. The sites in the Central or Southern European regions appeared to host different
care patterns or cultures of care compared to those in the North. One reason for this difference
in the use of IUC could be habit-based instead of evidence-based practice. Some of the
European countries had restricted use of the IUC, as noted by Ouslander (206). The predictors
for the use of IUC among home care clients in Europe document a complexity in the patients’
total situation (207). In the Nordic sites, the incidence of IUC use was low compared to the
sites in Southern Europe. However, there is no indication if something else was done to
address UI problems.
Dependency in toileting
The logistic regression showed that UI was a significant independent factor for being
homebound (OR=5.94, CI=4.32-8.17, p<0.0001) (Table 3). Frail older adults may need
assistance with toileting because cognitive dysfunction impairs their ability to recognise the
need to toilet and/or their ability to toilet independently, or because their locomotion deficits
74
interfere with their ability to use the toilet without assistance (208). These findings correspond
to variables that were independently associated with UI (binary logistic regression) in the AD
HOC data (III). Other factors were urinary infections and flare ups of chronic conditions:
reversible causes of incontinence that could be adequately handled (209).
The concept of ‘dependent continence’ is used to describe persons who are continent solely
through the efforts of a caregiver (210). In the current study, UI was strongly associated with
the need for assistance when using a toilet. Palmer et al. (211) stated that dependence on
others for ambulation significantly increased the odds of developing incontinence during
hospitalisation. In a homecare setting (on average, in all of the AD HOC sites, 61% of clients
lived alone), permanent help for toileting may simply be unavailable. The use of pads has
been a practical way to handle UI. The percentage of patients using pads and needing
assistance in toileting varied from one region to the other. In the Nordic capitals, as well as in
Prague and Amsterdam, most of the clients were able to toilet independently.
The association between the need for assistance during toileting and pad use was statistically
significant in many of the sites. This means that patients who needed assistance with toileting
were significantly more likely to wear pads than patients who manage to use a toilet
independently (p < 0.001). Results for Maidstone/Ashford showed an OR of 2.0, CI = 1.1-3.6,
p = 0.02.
In the AD HOC study population, pads were frequently used for the FI. Bliss & Savik (212)
studied the use of an absorbent product as a self-care strategy for managing faecal
incontinence that protects against visible soiling. The anorectal dressing was preferred to a
pad by 92%. This dressing lessened anxiety about fecal soiling in 81% of study participants
and was reported to improve quality of life in 76% of cases.
In the AD HOC study, the use of pads ranged from 29% to 52% across the different countries.
The cost of pads did not account for the enormous variation in use. In Prague, clients had to
pay for pads, and usage was low. In Monza, costs were completely reimbursed, and still usage
was relatively low (III). Boyle et al. (115) presented data from a four-centre population study:
10% of male subjects, ages 70-79, used pads. Female clients had higher pad use than
incidence of UI. Gotoh et al. (120) showed that 56% of subjects used diapers or similar
devices; diapers were used by 24% of continent persons mainly for protective purposes.
75
Wearing pads, however, may increase the rate of accidents and decrease the rate of successful
voids (213). Even in studies of younger women, pad usage contributes significantly to the
overall cost of UI (128). Pads may be used because of a lack of adequate examinations and
treatment. Diapers may be an excuse for not providing adequate staffing to assist the elderly
with toileting. Johnson et al. (214) showed that older users prefer medications (77%) to
diapers (21%), while their families and nurses prefer pads. These differences between users
and their helpers were statistically significant. The same was not true of prompted voiding
(41% stated that they would probably or definitely prefer prompted voiding, while 50%
reported that they would prefer diapers). However, pads can be a reasonable solution in some
cases, e.g. for those older persons who are frail, cognitively impaired, or in other ways unable
to regain continence from any routines or training models (215).
A study from Switzerland found that the presence of a urinary catheter was a predictor of
unscheduled service use (135). In this sample, the users of an IUC had a urinary tract
infection 6.5 times more often than those without a catheter. Landi et al. (216) concluded that
the uncritical use of IUCs should be considered an indicator of poor quality care. Pilloni et al.
(217) documented that intermittent catheterisation reduces the rate of urinary tract infection. If
one has to use an indwelling catheter, Robinson (218) suggests that fundamental principles
have to be followed. Indwelling catheters are not to be used without medical justification and
must be removed as soon as clinically warranted (219). This could reduce the risk of infection
and may prevent the IUC from becoming a permanent solution for the patient. Bucci (220)
has described how data from the RAI served as the basis for the CHAMP tool (Continence,
History, Assessment, Medications, Mobility, and Plan). The aim of this tool is to provide an
individualised plan of care to restore or improve the patient’s bladder function and to prevent
use of a catheter.
Risk factors related to nutrition
Univariate analyses revealed that central nutrition variables were significantly associated with
being homebound (Table 2). In the logistic regression, problems with swallowing (OR=1.49,
CI=1.19-1.86, p=0.001); reduced appetite (OR=1.39, CI=1.07-1.81, p=0.014); dependency in
meal preparations (OR=1.24, CI=1.01-1.51, p=0.036); and receiving meals on wheels
(OR=1.46, CI=1.21-1.76, p<0.0001) were significantly associated with being homebound
(Table 3).
76
The AD HOC data revealed that basic physiological needs were not met. On average, 12% of
homecare clients suffered from unintended weight loss (UWL); the frequency of UWL varied
across study sites from 2% (Helsinki) to 19% (Monza). The site-to-site variation was not
statistically significant after adjusting for confounding variables such as diagnoses, cognitive
status, and functional status (I). Nurses are the major observers of eating habits in older
people and are able to identify markers or predictive factors for patients at risk through the
use of a standardised assessment tool. Early identification of patients at risk can prevent more
severe nutritional problems (221). Assistance with transportation and shopping may be the
first indicator of nutritional insufficiency; both are statistically significant predictors of
unintended weight loss and of being homebound.
The importance of detecting malnutrition early is even greater in light of some recent research
findings. Beck et al. (73) conducted a 6-month prospective follow-up study of general
practice patients age 65 or older and concluded that a high percentage of the elderly,
especially those initially malnourished, will not benefit from nutritional support if the basic
causes of malnutrition are not identified. Faxen-Irving (222) carried out a study of elderly
with dementia in community-assisted, group housing and found that nutritional treatment did
not affect the rate of decline in cognitive or ADL function. Luchsinger et al. (223) concluded,
after analysing data from a cohort study of elderly age 65 or older, that the presence of
dementia did not explain the association between low BMI and higher mortality. However,
dementia may explain the association between weight loss and higher mortality. Early signs
of nutritional risk could be identified by observing nutritional status changes including
reduced appetite, insufficient fluid intake, or neglect of meals. Visual decline during the last
90 days was associated with UWL. This connection had not been observed in previous
studies.
The BMI is a well-documented measure in screening for malnutrition (223, 224). In most of
the homecare agencies in the AD HOC study,34 it was not obligatory to measure weight and
height. The health authorities did not seem to focus on BMI. The Norwegian national
screening tool for documenting individual care needs, IPLOS (161), does not measure weight
and height.
34 When the Norwegians introduced their national screening tool IPLOS, height and weight were not included.
77
In the Norwegian AD HOC data, ‘only’ 55 patients (14%) were reported to have unintended
weight loss. However, 46.2% of them had a BMI < 22 (225). These patients had been losing
weight gradually over time. One explanation could be that several of the younger patients
may have been struggling to stay slim and had been avoiding food with high fat content and
other high calorie products. When illness or other factors reduced their appetite, they
continued to use low calorie products. Martin et al. (82) found that the majority of older
people were unaware of the risks of poor nutrition and low weight. Several studies have
documented UWL as an important risk factor for hospitalisation and death (85, 228-231), a
finding that may indicate a special nutrition-directed home nurse visit after discharge. At the
12-month assessment, unintended weight loss was a statistically significant predictor of death
(VI).
The ‘meals-on-wheels’ activity was the same regardless of weight loss, so the simple addition
of ‘meals on wheels’ services was not enough to ensure that lost weight was regained. The
final model summarised the independent importance of appetite, constipation, pain, a flare up
of chronic diseases, and recent hospitalisation. These results may accelerate development of a
new approach to detecting malnutrition among home care clients (I). Sufficient guidelines are
needed.35 Those clients with UWL need more frequent help with meal preparation, shopping,
moving about the home, or eating (75, 221).
The majority of the characteristics and clinical features related to nutrition and elimination
problems in the RAI-HC were statistically significantly associated with being homebound. In
the final regression model, with homebound as the dependent variable, malnutrition and dry
mouth were included as independent variables. This creates a negative circle. Older people
who are homebound are at high risk of not getting sufficient food and fluid. Lack of sufficient
food and fluid makes frail older people homebound.
Turning the focus from UWL to extreme obesity (EO), nurses have to be aware of other
challenges. In Article II, EO was used as a clinical term without any specific linkage to BMI,
making this study difficult to compare with other studies. Another limitation is the relatively
35 An expert group has been working for the Ministry of Health on Norwegian guidelines. (http://www.shdir.no/ernaering/fagnytt/faglige_retningslinjer_for_forebygging_og_behandling_av_underern_rte_pasienter_og_pasienter_i_ern_ringsmessig_risiko_52757
78
small number of EO clients in the sample; the analysis may, therefore, have been hampered
by lack of statistical power. As this is a cross-sectional study, no comments on any cause and
effect relationships can be made. It is not clear whether multiple health complaints were the
cause or the consequence of obesity in this group. The prevalence of extreme obesity in this
study population is consistent with the findings of other studies. Friedmann et al. (226) found
that the prevalence of extreme obesity was 4% in women and 1.4% in men in a US sample
with a mean age of 71.7 years (SD = 5.7).
In the AD HOC study, the scores for Activities of Daily Living were approximately the same
in both EO and N-EO subjects. However, the EO subjects were, on average, 5 years younger
than their counterparts. In addition they more frequently had diabetes, dyspnoea,
incontinence, and less mobility. These results support the findings from other researchers (90,
94). Keith et al. (100) documented the associations between EO and headaches. The AD HOC
data did not specify ‘headache’ as an independent variable, but looked at the association
between ‘pain interrupting daily activities’ versus ‘no pain’. There were statistically
significant differences between the EO and the N-EO group. Waaler (227) reported a U-
shaped BMI–mortality curve for older people: a high BMI was associated with lower relative
mortality risk than in younger people. Elia (228) has given different explanations for this U-
curve: one possibility is that individuals who had been prone to the complications of obesity
may already have died, while those who remain are more resistant to the effects of obesity.
Zamboni et al. (229) have documented this ‘survival effect’.
Must et al. (230) found that the disease burden associated with extreme obesity was lower for
people age 55 or older than for those ages 25-54. Shafer et al. (103), in a study over 20 years,
revealed that obesity increased hospital admissions and length of stay. Among persons obese
at any time during the study, years of obesity also led to longer stays. Akinnusi (231) found
that the length of stay in the intensive care unit was longer for the obese person, but the
mortality rate was not higher than for the non-obese. These findings may correspond with the
findings in Article II that EO women had been receiving home care for longer than their
thinner counterparts. This has economic implications and is of special concern as populations
are aging and as obesity may not necessarily be associated with increased mortality (99, 232).
Extreme obesity in elderly women is a problem of the 21st century that governments will
have to address - at least until the obesity epidemic has been halted and reversed.
79
Dependency in transportation and shopping
The results from these data analyses have shown that patients with faecal and urinary
incontinence as well as nutrition problems are at risk for being homebound. In Article V ‘risk
for depression’ among patients with FI was significantly higher, compared to those who did
not suffer from FI. Case (61) emphasised the need for people to escape their homes and
recognize that interaction with friends and neighbours is an important part of home life. Deem
(65) referred to a ‘time on my hands’ syndrome. Older people often have little money,
experience poor health, and are socially isolated. Isolation is associated with depression. A
depressed person has little or no strength to leave home. A physically impaired elder could
develop symptoms of depression without encountering other people. Homebound older adults
are more vulnerable to depression than their mobility-unimpaired peers (99).
In the logistic regression, ‘dependency for transportation’ and ‘shopping’ were both
significantly independent factors of being homebound, p < 0.0001 (OR = 9.08, CI = 6.28-
13.15) and (OR = 5.62, CI = 3.79-8.35), respectively (Table 3).
For older people who are not able to drive their own cars, public transportation is not always a
good substitute. The use of a taxi is often looked upon as an unnecessary waste of money.
They have to rely on family, neighbours, or friends for shopping. A common pattern is that
the elder is transported to a shopping centre once or twice a week by a caregiver. That means
that the older patient has to get dressed and feel strong enough to manage a tour even with
assistance. After a time, the caregiver or the older patient (or both) may feel that it is more
practical to have groceries delivered to the patient’s home instead of letting the patient
participate in shopping. This may be due to shame about their incontinence, cognitive
impairment, or frailty. Without being able to pick out their own food, the pleasure of
preparing and eating meals may be reduced.
Caregiver burden
Those who cared for participants with UI were 2.2 times more likely to feel burdened or
distressed than those who cared for continent participants (OR = 2.2, CI = 1.8-2.7) (III). A
chi-square test showed that FI was statistically significantly associated with caregiver burden
80
(p < 0.0001). Health professionals spent more care time on patients with FI than on patients
who were continent. Faecal incontinence was associated with a high number of visiting
nurses’ care hours, and a high-to-moderate number of home health aides’ care hours. This
illustrates that health care service could give assistance to patients with FI and in this way
reduce caregiver stress (V). In the logistic regression, ‘caregiver stress’ was significantly
independently associated with being homebound (Table 3).
In the statistical analyses of Articles I-II, caregiver stress was not included. Updated analyses
show that obesity had no significant association with caregiver stress, neither had problems
with swallowing. Problems with swallowing may be related to a medical condition that
challenges the caregivers to do their very best.
Loss of appetite however, was associated with caregiver stress. Caregivers may spend a lot of
time and creativity in preparing food that may be tasty for the older patients. Reasonably, they
get stressed when the food is not eaten. The strongest association however was between
dependency in meal preparation and caregiver stress (OR = 4.67, CI = 3.48-6.25, p<0.0001)
(Appendix Table 6). Table 3 shows that ‘meals on wheels’ is an independent factor for being
homebound. For those who received ‘meals on wheels’ the caregivers were less likely to feel
stress than their counterparts (Appendix Table 7). These results tell how practical assistance
with meal preparation would reduce caregiver burden and hopefully create a more pleasant
eating situation for the older person.
‘Better off elsewhere’
This thesis has presented characteristics and clinical features in homecare patients related to
nutrition and elimination and their association with being homebound. The results show great
variations between the participant sites, and also variations inside a site. Could some patients
be ‘better off elsewhere’ or better off living in another environment?
Table 1 shows that the sites with the most heavy case-mix had the lowest frequency of
patients or caregivers who were assessed to be ‘better of elsewhere’, 3.4% in Monza and 6.3%
in Amiens. In Prague, 28% would like to be in another living environment; the corresponding
value for Reykjavik and Amsterdam was 18.0% and 17.2% respectively.
81
‘Better off elsewhere’ turned out to be a significantly independent factor in the logistic
regression model associated with being homebound (OR=1.29, CI=1.02-1.64, p=0.034) (Table
3). Article VI is only presenting data from the five Nordic capitals, but comparisons to the
rest of the AD HOC material and other countries are made. Article VI discusses patients’
characteristics relative to their and their caregivers’ satisfaction with the patient’s living
environment at the time of the baseline assessment. Predictors associated with NH placement
or death (within 12 months) have been identified. This is the first study that compares nursing
in home care in the Nordic countries using a standardised, comprehensive geriatric
assessment instrument.
Legal and economic rights have dominated research projects concerning Scandinavian
welfare policy (233). There has been less of a focus on services, health status, and the
practical aspects of home care (49). A qualified balance between the home and an institution
as an arena of care has been a common goal in the Nordic countries. However, nutrition or,
more probably, elimination problems may lead to great caregiver stress. Brittain & Shaw
(151) concluded, in their analyses of caregivers dealing with UI and FI, that both the patients
and the caregivers were stigmatised and socially isolated. In the AD HOC study, the
association between patients who ‘would be better off living in another environment’ and
were ‘feeling lonely’ was statistically significant compared to those patients who ‘would not
be better off living in another environment’; they did not ‘feel lonely’.
Palme and Lindh (234) have described how the Nordic countries have the most extensive
public system for caring for the elderly among European countries with reference to both
design and financing. The AD HOC data revealed that the recipients of home care in the
Nordic capitals appeared to be generally less dependent than those cared for in the other sites.
Patients in the Nordic sample had lower levels of ADL and cognitive impairment (5). Henrard
et al. (189) analysed service delivery in the AD HOC sample. The Nordic capitals’ (and
Amsterdam’s) long-term care systems mainly provide assistance for ADLs and basic nursing
care based on a socio-medical model (both social and medical services were given to the
home care population), while other sites had less integrated models (189). Care burden stress
was significantly associated with being assessed to be ‘better off living in another
environment’, OR = 3.0, CI = 1.6-5.7. Patients who had self-rated poor health were twice as
likely to be assessed as ‘being better off in another living environment’ than those patients
reporting fair or good health (p = 0.014). Other studies have shown that self-rated health is a
82
valid measure of a person’s health condition (235-237). When an older person is assessed by
her- or himself to be in poor health, this must be taken seriously by health care professionals,
and actions must be taken to meet his or her needs.
Several models have been developed for studying the risk associated with LTCF placement.
The MAPLe algorithm showed that those with a high or a very high priority level on the
MAPLe scale had three times the predicted estimated risk for LTCF placement after 12
months compared to those assigned a lower priority level. Akamigbo & Wolinsky (237, 238)
showed that older age, prior hospitalisation or nursing home use, lower self-rated health, and
difficulties with ADLs or IADLs were significant predictors of LTCF placement. Bradley et
al. (238) stated that the most common factors influencing long-term care decision-making
were family care burdens and caregiving expectations. In this Nordic study, caregiver stress
and being assessed as ‘better off living in another environment’ were strong predictors for
getting a bed in a nursing home. This finding corresponds with another international study
using the RAI-HC (239). Older individuals living in Oslo had greater access to a LTCF than
in the other Nordic capitals.
In this sample, no specific diagnoses were included in the final regression model for
predictors of death during a 12-month period. However, unintended weight loss was a
statistically significant predictor of death. Cancer patients could be expected to be in this
group, but only one cancer patient with unintended weight loss died during the 12-month
follow-up period (data not shown). Other predictors were: ADL ≥ 1, receiving nursing
procedures, and male gender. After 12 months, a higher frequency of study participants in
Stockholm and Oslo were dead compared to participants in Reykjavik and Copenhagen (VI).
Strengths and limitations
The strength of this study is its cross-national, cross-sectional design; all data were collected
during the same time frame in 11 different countries using the same CGA. The aim of
assessments using the RAI was to capture the minimum information needed in every essential
area when assessing a frail older patient. The strengths of this study were the large sample
size, the high number of participating sites in different countries with a similar welfare model,
and the use of a standardised assessment tool cross-nationally in a home-service setting. The
83
refusal rate varied between the different sites from 0 in Amiens to 57% in Helsinki. In Oslo
the refusal rate was 7%. The variations in refusal rates did not seem to change the case-mix at
the different sites.
One of the limitations of the present study is that the data were gathered from nursing units in
urban areas in each of the participating countries. Apart from France and Germany, the data
were gathered from one site - usually the capital - in each of the countries. Even inside the
same capital, different areas may offer different home care services. There is no way of
knowing whether variations reflect differences between sites or entire countries. The AD
HOC study has no information about basic needs of older people who are not receiving home
care.
Each site was supposed to have 405 participants, for a total of 4,455. Due to practical
circumstances (Table 1), the sample from each country varied from 187 in Helsinki36 to 469
in Copenhagen. The results of prior home care studies gave the background for power
calculations.
A sample size of about 250 from each nation allows 80% power to detect significant variations in the outcome variables over the study period and within each catchment area with an α error probability = 0.05 (NCSS Pass® 6.0 statistical software) and a lost-to-follow-up rate of up to 15%. (5) p. 261.
However, the power calculation was done on the entire study, not specifically for the separate
topics in this thesis. In this statistical analysis, accepted rules for including a sufficient
number of observations to calculate means have been followed.
Despite its widely use, dichotomization of independent continuous variables has been
criticised for potential loss of information about individual differences, loss of effect size and
power, and biased parameter estimates (240-241).The simplification gained through
dichotomization may thus represent a weakness in our study. Use of stepwise regression is
also subject to criticism for possibly overfitting the model, making replications of results
difficult due to the random selection of parameters in the sample at hand based upon pure
mathematical rather than theoretical grounds (242-243). The initial selection of variables was 36 Helsinki with 187 and Amsterdam with 198 participants are below the accepted cut point. This does not matter for using the whole material, but for data analysing the difference between sites, the results from Helsinki and Amsterdam may be less representative.
84
based upon theoretical considerations, although the subsequent use of stepwise methods may
introduce a weakness
The RAI-HC, with its more than 300 variables, created broad possibilities to look at
associations with special topics such as unintended weight loss (I), extreme obesity in women
(II), use of an indwelling catheter and bladder and bowel incontinence (III-V), level of care
(VI), and the concept of ‘homebound’ that connect the different articles.
Since the RAI-HC tries to incorporate many different domains, the assessment misses in-
depth information on certain conditions like nutrition and elimination. The BMI is a
recognised variable for evaluation of nutritional status (1, 223, 244). Unfortunately, the AD
HOC version of the RAI-HC did not measure weight and height.37 This limited the
opportunity to make comparisons with other nutrition studies. However, the clinical features
assessed with the RAI-HC gave statistically significant associations with important markers
of nutrition problems (I-II).
For urinary and bowel incontinence (IV-V), there were no specific questions about different
types of continence that occurred or what kind of examinations and treatment had been
previously administered. The great variation in different studies’ definitions made comparing
results difficult.
As this study was not designed to investigate whether participants required institutional care,
the power of the sample was not originally calculated for this analysis. The greatly reduced
set of variables embedded in the RAI- HC limited this study’s ability to measure patients’
views of their situation (VI).
Hansebo et al. (183) interviewed staff (n = 50) from three nursing homes about their views of
using the Resident Assessment Instrument for Nursing Homes (RAI-NH). Overall, the staff
evaluated the instrument’s ability to contribute to the improvement of the quality of care, to
documentation, and to co-operation. A minority of the staff had negative comments, for
example, that using the RAI was time consuming or that the assessment was complicated and
detailed, but all over the evaluation gave positive response for using RAI. The assessment 37 In Oslo the author used the same version as the rest of the AD HOC sites, but added weight and height. Data that used to be in an earlier
version and by date is included in most of the RAI instruments.
85
required contact with the relatives of the patients, which some staff found difficult. However,
they recognised that the assessment made them see the importance of relatives’ involvement
in care.
Acterberg (245) emphasised different problems in doing international comparisons. The
impact of the RAI cannot be expected to be consistent for all participant sites. The countries
may have different baseline conditions and contextual factors. The results from the Nordic
countries had several similarities (5). In Article VI, however, the results show the need to
consider the data from a national perspective.
The Milbank’s report on implementing RAI emphasised several important issues for
succeeding: adequate staffing, better training, and ensuring that the administrative staff
understood the potential multiple uses of the RAI data (187). The report stated that the RAI
system in and of itself cannot define optimal care for the elderly, nor can it measure quality of
life.
The RAI assessments can show the prevalence and identify possible causes for patients’
suffering. Actual questions of nutrition and elimination may be addressed through
professional debates. Hirdes at al. stated that the RAI instruments have the potential to define
the best placement of the older patients in the service chain (239).
International studies are important for developing good care for older people. The AD HOC
study was funded by the European Union, through the 5th Framework programme. In the 7th
Framework, a new RAI study has been funded: Services and Health for Elderly in Long-Term
Care (SHELTER). One of the aims of the new study, in which 8 countries will participate,38 is
to make this instrument applicable to a large European population (www.interrai.org). This
project will strengthen the position of the RAI as an approved comprehensive geriatric
assessment.
38 In this study, Finland is representing the Nordic countries.
86
Implications for home care
Local staff
The major findings of this thesis illuminate the importance of clinical observations concerning
basic needs. These observations have to be documented and reported to the individual
responsible for services. A comprehensive assessment should be considered a useful tool for
the planning, implementation, and evaluation of services for homebound older patients.
Follow-up procedures must ensure that individual care plans are properly implemented. The
care plan has to be developed with input from the visiting nurse, the older patient, the
physician, and other key persons. One specific staff member must be responsible for the
follow up of each patient.
Municipality
Each municipality must ensure that single, homebound older patients have a functioning
network of formal and/or informal caregivers. When basic needs are not met, physical or
psychosocial distress and illness may result. Meeting patients’ nutritional and elimination
needs is a central concern for nurses in home care. If nutrition and elimination cause serious
problems for a frail older person, the question of nursing home placement may arise.
The Norwegian government could learn from the Moray Caregivers project in England (246).
The project has issued several recommendations for community caregivers. It is important
that the caregiver is receiving help and support; it can be useful to contact the Community
Services Department. ‘The Moray’ recommends that an assessment of both the patient and the
caregiver is completed. It emphasises the importance of caregivers’ seeking economic and
emotional guidance. Registration as a caregiver results in eligibility for more support.
Older people risk insufficient nutrition. Sharkey (247) documented low nutritional intake and
co-morbidity in homebound older women, even among those receiving ‘home-delivery
meals’. Jensen et al. (165) found that obesity is a significant risk factor for reporting
homebound status among community-dwelling older persons.
People with urinary incontinence experience difficulty moving about outside the home. Monz
et al. (128) found that the possibilities for exercise were moderately-to-completely limited by
episodes of incontinence. The same was true with regard to family activities or travel. Palmer
et al. (210) used the concept of ‘dependent continence’ for persons who were continent solely
due to the efforts of a caregiver. In a home care setting, where patients are homebound and
87
live alone, permanent help for toilet use is difficult to maintain. Frail older people who
experience faecal incontinence are not able to cope properly at home without extensive
professional home care.
Research
Systematic research projects must be carried out to assess and analyse home care users’
nutrition and incontinence problems. Research projects carried out locally would give
ownership of the project to local nurses and would result in more effective implementation of
any necessary intervention programs.
Education
Baccalaureate nursing programmes teach students the importance of knowledge about basic
needs. This study supports the conclusion that more emphasis on nutrition and elimination is
necessary in these programs. In addition to learning about physiology and anatomy, students
must be well prepared to conduct clinical observations and take remedial action. Emphasis
must be placed on gerontological care, and students must be acquainted with research relevant
to the patient population they will serve.
Health policy
These findings may conflict with official Norwegian policy that the home should be the
primary arena for care of older people. In the Norwegian sample, the average age of
participants was 83.4 (SD = 6.3) and 74% lived alone. Home care patients are a vulnerable
group: 110 (28.4%) were homebound (had not been outside the house in the last week or were
in need of excessive assistance to get out). Research, education, and money have to be
allocated to prioritise those who are in greatest need. Homebound patients are one of the
groups at greatest risk. Politicians must strengthen ties between formal and informal care to
ensure that older people are able to live safely and with dignity.
Conclusion
Community care in Norway and the other Nordic countries generally provides services for
individuals with lighter care needs, compared to participant sites from Central and Southern
Europe. In the Nordic sample, more older people of both sexes live alone and independently
for longer than their counterparts in other AD HOC sites. A significant association between
88
being homebound and the signs and symptoms of nutrition and elimination problems was
identified. A logistic regression model explained approximately 51% of the estimated risks
for being homebound (95% confidence intervals). With changing family structures and labour
patterns in Europe, the care of older people will be a great challenge in the coming decades. A
CGA could provide valuable information to tailor care to the needs of the older patients.
89
REFERENCES
1 WHO. Obesity: Prevention and managing the global epidemic. Genève: World Health Organization 2004: 894. 2 Morris J, Fries B, Mehr D, Hawes C, Phillips C, Mor V, Lipsitz LA. MDS Cognitive Performance Scale. J Gerontol 1994; 49(4): 174-82. 3 Hartmaier SL, Sloane PD, Guess HA, Koch GG, Mitchell CM, Phillips CD. Validation of the Minimum Data Set Cognitive Performance Scale: agreement with the Mini-Mental State Examination. J Gerontol A Biol Sci Med Sci 1995; 50(2): M128-33. 4 Hirdes J, Brant E, Morris J. Home care quality indicators (HCQIs) based on the MDS-HC. Gerontologist 2004; 44(5): 665-79. 5 Carpenter I, Gambassi G, Topinkova E, Schroll M, Finne-Soveri H, Henrard JC, Garms-Homolova V, Jonsson P, Frijters D, Ljunggren G, Sørbye LW, Wagner C, Onder G, Pedone C, Bernabei R. Community care in Europe. The Aged in Home Care project (AdHOC). Aging Clin Exp Res 2004; 16(4): 259-69. 6 Finnset A. Gammel og farlig slank. (Old and dangerous slim.) Steg - Hilsen fra Diakonhjemmet 2002; 109(2): 14-7. 7 Esping-Andersen G, Korpi W. From poor relief to institutional welfare states: the development of Scandinavian social policy. In: The Scandinavian Model: Welfare States and Welfare Research (Eriksson R, Ringen E, Uusitalo H eds), New York: Sharpe ME 1987; 39-74. 8 Esping-Andersen G. Towards the good society, once again? In: Why we need a new welfare state (Esping-Andersen G ed), Oxford: Oxford University Press 2002; 1-25. 9 Kildal N, Kuhnle S. The Nordic welfare model and universalism In: In Normative foundation of the welfare state: The Nordic experience (Kildal N, Kuhnle S eds), London: Routledge 2005; 13-33. 10 Bosnich D. The principle of subsidiary. Journal of Religion & Liberty 1996; 6(4): 9-10. 11 Ot.prp. nr. 17 (1965-66) Om lov om folketrygd. Propositions to the Odelsting. (Law about General old age pension.) Oslo. 12 Elstad I, Hamran T. Sykdom i Nord Norge før 1940. (Illness in the Northern part of Norway before 1940.) Bergen: Fagbokforlaget 2006. 13 Aijänseppä S, Notkola I, Tijhuis M, van Staveren W, Kromhout D, Nissinen A. Physical functioning in elderly Europeans: 10 year changes in the north and south: the HALE project. Epidemiol Community Health 2005; 59(5): 413-9. 14 Mathers C. International trends in health expectancies: Do they provide evidence for expansion or compression of morbidity? Canberra: Department of Health and Aged Care. Occasional Papers 2005: 4. 15 Wanless D. Securing good care for older people. Taking a long-term view. London: Kings found 2006. 16 NOU 1992: 1. Trygghet-verdighet-omsorg. (Security-dignity and care.) Oslo: Government Document. 17 Olsen B. "Hjemliggjøring" av eldreomsorgen på 1990-tallet? (”Homeliness” in the care of the elderly in the 1990ies in Norway.) Samfunnsspeilet 1995; 13(5): 19-23. 18 St.meld. nr.50, 1996-1997. Handlingsplan for eldreomsorgen. Trygghet - respekt - kvalitet. (Security-dignity-quality.) Oslo: Reports to the Government. 19 Leeson GW. My Home is my castle - housing in old age: The Danish longitudinal future study. Journal of Housing for the Elderly 2006; 20(3): 61-75.
90
20 Hjort P. God dødpleie. In: Verdier ved livets slutt Verdikommisjonens styringsgruppe (Values at the end of life.) (Ronge K ed), Oslo: Forlaget Press 2001b; 240-6. 21 St.meld. nr. 31 (2001-2002). Avslutning av handlingplan for eldreomsorgen. «Fra hus til hender» (Final comments on the action plan for the older people ‘From house to hands’.) Oslo: Reports to the Government. 22 St.meld. nr. 9 (1974-75). Sykehusutbygging m.v. i et regionalisert helsevesen. (Hospital expansion in a regional health care system.) Oslo: Reports to the Government 1974. 23 Beauchamp TL, Childress JF. Principles of biomedical ethics, 5th edn. New York and London: Oxford University Press 2001; 26. 24 St.meld. nr. 67 (1986-87). Ansvar for tiltak og tjenester for psykisk utviklingshemma. (Responsibility for services for the mental impaired). Oslo: Reports to the Government. 25 Ot.prp. nr. 49 (1987-1988). Midlertidig lov om avvikling av institusjoner og kontrakter om privatpleie under det fylkeskommunale helsevern for psykisk utviklingshemmede. Propositions to the Odelsting. (Law about private care in the official health care for mental impaired people.) Oslo: Government Document. 26 Innst.St. meld. nr. 165 (1994-95) Innstilling fra sosialkomiteen om samarbeid og styring - mål og virkemidler for en bedre helsetjeneste. (Collaboration and organization source.) St.meld. nr. 50 (1993-94). Oslo: Reports to the Government. 27 St.meld. nr.50 (1996-1997). Handlingsplan for eldreomsorgen. Trygghet - respekt - kvalitet. Reports to the Government. (Security, dignity and quality.) Oslo: Reports to the Government. 28 NOU 1987: 23. Prinsipper for prioritering i et styrings- og ressursfordelingsperspektiv. (Principles of priorities.) Oslo: Government Document. 29 SOU 1995: 5. Vårdens svåra val. (Priorities in health care). Ethics, economy, implementation, final report by the Swedish parliamentary priorities commission. Stockholm: Fritzes 1995. 30 Det etiske råd. Prioritering i sundhedsvæsenet - en redegørelse. (Priorities in the health care service.) København: Det etiske råd 1996. 31 STAKES. Laadunhallinta Suomen sosiaali- ja terveydenhuollossa: valtakunnallinen suositus sosiaali- ja terveydenhuollon laadunhallinnan järjestämisestä ja sisällöstä. (Quality assurance in social welfare and health care in Finland: National guidelines on the organization and content of the quality assurance in social welfare and health care. National research and development centre for welfare and health in Finland.) Helsinki: Stakes 1995. 32 Liss PE. Hard choices in public health: the allocation of scarce resources. Scand J Public Health 2003; 31(2): 156-7. 33 Otterstad K, Tonnseth H. Sykepleiedekning er politisk motivert. Sykepleien 2003; 89(2): 41-5. 34 ICN. Code of ethics for nurses. Genève: International Council of Nurses 2002. 35 Low nr. 66 of 19 Nov 1982. Act relating to the municipal health services. Oslo 1982: http://www.ub.uio.no/ujur/ulovdata/lov-19821119-066-eng.pdf. 36 Low nr 81 of 13 December 1991 Act relating to Social Services etc., Oslo 1991://www.ub.uio.no/ujur/ulovdata/lov-19911213-081-eng.doc. 37 Low nr. 63 of 2 July 1999. Act relating to patients' rights. Oslo 1999: http://www.ub.uio.no/ujur/ulovdata/lov-19990702-063-eng.pdf. 38 Nilsen E, Myrhaug H, Johansen M, Oliver S, Oxman A. Methods of consumer involvement in developing health care policy and research, clinical practice guidelines and patient information material. Oslo: Cochrane Database of Systematic 2008: http://www.mrw.interscience.wiley.com/cochrane/clsysrev/articles/CD004563/frame.html.
91
39 Bastiaens H, Van Royen P, Pavlic DR, Raposo V, Baker R. Older people's preferences for involvement in their own care: a qualitative study in primary health care in 11 European countries. Patient Educ Couns 2007; 68(1): 33-42. 40 Geest TA, Wetzelsb R, Raposoc V, Lopes Ferreirac P, Bakerd R, Wensingb M, Olesena F. Elderly patients’ and GPs’ views on different methods for patient involvement: an international qualitative interview study. Family Practice 2005; 22(2): 184-91. 41 St.prp. nr.1 (2004-2005). Den kongelige proposisjon om statsbudsjettet medregnet folketrygden for budsjetterminen 1. januar - 31. desember 2005. Propositions to the Storting, the budget. Oslo. 42 Hanssen G, Helgesen M, Vabø S. Politikk og demokrati. En innføring i stats- og kommunalkunnskap. (Politics and democracy - an introduction in state- and community system.) Oslo: Gyldendal Akademisk 2005; 194-5. 43 Vabø M. Organisering for velferd - Hjemmetjenesten i en styringsideologisk brytningstid. (Organisation for welfare – Home care in a time of ideological changes.) Oslo: NOVA 2007: 22; 68-9. 44 Urisn D. Bestiller-utførerorganisering og brukermedvirkning - En evalueringsstudie av Bodø kommunes organisering av kommunale hjemmetjenester. (Principal-Agent model - an evaluation of the home care service in Bodø.). Master-thesis. Bergen: University in Bergen. Det psykologiske fakultet/ det samfunnsmedisinske fakultet, Institutt for utdanning og helse. Faculty of Psychology 2005. 45 Helsetilsynet. Pleie- og omsorgstjenesten i kommunene: Tjenestemottakere, hjelpebehov og tilbud. (Nursing and care services in the municipalities: service users, service needs and service supply.) Oslo: Norwegian Board of Health Supervision 2003:10. 46 Romøren TI. The carer careers of son and daughter primary carers of their very old parents in Norway. Aging & Society 2003; 23(4): 471−85. 47 Jeppsson-Grassman E. Anhörigskapets uttrycksformer. Lund: Studentlitteratur 2003; 40-8. 48 Lowenstein A, Katz R, Prilutzky D, Mehlhausen-Hansson D. Conflict and ambivalence within integrenerational relations. In: Ageing, intergenerational relations, care systems and quality of life – an introduction to the OASIS project. (Daatland SO, Herlofsen K eds) Oslo: NOVA, 2001:14; 11-30. 49 Szebehely M (ed). Äldreomsorgsforskning i Norden. En kunskapsöversikt. (Research of elderly care Nordic council - summary in English.) Copenhagen: Nordic Council 2005. 50 Romøren TI. Last years of long lives. The Larvik study. London: Routledge 2003; 118-29. 51 Daatland SO, Herlofson K. Familie, velferdsstat og aldring. Familiesolidaritet i et europeisk perspektiv. Oslo: NOVA, 2004:7; 74-87. 52 Rees J, O'Boyle C, MacDonagh R. Quality of life: impact of chronic illness on the partner. J R Soc Med 2001; 94(11): 563-6. 53 Lim J, Zebrack B. Caring for family members with chronic physical illness: a critical review of caregiver literature. Health Qual Life Outcomes 2004; 2: 50 Epub 2004 Sep 17. 54 Asker og Bærum kommune. Trygghet og verdighet når vi trenger det mest. Felles ansvar for utredning og behandling av personer med demens i Asker og Bærum. (Security when it is most needed.) (Worktask ed). 2006: http://www.google.no/search?hl=no&q=Omsorgsl%C3%B8nn+%2B+Asker+og++B%C3%A6rum+kommune+%2B+2006&btnG=Google-s%C3%B8k&meta=. 55 Sørbye LW. Characteristics of urban women, aged 70 + at 11 sites in European countries. The Aged in HOme Care project (AdHOC), Oslo: Diakonhjemmet University College 2006: 5. 56 Moore J. Placing home in context. J Environ Psychol 2000; 20(3): 207-17.
92
57 Lantz G. Människan, hemmet och tingen. In: Hemmet i vården – vården i hemmet. (Home in nursing - nursing at home.) (Gaunt D, Lantz G eds), Stockholm: Liber forlag 1996; 1-64. 58 Solheim M. Kan eg komme inn? Verdier og val i heimesjukepleie. (Values and choices in home care.) Oslo: Universitetsforlaget 1996. 59 Somerville P. The social construction of home. J Archit Plann Res 1997; 14(3): 226-45. 60 Heggdal K. En grunnleggende prosess for mestring av kronisk sykdom. Chronic illness. (The process of embodied knowledging.) PhD thesis. Bergen: University of Bergen, Department of Nursing 2003; 115-116. 61 Case D. Contributions of journeys away to the definition of home: An empirical study of a dialectical process. J Environ Psychol 1996; 16(1):1-15). 62 Sørbye LW, Hem SM, Karlsen C. Når en er så gammel som meg, ønsker en ikke å flytte. Eldres tanker om pleie- og omsorgstjenesten i en Østlandskommune. (When you are as old as I, you don´ want to move). Aldring & Eldre 1996; 13(4): 416-9. 63 Zingmark K, Norberg A, Sandman PO. The experience of being at home throughout the life span. Investigation of persons aged from 2 to 102. Int J Aging Hum Dev 1995; 41(1): 47-62. 64 Settles B. Being at home in a global society: A model for families' mobility and immigration decisions. J Comp Fam Stud 2001; 32(4): 627-45. 65 Deem R. Leisure and life cycles. In: All work and no play: A study of women and leisure (Deem R ed), Milton Keynes: Open University Press 1986; 117-33. 66 Sikron F, Giveon A, Aharonson-Daniel L, Peleg K. My home is my castle! Or is it? Hospitalizations following home injury in Israel. IMAJ 2004; 6(3):32-5. 67 Ljunggren G. Needs assessment. In: Integrating services for older people: a resource book for managers (Nies H, Berman P eds), Dublin: European health management association (EHMA), 2004: http://www.ehma.org/carmen/index.html. 68 Katz S, Ford AB, Moskowitz RW, Jackson BA, Jaffe MW. Studies of illness in the aged the index of ADL: A standardized measure of biological and psychosocial function. JAMA 1963; 185 (Sept 21): 914-9. 69 Katz S, Down T, Cash H, Grotz R. Progress in the development of the index of ADL. Gerontologist 1970; 10(1): 20-30. 70 de Groot CP, van Staveren WA. Survey in Europe on nutrition and the elderly, a concerted action. Undernutrition in the European SENECA studies. Clin Geriatr Med 2002; 18(4): 699-708, vi. 71 Guigoz Y. The Mini Nutritional Assessment (MNA) review of the literature. What does it tell us? J Nutr Health Aging 2006; 10(6): 466-87. 72 Charles R, Mulligan S, O'Neill D. The identification and assessment of undernutrition in patients admitted to the age related health care unit of an acute Dublin general hospital. Ir J Med Sci 1999; 168(3):180-5. 73 Beck AM, Ovesen L, Schroll M. A six months' prospective follow-up of 65+-y-old patients from general practice classified according to nutritional risk by the Mini Nutritional Assessment. Eur J Clin Nutr 2000; 55(11): 1028-33. 74 Neslé. Mini Nutrition Assessment. Neslé Nutrition Institute, 1999://www.mna-elderly.com/identifying_malnutrition.html. 75 Poulsen I. Functional and nutritional assessments in geriatric rehabilitation: a feasibility study. PhD thesis. Lund: Lund University; Department of Nursing, Faculty of Medicine 2005:17. 76 Todorovic V. Detecting and managing undernutrition of older people in the community. Br J Community Nurs 2001; 6(2): 54-60.
93
77 Pirlich M, Lochs H. Nutrition in the elderly. Best Pract Res Clin Gastroenterol 2001; 15(6): 869-84. 78 Mowé M, Bøhmer T, Kindt E. Reduced nutritional status in an elderly population (> 70 y) is probable before disease and possibly contributes to the development of disease. Am J Clin Nutr 1994; 59(2): 317-24. 79 Lesourd BM. Nutrition and immunity in the elderly: modification of immune responses with nutritional treatments. Am J Clin Nutr 1997; 66(2): 478S-84S. 80 Mazari L, Lesourd BM. Nutritional influences on immune response in healthy aged persons. Mech Ageing Dev 1998; Aug 1; 104(1): 25-40. 81 Nourissat A, Mille D, Delaroche G, Jacquin JP, Vergnon JM, Fournel P, Seffert P, Porcheron J, Michaud P, Merrouche Y, Chauvin F. Estimation of the risk for nutritional state degradation in patients with cancer: development of a screening tool based on results from a cross-sectional survey. Ann Oncol 2007; 18 (11):82-6. 82 Martin C, Kayser-Jones J, Stotts N, Porter C, Froeliche E. Risk for low weight in community-dwelling, older adults. Clin Nurse Spec 2007; 21(4): 203-11. 83 Mowé M, Bøhmer T. Increased 5 year mortality in malnourished, aged people. Clin Nutr 2000; 19(20): 19S - 20S. 84 Liu L, Bopp MM, Roberson PK, Sullivan DH. Undernutrition and risk of mortality in elderly patients within 1 year of hospital discharge. J Gerontol A Biol Sci Med Sci 2002; 57(11): M741-6. 85 Inoue K, Shono T, Toyokawa S, Kawakami M. Body mass index as a predictor of mortality in community-dwelling seniors. Aging Clin Exp Res 2006; 18(3): 205-10. 86 Wilson MM, Thomas DR, Rubenstein LZ, Chibnall JT, Anderson S, Baxi A, Diebold MR, Morley JE. Appetite assessment: simple appetite questionnaire predicts weight loss in community-dwelling adults and nursing home residents. Am J Clin Nutr 2005; 82(5): 1074-81. 87 Izawa S, Enoki H, Hirakawa Y, Masuda Y, Iwata M, Hasegawa J, Iguchi A, Kuzuya M. Lack of body weight measurement is associated with mortality and hospitalization in community-dwelling frail elderly. Clin Nutr 2007; 26(6): 764-70. 88 Thompson Martin C, Kaiser Jones J, Stotts NA, Sivarajan Froelicher E. Community-living elder's views on normal and low weight. J Nutr Health Aging 2008; 12(1): 45-8. 89 Morabia A, Constanza M. The obesity epidemic as harbinger of a metabolic disorder epidemic: trends in overweight, hypercholesterolemia, and diabetes treatment in Geneva, Switzerland, 1993-2003. Am J Public Health 2005; 95(4): 632-5. 90 Haslam DW, James PW. Prevalence of obesity worldwide. Lancet 2005; (366): 1197-209 91 Grøtvedt L, Gimmestad A. Helseprofil for Oslo: Eldre. (Health profile in Oslo: Older people.) Oslo: Nasjonalt folkehelseinstitutt & Oslo kommune, 2002. 92 Das S, Kinsinger L, Yancy W, Wang A, Ciesco E, Burdick M, Yevich S. Obesity prevalence among veterans at veterans affairs medical facilities. Am J Prev Med 2005; 28(23): 291-4. 93 Callen BL, Wells TJ. Screening for nutritional risk in community-dwelling old-old. Public Health Nurs 2005; 22(2): 138-46. 94 Horani MH, Mooradian AD. Management of obesity in the elderly: special considerations. Treat Endocrinol 2002; 1(6): 387-98. 95 Department of health. UK. Health of older people. In: Health Survey for England 2005: http://www.ic.nhs.uk/statistics-and-data-collections/health-and-lifestyles/obesity/statistics-on-obesity-physical-activity-and-diet-england-2006. 96 Reidpath D, Crawford D, Tilgner L, Gibbons C. Relationship between body mass index and the use of health care services in Australia. Obesity Research 2002; 10(6): 526-31.
94
97 Camden S, Gates J. Obesity: changing the face of geriatric care. Ostomy Wound Manage 2006; 52(10): 36-8, 40-4. 98 León-Muñoz L, Guallar-Castillón P, Banegas J, Gutiérrez-Fisac J, López-García E, Jiménez F, Rodríguez-Artalejo F. Changes in body weight and health-related quality-of-life in the older adult population. Int J Obes (Lond) 2005; (11): 385-91. 99 Banegas J, López-García E, Graciani A, Guallar-Castillón P, Gutierrez-Fisac J, Alonso J, Rodríguez-Artalejo F. Relationship between obesity, hypertension and diabetes, and health-related quality of life among the elderly. Eur J Cardiovasc Prev Rehabil 2007; 14(3): 456-62. 100 Keith SW, Wang C, Fontaine KR, Cowan CD, Allison DB. BMI and headache among women: results from 11 epidemiologic datasets. Obesity (Silver Spring) 2008; 16(2): 377-83. 101 Trakas K, Lawrence K, Shear NH. Utilization of health care resources by obese Canadians. CMAJ 1999; (10): 1457-62. 102 Quesenberry C, Caan B, Jacobson A. Obesity, health services use, and health care costs among members of a health maintenance organization. Arch Intern Med 1998; 158(5): 466-72. 103 Schafer MH, Ferraro KF. Obesity and hospitalization over the adult life course: does duration of exposure increase use? J Health Soc Behav 2007; 48(4): 434-49. 104 Branca F, Nikogosian H, Lobstein T. The challenge of obesity in the WHO European Region and the strategies for response. Copenhagen: WHO European Region 2007. 105 Rossner S. Obesity in the elderly - a future matter of concern? Obes Rev 2001; 2(3): 183-8. 106 Rhew I, Yasui Y, Sorensen B, Ulrich CM, Neuhouser ML, Tworoger SS, Chubak J, Bowen DJ, McTiernan A. Effects of an exercise intervention on other health behaviors in overweight/obese post-menopausal women. Contemp Clin Trials 2007; 28(4): 472-81. 107 Berke EM, Koepsell TD, Moudon AV, Hoskins RE, Larson EB. Association of the built environment with physical activity and obesity in older persons. Am J Public Health 2007; 97(3): 486-92. 108 Klausner A, Vapnek J. Urinary incontinence in the geriatric population. Mt Sinai J Med 2003; 70(1): 54-61. 109 Landi F, Cesari M, Russo A, Onder G, Lattanzio F, Bernabei R. Potentially reversible risk factors and urinary incontinence in frail older people living in community. Age Ageing 2003; 32(2): 194-9. 110 Roberts RO, Jacobsen SJ, Reilly WT, Pemberton JH, Lieber MM, Talley NJ. Prevalence of combined fecal and urinary incontinence: a community-based study. J Am Geriatr Soc 1999; 47(7): 837-41. 111 Tseng IJ, Chen YT, Chen MT, Kou HY, Tseng SF. Prevalence of urinary incontinence and intention to seek treatment in the elderly. J Formos Med Assoc 2000; 99(10): 753-8. 112 Li Y, Cai X, Glance LG, Mukamel DB. Gender differences in health care-seeking behavior for urinary incontinence and the impact of socioeconomic status: a study of the Medicare manage care population. Med Care 2007; 45(11): 1116-22. 113 Harris SS, Link CL, Tennstedt SL, Kusek JW, McKinlay JB. Care seeking and treatment for urinary incontinence in a diverse population. J Urol 2007; 177(2): 680-4. 114 Cheater FM, Baker R, Gillies C, Wailoo A, Spiers N, Reddish S, Robertson N, Cawood C. The nature and impact of urinary incontinence experienced by patients receiving community nursing services: a cross-sectional cohort study. Int J Nurs Stud 2008; 45(3): 339-51. 115 Boyle P, Robertson C, Mazzetta C, Keech M, Hobbs F, Fourcade R, Kiemeney L, Lee C, Group US. The prevalence of male urinary incontinence in four centres: the UREPIK study. BJU Int 2003; 92(9): 943-7.
95
116 Hunskaar S, Lose G, Sykes D, Voss S. The prevalence of urinary incontinence in women in four European countries. BJU Int 2004; 93(3): 324-30. 117 Molander U, Sundh V, Steen B. Urinary incontinence and related symptoms in older men and women studied longitudinally between 70 and 97 years of age. A population study. Arch Gerontol Geriatr 2002; 35(3): 237-44. 118 Song HJ, Bae JM. Continence care. Prevalence of urinary incontinence and lower urinary tract symptoms for community-dwelling elderly 85 years of age and older. J Wound Ostomy Continence Nurs 2007; 34(5): 535-41. 119 Boiko S. Diapers and diaper rashes. Dermatol Nurs 1997; 9(1): 33-9, 43-6, 66, 70. 120 Gotoh M, Yoshikawa Y, Hattori R, Ono Y, Ohshima S. A fact-finding inquiry on urinary management of the elderly in home care. Hinyokika Kiyo (Acta Urol Jpn) 2002; 48(11): 653-8. 121 Smith MJ. Indwelling catheter management: from habit-based to evidence-based practice. Ostomy Wound Manage 2003; 49(12): 34-45. 122 Johnson TM, Bernard SL, Kincade JE, Defriese GH. Urinary incontinence and risk of death among community-living elderly people: results from the national survey on self-care and aging. J Aging Health 2000; 12(1): 25-46. 123 Specht JK. 9 myths of incontinence in older adults: both clinicians and the over-65 set need to know more. Am J Nurs 2005; 105(6): 58-68. 124 Butler R, Maby J, Montella J, Young G. Urinary incontinence: keys to diagnosis of the elderly woman. Geriatrics 1999; 54(10): 22-6, 29-30. 125 Bradway CW, Barg F. Developing a cultural model for long-term female urinary incontinence. Soc Sci Med 2006; 63(12): 3150-61. 126 Dugan E, Roberts C, Cohen S, Preisser J, Davis C, Bland D, Albertson E. Why older community-dwelling adults do not discuss urinary incontinence with their primary care physicians. J Am Geriatr Soc 2001; 49(4): 462-5. 127 Hannestad Y, Rortveit G, Hunskaar S. Help-seeking and associated factors in female urinary incontinence. Scand J Prim Health care 2002; Jun;20(2): 102-7. 128 Monz B, Pons ME, Hampel C, Hunskaar S, Quail D, Samsioe G, Sykes D, Wagg A, Papanicolaou S. Patient-reported impact of urinary incontinence - results from treatment seeking women in 14 European countries. Maturitas 2005; 52 Suppl 2: S24-S34. Epub 2005 Nov 16. 129 Papanicolaou S, Pons ME, Hampel C, Monz B, Quail D, Schulenburg MG, Wagg A, Sykes D. Medical resource utilisation and cost of care for women seeking treatment for urinary incontinence in an outpatient setting; the PURE study. Maturitas 2005; 52 Suppl 2: 35S-47S. Epub 2005 Nov 16. 130 Borrie MJ, Bawden M, Speechley M, Kloseck M. Interventions led by nurse continence advisers in the management of urinary incontinence: a randomized controlled trial. CMAJ 2002; 166(10): 1267-73. 131 Cheater FM, Baker R, Reddish S, Spiers N, Wailoo A, Gillies C, Robertson N, Cawood C. Cluster randomized controlled trial of the effectiveness of audit and feedback and educational outreach on improving nursing practice and patient outcomes. Med Care 2006; 44(6): 542-51. 132 Vinsnes AG, Harkless GE, Nyronning S. Unit-based intervention to improve urinary incontinence in frail elderly. Nordic journal of Nursing Research & Clinical Studies 2007; 27(3): 53-6. 133 Du Moulin M, Hamers J, Paulus A, Berendsen C, Halfens R. The role of the nurse in community continence care: a systematic review Int J Nurs Stud 2005; 42(4): 479-92. 134 Cassells C, Watt E. The impact of incontinence on older spousal caregivers. J Adv Nurs 2003; 42(6): 607-16.
96
135 Santos-Eggimann B, Cirilli NC, Monachon JJ. Frequency and determinants of urgent requests to home care agencies for community-dwelling elderly. Home Health care Serv Q 2003; 22(1): 39-53. 136 Akamigbo A, Wolinsky F. Reported expectations for nursing home placement among older adults and their role as risk factors for nursing home admissions. Gerontologist 2006; 46(4): 464-73. 137 Leigh R, Turnberg L. Faecal incontinence: the unvoiced symptom. Lancet 1982 12; 1(8285):1349-51. 138 Edwards N, Jones D. The prevalence of faecal incontinence in older people living at home. Age Ageing 2001; 30(6): 503-7. 139 Wald A. Faecal incontinence in the elderly: epidemiology and management. Drugs Aging 2005; 22(2): 131-9. 140 Perry S, Shaw P, McGrother C, Matthews R, Assassa R, Dallosso H, Williams K, Brittain KR AU, Clarke M, Jagger C, Mayne C, Castleden CM. Prevalence of faecal incontinence in adults aged 40 years or more living in the community. Gut 2002; 50(4): 480-4. 141 Teunissen T, van den Bosch W, van den Hoogen H, Largo-Jansen A. Prevalence of urinary, fecal and double incontinence in the elderly living at home. Int Urogynekol J Pelvic Floor Dysfunct 2004; 15(1): 10-3. 142 Bliss DZ. Monitors in nutrition support. Nutr Clin Pract 2004; 19(5): 421-2. 143 Nelson R, Norton N, Cautley E, Furner S. Community-based prevalence of anal incontinence JAMA 1995; 274(7): 559-61. 144 Walter S, Hallbook O, Gotthard R, Bergmark M, Sjodahl R. A population-based study on bowel habits in a Swedish community: prevalence of faecal incontinence and constipation. Scand J Gastroenterol 2002; 37(8): 911-6. 145 Goode PS, Burgio KL, Halli AD, Jones RW, Richter HE, Redden DT, Baker PS, Allman RM. Prevalence and correlates of fecal incontinence in community-dwelling older adults. J Am Geriatr Soc 2005; 53(4): 629-35. 146 Siproudhis L, Pigot F, Godeberge P, Damon H, Soudan D, Bigard MA. Defecation disorders: a French population survey. Dis Colon Rectum 2006; 49(2): 219-27. 147 Varma MG, Brown JS, Creasman JM, Thom DH, Van Den Eeden SK, Beattie MS, Subak LL. Fecal incontinence in females older than aged 40 years: who is at risk? Dis Colon Rectum 2006; 49(6): 841-51. 148 Markland AD, Goode PS, Burgio KL, Redden DT, Richter HE, Sawyer P, Allman RM. Correlates of urinary, fecal, and dual incontinence in older African-American and white men and women. J Am Geriatr Soc 2008; 56(2): 285-90. 149 Pretlove SJ, Radley S, Toozs-Hobson PM, Thompson PJ, Coomarasamy A, Khan KS. Prevalence of anal incontinence according to age and gender: a systematic review and meta-regression analysis. Int Urogynecol J Pelvic Floor Dysfunct. 2006; 17(4): 407-17. 150 Fialkow MF MJ, Lentz GM, Miller EA, Miller J, Fenner DE. The functional and psychosocial impact of fecal incontinence on women with urinary incontinence. Am J Obstet Gynecol 2003; 189(1): 127-9. 151 Brittain KR, Shaw C. The social consequences of living with and dealing with incontinence - a carers perspective. Soc Sci Med 2007; 65(6): 1274-83. 152 Rauch D. Is There Really a Scandinavian Social Service Model? Acta Sociologica 2007; 50(3): 249-69. 153 Nielsen J. Nordic/Baltic Social Protection Statistics 2000 Scope, expenditure and financing. 2003: http://www.nom-nos.dk/NordBaltSoc/nordbaltsocpro.pdf. 154 Daatland SO, Herlofson K. Ageing, intergenerational relations, care systems and quality of life – an introduction to the OASIS project. Oslo: NOVA 2001: 4.
97
155 Daatland SO, Herlofson K. Norms and ideals about elder care in a European comparative perspective. In: OASIS Final report (Lowenstein A, Ogg J eds), Haifa: Centre for Research and Study of Aging, Haifa: University of Haifa 2003; 27-64. 156 Larsson K. Kvarboende eller flyttning på äldre dagar – en kunskapsöversikt. (In old age staying or move to another dwelling – a discretional study.) Stockholm: Rapporter/Stiftelsen Stockholms läns Äldrecentrum 2006: 9. 157 Pacolet J, Bouten R, Lanoye H, Versieck K. Social protection for dependency in old age. A study of the fifteen EU members’ states and Norway. Aldershot: Ashgate 2000. 158 Gaugler JE, Duval S, Anderson KA, Kane RL. Predicting nursing home admission in the US: a meta-analysis. BMC Geriatr 2007; 7: 13. Epub: 2007 June 19. 159 ICF-WHO. International classification of functioning, disability and health (ICF), resolution WHA 54.21. Genève: World Health Organization 2001. 160 Visschedijk J, Schols J. What are the most relevant parameters for malnutrition in nursing homes? (Article in Dutch). Tijdschr Gerontol Geriatr 2006; 37(5): 160-8. 161 IPLOS-instrument. National statistics linked to individual needs for care. Oslo: Norwegian Directorate of Health 2004: http://www.shdir.no/selectedtopics/iplos. 162 Kondrup J, Allison SP, M, Vellas B, Plauth M. ESPEN guidelines for nutrition screening 2002. Clin Nutr 2003; 22(4): 415-21. 163 NICE. CG32 Nutrition support in adults: NICE guideline; Oral nutrition support, enteral tube feeding and parenteral nutrition. London: National Institute for health and clinical excellence, 2006://www.nice.org.uk/guidance/index.jsp?action=download&o=29980. 164 Extermann M. Geriatric assessment with focus on instrument selectivity for outcomes. Cancer J 2005; 11(6): 474-80. 165 Jensen G, Silver H, Roy M, Callahan E, Still C, Dupont W. Obesity is a risk factor for reporting homebound status among community-dwelling older persons. Obesity (Silver Spring) 2006; 14(3): 509-17. 166 Mahoney FI, Barthel DW. Functional evaluation: the Barthel index. Md State Med J 1965; 14 (Febr): 61-5. 167 Abrams P, Cardozo L, Fall M, Griffiths D, Rosier P, Ulmsten U, van Kerrebroeck P, Victor A, Wein A. The standardisation of terminology of lower urinary tract function: report from the standardisation sub-committee of the International Continence Society Neurourol Urodyn 2002; 21(2): 167-78. 168 Sletvold O, Tilvis R, Jonsson A, Schroll M, Snaedal J, Engedal K, Schultz-Larsen K, Gustafson Y. Geriatric work-up in the Nordic countries. The Nordic approach to comprehensive geriatric assessment. Dan Med Bull 1996; 43(4): 350-9. 169 Rubenstein LZ. Geriatric imperative: geriatric assessment programs. J Med Soc N J 1984; 81(8): 651-4. 170 Wieland D, Stuck AE, Siu AL, Adams J, Rubenstein LZ. Meta-analytic methods for health services research--an example from geriatrics. Eval Health Prof 1995; 18(3): 252-82. 171 Medscape. 2006://www.medscape.com/viewarticle/465308_4. 172 Stuck AE, Zwahlen H, Neuenschannder B, Meyer Schweizer R. Methodological challenges of randomized controlled studies on in-home comprehensive geriatric assessmen: the evaluation of in-home geriatric health visits in elderly residents. Aging (Milano)1995; 7: 218-23. 173 Bula C, Berod A, Stuck A, Alessi C, Aronow H, Santos-Eggimann B, Rubenstein L, Beck J. Effectiveness of preventive in-home geriatric assessment in well functioning, community-dwelling older people: secondary analysis of a randomized trial. J Am Geriatr Soc 1999; 47(4): 389-95.
98
174 Stuck A, Minder C, Peter-Wuest I, Gillmann G, Egli C, Kesselring A. A randomized trial of in-home visits for disability prevention in community-dwelling older people at low and high risk for nursing home admission. Arch Intern Med 2000; 160(7): 977-86. 175 Stott D, Buttery A, Bowman A, Agnew R, Burrow K. Comprehensive geriatric assessment and home-based rehabilitation for elderly people with a history of recurrent non-elective hospital admissions. Age Ageing 2006; 35(5): 487-91. 176 Waaler HM. Pleiebehov blant mottakere av kommunale omsorgstjenester. Nursing needs among recipients of community health care. Tidsskr Nor Laegeforen 2005; 125(6): 1012-4. 177 Slade A, Fear J, Tennant A. Identifying patients at risk of nursing home admission: The Leeds Elderly Assessment Dependency Screening tool (LEADS). BMC Health Serv Res 2006; 6: 31. Epub 2006 March 13. 178 Hawes C, Fries BE, James ML, Guihan M. Prospects and pitfalls: use of the RAI-HC assessment by the Department of Veterans Affairs for home care clients. Gerontologist 2007; 47(3): 378-87. 179 Landi F, Onder G, Tua E, Carrara B, Zuccala G, Gambassi G, Carbonin P, Bernabei R. Impact of a new assessment system, the MDS-HC, on function and hospitalization of homebound older people: a controlled clinical trial. J Am Geriatr Soc 2001; 49(10): 1288-93. 180 Bernabei R, Landi F, Gambassi G, Sgadari A, Zuccala G, Mor V, Rubenstein LZ, Carbonin P. Randomised trial of impact of model of integrated care and case management for older people living in the community. BMJ 1998; 316(7141): 1348-51. 181 Fialova D, Topinkova E, Gambassi G, Finne-Soveri H, Jonsson PV, Carpenter I, Schroll M, Onder G, Sørbye LW, Wagner C, Reissigova J, Bernabei R. Potentially inappropriate medication use among elderly home care patients in Europe. JAMA 2005; 293(11): 1348-58. 182 Beck AM. Nutrition problems among home care clients and nursing home residents - early identification and preventive treatment. PhD thesis. København: Fødevaredirektoratet. 2001. 183 Hansebo G, Kihlgren M, Ljunggren G, Winblad B. Staff views on the Resident Assessment Instrument, RAI/MDS, in nursing homes, and the use of the Cognitive Performance Scale, CPS, in different levels of care in Stockholm. J Adv Nurs 1998; 28(3): 642-53. 184 Klinkenberg M, Visser G, van Groenou M. van der Wal G, Deeg DJ, Willems DL. The last 3 months of life: care, transitions and the place of death of older people. Health Soc Care Community 2005; 13(5): 420-30. 185 Mamhidir A-G. Meeting ethical and nutritional challenges in elder care: The life world and system world of staff and high level decision-makers. PhD thesis. Stocholm: Karolinska Institutet 2006. 186 Hirdes JP. Addressing the health needs of frail elderly people: Ontario's experience with an integrated health information system. Age Ageing 2006; 35(4): 329-31. 187 Milbank.Memorial.Fund. Implementing the Resident Assessment Instrument: Case studies of policymaking for long-term care in eight countries. New York: Milbank Memorial Foundation 2003. 188 InterRAI. Homepage, 2008: www.interrai.org. 189 Henrard JC, Ankri J, Frijters D, Carpenter I, Topinkova E, Garms-Homolova V, Finne-Soveri H, Sørbye LW, Jonsson PV, Ljunggren G, Schroll M, Wagner C, Bernabei R. Proposal of a service delivery integration index of home care for older persons: application in several European cities. Int J Integr Care 2006; 6e11; 2006 29 Nov. 190 Bos JT, Frijters DH, Wagner C, Carpenter GI, Finne-Soveri H, Topinkova E, Garms-Homolova V, Henrard JC, Jonsson PV, Sørbye LW, Ljunggren G, Schroll M, Gambassi G,
99
Bernabei R. Variations in quality of Home Care between sites across Europe, as measured by Home Care Quality Indicators. Aging Clin Exp Res 2007; 19(4): 323-9. 191 Alanen H, Finne-Soveri H, Fialova D, Topinkova E, Jonssons PV, Sørbye LW, Bernabei R, Leinonen E. Use of antipsychotic medications in older home-care patients. Report from nine European countries. Aging Clin Exp Res 2008; 20(3):260-5. 192 Vibe OE. «Rai - resident assessment instrument». Et internasjonalt multidimensjonelt instrument til bruk i geriatri - rapport del 1. Utprøving i Norge, Oslo: Diakonhjemmet sykehus 1995. 193 Grue E, Sørbye LW. Helse- og omsorgsbehov hos hjemmeboende vurdert i RAI-HC. Pleie- og omsorgstjenesten i St. Hanshaugen – Ullevål bydel. Oslo. Health and care needs for homeliving elderly, assessed with RAI, Oslo: Diakonhjemmets høgskolesenter 1998:8. 194 Sørbye LW, Grue E, Bondahl A. Hjemmeboende aldersdemente - grensen mellom trivsel og uforsvarlighet. Pleie- og omsorgstjenesten i Bydel 3 - RAI og Gerix (On the egde of wellbeing and danger - elderly living in their own home in Oslo, assessed with GERIX and RAI-HC), Oslo: Diakonhjemmets høgskolesenter 1998: 7. 195 Bondahl A, Grue E, Bjørnson J. "Står det noe sted?" Eldre pasienter registrert ved hjelp av RAI-MDS-AC og sykehusets dokumentasjonssystem. (Ordinary documentation compare to RAI in an acute hospital.) Oslo: Diakonhjemmet sykehus 1999. 196 Sorbye LW. A longitudinal study on dying in a Norwegian hospital. Int J Palliat Nurs 2000; 6(2): 71-9. 197 Brenden AK, Sørbye LW. Kan forsterket hjemmesykepleie hindre innleggelse i sykehjem? Could strengthen home care prevent placement in nursing home. Sykepleien 2000; 86(3): 48-52. 198 Buckles VD, Powlishta KK, Palmer JL, Coats M, Hosto T, Buckley A, Morris JC. Understanding of informed consent by demented individuals. Neurology 2003; 61(12): 1662-6. 199 Morris J, Fries B, Bernabei R, Murphy K, Nonemaker S, Hawes C, Phillips C, Mor V. RAI -Home Care (RAI-HC) 8 assessment manual for version 2.0. Marblehead, MA: Opus Communications 2000. 200 Morris J, Fries B, Steel K, Ikegami N, Bernabei R, Carpenter G, Gilgen R, Hirdes J, Topinkova E. Comprehensive clinical assessment in community setting: applicability of the MDS HC. J Am Geriatr Soc 1997; 45(8): 1017-24. 201 SPSS. Version 15. 2008: www.spss.no. 202 Arias E. United States life tables 2002. National vital statistic report 2002; 53(6). http://www.cdc.gov/nchs/data/nvsr/nvsr53/nvsr53_06.pdf. 203 König B. Life expectancy in the new EU. Federal statistical office Germany 2004: //www.destatis.de/presse/englisch/pm2004/p2050022.htm. 204 Bonke J, Koch-Weser E. The welfare state and time allocation, 2001: 9://www.sfi.dk/graphics/SFI/Pdf/Working_papers/workingpaper2001_9.pdf. 205 Smith DA. Evaluation of urinary incontinence. J Am Med Dir Assoc 2002; 3(1): 2S-10S. 206 Ouslander JG. Geriatric urinary incontinence. Dis Mon 1992 (1 Suppl); 38(2): 65-149. 207 Moore KN, Rayome RG. Problem solving and troubleshooting: the indwelling catheter. J Wound Ostomy Continence Nurs 1995; 2(5): 242-7. 208 Shamliyan T, Wyman J, Bliss Z, Kane RL, Wilt TJ. Prevention of urinary and fecal incontinence in adults. Evid Rep Technol Assess 2007; (161): 1-379. 209 Goldberg R. Urogenital aging. In: Medical problems in women over 70 (Rees M, Keith L eds), Oxford: Taylor and Francis 2007; 93-105. 210 Palmer MH, Czarapata BJ, Wells TJ, Newman DK. Urinary outcomes in older adults: research and clinical perspectives. Urol Nurs 1997; 7(1): 2-9.
100

211 Palmer MH, Baumgarten M, Langenberg P, Carson JL. Risk factors for hospital-acquired incontinence in elderly female hip fracture patients. J Gerontol A Biol Sci Med Sci 2002; 57(10): M672-7. 212 Bliss DZ, Savik K. Use of an absorbent dressing specifically for fecal incontinence. J Wound Ostomy Continence Nurs 2008; 35(2): 221-8. 213 Tarbox RS, Williams WL, Friman PC. Extended diaper wearing: effects on continence in and out of the diaper. J Appl Behav Anal 2004; 37(1): 97-100. 214 Johnson TM, Ouslander JG, Uman GC, Schnelle JF. Urinary incontinence treatment preferences in long-term care. J Am Geriatr Soc 2001; 49(6): 710-8. 215 Newman DK. Incontinence products and devices for the elderly. Urol Nurs 2004; 24(4): 316-33. 216 Landi F, Cesari M, Onder G, Zamboni V, Barillaro C, Lattanzio F, Bernabei R. Indwelling urethral catheter and mortality in frail elderly women living in community. Neurourol Urodyn 2004; 23(7): 697-701. 217 Pilloni S, Krhut J, Mair D, Madersbacher H, Kessler TM. Intermittent catheterisation in older people: a valuable alternative to an indwelling catheter? Age Ageing 2005; 34(1): 57-60. 218 Robinson J. Fundamental principles of indwelling urinary catheter selection. Br J Community Nurs 2004; 9(7): 281-4. 219 Newman D. Urinary incontinence, catheters, and urinary tract infections: an overview of CMS tag F 315. Ostomy Wound Manage 2006; 52(12): 34-6, 8, 40-4. 220 Bucci AT. Be a continence champion: use the CHAMMP tool to individualize the plan of care. Geriatr Nurs 2007; 28(2): 120-4. 221 Soini H, Routasalo P, Lauri S. Nutrition in patients receiving home care in Finland: tackling the multifactorial problem. J Gerontol Nurs 2006; 32(4): 12-7. 222 Faxen-Irving G, Andren-Olsson B, af Geijerstam A, Basun H, Cederholm T. The effect of nutritional intervention in elderly subjects residing in group-living for the demented Eur J Clin Nutr 2002; 56(3): 221-7. 223 Luchsinger JA, Patel B, Tang MX, Schupf N, Mayeux R. Body mass index, dementia, and mortality in the elderly. J Nutr Health Aging 2008; 12(2): 127-31. 224 NHS. Health survey for England 2005 latest trends. The Information Center - health and social care, 2006: http://www.ic.nhs.uk/statistics-and-data-collections/healthand-lifestyles-related-surveys/health-survey-for-england/health-survey-for-england-2005-latest-trends. 225 Sørbye LW. Hjemmetjenester til eldre i Bærum og Ullern - sammenlignende data fra AdHOC studiet. (Home care to older people in Bærum and Ullern the ADHOC study.) Oslo: Diakonhjemmet University College, Department of Nursing 2003. 226 Friedmann JM, Elasy T, Jensen GL. The relationship between body mass index and self-reported functional limitation among older adults: a gender difference. J Am Geriatr Soc 2001; 49(4): 398-403. 227 Waaler HT. Hazard of obesity - the Norwegian experience. Acta Med Scand Suppl 1988; 723:17S-21S. 228 Elia M. Obesity in the elderly. Obes Res 2001; 9 Suppl: 244S-8S. 229 Zamboni M, Mazzali G, Zoico E, Harris TB, Meigs JB, Di Francesco V, Fantin F, Bissoli L, Bosello O. Health consequences of obesity in the elderly: a review of four unresolved questions. Int J Obes (Lond) 2005; 29(9): 1011-29. 230 Must A, Spadano J, Coakley EH, Field AE, Colditz G, Dietz WH. The disease burden associated with overweight and obesity. JAMA 1999; 282(16): 1523-9. 231 Akinnusi ME, Pineda LA, El Solh AA. Effect of obesity on intensive care morbidity and mortality: a meta-analysis. Crit Care Med 2008; 36(1): 151-8.
101
232 Grabowski DC, Ellis JE. High body mass index does not predict mortality in older people: analysis of the Longitudinal Study of Aging. J Am Geriatr Soc 2001; 49(7): 968-79. 233 Hamran T. Kvinneforeningene, institusjonsbyggingen og den nasjonale velferdspolitikken. Nord-Norge før 1940 Women’s associations, establishment of institutions and national welfare policy Northern Norway prior to 1940. Historisk Tidsskrift 2007; 86(3): 411-30. 234 Palme J, Lindh T (eds). Sustainable policies in an ageing Europe. A human capital response. Växjö: Växjö University, Institute for future research 2006; 61-63. 235 Ellis JM, McManus C, Newton BA. How patients perceive the role of hospital chaplains: a preliminary exploration. Qual Health care 1995; 4(3): 174-7. 236 Molarius M, Janson S. Selfrated health, chronic diseases, and symptoms among middle-aged and elderly men and women. J Clin Epid 2000; 55(4): 364-70. 237 Akamigbo AB, Wolinsky FD. Reported expectations for nursing home placement among older adults and their role as risk factors for nursing home admissions. Gerontologist 2006; 46(4): 464-73. 238 Bradley E, McGraw S, Curry LA, Buckser A, King K, Kasl S, Andersen R. Expanding the Andersen model: the role of psychosocial factors in long-term care use. Health Services Research 2002://findarticlescom/p/articles/mi_m4149/is_5_37/ai_95105506/pg_6. 239 Hirdes J, Poss J, Curtin-Telegdi N. The Method for Assigning Priority Levels (MAPLe): a new decision-support system for allocating home care resources. BMC Med 2008; 6. Epub 2008 March 26. 240 MacCallum R.C., Zhang S., Preacher K. & Rucker D.D. On the practice of dichotomization of quantitative variables. Psychological Methods 2002; 7(1): 19-40. 241 Royston P., Altman D.G. & Sauerbrei W. Dichotomizing continuous predictors in multiple regression: a bad idea. Statistics in Medicine 2006; 25(1): 127-141. 242 Babyak, M.A. (2004) What you see may not be what you get: a brief, nontechnical introduction to overfitting in regression-type models. Psychosomatic Medicine 66(3): 411-421. 243 Field A. Discovering statistics using SPSS. London: Sage 2005; 161-2.244 NHS. Nutrition support in adults. Oral nutrition support, enteral nutrition and parenteral nutrition, London: National collaborating centre for acute care 2006: //www.nice.org.uk/CG32. 245 Achterberg W. Caring for quality. The use of the Minimum Data Set (MDS) for research into quality of care and patient functioning in nursing homes. PhD thesis. Amsterdam: Vrije University, Medical Centre and the Institute for Research in Extramural Medicine, 2004. 246 Moray. 2008: www.moray.gov.uk. 247 Sharkey J. The interrelationship of nutritional risk factors, indicators of nutritional risk, and severity of disability among home-delivered meal participants. Gerontologist 2002; 42(3): 373-80.
102
ACKNOWLEDGEMENTS
This thesis has been written at the Faculty of Medicine, Department of Clinical Medicine,
Section for Nursing and Health Sciences, at the University of Tromsø. I would like to express
my gratitude to those that have contributed to this work in a special way. In particular, I wish
to thank the following.
• My supervisor, Professor Astrid Norberg, who kindly agreed to go into this project in
its final stages. Her constructive and critical appraisal was invaluable.
• Professor Torunn Hamran for her advice, especially as related to history and social
science.
• Associate Professor Nils Henriksen for statistical advice.
• Special thanks to Associate Professor Sigrunn Holbek Sørbye for teaching me
statistical analysis and listening patiently to my questions.
• Thanks to physician in charge Stig Asplin for sending the application for money
through the Norwegian medical association. A special thanks to the home care staff in
Ullern and Bærum and the two external assessors Brita Berg and Ingrid Wergeland.
• The NorRAI group: Dr. Jan Bjørnson for introducing me to InterRAI, doctoral
candidate Else Vengnes Grue for mutual support for many years, and nursing
consultant Olaug Vibe at the Cathinka Guldberg-Centre for visualising quality of care
through clinical practice.
• The Nordic InterRAI fellowship and the Nordic Council for funding our research
meetings. This fellowship has been functioning as a close network of professionals
with enthusiasm for research. Special thanks to my AD HOC co-authors: Director
Harriet Finne-Soveri, Professor Marianne Schroll, Associate Professor Palmi Jónnson,
and Director Gunnar Ljunggren
• The AD HOC research team, in addition to the Nordic fellows: Project Coordinator
Professor Roberto Barnabei, Associate Director Iain Carpenter, Professor Jean-Claude
Henrard, Professor Eva Topinková, Professor Vjenka Garms-Homolová, and
Researcher Dinnus Frijters.
• The InterRAI collaborative network for making me a fellow in 2003. To be a part of
this network of researchers, committed to improving health care for patients who are
older, frail, or disabled, has been invaluable.
103

104
• My colleagues at Diakonhjemmet University College, who have continued to respect
my devotion to this international research; special thanks to the leader of our library,
Hilde Trygstad, and to her staff for their continued assistance
• Much gratitude goes to Professor Emeritus Peter F. Hjort, who let me join his Group
for Health Service Research in 1976, and since then has advised, supported, and
encourage me.
• I would like to acknowledge my dear family.

Appendix 1

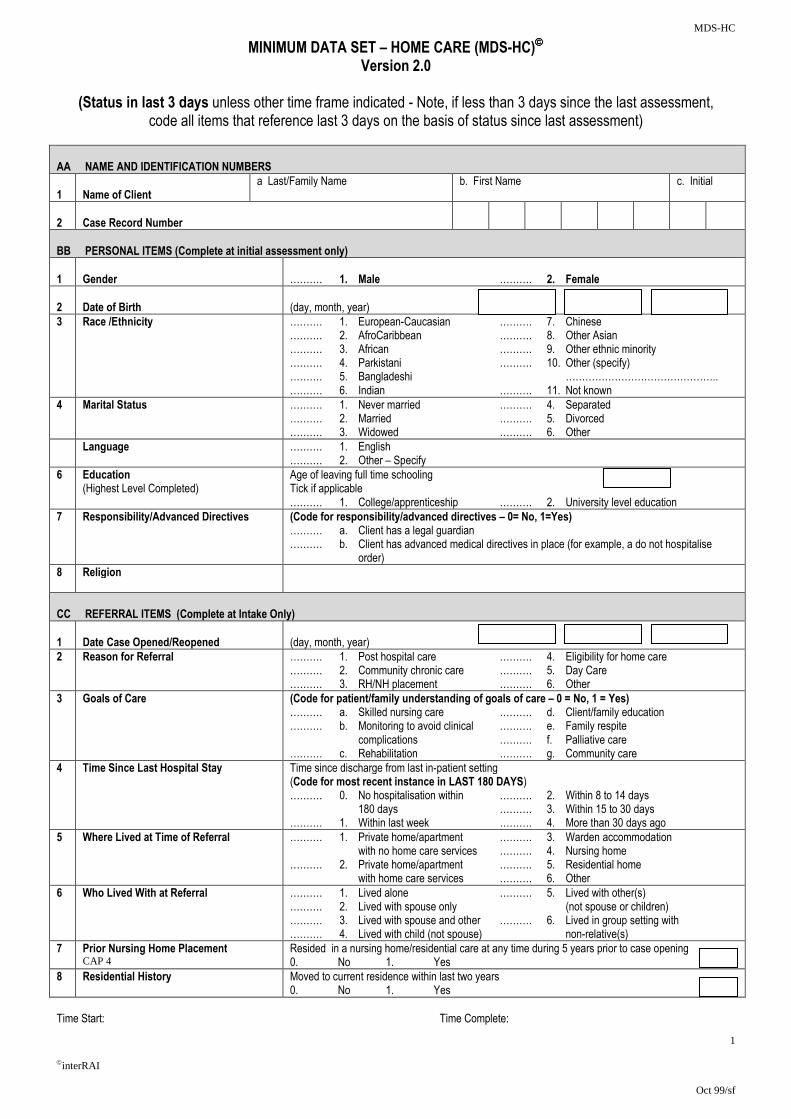
MDS-HC
1
interRAI
Oct 99/sf
MINIMUM DATA SET – HOME CARE (MDS-HC) Version 2.0
(Status in last 3 days unless other time frame indicated - Note, if less than 3 days since the last assessment,
code all items that reference last 3 days on the basis of status since last assessment) AA NAME AND IDENTIFICATION NUMBERS
1
Name of Client
a Last/Family Name
b. First Name c. Initial
2
Case Record Number
BB PERSONAL ITEMS (Complete at initial assessment only)
1
Gender
………. 1. Male ………. 2. Female
2
Date of Birth
(day, month, year)
3 Race /Ethnicity ………. 1. European-Caucasian ………. 7. Chinese ………. 2. AfroCaribbean ………. 8. Other Asian ………. 3. African ………. 9. Other ethnic minority ………. 4. Parkistani ………. 10. Other (specify) ………. 5. Bangladeshi ……………………………………….. ………. 6. Indian ………. 11. Not known
4 Marital Status
………. 1. Never married ………. 4. Separated ………. 2. Married ………. 5. Divorced ………. 3. Widowed ………. 6. Other
Language ………. 1. English ………. 2. Other – Specify
6 Education (Highest Level Completed)
Age of leaving full time schooling Tick if applicable ………. 1. College/apprenticeship ………. 2. University level education
7 Responsibility/Advanced Directives
(Code for responsibility/advanced directives – 0= No, 1=Yes) ………. a. Client has a legal guardian ………. b. Client has advanced medical directives in place (for example, a do not hospitalise order)
8 Religion
CC REFERRAL ITEMS (Complete at Intake Only)
1
Date Case Opened/Reopened
(day, month, year)
2 Reason for Referral ………. 1. Post hospital care ………. 4. Eligibility for home care ………. 2. Community chronic care ………. 5. Day Care ………. 3. RH/NH placement ………. 6. Other
3 Goals of Care (Code for patient/family understanding of goals of care – 0 = No, 1 = Yes) ………. a. Skilled nursing care ………. d. Client/family education ………. b. Monitoring to avoid clinical ………. e. Family respite complications ………. f. Palliative care ………. c. Rehabilitation ………. g. Community care
4 Time Since Last Hospital Stay Time since discharge from last in-patient setting (Code for most recent instance in LAST 180 DAYS) ………. 0. No hospitalisation within ………. 2. Within 8 to 14 days
180 days ………. 3. Within 15 to 30 days ………. 1. Within last week ………. 4. More than 30 days ago
5 Where Lived at Time of Referral ………. 1. Private home/apartment ………. 3. Warden accommodation with no home care services ………. 4. Nursing home ………. 2. Private home/apartment ………. 5. Residential home with home care services ………. 6. Other
6 Who Lived With at Referral ………. 1. Lived alone ………. 5. Lived with other(s) ………. 2. Lived with spouse only (not spouse or children) ………. 3. Lived with spouse and other ………. 6. Lived in group setting with ………. 4. Lived with child (not spouse) non-relative(s)
7 Prior Nursing Home Placement CAP 4
Resided in a nursing home/residential care at any time during 5 years prior to case opening 0. No 1. Yes
8 Residential History Moved to current residence within last two years 0. No 1. Yes
Time Start: Time Complete:
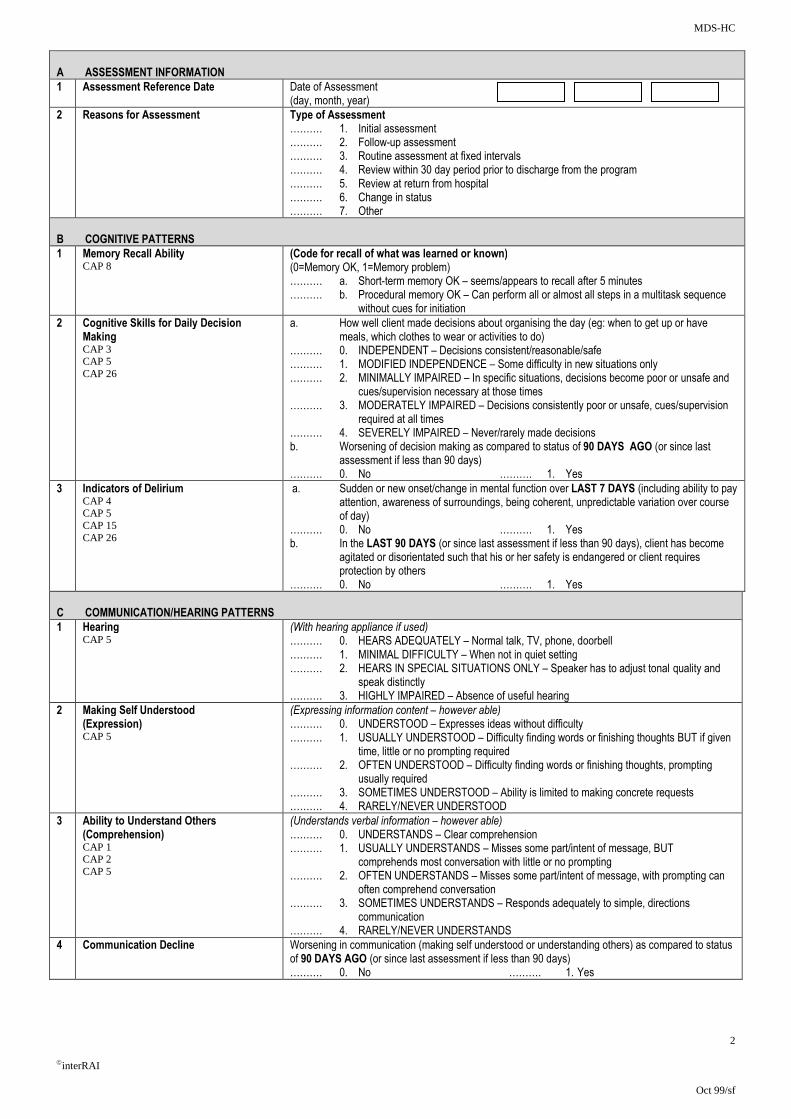
MDS-HC
2
interRAI
Oct 99/sf
A ASSESSMENT INFORMATION
1 Assessment Reference Date Date of Assessment (day, month, year)
2 Reasons for Assessment Type of Assessment ………. 1. Initial assessment ………. 2. Follow-up assessment ………. 3. Routine assessment at fixed intervals ………. 4. Review within 30 day period prior to discharge from the program ………. 5. Review at return from hospital ………. 6. Change in status ………. 7. Other
B COGNITIVE PATTERNS
1 Memory Recall Ability CAP 8
(Code for recall of what was learned or known) (0=Memory OK, 1=Memory problem) ………. a. Short-term memory OK – seems/appears to recall after 5 minutes ………. b. Procedural memory OK – Can perform all or almost all steps in a multitask sequence without cues for initiation
2 Cognitive Skills for Daily Decision Making CAP 3 CAP 5 CAP 26
a. How well client made decisions about organising the day (eg: when to get up or have meals, which clothes to wear or activities to do) ………. 0. INDEPENDENT – Decisions consistent/reasonable/safe ………. 1. MODIFIED INDEPENDENCE – Some difficulty in new situations only ………. 2. MINIMALLY IMPAIRED – In specific situations, decisions become poor or unsafe and cues/supervision necessary at those times ………. 3. MODERATELY IMPAIRED – Decisions consistently poor or unsafe, cues/supervision required at all times ………. 4. SEVERELY IMPAIRED – Never/rarely made decisions b. Worsening of decision making as compared to status of 90 DAYS AGO (or since last assessment if less than 90 days) ………. 0. No ………. 1. Yes
3 Indicators of Delirium CAP 4 CAP 5 CAP 15 CAP 26
a. Sudden or new onset/change in mental function over LAST 7 DAYS (including ability to pay attention, awareness of surroundings, being coherent, unpredictable variation over course of day) ………. 0. No ………. 1. Yes b. In the LAST 90 DAYS (or since last assessment if less than 90 days), client has become
agitated or disorientated such that his or her safety is endangered or client requires protection by others
………. 0. No ………. 1. Yes
C COMMUNICATION/HEARING PATTERNS
1 Hearing CAP 5
(With hearing appliance if used) ………. 0. HEARS ADEQUATELY – Normal talk, TV, phone, doorbell ………. 1. MINIMAL DIFFICULTY – When not in quiet setting ………. 2. HEARS IN SPECIAL SITUATIONS ONLY – Speaker has to adjust tonal quality and speak distinctly ………. 3. HIGHLY IMPAIRED – Absence of useful hearing
2 Making Self Understood (Expression) CAP 5
(Expressing information content – however able) ………. 0. UNDERSTOOD – Expresses ideas without difficulty ………. 1. USUALLY UNDERSTOOD – Difficulty finding words or finishing thoughts BUT if given time, little or no prompting required ………. 2. OFTEN UNDERSTOOD – Difficulty finding words or finishing thoughts, prompting usually required ………. 3. SOMETIMES UNDERSTOOD – Ability is limited to making concrete requests ………. 4. RARELY/NEVER UNDERSTOOD
3 Ability to Understand Others (Comprehension) CAP 1 CAP 2 CAP 5
(Understands verbal information – however able) ………. 0. UNDERSTANDS – Clear comprehension ………. 1. USUALLY UNDERSTANDS – Misses some part/intent of message, BUT comprehends most conversation with little or no prompting ………. 2. OFTEN UNDERSTANDS – Misses some part/intent of message, with prompting can often comprehend conversation ………. 3. SOMETIMES UNDERSTANDS – Responds adequately to simple, directions communication ………. 4. RARELY/NEVER UNDERSTANDS
4 Communication Decline Worsening in communication (making self understood or understanding others) as compared to status of 90 DAYS AGO (or since last assessment if less than 90 days) ………. 0. No ………. 1. Yes
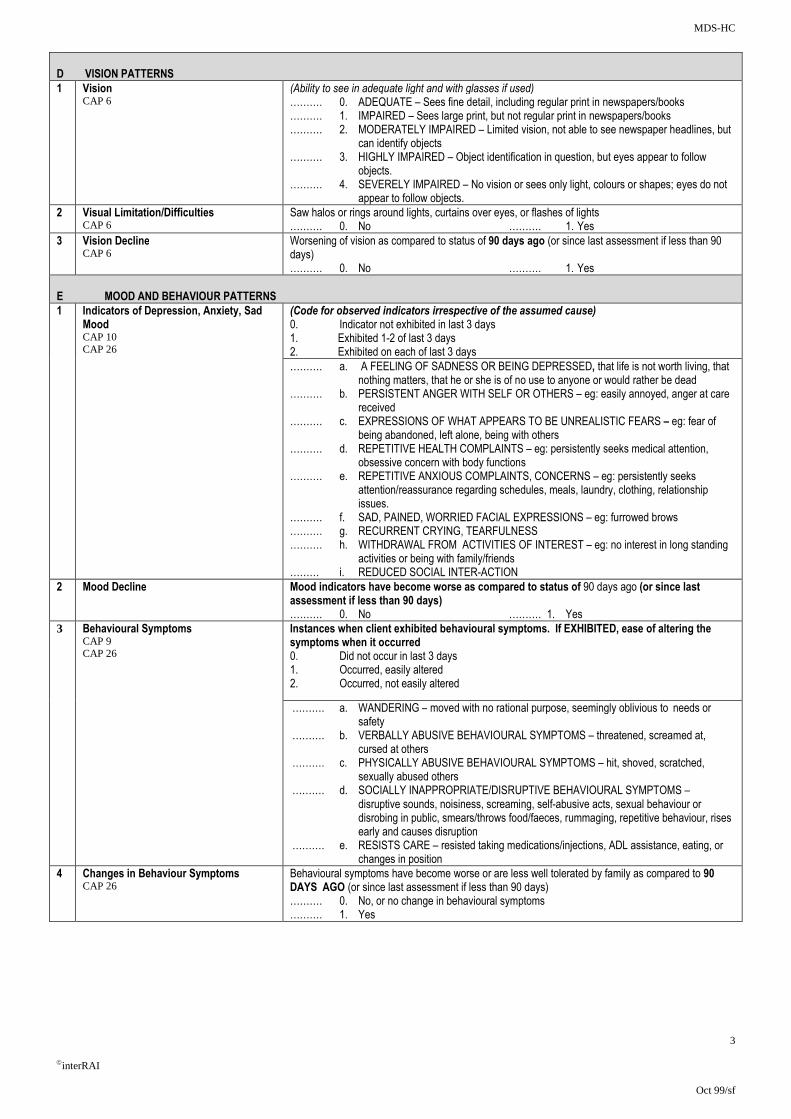
MDS-HC
3
interRAI
Oct 99/sf
D VISION PATTERNS
1 Vision CAP 6
(Ability to see in adequate light and with glasses if used) ………. 0. ADEQUATE – Sees fine detail, including regular print in newspapers/books ………. 1. IMPAIRED – Sees large print, but not regular print in newspapers/books ………. 2. MODERATELY IMPAIRED – Limited vision, not able to see newspaper headlines, but can identify objects ………. 3. HIGHLY IMPAIRED – Object identification in question, but eyes appear to follow objects. ………. 4. SEVERELY IMPAIRED – No vision or sees only light, colours or shapes; eyes do not appear to follow objects.
2 Visual Limitation/Difficulties CAP 6
Saw halos or rings around lights, curtains over eyes, or flashes of lights ………. 0. No ………. 1. Yes
3 Vision Decline CAP 6
Worsening of vision as compared to status of 90 days ago (or since last assessment if less than 90 days) ………. 0. No ………. 1. Yes
E MOOD AND BEHAVIOUR PATTERNS
1 Indicators of Depression, Anxiety, Sad Mood CAP 10 CAP 26
(Code for observed indicators irrespective of the assumed cause) 0. Indicator not exhibited in last 3 days 1. Exhibited 1-2 of last 3 days 2. Exhibited on each of last 3 days
………. a. A FEELING OF SADNESS OR BEING DEPRESSED, that life is not worth living, that nothing matters, that he or she is of no use to anyone or would rather be dead ………. b. PERSISTENT ANGER WITH SELF OR OTHERS – eg: easily annoyed, anger at care received ………. c. EXPRESSIONS OF WHAT APPEARS TO BE UNREALISTIC FEARS – eg: fear of being abandoned, left alone, being with others ………. d. REPETITIVE HEALTH COMPLAINTS – eg: persistently seeks medical attention, obsessive concern with body functions ………. e. REPETITIVE ANXIOUS COMPLAINTS, CONCERNS – eg: persistently seeks attention/reassurance regarding schedules, meals, laundry, clothing, relationship issues. ………. f. SAD, PAINED, WORRIED FACIAL EXPRESSIONS – eg: furrowed brows ………. g. RECURRENT CRYING, TEARFULNESS ………. h. WITHDRAWAL FROM ACTIVITIES OF INTEREST – eg: no interest in long standing activities or being with family/friends ……… i. REDUCED SOCIAL INTER-ACTION
2 Mood Decline Mood indicators have become worse as compared to status of 90 days ago (or since last assessment if less than 90 days) ………. 0. No ………. 1. Yes
3
Behavioural Symptoms CAP 9 CAP 26
Instances when client exhibited behavioural symptoms. If EXHIBITED, ease of altering the symptoms when it occurred 0. Did not occur in last 3 days 1. Occurred, easily altered 2. Occurred, not easily altered
………. a. WANDERING – moved with no rational purpose, seemingly oblivious to needs or safety ………. b. VERBALLY ABUSIVE BEHAVIOURAL SYMPTOMS – threatened, screamed at, cursed at others ………. c. PHYSICALLY ABUSIVE BEHAVIOURAL SYMPTOMS – hit, shoved, scratched, sexually abused others ………. d. SOCIALLY INAPPROPRIATE/DISRUPTIVE BEHAVIOURAL SYMPTOMS – disruptive sounds, noisiness, screaming, self-abusive acts, sexual behaviour or disrobing in public, smears/throws food/faeces, rummaging, repetitive behaviour, rises early and causes disruption ………. e. RESISTS CARE – resisted taking medications/injections, ADL assistance, eating, or changes in position
4 Changes in Behaviour Symptoms CAP 26
Behavioural symptoms have become worse or are less well tolerated by family as compared to 90 DAYS AGO (or since last assessment if less than 90 days) ………. 0. No, or no change in behavioural symptoms ………. 1. Yes
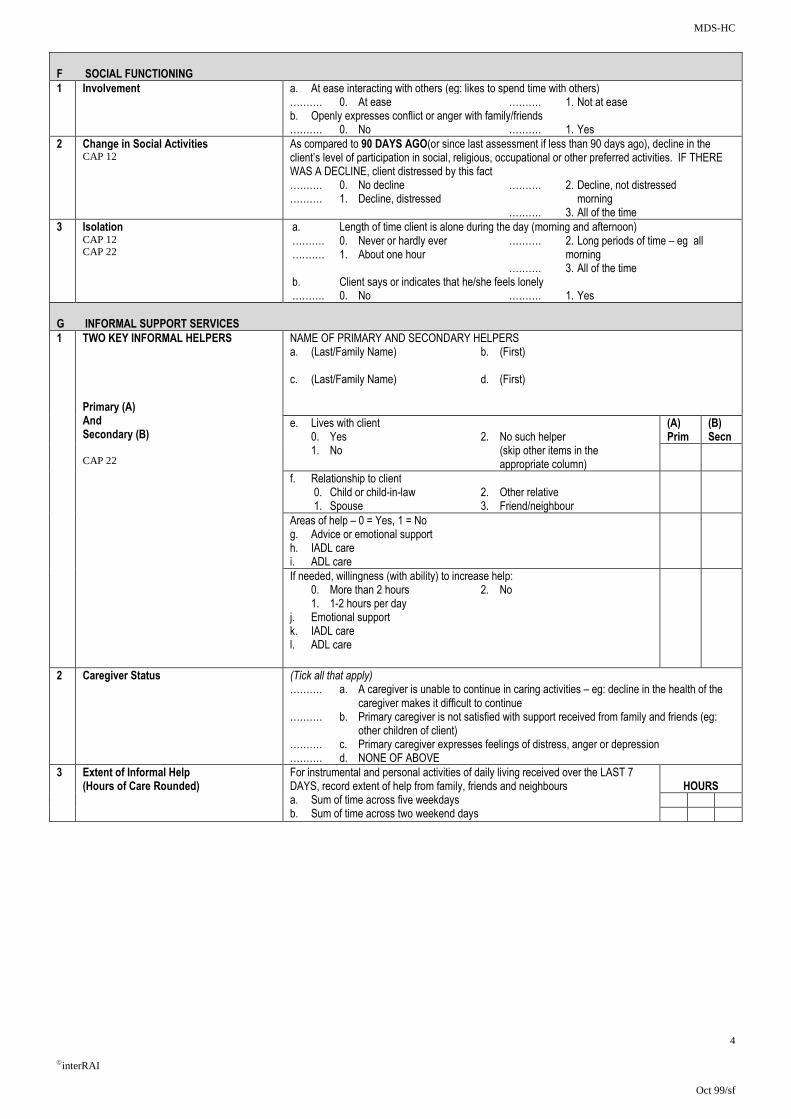
MDS-HC
4
interRAI
Oct 99/sf
F SOCIAL FUNCTIONING
1 Involvement a. At ease interacting with others (eg: likes to spend time with others) ………. 0. At ease ………. 1. Not at ease b. Openly expresses conflict or anger with family/friends ………. 0. No ………. 1. Yes
2 Change in Social Activities CAP 12
As compared to 90 DAYS AGO(or since last assessment if less than 90 days ago), decline in the client’s level of participation in social, religious, occupational or other preferred activities. IF THERE WAS A DECLINE, client distressed by this fact ………. 0. No decline ………. 2. Decline, not distressed ………. 1. Decline, distressed morning ………. 3. All of the time
3 Isolation CAP 12 CAP 22
a. Length of time client is alone during the day (morning and afternoon) ………. 0. Never or hardly ever ………. 2. Long periods of time – eg all ………. 1. About one hour morning ………. 3. All of the time b. Client says or indicates that he/she feels lonely ………. 0. No ………. 1. Yes
G INFORMAL SUPPORT SERVICES
1 TWO KEY INFORMAL HELPERS Primary (A) And Secondary (B) CAP 22
NAME OF PRIMARY AND SECONDARY HELPERS a. (Last/Family Name) b. (First) c. (Last/Family Name) d. (First)
e. Lives with client 0. Yes 2. No such helper 1. No (skip other items in the appropriate column)
(A) Prim
(B) Secn
f. Relationship to client 0. Child or child-in-law 2. Other relative 1. Spouse 3. Friend/neighbour
Areas of help – 0 = Yes, 1 = No g. Advice or emotional support h. IADL care i. ADL care
If needed, willingness (with ability) to increase help: 0. More than 2 hours 2. No 1. 1-2 hours per day j. Emotional support k. IADL care l. ADL care
2 Caregiver Status (Tick all that apply) ………. a. A caregiver is unable to continue in caring activities – eg: decline in the health of the caregiver makes it difficult to continue ………. b. Primary caregiver is not satisfied with support received from family and friends (eg: other children of client) ………. c. Primary caregiver expresses feelings of distress, anger or depression ………. d. NONE OF ABOVE
3 Extent of Informal Help (Hours of Care Rounded)
For instrumental and personal activities of daily living received over the LAST 7 DAYS, record extent of help from family, friends and neighbours a. Sum of time across five weekdays b. Sum of time across two weekend days
HOURS

MDS-HC
5
interRAI
Oct 99/sf
H PHYSICAL FUNCTIONING :
• IADL PERFORMANCE IN 7 DAYS
• ADL PERFORMANCE IN 3 DAYS
1
IADL Self Performance - Code for functioning in routine activities around the home or in the community during the LAST 7 DAYS
(A) IADL Self Performance Code (Code for clients performance during LAST 7 DAYS) 0. INDEPENDENT – did on own 1. SOME HELP – help some of the time 2. FULL HELP – performed with help all of the time 3. BY OTHERS – performed by others 8. ACTIVITY DID NOT OCCUR
(B) IADL Difficulty Code. How difficult it is (or would be) for client to do activity on own 0. NO DIFFICULTY 1. SOME DIFFICULTY – eg: needs some help, is very slow, or fatigues
2. GREAT DIFFICULTY – eg: little or no involvement in the activity is possible
CAP 2, CAP 4 a. MEAL PREPARATION – How meals are prepared (eg: planning meals, cooking, assembling ingredients, setting out food and utensils b. ORDINARY HOUSEWORK – How ordinary work around the house is performed (eg: doing dishes, dusting, making bed, tidying up, laundry) c. MANAGING FINANCE – How bills are paid, chequebook is balanced, household expenses are balanced d. MANAGING MEDICATIONS – How medications are managed (eg: remembering to take medicines, opening bottles, taking correct drug dosages, giving injections, applying ointments) e. PHONE USE – How telephone calls are made or received (with assistive devices such as large numbers on telephone,
amplification as needed) f. SHOPPING – How shopping is performed for food and household items (eg: selecting items, managing money) g. TRANSPORTATION – How client travels by vehicle – (eg: gets to places beyond walking distance)
(A) Perf
(B) Diff
a.
b.
c.
d.
e.
f.
g.
2 ADL Self Performance – The following address the client’s physical functioning in routine personal activities of daily live, for example, dressing, eating, etc during the last 3 days, considering all episodes of these activities. For clients who performed an activity independently, be sure to determine and record whether others encouraged the activity or were present to supervise or oversee the activity [Note – for bathing, code for most dependent single episode in LAST 7 DAYS] 0. INDEPENDENT – No help, setup, or oversight – OR – Help, setup, oversight provided only 1 or 2 times during last 3 days (with any task or
subtask) 1. SETUP HELP ONLY – Article or device provided within reach of client 3 or more times 2. SUPERVISION – Oversight, encouragement or cueing provided 3 or more times during last 3 days – OR – Supervision (1 or more times) plus
physical assistance provided only 1 or 2 times during last 3 days (for a total of 3 or more episodes of help or supervision) 3. LIMITED ASSISTANCE – Client highly involved in activity, received physical help in guided manoeuvring of limbs or other non-weight bearing
assistance 3 or more times – OR – combination of non-weight bearing help with more help provided only 1 or 2 times during period (for a total of 3 or more episodes of physical help)
4. EXTENSIVE ASSISTANCE – Client performed part of activity on own (50% or more of subtasks), period, but help of following type(s) were provided 3 or more times: - Weight-bearing support – OR – - Full performance by another during part (but not all) of last 3 days
5. MAXIMAL ASSISTANCE – Client involved and completed less than 50% of subtasks on own (includes 2+ person assist), received weight bearing help or full performance of certain subtasks 3 or more times
6. TOTAL DEPENEDENCE – Full performance of activity by another 8. ACTIVITY DID NOT OCCUR (regardless of ability)
CAP 1, CAP 4, CAP 19, CAP 26 ………. a. MOBILITY IN BED – Including moving to and from lying position, turning side to side, and positioning body while in bed ………. b. TRANSFER – Including moving to and between surfaces – to/from bed, chair, wheelchair, standing position [Note – Excludes to/from bath/toilet] ………. c LOCOMOTION IN HOME – [Note – If in wheelchair, self-sufficiency once in chair] ………. d. LOCOMOTION OUTSIDE OF HOME – {Note – If in wheelchair, self-sufficiency once in chair] ………. e. DRESSING UPPER BODY – How client dresses and undresses (street clothes, underwear) above the waist, includes prostheses, orthotics, fasteners, pullovers etc ………. f. DRESSING LOWER BODY – How patient dresses and undresses (street clothes, underwear) from the waist down, includes prostheses, orthotics, belts, pants, skirts, shoes, and fasteners ………. g. EATING – Includes taking in food by any method, including tube feedings ………. h. TOILET USE – Including using the toilet room or commode, bedpan, urinal, transferring on/off toilet, cleaning self after use, changing pad, managing any special devices required (ostomy or catheter), and adjusting clothes ………. i. PERSONAL HYGIENE – Including combing hair, brushing teeth, shaving, applying makeup, washing/drying face and hands (EXCLUDE baths and showers) ………. j. BATHING – How patient takes full-body bath/shower or sponge bath (EXCLUDE washing of back and hair). Includes how each part of body is bathed: arms, upper and lower legs, chest, abdomen, perineal area. Code for most dependent episode in LAST 7 DAYS
3 ADL Decline CAP 1 CAP 4
ADL status has become worse (ie now more impaired in self performance) as compared to status 90 days ago (or since last assessment if less than 90 days) ………. 0. No ………. 1. Yes
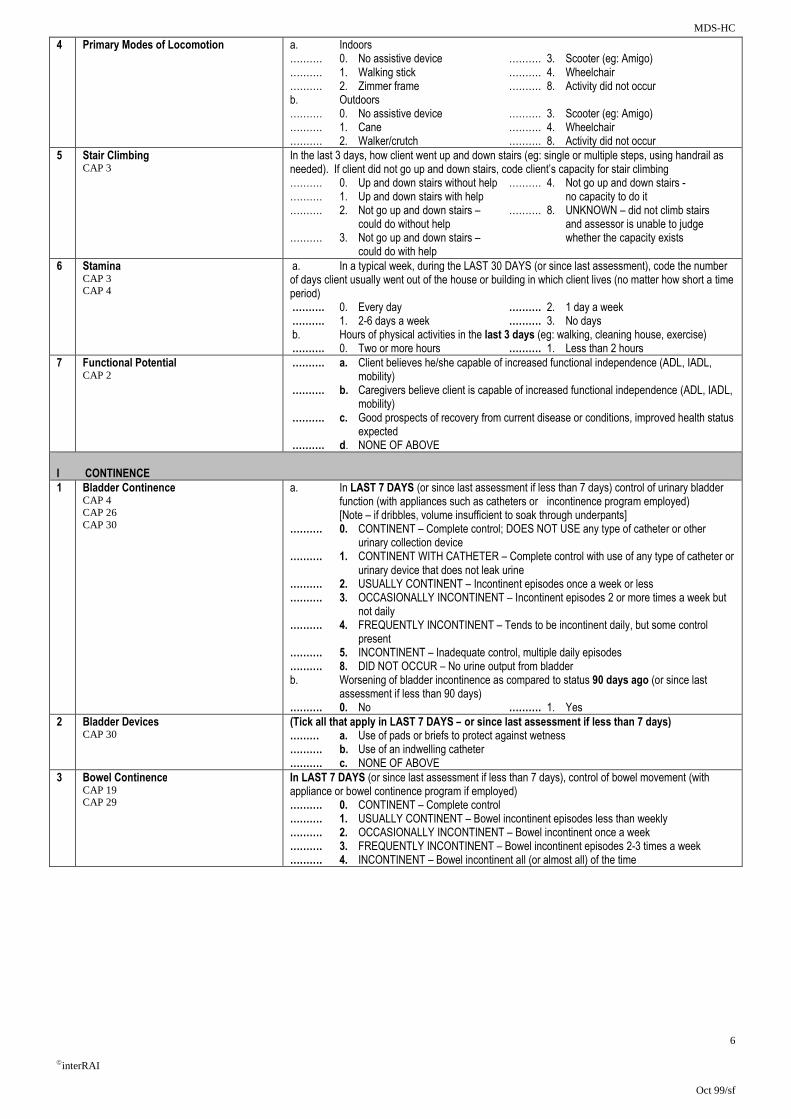
MDS-HC
6
interRAI
Oct 99/sf
4 Primary Modes of Locomotion a. Indoors ………. 0. No assistive device ………. 3. Scooter (eg: Amigo) ………. 1. Walking stick ………. 4. Wheelchair ………. 2. Zimmer frame ………. 8. Activity did not occur b. Outdoors ………. 0. No assistive device ………. 3. Scooter (eg: Amigo) ………. 1. Cane ………. 4. Wheelchair ………. 2. Walker/crutch ………. 8. Activity did not occur
5 Stair Climbing CAP 3
In the last 3 days, how client went up and down stairs (eg: single or multiple steps, using handrail as needed). If client did not go up and down stairs, code client’s capacity for stair climbing ………. 0. Up and down stairs without help ………. 4. Not go up and down stairs - ………. 1. Up and down stairs with help no capacity to do it ………. 2. Not go up and down stairs – ………. 8. UNKNOWN – did not climb stairs could do without help and assessor is unable to judge ………. 3. Not go up and down stairs – whether the capacity exists could do with help
6 Stamina CAP 3 CAP 4
a. In a typical week, during the LAST 30 DAYS (or since last assessment), code the number of days client usually went out of the house or building in which client lives (no matter how short a time period) ………. 0. Every day ………. 2. 1 day a week ………. 1. 2-6 days a week ………. 3. No days b. Hours of physical activities in the last 3 days (eg: walking, cleaning house, exercise) ………. 0. Two or more hours ………. 1. Less than 2 hours
7 Functional Potential CAP 2
………. a. Client believes he/she capable of increased functional independence (ADL, IADL, mobility) ………. b. Caregivers believe client is capable of increased functional independence (ADL, IADL, mobility) ………. c. Good prospects of recovery from current disease or conditions, improved health status expected ………. d. NONE OF ABOVE
I CONTINENCE 1 Bladder Continence
CAP 4 CAP 26 CAP 30
a. In LAST 7 DAYS (or since last assessment if less than 7 days) control of urinary bladder function (with appliances such as catheters or incontinence program employed) [Note – if dribbles, volume insufficient to soak through underpants] ………. 0. CONTINENT – Complete control; DOES NOT USE any type of catheter or other urinary collection device ………. 1. CONTINENT WITH CATHETER – Complete control with use of any type of catheter or urinary device that does not leak urine ………. 2. USUALLY CONTINENT – Incontinent episodes once a week or less ………. 3. OCCASIONALLY INCONTINENT – Incontinent episodes 2 or more times a week but not daily ………. 4. FREQUENTLY INCONTINENT – Tends to be incontinent daily, but some control present ………. 5. INCONTINENT – Inadequate control, multiple daily episodes ………. 8. DID NOT OCCUR – No urine output from bladder b. Worsening of bladder incontinence as compared to status 90 days ago (or since last assessment if less than 90 days) ………. 0. No ………. 1. Yes
2 Bladder Devices CAP 30
(Tick all that apply in LAST 7 DAYS – or since last assessment if less than 7 days) ……… a. Use of pads or briefs to protect against wetness ………. b. Use of an indwelling catheter ………. c. NONE OF ABOVE
3 Bowel Continence CAP 19 CAP 29
In LAST 7 DAYS (or since last assessment if less than 7 days), control of bowel movement (with appliance or bowel continence program if employed) ………. 0. CONTINENT – Complete control ………. 1. USUALLY CONTINENT – Bowel incontinent episodes less than weekly ………. 2. OCCASIONALLY INCONTINENT – Bowel incontinent once a week ………. 3. FREQUENTLY INCONTINENT – Bowel incontinent episodes 2-3 times a week ………. 4. INCONTINENT – Bowel incontinent all (or almost all) of the time
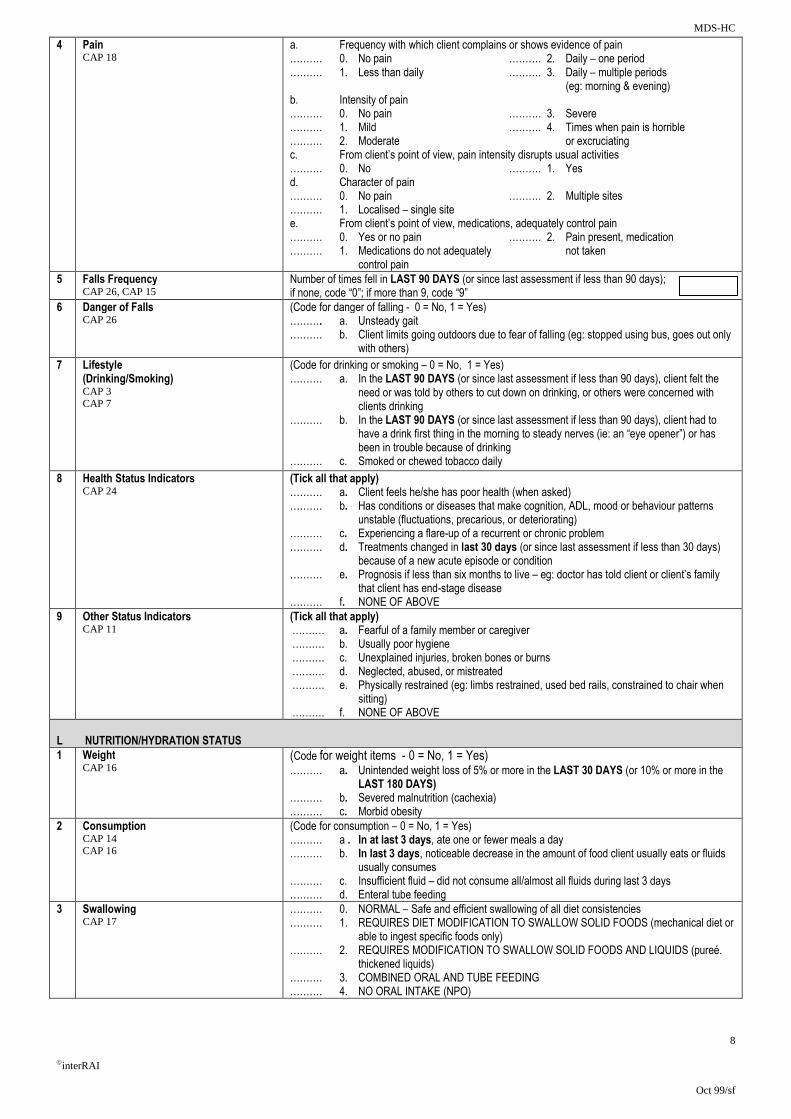
MDS-HC
8
interRAI
Oct 99/sf
4 Pain CAP 18
a. Frequency with which client complains or shows evidence of pain ………. 0. No pain ………. 2. Daily – one period ………. 1. Less than daily ………. 3. Daily – multiple periods (eg: morning & evening) b. Intensity of pain ………. 0. No pain ………. 3. Severe ………. 1. Mild ………. 4. Times when pain is horrible ………. 2. Moderate or excruciating c. From client’s point of view, pain intensity disrupts usual activities ………. 0. No ………. 1. Yes d. Character of pain ………. 0. No pain ………. 2. Multiple sites ………. 1. Localised – single site e. From client’s point of view, medications, adequately control pain ………. 0. Yes or no pain ………. 2. Pain present, medication ………. 1. Medications do not adequately not taken control pain
5 Falls Frequency CAP 26, CAP 15
Number of times fell in LAST 90 DAYS (or since last assessment if less than 90 days); if none, code “0”; if more than 9, code “9”
6 Danger of Falls CAP 26
(Code for danger of falling - 0 = No, 1 = Yes) ………. a. Unsteady gait ………. b. Client limits going outdoors due to fear of falling (eg: stopped using bus, goes out only with others)
7 Lifestyle (Drinking/Smoking) CAP 3 CAP 7
(Code for drinking or smoking – 0 = No, 1 = Yes) ………. a. In the LAST 90 DAYS (or since last assessment if less than 90 days), client felt the need or was told by others to cut down on drinking, or others were concerned with clients drinking ………. b. In the LAST 90 DAYS (or since last assessment if less than 90 days), client had to have a drink first thing in the morning to steady nerves (ie: an “eye opener”) or has been in trouble because of drinking ………. c. Smoked or chewed tobacco daily
8 Health Status Indicators CAP 24
(Tick all that apply) ………. a. Client feels he/she has poor health (when asked) ………. b. Has conditions or diseases that make cognition, ADL, mood or behaviour patterns unstable (fluctuations, precarious, or deteriorating) ………. c. Experiencing a flare-up of a recurrent or chronic problem ………. d. Treatments changed in last 30 days (or since last assessment if less than 30 days) because of a new acute episode or condition ………. e. Prognosis if less than six months to live – eg: doctor has told client or client’s family that client has end-stage disease ………. f. NONE OF ABOVE
9 Other Status Indicators CAP 11
(Tick all that apply) ………. a. Fearful of a family member or caregiver ………. b. Usually poor hygiene ………. c. Unexplained injuries, broken bones or burns ………. d. Neglected, abused, or mistreated ………. e. Physically restrained (eg: limbs restrained, used bed rails, constrained to chair when sitting) ………. f. NONE OF ABOVE
L NUTRITION/HYDRATION STATUS
1 Weight CAP 16
(Code for weight items - 0 = No, 1 = Yes) ………. a. Unintended weight loss of 5% or more in the LAST 30 DAYS (or 10% or more in the LAST 180 DAYS) ………. b. Severed malnutrition (cachexia) ………. c. Morbid obesity
2
Consumption CAP 14 CAP 16
(Code for consumption – 0 = No, 1 = Yes) ………. a . In at last 3 days, ate one or fewer meals a day ………. b. In last 3 days, noticeable decrease in the amount of food client usually eats or fluids usually consumes ………. c. Insufficient fluid – did not consume all/almost all fluids during last 3 days ………. d. Enteral tube feeding
3 Swallowing CAP 17
………. 0. NORMAL – Safe and efficient swallowing of all diet consistencies ………. 1. REQUIRES DIET MODIFICATION TO SWALLOW SOLID FOODS (mechanical diet or able to ingest specific foods only) ………. 2. REQUIRES MODIFICATION TO SWALLOW SOLID FOODS AND LIQUIDS (pureé. thickened liquids) ………. 3. COMBINED ORAL AND TUBE FEEDING ………. 4. NO ORAL INTAKE (NPO)
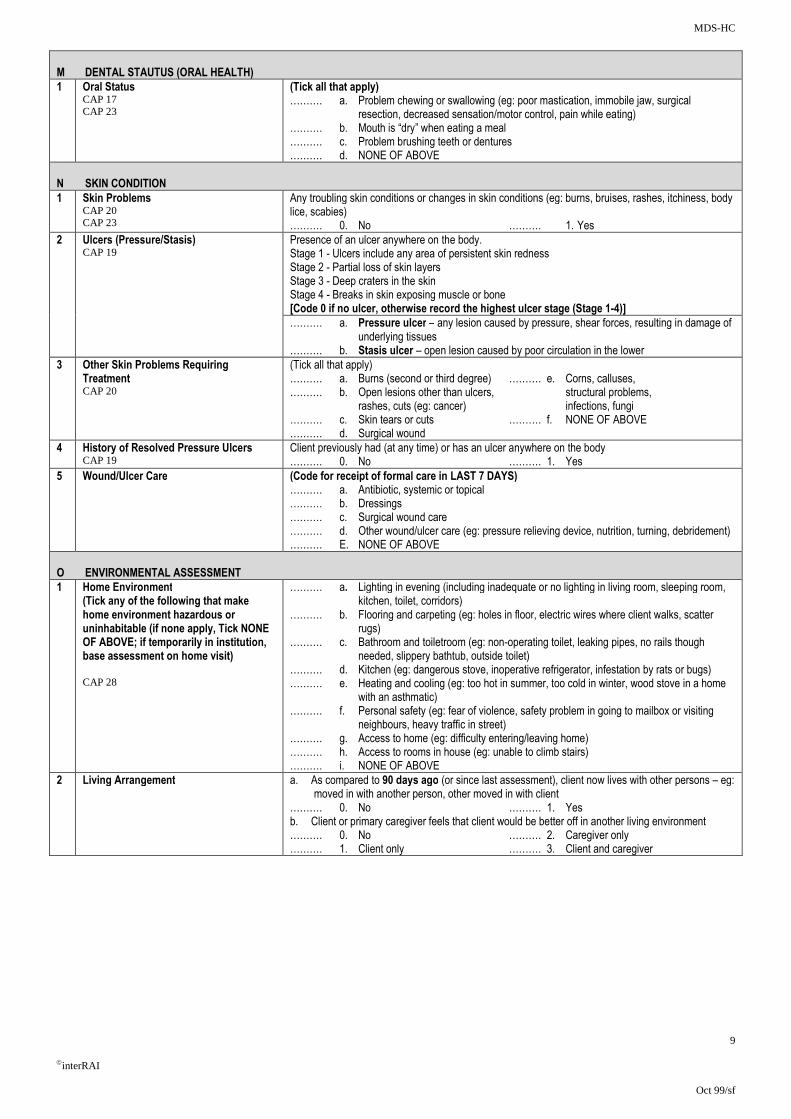
MDS-HC
9
interRAI
Oct 99/sf
M DENTAL STAUTUS (ORAL HEALTH)
1 Oral Status CAP 17 CAP 23
(Tick all that apply) ………. a. Problem chewing or swallowing (eg: poor mastication, immobile jaw, surgical resection, decreased sensation/motor control, pain while eating) ………. b. Mouth is “dry” when eating a meal ………. c. Problem brushing teeth or dentures ………. d. NONE OF ABOVE
N SKIN CONDITION
1 Skin Problems CAP 20 CAP 23
Any troubling skin conditions or changes in skin conditions (eg: burns, bruises, rashes, itchiness, body lice, scabies) ………. 0. No ………. 1. Yes
2 Ulcers (Pressure/Stasis) CAP 19
Presence of an ulcer anywhere on the body. Stage 1 - Ulcers include any area of persistent skin redness Stage 2 - Partial loss of skin layers Stage 3 - Deep craters in the skin Stage 4 - Breaks in skin exposing muscle or bone [Code 0 if no ulcer, otherwise record the highest ulcer stage (Stage 1-4)]
………. a. Pressure ulcer – any lesion caused by pressure, shear forces, resulting in damage of underlying tissues ………. b. Stasis ulcer – open lesion caused by poor circulation in the lower
3 Other Skin Problems Requiring Treatment CAP 20
(Tick all that apply) ………. a. Burns (second or third degree) ………. e. Corns, calluses, ………. b. Open lesions other than ulcers, structural problems, rashes, cuts (eg: cancer) infections, fungi ………. c. Skin tears or cuts ………. f. NONE OF ABOVE ………. d. Surgical wound
4 History of Resolved Pressure Ulcers CAP 19
Client previously had (at any time) or has an ulcer anywhere on the body ………. 0. No ………. 1. Yes
5 Wound/Ulcer Care (Code for receipt of formal care in LAST 7 DAYS) ………. a. Antibiotic, systemic or topical ………. b. Dressings ………. c. Surgical wound care ………. d. Other wound/ulcer care (eg: pressure relieving device, nutrition, turning, debridement) ………. E. NONE OF ABOVE
O ENVIRONMENTAL ASSESSMENT
1 Home Environment (Tick any of the following that make home environment hazardous or uninhabitable (if none apply, Tick NONE OF ABOVE; if temporarily in institution, base assessment on home visit) CAP 28
………. a. Lighting in evening (including inadequate or no lighting in living room, sleeping room, kitchen, toilet, corridors) ………. b. Flooring and carpeting (eg: holes in floor, electric wires where client walks, scatter rugs) ………. c. Bathroom and toiletroom (eg: non-operating toilet, leaking pipes, no rails though needed, slippery bathtub, outside toilet) ………. d. Kitchen (eg: dangerous stove, inoperative refrigerator, infestation by rats or bugs) ………. e. Heating and cooling (eg: too hot in summer, too cold in winter, wood stove in a home with an asthmatic) ………. f. Personal safety (eg: fear of violence, safety problem in going to mailbox or visiting neighbours, heavy traffic in street) ………. g. Access to home (eg: difficulty entering/leaving home) ………. h. Access to rooms in house (eg: unable to climb stairs) ………. i. NONE OF ABOVE
2 Living Arrangement a. As compared to 90 days ago (or since last assessment), client now lives with other persons – eg: moved in with another person, other moved in with client
………. 0. No ………. 1. Yes b. Client or primary caregiver feels that client would be better off in another living environment ………. 0. No ………. 2. Caregiver only ………. 1. Client only ………. 3. Client and caregiver

MDS-HC
10
interRAI
Oct 99/sf
P SERVICE UTILISATION (in last 7 days)
1 Formal Care (Minutes rounded to even 10 minutes)
Record extent of care or care management in LAST 7 DAYS (or since last assessment if less than 7 days) involving
a. Home carers b. Visiting nurses c. Home help d. Meals on wheels e. Volunteer services f. Physical therapy g. Occupational therapy h. Speech therapy i. Day care of day hospital j. Social worker in home
(A) # of Days
(B)
Hours
(C)
Mins
a.
b.
c.
d.
e.
f.
g.
h.
i.
j.
2 Special Treatments, Therapies, Programs CAP 21 CAP 24
Special treatments, therapies, and programs received or scheduled during the LAST 7 DAYS (or since last assessment if less than 7 days) and adherence to the required schedule. Includes services received in the home or on an out-patient basis. [Blank] Not applicable 1. Scheduled, full adherence 2. Scheduled, partial adherence as prescribed 3. Scheduled, not received (If no treatments provided, Tick NONE OF ABOVE P2aa)
Respiratory Treatments o. Occupational therapy o.
a. Oxygen a. p. Physical therapy p.
b. Respirator for assistive breathing b. Programs
c. All other respiratory treatments c. q. Day centre q.
Other Treatments r. Day hospital r.
d. Alcohol/drug treatment program d. s. Hospice care s.
e. Blood transfusion(s) e. t. Doctor or clinic visit t.
f. Chemotherapy f. u. Respite care u.
g. Dialysis g. Special procedures done in home
h. IV infusion – general h. v. Daily nujrse monitoring (eg EKG, Urinary output)
v.
i. IV infusion – peripheral i.
j. Medication by injection j. w. Nurse monitoring less than daily w.
k. Ostomy care k. x. Medical alert bracelet or electronic Security alert
x.
l. Radiation l.
m.Tracheostomy care m. y. Skin treatment y.
Therapies z. Special diet z.
n. Exercise therapy n. aa. NONE OF ABOVE aa.
3 Management of Equipment (In last 3 days) CAP 1
Record Management codes: 0. Not used 3. Partially performed 1. Managed on own by others 2. Managed on own if laid out or 4. Fully performed by
with verbal reminders others
……….a. Oxygen ………. b. IV ……….c. Catheter ………. d. Ostomy
4 Visits in Last 90 Days or Since Last Assessment
Enter 0 if none, if more than 9, code “9” ………. a. Number of times ADMITTED TO HOSPITAL with an overnight stay ………. b. Number of times VISITED A&E without an overnight stay ………. c. EMERGENCY CARE – including unscheduled nursing, doctor, or therapeutic visits to surgery or home doctor
5 Treatment Goals CAP 27
Any treatment goals that have been met in the LAST 90 DAYS (or since last assessment if less than 90 day)? ………. 0. No ………. 1. Yes
6 Overall Change in Care Needs CAP 4 CAP 27
Overall self sufficiency has changed significantly as compared to status of 90 DAYS AGO (or since last assessment. If less than 90 days) ………. 0. No change ………. 2. Deteriorated – receives more ………. 1. Improved – receives fewer support more support
7 Trade Offs Because of limited funds, during the last month, client made trade-offs among purchasing any of the following: sufficient home heat, adequate food, home care ………. 0. No ………. 1. Yes

MDS-HC
11
interRAI
Oct 99/sf
Q MEDICATIONS
1 Number of Medications Record the number of different medicines (prescriptions and over the counter), including Eye drops, taken regularly or on an occasional basis in the LAST 7 DAYS (or since last assessment) [If none, code “0”, if more than 9, code “9”)
2 Receipt of Psychotropic Medication Psychotropic medications taken in the LAST 7 DAYS (or since last assessment) [Note: Review client’s medications with the list that applies to the following categories] 0 = No 1 = Yes
………. a. Antipsychotic/neuroleptic ………. c. Antidepressants ………. b. Anxiolytic ………. d. Hypnotic
3 Medical Oversight Doctor reviewed client’s medications as a whole in LAST 180 DAYS (or since last assessment) ………. 0. Discussed with at least one doctor (or no medication taken) ………. 1. No single doctor reviewed all medications
4 Compliance/Adherence with Medications CAP 21
Compliant all or most of time with medications prescribed by doctor (both during and between therapy visits) in Last 7 days ………. 0. Always compliant ………. 1. Compliant 80% of time or more ………. 2. Compliant less than 80% of time, including failure to purchase prescribed medications ………. 3. NO MEDICATIONS PRESCRIBED
5 List of All Medications Other Drugs
List prescribed and non-prescribed medications taken in LAST 7 DAYS (or since last assessment) (a) Name and Dose – Record the name of the medication and dose ordered (b) Form: Code the route of Administration using the following list: 1. by mouth (PO) 6. rectal (R)
2. sub lingual (SL) 7. Topical 3. intramuscular (M) 8. Inhalation 4. intraveneous (IV) 9. Enteral tube 5. subcutaneous (SC) 10. Other
(c) Number taken – Record the amount of medication administered each time the medication is given (d) Freq: Code the number of times per day, week, or month the medication is administered using
the following list: PR = as necessary 5D = five times daily QH = every hour QOD = every other day Q2H = every two hours QW = once each week Q3H = every three hours 2W = two times each week Q4H = every four hours 3W = three times each week Q6H = every six hours 4W = four each week Q8H = every eight hours 5W = five times each week QD = daily 6W = six times each week BID = two times daily 1M = once every month
(includes every 12 hours) 2M = twice every month TID = three times daily C = continuous QID = four times daily O = other
(a) Name
(b) Form
(c) Number Taken
(d) Freq
a.
b.
c.
d.
e.
f.
g.
h.
i.
j.
k.
Additional Information
MDS-HC
12
interRAI
Oct 99/sf
R ASSESSMENT INFORMATION
1 Signatures of Person Completing the Assessment:
a. Signature of Assessment Coordinator
b. Title of Assessment Coordinator
c. Date Assessment Coordinator signed as complete (day, month, year)
d. Other Signatures Title Sections Date
e. Date
f. Date
g. Date
h. Date
i. Date
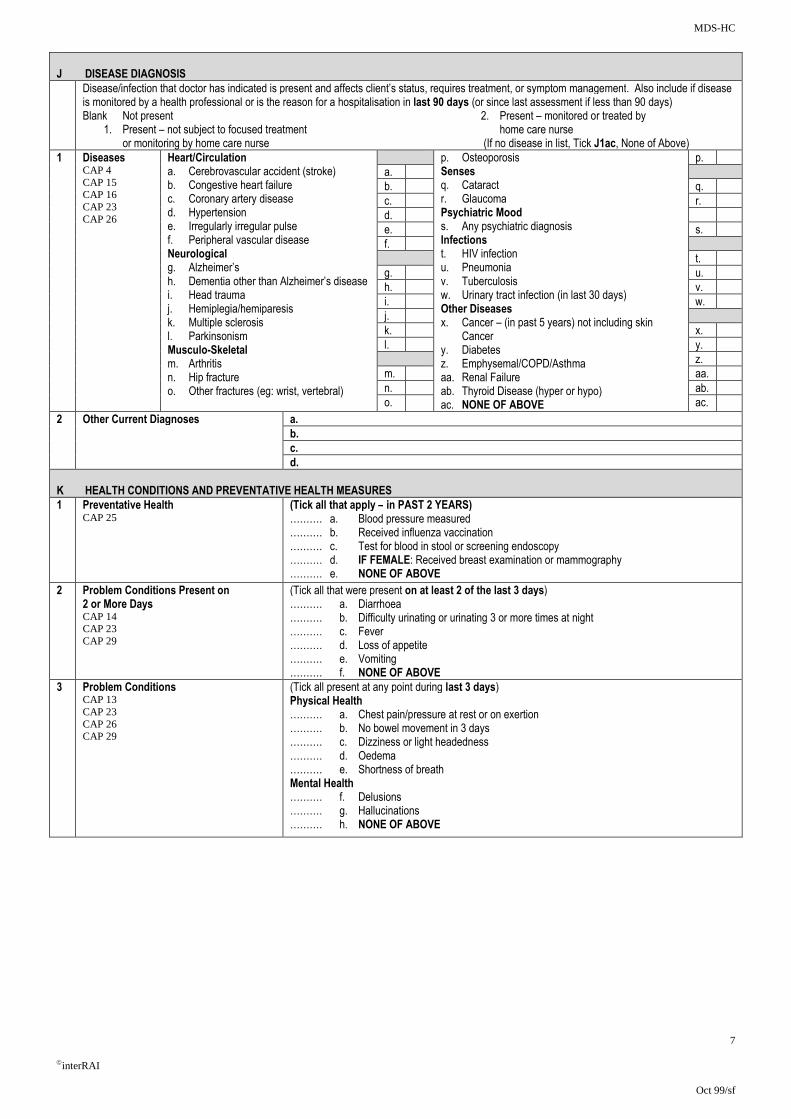
MDS-HC
7
interRAI
Oct 99/sf
J DISEASE DIAGNOSIS
Disease/infection that doctor has indicated is present and affects client’s status, requires treatment, or symptom management. Also include if disease is monitored by a health professional or is the reason for a hospitalisation in last 90 days (or since last assessment if less than 90 days) Blank Not present 2. Present – monitored or treated by 1. Present – not subject to focused treatment home care nurse or monitoring by home care nurse (If no disease in list, Tick J1ac, None of Above)
1 Diseases CAP 4 CAP 15 CAP 16 CAP 23 CAP 26
Heart/Circulation a. Cerebrovascular accident (stroke) b. Congestive heart failure c. Coronary artery disease d. Hypertension e. Irregularly irregular pulse f. Peripheral vascular disease Neurological g. Alzheimer’s h. Dementia other than Alzheimer’s disease i. Head trauma j. Hemiplegia/hemiparesis k. Multiple sclerosis l. Parkinsonism Musculo-Skeletal m. Arthritis n. Hip fracture o. Other fractures (eg: wrist, vertebral)
p. Osteoporosis Senses q. Cataract r. Glaucoma Psychiatric Mood s. Any psychiatric diagnosis Infections t. HIV infection u. Pneumonia v. Tuberculosis w. Urinary tract infection (in last 30 days) Other Diseases x. Cancer – (in past 5 years) not including skin Cancer y. Diabetes z. Emphysemal/COPD/Asthma aa. Renal Failure ab. Thyroid Disease (hyper or hypo) ac. NONE OF ABOVE
p.
a.
b. q.
c. r.
d.
e. s.
f.
t.
g. u.
h. v.
i. w.
j.
k. x.
l. y.
z.
m. aa.
n. ab.
o. ac.
2 Other Current Diagnoses a.
b.
c.
d.
K HEALTH CONDITIONS AND PREVENTATIVE HEALTH MEASURES
1 Preventative Health CAP 25
(Tick all that apply – in PAST 2 YEARS) ………. a. Blood pressure measured ………. b. Received influenza vaccination ………. c. Test for blood in stool or screening endoscopy ………. d. IF FEMALE: Received breast examination or mammography ………. e. NONE OF ABOVE
2 Problem Conditions Present on 2 or More Days CAP 14 CAP 23 CAP 29
(Tick all that were present on at least 2 of the last 3 days) ………. a. Diarrhoea ………. b. Difficulty urinating or urinating 3 or more times at night ………. c. Fever ………. d. Loss of appetite ………. e. Vomiting ………. f. NONE OF ABOVE
3 Problem Conditions CAP 13 CAP 23 CAP 26 CAP 29
(Tick all present at any point during last 3 days) Physical Health ………. a. Chest pain/pressure at rest or on exertion ………. b. No bowel movement in 3 days ………. c. Dizziness or light headedness ………. d. Oedema ………. e. Shortness of breath Mental Health ………. f. Delusions ………. g. Hallucinations ………. h. NONE OF ABOVE

Appendix 4

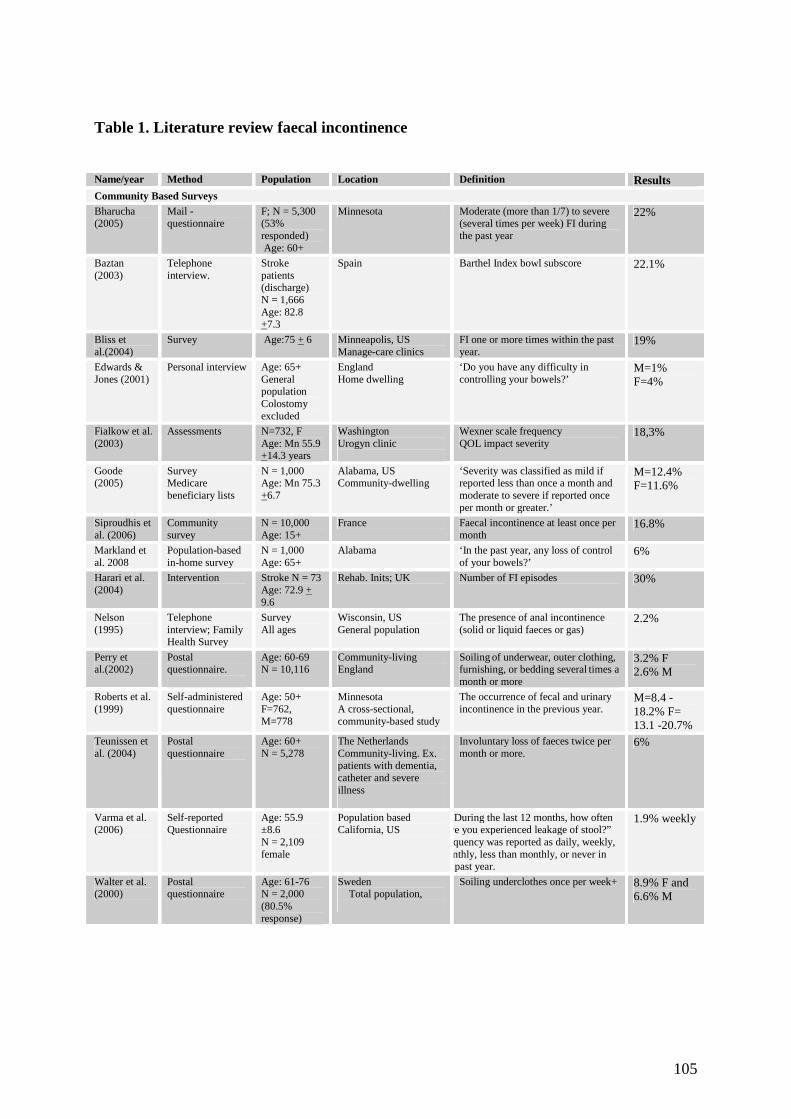
105
Table 1. Literature review faecal incontinence Name/year Method Population Location Definition Results Community Based Surveys Bharucha (2005)
Mail - questionnaire
F; N = 5,300 (53% responded) Age: 60+
Minnesota Moderate (more than 1/7) to severe (several times per week) FI during the past year
22%
Baztan (2003)
Telephone interview.
Stroke patients (discharge) N = 1,666 Age: 82.8 +7.3
Spain Barthel Index bowl subscore 22.1%
Bliss et al.(2004)
Survey Age:75 + 6 Minneapolis, US Manage-care clinics
FI one or more times within the past year.
19%
Edwards & Jones (2001)
Personal interview
Age: 65+ General population Colostomy excluded
England Home dwelling
‘Do you have any difficulty in controlling your bowels?’
M=1% F=4%
Fialkow et al. (2003)
Assessments N=732, F Age: Mn 55.9 +14.3 years
Washington Urogyn clinic
Wexner scale frequency QOL impact severity
18,3%
Goode (2005)
Survey Medicare beneficiary lists
N = 1,000 Age: Mn 75.3 +6.7
Alabama, US Community-dwelling
‘Severity was classified as mild if reported less than once a month and moderate to severe if reported once per month or greater.’
M=12.4% F=11.6%
Siproudhis et al. (2006)
Community survey
N = 10,000 Age: 15+
France Faecal incontinence at least once per month
16.8%
Markland et al. 2008
Population-based in-home survey
N = 1,000 Age: 65+
Alabama ‘In the past year, any loss of control of your bowels?’
6%
Harari et al. (2004)
Intervention Stroke N = 73 Age: 72.9 + 9.6
Rehab. Inits; UK Number of FI episodes 30%
Nelson (1995)
Telephone interview; Family Health Survey
Survey All ages
Wisconsin, US General population
The presence of anal incontinence (solid or liquid faeces or gas)
2.2%
Perry et al.(2002)
Postal questionnaire.
Age: 60-69 N = 10,116
Community-living England
Soiling of underwear, outer clothing, furnishing, or bedding several times a month or more
3.2% F 2.6% M
Roberts et al. (1999)
Self-administered questionnaire
Age: 50+ F=762, M=778
Minnesota A cross-sectional, community-based study
The occurrence of fecal and urinary incontinence in the previous year.
M=8.4 -18.2% F= 13.1 -20.7%
Teunissen et al. (2004)
Postal questionnaire
Age: 60+ N = 5,278
The Netherlands Community-living. Ex. patients with dementia, catheter and severe illness
Involuntary loss of faeces twice per month or more.
6%
Varma et al. (2006)
Self-reported Questionnaire
Age: 55.9 ±8.6 N = 2,109 female
Population based California, US
“D During the last 12 months, how often have you experienced leakage of stool?” Frequency was reported as daily, weekly, monthly, less than monthly, or never in the past year.
1.9% weekly
Walter et al. (2000)
Postal questionnaire
Age: 61-76 N = 2,000 (80.5% response)
Sweden Total population,
Soiling underclothes once per week+ 8.9% F and 6.6% M
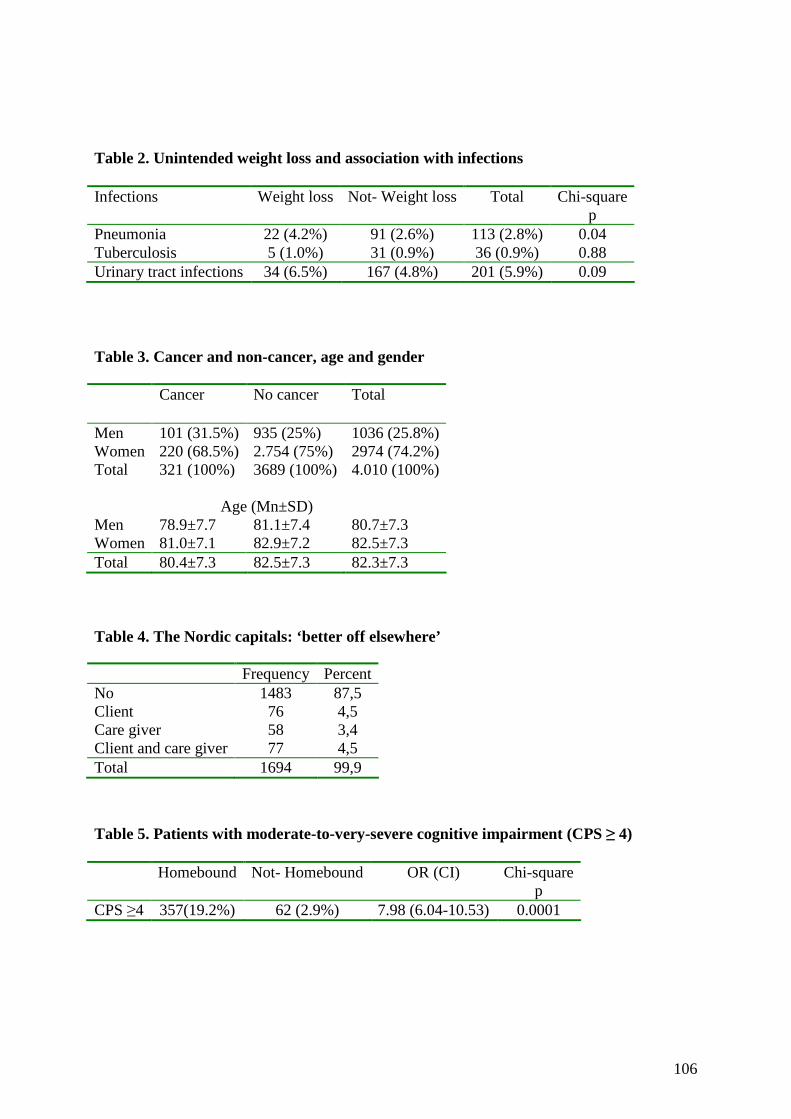
106
Table 2. Unintended weight loss and association with infections Infections Weight loss Not- Weight loss Total Chi-square
p Pneumonia 22 (4.2%) 91 (2.6%) 113 (2.8%) 0.04 Tuberculosis 5 (1.0%) 31 (0.9%) 36 (0.9%) 0.88 Urinary tract infections 34 (6.5%) 167 (4.8%) 201 (5.9%) 0.09 Table 3. Cancer and non-cancer, age and gender
Table 4. The Nordic capitals: ‘better off elsewhere’
Table 5. Patients with moderate-to-very-severe cognitive impairment (CPS ≥ 4) Homebound Not- Homebound OR (CI) Chi-square
p CPS ≥4 357(19.2%) 62 (2.9%) 7.98 (6.04-10.53) 0.0001
Cancer No cancer Total
Men 101 (31.5%) 935 (25%) 1036 (25.8%) Women 220 (68.5%) 2.754 (75%) 2974 (74.2%) Total 321 (100%) 3689 (100%) 4.010 (100%)
Age (Mn±SD) Men 78.9±7.7 81.1±7.4 80.7±7.3 Women 81.0±7.1 82.9±7.2 82.5±7.3 Total 80.4±7.3 82.5±7.3 82.3±7.3
Frequency Percent No 1483 87,5 Client 76 4,5 Care giver 58 3,4 Client and care giver 77 4,5 Total 1694 99,9
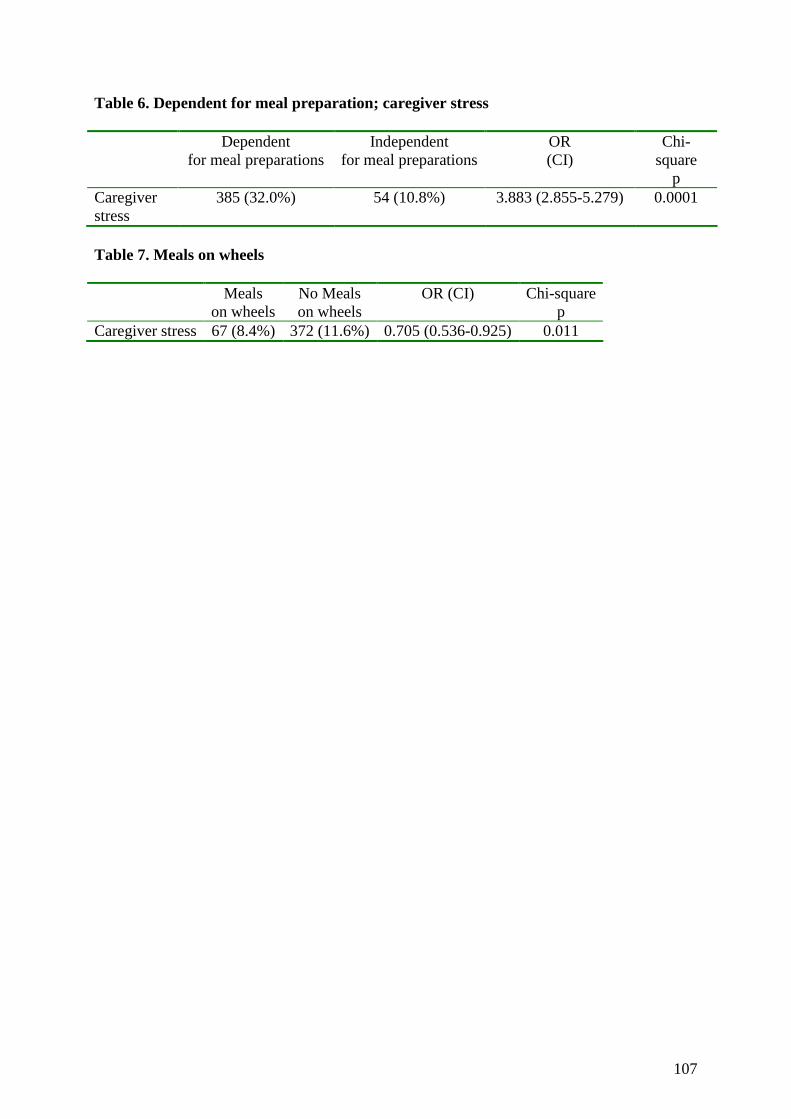
107
Table 6. Dependent for meal preparation; caregiver stress Dependent
for meal preparations Independent
for meal preparations
OR (CI)
Chi-square
p Caregiver stress
385 (32.0%) 54 (10.8%) 3.883 (2.855-5.279) 0.0001
Table 7. Meals on wheels Meals
on wheels No Meals on wheels
OR (CI) Chi-square p
Caregiver stress 67 (8.4%) 372 (11.6%) 0.705 (0.536-0.925) 0.011

Frail homebound elderly: basic nursing challenges
of home care
A comparative study across 11 sites in Europe
Liv Wergeland Sørbye
ISBN 978-82-7589-221-6
Liv Wergeland Sørbye Frail hom
ebound elderly: basic nursing challenges of home care
2009
University of TromsøFaculty of Medicine
Department of Clinical Medicine Section for Nursing and Health Sciences
February 2009
A dissertation for the degree of Philosophiae Doctor in Health Sciences