Effect of surface roughness on the strength of cleavage joints
Upload
independentCategory
view
1download
0
JOURNAL OF GEOPHYSICAL RESEARCH MAY 2001; 106(B5) : 8521-8543 http://dx.doi.org/10.1029/2000JB900394 Copyright © 2001 American Geophysical Union An edited version of this paper was published by AGU.
Archimer http://www.ifremer.fr/docelec/Archive Institutionnelle de l’Ifremer
Variations in axial morphology, segmentation, and seafloor roughness
along the Pacific-Antarctic Ridge between 56°S and 66°S
Hélène Ondréas1, Daniel Aslanian1, Louis Géli1, Jean-Louis Olivet1 and Anne Briais2
1Département des Géosciences Marines, Institut Français de Recherche et d’Exploitation de la Mer Plouzané, France 2Laboratoire d’Etudes en Géophysique et Océanographie Spatiale, Observatoire Midi-Pyrénées, CNRS Toulouse, France
Abstract: The spreading rate at the Pacific-Antarctic Ridge (PAR) increases rapidly from 54 mm/yr near Pitman Fracture Zone (FZ) up to 76 mm/yr near Udintsev FZ, resulting in three domains of axial morphology: an axial valley south of Pitman FZ, an axial high north of Saint Exupéry FZ, and in between, the transitional domain extends over 650 km. It comprises sections of ridge with an axial valley or an axial high and generally displays a very low cross-sectional relief. It is also characterized by two propagating rifts. Two domains of different seafloor roughness appear south of Udintsev FZ: east of 157 °W these two domains are separated by a 1000-km V-shaped boundary. West of 157 °W, the boundary approximately coincides with Chron 3a or Chron 4. The southward migration of the transitional area during the last 35 Myr explains the V-shaped boundary: (1) increases in spreading rate above a threshold value produced changes in axial morphology; and (2) in the transition zone, rotations of the spreading direction were accommodated by the plate boundary, either by rift propagation or by transitions from fracture zones to non transform discontinuities, leaving trails on the seafloor that presently delineate the V. Seafloor roughness variations are not controlled by exactly the same spreading rate dependence as changes in axial morphology. The transition from rough to smooth seems to have occurred everywhere for spreading rates greater than 50 mm/yr, except in a domain presently centered on Saint-Exupéry FZ, where it occurred for spreading rates >60 to 65 mm/yr. Independent results from melting model calculations of major elements [Vlastelicet al., 2000] indicate that the upper mantle temperature is likely to be cooler between Antipodes and La Rose FZs. The combination of these two results reveals the existence of a 700-km-long segmentation of the upper mantle, with a “cool” area centered on Saint-Exupéry FZ.
1

JOURNAL OF GEOPHYSICAL RESEARCH, VOL. 106, NO B5, PAGES 8,521-8,543, MAY 10, 2001
8521
Abstract. The spreading rate at the Pacific-Antarctic Ridge (PAR) increases rapidly from 54 mm/yr nearPitman Fracture Zone (FZ) up to 76 mm/yr near Udintsev FZ, resulting in three domains of axialmorphology: an axial valley south of Pitman FZ, an axial high north of Saint Exupéry FZ, and in between,the transitional domain extends over 650 km. It comprises sections of ridge with an axial valley or an axialhigh and generally displays a very low cross-sectional relief. It is also characterized by two propagatingrifts. Two domains of different seafloor roughness appear south of Udintsev FZ: east of 157°W these twodomains are separated by a 1000-km V-shaped boundary. West of 157°W, the boundary approximatelycoincides with Chron 3a or Chron 4. The southward migration of the transitional area during the last 35Myr explains the V-shaped boundary: (1) increases in spreading rate above a threshold value producedchanges in axial morphology; and (2) in the transition zone, rotations of the spreading direction wereaccommodated by the plate boundary, either by rift propagation or by transitions from fracture zones to nontransform discontinuities, leaving trails on the seafloor that presently delineate the V. Seafloor roughnessvariations are not controlled by exactly the same spreading rate dependence as changes in axialmorphology. The transition from rough to smooth seems to have occurred everywhere for spreading ratesgreater than 50 mm/yr, except in a domain presently centered on Saint-Exupéry FZ, where it occurred forspreading rates >60 to 65 mm/yr. Independent results from melting model calculations of major elements[Vlastelic et al., 2000] indicate that the upper mantle temperature is likely to be cooler between Antipodesand La Rose FZs. The combination of these two results reveals the existence of a 700-km-longsegmentation of the upper mantle, with a "cool" area centered on Saint-Exupéry FZ.
1. Introduction
Over the last 35 years the scientific community has focusedmuch interest on the comparative study of "slow" and "fast"spreading ridges, mainly the slow Mid-Atlantic Ridge and thefast East Pacific Rise. Because of their remoteness from theNorth American and European oceanographic bases, the"intermediate" spreading centers of the southern oceans havebeen surveyed using modern multibeam techniques only in thelast few years, in spite of their potential for understanding thetransition between the two styles of accretion. A recentgeophysical and geochemical survey of the South east IndianRidge (SEIR) has shown that while the spreading rate remainsnearly constant (70 to 75 mm/yr) between 88°E and 118°E,other parameters (such as variations in the upper mantletemperature and melt production) play an important role inshaping the axial relief and controlling the accretion processes[Cochran et al., 1997; Sempéré et al., 1997]. Here, we reportdata from the Pacific-Antarctic Ridge (PAR) between 65°30'Sand Udintsev Fracture Zone (FZ), which exhibits exactly theopposite characteristics compared to the SEIR between 88°Eand 118°E. (1) In contrast to what is observed along the SEIR,the PAR is devoid of any hot/cold spot influence, so thatchanges in mantle temperature or mantle heterogeneitesunderneath the spreading axis cannot be readilyascribed to the presence of a nearby large-scale mantletemperature anomaly [Géli et al., 1997; Vlastelic et al., 2000].(2) Owing to the proximity of the Euler pole of rotationbetween the Antarctic and the Pacific Plates, the spreading rateincreases along the PAR from 54 mm/yr near 65°30'S up to
76 mm/yr near Udintsev FZ, spanning a wide range ofspreading rates, from slow to fast.
In previous publications, we have presented general results[Géli et al., 1997] and a study of the chemical systematics[Vlastelic et al., 2000] of the Pacific-Antarctic Ridge south ofthe Udintsev FZ. Here we present a detailed, geological studyof the present-day, ridge axial morphology and segmentationand their variations in time, aiming at (1) describing the along-axis variations of the geometry, segmentation, and morphologyof the Pacific/Antarctic plate boundary; (2) correlatingvariations in axial relief with other observables; (3) assessingthe role of changes in the Pacific and Antarctic Plates relativemotion for shaping the geometry and the axial morphology ofthe plate boundary ; and (4) interpreting the changes inseafloor roughness that appear on the high resolution satellitegravity map of the Pacific-Antarctic area.
2. Geological Setting
2.1. Tectonic History
On the basis of detailed magnetic and multibeam dataacquired in a 60-km-wide corridor along the Pitman FZ(Figure 1a), Cande et al. [1995] have reconstructed the relativemotion of the Pacific and Antarctic Plates during the Cenozoic.The present-day Euler pole of rotation of the Pacific Platerelative to the Antarctic Plate is located near 67°S, 96°E, andthe angular rotation rate is 2.42°/Myr, resulting in a regular,along-axis increase in spreading rate from 54 to 76 mm/yr
Variations in axial morphology, segmentation, and seafloor roughnessalong the Pacific-Antarctic Ridge
between 56°S and 66°S
Hélène Ondréas1, Daniel Aslanian1, Louis Géli1, Jean-Louis Olivet1 and Anne Briais2
1Département des Géosciences Marines, Institut Français de Recherche et d’Exploitation de la MerPlouzané, France
2Laboratoire d’Etudes en Géophysique et Océanographie Spatiale, Observatoire Midi-Pyrénées, CNRS Toulouse, France

ONDREAS ET AL.: VARIATIONS IN AXIAL MORPHOLOGY, SEGMENTATION AND SEAFLOOR ROUGHNESS
8522
between 66°S and 56°S. The Pacific-Antarctic relative platemotion is characterized by a counter clockwise rotation of thespreading direction from Chron 27 (circa 61 Ma) to aboutChron 6c (circa 24 Ma) and a clockwise rotation since aboutChron 5a (12 Ma). Owing to the specific location of the Eulerpole during the Cenozoic (in the area of the Wilkes and GeorgeV Lands, in Antarctica) the changes in spreading directionsrecorded in the geometry of the plate boundary are much largeron the south western end of the ridge, explaining the sharpbends in the south western fracture zones. In recent times, asudden, major change occurred near the young end of Chron 3a
(5.9 Ma) clearly recorded by a sharp rotation of about ~ 8° ofthe abyssal hill fabric near the Pitman FZ [Macario et al.,1994], and two minor changes occurred at Chron 2a (circa 2.58Ma) and Chron 1 (circa 0.78 Ma) respectively. The evolutionof the Pacific/Antarctic plate boundary west of 180°W into aseries of short, en échelon spreading segments appears to resultfrom the changes in the relative plate motion during the lateNeogene [Cande et al., 1995]. We will show that these changesare also responsible for rearrangements in the geometry andsegmentation of the Pacific-Antarctic spreading center between180°W and Udintsev FZ.
Figure 1a. Regional map of the Pacific-Antarctic basins indicating survey area (inset). Black lines indicate track-lines of R/V L’Atalanteduring Pacantarctic cruise, in 1996. CTJ, Chile Triple Junction; MTJ, Macquarie Triple Junction; EPR, East Pacific Rise; PAC, Pacific Plate;ANT, Antarctic Plate. Solid black line indicates accreting plate boundaries; thin black line is for fracture zones.
2.2. Satellite Altimetry Observations of a LargeV-Shaped Boundary
Two domains of different satellite gravity signature[Smith and Sandwell, 1995] appear along the axis and onthe adjacent basins of the Pacific-Antarctic Ridgebetween Udintsev FZ and 180°W: one of rough seafloor,with a high density of apparent, well marked fracturezones, and one of smooth seafloor comparable with theoceanic basins that have generally been formed at fastspreading centers. East of 157°W, these two domains areseparated by a large V-shaped boundary, extending formore than 1000 km along the rise axis. According toSahabi et al. [1996] this large-scale feature, whichinitiated shortly before Chron 13o, reflects a change inaxial morphology that progressively propagated
southwards since 35 Ma: as the Euler pole of rotation wasmoving to the southwest (away from the PAR) and as thespreading rate was becoming greater than a thresholdvalue, the ridge axial morphology systematically changedfrom a valley to a high. Géli et al. [1997] furtherproposed that the large "V" may also reflect changes inaxial segmentation and geometry (in addition to changesin axial morphology) that propagated southward sinceOligocene times. In the present paper, we study thetransition in seafloor roughness over the entire area, eastand west of 157°W, and show that changes in seafloorroughness are not controlled by exactly the samespreading rate dependence as changes in axialmorphology.

ONDREAS ET AL.: VARIATIONS IN AXIAL MORPHOLOGY, SEGMENTATION AND SEAFLOOR ROUGHNESS
8523
3. Axial Morphology and Geometryof the Present-Day Plate Boundary
Between January 6 and February 20 1996, thePACANTARCTIC cruise of R/V L'Atalante aimed at thegeochemical and geophysical study of the Pacific-Antarctic Ridge, north of 65°35'S, 170°W and south ofthe Udintsev FZ (Figures 1a and 1b). Together withswath bathymetry [Bourillet et al., 1996] and imagery[Augustin et al., 1994] collected with the multibeamechosounder system, R/V L'Atalante acquired magneticdata with both a proton magnetometer towed behind theship and a shipboard three-component magnetometer.Twenty-six rock samples have also been collected along960 nautical miles of ridge axis including five from the
Hollister Ridge, an oblique, aseismic structure betweenthe Udintsev FZ and the Eltanin fault system [Vlastelic etal., 1998; Géli et al., 1998].
Basically, the PAR south of Udintsev FZ is dividedinto three domains of different morphologies: thesouthern area (Z1), between 65°30' S, 174°40'W and64°40'S, 172°W, displays an axial valley similar(although less pronounced) to that observed at slow tointermediate spreading centers; the northern area (Z3),northeast of 63°10'S, 157°20'W, has an axial domecharacteristic of fast spreading centers. In between, the650-km-long transition zone (Z2) shows sections ofridges with axial highs, rifted highs, and axial valleys(Figure 1b).
.
Figure 1b. Major structural features of studied area derived from 1-min grid satellite gravity map (D. Sandwell, personal communication,2000). Black lines indicate gravity lows; dotted black lines indicate gravity highs. The spreading axis location is based on R/V L’Atalantedata; it is marked by double black lines where a rift valley is present, in thick black line where a dome is present, and by dotted lines wherethe morphology is flat. Half spreading rate is indicated at places where the new data helped to determine it precisely. Axial morphology ininsets Z1, Z2A, Z2B, Z3A, and Z3B is shown in Plates 1, 2, 3, 4, and 5 respectively
3.1. Zone 1: Slow Spreading Morphology
Zone 1 extends from 70 km northeast of the ErebusFZ (southern boundary of our survey) to the N140Pitman FZ (Figure 1b and Plate 1) and shows axial valleymorphology. Following the nomenclature of Macdonaldet al. [1991], the axis is divided into three second-ordersegments named Z1-S1, Z1-S2, and Z1-S3. The segmentsare offset by two second-order discontinuities named Z1-D1 and Z1-D2 (Table 1). The clearly defined axialmagnetic anomaly (Plate 1) is used to locate the positionof the active spreading center and estimate a spreadingrate of 54 to 56 mm/yr all over the area.
Two observations in zone 1 contrast with what isusually observed on mid-ocean ridges: (1) the change inaxial morphology from deep rift valley to a platformalong segment Z1-S3 is not related to any axialdiscontinuity and occurs over a distance of 40 km only(Figure 2 and Plate 1); (2) while the axial seafloorplunges by about 500 to 800 m near the extremities ofsegments Z1-S1 and Z2-S2 as generally observed alongmid-ocean ridges [e.g., Macdonald et al., 1992], it doesnot deepen approaching the Pitman FZ.

ONDREAS ET AL.: VARIATIONS IN AXIAL MORPHOLOGY, SEGMENTATION AND SEAFLOOR ROUGHNESS
8524
Plate 1. Top bathymetric map (100-m isocontours) of zone 1 (see inset in Figure 1b) showing discontinuities and segment names. Spreadingaxis is materialized by a thick black line. White wiggle lines indicate along-track magnetic data. Positive and negative magnetic anomalies arerespectively above and below thin white line. Bathymetric cross sections (thin black lines) are shown in Figure 2. Full spreading rate isindicated. Bottom axial depth expressed versus distance from an arbitrary, southern point located at the Pacific Antarctic Ridge/Erebus FZintersection, near 65°58'S, 175°W.

ONDREAS ET AL.: VARIATIONS IN AXIAL MORPHOLOGY, SEGMENTATION AND SEAFLOOR ROUGHNESS
8525
Both discontinuities (D1 and D2) are very muchalike, shaping a rift/rift overlaping spreading center (OSC)type structure. The only other documented example of suchan OSC linking two segments having both an axial riftvalley is in the Central Indian Ridge near 21°40'S, 69°E
[Briais, 1995]. The observed wrapped structures may resultfrom changes in plate geometry [Lonsdale, 1994b], ratherthan the relative progression of the magma supply belowone segment [Macdonald et al., 1986].
Table 1. Nomenclature and Geological Characteristics of Segmentation for Zone 1a
Segment SegmentLength, km
Strike AxisMorphology
Width ofAxial Valley
or Axial High,km
AverageDepth at the
Axis, m
AxialValley
Depth, m
Discontinuity inthe South
Discontinuity inthe North
Z1-S1 > 80 N52°-N60° valley 14 3000-3200 400-600 not mapped OSC V/V65°03'S/173°13'W
Z1-S2 70 N50° valley 15-20 2800-3000 400-600 OSC V/V65°03'S/173°13'W
OSC V/V64°42'S/172°15'W
Z1-S3 75 N50° valley toflat axial
area
6-10 2400 200-400 OSC V/V64°42'S/172°15'W
Pitman FZ64°40'S/170°40'W
a See Plate 1 and location in Figure 1b. V/V, valley/valley; D/D, dome/dome.
Figure 2. Cross-sectional bathymetry from zone 1 (see sections location in Plate 1). Straight, black lines indicates 2800 m below sea surfacelevel. Spreading axis location is materialized by dashed lines.

ONDREAS ET AL.: VARIATIONS IN AXIAL MORPHOLOGY, SEGMENTATION AND SEAFLOOR ROUGHNESS
8526
3.2. Zone 2: Transitional Area
In the transitional area the axial morphology isgenerally ill defined, has a low cross-sectional relief,and alternates between more or less pronounced riftvalleys, flat areas, and axial highs (Figures 3 and 4,Table 2). The spreading rate increases between~ 56 mm/yr near 65°S, 171°W (close to Pitman FZ),and up to 66 mm/yr near 62°S, 158°W (close to LeRenard FZ) (Figure 1b). The zone has been coveredmore extensively off-axis south of Heirtzler transformfault than north of it. Figures 2 and 3 present the twosections separately (Z2A, Plate 2 and Figure 3; Z2B,Plate 3 and Figure 4).
Figure 3. Cross-sectional bathymetry from zone Z2A (seesections location in Plate 2). Straight, black lines indicate2800 m below sea surface level. Spreading axis location ismaterialized by dashed lines.
Discontinuities are of three types: small deviationsof axial linearity, OSC evolving in linking anddecapitation as described by Macdonald [1989], andpropagators. A major propagator has its tip at 63°30'S,167°20W and shows an offset of 40 km and anoverlapping of 25 km [Briais et al., 1996; Géli et al.,1997]. The pseudofaults are ~ 35° oblique to the
propagating ridge (PR), which implies a rate ofpropagation of 43 mm/yr., similar to that of other PRs[e.g., Hey et al., 1986]. Extrapolating the trace of thepropagator pseudofaults up to Heirtzler FZ yields anage of ~ 5 Ma for the initiation of the propagation, thatis shortly after Chron 3a, which corresponds to the ageof a clockwise change in spreading direction [Cande etal., 1995]. A second, smaller, southward propagator(discontinuity Z2A-D4) is observed northeast of themajor one at 63°15'S and 165°10'W, with amorphology similar to that of the larger one (Plate 2).The overlap is 25 km long and the offset 18 km wide. Itis inferred to have started at ~ 0.8 Ma, at the time of aclockwise rotation of the spreading direction.
Figure 4. Cross-sectional bathymetry from zone Z2B (seesections location in Plate 3). Straight, black lines indicate 2800m below sea surface level. Spreading axis location is indicatedby dashed lines.
Northeast of Heirtzler FZ (in zone Z2B Plate 3),only two small sections of the axis have been mapped.Between Heirtzler and La Rose FZs, along and across-strike profiles exhibit a flat axial morphology (Figure4). North of the 100-km-long, right-stepping La Roseoffset, one line crossing the axis near 62°40'S,159°30'W reveals a 15-km-wide, 300-m-deep riftvalley and provides a direct estimation of the spreadingrate of ~ 66 mm/yr.
Table 2. Nomenclature and Geological Characteristics of Segmentation for Zone 2A a
Segment SegmentLength, km
Strike AxisMorphology
Width of AxialValley or Axial
High, km
AverageDepth at the
Axis, m
Axial ValleyDepth, m
Discontinuity in theSouth
Discontinuity inthe North
Z2A-S1 55 N45° dome 12 2200 400 Pitman FZ64°40'S/170°40'W
DEVAL64°27'S/169°35'W
Z2A-S2 75 N45° flat axialarea
10 2300 200 Deval64°27'S/169°35'W
OSC D/D64°S/169°W
Z2A-S3 100 N45° dome 8 2200 300 OSC D/D64°S/169°W
PR163°45'S/167°W
Z2A-S4 150 N45°-50° valley 6-14 2700 300-400 PR163°45'S/167°W
PR263°20'S/165°W
Z2A-S5 > 30 N45°-50° valley 6-10 2800 500 PR263°20'S/165°W
Heirtzler FZ?
a See Plate 2 and location in Figure 1b.
ONDREAS ET AL.: VARIATIONS IN AXIAL MORPHOLOGY, SEGMENTATION AND SEAFLOOR ROUGHNESS
8527
Plate 2. Top bathymetric map (100-m isocontours) of zone 2A (see inset in Figure 1b) showing discontinuities and segment names. Spreadingaxis is materialized by a thick black line. The outer and inner pseudofaults of the 167°W propagator are materialized by dotted lines. White wigglelines indicate along-track magnetic data. Positive and negative magnetic anomalies are above and below, respectively, thin white line. Bathymetriccross sections (thin black lines) are shown in Figure 3. Full spreading rate is indicated. Bottom axial depth expressed versus distance from anarbitrary, southern point located at the Pacific Antarctic Ridge/Erebus FZ intersection, near 65°58'S, 175° W.

ONDREAS ET AL.: VARIATIONS IN AXIAL MORPHOLOGY, SEGMENTATION AND SEAFLOOR ROUGHNESS
8528
Plate 3. Bathymetric map (100-m isocontours) of zone 2B (see inset in Figure 1b) showing discontinuities and segment names. Spreading axis ismaterialized by a thick black line. Bathymetric cross sections (thin black lines) are shown in Figure 4. White wiggle lines indicate along-trackmagnetic data. Positive and negative magnetic anomalies are above and below, respectively, thin white line.
It is interesting to note that the bathymetric expression ofthe fossil traces of Heirtzler, La Rose, and Le Renard FZs(crossed near 63°30'S, 164°W; 62°30'S, 162°15'W; and62°45'S, 158°30'W, respectively) are not very pronouncedbut are characterized by a trough that is not deeper ~ about500 m. It is also difficult to follow the fracture zones in thesatellite gravity map. Some transform faults like theHeirtzler transform fault (TF) are even characterized by aseries of gravity highs, suggesting that the transform faultis presently evolving and progressively disappearing.
3.3. Zone 3: Fast Spreading Morphology
This zone extends from to 63°S, 159°W to55°30'S, 144°W, between Le Renard and Udintsev FZs,covering an along-axis distance of 1100 km (Figure1b).
It is characterized off-axis by the previously describedlarge V-shaped structure that appears in the satellitegravity map [Sahabi et al., 1996]. A gap in themapping coverage of the axial area exists between61°40'S, 154°W and 61°S, 153°15'W (Plate 4). Southof this gap, the mapping extends off-axis up to 6 Ma,covering the expected tip of the V. North of it, only theaxial rise crest has been covered, so that we have nomagnetic anomaly control on the location of thespreading axis (Plate 5) but old National GeophysicalData Center (NGDC) profiles have been studied to helpaxis localization. According to the previous kinematicsanalysis including magnetic data from Pitman FZ[Cande et al., 1995], the spreading rate in zone 3 variesbetween 68 and 76 mm/yr.

ONDREAS ET AL.: VARIATIONS IN AXIAL MORPHOLOGY SEGMENTATION AND SEAFLOOR ROUGHNESS
8529
Plate 4. Top bathymetric map (100-m isocontours) of zone 3A (see inset in Figure 1b) showing discontinuities and segment names.Spreading axis is materialized by a thick black line. Dotted lines near Saint-Exupéry FZ indicate volcanic structures overshooting thetransform fault. Bathymetric cross sections (thin black lines) are shown in Figure 5. Magnetic wiggles are shown in Figure 8. Full spreadingrate is indicated. Bottom axial depth expressed versus distance from an arbitrary, southern point located at the Pacific Antarctic Ridge/ErebusFZ intersection, near 65°58'S, 175° W.
ONDREAS ET AL.: VARIATIONS IN AXIAL MORPHOLOGY SEGMENTATION AND SEAFLOOR ROUGHNESS
8530
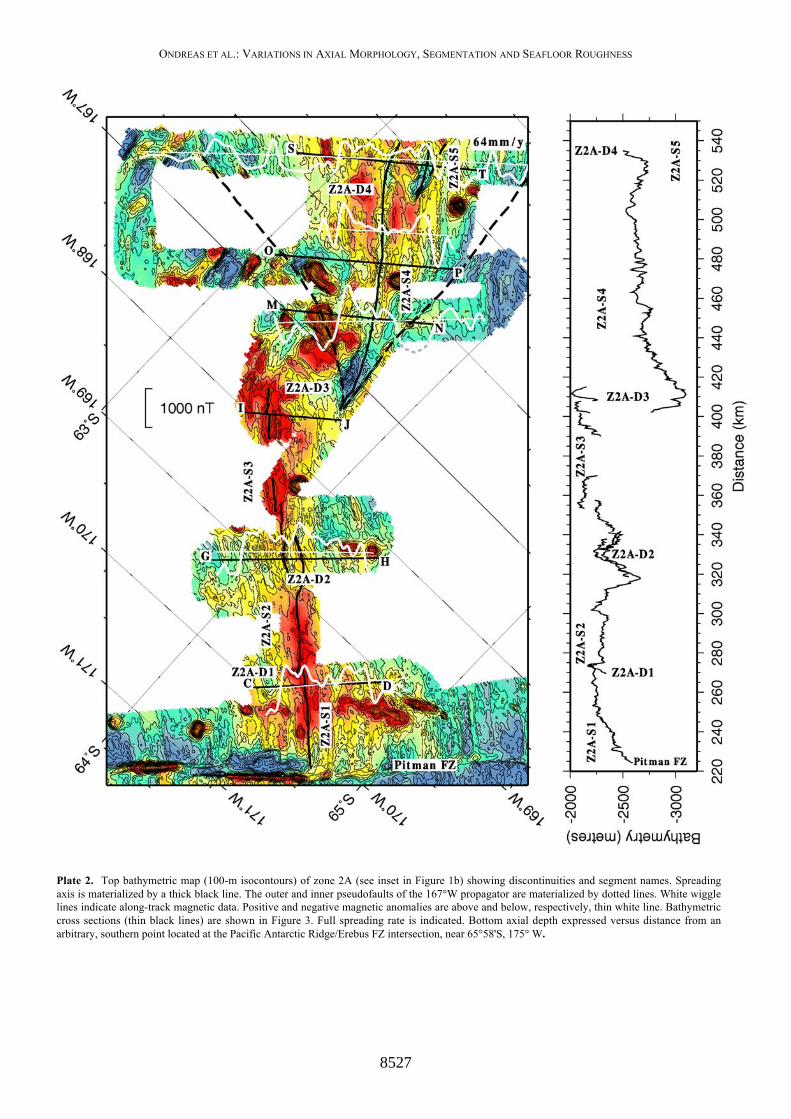
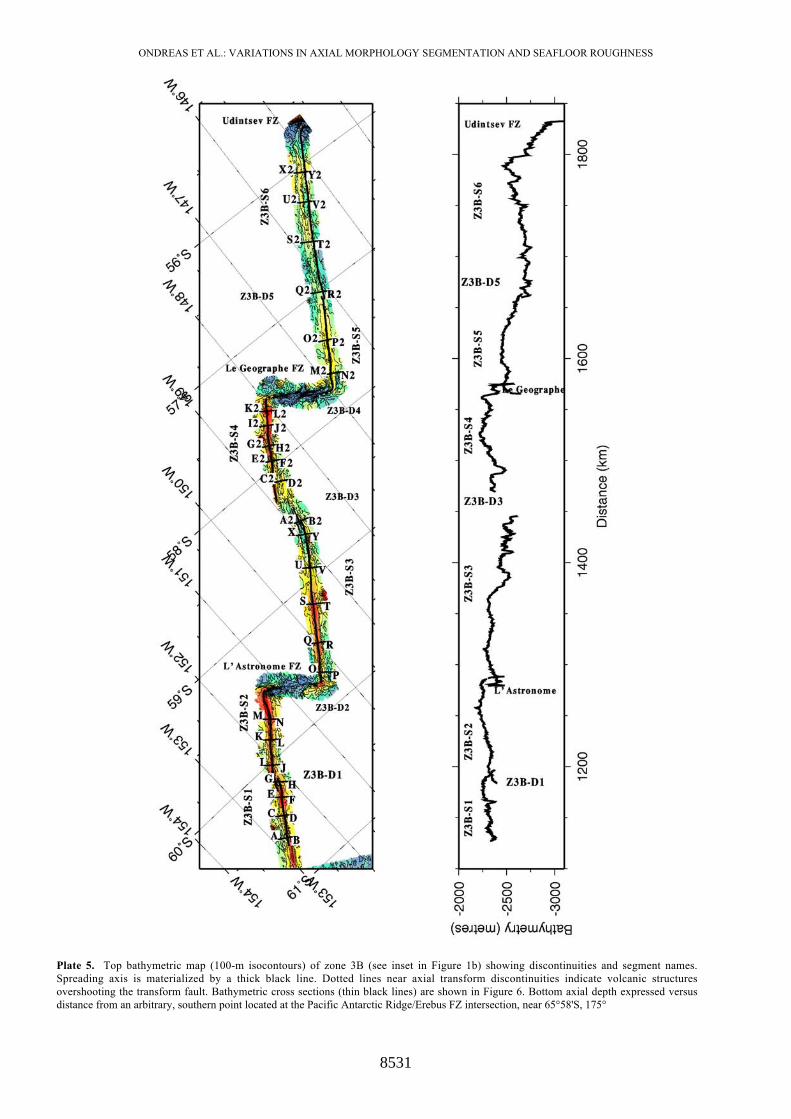
The main characteristic of the segmentation pattern andaxial morphology is the presence of axial high at the axis,except in the close vicinity of some of the axialdiscontinuities. These axial highs are similar to thoseobserved at the crest of the EPR, most particularly betweenSiqueiros and Rivera FZs, where the spreading rate rangesbetween 117 and 84 mm/yr [Macdonald et al., 1992], or atthe crest of the SEIR between 90°E and 100°E, where thespreading rate is ~ 80 mm/yr [Sempéré et al., 1997;Cochran et al., 1997]. The variations in axial morphologyare systematically related to variations in axial depth andcross-sectional area (Figures 5 and 6), suggesting that themorphology is likely to be primarily controlled by along-axis variations in magma supply [e.g., Macdonald et al.,1992].
Figure 5. Cross-sectional bathymetry from zone Z3A (seesections location in Plate 4). Solid lines indicate 2800 m belowsea surface level. Spreading axis location is materialized bydashed lines.
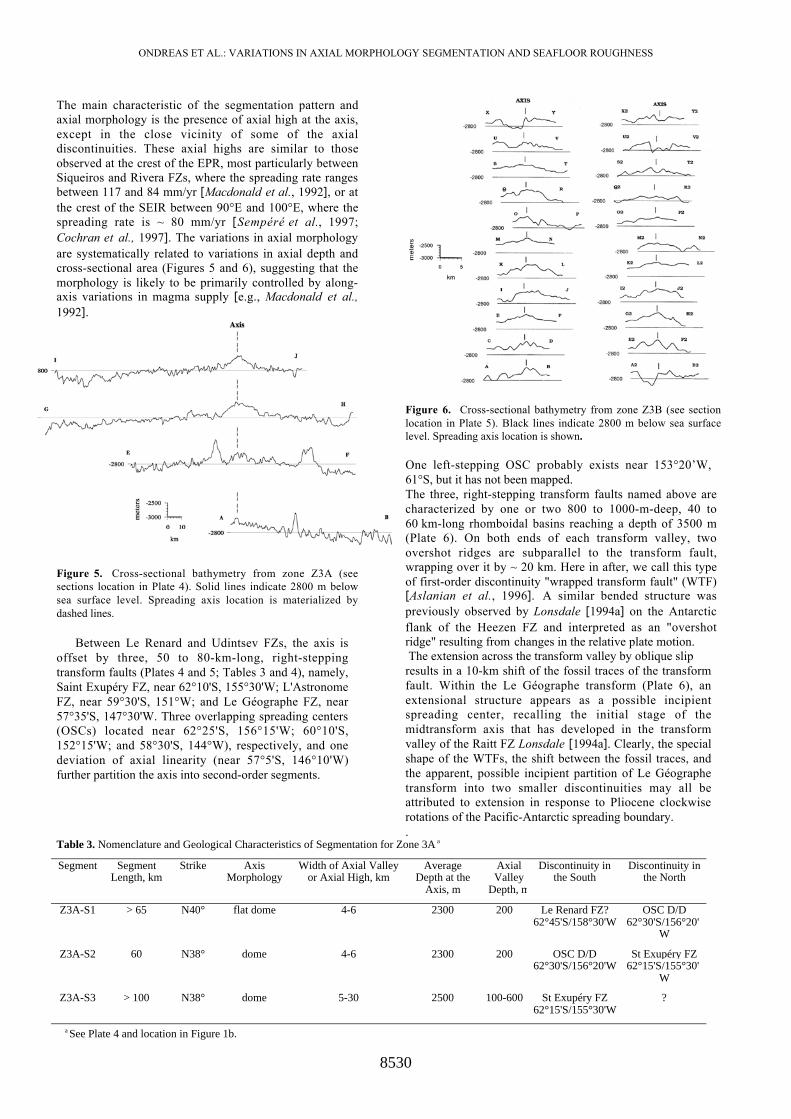
Between Le Renard and Udintsev FZs, the axis isoffset by three, 50 to 80-km-long, right-steppingtransform faults (Plates 4 and 5; Tables 3 and 4), namely,Saint Exupéry FZ, near 62°10'S, 155°30'W; L'AstronomeFZ, near 59°30'S, 151°W; and Le Géographe FZ, near57°35'S, 147°30'W. Three overlapping spreading centers(OSCs) located near 62°25'S, 156°15'W; 60°10'S,152°15'W; and 58°30'S, 144°W), respectively, and onedeviation of axial linearity (near 57°5'S, 146°10'W)further partition the axis into second-order segments.
Figure 6. Cross-sectional bathymetry from zone Z3B (see sectionlocation in Plate 5). Black lines indicate 2800 m below sea surfacelevel. Spreading axis location is shown.
One left-stepping OSC probably exists near 153°20’W,61°S, but it has not been mapped.The three, right-stepping transform faults named above arecharacterized by one or two 800 to 1000-m-deep, 40 to60 km-long rhomboidal basins reaching a depth of 3500 m(Plate 6). On both ends of each transform valley, twoovershot ridges are subparallel to the transform fault,wrapping over it by ~ 20 km. Here in after, we call this typeof first-order discontinuity "wrapped transform fault" (WTF)[Aslanian et al., 1996]. A similar bended structure waspreviously observed by Lonsdale [1994a] on the Antarcticflank of the Heezen FZ and interpreted as an "overshotridge" resulting from changes in the relative plate motion. The extension across the transform valley by oblique slipresults in a 10-km shift of the fossil traces of the transformfault. Within the Le Géographe transform (Plate 6), anextensional structure appears as a possible incipientspreading center, recalling the initial stage of themidtransform axis that has developed in the transformvalley of the Raitt FZ Lonsdale [1994a]. Clearly, the specialshape of the WTFs, the shift between the fossil traces, andthe apparent, possible incipient partition of Le Géographetransform into two smaller discontinuities may all beattributed to extension in response to Pliocene clockwiserotations of the Pacific-Antarctic spreading boundary..
Table 3. Nomenclature and Geological Characteristics of Segmentation for Zone 3A a
Segment SegmentLength, km
Strike AxisMorphology
Width of Axial Valleyor Axial High, km
AverageDepth at the
Axis, m
AxialValley
Depth, m
Discontinuity inthe South
Discontinuity inthe North
Z3A-S1 > 65 N40° flat dome 4-6 2300 200 Le Renard FZ?62°45'S/158°30'W
OSC D/D62°30'S/156°20'
W
Z3A-S2 60 N38° dome 4-6 2300 200 OSC D/D62°30'S/156°20'W
St Exupéry FZ62°15'S/155°30'
W
Z3A-S3 > 100 N38° dome 5-30 2500 100-600 St Exupéry FZ62°15'S/155°30'W
?
a See Plate 4 and location in Figure 1b.
ONDREAS ET AL.: VARIATIONS IN AXIAL MORPHOLOGY SEGMENTATION AND SEAFLOOR ROUGHNESS
8531
Plate 5. Top bathymetric map (100-m isocontours) of zone 3B (see inset in Figure 1b) showing discontinuities and segment names.Spreading axis is materialized by a thick black line. Dotted lines near axial transform discontinuities indicate volcanic structuresovershooting the transform fault. Bathymetric cross sections (thin black lines) are shown in Figure 6. Bottom axial depth expressed versusdistance from an arbitrary, southern point located at the Pacific Antarctic Ridge/Erebus FZ intersection, near 65°58'S, 175°

ONDREAS ET AL.: VARIATIONS IN AXIAL MORPHOLOGY SEGMENTATION AND SEAFLOOR ROUGHNESS
8532
Plate 6. Focus on wrapped transform faults (WTF) and interpretative sketch. The thick black line indicates the spreading axis. White linesindicate the main structural features. Dotted lines are for depressions; small crosses are for highs. Barbed lines (with tick marks pointingdownward) indicate faults. (a) Saint Exupéry WTF. This N125°E trending structure offsets the axis by 50 km. A deep 40-km-wideextensional basin, reaching 3500 m in depth, is present between the two branches of the spreading axis. These branches bend and areprolongated by overshot ridges that plunge inward, wrapping the basin. (b) Le Géographe WTF. This N123+E trending structure offsets theaxis by 65 km and shows more or less rhomboidal extensional basins reaching 3250 in depth. On both ends of the transform fault (TF), theaxial crest of the PAR bends and is prolongated by an overshot ridge that plunges inward. (c) Sketch showing the effect of a change in platesrelative motion on the geometry of the transform offset: Kinematic changes may induce the creation of transtensional basins, as well asovershot ridges and (possibly) accretion centers within the transform fault [after Lonsdale, 1994a]
Table 4. Nomenclature and Geological Characteristics of Segmentation for Zone 3B a
Segment SegmentLength, km
Strike AxisMorphology
Width of AxialValley or Axial
High, km
AverageDepth at the
Axis, m
AxialValley
Depth, m
Discontinuity inthe South
Discontinuity inthe North
Z3B-S1 > 120 N35° dome 4-6 2300 300 ? OSC D/D60°12'S/152°15'W
Z3B-S2 110 N34° dome 4-7 2200 200 OSC D/D60°12'S/152°15'W
L'Astronome FZ59°40'S/150°50'w
Z3B-S3 180 N33° dome 4-6 2300 100-300 L'Astronome FZ59°40'S/150°50'w
OSC?58°30'S/149°20'W
Z3B-S4 > 120 N32° dome 4-10 2300 200-400 OSC?58°30'S/149°20'W
Geographe FZ57°40'S/147°30'W
Z3B-S5 110 N31° dome 8-10 2400 200-300 Geographe FZ57°40'S/147°30'W
Deval57°05'S/146°12'W
Z3B-S6 180 N30° valley 2-5 2700 200-400 Deval57°05'S/146°12'W
Udintsev FZ
a See Plate 5 and location in Figure 1b.
ONDREAS ET AL.: VARIATIONS IN AXIAL MORPHOLOGY SEGMENTATION AND SEAFLOOR ROUGHNESS
8533
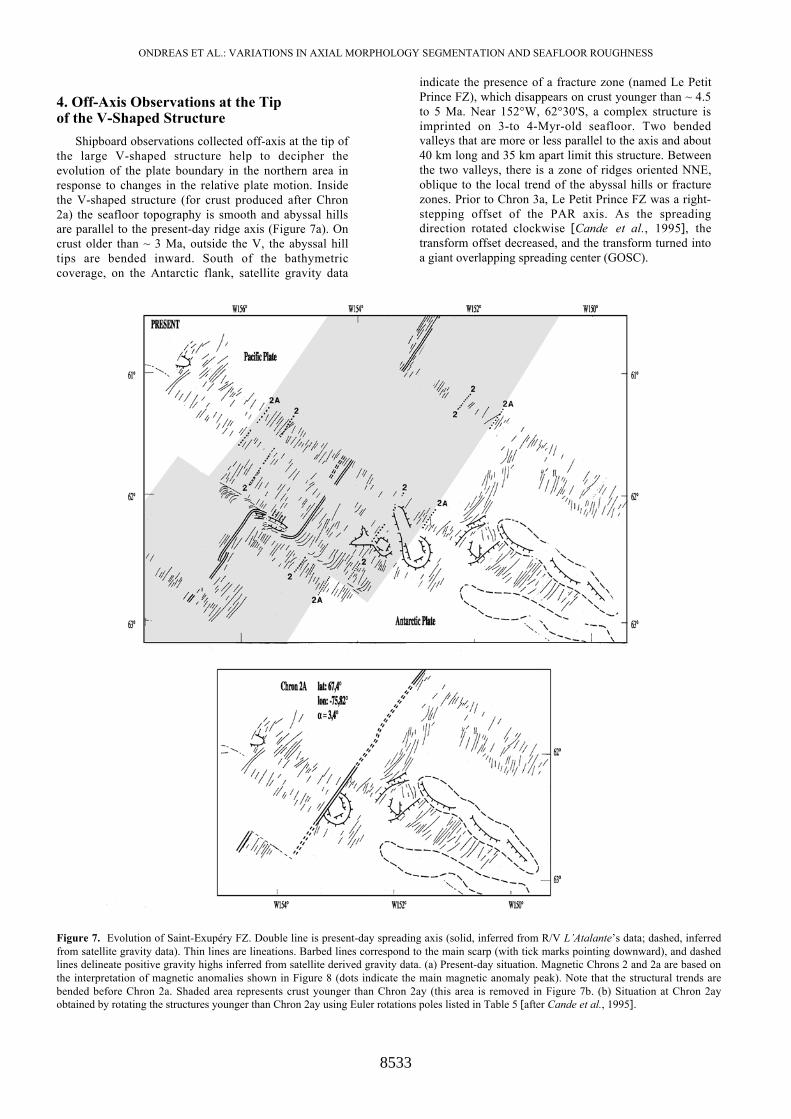
4. Off-Axis Observations at the Tipof the V-Shaped Structure
Shipboard observations collected off-axis at the tip ofthe large V-shaped structure help to decipher theevolution of the plate boundary in the northern area inresponse to changes in the relative plate motion. Insidethe V-shaped structure (for crust produced after Chron2a) the seafloor topography is smooth and abyssal hillsare parallel to the present-day ridge axis (Figure 7a). Oncrust older than ~ 3 Ma, outside the V, the abyssal hilltips are bended inward. South of the bathymetriccoverage, on the Antarctic flank, satellite gravity data
indicate the presence of a fracture zone (named Le PetitPrince FZ), which disappears on crust younger than ~ 4.5to 5 Ma. Near 152°W, 62°30'S, a complex structure isimprinted on 3-to 4-Myr-old seafloor. Two bendedvalleys that are more or less parallel to the axis and about40 km long and 35 km apart limit this structure. Betweenthe two valleys, there is a zone of ridges oriented NNE,oblique to the local trend of the abyssal hills or fracturezones. Prior to Chron 3a, Le Petit Prince FZ was a right-stepping offset of the PAR axis. As the spreadingdirection rotated clockwise [Cande et al., 1995], thetransform offset decreased, and the transform turned intoa giant overlapping spreading center (GOSC).
Figure 7. Evolution of Saint-Exupéry FZ. Double line is present-day spreading axis (solid, inferred from R/V L’Atalante’s data; dashed, inferredfrom satellite gravity data). Thin lines are lineations. Barbed lines correspond to the main scarp (with tick marks pointing downward), and dashedlines delineate positive gravity highs inferred from satellite derived gravity data. (a) Present-day situation. Magnetic Chrons 2 and 2a are based onthe interpretation of magnetic anomalies shown in Figure 8 (dots indicate the main magnetic anomaly peak). Note that the structural trends arebended before Chron 2a. Shaded area represents crust younger than Chron 2ay (this area is removed in Figure 7b. (b) Situation at Chron 2ayobtained by rotating the structures younger than Chron 2ay using Euler rotations poles listed in Table 5 [after Cande et al., 1995].

ONDREAS ET AL.: VARIATIONS IN AXIAL MORPHOLOGY SEGMENTATION AND SEAFLOOR ROUGHNESS
8534
Figure 8. (opposite) Interpretation of magnetic data collected with R/V L’Atalante during the Pacantarctic cruise (see inset for profileslocation, PR1 to PR10). (bottom) Scale of magnetic versus distance from the ridge axis, based on the magnetic chronostratigraphic scale ofCande and Kent [1995]. Spreading rates (cm/yr) versus distance to the axis are also indicated. The correspondence between distance andages is provided by the age (vertical numbers, in Ma) dating each change in spreading rate documented by Cande et al. [1995]: 0.78, 2.58,5.89 Ma, respectively. (top) Modeling (thin line) of the magnetic data (thick line), using spreading rates based on the kinematic parameters(Euler poles and rotation angles) of Cande et al. [1995] The zero origin on the x axis for each different profile corresponds to the location ofthe spreading axis. On PR 7 and PR8, the computed magnetic anomalies for ages older than ~ 3 Ma have been shifted by 45 km to the westin order to account for the presence of a vanished offset that existed prior to Chron 2a. On PR8 the shift is of a 5 km to the west (seeinterruption of thin line). The identification of Anomalies 1, 2, and 2a (younger part) is straightforward. Anomalies that are notunquestionally identified are indicated with a question mark. Profile PR4 crosses the spreading center two times, west and east of the SaintExupéry wrapped transform faults, producing a perturbed central magnetic anomaly. On PR7 and PR8, the younger wiggle of Anomaly 2aappears to be duplicated on the Antarctic flank, probably because these profiles cross the two branches of the fossil giant overlapping centernear 152°W, 62°30'S. On PR9, there are two wiggles that can be identified as characteristic of Anomaly 3A, assuming that a left steppingtransform fault existed between profiles 8 and 9 prior Chron 3a

ONDREAS ET AL.: VARIATIONS IN AXIAL MORPHOLOGY SEGMENTATION AND SEAFLOOR ROUGHNESS
8535
Between Chrons 3a and 2a (Figure 7b), the structuresbetween the two accreting limbs of the GOSC weresheared and rotated. Then, accretion progressivelystopped along the eastern branch of the GOSC, and itssouth-western branch linked with the northern one,leaving the fossil trace of the GOSC on the Antarcticplate. The linkage of the axis seems to have been fullycompleted shortly after Chron 2a. Since that time, theridge crest has been almost continuous between 62°20'Sand 59°30'S and characterized by an axial dome.
The present scenario is widely supported by thepattern of magnetic anomalies (Figure 8). Chrons J, 2,and the young part of 2A can be easily and consistentlypicked throughout all different across-strike profiles(Z4PR1 to Z4PR10). For ages older than ~ 3 Ma,however, the magnetic anomalies cannot always beeasily matched by synthetic models simply based on theopening rates of Cande et al., [1995]. For example,profile PR7 is better matched using a synthetic profileinvolving a small axial jump at the time of the old part ofAnomaly 2A. On this profile, two peaks related to theyoungest arch of magnetic Anomaly 2A are present onthe Antarctic flank, while on the Pacific flank the threearches of Anomaly 2A are much narrower than expected.Along profiles PR7 and PR8, the four wigglescharacteristic of Anomaly 3 are visible but shifted by asmuch as ~ 50 km relative to a simple magnetic model, apattern compatible with the generation of these magneticanomalies at the eastern branch of a vanished offset.
This supports the hypothesis that a giant overlappingspreading center (GOSC) was present with two activebranches prior to Chron 2A; this GOSC evolved and
finally vanished during Chron 2A, as suggested by Géliet al., [ 1997]. Along profile PR9, two wigglescharacteristic of Anomaly 3A seem to appear (Figure 8).If these two wiggles can be identified as such, then theconsistency between PR8 and PR9 can be obtained byassuming that a left stepping transform offset of about 55km was present between the two profiles (PR8 and PR9)prior to Anomaly 3A. In response to clockwise rotationsof the spreading direction this transform offsetprogressively evolved into a giant overlapping center andoff-axis reliefs formed (these reliefs are clearly visible asa series of topographic highs, presently located near62°30’S, 152°W and oriented in the N125° direction)(Plate 4). The presence of a complete, undisturbed seriesof magnetic anomalies (J, 2, 2A, and 3) along profilePR10 suggests that the evolution of the transform offsetwas most probably fully achieved at about the time ofChron 3.
5. Evolution of Seafloor Roughnessand Axial Geometry Since 35 Ma
In sections 2-4, on the basis of shipboard data wehave described the evolution of the axial morphologysouth of Udintsev FZ and the evolution of therough/smooth boundary near the tip of the large V. Inthis section, we extrapolate these results as ground truthfor interpreting satellite observations. First, we analyzedthe seafloor roughness using gravity and gravity slopesdeduced from 1-min grids (D. Sandwell, personalcommunication, 2000) (Figure 9) and old bathymetricprofiles (Figure 10).
Figure 9. Isocontoured (5 mGal), high-resolution (1-min grid, courtesy of D. Sandwell), satellite-derived gravity map of the study area. Onlythose isochrons that appear to correspond to changes in seafloor roughness are indicated. Note that the rough/smooth transition occurs shortly afterChron 3a in the area centered on Saint Exupéry FZ and at Chron 4 between La Rose FZ and Pitman FZ.

ONDREAS ET AL.: VARIATIONS IN AXIAL MORPHOLOGY SEGMENTATION AND SEAFLOOR ROUGHNESS
8536
Figure 10. Comparison between the rough/smooth boundary inferred from the contoured, high resolution gravity map and the boundaryinferred from actual bathymetric profiles. In total, Six ship’s tracks are shown: Three on the western flank of the ridge (elt25, elt15, andv1609) and three on the eastern flank (elt14, elt19, and rits93b). Along each line, there is an alternance of rough (R) and smooth (S) seafloordomains (rough and smooth seafloor are visually characterized by respectively high and small amplitude bathymetric variations). Note thegood correspondence with the rough/smooth boundary inferred from satellite-derived gravity data.
ONDREAS ET AL.: VARIATIONS IN AXIAL MORPHOLOGY SEGMENTATION AND SEAFLOOR ROUGHNESS
8537
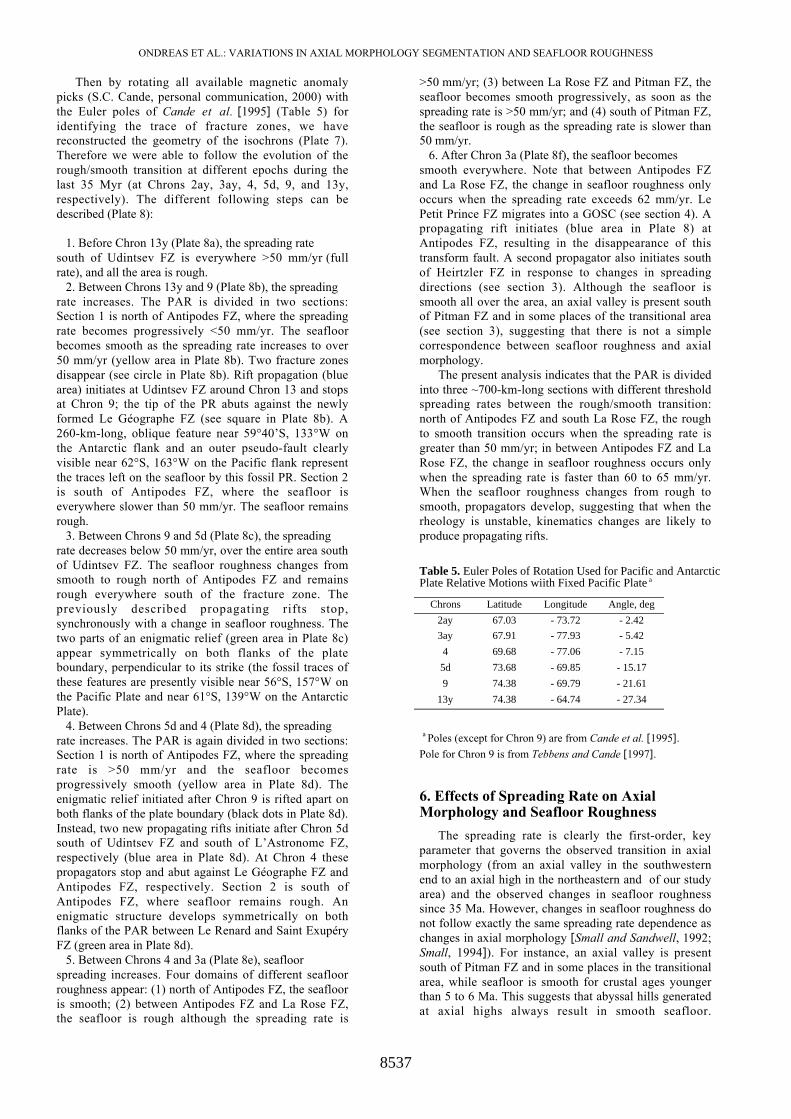
Then by rotating all available magnetic anomalypicks (S.C. Cande, personal communication, 2000) withthe Euler poles of Cande et al. [1995] (Table 5) foridentifying the trace of fracture zones, we havereconstructed the geometry of the isochrons (Plate 7).Therefore we were able to follow the evolution of therough/smooth transition at different epochs during thelast 35 Myr (at Chrons 2ay, 3ay, 4, 5d, 9, and 13y,respectively). The different following steps can bedescribed (Plate 8):
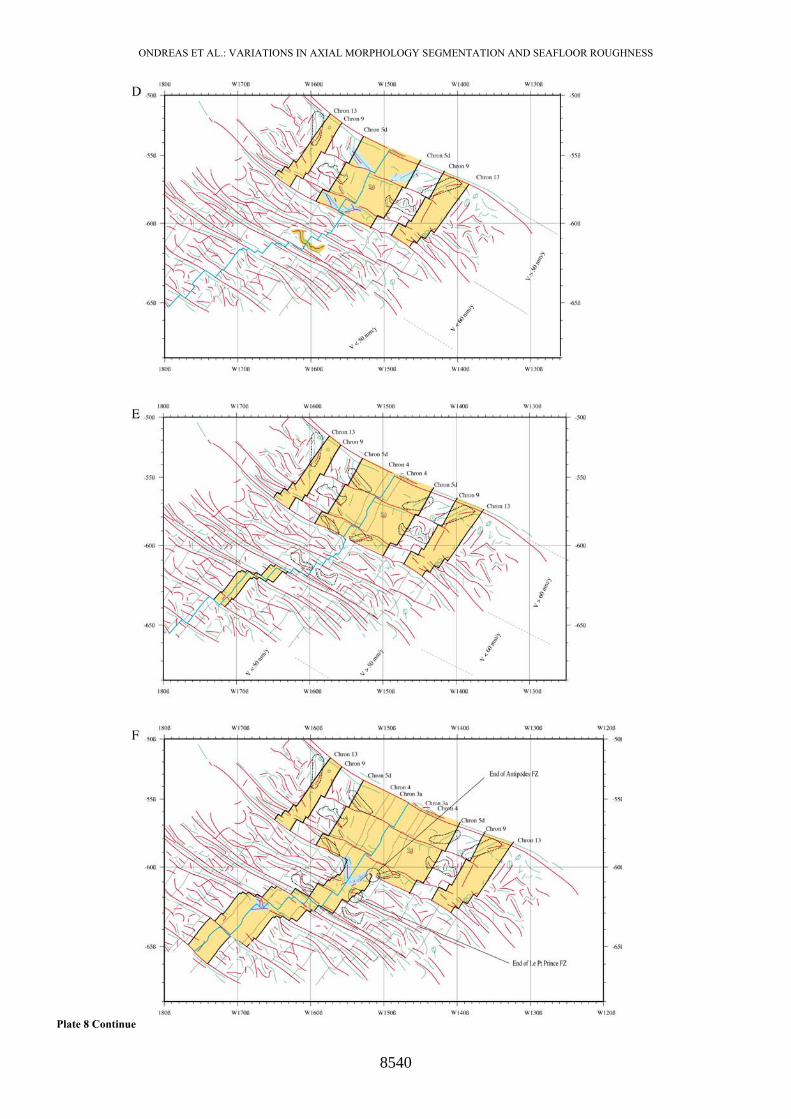
1. Before Chron 13y (Plate 8a), the spreading ratesouth of Udintsev FZ is everywhere >50 mm/yr (fullrate), and all the area is rough. 2. Between Chrons 13y and 9 (Plate 8b), the spreadingrate increases. The PAR is divided in two sections:Section 1 is north of Antipodes FZ, where the spreadingrate becomes progressively <50 mm/yr. The seafloorbecomes smooth as the spreading rate increases to over50 mm/yr (yellow area in Plate 8b). Two fracture zonesdisappear (see circle in Plate 8b). Rift propagation (bluearea) initiates at Udintsev FZ around Chron 13 and stopsat Chron 9; the tip of the PR abuts against the newlyformed Le Géographe FZ (see square in Plate 8b). A260-km-long, oblique feature near 59°40’S, 133°W onthe Antarctic flank and an outer pseudo-fault clearlyvisible near 62°S, 163°W on the Pacific flank representthe traces left on the seafloor by this fossil PR. Section 2is south of Antipodes FZ, where the seafloor iseverywhere slower than 50 mm/yr. The seafloor remainsrough. 3. Between Chrons 9 and 5d (Plate 8c), the spreadingrate decreases below 50 mm/yr, over the entire area southof Udintsev FZ. The seafloor roughness changes fromsmooth to rough north of Antipodes FZ and remainsrough everywhere south of the fracture zone. Thepreviously described propagating rifts stop,synchronously with a change in seafloor roughness. Thetwo parts of an enigmatic relief (green area in Plate 8c)appear symmetrically on both flanks of the plateboundary, perpendicular to its strike (the fossil traces ofthese features are presently visible near 56°S, 157°W onthe Pacific Plate and near 61°S, 139°W on the AntarcticPlate). 4. Between Chrons 5d and 4 (Plate 8d), the spreadingrate increases. The PAR is again divided in two sections:Section 1 is north of Antipodes FZ, where the spreadingrate is >50 mm/yr and the seafloor becomesprogressively smooth (yellow area in Plate 8d). Theenigmatic relief initiated after Chron 9 is rifted apart onboth flanks of the plate boundary (black dots in Plate 8d).Instead, two new propagating rifts initiate after Chron 5dsouth of Udintsev FZ and south of L’Astronome FZ,respectively (blue area in Plate 8d). At Chron 4 thesepropagators stop and abut against Le Géographe FZ andAntipodes FZ, respectively. Section 2 is south ofAntipodes FZ, where seafloor remains rough. Anenigmatic structure develops symmetrically on bothflanks of the PAR between Le Renard and Saint ExupéryFZ (green area in Plate 8d). 5. Between Chrons 4 and 3a (Plate 8e), seafloorspreading increases. Four domains of different seafloorroughness appear: (1) north of Antipodes FZ, the seaflooris smooth; (2) between Antipodes FZ and La Rose FZ,the seafloor is rough although the spreading rate is
>50 mm/yr; (3) between La Rose FZ and Pitman FZ, theseafloor becomes smooth progressively, as soon as thespreading rate is >50 mm/yr; and (4) south of Pitman FZ,the seafloor is rough as the spreading rate is slower than50 mm/yr. 6. After Chron 3a (Plate 8f), the seafloor becomessmooth everywhere. Note that between Antipodes FZand La Rose FZ, the change in seafloor roughness onlyoccurs when the spreading rate exceeds 62 mm/yr. LePetit Prince FZ migrates into a GOSC (see section 4). Apropagating rift initiates (blue area in Plate 8) atAntipodes FZ, resulting in the disappearance of thistransform fault. A second propagator also initiates southof Heirtzler FZ in response to changes in spreadingdirections (see section 3). Although the seafloor issmooth all over the area, an axial valley is present southof Pitman FZ and in some places of the transitional area(see section 3), suggesting that there is not a simplecorrespondence between seafloor roughness and axialmorphology.
The present analysis indicates that the PAR is dividedinto three ~700-km-long sections with different thresholdspreading rates between the rough/smooth transition:north of Antipodes FZ and south La Rose FZ, the roughto smooth transition occurs when the spreading rate isgreater than 50 mm/yr; in between Antipodes FZ and LaRose FZ, the change in seafloor roughness occurs onlywhen the spreading rate is faster than 60 to 65 mm/yr.When the seafloor roughness changes from rough tosmooth, propagators develop, suggesting that when therheology is unstable, kinematics changes are likely toproduce propagating rifts.
Table 5. Euler Poles of Rotation Used for Pacific and AntarcticPlate Relative Motions wiith Fixed Pacific Plate a
Chrons Latitude Longitude Angle, deg
2ay 67.03 - 73.72 - 2.42
3ay 67.91 - 77.93 - 5.42
4 69.68 - 77.06 - 7.15
5d 73.68 - 69.85 - 15.17
9 74.38 - 69.79 - 21.61
13y 74.38 - 64.74 - 27.34
a Poles (except for Chron 9) are from Cande et al. [1995].
Pole for Chron 9 is from Tebbens and Cande [1997].
6. Effects of Spreading Rate on AxialMorphology and Seafloor Roughness
The spreading rate is clearly the first-order, keyparameter that governs the observed transition in axialmorphology (from an axial valley in the southwesternend to an axial high in the northeastern and of our studyarea) and the observed changes in seafloor roughnesssince 35 Ma. However, changes in seafloor roughness donot follow exactly the same spreading rate dependence aschanges in axial morphology [Small and Sandwell, 1992;Small, 1994]). For instance, an axial valley is presentsouth of Pitman FZ and in some places in the transitionalarea, while seafloor is smooth for crustal ages youngerthan 5 to 6 Ma. This suggests that abyssal hills generatedat axial highs always result in smooth seafloor.

ONDREAS ET AL.: VARIATIONS IN AXIAL MORPHOLOGY SEGMENTATION AND SEAFLOOR ROUGHNESS
8538
Plate 7. Synoptic sketch of the present-day, tectonic situation. Major structural features south of Udintsev FZ are based on the 1-minsatellite gravity grid (D. Sandwell, personal communication, 2000) and on the one minute satellite gravity slopes grid. Red lines indicategravity lows (e.g. fracture zones). Green, dotted lines are for gravity highs. Blue thick line is for spreading center. Blue areas represent trailsof propagating rifts, fossil or present. Green areas represent trails of enigmatic structures that appear as gravity lineations, symmetricallyrelative to the spreading center. All available magnetic anomaly picks are represented by small black and green symbols (S.C. Cande,personal communication, 2000). For selected anomalies the picks (black symbols) have been rotated using the Euler poles (see Table 5) ofCande et al. [1995]. Rotated picks are in red. Isochrons (black lines) are based on both the actual and rotated anomaly picks, and on thedirection of fracture zones. Thick isochrons approximately date transitions in seafloor roughness. Circles on the Antarctic plate focus oninterruptions of fracture zones. Square focuses on the initiation of Le Géographe FZ.
.

ONDREAS ET AL.: VARIATIONS IN AXIAL MORPHOLOGY SEGMENTATION AND SEAFLOOR ROUGHNESS
8539
Plate 8. Kinematic reconstructions (based on the Euler poles of Cande et al. [1995]: see Table 5) at different, selected chrons: (a) chron 13y; (b)chron 9; (c) chron 5; (d) chron 4; (e) chron 3ay, and (f) chron 2ay. For description of structural features, see caption of Plate 7. Blue areas indicatesymmetric structures that initiate at the time of the given chron. Black, dotted lines indicate contour of structures that already exist. Areas ofsmooth seafloor are in yellow. Interruption and initiation of fractures are indicated by circles and squares, respectively. V is full spreading rateaveraged for the period comprised between the given chron and the previous one.
ONDREAS ET AL.: VARIATIONS IN AXIAL MORPHOLOGY SEGMENTATION AND SEAFLOOR ROUGHNESS
8540
Plate 8 Continue
ONDREAS ET AL.: VARIATIONS IN AXIAL MORPHOLOGY SEGMENTATION AND SEAFLOOR ROUGHNESS
8541
6. Effects of Spreading Rate on AxialMorphology and Seafloor Roughness
The spreading rate is clearly the first-order, keyparameter that governs the observed transition in axialmorphology (from an axial valley in the southwesternend to an axial high in the northeastern and of our studyarea) and the observed changes in seafloor roughnesssince 35 Ma. However, changes in seafloor roughness donot follow exactly the same spreading rate dependence aschanges in axial morphology [Small and Sandwell, 1992;Small, 1994]). For instance, an axial valley is present
south of Pitman FZ and in some places in the transitionalarea, while seafloor is smooth for crustal ages youngerthan 5 to 6 Ma. This suggests that abyssal hills generatedat axial highs always result in smooth seafloor. Incontrast, smooth seafloor does not mean necessarypresent-day axial high. This observation, based on ourqualitative analysis of seafloor roughness, is consistentwith previous, quantitative studies showing that abyssalhills generated at axial high mid-ocean ridges displaylittle if any functionality with spreading rate, in contrastwith those generated at axial valleys [Goff, 1991;Macario et al., 1994].
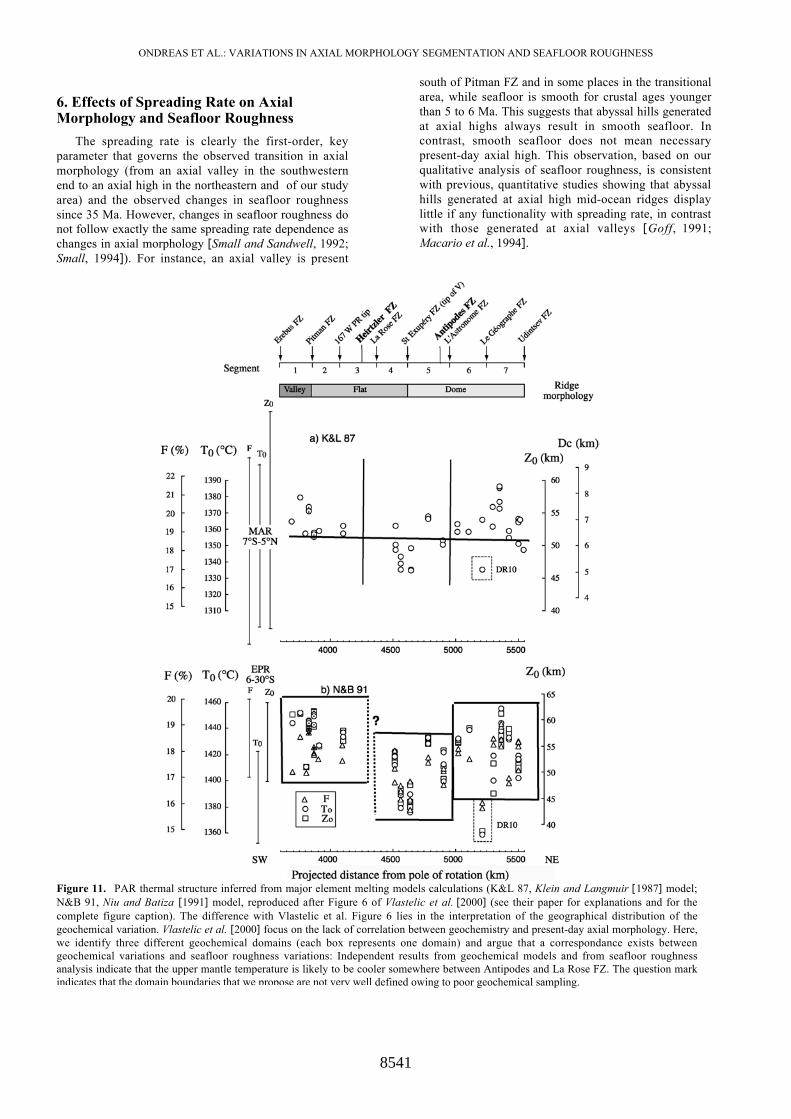
Figure 11. PAR thermal structure inferred from major element melting models calculations (K&L 87, Klein and Langmuir [1987] model;N&B 91, Niu and Batiza [1991] model, reproduced after Figure 6 of Vlastelic et al. [2000] (see their paper for explanations and for thecomplete figure caption). The difference with Vlastelic et al. Figure 6 lies in the interpretation of the geographical distribution of thegeochemical variation. Vlastelic et al. [2000] focus on the lack of correlation between geochemistry and present-day axial morphology. Here,we identify three different geochemical domains (each box represents one domain) and argue that a correspondance exists betweengeochemical variations and seafloor roughness variations: Independent results from geochemical models and from seafloor roughnessanalysis indicate that the upper mantle temperature is likely to be cooler somewhere between Antipodes and La Rose FZ. The question markindicates that the domain boundaries that we propose are not very well defined owing to poor geochemical sampling.
ONDREAS ET AL.: VARIATIONS IN AXIAL MORPHOLOGY SEGMENTATION AND SEAFLOOR ROUGHNESS
8542
The different models for explaining the spreadingrate dependence of axial introduce the concept of athreshold spreading rate that is mantle temperaturedependent. Increases in mantle temperature do producerheological changes (by decreasing the viscosity of theupper mantle and the thickness and strength of the crust)that allow the morphological transition from axial valleyto axial high to occur at slower spreading rates mantle[Neumann and Forsyth, 1993; Chen and Morgan, 1990a,1990b]. Consequently, the threshold spreading rate valueis expected to increase when the upper mantletemperature decreases. Using major element data sets(from 20 dredges collected between 65°S and 56°S) andtwo different petrological melting models [Klein andLangmuir, 1987; Niu and Batiza, 1991], Vlastelic et al.[2000] have attempted to infer the pattern of uppermantle temperature variations beneath the Pacific-Antarctic south of Udintsev FZ (Figure 11) and focusedon the lack of correlation between geochemistry andpresent-day axial morphology. However, at the segmentscale, changes in axial morphology are not recorded bythe geochemical properties of the ridge basalts (exceptthe cooling effects of fracture zones), and at wavelengthsof ~ 700 km, three sections appear: below the centralsection, the upper mantle temperature is inferred to be30° to 40°C cooler than below the two adjacent sections.In the cool area (approximately centered on SaintExupéry FZ), the transition from rough to smoothseafloor occurs for spreading rates >60-65 mm/yr, whilethe threshold value is anywhere else equal to 50 mm/yr.As expected, the cooler the mantle temperature, thehigher the threshold value of the rough/smooth transition.Both geochemical and seafloor roughness dataconsistently suggest that the upper mantle is segmentedwith a wavelength of about ~700 km.
7. Conclusion
The Pacific-Antarctic Ridge between 180°W andUdinsev FZ is characterized by a 650-km-longtransitional section where the axial morphologyalternates between axial valley, axial high, or flatprofiles. In this transitional section the mechanicalproperties of the axial lithosphere are close to thethreshold between slow spreading and fast spreadingridges. Owing to the proximity of the Euler pole ofrotation between the Pacific and Antarctic Plates, thegeometry of the plate boundary evolves rapidly inresponse to Pliocene changes in the Pacific/Antarcticrelative motion. Clearly, different types of adjustmentoccur, either by the initiation of propagating rifts or bytransitions from transform faults into giant overlappingspreading centers.
What we observe in the present-day transitional areais representative of the phenomena that have occurredsince 35 Ma:
Increases in spreading rate above the threshold valueproduced rheological changes that resulted in transitionsfrom rough to smooth seafloor topography. Owing to ageneral increase in the angular rotation rate betweenPacific and Antarctic, the transitional area hasprogressively migrated southward since 35 Ma, creatingthe V shaped of the rough to smooth boundary east of157°W.
Clockwise rotations of the spreading direction wereaccommodated by the plate boundary; in the transitional
area (past and present), these rotations resulted either inrift propagation, either in transitions from fracture zonesto non transform discontinuities that left the trails on theseafloor that presently delineate the 1000 km large Vshaped boundary. The V shape appears to be mostentirely related to changes in the relative plates motion.
In addition, the detailed study of the evolution ofseafloor roughness variations since 35 Ma reveals theexistence of a 700-km wavelength segmentation of thePAR south of Udintsev FZ, with a relatively cool areaapproximately centered on Saint Exupéry FZ. It isworthwhile to note that this segmentation is consistentwith the long-wavelength segmentation of the EastPacific Rise inferred from the filtered Pacific geoid[Cazenave et al., 1992]. Further studies are needed toinvestigate the relationship between this 700-km-longsegmentation and the temperature pattern of the Pacificupper mantle.
Acknowledgments. We thank the captain and crew of theR/V L'Atalante for making this study possible. Dave Sandwellkindly provided the 1-min gravity grid of the Pacific-Antarcticarea before publication and Steve Cande gave helpful advice.All the figures have been drawn using GMT freeware [Wesseland Smith, 1995].
ReferencesAslanian, D., H. Ondréas, L. Géli, and A. Briais, Axial
morphology of the Pacific-Antarctic Ridge from thePACANTARCTIC cruise of the N/O L'Atalante (abstract),Eos Trans. AGU, 77(46), Fall Meet. Suppl., 729, 1996.
Augustin, J. M., C. Edy, B. Savoye, and E. Le Drezen, Sonarmosaic computation from multibeam echo sounder,Proceedings in IEEE Oceans 94 - Brest, vol. II, pp. 433-438,Piscatawary, N.J., 1994.
Bourillet, J. F., C. Edy, F. Rambert, C. Satra, and B. Loubrieu,Swath mapping system processing: Bathymetry andcartography, Mar. Geophys. Res., 18, 487-506, 1996.
Briais, A., Structural analysis of the segmentation of the CentralIndian Ridge between 20°30'S and 25°30'S (RodriguezTriple Junction), Mar. Geophys. Res., 17, 431-467, 1995.
Briais, A., D. Aslanian, H. Ondréas, and L. Géli, The 167°Wpropagator along the Pacific-Antarctic Ridge: Results fromthe Pacantarctic cruise (abstract), Eos Trans. AGU, 77(46),Fall Meet. Suppl., 729, 1996.
Cande, S.C., and D.V. Kent, Revised calibration of thegeomagnetic polarity timescale for the Late Cretaceous andCenozoic, J. Geophys. Res., 100, 6093-6095, 1995.
Cande, S.C., C.A. Raymond, J. Stock, and W. F. Haxby,Geophysics of the Pitman Fracture Zone and Pacific-Antarctic Plate motions during the Cenozoic, Science, 270,947-953, 1995.
Cazenave, A., S. Houry, B. Lago, and K. Dominh, Geosat-derived geoid anomalies at medium wavelength, J. Geophys.Res., 97, 7081-7096, 1992.
Chen, Y., and J.W. Morgan, Rift valley/no rift valley transitionat mid-ocean ridges, J. Geophys. Res., 95, 17,571-17,581,1990a.
Chen, Y., and J.W. Morgan, A nonlinear rheology model formid-ocean ridge axis topography, J. Geophys. Res., 95,17,583-17,604, 1990b.
Cochran, J. R., J. C. Sempéré, and SEIR Scientific Team, TheSoutheast Indian Ridge between 88°E and 118°E: Gravityanomalies and crustal accretion at intermediate spreadingrates, J. Geophys. Res., 102, 15,463-15,487, 1997.
Géli, L., et al., Evolution of the Pacific-Antarctic Ridge Southof the Udintsev Fracture Zone, Science, 278, 1281-1284,1997.
Géli, L., D. Aslanian, J. L. Olivet, I. Vlastelic, L. Dosso, H.Guillou, and H. Bougault, Location of Louisville hotspot andorigin of Hollister ridge: Geophysical constraints, EarthPlanet. Sci. Lett., 164, 31-40, 1998.
ONDREAS ET AL.: VARIATIONS IN AXIAL MORPHOLOGY SEGMENTATION AND SEAFLOOR ROUGHNESS
8543
Goff, J. A., A global and regional stochastic analysis of near-ridge abyssal hill morphology, J. Geophys. Res., 96, 21,713-21,737, 1991.
Hey, R. N., M. C. Kleinrock, S. P. Miller, T. M. Atwater, andR. C. Searle, Sea Beam/Deep Tow investigation of an activeoceanic propagating rift system, Galapagos, 95,5°W, J.Geophys. Res., 91, 3369-3393, 1986.
Klein, E. M., and C. H. Langmuir, Global correlations ofoceanic ridge basalt chemistry with axial depth and crustalthickness, J. Geophys. Res., 92, 8089-8115, 1987.
Lonsdale, P., Structural geomorphology of the Eltanin FaultSystem and adjacent transform faults of the Pacific-Antarcticplate boundary, Mar. Geophys. Res., 16, 105-143, 1994a.
Lonsdale, P., Geomorphology and structural segmentation ofthe crest of the southern (Pacific-Antarctic) East PacificRise, J. Geophys. Res., 99, 4683-4702, 1994b.
Macario, A., W. F. Haxby, J. A. Goff, W. B. F. Ryan, S. C.Cande, and C. A. Raymond, Flow line variations in abyssalhill morphology for the Pacific-Antarctic Ridge at 65°S, J.Geophys. Res., 99, 17,921-17,934, 1994.
Macdonald, K. C., Tectonic and magmatic processes on the EastPacific Rise, in The Geology of North America, vol. N, TheEastern Pacific Ocean and Hawaii, pp. 93-110, Boulder,Colo., Geol. Soc. of Am., 1989.
Macdonald, K. C., J. C. Sempéré, and P. J. Fox, Reply tocomment on "The debate concerning overlapping spreadingcenters and mid-ocean ridge processes," J. Geophys. Res.,91, 10,501-10,510, 1986.
Macdonald, K. C., D. Scheirer, and S. M. Carbotte, Mid-OceanRidges: Discontinuities, segments and giant cracks, Science,253, 986-994, 1991.
Macdonald, K. C., et al., The East Pacific Rise and its flanks 8-18°N: History of segmentation, propagation and spreadingdirection based on Sea Beam studies, Mar. Geophys. Res.,14, 299-344, 1992.
Neumann, G. A., and D. W. Forsyth, Comparison of marinegravity from shipboard and high-density satellite altimetry
along the Mid-Atlantic Ridge, 30.5°-35.5°S, Geophys. Res.Lett., 20, 1639-1642, 1993.
Niu, Y., and R. Batiza, An empirical method for calculatingmelt compositions produced beneath mid-ocean ridges:Application for axis and off-axis (seamounts) melting, J.Geophys. Res., 96, 21,753-21,777, 1991.
Sahabi, M., L. Géli, J. L. Olivet, L. Gilg-Capar, G. Roult, H.Ondréas, P. Beuzart, and D. Aslanian, Morphologicalreorganization within the Pacific-Antarctic Discordance,Earth Planet. Sci. Lett., 137, 157-173, 1996.
Sempéré, J. C., J. R. Cochran, and the SEIR Scientific Team,The Southeast Indian Ridge between 88°E and 118°E:Variations in crustal accretion at constant spreading rate, J.Geophys. Res., 102, 15,489-15, 506, 1997.
Small, C., A global analysis of mid-ocean ridge axistopography, Geophys. J. Int., 116, 64-84, 1994.
Small, C., and D. T., Sandwell, An analysis of ridge axis gravityroughness and spreading rate, J. Geophys. Res., 97, 3235-3245, 1992.
Smith, W.H, and D.T. Sandwell, Marine gravity field fromdeclassified Geosat and ERS-1 altimetry (abstract), EosTrans AGU, 76(46), Fall Meet. Suppl., 156, 1995.
Tebbens, S.F., and S.C. Cande, Southeast Pacific tectonicevolution from early Oligocene to Present, J. Geophys. Res.,102, 12,061-12,084, 1997.
Vlastelic, I., L. Dosso, H. Guillou, H. Bougault, L. Géli, J.Etoubleau, and J. L. Joron, Geochemistry of the Hollisterridge: Relation with the Louisville hotspot and the Pacific-Antarctic Ridge, Earth Planet. Sci. Lett., 160, 777-793,1998.
Vlastelic, I., L. Dosso, H. Bougault, D. Aslanian, L. Géli, J.Etoubleau, M. Bohn, J. L. Joron, and C. Bollinger, Chemicalsystematics of an intermediate spreading ridge: The Pacific-Antarctic Ridge between 56 and 66°S, J. Geophys. Res., 105,2915-2936, 2000.
Wessel, P., and W. H. F. Smith, New version of the GenericMapping Tools released, Eos Trans. AGU, 76(46), 329,1995.
Copyright © 2022 FDOKUMEN