Effect of various fire retardants on surface roughness of plywood
6
Building and Environment 41 (2006) 887–892 Effect of various fire retardants on surface roughness of plywood Nadir Ayrilmis a, , Suleyman Korkut b , Ercan Tanritanir c , Jerrold E. Winandy d , Salim Hiziroglu e a Istanbul University, Forestry Faculty, Department of Wood Mechanics and Technology, Bahcekoy, Sariyer, 34473, Istanbul, Turkey b Abant Izzet Baysal University, Forestry Faculty, Department of Wood Mechanics and Technology, Duzce 81620, Turkey c Istanbul University, Forestry Faculty, Department of Forest Products Industry, Machinery and Business Administration, Bahcekoy, Sariyer, 34473, Istanbul, Turkey d USDA Forest Service, Forest Products Laboratory, Madison, WI 53726-2398, USA e Oklahoma State University, Department of Forestry, Stillwater, OK 74078-6013, USA Received 25 February 2005; received in revised form 5 April 2005; accepted 12 April 2005 Abstract In this study the surface roughness of plywood treated with various fire retardants was investigated. Commercially manufactured veneer of Akaba wood (Tetraberlinia bifoliolata) was treated with borax, boric acid, monoammonium phosphate and diammonium phosphate, then experimental plywood panels were made from these veneer sheets. A stylus method was employed to evaluate the surface characteristics of the samples. Three main roughness parameters, mean arithmetic deviation of profile (R a ), mean peak-to- valley height (R z ), and maximum roughness (R max ) obtained from the surface of plywood were used to evaluate the effect of chemical treatments on the surface characteristics of the specimens. Significant difference was determined (p ¼ 0:05) between surface roughness parameters (R a , R z , R max ) for four treatments and two retentions of fire retardants. Samples treated with 3% concentration of borax had the smoothest surface with 11:09 mm R a while the roughest surface was found for the samples treated with 6% boric acid having R a value of 12:44 mm. Results revealed that the surface quality of the panels reduced with increasing chemical concentration. r 2005 Elsevier Ltd. All rights reserved. Keywords: Fire retardant; Plywood; Surface roughness 1. Introduction Surface roughness of veneer plays an important role in plywood manufacture. Cross grain, annual ring width, rays, knots, reaction wood, ratio of early wood and late wood, pre-treatment and peeling conditions, such as knife angle, are some of the raw material and production parameters influencing roughness of veneer. Control of veneer surface in plywood production is essential to maintain plywood quality [1]. Rough veneers reduce contact between the layers resulting in a weak glueline and low strength properties of the plywood [2]. Veneer with a rough surface can also cause excessive resin use and may result in resin-bleed through the face veneer. Roughness of face veneer can be improved to a certain extend by sanding. However, this increases overall production cost [3,4]. Surface of wood products may be characterized by either topography or profile. Profiles are more widely used in evaluating surface irregularities since less expensive data acquisition equipment is required with the profile measurement in comparison to that of topography. Stylus technique among the other methods, such as pneumatic, laser, and acoustic emission, is accurate, practical, and repeatable. ARTICLE IN PRESS www.elsevier.com/locate/buildenv 0360-1323/$ - see front matter r 2005 Elsevier Ltd. All rights reserved. doi:10.1016/j.buildenv.2005.04.011 Corresponding author. Tel.: +90 212 226 1100; fax: +90 212 226 1113. E-mail addresses: [email protected] (N. Ayrilmis), [email protected] (S. Korkut), [email protected], [email protected] (J.E. Winandy), [email protected] (S. Hiziroglu).
Transcript of Effect of various fire retardants on surface roughness of plywood
ARTICLE IN PRESS
0360-1323/$ - se
doi:10.1016/j.bu
�Correspondfax: +90212 22
E-mail addr
korkut_suleyma
jwinandy@wisc
(S. Hiziroglu).
Building and Environment 41 (2006) 887–892
www.elsevier.com/locate/buildenv
Effect of various fire retardants on surface roughness of plywood
Nadir Ayrilmisa,�, Suleyman Korkutb, Ercan Tanritanirc, Jerrold E. Winandyd,Salim Hiziroglue
aIstanbul University, Forestry Faculty, Department of Wood Mechanics and Technology, Bahcekoy, Sariyer, 34473, Istanbul, TurkeybAbant Izzet Baysal University, Forestry Faculty, Department of Wood Mechanics and Technology, Duzce 81620, Turkey
cIstanbul University, Forestry Faculty, Department of Forest Products Industry, Machinery and Business Administration, Bahcekoy,
Sariyer, 34473, Istanbul, TurkeydUSDA Forest Service, Forest Products Laboratory, Madison, WI 53726-2398, USA
eOklahoma State University, Department of Forestry, Stillwater, OK 74078-6013, USA
Received 25 February 2005; received in revised form 5 April 2005; accepted 12 April 2005
Abstract
In this study the surface roughness of plywood treated with various fire retardants was investigated. Commercially manufactured
veneer of Akaba wood (Tetraberlinia bifoliolata) was treated with borax, boric acid, monoammonium phosphate and diammonium
phosphate, then experimental plywood panels were made from these veneer sheets. A stylus method was employed to evaluate the
surface characteristics of the samples. Three main roughness parameters, mean arithmetic deviation of profile (Ra), mean peak-to-
valley height (Rz), and maximum roughness (Rmax) obtained from the surface of plywood were used to evaluate the effect of
chemical treatments on the surface characteristics of the specimens. Significant difference was determined (p ¼ 0:05) between surface
roughness parameters (Ra, Rz, Rmax) for four treatments and two retentions of fire retardants. Samples treated with 3%
concentration of borax had the smoothest surface with 11:09mm Ra while the roughest surface was found for the samples treated
with 6% boric acid having Ra value of 12:44mm. Results revealed that the surface quality of the panels reduced with increasing
chemical concentration.
r 2005 Elsevier Ltd. All rights reserved.
Keywords: Fire retardant; Plywood; Surface roughness
1. Introduction
Surface roughness of veneer plays an important rolein plywood manufacture. Cross grain, annual ringwidth, rays, knots, reaction wood, ratio of early woodand late wood, pre-treatment and peeling conditions,such as knife angle, are some of the raw material andproduction parameters influencing roughness of veneer.Control of veneer surface in plywood production is
e front matter r 2005 Elsevier Ltd. All rights reserved.
ildenv.2005.04.011
ing author. Tel.: +90212 226 1100;
6 1113.
esses: [email protected] (N. Ayrilmis),
[email protected] (S. Korkut), [email protected],
.edu (J.E. Winandy), [email protected]
essential to maintain plywood quality [1]. Rough veneersreduce contact between the layers resulting in a weakglueline and low strength properties of the plywood [2].Veneer with a rough surface can also cause excessiveresin use and may result in resin-bleed through the faceveneer. Roughness of face veneer can be improved to acertain extend by sanding. However, this increasesoverall production cost [3,4]. Surface of wood productsmay be characterized by either topography or profile.Profiles are more widely used in evaluating surfaceirregularities since less expensive data acquisitionequipment is required with the profile measurement incomparison to that of topography. Stylus techniqueamong the other methods, such as pneumatic, laser, andacoustic emission, is accurate, practical, and repeatable.

ARTICLE IN PRESSN. Ayrilmis et al. / Building and Environment 41 (2006) 887–892888
Quantitative roughness parameters can be accuratelycalculated from the actual graph obtained from thesurface and all standard parameters can be generated tohave an objective information about the surfacemeasured [5–7]. Different techniques including stylusmethod were used in various studies to measure andquantify surface characteristics of wood and wood-based panels [8–11]. Roughness of southern pine veneersurfaces using a stylus tracing method was alsoevaluated in another study [7]. Knife setting and cuttingspeed were adjusted based on the roughness measure-ments of veneer in this work. Pneumatic method wasalso applied to wood surface to evaluate irregularitiescaused by sawing [12].
The use of plywood treated with fire retardants arebecoming popular. They are very important forspecialized construction applications and furnitureindustry [13,14]. Various types of thin overlays orfinishes are sometimes directly applied to the sandedsurface of fire retardant treated panels. Therefore, thesurface quality of the plywood panels plays animportant role for further applications. The objectiveof this study is to evaluate surface roughness of plywoodsamples made from veneer treated with four differentfire retardants by using a fine stylus tracing techniques.The influence of these chemical treatments on thesurface roughness of experimental plywood was quanti-fied based on three roughness parameters obtained fromthe stylus type profilometer.
2. Material and methods
2.1. Plywood manufacture
Commercially manufactured rotary cut veneer ofAkaba (Tetraberlinia bifoliolata) logs were used to makeplywood under laboratory conditions. Veneer sampleswere kept in a conditioning chamber until they reach7% moisture content. In the next step, the specimenswere soaked for 3 h in plexiglass boxes while laidhorizontally 4 cm apart from each other in 3% or 6%aqueous solutions of borax (Na2B4O7 � 10H2O) or boricacid (H3BO3), or in 3% or 11% aqueous solutions ofmonoammonium phosphate (NH4H2PO4) or, diammo-nium phosphate ((NH4Þ2HPO4). The temperature of thevarious solutions was 60 �C during the treatmentprocess. Each treated veneer sample was then recondi-tioned to 7% moisture content before plywood panelswere manufactured. Before and after treatment processsamples were weighted to calculate chemical retention.A total of 36 five-ply experimental panels, four for eachtreatment were manufactured from the veneer with thedimension of 490mm� 490mm� 2:20mm. Exteriorresin phenol formaldehyde with 47% solid content wasapplied to the veneers at a rate of 200 g=m2 and they
were pressed using a pressure of 65 bar at a temperatureof 130 �C for 12min in a computer controlled laboratorypress. Plywood panels were conditioned at 20 �Cof temperature and 65% relative humidity for threeweeks before initial surface roughness evaluations werecarried out.
2.2. Determination of surface roughness
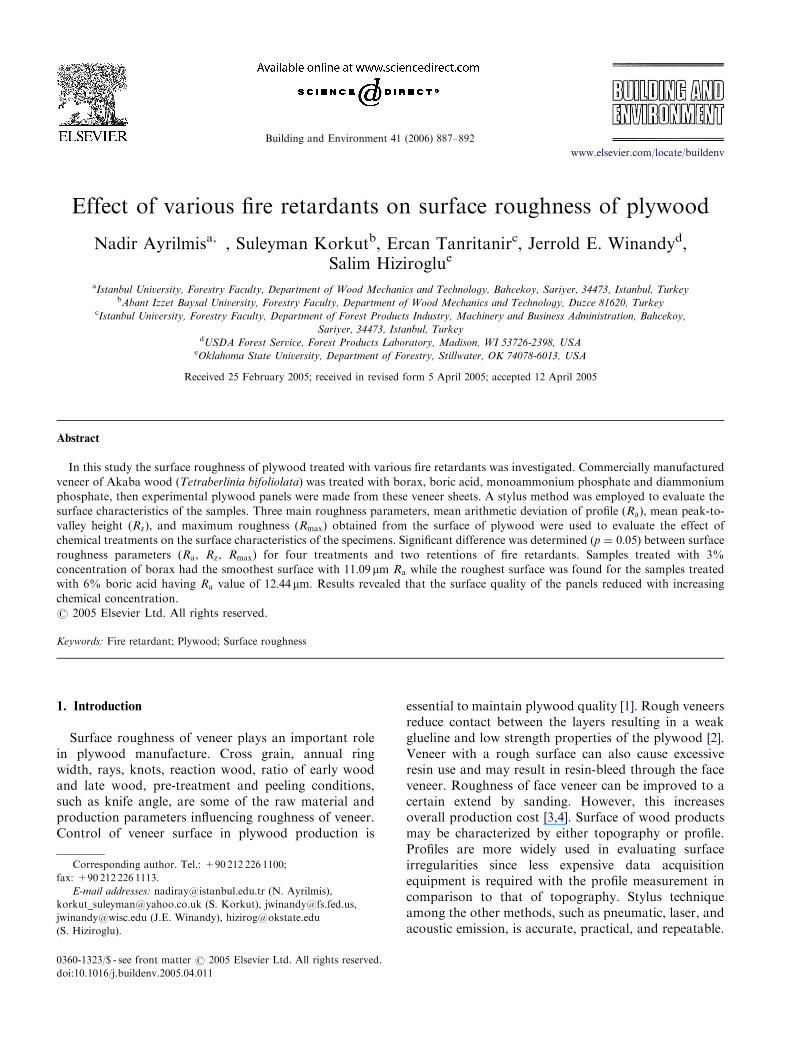
Ten 100mm� 100mm surface roughness test sampleswere cut from each panel. One measurement wasperformed on each surface roughness test sampleacross the grain orientation of the top ply. A totalof 40 roughness measurements along and acrossthe grain orientation of the surface of each typeof treated samples and control samples were takenusing a stylus type profilometer, Mitutoyo SurftestSJ-301 (Fig. 1). Tracing speed, stylus tip diameter,and tip angle were 10mm/min, 4mm and 90�,respectively. Fifteen millimeter tracing length (Lt)with 2.5mm cut-off was used for the measurements.The measuring force of the scanning arm on thesurfaces was 4mN (0.4 g) which did not put anysignificant damage on the surface [15]. Measurementswere repeated whenever the stylus tip fell into thecell lumen for several times during the tests. Thecalibration of the instruments was checked every 100measurements by using a standard reference platewith Ra values of 3.02 and 0:40mm. Fig. 2 illustratesa typical roughness profile for an untreated controland for plywood samples treated with 6% aqueoussolution of boric acid. Three roughness parameters,mean arithmetic deviation of profile (Ra), mean peak-to-valley height (Rz), and maximum roughness (Rmax)were commonly used in previous studies to evaluatesurface characteristics of wood and wood compositesincluding veneer [7,11,17,18]. Ra is the average distancefrom the profile to the mean line over the length ofassessment. Rz can be calculated from the peak-to-valleyvalues of five equal lengths within the profile whilemaximum roughness (Rmax) is the distance betweenpeak and valley points of the profile which can beused as an indicator of the maximum defect heightwithin the assesed profile [19].
Therefore, such parameters which are characterizedby ISO 4287 [16] were also employed to evaluateinfluence of chemical treatment on the surface roughnessof plywood specimens. The specifications of theseparameters are described in details in various works[17–19]. Analysis of variance (ANOVA) was used for thestatistical analysis. Also all multiple comparisons wereindividually evaluated and significance differences be-tween only the average values Ra, Rz, and Rmax ofroughness parameters between the surface of controland treated samples were determined using Duncan’smultiply range test.

ARTICLE IN PRESS
Fig. 1. Outline of the stylus type profilometer—Mitutoyo Surftest SJ-301.
Fig. 2. Surface roughness profiles of treated with 6% aqueous solutions boric acid and untreated samples.
N. Ayrilmis et al. / Building and Environment 41 (2006) 887–892 889
3. Results
Table 1 and Fig. 3 show results of average chemicalretention values and surface roughness parameters of thepanels. Significant difference was determined (p ¼ 0:05)
between surface roughness parameters (Ra, Rz, and Rmax)for four treatments and two retentions of fire retardantsaccording to the ANOVA statistical analysis (Table 2).Homogeneity groups were determined individually forRa, Rz and Rmax by Duncan’s multiply range test.

ARTICLE IN PRESS
Table 1
Retention values as function of chemical concentration and average values of roughness parameters
Treatment chemical Retention (kg=m3) Aqueous solutions (%) Roughness parameters
Ra ðmmÞ Rz ðmmÞ Rmax ðmmÞ
Untreated — — 10.13 F (12.17) 88.81 DEF (10.19) 123.00 CD (12.11)
Borax 8.60 3 11.09 DE (10.48) 91.01 CE (12.55) 125.42 BCD (12.23)
Borax 14.54 6 12.01 AB (10.21) 102.03 AB (10.10) 133.08 A (9.95)
Boric acid 11.07 3 11.58 BCD (9.42) 98.26 B (9.25) 130.99 AB (9.48)
Boric acid 19.37 6 12.44 A (10.48) 104.01 A (8.21) 134.52 A (9.07)
MAP 21.83 3 11.39 CE (8.17) 91.65 CD (11.41) 123.90 CD (12.63)
MAP 37.63 11 12.14 A (8.71) 98.53 B (9.21) 131.09 AB (8.80)
DAP 25.57 3 11.50 BCE (10.11) 93.71 C (8.90) 121.07 D (9.01)
DAP 41.81 11 11.90 AC (11.01) 85.24 F (9.98) 118.62 CD (8.90)
n: 40. Numbers in parentheses are standard deviations.
Homogeneity groups: same letters in each columns indicate that there is no statistical difference between the samples according to the Duncan’s
multiply range test.
Fig. 3. Average values of Ra and Rz parameters.
Table 2
Analysis of variance for Ra, Rz, and Rmax roughness parameters
Roughness parameter Source of variation Degree of freedom Sum of squares Mean square F -ratio (95%)
Ra Between treatments 8 148.76 18.595 14.865
Within treatments (Error) 351 439.07 1.251 4Total 359 587.83 19.846 2.016
Rz Between treatments 8 12624.68 1578.08 17.781
Within treatments (Error) 351 31150.99 88.75 4Total 359 43775.67 1666.83 2.016
Rmax Between treatments 8 10373.82 1296.72 8.137
Within treatments (Error) 351 55935.80 159.36 4Total 359 66309.62 1456.08 2.016
N. Ayrilmis et al. / Building and Environment 41 (2006) 887–892890

ARTICLE IN PRESS
Table 3
Increase of Ra values as function of chemical concentration
Treatment
chemical
Aqueous
solution
Increase of roughness parameters
Ra (%) Rz (%) Rmax (%)
Borax 3 9.48 2.48 1.97
Borax 6 18.56 14.89 8.20
Boric acid 3 14.31 10.64 6.50
Boric acid 6 22.80 17.12 9.37
MAP 3 12.44 3.20 0.73
MAP 11 19.84 10.94 6.58
DAP 3 13.52 5.52 �1.57
DAP 11 17.47 �4.02 �3.56
N. Ayrilmis et al. / Building and Environment 41 (2006) 887–892 891
3.1. Average surface roughness (Ra)
Ra values of all treated samples (eight groups: fourtreatments and two retentions) showed a significantdifference as compared to untreated sample according tothe Duncan’s multiply range test, as shown in Table 1.The treated specimens had significantly higher averagesurface roughness (i.e., rougher Ra) than that ofuntreated samples. The Ra values for the borax, boricacid, monoammonium phosphate (MAP), and diammo-nium phosphate (DAP) at higher concentration (6% or11%) are always rougher than the lower concentrations(3%). Average retention value of the samples treatedwith 3% concentration of borax was determined as8:60 kg=m3. These samples had also the smoothestsurface of any treated specimens with 11:09mm Ra. Asconcentration of borax was doubled, retention of thesamples increased 1.69 times and average Ra values alsoincreased 9.08%. Increased solution concentration ofboric acid also adversely influenced surface qualityof the samples. Samples treated with 3% concentra-tion of boric acid had the roughest surface with Ra valueof 12:44mm. Samples treated with 11% concentration ofMAP and DAP resulted in rougher surface with Ra thanthose of treated with 3%. As retention of the samplestreated MAP and DAP increased 1.72 and 1.64, theiraverage Ra values increased 7.4 and 3.95, respectively.Although samples treated with 11% concentration ofMAP and DAP had the highest chemical retention level(37.63 and 41:81 kg=m3) among all treated samples, theirRa values were lower than those of treated with 6%concentration of boric acid (19:37 kg=m3). Samplestreated with 6% boric acid and 11% MAP, and DAFwere not significantly different relating to Ra as can beseen in Table 1.
3.2. Mean peak-to-valley values (Rz)
The Rz value of 85:24mm of samples treated with 11%concentration of DAP had the lowest value among thetreated and untreated samples. It was determined asignificant difference among the treatment groups. Rz
values of 3% concentration of MAP, 3% borax, and11% DAP and the untreated control are the same, whileRz values of the other treated samples are significantlydifferent to the untreated control sample (Table 1).Samples treated with 6% concentration of boric acidhad the highest Rz value of 104:01mm with and samewith 6% concentration of borax of 102.03. The Rz
values of borax, boric acid, and MAP at higherconcentration (6% or 11%) were always rougher thanthe lower concentrations (3%) except for 11% concen-tration of DAP. However, the Rz value of the samplestreated with DAP does not follow this trend. The Rz
value of the samples treated with 11% concentration ofDAP were lower than that of treated with 3%
concentration of it. When eventual chemical retentionincreased 1.69, 1.75, 1.72 times for borax, boric acid,and MAP, the Rz value of the treated samples increased12.41%, 6.48%, 7.74%, respectively (Table 3).
3.3. Maximum roughness values (Rmax)
The Rmax values of all treated samples were higherthan that of untreated sample except for treatmentswhich were 3% and 11% concentration of DAP. Rmax
values of 3% concentration of MAP, 3% borax, and 3%and 11% DAP and the untreated control are the same,while Rmax values of the other treated samples aresignificantly different to the untreated control sample.Samples treated with 6% concentration of boric acidhad the highest Rmax value of 134:52mm like Ra, Rz.Increased solution concentration of fire retardantsadversely influenced Rmax values of the samples exceptfor DAP. Borax, MAP, and DAP follow Rmax value ofboric acid. Retention of the samples increased 1.69, 1.75,1.72 times for borax, boric acid, and MAP, the Rmax
value of the treated samples increased 6.23%, 2.87%,and 5.85%, respectively. However, Rmax value of thesamples with treated DAP decreased with increasingchemical concentration as shown in Table 1.
4. Conclusions and further work
This study evaluated surface roughness of plywoodtreated with four fire retardants. Three roughnessparameters could be used as an indicator to quantifythe surface characteristics of the treated samples. It wasfound that such parameters are able to differentiate thesurface roughness of the panels due to differentretention and concentration levels. All of the treatmentsadversely effected surface roughness of the panels exceptfor DAP 11% (Rz and Rmax) and DAP 3% (Rmax)treatments. However, negative influence of boric acid onthe surface roughness was the highest among allchemicals used for the treatment followed by mono-ammonium phosphate and borax.

ARTICLE IN PRESSN. Ayrilmis et al. / Building and Environment 41 (2006) 887–892892
Previous work on FRT blockboard plywood foundthat increased chemical concentrations gave higherretention values which in turn resulted in better fireresistance characteristics of the samples [20]. However,this study indicates that surface roughness of the panelscan be adversely influenced by increased concentrationsof fire retardants. Therefore, chemical concentrationshould be carefully adjusted to provide sufficient fireretardancy for treated plywood while also providingminimal negative effects on its surface roughness.Further studies performed to use treatment of thepanels should evaluate more than two concentrationsof chemicals to attain a better understanding of theeffect of treatment variables on the surface quality of thepanels. Also other roughness parameters such asmaximum valley height and core roughness can beincluded to have detailed information about the treatedsurfaces.
Acknowledgements
The authors gratefully acknowledge the materialsupport of Eti Boron Corporation, Bandirma, Balikesir,Turkey and Balmumcu Chemical Corporation, Emino-nu, Istanbul, Turkey. This article was written andprepared by Turkish and US Government employeeson official time, and it is therefore in the public domainand not subject to copyright.
References
[1] Heisel U, Krondorfer H. Surface method for vibration analysis in
peripheral milling of solid wood. Proceedings of the 12th
international wood machining seminar, Kyoto, Japan, 1995.
[2] Kantay R, Akbulut T, Korkut S. Effect of peeling temperature on
surface roughness of rotary cut veneer. Review of Faculty of
Forestry, Istanbul University. Series A 2004;53:1–11 Bahcekoy,
Istanbul (with English abstract).
[3] Lebow PK, Winandy JE. The role of grade and thickness in the
degradation of fire-retardant-treated plywood. Forest Products
Journal 1998;48(6):88–94.
[4] Taylor JB, Carrano AL, Lemaster RL. Quantification of process
parameters in a wood sanding operation. Forest Products Journal
1999;49(5):41–6.
[5] Ostman BAL. Surface roughness of wood-based panels after
aging. Forest Products Journal 1983;33(7/8):35–42.
[6] Goker Y, Demetci E, As N. Research on surface smoothness
applied to wood products. XI world forestry congress, vol. 4.
Antalya, Turkey, 1997. p. 51–3.
[7] Funck JW, Forrer JB, Butler DA, Brunner CC, Maristany AG.
Measuring surface roughness on wood: comparison of laser
scatter and tracing approaches. Proceedings of the society of
photo-optical instrument engineers, vol. 1821. Bellingham, Wash:
SPIE: 1992. p. 173–83.
[8] Lemaster RL, Beal F. The use of dual sensors to measure surface
roughness of wood-based composites. Proceedings of the ninth
international symposium on nondestructive testing of wood.
Madison, WI: Forest Products Society; 1993. p. 123–30.
[9] Peters C, Mergen A. Measuring wood surface smoothness: a
proposed method. Forest Products Journal 1971;21(7):28–30.
[10] Peters C, Cumming JD. Measuring wood surface smoothness: a
review. Forest Products Journal 1970;20(12):40–3.
[11] Stombo DA. Surface texture measurement. Forest Products
Journal 1963;13(6):299–304.
[12] Wieloch G. Chosen problems in measurements of wood surface
roughness. Proceedings of the 2nd international symposium on
wood structure, properties and quality 96. Moscow, Russia:
Moscow State Forestry University; 1997. p. 288–92.
[13] Tanritanir E, Akbulut T. Plywood industry and general situation
of plywood trade. Laminart-Furniture and Decoration Journal
1999;9:122–32 (in Turkish).
[14] Winandy JE. Thermal degradation of fire-retardant-treated wood:
predicting residual service life. Forest Products Journal
2001;51(2):47–54.
[15] Pohl P. Pressure of the gauging point a contact profilometer
exerted on wood surface. Proceedings of the second Medzinar-
odna Vedecka Knoferencia. Nitro, Slovensko, 1999.
[16] International Standard ISO 4287. Geometrical product specifica-
tions (GPS)—surface texture: profile method—terms, definitions
and surface texture parameters. Geneva, Switzerland: Interna-
tional Organization for Standardization; 1997.
[17] Hiziroglu S. Surface roughness analysis of wood composites: a
stylus method. Forest Products Journal 1996;46(7/8):67–72.
[18] Hiziroglu S, Graham M. Effect of press closing time and target
thickness on surface roughness of particleboard. Forest Products
Journal 1998;48(3):50–4.
[19] Mummery L. Surface texture analysis. The handbook. Muhlhau-
sen, Germany: Hommelwerke; 1993. 106p.
[20] Laufenberg T, Ayrilmis N, White RH. Fire and bending
properties of blockboard with fire retardant treated veneers. Holz
als Roh-und Werkstoff, 2005, in press.