Variation of geochemical risk associated with the use of ophiolitic washing mud as refilling...
16
ORIGINAL ARTICLE Variation of geochemical risk associated with the use of ophiolitic washing mud as refilling material in a basalt quarry of the Northern Apennine (Italy) M. Voltaggio M. Spadoni Received: 19 December 2006 / Accepted: 16 January 2007 / Published online: 17 February 2007 Ó Springer-Verlag 2007 Abstract Ophiolitic sequences in Northern Apen- nines are usually exploited as source of raw material for civil engineering works. Grinding procedures of basalts imply the production of dusts with relatively high concentration of PHES. This paper studied the increase of geochemical risk when washing mud pro- duced at Sasso di Castro quarry site (Tuscany) is re- used as rock keeper in a near dismissed quarry and highlighted geochemical fractionation produced on the base of different mineral hardness. Co, Cr, Ni and V concentration measured in washing mud were higher than the limits fixed by the Italian law but compatible with background values. The mobility of these four elements during future weathering processes were estimated by considering the element transfer coeffi- cients and assuming weathered rocks and soils as two different natural analogues of the future state of washing mud. The future concentration was estimated by considering the average lifetime of mineral grains calculated through their dissolution rate, molar volume and grain diameter. The variations of geochemical concentrations were used to estimate the percentage increase of the geochemical risk at the displacement place. After 50 years the associated geochemical risk is still considerably lower than the probability to be damaged by a single landslide event. Keywords Geochemical risk PHES Environmental geochemistry Washing mud Ophiolites Introduction Ophiolitic rocks, representing remnants of the Middle Jurassic–Early Cretaceous lithosphere of the Ligurian Tethys, widely outcrop in Italy along the Northern Apennine mountain belt in Tuscany, Liguria, and Emilia Romagna regions. Presently, ophiolites are mined in this area in about 70 different quarry sites where they also undergo specific grinding processes for the production of inert gravels destined to civil engi- neering works. As a consequence high amounts of dust and fine material can be potentially released in the surrounding environment. To minimize the impact on the health of both workers and environment, grinding is generally associated with in situ washing of gravels for the separation of dust and its removal as washing mud. Though the main risk associated with this mud is due to the possible release of asbestos mineral fibres, the relatively minor ‘‘geochemical’’ risk associated with high concentration of potentially hazardous elements and species (PHES) is also worthwhile to be investi- gated. Furthermore, the environmental conservation and recovery of the study area is also of particular interest for its high ecological value in terms of biodiversity, presence of endemic flora and typical landscape. Within this perspective it has to be considered as the rehabilitation of degraded sites requires the use of refilling materials that should be as much geochemi- cally similar as possible to local soils and rocks. In the case of ophiolites, the use of asbestos-free washing mud for this purpose could also represent an eco- nomically advantageous solution for their definitive storage that is worthwhile to be carefully evaluated. M. Voltaggio M. Spadoni (&) Consiglio Nazionale delle Ricerche, Istituto di Geologia Ambientale e Geoingegneria, Via Bolognola 7, Rome 00138, Italy e-mail: [email protected] 123 Environ Geol (2007) 53:417–432 DOI 10.1007/s00254-007-0657-2
-
Upload
independent -
Category
Documents
-
view
1 -
download
0
Transcript of Variation of geochemical risk associated with the use of ophiolitic washing mud as refilling...

ORIGINAL ARTICLE
Variation of geochemical risk associated with the useof ophiolitic washing mud as refilling materialin a basalt quarry of the Northern Apennine (Italy)
M. Voltaggio Æ M. Spadoni
Received: 19 December 2006 / Accepted: 16 January 2007 / Published online: 17 February 2007� Springer-Verlag 2007
Abstract Ophiolitic sequences in Northern Apen-
nines are usually exploited as source of raw material
for civil engineering works. Grinding procedures of
basalts imply the production of dusts with relatively
high concentration of PHES. This paper studied the
increase of geochemical risk when washing mud pro-
duced at Sasso di Castro quarry site (Tuscany) is re-
used as rock keeper in a near dismissed quarry and
highlighted geochemical fractionation produced on the
base of different mineral hardness. Co, Cr, Ni and V
concentration measured in washing mud were higher
than the limits fixed by the Italian law but compatible
with background values. The mobility of these four
elements during future weathering processes were
estimated by considering the element transfer coeffi-
cients and assuming weathered rocks and soils as two
different natural analogues of the future state of
washing mud. The future concentration was estimated
by considering the average lifetime of mineral grains
calculated through their dissolution rate, molar volume
and grain diameter. The variations of geochemical
concentrations were used to estimate the percentage
increase of the geochemical risk at the displacement
place. After 50 years the associated geochemical risk is
still considerably lower than the probability to be
damaged by a single landslide event.
Keywords Geochemical risk � PHES � Environmental
geochemistry � Washing mud � Ophiolites
Introduction
Ophiolitic rocks, representing remnants of the Middle
Jurassic–Early Cretaceous lithosphere of the Ligurian
Tethys, widely outcrop in Italy along the Northern
Apennine mountain belt in Tuscany, Liguria, and
Emilia Romagna regions. Presently, ophiolites are
mined in this area in about 70 different quarry sites
where they also undergo specific grinding processes for
the production of inert gravels destined to civil engi-
neering works. As a consequence high amounts of dust
and fine material can be potentially released in the
surrounding environment. To minimize the impact on
the health of both workers and environment, grinding
is generally associated with in situ washing of gravels
for the separation of dust and its removal as washing
mud.
Though the main risk associated with this mud is due
to the possible release of asbestos mineral fibres, the
relatively minor ‘‘geochemical’’ risk associated with
high concentration of potentially hazardous elements
and species (PHES) is also worthwhile to be investi-
gated.
Furthermore, the environmental conservation and
recovery of the study area is also of particular interest
for its high ecological value in terms of biodiversity,
presence of endemic flora and typical landscape.
Within this perspective it has to be considered as the
rehabilitation of degraded sites requires the use of
refilling materials that should be as much geochemi-
cally similar as possible to local soils and rocks. In the
case of ophiolites, the use of asbestos-free washing
mud for this purpose could also represent an eco-
nomically advantageous solution for their definitive
storage that is worthwhile to be carefully evaluated.
M. Voltaggio � M. Spadoni (&)Consiglio Nazionale delle Ricerche,Istituto di Geologia Ambientale e Geoingegneria,Via Bolognola 7, Rome 00138, Italye-mail: [email protected]
123
Environ Geol (2007) 53:417–432
DOI 10.1007/s00254-007-0657-2

Environmental mobility of Potentially Hazardous
Elements and Species (PHES) is strongly influenced by
geochemical environment in the soil, especially with
respect to redox conditions and leaching intensity.
Sometimes natural processes of mineral fractionation
and consequently of PHES accumulation have been
ascribed to merely physical processes associated with
mechanical erosion and differential transport of rock
and soil particles (e.g. Horowitz and Elrick 1987;
Muller et al. 2001; Wang et al. 2003; Tsai et al. 2003).
The geochemical background is usually calculated by
analyzing soil samples or stream and overbank sedi-
ments, the latter having the property of averaging
elemental concentrations on wide areas like catchment
basins. The influence of differently sized rock particles
in the determination of geochemical background val-
ues reserves particular interest, being also implicit in
the conventional definition of soils, (USDA 1993;
ISSS-ISRIC-FAO 1998) and of active stream sedi-
ments respectively as <2 mm sized aggregates and
<150 lm sized particles (Darnley et al. 1995; Salminen
et al. 1998).
The aim of this paper is to provide the geochemical
characterization of washing mud produced in the Sasso
di Castro (SC) quarry site, in Tuscany (Fig. 1a), in
order to assess possible environmental hazards linked
to their use as refilling material inside the near dis-
missed ophiolitic quarry site of Monte di Beni (MB,
Fig. 1b).
Case history
Massive basalts are extracted from an ophiolitic se-
quence at SC and crushed on site to produce inert
materials for the Bologna-Firenze tract of the new high
speed lines of Italian railways (Consorzio CAVET
1995). The crushing process, leading to the production
of differently sized gravels, caused the accumulation of
residual silty mud as by-product of gravel washing. A
significant share of washing mud was displaced in the
near and nowadays abandoned quarry of MB where, in
the past, an ophiolitic sequence very similar to the SC
one has been intensely mined (Fig. 1c).
However, displacement of washing mud needs
accurate geochemical investigation in order not to
transgress the Italian law that fix concentration limits
for the concentration of PHES in soils (Gazzetta Uf-
ficiale 1999). The departure from these limits is only
allowed in case the natural background concentrations
are higher than the fixed values (Gazzetta Ufficiale
2006).
Ophiolitic sequences outcrop at SC and MB
(Fig. 1c) in form of huge olistoliths dipped within the
Chaotic Complex (mainly limestone fragments in a
shaly matrix) of the external Liguride units (Late
Cretaceous, Cremonini and Elmi 1971). The lithologi-
cal sequence includes massive basalts, cut by frequent
basaltic dikes and intruded by plagiogranitic bodies,
overlained by pillow basalts and pillow basalt breccia
(Bocchi et al. 1976; Calanchi et al. 1987). Red bedded
cherts and Calpionella limestones outcrop at the top of
the sequence. At the contact between plagiogranites
and basalts, thermometamorphic processes led to the
formation of trondhjemite with xenoliths of lower
amphibolite facies (Calanchi et al. 1987). Mineralogy
of unaltered basalts consists of plagioclase (50–60%),
augitic clinopyroxene (30–40%), olivine (around 5%)
and accessory Fe–Ti oxides and apatite.
At SC quarry site massive basalt blocks are pres-
ently detached with explosive blasts and then grinded
into differently sized gravels through the passage into a
series of steel mills. After crushing, gravels are washed
with water for the removal of the residual fine fraction
(dust). The latter is finally separated from water by
subsequent filtration and pressing.
On the contrary, MB quarry is now dismissed and
the whole area has been included in a protected
natural site for its peculiar botanic and fauna value
(Site of European Community Interest). After the
occurrence of a huge landslide at MB, triggered by
the instability of the quarry front, the local adminis-
tration authorized the displacement of the washing
mud produced at SC to be used as rock keeper for
dissipating the energy of falling blocks. This decision
caused a civil protest and legal actions, still not de-
fined, for the high concentration of some PHES
(namely V, Co, Cr and Ni) that were measured in the
washing mud exceeding the limits fixed by the Italian
law. In this paper the legitimacy of the decision taken
by the local administration was not discussed or
judged. However a specific site evaluation on the in-
crease of geochemical risk connected to such a use of
washing mud was provided and framed in the wider
context of a possible correct procedure for estimating
the potential environmental impact of residual mining
products.
Percentage increase of the geochemical risk
In absence of an universally accepted definition of
‘‘geochemical hazard’’ and ‘‘geochemical risk’’, in this
paper we derived their operative definition from
UNESCO (1972).
Geochemical risk was therefore assumed as the
product of: (1) geochemical hazard, (2) vulnerability
and (3) value of elements at risk;
418 Environ Geol (2007) 53:417–432
123

• geochemical hazard is the probability that a given
amount of chemical element in an environmental
matrix (e.g. soil, water, air, etc.) causes health
damage to man by ingestion, inhalation, dermal
contact or other indirect pathways along an expo-
sure time equal to the average human life;
• vulnerability is the fraction of people exposed to the
geochemical hazard with respect to the entire
people living in a given area;
• value of elements at risk is the number of individuals
living in the area where the geochemical risk is
computed.
The geochemical risk for a given area is therefore
given by the number of damaged individuals over a
human lifetime.
The evaluation of geochemical hazard requires the
knowledge of the bioaccessibility (B) of chemical ele-
ments in soil, defined as that ‘‘amount of contaminant
that is soluble, due to simulated in vitro gastric func-
tions, and has the potential to cross the intestinal wall’’
(Stewart et al. 2003). Bioaccessibility depends mainly
on three factors: elemental concentrations (C), effi-
ciency of release (r), which, in turn, is linked to the
dissolution rate of mineral phases, and soil ingestion
rate (i), accordingly to the equation:
B ¼ KCri; ð1Þ
where K is a biological constant.
The identification of geochemical hazard also re-
quires a careful consideration of epidemiologic studies
and the use of models of interaction between chemical
elements and humans that are still not well assessed for
most of the PHES. In the case these data are not
available, the percentage increase of the geochemical
hazard and, consequently, of the geochemical risk can
at least been estimated by assuming that no threshold
Fig. 1 a Picture of Sasso diCastro quarry front; b Montedi Beni landslide and area ofrefilling; c Sketch of theophiolitic sequence at Sassodi Castro (from Calanchiet al. 1987, modified)
Environ Geol (2007) 53:417–432 419
123

effect exists in the relation between bioaccessibility
and geochemical hazard and that for low values of
bioaccessibility the relationship between these two
quantities is linear. Accordingly to these assumptions
the percentage increase of geochemical risk (IGR%)
consequent to a variation of the soil condition is:
IGR% ¼CiariaiiaCibribiib
� 1
� �100; ð2Þ
where subscript i stays for a generic hazardous element
and subscripts b and a stay for soil conditions respec-
tively before and after modification.
It is evident that, in case of soils, ingestion rate and
efficiency of release may play a more important role
than concentration itself in modifying the geochemical
risk of a site.
In the case of this study, we calculated the per-
centage increase of the geochemical risk since the
estimation of the real value of geochemical hazard in
MB area is not possible for the lack of specific and
accurate epidemiologic studies. We also considered the
future possible geochemical evolution of the washing
mud displaced at MB, including this way, an aspect
normally neglected in site specific hazard analysis.
Materials and methods
Sampling
The statistical significance of sampling procedure was
granted by collecting three sub-samples at each sam-
pling site, accordingly with a triangle scheme, that were
subsequently merged together. The overall weight of
each composite sample was not less than 2 kg. Six
different sample categories and a total of 31 samples
were collected:
• Washing mud (code: L, 10 samples). Silty mud from
SC quarry, transitorily accumulated at SC (7L) or
displaced inside MB inactive quarry area (16L1,
16L2, 16L4, 17L1, 17L2, 18L1, 18L2, 18L3), were
sampled at different places and depths (up to 1 m).
One sample of mud deriving from an heavy
weathered sector of the SC quarry front was also
collected (8L). Samples were successively dried at
<40�C before gently disaggregating particles using
an agate mortar.
• Soils (code: S, 7 samples). Residual soils developed
on gently sloping topographic surfaces made of
basalt talus and finer colluvial sediments were
sampled at SC (35S1, 35S2, 40S2) and MB (29S,
30S1, 30S2, 31S2) quarries. The two top horizons (A
and B) were homogeneously sampled by digging 40/
60 cm minipits. After drying at <40�C, soil aggre-
gates were gently crushed in an agate mortar and
successively sieved at <2 mm, accordingly to the soil
international standard procedure (e.g. EPA 1996).
• Rock, fresh (code: R, 8 samples) and altered (code:
P, one sample). Samples of basalt rocks with
different degrees of alteration were taken from
the quarry fronts at SC (1R, 3R, 10R, 12R, 15P) and
MB (19R, 26R, 28R). A sample of basalt breccias
(14R) was also collected in SC quarry site. Rocks
were roughly crushed in the lab for size reduction
using a heavy-metal free steel mill. Subsequently
some representative samples were further ground in
an agate mortar to obtain particles <75 lm.
• Gravels (code: G, 2 samples). Gravels from quar-
ried basalts at SC (5G, 6G), consisting in medium
and fine sized fragments of rocks crushed on-site
were sampled and treated as the previous samples
of parent rock.
• Talus (code: TT, 3 samples). Talus, mainly com-
posed of basalt gravels and blocks, were sampled in
the areas neighbouring SC (39TT), and MB (21TT,
23TT), quarries. Sample preparation was the same
as for the rock samples.
Analytical procedures
A first set of analysis was executed to measure the
concentration of major and minor chemical elements in
the different sample categories to assess their short and
long term environmentally available fraction. Further
analysis were aimed to identify the mineralogical
composition of samples.
In particular the following analyses were carried out:
4-acid strong digestion and analysis by ICP-MS
A 0.25 g sample split was heated in a 1:1:1 HNO3–
HClO4–HF solution up to fuming and taken to dryness.
The residue was successively dissolved in HCl. Con-
centrations of 41 elements (Ag, Al, As, Au, Ba, Be, Bi,
Ca, Cd, Ce, Cu, Co, Cr, Hf, K, La, Li, Mg, Mn, Mo, Na,
Nb, Ni, Fe, P, Pb, Sb, Sn, Rb, S, Sc, Sr, Ta, Th, Ti, U, V,
W, Y, Zn, Zr) were measured by Inductively Coupled
Plasma-Mass Spectrometry.
Tessier sequential leaching
Tessier sequential extraction procedure (Tessier et al.
1979) adapted by Campanella et al. (1995) was carried
out in order to selectively dissolve specific phases in a
particular order and hence to determine quantitatively
420 Environ Geol (2007) 53:417–432
123

the speciation and availability of Co, Cr, Ni, V. This
procedure consist of five steps:
• Step 1 (exchangeable fraction + bound to carbon-
ate fraction): 5 g sample was extracted with 90 ml
of NH4Ac and adjusted to pH 5 with HOAc.
• Step 2 (metals bound to Fe–Mn oxides fraction):
45 ml of NH2�OH�HCl and HOAc in 25% (v/v)
were added to the residue from step 1 for 24 h and
the solution was brought to 100 ml after centrifu-
gation.
• Step 3 (metals weakly bound to organic matter): the
residue from step 2 was leached with 25 ml HCl
0.1 M for 24 h and the solution was brought to
100 ml after centrifugation.
• Step 4 (metals bound to organic matter): the
residue from step 3 was leached with 25 ml NaOH
0.5 M for 48 h and the solution was brought to
50 ml after centrifugation.
• Step 5 (metals bound to sulphides): the residue
from step 4 was leached with 25 ml HNO3 8 M for
3 h at 80�C and the solution was brought to 50 ml
after centrifugation.
Electron probe microanalysis (EPMA)
Thin sections of rocks, soils and mud were analysed for
the major elements, in order to identify the most
abundant minerals, and for Co, Cr, Ni and V.
X-ray diffractometry (XRD)
Some fine ground powder from 12 samples of soils,
mud and rocks were analyzed using XRD technique
for the qualitative determination of the different min-
eralogical phase content.
Results and discussion
Mineralogical composition
Mineralogical modal analyses of the SC-MB ophiolites
have been previously given by Bocchi et al. (1976) and
Calanchi et al. (1987). These authors found a rather
constant abundance of Ab90–An10 plagioclase (50–
60%) and variable amounts of augitic pyroxene (12–
40%), olivine (5%), clinochlore (5–14%) and accessory
Fe–Ti oxides with pargasite (up to 10%). However
these estimates suffer of poor accuracy because the SC
and MB basalts appear altered under a static, hydro-
thermal ocean-floor type metamorphism resulting in
green-schists and lower amphibolite facies. In these
facies, primary plagioclase is replaced by a variable
mineral assemblage consisting of albite, clinochlore,
prehnite, and muscovite. Furthermore primary augitic
pyroxene is often replaced by clinochlore, epidote and
by a number of Fe–Ti oxides (ilmenite, rutile, magne-
tite). Finally primary ilmenite is replaced by titanite.
Similarly to most of gabbroic rocks outcropping in
the ophiolites of Northern Apennine, accessory parg-
asite is contained in interstices between plagioclase and
clinopyroxene and as rims around interstitial Fe–Ti-
oxides (Tribuzio et al. 2000). Pyrite and calcite are also
occasionally present. Ophiolites mineralogical vari-
ability is often accompanied by high variability in their
grade of porphiricity and by their unhomogeneous
structure frequently interested by veinlets and dykes.
The complexity of the mineralogical composition,
including primary phases (plagioclase and augitic
pyroxene), metamorphic phases (clinochlore and tita-
nite) and neo-formed clay minerals due to weathering
(kaolinite), is made evident from the data in Table 1,
where the whole mineral suite identified by XRD and
by electronic microprobe analyses is displayed.
A reliable modal-based comparison between
ophiolitic rocks, washing mud and local soils is pre-
cluded for the different representativeness of their thin
sections, much more indicative of the average compo-
sitions in the case of washing mud and soils than in the
case of rocks. Furthermore the mineral assemblage
consisting of a high number of mineralogical phases
(more than 20), many of which are solid solution terms,
makes complex the use of the refinement Rietvield
method (Kleeberg 2004). Therefore, the comparison
between sample types can be better done calculating
the grade of similarity of mineralogical composition
based on the recording of specific minerals in thin
sections (20 casual grains for each thin section) or
identified through electron microprobe microanalyses
and by XRD analysis of powdered samples (Table 1).
Mineralogical similarity analysis
The grade of mineralogical similarity is given in terms
of the Jaccard’s similarity coefficient (JSC) that is
based on the presence–absence relationship of mineral
phases shared between members of to two different
groups (Real and Vargas 1996) accordingly to the fol-
lowing equation:
JSC ¼ j
aþ b� jð Þ ; ð3Þ
where j is the number of mineral phases common to
both members and a and b are the number of species
Environ Geol (2007) 53:417–432 421
123

found on the member a and b, respectively. The coef-
ficient ranges from 1 to 0, where 1 indicating complete
similarity.
The mean of JSC (MJSC) calculated for rocks,
washing mud and soils showed that mud and rocks
have a grade of mineralogical similarity (MJSC = 0.60)
notably higher than rock and soil (MJSC = 0.38) or
mud and soil (MJSC = 0.38). The main differences
between mud/rocks and soils can be ascribed to the
transformation of primary oxides like ilmenite and
magnetite into goethite and to the transformation of
primary pyrite into parabutlerite [Fe(SO4)(OH)2 -
H2O]. Absence of calcite in the acid environment of
soils (measured values of pH around 5.5) are due to its
dissolution. Furthermore, phyllosilicates (muscovite,
sauconite, prehnite, saponite) are clearly more abun-
dant in soils than in rocks. The marked absence of
titanite in soils is expected, as this Ti-mineral displays
the highest dissolution rate during weathering (Velbel
1999) among the common orthosilicates, after olivine.
Discriminant analysis of analytical data from 4-acid
digestion
Geochemical similarities and differences are better
highlighted when the observed mineralogy is discussed
in the light of concentration data of major and trace
elements. On this purpose discriminant analysis is a
powerful statistical tool to differentiate among popu-
lation groups using a reduced number of variables in
order to simplify the interpretation of geochemical
underlying processes. Discriminant analysis was ap-
plied to the concentration data obtained from 29
samples treated with 4-acid digestion and belonging to
six different sample groups, namely soils, washing mud
(fresh), gravel, rocks, talus and altered rock (Table 2).
Since discriminant analysis gives reliable results only
when applied to normal distributed population, the
one-sample Kolmogorov–Smirnov test was prelimi-
narily run to compare the observed cumulative distri-
bution function of the variables to the normal
theoretical distribution. Ag, Bi, Be, Cd, P, Pb, Sn and
U did not pass the K–S test at 0.01 probability level and
were removed from the further statistical elaboration.
Major elements with the highest discriminant capabil-
ity were identified through the driven leave-one-out
software procedure (SPSS 1999). The elements were
preferentially selected among those particularly abun-
dant in clinochlore, augite, plagioclase and Ti–Fe
oxides, since they are the most common minerals of
the studied rock as already discussed above. The use
of only four variables, namely Na, Ca, Ti and Fe,
gave a rather good discriminant score of 79.3%. TheTa
ble
1Id
en
tifi
cati
on
of
min
era
lsp
eci
es
inth
ed
iffe
ren
tsa
mp
lety
pe
sb
yX
-ra
yd
iffr
act
om
etr
ya
nd
ele
ctro
nm
icro
pro
be
an
aly
sis
Sa
mp
leID
Qu
arr
ysi
teA
ug
ite
Na
-ric
hP
lag
iocl
ase
Pa
rga
-si
teC
lin
o-
chlo
reS
ap
o-
nit
eM
usc
o-
vit
eA
llo
-p
ha
ne
Sa
uco
-n
ite
Pre
h-
nit
eK
ao
li-
nit
eA
nk
e-
rite
Ca
lcit
eG
oe
-th
ite
Tit
a-
nit
eIl
me
-n
ite
Ma
gn
e-
tite
Py
rite
Pa
rab
utl
e-
rite
Qu
art
z
7L
SC
XX
XX
XX
XX
XX
16
L1
MB
XX
XX
XX
XX
X1
6L
4M
BX
XX
XX
XX
XX
XX
17
L2
MB
XX
XX
XX
XX
XX
1R
SC
XX
XX
XX
XX
X1
2R
SC
XX
XX
XX
XX
X1
4R
SC
XX
XX
XX
XX
XX
26
RM
BX
XX
XX
XX
XX
30
S2
MB
XX
XX
XX
XX
XX
31
S1
MB
XX
XX
XX
XX
XX
31
S2
MB
XX
XX
XX
XX
XX
XX
35
S2
SC
XX
XX
XX
XX
XX
SC
Sa
sso
di
Ca
stro
;M
BM
on
ted
iB
en
i
422 Environ Geol (2007) 53:417–432
123

Ta
ble
2G
eo
che
mic
al
con
cen
tra
tio
ns
of
40
ele
me
nts
aft
er
4a
cid
sd
ige
stio
na
nd
de
term
ina
tio
nb
yIC
P-M
S
IDG
rou
pA
g1
(mg
/k
g)
Al4
(%)
As2
(mg
/k
g)
Au
1
(mg
/k
g)
Ba
2
(mg
/k
g)
Be
2
(mg
/k
g)
Bi1
(mg
/k
g)
Ca
4
(%)
Ce
2
(mg
/k
g)
Cd
1
(mg
/k
g)
Cu
1
(mg
/k
g)
Co
2
(mg
/k
g)
Cr1
(mg
/k
g)
Hf1
(mg
/k
g)
K4
(%)
La
1
(mg
/k
g)
Li1
(mg
/k
g)
Mg
4
(%)
Mn
2
(mg
/k
g)
Mo
1
(mg
/k
g)
7L
1<
0.1
7.6
51
.0<
0.1
15
10
.13
.42
22
0.2
66
.55
5.0
19
9.2
2.5
0.1
07
.02
2.7
6.6
81
62
62
.41
6L
11
<0
.17
.39
2.0
<0
.19
10
.13
.77
18
0.3
76
.64
5.0
19
3.1
2.2
0.0
86
.01
8.0
5.2
41
40
51
.91
6L
21
<0
.17
.09
1.5
<0
.11
11
0.1
3.5
92
10
.27
7.3
47
.02
04
.02
.50
.10
6.2
19
.36
.17
15
46
2.4
16
L4
1<
0.1
6.5
71
.0<
0.1
10
10
.13
.33
19
0.2
64
.04
5.0
18
6.1
2.2
0.0
95
.71
8.1
5.5
61
41
91
.91
7L
11
0.1
7.2
42
.0<
0.1
90
10
.14
.87
30
0.1
62
.04
1.0
21
8.5
2.0
0.4
11
1.9
24
.34
.90
13
21
1.6
17
L2
10
.17
.17
3.0
<0
.18
31
0.1
4.7
52
90
.26
0.5
41
.02
25
.72
.10
.40
11
.22
3.9
5.0
21
36
51
.31
8L
11
0.1
7.3
13
.0<
0.1
12
81
0.1
5.4
23
40
.25
6.0
39
.02
18
.42
.00
.57
14
.22
7.3
4.5
61
28
51
.61
8L
21
0.1
7.4
43
.0<
0.1
12
61
0.1
5.4
43
50
.25
7.2
39
.02
18
.42
.20
.55
14
.32
6.2
4.7
81
29
31
.51
8L
31
<0
.17
.03
4.0
<0
.11
34
20
.15
.09
39
0.6
54
.43
9.0
21
7.1
2.0
0.6
91
4.8
29
.75
.46
12
92
1.6
30
S1
20
.16
.69
7.0
<0
.12
11
10
.40
.95
46
0.6
48
.22
5.0
11
2.2
0.9
1.3
42
3.8
43
.51
.47
20
89
0.7
30
S2
2<
0.1
8.8
77
.0<
0.1
25
73
0.3
0.6
86
10
.35
5.2
30
.01
36
.31
.31
.72
30
.95
9.9
1.6
92
04
70
.63
1S
22
<0
.17
.71
3.0
<0
.16
01
0.1
1.9
22
90
.31
09
.44
9.0
24
3.1
2.8
0.3
51
0.1
34
.05
.50
15
52
0.7
35
S1
20
.16
.60
4.0
<0
.15
2<
10
.12
.72
16
0.2
48
.14
9.0
38
9.1
1.5
0.2
36
.11
8.9
5.1
31
45
70
.43
5S
22
0.1
6.8
04
.0<
0.1
64
10
.22
.44
20
0.3
52
.94
8.0
42
3.7
1.7
0.2
37
.72
5.1
5.0
51
81
60
.44
0S
22
0.1
6.7
61
.5<
0.1
30
10
.12
.99
18
0.3
71
.84
7.0
15
2.7
2.4
0.1
25
.42
0.7
4.9
91
56
70
.31
R3
<0
.18
.10
1.5
<0
.11
51
0.1
5.8
81
50
.15
7.7
39
.02
03
.91
.80
.14
4.5
15
.95
.08
11
20
0.5
3R
30
.17
.25
3.0
<0
.12
21
0.1
4.4
11
70
.25
0.9
32
.01
27
.43
.60
.31
5.5
15
.63
.76
12
74
0.3
10
R3
<0
.17
.27
1.0
<0
.19
10
.15
.19
16
0.2
55
.73
8.0
14
3.2
2.7
0.0
74
.81
1.5
4.4
81
30
20
.11
2R
30
.17
.44
2.0
<0
.18
<1
0.1
3.9
11
80
.25
2.9
35
.01
10
.92
.60
.08
6.0
11
.94
.15
15
72
0.4
14
R3
<0
.16
.77
5.0
<0
.11
96
0.1
2.3
64
80
.12
0.5
13
.54
0.5
1.3
0.1
81
6.8
3.9
1.8
11
14
10
.71
9R
3<
0.1
7.7
51
.0<
0.1
28
10
.14
.24
24
0.2
52
.03
6.0
19
9.7
2.5
0.2
37
.21
8.5
4.5
21
82
00
.72
6R
30
.17
.25
6.0
<0
.12
51
0.1
5.1
61
50
.25
8.5
33
.01
25
.02
.00
.12
4.9
11
.03
.68
12
66
0.4
28
R3
<0
.15
.88
3.5
<0
.14
71
0.1
9.8
01
20
.34
2.4
35
.01
49
.62
.81
.44
3.7
15
.12
.76
16
35
0.4
5G
4<
0.1
7.6
71
.0<
0.1
9<
10
.15
.10
12
0.1
49
.33
5.0
19
7.0
2.1
0.1
13
.91
3.0
4.3
19
42
0.7
6G
4<
0.1
7.7
01
.0<
0.1
10
<1
0.1
5.3
81
60
.25
3.4
35
.01
96
.92
.70
.15
4.7
13
.04
.82
12
77
1.1
15
P5
0.1
6.8
81
.0<
0.1
13
10
.12
.76
15
0.2
59
.94
7.0
33
5.7
2.5
0.0
75
.21
6.1
4.1
11
53
50
.42
1T
T6
0.1
7.0
52
.0<
0.1
44
10
.16
.21
18
0.2
63
.43
5.0
23
6.0
2.4
0.4
68
.03
0.0
4.5
71
16
30
.22
3T
T6
0.1
7.5
52
.0<
0.1
24
10
.13
.48
16
0.2
74
.94
2.0
21
4.9
2.7
0.2
15
.32
2.2
4.6
31
53
50
.13
9T
T6
<0
.17
.64
1.0
<0
.11
71
0.1
3.9
01
70
.13
8.2
39
.03
06
.82
.80
.11
5.8
15
.75
.11
13
06
0.3
Environ Geol (2007) 53:417–432 423
123

Ta
ble
2co
nti
nu
ed
IDZ
rN
a3
(%)
Nb
1
(mg
/k
g)
Ni1
(mg
/k
g)
Fe
4
(%)
P5
(mg
/k
g)
Pb
1
(mg
/k
g)
Rb
1
(mg
/k
g)
S5
(%)
Sb
1
(mg
/k
g)
Sc2
(mg
/k
g)
Sn
1
(mg
/k
g)
Sr2
(mg
/k
g)
Ta
1
(mg
/k
g)
Th
1
(mg
/k
g)
Ti3
(mg
/k
g)
U5
(mg
/k
g)
V2
(mg
/k
g)
Y1
(mg
/k
g)
W1
(mg
/k
g)
Zn
2
(mg
/k
g)
7L
72
.82
.22
02
.11
75
.99
.14
11
70
.01
.12
.00
.10
.12
01
.61
32
0.1
0.2
84
00
0.1
22
24
0.8
0.1
11
51
6L
17
6.6
2.3
37
2.0
15
0.0
8.6
40
.11
.71
.30
.10
.12
22
.11
30
0.2
0.2
84
60
<0
.12
17
33
.10
.11
09
16
L2
67
.72
.36
32
.01
39
.98
.85
10
60
.01
.11
.60
.10
.12
41
.91
25
0.2
0.2
90
15
<0
.12
29
38
.00
.11
06
16
L4
63
.32
.08
81
.91
34
.88
.04
10
40
.01
.81
.70
.10
.12
11
.71
15
0.1
0.2
83
40
<0
.12
12
36
.00
.19
81
7L
17
1.5
2.0
06
3.5
16
7.7
7.4
30
.15
.32
1.5
0.2
0.2
19
2.6
18
50
.31
.97
04
00
.51
81
33
.80
.41
08
17
L2
58
.92
.12
63
.51
78
.97
.74
0.1
4.7
17
.30
.10
.21
82
.41
81
0.3
1.8
71
00
0.5
18
93
3.4
0.3
10
91
8L
15
7.5
1.9
52
4.3
15
9.8
6.8
10
.17
.42
8.0
0.1
0.2
17
3.2
19
90
.42
.66
68
00
.71
73
36
.30
.51
07
18
L2
60
.12
.05
24
.11
60
.67
.29
0.1
7.5
31
.10
.10
.22
03
.11
98
0.4
2.7
70
50
0.8
18
13
5.9
0.5
10
91
8L
35
7.1
1.9
20
4.6
16
1.0
7.0
18
50
.06
.73
5.8
0.2
0.2
18
3.0
18
40
.42
.96
88
00
.71
78
42
.70
.51
11
30
S1
24
.50
.57
47
.96
3.8
4.2
90
.11
68
.58
5.8
0.1
1.8
12
2.9
94
0.6
5.5
45
00
0.9
11
31
3.0
1.5
13
93
0S
23
2.6
0.7
58
9.4
74
.65
.55
0.0
42
.81
01
.4<
0.1
0.9
17
3.0
12
20
.86
.95
30
01
.11
48
17
.01
.41
32
31
S2
74
.71
.69
53
.51
33
.98
.62
53
0.0
21
.42
0.4
<0
.10
.52
62
.61
14
0.3
1.8
10
01
00
.42
27
34
.10
.41
37
35
S1
41
.11
.92
82
.23
38
.37
.17
0.1
29
.51
1.4
<0
.10
.81
72
.51
15
0.2
0.9
64
00
0.3
15
82
1.1
0.6
12
63
5S
24
8.0
1.8
35
3.0
31
0.0
7.5
30
.12
8.6
8.9
<0
.10
.51
52
.51
17
0.2
1.1
70
00
0.3
17
42
1.6
0.4
12
74
0S
25
8.7
2.7
15
2.1
99
.38
.14
81
5.0
14
.53
.0<
0.1
0.4
24
1.7
92
0.1
0.3
94
90
0.1
23
33
3.1
0.2
10
81
R4
9.1
2.2
76
1.7
12
6.8
6.3
68
15
.01
.22
.40
.10
.32
81
.31
74
0.1
0.1
10
06
0<
0.1
24
13
1.6
0.1
74
3R
10
1.4
3.3
98
2.3
75
.96
.36
0.1
2.1
4.0
<0
.11
.03
41
.82
45
0.2
0.1
11
90
00
.12
78
35
.50
.19
41
0R
71
.62
.91
61
.66
8.9
6.8
29
00
.01
.30
.8<
0.1
0.1
30
1.5
13
30
.10
.11
15
80
<0
.12
84
36
.20
.18
81
2R
65
.03
.57
22
.26
8.1
7.2
60
.11
.80
.80
.10
.32
71
.51
36
0.2
0.1
12
30
0<
0.1
27
33
2.1
0.1
10
31
4R
12
.84
.14
39
.81
9.9
3.5
50
.01
0.9
1.2
<0
.11
.11
51
3.8
67
0.8
1.2
60
00
0.2
13
08
6.9
0.2
78
19
R6
5.2
3.5
43
3.5
85
.46
.95
13
40
.01
.23
.9<
0.1
0.2
27
1.6
32
40
.20
.11
31
40
<0
.12
85
36
.6<
0.1
92
26
R4
4.9
3.2
74
1.8
75
.86
.22
0.1
2.4
1.3
<0
.13
.92
91
.41
06
0.1
0.1
10
40
0<
0.1
25
62
8.4
0.1
75
28
R8
0.6
2.5
74
1.4
67
.85
.69
72
0.0
1.9
26
.80
.11
.22
50
.92
16
0.1
0.1
83
50
0.1
21
23
1.7
0.1
68
5G
57
.92
.81
91
.91
44
.75
.30
0.1
1.1
1.1
0.1
0.1
26
1.4
16
80
.20
.18
30
0<
0.1
21
02
1.5
1.8
70
6G
76
.43
.37
72
.11
09
.06
.37
79
0.0
1.1
1.5
0.1
0.1
32
1.7
16
50
.10
.11
16
30
<0
.12
71
33
.30
.17
51
5P
61
.72
.94
12
.12
46
.17
.85
0.1
1.4
1.4
<0
.10
.12
91
.51
04
0.2
0.2
15
40
00
.13
70
31
.7<
0.1
10
32
1T
T6
6.2
2.0
43
2.7
14
7.2
6.3
20
.13
.41
8.5
<0
.10
.12
61
.51
58
0.2
1.0
87
00
0.3
19
72
7.2
0.2
89
23
TT
70
.92
.59
22
.01
28
.18
.20
0.1
1.2
3.2
<0
.10
.12
51
.91
54
0.1
0.2
11
00
00
.12
48
31
.9<
0.1
11
43
9T
T7
5.0
2.8
60
2.4
24
5.4
6.9
20
.13
.91
.8<
0.1
0.1
25
2.9
18
00
.10
.29
40
00
.12
16
31
.3<
0.1
94
Gro
up
s:1
mu
ds,
2so
ils,
3ro
cks,
4g
rav
els
,5
alt
ere
dro
cks,
6ta
lus
De
tect
ion
lim
its:
10
.1p
pm
;2
1p
pm
;3
0.0
01
%;
40
.01
%;
50
.1%
.T
he
de
tect
ion
lim
its
are
ba
sed
on
a9
8%
con
fid
en
cele
ve
l(3
sta
nd
ard
de
via
tio
ns)
424 Environ Geol (2007) 53:417–432
123
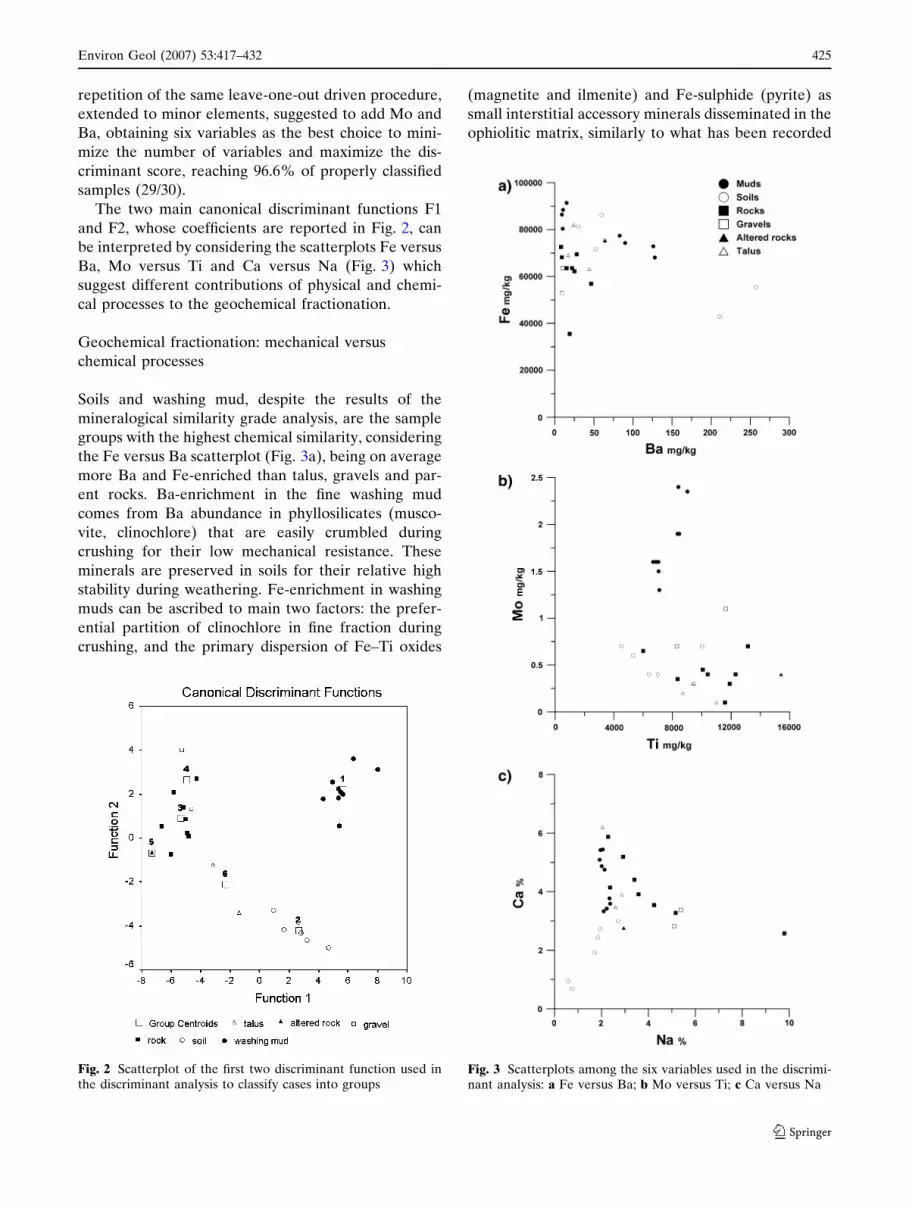
repetition of the same leave-one-out driven procedure,
extended to minor elements, suggested to add Mo and
Ba, obtaining six variables as the best choice to mini-
mize the number of variables and maximize the dis-
criminant score, reaching 96.6% of properly classified
samples (29/30).
The two main canonical discriminant functions F1
and F2, whose coefficients are reported in Fig. 2, can
be interpreted by considering the scatterplots Fe versus
Ba, Mo versus Ti and Ca versus Na (Fig. 3) which
suggest different contributions of physical and chemi-
cal processes to the geochemical fractionation.
Geochemical fractionation: mechanical versus
chemical processes
Soils and washing mud, despite the results of the
mineralogical similarity grade analysis, are the sample
groups with the highest chemical similarity, considering
the Fe versus Ba scatterplot (Fig. 3a), being on average
more Ba and Fe-enriched than talus, gravels and par-
ent rocks. Ba-enrichment in the fine washing mud
comes from Ba abundance in phyllosilicates (musco-
vite, clinochlore) that are easily crumbled during
crushing for their low mechanical resistance. These
minerals are preserved in soils for their relative high
stability during weathering. Fe-enrichment in washing
muds can be ascribed to main two factors: the prefer-
ential partition of clinochlore in fine fraction during
crushing, and the primary dispersion of Fe–Ti oxides
(magnetite and ilmenite) and Fe-sulphide (pyrite) as
small interstitial accessory minerals disseminated in the
ophiolitic matrix, similarly to what has been recorded
Fig. 2 Scatterplot of the first two discriminant function used inthe discriminant analysis to classify cases into groups
Fig. 3 Scatterplots among the six variables used in the discrimi-nant analysis: a Fe versus Ba; b Mo versus Ti; c Ca versus Na
Environ Geol (2007) 53:417–432 425
123

in most of the ophiolites of the Northern Apennine
(Tribuzio et al. 1999). The dispersion of these phases
support their mechanical release during crushing and,
consequently, their higher concentration in washing
mud. The persistence of Fe in soils is imputable to the
high stability of clinochlore during weathering and
pedogenesis processes that, acting over naturally
occurring incoherent sediments, led to the alteration
of magnetite into insoluble Fe(III)-oxyhydroxides
(goethite). Discriminant function 1 is dominated by
Fe and shows increasing values in the sequence
rocks < soils < washing mud, suggesting its link with
mainly mechanical processes acting on mineral phases
of different hardness. The importance of mechanical
processes are evident in the Mo versus Ti scatterplot
(Fig. 3b) showing how parent rocks are Ti-enriched
with respect to washing mud and soils. This is a con-
sequence of the decreasing abundance of titanite and
Ti-oxides in the sequence rocks > washing mud > soils
that can be explained by its high hardness and resis-
tance to crushing. The decrease of primary Ti-bearing
minerals in soils is also consistent with studies on the
relative mineral stabilities in saprolites derived from
weathering of meta-basalts and meta–gabbros (Sch-
roeder et al. 2000) where mineral dissolution rates
increase in the sequence goethite < quartz < phyllosi-
licates < Fe–Ti oxides < plagioclase. In the same scat-
terplot, washing mud show higher Mo concentration
than to soils and rocks that can be explained by the
relative abundance of Mo-bearing pyrite and its pref-
erential partition in fine fraction. These observations
and the relatively high positive value of Mo-coefficient
in the discriminant function 1 confirms that this
function reflects mainly mechanical effects in the
geochemical fractionation processes.
The Ca versus Na scatterplot (Fig. 3c) confirms the
mineralogical similarity grade analysis, highlighting the
preferential hydrolysis of Ca-plagioclase (anorthite)
with consequent heavy geochemical differentiation of
soils from rocks and mud. The high coefficient of Na
and Ca in the discriminant function 2 suggests that this
function reflects essentially chemical weathering pro-
cesses. The higher Ca/Na ratio in washing mud in
comparison with the rocks can be explained with the
relatively higher abundance of pargasite (the ratio of
its modal abundance in washing mud versus parent
rocks being approximately 2:1). This mineral is more
easily disgregated and has a Ca/Na ratio higher than
the average of the parent rocks.
Data discussed above give a first clear indication
that technological process of rock crushing can pro-
duce statistically significant geochemical fractionation,
whose extent can be compared to that produced in
natural weathering by a combination of mechanical
and chemical processes. From this point of view the
first two statistical function of our discriminant analysis
can be considered as two chemo-functions describing
respectively mechanical (function 1) and chemical
(function 2) processes, respectively identified by highly
positive and highly negative values.
A focus on the PHES belonging to the first
transition series metals
The variability trend of the first transition series metals
(TE) in the different sample groups (Fig. 4), highlights
enrichment of Cr and Ni and depletion of Sc, Ti and V
in washing mud and soils with respect to their parent
rock, while Mn, Fe, Co and Cu concentrations are
similar. The same diagram shows an analogue variation
of TE in talus with respect to soils and washing mud.
TE concentrations in washing mud are intermediate
between parent rocks and soils while the altered rock
sample shows constant TE enrichment with respect to
unweathered rocks.
TE show preference for solid over liquid phases
according to their OSPE (octahedral site preference
energy) values, following a predictable order Ni >
Co > Cu for bivalent ions and Cr > V > Ti for triva-
lent ions (White 2005). During weathering these ele-
ments should display a relative increase in Ni and Cr as
actually highlighted by their higher abundance in the
sample of altered rock (sample P15).
The relatively high Cr and Ni concentrations in soils
in spite of the absence of clinopyroxenes, a phase en-
riched in octahedral sites, is a consequence of the
abundance of oxidized phases and organic matter
Fig. 4 Plot of the averaged concentration of transition elementsin the different sample categories standardized by the averageconcentrations in the basalt rocks
426 Environ Geol (2007) 53:417–432
123

which act as sinks for these elements. On the contrary
the higher concentration of Cr and Ni in washing mud
than in parent rocks is a consequence of crushing
process. These evidences must be carefully considered
since most of TE are PHES and their concentration
limits in soils have been regulated by the Italian law
(Gazzetta Ufficiale 1999). In the SC washing mud tol-
erance limits were passed for residential and, in some
cases, industrial use of the soils relatively to Co, Cr, Ni
and V (limits for residential/industrial use: Co = 20/
250; Cr = 150/800; Ni = 120/500; V = 90/250). For this
reason in the following we specifically focused on the
mineralogical allocation and environmental behaviour
of these four elements whose descriptive statistics for
each sample group are reported in Table 3.
Electron microprobe analyses identified, in our
samples, augite, ilmenite, titanite, clinochlore, magne-
tite and plagioclase as the minerals with the highest
concentration of Ni, V, Co and Cr (Fig. 5).
Ni is particularly concentrated in magnetite while Cr
appears increasingly concentrated in the sequence:
augite < magnetite < ilmenite. As discussed above, the
dissemination of these oxides in the rock matrix caused
their higher concentration in washing mud than in
parent rocks. On the contrary V is more abundant in
rocks because of its high concentration in titanite. Fi-
nally, Co concentration is quite uniform both in the six
mineral phases and in the different sample groups.
As a direct consequence of these mineral assem-
blages, Cr concentration in washing mud at SC is
higher than the Italian tolerance limit of 200 mg/kg for
residential areas, while this limit has been passed only
for two out of eight rock samples. Ni concentrations
are also relatively high in washing mud where they
overpass the residential limits, while only in one rock
sample was recorded a value higher than 120 mg/kg. V
and Co overpass the residential limits both in rocks and
in washing mud without showing significant difference
of concentration among the two sample groups. Cr and
Ni show average concentrations higher in altered rock
than in fresh rock due to OSPE effects and higher in
soils than in parent rocks due to formation of sink
phases. Finally V displays the lowest concentration in
soils likely due to weathering of titanite and Ti-augite.
Background values
Accordingly to the Italian laws, an altered soil where a
PHES exceed the fixed limits needs remediation if its
concentration in PHES overpasses the concentration of
local natural background. This statement can be for-
malized saying that remediation is needed when the
‘‘enrichment factor’’ (Liu et al. 2006) or ‘‘pollution
index’’ (Subramanian et al. 1998) are >1. The natural
background can be calculated from the average PHES
concentrations in local natural unpolluted soils. In this
study, the four considered elements show average
concentrations and standard deviations in local natural
soils equal to: V = 176 ± 46 ppm, Cr = 243 ± 134 ppm,
Ni = 170 ± 122 ppm, Co = 41 ± 11 ppm. After com-
paring these values and their standard deviations with
the mean values of concentration in washing mud
(V = 198 ± 21 ppm, Cr = 208 ± 14 ppm, Ni = 158 ±
16 ppm, Co = 44 ± 5 ppm) it is clear that no remedi-
ation action should be required. However, in spite of
the close similarity with the natural background, the
Table 3 Descriptive statistics for Co, Cr, Ni and V concentra-tions in washing mud, soils and rocks
N Min Max Mean SD Var
CoW. mud 9 39.0 55.0 43.4 5.3 27.8Soils 6 25.0 49.0 41.3 10.9 117.9Rocks 8 13.5 39.0 32.7 8.1 65.5
CrW. mud 9 186.1 225.7 208.9 13.7 188.8Soils 6 112.2 423.7 242.9 134.6 18129.0Rocks 8 40.5 203.9 137.5 51.9 2689.3
NiW. mud 9 134.8 178.9 158.7 15.0 224.4Soils 6 63.8 338.3 170.0 122.2 14921.2Rocks 8 19.9 126.8 73.6 29.2 849.9
VW. mud 9 173.0 228.5 197.9 21.6 468.4Soils 6 113.0 232.5 175.4 46.6 2174.4Rocks 8 129.5 285.0 244.7 52.9 2799.6
Fig. 5 Average concentration of V, Cr, Co and Ni in theminerals where they are mostly abundant
Environ Geol (2007) 53:417–432 427
123

reutilization of washing mud at MB quarry site could
increase the geochemical hazard, since bioaccessibility
depends also on soil ingestion rate and release effi-
ciency.
Realise efficiency: discussion of Tessier sequential
leaching
Seven samples of washing mud, one sample of mud
coming from crushing of deeply weathered rocks and
four samples of soils from SC and MB were subjected
to Tessier modified sequential leaching (Tessier et al.
1979; Campanella et al. 1995) and examined for Co, Ni,
V, and Cr. Washing mud appeared as a rather homo-
geneous medium with respect to the soils, the latter
showing a far more pronounced geochemical variabil-
ity when considering altogether the five steps of the
analysis (Fig. 6).
Figure 6 highlights how Cr and Ni are extracted at a
similar rate and in a rather low amount (always below
15%) from washing mud and soils. It is interesting to
note that the sample of altered washing mud released
these elements at an extent comparable to that of fresh
washing mud. On the other hand, Co and V proved to
be more extractable from soils (up to 42% for Co and
21% for V) as a consequence of the association of Co
and V with insoluble organic complexes after the
complete alteration of the primary Co e V bearing
minerals (e.g. titanite). Generally, the exchangeable
(step 1) and acid soluble (step 3) fractions of heavy
metals are considered potentially bioavailable, while
the reducible (step 2) and oxidizable (step 4 and 5)
fractions are relatively stable. Therefore, to evaluate
possible release changes, we should compare the total
percentage extracted during the steps 1 and 3 from soils
and fresh washing mud. The results for soils are: 2.3%
(Ni), 5.9% (Co), 2.7% (V), 1.8% (Cr). The results for
washing mud differ slightly: 2.7% (Ni), 3.7% (Co),
2.6% (V), 2.0% (Cr) with the only exception of the
significantly lower Co-extractability. Therefore no sig-
nificant changes of bioaccessibility can be highlighted
when considering concentration and release efficiency.
Fig. 6 Fractions of Co, Cr, Niand V extracted during thefive steps of the sequentialleaching for nine samples ofmuds (filled circle) and soils(circle)
428 Environ Geol (2007) 53:417–432
123

Soil ingestion rate and bioaccessibility
Soil ingestion rate is closely influenced by grain size
and has a direct influence on bioaccessibility. Soil
ingestion depends primarily on the skin adherence.
Driver et al. (1989) found statistical increases in skin
adherence with decreasing of particle size. Unsieved
soils showed average adherence of about 0.6 mg/cm2
while average adherence for particle size lower than
150 lm (silty mud) is about 1.4 mg/cm2. Given the silty
nature of the washing mud at SC, a positive percentage
increase in skin adherence at the disposal site in MB
can be estimated around 130%.
Percentage increase of geochemical risk at MB:
present and future
From Eq. 2 we can estimate the percentage increase of
geochemical risk at MB after the displacement of the
washing mud for V (+149 ± 65%), Cr (+140 ± 132%),
Ni (+150 ± 177%) and Co (+54 ± 43%). It is clear
how, considering the associated errors, the geochemi-
cal risk is significantly increased in the case of Vana-
dium, mainly due to reduced grain size, while no
significant estimation can be done for the other ele-
ments due to the relatively high associated errors.
Since washing mud has not undergone significant
geochemical alteration yet, higher concentrations of
environmentally available Co, V, Ni and Cr have to be
expected in the next years, after prolonged weathering.
An estimation of the future release of PHES can be
provided considering data from in situ weathered rocks
and soils as two different natural analogues of the fu-
ture state of washing mud. The percent mass changes
of these elements during weathering can be estimated
using the dimensionless element transfer coefficient t
(Anderson et al. 2002) given by:
tj;w ¼Cj;wCi;p
Cj;pCi;w� 1
� �100; ð4Þ
where Cj,w(p) is the concentrations of a mobile element
j in weathered (w) or in parent (p) rock and Ci,w(p) is
the concentrations of a reference element i assumed
immobile in the same materials. Following Anderson
et al. (2002) we used Zr as reference immobile ele-
ment. Values of tj,w for the considered elements in al-
tered rocks are respectively equal to 233% (Ni), 144%
(Cr), 47% (V) and 41% (Co). The soil tj,w values are
rather similar: 203% (Ni), 133% (Cr), –6% (V), and
69% (Co). This convergence of transfer coefficient
suggests the existence of common geochemical pro-
cesses leading to the in situ formation of altered rocks
and soils. The mass increase of the considered ele-
ments, and especially of Ni and Cr, can be attributed
mainly to the magnetite–goethite transformation since
goethite in soils is particularly abundant in these two
elements (Quantin et al. 2002; Godgul and Sahu 1995).
A realistic forecast about the future concentrations of
all the four elements in altered washing mud can be
produced by: (a) using average element transfer coef-
ficient for soils and altered rocks and (b) supposing
that the Ci,w/Ci,p ratio relative to Zr in the transfor-
mation fresh mud-altered mud is close to the average
between the values measured for the transformation
parent rocks-soils and parent rocks-altered rocks.
When making these two assumptions, the predicted
concentration after a lag of time comparable to that of
Table 4 Dissolution rateparameters for magnetite,ilmenite and augite (fromPalandri and Kharaka 2004)
Mineralspecies
Molar volumecm3/mol
Log racid Logmol/cm2 s–1
D, avg graindiam. cm
n pH R, mol/cm2s–1
Magnetite 44.0 –12.59 0.01 0.28 5.5 10–14.13
Ilmenite 31.7 –12.35 0.01 0.42 5.5 10–14.66
Augite 66.8 –10.82 0.01 0.70 5.5 10–14.67
Fig. 7 Variation of the concentration of Co, Cr, Ni and V inwashing mud over the time. Black points are placed on Cr and Nicurves when they reach the concentration limits fixed by the law.Co and V curves already starts from concentration values higherthan the fixed limits
Environ Geol (2007) 53:417–432 429
123

soil formation or in situ weathering is 628 ppm for Ni,
621 ppm for Cr, 85 ppm for Co and 313 ppm for V.
We suppose that variation of concentration (X) over
time follows an exponential law:
Xt ¼ X0 þ XF �X0ð Þ 1� e�kt� �� �
; ð5Þ
where subscripts 0 and F point out the initial and final
situation and k is the transformation constant of the
fresh mud to weathered mud. According to this equa-
tion when t = 0, Xt = X0 and when t = infinite Xt = XF.
Mineral grain persistency in a soil, expressed in
terms of average lifetime (T), control the transforma-
tion constant value between fresh and altered washing
mud and can be predicted by the mineral dissolution
rate (r), its molar volume (Vm) and its grain diameter
(d) accordingly to the following equation (Kowalewski
and Rimstidt 2003; Jurinski and Rimstidt 2001):
T ¼ d
2rVm: ð6Þ
The dissolution rate of a mineral species in a specific
soil pH (equal to 5.5 in our case) can be estimated
starting from its dissolution rate at pH = 0 (racid)
accordingly to the following equation; Palandri and
Kharaka 2004):
Log rð Þ ¼ Log racidð Þ � npH soilð Þ; ð7Þ
where n is the reaction order with respect to H+.
Values of racid and n for magnetite, ilmenite, augite,
the mineral phases more relevant for Ni, Cr, V and Co
in the studied mud, are given in (Palandri and Kharaka
2004) and the parameters of interest for these three
mineral are given in Table 4. The application of Eqs. 6
and 7 to calculate lifetimes of the above mentioned
mineral species gave 556 years for magnetite,
2,239 years for ilmenite and 1,087 years for augite.
Unfortunately no accurate dissolution rate value is
reported for titanite in scientific literature. Since
accordingly to the Goldich series titanite is more
resistant to weathering than olivine, we can estimate its
lifetime as >366 years which is the calculate lifetime
for fayalite in the assumed conditions of soil pH.
The decay constants of these phases are therefore: k(1/T) = 0.0018a–1 for magnetite, k = 0.00044a–1 for
ilmenite, k = 0.000911a–1 for augite, k < 0.0027a–1 for
titanite. Given the uncertainty on the titanite data, we
took the value measured for magnetite, k = 0.0018a–1,
as conservative value for the transformation constant
of the washing mud. This value is really precautionary
as magnetite, during its transformation in goethite, is
predicted to develop a protective surface layer made of
goethite in function of the stoichiometric coefficients in
the reaction magnetite–goethite and their respective
molar volumes (for the calculations see the function
given in Velbel 1993). This is consistent with the fact
that V-enrichment process needs the presence of goe-
thite, as also highlighted by the high correlation coef-
ficient between Fe and V in soil samples.
Figure 7 highlights how over a period ranging be-
tween 0 and 50 years all the metals reach the back-
ground value assumed as the average concentration in
local soils. This time lag can be considered as largely
conservative also considering the major uncertainty
concerning the future value of pH in the weathered
mud which we have assumed to vary from the present
value of 7.2 to that measured in soils equal to 5.5. On
the contrary if we assume narrower variation the
average life time of the minerals will be notably in-
creased. Calculated lifetime for magnetite at pH close
to neutrality, for example, increase up to 112,000 years.
If we recalculate the percentage increase of geo-
chemical risk at a time = 70 years, in spite of the ex-
pected higher concentrations in altered washing mud,
the percentage increase of geochemical risk still keeps
significant only for V (+164 ± 69%), the other values
being affected by high uncertainty: +189 ± 159% for
Cr, +232 ± 238% for Ni and +76 ± 47% for Co.
Independently from the significance of these percent-
age increases, a wider discussion should be made
about the actual increase of geochemical risk ex-
pressed in number of damaged individuals. Unfortu-
nately, data on health effect of soil ingestion at usual
background concentrations are known only for nickel.
A single dose of nickel from soil ingestion equal to
0.009 mg/kg of body weight can produce contact der-
matitis (Calabrese et al. 1997). This is a non lethal
toxic dose whereas the lethal one is of 570 mg/kg of
body weight. When considering a standard weight of
10 kg for a child with an age of 2–4 years frequenting
MB quarry and an average soil ingestion of
50 ± 25 mg soil/day, the annual probability for him to
be affected by contact-dermatitis before and after a
time = 70 years is equal to 0.003 and 0.01%, respec-
tively. However the annual probability to be damaged
by a landslide event occurring at the MB site during
the same lag of time is at least equal to the 0.1%. It is
clear that if the engineering reutilization of the
washing mud at MB succeeds to reduce the geological
hazard even only of the 10%, the future increase of
geochemical risk regarding Ni-soil ingestion might be
accepted. In addition, it must be considered as the
altered washing mud can act as a sink for all the four
considered PHES. This is a further advantage for the
environment because the mud act over the time as
430 Environ Geol (2007) 53:417–432
123

filters for infiltrating waters reducing health risks due
to drinkable use of local ground water.
Conclusions
Washing mud originated as residuals of the techno-
logical process of basalt crushing have peculiar geo-
chemical features that must be investigated in order to
address their possible utilization in civil engineering.
However their environmental behaviour has also to be
interpreted by the light of their alteration over time
with consequent modification in the release rate of
PHES.
This study highlighted the many environmental
problems associated with the use as refilling material of
washing mud produced in an ophiolitic rock quarry of
the northern Apennine (Tuscany, Italy). Here washing
mud showed geochemical fractionation due to
mechanical processes acting on minerals of low hard-
ness as well as on primary finely disseminated mineral
phases, leading to their enrichment in V, Ni, Cr and
Co, up to values higher than parent rock but com-
pletely framed within the local natural background.
Geochemical fractionation on possible natural ana-
logues of future altered washing mud, like soils and
altered rocks, showed positive mass enrichment of V,
Ni, Cr and Co, mainly due to chemical weathering,
with consequent formation of both mineral and organic
phases acting as sinks for these elements. A simulation
based on the decay time of magnetite, ilmenite, augite
and titanite at pH 5.5, equal to the present value in
local soils, showed a clear trend to increase the con-
centration of V, Ni, Cr and Co in washing mud over the
time. In particular Ni concentration would reach the
background values within 50 years. Though this evo-
lutionary trend cause an increase of the absolute geo-
chemical risk due to soil ingestion, the usage of
washing mud has not to be precluded in case it reduces
significantly the risk associated with the landslide at
Monte di Beni quarry site.
Acknowledgments We sincerely acknowledge Giuseppe Cav-arretta for his scientific support and Maria Esposito, GiampaoloMarruzzo, Bruno Passariello, Luciano Passeri, Marcello Serra-cino, Elena Spaziani and Emanuela Tempesta for their activitiesof analytical determination in the geochemical laboratories.
References
Anderson SP, Dietrich WE, Brimball GHJ (2002) Weatheringprofiles, mass-balance analysis, and rate of solute loss:linkages between weathering and erosion in a small, steepcatchment. GSA Bull 114(9):1143–1158
Bocchi G, Calanchi N, Dal Rio G, Vinello G (1976) Studiochimico–petrografica delle ofioliti comprese tra le Valli delT. Sillaro e del F. Panaro (Appennino Bolognese – Mode-nese). Atti dell’Accademia delle Scienze dell’Istituto diBologna, Classe di Scienze Fisiche, Rendiconti, Serie XIII,Tomo III:164–200
Calabrese E, Stanek E, James RC, Roberts SM (1997) Soilingestion: a concern for acute toxicity in children. EnvironHealth Perspect 105(12):1354–1357
Calanchi N, Marroni M, Serri G (1987) Geology and Petrologyof the Sasso di Castro Ophiolite and associated plagiogra-nites. Ofioliti 12(1):151–178
Campanella L, D’Orazio D, Petronio BM, Pietrantonio E (1995)Proposal for a metal speciation study in sediments. AnalChim Acta 309:387–393
Consorzio CAVET (1995) Cava Sasso di Castro. ProgettoEsecutivo, Consorzio Impregilo -FIAT Engineering - Itinera
Cremonini G, Elmi C (1971) Note Illustrative della CartaGeologica d’Italia - Foglio 98 - Vergato. Servizio Geologicod’Italia
Darnley AG, Bjorklund A, Bølviken B, Gustavsson N, KovalPV, Plant JA, Steenfelt A, Tauchid M, Xie Xuejing, GarrettRG, Hall GEM (1995) A global geochemical database forenvironmental and resource management: recommendationfor international geochemical mapping. Final report ofIGCP Project 259. 2nd revised edition. UNESCO, Paris
Driver J, Konz J, Whitmyre G (1989) Soil adherence to humanskin. Bull Environ Contam Toxicol 43:814–820
EPA (1996) Soil screening guidance: user’s guide, 2nd edn.United States Environmental Protection Agency. Pubblica-tion 9355, pp 4–23
Gazzetta Ufficiale (1999) Regolamento recante criteri, proce-dure e modalita per la messa in sicurezza, la bonifica e ilripristino ambientale dei siti inquinati, ai sensi dell’articolo17 del decreto legislativo 5 febbraio 1997, n. 22, e successivemodificazioni e integrazioni. Decreto Ministeriale n� 471 del25/10/1999. Gazz Uff Suppl Ordin., 293, 15/12/1999
Gazzetta Ufficiale (2006) Norme in materia ambientale. DecretoLegislativo 3 aprile 2006 n.152. Gazz.Uff., 14/4/2006
Godgul G, Sahu KC (1995) Chromium contamination fromchromite mine. Environ Geol 25:251–257
Horowitz AJ, Elrick KA (1987) The relation of stream sedimentsurface area, grain size and composition to trace elementchemistry. Appl Geochem 2:437–451
ISSS-ISRIC-FAO (1998) World reference base for soil re-sources. World Soil Resources Reports 84. Food andAgriculture Organization of the United Nations, Rome
Kleeberg R (2004) Problems of the quantitative rietveld phaseanalysis of complex samples. In: Pecchio M et al (eds)Applied mineralogy. ICAM-BR, Sao Paulo, pp 129–132
Kowalewski M, Rimstidt JD (2003) Average Lifetime and agespectra of detrital grains: toward a unifying theory ofsedimentary particles. J Geol 111:427–239
Jurinski JB, Rimstidt JD (2001) Biodurability of talc. AmMineral 86:392–399
Liu L, Li F, Xiong D, Song C (2006) Heavy metal contaminationand their distribution in different size fractions of thesurficial sediment of Haihe river, China. Environ Geol50(3):431–438
Muller G, Ottenstein R, Yahya A (2001) Standardized particlesize for monitoring, inventory, and assessment of metals andother trace elements in sediments: <20 lm or <2 lm?Fresenius J Anal Chem 371:637–642
Palandri JL, Kharaka YK (2004) A compilation of rate param-eters of water-mineral interaction kinetics for application togeochemical modeling. USGS-open file report
Environ Geol (2007) 53:417–432 431
123

Quantin C, Becquer T, Rouiller JH, Berthelin J (2002) Redis-tribution of metals in a New Caledonia ferralsol aftermicrobial weathering. Soil Sci Soc Am J 66:1797–1804
Salminen R,Tarvainen T, Demetriades A, Duris M, Fordyce FM,Gregorauskiene V, Kahelin H, Kivisilla J, Klaver G, KleinH, Larson JO, Lis J, Locutura J, Marsina K, Mjartanova H,Mouvet C, O’Connor P, Odor L, Ottonello G, Paukola T,Plant JA, Reimann C, Schermann O, Siewers U, SteenfeltA, Van der Sluys J, De Vivo B, Williams L (1998) FOREGSgeochemical mapping field manual. Geological Survey ofFinland, Guide 47
Real R, Vargas JM (1996) The probabilistic basis of Jaccard’sindex of similarity. Syst Biol 45(3):380–385
Schroeder PA, Melear ND, West LT, Hamilton DA (2000)Meta-gabbro weathering in the Georgia piedmont, USA:implication for global silicate weathering rates. Chem Geol163:235–245
SPSS (1999) SPSS Base 10.0 application guide. SPSS IncStewart MA, Jardine PM, Barnett MO, Mehlhorn TL, Hyder
LK, McKay LD (2003) Influence of soil geochemical andphysical properties on the sorption and bioaccessibility ofchromium (III). J Environ Qual 32:129–137
Subramanian V, Datta, Dilip K (1998) Distribution and frac-tionation of heavy metals in the surface sediment of theGangae-Brahmaputra-Meghma river system in the Bengalbasin. Environ Geol 36(1–2):93–101
Tessier A, Campbell PGC, Bisson M (1979) Sequential extrac-tion procedure for speciation of particulate trace metals.Anal Chem 51:844–851
Tribuzio R, Tiepolo M, Vannucci R, Bottazzi P (1999) Traceelement distribution within olivine-bearing gabbros fromthe Northern Apennine ophiolites (Italy): evidence for post-cumulus crystallization in MOR-type gabbroic rocks. Con-trib Mineral Petrol 134:123–133
Tribuzio R, Tiepolo M, Thirwall MF (2000) Titanian Pargasite ingabbroic rocks from the Northern Apennine ophiolites(Italy): evidence for late percolation of igneous fluids in aMOR-type cumulate pile. Earth Planet Sci Lett 176:281–293
Tsai LJ, Yu KC, Ho ST, Chang JS, Wu TS (2003) Correlation ofparticle sizes and metals speciation in river sediment. In:Diffuse pollution conference, Dublin, Poster Papers
USDA (1993) Soil survey manual. Soil Conservation Service.Handbook 18. United States Department of Agriculture
UNESCO (1972) Consultative meeting of experts on thestatistical study of natural hazards and their consequences.United Nations Educational, Scientific and Cultural Orga-nization. Paris, 25–28 April
Velbel MA (1993) Formation of protective surface layers duringsilicate-mineral weathering under well-leached, oxidizingconditions. Am Mineral 78:405–414
Velbel MA (1999) Bond strength and relative weathering ratesof single orthosilicates. Am J Sci 299:679–696
Wang SX, Zhang SZ, Shan XQ (2003) Fractionation of heavymetals in different particle-size sediments and its relation-ship with heavy metal pollution. Bull Environ ContamToxicol 71:873–880
White WM (2005) Geochemistry. John-Hopkins UniversityPress, Baltimore
432 Environ Geol (2007) 53:417–432
123