Asbestos fibre identification vs. evaluation of asbestos hazard in ophiolitic rock mélanges, a case...
22
1 23 Environmental Earth Sciences ISSN 1866-6280 Volume 72 Number 9 Environ Earth Sci (2014) 72:3679-3698 DOI 10.1007/s12665-014-3303-9 Asbestos fibre identification vs. evaluation of asbestos hazard in ophiolitic rock mélanges, a case study from the Ligurian Alps (Italy) Gianluca Vignaroli, Paolo Ballirano, Girolamo Belardi & Federico Rossetti
Transcript of Asbestos fibre identification vs. evaluation of asbestos hazard in ophiolitic rock mélanges, a case...
1 23
Environmental Earth Sciences ISSN 1866-6280Volume 72Number 9 Environ Earth Sci (2014) 72:3679-3698DOI 10.1007/s12665-014-3303-9
Asbestos fibre identification vs. evaluationof asbestos hazard in ophiolitic rockmélanges, a case study from the LigurianAlps (Italy)
Gianluca Vignaroli, Paolo Ballirano,Girolamo Belardi & Federico Rossetti

1 23
Your article is protected by copyright and
all rights are held exclusively by Springer-
Verlag Berlin Heidelberg. This e-offprint is
for personal use only and shall not be self-
archived in electronic repositories. If you wish
to self-archive your article, please use the
accepted manuscript version for posting on
your own website. You may further deposit
the accepted manuscript version in any
repository, provided it is only made publicly
available 12 months after official publication
or later and provided acknowledgement is
given to the original source of publication
and a link is inserted to the published article
on Springer's website. The link must be
accompanied by the following text: "The final
publication is available at link.springer.com”.
ORIGINAL ARTICLE
Asbestos fibre identification vs. evaluation of asbestos hazardin ophiolitic rock melanges, a case study from the Ligurian Alps(Italy)
Gianluca Vignaroli • Paolo Ballirano •
Girolamo Belardi • Federico Rossetti
Received: 17 September 2013 / Accepted: 18 April 2014 / Published online: 11 May 2014
� Springer-Verlag Berlin Heidelberg 2014
Abstract In recent years, the high incidence of harmful
health effects through inhalation of airborne asbestos from
amphibole-bearing rock melanges has been thoroughly
documented. Here, we present a field-based, multi-scale
geological approach aimed at illustrating the occurrence of
amphibole fibrous mineralisation in an ophiolitic suite from
the Ligurian Alps (Italy) and discussing the implication on
in situ determination of the asbestos hazard. The rock
melange is composed of plurimetre-sized blocks of dif-
ferent lithotypes (metagabbro, serpentinite, chloritoschist)
juxtaposed by the meaning of tectonic structures. The
geological-structural survey revealed that the fibrous min-
eralisation is localised in specific structural sites of the rock
volume, including veins and schistosity. Both micro-
chemical and crystal structure analyses on selected fibrous
samples revealed that actinolite fibres grow in veins within
the metagabbro and in chloritoschists, while fibrous trem-
olite occurs in serpentinite schistosity. The morphological
features of these amphibole fibres have been analysed in
TEM images and used for classifying them as ‘‘asbesti-
form’’ or ‘‘non-asbestiform’’. The results show that the
asbestos hazard determination is not unequivocally identi-
fied when different procedures for asbestos fibre identifi-
cation and classification are applied. This may have impact
on normatives and regulations in defining environmental
hazards due to asbestos occurrence.
Keywords Amphibole � Asbestos hazard � Ophiolite
melange � Rock petrography � Mineralogy � Ligurian Alps
Introduction
Five fibrous amphiboles (anthophyllite, tremolite, actinolite,
crocidolite, and amosite) and the serpentine chrysotile are
the six minerals currently regulated by the normative as
‘‘asbestos’’ (e.g. Ross et al. 1984; World Health Organiza-
tion—WHO, 1986; NIOSH 2011). Their occurrence in both
built and natural environments determines the main issue for
evaluating the asbestos hazard (Lee et al. 2008; Gunter
2010). Actually, the combination of mineralogical (e.g.
Gunter et al. 2007; Gunter 2010), epidemiological (e.g. Doll
1955; Lippmann 1990; Rey et al. 1994; Honda et al. 2002;
Cattaneo et al. 2006) and environmental (e.g. Rohl et al.
1977; Wagner 1991; Pan et al. 2005) studies asserts that
serious health risks are directly connected with persistent
inhalation of asbestos particles. In particular, amphibole
asbestos are listed as a Group I human carcinogen material by
the international world health authorities (IARC (Interna-
tional Agency for Research on Cancer) 1987, 2012; Health
and Safety Executive 1997; WHO 1986; Kazan-Allen 2005).
The insights coming from the amphibole asbestos studies are
being extended also to other fibrous minerals not included in
the asbestos group (e.g. Groppo et al. 2005; Sullivan 2007).
G. Vignaroli (&) � F. Rossetti
Dipartimento di Scienze, Sezione di Geologia, Universita Roma
Tre, Largo S.L. Murialdo, 1, 00146 Rome, Italy
e-mail: [email protected]
P. Ballirano
Dipartimento di Scienze della Terra, Sapienza Universita di
Roma, P.le A. Moro, 5, 00185 Rome, Italy
P. Ballirano
Laboratorio Rettorale Fibre e Particolato Inorganico, Sapienza
Universita di Roma, P.le A. Moro, 5, 00185 Rome, Italy
G. Belardi
Istituto di Geologia Ambientale e Geoingegneria, CNR, Area
della Ricerca di Roma 1, Via Salaria Km 29,300, Monterotondo
Stazione, 00015 Rome, Italy
123
Environ Earth Sci (2014) 72:3679–3698
DOI 10.1007/s12665-014-3303-9
Author's personal copy
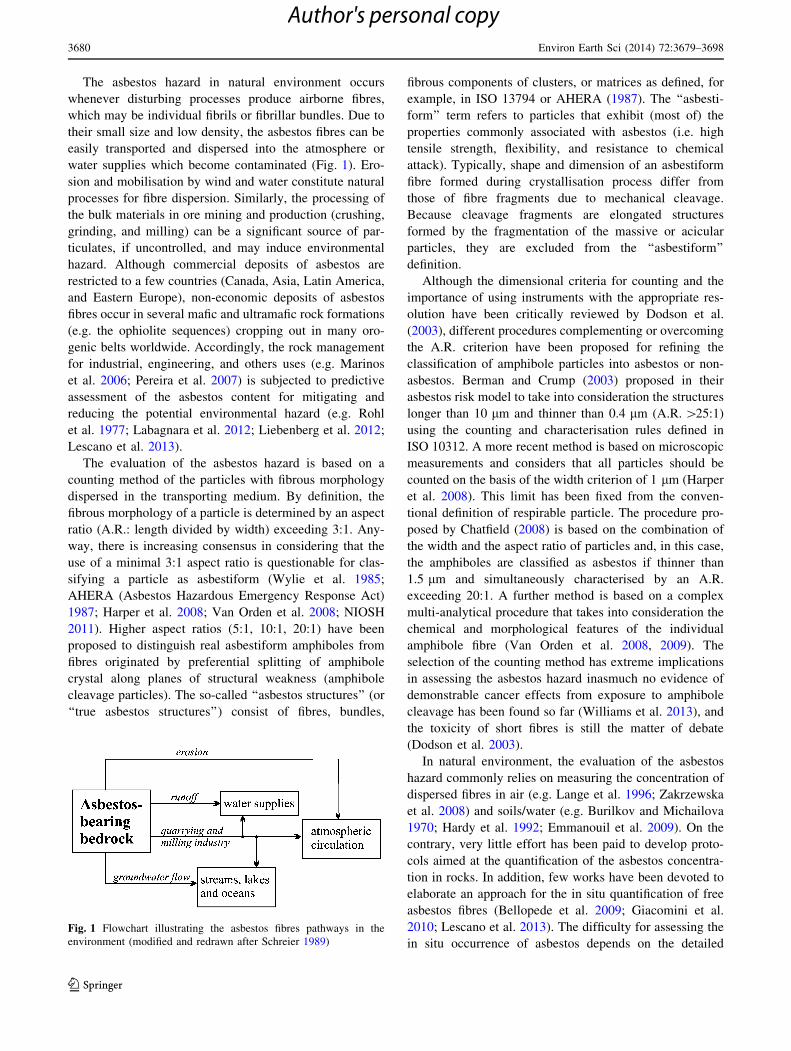
The asbestos hazard in natural environment occurs
whenever disturbing processes produce airborne fibres,
which may be individual fibrils or fibrillar bundles. Due to
their small size and low density, the asbestos fibres can be
easily transported and dispersed into the atmosphere or
water supplies which become contaminated (Fig. 1). Ero-
sion and mobilisation by wind and water constitute natural
processes for fibre dispersion. Similarly, the processing of
the bulk materials in ore mining and production (crushing,
grinding, and milling) can be a significant source of par-
ticulates, if uncontrolled, and may induce environmental
hazard. Although commercial deposits of asbestos are
restricted to a few countries (Canada, Asia, Latin America,
and Eastern Europe), non-economic deposits of asbestos
fibres occur in several mafic and ultramafic rock formations
(e.g. the ophiolite sequences) cropping out in many oro-
genic belts worldwide. Accordingly, the rock management
for industrial, engineering, and others uses (e.g. Marinos
et al. 2006; Pereira et al. 2007) is subjected to predictive
assessment of the asbestos content for mitigating and
reducing the potential environmental hazard (e.g. Rohl
et al. 1977; Labagnara et al. 2012; Liebenberg et al. 2012;
Lescano et al. 2013).
The evaluation of the asbestos hazard is based on a
counting method of the particles with fibrous morphology
dispersed in the transporting medium. By definition, the
fibrous morphology of a particle is determined by an aspect
ratio (A.R.: length divided by width) exceeding 3:1. Any-
way, there is increasing consensus in considering that the
use of a minimal 3:1 aspect ratio is questionable for clas-
sifying a particle as asbestiform (Wylie et al. 1985;
AHERA (Asbestos Hazardous Emergency Response Act)
1987; Harper et al. 2008; Van Orden et al. 2008; NIOSH
2011). Higher aspect ratios (5:1, 10:1, 20:1) have been
proposed to distinguish real asbestiform amphiboles from
fibres originated by preferential splitting of amphibole
crystal along planes of structural weakness (amphibole
cleavage particles). The so-called ‘‘asbestos structures’’ (or
‘‘true asbestos structures’’) consist of fibres, bundles,
fibrous components of clusters, or matrices as defined, for
example, in ISO 13794 or AHERA (1987). The ‘‘asbesti-
form’’ term refers to particles that exhibit (most of) the
properties commonly associated with asbestos (i.e. high
tensile strength, flexibility, and resistance to chemical
attack). Typically, shape and dimension of an asbestiform
fibre formed during crystallisation process differ from
those of fibre fragments due to mechanical cleavage.
Because cleavage fragments are elongated structures
formed by the fragmentation of the massive or acicular
particles, they are excluded from the ‘‘asbestiform’’
definition.
Although the dimensional criteria for counting and the
importance of using instruments with the appropriate res-
olution have been critically reviewed by Dodson et al.
(2003), different procedures complementing or overcoming
the A.R. criterion have been proposed for refining the
classification of amphibole particles into asbestos or non-
asbestos. Berman and Crump (2003) proposed in their
asbestos risk model to take into consideration the structures
longer than 10 lm and thinner than 0.4 lm (A.R. [25:1)
using the counting and characterisation rules defined in
ISO 10312. A more recent method is based on microscopic
measurements and considers that all particles should be
counted on the basis of the width criterion of 1 lm (Harper
et al. 2008). This limit has been fixed from the conven-
tional definition of respirable particle. The procedure pro-
posed by Chatfield (2008) is based on the combination of
the width and the aspect ratio of particles and, in this case,
the amphiboles are classified as asbestos if thinner than
1.5 lm and simultaneously characterised by an A.R.
exceeding 20:1. A further method is based on a complex
multi-analytical procedure that takes into consideration the
chemical and morphological features of the individual
amphibole fibre (Van Orden et al. 2008, 2009). The
selection of the counting method has extreme implications
in assessing the asbestos hazard inasmuch no evidence of
demonstrable cancer effects from exposure to amphibole
cleavage has been found so far (Williams et al. 2013), and
the toxicity of short fibres is still the matter of debate
(Dodson et al. 2003).
In natural environment, the evaluation of the asbestos
hazard commonly relies on measuring the concentration of
dispersed fibres in air (e.g. Lange et al. 1996; Zakrzewska
et al. 2008) and soils/water (e.g. Burilkov and Michailova
1970; Hardy et al. 1992; Emmanouil et al. 2009). On the
contrary, very little effort has been paid to develop proto-
cols aimed at the quantification of the asbestos concentra-
tion in rocks. In addition, few works have been devoted to
elaborate an approach for the in situ quantification of free
asbestos fibres (Bellopede et al. 2009; Giacomini et al.
2010; Lescano et al. 2013). The difficulty for assessing the
in situ occurrence of asbestos depends on the detailed
Fig. 1 Flowchart illustrating the asbestos fibres pathways in the
environment (modified and redrawn after Schreier 1989)
3680 Environ Earth Sci (2014) 72:3679–3698
123
Author's personal copy
knowledge of the geological properties of the asbestos-
bearing rocks, which include the lithology (e.g. Ross and
Nolan 2003; Van Gosen 2007; Hendrickx 2009) and the
tectonic–metamorphic conditions that favoured fibrous
mineralisation within the rock volume (e.g. Evans 1977;
Hoogerduijn Strating and Vissers 1994; Karkanas 1995;
Ross and Nolan 2003; Andreani et al. 2005; Compagnoni
and Groppo 2006; Vignaroli et al. 2011).
This paper is aimed at discussing the in situ asbestos
hazard by illustrating the identification and classification of
amphibole fibrous mineralisation occurring in an ophiolitic
rock suite (metagabbro-bearing melange) from the Liguri-
an Alps (Italy). A geological, field-based approach is used
for describing the presence of geological heterogeneities
(lithotypes, deformation structures, and secondary miner-
alisations), while multi-analytical laboratory techniques,
including petrographic microscopy, X-ray powder diffrac-
tion (XRPD), and transmission electron microscopy (TEM)
investigations, have been integrated for discriminating the
asbestos structure of collected amphibole fibres. The results
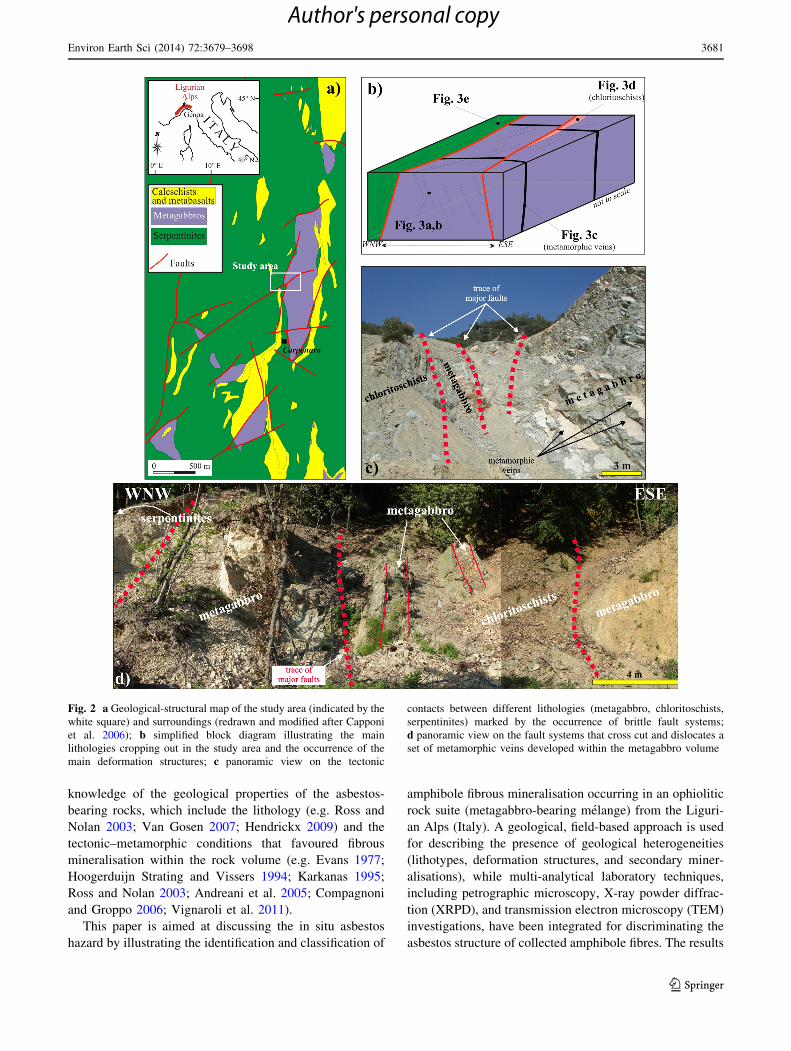
Fig. 2 a Geological-structural map of the study area (indicated by the
white square) and surroundings (redrawn and modified after Capponi
et al. 2006); b simplified block diagram illustrating the main
lithologies cropping out in the study area and the occurrence of the
main deformation structures; c panoramic view on the tectonic
contacts between different lithologies (metagabbro, chloritoschists,
serpentinites) marked by the occurrence of brittle fault systems;
d panoramic view on the fault systems that cross cut and dislocates a
set of metamorphic veins developed within the metagabbro volume
Environ Earth Sci (2014) 72:3679–3698 3681
123
Author's personal copy
are used for (1) comparing the different classification
methods for the asbestos fibre identification, (2) qualita-
tively evaluating the asbestos hazard in rock complexes,
and (3) discussing the issue of amphibole asbestos identi-
fication and classification in a natural site.
The field-based, multi-scale approach
This work is based on a multidisciplinary and multi-scale
approach that integrates the contributions deriving both
from field survey and laboratory. The field geological
survey is aimed at defining the geological complexities
within the rock volume at the mesoscale, with particular
emphasis on the lithotype, rock deformation fabrics, and
occurrence of secondary mineralisation. The necessity to
discriminate the geological-structural conditions of a rock
volume is imperative when considering rock melanges,
which are intrinsically characterised by different lithotypes
showing discontinuous shapes, sizes and deformation fab-
rics. This is a priority, since asbestos mineralisation does
not appear homogeneously dispersed within the rock vol-
ume; instead it is restricted to peculiar geological settings/
environments that should be treated carefully. The geo-
logical survey was then firstly focused on collection of
samples representative of the range of lithotypes, defor-
mation structures, and mineralisations addressed to a series
of laboratory analyses (see the Appendix for experimental
conditions). Microscale observations were addressed (1) to
define the mode of fibre growth (e.g. as individual or in
bundles), and (2) to constrain the relationships between
fibres nucleation and surrounding matrix. The first point
has implication on the determination of the amount of
fibres occurring in rock mass; the second has inference on
the potential of the rock to release free fibres. In this work,
the types of fibrous minerals were characterised in terms of
their geometrical relationships, occurrence and distribution
in relation to the primary and secondary structures of the
rock volume, by combining optical transmitted light
microscopy and scanning electron microscopy (SEM) on
polished thin sections. The crystal chemical and structural
characterisation was finalised to the identification of the
fibrous minerals, according to the asbestos nomenclature as
provided by the normative. Mineral chemistry of single
sampled fibre was obtained by combining electron micro-
probe analyses (EMPA) and structure refinements by the
Rietveld method on XRPD data. The morphological
parameters (i.e. length, width, shape, cleavage) of single
fibres have been extrapolated through image analysis of
particles resting on filters using a stepwise TEM exami-
nation. The results have been plotted in an aspect ratio/
width diagram according to different classification criteria
of fibres (Berman and Crump 2003; Harper et al. 2008;
Chatfield 2008). A further morphological characterisation
of the analysed fibres has been performed according to the
analytical procedure proposed by Van Orden et al. (2008).
Lithology and field structures
The investigated area is part of an ophiolitic suite,
belonging to the Ligurian Alps (north Italy; see insert in
Fig. 2a), composed of variably metamorphosed mafic and
ultramafic bodies and discontinuous cover successions. The
ophiolitic suite experienced a polyphasic tectono-meta-
morphic evolution with development of ductile and brittle
deformation structures (e.g. Hoogerduijn Strating 1994;
Capponi and Crispini 2002). Ductile structures are mainly
represented by S-tectonites (and subordinate SL-tectonites)
dominantly hosting sodic- and calcic-amphibole-bearing
mineral assemblages in mafic precursor rocks, whereas
brittle structures include fracture systems and fault damage
zones (e.g. Vignaroli et al. 2005, 2009; Federico et al.
2007, 2009; Crispini et al. 2009).
A kilometre-scale lens of metagabbro defines the main
lithotype in the study area (Fig. 2a). The metagabbro lens
has a N–S elongated shape. The internal portion of the
metagabbro is generally homogeneous, but locally contains
metre-scale boudins of chloritoschists and talcschists. The
metagabbro shows a dominant massive texture, locally
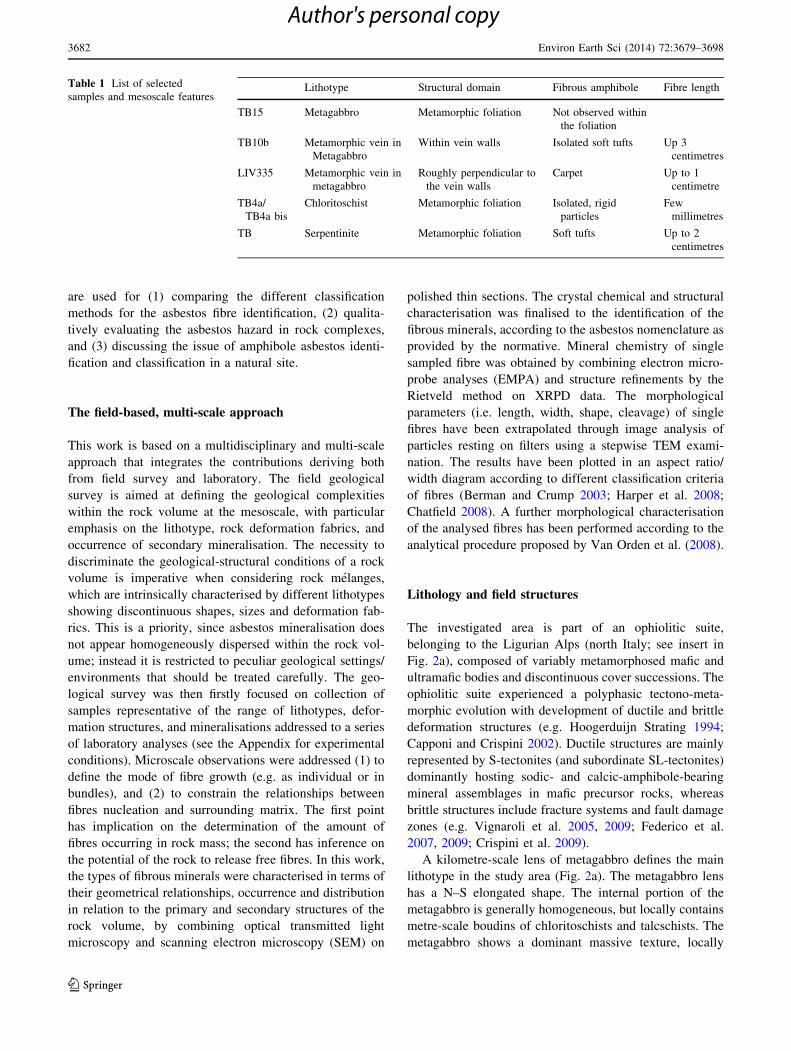
Table 1 List of selected
samples and mesoscale featuresLithotype Structural domain Fibrous amphibole Fibre length
TB15 Metagabbro Metamorphic foliation Not observed within
the foliation
TB10b Metamorphic vein in
Metagabbro
Within vein walls Isolated soft tufts Up 3
centimetres
LIV335 Metamorphic vein in
metagabbro
Roughly perpendicular to
the vein walls
Carpet Up to 1
centimetre
TB4a/
TB4a bis
Chloritoschist Metamorphic foliation Isolated, rigid
particles
Few
millimetres
TB Serpentinite Metamorphic foliation Soft tufts Up to 2
centimetres
3682 Environ Earth Sci (2014) 72:3679–3698
123
Author's personal copy
evolving in a steeply-dipping (50–70�) NW–SE striking
planar fabric. The body is cut across by a set of 2–3 cm-
thick metamorphic veins, showing variable spacing (from
20 to 30 centimetres up to several metres), and high per-
sistence ([10 m). Laterally, the metagabbro is in contact
with a huge sequence of antigorite serpentinites (see the
block diagram in Fig. 2b). The boundaries between
different lithotypes correspond to steeply-dipping bands of
highly strained fault rocks. Major faults have roughly
planar surface and are often characterised by decimetre-to-
metre thick damage zone and fault core (sensu Caine et al.
1996). Sporadic mineralisation, mainly consisting of iron
oxides and subordinately talc, decorates the fault surfaces.
Faults dismember the metagabbro body, and often produce
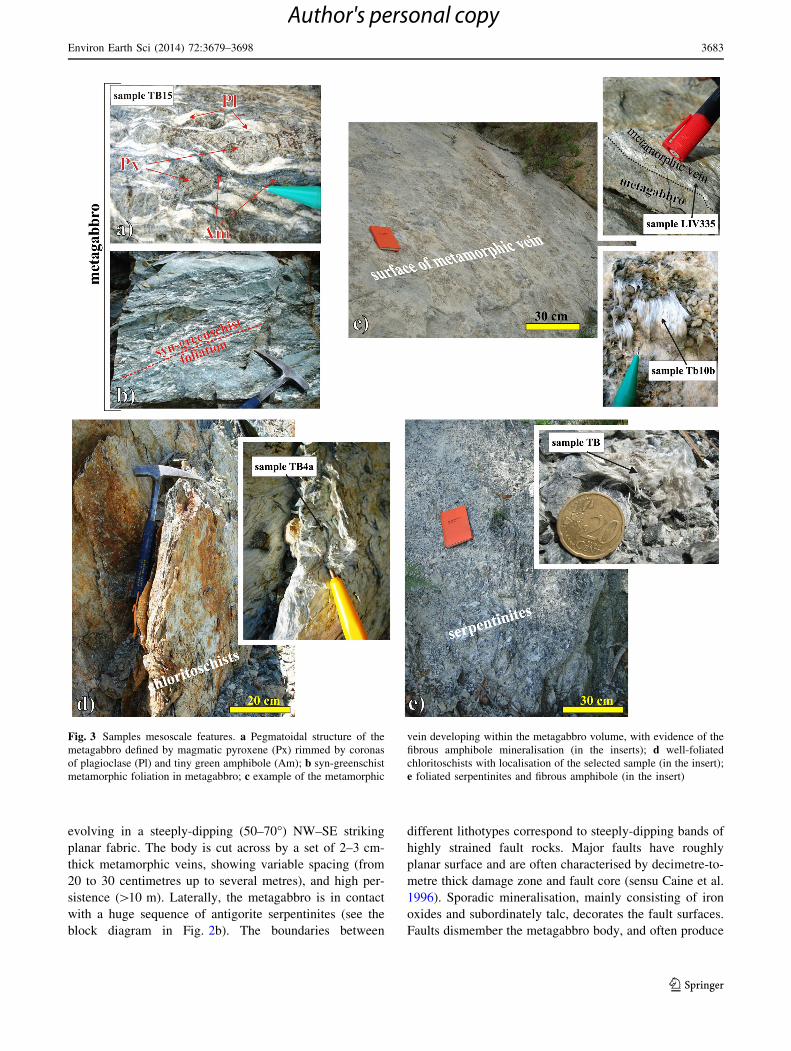
Fig. 3 Samples mesoscale features. a Pegmatoidal structure of the
metagabbro defined by magmatic pyroxene (Px) rimmed by coronas
of plagioclase (Pl) and tiny green amphibole (Am); b syn-greenschist
metamorphic foliation in metagabbro; c example of the metamorphic
vein developing within the metagabbro volume, with evidence of the
fibrous amphibole mineralisation (in the inserts); d well-foliated
chloritoschists with localisation of the selected sample (in the insert);
e foliated serpentinites and fibrous amphibole (in the insert)
Environ Earth Sci (2014) 72:3679–3698 3683
123
Author's personal copy
alternating metre thick repetition of metagabbro-chlor-
itoschists-serpentinites. The faults systematically truncate
and dissect the metamorphic vein sets (Fig. 2c, d). The
above-mentioned structures testify for a main brittle char-
acter of the metagabbro deformation during its exhumation
within the enveloping serpentinite matrix.
The major issues that can be extracted from the field
survey are: (1) the internal fabric of the metagabbro body is
characterised by a pervasive schistosity; (2) the metamor-
phic veins constitute a locus of secondary metamorphic
mineralisation, different to those of the internal metagab-
bro fabric; (3) variably sized and shaped lenses of chlori-
toschists and talcschists are embedded within the
metagabbro and thus define an abrupt change in lithology;
(4) deformational structures (mainly fault zones) control
contacts between the metagabbro, chloritoschists, talcs-
chists, and serpentinites. Taking into consideration those
aspects, the sampling strategy has been addressed to
investigate in detail these geo-diversities. The mesoscale
characteristics of the selected samples are summarised in
Table 1.
The massive metagabbro (sample TB15) shows a pri-
mary pegmatoid texture made of coarse-grained clinopy-
roxene–plagioclase assemblage, green to purple in colour
(Fig. 3a). The main metamorphic overprint consists of syn-
greenschist mineralogical assemblage (green amphibole,
plagioclase, chlorite, epidote) that rims the magmatic
clinopyroxene (Fig. 3a) and also produces a pervasive
foliation (Fig. 3b). Fibrous mineralisation does not appear
at the mesoscale within the metamorphic foliation of the
metagabbro. Metamorphic veins (samples TB10b and
LIV335) have sub-planar surface (Fig. 3c) and are filled by
albite plagioclase in blocky texture, seldom in association
with fibrous amphibole (inserts in Fig. 3c). These fibres are
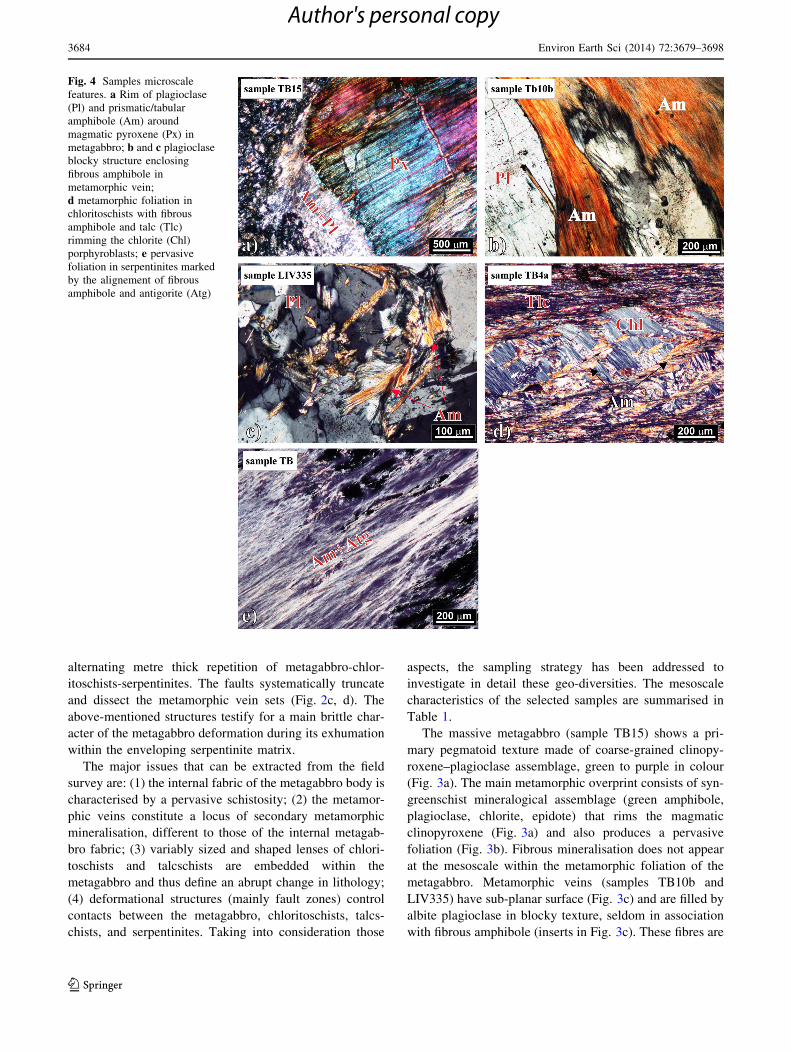
Fig. 4 Samples microscale
features. a Rim of plagioclase
(Pl) and prismatic/tabular
amphibole (Am) around
magmatic pyroxene (Px) in
metagabbro; b and c plagioclase
blocky structure enclosing
fibrous amphibole in
metamorphic vein;
d metamorphic foliation in
chloritoschists with fibrous
amphibole and talc (Tlc)
rimming the chlorite (Chl)
porphyroblasts; e pervasive
foliation in serpentinites marked
by the alignement of fibrous
amphibole and antigorite (Atg)
3684 Environ Earth Sci (2014) 72:3679–3698
123
Author's personal copy

whitish to green in colour. They are arranged to form both
isolated soft bundles with fibres up 2 cm of length (sample
TB10b) and rigid carpets disposed roughly perpendicular to
the boundaries of the vein (sample LIV335). Lenses of
chloritoschistes (sample TB4a) show an internal fabric
composed by a well-developed foliation (Fig. 3d) defined
by the chlorite-talc ± amphibole mineralogical associa-
tion. Very thin amphiboles are also observed in micro-fold
domains preserved within the metamorphic foliation.
Serpentinites show both massive and foliated (sample TB)
mesoscale texture. In massive one, the primary lherzolithic
texture (with occurrence of pyroxene porphyroclasts)
dominates, while secondary antigorite and amphibole
crystallise in the millimetre-spaced pervasive foliation
(Fig. 3e). Soft, ductile agglomerate of fibrous whitish-to-
green amphibole (insert in Fig. 3e) occurs disposed along
the foliation.
Laboratory analyses
Sample petrography
At the thin section scale, the main textural feature in
metagabbro (sample TB15) is represented by rims of fine
matrix of plagioclase and amphibole around large pyroxene
crystals (Fig. 4a). Amphibole is also variably distributed
within the foliation defining prismatic-to-acicular crystals
with width exceeding 5 lm. Samples from metamorphic
veins (TB10b and LIV335; Fig. 4b, c) show a blocky
texture composed by large grains of plagioclase. Amphi-
bole occurs as fibrous agglomerates accommodated within
interstices between plagioclase. The fibres tend to distrib-
ute from the interstices to the plagioclase crystal rims,
often superimposing to them. Fibre terminations show
cleavage and formation of individual smaller fibres
(fibrils). In chloritoschists (sample TB4a), large chlorite
grains are surrounded by thin foliation where acicular-to-
fibrous amphibole is aligned along the foliation surface
(Fig. 4d). Amphibole crystals tend to coalesce rather than
to be individual. Amphibole crystals have length up to
50 lm. The most evident microstructural feature in ser-
pentinite (sample TB) is a sub-millimetre-spaced meta-
morphic foliation where fibres of antigorite and amphibole
are interdigitated (Fig. 4e). Amphibole has width not
exceeding 5 lm and length of 10–20 lm.
Amphibole crystal chemistry and structure
Average chemical compositions and min–max composi-
tional ranges from EMPA of the analysed amphiboles are
reported in Table 2 and the corresponding crystal chemical
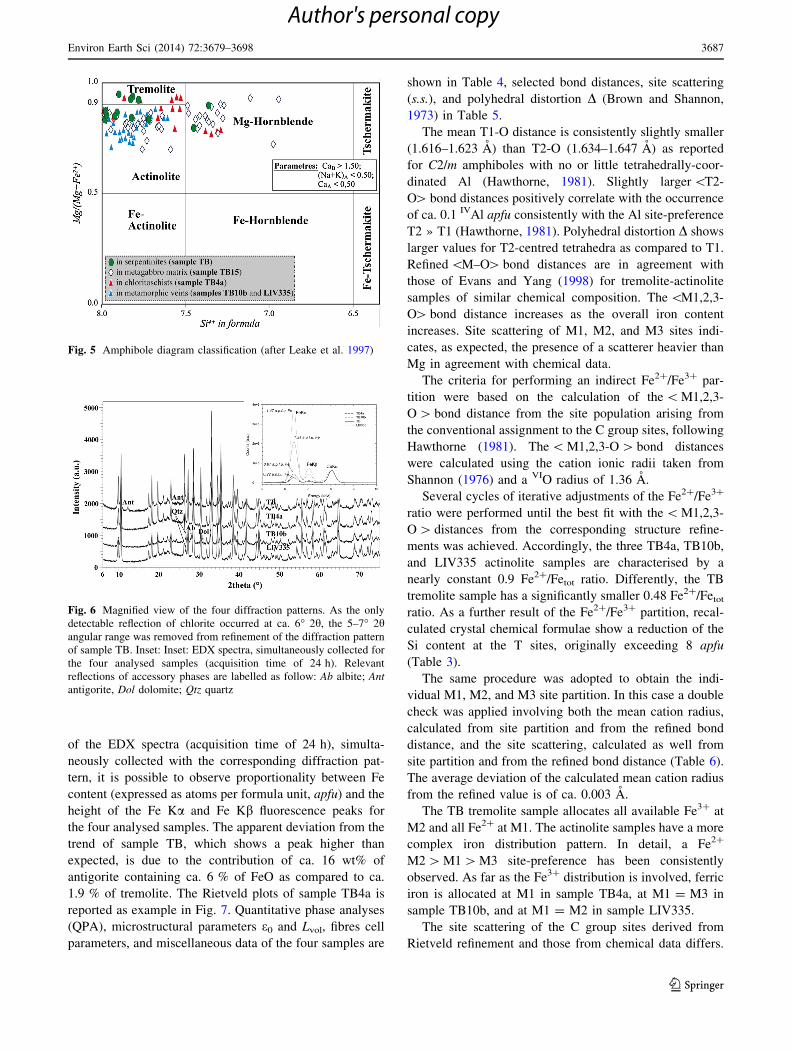
formulae are listed in Table 3. Amphibole classification is
reported in Fig. 5, distinguishing between non-fibrous
Table 2 Average chemical composition of the analysed amphiboles
TB TB4a TB4a bis TB10b LIV335
SiO2 58.31 (57.28–59.38) 57.18 (56.77–57.55) 58.65 (58.29–58.87) 55.51 (55.37–55.67) 55.14 (54.57–55.96)
TiO2 0.01 (0.00–0.02) 0.05 (0.02–0.12) 0.04 (0.02–0.07) 0.04 (0.01–0.09) 0.03 (0.00–0.06)
Al2O3 0.07 (0.03–0.14) 0.46 (0.26–0.77) 0.12 (0.05–0.15) 1.66 (1.60–1.72) 1.83 (1.13–2.53)
Cr2O3 0.01 (0.00–0.05) 0.03 (0.00–0.06) 0.01 (0.00–0.03) 0.05 (0.03–0.07) 0.01 (0.00–0.04)
FeOtot 1.94 (1.67–2.40) 7.47 (7.05–7.79) 4.96 (4.82–5.04) 11.26 (10.73–11.78) 12.28 (10.81–13.71)
MnO 0.15 (0.12–0.19) 0.43 (0.31–0.50) 0.22 (0.18–0.28) 0.21 (0.18–0.24) 0.15 (0.08–0.23)
MgO 23.05 (22.75–23.45) 19.18 (18.90–19.58) 21.36 (21.11–21.67) 16.49 (15.89–17.32) 15.77 (14.92–16.98)
CaO 13.19 (13.01–13.46) 12.33 (12.27–12.48) 12.74 (12.63–12.80) 11.97 (11.77–12.08) 11.85 (11.34–12.14)
Na2O 0.14 (0.07–0.24) 0.25 (0.15–0.41) 0.16 (0.12–0.21) 0.49 (0.42–0.60) 0.53 (0.31–0.82)
K2O 0.04 (0.01–0.11) 0.05 (0.04–0.05) 0.03 (0.01–0.08) 0.06 (0.04–0.08) 0.04 (0.00–0.19)
F 0.06 (0.00–0.16) 0.03 (0.00–0.08) 0.05 (0.00–0.18) 0.00 (0.00–0.00) 0.07 (0.00–0.19)
Cl 0.00 (0.00–0.00) 0.02 (0.00–0.04) 0.02 (0.00–0.03) 0.03 (0.00–0.09) 0.01 (0.00–0.03)
H2Oa 2.15 2.12 2.16 2.10 2.06
total 99.12 99.60 100.52 99.87 99.76
-F,Cl -0.03 -0.02 -0.03 -0.01 -0.03
99.09 99.58 100.49 99.86 99.73
Fe2O3 1.16 0.72 – 0.92 1.48
FeO 0.96 6.76 – 10.46 10.98
Min–max compositional ranges are reported in italica Calculated assuming OH ? F ? Cl = 2 apfu
Environ Earth Sci (2014) 72:3679–3698 3685
123
Author's personal copy
amphiboles (from metagabbro texture) and fibrous amphi-
boles (from metamorphic veins, chloritoschists, and
serpentinites).
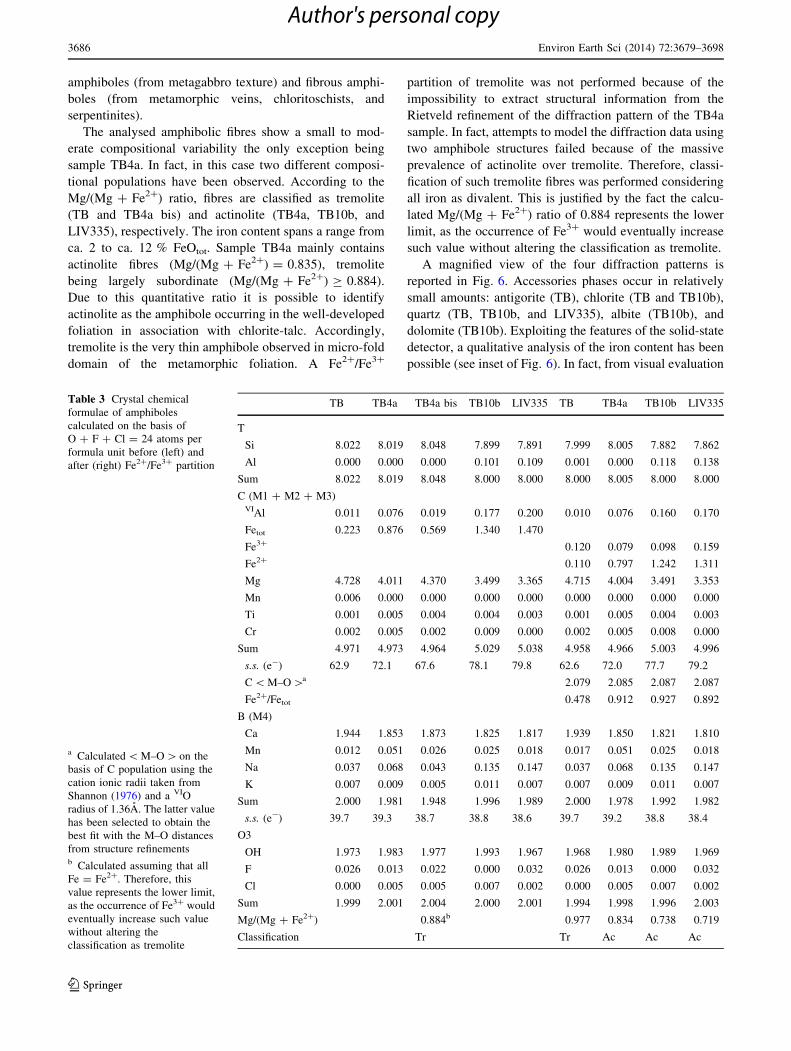
The analysed amphibolic fibres show a small to mod-
erate compositional variability the only exception being
sample TB4a. In fact, in this case two different composi-
tional populations have been observed. According to the
Mg/(Mg ? Fe2?) ratio, fibres are classified as tremolite
(TB and TB4a bis) and actinolite (TB4a, TB10b, and
LIV335), respectively. The iron content spans a range from
ca. 2 to ca. 12 % FeOtot. Sample TB4a mainly contains
actinolite fibres (Mg/(Mg ? Fe2?) = 0.835), tremolite
being largely subordinate (Mg/(Mg ? Fe2?) C 0.884).
Due to this quantitative ratio it is possible to identify
actinolite as the amphibole occurring in the well-developed
foliation in association with chlorite-talc. Accordingly,
tremolite is the very thin amphibole observed in micro-fold
domain of the metamorphic foliation. A Fe2?/Fe3?
partition of tremolite was not performed because of the
impossibility to extract structural information from the
Rietveld refinement of the diffraction pattern of the TB4a
sample. In fact, attempts to model the diffraction data using
two amphibole structures failed because of the massive
prevalence of actinolite over tremolite. Therefore, classi-
fication of such tremolite fibres was performed considering
all iron as divalent. This is justified by the fact the calcu-
lated Mg/(Mg ? Fe2?) ratio of 0.884 represents the lower
limit, as the occurrence of Fe3? would eventually increase
such value without altering the classification as tremolite.
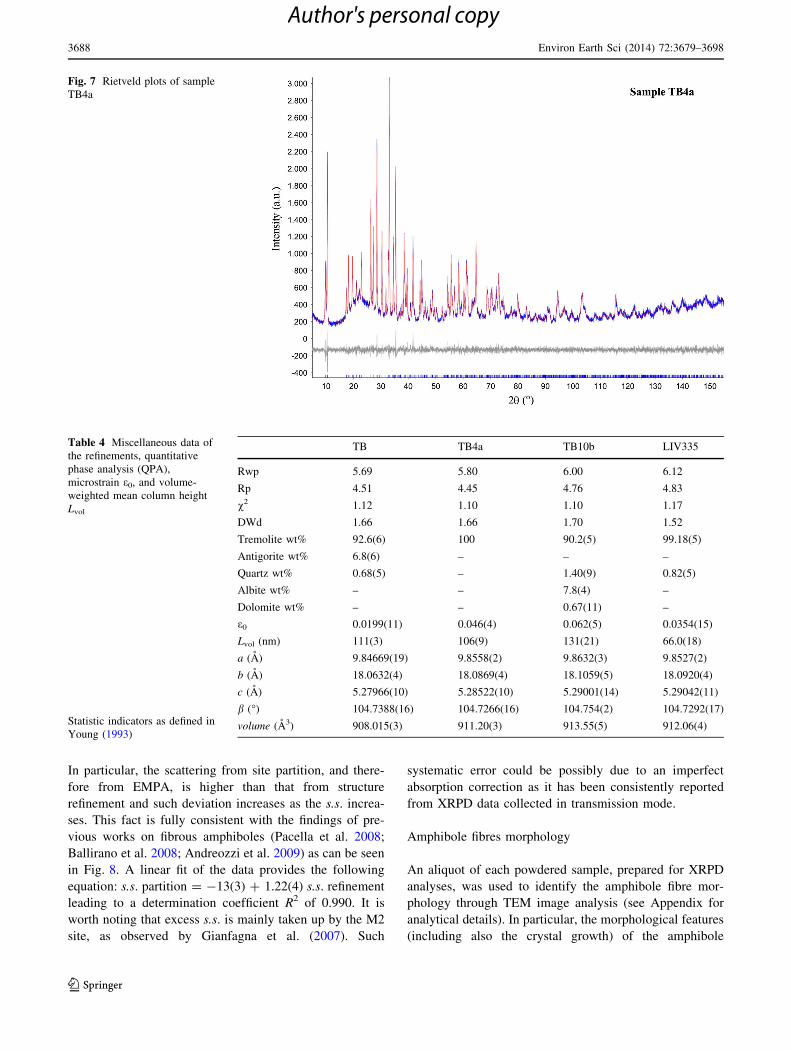
A magnified view of the four diffraction patterns is
reported in Fig. 6. Accessories phases occur in relatively
small amounts: antigorite (TB), chlorite (TB and TB10b),
quartz (TB, TB10b, and LIV335), albite (TB10b), and
dolomite (TB10b). Exploiting the features of the solid-state
detector, a qualitative analysis of the iron content has been
possible (see inset of Fig. 6). In fact, from visual evaluation
Table 3 Crystal chemical
formulae of amphiboles
calculated on the basis of
O ? F ? Cl = 24 atoms per
formula unit before (left) and
after (right) Fe2?/Fe3? partition
a Calculated \ M–O [ on the
basis of C population using the
cation ionic radii taken from
Shannon (1976) and a VIO
radius of 1.36A. The latter value
has been selected to obtain the
best fit with the M–O distances
from structure refinementsb Calculated assuming that all
Fe = Fe2?. Therefore, this
value represents the lower limit,
as the occurrence of Fe3? would
eventually increase such value
without altering the
classification as tremolite
TB TB4a TB4a bis TB10b LIV335 TB TB4a TB10b LIV335
T
Si 8.022 8.019 8.048 7.899 7.891 7.999 8.005 7.882 7.862
Al 0.000 0.000 0.000 0.101 0.109 0.001 0.000 0.118 0.138
Sum 8.022 8.019 8.048 8.000 8.000 8.000 8.005 8.000 8.000
C (M1 ? M2 ? M3)VIAl 0.011 0.076 0.019 0.177 0.200 0.010 0.076 0.160 0.170
Fetot 0.223 0.876 0.569 1.340 1.470
Fe3? 0.120 0.079 0.098 0.159
Fe2? 0.110 0.797 1.242 1.311
Mg 4.728 4.011 4.370 3.499 3.365 4.715 4.004 3.491 3.353
Mn 0.006 0.000 0.000 0.000 0.000 0.000 0.000 0.000 0.000
Ti 0.001 0.005 0.004 0.004 0.003 0.001 0.005 0.004 0.003
Cr 0.002 0.005 0.002 0.009 0.000 0.002 0.005 0.008 0.000
Sum 4.971 4.973 4.964 5.029 5.038 4.958 4.966 5.003 4.996
s.s. (e-) 62.9 72.1 67.6 78.1 79.8 62.6 72.0 77.7 79.2
C \ M–O [a 2.079 2.085 2.087 2.087
Fe2?/Fetot 0.478 0.912 0.927 0.892
B (M4)
Ca 1.944 1.853 1.873 1.825 1.817 1.939 1.850 1.821 1.810
Mn 0.012 0.051 0.026 0.025 0.018 0.017 0.051 0.025 0.018
Na 0.037 0.068 0.043 0.135 0.147 0.037 0.068 0.135 0.147
K 0.007 0.009 0.005 0.011 0.007 0.007 0.009 0.011 0.007
Sum 2.000 1.981 1.948 1.996 1.989 2.000 1.978 1.992 1.982
s.s. (e-) 39.7 39.3 38.7 38.8 38.6 39.7 39.2 38.8 38.4
O3
OH 1.973 1.983 1.977 1.993 1.967 1.968 1.980 1.989 1.969
F 0.026 0.013 0.022 0.000 0.032 0.026 0.013 0.000 0.032
Cl 0.000 0.005 0.005 0.007 0.002 0.000 0.005 0.007 0.002
Sum 1.999 2.001 2.004 2.000 2.001 1.994 1.998 1.996 2.003
Mg/(Mg ? Fe2?) 0.884b 0.977 0.834 0.738 0.719
Classification Tr Tr Ac Ac Ac
3686 Environ Earth Sci (2014) 72:3679–3698
123
Author's personal copy
of the EDX spectra (acquisition time of 24 h), simulta-
neously collected with the corresponding diffraction pat-
tern, it is possible to observe proportionality between Fe
content (expressed as atoms per formula unit, apfu) and the
height of the Fe Ka and Fe Kb fluorescence peaks for
the four analysed samples. The apparent deviation from the
trend of sample TB, which shows a peak higher than
expected, is due to the contribution of ca. 16 wt% of
antigorite containing ca. 6 % of FeO as compared to ca.
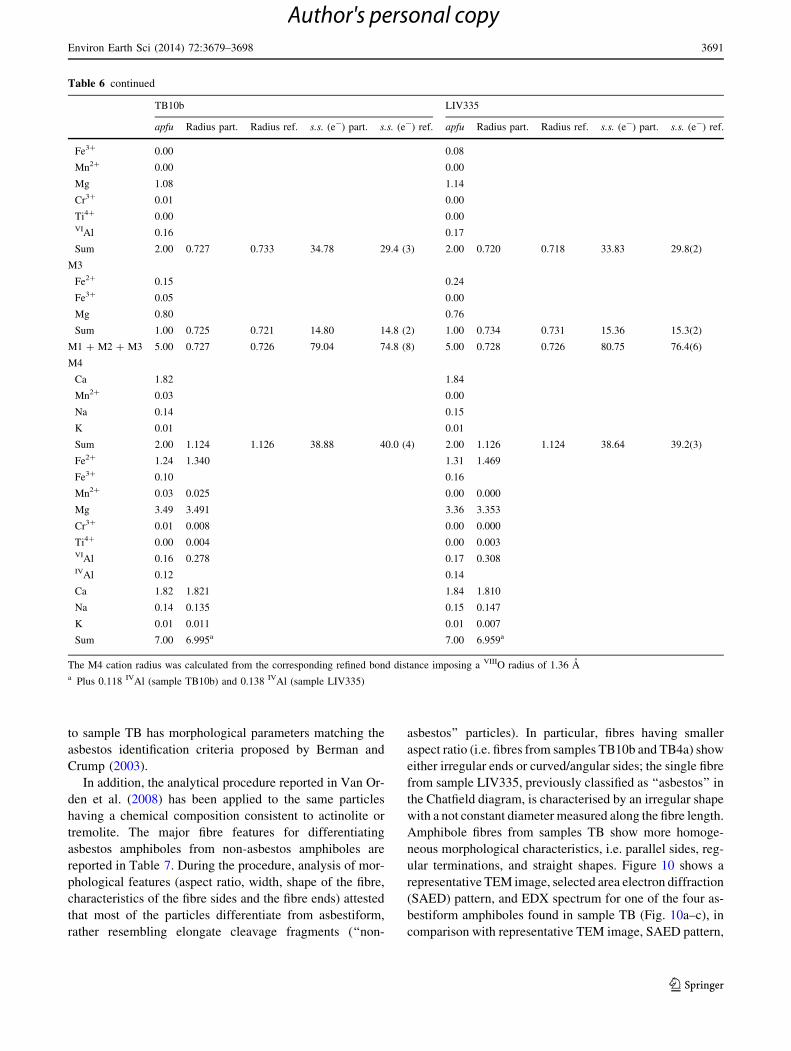
1.9 % of tremolite. The Rietveld plots of sample TB4a is
reported as example in Fig. 7. Quantitative phase analyses
(QPA), microstructural parameters e0 and Lvol, fibres cell
parameters, and miscellaneous data of the four samples are
shown in Table 4, selected bond distances, site scattering
(s.s.), and polyhedral distortion D (Brown and Shannon,
1973) in Table 5.
The mean T1-O distance is consistently slightly smaller
(1.616–1.623 A) than T2-O (1.634–1.647 A) as reported
for C2/m amphiboles with no or little tetrahedrally-coor-
dinated Al (Hawthorne, 1981). Slightly larger \T2-
O[ bond distances positively correlate with the occurrence
of ca. 0.1 IVAl apfu consistently with the Al site-preference
T2 » T1 (Hawthorne, 1981). Polyhedral distortion D shows
larger values for T2-centred tetrahedra as compared to T1.
Refined \M–O[ bond distances are in agreement with
those of Evans and Yang (1998) for tremolite-actinolite
samples of similar chemical composition. The \M1,2,3-
O[ bond distance increases as the overall iron content
increases. Site scattering of M1, M2, and M3 sites indi-
cates, as expected, the presence of a scatterer heavier than
Mg in agreement with chemical data.
The criteria for performing an indirect Fe2?/Fe3? par-
tition were based on the calculation of the \ M1,2,3-
O [ bond distance from the site population arising from
the conventional assignment to the C group sites, following
Hawthorne (1981). The \ M1,2,3-O [ bond distances
were calculated using the cation ionic radii taken from
Shannon (1976) and a VIO radius of 1.36 A.
Several cycles of iterative adjustments of the Fe2?/Fe3?
ratio were performed until the best fit with the \ M1,2,3-
O [ distances from the corresponding structure refine-
ments was achieved. Accordingly, the three TB4a, TB10b,
and LIV335 actinolite samples are characterised by a
nearly constant 0.9 Fe2?/Fetot ratio. Differently, the TB
tremolite sample has a significantly smaller 0.48 Fe2?/Fetot
ratio. As a further result of the Fe2?/Fe3? partition, recal-
culated crystal chemical formulae show a reduction of the
Si content at the T sites, originally exceeding 8 apfu
(Table 3).
The same procedure was adopted to obtain the indi-
vidual M1, M2, and M3 site partition. In this case a double
check was applied involving both the mean cation radius,
calculated from site partition and from the refined bond
distance, and the site scattering, calculated as well from
site partition and from the refined bond distance (Table 6).
The average deviation of the calculated mean cation radius
from the refined value is of ca. 0.003 A.
The TB tremolite sample allocates all available Fe3? at
M2 and all Fe2? at M1. The actinolite samples have a more
complex iron distribution pattern. In detail, a Fe2?
M2 [ M1 [ M3 site-preference has been consistently
observed. As far as the Fe3? distribution is involved, ferric
iron is allocated at M1 in sample TB4a, at M1 = M3 in
sample TB10b, and at M1 = M2 in sample LIV335.
The site scattering of the C group sites derived from
Rietveld refinement and those from chemical data differs.
Fig. 5 Amphibole diagram classification (after Leake et al. 1997)
Fig. 6 Magnified view of the four diffraction patterns. As the only
detectable reflection of chlorite occurred at ca. 6� 2h, the 5–7� 2hangular range was removed from refinement of the diffraction pattern
of sample TB. Inset: Inset: EDX spectra, simultaneously collected for
the four analysed samples (acquisition time of 24 h). Relevant
reflections of accessory phases are labelled as follow: Ab albite; Ant
antigorite, Dol dolomite; Qtz quartz
Environ Earth Sci (2014) 72:3679–3698 3687
123
Author's personal copy
In particular, the scattering from site partition, and there-
fore from EMPA, is higher than that from structure
refinement and such deviation increases as the s.s. increa-
ses. This fact is fully consistent with the findings of pre-
vious works on fibrous amphiboles (Pacella et al. 2008;
Ballirano et al. 2008; Andreozzi et al. 2009) as can be seen
in Fig. 8. A linear fit of the data provides the following
equation: s.s. partition = -13(3) ? 1.22(4) s.s. refinement
leading to a determination coefficient R2 of 0.990. It is
worth noting that excess s.s. is mainly taken up by the M2
site, as observed by Gianfagna et al. (2007). Such
systematic error could be possibly due to an imperfect
absorption correction as it has been consistently reported
from XRPD data collected in transmission mode.
Amphibole fibres morphology
An aliquot of each powdered sample, prepared for XRPD
analyses, was used to identify the amphibole fibre mor-
phology through TEM image analysis (see Appendix for
analytical details). In particular, the morphological features
(including also the crystal growth) of the amphibole
Table 4 Miscellaneous data of
the refinements, quantitative
phase analysis (QPA),
microstrain e0, and volume-
weighted mean column height
Lvol
Statistic indicators as defined in
Young (1993)
TB TB4a TB10b LIV335
Rwp 5.69 5.80 6.00 6.12
Rp 4.51 4.45 4.76 4.83
v2 1.12 1.10 1.10 1.17
DWd 1.66 1.66 1.70 1.52
Tremolite wt% 92.6(6) 100 90.2(5) 99.18(5)
Antigorite wt% 6.8(6) – – –
Quartz wt% 0.68(5) – 1.40(9) 0.82(5)
Albite wt% – – 7.8(4) –
Dolomite wt% – – 0.67(11) –
e0 0.0199(11) 0.046(4) 0.062(5) 0.0354(15)
Lvol (nm) 111(3) 106(9) 131(21) 66.0(18)
a (A) 9.84669(19) 9.8558(2) 9.8632(3) 9.8527(2)
b (A) 18.0632(4) 18.0869(4) 18.1059(5) 18.0920(4)
c (A) 5.27966(10) 5.28522(10) 5.29001(14) 5.29042(11)
b (�) 104.7388(16) 104.7266(16) 104.754(2) 104.7292(17)
volume (A3) 908.015(3) 911.20(3) 913.55(5) 912.06(4)
Fig. 7 Rietveld plots of sample
TB4a
3688 Environ Earth Sci (2014) 72:3679–3698
123
Author's personal copy

particles having chemical composition consistent with
tremolite and/or actinolite have been considered. This
resulted in approximately 120 fibres characterised by an
aspect ratio [3:1.
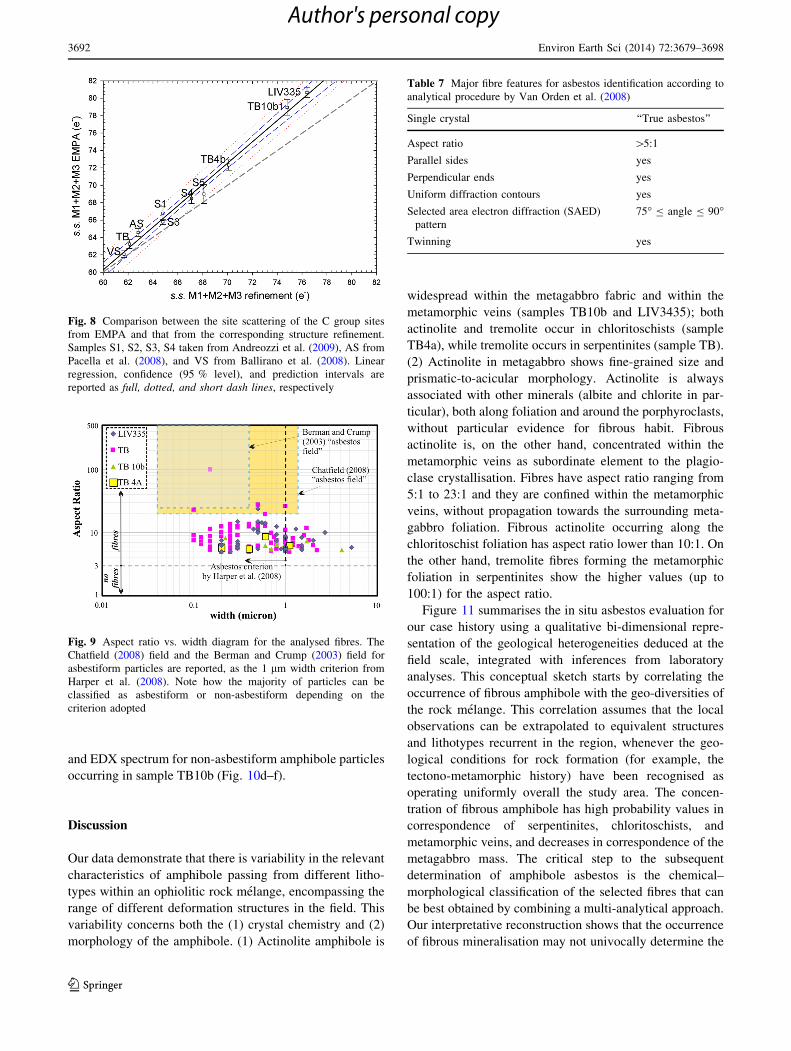
All the analysed fibres have width exceeding 0.1 lm.
Fibres from samples TB10b and TB4a have aspect ratio
ranging from 5:1 to 9:1, whereas those from sample
LIV335 have aspect ratio smaller than 20:1, except for just
one fibre. The majority of fibres from sample TB have
aspect ratio spanning from 5:1 to 20:1. Only four fibres
have aspect ratio exceeding 20:1 with one reaching 100:1.
Those morphometric data have been plotted in a width vs.
aspect ratio diagram (Fig. 9). Most of the fibres, indepen-
dently on the aspect ratio, have widths smaller than 1 lm,
fitting with the asbestos criterion proposed by Harper et al.
(2008). Differently, whenever considering the asbestos
classification as proposed by Chatfield (2008), this diagram
shows that only four amphiboles from sample TB and one
amphibole from sample LIV335 fall within the region
delimiting the ‘‘asbestos’’. Finally, only one fibre belonging
Table 5 Selected bond
distances, site scattering (s.s.),
and polyhedral distortion D
(9104), defined as D ¼1n
PRi�R
R
� �2
where n is the
number of ligands, R is the
average bond length and Ri an
individual bond length (Brown
and Shannon 1973), of the four
amphibole samples
TB TB4a TB10b LIV335
M1-O192 2.073(10) 2.064(9) 2.069(12) 2.088(10)
M1-O2 92 2.099(9) 2.086(8) 2.092(12) 2.092(9)
M1-O3 92 2.056(8) 2.085(7) 2.091(10) 2.087(7)
\M1-O[ 2.076 2.078 2.084 2.089
D (9104) 0.73 0.24 0.26 0.01
s.s. (e-) M1 24.6(2) 28.7(2) 30.6(3) 31.4(2)
M2-O1 92 2.146(9) 2.158(8) 2.157(11) 2.147(9)
M2-O2 92 2.086(10) 2.091(9) 2.114(13) 2.074(10)
M2-O4 92 1.991(9) 2.022(8) 2.008(10) 2.013(8)
\M2-O[ 2.074 2.090 2.093 2.078
D (x 104) 9.46 7.06 8.95 6.95
s.s. (e-) M2 25.2(2) 27.8(2) 29.4(3) 29.8(2)
M3-O1 94 2.084(8) 2.097(7) 2.094(10) 2.111(8)
M3-O3 92 2.088(13) 2.062(12) 2.056(16) 2.052(12)
\M3-O[ 2.084 2.085 2.081 2.091
D (9104) 0.01 0.63 0.74 1.77
s.s. (e-) M3 12.66(17) 13.51(16) 14.8(2) 15.26(17)
\M1,M2,M3-O[ 2.079 2.085 2.086 2.086
s.s. (e-) M1 ? M2 ? M3 62.5(6) 70.0(6) 74.8(8) 76.4(6)
M4-O2 92 2.384(9) 2.358(8) 2.364(11) 2.366(9)
M4-O4 92 2.344(11) 2.321(9) 2.325(13) 2.332(10)
M4-O5 92 2.756(8) 2.797(7) 2.783(10) 2.774(8)
M4-O6 92 2.563(9) 2.560(8) 2.592(11) 2.583(9)
\M4-O[ 2.512 2.509 2.516 2.514
D (x 104) 42.50 57.06 53.97 50.40
s.s. (e-) M4 39.9(3) 39.7(3) 40.0(4) 39.2(3)
T1-O1 1.585(10) 1.582(9) 1.600(12) 1.594(9)
T1-O5 1.663(11) 1.624(10) 1.615(14) 1.629(11)
T1-O6 1.615(10) 1.632(9) 1.621(12) 1.632(9)
T1-O7 1.629(6) 1.627(5) 1.639(7) 1.636(6)
\T1-O[ 1.623 1.616 1.619 1.623
D (9104) 2.98 1.53 0.74 1.07
T2-O2 1.630(11) 1.663(9) 1.623(13) 1.642(10)
T2-O4 1.628(9) 1.600(8) 1.604(11) 1.593(9)
T2-O5 1.640(10) 1.643(9) 1.681(12) 1.665(9)
T2-O6 1.689(9) 1.668(10) 1.652(13) 1.651(10)
\T2-O[ 1.647 1.644 1.640 1.634
D (9104) 2.27 2.66 3.17 3.31
Environ Earth Sci (2014) 72:3679–3698 3689
123
Author's personal copy

Table 6 Site partition (apfu), site scattering (s.s.), and mean cation radius as calculated from site partition (part.) and from refined bond distances
(ref.)
TB TB4a
apfu Radius part. Radius ref. s.s. (e-) part. s.s. (e-) ref. apfu Radius part. Radius ref. s.s. (e-) part. s.s. (e-) ref.
M1
Fe2? 0.02 0.22
Fe3? 0.04 0.08
Mg 1.94 1.70
Sum 2.00 0.719 0.716 24.72 24.6 (2) 2.00 0.724 0.718 28.20 28.7 (2)
M2
Fe2? 0.02 0.46
Fe3? 0.08 0.00
Mn2? 0.00 0.00
Mg 1.89 1.44
Cr3? 0.00 0.01
Ti4? 0.00 0.01VIAl 0.01 0.05
Sum 2.00 0.717 0.714 25.22 25.2 (2) 2.00 0.725 0.730 30.74 27.8 (2)
M3
Fe2? 0.07 0.11
Fe3? 0.00 0.00
Mg 0.93 0.89
Sum 1.00 0.724 0.725 12.84 12.66 (17) 1.00 0.727 0.725 13.54 13.5 (2)
M1 ? M2 ? M3 5.00 0.719 0.718 63.07 62.5 (6) 5.00 0.725 0.725 72.48 70.0 (6)
M4
Ca 1.93 1.87
Mn2? 0.02 0.05
Na 0.04 0.07
K 0.01 0.01
Sum 2.00 1.122 1.122 39.73 39.9 (3) 2.00 1.120 1.119 39.61 39.7 (3)
Fe2? 0.11 0.230 0.79 0.866
Fe3? 0.12 0.08
Mn2? 0.02 0.017 0.05 0.052
Mg 4.76 4.715 4.03 4.009
Cr3? 0.00 0.002 0.01 0.007
Ti4? 0.00 0.001 0.01 0.006VIAl 0.01 0.011 0.08 0.079IVAl 0.00 0.00
Ca 1.93 1.939 1.87 1.848
Na 0.04 0.037 0.07 0.070
K 0.01 0.007 0.01 0.009
Sum 7.00 6.959 7.00 6.946
TB10b LIV335
apfu Radius part. Radius ref. s.s. (e-) part. s.s. (e-) ref. apfu Radius part. Radius ref. s.s. (e-) part. s.s. (e-) ref.
M1
Fe2? 0.34 0.46
Fe3? 0.05 0.08
Mg 1.61 1.46
Sum 2.00 0.728 0.724 29.46 30.6 (3) 2.00 0.731 0.729 31.56 31.4(2)
M2
Fe2? 0.75 0.61
3690 Environ Earth Sci (2014) 72:3679–3698
123
Author's personal copy
to sample TB has morphological parameters matching the
asbestos identification criteria proposed by Berman and
Crump (2003).
In addition, the analytical procedure reported in Van Or-
den et al. (2008) has been applied to the same particles
having a chemical composition consistent to actinolite or
tremolite. The major fibre features for differentiating
asbestos amphiboles from non-asbestos amphiboles are
reported in Table 7. During the procedure, analysis of mor-
phological features (aspect ratio, width, shape of the fibre,
characteristics of the fibre sides and the fibre ends) attested
that most of the particles differentiate from asbestiform,
rather resembling elongate cleavage fragments (‘‘non-
asbestos’’ particles). In particular, fibres having smaller
aspect ratio (i.e. fibres from samples TB10b and TB4a) show
either irregular ends or curved/angular sides; the single fibre
from sample LIV335, previously classified as ‘‘asbestos’’ in
the Chatfield diagram, is characterised by an irregular shape
with a not constant diameter measured along the fibre length.
Amphibole fibres from samples TB show more homoge-
neous morphological characteristics, i.e. parallel sides, reg-
ular terminations, and straight shapes. Figure 10 shows a
representative TEM image, selected area electron diffraction
(SAED) pattern, and EDX spectrum for one of the four as-
bestiform amphiboles found in sample TB (Fig. 10a–c), in
comparison with representative TEM image, SAED pattern,
Table 6 continued
TB10b LIV335
apfu Radius part. Radius ref. s.s. (e-) part. s.s. (e-) ref. apfu Radius part. Radius ref. s.s. (e-) part. s.s. (e-) ref.
Fe3? 0.00 0.08
Mn2? 0.00 0.00
Mg 1.08 1.14
Cr3? 0.01 0.00
Ti4? 0.00 0.00VIAl 0.16 0.17
Sum 2.00 0.727 0.733 34.78 29.4 (3) 2.00 0.720 0.718 33.83 29.8(2)
M3
Fe2? 0.15 0.24
Fe3? 0.05 0.00
Mg 0.80 0.76
Sum 1.00 0.725 0.721 14.80 14.8 (2) 1.00 0.734 0.731 15.36 15.3(2)
M1 ? M2 ? M3 5.00 0.727 0.726 79.04 74.8 (8) 5.00 0.728 0.726 80.75 76.4(6)
M4
Ca 1.82 1.84
Mn2? 0.03 0.00
Na 0.14 0.15
K 0.01 0.01
Sum 2.00 1.124 1.126 38.88 40.0 (4) 2.00 1.126 1.124 38.64 39.2(3)
Fe2? 1.24 1.340 1.31 1.469
Fe3? 0.10 0.16
Mn2? 0.03 0.025 0.00 0.000
Mg 3.49 3.491 3.36 3.353
Cr3? 0.01 0.008 0.00 0.000
Ti4? 0.00 0.004 0.00 0.003VIAl 0.16 0.278 0.17 0.308IVAl 0.12 0.14
Ca 1.82 1.821 1.84 1.810
Na 0.14 0.135 0.15 0.147
K 0.01 0.011 0.01 0.007
Sum 7.00 6.995a 7.00 6.959a
The M4 cation radius was calculated from the corresponding refined bond distance imposing a VIIIO radius of 1.36 Aa Plus 0.118 IVAl (sample TB10b) and 0.138 IVAl (sample LIV335)
Environ Earth Sci (2014) 72:3679–3698 3691
123
Author's personal copy
and EDX spectrum for non-asbestiform amphibole particles
occurring in sample TB10b (Fig. 10d–f).
Discussion
Our data demonstrate that there is variability in the relevant
characteristics of amphibole passing from different litho-
types within an ophiolitic rock melange, encompassing the
range of different deformation structures in the field. This
variability concerns both the (1) crystal chemistry and (2)
morphology of the amphibole. (1) Actinolite amphibole is
widespread within the metagabbro fabric and within the
metamorphic veins (samples TB10b and LIV3435); both
actinolite and tremolite occur in chloritoschists (sample
TB4a), while tremolite occurs in serpentinites (sample TB).
(2) Actinolite in metagabbro shows fine-grained size and
prismatic-to-acicular morphology. Actinolite is always
associated with other minerals (albite and chlorite in par-
ticular), both along foliation and around the porphyroclasts,
without particular evidence for fibrous habit. Fibrous
actinolite is, on the other hand, concentrated within the
metamorphic veins as subordinate element to the plagio-
clase crystallisation. Fibres have aspect ratio ranging from
5:1 to 23:1 and they are confined within the metamorphic
veins, without propagation towards the surrounding meta-
gabbro foliation. Fibrous actinolite occurring along the
chloritoschist foliation has aspect ratio lower than 10:1. On
the other hand, tremolite fibres forming the metamorphic
foliation in serpentinites show the higher values (up to
100:1) for the aspect ratio.
Figure 11 summarises the in situ asbestos evaluation for
our case history using a qualitative bi-dimensional repre-
sentation of the geological heterogeneities deduced at the
field scale, integrated with inferences from laboratory
analyses. This conceptual sketch starts by correlating the
occurrence of fibrous amphibole with the geo-diversities of
the rock melange. This correlation assumes that the local
observations can be extrapolated to equivalent structures
and lithotypes recurrent in the region, whenever the geo-
logical conditions for rock formation (for example, the
tectono-metamorphic history) have been recognised as
operating uniformly overall the study area. The concen-
tration of fibrous amphibole has high probability values in
correspondence of serpentinites, chloritoschists, and
metamorphic veins, and decreases in correspondence of the
metagabbro mass. The critical step to the subsequent
determination of amphibole asbestos is the chemical–
morphological classification of the selected fibres that can
be best obtained by combining a multi-analytical approach.
Our interpretative reconstruction shows that the occurrence
of fibrous mineralisation may not univocally determine the
Table 7 Major fibre features for asbestos identification according to
analytical procedure by Van Orden et al. (2008)
Single crystal ‘‘True asbestos’’
Aspect ratio [5:1
Parallel sides yes
Perpendicular ends yes
Uniform diffraction contours yes
Selected area electron diffraction (SAED)
pattern
75� B angle B 90�
Twinning yes
Fig. 8 Comparison between the site scattering of the C group sites
from EMPA and that from the corresponding structure refinement.
Samples S1, S2, S3, S4 taken from Andreozzi et al. (2009), AS from
Pacella et al. (2008), and VS from Ballirano et al. (2008). Linear
regression, confidence (95 % level), and prediction intervals are
reported as full, dotted, and short dash lines, respectively
Fig. 9 Aspect ratio vs. width diagram for the analysed fibres. The
Chatfield (2008) field and the Berman and Crump (2003) field for
asbestiform particles are reported, as the 1 lm width criterion from
Harper et al. (2008). Note how the majority of particles can be
classified as asbestiform or non-asbestiform depending on the
criterion adopted
3692 Environ Earth Sci (2014) 72:3679–3698
123
Author's personal copy

probability of the asbestos concentration in rock (Fig. 11).
On this ground, it is worth nothing that our results show
that only the tremolite crystals in serpentinite can be
classified as normative ‘‘asbestos’’ by the application of the
Van Orden et al. (2008) procedure, while amphibole fibres
from the other lithotypes/structures do not fit all the
properties for the ‘‘true asbestos’’. In this case, despite the
morphological similarities at the mesoscale, tremolite from
serpentinite and actinolite from metamorphic vein do not
give the same score of in situ asbestos hazard.
The results from this study can be generalised in two
main points: (1) importance of identifying the geological
conditions (protolith and deformation/mineralisation envi-
ronments) that catalyse the development of the fibrous
Fig. 10 TEM images (a and d), SAED patterns (b and e), and EDX spectra (c and f) for asbestiform amphibole from sample TB and non-
asbestiform amphibole from sample TB10b. The major fibre features for asbestos identification are listed in Table 7
Environ Earth Sci (2014) 72:3679–3698 3693
123
Author's personal copy

mineralisation; and (2) the assessment of which fibrous
mineral can be really classified as normative asbestos.
1. In melange sequences, block lithotypes vary in size
(from few centimetres to several kilometres), in
distribution (they may be parallel or discordant to the
main tectonic features at the regional scale), and in
shape (they may appear as discontinuous, rootless
lenses wrapped by the country rocks). The identifica-
tion of different lithotypes is important for asbestos
detection purposes as certain rock units may have more
attitudes to encompass amphibole crystallisation than
others. Within the wide spectrum of ophiolitic rock-
types, the amphibole asbestos is mostly present in
gabbros, serpentinoschists, and various meta-sedimen-
tary rocks (e.g. Ross and Nolan 2003; Van Gosen
2007). In general, the bulk rock chemistry controls the
amphibole mineral chemistry during the progress of
the deformation-metamorphism in presence of external
silica-rich mineralising fluids (e.g. Evans 1977; Cart-
wright and Barnicoat 2003). Fibrous amphibole con-
centration in ophiolites is triggered by the chemical
disequilibrium occurring in strain environment of bulk
rock, such as within schistosity, fault surfaces, vein
network (Vignaroli et al. 2011 and references therein).
The geometrical properties (persistence, length, width,
spacing) of these deformation structures as well as
their orientation should be investigated in detail to
provide clues about the distribution of the fibrous
mineralisation in rocks.
2. There is not a univocal correspondence between the
fibres occurrence and assessment of normative asbes-
tos. Despite the relevance of fibrous morphology
detected at the field scale, not all fibres encounter the
properties (chemical, morphological, or both) of the
normative asbestos. Passing from the mesoscale to the
microscale is an imperative step within the identifica-
tion of asbestiform mineralisation, with respect to the
current normative. The integration of different miner-
alogical techniques (EMPA, XRPD) constrains the
chemical composition of the fibre bundles and the
single fibre. Observations at TEM reduce the ambigu-
ities in identifying the morphological and crystal
chemical properties of the single fibre for assessing
the real asbestos structure.
Anyway, the amphibole asbestos identification and
classification are still matter of ongoing debate (compare,
for example, Dodson et al. 2003 vs. Williams et al. 2013).
Classification methods dominantly based on the fibre
dimensional criteria (Berman and Crump 2003; Harper
et al. 2008; Chatfield 2008) do not provide univocal infor-
mation about the asbestos identification. A detailed evalu-
ation of the chemical and morphological parameters of the
fibrous minerals is thus needed. On the other hand, through
the combination of crystal chemical analysis and TEM
observations, the procedure proposed by Van Orden et al.
(2008) provides a more restrictive differentiation between
‘‘true asbestos’’ and ‘‘non-asbestos’’ cleavage fragments.
Further multidisciplinary studies (including epidemio-
logical ones) should be encouraged for supporting the
hypothesis that the most restrictive classification method
may be the safest in term of environment and health pro-
tection. At the present, the in situ asbestos hazard can be
associated to specific geological-structural sites where the
fibres show all chemical and morphological characteristics
for being classified as ‘‘true asbestos’’. The ‘‘true asbestos’’
definition remains subordinate to the selected counting
method for fibre.
Conclusions
This work outlines the importance to perform a multidis-
ciplinary, multi-analytical approach for evaluating the
in situ amphibole asbestos hazard in rock melanges affec-
ted by post-formation deformation structures. This evalu-
ation passes through the determination of the geological
features at the field scale and successive petrographic,
mineralogical and morphological laboratory analyses. The
effects of an appropriate, geological-based, approach have
Fig. 11 Qualitative schematization illustrating the probability of
asbestos concentration within the geo-diversities faced in the studied
ophiolitic suite
3694 Environ Earth Sci (2014) 72:3679–3698
123
Author's personal copy

direct implication for all environments where disturbing
processes, either natural or anthropic in origin, of bulk rock
material produce and disperse airborne fibres and lead to
toxicity and consequent negative health effects.
Our results reveal that (1) the development of fibrous
mineralisation depends on several parameters during the
metamorphic evolution of the rock sequence, ranging from
strain, fluid activity, chemistry of the involved domain, (2)
a relationship between the field scale geological-structural
conditions and the in situ concentration of fibrous miner-
alisation can be documented, and (3) the evaluation of the
asbestos hazard is strongly affected by the fibre classifi-
cation method. Presently, the procedures for differentiating
the asbestiform and non-asbestiform fibres led to divergent
interpretations in assessing the potential environmental
impact in natural sites. A critical review of the analytical
protocols for asbestos counting method is needed, as nor-
matives regulating the asbestos hazard determination are
still controversial.
Acknowledgments The authors are grateful to M. Serracino and M.
Albano for the assistance at the electron microprobe and for SEM
investigations. We thank D.R. Van Orden and M.S. Sanchez for
helpful discussions and suggestions on the analytical procedures
adopted for the TEM analysis. The laboratory staff of the RJ Lee
Group Inc (Monroeville, PA, USA) is acknowledged for the assis-
tance in TEM analysis. The manuscript benefited of fruitful comments
and suggestions by three anonymous reviewers.
Appendix: experimental conditions for the laboratory
analyses
EMPA
The composition of the amphiboles was determined using a
Cameca SX50 electron microprobe equipped with five
wavelength-dispersive spectrometers using the following
conditions: 10 s counting time (peak), 5 s counting time
(background), beam diameter 2 lm, excitation voltage
15 kV, specimen current 15 nA. The following standards
were used: wollastonite (Si Ka and Ca Ka), rutile (Ti Ka),
corundum (Al Ka), magnetite (Fe Ka), metallic manganese
(Mn Ka), periclase (Mg Ka), orthoclase (K Ka), jadeite
(Na Ka), fluorophlogopite (F Ka), and sylvite (Cl Ka).
Raw data were corrected on-line for drift, dead time, and
background; matrix correction was performed with a
standard ZAF programme. Formulae were calculated on
the basis of O ? F?Cl = 24 apfu. Cations were assigned
to the B, C, and T group sites following Hawthorne (1981),
filled according to the order recommended by Leake et al.
(1997). Differently from several papers (Ballirano et al.
2008; Gianfagna et al. 2003, 2007; Pacella et al. 2008), no
Mossbauer spectroscopy was performed on the samples
because of the presence of other Fe-bearing silicates (an-
tigorite, chlorite) and iron oxides admixed with the fibres
as well as the presence of two admixed amphiboles in
sample TB4a. In fact, their occurrence would produce a
significant complication in data analysis rendering unreli-
able results with specific reference to site attribution.
However, an indirect Fe2?/Fe3? partition has been per-
formed following a procedure that will be described below.
X-ray powder diffraction (XRPD)
X-ray powder diffraction (XRPD) data were collected on
samples hand picked under a binocular that were ground with
a pestle, under ethanol, in an agate mortar. The corre-
sponding powders were loaded in 0.7-mm diameter boro-
silicate-glass capillaries that were subsequently aligned on a
standard goniometer head. Data were collected, using Cu Karadiation, on a parallel-beam Bruker AXS D8 Focus auto-
mated diffractometer operating in Debye-Scherrer geome-
try. It is fitted with Soller slits along both the incident and the
diffracted beam and a Peltier-cooled Si(Li) SolX detector.
Data were collected in the 5–155� 2h angular range, step size
0.02� 2h, and 40 s counting time.
Rietveld method
Diffraction data were evaluated by the Rietveld method
using TOPAS v. 4.2 (Bruker AXS, 2009). This programme
implements the Fundamental Parameters Approach FPA
(Cheary and Coelho, 1992). Such approach has been shown
to improve the quality of the fit as a result of a more
accurate description of the peak shape (Ballirano et al.
2009; Ballirano 2011a,b). Peak shape was modelled
through FPA imposing a simple axial model (14 mm) and
the size of the divergence (0.6 mm) and of the receiving
(0.2 mm) slits. Peak broadening was assumed to follow a
Lorentzian (size) and a Gaussian (strain) behaviour (Del-
hez et al. 1993). From evaluation of the integral breadths bi
of the individual reflections, microstructural parameters as
e0 microstrain (lattice strain), defined as bi = 4e0 tan h, and
volume-weighted mean column height Lvol, defined as
bi = k/Lvol cos h were extracted (Ballirano and Sadun,
2009). Absorption was refined following the formalism of
Sabine et al. (1998) for a cylindrical sample.
Starting fractional coordinates for amphiboles were
those of sample 93728 of Evans and Yang (1998). This
tremolite sample was characterised by an Mg/(Mg ? Fe2?)
ratio of 0.901 that is reasonably similar to that of all ana-
lysed samples. The isotropic displacement parameters were
set to the corresponding values calculated as the average of
the 20 samples of tremolite-actinolite-ferro-actinolite ana-
lysed by X-ray single crystal diffraction by Evans and
Yang (1998). Because of strong correlations with the site
Environ Earth Sci (2014) 72:3679–3698 3695
123
Author's personal copy
occupancies they were kept fixed throughout the refine-
ments following the same approach used by Andreozzi
et al. (2009). No restraints on bond distances and angles
were imposed. Structural data for accessories phases were
taken from: Capitani and Mellini (2006) (antigorite), Lager
et al. (1982) (quartz), Meneghinello et al. (1999) (albite),
and Ross and Reeder (1992) (dolomite). As the only
detectable reflection of chlorite occurred at ca. 6� 2h, the
5–7� 2h angular range was removed from refinement of the
diffraction pattern of sample TB. Cell parameters were
refined for all phases, whereas fractional coordinates for all
atoms and site scattering for M(1), M(2), M(3), and M(4)
were also refined for the fibres. An attempt to detect the
occurrence of electron density at A, Am, and A2 failed in
keeping with none or small (\0.01 apfu) cationic excess at
M4 for all investigated samples.
Preferred orientation for amphiboles was modelled by
means of spherical harmonics (nine refinable parameters up
to the 8th order). Optimization of the spherical harmonics
terms produced a very marginal improvement of the fits, as
they were consistently found to be extremely small, as
expected for a capillary mount.
TEM
Samples were prepared for transmission electron micro-
scope (TEM) analysis by suspending a small portion of
each powdered samples in a beaker containing de-ionised
water. Each suspension was allowed to settle for 1 min
before removing an aliquot sample that was subsequently
filtered through a polycarbonate filter showing a porosity of
0.4 lm. The amount of the material was about 0.190 mg
for each dust samples on an effective filter area of
385 mm2 with a dilution factor of about 0.0001. The filter
area analysed for each sample was about 0.3336 mm2.
Filters were prepared and analysed for asbestos using
ASTM D5756-02 and Yamate et al. (1984) protocol to take
into consideration the structures having a minimum length
of 0.5 lm with an aspect ratio exceeding or equalling 3:1.
Analyses were carried out with a Jeol 1200 and a Jeol 2000
TEM, the latter equipped with an EDAX microanalysis.
Experimental conditions were as follow: acceleration
voltage was of 120 kV, magnification in the 10–20 kX
range, grid opening in the 10–25 lm range. The counting
method for identifying fibres on polycarbonate filters fol-
lowed the protocol in Yamate et al. (1984).
References
AHERA (Asbestos Hazardous Emergency Response Act) (1987)
Interim transmission electron microscopy analytical methods—
mandatory and non-mandatory—and mandatory section to
determine completion of response. Fed Regist 52:41857–41897
Andreani M, Boullier AM, Gratier JP (2005) Development of
schistosity by dissolution-crystallization in a Californian ser-
pentinite gouge. J Struct Geol 27:2256–2267
Andreozzi GB, Ballirano P, Gianfagna A, Mazziotti-Tagliani S,
Pacella A (2009) Structural and spectroscopic characterization of
a suite of fibrous amphiboles with high environmental and health
relevance from Biancavilla (Sicily, Italy). Am Miner
94:1333–1340
ASTM D5756–02 (approved 2008) (1995) Standard test method for
microvacuum sampling and indirect analysis of dust by trans-
mission electron microscopy for asbestos mass surface loading,
Annual Book of ASTM Standards
Ballirano P (2011a) Laboratory parallel-beam transmission X-ray
powder diffraction investigation of the thermal behavior of
calcite: comparison with X-ray single-crystal and synchrotron
powder diffraction data. Periodico di Mineralogia 80:123–134
Ballirano P (2011b) Laboratory parallel-beam transmission X-ray
powder diffraction investigation of the thermal behavior of
nitratine NaNO3: spontaneous strain and structure evolution.
Phys Chem Miner 38:531–541
Ballirano P, Sadun C (2009) Thermal behavior of trehalose dihydrate
(Th) and b-anhydrous trehalose (Tb) by in situ laboratory
parallel-beam X-ray powder diffraction. Struct Chem
20:815–823
Ballirano P, Andreozzi GB, Belardi G (2008) Crystal chemical and
structural characterization of fibrous tremolite from Susa Valley,
Italy, with comments on potential harmful effects on human
health. Am Miner 93:1349–1355
Ballirano P, Andreozzi GB, Dogan M, Dogan AU (2009) Crystal
structure and iron topochemistry of erionite-K from Rome,
Oregon, USA. Am Miner 94:1262–1270
Bellopede R, Clerici C, Marini P, Zanetti G (2009) Rocks with
asbestos: risk evaluation by means of an abrasion Test. Am J
Environ Sci 5:500–506
Berman DW, Crump KS (2003) Final draft: technical support
document for a protocol to assess asbestos-related risk. Prepared
for Office of Solid Waste and Emergency Response, US
Environmental Protection Agency, Washington, DC.20460,
USEPA #9345.4–06 October 2003
Brown ID, Shannon RD (1973) Empirical bond-strength-bond-length
curves for oxides. Acta Crystallogr A A29:266–282
Bruker AXS, (2009) Topas V4.2: general profile and structure
analysis software for powder diffraction data. Bruker AXS,
Karlsruhe, Germany
Burilkov T, Michailova L (1970) Asbestos content of the soil and
endemic pleural asbestosis. Environ Res 3:443–451
Caine JS, Evans JP, Forster CB (1996) Fault zone architecture and
permeability structure. Geology 24:1025–1028
Capitani GC, Mellini M (2006) The crystal structure of a second
antigorite polysome (m = 16), by single-crystal synchrotron
diffraction. Am Miner 91:394–399
Capponi G, Crispini L (2002) Structural and metamorphic signature
of alpine tectonics in the Voltri Massif (Ligurian Alps, Noth-
Western Italy). Eclogae Geol Helv 95:31–42
Capponi G, Crispini L (with collaboration by Bonci MC, Bruzzo D,
Cortesogno L, Firpo M, Gaggero L, Garofano M, Lano M,
Pacciani G, Piccazzo M, Ramella A, Vannucci G, Vigo E)
(2006) Elemento 213–3 ‘‘Pegli’’, scala 1/25’000, Progetto
CARG - Regione Liguria. http://www.cartografia.regione.
liguria.it
Cartwright I, Barnicoat AC (2003) Geochemical and stable isotope
resetting in shear zones from Taschalp: constraints on fluid flow
during exhumation in the Western Alps. J Metamorph Geol
21:143–161
3696 Environ Earth Sci (2014) 72:3679–3698
123
Author's personal copy
Cattaneo A, Cavallo DM, Foa V (2006) Patologia umana conseguente
all’inalazione di fibre di asbestos. Rendiconti della Societa
Geologica Italiana 3:37–40
Chatfield EJ (2008) A procedure for quantitative description of
fibrosity in amphibole minerals, : in 2008 Johnson Conference:
critical issues in monitoring asbestos, ASTM International,
Burlington, Vermont, July 14–July 18, 2008. Available at: http://
www.cdc.gov/niosh/docket/archive/docket099C.html
Cheary RW, Coelho A (1992) A fundamental parameters approach to
X-ray line-profile fitting. J Appl Crystallogr 25:109–121
Compagnoni R, Groppo C (2006) Gli amianti in Val di Susa e le rocce
che li contengono. Rendiconti della Societa Geologica Italiana
3:21–28
Crispini L, Federico L, Capponi G, Spagnolo S (2009) Late orogenic
transpressional tectonics in the «Ligurian Knot». Ital J Geosci
(Boll Soc Geol It) 128:433–441
Delhez R, de Keijser TH, Langford JI, Louer D, Mittemeijer EJ,
Sonneveld EJ (1993) Crystal imperfection broadening and peak
shape in the Rietveld method. In: Young RA (ed) The Rietveld
method. Oxford University Press, Oxford, UK, pp 132–166
Dodson RF, Atkinson MAL, Levin JL (2003) Asbestos fiber length as
related to potential pathogenicity: a critical review. Am J Ind
Med 44:291–297
Doll R (1955) Mortality from lung cancer in asbestos workers. Br J
Ind Med 12:81–86
Emmanouil K, Kalliopi A, Dimitrios K, Evangelos G (2009) Asbestos
pollution in an inactive mine: determination of asbestos fibers in
the deposit tailings and water. J Hazard Mater 167:1080–1088
Evans BW (1977) Metamorphism of Alpine peridotites and serpent-
inite. Ann Rev Earth Planet Sci 5:397–447
Evans BW, Yang H (1998) Fe-Mg order-disorder in tremolite-
actinolite-ferro-actinolite at ambient and high temperature. Am
Miner 83:458–475
Federico L, Crispini L, Scambelluri M, Capponi G (2007) Different PT
paths recorded in a tectonic melange (Voltri Massif, NW Italy):
implications for the exhumation of HP rocks. Geodin Acta 20:3–19
Federico L, Spagnolo C, Crispini L, Capponi G (2009) Fault-slip
analysis in the metaophiolites of the Voltri Massif: constraints
for the tectonic evolution at the Alps/Apennine boundary. Geol J
44:225–240
Giacomini F, Boerio V, Polattini S, Tiepolo M, Tribuzio R, Zanetti A
(2010) Evaluating asbestos fibre concentration in metaophiolites:
a case study from the Voltri Massif and Sestri-Voltaggio Zone
(Liguria, NW Italy). Environ Earth Sci 61:1621–1639. doi:10.
1007/s12665-010-0475-9
Gianfagna A, Ballirano P, Bellatreccia F, Bruni BM, Paoletti L,
Oberti R (2003) Characterization of amphibole fibers linked to
mesothelioma in the area of Biancavilla, Eastern Sicily, Italy.
Miner Mag 67:1221–1229
Gianfagna A, Andreozzi GB, Ballirano P, Mazziotti-Tagliani S, Bruni
BM (2007) Structural and chemical contrasts between prismatic
and fibrous fluoro-edenite from Biancavilla, Sicily, Italy. Can
Miner 45:249–262
Groppo C, Tomatis M, Turci F, Gazzano E, Ghigo D, Compagnoni R,
Fubini B (2005) Potential toxicity of nonregulated asbestiform
minerals: balangeroite from the Western Alps. Part 1: identifi-
cation and characterization. J Toxicol Environ Health Part A
68(1):1–19. doi:10.1080/15287390590523867
Gunter ME (2010) Defining asbestos: differences between the built
and natural environments. Chimia 64:747–752
Gunter ME, Belluso E, Mottana A (2007) Amphiboles: environmental
and health concerns. Rev Miner Geochem 67:453–516
Hardy RJ, Highsmith VR, Costa DL, Krewert JA (1992) Indoor
asbestos concentrations associated with the use of asbestos
contaminated tap water in portable home humidifiers. Environ
Sci Technol 26:680–689
Harper M, Gyung Lee E, Doorn SS, Hammond O (2008) Differen-
tiating non-asbestiform amphibole and amphibole asbestos by
size characteristics. J Occup Environ Hyg 5:761–770
Hawthorne FC (1981) Crystal chemistry of the amphiboles. In:
Veblen DR (ed.) Amphiboles and other hydrous pyriboles
Mineralogy. Reviews in Mineralogy 9A, Mineralogical Society
of America pp. 1–102
Health and Safety Executive (1997) Dust: general principles of
protection. Health and safety executive, Sudbury, p 44
Hendrickx M (2009) Naturally occurring asbestos in eastern Austra-
lia: a review of geological occurrence, disturbance and meso-
thelioma risk. Environ Geol 57:909–926
Honda Y, Beall C, Delzell E, Oestenstad K, Brill I, Matthews R
(2002) Mortality among workers at a talc mining and milling
facility. Ann Occup Hyg 46(7):575–585
Hoogerduijn Strating EH (1994) Extensional faulting in an intraoce-
anic subduction complex-working hypothesis for the Palaeogene
of the Alps-Apennine system. Tectonophysics 238:255–273
Hoogerduijn Strating EH, Vissers RLM (1994) Structures in natural
serpentinite gouges. J Struct Geol 16:1205–1215
IARC (International Agency for Research on Cancer) (1987) Mono-
graphs on the evaluation of the carcinogenic risk to humans.
Overall evaluations of carcinogenicity: an updating of IARC
Monographs, vol 1-42, Suppl 7. WHO-IARC, France, pp 106–116
IARC (International Agency for Research on Cancer) (2012)
Monographs on the evaluation of the carcinogenic risk to
humans. Arsenic, metals, fibres, and dusts. IARC Monographs,
vol 100. World Health Organization, pp 11–465
ISO 10312 (1995) Ambient air—determination of asbestos fibres—
direct transfer transmission electron microscopy method, Stan-
dards catalogue ISO/TC 146/SC 3
ISO 13794 (1999) Ambient air—determination of asbestos fibres—
indirect-transfer transmission electron microscopy method,
Standards catalogue ISO/TC 146/SC 3
Karkanas P (1995) The slip-fiber chrysotile asbestos deposit in the
Zidani area, northern Greece. Ore Geol Rev 10:19–29
Kazan-Allen L (2005) Asbestos and mesothelioma: worldwide trends.
Lung Cancer 49(S1):S3–S8
Labagnara D, Patrucco M, Rossetti P, Pellegrino V (2012) Predictive
assessment of the asbestos content in the Western Italian Alps:
an essential tool for an effective approach to risk analysis and
management in tunnelling operations and muck reuse. Environ
Earth Sci 70:857–868. doi:10.1007/s12665.012.2174.1
Lager GA, Jorgensen JD, Rotella FJ (1982) Crystal structure and
thermal expansion of alpha-quartz SiO2 at low temperatures.
J Appl Phys 53:6751–6756
Lange JH, Lange PR, Reinhardt TK, Thomulkat KW (1996) A study
of personal and area airborne asbestos concentrations during
asbestos abatement: a statistical evaluation of fibre concentration
data. Ann Occup Hyg 40:449–466
Leake BE, Woolley AR, Arps CES, Birch WD, Gilbert MC, Grice JD,
Hawthorne FC, Kato A, Kisch HJ, Krivovichev VG, Linthout K,
Laird J, Mandarino JA, Maresch VW, Nickel EH, Rock NMS,
Schumacher JC, Smith DC, Stephenson NN, Ungaretti L,
Withtaker EJW, Youzhi G (1997) Nomenclature of amphiboles:
report of the subcommittee on amphiboles of the International
Mineralogical Association, Commission on New Minerals and
Mineral Names. Am Miner 82:1019–1037
Lee RJ, Strohmeier BR, Bunker KL, Van Orden DR (2008) Naturally
occurring asbestos—a recurring public policy challenge. J Haz-
ard Mater 153:1–21
Lescano L, Marfil S, Maiza P, Sfragulla J, Bonalumi A (2013)
Amphibole in vermiculite mined in Argentina. Morphology,
quantitative and chemical studies on the different phases of
production and their environmental impact. Environ Earth Sci
70(4):1809–1821. doi:10.1007/s12665-013-2268-4
Environ Earth Sci (2014) 72:3679–3698 3697
123
Author's personal copy
Liebenberg D, Claassens S, Van Rensburg L (2012) A multidisci-
plinary approach for the assessment of rehabilitation at asbestos
mines in South Africa. Environ Earth Sci 67(4):1237–1244.
doi:10.1007/s12665-012-1650
Lippmann M (1990) Effects of fiber characteristics on lung deposi-
tion, retention, and disease. Environ Health Perspect 38:311–317
Marinos P, Hoek E, Marinos V (2006) Variability of the engineering
properties of rock masses quantified by the geological strength
index: the case of ophiolites with special emphasis on tunnelling.
Bull Eng Geol Env 65:129–142. doi:10.1007/s10064-005-0018-x
Meneghinello E, Alberti A, Cruciani G (1999) Order-disorder process
in the tetrahedral sites of albite. Am Miner 84:1144–1151
NIOSH (2011) Asbestos fibers and other elongate mineral particles:
state of the science and roadmap for research. DHHS Publication
No. 2011-159
Pacella A, Andreozzi GB, Ballirano P, Gianfagna A (2008) Crystal
chemical and structural characterization of fibrous tremolite
from Ala di Stura (Lanzo Valley, Italy). Periodico di Minera-
logia 77:51–62
Pan XL, Day HW, Wang W, Beckett LA, Schenker MB (2005)
Residential proximity to naturally occurring asbestos and
mesothelioma risk in California. Am J Respir Crit Care Med
172:1019–1025
Pereira D, Yenes M, Blanco JA, Peinado M (2007) Characterization
of serpentinites to define their appropriate se as dimension stone.
In: Prıkryl R, Smith BJ (eds) Building stone decay: from
diagnosis to conservation. Geological Society, London, Special
Publications, 271: 55–62
Rey F, Boutin C, Viallat JR, Steinbauer J, Alessandroni P, Jutisz P, Di
Giambattista D, Billon-Galland MA, Hereng P, Dumortier P, De
Vuyst P (1994) Environmental asbestotic pleural plaques in
northeast Corsica: correlation with airborne and pleural miner-
alogic analysis. Environ Health Perspect 102:251–252
Rohl AN, Langer AM, Selikoff IR (1977) Environmental asbestos
pollution related to use of quarried serpentine rock. Science
196:1319–1322
Ross M, Nolan RP (2003) History of asbestos discovery and use and
asbestos-related disease in context with the occurrence of
asbestos within ophiolite complexes. Geol Soc Am Sp Paper
373:447–470
Ross NL, Reeder RJ (1992) High-pressure structural study of
dolomite and ankerite. Am Miner 77:412–421
Ross M, Kuntze RA, Clifton RA (1984) A definition for asbestos. In:
Levadie B (ed) Definitions for asbestos and other health-related
silicates, ASTM STP 834. American Society for Testing and
Materials, Philadelphia, pp 139–147
Sabine TM, Hunter BA, Sabine WR, Ball CJ (1998) Analytical
expressions for the transmission factor and peak shift in
absorbing cylindrical specimens. J Appl Crystallogr 31:47–51
Schreier H (1989) Asbestos in the natural environment. Elsevier,
Studies in Environmental Science, 37 p 158
Shannon RD (1976) Revised effective ionic radii and systematic
studies of interatomic distances in halides and chalcogenides.
Acta Crystallogr A A32:751–767
Sullivan PA (2007) Vermiculite, respiratory disease and asbestos
exposure in Libby, Montana: update of a cohort mortality study.
Environ Health Perspect 115:579–585
Van Gosen BS (2007) The geology of asbestos in the United States
and its practical applications. Environ Eng Geosci 13:55–68
Van Orden DR, Allison KA, Lee RJ (2008) Differentiating amphibole
asbestos from non-asbestos in a complex mineral environment.
Indoor Built Environ 17:58–68
Van Orden DR, Lee RJ, Allison KA, Addison J (2009) Width
distributions of asbestos and non-asbestos amphibole minerals.
Indoor Built Environ 18:531–540
Vignaroli G, Rossetti F, Bouybaouene M, Massonne HJ, Theye T,
Faccenna C, Funiciello R (2005) A counter-clockwise P-T path
for the Voltri Massif eclogites (Ligurian Alps, Italy). J Meta-
morph Geol 23:533–555
Vignaroli G, Faccenna C, Rossetti F (2009) Retrogressive fabric
development during exhumation of the Voltri Massif (Ligurian
Alps, Italy): arguments for an extensional origin and implications
for the Alps-Apennine linkage. Int J Earth Sci 98:1077–1093
Vignaroli G, Rossetti F, Belardi G, Billi A (2011) Linking rock fabric
to fibrous mineralisation: a basic tool for the asbestos hazard. Nat
Hazards Earth Syst Sci 11:1267–1280
Wagner JC (1991) The discovery of the association between blue
asbestos and mesotheliomas and the aftermath. Br J Ind Med
48:399–403
Williams C, Dell L, Adams R, Rose T, Van Orden D (2013) State-of-
the-science assessment of non-asbestos amphibole exposure: is
there a cancer risk? Environ Geochem Health 35:357–377.
doi:10.1007/s10653-012-9500-0
World Health Organization (1986) Asbestos and other natural mineral
fibres, Environmental Health Criteria, No. 53, Geneva
Wylie AG, Virta RL, Russek E (1985) Characterizing and discrim-
inating airborne amphibole cleavage fragments and amosite
fibers: implications for the NIOSH method. Am Ind Hyg J
46:197–201
Yamate G, Agarwal SC, Gibbons RD (1984) Methodology for the
measurement of airborne asbestos by electron microscopy, IIT
Research Institute, Chicago, Illinois 60616, Contract No. 68-02-
3266, Environmental Monitoring Systems Laboratory, US
Environmental Protection Agency, Research Triangle Park,
North Carolina 27711
Young RA (1993) Introduction to the rietveld method. In: Young RA
(ed) The rietveld method. Oxford University Press, Oxford, UK,
pp 1–38
Zakrzewska AM, Capone PP, Ianno A, Tarzia V, Campopiano A,
Villella E, Giardino R (2008) Calabrian ophiolites: dispersion of
airborne asbestos fibers during mining and milling operations.
Periodico di Mineralogia 72:27–34
3698 Environ Earth Sci (2014) 72:3679–3698
123
Author's personal copy