Organo-inorganic composite membranes: a mathematical modelling approach to the solid-liquid...
9
JOURNAL OF MATERIALS SCIENCE 26 (1991) 2557--2565 Organo-inorganic composite membranes: a mathematical modelling approach to the solid-liquid interaction properties of asbestos in its composites L. PELLEGRINI, E. MONTONERI* Dipartimento di Chimica Industriale ed Ingegneria Chimica Gfulio Natta, Politecnico di Milano, P. zza L. da Vinci 32, 20133 Milano, Italy P. SAVARINO Dipartimento di Chimica Generale ed Organica Applicata, Universitd di Torino, Corso Massimo D'Azegfio n.48, 10125 Torino, Italy G. C. PAPPALARDO II Cattedra di Chimica Generale, Facolta di Farmacia, Dipartimento di Scienze Chimiche dell'Universit# di Catania, V. le A. Doria 8, 95125 Catania, Italy Data for the liquid sorption (Y) by asbestos membranes, coated with polyphenylene sulphide or with polyphenylene sulphide sulphonic acid and having variable polymer concentration (X) and acid equivalent (El/V) values, have been fitted by multivariable mathematical models relating Yto Xand EWin the bulk and in the surface membrane phase. The results point out that (i) the membrane surface is the sorption-limiting phase at low porosity, (ii) under this condition the liquid sorption selectivity depends on the membrane acid equivalent concentration, and (iii) the membrane acid functions allow both macro-permeation, into the bulk phase, and micro-permeation, through the coating layer into the asbestos support structure, of aqueous media. 1. Introduction A subject of interest in membrane studies is the evalu- ation of the single contributions of the membrane physical structure and of the chemical nature to its performance. In an organo-inorganic composite mem- brane, both these parameters can be varied over a wide range upon changing the concentration ratio of the constituents. Asbestos coated with organic poly- mers is a typical example of this situation. In the composites manufactured by soaking asbestos paper with a polymer solution and drying [1], the polymer is deposited over the asbestos fibres and, as the thickness of the coating layer grows by increasing the concentra- tion of the polymer in the soaking bath, the material void fraction decreases. At the same time, as the concentration ratio of the lipophilic organic polymer to the hydrophilic inorganic material increases, the chemical interaction between the solid phase and the external phase is subject to substantial changes. This manufacturing technique has also been found [2] to yield higher polymer concentration on the membrane surface faces than in the bulk of the solid phase. Therefore, both the physical structure and the chem- ical nature of the membrane change throughout the membrane phase. In addition to their importance as * Author to whom all correspondence should be addressed. cell separators [3, 4] for alkaline water electrolysis and electrochemical chlor-alkali production, these composites offer scope for investigating the role of the membrane's physical and chemical features and of the bulk and surface membrane phases in solid-liquid interactions. In a previous work on asbestos coated with poly- phenylene sulphide (PPS), a quantitative ev~tluation [53 of the relative contributions of the above para- meters to the membrane performance was attempted, based on the study of the sorption of chemically different liquids by the solid material and on a step- wise multivariable regression analysis of the experi- mental data. The results pointed out that, whereas water sorption is strongly dependent on the concen- tration of the organic polymer upon the membrane surface, the sorption of toluene is not affected by this parameter. It has therefore been suggested that, at low membrane porosity, liquid sorption by the solid phase is ruled mainly by the solid-liquid chemical inter- actions and that the liquid sorption selectivity should be largely governed by the chemical nature of the membrane surface phase. This work aimed to provide experimental support for the above indications and to investigate how the 0022-2461/91 $03.00 + .12 1991 Chapman and Hall Ltd. 2557
-
Upload
independent -
Category
Documents
-
view
0 -
download
0
Transcript of Organo-inorganic composite membranes: a mathematical modelling approach to the solid-liquid...

J O U R N A L OF MATERIALS SCIENCE 26 (1991) 2557--2565
Organo-inorganic composite membranes: a mathematical modelling approach to the solid-liquid interaction properties of asbestos in its composites
L. PELLEGRINI, E. MONTONERI* Dipartimento di Chimica Industriale ed Ingegneria Chimica Gfulio Natta, Politecnico di Milano, P. zza L. da Vinci 32, 20133 Milano, Italy
P. SAVARINO Dipartimento di Chimica Generale ed Organica Applicata, Universitd di Torino, Corso Massimo D'Azegfio n.48, 10125 Torino, Italy
G. C. PAPPALARDO II Cattedra di Chimica Generale, Facolta di Farmacia, Dipartimento di Scienze Chimiche dell'Universit# di Catania, V. le A. Doria 8, 95125 Catania, Italy
Data for the liquid sorption (Y) by asbestos membranes, coated with polyphenylene sulphide or with polyphenylene sulphide sulphonic acid and having variable polymer concentration (X) and acid equivalent (El/V) values, have been fitted by multivariable mathematical models relating Yto Xand EWin the bulk and in the surface membrane phase. The results point out that (i) the membrane surface is the sorption-limiting phase at low porosity, (ii) under this condition the liquid sorption selectivity depends on the membrane acid equivalent concentration, and (iii) the membrane acid functions allow both macro-permeation, into the bulk phase, and micro-permeation, through the coating layer into the asbestos support structure, of aqueous media.
1. In t roduct ion A subject of interest in membrane studies is the evalu- ation of the single contributions of the membrane physical structure and of the chemical nature to its performance. In an organo-inorganic composite mem- brane, both these parameters can be varied over a wide range upon changing the concentration ratio of the constituents. Asbestos coated with organic poly- mers is a typical example of this situation. In the composites manufactured by soaking asbestos paper with a polymer solution and drying [1], the polymer is deposited over the asbestos fibres and, as the thickness of the coating layer grows by increasing the concentra- tion of the polymer in the soaking bath, the material void fraction decreases. At the same time, as the concentration ratio of the lipophilic organic polymer to the hydrophilic inorganic material increases, the chemical interaction between the solid phase and the external phase is subject to substantial changes. This manufacturing technique has also been found [2] to yield higher polymer concentration on the membrane surface faces than in the bulk of the solid phase. Therefore, both the physical structure and the chem- ical nature of the membrane change throughout the membrane phase. In addition to their importance as
* Author to whom all correspondence should be addressed.
cell separators [3, 4] for alkaline water electrolysis and electrochemical chlor-alkali production, these composites offer scope for investigating the role of the membrane's physical and chemical features and of the bulk and surface membrane phases in solid-liquid interactions.
In a previous work on asbestos coated with poly- phenylene sulphide (PPS), a quantitative ev~tluation [53 of the relative contributions of the above para- meters to the membrane performance was attempted, based on the study of the sorption of chemically different liquids by the solid material and on a step- wise multivariable regression analysis of the experi- mental data. The results pointed out that, whereas water sorption is strongly dependent on the concen- tration of the organic polymer upon the membrane surface, the sorption of toluene is not affected by this parameter. It has therefore been suggested that, at low membrane porosity, liquid sorption by the solid phase is ruled mainly by the solid-liquid chemical inter- actions and that the liquid sorption selectivity should be largely governed by the chemical nature of the membrane surface phase.
This work aimed to provide experimental support for the above indications and to investigate how the
0022 -2461 /91 $03.00 + .12 �9 1991 Chapman and Hall Ltd. 2557

change in the polymer nature, from the lipophilic state, as in PPS, to the more hydrophilic state, as in sulphonated polyphenylene sulphide (SPPS) [6], affects the membrane surface behaviour. Thus, the previous approach 1-5] used to study asbestos coated with PPS has now been extended to the study of asbestos coated with SPPS. Three types of sulphon- ated polymer were used to coat asbestos; these differ in the concentration of acid equivalents (PAE = 1.40, 0.769 and 0.625 H § meq/g polymer). The change in the type and concentration of the polymer in the composite membrane provided a large number of samples having a range of membrane acid equivalents (EW) from 0-6.4 x 10 -4 H § eq/membrane g, dis- tributed in the bulk and surface phase of the com- posite membrane. Several multivariable mathematical models relating liquid sorption with the membrane polymer concentration and with the membrane acid equivalents, both in the bulk and surface phases, have been tested to fit the experimental data. The previous models [2] tested for asbestos coated with PPS did
not account for the change in the polymer nature as given by the E W parameter.
2. Experimental procedure The manufacture of the asbestos-PPS (ASB-PPS) composites from commercial crysotile asbestos (ASB) paper (0.55 mm thick) and polyphenylene sulphide, and of the asbestos-SPPS (ASB-SPPS) composites from ASB and polyphenylene sulphide sulphonic acid (SPPS) was accomplished as previously reported [2, 6]. The polymer concentrations (% wt/wt) in the bulk (Xz) and in the surface (X2) phases of the membrane and the total polymer concentration (P) and brucite (B) concentration have been determined by infrared spectroscopy [2]. The acid equivalent concentration of the neat organic polymer (PAE = SO3H eq/g polymer) was obtained by titration with 0.1 y NaOH. The acid equivalent concentration of the composite material (EW = SO3H eq/g com- posite) in the bulk (EW1) and in the surface (EW2)
T A B L E I Polymer (X,, % wt/wt) and membrane acid equivalent (E 14/",, H + eq/g membrane) concentrations in the bulk (n = 1) and surface (n = 2) phases of fresh asbestos composites versus sorption ( Y~, ml/g dry membrane) of water (i = H) and of toluene (i = t)
X 1 EWI( x 10 4) X z EWz( • 10 4) Yrl Yt Yn/Yt
0.0 0.00 0.0 0.00 0.440 0.439 1.002 8.9 0.00 23.3 0.00 0,399 0,439 0.909 8.9 0.00 23.3 0.00 0.389 0.455 0.855
11.3 0.00 18.9 0.00 0.330 0.366 0.902 11.3 0.00 18.9 0.00 0.330 0.379 0.871 16.5 0.00 19.9 0,00 0.317 0.350 0.906 16.5 0.00 19.9 0.00 0,344 0.358 0.961 17.1 0.00 36.5 0.00 0,195 0.337 0.579 21.6 0.00 27.3 0.00 0.198 0.290 0.683 21.6 0.00 27.3 0.00 0,153 0.270 0.567 21.5 0.00 52.7 0.00 0.117 0.296 0.395 29.4 0.00 60.4 0.00 0,090 0.195 0.462 29.4 0.00 60.4 0.00 0.083 0.194 0.428 28.9 0.00 52.7 0.00 0.129 0.207 0.623 52.4 0.00 68.1 0.00 0.041 0.079 0.519 52.4 0.00 68.1 0.00 0.071 0.116 0.612 51.5 0,00 80.9 0.00 0.069 0,095 0.726 41.3 5.16 51.1 6.39 0.150 0.180 0,833 28.3 1.77 40.2 2.52 0.220 0.320 0.688 28.3 1.77 40.2 2.52 0.230 0.330 0,697 26.1 2.01 35.5 2.73 0.220 0.430 0.512 26.1 2.01 35.5 2.73 0,210 0.410 0.512 24.0 1.84 33.5 2.58 0,230 0,380 0.605 24.0 1.84 33.5 2.58 0.180 0.400 0.450 24.6 1.89 45.9 3.53 0.190 0.410 0,463 24.6 1.89 45.9 3.53 0.240 0,390 0.615 21.2 2.97 31.8 4.45 0.230 0.430 0.535 21.2 2.97 31.8 4.45 0.170 0.460 0.370 16.9 2.37 39.6 5.55 0.230 0.450 0.511 16.9 2.37 39.6 5.55 0.180 0,470 0.383 8.1 1,14 22.9 3.21 0.210 0,480 0.438 8.1 1.14 22.9 3.21 0.210 0.470 0.447
25.5 1.59 36.9 2.31 0.180 0,430 0.419 27.5 1.72 45.9 2.87 0.170 0.430 0.395 22.2 1.39 36.7 2.29 0.180 0.230 0.783 25.0 1.93 40.5 3.11 0.210 0.380 0,553 25.5 1.59 36.9 2.31 0.410 27.5 1.72 45.9 2.87 0.360 25.0 1.93 40.5 3.11 0.180 22.2 1.39 36.7 2.29 0.250 0.390 0.641
2558
phases was calculated as follows: E W 1 = P A E X I / 100
and E W 2 = P A E X 2 / 1 0 0 . All other experimental details are as previously published [2 ] .
3. Results and discussion 3.1. The chemical and physical nature of
the composites There are two sets of samples in this work. The first set (Table I) contains materials as-made, the second set (Table II) contains the same materials which were aged in 30% boiling KOH for 2500 h in order to test the chemical stability of asbestos as a function of the coating polymer. SEM studies have shown that, whereas in the fresh materials the membrane porosity is directly related to the concentration of the organic polymer, no such relationship appears in the aged materials. The composites, particularly those contain- ing SPPS, undergo weight loss in alkali. This pheno- menon is mainly due to the degradation of asbestos
by the alkali and to leaching of soluble silicon into the aqueous phase [2]
Mg3SizOs(OH)4 + 2 KOH = 3 Mg(OH)2
+ soluble silicates(aq) (1)
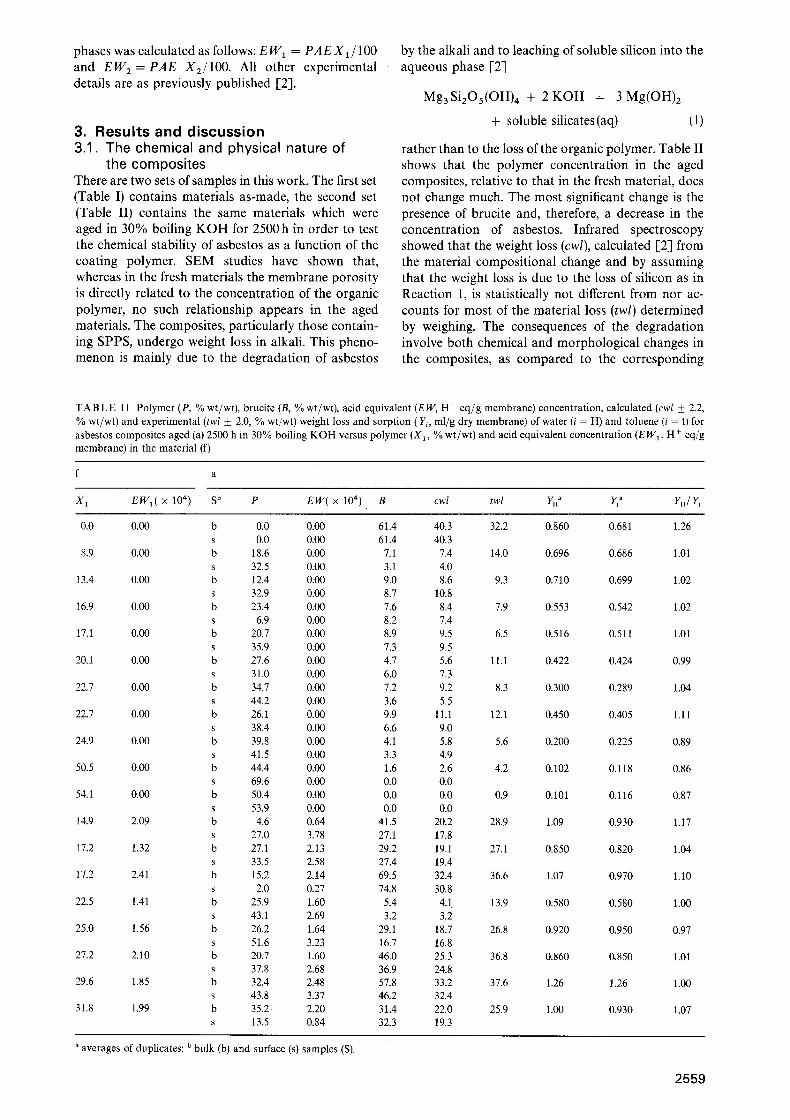
rather than to the loss of the organic polymer. Table II shows that the polymer concentration in the aged composites, relative to that in the fresh material, does not change much. The most significant change is the presence of brucite and, therefore, a decrease in the concentration of asbestos. Infrared spectroscopy showed that the weight loss (cwl), calculated [-2] from the material compositional change and by assuming that the weight loss is due to the loss of silicon as in Reaction 1, is statistically not different from nor ac- counts for most of the material loss (twl) determined by weighing. The consequences of the degradation involve both chemical and morphological changes in the composites, as compared to the corresponding
T A B L E I I Polymer (P, % wt/wt), brucite (B, % wt/wt), acid equivalent (EW, H-- eq/g membrane) concentration, calculated (cwl 4- 2.2, % wt/wt) and experimental (twl +_ 2.0, % wt/wt) weight loss and sorption ( Yi, ml/g dry membrane) of water (i = H) and toluene (i = t) for asbestos composites aged (a) 2500 h in 30% boiling KOH versus polymer (X1, % wt/wt) and acid equivalent concentration (EW1, H + eq/g membrane) in the material (f)
f a
X 1 E W I ( x 10") S b P E W ( x i0 ' ) B cwl twl YH" Yt a YH/Yt
0.0 0.00 b 0.0 0.00 61.4 40.3 32.2 0.860 0.681 1.26 s 0.0 0.00 61.4 40.3
8.9 0.00 b 18.6 0.00 7.1 7.4 14.0 0.696 0.686 1.01 s 32.5 0.00 3.1 4.0
13.4 0.00 b 12.4 0.00 9.0 8.6 9.3 0.710 0.699 1.02 s 32.9 0.00 8.7 10.8
16.9 0.00 b 23.4 0.00 7.6 8.4 7.9 0.553 0.542 1.02 s 6.9 0.00 8.2 7.4
17.1 0.00 b 20.7 0.00 8.9 9.5 6.5 0.516 0.511 1.01 s 35.9 0.00 7.3 9.5
20.1 0.00 b 27.6 0.00 4.7 5.6 11.1 0.422 0.424 0.99 s 31.0 0.00 6.0 7.3
22.7 0.00 b 34.7 0.00 7.2 9.2 8.3 0.300 0.289 1.04 s 44.2 0.130 3.6 5.5
22.7 0.00 b 26.1 0.00 9.9 11.1 12.1 0.450 0.405 1.11 s 38.4 0.00 6.6 9.0
24.9 0.00 b 39.8 0.00 4.1 5.8 5.6 0.200 0.225 0.89 s 41.5 0.00 3.3 4.9
50.5 0.00 b 44.4 0.00 1.6 2.6 4.2 O. 102 O. 118 0.86 s 69.6 0.00 0.0 0.0
54.1 0.00 b 50.4 0.00 0.0 0.0 0.9 0.101 0.116 0.87 s 53.9 0.00 0.0 0.0
14.9 2.09 b 4.6 0.64 41.5 20.2 28.9 1.09 0.930 1.17 s 27.0 3.78 27.1 17.8
17.2 1.32 b 27.1 2.13 29.2 19.1 27.1 0.850 0.820 1.04 s 33.5 2.58 27.4 19.4
17.2 2.41 b 15.2 2.14 69.5 32.4 36.6 1.07 0.970 1.10 s 2.0 0.27 74.8 30.8
22.5 1.41 b 25.9 1.60 5.4 4.1 13.9 0.580 0.580 1.00 s 43.1 2.69 3.2 3.2
25.0 1.56 b 26.2 1.64 29.1 18.7 26.8 0.920 0.950 0.97 s 51.6 3.23 16.7 16.8
27.2 2.10 b 20.7 1.60 46.0 25.3 36.8 0.860 &850 1.01 s 37.8 2.68 36.9 24.8
29.6 1.85 b 32.4 2.48 57.8 33.2 37.6 1.26 1.26 1.00 s 43.8 3.37 46.2 32.4
31.8 1.99 b 35.2 2.20 31.4 22.0 25.9 1.00 0.930 1.07 s 13.5 0.84 32.3 19.3
a averages of duplicates; b bulk (b) and surface (s) samples (S).
2559

initial material. Because of the formation of brucite, the aged materials are tricomposite materials which contain unconverted asbestos, brucite and the organic polymer. Thus, in the aged material the type of chem- ical interaction with the external liquid phase is ex- pected to change relative to the initial material. Also, because of the loss of silicon, the void volume of the initial material increases in the aged material and this also causes a change in the solid-liquid physical inter- action. Degradation indeed involves a change in the initial microstructure, where asbestos is the mechan- ical support component [2], into one where the or- ganic polymer seems to work as a binding agent [7] for the brucite particles formed. For the scope of this work, the fresh and aged materials have therefore been treated as separate sets.
3.2. Liquid sorption Liquid sorption may occur by physical entrapment of the liquid into the void volume of the solid phase and/or by chemisorption. Thus the total amount of sorbed liquid (Y) is given by Y = Yph + Yen, where Ypn is the volume of physisorbed liquid and Ych is the volume of chemisorbed liquid which is bound to the solid phase by ionic, polar or Van der Waals inter- actions. For the fresh materials, the volume of sorbed liquid ( Y, ml/g dry solid) has been assumed to change with the concentration (X, % wt/wt) of organic poly- mer in the solid phase as in
Y = V o - X/(100d) + So(100 - X)/100
+ sl X/100 (2)
where Vo (ml g- l ) is the void volume of uncoated asbestos, d (ml g- 1) is the density of the solid coating polymer, s (mlg-1) is the specific volume of chemi- sorbed liquid by the asbestos phase (So) or by the poly- mer phase (sl), X and 100-X are the concentrations (% wt/wt) of the polymer and of asbestos, respectively, as defined in Section 2. In Equation 2, X/100 d is the specific volume occupied by the polymer phase. Thus Vo - X/(100 d) = Yph and the sum of the terms preceded by the coefficient s represents the total spe- cific volume of chemisorbed liquid (Y~h). If no chem- ical solvation interaction occurs between the solid and the liquid, s = 0 and Y should not depend on the nature of the liquid, but only on the sorbing material. Where chemical interactions occur, s (and therefore Y) depends on the nature of the liquid and of the solid. The porous neat asbestos which has been used in this work absorbs equal volumes of liquids which differ greatly in polarity (Table I). It may be assumed, therefore, that due to the high porosity, Yph >~ YCh and, therefore, V o >> s o (100- X)/100. Thus, Equa- tion 2 is approximated to
Y =- V o - X / ( lOOd) + s l X / l O 0 (3)
The experimental data (Table I) show, however, that for the composites, the volume of sorbed water (Yph) and that of sorbed toluene (Yt) are not equal; therefore the relative contribution (Y~h/Y) of chemisorption to the total liquid sorption cannot be neglected. Equa-
tion 2 predicts that this contribution is expected to grow as the solid phase porosity (Ypn) decreases.
In the case of membranes, in order for the liquid to occupy the whole void volume in the solid phase, diffusion through the surface into the bulk phase is necessary. If the surface is not porous, diffusion may occur only by a chemical mechanism; it requires that the liquid is soluble in the surface phase and that chemicaLexchange of solute molecules occurs between the surface and the bulk phase. If the coefficient s for a given solid-liquid system is small or nil, the total liquid sorption by the membrane may be far lower than that expected by the total membrane void vol- ume, even if this is large because the bulk phase is very porous. Because the materials of this work present such a morphological difference between the bulk and the surface phase, we have assumed the following modified form for Equation 3
Y = V o -- X~/(lOOd) + $1X1/100 - - X2/( lOOd )
+ $ 1 X 2 / 1 0 0 (4)
where the physical and chemical contributions of the bulk and surface phases are represented by the re- spective X1 and X2 polymer concentration terms.
It may be observed that the composite membranes in Table I may be grouped in two categories, apolar or lipophilic (ASB-PPS, E W = 0) and polar or hydro- philic (ASB-SPPS, EW > 0). For each category, the sorption of a polar (water) and of an apolar (toluene) liquid has been studied. The change of the coefficients d and s in Equation 4, due to the change of the liquid and the polymer nature, is not known. Also the con- centration variables X1 and X2 in Table I do not identify the chemical nature of the solid phase, where- as the variables EW 1 and EW 2 do.
In order to relate the water (YH) and the toluene (Y,) sorption to the materials' measured variables, we have analysed several model equations which are based on the additivity principle of Equations 2~4 and contain the X and E W variables and the constants B and A, , 1 <..<_ ~.o
Y. = Y.. + Y.b (5)
where
and
B + A 1 X 1 + A 2 X z + A3/(1 + X l ) 2
+ A 4 X 1 X 2 (6)
= A s E W 3 + A6EW22 + A v E W 2 X 2
+ A 8 E W 3 -[- A 9 E W 2 -~- A l o E W 1 (7)
or
YHb = A s ( E W 2 + 1) 3 + A6(EW2 + 1) 2
+ A v E W 2 X 2 (8)
Yt = B + A 1 X , + A2 X2 + A3/(1 -4- X1)
+ A4/(1 + X l ) 2 + A 5 E W 3 + A6/( | + EW1)
+ A 7 E W 2 X 1 + A s E W 3 + A9/(1 + EW2)
+ A l o E W 1 X 1 (9)
2560

Y t - - B + A I X 1 + A 2 X 2 1 + A 3 / ( 1 + X 1 )
+ A4/(1 + X~) z + A s E W 3 + A6EW21 + ATEW~
+ AsEW32 + A9EW22 + A~oEW2X~ (10)
Yt = S + A~X~ + AzX21 + A3/(1 + X1)
+ A4/(1 + X , ) 2 + As/(1 + X1) 3 + A 6 E W 3
+ A v E W 2 + A 8 E W 1 + A 9 E W 1 X 1 (11)
These models contain more terms than Equation 4. The additional terms have been arbitrarily introduced in the attempt to find any dependence of d and s on the membrane chemical composition, because this dependence is not defined in Equation 4. The evalu- ation of the degree of fitting of models 5-11 with experimental data is performed here by stepwise elim- ination of one least-significant parameter per run (Tables III and IV), starting with the full model. The
T A B L E I I I S tepwise r eg res s ion ana lys i s of m o d e l s 5 -8 wi th T a b l e I w a t e r s o r p t i o n d a t a
R u n M o d e l Tsd. a n d sign. coeff, a
A s A 2 A 3 A , A 5 A 6 A v A s A 9 A l o
p b E ~ F d
1 5, 6, 7" a a a a a a c a b d 0.957 0.9663 2.65
2 a a a a a a a a a 0.956 0.9601 2.64
3 a a a a a a b b 0.930 1.46'22 4.02
4 a a a b a a d 0.912 1.7443 4.79
5 a a a b a a 0.910 1.7283 4.75
6 b a a b b 0.889 2.0377 5.60
7 c a c d 0.873 2.2487 6.18
8 c a c 0 .872 2.2009 6.04
9 a d 0.857 2.3613 6.69
10 a 0 .854 2.3472 6.45
11 5, 6, 8 f a a d a a d a 0.917 1.6615 4.56
12 a a d b a a 0.913 1.6703 4.59
13 b a b a a 0.908 1.7131 4.71
"Tested coefficient wi th F- tes t s igni f icance < 9 0 % (d), _> 9 0 % (c), _> 9 5 % (b), > 9 9 % (a). b C o r r e l a t i o n coefficient.
103 M S E ; M S E ( res idual m e a n s q u a r e error) .
a F = MSE/t~z~x; ~2 X (pooled v a r i a n c e f r o m YH dup l i ca t e m e a s u r e m e n t s ) = 0 .3640 x 1 0 - 3 ; 9 9 % conf idence level va lue f r o m F - T a b l e s a t 37 a n d 15 degrees o f f r e e d o m = 3.15.
e U s i n g m o d e l 5, where Yna is g iven b y E q u a t i o n 6 a n d Ynb is g iven b y E q u a t i o n 7 in r u n s 1-10.
f U s i n g m o d e l 5, where YHa is g iven b y E q u a t i o n 6 a n d Ynb is given b y E q u a t i o n 8 in runs 11-13.
T A B L E I V Stepwise regress ion ana lys i s o f m o d e l s o f 9 -11 wi th T a b l e I to luene s o r p t i o n d a t a "
R u n M o d e l Tsd. a n d sign. c o e ~ 9 E F
A 1 A 2 Aa A 4 A s A 6 A 7 A 8 A 9 A lo
1 9 b d d d d b d d d d d 0.9531 1.5513 2.77
2 9 b d d d d a b d d d 0.9531 1.4959 2.67
3 9 b a a a a a d d b 0 .9526 1.4576 2.60
4 9 u a b b a a d d 0.9491 1.5119 2.70
5 9 u a b b a a d 0 .9460 1.5480 2.76
6 9 u a b b a a 0 .9432 1.5756 2.81
7 9 b a d a a 0.9371 1.6874 3.01
8 9 b a a a 0 .9367 1.6468 2.94
9 9 u a a 0 .8770 3.0149 5.38
10 9 b a 0.7773 5.0251 8.97
11 10 ~ d d d d b c d d d c 0.9549 1.4936 2.67
12 10 c a a a a b d d d c 0 .9546 1.4466 2.62
13 10 c a a a a a d d b 0.9541 1.4130 2.52
14 10 c a a a a a d b 0.9519 1.4299 2.55
15 10 ~ a a a a a c 0 .9480 1.4922 2.66
16 10 * a b b a a 0 .9420 1.6083 2.87
17 10 r a d a a 0 .9335 1.7795 3.18
i8 10 c a a a 0 .9329 1.7431 3.11
19 10 c a b 0 .8045 4 .6064 8.22
20 11 d d d d d d a b d d 0 .9580 1.3413 2.39
21 11 d c d d d a b d a 0 .9569 1.3289 2.37
22 l l d a a a a b d a 0.9563 1.3014 2.32
23 11 e a a b a a a 0.9541 1.3232 2136
24 11 d a c a a b 0 .9450 1.5283 2.73
25 11 d a a a d 0 .9380 1.6648 2.97
a All s y m b o l s a n d a b b r e v i a t i o n s as in T a b l e III; crux = 0.5603 x 10 3. b Used in runs 1-10.
~ U s e d i n runs 11 19. d Used in runs 20-25 .
2561

choice of the best fitting equation is based on several criteria [8, 9]: the value of the correlation coefficient (p), the significance level of the A constants and the significance of the residual mean square error of the correlation (MSE) relative to the variance (O~x) of the experimental YH measurements as obtained from the pool of each duplicate measurement variance.
For water sorption, the MSE/O2x variance test shows that, for the equations tested in runs 1 and 2, this ratio is lower than the statistical Fo.ox tabulated value. It can therefore be assessed, with over 99% probability of not being wrong, that the MSE value is
2 and that these equa- not significantly higher than CLx tions are correct models, with that in run 2 (Equation 2-111 i.e. run 2, Table Ill-see Table V) containing constants that are all significantly more than zero from the statistical point of view. The other equations do not seem to account as well for the variability of YH in excess of the experimental error. It may be observed that among the EW terms, the EW2 terms are more significant than the E W1 ones, these latter being elim- inated first. Other models (not shown), which contain all or part Of the other E W terms in the models 5-8 multiplied by X 2 or by X 1 , were definitely worse than those shown in Table III.
For toluene sorption, all equations tested in Table IV appear correct based on the MSE/Cr2x criterion, except those in runs 9, 10, 17, 18 and 19. There are four equations (i.e. those in run 6, 8, 16 and 23) which pass all three statistical tests as follows: p > 0.90, MSE/O~x < statistical Fo.ol tabulated value at > 99% confidence level, and the parameters signifi-
cance level > 95%. These equations, contrary to the water sorption equations in Table III, contain only bulk parameters.
For the most significant equations of Tables III and IV, the values of the constants are given in Table V. It can be observed that one same variable appears often more than once in the same equation and exhibits at the same time a positive and a negative effect on Y, according to the theoretical expectations.
Owing to their empirical nature, the values of the constants in Table V are strictly valid in the experimental ranges (0 < X (%) < 80, 0 < E W (meqg-1) < 0.64) and for the experimental X - E W sets of values. Therefore, extrapolations of the above
Equation (i-n)
2-III 23-IV
0 . 5 -
B 0.657 0.559 A 1 - (1.73 -I- 0.27) x 10 -2 - (1.60 -I- 0.27) x 10 z A 2 -(7.91 4- 1.06) x 10 -3 (1.36 4-0.43) x 10 -4 A 3 - (2.16 -I- 0.54) x 10 -1 A4 (2.32 + 0.38) • 10 -5 A 5 (6.57 -I- 1.12) • 109 - (1.20 -I- 0.49) • 10-1 a 6 - (5 .82 +0.88) • 106 -(8.51 -I- 1.18) x 109 A 7 (2.06 4- 0.33) x 10 (2.79 4- 0.90) x 106 A 8 - (1.25 4- 0.26) x 101~ A 9 (6.87 -t- 1.49) • 106 (2.23 4- 0.72) • 10
a Identified by the run number (i) followed by the table number (n).
2562
equations to X and E W values which are far out of the experimental range may yield unreal predictions. The results appear consistent with the expectation (Equa- tions 2, 3 and 4) that, as porosity decreases, the relative contribution of chemical solvation interactions to the total membrane liquid sorption increases, and that as the contribution of chemical sorption increases, the membrane surface acquires a dominant role in deter- mining liquid sorption selectivity. Water sorption on ASB-PPS may be assumed to occur mainly by a physical mechanism due to the low solubility in the PPS coating phase [5]. Thus the membrane surface is expected to be the sorption-limiting phase. The plot of Equation 2-1II (i.e. that of run 2 in Table III) at E W1 = EW2 = 0 shows indeed (Fig. 1) a strong sorption- inhibiting effect from the membrane surface polymer concentration. For toluene sorption, on the other hand, the PPS surface concentration does not need to be considered. The previous work performed on ASB-PPS membranes only [5] showed indeed that a model containing the surface concentration may also fit the toluene sorption experimental data, but the predicted effect is quantitatively negligible. The results here indicate that the highest sorption selectivity is achieved with membranes having very porous bulk phase and a non-porous surface phase. For an ASB-PPS membrane (EW 1 = EW2 = 0) with porous bulk phase (X1 = 10%), Fig. 2 shows the effect of the
0.4-
0.1
'~ 0.3-
~.= 02
0 0
1.2
6O
I0 20 30 40 50 60 X I (% wt/wt)
Figure I Water sorption ( YH, ml g- 1) versus bulk polymer concen- tration (X1, %wt/wt): YH calculated from Equation 2-11I for /~ W~ = 0 at constant surface polymer concentration (X2,% wt/wt, number next to each solid line); (�9 experimental points.
1.0
0.8
o J
0.4-
0.2 10 20 30 40 50 60 70
X 2 {% wtlwt)
T A B L E V Values of the constants in the best fitting equations (i-n) a of Tables III and IV
Figure 2 Sorbed water to sorbed toluene volume ratio (Yn/Yt) versus polymer surface concentration (X2, %wt/wt) calculated from the equations of Table V at EW~ = 0 and X 1 = t0% wt/wt.

polymer surface concentration on the Yu/Yt ratio, calculated by the use of the constants in Table V.
For ASB-SPPS, diffusion of water through the surface phase is expected due to the presence of the hydrophilic sulphonic functions. Indeed, these mater- ials absorb more water than that expected on the basis of the concentration parameters only. Fig. 3 reports the increase of water sorption (AYn) predicted by the E W terms (i.e. A YH is obtained, for each X-EW experimental set of values in Table I and from Equation 2-III, by calculating the corresponding Yn value and by subtracting from it the value calculated for the same X values, but for E W--0). It can be observed that at X 1 < 21 there is no appreciable effect of the membrane acidity on water sorption al- though, for these membranes, the acidity values (0.11-0.55 meqg -1) cover almost the entire EW ex- perimental range (extending up to 0.64 meq g-1). At Xt > 21, the acidity effect on water sorption is felt significantly (A YH > ~ex), more and more as the poly- mer concentration increases and porosity decreases. Fig. 4 shows that, at about the concentration at which A Yn is significantly more than zero, the largest pores which are visible on the surface have a diameter of 11/am, whereas in the bulk phase there are pores as large as 130/am. By comparison, the largest pores in uncoated asbestos have been shown [7] to be 58/am on the surface and 200-300/am in the bulk phase. The pore size of the former composite therefore seems to be that at which the contribution of chemical inter- action between the membrane and the external envi- ronment becomes appreciable relative to the total liquid sorption. At this pore size, the presence of sulphonic functions within a range of E W values also determines a loss of liquid sorption selectivity by the
1o
E"
5
O
O
0 - O �9
I [ I I I 10 20 30 40 50
X 1 ( % w t / w t )
Figure 3 Increase of water sorption (AYH, ml g 1), due to the membrane acidity, for the fresh composites of Table I: (O) (AY H = Yncld- Yrtcad{Ew=o), Yncld calculated from Equations 2-11I
for the X-EW experimental values set in Table I, YHclatew=o) calcul&ted as above for EW i=0); (O) (AYn = YHexp - - YH~JdtEW=O), Ynexp = experimental value in Table I).
Figure 4 Scanning electron micrograph of fresh ASB-PPS (a) bulk (Xi = 22.2% wt/wt) and (b) surface (X 2 = 36.7% wt/wt) phase.
membrane. The plot (Fig. 5) of the experimental YH/Yt ratio for the acid membranes shows that this loss of selectivity begins to be appreciated at X 1 > 21%. The plot obviously shows that the bulk polymer concen- tration is not the only parameter to determine selectiv- ity. Fig. 6 shows the effect of the membrane acidity on the calculated YH/Yt ratio for the membrane with porous bulk phase (X 1 = 10%) and non-porous sur- face (X 2 = 70%), which at EW = 0 has been shown to exhibit relatively high toluene sorption selectivity (Fig. 2). The lower selectivity of the acid membrane is explained by the fact that the coating polymer is made by a hydrocarbon lipophilic chain with pendent hy- drophilic functions and can allow, within a certain range of E W values, diffusion of the polar and of the non-polar liquid. Extrapolation of the plot in Fig. 6, out of the experimental range, indicates, however, that a selective absorption of water relative to toluene is possible at high membrane acidity.
For the aged materials (Table II), none of the models in Tables III and IV accounts fully for the change of liquid sorption in excess of the experimental variance. The results of the linear regression analysis (not given), showed that although the correlation coefficient and the parameter's significance levels are
2 The reason for the high, MSE is significantly > Crex. excess variance probably lies in the fact that, due to the changes brought about by the chemical degrada- tion in the aged material, the independent variables (X and E W) in the above models do not represent the physical and chemical structure of the composite as well as in the fresh material. For the aged materials, the membrane porosity and, therefore the physisorbed
2563

~).9~
2.8-
2.7-
~'- 2.6-
2.5-
2.4
o
o o
o o
, , , ~ [ , , , , I ' ' ~ L I ' t ' t I ' ' ' L I ' ' ' L I L ~ = ~ [ ' ' ' ' . I 10 15 20 25 30 35 40 45
X 1 (% wt/wt)
Figure 5 Sorbed water to sorbed toluene volume ratio (Y H~ Yt = average values of duplicates in Table I) for fresh ASB membranes
coated with variable concentration (X1, % wt/wt) of SPPS.
1.4
1.2
1.0
X.."-'
"-- 0.8
0.6
0.4.
0.2
/ /Ewl:0
cw2-0
[ ' I ' I ' I
0 0.2 0.4 0.6 0.8 EW (H+ meq g- l )
3.3. Behaviour in strong aqueous alkali The data in Table II require further comment-, relevant for the application of asbestos in some major in- dustrial electrochemical processes. The research on asbestos composite cell separators has been aimed at improving the material's chemical stability and at maintaining, at the same time, a good electrical con- ductivity in the separator phase. For the materials in Table I, Fig. 7 reports the specific conductivity, cr, measured in 30% KOH at 30~ The superior per- formance of the hydrophilic ASB-SPPS separators, Over that of ASB-PPS at equal polymer concentra- tion, is clear. Table II, however, shows the opposite order for the chemical stability. It may be observed that, whereas for the ASB-PPS material the weight loss is contained within 14% and seems to decrease for the more concentrated PPS materials, for ASB-SPPS it ranges from 13.9%-37.6% regardless of the polymer concentration. In the light of the results obtained in the liquid sorption study, this behaviour suggests that water chemisorption in ASB-SPPS not only occurs on the polymer membrane surface layer to allow macro- diffusion of the liquid phase into the membrane bulk phase, but also that micro-diffusion within the single asbestos fibre occurs because of the chemical exchange of the alkali between the polymer coating layer and the supporting asbestos fibre. This result reveals that the attainment of low electrical resistance through the use of hydrophilic coating materials is not compatible with securing protection of the asbestos fibres from chemical attack by the alkali.
Figure 6 Sorbed water to sorbed toluene volume ratio (YH/Yt) versus membrane acidity calculated from the equations in Table V at Xa = 10%, X 2 = 7 0 % and at EWa =0, EW2 > 0 or at E W 1 = E W 2 > O.
volume (Ypha) may tentatively be assumed to be re- lated to the volume in the fresh material (Yph) as in
Ypha = Yph d- a t w l (12)
where Yph is given by Vo, X1 and X2 in the fresh material as in Equation 4 and a twl represents the additional porosity created by weight loss. For the calculation of the chemisorbed volume (Ycha), it must be considered that the aged material contains a new component, brucite, which may interact with the per- meant liquid. Ycha therefore may be assumed to be given by
Ycha : ( S l X l a + s 1 X 2 a -~- $2X3 + $ 4 X 4 ) / 1 0 0 (13)
where sl and s2 are the specific solubilities in the polymer and in the brucite phase, Xla and X2~ are the polymer concentrations in the aged material and X 3 and X 4 are the bulk and surface brucite concentra- tions. An independent measurement of total porosity would provide a direct estimate of Yph~ to fit into a model containing Ycha as a function of the concentra- tion parameters in the aged samples. This additional experimental work, however, was felt unnecessary for the scope of this investigation.
4 . C o n c l u s i o n It has been shown that the properties of asbestos in its composites with organic polymers depend on the nature and concentration of the organic polymer. Liquid sorption by these materials occurs by physi-
(_~0 0 0
-Z.O
~" -I.0 t E u T
b o ~
I I I I I 10 ZO 30 40 50
Xll~
Figure 7 Specific conductivity (log~, ~ - ; cm-1), in 30 ~ 30% KOH, of({#) ASB-PPS and (�9 ASB-SPPS membranes at variable polymer concentration (X 1, % wt/wt).
2564

sorption and/or by chemisorption, depending on the degree of porosity of the solid phase. A mathematical modelling approach, based on a theoretical rational- ization of the sorption mechanism, has been used to fit experimental data. The results have shown the import- ance of the membrane surface phase in determining liquid sorption selectivity and suggest that the mem- brane surface acidity may be tailored for the separa- tion of molecules which differ in polarity.
For applications in strong corrosive aqueous sys- tems, the membrane acidity is necessary to improve the chemical-physical properties such as the ion trans- port through a non-porous solid phase. However, in the specific case of alkali-unstable asbestos, it is shown that hydrophilic coating also allows micro-permea- tion of the alkali through the coated fibre and, con- sequently, the chemical degradation of the support component. For high-temperature water electrolysis, a porous ASB-PPS material, which works by physi- sorption only, has been established [10] as a better choice.
References 1. E. M O N T O N E R I , L. GIUFFRI~, G. MODICA and
E. TEMPESTI , Int. J. Hydrogen Energy 11 (1986) 233. 2. E. MONTONERI , G. MODICA and S. MAFFI , J. Compos.
Mater. 20 (1986) 503. 3. P. G A L L O N E, "Trattato di Ingegneria Chimica" (Tamburini,
Milan, 1973). 4. M.O . COULTER, "Modern Chlor-Alkali Technology" (Ellis
Horwood, Chichester, 1980). 5. E. M O N T O N E R I , E. RANZI, G. MODICA and
H. H O F M A N N , J. Compos. Mater. 21 (1987) 690. 6. E. MONTONERI , G. MODICA, L. GIUFFRI~,
L. PERALDO BICELL1 and S. MAFFI , Int. J. Polym. Mater. 11 (1987) 263.
7. E. M O N T O N E R I , L. GIUFFRE, E. TEMPESTI , S. MAFFI and G. MODICA, Int. J. Hydrogen Energy 9 (1984) 571.
8. N . R . DRAPER and H. SMITH, "Applied Regression Ana- lysis" (Wiley, New York, 1986).
9. G. BUZZI, FERRARIS, "Analisi ed Identificazione di Modelli", ENI-Ente Nazionale Idrocarburi, Servizio Formaz- ione e Sviluppo, San Donato, Milano (1974).
10. E. M O N T O N E R I , G. MODICA, C. BOWEN, D. G A U T H I E R and R. RENAUD, Int. J. Hydrogen Energy 12 (1987) 831.
Acknowledgement This work has been partly sponsored by "Progetto Finalizzato del CNR Chimica Fine".
Received 4 September and accepted 1 December 1989
2565