Climate teleconnections at monthly time scales in the Ligurian Sea inferred from satellite data
14
Climate teleconnections at monthly time scales in the Ligurian Sea inferred from satellite data A. Orfila * , A. A ´ lvarez, J. Tintore ´, A. Jordi, G. Basterretxea IMEDEA, Instituto Mediterra ´ neo de Estudios Avanzados (CSIC-UIB) Miquel Marque ´s, 21, 07190 Esporles, Spain Received 5 September 2002; received in revised form 12 April 2003; accepted 29 July 2004 Available online 23 May 2005 Abstract The existence and spatial distribution of possible teleconnections between the South Pacific and North Atlantic oceans and the Ligurian Sea (North-western Mediterranean) are investigated in the present paper. Teleconnections are searched by cross-correlating monthly spatio-temporal time series of 1.1 km resolution sea surface temperature (SST), and a 22.2 km resolution sea level anomaly (SLA), measured from satellite from March 1993 to August 1999, with two indices characterising the South Pacific and the North Atlantic variability: the Southern Oscillation (SO) and the North Atlantic Oscillation (NAO) indices, respectively. Concerning the variability induced by the North Atlantic Ocean, it is shown that it mostly influences the SLA field in the Ligurian Sea. Specifically, relevant anti- correlations between SLA and North Atlantic variability have been found in all the Ligurian sub-basin. As expected by geographical proximity, the effects of North Atlantic on the SLA field in the Ligurian Sea are instantaneous at monthly time scales. Instead, correlations between SST and NAO Index are found at time lag s = 1 month in the south- ern part of the basin highlighting the memory of the ocean related to their heat capacity. Significant anti-correlations between SO Index and the SST field in the Ligurian Sea, were obtained at time lag s = 4 months in the coastal areas of the sub-basin. Results also indicate that the impact of teleconnections in the area studied is not geographically uniform. Ó 2005 Elsevier Ltd. All rights reserved. Keywords: Teleconnections; Ligurian Sea; South Pacific and North Atlantic variability 1. Introduction Teleconnections are interactions between widely separated parts of the ocean and the atmosphere occur- ring at different time scales. These interactions originate recurring and persistent modes of low-frequency 0079-6611/$ - see front matter Ó 2005 Elsevier Ltd. All rights reserved. doi:10.1016/j.pocean.2004.07.011 * Corresponding author. Present Address: School of Civil and Environmental Engineering, Cornell University, Ithaca, NY 14853, United States. Fax: +1 607 255 9004. E-mail address: a.orfi[email protected] (A. Orfila). Progress in Oceanography 66 (2005) 157–170 Progress in Oceanography www.elsevier.com/locate/pocean
Transcript of Climate teleconnections at monthly time scales in the Ligurian Sea inferred from satellite data
Progress in Oceanography 66 (2005) 157–170
Progress inOceanography
www.elsevier.com/locate/pocean
Climate teleconnections at monthly time scales in theLigurian Sea inferred from satellite data
A. Orfila *, A. Alvarez, J. Tintore, A. Jordi, G. Basterretxea
IMEDEA, Instituto Mediterraneo de Estudios Avanzados (CSIC-UIB) Miquel Marques, 21, 07190 Esporles, Spain
Received 5 September 2002; received in revised form 12 April 2003; accepted 29 July 2004
Available online 23 May 2005
Abstract
The existence and spatial distribution of possible teleconnections between the South Pacific and North Atlantic
oceans and the Ligurian Sea (North-western Mediterranean) are investigated in the present paper. Teleconnections
are searched by cross-correlating monthly spatio-temporal time series of 1.1 km resolution sea surface temperature
(SST), and a 22.2 km resolution sea level anomaly (SLA), measured from satellite from March 1993 to August
1999, with two indices characterising the South Pacific and the North Atlantic variability: the Southern Oscillation
(SO) and the North Atlantic Oscillation (NAO) indices, respectively. Concerning the variability induced by the North
Atlantic Ocean, it is shown that it mostly influences the SLA field in the Ligurian Sea. Specifically, relevant anti-
correlations between SLA and North Atlantic variability have been found in all the Ligurian sub-basin. As expected
by geographical proximity, the effects of North Atlantic on the SLA field in the Ligurian Sea are instantaneous at
monthly time scales. Instead, correlations between SST and NAO Index are found at time lag s = 1 month in the south-
ern part of the basin highlighting the memory of the ocean related to their heat capacity. Significant anti-correlations
between SO Index and the SST field in the Ligurian Sea, were obtained at time lag s = 4 months in the coastal areas of
the sub-basin. Results also indicate that the impact of teleconnections in the area studied is not geographically uniform.
� 2005 Elsevier Ltd. All rights reserved.
Keywords: Teleconnections; Ligurian Sea; South Pacific and North Atlantic variability
1. Introduction
Teleconnections are interactions between widely separated parts of the ocean and the atmosphere occur-
ring at different time scales. These interactions originate recurring and persistent modes of low-frequency
0079-6611/$ - see front matter � 2005 Elsevier Ltd. All rights reserved.
doi:10.1016/j.pocean.2004.07.011
* Corresponding author. Present Address: School of Civil and Environmental Engineering, Cornell University, Ithaca, NY 14853,
United States. Fax: +1 607 255 9004.
E-mail address: [email protected] (A. Orfila).
158 A. Orfila et al. / Progress in Oceanography 66 (2005) 157–170
variability in large-scale patterns of atmospheric pressure and ocean circulation anomalies. Anomalies
can persist for several consecutive years, reflecting an important part of the interannual and interdeca-
dal climate variability and inducing very large spatial and temporal scale correlations (Kiladis & Diaz,
1989; Watanabe & Kimoto, 1999). Teleconnections may influence the air–sea interactions, either by
altering the latent and sensible heat fluxes through a change in low level wind conditions or by alteringthe radiation through a change of the cloud covering pattern and as a consequence, devastating socio
economic effects in a certain area of the globe may be induced by climatic processes occurring at remote
locations.
One of the most important modes of climatic variability is El Nino-Southern Oscillation (ENSO). ENSO
is a coupled ocean–atmosphere oscillation originated by the feedback between the large scale vertical mo-
tions occurring in the atmosphere and the coherent warming/cooling of the sea surface temperature (SST)
in the Tropical Pacific Ocean (Philander, 1990; Threnbert et al., 1998). ENSO is usually characterized by
the so called SO Index defined by the normalized differences of sea level pressure anomalies between Tahiti(French Polynesia) and Darwin (Australia) (Troup, 1965).
ENSO oscillation seems to affect the climate of large and remote areas of the globe (Enfield & Mayer,
1997; Kiladis & Diaz, 1989). Several efforts have been done to explain the world wide implications of
ENSO, especially after the Tropical Ocean–Global Atmosphere (TOGA) program (Threnbert et al.,
1998), mainly focused in North America, Caribean Sea, South Africa, Japan and India (Barnet, 1991;
Ropelewski & Halpert, 1987). Although the relationship between ENSO and climate anomalies in the tro-
pics are now well established, its influence in extratropical regions like Europe still needs more study (Pozo-
Vazquez, Esteban-Parra, Rodrigo, & Castro-Diez, 2001; Rodo, Baert, & Comin, 1997; Zorita, Kharin, &Von Storch, 1992).
Unlike the Pacific where a dominant mode of ocean–atmosphere interannual interaction controls the cli-
matic variability, the Atlantic ocean–atmosphere system shows several climate oscillation modes which ap-
pear to coexist (Okumura & Xie, 2001). The dominant mode, responsible for the atmospheric behaviour in
the North Atlantic sector throughout the year, is the North Atlantic Oscillation (NAO) (Marshall et al.,
2001). NAO consists of an alternation of the dipole formed by the Iceland low and the Azores high (Hur-
rell, 1995; Rodwell, Rowell, & Folland, 1999), producing changes in the mass and pressure fields that mod-
ify the paths of the storms crossing the north Atlantic from the east coast of America to Europe. Similarlyto ENSO, a NAO Index is defined by the difference of sea level pressure anomalies between Lisbon (Por-
tugal) and Stykkisholmur (Iceland) (Hurrell, 1995). Although recently a number of different studies have
shown the influence of NAO in the winter climate of European and Atlantic coast (Rogers, 1997; Trigo,
Osborn, & Corte-Real, 2002), its spatial distribution in the climate variability of the Mediterranean region
is still controversial.
Correlations between NAO and certain dynamical aspects at the north of the Western Mediterranean
Basin have been recently found from in situ measurements (Vignudelli, Gasparini, Astraldi, & Schiano,
1999). The strong air–sea interactions occurring over this ocean region would make this area of the WesternMediterranean more sensitive to atmospheric perturbations induced by climatic processes occurring at re-
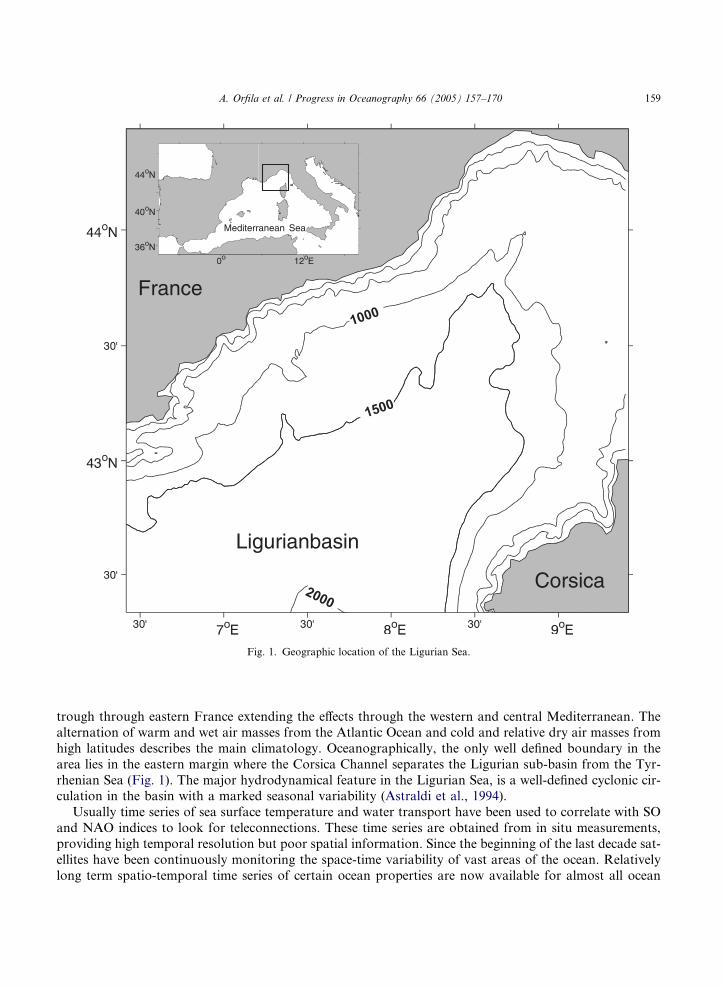
mote locations. For this reason the Ligurian Sea (Fig. 1), the northernmost sub-basin of the Western Med-
iterranean Sea, could constitute an adequate ocean location where to search for climatic teleconnections in
the Mediterranean Sea.
The basin circulation of the Ligurian Sea is mainly conditioned by the severe atmospheric-climatic forc-
ing during winters (Astraldi, Gasparini, & Sparnocchia, 1994). The mountains range in the vicinity is a key
factor in the climatic characteristics of the Ligurian Sea. The role of the Pyrenees in the western area and
the Alps in the north-eastern area are decisive boundaries for the pressure and wind distribution over thebasin. The north-western and central part of the sub-basin is forced by northerly (mistral) winds during the
year, while the eastern part is in general modulated by seasonal variability (Beckers et al., 2002). Gale-force
mistrals often develop when cyclogenesis occurs over the Gulf of Genoa with the passage of the 500 mb
Mediterranean Sea
Ligurianbasin
Corsica
France
Fig. 1. Geographic location of the Ligurian Sea.
A. Orfila et al. / Progress in Oceanography 66 (2005) 157–170 159
trough through eastern France extending the effects through the western and central Mediterranean. The
alternation of warm and wet air masses from the Atlantic Ocean and cold and relative dry air masses from
high latitudes describes the main climatology. Oceanographically, the only well defined boundary in the
area lies in the eastern margin where the Corsica Channel separates the Ligurian sub-basin from the Tyr-
rhenian Sea (Fig. 1). The major hydrodynamical feature in the Ligurian Sea, is a well-defined cyclonic cir-culation in the basin with a marked seasonal variability (Astraldi et al., 1994).
Usually time series of sea surface temperature and water transport have been used to correlate with SO
and NAO indices to look for teleconnections. These time series are obtained from in situ measurements,
providing high temporal resolution but poor spatial information. Since the beginning of the last decade sat-
ellites have been continuously monitoring the space-time variability of vast areas of the ocean. Relatively
long term spatio-temporal time series of certain ocean properties are now available for almost all ocean
160 A. Orfila et al. / Progress in Oceanography 66 (2005) 157–170
locations. Unfortunately, satellite records are not yet long enough to assess the impact of teleconnections at
interannual and interdecadal time scales. However, they constitute a valuable source of information to
determine at monthly time scales, the existence of teleconnections as well as the spatial distribution of their
influence in a given ocean area.
In the present work, we attempt to explore the influences of the variability of the South Pacific andNorth Atlantic oceans in the Ligurian Sea using satellite data. Monthly averages of sea surface temperature
(SST) and sea level anomaly (SLA) are the variables analysed in the Ligurian Sea, as they are directly influ-
enced by atmospheric forcing. On the other hand, monthly values of SO and NAO indices have been em-
ployed as general descriptors of the variability in the South Pacific and North Atlantic areas, respectively.
Thus, the main goal of the work is to find correlations between the variability of SST and SLA fields ob-
served from satellite in the Ligurian Sea and the South Pacific and North Atlantic variability described by
the SO and NAO indices, respectively, elucidating the spatial distribution of the impact in the area. The
article is structured as follows: Section 2 describes the data and methodology employed in the study. Re-sults are shown in Section 3. Section 4 discusses and concludes the work.
2. Data and methodology
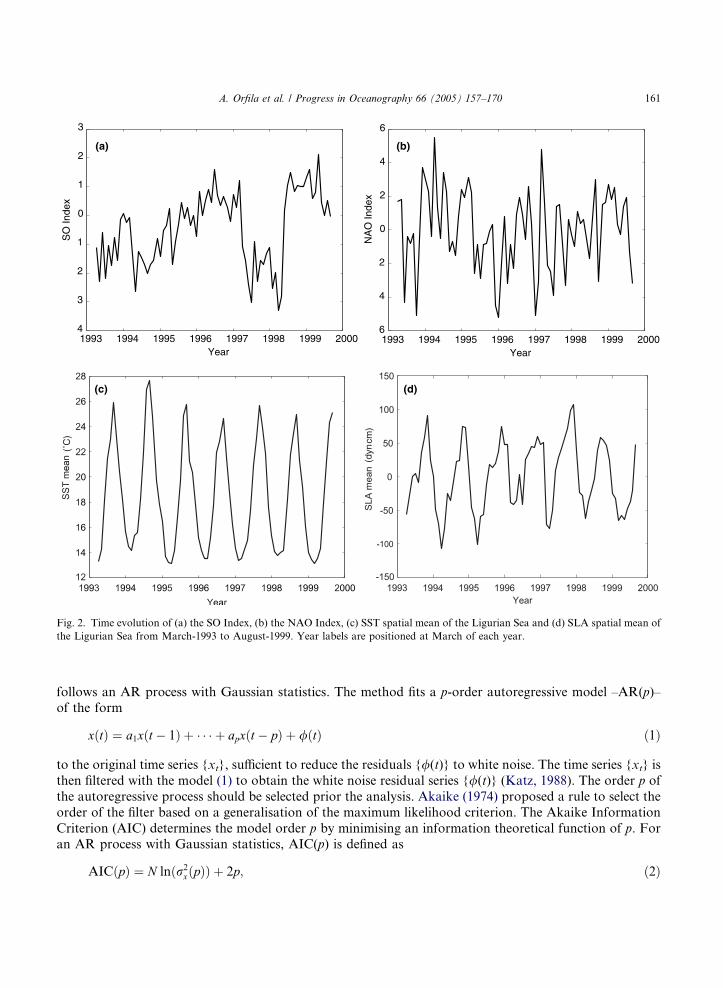
Possible teleconnections between the Ligurian Sea and the South Pacific and North Atlantic areas, are
studied using 78 monthly averages from March 1993 to August 1999 of the SO and NAO indices, respec-
tively (Figs. 2(a) and (b)). The period covered by the time series of indices was restricted to coincide withavailable satellite data.
Monthly averaged SLA data from ERS – TOPEX/POSEIDON (Le Traon, Gaspar, Bouyssel, & Makh-
mara, 1995) interpolated onto a 22.2 km mesh and ranging from March 1993 to August 1999, were em-
ployed. Although the SLA map resolution is fictitious, previous studies have shown that mesoescale
variability can be rather well mapped by combining multiple altimeter missions (Le Traon & Dibarboure,
1998). Time series of monthly averaged Advanced Very High Resolution Radiometer (AVHRR) Multi
Channel (MC) SST fields of the region covering the same time period, were obtained from the German
Aerospace Research Centre-DLR. Derivation of MCSST is based on the brightness temperatures ofAVHRR channels 4 and 5 as described by McClain, Pichel, and Walton (1985). Details on cloud cleaning
and image processing can be found at http://isis.dlr.de. Figs. 2(c) and (d) display the SST and SLA spatial
mean, respectively, over the area for the period considered. Initial SST fields, with a spatial resolution of 1.1
km, were linearly interpolated to the coarser grid defined by the SLA fields to facilitate comparison and
computations. A total of 116 time series, corresponding to the time evolution of the measured variables
at each pixel, were generated from each satellite dataset.
In order to determine possible relationships between SO and NAO indices and the observed variability
patterns in the Ligurian Sea, the SST and SLA satellite datasets were encoded using Empirical OrthogonalFunctions (EOFs) (Preisendorfer, 1988). Only the amplitude functions corresponding to the most relevant
EOFs were selected to cross-correlate with SO and NAO indices (Figs. 3(a) and (b)). Besides, the existence
of teleconnections as well as their spatial distribution was also determined computing the sample cross-
correlation functions between the time series built from the evolution of SST and SLA at each pixel of
the satellite images, and the SO and NAO indices.
Cross-correlation functions strongly depend on the structure of the original time series through the auto-
correlation, implying that nonzero values of the cross-correlation function do not necessarily imply a rela-
tionship between two time series if they are auto-correlated (Katz, 1988). Commonly, atmospheric andoceanic time series are highly auto-correlated producing fictitious cross-correlations if computations are
directly carried out with the original records. In order to avoid possible artificial cross-correlations, a pre-
whitening of each time series was carried out. Briefly, prewhitening assumes that the data under study
1993 1994 1995 1996 1997 1998 1999 20004
3
2
1
0
1
2
3
Year
SO
Inde
x
1993 1994 1995 1996 1997 1998 1999 20006
4
2
0
2
4
6
Year
NA
O In
dex
(˚C
)
(dyn
cm)
(a) (b)
(d)(c)
Fig. 2. Time evolution of (a) the SO Index, (b) the NAO Index, (c) SST spatial mean of the Ligurian Sea and (d) SLA spatial mean of
the Ligurian Sea from March-1993 to August-1999. Year labels are positioned at March of each year.
A. Orfila et al. / Progress in Oceanography 66 (2005) 157–170 161
follows an AR process with Gaussian statistics. The method fits a p-order autoregressive model –AR(p)–of the form
xðtÞ ¼ a1xðt � 1Þ þ � � � þ apxðt � pÞ þ /ðtÞ ð1Þ
to the original time series {xt}, sufficient to reduce the residuals {/(t)} to white noise. The time series {xt} is
then filtered with the model (1) to obtain the white noise residual series {/(t)} (Katz, 1988). The order p of
the autoregressive process should be selected prior the analysis. Akaike (1974) proposed a rule to select the
order of the filter based on a generalisation of the maximum likelihood criterion. The Akaike Information
Criterion (AIC) determines the model order p by minimising an information theoretical function of p. Foran AR process with Gaussian statistics, AIC(p) is defined as
AICðpÞ ¼ N lnðr2xðpÞÞ þ 2p; ð2Þ
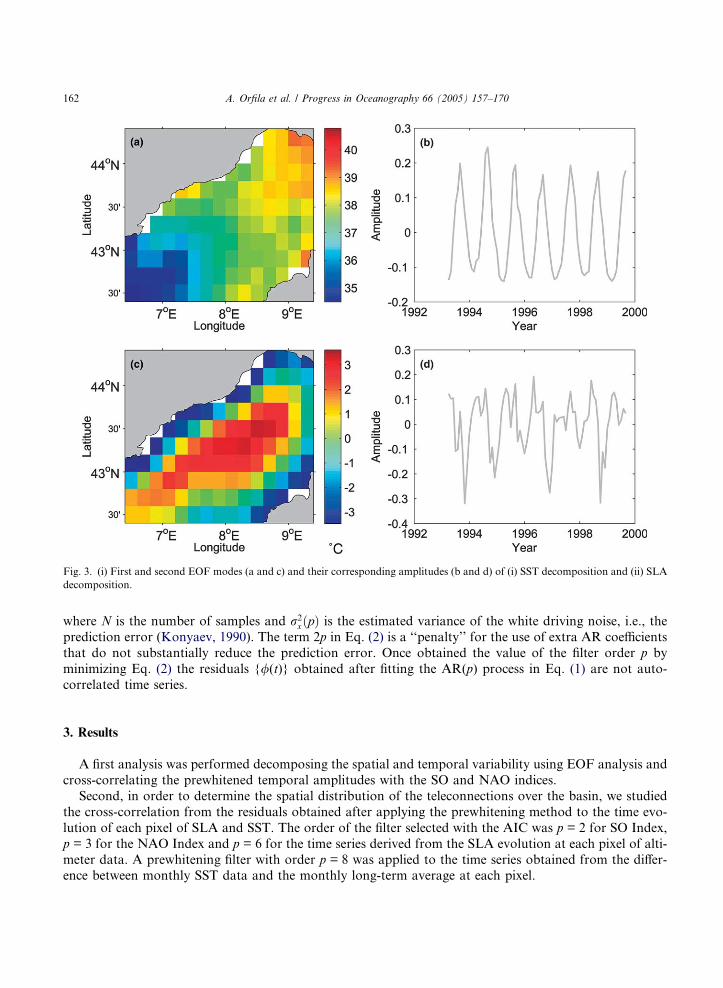
Fig. 3. (i) First and second EOF modes (a and c) and their corresponding amplitudes (b and d) of (i) SST decomposition and (ii) SLA
decomposition.
162 A. Orfila et al. / Progress in Oceanography 66 (2005) 157–170
where N is the number of samples and r2xðpÞ is the estimated variance of the white driving noise, i.e., the
prediction error (Konyaev, 1990). The term 2p in Eq. (2) is a ‘‘penalty’’ for the use of extra AR coefficients
that do not substantially reduce the prediction error. Once obtained the value of the filter order p by
minimizing Eq. (2) the residuals {/(t)} obtained after fitting the AR(p) process in Eq. (1) are not auto-
correlated time series.
3. Results
A first analysis was performed decomposing the spatial and temporal variability using EOF analysis and
cross-correlating the prewhitened temporal amplitudes with the SO and NAO indices.
Second, in order to determine the spatial distribution of the teleconnections over the basin, we studied
the cross-correlation from the residuals obtained after applying the prewhitening method to the time evo-
lution of each pixel of SLA and SST. The order of the filter selected with the AIC was p = 2 for SO Index,
p = 3 for the NAO Index and p = 6 for the time series derived from the SLA evolution at each pixel of alti-
meter data. A prewhitening filter with order p = 8 was applied to the time series obtained from the differ-ence between monthly SST data and the monthly long-term average at each pixel.
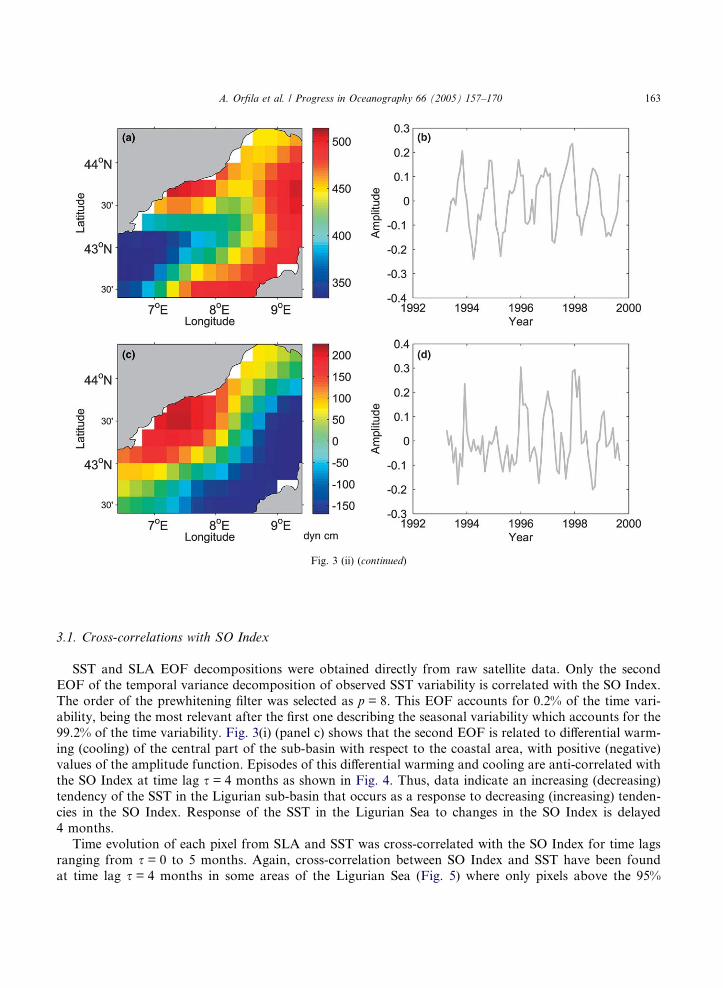
Fig. 3 (ii) (continued)
A. Orfila et al. / Progress in Oceanography 66 (2005) 157–170 163
3.1. Cross-correlations with SO Index
SST and SLA EOF decompositions were obtained directly from raw satellite data. Only the second
EOF of the temporal variance decomposition of observed SST variability is correlated with the SO Index.
The order of the prewhitening filter was selected as p = 8. This EOF accounts for 0.2% of the time vari-
ability, being the most relevant after the first one describing the seasonal variability which accounts for the
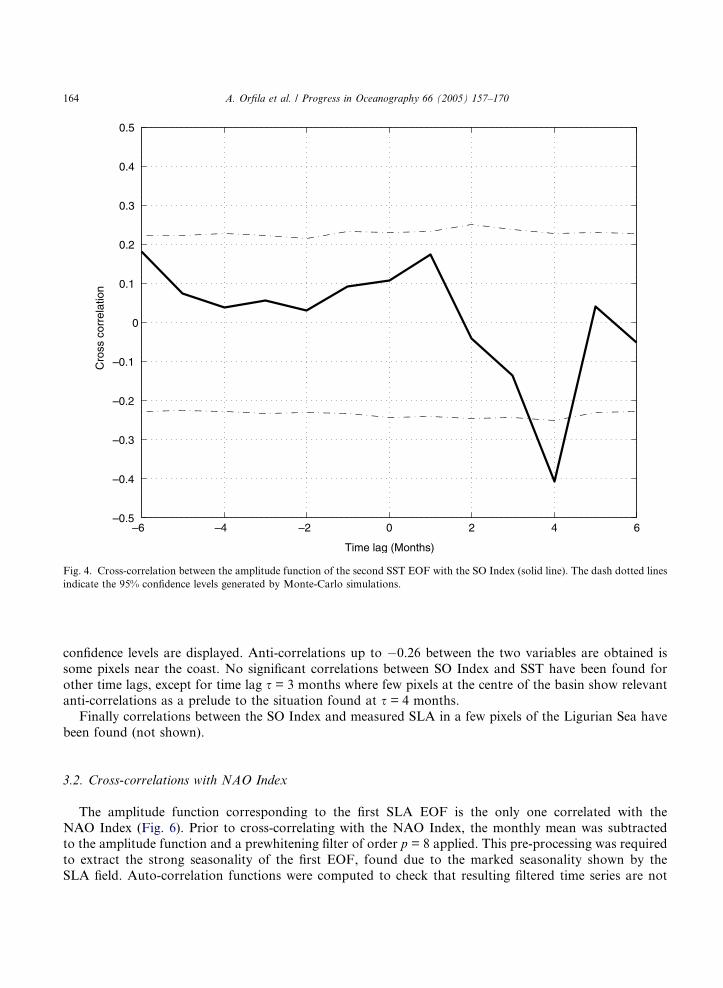
99.2% of the time variability. Fig. 3(i) (panel c) shows that the second EOF is related to differential warm-
ing (cooling) of the central part of the sub-basin with respect to the coastal area, with positive (negative)values of the amplitude function. Episodes of this differential warming and cooling are anti-correlated with
the SO Index at time lag s = 4 months as shown in Fig. 4. Thus, data indicate an increasing (decreasing)
tendency of the SST in the Ligurian sub-basin that occurs as a response to decreasing (increasing) tenden-
cies in the SO Index. Response of the SST in the Ligurian Sea to changes in the SO Index is delayed
4 months.
Time evolution of each pixel from SLA and SST was cross-correlated with the SO Index for time lags
ranging from s = 0 to 5 months. Again, cross-correlation between SO Index and SST have been found
at time lag s = 4 months in some areas of the Ligurian Sea (Fig. 5) where only pixels above the 95%
–6 –4 –2 0 2 4 6–0.5
–0.4
–0.3
–0.2
–0.1
0
0.1
0.2
0.3
0.4
0.5
Cro
ssco
rrel
atio
n
Time lag (Months)
Fig. 4. Cross-correlation between the amplitude function of the second SST EOF with the SO Index (solid line). The dash dotted lines
indicate the 95% confidence levels generated by Monte-Carlo simulations.
164 A. Orfila et al. / Progress in Oceanography 66 (2005) 157–170
confidence levels are displayed. Anti-correlations up to �0.26 between the two variables are obtained is
some pixels near the coast. No significant correlations between SO Index and SST have been found for
other time lags, except for time lag s = 3 months where few pixels at the centre of the basin show relevantanti-correlations as a prelude to the situation found at s = 4 months.
Finally correlations between the SO Index and measured SLA in a few pixels of the Ligurian Sea have
been found (not shown).
3.2. Cross-correlations with NAO Index
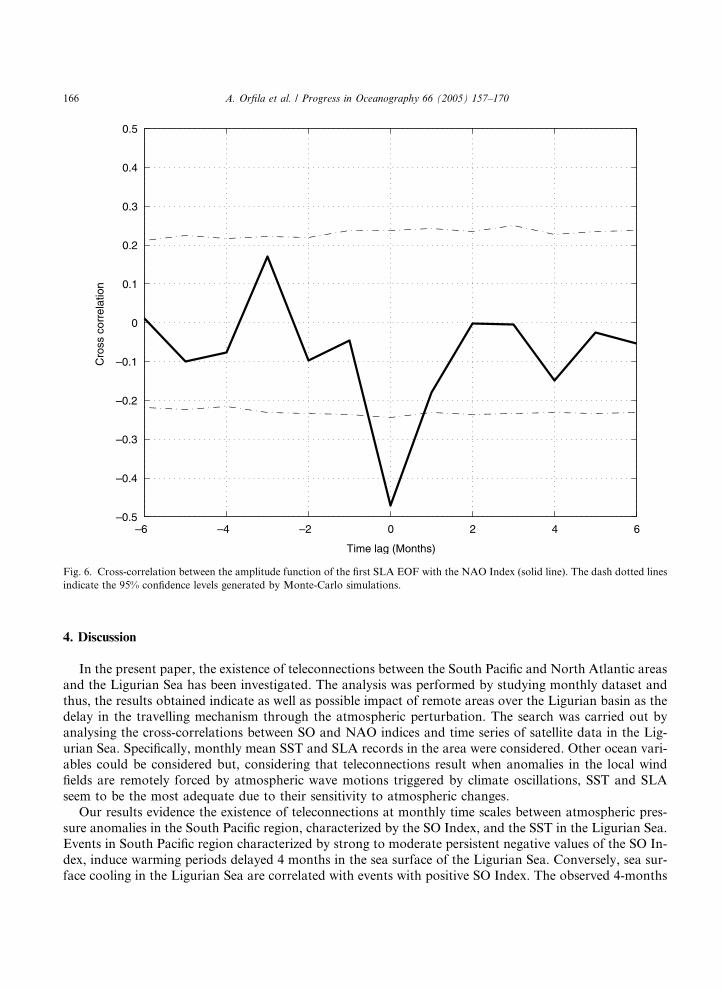
The amplitude function corresponding to the first SLA EOF is the only one correlated with the
NAO Index (Fig. 6). Prior to cross-correlating with the NAO Index, the monthly mean was subtractedto the amplitude function and a prewhitening filter of order p = 8 applied. This pre-processing was required
to extract the strong seasonality of the first EOF, found due to the marked seasonality shown by the
SLA field. Auto-correlation functions were computed to check that resulting filtered time series are not
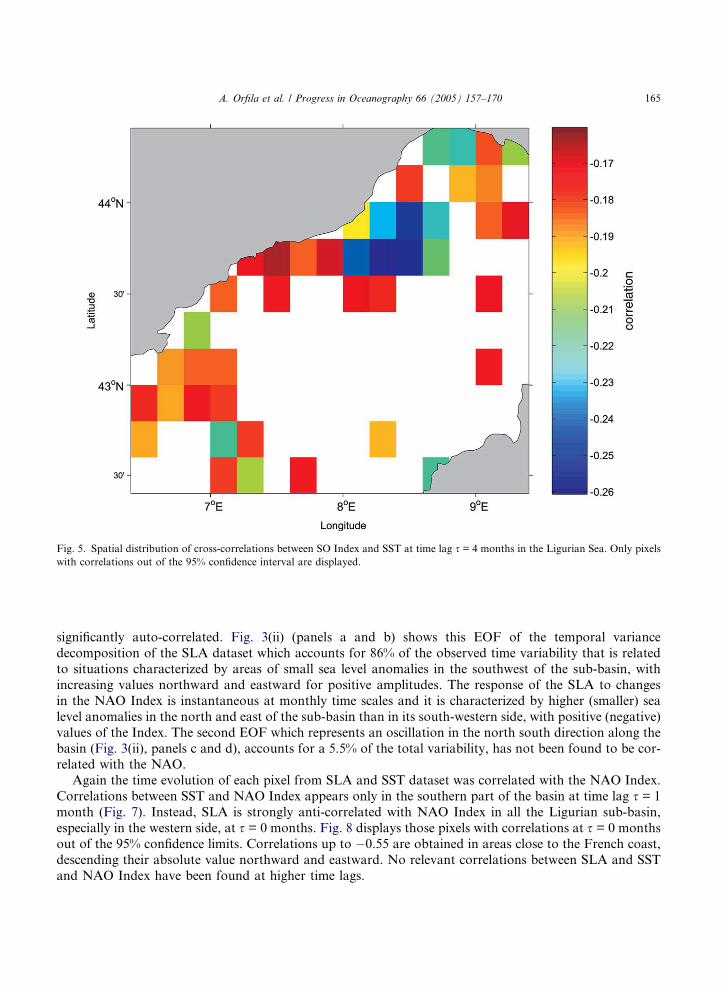
Fig. 5. Spatial distribution of cross-correlations between SO Index and SST at time lag s = 4 months in the Ligurian Sea. Only pixels
with correlations out of the 95% confidence interval are displayed.
A. Orfila et al. / Progress in Oceanography 66 (2005) 157–170 165
significantly auto-correlated. Fig. 3(ii) (panels a and b) shows this EOF of the temporal variance
decomposition of the SLA dataset which accounts for 86% of the observed time variability that is related
to situations characterized by areas of small sea level anomalies in the southwest of the sub-basin, with
increasing values northward and eastward for positive amplitudes. The response of the SLA to changes
in the NAO Index is instantaneous at monthly time scales and it is characterized by higher (smaller) sea
level anomalies in the north and east of the sub-basin than in its south-western side, with positive (negative)
values of the Index. The second EOF which represents an oscillation in the north south direction along the
basin (Fig. 3(ii), panels c and d), accounts for a 5.5% of the total variability, has not been found to be cor-related with the NAO.
Again the time evolution of each pixel from SLA and SST dataset was correlated with the NAO Index.
Correlations between SST and NAO Index appears only in the southern part of the basin at time lag s = 1
month (Fig. 7). Instead, SLA is strongly anti-correlated with NAO Index in all the Ligurian sub-basin,
especially in the western side, at s = 0 months. Fig. 8 displays those pixels with correlations at s = 0 months
out of the 95% confidence limits. Correlations up to �0.55 are obtained in areas close to the French coast,
descending their absolute value northward and eastward. No relevant correlations between SLA and SST
and NAO Index have been found at higher time lags.
–6 –4 –2 0 2 4 6–0.5
–0.4
–0.3
–0.2
–0.1
0
0.1
0.2
0.3
0.4
0.5
Cro
ssco
rrel
atio
n
Time lag (Months)
Fig. 6. Cross-correlation between the amplitude function of the first SLA EOF with the NAO Index (solid line). The dash dotted lines
indicate the 95% confidence levels generated by Monte-Carlo simulations.
166 A. Orfila et al. / Progress in Oceanography 66 (2005) 157–170
4. Discussion
In the present paper, the existence of teleconnections between the South Pacific and North Atlantic areas
and the Ligurian Sea has been investigated. The analysis was performed by studying monthly dataset and
thus, the results obtained indicate as well as possible impact of remote areas over the Ligurian basin as thedelay in the travelling mechanism through the atmospheric perturbation. The search was carried out by
analysing the cross-correlations between SO and NAO indices and time series of satellite data in the Lig-
urian Sea. Specifically, monthly mean SST and SLA records in the area were considered. Other ocean vari-
ables could be considered but, considering that teleconnections result when anomalies in the local wind
fields are remotely forced by atmospheric wave motions triggered by climate oscillations, SST and SLA
seem to be the most adequate due to their sensitivity to atmospheric changes.
Our results evidence the existence of teleconnections at monthly time scales between atmospheric pres-
sure anomalies in the South Pacific region, characterized by the SO Index, and the SST in the Ligurian Sea.Events in South Pacific region characterized by strong to moderate persistent negative values of the SO In-
dex, induce warming periods delayed 4 months in the sea surface of the Ligurian Sea. Conversely, sea sur-
face cooling in the Ligurian Sea are correlated with events with positive SO Index. The observed 4-months
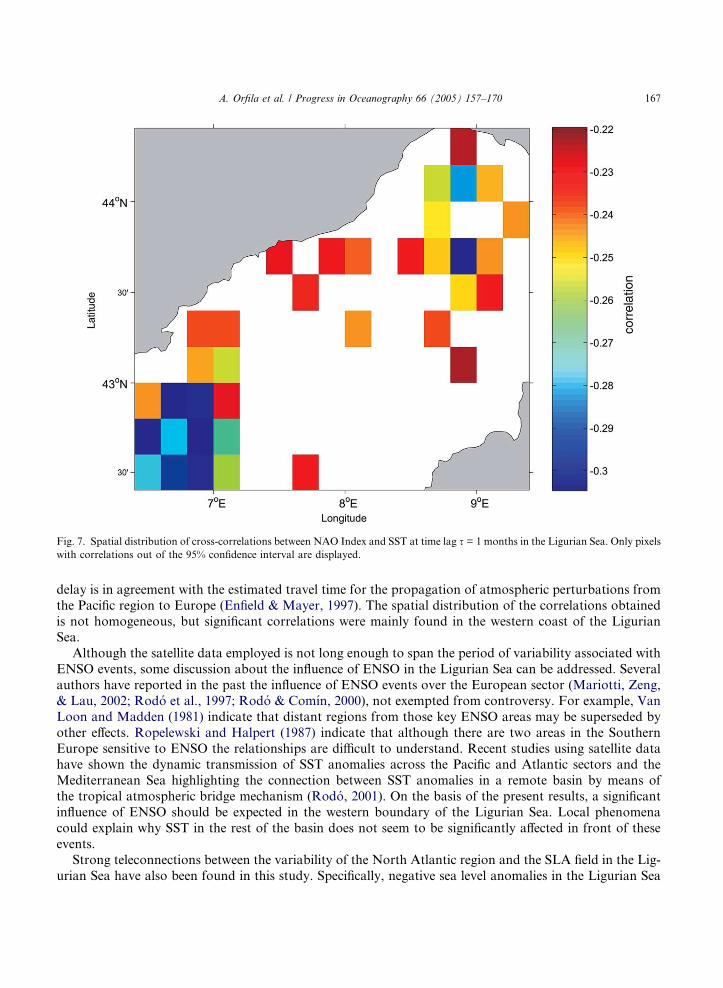
Fig. 7. Spatial distribution of cross-correlations between NAO Index and SST at time lag s = 1 months in the Ligurian Sea. Only pixels
with correlations out of the 95% confidence interval are displayed.
A. Orfila et al. / Progress in Oceanography 66 (2005) 157–170 167
delay is in agreement with the estimated travel time for the propagation of atmospheric perturbations from
the Pacific region to Europe (Enfield & Mayer, 1997). The spatial distribution of the correlations obtained
is not homogeneous, but significant correlations were mainly found in the western coast of the LigurianSea.
Although the satellite data employed is not long enough to span the period of variability associated with
ENSO events, some discussion about the influence of ENSO in the Ligurian Sea can be addressed. Several
authors have reported in the past the influence of ENSO events over the European sector (Mariotti, Zeng,
& Lau, 2002; Rodo et al., 1997; Rodo & Comın, 2000), not exempted from controversy. For example, Van
Loon and Madden (1981) indicate that distant regions from those key ENSO areas may be superseded by
other effects. Ropelewski and Halpert (1987) indicate that although there are two areas in the Southern
Europe sensitive to ENSO the relationships are difficult to understand. Recent studies using satellite datahave shown the dynamic transmission of SST anomalies across the Pacific and Atlantic sectors and the
Mediterranean Sea highlighting the connection between SST anomalies in a remote basin by means of
the tropical atmospheric bridge mechanism (Rodo, 2001). On the basis of the present results, a significant
influence of ENSO should be expected in the western boundary of the Ligurian Sea. Local phenomena
could explain why SST in the rest of the basin does not seem to be significantly affected in front of these
events.
Strong teleconnections between the variability of the North Atlantic region and the SLA field in the Lig-
urian Sea have also been found in this study. Specifically, negative sea level anomalies in the Ligurian Sea
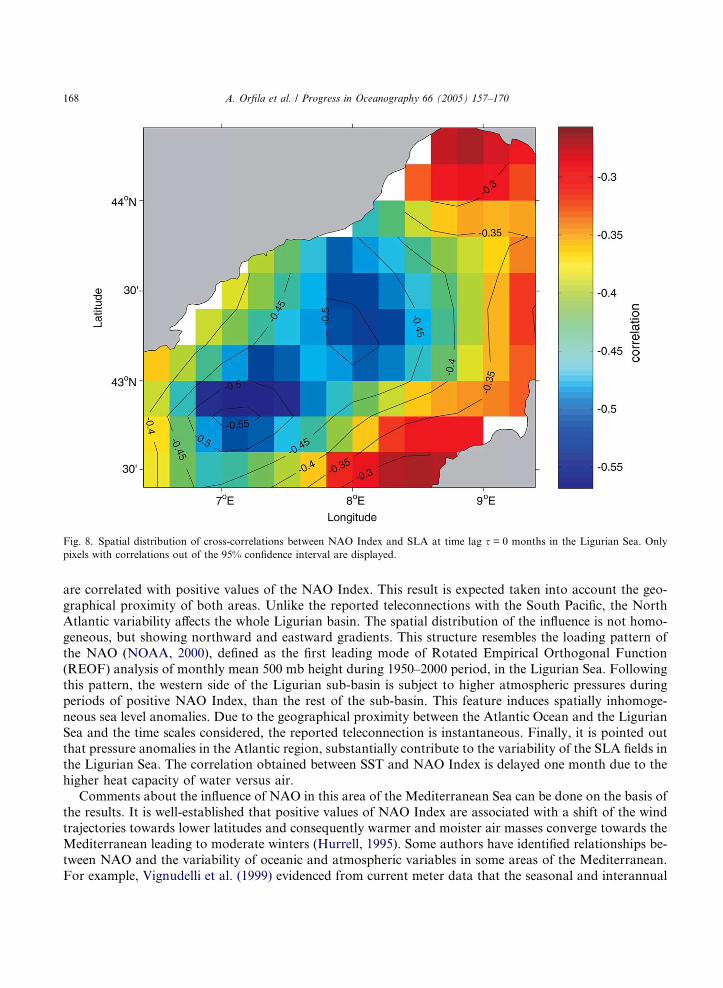
Fig. 8. Spatial distribution of cross-correlations between NAO Index and SLA at time lag s = 0 months in the Ligurian Sea. Only
pixels with correlations out of the 95% confidence interval are displayed.
168 A. Orfila et al. / Progress in Oceanography 66 (2005) 157–170
are correlated with positive values of the NAO Index. This result is expected taken into account the geo-
graphical proximity of both areas. Unlike the reported teleconnections with the South Pacific, the North
Atlantic variability affects the whole Ligurian basin. The spatial distribution of the influence is not homo-geneous, but showing northward and eastward gradients. This structure resembles the loading pattern of
the NAO (NOAA, 2000), defined as the first leading mode of Rotated Empirical Orthogonal Function
(REOF) analysis of monthly mean 500 mb height during 1950–2000 period, in the Ligurian Sea. Following
this pattern, the western side of the Ligurian sub-basin is subject to higher atmospheric pressures during
periods of positive NAO Index, than the rest of the sub-basin. This feature induces spatially inhomoge-
neous sea level anomalies. Due to the geographical proximity between the Atlantic Ocean and the Ligurian
Sea and the time scales considered, the reported teleconnection is instantaneous. Finally, it is pointed out
that pressure anomalies in the Atlantic region, substantially contribute to the variability of the SLA fields inthe Ligurian Sea. The correlation obtained between SST and NAO Index is delayed one month due to the
higher heat capacity of water versus air.
Comments about the influence of NAO in this area of the Mediterranean Sea can be done on the basis of
the results. It is well-established that positive values of NAO Index are associated with a shift of the wind
trajectories towards lower latitudes and consequently warmer and moister air masses converge towards the
Mediterranean leading to moderate winters (Hurrell, 1995). Some authors have identified relationships be-
tween NAO and the variability of oceanic and atmospheric variables in some areas of the Mediterranean.
For example, Vignudelli et al. (1999) evidenced from current meter data that the seasonal and interannual
A. Orfila et al. / Progress in Oceanography 66 (2005) 157–170 169
variability in the Corsica Channel are related to NAO variability. Rimbu, Le Treut, Janicot, Boroneant,
and Laurent (2001) found the winter precipitation over the Mediterranean area highly correlated to
NAO and Eshel and Farrell (2000) identified a strong teleconnection between the northern North Atlantic
and the Eastern Mediterranean basin. Our results confirm that monthly and seasonal variability of the Lig-
urian Sea is linked to the variability of the North Atlantic, at least for the SLA. Extrapolation to interan-nual scales could follow, indicating that NAO could constitute a relevant source of low-frequency
variability in the Ligurian Sea. This would have an important impact on the predictability of the dynamic
states of the Ligurian Sea.
Summarizing, although the short time span covered by satellite data, this data can be employed to deter-
mine the existence and spatial distribution of climate teleconnections at monthly time scales and thus to
predict some aspects of the ocean variability of certain areas of the ocean. Present results analysing different
ocean variables measured in the Ligurian Sea from satellite indicate that some of the variability of this area
at monthly time scales can be induced by extra tropical teleconnections with the South Pacific and NorthAtlantic variability. The SLA data seems to be more sensitive to North Atlantic variability in the area due
to the effect of the anomalously high/low pressures over the subtropical Atlantic that extends its effects
immediately over the Ligurian Sea. The tropical–extratropical feedback between the Pacific and the Ligu-
rian Sea seems to be highly perturbed by many other effects producing no clear patterns in the correlation
between the SO Index and the Ligurian sub-basin.
Acknowledgments
This work has been partially supported by the EVK3-CT-2000-0028 European Project. Comments to the
manuscript from Dr. Balle and two anonymous referees are greatly acknowledged.
References
Akaike, H. (1974). A new look at the statistical model identification. IEEE Transactions on Automatic Control, 19, 716–723.
Astraldi, M., Gasparini, P., & Sparnocchia, S. (1994). The seasonal and interannual variability in the Ligurian-Provencal Basin. In P.
La Violette (Ed.). Seasonal variability in the western Mediterranean sea, coastal and estuarine studies (Vol. 46, pp. 93–113).
Washington: AGU.
Barnet, T. P. (1991). The interaction of multiple time scales in the tropical climate system. Journal of Climate, 4, 269–285.
Beckers, J.-M., Rixen, M., Brasseur, P., Brankart, J.-M., Elmoussaoui, A., Crepon, M., et al. (2002). Model intercomparison in the
Mediterranean. The MEDMEX simulations of the seasonal cycle. Journal of Marine Systems, 33–34, 215–251.
Enfield, D. B., & Mayer, D. A. (1997). Tropical Atlantic sea surface temperature variability and its relation to El Nino-Southern
Oscillation. Journal of Geophysical Research, 102(C1), 929–945.
Eshel, G., & Farrell, B. F. (2000). Mechanisms of Eastern Mediterranean rainfall variability. Journal of the Atmospheric Sciences,
57(19), 3219–3232.
Hurrell, J. W. (1995). Decadal trends in the North Atlantic oscillation: regional temperatures and precipitation. Science, 269, 676–679.
Katz, R. W. (1988). Use of cross correlations in the search for teleconnections. Journal of Climate, 8, 241–253.
Kiladis, G. N., & Diaz, H. (1989). Global climatic anomalies associated with extremes in the Southern Oscillation. Journal of Climate,
2, 1069–1090, 217 pp..
Konyaev, K. V. (1990). Spectral analysis of physical oceanographic data. Russian Translation Series (Vol. 81). Rotterdam: A.A.
Balkema, 217 pp.
Le Traon, P. Y., Gaspar, P., Bouyssel, F., & Makhmara, H. (1995). Using Topex/Poseidon data to enhance ERS-1 data. Journal of
Atmospheric and Oceanic Technology, 12, 161–170.
Le Traon, P. Y., & Dibarboure, G. (1998). Mesoescale mapping capabilities of Multiple-satellite altimeter missions. Journal of
Atmospheric and Oceanic Technology, 16, 1208–1223.
Mariotti, A., Zeng, N., & Lau, K.-M. (2002). Euro-Mediterranean rainfall and ENSO – a seasonally varying relationship. Geophysical
Research Letters, 29(12), 10.1029.
170 A. Orfila et al. / Progress in Oceanography 66 (2005) 157–170
McClain, E. P., Pichel, W. G., & Walton, C. (1985). Comparative performance of AVHRR-based multichannel sea surface
temperatures. Journal of Geophysical Research, 90, 11587–11601.
Marshall, J., Kushnir, Y., Battisti, D. S., Chang, P., Hurrell, J., McCartney, M., et al. (2001). North Atlantic climate variability:
phenomena, impacts and mechanisms. International Journal of Climatology, 15, 1863–1898.
NOAA. (2000). Available: http://www.cpc.ncep.noaa.gov/products/precip/CWlink/pna/nao_loading.html.
Okumura, Y., & Xie, S. P. (2001). Tropical Atlantic air–sea interaction and its influence on the NAO. Geophysical Research Letters,
28(8), 1507–1510.
Philander, S. G. (1990). El Nino, La Nina and the southern oscillation. New York: Academic Press, 289 pp.
Pozo-Vazquez, D., Esteban-Parra, M. J., Rodrigo, F. S., & Castro-Diez, Y. (2001). The association between ENSO and winter
atmospheric circulation and temperature in the North Atlantic region. Journal of Climate, 14, 3408–3420.
Preisendorfer, R. W. (1988). Principal component analysis in meteorology and oceanography. New York: Elsevier, 425 pp.
Rimbu, N., Le Treut, H., Janicot, S., Boroneant, C., & Laurent, C. (2001). Decadal precipitation variability over Europe and its
relation with surface atmospheric circulation and sea surface temperature. Quarterly Journal of the Royal Meteorological Society,
127(572), 315–329.
Rodo, X., Baert, E., & Comin, F. A. (1997). Variations in seasonal rainfall in Southern Europe during the present century:
relationships with the North Atlantic Oscillation and the El Nino-Southern Oscillation. Climate Dynamics, 13, 275–284.
Rodo, X., & Comın, F. A. (2000). Links between large-scale anomalies, rainfall and wine quality in the Iberian Peninsula during the
last three decades. Global Change Biology, 6, 267–273.
Rodo, X. (2001). Reversal of three global atmospheric fields linking changes in SST anomalies in the Pacific, Atlantic and Indian
Oceans at tropical latitudes and midlatitudes. Climate Dynamics, 18, 203–217.
Rogers, J. C. (1997). North Atlantic storm track variability and its association to the North Atlantic Oscillation and climate variability
of northern Europe. Journal of Climate, 10, 1635–1647.
Rodwell, M. J., Rowell, D. P., & Folland, C. K. (1999). Oceanic forcing of the wintertime North Atlantic Oscillation and European
climate. Nature, 398, 320–323.
Ropelewski, C. F., & Halpert, M. S. (1987). Global and regional-scale precipitation patterns associated with EL Nino-Southern
Oscillation. Monthly Weather Review, 115, 1606–1626.
Threnbert, K. E., Branstator, G. W., Karoly, D., Kumar, A., Lau, N, & Ropelewski, C. (1998). Progress during TOGA in
understanding and modelling global teleconnections associated with tropical sea surface temperatures. Journal of Geophysical
Research, 103(C7), 14.291–14.324.
Trigo, R. M., Osborn, T. J., & Corte-Real, J. M. (2002). The North Atlantic Oscillation influence on Europe: climate impacts and
associated physical mechanisms. Climate Research, 20, 9–17.
Troup, A. J. (1965). The Southern Oscillation. Quarterly Journal of the Royal Meteorological Society, 91, 490–506.
Van Loon, H., & Madden, R. A. (1981). The Southern Oscillation. Part I: global associations with pressure and temperature in
northern winter. Monthly Weather Review, 109, 1150–1162.
Vignudelli, S., Gasparini, G. P., Astraldi, M., & Schiano, M. (1999). A possible influence of the North Atlantic Oscillation on the
circulation of the Western Mediterranean Sea. Geophysical Research Letters, 26(5), 623.
Watanabe, M., & Kimoto, M. (1999). Tropical–extratropical connection in the Atlantic atmosphere–ocean variability. Geophysical
Research Letters, 26, 2247–2250.
Zorita, E., Kharin, V., & Von Storch, H. (1992). The atmospheric circulation and sea surface temperature in the North Atlantic area in
winter: their interaction and relevance for the Iberian precipitation. Journal of Climate, 5, 1097–1108.