Variation in soil strength and rooting characteristics of wheat in relation to soil management
11
Variation in soil strength and rooting characteristics of wheat in relation to soil management Pramila Aggarwal a, ⁎ , Karun Kumar Choudhary a , Anil Kumar Singh b , Debashis Chakraborty a a Division of Agricultural physics, Indian Agricultural Research Institute, New Delhi-110012, India b Water Technology Centre, Indian Agricultural Research Institute, New Delhi-110012, India Received 11 August 2005; received in revised form 31 January 2006; accepted 2 April 2006 Available online 12 June 2006 Abstract Studies on soil strength and rooting characteristics of crops are important for water and nutrient budgeting and also for deciding the adoption of suitable soil management practice for sustainable crop production. In the present field trial, the variation of soil penetration resistance (PR) with soil water content (SWC (w/w)) and bulk density (BD) changes under bed and conventionally planted wheat was studied on a sandy loam soil of research farm of Indian Agricultural Research Institute, New Delhi. The differences in root characteristics of both systems were also compared. The results showed that, in general for all SWC, with increase in BD from 1.2 to 1.6 Mg m − 3 , PR increased but the increase was more sharp in conventional than in bed planting system. It was further seen that, at all BDs, the critical soil strength of 2 MPa arrived at higher SWC in conventional as compared to bed planting. It thus indicated that root growth continued normally at relative lower SWC in bed planting as compared to conventional planting. Multiple regression analysis of soil penetration resistance as a function of BD, SWC and soil depth showed that SWC alone accounted for 59% variation and along with BD accounted for 93–96% variation in PR. Addition of depth did not improve the correlation. Sensitivity analysis of multiple regression equation predicting penetration as a function of SWC and BD indicated that PR was more sensitive to SWC changes than BD changes. Lower sensitivity indices for both SWC and BD in bed planting than in conventional planting indicated relatively lesser change in PR per unit change in SWC or BD in bed system. Computer aided root length scanning system ‘RHIZO’ was used to study rooting characteristics. Analysis showed that root characteristics including root length density, average root diameter, surface area density and volume density of roots of wheat up to 30 cm were significantly higher in bed over conventional system. In both systems, nearly 70% of root length density and 76–82% of root surface area was confined in upper 30 cm. It was further seen that more than 70% of total root length was in root diameter range below 0.3 mm. Geoderma 136 (2006) 353 – 363 www.elsevier.com/locate/geoderma Abbreviations: PR, soil penetration resistance; SWC, soil water content by weight; SWC 2MPa , soil water content (by weight ) at 2 MPa soil penetration resistance; BD, bulk density; DEP, soil depth; RLD, root length density; RSD, root surface area density; RVD, root volume density; SREL i , relative sensitivity; P o , optimum input parameter value; P i , input parameter value equal to % i times of P o ; O o , optimum output parameter value; O i , value of output parameter corresponding to a given P i value as obtained from spider chart of sensitivity analysis module (one of Microsoft excel addins); DAS, days after sowing; TPU, transparency unit of root length scanner; RHIZO, software of root length scanner required to calculate root morphological characteristics. ⁎ Corresponding author. Tel.: +91 11 25833303; +91 11 25841178. E-mail address: [email protected] (P. Aggarwal). 0016-7061/$ - see front matter © 2006 Published by Elsevier B.V. doi:10.1016/j.geoderma.2006.04.004
-
Upload
independent -
Category
Documents
-
view
1 -
download
0
Transcript of Variation in soil strength and rooting characteristics of wheat in relation to soil management

006) 353–363www.elsevier.com/locate/geoderma
Geoderma 136 (2
Variation in soil strength and rooting characteristics of wheat inrelation to soil management
Pramila Aggarwal a,⁎, Karun Kumar Choudhary a, Anil Kumar Singh b,Debashis Chakraborty a
a Division of Agricultural physics, Indian Agricultural Research Institute, New Delhi-110012, Indiab Water Technology Centre, Indian Agricultural Research Institute, New Delhi-110012, India
Received 11 August 2005; received in revised form 31 January 2006; accepted 2 April 2006Available online 12 June 2006
Abstract
Studies on soil strength and rooting characteristics of crops are important for water and nutrient budgeting and also for decidingthe adoption of suitable soil management practice for sustainable crop production. In the present field trial, the variation of soilpenetration resistance (PR) with soil water content (SWC (w/w)) and bulk density (BD) changes under bed and conventionallyplanted wheat was studied on a sandy loam soil of research farm of Indian Agricultural Research Institute, New Delhi. Thedifferences in root characteristics of both systems were also compared. The results showed that, in general for all SWC, withincrease in BD from 1.2 to 1.6 Mg m−3, PR increased but the increase was more sharp in conventional than in bed planting system.It was further seen that, at all BDs, the critical soil strength of 2 MPa arrived at higher SWC in conventional as compared to bedplanting. It thus indicated that root growth continued normally at relative lower SWC in bed planting as compared to conventionalplanting.
Multiple regression analysis of soil penetration resistance as a function of BD, SWC and soil depth showed that SWC aloneaccounted for 59% variation and along with BD accounted for 93–96% variation in PR. Addition of depth did not improve thecorrelation.
Sensitivity analysis of multiple regression equation predicting penetration as a function of SWC and BD indicated that PR wasmore sensitive to SWC changes than BD changes. Lower sensitivity indices for both SWC and BD in bed planting than inconventional planting indicated relatively lesser change in PR per unit change in SWC or BD in bed system.
Computer aided root length scanning system ‘RHIZO’ was used to study rooting characteristics. Analysis showed that rootcharacteristics including root length density, average root diameter, surface area density and volume density of roots of wheat up to30 cm were significantly higher in bed over conventional system. In both systems, nearly 70% of root length density and 76–82%of root surface area was confined in upper 30 cm. It was further seen that more than 70% of total root length was in root diameterrange below 0.3 mm.
Abbreviations: PR, soil penetration resistance; SWC, soil water content by weight; SWC2MPa, soil water content (by weight ) at 2 MPa soilpenetration resistance; BD, bulk density; DEP, soil depth; RLD, root length density; RSD, root surface area density; RVD, root volume density;SRELi, relative sensitivity; Po, optimum input parameter value; Pi, input parameter value equal to % i times of Po; Oo, optimum output parametervalue; Oi, value of output parameter corresponding to a given Pi value as obtained from spider chart of sensitivity analysis module (one of Microsoftexcel addins); DAS, days after sowing; TPU, transparency unit of root length scanner; RHIZO, software of root length scanner required to calculateroot morphological characteristics.⁎ Corresponding author. Tel.: +91 11 25833303; +91 11 25841178.
E-mail address: [email protected] (P. Aggarwal).
0016-7061/$ - see front matter © 2006 Published by Elsevier B.V.doi:10.1016/j.geoderma.2006.04.004

354 P. Aggarwal et al. / Geoderma 136 (2006) 353–363
Hence, it was concluded that sowing of wheat on beds reduced mechanical impedance and increased root growth in upper30 cm of soil, which ultimately resulted in higher crop yield.© 2006 Published by Elsevier B.V.
Keywords: Soil penetration resistance; Soil physical properties; Bed planting; Rooting characteristics of wheat
1. Introduction
Studies designed to assess soil and water quality,farm management and precision agriculture requireknowledge about the spatial and temporal variation ofsoil physical properties at field scale. However, thecontinuous monitoring of these soil physical propertiesis time consuming and expensive. Alternatively, somesoil physical properties can be inferred rapidly usingpenetrometer. Improved penetrometer with morevertical penetration range, small cone diameters anddata loggers could be easily operated in fields undervariable soil water content range. These penetrometersare used to measure penetration resistance that couldbe related to soil characteristics. The soil penetrationresistance, which limits root growth, depends upon thesoil characteristics, management practices followedand the crop of interest. Among many soil factors,which affect the soil penetration resistance (PR), themost prominent ones are soil bulk density (BD),organic matter (OM), soil water content (SWC (w/w))and amount of cementing agent present (Gerard et al.,1982; Ehlers et al., 1983; Cassel and Nelson, 1985;Spivey et al., 1986; Busscher, 1990; Campbell andO'Sullivan, 1991; Gajri et al., 1991; Grunwald et al.,2001). Generally, PR increases with increase incompaction or bulk density (BD) and decreases withincrease in soil water content (SWC) and increase insand percentage (Ayers and Perumpral, 1982; Vepras-kas, 1984; Henderson et al., 1988; Lowery andSchuler, 1994; Puppala et al., 1995). Soil managementpractices like deep tillage, bed planting and organicmatter incorporation also reduce penetration resistanceappreciably (Gajri et al., 1991; Aggarwal andGoswami, 2003). A penetrometer measurement of2.0 MPa is generally regarded as sufficient to hinderthe growth and development of crops (Taylor et al.,1966; Kay and Anger, 2002). A study by Fulton et al.(1996) showed that, for Maury silt-loam soil, littlecorrelation was obtained between cone index valuesand dry density at near field capacity soil watercontent. In an another study by Domsch and Wendroth(1997) to determine the effect of tillage on the soilstructural con- dition, results revealed that penetrationresistance values could reflect spatial soil structural
differences fairly well if soil texture and soil watercontent are fairly constant within the area of study.Penetration measured at about field capacity couldreflect the effects of previous loads or tillageoperations both qualitatively and quantitatively. Gajriet al. (1991) reported a linear decline in PR withincrease in SWC. Pedotransfer functions (multipleregression equations) were developed by Grunwald etal. (2001) to describe the relationship between coneindex and soil texture, BD and SWC and depth (DEP)to evaluate the sensitivity of each of the above inputparameter used in computing PR. Such relationshipscould be used in predicting critical bulk densities andcritical soil water contents corresponding to criticalsoil penetration resistance values (2–3 MPa for mostof the crops) beyond which the crop yields decline.
Since PR measures impedance offered by soil toroot growth, there exists a strong correlation betweenPR and root growth. Besides, quantification of rootgrowth is also necessary to study water and nutrientdynamics in rhizosphere (Hanson et al., 1999). Totalroot mass being easier to measure than root length andsurface area was used frequently to compare rootsystems (Murphy and Smucker, 1995; Aggarwal et al.,1997; Aggarwal et al., 1998). However, later on, itwas seen that root mass alone could not describemany root functions involved in studying plant–soilrelationships such as uptake of water and nutrient byroots from soil. It was the finer roots with largerlength density (RLD) and surface area which contrib-uted to more water and nutrient uptake from surface aswell as subsurface soil than the thicker roots whichremained confined to upper surface layer only(Brewster and Tinker, 1970; Raper et al., 1978;Fiscus, 1981; Box and Ramseur, 1993; Fitter, 1996).
RLD distribution changed with different soil envi-ronment. Different patterns of root growth were ob-served in treatments with different soil water regimesand nitrogen application rates (Gajri et al., 1992; Merillet al., 1996). At low SWC, higher mechanical impe-dance blocked root elongation (Goss, 1977). Subsoilcompaction was another factor that adversely affectedvertical root penetration as well as root proliferation(Chaudhary et al., 1991; Ishaq et al., 2003). Soil mana-gement practices like tillage, bed formation and organic
355P. Aggarwal et al. / Geoderma 136 (2006) 353–363
matter incorporation into soil enhanced root prolifera-tion as evident from increase in RLD (Chaudhary et al.,1991; Aggarwal and Sharma, 2002; Aggarwal and Gos-wami, 2003). Root growth systems are hierarchical andeach lower order class of root members has greater rootlength, lower root diameter and less mass per unit length(Fiscus, 1981).
Improvement in lighting source and technical deve-lopment in scanning technology and development ofimage analysis software made root length measure-ment easy and accurate. One such image analysissoftware developed by RHIZO (Regent Instruments,Quebec, 1995) was tested for its accuracy inmeasuring root length for samples in which rootsoverlap and also for measuring the accuracy forcomputing the distribution of length in differentdiameter classes (Bauhus and Messier, 1999). Resultssuggested that total root length was accuratelydetermined for length per unit areas of b 1.5 cm/cm2. In samples that contained different rootdiameters, the total root length and average root dia-meter could be accurately measured.
However, very little information was available onthe influence of soil management practices such asbed planting on reduction in initial soil mechanicalimpedance, its variation with bulk density and soilwater content changes which led to variation inrooting characteristics and ultimately yield of wheat.Hence, a field experiment was carried out with theobjectives (i) to study and compare the temporalvariation of soil penetration resistance, soil watercontent and bulk density of a sandy loam soil underbed and conventionally planted wheat, and (ii) tocompare the rooting characteristics of wheat in bothsystems for a better understanding of changes in soilphysical environment and rooting pattern broughtabout by planting of wheat on beds.
2. Materials and methods
2.1. Description of study area
The study was conducted at Indian AgriculturalResearch farm, New Delhi, India, during winter seasonof 2000–2001 and 2001–2002. The study area issituated at 28.38°N, 77.2°E and has semiarid climate.The average maximum and minimum aerial tempera-tures during wheat season were 22.1 °C and 5.4 °C,respectively. The total rainfall during the crop season(average of 2 years) was 50 mm. Land use was a maize–wheat rotation. The soil was sandy loam (TypicUstochrept) with 71.95% sand and 19.2% clay.
2.1.1. Details of bed planterBed planter had four components:
(a) Bed maker (at front side of planter) consisted ofthree big tines with digger bodies, attached tothree iron rods, the other ends of which were fixedfirmly to a horizontal iron bar through nuts andbolts. Since the bar had grooves at 10 cmintervals, the width of bed and furrow could beadjusted by changing the position of these rods.
(b) Seed drill (at back side of planter) for sowing oneto three rows per bed.
(c) Fertilizer drill for drilling fertilizer near seededrows.
(d) Big heavy iron bar at back end for smootheningthe beds.
The bed planter was mounted at the back of a mediumsize tractor. In one pass of tractor, the front big tines ofplanter made two beds and three furrows and seed drill atback sow three rows of wheat and heavy iron bar behindit closed the seeded rows and smoothened the beds.
2.2. Treatments
Main treatment consisted of sowing of three rows ofwheat (HD2285) on 37.5 cm wide beds alternating with30 cm wide furrows by using a tractor drawn bed planter(bed system) and flat line sowing at 22.5 cm row-to-rowspacing using a seed drill (conventional system). Eachtreatment was replicated eight times. The experimentwas laid out in randomized block design.
2.2.1. Data setBulk density samples of 0–15, 15–30 and 30–45 cm
soil layers were taken by using a core auger of 5 cm corediameter. Samples were collected on 0, 15, 30, 60, 90and 105 days after sowing (DAS) to collect at least onedata point of bulk density during drying phase of eachirrigation, which was required for the multiple regres-sion model. Soil penetration resistance was measured byRimik cone penetrometer (model no. CP20). The maxi-mum value of PR, which this instrument could measure,was 5000 kPa; maximum depth of penetration was600 mm, which was measured by an ultrasonic trans-ducer. The diameter of the base of cone was 12 mm,slant height of cone was 24 mm and angle of cone was30°. The capacity of load cell was 60 kg. Penetrometerhad a data logger system attached to it for automaticrecording of data in the field. Retrieval of data on PCusing CP20V2 software gave the recorded PR data at aninterval 15 or 20 mm soil depth in graphical as well as

356 P. Aggarwal et al. / Geoderma 136 (2006) 353–363
tabular form (detail can be obtained from hardwaremanual of ‘Rimik cone penetrometer CP20’). PR wasrecorded for 0–60 cm soil at an interval of 15 cm on 7,11, 15 and 20 DAS (drying phase of pre-sowingirrigation) and again on 30, 33, 38 and 42 DAS (dryingphase of first irrigation given on 24 DAS). Simulta-neously, soil samples were taken from 0 to 15, 15 to 30and 30 to 45 cm using a screw auger and oven dried at105 °C for gravimetric SWC determination. Similarly,after second and third irrigations on 48 and 70 DAS, PRand SWC were recorded on 55, 59, 63, 68, 77, 83, 88and 93 DAS, which formed the data sets during dryingphases after second and third irrigation. Thus, a total of16 data set (4 for each drying phase) of PR and SWC foreach soil layer were obtained for both bed and conven-tional systems.
2.3. Statistical analysis
Values of BD, SWC and PR recorded for 0–15, 15–30 and 30–45 cm soil layers at different times were usedfor developing the multiple regression equations using‘STASTICA 6.0’ software package.
2.3.1. Sensitivity analysisA sensitivity analysis was done to evaluate the
relative importance of different input parameters in theregression model. Sensitivity analysis add in module ofMicrosoft Excel 2003 (mm sensitivity) performedsingle-factor sensitivity analysis on regression modelby automatically varying the input values, tabulating thecorresponding output values, and created a SpiderGraph, which showed the rate of change of differentinputs against the rate of change of an output. Toeliminate scale effects, the relative sensitivity wasintroduced (Vereecken et al., 1989):
SRELi ¼ ORi=PRi ð1Þ
Where ORi ¼ jOi−Oi−1j=Oo ð2Þ
and PRi ¼ jPi−Pi−1j=Po ð3ÞWhere SRELi is the relative sensitivity, P is theparameter of interest, Po is the optimum parametervalue, Pi is the parameter value at i times P from theoptimum, O is the objective function or output, Oo isthe value of the optimal objective function (so-calledbase value), and Oi is the value of the objectivefunction at a distance i times P from the optimum. Theparameters with the largest SRELi have the greatest
impact on model output. This provides a basis forcomparing various parameters and focusing on sensi-tive parameters.
2.4. 3D contour plot of BD-SWC-PR
A three-dimensional contour plot of BD-SWC-PRdatawith linear fitting was prepared for the surface 0–15 cmsoil layer using STASTICA 6.0' software package.
2.5. Root sampling and washing
Root samples were taken only once at grain fillingstage (100 DAS). In bed planting treatment, rootsamples were taken from each of the three rows on agiven bed. In flat planting system, root samples weretaken from three consecutive rows. A root auger of 7 cmdiameter was used to take root samples at 15 cm intervalup to 120 cm of soil profile. The core of the auger wasplaced so as to keep the base of the stem at the center.
The root samples were soaked overnight in watercontaining sodium hexametaphosphate in small amountin a pail (Aggarwal and Sharma, 2002). The water on thetop with floating roots was decanted into anothercontainer. Roots were then separated by carefully passingthe decanted water over a fine sieve. The procedure wasrepeated three to four times for complete separation ofroots from soils. Then, the roots were air-dried so as tomake the root samples ready for scanning.
2.5.1. Scanning and Image analysis using RHIZOsystem
The scanner of RHIZO system had two light sources,one below the scanner glass called flat bed or reflectiveand one above it (in the scanner cover) calledtransparency unit or TPU. For root morphologicalmeasurements TPU lighting system was used forscanning. The light rays from TPU passed through thesample and then to the camera sensor below the scannerglass. The resulting image was sharp and clear withwell-contrasted silhouette.
The image analysis system RHIZO acquires a directdigital (grayscale) image from the scanner and thencreated two other types of images for its analysis. Onetype of the image created was termed as ‘Pixelsclassification image’ in which all parts of the originalimage that fell below a user defined threshold of grayscalevalue were removed. The image had only two intensitiesblack for pixels belonging to roots and white for pixelsbelonging to the background. Another created image wastermed as skeleton image, which consisted of a line, onepixel in diameter, which is superimposed over the earlier

357P. Aggarwal et al. / Geoderma 136 (2006) 353–363
root image. RHIZO system measured the root length byscanning the length of the root skeleton. The colour of theskeleton indicated the diameter classification. Measure-ments of rootmorphological characteristics were based onRegent's non-statistical method (Arsenault et al., 1995;Guay and Arseneault, 1996) with overlap compensation.The advantage of Regent's non-statistical method overTennant's (1975) statistical method was that, in additionto total RLD, root surface area and volumemeasurements,it further gave information of their distribution in variousdiameter classes.
2.5.2. Statistical analysis of root parametersT-test was performed to find out if the differences in
RLD and root diameter between bed and conventionalsystem were significant or not for different soil layersseparately.
3. Results and discussion
3.1. Soil bulk density
Table 1 showed temporal variation ofBDof surface soilunder bed and conventional system. BD of surface 0–15 cm increased gradually from sowing to harvest. In-crease in BD with time indicated increase in soil com-paction with time, which could be due to settling of soilafter tillage or breaking up of the aggregates under theinfluence of irrigation or rainfall. BD of soil under bedsystem for 0–15 cm was less than conventional system
Table 1Temporal variation of bulk density in bed and conventional plantingsystems
Soildepth(cm)
DAS Bulk density (Mg m−3) T-test
Bed planting Conventional planting
0–15 0 1.20 1.32 ⁎⁎
15 1.27 1.36 ⁎⁎
30 1.36 1.42 ⁎
60 1.40 1.46 ⁎
90 1.48 1.51 NS105 1.53 1.51 NS
15–30 0 1.47 1.54 ⁎
15 .50 1.58 ⁎
30 1.55 1.59 ⁎
60 1.58 1.58 NS90 1.56 1.56 NS105 1.57 1.58 NS
30–45 0 1.45 1.58 ⁎⁎
15 153 1.60 ⁎⁎
30 1.55 1.61 ⁎
60 1.56 1.56 NS90 1.56 1.55 NS105 1.56 1.56 NS
throughout the crop growth as the 20 cm high beds wereformed initially by flattening the loose heap of soil formedby removing the soil from furrow. The differences, whichwere highly significant initially, became less significant atlater crop stage and nonsignificant at harvest. For 15–30 cm and 30–45 cm also, the difference were significantinitially, but as crop growth advanced they became nonsig-nificant. The nonsignificant BD differences between bothsystems at maturity were due to flattening of beds in duecourse (shift in height of bed from 20 cm at sowing to just4 cm at harvest) because of the movement and settling ofsoil from beds in furrows after each irrigation and rain.
3.2. Soil penetration resistance
For better understanding, the variation of PR with BDand SWC for surface 0–15 cm soil layer, three-dimensional contour plot of BD-SWC-PR data with linearfitting was prepared (Fig. 1). It was observed that, in bothmethods of planting, irrespective of bulk density varia-tions, at low SWC (4–5%), PR remained higher than2 MPa but at higher SWC (16%) PR was lowered to 800–1600 kPa. In general, for all SWC, with increase in BDfrom 1.3 to 1.5Mgm−3, PR increased but the increase wasmore sharp in conventional than in bed planting system. Itwas further seen that, at all BDs, the critical soil strength of2MPa arrived at higher SWC in conventional planting andat relatively lower SWC under bed planting. Lower soilwater content at 2 MPa soil strength (SWC2MPa is anindicator of critical level of soil water content at which soilmechanical impedance become sufficiently high to reducethe root growth by more than 50% in most of the crops) inbed planting thus indicated that root growth continuednormally at relative lower SWC in bed planting,whereas inconventional planting, at such lower SWC, soil strengthbecame sufficiently high to interfere with root growth(Imhoff et al., 2000).
3.2.1. Statistical analysisStatistical analysis of 16 data of PR and SWC for each
soil layer (4 data set for each drying phase) along with 4BD data (one for each drying phase) revealed that range ofBDunder bed system varied from1.2 to 1.56Mgm−3 withamean value of 1.46Mgm−3, whereas under conventionalit varied between 1.32 and 1.61Mgm−3 with amean valueof 1.52 Mg m−3 (Table 2). Similarly, under bed and con-ventional systems, mean SWC were 10.78% and 11.42%and PR were 1533 and 1780 kPa, respectively.
Correlation matrix of regression model for predictingPR (dependent variable) as a function of SWC, BD andDEP (input variables) showed that a correlation of 0.31 to0.33 existed between PR and BD, −0.77 to −0.80

Fig. 1. Soil resistance curve of 0–15 cm soil layer under bed and conventional planting of wheat.
358 P. Aggarwal et al. / Geoderma 136 (2006) 353–363
between PR and SWC and 0.12 to 0.19 between PR andDEP (Table 3). Similar trends were reported by Grunwaldet al. (2001).
A correlation between dependent variable and inputvariable is significant only if the coefficient of the inputparameter inmultiple regression analysis is about twice aslarge as the corresponding standard error (Decision Pro 4,a data analysis package). Thus the absolute value of Tstatic
Table 2Basic statistics of parameters used in multiple regression equation
Method of planting Soil parameter Mean of the season Sta
Bed Bulk density (Mg m−3) 1.46Soil water content (% w/w) 10.78Depth (cm) 22.5 1Penetration Resistance (kPa) 1533.28 55
Conventional Bulk density (Mg m−3) 1.52Soil water content (% w/w) 11.41Depth (cm) 22.5Penetration resistance (kPa) 1780.22 4
(the coefficient of a parameter in multiple regressionequation divided by its standard error) greater than twoindicated strong negative correlation between PR andSWC and positive correlation between PR and BD. Thedepth, which had absolute value of Tstatic less than 2, wastherefore treated as redundant input variable (Table 4).Stepwise regression analysis showed that for both systemsSWC alone contributed to 59–65%, whereas both SWC
ndard deviation Maximum Minimum Total number of data points
0.114 1.56 1.2 483.073 15.89 4.5 482.421 37.5 7.5 483.817 2514 488 480.015 1.61 1.32 480.48 16.23 5.6 482.07 37.5 7.5 485.85 2222 1200 48

Table 3Correlation coefficients of multiple regression model for predicting PRas a function of BD, SWC and DEP
BD SWC DEP PR
Bed plantingBD 1.00 0.33 0.63 0.33SWC 0.33 1.00 0.33 −0.77DEP 0.63 0.33 1.00 0.12PR 0.33 −0.77 0.12 1.00
Conventional plantingBD 1.0 0.27 0.77 0.31SWC 0.27 1.00 0.24 −0.80DEP 0.77 0.24 1.00 0.19PR 0.31 −0.80 0.19 1.00
359P. Aggarwal et al. / Geoderma 136 (2006) 353–363
and BD contributed 93–96% towards the variation of PR.Inclusion of depth did not improve the correlation.
3.2.2. The sensitivity analysisIn order to evaluate the relative importance of the
BD and SWC used in a regression equation, asensitivity analysis was performed for multipleregression equations for bed and conventional planting(Table 5). Mean values of BD and SWC of bothsystems were used as optimum input parameter values(Po) and mean PR value as optimum output (Oo).Each Po was changed by ±10% to derive Pi valuesand corresponding Oi values were read from the spiderchart created by sensitivity analysis add in module ofMicrosoft Excel-2003. Sensitivity indices computedfor both systems showed that PR was more sensitiveto SWC changes than BD. Again, sensitive indices ofboth SWC and BD were more for conventional systemthan bed system.
Table 4Stepwise statistics of multiple regression model
Method/no of step Parameter Intercept
Bed plantingForward stepwise/1 Coefficient 3024.754
Tstatic 13.64Forward stepwise/final Coefficient −1155.50
Tstatic −4.835Standard Coefficient −1005.16
Tstatic −3.55
Conventional systemForward stepwise/1 Coefficient 2650.73
Tstatic 23.34Forward stepwise/final Coefficient 192.754
Tstatic 0.96Standard Coefficient 99.79
Tstatic 0.33
The above results thus indicated that in bed system,greater moisture losses during drying after irrigation orincrease in BD with passage of time during crop growthcaused smaller increase in PR as compared to conven-tional. Lower PR of surface layer in bed system allthroughout crop growth favored more root growth insurface layer.
3.3. Rooting characteristics
From Fig. 2, it is evident that, for both methods ofplanting, the 50% of average root length density (RLD)was in 0–15 cm layer, 17–19% in 15–30 cm layer andremaining 30–32% in 30–90 cm. Chaudhary et al. (1991)and Gajri et al. (1992) also reported similar trends.However, the RLD of 0–30 cm layers in bed plantingsystem was significantly higher (nearly 22%) thanconventional flat planting system. Similarly, in bothsystems, 76% to 82% of total root surface area density(RSD) was confined in upper 0–30 cm soil layer and itwas nearly 60% higher in bed over conventional system.Likewise, average root diameter of upper 0–30 cm wasalso significantly higher under bed planting system overconventional and beyond 30 cm the differences werenonsignificant. For both systems, average root diameterwas between 0.45 mm to 0.60 mm in the upper 0–15 cmlayer, whereas the value reduced below 0.3 mm beyond60 cm. Similarly, root volume density (RVD) was alsohigher in bed planting system.
Distribution of total root length in various diameterclasses showed that for all depths≥75% of the total rootlength was in 0–0.3 mm diameter range (Fig. 3). Theseresults were in agreement with those reported by Fiscus(1981), Pallant et al. (1993) and Merrill et al. (2002). In
BD SWC DEP R2
– −138.34 – 0.589– −6.99 –3137.25 −176.58 – 0.96318.23 −27.61 –3012.12 −177.59 1.94 0.96414.16 −27.44 0.9918
– −76.28 – 0.647– −7.9 –1724.22 −90.39 – 0.93512.54 −21.35 –1794.40 −90.28 −0.66 0.9398.43 −21.02 −0.44

Table 5Sensitivity analysis of input parameters of multiple regression equations a used for bed and conventional planting system
Planting system Mean parameter values used in analysis Sensitivity index
Bulk density(Mg m−3) (BD)
Soil water content(% w/w) (SWC)
Depth(DEP)
Soil penetration resistance(kPa) (PR)
Bulk density(Mg m−3)
Soil water content(% w/w)
Bed system 1.464 10.78 22.5 1445.90 0.33 0.75Conventional system 1.519 11.41 22.5 1780.72 0.65 1.73a Multiple regression equation for: (1) bed planting: PR=−1005.16+3012.118⁎BD−177.589⁎SWC−1.941723⁎DEP; (2) conventional
planting: PR=99.7891+1794.403⁎BD−90.2803⁎SWC−0.663⁎DEP.
360 P. Aggarwal et al. / Geoderma 136 (2006) 353–363
the diameter range beyond 0.6 mm, the percentage oftotal root length was less than 10%.
The above results thus indicated that all threeimportant rooting characteristics namely RLD, RSDand RVD were higher in upper 0–30 cm of soilbecause of loosening of soil due to tilling whichfavored more root growth in the upper loose layer ascompared to deeper layers which remained untilled.Moreover, since it was an irrigated crop, it resulted inlower RLD in deeper layers .RLD of deeper layerspossibly would had been higher under rainfed crop as
Fig. 2. Morphological characteristics of roots of whe
roots would had gone deep down in search of waterunder stress conditions.
Again, higher RLD, RSD and RVD in 0–30 cm of bedas compared to conventional systemwas mainly due to thefact that beds were formed after normally tilling the soil(surface of bed was higher by 20 cm than the surface ofconventional flat planting) and upper 0–20 cmof bedweremore loose than that of conventional system. Moreover,during bed making, upper 40 cm soil was disturbed,whereas in conventional only upper 20 cm soil wasdisturbed. Because of the above reasons, the mechanical
at on beds and conventionally planted wheat.
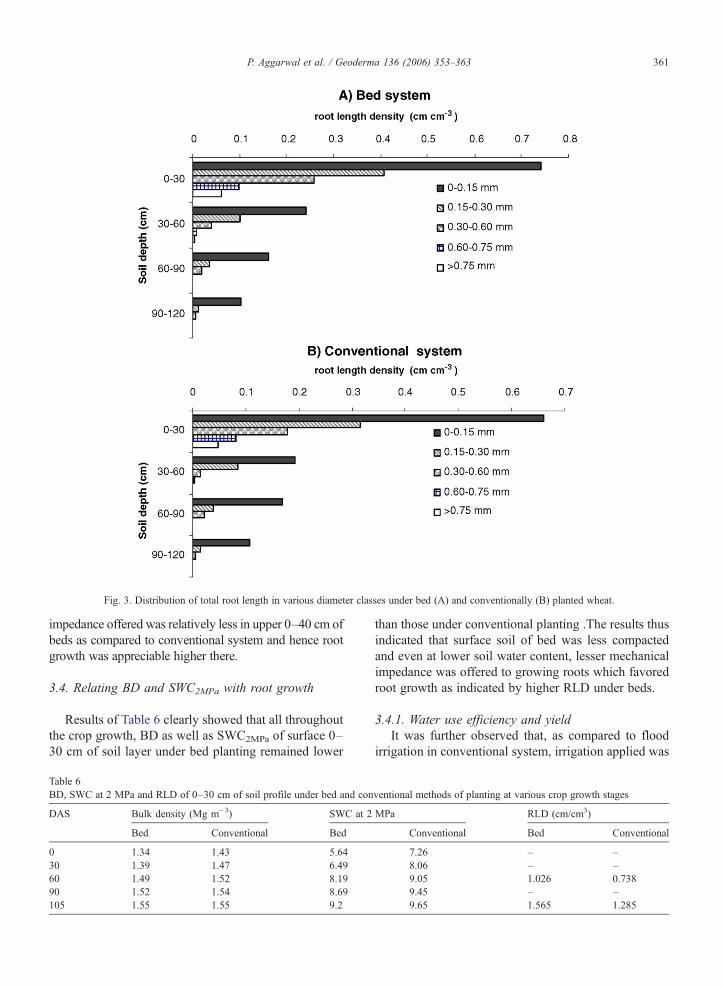
Fig. 3. Distribution of total root length in various diameter classes under bed (A) and conventionally (B) planted wheat.
361P. Aggarwal et al. / Geoderma 136 (2006) 353–363
impedance offered was relatively less in upper 0–40 cm ofbeds as compared to conventional system and hence rootgrowth was appreciable higher there.
3.4. Relating BD and SWC2MPa with root growth
Results of Table 6 clearly showed that all throughoutthe crop growth, BD as well as SWC2MPa of surface 0–30 cm of soil layer under bed planting remained lower
Table 6BD, SWC at 2 MPa and RLD of 0–30 cm of soil profile under bed and con
DAS Bulk density (Mg m−3) SWC at 2
Bed Conventional Bed
0 1.34 1.43 5.6430 1.39 1.47 6.4960 1.49 1.52 8.1990 1.52 1.54 8.69105 1.55 1.55 9.2
than those under conventional planting .The results thusindicated that surface soil of bed was less compactedand even at lower soil water content, lesser mechanicalimpedance was offered to growing roots which favoredroot growth as indicated by higher RLD under beds.
3.4.1. Water use efficiency and yieldIt was further observed that, as compared to flood
irrigation in conventional system, irrigation applied was
ventional methods of planting at various crop growth stages
MPa RLD (cm/cm3)
Conventional Bed Conventional
7.26 – –8.06 – –9.05 1.026 0.7389.45 – –9.65 1.565 1.285

Table 7Irrigation water applied, water use, grain yield and water use efficiency(WUE) of bed and conventionally planted wheat (average of 2 years)
Plantingsystem
Total amount ofirrigation applied(cm)
Water usedby crop(cm)
Grainyield(tonnes/ha)
WUE(tonnes/ha cm)
Bed 21.39 29.31 5.38 0.184Conventional 24.94 32.48 5.02 0.155T-test – S S S
362 P. Aggarwal et al. / Geoderma 136 (2006) 353–363
less in bed planting system as water was applied infurrows only (Table 7). Again water use was signifi-cantly lower but grain yield and water use efficiencywas significantly higher in bed planting as compared toconventional planting. These results further confirmedthe earlier reported findings that sowing of wheat onbeds improved input use and increased crop yield aswell as input use efficiency (Agustin et al., 2000; Hobbs,2001; Aggarwal and Goswami, 2003).
3.4.2. Summary and conclusionsStudying the changes in PR with changes in other
dynamic soil physical parameters such as SWC and BDwould help in understanding the changes in soil physicalenvironment brought about by the adoption of aparticular soil and or water management practice andaccordingly the merits or demerits of that managementpractice could be decided. Such empirical relationshipscould further be used in various soil quality, soil tillageand crop growth models.
In the present paper, comparison of soil physicalenvironment and root distribution of wheat planted onbeds and conventionally was done. Results indicatedthat bed planting system could emerge as a viable andsustainable option to conventional planting becausesurface soil of beds remained relatively loose andoffered less impedance to growing roots and rate ofincrease of PR with decrease in SWC or increase inBD was also less. Lower mechanical impedanceoffered by surface soil of bed to growing rootsincreased RLD, RSD and RVD and ultimatelyincreased crop yield.
References
Aggarwal, P., Goswami, B., 2003. Bed planting system for increasingwater use efficiency of wheat grown on Inceptisol. Indian J. Agric.Sci. 73, 422–425.
Aggarwal, P., Sharma, N.K., 2002. Water uptake and yield of rainfedwheat in relation to tillage and mulch. Indian J. Soil Conserv. 30,155–160.
Aggarwal, P., Parashar, D.K., Kumar, V., Gupta, R.P., 1997. Effect ofkharif greenmanuring and rabi tillage on physical properties of
puddle clay loam under rice–wheat rotation. J. Indian Soc. SoilSci. 45, 434–438.
Aggarwal, P., Saxena, C.M., Singh, S., 1998. Modification of soilhydrothermal regimes and growth of rainfed maize on ridges bymulch application at tasseling stage. Proc. of the NationalSeminar on “Water Management for Sustainable Agriculture—Problems and Perspectives of the 21st Century, 15–17 April”.IARI, New Delhi.
Agustin, L.O., Kenneth, D.S., Charles, A.F., 2000. Wheat and maizeyields in response to straw management and nitrogen under a bedplanting system. Agron. J. 92, 303–308.
Arsenault, J.L., Poulcur, S., Messier, C., Guay, R., 1995. WinRHIZO™,a root-measuring system with a unique overlap correction method.HortScience 30, 906.
Ayers, P.D., Perumpral, J.V., 1982. Moisture and density effect on coneindex. Trans. ASAE 24, 1169–1172.
Bauhus, J., Messier, C., 1999. Evaluation of fine root length anddiameter measurements obtained using RHIZO analysis. Agron. J.91, 142–147.
Box, J.E., Ramseur, E.L., 1993. Minirhizotron wheat root data:comparisons to soil core root data. Agron. J. 85, 1058–1060.
Brewster, J.L., Tinker, P.B., 1970. Nutrient cation flows in soil aroundplant roots. Proc. Soil Sci. Soc. Am. 34, 421–426.
Busscher, W.J., 1990. Adjustment of flat-tipped penetrometerresistance data to a common water content. Trans. ASAE 33,519–524.
Campbell, D.J., O'Sullivan, M.F., 1991. The cone penetrometerin relation to trafficability, compaction, and tillage. In: Smith,K.A., Mullis, C.E. (Eds.), Soil Analysis (Physical Methods),pp. 399–429.
Cassel, D.K., Nelson, L.A., 1985. Spatial and temporal variability ofsoil physical properties. Soil Tillage Res. 5, 5–17.
Chaudhary, M.R., Khera, R., Singh, C.J., 1991. Tillage and irrigationeffects on root growth, soil water depletion and yield of wheatfollowing rice. J. Agric. Sci. 116, 9–16.
Domsch, H., Wendroth, O., 1997. On site diagnosis of soil structure forsite specific management. Proceedings of First European Confer-ence on ‘ Precision Agriculture’ held at Warwick UniversityConference Center, UK, 7–10 September 1997, pp. 95–101.
Ehlers, W., Fopke, V., Hesse, F., Bohm, W., 1983. Penetrationresistance and root growth of oats in tilled and untilled loam soil.Soil Tillage Res. 3, 261–275.
Fiscus, E.L., 1981. Analysis of the components of area growth of beanroot systems. Crop Sci. 21, 909–913.
Fitter, A., 1996. Characteristics and functions of root systems. In:Waisel, Y., et al. (Ed.), Plant Roots: The Hidden Half. MarcelDekker, New York, pp. 1–20.
Fulton, J.P., Wells, L.G., Shearer, S.A., Barnhisel, R.I., 1996. Spatialvariation of soil physical properties: a precursor to precisiontillage. ASAE Paper No. 961002. International Meeting, Phoenix,Arizona, July 14–18.
Gajri, P.R., Parihar, S.S., Cheema, H.S., Kapoor, A., 1991. Irrigationand tillage effects on development, water use and yield of wheat oncoarse textured soils. Irrig. Sci. 12, 161–168.
Gajri, P.R., Arora, V.K., Parihar, S.S., 1992. Tillage management forefficient water and nitrogen use in wheat following rice. SoilTillage Res. 24, 167–182.
Gerard, C.J., Sextan, P., Shaw, G., 1982. Physical factors influencingsoil strength and root growth. Agron. J. 74, 875–879.
Goss, M.J., 1977. Effects of mechanical impedance on root growth inbarley (Hordeum vulgare L.): I. Effects on the elongation andbranching of seminal root axes. J. Exp. Bot. 28, 96–111.

363P. Aggarwal et al. / Geoderma 136 (2006) 353–363
Grunwald, S., Rooney, D.J., McSweeney, K., Lowery, B., 2001. De-velopment of pedotransfer functions for a profile cone penetrom-eter. Geoderma 100, 25–47.
Guay, R., Arseneault, J.L., 1996. Win/MacRhizo Root OverlapCompensation Method. Internal Technical Note, vol. 4. RegentInstruments Inc.
Hanson, J.D., Rojas, K.W., Schaffer, M.J., 1999. Calibrating the rootzone water quality model. Agron. J. 91, 171–177.
Henderson, C., Levett, A., Lisle, D., 1988. The effect of soil watercontent and bulk density on the compactability and soil penetrationresistance of some western Australian sandy soils. Aust. J. SoilRes. 26, 391–400.
Hobbs, P.R., 2001. Tillage and crop establishment in South Asianrice–wheat systems: present practices and future options. J. CropProd. 4, 1–23.
Ishaq, M., Ibrahim, M., Lal, R., 2003. Persistence of subsoilcompaction effects on soil properties and growth of wheat andcotton. Exp. Agric. 39 (4), 341–348.
Imhoff, S., Silva, A.P., Tormena, C.A., 2000. Aplicações da curva deresistência no controle da qualidade fisica de um solo sobpastagem. Pesqui. Agropecu. Bras. 35, 1493–1500.
Kay, B.D., Anger, D.A., 2002. Soil structure. In: Warrick, A.W. (Ed.),Soil Physics Companion, pp. 249–296.
Lowery, B., Schuler, R.T., 1994. Duration and effects of compactionon soil and plant growth in Wisconsin. Soil Tillage Res. 29,205–210.
Merill, S.D., Black, A.L., Bauer, A., 1996. Conservation tillage affectsroot growth of dryland spring wheat under drought. Soil Sci. Soc.Am. J. 60, 575–583.
Merrill, S.D., Tanaka, D.L., Hanson, J.D., 2002. Root length growth ofeight crop species in Haplustoll soils. Soil Sci. Soc. Am. J. 66,913–923.
Murphy, S.L., Smucker, A.J.M., 1995. Evaluation of video imageanalysis and line-intercept methods for measuring root systems ofalfalfa and ryegrass. Agron. J. 87, 865–868.
Pallant, E., Holmgren, R.A., Schuler, G.E., McCracken, K.L., Drbal,B., 1993. Using a fine root extraction device to quantify smalldiameter maize roots (0.025 mm) in field soils. Plant Soil. 153,273–279.
Puppala, A.J., Acar, Y.B., Tumay, M.T., 1995. Cone penetration invery weakly cemented sand. J. Geotech. Eng. 121, 589–600.
Raper, C.D.J., Osmond, D.L., Wann, M., Weeks, W.W., 1978. Inter-dependence of root and shoot activities in determining nitrogenuptake rate of roots. Bot. Gaz. (Chicago) 139, 289–294.
Regent Instruments, 1995. Mac/WinRhizo v 3.0.3 User's Guide,Regent Instruments, Quebec, QC.
Spivey, L.D., Busscher, W.J., Campbell, R.B., 1986. The effects oftexture on strength of southeastern Coastal Plain Soils. Soil TillageRes. 6, 351–363.
Taylor, H.M., Roberson, G.M., Parker Jr., J.J., 1966. Soil strength–root penetration relations for medium to coarse textured soilmaterials. Soil Sci. 102, 18–22.
Tennant, D., 1975. A test of a modified line intersect method ofestimating root length. J. Ecol. 63, 995–1101.
Vepraskas, M.J., 1984. Cone index of loamy sands as influenced bypore size distribution and effective stress. Soil Sci. Soc. Am. J. 48,1220–1225.
Vereecken, H., Maes, J., Feyen, J., Darius, P., 1989. Estimating the soilmoisture retention characteristic from texture, bulk density, carboncontent. J. Soil Sci. 148, 389–403.