Influence of continuous application of inorganic nutrients to a Maize–Wheat rotation on soil...
11
Original article Influence of continuous application of inorganic nutrients to a Maize–Wheat rotation on soil enzyme activity and grain quality in a rainfed Indian soil Supradip Saha*, K.A. Gopinath, Banshi Lal Mina, Hari Shankar Gupta Vivekananda Institute of Hill Agriculture (Indian Council of Agricultural Research), Line Estate, Hawalbagh, Almora, Uttarakhand 263 601, India article info Article history: Received 3 July 2008 Received in revised form 22 August 2008 Accepted 20 September 2008 Published online 14 October 2008 Keywords: Long-term experiment Maize–wheat system Grain quality Soil enzymes Yield abstract To explore long-term impact of organic and inorganic fertilizers on soil health and grain quality, we monitored the enzyme activities and chemical properties of soil; and chemical composition of grain from eight treatments at an experimental field site established in 1996. There were eight treatments applied to both wheat and maize seasons: a control; four inorganic fertilizers, that is, nitrogen and phosphorus (NP), nitrogen and potassium (NK), phosphorous and potassium (PK) and nitrogen, phosphorus and potassium (NPK); farm yard manure alone (FYM) and addition of FYM at two different doses (100 and 50% of recommendation) to NPK that is, NPK þ FYM and 1 / 2 NPK þ FYM. After 11 years of the experiment the NPK þ FYM and 1 / 2 NPK þ FYM treatments had the highest yields, about 5 Mg maize ha 1 and 2 Mg wheat ha 1 with about 2 and 0.5 Mg ha 1 , respectively more than the NPK treatments. The dehydrogeanse activity of soils increased significantly in FYM and 1 / 2 NPK þ FYM. Except urease all other enzymatic activities were increased in those treat- ments, which received manure. Urease activity was higher in mineral-N applied plots. Grain protein content of both maize and wheat was highest in mineral fertilized plots. Test weight also increased significantly on application of mineral fertilizer. Plots treated with half dose of recommended mineral fertilizer along with FYM were higher in urease, phosphomono and diesterase activities than that of NPK þ FYM treated plots. Long-term application of inorganic nutrients along with FYM improved grain mineral composition and yield. Inhibition of few enzymatic activities were also observed upon application of inorganic nutrients either alone or in combination. ª 2008 Elsevier Masson SAS. All rights reserved. 1. Introduction Agriculture has transformed from single-goal to multi-goal management systems. Today optimization of yield is not the sole criterion for assessing the success of agricultural production. Instead, concerns about the impacts of agricul- tural activities on soil fertility, water resources, and environ- mental safety are now included in assessments of best management practices [42]. Sustaining the agricultural production in the era of global climate change maintaining * Corresponding author. Fax: þ91 5962 231539. E-mail address: [email protected] (S. Saha). available at www.sciencedirect.com journal homepage: http://www.elsevier.com/locate/ejsobi 1164-5563/$ – see front matter ª 2008 Elsevier Masson SAS. All rights reserved. doi:10.1016/j.ejsobi.2008.09.009 european journal of soil biology 44 (2008) 521–531
-
Upload
independent -
Category
Documents
-
view
1 -
download
0
Transcript of Influence of continuous application of inorganic nutrients to a Maize–Wheat rotation on soil...

e u r o p e a n j o u r n a l o f s o i l b i o l o g y 4 4 ( 2 0 0 8 ) 5 2 1 – 5 3 1
ava i lab le at www.sc ienced i rec t . com
journa l homepage : h t tp : / /www.e lsev ie r . com/ loca te /e jsob i
Original article
Influence of continuous application of inorganic nutrients toa Maize–Wheat rotation on soil enzyme activity and grainquality in a rainfed Indian soil
Supradip Saha*, K.A. Gopinath, Banshi Lal Mina, Hari Shankar Gupta
Vivekananda Institute of Hill Agriculture (Indian Council of Agricultural Research),
Line Estate, Hawalbagh, Almora, Uttarakhand 263 601, India
a r t i c l e i n f o
Article history:
Received 3 July 2008
Received in revised form
22 August 2008
Accepted 20 September 2008
Published online 14 October 2008
Keywords:
Long-term experiment
Maize–wheat system
Grain quality
Soil enzymes
Yield
* Corresponding author. Fax: þ91 5962 23153E-mail address: [email protected] (
1164-5563/$ – see front matter ª 2008 Elsevidoi:10.1016/j.ejsobi.2008.09.009
a b s t r a c t
To explore long-term impact of organic and inorganic fertilizers on soil health and grain
quality, we monitored the enzyme activities and chemical properties of soil; and chemical
composition of grain from eight treatments at an experimental field site established in
1996. There were eight treatments applied to both wheat and maize seasons: a control; four
inorganic fertilizers, that is, nitrogen and phosphorus (NP), nitrogen and potassium (NK),
phosphorous and potassium (PK) and nitrogen, phosphorus and potassium (NPK); farm
yard manure alone (FYM) and addition of FYM at two different doses (100 and 50% of
recommendation) to NPK that is, NPKþ FYM and 1⁄2 NPKþ FYM. After 11 years of the
experiment the NPKþ FYM and 1⁄2 NPKþ FYM treatments had the highest yields, about
5 Mg maize ha�1 and 2 Mg wheat ha�1 with about 2 and 0.5 Mg ha�1, respectively more than
the NPK treatments. The dehydrogeanse activity of soils increased significantly in FYM and1⁄2 NPKþ FYM. Except urease all other enzymatic activities were increased in those treat-
ments, which received manure. Urease activity was higher in mineral-N applied plots.
Grain protein content of both maize and wheat was highest in mineral fertilized plots. Test
weight also increased significantly on application of mineral fertilizer. Plots treated with
half dose of recommended mineral fertilizer along with FYM were higher in urease,
phosphomono and diesterase activities than that of NPKþ FYM treated plots. Long-term
application of inorganic nutrients along with FYM improved grain mineral composition
and yield. Inhibition of few enzymatic activities were also observed upon application of
inorganic nutrients either alone or in combination.
ª 2008 Elsevier Masson SAS. All rights reserved.
1. Introduction production. Instead, concerns about the impacts of agricul-
Agriculture has transformed from single-goal to multi-goal
management systems. Today optimization of yield is not the
sole criterion for assessing the success of agricultural
9.S. Saha).er Masson SAS. All rights
tural activities on soil fertility, water resources, and environ-
mental safety are now included in assessments of best
management practices [42]. Sustaining the agricultural
production in the era of global climate change maintaining
reserved.

Table 1 – Details of experimental treatments.
Treatment Maize Wheat
N (kg ha�1) P (kg ha�1) K (kg ha�1) FYMa (Mg ha�1) N (kg ha�1) P (kg ha�1) K (kg ha�1) FYMa (Mg ha�1)
Control 0 0 0 0 0 0 0 0
NPK 90 26 33.2 0 60 13 16.6 0
NP 90 26 0 0 60 13 0 0
NK 90 0 33.2 0 60 0 16.6 0
PK 0 26 33.2 0 0 13 16.6 0
FYM 0 0 0 5 0 0 0 51⁄2 NPKþ FYM 45 13 16.6 5 30 6.5 8.3 5
NPKþ FYM 90 26 33.2 5 60 13 16.6 5
a Dry weight basis.
e u r o p e a n j o u r n a l o f s o i l b i o l o g y 4 4 ( 2 0 0 8 ) 5 2 1 – 5 3 1522
other related aspects is a new challenge. A crucial task is to
quantify the simultaneous impacts of management practices
on crop yield, soil carbon storage, nutrient leaching and soil
health. Agricultural practices that improve soil quality and
agricultural sustainability have been receiving more attention
by researchers and farmers [12]. Inorganic fertilizer, especially
N, P and K, not only maintain, but also can directly or indirectly
change chemical, physical and biological properties of soil.
These changes, in long term, are believed to have significant
influences on the quality and productive capacity of soils.
Soil enzyme activities are important for the transformation
of nutrients, required for plant growth and they depends on
crop rotation, amendments, tillage and agricultural manage-
ment [6,12,19,23].
Although some researchers commented that soil organic
matter was not a plant growth requirement in-and-off itself
[31], almost all have realized its ecological significance in over-
coming constraints to crop growth, particularly, in the areas of
nutrient supply, nutrient and moisture relation, soil structural
stability and detoxification [36]. Information is also needed to
assess the contribution of the organic matter in maintaining soil
microbial community and which in turn, related to specific
enzymatic reactions, i.e. to biochemical processes involved in
different nutrient cycling for assessing sustainability.
There is scant information on enzyme activities in the sub-
temperate condition and we are unaware of information
available about the enzyme activities of soils in North western
Himalayan region. This study investigated enzyme activities
known to play critical roles in organic matter decomposition
and mineralization of C, N, and P nutrients in soils, and that
are reported to be sensitive to changes in soil quality due to
fertilizer application [4,6,7,15,16]. Information regarding the
changes in quality attributed due to long-term fertilizer
treatment is also limited.
We hypothesized that long-term application of C through
manure and N, P through fertilizers will have distinct effects
on the activities of dehydrogenase, cellulase, invertase,
protease, urease, acid and alkaline phosphatase which in turn
will depict the efficiency of C, N and P cycle. Further more, we
hypothesized that the changes in soil chemical attributes will
have definite role in grain mineral constituents, mainly, N, P
and K contents. For this reason, soil enzymatic and chemical
properties, grain yield and quality were compared in soils
from a long-term field experiment with eight different
treatments.
2. Materials and methods
2.1. Experimental treatments and crop management
The experiment included two crops per year, maize (June–
Sept) and wheat (Oct–May), and commenced with the maize
crop in 1996. Eight treatments (summarized in Table 1) were
applied to each crop in each year. The experiment was con-
ducted at the experimental farm of Vivekananda Institute of
Hill Agriculture, located in the Indian Himalayan region at
Hawalbagh (29� 360N and 79�400E with 1250 m above mean sea
level), in the state of Uttarakhand, India. The climate is sub-
temperate, characterised by moderate summer (May–June),
extreme winter (Dec–Jan) and general dryness, except during
the southwest monsoon season (June–Sept). Weekly rainfall,
average air and soil temperature during the experimental
period are shown on Fig. 1.
Treatments were arranged in a randomized complete block
design with three replications. The plot size was 10.8 m2. The
fertilizer application rates used in both the crops were those
recommended for Uttarakhand hills (Table 1) [37]. The sources
of fertilizers were urea for N, single super-phosphate for P,
and muriate of potash for K. In both crops, half of the N and
full dose of P and K were applied before sowing. Remaining
half of the N was applied as a top dressing 30–35 days after
sowing in maize and during January in wheat, coinciding with
winter rains. The applied FYM, analysed every five year, had
370 g moisture kg�1 and contained 7.1–7.5 g N kg�1, 2.1–
2.4 g P kg�1 and 5.3–5.8 g K kg�1 on oven-dry weight basis. FYM
was thoroughly incorporated into 15 cm surface soil three
weeks before sowing of each crop.
The maize variety VL Sankul Makka 16 was used till 2004
and thereafter VL Sankul Makka 11 was grown. For wheat, the
variety used was VL 616 till 2003–2004 and VL 829 was grown in
the subsequent years. Both crops were grown under rainfed
conditions in all the years. For weed control, atrazine @
1.25 kg a.i. ha�1 and isoproturon @ 1.0 kg a.i. ha�1 was applied
to maize and wheat respectively.
2.2. Sampling and handling of soil
Fresh samples were taken after harvest of maize in October,
2006 for being analysed for their enzyme activities. Random
cores were taken from each plot with 5-cm diameter tube

0
10
20
30
40
50
July
, 96
Jan,
97
Jul,
97
Jan,
98
Jul,
98
Jan,
99
July
, 99
Jan,
00
Jul,
00
Jan,
01
July
, 01
Jan,
02
Jul,
02
Jan,
03
Jul,
03
Jan,
04
Jul,
04
Jan,
05
Jul,
05
Jan,
06
Jul,
06Se
p, 0
6Se
p, 0
6
July
, 96
Jan,
97
Jul,
97
Jan,
98
Jul,
98
Jan,
99
July
, 99
Jan,
00
Jul,
00
Jan,
01
July
, 01
Jan,
02
Jul,
02
Jan,
03
Jul,
03
Jan,
04
Jul,
04
Jan,
05
Jul,
05
Jan,
06
Jul,
06
Ave
rage
air
tem
pera
ture
(°C
)
0
10
20
30
40
Soil temperature-m
id day (°C)
Avg. air temp. Soil temp.
0
40
80
120
160
200
Rai
nfal
l (m
m)
A
B
Fig. 1 – Weekly total rainfall (A) and average air temperature and mid-day soil temperature measured at 15 cm depth (B)
during the total experimental period.
e u r o p e a n j o u r n a l o f s o i l b i o l o g y 4 4 ( 2 0 0 8 ) 5 2 1 – 5 3 1 523
auger and bulked. The moist soil samples were sieved
(2 mm) after removing plant material and roots. Half of soil
samples were air-dried and stored at room temperature
until analysed for their chemical properties. All chemical
results are means of triplicate analyses and are expressed on
an oven-dry basis. Soil moisture was determined after
drying at 105 �C for 24 h.
The sieved fresh soils (2 mm) were immediately trans-
ferred to the laboratory for biochemical analysis. Soil samples
were kept at 4 �C in plastic bags for a few days to stabilise the
microbiological activity disturbed and then analysed within 2
weeks. Dry soil samples were rewetted and analysed for their
dehydrogeanase activity after wheat crop (2005–2006). All
microbial results reported are means of three replicates and
are expressed on a moisture-free basis. Moisture content was
determined after drying at 105 �C for 24 h.
2.3. Chemical and biochemical analyses
The pH of soil was analysed in 1:2.5 soil:water suspension [17],
available K by 1 N NH4OAc using a flame photometer [17], total
C and N by dry combustion [26] with a CHN analyzer (Foss-
Heraeus, Germany), oxidizable SOC as reported by Walkley
and Black [44], Kjeldahl-N by FOSS Tecator (Model 2200), and
available P by the method of Olsen et al. [27].
Soil dehydrogenase activity was estimated by reducing
2,3,5-triphenyltetrazolium chloride [8]. Soil (5 g) sample was
mixed with 50 mg CaCO3 and 1 ml 3% (w/v) 2,3,5-triphenylte-
trazolium chloride (TTC) and incubated for 24 h at 37� 1 �C.
The enzyme converts TTC to 2,3,5-triphenylformazan (TPF).
The TPF formed was extracted with acetone (3� 15 ml), the
extracts were filtered through Whatman No. 5 and absorption
was measured at 485 nm with a spectrophotometer (Analytik
Jena, Germany).
Cellulase activity was determined by estimating glucose
equivalent after mixing soil sample (10 g) with 15 ml
acetate buffer (2 M, pH 5.5) and 15 ml 0.7% (w/v) carboxy
methyl cellulose and incubated for 24 h at 50� 1 �C [32].
Glucose equivalent was estimated following the DNS
method [24].
Protease activity was assayed by determining the tyrosine
released when 1 g oven-dry equivalent of field-moist soil

Table 2 – Soil pH, organic matter, C-to-N ratio, available N, P, K of 0–15 cm soil affected by differential fertilizer treatments.
Fertilization pH C-to-N ratio Organic matter (g kg�1) Available N (mg kg�1) Olsen-P (mg kg�1) Available K (mg kg�1)
Control 6.5 15.6 10.5 91 4.8 61.0
NPK 5.8 14.5 11.6 120 8.5 96.4
NP 5.5 13.1 12.4 144 8.5 87.5
NK 5.4 12.5 12.4 151 5.9 100.2
PK 6.3 13.2 13.0 100 8.5 90.0
FYM 6.9 15.1 18.7 96 7.4 94.01⁄2 NPKþ FYM 6.5 14.5 15.2 112 8.0 83.2
NPKþ FYM 6.7 13.6 18.7 110 8.2 94.4
e u r o p e a n j o u r n a l o f s o i l b i o l o g y 4 4 ( 2 0 0 8 ) 5 2 1 – 5 3 1524
sample was incubated with 5 ml 50 mM tris buffer (pH 8.1) and
5 ml of 2% Na-caseinate at 50� 1 �C for 2 h [20]. The residual
substrate was precipitated with 0.92 M trichloroacetic acid;
the aromatic amino acids released were extracted and
measured colorimetrically using Folin–Ciocalteu reagent at
700 nm. Protease activity was expressed as mg tyrosine
produced g�1 soil 2 h�1.
Urease activity was measured following the method
developed by Tabatabai and Bremner [39]. Soil (5 g) was
incubated with 5 ml of 0.05 M THAM buffer (pH 9.0) and 1 ml of
0. M of urea solution at 37� 1 �C for 2 h. Excess urea was
extracted with KCl-PMA solution and estimated colorimetri-
cally at 527 nm.
Both acid and alkaline phosphatase activities were assayed
using 1 g soil (wet equivalent), 4 ml of 0.1 M modified universal
buffer (pH 11 for alkaline phosphatase and pH 6.5 for acid
phosphatase), and 1 ml of 25 mM p-nitrophenyl phosphate
[38]. After incubation for 1 h at 37� 1 �C the enzyme reaction
was stopped by adding 4 ml of 0.5 M NaOH and 1 ml of 0.5 M
CaCl2 to prevent dispersion of humic substances. After
centrifugation at 4000 rpm for 10 min, the absorbance was
measured in the supernatant at 400 nm; enzyme activity was
expressed as mg p-nitrophenol released g�1 soil h�1. Phos-
phodiesterase activity was measured as reported by Browman
and Tabatabai [5]. In this case substrate used was 0.005 M bis-
p-nitrophenyl phosphate and concentration of p-nitrophenol
was measured.
0
10
20
30
40
50
Control NPK NP NK
mic
rogr
am T
PF
pro
duce
d g-1
h-1
After Wheat
After Maize
cdc
aab
bca
ab bc
Fig. 2 – Dehydrogenase activity in soils of different treatments
letter are not significantly different (P < 0.05). Error bars represent
2.4. Grain analysis and crop yield
Maize and wheat grains were harvested at maturity and dried
naturally for further processing. The dried grains were stored
at room temperature for three months prior to analysis. The
samples were analysed in laboratory for chemical parameters
after tri-acid digestion. Samples were taken using the quar-
tering procedure [21]. Protein content was determined as
described by AOAC method using formula N� 6.25 and
N� 5.83 for maize and wheat respectively [1]. Phosphorus was
estimated photometrically via development of phospho-
molybdate complex, as described by Taussky and Shorr, [41].
Potassium was determined by flame photometer.
Whole plots were harvested in May and October each year
for wheat and maize respectively. Grain yield was deter-
mined at 14% moisture content. Thousand kernel weight was
calculated as the mean weight of three sets of 100 grains per
plot.
2.5. Statistical analyses
Each sample was analysed in triplicate and the values were
then averaged. Data were assessed by Duncan’s multiple
range tests [10] with a probability P� 0.05. Differences
between mean values were evaluated by a one-way analysis
of variance (ANOVA) (SPSS version 10.0). Pearson correlation
analyses were performed using the SPSS programme.
PK FYM 1/2NPK+FYM
NPK+FYM
dc
h
f
gg
e
f
after wheat and maize crop season. Bars sharing the same
standard deviation.

0.0 50.0 100.0 150.0 200.0 250.0 300.0
Control
NPK
NP
NK
PK
FYM
1/2 NPK+FYM
NPK+FYM
mg glucose eq. g-1 h-1/mg glucose eq. g-1 h-1
Cellulase
Invertase
bc
a
ab
d
cde
bcbc
bc
bc
a
a
ee
cd
ab
Fig. 3 – Cellulase and invertase activity in soils of different treatments. Bars sharing the same letter are not significantly
different (P < 0.05). Error bars represent standard deviation.
e u r o p e a n j o u r n a l o f s o i l b i o l o g y 4 4 ( 2 0 0 8 ) 5 2 1 – 5 3 1 525
3. Results
3.1. Chemical properties of soil
The pH values in the 0–15 cm surface soil ranged from 5.4 to
6.9, with that of the untreated control soil around pH 6.5
(Table 2). Manure application increased soil pH significantly
(P< 0.05), while chemical fertilizer application decreased soil
pH (Table 2). The C-to-N ratio was lowest in NP treatment
and highest in FYM treatment (Table 2). Considerable
difference was detected in SOC and N content among
samples from different sampling times. In the surface 0–
15 cm, soil oxidizable carbon was less in different fertilized
treatment than FYM treated plots. Application of FYM alone
0 50 100
Control
NPK
NP
NK
PK
FYM
1/2 NPK+FYM
NPK+FYM
µg urea hydrolysed g-1 h
ca
b
b
a
a
a
b
a
c
c
Fig. 4 – Urease and protease activity in soils of different treatme
(P < 0.05). Error bars represent standard deviation.
increased the C content in surface soil. Addition of FYM at
10 Mg ha�1 year�1 along with NPK for 11 years increased 62
per cent organic C content than NPK alone.
Available N content also varied among the treatments
(Table 2). The Kjeldahl-N content of soils was higher in
mineral fertilized soils than others. It follows the order of
NPK<NP<NK. Depletion of available P in soil occurred in NK
treatment. NPKþ FYM and 1⁄2 NPKþ FYM helped to maintain
available P in the soil. Soil K content was increased by most of
the mineral fertilized treatments as compared to the control.
3.2. Soil enzymatic activities
Application of manure increased dehydrogenase activity,
which is an index of microbial activity of soil (Fig. 2). The
150 200 250 300
-1/µg tyrosine produces g-1 2h-1
UreaseProtease
d
d
d
d
e
nts. Bars sharing the same letter are not significantly different

e u r o p e a n j o u r n a l o f s o i l b i o l o g y 4 4 ( 2 0 0 8 ) 5 2 1 – 5 3 1526
enzymatic activities NP, NK and NPK treated soil were
significantly lower than that of control. Application of FYM in
soil enhanced soil dehydrogenase activity from 9.7 and 11.4 mg
TPF produced g�1 h�1 in control to 34.4 and 40.4 mg TPF
produced g�1 h�1 in FYM treatment after maize and wheat
crop respectively.
The highest cellulase activity was found in NPKþ FYM
treated soil (240 mg glucose eq. g�1 h�1), followed by FYM
(195 mg glucose eq. g�1 h�1) treated soil (Fig. 3). Invertase
activity was little affected by treatments and highest value
was found in NPKþ FYM treated soil (69 mg glucose
eq. g�1 h�1), followed by control soil. The FYM treated soil
showed the lowest invertase activity (46 mg glucose
eq. g�1 h�1).
Unlike the other enzyme activities, urease activity was
higher in soils treated with mineral fertilizer (Fig. 4). Highest
value was found in NK (259 mg urea hydrolysed g�1 h�1) fol-
lowed by NP (237 mg urea hydrolysed g�1 h�1) and NPK
(227 mg urea hydrolysed g�1 h�1) treated soil. Protease activity
was higher in manure applied soil with or without mineral
fertilizer. The activity was least in control and is at par with
NK treatment. Among mineral fertilized treatments, PK was
found best.
Highest acid phosphatase activity was found in1⁄2 NPKþ FYM treatment and was significantly more than
NPKþ FYM (Fig. 5). Similar trends were also observed in case
of alkaline phosphatase and phosphodiesterase activity.
Mineral fertilizer treated soil was least and FYM was highest
in this enzyme activity.
A correlation matrix (Table 3) shows some significant
relationships among the enzyme activities studied. There was
positive correlation (r¼ 0.810; P< 0.01) between SOC and
dehydrogeanse activity among treatments. Total organic
carbon was correlated with the entire assayed enzyme except
urease, invertase and acid phosphatase. Dehydrogenase
activity showed a strong positive correlation with phospho-
mono and di-esterases. Soil pH was correlated with most of
0
200
400
600
800
1000
Control NPK NP NK
mic
rogr
am p
-nir
ophe
nol g
-1 h
-1
AcP
AkP
PDE
a
aaaa
b
b
b
a
a
aa
Fig. 5 – Acid, alkaline monoesterases and diesterase activity of
are not significantly different (P < 0.05). Error bars represent stand
the enzymes. Acid phosphatase shared a strong correlation
with phosphodiesterase (r¼ 0.830, P< 0.01).
3.3. Yield
Weather conditions are summarized in Fig. 1. The quantity
and distribution of rainfall were highly variable during the
total experimentation years, which affected the yield of maize
and wheat. Grain yields of maize and wheat were affected by
the different fertilizer treatments (Table 4). Eleven years
average maize grain was highest in NPKþ FYM and least in
un-amended control. 1⁄2 NPKþ FYM resulted less grain yield
than NPKþ FYM. On the other hand, it was similar in case of
wheat yield (Table 4). Maize yield was increased by eight fold,
whereas, it was doubled in wheat yield. Application of manure
only also increased grain yield by more than 2.5 fold in maize.
The yield increase was more prominent in maize than in
wheat.
3.4. Grain quality
Grain protein content was more in those treatments which
received N only through mineral fertilizer (Table 5). The trend
in P and K in maize and wheat grains was almost similar.
Grain protein content was highest in NP and least in FYM
treatment in both the crops. Though protein content was
detected less in NPKþ FYM treatment than NPK alone,
total protein yield was highest in the former treatment.
Thousands grain weight of maize was highest in NPKþ FYM
followed by 1⁄2 NPKþ FYM. On the other hand, in wheat it was
highest in PK treatment followed by NPKþ FYM treatment.
Figs. 6 and 7 summarize the composition of maize and wheat
grain, respectively, grown under different treatments. Grain P
and K content was highest in NPKþ FYM treatment and least
in control and NPK. Manure application increased the P and K
content in grain when applied along with different doses of
mineral fertilizer.
PK FYM 1/2NPK+FYM
NPK+FYM
bc
c
c
d
d
e
ef
d d
d
soils with different treatments. Bars sharing the same letter
ard deviation.
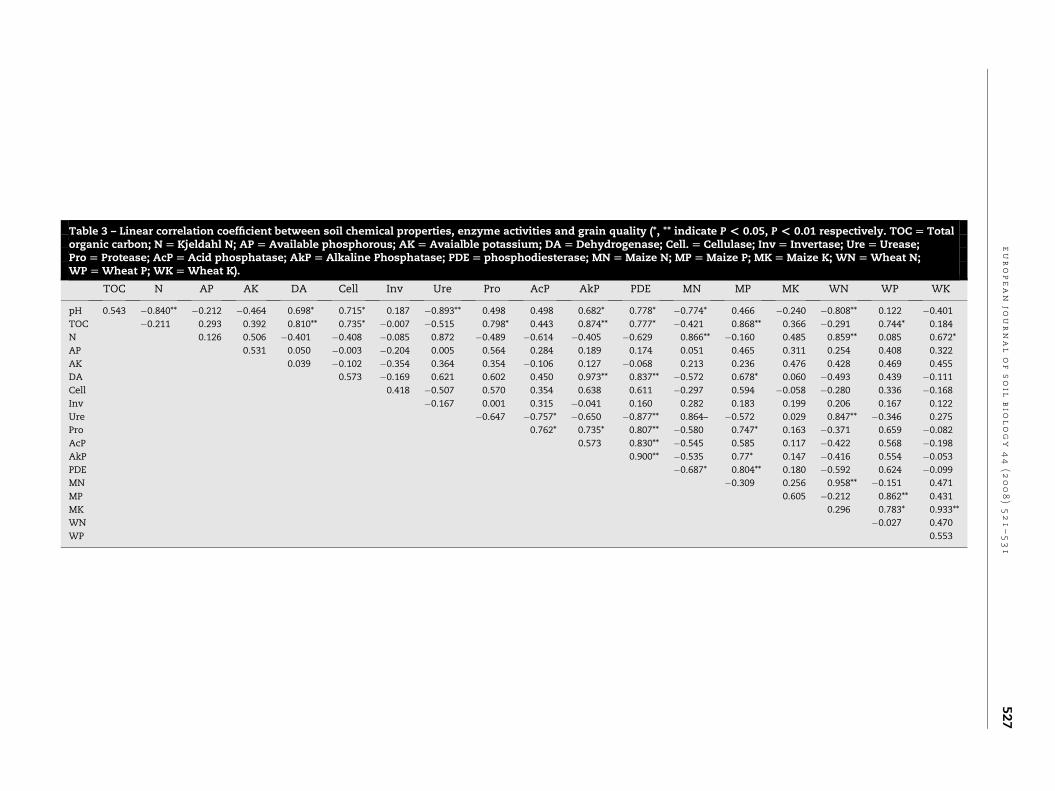
Table 3 – Linear correlation coefficient between soil chemical properties, enzyme activities and grain quality (*, ** indicate P < 0.05, P < 0.01 respectively. TOC [ Totalorganic carbon; N [ Kjeldahl N; AP [ Available phosphorous; AK [ Avaialble potassium; DA [ Dehydrogenase; Cell. [ Cellulase; Inv [ Invertase; Ure [ Urease;Pro [ Protease; AcP [ Acid phosphatase; AkP [ Alkaline Phosphatase; PDE [ phosphodiesterase; MN [ Maize N; MP [ Maize P; MK [ Maize K; WN [ Wheat N;WP [ Wheat P; WK [ Wheat K).
TOC N AP AK DA Cell Inv Ure Pro AcP AkP PDE MN MP MK WN WP WK
pH 0.543 �0.840** �0.212 �0.464 0.698* 0.715* 0.187 �0.893** 0.498 0.498 0.682* 0.778* �0.774* 0.466 �0.240 �0.808** 0.122 �0.401
TOC �0.211 0.293 0.392 0.810** 0.735* �0.007 �0.515 0.798* 0.443 0.874** 0.777* �0.421 0.868** 0.366 �0.291 0.744* 0.184
N 0.126 0.506 �0.401 �0.408 �0.085 0.872 �0.489 �0.614 �0.405 �0.629 0.866** �0.160 0.485 0.859** 0.085 0.672*
AP 0.531 0.050 �0.003 �0.204 0.005 0.564 0.284 0.189 0.174 0.051 0.465 0.311 0.254 0.408 0.322
AK 0.039 �0.102 �0.354 0.364 0.354 �0.106 0.127 �0.068 0.213 0.236 0.476 0.428 0.469 0.455
DA 0.573 �0.169 0.621 0.602 0.450 0.973** 0.837** �0.572 0.678* 0.060 �0.493 0.439 �0.111
Cell 0.418 �0.507 0.570 0.354 0.638 0.611 �0.297 0.594 �0.058 �0.280 0.336 �0.168
Inv �0.167 0.001 0.315 �0.041 0.160 0.282 0.183 0.199 0.206 0.167 0.122
Ure �0.647 �0.757* �0.650 �0.877** 0.864– �0.572 0.029 0.847** �0.346 0.275
Pro 0.762* 0.735* 0.807** �0.580 0.747* 0.163 �0.371 0.659 �0.082
AcP 0.573 0.830** �0.545 0.585 0.117 �0.422 0.568 �0.198
AkP 0.900** �0.535 0.77* 0.147 �0.416 0.554 �0.053
PDE �0.687* 0.804** 0.180 �0.592 0.624 �0.099
MN �0.309 0.256 0.958** �0.151 0.471
MP 0.605 �0.212 0.862** 0.431
MK 0.296 0.783* 0.933**
WN �0.027 0.470
WP 0.553
eu
ro
pe
an
jo
ur
na
lo
fs
oil
bio
lo
gy
44
(2
00
8)
52
1–
53
15
27

Table 4 – Average grain yields (1996–2006) of maize and wheat in a maize–wheat long-term experiment.
Treatment Maize Wheat
Grain yield (Mg ha�1) Yield increase (%) Grain yield (Mg ha�1) Yield increase (%)
Control 0.61a� 0.12 – 0.70a� 0.20 –
NPK 2.87d� 0.91 370 1.66bc� 0.37 138
NP 1.68bc� 0.27 176 1.11ab� 0.25 60
NK 1.59bc� 0.17 160 0.93a� 0.25 33
PK 1.23ab� 0.17 102 0.83a� 0.37 18
FYM 2.33cd� 0.55 282 1.03a� 0.27 481⁄2 NPKþ FYM 4.87e� 0.35 697 2.04c� 0.36 192
NPKþ FYM 5.55e� 0.47 808 2.09c� 0.39 199
Values are the mean� SD of three independent determinations; Means with the same letter within a column do not differ significantly (P< 0.05).
e u r o p e a n j o u r n a l o f s o i l b i o l o g y 4 4 ( 2 0 0 8 ) 5 2 1 – 5 3 1528
4. Discussion
Soil management not only changed C and N content in the
surface soil (0–15 cm), but also in the enzymatic activity. Soil
pH ranged from 5.4 in the NK plots, which is significantly
lower than in all other treatments, to 6.9 in the FYM plots. The
pH of the N treated plots were significantly lower than that of
the control and manured plots. Long-term applications,
especially N, therefore had acidifying effects resulting in
lowering of pH. This result confirms earlier findings that most
N-containing fertilizers tend to acidify soil [2,3]. This is mainly
due to the fact that most fertilizers supply N as NH4þ first,
which upon oxidation released Hþ ions, responsible for acidity
[22]. This result is consistent with our earlier study in same
agroclimatic region, where pH of NK plot was 5.3 and 6.5 in
NPKþ FYM plot [30].
Manure-treated plots were significantly greater in C built
up than fertilized treatments. Recommended dose of fertilizer
application has been shown to result in modest increases in
labile organic matter content. This is attributable to higher
yields under fertilized conditions, which result in increased
inputs of organic matter to the soil in the form of both root
turnover and crop residues. Soil samples from fertilized plots
had lower C-to-N ratios than soil from the unfertilized plots.
The C-to-N ratio was narrowed down most in NK treatment.
Table 5 – Grain protein content and yield, thousand grain weigapplication.
Treatment Maize
Protein Thousand grain weigh
Concentration(g kg�1)
Yield(kg ha�1)
Control 84.1b� 3.7 51.23a� 9.4 117.0a� 4.6
NPK 93.8c� 2.2 269.65d� 88.1 153.8abc� 15.2
NP 97.6c� 2.5 164.74bc� 29.3 141.7ab� 50.1
NK 96.7c� 2.6 153.64bc� 18.8 141.2ab� 5.0
PK 76.1a� 2.7 93.93ab� 14.8 165.2bc� 6.7
FYM 72.8a� 1.7 170.37c� 43.6 179.4bcd� 23.21⁄2 NPKþ FYM 86.5b� 0.9 420.77e� 36.3 214.0d� 7.0
NPKþ FYM 87.6b� 2.3 485.34e� 15.9 191.5cd� 13.3
Values are the mean� SD of three independent determinations; Means wi
Available P in soil was built up due to application of
mineral-P fertilizer along with manure. Whereas, K content in
soil was more in only mineral fertilized soils. Build up of P in
soil is due to maintaining soil pH towards neutral range,
which prevents from P fixation.
Enzyme activities of soil depend on the type of treatment
and the type of enzyme. Dehydrogenase activity was lower in
soils that had received the mineral fertilizers and it was
increased several folds in the presence of manure. This
maximum activity might be linked to more substrate avail-
ability in these soils. This reflects the greater biological
activity in these plots and the stabilization of extracellular
enzymes through complexation with humic substances
[7,9,14,18,25]. This result is in consistent with our previous
study conducted under similar soil and climatic influence [30].
In our earlier study also more than three fold increase in
dehydrogenase activity in FYM treated soils. This result also
suggests that dehydrogenase activity was highly sensitive to
the inhibitory effects associated with mineral fertilizer addi-
tions. Greater dehydrogenase activity of 1⁄2 NPKþ FYM as
compared to NPKþ FYM confirms the negative impact of
mineral fertilizer on the enzyme. Simek et al. [33] reported
that dehydrogenase activity was inhibited by large amount of
fertilizer in a long-term experiment.
Soil invertase catalyses the hydrolysis of sucrose to glucose
and fructose, and is linked to the soil microbial biomass
ht of maize and wheat grown under different fertilizer
Wheat
t (g) Protein Thousand grain weight (g)
Concentration(g kg�1)
Yield(kg ha�1)
74.2b� 0.67 51.68a� 14.5 41.4a� 1.1
87.5d� 0.86 144.98b� 31.3 46.3abcd� 2.4
87.6d� 0.57 97.53a� 21.6 41.8ab� 5.9
87.2d� 0.92 81.08a� 21.1 42.9abc� 3.9
73.0ab� 1.57 60.02a� 26.5 49.7d� 0.5
71.4a� 1.67 73.76a� 19.1 47.9bcd� 1.5
80.9c� 0.29 165.05b� 31.3 45.9abcd� 4.8
81.5c� 1.50 169.88b� 27.8 48.7cd� 3.8
th the same letter within a column do not differ significantly (P< 0.05).

0
5
10
15
20
Control NPK NP NK PK FYM 1/2NPK+FYM
NPK+FYM
Con
cent
rati
on (
g kg
-1)
NPK
c c
c
abc
d
cd
a
dc
a a a
d
bc
d
ab
cd
bc
cd
ab
cd a
b
a
d
Fig. 6 – N, P and K content in maize grain, grown under different treatments. Bars sharing the same letter are not significantly
different (P < 0.05). Error bars represent standard deviation.
e u r o p e a n j o u r n a l o f s o i l b i o l o g y 4 4 ( 2 0 0 8 ) 5 2 1 – 5 3 1 529
[13,29]. In our earlier study [30], it was found that FYM did not
contribute significantly to invertase activity. In this experi-
ment also lowest activity of invertase in FYM treated plots
confirms that organic amendment has very little role in the
functioning of invertase activity. Cellulases play an important
role as a group of enzymes in global recycling of the most
abundant natural polymer, cellulose. The rate of cellulase
activity was highest in NPKþ FYM followed by FYM. This is
attributed to addition of more substrate which leads to more
enzymatic activity. This result confirms our earlier study in
soybean–wheat cropping system [30], where application of
FYM improved cellulase activity significantly. Significant
correlation (0.735, P< 0.05) between TOC and cellulase activity
confirms the impact of substrate on enzyme activity.
The activity of assayed enzymes was generally well
correlated with the organic C content because all of these
0
5
10
15
20
Control NPK NP NK
Con
cent
rati
on (
g kg
-1)
abbc
a
aab b
ababcd bcd cd
a
NPK
Fig. 7 – N, P and K content in wheat grain, grown under differen
different (P < 0.05). Error bars represent standard deviation.
parameters were increased substantially by increasing
returns of organic residues. Indeed, in general, the activity of
soil enzymes is significantly correlated with organic C content
[15,34]. Being the substrate of enzymes, soil organic matter
plays a vital role in protecting soil enzymes since they form
complexes with clay and humus [40].
Our results show that the most of the enzymatic activities
were highest in plots, which received NPK and FYM. In
contrast, urease activity followed different pattern, where
organic manure had very little effect on the activity. Activity of
urease was significantly higher in plots received N fertilizer in
mineral form. This result is in contrast with our earlier result
[23,30]. In another study [12] reported that urease activity
decreased during first 4 h with addition of C and N and then
increased continuously. Variation of urease activity was due
to the extracellular character of this enzyme, which is
PK FYM 1/2NPK+FYM
NPK+FYM
c
cb b bbcd abc dabcd
a a
c
t treatments. Bars sharing the same letter are not significantly

e u r o p e a n j o u r n a l o f s o i l b i o l o g y 4 4 ( 2 0 0 8 ) 5 2 1 – 5 3 1530
adsorbed and protected by organic complexes. Both intracel-
lular and extracellular forms of urease resulting from micro-
bial activity exist in soil. The decrease of urease observed in
mineral fertilized plots could be related to the crop, a legume
that obtains N from its symbiosis with Rhizobium [23].
The N mineralization potential in soil was characterised by
measuring extracellular protease activity. The rates of
protease activity were higher with the organic amendments
than in the other treatments. The high activity of manure-
treated soil is mainly due to an increased growth of the
microbial community and it was supported by the study of
Kandeler et al. [18], which showed that biomass-specific
protease activities of different soils were not related to the
organic matter content or texture. More opinion was available
for the greater enzyme activity and it was suggested that
strong binding of the enzyme to soil colloids protects from
denaturation [7]. In another study, protease activity was
always higher in organic matter amended soil than conven-
tionally managed soil [23].
Since pH of the soil was generally below 7.0, acid phos-
phatase was higher than alkaline phosphatase [11]. Acid
phosphates activity was more in those plots, which received
manure and it was supported by Saha et al. [30] and Haynes
and Swift, [16], who found that acid phosphatase activity of
soils generally decreases in response to fertilizer application.
In our earlier study [30], the influence of FYM or pH was more
pronounced than this study, which may be due to long-term
(33 years) impact. Phosphatases play an important role in P
cycling where organic P is more due to limited biological
mineralization of organic matter as a result of formation of
complexes of organic P with active Al and Fe [43] and the
amount of available P is low. P transformation and cycle also
depend on soil reaction. Acid phosphatase activities in
different treatment were greatly regulated by soil pH. In
general FYM applied to soil have long been employed to
enhance favorable soil conditions in terms of pH and avail-
ability of P. In this study, higher acid phosphatase activity was
shown in soils with pH of 6.5. The observed effect could be due
to quantity, specific activity, or stability of the enzyme at that
particular soil pH. Acid phosphatase activity was correlated
with protease (P < 0.01). The significantly greater activities of
alkaline phosphatase in the manure-treated soil were due to
enhanced microbial activity and diversity due to manure input
over the years. Manure addition to a soil may have resulted in
changes in origin, states, and/or persistence of enzymes in the
soil [28]. The inhibition of phosphatase activities with mineral
fertilizer could be seen as well. Control soils exhibited similar
activities than the mineral fertilized soils except PK. This can
be explained by the inhibition of phosphatase synthesis by
mineral fertilization. In slight contrast to our result, literature
reported that this inhibition was due to mineral-P [4,35].
Alkaline phosphatase was negatively correlated to soil P
concentrations and microbial biomass C and P [45]. Phospho-
diesterases was highest in 1⁄2 NPKþ FYM treatment and was
more than NPKþ FYM. This clearly depicts that mineral
fertilizer had a negative impact on this enzyme.
Maize responded more to applied nutrient sources espe-
cially N than wheat. Yield increase was more prominent in
maize than wheat after 11 years of continuous application of
manures and fertilizers. This is attributed to favorable crop
physiology to draw nutrients. Accumulation of dry matter in
grain was higher in treatments, which received both the
mineral and organic fertilizer. Interestingly, phosphorous and
potassium contributed more in dry matter accumulation in
wheat grain. This may be attributed to important role of
potassium in carbohydrate translocation. Grain protein
content was more in those treatments, where N was applied
only in mineral form. This is due to quick availability of this
nutrient to plants. Plants that received both mineral and
organic fertilizer produced more protein yield per plot rather
than more concentration in grain. Grain phosphorous and
potassium content was more in NPKþ FYM treatment than
others. This may be attributed to continuous availability of
these nutrients, which can be seen in significant correlation of
soil available N and grain N concentration (P < 0.01).
5. Conclusion
It is concluded that the accumulation of organic matter and
recycling of C have substantial effects on the activity of
enzymes involved in mineralization of C, N and P. Farm yard
manure along with recommended fertilizer even at half of
recommended dose increased microbiological activities in
sub-temperate soil. Manure along with reduced dose of
mineral fertilizer not only increased grain yield, but also
enhanced grain quality with significant nutrient build up in
soil. It also maintained a balance in enzymatic activity with
a lesser pollution potential than higher doses of mineral
fertilizers.
r e f e r e n c e s
[1] AOAC, Official Methods of Chemical Analysis, fifteenth ed.Association of Official Analytical Chemists, Arlington, 1990.
[2] S. Aref, M.M. Wander, Long term trends of corn yield and soilorganic matter in different crop sequences and soil fertilitytreatments on the morrow plots, Adv. Agro 62 (1998) 153–161.
[3] A. Belay, A.S. Claassens, F.C. Wehner, Effect of directnitrogen and potassium and residual phosphorous fertilizerson soil chemical properties, microbial components andmaize yield under long term crop rotation, Biol. Fert. Soil 35(2002) 420–427.
[4] L. Bohme, F. Bohme, Soil microbiological and biochemicalproperties affected by plant growth and different long-termfertilization, Eur. J. Soil Biol. 42 (2006) 1–12.
[5] M.G. Browman, M.A. Tabatabai, Phosphodiesterases activityof soils, Soil Sci. Soc. Am. J. 42 (1978) 284–290.
[6] M. Brzezinska, Significance of soil enzymes in nutrienttransformations, Acta Agrophysica 63 (2002) 5–23.
[7] R.G. Burns, Enzyme activity in soil: location and a possiblerole in microbial ecology, Soil Biol. Biochem. 14 (1982)423–427.
[8] L.E. Casida, D. Klein, T. Santoro, Soil dehydrogenase activity,Soil Sci. 98 (1964) 371–376.
[9] S.R. Colvan, J.K. Syers, A.G. O’Donnel, Effect of long termfertilizer use on acid and alkaline phosphomonoesterase andphosphodiesterase activities in managed grassland, Biol.Fert. Soils 34 (2001) 258–263.
[10] D.M. Duncan, Multiple range and multiple F-test, Biometric11 (1955) 1–42.

e u r o p e a n j o u r n a l o f s o i l b i o l o g y 4 4 ( 2 0 0 8 ) 5 2 1 – 5 3 1 531
[11] J. Eivazi, M.A. Tabatabai, Phosphatases in soil, Soil Biol.Biochem. 27 (1977) 1011–1016.
[12] F. Eivazi, M.R. Bayan, K. Schmidt, Select soil enzymeactivities in the historic sanborn field as affected by longterm cropping systems, Comm. Soil Sci. Pl. Anal. 34 (15–16)(2003) 2259–2275.
[13] W.T. Frankenberger, J.B. Johanson, Factors affectinginvertase activity in soils, Plant Soil 74 (1983) 313–323.
[14] A.M.V. Garzillo, L. Badalucco, F. De Cesare, S. Grego,V. Buonocore, Synthesis and characterization of an acidphosphatase–polyresorcinol complex, Soil Biol. Biochem 28(1996) 1155–1161.
[15] M.H. Graham, R.J. Haynes, Organic matter accumulationand fertilizer-induced acidification interact to affect soilmicrobial and enzyme activity on a long-term sugarcanemanagement experiment, Biol. Fert. Soils 41 (2005)249–256.
[16] R.J. Haynes, R.S. Swift, Effects of lime and phosphateadditions on changes in enzyme activities, microbialbiomass and levels of extractable nitrogen, sulphur, andphosphorus in an acid soil, Biol. Fert. Soils 6 (1988) 153–158.
[17] M.L. Jackson, Soil Chemical Analysis, Prentice Hall of IndiaPvt. Ltd., New Delhi, 1962.
[18] E. Kandeler, J. Luxhoi, D. Tscherko, J. Magid, Xylanase,invertase and protease at the soil-litter interface of a loamysand, Soil Biol. Biochem. 31 (1999) 1171–1179.
[19] J. Kucharski, T. Niklewska, The effect of manuring withstraw on microbial properties of light soil, Pol. J. Soil Sci. 24(1991) 171–177.
[20] J.N. Ladd, J.H.A. Butler, Short-term assays of soil proteolyticenzyme activities using proteins and dipeptide derivatives assubstrates, Soil Biol. Biochem. 4 (1972) 19–30.
[21] R. Lees, Food Analysis. Analytical and Quality Methods forthe Food Manufacturers and Buyer, third ed. Leonard HillBooks, London, 1975.
[22] F. Magdof, L. Lanyon, B. Liebhardt, Nutrient cycling,transformations and flows: implications for a moresustainable agriculture, Adv. Agron. 60 (1997) 1–73.
[23] S. Melero, J.C.R. Porras, J.F. Herencia, E. Madejon, Chemicaland biochemical properties in a silty loam soil underconventional and organic management, Soil Till Res. 90(2006) 162–170.
[24] G.L. Miller, Use of dinitrosalicylic acid reagent fordetermination of reducing sugar, Anal. Chem. 31 (1969)426–428.
[25] P. Nannipieri, R.L. Johnson, A.E. Paul, Criteria formeasurement of microbial growth and activity in soil, SoilBiol. Biochem. 10 (1978) 223–229.
[26] D.W. Nelson, L.E. Sommers, Total carbon, organic carbon,and organic matter, in: A.L. Page, R.H. Miller, D.R. Keeney(Eds.), Methods of Soil Analysis, Part 2, Am Soc Agron/Soil SciSoc Am, Madison, WI, 1982, pp. 539–579.
[27] S.R. Olsen, C.V. Cole, F.S. Watanabe, L.A. Dean, Estimation ofAvailable Phosphorous in Soils by Extraction with Sodium bicarbonate, US Dept of Agric, 1954, Circular 939.
[28] J.A. Parham, S.P. Deng, W.R. Raun, G.V. Johnson, Long termcattle manure application in soil, I. Effect on soilphosphorous levels, microbial biomass C, and
dehydrogenase and phosphatase activities, Biol. Fert. Soils 35(2002) 328–337.
[29] D.J. Ross, Invertase and amylase activities as influenced byclay minerals, soil-clay fractions and topsoils undergrassland, Soil Biol. Biochem. 15 (1983) 287–293.
[30] S. Saha, V. Prakash, S. Kundu, N. Kumar, B.L. Mina, Soilenzymatic activity as affected by long term application offarm yard manure and mineral fertilizer under a rainfedsoybean–wheat system in N-W Himalaya, Eur. J. Soil Biol. 44(2008) 309–315.
[31] P.A. Sanchez, R.H. Miller, Organic matter and soil fertilitymanagement in acid soils of the tropics, in: Transactions ofthe 13th International Congress on Soil Science, Hamburg,vol. 6, 1986, 609–625.
[32] F. Schinner, W. Von Mersi, Xylanase, CM-cellulase andinvertase activity in soil, an improved method, Soil Biol.Biochem. 22 (1996) 511–515.
[33] M. Simek, D.W. Hopkins, J. Kalcik, T. Picek, H. Santruckova,J. Stana, K. Travnik, Biological and chemical properties ofarable soils affected by long-term organic and inorganicfertilizer applications, Boil. Fert. Soils 29 (1999) 300–308.
[34] T.W. Speir, D.J. Ross, Soil phosphatase and sulfatase, in: R.G.Burns (Ed.), Soil Enzyme, Academic Press, New York, 1978,pp. 197–250.
[35] T.W. Speir, J.C. Cowling, Phosphatase activities of pastureplants and soils: relationship with plant productivity and soilP fertility indices, Biol. Fert. Soils 12 (1991) 189–194.
[36] M.J. Swift, P. Woomer, Organic matter and the sustainability ofagricultural systems: definition and measurement, in:K. Mulongoy, R. Merckx (Eds.), Soil Organic Matter Dynamicsand Sustainability of Tropical Agriculture, John Wiley and Sons,Chichester, UK, 1993, pp. 3–18.
[37] Technical bulletin Technological Option For ImprovingAgricultural Productivity In The North-western Hill, fourthed. VPKAS, (ICAR), Almora, India, 2002.
[38] M.A. Tabatabai, J.M. Bremner, Use of p-nitrophenylphosphate for assay of soil phosphatase activity,Soil Biol. Biochem. 1 (1969) 301–307.
[39] M.A. Tabatabai, J.M. Bremner, Assay of urease activity insoils, Soil Biol. Biochem. 4 (1972) 479–487.
[40] A. Tabatabai, Soil enzymes, in: R.W. Weaver, J.S. Angle,P.S. Bottomley (Eds.), Methods of Soil Analysis, Part2Mirobiological and biochemical properties, SSSA,Madison, WI, 1994, pp. 775–833.
[41] H.H. Taussky, E. Shorr, E. A microcolorimetric method for thedetermination of inorganic phosphorus, J. Biol. Chem. 202(1953) 675–682.
[42] D. Tilman, K.G. Cassman, P.A. Matson, R. Naylor, S. Polasky,Agricultural sustainability and intensive productionpractices, Nature 418 (2002) 671–677.
[43] M.B. Turrion, B. Glaser, D. Solomon, A. Ni, W. Zech, Effects ofdeforestation on phosphorus pools in mountain soils of theAlay Range, Khyrgyzia, Biol. Fert. Soils 31 (2000) 134–142.
[44] A. Walkley, J.A. Black, Estimation of soil organic carbon bychromic acid titration method, Soil Sci. 17 (1934) 29–38.
[45] A.L. Wright, K.R. Reddy, Phosphorus loading effects onextracellular enzyme activity in Everglades wetland soils,Soil Sci. Soc. Am. J. 65 (2001) 588–595.