Under the Shadow of Development: Rainfed Agriculture and ...
154
Under the Shadow of Development: Rainfed Agriculture and Droughts in Agriculture Development of India R. S. Deshpande NABARD Research and Policy Series No. 2/2022
-
Upload
khangminh22 -
Category
Documents
-
view
1 -
download
0
Transcript of Under the Shadow of Development: Rainfed Agriculture and ...
Under the Shadow of Development: Rainfed Agriculture and Droughts in
Agriculture Development of IndiaR. S. Deshpande
NABARD Research and Policy Series No. 2/2022
vinay.jadhav
Cross-Out
O³es³e
NABARD Research and Policy Series No. 2/2022
कृषि षिकास की छाया में – प्रगति से िचंिि भारिीय ििाषा ससचंिि एि ंसखूा ग्रसि क्ते्र Under the Shadow of Development: Rainfed Agriculture
and Droughts in Agricultural Development of India
आर एस देशपाडं ेR S Deshpande
आच्षाक षिश्ेिण और अनुसंधान षिभागDepartment of Economic Analysis and Research
राष्ट्रीय कृषि और ग्रामीण षिकास बैंक, मुंबईNational Bank for Agriculture and Rural Development, Mumbai
2
Under the Shadow of Development: Rainfed Agriculture and Droughts in Agricultural Development of India
National Bank for Agriculture and Rural Development
Office AddressNational Bank for Agriculture and Rural DevelopmentPlot No. C-24. ‘G’ Block, Bandra-Kurla ComplexBandra (E), Mumbai - 400051Email : [email protected] : www.nabard.org
© National Bank for Agriculture and Rural Development 2022
ISBN 978-93-5593-416-1
Published byDepartment of Economic Analysis and ResearchNational Bank for Agriculture and Rural DevelopmentPlot No. C-24. ‘G’ Block, Bandra-Kurla ComplexBandra (E), Mumbai –400051
Printed atImage ImpressionMumbai
पेपर में उद्िृ िथयों और वयकि षििारों के स्ए राष्ट्रीय बैंक ज़िममेदार नहरी ंहै।The National Bank is not responsible for the facts cited and views expressed in the paper.

i
“cesjs ieg©peer ÒeesHesÀmej vee[keÀCeea peer keÀes Þe×eHetJe&keÀ DeHe&Ce”“Dedicated with Gratitude to my Guru Professor M V
Nadkarni”

ii
i
Chairman’s Message
Academic research can inform policy making. However, since each piece of research may cover certain aspects of an issue, a comprehensive review of research may help collate the findings that may lead to policy recommendations. Further, the research available may be often very technical and less communicative to the policy makers. NABARD commenced the “Research and Policy” series to commission review papers on various themes to bring research findings on a given theme in a capsule form.
With this series, veteran scholars in different fields of specialisation have been requested to document research in their field highlighting various issues, policy relevance and prescriptions, and suggestions for future research. I am glad to present the paper on “Rainfed Agriculture and Droughts” by Dr. R. S. Deshpande who has been an authority on the subject.
The series will present more such authoritative papers on various issues ranging from climate change to agricultural policy in the coming months. I hope that series will be beneficial to academicians, researchers and policy makers for use at the ground level.
My best wishes to the authors and the Department of Economic Analysis and Research (DEAR) for initiating such wonderful series.
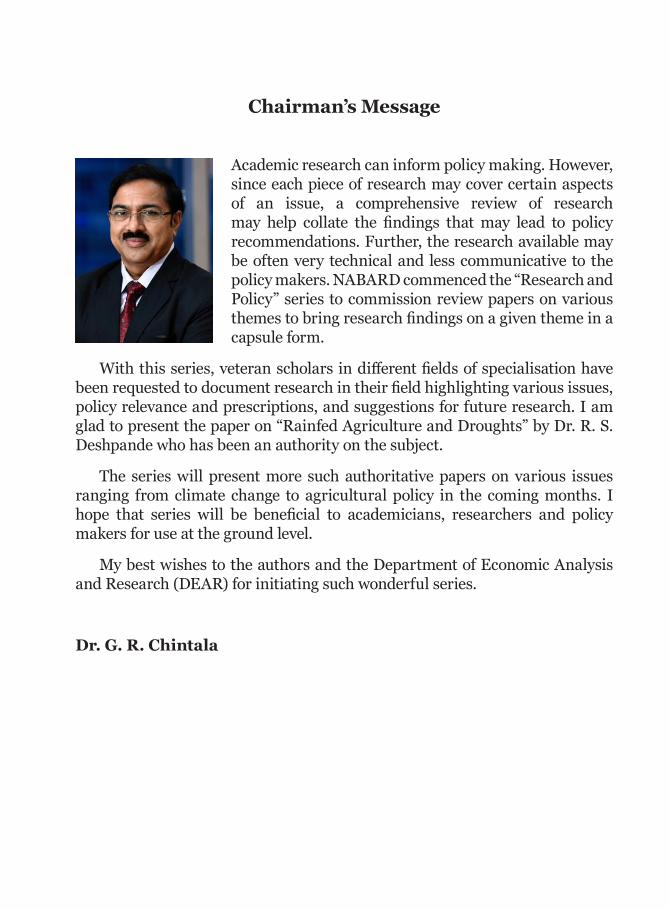
Dr. G. R. Chintala

ii

iii
Foreword
There is a vast body of research available on topics related to agriculture and rural development in the academic world. But, most of it is in the technical realm and not in a form which could feed into the policy. Research must first lead to better under-standing of a subject and then into a robust policy, wherever it can, so that it touches the multitude of Indians across the length and breadth of our country through better public policy and efficient services. Discussion with my colleagues on this issue lead to this new series “Research & Policy”. We wish that
this series will provide the breadth and depth of research in to an area topped up by a lucid presentation for the policy makers.
I am happy to present the second publication in this series on “Rainfed Agriculture and Droughts” written by Dr. R. S. Deshpande.
I wish this new series acts as a bridge between the researchers and policy makers.
P. V. S. SuryakumarDeputy Managing Director

iv
v
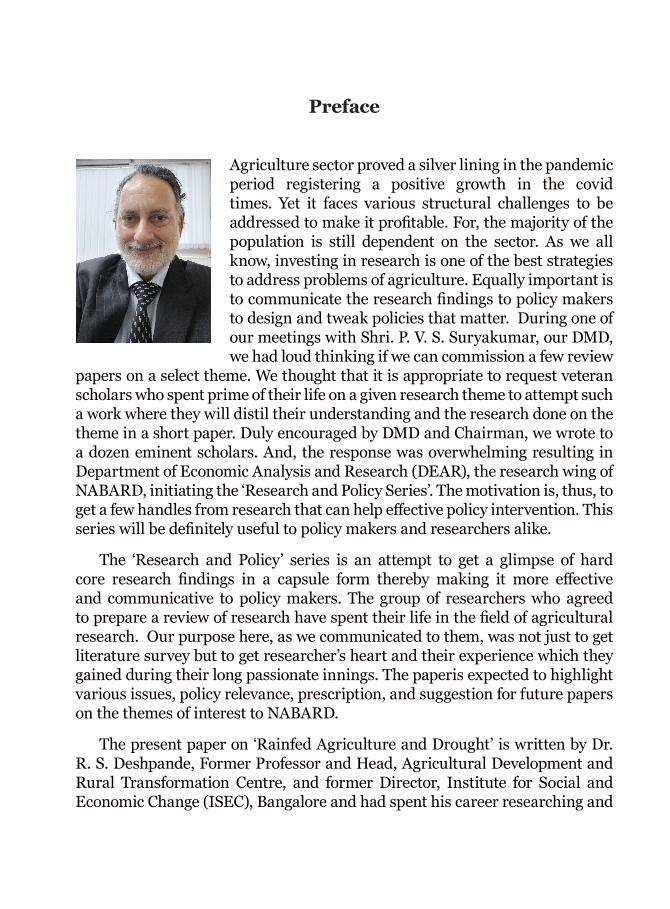
Preface
Agriculture sector proved a silver lining in the pandemic period registering a positive growth in the covid times. Yet it faces various structural challenges to be addressed to make it profitable. For, the majority of the population is still dependent on the sector. As we all know, investing in research is one of the best strategies to address problems of agriculture. Equally important is to communicate the research findings to policy makers to design and tweak policies that matter. During one of our meetings with Shri. P. V. S. Suryakumar, our DMD, we had loud thinking if we can commission a few review
papers on a select theme. We thought that it is appropriate to request veteran scholars who spent prime of their life on a given research theme to attempt such a work where they will distil their understanding and the research done on the theme in a short paper. Duly encouraged by DMD and Chairman, we wrote to a dozen eminent scholars. And, the response was overwhelming resulting in Department of Economic Analysis and Research (DEAR), the research wing of NABARD, initiating the ‘Research and Policy Series’. The motivation is, thus, to get a few handles from research that can help effective policy intervention. This series will be definitely useful to policy makers and researchers alike.
The ‘Research and Policy’ series is an attempt to get a glimpse of hard core research findings in a capsule form thereby making it more effective and communicative to policy makers. The group of researchers who agreed to prepare a review of research have spent their life in the field of agricultural research. Our purpose here, as we communicated to them, was not just to get literature survey but to get researcher’s heart and their experience which they gained during their long passionate innings. The paperis expected to highlight various issues, policy relevance, prescription, and suggestion for future papers on the themes of interest to NABARD.
The present paper on ‘Rainfed Agriculture and Drought’ is written by Dr. R. S. Deshpande, Former Professor and Head, Agricultural Development and Rural Transformation Centre, and former Director, Institute for Social and Economic Change (ISEC), Bangalore and had spent his career researching and
vi
teaching agricultural development policy, watershed development, rural policy and poverty, economics of drought-prone areas and rainfed regions.
This paper charted out evolution of policy on rainfed areas and mitigation of droughts since colonial period and focuses on how distress in agricultural sector majorly due to droughts and rainfed areas gets directly echoed in the national income. It also discusses various interventions and initiatives undertaken at the state and national level, their issues and way ahead. Further after analyzing the drought situation and history of meeting the drought with policy tools this paper goes ahead to suggest a few important policy leads. Overall, the paper is a treat to the readers.
In bringing this series as planned, I would like to express our sincere gratitude to Dr. G. R. Chintala, Chairman, NABARD for his inspiring leadership, unstinted support and guidance. We also wish to express our sincere thanks to Shri. P. V. S. Suryakumar, DMD, for being the inspiration and the driving force behind the publication of this first of its kind series. We are grateful to the authors of this series who agreed to write on themes relevant to NABARD in such a short period of time. Indeed, it has been a great privilege for us.
I also acknowledge the contributions of the officers of DEAR, NABARD especially Dr. Ashutosh Kumar, DGM; Mrs. Geeta Acharya, Manager; Ms Neha Gupta, Shri. Vinay Jadhav, Asst. Managers and others who coordinated with the authors and the editor to bring out the series as envisaged.
Thanks are due to Dr. J. Dennis Rajakumar, Director, EPWRF and his team for their contribution in copy editing and bringing uniformity to the document.
Wishing a very Happy New Year and great years ahead.
K. J. SatyasaiChief General ManagerDepartment of Economic Analysis and Research (DEAR) NABARD, Mumbai- 400051

vii
Acknowledgement
My rendezvous with studies on drought began with the drought of 1972-73, when I started working as a research assistant in the two drought prone villages of Marathwada, namely, Adul and Bhadji. I had then just passed out of my post-graduation and got this work to help in a research study in 1973. I witnessed the suffering of the villagers that was too severe for me to bear. My tender mind was deeply scarred, and I had decided to work on this aspect for my PhD. My work as a research assistant in Adul and Bhadji was used in the book titled Impact of Drought by Professor V V Borkar and Professor M V Nadkarni. I worked for my doctoral thesis on drought-prone areas of Maharashtra. After that, I wrote several times on droughts, dryland farming, rainfed agriculture, watershed development, irrigation and farmers’ distress. The common thread in all these works was the suffering undergone in the climatically and agricultural vulnerable regions of the country.
Therefore, when Dr. K J Satyasai, Chief General Manager, Department of Economic Analysis and Research (DEAR), National Bank for Agriculture and Rural Development (NABARD) called me up to ask if I could undertake writing a review paper for NABARD, I immediately agreed to work on rainfed agriculture and droughts. I must profusely thank Dr. Satyasai for giving me this responsibility and the chance to work on my beloved area of research. Words are insufficient to express my gratitude to him. I am equally grateful to NABARD for the opportunity to write this monograph.
Rainfed regions of the country have always remained under the shadow of developed regions, and droughts continue as the continuous despoilers of the livelihood system in rural areas. It was a pleasure to work on this, in spite of some of my personal health issues and the slight shiver in my hands due to some nervous system related problem. On the one hand, I had the opportunity to work on my beloved topic, and on the other hand, health had its own say. I could win over the physical inability with the strength of my commitment, and I could complete.
I derived data and literature support from by Dr. Khalil Musa Shaha of Institute for Social and Economic Change (ISEC), Bangalore. My discussions with Dr. V S Prakash, former director of Karnataka State Natural Disaster Management Centre (KSNDMC), Government of Karnataka, Bangalore, enriched my understanding. I must also acknowledge the prompt help given
viii
by my friend Dr. Ashok Dalwai IAS, presently the Chief Executive Officer of National Rainfed Area Authority (NRAA), New Delhi. The reports available at NRAA website were of exemplary use. The only difficulty that plagues Indian academic writings is that their suggestions getting on to the ground through implementation by the administrators. The best of the works carried out in the country have collapsed at the doorstep of administration, and therefore, one feels sorry that we could not accomplish the potential, which was easily realisable.
The research material on both rainfed areas as well as droughts is wide-spread. There are a lot of scientific material and research studies that go quite in-depth into the areas of work. At the same time, there are quite a few superstitions both scientific and social scientific as far as dealing with the rainfed areas and droughts. There are three major disciplines involved in this entire framework of the report. First, meteorology and climatology are the major decision-making disciplines, followed by the scientific inputs in rainfed agriculture through various programmes undertaken by the state and the non-state organisations. Second, biological sciences have a major role to turn around the climatic constraints into opportunities. And, third, it is the stakeholders who can either make or break an opportunity due to information asymmetry. The financial allocation to these programs, if aggregated, reach to a gigantic sum of money. This should be an eye-opener to make us look into our mistakes. A lot of achievements have been recorded, and over time, we have come a long distance from the extremely fragile drought ecosystem, habitually turning into famine during the British Raj, to a comfortable rural India that performs well during testing times. We should be proud that the situation has changed significantly, and specifically, after 1987 drought year. I tried my best to address many issues and provided possible solutions to the ulcerating issues. My efforts may not be sufficient to reach and solve the intricate problems confronting these two issues, but I tried my best. I shall not hesitate to accept the failures of mine, and with an open heart, I shall welcome all the suggestions.
Our achievements are certainly exemplary, but we cannot be complacent about that. We still have to go a long way to reach our destination of main-streaming these regions into development hubs comparable with others. We have reached here at this destination and have a turning ahead of us to overcome these two major issues in the Indian economy. This is certainly a tall challenge in front of us for the 21st century, and we have certainly achieved a lot, but still many challenges to meet.

ix
³eespeveeveeb menm$eced leg Mevewie&ísle efHeHeerueerkeÀe: ~Deeie®íve Jewveles³eesHeer HeoceskeÀ ve ie®íleer ~~
(Even a tiny creature such as an ant can move thousands of kilometres ahead, if it keeps on walking consistently. But if an eagle
doesn’t move from its place then it can’t move even a foot ahead.)
Ganga Bhagvatham (Garg Samhita)
Needless to add that the errors, if any, are solely mine.
R S Deshpande Visiting ProfessorInstitute for Social and Economic ChangeBangalore 560072

x

xi
Contents
Chairman’s Message iForeword iiiPreface vAcknowledgement viiList of Tables xiii List of Figures xvList of Maps xviiAbbreviations xixExecutive Summary xxv
Part - IRainfed Agriculture
1 Introduction 1
2 The Achilles’ Heel for the Indian Agriculture 3
3 Deciphering the Contours 7
4 Expanse of Rainfed Areas 18
5 Grammar of Underdevelopment 26
5.1 Deciphering the Micro-Component of the Grammar: 29 NRAA Method5.2 Components of the Grammar of Underdevelopment 39
6 Edifices in the Policy Domain 46
7 Policy Efforts through Five Year Plans 47
8. Mainstreaming the Development of Rainfed Areas 53
(Contd.....)
xii
Contents (Concluded)
Part - IIDroughts: The Regular Despoiler
1 Introduction 59
2 Drought to Famine: A Devastating Change 60
3 Semantics of Drought 65
4 Monitoring of Drought 75
5 Economics and Impact of Drought 81
6 Conclusions and Way Forward 88
References 95

xiii
List of Tables
No. Title Page
1 Total Cropped Area Falling Under Different Rainfall Ranges 11
2 Regions Based on Thornthwaite Moisture Index 13
3 Classification of Rainfed Areas Vulnerability and Rainfall Ranges 13
4 Suggested Analytical Classification Based on Multiple Criteria 14
5 State-wise Distribution of Rainfed Area (in lakh hectare) 19
6a Land Use Pattern and Estimates of Rainfed Area in India 21(In million hectare)
6b Land Use Pattern and Share of Rainfed Area in India 22(As % to reporting area)
7 Categorisation of Districts Based on Composite Index 33
8 Procurement of Rice, Wheat and Nutri Cereals 38(In ‘000 million tons)
9 Share of Area under Major Rainfed Crops: Average of 39Triennium Ending (As % to Gross Cropped Area)
10 Changes in Agricultural Workers between 2001 and 2011 40(In Lakh)
11 Migrants for Work to Cities: 2011 Census 41(As % to total migrant in the State)
(Contd.....)
xiv
List of Tables (Concluded)
No. Title Page
Part -IIDroughts: The Regular Despoiler
12 Visitations of Drought and Famines in India: 1800 t0 2020 61
13 Palmer’s Index of Drought Classification 68
14 Meteorological Sub-Divisions with Deficit Rain 68in the Crop Growth Period
15 Distribution of Rainfall Across Seasons 72
16 Similarities in Rainfall Pattern but Dissimilarities 72in Drought Impact
17 Periodicity of CWWG Monitoring Time Table 76
18 Economic, Hydrological Social and Environmental 87Impact of Drought
19 Releases under National Disaster Management Fund to States; 88 2015-16 to 2019-20 (Rs crore)
xv
List of Figures
No. Title Page
1
2
Share of Agricultural Sector in the Aggregate GVA (in%) 4 (At 2011-12 prices)
Growth Performance of Agricultural Sector (%) and GVA of India (Constant Prices: 2011-12 Series) 5
3 Rainfed Area (million hectare), Cropping Intensity (in %) 19and Net Irrigated Area (in %)
4 State-wise Rainfed Area as Percentage of Net Sown Area 20
5 Contribution of Rainfed Crops to the Total Foodgrains 37Production
6 Long Run Rainfall Behaviour 73
7 Four Dimensions of Deprivation Due to Drought 74
8.1 System Diagram of the Impact of Drought During Three Stages 82
8.2 System Diagram of the Impact of Drought 83
8.3 System Diagram of the Impact of Drought 84

xvi
xvii
List of Maps
No. Title Page
1 Map Showing Climatic Regions of India up to 10 District Boundaries
2 Rainfed Areas as Identified in NRAA Report No 4 (2012) 15
3 Districts Classified According to Annual Rainfall Ranges 17
4 Protection of Irrigation to the Rainfed Districts 24
5 Percentage of Net Rainfed Areas as Identified by NRAA 25
6 Priority Districts Based on Natural Resource Based 33Index (NRI)
7 Livelihood Based Index (LI) 34(Priority Low, Medium and High)
8 Rainfed Area Composite Index indicating Priority {CI} 35(Priority Low, Medium and High)
9 Crop Constellations in Rainfed Districts 38
10 Frequency of the Occurrence of Droughts (2000-2016) 75

xviii
xix
Abbreviations
ACRP Agro-Climatic Regional Planning
ADB Asian Development Bank
AER Agro-Ecological Regions
AESR Agro-Ecological Sub-Regions
AI Aridity Index
AICRPDA All India Coordinated Research Project for Dry Land Agriculture
AL Agricultural Labourers
ATE Average at Triennium Ending
BADP Backward Area Development Programme
CADP Command Area Development Programme
CAFEC Climatologically Appropriate for Existing Conditions
CAG Controller and Auditor General
CEO Chief Executive Officer
CGWB Central Ground Water Board
CI Composite Index
CMG Crisis Management Group
CMI Crop Moisture index
COWDEP Comprehensive Watershed Development Programme
CPI Consumer Price Index
CSWCRTI Central Soil and Water Conservation Research and Training Institute
CV Coefficient of Variation
(Contd.....)
xx
Abbreviations (Contd.....)
CWWG Crop Weather Watch Group
DANIDA Danish International Development Agency
DDP Desert Development Programme
DEAR Department of Economic Analysis and Research
DFID Department for International Development
DLDB Dry Land Development Board
DPAP Drought Prone Area Programme
DRDA District Rural Development Agency
FPOs Farmer Producer Organisations
GDP Gross Domestic Product
GIPE Gokhale Institute of Politics and Economics
GIS Geographical Information System
GSA Gross Sown Area
GVA Gross Value Added
IADP Intensive Area Development Programme
ICAR Indian Council of Agricultural Research
ICRISAT International Crops Research Institute for Semi-Arid Tropics
IEO Independent Evaluation Organisation
IFC Indian Famine Commission
IGWDP Indo-German Watershed Development Programme
IITM Indian Institute of Tropical Meteorology
(Contd.....)
xxi
Abbreviations (Contd.....)
ILI Integrated Livelihood Index
IMD Indian Meteorological Department
IRDP Integrated Rural Development Programme
ISEC Institute for Social and Economic Change
KAWAD Karnataka Watershed Development Project
KSDMC Karnataka State Disaster Management Centre
KSNDMC Karnataka State Natural Disaster Management Centre
LF Large Farmers
LI Livelihood Index
LRI Land Resource Inventory
LSC Labour Supply Corporation
LUP Land Use Planning
MAE Mean Annual Evapotranspiration
MAI Moisture Adequacy Index
Mham Million Hectare Meters
MI Moisture Index
MSP Minimum Support Prices
MYRADA Mysore Resettlement and Development Agency
NABARD National Bank for Agriculture and Rural Development
NARP National Agricultural Research Project
NASDORA National Authority for Sustainable Development of Rainfed Areas
(Contd.....)
xxii
Abbreviations (Contd.....)
NBSS National Bureau of Soil Sciences
NCMC National Crisis Management Committee
NDC National Development Council
NDVI Normalised Difference in Vegetative Index
NGOs Non-Governmental Organisations
NIA Net Irrigated Area
NRAA National Rainfed Area Authority
NRI Natural Resource Index
NSA Net Sown Area
NWDPRA National Watershed Development Programme for Rainfed Areas
PCA Principal Component Analysis
PDS Public Distribution System
PDSI Palmer Drought Index includes Palmer Drought Severity Index
PHCs Public Health Centres
PHDI Palmer Hydrological Drought Index
PRI Panchayati Raj Institutions
R&D Research and Development
RADP Rainfed Area Development Plan
RAPI Rainfed Areas Prioritisation Index
RKVY Rashtriya Krishi Vikas Yojana
SAT Semi-Arid Tropics
(Contd.....)

xxiii
Abbreviations (Concluded)
SC Scheduled Caste
SF Small Farmers
SFI Streamflow Index
SHGs Self-Help Groups
SMS Short Message Service
SNDI Seasonal Negative Deviation Index
SPI Standardised Precipitation Index
ST Scheduled Tribe
SWSI Surface Water Supply Index
UIP Ultimate Irrigation Potential
UTs Union Territories
WASSAN Watershed Support Services and Activities Network
WDF Watershed Development Fund
WMO World Meteorological Organisation
ZP Zilla Panchayat

xxiv
xxv
Executive Summary
After independence, India’s agricultural sector demonstrated a spasmodic behaviour in its growth pattern with intermittent peaks and troughs. During the early 1960s, India had just emerged out of the war with China with a huge baggage of overspending from the national treasury. Added to this, the shocks of the mid-1960s with the two consecutive drought years in 1965-67 and the war with Pakistan crippled the Indian economy, and agriculture and food security suffered intensively. India was not considered even a candidate to be helped, if a catastrophic famine was to strike the country as was predicted in the book Famine 1975! America’s Decision: Who Will Survive? by William Paddock and Paul Paddock. It was only during the Fourth Plan that the Planning Commission of India considered to include a full chapter on agriculture; until then, agriculture was treated as one among the many other components with-out any specific focus. It was only due to the intervention by Dr. Benjamin Peary Pal, a well-known wheat breeder and the first Director General of the newly reorganised Indian Council for Agricultural Research (ICAR) in 1965-72, when the Green Revolution was implemented in the country. It was during his regime that the new technology was ushered in, and he along with the then Minister for Agriculture Shri. C Subramanyam steered the new seed-water-fertiliser technology by importing new seeds of wheat and rice. The situation started to change significantly after that. In this entire pursuit of the Green Revolution, a large share of the total cropped area of the country remained under the shadow of the developed regions, quietly suffering from the vagaries of the monsoons, droughts and food insecurity causing untold miseries and perpetuation of poverty. It is only after the shock of the 1972-73 drought that the policymakers recognised the importance of rainfed regions in the country, which were subjected to significant fluctuations due to failure of monsoons resulting in severe droughts. The disastrous drought of the early 1990s taught many lessons, and the policy towards rainfed areas and mitigation of droughts came into the light from behind the shadow.
The share of agriculture in the country’s total income (that is, gross value added, GVA) has been sliding downward, and this rate of decline was rather rapid during the last five decades. But agriculture continued to exert significant influence on the aggregate growth. A long-term observation of the fluctuations in GVA of all sectors reveals that the peaks and troughs in agricultural sector
xxvi
get directly reflected on the aggregate GVA, despite the reduction in the sector’s share in the overall GVA; thus, when agricultural sector performed better, the aggregate growth in GVA of the economy was good, and when agricultural sector confronted a trough, the performance of the economy also dipped. In the Economic Survey of the Government of India, it is almost proverbial to blame the bad performance of the aggregate economy on the bad monsoons or performance of the agriculture sector. No doubt, the performance of the agriculture sector hinges on the drag it carries of the poor performance from the rainfed areas and drought prone areas of the country. These two factors together have continuously kept the agriculture sector under the shadow of under-development, and the distress confronted by the farmers is visible in every part of the country culminating into the farmers’ suicides. The rainfed areas constitute more than 50% of the total cropped area, and therefore, under the rainfed conditions, these regions certainly cause stress on sustaining the growth performance of agricultural sector.
The understanding of the concept of rainfed areas itself was a problem for many years. Following the Famine Commission’s Report in colonial India, the terminology of calling rainfed areas as drylands began, and it continued erroneously in all the government documents. We have discussed at length the contours of defining the rainfed area and climatic regions of the country based on various scientific studies. In this context, we have discussed the Palmer Index, Moisture Index, Aridity Index, Natural Resource Index (NRI) and other issues connected with the classification of climatic regions in India. Subsequently, an effort has been made to examine the contribution of rainfed areas to the structure as well as growth of agricultural sector. It is necessary to understand that the rainfed areas need a prominent policy focus. Following the Parthasarathy Committee Report (Government of India 2006), the National Rainfed Area Authority (NRAA) was established in November 2006. A large amount of work was carried out at the NRAA, and some of its important recent works provide a list of the districts that need specific attention for the purpose of development of the rainfed areas. Since NRAA is only an advisory body, the district development has to be undertaken by the Ministry of Agriculture or respective state governments. Earlier attempts of preparing agro-climatic regional plans for the districts in the country, under Agro- climatic Regional Planning (ACRP), Rashtriya Krishi Vikas Yojana (RKVY) and Ministry of Rural Development, have already been pushed under the carpet in the cellars of the Planning Commission, but one lesson that our planners learnt was that
xxvii
the planning for agricultural development must be location specific, and should start from below. The top-down planning approach does not help to carry the development initiatives at the district and sub-district levels. Dr. Ajay Chibber Committee (Director General of India’s Independent Evaluation Organisation, IEO) noted that the ineffectiveness of the Planning Commission was mainly because it was an advisory body. Following the same logic, it is suggested that NRAA should not remain just as a toothless advisory body, but it should participate in the administration of the programme. Further, it is also suggested that an institutional network structure may be put in place that connects taluk/blocks to the districts, and finally, the state and the NRAA should be put in apex place in order to implement some of the important recommendations, which would flow out of the work at NRAA.
The second part of the report highlights how drought has emerged as the despoiler of the economic activities in the country. The available reports on droughts and the state interventions have enriched the understanding and, thereby, help to systematically analyse the experience of droughts during the last seven decades. There are no two opinions that the drought has been one of the major despoilers of growth in the rainfed areas. In the Indian context, drought strikes with almost certainty with a probability ranging from 10% to 50%. There are many regions like Rajasthan and a few other districts in the country, which confront drought almost every second year. A complete review suggests a clear failure of systematic efforts till the 1987 drought, despite undertaking many programmes. The evaluation reports of ACRP, RKVY, Soil Conservation of the First Five Year Plan, Desert Development Programme (DDP), Drought Prone Area Programme (DPAP), Backward Area Development Programme (BADP), Dry Land Development Board (DLDB), Comprehensive Watershed Development Programme of Maharashtra (COWDEP), World Bank aided projects, National Watershed Development Programme (NWDPRA), in its all incarnations changing guidelines eight times, and sometimes even after only one year of experience), Watershed Development Programme of Karnataka (SUJALA) and many state level programmes indicate very unsatisfactory design as well as implementation of these programmes. It would not be erroneous to say that a lot of investment in these programmes has gone down the drain. After the 1987 drought, the situation changed significantly. The shocks of droughts in 1966 and 1972 taught the policy makers a few lessons, but the possibility of working on these lessons was quite slow till 1987. Following the 1987 catastrophe, the Government of India initiated quick steps to prepare a few reports in order to
xxviii
understand the steady and slithering drought in the country. The next shudder came in 2002, and that was a real shocker which initiated many studies and reports providing very rich material to understand the drought situation and provoke our ingenuity to overcome the situation. There are also a few other climatic disasters that struck many regions of the country, and all these shocks provoked the policy makers to take steps to establish Disaster Management Act 2005. Subsequently, several studies were commissioned, and steps were taken to meet the challenges of the disaster-prone areas. These reports provided a mine of information and policy suggestions. After analysing the drought situation and history of meeting the droughts with policy tools that helped to ameliorate the conditions of rural India, this paper suggests a few important policy leads.
Drought is a frequent phenomenon and, therefore, an early warning system needs to be harnessed at the state headquarters. The Government of Karnataka has put in place a unique and systematic effort to monitor drought thoroughly. Initially, it established a Drought Monitoring Cell, which was converted to a full-fledged Karnataka State Disaster Management Centre (KSDMC). This institution has created a network of more than 5,600 telemetric rain gauge stations across all the gram panchayats in the state, which provide weather information to the state headquarters without any time loss and on a real-time basis. Within an hour after the episode of dry spell or heavy rainfall, the information is passed on to the state headquarters in order to alert administrative network. This needs to be worked out as a model of early warning system with the help of satellite imageries and ground level verification so as to monitor and control the parameters and to help various stakeholders.
Drought is a specific occurrence that provokes the cycle of perpetuating poverty and underdevelopment in the drought prone regions. These districts come under the most backward regions of the country and have been habitually the abode of poor people. Technology is still primitive in many of these far-flung regions, and the state-initiated schemes do not reach the beneficiaries in time. As a result, it is not only the perpetuation of the poverty, but an increment in poverty is taking place every year, pushing more people below the poverty line. This is not visible in the secondary and macro-level data, as many employment and direct cash benefit programmes keep the poor people hanging precariously just above the poverty line and plummet down in the ditch of poverty. This situation is quite prevalent in most of the rainfed areas, which are habitually drought prone. The report suggests a few policy measures that may help in
xxix
ameliorating the situation. Immediately after independence, though agricul-ture was accorded the highest priority, unfortunately rainfed areas and drought prone areas waited for decades to participate in the overall development expe-rience of the country. This situation needs to be changed, and these regions should be incorporated in the mainstream development.
The distilled suggestions are as follows:
1. It will be good if NRAA is made as a permanent institutional structure.The NRAA should be connected with similar working institutionsacross the rainfed states in the country.
2. Following the model for the early warning system available in theKSNDMC programme of establishing a network of telemetric raingauge stations and obtaining the data on real-time basis, NRAA shouldput in place an early warning system connected from taluk to districtand through the state governments.
3. National Weather Watch Committee should include some of the droughtexperts in order to sharpen the policy interventions.
4. Drought is one of the usual phenomena in the rainfed areas, but it canalso strike irrigated regions in the rainfed areas. This possibility shouldnot be ignored, and hence, there should be a preparation of droughtstriking in all the rainfed regions.
5. Rural-based industries could be established in the rainfed areas thatwould provide employment for the rural youth, who prefer to workin industries rather than in agriculture. This will also control the outmigration from rural India to urban centres.
6. MGNREGS can be converted into a Labour Supply Corporation (LSC),wherein the labourer should first register with the LSC about theiravailability and time. The LSC, in turn, will supply labourers to theworks undertaken by the governments and the private constructioncompanies at a pre-decided wage rate.
7. Watershed management follows top-down approach, and the stake-holders are compelled to participate than volunteer to participate. Thetechnologies developed by the World Bank experts are pushed downthe throat of the state governments, implementing agencies and the
xxx
stakeholder farmers. While designing and planning for watershed projects,various stakeholders should be consulted and involved.
8. The solutions to the rural problems lie with the people from the societyand this tagline was used in the projects initiated by NABARD in manylocations. The design has been prepared by NABARD painstakingly andimplemented with the intervention by the officers with participationby the stakeholders. Government of India should take clue from theseprojects to implement the methodology and process of interacting withpeople.
9. There is a strong need of increasing the public investment in the rain-fed areas as well as drought prone areas and taking up projects in ruralindustrialisation with the help of private industries supported by thegovernment, wherever possible.
10. There are many attempts at focusing research on the rainfed areasand drought prone areas, but philosophical blockade behind all these researches is the methodology of Green Revolution with seed-water-fertiliser as the core of the recommended technology. It is possible todovetail the extension with the panchayat raj institutions placing oneextension person trained with a diploma in extension at the gram panchayat level. This person could be given multiple responsibilitieswith ease of monitoring the drought situation and connecting with thechain that need to be established from the village to the NRAA in Delhi.
11. Crop insurance is not a perfect medication anymore, and it has becomemore an institution governed by the private interests. Crop Insurancescheme carries along with it the baggage of the earlier failed crop insurance schemes which include: (1) private companies are given fullauthority to insure and pay the indemnity, and they get the State supportin this operation; (2) area approach is being followed by the insurancecompanies, and this will depend on the crop cutting experiments or themeteorological data which comes with a lag, and it must be understoodthat if the farmers’ kharif crop has failed, then she/he will not be able to undertake cultivation immediately in the second season due to delay inthe payment of indemnity; and, (3) the scheme is again connected withthe crop loan system through the banks, thereby, actually ensuring therepayment of loan to the banks but in the name of insuring the farmers.The scheme needs full revamping.
xxxi
12. With the constitutional amendment in 1993, decentralised development planning has been accepted as the methodology for development. The panchayat raj institutions could be very effectively used in order to monitor and promote developmental initiatives through their representatives. Recently, there is a specialised university established at Gadag, Karnataka, to train young personnel to work in the panchayat raj institutional framework equipped with essential tools and techniques.

xxxii
Under the Shadow of Development: Rainfed Agriculture and Droughts in Agricultural Development of India
PART - I
RAINFED AGRICULTURE
1. IntroductionIndia is now entering into a turbulent phase to resurrect itself in its economic,
political and social development track due to the impact of the pandemic. During this period, the slump in economic activities and the sliding down of growth caused tremors in all the sectors of the economy except agriculture. It is in these difficult times when everything else failed, only the agricultural sector emerged as the saviour of the economy, especially in rural areas. Certainly, investment in irrigation has paid rich dividends in terms of protecting the agricultural sector and also enhancing productivity (Dhawan 1988, 1999). In Indian conditions, irrigation has its own limitation as far as rainfed areas and droughts are concerned due to the fact that the limits of the ultimate irrigation potential has been reached (Government of India 1992; Parikh 2009). Dhawan (1988) warned, “Irrigators had to come to terms with the situation as governments no longer guaranteeing a high-security water supply, with annual allocations varying according to what is stored in dams and complex year-to-year scientific modelling of how much is likely to be available” (p.57). Recently, it was also commented by a high-level committee of Government of India:
“Our review thus far shows that the limits to further expansion of surface and groundwater irrigation through big dams and tube wells are being reached rapidly. This makes the urgency of a different strategy for India’s drylands even greater. Such a strategy needs to recognise the location-specific characteristics of different parts of India and also needs to be sensitive to the limits set by the eco-system” (Government of India 2006a: 34).
Over the last few decades, agriculture remained a neglected sector with the economy pushing towards double-digit growth rates of gross domestic product (GDP), but actually agriculture saved the day for the economy in difficult times. In the early years of this decade, Indian policy makers, for some time, were
2 R S Deshpande
quite happy that the country was marching towards the double-digit growth rate, but there was a lot that was concealed below this seemingly euphoric crest. The growth benefits were certainly not secular across regions as also sectors of the economy. There cannot be another opinion that hitherto, larger benefits of the accelerated growth reached only a few favoured regions and groups. Among them, a disproportionately high share of benefits reached the irrigated sector as against rainfed sector. The development experience of seven decades bears it out that policy emphasis was more on the resource rich regions, and hence, a major share of developmental funds also has gone to these regions, consequently inflicting an unintended neglect on the fragile resource regions, which initiated a spiraling backwardness across these tracts. This process was initiated by the historically existing criticality in natural resources and intensified due to the policy neglect of rainfed areas. The backward regions or social groups of the country are actually stressed due to these natural disadvantages. Resource stressed regions were incidentally bypassed in the policy and livelihood miseries found these regions or groups as conducive ground (Rao 1992; Aparna 2012). Any analyst can point out the prominent presence of rainfed and drought prone areas in the backward regions of the country. Incidentally, these regions were well identified over the last two centuries (First reference is in Famine Commission of 1898. Government of India 1898), and so, if needed attention was provided to these regions in the process of agricultural development, possibly the story of the sector could have been different (Deshpande and Shaha 2018).
Recent history of agricultural development noted very proudly that Indian agriculture made great strides after the technological revolution of the mid-1960s (Dantwala 1991), but at the same time, caused severe regional imbalances in the sector (Rao 1975). During these decades, Indian agriculture has gone through phases of non-secular growth with intermittent troughs and peaks (Sawant and Achutan 1995; Deshpande et al. 2004), and every trough in the growth trend was setting back the development clock specifically in rainfed areas. Certain problems like drought, famines and floods continued to pull down the performance of the agricultural sector spasmodically during the last century. It would not be erroneous, if one says that in the last seven decades, our developmental policies remained more urban centric, and even within the rural sector, the emphasis has always been on urban consumerism. Right from the British Raj, urbanism was almost synonymous with development, be it attire, consumption pattern, language or economic activity, thus, pushing the other regions in the shadowed backwardness. In the process, resource poor regions stayed glued with the fate of underdevelopment. This incidental neglect of the

3Under the Shadow of Development: Rainfed Agriculture and Droughts....
vast rainfed areas and drought prone areas pulled down the aggregate growth performance.
This monograph is focused prominently on the following objectives:
1. Documenting and understanding the critical role of rainfed areas and droughts in India’s agricultural development dynamics. Critically reviewing and understanding the economics of rainfed areas and droughts, and setting the issues from historical to the current perspective.
2. Considering whether policy makers have been squarely dealing with these issues through interventions and examining whether the policies have gone in right direction in dealing with these twin massive problems.
3. Examining why these two problems still haunt our economy. And after analysing the current policies and locating the critical spots, an attempt is to be made to point out an implementable policy matrix.
The approach here is to utilise the vast literature available on this subject and analyse the data from a new perspective. It is a fact that the economics of rainfed areas and droughts is intertwined and mutually aggravating. Hitherto, the two sectors are treated independently on the policy front, and it was only incidental that while attending to drought amelioration, the rainfed areas were incidentally benefitted by the policy. While drought prone areas are the subset of rainfed areas, the issues of development are certainly interwoven but need different platforms. In this monograph, we initially make a full review of the role of rainfed areas in India’s agricultural development and the historical pitfalls as well as the policies that have been put in place over decades. The economics of rainfed areas and their criticality in the process of development needs no emphasis, as it is well documented (Rao 1992, 2004). It is well-known that India’s agricultural growth quaver under the pressure of even a moderate to severe shock of drought. Droughts and drought prone areas constitute the second part of this monograph. Here again, after reviewing the literature and historical experience of droughts in India, an attempt is made towards reaching a sustainable policy for drought proofing (Kerr 1996).
2. The Achilles’ Heel for the Indian AgricultureRainfed areas and droughts are usually termed as growth inhibiting factors
in Indian agriculture (Rao 2009). It has almost become proverbial to write that the agriculture sector’s contribution to the country’s GVA has been declining
4 R S Deshpande
sharply, and it has reached to 17% of the total GVA now. Many researchers in the domain of agricultural economics as well as very senior academicians, including the strong long-term policymaker Dr. M S Swaminathan, speak about Indian agriculture being at crossroads. Have we stagnated for decades at these proverbial crossroads? If yes, why? These are the questions that seek answers (Deshpande and Shaha 2018). Possibly, most of the academicians of repute comment on the reducing share of agriculture in the total GVA to belittle the contribution of agriculture to the country’s national income, but they overlook the basic mathematical understanding that the share of a sector moves relative to the growth in other sectors. The growth rate of both industry and services sectors’ GVA has depressed the share of agriculture. India’s GVA shows quite a zigzag movement over seven decades with intermittent peaks and troughs, depending on the transitory economic issues confronted by the country.
It can be seen from Figure 1 that the share of the agricultural sector in the aggregate GVA has been declining, but at the same time, that of services sector has expanded phenomenally and of industrial sector has also increased steadily.
Figure 1: Share of Agricultural Sector in the Aggregate GVA (in %) (At 2011-12 prices)
Source: Based on data from Indiastat.com
5Under the Shadow of Development: Rainfed Agriculture and Droughts....
The implication of this comprehensive scenario is that the employment in agriculture has been squeezed, and additional labour in agriculture is getting pushed out to the services sector, largely creating mass of casual temporary employment for the migrants from agriculture. Economists have heralded this as a Lewisian process, albeit ignoring the fact that the living conditions provided to the migrants in the immigrated place are pitiable and deplorable. The employers of migrant workers take no responsibility for their basic needs. The other reason for agricultural sector losing its importance, as reflected in its dwindling share in aggregate GVA, is due to both productivity and product prices not keeping pace with the growth of the economy.
One of the major reasons for the subdued performance of agricultural sector is the low productivity on account of the fact that a vast cropped area is rainfed. Besides, the sudden tremors of droughts set back the pace of the development clock. Despite this, agriculture GVA continues to influence the fluctuations in the aggregate GVA of the country (Figure 2). Immediately after independence, Indian agriculture was confronting serious issues like productivity stagnation, vast rainfed steppe, regular visitation of droughts in one or the other parts of
Figure 2: Growth Performance of Agricultural Sector and GVA of India (in %) (At 2011-12 prices)
Note: GVA refers to Gross Value Added at Constant Prices. Source: Computed by the author based on data extracted from Indiastat.com
6 R S Deshpande
the country, skewed distribution of land, vast rainfed and vulnerable areas, low irrigation, primitive technology, absence of net-work of support institutions and severe food insecurity. It is only after the tormenting years of 1965-66 (drought and war years) that serious steps were taken to set right the issues. Of these, land reforms and irrigation (in the 1970s), agricultural prices, new technology, network of research and education institutions and public distribution system (PDS) (in the late 1960s) were attended to, but the attempts were insufficient and evaded the fragile resource regions. In this process, development of rainfed and drought prone areas remained in the shadow. Unfortunately, on the policy front (investment and research and development), the agricultural sector has always remained neglected relative to the other policies for industries as well as services sector (Rao and Deshpande 1991; Raju et al. 2016). As a result, farm income of farmers grew marginally, but not exceeding the inflation rate (Narayanamoorthy 2021). If the growth of income in agriculture is adjusted for inflation during these decades, the situation becomes deplorable (Sen and Bhatia 2004; Deshpande and Prabhu 2002). As seen in Figure 1, the contribution of the agriculture sector to the aggregate GVA got reduced over the years, but surprisingly it is not compensated by the growth in the industrial sector but made good by services sector that attracted labourers from agriculture. Though services sector’s contribution has increased, the overall fluctuations in the growth of GVA have been largely influenced by the fluctuations in the agriculture sector (Figure 2). This suggests that the shocks in agricultural sector are always, and invariably, transmitted to the overall economic growth of the country.
The GVA of agricultural sector as also the aggregate GVA of the economy have fluctuated around the 5% growth line (Figure 2). Here, one may question the veracity of the claim of around 9% growth in GDP during the 2004-19. Has that growth been reflected in this long-term behaviour of GVA? There cannot be two opinions that agricultural sector registered an annual growth rate of about 3.5% over the long run, but the fluctuations were problematic (Deshpande et al. 2004). It is also true that GDP has grown at higher rates after 2000-01, but not the GVA which is a better description of the health of the economy than the GDP. The concern here is about the fluctuations around the 5% line of growth of GVA over years and that describes the performance of the economy. It is observed that there are 18 peaks (good years) experienced during 1951-2020 and 19 troughs (bad years) in the series. The performance of agriculture during these years has always got influenced (better to say pulled down) by the presence of rainfed areas and intermittent droughts.
7Under the Shadow of Development: Rainfed Agriculture and Droughts....
An interesting revelation is that whenever GVA from agriculture showed a peak, the aggregate GVA also reflected the same; and, whenever GVA from agriculture dipped, the aggregate GVA also dipped and confronted a trough. This happened in 1955-56, 1957-58, 1959-60, 1962-63, 1965-66, 1972-73, 1974-75, 1979-80, 1982-83, 1987-88, 1991-92, 1997-98, 2000-01, 2002-03, 2004-05 and 2008-09. In 1995-96, 2009-10 and 2014-15, the agriculture GVA dropped with the aggregate GVA going up, and thus, in these three years only that the non-agricultural sectors could compensate the loss in GVA owing to the bad performance of agriculture. The aggregate GDP suffered due to the failure on two fronts, namely, production and prices. Out of these 18 years, eight years were severe drought years and 10 years were moderately bad years, but in all these years, the contribution of rainfed areas dipped significantly. Needless to mention that rainfed tracts could potentially impede the growth process.
The above comparison brings forth some disturbing facts. First, there is enough doubt that India’s growth (in terms of GVA) is about 5%-6%, and it is largely achieved by the contribution from non-agricultural sectors. Even in 2020, agriculture remains a critical sector that can create a crater in the aggregate GVA. Second, whenever the economy performed well, the GVA from agriculture showed a peak, but trough in GVA of agricultural sector pulled down the overall economic performance. It has almost become a proverbial in the Economic Survey to explain the bad performance of the economy in the worn out words – ‘the bad monsoon has depressed the overall performance of the economy’. True that the spiraling impact of the agricultural sector may be one of the reasons, but the fact remains that it is more due to the encumbrance caused by the rainfed areas and drought-proneness on the aggregate economic performance. This underscores the importance of policy attention towards rainfed areas and drought preparedness for the economy.
3. Deciphering the ContoursUnderstanding the complexities of rainfed area is better said than done.
Policy makers are still struggling to rope in these areas in the mainstream of development. The entire agricultural land is dependent on rainfall, and hence, one could say without being mistaken that the entire agricultural land is completely rainfed. It is necessary to understand, for the purpose of differential development policies, the terminologies like rainfed areas, dry lands, arid or semi-arid areas, as they are used interchangeably for a long time and sometimes, mostly erroneously. Right from the Royal Commission on Agriculture, the use of
8 R S Deshpande
a homogeneous term dry agriculture was frequent in the literature. Before that, the Famine Commission 1898 used the terminology of dry lands. No attention was paid to the involved semantics. Taking note of the issues confronted by the cultivators of rainfed areas, the Royal Commission on Agriculture 1928 noted, ‘Cultivators in Dry and Precarious Tracts are those whose struggle for livelihood is commonly hardest, and whose standards of living most depressed’ (Government of India 1928: 116, para 112). Under their recommendations back in 1928, it is stated, “The Agriculture Department should pay greater attention to the problems of cultivation in dry and precarious tracts” (Government of India 1928: 127, para 73). The Commission further related climatically vulnerable areas to famine and called these regions as dry lands (tracts) – actually, the report stated that famines largely devastated the dryland agriculture. Following the Commission’s recommendations, four ‘Dry Farming’ research stations were started in the 1930s by the British Indian Government. The Royal Commission on Agriculture had also dealt elaborately with Famine Code, as the issue was captured from the earlier Famine Commissions’ reports which made incidental reference as the famine prone areas.
There seems to be a common practice in the literature to use the terminologies like dryland or rainfed agriculture loosely, representing arid and semi-arid agriculture. The first book on this subject after independence came from Kanitkar and Sirur (1960) at the initiative of Indian Council of Agricultural Research (ICAR). They preferred to call all the areas receiving precipitation below 750 millimeters (mm) as dry lands, and hence, the term dryland agriculture got settled in the academics. Sagar (2010) and Shah and Sah (1993), while looking at the natural resources and livelihood security, brought out the economic insubstantiality of dryland. This was further strengthened by the existing dry farming research stations already functioning in India. A reference to rainfed areas as dry lands continued unabated, even recently Stewart (2006) Rao and Ryan (2004) referred to them only as dry lands in their works. None of the academics paid even an iota of attention that dry means without even a drop of water, and hence, no agricultural land can be called as dryland. However, the practice is that drylands (rainfed regions) receive rainfall less than 500 mm or between 500 and 750 mm. At times, this goes even beyond 750 mm up to 1,150 mm to recommend certain crops in the drylands. The semantics of the emergence of these terms is quite erroneous, as scientifically no vegetative growth can take place on dry lands, and therefore, it is necessary to clarify at the beginning that climatically drylands (arid lands) and rainfed agriculture differ not only scientifically but also socio-culturally. This is not erroneous till the time one understands that the use
9Under the Shadow of Development: Rainfed Agriculture and Droughts....
of terms is completely synonymous, but also comprehends that the bio-science behind growing crop on the dryland is infeasible.
According to the agro-meteorologists, rainfed areas are mainly dependent on rainfall for all the biotic activities with limited water availability (Hubers 1974). Mann (1955) connected the rainfall and famine in an analytical way to emphasize that even if there was no periodicity, there was some estimable probability with which the failures occurred. Efforts were made in the 1970s to attempt a classification of similar type under the Second Irrigation Commission (1972), the Agricultural Commission (1976) and the Drought Prone Area Programme (DPAP). It was then officially agreed that the regions falling under the isoclines of average annual rainfall of 750 mm, having coefficient of variation (CV) of more than 20% in average annual rainfall and having irrigated sown area of less than 30% are included under the definition of rainfed areas and drought prone areas (Government of India 1972, 1976; Government of Maharashtra 1973). During the initial years after establishment of the International Crops Research Institute for Semi-Arid Tropics (ICRISAT), a seminar was conducted specifically to discuss the classification of areas into various climatic regions, and a long discussion on the concept of rainfed and semi-arid tropics (SAT) areas helped to iron out the conceptual differences (ICRISAT 1980). Virmani et al. (1980) discussed these concepts very elaborately. Finally, it was stated, “The generalised classification of semi-arid tropical areas classified by Troll (1965) seems to be adequate” (Virmani et al. 1980: 18). Meher-Homji (1965, 1967) and Krishnan (1988) had argued almost similarly, but brought in more sophisticated Moisture Index and Aridity Index. It was unanimously agreed that rainfed areas were those areas that receive average annual rainfall between 750 mm and 1,150 mm. Areas receiving average annual precipitation below 500 mm were to be called as arid lands (bearing in mind that a very little vegetation grows on these lands without irrigation).
In the available literature on climatic classification, there are two important groups. One group was happy at classifying the arid, semi-arid and humid sub-humid regions, and this classification began with the early works of Troll (1965) at international level and by Meher-Homji (1965, 1967) for Indian conditions. The second group of researchers, however, preferred multiple criteria that traversed beyond the usual classification. The entire emphasis of this classification was on the average annual rainfall and computation of some indices. This group had mainly the contributors from the Indian Meteorological department (IMD). Many of these authors used Aridity Index, Moisture Availability Index, Potential
10 R S Deshpande
Evapo-Transpiration Rates, Koppen Index and Thornthwaite and Mather Index (1957) to classify the regions climatically. Ryan (1980) used the average annual rainfall data at the district level from the IMD, overlooking the thin density that the standard rain gauge stations have in the country. Despite commenting on this thin density in some of her earlier works, Shakuntala Gadgil in her paper in this seminar also used the same data to represent a huge geographical coverage. In many of these studies, help was derived from the isoclines of the average annual rainfall, and therefore, possibly the classification ironed out the error arising from the thin density of rain gauge stations. Bapna et al. (1981) took irrigation and rainfall as the two criteria to delineate the rainfed areas with the gross irrigated area of less than 25% and rainfall in the range of 500 mm to 1,500 mm.
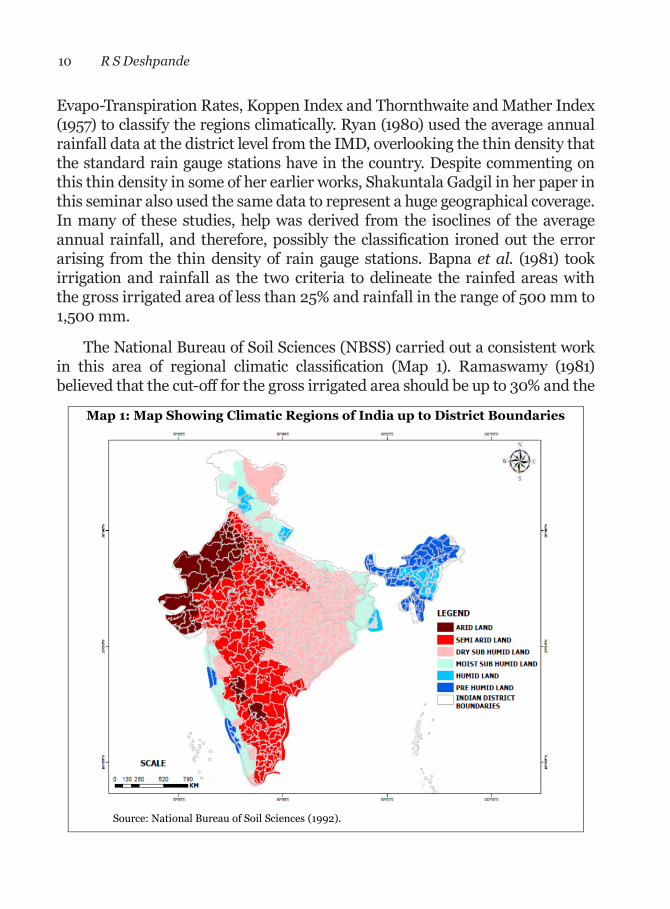
The National Bureau of Soil Sciences (NBSS) carried out a consistent work in this area of regional climatic classification (Map 1). Ramaswamy (1981) believed that the cut-off for the gross irrigated area should be up to 30% and the
Map 1: Map Showing Climatic Regions of India up to District Boundaries
Source: National Bureau of Soil Sciences (1992).
11Under the Shadow of Development: Rainfed Agriculture and Droughts....
annual rainfall range can be brought down to 375 mm from 1,125 mm. He gave the classification accordingly, but did not provide any logic for the thresholds that were given in his paper. Another classification was given by Jodha (1985), who agreed with Bapna on having less than 25% of gross irrigated area as cut-off point and rainfall between 500 mm and 1,500 mm. Subbarao (1985) and Shah and Sah (1993) followed more or less similar lines to delineate the rainfed areas. Kelly et al. (1997) used the agro-climatic regional classification to give the typology of rainfed agriculture in India, and their findings did not differ from the earlier attempts. Recently a map was developed at the IMD/NBSS (1992) giving districts in various climatic regions up to district boundaries (Map 1). This was a development over the earlier work of Velayutham et al. (1980). It can be seen from the Map 1 that largely the central India (Deccan plateau) with Rajasthan and Gujarat come under the arid and semi-arid regions, and that almost is found in agreement with the vulnerable rainfed areas classified at ICRISAT.
As an essence of all this discussion, it is noted that largely protective irrigation beyond 25%-30% and precipitation of up to 1,150 mm could be taken for delineation of rainfed areas. In furthering the Moisture Index and Aridity Index, Thornthwaite (1948), Krishnan (1988) and Krishnan and Venkataraman (1992) dominated in the classification of areas. Incidentally, even these highly sophisticated indices confirm the classification done on the broad criteria of isoclines of average annual rainfall and coefficient of variation (CV) in that. A similar remark was made in the National Agriculture Commissions Report (1976), after an elaborate exercise done by expert meteorologists and hydrologists in Volume IV of the report (Government of India 1976). Finally, it was stated that climatically vulnerable regions were those that had a precipitation of less than 1,150 mm, and CV and probability of failure of more than 20% each. Climate variations have a very broad frequency spectrum ranging from one cycle in two years to one cycle in hundreds of thousands of years, or even longer (Mehta 2017:15). There are further advances wherein researchers have used soil type, soil depth, crop pattern, periodicity of rainfall and other such variables in
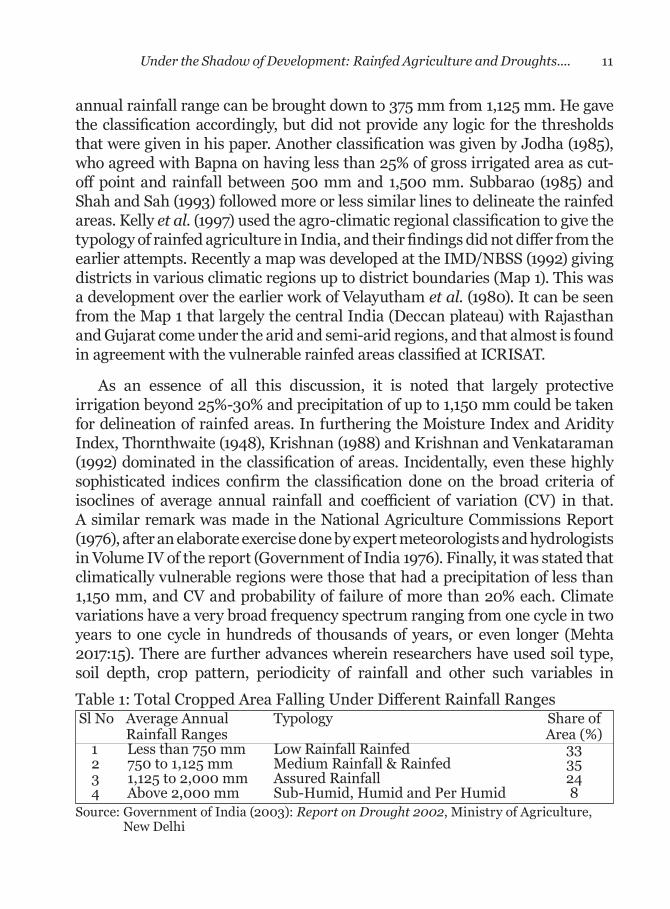
Table 1: Total Cropped Area Falling Under Different Rainfall Ranges Sl No Average Annual Typology Share of Rainfall Ranges Area (%)
1 Less than 750 mm Low Rainfall Rainfed 332 750 to 1,125 mm Medium Rainfall & Rainfed 353 1,125 to 2,000 mm Assured Rainfall 244 Above 2,000 mm Sub-Humid, Humid and Per Humid 8
Source: Government of India (2003): Report on Drought 2002, Ministry of Agriculture, New Delhi
12 R S Deshpande
order to classify regions according to the climate, but fact remains that always precipitation or rainfall dictated the entire methodological cauldron (Mandal et al. 1999). All these researchers seem to agglomerate to the original place.
Given the fact that the density of rain gauge stations in the country is low with each unit covering about 17,000 hectare (ha) of net sown area (NSA). The total number of rain gauges are about 8,000, working under different institutional norms and serving 139 million NSA. The classification given in Table 1 is used by many researchers. Added to this is a simple method of classification to eliminate the regions that receive assured irrigation for more than 30% of their cropped area. One of the simplest classifications was given in the Government of India (2003). Accordingly, about 68% of the area comes under the isocline of 1,150 mm of average annual rainfall.
In a few studies conducted at National Bureau of Soil Survey and Land Use Planning (NBSS and LUP), the scientists followed a classification to identify the dry lands (more precisely rainfed areas). In 1982, the ICAR brought out a special publication titled A Decade of Dryland Agricultural Research in India – 1970-80 (ICAR 1982). This study brought forth the problem in failure of extension in disseminating the research output available from the dryland research centers (ICAR 1982). The NBSS study arrived at 20 agro-ecological regions (AER) and 60 agro-ecological sub-regions (AESR) on the criteria of soil, bio-climatic type and physiographic situations. These scientists also classified the National Agricultural Research Project (NARP) regions into (1) arid, (2) semi-arid, (3) dry-subhumid, (4) moist-sub-humid, (5) humid, and (6) per-humid. Accordingly, 211 dry land (rainfed) districts in the country were distributed as follows: 25 arid districts, 131 semi-arid and 55 dry-sub-humid districts.
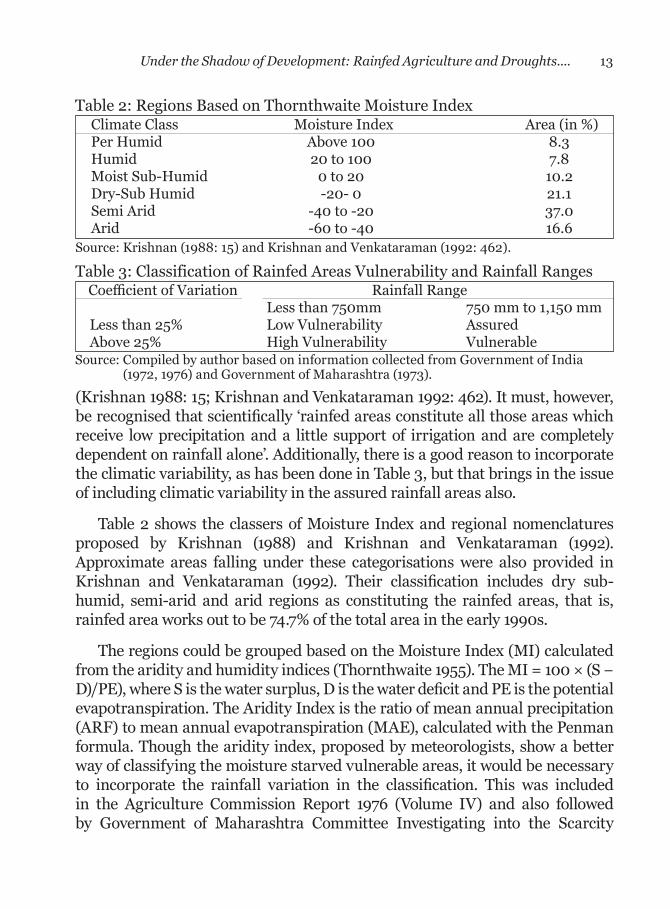
Another way of looking at this classification is to take into consideration the level of annual precipitation along with the CV. This approach was followed by the Agriculture Commission 1976 (Volume IV), which arrived at a 2x2 classification of rainfed areas coming under the high vulnerability category (high CV), the vulnerability as measured through the Moisture Index and rainfall ranges (Table 2). The fourth factor in terms of variation in precipitation could be added to this classification. Such classification based on the core indicators would help in identifying the rainfed areas for sharpening the policy.
Among all these, the Moisture Index-based classification called as the Thornthwaite Moisture Index method is far better, even though it is based on the long-term normal rainfall, which probably undergoes changes over the years
13Under the Shadow of Development: Rainfed Agriculture and Droughts....
(Krishnan 1988: 15; Krishnan and Venkataraman 1992: 462). It must, however, be recognised that scientifically ‘rainfed areas constitute all those areas which receive low precipitation and a little support of irrigation and are completely dependent on rainfall alone’. Additionally, there is a good reason to incorporate the climatic variability, as has been done in Table 3, but that brings in the issue of including climatic variability in the assured rainfall areas also.
Table 2 shows the classers of Moisture Index and regional nomenclatures proposed by Krishnan (1988) and Krishnan and Venkataraman (1992). Approximate areas falling under these categorisations were also provided in Krishnan and Venkataraman (1992). Their classification includes dry sub-humid, semi-arid and arid regions as constituting the rainfed areas, that is, rainfed area works out to be 74.7% of the total area in the early 1990s.
The regions could be grouped based on the Moisture Index (MI) calculated from the aridity and humidity indices (Thornthwaite 1955). The MI = 100 × (S − D)/PE), where S is the water surplus, D is the water deficit and PE is the potential evapotranspiration. The Aridity Index is the ratio of mean annual precipitation (ARF) to mean annual evapotranspiration (MAE), calculated with the Penman formula. Though the aridity index, proposed by meteorologists, show a better way of classifying the moisture starved vulnerable areas, it would be necessary to incorporate the rainfall variation in the classification. This was included in the Agriculture Commission Report 1976 (Volume IV) and also followed by Government of Maharashtra Committee Investigating into the Scarcity
Table 2: Regions Based on Thornthwaite Moisture IndexClimate Class Moisture Index Area (in %)Per Humid Above 100 8.3Humid 20 to 100 7.8Moist Sub-Humid 0 to 20 10.2Dry-Sub Humid -20- 0 21.1Semi Arid -40 to -20 37.0Arid -60 to -40 16.6
Source: Krishnan (1988: 15) and Krishnan and Venkataraman (1992: 462).
Table 3: Classification of Rainfed Areas Vulnerability and Rainfall RangesCoefficient of Variation Rainfall Range
Less than 750mm 750 mm to 1,150 mmLess than 25% Low Vulnerability AssuredAbove 25% High Vulnerability Vulnerable
Source: Compiled by author based on information collected from Government of India (1972, 1976) and Government of Maharashtra (1973).
14 R S Deshpande
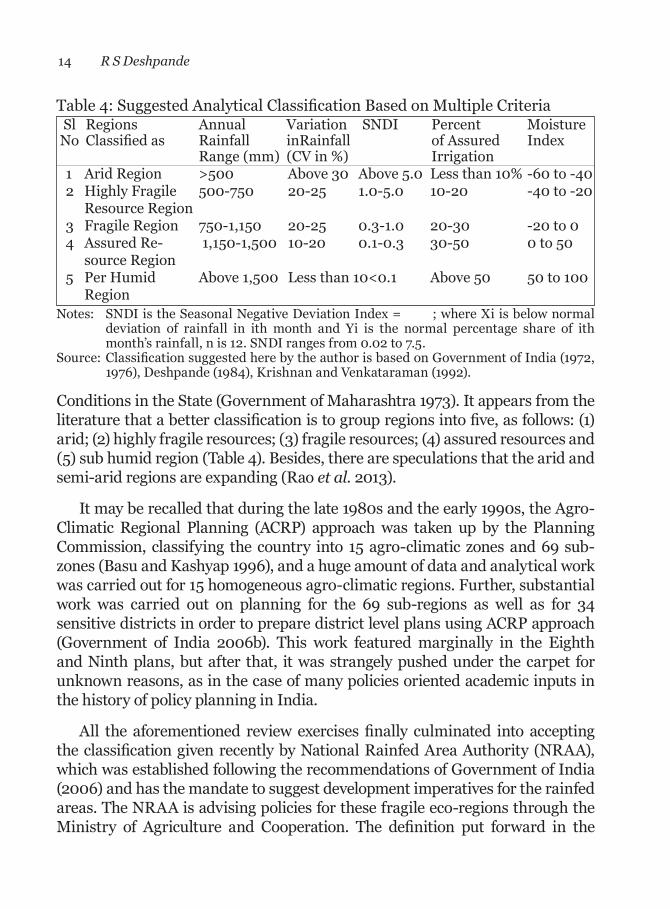
Conditions in the State (Government of Maharashtra 1973). It appears from the literature that a better classification is to group regions into five, as follows: (1) arid; (2) highly fragile resources; (3) fragile resources; (4) assured resources and (5) sub humid region (Table 4). Besides, there are speculations that the arid andsemi-arid regions are expanding (Rao et al. 2013).
It may be recalled that during the late 1980s and the early 1990s, the Agro-Climatic Regional Planning (ACRP) approach was taken up by the Planning Commission, classifying the country into 15 agro-climatic zones and 69 sub-zones (Basu and Kashyap 1996), and a huge amount of data and analytical work was carried out for 15 homogeneous agro-climatic regions. Further, substantial work was carried out on planning for the 69 sub-regions as well as for 34 sensitive districts in order to prepare district level plans using ACRP approach (Government of India 2006b). This work featured marginally in the Eighth and Ninth plans, but after that, it was strangely pushed under the carpet for unknown reasons, as in the case of many policies oriented academic inputs in the history of policy planning in India.
All the aforementioned review exercises finally culminated into accepting the classification given recently by National Rainfed Area Authority (NRAA), which was established following the recommendations of Government of India (2006) and has the mandate to suggest development imperatives for the rainfed areas. The NRAA is advising policies for these fragile eco-regions through the Ministry of Agriculture and Cooperation. The definition put forward in the
Table 4: Suggested Analytical Classification Based on Multiple Criteria Sl Regions Annual Variation SNDI Percent Moisture No Classified as Rainfall inRainfall of Assured Index
Range (mm) (CV in %) Irrigation 1 Arid Region >500 Above 30 Above 5.0 Less than 10% -60 to -402 Highly Fragile 500-750 20-25 1.0-5.0 10-20 -40 to -20
Resource Region 3 Fragile Region 750-1,150 20-25 0.3-1.0 20-30 -20 to 04 Assured Re- 1,150-1,500 10-20 0.1-0.3 30-50 0 to 50 source Region 5 Per Humid Above 1,500 Less than 10<0.1 Above 50 50 to 100
RegionNotes: SNDI is the Seasonal Negative Deviation Index = ; where Xi is below normal
deviation of rainfall in ith month and Yi is the normal percentage share of ith month’s rainfall, n is 12. SNDI ranges from 0.02 to 7.5.
Source: Classification suggested here by the author is based on Government of India (1972, 1976), Deshpande (1984), Krishnan and Venkataraman (1992).
15Under the Shadow of Development: Rainfed Agriculture and Droughts....
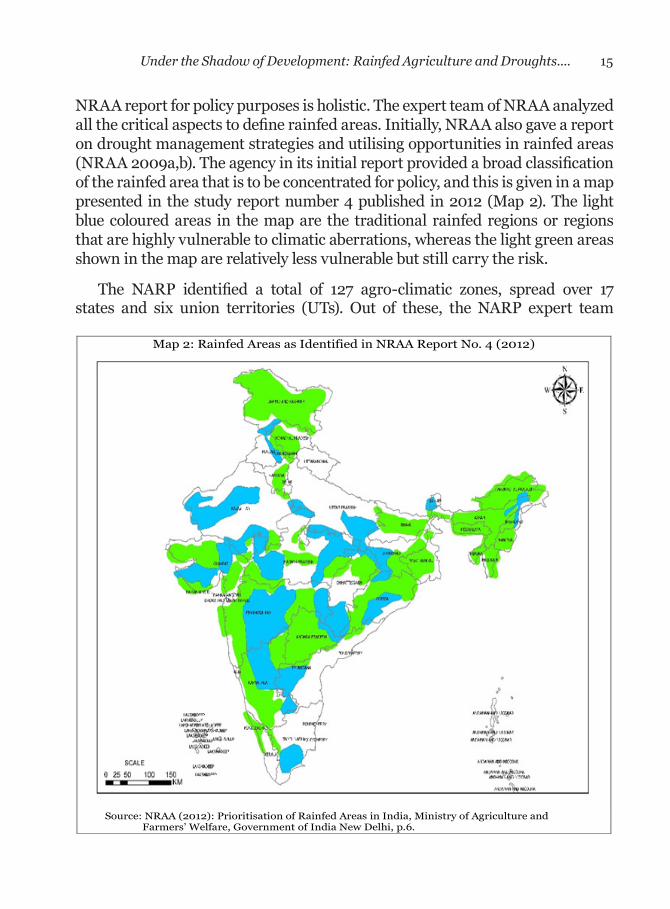
NRAA report for policy purposes is holistic. The expert team of NRAA analyzed all the critical aspects to define rainfed areas. Initially, NRAA also gave a report on drought management strategies and utilising opportunities in rainfed areas (NRAA 2009a,b). The agency in its initial report provided a broad classification of the rainfed area that is to be concentrated for policy, and this is given in a map presented in the study report number 4 published in 2012 (Map 2). The light blue coloured areas in the map are the traditional rainfed regions or regions that are highly vulnerable to climatic aberrations, whereas the light green areas shown in the map are relatively less vulnerable but still carry the risk.
The NARP identified a total of 127 agro-climatic zones, spread over 17 states and six union territories (UTs). Out of these, the NARP expert team
Map 2: Rainfed Areas as Identified in NRAA Report No. 4 (2012)
Source: NRAA (2012): Prioritisation of Rainfed Areas in India, Ministry of Agriculture and Farmers’ Welfare, Government of India New Delhi, p.6.

16 R S Deshpande
identified 73 zones that included traditional and newly identified vulnerable rainfed areas based on rainfall, irrigation, soil type, topography and crop pattern (Venkateshswaralu 2016; Higgins et al. 1981). The NRAA also brought out two very elaborate reports in 2011 and 2020, both focusing on prioritising the districts in rainfed areas for the purpose of policy. The report number 4, released more recently in 2020, gives the logical steps involved in the delineation of rainfed areas, with a slightly wider definition and coverage as against the earlier works. It is interesting to note that the delineation work of rainfed area was taken by NRAA on priority. The purpose behind such priority was to plan for the delineated areas after understanding the constraints at the local level. Many of the evaluation studies carried out on rainfed agriculture, including those of soil conservation and watershed management, clearly pointed out that location specific planning and policy solutions rather than macro level planning provide better solutions; for instance, watershed management may not succeed everywhere due to the local constraints (Deshpande 1996). The same approach was followed during the ACRP, wherein initially the statistical outline and the basic parameters of the regions were documented and then, after identification of sub regions, the development imperatives were outlined for each sub-zone for the planning purpose. This exercise could have helped the planners to intricately plan for the development of the rainfed areas, however, it was decided to almost shelve all these efforts during Eleventh Plan after the working group on ACRP submitted its report. The Volume III of the Eleventh Plan includes an interesting recommendation:
“The third Research priorities have to shift towards evolving cropping systems suited to various agro-climatic conditions and towards enhancing the yield potential in rainfed areas through development of drought- and pest-resistant varieties” (Government of India, Eleventh Plan, Volume III: 35).
Other than this, the Eleventh Plan Volume III has reference to agro-climatic word only 10 times, and there is no mention of any planning using the material prepared under this initiative. Again in the Twelfth Plan, the word agro-climatic appears only three times and the ACRP was totally bypassed. The Twelfth Plan, heralded the establishment of the NRAA stating:
“The authority was expected to play a major role in training of the officials associated with the watershed development projects and also take a lead role in social mobilisation which is critical in the success of the watershed development programmes. It was also

17Under the Shadow of Development: Rainfed Agriculture and Droughts....
expected to take up studies for evaluation of the implementation of projects by the States. So far Departments both at the Central and State level has not taken much interest in associating NRAA either in evaluation of the programmes or for providing technical input for these” (Government of India, Twelfth Plan, Volume II: 44).
The expectations of the planners were that NRAA would involve in social mobilisation that was not even a part of the mandate as stated in 2006 NRAA documents. It is not, therefore, surprising that the ‘Departments both at Central and State level has not taken much interest in associating NRAA either in evaluation of the programmes or for providing technical input for these’. The main hurdle in the effectiveness of any institution is providing autonomy in the implementation of the philosophy of the institutions and persuasion of the core theme.
Map 3: Districts Classified According to Annual Rainfall Ranges
Source: NRAA (2020): Prioritisation of Districts for Development in India: A Composite Index Approach, Ministry of Agriculture and Farmers’ Welfare, Government of India, New Delhi, Figure 2.2.
18 R S Deshpande
4. Expanse of Rainfed AreasRainfed regions delineated on the basis of the criteria, namely, that the
region receives less than 1,150 mm of annual normal precipitation, has CV of more than 20% in seasonal rainfall and has a protection of irrigation with less than 30% of NSA, could be taken for intensive policy intervention for rainfed agriculture. During the early years of independence, we had about 82.6% of area (99.5 million ha) under the rainfed category or receiving a little irrigation support. However, over time, the efforts towards bringing in irrigation to the drought prone areas and precariously water scarce regions began with strong initiatives of the Government of India focusing on equity and stability (Dhawan 1988a). With regard to the progress of irrigation, Dhawan observed, ‘... the irrigation development in the country has been quite satisfactory and it had given significant protection to the agriculture in sensitive areas, but it has limitations’ (Dhawan 1988: 36). Initially the entire focus of the public policy on irrigation was on expanding the surface irrigation, and this policy continued till the mid-1970s. Groundwater development became prominent policy since then with the help of dug-well/bore well loans from the commercial and cooperative banks. In Karnataka, a former Minister of Rural Development, Late Abdul Nazir Saab, went ahead in undertaking a massive programme of well irrigation in some of the districts hugely subsidised by the state’s resources. He was nick-named as BaviSachiva meaning ‘Minister of Wells’. The districts of Kolar, Bijapur and Chitradurga have the highest density of these wells, and today in these three districts, groundwater levels have gone up to 100 feet below ground level (ft bgl).
Over the last 65 years, the irrigation development including public and private sources of investment could bring 68 million ha under net irrigated area. This works out to be almost 0.72 million ha per year. Though satisfactory, this progress is not exemplary as the irrigation potential is largely tapped from the surface irrigation sources and the recharge structures remained neglected. Many writers termed canal irrigation as inefficient (Chambers 1985; Vaidyanathan 1992). This was strongly contradicted by Dhawan (1998), who, in his Presidential Address to the Indian Society of Agricultural Economics, argued that proper maintenance and regular upkeep of the canal irrigation could help in enhancing the efficiency of canal irrigation. Presently, we have 708.9 lakh ha of net cropped area unirrigated, of which 618.2 lakh ha falls under climatically vulnerable drought prone states (Table 5, Figure 3). Questions were, therefore, raised by a few irrigation economists about the veracity of the one-

19Under the Shadow of Development: Rainfed Agriculture and Droughts....
Table 5: State-wise Distribution of Rainfed Area (in lakh hectare) States Rainfed Area Rainfed Area As % to
(lakh hectare) Net Sown Area1972-73 2010-11 2017-18 1972-73 2010-11 2017-18
Andhra Pradesh 82.7 59.9 60.0 72.8 56.1 55.9 Bihar 59.9 33.4 33.8 72.5 50.1 50.6 Gujarat 79.9 60.7 60.7 85.3 58.9 58.9 Karnataka 89.1 69.9 67.5 88.0 67.5 68.1 Madhya Pradesh 168.7 115.2 84.5 91.5 58.5 42.6 Maharashtra 155.5 141.5 138.3 92.1 81.3 81.3 Rajasthan 129.1 113.7 99.7 85.5 64.5 55.3 Tamil Nadu 35.8 20.6 19.9 56.9 41.5 43.2 India 1077.5 778.3 708.9 77.4 55.2 50.9 Other High Rainfall States with Large Rain dependence Assam 17.0 26.4 24.3 74.79 94.1 87.8 Odisha 49.2 31.3 29.5 85.08 62.4 72.7Notes: Data for Andhra Pradesh, Bihar, Madhya Pradesh and Uttar Pradesh are of undivided states. States with less than 40% rainfed areas are not included. Source: Based on data from Indiastat.com.
Figure 3: Rainfed Area (million hectare), Cropping Intensity (in %) and Net Irrigated Area (in %)
99.5109.9 107.7
101.193
70.9
17.43 18.59 22.63 28.3534.69
49.14
0
20
40
60
80
100
120
140
160
1952-53 1962-63 1972-73 1982-83 1992-93 2017-18
Net Rainfed Area Ml Ha Cropping Intensity (%) Net Irrigated Area (NIA)
Source: Government of India (2020b): Agricultural Statistics at a Glance, Ministry of Agriculture and Farmers Welfare, New Delhi, and its related previous issues.

20 R S Deshpande
sided irrigation development policies without paying attention to augmenting the sources of irrigation (Vaidyanathan 1992, 2006; Narayanamoorthy and Deshpande 2005).
The estimates of rainfed areas also vary significantly across the states (Table 5). There are a few states which have a higher rainfed area as percentage of their net cropped area, and as it goes logically, these are the states that suffer from the vagaries of droughts with more than 20% probability. There are 10 states that have more than 40% of their net sown area under rainfed conditions. Among these, Assam comes under assured rainfall zone (2,579 mm per year), but has 87% of its net sown area as rain dependent, and so is the case of Odisha. The rest of the states have a large share of net sown area under rainfed conditions (Figure 4). States like Maharashtra, Karnataka, Andhra Pradesh, Gujarat and Rajasthan are the most climatically vulnerable regions.
Overall, it can be noted that over the last six decades, there has been a significant reduction in the rainfed area, but the same thing is not true during the last two decades ending 2017-18. It was also noticed that the speed of increasing irrigation in the drought prone and rainfed areas has substantially slowed down
Figure 4: State-wise Rainfed Area as Percentage of Net Sown Area
0102030405060708090
100
1972-73 2010-11 2017-18
Source: Same as Figure 3.

21Under the Shadow of Development: Rainfed Agriculture and Droughts....
as noted in the mid-term appraisal of the Eleventh Plan. Many of the irrigation projects as well as minor irrigation schemes have been lingering in the states leaving large areas to the mercy of vagaries of monsoon.
Analysis of the trends in rainfed areas in the context of land utilisation during the last seven decades (Table 6a and 6b) brings out certain interesting analytical observations. First, an increase of more than 100% in the category of
Table 6a: Land Use Pattern and Estimates of Rainfed Area in India (In million hectare)
Particulars 1952-53 1962-63 1972-73 1982-83 1992-93 2017-18 Geographical area 328.7 328.7 328.7 328.7 328.7 328.7 Area reported 287.6 300.9 304 304.2 304.9 307.9 Forest 46.8 56.3 64.3 67.4 67.8 72.0 Area under non- 11.5 14.9 16.7 19.7 21.5 27.4 agri-cultural uses Barren and uncul- 37.7 35.7 27.3 20.1 19.3 17.0 turable land Total 49.1 50.6 44.0 39.7 40.8 44.4 Permanent pastures 8.0 14.1 13.0 12.0 11.3 10.3 and other grazing lands Land under 11.8 4.5 4.4 3.6 3.8 3.1 miscellaneous tree crops and groves (not included in net area sown) Culturable 23.5 18.6 17.4 16.5 14.9 12.3 waste land Total 43.3 37.1 34.8 32.1 29.9 25.7 Fallow lands other 15.4 10.6 8.7 9.6 9.8 11.4 than current fallows Current fallows 12.5 11.3 12.8 14.3 14.2 15.1 Total 27.8 21.9 21.6 23.9 24.0 26.5 Net area Sown 120.5 135.0 139.2 141.1 142.4 139.4 Gross sown area 134.3 155.2 164.4 174.0 184.5 199.1 Net irrigated area 21.0 25.1 31.5 40.0 49.4 68.5 Gross irrigated area 23.0 28.6 38.6 51.0 65.2 98.3 Net rainfed area 99..5 109.9 107.7 101.1 93.0 70.9 Cropping intensity (%) 111 115 118 123 130 143Source: Based on Land Use Statistics. Retrieved from Ministry of Agriculture and Farmers’ Welfare, Government of India (https://eands.dacnet.nic.in/LUS_1999_2004.htm).
Not
ava
ilabl
e fo
r cu
ltiv
atio
nO
ther
unc
ulti
vate
d la
nd
excl
udin
g fa
llow
land
Fallo
w
Land
s
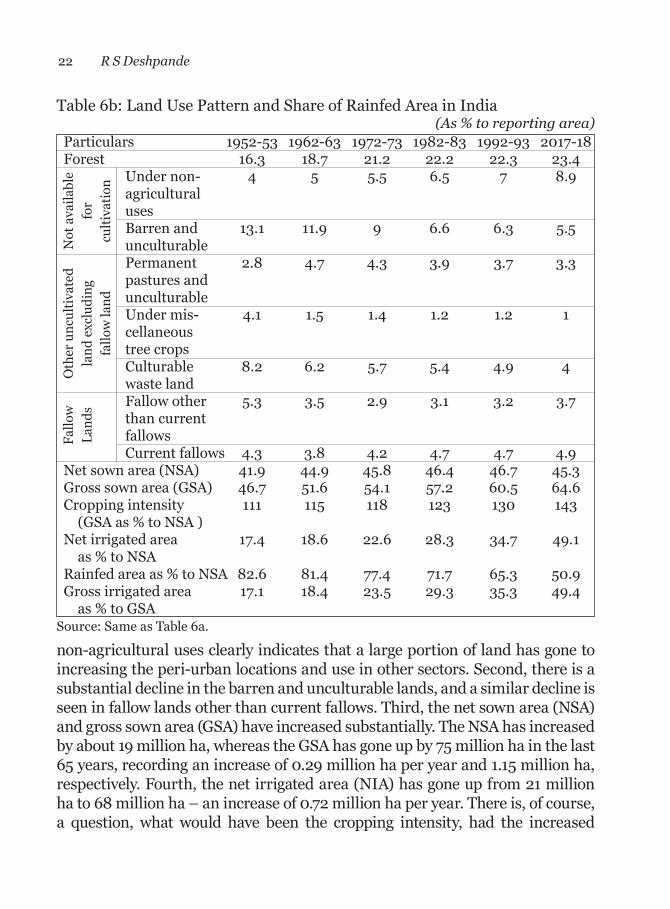
22 R S Deshpande
non-agricultural uses clearly indicates that a large portion of land has gone to increasing the peri-urban locations and use in other sectors. Second, there is a substantial decline in the barren and unculturable lands, and a similar decline is seen in fallow lands other than current fallows. Third, the net sown area (NSA) and gross sown area (GSA) have increased substantially. The NSA has increased by about 19 million ha, whereas the GSA has gone up by 75 million ha in the last 65 years, recording an increase of 0.29 million ha per year and 1.15 million ha, respectively. Fourth, the net irrigated area (NIA) has gone up from 21 million ha to 68 million ha – an increase of 0.72 million ha per year. There is, of course, a question, what would have been the cropping intensity, had the increased
Table 6b: Land Use Pattern and Share of Rainfed Area in India (As % to reporting area)
Particulars 1952-53 1962-63 1972-73 1982-83 1992-93 2017-18 Forest 16.3 18.7 21.2 22.2 22.3 23.4 Under non- 4 5 5.5 6.5 7 8.9 agricultural uses Barren and 13.1 11.9 9 6.6 6.3 5.5 unculturable Permanent 2.8 4.7 4.3 3.9 3.7 3.3 pastures and unculturable Under mis- 4.1 1.5 1.4 1.2 1.2 1 cellaneous tree crops Culturable 8.2 6.2 5.7 5.4 4.9 4 waste land Fallow other 5.3 3.5 2.9 3.1 3.2 3.7 than current fallows Current fallows 4.3 3.8 4.2 4.7 4.7 4.9 Net sown area (NSA) 41.9 44.9 45.8 46.4 46.7 45.3 Gross sown area (GSA) 46.7 51.6 54.1 57.2 60.5 64.6 Cropping intensity 111 115 118 123 130 143 (GSA as % to NSA ) Net irrigated area 17.4 18.6 22.6 28.3 34.7 49.1 as % to NSA Rainfed area as % to NSA 82.6 81.4 77.4 71.7 65.3 50.9 Gross irrigated area 17.1 18.4 23.5 29.3 35.3 49.4 as % to GSASource: Same as Table 6a.
Not
ava
ilabl
e fo
r cu
ltiv
atio
n
Oth
er u
ncul
tiva
ted
land
exc
ludi
ng
fallo
w la
nd
Fallo
w
Land
s
23Under the Shadow of Development: Rainfed Agriculture and Droughts....
irrigation been used towards double cropping? This was discussed by Dhawan (1988). The area irrigated more than once was two million ha in 1952-53, and it has gone up 30 million ha by 2017-18, recording an increase of 28 million ha. It can be expected that all of it would be used for double cropping. However, we find almost 46 million ha of additional area that has been brought under double cropping. It becomes clear that at least 28 million ha double cropping is achieved due to the increased irrigation. Has this double cropping happened in the rainfed areas with the support of rain water alone? Or, is it a testimony of the increased water augmenting programmes? The latter seems to be happening. It is interesting to note that between 1952 and 2018, while the gross irrigated area increased by 75.3 million ha, the GSA increased only by 65.1 million ha. That is, only about 10 million ha was provided irrigation for cultivation in one season only.
Right from the beginning of planning process in India, irrigation was emphasized as the saviour for the rainfed areas and insurance against drought (Deshpande 2008, Deshpande and Shaha 2018). As far as India’s water resources are concerned, certainly there are limitations and the limitations are being reached very fast (Parikh 2009). It is estimated that India has 1,122 cubic kilometer (km3) utilisable water resources; out of this, 690 km3 are utilisable surface water and 396 km3 are utilisable groundwater (Government of India 2009b). Rainfall has been providing 392 million hectare meters (Mham), and a further 8 Mham is provided through snowfall. Out of all this, only 400 Mham can be accounted for as utilisable resources (Raju et al. 2004). Similarly, the Report of the Task Force appointed by the Planning Commission has stated that:
“The Second Irrigation Commission (1972) assessed the ultimate irrigation potential (UIP) of the country as 113.47 Mha. Comprising of 58.47 Mha from major & medium irrigation schemes and 55 Mha from minor schemes. In 1995, Central Ground Water Board (CGWB) brought out a publication entitled ‘Ground Water Resources of India’ where potential from ground water has been reassessed as 64.05 Mha” (Parikh 2009, c: 3).
Currently, almost 85% of the utilisable water resources are utilised for agriculture, domestic and livestock use. Even then, the rainfed area could not be squarely protected against the vagaries of monsoons or resilience to drought could not be built. It is an irony of the situation that a large amount of irrigation projects was developed in the regions, which were not drought prone areas of the country. In the recent past, the pace of investment in irrigation projects has
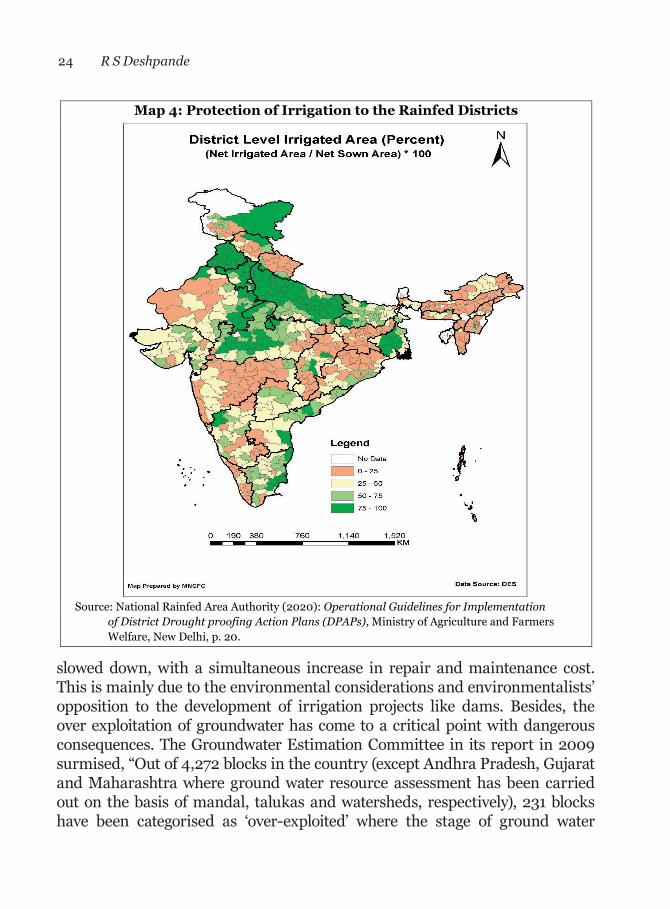
24 R S Deshpande
slowed down, with a simultaneous increase in repair and maintenance cost. This is mainly due to the environmental considerations and environmentalists’ opposition to the development of irrigation projects like dams. Besides, the over exploitation of groundwater has come to a critical point with dangerous consequences. The Groundwater Estimation Committee in its report in 2009 surmised, “Out of 4,272 blocks in the country (except Andhra Pradesh, Gujarat and Maharashtra where ground water resource assessment has been carried out on the basis of mandal, talukas and watersheds, respectively), 231 blocks have been categorised as ‘over-exploited’ where the stage of ground water
30
Map 4: Protection of Irrigation to the Rainfed Districts
Source: National Rainfed Area Authority (2020): Operational Guidelines for Implementation of District Drought proofing Action Plans (DPAPs), Ministry of Agriculture and Farmers Welfare, New Delhi, p. 20.
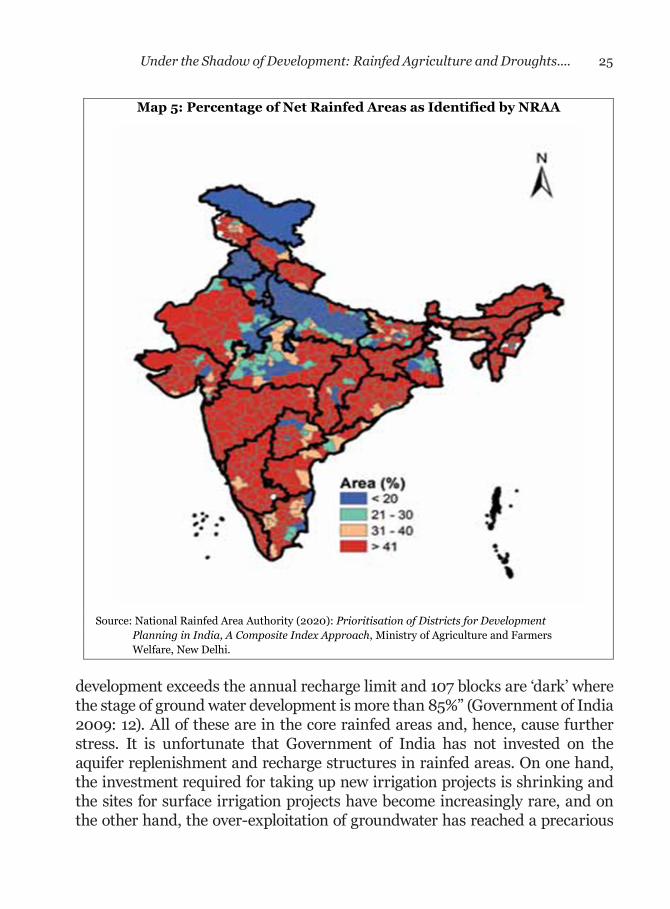
25Under the Shadow of Development: Rainfed Agriculture and Droughts....
development exceeds the annual recharge limit and 107 blocks are ‘dark’ where the stage of ground water development is more than 85%” (Government of India 2009: 12). All of these are in the core rainfed areas and, hence, cause further stress. It is unfortunate that Government of India has not invested on the aquifer replenishment and recharge structures in rainfed areas. On one hand, the investment required for taking up new irrigation projects is shrinking and the sites for surface irrigation projects have become increasingly rare, and on the other hand, the over-exploitation of groundwater has reached a precarious
Map 5: Percentage of Net Rainfed Areas as Identified by NRAA
Source: National Rainfed Area Authority (2020): Prioritisation of Districts for Development Planning in India, A Composite Index Approach, Ministry of Agriculture and Farmers
Welfare, New Delhi.
26 R S Deshpande
stage. The Millennium Study on Water Resources surmised, “Situation may become worse once these recurring expenditures are dominated more by establishment costs (salaries) than operation and maintenance expenditures. Governments, of late, are borrowing for current expenditure purpose leaving very little for the investment in any of the core sectors” (Raju et al. 2004: 40). Farmers from rainfed regions look at the government efforts with expectations and argue for new irrigation sources and loans for well irrigation, but very hesitantly participate in the watershed development programmes. It has been observed that the dependence of beneficiaries on the government funds has increased substantially during last three decades, and their personal role in their own development has been receding significantly. This over-dependence on the government is to be called as new governmentality, and this has substantially increased across the developmental programmes (Deshpande 2017). With the limits of supportive irrigation approaching fast and government funds being used for other purposes, warning bells are clearly sounding that the rainfed agriculture and drought prone areas would suffer significantly under the stress. The conditions of rainfed areas and drought prone areas are quite precarious, as they experience poor and low productivity. Policy makers need to, therefore, search for new policy matrix, and not to depend on the traditional worn out irrigation-based solutions.
5. Grammar of UnderdevelopmentThe grammar of underdevelopment is construed on the perpetuation of
economic fragility of rainfed agriculture caused by its natural resource criticality. Rainfed areas connote exactly the concept of a fragile resource region, developed earlier in the context of evaluation of the National Watershed Development Programme in one of the studies conducted at Gokhale Institute of Politics and Economics (GIPE), Pune and also used by Jodha (1991). In the GIPE study (Deshpande and Reddy, 1990), the watershed programmes of Maharashtra were evaluated from two different perspectives. The first attempt was to look into the hypothesis that watershed programme was the redeemer for rainfed areas. Keeping this in focus, the first study concentrated on a programme originated and operated totally by the soil conservation department of the Government of Maharashtra. The programme was called as Comprehensive Watershed Development Programme (COWDEP). This programme had soil conservation as its major intervention and, therefore, dominated by engineers and civil works. No substantial differences in the crop pattern, intensity of cropping, proportion of waste lands brought under cultivation and yield per

27Under the Shadow of Development: Rainfed Agriculture and Droughts....
hectare were observed in the treated areas, as against the controlled areas. But the beneficiaries reported some increase in the water table, but connecting that directly to the sub-surface civil works was a far stretched logic. The programme was absolutely engineering focused with bunding as the central activity. The fragile resource region, thus, stayed glued to the under-developed state. In analysing the National Watershed Development Programme initiated during the Sixth Plan period and followed through the Seventh Plan onwards, the holistic impact of the programme was brought out, but the authors surmised about the sustainability over time (Deshpande and Reddy 1991). The impact parameters were analysed in the context of three different agro-climatic zones, namely, scarcity zone, moderate rainfall zone and assured rainfall zone. It was observed that the impact parameters in the three zones were quite different, and it was strongly recommended that the same engineering- and water-based strategy does not fit all sizes. Location specific interventions are better than the top-down planning. In a similar study, Deshpande (1996) also analysed the issue of watershed management from the standpoint of differential impact parameters across all the agro-climatic zones with a specific focus on rainfed regions. The analyses done during that phase suggested that the impact parameters were a direct function of the agro-climatic characteristics of the region and that these parameters always needed problem specific treatments planned a priori (Deshpande and Narayanamoorthy 1999; Joshi et al. 2005). It was brought forth that economic participation of rainfed areas through watershed development had remained as historical impediments in aggregate agricultural development (World Bank 2005). These regions which contribute significantly (Sharma et al. 2010) have now stagnated at the precarious margins in terms of natural resource augmentation, livelihood security and inadequate investment. As a result, these regions continue as a drag on aggregate economic growth. On the policy front also rainfed areas remained more or less out of the ambit of the strongly heralded seed-water-fertilizer technology of the mid-1960s, or unfortunately our policy makers searched solutions for rainfed areas in the philosophy of the Green Revolution, like searching a black cat in the dark room.
Many voluntary agencies and non-governmental organisations (NGOs) have participated in initiating development through watershed management and other programmes in the rainfed areas as well as drought prone areas of the country. These include Department for International Development (DFID) that funded Karnataka Watershed Development Project (KAWAD), Watershed Support Services and Activities Network (WASSAN), Samaj Pragati Sahyog, Danish International Development Agency (DANIDA), Mysore Resettlement and Development Agency

28 R S Deshpande
(MYRADA), Indo-German Watershed Development Programme (IGWDP), Swaraj Foundation, and many others (Kolvali and Kerr 2002). The role of NABARD as a bank for agriculture and rural development is quite commendable. Initially, it was the Chairman of NABARD, P R Nayak, who introduced a special programme on watershed management and supported the efforts. Over the years, NABARD has also contributed significantly in terms of studies and active interventions. NABARD supported the watershed development programmes through its own Watershed Development Fund (WDF) and the IGWDP, since 1990. NABARD supported 123 projects across five states with an outlay of Rs. 607.7 million, and by December 2017, it already released Rs. 138.5 million (Bhatia 2005; NABARD 2018).
Despite many efforts from the government and also from the civil society, the development in the rainfed and drought-prone areas seem to be moving very slowly. It is certainly reeling below the underdevelopment trap perpetually haunting the rainfed areas. This trap begins with the constraints on water availability in these regions and continues as a stumbling block coupled with continuous natural resource degradation. The most vital input for enhancing the technological change, that is, investment by both public and private sources did not take place in these regions at the required pace. In this context, Jodha surmised that even the agricultural research inputs also catered only to the superior crops, regions and groups of cultivators (Jodha 1978, 1991). Nothing changed among the agro-scientists. A fragile resource region would be operating under six broad natural restraints on which there is little human control. First, these regions receive low annual average precipitation and that limits up to 1,150 mm, and at times, as low as 350 mm. In strict agronomic terms, this precipitation is sufficient for crop growth with proper choice of crops, which may be termed as rainfed crops. Second, these regions also confront unpredictable erratic behaviour of rainfall and the variability (CV) of rainfall is almost up to 30%. Third, there are within year fluctuations that also disturb the entire cropping activities and inflict losses on the farmer. Barron et al. (2003) indulged in a dry spell analysis to bring forth the issue of seasonality and Deshpande (1984) had earlier given the method to capture this empirically. This can be explained in the seasonality of the year-long precipitation that matters a lot in the fragile resource region, as the Seasonal Negative Deviation Index (SNDI) is quite precarious in the rainfall deficient regions (Deshpande 1984; Barron et al. 2003). In other words, rains fail exactly in the months when the crops growth critically needs water for survival. There were a few attempts to understand the psychical behaviour of rainfall and predict its seasonality, however, each one of these have yielded no research results. Similarly, the statistical forecasting also met with a
29Under the Shadow of Development: Rainfed Agriculture and Droughts....
similar fate (Deshpande 1984; Bean 1969). Fourth, there are typical degraded lands with impoverished farmers in the regions that inhibit any development of infrastructure in these areas, therefore, these regions have stayed hitherto on the margins in the policy matrix. Even the usual infrastructure like schools and public health centres (PHCs) have a very low density in these regions (NRAA 2020). It is due to the location of these regions, and the soil depth is not sufficient in most of the districts. Some of the districts also showed problem of soil degradation that adds to the fragile nature of this economy. Fifth, the economic activities in these regions are centered only on crop and animal husbandry, more due to tradition and also the policy failures, ignoring the basic fragility of sustaining agricultural activities in the context of fragile resource base. It is well-known that the water availability both from natural and man-made sources is limited, and the success of the huge watershed development programmes in the country does not seem to have made any perceptible difference in the rainfed region (Government of India 1964, 1994a, b, 2006, 2008).
The Working group of the Planning Commission on Watershed Development and Rainfed farming for the Tenth Plan stated: “Although guidelines of the Ministry of Rural Development emphasize decentralisation and participation, implementation of watershed projects has remained poor because of little participation of local people, limited human resources capability and practically no involvement of senior state government officers and line agencies. Watershed development programmes require a comprehensive integrated approach involving several line departments” (Government of India 2001, Tenth Plan). This is mainly because the emphasis was always on technical engineering components ignoring social engineering. There was also a strong aversion towards risk and adoption of the new techniques by farmers of any region. And, finally, being a cereal-based, monsoon dependent and with cropping pattern dominated by low-value and low-density crops, the income of the farmers in rainfed areas are certainly non-comparable to those farmers from the well-endowed regions (Dhawan 1988b; Narayanamoorthy 2021). Given this level of fragility, the economy of the rainfed regions has remained impoverished and precariously dependent on the government’s support, but at the same time, causing an uneasy drag on overall economic growth.
5.1 Deciphering the Micro-Component of the Grammar: NRAA Method The First Five Year Plan incorporated soil conservation as the major strategy
to deal with rainfed areas, however, the evaluation of this programme pointed
30 R S Deshpande
out that the programme was completely ineffective, non-location specific and dominated by engineering structures. Many interventions were taken after that like dryland research centres, World Bank aided watershed development projects (three different models), state level watershed development programmes under various nomenclatures like National Watershed Development Programme for Rainfed Areas (NWDPRA), ICRISAT supported watershed development programmes, other programmes for soil and water conservation undertaken by the NGOs and state governments designed programmes (like SUJALA in Karnataka). These were under the Ministry of Agriculture and Ministry of Rural Development, and many times, at the behest of the Planning Commission. There are a few evaluation studies available on most of these programmes, and one of the common observations is that the promises made by these programmes in the design were not met. Ministry of Rural Development appointed a Committee under the Chairmanship of Parthasarathy (Government of India 2006). The Committee was quite critical in its report and stated, “Perhaps the most critical weakness of watershed programmes in India is that they operate almost as if groundwater does not exist. It enters only as something to be recharged and replenished. But it appears to play almost no role at all in watershed planning. Watershed planners forget that just as there is a surface water catchment, there also exists a groundwater catchment” (Government of India 2006: 6). The National Advisory Council in its note in 2005, possibly after understanding the outcomes of all the watershed development programme and soil and water conservation interventions in the country, observed:
“There are, at present, a multiplicity of programmes for rehabilita-tion of degraded lands through watershed development run by different Ministries. There has been a proposal in the government to bring all these programmes under a single Ministry – a necessary condition for implementing them on a Mission Mode While the concerned departments are in agreement about the desirability of bringing together all the watershed programmes under one umbrella with a view to implementing them on a Mission Mode, serious differences persist among different Ministries regarding the ownership of the unified programme. It is of utmost importance to resolve this issue at the earliest so that the different programmes are merged and run on a mission mode by a single nodal ministry, as promised in the NCMP” (Quoted in Government of India 2006: 112).
31Under the Shadow of Development: Rainfed Agriculture and Droughts....
Following these important reports of 2005 and 2006 and the promises given, the then Prime Minister Manmohan Singh, in his Independence Day Address to the nation on the 15 August 2005, announced the establishment of a permanent institution in the government sector to oversee the rainfed area development programme. This was in line with a recommendation of the Parthasarathy Committee (Government of India 2006). To quote, ‘We believe that a National Authority for Sustainable Development of Rainfed Areas (NASDORA) needs to be set up as a quasi-independent authority to manage the entire primarily Central Government funded watershed programme’ (Government of India 2006: 112). The report also provided a design for such authority and recommended that the implementation be brought largely under the non-governmental sector and voluntary organisations, which had been working in this field. After some deliberations the NRAA was established as an apex body on the similar lines of NASDORA with a few modifications. Almost immediately from 3 November 2006, the NRAA started functioning as an independent apex body governed under the Ministry of Agriculture with the Chief Executive Officer (CEO) and subject experts as Directors to provide inputs regarding systematic upgrading and management of the country’s rainfed agriculture. The focus of NRAA had been location specific for rainfed agriculture. The NRAA brought out a few excellent publications and reports on drought and flood management in the country, followed with implementation guidelines (NRAA 2008, 2009a,b, 2010,a,b, 2011, 2012a,b,c,d, 2015, 2020).
The NRAA expert group followed an index construction approach for Integrated Livelihood Index (ILI) and Natural Resource Index (NRI) with appropriate weights and formulations. Its publication on Prioritisation of Districts for Development Planning in India – A Composite Index Approach in 2012, and the revised version in 2020, focused on the natural resource constraints and analytically merged together important components to arrive at NRI. This approach was quite crisp from the implementation perspective, therefore, useful analytically. The NRAA (2012, 2020) used this unique approach to prioritise the rainfed districts (out of the total 670 districts) for the policy purpose on the basis of various indices. Rainfed Areas Prioritisation Index (RAPI) was the final index derived through combination of NRI and ILI (NRAA 2020).
The report describes the methodology as,
“The indices for NRI and for components of ILI were arrived at by summing the values of relevant normalised indicators multiplied
32 R S Deshpande
by their respective weights. Further, the final ILI – an aggregate of three (3) components was then a summation of rescaled indices of these three, namely socio-economic, infrastructure, and health and sanitation with weights assigned respectively at 65, 25 and 10 per cent. The NRI and ILI were then rescaled to build Composite Index (CI). Finally, CI was constructed by assigning 2/3 (two-thirds) weight to NRI and 1/3 (one-thirds) weight to ILI using the following formula, CI = [2/3(1-NRI)] + [1/3(1-ILI)]” (NRAA 2020: 20).
The NRI and ILI were computed for 670 districts using about 12 parameters for NRI and giving proper weights to each of the parameters (NRAA 2020: 16, Table 1). The parameters included drought frequency, net rainfed cultivated area, annual rainfall, status of groundwater, available water resources, normalised difference in vegetative index (NDVI), pastures and other grazing land, cultivable waste, other fallows and current fallows, barren and uncultivated lands elevation, and degraded lands. The results were presented in the thematic maps, an instrument that makes administration easy (Map 4). For the ILI or simply the Livelihood Index (LI), there were 18 components considered. These include share of small and marginal farmers, Scheduled Caste (SC) and Scheduled Tribe (ST) population, share of total workforce, rural population density, literacy in rural areas, density of self-help groups (SHGs) and livestock, share of agriculture, per capita income and consumption of fertilizers. The other two components are infrastructure (represented by five indicators) along with health and sanitation (three indicators). A composite index was, thus, computed by combining the NRI and LI, assigning two-third and one-third weights, respectively. The methodology has a few uncomfortable issues like the rationale behind the assignment of weights and the logic of some of the overriding correlates. There are multiple number of indicators, which are internally correlated, and hence, may distort the weighing diagrams. A principal component analysis (PCA) would have been a better technique. Fortunately, this does not distort the results on an ordinal scale without misrepresenting the hierarchy and could be utilised for administration. Hence, the issue of any arbitrariness in weights does not create any irritating problems.
One must appreciate that this was the first time that such an elaborate exercise was carried out twice by NRAA first in 2011 and modified in 2020. The maps presented (Maps 4 to 8) and the results they represent are absolutely verifiable on the ground and experience as well as literature from the other
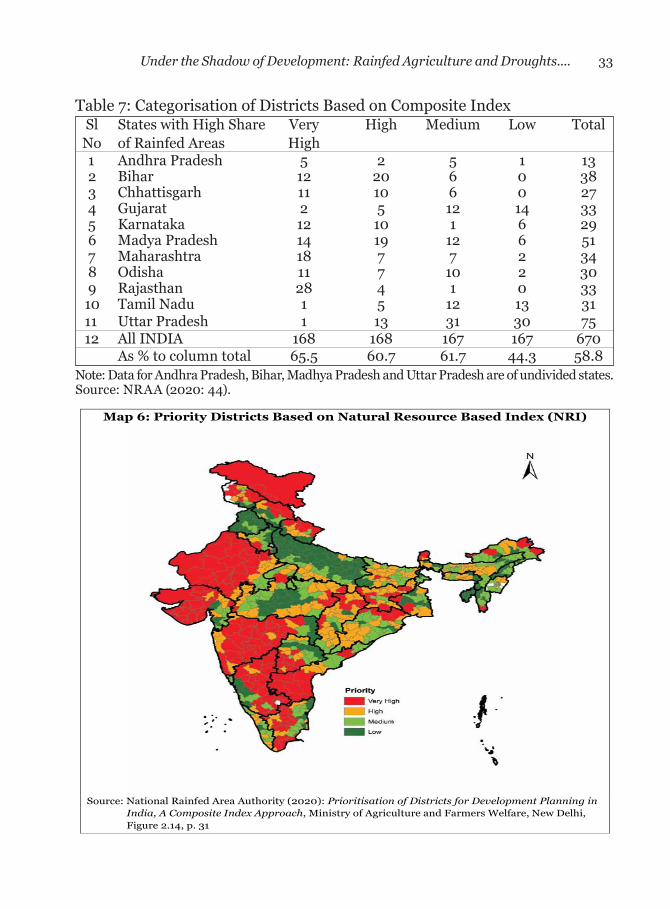
33Under the Shadow of Development: Rainfed Agriculture and Droughts....
Table 7: Categorisation of Districts Based on Composite Index Sl States with High Share Very High Medium Low Total No of Rainfed Areas High
1 Andhra Pradesh 5 2 5 1 13 2 Bihar 12 20 6 0 38 3 Chhattisgarh 11 10 6 0 27 4 Gujarat 2 5 12 14 33 5 Karnataka 12 10 1 6 29 6 Madya Pradesh 14 19 12 6 51 7 Maharashtra 18 7 7 2 34 8 Odisha 11 7 10 2 30 9 Rajasthan 28 4 1 0 3310 Tamil Nadu 1 5 12 13 3111 Uttar Pradesh 1 13 31 30 7512 All INDIA 168 168 167 167 670 As % to column total 65.5 60.7 61.7 44.3 58.8
Note: Data for Andhra Pradesh, Bihar, Madhya Pradesh and Uttar Pradesh are of undivided states. Source: NRAA (2020: 44).
Map 6: Priority Districts Based on Natural Resource Based Index (NRI)
Source: National Rainfed Area Authority (2020): Prioritisation of Districts for Development Planning in
India, A Composite Index Approach, Ministry of Agriculture and Farmers Welfare, New Delhi, Figure 2.14, p. 31
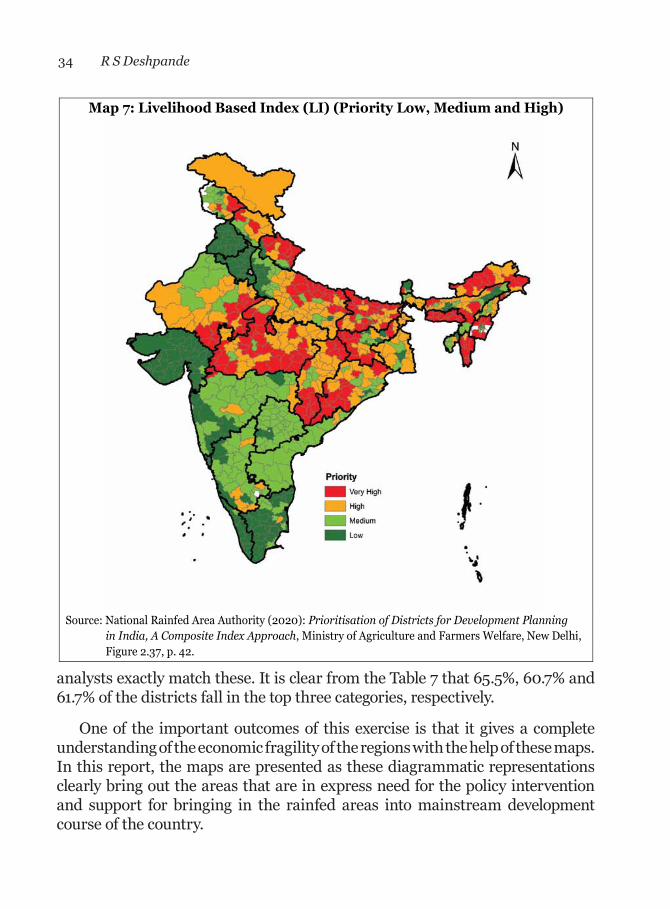
34 R S Deshpande
analysts exactly match these. It is clear from the Table 7 that 65.5%, 60.7% and 61.7% of the districts fall in the top three categories, respectively.
One of the important outcomes of this exercise is that it gives a complete understanding of the economic fragility of the regions with the help of these maps. In this report, the maps are presented as these diagrammatic representations clearly bring out the areas that are in express need for the policy intervention and support for bringing in the rainfed areas into mainstream development course of the country.
Map 7: Livelihood Based Index (LI) (Priority Low, Medium and High)
Source: National Rainfed Area Authority (2020): Prioritisation of Districts for Development Planning
in India, A Composite Index Approach, Ministry of Agriculture and Farmers Welfare, New Delhi, Figure 2.37, p. 42.
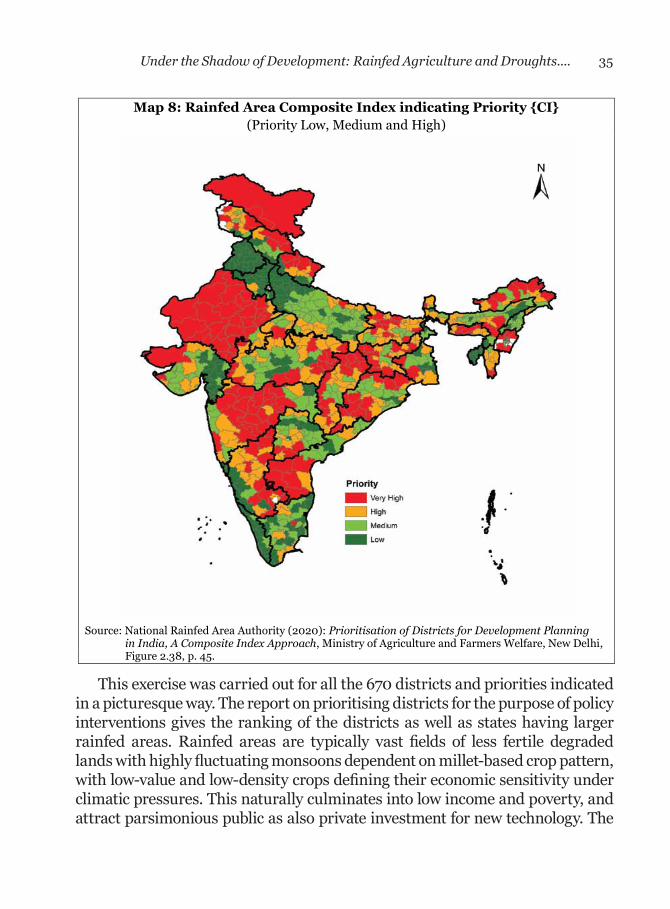
35Under the Shadow of Development: Rainfed Agriculture and Droughts....
This exercise was carried out for all the 670 districts and priorities indicated in a picturesque way. The report on prioritising districts for the purpose of policy interventions gives the ranking of the districts as well as states having larger rainfed areas. Rainfed areas are typically vast fields of less fertile degraded lands with highly fluctuating monsoons dependent on millet-based crop pattern, with low-value and low-density crops defining their economic sensitivity under climatic pressures. This naturally culminates into low income and poverty, and attract parsimonious public as also private investment for new technology. The
Map 8: Rainfed Area Composite Index indicating Priority {CI} (Priority Low, Medium and High)
Source: National Rainfed Area Authority (2020): Prioritisation of Districts for Development Planning
in India, A Composite Index Approach, Ministry of Agriculture and Farmers Welfare, New Delhi, Figure 2.38, p. 45.
36 R S Deshpande
low capital investment coupled with risk aversion towards adoption of new technology or experimenting with new crops is not accepted by the risk averse farmers. The production and consumption demand as well as the factors of production cause the Schultzian low equilibrium trap (Schultz 1964), and this cannot be even tangentially intersected by sporadic interventions largely with an outmoded top-down approach. In this context, in his Presidential Address to the Indian Society of Agricultural Economics in 1991, Professor V M Rao aptly noted:
“I have a feeling that the growing contrast between the two areas (drylands and irrigated area sic) is in a part due to the fact that the planning process does not work as well in the dryland areas as in the irrigated areas. Generation and utilisation of new opportunities which is what a planning process is expected to stimulate – tend to be weak, uncertain and unstable in the dryland areas. Instead of helping these areas to overcome the constraints on development, the planning process seems only to add to the difficulties by the poor performance” (Rao 1992: 1-2).
There cannot be two opinions that the rainfed areas represent the food bowl for the poor and other population especially dominating in these regions. Historically, a substantial share of India’s poor population used to have millets and coarse cereals as their staple food, and their demands were met with dominant role of these crops in the crop pattern. Rao and Deshpande (2002) argued that village could be self-sufficient in food produced and consumed, if their diet was traditional and not altered by the PDS wheat and rice. Thus, the millets, coarse cereals and minor pulses were relegated in their area share, with rice and wheat emerging as elite crops in PDS with an irrational financial support from the government in terms of minimum support prices (MSP). As a result, the area under millets and coarse cereals went down substantially. So also did the production of these crops (Deshpande and Rao 2004; Higgins and Kassam 1981; FAO 2002). On the research and technology front also these crops received secondary treatment at the hands of scientists (Jodha 1979). Even with this strong deliberate crushing on the policy front, production of the coarse cereals remains at about 17% of the total foodgrains (Figure 5). In a few states, the millets form a very important part of the poor person’s diet (Jena and Mishra 2020). In one of the very important contributions, it was argued that the PDS and procurement of grains should be totally decentralised, and minor millets should be included in the procurement policy (Deshpande and Rao 2004). It

37Under the Shadow of Development: Rainfed Agriculture and Droughts....
was argued that such policy would provide incentive to the poor farmers in the rainfed areas, and at the same time, ensure food self-sufficiency. They were actually made addicted to the PDS for purchasing and consuming wheat and rice, despite the non-suitability of these grains in their traditional diets.
As a result of the discriminatory policy, area share of the rainfed crops has been significantly going down over years. Earlier, it was above 45% in 1953 and went on continuously declining to 32.68% in 2017-18. Contribution of the production of these crops has stagnated over years, despite the claimed investment in the technology and crop breeding. No significant breakthrough has come about, except a few new cultivators. Any back of the envelop computation of research and development (R&D) resources spent on the crops cultivated in rainfed areas, as against irrigated crops, demonstrates a clear neglect of the crops grown in rainfed areas. In the state’s support in terms of procurement and new support prices, the rainfed crops do not necessarily get a representation proportionate to their share in the total production of foodgrains. It can be seen from Table 8 that the procurement of wheat and rice together is 250 to 800 times higher than the nutria-cereals, and only 0.12% to 0.77% of the total wheat and rice is procured under nutri-cereals (Table 8).
Figure 5: Contribution of Rainfed Crops to the Total Foodgrains Production
0
5
10
15
20
25
30
35
40
1950-51 1957-58 1964-65 1971-72 1978-79 1985-86 1992-93 1999-00 2006-07 2013-14
Jowar Bajra Total Coarse Cereals Jowar +Bajra
Source: Same as Figure 3.
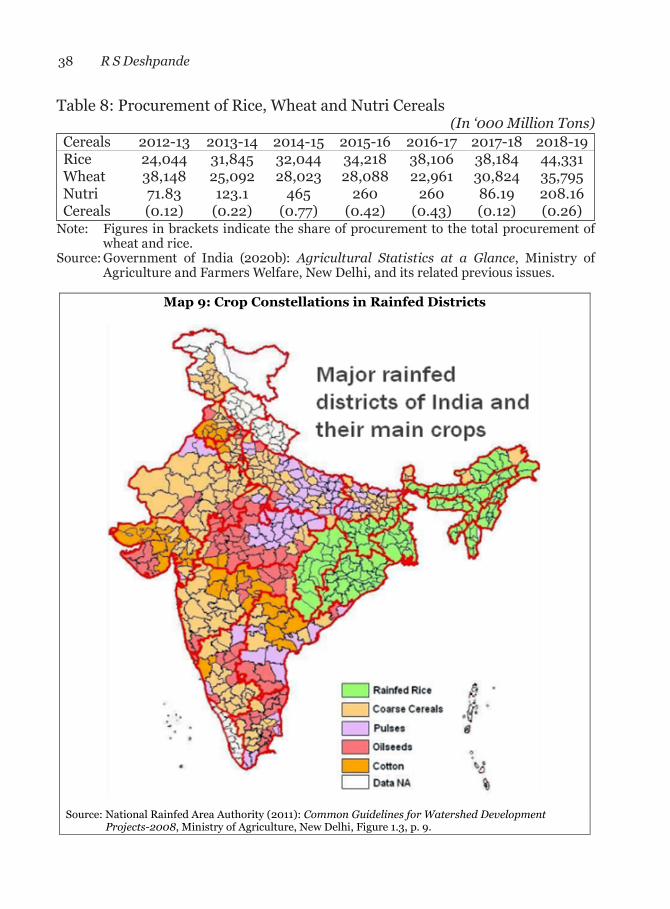
38 R S Deshpande
Table 8: Procurement of Rice, Wheat and Nutri Cereals (In ‘000 Million Tons)
Cereals 2012-13 2013-14 2014-15 2015-16 2016-17 2017-18 2018-19Rice 24,044 31,845 32,044 34,218 38,106 38,184 44,331Wheat 38,148 25,092 28,023 28,088 22,961 30,824 35,795Nutri 71.83 123.1 465 260 260 86.19 208.16Cereals (0.12) (0.22) (0.77) (0.42) (0.43) (0.12) (0.26)
Note: Figures in brackets indicate the share of procurement to the total procurement of wheat and rice.
Source: Government of India (2020b): Agricultural Statistics at a Glance, Ministry of Agriculture and Farmers Welfare, New Delhi, and its related previous issues.
Map 9: Crop Constellations in Rainfed Districts
Source: National Rainfed Area Authority (2011): Common Guidelines for Watershed Development Projects-2008, Ministry of Agriculture, New Delhi, Figure 1.3, p. 9.
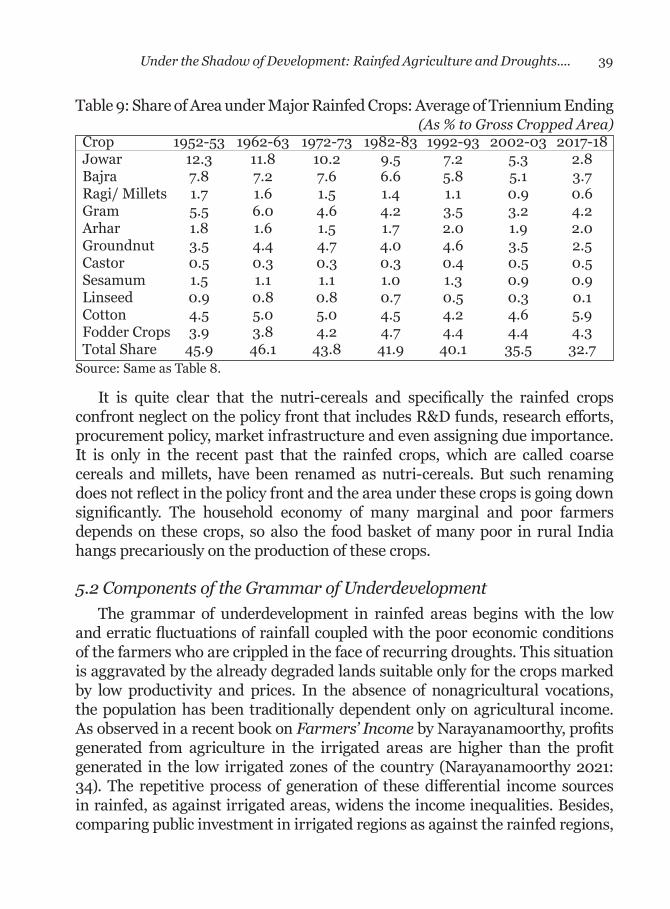
39Under the Shadow of Development: Rainfed Agriculture and Droughts....
It is quite clear that the nutri-cereals and specifically the rainfed crops confront neglect on the policy front that includes R&D funds, research efforts, procurement policy, market infrastructure and even assigning due importance. It is only in the recent past that the rainfed crops, which are called coarse cereals and millets, have been renamed as nutri-cereals. But such renaming does not reflect in the policy front and the area under these crops is going down significantly. The household economy of many marginal and poor farmers depends on these crops, so also the food basket of many poor in rural India hangs precariously on the production of these crops.
5.2 Components of the Grammar of UnderdevelopmentThe grammar of underdevelopment in rainfed areas begins with the low
and erratic fluctuations of rainfall coupled with the poor economic conditions of the farmers who are crippled in the face of recurring droughts. This situation is aggravated by the already degraded lands suitable only for the crops marked by low productivity and prices. In the absence of nonagricultural vocations, the population has been traditionally dependent only on agricultural income. As observed in a recent book on Farmers’ Income by Narayanamoorthy, profits generated from agriculture in the irrigated areas are higher than the profit generated in the low irrigated zones of the country (Narayanamoorthy 2021: 34). The repetitive process of generation of these differential income sources in rainfed, as against irrigated areas, widens the income inequalities. Besides, comparing public investment in irrigated regions as against the rainfed regions,
Table 9: Share of Area under Major Rainfed Crops: Average of Triennium Ending (As % to Gross Cropped Area)
Crop 1952-53 1962-63 1972-73 1982-83 1992-93 2002-03 2017-18 Jowar 12.3 11.8 10.2 9.5 7.2 5.3 2.8 Bajra 7.8 7.2 7.6 6.6 5.8 5.1 3.7 Ragi/ Millets 1.7 1.6 1.5 1.4 1.1 0.9 0.6 Gram 5.5 6.0 4.6 4.2 3.5 3.2 4.2 Arhar 1.8 1.6 1.5 1.7 2.0 1.9 2.0 Groundnut 3.5 4.4 4.7 4.0 4.6 3.5 2.5 Castor 0.5 0.3 0.3 0.3 0.4 0.5 0.5 Sesamum 1.5 1.1 1.1 1.0 1.3 0.9 0.9 Linseed 0.9 0.8 0.8 0.7 0.5 0.3 0.1 Cotton 4.5 5.0 5.0 4.5 4.2 4.6 5.9 Fodder Crops 3.9 3.8 4.2 4.7 4.4 4.4 4.3 Total Share 45.9 46.1 43.8 41.9 40.1 35.5 32.7Source: Same as Table 8.
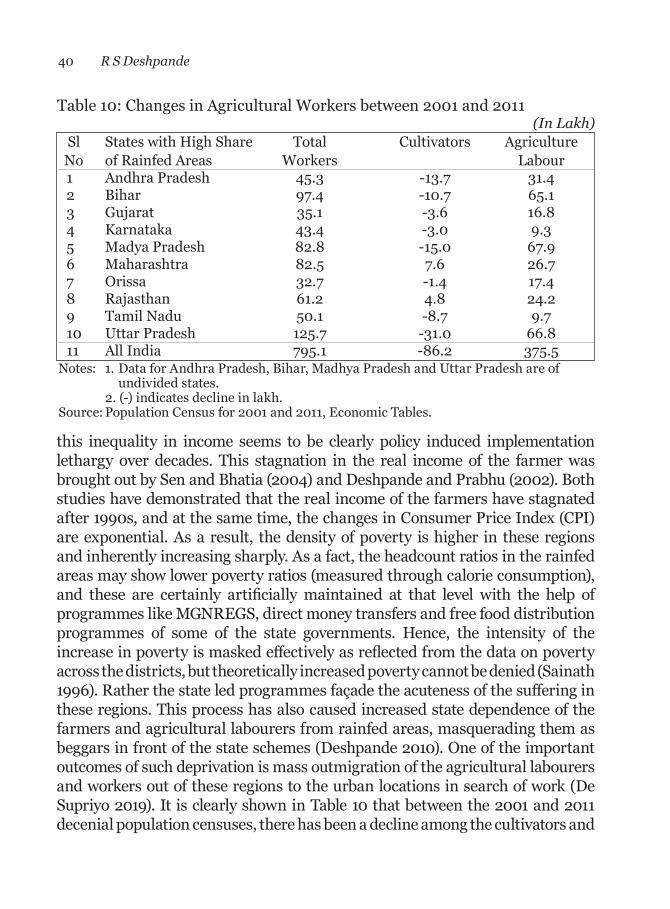
40 R S Deshpande
this inequality in income seems to be clearly policy induced implementation lethargy over decades. This stagnation in the real income of the farmer was brought out by Sen and Bhatia (2004) and Deshpande and Prabhu (2002). Both studies have demonstrated that the real income of the farmers have stagnated after 1990s, and at the same time, the changes in Consumer Price Index (CPI) are exponential. As a result, the density of poverty is higher in these regions and inherently increasing sharply. As a fact, the headcount ratios in the rainfed areas may show lower poverty ratios (measured through calorie consumption), and these are certainly artificially maintained at that level with the help of programmes like MGNREGS, direct money transfers and free food distribution programmes of some of the state governments. Hence, the intensity of the increase in poverty is masked effectively as reflected from the data on poverty across the districts, but theoretically increased poverty cannot be denied (Sainath 1996). Rather the state led programmes façade the acuteness of the suffering in these regions. This process has also caused increased state dependence of the farmers and agricultural labourers from rainfed areas, masquerading them as beggars in front of the state schemes (Deshpande 2010). One of the important outcomes of such deprivation is mass outmigration of the agricultural labourers and workers out of these regions to the urban locations in search of work (De Supriyo 2019). It is clearly shown in Table 10 that between the 2001 and 2011 decenial population censuses, there has been a decline among the cultivators and
Table 10: Changes in Agricultural Workers between 2001 and 2011 (In Lakh)
Sl States with High Share Total Cultivators Agriculture No of Rainfed Areas Workers Labour
1 Andhra Pradesh 45.3 -13.7 31.42 Bihar 97.4 -10.7 65.13 Gujarat 35.1 -3.6 16.84 Karnataka 43.4 -3.0 9.35 Madya Pradesh 82.8 -15.0 67.96 Maharashtra 82.5 7.6 26.77 Orissa 32.7 -1.4 17.48 Rajasthan 61.2 4.8 24.29 Tamil Nadu 50.1 -8.7 9.710 Uttar Pradesh 125.7 -31.0 66.811 All India 795.1 -86.2 375.5
Notes: 1. Data for Andhra Pradesh, Bihar, Madhya Pradesh and Uttar Pradesh are of undivided states.
2. (-) indicates decline in lakh.Source: Population Census for 2001 and 2011, Economic Tables.

41Under the Shadow of Development: Rainfed Agriculture and Droughts....
substantial increase in the agricultural labourers in the states, with a very large share coming from rainfed areas. About 8.62 million cultivators had declared (in the census) that they were no more in the vocation of cultivation, and at the same time, there was an increase of 37.55 million agricultural labourers in these states. It is also true that most of the migrant labourers from these states (also from the intra-state migration) come to the urban locations in search of menial jobs on the construction sites, which has increased substantially during the last two decades.
Another way of understanding about outmigration is as an insurance for failure of usual agricultural economic activities and loss of usual vocation (Shukla 1977, 1981; Mukherjee and Prakasam 1981). In fact, migration was taken as one of the indicators of declaring drought in any region in British India following the Famine Code. Outmigration from the resource stressed regions has been one of the survival strategies for accommodating the impact of drought under economic stress. The data on migration available from the 2011 Census indicate a significant change in the share of migrating population in the country for the purpose of work/employment. The 2011 Census figures clearly indicate a large percentage of migrants for work from the major rainfed areas indicating ‘out-migration from rural areas’ and ‘in-migration within states to cities from rural areas’ (Table 11). The migration due to economic stress for the purpose of work
Table 11: Migrants for Work to Cities: 2011 Census(As % to Total Migrant in the State)
Sl States with High Share OMRC IMWSR % Total Migrants No of Rainfed Areas
1 Andhra Pradesh 21.3 10.3 3.02 Bihar 32.8 2.3 17.63 Gujarat 17.8 8.4 2.24 Karnataka 18.0 9.2 4.35 Madya Pradesh 18.9 8.8 5.96 Maharashtra 16.0 11.3 4.27 Odisha 32.3 5.0 2.78 Rajasthan 18.6 6.6 7.59 Tamil Nadu 25.8 11.2 2.610 Uttar Pradesh 33.3 4.6 26.8
Notes: 1. Data for Andhra Pradesh, Bihar, Madhya Pradesh and Uttar Pradesh are of undivided states. 2. OMRC means Out-migration from rural areas of major states of India. 3. IMWSR -In-migration within states to cities from rural areas.Source: Population Census for 2011, Migration Tables.
42 R S Deshpande
or employment takes place largely from Bihar and Uttar Pradesh as well as from the states having larger proportion of rainfed areas. This lends credence to the hypothesis that under economic stress, workers migrate from the rainfed areas to the cities. The outmigration to be encouraged from the economically weaker regions to the economically stable regions was hypothesised by Arthur Lewis, and possibly, the Lewis’s framework was always in operation during the drought seasons causing economic stress in India.
The grammar of underdevelopment begins with the low and uncertain rainfall regions of the country with the degraded lands. These have been identified right from the First Five Year Plan onwards and, in fact, if one goes back to the Famine Commission of 1898, there are frequent references to these regions. As it goes in the grammar, the places under climatic stress were once termed as dryland areas, which was later on were named as rainfed areas. The identification was done in the First Plan onwards, when the soil conservation works were undertaken across the states and priority was given to the low irrigation low rainfall regions. The evaluation committee report of the soil conservation works and dryland farming has condemned the shabby implementation stating that the programme were ‘inadequate, efforts were insufficient, delay and shortage of funds, faulty criteria for choosing the area for treatment, the implementation was not strictly according to the guidelines, and the project suffered in 11 states due to untrained staff’ (Government of India 1964). That had sent huge investments down the drain, obviously without any accountability. The grammar of underdevelopment was fueled by these adjectives that accolades the programme implementation. Added to this, the research and investment backup in the rainfed areas was also quite derisory, and this does not stop only with the development of irrigation, but it also reaches to the technology shelf, suitability of seed varieties, suggestions for new cultivation practices and economic variables like credit supply, institutions and other linkages to the institutions for the farmers. Unfortunately, in many efforts that have been undertaken from 1930 onwards beginning with the dry farming research stations, the connectivity of the farmers with the development initiatives from the rainfed regions has been quite scrappy, and if one uses the underdevelopment as an adverb, the connectivity with the stakeholders was depraved. Jodha (1989a,b) very elaborately dealt with the issues mentioned in the evaluation of dry farming research to the stakeholders. He emphasised the incremental benefits after adopting the technology and the high cost of the technology. In fact, the technical committee for evaluating the Drought Prone Areas Programme (DPAP) and Desert Development Programme (DDP), headed by C H Hanumantha Rao, stated their findings in the fourth chapter on Strategy.

43Under the Shadow of Development: Rainfed Agriculture and Droughts....
To quote:
“One major lesson that has emerged from the experience of the working of DPAP and DDP is that these programmes failed to make the desired impact in areas treated not so much because of the wrong identification or inadequate allocation of funds, but mainly because of (a) poor and ad-hoc planning without any serious regard for watershed approach; (b) almost complete lack of people’s participation; and (c) weak coordination between, and lack of integration among works undertaken by different agencies involved in operation” (Government of India 1994: 16, para 4.1.1).
Further, after a long journey of implementation and experience of the programmes for development in rainfed areas (from the First Five Year Plan to 2006), involving many experts’ committees and commissions, and after gathering experience of implementing the watershed development programmes, the experience was sufficient to consolidate. It began with an externally funded project – the World Bank’s involvement in India with watershed development that began in 1980 with the Kandi Watershed and Area Development Project. The Government of India appointed a Technical Committee on Watershed Programmes in India, From Hariyali to Neelanchal, under the Chairmanship of Parthasarthy, armed with the task: “To examine the issue of integrating DPAP, DDP and IWDP with their financial allocations as additionality with related area development and poverty alleviation programmes such as NWDPRA, national wasteland development programme for degraded forest lands, food for work programme, employment guarantee scheme, etc., and recommend a suitable strategy for such convergence” (Government of India 2006: 221).
The report contains a painstaking review of all the watershed development programmes in the country and a series of recommendations. In the initial pages, the committee painfully records, ‘Such a strategy needs to recognise the location-specific characteristics of different parts of India and also needs to be sensitive to the limits set by the eco-system. This, we believe, is the broad strategy of watershed development’ (Government of India 2006: 5). This committee further commented:
“One of the major problems with the watershed programme in India is that at each level it is administered by people who have many other responsibilities. This is true at all levels but especially at the district level where the Collector or the Chief Executive Officer (CEO), Zilla
44 R S Deshpande
Panchayat (ZP) or the District Rural Development Agency (DRDA) are expected to look after the programme. Similarly, under the Hariyali Guidelines it is the Panchayat Secretary who is the CEO of the programme at the micro-watershed level. These are officials with a whole host of responsibilities who are unable to do full justice to the requirements of this quality- and process-intensive programme at times for no fault of their own” (Government of India 2006: 111).
These adjectives emphasizing the poorly implemented programmes for the rainfed regions continue to plague their underdevelopment, despite the interventions and huge investments along with other programmes like (sickeningly) many versions of the watershed development programmes. The earlier reviews of the development interventions in the dryland/rainfed areas programmes, undertaken in 1973 by a task force headed by B S Minhas, and another task force headed by M S Swaminathan in 1982 as well as by an inter-departmental group in 1984, were also quite critical and suggested a number of ways to make the programme for drylands operative, however, things did not change towards effective implementation. Inefficiency in implementation came out as the most common denominator along with lack of location specificity and stakeholder connect.
The rainfed areas continued under the pressure of fragile natural resources and inadequate planning for development. It comes out from various reports that the programmes for development of rainfed areas were implemented along with other rural development programmes, and hence, the focus was not specifically to unshackle rainfed areas from the bondage of underdevelopment but more towards reaching the expenditure targets. Various committees and expert groups talked about insufficient funds, delay in release of funds, inadequate preparations, myriad ever-changing guidelines, project implementation bottle-necks and the guidelines not being strictly adhered to, presumed participation of the stakeholders and state governments. These were only a few of the indicators which clearly demonstrated that the programmes beginning from the dryland development centres through DDP, DPAP, various international agency programmes and myriad number of watershed development programmes in new incarnations, failed to bring any positive observable changes in the acute rainfed districts (Government of India 1986). The climatic vulnerability of these regions continued to haunt the helpless population with hardly any proper social protective nets, nor did the groundwater table enhanced. This could be clearly
45Under the Shadow of Development: Rainfed Agriculture and Droughts....
seen in the study report number 4 of NRAA titled as Prioritisation of Rainfed Areas in India brought out in 2020 with the latest data. The maps presented in the report about the socio-economic status of the districts falling under rainfed tracts painfully depict that, after the initial experiment of soil conservation started in the First Five Year Plan in 1952 and various programmes through all seven decades, we came to a destination in 2020, where there was a little pride to say that India’s planers could succeed at least in scratching some of the major constraints of underdevelopment in the rainfed regions. The maps depicting components of Livelihood Index (LI) clearly show that backwardness is still an assured abode of the rainfed regions (districts) in the country. Almost on every count of LI, the backward districts as well as those identified during the Second Five Year Plan continue to be at the bottom of the development ladder even in 2020. The question is: why did this happen? That requires understanding of the structural base of the economy of rainfed areas.
Even today agriculture is considered as the mainstay of rainfed areas’ economy, but that grand assumption is untenable as the resources required for a successful agriculture cannot be made available to these regions. A usual response to the problems of rainfed areas comes from the thinking that, influenced by the Green Revolution technology, this can be attained by increasing resource intensity and cash inputs in order to increase the productivity. The philosophical dogma of Green Revolution that miraculous changes can be brought with the new seed-water-fertilizer technology does not fit to the development requirements of the rainfed regions. In that mythical belief, one of the very important policy documents recommended a second Green Revolution, possibly not understanding the problems of regional disparities and agrarian distress created by the first Green Revolution. Therefore, the strategy has to be agriculture-plus rather than the seed-water-fertilizer philosophy, and that can only sustain the rainfed economy. One of the recent watershed development programmes funded by the World Bank (SUJALA) in Karnataka introduced a soil health card called as Land Resource Inventory Card (LRI). The card was prepared in such a difficult technical manner, and except for the details on the current chemicals in the farm soil, there is no prescription on how to treat the soil problem. Needless to say, farmers did not understand even a bit out of that. A huge amount of money was invested in preparing these LRI cards, and the farmers had just to keep them in a safe place without using.
Always, participation of the stakeholders in most of the watershed programmes was forced from the top leaving very little possibility for the farmers to innovate. Unfortunately, with the fragile resource base in the rainfed areas, the old 1965

46 R S Deshpande
vintage technical philosophy may be a difficult proposition to find inroads in the rainfed regions. Location specificity and participation of stakeholders in any technology has been highlighted by all the evaluations of technology infusions in rainfed areas. It is a fact that every part of every district and every region in the agricultural economy of this country responds to different stimuli. An important task completed by the expert team of NRAA about prioritising the districts gives a blue-print for future strategy implementation. After the ACRP approach of the Planning Commission, which miserably failed and was quietly pushed under the carpet, it was the first time that a significantly different approach was followed by the policymakers. The grammar of underdevelopment in the rainfed areas must take note of the important nouns and verbs that describe the economic fragility with the adjectives like depleting groundwater ultimate irrigation potential being reached, deforestation and acute poverty. Note also has to be taken of the role of verbs and adverbs like administrative actions, horizontal coordination, careful planning and outcome-oriented implementation, to be very carefully understood and placed sequentially on the policy platform (Sharma 2019). Sometimes, metaphors make the meaning very clear like Albert Einstein once said, “Life is like riding a bicycle, to keep your balance, you must keep moving”. In the same spirit, it is necessary to correct and understand the grammar of underdevelopment of rainfed areas in order to keep moving and reach the policy goals.
6. Edifices in the Policy DomainOut of India’s total 139.4 million ha of net cropped area, more than 50%
of the cultivated lands are still at the mercy of the monsoons. Climate change has simultaneously brought in new challenges about appropriate use of land and water resources, especially in vulnerable regions. Birthal et al. recently tried to highlight the sensitivity of Indian agriculture to climate change, and noted that there were quite a few sensitive issues that emerged in this context (Birthal et al. 2014, 2015). Numerous programmes were introduced during the last seven decades to deal with the constraints of rainfed farming of planning. These included: dry-farming research stations, soil-conservation, DDP, ICAR-specialised institutions like CAZRI, DPAP (with two incarnations), NWDPRA, watershed development programmes from the World Bank initiative (Smyle 2014) up to Neelanchal, Different employment generating programmes like MGNREGA, watershed development programmes under nine different guidelines, ACRP, NRAA, special programmes by NABARD, Accelerated Irrigation Benefit Programme, PM Sinchai Yojana including many initiatives in the NGO sector like MYRADA, Prayas, SOPECOM, and many showcased
47Under the Shadow of Development: Rainfed Agriculture and Droughts....
experiments like Sukhomajri, Mittemari, Ralegan Siddhi. There were a few committed organisations and persons from the voluntary sector who contributed significantly to make this a vehicle of development of rainfed areas (Shah 1998; Government of India 2006). Despite all these efforts, the rainfed areas continue to remain undeserved for want of development funds (the testimony of the cumulative backwardness can be seen in the maps preceding the Livelihood Index calculated by NRAA, 2020). The productivities of these areas in any crop have been low or stagnated (compared to well-endowed regions) and continue to be at that level for over last seven decades (Narayanamoorthy 2021; Government of India 2007).
Making water available for irrigation is the usual recommendation and thread of any research initiative in rainfed areas. This is certainly important. Today, India has an irrigated area of 68.5 million ha, which is about 49.1% of the cultivated area leaving about 70.9 million ha or 50.9% under rainfed conditions. Even today, half of India’s agriculture is still dependent on rainfed areas posing significant growth constraints (Deshpande and Nayaka 2018). Fortunately, the situation has improved over the years with the share of rainfed area steadily coming down from 109.9 million ha in average at triennium ending (ATE) 1962-63 to 70.9 million ha in ATE 2017-18. This decline has to be solely attributed to the progress of irrigation. In the seven decades, a number of programmes and policies were designed and implemented with the noble intention of bringing these areas in the mainstream of development. However, the impact of these interventions are peripheral (Deshpande 2008; Deshpande and Reddy 1991; Deshpande and Narayanamoorthy 1999; Government of India 1964, 1986, 1994, 2001, 2006, 2007).
7. Policy Efforts through Five Year PlansPlanning in India began with all the earnest efforts and the First Five Year
Plan expert team was constituted, which focused on the new economic and social relations after independence and called for rapid changes. At that time, agriculture was the mainstay and the rural population constituted more than 80% with large underemployment. Extension of irrigation, use of fertilisers and seeds and intensive agriculture were focused as immediate policy platforms. The First Five Year Plan, in the initial hurry of chalking out the economic development design for the country, strangely did not include a separate chapter on agriculture, however, the plan recognised the need for soil conservation and land reforms along with a programme of community development. It was stated that a large part of the soil conservation work had to be done by the farmers on
48 R S Deshpande
their fields, after a proper understanding of the nature of the erosion problem, and their active participation in soil conservation programmes were considered essential for the success of this programmes (Government of India, First Five Year Plan). In a nutshell, rainfed agriculture was incorporated as a component of the aggregate agricultural sector, and no special attention was paid even after knowing that 80% of India’s agriculture was monsoon dependent.
The Second Five Year Plan also did not have any specific chapter assigned for agriculture sector, but there was sufficient discussion on rapid industrialisation, large expansion of employment and raising the levels of living. The plan document dealt with land reforms in chapter 9 and agriculture sector in chapter 13 emphasising cooperation, improvement in district administration and irrigation. The Community Development approach, taken from the First Plan, continued in the Second plan also. The same story continued in the Third Plan wherein, again agriculture was taken as a part of other connected programmes like irrigation, soil conservation, land reclamation, supply of fertilizers and manures, seed multiplication and distribution, plant protection and better equipment that dominated the discussion in the plan document. The first time that agriculture was included as a separate chapter was in the Fourth Five Year Plan in Chapter 7 and the subject continued with all its branches till Chapter 11. There was a comprehensive treatment for the sector, and possibly, due to the shock of the mid-1960s in the form of two consecutive droughts aggravated by the war with Pakistan with consequent food shortages. It was at this time that the book title Famine 1975 by Paddock and Paddock argued that India was not a candidate to be helped during the predicted calamity when millions of deaths were forecasted. The objective of the plan was defined as, ‘.. rapid economic development accompanied by continuous progress towards equality and social justice’ (Government of India 1969). The inter-regional equality in development efforts was conceivably implicit. It was the first time that ICAR was asked to organise coordinated research projects for various crops and on different issues.
It is only in the Fourth Plan, the concept of ‘rainfed agriculture’ was used in correct way for the first time. One must note that the plan was presented after the severe droughts of 1965-66 and 1966-67, that possibly caused a knee-jerk reaction to the planners. It is only after the Fifth Plan and the Sixth Plan, agriculture started receiving significant attention in the planning process of the economy. The real breakthrough for the rainfed areas came only after the reconstitution of the Planning Commission in April 1980. Programmes like Integrated
49Under the Shadow of Development: Rainfed Agriculture and Droughts....
Rural Development Programme (IRDP), DPAP, Command Area Development Programme (CADP), and Irrigation Development Programme were started in 2,600 blocks in the country by 31 March 1980. Subsequently, Intensive Area Development Programme (IADP) and the refurbished DPAP were undertaken for the development of rainfed areas. These were intended for technology enhancement in these regions and creating employment opportunities. As many as 54 districts across 13 states were included in the DPAP programme. The emphasis, however, remained on civil engineering with soil conservation works, seasonal employment generation and the top-down approach, therefore, the programme could not get a foothold in the rural areas and recognition as a successful rainfed farming intervention. Another important policy intervention was in the form of a well-designed DPAP that was in operation since the Fourth Plan. The DPAP, DDP and CDP remained as the flagship programmes of the Planning Commission dealing with the rain-shadow regions and placed core focus on these three important programmes.
The development interventions during the Fifth Five Year Plan followed an integrated area strategy for development as laid down by the Task Force of the Planning Commission in 1971 under the Chairmanship of B S Minhas. The Task Force recommended that the Programmes should be based on resource endowment analysis of the region. It was clear that the programmes have to be location specific. The DPAP, DDP and CDP were evaluated by Minhas Committee in 1973.
This was followed by M S Swaminathan Committee in 1982 and Inter-Departmental Group in 1984. A technical committee, termed as National Committee was set up in May 1988 under the Chairmanship of a Member of the Planning Commission to appraise and review DPAP and DDP. Despite all these experts advises and solutions for the improvement of the programmes, these programmes had only a fragmentary influence on the status of rainfed farming. The impact of DPAP and DDP was analysed by a committee headed by C H Hanumantha Rao and that actually brought forth the fissures in the design and planning for these programmes. The Hanumantha Rao Committee strongly recommended an approach based on watershed area development and further stated:
“The Technical Committee has, therefore, recommended revam-ping of the strategy for the implementation of these Programmes. The works should hereafter be sanctioned on the basis of the action plans prepared on watershed basis instead of a fixed amount being allocated per block as at present” (Government of India 1994: i).
50 R S Deshpande
Two observations come out very specifically, namely, that the programme needs entire revamping and there was no remedial action plan in the entire programmes. This brings forth the failures in the programmes for rainfed areas till 1994. Around this time, the watershed development approach was circulating in the development corridors across a few states in the country. The Watershed Development Programme entered in the vocabulary through the World Bank aided watershed development projects initially taken at four locations - Manoli (Maharashtra), Kabbal Nala (Karnataka), Purua Nala (Madhya Pradesh) and Maheshwar Nala (Andhra Pradesh) – where not even a stone from the watershed works carried out exists on the ground. Besides, at the state level a programme based on watershed development was sanctioned to Karnataka that led to the establishment of the Dry Land Development Board (DLDB), which initiated 19 huge watersheds projects (one in each district) in the state. This programme withered out without recording any significant improvement in the rainfed areas of the state. Similar programmes were also undertaken in a few other states like Maharashtra, which called the programme as Comprehensive Watershed Development Programme – the impact of this was again absolutely marginal (Deshpande and Reddy 1991; Deshpande 2008).
At the institutional level, the All India Coordinated Research Project for Dry Land Agriculture (AICRPDA) was established in 1970 to work on R&D of drylands and dissemination of the results through testing the technology on pilot projects. The AICRPDA was specifically assigned the task of understanding and innovating new technologies and testing these under field conditions (AICRPDA 1982). In the mid-1970s, we had another internationally reputed institution established at Hyderabad, that is, the International Crop Research Institute for Semi-Arid Tropics (ICRISAT), which was entirely focusing on the semi-arid tracts from the point of view of crop technologies and cultivation technologies, and understanding the constraints of farmers from semi-arid tropics (SAT) by conducting field trials and contacting farmers across villages in the semi-arid regions. Over the years, the ICRISAT developed technologies for millets, pulses and grains from rainfed agriculture. The importance of short duration crops to match the soil water availability period was recognised in the 1960s. At ICRISAT, the scientists not only developed and spread the technology for moisture tolerant varieties, but provided environmentally suitable packages for SAT including crop cultivation practices and for tackling the disasters in the form of pests and diseases. The ICRISAT scientists also worked incessantly on establishing methodologies for the study of economics of rainfed farming, risk management and such other issues (Walker and Jodha 1982; Walker and Ryan
51Under the Shadow of Development: Rainfed Agriculture and Droughts....
1990; Report of the Fifth External Management Review, CGIAR System Office 2003, 2009).
An important milestone in the policy towards rainfed farming emerged from the beginning of the Sixth Plan. The Sixth Plan attempted for the first time to put the framework of rainfed farming in the watershed development approach to check the spread and deterioration by erosion of arable land and to encourage natural vegetative cover of non-arable land. Water harvesting and development of small watersheds of about 50 ha to 100 ha was suggested as a strategy (Government of India 1981). The policy was strengthened during the Seventh Plan and the National Watershed Development Project for Rainfed Agriculture (NWDPRA) was taken up with three-fold objectives: (1) to harvest rain water, (2) to conserve soil moisture, and (3) to extend cropping systems and farming practices for increasing production and mitigating risk (Deshpande and Narayanamoorthy 1999).
There is enough evidence that corroborates the failure of these interventions. The evaluation of the soil conservation programme by the Perspective Planning Division of Planning Commission, evaluation of dryland technologies towards enhancing income and welfare of the farmers (Government of India 1964), evaluation of the Watershed Development Programme by various agencies (Deshpande and Narayanamoorthy 1999; Technical Committee Report 2006; Neelanchal Guidelines 2006) have all pointed out these failures. The NWDPRA programme was sanctioned for four years and continued through the successive phases and was revised in 1990. The Ninth Plan reiterated the emphasis on the approach towards watershed development in no uncertain terms. Emergence of Rashtriya Krishi Viks Yojana (RKVY) after the special National Development Council (NDC) meeting, undertaken at the behest of the of Planning Commission, highlighted planning from below for the agricultural sector and initiated a huge programme of district agricultural plans for all the districts of the country. The entire country was seized with this programme and umpteen number of agricultural plans for the districts were prepared with huge investment both in terms of money and intellectual inputs. However, as it goes, soon after the completion, the entire work disappeared in the basement of the Planning Commission. The Controller and Auditor General (CAG) of India in its report number 11 of 2015, commented:
“Out of 27 states covered in the review, Audit observed that the planning process was deficient in many States in several aspects such as non-voluntary/participation of the grassroots level agencies like Gram Panchayat/Gram Sabha/BAPU /VAPU/ TAPU, absence
52 R S Deshpande
of grass root inputs in the preparation of DAP, the efficiencies in the preparation of SAP such as absence of agro-climatic study/convergence with other programs et cetera” (CAG Report 2015: 9).
Besides these, there were a few experimental interventions undertaken by the NGO sector with the help of donors, and among them, MYRADA, PIDOW, KAWAD Ahmednagar, WASAN, Ralegan Siddhi, Hiwre Bazar, Sukhomajari are the notable ones. The Sukhomajri experiment was fully supported by technical inputs from scientists of Central Soil and Water Conservation Research and Training Institute (CSWCRTI), therefore, it had a more engineer dominated approach. In a similar experiment supported by ICRISAT for the watershed projects in Hyderabad, Solapur and Akola districts, Sarin and Ryan (1983) noted the stabilisation of cash flows in the economy, increase in productivity and incremental income. They also recorded the additional employment generated from the programme. Walker et al. (1989) also reviewed the impact of ICRISAT watershed programmes at different locations and noted yield differences as well as changes in crop patterns. However, the replication of these were not possible, as it is said many times that ‘cloning in the biological sciences is feasible, as all the scientific parameters are controlled, but cloning in social experiment is infeasible, as most of the determinants are operated from outside the system’. Even though the voluntary organisations and NGOs have been successful sporadically, the spirit could not be carried out to other locations across the states and outside the boundaries of the states. After reviewing the entire watershed development approach followed in the planning process, the Parthasarathy Committee raised issues about the effectiveness of the experiments thus far and recommended establishment of NRAA, an independent agency on 3rd November, 2006. The NRAA was designed as only an advisory, policymaking and monitoring body charged with examining guidelines in various existing schemes and in the formulation of new schemes. The NRAA brought together all the guidelines issued by Government of India and other agencies as common guidelines.
The importance of NRAA became clear when the then Prime Minister of India Manmohan Singh, while addressing the NDC meeting declared constitution of NRAA with the following objectives:
“(i) To prepare a perspective plan, outlining the national strategy and road map for holistic and sustainable development of rainfed farming areas. (ii) To evolve common guidelines for all schemes of different Ministries including Externally Aided Projects (EAPs) for development of Rainfed/Dry land Farming Systems (NRAA, 2011). (iii)
53Under the Shadow of Development: Rainfed Agriculture and Droughts....
To coordinate and bring convergence within and among agricultural and wasteland development programmes being implemented in rainfed areas of the country” (www. https://nraa.gov.in/).
Experts at NRAA prepared a few reports immediately after its establishment. Initially, the focus of these reports were on identifying the rainfed areas beginning with clarification of the concepts and methodology. The common guidelines for watershed development and other programmes for the development of rainfed conditions was the initial concerns.
NRAA provides the pathway for harnessing the opportunities in its report titled Vision 2025 that was brought out immediately after its inception. There was a drought in Bundelkhand, and NRAA responded to that emergency with reports on drought management strategies and operational guidelines for drought proofing in the drought prone region. The NRAA presented an in-depth analysis of dealing with the situation. One of the very important works carried out by NRAA includes prioritisation of districts for development planning in India with the help of composite indexes. This report came out in 2011 and another revised report was brought out in 2020, which includes implementable instruments (actually used for constructing the Indexes), with identified districts requiring interventions. Along with these common guidelines for watershed management, meeting the contingency plan for droughts and floods and product diversification were also attempted with an in-depth analytical framework. The work carried out by NRAA is intensively useful for the purpose of meeting the challenge in the rainfed areas, provided it is used. There are a few methodological issues, however, the enormous span of the work with a few methodological issues may not matter on ordinal scale in hierarchy or priority assigned to the districts. In these reports, any administrator would find very useful information for the purpose of planning at a district level and to set priorities. With this initiative, the Planning Commission has turned a full circle and came back to district and block level planning that was insisted during the Second Plan, and followed up till the Eleventh Plan through ACRP and RKVY programmes focusing on district level planning. It can be hoped that this painstaking work carried out at NRAA would not be another monument alongside the ACRP and RKVY.
8. Mainstreaming the Development of Rainfed AreasIt is a matter of common understanding that rainfed areas confront a few
important constraints, which are obstacles in mainstreaming these areas in
54 R S Deshpande
the development dynamics. Rainfed areas receive low annual rainfall, but that is actually sufficient to grow crops like nutri-cereals and fodder that are less water consuming. Efforts towards mainstreaming the development of rainfed areas began way back with the series of Famine Commission Reports prepared for British India in the late 18th century. The First Irrigation Commission also emphasised dealing with the rainfed areas, while promoting irrigation in this hungry steppe. It was clearly stated that irrigation should be provided to the regions, which were in the rain shadow zone of the country. The Royal Commission on Agriculture in 1928 also reiterated the necessity of mainstreaming rainfed areas (dry farming as the report refers to). However, the approach towards such efforts was more technically oriented and totally based on enhancing agricultural crop technologies through irrigation. Certainly, institutional approach was also recommended, and on the basis of that, the dry farming research stations were started. After independence and with the beginning of planning in India, the First Five Year Plan undertook soil conservation as the major intervention needed in the rainfed areas, and hence, a programme of soil conservation was taken up across the country. As stated earlier, it was the Fourth Five Year Plan, coming after the two devastating droughts of 1965-66 and 1966-67, that took note of the issues by assigning a separate chapter on agriculture in the plan document.
A few interventions were made and that led to the seed-water-fertiliser based new technology and termed it as Green Revolution. This technological intervention gave primacy to these three technical components, and provision of water became the foremost tool for the purpose of mainstreaming development of rainfed areas. A number of interventions were also undertaken following this, as discussed above. Among all these, there was a complete lack of location specificity and failure to incorporate the understanding and knowledge of the stakeholders and the ground realities of the region. That is the most common observation, which has been unanimously pointed out by scholars and committees who made critical assessment and evaluation of all these interventions. It is, therefore, necessary to recapitulate all this stock of knowledge and critically examine an appropriate model of interventions required to meet the objective of mainstreaming rainfed areas in the process of development. After noting the failure of many technologies that were tried, the NRAA was established. Recently, the CEO of NRAA has put it very succinctly stating, “The ‘Everything Everywhere’ approach of taking up all major interventions uniformly across all regions of the country is not the way forward, given competing demands on all resources, including financial resources.” (In Foreword to the Task Force Report (NRAA 2020)). He was suggesting a tailored

55Under the Shadow of Development: Rainfed Agriculture and Droughts....
approach depending on the conditions of the district, which can be achieved only with micro-level planning.
The work done at NRAA has a significant role in preparing the rainfed areas to push on the track of development, however, the authority of NRAA is restricted only as a recommending agency and to draw up the strategy rather than participating in any implementation or monitoring process. The maps presented in the NRAA report (2020) clearly bring out the priority regions up to district level. Two significantly important aspects for mainstreaming development are covered under NRI and ILI or LI. These two are combined into one index prioritising rainfed areas under the CI or Rainfed Area Prioritisation Index (RAPI) (in Map 8 presented earlier). A lot of work was done in preparation of these indices, and hence, on an ordinal scale, these indexes are certainly quite useful for implementation. Therefore, as the first policy task, these indices should be taken on board in order to plan for the districts which fall in different categories. There should be four steps in the policy formulations. First, a databank should be set up for assembling all the data pertaining to development initiatives and development drivers for these districts in the separate groups. Second, categorise the districts according to the prime driver (mover) of development which can become the vanguard of the new policy. Third, a district level Rainfed Area Development Plan (RADP) can be prepared keeping in view the process of development followed in the last three decades and picking up major development drivers, in order to plan for the next five years with a focus on overcoming the shortcomings due to rainfed character of the districts. These plans could be prepared in collaboration with NABARD district level credit plans. And, four, a specially designed development vehicle or institution could be organised in order to manage the funds in the district and oversee the implementation of the programmes. It has been noted that in the entire experience of development in the rainfed area every policy has failed at the threshold of implementation. It is necessary to have this special purpose vehicle to ensure that the implementation is carried out exactly on the suggested lines. It will be better if the new initiative is undertaken through the decentralised development of panchayat raj institutions (PRI), which would follow the common guidelines given by NRAA under the watershed development programme. The implementation as well as funds should be operated only through the PRIs.
The usual seed-water-fertiliser technology may not be very suitable for these regions, as the lands are quite degraded and lack in nutrition. The World Bank programme of preparing soil health cards for each farm has been in operation
56 R S Deshpande
in a few districts in Karnataka. This is a completely quixotic programme. The points that underscore the uselessness of this programme are: (1) There is a huge investment involved and all these funds are likely to be in the form of loans from the World Bank that has to be repaid. (2) The soil health is a dynamic issue, and as it is sensitive to climatic conditions, it will change over years due to climatic factors and vegetation or crops grown. Just one torrential rain may wash off the top soil changing the chemistry. (3) The Land Resource Inventory (LRI) cards, as called in the World Bank terminology, give only the data about nutrients and micro-nutrients – a vocabulary that farmers cannot understand. (4) There is no prescription for improving the soil health recorded on the card, and thus the farmers are not equipped to use that card at all. Instead of this infeasible policy introduced under the pressure of the World Bank, only because there was a loan available for the programme, it would have been better to provide organic nutrients to the farmers, which could be spread over farms to re-establish the soil health. Organic farming would also have better returns than the low returns due to partially following the seed-water-fertiliser technology in the rainfed farming, especially with a heavy cash component in the cost of cultivation. Besides, it would be necessary to adjust the crop rotation to the seasonal variations across the seasons and plan the crop patterns, which should be recommended in the district Rainfed Area Development Plans (RADPs) for the rainfed districts. In the watershed development programmes which are ongoing, emphasis may be placed on creating small water bodies and farm ponds, which would help to protect crops by providing light irrigation at a critical juncture. Geographical Information System (GIS) based maps could be prepared in order to advise the farmers about the crops to be grown specifically on the degraded lands and low yielding lands. It would be better to incentivise farmers to grow fodder or fodder crops, which would also help the farmers in their animal husbandry vocation.
Identifying irrigated farming as the saviour of the farmer should be discouraged, and diversification from the traditional agriculture to animal husbandry, poultry farming, fisheries, rainfed sericulture, rainfed horticulture and some of the silvicultural practices would help the farmers to have a sustained income flow. Fodder farming should be encouraged as that is a least cost but high profit enterprise. It is unfortunate that most of the crop scientists are totally sold out to the Green Revolution kind of technology. This suppresses the other vocations in the rainfed areas, which could be quite economical and reduce the cost aspect.
57Under the Shadow of Development: Rainfed Agriculture and Droughts....
Rainfed areas are also known for their underdeveloped infrastructure – be it education, health, state offices or even the markets. It is necessary to focus on infrastructural development in the rainfed areas, and the available surplus labor can be utilised for enhancing the infrastructure using the MGNREGA allocation. This would be easier when the farming activity is depressed at the time of critical rainfall failure and drought situations, and when the available labour could be easily diverted from agriculture and farms. This would save on starting new drought relief works and also build infrastructure.
A massive programme of establishing low-cost rural industries could be undertaken utilising the local resources as well as the local labour power. Any process of rural industrialisation would bring in a significant change in the economy of rainfed areas and the lifestyle of the farmers as well as the agricultural labourers. Agro processing of the produce from the nearby irrigated or assured rainfall areas could be established in the hinterlands of rainfed region. One of the important policy initiatives is to establish Farm Producers’ Organisations (FPOs). These will become the most successful vehicle of development in the rainfed areas, which will smoothen the technology transfer and provide increased bargaining power in the hands of the farmers, as well as bring in economic metamorphosis of these backward regions (NRAA 2012b). Along with this, new safety net programmes based on the self-help group (SHG) approach could be introduced. That would include credit facilities and agricultural insurance, which can be done on the group basis. The credit policy for the rainfed areas has to be transformed from the individual loans given to the farmers to group loans provided either to the gram panchayat or FPOs. It will be necessary to utilise the PRIs to the best effect in order to properly implement the programme and also introduce accountability at the panchayat level for such programmes. In this context, V M Rao stated:
“The depressed dryland communities, many of which are weakly integrated with the mainstream processes, end up by sharing more of the costs of growth and development in the national economy than the benefits. The planning process does provide some positive components of change to these communities. However, it shows little interest in investing in poor areas, poor resources and poor people and in generating new technologies for them” (Rao 1992: 61)
58 R S Deshpande
The most important intervention needed is to provide extra powers to the NRAA and create a network up to the district level at least for the prioritised districts. At each state headquarters, connecting offices of NRAA should monitor and assist in the implementation of these programmes. The half-hearted approach of only making NRAA as an advisory body have had a little effect on the development pattern of rainfed areas. The mandate of NRAA states that it was established ‘To guide the implementing agencies on priority setting, and monitor the specific interventions required’. The NRAA should also work as an apex body overseeing the implementation of the programmes suggested. It has to work as an independent organisation that not only draws the programme but also oversees the implementation of the programmes at the district level. An independent monitoring body, with only a few persons drawn from outside the government institutions, could be established in each of the states, and regular reports should be submitted to the apex body of NRAA established at the state level.
Before closing the section, it will be essential to answer one intriguing question that comes to the mind of any analyst. Most of the interventions undertaken by the Government of India through the Planning Commission or state governments, along with many committees and commissions, utilising the best brains in the country, remained only in books. Why is it that the recommendations made by these groups and under various programmes, even though excellent, largely remained on paper and unimplemented for decades? The reason for this is that the planners, experts and the influential groups collectively work to put together policies on paper for the government. But over time the planners and implementers change, and the new group takes up new initiatives. The new group does not have interest in the work that has been put in with lots of efforts by the earlier groups. It is only when the planning process and the policy recommendations serve the interest of the current dominant groups that the implementation gets feasible, and is carried out. Implementation is specifically tardy, when the immediate gains from the interventions are not visible or not perceived rationally by the stakeholders. More importantly, when the beneficiaries and stakeholders belong to the bottom of the society, the implementation fails.

59Under the Shadow of Development: Rainfed Agriculture and Droughts....
PART - IIDROUGHTS: THE REGULAR DESPOILER
1. IntroductionHuman civilisation over centuries has accommodated the climatic
fluctuations of various magnitudes and evolved through these testing times by very imaginatively adapting to these changes. There were a few episodes of acute suffering owing to the devastations caused by some extreme events. The infamous example of such miseries are many, like Doji Bara (famine with heaps of human skulls) in 1791-92 and the 1943 famine in Bengal. The Bengal famine left a devastating scar on Bengal when a large number of deaths took place. Actually, this famine brought the studies of famine into academics looking at it both ways. Failure of entitlement was argued to be a major contributory factor as against other possibilities for the devastation (Sen 1981; Dreze 1988; Sen and Dreze 1991; Mc Minn 1902). The accommodative mechanisms developed over centuries included crop choices, seasonal calendars, adjustments with soil quality and meeting the climatic aberrations with advanced planning. Traditional knowledge system has many examples of such adaptations to the human-nature conflict (Stern 2006). The climatic aberrations could be in the form of (a) usual regular micro climatic fluctuations occurring within a short range of the normal behaviour, (b) serious irregularities where the fluctuations in the climatic parameters cross certain pre-set limits, and (c) extreme events like famines that cause significant economic disasters and human miseries. The normal thresholds used for such differentiations are predefined by long run experience, as against the long-term normal behaviour. Accumulated knowledge of more than two centuries have taught many lessons in understanding the behaviour of droughts and famines. Even then, with every new drought, the shiver runs down the spine, and policy makers shudder of the consequences.
Drought is a pervasive phenomenon, which spans out over every region of the country. Irrigated regions do not get excluded from the possibility of confronting a drought situation, but droughts are frequent visitors to the rainfed regions of the country. It is a climatic event that intensifies already existing volatility of the economy of rainfed regions. Broadly, drought is defined as failure of seasonal rainfall below 75% of the normal and a dry spell of 11 weeks in areas with protective irrigation of less than 30% of the net sown area (Government of India 1976). Drought represents also a climatic aberration of various magnitudes, depending on the intensity of aggregate rainfall as well as timeliness of rainfall
60 R S Deshpande
(Nadkarni and Deshpande 1982). The intensity of any drought is determined by the seasonality and intensity of rainfall failure with its magnitude. A drought turns into a famine when the climatic aberration is significantly high, continued over time, along with ineffective responses towards amelioration, marked by acute human miseries and human and animal deaths. Drought culminating into famines cause devastation of the economy and perpetrates incisive damage on human life. A distressing famine sets back the development clock, besides inflicting serious miseries on the human population.
2. Drought to Famine: A Devastating ChangeThe phenomenon of famines was quite pervasive in colonial India during
18th and 19th centuries. The Famine Commission’s Reports from 1870 to 1901 documented the experiences and vividly brought forth pathetic conditions of rural India during famines. A number of researchers have documented the analytical components from the reports of the Indian Famine Commission (IFC) from 1878 to 1901 (Romesh Dutt 1901; Loveday 1914; Bhatia 1967; Srivastava 1968; Baishya 1975; Brennan 1984). Thus, the efforts in understanding the phenomenon of drought, or for that matter famine, can be traced back to the Famine Commission’s Reports of 1880 to 1901 as well as the First Irrigation Commission 1903, and the Royal Commission on Agriculture 1928 (Government of India 1928). Actually, the 1770 Bengal Famine and the 1858 crop failures under the British rule went unnoticed, and were not even reported (Blair 1874).
The first Famine Commission Report in British India came out in 1880 and the last one was in 1945 after the devastating 1943 Bengal famine that highlighted the incompetence of the British Government in managing the food supply (Sen 1981; Dreze and Sen 1991). It comes out of these studies that the lassitude or administrative failures were the core causes of the huge unbearable misery. Dreze (1988) and Sen (1981) brought forth this failure of entitlement in trade, exchange, labour and inheritance. India faced 54 droughts or famines during 19th and 20th century and four in the current century (Table 12).
Famines and droughts were certainly frequent during the British Raj, even though their number seems to be lower than their occurrences in the independent India, but intensity was heavily distressing. Besides, the possibility of underreporting during British India cannot be ruled out, as the colonial government would have considered droughts as normal occurrences. However, no one can deny that famines were pervasive affecting large areas, and there
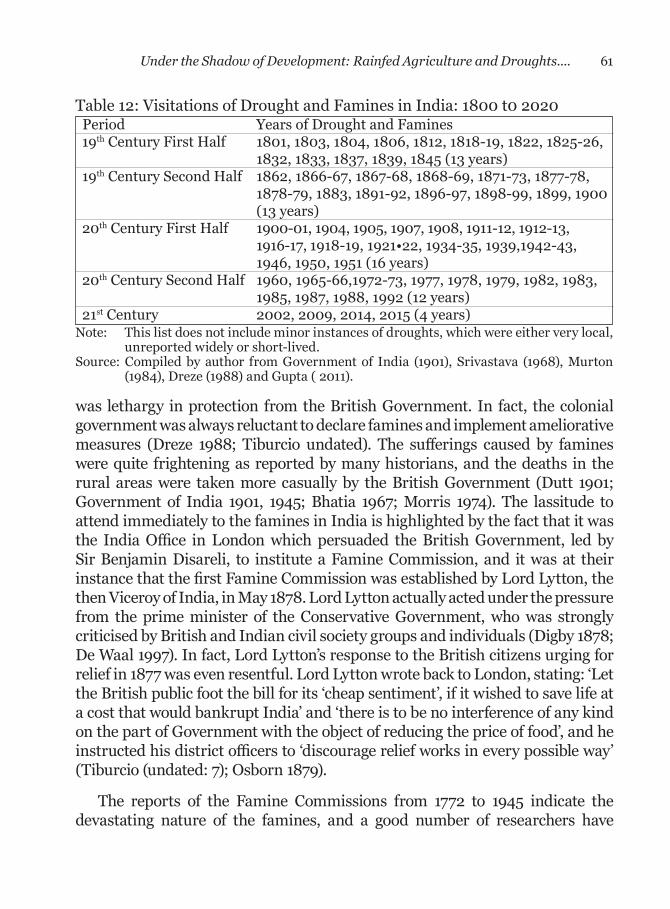
61Under the Shadow of Development: Rainfed Agriculture and Droughts....
was lethargy in protection from the British Government. In fact, the colonial government was always reluctant to declare famines and implement ameliorative measures (Dreze 1988; Tiburcio undated). The sufferings caused by famines were quite frightening as reported by many historians, and the deaths in the rural areas were taken more casually by the British Government (Dutt 1901; Government of India 1901, 1945; Bhatia 1967; Morris 1974). The lassitude to attend immediately to the famines in India is highlighted by the fact that it was the India Office in London which persuaded the British Government, led by Sir Benjamin Disareli, to institute a Famine Commission, and it was at their instance that the first Famine Commission was established by Lord Lytton, the then Viceroy of India, in May 1878. Lord Lytton actually acted under the pressure from the prime minister of the Conservative Government, who was strongly criticised by British and Indian civil society groups and individuals (Digby 1878; De Waal 1997). In fact, Lord Lytton’s response to the British citizens urging for relief in 1877 was even resentful. Lord Lytton wrote back to London, stating: ‘Let the British public foot the bill for its ‘cheap sentiment’, if it wished to save life at a cost that would bankrupt India’ and ‘there is to be no interference of any kind on the part of Government with the object of reducing the price of food’, and he instructed his district officers to ‘discourage relief works in every possible way’ (Tiburcio (undated: 7); Osborn 1879).
The reports of the Famine Commissions from 1772 to 1945 indicate the devastating nature of the famines, and a good number of researchers have
Table 12: Visitations of Drought and Famines in India: 1800 t0 2020 Period Years of Drought and Famines19th Century First Half 1801, 1803, 1804, 1806, 1812, 1818-19, 1822, 1825-26, 1832, 1833, 1837, 1839, 1845 (13 years)19th Century Second Half 1862, 1866-67, 1867-68, 1868-69, 1871-73, 1877-78, 1878-79, 1883, 1891-92, 1896-97, 1898-99, 1899, 1900 (13 years)20th Century First Half 1900-01, 1904, 1905, 1907, 1908, 1911-12, 1912-13, 1916-17, 1918-19, 1921•22, 1934-35, 1939,1942-43, 1946, 1950, 1951 (16 years)20th Century Second Half 1960, 1965-66,1972-73, 1977, 1978, 1979, 1982, 1983, 1985, 1987, 1988, 1992 (12 years)21st Century 2002, 2009, 2014, 2015 (4 years)
Note: This list does not include minor instances of droughts, which were either very local, unreported widely or short-lived.
Source: Compiled by author from Government of India (1901), Srivastava (1968), Murton (1984), Dreze (1988) and Gupta ( 2011).
62 R S Deshpande
brought this out very clearly. Sir J B Lyall, in the report on Famine Commission 1898, remarked, ‘The general conclusion drawn by the Chief Commissioner of the Central Provinces is that the resisting power of the people has very markedly increased during the past generation, and that the destitution following on severe disaster is limited to certain classes of the community much more narrowly than before’ (Government of India 1898: 362). The Famine Commission also reported a large number of deaths. To quote:
“The average number of recorded deaths per mortality in the Ganjam famine per annum in the Ganjam district for the ten years ending the 3oth September 1888 was 19,000 from all causes, and 18,400 excluding cholera. In the 12 months from the 1st October 1888 to the 3oth September 1889, the recorded number of deaths was 38,463 from all causes, and 24,422 excluding cholera. This gives a recorded death-rate for these twelve months of 42·o per mile from all causes, and 25·6 excluding cholera” (Government of India 1898: 17).
The causes of famines begun with a drought, which g0t magnified into a famine because of the scarcity of food, shortage of water and basic necessities like sanitation and health infrastructure, and added to that, the criminal lethargy of the British government. The inaction of the colonial Government had been commented by some of the ardent researchers of famine in India during British Raj. In the first 50 years of the 19th century, India confronted as many as 12 droughts; of which, at least three got converted into severe wide-scale famine, which itself could be an under-estimate (UN 1990a, b; Banerjee 1982). The post-independence India did not face famine-like situations, but it was not free of regular visitations of droughts. In the post-independent period, the two droughts of 1965-66 and 1966-67 were quite devastating, but the government of India managed the situation really well through the PDS and provision of food to the population (Jaiswal 1978; Dreze 1988). The worst drought was witnessed during 1972-73 that had devastating effect on the Deccan Plateau, especially in Maharashtra, Karnataka and Andhra Pradesh (Government of India 1973; Borkar and Nadkarni 1975; Jaiswal 1978; Jodha 1975). Large-scale migrations took place, and a number of deaths and degradation of the lands were witnessed (Government of Maharashtra 1973). The drought of 1972-73 covered Maharashtra, Karnataka, Telangana and parts of Gujarat and Madhya Pradesh (Government of India 1981). In the post-independence India, this was certainly the most widespread and severe drought. Full account of the devastation in
63Under the Shadow of Development: Rainfed Agriculture and Droughts....
Maharashtra was presented in the report of the committee headed by Sukthankar to investigate into the scarcity conditions. It was during 1972-73 that the policy towards droughts were reviewed by most of the states, and steps were taken to establish an early warning system (Government of Maharashtra 1973). The procedures for declaration of drought came under severe criticism. There is no common thread, however, across the states in the methodology of the early warning system or declaration of drought, but the fact remained that till 1987, the declaration of drought was under the legacy of the Famine Commission’s design of the famine code.
The Famine Commission in 1883 introduced the Indian Famine Code, which was considered the first famine code. Famine Code categorised three levels of food insecurity, namely, near-scarcity, scarcity and famine. Near scarcity was a condition of a mild drought. Scarcity was defined as three successive years of crop failures, when crop yields are at one-third/one-half of the normal and the population reports a critical situation in terms of availability of food, fodder and water. Famine conditions include an unusual increase in food prices above 140% of normal and the movement of people (migration out of the village of persons and livestock) in search of food with increased rate of mortality. A famine begins with droughts and results in economic and ecological wreckage. There is no doubt that the drought conditions come about due to failure of rainfall, but they aggravate into a famine due to non-responsive public policies relating to food supply, distribution system and availability of work and failure of exchange entitlements. (Sen 1981; Currey and Hugo 1985; Kelly 1992). In his book Development and Freedom, Sen argued that the nature of the British Raj and the absence of democracy were the main causal factors for the endemic nature and desolations by famines in British India.
One of the important outcomes of the Famine Commission was the development of Indian Famine Code. The famine code was first applied during the Bihar famine in 1883. After that, it stayed in the official lexicography of famines. Essentially the famine code worked specifically on food insecurity levels to illustrate the crawling nature of famine in the rural society. The increase in the food prices above 140% of the normal was considered as an extreme case, and in such cases, it was considered imperative to transport food to the regions where there was acute shortage. The famine code further provided for declaration of famine by the local authorities based on its criteria including: unusual cattle migration, people migration, drying of wells, non-availability of fodder, withering away of the crops, higher density of beggars and so on (Brennan
64 R S Deshpande
1984; Murton 1984). The Famine Commission (1880) formulated this code and received official sanction after the approval of the British Government. This code provided instructions and rules to the local officials for dealing with the famine conditions. The Government of Maharashtra’s committee on the survey of scarcity areas gave a detailed description of the procedures being followed under the famine code (Government of Maharashtra 1973).
The Famine Code instructions broadly included:
1. Putting in place a system of collecting information from all the sub divisions of the provincial government about the conditions of scarcity and famine.
2. Instructions for the type of relief works to be undertaken like metal breaking, road construction, canal digging and repairs.
3. Special instructions for classification of relief and the wage levels to be paid to them.
4. Organisation and collection of a gratis fund from the willing donors.
5. Regularisation of the system of village inspections at short intervals.
6. Suspension of land revenue and grant of Taccavi loans.
7. Relaxation of forest laws and provision for protection of cattle.
The various relief measure adopted during the British rule were according to this code. In fact, the system of Annavari (measure of crop condition) to declare drought was the remnant of the famine code, and it was after the 1972-73 drought that this system was changed by Government of Maharashtra and converted to Paiseari system – basically only a change in nomenclatures. As the rainfall data from the IMD used to come with a significant time lag, the eye estimate of the crop condition continued to dictate the declaration of drought in most of the states in the country. Interestingly, the declaration of famine (later on drought) continued to be dictated by the famine code till 1972-73. There were quite a few changes that had come in the India’s drought policy in the early 1970s after the devastation of the drought of 1972-73 (Deshpande 1984).
After independence, the Government of India could avoid many famines despite extreme climatic events. Droughts, however, continued to be pervasive in the country and the number of declared droughts were large in number, striking with a probability of more than 25%, signifying at least two years of drought in every decade
65Under the Shadow of Development: Rainfed Agriculture and Droughts....
(Banerji 1982). Certainly, drought is an abnormal climatic condition and can vary in its intensity and span of incidence. The incidence of drought is directly associated with the failure of rainfall along with the timing of its failure, whereas the intensity of the devastation caused by the drought is in terms of economic wreckage and the spread across regions dictates the expanse (Arctowski 1938; Funk and Shukla 2020). It is certain that famines were more frequent during the colonial rule (Dreze 1988), but after independence even though the frequency of droughts has increased, the conversion of drought into a widespread famine has been controlled effectively – this did not happen in the droughts of the mid-1960s and 1972-73, which had a severe and invasive impact. Probability of droughts in various parts of the country as well as systematic identification of the drought prone area was initially undertaken by the Second Irrigation Commission 1972, followed by the Report of Agricultural Commission 1976 (Part IV). The information provided in these two reports were extremely useful in controlling the situation, but that was not sufficient. After the 1987 drought, the Ministry of Agriculture of the Government of India took a number of significant steps to enhance the understanding about droughts and their impact. Many studies were conducted thereafter to help in mitigating the impact of droughts after analysing it in detail. These studies include (Government of Maharashtra 1973; Government of India 2004, 2009a, 2016, 2019; NRAA 2012, 2020). The reports coming out of the government system have brought forth the conditions facilitating the emergence of drought, need for developing early warning systems, classification of the drought on various indices, meeting the challenge of drought and policy measures for that purpose (Sinha Ray 2000; Rathore 2005). The best testimony of the continued control on the phenomenon could be witnessed from the reports of the Government of India (2004), NRAA (2009a) and KSNDMC (2019). It is only due to this voluminous work that India has now sufficient stock of knowledge to deal with any unforeseen droughts. Our experience after independence indicate that the Indian policy makers and administration seem to have left famine behind and reduced the chances of even a severe drought getting converted into a devastating experience of famine. Now, we are more equipped in accommodating droughts, but Indian planners cannot remain complacent due to the reduction or elimination of famine conditions – as droughts still haunts the agriculturists. Famine remains a very thin probability, but its non-occurrence cannot be guaranteed and, hence, keeping the guards on is a better policy.
3. Semantics of DroughtDrought is a multifaceted climatic occurrence that strikes without sufficient
warning. There can be a situation when an agricultural drought is prevalent and
66 R S Deshpande
crop growth has stunted, but at the same time, taking the annual rainfall data, one can come to the conclusion that there is no meteorological drought. This situation can occur when climatic failure is experienced in a critical growth week of the crop. A region may have got near normal annual rainfall and still may confront crop failures. There can be a marked reduction in the flow of rivers, streams and springs due to the rainfall pattern in the upper catchment areas or failure in recharge zones. This is associated with the climatic pattern in the area that feeds the river or the streams. One cannot conclude that a significant fall in groundwater table is only due to drought, but it can also happen due to severe well interference, irrespective of the fact that rainfall was normal and above normal. There are many interconnected forces operating at different levels; operate in concordance or get co-opted and orchestrated into a severe drought (Sainath 1996: 370). We have seen that declaration of drought till 1972-73 was based on what was popularly called as Annawari system (eye estimate by the village officer), wherein the normal crop was taken as equivalent to 12 anna (one rupee was equivalent to 16 annas before the introduction of decimal). It was the duty of the village accountant to report to the tehsil office (Girdawar) about the crop condition. Twelve annas were considered as equal to perfectly normal crop condition, and anything below eight annas was to be reported as failure to the tahsildar (a taluka magistrate or government official in charge of a tehsil). In addition to this, the activities of migrating cattle, human population, stoppage of certain usual village activities and availability of foodgrains in the market were reported to the higher ups by the village official. Based on this information and after collating them, the tahsildar used to report drought affected villages to the district officer. Drought as a failure of rainfall was certainly recognised in official circles as the main cause, however, till the mid-1970s and beyond that in many states, the declaration of drought affected villages was solely done by the revenue department through the tahsildar and the district collector. It is strange that the practice of declaration of drought still continues in the formal domain of revenue department than the department of agriculture.
There are a large number of climatic events that take place in and around India, and scientists from the India Meteorological Department (IMD) and World Meteorological Organisation (WMO) are having a continuous analytical scrutiny of them (Ananthkrishnan and Pathan 1971). Drought is one such climatic event that begins with the meteorological episode of significant deviation in the critical season. It is essentially a meteorological phenomenon having a significant influence on agricultural and human activity, as it is connected with water that is the basic resource for many economic activities. The academicians engaged
67Under the Shadow of Development: Rainfed Agriculture and Droughts....
in drought related studies prefer to categorise droughts as (1) Meteorological Drought, (2) Hydrological Drought, (3) Agricultural Drought, (4) Ecological Drought, and (5) Famine Like Conditions. These are clarified in the paragraphs below:
Meteorological Drought: In meteorological parlance, drought is viewed in many ways. Initial attempt to define drought began sometime in the late 1950s, when some of the state governments, seized with the problem of drought, appointed expert committees to look into the definitions. One of the best reports from the Government of Maharashtra was that headed by Pardasani for surveying the scarcity and drought conditions in the Bombay state (Maharashtra). Drought was defined by the IMD as a situation where the annual rainfall was less than 75% of the normal or there is a departure of (-)25% from the normal. However, the Second Irrigation Commission (1972), recommended that the deviation from the annual average rainfall below (-)20% could be considered as a drought situation. In addition to this, the meteorological scientists also developed criteria based on Moisture Index and Aridity Index:
Aridity Index (AI) = (Rainfall/Potential Evapotranspiration in mms)
The Aridity Index (AI) classifies regions as: Hyper Arid if AI< 0.05; Arid Area 0.05 <AI<0.20; Semi-Arid 0.20<AI<0.50; and, Dry Sub Humid 0.50<AI<0.65. The Second Irrigation Commission followed two important indicators, namely, the annual precipitation of the taluk falling below 750 mm (or less than 75% of the normal as the case may be) and with less than 30% net sown area under irrigation. The IMD and Indian Institute of Tropical Meteorology (IITM) together had done a significant amount of work on identifying the drought prone areas, and along with that, they had also commented that the drought could be identified with the help of long-term meteorological data.
A system of classification of drought years was advanced earlier in Australia, but it can be adopted for India also. This method uses deciles for delineating the occurrence of drought. According to this method, “Drought occurs at a period in a certain area when its rainfall is less than decile -2 and severe drought occurs when rainfall is below decile -1”. Similarly, another method called Palmer’s Drought Index (1965) uses a two-layer approach for arriving at water balance. The Palmer Drought Index includes Palmer Drought Severity Index (PDSI), the Palmer Hydrological Drought Index (PHDI) and the Palmer Z Index (Moisture Anomaly Index). The Z Index is calculated as the difference between the actual precipitation in a month and precipitation that is ‘Climatologically Appropriate

68 R S Deshpande
for Existing Conditions’ (CAFEC). Palmer (1968) used parameters such as potential loss, potential recharge, potential run-off, etc. However, considering its limitations, Palmer (1968) subsequently developed an Agriculture Drought Index based on successive weekly values of the computed abnormal evapotranspiration. Classification of droughts at various intensities, as given by Palmer (1968), is given in Table 13.
It is difficult to point out to a universally acceptable definition of drought as the moisture requirements vary across crops, soils and seasons. Every crop has a different lower tolerance limit, so also every type of soil has different moisture holding capacity (Singh 1978; Kulkarni 2015). Therefore, broadly the incidence of rainfall and timeliness, crop situation, satellite imageries, electrical conductivity, groundwater and surface water situation are taken into consideration. After the widespread drought of 1966, the country has faced nine significant drought years, which mostly confronted the failure of rainfall in mid-July, mid-August and mid-September, as these are the months that support crop growth. Effective management is understood as the critical link and that certainly helps in amelioration measures (Jodha 1990). Realising the need for
Table 13: Palmer’s Index of Drought ClassificationPalmer’s Drought Index Value Typology of Drought≥4.00 Extremely Wet3.00 to 0.99 Very Wet to Incipient Wet Spell 0.49 to -0.49 Near Normal -0.50 to -0.90 Incipient Drought -1.00 to-1.99 Mild Drought-2.00 to -2.99 Moderate Drought-3.00 to -3.99 Severe Drought≤-4.00 Extreme Drought
Source: Alley (1984).
Table 14: Meteorological Sub-Divisions with Deficit Rain in the Crop Growth Period Drought Year 1966 1972 1979 1987 2002 2009 2014 2015 Mid July 19 19 19 19 19 19 19 19
(52.8) (52.8) (52.8) (52.8) (52.8) (52.8) (52.8) (52.8) Mid-August 14 16 14 16 14 16 14 16
(38.9) (44.4) (38.9) (44.4) (38.9) (44.4) (38.9) (44.4) Mid September 21 21 21 21 21 21 21 21
(58.3) (58.3) (58.3) (58.3) (58.3) (58.3) (58.3) (58.3)Source: Government of India (2016b).
69Under the Shadow of Development: Rainfed Agriculture and Droughts....
management of severe drought, the Government of India prepared a manual based on the experience of managing droughts from 1966 to 2015.
More sophisticated techniques like Moisture Index (MI) were calculated based on the works of Thornthwaite (1948) and Thornthwaite and Mather (1955), and based on Aridity and Humidity indices. The MI is expressed as:
MI = 100 × (WS − WD)/PE,
where MI is the moisture index, WS is the water surplus, WD is the water deficit, and PE is the potential evapotranspiration.
The Agriculture Commission Report 1976 (Volume IV) elaborately presented the work on defining drought and drought prone areas; interestingly, the areas identified with the help of the most of these criteria match almost up to the taluk boundaries with the areas identified by the Agriculture Commission Report. Krishnan and Shankarnarayanan (1964) used the Moisture Adequacy Index (MAI), expressed in percentage terms, to define, identify and measure the degree of severity of drought. The MAI is the “ratio of actual evapotranspiration to potential evapotranspiration expressed in percentages”. The weeks with MAI less than 25% of normal are taken as severe drought weeks, and MAI in the range of 25% to 50% are considered as moderate drought weeks. This method considered the agricultural growing season for its formulation. In all these cases, the entire exercise amounts to largely a cold blooded, but supposedly scientific approach, forgetting the population on the ground and the reality that sometimes even with least precipitation, there can be sufficient economic activities that can sustain life. At the same time, the complexities of the natural parameters are such that even a normal rainfall can result in a drought and crop failures. In order to overcome this difficulty, the NRAA developed Natural Resource Index (NRI) and used it in the reports submitted by NRAA in 2012 and 2020.
Hydrological Drought is a resultant of the meteorological drought, which puts stress on the surface and groundwater, thereby, reducing the availability of water for different uses. Earlier in the famine code, the water level in the wells and drying rivers were considered as criteria for declaration of drought. Major indicators for hydrological drought are the volume of water in the permanent water bodies, inadequate flows in the streams and rivers, measurement of run-off and its deviation from the normal run of, and, finally, the Surface Water Supply Index (SWSI). These measurements are used for the hydrological drought (Nagrajan 2010). The density of grey and black blocks classified by
70 R S Deshpande
the groundwater experts can be taken as the starting point in categorisation (Government of India 2009b).
Agricultural Drought is a resultant of meteorological drought and hydrological drought, as all the activities in agricultural sector depend on availability of water either through rainfall or irrigation. Thus, the existence of the first two types of droughts essentially reflects on the certainty of the agricultural drought. It actually refers to the adequacy in the soil moisture during the growing season and increased Aridity Index. Even though, it is very simple to understand the agricultural drought with the satellite imageries, a crop moisture index (CMI) is utilised in order to declare an agricultural drought. In the crop insurance operations, the declaration of agricultural drought decides the payment of indemnity, therefore, this index assumes importance. Unfortunately, most of the state governments declare an agricultural drought on the basis of crop cutting experiments and only after these are completed, the crop insurance claim is allowed. This actually puts the farmer under stress and farmer is compelled to borrow from money lenders, and so the agitations by the farmer on non-receipt of the insurance indemnity are quite legitimate.
Ecological or Widespread Drought is a resultant of all the above three typologies. This type of drought covers not only the water resources, crop resources, land resources but also includes the forest resources and the uncultivated fodder lands. Ecological drought occurs when primary productivity of the natural ecosystem significantly goes down as an effect of reduced precipitation and availability of water in the ecosystem on which human as well as animal population depend. Since ecological concerns also involves human habitation as also animal population, the ecological drought creates significant human, animal and biological miseries also.
Famine Like Conditions prevail when there is extreme aridity and the moisture index is at the lowest impacting both crop growth as well as water in the streams, wells, sources of drinking water and rivers (Morris 1974). In such a situation, the water availability is restricted, and usually, a famine like conditions prevail, when the drought is in successive years and widespread across the regions. Famine conditions are indicated by significant human and animal migration (Government of India 1901; De Supriyo 2019), stress on availability of water for drinking and other purposes, and deaths of animals and infants due to water shortages or due to drinking contaminated water. As water availability reduces in the villages, the population of the village is compelled to drink wherever water
71Under the Shadow of Development: Rainfed Agriculture and Droughts....
is available, irrespective of the potability. During famine conditions, deaths due to cholera like epidemics have been noted significantly. Food grain availability is also limited due to disruptions in the usual supply chains and failure of the state to provide food through PDS. The market prices of food grain, fruits or vegetables increase substantially, making it difficult for the poor to buy for their survival. It was reported in the newspapers in 1972-73 that a number of poor people had to sell out their children, and the flesh trade became very prominent in the drought prone districts of Bijapur, Saudatti, Osmanabad, Solapur, Beed and a few more. This happened only during the 1972-73 drought, which took place after independence and had been heralded as quite effectively managed by the government. But despite that such incidences were reported. One can only imagine what would have happened to the population and the severity of the sufferings during the famine that took place in British India.
As regards meteorological declaration of drought besides annual rainfall, the seasonality also becomes an important aspect. An innovative seasonality index was developed by Deshpande (1984) called Seasonal Negative Deviation Index, which was explained earlier. A similar criterion was devised by Sukhatankar Committee about continuous dry spell for 6 weeks during the growing period suggested by agronomists. This was sufficient for declaration of a severe drought with least time lag. It is, therefore, clear that an event of drought can be defined as failure below 20% of the normal rainfall in the kharif season or rabi season, and/or there is a continuous dry spell for 6 weeks in the growing season. The only problem with the meteorological definition of drought is that the drought is declared ex-facto. It is quite known that the meteorological data in most of the states (except Karnataka) and districts in the country are available with a large time lag and come almost a few months after the drought event has actually occurred, and therefore, the Government of India has organised Crop Weather Watch Group (CWWG) in each of the states as well as at the centre. It can be seen from Table 15 that the largest share of the total rainfall in the year comes in the months of June to September (Table 15), and these are the crucial months of declaration of droughts. These months overlap both the kharif and rabi seasons. It is a critical period and so the CWWG meet almost every week during this period. Despite this, the difficulty of the thin density of rain gauge stations (one for 17,438 ha) continued to haunt the declaration of drought in India. With the development of satellite imageries and data from the satellites, it has become easier than it was earlier. One of the important developments in Karnataka, as compared to other states is the introduction of telemetric rain gauge stations. The spread of these rain gauge stations has covered 5,626 gram panchayats
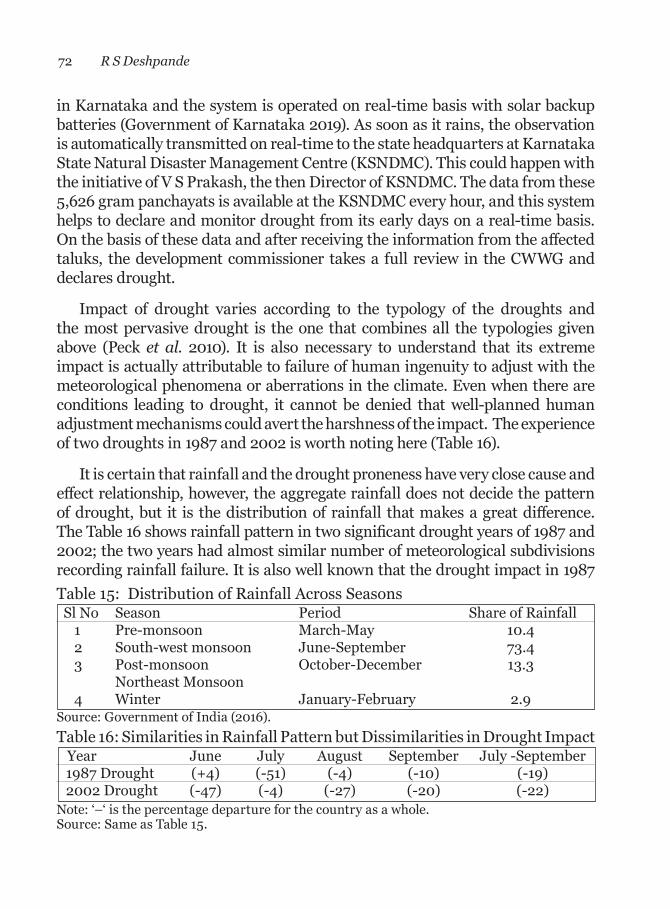
72 R S Deshpande
in Karnataka and the system is operated on real-time basis with solar backup batteries (Government of Karnataka 2019). As soon as it rains, the observation is automatically transmitted on real-time to the state headquarters at Karnataka State Natural Disaster Management Centre (KSNDMC). This could happen with the initiative of V S Prakash, the then Director of KSNDMC. The data from these 5,626 gram panchayats is available at the KSNDMC every hour, and this system helps to declare and monitor drought from its early days on a real-time basis. On the basis of these data and after receiving the information from the affected taluks, the development commissioner takes a full review in the CWWG and declares drought.
Impact of drought varies according to the typology of the droughts and the most pervasive drought is the one that combines all the typologies given above (Peck et al. 2010). It is also necessary to understand that its extreme impact is actually attributable to failure of human ingenuity to adjust with the meteorological phenomena or aberrations in the climate. Even when there are conditions leading to drought, it cannot be denied that well-planned human adjustment mechanisms could avert the harshness of the impact. The experience of two droughts in 1987 and 2002 is worth noting here (Table 16).
It is certain that rainfall and the drought proneness have very close cause and effect relationship, however, the aggregate rainfall does not decide the pattern of drought, but it is the distribution of rainfall that makes a great difference. The Table 16 shows rainfall pattern in two significant drought years of 1987 and 2002; the two years had almost similar number of meteorological subdivisions recording rainfall failure. It is also well known that the drought impact in 1987 Table 15: Distribution of Rainfall Across Seasons Sl No Season Period Share of Rainfall 1 Pre-monsoon March-May 10.4 2 South-west monsoon June-September 73.4 3 Post-monsoon October-December 13.3 Northeast Monsoon 4 Winter January-February 2.9Source: Government of India (2016).Table 16: Similarities in Rainfall Pattern but Dissimilarities in Drought Impact Year June July August September July -September
1987 Drought (+4) (-51) (-4) (-10) (-19)2002 Drought (-47) (-4) (-27) (-20) (-22)
Note: ‘–‘ is the percentage departure for the country as a whole.Source: Same as Table 15.
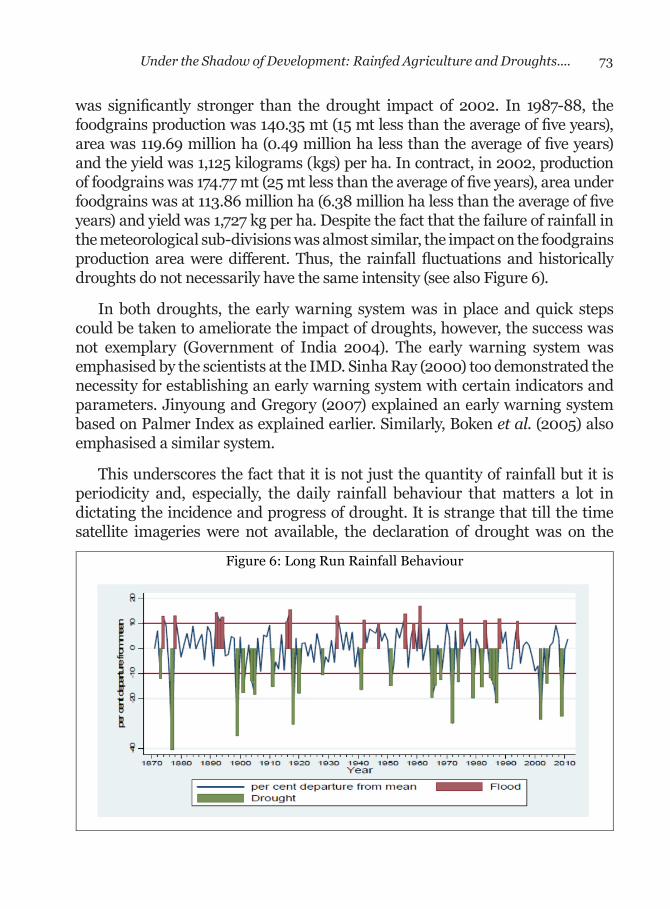
73Under the Shadow of Development: Rainfed Agriculture and Droughts....
was significantly stronger than the drought impact of 2002. In 1987-88, the foodgrains production was 140.35 mt (15 mt less than the average of five years), area was 119.69 million ha (0.49 million ha less than the average of five years) and the yield was 1,125 kilograms (kgs) per ha. In contract, in 2002, production of foodgrains was 174.77 mt (25 mt less than the average of five years), area under foodgrains was at 113.86 million ha (6.38 million ha less than the average of five years) and yield was 1,727 kg per ha. Despite the fact that the failure of rainfall in the meteorological sub-divisions was almost similar, the impact on the foodgrains production area were different. Thus, the rainfall fluctuations and historically droughts do not necessarily have the same intensity (see also Figure 6).
In both droughts, the early warning system was in place and quick steps could be taken to ameliorate the impact of droughts, however, the success was not exemplary (Government of India 2004). The early warning system was emphasised by the scientists at the IMD. Sinha Ray (2000) too demonstrated the necessity for establishing an early warning system with certain indicators and parameters. Jinyoung and Gregory (2007) explained an early warning system based on Palmer Index as explained earlier. Similarly, Boken et al. (2005) also emphasised a similar system.
This underscores the fact that it is not just the quantity of rainfall but it is periodicity and, especially, the daily rainfall behaviour that matters a lot in dictating the incidence and progress of drought. It is strange that till the time satellite imageries were not available, the declaration of drought was on the
Figure 6: Long Run Rainfall Behaviour
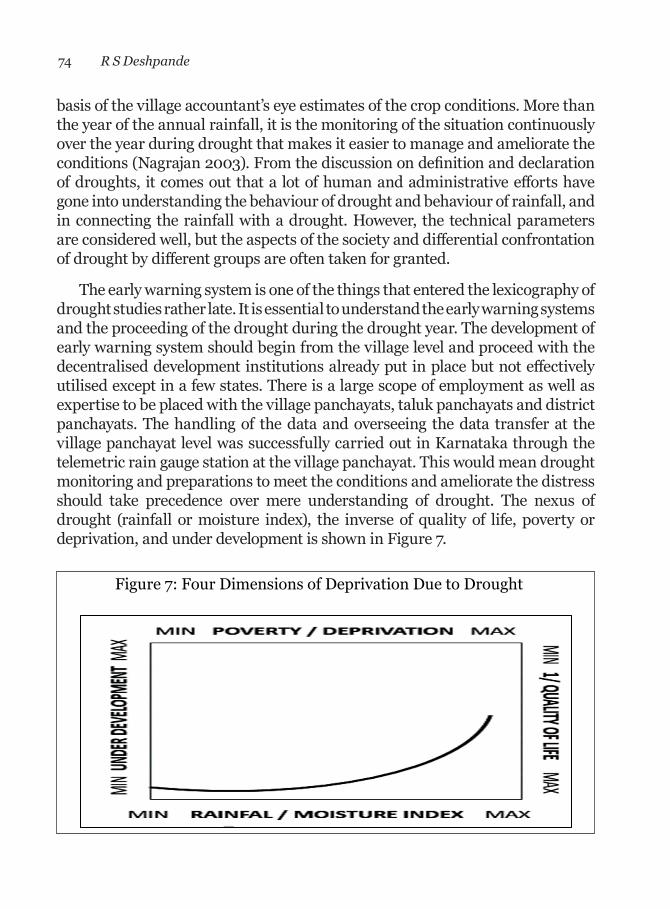
74 R S Deshpande
basis of the village accountant’s eye estimates of the crop conditions. More than the year of the annual rainfall, it is the monitoring of the situation continuously over the year during drought that makes it easier to manage and ameliorate the conditions (Nagrajan 2003). From the discussion on definition and declaration of droughts, it comes out that a lot of human and administrative efforts have gone into understanding the behaviour of drought and behaviour of rainfall, and in connecting the rainfall with a drought. However, the technical parameters are considered well, but the aspects of the society and differential confrontation of drought by different groups are often taken for granted.
The early warning system is one of the things that entered the lexicography of drought studies rather late. It is essential to understand the early warning systems and the proceeding of the drought during the drought year. The development of early warning system should begin from the village level and proceed with the decentralised development institutions already put in place but not effectively utilised except in a few states. There is a large scope of employment as well as expertise to be placed with the village panchayats, taluk panchayats and district panchayats. The handling of the data and overseeing the data transfer at the village panchayat level was successfully carried out in Karnataka through the telemetric rain gauge station at the village panchayat. This would mean drought monitoring and preparations to meet the conditions and ameliorate the distress should take precedence over mere understanding of drought. The nexus of drought (rainfall or moisture index), the inverse of quality of life, poverty or deprivation, and under development is shown in Figure 7.
Figure 7: Four Dimensions of Deprivation Due to Drought

75Under the Shadow of Development: Rainfed Agriculture and Droughts....
4. Monitoring of DroughtThe issue of monitoring the incidence and progress of drought has been
bothering the agricultural scientists as well as policy makers for a long time. It is necessary to know the incidence from the early warning system, and as the drought proceeds further, it is necessary to follow its headway over time. The Government of India has, time and again, emphasised the need for an early warning system and monitoring of the drought situation from the beginning, and for estimating the possible impact and probable losses at the earliest.
Drought declaration is largely the responsibility of the state governments because the incidence is initially reported by the taluk and village level officers.
Map 10: Frequency of the Occurrence of Droughts (2000-2016)
Source: Government of India (2016:13).
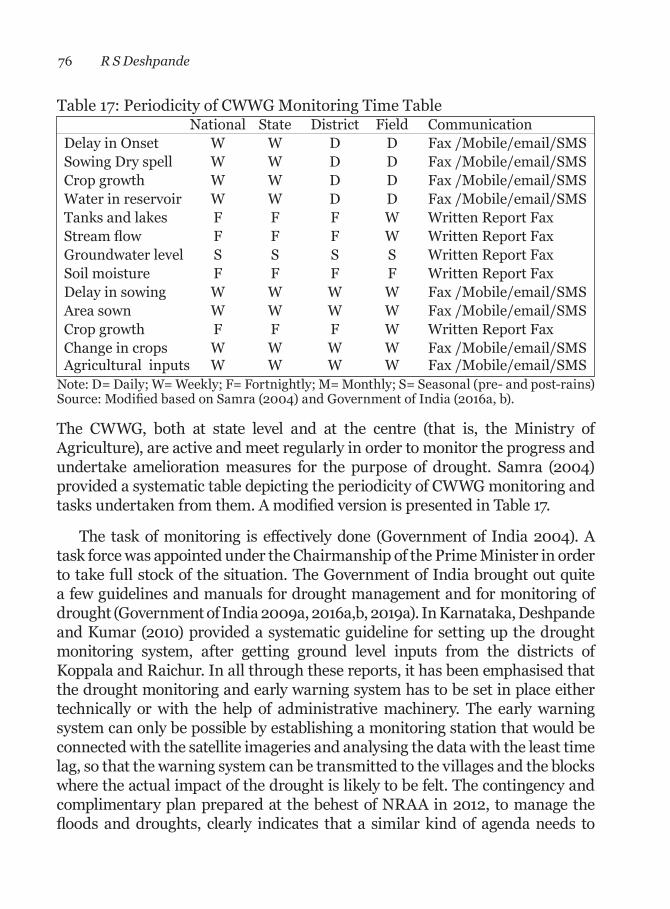
76 R S Deshpande
The CWWG, both at state level and at the centre (that is, the Ministry of Agriculture), are active and meet regularly in order to monitor the progress and undertake amelioration measures for the purpose of drought. Samra (2004) provided a systematic table depicting the periodicity of CWWG monitoring and tasks undertaken from them. A modified version is presented in Table 17.
The task of monitoring is effectively done (Government of India 2004). A task force was appointed under the Chairmanship of the Prime Minister in order to take full stock of the situation. The Government of India brought out quite a few guidelines and manuals for drought management and for monitoring of drought (Government of India 2009a, 2016a,b, 2019a). In Karnataka, Deshpande and Kumar (2010) provided a systematic guideline for setting up the drought monitoring system, after getting ground level inputs from the districts of Koppala and Raichur. In all through these reports, it has been emphasised that the drought monitoring and early warning system has to be set in place either technically or with the help of administrative machinery. The early warning system can only be possible by establishing a monitoring station that would be connected with the satellite imageries and analysing the data with the least time lag, so that the warning system can be transmitted to the villages and the blocks where the actual impact of the drought is likely to be felt. The contingency and complimentary plan prepared at the behest of NRAA in 2012, to manage the floods and droughts, clearly indicates that a similar kind of agenda needs to
Table 17: Periodicity of CWWG Monitoring Time TableNational State District Field Communication
Delay in Onset W W D D Fax /Mobile/email/SMS Sowing Dry spell W W D D Fax /Mobile/email/SMS Crop growth W W D D Fax /Mobile/email/SMS Water in reservoir W W D D Fax /Mobile/email/SMS Tanks and lakes F F F W Written Report Fax Stream flow F F F W Written Report Fax Groundwater level S S S S Written Report Fax Soil moisture F F F F Written Report Fax Delay in sowing W W W W Fax /Mobile/email/SMS Area sown W W W W Fax /Mobile/email/SMS Crop growth F F F W Written Report Fax Change in crops W W W W Fax /Mobile/email/SMS Agricultural inputs W W W W Fax /Mobile/email/SMSNote: D= Daily; W= Weekly; F= Fortnightly; M= Monthly; S= Seasonal (pre- and post-rains)Source: Modified based on Samra (2004) and Government of India (2016a, b).
77Under the Shadow of Development: Rainfed Agriculture and Droughts....
be taken and revised every year so that the contingency plans are available as per the incidence of the drought or flood. Possibly the report came a year later, but the work was undertaken earlier. An improvised report NRAA (2019) on contingency plans for management of livestock and the rainfall deficit prepared by the expert committees have been placed on the NRAA website (www.nraa.gov.in). Both the reports clearly provide footsteps to follow and manage effectively the drought situation, including the livestock and supply of inputs, credit and dissemination of appropriate technologies (NRAA 2015). Many efforts were taken after learning painful lessons from 1987 drought onwards. The proof of this is available in terms of many reports prepared at the Ministry of Agriculture, Government of India, and their approach has been mainly to identify the key responsible variables and collecting them at a periodic interval. Some variables of interest include fluctuations in critical season rainfall, the standardised precipitation index (SPI), decline in the sown area either through the satellite imagery or the village level intelligence reports, the crop condition report based on the satellite imageries with the help of ISRO, streamflow index (SFI), groundwater situation from CGSD, and the reservoir water levels from irrigation department. It may be noted that reservoir water levels are important not only for supportive irrigation, but also matters as the large irrigated area also depends not only on rainfall but irrigation from the reservoirs, besides there is a possibility of augmenting the groundwater table if there are good rains in the catchment area.
The essential steps to improve the monitoring of the drought situation begin with the formation of a contingency plan from micro level moving upwardly to the meso-level. This plan should be further aggregated at the state level, and must include all the important data in order to understand the intensity and spread of drought. The data should be available on the rainfall variability, moisture index of the soil with the well spread sample, crop conditions and socio-economic responses of the people (Bhatia 2005). The soil health card scheme followed in many states provide only scientific information on the cards, supplied to farmers which they hardly understand. Even if farmers are aware of the card, they would have no knowledge as to how to deal with the soil chemistry as the recommendations are not available in the language that they can understand. The process of preparing these soil health card presumes the knowledge of chemistry possessed by the farmer and, therefore, these cards are of little use, unless the soil treatment is explained in simple language. Recently a World Bank supported project through loan for the ongoing SUJALA project in Karnataka, emphasised the importance of a land resource inventory card (LRI), with a huge
78 R S Deshpande
funds being invested in them (Pixel 2019). This is not the only case of putting a huge amount of fund going down the drain on the expert advice. Earlier on the advice of the World Bank expert, vetiver grass was planted on the contour bunds covering thousands of bunds, with large investments in Manoli, Kabbalnala, Maheshwar Nala and Purua Nala watershed projects. That entire investment (or borrowed funds for which interest is being paid) went down the drain without any accountability. Unfortunately, not a blade of that grass is available in any of these watersheds and the borrowed funds invested was certainly wasted.
One of the important aspects of monitoring drought is the visible migration of animals and labourers out of the villages. In the face of non-availability of work and shrinking income, it becomes difficult to maintain animals with own resources. The famine code in British India clearly mentioned the first signs of cattle migration or sale of animals as indicators for the purpose of monitoring. This information must reach the policy makers at the earliest, therefore, a net-work mechanism is needed. Effective monitoring is possible only with a network mechanism woven from below, and this should be institutionalised not only at the state level but also at the sub- state level up to the taluk. Every monitoring structure should follow holistic approach of all the factors causing as also impacted by drought, and empirical measurements should be developed like various indices suggested in NRAA (2020) up to taluka/block level. The drought manuals of the Government of India (2016, 2019) provide sufficient information and checklists for the purpose of monitoring, however, the monitoring of the situation has to be location specific, since drought is a location specific phenomenon. Various sectors like health, availability of fodder, supply of essentials, livestock health, requirement of water for industries and other activities should be incorporated in the checklist for monitoring. One of the best examples of monitoring has been put forth by the KSNDMC in Karnataka, giving an elaborate report on establishment of early warning system as well as monitoring of the drought as it proceeds in the state (KSNDMC 2018).
Drought monitoring system has been on the top of agenda for Government of India since the devastating drought of 1966, and after a gap of six years, the 1972-73 drought shook the diffident policy makers again and forced them to prepare for monitoring of drought (Government of India 1972, 1973). The CWWG was formed at the Ministry of Agriculture, and the crop and weather forecasting division were established and new guidelines were issued (Government of India 1981). Many research studies were undertaken to understand the seasonal fluctuations and rainfall forecast models, and many typologies of indices were

79Under the Shadow of Development: Rainfed Agriculture and Droughts....
formulated. The IMD, IITM and WMO developed a few models in order to forecast the possible drought in the coming period, but the forecast have been restricted only up to a two weeks margin (Kulkarni 2015). These studies began almost a century back, but initially these were confined only to the annual rainfall, and did not venture into the intricacies. The Commission on Climatic Variations in 1938 made some progress in order to understand the climatic fluctuations (Arctowski 1938) basing their recommendations on the available technology in those years, which are now quite outdated, however, the philosophy of monitoring drought week by week is an essential takeaway from the report. Palmer, Thornthwaite, Penman and many such authors were engaged in understanding the behaviour of precipitation with respect to drought. Bean (1969) provided a new approach to statistical forecasting, but then it did not work in reality. Deshpande (1984) took a full review of the crop weather relationship from more than 80 IMD and WMO studies, and analysed the monthly and annual rainfall data for all the drought prone districts of Maharashtra, in order to assess if there was any cycle, periodicity, forecasting or shift in the patterns. He undertook this analysis using data for 71 years including the monthly and annual rainfall, and rainy days data of all the rain gauge stations in the drought prone districts of Maharashtra. A similar work was done for Karnataka, Tamil Nadu and Andhra Pradesh. No trends, periodicities or forecasting could be concluded. Finally, after an intricate time series analysis, Deshpande (1984) concluded that the rainfall series monthly, seasonal as well as annual only depict ‘White Noise and a Random Walk’ for the rainfall data of 71 years of all the drought prone districts in Maharashtra. The IMD also started significant research on models of crop forecasting. These included Rangarao and Panditrao (1963), which talked about retro symmetry, and then there were a few models that tried to establish the crop weather relationship. Long ago before such studies were attempted, Mann, as Director of Agriculture of the Mumbai Province after independence, completed a study connecting weather and agriculture (Mann, 1955). Other attempts include that of Ananthakrishnan and Pathan (1971), Raghvendra (1974), Morris (1974), Ryan and Subramanian (1975), Mason (1976), Michalczyk (1979) and Kulkarni (2015). None of the studies could, however, give any insights to reach an advanced understanding of the impending drought. The search continued with Gore et al. (1987), Pandey et al. (2011), Parry and Carter (1985) and Baron et al. (2003) without reaching a conclusive result to understand drought forecasting. Recently, the National Drought Mitigation Centre, University of Nebraska (2020) concluded, “Studies over the past century have shown that meteorological drought is never the result of a single cause. It is the consequence of complex individual interactions. There
80 R S Deshpande
could be many components of a drought event. Therefore, there are quite a few hurdles in a primary understanding and forecasting the drought situation for complete preparedness”.1 The Chinese scientists worked on remote sensing data to conclude that the possibility of predicting a drought with quite low reliability and only between 1 month and 3 months lead time (Wang et al. 2020). As an alternative, they suggest monitoring the situation when the first warnings of the drought are signalled.
There is no ideal monitoring system. However, there are two components which need to be kept in view while designing any monitoring system for droughts. In India, currently, under the Central Drought Relief Commissioner, an institutional structure has been put in place. There is a CWWG and the Additional Secretary Department of Agriculture, Cooperation and Farmers Welfare heads it, along with the Central Drought Relief Commissioner. This group has participants invited from the drought affected states and some of the experts from the specialised fields. The group meets periodically and even daily when the drought situation is prevalent in the country. The participating institutions include IMD, Central Water Commission, Animal Husbandry Department, Ministry of Power, ICAR (crop division), Central Research Institute for Dry Land Agriculture, National Centre for Medium Range Weather Forecasting, remote sensing centres providing satellite-based inputs, Mahalanobis National Crop Forecast Centre and concerned scientists from ISRO. With such a powerful monitoring institutional structure, it should be possible to get control on the management of drought and ameliorating the conditions of the affected population without much delay. One limitation in the monitoring mechanism is that the group is overcrowded, and has less empirical support in the form of data on a real-time basis. Only in the state of Karnataka, the data are available on real-time basis from the telemetric rain gauge stations, and therefore, decisions could be taken without losing any time between the first signals of drought and the launch of the alleviating mechanism. Even then, the alleviation programmes is in the hands of many departments that include revenue, agriculture, disaster management group, local administration, political leaders, and sometimes, the local NGOs.
A national crisis management plan was worked out in 2019 at the Ministry of Agriculture, Government of India (Government of India 2019b). It was recommended in the report that a crisis management group (CMG) be set up for managing the drought situation at different stages of drought. This group would be having the Joint Secretary (Drought Management), and the Chairperson would be Additional Secretary and the Central Drought Relief Commissioner along
81Under the Shadow of Development: Rainfed Agriculture and Droughts....
with the nodal officer from the Department of Agriculture. It is interesting that this report gives very elaborate mechanism for monitoring the drought situation and reducing the impact parameters with timely intervention. Despite all the systematic efforts, the flow of information is not on a real-time basis, and there is a lag between the incidence of climatic stress and information reaching the crisis group (Mehta 2000). This time lag can be reduced with the help of modern mobile technology either through short message service (SMS) or e-mail. This group would monitor the drought situation and the National Crisis Management Committee (NCMC) would take the inputs from all the state governments. It was further recommended that similar bodies could be established in all the states with large drought prone areas.
5. Economics and Impact of DroughtEvery climatic aberration has sufficient potential to cripple economic
activities, and if such episode is beyond a certain limit, they fuel instability and the impact can be severe. Such instances may leave deeper scars on the affected economy (Deshpande 1984). Primarily, drought affects rural India, and especially, begins with the agricultural activities that are largely dependent on the precipitation received during the cropping seasons. In the Indian context, we normally have two broad cropping seasons, namely, kharif and rabi crop seasons. Sometimes, late kharif and late rabi are called zaid kharif and zaid rabi crop seasons. In West Bengal, Odisha and Tamil Nadu, the seasons have different names in the local language. In fact, in some of the horticultural crops, farmers purchase water in tankers from the nearby water sources and save the crops. This happened during the 1987 drought in Marathwada, where the crop of sweet lime was saved using tanker water from Jalana district. The entire process of drought and its impact is quite a complex system, and this could be made simple for understanding through a system diagram (Figure 8.1, 8.2 and 8.3). It is at the growing stage that the crop has to be sustained, so that grains could be formed and the crop can be harvested. Drought cannot be only due to the failure of rainfall, but also due to time of its occurrence: before growing, during growth, at the time of harvest or after the harvest. It is a complete misnomer that incidence of drought is only due to failure of rainfall, but there are instances of complete harvests being wiped out by an untimely deluge when harvested grains are still in the field.
The system diagram presented shows three stages in the process of drought. In the first stage, as soon as pre-sowing tillage is undertaken, the farmer expects
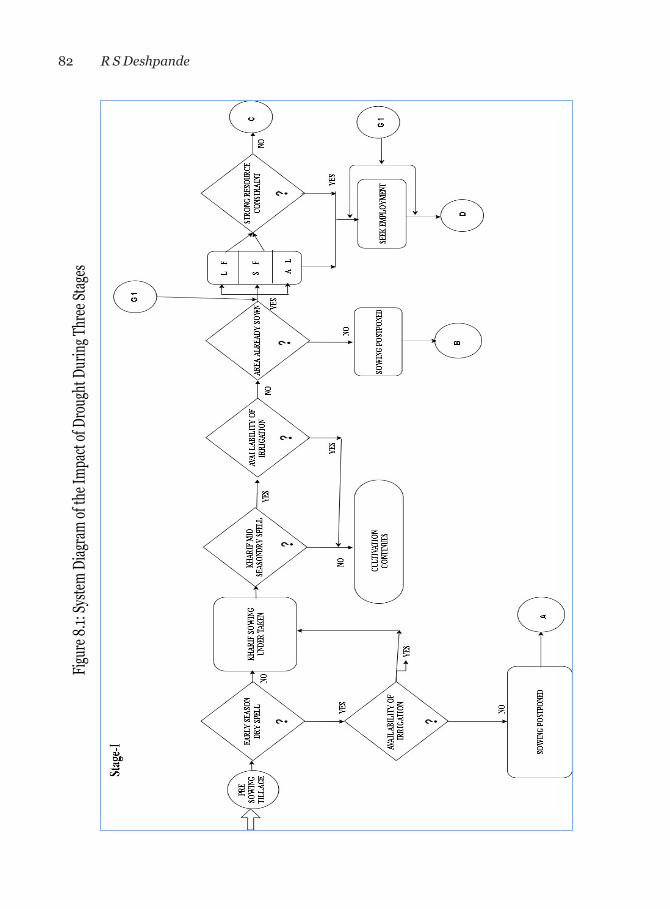
82 R S Deshpande
Figu
re 8
.1: Sy
stem
Diag
ram
of th
e Im
pact
of D
roug
ht D
urin
g Thr
ee St
ages
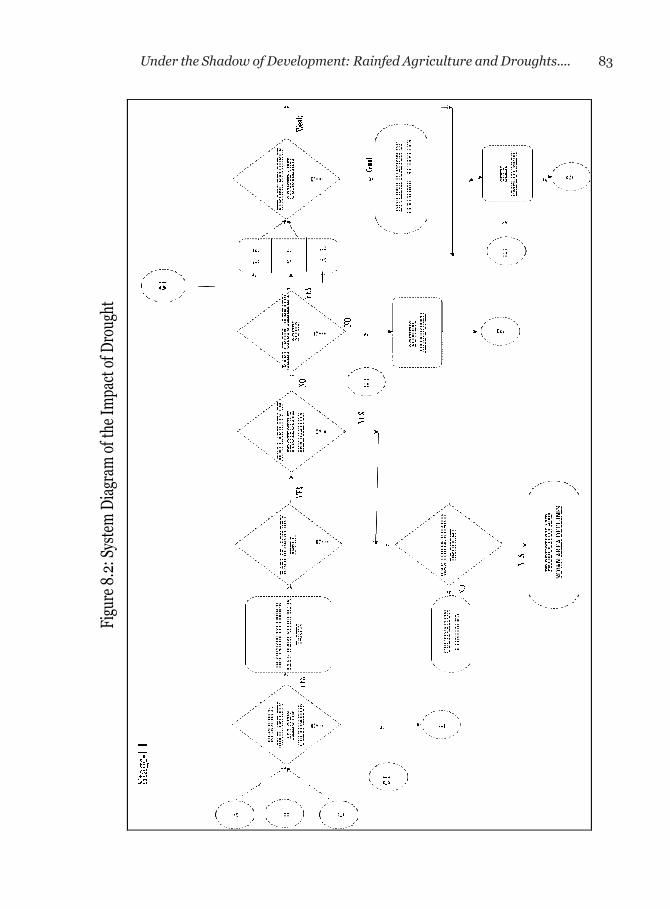
83Under the Shadow of Development: Rainfed Agriculture and Droughts....
Figu
re 8
.2: S
yste
m D
iagra
m of
the I
mpa
ct of
Dro
ught

84 R S DeshpandeFi
gure
8.3
: Sys
tem
Dia
gram
of t
he I
mpa
ct o
f Dro
ught

85Under the Shadow of Development: Rainfed Agriculture and Droughts....
the first monsoon shower that drenches the field. Sometimes, the pre-monsoon shower is in time, but if they are below the normal of those three weeks, the farmer continues with the first season activities only when protective irrigation is available. In this initial stage of the crops, at least 2 to 3 showers are required for healthy crop growth as well as application of fertilisers and manure. In this mid-season of crop growth, when the plants are 8 to 12 inch tall, and if there is a dry spell at such time, farming activities would continue only with the protective irrigation. In the absence of the dry spell, the farming activities continue. In case these two conditions are not satisfied, and if the areas are already sown, then the farmer suffers the loss of seeds, labour charges utilised for tillage, sowing and other activities. Initially, the farmer can postpone sowing and may get connected to either the places indicated as (A) or (B) to reach the second stage in the system diagram. The impact on the large farmers (LF), small farmers (SF) and agricultural labourers (AL) are different, and the availability of resources only dictate the further continuation of farming. At this stage, the farming activities get connected to (C) (D) or (G1), as depicted in stage 1.
The second stage in the system diagram picks up from (A), (B) or (C) from stage 1, and the farming activities continue under the condition of availability of resources to continue with the second season cropping. It is necessary to bear in mind that the loss in the kharif season makes it difficult for the farmers to have adequate working capital in hand. In such situations, many farmers tend to borrow from the moneylenders, as already the crop loan is exhausted and the usual institutional sources of credit are also unobtainable as in the first season. Early dry spell in the raising rabi season puts two conditions; one, availability of irrigation and no drought in the kharif season signifies that the economic condition of the farmer is better, and therefore, the cultivator continues with rabi farming, and, two, in case there was a kharif drought suffered earlier by the farmer, the economic condition of the household gets deteriorated. However, if there is some protective irrigation available, the farmer continues with farming. If irrigation is not available and rabi sowing has already taken place, then the farmer suffers rabi season drought along with the loss of seeds, fertilisers and other components of the cost of cultivation. Again, the survival to the third stage depends on the resource position of the farmers, and those who cannot afford to sustain their usual lifestyle either migrate out of the village or seek employment in their own village or outside in urban locations. At this stage, the farmers tend to diversify their activities. The third stage of the system diagram begins with connectors (D), (E), (F), (G) and (GI) from the earlier stages. If the drought prevails and if the said position is quite strong, then the farmer continues with

86 R S Deshpande
normal economic activities or diversifies into other ancillary income sources. At this position, the farmer’s availability for work decides quite a bit about the future sustenance. Otherwise, if there are household assets for the purpose of sale and at times even land, the cultivator resorts to the sale of livestock, household assets, jewellery and even land (Borkar and Nadkarni 1975). At this point of time, the cultivator is absolutely helpless, and the entire household economy is in a wreck. The economics of drought does directly hinge on three important components: one, timeliness of rainfall and availability of resources for continuing in the cultivation, two, the capability to diversify and enter into the labour market or other economic activities to help the household survive a complete wreckage, and three, when the survival through these stages is infeasible and the farmer has already committed huge debts due to the frequent visitations of drought, the farmer is compelled many times to take extreme steps either to commit suicide or migrate to far off places.
Drought can lead to economic wreckage only when the cultivator as well as the policy makers fail in their ingenuity to decipher the arrival of drought, adjust with the situation of drought at the earliest and diversify the economic activities. In fact, the first preference is for diversification to livestock or animal husbandry. But these activities could also get impacted by the non-availability of fodder, as grazing lands get dried up. Added to this is the non-availability of water leading to the collapse of many economic activities, besides giving rise to epidemics like cholera, influenza, diarrhoea, stomach infections or many such diseases due to use of contaminated water. The economic, hydrological, environmental and social impacts are summarised in Table 18.
The Government of India releases funds for drought relief on the basis of the memorandum received from the respective state governments. From 2019, there is a fixed format for submission of this memorandum for demand of funds (Government of India 2019). After the receipt of the memorandum for relief due to drought, a central team visits the state for assessing the loss due to drought. Often the state government’s claim for relief is far higher (actually exaggerated) than the actual needs felt in the state. The central team understands this exaggeration and decides on the funds to be released to the state for drought relief. The difference between the claims or needs and the released funds range anywhere between 30% and 65%, as the released funds are always far short of claims made by the state governments. This a typical political economy of trying to bloat the demand for funds and the central team squeezing the release. Interestingly, the central team declares that they have fixed the amount rationally,
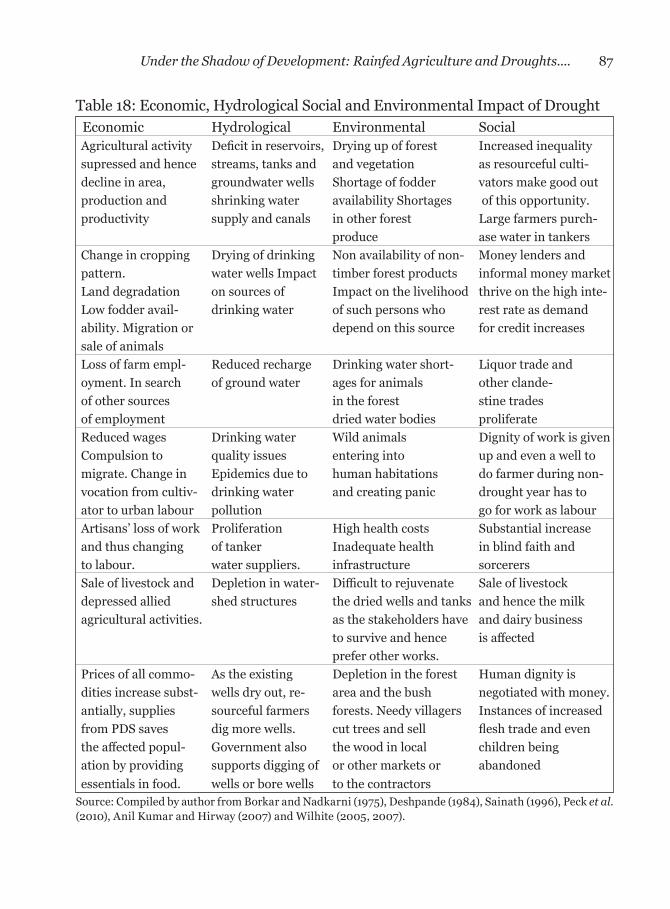
87Under the Shadow of Development: Rainfed Agriculture and Droughts....
Table 18: Economic, Hydrological Social and Environmental Impact of Drought Economic Hydrological Environmental SocialAgricultural activity Deficit in reservoirs, Drying up of forest Increased inequality supressed and hence streams, tanks and and vegetation as resourceful culti-decline in area, groundwater wells Shortage of fodder vators make good outproduction and shrinking water availability Shortages of this opportunity. productivity supply and canals in other forest Large farmers purch- produce ase water in tankersChange in cropping Drying of drinking Non availability of non- Money lenders andpattern. water wells Impact timber forest products informal money market Land degradation on sources of Impact on the livelihood thrive on the high inte-Low fodder avail- drinking water of such persons who rest rate as demandability. Migration or depend on this source for credit increasessale of animals Loss of farm empl- Reduced recharge Drinking water short- Liquor trade and oyment. In search of ground water ages for animals other clande-of other sources in the forest stine trades of employment dried water bodies proliferateReduced wages Drinking water Wild animals Dignity of work is given Compulsion to quality issues entering into up and even a well to migrate. Change in Epidemics due to human habitations do farmer during non-vocation from cultiv- drinking water and creating panic drought year has toator to urban labour pollution go for work as labourArtisans’ loss of work Proliferation High health costs Substantial increase and thus changing of tanker Inadequate health in blind faith and to labour. water suppliers. infrastructure sorcerersSale of livestock and Depletion in water- Difficult to rejuvenate Sale of livestock depressed allied shed structures the dried wells and tanks and hence the milkagricultural activities. as the stakeholders have and dairy business to survive and hence is affected prefer other works. Prices of all commo- As the existing Depletion in the forest Human dignity is dities increase subst- wells dry out, re- area and the bush negotiated with money.antially, supplies sourceful farmers forests. Needy villagers Instances of increased from PDS saves dig more wells. cut trees and sell flesh trade and even the affected popul- Government also the wood in local children being ation by providing supports digging of or other markets or abandonedessentials in food. wells or bore wells to the contractors
Source: Compiled by author from Borkar and Nadkarni (1975), Deshpande (1984), Sainath (1996), Peck et al. (2010), Anil Kumar and Hirway (2007) and Wilhite (2005, 2007).
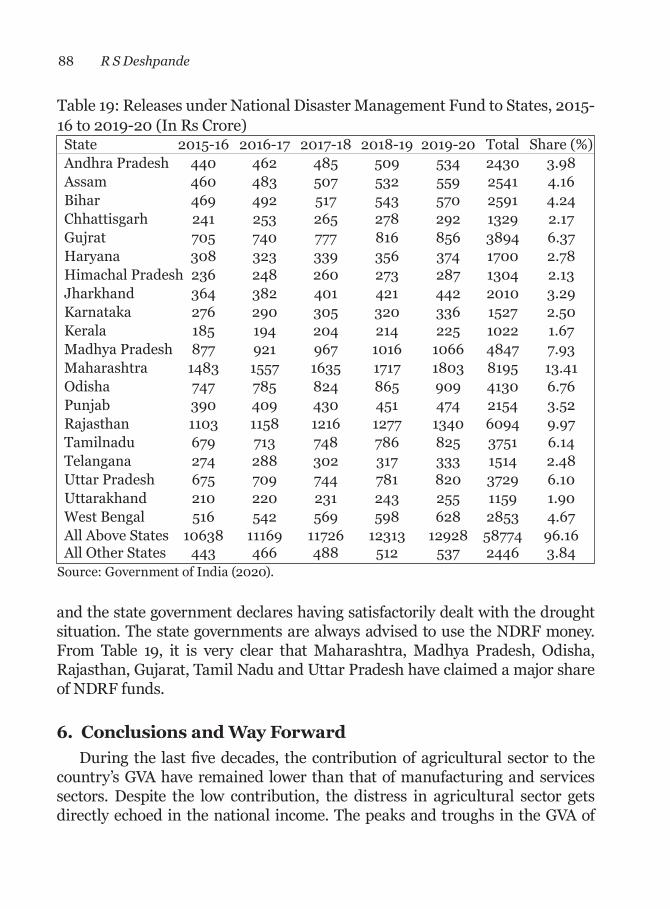
88 R S Deshpande
and the state government declares having satisfactorily dealt with the drought situation. The state governments are always advised to use the NDRF money. From Table 19, it is very clear that Maharashtra, Madhya Pradesh, Odisha, Rajasthan, Gujarat, Tamil Nadu and Uttar Pradesh have claimed a major share of NDRF funds.
6. Conclusions and Way ForwardDuring the last five decades, the contribution of agricultural sector to the
country’s GVA have remained lower than that of manufacturing and services sectors. Despite the low contribution, the distress in agricultural sector gets directly echoed in the national income. The peaks and troughs in the GVA of
Table 19: Releases under National Disaster Management Fund to States, 2015-16 to 2019-20 (In Rs Crore) State 2015-16 2016-17 2017-18 2018-19 2019-20 Total Share (%) Andhra Pradesh 440 462 485 509 534 2430 3.98 Assam 460 483 507 532 559 2541 4.16 Bihar 469 492 517 543 570 2591 4.24 Chhattisgarh 241 253 265 278 292 1329 2.17 Gujrat 705 740 777 816 856 3894 6.37 Haryana 308 323 339 356 374 1700 2.78 Himachal Pradesh 236 248 260 273 287 1304 2.13 Jharkhand 364 382 401 421 442 2010 3.29 Karnataka 276 290 305 320 336 1527 2.50 Kerala 185 194 204 214 225 1022 1.67 Madhya Pradesh 877 921 967 1016 1066 4847 7.93 Maharashtra 1483 1557 1635 1717 1803 8195 13.41 Odisha 747 785 824 865 909 4130 6.76 Punjab 390 409 430 451 474 2154 3.52 Rajasthan 1103 1158 1216 1277 1340 6094 9.97 Tamilnadu 679 713 748 786 825 3751 6.14 Telangana 274 288 302 317 333 1514 2.48 Uttar Pradesh 675 709 744 781 820 3729 6.10 Uttarakhand 210 220 231 243 255 1159 1.90 West Bengal 516 542 569 598 628 2853 4.67 All Above States 10638 11169 11726 12313 12928 58774 96.16 All Other States 443 466 488 512 537 2446 3.84Source: Government of India (2020).

89Under the Shadow of Development: Rainfed Agriculture and Droughts....
the agricultural sector get immediately reflected in the aggregate GVA series. When the agricultural sector performs well, the economy as a whole does better, but when agricultural sector confronts a trough, the aggregate economic performance also goes down. It is well-known now that despite enormous difficulties, agricultural sector had been the saviour of the economy even during the terrible shock of the pandemic. Notwithstanding the importance of agriculture sector in the economy, the sector reels under the pressure of large rainfed areas and frequent visitations of drought. These two factors together have continuously kept the agricultural sector under the shadow of under-development, and the distress confronted by the farmers is nakedly visible in every rainfed part of the country culminating into the farmer suicides. Rainfed areas constitute more than 50% of the total cropped area, and therefore, with low productivity and production, these areas create a significant drag on sustained growth performance of the agricultural sector.
The understanding of rainfed area itself was a problem for over decades. Following the Famine Commission Report (1898) in the colonial period, the nomenclature of calling rainfed areas as dryland took the centre stage for the first time. After that for decades, the erroneous nomenclature stuck to the vulnerable rainfed areas. We have discussed at length the contours of defining the rainfed area and climatic regions of the country based on various scientific studies. After clarifying the understanding of the basic contours, the expanse of rainfed area is brought to the fore. The effort is to show that the contribution of rainfed area in the structure as well as growth of agricultural sector is quite an important factor. Therefore, the rainfed areas should have a prominent policy focus, if we are intending to step up the growth in agricultural sector. This is more so because, on the one hand, irrigated agriculture is fast reaching its optima in productivity growth, and on the other hand, if the promise of doubling the farm income is to be upheld then, the farmers’ income from rainfed areas need to grow at a much faster rate. After understanding the failure of the many interventions in rainfed areas and following the Parthasarathy Committee report, the Government of India established the NRAA. A large amount of work was done at NRAA and the most important as well as the recent work was prioritising the districts for development purposes from among all the districts of the country. Entering into the scientific domain and creating a few rationally based indices, the NRAA provided a list of the districts that need specific attention for the purpose of development among the rainfed areas. As of today, the NRAA is mandated only as an advisory body and the district level development planning has to be undertaken by the Ministry of Agriculture or
90 R S Deshpande
the respective state governments. Earlier attempts of preparing agro-climatic regional plans for the districts have already gone below the carpet in the cellars of the Planning Commission, but one lesson which was learnt is that the planning must be bottom-up and not top-down. The planning dictated from above does not help to carry the development initiatives at the district and sub-district levels. Ajay Chibber, in the IEO of the Planning Commission, noted that the ineffectiveness of the Planning Commission was mainly due to the indirect restrictions imposed on it as an advisory body. Following the same logic, it is necessary that NRAA should not remain just a toothless advisory body, but it should participate in the administration of the programme under their design. An institutional structure may be put in place that connects taluk/blocks to the districts, and finally, the state and the NRAA should be put as the apex body in order to implement some of the important recommendations that would flow out of the work at NRAA.
Drought has been one of the major despoilers of growth of the rainfed areas. In the Indian context, drought strikes with almost 10% and 50% certainty. There are many regions like Rajasthan and a few other districts which confront drought every second year. A complete review of the drought situation in the country, as can be understood from various reports and academic researchers, suggest failure of systematic efforts till the 1987 drought. The shocks of droughts in 1966 and 1973 taught the policymakers a few lessons. Following this, the Government of India took some quick steps to prepare a few important reports in order to understand the steady slithering drought in the country. These reports provide very rich material to understand the drought situation and inspire our ingenuity to overcome the situation. Beginning with 2002, a good number of reports and policy instruments have been provided by the Ministry of Agriculture and Cooperation. These reports contain a mine of information and policy suggestions. After analysing the drought situation and history of meeting the droughts with policy tools that helped to ameliorate the conditions of the rural India, this report goes ahead to suggest a few important policy leads.
1. First and foremost, it is necessary to make NRAA a permanent institutional structure to deal with policy initiatives in rainfed areas and for undertaking measures to ameliorate drought effects. The NRAA should be connected with similar working institutions across the rainfed states in the country, especially the states confronting droughts with high probability and having a large share of rainfed areas.
91Under the Shadow of Development: Rainfed Agriculture and Droughts....
2. It is necessary to put in place an early warning system connected from taluk to the district and through the state governments to NRAA. The best model for the early warning system is available in the Karnataka State Natural Disaster Management Centre’s (KSNDMC) programme of establishing a network of telemetric rain gauge stations and obtaining the data on real-time basis. The state level institutions assisting NRAA may consider developing a network of telemetric rain gauge stations across the country on the lines of KSNDMC to monitor the early warning system as well as the progress of the droughts. This should be connected with the IMD and the other concerned departments at the state level.
3. The national CWWG takes note of the process of drought in the country, and the meeting of the CWWG takes place almost every week and almost daily during drought situations. The CWWG include only the officials, and therefore, the discussion is dominated by the hierarchy rather than expertise. The CWWGs are also functional in most of the states, but the composition of it in the drought sensitive states should incorporate some of the drought experts in order to sharpen the policy interventions. The institutional structure that has been put in place at the Ministry of Agriculture, Government of India, is one of the best examples to be followed by the state governments confronting droughts with higher probability.
4. Drought is one of the usual phenomena in the rainfed areas, but it can also strike irrigated regions at any time. This possibility cannot be ignored and, hence, there should be a preparation of drought striking in all the rainfed regions.
5. Agriculture is the mainstay of the population in the rainfed areas, and there are not many opportunities for diversification except animal husbandry, poultry and piggery. Rural-based industries have not been proliferating, as they should be in the rainfed areas to provide employment for the rural youth, who prefer to work in industries rather than in agriculture. This will also control the outmigration from rural areas to urban centres.
6. The MGNREGS is a flagship programme of Government of India that employs a large number of agricultural labourers from rural India. Under this scheme, employment is provided for 100 days, and the rest of the time, the labourer is left to fend for themselves. It will be possible to establish a Labour Supply Corporation (LSC), wherein the labourer should first
92 R S Deshpande
register with the corporation about their availability and time. The LSC, in turn, will supply labourers to the works undertaken by the governments in the construction sector. Similarly, a certain share of labourers should be made available also to the private construction companies at a pre-decided wage rate. This will not only reduce the burden of expenditure on the government but also help skill development.
7. Watershed management is considered as a panacea for the development of rainfed areas. Beginning with the initial projects in the domain of agricultural universities, a huge World Bank funded watershed development project at four important centres in the country have shown only the path. This was followed by another World Bank funded project titled as Dry Land Development Board (DLDB) in Karnataka, which provided a useful context for implementing the scheme. Immediately after this, a few guidelines were issued under watershed development (Government of India 2001a, 2001b, 2003, 2005). Experience of many of these projects, except those under the NGO and other voluntary sectors, reveals that farmers do not adopt recommended practices. The transfer of technology in the watershed projects heavily follows a top-down approach, and the stakeholders are compelled to participate rather than volunteer to participate (Deshpande and Kumar 2010). The technologies developed by the World Bank experts are pushed down the throat of the state governments, implementing agencies and the stakeholder farmers. These interventions disappear as soon as the World Bank team leaves the country, and the project is closed after filing an impact evaluation report. In this way, the funds provided by the World Bank in many of the watershed projects seem to have gone down the drain. The best example of this could be the first phase of watershed development undertaken at Kabbalnala, Purua Nala, Maheshwar Nala and Manoli in different states at the behest of the World Bank. Similar is the case of Land Resource Inventory Card issued to the farmer (under SUJALA Watershed project funded by the World Bank), where the farmer cannot decipher anything out of it. The LRI cards do not carry any recommendations on it, but the entire process gobbled huge investment. Similarly, during the late 1980s, vetiver grass was strongly recommended for planting on the field bunds with huge investment. Today when we go back to these watershed areas, we do not find even a blade of vetiver grass. All these investments have gone down the drain burdening the government with huge debts. Designing and planning for watershed projects should be with the
93Under the Shadow of Development: Rainfed Agriculture and Droughts....
help and full involvement of stakeholders. For this, the panchayati raj institutions (PRI) could be roped in. That will ensure accountability.
8. The solutions to the rural problems lie with the local communities and this tagline was used in the projects initiated by NABARD in many locations. The design has been prepared by NABARD painstakingly and implemented with the intervention by the officers with participation by the stakeholders (NABARD 2018a, 2018b). The results are exemplary, but the institution may have financial limitation for extending this all over the country and throughout the rainfed areas. This is the only success among the large number of failed experiments across the country. The Government of India should take clue from these projects to implement the methodology and process of interacting with people.
9. There is a strong need for increasing the public investment in the rainfed areas as well as drought prone areas and taking up projects in rural industrialisation with the help of private industries supported by the government, wherever possible. This will enhance the availability of alternative employment; it is possible that the out-migration from the rural areas will reduce and the rural folks will find better alternative sources for sustaining their livelihood.
10. There are many attempts at focusing research on the rainfed areas and drought prone areas, but philosophical blockade behind all these researches is the methodology of the Green Revolution with seed-water-fertiliser as the core of the recommended technology. It was correct at the time when food sufficiency was the major concern, but today the major concern is to bring the rainfed areas into the mainstream. Even today, the productivity of the same crop in the rainfed area, as against non-rainfed areas, are quite different. Added to this, there is hardly any presence of extension personnel in the rainfed areas. It is possible to dovetail the extension with the panchayat raj institutions placing one extension person trained with a diploma in extension at the gram panchayat level. This person could be given multiple responsibilities for monitoring the drought situation and connecting with the chain that need to be established from the village to the NRAA in Delhi.
11. Crop insurance is not a perfect medication anymore, and it has become more an institution governed by the corporate interests. Dandekar (1976, 1985) argued strongly to implement crop insurance across the country,
94 R S Deshpande
however, the core of it was crop credit insurance rather than directly ensuring the farmer’s production of the crop (Roumasset 1978). The premium will be deducted from the crop loan borrowed by the farmer at the bank, and the indemnity will be paid through the bank. Millions of vehicles are insured by the insurance agencies, and the accidents or any damage to the vehicle is assessed within weeks, after which the indemnities is paid to the owner with the least time lag. A similar methodology could be applied to the crop insurance, and every farmer’s damage could be assessed with least time lag and indemnity paid. Today, farmers complain about the inordinate delay of payment of indemnity by the insurance companies. The Pradhan Mantri Fasal Bima Yojana carries along with it the baggage of the earlier failed crop insurance schemes, which include: (1) private companies are given full authority to insure and pay the indemnity, and they get the State support in this operation; (2) area approach is being followed by the insurance companies, and this will depend on the crop cutting experiments or the meteorological data which comes with a lag, and it must be understood that if the farmers’ kharif crop has failed she/he will not be able to undertake cultivation immediately in the second season due to delay in the payment of indemnity; and, (3) the scheme is again connected with the crop loan system through the banks, thereby, actually ensuring the repayment of loan to the banks but in the name of insuring the farmers. The scheme needs full revamping.
12. With the constitutional amendment in 1993, decentralised development planning has been accepted as the methodology for development. This was promised right from Ashok Mehta Committee onwards and culminated into the constitutional guarantee, which has not been implemented with full zest. The panchayat raj institutions could be very effectively used in order to monitor and promote developmental initiatives through their representatives. Recently there is a specialised university established at Gadag, Karnataka, to train young personal to work in the panchayat raj institutional framework equipped with essential tools and techniques.
Note1. Available at: https://drought.unl.edu/Education/DroughtIn-depth/Predi-
cting. aspx.

95Under the Shadow of Development: Rainfed Agriculture and Droughts....
ReferencesAlley, W M (1984): “The Palmer Drought Severity Index: Limitations and
Assumptions”, Journal of Climate and Applied Meteorology, Vol. 23, No. 7, pp. 1100-1109.
Ananthakrishnan, R and J M Pathan (1971): Rainfall Patterns over India and Adjacent Seas, Scientific Report No. 144, India Meteorological Department, Poona.
Aparna, P (2012): Rural Livelihoods in Dry Lands of India: A Sustainable Livelihoods Framework, CESS Monograph Series No. 25, Centre for Economic and Social Studies, Hyderabad.
Arctowski, H (1938): “Report of the American Committee of the International Commission of Climatic Variations, to the International Geographical Congress, Amsterdam, Holland, July, 1938”, Bulletin of The American Meteorological Society, Vol. 19, No. 5.
Baishya, P (1975): “Man-Made Famine”, Economic & Political Weekly, Vol. 10, No. 21, pp.821-822.
Banerji, Debabar (1982): “Impact of Drought on Nutrition and Health Status of the Population of India”, In Garcia R V, and J C Escudero (eds.), The Constant Catastrophe: Malnutrition Famine and Drought, pp. 102-112, Pergomon Press, London.
Bapna, S L, H Binswanger and J Quizon (1984): “Systems of Output Supply and Factor Demand Equations for Semi-Arid Tropical India”, Indian Journal of Agricultural Economics, Vol. 39, No. 2, pp. 179-202.
Barron, J, J Rockström, F Gichuki and N Hatibu (2003): “Dry Spell Analysis and Maize Yields for Two Semiarid Locations in East Africa”, Agricultural and Forest Meteorology, Vol. 117, No. 1-2, pp. 23-37.
Basu, D N and S P Kashyap (1996): Agro-Climatic Regional Planning in India (In Two Volumes), Concept, New Delhi.
Bean, Louis H (1969): “A New Approach to Statistical Forecasting of Next Years’ Weather and Crops”, Agricultural Situation in India, Vol. 23, No. 12, pp. 1227-1242.

96 R S Deshpande
Bhatia, B M (1967): Famines in India: A Study in Some Aspects of the Economic History of India, 1860-1965, Asia Publishing House, London.
Bhatia, M S (2005): Viability of Rainfed Agriculture in Semi-Arid Regions, NABARD Occasional Paper No. 40, National Bank for Agriculture and Rural Development, Mumbai.
Birthal, P S, D S Negi, Md. T Khan, S Kumar and S Aggarwal (2015): “Is Indian Agriculture Becoming Resilient to Droughts? Evidence from Rice Production Systems”, Food Policy, Vol. 56, No. C, pp. 1-12.
Birthal, P S, D S Negi, S Kumar, S Aggarwal, A Suresh and Md. T Khan (2014): “How Sensitive is Indian Agriculture to Climate Change?” Indian Journal of Agricultural Economics, Vol. 69, No. 4, pp. 474-487.
Blair, C (1874): Indian Famines: Their Historical Financial and Other Aspects, W. Blackwood and Sons, London.
Boken, V K, A P Cracknell and R L Heathcote (2005): Monitoring and Predicting Agricultural Drought: A Global Study, Oxford University Press, London.
Borkar, V V and M V Nadkarni (1975): Impact of Drought on Rural Life, Popular Prakashan, Bombay.
Brennan, L (1984): “The Development of the India Famine Codes: Personalities, Policies and Politics”, In Bruce Currey, and G Hugo (eds.), Famine: As a geographical phenomenon, pp. 91-110, D. Reidel Publishing Company, Frankfort.
Burgos, J (1958): Agro-Climatic Classification, Document No. 18, World Meteorological Organization, Commission for Agricultural Meteorology, Warsaw.
Currey, B and G Hugo (eds.) (1984): Famine: As A Geographical Phenomenon, D. Reidel Publishing Company, Frankfort.
Dandekar, V M (1976): “Crop Insurance in India”, Economic & Political Weekly, Vol. 11, No. 26, pp. A-61 - A-80.
Dandekar, V M (1985): “Crop Insurance in India-A Review, 1976-77 to 1984-85”, Economic & Political Weekly, Vol. 20, No. 25-26, pp. A-46 - A-59.
97Under the Shadow of Development: Rainfed Agriculture and Droughts....
Dantwala, M L (1991): “Strategy of Agricultural Development since Independence”, In M L Dantwala (eds.), Indian Agricultural Development Since Independence: A Collection of Essays, Oxford & IBH, New Delhi.
De Supriyo (2019): “Internal Migration in India Grows, but Inter-State Movements Remain Low”, In observance of the International Migrants Day December 18, World Bank. Accessed on 15-09-2021, https://blogs.worldbank.org/peoplemove/internal-migration-india-grows-inter-state-movements-remain-low.
Deshpande, R S (1984): Yield Uncertainty in Maharashtra Agriculture, A Study with Special Reference to Drought prone Areas, Unpublished PhD Thesis, Marathwada University, Aurangabad.
Deshpande, R S (1996): “Watershed Development Programme: A Strategy under ACRP Approach”, in D N Basu, G S Guha and S P Kashyap (eds), Agro-Climatic Regional Planning in India, Vol. II, Concept Publications Co, New Delhi.
Deshpande, R S (2008): “Rapporteur’s Report on Rainfed Agriculture: Myriad Issues”, Indian Journal of Agricultural Economics, Vol. 63, No. 3, p. 565.
Deshpande, R S (2017): “Farmer, State and Agriculture”, Arthaniti, Vol. 16, Nos. 1 & 2, pp. 27-52.
Deshpande, R S and A Narayanamoorthy (1999): “An Appraisal of Watershed Development Programme Across Regions in India”, Artha Vijnana, Vol. XLI, No. 4, pp. 315-415.
Deshpande, R S and S Nayka (2018): “Agrarian Crisis in India: Struggling with Policy Fallow”, Geography and You, June. Available at https://geographyandyou.com/agrarian-crisis-in-india-struggling-with-policy-fallow/
Deshpande, R S and N Prabhu (2005): “Farmers Distress: Proof Beyond Doubt”, Economic & Political Weekly, Vol. 40, No. 44-45, pp. 4663-4665.
Deshpande, R S and V M Rao (2004): Coarse Cereals in a Drought–prone Region, Monograph No. 2, Institute for Social and Economic Change, Bangalore.
Deshpande, R S and V R Reddy (1991): Watershed Development Approach in a Fragile Resource Region: An Analytical Study of Maharashtra,
98 R S Deshpande
Mimeograph Series No. 33, Gokhale Institute of Politics and Economics, Pune.
Deshpande, R S and K Shaha (2018): “Stranded at Jagged Crossroads: Agricultural Sector of India”, In Uma Kapila (eds.), India’s Economy – Pre-Liberalisation to GST, Academic Foundation, New Delhi.
Deshpande, R S and K S Vijayakumar (2010): Integrated Approach to Drought Studies and Management: A Socio-Economic Study of Raichur and Koppal District, Drought Monitoring Cell, Government of Karnataka, Bangalore.
Deshpande, R S, M J Bhende, P Thippaiah and M Vivekananda (2004): State of Indian Farmer: Crops and Cultivation, Vol. 9, Academic Foundation, New Delhi.
De Waal, Alexander (1997): Famine Crimes: Politics and the Disaster Relief Industry in Africa, African Rights and the International African Institute, London.
Dhawan, B D (1988a): Irrigation in India’s Agricultural Development: Productivity, Stability and Equity, Studies in Economic Development and Planning, Sage, New Delhi.
Dhawan, B D (1988b): “Dryland versus Irrigated Farming”, Economic & Political Weekly, Vol. 23, No. 12, pp. 575-576.
Dhawan, B D (1998): “India’s Irrigation Sector: Myths and Realities”, Presidential Address to the 57th Annual Conference of the Indian Society of Agricultural Economics, Indian Journal of Agricultural Economics, Vol. 53, No. 1, Jan-March, pp. 1-14.
Dhawan, B D (1999): Studies in Indian Irrigation, Commonwealth Publications, New Delhi.
Digby, W (1878): The Famine Campaign in Southern India 1876-1878, Longmans, Green and Co., London.
Drèze, J (1988): Famine Prevention in India, Wider Working Paper No. 45, World Institute of Development Economics Research, United Nations University, Helsinki.
Drèze, J and A Sen (1991): The Political Economy of Hunger: Volume 1: Entitlement and Well-being, Oxford University Press, London.

99Under the Shadow of Development: Rainfed Agriculture and Droughts....
Dutt, R C (1901): Indian Famines, Their Causes and Prevention, P S King & Sons, Springer, London.
Food and Agriculture Organisation (2002): Agriculture: Towards 2015/30, Technical Interim Report, (http://www.fao.org/es/esd/at2015/toce.html).
Funk, Chris and S Shukla (2020): Drought Early Warning and Forecasting, Elsevier, Amsterdam.
Gore, P G, Thakur Prasad and H R Hatwar (1987): Mapping of Drought Areas over India, Research Report No. 12/2010 National Climate Centre, India Meteorological Department, Pune.
Government of India (1880): Report of the Indian Famine Commission, Famine Commission (1878-1880), G E Eyre and W Spottiswoode, London.
Government of India (1898): Report of the Famine Commission, (Presided by Sir J B Lyall), Government Central Printing Press, Shimla.
Government of India (1901): Report of the Indian Famine Commission, Superintendent Government Printing, Calcutta.
Government of India (1928): Report of the Royal Commission on Agriculture in India, (Presided by Sir Flickr Linlithgow), Reprinted by Agricole Publisher, New Delhi (1983).
Government of India (1945): Famine Inquiry Commission: Report of Bengal, Manager of Publications, New Delhi.
Government of India (1964): Study of Soil Conservation Programme for Agricultural Land, Programme Evaluation Organization Study No. 44, Planning Commission, New Delhi.
Government of India (1972): Report of the Irrigation Commission, Second National Irrigation Commission, Ministry of Irrigation, New Delhi.
Government of India (1973): Review of Drought Situation in India, Department of Food, Ministry of Agriculture, New Delhi.
Government of India (1976): National Commission on Agriculture – Climate and Agriculture, Vol. IV, Ministry of Agriculture and Cooperation, New Delhi.
100 R S Deshpande
Government of India (1981): Report for Drought Management – For the National Committee on Development of Backward Areas, Planning Commission, New Delhi.
Government of India (1986): Report on Dry Farming: Trends and Prospects, Planning Commission, New Delhi.
Government of India (1992): Report of the Committee on Pricing of Irrigation Water (Chairman: A Vaidyanathan), Planning Commission, New Delhi.
Government of India (1994): Report of the Technical Committee on Drought Prone Areas Programme and Desert Development Programme (Chairman: C H Hanumantha Rao), Ministry of Rural Development, New Delhi.
Government of India (1994a): Guidelines for Watershed Development, Ministry of Rural Development, Department of Land Resources, New Delhi.
Government of India (2001): Guidelines for Watershed Development (Revised-2001), Department of Land Resources, Ministry of Rural Development, New Delhi.
Government of India (2001a): Report of the Working Group on Watershed Development, Rainfed Farming and Natural Resource Management for the Tenth Five-Year Plan, Planning Commission, New Delhi.
Government of India (2003): Compendium of Environment Statistics - 2003, Ministry of Statistics and Programme Implementation, New Delhi.
Government of India (2003a): Hariyali Guidelines, Department of Land Resources, Ministry of Rural Development, New Delhi.
Government of India (2004): Drought 2002: A Report, Department of Agriculture and Cooperation, New Delhi.
Government of India (2005): Brief Note on Watershed Development, National Advisory Council, New Delhi.
Government of India (2006): From Hariyali to Neeranchal Report of the Technical Committee on Watershed Programmes in India, Department of Land Resources, Ministry of Rural Development, New Delhi.
101Under the Shadow of Development: Rainfed Agriculture and Droughts....
Government of India (2006a): Final Report of the Working Group on Agro-Climatic Zonal Planning Including Agriculture Development in North-Eastern India for XI Five Year Plan (2007-12), Planning Commission, New Delhi.
Government of India (2007): Report of The Working Group on Rainfed Areas for Formulation of XI Five Year Plan (2007-12), Planning Commission, New Delhi.
Government of India (2008): Common Guidelines for Watershed Development Projects, Ministry of Land Resources, New Delhi.
Government of India (2009): Manual for Drought Management, Department of Agriculture and Cooperation, Ministry of Agriculture, New Delhi.
Government of India (2009a): Report of the Ground Water Resource Estimation Committee, Ministry of Water Resources, New Delhi.
Government of India (2014): Report of the Director General Independent Evaluation Organisation, Planning Commission, New Delhi.
Government of India (2015): Performance Report-2015-16, Office of the Comptroller and Auditor General of India, Ministry of Home, New Delhi.
Government of India (2015a): Performance Audit of Rashtriya Krishi Vikas Yojana RKVY, Report No. 11 of 2015, Ministry of Agriculture, New Delhi.
Government of India (2016): National Disaster Management Plan, National Disaster Management Authority, New Delhi.
Government of India (2016a): Manual for Drought Management, Department of Agriculture, Cooperation and Farmers Welfare, Ministry of Agriculture and Farmers Welfare, New Delhi.
Government of India (2019): Agricultural Statistics at a Glance 2019, Ministry of Agriculture and Farmers Welfare, New Delhi.
Government of India (2019a): National Crisis Management Plan for Drought, Ministry of Agriculture and Farmers Welfare, New Delhi.
Government of India (2020): National Crisis Management Plan for Drought, Ministry of Agriculture and Farmers Welfare, New Delhi.
102 R S Deshpande
Government of India (2020a): National Agricultural Disaster Management Plan, Ministry of Agriculture and Farmers Welfare, New Delhi.
Government of India (2020b): Agricultural Statistics at a Glance, Ministry of Agriculture and Farmers Welfare, New Delhi.
Government of India (2020c): Report of the Task Force on “Prioritization of Districts for Development Planning in India: A Composite Index Approach”, Ministry of Cooperation and Farmers Welfare, New Delhi.
Government of India (2020d): Safety First, Report of the Standing Committee on Finance 2018-19, (Sixteenth Loksabha), Ministries of Home Affairs and Finance, New Delhi.
Government of India, Five Year Plan, Various Plan Documents, Available at: https://niti.gov.in/planningcommission.gov.in/docs/plans/planrel/fiveyr/welcome.html
Government of Karnataka (2001): Report of the Working Group on Watershed Development, Rainfed Farming and Natural Resource Management for the Tenth Five Year Plan, Planning Commission, New Delhi.
Government of Karnataka (2018): Drought Management: Policy Guidelines Karnataka State, Karnataka State Natural Disaster Monitoring Centre, Bangalore.
Government of Maharashtra (1973): Report of the Fact Finding Committee for Survey of Scarcity Areas of Maharashtra State (Sukhtankar Committee Report, Vols. I & II), Bombay.
Gupta, A K, P Tyagi and V K Sehgal (2011): “Drought Disaster Challenges and Mitigation in India: Strategic Appraisal”, Current Science, Vol. 100, No. 12. pp. 1795-1806.
Hayman, Peter and L Rickards (2013): “Drought, Climate Change, Farming, and Science: The Interaction of Four Privileged Topics”, In L C Botterill and G Cockfield (eds.), Drought, Risk Management, and Policy Decision-Making Under Uncertainty, CRC Press, Boca Raton
Higgins, G M and A H Kassam (1981): “The FAO Agro-ecological Zone Approach to Determination of Land Potential”, Pedologie, Vol. 31, No. 2, pp. 147-168.
103Under the Shadow of Development: Rainfed Agriculture and Droughts....
Huibers, F P (1974): “Rainfed Agriculture in Semi-Arid Tropical Climate: Aspects of Land and Water Management for Red Soils in India”, In Ch Krishnamoorthy, S L Chowdhury and E D Spratt (eds.), India’s Great Potential for More Food Production is in its Drylands, International Crops Research Institute for Semi-Arid Tropics, Hyderabad.
Indian Council for Agricultural Research (1982): A Decade of Dryland Agricultural Research in India – 1970-80, All India Coordinated Research Project on Dryland Agriculture, Hyderabad.
Iglesias, Ana, Dionysis Assimacopoulos and Henry A J Van Lanen (2015): Drought: Science and Policy, Wiley Blackwell, New York.
Jaiswal, N K (1978): Droughts and Famines in India, National Institute of Rural Development and Panchayati Raj, Hyderabad.
Jena, Diptimayee and Srijit Mishra (2020): Growth, Instability and Decomposition of Millets in Odisha: 1960-61 to 2017-18, Odisha Economy Discussion Series 7, Nabakrushna Choudhury Centre for Development Studies, Bhubaneswar.
Jinyoung Rhee and Gregory J. Carbone (2007): “A Comparison of Weekly Monitoring Methods of the Palmer Drought Index”, Journal of Climate, Vol. 20, No. 24, pp. 6033–6044.
Jodha, N S (1975): “Famine and Famine Policies: Some Empirical Evidence”, Economic & Political Weekly, Vol. 10, No. 41, pp. 1609-1623.
Jodha N S (1978): “Effectiveness of Farmers Adjustments to Risk”, Economic & Political Weekly, Vol. 13, No. 25, pp. A38-A48.
Jodha, N S (1985): Development Strategy for Rain-fed Agriculture: Possibilities and Constrains, Implications, Economics Programme, Mimeo, ICRISAT, Patancheru, Andhra Pradesh.
Jodha, N S (1989): “Dry Farming Research: Issues and Approaches and Summary of Proceedings”, In N S Jodha (eds.) Technology Options and Economic Policy for Dryland Agriculture: Potential and Challenge, Concept Publishing Company, New Delhi.
Jodha, N S (1989a): Technology Options and Economic Policy for Dryland Agriculture: Potential and Challenge, Concept Publishing Company, New Delhi.
104 R S Deshpande
Jodha, N S (1990): Drought Management: The Farmers’ Strategies and Their Policy Implications, Dryland Networks Programme Paper No. 21, International Institute for Environment and Development, London.
Jodha, N S (1991): “Sustainable Agriculture in Fragile Resource Zones: Technological Imperatives”, Economic & Political Weekly, Vol. 26, No. 13, pp. A15-A26.
Joshi, P K, A K Jha, S P Wani, L Joshi and R L Shiyani (2005): Meta-Analysis to Assess Impact of Watershed Programme and People’s Participation, Comprehensive Assessment Research Report No. 8, ICRISAT, Patancheru, Andhra Pradesh.
Kanitkar, N V and S S Sirur (1960): Dry Farming in India, Indian Council of Agricultural Research, New Delhi.
Karanataka State Natural Disaster Management Centre (2019): Drought Management: Policy Guidelines Karnataka State, Government of Karnataka, Bangalore.
Kelly, T G, M Jayawant and P P Rao (1997): “Rainfed Agriculture Typology in India”, Economic & Political Weekly, Vol. 32, No. 26, pp. A68-A70.
Kerr, J M (1996): Sustainable Development of Rainfed Agriculture in India, Discussion Paper No. 20, International Food Policy Research Institute, Washington D.C.
Kolavalli, S and J M Kerr (2002): “Mainstreaming Participatory Watershed Development”, Economic & Political Weekly, Vol. 37, No. 3, pp. 225-242.
Krishnan, A (2001): Agro-Meteorology of Drought in Raichur and Koppal Districts, Report submitted to Drought Monitoring Cell, Government of Karnataka, Bangalore.
Krishnan, A and K A Shankarnarayan (1964): “Climatic Classification of Arid Zone of Rajasthan”, In Proceedings of the Symposium o Problems of Arid Zones of India, Central Arid Zone Research Institute, Jodhpur, pp. 380-387.
Kulkarni, M N (2015): “New Tool for Predicting Drought: An Application over India”, Science Reporter, Vol. 5. Available at: https://doi.org/10.1038/srep07680.
105Under the Shadow of Development: Rainfed Agriculture and Droughts....
Loveday, A (1914): The History and Economics of Indian Famines, G Bell and Sons, London.
Mandal, C, D K Mandal, C V Srinivas, J Sehgal and M Velayutham (1999): Soil-Climatic Database for Crop Planning in India, Technical Bulletin No. 53, National Bureau of Soil Sciences and Land Use Planning, Nagpur.
Mann, H H (1955): Rainfall and Famine: A Study of Rainfall in the Bombay Deccan, 1865-1938, Indian Society of Agricultural Economics, Bombay.
Mason, B J (1976): “Towards the Understanding and Prediction of Climatic Variations”, Quarterly Journal of Royal Meteorological Society, Vol. 102, No. 433, pp. 473-498.
Mc Minn, C W (1902): Famine Truth, Half-truths and Untruths, Baptist Mission Press, Calcutta.
Meher-Homji, V M (1965): “Aridity and Semi-Aridity: A Phyto-Climatic Consideration with Reference to India”, Annals of Arid Zone, Vol. 4, No. 2, pp. 152-158.
Meher-Homji, V M (1967): “On Delimiting Arid and Semi-Arid Climates in India”, Indian Geographical Journal, Vol. 42, No. 1-2, pp. 1-6.
Mehta, L (2000): “Drought Diagnosis: Dryland Blindness of Planners”, Economic and Political Weekly, Vol. 35, No. 27, pp. 2439-2445.
Mehta, V M (2017): Natural Decadal Climate Variability: Societal Impacts, CRC Press, Boca Raton.
Michalczyk, Klaus-Wolfgang (1979): “The Effect of Climatic Variations on the Significance of Agricultural Planning Data”, Agricultural Meteorology, Vol. 20, No. 4, pp. 319-326.
Minucci, G (2021): Enabling Adaptive Water Management to Face Drought Risk in a Changing Climate, Springer, Switzerland.
Morris, M D (1974): “What is Famine”?, Economic & Political Weekly, Vol. 9, No. 44, pp. 1855-1864.
Mukherji, S and C P Prakasam (1981): Relationship between Population Variables and Agricultural Output - A District Level Analysis, Paper presented at FAO Workshop on Agricultural Rural Planning, Ahmedabad, March.

106 R S Deshpande
Murton, B (1984): “Spatial and Temporal Patterns of Famine in Southern India, before the Famine Codes”, In Bruce Currey, and G Hugo (eds.), Famine: As a geographical phenomenon, pp. 71-90, D. Reidel Publishing Company, Frankfort.
Nadkarni M V and R S Deshpande (1982): “Agricultural Growth, Instability in Productivity and Rainfall — Case of Karnataka”, Economic & Political Weekly, Vol. 17, No. 52, pp. A127-A134.
Nadkarni M V and R S Deshpande (1983): “Growth and Instability in Crop Yields – A Case Study of Agriculture in Karnataka, South India”, The Journal of the Regional Studies Association, Vol. 17, N0. 1, pp. 29-39.
Nagarajan, R (2003): Drought: Assessment, Monitoring, Management and Resource Conservation, Capital Publishing Company, New Delhi.
Nagarajan, R (2010): Drought Assessment, Springer, Switzerland.
Narayanamoorthy, A (2021): Farm Income in India: Myths and Realities, Oxford, New Delhi.
Narayanamoorthy A and R S Deshpande (2000): Where Water Seeps, Towards a New Phase in India’s Irrigation Reforms, Academic Foundation, New Delhi.
National Advisory Council (2005): Brief Note of NAC on Watershed Development, National Advisory Council, New Delhi.
National Bank for Agriculture and Rural Development (2018): Climate Proofing of Watershed Projects in Rainfed Areas, Farm Sector Development Department, NABARD, Mumbai.
National Bank for Agriculture and Rural Development (2018a): Sectoral Paper: Soil Water and Crop Management, Farm Sector Policy Department, NABARD, Mumbai.
National Bureau of Soil Survey and Land Use Planning (1992): Agro-Ecological Regions of India, Technical Bulletin No. 24, National Bureau of Soil Survey and Land Use Planning, Indian Council of Agricultural Research, Nagpur.
National Rainfed Area Authority (2009a): Drought Management Strategies - 2009, Ministry of Agriculture, New Delhi.
107Under the Shadow of Development: Rainfed Agriculture and Droughts....
National Rainfed Area Authority (2009b): Harnessing Opportunities in Rainfed Areas: A Pathway to Prosperity – Vision 2025, Ministry of Agriculture, New Delhi.
National Rainfed Area Authority (2010a): Drought Mitigation Strategy for Bundelkhand, Ministry of Agriculture, New Delhi.
National Rainfed Area Authority (2010b): Operational Guidelines for implementation of District Drought Proofing Action Plans (DPAPs), Ministry of Agriculture, New Delhi.
National Rainfed Area Authority (2011): Common Guidelines for Watershed Development Projects-2008, Ministry of Agriculture, New Delhi.
National Rainfed Area Authority (2012a): Prioritisation of Districts for Development Planning in India – A Composite Index Approach, Ministry of Agriculture, New Delhi.
National Rainfed Area Authority (2012b): Producer Company Case Study of IOFPCL Kerala, Ministry of Agriculture, New Delhi.
National Rainfed Area Authority (2012c): Product, Diversification, Marketing and Price Discovery of Pearl Millet in India, Policy Paper 2, NRAA, Ministry of Agriculture, New Delhi.
National Rainfed Area Authority (2013): Contingency and Compensatory Agriculture Plans for Droughts and Floods in India - 2012, Position Paper No. 6, NRAA, Ministry of Agriculture, New Delhi.
National Rainfed Area Authority (2015): Identify Gaps In Input Supply, Credit Availability, Dissemination of Appropriate Technology and other Requirements Relevant for Improvement of Productivity of Field And Horticultural Crops in Rainfed Areas of Bundelkhand Region, Ministry of Agriculture, New Delhi.
National Rainfed Area Authority (2020): Prioritisation of Districts for Development Planning in India, A Composite Index Approach, Ministry of Agriculture and Farmers Welfare, New Delhi.
National Rainfed Area Authority (Undated): Managing Rainfall Deficits: A Technical Advisory Note, Ministry of Agriculture, New Delhi.
108 R S Deshpande
National Rainfed Area Authority (Undated): Mid-term Quick Impact Evaluation Study of Special Package for Drought Mitigation and Integrated Development of Bundelkhand Region, Ministry of Agriculture, New Delhi.
National Rainfed Area Authority (Undated): State Specific Technology Manual for Watershed Development Programme in Tamil Nadu, Ministry of Agriculture, New Delhi.
Osborn, R D (1879): “The Truth About the Indian Famine of 1877-78”, Contemporary Review, 1866-1900, Vol. 37, pp. 227-246.
Palmer, W C (1965): Meteorological Drought, Research Paper No. 45, U S Department of Commerce, Washington D.C.
Pande, R P, B B Dash, S K Mishra and R Singh (2008): “Study of indices for drought Characterisation in KBK Districts in Orissa (India)”, Hydrological Processes, Vol. 22, No. 12, pp. 1895-1907.
Pandey, S, M Kumar, S Chakraborty and N C Mahanti (2011): “Analysing the Variability of Rainfall for Drought Progonosis in Jharkhand State: A Statistical Approach”, Irrigation and Drainage, Vol. 60, No. 4, pp. 556-566.
Parikh, K S (2009): Report of the Task Force on Irrigation, Planning Commission, Government of India, New Delhi.
Parry M L and T R Carter (1985): The Effect of Climatic Variations on Agricultural Risk, International Institute for Applied Systems Analysis, Working Paper - 84-069, Austria.
Peck, D E, and R M Adams (2010): “Farm-level Impacts of Prolonged Drought: Is a Multiyear Event More than the Sum of its Parts?”, Australian Journal of Agricultural and Resource Economics, Vol. 54, No. 1, pp. 43-60.
Penman, H L (1948): “Natural Evaporation from Open Water, Bare Soil and Grass”, Proceedings of the Royal Society of London. Series A, Mathematical and Physical Sciences, Vol. 193, No. 1032, pp. 120-145.
PIXEL (2019): End of Project Impact Evaluation Study of Sujala Watershed funded by the World Bank, Prepared by PIXEL Foftek Pvt Ltd for Watershed Development Department, Government of Karnataka, Bangalore.
109Under the Shadow of Development: Rainfed Agriculture and Droughts....
Raghvendra, V K (1974): “Trends and Periodicity of Rainfall in Sub-divisions of Maharashtra State”, Indian Journal of Meteorology and Geophysics, Vol. 25, No. 2, pp. 197-210.
Raju, K V and A Narayanamoorthy (2004): State of Indian Farmer: Water Resources, Vol. 3, Academic Foundation, New Delhi.
Raju, K V, R S Deshpande and B Satyasiba Deshpande, R S (2016): “Socio-Economic and Agricultural Vulnerability Across Districts of Karnataka”, In S Nautiyal, R Schaldach, K V Raju, H Kaechele, B Pritchard and K S Rao (eds.), Climate Change Challenge (3C) and Social-Economic and Ecological-Interphase Building, pp. 161-190, Springer, New York.
Rangarao, D S R and V N Panditrao (1963): “A Statistical Study of the Rainfall Data at the Four District Headquarter Stations of the Former Bombay State During the Period from 1931-32 to 1955-56”, Indian Journal of Agricultural Economics, Vol. 18, No. 3.
Rao Hanumantha, C H (1975): Technological Change and Distribution of Gains in Indian Agriculture, Macmillan, New Delhi.
Rao Hanumantha, C H, S K Ray and S Subbarao (1988): Unstable Agriculture and Droughts: Implications for Policy, Food and Agriculture Organisation of the United Nations, Vikas, New Delhi.
Rao, K, S Wani, K K Singh, I Ahmed, K Srinivas, S D Bairagi and O Ramadevi (2013): “Increased Arid and Semi-arid Areas in India with Associated Shifts during 1971-2004”, Journal of Agrometeorology, Vol. 15, No. 1, pp. 11-18.
Rao, S C and J Ryan (eds.) (2004): Challenges and Strategies of Dryland Agriculture, Vol. 32, American Society of Agronomy, Madison.
Rao, V M (1991): “Growth in the Context of Underdevelopment: Case of Dryland Agriculture”, Economic & Political Weekly, Vol. 26, No. 13, pp. A2-A14.
Rao, V M (1992): “Change Processes in Dryland Communities”, Indian Journal of Agricultural Economics, Vol. 47, No. 1, pp. 1-23.
Rao, V M (2004): Rainfed Agriculture, Farmer at the Millennium Studies Vol 10, Academic Foundation, Delhi.
110 R S Deshpande
Rao, V M (2009): “Rainfed Agriculture: In the Throes of a Crisis”, Prepared for the 68th Annual Conference of Indian Society of Agricultural Economics, Indian Journal of Agricultural Economics, Vol. 64, No.1.
Rao, V M, and R S Deshpande (1991): “Agricultural Production: Pace and Pattern of Growth”, In M L Dantwala (eds.), Indian Agricultural Development Since Independence: A Collection of Essays, Oxford & IBH, New Delhi.
Rao, V M and R S Deshpande (2002): “Food Security in Drought-Prone Areas A Study in Karnataka”, Economic & Political Weekly, Vol. 37, No. 35, pp. 3677-3681.
Rathore, M S (2005): State Level Analysis of Drought Policies and Impacts in Rajasthan, India, Working Paper 93, Drought Series Paper No. 6, International Water Management Institute, Colombo.
Reddy, V R, M G Reddy, S Galab, O Springate-Baginski and J Soussan (2001): Watershed development and rural livelihoods: An Assessment of Linkages and Impact, Project Report, Centre for Economic and Social Studies, Hyderabad.
Roumasset, J A (1978): “The Case Against Crop Insurance in Developing Countries”, Philippine Review of Business and Economics, No. 3, pp. 1-22.
Roy, A K and I Hirway (2007): Multiple Impacts of Droughts and Assessment of Drought Policy in Major Drought Prone States in India, Project Report Submitted to the Planning Commission, Government of India, New Delhi.
Roy, T (2011): The Economic History of India, 1857-1947, Oxford University Press, London.
Ryan, J G and K V Subramanyam (1975): An Analysis of Average Annual Rainfall Zones in the Semi-Arid Tropics of India, Africa and Brazil, ICRISAT, Patancheru, Andhra Pradesh.
Sagar, V (2010): Dry Lands in India: Natural Resources and Livelihoods, Status Paper, Centre for Economic and Social Studies, Hyderabad.
Sainath, P (1996): Everybody Loves a Good Drought: Stories from India’s Poorest Districts, Penguin Books, New Delhi.

111Under the Shadow of Development: Rainfed Agriculture and Droughts....
Samaj Pragati Sahayog (2005): A New Framework of Macro - Watershed Institutions for Nature-Based Livelihoods, Bagli.
Samra, J S (2004): Review and Analysis of Drought Monitoring, Declaration and Management in India, Working Paper 84, International Water Management Institute, Colombo.
Sanderson, F (1954): Methods of Crop Forecasting, Harvard University Press, London.
Sawant, S D and C V Achutan (1995): “Agricultural Growth across Crops and Regions: Emerging Trends and Patterns”, Economic & Political Weekly, Vol. 30 No. 12, pp. A2-A13.
Schultz, T W (1964): Transforming Traditional Agriculture, Yale University Press, London.
Selvaraj, K N and C Ramasamy (2006): “Drought, Agricultural Risk and Rural Income: Case of a Water Limiting Rice Production Environment, Tamil Nadu”, Economic & Political Weekly, Vol. 41, No. 26, pp. 2739-2746.
Sen, A (1981): Poverty and Famines: An Essay on Entitlement and Deprivation, Oxford Clarendon Press, London.
Shah, A (2000): Who Benefits from Watershed Development: Evidence from Gujarat, Working Paper No. 118, Gujarat Institute for Development Research, Ahmedabad.
Shah, A and D C Sah (1993): “Dry Farming under the Changing Environment: A Case Study of Gujarat, Artha Vijnana, Vol. 35, No. 3, pp. 241-269.
Shah, M (1998): Mid-term Evaluation of the Rajiv Gandhi Mission for Watershed Development, Bhopal.
Shah, M and D Banerji (1998): India’s Drylands: Tribal Societies and development through Environmental Regeneration, Oxford University Press, New Delhi.
Sharma, A (2019): “Drought Management Policy of India: An Overview”, A Review Paper, Disaster Advances, Vol. 12, No. 11, pp. 51-62.
Sharma, B R, K V Rao, K P R Vittal and U A Amarasinghe (2010): “Realising the Potential of Rainfed Agriculture in India: prospects for water
112 R S Deshpande
productivity improvements”, Agricultural Water Management, Vol. 97, No. 1, pp. 23-30.
Shukla, R (1977): “Employment Behavior in a Labour Surplus Economy in a Famine Situation: A Study of Gujarat”, Anvesak, Vol. 7, No. 1, June.
Shukla, R (1981): “Employment Implications of Drought Situation: Issues and Experience”, Anvesak, Vol. XI, Nos. 1-2, June-December.
Singh, P, H C Behera and A Singh (1997): Impact and Effectiveness of - Watershed Development Programmes in India, Centre or Rural Studies, Lal Bahadur Shastri National Academy of Administration, Mussoorie.
Singh, T (1978): Drought-Prone Areas in India, People’s Publishing House, New Delhi.
Sinha Ray, K C (2000): “Role of Drought Early Warning Systems for Sustainable Agriculture Research in India”, In Donald A. Wilhite, M.V.K. Sivakumar and Deborah A. Wood (eds.), Early Warning Systems for Drought Preparedness and Drought Management, pp. 131-146, Proceedings of an Expert Group Meeting held 5-7 September, 2000, in Lisbon, Portugal, World Meteorological Organisation, Geneva.
Smyle, J, C Lobo, G Milne and M Williams (2014): Watershed Development in India: An Approach Evolving through Experience, Agriculture and Environmental Services Discussion Paper No. 4, World Bank, Washington D. C.
Srivastava, H S (1968): History of Indian Famines and Development of Famine Policy 1858-1918, Sri Ram Mehra and Co., Agra.
Stern, N (2006): Stern Review: The Economics of Climate Change, H M Treasury, London.
Stewart, B A, P Koohafkan, K Ramamoorthy (2006): “Dryland Agriculture Defined and Its Importance to the World”, In G A Peterson, P W Unger and W A Payne, Dryland Agriculture, pp. 1-26, American Society of Agronomy, Madison.
Thornthwaite, C W (1948): “An Approach towards a Rational Classification of Climate”, Geographical Review, Vol. 38, No. 1, pp. 55-94.

113Under the Shadow of Development: Rainfed Agriculture and Droughts....
Thornthwaite, C W and J R Mather (1957): Instructions and Tables for Computing Potential Evapotranspiration and the Water Balance, Laboratory of Climatology, New Jersey.
Tiburcio, J (Undated): Thinking through the Indian Famine Commission Reports as the foundation of Contemporary Indian Food Policy – 1880-1901. Available at https://archive.azimpremjiuniversity.edu.in/SitePages/pdf/Tiburcio-Famine-Commissions-of-1880-1901.pdf
Troll, C (1965): “Seasonal Climates of the Earth”, In E Rodenwalt and H Jusatz (eds.), World Maps of Climatology, p. 28, Springer, Verlag, Berlin.
United Nations (1990): What can be done about Drought?, International Decade for Natural Disaster Reduction, IDNDR Secretariat, Geneva.
United Nations (1990a): Desertification and Drought: At a Glance, International Decade for Natural Disaster Reduction, IDNDR Secretariat, Geneva.
Velayutham, M, D K Mandal, C Mandal and J Sehgal (1999): Agro-Ecological Sub-Regions of India for Planning and Development, National Bureau of Soil Survey and Land Use Planning, Indian Council of Agricultural Research, Nagpur.
Virmani, S M, M V K Sivakumar and S J Reddy (1980): Climatic Classification of the Semi-Arid Tropics in Relation to Farming Systems Research, Monograph, ICRISAT, Patancheru, Andhra Pradesh.
Walker, T S and N S Jodha (1982): Efficiency of Risk Management by Small Farmers and Implications for Crop Insurance, Monograph, ICRISAT, Patancheru, Andhra Pradesh.
Wang, Y, J Yang, Y Chen, Zhicheng Su , B Li, H Guo and P De Maeyer (2020): “Monitoring and Predicting Drought Based on Multiple Indicators in an Arid Area, China”, Remote Sensing, Vol. 12, No. 14, pp. 1-18.
Wani, S P, T K Sreedevi, J Rockström and Y S Ramakrishna (2009): “Rainfed Agriculture – Past Trends and Future Prospects”, In S P Wani, J Rockström, and T Y Oweis (eds.), Rainfed Agriculture: Unlocking the Potential, pp. 1-34, CAB International, Oxfordshire.
Wilhite, D A, M J Hayes and C L Knutson (2005): “Drought Preparedness Planning: Building Institutional Capacity”, In D. A. Wilhite (eds.),

114 R S Deshpande
Drought and Water Crises: Science, Technology and Management Issues, pp. 93-135, CRC Press, Boca Raton, FL.
Wilhite, D A, M Svoboda and M J Hayes (2007): “Understanding the Complex Impacts of Drought: A Key to Enhancing Drought Mitigation and Preparedness”, Water Resource Management, Vol. 21, No. 5, pp. 763- 774.
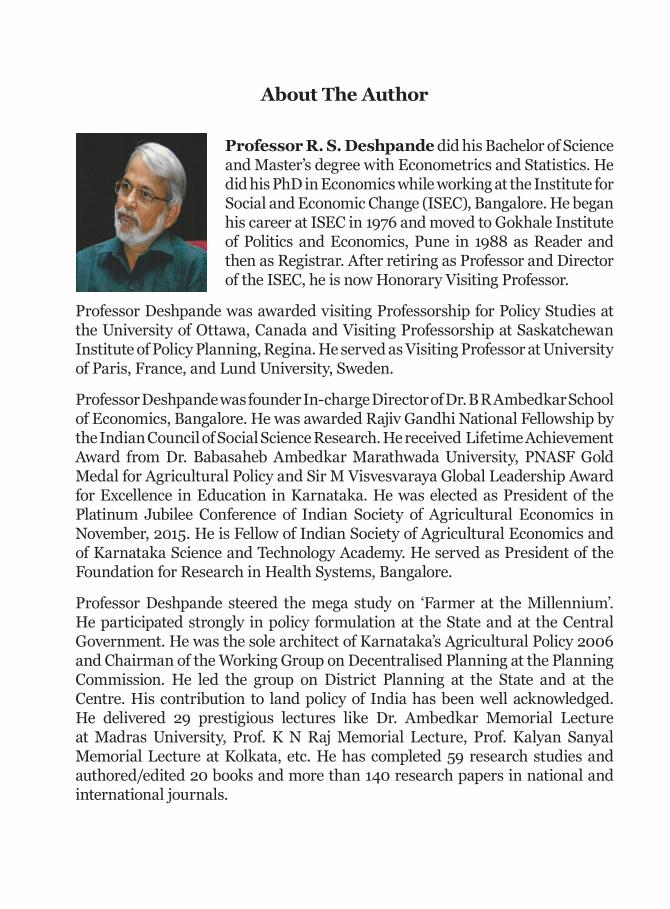
About The Author
Professor R. S. Deshpande did his Bachelor of Science and Master’s degree with Econometrics and Statistics. He did his PhD in Economics while working at the Institute for Social and Economic Change (ISEC), Bangalore. He began his career at ISEC in 1976 and moved to Gokhale Institute of Politics and Economics, Pune in 1988 as Reader and then as Registrar. After retiring as Professor and Director of the ISEC, he is now Honorary Visiting Professor.
Professor Deshpande was awarded visiting Professorship for Policy Studies at the University of Ottawa, Canada and Visiting Professorship at Saskatchewan Institute of Policy Planning, Regina. He served as Visiting Professor at University of Paris, France, and Lund University, Sweden.
Professor Deshpande was founder In-charge Director of Dr. B R Ambedkar School of Economics, Bangalore. He was awarded Rajiv Gandhi National Fellowship by the Indian Council of Social Science Research. He received Lifetime Achievement Award from Dr. Babasaheb Ambedkar Marathwada University, PNASF Gold Medal for Agricultural Policy and Sir M Visvesvaraya Global Leadership Award for Excellence in Education in Karnataka. He was elected as President of the Platinum Jubilee Conference of Indian Society of Agricultural Economics in November, 2015. He is Fellow of Indian Society of Agricultural Economics and of Karnataka Science and Technology Academy. He served as President of the Foundation for Research in Health Systems, Bangalore.
Professor Deshpande steered the mega study on ‘Farmer at the Millennium’. He participated strongly in policy formulation at the State and at the Central Government. He was the sole architect of Karnataka’s Agricultural Policy 2006 and Chairman of the Working Group on Decentralised Planning at the Planning Commission. He led the group on District Planning at the State and at the Centre. His contribution to land policy of India has been well acknowledged. He delivered 29 prestigious lectures like Dr. Ambedkar Memorial Lecture at Madras University, Prof. K N Raj Memorial Lecture, Prof. Kalyan Sanyal Memorial Lecture at Kolkata, etc. He has completed 59 research studies and authored/edited 20 books and more than 140 research papers in national and international journals.

NATIONAL BANK FOR AGRICULTURE AND RURAL DEVELOPMENTPlot No. C-24, ‘G’ Block, BKC, Bandra (E), Mumbai - 400 051
Department of Economic Analysis and Research
www.nabard.orgTaking Rural India >>Forward /nabardonlineYou Tube