Vapor-Phase Transport in the Near-Drift Environment at Yucca Mountain
17
Vapor-phase transport in the near-drift environment at Yucca Mountain Rohit Salve and Timothy J. Kneafsey Earth Sciences Division, Lawrence Berkeley National Laboratory, Berkeley, California, USA Received 27 May 2004; revised 17 August 2004; accepted 10 November 2004; published 20 January 2005. [1] A key issue regarding the performance of the potential high-level radioactive waste repository at Yucca Mountain, Nevada, is the likelihood of precipitation percolating a vertical distance of 300 m through fractured unsaturated rock into drifts containing waste packages. Water enhances waste package corrosion and is required for transport of released radionuclides. To evaluate the propensity for seepage into tunnels at Yucca Mountain, a 5-m-diameter, 2.7-km-long tunnel, commonly referred to as the Cross Drift (CD), was excavated in 1998, branching off from the main Exploratory Studies Facility tunnel. Sections of this tunnel have been isolated from ventilation for extended periods over the last 4 years. We present continuous measurements of relative humidity and temperature and periodic observations of liquid water in the CD over two periods. During this observation duration the terminal section of the drift was partitioned into four sections by bulkheads, and ventilation to these sections was minimized to a few days. We compare these observations to results from analytical and numerical models to investigate processes associated with the movement of water vapor between the tunnel bore and the surrounding fractured rock formation. Observations from this effort indicate that fractures can be primary paths for unsaturated zone vapor flow in the immediate vicinity of emplacement drifts. Observations, measurements, and analysis indicate the need for a model that includes fracture-dominated vapor transport as a significant contributor to total water flow into the drifts. Citation: Salve, R., and T. J. Kneafsey (2005), Vapor-phase transport in the near-drift environment at Yucca Mountain, Water Resour. Res., 41, W01012, doi:10.1029/2004WR003373. 1. Introduction [2] The U.S. Department of Energy (DOE) is currently assessing Yucca Mountain, located 160 km northwest of Las Vegas, Nevada, as a potential site for disposing spent nuclear fuel and high-level radioactive waste (Figure 1a). In the proposed repository design, the waste is to be stored in packages placed in nearly horizontal cylindrical tunnels (drifts). A key factor in repository performance is the likelihood of precipitation entering the mountain to perco- late a vertical distance of 300 m through unsaturated rock, into drifts containing the waste. The amount of water that flows through the mountain and into drifts is thought to control the corrosion rates of waste packages, as well as mobilization and transport of radionuclides. As such, two important factors affecting repository performance are (1) the fraction of waste packages contacted by liquid water and (2) the flow rate of the water. [3] To facilitate the characterization effort at Yucca Mountain, an 8-km-long, 8-m-diameter tunnel, the Explor- atory Studies Facility (ESF), was excavated in 1996. A second 2.7-km-long, 5-m-diameter exploratory tunnel, the Cross Drift (CD), was excavated in 1998 to further enhance characterization activities (Figure 1b). Subsequently, much effort has been directed toward estimating seepage from the near-drift environment into underground openings, in the form of both field experiments [e.g., Wang et al., 1999; Trautz and Wang, 2002, Salve et al., 2002, 2003, 2004] and numerical modeling exercises [e.g., Birkholzer et al., 1999; Finsterle et al., 2003; Li and Tsang, 2000]. Key to these investigations has been work by Philip et al. [1989a, 1989b], which suggests that water is likely to drip into waste emplacement drifts if it can overcome the capillary forces in the surrounding fractured tuff rock. [4] To date, no naturally occurring seepage has been observed in the excavated tunnels and cavities at Yucca Mountain, despite findings from numerical studies such as those by Birkholzer et al. [1999], which show that seepage can occur at steady state percolation fluxes of tens of millimeters per year. Current infiltration estimates vary with location and range, from zero to several centimeters per year [Bodvarsson et al., 2003]. A possible explanation is that potential seepage is masked by increased evaporation in the drifts, resulting from engineered ventilation that provides a continuous stream of air from outside the mountain. [5] To evaluate the tendency for seepage to occur in unventilated drifts at Yucca Mountain, scientists have peri- odically terminated ventilation along the terminal 914 m section of the CD (Figure 1b) by installing bulkheads and ceasing active ventilation for extended periods between 1999 and 2001. Immediately following each of these periods of suppressed ventilation, the CD was visually inspected for any evidence of water. During each inspection, This paper is not subject to U.S. copyright. Published in 2005 by the American Geophysical Union. W01012 WATER RESOURCES RESEARCH, VOL. 41, W01012, doi:10.1029/2004WR003373, 2005 1 of 13
-
Upload
independent -
Category
Documents
-
view
5 -
download
0
Transcript of Vapor-Phase Transport in the Near-Drift Environment at Yucca Mountain
Vapor-phase transport in the near-drift environment at Yucca
Mountain
Rohit Salve and Timothy J. Kneafsey
Earth Sciences Division, Lawrence Berkeley National Laboratory, Berkeley, California, USA
Received 27 May 2004; revised 17 August 2004; accepted 10 November 2004; published 20 January 2005.
[1] A key issue regarding the performance of the potential high-level radioactive wasterepository at Yucca Mountain, Nevada, is the likelihood of precipitation percolating avertical distance of �300 m through fractured unsaturated rock into drifts containingwaste packages. Water enhances waste package corrosion and is required for transport ofreleased radionuclides. To evaluate the propensity for seepage into tunnels at YuccaMountain, a 5-m-diameter, 2.7-km-long tunnel, commonly referred to as the Cross Drift(CD), was excavated in 1998, branching off from the main Exploratory Studies Facilitytunnel. Sections of this tunnel have been isolated from ventilation for extended periodsover the last 4 years. We present continuous measurements of relative humidity andtemperature and periodic observations of liquid water in the CD over two periods. Duringthis observation duration the terminal section of the drift was partitioned into four sectionsby bulkheads, and ventilation to these sections was minimized to a few days. We comparethese observations to results from analytical and numerical models to investigateprocesses associated with the movement of water vapor between the tunnel bore and thesurrounding fractured rock formation. Observations from this effort indicate that fracturescan be primary paths for unsaturated zone vapor flow in the immediate vicinity ofemplacement drifts. Observations, measurements, and analysis indicate the need for amodel that includes fracture-dominated vapor transport as a significant contributor to totalwater flow into the drifts.
Citation: Salve, R., and T. J. Kneafsey (2005), Vapor-phase transport in the near-drift environment at Yucca Mountain, Water
Resour. Res., 41, W01012, doi:10.1029/2004WR003373.
1. Introduction
[2] The U.S. Department of Energy (DOE) is currentlyassessing Yucca Mountain, located 160 km northwest of LasVegas, Nevada, as a potential site for disposing spentnuclear fuel and high-level radioactive waste (Figure 1a).In the proposed repository design, the waste is to be storedin packages placed in nearly horizontal cylindrical tunnels(drifts). A key factor in repository performance is thelikelihood of precipitation entering the mountain to perco-late a vertical distance of �300 m through unsaturated rock,into drifts containing the waste. The amount of water thatflows through the mountain and into drifts is thoughtto control the corrosion rates of waste packages, as wellas mobilization and transport of radionuclides. As such,two important factors affecting repository performance are(1) the fraction of waste packages contacted by liquid waterand (2) the flow rate of the water.[3] To facilitate the characterization effort at Yucca
Mountain, an 8-km-long, 8-m-diameter tunnel, the Explor-atory Studies Facility (ESF), was excavated in 1996. Asecond 2.7-km-long, 5-m-diameter exploratory tunnel, theCross Drift (CD), was excavated in 1998 to further enhancecharacterization activities (Figure 1b). Subsequently, mucheffort has been directed toward estimating seepage from the
near-drift environment into underground openings, in theform of both field experiments [e.g., Wang et al., 1999;Trautz and Wang, 2002, Salve et al., 2002, 2003, 2004] andnumerical modeling exercises [e.g., Birkholzer et al., 1999;Finsterle et al., 2003; Li and Tsang, 2000]. Key to theseinvestigations has been work by Philip et al. [1989a,1989b], which suggests that water is likely to drip intowaste emplacement drifts if it can overcome the capillaryforces in the surrounding fractured tuff rock.[4] To date, no naturally occurring seepage has been
observed in the excavated tunnels and cavities at YuccaMountain, despite findings from numerical studies such asthose by Birkholzer et al. [1999], which show that seepagecan occur at steady state percolation fluxes of tens ofmillimeters per year. Current infiltration estimates vary withlocation and range, from zero to several centimeters per year[Bodvarsson et al., 2003]. A possible explanation is thatpotential seepage is masked by increased evaporation in thedrifts, resulting from engineered ventilation that provides acontinuous stream of air from outside the mountain.[5] To evaluate the tendency for seepage to occur in
unventilated drifts at Yucca Mountain, scientists have peri-odically terminated ventilation along the terminal 914 msection of the CD (Figure 1b) by installing bulkheads andceasing active ventilation for extended periods between1999 and 2001. Immediately following each of theseperiods of suppressed ventilation, the CD was visuallyinspected for any evidence of water. During each inspection,
This paper is not subject to U.S. copyright.Published in 2005 by the American Geophysical Union.
W01012
WATER RESOURCES RESEARCH, VOL. 41, W01012, doi:10.1029/2004WR003373, 2005
1 of 13
liquid water was observed along sections of the drift.This water appeared as droplets spread along nonporoussurfaces (such as metals and cables) and small pools ofwater (<1 liter) scattered at random along impermeablesurfaces. Additionally, the presence of water at other loca-tions was suggested by rust on steel surfaces and densemold populations on other, nonmetallic surfaces. However,despite the presence of liquid water, there has been noevidence to suggest that the observed water entered the driftas seepage through localized flow paths.[6] We hypothesize that the observed water likely entered
the nonventilated drift through natural fractures as watervapor, and then condensed along sections of the drift. In thispaper, we present observations of moisture and temperaturedynamics made along the terminal �1.2 km of the CD whenairflow into this section of the drift was minimized. We alsopresent modeling results suggesting that fractures can beprimary paths for vapor flow driven by a potential gradient(primarily pressure and temperature) within the unsaturatedzone in the immediate vicinity of emplacement drifts. Amodel that incorporates fracture-dominated vapor flow con-ditions would be a strong departure from existing conceptualmodels, which postulate the overwhelming importance ofliquid traveling through fractures as the primary watertransport mechanism.However, this type of model is requiredto explain recent observations and may be required to predict
moisture dynamics under conditions encountered in anoperating repository.
2. Development of the Cross Drift
[7] The 2.7-km-long CD was excavated using a tunnel-boring machine (TBM) over a period of about 9 months,beginning in March 1998. The CD extends across the entireplanned width of the potential repository. During the exca-vation process, water was sprayed on the cutting head of theTBM while the excavated bore was continuously ventilated(with both activities influencing moisture dynamics in thenear-drift environment). After completion of tunneling, noadditional water was intentionally introduced into freshlyexcavated sections of the drift.[8] As tunneling progressed, railway tracks, ventilation
tubing, conveyor belts, and pipes to supply water andremove drainage were continuously extended (Figure 2a).Once complete, the 5-m-diameter drift also containedelectrical cables running along its length, with electricaltransformers located at periodic intervals. The conveyorbelt system, which was used to remove debris from theexcavation process, included a rubber belt �0.5 m wide thatformed a loop such that at any given location, there weretwo belt surfaces �0.30 m apart.[9] After boring of the CD was completed in June 1999,
the TBM was left at the end of the tunnel. Until early April2001, the TBM was continuously powered to facilitate theextension of the CD pending the decision to do so. Thus theTBM was a heat source for �22 months, continuouslyheating the rock and tunnel air in its immediate vicinity atthe end of the CD. The CD has been ventilated duringand since excavation, with a series of fans located within a�1-m-diameter tube that currently extends the length of thetunnel. The fans are located such that when activated, air isdrawn into the terminal end of the tube and transported outof the tunnel. As a result, ‘‘fresh air’’ enters the north portalof the Exploratory Studies Facility and travels along thetunnel, before being drawn into the ventilation tube. Thenatural ambient rock temperature at the elevation of the CDis about 23�C; ventilation air properties from the aridNevada desert depend on the season.[10] Since June 1999, sections along the terminal 914 m
of the CD have been isolated from ventilation for varyingperiods. This was achieved by terminating the ventilationtube at station 17+63, such that air further into the drift(i.e., beyond the bulkhead at station 17+63) would notbe drawn into the ventilation system. (Note that stationnumbers indicate distance in meters from the start of theCD tunnel, with 17+63 indicating the location to be 1763 mfrom the start of the tunnel). To prevent upstream air fromtraveling into the terminal section of the drift, steel doors(bulkheads) were installed at 17+63 and 25+03 in June1999 (Figure 2b). Thirteen months later, a third bulkheadwas installed at 26+00 to better contain the TBM-generatedheat. A final bulkhead was located at 22+00 in December2001.[11] There were 28 occasions over the interval between
June 1999 and July 2003 when the terminal sections of theCD were accessed and the drift was subject to ventilation.Most of these ventilation events were restricted to durationsof 2–4 days. There were two periods (June–August 2000and October–December 2001) when these sections of the
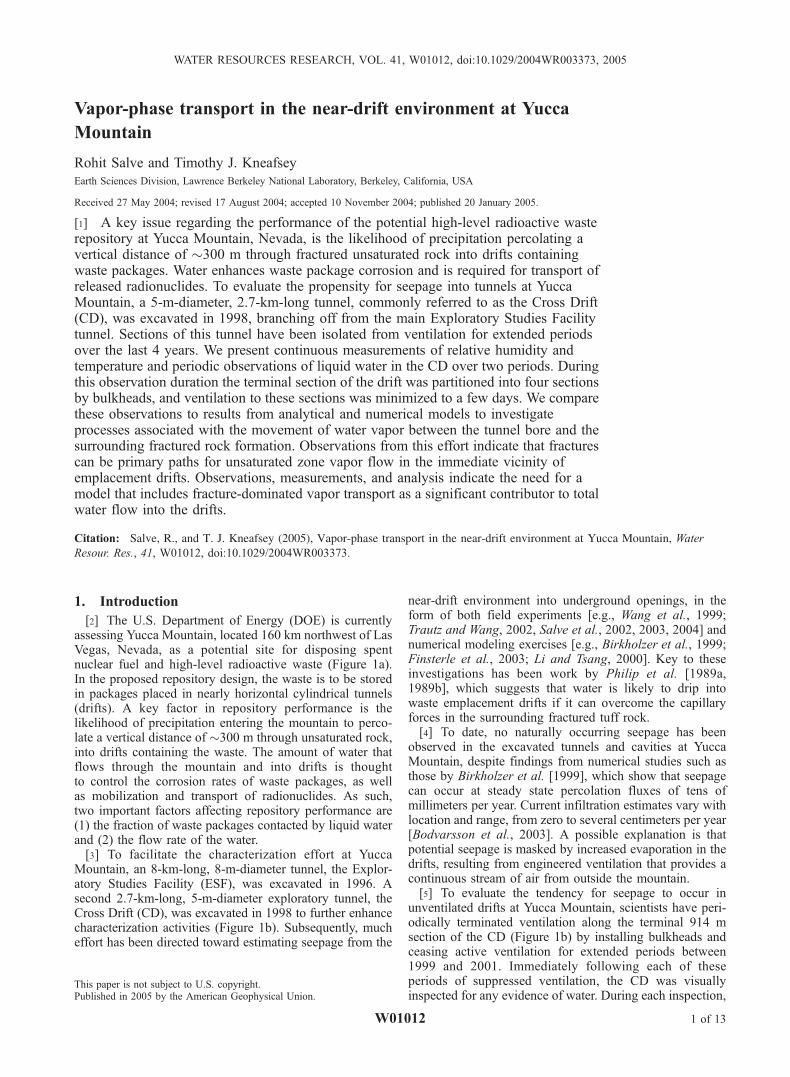
Figure 1. (a) Location of Yucca Mountain. (b) Three-dimensional view of tunnels in the Exploratory StudiesFacility at Yucca Mountain. The test bed for this study islocated along the terminal sections of the Cross Drift (CD).
2 of 13
W01012 SALVE AND KNEAFSEY: VAPOR-PHASE TRANSPORT AT YUCCA MOUNTAIN W01012
CD were continuously ventilated, for 35 and 90 days,respectively.
3. Monitoring of Near-Drift Moisture Dynamics
[12] Near-drift moisture dynamics were monitored withtemperature sensors in boreholes, and relative humidity andtemperature sensors in the drift.
3.1. Rock Water Potential and Temperature
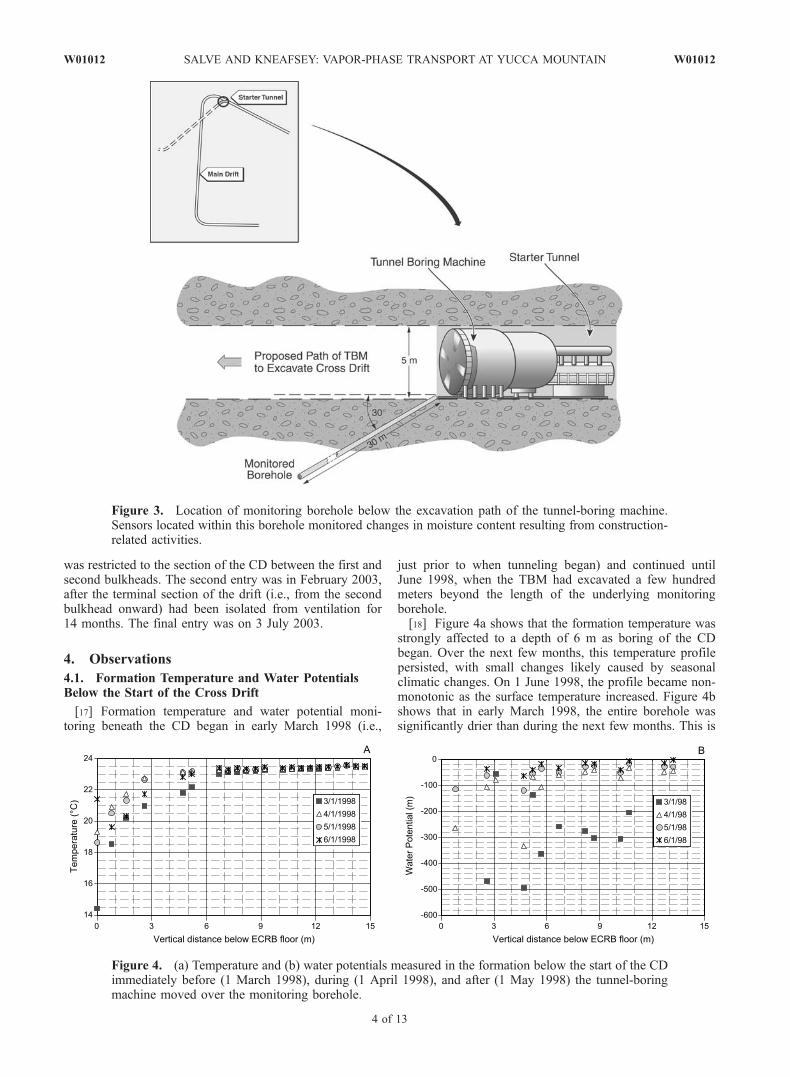
[13] In the mining process used to excavate the CD, waterwas sprayed on the rock in contact with the TBM cuttinghead to reduce airborne dust. To determine the ambient rocktemperature and water potentials (potential energy of thewater), and to assess perturbations to the temperature andmoisture conditions in the near-drift rock formation result-ing from water released during mining, scientists drilled a30-m-long borehole with 0.10 m diameter. This ‘‘startertunnel borehole’’ originated at the start of the CD and wasdrilled at an angle of 30� downward from the horizontalalong the proposed path of the CD (Figure 3). Prior to andduring CD mining, water potentials and rock temperatureslocated immediately below the first �20 m of the CD pathwere monitored.[14] Following the construction of the CD, three 6-m-long
horizontal boreholes with 0.10 m diameter were drilledat 15+00, 20+00, and 25+00 perpendicular to the wall ofthe tunnel. These boreholes were instrumented to allowmeasurement of rock temperature and water potential.Psychrometers (model PST-55, Wescor Inc.) were installedin the boreholes, at distances of 1.0 m along the starter tunnelborehole and at 0.5 m intervals in the three horizontalboreholes, and contacted the rock wall through small cavi-ties. Automated measurements of up to 30 psychrometers
were made using a single data logger (model CR7, CampbellScientific, Inc.).
3.2. Temperature and Relative Humidity
[15] Between November 2001 and December 2003, the in-drift humidity and temperature weremonitored along the fourCD sections isolated from ventilation effects. Within eachsection there were three locations where relative humidityand temperature probes were installed (Model HMP45C,Campbell Scientific, Inc.). In addition to these locations,temperature, relative humidity, barometric pressure (ModelPTB100B, Campbell Scientific, Inc.) and wind speed (Model014A, Met One Instruments) were monitored at 15+00. Thisstation, located in the ventilated section outside the firstbulkhead door (at 17+63), represented ventilated sectionsof the CD. The other monitoring stations were (for the mostpart) under nonventilated conditions. Measurement timingwas controlled by data loggers (Model CR10X, CampbellScientific, Inc.) to collect data at 15 min intervals.
3.3. Periodic Visual Inspections UnderNonventilated Conditions
[16] After the terminal section of the drift had beenisolated for extended time periods, the drift was accessedthree times (without ventilation) for visual observationsunder ‘‘ambient’’ conditions. During these entries, locationsof wet spots, mold, and other observations suggesting thepresence of moisture were documented. To facilitate theseobservations, canvas sheets (�4 � 4 m) were suspended atrandom along the drift. These sheets were coated with adesiccant which changed color as the sheet wetted. Inaddition, plastic sheets (4 � 4 m) were spread across thefloor of a few drift sections to collect any water dripping offthe drift ceiling. The first such entry was in June 2002, and
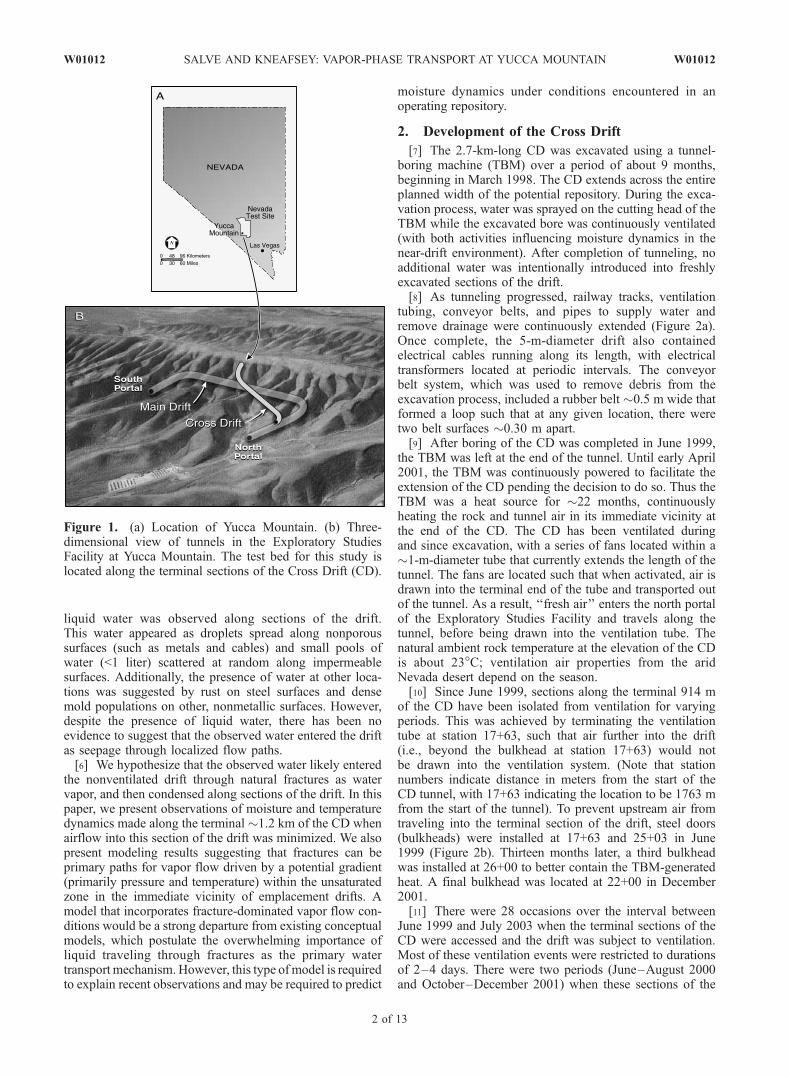
Figure 2. (a) Cross-sectional view of the CD, showing location of various in-drift features. (b) Locationof bulkhead doors along the terminal section of the CD.
W01012 SALVE AND KNEAFSEY: VAPOR-PHASE TRANSPORT AT YUCCA MOUNTAIN
3 of 13
W01012
was restricted to the section of the CD between the first andsecond bulkheads. The second entry was in February 2003,after the terminal section of the drift (i.e., from the secondbulkhead onward) had been isolated from ventilation for14 months. The final entry was on 3 July 2003.
4. Observations
4.1. Formation Temperature and Water PotentialsBelow the Start of the Cross Drift
[17] Formation temperature and water potential moni-toring beneath the CD began in early March 1998 (i.e.,
just prior to when tunneling began) and continued untilJune 1998, when the TBM had excavated a few hundredmeters beyond the length of the underlying monitoringborehole.[18] Figure 4a shows that the formation temperature was
strongly affected to a depth of 6 m as boring of the CDbegan. Over the next few months, this temperature profilepersisted, with small changes likely caused by seasonalclimatic changes. On 1 June 1998, the profile became non-monotonic as the surface temperature increased. Figure 4bshows that in early March 1998, the entire borehole wassignificantly drier than during the next few months. This is
Figure 3. Location of monitoring borehole below the excavation path of the tunnel-boring machine.Sensors located within this borehole monitored changes in moisture content resulting from construction-related activities.
Figure 4. (a) Temperature and (b) water potentials measured in the formation below the start of the CDimmediately before (1 March 1998), during (1 April 1998), and after (1 May 1998) the tunnel-boringmachine moved over the monitoring borehole.
4 of 13
W01012 SALVE AND KNEAFSEY: VAPOR-PHASE TRANSPORT AT YUCCA MOUNTAIN W01012
probably the result of dry drilling of the borehole itself,because other ambient water potential measurements atYucca Mountain range from 0 to approximately �10 m.The data from the following months show that the boreholewall got significantly wetter, with potentials asymptoticallyapproaching saturation levels (zero) at an increasing distancefrom the tunnel bore.
[19] These observations suggest that tunneling of the CDbore did not result in measurable amounts of constructionwater entering the near-drift formation. Rather, the lowerwater potentials that developed over the first 3 m indicatethat the formation likely began to dry out as ventilationpersisted during the development of the drift.
4.2. Water Potentials in the Formation Surroundingthe Cross Drift
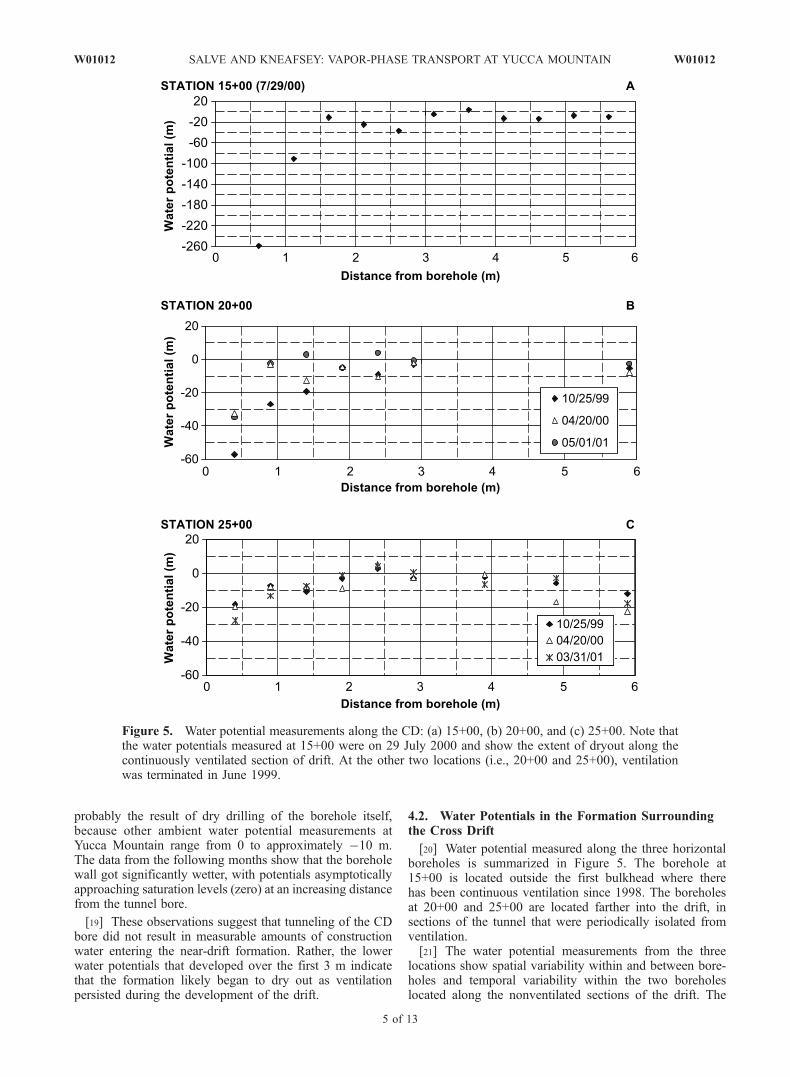
[20] Water potential measured along the three horizontalboreholes is summarized in Figure 5. The borehole at15+00 is located outside the first bulkhead where therehas been continuous ventilation since 1998. The boreholesat 20+00 and 25+00 are located farther into the drift, insections of the tunnel that were periodically isolated fromventilation.[21] The water potential measurements from the three
locations show spatial variability within and between bore-holes and temporal variability within the two boreholeslocated along the nonventilated sections of the drift. The
Figure 5. Water potential measurements along the CD: (a) 15+00, (b) 20+00, and (c) 25+00. Note thatthe water potentials measured at 15+00 were on 29 July 2000 and show the extent of dryout along thecontinuously ventilated section of drift. At the other two locations (i.e., 20+00 and 25+00), ventilationwas terminated in June 1999.
W01012 SALVE AND KNEAFSEY: VAPOR-PHASE TRANSPORT AT YUCCA MOUNTAIN
5 of 13
W01012
general spatial pattern within boreholes is lower waterpotentials near the drift, increasing rapidly over a distanceof 1–2 m, and then approaching ambient saturation fartherin. Among the three monitored boreholes, the one located at15+00 had the lowest water potentials close to the drift wall.The borehole at 20+00 also had lower water potentials up toa distance of �1.5 m from the borehole collar in September1999 (prior to the installation of the bulkhead doors), whichincreased over the subsequent 1.5 years. The boreholelocated farthest into the CD (at 25+00) showed a milderdecrease in water potential measurements closer to the drift,and minor increases in water potentials following theinstallation of the bulkhead doors.[22] These measurements suggest that the extent of
formation dryout surrounding the drift is largest in sectionsthat have been ventilated for the longest period. Close tothe terminal section of the drift, where the least ventilation
has occurred, the dryout zone is less extensive and lessdry.
4.3. Temperature Along the Cross Drift
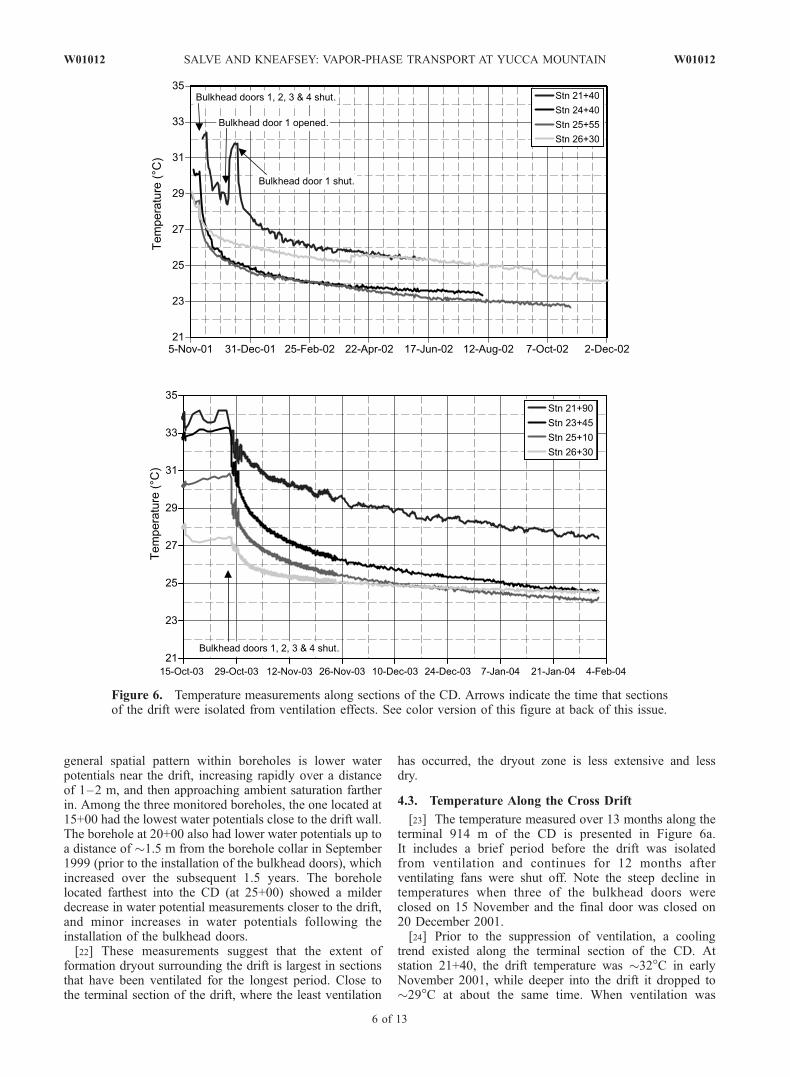
[23] The temperature measured over 13 months along theterminal 914 m of the CD is presented in Figure 6a.It includes a brief period before the drift was isolatedfrom ventilation and continues for 12 months afterventilating fans were shut off. Note the steep decline intemperatures when three of the bulkhead doors wereclosed on 15 November and the final door was closed on20 December 2001.[24] Prior to the suppression of ventilation, a cooling
trend existed along the terminal section of the CD. Atstation 21+40, the drift temperature was �32�C in earlyNovember 2001, while deeper into the drift it dropped to�29�C at about the same time. When ventilation was
Figure 6. Temperature measurements along sections of the CD. Arrows indicate the time that sectionsof the drift were isolated from ventilation effects. See color version of this figure at back of this issue.
6 of 13
W01012 SALVE AND KNEAFSEY: VAPOR-PHASE TRANSPORT AT YUCCA MOUNTAIN W01012
minimized for the terminal three sections in mid-November2001, there was an immediate, rapid decrease in temperaturethat persisted for �1 week, following which there was agradual decrease over the remaining 12 months. The patternof temperature changes in the most outward (i.e., loweststation number) section of drift, which was isolated fromventilation effects during the third week in December 2001,was similar to those in the other three sections.[25] During the entire monitoring period, the temperature
along the first isolated section of drift (measured at 21+40)was consistently higher than in the other three sections. Thislikely resulted from the warmer temperatures in the adjacentventilated sections of the drift. Temperatures were alsohigher in the terminal section (measured at station 26+30),with the two intermediate sections remaining cooler. Thewarmer terminal section is likely the result of residual heatassociated with the warm TBM that heated the surroundingrock until April 2001, when it was powered off.[26] When temperatures were measured along the CD
immediately before and after ventilation was terminated inmid-October 2003 (Figure 6b), a response pattern similar tothe previous year was observed. Before ventilation suppres-sion, temperatures along the first section were highest, andlowest temperatures occurred at the terminal section of thedrift. Once ventilation was stopped, the first section cooledbut remained warmer than the other sections. The terminalsection cooled significantly more slowly than the twomiddle sections, such that by early February 2003, thissection of drift was warmer than the two middle sections.[27] These measurements suggest that temperatures in the
terminal 914 m of the CD are influenced by a series offactors that become apparent when ventilation is sup-pressed. Under reduced ventilation, the drift temperaturedrops toward the surrounding ambient rock temperature(�24�C). However, the warmer temperatures of the venti-lating air appear to impact temperatures in the first isolatedsection, whereas residual heat from the TBM keeps theterminal section of the drift warmer than the adjacentsection.
4.4. Relative Humidity Along the Cross Drift
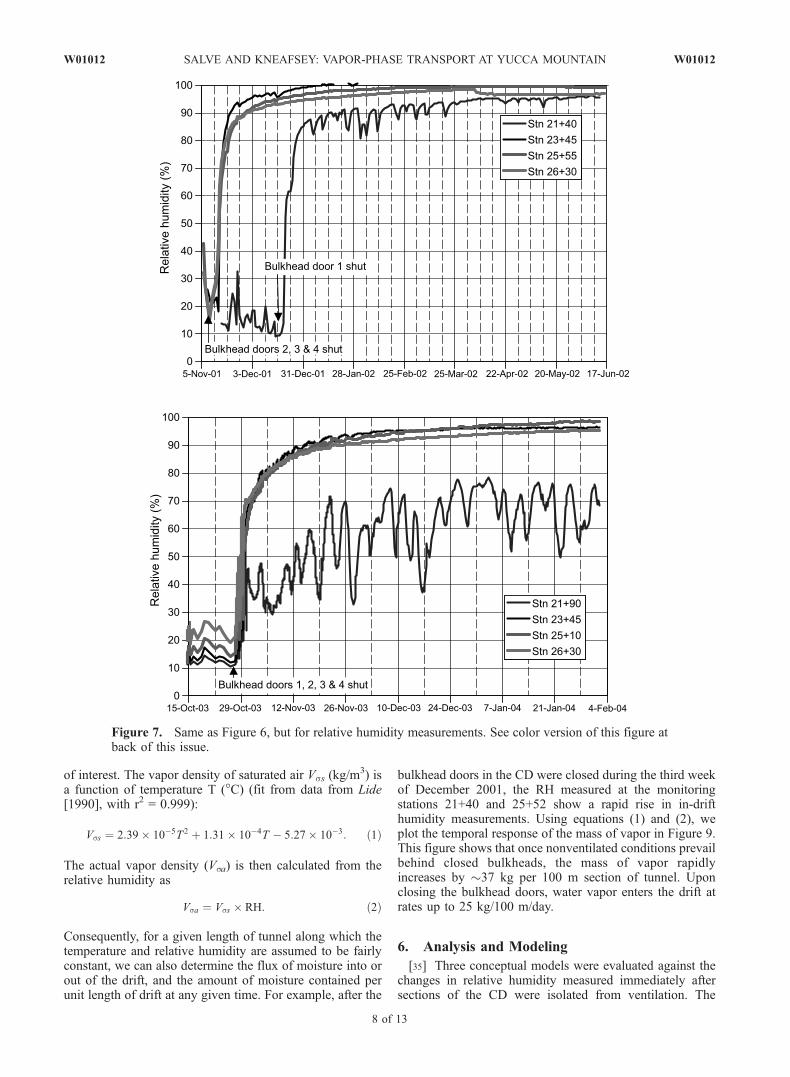
[28] Relative humidity (RH) was measured along theterminal section of the CD over two periods (5 November2001 to 17 June 2002 and 15 October 2003 to 4 February2004), each of which included a brief period before thesuppression of ventilation and continued for 4–6 monthsunder nonventilated conditions. RH measurements are sum-marized in Figure 7, which shows that during both periods,humidity in the four nonventilated sections began to in-crease after the bulkhead doors were closed and ventilationfans were shut off. Similar to the temperature response atthese locations, there was an initial period of rapid changein RH, followed by a slower rise after the first few weeks ofminimized air movement.[29] Changes in RH along the first section (measured at
21+40), after the section was isolated from ventilation inDecember 2001, were initially rapid and continuous over aperiod of two weeks, jumping from �10 to �90%. In thefollowing 5 months, the RH continued to rise, but wasinterrupted at weekly intervals. This periodic rise and fall inRH is likely the result of ventilation effects associated withthe adjacent section of drift, in which ventilation wasmaintained during the working weekdays (i.e., Monday to
Thursday) and turned off over the long weekend. A similarresponse was again observed in this section when ventila-tion was suppressed in October 2003. However, during thissecond period, the fluctuations were much larger during theweekly cycles, and the RH remained at �70%. This waslikely caused by an increased flux of ventilation air flowingthrough the ventilated drift, resulting from the use of alarger number of ventilation fans.[30] Deeper in the CD, the RH response was almost
identical during both monitoring periods. Here, the RHrapidly increased to �90% and then continued to approach100% RH in the ensuing months. At these locations, theperiodic decreases in RH observed in the first isolatedsection were not apparent.
4.5. Observations of Wet Zones in the Cross Drift
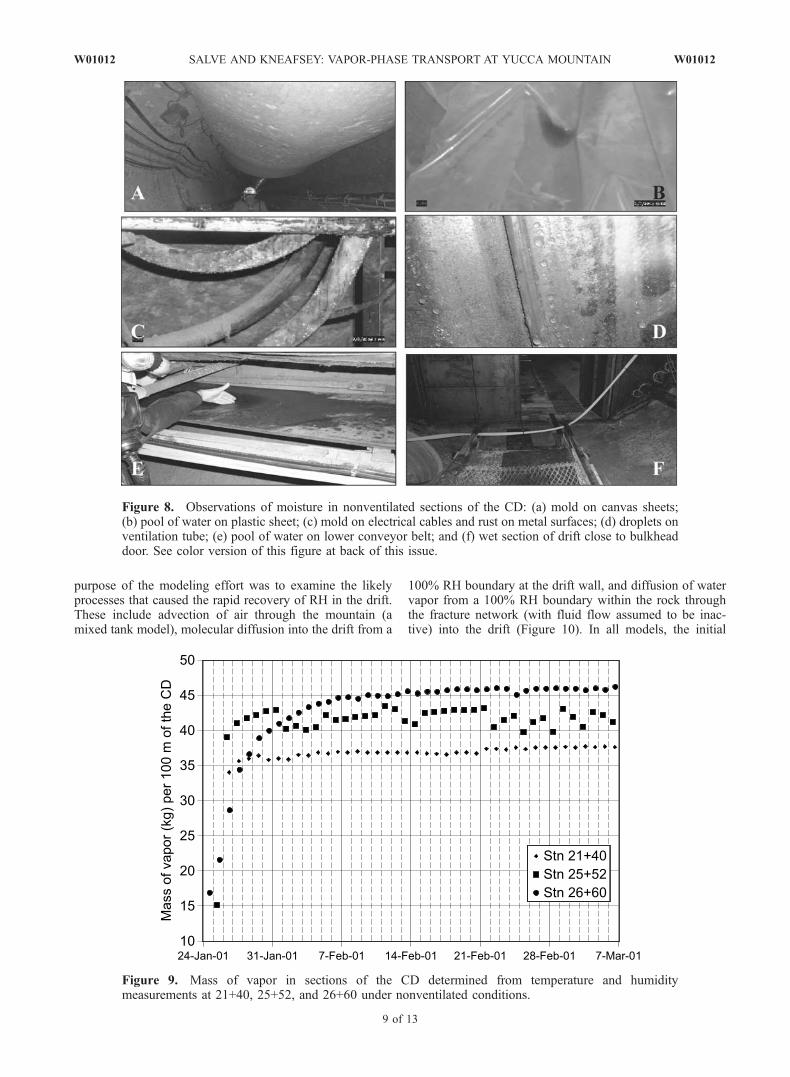
[31] Figure 8 includes a series of photographs fromvarious entries into the CD that show the presence of waterat different locations. In June 2002, when only the first ofthe four isolated sections (i.e., between 17+63 and 22+00)was accessed, the evidence of moisture along this section ofdrift was limited to mold that was present on canvas sheetslocated between 18+10 and 19+00 (Figure 8a). Deeper inthe drift, the mold was less apparent on the canvas sheets.No standing water was observed, but a few droplets of waterappeared along the bulkhead door at 22+00.[32] During subsequent entries, the location between
20+00 and 22+80 was usually dry, with no moistureobserved. Water droplets were observed on electrical cablesfrom 22+85 and often persisted for �300 m. Occasionally,small amounts of water were observed on plastic sheetsspread along the floor (Figure 8b). Between the second andthird bulkhead, there were alternating zones where sectionsof both the conveyor belt and ventilation tube had waterdroplets. Large drops of water were often observed alongthe ventilation tube in the immediate vicinity of bulkhead at25+00. The section of drift between the bulkhead door at25+00 and 25+15 was consistently and uniformly damp,with films of water visible on metal surfaces. Beyond25+15, the tunnel stayed visibly drier, and no liquidwater was observed on the rock. A few water dropletswere observed on the electrical cable at 26+10, and at26+40, there was evidence of mold on some of the electricalcables.[33] Overall, during the three entries into the terminal
section of the CD that followed months of suppressedventilation, there was direct and indirect evidence of mois-ture along the drift. The direct evidence included observa-tions of water droplets coating impermeable surfaces suchas electrical cables, rubber sheets along the conveyorbelt, and the ventilation tube and bulkhead doors. Theindirect evidence included the presence of mold on canvassheets and fungus growing along the rail ties separating thetracks.
5. Calculations of Vapor Flux Into theNonventilated Sections of the Cross Drift
[34] From measurements of relative humidity (i.e., theratio of the existing water vapor pressure to the saturationvapor pressure at the same temperature), the density ofwater vapor (i.e., the mass of water vapor per unit volume ofair) along the CD can be estimated for the temperature range
W01012 SALVE AND KNEAFSEY: VAPOR-PHASE TRANSPORT AT YUCCA MOUNTAIN
7 of 13
W01012
of interest. The vapor density of saturated air Vss (kg/m3) is
a function of temperature T (�C) (fit from data from Lide[1990], with r2 = 0.999):
Vss ¼ 2:39� 10�5T 2 þ 1:31� 10�4T � 5:27� 10�3: ð1Þ
The actual vapor density (Vsa) is then calculated from therelative humidity as
Vsa ¼ Vss � RH: ð2Þ
Consequently, for a given length of tunnel along which thetemperature and relative humidity are assumed to be fairlyconstant, we can also determine the flux of moisture into orout of the drift, and the amount of moisture contained perunit length of drift at any given time. For example, after the
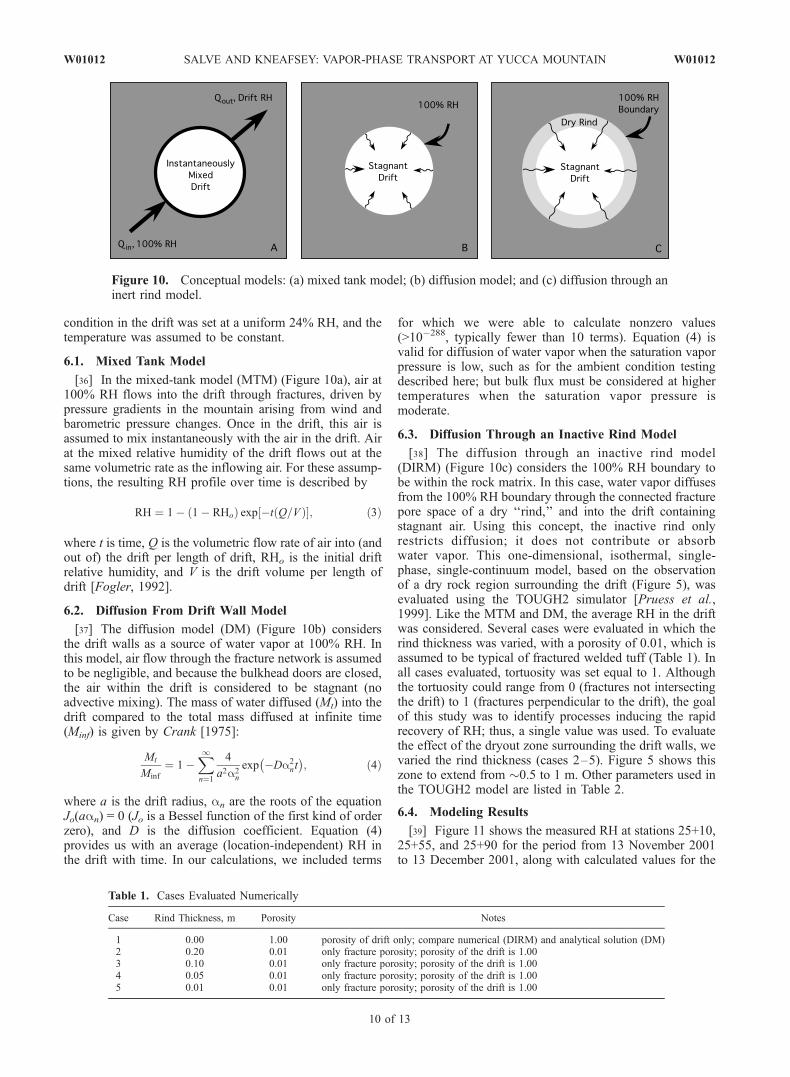
bulkhead doors in the CD were closed during the third weekof December 2001, the RH measured at the monitoringstations 21+40 and 25+52 show a rapid rise in in-drifthumidity measurements. Using equations (1) and (2), weplot the temporal response of the mass of vapor in Figure 9.This figure shows that once nonventilated conditions prevailbehind closed bulkheads, the mass of vapor rapidlyincreases by �37 kg per 100 m section of tunnel. Uponclosing the bulkhead doors, water vapor enters the drift atrates up to 25 kg/100 m/day.
6. Analysis and Modeling
[35] Three conceptual models were evaluated against thechanges in relative humidity measured immediately aftersections of the CD were isolated from ventilation. The
Figure 7. Same as Figure 6, but for relative humidity measurements. See color version of this figure atback of this issue.
8 of 13
W01012 SALVE AND KNEAFSEY: VAPOR-PHASE TRANSPORT AT YUCCA MOUNTAIN W01012
purpose of the modeling effort was to examine the likelyprocesses that caused the rapid recovery of RH in the drift.These include advection of air through the mountain (amixed tank model), molecular diffusion into the drift from a
100% RH boundary at the drift wall, and diffusion of watervapor from a 100% RH boundary within the rock throughthe fracture network (with fluid flow assumed to be inac-tive) into the drift (Figure 10). In all models, the initial
Figure 8. Observations of moisture in nonventilated sections of the CD: (a) mold on canvas sheets;(b) pool of water on plastic sheet; (c) mold on electrical cables and rust on metal surfaces; (d) droplets onventilation tube; (e) pool of water on lower conveyor belt; and (f) wet section of drift close to bulkheaddoor. See color version of this figure at back of this issue.
Figure 9. Mass of vapor in sections of the CD determined from temperature and humiditymeasurements at 21+40, 25+52, and 26+60 under nonventilated conditions.
W01012 SALVE AND KNEAFSEY: VAPOR-PHASE TRANSPORT AT YUCCA MOUNTAIN
9 of 13
W01012
condition in the drift was set at a uniform 24% RH, and thetemperature was assumed to be constant.
6.1. Mixed Tank Model
[36] In the mixed-tank model (MTM) (Figure 10a), air at100% RH flows into the drift through fractures, driven bypressure gradients in the mountain arising from wind andbarometric pressure changes. Once in the drift, this air isassumed to mix instantaneously with the air in the drift. Airat the mixed relative humidity of the drift flows out at thesame volumetric rate as the inflowing air. For these assump-tions, the resulting RH profile over time is described by
RH ¼ 1� 1� RHoð Þ exp �t Q=Vð Þ½ ; ð3Þ
where t is time, Q is the volumetric flow rate of air into (andout of) the drift per length of drift, RHo is the initial driftrelative humidity, and V is the drift volume per length ofdrift [Fogler, 1992].
6.2. Diffusion From Drift Wall Model
[37] The diffusion model (DM) (Figure 10b) considersthe drift walls as a source of water vapor at 100% RH. Inthis model, air flow through the fracture network is assumedto be negligible, and because the bulkhead doors are closed,the air within the drift is considered to be stagnant (noadvective mixing). The mass of water diffused (Mt) into thedrift compared to the total mass diffused at infinite time(Minf) is given by Crank [1975]:
Mt
Minf
¼ 1�X1
n¼1
4
a2a2n
exp �Da2nt
� �; ð4Þ
where a is the drift radius, an are the roots of the equationJo(aan) = 0 (Jo is a Bessel function of the first kind of orderzero), and D is the diffusion coefficient. Equation (4)provides us with an average (location-independent) RH inthe drift with time. In our calculations, we included terms
for which we were able to calculate nonzero values(>10�288, typically fewer than 10 terms). Equation (4) isvalid for diffusion of water vapor when the saturation vaporpressure is low, such as for the ambient condition testingdescribed here; but bulk flux must be considered at highertemperatures when the saturation vapor pressure ismoderate.
6.3. Diffusion Through an Inactive Rind Model
[38] The diffusion through an inactive rind model(DIRM) (Figure 10c) considers the 100% RH boundary tobe within the rock matrix. In this case, water vapor diffusesfrom the 100% RH boundary through the connected fracturepore space of a dry ‘‘rind,’’ and into the drift containingstagnant air. Using this concept, the inactive rind onlyrestricts diffusion; it does not contribute or absorbwater vapor. This one-dimensional, isothermal, single-phase, single-continuum model, based on the observationof a dry rock region surrounding the drift (Figure 5), wasevaluated using the TOUGH2 simulator [Pruess et al.,1999]. Like the MTM and DM, the average RH in the driftwas considered. Several cases were evaluated in which therind thickness was varied, with a porosity of 0.01, which isassumed to be typical of fractured welded tuff (Table 1). Inall cases evaluated, tortuosity was set equal to 1. Althoughthe tortuosity could range from 0 (fractures not intersectingthe drift) to 1 (fractures perpendicular to the drift), the goalof this study was to identify processes inducing the rapidrecovery of RH; thus, a single value was used. To evaluatethe effect of the dryout zone surrounding the drift walls, wevaried the rind thickness (cases 2–5). Figure 5 shows thiszone to extend from �0.5 to 1 m. Other parameters used inthe TOUGH2 model are listed in Table 2.
6.4. Modeling Results
[39] Figure 11 shows the measured RH at stations 25+10,25+55, and 25+90 for the period from 13 November 2001to 13 December 2001, along with calculated values for the
Figure 10. Conceptual models: (a) mixed tank model; (b) diffusion model; and (c) diffusion through aninert rind model.
Table 1. Cases Evaluated Numerically
Case Rind Thickness, m Porosity Notes
1 0.00 1.00 porosity of drift only; compare numerical (DIRM) and analytical solution (DM)2 0.20 0.01 only fracture porosity; porosity of the drift is 1.003 0.10 0.01 only fracture porosity; porosity of the drift is 1.004 0.05 0.01 only fracture porosity; porosity of the drift is 1.005 0.01 0.01 only fracture porosity; porosity of the drift is 1.00
10 of 13
W01012 SALVE AND KNEAFSEY: VAPOR-PHASE TRANSPORT AT YUCCA MOUNTAIN W01012
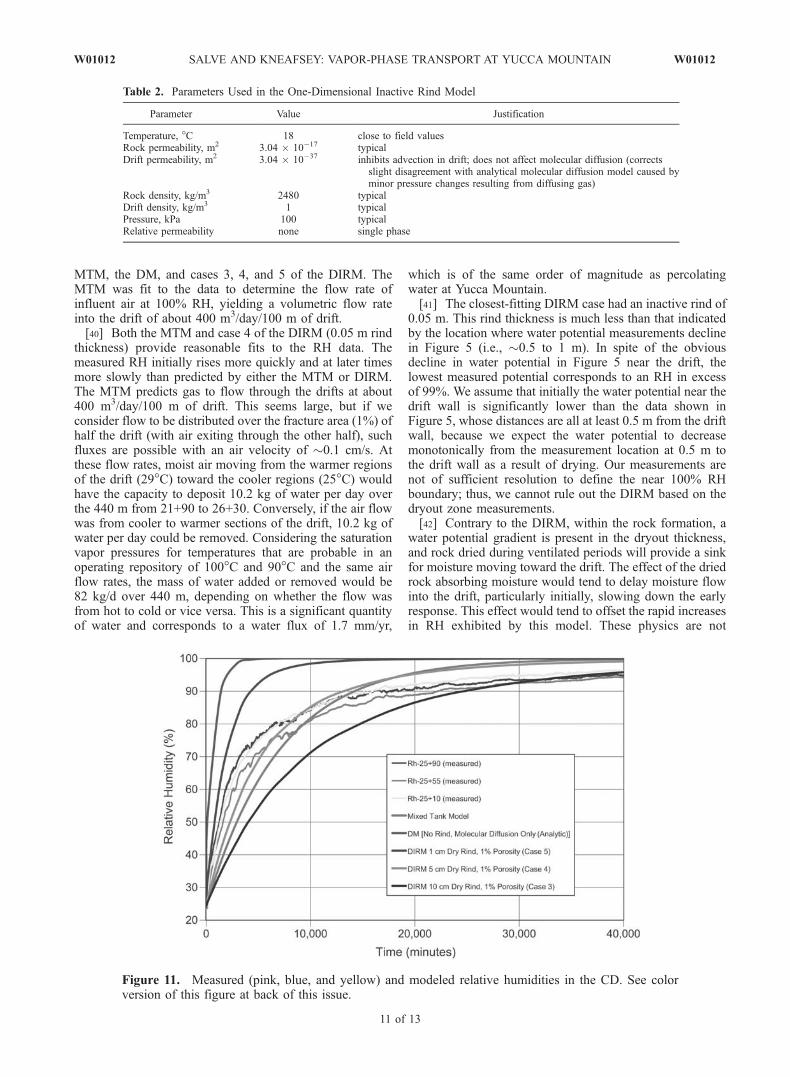
MTM, the DM, and cases 3, 4, and 5 of the DIRM. TheMTM was fit to the data to determine the flow rate ofinfluent air at 100% RH, yielding a volumetric flow rateinto the drift of about 400 m3/day/100 m of drift.[40] Both the MTM and case 4 of the DIRM (0.05 m rind
thickness) provide reasonable fits to the RH data. Themeasured RH initially rises more quickly and at later timesmore slowly than predicted by either the MTM or DIRM.The MTM predicts gas to flow through the drifts at about400 m3/day/100 m of drift. This seems large, but if weconsider flow to be distributed over the fracture area (1%) ofhalf the drift (with air exiting through the other half), suchfluxes are possible with an air velocity of �0.1 cm/s. Atthese flow rates, moist air moving from the warmer regionsof the drift (29�C) toward the cooler regions (25�C) wouldhave the capacity to deposit 10.2 kg of water per day overthe 440 m from 21+90 to 26+30. Conversely, if the air flowwas from cooler to warmer sections of the drift, 10.2 kg ofwater per day could be removed. Considering the saturationvapor pressures for temperatures that are probable in anoperating repository of 100�C and 90�C and the same airflow rates, the mass of water added or removed would be82 kg/d over 440 m, depending on whether the flow wasfrom hot to cold or vice versa. This is a significant quantityof water and corresponds to a water flux of 1.7 mm/yr,
which is of the same order of magnitude as percolatingwater at Yucca Mountain.[41] The closest-fitting DIRM case had an inactive rind of
0.05 m. This rind thickness is much less than that indicatedby the location where water potential measurements declinein Figure 5 (i.e., �0.5 to 1 m). In spite of the obviousdecline in water potential in Figure 5 near the drift, thelowest measured potential corresponds to an RH in excessof 99%. We assume that initially the water potential near thedrift wall is significantly lower than the data shown inFigure 5, whose distances are all at least 0.5 m from the driftwall, because we expect the water potential to decreasemonotonically from the measurement location at 0.5 m tothe drift wall as a result of drying. Our measurements arenot of sufficient resolution to define the near 100% RHboundary; thus, we cannot rule out the DIRM based on thedryout zone measurements.[42] Contrary to the DIRM, within the rock formation, a
water potential gradient is present in the dryout thickness,and rock dried during ventilated periods will provide a sinkfor moisture moving toward the drift. The effect of the driedrock absorbing moisture would tend to delay moisture flowinto the drift, particularly initially, slowing down the earlyresponse. This effect would tend to offset the rapid increasesin RH exhibited by this model. These physics are not
Table 2. Parameters Used in the One-Dimensional Inactive Rind Model
Parameter Value Justification
Temperature, �C 18 close to field valuesRock permeability, m2 3.04 � 10�17 typicalDrift permeability, m2 3.04 � 10�37 inhibits advection in drift; does not affect molecular diffusion (corrects
slight disagreement with analytical molecular diffusion model caused byminor pressure changes resulting from diffusing gas)
Rock density, kg/m3 2480 typicalDrift density, kg/m3 1 typicalPressure, kPa 100 typicalRelative permeability none single phase
Figure 11. Measured (pink, blue, and yellow) and modeled relative humidities in the CD. See colorversion of this figure at back of this issue.
W01012 SALVE AND KNEAFSEY: VAPOR-PHASE TRANSPORT AT YUCCA MOUNTAIN
11 of 13
W01012
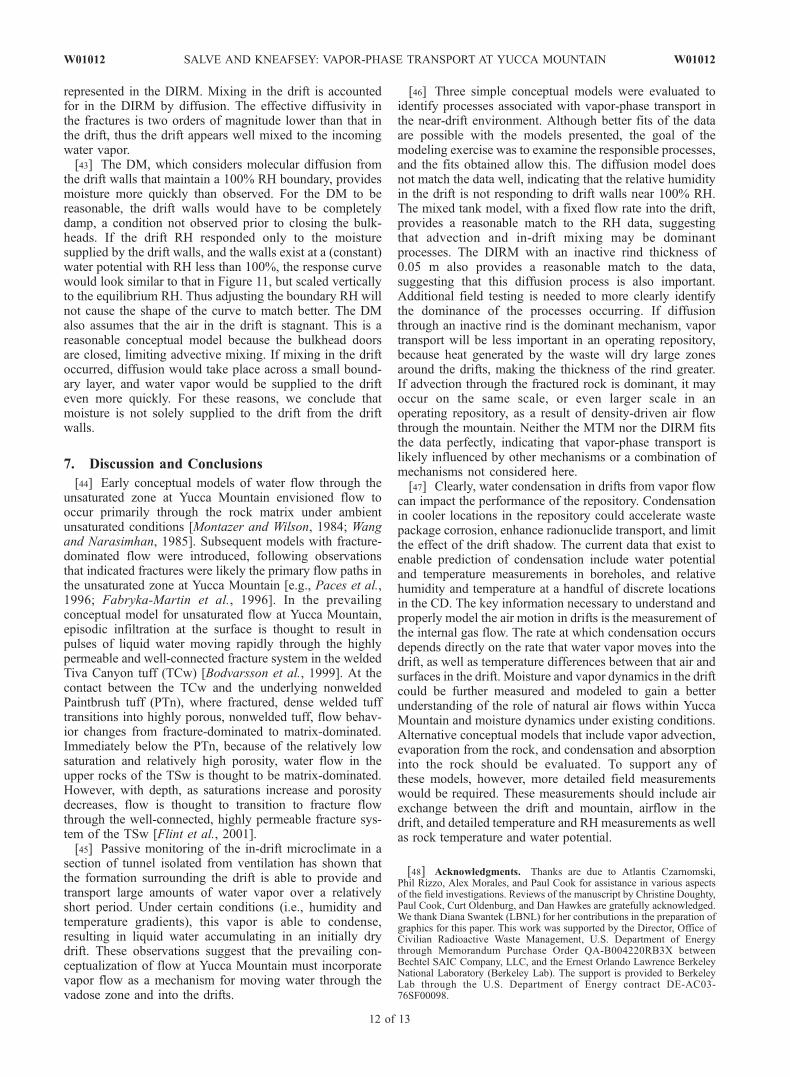
represented in the DIRM. Mixing in the drift is accountedfor in the DIRM by diffusion. The effective diffusivity inthe fractures is two orders of magnitude lower than that inthe drift, thus the drift appears well mixed to the incomingwater vapor.[43] The DM, which considers molecular diffusion from
the drift walls that maintain a 100% RH boundary, providesmoisture more quickly than observed. For the DM to bereasonable, the drift walls would have to be completelydamp, a condition not observed prior to closing the bulk-heads. If the drift RH responded only to the moisturesupplied by the drift walls, and the walls exist at a (constant)water potential with RH less than 100%, the response curvewould look similar to that in Figure 11, but scaled verticallyto the equilibrium RH. Thus adjusting the boundary RH willnot cause the shape of the curve to match better. The DMalso assumes that the air in the drift is stagnant. This is areasonable conceptual model because the bulkhead doorsare closed, limiting advective mixing. If mixing in the driftoccurred, diffusion would take place across a small bound-ary layer, and water vapor would be supplied to the drifteven more quickly. For these reasons, we conclude thatmoisture is not solely supplied to the drift from the driftwalls.
7. Discussion and Conclusions
[44] Early conceptual models of water flow through theunsaturated zone at Yucca Mountain envisioned flow tooccur primarily through the rock matrix under ambientunsaturated conditions [Montazer and Wilson, 1984; Wangand Narasimhan, 1985]. Subsequent models with fracture-dominated flow were introduced, following observationsthat indicated fractures were likely the primary flow paths inthe unsaturated zone at Yucca Mountain [e.g., Paces et al.,1996; Fabryka-Martin et al., 1996]. In the prevailingconceptual model for unsaturated flow at Yucca Mountain,episodic infiltration at the surface is thought to result inpulses of liquid water moving rapidly through the highlypermeable and well-connected fracture system in the weldedTiva Canyon tuff (TCw) [Bodvarsson et al., 1999]. At thecontact between the TCw and the underlying nonweldedPaintbrush tuff (PTn), where fractured, dense welded tufftransitions into highly porous, nonwelded tuff, flow behav-ior changes from fracture-dominated to matrix-dominated.Immediately below the PTn, because of the relatively lowsaturation and relatively high porosity, water flow in theupper rocks of the TSw is thought to be matrix-dominated.However, with depth, as saturations increase and porositydecreases, flow is thought to transition to fracture flowthrough the well-connected, highly permeable fracture sys-tem of the TSw [Flint et al., 2001].[45] Passive monitoring of the in-drift microclimate in a
section of tunnel isolated from ventilation has shown thatthe formation surrounding the drift is able to provide andtransport large amounts of water vapor over a relativelyshort period. Under certain conditions (i.e., humidity andtemperature gradients), this vapor is able to condense,resulting in liquid water accumulating in an initially drydrift. These observations suggest that the prevailing con-ceptualization of flow at Yucca Mountain must incorporatevapor flow as a mechanism for moving water through thevadose zone and into the drifts.
[46] Three simple conceptual models were evaluated toidentify processes associated with vapor-phase transport inthe near-drift environment. Although better fits of the dataare possible with the models presented, the goal of themodeling exercise was to examine the responsible processes,and the fits obtained allow this. The diffusion model doesnot match the data well, indicating that the relative humidityin the drift is not responding to drift walls near 100% RH.The mixed tank model, with a fixed flow rate into the drift,provides a reasonable match to the RH data, suggestingthat advection and in-drift mixing may be dominantprocesses. The DIRM with an inactive rind thickness of0.05 m also provides a reasonable match to the data,suggesting that this diffusion process is also important.Additional field testing is needed to more clearly identifythe dominance of the processes occurring. If diffusionthrough an inactive rind is the dominant mechanism, vaportransport will be less important in an operating repository,because heat generated by the waste will dry large zonesaround the drifts, making the thickness of the rind greater.If advection through the fractured rock is dominant, it mayoccur on the same scale, or even larger scale in anoperating repository, as a result of density-driven air flowthrough the mountain. Neither the MTM nor the DIRM fitsthe data perfectly, indicating that vapor-phase transport islikely influenced by other mechanisms or a combination ofmechanisms not considered here.[47] Clearly, water condensation in drifts from vapor flow
can impact the performance of the repository. Condensationin cooler locations in the repository could accelerate wastepackage corrosion, enhance radionuclide transport, and limitthe effect of the drift shadow. The current data that exist toenable prediction of condensation include water potentialand temperature measurements in boreholes, and relativehumidity and temperature at a handful of discrete locationsin the CD. The key information necessary to understand andproperly model the air motion in drifts is the measurement ofthe internal gas flow. The rate at which condensation occursdepends directly on the rate that water vapor moves into thedrift, as well as temperature differences between that air andsurfaces in the drift. Moisture and vapor dynamics in the driftcould be further measured and modeled to gain a betterunderstanding of the role of natural air flows within YuccaMountain and moisture dynamics under existing conditions.Alternative conceptual models that include vapor advection,evaporation from the rock, and condensation and absorptioninto the rock should be evaluated. To support any ofthese models, however, more detailed field measurementswould be required. These measurements should include airexchange between the drift and mountain, airflow in thedrift, and detailed temperature and RH measurements as wellas rock temperature and water potential.
[48] Acknowledgments. Thanks are due to Atlantis Czarnomski,Phil Rizzo, Alex Morales, and Paul Cook for assistance in various aspectsof the field investigations. Reviews of the manuscript by Christine Doughty,Paul Cook, Curt Oldenburg, and Dan Hawkes are gratefully acknowledged.We thank Diana Swantek (LBNL) for her contributions in the preparation ofgraphics for this paper. This work was supported by the Director, Office ofCivilian Radioactive Waste Management, U.S. Department of Energythrough Memorandum Purchase Order QA-B004220RB3X betweenBechtel SAIC Company, LLC, and the Ernest Orlando Lawrence BerkeleyNational Laboratory (Berkeley Lab). The support is provided to BerkeleyLab through the U.S. Department of Energy contract DE-AC03-76SF00098.
12 of 13
W01012 SALVE AND KNEAFSEY: VAPOR-PHASE TRANSPORT AT YUCCA MOUNTAIN W01012
ReferencesBirkholzer, J., G. Li, C. F. Tsang, and Y. Tsang (1999), Modeling studiesand analysis of seepage into drifts at Yucca Mountain, J. Contam.Hydrol., 38, 349–384.
Bodvarsson, G. S., W. Boyle, R. Patterson, and D. Williams (1999), Over-view of scientific investigations at Yucca Mountain—The potentialrepository for high-level nuclear waste, J. Contam. Hydrol., 38, 3–24.
Bodvarsson, G. S., E. Kwicklis, C. Shan, and Y. S. Wu (2003), Estimationof percolation flux from borehole temperature data at Yucca Mountain,Nevada, J. Contam. Hydrol., 62–63, 3–22.
Crank, J. (1975), The Mathematics of Diffusion, 414 pp., Clarendon Press,Oxford, U. K.
Fabryka-Martin, J. T., P. R. Dixon, S. Levy, B. Liu, H. J. Turin, and A. V.Wolfsberg (1996), Systematic sampling for chlorine-36 in the Explora-tory Studies Facility, Rep. LA-CST-TIP-96-001, Milestone 3783AD, LosAlamos Natl. Lab., Los Alamos, N. M.
Finsterle, S., C. F. Ahlers, R. C. Trautz, and P. J. Cook (2003), Inverse andpredictive modeling of seepage into underground openings, J. Contam.Hydrol., 62–63, 89–109.
Flint, A. L., L. E. Flint, G. S. Bodvarsson, E. M. Kwicklis, and J. Fabryka-Martin (2001), Evolution of the conceptual model of unsaturated zonehydrology at Yucca Mountain, Nevada, J. Hydrol., 247, 1–30.
Fogler, H. S. (1992), Elements of Chemical Reaction Engineering, 838 pp.,Prentice Hall, Upper Saddle River, N. J.
Li, G. M., and C. F. Tsang (2000), Seepage into drifts with mechanicaldegradation, J. Contam. Hydrol., 62–63, 157–172.
Lide, D. R. (1990), CRC Handbook of Chemistry and Physics, 71st ed.,CRC Press, Boca Raton, Fla.
Montazer, P., and W. E. Wilson (1984), Conceptual hydrologic model oflow in the unsaturated zone, Yucca Mountain, Nevada, U.S. Geol. Surv.Water Resour. Invest. Rep., 84-4355.
Paces, J. B., L. A. Newmark, B. D. Marshall, J. F. Whelan, and Z. E.Peterman (1996), Ages and origins of subsurface secondary mineralsin the Exploratory Studies Facility, Milestone Rep. 3GQH450M, U.S.Geol. Surv., Denver, Colo.
Philip, J. R., J. H. Knight, and R. T. Waechter (1989a), Unsaturated seepageand subterranean holes: Conspectus, and exclusion problem for circularcylindrical cavities, Water Resour. Res., 25, 16–28.
Philip, J. R., J. H. Knight, and R. T. Waechter (1989b), The seepageexclusion problem for parabolic and paraboloidal cavities, Water Resour.Res., 25, 605–618.
Pruess, K., C. Oldenburg, and G. Moridis (1999), TOUGH2 User’s Guide,vers. 2.0., Rep. LBNL-43134, Lawrence Berkeley Natl. Lab., Berkeley,Calif.
Salve, R., J. S. Y. Wang, and C. Doughty (2002), Liquid flow in unsa-turated fractured welded tuffs: I. Field investigations, J. Hydrol., 256,60–79.
Salve, R., C. M. Oldenburg, and J. S. Y. Wang (2003), In situ flow experi-ments in nonwelded tuff: Conceptual models and implications for flow inthe PTn, J. Contam. Hydrol., 62–63, 269–286.
Salve, R., H.-H. Liu, P. Cook, A. Czarnomski, Q. Hu, and D. Hudson(2004), Unsaturated flow and transport through a fault embeddedin fractured welded tuff, Water Resour. Res., 40, W04210, doi:10.1029/2003WR002571.
Trautz, R. C., and J. S. Y. Wang (2002), Seepage into an undergroundopening constructed in unsaturated fractured rock under evaporative con-ditions, Water Resour. Res., 38(10), 1188, doi:10.1029/2001WR000690.
Wang, J. S. Y., and T. N. Narasimhan (1985), Hydrologic mechanismsgoverning fluid flow in a partially saturated, fractured, porous medium,Water Resour. Res., 21, 1861–1874.
Wang, J. S. Y., R. C. Trautz, P. J. Cook, S. Finsterle, A. L. James, andJ. Birkholzer (1999), Field tests and model analyses of seepage into drift,J. Contam. Hydrol., 38, 323–347.
����������������������������T. J. Kneafsey and R. Salve, Earth Sciences Division, Lawrence
Berkeley National Laboratory, 1 Cyclotron Road, Berkeley, CA 94720,USA. ([email protected]; [email protected])
W01012 SALVE AND KNEAFSEY: VAPOR-PHASE TRANSPORT AT YUCCA MOUNTAIN
13 of 13
W01012
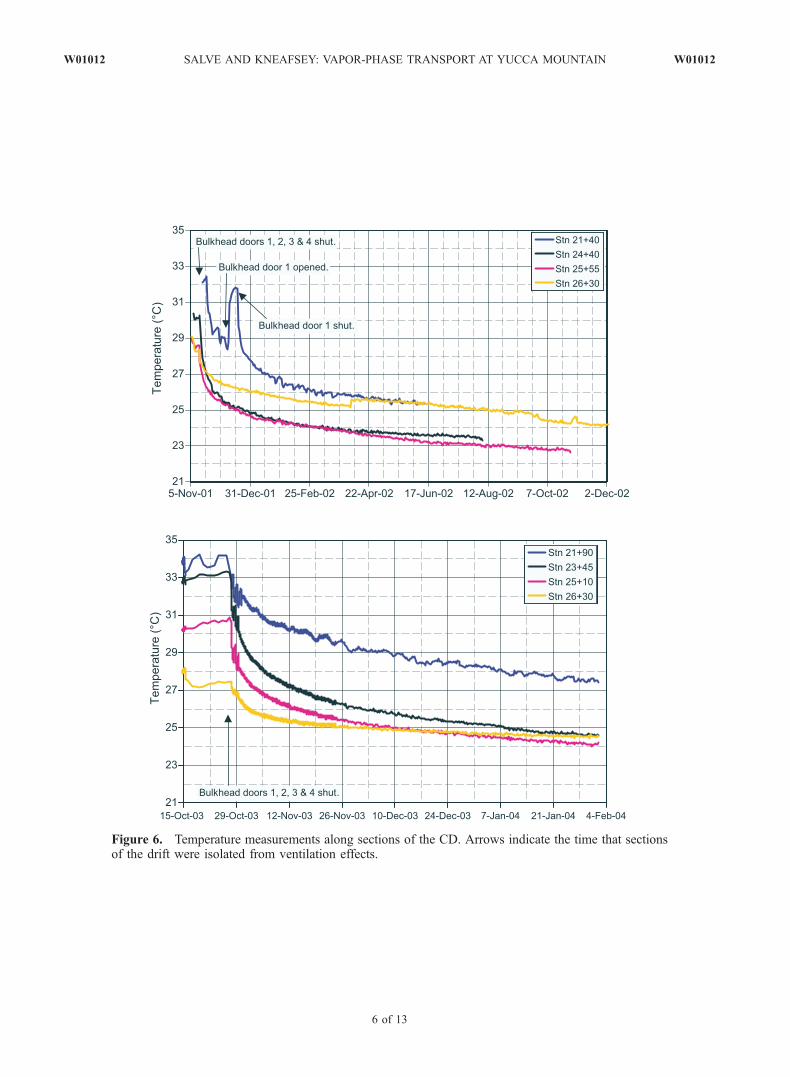
Figure 6. Temperature measurements along sections of the CD. Arrows indicate the time that sectionsof the drift were isolated from ventilation effects.
W01012 SALVE AND KNEAFSEY: VAPOR-PHASE TRANSPORT AT YUCCA MOUNTAIN W01012
6 of 13
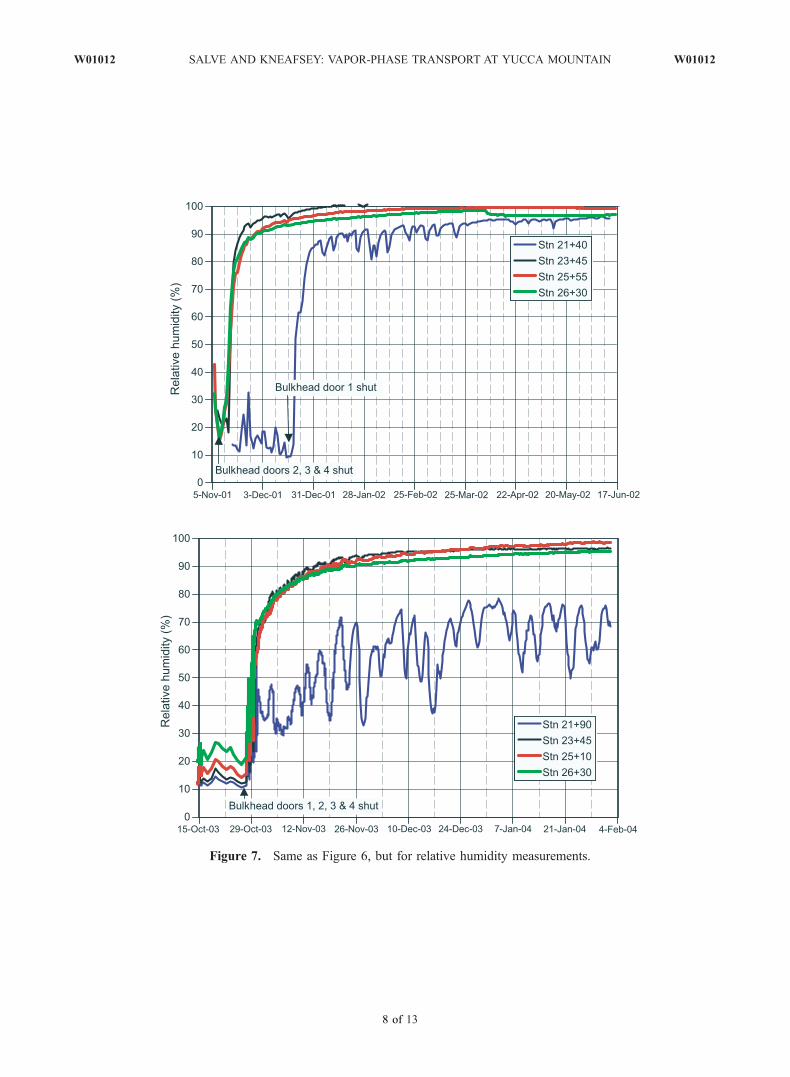
Figure 7. Same as Figure 6, but for relative humidity measurements.
W01012 SALVE AND KNEAFSEY: VAPOR-PHASE TRANSPORT AT YUCCA MOUNTAIN W01012
8 of 13
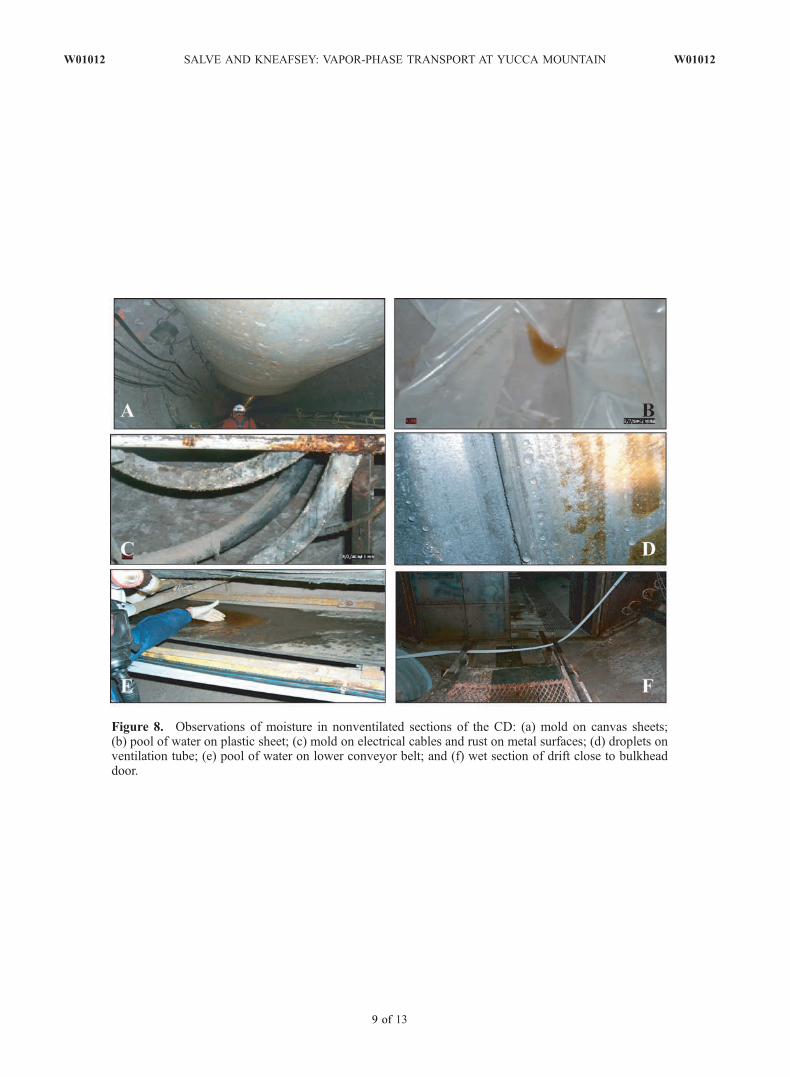
Figure 8. Observations of moisture in nonventilated sections of the CD: (a) mold on canvas sheets;(b) pool of water on plastic sheet; (c) mold on electrical cables and rust on metal surfaces; (d) droplets onventilation tube; (e) pool of water on lower conveyor belt; and (f) wet section of drift close to bulkheaddoor.
W01012 SALVE AND KNEAFSEY: VAPOR-PHASE TRANSPORT AT YUCCA MOUNTAIN W01012
9 of 13
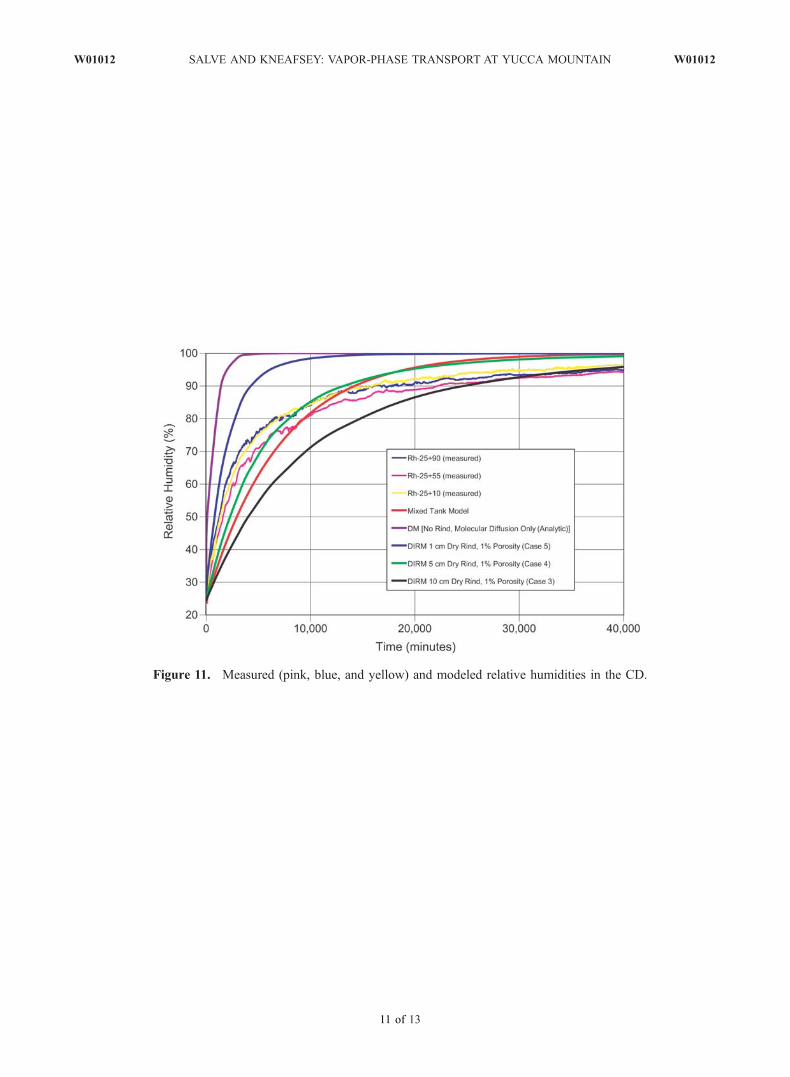
Figure 11. Measured (pink, blue, and yellow) and modeled relative humidities in the CD.
W01012 SALVE AND KNEAFSEY: VAPOR-PHASE TRANSPORT AT YUCCA MOUNTAIN W01012
11 of 13