
Het technologische systeem van Ypenburg. Een gebruikssporenanalyse van diverse werktuigtypen
Upload
khangminh22Category
view
0download
0
T.R.
VAN YUZUNCU YIL UNIVERSITY
INSTITUTE OF NATURAL AND APPLIED SCIENCES
DEPARTMENT OF BIOLOGY
THE EFFECTS OF CYPERMETHRIN ON PRIMARY HEPATOCYTE
CULTURE OF VAN FISH (Alburnus tarichi Güldenstädt, 1814)
M. Sc. THESIS
PREPARED BY: Aso Hemn OMAR
SUPERVISOR: Assoc. Prof. Dr. Ahmet Regaib OĞUZ
VAN-2018


T.R.
VAN YUZUNCU YIL UNIVERSITY
INSTITUTE OF NATURAL AND APPLIED SCIENCES
DEPARTMENT OF BIOLOGY
THE EFFECTS OF CYPERMETHRIN ON PRIMARY HEPATOCYTE
CULTURE OF VAN FISH (Alburnus tarichi Güldenstädt, 1814)
M. Sc. THESIS
PREPARED BY: Aso Hemn OMAR
VAN-2018


THESIS STATEMENT
All information presented in the thesis that ethical behavior and academic rules
were obtained in the frame, as well as all kinds of work that does not belong to me in this
statement prepared in accordance with the rules of writing theses and reports that I referred
to the complete information source.
Signature
Aso Hemn OMAR


i
ABSTRACT
THE EFFECTS OF CYPERMETHRIN ON PRIMARY HEPATOCYTE CULTURE
OF LAKE VAN FISH (Alburnus tarichi Güldenstädt, 1814)
OMAR, Aso Hemn
M.Sc. Thesis, Department of Biology
Supervisor: Assoc. Prof. Dr. Ahmet Regaib OĞUZ
January 2018, 63 pages
Cypermethrin is a synthetic insecticide widely used in the fight against harmful
insects in animal husbandry and agriculture. Although used for combat against insects, it
also has negative effects on other harmless animals. Cypermethrin is used in livestock and
agriculture fields in Van Lake. Congestion can also cause accumulation in lakes and aquatic
areas. In this study, we aimed to determine the effects of cypermethrin on the primary
hepatocyte culture of Van fish (Alburnus tarichi). Different concentrations of cypermethrin
(1 × 10⁻⁷, 1 × 10
-6 and 1 × 10
-5 M) were applied to the liver cells isolated from Van bean for
48 hours. Changes in Aspartate Aminotransferase (AST), Alanine Aminotransferase (ALT)
and Lactate dehydrogenase (LDH) levels at 24 and 48 hours of cell culture were determined
in the culture medium. We also tried to determine the effects of cypermethrin on total
oxidant (TOS) and antioxidant levels (TAS), malondialdehyde levels (MDA) and DNA
damage. As a result of the experiments, invert light microscopy revealed that the number of
hepatocytes significantly decreased in the groups treated with cypermethrin. Although the
levels of AST, ALT and LDH frequently used in liver damage were increased due to the
doses of cypermethrin, this increase was low or statistically insignificant compared to the
control group. MDA levels increased at the end of the incubation depending on the dose.
There was no difference in TAS and TOS levels when compared to the control group. DNA
damage was found to increase with time of typhoon and time. As a result, it has been
clearly demonstrated that the administered cypermethrin has high toxic effects on the
primary hepatocyte culture of Van fish.
Keywords: Alburnus tarichi, Cypermethrin, Primary hepatocyte culture, Van Fish

ii

iii
ÖZET
SİPERMETRİNİN VAN BALIĞI (Alburnus tarichi Güldenstädt, 1814) PRİMER
KARACİĞER KÜLTÜRÜ ÜZERİNE ETKİLERİ
OMAR, Aso Hemn
Yüksek Lisans Tezi, Biyoloji Anabilim Dalı
Tez DanıĢmanı: Doç. Dr. Ahmet Regaib OĞUZ
Ocak 2018, 63 sayfa
Sipermetrin hayvancılık ve ziraat alanlarında zararlı böceklerle mücadelede yaygın
olarak kullanılan sentetik bir insektisittir. Her ne kadar böceklerle mücade için kullanılsa da
zararsız diğer canlılar üzerine de olumsuz etkileri mevcuttur. Sipermetrin, Van Gölü
havzasında hayvancılık ve zirai alanlarda kullanılmaktadır. Yoğun kullanım göl ve sucul
alanlarda da birikime neden olabilmektedir. Bu çalıĢmada, sipermetrin'in Van balığı
(Alburnus tarichi) primer hepatosit kültürü üzerine etkilerinin belirlenmesi amaçlamıĢtır.
Van Balığından izole edilen karaciğer hücrelerine sipermetrinin farklı konsantrasyonları
(1×10⁻⁷
, 1×10⁻⁶
ve 1×10⁻⁵
M) 48 saat süresince uygulanmıĢtır. Hücre kültürünün 24 ve 48
saatlerinde Aspartat Aminotransferaz (AST), Alanin Aminotransferaz (ALT) ve Laktat
dehidrogenaz (LDH) seviyelerindeki değiĢim hücre kültür ortamında belirlenmiĢtir. Ayrıca
sipermetrinin total oksidan (TOS) ve antioksidan seviyeleri (TAS), malondialdehit
seviyeleri (MDA) ve DNA hasarı üzerine etkileri belirlenmeye çalıĢılmıĢtır. Deneyler
sonucunda hepatosit sayısının sipermetrin uygulanan gruplarda önemli ölçüde azaldığı
invert ıĢık mikroskobunda belirlendi. Karaciğer hasarında sıklıkla kullanılan AST, ALT ve
LDH seviyeleri sipermetrin dozlarına bağlı olarak artıĢ göstermesine rağmen bu artıĢ
kontrol grubuna göre düĢük veya istatistiksel olarak önemli değildi. MDA seviyeleri,
inkübasyon sonunda doza bağlı olarak artıĢ gösterdi. TAS ve TOS seviyeleri, kontrol grubu
ile karĢılaĢtırıldığında herhangi bir farkın olmadığı gözlendi. DNA hasarının ise doza ve
zamana bağlı olarak artıĢ gösterdiği belirlendi. Sonuç olarak, uygulanan sipermetrinin Van
Balığı primer hepatosit kültürü üzerine yüksek toksik etkilerinin olduğu net bir biçimde
ortaya konulmuĢtur.
Anahtar kelimeler: Alburnus tarichi, Primer hepatosit kültür, Sipermetrin, Van
Balığı

iv

v
ACKNOWLEDGEMENTS
Firstly, I am thankful to the almighty Allah who showed me rays of light to
complete my scientific project successfully.
I want to thank all the people who contributed directly or indirectly to this work.
A special thanks to my thesis adviser Assoc. Prof. Dr. Ahmet Regaib OĞUZ my
supervisor, for his patience in guiding me throughout the duration of the project support,
comments and suggestions that I benefited during my study. The author most gratefully and
sincerely acknowledges other academic staff of the Biology, Van Yüzüncü Yıl University.
Finally, from the bottom of my heart, I would like to give my warmest thanks to my
parents, family members and friends, for their endless love, support and patience
throughout the years. Without their help in every possible way, this work wouldn’t have
been possible. It a pleasure for me to dedicate this thesis to them.
2018
Aso Hemn OMAR

vi

vii
CONTENTS
Page
ABSTRACT .......................................................................................................................... i
ÖZET ................................................................................................................................... iii
ACKNOWLEDGEMENTS.................................................................................................. v
CONTENTS ....................................................................................................................... vii
LIST OF TABLES............................................................................................................... ix
LIST OF FIGURES ............................................................................................................. xi
SYMBOLS AND ABBREVIATIONS ............................................................................. xiii
1. INTRODUCTION ............................................................................................................ 1
2. LITERATURE REVIEW ................................................................................................. 4
2.1. Cypermethrin and Effects on Animals ....................................................................... 4
2.2. The Liver Morphology ............................................................................................... 9
2.3. Hepatotoxicity .......................................................................................................... 11
2.4. In Vitro Liver Models .............................................................................................. 13
2.5. Cultures of Isolated Primary Liver Cells ................................................................. 14
2.6. Hepatocyte Cultures ................................................................................................. 16
3. MATERIALS AND METHODS ................................................................................... 18
3.1. Materials .................................................................................................................. 18
3.1.1. Fish .................................................................................................................. 18
3.1.2. Reagents and chemicals ................................................................................... 18
3.1.3. Devices and materials ...................................................................................... 19
3.2. Methods.................................................................................................................... 20
3.2.1. Hepatocyte isolation ........................................................................................ 20
3.2.2. Cell culture....................................................................................................... 20
3.2.3. Preparation of cell extraction ........................................................................... 21
3.2.4. Determination of enzyme assays ..................................................................... 21
3.2.5. Determination of lactate dehydrogenase (LDH) .............................................. 21
3.2.6. Determination of malondialdehyde (MDA) .................................................... 22

viii
Page
3.2.7. Determination of total antioxidants status (TAS) ............................................ 22
3.2.8. Determination of total oxidant status (TOS) ................................................... 23
3.2.9. Determination of 8-Hydroxydeoxyguanosine (8-OHdG) ................................ 23
3.2.10. Protein assay .................................................................................................. 25
3.3. Statistical Analysis ................................................................................................... 25
4. RESULTS ....................................................................................................................... 26
4.1. Fish…. ...................................................................................................................... 26
4.2. Cell Culture .............................................................................................................. 26
4.3. Aspartate Aminotransferase (AST).......................................................................... 28
4.4. Alanine Aminotransferase (ALT) ............................................................................ 29
4.5. Lactate Dehydrogenase (LDH) ................................................................................ 30
4.6. Malondialdehyde (MDA)......................................................................................... 31
4.7. Total Antioxidant Status (TAS) ............................................................................... 32
4.8. Total Oxidative Status (TOS) .................................................................................. 33
4.9. 8-Hydroxydeoxyguanosine (8-OHdG) .................................................................... 34
4.10. Protein Assay ......................................................................................................... 35
5. DISCUSSION AND CONCLUSION ............................................................................ 38
REFERENCES ................................................................................................................... 40
APPENDIX ....................................................................................................................... 49
APPENDIX 1. GeniĢletilmiĢ Türkçe Özet (Extended Turkish Summary) ..................... 49
CURRICULUM VITAE..................................................................................................... 63

ix
LIST OF TABLES
Table Page
Table 2.1. Advantages and disadvantages of primary hepatocyte culture. ........................... 17
Table 4.1. AST levels in the culture medium. .......................................................................... 28
Table 4.2. ALT levels in the culture medium........................................................................... 29
Table 4.3. LDH levels in the culture medium. ......................................................................... 30
Table 4.4. MDA levels in the culture medium. ........................................................................ 31
Table 4.5. TAS levels in the culture medium. .......................................................................... 32
Table 4.6. TOS levels in the culture medium. .......................................................................... 33
Table 4.7. 8-OHdG levels in the culture medium. ................................................................... 34
Table 4.8. Protein levels in the culture medium....................................................................... 36

x

xi
LIST OF FIGURES
Figure Page
Figure 1.1. Lake Van Basin .......................................................................................................... 1
Figure 2.1. Molecular structure of cypermethrin. ...................................................................... 5
Figure 2.2. Microscopic anatomy of the liver. ........................................................................ 11
Figure 3.1. Van Fish (Alburnus tarichi) .................................................................................... 18
Figure 3.2. Schematic of the 8-Hydroxydeoxyguanosine competitive ELISA .................... 24
Figure 4.1. Hepatocytes culture on poly-L- lysine-coated dish after cell isolation.............. 26
Figure 4.2. Cypermetrin (10-5
M) applied hepatocytes culture on
poly-L- lysine-coated dish after 24 hours of cell isolation. ............................... 27
Figure 4.3. Cypermetrin (10-5
M) applied hepatocytes culture on
poly-L- lysine-coated dish after 48 hours of cell isolation. ............................... 27
Figure 4.4. The effect of cypermethrin on the synthesis of AST in primary
hepatocyte culture. Results are expressed as Mean SEM (n = 5).
Different letters denote significant difference (P < 0.05). ................................. 28
Figure 4.5. The effect of cypermethrin on the synthesis of ALT in primary
hepatocyte culture. Results are expressed as Mean SEM (n = 5).
Different letters denote significant difference (P < 0.05). ................................. 29
Figure 4.6. The effect of cypermethrin on the synthesis of LDH in primary
hepatocyte culture. Results are expressed as Mean SEM (n = 5).
Different letters denote significant difference (P < 0.05). ................................. 30
Figure 4.7. The effect of cypermethrin on the synthesis of MDA in primary
hepatocyte culture. Results are expressed as Mean SEM (n = 5).
Different letters denote significant difference (P < 0.05). ................................. 31
Figure 4.8. The effect of cypermethrin on the synthesis of TAS in primary
hepatocyte culture. Results are expressed as Mean SEM (n = 5).
Different letters denote significant difference (P < 0.05). ................................. 32

xii
Figure Page
Figure 4.9. The effect of cypermethrin on the synthesis of TOS in primary
hepatocyte culture. Results are expressed as Mean SEM (n = 5).
Different letters denote significant difference (P < 0.05). ................................. 33
Figure 4.10. Standard curve of 8-OHdG assay in the hepatocyte culture. ............................ 34
Figure 4.11. The effect of cypermethrin on the synthesis of 8-OHdG in primary
hepatocyte culture. Results are expressed as Mean SEM (n = 5).
Different letters denote significant difference (P < 0.05). ............................... 35
Figure 4.12. Standard curve of protein assay in the hepatocyte culture. ............................... 36
Figure 4.13. Protein concentration in primary hepatocyte culture. Results are
expressed as Mean SEM (n = 5). Different letters denote
significant difference (P < 0.05). ........................................................................ 37

xiii
SYMBOLS AND ABBREVIATIONS
Some symbols and abbreviations used in this study were presented below, Along
with descriptions.
Symbols Description
% Percentage
°C Centigrade degree
h Hour
L Liter
M Molarity
mg Milligram
Min Minute
mL Mililiter
mm Milimoler
UV UltraViolet
μL Microliter
Abbreviations Description
8-OHdG 8-hydroxydeoxyguanosine
BHT Butylated hydroxytoluene
CaCl2 Calcium chloride
EDTA Ethylenediaminetetraacetic acid
KCl Potassium chloride
KH2PO4 Potassium dihydrogen phosphate
L-15 Leibovitz-15
LDH Lactate Dehydrogenase

xiv
MDA Malondialdehyde
NaCl Sodium chloride
NADH Nicotinamide adenine dinucleotide
NaH2CO3 Sodium hydrogen carbonate
NaH2PO4 Sodium dihydrogen phosphate
NaHCO3 Sodium bicarbonate
NaHPO4 Sodium phosphate
PBS Phosphate buffer saline
pH Potential Hydrogen
rpm Round per minute
TAS Total antioxidant status
TBA Thiobarbituric acid
TCA Trichloroacetic acid
TOS Total oxidant status

1. INTRODUCTION
Van Fish (Alburnus taritch) is an endemic carp species on Lake Van, and it is a kind
of Cyprinidae family. Lake Van is the largest lake in Turkey. The third biggest closed lake,
and the largest soda lake of the world that situated in eastern Turkey (Figure 1.1). The
surface area of the lake is 3522 km2, the volume is 576 km
3, and surface height is 1648m
(Reimer et al., 2009). The saltiness of Lake is 2.2%, pH 9.8 and alkalinity 153 mEqxl-1
, just
a few animals are available, and one type of vertebrate species and a few invertebrate
species inhabit the lake. The only vertebrate living in the Lake is Van fish (Danulat and
Kempe, 1992; Oğuz, 2015). It's a food source with high and an important protein content
for local people from ancient times to the present day (Çetinkaya, 1993).
Figure 1.1. Lake Van Basin.

2
The liver is a vital organ and it is necessary for life due to the various functions, it is
classified into two glands, an endocrine and exocrine. Endocrine function is to release IFG
(Insulin like Growth Factors) that is needed for skeletal growth. Exocrine function is
secretion of bile through biliary tract. The synthesis of bile, which is transported by ducts to the
duodenum and in fish to the anterior intestine. One of the functions of the liver is that it acts as a
storage center for many substances, mainly glycogen and to a lesser degree lipids. Furthermore, the
liver plays another vital role in the coupling and chemical decomposition of toxins and the
deamination of amino acids (Takashima and Hibiya, 1995). The liver is composed of the stroma
(connective tissue, trabeculae, and a reticular network) and the parenchyma (hepatocytes, blood
vessels, and bile ducts).
Hepatocytes make up 70-80% of the livers mass and therefore they are the major cells of the
parenchymal tissue of the liver. A typical hepatocyte is a polygonal plate-like shape with a size of 20-
30 μm, they are found stacked on top of each other in layers; this proximity between them facilitates
certain functions performed by hepatocytes, they are in close contact with blood-filled sinusoids and
lie adjacent to canaliculi into which bile is secreted. Hepatocytes in combination with other organs
play a vital role in metabolism. Some of these functions include detoxification of various
metabolites, synthesis of proteins, production of biochemical necessary for digestion, synthesis and
breakdown of small and complex molecules and emulsification of lipids.
Cell culture is a technique which is used to maintain and grow cells in vitro outside
of their original environments. This technique has been used extensively as a model system
for biology, disease and therapeutics. It is applied across the fields of genetics immunology,
cancer, medicine, vaccine production, tissue engineering and innumerable other
applications.
Cypermethrin is one of the synthetic insecticides that has been considered among
the safest pesticides that are available and is used worldwide (Igbedioh, 1991). Pyrethroids
are artificial forms of pyrethrins (insecticides derived from Chrysanthemum plants extracts)
(Soderlund et al., 2002). Synthetic pyrethroids have become an environmentally and
economically significant collection of insecticides (Kapoor et al., 1988). They are also
highly effective against a broad spectrum of insects and have low mammalian toxicity
(Bhunya and Pati, 1988).

3
In general, the chemically induced liver harm can be easily investigated in tissue
culture more than in the whole animals. Cypermethrin is used for the control of a large
several of veterinary and agricultural insects. It is used for crack, crevice and spot treatment
and for the control of insects and pests because of its low toxicity to mammals and
cypermethrin is one of the most popular contaminants in the freshwater aquatic system
(Carriquiriborde et al., 2007).
There is not any scientific research about in vivo and in vitro that effects of
cypermethrin on Alburnus tarichi. Therefore, the aim of this study is to determine the
effects of cypermethrin on primary hepatocyte culture in Van fish (Alburnus tarichi).

2. LITERATURE REVIEW
2.1. Cypermethrin and Effects on Animals
Cypermethrin pesticides are materials that used for protecting and controlling
plagues, including vectors of human or animal illness. They are used to control undesirable
types of plants or animals causing damage through, or otherwise interfering with, the
production, processing, store, or transfer or marketing of food (WHO, 2002).
The term of pesticide includes all chemicals that are used to kill or control pests. In
marine cage culture of Atlantic salmon, Salmo salar (Richards, 1983; Roth et al., 1993;
Hart et al., 1997; Boxaspen and Holm, 2001; Treasurer and Wadsworth, 2004). Fish
sensitivity to pyrethroids may be explained by their relatively slow metabolism and
elimination of these compounds. Fish are the most often tested aquatic organisms because
they are the most conspicuous as predominant and are economically important to man
because they are linked to the food chain.
Cypermethrin is a tacky semi-solid, yellowish brown colored and odorless chemical
with a molecular form: C22H19Cl2NO3 (Figure 2.1). It is a synthetic pyrethroid pesticide
having three chiral centers, giving a racemic mixture of all eight possible chiral isomeric
comprising four disaster isomeric pairs. It is a structure which is based on pyrethrum that
having higher biological action and stability than its naturalist model (WHO, 1989).
Cypermethrin, (RS)-α-cyano-3phenoxy benzyl (IRS)- cis, trans-3-(2, 2-dichlorovinyl)-2, 2-
dimethyl cyclopropane carboxylate, belongs to type II pyrethroid and possess α- cyano
group. Its degradation products are 3-(2, 3-dichlorovinyl)-2, 2-dimethyl cyclopropane
carboxylic acid (cis + trans isomer) and 3-phenoxy benzoic acid. It is photostable and
possesses high insecticidal activity.

5
Figure 2.1. Molecular structure of cypermethrin.
Cypermethrin enters into the environment through its application as an agricultural
pesticide, during its industry, transmit and storage spinal tract and may also be absorbed by
inhalation of spray mist and only simply through the intact skin. Due to its lipophilic
nature, cypermethrin has been found to collect in body fat, skin, liver, kidneys, adrenal
glands, ovaries and brain (Tao et al., 2008).
Pyrethroids are shown to produce toxic effects on biochemical and hematology of
various aquatic animals (Saxena and Seth, 2002; Saxena and Gupta, 2003). Cypermethrin is
very toxic to fish and bees, humans are indirectly affected as humans consume fish in their
food and also honey which is made by the bees. Thus humans can be exposed to
cypermethrin toxicity directly through spraying and contact methods or indirectly through
consumption the pesticide contaminated products such as fish and honey (Meister, 1992).
Cypermethrin is a broad-spectrum insecticide. In addition to kill the insects that are
the target of a particular treatment, it can also reduce populations of insects and other
arthropods that are economically desirable because they prey on unwanted insects or are
useful pollinators.
Pyrethroids can be classified into two large groups. The kind I pyrethroids do not
contain a cyano group in their molecules and include allethrin, tetramethrin, permethrin,
and phenothrin. Kind II pyrethroids contain a cyano group at the carbon position and
include modern compounds, such as deltamethrin, cyphenothrin, cypermethrin, and
fenvalerate (Norman, 1992).
6
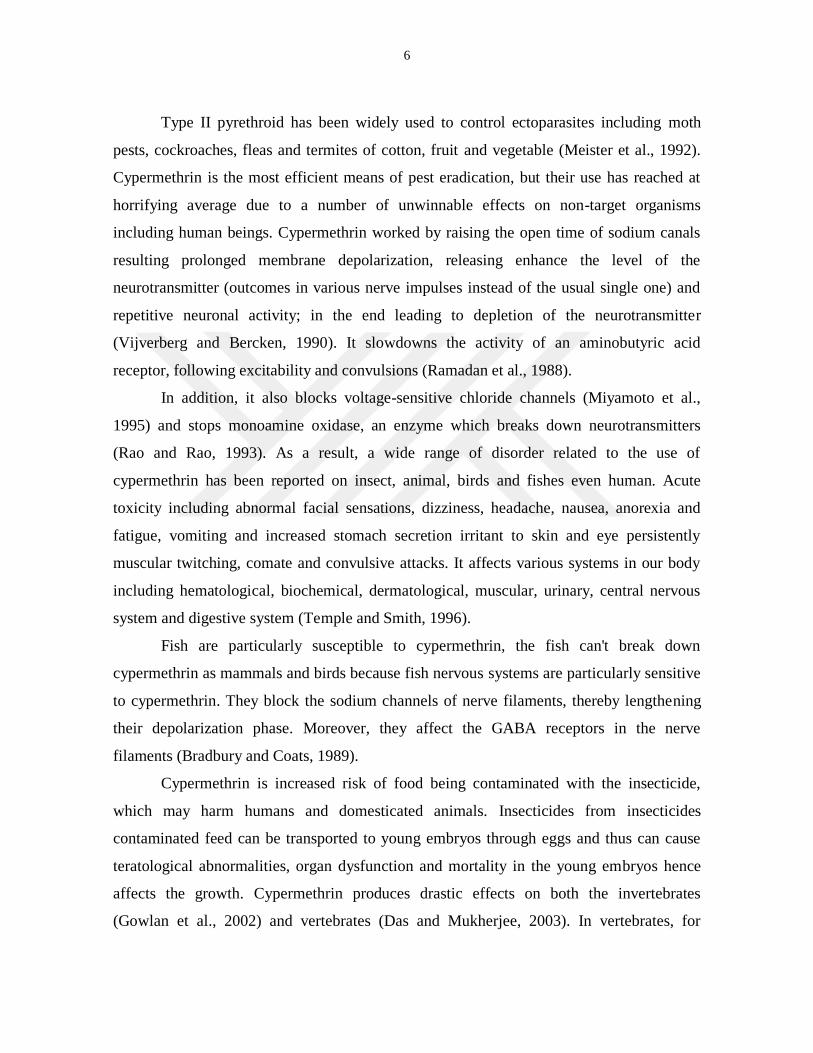
Type II pyrethroid has been widely used to control ectoparasites including moth
pests, cockroaches, fleas and termites of cotton, fruit and vegetable (Meister et al., 1992).
Cypermethrin is the most efficient means of pest eradication, but their use has reached at
horrifying average due to a number of unwinnable effects on non-target organisms
including human beings. Cypermethrin worked by raising the open time of sodium canals
resulting prolonged membrane depolarization, releasing enhance the level of the
neurotransmitter (outcomes in various nerve impulses instead of the usual single one) and
repetitive neuronal activity; in the end leading to depletion of the neurotransmitter
(Vijverberg and Bercken, 1990). It slowdowns the activity of an aminobutyric acid
receptor, following excitability and convulsions (Ramadan et al., 1988).
In addition, it also blocks voltage-sensitive chloride channels (Miyamoto et al.,
1995) and stops monoamine oxidase, an enzyme which breaks down neurotransmitters
(Rao and Rao, 1993). As a result, a wide range of disorder related to the use of
cypermethrin has been reported on insect, animal, birds and fishes even human. Acute
toxicity including abnormal facial sensations, dizziness, headache, nausea, anorexia and
fatigue, vomiting and increased stomach secretion irritant to skin and eye persistently
muscular twitching, comate and convulsive attacks. It affects various systems in our body
including hematological, biochemical, dermatological, muscular, urinary, central nervous
system and digestive system (Temple and Smith, 1996).
Fish are particularly susceptible to cypermethrin, the fish can't break down
cypermethrin as mammals and birds because fish nervous systems are particularly sensitive
to cypermethrin. They block the sodium channels of nerve filaments, thereby lengthening
their depolarization phase. Moreover, they affect the GABA receptors in the nerve
filaments (Bradbury and Coats, 1989).
Cypermethrin is increased risk of food being contaminated with the insecticide,
which may harm humans and domesticated animals. Insecticides from insecticides
contaminated feed can be transported to young embryos through eggs and thus can cause
teratological abnormalities, organ dysfunction and mortality in the young embryos hence
affects the growth. Cypermethrin produces drastic effects on both the invertebrates
(Gowlan et al., 2002) and vertebrates (Das and Mukherjee, 2003). In vertebrates, for

7
example in amphibians, it induces apoptosis in the telencephalon of Physalaemus
biligonigerus tadpoles (Anura, Leptodactylidae) (Izaguirre et al., 2000). In fish,
cypermethrin inhibits trypsin, lipase and carboxypeptidase A activity in Carp (Cyprinus
carpio) and causes a slight increase in alpha-chymotrypsin activity (Simon et al., 1999).
Cypermethrin is known to cause decrease in glycogen, pyruvate and lactate dehydrogenase
and phosphorylase B activity and increase in lactate level, phosphorylase A and aldolase
activities (Reddy and Yellamma, 1991). Sheela and Muniandi (1992) noticed decreases in
protein, RNA and glycogen in muscle and liver of fish following cypermethrin treatment.
Das and Mukherjee (2003) observed cypermethrin induced changes in DNA, RNA, LDH
and ATPase of muscle, liver, brain and kidney of Indian major carp, Labeo rohita. Sheela
(2000) observed that young rats are more sensitive to the toxic effects of cypermethrin than
old rats because of their less developed metabolic capacity. Cypermethrin is known to
affect the blood and immune system, e.g. Santoni et al. (1997) noted the cypermethrin
induced increases in peripheral natural killer cell and antibody dependent cytotoxic activity
in rats and Institoris et al. (1999) found that cypermethrin decreases delayed type
hypersensitivity reaction, increases the number of numerical chromosome aberrations of the
bone marrow cells, decreases mean cell volume of the RBCs and hematocrit value and
reduces the white blood cell count in the peripheral blood of male Wistar rats. Recently,
Haratym-Maj (2002) observed an increase in the number of leukocytes in peripheral blood
and inhibition and mobilization of hemopoietic system in female mice following
cypermethrin administration. Toxicity of cypermethrin has also been evaluated in muscular
and nervous system of fish and mammals. Tonini et al., (1989) observed that cypermethrin
affects the electrically evoked contractions in the muscles of guinea pig. Cypermethrin
effects of Neurotoxic it has been studied in rats by Eells et al., (1992) who observed the
release of acetylcholinesterase from rat brain synaptosomes with cypermethrin and its
effects on the voltage sensitive sodium channel. Later on, these authors noted the
cypermethrin induced depolarizing responses in rat and trout synaptosomes (Eells et al.,
1993). Although a lot of work has been done on the toxicity of cypermethrin on fish and
mammals, but a little work has been carried out on chicks (Kapoor et al., 1988).

8
Pyrethroid insecticides have been used for more than 40 years and account for 25%
of the worldwide insecticide market (Shafer et al., 2005). Toxicity of pyrethroids to fish has
been shown to be 1000 fold greater than to mammals and birds at comparable
concentrations (Bradbury and Coats, 1989). The sensitivity of fish to aqueous pyrethroid
exposure is due partly to a high rate of gill absorption and rather slow hydrolytic
detoxification, but principally to the hypersensitivity of the piscine nervous system to these
pesticides (Aydin et al., 2005; Viran et al., 2003). The primary target sites for pyrethroids
are the voltage gated sodium channels (VGSCs) (Casida et al., 1983). Pyrethroids exert
neurotoxicity by binding to and delaying the inactivation of the sodium channels, resulting
in convulsions, prostration and ultimately death (Werner and Moran, 2008).
Pesticides are among the major contributor of aquatic pollution. According to Latif
et al. (2013), there are more than 200 types of organic pesticides, being used in thousands
of different products. These pesticides contain a number of heavy metals such as iron,
chromium, cadmium, nickel, copper, lead, zinc and manganese etc. These elements
ultimately reach the water bodies, and adversely affect the growth, reproduction,
physiology and even survival of the nontarget aquatic organisms including fish (Hayat et
al., 2007). Liver, gills and brain are the most important organs of all vertebrates, as these
controls and maintain the most important life activities such as metabolism, detoxification,
excretion and respiration etc. The chemical pollutants including heavy metals and
pesticides adversely affected the morphology and functions of these organs and disturb the
normal physiology of all animals (Atamanalp et al., 2008).
Toxic chemicals such as pesticides have been found in soil, air, water and even in
animal and human tissues. These pesticides render injurious effects and even mortalities.
Annually about 3 million cases of pesticide toxicity and 220,000 casualties all over the
world have been reported (Naz et al., 2010). Pyrethroid insecticides were used preferably
over organochlorines, organophosphates and carbamates due to their high effectiveness
against a wide range of insects, low toxicity to non-target organisms (mammals) and easy
biodegradability. Recently, the toxicity of pyrethroid insecticides to mammals received
much attention because animals exposed to these insecticides showed changes in their

9
physiological activities, reproductive performance in addition to change in the enzymes
activities, biochemical and hematological parameters (Yousef et al., 2003: Yousef, 2010).
Water pollution is any chemical, physical or biological changes in the quality of
water that has a harmful effect on any living thing that drinks, uses or lives in (Lenntech,
1998). However, there is overwhelming evidence that agricultural use of pesticides has a
major impact on water quality and leads to serious environmental consequences.
Appreciation of fisheries and aquatic systems has been accompanied by increasing concern
about the effects of growing human populations and human activities on aquatic life and
water quality. Pesticides are one group of toxic compounds linked to human use that have a
profound effect on aquatic life and water quality (Virginia, 2009). Fish and other aquatic
biota may be harmed by pesticides contaminated water. Pesticides surface runoffs into the
rivers and streams can be highly lethal to aquatic life, sometimes killing all the fish in a
particular stream (Toughill, 1999).
2.2. The Liver Morphology
The liver is the largest and most complex gland of the body. It is the main
detoxifying organ in mammals, with large amounts of phase 1 and phase 2 metabolic
enzymes and it is responsible for large parts of lipid and cholesterol metabolism, the
production of hormones, phagocytosis of debris and bacteria as well as participating in iron
metabolism. Additionally, it has an important role in many vital functions of the body, like
the production of bile, the processing and storage of nutrients and Vitamin A and the
synthesis of blood proteins including albumin, lipoproteins, transferrin, growth factors and
coagulation factors (LaBrecque, 1994; Kevresan et al., 2007).
In vertebrates, the liver is divided into four lobes, with each containing thousands of
equally built lobules, and is served by two distinct blood supplies. The blood flows out of
the liver via the hepatic vein in the direction of the inferior vena cava. Thereby, xenobiotics
absorbed by ingestion have to pass the hepatocytes, the predominant cell type in liver, and
can be taken up, metabolized and/or detoxified. The metabolites are excreted partly,
depending on their chemical properties, into the bile canaliculi or via the venous blood into

10
the urine. Hepatocytes, the liver parenchymal cells, account for about 70-80% of liver mass
and 65% of cell number of a normal liver, Non-parenchymal cells like Kupffer cells (15%),
endothelial cells, hepatic stellate cells or pit cells make up the remaining mass (Widmann et
al., 1972; Blouin et al., 1977).
In a hexagonal shaped liver lobule, the central vein is surrounded by 4-6 portal areas
(Matsumoto and Kawakami, 1982) and hepatocytes are arranged in cords radiating from the
central vein (Figure 2.2). Hepatic endothelial cells from the walls of the sinusoidal, the
capillaries between the cords of hepatocytes. Unlike other endothelial cells, they lack a
basement membrane and the endothelial structures possess pores called fenestrae, allowing
the blood to flow directly around the hepatocytes. They express several adhesion molecules
facilitating inflammatory cell migration, usually a response to activation by Kupffer cell
signaling following liver damage (Scoazec and Feldmann, 1994; Ohira et al., 2003). The
Kupffer cells, resident macrophages in the liver, represent the second largest cell population
of the liver. They are located in the hepatic sinusoids, in between or on top of endothelial
cells, but they also make contact to the hepatocytes through their extensions. They exhibit
several important functions, such as endocytosis of foreign material and bacteria, antigen
presentation and secretion of biologically active products (e.g. nitric oxide and cytokines)
and play an important role in immune and inflammatory responses involving cytokine-
signaling (Winwood and Arthur, 1993). Stellate cells are the fat storing cells of the liver
where they reside in the space of Disse between hepatocytes and endothelial cells. They
store Vitamin A in lipid droplets, synthesize extracellular matrix proteins and it has been
suggested that they contribute to liver fibrosis and immune response (Ogata et al., 1991;
Friedman, 1997).

11
Figure 2.2. Microscopic anatomy of the liver.
2.3. Hepatotoxicity
Hepatotoxicity is a major issue in pharmaceutical drug development (Ballet, 1997).
Drug-induced liver injury is the major reason for attrition in clinical studies (Wysowski and
Swartz, 2005) and hepatotoxic side effects are the main reason for drug withdrawals from
the market (31%). A broad variety of liver pathophysiologies have been reported, including
steatosis (fatty liver), cholestasis (obstruction of bile secretion), fibrosis (increased
production and deposition of extracellular matrix components), hepatitis (inflammation),
necrosis (cell death) or the formation of liver tumors. These pathological findings may arise
from diseases affecting the liver, but also from xenobiotics, alcohol abuse or undesired

12
drug-drug interactions. The pathological symptoms of certain liver diseases allow
conclusions about the affected intracellular organelles. Although different histological
changes can appear, a compound class often displays a typical clinical or pathological
appearance. Xenobiotics administered orally first pass through the liver before entering the
general blood circulation. Because the liver has multiple functions for the homeostasis of
the whole body, drug-induced liver toxicity can have severe consequences. Thirty to fifty
percent of acute liver failures and fifteen percent of liver transplantations are related to
chemical induced hepatotoxicity (Kaplowitz, 2001; Lewis, 2002; Andrade et al.,
2004).There is often a lack of reasonable understanding of the general molecular
mechanisms of most drug-induced hepatoxicities (Jaeschke et al., 2002; Boelsterli, 2003;
Lee, 2003). The inhibition of mitochondrial function, disruption of intracellular calcium
homeostasis, activation of apoptosis, oxidative stress, inhibition of specific enzymes or
transporters and the formation of reactive metabolites that cause direct toxicity or
immunogenic responses are some mechanisms that have to be considered.
The drug development process comprises a variety of steps to assess whether a test
compound has adequate efficacy, appropriate physicochemical properties, metabolic
stability, safety and bioreactivity in humans. Hepatotoxicity in humans has a poor
correlation with regulatory animal toxicity tests (Olson et al., 1998; Olson et al., 2000).
However, if assays identified a compound as a human liver-toxicant, there is more than
80% correlation to the corresponding findings in animals (Xu et al., 2004). While in vivo
models, limited by animal welfare/ethical concerns, are used to investigate systemic
influences, cell culture models provide systems that can investigate specific mechanisms in
a precisely controlled environment (Ulrich et al., 2003). Although there are ways to
analyses the many toxicological parameters individually in vitro, most have low predictive
value for the detection of human hepatotoxicity. The poor predictivity and sensitivity of
standard in vitro cytotoxicity assays is due to several reasons, including strong inter-species
variation, the lack of a true physiological environment of in vitro experiments or the
insufficient culturing conditions, resulting in a loss of metabolic capabilities (Olson et al.,
1998). The in vitro assays usually measure lethal events in late stages of toxicity, but
toxicity may not always be lethal. Cytotoxicity may take several days to appear (Olson et

13
al., 1998; Slaughter et al., 2002; Schoonen et al., 2005), demanding repeated drug
administration. In contrast to directly active compounds (primary toxins), some compounds
elicit their toxic potential only as a metabolite (secondary toxins) and usually cause damage
in the organ where they are produced. It raises the need for metabolically active long-term
in vitro models that facilitate extended exposure times. Several models have been used for
the detection of acute toxicity, but sub-chronic and chronic toxicities have not been
addressed so far. Furthermore, standard tests generally investigate only one parameter
whereas hepatotoxicity can develop via many different mechanisms and is considered a
multifactorial process. In order to improve sensitivity it will be necessary to analyze several
morphological, biochemical and functional endpoints in parallel. Finally, tests should be
performed not only with high concentrations, causing acute toxicity, but also with in vivo
pharmacological concentrations.
2.4. In Vitro Liver Models
In vitro tests have the advantage of allowing multiple testing of different
compounds, doses and/ or time points simultaneously under well-defined conditions. The
simplicity of some in vitro systems, besides saving time, money and animals used for
experimentation, provides the ability to specifically manipulate and analyze a small number
of well-defined parameters. The most commonly used test systems include, the isolated
perfused liver, liver slices, primary hepatocytes in suspension or culture, cell lines,
transgenic cells and sub-cellular fractions such as microsomes, supersomes or cytosol. The
reduction in the complexity of the system and the increase in throughput offer the ability to
study specific parameters more closely but create inherent constraints for each model.
However, this limits their widespread use and acceptance by the regulatory authorities as an
alternative for in vivo testing (Brandon et al., 2003). Although studies have shown that in
vitro cytotoxicity data can be used to identify appropriate doses for in vivo studies (Scholz
et al., 1999).
14
2.5. Cultures of Isolated Primary Liver Cells
Freshly isolated hepatocytes are often used for toxicological research. Although
these are mostly mono-factorial systems which do not take into account the interactions
between cell types or even whole organs in the body, cultures of primary rat and human
hepatocytes are used in a variety of pharmacological and toxicological experiments, for
example the evaluation of hepatic drug uptake and metabolism, drug interactions and
hepatotoxicity (Cross and Bayliss, 2000; Brandon et al., 2003; Gebhardt et al., 2003).
Fresh liver cells can be obtained by different procedures, all of which involve
perfusion of the liver with Ca+2
-free buffers combined with enzymes/proteases which
disintegrate the extracellular matrix, leading to the separation of the cells from each other
(Howard et al., 1967; Seglen, 1976). The isolation of liver cells is routinely performed for
many species used in toxicity testing, but also with tissue from partial liver resections and
non-transplantable whole livers from human donors (Richert et al., 2004; LeCluyse et al.,
2005). In suspension, the survival of cells is short-lived, normally not longer than 6 hours.
Although the system is relatively high throughput, easy to use and preserves most of the
metabolizing enzymes at in vivo levels for a short time, it is only usable for acute
toxicology or metabolism studies because the loss of contact to surrounding cells and the
(ECM) environment has severe influence on the defined cell polarization and shape
(Gebhardt et al., 2003).
The survival time in culture can be increased if hepatocytes are cultured on adhesive
surfaces, for example, tissue culture dishes coated with extracellular matrix (ECM)
components. During the perfusion procedure the cells are already primed for proliferation
and can easily be forced to proliferate by the addition of mitogenic compounds, for
example epidermal growth factor (EGF), allowing longer culturing (Etienne et al., 1988).
However, this causes a down-regulation of metabolic enzymes and thereby induces
dedifferentiation associated with a loss of many liver-specific functions and defined cell
polarity (Skett and Bayliss, 1996; Luttringer et al., 2002; Paine and Andreakos, 2004).
Additionally, it is known that the typical phenotypic change of hepatocytes in monolayer
culture, the spreading of the cells, has a negative effect on liver-specific gene expression

15
(Miranti, 2002). Intracellular signaling is closely connected to the interaction between
extracellular matrix (ECM), cell-adhesion molecules and the cytoskeleton and therefore has
a major impact on gene expression and the metabolic capacity of the cells. Altogether, this
processes lead to a loss of up to 80-90% of phase 1 and about 50% of phase 2 metabolic
activity during the first 24 hours in culture (Rodriguez-Antona et al., 2002; Wilkening, et
al., 2003). Culturing hepatocytes in a sandwich configuration, embedded between two
layers of gelled ECM proteins (e.g., collagen I or Matrigel), has prolonged the time in
culture displaying hepatocyte-specific functions dramatically (Dunn et al., 1991; Dunn et
al., 1989; Richert et al., 2002; LeCluyse et al., 2000). Cells adapted and maintained their
physiologically occurring polygonal shape and bile canalicular-like structures could be
observed for up to 14 days in culture (Tuschl and Müller, 2006). The development of long-
term primary hepatocyte cultures is an essential step towards the study of chronic effects in
vitro. Another factor greatly influencing the morphological development and cell survival
of hepatocytes in culture is the medium formulation and the addition/omission of serum,
specified hormone mixtures or other supplements (Sidhu et al., 2004; Pascussi et al., 2000;
Turncliff et al., 2004). Among the most frequently used basal media, Dulbecco's modified
Eagle medium (DMEM), modified Chee's medium (MCM) and Williams' medium E
(WME), the DMEM/F12 mix seems most appropriate to maintain liver-specific functions
and to help rebuild bile canaliculi (Turncliff et al., 2006). In culture, the addition of the
glucocorticoid dexamethasone (DEX), at nanomolar concentrations, is essential for the
long-term preservation of hepatocyte-specific functions like polygonal hepatocyte
morphology, structural integrity of cytoplasmic membranes, bile canaliculi-like structures
and by maintaining the expression of liver specific transcription factors. Insulin enhances
the glucose uptake of cells and contributes to maintaining liver specific gene expression.
Selenium, a structural component of the enzyme glutathione peroxidase, which plays an
essential role in the neutralization of metabolically generated peroxides, has also been
shown to be beneficial when added to the medium (Yamada et al., 1980; Müller and
Pallauf, 2003). Since it is well known that serum enhances the surface attachment ability of
hepatocytes (Williams et al., 1977), cells are generally seeded in medium containing fetal
calf serum, regardless of the subsequent culture conditions.

16
2.6. Hepatocyte Cultures
Hepatocytes are the main parts of the liver. However, liver toxicity may not always
originate from these cells. Therefore, co-cultures of hepatocytes with other non-
parenchymal liver cells, such as endothelial, Kupffer, or stellate cells and also stable cell
lines or fibroblasts can be applied to reflect a more physiological situation. For example,
the excretion of TNFα or nitric oxide by Kupffer cells can lead to inflammatory reactions or
apoptosis (El-Bahay et al., 1999; Kmieć, 2001). Spheroids (spherical multicellular
aggregates) will form if a crude liver cell suspension is prevented from adherence to the
surface by continuous shaking. Cell-cell contacts are re-established, hepatocytes are located
in the inside, non-parenchymal cells on the outside and the deposition of ECM is seen
throughout the spheroids. Alginate or other materials can be added to make up the internal
structure of the spheres. Several studies showed the positive effect of this culture method
on the expression of hepatotypic genes and the maintenance of metabolic capacity (Landry
et al., 1985; Guigoz et al., 1987). The maintenance of prolonged functional activity has
been related to the restoration and stability of cell polarity and close cell-to-cell contacts
(Lu et al., 2005). However, the formation of these spheroids leads to hypoxic and necrotic
cells dying at their center. Additional problems arise from the accumulation of bile in the
center of spheroids. Another skillful attempt to mimic a liver-like environment in vitro is
the bioartificial liver system (3D-bioreactors). Their major advantage is the re-
establishment of the 3D liver cytoarchitecture with cell-cell contacts and a three-
dimensional ECM environment, combined with continuous medium perfusion, providing a
constant supply of oxygen and nutrients. Today a variety of culture systems are being used
for bioreactor setups (Powers et al., 2002). Different studies have shown an improvement in
some hepatocyte-specific functions in co-culture with other cell types, in spheroids and in
3D-bioreactors (Sivaraman et al., 2005). They co-cultured primary hepatocytes and
microvascular endothelial cells by seeding them into a decellularized porcine jejunal
segment with preserved vascular structures. The supply with nutrients was accomplished by
perfusion of the blood vessels with culture medium. Biochemical testing showed metabolic
and morphological stability for up to three weeks. However, the preparation of these

17
cultures is quite elaborate, therefore their use as a high throughput tool for toxicological
screening tests is unlikely.
Table 2.1. Advantages and disadvantages of primary hepatocyte culture.
Advantages Disadvantages
Primary
Hepatocyte
Culture
- Reasonably high throughput.
- Viability and differentiation
preserved for up to 2 weeks.
- Potential for use of long-term
cultures in chronic toxicity.
- Analysis of human samples
possible.
- Functional drug metabolizing
enzymes, transporters and bile
canaliculi.
- Co-culture with other liver cells
possible.
- Culture may need special
supplements in media.
- Survival, differentiation status
and function depends on
culture conditions.
- No culture system is able to
preserve all the different liver
specific functions in vitro.
- Difficult to regain cells for
fluorescence-activated cell
sorting (FACS) analysis.

3. MATERIALS AND METHODS
3.1. Materials
3.1.1. Fish
Fish were caught by using the cover net in the freshwater through the Lake Van.
They were feed with commercial trout feed and maintain in a light/dark cycle of 12:12 hrs.
At 24ºC static condition with filter tap water (Figure 3.1).
Figure 3.1. Van Fish (Alburnus tarichi).
3.1.2. Reagents and chemicals
Cypermethrin that molecular weight is 416.3 g/mol, a density is 1.14 g/ml, and a
purity is 91%. Leibovitz-15 (L-15) medium (1 X) with L-glutamine, liquid, sterile-filtered
was from Sigma. Total antioxidants status (TAS) kit and Total oxidant status (TOS) kit
purchase from Rel assay diagnostics (Turkey). 8-Hydroxydeoxyguanosine (8-OHdG) kit
purchase from Bioassay technology laboratory (China). All other Labware was purchased
from Sigma-Aldrich (Germany).

19
3.1.3. Devices and materials
- Adjustable Automotive Pipettes (Thermo Scientific, Germany)
- Aspirator (Biosan, Lativa)
- Automated Pipette Tip
- Beaker (Germany)
- Cell Culture Plates (Greiner, Malaysia)
- Cobas 6000 (Japan)
- Cooled Centrifuge (Unive, Germany)
- Erlenmeyer Flask (Germany)
- Glass Pipette (Italy)
- Hot Plate Stirrers (Korea)
- Incubator (BINDER, UK)
- Lab Bottle (Germany)
- Laboratory Hood (ESCO, UK)
- Microscope (DM 6000 Leica Microsystems, Wetzlar, Germany)
- Oven (SANYO, Germany)
- Overhead Stirrers (inoLab, Germany)
- pH-meter (inoLab, Germany)
- Refrigerator (-80ºC) (Thermo Scientific, Germany)
- Sensitive balance (precise, USA)
- Shaker (biosan, Lativa)
- Spectrophotometer (SHIMADZU UV-1800, Japan)
- Spectrophotometer cuvette (Sigma-Aldrich, Germany)
- Stopwatch
- Thermostated Water Bath
- Vortex (SciLOGEX, USA)

20
3.2. Methods
3.2.1. Hepatocyte isolation
After the fish were anesthetized with amino benzonate methanesulfonate (MS 222,
100 mg/L), they were sterilized by immersion in 70% ethanol. Later, the fish were
dissected in laminar flow under sterile conditions, were open the abdomen of the fish
(Alburnus tarichi), then the liver carefully excised and put into a watch glass, the fat tissue
on the liver was removed. Then, the liver tissue was divided by using sterile stainless-steel
and forceps into small pieces and kept in sterile buffer (Hepatocyte Buffer: 0.145 M NaCl,
5.4 mM KCl, 5 mM EDTA, 1.1 mM KH2PO4, 12 mM NaH2CO3, 3 mM NaHPO4 and pH
7.5) at room temperature. This process was repeated several times in 30 minutes. Then, the
tissue was transferred into hepatocyte buffer containing 2.5 mM CaCl2 without EDTA. So
the tissue cleaned from the blood was incubated in L-15 containing collagenase (0.5
mg/mL) for 30 minutes. After the incubation, the cells were mechanically dissociated by
triturating with pipette tips. The cells that were obtained at the end of this process were
centrifuged a few times in 90 Xg for 5 minutes until the supernatant in the suspension got
clear, the L-15 was put instead of the supernatant. The cell pellet was suspended by
mechanical agitation. Antibiotic-antimycotic solution 10 ml/L and 5 mM NaHCO3 were
added to the medium to prevent contamination and pH optimization. Isolate cells were
stained with trypan blue (4%) and live and dead cell counts were performed by using
Thomas slide. The rate of the live cells in the culture was remarked to be over 90%. The
erythrocytes were observed in culture after the process of isolation. However, the number
of erythrocytes have never exceeded 10%.
3.2.2. Cell culture
Cypermethrin was prepared, the stock solution was used to prepare different
concentrations (1×10⁻⁵, 1×10
-6 and 1×10
-7 M). Then we began the culture, isolate
hepatocytes were seeded in 24-cell culture plates that were previously coated with poly-L-

21
Lysine (P4526, Sigma) one hour later washed by distillate water. Cypermethrin in different
concentrations was dissolved in L-15. In each concentration, the culture was introduced.
Totally, 1 mL medium was added to each well and then the cultures were incubated at 24ºC
in the humid atmosphere. Morphological changes and all the changes were investigated by
the inverted microscope (Leica DM 6000), the effect of toxicity on the culture was recorded
in each concentration at an interval of 24 up to 48 hours and photographs were taken. The
culture medium and extracted cell were collected from plates and kept in deep freeze at -
80ºC.
3.2.3. Preparation of cell extraction
Hepatocytes were exposesd to different concentration of cypermethrin (1×10⁻⁵
,
1×10⁻⁶
and 1×10⁻⁷
M) for 48 hours. After 24 and 48 hours cells were trypsined and
centrifuged for 2000 g for 5 min. cell pellet was washed with PBS. Cell were homogenase
and cell pellet were centrifuged and supernatant were collected.
3.2.4. Determination of enzyme assays
Aspartate Aminotransferase (AST) activity was measured by (Cobas 6000, Japan).
That conversion of aspartic acid and ketoglutamic acid to glutamic and oxaloacetic acids.
Alanine Aminotransferase (ALT) activity was measured by conversion of alanine and
ketoglutamic acid to glutamic and pyruvic acids. The enzyme processes were coupled with
nicotinamide adenine dinucleotide by converting the reduced form (NADH) to the oxidized
form (NAD).
3.2.5. Determination of lactate dehydrogenase (LDH)
Firstly, washed each well twice, each time with 2 ml PBS. Then added 10 μl of 10%
Triton X-100 in 1 ml potassium phosphate buffer to each well to lyse hepatocytes. After
that scrape cells and transferred to a 1 ml microcentrifuge tube. Then incubated on ice for

22
30 minutes. Then added 50 μl of cell lysate to 2.85 ml of reaction buffer (0.1 M phosphate
buffer, pH 7.4 and 5 mM NADH). Then initiate the reaction by adding 100 μl of 20 mM
sodium pyruvate solution, and activity was measured by (Cobas 6000, Japan).
3.2.6. Determination of malondialdehyde (MDA)
After the cell was incubated, 200 µl from the sample was taken and put into 1 tube.
800 µl phosphate buffer, 25 µl BHT solution, and 500 µl of 30% TCA were added. The
tubes were stirred with vortex and kept on the refrigerator (-80ºC) for 30 minutes. Then
centrifuged at 2000 rpm for 15 minutes. 1ml from the supernatant was taken and transferred
to other tubes. Then 75 µl of EDTA and 250 µl of TBA were added. Tubes were mixed in
the vortex and kept in a boiling water bath (90oC) for 15 minutes. Later, they were brought
to room temperature and their absorbance was read by spectrophotometer at 532 nm.
3.2.7. Determination of total antioxidants status (TAS)
Total Antioxidant Status (TAS) was determined with assay kits by Rel assay
diagnostics.
Placed 500 µl reagent 1 in cell and added 30 µl standard (or sample). Read the initial
absorbance at 660 nm for the first absorbance point.
Added 75 µl reagent 2 to the cell and incubated 10 min at room temperature or 5
minutes at 37 oC. Read the absorbance a second time at 660nm.
Calculating the results
Δ Absorbance Standard1= (Second Absorbance of Std1- First Absorbance of Std1)
Δ Absorbance Standard2 = (Second Absorbance of Std2- First Absorbance of Std2)
Δ Sample Absorbance = (Second Absorbance of Sample- First Absorbance of Sample)

23
3.2.8. Determination of total oxidant status (TOS)
Total Oxidant Status (TOS) was determined with assay kit by Rel assay diagnostics.
Prepare working standard solution, is diluted 40,000 times with deionized water. A liquid
of 50 ml is added to 10 ml deionized water and vortexed (The first step dilution). A liquid
of 50 ml of the prepared solution is added to 10 ml deionized water and vortexed.
Placed 500 µl reagent 1 in cell and added 75 µl the prepared standard (or sample). Read
the initial absorbance at 530 nm for the first absorbance point.
Added 25 µl reagent 2 to the cell and incubated 10 min at room temperature or 5 min at
37oC. Read the absorbance a second time at 530 nm.
Calculating the results
Result =
Δ Sample Absorbance = (Second Absorbance of Sample - First Absorbance of Sample)
Δ Absorbance Standard 2 = (Second Absorbance of Std 2 - First Absorbance of Std 2)
Standart 2 Value = 10 μmol H2O2 Equiv. /L
3.2.9. Determination of 8-Hydroxydeoxyguanosine (8-OHdG)
All reagents, standard solutions and samples were prepared as instructed (Figure
3.2). All reagents were allowed to become similar with room temperature before use. The
assay was performed at room temperature. Number of strips required for the assay was
determined. Strips in the frames were inserted for use. The unused strips were stored at 2-
8°C. 50 μl standard was added to standard well. 40 μl sample was added to sample wells
and then 10 μl anti-8-OHdG antibody was added to sample wells, then 50 μl streptavidin-
HRP was added to sample wells and standard wells(Not blank control well). After
appropriate mixing plates were covered with a sealer. After 60 minutes of incubation at

24
37°C the sealer was removed and plate was washed 5 times with wash buffer. Wells were
soaked with at least 0.35 ml wash buffer for 30 seconds to 1 minute for each wash. For
automated washing, all wells were aspirated and washed 5 times with wash buffer,
overfilling wells with wash buffer. The plate was blotted onto paper towels or other
absorbent material. 50 μl substrate solution A was added to each well and then 50 μl
substrate solution B was added to each well. Plate covered with a new sealer was incubated
for 10 minutes at 37°C in the dark. 50 μl stop solution was added to each well, and
observing color change from blue to yellow immediately. The optical density (OD value) of
each well was determined immediately using a microplate reader set to 450 nm within 30
min after adding the stop solution.
Figure 3.2. Schematic of the 8-Hydroxydeoxyguanosine competitive ELISA.

25
3.2.10. Protein assay
Total protein content was determined by Bradford protein assay (Bradford, 1976).
At first prepared Bradford reagent. Used 200 mg of Coomassie Blue G250 dye and
dissolved it in 50 ml of 95% ethanol. Then mixed this solution with 100 ml of concentrated
(85%) phosphoric acid. After that made the final volume of the solution to 1 liter by adding
distilled water. Later filtered the reagent through Whatman filter paper. After that transfer
the filtrate in an amber colored bottle and stored at room temperature. Then prepared
Protein standard by using 5 mg ovalbumin. Then dissolved it in 5 ml distilled water; this
gave a protein stock solution of 1 mg/ml concentration. Later, stored the protein standard at
-20°C. After that pipetted out (10 μl, 20 μl, 30 μl, 40 μl, 50 μl, 60 μl, 70 μl, 80 μl, 90 μl and
100 μl) ovalbumin standard in the glass tubes labeled 1–10. Then added distilled water to
make the final volume 100 μl in each of the tubes. Then took 100 μl of each of the
unknown protein dilutions in the tubes. After that added 5 ml of Bradford reagent in each of
the tubes and mixed well by inversion or gentle vortex mixing. At last the absorbance was
read at 595 nm.
3.3. Statistical Analysis
All values obtained at the end of analysis of samples were expressed as mean ±
standard error of mean. The difference between control and cypermethrin groups were
analyzed by one-way analysis of variance (ANOVA) followed by Duncan’s test. The
differences between the groups were considered significant at P < 0.05.

4. RESULTS
4.1. Fish
Van fish were used to cell isolation, the total weight and the total length of them
were about 76-120 g and 18-20 cm. All expremental procedures performed on fish was
carried out in a ccordance with animal study protocols approved by the Animal Researchers
Local Ethics committee of Van Yüzüncü Yıl University. Turkey (2017/11).
4.2. Cell Culture
During experimental period cell culture was checked by inverted microscope.
Isolated cells were attached with the poly-L-Lysine coat cell plate (Figure 4.1). However,
there were not dead cells (Figure 4.2). At the end of cell isolation, hepatocyte cells were
seen roundly. After 48 hours the 10-5
M groups at the end of the culture, cells were
gradually decreased in all cypermethrin groups and control groups (Figure 4.3). While
contamination and pH changes were not observed.
Figure 4.1. Hepatocytes culture on poly-L- lysine-coated dish after cell isolation.

27
Figure 4.2. Cypermetrin (10-5
M) applied hepatocytes culture on poly-L- lysine-coated dish
after 24 hours of cell isolation.
Figure 4.3. Cypermetrin (10-5
M) applied hepatocytes culture on poly-L- lysine-coated dish
after 48 hours of cell isolation.

28
4.3. Aspartate Aminotransferase (AST)
Hepatocytes culture were treated with different concentration of cypermethrin (10-7
,
10-6
and 10-5
M), after 24 and 48 hours of incubation. Investigate the effect of our chemical
on culture was compared with control doses. The result showed AST levels increased after
24 hours of incubation as shown in (Table 4.1). Therefore after 48 hours of incubation, the
AST levels was not changed, as displayed in (Figure 4.4).
Table 4.1. AST levels in the culture medium.
Concentration 24 Hours 48 Hours
Control 81.44 ± 8.13939de
51.06 ± 0.39573ab
10-7
M 61.2 ± 2.37971bc
53.14 ± 1.33963ab
10-6
M 72.38 ± 6.37585cd
54.3 ± 0.80436ab
10-5
M 86.44 ± 5.31513e 45.98 ± 1.58316
a
Values mean ± mean of standard error, and groups with different alphabetic superscripts
differ significantly at P < 0.05.
Figure 4.4. The effect of cypermethrin on the synthesis of AST in primary hepatocyte
culture. Results are expressed as Mean SEM (n = 5). Different letters denote
significant difference (P < 0.05).
d e
b c
c d
e
a b a b a b
a
0
10
20
30
40
50
60
70
80
90
100
AS
T l
evel
in h
epat
ocy
te c
ult
ure
(U
/l)
Cypermethrin concentrations (M)
48 hrs incubation 24 hrs incubation control 10-5 M 10-7 M 10-6 M control 10-7 M 10-6 M 10-5 M

29
4.4. Alanine Aminotransferase (ALT)
Hepatocyte cultures were treated with different concentrations of cypermethrin (10-
7, 10
-6 and 10
-5 M). After 24 hours of incubation, ALT level of cypermethrin groups were
increased but this increase was not significant as shown in (Table 4.2). Therefore after 48
hours of incubation ALT level of cypermethrin groups decreased when compared with the
control group. But in the cypermethrin groups, the ranges were increased as seen in (Figure
4.5).
Table 4.2. ALT levels in the culture medium.
Concentration 24 Hours 48 Hours
Control 17.64 ± 1.76227de
21.04 ± 1.37862ef
10-7
M 19.92 ± 0.56160ef
11.28 ± 0.42708a
10-6
M 22.68 ± 0.56427e 13.4 ± 0.54406
ab
10-5
M 16.42 ± 0.67483cd
14.14 ± 0.32187bc
Values mean ± mean of standard error, and groups with different alphabetic superscripts
differ significantly at P < 0.05.
Figure 4.5. The effect of cypermethrin on the synthesis of ALT in primary hepatocyte
culture. Results are expressed as Mean SEM (n = 5). Different letters denote
significant difference (P < 0.05).
d e e f
e
c d
e f
a a b b c
0
5
10
15
20
25
AL
T l
evel
in h
epat
ocy
te c
ult
ure
(U
/l)
Cypermethrin concentration (M)
24 hrs incubation 48 hrs incubation
control 10-5 M 10-7 M 10-6 M control 10-7 M 10-6 M 10-5 M

30
4.5. Lactate Dehydrogenase (LDH)
The LDH measurement of hepatocyte extracted that exposed in different dose of
cypermethrin (10-7
, 10-6
and 10-5
M). The LDH results, as shown in (Table 4.3), levels were
increased in the doses and times manner, but this increase was not significant.
Cypermethrin groups significantly decreased and they were compared with control groups
as illustrated in Figure 4.6.
Table 4.3. LDH levels in the culture medium.
Concentration 24 Hours 48 Hours
Control 295 ± 55.87307bc
428.6 ± 28.60524bc
10-7
M 171 ± 21.28849ab
61.4 ± 12.58014a
10-6
M 292 ± 50.71548bc
77.4 ± 16.09534a
10-5
M 342.8 ± 49.16442bc
87.6 ± 8.90281a
Values mean ± mean of standard error, and groups with different alphabetic superscripts
differ significantly at P < 0.05.
Figure 4.6. The effect of cypermethrin on the synthesis of LDH in primary hepatocyte
culture. Results are expressed as Mean SEM (n = 5). Different letters denote
significant difference (P < 0.05).
b c
a b
b c
b c b c
a a a
0
50
100
150
200
250
300
350
400
450
LD
H lev
el i
n h
epat
ocy
te c
ult
ure
(U
/l)
Cypermethrin concentration (M)
24 hrs incubation 48 hrs incubation
control 10-5 M 10-7 M 10-6 M control 10-7 M 10-6 M 10-5 M

31
4.6. Malondialdehyde (MDA)
At the end of incubation, MDA levels increased in the cypermethrin groups after 24
and 48 hours of incubation as observed in (Table 4.4). But when they compared with
control groups the range was decreased as seen in (Figure 4.7).
Table 4.4. MDA levels in the culture medium.
Concentration 24 Hours 48 Hours
Control 0.3226 ± 0.02795d 0.2130 ± 0.01342
bc
10-7
M 0.2244 ± 0.01780bc
0.1520 ± 0.0812a
10-6
M 0.2476 ± 0.01698c 0.1702 ± 0.01770
ab
10-5
M 0.2602 ± 0.02365c 0.1982 ± 0.02297
abc
Values mean ± mean of standard error, and groups with different alphabetic superscripts
differ significantly at P < 0.05.
Figure 4.7. The effect of cypermethrin on the synthesis of MDA in primary hepatocyte
culture. Results are expressed as Mean SEM (n = 5). Different letters denote
significant difference (P < 0.05).
d
b c c
c
b c
a a b
a b c
0
0,05
0,1
0,15
0,2
0,25
0,3
0,35
0,4
MD
A l
evel
in h
epat
ocy
te c
ult
ure
(nm
ol/
mg p
rote
in)
Cypermethrin concentration (M)
24 hrs incubation 48 hrs incubation
control 10-5 M 10-7 M 10-6 M control 10-7 M 10-6 M 10-5 M

32
4.7. Total Antioxidant Status (TAS)
Hepatocyte culture was treated with different concentration of cypermethrin (10-7
,
10-6
and 10-5
M) during 24 and 48 hours. The TAS levels, when they compared with the
control groups, was not significant. The results of the analysis were displayed in Table 4.5
and Figure 4.5.
Table 4.5. TAS levels in the culture medium.
Concentration 24 Hours 48 Hours
Control 0.6542 ± 0.18918a 0.5110 ± 0.11704
a
10-7
M 0.5703 ± 0.20701a 0.8600 ± 0.14735
a
10-6
M 0.6234 ± 0.17441a 0.3012 ± 0.09703
a
10-5
M 0.7036 ± 0.22135a 0.5703 ± 0.12845
a
Values mean ± mean of standard error, and groups with different alphabetic superscripts
differ significantly at P < 0.05.
Figure 4.8. The effect of cypermethrin on the synthesis of TAS in primary hepatocyte
culture. Results are expressed as Mean SEM (n = 5). Different letters denote
significant difference (P < 0.05).
a a a
a
a
a
a
a
0
0,2
0,4
0,6
0,8
1
1,2
TA
S (
nm
ol
Tro
lox E
q./
mg p
rote
in)
Cypermethrin concentration (M)
24 hrs incubation 48 hrs incubation control 10-5 M 10-7 M 10-6 M control 10-7 M 10-6 M 10-5 M

33
4.8. Total Oxidative Status (TOS)
TOS level was measured by using spectrophotometer. Three different
concentrations of cypermethrin (10-7
, 10-6
and 10-5
M) treated on hepatocyte cells. After 24
hours of incubation the values of TOS decreased when compared with the control group as
shown in (Table 4.6). However, in the end of 48 hours of incubation, the range was
increased significantly as illustrated in Figure 4.9.
Table 4.6. TOS levels in the culture medium.
Concentration 24 Hours 48 Hours
Control 19.3818 ± 0.83059cd
8.0190 ± 0.47231a
10-7
M 13.4356 ± 0.53533bc
9.0190 ± 0.69894a
10-6
M 13.6498 ± 0.64288ab
9.7660 ± 0.41183a
10-5
M 13.8605 ± 1.7388bc
9.5073 ± 0.37557a
Values mean ± mean of standard error, and groups with different alphabetic superscripts
differ significantly at P < 0.05.
Figure 4.9. The effect of cypermethrin on the synthesis of TOS in primary hepatocyte
culture. Results are expressed as Mean SEM (n = 5). Different letters denote
significant difference (P < 0.05).
c d
b c a b b c
a a a a
0
5
10
15
20
25
TOS (µmol Equiv H
2O
2 /L
)
Cypermethrin concentration (M)
24 hrs incubation 48 hrs incubation
control 10-5 M 10-7 M 10-6 M control 10-7 M 10-6 M 10-5 M

34
4.9. 8-Hydroxydeoxyguanosine (8-OHdG)
The 8-OHdG levels were measured by using ELISA kit. Three different
concentrations of cypermethrin (10-7
, 10-6
and 10-5
M) were treated on hepatocyte cells. The
values of 8-OHdG decreased significantly in 10-7
M more than 10-6
M and 10-5
M when
they compared with the control group. The results of the analysis were displayed in Table
4.7 and Figure 4.11.
Figure 4.10. Standard curve of 8-OHdG assay in the hepatocyte culture.
Table 4.7. 8-OHdG levels in the culture medium.
Concentration 24 Hours 48 Hours
Control 16.2181 ± 1.21867a 20.2747 ± 1.30813
bc
10-7
M 20.2377 ± 2.11896ab
22.9804 ± 0.65993bc
10-6
M 20.8668 ± 0.92706ab
27.6176 ± 1.88795cd
10-5
M 23.0074 ± 1.46299ab
26.6569 ± 0.69192cd
Values mean ± mean of standard error, and groups with different alphabetic superscripts
differ significantly at P < 0.05.
y = 0,0204x + 0,1154 R² = 0,9902
0
0,2
0,4
0,6
0,8
1
1,2
1,4
1,6
0 10 20 30 40 50 60 70
Op
tica
l D
ansi
ty
Concentration (ng/mL)

35
Figure 4.11. The effect of cypermethrin on the synthesis of 8-OHdG in primary hepatocyte
culture. Results are expressed as Mean SEM (n = 5). Different letters denote
significant difference (P < 0.05).
4.10. Protein Assay
Amount of protein in the primary hepatocyte was determined by Bradford method
and three different concentrations of cypermethrin (10-7
, 10-6
and 10-5
M) were treated on
hepatocyte cells during 24 and 48 hours. The values of protein were decreased in 10-7
M
more than 10-6
M and 10-5
M when they compared with the control group. The results of the
analysis were displayed in Table 4.8 and Figure 4.13.
a
a b
a b
a b
b c
b c
c d c d
0
50
100
150
200
250
3008
-OH
dG
(n
g/m
l)
Cypermethrin concentration (M)
48 hrs incubation 24 hrs incubation
control 10-5 M 10-7 M 10-6 M control 10-7 M 10-6 M 10-5 M

36
Figure 4.12. Standard curve of protein assay in the hepatocyte culture.
Table 4.8. Protein levels in the culture medium.
Concentration 24 Hours 48 Hours
Control 53.5357 ± 12.68489c 44.0102 ± 8.98855
bc
10-7
M 21.8061 ± 2.57406a 30.6224 ± 6.40093
ab
10-6
M 26.7857 ± 2.60366ab
25.3214 ± 5.12479a
10-5
M 40.1122 ± 6.35464ab
21.2142 ± 4.11681a
Values mean ± mean of standard error, and groups with different alphabetic superscripts
differ significantly at P < 0.05.
Y = 0,0098x + 0,8881
R² = 0,9918
0
0,2
0,4
0,6
0,8
1
1,2
1,4
1,6
1,8
2
0 20 40 60 80 100
Ab
sorb
ance
Protein concentration (mg/ml)
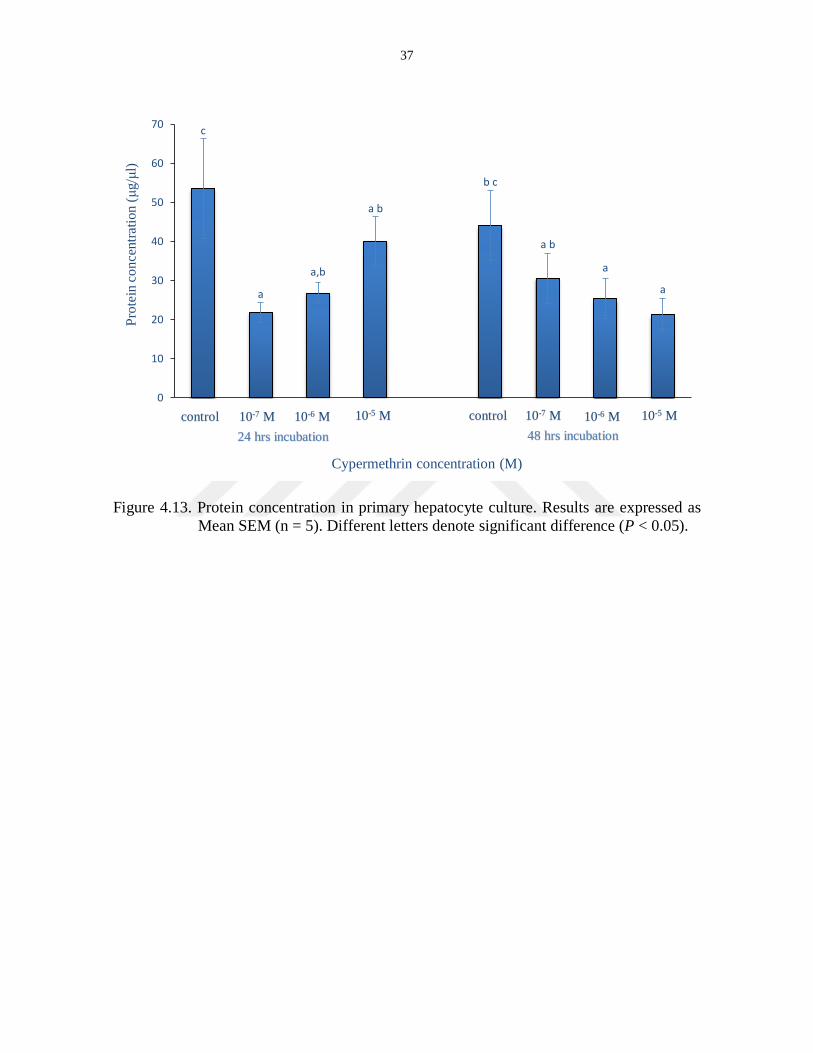
37
Figure 4.13. Protein concentration in primary hepatocyte culture. Results are expressed as
Mean SEM (n = 5). Different letters denote significant difference (P < 0.05).
c
a
a,b
a b
b c
a b
a
a
0
10
20
30
40
50
60
70P
rote
in c
on
centr
atio
n (μ
g/μ
l)
Cypermethrin concentration (M)
24 hrs incubation 48 hrs incubation
control 10-5 M 10-7 M 10-6 M control 10-7 M 10-6 M 10-5 M

5. DISCUSSION AND CONCLUSION
Cypermethrin is commonly used in the agriculture sector that continuously pollutes
the inland fishery water. It has also been widely used as a chemotherapeutic agent for the
control of ectoparasite infestations in freshwater aquaculture. In this study it is revealed the
toxic effect of different doses cypermethrin (1×10⁻⁷, 1×10
-6 and 1×10
-5 M) on the primary
hepatocyte culture of Van fish was assessed by Aspartate Aminotransferase (AST), Alanine
Aminotransferase (ALT), Lactate dehydrogenase (LDH), Malondialdehyde (MDA), Total
antioxidant status (TAS), Total oxidative status (TOS), 8-Hydroxydeoxyguanosine (8-
OHdG) and Protein Assay.
Cell viability of Van fish hepatocytes reduced during experimental period and dose
of cypermethrin. Several studies in vitro have shown severe toxic effects of the liver such
as hypertrophy of hepatocytes and nuclei (Shakoori et al., 1988) and focal necrosis severe
vacuolation (Monir et al., 2016) and depletion of polysaccharide content in hepatocytes
(Nagarjuna and Doss, 2010). Also, similar results were shown in vitro studies (El-Tawil
and Abdel-Rahman, 2001).
AST, ALT and LDH are widely use to determining cellular damage, both in vivo
and in vitro studies. Therefore, the effects of harmful chemicals on liver toxicity are
determine by these parameters. In this study, AST, ALT and LDH were used to determine
the effects of cypermethrin on Van fish primary hepatocyte culture. Levels of AST, ALT
and LDH increased with the doses of cypermethrin (Table 4.1, 4.2 and 4.3; Figure 4.4, 4.5
and 4.6). But this increase was only important after 24 hours. At the end of 48 hours, an
increase in all doses of cypermethrin was observed. The groups with different doses of
cypermethrin were statistically low compared to the control group. Contrary to the
literature, this suggests that cypermethrin is highly toxic to Van fish hepatocytes and leads
to decrease of cell numbers in cultures. El-Tawil and Abdel-Rahman, (1997) reported that
cypermethrin killed approximately 50% of rat hepatocytes within 2 hours. In vivo
applications of cypermethrin also cause irreversible damage to the liver (Velisek et al.,
2006; Monir et al., 2015). At the end of 48 hours, the cause of elevated AST, ALT and

39
LDH in the control group may be damage to cells caused by different enzymes and
mechanical agitation during hepatocyte isolation. In addition, the total protein range in the
culture medium shows a decrease in cell count due to time (Figure 4.13 and Table 4.10).
Increased levels of lipid peroxidation were observed in tissues exposed to
pollutants. For this reason, lipid peroxidation is often used as a bioindicator in determining
oxidative stress (Farombi et al., 2008; Tiwari et al., 2010). In this study, MDA levels
increased with dose of cypermethrin (Figure 4.7 and Table 4.4). However, this increase was
not statistically significant. At the end of the 24 and 48 hours, it was also lower than the
control group (P < 0.05). This may be due to the short half-life of MDA and dead cells in
cultures administered with cypermethrin. Gil et al. (2010) stated that patients with paraquet
poisoning had a fluctuating MDA level and that MDA was not reliable in determining the
oxidative damage due to the short half-life of MDA.
Total antioxidant and total oxidant levels are shown in (Table 4.5 and 4.6; Figure
4.8 and 4.9). TAS and TOS levels decreased at the end of 48 hours compared to 24 hours.
When compared with the control group, we observed that there was no statistical
difference. Oxidized substances produced by cells which they are unavoidable within
certain boundaries. Along with the increase of the oxidant substances in the cell, it causes
damage to the lipid, protein and DNA in the cell (Sies, 1997; Velisek et al., 2006; Birben et
al., 2012).
8-OHdG is a bioindicator that is often used to determine DNA-based oxidative
damage. It has been used in many species and in the determination of damage to different
tissues (Honda et al., 2000; Arslan et al., 2017; Geyikoglu et al., 2017). As a result of the
application of cypermethrin, the levels of 8-OHdG (Table 4.7 and Figure 4.11) increase
with dose and time (P < 0.05). The results are clearly demonstrate the damage of
cypermethrin on hepatocytes.
In conclusion, oxidative damage of cypermethrin on primary hepatocyte culture has
not been clearly demonstrated with liver enzymes, TAS and TOS. This thought due to the
direct lethal effect of the doses used in the study of Van fish liver cells. However, oxidative
damage is clearly demonstrated by parameters such as MDA and DNA damage.

REFERENCES
Andrade, R. J., Camargo, R., Lucena, M. I., González-Grande, R., 2004. Causality
assessment in drug-induced hepatotoxicity. Expert Opinion on Drug Safety, 3(4):
329-344.
Arslan, H., Özdemir, S., Altun, S., 2017. Cypermethrin toxication leads to histopathological
lesions and induces inflammation and apoptosis in common carp (Cyprinus carpio
L.). Chemosphere 180: 491-499.
Atamanalp, M., Angis, S., Oguzhan, P., Aksakal, E., 2008. Alterations in hematological
parameters of rainbow trout (Oncorhynchus mykiss) exposed to DDVP. Israil
Journal Aquaculture Bamidgeh, 60(1): 9-12.
Aydin, R., Koprucu, K., Dorucu, M., Koprucu, S. S., Pala, M., 2005. Acute toxicity of
synthetic pyrethroid cypermethrin on the common carp (Cyprinus carpio L.)
embryos and larvae. Aquaculture International, 13: 451-458.
Ballet, F., 1997. Hepatotoxicity in drug development: detection, significance and solutions.
Journal Hepatology, 26(2): 26-36.
Bhunya Kevresan, S., Kuhajda, K., Kandrac, J., Fawcett, J. P., Mikov, M., 2007.
Biosynthesis of bile acids in mammalian liver. European Journal of Drug
Metabolism and Pharmacokinetics, 31(3): 145-56.
Bhunya, S. P., Pati, P. C., 1988. Genotoxic effects of a synthetic pyrethroid insecticide,
cypermethrin, in mice in vivo. Toxicology Letters, 41(3): 223-230.
Birben, E., Sahiner, U. M., Sackesen, C., Erzurum, S., Kalayci, O., 2012. Oxidative stress
and antioxidant defense. World Allergy Organization Journal, 5(1): 9.
Blouin, A., Bolender, R. P., Weibel, E. R., 1977. Distribution of organelles and membranes
between hepatocytes and nonhepatocytes in the rat liver parenchyma. A
stereological study. Journal Cell Biology, 72(2): 441-55.
Boelsterli, U. A., 2003. Disease-related determinants of susceptibility to drug-induced
idiosyncratic hepatotoxicity. Current Opinion in Drug Discovery and
Development, 6(1): 81-91.
Boxaspen, K., Holm, J. C., 2001. The development of pyrethrum-based treatments against
the ectoparasitic salmon lice Lepeophtheirus salmonis in sea cage rearing of
Atlantic salmon Salmo salar L. Aquaculture Research, 32: 701-707.
Bradbury, S. P., Coats, J. R., 1989. Comparative toxicology of the pyrethroid insecticides.
Reviews of Environmental Contamination and Toxicology, 108: 133-177.
Bradford, M. M. 1976. A Rapid and Sensitive Method for the Quantitation of Microgram
Quantities of Protein Utilizing the Principle of Dye Binding. Analytical
Biochemistry. 72: 248-254.
Brandon, E. F., Raap, C. D., Meijerman, I., Beijnen, J. H., Schellens, J. H., 2003. An update
on in vitro test methods in human hepatic drug biotransformation research: pros and
cons. Toxicology and Applied Pharmacology, 189(3): 233-246.

41
Carriquiriborde, P., Díaz, J., Mugni, H., Bonetto, C., Ronco, A. E., 2007. Impact of
cypermethrin on stream fish populations under field-use in biotech-soybean
production. Chemosphere, 68(4): 613-621.
Casida, J. E., Gammon, D. W., Glickman, A. H., Lawrence, L. J., 1983. Mechanisms of
selective action of pyrethroid insecticides. Annu. Reviews Pharmacology
Toxicology, 23: 413-438.
Çetinkaya, O., 1993. Van Gölü havzası su kaynakları ve balıkçılık potansiyeli, Doğu
Anadolu Bölgesi 1. Su Ürünleri Sempozyumu, Ziraat Fakültesi Su Ürünleri Bölümü
Öğretim Üyesi 65080 Van, 23-25.
Chicago, G. Y., Werffeli, P., Favre, D., Juillerat, M., Wellinger, R., Honegger, P., 1987.
Aggregate cultures of foetal rat liver cells: development and maintenance of liver
gene expression. Biology of the Cell, 60(3): 163-171.
Cross, D. M., Bayliss, M. K., 2000. A commentary on the use of hepatocytes in drug
metabolism studies during drug discovery and development. Drug Metabolism
Reviews, 32(2): 219-240.
Danulat, E., Kempe, S., 1992. Nitrogenous waste excretion and accumulation of urea and
ammonia in Chalcalburnus tarichi (Cyprinidae), endemic to the extremely alkaline
Lake Van (Eastern Turkey). Fish Physiology and Biochemistry, 9(5-6): 377-386.
Das, B. K., Mukherjee, S. C., 2003. Toxicity of cypermethrin in Labeo rohita fingerlings:
biochemical, enzymatic and haematological consequences. Comparative
Biochemistry and Physiology Part C: Toxicology and Pharmacology, 134(1): 109-
121.
Dunn, J. C., Tompkins, R. G., Yarmush, M. L., 1991. Long-term in vitro function of adult
hepatocytes in a collagen sandwich configuration. Biotechnology Progress, 7(3):
237-245.
Dunn, J. C., Yarmush, M. L., Koebe, H. G., Tompkins, R. G., 1989. Hepatocyte function
and extracellular matrix geometry: long-term culture in a sandwich configuration.
The FASEB Journal, 3(2): 174-177.
Eells, J. T., Bandettini, P. A., Holman, P. A., Propp, J. M., 1992. Pyrethroid insecticide-
induced alterations in mammalian synaptic membrane potential. Journal of
Pharmacology and Experimental Therapeutics, 262: 73-81.
Eells, J. T., Rasmussen, J. L. Bandettini, P. A. Propp, J. M., 1993. Differences in the
neuroexcitatory actions of pyrethroid insecticides and sodium channel-specific
neurotoxins in rat and trout brain synaptosomes. Toxicology and Applied
Pharmacology, 123: 107-19.
El-Bahay, C., Gerber, E., Horbach, M., Tran-Thi, Q. H., Röhrdanz, E., Kahl, R., 1999.
Influence of tumor necrosis factor-α and silibin on the cytotoxic action of α-
amanitin in rat hepatocyte culture. Toxicology and Applied Pharmacology, 158(3):
253-260.
El-Tawil, O. S., Abdel-Rahman, M. S., 1997. Effect of cypermethrin on isolated male and
female rat hepatocytes. Journal of Toxicology and Environmental Health, 52(5):
461-474.
El-Tawil, O. S., Abdel-rahman, M. S., 2001. The role of enzyme induction and inhibition on cypermethrin hepatotoxicity. Pharmacological Research, 44(1): 33-39.

42
Etienne, P. L., Baffet, G., Desvergne, B., Boisnard-Rissel, M., Glaise, D., Guguen-
Guillouzo, C., 1988. Transient expression of c-fos and constant expression of c-myc
in freshly isolated and cultured normal adult rat hepatocytes. Oncogene Reserch,
3(3): 255-262.
Farombi, E. O., Ajimoko, Y. R., Adelowo, O. A., 2008. Effect of butachlor on antioxidant
enzyme status and lipid peroxidation in freshwater African catfish (Clarias
gariepinus). International Journal of Environmental Research and Public Health,
5: 423-427.
Friedman, S. L., 1997. Molecular mechanisms of hepatic fibrosis and principles of therapy.
Journal of Gastroenterology, 32(3): 424-430.
Gebhardt, R., Hengstler, J. G., Müller, D., Glöckner, R., Buenning, P., Laube, B., Ringel,
M., 2003. New hepatocyte in vitro systems for drug metabolism: metabolic capacity
and recommendations for application in basic research and drug development,
standard operation procedures. Drug Metabolism Reviews, 35(2-3): 145-213.
Geyikoglu, F., Emir, M., Colak, S., Koc, K., Turkez, H., Bakir, M., Hosseinigouzdagani,
M., Cerig, S., Keles, O. N., Ozek, N. S., 2017. Effect of oleuropein against
chemotherapy drug-induced histological changes, oxidative stress, and DNA
damages in rat kidney injury. Journal of Food and Drug Analysis 25: 447-459.
Gil, H. W., Seok, S. J., Jeong, D. S., Yang, J. O., Lee, E. Y., Hong, S. Y., 2010. Plasma
level of malondialdehyde in the cases of acute paraquat intoxication. Clinical
Toxicology, 48(2): 149-152.
Gowlan, B. T., Moffat, C. F., Stagg, R. M., Houlihan, D. F., Davies, I. M., 2002.
Cypermethrin induces glutathione S-transferase activity in the shore crab, Carcinus
maenas. Marine Environmental Research, 54: 69-77.
Guigoz, Y., Werffeli, P., Favre, D., Juillerat, M., Wellinger, R., Honegger, P., 1987.
Aggregate cultures of foetal rat liver cells: development and maintenance of liver
gene expression. Biology of the Cell, 60(3): 163-171.
Haratym-Maj, A., 2002. Hematological alternations after pyrethroids poisoning in mice.
Annals of Agricultural and Environmental Medicine, 9(2): 199-206.
Hart J. L., Thacker J. R., Braidwood, J. C., Fraser N. R., Mattews J. E., 1997. Novel
cypermethrin formulation for the control of sea lice on salmon (Salmo salar).
Veterinary Records, 140: 179-181.
Hayat, S., Ali, B., Ahmad, A., 2007. Salicylic acid: biosynthesis, metabolism and
physiological role in plants. Salicylic Acid: A Plant Hormone, 1-14.
Honda, M., Yamada, Y., Tomonaga, M., Ichinose, H., Kamihira, S., 2000. Correlation of
urinary 8-hydroxy-2′-deoxyguanosine (8-OHdG), a biomarker of oxidative DNA
damage, and clinical features of hematological disorders: a pilot study. Leukemia
Research, 24: 461-468.
Howard, R. B., Christensen, A. K., Gibbs, F. A., Pesch, L. A., 1967. The enzymatic
preparation of isolated intact parenchymal cells from rat liver. Journal of Cell
Biology, 35(3): 675-684.
Igbedioh, S. O., 1991. Effects of agricultural pesticides on humans, animals, and higher
plants in developing countries. Archives of Environmental Health: An International
Journal, 46(4): 218-224.

43
Institoris, L., U ndeger, U., Siroki, O., Nehéz, M., Dési, I., 1999. Comparison of detection
sensitivity of immuno-and genotoxicological effects of subacute cypermethrin and
permethrin exposure in rats. Toxicology, 137(1): 47-55.
Izaguirre, M. F., Lajmanovich, R. C., Peltzer, P. M., Soler, A. P., Casco, V. H., 2000.
Cypermethrin-induced apoptosis in the telencephalon of Physalaemus biligonigerus
tadpoles (Anura: Leptodactylidae). Bulletin of Environmental Contamination and
Toxicology, 65(4): 501-507.
Jaeschke, H., Gores, G. J., Cederbaum, A. I., Hinson, J. A., Pessayre, D., Lemasters, J. J.,
2002. Mechanisms of hepatotoxicity. Toxicological Sciences, 65(2): 166-176.
Kaplowitz, N., 2001. Drug-induced liver disorders. Drug Safety, 24(7): 483-490.
Kapoor, R. K., Chauhan, S. S., Singh, N., Misra, U. K. 1988. Induction of hepatic mixed
function oxidases by permethrin and cypermethrin in chicks fed vitamin A deficient
diet. Pesticide Biochemistry and Physiology, 32: 205-211.
Kmieć, Z., 2001. Cooperation of liver cells in health and disease. Advances in Anatomy,
Embryology and Cell Biology, 161: 1-151.
LaBrecque, D., 1994. Liver regeneration: a picture emerges from the puzzle. The American
Journal of Gastroenterology, 89(8): 86-96.
Landry, J., Bernier, D., Ouellet, C., Goyette, R., Marceau, N., 1985. Spheroidal aggregate
culture of rat liver cells: histotypic reorganization, biomatrix deposition, and
maintenance of functional activities. Journal of Cell Biology, 101(3): 914-923.
Latif, H., Lerman, J. A., Portnoy, V. A., Tarasova, Y., Nagarajan, H., Schrimpe-Rutledge,
A. C., Zengler, K., 2013. The genome organization of Thermotoga maritima reflects
its lifestyle. PLoS Genetics, 9(4): e1003485.
LeCluyse, E. L., Alexandre, E., Hamilton, G. A., Viollon-Abadie, C., Coon, D. J., Jolley,
S., Richert, L., 2005. Isolation and culture of primary human hepatocytes. Methods
in Molecular Biology, 290: 207-229.
Lee, W. M., 2003. Drug-induced hepatotoxicity. The New England Journal of Medicine,
349(5): 474-485.
Lenntech, 1998. Water pollution, www.lenntech.com/water pollution/water pollution-
FAO.htm (10/07/2017).
Lewis, J. H., 2002. Drug-induced liver disease. Current Opinion in Gastroenterology,
18(3): 307-313.
Lu, H., Chua, K., Zhang, P., Lim, W., Ramakrishna, S., Leong, K. W., Mao, H. Q., 2005.
Three-dimensional co-culture of rat hepatocyte spheroids and NIH/3T3 fibroblasts
enhances hepatocyte functional maintenance. Acta Biomaterialia, 1(4): 399-410.
Luttringer, O., Theil, F. P., Lavé, T., Wernli-Kuratli, K., Guentert, T. W., de Saizieu, A.,
2002. Influence of isolation procedure, extracellular matrix and dexamethasone on
the regulation of membrane transporters gene expression in rat hepatocytes.
Biochemical Pharmacology, 64(11): 1637-1650.
Matsumoto, T., Kawakami, M., 1982. The unit-concept of hepatic parenchyma-a
reexamination based on angioarchitectural studies. Acta Pathologica Japonica,
32(2): 285-314.
Meister, R., 1992. Farm Chemicals Handbook '92. Meister Publishing Company, Willoughby, OH.

44
Miranti, C. K., 2002. Application of cell adhesion to study signaling networks. Methods in
Cell Biology, 69: 359-383.
Miyamoto, J., Kaneko, H., Tsuji, R., Okuno, Y., 1995. Pyrethroids, nerve poisons: how
their risks to human health should be assessed, Toxicollett, 82: 933-940.
Monir, K., Bagdi, A. K., Ghosh, M., Hajra, A. 2015. Regioselective Oxidative
Trifluoromethylation of Imidazoheterocycles via C (sp2)–H Bond
Functionalization. The Journal of organic chemistry, 80(3); 1332-1337.
Monir, M. S., Doulah, M. A. U., Rahman, M. K., Akhter, J. N., Hossain, M. R., 2016.
Effect of cypermethrin on the histoarchitecture of gills and liver of a freshwater
catfish, Pangasianodon hypophthalmus. Asian Journal of Medical and Biological
Research, 1(3): 641-647.
Müller, A. S., Pallauf, J., 2003. Effect of increasing selenite concentrations, vitamin E
supplementation and different fetal calf serum content on GPx1 activity in primary
cultured rabbit hepatocytes. Journal of Trace Elements in Medicine and Biology,
17(3) 183-192.
Nagarjuna A., Doss P. J., 2010. Cypermethrin-induced histochemical changes in liver of
albino rats. Journal of the Indian Society of Toxicology, 6(2): 1-4.
Naz, S., Rana, S. A., Javed, M., Rehman, K. U., 2010. Effect of two different rodenticides
on serum biochemistry of house rats (Rattus rattus). Pakistan Veterinary, 30: 239-
241.
Norman, G., 1992. Biologic basis of Neurotoxicity. National Academies Press, 21.
Ogata, I., Mochida, S., Tomiya, T., Fujiwara, K., 1991. Minor contribution of hepatocytes
to collagen production in normal and early fibrotic rat livers. Hepatology, 14(2):
361-367.
Oğuz, A. R., 2015. Histological changes in the gill epithelium of endemic Lake Van Fish
(Chalcalburnus tarichi) during migration from alkaline water to freshwater. North-
Western Journal of Zoology, 11(1): 51-57.
Ohira, H., Abe, K., Yokokawa, J., Takiguchi, J., Rai, T., Shishido, S., Sato, Y. (2003.
Adhesion molecules and CXC chemokines in endotoxin-induced liver injury.
Fukushima Journal of Medical Science, 49(1): 1-13.
Olson, H., Betton, G., Robinson, D., Thomas, K., Monro, A., Kolaja, G., Lilly, P., Sanders,
J., Sipes, G., Bracken, W., Dorato, M., Van Deun, K., Smith, P., Berger, B., Heller,
A., 2000. Concordance of the toxicity of pharmaceuticals in humans and in animals.
Regul Toxicol Pharmacology, 32(1): 56-67.
Olson, H., Betton, G., Stritar, J., Robinson, D., 1998. The predictivity of the toxicity of
pharmaceuticals in humans from animal data- an interim assessment. Toxicology
Letters, 102-103: 535-538.
Paine, A. J., Andreakos, E., 2004. Activation of signalling pathways during hepatocyte
isolation: relevance to Toxicol in vitro. Toxicology in Vitro, 18(2): 187-193.
Pascussi, J. M., Gerbal-Chaloin, S., Fabre, J. M., Maurel, P., Vilarem, M. J., 2000.
Dexamethasone enhances constitutive androstane receptor expression in human
hepatocytes: consequences on cytochrome P450 gene regulation. Molecular
Pharmacology, 58(6): 1441-1450.

45
Powers, M. J., Domansky, K., Kaazempur-Mofrad, M. R., Kalezi, A., Capitano, A., R.,
Griffith, L. G., 2002. A microfabricated array bioreactor for perfused 3D liver
culture. Biotechnology and Bioengineering, 78(3): 257-269.
Ramadan, A., Bakry, M., Salam, M., Marei, Eldefrawi A., Eldefrawi, M., 1988. Action of
pyrethroids GABA receptor function, Pest. Journal of Physiology and
Biochemistry, 32: 97-105.
Rao, G. V., Rao, K. J., 1993. Inhibition of monoamine oxidase-A of rat brain by
pyrethroids an in vitro kinetic study. Molecular and Cellular Biochemistry, 124(2):
107-114.
Reddy, A. T., Ayyanna, K., Yellamma, K., 1991. Cypermethrin induced modulations in
lipid metabolism of freshwater teleost, Tilapia mossambica. Biochemistry
International, 23(5): 963-967.
Reimer, P. J., Baillie, M. G., Bard, E., Bayliss, A., Beck, J. W., Blackwell, P. G., Friedrich,
M., 2009. IntCal09 and Marine09 radiocarbon age calibration curves, 0–50,000
years cal BP. Radiocarbon, 51(4): 1111-1150.
Richards, R. H., 1983. Diseases of farmed fish: Salmonids. Veterinary Records, 112: 124-
126.
Richert, L., Alexandre, E., Lloyd, T., Orr, S., Viollon‐ Abadie, C., Patel, R., Mantion, G.,
2004. Tissue collection, transport and isolation procedures required to optimize
human hepatocyte isolation from waste liver surgical resections. A multilaboratory
study. Liver International, 24(4): 371-378.
Richert, L., Binda, D., Hamilton, G., Viollon-Abadie, C., Alexandre, E., Bigot-Lasserre, D.,
LeCluyse, E., 2002. Evaluation of the effect of culture configuration on
morphology, survival time, antioxidant status and metabolic capacities of cultured
rat hepatocytes. Toxicology in vitro, 16(1): 89-99.
Rodriguez-Antona, C., Donato, M. T., Boobis, A., Edwards, R. J., Watts, P. S., Castell, J.
V., Gómez-Lechón, M. J., 2002. Cytochrome P450 expression in human
hepatocytes and hepatoma cell lines: molecular mechanisms that determine lower
expression in cultured cells. Xenobiotica, 32(6): 505-520.
Roth, M., Richards, R. H., Sommerville, C., 1993. Current practices in the
chemotherapeutic control of sea lice infestations in aquaculture: A review. Journal
of Fish Diseases, 16: 1-26.
Santoni, G., Cantalamessa, F., Mazzucca, L., Romagnoli, S., Piccoli, M., 1997. Prenatal
exposure to cypermethrin modulates rat NK cell cytotoxic functions. Toxicology,
120(3): 231-242.
Saxena, K., Gupta, P., 2003. Effect of cypermethrin in the activities of acid and alkaline
phosphor mone esterases in a freshwater fish Channa punctatus. Proc. Journal of
Environment and Health Science, 477-479.
Saxena, K., Seth, N., 2002. Toxic effects of cypermethrin on certain hematological aspects
of freshwater fish Channa punctatus. Bull. Reviews of Environmental
Contamination and Toxicology, 69: 364-369.
Scholz, G., Pohl, I., Genschow, E., Klemm, M. Spielmann, H., 1999. Embryotoxicity
screening using embryonic stem cells in vitro: correlation to in vivo teratogenicity. Cells Tissues Organs, 165(3-4): 203-211.

46
Schoonen, W. G., Westerink, W. M., de Roos, J. A., Débiton, E., 2005. Cytotoxic effects of
100 reference compounds on Hep G2 and HeLa cells and of 60 compounds on
ECC-1 and CHO cells. I mechanistic assays on ROS, glutathione depletion and
calcein uptake. Toxicology in vitro, 19(4): 505-516.
Scoazec, J. Y., Feldmann, G., 1994. The cell adhesion molecules of hepatic sinusoidal
endothelial cells. Journal of Hepatology, 20(2): 296-300.
Seglen, P. O., 1976. Preparation of isolated rat liver cells. Methods Cell Biology, 13, 29-83.
Shafer, T. J., Meyer, D. A., Crofton, K. M., 2005. Developmental neurotoxicity of
pyrethroid insecticides: critical review and future research needs. Environmental
Health Perspectives, 113(2): 123.
Shakoori, A. R., Ali, S. S., Saleem, M. A., 1988. Short communication effects of six
months' feeding of cypermethrin on the blood and liver of albino rats. Journal of
Biochemical and Molecular Toxicology, 3(1); 59-71.
Sheela S. C., Shyamaladevi, C. S., 2000. Protective effect of Abana: A polyherbal
formulation, on isoproterenol induced myocardial infarction in rats. Indian Journal
Pharmacology, 32(3): 198-201.
Sheela, M., Muniandy, S., 1992. Impact of cypermethrin on protein conversion efficiency,
RNA, protein, glycogen content and protease enzyme activity in different tissues of
the fish Lepidocephalichthyes thermalis. Environment and Ecology. Kalyani,
10(4): 829-832.
Sidhu, J. S., Liu, F., Omiecinski, C. J., 2004. Phenobarbital responsiveness as a uniquely
sensitive indicator of hepatocyte differentiation status: requirement of
dexamethasone and extracellular matrix in establishing the functional integrity of
cultured primary rat hepatocytes. Experimental Cell Research, 292(2): 252-264.
Sies, H., 1997. Oxidative stress: oxidants and antioxidants. Experimental Physiology,
82(2): 291-295.
Simon, L. M., Laszlo, K., Kotorman, M., Vertesi, A., Bagi, K., Nemcsok, J., 1999. Effects
of synthetic pyrethroids and methidation on activities of some digestive enzymes in
carp (Cyprinus carpio L.). Journal of Environmental Science and Health Part B,
34(5): 819-828.
Sivaraman, A., Leach, J. K., Townsend, S., Iida, T., Hogan, B. J., Stolz, D. B., Griffith, L.
G., 2005. A microscale in vitro physiological model of the liver: predictive screens
for drug metabolism and enzyme induction. Current Drug Metabolism, 6(6): 569-
591.
Slaughter, M. R., Thakkar, H., O'Brien, P. J., 2002. Effect of diquat on the antioxidant
system and cell growth in human neuroblastoma cells. Toxicology and Applied
Pharmacology, 178(2): 63 70.
Soderlund, D. M., Clark, J. M., Sheets, L. P., Mullin, L. S., Piccirillo, V. J., Sargent, D.,
Weiner, M. L., 2002. Mechanisms of pyrethroid neurotoxicity: implications for
cumulative risk assessment. Toxicology, 171(1): 3-59.
Takashima, Hibiya, 1995. An atlas of fish histology: normal and pathological features- 2nd
edn. Kodansha, Tokyo.
Tao, T., Wei, L., Yang, Y., Tao, Z., Zhwo, Y., 2008. Effects of alpha and theta cypermethrin insecticide on transient outward potassium current in rat hippocampal
CA3 neurons. Pesticide Biochemistry and Physiology, 90: 1-7.

47
Temple, W., Smith, N., 1996. Cypermethrin. Environmental Potential Agency.
Tiwari, M. N., Singh, A. K., Ahmad, I., Upadhyay, G., Singh, D., Patel, D. K., Singh, M.
P., 2010. Effects of cypermethrin on monoamine transporters, xenobiotic
metabolizing enzymes and lipid peroxidation in the rat nigrostriatal system. Free
Radical Research, 44(12): 1416-1424.
Tonini, M., Costa, L. G., Candura, S. M., Olibet, G., Rizzi, C. A., Garlaschelli, L., Manzo,
L., 1989. Interaction of the pyrethroid insecticides tetramethrin and cypermethrin
with enteric cholinergic transmission in the guinea-pig. Neurotoxicology, 10(4):
707-715.
Toughill, K., 1999. The summer the liver died: Toxic run-off from potato farms is
poisoning P.E.I originally published in Toronto Star Atlantic Canada Bureau, 12:
132-135.
Treasurer, J. W., Wadsworth, S. L., 2004. Interspecific comparison of experimental and
natural routes of Lepeophtheirus salmonis and Caligus elongatus challenge and
consequences for distribution of chalimus on salmonids and therapeutant screening.
Aquaculture Research, 35: 773-783.
Turncliff, R. Z., Meier, P. J., Brouwer, K. L. R., 2004. Effect of dexamethasone treatment
on the expression and function of transport proteins in sandwichcultured rat
hepatocytes. Drug Metabolism and Disposition, 32(8): 834-839.
Tuschl, G., Müller, S. O., 2006. Effects of cell culture conditions on primary rat
hepatocytes cell morphology and differential gene expression. Toxicology, 218(2-
3): 205-215.
Ulrich, R. G., Bacon, J. A., Cramer, C. T., Peng, G. W., Petrella, D. K., Stryd, R. P. and
Upadhyaya, A., Upadhyaya, A., Kurzawski, P., Wack, K. E., Stolz, D. B., Kamm,
Wilkening, S., Stahl, F., Bader, A., 2003. Comparison of primary human
hepatocytes and hepatoma cell line Hepg2 with regard to their biotransformation
properties. Drug Metabolism and Disposition, 31(8): 1035-1042.
Velisek, J., Wlasow, T., Gomulka, P., Svobodova, Z., Dobsikova, R., Novotny, L., Dudzik,
M., 2006. Effects of cypermethrin on rainbow trout (Oncorhynchus mykiss).
Veterinarni Medicina, 51(10); 469.
Vijverberg, H. P., vanden B., J., 1990. Neurotoxicological effects and the mode of action of
pyrethroid insecticides. Critical Reviews in Toxicology, 21(2): 105-126.
Viran, R., Unlu, E. F., Polat, H., Kocak, O., 2003. Investigation of acute toxicity of
deltamethrin on guppies (Poecilia reticulata). Ecotoxicology and Environmental
Safety, 55: 82-85.
Virginia, C. E., 2009. Pesticide and Aquatic Animals: A guide to reducing impact on
aquatic systems. Virginia Cooperative Extension Publication, 420-017. Virginia
Tech, Blacksburg, USA.
Werner, I., Moran, K., 2008. Effects of pyrethroid insecticides on aquatic organisms. In:
Gan, J., Spurlock, F., Hendley, P., Weston, D.P. (Eds.), Synthetic Pyrethroids:
Occurrence and Behavior in Aquatic Environments American Chemical Society,
Washington District of Columbia, 310-335.
Widmann, J. J., Cotran, R. S., Fahimi, H. D., 1972. Mononuclear phagocytes (Kupffer cells) and endothelial cells. The Journal of Cell Biology, 52(1): 159-170.

48
Williams, G. M., Bermudez, E., Scaramuzzino, D., 1977. Rat hepatocyte primary cell
cultures III. Improved dissociation and attachment techniques and the enhancement
of survival by culture medium. In vitro, 13(12): 809-817.
Winwood, P. J., Arthur, M. J., 1993. Kupffer cells: their activation and role in animal
models of liver injury and human liver disease. Seminars in Liver Disease, 13(1):
50-90.
World Health Organization. Environmental Health Criteria, 1989. Cypermethrin, Geneva:
United Nations Environmental Programme, the International labor organization, and
the World Health Organization. 82.
Wysowski, D. K., Swartz, L., 2005. Adverse Drug Event Surveillance and Drug
Withdrawals in the United States, 1969-2002: The Importance of Reporting
Suspected Reactions. Archives of Internal Medicine, 165(12): 1363-1369.
Xu, J. J., Diaz, D., O'Brien, P. J., 2004. Applications of cytotoxicity assays and prelethal
mechanistic assays for assessment of human hepatotoxicity potential. Chemico-
Biological Interactions, 150(1): 115-128.
Yamada, S., Otto, P. S., Kennedy, D. L., Whayne, T. F., 1980. The effects of
dexamethasone on metabolic activity of hepatocytes in primary monolayer culture.
In Vitro, 16(7): 559-570.
Yousef, M. I., 2010. Vitamin E modulates reproductive toxicity of pyrethroid lambda-
cyhalothrin in male rabbits. Food Chemical Toxicology, 48: 1152-1159.
Yousef, M. I., El-Demerdash, F. M., Al-Salhen, K. S., 2003. Protective role of isoflavones
against the toxic effect of cypermethrin on semen quality and testosterone levels of
rabbits. Journal of Environmental Science and Health, Part B, 38: 463-478.

49
APPENDIX
APPENDIX 1. GeniĢletilmiĢ Türkçe Özet (Extended Turkish Summary)
SİPERMETRİNİN VAN BALIĞI (Alburnus tarichi Güldenstädt, 1814) PRİMER
KARACİĞER KÜLTÜRÜ ÜZERİNE ETKİLERİ
OMAR, Aso Hemn
Yüksek Lisans Tezi, Biyoloji Anabilim Dalı
Tez DanıĢmanı: Doç. Dr. Ahmet Regaib OĞUZ
Ocak 2018, 63 sayfa
Sipermetrin hayvancılık ve ziraat alanlarında zararlı böceklerle mücadelede yaygın
olarak kullanılan sentetik bir insektisittir. Her ne kadar böceklerle mücade için kullanılsa da
zararsız diğer canlılar üzerine de olumsuz etkileri mevcuttur. Sipermetrin, Van Gölü
havzasında hayvancılık ve ziraai alanlarda kullanılmaktadır. Yoğun kullanım göl ve sucul
alanlarda da birikime neden olabilmektedir. Bu çalıĢmada, sipermetrin'in Van balığı
(Alburnus tarichi) primer hepatosit kültürü üzerine etkilerinin belirlemesi amaçlamıĢtır.
Van Balığından izole edilen karaciğer hücrelerine sipermetrinin farklı konsantrasyonları
(1×10⁻⁷
, 1×10⁻⁶
ve 1×10⁻⁵
M) 48 saat süresince uygulanmıĢtır. Hücre kültürünün 24 ve 48
saatlerinde Aspartat Aminotransferaz (AST), Alanin Aminotransferaz (ALT) ve Laktat
dehidrogenaz (LDH) seviyelerindeki değiĢim kültür ortamında belirlenmiĢtir. Ayrıca
sipermetrinin total oksidan (TOS) ve antioksidan seviyeleri (TAS), malondialdehit
seviyeleri (MDA) ve DNA hasarı üzerine etkileri belirlenmeye çalıĢılmıĢtır. Deneyler
sonucunda hepatosit sayısının sipermetrin uygulanan gruplarda önemli ölçüde azaldığı
invert ıĢık mikroskobunda belirlendi. Karaciğer hasarında sıklıkla kullanılan AST, ALT ve
LDH seviyeleri sipermetrin dozlarına bağlı olarak artıĢ göstermesine rağmen bu artıĢ
kontrol grubuna göre düĢük veya istatistiksel olarak önemsizdi. MDA seviyeleri,
inkübasyon sonunda doza bağlı olarak artıĢ gösterdi. TAS ve TOS seviyeleri, kontrol grubu
ile karĢılaĢtırıldığında herhangi bir farkın olmadığı gözlendi. DNA hasarının ise doza ve
zamana bağlı olarak artıĢ gösterdiği belirlendi. Sonuç olarak, uygulanan sipermetrinin Van
Balığı primer hepatosit kültürü üzerine yüksek toksik etkilerinin olduğu net bir biçimde
ortaya konmuĢtur.

50
1. GİRİŞ
Sipermetrin, sentetik bir piretroid olup zararlı böceklerle mücadelede dünya çapında
kullanılmaktadır (Igbedioh, 1991). Piretroitler piretrinin (Kasımpatı bitkilerinden elde
edilen haĢere ilaçları) yapay formlarıdır (Soderlund, 2002). Veterinerlik ve tarımsal
alanlarda böcek kontrolü için kullanılır (Gupta, 1990). Sipermetrin, geniĢ bir alanda
böceklere karĢı oldukça etkilidir. Fakat hedef olmayan kuĢ, balık ve arı gibi canlılarda da
toksik etkilere sahiptirler (Bhunya ve Pati, 1988). Balıklar, kimyasalın sucul alanlarda
birikimi nedeniyile fazla etkilenen canlı grubudur.
Sipermetrin Van Gölü havzasında sıklıkla kullanılan bir insektisittir. Fakat
kimyasalın Van Balıklarında in vivo ve in vitro etkileri hakkında herhangi bir bilimsel
araĢtırma bulunmamaktadır. Bu çalıĢmanın amacı, Van balıklarında (Alburnus tarichi)
primer hepatosit kültürü üzerine sipermetrin'in etkilerini belirlemektir.

51
2. MATERYAL ve YÖNTEM
1.1. Balık
Balıklar, serpme ağlar ile göle dökülen tatlı sulardan yakalandı. Yakalanan balıklar
oksijen bağlı taĢıma kaplarına alınarak laboratuvar ortamına getirildi. Balıklar, ticari
alabalık yemi ile beslendi ve 12:12 saat fotoperiyoda bırakıldı. Akvaryumlar için filtre
edilmiĢ çeĢme suyu kullanıldı ve su sıcaklığı hepatosit izolasyonu yapılıncaya kadar 24ºC
ye ayarlandı.
1.2. Kimyasallar
Sipermetrin oda sıcaklığında ve karanlıkta muhafaza edildi. ÇalıĢmada kullanılacak
Leibovitz-15 (L-15), enzimler ve diğer kimyasallar Sigma-Aldrich (Almanya) firmasından
satın alındı. Diğer bütün kimyasallar yüksek saflıkta kullanıldı.
1.3. Hepatosit İzolasyonu
Balıklar su içerisine katılan fenoksi etanol (320 mg/lt) ile anestezi edildi ve
sterilizasyon için %70’lik etanole daldırıldı. Daha sonra steril koĢullarda laminar akım
kabini (Esco) içerisinde disekte edildi. Balıkların karaciğerleri çıkartılarak saat camı
içerisine alındı. Doku etrafındaki yağ dokusu temizlendikten sonra küçük parçalara ayrılan
karaciğer dokusu, steril hepatosit tamponu (Hepatosit Tamponu: 0.145 M NaCl, 5.4 mM
KCl, 5 mM EDTA, 1.1 mM KH2PO4, 12 mM NaH2CO3, 3 mM NaHPO4 and pH:7.6) ile
oda sıcaklığında muamele edildi. Bu iĢlem, 30 dakikalık süre içerisinde birkaç kez
tekrarlandı. Daha sonra doku 2.5 mM CaCl2 içeren EDTA’sız hepatosit tamponu içerisine
alındı. Böylece kandan temizlenen doku, kollejenaz (0.5 mg ml) içeren L-15 içerisinde 30
dakika inkübe edildi. Ġnkübasyondan sonra doku iki defa farklı çaplara sahip mikropipet
uçları ile pipetlenip insülin enjektöründen geçirilerek tiritüre edidi. Bu iĢlem sonucunda

52
elde edilen hücre süspansiyounundaki süpernatant berraklaĢana kadar birkaç kez 90 Xg de
5 dakika santrifüj edildi. Santrifüj sonunda süpernatant atılarak yerine besi ortamı
(Leibovitz-15) konuldu. Besi ortamına kontaminasyonun önlenmesi amacıyla antibiyotik-
antimikotik solüsyon (10 ml/L) ve pH optimizasyonu için 5 mM NaHCO3 eklendi. Ġzole
edilen hücreler trypan blue (%4) ile boyanarak canlı ve ölü hücre ayrımı yapıldı. Thoma
lamı kullanılarak hücre sayımı gerçekleĢtirildi. Kültür içerindeki canlı hücrelerin oranının
%90’dan fazla olmasına dikkat edildi.
1.4. Hücre Kültürü
Ġzole edilen hücreler, önceden poly-L-lysine ile kaplanmıĢ 48 kuyucuklu kültür
kaplarına 1×10⁶ ml olacak Ģekilde ekildi. Her bir kuyucuğa toplam 500 μl besi ortamı ilave
edilerek kültür süresince 24ºC’lik inkübatörde nemli ortamda inkübe edildi. Hücrelerdeki
morfolojik değiĢimler ve kontaminasyon olup olmadığı invert mikroskopta (Leica marka
DM 6000 model) incelenecek ve görüntüleri alındı. Kültür ortamındaki pH değiĢimleri de
sürekli olarak kontrol edildi. Kültür besi ortamına farklı konsantrasyonlarda (1×10⁻⁷
, 1×10-
6 ve 1×10
-5 M) sipermetrin, kontrol grubuna ise sadece çözücü ilave edildi. Her bir doz
sipermetrin ve kontrol grubu 5’er adet kuyucuğa uygulandı. Kültürden alınan ekstrakt
analiz yapılıncaya kadar -80ºC’de derin dondurucuda saklandı.
1.5. Aspartat Aminotransferaz ve Alanin Aminotransferaz Seviyesinin Belirlenmesi
Aspartat aminotransferaz (AST) aktivitesi, aspartik asit ve ketoglutamik asitin
glutamik ve okzaloasetik asitlere dönüĢtürülmesi ile ölçüldü. Alanin aminotransferaz (ALT)
aktivitesi alanin ve ketoglutamik asitin glutamik ve piruvik asitlere dönüĢtürülmesi ile
belirlendi. Enzim iĢlemleri, indirgenmiĢ formun (NADH) oksitlenmiĢ forma (NAD)
dönüĢtürerek nikotinamid adenin dinükleotidi ile birleĢtirildi. NADH'nin oksidasyonu ile
üretilen absorbans azalıĢı 340 nm'de ölçüldü.

53
1.6. Lactate Dehydrogenase (LDH) Seviyesinin Belirlenmesi
LDH seviyesi, hücre kültür ortamından alınan örneklerden belirlendi. Bu nedenle
aĢağıdaki prosedür uygulandı:
1. Her kuyucuk iki kez, 2 ml PBS ile yıkandı.
2. Hepatositleri lize etmek için her kuyucuğa 1 ml potasyum fosfat tamponu içeren 10 μl
%10 Triton X-100 eklendi.
3. Hücreler kazınarak 1 ml'lik mikrosantrifüj tüpüne aktarıldı.
4. Tüpler, 30 dakika boyunca buz üzerinde inkübe edildi.
5. 2.85 ml reaksiyon tamponuna (0.1 M fosfat tamponu, pH 7.4 ve 5 mM NADH) 50 μl
hücre lizatı eklendi.
6. 100 μl, 20 mM sodyum piruvat solüsyonu ilave ederek reaksiyon baĢlatıldı.
7. 340 nm'de azalan absorbans oranını ölçülerek LDH değeri hesaplandı.
1.7. Malondialdehit (MDA) Seviyesinin Belirlenmesi
Hücreler inkübe edildikten sonra, numuneden 200 μl alınır ve 1 tüp içine
konulduktan sonra. 800 µl fosfat tamponu, 25 µl BHT çözeltisi ve 500 µl %30’luk TCA
ilave edildi. Tüpler vorteks ile karıĢtırıldıktan sonra buzdolabında (-80ºC) 30 dakika
tutuldu. Daha sonra 2000 rpm'de 15 dakika santrifüjlendi. Süpernatandan 1 ml alınarak
diğer tüplere aktarıldı. Daha sonra 75 μl EDTA ve 250 μl TBA ilave edildi. Tüpler
vorteksde karıĢtırıldı ve kaynar su banyosunda (90ºC) 15 dakika bekletildi. Daha sonra,
absorbansları 532 nm'de UV/V spektrofotometre ile okundu.

54
1.8. Total Antioksidan (TAS) ve Total Oksidan (TOS) Seviyesinin Belirlenmesi
Örneklerdeki antioksidanların koyu mavi-yeĢil renkli ABST radikalini renksiz
forma indirgemesine dayanan TAS ölçümünde; ticari kitler (Rel Assay Diagnostics)
kullanılarak kit prosedüründe belirtildiği Ģekilde spektrofotometrede örneklerin
absorbansları 660 nm'de ölçüldü. ÇalıĢmalarda verilen standart formüle göre örneklerin
TAS düzeyleri (mmol Trolox Eq L) hesaplandı. Örnekteki oksidanların ferröz iyon-Ģelatör
kompleksini ferrik iyonlara okside etmesiyle ferrik iyonlar asidik ortamda kromojen madde
ile renk oluĢturması esasına dayanan TOS ölçümünde; ticari kit (Rel Assay Diagnostics) ve
kit prosedürü kullanılarak spektrofotometrede örneklerin absorbansları (530 nm'de) ölçüldü
ÇalıĢmalarda verilen standart formüle göre örneklerin TOS düzeyleri (µmol H2O2 Eq./L)
hesaplandı.
1.9. DNA hasarının belirlenmesi
DNA hasarı ELISA kiti prosedürüne göre yapıldı. Buna göre:
1. Numune ve Standartları sulandırma solüsyonunda hazırlandı.
2. Hazırlanan standart ve numuneler, uygun kuyucuklara üçer defa eklendi.
3. Uygun kuyucuklara 10 μL seyreltilmiĢ antikor solüsyonu eklendi.
4. Mikpoplakanın üzerini örtün ve 1 saat (37°C) sıcaklıkta inkübe edildi.
5. Plakayı 0.35 ml Yıkama Tamponu ile 5 kez yıkayın. 30 saniye bekledikten sonra sıvı
boĢaltıldı.
6. Önce her kuyucuğa 50 μL kromojen çözeltisi eklendi ve sonra her kuyuya 50 μL
kromojen ekledi.
7. Plaka kapatıldı ve (37°C) 10 dakika boyunca inkübe edildi.
8. Her kuyucuğa 50 μL durdurma çözeltisi eklendi.
9. 450 nm'de bir plaka okuyucu üzerinde absorbansı ölçüldü.
10. Standart eğri çizildi ve örnek konsantrasyonu hesaplandı.

55
1.10. İstatistiksel Analiz
Deneyler sonunda elde edilen veriler ortlama ± Standart hata olarak verildi. Kontrol
ve sipermetrin grupları arasındaki fark ANOVA (one-way analysis of variance) ile farkın
derecesi ise Duncan testi ile belirlendi. Gruplar arasındaki fark P < 0.05’e göre verildi.

56
2. BULGULAR
2.1. Hücre kültürü
Kontrol ve sipermetrin uygulanan gruplar deney süresince invert ıĢık mikroskobu ile
kontrol edildi. Ġzolasyon sonunda bütün hücrelerin yuvarlak Ģekilli olduğu gözlendi. Her ne
kadar farklı iĢlemler uygulansa da oval Ģekilli eritrositlere kültür içerisinde rastlanıldı.
Hücrelerin izolasyondan sonra poly-L-Lysine kaplı hücre kültürü kaplarının tabanına
yapıĢtığı, hücre artıklarının ise medium içerisinde asılı kaldığı belirlendi. 24 saat sonunda
hücrelerin gruplar oluĢturarak bir araya geldiği gözlendi. Kültür sonunda gerek kontrol
gerekse sipermetrin uygulanan kuyucuklarda hücre sayısında azalmanın olduğu bu
azalmanın sipermetrin dozuna bağlı olarak arttığı ortaya konuldu. Kültür süresince herhangi
bir kontaminasyona ve pH değiĢimine rastlanılmadı.
ġekil A. Ġzolasyon sonunda poly-L-lysine kaplı kültür kaplarındaki hepatositler.
ġekil B. Sipermetrin (10-5
M) uygulanan hepatositlerin 24 saat sonundaki görüntüleri.
ġekil C. Sipermetrin (10-5
M) uygulanan hepatositlerin 48 saat sonundaki görüntüleri.

57
2.2. Aspartat Aminotransferaz (AST)
AST seviyesi sipermetrin uygulanan dozlarda 24 saat sonunda artıĢ gösterdi (Tablo
1). 48 saat sonra ise AST seviyesinde bir azalma görüldü. Bu artıĢlar kontrol grubu ile
kıyaslandığında istatistiksel olarak önemsizdi.
Tablo 1. Kontrol ve sipermetrin uygulanan kültürlerdeki AST seviylerindeki değiĢim.
Konsantrasyon 24 Saat 48 Saat
Kontrol 81.44 ± 8.13939de
51.06 ± 0.39573ab
10-7
M 61.2 ± 2.37971bc
53.14 ± 1.33963ab
10-6
M 72.38 ± 6.37585cd
54.3 ± 0.80436ab
10-5
M 86.44 ± 5.31513e 45.98 ± 1.58316
a
Değerler ortalama ± standart hatanın ortalaması olarak verilmiĢtir. Farklı harfler gruplar
arasındaki farklılıkları ifade eder P < 0.05.
2.3. Alanin Aminotransferaz (ALT)
ALT seviyesi sipermetrinin artan dozlarına bağlı olarak 24 ve 48 saatler sonunda
(10-7
, 10-6
ve 10-5
M) artıĢ göstermiĢtir (Tablo 2). 24 saat sonunda sipermetrin grubu kontrol
grubu ile kıyaslandığında istatistiksel olarak artıĢ göstermiĢtir. 48 saat sonunda ALT
seviyeleri bütün gruplarda azalma göstermiĢtir.
Tablo 2. Kontrol ve sipermetrin uygulanan kültürlerdeki ALT seviylerindeki değiĢim.
Konsantrasyon 24 Saat 48 Saat
Kontrol 17.64 ± 1.76227de
21.04 ± 1.37862ef
10-7
M 19.92 ± 0.56160ef
11.28 ± 0.42708a
10-6
M 22.68 ± 0.56427e 13.4 ± 0.54406
ab
10-5
M 16.42 ± 0.67483cd
14.14 ± 0.32187bc
Değerler ortalama ± standart hatanın ortalaması olarak verilmiĢtir. Farklı harfler gruplar
arasındaki farklılıkları ifade eder P < 0.05.

58
2.4. Laktat dehidrogenaz (LDH)
Laktat dehidrogenz seviyesi sipermetrin uygulanan gruplarında artıĢ göstermiĢtir
(Tablo 3). Fakat bu seviye 48 saat sonunda azalma göstermiĢtir.
Tablo 3. Kontrol ve sipermetrin uygulanan kültürlerdeki LDH seviylerindeki değiĢim.
Konsantrasyon 24 Saat 48 Saat
Kontrol 295 ± 55.87307bc
428.6 ± 28.60524bc
10-7
M 171 ± 21.28849ab
61.4 ± 12.58014a
10-6
M 292 ± 50.71548bc
77.4 ± 16.09534a
10-5
M 342.8 ± 49.16442bc
87.6 ± 8.90281a
Değerler ortalama ± standart hatanın ortalaması olarak verilmiĢtir. Farklı harfler gruplar
arasındaki farklılıkları ifade eder P < 0.05.
3.5. Malondialdehyde (MDA)
MDA seviyesi sipermetrin uygulanan gruplarda doza bağlı olarak artıĢ göstermiĢtir
(Tablo 4). Fakat zamana bağlı olarak (48 saat) hem sipermetrin gruplarıda hem de kontrol
grubunda azalma göstermiĢtir.
Tablo 4. Kontrol ve sipermetrin uygulanan kültürlerdeki MDA seviyelerindeki değiĢim.
Konsantrasyon 24 Saat 48 Saat
Kontrol 0.3226 ± 0.02795d 0.2130 ± 0.01342
bc
10-7
M 0.2244 ± 0.01780bc
0.1520 ± 0.0812a
10-6
M 0.2476 ± 0.01698c 0.1702 ± 0.01770
ab
10-5
M 0.2602 ± 0.02365c 0.1982 ± 0.02297
abc
Değerler ortalama ± standart hatanın ortalaması olarak verilmiĢtir. Farklı harfler gruplar
arasındaki farklılıkları ifade eder P < 0.05.

59
3.6. Total antioksidan (TAS) ve Total oksidan seviyesi (TOS)
Uygulama sonunda TAS seviyesinde gruplar arasında herhangi bir fark
gözlenmemiĢtir (Tablo 5). TOS seviyesinde ise zamana bağlı olarak bir azalma
belirlenmiĢtir (Tablo 6).
Tablo 5. Kontrol ve sipermetrin uygulanan kültürlerdeki TAS seviyelerindeki değiĢim.
Konsantrasyon 24 Saat 48 Saat
Kontrol 0.6542 ± 0.18918a 0.5110 ± 0.11704
a
10-7
M 0.5703 ± 0.20701a 0.8600 ± 0.14735
a
10-6
M 0.6234 ± 0.17441a 0.3012 ± 0.09703
a
10-5
M 0.7036 ± 0.22135a 0.5703 ± 0.12845
a
Değerler ortalama ± standart hatanın ortalaması olarak verilmiĢtir. Farklı harfler gruplar
arasındaki farklılıkları ifade eder P < 0.05.
Tablo 6. Kontrol ve sipermetrin uygulanan kültürlerdeki TOS seviyelerindeki değiĢim.
Konsantrasyon 24 Saat 48 Saat
Kontrol 19.3818 ± 0.83059cd
8.0190 ± 0.47231a
10-7
M 13.4356 ± 0.53533bc
9.0190 ± 0.69894a
10-6
M 13.6498 ± 0.64288ab
9.7660 ± 0.41183a
10-5
M 13.8605 ± 1.7388bc
9.5073 ± 0.37557a
Değerler ortalama ± standart hatanın ortalaması olarak verilmiĢtir. Farklı harfler gruplar
arasındaki farklılıkları ifade eder P < 0.05.

60
3.7. 8-Hydroksi deoksiguanozin (8-OHdG) seviyesi
8-Hydroksi deoksiguanozin (8-OHdG) seviyesi incelendiğinde hem doza hem de
zamana bağlı olarak bir artıĢın olduğu görülmektedir. Diğer değerlerin aksine deney
süresinin sonuna kadar artarak devam etmiĢtir (Tablo 7.).
Tablo 7. Kontrol ve sipermetrin uygulanan kültürlerdeki 8-Hydroksi deoksiguanozin
seviylerindeki değiĢim.
Konsantrasyon 24 Saat 48 Saat
Kontrol 16.2181 ± 1.21867a 20.2747 ± 1.30813
bc
10-7
M 20.2377 ± 2.11896ab
22.9804 ± 0.65993bc
10-6
M 20.8668 ± 0.92706ab
27.6176 ± 1.88795cd
10-5
M 23.0074 ± 1.46299ab
26.6569 ± 0.69192cd
Değerler ortalama ± standart hatanın ortalaması olarak verilmiĢtir. Farklı harfler gruplar
arasındaki farklılıkları ifade eder P < 0.05.

61
3. TARTIŞMA ve SONUÇ
Sipermetrin, tarım sektöründe ve hayvancılıkta kullanılan bir pestisittir. Ayrıca,
balık yetiĢtiriciliğinde ektoparazit enfeksiyonlarının kontrolü için yaygın olarak
kullanılmaktadır. Bu çalıĢmada Van balıklarının birincil hepatosit kültüründe sipermetrin (1
× 10-7
, 1 × 10⁻⁶
ve 1 × 10⁻⁵
M) farklı dozların toksik etkileri Aspartat Aminotransferaz
(AST), Alanin Aminotransferaz (ALT), Laktat dehidrogenaz (LDH), Malondialdehit
(MDA), Toplam antioksidan durumu (TAS), Toplam oksidatif durum (TOS), 8-
Hidroksideoksiguanozin (8-OHdG) ve Protein Analizi ile belirlendi.
Hepatosit izolasyonu ve deney süresi sonunda kontrol grubundaki hücre yapılarının
literatürlere uyumlu olduğu gözlendi. Herhangi bir kimyasal uygulanmayan kontrol
grubunda da hücre ölümleri gerçekleĢti. Sipermetrin uygulanan gruplarda hücre sayılarının
doza ve zamana bağlı olarak azaldığı mikroskobik olarak belirlendi.
Hücresel hasarın belirlenmesinde AST, ALT ve LDH hem in vivo hem de in vitro
çalıĢmalarda yaygın bir Ģekilde kullanılmaktadır. Bu nedenle zararlı kimyasalların karaciğer
toksisitesi üzerine etkileri bu parametreler ile belirlenmektedir. Bu çalıĢmada, sipermetrinin
Van Balığı primer hepatosit kültürü üzerine etkilerinin belirlenmesinde AST, ALT ve LDH
kullanıldı. Değerler sipermetrin dozuna bağlı olarak artıĢ gösterdi. Fakat bu artıĢ sadece 24
saat sonunda önemliydi. 48 saat sonunda bütün sipermetrin dozlarında azalma gözlendi.
Farklı sipermetrin uygulanan gruplar, kontrol grubu ile kıyaslandığında istatistiksel olarak
düĢüktü. Literatüre göre zıtlık gösteren bu durum sipermetrinin Van Balığı hepatositleri için
yüksek derecede toksik olduğunu ve kültürlerde hücre sayısındaki azalmaya neden olduğu
söylenebilir. El-Tawil ve Ark., (1997) sipermetrinin 2 saat içerisinde rat hepatositlerininin
yaklaĢık %50 sini öldürdüğünü belirtmiĢtir. Ayrıca sipermetrinin in vivo uygulamaları da
karaciğerde geri dönüĢümsüz hasara neden olmaktadır (Velisek et al., 2006; Monir ve Ark.,
2015). 48 saatin sonunda kontrol grubunda yüksek AST, ALT ve LDH’ın nedeni ise
hepatosit izolasyonu sırasında farklı enzim ve mekanik ayrıĢtırmanın hücrelerde
oluĢturduğu hasar olabilir. Ayrıca, kültür ortamındaki total protein seviyeleride zamana
bağlı olarak hücre sayısındaki azalmayı dolaylı olarak göstermektedir (Tablo 1-3).

62
Kirleticilere maruz kalan dokularda lipid peroksidasyon seviyesinde artıĢ
gözlenmektedir. Bu nedenle oksidatif stresin belirlenmesinde lipid peroksidasyonu sıklıkla
kullanılan bir biyoindikatördür (Farombi et al., 2008; Tiwari et al., 2010). Bu çalıĢmada
sipermetrinin dozlarına bağlı olarak MDA seviyeleri artıĢ göstermiĢtir (Tablo 4). Fakat bu
artıĢ istatistiksel olarak önemli değildi. Ayrıca, 24 ve 48 Saatler sonunda kontrol grubuna
göre de düĢük seviyedeydi (P<0.05). Bu durum MDA’nın yarılanma ömürün kısa
olmasından ve sipermetrin uygulanan kültürlerdeki hücre ölümlerinden kaynaklanmıĢ
olabilir. Gil ve Ark., (2010) Paraquat zehirlenmesi gösteren hastalarda MDA seviyesinin
dalgalı olduğunu ve MDA’nın yarı ömrünün kısa olması nedeni ile MDA’nın oksidatif
hasar belirlemesinde güvenilir olmadığını belirtmiĢtir.
Total antioksidan ve total oksidan seviyeleri Tablo 5 ve Tablo 6 de gösterilmiĢtir.
TAS ve TOS seviyeleri 48 saatin sonunda 24 saate göre azalma göstermiĢtir. Değerler
konrol grubu ile karĢılaĢtırıldığında istatistiksel olarak bir farkın olmadığı gözlemiĢtir.
Hücreler tarafından üretilen oksidan maddeler belirli sınırlar içerisinde kaçınılmazdır.
Oksidan maddelerin hücre içerisinde artmasıyla birlikte hücre içerisindeki lipid, protein ve
DNA’da hasarlara neden olmaktadır (Sies, 1997; Velisek et al., 2006; Birben et al., 2012).
8-OHdG, DNA temelli oksidatif hasarın belirlenmesinde sıklıkla kullanılan bir
biyoindikatördür. Pek çok canlı türünde ve farklı dokularındaki hasarın belirlenmesinde
kullanılmıĢtır (Honda et al., 2000; Arslan et al., 2017; Geyikoglu et al., 2017). Sipermetrin
uygulaması sonucunda 8-OHdG seviyeleri (Tablo 7) doza ve zamana bağlı olarak (P<0.05)
artıĢ göstermektedir. Sonuçlar sipermetrinin hepatositler üzerindeki hasarını net bir Ģekilde
ortaya koymuĢtur.
Sonuç olarak, Sipermetrinin primer hepatosit kültürü üzerine oksidatif hasarı her ne
kadar karaciğer enzimleri, TAS ve TOS ile çok net olarak gösterilememiĢtir. Bu da
çalıĢmada kullanılan dozların Van balığı karaciğer hücreleri için direkt öldürücü etkisinden
kaynaklandığı düsünülmektedir. Fakat oksidatif hasar MDA, DNA hasarı gibi parametreler
ile net bir Ģekilde ortaya konmuĢtur.

CURRICULUM VITAE
Aso Hemn OMAR was born on 9 January 1993, in sub-district of Pirmam, Erbil
province of Iraq. I finished my primary, basic and high school in Pirmam. Then in the year
of 2011, accepted to study Bachelor degree in Biology Department, Faculty of Science and
Health at Koye University, and graduated in 2015. Began my Master of Science degree in
General Biology in February, 2016 at Van Yüzüncü Yıl University in Van-Turkey.

64
Copyright © 2022 FDOKUMEN


![Die rol van Nederland in die transnasionale beweging van enkele Afrikaanse skrywers [Andre Brink, Breyten Breytenbach, Etienne van Heerden, Antjie Krog, Marlene van Niekerk]](https://static.fdokumen.com/doc/165x107/63193579e9c87e0c091003c7/die-rol-van-nederland-in-die-transnasionale-beweging-van-enkele-afrikaanse-skrywers.jpg)