Valuation of Mangrove in Kupang Bay, West Timor, Indonesia ...
16
Nat. Volatiles & Essent. Oils, 2021; 8(4): 15459-15474 15459 Valuation of Mangrove in Kupang Bay, West Timor, Indonesia (A Case Study of Bipolo Village) Fredrik L. Benu 1 ; Fouren Dethan 1 ; Paul King 2 ; Hamza H. Wulakada 3 ; Agus Nalle 1 1 Department of Environment, Nusa Cendana University, Indonesia 2 Department of Environment, Griffith University, Australia 3 Department of Geography, Nusa Cendana University, Indonesia ABSTRACT: BACKGROUND AND OBJECTIVES:Mangrove in Bipolo Village, located on Kupang Bay, East Nusa Tenggara (NTT), is part of the ecosystem of the Marine Tourism Park of Kupang Bay established by Decree of the Minister of Forestry of Indonesia No. 18/Kpts-II/1993. A critical question that needs to be addressed regarding the value of mangrove resources. This study has analyzed various aspects of mangrove conversion to salt pond, especially the economic value of mangrove based on market prices for the various outputs. This study used accidental sampling to collect information regarding the benefits (products and services) produced by mangrove for people who have socio-economic (livelihood) activities along the bay coastline. Purposive sampling was used to collect information from the investors and laborers in the salt pond industry regarding the technical details of the salt industry salt production. METHODS:This study analyses (i) the types and components of input and output for salt production, (ii) the value of mangrove utilization based upon production volume and Market Price/ha/year, (iii) the value of mangrove wood, (iv) the recapitulation of type and direct benefit of mangrove resources, (v) the value of physical function of indirect use of mangrove, and (vi) the total economic. FINDINGS:The results of the research show that (i) the values indicate that natural resources and the envi-ronment need a higher level of appreciation, and (ii) the total economic value of mangrove vegetation in Bipolo Village, which reaches IDR374,731,172/ha/year or US $ 25,622/ha/year, could be considered as the compensation fee paid by commercial industries that convert mangrove vegetation for commercial purposes. CONCLUSION: This compensation fee could benefit the local authority for mangrove restoration projects. KEYWORDS:Valuation, Economy, Mangrove, Salt, Indonesia. INTRODUCTION
-
Upload
khangminh22 -
Category
Documents
-
view
1 -
download
0
Transcript of Valuation of Mangrove in Kupang Bay, West Timor, Indonesia ...

Nat. Volatiles & Essent. Oils, 2021; 8(4): 15459-15474
15459
Valuation of Mangrove in Kupang Bay, West Timor,
Indonesia (A Case Study of Bipolo Village) Fredrik L. Benu1 ; Fouren Dethan1 ; Paul King2 ; Hamza H. Wulakada3 ; Agus
Nalle1
1 Department of Environment, Nusa Cendana University, Indonesia
2 Department of Environment, Griffith University, Australia
3 Department of Geography, Nusa Cendana University, Indonesia
ABSTRACT:
BACKGROUND AND OBJECTIVES:Mangrove in Bipolo Village, located on Kupang Bay, East Nusa Tenggara (NTT), is part of
the ecosystem of the Marine Tourism Park of Kupang Bay established by Decree of the Minister of Forestry of Indonesia No.
18/Kpts-II/1993. A critical question that needs to be addressed regarding the value of mangrove resources. This study has
analyzed various aspects of mangrove conversion to salt pond, especially the economic value of mangrove based on market
prices for the various outputs. This study used accidental sampling to collect information regarding the benefits (products
and services) produced by mangrove for people who have socio-economic (livelihood) activities along the bay coastline.
Purposive sampling was used to collect information from the investors and laborers in the salt pond industry regarding the
technical details of the salt industry salt production.
METHODS:This study analyses (i) the types and components of input and output for salt production, (ii) the value of
mangrove utilization based upon production volume and Market Price/ha/year, (iii) the value of mangrove wood, (iv) the
recapitulation of type and direct benefit of mangrove resources, (v) the value of physical function of indirect use of
mangrove, and (vi) the total economic.
FINDINGS:The results of the research show that (i) the values indicate that natural resources and the envi-ronment need a
higher level of appreciation, and (ii) the total economic value of mangrove vegetation in Bipolo Village, which reaches
IDR374,731,172/ha/year or US $ 25,622/ha/year, could be considered as the compensation fee paid by commercial
industries that convert mangrove vegetation for commercial purposes.
CONCLUSION: This compensation fee could benefit the local authority for mangrove restoration projects.
KEYWORDS:Valuation, Economy, Mangrove, Salt, Indonesia.
INTRODUCTION
Nat. Volatiles & Essent. Oils, 2021; 8(4): 15459-15474
15460
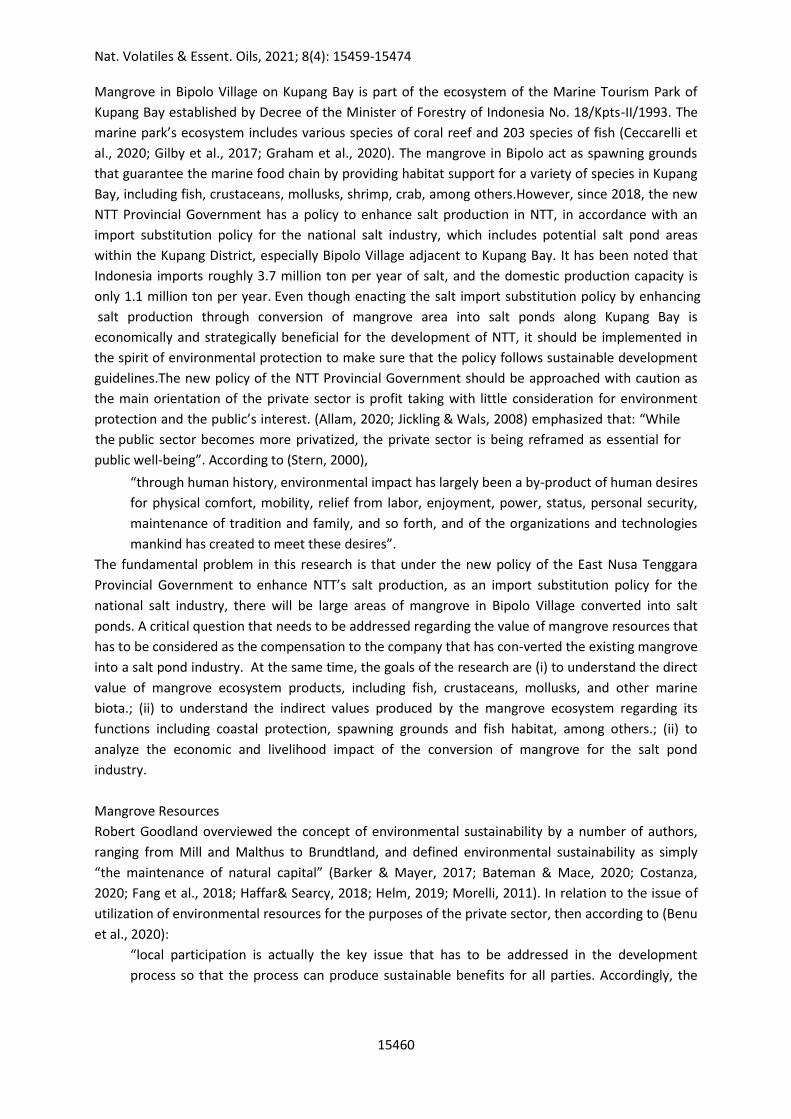
“through human history, environmental impact has largely been a by-product of human desires
for physical comfort, mobility, relief from labor, enjoyment, power, status, personal security,
maintenance of tradition and family, and so forth, and of the organizations and technologies
mankind has created to meet these desires”.
The fundamental problem in this research is that under the new policy of the East Nusa Tenggara
Provincial Government to enhance NTT’s salt production, as an import substitution policy for the
national salt industry, there will be large areas of mangrove in Bipolo Village converted into salt
ponds. A critical question that needs to be addressed regarding the value of mangrove resources that
has to be considered as the compensation to the company that has con-verted the existing mangrove
into a salt pond industry. At the same time, the goals of the research are (i) to understand the direct
value of mangrove ecosystem products, including fish, crustaceans, mollusks, and other marine
biota.; (ii) to understand the indirect values produced by the mangrove ecosystem regarding its
functions including coastal protection, spawning grounds and fish habitat, among others.; (ii) to
analyze the economic and livelihood impact of the conversion of mangrove for the salt pond
industry.
Mangrove Resources
Robert Goodland overviewed the concept of environmental sustainability by a number of authors,
ranging from Mill and Malthus to Brundtland, and defined environmental sustainability as simply
“the maintenance of natural capital” (Barker & Mayer, 2017; Bateman & Mace, 2020; Costanza,
2020; Fang et al., 2018; Haffar& Searcy, 2018; Helm, 2019; Morelli, 2011). In relation to the issue of
utilization of environmental resources for the purposes of the private sector, then according to (Benu
et al., 2020):
“local participation is actually the key issue that has to be addressed in the development
process so that the process can produce sustainable benefits for all parties. Accordingly, the
Mangrove in Bipolo Village on Kupang Bay is part of the ecosystem of the Marine Tourism Park of
Kupang Bay established by Decree of the Minister of Forestry of Indonesia No. 18/Kpts-II/1993. The
marine park’s ecosystem includes various species of coral reef and 203 species of fish (Ceccarelli et
al., 2020; Gilby et al., 2017; Graham et al., 2020). The mangrove in Bipolo act as spawning grounds
that guarantee the marine food chain by providing habitat support for a variety of species in Kupang
Bay, including fish, crustaceans, mollusks, shrimp, crab, among others.However, since 2018, the new
NTT Provincial Government has a policy to enhance salt production in NTT, in accordance with an
import substitution policy for the national salt industry, which includes potential salt pond areas
within the Kupang District, especially Bipolo Village adjacent to Kupang Bay. It has been noted that
Indonesia imports roughly 3.7 million ton per year of salt, and the domestic production capacity is
only 1.1 million ton per year. Even though enacting the salt import substitution policy by enhancing
salt production through conversion of mangrove area into salt ponds along Kupang Bay is
economically and strategically beneficial for the development of NTT, it should be implemented in
the spirit of environmental protection to make sure that the policy follows sustainable development
guidelines.The new policy of the NTT Provincial Government should be approached with caution as
the main orientation of the private sector is profit taking with little consideration for environment
protection and the public’s interest. (Allam, 2020; Jickling & Wals, 2008) emphasized that: “While
the public sector becomes more privatized, the private sector is being reframed as essential for
public well-being”. According to (Stern, 2000),

Nat. Volatiles & Essent. Oils, 2021; 8(4): 15459-15474
15461
local people should understand that their participation in the development process might
produce a benefit for themselves in the long term”.
Research conducted by (Alfahmi et al., 2019; Amron&Hilmi, 2018; Daryono et al., 2021; Priyatna et
al., 2014; Purba et al., 2021; Sui et al., 2020) found that there are at least 19 different characteristics
of coastlines in Indonesia, being (1) Coastline of Small Island (2) Settlement facing directly to
Coastline, (3) Coast-Settlement-Hill, (4) Coast-Open land-Settlement, (5) Coast-Agriculture area-
Settlement-Hill, (6) Settlement Behind Forest, (7) Settlement behind Hill, (8) Coastal-Open Land-
Agriculture Area-Forest, (9) Fishpond and settlement facing directly to coastline, (10) Settlement
behind mangrove, (11) Mangrove forest, (12) Gulf coast and settlement, (13) Coastal Hill, (14)
Fishpond-Settlement-Hill facing directly to coastline, (15) Gulf-settlement hill facing directly to
coastline, (16) Coastal forestry, (17) Open land facing coastline, (18) Fishpond-hill facing coastline,
and (19) Swamp-Open land facing coastline.
Mangrove Resources
According to (Sousa et al., 2019; Turner et al., 1994), in order to arrive at an aggregate measure of
value (total economic value) of natural resources, we should distinguish the concept of “use values”
and “non-use values”. The relationship between use values and non-use values for a woodland case
is presented in Figure 1.
Woodland Resource
Non - Use ValueUse Value
Direct Use Value Indirect Use Value Option Use Value Bequest Value Existence Value
e.g. timber revenues
e.g. recreation (variuns forms carbon fixing)
e.g. future personal
recreation
e.g. future generation
recreation, or nature
preservation wants
e.g. preserving biodiversity
from development from conservation
Total Development Benefits Total Conservation Benefits
Figure 1. The total Economic Value of Natural Resources (Woodland)
Source: (Turner et al., 1994)
As shown in Figure 1 the total value of woodland can be categorized into “use value” and “non-use
value”. The use value itself consists of (i) “direct value” and “in-direct value”, (ii) option use value and
(iii) part of “bequest value”. At the same time, non-use value consists of (i) “existence value” and (ii)
part of “bequest value”. Furthermore, any component of direct value, indirect value, option use
value, bequest value and existing value will depend on the type of natural resource evaluated. The
concept of total economic benefit and cost of mangrove ecosystem is seen in Figure 2.

Nat. Volatiles & Essent. Oils, 2021; 8(4): 15459-15474
15462
Direct Use ValueOutputs that can be
consumed directly, such as timber medicine, food,
recreaation, etc.
Indirect Use Value Ecological services,
such as food control, storm protection,
carbon sequestration, climatic control, etc.
Option Use ValueThe premium placed on
maintaining PA s for future possible direct and indirect uses, some of which may
not be known now
Existence ValueThe intrinsic value of PA
resources and ecosystems, irrespective of their use,
such as cultural, aesrhetic, bequest significance, etc
USE
TOTAL ECONOMIC BENEFIT OF ECOSYSTEMS
Management CostsCost of equipment capital,
wages buildings running costs, policing, etc
Costs to Other ActivitiesHuman disease and injury
livestock losses, crop destruction competition for
resources, etc
NON USE
TOTAL ECONOMIC COST OF ECOSYSTEMS
DIRECT INDIRECT
Opportunity CostsAlternative land and resource uses foregone loss of profits and alternative investments,
etc Figure 2. The Concept of Total Economic Value of Mangrove Ecosystem
Sources: IUCN, The World Conservation Union
As stated in (Plottu&Plottu, 2007) Total Economic Value (TEV):
… highlights the multidimensional nature of the economic value of ecosystems, which ranges
far beyond direct use values and encompasses indirect use values, optional values and non-use
values. TEV is useful to relate to the socio-economic values (for example livelihoods) through
direct use values such as fish, mollusks, crustaceans, medicines, and forest products.
In the same vein, mangrove also contributes indirect value to support economic activity through
habitat provision, nutrient recycling, water purification, and flood control (de Souza Queiroz et al.,
2017; Gillanders et al., 2019; Matos et al., 2020; Morris et al., 2018; Onyena & Sam, 2020). One of the
most important indirect values of mangrove is the protective function provided by mangrove
ecosystems against wave and storm energy, both in terms of ongoing coastal erosion and damage
from extreme events (Amma & Bhaskaran, 2020; Charrua et al., 2020; de Jong et al., 2021; Gracia et
al., 2018; Mafi-Gholami et al., 2020; Mentaschi et al., 2018).Based on the logical framework of this
study, there is an inextricable link between the structure and processes of the ecologic functions of
mangrove and the ecological-economic benefits produced by mangrove. Some benefits of mangrove
ecosystem functions that can be identified, including clean water and regulation of water supply,
storm protection, assimilative capacity including carbon sequestration, biochemical cycling,
purification and detoxification processes, nutrient flows, biodiversity maintenance, wood for fuel and
building materials, various non-timber forest products (NTFPs) and opportunities for tourism and
recreational activities (Mitra, 2020; Owuor et al., 2019; Pastorinho&Pais, 2019; Rizal et al., 2018;
Sofian et al., 2019).There are three methods of analysis that might be used to value all the products
and services provided by mangrove including: (i) market price method to value non-fish mangrove
products (NFMFP); (ii) effect on product method to value fisheries production through habitat
provision; and (iii) restoration cost method to value coastal protection “Economic Value of Mangrove
(Word)” (n.d.).

Nat. Volatiles & Essent. Oils, 2021; 8(4): 15459-15474
15463
MATERIALS AND METHODS
This study was conducted along the coastline of Bipolo Village in the District of Kupang, East Nusa
Tenggara Province (NTT) of Indonesia. The study relies on both primary data collection and the use of
secondary data sources to draw conclusions. Data collection methods were focused on mangrove
habitat and local community impacts. This study used accidental sampling to collect information
regarding the benefits (products and services) produced by mangrove for people who have socio-
economic (livelihood) activities along the bay coastline. Purposive sampling was used to collect
information from the investors and laborers in the salt pond industry regarding the technical details
of the salt industry salt production. This study analyzed aspects of mangrove conversion to salt pond,
especially regarding the economic value of mangrove, based on market prices for the various
outputs.This study analyses (i) the types and components of input and output for salt production, (ii)
the value of mangrove utilization based upon production volume and Market Price/ha/year, (iii) the
value of mangrove wood, (iv) the recapitulation of type and direct benefit of mangrove resources, (v)
the value of physical function of indirect use of mangrove, and (vi) the total economic.The method
used to assess the value of direct use of mangrove area is based upon the combined annual market
value of catch-fish products, including prawns, crabs, and the value of mangrove fruit and seeds. The
net direct value is calculated by taking the value of annual production, at market price, and
subtracting operational costs. Meanwhile, the value of mangrove wood is calculated by the use of
the following for-mula:
Vha x H = 1/2n D2TK x H-B (US $ m3/ha/year).
Where: Vha is the mangrove wood volume per ha per year for 1000 logs.
At the same time, the indirect value of mangrove is calculated based on the function of mangrove as
feeding ground, nursery ground, spawning ground, and the physical value of mangrove as an
abrasion barrier. Furthermore, a biodiversity value suggested by (Ruitenbeek, 1994) is used to
estimate optional value of mangrove.Finally, bequest value can be interpreted as the value of
nurturing resources for utilization in the future. The value of nurturing the resources might be
calculated based on a prediction approach of about 10 % of the direct utilization value (Ruitenbeek,
1994).
RESULTS AND DISCUSSION
Historical Perspective
Bipolo is one of the villages located in the eastern part of Kupang Bay under the authority of the
government of Kupang District, East Nusa Tenggara Province of Indonesia. Bipolo is located adjacent
to the border of the capital city of Kupang District, ap-proximately 12 km from the city center. Bipolo
Village is surrounded by Kupang Bay to the south, Oelatimo Village and Nunkurus Village to the east,
Oeteta Village to the west, and West Fatuleu District, Oelbiteno Village and Nunsaen Village to the
north (See Figure 4).The government system of Bipolo Village was actually an old government system
called “Temukung Bipolo”. This traditional governmental system, together with an-other old village
government system called “Temukung NaiLete”, are representative of a higher traditional
governmental hierarchy which is call “Kefetoran Babau”. Furthermore, this old government system
was reformed into a governmental system called “Desa Gaya Baru” based on the East Nusa Tenggara
Province Governor Decree of No. 2/1/27 in 1964. This had the effect that both the previous

Nat. Volatiles & Essent. Oils, 2021; 8(4): 15459-15474
15464
governmental system of “temukung” Bipolo and NaiLete, were merged into one new village
government called “Desa Bipolo”.However, the traditional leadership of Bipolo Village still exists in
the new gov-ernment system until now. Generally, there are four dominant clans that are the land-
lords of Bipolo Village. They are Clan Tapikap, Clan Kasenube, Clan Utan, and Clan Tanono. The
leadership of Bipolo Village is always rotated periodically among the four clans. Currently, the Head
of Bipolo Village is TheofilusTapikap (2018-2024), who replaced Matheos Tapikap, the previous Head
of Bipolo Village (2007 – 2018).
Natural Resources, Dry Land Agriculture and Food Security
Climatic conditions in Bipolo Village are generally influenced by two seasons, the wet season from
December to March and the dry season from June until September. Like most regions in East Nusa
Tenggara Province, the dry season during the period of June – September is determined by the wind
blowing from the south with limited water vapor. The wet season is determined by the wind blowing
from the north laden with an abundance of water vapor, after crossing Asia and the Pacific Ocean.
This vapor laden wind first passes over other regions to the north, including Sumatra, Java, Borneo,
and Sulawesi, delivering large amounts of precipitation before dropping the remaining smaller
portion of water on Timor Island, including Bipolo Village. These climatic conditions determine the
type of agricultural activities conducted in Bipolo Village, which are dominated by dry land
agriculture. The average annual air temperature is about 30 – 36 0C with a minimum temperature
range of about 21 – 24.5 0C and an average annual precipitation of about 1164 mm/year. Although
there are 12 ha of dry paddy field with semiirrigated facilities, other dry land farmers on Timor Island,
in relation to the hard climate condition and food security issue, develop their own mitigation and
adaptation strategies to overcome extreme climate conditions such as drought and flood. Some dry
land farmers, over generations have developed a traditional mixed cropping system by putting all
food crop seeds in the one furrow. This coping method is to anticipate the failure of crops in extreme
weather condition. In general, local Timorese farmers put food security as the first priority over
income. Timorese farmers totally rely on nature as their provider, rather than on other actors such as
financial institutions (banks, cooperatives), government subsidies, and NGO and research agency
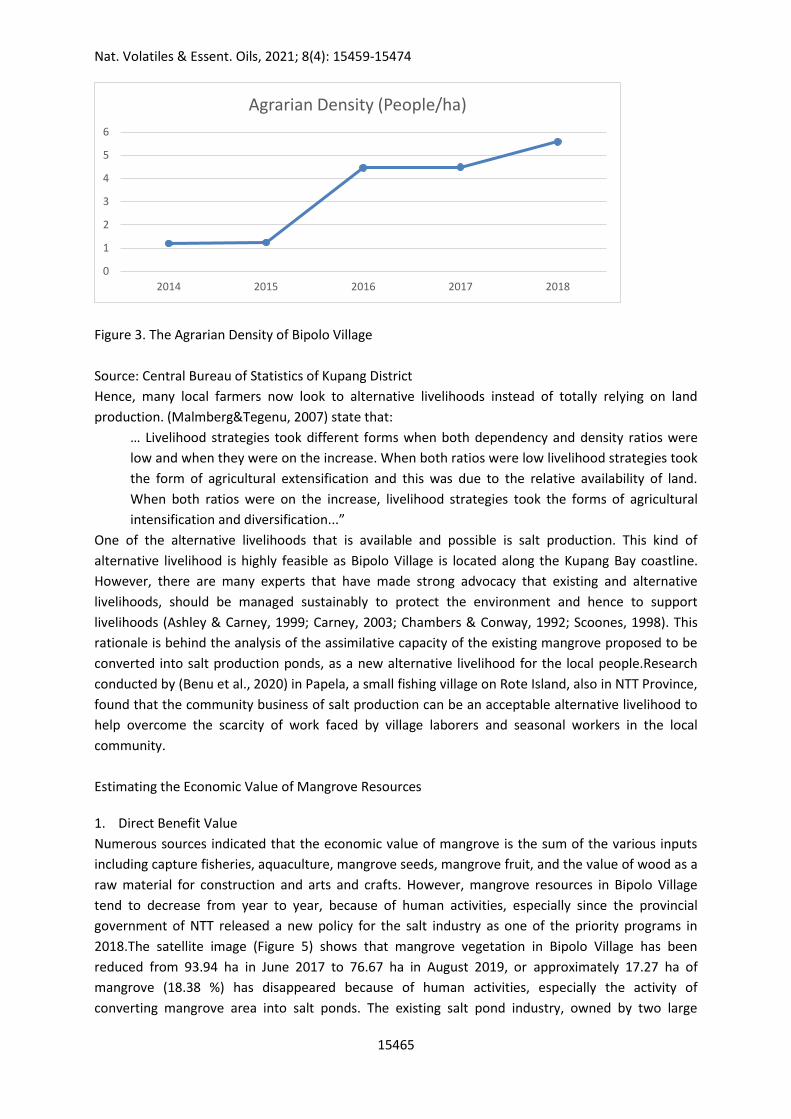
support.Additionally, there is population pressure on land occupation that has influenced the low
productivity per capita of the available productive land. The population of Bipolo Village has tended
to increase over the last 5 years. At the same time, the available area of arable land has decreased
due to the conversion of productive land to settlement areas, infrastructure facilities and other
economic activities. This condition has dictated an increase in agrarian density, as seen in Figure 3.
Nat. Volatiles & Essent. Oils, 2021; 8(4): 15459-15474
15465
Figure 3. The Agrarian Density of Bipolo Village
Source: Central Bureau of Statistics of Kupang District
Hence, many local farmers now look to alternative livelihoods instead of totally relying on land
production. (Malmberg&Tegenu, 2007) state that:
… Livelihood strategies took different forms when both dependency and density ratios were
low and when they were on the increase. When both ratios were low livelihood strategies took
the form of agricultural extensification and this was due to the relative availability of land.
When both ratios were on the increase, livelihood strategies took the forms of agricultural
intensification and diversification...”
One of the alternative livelihoods that is available and possible is salt production. This kind of
alternative livelihood is highly feasible as Bipolo Village is located along the Kupang Bay coastline.
However, there are many experts that have made strong advocacy that existing and alternative
livelihoods, should be managed sustainably to protect the environment and hence to support
livelihoods (Ashley & Carney, 1999; Carney, 2003; Chambers & Conway, 1992; Scoones, 1998). This
rationale is behind the analysis of the assimilative capacity of the existing mangrove proposed to be
converted into salt production ponds, as a new alternative livelihood for the local people.Research
conducted by (Benu et al., 2020) in Papela, a small fishing village on Rote Island, also in NTT Province,
found that the community business of salt production can be an acceptable alternative livelihood to
help overcome the scarcity of work faced by village laborers and seasonal workers in the local
community.
Estimating the Economic Value of Mangrove Resources
1. Direct Benefit Value
Numerous sources indicated that the economic value of mangrove is the sum of the various inputs
including capture fisheries, aquaculture, mangrove seeds, mangrove fruit, and the value of wood as a
raw material for construction and arts and crafts. However, mangrove resources in Bipolo Village
tend to decrease from year to year, because of human activities, especially since the provincial
government of NTT released a new policy for the salt industry as one of the priority programs in
2018.The satellite image (Figure 5) shows that mangrove vegetation in Bipolo Village has been
reduced from 93.94 ha in June 2017 to 76.67 ha in August 2019, or approximately 17.27 ha of
mangrove (18.38 %) has disappeared because of human activities, especially the activity of
converting mangrove area into salt ponds. The existing salt pond industry, owned by two large
0
1
2
3
4
5
6
2014 2015 2016 2017 2018
Agrarian Density (People/ha)
Nat. Volatiles & Essent. Oils, 2021; 8(4): 15459-15474
15466
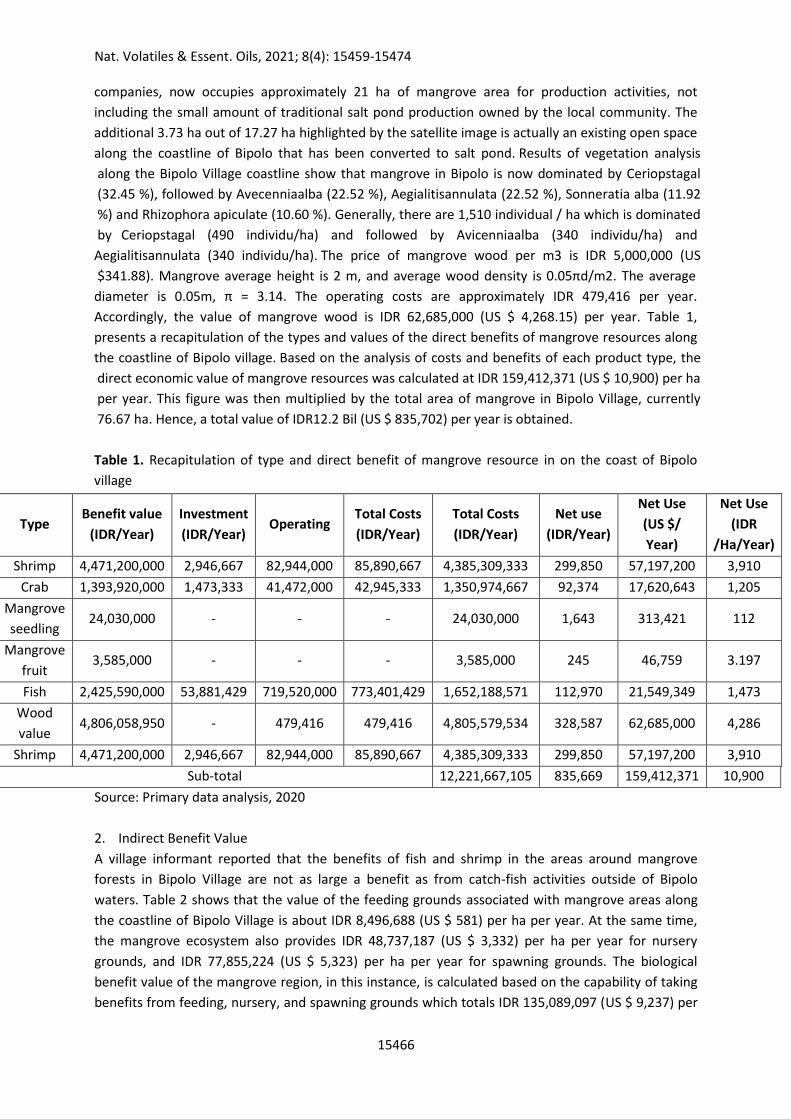
Type Benefit value
(IDR/Year)
Investment
(IDR/Year) Operating
Total Costs
(IDR/Year)
Total Costs
(IDR/Year)
Net use
(IDR/Year)
Net Use
(US $/
Year)
Net Use
(IDR
/Ha/Year)
Shrimp 4,471,200,000 2,946,667 82,944,000 85,890,667 4,385,309,333 299,850 57,197,200 3,910
Crab 1,393,920,000 1,473,333 41,472,000 42,945,333 1,350,974,667 92,374 17,620,643 1,205
Mangrove
seedling 24,030,000 - - - 24,030,000 1,643 313,421 112
Mangrove
fruit 3,585,000 - - - 3,585,000 245 46,759 3.197
Fish 2,425,590,000 53,881,429 719,520,000 773,401,429 1,652,188,571 112,970 21,549,349 1,473
Wood
value 4,806,058,950 - 479,416 479,416 4,805,579,534 328,587 62,685,000 4,286
Shrimp 4,471,200,000 2,946,667 82,944,000 85,890,667 4,385,309,333 299,850 57,197,200 3,910
Sub-total 12,221,667,105 835,669 159,412,371 10,900
Source: Primary data analysis, 2020
2. Indirect Benefit Value
A village informant reported that the benefits of fish and shrimp in the areas around mangrove
forests in Bipolo Village are not as large a benefit as from catch-fish activities outside of Bipolo
waters. Table 2 shows that the value of the feeding grounds associated with mangrove areas along
the coastline of Bipolo Village is about IDR 8,496,688 (US $ 581) per ha per year. At the same time,
the mangrove ecosystem also provides IDR 48,737,187 (US $ 3,332) per ha per year for nursery
grounds, and IDR 77,855,224 (US $ 5,323) per ha per year for spawning grounds. The biological
benefit value of the mangrove region, in this instance, is calculated based on the capability of taking
benefits from feeding, nursery, and spawning grounds which totals IDR 135,089,097 (US $ 9,237) per
companies, now occupies approximately 21 ha of mangrove area for production activities, not
including the small amount of traditional salt pond production owned by the local community. The
additional 3.73 ha out of 17.27 ha highlighted by the satellite image is actually an existing open space
along the coastline of Bipolo that has been converted to salt pond. Results of vegetation analysis
along the Bipolo Village coastline show that mangrove in Bipolo is now dominated by Ceriopstagal
(32.45 %), followed by Avecenniaalba (22.52 %), Aegialitisannulata (22.52 %), Sonneratia alba (11.92
%) and Rhizophora apiculate (10.60 %). Generally, there are 1,510 individual / ha which is dominated
by Ceriopstagal (490 individu/ha) and followed by Avicenniaalba (340 individu/ha) and
Aegialitisannulata (340 individu/ha). The price of mangrove wood per m3 is IDR 5,000,000 (US
$341.88). Mangrove average height is 2 m, and average wood density is 0.05πd/m2. The average
diameter is 0.05m, π = 3.14. The operating costs are approximately IDR 479,416 per year.
Accordingly, the value of mangrove wood is IDR 62,685,000 (US $ 4,268.15) per year. Table 1,
presents a recapitulation of the types and values of the direct benefits of mangrove resources along
the coastline of Bipolo village. Based on the analysis of costs and benefits of each product type, the
direct economic value of mangrove resources was calculated at IDR 159,412,371 (US $ 10,900) per ha
per year. This figure was then multiplied by the total area of mangrove in Bipolo Village, currently
76.67 ha. Hence, a total value of IDR12.2 Bil (US $ 835,702) per year is obtained.
Table 1. Recapitulation of type and direct benefit of mangrove resource in on the coast of Bipolo
village
Nat. Volatiles & Essent. Oils, 2021; 8(4): 15459-15474
15467
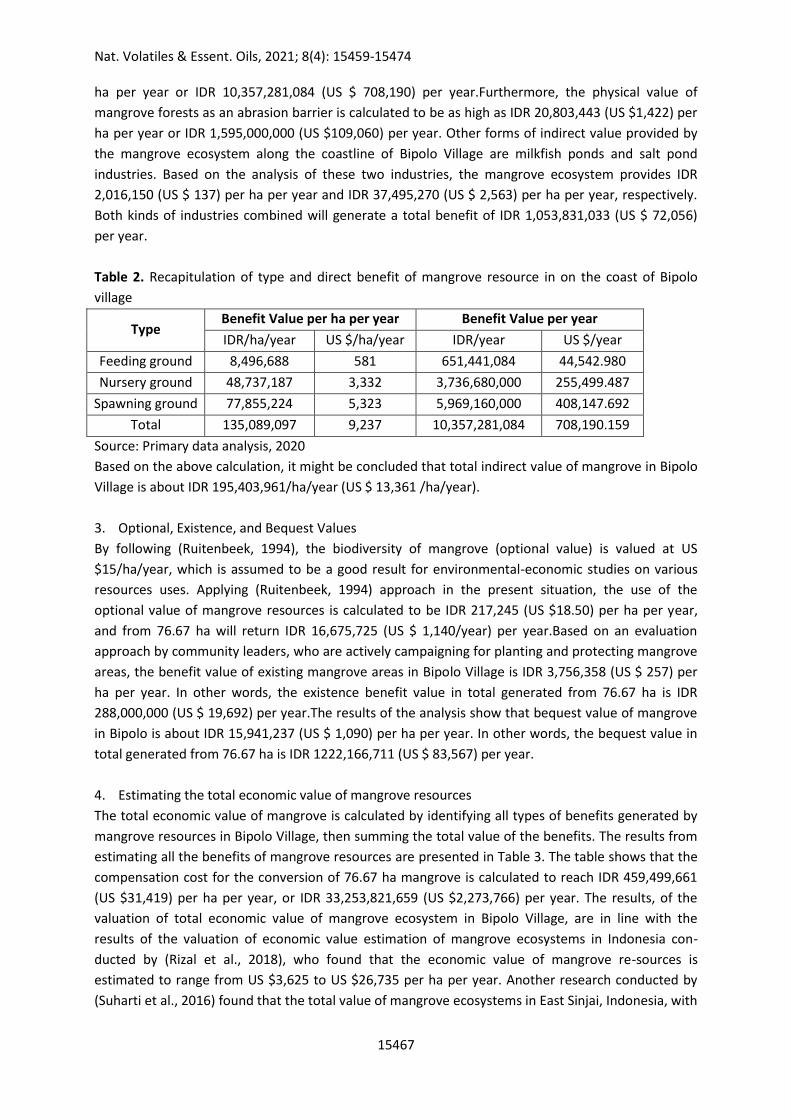
ha per year or IDR 10,357,281,084 (US $ 708,190) per year.Furthermore, the physical value of
mangrove forests as an abrasion barrier is calculated to be as high as IDR 20,803,443 (US $1,422) per
ha per year or IDR 1,595,000,000 (US $109,060) per year. Other forms of indirect value provided by
the mangrove ecosystem along the coastline of Bipolo Village are milkfish ponds and salt pond
industries. Based on the analysis of these two industries, the mangrove ecosystem provides IDR
2,016,150 (US $ 137) per ha per year and IDR 37,495,270 (US $ 2,563) per ha per year, respectively.
Both kinds of industries combined will generate a total benefit of IDR 1,053,831,033 (US $ 72,056)
per year.
Table 2. Recapitulation of type and direct benefit of mangrove resource in on the coast of Bipolo
village
Type Benefit Value per ha per year Benefit Value per year
IDR/ha/year US $/ha/year IDR/year US $/year
Feeding ground 8,496,688 581 651,441,084 44,542.980
Nursery ground 48,737,187 3,332 3,736,680,000 255,499.487
Spawning ground 77,855,224 5,323 5,969,160,000 408,147.692
Total 135,089,097 9,237 10,357,281,084 708,190.159
3. Optional, Existence, and Bequest Values
By following (Ruitenbeek, 1994), the biodiversity of mangrove (optional value) is valued at US
$15/ha/year, which is assumed to be a good result for environmental-economic studies on various
resources uses. Applying (Ruitenbeek, 1994) approach in the present situation, the use of the
optional value of mangrove resources is calculated to be IDR 217,245 (US $18.50) per ha per year,
and from 76.67 ha will return IDR 16,675,725 (US $ 1,140/year) per year.Based on an evaluation
approach by community leaders, who are actively campaigning for planting and protecting mangrove
areas, the benefit value of existing mangrove areas in Bipolo Village is IDR 3,756,358 (US $ 257) per
ha per year. In other words, the existence benefit value in total generated from 76.67 ha is IDR
288,000,000 (US $ 19,692) per year.The results of the analysis show that bequest value of mangrove
in Bipolo is about IDR 15,941,237 (US $ 1,090) per ha per year. In other words, the bequest value in
total generated from 76.67 ha is IDR 1222,166,711 (US $ 83,567) per year.
4. Estimating the total economic value of mangrove resources
The total economic value of mangrove is calculated by identifying all types of benefits generated by
mangrove resources in Bipolo Village, then summing the total value of the benefits. The results from
estimating all the benefits of mangrove resources are presented in Table 3. The table shows that the
compensation cost for the conversion of 76.67 ha mangrove is calculated to reach IDR 459,499,661
(US $31,419) per ha per year, or IDR 33,253,821,659 (US $2,273,766) per year. The results, of the
valuation of total economic value of mangrove ecosystem in Bipolo Village, are in line with the
results of the valuation of economic value estimation of mangrove ecosystems in Indonesia con-
ducted by (Rizal et al., 2018), who found that the economic value of mangrove re-sources is
estimated to range from US $3,625 to US $26,735 per ha per year. Another research conducted by
(Suharti et al., 2016) found that the total value of mangrove ecosystems in East Sinjai, Indonesia, with
Source: Primary data analysis, 2020
Based on the above calculation, it might be concluded that total indirect value of mangrove in Bipolo
Village is about IDR 195,403,961/ha/year (US $ 13,361 /ha/year).
Nat. Volatiles & Essent. Oils, 2021; 8(4): 15459-15474
15468
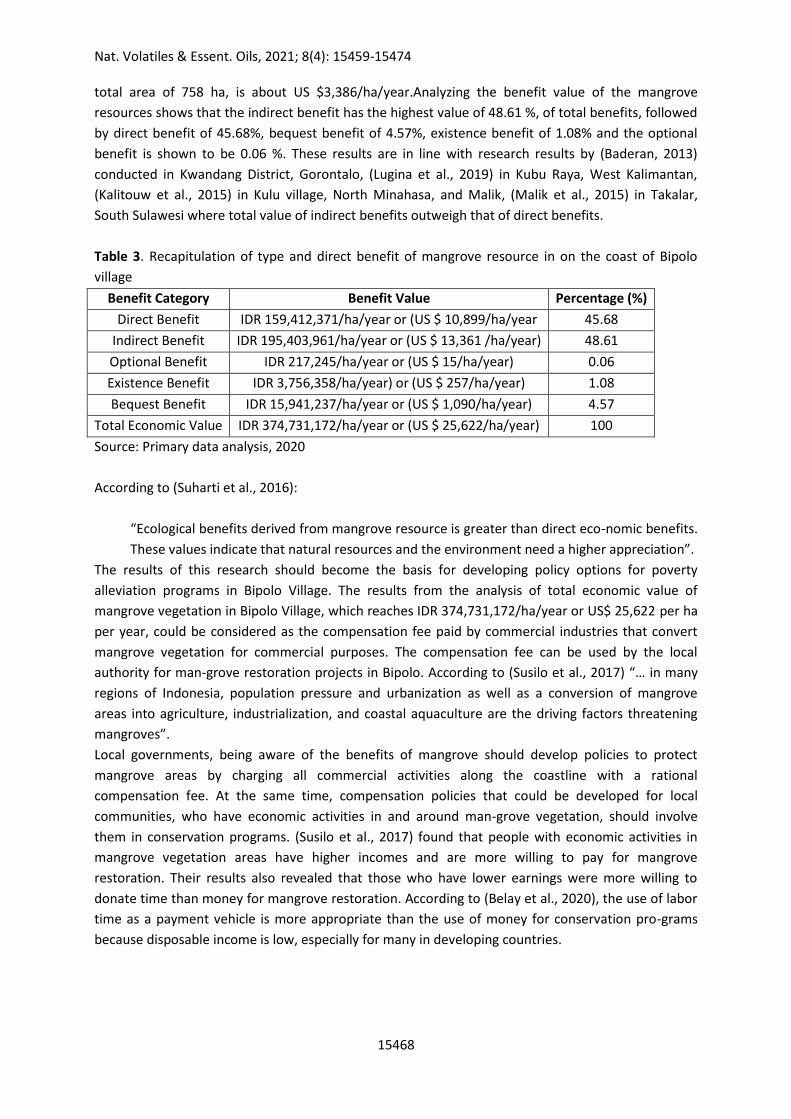
total area of 758 ha, is about US $3,386/ha/year.Analyzing the benefit value of the mangrove
resources shows that the indirect benefit has the highest value of 48.61 %, of total benefits, followed
by direct benefit of 45.68%, bequest benefit of 4.57%, existence benefit of 1.08% and the optional
benefit is shown to be 0.06 %. These results are in line with research results by (Baderan, 2013)
conducted in Kwandang District, Gorontalo, (Lugina et al., 2019) in Kubu Raya, West Kalimantan,
(Kalitouw et al., 2015) in Kulu village, North Minahasa, and Malik, (Malik et al., 2015) in Takalar,
South Sulawesi where total value of indirect benefits outweigh that of direct benefits.
Table 3. Recapitulation of type and direct benefit of mangrove resource in on the coast of Bipolo
village
Benefit Category Benefit Value Percentage (%)
Direct Benefit IDR 159,412,371/ha/year or (US $ 10,899/ha/year 45.68
Indirect Benefit IDR 195,403,961/ha/year or (US $ 13,361 /ha/year) 48.61
Optional Benefit IDR 217,245/ha/year or (US $ 15/ha/year) 0.06
Existence Benefit IDR 3,756,358/ha/year) or (US $ 257/ha/year) 1.08
Bequest Benefit IDR 15,941,237/ha/year or (US $ 1,090/ha/year) 4.57
Total Economic Value IDR 374,731,172/ha/year or (US $ 25,622/ha/year) 100
Source: Primary data analysis, 2020
According to (Suharti et al., 2016):
“Ecological benefits derived from mangrove resource is greater than direct eco-nomic benefits.
These values indicate that natural resources and the environment need a higher appreciation”.
The results of this research should become the basis for developing policy options for poverty
alleviation programs in Bipolo Village. The results from the analysis of total economic value of
mangrove vegetation in Bipolo Village, which reaches IDR 374,731,172/ha/year or US$ 25,622 per ha
per year, could be considered as the compensation fee paid by commercial industries that convert
mangrove vegetation for commercial purposes. The compensation fee can be used by the local
authority for man-grove restoration projects in Bipolo. According to (Susilo et al., 2017) “… in many
regions of Indonesia, population pressure and urbanization as well as a conversion of mangrove
areas into agriculture, industrialization, and coastal aquaculture are the driving factors threatening
mangroves”.
Local governments, being aware of the benefits of mangrove should develop policies to protect
mangrove areas by charging all commercial activities along the coastline with a rational
compensation fee. At the same time, compensation policies that could be developed for local
communities, who have economic activities in and around man-grove vegetation, should involve
them in conservation programs. (Susilo et al., 2017) found that people with economic activities in
mangrove vegetation areas have higher incomes and are more willing to pay for mangrove
restoration. Their results also revealed that those who have lower earnings were more willing to
donate time than money for mangrove restoration. According to (Belay et al., 2020), the use of labor
time as a payment vehicle is more appropriate than the use of money for conservation pro-grams
because disposable income is low, especially for many in developing countries.
Nat. Volatiles & Essent. Oils, 2021; 8(4): 15459-15474
15469
CONCLUSION
Based on the analysis of the benefits of mangrove, it might be concluded that: (i) the population in
Bipolo Village has tended to increase over the last 5 years, causing the amount of arable land to
decrease as productive land is converted for settlements, infrastructure and other economic
activities, (ii) currently, there are two major companies that have established a modern salt industry
in Bipolo Village with a production capacity of approximately 100 ton/ha/year. The two companies, in
collaboration with the four landlords, established a large potential salt industry in 2016, which now
occu-pies 2.64 ha for production activities; (iii) mangrove in Bipolo is now dominated by Ceriopstagal
(32.45%), followed by Avecenniaalba (22.52%), Aegialitisannulata (22.52%), Sonneratia alba (11.92%)
and Rhizophora apiculate (10.60%). Generally, there are 1,510 individual/ha which is dominated by
Ceriopstagal (490 individu/ha) and followed by Avicenniaalba (340 individu/ha) and
Aegialitisannulata (340 individu/ha); (iv) based on calculation of the benefit value of the mangrove
resources, the results showed that the indirect benefit has the highest value of 58.68%, of total
benefits, followed by direct benefit of 36.75%, bequest benefit of 3.68%, existence benefit of 0.87%
and the optional benefit is shown to be 0.05%. These values indicate that natural resources and the
environment need a higher level of appreciation, (v) the results from the analysis of total economic
value of mangrove vegetation in Bipolo Village, which reaches IDR374,731,172/ha/year or (US $
25,622/ha/year), could be considered as the compensation fee of commercial industries that convert
mangrove vegetation for commercial purposes. This compensation fee could benefit the local
authority for mangrove resto-ration projects in Bipolo Village.
AUTHOR CONTRIBUTIONS
Conceptualization, F.B and P. K; methodology, P.K.; validation, F.D, H.W. and A.N; formal analysis,
H.W and A.N.; investigation, P.K; writing—original draft preparation, P.K.; writing—review and
editing, A.N.; visualization, H.W.; supervision, F.D.; project administration, F.B. All authors have read
and agreed to the published version of the manuscript.
ACKNOWLEDGEMENT
We would like to thank the investors and laborers in the salt pond industry in Bipolo Village, located
on Kupang Bay, East Nusa Tenggara (NTT), Indonesia for the collaboration and data that was
provided openly to the authors to enrich knowledge in management as well as a reference for
research sites to improve performance by implementing strategies.
CONFLICT OF INTEREST
The authors declare no conflict of interest.
Appendix
Nat. Volatiles & Essent. Oils, 2021; 8(4): 15459-15474
15470
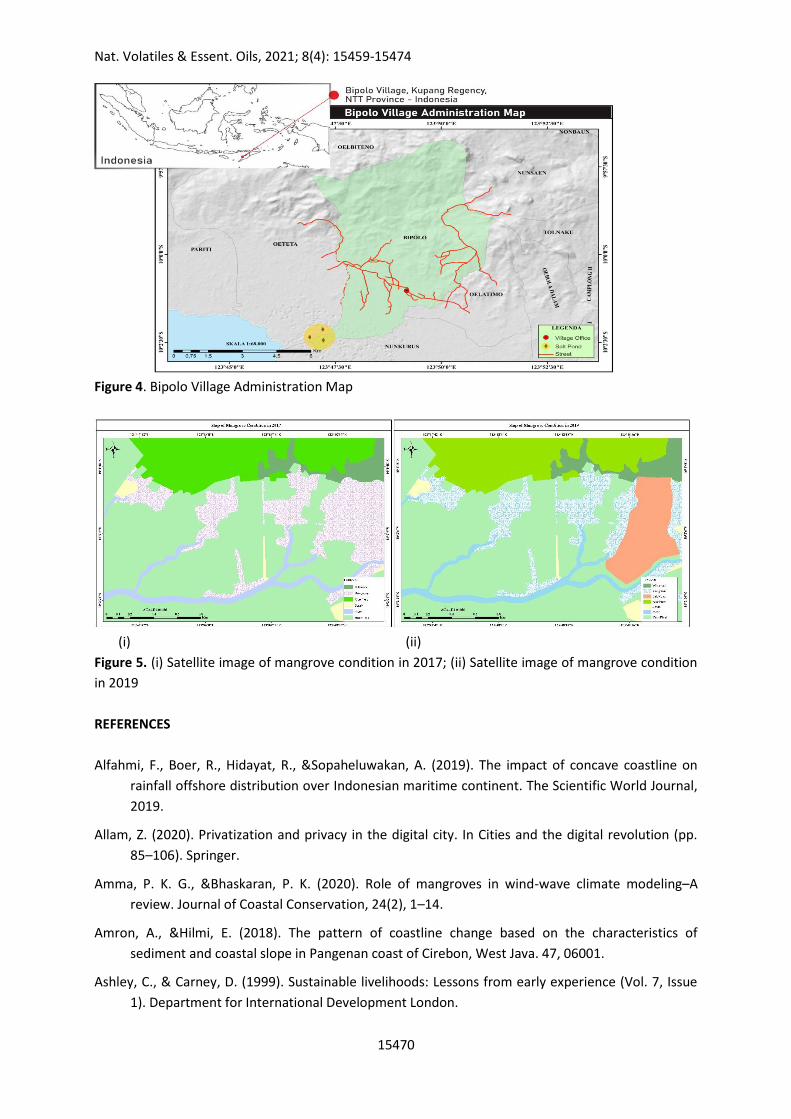
Figure 4. Bipolo Village Administration Map
(i) (ii)
Figure 5. (i) Satellite image of mangrove condition in 2017; (ii) Satellite image of mangrove condition
in 2019
REFERENCES
Alfahmi, F., Boer, R., Hidayat, R., &Sopaheluwakan, A. (2019). The impact of concave coastline on
rainfall offshore distribution over Indonesian maritime continent. The Scientific World Journal,
2019.
Allam, Z. (2020). Privatization and privacy in the digital city. In Cities and the digital revolution (pp.
85–106). Springer.
Amma, P. K. G., &Bhaskaran, P. K. (2020). Role of mangroves in wind-wave climate modeling–A
review. Journal of Coastal Conservation, 24(2), 1–14.
Amron, A., &Hilmi, E. (2018). The pattern of coastline change based on the characteristics of
sediment and coastal slope in Pangenan coast of Cirebon, West Java. 47, 06001.
Ashley, C., & Carney, D. (1999). Sustainable livelihoods: Lessons from early experience (Vol. 7, Issue
1). Department for International Development London.
Nat. Volatiles & Essent. Oils, 2021; 8(4): 15459-15474
15471
Baderan, D. W. K. (2013). Model valuasiekonomisebagaidasaruntukrehabilitasikerusakanhutan
mangrove di wilayah pesisirKecamatanKwandangKabupaten Gorontalo Utara Provinsi
Gorontalo.
Barker, R., & Mayer, C. (2017). How Should a ‘Sustainable Corporation’Account for Natural Capital?
Saïd Business School WP, 15.
Bateman, I. J., & Mace, G. M. (2020). The natural capital framework for sustainably efficient and
equitable decision making. Nature Sustainability, 3(10), 776–783.
Belay, G., Ketema, M., &Hasen, M. (2020). Households’ willingness to pay for soil conservation on
communal lands: Application of the contingent valuation method in north eastern Ethiopia.
Journal of Environmental Planning and Management, 63(12), 2227–2245.
Benu, F., Muskanan, M. W., King, P. G., Asa, H. M., &Wulakada, H. H. (2020). Community
Participation and Sustainable Tourism Development Model in Komodo National Park. Journal
of Environmental Management & Tourism, 11(2 (42)), 250–262.
Carney, D. (2003). Sustainable livelihoods approaches: Progress and possibilities for change.
Department for International Development London.
Ceccarelli, D. M., Evans, R. D., Logan, M., Mantel, P., Puotinen, M., Petus, C., Russ, G. R., &
Williamson, D. H. (2020). Long‐term dynamics and drivers of coral and macroalgal cover on
inshore reefs of the Great Barrier Reef Marine Park. Ecological Applications, 30(1), e02008.
Chambers, R., & Conway, G. (1992). Sustainable rural livelihoods: Practical concepts for the 21st
century. Institute of Development Studies (UK).
Charrua, A. B., Bandeira, S. O., Catarino, S., Cabral, P., &Romeiras, M. M. (2020). Assessment of the
vulnerability of coastal mangrove ecosystems in Mozambique. Ocean & Coastal Management,
189, 105145.
Costanza, R. (2020). Valuing natural capital and ecosystem services toward the goals of efficiency,
fairness, and sustainability. Ecosystem Services, 43, 101096.
Daryono, L. R., Nakashima, K., Kawasaki, S., Titisari, A. D., Barianto, D. H., Suyanto, I., &Rahmadi, A.
(2021). Shoreline mapping based on beachrocks identification in Krakal-Sadranan beach,
Yogyakarta, Indonesia. Bulletin of Engineering Geology and the Environment, 80(3), 2825–
2844.
de Jong, S. M., Shen, Y., de Vries, J., Bijnaar, G., van Maanen, B., Augustinus, P., & Verweij, P. (2021).
Mapping mangrove dynamics and colonization patterns at the Suriname coast using historic
satellite data and the LandTrendr algorithm. International Journal of Applied Earth Observation
and Geoinformation, 97, 102293.
de Souza Queiroz, L., Rossi, S., Calvet-Mir, L., Ruiz-Mallén, I., García-Betorz, S., Salvà-Prat, J., & de
Andrade Meireles, A. J. (2017). Neglected ecosystem services: Highlighting the socio-cultural
perception of mangroves in decision-making processes. Ecosystem Services, 26, 137–145.
Fang, K., Zhang, Q., Yu, H., Wang, Y., Dong, L., & Shi, L. (2018). Sustainability of the use of natural
capital in a city: Measuring the size and depth of urban ecological and water footprints. Science
of the Total Environment, 631, 476–484.
Nat. Volatiles & Essent. Oils, 2021; 8(4): 15459-15474
15472
Gilby, B. L., Olds, A. D., Yabsley, N. A., Connolly, R. M., Maxwell, P. S., &Schlacher, T. A. (2017).
Enhancing the performance of marine reserves in estuaries: Just add water. Biological
Conservation, 210, 1–7.
Gillanders, B., Fernandes, M., Gaylard, S., Sandhu, H., Waycott, M., Cavagnaro, T., & Jones, A. (2019).
Coastal carbon opportunities: Summary report on the ecosystem services provided by blue
carbon habitats in South Australia. Goyder Institute for Water Research Summary Report
Series, 19/27, 3.
Gracia, A., Rangel-Buitrago, N., Oakley, J. A., & Williams, A. (2018). Use of ecosystems in coastal
erosion management. Ocean & Coastal Management, 156, 277–289.
Graham, N. A., Robinson, J. P., Smith, S. E., Govinden, R., Gendron, G., & Wilson, S. K. (2020).
Changing role of coral reef marine reserves in a warming climate. Nature Communications,
11(1), 1–8.
Haffar, M., & Searcy, C. (2018). Target‐setting for ecological resilience: Are companies setting
environmental sustainability targets in line with planetary thresholds? Business Strategy and
the Environment, 27(7), 1079–1092.
Helm, D. (2019). Natural capital: Assets, systems, and policies. Oxford Review of Economic Policy,
35(1), 1–13.
Jickling, B., &Wals, A. E. (2008). Globalization and environmental education: Looking beyond
sustainable development. Journal of Curriculum Studies, 40(1), 1–21.
Kalitouw, D. W., Darusman, D., &Kusmana, C. (2015). POTENSI EKONOMI EKOSISTEM HUTAN
MANGROVE DI DESA KULU, KECAMATAN WORI KABUPATEN MINAHASA UTARA. RISALAH
KEBIJAKAN PERTANIAN DAN LINGKUNGAN Rumusan Kajian StrategisBidangPertanian Dan
Lingkungan, 2(1), 17–24.
Lugina, M., Indartik, I., &Pribadi, M. A. (2019). ECONOMIC VALUATION OF MANGROVE ECOSYSTEMS
AND THEIR CONTRIBUTION TO HOUSEHOLD INCOME: CASE STUDIES AT PEMOGAN, TUBAN,
AND KUTAWARU VILLAGES. JurnalPenelitianSosial Dan EkonomiKehutanan, 16(3), 197–210.
Mafi-Gholami, D., Jaafari, A., Zenner, E. K., Kamari, A. N., & Bui, D. T. (2020). Spatial modeling of
exposure of mangrove ecosystems to multiple environmental hazards. Science of the Total
Environment, 740, 140167.
Malik, A., Fensholt, R., & Mertz, O. (2015). Economic valuation of mangroves for comparison with
commercial aquaculture in South Sulawesi, Indonesia. Forests, 6(9), 3028–3044.
3Malmberg, B., &Tegenu, T. (2007). Population pressure and dynamics of household livelihoods in an
Ethiopian Village: An elaboration of the Boserup-Chayanovian framework. Population and
Environment, 29(2), 39–67.
Matos, C. R., Berrêdo, J. F., Machado, W., Sanders, C. J., Metzger, E., & Cohen, M. C. (2020). Carbon
and nutrient accumulation in tropical mangrove creeks, Amazon region. Marine Geology, 429,
106317.
Mentaschi, L., Vousdoukas, M. I., Pekel, J.-F., Voukouvalas, E., &Feyen, L. (2018). Global long-term
observations of coastal erosion and accretion. Scientific Reports, 8(1), 1–11.
Mitra, A. (2020). Ecosystem Services of Mangroves: An Overview. Mangrove Forests in India, 1–32.
Nat. Volatiles & Essent. Oils, 2021; 8(4): 15459-15474
15473
Morelli, J. (2011). Environmental sustainability: A definition for environmental professionals. Journal
of Environmental Sustainability, 1(1), 2.
Morris, R. L., Konlechner, T. M., Ghisalberti, M., & Swearer, S. E. (2018). From grey to green: Efficacy
of eco‐engineering solutions for nature‐based coastal defence. Global Change Biology, 24(5),
1827–1842.
Onyena, A. P., & Sam, K. (2020). A review of the threat of oil exploitation to mangrove ecosystem:
Insights from Niger Delta, Nigeria. Global Ecology and Conservation, 22, e00961.
Owuor, M. A., Mulwa, R., Otieno, P., Icely, J., & Newton, A. (2019). Valuing mangrove biodiversity and
ecosystem services: A deliberative choice experiment in Mida Creek, Kenya. Ecosystem
Services, 40, 101040.
Pastorinho, M. R., &Pais, R. (2019). Sampling Pelagic Marine Organisms.
Plottu, E., &Plottu, B. (2007). The concept of Total Economic Value of environment: A reconsideration
within a hierarchical rationality. Ecological Economics, 61(1), 52–61.
Priyatna, M., Khomarudin, R., &Ambarwati, D. (2014). Coastal Characteristics of Indonesia and its
Relation to the Tsunami Hazard. 12th Biennial Conference of Pan Ocean Remote Sensing
Conference.
Purba, N. P., Faizal, I., Cordova, M. R., Abimanyu, A., Afandi, N. K., Indriawan, D., & Khan, A. M.
(2021). Marine Debris Pathway Across Indonesian Boundary Seas. Journal of Ecological
Engineering, 22(3), 82–98.
Rizal, A., Sahidin, A., &Herawati, H. (2018). Economic value estimation of mangrove ecosystems in
Indonesia. Biodiversity International Journal, 2(1), 98–100.
Ruitenbeek, H. J. (1994). Modelling economy-ecology linkages in mangroves: Economic evidence for
promoting conservation in Bintuni Bay, Indonesia. Ecological Economics, 10(3), 233–247.
Scoones, I. (1998). Sustainable rural livelihoods: A framework for analysis.
Sofian, A., Kusmana, C., Fauzi, A., &Rusdiana, O. (2019). Ecosystem services-based mangrove
management strategies in Indonesia: A review. Aquaculture, Aquarium, Conservation &
Legislation, 12(1), 151–166.
Sousa, S., Botelho, A., Pinto, L. M. C., & Valente, M. (2019). How relevant are non-use values and
perceptions in economic valuations? The case of hydropower plants. Energies, 12(15), 2986.
Stern, P. C. (2000). New environmental theories: Toward a coherent theory of environmentally
significant behavior. Journal of Social Issues, 56(3), 407–424.
Suharti, S., Darusman, D., Nugroho, B., &Sundawati, L. (2016). Economic valuation as a basis for
sustainable mangrove resource management: A case in East Sinjai, South Sulawesi.
JurnalManajemenHutanTropika, 22(1), 13–23.
Sui, L., Wang, J., Yang, X., & Wang, Z. (2020). Spatial-temporal characteristics of coastline changes in
Indonesia from 1990 to 2018. Sustainability, 12(8), 3242.
Susilo, H., Takahashi, Y., & Yabe, M. (2017). The opportunity cost of labor for valuing mangrove
restoration in Mahakam Delta, Indonesia. Sustainability, 9(12), 2169.

Nat. Volatiles & Essent. Oils, 2021; 8(4): 15459-15474
15474
Turner, R. K., Pearce, D., & Bateman, I. (1994). Environmental economics: An elementary
introduction. Harvester Wheatsheaf.