Vacuum impregnation modulates the metabolic activity of spinach leaves
30
Vacuum impregnation modulates the metabolic activity of spinach leaves Valentina Panarese, Pietro Rocculi, Elena Baldi, Lars Wads¨ o, Allan G. Rasmusson, Federico G ´ omez Galindo PII: S1466-8564(14)00161-1 DOI: doi: 10.1016/j.ifset.2014.10.006 Reference: INNFOO 1234 To appear in: Innovative Food Science and Emerging Technologies Received date: 19 February 2014 Accepted date: 5 October 2014 Please cite this article as: Panarese, V., Rocculi, P., Baldi, E., Wads¨ o, L., Rasmus- son, A.G. & G´omez Galindo, F., Vacuum impregnation modulates the metabolic ac- tivity of spinach leaves, InnovativeFood Science and Emerging Technologies (2014), doi: 10.1016/j.ifset.2014.10.006 This is a PDF file of an unedited manuscript that has been accepted for publication. As a service to our customers we are providing this early version of the manuscript. The manuscript will undergo copyediting, typesetting, and review of the resulting proof before it is published in its final form. Please note that during the production process errors may be discovered which could affect the content, and all legal disclaimers that apply to the journal pertain.
Transcript of Vacuum impregnation modulates the metabolic activity of spinach leaves

�������� ����� ��
Vacuum impregnation modulates the metabolic activity of spinach leaves
Valentina Panarese, Pietro Rocculi, Elena Baldi, Lars Wadso, Allan G.Rasmusson, Federico Gomez Galindo
PII: S1466-8564(14)00161-1DOI: doi: 10.1016/j.ifset.2014.10.006Reference: INNFOO 1234
To appear in: Innovative Food Science and Emerging Technologies
Received date: 19 February 2014Accepted date: 5 October 2014
Please cite this article as: Panarese, V., Rocculi, P., Baldi, E., Wadso, L., Rasmus-son, A.G. & Gomez Galindo, F., Vacuum impregnation modulates the metabolic ac-tivity of spinach leaves, Innovative Food Science and Emerging Technologies (2014), doi:10.1016/j.ifset.2014.10.006
This is a PDF file of an unedited manuscript that has been accepted for publication.As a service to our customers we are providing this early version of the manuscript.The manuscript will undergo copyediting, typesetting, and review of the resulting proofbefore it is published in its final form. Please note that during the production processerrors may be discovered which could affect the content, and all legal disclaimers thatapply to the journal pertain.

ACC
EPTE
D M
ANU
SCR
IPT
ACCEPTED MANUSCRIPT
1
VACUUM IMPREGNATION MODULATES THE METABOLIC ACTIVITY OF SPINACH
LEAVES
Panarese, Valentinaa,*
; Rocculi, Pietroa; Baldi, Elena
b; Wadsö, Lars
c; Rasmusson, Allan G.
d; Gómez Galindo,
Federicoe
a Department of Food Science, Alma Mater Studiorum, University of Bologna, Piazza Goidanich
60, 47521, Cesena (FC), Italy
b Department of Agricultural Science, Alma Mater Studiorum, University of Bologna, Viale Fanin
44, 40127, Bologna, Italy.
c Division of Building Materials, Lund University, P.O. Box 118, SE-221 00, Lund, Sweden
d Department of Biology, Lund University, Sölvegatan 35B, SE-223 62, Lund, Sweden
e Department of Food Technology, Engineering and Nutrition, Lund University, P.O. Box 124, SE-
221 00, Lund, Sweden
* Corresponding author. Phone: +39 0547 338 120; Fax: +39 0547 382 348;
e-mail: [email protected]

ACC
EPTE
D M
ANU
SCR
IPT
ACCEPTED MANUSCRIPT
2
Abstract
In this study calorimetric measurements provided evidence of a drastic increase of spinach leaf gross
metabolism as a consequence of vacuum impregnation (VI) at a minimum pressure of 150 mbar with
trehalose and sucrose isotonic solutions. When applying VI extracellular air is replaced by the impregnation
solution, potentially limiting tissue respiration to any remaining air volume in the tissue. However the
observation that impregnated leaves showed photosynthetic activity suggests that not all air was exhausted
during VI. Hence impregnation appears to reach a maximum with remaining gas filled compartments.
Metabolic inhibitors impregnated together with sugars showed that the short-term metabolic response,
causing the drastic increase of gross metabolism upon VI, depends on mitochondrial oxygen consuming
pathways. The metabolic effect following mannitol impregnation was comparable with water impregnation,
suggesting that the strong metabolic effect reported here is only seen for molecules that can be metabolized
and provide energy to the cells.
Industrial relevance
Vacuum impregnation is used to incorporate additives in fruit and vegetable tissues, such as anti-browning
agents, microbial preservatives or cryoprotectants. As a promising technology in the food industry, deeper
insights on the metabolic consequences of vacuum impregnation are required to define and control the shelf-
life of the processed fruits and vegetables.
Keywords Vacuum impregnation · metabolism · photosynthesis · Spinacia oleracea · isothermal
calorimetry
Running title Spinach metabolic responses to VI

ACC
EPTE
D M
ANU
SCR
IPT
ACCEPTED MANUSCRIPT
3
1. Introduction
Vacuum impregnation (VI) is a unit operation in which porous products are immersed in solutions of
various compositions and/or concentrations and subjected to a two-step pressure change. The first step
(application of vacuum) consists on the reduction of the pressure in the solid-liquid system. During this step,
the gas in the product pores is expanded and flows out until mechanical equilibrium is achieved. When the
atmospheric pressure (second step) is restored, the residual gas in the pores is compressed and the external
liquid flows into the pores (Tylewicz et al., 2013). VI is widely used in several processes to incorporate
additives in fruit and vegetable tissues, such as anti-browning agents, microbial preservatives or
cryoprotectants (Barrera et al., 2009; Phoon et al., 2008). There is a large amount of literature focused on the
effects of the vacuum level and the structure and mechanical properties of the foodstuff on mass transfer
phenomena during VI (Chiralt & Fito, 2003; Mujica-Paz, 2003; Fito & Pastor, 1994; Laurindo et al., 2007;
Paes et al., 2006; Carciofi et al., 2012), as well as the effects of the impregnating liquid on structure and
mechanical properties (Guillemin et al., 2008). However, to the best of our knowledge, little is known about
the metabolic consequences of VI that are provoked by structural modifications induced by the pressure
changes, the impregnated molecules, and/or anaerobic stress. The onset of anaerobic metabolism in sucrose
solution-impregnated strawberries was demonstrated after 24 hours of storage at 10 °C (Castelló et al.,
2010). Recently, we showed that cell membrane vesicles are formed 30 min after the impregnation of apple
tissue with different concentrations of sucrose and trehalose, suggesting that the impregnated sugars may not
totally remain in the extracellular space, as normally believed, but that at least a fraction of these compounds
will be incorporated into the cells (Tylewicz et al., 2013). In this paper, further exploration of short-term
metabolic responses is done in spinach using isothermal calorimetry. The calorimetrically measured heat and
heat production rate (thermal power) of a biological tissue is related to its metabolic rate and provides a
direct indication of integrated metabolic responses, such as respiration and reaction to stress (Gómez Galindo
et al., 2008; Criddle et al., 1991).
2. Material and Methods
2.1 Raw material handling and storage
Baby spinach leaves (Spinacia oleracea) grown in southern Sweden were harvested and stored in a
packing house storage facility in a normal storage atmosphere (1-2 °C; 90-95% RH). Within 5 days of
harvesting, the leaves were washed, air-dried, packed in 65 g bags, as routinely practiced by the producer,
and delivered the same day to our laboratory. During the experimental period the packages were stored at 2 ±
1 °C, and experiments were performed within the product expiration time (7 days). Undamaged leaves (30 ±
3 mm in width 60 ± 3 mm in length) were manually selected.

ACC
EPTE
D M
ANU
SCR
IPT
ACCEPTED MANUSCRIPT
4
2.2 Raw material characterization
Porosity
The apparent density (a) and the true solid-liquid density (t) of spinach were determined by volume
displacement in a pycnometer using appropriate aqueous isotonic sucrose solutions as reference liquid (see
below) (Gras et al., 2003). The true solid-liquid density was also obtained by volume displacement using
sample purees obtained by manually grinding the samples using a mortar and pestle. The purees were placed
in a Büchner flask and degasified for 10 min by creating vacuum in the flask. The porosity of the sample ()
is the dimensionless ratio of air volume to total volume, and can have values between 0 and 1 (Equation 1)
(Lozano et al., 1980)
1a
t
(1)
2.3 Sample preparation
For calorimetric measurements each leaf, placed in a covered Petri dish, was equilibrated in room light
at 25 °C for 15 min and each sample (50 ± 1 mm of height 30 ± 1 mm of length) was obtained using a
sharp microtome blade.
For photosynthesis measurements each leaf, placed in a covered Petri dish, was equilibrated in
darkness at 25 °C for 15 min and one disc of 36 mm of diameter was removed from each of twelve spinach
leaves with a sharp cork borer. Three discs were placed in the dark inside a Petri dish (untreated samples).
The remaining nine discs were divided in three 100 ml beakers and flooded with the impregnating solutions.
A 1 mm thick plastic net allowed the samples to remain separated and submerged during the whole VI
treatment. The three beakers were placed in the VI vessel (a desiccator) and subjected to VI.

ACC
EPTE
D M
ANU
SCR
IPT
ACCEPTED MANUSCRIPT
5
2.4 Impregnating solutions
Isotonic solutions with aw of 0.999 (AquaLab series 3TE, Decagon Devices Inc., Washington) in
equilibrium with spinach leaves were designed with respect to the cell sap. The isotonic solution
concentrations were determined by immersion of three spinach leaves (without petioles) in a series of
solutions of different sucrose, trehalose or mannitol concentrations, according to Tylewicz et al. (2013). The
variation in tissue weight was recorded every 30 min until equilibrium.
When metabolic inhibitors were used, sucrose and trehalose solutions were mixed with inhibitor stock
solutions to reach 10 mM salicylhydroxamic acid (SHAM) and 2 mM KCN. KCN and SHAM stocks
contained 100 mM in a 20 mM MOPS buffer (pH 7) and 1 M in dimethyl sulfoxide, respectively.
2.5 Automatic vacuum controller system
The automatic vacuum controller system (AVCS, S.I.A., Bologna, Italy) is a programmable device designed
to control the pressure acting on the impregnating solution during the impregnation process. The AVCS is
connected to the VI chamber by a Teflon tube and includes a number of components: a pressure transmitter,
vacuum actuators (valves and vacuum pump), a computer and a programmable logic controller device (PLC,
Series 90-30, General Electric, Charlottesville, VA, USA) as illustrated in Figure 1. The PLC is the core of
the AVCS as it manages the vacuum actuators, supervising the value of pressure, time and vacuum release
rate by controlling the start and stop of the vacuum pump and the opening and closing of the air inlet and air
outlet valves. A software interface (CIMPLICITY Workbench Version 6.10 Service Pack 3, General
Electric, Charlottesville, VA, USA) allows the working parameters of the AVCS to be set and controlled
(Panarese et al., 2013).
Figure 1
2.6 Vacuum impregnation
Based on preliminary experiments to establish maximum weight gain and avoiding visible tissue
damage of spinach, a stepwise protocol with a minimum absolute pressure of 150 mbar was chosen. As
shown in Figure 2, pressure was applied in 20 consecutive steps. The chosen pressure profile ensured that
cell viability was maintained. Two parameters were set for each pressure step: duration (s) and absolute
pressure value (mbar). As outlined in Figure 2, during the first phase of VI the pressure gradually decreased
from the atmospheric value (1000 mbar) to the final reduced pressure value (150 mbar, step 8). During the
second phase, vacuum was released and the pressure progressively returned to the atmospheric value. The
chosen duration for each step was: 10 s for each step 1 to 4 and step 15 to 20; 20 s for step 5 and steps 12 to

ACC
EPTE
D M
ANU
SCR
IPT
ACCEPTED MANUSCRIPT
6
14; 60 s for steps 6, 7 and steps 9 to 11; 120 s for step 8. Thus the VI treatment applied had a total duration
of 600 s and was controlled by the AVCS.
Figure 2
2.7 Calorimetry: Experimental set-up and heat production measurement
A 20 ml stainless steel ampoule, containing the sample, was closed with a stainless steel lid with
bayonet mount and a disposable Teflon seal. Two o-ring sealed lead-throughs were made in the lid. Through
each of these a 1 mm stainless steel tube was inserted. These tubes were connected to a 20 ml syringe and to
the AVCS, as shown in Figure 3.
Figure 3
The calorimetric measurements were made with a “microcalorimeter” of the type described in Figure
2a in Bäckman et al. (1995) and manufactured by Thermometric AB (now TA Instruments, New Castle, DE,
USA). This was placed in a precision water thermostat. The 24 h baseline noise of the instrument without the
VI had a standard deviation of about 0.4 W.
The sealed stainless steel ampoule containing the sample was placed in the calorimeter ampoule
holder (Figure 3) at 25 °C. When the sample thermal power was stable, 18 ml of impregnating solution
previously thermostated at 25°C was injected with the syringe into the ampoule, followed by the application
of the VI treatment. Immediately after the VI treatment the solution in the ampoule was drawn back into the
syringe, emptying the ampoule. The headspace of the emptied ampoule was either filled with air or nitrogen.
Thus, the ampoule openings were sealed either immediately or after flushing through the syringe needle
100% nitrogen gas at 30 ± 3 (cm3 min
-1) for 10 min. The rate of heat production after VI was continuously
measured with the calorimeter.
During the calorimetric measurement, heat is allowed to flow between the ampoule containing the
sample and a heat sink, the temperature of which is kept essentially constant. The heat transfer takes place
through a heat flow sensor that is located between the ampoule and the heat sink. The calorimeter had a
reference that consisted of an empty sealed 20 ml volume stainless steel ampoule. The isothermal
measurements were performed for periods of about 4 h. Baselines were recorded before or after each
measurement. The primary output from the heat flow sensors in the calorimeter (a voltage) was recorded
every 10 s by a computer. The corresponding thermal powers (heat production rates) were calculated as:

ACC
EPTE
D M
ANU
SCR
IPT
ACCEPTED MANUSCRIPT
7
P VS VBL
M (2)
where P (W g−1
) is the specific thermal power of the spinach sample, ε (W V−1
) the calibration
coefficient of the calorimeter, VS (V) the voltage signal from the calorimeter, VBL (V) the corresponding
voltage recorded for the baseline, and M (g) is the mass of the sample measured after the sample preparation.
The calibration coefficients were calculated from electrical calibrations made at 20 °C. The heat production
measurement was performed on at least three samples for each impregnating solution tested.
2.8 Photosynthesis: Experimental set-up and O2 production measurement
VI was performed in a dark chamber. After the treatment the leaf discs were blotted with tissue paper
(5 s for each sample side), weighed and kept in darkness for 30 min (at 25 °C). Thereafter the photosynthesis
rate was registered for 30 min. The leaf disc photosynthesis, expressed in term of O2 evolution (nmolO2 min-
1 cm
-2) was determined at 25 °C with an O2 electrode (S1 O2 electrode, Hansatech, Norfolk, England). The
leaf disc sample and the electrodes were both placed in a thermostated electrode chamber (LD2/3, Gas-Phase
Oxygen Electrode Chamber). The electrode was placed at the bottom of the chamber while the leaf disc was
placed on a fabric plate soaked with bicarbonate buffer, pH 9. This contained one part saturated KCl
solution, one part 0.4 M NaBO3-buffer (pH 9) and two parts 1 M Na2CO3-buffer (pH 9) (Walker & Walker,
1987; Delieu & Walker, 1981). Once the chamber was sealed, the leaf disc was irradiated with 1230 E m-2
s-1
(LS3 Computer Controlled UV Light Source, Hansatech, Norfolk, England), as natural daylight varies in
the range 1200 - 1500 E m-2
s-1
(Jifon & Syvertsen, 2003). The light source, designed to be coupled with the
electrode chamber, was set on the chamber glass window and the leaf was continuously irradiated through
the window during the photosynthesis measurement. O2 electrodes were calibrated before each measurement
with air and N2 (Glazer et al., 2004). The measurement was repeated at least three times for each
impregnating solution tested. Statistical significance of the effect of each impregnating solution on
photosynthetic activity was evaluated with one-way analysis of variance using the software STATISTICA
6.0 (Statsoft Inc., Tulsa, UK).
3. Results
3.1 Porosity, isotonicity and weight gain after vacuum impregnation
The porosity of the spinach was found to be 0.386 0.026, in agreement with previous findings
(Warmbrodt & Van Der Woude, 1990).
Isotonic concentrations with respect to the cell sap were defined as those leading to the lowest weight
change in the tissue at the equilibrium. Concentrations of 13% sucrose, 11% trehalose, 8% mannitol gave 2.0
± 0.5% weight gain after 7 h of immersion and was concluded isotonic for spinach samples.

ACC
EPTE
D M
ANU
SCR
IPT
ACCEPTED MANUSCRIPT
8
The average weight gain ( SEM, n=23) of the leaf obtained after VI in isotonic solutions was 38.1
2.5%. A further decrease to 40 mbar did not significantly affect the weight gain (40.5 3.8 %, n=5).
3.2 Effect of VI on metabolic activity
Calorimetric Measurements
To assess the metabolic responses upon VI, calorimetry measurements (in darkness) were performed
and, as an example, the result from measurement on spinach tissue impregnated with trehalose is reported in
Figure 4. Each time an ampoule was changed into the calorimeter, there was an initial disturbance lasting
about 30 min. After that the true thermal power from the sample was measured. In the untreated samples
(dashed line in Figure 4) the thermal power showed an average (± SEM) overall decrease of 11.2 ± 3.0 %
during the time of the measurement. For the sample to be VI treated (continuous line in Figure 4), vacuum
was applied when the thermal power was relatively stable (indicated with an arrow in Figure 4). The VI
treatment significantly disturbed the thermal balance of the calorimeter, resulting in a gap in the
measurements lasting about 50 min. Once the thermal power values were back within the detectable range,
the disturbance in the calorimetric measurements lasted another 20 min before the true thermal power from
the treated sample was measured. The experiment was interrupted after about 150 min from the application
of the VI by taking the sample out from the calorimeter.
Figure 4
Impregnation with sucrose and trehalose drastically increased the metabolic activity of spinach leaves
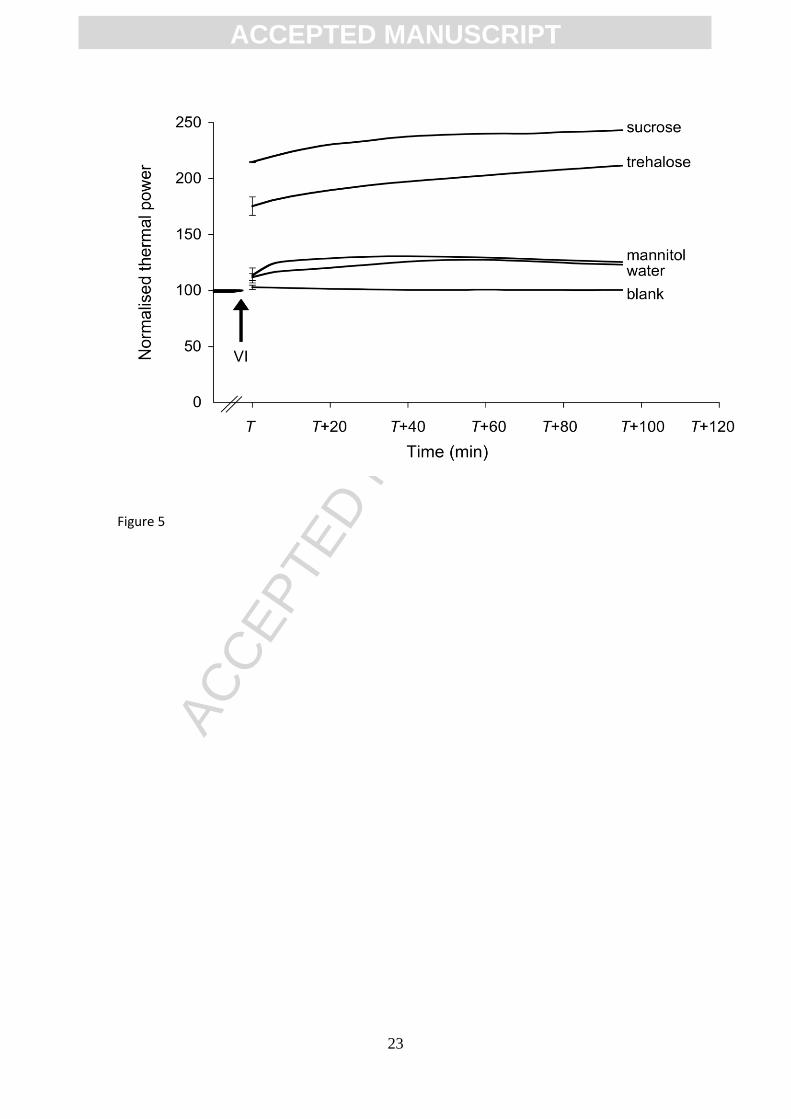
To facilitate the comparison among VI treatments each thermal power curve (reported in Figure 5)
was normalized by setting the initial sample thermal power value before VI to 100, corresponding to an
average (± SEM; n=15) value of 887 ± 71 W g-1
. From the three replicates for each treatment, average
normalised curves are reported. In the x-scale of Figure 5 a variable T (min) has been used. Equation 3
defines the variable T, marked in Figure 4:
T t1 t2 t3 (3)
where t1 is the duration of the initial disturbance of the calorimetric measurement; t2 is the time for the
thermal power to stabilise before the application of vacuum; t3 is the duration of the disturbance provoked by
VI. The average values (± SEM; n=15) of t1, t2 and t3 were, respectively, of 33 ± 1 min, 60 ± 11 min and 72 ±
6 min.

ACC
EPTE
D M
ANU
SCR
IPT
ACCEPTED MANUSCRIPT
9
Figure 5
Figure 5 shows that impregnation with sucrose and trehalose caused a dramatic increase in the thermal power
values with respect to the thermal power before the application of vacuum (indicated with an arrow). The
impregnation with both sugars led to a further slow increase in the thermal power during the time of the
measurement. The measurement done with a sample subjected to vacuum and atmospheric pressure
restoration without the presence of solution (blank, Figure 5) showed no increase of the heat production. By
impregnating spinach samples with an isotonic solution of mannitol, a polyol that cannot be metabolized by
plant cells (Trip et al., 1964), only a slight increase of the thermal power was recorded (Figure 5) and no
further increase of the thermal power during the time of the measurement was observed. A comparable
metabolic response was recorded by impregnating the sample with water.
Effect of metabolic inhibitors
The effect of impregnating spinach sample with both sucrose and trehalose in combination with KCN
(an inhibitor of the cytochrome pathway of mitochondrial electron transport) and SHAM (an inhibitor of the
alternative pathway of electron transport in mitochondria) on the metabolic activity of spinach is shown in
Figure 6. After VI, the recorded thermal power values were close to the baseline of the calorimeter indicating
a strong suppression of the metabolic activity.
Figure 6
Effect of anaerobic metabolism induced by nitrogen
The examples reported in Figure 7 show the metabolic activity of untreated samples (7a) and sucrose
and trehalose impregnated samples (7b) in anaerobic condition (nitrogen gas in the headspace). After
anaerobiosis, the thermal power values of untreated samples slowly decreased to zero. After VI the thermal
power of treated samples slowly increased reaching, in about 2 h, the initial sample thermal power.
Figure 7a
Figure 7b
3.3 Impregnated samples show photosynthetic activity

ACC
EPTE
D M
ANU
SCR
IPT
ACCEPTED MANUSCRIPT
10
Figure 8a shows the O2 production at saturating light for untreated samples and sucrose, trehalose and
mannitol impregnated samples. Untreated spinach leaves showed the highest photosynthesis. The
photosynthetic activity of leaves impregnated with sucrose was significantly lower than the activity of leaves
impregnated with mannitol. Leaves impregnated with trehalose displayed a value not significantly different
from either sucrose or mannitol impregnated leaves, but lower than untreated leaves (Figure 8a). Figure 8b
shows a negative correlation between photosynthesis values and the first normalised thermal power values
measured after VI for untreated, mannitol, sucrose and trehalose impregnated spinach.
Figure 8a
Figure 8b
4. Discussion
A deeper understanding of the consequences of VI on the metabolism of impregnated plant tissues is a
key element for product development, as the product shelf-life is strongly dependent on the tissue metabolic
activity. A more active metabolism will induce a faster deterioration of the product, involving loss of acids,
sugars and other components which contribute to flavour quality and nutritional value (Cantwell & Suslow,
2002). On the other hand, the addition of a carbohydrate to the leaf interior by VI may compensate for such a
loss, so the final effect may depend on the relative magnitude of the treatment and the metabolic effect.
In this study, calorimetric measurements provided evidence of a drastic increase of spinach leaf gross
metabolism as a consequence of impregnation with isotonic solutions of trehalose or sucrose (Figure 5). In
contrast, the metabolic thermal power of untreated spinach leaves slowly and slightly decreased (Figure 4),
possibly due to changes in the rate of respiratory substrate mobilisation or by down-regulation or damage of
the respiratory pathways (McCutchan & Monson, 2001). However, since the leaves were exposed to light
before the calorimetric measurement, a late phase of light-enhanced dark respiration might contribute in
decreasing the leaf metabolic activity (Padmasree et al., 2002). Interestingly, the metabolic effect of VI in the
presence of mannitol (Figure 5) was less pronounced and comparable with water impregnation, suggesting
that the strong metabolic effect here reported is caused by sugars that are metabolized by the cells. The
inhibition of photosynthesis by sucrose is consistent with Foyer et al. (1983) where sucrose strongly
decreased CO2 fixation in protoplast from spinach.
The thermal power measured on untreated leaves was dependent on the presence of oxygen, as the
anaerobic condition created in the calorimeter ampoule provoked decrease to zero of the leaf‟s metabolic
activity (Figure 7a). With the application of VI, extracellular air is replaced by the impregnation solution,
potentially limiting tissue respiration to any remaining volume of air in the tissue. However the observation

ACC
EPTE
D M
ANU
SCR
IPT
ACCEPTED MANUSCRIPT
11
that the impregnated leaves show photosynthetic activity (Figure 8a) strongly suggests that not all air was
exhausted after VI. Photosynthesis measurements are also an indication of a possible restriction in gas
transport by VI because photosynthetic rates are much higher and therefore should be much more sensitive to
a restriction in gas transport. So, even in the case where photosynthesis is most inhibited, the gas transport is
still several-fold higher than the transport needed for saturating respiration with oxygen. The stronger
inhibition by sucrose and trehalose than by mannitol is fully consistent with that photosynthesis-driven sugar
accumulation in leaves negatively influences the photosynthetic rate (Paul & Foyer, 2001). In a separate
experiment, KCN and SHAM were impregnated together with the sugars (Figure 6). The results clearly
demonstrate that the metabolic response provoking the drastic and rapid increase in gross metabolism upon
VI depends on the mitochondrial oxygen consuming pathways. This is further supported by the observation
that under anaerobic condition the leaf metabolic activity is not stimulated by sucrose-impregnation (Figure
7b), but instead the metabolic activity is similar to the untreated leaves under aerobic condition (Figure 5).
The remaining background metabolic activity after VI with sucrose under anareobic conditions (Figure 7b),
is likely due to fermentation pathways, which in this case, but not in the presence of inhibitors (Figure 6),
can be induced during the time of equipment stabilisation by hypoxia-responsive gene expression (Bailey-
Serres et al. 2012). Such gene expression can, however, be prevented by respiratory inhibition, e.g. by
cyanide (Tucker & Laties 1984).
It has been demonstrated that exogenously administrated sucrose to Urtica dioica leaves is taken up
and metabolized by cells (Möller & Beck, 1992). Further, the respiration in spinach leaves is enhanced by
both the exogenous administration of sucrose and by light-induced elevations in endogenous carbohydrate
status (Noguchi & Terashima, 1997; Azcon-Bieto et al., 1983). As suggested by Voitsekhovskaya et al.
(2002), sucrose molecules loaded into the apoplast, can be co-transported with protons into the symplast,
leading to the decrease of the membrane potential. Thus, the plasma membrane ATPase is stimulated to
pump protons into the apoplast. Proton pumping consumes ATP and, by increasing the ADP symplastic
concentration, the respiration consequently increases.
Impregnated trehalose, provoking a drastic increase in the gross metabolic activity of spinach, also
suggests the possibility of its uptake and metabolization by the cells. Trehalose and trehalose-6-phosphate
(T6P) play a central role in the coordination of the metabolism in plants. Paul et al. (2008) reported a
possible regulatory function of trehalose and T6P on the size of the cellular pool of uridine diphosphoglucose
(UDPG) and hexose phosphates, i.e. glucose-1-phosphate (G1P), glucose-6-phosphate (G6P) and fructose-6-
phosphate (F6P). UDPG and G6P are two central molecules from which all other cellular functions can be
ultimately derived, including glycolysis and respiration. A possible role of trehalose on plant metabolism
was also shown by Müller et al. (1998), reporting that the invertase activity and sucrose catabolism were
stimulated in soybean seedlings either grown in the presence of trehalose or inoculated with a symbiotic
microrganism producing trehalose.

ACC
EPTE
D M
ANU
SCR
IPT
ACCEPTED MANUSCRIPT
12
The complex layered tissue morphology and the extensive intercellular space of spinach (Warmbrodt
& Van Der Woude, 1990) suggests that the leaf volume changes during VI, e.g. leaf expansion during
vacuum formation and volume decrease during atmospheric pressure restoration. During the two phases of
VI, tissue volume deformation may give an accumulation of mechanical stress in the cell-cell bonding zones
and the subsequent stress relaxation through either volume recovery or rupture response (Chiralt & Fito,
2003). Knight et al. (1991) showed that mechanical tissue deformation can increase intracellular calcium
concentration. Calcium is a dynamic signalling molecule, which acts to transduce numerous signals in plant
tissues (Trewavas & Knight, 1994) and calcium signalling might trigger a more rapid oxygen consumption
(Manzoor et al., 2012). The slight increase of spinach thermal power after the impregnation with either water
or mannitol isotonic solution may be related to calcium signalling promoted by tissue deformation occurring
during VI treatment. Mechanical signalling related to the tissue deformation may also contribute to the
metabolic response seen after impregnation with sucrose and trehalose solutions.
5. Concluding remarks
This study explored metabolic responses of spinach tissue that follows the application of VI. The
following are the main results:
i. The short-term metabolic response of spinach tissue to the application of VI involves mitochondrial
oxygen consuming pathways;
ii. The increase of spinach metabolism upon VI is related to the impregnated molecule. Metabolizable
molecules (e.g. sucrose, trehalose) are stimulants of metabolic activity. The direct effects of the
mechanical treatment appear to be quite low;
iii. Impregnation appears to reach a maximum while there still remain gas-filled compartments;
iv. Calorimetry is a simple and powerful method that gives information on metabolic responses
provoked by unit operations such as VI.
Acknowledgments The authors would like to thank the company „Norrvidinge Boställe AB‟, Kävlinge,
Sweden for providing the raw material. V. Panarese acknowledges the Marco Polo Programme, Italy, EU,
that financially supported this research. F Gómez Galindo acknowledges financial support from The
Swedish Research Council for Environment, Agricultural Sciences and Spatial Planning, FORMAS and the
European Community‟s Seventh Framework Programme (FP7/2007-2013) under grant agreement no.
245280, also known as PRESERF.

ACC
EPTE
D M
ANU
SCR
IPT
ACCEPTED MANUSCRIPT
13
References
Azcón-Bieto, J., Lambers, H., & Day, D. A. (1983). Effect of photosynthesis and carbohydrate status on
respiratory rates and the involvement of the alternative pathway in leaf respiration. Plant Physiology,
72(3), 598–603.
Bäckman, P., Breidenbach, R. W., Johansson, P., & Wadsö, I. (1995). A gas perfusion microcalorimeter for
studies of plant tissue. Thermochimica acta, 251, 323–333.
Bailey-Serres, J., Fukao, T., Gibbs, D. J., Holdsworth, M. J., Lee, S. C., Licausi, F., Perata, P., Voesenek, L.A.,
& van Dongen, J. T. (2012). Making sense of low oxygen sensing. Trends in plant science, 17(3), 129–
138.
Barrera, C., Betoret, N., Corell, P., & Fito, P. (2009). Effect of osmotic dehydration on the stabilization of
calcium-fortified apple slices (var. Granny Smith): Influence of operating variables on process kinetics
and compositional changes. Journal of food engineering, 92(4), 416–424.
Cantwell, M., & Suslow, T. (2002). Postharvest handling systems: fresh-cut fruits and vegetables. In A. Kader
(Ed.), Postharvest technology of horticultural crops (3rd ed., pp. 445–463). Davis: University of
California.
Carciofi, B. A., Prat, M., & Laurindo, J. B. (2012). Dynamics of vacuum impregnation of apples: Experimental
data and simulation results using a VOF model. Journal of Food Engineering, 113(2), 337–343.
Castelló, M. L., Fito, P. J., & Chiralt, A. (2010). Changes in respiration rate and physical properties of
strawberries due to osmotic dehydration and storage. Journal of food engineering, 97(1), 64–71.
Chiralt, A., & Fito, P. (2003). Transport mechanisms in osmotic dehydration: the role of the structure. Food
Science and Technology International, 9(3), 179–186.
Criddle, R. S., Breidenbach, R. W., & Hansen, L. D. (1991). Plant calorimetry: how to quantitatively compare
apples and oranges. Thermochimica Acta, 193, 67–90.
Delieu, T., & Walker, D. A. (1981). Polarographic measurement of photosynthetic oxygen evolution by leaf
discs. New Phytologist, 89(2), 165–178.
Fito, P., & Pastor, R. (1994). Non-diffusional mechanisms occurring during vacuum osmotic dehydration.
Journal of Food Engineering, 21(4), 513–519.
Foyer, C., Rowell, J., & Walker, D. (1983). The effect of sucrose on the rate of de novo sucrose biosynthesis in
leaf protoplasts from spinach wheat and barley. Archives of biochemistry and biophysics, 220(1), 232–
238.

ACC
EPTE
D M
ANU
SCR
IPT
ACCEPTED MANUSCRIPT
14
Galindo, F. G., Wadsö, L., Vicente, A., & Dejmek, P. (2008). Exploring metabolic responses of potato tissue
induced by electric pulses. Food biophysics, 3(4), 352–360.
Glazer, B. T., Marsh, A. G., Stierhoff, K., & Luther III, G. W. (2004). The dynamic response of optical oxygen
sensors and voltammetric electrodes to temporal changes in dissolved oxygen concentrations. Analytica
chimica acta, 518(1), 93–100.
Gras, M. L., Vidal, D., Betoret, N., Chiralt, A., & Fito, P. (2003). Calcium fortification of vegetables by vacuum
impregnation: Interactions with cellular matrix. Journal of Food Engineering, 56(2), 279–284.
Guillemin, A., Guillon, F., Degraeve, P., Rondeau, C., Devaux, M.-F., Huber, F., Badel, E., Saurel, R., &
Lahaye, M. (2008). Firming of fruit tissues by vacuum-infusion of pectin methylesterase: visualisation of
enzyme action. Food chemistry, 109(2), 368–378.
Jifon, J. L., & Syvertsen, J. P. (2003). Moderate shade can increase net gas exchange and reduce photoinhibition
in citrus leaves. Tree physiology, 23(2), 119–127.
Knight, M. R., Campbell, A. K., Smith, S. M., & Trewavas, A. J. (1991). Transgenic plant aequorin reports the
effects of touch and cold-shock and elicitors on cytoplasmic calcium.
Laurindo, J. B., Stringari, G. B., Paes, S. S., & Carciofi, B. A. M. (2007). Experimental determination of the
dynamics of vacuum impregnation of apples. Journal of food science, 72(8), E470–E475.
Lozano, J. E., Rotstein, E., & Urbicain, M. J. (1980). Total porosity and open‐ pore porosity in the drying of
fruits. Journal of Food Science, 45(5), 1403–1407.
Manzoor, H., Chiltz, A., Madani, S., Vatsa, P., Schoefs, B., Pugin, A., & Garcia-Brugger, A. (2012). Calcium
signatures and signaling in cytosol and organelles of tobacco cells induced by plant defense elicitors. Cell
calcium, 51(6), 434–444.
McCutchan, C. L., & Monson, R. K. (2001). Night‐ time respiration rate and leaf carbohydrate concentrations are
not coupled in two alpine perennial species. New phytologist, 149(3), 419–430.
Möller, I., & Beck, E. (1992). The fate of apoplastic sucrose in sink and source leaves of Urtica dioica.
Physiologia Plantarum, 85(4), 618–624.
Mujica-Paz, H., Valdez-Fragoso, A., López-Malo, A., Palou, E., & Welti-Chanes, J. (2003). Impregnation and
osmotic dehydration of some fruits: effect of the vacuum pressure and syrup concentration. Journal of
food engineering, 57(4), 305–314.
Müller, J., Boller, T., & Wiemken, A. (1998). Trehalose affects sucrose synthase and invertase activities in
soybean (Glycine max L. Merr.) roots. Journal of Plant Physiology, 153(1), 255–257.

ACC
EPTE
D M
ANU
SCR
IPT
ACCEPTED MANUSCRIPT
15
Noguchi, K., & Terashima, I. (1997). Different regulation of leaf respiration between Spinacia oleracea, a sun
species, and Alocasia odora, a shade species. Physiologia Plantarum, 101(1), 1–7.
Padmasree, K., Padmavathi, L., & Raghavendra, A. S. (2002). Essentiality of mitochondrial oxidative
metabolism for photosynthesis: optimization of carbon assimilation and protection against photoinhibition.
Critical Reviews in Biochemistry and Molecular Biology, 37(2), 71–119.
Paes, S. S., Stringari, G. B., & Laurindo, J. B. (2006). Effect of vacuum impregnation-dehydration on the
mechanical properties of apples. Drying technology, 24(12), 1649–1656.
Panarese, V., Dejmek, P., Rocculi, P., & Gómez Galindo, F. (2013). Microscopic studies providing insight into
the mechanisms of mass transfer in vacuum impregnation. Innovative Food Science & Emerging
Technologies, 18, 169–176.
Paul, M. J., & Foyer, C. H. (2001). Sink regulation of photosynthesis. Journal of Experimental Botany, 52, 1383-
1400.
Paul, M. J., Primavesi, L. F., Jhurreea, D., & Zhang, Y. (2008). Trehalose metabolism and signaling. Annu. Rev.
Plant Biol., 59, 417–441.
Phoon, P. Y., Galindo, F. G., Vicente, A., & Dejmek, P. (2008). Pulsed electric field in combination with
vacuum impregnation with trehalose improves the freezing tolerance of spinach leaves. Journal of food
engineering, 88(1), 144–148.
Trewavas, A., & Knight, M. (1994). Mechanical signalling, calcium and plant form. In Signals and Signal
Transduction Pathways in Plants (pp. 93–105). Springer.
Trip, P., Krotkov, G., & Nelson, C. D. (1964). Metabolism of mannitol in higher plants. American Journal of
Botany, 828–835.
Tucker, M. L., & Laties, G. G. (1984). Comparative effects of ethylene and cyanide on respiration, polysome
prevalence, and gene expression in carrot roots. Plant physiology, 75(2), 342–348.
Tylewicz, U., Romani, S., Widell, S., & Galindo, F. G. (2013). Induction of vesicle Formation by exposing apple
tissue to vacuum impregnation. Food and Bioprocess Technology, 6(4), 1099–1104.
Voitsekhovskaya, O. V., Heber, U., Wiese, C., Lohaus, G., Heldt, H.-W., & Gamalei, Y. V. (2002). Energized
uptake of sugars from the apoplast of leaves: A study of some plants possessing different minor vein
anatomy. Russian journal of plant physiology, 49(1), 44–53.
Walker, D., & Walker, R. (1987). The use of the oxygen electrode and fluorescence probes in simple
measurements of photosynthesis.

ACC
EPTE
D M
ANU
SCR
IPT
ACCEPTED MANUSCRIPT
16
Warmbrodt, R. D., & VanDer Woude, W. J. (1990). Leaf of Spinacia oleracea (spinach): ultrastructure, and
plasmodesmatal distribution and frequency, in relation to sieve-tube loading. American journal of botany,
1361–1377.

ACC
EPTE
D M
ANU
SCR
IPT
ACCEPTED MANUSCRIPT
17
Figure Captions
Figure 1. Schematic illustration of the AVCS: 1. Treatment chamber, 2. Pressure transmitter, 3. Valve
regulating air outlet, 4. Vacuum pump, 5. Valve regulating air inlet, 6. PLC. Arrows indicate the
direction of air flow. Solid lines represent pneumatic connections, dashed lines represent
electrical connections.
Figure 2. VI of spinach samples with a minimum pressure of 150 mbar. The complete process
involved 20 consecutive steps (indicated by numbers from 1 to 20). Each step is defined by two
parameters: duration (s) and absolute pressure (mbar).
Figure 3. A schematic picture of the experimental set-up that combines vacuum impregnation (VI)
and calorimetry.
Figure 4. Calorimetric measurements of metabolic thermal powers. Typical calorimeter output from
untreated spinach (dashed line) and spinach tissue subjected to VI with isotonic trehalose
solution (continuous line). In the continuous line the time of VI application is indicated with an
arrow and the variables T, t1, t2 and t3 are marked (see text for a further discussion).
Figure 5. Normalised calorimetric metabolic thermal power measurements of spinach samples
subjected to VI. Spinach was impregnated with sucrose solution (13%), trehalose solution
(11%), mannitol solution (8%), water or no solution (blank). Average curves from three
replicates are shown. The variable T (min) on the x-axis is discussed in the text.
Figure 6. Typical calorimeter output (μW) from spinach tissue subjected to VI with sucrose or
trehalose mixed with metabolic inhibitors (continuous line). The time of the VI application is
indicated with an arrow in the continuous line. The dashed line is from a baseline measurement
(no thermal power).
Figure 7. Calorimetric measurements of metabolic thermal powers under anaerobic condition. Typical
calorimeter output from a untreated spinach and b spinach tissue subjected to VI with isotonic
sucrose or trehalose solution. The timing for VI application, beginning of nitrogen flow and
ending of nitrogen flows are indicated with arrows. After flushing nitrogen the ampoule was
sealed to prevent oxygen from entering.
Figure 8. a Photosynthesis measurements on untreated spinach, and mannitol, sucrose and trehalose
impregnated spinach. Average and SEM from at least three replicates is reported. Different

ACC
EPTE
D M
ANU
SCR
IPT
ACCEPTED MANUSCRIPT
18
letters indicate statistical differences (p < 0.05); b Correlation between photosynthesis
measurements of oxygen production (molO2 min-1
cm-2
) and normalised thermal power for
untreated, mannitol, sucrose and trehalose impregnated spinach.

ACC
EPTE
D M
ANU
SCR
IPT
ACCEPTED MANUSCRIPT
19
Figure 1

ACC
EPTE
D M
ANU
SCR
IPT
ACCEPTED MANUSCRIPT
20
Figure 2

ACC
EPTE
D M
ANU
SCR
IPT
ACCEPTED MANUSCRIPT
21
Figure 3

ACC
EPTE
D M
ANU
SCR
IPT
ACCEPTED MANUSCRIPT
22
Figure 4
ACC
EPTE
D M
ANU
SCR
IPT
ACCEPTED MANUSCRIPT
23
Figure 5

ACC
EPTE
D M
ANU
SCR
IPT
ACCEPTED MANUSCRIPT
24
Figure 6

ACC
EPTE
D M
ANU
SCR
IPT
ACCEPTED MANUSCRIPT
25
Figure 7a

ACC
EPTE
D M
ANU
SCR
IPT
ACCEPTED MANUSCRIPT
26
Figure 7b

ACC
EPTE
D M
ANU
SCR
IPT
ACCEPTED MANUSCRIPT
27
Figure 8a

ACC
EPTE
D M
ANU
SCR
IPT
ACCEPTED MANUSCRIPT
28
Figure 8b

ACC
EPTE
D M
ANU
SCR
IPT
ACCEPTED MANUSCRIPT
29
Highlights
Short-term metabolic response to VI involves mitochondrial O2 consuming pathways;
Impregnation of metabolizable molecules stimulates the metabolic activity.
Impregnation reaches a maximum while there still remain gas-filled compartments;
Calorimetry gives information on metabolic responses provoked by VI.